UNITED STATES
SECURITIES AND EXCHANGE COMMISSION
Washington, D.C. 20549
FORM 6-K
REPORT OF FOREIGN PRIVATE ISSUER
Pursuant to Rule 13a-16 or 15d-16
under the Securities Exchange Act of 1934
For the month of May, 2014
Commission File Number: 333-13302
ETABLISSEMENTS DELHAIZE FRÈRES
ET CIE “LE LION” (GROUPE DELHAIZE)
(Exact name of registrant as specified in its charter)*
DELHAIZE BROTHERS AND CO.
“THE LION” (DELHAIZE GROUP)
(Translation of registrant’s name into English)*
SQUARE MARIE CURIE 40
1070 BRUSSELS, BELGIUM
(Address of principal executive offices)
* The registrant’s charter (articles of association) specifies the registrant’s name in French, Dutch and English.
Indicate by check mark whether the registrant files or will file annual reports under cover of Form 20-F or Form 40-F.
Form 20-F X Form 40-F
Indicate by check mark if the registrant is submitting the Form 6-K in paper as permitted by Regulation S-T Rule 101(b)(1):
Indicate by check mark if the registrant is submitting the Form 6-K in paper as permitted by Regulation S-T Rule 101(b)(7):
 | Interim Financial Reporting First Quarter 2014 Regulated Information May 7, 2014 – 7:00 a.m. CET | |
DELHAIZE GROUP FIRST QUARTER 2014 RESULTS
Financial Summary
| » | Revenue growth of 2.8% at identical exchange rates |
| » | Comparable store sales growth of 4.6% in the U.S. and -0.8% in Belgium |
| » | Group underlying operating profit of€161 million |
| » | Group underlying operating margin of 3.1% (3.6% in the U.S. and 3.1% in Belgium) |
» CEO Comments
Frans Muller, President and Chief Executive Officer of Delhaize Group, commented: “Our first quarter shows a mixed performance, with very strong revenues in the U.S. but disappointing results in Belgium. In the U.S., our comparable store sales growth was primarily driven by the continued momentum at Food Lion. Hannaford comparable store sales growth was also positive. As expected, our price investments and commodity cost increases impacted our margin. In Belgium, we experienced weak first quarter sales and profitability, being the result of continuing vigorous competition, requiring more promotions and price investments, as well as a further increase in SG&A costs. At the same time customer satisfaction improved compared to last year. While we continued to face challenges in Serbia, we achieved comparable store sales growth and further market share gains in Greece and Romania.”
“In light of our focus on our core markets announced in March, we have recently signed agreements to divest our Bulgarian and Bosnian & Herzegovinian operations. We are on track to implement our strategy of Easy, Fresh & Affordable at 77 Food Lion stores later in the year. In Belgium, we are working on further differentiating the customer experience in our stores. The opening of two next generation stores in Belgium 10 days ago, bringing to life our new strategy centered on ‘buy well, eat well’, is an important step to improve our performance.”
“We re-iterate that, for 2014, our capital expenditures will increase to approximately€625 million at identical exchange rates and we plan to open 180 stores. We also intend to continue to generate a healthy level of free cash flow.”
» Financial Summary
| Q1 2014(1) | ||||||||||||
|
| |||||||||||
| € in millions, except EPS (in €) | Actual Results | At Actual Rates | At Identical Rates | |||||||||
|
|
| ||||||||||
Revenues | 5 120 | +0.3% | +2.8% | |||||||||
EBITDA | 301 | -2.9% | -0.4% | |||||||||
Operating profit | 156 | -5.7% | -3.1% | |||||||||
Operating margin | 3.0% | - | - | |||||||||
Underlying operating profit | 161 | -16.5% | -14.2% | |||||||||
Underlying operating margin | 3.1% | - | - | |||||||||
Profit before taxes and discontinued operations | 112 | -6.0% | -3.5% | |||||||||
Net profit from continuing operations | 90 | -9.6% | -7.2% | |||||||||
Group share in net profit | 80 | +57.6% | +63.0% | |||||||||
Basic earnings per share - Group share in net profit | 0.79 | +57.0% | +62.5% | |||||||||
|
|
| ||||||||||
| (1) | The average exchange rate of the U.S. dollar against the euro weakened by 3.6% in the first quarter of 2014 (€1= $1.3696) compared to the first quarter of 2013. |
| Delhaize Group – Earnings Release – First Quarter 2014 | 1 of 21 | |||||
» First Quarter 2014 Income Statement
Revenues
In the first quarter of 2014, Delhaize Group’s revenues increased by 0.3% and 2.8% at actual and identical exchange rates, respectively. The latter equals the organic revenue growth.
In the U.S., revenues grew by 4.1% in local currency, supported by strong comparable store sales growth of 4.6% partly offset by a 0.8% negative calendar impact due to the timing of Easter. The 4.6% U.S. comparable store sales growth was fueled by solid momentum at Food Lion, helped by severe winter weather, which boosted our sales. Hannaford also realized positive comparable store sales growth. Retail inflation in the U.S. was slightly negative at -0.2%. Revenues at Delhaize Belgium decreased by 0.8%, impacted by a comparable store sales evolution of -0.8% and a calendar impact of -0.7%. Retail inflation in Belgium decreased compared to previous quarters and stood at 1.4%. Revenues in Southeastern Europe grew by 3.5% at identical exchange rates, driven by positive comparable store sales growth and volume growth in Greece and Romania and store openings in both countries. Serbia’s negative revenue growth weighted on the segment’s overall performance, which in total recorded a comparable store sales evolution of -0.4%.
Gross margin
Gross margin was 24.0% of revenues, a 58 basis points decrease at identical exchange rates, as a result of continued price investments across the Group, commodity cost increases in the U.S. and higher promotions in Belgium, partly offset by improved supplier terms in Southeastern Europe.
Other operating income
Other operating income was in line with last year at€26 million.
Selling, general and administrative expenses
Selling, general and administrative expenses (SG&A) were 21.3% of revenues and were flat both at actual and identical exchange rates. SG&A as a percentage of revenues decreased in the U.S. as a result of positive sales leverage and the reorganization done last year, while expenses continued to increase in Belgium due to higher staff and remodeling related costs.
Other operating expenses
Other operating expenses were€6 million compared to€28 million last year, which included reorganization and store closing charges in the U.S.
Underlying operating profit
Underlying operating profit decreased by 16.5% at actual exchange rates and 14.2% at identical exchange rates. The decrease in underlying operating profit was most significant in Belgium, due to weak sales combined with price and promotional investments and higher costs. U.S. profitability continued to be impacted by the price investments in both Food Lion’s Phases 4 and 5 stores and Hannaford. Underlying operating margin was 3.1% of revenues compared to 3.8% in the first quarter of 2013.
EBITDA
EBITDA decreased by 2.9% to€301 million, or 0.4% at identical exchange rates.
Operating profit
Operating profit decreased from€166 million to€156 million as a result of a lower gross profit partly offset by lower other operating expenses.
Net financial expenses
Net financial expenses decreased by 4.4%, or 1.4% at identical exchange rates, to€45 million compared to the€48 million reported in the first quarter last year primarily as a result of lower net debt.
Income tax
During the first three months of 2014, the effective tax rate (from continued operations) was 20.1% compared to 16.8% in the first quarter of last year. The increase relates primarily to non recurring tax benefits, which were recognized in our Serbian business last year.
Net profit from continuing operations
Net profit from continuing operations was€90 million compared to€99 million in last year´s first quarter. This resulted in€0.88 basic earnings per share compared to€0.98 in the first quarter of 2013.
| Delhaize Group – Earnings Release – First Quarter 2014 | 2 of 21 | |||||
Result from discontinued operations
Result from discontinued operations was a loss of€10 million, which included€14 million of impairment losses to write down the carrying value of Delhaize’s Bulgarian and Bosnian & Herzegovinian operations to their estimated fair value less cost to sell. The first quarter of 2013 resulted in a loss of€48 million, primarily due to€65 million store closing charges at Sweetbay.
Net profit
Group share in net profit amounted to€80 million compared to€51 million last year. Basic and diluted net profit per share was€0.79 and€0.78, respectively compared to€0.50 last year in both cases.
» Cash Flow Statement and Balance Sheet
Free cash flow
The Group generated€87 million free cash flow in the first quarter of 2014, which includes€41 million ($56 million) from the first part of the proceeds from the divestiture of Sweetbay, Harveys and Reid’s. The decrease compared to the€255 million generated last year is mainly due to higher payments of accounts payable partly due to timing, and the payment of a higher bonus in the U.S.
Net debt
The net debt to EBITDA ratio was 1.1 at the end of the first quarter compared to 1.3 at the end of the first quarter 2013. Compared to the end of 2013, net debt decreased by€82 million to€1.4 billion as a result of free cash flow generation.
| Delhaize Group – Earnings Release – First Quarter 2014 | 3 of 21 | |||||
» Segment Information (at actual exchange rates)(1)
| Q1 2014 | Revenues | Underlying Operating Margin (4) | Underlying Operating Profit/(Loss) (4) | |||||||||||||||
| (in millions) | Q1 2014 | Q1 2013 | 2014 /2013 | Q1 2014 | Q1 2013 | Q1 2014 | Q1 2013 | 2014 /2013 | ||||||||||
United States(2) | $ | 4 353 | 4 183 | +4.1% | 3.6% | 4.0% | 155 | 169 | -8.2% | |||||||||
United States(2) | € | 3 179 | 3 168 | +0.3% | 3.6% | 4.0% | 113 | 128 | -11.5% | |||||||||
Belgium | € | 1 210 | 1 220 | -0.8% | 3.1% | 4.8% | 38 | 59 | -36.0% | |||||||||
Southeastern Europe(3) | € | 731 | 716 | +2.1% | 1.9% | 2.2% | 14 | 16 | -10.9% | |||||||||
Corporate | € | - | - | N/A | N/A | N/A | (4) | (10) | +62.1% | |||||||||
TOTAL | € | 5 120 | 5 104 | +0.3% | 3.1% | 3.8% | 161 | 193 | -16.5% | |||||||||
| (1) | 2014 affected by and 2013 restated for the impact of IFRIC 21,Levies, see additional information on page 21 |
| (2) | The segment “United States” excludes Sweetbay, Harveys and Reid’s which are currently in the process of being sold. |
| (3) | The segment “Southeastern Europe” includes our operations in Greece, Serbia and Romania. Bulgaria and Bosnia & Herzegovina are included in discontinued operations given their planned divestiture. |
| (4) | For a definition of underlying operating profit, please refer to the “Definitions” page of this document. A reconciliation with reported operating profit is provided on page 17. |
United States
In the first quarter of 2014, revenues in the U.S. increased by 4.1% to $4.4 billion (€3.2 billion). Comparable store sales increased by 4.6% (adjusted for a negative calendar impact of 0.8%), with very strong performance at Food Lion, helped by the severe winter weather, and positive comparable store sales growth at Hannaford. Retail inflation remained negative at -0.2% as a result of the price investments in Food Lion Phase 4 and 5 stores and at Hannaford, although inflation started to increase in some fresh categories.
Underlying operating profit decreased by 8.2% to $155 million resulting in an underlying operating margin of 3.6% compared to 4.0% last year. This decrease is due to a lower gross margin, as a result of price investments, commodity cost increases and costs related to the snow storms, while our SG&A as a percentage of revenues decreased primarily as a result of positive sales leverage and last year’s reorganization.
Belgium
Revenues in Belgium were€1.2 billion, a decrease of 0.8% compared to the first quarter of 2013, with comparable store sales evolution of -0.8% (partly impacted by some large supermarkets being remodeled) and a negative calendar impact of 0.7% partly offset by store openings. Retail inflation decreased to 1.4%, compared to 2.1% in the fourth quarter of 2013. The Belgian market remained very competitive.
Underlying operating profit decreased by 36.0% to€38 million as a result of lower revenues, more promotions and price investments, higher staff costs and increased remodeling related expenses.
Southeastern Europe
In the first quarter of 2014, revenues in Southeastern Europe increased by 2.1% to€731 million (+3.5% at identical exchange rates). Both Greece and Romania experienced positive comparable store sales growth and increased their store networks, while Serbia’s revenues declined. Comparable store sales evolution was -0.4% for the segment.
Underlying operating profit decreased by 10.9% to€14 million (-9.9% at identical exchange rates), while the underlying operating margin decreased from 2.2% to 1.9%, as the weak performance in Serbia more than offsets Greece and Romania’s underlying operating profit growth.
| Delhaize Group – Earnings Release – First Quarter 2014 | 4 of 21 | |||||
» 2014 Outlook
We re-iterate our full year outlook as communicated in March. For 2014, we expect Group capital expenditures of approximately€625 million at identical exchange rates excluding leases, and plan to open 180 new stores. In addition, we plan to generate a healthy level of free cash flow.
» Conference Call and Webcast
Delhaize Group’s management will comment on the first quarter 2014 results during a conference call starting May 7, 2014 at 09:00 am CET / 03:00 am ET. The conference call can be attended by calling +44 (0)20 3427 1919 (U.K.), +1 212 444 0896 (U.S.) or +32 2 404 0662 (Belgium), with “Delhaize” as password. The conference call will also be broadcast live over the internet athttp://www.delhaizegroup.com. An on-demand replay of the webcast will be available after the conference call athttp://www.delhaizegroup.com.
» Delhaize Group
Delhaize Group is a Belgian international food retailer present in nine countries on three continents. At the end of the first quarter of 2014, Delhaize Group’s sales network consisted of 3 520 stores. In 2013, Delhaize Group posted€20.9 billion ($27.8 billion) in revenues and€179 million ($237 million) in net profit (Group share). At the end of 2013, Delhaize Group employed approximately 160 000 people. Delhaize Group’s stock is listed on NYSE Euronext Brussels (DELB) and the New York Stock Exchange (DEG).
This press release is available in English, French and Dutch. You can also find it on the websitehttp://www.delhaizegroup.com. Questions can be sent toinvestor@delhaizegroup.com.
» Financial Calendar
| — Ordinary Shareholder’s Meeting | May 22, 2014 | |
— Press release – 2014 second quarter results | August 7, 2014 | |
— Press release – 2014 third quarter results | November 6, 2014 |
» Contacts
Investor Relations: + 32 2 412 2151
Media Relations: + 32 2 412 8669
| Delhaize Group – Earnings Release – First Quarter 2014 | 5 of 21 | |||||
DELHAIZE GROUP CONDENSED CONSOLIDATED FINANCIAL STATEMENTS
» Condensed Consolidated Balance Sheet (Unaudited)
| (in millions of€) | March 31, 2014 | December 31, 2013 | March 31, 2013 | |||
Assets | ||||||
Non-current assets | 7 812 | 7 930 | 8 838 | |||
Goodwill | 2 960 | 2 959 | 3 270 | |||
Intangible assets | 713 | 732 | 866 | |||
Property, plant and equipment | 3 882 | 3 973 | 4 316 | |||
Investment property | 88 | 100 | 118 | |||
Investments accounted for using the equity method | 26 | 24 | 29 | |||
Financial assets | 29 | 29 | 32 | |||
Derivative instruments | 4 | 1 | 71 | |||
Other non-current assets | 110 | 112 | 136 | |||
Current assets | 3 642 | 3 665 | 3 401 | |||
Inventories | 1 319 | 1 353 | 1 446 | |||
Receivables and other assets | 680 | 722 | 744 | |||
Financial assets | 219 | 151 | 176 | |||
Derivative instruments | 41 | 40 | - | |||
Cash and cash equivalents | 1 147 | 1 149 | 1 025 | |||
Assets classified as held for sale | 236 | 250 | 10 | |||
Total assets | 11 454 | 11 595 | 12 239 | |||
Liabilities | ||||||
Total equity | 5 156 | 5 074 | 5 361 | |||
Shareholders’ equity | 5 150 | 5 068 | 5 359 | |||
Non-controlling interests | 6 | 6 | 2 | |||
Non-current liabilities | 3 335 | 3 377 | 4 024 | |||
Long-term debt | 2 019 | 2 011 | 2 348 | |||
Obligations under finance lease | 487 | 496 | 615 | |||
Deferred tax liabilities | 411 | 443 | 526 | |||
Derivative instruments | 6 | 8 | 26 | |||
Provisions | 356 | 355 | 440 | |||
Other non-current liabilities | 56 | 64 | 69 | |||
Current liabilities | 2 963 | 3 144 | 2 854 | |||
Long-term debt - current portion | 223 | 228 | 84 | |||
Obligations under finance lease | 60 | 59 | 62 | |||
Bank overdrafts | - | 4 | - | |||
Accounts payable | 1 799 | 1 993 | 1 922 | |||
Derivative instruments | 3 | 3 | - | |||
Other current liabilities | 803 | 799 | 786 | |||
Liabilities associated with assets held for sale | 75 | 58 | - | |||
Total liabilities and equity | 11 454 | 11 595 | 12 239 | |||
$ per€ exchange rate | 1.3788 | 1.3791 | 1.2805 |
| Delhaize Group – Earnings Release – First Quarter 2014 | 6 of 21 | |||||
» Condensed Consolidated Income Statement (Unaudited)
| (in millions of€) | Q1 2014 | Q1 2013 | ||
Revenues | 5 120 | 5 104 | ||
Cost of sales | (3 891) | (3 847) | ||
Gross profit | 1 229 | 1 257 | ||
Gross margin | 24.0% | 24.6% | ||
Other operating income | 26 | 26 | ||
Selling, general and administrative expenses | (1 093) | (1 089) | ||
Other operating expenses | (6) | (28) | ||
Operating profit | 156 | 166 | ||
Operating margin | 3.0% | 3.2% | ||
Finance costs | (47) | (48) | ||
Income from investments | 2 | - | ||
Share of results of joint venture equity accounted | 1 | 1 | ||
Profit before taxes and discontinued operations | 112 | 119 | ||
Income tax expense | (22) | (20) | ||
Net profit from continuing operations | 90 | 99 | ||
Result from discontinued operations, net of tax | (10) | (48) | ||
Net profit | 80 | 51 | ||
Net profit attributable to non-controlling interests | - | - | ||
Net profit attributable to equity holders of the Group - Group share in net profit | 80 | 51 | ||
(in€, except number of shares) | ||||
Group share in net profit from continuing operations: | ||||
Basic earnings per share | 0.88 | 0.98 | ||
Diluted earnings per share | 0.88 | 0.97 | ||
Group share in net profit: | ||||
Basic earnings per share | 0.79 | 0.50 | ||
Diluted earnings per share | 0.78 | 0.50 | ||
Weighted average number of shares outstanding: | ||||
Basic | 101 249 489 | 100 886 106 | ||
Diluted | 101 725 647 | 101 323 375 | ||
Shares issued at the end of the period | 102 449 570 | 101 921 498 | ||
Shares outstanding at the end of the period | 101 254 130 | 100 893 033 | ||
Average $ per€ exchange rate | 1.3696 | 1.3206 |
| Delhaize Group – Earnings Release – First Quarter 2014 | 7 of 21 | |||||
» Condensed Consolidated Statement of Comprehensive Income (Unaudited)
| (in millions of€) | Q1 2014 | Q1 2013 | ||
Net profit of the period
|
80 |
51 | ||
Total items that will not be reclassified to profit or loss | - | - | ||
Unrealized gain (loss) on financial assets available for sale | 1 | - | ||
Reclassification adjustment to net profit | - | - | ||
Tax (expense) benefit | - | - | ||
Unrealized gain (loss) on financial assets available for sale, net of tax | 1 | - | ||
Exchange gain (loss) on translation of foreign operations | (1) | 121 | ||
Reclassification adjustment to net profit | - | (1) | ||
Exchange gain (loss) on translation of foreign operations
| (1) | 120 | ||
Total items that are or may be reclassified subsequently to profit or loss | - | 120 | ||
Other comprehensive income | - | 120 | ||
Attributable to non-controlling interests | - | - | ||
Attributable to equity holders of the Group | - | 120 | ||
Total comprehensive income for the period | 80 | 171 | ||
Attributable to non-controlling interests | - | - | ||
Attributable to equity holders of the Group | 80 | 171 |
| Delhaize Group – Earnings Release – First Quarter 2014 | 8 of 21 | |||||
» Condensed Consolidated Statement of Changes in Equity (Unaudited)
| (in millions of€, except number of shares) | Shareholders’ Equity | Non-controlling Interests | Total Equity | |||
Balances at January 1, 2014 | 5 068 | 6 | 5 074 | |||
Other comprehensive income | - | - | - | |||
Net profit | 80 | - | 80 | |||
Total comprehensive income for the period | 80 | - | 80 | |||
Share-based compensation expense | 2 | - | 2 | |||
Balances at March 31, 2014 | 5 150 | 6 | 5 156 | |||
Shares issued | 102 449 570 | |||||
Treasury shares | 1 195 440 | |||||
Shares outstanding | 101 254 130 |
| (in millions of€, except number of shares) | Shareholders’ Equity | Non-controlling Interests | Total Equity | |||
Balances at January 1, 2013 | 5 184 | 2 | 5 186 | |||
Other comprehensive income | 120 | - | 120 | |||
Net profit | 51 | - | 51 | |||
Total comprehensive income for the period | 171 | - | 171 | |||
Excess tax benefit on employee stock options and restricted stock units | 1 | - | 1 | |||
Share-based compensation expense | 3 | - | 3 | |||
Balances at March 31, 2013 | 5 359 | 2 | 5 361 | |||
Shares issued | 101 921 498 | |||||
Treasury shares | 1 028 465 | |||||
Shares outstanding | 100 893 033 |
| Delhaize Group – Earnings Release – First Quarter 2014 | 9 of 21 | |||||
» Condensed Consolidated Statement of Cash Flows (Unaudited)
| (in millions of€) | Q1 2014 | Q1 2013 | ||
Operating activities | ||||
Net profit | 80 | 51 | ||
Adjustments for: | ||||
Share of results of joint venture equity accounted | (1) | (1) | ||
Depreciation and amortization | 144 | 155 | ||
Impairment losses | 16 | - | ||
Income taxes, finance costs and income from investments | 72 | 50 | ||
Other non-cash items | 3 | 3 | ||
Changes in operating assets and liabilities | (154) | 98 | ||
Interest paid | (32) | (26) | ||
Interest received | 3 | 1 | ||
Income taxes paid | (10) | (5) | ||
Net cash provided by operating activities | 121 | 326 | ||
Investing activities | ||||
Business acquisitions and disposals | 37 | (1) | ||
Purchase of tangible and intangible assets (capital expenditures) | (79) | (78) | ||
Sale of tangible and intangible assets | 7 | 8 | ||
Net investment in debt securities | - | (42) | ||
Net investment in term deposits | (68) | (36) | ||
Other investing activities | 1 | - | ||
Net cash used in investing activities | (102) | (149) | ||
Financing activities | ||||
Borrowings under (repayments of) long-term loans, net of direct financing costs | (12) | (90) | ||
Settlement of derivative instruments | (1) | (1) | ||
Net cash used in financing activities | (13) | (91) | ||
Effect of foreign currency translation | (1) | 18 | ||
Net increase in cash and cash equivalents | 5 | 104 | ||
Cash and cash equivalents at beginning of period | 1 147 (2) | 921 (1) | ||
Cash and cash equivalents at end of period | 1 152 (3) | 1 025 |
| (1) | Includes €1 million in assets classified as held for sale |
| (2) | Includes €2 million in assets classified as held for sale, net of €4 million bank overdrafts |
| (3) | Includes €5 million in assets classified as held for sale |
| Delhaize Group – Earnings Release – First Quarter 2014 | 10 of 21 | |||||
» Selected Explanatory Notes
General information
Delhaize Group is a Belgian international food retailer with operations in nine countries on three continents. The Company’s stock is listed on NYSE Euronext Brussels (DELB) and the New York Stock Exchange (DEG).
The condensed interim financial statements of the Group for the three months ended March 31, 2014 were authorized for issue by the Board of Directors on May 6, 2014.
This interim report only provides an explanation of events and transactions that are significant to an understanding of the changes in financial position and reporting since the last annual reporting period, and should therefore be read in conjunction with the consolidated financial statements for the financial year ended on December 31, 2013.
Basis of presentation and accounting policies
These condensed interim financial statements have been prepared in accordance with International Accounting Standard (IAS) 34Interim Financial Reporting, as issued by the International Accounting Standards Board (IASB), and as adopted by the European Union (EU).
The condensed interim financial statements are presented in millions of euros, the Group’s presentation currency, except where stated otherwise.
The accounting policies applied in this report are consistent with those of the previous financial year except for the impact of new accounting pronouncements adopted in 2014, of which the most important ones for Delhaize Group are listed below:
| — | IFRIC 21 Levies; |
| — | Amendments to IAS 32Offsetting Financial Assets and Financial Liabilities; |
| — | Amendments to IAS 39Novation of Derivatives and Continuation of Hedge Accounting; and |
| — | Amendments to IFRS 10, IFRS 12 and IAS 27 regardingInvestment Entities. |
Except for the impact of IFRIC 21, the initial application of these new, amended or revised pronouncements did not have a material impact on the financial position and financial performance of the Group.
IFRIC 21 requires recognising levies in full when the obligating event that triggers the payment of the levy, as identified by the relevant legislation, occurs. In accordance with the interpretation, several levies (for example property or similar taxes), mainly in the U.S. and Belgium, can no longer be spread over the calendar year, and are recorded in full at the date of the obligating event.
While from a financial year perspective, the impact of IFRIC 21 is insignificant, it has an impact on the Group’s quarterly results, as in some cases the timing of recognition has changed significantly. For the first quarter of 2013, operating profit was negatively impacted by€13 million (mainly in selling, general and administrative expenses) and net profit by€10 million. Correspondingly, basic and diluted earnings per share in net profit (Group share) were both negatively impacted by€0.10.
In accordance with IAS 8 the changes have been made retrospectively and the comparative periods have been restated. As said, the overall annual impact is immaterial for the Group, with a total negative impact on shareholders’ equity of€2 million for December 31, 2013 and 2012, respectively and€3 million for 2011. Profit and loss timing impact resulted in an increase in both basic and diluted earnings per share (Group share in net profit) of€ 0.01 for 2012, with no impact for 2013.
For additional details on the new accounting pronouncements, see Note 2.5 of the Delhaize Group 2013 consolidated financial statements.
Delhaize Group did not early adopt any new IASB pronouncements that were issued but not yet effective at the balance sheet date.
| Delhaize Group – Earnings Release – First Quarter 2014 | 11 of 21 | |||||
Segment reporting
Segment information, including a reconciliation from operating profit to underlying operating profit, required by IAS 34, can be found on pages 17 and 18 of this press release and forms an integral part of this report.
Business combinations
During 2014, Delhaize Group entered into several agreements in Southeastern Europe that have resulted in the acquisition of businesses and were accounted for as business combinations. The total consideration transferred during the first quarter for these transactions was€4 million and resulted in an increase of goodwill of€3 million.
Divestitures and discontinued operations
Disposal groups and assets held for sale
At March 31, 2014, the carrying value of assets classified as held for sale and associated liabilities were as follows:
(in millions of€) | March 31, 2014 | |||
Intangible assets | 10 | |||
Property, plant and equipment | 159 | |||
Investment property | 2 | |||
Inventories | 55 | |||
Receivables and other current assets | 5 | |||
Cash and cash equivalents | 5 | |||
|
| |||
Assets classified as held for sale | 236 | |||
Less: | ||||
Obligations under finance lease | (28) | |||
Non-current liabilities | (9) | |||
Accounts payable, accrued expenses and other liabilities | (38) | |||
|
| |||
Assets classified as held for sale, net of associated liabilities | 161 | |||
Disposal of Bulgarian and Bosnian & Herzegovinian operations
On February 26, 2014 and April 1, 2014, respectively, Delhaize Group announced the planned sale of its Bulgarian operations to AP Mart and of Delhaize Bosnia & Herzegovina to Tropic Group B.V. Both activities are part of the “Southeastern Europe” segment and the Group classified the related assets and liabilities as disposal groups held for sale. These transactions also meet the requirements of discontinued operations and therefore, the profit or loss after tax relating to our operations in Bulgaria and Bosnia & Herzegovina has been classified as “Result from discontinued operations” and comparative information re-presented.
The sale transactions of the Bulgarian and Bosnian & Herzegovinian operations are expected to close in the second and third quarter of 2014, respectively. Both transactions are subject to regulatory approval as well as customary closing conditions and working capital adjustments.
Disposal of Sweetbay, Harveys and Reid’s
On May 27, 2013, Delhaize Group signed an agreement with Bi-Lo Holdings to divest its Sweetbay, Harveys, and Reid´s operations. The sales price is $267 million (€194 million) in cash, to be reduced by $20 million (€15 million) for restrictions imposed during the regulatory approval process and subject to other customary adjustments. The assets and liabilities of Sweetbay, Harveys and Reid’s, part of the “United States” segment, have been presented as “held for sale” as of the second quarter of 2013 and the operating results for such banners for all periods presented were classified as “Results from discontinued operations” in the income statement. In 2013, the stores included in the transaction generated revenues of approximately $1.7 billion.
On February 25, 2014, Delhaize Group received approval from the U.S. Federal Trade Commission (FTC) to proceed with the sale of its Sweetbay, Harveys and Reid’s operations to Bi-Lo Holdings. As part of the clearance, Bi-Lo Holdings agreed to divest 12 Delhaize America stores and Delhaize Group agreed to retain two other stores and convert them into the Food Lion banner.
| Delhaize Group – Earnings Release – First Quarter 2014 | 12 of 21 | |||||
In a first phase, at the end of the first quarter of 2014, Delhaize Group sold 35 operating Sweetbay stores and 2 previously closed stores to Bi-Lo Holdings for an initial net cash consideration of€41 million. The transaction will take place in different phases and is expected to be completed in the first half of 2014.
Disposal of individual properties
Delhaize Group has also identified a number of individual properties, mainly small shops, office buildings, pharmacies or bank branches, which it considers not incremental to its retail operations. During the first quarter of 2014, Delhaize America reclassified a Sweetbay distribution center, which was not part of the Bi-Lo Holdings’ agreement and used to continue to supply operating Sweetbay stores through April 12, 2014. The carrying value of individual properties held for sale amounts to€31 million at March 31, 2014, of which€28 million in the U.S. and including€17 million related to the DC and€3 million in the “Southeastern Europe” segment.
Discontinued operations
As mentioned above, the Bulgarian operations, Delhaize Bosnia & Herzegovina and the banners Sweetbay, Harveys and Reid’s qualified as discontinued operations.
The overall “Result from discontinued operations” and corresponding net cash flows of the entities classified as discontinued operations are summarized as follows:
(in millions of€, except per share information) | Q1 2014 | Q1 2013 | ||||||||||
Revenues | 354 | 417 | ||||||||||
Cost of sales | (265) | (310) | ||||||||||
Other operating income | 1 | 5 | ||||||||||
Selling, general and administrative expenses | (80) | (110) | ||||||||||
Other operating expenses | (1) | (68) | ||||||||||
Net financial costs | (4) | (2) | ||||||||||
|
|
|
| |||||||||
Result before tax | 5 | (68) | ||||||||||
Income taxes | (1) | 20 | ||||||||||
|
|
|
| |||||||||
Result of discontinued operations (net of tax) | 4 | (48) | ||||||||||
Pre-tax loss recognized on re-measurement of assets of disposal groups | (14) | - | ||||||||||
Income taxes | - | - | ||||||||||
|
|
|
| |||||||||
Result from discontinued operations (net of tax), fully attributable to equity holders of the Group | (10) | (48) | ||||||||||
Basic earnings per share from discontinued operations | (0.10) | (0.48) | ||||||||||
Diluted earnings per share from discontinued operations | (0.10) | (0.47) | ||||||||||
Operating cash flows | (8) | (13) | ||||||||||
Investing cash flows | (1) | (2) | ||||||||||
Financing cash flows | 2 | (1) | ||||||||||
|
|
|
| |||||||||
Total cash flows | (7) | (16) | ||||||||||
In 2014, the Group recognized a total impairment loss of€14 million to write down the carrying value of its Bulgarian operations and Delhaize Bosnia & Herzegovina to their estimated fair value less cost to sell.
| Delhaize Group – Earnings Release – First Quarter 2014 | 13 of 21 | |||||
» Balance Sheet and Cash Flow Statement
Capital expenditures
During the first quarter of 2014, Delhaize Group incurred capital expenditures of€79 million, consisting of€65 million in property, plant and equipment and€14 million in intangible assets.
In addition, the Group added property under finance leases in the first quarter of 2014 for a total amount of€4 million. The carrying amount of tangible and intangible assets that were sold or disposed in 2014 was€5 million.
Equity
In the first quarter of 2014, Delhaize Group did not purchase any treasury shares and used 5 503 treasury shares satisfying mainly the exercise of stock options that were granted as part of the share-based incentive plans. At March 31, 2014, the Group owned 1 195 440 treasury shares.
Dividends
The gross dividend payment of€1.56 per share, proposed by the Board of Directors in the 2013 financial statements is subject to shareholder’s approval at the Ordinary Shareholders’ Meeting of May 22, 2014 and will be paid thereafter.
Financial instruments
Financial instruments measured at fair value by fair value hierarchy:
March 31, 2014 | ||||||||||||||||
(in millions of€) | Quoted prices in active markets (Level 1) | Significant other observable inputs (Level 2) | Significant unobservable inputs (Level 3) | Total | ||||||||||||
Financial Assets | ||||||||||||||||
Non-Current | ||||||||||||||||
Financial assets – measured at fair value | 8 | - | - | 8 | ||||||||||||
Derivative instruments | - | 4 | - | 4 | ||||||||||||
Current | ||||||||||||||||
Financial assets – measured at fair value | 127 | - | - | 127 | ||||||||||||
Derivative instruments | - | 41 | - | 41 | ||||||||||||
|
|
|
|
|
|
|
| |||||||||
Total financial assets measured at fair value | 135 | 45 | - | 180 | ||||||||||||
Financial assets measured at amortized cost | 1 823 | |||||||||||||||
|
| |||||||||||||||
Total financial assets | 2 003 | |||||||||||||||
Financial Liabilities | ||||||||||||||||
Non-Current | ||||||||||||||||
Derivative instruments | - | 6 | - | 6 | ||||||||||||
Current | ||||||||||||||||
Derivative instruments | - | 3 | - | 3 | ||||||||||||
|
|
|
|
|
|
|
| |||||||||
Total financial liabilities measured at fair value | - | 9 | - | 9 | ||||||||||||
Financial liabilities being part of a fair value hedge relationship | 531 | |||||||||||||||
Financial liabilities measured at amortized cost | 4 057 | |||||||||||||||
|
| |||||||||||||||
Total financial liabilities | 4 597 | |||||||||||||||
During the period there was no transfer between fair value hierarchy levels and there were no changes in the valuation techniques and inputs applied.
| Delhaize Group – Earnings Release – First Quarter 2014 | 14 of 21 | |||||
Fair value of financial instruments not measured at fair value:
(in millions of€) | Carrying amount | Fair value | ||||||
Financial liabilities being part of a fair value hedge relationship | 531 | 548 | ||||||
Financial liabilities at amortized cost | 1 711 | 2 056 | ||||||
Total long-term debt | 2 242 | 2 604 | ||||||
The fair value of the receivables, other financial assets, cash and cash equivalents and accounts payable, all measured at amortized cost, approximate their carrying amounts.
» Income Statement
Other operating income
| (in millions of€) | Q1 2014 | Q1 2013 | ||
| Rental income | 13 | 12 | ||
| Income from waste recycling activities | 5 | 5 | ||
| Services rendered to wholesale customers | 2 | 1 | ||
| Gain on sale of property, plant and equipment | 2 | 3 | ||
| Other | 4 | 5 | ||
| Total | 26 | 26 |
Other operating expenses
| (in millions of€) | Q1 2014 | Q1 2013 | ||
| Store closing expenses | (1) | (7) | ||
| Reorganization expenses | - | (16) | ||
| Impairment losses | (2) | - | ||
| Loss on sale of property, plant and equipment | (2) | (4) | ||
| Other | (1) | (1) | ||
| Total | (6) | (28) |
In the first quarter of 2013, the Group recorded€16 million reorganization charges related to the severance of support services senior management and employees in the U.S.
Income taxes
During the first quarter of 2014, the effective tax rate (on continued operations) was 20.1%, compared to previous year’s rate of 16.8%. Prior year’s tax rate was lower primarily due to non-recurring tax benefit which was recognized at Delhaize Serbia.
Related party transactions
On March 13, 2014, Nicolas Hollanders, Executive Vice President HR, IT and Sustainability, and the Company entered into a mutually separation agreement that provided Mr. Hollanders with ten months of total direct compensation and benefits, and accelerated or forward vesting of his previously awarded long-term incentive grants. As a result, the Group recognized termination benefits of€1.8 million.
» Contingencies, Commitments and Guarantees
Following the closing of Delhaize Group’s agreed sale of Sweetbay, Harveys and Reid’s, the Group will continue to provide guarantees for a number of existing operating or finance lease contracts, which extend through 2036. In the event of a future default of the buyer, Delhaize Group will be obligated to pay rent and otherwise perform the guaranteed leases. The future minimum lease payments over the non-cancellable lease term of the guaranteed leases, excluding other direct costs such as common area maintenance expenses and real estate taxes, amount to $268 million (€194 million) as of March 31, 2014. Currently, the Group does not expect to be required to pay any amounts under these guarantees.
| Delhaize Group – Earnings Release – First Quarter 2014 | 15 of 21 | |||||
Other contingencies are materially unchanged from those described in Note 34 on page 152 of the 2013 Annual Report.
» Subsequent Events
Effective April 7, 2014, the ratio of Delhaize Group American Depositary Shares (“ADS”) to Delhaize Group ordinary shares changed from one ADS for every one ordinary share to four ADSs for every one ordinary share.
In April 2014, Delhaize Group and certain of its subsidiaries, including Delhaize America LLC, entered into a new€400 million, five-year multi-currency, unsecured revolving credit facility (the “New Facility Agreement”), which is extendable by a maximum of two years if requested by the Group and agreed by each lender for their commitment in the New Facility Agreement. Subsequent to the execution of the New Facility Agreement, Delhaize Group terminated all of its commitments under the€600 million, five-year multi-currency, unsecured revolving credit facility that was in place since April 2011.
| Delhaize Group – Earnings Release – First Quarter 2014 | 16 of 21 | |||||
OTHER FINANCIAL AND OPERATING INFORMATION (UNAUDITED)
» Use of non-GAAP (Generally Accepted Accounting Principles) Financial Measures
Delhaize Group uses certain non-GAAP measures in its financial communication. Delhaize Group does not consider these measures as alternative measures to net profit or other financial measures determined in accordance with IFRS. These measures as reported by Delhaize Group may differ from similarly titled measures used by other companies. We believe that these measures are important indicators of our business performance and are widely used by investors, analysts and other interested parties. In the press release, the non-GAAP measures are reconciled to financial measures prepared in accordance with IFRS.
» Number of Stores
| End of 2013 | Change Q1 2014 | End of Q1 2014 | ||||||||||
United States(1) | 1 514 | -33 | 1 481 | |||||||||
Belgium & Luxembourg | 852 | +4 | 856 | |||||||||
Greece | 281 | +9 | 290 | |||||||||
Romania | 296 | +6 | 302 | |||||||||
Serbia | 381 | - | 381 | |||||||||
Bulgaria(2) | 54 | - | 54 | |||||||||
Bosnia & Herzegovina(2) | 39 | - | 39 | |||||||||
Indonesia | 117 | - | 117 | |||||||||
Total | 3 534 | -14 | 3 520 | |||||||||
| (1) | Of which 119 stores held for sale at the end of the first quarter of 2014 |
| (2) | Held for sale |
» Organic Revenue Growth Reconciliation
| (in millions of€) | Q1 2014 | Q1 2013 | % Change | |||
| Revenues | 5 120 | 5 104 | +0.3% | |||
Effect of exchange rates | 128 | |||||
Revenues at identical exchange rates | 5 248 | 5 104 | +2.8% | |||
Effect of acquisitions and divestitures | - | - | ||||
Organic revenue growth | 5 248 | 5 104 | +2.8% |
» Underlying Operating Profit
Delhaize Group believes “underlying operating profit” is a measure that, for external users of the financial statements, offers a more detailed view than “operating profit” of the operating performance of the period for the Group as it adjusts for a number of elements that management considers as non-representative of underlying operating performance.
| Q1 2014 | ||||||||||||||||||
| (in millions) | United States | United States | Belgium | SEE | Corporate | TOTAL | ||||||||||||
| $ | € | € | € | € | € | |||||||||||||
Operating profit (as reported) | 150 | 109 | 38 | 14 | (5) | 156 | ||||||||||||
Add/(substract): | ||||||||||||||||||
Store closing expenses (reversals) | 1 | 1 | - | - | - | 1 | ||||||||||||
Fixed assets impairment charges (reversals) | 3 | 2 | - | - | - | 2 | ||||||||||||
(Gains)/losses on disposal of fixed assets | 1 | 1 | (1) | - | - | - | ||||||||||||
Other | - | - | 1 | - | 1 | 2 | ||||||||||||
Underlying Operating Profit | 155 | 113 | 38 | 14 | (4) | 161 | ||||||||||||
| Delhaize Group – Earnings Release – First Quarter 2014 | 17 of 21 | |||||
In the first quarter of 2014, the caption “Other” primarily consists of€2 million termination expenses for one Executive Committee member.
| Q1 2013 | ||||||||||||||||||
| (in millions) | United States | United States | Belgium | SEE | �� | Corporate | TOTAL | |||||||||||
| $ | € | € | € | € | € | |||||||||||||
Operating profit (loss) (as reported) | 135 | 102 | 58 | 13 | (7) | 166 | ||||||||||||
Add/(substract): | ||||||||||||||||||
Store closing expenses (reversals) | 9 | 7 | - | - | 7 | |||||||||||||
Fixed assets impairment charges (reversals) | - | - | - | - | - | |||||||||||||
(Gains)/losses on disposal of fixed assets | (1) | - | 1 | - | 1 | |||||||||||||
Other | 3 | 2 | - | 3(3) | 2 | |||||||||||||
Underlying Operating Profit | 169 | 128 | 59 | 16(10) | 193 | |||||||||||||
The first quarter of 2013 was primarily impacted by€7 million store closing expenses,€2 million of related expenses, primarily sales price mark-downs (part of the caption “Other”) and€17 million reorganization expenses related to the severance of support services senior management and employees in the U.S. (primarily recorded in “Other operating expenses”).
» EBITDA Reconciliation
| (in millions of€) | Q1 2014 | Q1 2013 | ||
Operating profit | 156 | 166 | ||
Depreciation and amortization | 143 | 144 | ||
Impairment | 2 | - | ||
EBITDA | 301 | 310 | ||
| (in millions of€) | Q1 2014 | Q1 2013 | ||
Underlying operating profit | 161 | 193 | ||
Depreciation and amortization | 143 | 144 | ||
Underlying EBITDA | 304 | 337 |
» Free Cash Flow Reconciliation
| (in millions of€) | Q1 2014 | Q1 2013 | ||
Net cash provided by operating activities | 121 | 326 | ||
Net cash used in investing activities | (102) | (149) | ||
Net investment in debt securities and term deposits | 68 | 78 | ||
Free cash flow | 87 | 255 |
| Delhaize Group – Earnings Release – First Quarter 2014 | 18 of 21 | |||||
» Net Debt Reconciliation
| (in millions of€, except net debt to equity ratio) | March 31, 2014 | December 31, 2013 | March 31, 2013 | |||
Non-current financial liabilities | 2 506 | 2 507 | 2 963 | |||
Current financial liabilities | 283 | 291 | 146 | |||
Derivative liabilities | 9 | 11 | 26 | |||
Derivative assets | (45) | (41) | (71) | |||
Investment in securities - non-current | (8) | (8) | (12) | |||
Investment in securities - current | (127) | (126) | (138) | |||
Term deposits - current | (80) | (12) | (37) | |||
Cash and cash equivalents | (1 147) | (1 149) | (1 025) | |||
Net debt | 1 391 | 1 473 | 1 852 | |||
Net debt to equity ratio | 27.0% | 29.0% | 34.5% | |||
EBITDA (last 12 months) | 1 288 | 1 297 | 1 392 | |||
Net debt to EBITDA ratio | 108.0% | 113.6% | 133.1% | |||
» Identical Exchange Rates Reconciliation
| (in millions of€, except per share amounts) | Q1 2014 | Q1 2013 | 2014/2013 | |||||||||||||||
| At Actual Rates | Impact of Exchange Rates | At Identical Rates | At Actual Rates | At Actual Rates | At Identical Rates | |||||||||||||
Revenues | 5 120 | 128 | 5 248 | 5 104 | +0.3% | +2.8% | ||||||||||||
Operating profit | 156 | 4 | 160 | 166 | -5.7% | -3.1% | ||||||||||||
Net profit from continuing operations | 90 | 1 | 91 | 99 | -9.6% | -7.2% | ||||||||||||
Basic EPS from continuing operations | 0.88 | 0.03 | 0.91 | 0.98 | -9.6% | -7.2% | ||||||||||||
Group share in net profit | 80 | 2 | 82 | 51 | +57.6% | +63.0% | ||||||||||||
Basic EPS from Group share in net profit | 0.79 | 0.02 | 0.81 | 0.50 | +57.0% | +62.5% | ||||||||||||
Free cash flow | 87 | 6 | 93 | 255 | -65.9% | -63.5% | ||||||||||||
| (in millions of€) | March 31, 2014 | December 31, 2013 | Change | |||||||||||||||
Net debt | 1 391 | - | 1 391 | 1 473 | -5.5% | -5.6% | ||||||||||||
CERTIFICATION OF RESPONSIBLE PERSONS
The undersigned Frans Muller, President and Chief Executive Officer of Delhaize Group, and Pierre Bouchut, Chief Financial Officer of Delhaize Group, confirm that to the best of their knowledge:
a) these interim condensed consolidated financial statements for the three-month period ending March 31, 2014 are prepared in accordance with IFRS (International Financial Reporting Standards) and give, in all material respects, a true and fair view of the consolidated financial position and consolidated results of Delhaize Group;
b) the interim financial report gives, in all material respects, a true and fair view of all important events and significant transactions with related parties that have occurred in the first three months of the financial year 2014 and their effects on the summary financial statements, as well as an overview of the most significant risks and uncertainties with which we are confronted.
Brussels, May 6, 2014
| Frans Muller | Pierre Bouchut | |||
| President and CEO | Executive Vice President and CFO |
REPORT OF THE STATUTORY AUDITOR
We have performed a limited review of the accompanying condensed balance sheet, condensed consolidated income statement, condensed statements of comprehensive income, condensed statements of changes in shareholders’ equity, condensed statements of cash flows and selected explanatory notes (jointly the “interim financial information”) of Delhaize Brothers and Co “The Lion” (Delhaize Group) SA (“the company”) and its subsidiaries (jointly “the group”) for the three-months period ended 31 March 2014. The Board of Directors of the company is responsible for the preparation and fair presentation of this interim financial information. Our responsibility is to express a conclusion on this interim financial information based on our review.
| Delhaize Group – Earnings Release – First Quarter 2014 | 19 of 21 | |||||
The interim financial information has been prepared in accordance with IAS 34, “Interim Financial Reporting” as adopted by the EU.
Our limited review of the interim financial information was conducted in accordance with the recommended auditing standards on limited reviews applicable in Belgium, as issued by the “Institut des Réviseurs d’Entreprises/Instituut van de Bedrijfsrevisoren”. A limited review consists of making inquiries of group management and applying analytical and other review procedures to the interim financial information and underlying financial data. A limited review is substantially less in scope than an audit performed in accordance with the auditing standards on consolidated annual accounts as issued by the “Institut des Réviseurs d’Entreprises/Instituut van de Bedrijfsrevisoren”. Accordingly, we do not express an audit opinion.
Based on our limited review, nothing has come to our attention that causes us to believe that the interim financial information for the three-months period ended 31 March 2014 is not prepared, in all material respects, in accordance with IAS 34 Interim Financial Reporting as adopted by the EU.
RISKS
In accordance with the Belgian Royal Decree of November 14, 2007, Delhaize Group states that the other fundamental risks confronting the Company are unchanged from those described on the pages 62 through 67 of the 2013 Annual Report. To the best of our knowledge as of May 6, 2014, there are no other fundamental risks confronting the Company and influencing the remaining months of the financial year 2014. On a regular basis, the Board of Directors and Company management evaluate the business risks that confront Delhaize Group.
DEFINITIONS
| — | American Depositary Share (ADS): An American Depositary Share represents ownership in the common share of a non-U.S. corporation. The underlying common shares are held by a U.S. bank, as depositary agent. The holder of an ADS benefits from dividend and voting rights pertaining to the underlying common share through the bank that issued the ADS. Four Delhaize ADSs represent one share of Delhaize Group common stock and are traded on the New York Stock Exchange. |
| — | Basic earnings per share: profit or loss attributable to ordinary equity holders of the parent entity divided by the weighted average number of shares outstanding during the period. Basic earnings per share are calculated on profit from continuing operations less non-controlling interests attributable to continuing operations, and on the group share in net profit |
| — | Comparable store sales: sales from the same stores, including relocations and expansions, and adjusted for calendar effects |
| — | Diluted earnings per share: is calculated by adjusting the profit or loss attributable to ordinary equity shareholders and the weighted average number of shares outstanding for the effects of all dilutive potential ordinary shares, including those related to convertible instruments, options or warrants or shares issued upon the satisfaction of specified conditions |
| — | EBITDA: operating profit plus depreciation, amortization and impairment |
| — | Free cash flow: cash flow before financing activities, investment in debt securities and term deposits and sale and maturity of debt securities and term deposits |
| — | Net debt: non-current financial liabilities, plus current financial liabilities and derivatives liabilities, minus derivative assets, investments in securities and term deposits, and cash and cash equivalents |
| — | Net financial expenses: finance costs less income from investments |
| — | Organic revenue growth: sales growth, excluding sales from acquisitions and divestitures, at identical currency exchange rates |
| — | Outstanding shares: the number of shares issued by the Company, excluding treasury shares |
| — | Underlying EBITDA: Underlying operating profit plus depreciation and amortization less any depreciation or amortization that has been excluded from underlying operating profit |
| — | Underlying operating profit: operating profit excluding fixed assets impairment charges, reorganization charges, store closing expenses, gains/losses on disposal of fixed assets and businesses and other items that management considers as not being representative of the Group’s operating performance of the period. |
| — | Weighted average number of shares: number of shares outstanding at the beginning of the period less treasury shares, adjusted by the number of shares cancelled, repurchased or issued during the period multiplied by a time-weighting factor |
| — | Working capital: inventories plus receivables and other current assets, minus accounts payable and other current liabilities |
| Delhaize Group – Earnings Release – First Quarter 2014 | 20 of 21 | |||||
CAUTIONARY NOTE REGARDING FORWARD LOOKING STATEMENTS
Statements that are included or incorporated by reference in this press release and other written and oral statements made from time to time by Delhaize Group and its representatives, other than statements of historical fact, which address activities, events and developments that Delhaize Group expects or anticipates will or may occur in the future, including, without limitation, when the sale of Sweetbay, Harveys and Reid´s to Bi-Lo Holdings is expected to be completed; the financial flexibility that will result from the sale; the ultimate value of the transaction to Delhaize Group after working capital adjustments, expected costs savings, the closing, conversion and opening of stores, the expected effect of the portfolio optimization, anticipated revenue and net profit growth, anticipated free cash flow generation, strategic options, future strategies and the anticipated benefits of these strategies and (underlying) operating profit guidance, are “forward-looking statements” within the meaning of the U.S. federal securities laws that are subject to risks and uncertainties. These forward-looking statements generally can be identified as statements that include phrases such as “guidance,” “outlook,” “projected,” “believe,” “target,” “predict,” “estimate,” “forecast,” “strategy,” “may,” “goal,” “expect,” “anticipate,” “intend,” “plan,” “foresee,” “likely,” “will,” “should” or other similar words or phrases. Although such statements are based on current information, actual outcomes and results may differ materially from those projected depending upon a variety of factors, including, but not limited to, changes in the general economy or the markets of Delhaize Group, in strategy, in consumer spending, in inflation or currency exchange rates or in legislation or regulation; competitive factors; adverse determination with respect to claims; inability to timely develop, remodel, integrate, open, convert or close stores; and supply or quality control problems with vendors. Additional risks and uncertainties that could cause actual results to differ materially from those stated or implied by such forward-looking statements are described in Delhaize Group’s most recent Annual Report on Form 20-F and other filings made by Delhaize Group with the U.S. Securities and Exchange Commission, which risk factors are incorporated herein by reference. Delhaize Group disclaims any obligation to update developments of these risk factors or to announce publicly any revision to any of the forward-looking statements contained in this release, including guidance with respect to underlying operating profit, SG&A, net finance costs, capital expenditures, store openings and free cash flow, or to make corrections to reflect future events or developments.
| Delhaize Group – Earnings Release – First Quarter 2014 | 21 of 21 | |||||
DELHAIZE GROUP Q1 2014 results May 7, 2014
Forward looking statements This presentation includes forward-looking statements within the meaning of the U.S. federal securities laws that are subject to risks and uncertainties. Forward-looking statements describe further expectations, plans, options, results or strategies. Actual outcomes and results may differ materially from those projected depending upon a variety of factors, including but not limited to changes in the general economy or the markets of Delhaize Group in consumer spending in inflation or currency exchange Group, spending, rates or in legislation or regulation; competitive factors; adverse determination with respect to claims; inability to timely develop, remodel, integrate or convert stores; and supply or quality control problems with vendors. Additional risks and uncertainties that could cause actual results to differ materially from those stated or implied by such forward-looking statements are described in our most recent annual report or Form 20-F and other filings with the Securities and Exchange Commission. Delhaize Group disclaims any obligation to update or revise the information contained in this presentation. 2

Clear priorities have been set in March Who we are Principles Priorities Preferred food retailer in the The customer is at the center Put the customer back at the center Focus on core markets Business is local and market share matters Strengthen our core capabilities and i th d d t d supermarket segment Differentiated concept and offering that are relevant to our customers fresh assortment and Realize more operating efficiencies improve those needed to succeed Exercise discipline in capital allocation Use scale to reduce costs Recognized for Private Label expertise Multinational Strong local identity ( convenient Execute with speed Respond to industry dynamics and trends g y locations, local brands and assortment, local community) Respectful of all Stakeholders 3
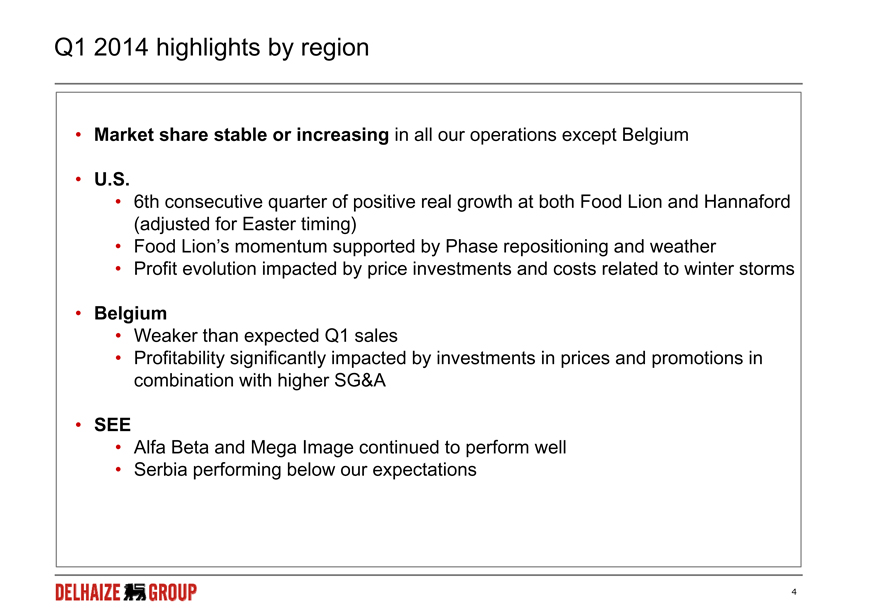
Q1 2014 highlights by region Market share stable or increasing in all our operations except Belgium U.S. 6th consecutive quarter of positive real growth at both Food Lion and Hannaford ( adjusted for Easter j timing) Food Lion’s momentum supported by Phase repositioning and weather Profit evolution impacted by price investments and costs related to winter storms Belgium Weaker than expected Q1 sales Profitability significantly impacted by investments in prices and promotions in combination with higher SG&A SEE Alfa Beta and Mega Image continued to perform well Serbia performing below our expectations 4
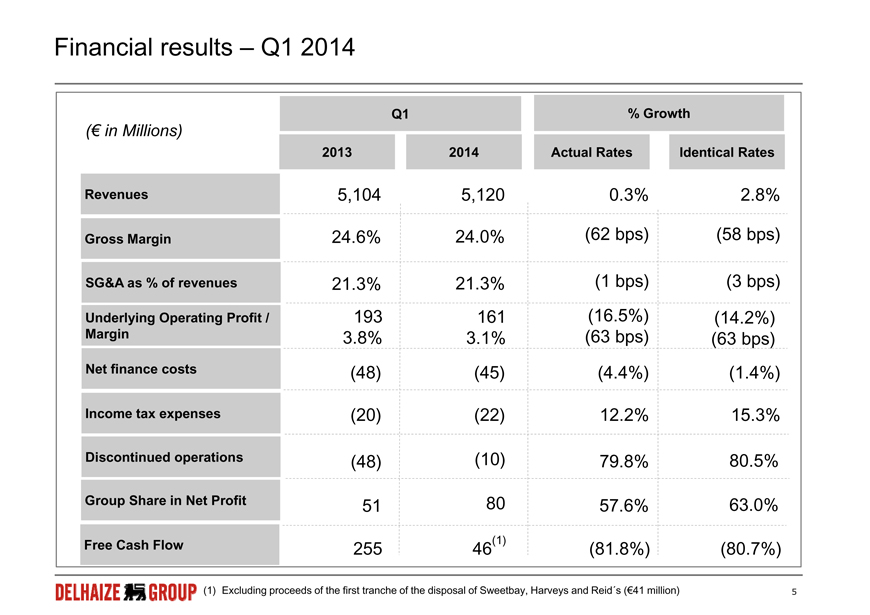
Financial results – Q1 2014 Q1 (€ in Millions) % Growth 2013 2014 Rates Identical Rates Revenues 5,104 5,120 0.3% 2.8% 24 6% 24 0% (62 (58 Actual 24.6% 24.0% bps) Gross Margin bps) SG&A as % of revenues 21.3% 21.3% (1 bps) (3 bps) 193 3.8% 161 3.1% (16.5%) (63 bps) (14.2%) (63 bps) (48) (45) (4.4%) (1.4%) Underlying Operating Profit / Margin Net finance costs (20) (22) 12.2% 15.3% (48) (10) 79 8% 80 5% Income tax expenses Discontinued operations 51 80 57.6% 63.0% 79.8% 80.5% Group Share in Net Profit 5 255 46(1) (81.8%) (80.7%) (1) Excluding proceeds of the first tranche of the disposal of Sweetbay, Harveys and Reid´s (€41 million) Free Cash Flow
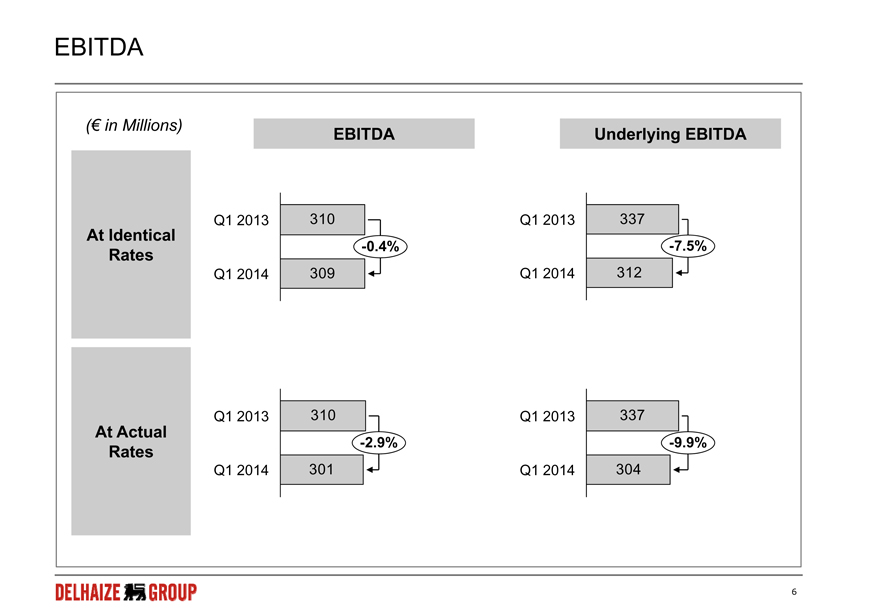
EBITDA (€ in Millions) EBITDA Underlying EBITDA Id ti l Q1 2013 310 Q1 2013 337 At Identical Rates 312 -7.5% 309 Q1 2014 -0.4% Q1 2014 At Actual Rates 337 -9.9% 310 Q1 2013 -2.9% Q1 2013 Q1 2014 301 Q1 2014 304 6
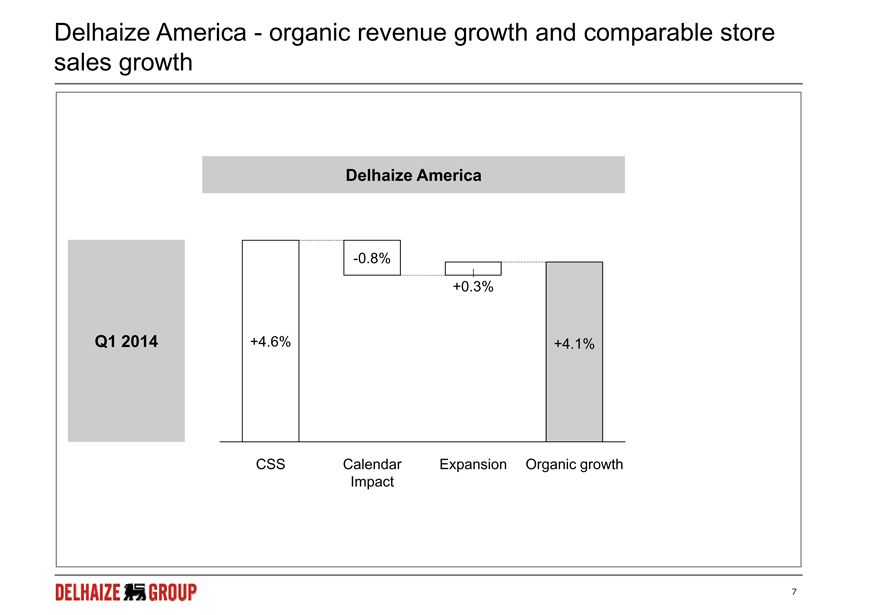
Delhaize America - organic revenue growth and comparable store sales growth Delhaize America +0.3% -0.8% Q1 2014 +4.6% +4.1% CSS Calendar Expansion Organic growth Impact 7
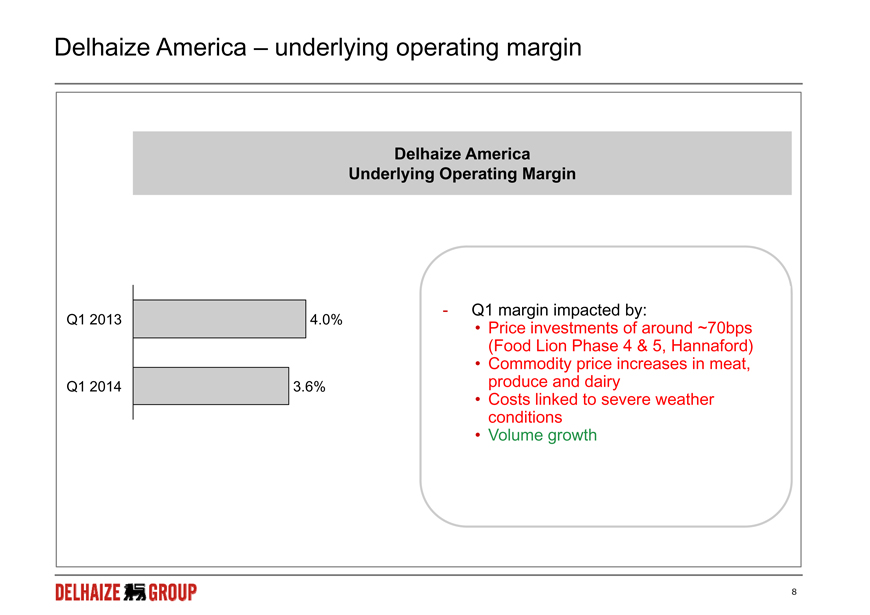
Delhaize America – underlying operating margin Delhaize America Underlying Operating Margin margin impacted by: Q1 3 6% Q1 2013 4.0% - Q1 Price investments of around ~70bps (Food Lion Phase 4 & 5, Hannaford) Commodity price increases in meat, 2014 3.6% produce and dairy Costs linked to severe weather conditions Volume growth 8
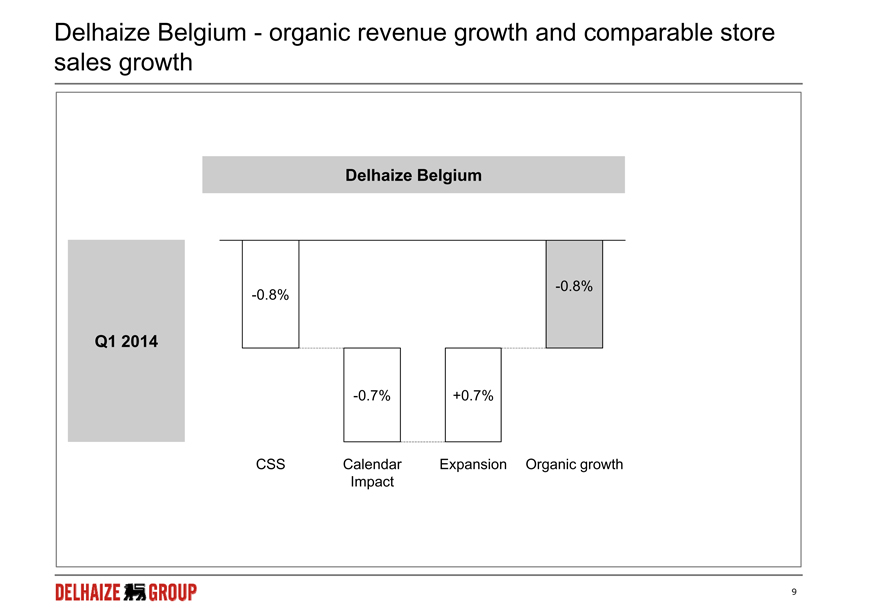
Delhaize Belgium - organic revenue growth and comparable store sales growth Delhaize Belgium -0.8% -0.8% Q1 2014 -0.7% CSS E i O i h +0.7% Calendar Expansion Organic growth Impact 9
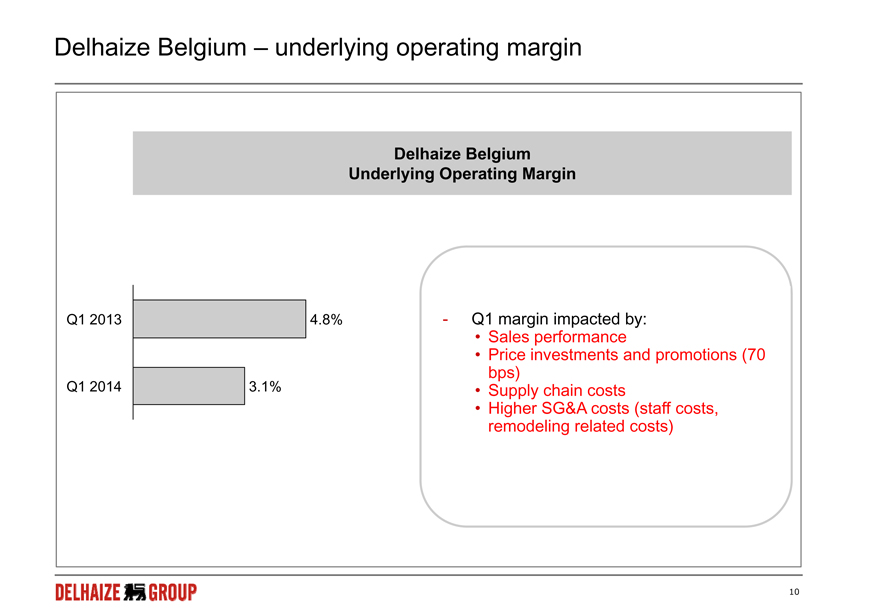
Delhaize Belgium – underlying operating margin Delhaize Belgium Underlying Operating Margin Q1 3 1% Q1 2013 4.8% - Q1 margin impacted by: Sales performance Price investments and promotions (70 bps) 2014 3.1% Supply chain costs Higher SG&A costs (staff costs, remodeling related costs) 10Delhaize Belgium – underlying operating margin Delhaize Belgium Underlying Operating Margin Q1 3 1% Q1 2013 4.8% - Q1 margin impacted by: Sales performance Price investments and promotions (70 bps) 2014 3.1% Supply chain costs Higher SG&A costs (staff costs, remodeling related costs) 10
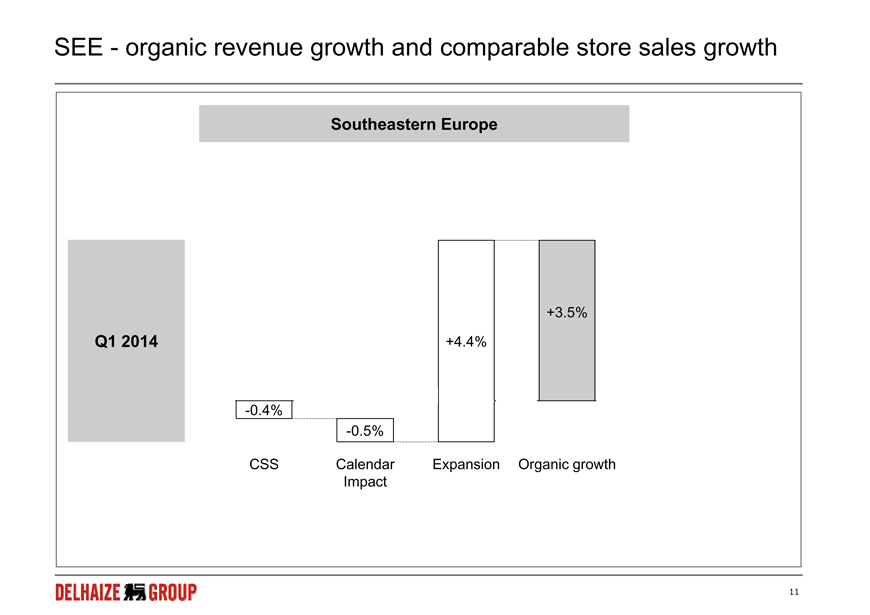
SEE - organic revenue growth and comparable store sales growth Southeastern Europe 3 5% Q1 2014 +3.5% +4.4% CSS C l d E i O i h -0.4% -0.5% Calendar Expansion Organic growth Impact 11
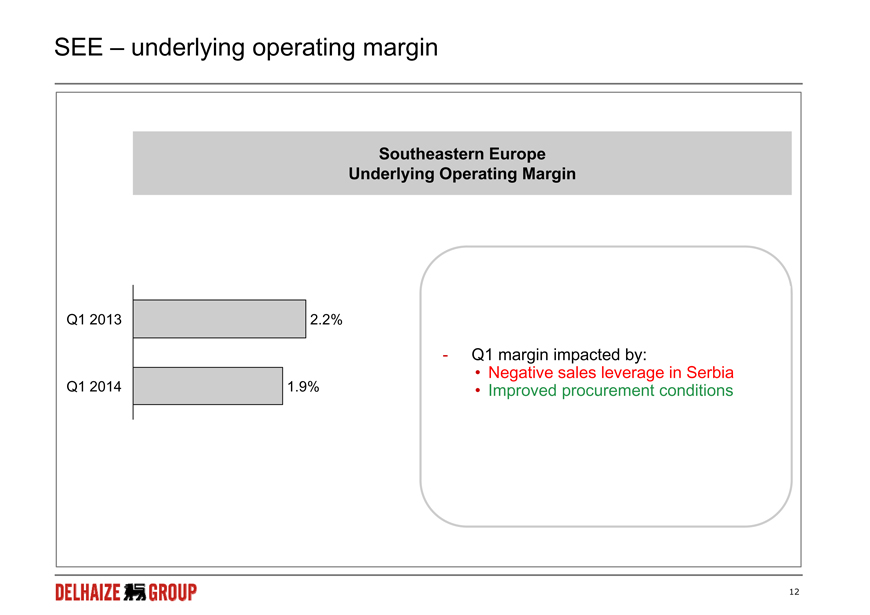
SEE – underlying operating margin Southeastern Europe Underlying Operating Margin Q1 1 9% Q1 2013 2.2% - Q1 margin impacted by: Negative sales leverage in Serbia 2014 1.9% Improved procurement conditions 12
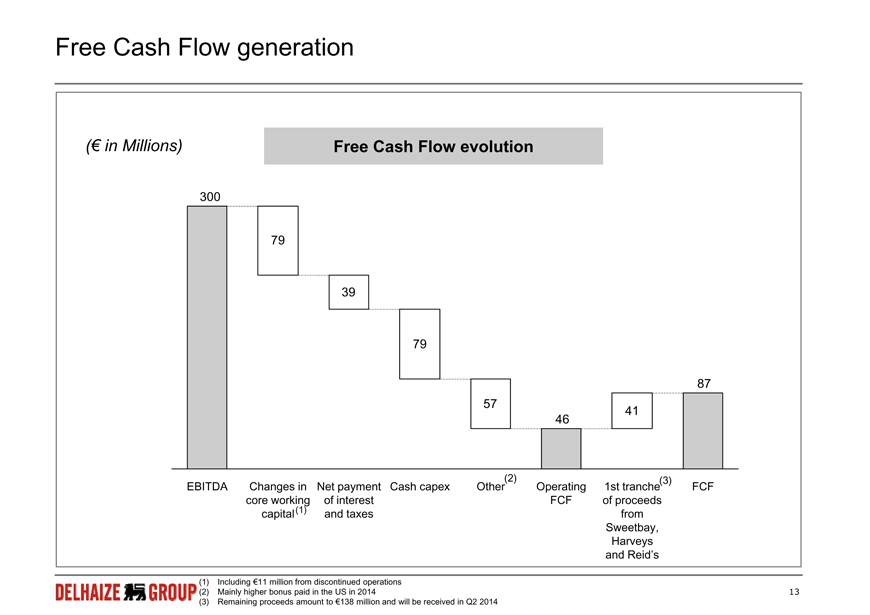
Free Cash Flow generation (€ in Millions) Free Cash Flow evolution 300 79 39 79 87 57 41 46 (2) Operating FCF Net payment Cash capex Other of interest and taxes Changes in core working capital EBITDA 1st tranche FCF of proceeds from Sweetbay, (1) (3) 13 (1) Including €11 million from discontinued operations (2) Mainly higher bonus paid in the US in 2014 (3) Remaining proceeds amount to €138 million and will be received in Q2 2014 Harveys and Reid’s 13
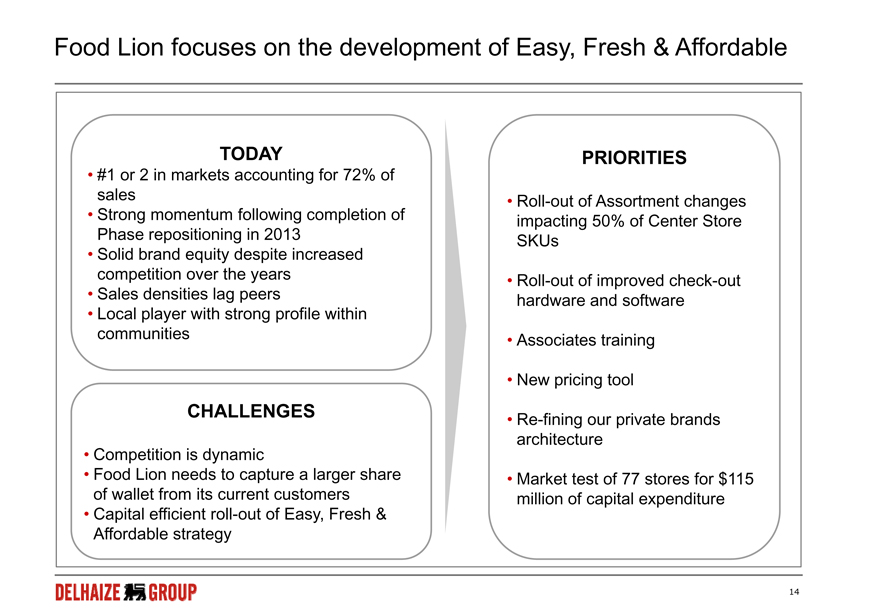
Food Lion focuses on the development of Easy, Fresh & Affordable TODAY PRIORITIES Roll-out of Assortment changes impacting 50% of Center Store #1 or 2 in markets accounting for 72% of sales Strong momentum following completion of SKUs Roll-out of improved check-out hardware and software Phase repositioning in 2013 Solid brand equity despite increased competition over the years Sales densities lag peers L l l ih fil ihi Associates training Local player with strong profile within communities New pricing tool Re-fining our private brands architecture CHALLENGES Competition is Market test of 77 stores for $115 million of capital expenditure dynamic Food Lion needs to capture a larger share of wallet from its current customers Capital efficient roll-out of Easy, Fresh & strategy 14 Affordable
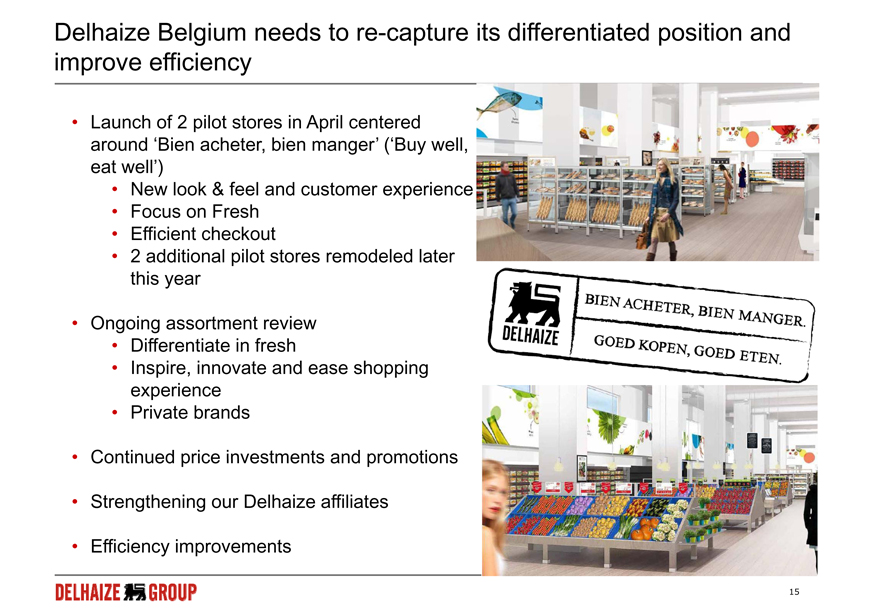
Delhaize Belgium needs to re-capture its differentiated position and improve efficiency Launch of 2 pilot stores in April centered around ‘Bien acheter, bien manger’ (‘Buy well, eat well’) New look & feel and customer experience Focus on Fresh Efficient checkout 2 additional pilot stores remodeled later this year Ongoing assortment review Differentiate in fresh Inspire, innovate and ease shopping experience Private brands Continued price investments and promotions Strengthening our Delhaize affiliates 15 Efficiency improvements BIEN ACHETER, BIEN MANGER GOED KOPEN, GOED ETEN
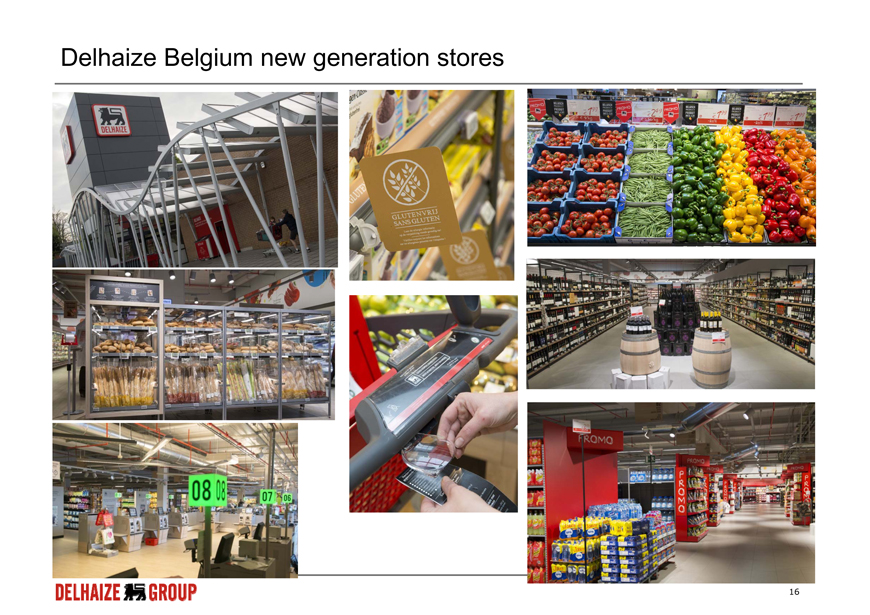
Delhaize Belgium new generation stores 16
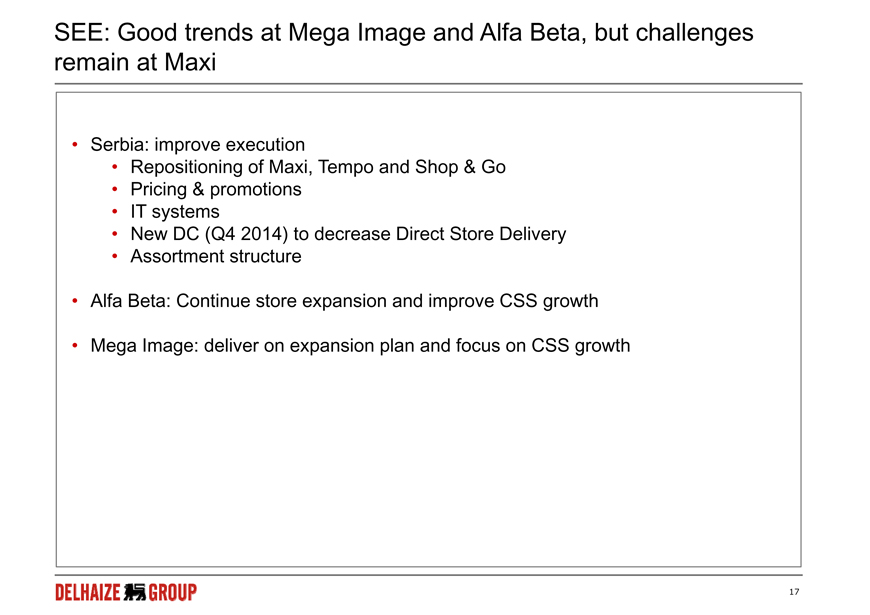
SEE: Good trends at Mega Image and Alfa Beta, but challenges remain at Maxi Serbia: improve execution Repositioning of Maxi, Tempo and Shop & Go Pricing & promotions IT systems New Q4 2014) to decrease DC (Direct Store Delivery Assortment structure Alfa Beta: Continue store expansion and improve CSS growth Mega Image: deliver on expansion plan and focus on CSS growth 17
Conclusion Strong quarter U S led sales in the U.S., by Food Lion Profitability declined as expected due to price investments Belgium difficult both in terms of competitive pressure and profitability 2 pilot stores launched in April SG&A pressure continues SEE performs well except in Serbia Important strategic initiatives underway Food Lion preparing for Easy, Fresh and Affordable strategy Belgium new generation stores Re-iterated 2014 guidance (1) Capex of approximately €625 million 180 new stores Healthy free cash flow generation 18 (1) At identical exchange rates (1€ = $1.3281)
SIGNATURES
Pursuant to the requirements of the Securities Exchange Act of 1934, the registrant has duly caused this report to be signed on its behalf by the undersigned hereunto duly authorized.
ETABLISSEMENTS DELHAIZE FRÈRES ET CIE “LE LION” (GROUPE DELHAIZE) | ||||||||
| Date:May 8, 2014 | By: | /s/ G. Linn Evans | ||||||
| G. Linn Evans | ||||||||
| Senior Vice President | ||||||||