Exhibit 99.2

Q2 2015 results July 30, 2015
Forward looking statements
This presentation includes forward-looking statements within the meaning of the U.S. federal securities laws that are subject to risks and uncertainties. Forward-looking statements describe further expectations, plans, options, results or strategies. Actual outcomes and results may differ materially from those projected depending upon a variety of factors, including but not limited to changes in the general economy or the markets of Delhaize Group, in consumer spending, in inflation or currency exchange rates or in legislation or regulation; competitive factors; adverse determination with respect to claims; inability to timely develop, remodel, integrate or convert stores; and supply or quality control problems with vendors. Additional risks and uncertainties that could cause actual results to differ materially from those stated or implied by such forward-looking statements are described in our most recent annual report or Form 20-F and other filings with the Securities and Exchange Commission. Delhaize Group disclaims any obligation to update or revise the information contained in this presentation.
2 |
|
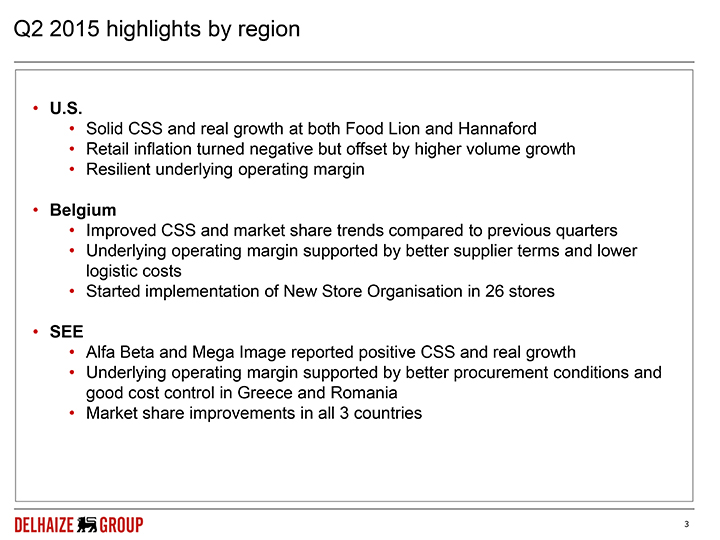
Q2 2015 highlights by region
U.S.
Solid CSS and real growth at both Food Lion and Hannaford
Retail inflation turned negative but offset by higher volume growth
Resilient underlying operating margin
Belgium
Improved CSS and market share trends compared to previous quarters
Underlying operating margin supported by better supplier terms and lower logistic costs
Started implementation of New Store Organisation in 26 stores
SEE
Alfa Beta and Mega Image reported positive CSS and real growth
Underlying operating margin supported by better procurement conditions and good cost control in Greece and Romania
Market share improvements in all 3 countries
3 |
|
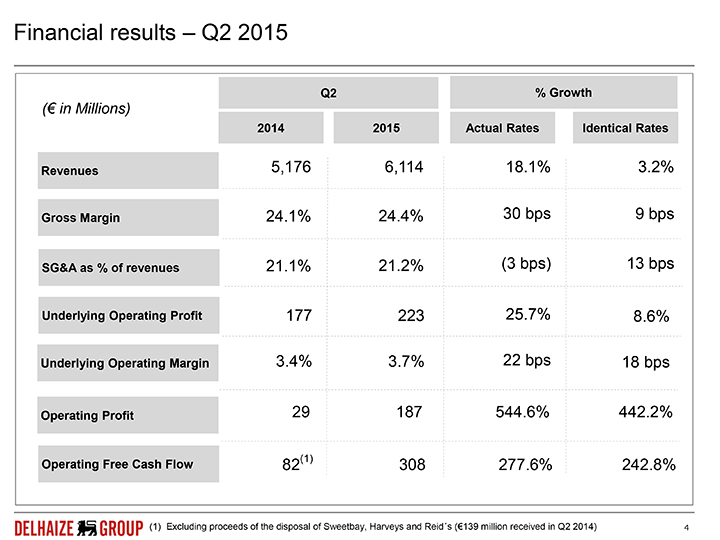
Financial results – Q2 2015
Q2% Growth
(€ in Millions)
2014 2015 Actual Rates Identical Rates
Revenues 5,176 6,114 18.1% 3.2%
Gross Margin 24.1% 24.4% 30 bps 9 bps
SG&A as % of revenues 21.1% 21.2%(3 bps) 13 bps
Underlying Operating Profit 177 223 25.7% 8.6%
Underlying Operating Margin 3.4% 3.7% 22 bps 18 bps
Operating Profit 29 187 544.6% 442.2%
Operating Free Cash Flow 82(1) 308 277.6% 242.8%
(1) |
| Excluding proceeds of the disposal of Sweetbay, Harveys and Reid´s (€139 million received in Q2 2014) |
4 |
|
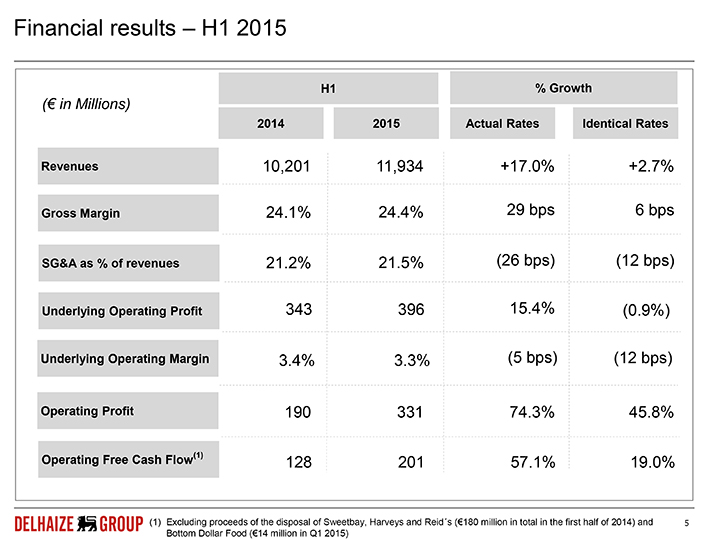
Financial results – H1 2015
H1% Growth
(€ in Millions)
2014 2015 Actual Rates Identical Rates
Revenues 10,201 11,934 +17.0% +2.7%
Gross Margin 24.1% 24.4% 29 bps 6 bps
SG&A as % of revenues 21.2% 21.5%(26 bps)(12 bps)
Underlying Operating Profit 343 396 15.4%(0.9%)
Underlying Operating Margin 3.4% 3.3%(5 bps)(12 bps)
Operating Profit 190 331 74.3% 45.8%
Operating Free Cash Flow(1) 128 201 57.1% 19.0%
(1) Excluding proceeds of the disposal of Sweetbay, Harveys and Reid´s (€180 million in total in the first half of 2014) and Bottom Dollar Food (€14 million in Q1 2015)
5 |
|
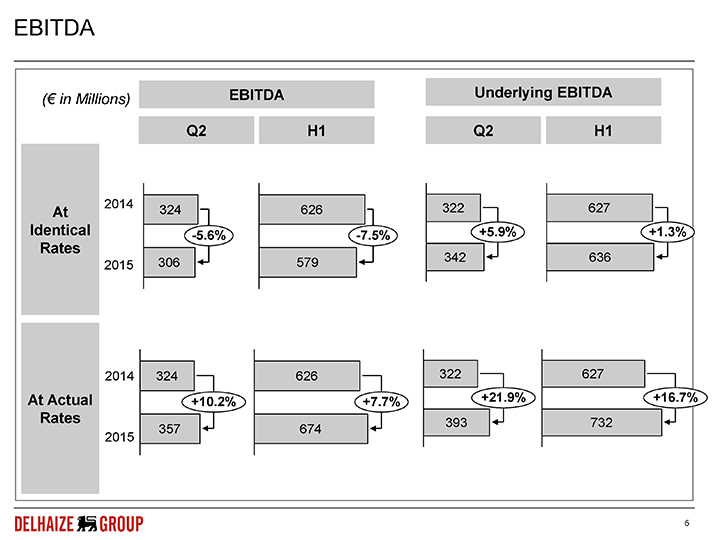
EBITDA
(€ in Millions) EBITDA Underlying EBITDA
Q2 H1 Q2 H1
At 2014 324 626 322 627
Identical -5.6% -7.5% +5.9% +1.3%
Rates
2015 306 579 342 636
2014 324 626 322 627
At Actual +10.2% +7.7% +21.9% +16.7%
Rates 393 732
2015 357 674
6 |
|
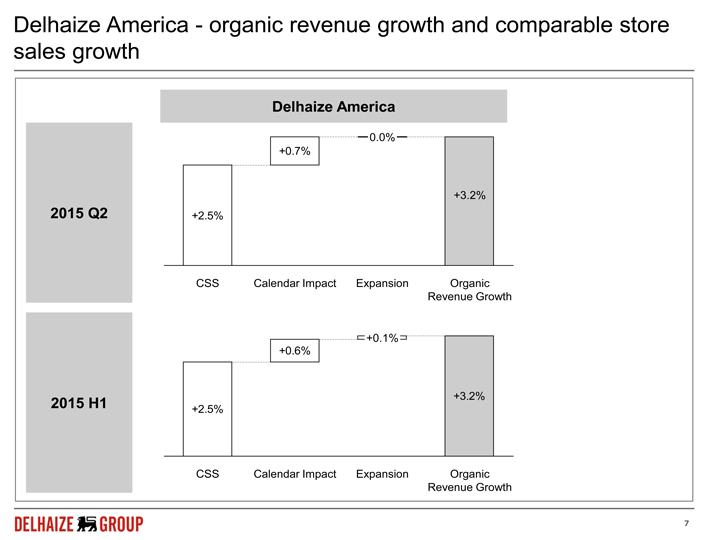
Delhaize America — organic revenue growth and comparable store sales growth
Delhaize America
+0.7%
-0.0-%
+3.2%
2015 Q2 +2.5%
CSS Calendar Impact Expansion Organic
Revenue Growth
+0.6%
+0.1%
2015 H1 +3.2%
+2.5%
CSS Calendar Impact Expansion Organic
Revenue Growth
7 |
|
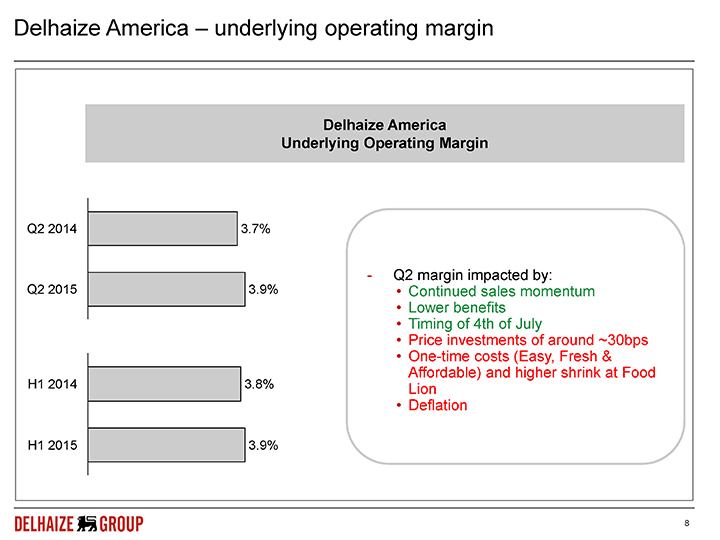
Delhaize America – underlying operating margin
Delhaize America
Underlying Operating Margin
Q2 2014 3.7%
—Q2 margin impacted by:
Q2 2015 3.9% Continued sales momentum
Lower benefits
Timing of 4th of July
Price investments of around ~30bps
One-time costs (Easy, Fresh &
Affordable) and higher shrink at Food
H1 2014 3.8% Lion
Deflation
H1 2015 3.9%
8 |
|
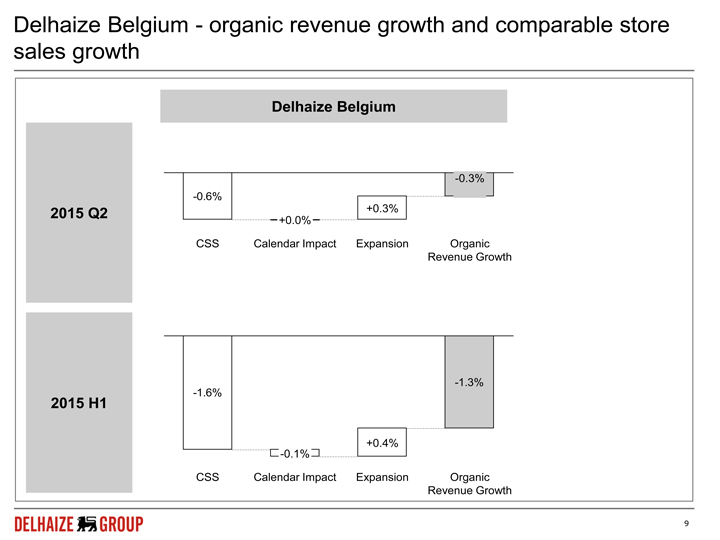
Delhaize Belgium—organic revenue growth and comparable store sales growth
Delhaize Belgium
-0.3%
-0.6%
2015 Q2 +0.3%
+0.0%
CSS Calendar Impact Expansion Organic
Revenue Growth
-1.3%
-1.6%
-0.1%
+0.4%
2015 H1
CSS Calendar Impact Expansion Organic
Revenue Growth
9
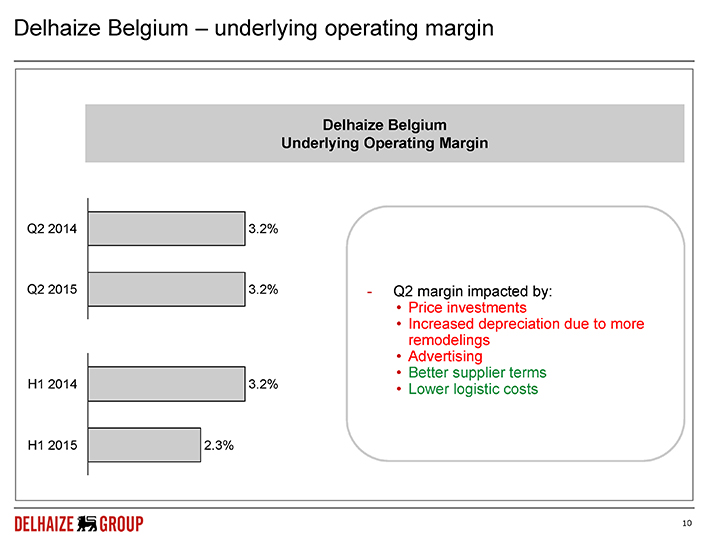
Delhaize Belgium – underlying operating margin
Delhaize Belgium
Underlying Operating Margin
Q2 2014 3.2%
Q2 2015 3.2%—Q2 margin impacted by:
Price investments
Increased depreciation due to more
remodelings
Advertising
Better supplier terms
H1 2014 3.2% Lower logistic costs
H1 2015 2.3%
10
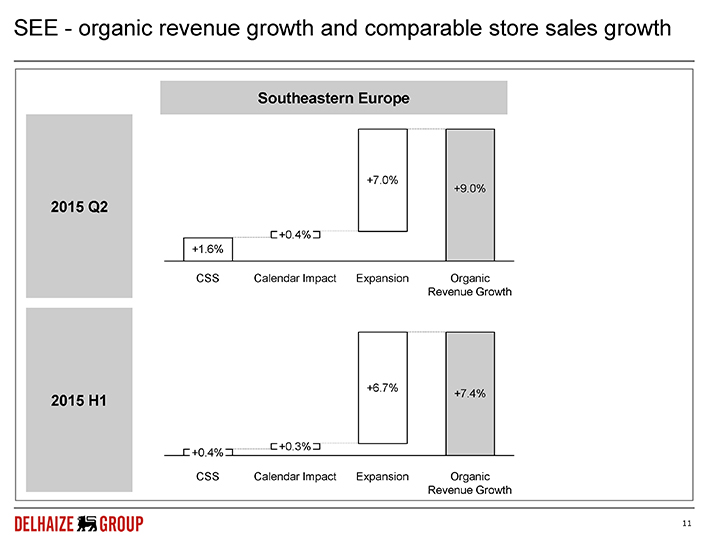
SEE—organic revenue growth and comparable store sales growth
Southeastern Europe
+7.0%
+9.0%
2015 Q2
+0.4%
+1.6%
CSS Calendar Impact Expansion Organic
Revenue Growth
+6.7%
2015 H1 +7.4%
+0.4% |
| +0.3% |
CSS Calendar Impact Expansion Organic
Revenue Growth
11
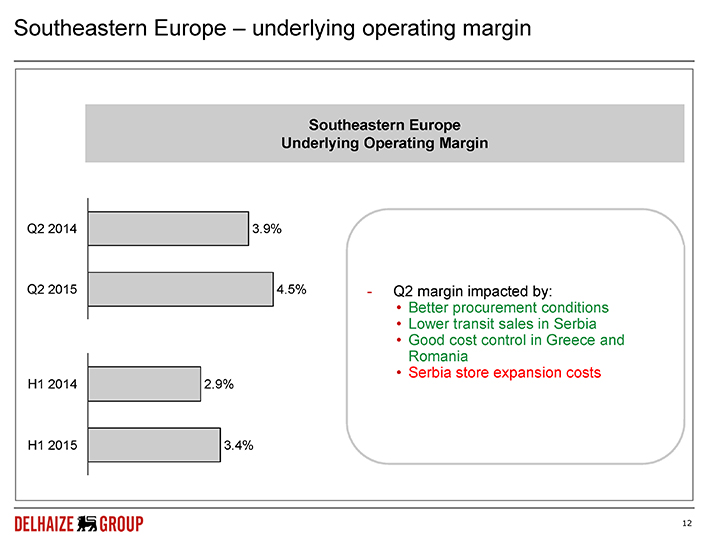
Southeastern Europe – underlying operating margin
Southeastern Europe
Underlying Operating Margin
Q2 2014 3.9%
Q2 2015 4.5%—Q2 margin impacted by:
• Better procurement conditions
• Lower transit sales in Serbia
• Good cost control in Greece and
Romania
• Serbia store expansion costs
H1 2014 2.9%
H1 2015 3.4%
12
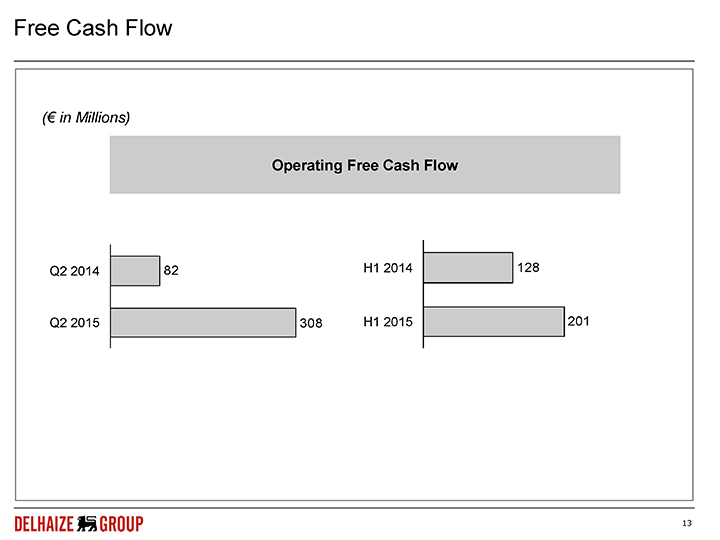
Free Cash Flow
(€ in Millions)
Operating Free Cash Flow
Q2 2014 82 H1 2014 128
Q2 2015 308 H1 2015 201
13
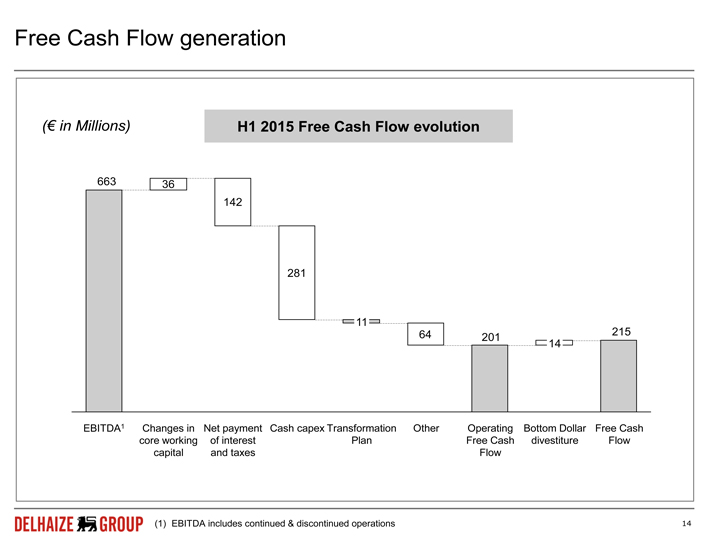
Free Cash Flow generation
(€ in Millions) H1 2015 Free Cash Flow evolution
663 36
142
281
11
64 |
| 201 14 215 |
EBITDA1
Changes in
core working capital
Net payment of interest and taxes
Cash capex
Transformation Plan
Other
Operating Free Cash Flow
Bottom Dollar divestiture
Free Cash Flow
(1) |
| EBITDA includes continued & discontinued operations |
14
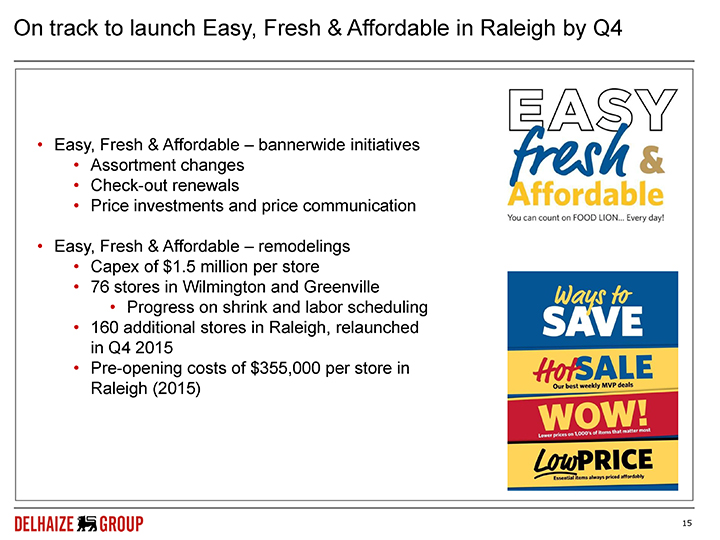
On track to launch Easy, Fresh & Affordable in Raleigh by Q4
Easy, Fresh & Affordable – bannerwide initiatives
Assortment changes
Check-out renewals
Price investments and price communication
Easy, Fresh & Affordable – remodelings
Capex of $1.5 million per store
76 stores in Wilmington and Greenville
Progress on shrink and labor scheduling
160 additional stores in Raleigh, relaunched in Q4 2015
Pre-opening costs of $355,000 per store in Raleigh (2015)
15
Transformation Plan in Belgium executed according to plan
Final agreement with unions reached in February 2015
Plan to generate at least €80 million savings by 2018
First wave of voluntary leaves took place in May (950 leavers out of 1,500 signed up so far), second wave in Q4
Closed Kortrijk-Ring store and plan to Affiliate 4 out of 9 stores in 2015
New Store Organisation implemented in 26 stores in June
Second batch of 27 stores being prepared
Pleased with performance of 4 New Generation stores
Learnings to be included in 2016 remodelling plan
16
SEE increases profitable growth through consistent customer focus
Strong performance in the region, driven by growth in Greece and Romania with a stable performance in Serbia
Maxi remodelings continue to post positive CSS
All three countries are seeing further market share gains
Greek situation limits visibility
17
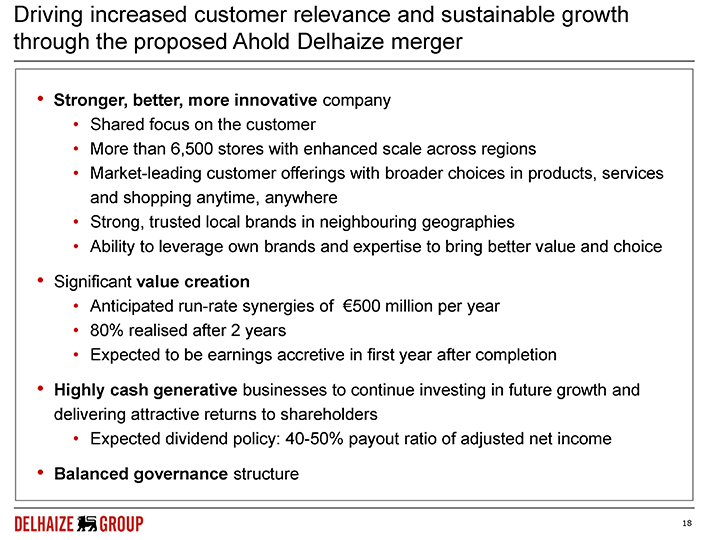
Driving increased customer relevance and sustainable growth through the proposed Ahold Delhaize merger
Stronger, better, more innovative company
Shared focus on the customer
More than 6,500 stores with enhanced scale across regions
Market-leading customer offerings with broader choices in products, services and shopping anytime, anywhere
Strong, trusted local brands in neighbouring geographies
Ability to leverage own brands and expertise to bring better value and choice
Significant value creation
Anticipated run-rate synergies of €500 million per year
80% realised after 2 years
Expected to be earnings accretive in first year after completion
Highly cash generative businesses to continue investing in future growth and delivering attractive returns to shareholders
Expected dividend policy: 40-50% payout ratio of adjusted net income
Balanced governance structure
18
Ahold Delhaize: an exciting future together
Focused management team to achieve synergies
Creating a stronger, international food retailer and delivering value for all stakeholders
A superior customer offering
Attractive opportunities for our associates
Better serving our communities
A compelling value proposition for shareholders
19
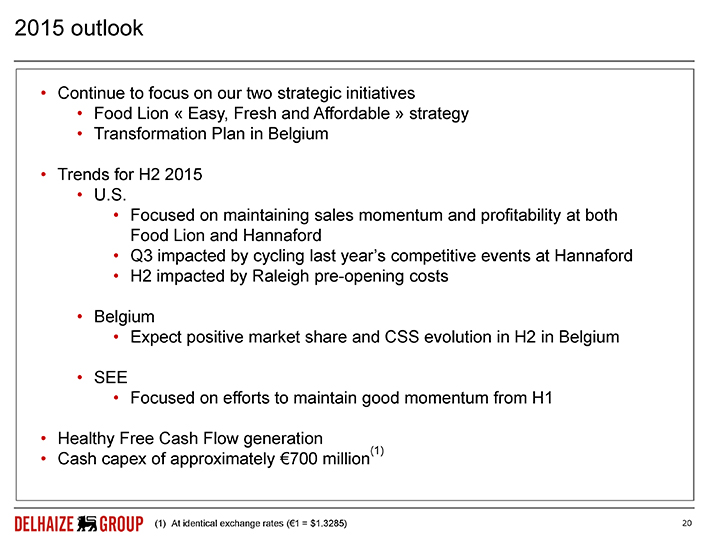
2015 outlook
Continue to focus on our two strategic initiatives
Food Lion « Easy, Fresh and Affordable » strategy
Transformation Plan in Belgium
Trends for H2 2015
U.S.
Focused on maintaining sales momentum and profitability at both Food Lion and Hannaford
Q3 impacted by cycling last year’s competitive events at Hannaford
H2 impacted by Raleigh pre-opening costs
Belgium
Expect positive market share and CSS evolution in H2 in Belgium
SEE
Focused on efforts to maintain good momentum from H1
Healthy Free Cash Flow generation (1)
Cash capex of approximately €700 million
(1) |
| At identical exchange rates (€1 = $1.3285) |
20