June 28, 2013
Tia L. Jenkins
Senior Assistant Chief Accountant
United States Securities and Exchange Commission
450 Fifth Street, N.W.
Washington, DC 20549
| Re: | Viña Concha y Toro S.A. Form 20-F for Fiscal Year Ended December 31, 2011 Filed April 30, 2012 File No. 001-13358 |
Dear Ms. Jenkins,
In my capacity as Chief Financial Officer of Viña Concha y Toro S.A.(“Concha y Toro”, “we” or the “Company”), I transmit for your review this letter that provides the Company’s responses to the comments of the Staff of the Securities and Exchange Commission (the “Commission”) received in the letter dated May 23, 2013 (the “Comment Letter”) regarding the Company’s Annual Report on Form 20-F (“Form 20-F”) for the Fiscal Year Ended December 31, 2011, filed with the Commission on April 30, 2012. This letter is keyed to the headings and comment numbers contained in the Comment Letter. For ease of reference, each comment contained in the Comment Letter is printed below in bold and is followed by the Company’s response.
Form 20-F for the fiscal year ended December 31, 2011
General
1. During the Company’s May 22, 2013 conference call with the Staff it was communicated to the Staff that certain of the Company’s prior written responses were not correct. In your response letter, please separately identify the prior response(s) that were not correct and provide the revised corrected response(s) as necessary
The Company’s prior response did not provide the Staff with a sufficiently comprehensive view of the facts and circumstances with respect to:
a) Response to letter of November 20, 2012, in the following part:
i. Comment number 2.
We overdraft our original response to this comment included in our letter of November 20, 2012.
Should read:
Agricultural produce is measured at fair value less cost to sell at the point of harvest, as required by paragraph 134 of IAS 41. Further detail is included in comment number 13 of this letter.
| 1 |
b) Response to letter of January 03, 2013, in the following part:
i. Comment number 4.
Item “Regarding your questions on this point we can inform you of the following:”
Where it says:
The Company performs annual impairment test of biological asset “Grapevines”.
To this end, an internal technical report is prepared to determine whether there is any sign of deterioration that could indicate possible impairment of the asset “grapevines”
Regarding the paragraph that says “All this information is analyzed in terms of the final margin obtained. Margins have increased over time, making a possible impairment on plantings value increasingly unlikely, as the grapevine’s production is precisely the source of the Company´s sales growth and profits margins”. We understand that IAS 41 standard was drafted to avoid deferring of profit and therefore “accounting for margins increase” would be accounting immediately via the change in fair value of biological assets. Consequently, we had deleted this comment in the correction bellow.
Should read:
The Company assess at the end of each reporting period whether there is any indication that the grapevines may be impaired. An internal technical report is prepared for this purpose and the Company considers impairment indicators in assessing the need for impairment at least annually. At December 31, 2011 there are no impairment indicators and we did not test the biological assets for impairment. The impairment test date is December 31 each year.
ii. Comment number 5.
Item “Regarding your questions on this point we can inform you of the following:”
Where it says:
In the case of the first question, as expressed in the notes to the financial statements, vineyards are valued at their acquisition cost.
Should read:
Paragraph deleted
iii. Comment number 5.
Item, letter c) “Prices are available to the public:”
| 2 |
Where it says:
On the other hand, the transactions that have taken place in recent years are not significant and the values involved cannot be extrapolated, to be used as comparable figures for valuation effects.
Should read:
It is not appropriate to use the information from the acquisitions of new vineyards in the period 2003-2011, because these transactions were not agreed at fair value. The purchase prices for these acquisitions were set considering that Viña Concha y Toro would acquire net assets from a company in bankruptcy or in deficit of cash and therefore, in the Company’s view; this price cannot be considered as fair value.
In addition, Viña Concha y Toro paid for the land and not for the vineyard, which were in most of cases uprooted because of the low quality.
iv. Comment number 5.
Item, letter c) “Prices are available to the public:”
Where it says:
According to IAS 41, companies often enter into contracts to sell their biological assets or agricultural produce at a future date. The prices of these contracts are not necessarily relevant in determining fair value, as this value reflects the current market in which a willing buyer and seller would enter into a transaction. As consequence of the above, the value in the type of contract described above will not correspond to the fair value of a biological asset or of an agricultural product.
Should read:
Companies often enter into contracts to sell their biological assets or agricultural produce at a future date. We concluded that the prices of these contracts are not necessarily relevant in determining fair value, as they do not necessarily reflects the market price in which a willing buyer and seller would enter into a transaction. As consequence of the above, the value in the type of contract described above will not correspond to the fair value of a biological asset or of an agricultural product.
c) Response to letter of March 19, 2013, in the following part:
i. Comment number 4,
Where it says:
Plantings (acquired in April 2011) were valued at cost “fair value” because there was no reliable market history to determine fair value according to IAS 41 paragraph 30.
| 3 |
The company decided to use cost for this asset, as according to the analysis carried out by the company it was concluded that if IAS 41 is used, in terms of biological assets, the requirements established there are not met, that is, that fair value can be reliably determined as there is no active market, either in Chile, Argentina and the US that can determine a fair value.
Moreover, it is not possible to use information and other parameters to determine a fair value that meet the requirements set forth by IAS 41, since not all the variables considered provide a reliable basis for constructing fair value.
There are no statistics of transactions of vine plantings or of land planted with grape varieties which are of a quality similar to those owned by the winery in the various countries where the company has vineyard plantings. The information that could be obtained does not indicate the geographic area where a purchase transaction was carried out, if the price is a market price, the age of the plantings and quality of the vines.
Also according to a research conducted in 2012 in Fetzer it was checked and confirmed that there are no market transactions of plantings similar to those owned by Fetzer.
The research also confirms that the information available must correspond to studies of valuations of vineyards in geographical areas where the type of plantings, vine age, grape variety and grape quality are not identified. In addition, in these appraisals it is not specified whether values correspond exclusively to plantings, as it is possible that the value of irrigation system, water supply, fences and others are included in the appraisal.
The value of vine plantings of the subsidiary Fetzer represents approximately 7% of the consolidated value of vine plantings and 1.7% of the total value of the item property, plants and equipment. Accordingly, the Company determined the acquisition balance at fair value for assets, with the corresponding adjustment, establishing that the vines are valued at cost due to the reasons mentioned in the previous paragraph.
Should read:
The biological assets (acquired in April 2011) were measured at fair value. This approximates the book value
ii. Comment number 5.
Where it says:
The value assigned to the vineyards is cost, as noted in comment number 4 in the response.
Should read:
The value assigned to the vineyards is fair value as noted in comment number 4 in the response.
| 4 |
iii. Comment number 6.
Item. “Further explain to us in reasonable detail the basis for your belief that Fetzer’s book value of inventory was equal to its fair value (i.e., replacement cost) as of the acquisition date.”
Where it says:
Inventories were valued using the replacement cost method (RCM).
Should read:
Inventories were valued using the replacement cost method (RCM) for purposes of determining the fair value of inventories. In performing the fair value measurements we concluded that the fair value amount approximates book value and we recorded that book value at the acquisition date. Please see further detail in the following “iv Comment number 6”
iv. Comment number 6.
Item. “Further explain to us in reasonable detail the basis for your belief that Fetzer’s book value of inventory was equal to its fair value (i.e., replacement cost) as of the acquisition date.”
Where it says:
| Bulk wine ThUS$ | FG ThUS$ | RAW Material ThUS$ | TOTAL ThUS$ | ||
| Selling Price | 95,913 | 29,136 | |||
| - | Manufacturing effort remaining | 322 | — | ||
| - | Brand Expenses | 7,725 | 2,169 | ||
| - | Sales and marketing | 7,372 | 2,070 | ||
| - | Profit allocable to the buyer | 12,990 | 3,690 | ||
| - | Selling and administrative expenses | 3,771 | 1,037 | ||
| - | Raw Material remaining | 2,897 | — | ||
| Value | 60,836 | 20,170 | 4,104 | 85,110 | |
| Book Value | 61,161 | 18,078 | 4,104 | 83,343 | |
| 5 |
Should read:
Comparison between fair value and book values as follows:
| Bulk wine ThUS$ | FG ThUS$ | RAW Material ThUS$ | TOTAL ThUS$ | ||
| Selling Price | 98,986 | 27,796 | |||
| - | Manufacturing effort remaining | 322 | — | ||
| - | Brand Expenses | 7,725 | 2,169 | ||
| - | Sales and marketing | 7,372 | 2,070 | ||
| - | Profit allocable to the buyer | 12,990 | 3,690 | ||
| - | G&A | 3,771 | 1,037 | ||
| - | Raw Material remaining | 2,897 | — | ||
Fair Value | 63,909 | 18,830 | 4,104 | 86,843 | |
Book Value | 61,161 | 18,078 | 4,104 | 83,343 | |
| Difference | 2,748 | 752 | — | 3,500 | |
The company considers that the difference between fair value of the acquired inventory and Fetzer’s book value is immaterial and consequently it was recorded at book value.
| 6 |
v. Comment number 6.
Item. “Further explain to us in sufficient detail the process that the Company undertook to determine the replacement cost of the acquired Fetzer inventory as of the acquisition date. In your response, please separately address how you determined the fair value of each type of acquired inventory (e.g. finished goods, work in progress and raw materials).”
Where it says:
| Inventory Class | Book value | Step-up /(step- down) | Percent step up/(step-down) | Fair market value | |
| Raw materials | 4,104,071 | 0 | 0.0% | 4,104,071 | |
| Work In Progress | 61,160,828 | -324,862 | -0.5% | 60,835,966 | |
| Finished goods | 18,078,408 | 2,091,409 | 11.6% | 20,169,817 | |
| Total | 83,343,307 | 1,766,547 | 85,109,854 | ||
| Key Assumption | Calculations | WIP | FG | ||
| Income statement assumption | Top-down approach calculations | ||||
| Net sales | 100.0% | Selling price | 143,856.1 | 28,733.2 | |
| Cost of goods sold | 62.9% | less: Manufacturing effort remaining | 29,350.9 | — | |
| Gross profit | 37.1% | less: Brand expenses | 11,226.6 | 2,242.4 | |
| Brand expense | 7.8% | less: Selling, marketing and advertising cost | 10,714.0 | 2,140.0 | |
| Sales & marketing | 7.4% | less: General and administrative costs remaining | 12,617.7 | 1,100.0 | |
| General & administrative | 5.3% | less: Profit allocable to the buyer | 19,110.8 | 3,081.0 | |
| Operating income | 16.5% | less: Raw material remaining | — | — | |
| Subtotal | 60,836.0 | 20,169.8 | |||
| 7 |
| |||||
| Step-up and indications of value | |||||
| Book value of inventory | Step up in value ( $ and % increase) | ||||
| Raw materials | 4,104.1 | Raw material | — | ||
| Work In Progress | 61,160.8 | Work-in-progess (WIP) | (324.9) | ||
| Finished goods | 18,078.4 | Finished goods (FG) | 2,091.4 | ||
| Total net inventory | 83,343.3 | Total net inventory step-up | 1,766.55 | ||
| Other key assumptions | Indicated fair market value | ||||
| WIP percent complete | 67.6% | Raw material | 4,104.07 | ||
| FG percent complete | 100.0% | Work-in-progess (WIP) | 60,836.0 | ||
| Raw material portion of completed inventory | 90.0% | Finished goods (FG) | 20,169.8 | ||
| Raw material pricing adjustment | 0.0% | Total net inventory | 85,109.85 |
| 8 |
Supporting calculations | WIP | FG |
| Selling price | ||
| Net book value | 61,160.8 | 18,078.4 |
| % Complete | 67.6% | 100% |
| Grossed up net book value | 90,511.7 | 18,078.4 |
| Cost of goods sold (%) | 62.9% | 62.9% |
| Total selling price | 143,856.1 | 28,733.2 |
| Manufacturing effort remaining | ||
| Grossed up net book value | 90,511.7 | 18,078.4 |
| Raw material portion | 81,460.6 | 16,270.6 |
| Total manufacturing effort | 9,051.2 | 1,807.8 |
| Net book value | 61,160.8 | 18,078.4 |
| Raw material portion | 81,460.6 | 16,270.6 |
| Manufacturing effort to date | 20,299.8 | 1,807.8 |
| Manufacturing effort remaining | 29,350.9 | — |
| Brand expense | ||
| Total selling price | 143,856.1 | 28,733.2 |
| Brand expense (%) | 7.8% | 7.8% |
| Brand expense | 11,226.6 | 2,242.4 |
| Sales and marketing | ||
| Total selling price | 143,856.1 | 28,733.2 |
| Sales and marketing costs (%) | 7.4% | 7.4% |
| Sales and marketing | 10,714.0 | 2,140.0 |
| General and administrative costs (G&A) | ||
| Total selling price | 143,856.1 | 28,733.2 |
| General and administrative costs (%) | 5.3% | 5.3% |
| Total general and administrative costs | 7,654.7 | 1,528.9 |
| Total value added costs excluding G&A | 31,116.6 | 6,091.3 |
| G&A as % of value-added-costs | 24.6% | 25.1% |
| Manufacturinf effort remaining | 29,350.9 | — |
| Brand expense | 11,226.6 | 2,242.4 |
| Sales and marketing | 10,714.0 | 2,140.0 |
| Subtotal | 51,291.6 | 4,382.3 |
| G&A as % of value-added-costs | 24.6% | 25.1% |
| General and administrative costs remaining | 12,617.7 | 1,100.0 |
| Profit allocable to the buyer | ||
| Total selling price | 143,856.1 | 28,733.2 |
| Profit on sales (%) | 16.5% | 16.5% |
| Profit on sales | 23,749.0 | 4,743.5 |
| Total value added costs | 42,945.8 | 8,440.4 |
| Profit on value added costs (%) | 55.3% | 56.2% |
| Brand expense | 11,226.6 | 2,242.4 |
| Sales and marketing | 10,714.0 | 2,140.0 |
| General and administrative cost remaining | 12,617.7 | 1,100.0 |
| Total value added cost incurred by buyer | 34,558.4 | 5,482.3 |
| Profit on value added costs (%) | 55.3% | 56.2% |
| Profit allocable to the buyer | 19,110.8 | 3,081.0 |
| Raw material remaining | ||
| Total raw material | 81,460.56 | 16,270.56 |
| Raw material to date | 81,460.56 | 16,270.56 |
| Raw material remaining | — | — |
| 9 |
Should read:
| Key Assumption | |||||||
| Income Statement assumptions | |||||||
| Net Sales | 100% | ||||||
| Cost of good sales | 65.04% | ||||||
| Gross Profit | 34.96% | ||||||
| Brand expense | 7.80% | ||||||
| Sales & marketing | 7.45% | ||||||
| General & administrative | 5.32% | ||||||
| Operating Income | 14.39% | ||||||
| Book Value of inventory | accountant | ||||||
| Raw material | 4,104 | ||||||
| WIP | 61,161 | ||||||
| FG | 18,078 | ||||||
| Total | 83,343 | ||||||
| Other | |||||||
| WIP % | 95.00% | ||||||
| Raw material portion of complete inventory | 90.00% | ||||||
| 10 |
Supporting calculations | ||||||||
| Selling Price | WIP | FG | ||||||
| Net book value | 61,161 | 18,078 | ||||||
| % complete | 95.0% | 100% | ||||||
| Grossed up net book value | 64,380 | 18,078 | ||||||
| Cost of good % | 65.04% | 65.04% | ||||||
| Total selling Price | 98,986 | 27,796 | ||||||
| Manufacturing effort remaining | ||||||||
| Grossed up net book value | 64,380 | 18,078 | ||||||
| Raw material effort | 57,942 | 16,270 | ||||||
| Total manufacturing effort | 6,438 | 1,808 | ||||||
| Net book value | 61,161 | 18,078 | ||||||
| Raw material effort | 55,045 | 16,270 | ||||||
| Total manufacturing to date | 6,116 | 1,808 | ||||||
| Manufacturing effort remaining | 322 | — | ||||||
| Brand Expenses | ||||||||
| Total selling price | 98,986 | 27,796 | ||||||
| 7.80% | 7.80% | |||||||
| Brand Expenses | 7,725 | 2,169 | ||||||
| Sales and marketing | ||||||||
| Total selling price | 98,986 | 27,796 | ||||||
| 7.45% | 7.45% | |||||||
| Sales and marketing | 7,372 | 2,070 | ||||||
| G&A | ||||||||
| Total selling price | 98,986 | 27,796 | ||||||
| G&A % | 5.32% | 5.32% | ||||||
| G&A | 5,267 | 1,479 | ||||||
| Total value-added cost excluding G&A | 21,535 | 6,047 | ||||||
| G&A as % of value-added cost | 24% | 24% | ||||||
| Manufacturing effort remaining | 322 | — | ||||||
| Brand Expenses | 7,725 | 2,169 | ||||||
| Sales and marketing | 7,372 | 2,070 | ||||||
| Total | 15,419 | 4,239 | ||||||
| 3,771 | 1,037 | |||||||
Profit allocable to the buyer | ||||||||
| Total selling price | 98,986 | 27,796 | ||||||
| % Profit on sales | 14.39% | 14.39% | ||||||
| Profit on sales | 14,242 | 3,999 | ||||||
| Total value added | 20,686 | 5,718 | ||||||
| 68.8% | 69.9% | |||||||
| Brand Expenses | 7,725 | 2,169 | ||||||
| Sales and marketing | 7,372 | 2,070 | ||||||
| G&A | 3,771 | 1,037 | ||||||
| 18,868 | 5,276 | |||||||
| Profit allocable to the buyer | 12,990 | 3,690 | ||||||
| Raw Material remaining | ||||||||
| Total raw material | 57,942 | 16,270 | ||||||
| Raw material to date | 55,045 | 16,270 | ||||||
| 2,897 | — | |||||||
| 11 |
vi. Comment number 6,
Item, “Identify the biological assets you acquired from Fetzer and how they are classified within the line items appearing in the table. Also, explain how your process used to estimate fair value of these assets under IFRS 3.18 might be useful to measure your biological assets under IAS 41.12.”
Where it says:
The vineyards are classified in the item Property, Plant and Equipment and are valued at cost for the reasons stated in the response to comment 4 (IAS 41 paragraph 30).
Should read:
Biological assets acquired from Fetzer consist of eleven vineyards. These assets are located at Mendocino County, California, and San Luis Obispo County, California
The vineyards are classified as Biological Assets and are recognized at fair value. This approximates the book value
d) Response to letter of April 18, 2013, in the following part:
i. Comment number 1.
Where it says:
In the case of Fetzer’s biological assets acquired in the business combination, the Company’s Management has valued them at cost, because as there is no market history providing reliable values to determine the fair value of these assets according to IFRS 13 methodology, these values are considered a more sustainable representation. In previous responses to SEC, the Company, based on internal and external analyses, has supported the criteria applied of using cost as the value for the biological assets.
| 12 |
While it is possible to structure a model of fair value measurement, IFRS 13 itself states, in paragraph 72, that the lowest priority in the use of an input variable for determining fair value corresponds to the unobservable variables (level 3). The Company has found that, in the case of grapevines, the super premium and ultra premium varieties which do not have a market benchmark, the value could only be determined by the use of such variables generating a measurement that would not be in the line with an objective measurement criterion. Also, in the case of biological assets, it would have a recurring aspect (i.e., the measurement is periodic), which would distort the determination of a reliable value.
Should read:
Fetzer’s biological assets acquired in the business combination were measured at fair value. This approximates the book value.
ii. Comment number 1,
Where it says:
The other wine companies operating in Chile reveal in their accounting policies, as defined in their financial statements, that cost is the principle followed to assess vine plantings, as there is no record of transactions in the open market in the country and therefore on which to build values, as noted in IFRS 13. The obstacle is that past records and variables to consider are estimates that have no reasonable technical basis which means results obtained would not be reliable.
Should read:
Paragraph is deleted.
iii. Comment number 3,
Item, B “Equipment.”
Where it says:
Biological assets are included as part of these, and as noted in our comments to question 1, in the case of Fetzer’s biological assets acquired in a business combination, the Company’s Management has valued at cost as it believes these values are more sustainable, as there is no market history which can provide reliable values to determine the fair value of these assets according to IAS 13 methodology. In previous responses to SEC, the Company has supported the criterion of using cost as the value for biological assets, based on internal and external analyses.
Should read:
Biological assets were included as part of “equipment” for determining the fair value of the acquire entity. However, for reporting purposes (financial statements), they were classified in the item Biological Assets. The Company valued the biological assets at fair value. This approximates the book value.
| 13 |
Notes to Consolidated Financial Statements, page F-13
Note 12. Goodwill, page F-58
Acquisition of Fetzer Vineyards, Inc., page F-58
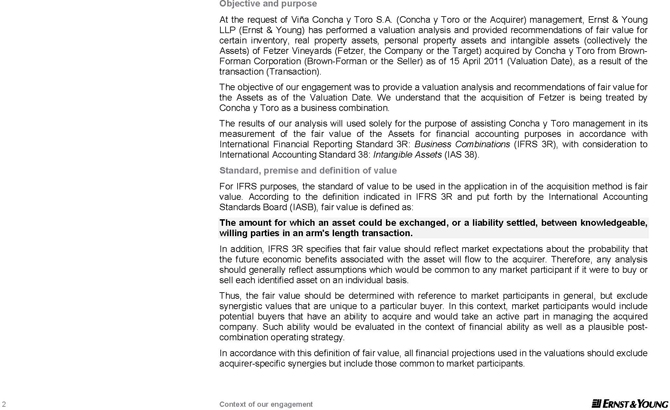
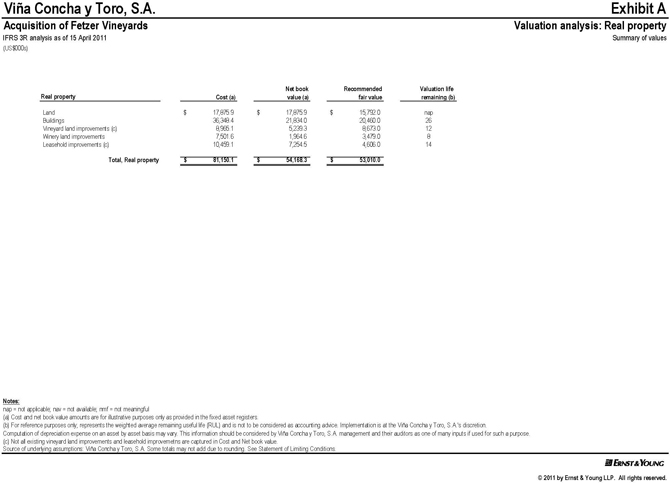
| 2. | During the Company’s May 22, 2013 conference call with the Staff it was communicated to the Staff that the Company obtained a third party valuation report in connection with its acquisition of Fetzer; and that based on this report the Company determined that the value assigned to certain acquired Fetzer assets approximated their fair value. Please provide us with a courtesy copy of this report (in English). |
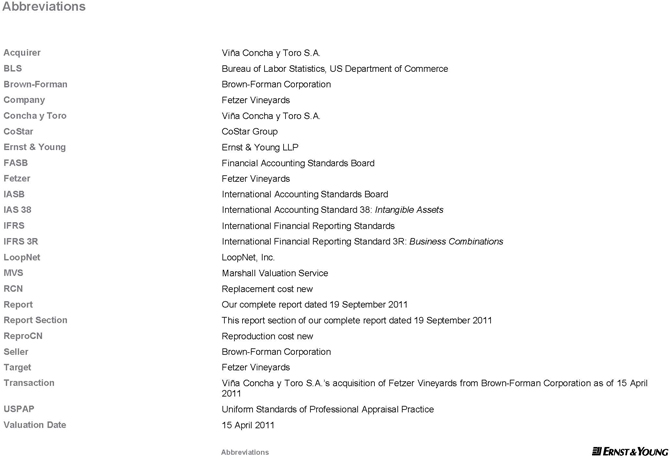
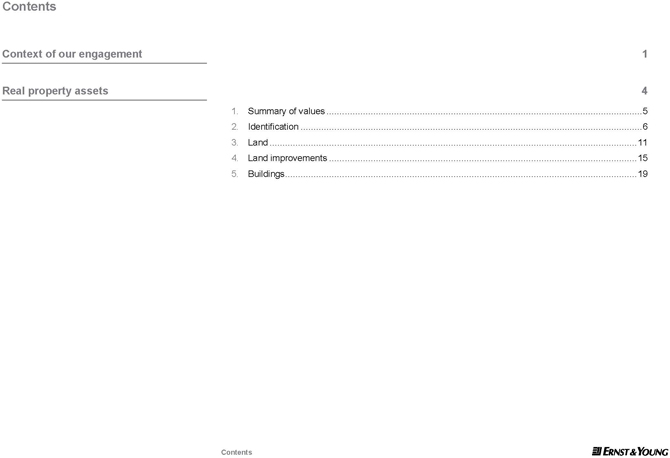
In accordance to your request enclosed please find:
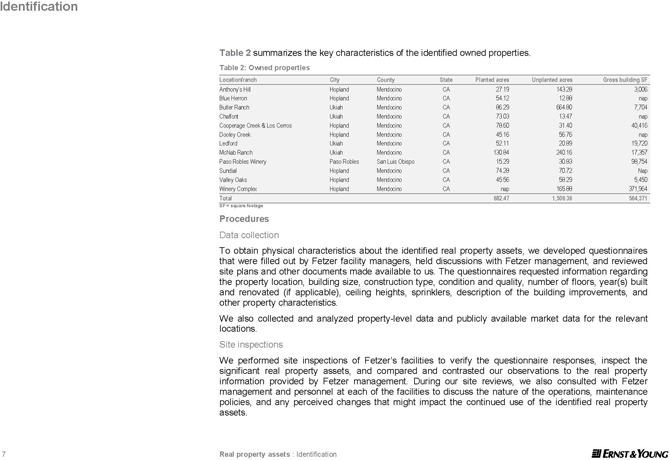
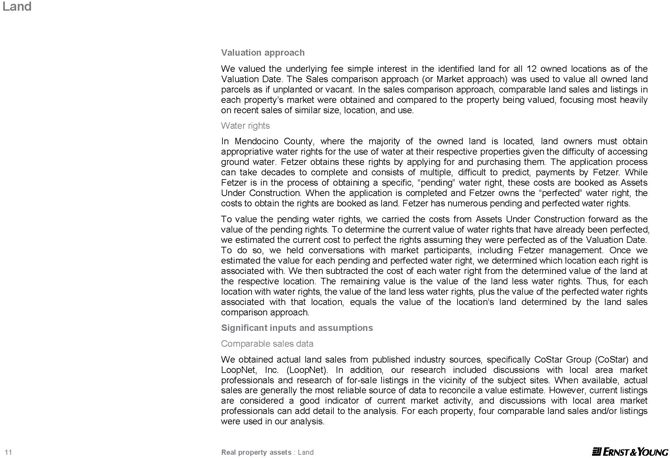
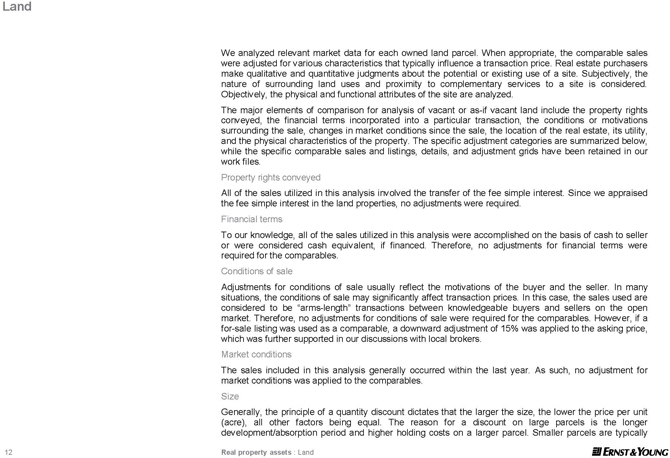
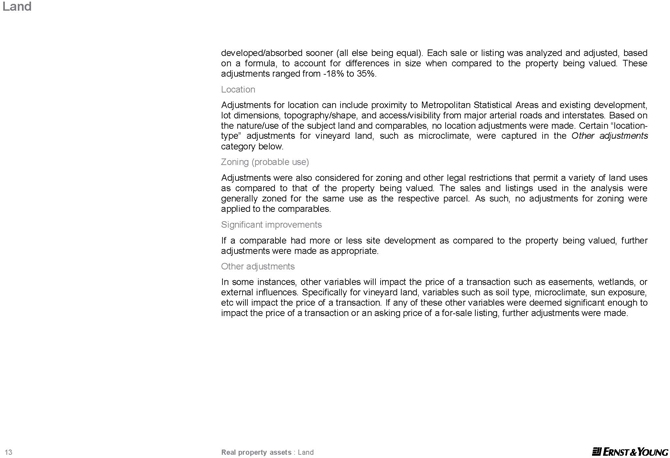
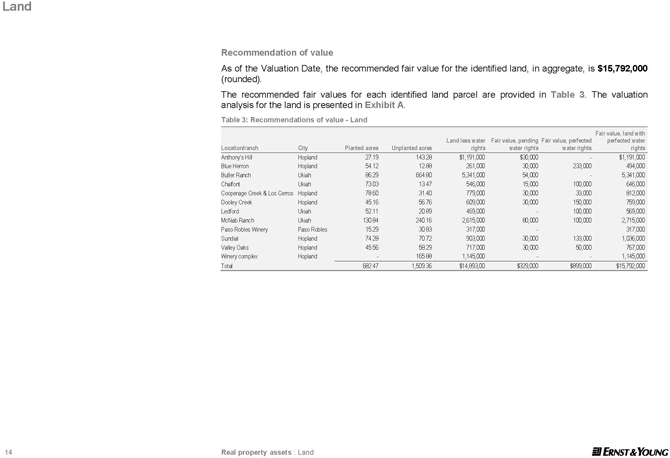
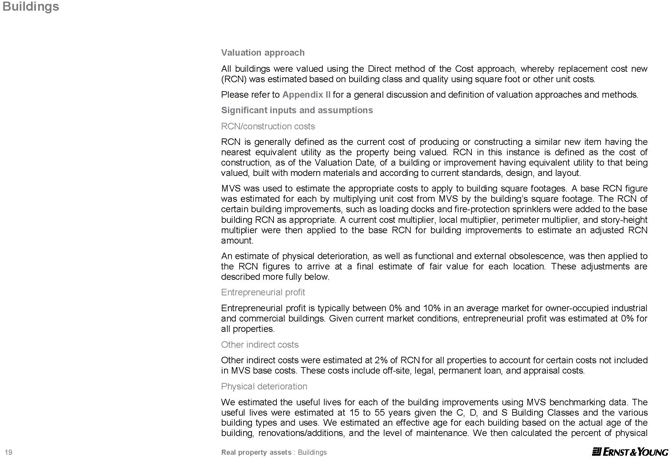
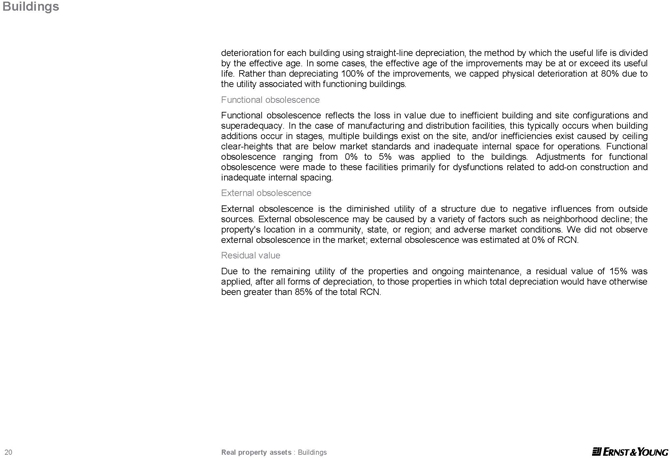
On Exhibit: Real property report section of our complete valuation report dated 19 September 2011.
| 3. | We note your responses to comment six of our letter dated February 11, 2013 and comment two of our letter dated April 4, 2013 with respect to inventory acquired in your Fetzer acquisition. Please provide us with the additional information in the following comments with respect to your work in process, finished goods and raw materials inventory. |
Please see the answers in No. 4 below
Work in Process (WIP) and Finished Goods Inventory
| 4. | Further describe to us the nature of the WIP and finished goods inventory acquired; for example, whether WIP represents wine in the production phase and finished goods represents bottled wine, or if these inventory components are comprised of other items. |
The WIP (Work in progress) inventory is Bulk Wine in different stages of production, from fermentation to final Blends. Finish products are bottled wine prepared to be shipped.
| 5. | Reconcile the valuation information provided on page eight of your March 19, 2013 response to the information on page nine. In this regard, there are significant differences in the amounts used to arrive at the WIP and finished goods inventory values between these two pages. |
This difference don’t exist, files were confused during the translation of the letter. We apologize for the confusion this may have caused.
The correct information is shown in our response to your question N° 1 c) (v) to this letter.
| 14 |
| 6. | Further describe to us your computations of the “general and administrative costs remaining” line item on page 10 of your March 19, 2013 response, including: |
| · | Why this computation does not simply multiply the 5.3% “general & administrative” assumption on page nine by the selling price in a manner similar to the other remaining costs (e.g., brand expense); and |
| · | Explain how to recalculate the “total value added costs excluding G&A” amounts presented for WIP (Th$31,116.6) and finished goods (Th$6,091.3). |
We corrected the information as indicated in “v. Comment number 6” related to our response letter of March 19, 2013. We present our analysis based on the corrected information:
On the projections used to value the company we determined a 5.3% of G&A expenses over Net Sales. For example, in the case of WIP, in absolute values, this is USD$5,267 over a Net sale projection of USD$ 98,986.
The same methodology was applied to Brand Expenses (7.8% & USD$7,725) and Selling Expenses (7.4% & USD$7,372)
With regard to “Total value added costs excluding G & A”, and according to our revised wording N° 1 c) (v) above, the values are: “Total value added costs excluding G & A” Amounts presented for WIP (Th $ 21.535) and finished goods (Th $ 6.047).
On the model each of these relative values (in %) where multiplied by the estimated Net sales that the inventories will generate. On this calculations there’s a difference between the sales driven expenses (Brand expenses and selling expenses) and the General and administrative expenses. The last ones where converted from a sales base point margin to a cost based margin to determine the percentage over the value added costs. This conversion is to capture what’s remaining to spend based on the value added costs.
Brand expenses and selling expenses have cero allocation to the seller, so they are 100% remaining to execute to sell the inventory purchased.
The total of value added cost excluding G&A is calculated adding Brand expenses, Selling expenses and the Manufacturing effort remaining. The Manufacturing effort remaining is calculated deducting from the total manufacturing effort, the Manufacturing effort to date. Those two calculations are determined deducting from the grossed up net book value (that is the Net book value of the inventory divided by the % of completion of each type of inventory) and from the Net book value respectively, the Raw material portion.
| 15 |
| 7. | Further describe to us your computations of the “total value added costs” line item on page 10 of your March 19, 2013 response, including: |
| · | Explain how to recalculate the “total value added costs” amounts presented for WIP (Th$42,945.8) and finished goods (Th$8,440.4); and |
The total value added cost is calculated by adding the Manufacturing effort remaining, the Brand expenses the Selling expenses and the G&A Expenses, resulting in Th$20,686 for WIP and Th$5,718 for FG (figures comparable to the in Th$42,945.8 for WIP and Th$8,440.4 for FG on the corrupted file)
| Incorrect file | Correct file | ||||
| WIP | FG | WIP | FG | ||
| Profit allocable to the buyer | |||||
| Total selling price | 143,856.1 | 28,733.2 | 98,986.0 | 27,795.5 | |
| Profit on sales (%) | 16.5% | 16.5% | 14.4% | 14.4% | |
| Profit on sales | 23,749.0 | 4,743.5 | 14,241.9 | 3,999.2 | |
| Total value added costs | 42,945.8 | 8,440.4 | 20,686.2 | 5,718.3 | |
| Profit on value added costs (%) | 55.3% | 56.2% | 68.8% | 69.9% | |
| · | Describe the relationship between profit on sales and value added costs, and tell us why there is a direct relationship between total profit and value added costs |
The model estimate the profit over sales based on the company projections at April 15th 2011 and determined the percentage of that estimated profit over the calculated value added costs. This final percentage is used to calculate the profit allocable to the buyer multiplying it with the value added costs remaining.
When valuing inventory, the Company applied a reasonable profit allowance for the remaining manufacturing (applies only to WIP and not FG) and selling effort (applies to both WIP and FG), all from the viewpoint of a market participant. So as the profit on value added costs are generally correlated to the profitability overall, but to the exclusion of items where there is not expectation of a reasonable profit (e.g.,areas where there is no valueadded costs, like raw materials, etc.).
| 16 |
| 8. | We note that your profit calculations result in total profit allocable to the buyer of 80% for WIP and 65% for finished goods. Please explain to us why such a large portion of the profit margin is being associated with the buyer’s efforts. In your response, also address the following factors with respect to the profit allocable to the seller: |
| · | WIP was 67.6% complete with 49% of total costs incurred while only 20% of total profit was allocable to the seller; and |
| · | Finished goods were 100% complete with 76% of total costs incurred while only 35% of total profit was allocable to the seller. |
We corrected the information as indicated in “v. Comment number 6” related to our response letter of March 19, 2013. With the corrected information a large portion of the profit margin is still being associated with the buyer´s efforts, which it is consistent with two major concepts that describe the wine business where Fetzer Vineyards participate:
| 1. | The value of a winery: Wineries are companies that need to develop their brands, have an appropriate distribution network and marketing campaign, so the products meet consumer expectations. The bulk wine used (excluding the Ultra premium wine) is not relevant for determining value added to the company. Wine making internally (excluding the ultra premium wines) is more a long term supply concern. There are examples of wineries that subcontract everything and with a good commercial proposal and distribution network, can sell more and with better prices than some wineries that control the production and have better quality but without the correct selling proposal. |
| 2. | The production wines (excluding ultra premium wines) are replaceable: As stated in the previous point, the wines on the popular to premium level can be vinified by everybody and are available in the market. Saying that, we should assume that the bulk wine (WIP, excluding the ultra premium wines) should be treated as a Raw material. |
With that said and considering that the Brand and Selling expenses are considerable high, that a portion of the G&A expenses is also related to selling processes. Allocating a big portion of the profit to the buyer is considered reasonable.
| 17 |
| 9. | Further explain to us the nature of the following costs that are listed on page nine of your March 19, 2013 response: |
| · | Brand expenses, | |
| · | Selling, marketing and advertising costs, and | |
| · | General and administrative costs | |
| Incorrect file | Correct file | ||||
| WIP | FG | WIP | FG | ||
| Cost incurred | |||||
| Brand expense | 11,226.6 | 2,242.4 | 7,724.9 | 2,169.2 | |
| Selling, marketing and advertising cost | 10,714.0 | 2,140.0 | 7,372.2 | 2,070.1 | |
| General and administrative cost remaining | 12,617.7 | 1,100.0 | 3,771.2 | 1,036.9 | |
| Total value added cost incurred by buyer | 34,558.4 | 5,482.3 | 18,868.4 | 5,276.2 | |
The nature of the following costs area as follows:
| · | Brand Expenses: Are marketing expenses. These costs include: advertising and media agency costs, brand development, packaging developments, media advertising, meetings with distributor to develop and implement marketing strategy and product presentation. |
| · | Selling expenses: Relate to the cost of the selling division that included: salaries, traveling, incentives and benefits (performance bonus, health insurance, etc.), loyalty programs (Couponing related costs), representation expenses distributor and retailers meetings and entertaining expenses. |
| · | General and administrative costs: These costs include; salary, incentives and benefits (insurance, performance bonus, etc.) of: CEO, Finance, Accounting, Treasury, internal control, Accounts receivable, Accounts payable, Human Resources, Planning Information Technology. |
| 10. | Also explain how the those costs listed directly above relate to the completion and disposal efforts as described in your response to comment two of our letter dated April 4, 2013. In this regard, we highlight that general practice is to exclude indirect costs and general and administrative costs; and direct costs would include items such as packaging, sales commissions, transportation, etc. Please address your consideration of these points in your response letter. |
We concur with your comment. The indirect expenses and general and administrative costs were excluded from the calculation.
| 18 |
Raw Materials Inventory
| 11. | Please describe to us the nature of the raw materials acquired. For example, whether raw materials represent grapes or if this inventory component is comprised of other items. |
The raw materials are mainly packaging materials, including but not limited to, bottles, cases, labels, corks, capsules, caps,neckwrap, shipping materials and enological supplies. Also, but in minor percentage there are production supplies like glue, shrink wrap film, pallets within other minor supplies. The Raw material inventory does not include grapes(agricultural product), but does include the cumulative cost by expenditure of the next harvest (Ranch Crops-In-Progress).
| Raw materials | Th$ |
| Raw Material Inventory | 1,507 |
| Ranch Crops -In- Progress | 2,597 |
| Total Raw materials | 4,104 |
Please note the Ranch Crops- In- Progress is classified as Biological Assets in the financial statements as of December 31, 2011.
| 12. | In your response to comment two of our letter dated April 4, 2013 you state that one of your key inventory assumptions is to “assume that the estimates of raw materials reposition costs are the same as book value.” Please further explain to us your basis for this assertion given that the measurement principle in IFRS 3 is fair value, and the presumption that the sales price for grapes would be greater than the cost of producing grapes. Also tell us the assumed profit margin used to arrive at your conclusion. |
As explained in previous comment 11, the raw materials are mainly items with high turnover.
In order to estimate the fair value of raw materials we used the cost approach. In our estimate we considered the assumptions that raw material are mostly at fixed price throughout the year as per supply contracts, materiality, the timing of the delivery of goods. The result of this estimate was that the fair value was closed to book value.
In relation to the profit margin we used the valuation of the company based on information provided by the seller and Concha y Toro best estimated determined on the experience of managing wineries at the moment of the purchase. The estimate excludes any subsequent information that the administration determined or became aware after taking the control of the company.
| 19 |
Note 15. Biological Assets, page F-67
| 13. | We note that IAS 41 requires an entity to measure agricultural produce at the point of harvest at its fair value less costs to sell in all cases, which reflects the view that the fair value of agricultural produce at the point of harvest can always be measured reliably. Refer to paragraphs 13 and 32 of IAS 41. It appears that the Company has not historically valued its agricultural produce (i.e. grapes) at its fair value less costs to sell at the point of harvest since the adoption of IFRS. Please explain to us why you have not done so. We do not believe that IAS 41 provides any measurement exception for valuing agricultural produce at the point of harvest. |
We concur with you that IAS 41 does not provide any measurement exception to valuing agricultural produce at the point of harvest. Our agricultural produces (grapes) at the point of harvest is measured at fair value. In our case, the point of harvest of agricultural produce takes place in May of each year.
In this regards, upon adopting IFRS our grapes at the point of harvest are measured at fair value less cost to sell as required by IAS 41.
The results of our model used to measure fair value less cost to sell of our grapes at the point of harvest approximate cost. The valuation technique used to measure fair value less cost to sell of our grapes at the point of harvest is the cost approach. The reason is because given the unique circumstances for determining the fair value of our grapevines as disclosed in page F-67, our conclusion is that the cost approach reflects the present value of the amounts that would be required currently to replace the grapes at the point of harvest.
The observable inputs for valuing grapes included in our model are as follows:
| · | Annual cash outflows on land preparation, plants, planting, fertilization, grafting, pruning, equipment use, and irrigation. |
| · | All direct (labor) and indirect (fuel, maintenance, etc.) cash outflows incurred based on annual budgets and disbursements by land and grape after prior period harvest until the day of harvest. |
| · | Discounted rated of 9.2%. |
The chart below shows the results of fair value measurement of our grapes at the point of harvest compared to costs (in thousands of Chilean pesos):
| Date of the harvest May 2012 | ||||
| Th$ | ||||
| Cost (book value) | 16.081.000 | |||
| Fair value | 16.868.000 | |||
| Difference | 787.000 |
| 20 |
We also believe that the disclosures on the financial statements in pages F-28 and F-68 are not misleading. However, given the recent discussions in your comment letter, we will improve the disclosure of the accounting policy to specifically address the treatment of the grapes at the point of harvest in future filings. We also considered the effect of grapes that are part of inventory as of December 31, 2011 and concluded based on the above analysis that agricultural produce which is part of inventory as of December 31, 2011, was recorded at fair value in the point of harvest of 2011.
The accounting policy will read as follows:
Biological assets include all grapevine plantations. The agricultural produce (grapes) derived from productive plantations is intended to be the supply for the wine production process.
In conformity with IAS 41, upon the adoption of IFRS in 2011 and based on the results of the analysis and calculation of the Company concluded that the fair value of the grapes at the time of harvest approximates the book value and consequently the grapes at the point of harvest are measured at fair value less cost to sell, and then transferred to inventory.
| 21 |
As requested by the Commission in the Comment Letter, I acknowledge, on behalf of the Company, the following:
| a) | The company is responsible for the adequacy and accuracy of the disclosure in the filing; |
| b) | Staff comments or changes to disclosure in response to staff comments do not foreclose the Commission from taking any action with respect to the filing; and |
| c) | The company may not assert staff comments as a defense in any proceeding initiated by the Commission or any person under the federal securities laws of the United States. |
If you would like to discuss any of the Company’s responses to the comments or any other matters, please call me at (56-2) 2476-5644.
| Sincerely, | ||
| /s/ OSVALDO SOLAR VENEGAS | ||
| Osvaldo Solar Venegas | ||
| Chief Financial Officer | ||
| Viña Concha y Toro S.A. |
| 22 |
EXHIBIT