Exhibit 99.1
 | Osvaldo Solar - CFO | |
| Patricio Garreton - Head of IR | ||
| Tel: (56 2) 2476 5644 | ||
| conchaytoro-ir@conchaytoro.cl | ||
| www.conchaytoro.com |
VIÑA CONCHA Y TORO REPORTS
FOURTH QUARTER 2015 RESULTS
Santiago, Chile, March 28th, 2016 - Viña Concha y Toro S.A. (“The Company” or “Concha y Toro”) (NYSE: VCO, IPSA: Conchatoro), global leading winery and the principal wine producer and exporter of Chile, announced today its consolidated financial results, stated under IFRS, for the fourth quarter 2015 ended December 31st, 2015. US dollar figures (US$), except export figures, are based on the exchange rate effective December 31st, 2015 (US$1.00 = Ch$ 716.10).
Highlights 4Q2015 vs 4Q2014
| · | Total sales increased by 8.1% to Ch$192,066 million in the quarter. |
| · | Total volume increased 3.0%. TheWine Operating Segment (“Wine”) contributed with a 2.1% growth, while theOthers Operating Segment (“Others”) contributed with a 15.6% increase during this quarter. |
| · | Regarding Wine sales, stands out: |
| o | Export Markets increasing 5.3% in value totaling Ch$131,137 million, driven by a 1.0% of higher volumes. |
| o | Chilean Domestic Market growing 14.5% and 6.4% in value and volume, respectively. |
| o | Consolidated sales in Argentinean Markets increasing 30.8% in value, explained by higher sales in Export Market and Domestic Market totaling Ch$4,827 million (+20.2%) and Ch$2,251 million (+61.4%), respectively. |
| o | Consolidated sales in US markets totaling Ch$20,134 million, figure that represents a growth of 14.7% in value and 2.4% in volume. |
| · | Net income attributable to owners of the company totaled Ch$18,083 million, representing an increase of 33.9% during the quarter. |
| · | Operating Income plus depreciation and amortization increased 12.3% to Ch$31,206 million, the figure over sales reached 16.2%. |
Summary
In spite of the tough comparison base set in the 4Q2014, during the fourth quarter of 2015, net sales increased by 8.1% totaling Ch$192,066 million, in comparison to the Ch$177,700 totaled in 2014. The increase in sales is explained by higher sales in both operating segments, Wines and Others, registering 8.0% and 8.7% of growth in value, respectively.
The increase in Wine sales was driven by: i) higher sales in Exports Markets of 5.3% in value and 1.0% in volume; ii) higher sales in Chilean Domestic Markets of 14.5% and 6.4% in value and volume; iii) higher sales in the Argentinean operation of 30.8% and 2.5% in value and volume; iv) higher sales in the US operation of 14.7% and 2.4% in value and volume respectively; v) and a positive impact derived from exchange rate fluctuations.
Fetzer’s total wine sales to third parties (excluding shipments to distribution subsidiaries) in Chilean pesos increased 14.7% during the fourth quarter of 2015, driven by higher commercialized volumes in export markets (43.1%) and a positive impact derived from exchange rate fluctuations.
In the quarter, Argentinean total wine sales to third parties (excluding shipments to distribution subsidiaries) increased 30.8% in value and 2.5% in volume. The rise in sales was mainly due by higher commercialized volumes in the Domestic Market; higher average sales price in US dollar and a positive impact derived from exchange rate fluctuations.
In the quarter, the operating income plus depreciation and amortization totaled Ch$31,206 million, representing an increase of 12.3% in comparison to the same period of 2014. The result is explained by higher commercialized volumes; lower costs from an historical harvest; premiumization of the mix of sales and a positive effect from currency fluctuations. As a resultant, the figure of the operating income plus depreciation and amortization over sales reached 16.2% during the fourth quarter of 2015, representing an expansion of 62bp in margins in comparison to the 4Q14.
Finally, the net income attributable to owners of the company increased 30.5% to Ch$18,083 million, a 9.4% as percentage over sales.
| 2 |
Fourth Quarter 2015 Results
| 1. | Consolidated Sales |
Consolidated sales increased 8.1% totaling Ch$192,066 million in the fourth quarter, in value. In spite of the tough comparison base set in 4Q2014, the quarter registered two digits growth in several markets.
Table 1
Total Sales
| Total Sales(*) (in Ch$ million) | 4Q15 | 4Q14 | Change (%) | 12M 2015 | 12M 2014 | Change (%) | ||||||||||||||||||||||
| Chile Domestic Market - wine | 17,423 | 15,210 | 14.5 | % | 65,078 | 59,981 | 8.5 | % | ||||||||||||||||||||
| Export markets(1) | 131,137 | 124,535 | 5.3 | % | 426,196 | 396,179 | 7.6 | % | ||||||||||||||||||||
| Argentina Domestic | 2,251 | 1,395 | 61.4 | % | 6,748 | 4,451 | 51.6 | % | ||||||||||||||||||||
| Argentina Exports(2) | 4,827 | 4,017 | 20.2 | % | 18,719 | 16,382 | 14.3 | % | ||||||||||||||||||||
| U.S.A. Domestic | 18,556 | 16,478 | 12.6 | % | 58,850 | 52,252 | 12.6 | % | ||||||||||||||||||||
| U.S.A. Exports(2) | 1,578 | 1,080 | 46.0 | % | 5,295 | 4,875 | 8.6 | % | ||||||||||||||||||||
| Total Wine Operating Segment | 175,771 | 162,715 | 8.0 | % | 580,885 | 534,121 | 8.8 | % | ||||||||||||||||||||
| Chile Domestic Market - new business | 14,549 | 11,770 | 23.6 | % | 47,968 | 41,645 | 15.2 | % | ||||||||||||||||||||
| Other Revenues | 1,745 | 3,215 | -45.7 | % | 7,341 | 7,548 | -2.7 | % | ||||||||||||||||||||
| Total Other Operating Segment | 16,294 | 14,985 | 8.7 | % | 55,309 | 49,192 | 12.4 | % | ||||||||||||||||||||
| Consolidated Sales | 192,066 | 177,700 | 8.1 | % | 636,194 | 583,313 | 9.1 | % | ||||||||||||||||||||
| Total Volume(*) (thousand liters) | 4Q15 | 4Q14 | Change (%) | 12M 2015 | 12M 2014 | Change (%) | ||||||||||||||||||||||
| Chile Domestic Market - wine | 16,265 | 15,284 | 6.4 | % | 65,780 | 62,688 | 4.9 | % | ||||||||||||||||||||
| Export markets(1) | 62,336 | 61,699 | 1.0 | % | 209,287 | 201,526 | 3.9 | % | ||||||||||||||||||||
| Argentina Domestic | 1,961 | 1,785 | 9.8 | % | 5,405 | 5,027 | 7.5 | % | ||||||||||||||||||||
| Argentina Exports(2) | 2,344 | 2,415 | -2.9 | % | 9,583 | 9,941 | -3.6 | % | ||||||||||||||||||||
| U.S.A. Domestic | 5,245 | 5,257 | -0.2 | % | 17,317 | 17,977 | -3.7 | % | ||||||||||||||||||||
| U.S.A. Exports(2) | 487 | 340 | 43.1 | % | 1,602 | 1,590 | 0.8 | % | ||||||||||||||||||||
| Total Wine Operating Segment | 88,637 | 86,779 | 2.1 | % | 308,974 | 298,749 | 3.4 | % | ||||||||||||||||||||
| Chile Domestic Market - New Business | 7,064 | 6,110 | 15.6 | % | 23,838 | 22,056 | 8.1 | % | ||||||||||||||||||||
| Total Other Operating Segment | 7,064 | 6,110 | 15.6 | % | 23,838 | 22,056 | 8.1 | % | ||||||||||||||||||||
| Consolidated Volume | 95,702 | 92,890 | 3.0 | % | 332,812 | 320,805 | 3.7 | % | ||||||||||||||||||||
| Average Price (per liter) | Currency | |||||||||||||||||||||||||||
| Chile Domestic Market - wine | Ch$ | 1,068.8 | 995.2 | 7.4 | % | 988.7 | 957.0 | 3.3 | % | |||||||||||||||||||
| Export Markets | US$ | 3.05 | 3.40 | -10.2 | % | 3.15 | 3.47 | -9.5 | % | |||||||||||||||||||
| Argentina Domestic | US$ | 2.11 | 1.86 | 13.5 | % | 2.15 | 1.89 | 13.6 | % | |||||||||||||||||||
| Argentina Exports | US$ | 3.22 | 3.02 | 6.9 | % | 3.20 | 3.14 | 1.9 | % | |||||||||||||||||||
| U.S.A. Domestic | US$ | 5.14 | 5.31 | -3.1 | % | 5.35 | 5.23 | 2.2 | % | |||||||||||||||||||
| U.S.A. Exports | US$ | 4.63 | 5.31 | -12.7 | % | 5.04 | 5.40 | -6.6 | % | |||||||||||||||||||
(1) Export Volumes include exports to third parties and sales volumes of the company’s distribution subsidiaries (UK, Nordics, Brazil, Singapore, Mexico).
(2) This figure excludes shipments to the company’s distribution subsidiaries.
(*) This figure includes bulk wine sales.
| 3 |
| 1.1. | Consolidated Sales in Wine Operating Segment |
Consolidated Sales that come fromWine sales increased 8.0% in the fourth quarter of 2015 explained by higher commercialized volumes; a premiumization of sales; and a positive effect derived from exchange rate fluctuations.
| 1.1.1. | Export Sales |
Export sales from Chile and distribution subsidiaries increased 5.3% to Ch$131,137 million as compared to Ch$124,535 million in 4Q2014. Higher commercialized volumes (+1.0%) drove the increase in sales during the quarter. In addition, Export Sales were beneficiated by a positive effect that came from the FX fluctuations. The depreciation of the Chilean peso against U.S. dollar (16.7%) and Sterling pound (11.8%) boosted the top line that was partially offset by the appreciation of Chilean peso against the Brazilian Real (22.8%); Norwegian krones (6.0%); Mexican peso (3.5%); Argentinean peso (1.7%) and Canadian dollar (0.8%).
Graph 1
Total Export Bottled Volume by Region
(Considers Exports from Chile, Argentina, Fetzer and Distribution Subsidiaries)
4thQuarter 2015
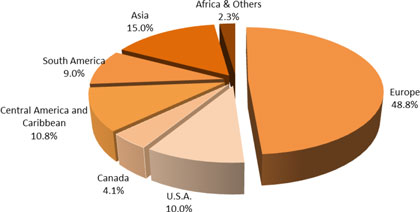
In accordance to the commercialized volume in export regions, the fourth quarter brought increases in most regions highlighting the 14.1% of growth in Canada. Others regions that registered growth were: Asia (9.9%); US (7.4%) and Central America & Caribbean (4.2%). In the other hand, Africa registered a drop of 24.3% as well as South America (16.1%) and Europe (0.4%).
| 4 |
| 1.1.2. | Domestic Sales, Chile |
Domestic wine sales increased 14.5% in value totaling Ch$17,423 million and 6.4% in volume totaling 1.8 million nine liter cases. The average sale price increased 7.4% during the quarter.
The increase in value reflects higher sales in value in the Premium segment (25.2%) as well in Non-Premium segment (8.8%). In terms of volume, both categories (Premium and Non-Premium) also registered increases of 29.6% and 4.1%, respectively. Premium (and above) categories represented 11.1% of the domestic volume and 36.3% of the domestic sales in Chilean pesos.
| 1.1.3. | Argentinean Operations |
Total sales from the Argentine operation (excluding shipments to distribution subsidiaries) registered an increase of 30.8% to Ch$7,078 million as a resultant of higher sales in export markets (20.2%) as well as in the domestic market (61.4%).
In terms of volume, the domestic market registered an increase of 9.8% offset by a drop of 2.9% in export markets. In the fourth quarter, export sales totaled 260 thousand of nine liter cases. Regarding the domestic market, the 4Q2015 totaled sales of 218 thousand of nine liter cases.
The average sales price registered in the domestic market increased 13.5% reaching US$2.11 per liter during the fourth quarter. In export markets, the average sales price rose 6.9% reaching US$3.22 per liter.
| 1.1.4. | U.S.A (Fetzer) |
During the fourth quarter of 2015, Fetzer’s total sales (excluding shipments to distribution subsidiaries) increased 14.7% totaling Ch$20,134 million, driven by higher sales in export markets (46.0%) as well in domestic market (12.6%), both in terms of value.
In terms of volume, Fetzer’s sales rose 2.4% totaling 637 thousand of nine liter cases in the fourth quarter. Higher sales in export markets (43.1%) and flat volumes in the domestic market explained the growth registered during the 4Q2015.
The average sales price in the domestic market reached US$5.14 per liter, representing a drop of 3.1%. The average sales price in Export Markets dropped 12.7% totaling US$4.63 per liter, impacted by the depreciation of the Canadian dollar, Sterling Pound and Euro against the U.S. dollar.
| 1.2. | Consolidated Sales in Others Operating Segment |
Consolidated Sales that come from theOthers sales increased 8.7% during the fourth quarter of 2015 driven by the growth registered in the distribution of spirits, beers, energy drinks and mineral water.
| 5 |
| 1.2.1. | Chilean Domestic Sales - New Business |
Domestic sales of new business, carried out by the domestic distribution subsidiary “Comercial Peumo”, including premium beer; spirits; and energy drinks increased 23.6% totaling Ch$14,549 million in terms of value and 15.6% totaling 7.1 million liters in terms of volume. The mentioned increase in value is explained by higher sales in the distribution of Diageo’s portfolio (18.5%); beers category (14.6%); and energy drink category (60.3%).
| 1.2.2. | Other Revenues |
Other revenues, comprising fees for bottling services, sales of fruit, among others, decreased 45.7% to Ch$1,745 million, in comparison to the 4Q2014.
| 2. | Cost of Sales |
In the quarter, the total cost of sales increased 6.9% to Ch$115,822 million (US$163.1 million) from Ch$108,326 million (US$152.5 million) in 4Q2014. The cost of sales as a percentage of total sales reached 60.3%, representing an improvement of 66bp in comparison to 4Q2014. The mentioned improvement had a positive impact over the gross margin reaching 39.7% as percentage over total sales in comparison to the 39.0% registered in 4Q2014. The lower cost as percentage over sales is explained by a lower wine cost.
| 3. | Selling, General and Administrative Expenses |
Selling, General and Administrative Expenses (Distribution costs and Administrative expenses) increased 7.4% to Ch$51,511 million (US$72.5 million) in 4Q2015 compared to Ch$47,948 million (US$67.5 million) in 4Q2014. As a percentage of sales, SG&A reached 26.8%, 16bp over the figure registered in 2014.
| 4. | Operating Income |
In the fourth quarter the Operating Income (Gross Profit - Distribution Cost and Administrative Expenses) increased 15.4% to Ch$24,733 million in comparison to Ch$21,427 million in 4Q2014. The operating margin as a percentage of sales improved 82bp from 12.1% in 4Q2014, reaching a 12.9% over total sales. The increase is driven by the effects mentioned above, mainly explained by higher commercialized volumes; premiumization of sales; lower cost of wine; and a positive effect derived to exchange rate fluctuations.
| 5. | Operating Income plus Depreciation and Amortization |
In the fourth quarter of 2015 the Operating Income plus Depreciation and Amortization increased 12.3% to Ch$31,206 million in comparison to Ch$27,778 million in 4Q2014. The operating income plus depreciation and amortization margin as a percentage of sales reached 16.2% in comparison to the 15.6% in 4Q2014. Higher commercialized volumes; premiumization of sales; lower cost of wine; and a positive effect derived from the exchange rate fluctuations, explained the improvement in margins during the quarter.
| 6 |
| 6. | Other Results by Function |
The Other Results by Function (Other Income, Other Expenses, Financial Income, Financial Expenses, Participation of Associates, Exchange Differences and Expenses by Adjustment Units) registered a loss of Ch$795 million a 79.7% down in comparison to the 4Q2014.
Financial expenses registered a decrease of 10.6% totaling Ch$2,627 million in the quarter, in comparison to the Ch$2,939 million obtained during the same period of 2014.
During the quarter, the Exchange rate Differences influenced positively the non-operating income due to the depreciation of the Argentinean peso against the US dollar.
As of December 31st, 2015, Net Financial Debt1 amounted to Ch$205,582 million, representing a decrease of Ch$11,047 million as compared to the Net Financial Debt as of December 31st, 2014.
| 7. | Net Income and Earnings per Share (EPS) |
Net Income attributable to owners of the company increased 33.9%, totaling Ch$18,083 million. Based on 747,005,982 weighted average shares, Concha y Toro’s earnings totaled Ch$24.2 per share in comparison to Ch$18.1 registered during the 4Q2014.
1 Net Financial Debt: Other current financial liabilities + Other non-current financial liabilities - Cash and cash equivalents - Derivatives.
| 7 |
Twelve Months 2015 Results
| 1. | Consolidated Sales |
Consolidated sales increased 9.1% totaling Ch$636,194 million during 2015, as a resultant of increases in most markets, highlighting higher sales in Export and Domestic Markets and New Business from Chile.
| 1.1. | Consolidated Sales in Wine Operating Segment |
Consolidated Sales that come from theWine’ssales increased 8.8% in 2015 explained by higher commercialized volumes; a premiumization of sales; and a positive effect derived from exchange rate fluctuations.
| 1.1.1. | Export Sales |
Export sales from Chile and distribution subsidiaries increased 7.6% to Ch$426.196 million as compared to Ch$396,179 million in 2014. Higher commercialized volumes drove the increase in sales during the period (3.9%). In addition, Export Sales were beneficiated by a positive effect that came from the exchange rate due to the depreciation of the Chilean peso against U.S. dollar (14.8%) and Sterling pound (6.5%). The upside was partially offset by the appreciation of Chilean peso against the Brazilian Real (19.0%); Euro (4.1%); Norwegian (10.4%) and Swedish (6.7%) crowns; Mexican peso (3.8%); and Canadian dollar (0.9%).
Graph 2
Total Export Bottled Volume by Region
(Considers Exports from Chile, Argentina, Fetzer and Distribution Subsidiaries)
Twelve Months 2015

In accordance to the commercialized volume in export regions, 2015 has brought increases in several regions: Asia (8.1%); Canada (5.2%); Central America & Caribbean (4.6%); US (3.6%); Europe (2.2%) and Africa & Others (1.5%). Only South America registered lower volumes (-2.3%) during 2015.
| 8 |
| 1.1.2. | Domestic Sales, Chile |
Domestic wine sales increased 8.5% in value totaling Ch$65,078 million, based on an expansion of 4.9% in volume, where sales totaled 7.3 million nine liter cases. The average sale price rose 3.3% to Ch$988.7 per liter in 2015.
The increase in value reflects higher sales in the Premium segment (17.2%) as well in Non-Premium segment (5.1%). In terms of volume, both categories (Premium and Non-Premium) also registered increases of 20.9% and 3.7%, respectively. Premium (and above) categories represented 8.3% of the domestic volume and 30.2% of the domestic sales in Chilean pesos.
| 1.1.3. | Argentinean Operation |
Total sales from the Argentine operation (excluding shipments to distribution subsidiaries) registered an increase of 22.2% to Ch$25,467 million as a resultant of higher average sales price in domestic and export markets; higher commercialized volumes in domestic market (7.5%); and a drop in volume in export markets (3.6%).
In 2015, export sales totaled 1.1 million nine liter cases. Regarding the domestic market, the 2015 registered an increase in commercialized volume totaling 600 thousand of nine liter cases.
The average sales price registered in the domestic market increased 13.6% reaching US$2.15 per liter in 2015. In export markets the average sales price rose 1.9% to US$3.20 per liter in the period.
| 1.1.4. | U.S.A (Fetzer) |
During 2015, Fetzer’s total sales (excluding shipments to distribution subsidiaries) increased 12.3% totaling Ch$64,145 million, as a resultant of higher sales in the domestic market (12.6%) as well as in export markets (8.6%). Sales in value in Ch$ terms were benefited by the depreciation of the Chilean peso against de US dollar.
In terms of volume, Fetzer’s sales dropped 3.3% totaling 2.1 million of nine liter cases during the period. Export Markets registered a growth of 0.8% in terms of volume, while the Domestic Market dropped a 3.7% during 2015.
The average sales price in the domestic market reached US$5.35 per liter, representing an increase of 2.2% in line with the positioning that has been implementing Fetzer’s products in premium categories. The average sales price in Export Market dropped 6.6% to US$5.04 per liter, mainly explained by the depreciation of Canadian dollar; Sterling Pound; and Euro against U.S. dollar, currencies that are predominant within the export portfolio.
| 9 |
| 1.2. | Consolidated Sales in Others Operating Segment |
Consolidated Sales that come from theOtherssalesincreased 12.4% during 2015, driven by the growth registered in the distribution of spirits, beers, energy drinks and mineral water.
| 1.2.1. | Chilean Domestic Sales - New Business |
Domestic sales of new business, carried out by the domestic distribution subsidiary “Comercial Peumo”, including premium beer and spirits increased 15.2% totaling Ch$47,968 million in terms of value and 8.1% totaling 23.8 million liters in terms of volume. The mentioned increase is explained by higher sales in Diageo’s portfolio (10.2% in value); beers category (12.7% in value); and energy drink category (42.8% in value).
| 1.2.2. | Other Revenues |
Other revenues, comprising fees for bottling services and sales of fruit, decreased 2.7% to Ch$7,341 million, in comparison to 2014.
| 2. | Cost of Sales |
During 2015, the total cost of sales increased 8.7% to Ch$391,505 million (US$551.3 million) from Ch$360,131 million (US$507.1 million) in 2014. The cost of sales as a percentage of total sales reached 61.5%. The gross margin reached 38.5%, representing an expansion of 20bp during the period.
| 3. | Selling, General and Administrative Expenses |
Selling, General and Administrative Expenses (Distribution costs and Administrative expenses) increased 8.3% to Ch$172,453 million (US$242.8 million) in 2015 compared to Ch$159,300 million (US$224.3 million) in 2014. As a percentage of sales, SG&A reached 27.1%, an improvement of 20bp over the 27.3% registered in 2014.
| 4. | Operating Income |
During 2015, the Operating Income (Gross Profit - Distribution Cost and Administrative Expenses) increased 13.1% to Ch$72,236 million in comparison to Ch$63,882 million in 2014. The operating margin reached 11.4%, representing an expansion of 40bp compared to the 11.0% registered in 2014.
| 5. | Operating Income plus Depreciation and Amortization |
In 2015, the Operating Income plus Depreciation and Amortization increased 12.3% to Ch$94,646 million in comparison to Ch$84,296 million in 2014. The operating income plus depreciation and amortization margin reached 14.9% in comparison to the 14.5% in 2014. Higher commercialized volumes; premiumization of sales; lower cost of wine and a positive effect derived from the exchange rate fluctuations, explained the improvement in margins.
| 10 |
| 6. | Other Results by Function |
The Other Results by Function (Other Income, Other Expenses, Financial Income, Financial Expenses, Participation of Associates, Exchange Differences and Expenses by Adjustment Units) registered a loss of Ch$5,355 million, representing an improvement of 28.4%, explained by a higher income from participation in associates; lower losses from adjustment units and lower financial expenses.
Financial expenses dropped 3.0% totaling Ch$10,035 million in the period, in comparison to the Ch$10,342 million registered during 2014.
As of December 31st, 2015, Net Financial Debt2 amounted to Ch$205,582 million, representing a decrease of Ch$11,047 million as compared to the Net Financial Debt as of December 31st, 2014.
| 7. | Net Income and Earnings per Share (EPS) |
Net Income attributable to owners of the company increased 15.7%, totaling Ch$49,797 million, result that is explained by a higher operating income that is partially offset by the loss resulting from a lower exchange difference during the period. Based on 747,005,982 weighted average shares, Concha y Toro’s earnings totaled Ch$66.7 per share in comparison to Ch$57.6 registered during 2014.
2 Net Financial Debt: Other current financial liabilities + Other non-current financial liabilities - Cash and cash equivalents - Derivatives.
| 11 |
Balance Sheet
Assets
As of December 31st, 2015, Concha y Toro consolidated assets totaled Ch$987,471 million, representing an increase of 7.6% in comparison to December 31st, 2014, mainly due to a higher level of Inventories and Account Receivables.
Liabilities
As of December 31st, 2015, Net Financial Debt3 amounted to Ch$205,582 million, representing a decrease of Ch$11,047 million as compared to the Net Financial Debt as of December 31st, 2014.
* * * * *
About Viña Concha y Toro
Viña Concha y Toro is South America’s leading wine producer whose products are distributed in 145 countries. Founded in 1883 by Don Melchor Concha y Toro, the Company produces and markets fine wines under the labels: Don Melchor, Amelia, Terrunyo, Marqués de Casa Concha, Trio, Casillero del Diablo, Sunrise and Frontera. The Company cultivates around 9,194 hectares of vineyards in Chile; 1,142 hectares in Argentina and 468 in the U.S (As of December 31st, 2015).
Viña Concha y Toro has been listed on the Santiago Stock Exchange since 1933 under the ticker symbol “Conchatoro”. In 1994, it became the first winery in the world to be listed on the New York Stock Exchange, under the ticker symbol “VCO”. The Company has 3,450 employees and is headquartered in Santiago, Chile (As of December 31st, 2015).
Forward Looking Statements
This press release may contain certain forward-looking statements within the meaning of Section 27A of the Securities Act of 1933, as amended, and Section 21E of the Securities Exchange Act of 1934, as amended, with respect to the financial condition, results of operations and business of the Company and certain plans and objectives of the Company with respect to these items. Forward-looking statements may be identified by the use of words such as “anticipate”, “continue”, “estimate”, “expect”, “intend”, “may”, “believe” and similar expressions. By their nature, forward-looking statements involve risk and uncertainty because they relate to events and depend on circumstances that occur in the future. There are a number of factors that could cause results and developments to differ materially from those expressed or implied by these forward-looking statements. These factors include: levels of consumer spending in major economies, changes in consumer tastes and preferences, the levels of marketing and promotional expenditures by the Company and its competitors, raw materials costs, future exchange and interest rates, as well as other risk factors referred in the Company’s filings with the Securities and Exchange Commission.
3 Net Financial Debt: Other current financial liabilities + Other non-current financial liabilities - Cash and cash equivalents - Derivatives.
| 12 |
Viña Concha y Toro S.A.
Consolidated Income Statement
In thousand Chilean pesos
| STATEMENT OF INCOME BY FUNCTION | 4Q2015 | 4Q2014 | Change | 12M 2015 | 12M 2014 | Change | ||||||||||||||||||
| Th. Ch$ | Th. Ch$ | % | Th. Ch$ | Th. Ch$ | % | |||||||||||||||||||
| Income from ordinary activities | 192,065,833 | 177,700,495 | 8.1 | % | 636,194,074 | 583,313,064 | 9.1 | % | ||||||||||||||||
| Cost of sales | (115,822,146 | ) | (108,325,781 | ) | 6.9 | % | (391,505,147 | ) | (360,130,910 | ) | 8.7 | % | ||||||||||||
| Gross Profit | 76,243,687 | 69,374,714 | 9.9 | % | 244,688,927 | 223,182,154 | 9.6 | % | ||||||||||||||||
| Other income by function | 531,493 | 205,360 | 158.8 | % | 1,683,792 | 1,108,421 | 51.9 | % | ||||||||||||||||
| Distribution costs | (45,251,488 | ) | (41,545,529 | ) | 8.9 | % | (140,617,106 | ) | (129,478,984 | ) | 8.6 | % | ||||||||||||
| Administrative expenses | (6,259,434 | ) | (6,402,319 | ) | -2.2 | % | (31,836,192 | ) | (29,821,043 | ) | 6.8 | % | ||||||||||||
| Other expenses by function | (1,055,663 | ) | (1,171,384 | ) | -9.9 | % | (2,897,513 | ) | (1,980,063 | ) | 46.3 | % | ||||||||||||
| Financial income | 116,449 | 262,549 | -55.6 | % | 621,644 | 736,622 | -15.6 | % | ||||||||||||||||
| Financial expenses | (2,626,810 | ) | (2,938,897 | ) | -10.6 | % | (10,034,845 | ) | (10,342,307 | ) | -3.0 | % | ||||||||||||
| Participation in income (loss) of associates and joint-ventures recorded using the equity method | 1,079,357 | 497,745 | 116.8 | % | 5,324,722 | 3,694,551 | 44.1 | % | ||||||||||||||||
| Exchange differences | 1,246,210 | 515,537 | 141.7 | % | 796,468 | 2,231,871 | -64.3 | % | ||||||||||||||||
| Income/expense by adjustment units | (86,449 | ) | (1,295,398 | ) | -93.3 | % | (849,417 | ) | (2,933,059 | ) | -71.0 | % | ||||||||||||
| Income before tax | 23,937,352 | 17,502,378 | 36.8 | % | 66,880,480 | 56,398,163 | 18.6 | % | ||||||||||||||||
| Income tax expense | (5,489,900 | ) | (3,535,612 | ) | 55.3 | % | (16,518,092 | ) | (12,747,100 | ) | 29.6 | % | ||||||||||||
| Net Income | 18,447,452 | 13,966,766 | 32.1 | % | 50,362,388 | 43,651,063 | 15.4 | % | ||||||||||||||||
| Net income attributable to owners of the company | 18,082,897 | 13,500,212 | 33.9 | % | 49,797,379 | 43,051,491 | 15.7 | % | ||||||||||||||||
| Net income attributable to non-controling interests | 364,555 | 466,554 | -21.9 | % | 565,009 | 599,572 | -5.8 | % | ||||||||||||||||
| Operating Income plus Depreciation and Amortization | 31,205,641 | 27,777,960 | 12.3 | % | 94,645,637 | 84,296,486 | 12.3 | % | ||||||||||||||||
| Gross Revenue | 76,243,687 | 69,374,714 | 9.9 | % | 244,688,927 | 223,182,154 | 9.6 | % | ||||||||||||||||
| Distribution costs | (45,251,488 | ) | (41,545,529 | ) | 8.9 | % | (140,617,106 | ) | (129,478,984 | ) | 8.6 | % | ||||||||||||
| Administrative expenses | (6,259,434 | ) | (6,402,319 | ) | -2.2 | % | (31,836,192 | ) | (29,821,043 | ) | 6.8 | % | ||||||||||||
| Depreciation | 6,184,206 | 6,081,706 | 1.7 | % | 21,311,957 | 19,371,684 | 10.0 | % | ||||||||||||||||
| Amortization | 288,670 | 269,388 | 7.2 | % | 1,098,051 | 1,042,675 | 5.3 | % | ||||||||||||||||
| 13 |
Viña Concha y Toro S.A.
Consolidated Balance Sheet
In thousand Chilean pesos
| As of | As of | |||||||
| December 31, 2015 | December 31, 2014 | |||||||
| Assets | ||||||||
| Cash and cash equivalents | 30,635,184 | 30,304,154 | ||||||
| Inventories | 235,986,491 | 218,336,130 | ||||||
| Accounts receivable | 186,481,426 | 165,117,318 | ||||||
| Biological current assets | 18,259,302 | 16,317,102 | ||||||
| Other current assets | 43,479,036 | 43,850,459 | ||||||
| Total current assets | 514,841,439 | 473,925,163 | ||||||
| Property, plant & equipment, net | 347,762,584 | 341,758,199 | ||||||
| Investments accounted for using the equity method | 23,602,244 | 20,311,097 | ||||||
| Other non current assets | 101,264,779 | 82,016,849 | ||||||
| Total non current assets | 472,629,607 | 444,086,145 | ||||||
| Total assets | 987,471,046 | 918,011,308 | ||||||
| Liabilities | ||||||||
| Other current financial liabilities | 90,851,939 | 61,269,989 | ||||||
| Other current liabilities | 180,525,124 | 151,376,307 | ||||||
| Total current liabilities | 271,377,063 | 212,646,296 | ||||||
| Other non-current financial liabilities | 208,990,120 | 216,322,033 | ||||||
| Other non current liabilities | 52,768,315 | 46,062,156 | ||||||
| Total non current liabilities | 261,758,435 | 262,384,189 | ||||||
| Total Liabilities | 533,135,498 | 475,030,485 | ||||||
| Equity | ||||||||
| Issued capital | 84,178,790 | 84,178,790 | ||||||
| Accumulated Profits/(losses) | 397,480,284 | 367,635,107 | ||||||
| Other reserves | -28,948,025 | -10,230,220 | ||||||
| Net equity attributable to parent comp. shareholders | 452,711,049 | 441,583,677 | ||||||
| Non-controlling interest | 1,624,499 | 1,397,146 | ||||||
| Total Equity | 454,335,548 | 442,980,823 | ||||||
| Total liabilities and Equity | 987,471,046 | 918,011,308 | ||||||
| 14 |