Exhibit 99.1

VIÑA CONCHA Y TORO ANNOUNCES ITS CONSOLIDATED
FOURTH QUARTER 2016 RESULTS
Santiago, Chile, March 31, 2017 - Viña Concha y Toro S.A. (“The Company” or “Concha y Toro”) (NYSE: VCO, IPSA: Conchatoro), global leading winery and the principal wine producer and exporter of Chile, announced today its consolidated financial results, stated under IFRS, for the fourth quarter 2016 ended December 31th, 2016.
Principal Figures for the 4Q2016
| - | The commercialized volumes during the quarter, registering an increase of 1.4% reaching 89.9 million of liters. |
| - | The consolidate Sales totaling Ch$183,200 during the quarter, representing a decrease of 4.6%, affected by the negative impact of the XR fluctuation. |
| - | The Operating Income plus Depreciation and Amortization registered a margin of 13.9% over sales, representing a drop of 212 bp in comparison to 4Q2015. |
| - | The Net Income decreased a 23.3% totaling Ch$13,874 million during the quarter, impacted by a higher cost of the wine, higher expenses and FX fluctuations. |
Principal Figures for the 12M2016
| - | During 2016, the consolidate Sales reach Ch$658,448 million, registering an increase of 3.5% in comparison to 2015. The commercialized volume show an increase of 5.5%. |
| - | The Operating Income plus Depreciation and Amortization decrease 0.8% reaching Ch$92,701 million, registered a margin of 14.1% over sale, 60 bp lower than 2015 |
| - | During 2016, the Net Income decreased a 3.7% totaling Ch$47,931 million, impacted by a higher cost of the wine, higher expenses and FX fluctuations. |
Osvaldo Solar – Chief Financial Officer
Tel: (56 2) 2476 5768
conchaytoro-ir@conchaytoro.cl
www.conchaytoro.com
Summary
An external scenario marked by high volatility of FX, with a depreciation of the main currencies in which the Company generates its sales, characterized the last quarter of the year.
Indeed, Europe was the area most affected by currency depreciation, showing a drop of 10.9% in volume. Particularly, in the United Kingdom the volume decreased 11.3%, reflecting the impact on price increases that was informed to the large retailers post Brexit.
In opposite direction, all the other regions shows important growths in volume, highlighting EE.UU. with 17.3% and Canada with 15.2%; Latin America and the Caribbean grew 8%, with a dynamic Mexico (+21.5%) and Asia (+4.8%) powered by Corea and Japan (+44% and +8.4% respectively).
In Chile, the volume of bottled wine increased 7.4%, highlighting the performance of the premium category with a growth of 9.9% in volume and 11.1% in value. Higher sales exhibited in Concha y Toro’s premium portfolio were Casillero del Diablo and Sparkling wine category, which grew more than 20% in the quarter. Other business category shows a drop in volume, mainly because of the end of the distribution of Monster energy drink, however the rest of the portfolio shows positive performance.
The Operating Income plus Depreciation and Amortization decreased 17.3% totaling Ch$25,374 million, representing a margin of 13.9% over sales. The lower result is explained by the impact of exogenous variables, driven by the devaluation of the main currencies in which the Company commercialize its products (GBP -21.9%; EUR -6.1%; USD -4.6%), the higher cost of the wine (derived by a harvest affected by heavy rains in April), and the flattening of sales, product of the impact on price increases in the main export markets.
Finally, the Net Income attributable to owners of the company totaled Ch$13,874 million, registering a decrease of 23.3% in the quarter.
Osvaldo Solar – Chief Financial Officer
Tel: (56 2) 2476 5768
conchaytoro-ir@conchaytoro.cl
www.conchaytoro.com
| 2 |
Fourth Quarter 2016 Results
| 1. | Consolidated Sales |
Consolidated sales during the fourth quarter registered a drop of 4.6%, totaling Ch$183,200 million. Flat commercialized volumes in main markets were offset by a negative impact derived from exchange rate fluctuations. Refer to Table N°1.
Table 1
Total Sales
| Change | Change | |||||||||||||||||||||||||||
| Total Sales(*) (in Ch$ million) | 4Q16 | 4Q15 | (%) | 12M 2016 | 12M 2015 | (%) | ||||||||||||||||||||||
| Chile Domestic Market - wine | 18,905 | 17,423 | 8.5 | % | 71,265 | 65,078 | 9.5 | % | ||||||||||||||||||||
| Export markets(1) | 120,920 | 131,136 | -7.8 | % | 432,953 | 426,188 | 1.6 | % | ||||||||||||||||||||
| Argentina Domestic | 2,435 | 2,251 | 8.1 | % | 7,562 | 6,748 | 12.1 | % | ||||||||||||||||||||
| Argentina Exports(2) | 4,099 | 4,827 | -15.1 | % | 20,057 | 18,719 | 7.1 | % | ||||||||||||||||||||
| U.S.A. Domestic | 19,043 | 18,556 | 2.6 | % | 62,127 | 58,850 | 5.6 | % | ||||||||||||||||||||
| U.S.A. Exports(2) | 1,573 | 1,578 | -0.3 | % | 5,832 | 5,295 | 10.2 | % | ||||||||||||||||||||
| Total Wine Operating Segment | 166,974 | 175,770 | -5.0 | % | 599,796 | 580,878 | 3.3 | % | ||||||||||||||||||||
| Chile Domestic Market - new business | 13,692 | 14,548 | -5.9 | % | 51,030 | 47,966 | 6.4 | % | ||||||||||||||||||||
| Other Revenues | 2,534 | 1,748 | 45.0 | % | 7,622 | 7,350 | 3.7 | % | ||||||||||||||||||||
| Total Other Operating Segment | 16,227 | 16,296 | -0.4 | % | 58,652 | 55,316 | 6.0 | % | ||||||||||||||||||||
| Consolidated Sales | 183,200 | 192,066 | -4.6 | % | 658,448 | 636,194 | 3.5 | % | ||||||||||||||||||||
| Change | Change | |||||||||||||||||||||||||||
| Total Volume(*) (thousand liters) | 4Q16 | 4Q15 | (%) | 12M 2016 | 12M 2015 | (%) | ||||||||||||||||||||||
| Chile Domestic Market - wine | 17,970 | 16,265 | 10.5 | % | 70,680 | 65,780 | 7.4 | % | ||||||||||||||||||||
| Export markets(1) | 62,124 | 62,336 | -0.3 | % | 219,106 | 209,287 | 4.7 | % | ||||||||||||||||||||
| Argentina Domestic | 2,101 | 1,961 | 7.1 | % | 7,223 | 5,405 | 33.6 | % | ||||||||||||||||||||
| Argentina Exports(2) | 2,009 | 2,344 | -14.3 | % | 10,065 | 9,583 | 5.0 | % | ||||||||||||||||||||
| U.S.A. Domestic | 5,150 | 5,245 | -1.8 | % | 16,951 | 17,317 | -2.1 | % | ||||||||||||||||||||
| U.S.A. Exports(2) | 537 | 487 | 10.2 | % | 1,925 | 1,602 | 20.1 | % | ||||||||||||||||||||
| Total Wine Operating Segment | 89,890 | 88,637 | 1.4 | % | 325,950 | 308,974 | 5.5 | % | ||||||||||||||||||||
| Chile Domestic Market - New Business | 6,195 | 7,063 | -12.3 | % | 25,065 | 23,837 | 5.2 | % | ||||||||||||||||||||
| Total Other Operating Segment | 6,195 | 7,063 | -12.3 | % | 25,065 | 23,837 | 5.2 | % | ||||||||||||||||||||
| Consolidated Volume | 96,085 | 95,701 | 0.4 | % | 351,015 | 332,811 | 5.5 | % | ||||||||||||||||||||
| Average Price (per liter) | Currency | |||||||||||||||||||||||||||
| Chile Domestic Market - wine | Ch$ | 1,122.5 | 1,068.8 | 5.0 | % | 1,024.0 | 988.7 | 3.6 | % | |||||||||||||||||||
| Export Markets | US$ | 2.97 | 3.05 | -2.6 | % | 2.99 | 3.15 | -5.1 | % | |||||||||||||||||||
| Argentina Domestic | US$ | 2.15 | 2.11 | 1.5 | % | 1.90 | 2.15 | -11.5 | % | |||||||||||||||||||
| Argentina Exports | US$ | 3.19 | 3.22 | -1.0 | % | 3.12 | 3.20 | -2.5 | % | |||||||||||||||||||
| U.S.A. Domestic | US$ | 5.56 | 5.14 | 8.0 | % | 5.46 | 5.35 | 2.1 | % | |||||||||||||||||||
| U.S.A. Exports | US$ | 4.40 | 4.63 | -5.0 | % | 4.50 | 5.04 | -10.8 | % | |||||||||||||||||||
Osvaldo Solar – Chief Financial Officer
Tel: (56 2) 2476 5768
conchaytoro-ir@conchaytoro.cl
www.conchaytoro.com
| 3 |
| 1.1. | Consolidated Sales in Wine Operating Segment |
Consolidated Sales that come fromWine segment dropped 5.0% during the fourth quarter of 2016 driven by the effects of the increase prices process that began on the second half of the year, and a negative effect derived from exchange rate fluctuations, been partially offset by the good results on the domestic markets
| 1.1.1. | Export Sales |
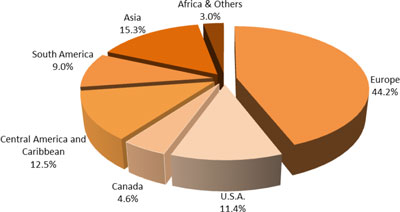
Export sales from Chile and distribution subsidiaries decreased 7.8% to Ch$120,920 million as compared to Ch$131,136 million in 4Q2015. The result reflects the impact of the devaluations of the different currencies in which the Company commercialize its products in the export markets and flat volumes respect to 2015, which shows a strong impact of the European region, which decrease in volumes 11.2%, explained by the price increase, partially offset by increases in volumes in the rest of the markets, USA and Canada +16.7%, Asia and Oceania +11%, Latin America and the Caribbean +6.1% and Africa And the Middle East with a 7.7% increase in volume.
According to the Chilean Central Bank, the Chilean peso appreciated against the pund (21.9%), U.S. dollar (4.6%), Euro (6.1%), Swedish crown (10.3%), Norwegian crown (2.9%), Canadian dollar (4.6%), Mexican peso (19.4%) and Argentinean peso (37.6%). In the opposite, the Chilean peso just depreciated against the Brazilian Real (11.4%), depreciation that was not enough to offset the negative impact of the other currencies.
Graph 1
Total Export Bottled Volume by Region
(Considers Exports from Chile, Argentina, Fetzer and Distribution Subsidiaries)
Fourth Quarter 2016
In the fourth quarter, the Premium category is continuously showing an increase in rates over the average sales, highlighting the growth of Super and Ultra Premium categories, that registered a grow of 7% higher than 2015, driven by the sales of the main brands of the company: Don Melchor +9%, Marqués de Casa Concha +38% and Gran Serie Riberas +24%.
Osvaldo Solar – Chief Financial Officer
Tel: (56 2) 2476 5768
conchaytoro-ir@conchaytoro.cl
www.conchaytoro.com
| 4 |
| 1.1.2. | Domestic Sales, Chile |
Domestic wine sales increased 5.8% in value totaling Ch$18,386 million. Commercialized volumes grew 0.7% totaling 1.8 million nine-liter cases, while the average sales price rose 5% in the quarter.
Premium categories registered an increase of 9.9% in volume, while Non-Premium categories decreased 0.4%. Premium categories represented 12.1% of the domestic volume and 38.1% of domestic sales in Chilean pesos.
In terms of market share by the end of 2016, the Company reached a 27.96%, being one of the three main wineries in the domestic market.
| 1.1.3. | Argentinean Operations |
Total sales from the Argentina operation (excluding shipments to distribution subsidiaries) registered a decrease of 7.7% totaling Ch$6,533 million as a resultant of higher sales in Export Markets (+8.1%) and lower sales in domestic market (-15.1%).
In terms of volume, the Export Markets decrease 14.3% while the Domestic Market increased 7.1%. In the quarter, export sales totaled 223 thousand of cases, including bottled and bulk wine. Regarding the domestic market totaled sales of 233 thousand of cases.
The average sales price, in U.S. dollars, registered in the domestic market raised 1.5% reaching US$2.15 per liter during the quarter. In export markets, the average sales price decreased 1% reaching US$3.19 per liter.
| 1.1.4. | U.S.A (Fetzer) |
During the last quarter of 2016, Fetzer’s total sales (excluding shipments to distribution subsidiaries) increased 8%, which reflected an increase of 3% in Chilean pesos, totaling Ch$20,608 million, driven by higher sales in domestic market (+8.3% in dollars and +3.2% in Chilean pesos) as well in export markets (+4.7% in dollars and -0.3% in Chilean pesos). On the other hand, the sale of bulk wine in domestic market dropped 93%.
In terms of volume, bottled sales rose 1.1% totaling 631 thousand of nine-liter cases in the last quarter. Stands out the growth collected in Export Markets, where commercialized volumes increased 10.2% during the quarter, based on a good performance of Anthony’s Hill and 1000 Stories. Regarding the domestic market, bottled sales registered a slight increase of 0.2% with an increase of the average price in the domestic market (+8%), positively influenced by the strong performance of 1000 Stories.
Osvaldo Solar – Chief Financial Officer
Tel: (56 2) 2476 5768
conchaytoro-ir@conchaytoro.cl
www.conchaytoro.com
| 5 |
| 1.2. | Consolidated Sales in Others Operating Segment |
Consolidated Sales that come from theOtherssalesslightly increased 5.9% during the fourth quarter of 2016.
| 1.2.1. | Chilean Domestic Sales - New Business |
Domestic sales of new business, carried out by the domestic distribution subsidiary “VCT Chile” (former “Comercial Peumo”), including premium beer and spirits decreased 5.9% totaling Ch$13,692 million. In terms of volume, sales dropped 12.3%, totaling 6.2 million liters. This lower sale is due to the fact that, from September 2016, VCT Chile no longer distributes Monster energy drink, so in comparable terms (without Monster) there is a grow of 18.7% in value and 17.8% in volume against last year.
| 1.2.2. | Other Revenues |
Other revenues, comprising fees for bottling services, sales of fruit, among others, increased 45.0% to Ch$2,534 million, in comparison to the 4Q2015
| 2. | Cost of Sales |
In the quarter, the total cost of sales increased 2.3% totaling Ch$118,541 million from Ch$115,822 million in 4Q2015. The cost of sales as a percentage of total sales reached 64.7%, representing a rise of 440bp in comparison to 4Q2015. The higher cost of sales is mainly explained because an adjustment in the cost of the wine of Fetzer Vineyards to realization value, increasing the cost by Ch$5,510 million in non-recurring basis. That explains 300 pb of the rise in costs, due to excess cost resulting from inventories and long term grape purchase contracts, already expired, dragged from the purchase of the company. Additionally, there was a higher cost of the wine of Chile (+7.36%), as resultant of a weak Chilean harvest in April 2016, highly impacted by rains faced in April of 2016. This reflected a drop of 21% of the produced volume.
| 3. | Selling, General and Administrative Expenses |
Selling, General and Administrative Expenses (Distribution costs and Administrative expenses) decreased 1.3% to Ch$50,838 million in 4Q2016 compared to Ch$51,511 million in 4Q2015. As a percentage of sales, SG&A reached 27.7%, representing an increase of expenses of 90bp in the quarter.
This increase is due to an increase of distribution expenses, in particular expenses that point to greater visibility and product rotation, just as brand building investment in main markets.
| 4. | Operating Income |
In the fourth quarter, the Operating Income dropped 22.2% totaling Ch$18,826 million in comparison to Ch$24,209 million in 4Q2015. The operating margin as a percentage of sales reached 10.3% over total sales, as compared to the 12.6% registered in 4Q2015. The Operating Income was impacted the cost by Ch$5,510 million in non-recurring basis. That explains 300 pb of the rise in costs, due to excess cost resulting from inventories and long term grape purchase contracts, already expired, dragged from the purchase of the company. Additionally, there was a higher cost of the wine of Chile (+7.36%), as resultant of a weak Chilean harvest in April 2016, highly impacted by rains faced in April of 2016. This reflected a drop of 21% of the produced volume.
Osvaldo Solar – Chief Financial Officer
Tel: (56 2) 2476 5768
conchaytoro-ir@conchaytoro.cl
www.conchaytoro.com
| 6 |
Additionally, Fetzer Vineyard made the sale of a wine cellar located in Paso Roble, south of California, generating a utility of Ch$5,330 million, which is reflected in other operating income.
| 5. | Operating Income plus Depreciation and Amortization |
In the quarter, the Operating Income plus Depreciation and Amortization decreased 17.3% totaling Ch$25,374 million in comparison to Ch$30,681 million in 4Q2015. The operating income plus depreciation and amortization margin as a percentage of sales reached 13.9% in comparison to 16% in 4Q2015. A lower margin is a resultant of a negative contribution derived from exchange rate fluctuations, a higher cost of the wine and higher expenses.
| 6. | Non-Operating Income |
The Non-Operating Income registered an utility of Ch$1,039 million in comparison to the loss of Ch$271 million registered in 4Q2015.
Financial expenses registered an increase of 9.3% totaling Ch$2,870 million in the quarter, in comparison to the Ch$2,627 million obtained during the same period of 2015.
During the fourth quarter an extraordinary expense was recognized, and only for one time, of Ch$853 million, due to payment of tax from previous periods that were in dispute with the General Administration of Public Income of Argentina (AFIP).
As of December 31th, 2016, Net Financial Debt amounted to Ch$191,858 million, representing a decrease of Ch$13,724 million as compared to the Net Financial Debt as of December 31th, 2015.
| 7. | Net Income and Earnings per Share (EPS) |
Finally, the Net Income totaled Ch$13,874 million, registering a decrease of 23.3% in the quarter. The figure over sales reached 7.6%. Based on 747,005,982 weighted average shares, Concha y Toro’s earnings totaled Ch$18.57 per share in comparison to Ch$24.2 registered during the 4Q2015.
Osvaldo Solar – Chief Financial Officer
Tel: (56 2) 2476 5768
conchaytoro-ir@conchaytoro.cl
www.conchaytoro.com
| 7 |
Twelve Month 2016 Results
| 1. | Consolidated Sales |
Consolidated sales increased 3.5% totaling Ch$658,448 million during 2016. This results is explained by the increased in volume of the wine segment of 5.5%, driven by the growth of the Premium segment. Trivento and Fetzer Vineyards are highlighted by their dynamism and contribution of the Premium growth.
| 1.1. | Consolidated Sales in Wine Operating Segment |
Consolidated Sales that come from Wine sales increased 3.3% during 2016 driven by higher commercialized volumes, a premiumization of sales, highlighting the growth in export market from Chile, Argentina and U.S., as well as the growth in domestic markets in Chile and Argentina.
| 1.1.1. | Export Sales |
Export sales from Chile and distribution subsidiaries increased 1.6% to Ch$432,953 million as compared to Ch$426,188 million in 2015. Higher commercialized volumes (+4.7%) drove the increase in sales during the 2016.
According to the Chilean Central Bank, the Chilean peso depreciated against U.S. dollar (3.4%), Euro (3.1%) and Swedish crown (1.9%). In the opposite, the Chilean peso appreciated against the Brazilian Real (1.2%), Sterling pound (8.6%), Mexican peso (12.2%), Argentinean peso (35.3%), Norwegian crown (0.7%) and Canadian dollar (0.2%).
Graph 2
Total Export Bottled Volume by Region
(Considers Exports from Chile, Argentina, Fetzer and Distribution Subsidiaries)
Twelve Month 2016
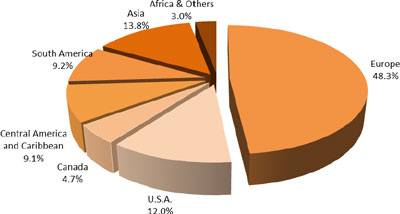
During 2016, most export markets showed increasing, highlighting the growth of bottled wine in Asia and Oceania (15.3%), boosted by the performance in China (+43%), Japan (+11%), South Korea (+21%) and Singapore (+16%), as a resultant of higher sales of Casillero del Diablo with a growth of 30%, reaching more than 400 thousand cases in this region.
Osvaldo Solar – Chief Financial Officer
Tel: (56 2) 2476 5768
conchaytoro-ir@conchaytoro.cl
www.conchaytoro.com
| 8 |
In Canada, sales grew 14.9%, highlighting the Premium category with sales rates that grows 20% driven by the performance of Don Melchor (+13.4%), Casillero del Diablo (+24%) and Cono Sur Organic (+23%).
In Europe, volumes increased 1.3% due a combined effect in the two halves of the year. During the first half, the growth was 6.8%, meanwhile the second half of the year shows a decreased on volume of 3.2%. In 2016, the Premium category presents an increased of 9% in volume, highlighting sales of Don Melchor (+11%) and Casillero del Diablo (+9%).
Other regions that shows growing were Latin America & the Caribbean (5.8%) and Africa & the Middle East (+17%). In the opposite, U.S. dropped 1.4% during 2016.
| 1.1.2. | Domestic Sales, Chile |
Domestic wine sales increased 9.5% in value totaling Ch$71,265 million. The commercialized volume grew 7.4% adding 7.9 million cases, while the average sales price rise 3.6% during 2016.
Premium categories registered an increase of 11.8% in cases, keeping the trend that this market has shown in last years, while the Non-Premium categories increased 4.4%. Premium (and above) categories represented 8.6% of the domestic volume and 30.8% of the domestic sales in Chilean pesos.
In terms of market share, the Company reached a 27.96%, being one of the three main wineries in the domestic market (accumulative figure as of December 2016 according to Nielsen).
| 1.1.3. | Argentinean Operations |
Total sales from the Argentine operation (excluding shipments to distribution subsidiaries) registered an increase of 15.3% to Ch$27,619 million as a resultant of higher sales in Export Markets (7.1%) and domestic market (12.1%).
In terms of volume, sales in Export Markets grew 5.0% driven by the performance of the Asia Zone, increasing 94% in volume, while the Domestic Market increased 33.6%.
The average sales price, in U.S. dollar terms, registered in the domestic market dropped 11.5% reaching US$1.9 per liter during 2016, impacted by the depreciation of the Argentinean peso. In export markets, the average sales price decreased 2.5% reaching US$3.12 per liter.
| 1.1.4. | U.S.A (Fetzer) |
In the first nine months of 2016, Fetzer’s total sales (excluding shipments to distribution subsidiaries) increased 5.9% totaling Ch$67,959 million, driven by higher sales in export markets as well in domestic market, both in terms of value.
Osvaldo Solar – Chief Financial Officer
Tel: (56 2) 2476 5768
conchaytoro-ir@conchaytoro.cl
www.conchaytoro.com
| 9 |
In terms of volume, bottled sales rise 4.0% driven by higher sales in the focus brands Bonterra (9.6%), Anthony’s Hill (7.7%) and the succesful launch of 1000 Stories, increasing its sales in 410%, reaching close to 80 thousand cases sold in the US on 2016.
For the Export Markets, 2016 present good performance in all the regions, Europe increase 44%, Asia 21%, Latin America 117%, Africa 76% and Canadá, the biggest Export Market for Fetzer, grew a 4%, reaching 125 thousand cases in the year.
| 1.2. | Consolidated Sales in Others Operating Segment |
Consolidated Sales that come from theOtherssalesincreased 6.0% during 2016, derived from the growth of the distribution of spirits, beers and mineral water.
| 1.2.1. | Chilean Domestic Sales - New Business |
Domestic sales of new business, carried out by the domestic distribution subsidiary “VCT Chile” (former “Comercial Peumo”), including premium beer; spirits; and energy drinks increased 6.4% totaling Ch$51,030 million. In terms of volume, sales grew 5.2% totaling 25.1 million liters.
Since September 1st, 2016, VCT Chile is not distributing Monster energy drink anymore, due to the anticipated closure of the distribution agreement executed by Monster.
| 1.2.2. | Other Revenues |
Other revenues, comprising fees for bottling services, sales of fruit, among others, decreased 3.7% to Ch$7,622 million.
| 2. | Cost of Sales |
During the 2016, total costs increased 5.3% to Ch$412,382 million from Ch$391,505 million in 2015. The cost of sales as a percentage of total sales reached 62.6%, representing an increase of 110bp in comparison to last year. The higher cost of sales is mainly explained because an adjustment in the cost of the wine of Fetzer Vineyards to realization value, increasing the cost by Ch$5,510 million in non-recurring basis. That explains 80 pb of the rise in costs, due to excess cost resulting from inventories and long term grape purchase contracts, already expired, dragged from the purchase of the company. Additionally, there was a higher cost of the wine of Chile (+1.5%), as resultant of a weak Chilean harvest, highly impacted by rains faced in April of 2016. This reflected a drop of 21% of the produced volume.
| 3. | Selling, General and Administrative Expenses |
Selling, General and Administrative Expenses (Distribution costs and Administrative expenses) increased 5.8% to Ch$182,475 million in 2016 compared to Ch$172,453 million in 2015. As a percentage of sales, SG&A reached 27.7%.
The increase in SG&A is mainly explained for the increase in the distribution expenses, specially expenses due to create more visibility of our products and investments in brand building in the mainly markets.
Osvaldo Solar – Chief Financial Officer
Tel: (56 2) 2476 5768
conchaytoro-ir@conchaytoro.cl
www.conchaytoro.com
| 10 |
| 4. | Operating Income |
During 2016, the Operating Income decreased 1.2% totaling Ch$70,185 million in comparison to Ch$71,011 million in 2015. The operating margin as a percentage of sales decrease 50bp reaching a 10.7% over total sales. The decrease of operation income is mainly explained by the adjustment in the cost of the wine of Fetzer Vineyards, the rise in the Chilean cost of the wine and the FX fluctuations of the second half of the year.
| 5. | Operating Income plus Depreciation and Amortization |
In the 2016, the Operating Income plus Depreciation and Amortization decreased 0.8% totaling Ch$92,701 million in comparison to Ch$93,432 million in 2015. The operating income plus depreciation and amortization margin as a percentage of sales reached 14.1%, as compared to the 14.7% registered in 2015.
| 6. | Non-Operating Income |
The Non-Operating Income registered a loss of Ch$4,113 million in comparison to the loss of Ch$4,141 million registered in 2015.
Financial expenses remained in line with the 2015 totaling Ch$10,305 million in 2016, in comparison to the Ch$10,035 million obtained during the same period of 2015.
As of December 31th, 2016, Net Financial Debt1 amounted to Ch$191,858 million, representing a decrease of Ch$13,724 million as compared to the Net Financial Debt as of December 31th, 2015.
| 7. | Net Income and Earnings per Share (EPS) |
Finally, the Net Income totaled Ch$47,931 million, registering an decrease of 3.7% in 2016. The figure over sales reached 7.3%. Based on 747,005,982 weighted average shares, Concha y Toro’s earnings totaled Ch$64.2 per share in comparison to Ch$66.7 registered during 2015.
1 Net Financial Debt: Other current financial liabilities + Other non-current financial liabilities - Cash and cash equivalents - Derivatives.
Osvaldo Solar – Chief Financial Officer
Tel: (56 2) 2476 5768
conchaytoro-ir@conchaytoro.cl
www.conchaytoro.com
| 11 |
Balance Sheet
Assets
As of December 31th, 2016, Viña Concha y Toro consolidated assets totaled Ch$1,015,839 million, representing an increase of 3.4% in comparison to December 31th, 2015, mainly due to a higher level of Cash and Cash equivalent, Fixed Assets and Other non-current Financial Assets.
Liabilities
As of December 31th, 2016, Net Financial Debt2 amounted to Ch$191,858 million, representing a decrease of Ch$13,724 million as compared to the Net Financial Debt as of December 31th, 2015.
* * * * *
About Viña Concha y Toro
Viña Concha y Toro is South America’s leading wine producer whose products are distributed in 147 countries. Founded in 1883 by Don Melchor Concha y Toro, the Company produces and markets fine wines under the labels: Don Melchor, Amelia, Terrunyo, Marqués de Casa Concha, Trio, Casillero del Diablo, Sunrise and Frontera. The Company cultivates around 9,388 hectares of vineyards in Chile; 1,140 hectares in Argentina and 469 in the U.S (As of December 31th, 2016).
Viña Concha y Toro has been listed on the Santiago Stock Exchange since 1933 under the ticker symbol “Conchatoro”. In 1994, it became the first winery in the world to be listed on the New York Stock Exchange, under the ticker symbol “VCO”. The Company has 3,486 employees and is headquartered in Santiago, Chile (As of December 31th, 2016).
Forward Looking Statements
This press release may contain certain forward-looking statements within the meaning of Section 27A of the Securities Act of 1933, as amended, and Section 21E of the Securities Exchange Act of 1934, as amended, with respect to the financial condition, results of operations and business of the Company and certain plans and objectives of the Company with respect to these items. Forward-looking statements may be identified by the use of words such as “anticipate”, “continue”, “estimate”, “expect”, “intend”, “may”, “believe” and similar expressions. By their nature, forward-looking statements involve risk and uncertainty because they relate to events and depend on circumstances that occur in the future. There are a number of factors that could cause results and developments to differ materially from those expressed or implied by these forward-looking statements. These factors include: levels of consumer spending in major economies, changes in consumer tastes and preferences, the levels of marketing and promotional expenditures by the Company and its competitors, raw materials costs, future exchange and interest rates, as well as other risk factors referred in the Company’s filings with the Securities and Exchange Commission.
2 Net Financial Debt: Other current financial liabilities + Other non-current financial liabilities - Cash and cash equivalents - Derivatives.
Osvaldo Solar – Chief Financial Officer
Tel: (56 2) 2476 5768
conchaytoro-ir@conchaytoro.cl
www.conchaytoro.com
| 12 |
Viña Concha y Toro S.A.
Consolidated Income Statement
In thousand Chilean pesos
| 4Q2016 | 4Q2015 | Change | 9M 2016 | 9M 2015 | Change | |||||||||||||||||||
| STATEMENT OF INCOME BY FUNCTION | Th. Ch$ | Th. Ch$ | % | Th. Ch$ | Th. Ch$ | % | ||||||||||||||||||
| Income from ordinary activities | 183,200,394 | 192,065,833 | -4.6 | % | 658,447,621 | 636,194,074 | 3.5 | % | ||||||||||||||||
| Cost of sales | (118,540,640 | ) | (115,822,146 | ) | 2.3 | % | (412,381,871 | ) | (391,505,147 | ) | 5.3 | % | ||||||||||||
| Gross Profit | 64,659,754 | 76,243,687 | -15.2 | % | 246,065,750 | 244,688,927 | 0.6 | % | ||||||||||||||||
| Other income by function | 5,736,536 | 531,493 | 979.3 | % | 8,661,903 | 1,683,792 | 414.4 | % | ||||||||||||||||
| Distribution costs | (46,389,072 | ) | (45,251,488 | ) | 2.5 | % | (150,913,076 | ) | (140,617,106 | ) | 7.3 | % | ||||||||||||
| Administrative expenses | (4,448,720 | ) | (6,259,434 | ) | -28.9 | % | (31,562,168 | ) | (31,836,192 | ) | -0.9 | % | ||||||||||||
| Other expenses by function | (732,306 | ) | (1,055,663 | ) | -30.6 | % | (2,067,273 | ) | (2,897,513 | ) | -28.7 | % | ||||||||||||
| Operating Income | 18,826,192 | 24,208,595 | -22.2 | % | 70,185,136 | 71,021,908 | -1.2 | % | ||||||||||||||||
| Financial income | 338,822 | 116,449 | 191.0 | % | 970,651 | 621,644 | 56.1 | % | ||||||||||||||||
| Financial expenses | (2,870,212 | ) | (2,626,810 | ) | 9.3 | % | (10,305,449 | ) | (10,034,845 | ) | 2.7 | % | ||||||||||||
| Participation in income (loss) of associates and joint-ventures recorded using the equity method | 2,000,830 | 1,079,357 | 85.4 | % | 4,511,072 | 5,324,722 | -15.3 | % | ||||||||||||||||
| Exchange differences | 1,682,564 | 1,246,210 | 35.0 | % | 749,876 | 796,468 | -5.8 | % | ||||||||||||||||
| Income/expense by adjustment units | (112,804 | ) | (86,449 | ) | 30.5 | % | (39,279 | ) | (849,417 | ) | -95.4 | % | ||||||||||||
| Income before tax | 19,865,392 | 23,937,352 | -17.0 | % | 66,072,007 | 66,880,480 | -1.2 | % | ||||||||||||||||
| Income tax expense | (5,664,649 | ) | (5,489,900 | ) | 3.2 | % | (17,542,419 | ) | (16,518,092 | ) | 6.2 | % | ||||||||||||
| Net Income | 14,200,743 | 18,447,452 | -23.0 | % | 48,529,588 | 50,362,388 | -3.6 | % | ||||||||||||||||
| Net income attributable to owners of the company | 13,873,702 | 18,082,897 | -23.3 | % | 47,931,093 | 49,797,379 | -3.7 | % | ||||||||||||||||
| Net income attributable to non-controling interests | 327,041 | 364,555 | -10.3 | % | 598,495 | 565,009 | 5.9 | % | ||||||||||||||||
| Operating Income plus Depreciation and Amortization | 25,373,691 | 30,681,471 | -17.3 | % | 92,701,338 | 93,431,916 | -0.8 | % | ||||||||||||||||
| Operating Income | 18,826,192 | 24,208,595 | -22.2 | % | 70,185,136 | 71,021,908 | -1.2 | % | ||||||||||||||||
| Depreciation | 6,175,695 | 6,184,206 | -0.1 | % | 21,396,547 | 21,311,957 | 0.4 | % | ||||||||||||||||
| Amortization | 371,804 | 288,670 | 28.8 | % | 1,119,655 | 1,098,051 | 2.0 | % | ||||||||||||||||
Osvaldo Solar – Chief Financial Officer
Tel: (56 2) 2476 5768
conchaytoro-ir@conchaytoro.cl
www.conchaytoro.com
| 13 |
Viña Concha y Toro S.A.
Consolidated Balance Sheet
In thousand Chilean pesos
| As of | As of | |||||||
| December 31, 2016 | December 31, 2015 | |||||||
| Assets | ||||||||
| Cash and cash equivalents | 47,213,517 | 30,635,184 | ||||||
| Inventories | 231,224,426 | 235,986,491 | ||||||
| Accounts receivable | 193,287,401 | 198,418,185 | ||||||
| Biological current assets | 19,186,291 | 18,259,302 | ||||||
| Other current assets | 30,492,222 | 26,758,703 | ||||||
| Total current assets | 521,403,857 | 510,057,865 | ||||||
| Property, plant & equipment, net | 361,004,006 | 347,762,584 | ||||||
| Investments accounted for using the equity method | 23,433,439 | 23,602,244 | ||||||
| Other non current assets | 109,997,284 | 101,264,779 | ||||||
| Total non current assets | 494,434,729 | 472,629,607 | ||||||
| Total assets | 1,015,838,586 | 982,687,472 | ||||||
| Liabilities | ||||||||
| Other current financial liabilities | 101,999,046 | 90,851,939 | ||||||
| Other current liabilities | 192,870,916 | 175,741,550 | ||||||
| Total current liabilities | 294,869,962 | 266,593,489 | ||||||
| Other non-current financial liabilities | 148,992,036 | 208,990,120 | ||||||
| Other non current liabilities | 54,269,968 | 52,768,315 | ||||||
| Total non current liabilities | 203,262,004 | 261,758,435 | ||||||
| Total Liabilities | 498,131,966 | 528,351,924 | ||||||
| Equity | ||||||||
| Issued capital | 84,178,790 | 84,178,790 | ||||||
| Accumulated Profits/(losses) | 426,521,298 | 397,480,284 | ||||||
| Other reserves | 5,509,389 | -28,948,025 | ||||||
| Net equity attributable to parent comp. shareholders | 516,209,477 | 452,711,049 | ||||||
| Non-controlling interest | 1,497,143 | 1,624,499 | ||||||
| Total Equity | 517,706,620 | 454,335,548 | ||||||
| Total liabilities and Equity | 1,015,838,586 | 982,687,472 | ||||||
Osvaldo Solar – Chief Financial Officer
Tel: (56 2) 2476 5768
conchaytoro-ir@conchaytoro.cl
www.conchaytoro.com
| 14 |