Exhibit 99.1

VIÑA CONCHA Y TORO ANNOUNCES CONSOLIDATED
SECOND QUARTER 2017 RESULTS
Santiago, Chile, August 31st, 2017 - Viña Concha y Toro S.A. (“The Company” or “Concha y Toro”) (NYSE: VCO, IPSA: Conchatoro), global leading winery and the main producer and exporter of Chilean wine, announced today consolidated financial results, stated under IFRS, for the second quarter 2017 ended June 30th, 2017. US dollar figures (US$), except export figures, are based on the exchange rate effective June 30th, 2017 (US$1.00 = Ch$ 664.3).
Highlights 2Q17 vs 2Q16
| · | Average sales price, measured in local currencies, increased in our key markets: sales in Chilean peso (+14.9%), sterling pound (+10.8%), US dollar (+6.6%), and euro (+2.9%). |
| · | Consolidated sales decreased 4.2%, totaling $165,942 million, due to lower volume and adverse exchange rate impact. |
| · | Total volume of wine declined 7.3%, due to the decrease of 10.5% in Non-Premium wine. Premium wine volume increased 1.9%. |
| · | Operating Income plus depreciation and amortization was down 14.7% to Ch$22,697 million, on a higher cost of wine and adverse currency fluctuations. Its margin on sales reached 13.7% (-170 basis points). |
| · | Net income attributable to owners of the company totaled Ch$11,535 million, down 12.9%. |
Highlights 1H17 vs 1H16
| · | Average sales price, measured in local currencies, increased in our key markets: +10.0% for sales in Chilean peso, +9.2% for sales in sterling pound, +3.5% for sales in US dollar, and +3.4% for sales in euro. |
| · | Consolidated sales decreased 3.9%, totaling $293,416 million, due to lower volume and adverse exchange rate impact. |
| · | Total volume of wine declined 2.4%, due to the decrease of 3.6% in Non-Premium wine. Premium wine volume increased 0.7%. |
| · | Operating Income plus depreciation and amortization was down 18.4% to Ch$35,463 million, on a higher cost of wine and adverse currency fluctuations. Its margin on sales reached 12.1% (-170bp). |
| · | Net income attributable to owners of the company totaled Ch$151,340 million, down 25.3%. |
Osvaldo Solar – Chief Financial Officer Claudia Cavada - Head of Investor Relations Tel: (56 2) 2476 5768 conchaytoro-ir@conchaytoro.cl www.conchaytoro.com |
Summary
Results for the second quarter of 2017 reflect the adverse impact of exchange rate fluctuations and a higher cost of wine following lower grape harvests in Chile and Argentina. Against this backdrop, Viña Concha y Toro has realigned its commercial strategy through price adjustments and reduced promotional activities, focused on profitability and brand building. As a result, sales volume growth was affected, mainly in Non-Premium wine categories, which declined in the period. Premium wines remained growing, showing the strong position held by priority premium brands.
In 2016, the company started a restructuring process aimed to generate operational synergies and cost savings. This process will end in the first quarter of 2018 and its effects are not yet reflected in results. On a reported basis, SG&A/sales was 26.1%, 10bp above the level in the last year. Excluding incremental extraordinary expenses related to restructuring, SG&A/sales was 25.7%, 30bps below the figure of 2Q16.
Regarding the Wine operating segment, sales totaled Ch$152,890 million, down 4.0%, on lower Non-Premium volume and the aforementioned F/X impact. Premium wine volume grew 1.9% and its share of the portfolio mix increased +300bp to 47.6% of sales value.
In the domestic market (Chile), wine sales grew 4.0% in value. This is the result of an increase in prices, and a positive mix effect. Premium volume remained strong, increasing 9.3%, when compared to 2Q16. On the other hand, Non-Premium sales volume declined 10.9%.
Export sales from Chile and distribution subsidiaries declined 4.7%. A higher average price, measured in local currencies was offset by lower sales volume of Non-Premium wine (-7.3%) and negative exchange rate effects. Premium wine volume increased 4.8%, which is in line with the Company’s strategy focused on priority brands: Casillero del Diablo, Cono Sur, Trivento Reserve, Bonterra, and 1,000 Stories.
In the second quarter, the Operating Income plus Depreciation and Amortization declined 14.7% to Ch$22,697 million, reflecting a higher cost of wine and negative effects from exchange rate fluctuations. Net Income attributable to owners of the company was Ch$11,535 million, 12.9% below the figure in the same period of the last year.
Osvaldo Solar – Chief Financial Officer Claudia Cavada - Head of Investor Relations Tel: (56 2) 2476 5768 conchaytoro-ir@conchaytoro.cl www.conchaytoro.com |
| 2 |
Second Quarter 2017 Results
| 1. | Consolidated Sales |
Consolidated sales totaled Ch$165,942 million in the second quarter (-4.2% YoY). The decline reflects lower volume and the appreciation of the Chilean peso against most exports currencies, partly offset by a higher average price.
Table 1
Total Sales
| Total Sales(*) (in Ch$ million) | 2Q17 | 2Q16 | Change (%) | 6M 2017 | 6M 2016 | Change (%) | ||||||||||||||||||||||
| Chile Domestic Market - wine | 19,203 | 18,465 | 4.0 | % | 33,484 | 32,176 | 4.1 | % | ||||||||||||||||||||
| Export markets(1) | 111,005 | 116,463 | -4.7 | % | 192,027 | 200,818 | -4.4 | % | ||||||||||||||||||||
| Argentina Domestic | 2,425 | 2,178 | 11.4 | % | 4,407 | 2,959 | 48.9 | % | ||||||||||||||||||||
| Argentina Exports(2) | 4,282 | 5,431 | -21.2 | % | 7,914 | 10,281 | -23.0 | % | ||||||||||||||||||||
| U.S.A. Domestic | 14,402 | 15,193 | -5.2 | % | 27,212 | 27,434 | -0.8 | % | ||||||||||||||||||||
| U.S.A. Exports(2) | 1,573 | 1,592 | -1.2 | % | 2,946 | 2,787 | 5.7 | % | ||||||||||||||||||||
| Total Wine Operating Segment | 152,890 | 159,323 | -4.0 | % | 267,989 | 276,455 | -3.1 | % | ||||||||||||||||||||
| Chile Domestic Market - new business | 11,152 | 12,203 | -8.6 | % | 21,042 | 25,891 | -18.7 | % | ||||||||||||||||||||
| Other Revenues | 1,900 | 1,766 | 7.6 | % | 4,385 | 3,100 | 41.4 | % | ||||||||||||||||||||
| Total Other Operating Segment | 13,052 | 13,970 | -6.6 | % | 25,427 | 28,992 | -12.3 | % | ||||||||||||||||||||
| Consolidated Sales | 165,942 | 173,292 | -4.2 | % | 293,416 | 305,447 | -3.9 | % | ||||||||||||||||||||
| Total Volume(*) (thousand liters) | 2Q17 | 2Q16 | Change (%) | 6M 2017 | 6M 2016 | Change (%) | ||||||||||||||||||||||
| Chile Domestic Market - wine | 17,253 | 19,068 | -9.5 | % | 30,951 | 32,703 | -5.4 | % | ||||||||||||||||||||
| Export markets(1) | 55,270 | 57,623 | -4.1 | % | 98,779 | 98,708 | 0.1 | % | ||||||||||||||||||||
| Argentina Domestic | 1,381 | 2,362 | -41.5 | % | 3,114 | 3,488 | -10.7 | % | ||||||||||||||||||||
| Argentina Exports(2) | 1,853 | 2,601 | -28.7 | % | 3,484 | 4,981 | -30.1 | % | ||||||||||||||||||||
| U.S.A. Domestic | 4,020 | 4,443 | -9.5 | % | 7,675 | 7,733 | -0.8 | % | ||||||||||||||||||||
| U.S.A. Exports(2) | 527 | 561 | -6.1 | % | 962 | 893 | 7.7 | % | ||||||||||||||||||||
| Total Wine Operating Segment | 80,304 | 86,658 | -7.3 | % | 144,965 | 148,506 | -2.4 | % | ||||||||||||||||||||
| Chile Domestic Market - New Business | 4,139 | 5,264 | -21.4 | % | 9,639 | 13,107 | -26.5 | % | ||||||||||||||||||||
| Total Other Operating Segment | 4,139 | 5,264 | -21.4 | % | 9,639 | 13,107 | -26.5 | % | ||||||||||||||||||||
| Consolidated Volume | 84,443 | 91,922 | -8.1 | % | 154,604 | 161,613 | -4.3 | % | ||||||||||||||||||||
| Average Price (per liter) | Currency | |||||||||||||||||||||||||||
| Chile Domestic Market - wine | Ch$ | 1,113.0 | 968.4 | 14.9 | % | 1,081.8 | 983.9 | 10.0 | % | |||||||||||||||||||
| Export Markets | US$ | 3.09 | 3.05 | 1.3 | % | 3.02 | 3.03 | -0.3 | % | |||||||||||||||||||
| Argentina Domestic | US$ | 2.64 | 1.79 | 48.1 | % | 2.55 | 1.66 | 54.0 | % | |||||||||||||||||||
| Argentina Exports | US$ | 3.61 | 3.17 | 13.7 | % | 3.55 | 3.11 | 14.0 | % | |||||||||||||||||||
| U.S.A. Domestic | US$ | 5.39 | 5.09 | 6.0 | % | 5.38 | 5.20 | 3.6 | % | |||||||||||||||||||
| U.S.A. Exports | US$ | 4.49 | 4.19 | 7.1 | % | 4.64 | 4.56 | 1.7 | % | |||||||||||||||||||
(1) Export Volumes include exports to third parties and sales volumes of the company’s distribution subsidiaries (UK, Nordics, Brazil, Singapore, Mexico).
(2) This figure excludes shipments to the company’s distribution subsidiaries.
(*) This figure includes bulk wine sales.
| 3 |
| 1.1. | Wine Operating Segment |
Total sales of wine declined 4.0% in the quarter, primarily due to lower Non-Premium-wine volume and the depreciation of key export currencies against the Chilean peso. On a constant currency basis, total sales of wine were in line with the same quarter last year (-0.1%).
| 1.1.1. | Export Markets |
Export sales from Chile and distribution subsidiaries totaled Ch$111,005 million, declining 4.7% when compared to the same period last year. Higher average price, measured in local currencies of our markets (+10.8% in sterling pound, +6.6% in US dollar, and+2.9% in euro), were offset by lower volume and the negative effect of currency fluctuations.
In the second quarter, the Chilean peso appreciated against U.S. dollar (1.9%), Sterling pound (14.4%), Canadian dollar (6.4%), Euro (4.5%), Mexican peso (4.6%), Swedish krona (9.2%), Norwegian krone (5.3%), and Argentine peso (13.0%). The Chilean peso depreciated only against one of our relevant foreign currencies, the Brazilian Real (6.5%).
Regarding the portfolio mix, in the quarter Premium wine volume increased 4.8%. Non-Premium volume declined 7.3%, impacted by higher sales price and reduced promotional activities. In terms of value, Premium segment was up 2.4% (Ch$ terms) while Non-Premium segment was down 9.7%. Therefore, Premium categories increased their share to 44.3% of the portfolio value, +310bp higher than in the same quarter of the previous year.
Graph 1
Sales volume of bottled wine, by Region
Export Markets(*)
Second Quarter 2017
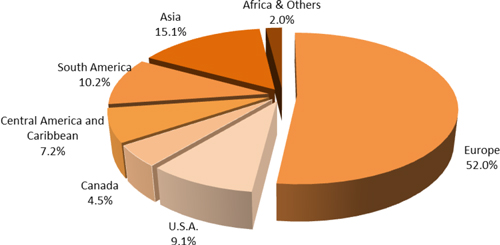
(*) Includes exports from Chile and Distribution Subsidiaries.
| 4 |
Regarding export regions, sales volume increased in Europe (+2.2%). Volume declined in Africa and others (-33.7%), United States (-16.3%), Asia (-7.0%), South America (-10.2%), Central America and Caribbean (-4.6%), and Canada (-0.3%).
| 1.1.2. | Chile Domestic Market - Wine |
Domestic wine sales grew 4.0% in value, totaling Ch$19,203 million, driven by a higher average price (+14.9%). Sales volume declined 9.5% to 17,253 Th.Lt., reflecting the contraction of Non-Premium categories.
Regarding the portfolio mix, this quarter Premium sales volume increased 9.3%, while the Non-Premium category decreased 10.9%. This has resulted in a mix improvement with the premium category increasing its share to 8.3% in volume terms (+140bp), and 28.5% in value terms (+230bp).
| 1.1.3. | Operation in Argentina |
Sales from the Argentine operation (excluding shipments to distribution subsidiaries) totaled Ch$6,707 million, down 11.9% in comparison to the previous year, as a result of higher sales in the domestic market (+11.4%) more than offset by a drop in exports (-21.2%).
In line with the company’s strategy and facing a scenario of higher wine costs due to a challenging harvest, the company has increased prices and remains focused on more profitable products. In the domestic market, average per-liter price was US$2.64, up 48.1% in USD, and up 62.0% in local currency. Exports price was US$3.61, up 13.7% in USD.
In terms of volume, the domestic market decreased 41.5% while exports were down 28.7%. This figure excludes Trivento sales carried out by distribution subsidiaries, which in the quarter accounted for the 57.3% of total Argentina exports. Moreover, Trivento sales in the UK, through Concha y Toro UK, grew 54.0% in volume, led by Trivento Reserve brand.
| 1.1.4. | Operation in U.S.A (Fetzer) |
During the quarter, Fetzer’s sales (excluding shipments to distribution subsidiaries) declined 4.8% totaling Ch$15,976 million, on lower volume (-9.1%) and the negative effect of currency fluctuation. This was partly offset by higher sales price in both, the domestic market and export markets.
The average sales price in the domestic market increased 6.0%. This was offset in part by a lower volume, mainly in Fetzer brands. Our key priority brands, Bonterra and 1000 Stories, showed increases of 8.8% and 42.0%, respectively, in volume. At Fetzer exports, the average price rose 7.1% to US$4.49 per liter, and volume declined 6.1%.
| 5 |
| 1.2. | Other Operating Segment |
Otheroperating segment decreased 6.6% during the quarter. Adjusting for the distribution of Monster energy drink in 2016 not repeated in the current period, sales increased 13.9% from the previous year, driven by the distribution of Diageo’s liquor portfolio, beer, and pisco.
| 1.2.1. | Chilean Domestic market - New Business |
New business sales, carried out by the domestic distribution subsidiary VCT Chile, including premium beer and spirits declined 8.6% totaling Ch$11,152 million. The aforementioned is explained by the ending of the distribution of Monster energy drink in 3Q16. On a comparable basis, New business sales increased 15.1%.
During the quarter the company evidenced strong increases across the portfolio: Beer (+20.9%), Diageo’s liquor portfolio (+11.2%); and pisco category (+42.0%).
| 1.2.2. | Other Revenues |
Other revenues, comprising fees for bottling services, sales of fruit, among others, were up 7.6%, reaching Ch$1,900 million.
| 2. | Cost of Sales |
In the quarter, the total cost of sales decreased 0.8% to Ch$105,610 million from Ch$106,451 million in the same quarter of 2016. The cost of sales as a percentage of total sales reached 63.6%, increasing 220bp, reflecting a higher cost of wine, following a lower harvested volume. In Chile, the harvested volume declined 21.2% in 2016, and 6.4% in 2017.
| 3. | Selling, General and Administrative Expenses |
Selling, General and Administrative Expenses (Distribution costs and Administrative expenses) decreased 3.8% to Ch$43,312 million in the quarter, when compared to Ch$45,026 million in the previous year. As a percentage of sales, SG&A reached 26.1%, 10bp above the figure of the same quarter of 2016.
In the quarter, the Company recognized extraordinary expenses of Ch$619 million, related to the restructuring process. Excluding these expenses, SG&A/sales was 25.7%, down 30bps.
| 4. | Operating Income |
In the quarter, the Operating Income decreased 21.7% to Ch$16,896 million in comparison to Ch$21,569 million in 2Q16. The operating margin was 10.2%, a decline of 230bp. This was driven by the higher cost of wine and a negative exchange rate impact.
| 6 |
| 5. | Operating Income plus Depreciation and Amortization |
In the second quarter of 2017 the Operating Income plus Depreciation and Amortization declined 14.7% to Ch$22,697 million in comparison to Ch$26,613 million in 2Q16. The operating income plus depreciation and amortization as a percentage of sales reached 13.7% in comparison to 15.4% in 2Q16. The lower margin is a result of a higher cost of wine and negative effects from exchange rate fluctuations.
| 6. | Non-Operating Income |
The Non-Operating Income registered a loss of Ch$1,510 million, which was lower than the loss of Ch$3,298 million in 2Q16, mostly due to the higher exchange differences, and income of associates and joint ventures.
Financial expenses totaled Ch$2,402 million in the quarter, increasing 1.1% in comparison to the Ch$2,377 million registered in the same period of 2016.
| 7. | Net Income and Earnings per Share (EPS) |
Net Income attributable to owners of the company declined 12.9%, totaling Ch$11,535 million. Based on 747,005,982 weighted average shares, Concha y Toro’s earnings totaled Ch$15.4 per share, below the Ch$17.7 per share registered during the same period of the previous year.
| 7 |
First-Half 2017 Results
| 1. | Consolidated Sales |
Consolidated sales totaled Ch$293,416 million in the first half of the year (-3.9% YoY). The decline reflects lower volume, and the appreciation of the Chilean peso against most export currencies, partly offset by a higher average sales price.
| 1.1. | Wine Operating Segment |
Total sales of wine declined 3.1% in the period, primarily due to lower Non-Premium-wine volume and the depreciation of key export currencies against the Chilean peso. On a constant currency basis, total sales of wine increased 3.1%.
| 1.1.1. | Export Markets |
Export sales from Chile and distribution subsidiaries totaled Ch$192,027 million, declining 4.4% when compared to the same period last year. Price adjustments carried out in the period are reflected in higher average prices, measured in the local currencies of our markets: +9.2% in sterling pound, +3.5% in US dollar, and +3.4% in euro. This, combined with flat volume (+0.1%), were offset by adverse currency fluctuations.
In the first half of the year, the Chilean peso appreciated against U.S. dollar (4.5%), Sterling pound (18.9%), Canadian dollar (4.8%), Euro (7.6%), Mexican peso (12.1%), Swedish krona (11.1%), Norwegian krone (4.9%), and Argentine peso (14.5%). The Chilean peso depreciated only against one of our relevant foreign currencies, the Brazilian Real (10.2%).
Graph 2
Sales volume of bottled wine, by Region
Export Markets(*)
First Half 2017
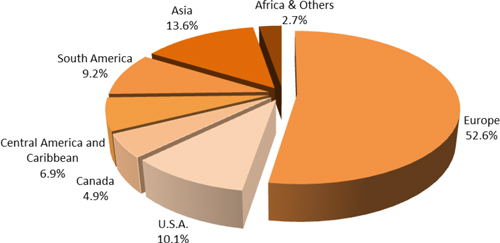
(*) Includes exports from Chile and Distribution Subsidiaries.
| 8 |
Regarding export regions, in the first half of the year, sales volume increased in Canada (+17.7%), Africa and others (+17.2%), South America (+3.9%). Volume declined in United States (-10.6%), Central America and Caribbean (-6.1%), Asia (-1.5%), and Europe (-0.4%).
| 1.1.2. | Chile Domestic Market - Wine |
Domestic wine sales grew 4.1% in value, totaling Ch$33,484 million, driven by a higher average price (+10.0%). Sales volume declined 5.4% to 30,951 Th.Lt., reflecting the contraction of Non-Premium categories.
Regarding the portfolio mix, this quarter Premium sales volume increased 9.6%, while the Non-Premium category decreased 6.6%. This has resulted in a mix improvement, with the premium category increasing its share to 8.8% in volume terms (+120bp), and 30.0% in value terms (+190bp).
| 1.1.3. | Operation in Argentina |
Sales in the Argentine operation (excluding shipments to distribution subsidiaries) totaled Ch$12,321 million, down 6.9% in comparison to the previous year, as a result of higher sales in the domestic market (+48.9%) more than offset by a drop in exports (-23.0%).
In line with the company’s strategy and facing a scenario of higher wine costs due to a challenging harvest, the company has increased prices and remains focused on more profitable products. In the domestic market, the average per-liter price was US$2.55, up 54.0% in USD, and up 66.5% in local currency. Exports price was US$3.55, up 14.0% in USD.
In terms of volume, the domestic market decreased 10.7% while export markets were down 30.1%. This figure excludes sales of Trivento through distribution subsidiaries.
| 1.1.4. | Operation in U.S.A (Fetzer) |
In the first half of 2017, Fetzer’s total sales (excluding shipments to distribution subsidiaries) was Ch$30,158 million, 0.2% below the previous year, and reflected higher sales price in the domestic market and exports, flat volume, and negative currency effects.
The average sales price in the domestic market increased 3.6% to US$5.38 per liter, and volume was down 0.8%. In exports, the average price increased 1.7%, to US$4.64, and volume increased 7.7%.
| 1.2. | Other Operating Segment |
Otheroperating segment reported a decrease of 12.3% in salesin the first half of the year. Adjusting for the distribution of Monster energy drink in 2016 not repeated in the current period, sales increased 11.2% from the previous year.
| 9 |
| 1.2.1. | Chile Domestic Market - New Business |
New business sales, including premium beer; spirits; and pisco, declined 18.7% totaling Ch$21,042 million. The aforementioned is explained by the ending of the distribution of Monster energy drink in 3Q16. This was offset in part by higher sales in the distribution of beer (+11.5%), Diageo’s liquor portfolio (+2.8%), and pisco category (+14.3%).
| 1.2.2. | Other Revenues |
Other revenues, comprising fees for bottling services, sales of fruit, among others, were up 41.4%, reaching Ch$4,385 million.
| 2. | Cost of Sales |
In the first half of 2017, the total cost of sales was Ch$188,598 million, up 0.3% from Ch$187,971 million reported in the same period of the previous year. The cost of sales as a percentage of total sales reached 64.3%, up 270bp, reflecting a higher cost of wine. This was primary due to a lower harvested volume.
| 3. | Selling, General and Administrative Expenses |
Selling, General and Administrative Expenses (Distribution costs and Administrative expenses) decreased 4.1% to Ch$80,119 million in the period, when compared to Ch$83,509 million in the previous year. As a percentage of sales, SG&A reached 27.3%, in line with the figure of the same period of 2016 (27.3%).
In the first half of 2017, the Company recognized extraordinary expenses of Ch$826 million, related to the restructuring process. Excluding these expenses, SG&A/sales was 27.0%, down 30bps.
| 4. | Operating Income |
In the first half of 2017, the Operating Income decreased 26.8% to Ch$24,650 million in comparison to Ch$33,692 million in the 1H16. The operating margin was 8.4%, a decline of 260bp. This was driven by the higher cost of wine and a negative exchange rate impact.
| 5. | Operating Income plus Depreciation and Amortization |
In the first semester of 2017, the Operating Income plus Depreciation and Amortization declined 18.4% to Ch$35,463 million in comparison to Ch$43,439 million in 1H16. The operating income plus depreciation and amortization as a percentage of sales reached 12.1% in comparison to 14.2% in 1H16. The lower margin is a result of a higher cost of wine and negative effects from exchange rate fluctuations.
| 10 |
| 6. | Non-Operating Income |
The Non-Operating Income registered a loss of Ch$3,778 million, which was lower than the loss of Ch$4,696 million in 2016, mostly due to the higher exchange differences.
Financial expenses totaled Ch$4,715 million in 2017, decreasing 1.2% in comparison to the Ch$4,772 million registered in the same period of 2016.
| 7. | Net Income and Earnings per Share (EPS) |
Net Income attributable to owners of the company declined 25.3%, totaling Ch$15,340 million. Based on 747,005,982 weighted average shares, Concha y Toro’s earnings totaled Ch$20.5 per share, below the Ch$27.5 per share registered during the same period of the previous year.
| 11 |
Balance Sheet
Assets
As of June 30th, 2017, Viña Concha y Toro consolidated assets totaled Ch$1,052,927 million, 3.7% above the figure as of December 31st, 2016.
Liabilities
As of June 30th, 2017, Net Financial Debt1 amounted to Ch$252,084 million, increasing Ch$60,226 million when compared to the figure as of December 31st, 2016.
* * * * *
About Viña Concha y Toro
Founded in 1883, Viña Concha y Toro is the leading Latin American wine maker, and a one of the world’s largest wine company. It holds around 11,000 hectares of vineyards in Chile, Argentina, and United States, and its wine portfolio includes iconic brands, such as Don Melchor and Almaviva, its flagship brand Casillero del Diablo, Trivento from Argentina, and Fetzer and Bonterra brands from California.
Forward Looking Statements
This press release may contain certain forward-looking statements within the meaning of Section 27A of the Securities Act of 1933, as amended, and Section 21E of the Securities Exchange Act of 1934, as amended. With respect to the financial condition, results of operations and business of the Company and certain plans and objectives of the Company with respect to these items. Forward-looking statements may be identified by the use of words such as “anticipate”, “continue”, “estimate”, “expect”, “intend”, “may”, “believe” and similar expressions. By their nature, forward-looking statements involve risk and uncertainty because they relate to events and depend on circumstances that occur in the future. There is a number of factors that could cause results and developments to differ materially from those expressed or implied by these forward-looking statements. These factors include: levels of consumer spending in major economies, changes in consumer tastes and preferences, the levels of marketing and promotional expenditures by the Company and its competitors, raw materials costs, future exchange and interest rates, as well as other risk factors referred in the Company’s filings with the Securities and Exchange Commission.
1 Net Financial Debt: Other current financial liabilities + Other non-current financial liabilities - Cash and cash equivalents - Derivatives.
| 12 |
Viña Concha y Toro S.A.
Consolidated Income Statement
| 2Q17 | 2Q16 | Change | 6M17 | 6M16 | Change | |||||||||||||||||||
| Income Statement by Function | Th. Ch$ | Th. Ch$ | % | Th. Ch$ | Th. Ch$ | % | ||||||||||||||||||
| Income from ordinary activities | 165,942,108 | 173,292,158 | -4.2 | % | 293,416,242 | 305,446,760 | -3.9 | % | ||||||||||||||||
| Cost of sales | (105,609,844 | ) | (106,451,088 | ) | -0.8 | % | (188,597,581 | ) | (187,970,759 | ) | 0.3 | % | ||||||||||||
| Gross Profit | 60,332,264 | 66,841,070 | -9.7 | % | 104,818,661 | 117,476,001 | -10.8 | % | ||||||||||||||||
| Other income by function | 285,352 | 380,157 | -24.9 | % | 645,103 | 606,305 | 6.4 | % | ||||||||||||||||
| Distribution costs | (34,564,990 | ) | (36,030,505 | ) | -4.1 | % | (61,746,966 | ) | (66,213,844 | ) | -6.7 | % | ||||||||||||
| Administrative expenses | (8,746,687 | ) | (8,995,774 | ) | -2.8 | % | (18,371,647 | ) | (17,295,514 | ) | 6.2 | % | ||||||||||||
| Other expenses by function | (410,159 | ) | (625,854 | ) | -34.5 | % | (694,785 | ) | (880,893 | ) | -21.1 | % | ||||||||||||
| Operating Income | 16,895,780 | 21,569,094 | -21.7 | % | 24,650,366 | 33,692,055 | -26.8 | % | ||||||||||||||||
| Financial income | 135,998 | 175,913 | -22.7 | % | 481,143 | 547,137 | -12.1 | % | ||||||||||||||||
| Financial expenses | (2,401,977 | ) | (2,376,920 | ) | 1.1 | % | (4,715,089 | ) | (4,771,885 | ) | -1.2 | % | ||||||||||||
| Participation in income (loss) of associates and joint-ventures recorded using the equity method | (304,710 | ) | (515,715 | ) | -40.9 | % | (211,072 | ) | 132,436 | -259.4 | % | |||||||||||||
| Exchange differences | 1,421,077 | (660,454 | ) | -315.2 | % | 1,273,038 | (666,796 | ) | -290.9 | % | ||||||||||||||
| Income/expense by adjustment units | (360,686 | ) | 78,793 | -557.8 | % | (606,020 | ) | 63,354 | -1056.6 | % | ||||||||||||||
| Income before tax | 15,385,482 | 18,270,711 | -15.8 | % | 20,872,366 | 28,996,301 | -28.0 | % | ||||||||||||||||
| Income tax expense | (3,795,352 | ) | (4,912,310 | ) | -22.7 | % | (5,452,278 | ) | (8,197,439 | ) | -33.5 | % | ||||||||||||
| Net Income | 11,590,130 | 13,358,401 | -13.2 | % | 15,420,088 | 20,798,862 | -25.9 | % | ||||||||||||||||
| Net income attributable to owners of the company | 11,535,205 | 13,247,900 | -12.9 | % | 15,340,476 | 20,545,152 | -25.3 | % | ||||||||||||||||
| Net income attributable to non- controling interests | 54,925 | 110,501 | -50.3 | % | 79,612 | 253,710 | -68.6 | % | ||||||||||||||||
| Operating Income plus Depreciation and Amortization | 22,697,413 | 26,613,357 | -14.7 | % | 35,463,429 | 43,438,642 | -18.4 | % | ||||||||||||||||
| Operating Income | 16,895,780 | 21,569,094 | -21.7 | % | 24,650,366 | 33,692,055 | -26.8 | % | ||||||||||||||||
| Depreciation | 5,541,455 | 4,908,305 | 12.9 | % | 10,292,343 | 9,326,755 | 10.4 | % | ||||||||||||||||
| Amortization | 260,178 | 135,958 | 91.4 | % | 520,720 | 419,832 | 24.0 | % | ||||||||||||||||
| 13 |
Viña Concha y Toro S.A.
Consolidated Balance Sheet
| As of | As of | |||||||
| (ThCh$) | June 30, 2017 | December 31, 2016 | ||||||
| Assets | ||||||||
| Cash and cash equivalents | 18,892,196 | 47,213,517 | ||||||
| Inventories | 306,666,591 | 231,224,426 | ||||||
| Accounts receivable | 191,371,064 | 193,287,401 | ||||||
| Biological current assets | 4,756,680 | 19,186,291 | ||||||
| Other current assets | 23,241,919 | 30,492,222 | ||||||
| Total current assets | 544,928,450 | 521,403,857 | ||||||
| Property, plant & equipment, net | 381,649,187 | 361,004,006 | ||||||
| Investments accounted for using the equity method | 21,611,696 | 23,433,439 | ||||||
| Other non current assets | 104,737,184 | 109,997,284 | ||||||
| Total non current assets | 507,998,067 | 494,434,729 | ||||||
| Total assets | 1,052,926,517 | 1,015,838,586 | ||||||
| Liabilities | ||||||||
| Other current financial liabilities | 157,341,385 | 101,999,046 | ||||||
| Other current liabilities | 199,884,262 | 192,870,916 | ||||||
| Total current liabilities | 357,225,647 | 294,869,962 | ||||||
| Other non-current financial liabilities | 121,140,977 | 148,992,036 | ||||||
| Other non current liabilities | 55,501,886 | 54,269,968 | ||||||
| Total non current liabilities | 176,642,863 | 203,262,004 | ||||||
| Total Liabilities | 533,868,510 | 498,131,966 | ||||||
| Equity | ||||||||
| Issued capital | 84,178,790 | 84,178,790 | ||||||
| Accumulated Profits/(losses) | 428,260,522 | 426,521,298 | ||||||
| Other reserves | 5,266,654 | 5,509,389 | ||||||
| Net equity attributable to parent comp. shareholders | 517,705,966 | 516,209,477 | ||||||
| Non-controlling interest | 1,352,041 | 1,497,143 | ||||||
| Total Equity | 519,058,007 | 517,706,620 | ||||||
| Total liabilities and Equity | 1,052,926,517 | 1,015,838,586 | ||||||
| 14 |