Exhibit 99.1

VIÑA CONCHA Y TORO ANNOUNCES CONSOLIDATED
THIRD QUARTER 2017 RESULTS
Santiago, Chile, November 6, 2017 - Viña Concha y Toro S.A. (“The Company” or “Concha y Toro”) (NYSE: VCO, IPSA: Conchatoro), global leading winery and the main producer and exporter of Chilean wine, announced today consolidated financial results, stated under IFRS, for the third quarter 2017 ended September 30th, 2017. US dollar figures (US$), except export figures, are based on the exchange rate effective September 30th, 2017 (US$1.00 = Ch$ 637.9).
Consolidated figures of the following analysis are expressed in Chilean Pesos and according to the rules and instructions of the Chilean Superintendence of Securities and Insurance (“SVS”), which are in accordance with IFRS. For a better understanding of the results, we disclose some variations on a constant currency basis, i.e. figures for the third quarter of 2016 and nine months 2016 are translated into Chilean peso using the exchange rate recorded in our results as of the same period of 2017.
In 2016 and 2017, several expenses, costs, and extraordinary income were recorded, which is why we also present, in comparative form, the information of the results excluding or isolating - just for the purposes of a better analysis, the aforementioned items. Thus, throughout this press release every reference to “Adjusted” information, should be understood that itdoes not correspond to the reported one, but to the one in which the referred costs, expenses and extraordinary income have been isolated.1
This document is complemented by the Investor Day Presentation, Corporate Strategy Update, dated November 6, 2017, which will be available on our website:https://www.conchaytoro.com/concha-y-toro-holding/presentaciones-financieras/
Conference Call
We will host a conference call to discuss Results on Wednesday, November 8, at 5:00 pm, Santiago time – 3:00 pm, EST. To join the conference call, please dial, Domestic USA: 1-866-739-7845. International: 1-412-858-4608. ID Code: VIÑA CONCHA CALL.
3Q17 Highlights
| · | Net income increased 8.4% to Ch$14,642 million. Excluding non-recurring items (NRI)2, Net Income increased 38.8%. |
| · | Consolidated sales totaled Ch$160,532 million, declining 5.5% on a reported basis, and 4.0%, on a constant currency basis. |
| · | OperatingIncome decreased 15.7% to Ch$14,891 million. Excluding NRI, Operating Income increased 3.3% to Ch$16,022 million. |
| · | Steps taken to achieve efficiencies and cost savings are progressing as planned, and starting to be reflected in results. |
1 It refers to expenses and costs, as consequences of the internal restructuring process that the company is carrying out; and, on the other hand, compensation received.
2 Adjustments incorporated in the Income Statement table, isolating only for analysis purposes, costs, expenses and extraordinary compensation.
CEO Comments
We are pleased to report this quarter growth of 38.8% in Net Income and a 3.3% increase of Operating Income, both adjusted for non-recurring items3. These results present an encouraging evolution to what is our vision and strategic program for the next five years. A strategy that seeks sustained growth in value and a recovery in the profitability of our business.
In this context, the restructuring process in place has already begun to generate efficiencies. Proof of the cost containment that we are carrying out, for the quarter SG&A as a percentage of sales declined 140 basis points to 27.0%, and excluding incremental extraordinary expenses related to the restructuring process, it decreased 190 basis points. This is just the beginning, according to our estimates this restructuring process is expected to drive permanent savings of around Ch$18,000 million per year.
Third quarter consolidated sales of Ch$160,532 million were down 5.5%. This mainly reflects a lower volume that has been impacted by price increases that we have carried out in our main markets, in addition to a more focused promotional activity. It is important to note that this is consistent with our medium term goals, where the focus of the new commercial vision is on the growth of Premium categories, prioritizing brands and repositioning of our products towards higher price points.
In Chile, we highlight the results achieved with wine segment sales increasing 10.5% in value. This has been driven by an increase in prices and volume growth of Premium wine. The external markets are evolving in line with what was expected in a scenario of price adjustments and greater cost containment aimed at achieving a positive evolution of profitability.
On a topic that has been of concern, the wildfires occurred in California have challenged the wine industry. Fortunately, the operation of Fetzer Vineyards, its facilities, and planted area in Mendocino County did not suffer damages. Fetzer operations continue their normal course.
Finally, we want to share with you a worldwide recognition that gives us the highest pride. Almaviva 2015 has been recently named Wine of the Year, in the annual ranking ‘Top 100 Wines of 2017’, with a perfect score of 100 points given by James Suckling, one of the most influential wine critics of the United States and one of the most respected in a global scale. Viña Almaviva is a subsidiariy of Viña Concha y Toro S.A.
3 It refers to expenses and costs, as consequences of the internal restructuring process that the company is carrying out; and, on the other hand, compensation received.
| 2 |
Third Quarter 2017 Results
| 1. | Consolidated Sales |
Consolidated sales totaled Ch$160,532 million in the third quarter, down 5.5% YoY on a reported basis and down 4.0% on a constant currency basis. This mainly due to lower volume, in line with a new commercial strategy, with a higher focus on Premium category, across-the-board price increases, and reduced promotional activities.
| Sales(3) (in Ch$ million) | 3Q17 | 3Q16 | Change (%) | 9M17 | 9M16 | Change (%) | ||||||||||||||||||||||
| Chile Domestic Market - wine | 22,307 | 20,184 | 10.5 | % | 55,791 | 52,360 | 6.6 | % | ||||||||||||||||||||
| Export markets(1) | 102,041 | 111,215 | -8.2 | % | 294,042 | 312,033 | -5.8 | % | ||||||||||||||||||||
| Argentina Domestic | 2,779 | 2,168 | 28.2 | % | 7,186 | 5,127 | 40.2 | % | ||||||||||||||||||||
| Argentina Exports(2) | 4,511 | 5,678 | -20.5 | % | 12,425 | 15,958 | -22.1 | % | ||||||||||||||||||||
| U.S.A. Domestic | 14,539 | 15,649 | -7.1 | % | 41,815 | 43,084 | -2.9 | % | ||||||||||||||||||||
| U.S.A. Exports(2) | 1,598 | 1,473 | 8.5 | % | 4,475 | 4,260 | 5.1 | % | ||||||||||||||||||||
| Total Wine Operating Segment | 147,776 | 156,367 | -5.5 | % | 415,735 | 432,822 | -3.9 | % | ||||||||||||||||||||
| Chile Domestic Market - new business | 10,016 | 11,447 | -12.5 | % | 31,059 | 37,338 | -16.8 | % | ||||||||||||||||||||
| Other Revenues | 2,740 | 1,987 | 37.9 | % | 7,155 | 5,087 | 40.6 | % | ||||||||||||||||||||
| Total Other Operating Segment | 12,756 | 13,434 | -5.0 | % | 38,213 | 42,425 | -9.9 | % | ||||||||||||||||||||
| Consolidated Sales | 160,532 | 169,800 | -5.5 | % | 453,948 | 475,247 | -4.5 | % | ||||||||||||||||||||
| Volume(3)(thousand liters) | 3Q17 | 3Q16 | Change (%) | 9M17 | 9M16 | Change (%) | ||||||||||||||||||||||
| Chile Domestic Market - wine | 19,319 | 20,008 | -3.4 | % | 50,270 | 52,711 | -4.6 | % | ||||||||||||||||||||
| Export markets(1) | 51,598 | 58,275 | -11.5 | % | 150,363 | 156,982 | -4.2 | % | ||||||||||||||||||||
| Argentina Domestic | 2,020 | 1,634 | 23.7 | % | 5,134 | 5,122 | 0.2 | % | ||||||||||||||||||||
| Argentina Exports(2) | 1,941 | 3,075 | -36.9 | % | 5,424 | 8,056 | -32.7 | % | ||||||||||||||||||||
| U.S.A. Domestic | 4,150 | 4,068 | 2.0 | % | 11,871 | 11,801 | 0.6 | % | ||||||||||||||||||||
| U.S.A. Exports(2) | 516 | 495 | 4.3 | % | 1,453 | 1,388 | 4.7 | % | ||||||||||||||||||||
| Total Wine Operating Segment | 79,544 | 87,554 | -9.1 | % | 224,516 | 236,060 | -4.9 | % | ||||||||||||||||||||
| Chile Domestic Market - New Business | 4,616 | 5,763 | -19.9 | % | 14,255 | 18,870 | -24.5 | % | ||||||||||||||||||||
| Total Other Operating Segment | 4,616 | 5,763 | -19.9 | % | 14,255 | 18,870 | -24.5 | % | ||||||||||||||||||||
| Consolidated Volume | 84,160 | 93,317 | -9.8 | % | 238,771 | 254,930 | -6.3 | % | ||||||||||||||||||||
| Average Price (per liter) | Currency | |||||||||||||||||||||||||||
| Chile Domestic Market - wine | Ch$ | 1,155 | 1,009 | 14.5 | % | 1,110 | 993 | 11.7 | % | |||||||||||||||||||
| Export Markets(1) | US$ | 3.14 | 2.93 | 7.1 | % | 3.06 | 2.99 | 2.3 | % | |||||||||||||||||||
| Argentina Domestic | US$ | 2.37 | 2.01 | 18.1 | % | 2.48 | 1.80 | 37.5 | % | |||||||||||||||||||
| Argentina Exports(2) | US$ | 3.77 | 3.09 | 21.8 | % | 3.63 | 3.10 | 16.8 | % | |||||||||||||||||||
| U.S.A. Domestic | US$ | 5.65 | 5.84 | -3.3 | % | 5.47 | 5.42 | 0.8 | % | |||||||||||||||||||
| U.S.A. Exports(2) | US$ | 4.82 | 4.50 | 7.3 | % | 4.71 | 4.54 | 3.9 | % | |||||||||||||||||||
(1) Export Volumes include exports to third parties and sales volumes of the company’s distribution subsidiaries (UK, Nordics, Brazil, Singapore, Mexico).
(2) This figure excludes shipments to the company’s distribution subsidiaries.
(3) This figure includes bulk wine sales.
| 3 |
| 1.1. | Wine Operating Segment |
| 1.1.1. | Export Markets |
Export sales from Chile and distribution subsidiaries totaled Ch$102,041 million, declining 8.2% on a reported basis and 6.9% on a constant currency basis. Higher average prices, measured in the local currencies of our markets: +11.6% in sterling pound, +4.1% in US dollar, and +0.1% in euro, were offset by lower volume.
In the third quarter, the Chilean peso appreciated against U.S. dollar (2.9%), Sterling pound (3.4%), and Argentine peso (19.1%). The Chilean peso depreciated against the Euro (2.2%), Mexican peso (2.3%), Swedish krona (1.7%), Norwegian krone (1.6%), Canadian dollar (1.1%), and the Brazilian Real (0.2%).
Sales volume of bottled wine, by Region
Export Markets
3Q17
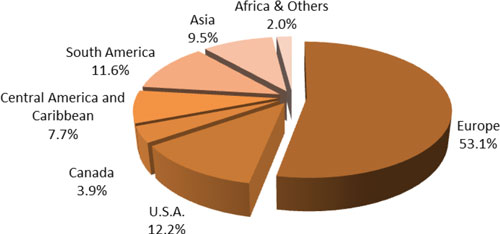
Regarding the export regions, sales volume declined in Europe (-6.6%), Africa and others (-58.3%), United States (-0.3%), Asia (-32.6%), South America (-0.1%), Central America and Caribbean (-15.7%), and Canada (-20.3%).
| 4 |
| 1.1.2. | Chile Domestic Market – Wine |
A positive result was achieved in Chile’s domestic market. Domestic wine sales grew 10.5% totaling Ch$22,307 million, driven by a higher average price (+14.5%) and higher sales on both the Premium and Non-Premium segments. Sales volume declined 3.4% to 19,319 Th.Lt., reflecting the contraction of Non-Premium wine.
In the quarter, Premium sales increased 12.1%, reflecting a volume increase of 4.0% and a 7.8% higher average price. Non-Premium-wine sales increased 9.9% in value, resulting from a 14.6% higher average price, partly offset by a decrease of 4.1% in volume. This has resulted in a mix improvement with the premium category increasing its share to 8.6% in volume terms (+60bp), and 29.5% in value terms (+40bp).
| 1.1.3. | Operation in Argentina |
Sales from the Argentine operation (excluding shipments to distribution subsidiaries) totaled Ch$7,291 million, down 7.1% on a reported basis. On a constant currency basis Argentina sales decreased 1.2%, on lower exports in the Non-Premium category, as the company has exited lower-end, less-profitable products in a scenario of lower availability of wine.
Premium category remained growing, led by Trivento Premium brands, with double-digit volume growth in its major markets the UK and USA.
In line with the company’s strategy and facing a scenario of higher wine costs due to challenging harvests, the company has increased prices and remains focused on more- profitable products. In the domestic market, average per-liter price was US$2.37, up 18.1% in USD, and up 23.8% in local currency. Exports price was US$3.77, up 21.8%.
| 1.1.4. | Operation in U.S.A (Fetzer) |
During the quarter, Fetzer’s sales (excluding shipments to distribution subsidiaries) totaled Ch$16,137 million, declining 5.8% on a reported basis, and 2.8% on a constant currency basis.
Sales volume increased at the domestic market (+2.0%) and exports (+4.3%). Our priority brands, Bonterra and 1000 Stories, showed increases of 17.4% and 7.9%, respectively, in volume.
The average price rose 7.3% in exports and declined 3.3% in the domestic market.
| 5 |
| 1.2. | Other Operating Segment |
Otheroperating segment decreased 5.0% in the quarter. This result mainly reflects the ending of the distribution agreement of Monster energy drink. Adjusting for Monster’s sales figure (not repeated in the current period), sales increased 12.0% from the previous year, driven by dynamic categories of premium beer (+16.2%) and pisco category (+15.6%).
| 2. | Other Income and expenses |
Other Income by Function, net of Other Expenses by function totaled Ch$160 million, compared to Ch$1,865 million in 3Q16, a decrease of 91.4%. This is explained by compensations received in 2016, mainly the compensation for the early termination of the Monster distribution contract in October 2016.4
| 3. | Cost of Sales |
The total Cost of Sales decreased 3.2% to Ch$102,535 million from Ch$105,870 million in the same quarter of 2016. The Cost of Sales as a percentage of sales reached 63.9%, increasing 150bp, reflecting a higher cost of wine, following a lower harvested volume. In Chile, the harvested volume declined 21.2% in 2016, and 6.4% in 2017.
In the quarter, the Company recognized extraordinary costs of Ch$394 million related to the restructuring process4. Excluding these costs, the adjusted Cost of Sales totaled Ch$102,141 million, a decrease of 3.5%.
| 4. | Selling, General and Administrative Expenses (SG&A) |
Selling, General and Administrative Expenses (Distribution costs and Administrative expenses) decreased 10.1% to Ch$43,265 million in the quarter, when compared to Ch$48,128 million in the previous year. As a percentage of sales, SG&A reached 27.0%, 140bp below the figure of 3Q2016.
In the quarter, the Company recognized extraordinary expenses4of Ch$737 million related to the restructuring process. Excluding these expenses, adjusted SG&A totaled Ch$42,528 million, a decrease of 11.6% and SG&A/sales was 26.5%, down 190 basis points.
| 5. | Operating Income |
Operating Income decreased 15.7% to Ch$14,891 million in comparison to Ch$17,667 million in 3Q16. The operating margin was 9.3%, a decline of 110bp.
To better understand the Company’s operating performance, we have adjusted this result for extraordinary items4: i) in 3Q2016 the company registered nonrecurring income of Ch$2,150 million, related mainly to the compensation for the anticipated ending of the Monster distribution agreement; and ii) in 3Q17, extraordinary expenses totaled Ch$1,131 million, related to the restructuring process mainly severance payments and consultancy fees.
Excluding NRI, 3Q17 Adjusted Operating Income reached Ch$16,022 million as compared to Ch$15,517 million in 3Q16 representing a 3.3% increase. Adjusted Operating margin rose to 10.0% in 3Q17, from 9.1% in 3Q16.
4 Adjustments incorporated in the Income Statement table, isolating only for analysis purposes, costs, expenses and extraordinary compensation. See page 14.
| 6 |
| 6. | EBITDA |
In the third quarter of 2017, EBITDA (Operating Income plus Depreciation and Amortization) declined 12.1% to Ch$21,003 million in comparison to Ch$23,889 million in 3Q16. EBITDA margin reached 13.1%, 100bp below the figure of 3Q16.
Excluding NRI, adjusted EBITDA5 reached Ch$22,134 million, as compared to Ch$21,739 million in 3Q16, and representing a 1.8% increase. Adjusted EBITDA margin rose to 13.8% in 3Q17, from 12.8% in 3Q16 (+100 bp).
| 7. | Non-Operating Income |
The Non-Operating Income registered a profit of Ch$4,112 million, as compared to a loss of Ch$457 million reported in 3Q16. This is mainly explained by a positive exchange rate differences result of Ch$3,791 million in the quarter. The company uses derivatives contracts as part of its hedging policy in order to mitigate the effects of currency fluctuations.
Financial expenses totaled Ch$2,658 million in the quarter, declining 0.2% in comparison to the Ch$2,663 million registered in the same period of 2016.
| 8. | Net Income and Earnings per Share (EPS) |
Net Income attributable to owners of the company increased 8.4%, totaling Ch$14,642 million. Net margin rose to 9.1% in 3Q17, from 8.0% in 3Q16 (+120 bp). Before non-recurring items, Adjusted Net Income5 reached Ch$15,773 million, as compared to Ch$11,362 million in 3Q16, and representing a 38.8% increase. Adjusted Net margin rose to 9.8% in 3Q17, from 6.7% in 3Q16 (+310 bp).
Based on 747,005,982 weighted average shares, Viña Concha y Toro’s earnings totaled Ch$19.60 per share, above the Ch$18.09 per share registered during the same period of the previous year.
5 Adjustments incorporated in the Income Statement table, isolating only for analysis purposes, costs, expenses and extraordinary compensation. See page 14.
| 7 |
Results for the First Nine Months of 2017
| 1. | Consolidated Sales |
Consolidated sales totaled Ch$453,948 million in the first nine months of the year, which was down 4.5% YoY on a reported basis, and down 0.5% on a constant currency basis. This mainly due to lower volume, in line with a new commercial strategy, with a higher focus on Premium category, across-the-board price increases, and reduced promotional activities.
| 1.1. | Wine Operating Segment |
| 1.1.1. | Export Markets |
Export sales from Chile and distribution subsidiaries totaled Ch$294,042 million, declining 5.8% on a reported basis and 0.6% on a constant currency basis. Higher average prices, measured in local currencies of our markets: +10.0% in sterling pound, +3.0% in US dollar, and +2.0% in euro were offset by lower volume.
In the period, the Chilean peso appreciated against U.S. dollar (3.9%), Sterling pound (13.7%), Euro (4.2%), Argentine peso (15.9%), Mexican peso (7.1%), Canadian dollar (2.8%), Swedish krona (6.6%), and Norwegian krone (2.7%). The Chilean peso depreciated only against one of our relevant foreign currencies, the Brazilian Real (6.8%).
Sales volume of bottled wine, by Region
Export Markets
9M17
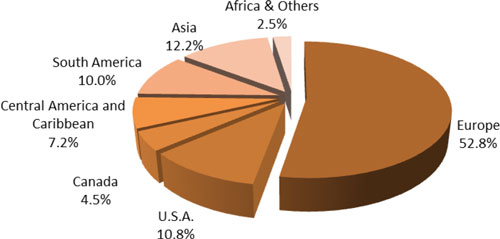
Regarding export regions, in the period, sales volume increased in Canada (+3.3%), and South America (+2.2%). Volume declined in Africa and others (-22.6%), Asia (-12.4%), Central America and Caribbean (-9.9%), United States (-6.9%), and Europe (-2.6%).
| 8 |
| 1.1.2. | Chile Domestic Market - Wine |
A positive result was achieved in Chile’s domestic market. Domestic wine sales grew 6.6% totaling Ch$55,791 million, driven by a higher average price (+11.7%) and higher sales on both the Premium and Non-Premium segments. Sales volume declined 4.6% to 50,270 Th.Lt., reflecting the contraction of Non-Premium volume.
In the period, Premium sales increased 11.4%, reflecting a volume increase of 7.4% and a 3.7% higher average price. Non-Premium-wine sales increased 4.6% in value, resulting from a 10.9% higher average price, partly offset by a decrease of 5.6% in volume. This has resulted in a mix improvement with the premium category increasing its share to 8.8% in volume terms (+100bp), and 29.8% in value terms (+130bp).
| 1.1.3. | Operation in Argentina |
Sales in the Argentine operation (excluding shipments to distribution subsidiaries) totaled Ch$19,611 million, down 7.0% on a reported basis. On a constant currency basis Argentina sales decreased 1.3% on lower exports in the Non-Premium category, as the company has exited lower-end, less-profitable products in a scenario of lower availability of wine.
Premium category remained growing, led by Trivento Premium brands, with double-digit volume growth in its major markets the UK and USA.
In line with the company’s strategy and facing a scenario of higher wine costs due to challenging harvests, the company has increased prices and remains focused on more profitable products. In the domestic market, the average per-liter price was US$2.48, up 37.5% in USD, and up 60.4% in local currency. Exports price was US$3.63, up 16.8%.
| 1.1.4. | Operation in U.S.A (Fetzer) |
In the period, Fetzer’s total sales (excluding shipments to distribution subsidiaries) was Ch$46,290 million, 2.2% below the previous year, and up 1.3% on a constant currency basis.
Sales volume increased at the domestic market (+0.6%) and exports (+4.7%). Our priority brands, Bonterra and 1000 Stories, showed increases of 9.6% and 28.0%, respectively, in volume.
The average price increased 3.9% in exports and 0.8% in the domestic market.
| 9 |
| 1.2. | Other Operating Segment |
Otheroperating segment decreased 9.9% in the period. This result mainly reflects the ending of the distribution agreement of Monster energy drink, as of October 2016. Adjusting for Monster’s sales figure (not repeated in the current period), sales increased 11.6% from the previous year, driven by dynamic categories of premium beer (+13.0%) and pisco category (+14.5%).
| 2. | Other Income and expenses |
Other Income by Function, net of Other Expenses by function totaled Ch$110 million, compared to Ch$1,590 million in 9M16, a decrease of 93.1%. This is explained by compensations received in 2016, mainly the compensation for the early termination of the Monster distribution contract6.
| 3. | Cost of Sales |
The Cost of Sales decreased 0.9% to Ch$291,133 million, from Ch$293,841 million reported in the previous year. The cost of sales as a percentage of total sales reached 64.1%, up 230bp, reflecting a higher cost of wine, following a lower harvested volume. In Chile, the harvested volume declined 21.2% in 2016, and 6.4% in 2017.
In the period, the Company recognized extraordinary costs of Ch$706 million related to the restructuring process6. Excluding these costs, the adjusted Cost of Sales totaled Ch$290,427 million, a decrease of 1.2%.
| 4. | Selling, General and Administrative Expenses |
Selling, General and Administrative Expenses (Distribution costs and Administrative expenses) decreased 6.3% to Ch$123,384 million in the period, when compared to Ch$131,637 million in the prior year. As a percentage of sales, SG&A was 27.2%, down 50bp from the figure of 2016 (27.7%).
In the quarter, the Company recognized extraordinary expenses of Ch$1.800 million related to the restructuring process. Excluding these expenses, adjusted SG&A6 totaled Ch$121,583 million, a decrease of 7.6% and SG&A/sales was 26.8%, down 90 basis points.
| 5. | Operating Income |
The Operating Income decreased 23.0% to Ch$39,541 million in comparison to Ch$51,359 million in 9M16. The operating margin was 8.7%, a decline of 210bp.
To better understand the Company’s operating performance, we have adjusted this result for extraordinary items: i) in 9M16, the company registered non-recurring income of Ch$2,150 million, related mainly to the compensation for the anticipated ending of the Monster distribution agreement; and ii) in 9M17, extraordinary expenses related to the restructuring process totaled Ch$1,800 million, mainly from severance payments and consultancy fees.
6 Adjustments incorporated in the Income Statement table, isolating only for analysis purposes, costs, expenses and extraordinary compensation. See page 14.
| 10 |
On a comparable basis, 9M17 Adjusted Operating Income7 reached Ch$42,048 million as compared to Ch$49,209 million in 9M16 representing a 14.6% decrease. Adjusted Operating margin was 9.3% in 9M17, from 10.4% in 9M16.
| 6. | EBITDA |
In 9M17, EBITDA (Operating Income plus Depreciation and Amortization) declined 16.1% to Ch$56,466 million in comparison to Ch$67,328 million in 9M16. EBITDA margin reached 12.4%, 170bp below the figure of 9M16.
On a comparable basis, adjusted EBITDA7 reached Ch$58,973 million, as compared to Ch$65,177 million in 9M16, and representing a decrease of 9.5%. Adjusted EBITDA margin was 13.0% in 9M17, a decline of 70bp from 13.7% in 9M16.
| 7. | Non-Operating Income |
The Non-Operating Income registered a profit of Ch$334 million, as compared to a loss of Ch$5,152 million in 2016. This is mainly explained by a positive exchange rate differences result of Ch$5,064 million. The company uses derivatives contracts as part of its hedging policy in order to mitigate the effects of currency fluctuations.
Financial expenses totaled Ch$7,373 million in 2017, decreasing 0.8% in comparison to the Ch$7,435 million registered in the same period of 2016.
| 8. | Net Income and Earnings per Share (EPS) |
Net Income attributable to owners of the company declined 12.0%, totaling Ch$29,983 million. Net margin was 6.6% in 9M17, 60bp below the figure in 9M16.
Before non-recurring items, Adjusted Net Income7 reached Ch$32,490 million, as compared to Ch$31,907 million, the adjusted figure in 9M16, and representing a 1.8% increase. Adjusted Net margin rose to 7.2%, 40bp above the figure of the prior year.
Based on 747,005,982 weighted average shares, Concha y Toro’s earnings totaled Ch$40.14 per share, below the Ch$45.59 per share registered during the same period of the previous year.
7 Adjustments incorporated in the Income Statement table, isolating only for analysis purposes, costs, expenses and extraordinary compensation. See page 14.
| 11 |
Balance Sheet
Assets
As of September 30th, 2017, Viña Concha y Toro consolidated assets totaled Ch$1,041,666 million, 2.5% above the figure as of December 31st, 2016.
Liabilities
As of September 30th, 2017, Net Financial Debt amounted to Ch$241,242 million, increasing Ch$49,384 million when compared to the figure as of December 31st, 2016.
Net Financial Debt is calculated as: Other current financial liabilities + Other non-current financial liabilities - Cash and cash equivalents - Derivatives.
* * * * *
About Viña Concha y Toro
Founded in 1883, Viña Concha y Toro is the leading Latin American wine maker, and a one of the world’s largest wine company. It holds around 11,000 hectares of vineyards in Chile, Argentina, and United States, and its wine portfolio includes iconic brands, such as Don Melchor and Almaviva, its flagship brand Casillero del Diablo, Trivento from Argentina, and Fetzer and Bonterra brands from California.
Forward Looking Statements
This press release may contain certain forward-looking statements within the meaning of Section 27A of the Securities Act of 1933, as amended, and Section 21E of the Securities Exchange Act of 1934, as amended. With respect to the financial condition, results of operations and business of the Company and certain plans and objectives of the Company with respect to these items. Forward-looking statements may be identified by the use of words such as “anticipate”, “continue”, “estimate”, “expect”, “intend”, “may”, “believe” and similar expressions. By their nature, forward-looking statements involve risk and uncertainty because they relate to events and depend on circumstances that occur in the future. There is a number of factors that could cause results and developments to differ materially from those expressed or implied by these forward-looking statements. These factors include: levels of consumer spending in major economies, changes in consumer tastes and preferences, the levels of marketing and promotional expenditures by the Company and its competitors, raw materials costs, future exchange and interest rates, as well as other risk factors referred in the Company’s filings with the Securities and Exchange Commission.
| 12 |
Viña Concha y Toro S.A.
Consolidated Income Statement
| 3Q17 | 3Q16 | Change | 9M17 | 9M16 | Change | |||||||||||||||||||
| Income Statement by Function | Th. Ch$ | Th. Ch$ | % | Th. Ch$ | Th. Ch$ | % | ||||||||||||||||||
| Net sales | 160,531,582 | 169,800,467 | -5.5 | % | 453,947,824 | 475,247,227 | -4.5 | % | ||||||||||||||||
| Cost of sales | (102,534,984 | ) | (105,870,472 | ) | -3.2 | % | (291,132,565 | ) | (293,841,231 | ) | -0.9 | % | ||||||||||||
| Gross profit | 57,996,598 | 63,929,995 | -9.3 | % | 162,815,259 | 181,405,996 | -10.2 | % | ||||||||||||||||
| Gross margin | 36.1 | % | 37.7 | % | -150 | bp | 35.9 | % | 38.2 | % | -230 | bp | ||||||||||||
| Other income by function | 380,635 | 2,319,062 | -83.6 | % | 1,025,738 | 2,925,367 | -64.9 | % | ||||||||||||||||
| Distribution costs | (35,876,885 | ) | (38,310,160 | ) | -6.4 | % | (97,623,851 | ) | (104,524,004 | ) | -6.6 | % | ||||||||||||
| Administrative expenses | (7,388,352 | ) | (9,817,934 | ) | -24.7 | % | (25,759,999 | ) | (27,113,448 | ) | -5.0 | % | ||||||||||||
| Other expenses by function | (221,066 | ) | (454,074 | ) | -51.3 | % | (915,851 | ) | (1,334,967 | ) | -31.4 | % | ||||||||||||
| Operating income | 14,890,930 | 17,666,889 | -15.7 | % | 39,541,296 | 51,358,944 | -23.0 | % | ||||||||||||||||
| Operating margin | 9.3 | % | 10.4 | % | -110 | bp | 8.7 | % | 10.8 | % | -210 | bp | ||||||||||||
| Financial income | 58,030 | 84,692 | -31.5 | % | 539,173 | 631,829 | -14.7 | % | ||||||||||||||||
| Financial expenses | (2,657,722 | ) | (2,663,352 | ) | -0.2 | % | (7,372,811 | ) | (7,435,237 | ) | -0.8 | % | ||||||||||||
| Share of profit (loss) of investments recorded using the equity method | 2,905,078 | 2,377,806 | 22.2 | % | 2,694,006 | 2,510,242 | 7.3 | % | ||||||||||||||||
| Exchange rate differences | 3,790,650 | (265,892 | ) | -1525.6 | % | 5,063,688 | (932,688 | ) | -642.9 | % | ||||||||||||||
| Income/expense by adjustment units | 16,000 | 10,171 | 57.3 | % | (590,020 | ) | 73,525 | -902.5 | % | |||||||||||||||
| Non-operating income | 4,112,036 | (456,575 | ) | -1000.6 | % | 334,036 | (5,152,329 | ) | -106.5 | % | ||||||||||||||
| Net income before income taxes | 19,002,966 | 17,210,314 | 10.4 | % | 39,875,332 | 46,206,615 | -13.7 | % | ||||||||||||||||
| Income tax expense | (4,406,995 | ) | (3,680,331 | ) | 19.7 | % | (9,859,273 | ) | (11,877,770 | ) | -17.0 | % | ||||||||||||
| Net income | 14,595,971 | 13,529,983 | 7.9 | % | 30,016,059 | 34,328,845 | -12.6 | % | ||||||||||||||||
| Net income attributable to non-controling interests | (46,124 | ) | 17,744 | -359.9 | % | 33,488 | 271,454 | -87.7 | % | |||||||||||||||
| Net income attributable to owners of the company | 14,642,095 | 13,512,239 | 8.4 | % | 29,982,571 | 34,057,391 | -12.0 | % | ||||||||||||||||
| Net margin | 9.1 | % | 8.0 | % | 120 | bp | 6.6 | % | 7.2 | % | -60 | bp | ||||||||||||
| Depreciation | 5,846,708 | 5,894,097 | -0.8 | % | 16,139,051 | 15,220,853 | 6.0 | % | ||||||||||||||||
| Amortization | 265,076 | 328,019 | -19.2 | % | 785,796 | 747,851 | 5.1 | % | ||||||||||||||||
| EBITDA* | 21,002,714 | 23,889,005 | -12.1 | % | 56,466,143 | 67,327,648 | -16.1 | % | ||||||||||||||||
| as % of Net sales | 13.1 | % | 14.1 | % | -100 | bp | 12.4 | % | 14.2 | % | -170 | bp | ||||||||||||
* EBITDA = Operating income + Depreciation + Amortization
| 13 |
3Q17 Adjusted Results8
| 3Q17 | 3Q16 | Change | 3Q17 | 3Q16 | Change | |||||||||||||||||||
| (million Ch$) | Reported | Reported | % | Adjusted | Adjusted | % | ||||||||||||||||||
| Sales | 160,532 | 169,800 | -5.5 | % | 160,532 | 169,800 | -5.5 | % | ||||||||||||||||
| Cost of sales | (102,535 | ) | (105,870 | ) | -3.2 | % | (102,141 | ) | (105,870 | ) | -3.5 | % | ||||||||||||
| Gross profit | 57,997 | 63,930 | -9.3 | % | 58,391 | 63,930 | -8.7 | % | ||||||||||||||||
| Gross margin | 36.1 | % | 37.7 | % | -150 | bp | 36.4 | % | 37.7 | % | -130 | bp | ||||||||||||
| SG&A* | (43,265 | ) | (48,128 | ) | -10.1 | % | (42,528 | ) | (48,128 | ) | -11.6 | % | ||||||||||||
| Other op. income, expenses | 160 | 1,865 | -91.4 | % | 160 | (285 | ) | -156 | % | |||||||||||||||
| Operating income | 14,891 | 17,667 | -15.7 | % | 16,022 | 15,517 | 3.3 | % | ||||||||||||||||
| Operating margin | 9.3 | % | 10.4 | % | -110 | bp | 10.0 | % | 9.1 | % | 80 | bp | ||||||||||||
| Non-operating income | 4,112 | (457 | ) | -1001 | % | 4,112 | (457 | ) | -1001 | % | ||||||||||||||
| Income before tax | 19,003 | 17,210 | 10.4 | % | 20,134 | 15,060 | 33.7 | % | ||||||||||||||||
| Income tax expense | (4,407 | ) | (3,680 | ) | 19.7 | % | (4,407 | ) | (3,680 | ) | 19.7 | % | ||||||||||||
| Minority interest | 46 | (18 | ) | -360 | % | 46 | (18 | ) | -360 | % | ||||||||||||||
| Net income | 14,642 | 13,512 | 8.4 | % | 15,773 | 11,362 | 38.8 | % | ||||||||||||||||
| Net margin | 9.1 | % | 8.0 | % | 120 | bp | 9.8 | % | 6.7 | % | 310 | bp | ||||||||||||
| EBITDA** | 21,003 | 23,889 | -12.1 | % | 22,134 | 21,739 | 1.8 | % | ||||||||||||||||
| EBITDA margin | 13.1 | % | 14.1 | % | -100 | bp | 13.8 | % | 12.8 | % | 100 | bp | ||||||||||||
9M17 Adjusted Results8
| 9M17 | 9M16 | Change | 9M17 | 9M16 | Change | |||||||||||||||||||
| (million Ch$) | Reported | Reported | % | Adjusted | Adjusted | % | ||||||||||||||||||
| Sales | 453,948 | 475,247 | -4.5 | % | 453,948 | 475,247 | -4.5 | % | ||||||||||||||||
| Cost of sales | (291,133 | ) | (293,841 | ) | -0.9 | % | (290,427 | ) | (293,841 | ) | -1.2 | % | ||||||||||||
| Gross profit | 162,815 | 181,406 | -10.2 | % | 163,521 | 181,406 | -9.9 | % | ||||||||||||||||
| Gross margin | 35.9 | % | 38.2 | % | -230 | bp | 36.0 | % | 38.2 | % | -210 | bp | ||||||||||||
| SG&A* | (123,384 | ) | (131,637 | ) | -6.3 | % | (121,583 | ) | (131,637 | ) | -7.6 | % | ||||||||||||
| Other op. income, expenses | 110 | 1,590 | -93.1 | % | 110 | (560 | ) | -120 | % | |||||||||||||||
| Operating income | 39,541 | 51,359 | -23.0 | % | 42,048 | 49,209 | -14.6 | % | ||||||||||||||||
| Operating margin | 8.7 | % | 10.8 | % | -210 | bp | 9.3 | % | 10.4 | % | -110 | bp | ||||||||||||
| Non-operating income | 334 | (5,152 | ) | -106 | % | 334 | (5,152 | ) | -106 | % | ||||||||||||||
| Income before tax | 39,875 | 46,207 | -13.7 | % | 42,382 | 44,056 | -3.8 | % | ||||||||||||||||
| Income tax expense | (9,859 | ) | (11,878 | ) | -17.0 | % | (9,859 | ) | (11,878 | ) | -17.0 | % | ||||||||||||
| Minority interest | (33 | ) | (271 | ) | -88 | % | (33 | ) | (271 | ) | -88 | % | ||||||||||||
| Net income | 29,983 | 34,057 | -12.0 | % | 32,490 | 31,907 | 1.8 | % | ||||||||||||||||
| Net margin | 6.6 | % | 7.2 | % | -60 | bp | 7.2 | % | 6.7 | % | 40 | bp | ||||||||||||
| EBITDA** | 56,466 | 67,328 | -16.1 | % | 58,973 | 65,177 | -9.5 | % | ||||||||||||||||
| EBITDA margin | 12.4 | % | 14.2 | % | -170 | bp | 13.0 | % | 13.7 | % | -70 | bp | ||||||||||||
*SG&A = Distribution costs + Administration expenses
**EBITDA= Operating income + Depreciation + Amortization
8 Adjusted results include adjustments to cost of sales and SG&A, related to the restructuring process carried out in 2017, and adjustments to Non-operating income related to compensations received in 2016, not repeated in 2017. Each adjustment is explained in its correspondent account analysis.
| 14 |
Viña Concha y Toro S.A.
Consolidated Balance Sheet
| As of | As of | Change | As of | Change | ||||||||||||||||
| (Th. Ch$) | Sept. 30, 2017 | Dec. 31, 2016 | % | Sept. 30, 2016 | % | |||||||||||||||
| Assets | ||||||||||||||||||||
| Cash and cash equivalents | 26,909,126 | 47,213,517 | -43.0 | % | 25,393,040 | 6.0 | % | |||||||||||||
| Inventories | 280,439,020 | 231,224,426 | 21.3 | % | 265,359,683 | 5.7 | % | |||||||||||||
| Accounts receivable | 175,711,629 | 193,287,401 | -9.1 | % | 175,905,794 | -0.1 | % | |||||||||||||
| Biological current assets | 13,905,715 | 19,186,291 | -27.5 | % | 13,753,679 | 1.1 | % | |||||||||||||
| Other current assets | 32,791,464 | 30,492,222 | 7.5 | % | 30,343,687 | 8.1 | % | |||||||||||||
| Total current assets | 529,756,954 | 521,403,857 | 1.6 | % | 510,755,883 | 3.7 | % | |||||||||||||
| Property, plant & equipment, net | 379,369,553 | 361,004,006 | 5.1 | % | 355,525,410 | 6.7 | % | |||||||||||||
| Inv. accounted for using the equity method | 24,582,302 | 23,433,439 | 4.9 | % | 21,898,929 | 12.3 | % | |||||||||||||
| Other non current assets | 107,957,230 | 109,997,284 | -1.9 | % | 111,376,422 | -3.1 | % | |||||||||||||
| Total non current assets | 511,909,085 | 494,434,729 | 3.5 | % | 488,800,761 | 4.7 | % | |||||||||||||
| Total assets | 1,041,666,039 | 1,015,838,586 | 2.5 | % | 999,556,644 | 4.2 | % | |||||||||||||
| Liabilities | ||||||||||||||||||||
| Other current financial liabilities | 162,751,514 | 101,999,046 | 59.6 | % | 126,913,161 | 28.2 | % | |||||||||||||
| Other current liabilities | 176,256,782 | 192,870,916 | -8.6 | % | 197,858,125 | -10.9 | % | |||||||||||||
| Total current liabilities | 339,008,296 | 294,869,962 | 15.0 | % | 324,771,286 | 4.4 | % | |||||||||||||
| Other non-current financial liabilities | 112,423,853 | 148,992,036 | -24.5 | % | 115,501,770 | -2.7 | % | |||||||||||||
| Other non current liabilities | 55,285,375 | 54,269,968 | 1.9 | % | 52,196,452 | 5.9 | % | |||||||||||||
| Total non current liabilities | 167,709,228 | 203,262,004 | -17.5 | % | 167,698,222 | 0.0 | % | |||||||||||||
| Total Liabilities | 506,717,524 | 498,131,966 | 1.7 | % | 492,469,508 | 2.9 | % | |||||||||||||
| Equity | ||||||||||||||||||||
| Issued capital | 84,178,790 | 84,178,790 | 0.0 | % | 84,178,790 | 0.0 | % | |||||||||||||
| Accumulated Profits/(losses) | 442,615,407 | 426,521,298 | 3.8 | % | 419,183,370 | 5.6 | % | |||||||||||||
| Other reserves | 6,902,008 | 5,509,389 | 25.3 | % | 2,357,031 | 193 | % | |||||||||||||
| Net equity attributable to parent comp. shareholders | 533,696,205 | 516,209,477 | 3.4 | % | 505,719,191 | 5.5 | % | |||||||||||||
| Non-controlling interest | 1,252,310 | 1,497,143 | -16.4 | % | 1,367,945 | -8.5 | % | |||||||||||||
| Total Equity | 534,948,515 | 517,706,620 | 3.3 | % | 507,087,136 | 5.5 | % | |||||||||||||
| Total liabilities and Equity | 1,041,666,039 | 1,015,838,586 | 2.5 | % | 999,556,644 | 4.2 | % | |||||||||||||
| 15 |