Exhibit 99.1

FIRST QUARTER 2018 CONSOLIDATED RESULTS
Santiago, Chile, May 22, 2018 - Viña Concha y Toro S.A. (“The Company” or “Concha y Toro”) (NYSE: VCO, IPSA: Conchatoro), global leading winery and the main producer and exporter of Chilean wine, announced today consolidated financial results, stated under IFRS, for the first quarter 2018 ended March 31, 2018.
Consolidated figures of the following analysis are expressed in Chilean Pesos, and according to the rules and instructions of the Chilean Commission for the Financial Market or CMF (former SVS), which are in accordance with IFRS. For a better understanding of results, we also disclose some variations on a constant currency basis, i.e. figures for the first quarter of 2017 translated into Chilean pesos, using the exchange rate recorded in our results as of the same period of 2018.
In 2018 and 2017, the Company recorded non-recurring expenses and costs related to the Company´s internal restructuring process. For this reason, we also present, incomparative form, information of results excluding or isolating, just for the purpose of a comprehensive analysis, the aforementioned items (Non-recurring items or NRI). Thus, throughout this document every reference to “Adjusted” data, should be understood that itdoes not correspond to the reported one, but to the one in which the referred costs and expenses have been isolated.
As of January 1, 2018, the Company adopted IFRS 15 accounting standard for revenue recognition. For the Company, in practice, this new accounting criteria affects the Income Statement in two ways: a lower revenue (impact of Ch$5,994 million or 4.7% in 1Q17 and Ch$5,826 million or 4.5% in 1Q18), and an equivalent reduction in the distribution costs line. Therefore, the gross profit line decreases in the same magnitude as revenue, but the profit from operating activities and net profit lines remain unchanged. For further details, see Note 2.1.6 to the Consolidated Financial Statements.
1Q18 Highlights
| · | Net profit up 69.8% to Ch$6,462 million. Excluding non-recurring items (NRI), net profit up 62.3%. |
| · | Consolidated revenue up 2.4% on a reported basis, and 5.1%, on a constant currency basis, driven by higher average prices. |
| · | Operating profit up 24.7% to Ch$9,671 million. Operating margin increased 140 basis points (bp) to 7.8%. |
| · | EBITDA up 18.4%, totaling Ch$15,117 million. EBITDA margin up 160bp, to 12.1%. |
| · | VCT Chile and Fetzer Vineyards showed a recovery in their operating profit, increasing their contribution to the consolidated operating profit. |
CEO Comments
We are pleased to report the results of the first quarter 2018 with increases of 18.4% in EBITDA and of 69.8% in Net Profit. This is in part the outcome of our focus on value growth and profitability, combined with operating efficiencies generated through the ongoing restructuring plan.
In the first quarter, we recorded higher average prices in most of our key markets and an improvement in the sales mix, driven by the 7.8% growth in value of the Premium Category. This, combined with cost savings, has allowed us to offset a higher cost of wine, which is reflected in an expansion of 160 bp in the EBITDA margin.
In Chile, our domestic wine business had a strong performance with a sales growth rate of 16.3%. This is a result of price increases carried out during 2017, and a better sales mix led by a 23.1% growth at the premium category.
In the US, Fetzer Vineyards’ results are positive, delivering growth and greater profitability in line with the medium-term objectives. Revenues increased 13.0% in US dollar terms, reflecting larger sales volumes in the domestic and exports markets. Meanwhile, the operating margin showed an expansion of 770 bps as a result of an increase in the average price, a better sales mix and a decrease in unit costs.
Regarding export markets, our focus on value growth was reflected in an increase of 8.0% in sales in US dollar terms. We highlight a larger contribution from our distribution offices led by CYT UK and Nordics, revealing higher average prices, better mix, and a favorable exchange rate impact.
In Argentina, a higher cost of raw material, following the lower harvested volume in 2016 and 2017, led us to adjust prices upwards, with the sequential impact on volume. However, our priority brand, Trivento Reserve continued to show a remarkable performance in such key markets as UK and Canada.
Finally, we believe that we are in right path to achieve our 2022 targets following the progress seen in our strategic program that seeks sustained growth in value and in the profitability of our business.
| 2 |
First Quarter 2018 Results
| 1. | Revenue |
Revenue totaled Ch$124,442 million, increasing 2.4% YoY on a reported basis and 5.1% on a constant currency basis, reflecting higher average price and mix improvement, in line with the new commercial strategy in place, with a higher focus on the Premium category.
| Sales(1) (Ch$ million) | 1Q18 | 1Q17(6) | Chg (%) | |||||||||||||
| Export Markets(2) | 76,877 | 77,149 | -0.4 | % | ||||||||||||
| Chile Domestic Market - Wine | 15,240 | 13,108 | 16.3 | % | ||||||||||||
| Argentina Domestic Market | 1,186 | 1,506 | -21.3 | % | ||||||||||||
| Argentina Exports(3) | 3,075 | 3,632 | -15.3 | % | ||||||||||||
| USA Domestic Market | 12,464 | 12,858 | -3.1 | % | ||||||||||||
| USA Exports(3) | 2,226 | 1,325 | 68.1 | % | ||||||||||||
| Wine Operating Segment | 111,069 | 109,577 | 1.4 | % | ||||||||||||
| New Business(4) | 10,953 | 9,424 | 16.2 | % | ||||||||||||
| Other Revenues | 2,421 | 2,479 | -2.4 | % | ||||||||||||
| Other Operating Segment | 13,373 | 11,903 | 12.3 | % | ||||||||||||
| Total Sales | 124,442 | 121,480 | 2.4 | % | ||||||||||||
| Volume(1) (thousand liters) | 1Q18 | 1Q17 | Chg (%) | |||||||||||||
| Export Markets(2) | 41,970 | 43,510 | -3.5 | % | ||||||||||||
| Chile Domestic Market - Wine | 13,608 | 13,698 | -0.7 | % | ||||||||||||
| Argentina Domestic Market | 1,132 | 1,732 | -34.6 | % | ||||||||||||
| Argentina Exports(3) | 1,275 | 1,630 | -21.8 | % | ||||||||||||
| USA Domestic Market | 3,784 | 3,672 | 3.1 | % | ||||||||||||
| USA Exports(3) | 575 | 419 | 37.4 | % | ||||||||||||
| Wine Operating Segment | 62,345 | 64,660 | -3.6 | % | ||||||||||||
| New Business(4) | 5,830 | 5,506 | 5.9 | % | ||||||||||||
| Other Operating Segment | 5,830 | 5,506 | 5.9 | % | ||||||||||||
| Total Volume | 68,175 | 70,167 | -2.8 | % | ||||||||||||
| Average Price(5) (per liter) | 1Q18 | 1Q17(6) | Chg (%) | |||||||||||||
| Export Markets(2) | (US$) | 3.14 | 2.78 | 12.8 | % | |||||||||||
| Chile Domestic Market - Wine | (Ch$) | 1,120 | 959 | 16.8 | % | |||||||||||
| Argentina Domestic Market | (US$) | 1.76 | 1.77 | -0.7 | % | |||||||||||
| Argentina Exports(3) | (US$) | 4.14 | 3.48 | 18.8 | % | |||||||||||
| USA Domestic Market - Wine | (US$) | 5.47 | 5.37 | 2.0 | % | |||||||||||
| USA Exports(3) | (US$) | 6.58 | 4.84 | 35.9 | % | |||||||||||
(1) Includes bulk wine sales.
(2) Includes exports to third parties from Chile, and sales through the Company’s distribution subsidiaries (UK, Nordics, Brazil, Singapore, Mexico) from Chile, Argentina, and USA.
(3) Excludes sales through the Company’s distribution subsidiaries.
(4) Includes sales of beer and liquors.
(5) Excludes bulk wine sales.
(6) 2018 financial data are provided in accordance with IFRS 15, effective since January 1, 2018. In order to ensure a meaningful comparison with 2017, 2017 figures have been restated in accordance with this new standard.
| 3 |
| 1.1. | Wine Operating Segment |
| 1.1.1. | Export Markets |
Export sales from Chile and distribution subsidiaries totaled Ch$76,877 million, declining 0.4% on a reported basis and increasing 1.4% on a constant currency basis. This is a result of a higher average price (+12.8% in US dollar terms) offset by lower volume (-3.5%).
Regarding the portfolio mix, Premium category increased its share of sales in 310bp to 47.5% of value. Priority brands, such as Casillero del Diablo and Trivento Reserve showed a strong performance, leading the increase in Premium wine sales (+15.6% in US dollar terms).
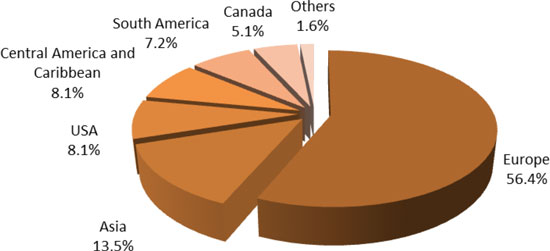
In export regions, sales in Europe recorded an increase of 17.4% in US dollar terms, driven by United Kingdom (+17.8%), Belgium (155.1%), Russia (+96.2%), and Denmark (+32.5%). Nordics (Sweden, Norway, and Finland) grew 14.8%. Other regions where sales grew were
Central America and Caribbean (+18.8%), Canada (+5.5%), and Asia (+1.5%). Exports declined in USA (-4.8%), South America (-18.5%), and Others (-29.9%).
Exports volume increased in Central America and Caribbean (+10.1%), and Asia (+2.7%). Volume decreased in Europe (-0.6%), Others (-46.0%), South America (-27.5%), United States (-1.2%), and Canada (-9.2%).
Regarding the exchange rate effect, in the quarter the average Chilean peso appreciated against the US dollar (8.9%), Canadian dollar (4.0%), Norwegian krone (1.1%), Brazilian Real (12.5%), and Mexican peso (0.7%). The Chilean peso depreciated against the Euro (5.6%), Sterling pound (3.1%), and Swedish krona (1.0%).
Wine Sales in Export Markets, Value by Region
1Q18
| 4 |
| 1.1.2. | Chile Domestic Market – Wine |
Sales increased 16.3%, totaling Ch$15,240 million, from larger sales at the Premium and Non-Premium categories. In the quarter, the segment recorded a higher average price (+16,8%) and lower volume (-0.7%).
Premium wine grew 12.5% in volume, led by Casillero del Diablo brand (+13.5%). Non-Premium volume decreased 1.9%.
Regarding the sales mix, in the quarter, the Premium category increased its share to 10.1% of the portfolio volume (+70bp), and to 32.7% in value terms (+70bp).
| 1.1.3. | Argentina |
Sales from the Argentine operation (excluding shipments to distribution subsidiaries) totaled Ch$4,261 million, down 17.1% on a reported basis (-3.2% in constant currency), reflecting lower volume in a scenario of lower availability of wine and the Company’s strategy of exiting lower-end, less-profitable products.
In line with the company’s strategy and facing a scenario of higher wine costs due to challenging harvests, the Company has increased prices and remains focused on more- profitable products. Exports price increased 18.8% to US$4.14, and at the domestic market, average price was US$1.76 (-0.7% in US dollar and +23.8% in local currency).
| 1.1.4. | USA (Fetzer Vineyards) |
During the quarter, sales of Fetzer Vineyards (excluding shipments to distribution subsidiaries) totaled Ch$14,690 million, increasing 3.6% on a reported basis and 12.4% on a constant currency basis.
Domestic market sales increased 3.1% in volume, increased 5.8% in US dollar, and decreased 3.1% in Chilean peso. Exports sales from the US increased 37.4% in volume, 82.4% in US dollar, and 68.1% in Chilean peso.
In the quarter, Fetzer Vineyards sales growth was driven by 1000 Stories, and Fetzer brands.
| 1.2. | Other Operating Segment |
Other operating segment increased 12.3% in the quarter, driven by higher revenues of liquors and premium beer.
| 5 |
| 2. | Cost of Sales |
Cost of sales increased 2.5% to Ch$85,041 million, driven by a higher cost of wine in Chile, and partly offset by a positive exchange rate impact related to US dollar-denominated costs. The cost of sales as a percentage of sales was stable at 68.3% as compared to the same quarter in 2017.
In the quarter, the Company recognized extraordinary costs of Ch$221 million related to the ongoing restructuring process1. The figure was Ch$190 million in 1Q17.
| 3. | Selling, General and Administrative Expenses (SG&A) |
Selling, general and administrative expenses (distribution costs and administrative expenses) were Ch$30,074 million in the quarter, down 2.4% when compared to Ch$30,813 million in the previous year. As a percentage of sales, SG&A reached 24.2% in the quarter, 120bp below the figure of 1Q17.
Regarding the restructuring process, in 1Q18 and 1Q17 the Company recognized extraordinary expenses (consultancy fees and severance payments) for Ch$738 million and Ch$576 million, respectively. Excluding these expenses, adjusted SG&A totaled Ch$29,336 million, a decrease of 3.0%. Adjusted SG&A/sales was 23.6%, down 130 bp.1
| 4. | Other Income and Expense |
Other income net of Other expense totaled Ch$344 million in 1Q18, higher than the figure of Ch$75 million in 1Q17, mainly reflecting insurance payments received in 1Q18 for Ch$187 million.
| 5. | Operating Profit |
Profit from operating activities increased 24.7% to Ch$9,671 million in the quarter, resulting from higher sales, mix improvement, and cost and expenses containment through operational efficiencies from our restructuring program. In addition, these results show an improvement in the operating results of VCT Chile, with an operating margin increasing to 4.0% in 1Q18 from -4.9% in 1Q17, and the US subsidiary Fetzer Vineyards, with an operating margin increasing to 7.2% in 1Q18 from -0.5% in 1Q17. In general, results show a higher contribution of the distribution subsidiaries that have increased prices and remain focused on priority premium brands. The consolidated operating margin was 7.8% in 1Q18, 140bp above the figure in 1Q17.
Excluding NRI, 1Q18 adjusted profit from operating activities reached Ch$10,630 million, 24.8% above the adjusted figure in 1Q17. Adjusted operating margin rose 150bp to 8.5% in 1Q18, from 7.0% in 1Q17.
1 In order to facilitate analysis, in page 10 an Adjusted Income Statement is provided. Adjustments comprise restructuring costs and expenses (NRI).
| 6 |
| 6. | EBITDA |
EBITDA (profit from operating activities plus depreciation and amortization expenses) increased 18.4% to Ch$15,117 million in 1Q18. EBITDA margin reached 12.1%, 160bp above the figure in 1Q17.
Excluding NRI, adjusted EBITDA reached Ch$16,076 million, increasing 18.8% from the adjusted figure of Ch$13,532 million in 1Q17. Adjusted EBITDA margin rose to 12.9% in 1Q18, from 11.1% in 1Q17 (+180 bp).
| 7. | Non-Operating Profit |
In 1Q18, the Non-operating profit (loss) was a loss of Ch$689 million, 69.6% below the loss of Ch$2,268 million in 1Q17. This is mainly explained by higher exchange differences of Ch$2,065 million in the quarter, compared with a negative figure of Ch$148 million in 1Q17. The Company uses derivatives contracts as part of its hedging policy in order to mitigate the effects of currency fluctuations.
Net financial costs increased 26.3% to Ch$2,486 million in the quarter, reflecting a higher financial debt during 2017, and a bond placement in January 2018, which proceeds will be used to refinance debt during 2018.
| 8. | Income Tax Expense |
For the period, Income tax expense was Ch$2,396 million, above the figure of Ch$1,657 million in 1Q17. The higher the tax expense is a result of higher profit before taxes, and an increase in the income tax rate in Chile (from 25.5% to 27.0%).
| 9. | Profit and Earnings per Share (EPS) |
Profit attributable to owners of parent increased 69.8%, totaling Ch$6,462 million. Net margin rose to 5.2% in 1Q18, from 3.1% in 1Q17 (+210 bp).
Before non-recurring items, adjusted profit attributable to owners of parent increased 62.3% to Ch$7,421 million in 1Q18. Adjusted net margin rose to 6.0% in 1Q18, from 3.8% in 1Q17 (+220 bp).
Based on 747,005,982 weighted average shares, Viña Concha y Toro’s earnings per share totaled Ch$8.65, above the Ch$5.09 per share recorded in the same period of the previous year.
| 7 |
Statement of Financial Position as of March 31, 2018
Assets
As of March 31st, 2018, Viña Concha y Toro’s assets totaled Ch$1,054,812 million, 0.2% below the figure as of December 31, 2017.
Liabilities
As of March 31, 2018, Net financial debt amounted to Ch$206,235 million, decreasing Ch$24,422 million when compared to the figure as of December 31, 2017. This a result of higher cash and cash equivalents account offset in part by higher financial debt following the placement of debt in January 2018.
Net Financial Debt is calculated as: Other current financial liabilities + Other non-current financial liabilities - Cash and cash equivalents - Derivatives.
* * * * *
About Viña Concha y Toro
Founded in 1883, Viña Concha y Toro is the leading Latin American wine maker, and a one of the world’s largest wine company. It holds around 11,000 hectares of vineyards in Chile, Argentina, and United States, and its wine portfolio includes iconic brands, such as Don Melchor and Almaviva, its flagship brand Casillero del Diablo, Trivento from Argentina, and Fetzer and Bonterra brands from California.
Forward Looking Statements
This press release may contain certain forward-looking statements within the meaning of Section 27A of the Securities Act of 1933, as amended, and Section 21E of the Securities Exchange Act of 1934, as amended. With respect to the financial condition, results of operations and business of the Company and certain plans and objectives of the Company with respect to these items. Forward-looking statements may be identified by the use of words such as “anticipate”, “continue”, “estimate”, “expect”, “intend”, “may”, “believe” and similar expressions. By their nature, forward-looking statements involve risk and uncertainty because they relate to events and depend on circumstances that occur in the future. There is a number of factors that could cause results and developments to differ materially from those expressed or implied by these forward-looking statements. These factors include: levels of consumer spending in major economies, changes in consumer tastes and preferences, the levels of marketing and promotional expenditures by the Company and its competitors, raw materials costs, future exchange and interest rates, as well as other risk factors referred in the Company’s filings with the Securities and Exchange Commission.
| 8 |
Income Statement2
| (Ch$ thousand) | 1Q18 | 1Q17 | Chg (%) | |||||||||
| Revenue | 124,442,020 | 121,479,964 | 2.4 | % | ||||||||
| Cost of sales | (85,040,972 | ) | (82,987,737 | ) | 2.5 | % | ||||||
| Gross profit | 39,401,048 | 38,492,227 | 2.4 | % | ||||||||
| Gross margin | 31.7 | % | 31.7 | % | 0 | bp | ||||||
| Other income | 507,794 | 359,751 | 41.2 | % | ||||||||
| Distribution costs | (22,384,983 | ) | (21,187,806 | ) | 5.7 | % | ||||||
| Administrative expense | (7,688,765 | ) | (9,624,960 | ) | (20.1 | %) | ||||||
| Other expense by function | (164,280 | ) | (284,626 | ) | (42.3 | %) | ||||||
| Profit (loss) from operating activities | 9,670,814 | 7,754,586 | 24.7 | % | ||||||||
| Operating margin | 7.8 | % | 6.4 | % | 140 | bp | ||||||
| Financial income | 315,045 | 345,145 | (8.7 | %) | ||||||||
| Financial costs | (2,801,355 | ) | (2,313,112 | ) | 21.1 | % | ||||||
| Share of profit (loss) of associates and joint ventures accounted for using equity method | 124,568 | 93,638 | 33.0 | % | ||||||||
| Exchange differences | 2,064,598 | (148,039 | ) | |||||||||
| Adjustment units | (392,163 | ) | (245,334 | ) | 59.8 | % | ||||||
| Non-operating profit (loss) | (689,307 | ) | (2,267,702 | ) | (69.6 | %) | ||||||
| Profit (loss) before tax | 8,981,507 | 5,486,884 | 63.7 | % | ||||||||
| Income tax expense continuing operations | (2,395,973 | ) | (1,656,926 | ) | 44.6 | % | ||||||
| Profit (loss) | 6,585,534 | 3,829,958 | 71.9 | % | ||||||||
| Profit (loss) attributable to noncontrolling interests | 123,464 | 24,687 | 400.1 | % | ||||||||
| Profit (loss) attributable to owners of parent | 6,462,070 | 3,805,271 | 69.8 | % | ||||||||
| Net margin | 5.2 | % | 3.1 | % | 210 | bp | ||||||
| Depreciation expense | 5,180,335 | 4,750,888 | 9.0 | % | ||||||||
| Amortization expense | 265,927 | 260,542 | 2.1 | % | ||||||||
| EBITDA* | 15,117,076 | 12,766,016 | 18.4 | % | ||||||||
| EBITDA margin* | 12.1 | % | 10.5 | % | 160 | bp | ||||||
2 As of January 1, 2018, the Company adopted IFRS 15 accounting standard for revenue recognition. For the Company, in practice, this new accounting criteria affects the Income Statement in two ways: a lower revenue (impact of Ch$5,994 million in 1Q17 and Ch$5,826 million in 1Q18), and an equivalent reduction in the distribution costs line. Therefore, the Gross profit line decreases in the same magnitude as Revenue, but the profit from operating activities and net profit lines remain unchanged. For further details, see Note 2.1.6 to the Consolidated Financial Statements.
| 9 |
1Q18 Reported and Adjusted Results3
| 1Q18 | 1Q17 | 1Q18 | 1Q17 | |||||||||||||||||||||
| (Ch$ million) | Reported | Reported | Chg (%) | Adjusted | Adjusted | Chg (%) | ||||||||||||||||||
| Revenue | 124,442 | 121,480 | 2.4 | % | 124,442 | 121,480 | 2.4 | % | ||||||||||||||||
| Cost of sales | (85,041 | ) | (82,988 | ) | 2.5 | % | (84,820 | ) | (82,798 | ) | 2.4 | % | ||||||||||||
| Gross profit | 39,401 | 38,492 | 2.4 | % | 39,622 | 38,682 | 2.4 | % | ||||||||||||||||
| Gross margin | 31.7 | % | 31.7 | % | 0 | bp | 31.8 | % | 31.8 | % | 0 | bp | ||||||||||||
| SG&A* | (30,074 | ) | (30,813 | ) | (2.4 | %) | (29,336 | ) | (30,237 | ) | (3.0 | %) | ||||||||||||
| Other op. income, expense | 344 | 75 | 357.3 | % | 344 | 75 | 357.3 | % | ||||||||||||||||
| Profit (loss) from operating activities | 9,671 | 7,755 | 24.7 | % | 10,630 | 8,521 | 24.8 | % | ||||||||||||||||
| Operating margin | 7.8 | % | 6.4 | % | 140 | bp | 8.5 | % | 7.0 | % | 150 | bp | ||||||||||||
| Non-operating profit (loss) | (689 | ) | (2,268 | ) | (69.6 | %) | (689 | ) | (2,268 | ) | (69.6 | %) | ||||||||||||
| Profit (loss) before tax | 8,982 | 5,487 | 63.7 | % | 9,941 | 6,253 | 59.0 | % | ||||||||||||||||
| Income tax expense continuing operations | (2,396 | ) | (1,657 | ) | 44.6 | % | (2,396 | ) | (1,657 | ) | 44.6 | % | ||||||||||||
| Profit (loss) attributable to noncontrolling interests | 123 | 25 | 400.1 | % | 123 | 25 | 400.1 | % | ||||||||||||||||
| Profit (loss) attributable to owners of parent | 6,462 | 3,805 | 69.8 | % | 7,421 | 4,571 | 62.3 | % | ||||||||||||||||
| Net margin | 5.2 | % | 3.1 | % | 210 | bp | 6.0 | % | 3.8 | % | 220 | bp | ||||||||||||
| EBITDA** | 15,117 | 12,766 | 18.4 | % | 16,076 | 13,532 | 18.8 | % | ||||||||||||||||
| EBITDA margin | 12.1 | % | 10.5 | % | 160 | bp | 12.9 | % | 11.1 | % | 180 | bp | ||||||||||||
* SG&A = Distribution costs + Administration expense
** EBITDA= Profit from operating activities + Depreciation + Amortization
3 Adjusted results are presented with the purpose of facilitating comparison, excluding restructuring costs and expenses, which are considered non-recurring items (NRI).
| 10 |
Statement of Financial Position
| (Ch$ thousand) | Mar. 31, 2018 | Dec. 31, 2017 | Chg (%) | |||||||||
| Assets | ||||||||||||
| Cash and cash equivalents | 84,679,032 | 31,162,346 | 171.7 | % | ||||||||
| Inventories | 235,905,741 | 235,733,091 | 0.1 | % | ||||||||
| Trade and other current receivables | 158,195,488 | 198,802,120 | -20.4 | % | ||||||||
| Current biological assets | 11,249,910 | 18,949,252 | -40.6 | % | ||||||||
| Other current assets | 36,924,068 | 47,260,579 | -21.9 | % | ||||||||
| Current assets | 526,954,239 | 531,907,388 | -0.9 | % | ||||||||
| Property, plant and equipment | 384,247,113 | 381,736,948 | 0.7 | % | ||||||||
| Inv. accounted for using equity method | 22,167,080 | 21,819,709 | 1.6 | % | ||||||||
| Other non current assets | 121,443,396 | 121,362,542 | 0.1 | % | ||||||||
| Noncurrent assets | 527,857,589 | 524,919,199 | 0.6 | % | ||||||||
| Assets | 1,054,811,828 | 1,056,826,587 | -0.2 | % | ||||||||
| Liabilities | ||||||||||||
| Other current financial liabilities | 140,537,230 | 140,452,483 | 0.1 | % | ||||||||
| Other current liabilities | 140,848,626 | 180,239,657 | -21.9 | % | ||||||||
| Current liabilities | 281,385,856 | 320,692,140 | -12.3 | % | ||||||||
| Other noncurrent financial liabilities | 157,810,541 | 127,810,125 | 23.5 | % | ||||||||
| Other noncurrent liabilities | 57,026,455 | 57,091,086 | -0.1 | % | ||||||||
| Noncurrent liabilities | 214,836,996 | 184,901,211 | 16.2 | % | ||||||||
| Liabilities | 496,222,852 | 505,593,351 | -1.9 | % | ||||||||
| Equity | ||||||||||||
| Issued capital | 84,178,790 | 84,178,790 | 0.0 | % | ||||||||
| Retained earnings | 462,386,239 | 455,924,169 | 1.4 | % | ||||||||
| Other reserves | 8,945,191 | 8,263,848 | 8.2 | % | ||||||||
| Equity attributable to owners of parent | 555,510,220 | 548,366,807 | 1.3 | % | ||||||||
| Non-controlling interests | 3,078,756 | 2,866,429 | 7.4 | % | ||||||||
| Equity | 558,588,976 | 551,233,236 | 1.3 | % | ||||||||
| Equity and liabilities | 1,054,811,828 | 1,056,826,587 | -0.2 | % | ||||||||
| 11 |