
SECOND QUARTER AND FIRST HALF 2018 CONSOLIDATED RESULTS
Santiago, Chile, August 31, 2018 - Viña Concha y Toro S.A. (“The Company” or “Concha y Toro”) (NYSE: VCO, IPSA: Conchatoro), global leading winery and the main producer and exporter of Chilean wine, announced today consolidated financial results, stated under IFRS, for the period ended June 30, 2018.
Consolidated figures of the following analysis are expressed in Chilean pesos, in accordance with reporting standards of the Financial Markets Commission of Chile. For a better understanding of results, we also disclose some variations on constant currency basis, i.e. where figures for 2017 were translated into Chilean pesos using exchanges rate recorded in the same period of 2018.
In 2018 and 2017, the Company recorded non-recurring expenses and costs (NRI) related to the internal restructuring process. For a better understanding of results, we also present in acomparative form, information of results excluding the aforementioned items. Thus, throughout this document, references to “Adjusted” data should not be understood as the reported data, but the one in which the referred costs and expenses have been isolated.
2Q18 Highlights
| · | Net profit up 17.3% to Ch$13,536 million. Net margin up to 8.9% (+170bp). |
| · | Average price up 8.0% in Export Markets and 6.8% in Chile Domestic Market. |
| · | Revenue down 4.8% on a reported basis and 0.5% on a constant currency basis. |
| · | SG&A down 5.0% and SG&A/Sales unchanged at 22.8%, reflecting cost efficiencies. |
| · | EBITDA was Ch$20,365 million, down 10.3% YoY on higher cost of wine and f/x impact. EBITDA margin was 13.5%, down 80bp. |
1H18 Highlights
| · | Net profit up 30.4% to Ch$19,998 million. Net margin up to 7.3% (+180bp) |
| · | Average price up 5.5% in Export Markets and 11.7% in Chile Domestic Market. |
| · | Revenue down 1.7% on a reported basis, and up 2.0% on a constant currency basis. |
| · | SG&A down 3.8% and down 50bp as percentage of revenue, to 23.4%. |
| · | EBITDA was Ch$35,482 million, up 0.1%. EBITDA margin was 12.9%, up 20bp. |
CEO Comments
During the second quarter of 2018, the Company has continued to make progress in the implementation of its new strategy, focused on the sustained growth of value and profitability. In this context, we remain working on the positioning of our priority brands, which is reflected by higher average prices in Export Markets and in the domestic market of Chile.
Consolidated revenue decreased 4.8% in pesos and 0.5% in constant currency. This reflects a lower volume, in line with price increases, the orientation towards higher-value segments and the deliberated exit from some brands that do not perform according to the new profitability targets.
We highlight the performance of the Chile domestic business, where wine sales grew 9.8% in value, resulting from higher volume and average price, and a better sales mix, which has contributed to increase the profitability of this business. In Export Markets, sales in US dollar increased 1.9%. An increase of 8.0% in the average price was offset by a decline in volume and the negative impact of f/x rates.
In the US, as of July 2018 we have taken an important step towards strengthening our commercial position, through the integration of our sales force into Fetzer Vineyards commercial branch. With this operation, Fetzer Vineyards is becoming the 12th largest wine marketer in the United States, with an enhanced portfolio, comprising the multi-origin wine portfolio of the group. Synergies and efficiencies generated through this process will allow us to direct resources into brand building, focused on the Premium segment.
Fetzer Vineyards has oriented its commercial activities with focus on higher-end brands and new launches. In the quarter, sales in US dollar terms declined 4.3%, which is explained mainly by logistical issues at a large distributor, with the subsequent impact on volume.
In Argentina, our operation faces a complex economic environment, with currency depreciation and a lower availability of raw materials impacting volume and results. In this scenario, we remain working on price positioning and orienting our commercial efforts to our key brands.
Net income increased 17.3% in the quarter, recognizing a positive exchange differences result, mainly explained by the depreciation of the Argentine peso. At the operating level, the EBITDA decreased 10.3%; the efficiencies generated by our restructuring program and our efforts on cost contention were offset by a higher cost of wine and negative f/x impact.
2018 Vintage
In Chile, following two low-volume vintages in 2016 and 2017, in 2018 the harvested volume increased 35.9%. Additionally, the harvest season offered ideal climatic conditions contributing to obtain high-quality grapes. In Argentina, the 2018 harvest increased 30.0% in volume, also marking a change, after two years in a row with low harvested volume1.
1 Source:Servicio Agrícola y Ganadero, Chile;INV Argentina. August 2018.
| 2 |
Second Quarter 2018 Results
| 1. | Revenue |
Revenue totaled Ch$151,291 million, decreasing 4.8% YoY on a reported basis and 0.5% on a constant currency basis, reflecting lower volume and higher average prices, in line with the new commercial strategy in place, focused on the profitability of our businesses. New business declined 18.9% on the ending of a distribution contract for spirits.
| Sales(1) (Ch$ million) | 2Q18 | 2Q17(6) | Chg (%) | 6M18 | 6M17(6) | Chg (%) | ||||||||||||||||||||||
| Export Markets(2) | 101,544 | 106,421 | -4.6 | % | 178,421 | 183,570 | -2.8 | % | ||||||||||||||||||||
| Chile Domestic Market - Wine | 19,461 | 17,725 | 9.8 | % | 34,701 | 30,694 | 13.1 | % | ||||||||||||||||||||
| Argentina Domestic Market | 1,225 | 2,053 | -40.4 | % | 2,549 | 3,739 | -31.8 | % | ||||||||||||||||||||
| Argentina Exports(3) | 2,996 | 4,049 | -26.0 | % | 5,932 | 7,501 | -20.9 | % | ||||||||||||||||||||
| USA Domestic Market | 12,954 | 14,419 | -10.2 | % | 25,418 | 27,276 | -6.8 | % | ||||||||||||||||||||
| USA Exports(3) | 1,402 | 1,553 | -9.7 | % | 3,629 | 2,877 | 26.1 | % | ||||||||||||||||||||
| Wine Operating Segment | 139,581 | 146,219 | -4.5 | % | 250,650 | 255,657 | -2.0 | % | ||||||||||||||||||||
| New Business(4) | 8,734 | 10,767 | -18.9 | % | 19,687 | 20,330 | -3.2 | % | ||||||||||||||||||||
| Other Revenues | 2,976 | 1,931 | 54.1 | % | 5,397 | 4,409 | 22.4 | % | ||||||||||||||||||||
| Other Operating Segment | 11,710 | 12,698 | -7.8 | % | 25,083 | 24,739 | 1.4 | % | ||||||||||||||||||||
| Total Sales | 151,291 | 158,916 | -4.8 | % | 275,733 | 280,396 | -1.7 | % | ||||||||||||||||||||
| Volume(1) (thousand liters) | 2Q18 | 2Q17 | Chg (%) | 6M18 | 6M17 | Chg (%) | ||||||||||||||||||||||
| Export Markets(2) | 52,106 | 55,256 | -5.7 | % | 94,076 | 98,766 | -4.7 | % | ||||||||||||||||||||
| Chile Domestic Market - Wine | 17,747 | 17,253 | 2.9 | % | 31,355 | 30,951 | 1.3 | % | ||||||||||||||||||||
| Argentina Domestic Market | 1,263 | 1,381 | -8.5 | % | 2,396 | 3,114 | -23.1 | % | ||||||||||||||||||||
| Argentina Exports(3) | 1,335 | 1,853 | -28.0 | % | 2,610 | 3,484 | -25.1 | % | ||||||||||||||||||||
| USA Domestic Market | 3,567 | 4,049 | -11.9 | % | 7,351 | 7,721 | -4.8 | % | ||||||||||||||||||||
| USA Exports(3) | 491 | 518 | -5.3 | % | 1,066 | 937 | 13.7 | % | ||||||||||||||||||||
| Wine Operating Segment | 76,509 | 80,311 | -4.7 | % | 138,854 | 144,972 | -4.2 | % | ||||||||||||||||||||
| New Business(4) | 3,794 | 4,139 | -8.3 | % | 9,624 | 9,641 | -0.2 | % | ||||||||||||||||||||
| Other Operating Segment | 3,794 | 4,139 | -8.3 | % | 9,624 | 9,641 | -0.2 | % | ||||||||||||||||||||
| Total Volume | 80,303 | 84,450 | -4.9 | % | 148,477 | 154,613 | -4.0 | % | ||||||||||||||||||||
| Average Price(5) (per liter) | 2Q18 | 2Q17(6) | Chg (%) | 6M18 | 6M17(6) | Chg (%) | ||||||||||||||||||||||
| Export Markets(2) | (US$) | 3.20 | 2.96 | 8.0 | % | 3.17 | 3.01 | 5.5 | % | |||||||||||||||||||
| Chile Domestic Market - Wine | (Ch$) | 1,097 | 1,028 | 6.8 | % | 1,108 | 992 | 11.7 | % | |||||||||||||||||||
| Argentina Domestic Market | (US$) | 1.56 | 2.24 | -30.4 | % | 1.75 | 2.14 | -18.4 | % | |||||||||||||||||||
| Argentina Exports(3) | (US$) | 3.65 | 3.41 | 7.2 | % | 3.79 | 3.36 | 12.9 | % | |||||||||||||||||||
| USA Domestic Market - Wine | (US$) | 5.82 | 5.38 | 8.2 | % | 5.64 | 5.37 | 5.0 | % | |||||||||||||||||||
| USA Exports(3) | (US$) | 4.57 | 4.50 | 1.6 | % | 5.57 | 4.65 | 19.8 | % | |||||||||||||||||||
(1) Includes bulk wine sales.
(2) Includes exports to third parties from Chile, and sales through the Company’s distribution subsidiaries (UK, Nordics, Brazil, Singapore, Mexico) from Chile, Argentina, and USA.
(3) Excludes sales through the Company’s distribution subsidiaries.
(4) Includes sales of beer and liquors.
(5) Excludes bulk wine sales.
(6) 2018 financial data are provided in accordance with IFRS 15, effective since January 1, 2018. In order to ensure a meaningful comparison with 2017, 2017 figures have been restated in accordance with this new standard.
| 3 |
| 1.1. | Wine Operating Segment |
| 1.1.1. | Export Markets |
Export sales from Chile and distribution subsidiaries totaled Ch$101,544 million, declining 4.6% on a reported basis and increasing 0.1% on a constant currency basis. Export sales in US dollar increased 1.9%.
Reflecting our strategy focused on the positioning of our brands, the average price increased 8.0% in US dollar terms, and 6.6% in local currencies of sales. In terms of volume, exports declined 5.7%, mainly due to lower volumes in Europe in a scenario double-digit price increases.
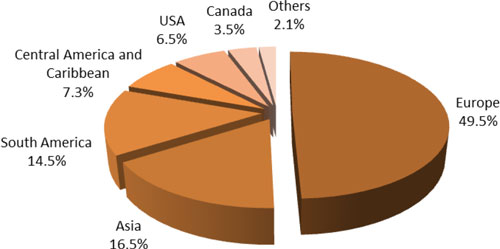
In this quarter, sales in US dollar terms increased in Europe (+3.5%) driven by United Kingdom (+10.5%). In this market, we have carried our significant price adjustments and our priority brand Casillero del Diablo grew 3.0% in volume. Sales in Europe also grew in Belgium (+21.9%), Switzerland (+224.4%), Finland (+5.4%), and Norway (+5.1%). Other regions where sales grew were Central America and Caribbean (+3.6%), South America (+1.5%), and Others (+15.6%). Exports declined in USA (-4.5%), Canada (-1.8%), and Asia (-1.4%).
Regarding the exchange rate effect, in the quarter the average Chilean peso appreciated against the US dollar (6.9%), Sterling pound (0.7%), Swedish krona (5.5%), Canadian dollar (2.7%), Norwegian krone (0.8%), Brazilian Real (19.8%), and Mexican peso (11.8%). The Chilean peso depreciated against the Euro (1.1%).
Wine Sales in Export Markets, Value by Region
2Q18
| 4 |
| 1.1.2. | Chile Domestic Market – Wine |
Sales increased 9.8%, totaling Ch$19,461 million as a result of higher average price (+6.8%) and higher volume (+2.9%).
Premium wine grew 13.4% in value. In terms of volume, the category grew 7.1%, led by the upper extensions of Casillero del Diablo brand. Non-Premium wine increased 8.5% in value and 2.5% in volume.
Regarding the sales mix, in the quarter, the Premium category increased its share to 8.2% of the portfolio volume (+30bp), and to 27.0% in value terms (+90bp).
| 1.1.3. | Argentina |
Sales from the Argentine operation (excluding shipments to distribution subsidiaries) totaled Ch$4,220 million, down 30.8%, reflecting a volume decline in a scenario of lower availability of wine and the Company’s strategy of exiting lower-end, less-profitable products. In the quarter, a portfolio rationalization and price adjustments are reflected in a higher average price of exports (+7.2% in US dollar) and in the domestic market (+7.9% in local currency).
| 1.1.4. | USA (Fetzer Vineyards) |
During the quarter, sales of Fetzer Vineyards (excluding shipments to distribution subsidiaries) totaled Ch$14,356 million, decreasing 10.1% on a reported basis and 4.6% on a constant currency basis. This reflects a decline in volume, mainly explained by logistical issues at a large distributor. Average prices increased in the domestic market (+8.2%, reaching US$5.82 per liter) and in exports (+1.6%, to US$4.6 per liter). Sales volume declined 11.9% and 5.3%, respectively.
In the US, as of July 2018 we have taken an important step towards strengthening our commercial position, through the integration of our sales force into Fetzer Vineyards commercial branch. With this operation, Fetzer Vineyards is becoming the 12th largest wine marketer in the United States, with an enhanced portfolio, comprising the multi-origin brand portfolio of the group. Synergies and efficiencies generated through this process will allow us to relocate resources into brand building, focused on the Premium segment.
| 1.2. | Other Operating Segment |
Otheroperating segment decreased 7.8% in the quarter, on lower revenues at the New Business segment. Diageo liquors declined 29.2%, reflecting the end of the distribution agreement with Diageo. This was partly offset by higher revenues of Premium beer, such as Miller, Kross, and the recently launched Estrella Damm, and other revenue related to merchandising and services.
| 5 |
| 2. | Cost of Sales |
Cost of sales decreased 3.6% to Ch$101,840 million, and in terms of percentage of sales was 67.3%, 90bp higher than in the same quarter in 2017, reflecting mainly an increase in the cost of wine in Chile, partly offset by lower dry costs and efficiencies in winemaking and supply chain.
In the quarter, the Company recognized extraordinary costs of Ch$368 million related to the ongoing restructuring process2. The figure was Ch$445 million in 2Q17.
| 3. | Selling, General and Administrative Expenses (SG&A) |
Selling, general and administrative expenses (distribution costs and administrative expenses) were Ch$34,469 million in the quarter, down 5.0% when compared to the previous year. The efficiencies emerged from our restructuring program allowed us to maintain unchanged the SG&A/sales ratio from the previous year at 22.8%.
In 2Q18 and 2Q17 the Company recognized extraordinary restructuring expenses (consultancy fees and severance payments) for Ch$1,363 million and Ch$842 million, respectively. Excluding these expenses, adjusted SG&A totaled Ch$33,107 million, a decrease of 6.6%. Adjusted SG&A/sales was 21.9%, 40bp below the adjusted figure of 22.3% in 2Q17.1
| 4. | Other Income and Expense |
Other income net of Other expense totaled a loss of Ch$305 million in 2Q18, higher than the loss of Ch$125 million in 2Q17, reflecting lower tax refunds and non-recurring items accounting for Ch$375 million, related to goodwill impairment at the Brazilian subsidiary.
| 5. | Operating Profit |
Profit from operating activities was Ch$14,677 million, decreasing 13.1% on a reported basis and increasing 7.4% on a constant currency basis. The operating margin was 9.7%, with a decline of 90bp reflecting higher wine costs, and adverse f/x impact. This was partly offset by costs savings and lower expenses.
Excluding NRI, 2Q18 adjusted profit from operating activities reached Ch$16,782 million, 7.7% below the adjusted figure in 2Q17. Adjusted operating margin was 11.1% in 2Q18, 30bp below the figure in 2Q17.
2 In order to facilitate analysis, in page 14 an Adjusted Income Statement is provided. Adjustments comprise restructuring costs and expenses, and other non-recurring expenses (NRI).
| 6 |
| 6. | EBITDA |
EBITDA (profit from operating activities plus depreciation and amortization expenses) decreased 10.3% to Ch$20,365 million in 2Q18. EBITDA margin was 13.5%, 80bp below the figure in 2Q17.
Excluding NRI, adjusted EBITDA reached Ch$22,471 million, 6.3% below the adjusted figure in 2Q17. Adjusted EBITDA margin was 14.9% in 2Q18, from 15.1% in 2Q17 (-20 bp).
| 7. | Non-Operating Profit |
In 2Q18, the Non-operating profit (loss) was Ch$3,140 million, which compares to a loss of Ch$1,510 million in 2Q17. This is mainly explained by higher exchange differences of Ch$5,832 million in the quarter, compared with Ch$1,421 million in 2Q17, largely reflecting benefits from our hedging strategy in Argentina. Financial costs, net of financial income and adjustment units, increased 0.7% to Ch$2,645 million
| 8. | Income Tax Expense |
For the period, Income tax expense was Ch$4,130 million, 8.8% higher than the figure of 2Q17, on a higher profit before tax and a higher corporate tax rate in Chile (from 25.5% in 2017 to 27.0% in 2018).
| 9. | Profit and Earnings per Share (EPS) |
Profit attributable to owners of parent increased 17.3%, totaling Ch$13,536 million. Net margin rose to 8.9% in 2Q18, from 7.3% in 2Q17 (+170bp).
Before non-recurring items, adjusted profit attributable to owners of parent increased 22.0% to Ch$15,641 million in 2Q18. Adjusted net margin rose 230bp to 10.3% in 2Q18, from 8.1% in 2Q17.
Based on 747,005,982 weighted average shares, Viña Concha y Toro’s earnings per share totaled Ch$18.12, 17.3% above the Ch$15.44 per share recorded in the same period of the previous year.
| 7 |
First Half 2018 Results
| 1. | Revenue |
Revenue totaled Ch$275,733 million, 1.7% below YoY on a reported basis and increasing 2.0% on a constant currency basis, reflecting a lower volume, partly offset by higher average price and mix improvement, in line with the new commercial strategy in place, with a higher focus on the profitability of our business.
| 1.1. | Wine Operating Segment |
| 1.1.1. | Export Markets |
Export sales from Chile and distribution subsidiaries totaled Ch$178,421 million, declining 2.8% on a reported basis and increasing 0.9% on a constant currency basis. This is result of a higher average price (+5.5% in US dollar terms) offset by lower volume (-4.7%).
Regarding the portfolio mix, Premium category increased its share of sales in 20bp to 44.9% of value. Priority brand Casillero del Diablo drove the increase of Premium wine sales (+10.2% in US dollar terms).
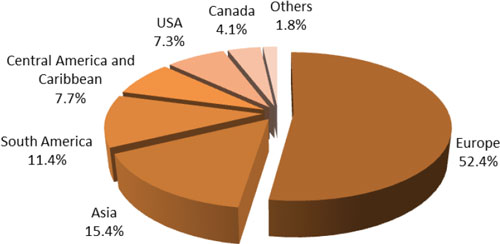
In export regions, sales in US dollar terms recorded an increase of 10.2% in Europe, driven by United Kingdom (+13.7%), Belgium (+58.7%), Ireland (+13.0%). Nordics (Sweden, Norway, and Finland) grew 6.6%. Other regions where sales grew were Canada (+3.9%), Central America and Caribbean (+10.3%). Exports declined in USA (-3.4%), South America (-5.2%), Asia (-0.2%), and Others (-14.4%).
Regarding the exchange rate effect, in the period the average Chilean peso appreciated against the US dollar (7.9%), Canadian dollar (3.3%), Swedish krona (2.1%), Norwegian krone (1.0%), Brazilian Real (16.0%), and Mexican peso (6.1%). The Chilean peso depreciated against the Euro (3.4%), and the Sterling pound (1.2%).
Wine Sales in Export Markets, Value by Region
1H18
| 8 |
| 1.1.2. | Chile Domestic Market – Wine |
Sales increased 13.1%, totaling Ch$34,701 million, from higher average price (+11,7%) and volume (+1.3%).
Premium wine grew 17.8% in value. In terms of volume, the category grew 9.6%, led by the upper extensions of Casillero del Diablo brand. Non-Premium wine increased 11.2% in value and 0.5% in volume.
Regarding the sales mix, in the quarter, the Premium category increased its share to 9.0% of the portfolio volume (+70bp), and to 28.9% in value terms (+120bp).
| 1.1.3. | Argentina |
Sales from the Argentine operation (excluding shipments to distribution subsidiaries) totaled Ch$8,481 million, down 24.5%, reflecting lower volume in a scenario of lower availability of wine and the Company’s strategy of exiting lower-end, less-profitable products. In the period, a portfolio rationalization and price adjustments are reflected in a higher average price of exports (+12.9% in US dollar) and in the domestic market (+34.5% in local currency).
| 1.1.4. | USA (Fetzer Vineyards) |
During the period, sales of Fetzer Vineyards (excluding shipments to distribution subsidiaries) totaled Ch$29,046 million, decreasing 3.7% on a reported basis and increasing 3.4% on a constant currency basis.
Average prices increased in both, the domestic market (+5.0%, reaching US$5.64 per liter) and in exports (+19.8%, reaching US$5.57 per liter). Sales volume declined 4.8% in the domestic market and increased 13.7% in exports.
| 1.2. | Other Operating Segment |
Otheroperating segment increased 1.4% to Ch$25,083 million in the period, driven by higher revenues of Premium beer.
| 9 |
| 2. | Cost of Sales |
Cost of sales was Ch$186,881 million, 0.9% below the figure of the previous year. The cost of sales as a percentage of sales was 67.8%, 50bp higher than in the same period of 2017, reflecting an increased cost of wine.
In the period, the Company recognized extraordinary costs of Ch$589 million related to the ongoing restructuring process3. The figure was Ch$635 million in 1H17.
| 3. | Selling, General and Administrative Expenses (SG&A) |
Selling, general and administrative expenses (distribution costs and administrative expenses) were Ch$64,543 million in the period, down 3.8% from the previous year. As a percentage of sales, SG&A reached 23.4% in the period, 50bp below the figure of 1H17.
Regarding the restructuring process, in 1H18 and 1H17 the Company recognized extraordinary expenses (consultancy fees and severance payments) for Ch$2,005 million and Ch$1,336 million, respectively. Excluding these expenses, adjusted SG&A totaled Ch$62,538 million, a decrease of 4.9%. Adjusted SG&A/sales was 22.7%, 80bp below the adjusted figure of 23.5% in 1H17.1
| 4. | Other Income and Expense |
Other income net of Other expense totaled Ch$38 million in 1H18, which compares with the loss of Ch$50 million in 1H17, reflecting insurance payments received in 1Q18, lower tax refunds and non-recurring items accounting for $375 million in the 2Q18, related to goodwill impairment at the Brazilian subsidiary.
| 5. | Operating Profit |
Profit from operating activities decreased 1.2% to Ch$24,348 million in the period, resulting from lower sales, offset in part by costs savings and lower expenses. The operating margin was 8.8% in 1H18, remaining unchanged from 1H17.
Excluding NRI, adjusted profit from operating activities reached Ch$27,412 million, increasing 2.7% from the adjusted figure in 1H17. Adjusted operating margin was 9.9% in 1H18, 40bp above the figure in 1H17.
3 In order to facilitate analysis, in page 14 an Adjusted Income Statement is provided. Adjustments comprise restructuring costs and expenses, and other non-recurring expenses (NRI).
| 10 |
| 6. | EBITDA |
EBITDA (profit from operating activities plus depreciation and amortization expenses) was Ch$35,482 million in 1H18, in line (+0.1%) with the figure of 1H17. EBITDA margin was 12.9%, 20bp above the figure in 1H17.
Excluding NRI, adjusted EBITDA reached Ch$38,547 million, 2.7% above the adjusted figure in 1H17. Adjusted EBITDA margin was 14.0% in 1H18, 60bp above the figure in 1H17.
| 7. | Non-Operating Profit |
In 1H18, Non-operating profit was Ch$2,451 million, which compares to a loss of Ch$3,778 million in 1H17. This is mainly explained by higher exchange differences of Ch$7,897 million in the period, compared with Ch$1,273 million in 1H17, largely reflecting gains from our hedging strategy in Argentina.
Financial costs net of financial income and adjustment units, increased 14.1% to Ch$5,524 million in the period, reflecting an increase of financial debt during 2017, and a bond placement in January 2018, whose proceeds will be used to refinance debt during 2018.
| 8. | Income Tax Expense |
For the period, Income tax expense was Ch$6,526 million, 19.7% higher than the figure of Ch$5,452 million in 1H17, on a higher profit before tax, and a higher corporate tax rate in Chile.
| 9. | Profit and Earnings per Share (EPS) |
Profit attributable to owners of parent increased 30.4%, totaling Ch$19,998 million. Net margin rose to 7.3% in 1H18, from 5.5% in 1H17 (+180 bp).
Before non-recurring items, adjusted profit attributable to owners of parent increased 32.6% to Ch$23,062 million in 1H18. Adjusted net margin rose 220bp to 8.4% in 1H18, from 6.2% in 1H17.
Based on 747,005,982 weighted average shares, Viña Concha y Toro’s earnings per share totaled Ch$26.77, 30.4% above the Ch$20.54 per share recorded in the same period of the previous year.
| 11 |
Statement of Financial Position as of June 30, 2018
Assets
As of June 30, 2018, Viña Concha y Toro’s assets totaled Ch$1,129,439 million, 6.9% above the figure as of December 31, 2017.
Liabilities
As of June 30, 2018, Net financial debt amounted Ch$238,555 million, increasing Ch$7,898 million, 3,4% when compared to the figure as of December 31, 2017. This reflects seasonality in the operating cash flow and a debt placement in January 2018.
Net Financial Debt is calculated as Other current financial liabilities + Other non-current financial liabilities - Cash and cash equivalents - Derivatives.
* * * * *
About Viña Concha y Toro
Founded in 1883, Viña Concha y Toro is the leading Latin American wine maker, and a one of the world’s largest wine company. It holds around 11,000 hectares of vineyards in Chile, Argentina, and United States, and its wine portfolio includes iconic brands, such as Don Melchor and Almaviva, its flagship brand Casillero del Diablo, Trivento from Argentina, and Fetzer and Bonterra brands from California.
Forward Looking Statements
This press release may contain certain forward-looking statements within the meaning of Section 27A of the Securities Act of 1933, as amended, and Section 21E of the Securities Exchange Act of 1934, as amended. With respect to the financial condition, results of operations and business of the Company and certain plans and objectives of the Company with respect to these items. Forward-looking statements may be identified by the use of words such as “anticipate”, “continue”, “estimate”, “expect”, “intend”, “may”, “believe” and similar expressions. By their nature, forward-looking statements involve risk and uncertainty because they relate to events and depend on circumstances that occur in the future. There is a number of factors that could cause results and developments to differ materially from those expressed or implied by these forward-looking statements. These factors include: levels of consumer spending in major economies, changes in consumer tastes and preferences, the levels of marketing and promotional expenditures by the Company and its competitors, raw materials costs, future exchange and interest rates, as well as other risk factors referred in the Company’s filings with the Securities and Exchange Commission.
| 12 |
Income Statement4
| (Ch$ thousand) | 2Q18 | 2Q17 | Chg (%) | 6M18 | 6M17 | Chg (%) | ||||||||||||||||||
| Revenue | 151,290,894 | 158,916,483 | (4.8 | %) | 275,732,914 | 280,396,447 | (1.7 | %) | ||||||||||||||||
| Cost of sales | (101,839,559 | ) | (105,609,844 | ) | (3.6 | %) | (186,880,531 | ) | (188,597,581 | ) | (0.9 | %) | ||||||||||||
| Gross profit | 49,451,335 | 53,306,639 | (7.2 | %) | 88,852,383 | 91,798,866 | (3.2 | %) | ||||||||||||||||
| Gross margin | 32.7 | % | 33.5 | % | (90 | pb) | 32.2 | % | 32.7 | % | (50 | pb) | ||||||||||||
| Other income | 420,015 | 285,352 | 47.2 | % | 927,809 | 645,103 | 43.8 | % | ||||||||||||||||
| Distribution costs | (25,269,564 | ) | (27,539,365 | ) | (8.2 | %) | (47,654,547 | ) | (48,727,171 | ) | (2.2 | %) | ||||||||||||
| Administrative expense | (9,199,667 | ) | (8,746,687 | ) | 5.2 | % | (16,888,432 | ) | (18,371,647 | ) | (8.1 | %) | ||||||||||||
| Other expense by function | (725,080 | ) | (410,159 | ) | 76.8 | % | (889,360 | ) | (694,785 | ) | 28.0 | % | ||||||||||||
| Profit (loss) from operating activities | 14,677,039 | 16,895,780 | (13.1 | %) | 24,347,853 | 24,650,366 | (1.2 | %) | ||||||||||||||||
| Operating margin | 9.7 | % | 10.6 | % | (90 | pb) | 8.8 | % | 8.8 | % | 0 | pb | ||||||||||||
| Financial income | 295,655 | 135,998 | 117.4 | % | 610,700 | 481,143 | 26.9 | % | ||||||||||||||||
| Financial costs | (2,803,234 | ) | (2,401,977 | ) | 16.7 | % | (5,604,589 | ) | (4,715,089 | ) | 18.9 | % | ||||||||||||
| Share of profit (loss) of associates and joint ventures using equity method | (46,728 | ) | (304,710 | ) | (84.7 | %) | 77,840 | (211,072 | ) | |||||||||||||||
| Exchange differences | 5,832,369 | 1,421,077 | 310.4 | % | 7,896,967 | 1,273,038 | 520.3 | % | ||||||||||||||||
| Adjustment units | (137,610 | ) | (360,686 | ) | (61.8 | %) | (529,773 | ) | (606,020 | ) | (12.6 | %) | ||||||||||||
| Non-operating profit (loss) | 3,140,452 | (1,510,298 | ) | 2,451,145 | (3,778,000 | ) | ||||||||||||||||||
| Profit (loss) before tax | 17,817,491 | 15,385,482 | 15.8 | % | 26,798,998 | 20,872,366 | 28.4 | % | ||||||||||||||||
| Income tax expense continuing operations | (4,130,416 | ) | (3,795,352 | ) | 8.8 | % | (6,526,389 | ) | (5,452,278 | ) | 19.7 | % | ||||||||||||
| Profit (loss) | 13,687,075 | 11,590,130 | 18.1 | % | 20,272,609 | 15,420,088 | 31.5 | % | ||||||||||||||||
| Profit (loss) attributable to noncontrolling interests | 151,522 | 54,925 | 175.9 | % | 274,986 | 79,612 | 245.4 | % | ||||||||||||||||
| Profit (loss) attributable to owners of parent | 13,535,553 | 11,535,205 | 17.3 | % | 19,997,623 | 15,340,476 | 30.4 | % | ||||||||||||||||
| Net margin | 8.9 | % | 7.3 | % | 170 | pb | 7.3 | % | 5.5 | % | 180 | pb | ||||||||||||
| Basic earnings per share | 18.12 | 15.44 | 17.3 | % | 26.77 | 20.54 | 30.4 | % | ||||||||||||||||
| Depreciation expense | 5,422,298 | 5,541,455 | (2.2 | %) | 10,602,633 | 10,292,343 | 3.0 | % | ||||||||||||||||
| Amortization expense | 266,035 | 260,178 | 2.3 | % | 531,961 | 520,720 | 2.2 | % | ||||||||||||||||
| EBITDA* | 20,365,372 | 22,697,413 | (10.3 | %) | 35,482,448 | 35,463,429 | 0.1 | % | ||||||||||||||||
| EBITDA margin* | 13.5 | % | 14.3 | % | (80 | pb) | 12.9 | % | 12.6 | % | 20 | pb | ||||||||||||
* EBITDA = Profit (loss) from operating activities + Depreciation & Amortization expenses
4 As of January 1, 2018, the Company adopted IFRS 15 accounting standard for revenue recognition. For the Company, in practice, this new accounting criteria affects the Income Statement in two ways: a lower revenue (impact of Ch$7,026 million or 4.2% in 2Q17 and Ch$6,265 million or 4.0% in 2Q18), and an equivalent reduction in the distribution costs line. Therefore, the Gross profit line decreases in the same magnitude as Revenue, but the profit from operating activities and net profit lines remain unchanged. For further details, see Note 2.1.6 to the Consolidated Financial Statements.
| 13 |
2Q18 and 1H18
Reported and Adjusted Results5
| (Ch$ million) | 2Q18 Reported | 2Q17 Reported | Chg (%) | 2Q18 Adjusted | 2Q17 Adjusted | Chg (%) | ||||||||||||||||||
| Revenue | 151,291 | 158,916 | (4.8 | %) | 151,291 | 158,916 | (4.8 | %) | ||||||||||||||||
| Cost of sales | (101,840 | ) | (105,610 | ) | (3.6 | %) | (101,472 | ) | (105,165 | ) | (3.5 | %) | ||||||||||||
| Gross profit | 49,451 | 53,307 | (7.2 | %) | 49,819 | 53,752 | (7.3 | %) | ||||||||||||||||
| Gross margin | 32.7 | % | 33.5 | % | (90 | bp) | 32.9 | % | 33.8 | % | (90 | bp) | ||||||||||||
| SG&A* | (34,469 | ) | (36,286 | ) | (5.0 | %) | (33,107 | ) | (35,444 | ) | (6.6 | %) | ||||||||||||
| Other op. income, expense | (305 | ) | (125 | ) | 144.4 | % | 70 | (125 | ) | |||||||||||||||
| Profit (loss) from operating activities | 14,677 | 16,896 | (13.1 | %) | 16,782 | 18,183 | (7.7 | %) | ||||||||||||||||
| Operating margin | 9.7 | % | 10.6 | % | (90 | bp) | 11.1 | % | 11.4 | % | (30 | bp) | ||||||||||||
| Non-operating profit (loss) | 3,140 | (1,510 | ) | 3,140 | (1,510 | ) | ||||||||||||||||||
| Profit (loss) before tax | 17,817 | 15,385 | 15.8 | % | 19,923 | 16,673 | 19.5 | % | ||||||||||||||||
| Income tax expense continuing operations | (4,130 | ) | (3,795 | ) | 8.8 | % | (4,130 | ) | (3,795 | ) | 8.8 | % | ||||||||||||
| Profit (loss) attributable to noncontrolling interests | 152 | 55 | 175.9 | % | 152 | 55 | 175.9 | % | ||||||||||||||||
| Profit (loss) attributable to owners of parent | 13,536 | 11,535 | 17.3 | % | 15,641 | 12,823 | 22.0 | % | ||||||||||||||||
| Net margin | 8.9 | % | 7.3 | % | 170 | bp | 10.3 | % | 8.1 | % | 230 | bp | ||||||||||||
| EBITDA** | 20,365 | 22,697 | (10.3 | %) | 22,471 | 23,985 | (6.3 | %) | ||||||||||||||||
| EBITDA margin | 13.5 | % | 14.3 | % | (80 | bp) | 14.9 | % | 15.1 | % | (20 | bp) | ||||||||||||
| (Ch$ million) | 6M18 Reported | 6M17 Reported | Change % | 6M18 Adjusted | 6M17 Adjusted | Change % | ||||||||||||||||||
| Revenue | 275,733 | 280,396 | (1.7 | %) | 275,733 | 280,396 | (1.7 | %) | ||||||||||||||||
| Cost of sales | (186,881 | ) | (188,598 | ) | (0.9 | %) | (186,292 | ) | (187,963 | ) | (0.9 | %) | ||||||||||||
| Gross profit | 88,852 | 91,799 | (3.2 | %) | 89,441 | 92,434 | (3.2 | %) | ||||||||||||||||
| Gross margin | 32.2 | % | 32.7 | % | (50 | bp) | 32.4 | % | 33.0 | % | (50 | bp) | ||||||||||||
| SG&A* | (64,543 | ) | (67,099 | ) | (3.8 | %) | (62,442 | ) | (65,680 | ) | (4.9 | %) | ||||||||||||
| Other op. income, expense | 38 | (50 | ) | 413 | (50 | ) | ||||||||||||||||||
| Profit (loss) from operating activities | 24,348 | 24,650 | (1.2 | %) | 27,412 | 26,703 | 2.7 | % | ||||||||||||||||
| Operating margin | 8.8 | % | 8.8 | % | 0 | bp | 9.9 | % | 9.5 | % | 40 | bp | ||||||||||||
| Non-operating profit (loss) | 2,451 | (3,778 | ) | 2,451 | (3,778 | ) | ||||||||||||||||||
| Profit (loss) before tax | 26,799 | 20,872 | 28.4 | % | 29,863 | 22,925 | 30.3 | % | ||||||||||||||||
| Income tax expense continuing operations | (6,526 | ) | (5,452 | ) | 19.7 | % | (6,526 | ) | (5,452 | ) | 19.7 | % | ||||||||||||
| Profit (loss) attributable to noncontrolling interests | 275 | 80 | 245.4 | % | 275 | 80 | 245.4 | % | ||||||||||||||||
| Profit (loss) attributable to owners of parent | 19,998 | 15,340 | 30.4 | % | 23,062 | 17,393 | 32.6 | % | ||||||||||||||||
| Net margin | 7.3 | % | 5.5 | % | 180 | bp | 8.4 | % | 6.2 | % | 220 | bp | ||||||||||||
| EBITDA** | 35,482 | 35,463 | 0.1 | % | 38,547 | 37,516 | 2.7 | % | ||||||||||||||||
| EBITDA margin | 12.9 | % | 12.6 | % | 20 | bp | 14.0 | % | 13.4 | % | 60 | bp | ||||||||||||
* SG&A = Distribution costs + Administration expense
** EBITDA= Profit from operating activities + Depreciation + Amortization
5 Adjusted results are presented with the purpose of facilitating comparison, excluding restructuring costs and such expenses that are considered non-recurring items (NRI).
| 14 |
Statement of Financial Position
| (Ch$ thousand) | Jun. 30, 2018 | Dec. 31, 2017 | Chg (%) | |||||||||
| Assets | ||||||||||||
| Cash and cash equivalents | 59,938,998 | 31,162,346 | 92.3 | % | ||||||||
| Inventories | 323,802,435 | 235,733,091 | 37.4 | % | ||||||||
| Trade and other current receivables | 181,541,109 | 198,802,120 | (8.7 | %) | ||||||||
| Current biological assets | 5,101,801 | 18,949,252 | (73.1 | %) | ||||||||
| Other current assets | 24,791,954 | 47,260,579 | (47.5 | %) | ||||||||
| Current assets | 595,176,297 | 531,907,388 | 11.9 | % | ||||||||
| Property, plant and equipment | 388,073,714 | 381,736,948 | 1.7 | % | ||||||||
| Inv. accounted for using equity method | 21,810,721 | 21,819,709 | (0.0 | %) | ||||||||
| Other non current assets | 124,378,204 | 121,362,542 | 2.5 | % | ||||||||
| Noncurrent assets | 534,262,639 | 524,919,199 | 1.8 | % | ||||||||
| Assets | 1,129,438,936 | 1,056,826,587 | 6.9 | % | ||||||||
| Liabilities | ||||||||||||
| Other current financial liabilities | 128,211,193 | 140,452,483 | (8.7 | %) | ||||||||
| Other current liabilities | 197,338,988 | 180,239,657 | 9.5 | % | ||||||||
| Current liabilities | 325,550,181 | 320,692,140 | 1.5 | % | ||||||||
| Other noncurrent financial liabilities | 185,935,876 | 127,810,125 | 45.5 | % | ||||||||
| Other noncurrent liabilities | 59,315,654 | 57,091,086 | 3.9 | % | ||||||||
| Noncurrent liabilities | 245,251,530 | 184,901,211 | 32.6 | % | ||||||||
| Liabilities | 570,801,711 | 505,593,351 | 12.9 | % | ||||||||
| Equity | ||||||||||||
| Issued capital | 84,178,790 | 84,178,790 | 0.0 | % | ||||||||
| Retained earnings | 464,276,983 | 455,924,169 | 1.8 | % | ||||||||
| Other reserves | 7,273,006 | 8,263,848 | (12.0 | %) | ||||||||
| Equity attributable to owners of parent | 555,728,779 | 548,366,807 | 1.3 | % | ||||||||
| Non-controlling interests | 2,908,446 | 2,866,429 | 1.5 | % | ||||||||
| Equity | 558,637,225 | 551,233,236 | 1.3 | % | ||||||||
| Equity and liabilities | 1,129,438,936 | 1,056,826,587 | 6.9 | % | ||||||||
| 15 |