Table of Contents
UNITED STATES
SECURITIES AND EXCHANGE COMMISSION
Washington, D.C. 20549
FORM N-CSR
CERTIFIED SHAREHOLDER REPORT OF REGISTERED
MANAGEMENT INVESTMENT COMPANIES
Investment Company Act file number 811-09102
iShares, Inc.
| (Exact name of registrant as specified in charter) |
c/o: Investors Bank & Trust Company 200 Clarendon Street; Boston, MA 02116 |
| (Address of principal executive offices) (Zip code) |
Corporation Trust Incorporated
300 East Lombard Street; Baltimore, MD 21202
| (Name and address of agent for service) |
Registrant’s telephone number, including area code: 1-800-474-2737
Date of fiscal year end: August 31, 2006
Date of reporting period: August 31, 2006
Table of Contents
| Item 1. | Reports to Stockholders. |
Table of Contents
| 1 | ||
| 23 | ||
| 25 | ||
| 25 | ||
| 31 | ||
| 37 | ||
| 46 | ||
| 53 | ||
| 60 | ||
| 66 | ||
| 72 | ||
| 79 | ||
| 86 | ||
| 93 | ||
| 97 | ||
| 105 | ||
| 116 | ||
| 125 | ||
| 126 | ||
Board Review and Approval of Investment Advisory Contracts (Unaudited) | 127 | |
| 130 | ||
| 136 | ||
| 140 |
Table of Contents
Management’s Discussion of Fund Performance
iSHARES® MSCI AUSTRIA INDEX FUND
Performance as of August 31, 2006
Average Annual Total Returns
| Year Ended 8/31/06 | Five Years Ended 8/31/06 | Ten Years Ended 8/31/06 | |||||||||||||||||||||||
| NAV | MARKET | INDEX | NAV | MARKET | INDEX | NAV | MARKET | INDEX | |||||||||||||||||
| 18.00 | % | 17.28 | % | 17.59 | % | 31.64 | % | 31.65 | % | 32.73 | % | 13.06 | % | 13.11 | % | 13.70 | % | ||||||||
Cumulative Total Returns
| Year Ended 8/31/06 | Five Years Ended 8/31/06 | Ten Years Ended 8/31/06 | |||||||||||||||||||||||
| NAV | MARKET | INDEX | NAV | MARKET | INDEX | NAV | MARKET | INDEX | |||||||||||||||||
| 18.00 | % | 17.28 | % | 17.59 | % | 295.33 | % | 295.40 | % | 311.99 | % | 241.33 | % | 242.83 | % | 261.02 | % | ||||||||
“Average annual total returns” represent the average annual change in value of an investment over the periods indicated. “Cumulative total returns” represent the total change in value of an investment over the periods indicated.
The Fund’s per share net asset value or “NAV” is the value of one share of the Fund as calculated in accordance with the standard formula for valuing mutual fund shares. The NAV return is based on the NAV of the Fund, and the market return is based on the market price per share of the Fund. The price used to calculate market return (“Market Price”) is determined by using the midpoint between the highest bid and the lowest offer on the stock exchange on which the shares of the Fund are listed for trading, as of the time that the Fund’s NAV is calculated. Market and NAV returns assume that dividends and capital gain distributions have been reinvested in the Fund at Market Price and NAV, respectively.
An index is a statistical composite that tracks a specified financial market or sector. Unlike the Fund, an index does not actually hold a portfolio of securities and therefore does not incur the expenses incurred by the Fund. These expenses negatively impact the performance of the Fund. Also, market returns do not include brokerage commissions that may be payable on secondary market transactions. If brokerage commissions were included, market returns would be lower. The returns shown in the tables above do not reflect the deduction of taxes that a shareholder would pay on fund distributions or the redemption or sale of fund shares. The investment return and principal value of shares of the Fund will vary with changes in market conditions. Shares of the Fund may be worth more or less than their original cost when they are redeemed or sold in the market. The Fund’s past performance is no guarantee of future results.
GROWTH OF $10,000 INVESTMENT
(AT NET ASSET VALUE)
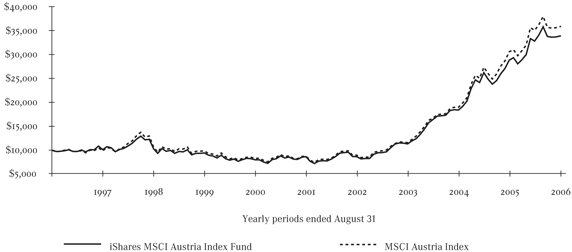
Performance figures assume reinvestment of all dividends and capital gain distributions and do not reflect the deduction of taxes that a shareholder would pay on fund distributions or the redemption of fund shares. An index is a statistical composite that tracks a specified financial market or sector. Unlike the Fund, an index does not actually hold a portfolio of securities and therefore does not incur the expenses incurred by the Fund. These expenses negatively impact the performance of the Fund. The Fund’s past performance is no guarantee of future results.
| MANAGEMENT’S DISCUSSIONSOF FUND PERFORMANCE | 1 |
Table of Contents
Management’s Discussion of Fund Performance (Continued)
iSHARES® MSCI AUSTRIA INDEX FUND
PORTFOLIO ALLOCATION
As of 8/31/06
Sector | Percentage of Net Assets | ||
Financial | 42.46 | % | |
Energy | 14.52 | ||
Communications | 14.10 | ||
Industrial | 11.44 | ||
Basic Materials | 10.28 | ||
Utilities | 5.63 | ||
Consumer Cyclical | 1.36 | ||
Short-Term and Other Net Assets | 0.21 | ||
TOTAL | 100.00 | % | |
TOP TEN FUND HOLDINGS
As of 8/31/06
Security | Percentage of Net Assets | ||
Erste Bank der Oesterreichischen Sparkassen AG | 18.66 | % | |
OMV AG | 14.52 | ||
Telekom Austria AG | 14.10 | ||
Wienerberger Baustoffindustrie AG | 4.98 | ||
Voestalpine AG | 4.95 | ||
Meinl European Land Ltd. | 4.91 | ||
Raiffeisen International Bank Holding AG | 4.85 | ||
Oesterreichische Elektrizitaetswirtschafts AG Class A | 4.80 | ||
CA Immobilien Anlagen AG | 4.22 | ||
Boehler-Uddeholm AG | 3.98 | ||
TOTAL | 79.97 | % | |
The iShares MSCI Austria Index Fund (the “Fund”) seeks to provide investment results that correspond generally to the price and yield performance, before fees and expenses, of publicly traded securities in the aggregate in the Austrian market, as measured by the MSCI Austria Index (the “Index”). The Fund invests in a representative sample of securities in the Index, which has a similar investment profile as the Index. Due to the use of representative sampling, the Fund may or may not hold all of the securities that are included in the Index. For the twelve-month period ended August 31, 2006 (the “reporting period”), the Fund returned 18.00%, while the Index returned 17.59%.
The Austrian stock market enjoyed double-digit gains for the reporting period but trailed the broad performance of European equities overall. Austria continued to benefit from its central location in Europe; the Austrian economy is tied to both the established economies of the Euro zone in western Europe and the “new economies” of eastern Europe, where demand growth in recent years has been considerably higher than in the Euro zone. However, a global shift toward risk aversion in the last few months of the reporting period led to increased volatility and substantial declines in developing markets, including many of those in eastern Europe. Consequently, the Austrian stock market suffered a sharp decline in May and June 2006, causing it to lag other Euro zone markets.
On the positive side, currency fluctuations enhanced Austrian stock returns for U.S. investors; for the reporting period, the U.S. dollar declined by 3.6% against the euro. In local-currency terms, the Index returned just 12.97%.
Within the Fund, the ten largest holdings accounted for approximately 80% of net assets as of August 31, 2006. Among the Fund’s ten largest holdings as of August 31, 2006, two of the top performers for the reporting period were steelmakers Voestalpine AG and Boehler-Uddeholm AG. Both companies reported strong operating results due to healthy demand for steel and higher prices. Strong demand also helped electric utility Oesterreichische Elektrizitaetswirtschafts AG produce a robust return. The weakest performer among the ten largest holdings was energy producer OMV AG, which declined modestly as declining oil prices led to a drop in share price late in the reporting period.
| 2 | 2006 iSHARES ANNUAL REPORTTO SHAREHOLDERS |
Table of Contents
Management’s Discussion of Fund Performance
iSHARES® MSCI BELGIUM INDEX FUND
Performance as of August 31, 2006
Average Annual Total Returns
| Year Ended 8/31/06 | Five Years Ended 8/31/06 | Ten Years Ended 8/31/06 | ||||||||||||||||||||||
| NAV | MARKET | INDEX | NAV | MARKET | INDEX | NAV | MARKET | INDEX | ||||||||||||||||
| 25.66% | 25.39 | % | 26.73 | % | 17.61 | % | 17.73 | % | 15.04 | % | 10.10 | % | 10.10 | % | 10.42 | % | ||||||||
Cumulative Total Returns
| Year Ended 8/31/06 | Five Years Ended 8/31/06 | Ten Years Ended 8/31/06 | ||||||||||||||||||||||
| NAV | MARKET | INDEX | NAV | MARKET | INDEX | NAV | MARKET | INDEX | ||||||||||||||||
| 25.66% | 25.39 | % | 26.73 | % | 124.99 | % | 126.16 | % | 101.52 | % | 161.71 | % | 161.64 | % | 169.55 | % | ||||||||
“Average annual total returns” represent the average annual change in value of an investment over the periods indicated. “Cumulative total returns” represent the total change in value of n investment over the periods indicated.
The Fund’s per share net asset value or “NAV” is the value of one share of the Fund as calculated in accordance with the standard formula for valuing mutual fund shares. The NAV return is based on the NAV of the Fund, and the market return is based on the market price per share of the Fund. The price used to calculate market return (“Market Price”) is determined by using the midpoint between the highest bid and the lowest offer on the stock exchange on which the shares of the Fund are listed for trading, as of the time that the Fund’s NAV is calculated. Market and NAV returns assume that dividends and capital gain distributions have been reinvested in the Fund at Market Price and NAV, respectively.
An index is a statistical composite that tracks a specified financial market or sector. Unlike the Fund, an index does not actually hold a portfolio of securities and therefore does not incur the expenses incurred by the Fund. These expenses negatively impact the performance of the Fund. Also, market returns do not include brokerage commissions that may be payable on secondary market transactions. If brokerage commissions were included, market returns would be lower. The returns shown in the tables above do not reflect the deduction of taxes that a shareholder would pay on fund distributions or the redemption or sale of fund shares. The investment return and principal value of shares of the Fund will vary with changes in market conditions. Shares of the Fund may be worth more or less than their original cost when they are redeemed or sold in the market. The Fund’s past performance is no guarantee of future results.
GROWTH OF $10,000 INVESTMENT
(AT NET ASSET VALUE)
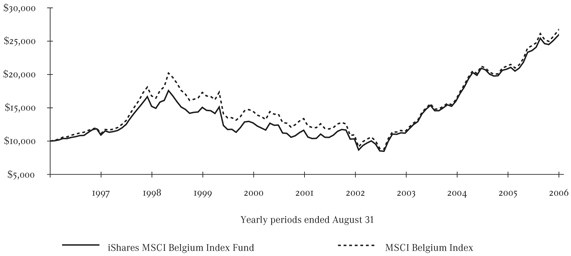
Performance figures assume reinvestment of all dividends and capital gain distributions and do not reflect the deduction of taxes that a shareholder would pay on fund distributions or the redemption of fund shares. An index is a statistical composite that tracks a specified financial market or sector. Unlike the Fund, an index does not actually hold a portfolio of securities and therefore does not incur the expenses incurred by the Fund. These expenses negatively impact the performance of the Fund. The Fund’s past performance is no guarantee of future results.
| MANAGEMENT’S DISCUSSIONSOF FUND PERFORMANCE | 3 |
Table of Contents
Management’s Discussion of Fund Performance (Continued)
iSHARES® MSCI BELGIUM INDEX FUND
PORTFOLIO ALLOCATION
As of 8/31/06
Sector | Percentage of Net Assets | ||
Financial | 53.08 | % | |
Consumer Non-Cyclical | 16.94 | ||
Basic Materials | 9.02 | ||
Diversified | 8.08 | ||
Communications | 6.85 | ||
Industrial | 4.28 | ||
Consumer Cyclical | 1.13 | ||
Short-Term and Other Net Assets | 0.62 | ||
TOTAL | 100.00 | % | |
TOP TEN FUND HOLDINGS
As of 8/31/06
Security | Percentage of Net Assets | ||
Fortis | 24.65 | % | |
KBC Groupe | 14.34 | ||
Dexia Group | 9.46 | ||
InBev | 4.97 | ||
Belgacom SA | 4.91 | ||
Solvay SA | 4.85 | ||
Groupe Bruxelles Lambert SA | 4.84 | ||
Cofinimmo | 4.19 | ||
Umicore | 4.17 | ||
UCB SA | 4.05 | ||
TOTAL | 80.43 | % | |
The iShares MSCI Belgium Index Fund (the “Fund”) seeks to provide investment results that correspond generally to the price and yield performance, before fees and expenses, of publicly traded securities in the aggregate in the Belgian market, as measured by the MSCI Belgium Index (the “Index”). The Fund invests in a representative sample of securities in the Index, which has a similar investment profile as the Index. Due to the use of representative sampling, the Fund may or may not hold all of the securities that included in the Index. For the twelve-month period ended August 31, 2006 (the “reporting period”), the Fund returned 25.66%, while the Index returned 26.73%.
Belgium’s stock market enjoyed a strong return for the reporting period and surpassed the broad performance of European equities. Financial stocks, which comprise more than half of the Index, historically have had the greatest impact on Belgian stock performance. Relatively low interest rates, a favorable investment environment, and increased merger activity provided a strong boost to financial stocks during the reporting period. Economic conditions in Belgium also improved after a downturn in the first half of 2005. Consumer confidence began to pick up due to employment growth and tax relief, while manufacturing activity increased as growth accelerated within Belgium’s main trading partners.
Currency fluctuations also enhanced Belgian stock returns for U.S. investors; for the reporting period, the U.S. dollar declined by 3.6% against the euro. In local-currency terms, the Index returned 21.76%.
The ten largest Fund holdings represented approximately 80% of the net assets of the Fund as of August 31, 2006. Each of the Fund’s ten largest holdings as of August 31, 2006, posted positive results for the reporting period. The top performer was materials and metals company Umicore, which reported strong earnings growth due to healthy demand and soaring prices for many precious metals. The Fund’s largest holding, banking and insurance company Fortis, also produced a robust gain for the reporting period as it continued to increase its market share. The weakest performers among the ten largest holdings were biotechnology firm UCB SA and telecommunications services provider Belgacom SA.
| 4 | 2006 iSHARES ANNUAL REPORTTO SHAREHOLDERS |
Table of Contents
Management’s Discussion of Fund Performance
iSHARES® MSCI EMU INDEX FUND
Performance as of August 31, 2006
Average Annual Total Returns
| Year Ended 8/31/06 | Five Years Ended 8/31/06 | Inception to 8/31/06 | ||||||||||||||||||||||
| NAV | MARKET | INDEX | NAV | MARKET | INDEX | NAV | MARKET | INDEX | ||||||||||||||||
| 25.18% | 24.44 | % | 25.68 | % | 11.51 | % | 11.45 | % | 11.88 | % | 3.39 | % | 3.43 | % | 3.74 | % | ||||||||
Cumulative Total Returns
| Year Ended 8/31/06 | Five Years Ended 8/31/06 | Inception to 8/31/06 | ||||||||||||||||||||||
| NAV | MARKET | INDEX | NAV | MARKET | INDEX | NAV | MARKET | INDEX | ||||||||||||||||
| 25.18% | 24.44 | % | 25.68 | % | 72.43 | % | 71.94 | % | 75.28 | % | 22.59 | % | 22.88 | % | 25.09 | % | ||||||||
Total returns for the periods since inception are calculated from the inception date of the Fund (7/25/00). “Average annual total returns” represent the average annual change in value of an investment over the periods indicated. “Cumulative total returns” represent the total change in value of an investment over the periods indicated.
The Fund’s per share net asset value or “NAV” is the value of one share of the Fund as calculated in accordance with the standard formula for valuing mutual fund shares. The NAV return is based on the NAV of the Fund, and the market return is based on the market price per share of the Fund. The price used to calculate market return (“Market Price”) is determined by using the midpoint between the highest bid and the lowest offer on the stock exchange on which the shares of the Fund are listed for trading, as of the time that the Fund’s NAV is calculated. Since shares of the Fund did not trade in the secondary market until several days after the Fund’s inception, for the period from inception to the first day of secondary market trading in shares of the Fund (7/31/00), the NAV of the Fund is used as a proxy for secondary market trading price to calculate market returns. Market and NAV returns assume that dividends and capital gain distributions have been reinvested in the Fund at Market Price and NAV, respectively.
An index is a statistical composite that tracks a specified financial market or sector. Unlike the Fund, an index does not actually hold a portfolio of securities and therefore does not incur the expenses incurred by the Fund. These expenses negatively impact the performance of the Fund. Also, market returns do not include brokerage commissions that may be payable on secondary market transactions. If brokerage commissions were included, market returns would be lower. The returns shown in the tables above do not reflect the deduction of taxes that a shareholder would pay on fund distributions or the redemption or sale of fund shares. The investment return and principal value of shares of the Fund will vary with changes in market conditions. Shares of the Fund may be worth more or less than their original cost when they are redeemed or sold in the market. The Fund’s past performance is no guarantee of future results.
GROWTH OF $10,000 INVESTMENT
SINCE INCEPTION AT NET ASSET VALUE
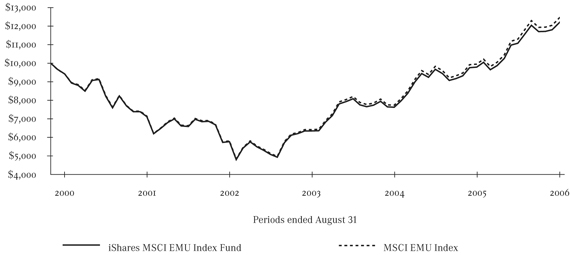
Performance figures assume reinvestment of all dividends and capital gain distributions and do not reflect the deduction of taxes that a shareholder would pay on fund distributions or the redemption of fund shares. An index is a statistical composite that tracks a specified financial market or sector. Unlike the Fund, an index does not actually hold a portfolio of securities and therefore does not incur the expenses incurred by the Fund. These expenses negatively impact the performance of the Fund. The Fund’s past performance is no guarantee of future results.
| MANAGEMENT’S DISCUSSIONSOF FUND PERFORMANCE | 5 |
Table of Contents
Management’s Discussion of Fund Performance (Continued)
iSHARES® MSCI EMU INDEX FUND
PORTFOLIO ALLOCATION As of 8/31/06 |
| ||
Sector | Percentage of Net Assets | ||
Financial | 33.68 | % | |
Communications | 12.03 | ||
Consumer Non-Cyclical | 11.78 | ||
Industrial | 10.43 | ||
Utilities | 8.80 | ||
Energy | 7.48 | ||
Consumer Cyclical | 6.37 | ||
Basic Materials | 5.65 | ||
Technology | 2.51 | ||
Diversified | 0.90 | ||
Short-Term and Other Net Assets | 0.37 | ||
TOTAL | 100.00 | % | |
TOP TEN FUND HOLDINGS As of 8/31/06 |
| ||
Security | Percentage of Net Assets | ||
Total SA (France) | 3.86 | % | |
Banco Santander Central Hispano SA (Spain) | 2.40 | ||
Sanofi-Aventis (France) | 2.38 | ||
BNP Paribas SA (France) | 2.30 | ||
Nokia OYJ (Finland) | 2.28 | ||
ING Groep NV (Netherlands) | 2.18 | ||
ENI SpA (Italy) | 2.10 | ||
E.ON AG (Germany) | 2.04 | ||
Banco Bilbao Vizcaya Argentaria SA (Spain) | 2.02 | ||
Telefonica SA (Spain) | 1.94 | ||
TOTAL | 23.50 | % | |
The iShares MSCI EMU Index Fund (the “Fund”) seeks to provide investment results that correspond generally to the price and yield performance, before fees and expenses, of publicly traded securities in the aggregate in the European Monetary Union (“EMU”) markets, as measured by the MSCI EMU Index (the “Index”). The Fund invests in a representative sample of securities in the Index, which has a similar investment profile as the Index. Due to the use of representative sampling, the Fund may or may not hold all of the securities that are included in the Index. For the twelve-month period ended August 31, 2006 (the “reporting period”), the Fund returned 25.18%, while the Index returned 25.68%.
European stocks enjoyed strong returns during the reporting period. Economic conditions across the continent showed gradual improvement, business and consumer confidence reached multi-year highs in several EMU countries (particularly Germany, Italy, and the Netherlands), and unemployment figures generally decreased. Stocks also benefited from improved corporate earnings growth and increased merger-and-acquisition activity. For U.S. investors, the U.S. dollar’s 3.6% decline against the euro for the reporting period enhanced returns; in local-currency terms, the Index returned 20.75%.
Despite their strong overall performance, EMU stocks gave back some gains in the last few months of the reporting period. Signs of rising inflation led the European Central Bank to raise borrowing costs four times during the reporting period, and the Bank of England also boosted its central rate in August 2006. As a result, volatility in many European markets increased as investors appeared to grow concerned about the impact of higher inflation and rising interest rates on economic growth and corporate earnings.
As of August 31, 2006, the ten largest Fund holdings accounted for approximately 24% of the net assets of the Fund. Each of the Fund’s ten largest holdings as of August 31, 2006, registered positive returns for the reporting period. The best performers were financial stocks, led by ING Groep NV (Netherlands) and BNP Paribas SA (France), both of which posted large gains for the reporting period. Two Spanish commercial banks, Banco Bilbao Vizcaya Argentaria SA and Banco Santander Central Hispano SA, also posted strong returns due to rising profits and strong revenue growth in their Latin American operations. Utilities firm E.ON AG also enjoyed robust earnings amid increasing demand and rising prices. Two of the weaker performers amongst the ten largest holdings were energy stocks Total SA (France), the Fund’s largest holding, and ENI SpA (Italy). Oil prices were up during the reporting period, although they did trend downward towards the end of the reporting period.
| 6 | 2006 iSHARES ANNUAL REPORTTO SHAREHOLDERS |
Table of Contents
Management’s Discussion of Fund Performance
iSHARES® MSCI FRANCE INDEX FUND
Performance as of August 31, 2006
| Average Annual Total Returns | ||||||||||||||||||||||||
| Year Ended 8/31/06 | Five Years Ended 8/31/06 | Ten Years Ended 8/31/06 | ||||||||||||||||||||||
| NAV | MARKET | INDEX | NAV | MARKET | INDEX | NAV | MARKET | INDEX | ||||||||||||||||
| 24.13% | 23.99 | % | 24.48 | % | 10.92 | % | 10.91 | % | 11.23 | % | 11.32 | % | 11.44 | % | 11.72 | % | ||||||||
| Cumulative Total Returns | ||||||||||||||||||||||||
| Year Ended 8/31/06 | Five Years Ended 8/31/06 | Ten Years Ended 8/31/06 | ||||||||||||||||||||||
| NAV | MARKET | INDEX | NAV | MARKET | INDEX | NAV | MARKET | INDEX | ||||||||||||||||
| 24.13% | 23.99 | % | 24.48 | % | 67.90 | % | 67.85 | % | 70.24 | % | 192.23 | % | 195.45 | % | 202.89 | % | ||||||||
“Average annual total returns” represent the average annual change in value of an investment over the periods indicated. “Cumulative total returns” represent the total change in value of an investment over the periods indicated.
The Fund’s per share net asset value or “NAV” is the value of one share of the Fund as calculated in accordance with the standard formula for valuing mutual fund shares. The NAV return is based on the NAV of the Fund, and the market return is based on the market price per share of the Fund. The price used to calculate market return (“Market Price”) is determined by using the midpoint between the highest bid and the lowest offer on the stock exchange on which the shares of the Fund are listed for trading, as of the time that the Fund’s NAV is calculated. Market and NAV returns assume that dividends and capital gain distributions have been reinvested in the Fund at Market Price and NAV, respectively.
An index is a statistical composite that tracks a specified financial market or sector. Unlike the Fund, an index does not actually hold a portfolio of securities and therefore does not incur the expenses incurred by the Fund. These expenses negatively impact the performance of the Fund. Also, market returns do not include brokerage commissions that may be payable on secondary market transactions. If brokerage commissions were included, market returns would be lower. The returns shown in the tables above do not reflect the deduction of taxes that a shareholder would pay on fund distributions or the redemption or sale of fund shares. The investment return and principal value of shares of the Fund will vary with changes in market conditions. Shares of the Fund may be worth more or less than their original cost when they are redeemed or sold in the market. The Fund’s past performance is no guarantee of future results.
GROWTH OF $10,000 INVESTMENT
(AT NET ASSET VALUE)
Performance figures assume reinvestment of all dividends and capital gain distributions and do not reflect the deduction of taxes that a shareholder would pay on fund distributions or the redemption of fund shares. An index is a statistical composite that tracks a specified financial market or sector. Unlike the Fund, an index does not actually hold a portfolio of securities and therefore does not incur the expenses incurred by the Fund. These expenses negatively impact the performance of the Fund. The Fund’s past performance is no guarantee of future results.
| MANAGEMENT’S DISCUSSIONSOF FUND PERFORMANCE | 7 |
Table of Contents
Management’s Discussion of Fund Performance (Continued)
iSHARES® MSCI FRANCE INDEX FUND
PORTFOLIO ALLOCATION
As of 8/31/06
Sector | Percentage of Net Assets | ||
Financial | 22.38 | % | |
Consumer Non-Cyclical | 19.50 | ||
Energy | 13.48 | ||
Industrial | 12.23 | ||
Communications | 10.09 | ||
Consumer Cyclical | 7.20 | ||
Utilities | 5.80 | ||
Basic Materials | 4.22 | ||
Technology | 2.69 | ||
Diversified | 2.19 | ||
Short-Term and Other Net Assets | 0.22 | ||
TOTAL | 100.00 | % | |
TOP TEN FUND HOLDINGS
As of 8/31/06
Security | Percentage of Net Assets | ||
Total SA | 12.95 | % | |
Sanofi-Aventis | 7.91 | ||
BNP Paribas SA | 7.67 | ||
AXA | 5.36 | ||
Societe Generale Class A | 4.85 | ||
Suez SA | 3.78 | ||
Vivendi Universal SA | 3.45 | ||
Carrefour SA | 3.21 | ||
France Telecom | 3.12 | ||
Groupe Danone | 2.85 | ||
TOTAL | 55.15 | % | |
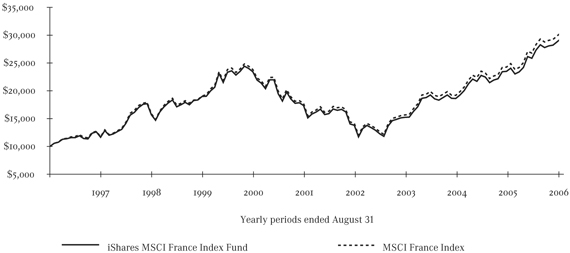
The iShares MSCI France Index Fund (the “Fund”) seeks to provide investment results that correspond generally to the price and yield performance, before fees and expenses, of publicly traded securities in the aggregate in the French market, as measured by the MSCI France Index (the “Index”). The Fund invests in a representative sample of securities in the Index, which has a similar investment profile as the Index. Due to the use of representative sampling, the Fund may or may not hold all of the securities that are included in the Index. For the twelve-month period ended August 31, 2006 (the “reporting period”), the Fund returned 24.13%, while the Index returned 24.48%.
France’s stock market posted healthy gains for the reporting period, essentially matching the broad performance of European equities. The strong performance of the French stock market resulted primarily from improving economic conditions. In June 2006, the country’s unemployment rate fell to a four-year low of 9%, benefiting from relaxed labor laws. Better employment figures also seemed to spark an increase in consumer confidence, which helped lift earnings in the retail sector. By the second quarter of 2006, the French economy was growing at its fastest pace in five years.
Within the Fund, the ten largest holdings as of August 31, 2006 accounted for approximately 55% of Fund net assets. Nearly all of the Fund’s ten largest holdings as of August 31, 2006, gained ground for the reporting period. Two of the top performers were Societe Generale and BNP Paribas SA, both of which reported better-than-expected earnings and appeared to benefit from speculation about potential industry consolidation. Utilities company Suez SA, which agreed to merge with Gaz de France in a transaction that would form the world’s second-largest energy group, also produced a strong gain. On the downside, the only holding to decline for the reporting period was telecommunications services provider France Telecom SA. Fierce competition, particularly from internet-based phone companies, led to disappointing results at the French telecom company.
| 8 | 2006 iSHARES ANNUAL REPORTTO SHAREHOLDERS |
Table of Contents
Management’s Discussion of Fund Performance
iSHARES® MSCI GERMANY INDEX FUND
Performance as of August 31, 2006
| Average Annual Total Returns | |||||||||||||||||||||||||
| Year Ended 8/31/06 | Five Years Ended 8/31/06 | Ten Years Ended 8/31/06 | |||||||||||||||||||||||
| NAV | MARKET | INDEX | NAV | MARKET | INDEX | NAV | MARKET | INDEX | |||||||||||||||||
| 24.82 | % | 24.00 | % | 25.10 | % | 10.18 | % | 10.27 | % | 10.40 | % | 7.93 | % | 8.05 | % | 8.33 | % | ||||||||
| Cumulative Total Returns | |||||||||||||||||||||||||
| Year Ended 8/31/06 | Five Years Ended 8/31/06 | Ten Years Ended 8/31/06 | |||||||||||||||||||||||
| NAV | MARKET | INDEX | NAV | MARKET | INDEX | NAV | MARKET | INDEX | |||||||||||||||||
| 24.82 | % | 24.00 | % | 25.10 | % | 62.40 | % | 63.05 | % | 64.04 | % | 114.52 | % | 116.94 | % | 122.52 | % | ||||||||
“Average annual total returns” represent the average annual change in value of an investment over the periods indicated. “Cumulative total returns” represent the total change in value of an investment over the periods indicated.
The Fund’s per share net asset value or “NAV” is the value of one share of the Fund as calculated in accordance with the standard formula for valuing mutual fund shares. The NAV return is based on the NAV of the Fund, and the market return is based on the market price per share of the Fund. The price used to calculate market return (“Market Price”) is determined by using the midpoint between the highest bid and the lowest offer on the stock exchange on which the shares of the Fund are listed for trading, as of the time that the Fund’s NAV is calculated. Market and NAV returns assume that dividends and capital gain distributions have been reinvested in the Fund at Market Price and NAV, respectively.
An index is a statistical composite that tracks a specified financial market or sector. Unlike the Fund, an index does not actually hold a portfolio of securities and therefore does not incur the expenses incurred by the Fund. These expenses negatively impact the performance of the Fund. Also, market returns do not include brokerage commissions that may be payable on secondary market transactions. If brokerage commissions were included, market returns would be lower. The returns shown in the tables above do not reflect the deduction of taxes that a shareholder would pay on fund distributions or the redemption or sale of fund shares. The investment return and principal value of shares of the Fund will vary with changes in market conditions. Shares of the Fund may be worth more or less than their original cost when they are redeemed or sold in the market. The Fund’s past performance is no guarantee of future results.
GROWTH OF $10,000 INVESTMENT
(AT NET ASSET VALUE)
Performance figures assume reinvestment of all dividends and capital gain distributions and do not reflect the deduction of taxes that a shareholder would pay on fund distributions or the redemption of fund shares. An index is a statistical composite that tracks a specified financial market or sector. Unlike the Fund, an index does not actually hold a portfolio of securities and therefore does not incur the expenses incurred by the Fund. These expenses negatively impact the performance of the Fund. The Fund’s past performance is no guarantee of future results.
| MANAGEMENT’S DISCUSSIONSOF FUND PERFORMANCE | 9 |
Table of Contents
Management’s Discussion of Fund Performance (Continued)
iSHARES® MSCI GERMANY INDEX FUND
PORTFOLIO ALLOCATION
As of 8/31/06
Sector | Percentage of Net Assets | ||
Financial | 26.85 | % | |
Industrial | 14.83 | ||
Utilities | 14.82 | ||
Consumer Cyclical | 14.38 | ||
Basic Materials | 11.18 | ||
Technology | 6.20 | ||
Consumer Non-Cyclical | 6.09 | ||
Communications | 5.11 | ||
Energy | 0.26 | ||
Short-Term and Other Net Assets | 0.28 | ||
TOTAL | 100.00 | % | |
TOP TEN FUND HOLDINGS
As of 8/31/06
Security | Percentage of Net Assets | ||
E.ON AG | 9.53 | % | |
Siemens AG | 8.73 | ||
Allianz AG | 8.37 | ||
Deutsche Bank AG | 7.09 | ||
DaimlerChrysler AG | 5.79 | ||
RWE AG | 4.98 | ||
BASF AG | 4.84 | ||
SAP AG | 4.82 | ||
Deutsche Telekom AG | 4.73 | ||
Bayer AG | 4.36 | ||
TOTAL | 63.24 | % | |
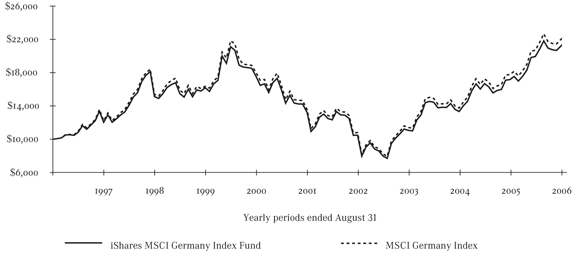
The iShares MSCI Germany Index Fund (the “Fund”) seeks to provide investment results that correspond generally to the price and yield performance, before fees and expenses, of publicly traded securities in the aggregate in the German market, as measured by the MSCI Germany Index (the “Index”). The Fund invests in a representative sample of securities in the Index, which has a similar investment profile as the Index. Due to the use of representative sampling, the Fund may or may not hold all of the securities that are included in the Index. For the twelve-month period ended August 31, 2006 (the “reporting period”), the Fund returned 24.82%, while the Index returned 25.10%.
Germany’s stock market rallied sharply for the reporting period, mirroring the broad performance of European equities. The German economy was struggling as the reporting period began, but economic conditions improved markedly over the one-year period. Business confidence reached its highest level in 15 years as companies increased their investment in plants and equipment. In August 2006, consumer confidence rose to its highest level since 2001, while spending rose late in the period in advance of a 3% increase in the value added tax in 2007. Retailers also enjoyed a strong boost from the World Cup soccer tournament, which Germany hosted in June and July 2006. Finally, by the end of the reporting period, the unemployment rate had fallen to its lowest level in two years, although it still remained above 10%.
The favorable economic environment contributed to solid earnings growth and strong stock market performance. Currency fluctuations also enhanced German stock returns for U.S. investors; for the reporting period, the U.S. dollar declined by 3.6% against the euro. In local-currency terms, the Index returned 20.19%.
The ten largest Fund holdings represented approximately 63% of the net assets of the Fund as of August 31, 2006. Nine of the Fund’s ten largest holdings as of August 31, 2006, posted positive returns for the reporting period. Utilities firms E.ON AG and RWE AG were among the top performers, enjoying robust earnings amid increasing demand and rising prices. Pharmaceutical conglomerate Bayer AG produced the best return among the ten largest Fund holdings due to strong results from its drug business and a favorable acquisition of competitor Schering AG. Deutsche Telekom AG, the country’s largest telecommunications services provider, was the only holding to decline for the reporting period. Fierce competition, both in Europe and for its T-Mobile wireless unit in the U.S., led to lowered profit guidance at Deutsche Telekom.
| 10 | 2006 iSHARES ANNUAL REPORTTO SHAREHOLDERS |
Table of Contents
Management’s Discussion of Fund Performance
iSHARES® MSCI ITALY INDEX FUND
Performance as of August 31, 2006
Average Annual Total Returns
| Year Ended 8/31/06 | Five Years Ended 8/31/06 | Ten Years Ended 8/31/06 | |||||||||||||||||||||||
| NAV | MARKET | INDEX | NAV | MARKET | INDEX | NAV | MARKET | INDEX | |||||||||||||||||
| 20.61 | % | 20.39 | % | 20.48 | % | 13.63 | % | 13.63 | % | 13.44 | % | 12.84 | % | 12.88 | % | 12.78 | % | ||||||||
| Cumulative Total Returns | |||||||||||||||||||||||||
| Year Ended 8/31/06 | Five Years Ended 8/31/06 | Ten Years Ended 8/31/06 | |||||||||||||||||||||||
| NAV | MARKET | INDEX | NAV | MARKET | INDEX | NAV | MARKET | INDEX | |||||||||||||||||
| 20.61 | % | 20.39 | % | 20.48 | % | 89.47 | % | 89.47 | % | 87.86 | % | 234.81 | % | 235.97 | % | 232.83 | % | ||||||||
“Average annual total returns” represent the average annual change in value of an investment over the periods indicated. “Cumulative total returns” represent the total change in value of an investment over the periods indicated.
The Fund’s per share net asset value or “NAV” is the value of one share of the Fund as calculated in accordance with the standard formula for valuing mutual fund shares. The NAV return is based on the NAV of the Fund, and the market return is based on the market price per share of the Fund. The price used to calculate market return (“Market Price”) is determined by using the midpoint between the highest bid and the lowest offer on the stock exchange on which the shares of the Fund are listed for trading, as of the time that the Fund’s NAV is calculated. Market and NAV returns assume that dividends and capital gain distributions have been reinvested in the Fund at Market Price and NAV, respectively.
An index is a statistical composite that tracks a specified financial market or sector. Unlike the Fund, an index does not actually hold a portfolio of securities and therefore does not incur the expenses incurred by the Fund. These expenses negatively impact the performance of the Fund. Also, market returns do not include brokerage commissions that may be payable on secondary market transactions. If brokerage commissions were included, market returns would be lower. The returns shown in the tables above do not reflect the deduction of taxes that a shareholder would pay on fund distributions or the redemption or sale of fund shares. The investment return and principal value of shares of the Fund will vary with changes in market conditions. Shares of the Fund may be worth more or less than their original cost when they are redeemed or sold in the market. The Fund’s past performance is no guarantee of future results.
GROWTH OF $10,000 INVESTMENT
(AT NET ASSET VALUE)
Performance figures assume reinvestment of all dividends and capital gain distributions and do not reflect the deduction of taxes that a shareholder would pay on fund distributions or the redemption of fund shares. An index is a statistical composite that tracks a specified financial market or sector. Unlike the Fund, an index does not actually hold a portfolio of securities and therefore does not incur the expenses incurred by the Fund. These expenses negatively impact the performance of the Fund. The Fund’s past performance is no guarantee of future results.
| MANAGEMENT’S DISCUSSIONSOF FUND PERFORMANCE | 11 |
Table of Contents
Management’s Discussion of Fund Performance (Continued)
iSHARES® MSCI ITALY INDEX FUND
PORTFOLIO ALLOCATION
As of 8/31/06
Sector | Percentage of Net Assets | ||
Financial | 48.25 | % | |
Energy | 17.29 | ||
Communications | 13.55 | ||
Utilities | 9.65 | ||
Consumer Cyclical | 4.29 | ||
Consumer Non-Cyclical | 4.16 | ||
Industrial | 2.69 | ||
Short-Term and Other Net Assets | 0.12 | ||
TOTAL | 100.00 | % | |
TOP TEN FUND HOLDINGS
As of 8/31/06
Security | Percentage of Net Assets | ||
ENI SpA | 17.28 | % | |
UniCredito Italiano SpA | 13.01 | ||
Enel SpA | 8.37 | ||
Telecom Italia SpA | 6.70 | ||
Sanpaolo IMI SpA | 4.90 | ||
Assicurazioni Generali SpA | 4.75 | ||
Banca Intesa SpA | 4.71 | ||
Capitalia SpA | 3.44 | ||
Banca Popolare di Verona e Novara Scrl | 3.37 | ||
Telecom Italia SpA RNC (Preferred) | 3.26 | ||
TOTAL | 69.79 | % | |
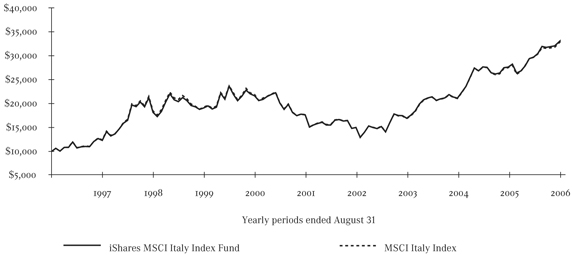
The iShares MSCI Italy Index Fund (the “Fund”) seeks to provide investment results that correspond generally to the price and yield performance, before fees and expenses, of publicly traded securities in the aggregate in the Italian market, as measured by the MSCI Italy Index (the “Index”). The Fund invests in a representative sample of securities in the Index, which has a similar investment profile as the Index. Due to the use of representative sampling, the Fund may or may not hold all of the securities that are included in the Index. For the twelve-month period ended August 31, 2006 (the “reporting period”), the Fund returned 20.61%, while the Index returned 20.48%.
The Italian stock market enjoyed strong gains for the reporting period but trailed the broad performance of European equities. Along with the rest of the European Union (“EU”), Italy benefited from gradually improving economic conditions, though Italy’s economy remains the weakest in the EU following its 2005 recession. However, the modest economic recovery helped boost tax revenues, assisting the country’s struggle as the world’s third-largest debt load and its current budget deficit that exceeds EU restrictions. Through a combination of higher tax revenues and budget cuts, Italy appears to be on track to potentially reduce its deficit in 2006.
Currency fluctuations enhanced Italian stock returns for U.S. investors; for the reporting period, the U.S. dollar declined by 3.6% against the euro. In local-currency terms, the Index returned 15.76%.
The ten largest Fund holdings accounted for approximately 70% of the Fund’s net assets as of August 31, 2006. All but one of the Fund’s ten largest holdings as of August 31, 2006, produced positive returns for the reporting period. The five best performers were financial services stocks, led by commercial banks Banca Popolare di Verona e Novara Scrl, Capitalia SpA, and Sanpaolo IMI SpA. These companies benefited from an environment of low interest rates, improving economic growth, and increased merger activity. The only stock among the ten largest holdings to decline for the reporting period was telecommunications services provider Telecom Italia SpA, which faced increasing competition and a substantial amount of debt.
| 12 | 2006 iSHARES ANNUAL REPORTTO SHAREHOLDERS |
Table of Contents
Management’s Discussion of Fund Performance
iSHARES® MSCI NETHERLANDS INDEX FUND
Performance as of August 31, 2006
| Average Annual Total Returns
| |||||||||||||||||||||||||
| Year Ended 8/31/06 | Five Years Ended 8/31/06 | Ten Years Ended 8/31/06 | |||||||||||||||||||||||
| NAV | MARKET | INDEX | NAV | MARKET | INDEX | NAV | MARKET | INDEX | |||||||||||||||||
| 29.53 | % | 29.08 | % | 30.15 | % | 7.12 | % | 7.18 | % | 7.55 | % | 6.50 | % | 6.49 | % | 7.92 | % | ||||||||
| Cumulative Total Returns
| |||||||||||||||||||||||||
| Year Ended 8/31/06 | Five Years Ended 8/31/06 | Ten Years Ended 8/31/06 | |||||||||||||||||||||||
| NAV | MARKET | INDEX | NAV | MARKET | INDEX | NAV | MARKET | INDEX | |||||||||||||||||
| 29.53 | % | 29.08 | % | 30.15 | % | 41.05 | % | 41.43 | % | 43.89 | % | 87.65 | % | 87.49 | % | 114.25 | % | ||||||||
“Average annual total returns” represent the average annual change in value of an investment over the periods indicated. “Cumulative total returns” represent the total change in value of an investment over the periods indicated.
The Fund’s per share net asset value or “NAV” is the value of one share of the Fund as calculated in accordance with the standard formula for valuing mutual fund shares. The NAV return is based on the NAV of the Fund, and the market return is based on the market price per share of the Fund. The price used to calculate market return (“Market Price”) is determined by using the midpoint between the highest bid and the lowest offer on the stock exchange on which the shares of the Fund are listed for trading, as of the time that the Fund’s NAV is calculated. Market and NAV returns assume that dividends and capital gain distributions have been reinvested in the Fund at Market Price and NAV, respectively.
An index is a statistical composite that tracks a specified financial market or sector. Unlike the Fund, an index does not actually hold a portfolio of securities and therefore does not incur the expenses incurred by the Fund. These expenses negatively impact the performance of the Fund. Also, market returns do not include brokerage commissions that may be payable on secondary market transactions. If brokerage commissions were included, market returns would be lower. The returns shown in the tables above do not reflect the deduction of taxes that a shareholder would pay on fund distributions or the redemption or sale of fund shares. The investment return and principal value of shares of the Fund will vary with changes in market conditions. Shares of the Fund may be worth more or less than their original cost when they are redeemed or sold in the market. The Fund’s past performance is no guarantee of future results.
GROWTH OF $10,000 INVESTMENT
(AT NET ASSET VALUE)
Performance figures assume reinvestment of all dividends and capital gain distributions and do not reflect the deduction of taxes that a shareholder would pay on fund distributions or the redemption of fund shares. An index is a statistical composite that tracks a specified financial market or sector. Unlike the Fund, an index does not actually hold a portfolio of securities and therefore does not incur the expenses incurred by the Fund. These expenses negatively impact the performance of the Fund. The Fund’s past performance is no guarantee of future results.
| MANAGEMENT’S DISCUSSIONSOF FUND PERFORMANCE | 13 |
Table of Contents
Management’s Discussion of Fund Performance (Continued)
iSHARES® MSCI NETHERLANDS INDEX FUND
PORTFOLIO ALLOCATION
As of 8/31/06
Sector | Percentage of Net Assets | ||
Financial | 41.05 | % | |
Consumer Non-Cyclical | 20.48 | ||
Industrial | 14.07 | ||
Communications | 11.09 | ||
Basic Materials | 6.53 | ||
Technology | 3.58 | ||
Energy | 1.61 | ||
Consumer Cyclical | 1.17 | ||
Short-Term and Other Net Assets | 0.42 | ||
TOTAL | 100.00 | % | |
TOP TEN FUND HOLDINGS
As of 8/31/06
Security | Percentage of Net Assets | ||
ING Groep NV | 19.24 | % | |
ABN AMRO Holding NV | 11.98 | ||
Koninklijke Philips Electronics NV | 9.52 | ||
Unilever NV | 8.72 | ||
Koninklijke KPN NV | 4.87 | ||
Aegon NV | 4.73 | ||
Akzo Nobel NV | 4.57 | ||
TNT NV | 4.55 | ||
Reed Elsevier NV | 4.04 | ||
Koninklijke Ahold NV | 4.00 | ||
TOTAL | 76.22 | % | |
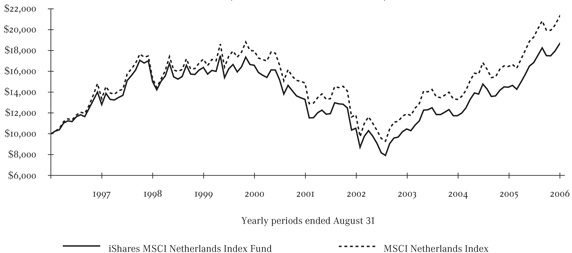
The iShares MSCI Netherlands Index Fund (the “Fund”) seeks to provide investment results that correspond generally to the price and yield performance, before fees and expenses, of publicly traded securities in the aggregate in the Dutch market, as measured by the MSCI Netherlands Index (the “Index”). The Fund invests in a representative sample of securities in the Index, which has a similar investment profile as the Index. Due to the use of representative sampling, the Fund may or may not hold all of the securities that are included in the Index. For the twelve-month period ended August 31, 2006 (the “reporting period”), the Fund returned 29.53%, while the Index returned 30.15%.
The Netherlands’ stock market enjoyed very strong returns for the reporting period, posting the best results in the European Union (“EU”). The Dutch economy, which is largely dependent on exports to other European countries, showed substantial improvement as economic activity in the Euro zone increased. An export-led recovery in the manufacturing sector and increased business investment sparked by buoyant corporate profits boosted the Dutch economy to its fastest growth rate in more than five years. Rising employment growth led to increased consumer confidence and greater consumer spending. Inflation increased modestly over the past year, but remains below most other EU countries.
Currency fluctuations also enhanced Dutch stock returns for U.S. investors; for the reporting period, the U.S. dollar declined by 3.6% against the euro. In local-currency terms, the Index returned 25.05%.
The ten largest Fund holdings accounted for approximately 76% of Fund net assets as of August 31, 2006. Each of the Fund’s ten largest holdings as of August 31, 2006, gained for the reporting period. The top performer was the Fund’s largest holding, financial services provider ING Groep NV, which benefited from an environment of low interest rates, improving economic growth, and increased merger activity. Shipping company TNT NV and chemicals maker Akzo Nobel NV also posted strong returns. The weakest performers among the ten largest holdings included consumer products maker Unilever NV, which struggled with weak revenue growth and declining profit margins, and grocery chain Koninklijke Ahold NV, which reported lower-than-expected earnings and admitted to overstating profits in 2003.
| 14 | 2006 iSHARES ANNUAL REPORTTO SHAREHOLDERS |
Table of Contents
Management’s Discussion of Fund Performance
iSHARES® MSCI SPAIN INDEX FUND
Performance as of August 31, 2006
Average Annual Total Returns
| Year Ended 8/31/06 | Five Years Ended 8/31/06 | Ten Years Ended 8/31/06 | |||||||||||||||||||||||
| NAV | MARKET | INDEX | NAV | MARKET | INDEX | NAV | MARKET | INDEX | |||||||||||||||||
| 28.09 | % | 27.73 | % | 28.32 | % | 17.32 | % | 17.36 | % | 17.27 | % | 15.02 | % | 15.05 | % | 15.26 | % | ||||||||
| Cumulative Total Returns | |||||||||||||||||||||||||
| Year Ended 8/31/06 | Five Years Ended 8/31/06 | Ten Years Ended 8/31/06 | |||||||||||||||||||||||
| NAV | MARKET | INDEX | NAV | MARKET | INDEX | NAV | MARKET | INDEX | |||||||||||||||||
| 28.09 | % | 27.73 | % | 28.32 | % | 122.21 | % | 122.68 | % | 121.76 | % | 305.43 | % | 306.35 | % | 313.96 | % | ||||||||
“Average annual total returns” represent the average annual change in value of an investment over the periods indicated. “Cumulative total returns” represent the total change in value of an investment over the periods indicated.
The Fund’s per share net asset value or “NAV” is the value of one share of the Fund as calculated in accordance with the standard formula for valuing mutual fund shares. The NAV return is based on the NAV of the Fund, and the market return is based on the market price per share of the Fund. The price used to calculate market return (“Market Price”) is determined by using the midpoint between the highest bid and the lowest offer on the stock exchange on which the shares of the Fund are listed for trading, as of the time that the Fund’s NAV is calculated. Market and NAV returns assume that dividends and capital gain distributions have been reinvested in the Fund at Market Price and NAV, respectively.
An index is a statistical composite that tracks a specified financial market or sector. Unlike the Fund, an index does not actually hold a portfolio of securities and therefore does not incur the expenses incurred by the Fund. These expenses negatively impact the performance of the Fund. Also, market returns do not include brokerage commissions that may be payable on secondary market transactions. If brokerage commissions were included, market returns would be lower. The returns shown in the tables above do not reflect the deduction of taxes that a shareholder would pay on fund distributions or the redemption or sale of fund shares. The investment return and principal value of shares of the Fund will vary with changes in market conditions. Shares of the Fund may be worth more or less than their original cost when they are redeemed or sold in the market. The Fund’s past performance is no guarantee of future results.
GROWTH OF $10,000 INVESTMENT
(AT NET ASSET VALUE)
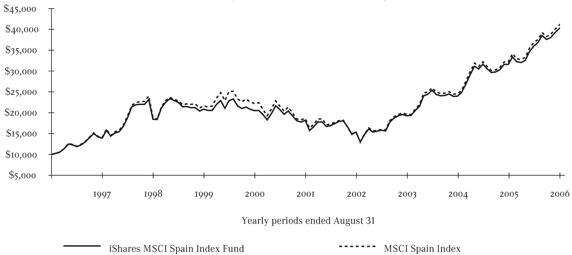
Performance figures assume reinvestment of all dividends and capital gain distributions and do not reflect the deduction of taxes that a shareholder would pay on fund distributions or the redemption of fund shares. An index is a statistical composite that tracks a specified financial market or sector. Unlike the Fund, an index does not actually hold a portfolio of securities and therefore does not incur the expenses incurred by the Fund. These expenses negatively impact the performance of the Fund. The Fund’s past performance is no guarantee of future results.
| MANAGEMENT’S DISCUSSIONSOF FUND PERFORMANCE | 15 |
Table of Contents
Management’s Discussion of Fund Performance (Continued)
iSHARES® MSCI SPAIN INDEX FUND
PORTFOLIO ALLOCATION
As of 8/31/06
Sector | Percentage of Net Assets | ||
Financial | 41.90 | % | |
Communications | 16.88 | ||
Utilities | 15.10 | ||
Industrial | 7.66 | ||
Consumer Non-Cyclical | 7.59 | ||
Energy | 5.59 | ||
Consumer Cyclical | 3.08 | ||
Basic Materials | 1.37 | ||
Technology | 0.70 | ||
Short-Term and Other Net Assets | 0.13 | ||
TOTAL | 100.00 | % | |
TOP TEN FUND HOLDINGS
As of 8/31/06
Security | Percentage of Net Assets | ||
Banco Santander Central Hispano SA | 18.56 | % | |
Telefonica SA | 15.84 | ||
Banco Bilbao Vizcaya Argentaria SA | 14.83 | ||
Iberdrola SA | 4.92 | ||
Endesa SA | 4.83 | ||
Repsol YPF SA | 4.82 | ||
Banco Popular Espanol SA | 4.61 | ||
Altadis SA | 3.27 | ||
Actividades de Construcciones y Servicios SA | 3.09 | ||
Inditex SA | 2.52 | ||
TOTAL | 77.29 | % | |
The iShares MSCI Spain Index Fund (the “Fund”) seeks to provide investment results that correspond generally to the price and yield performance, before fees and expenses, of publicly traded securities in the aggregate in the Spanish market, as measured by the MSCI Spain Index (the “Index”). The Fund invests in a representative sample of securities in the Index, which has a similar investment profile as the Index. Due to the use of representative sampling, the Fund may or may not hold all of the securities that are included in the Index. For the twelve-month period ended August 31, 2006 (the “reporting period”), the Fund returned 28.09%, while the Index returned 28.32%.
The Spanish stock market posted strong returns and outpaced the broad performance of European equities during the reporting period. Spain’s economy continued to show signs of improvement and grew at a faster rate than its European neighbors. Spain has posted better economic growth than the Euro zone in every quarter since the first quarter of 2003. The main drivers of this growth appear to be low interest rates, a housing and construction boom, and solid consumer spending. In addition, during the first two quarters of 2006, exports outpaced imports for the first time in two years, industrial production surged to its fastest growth rate in six years, and employment growth remained solid. Spain has created over half of all new jobs in the Euro zone over the past four years. The flip side to this robust economic growth is inflation, which at 4% is the highest in the European Union.
Currency fluctuations enhanced Spanish stock returns for U.S. investors; for the reporting period, the U.S. dollar declined by 3.6% against the euro. In local-currency terms, the Index returned 23.29%.
Within the Fund, the ten largest holdings accounted for approximately 77% of Fund net assets as of August 31, 2006. Nine of the Fund’s ten largest holdings as of August 31, 2006, delivered positive returns for the reporting period. The top performer was fashion retailer Inditex SA, which reported better-than-expected earnings due to strong sales across Europe and improving profit margins. Endesa SA, Spain’s largest electric utility, posted a healthy return amid rising demand and higher power prices, while construction company Actividades de Construcciones y Servicios SA benefited from the country’s housing boom. The only holding to decline during the reporting period was oil producer Repsol YPF SA, which fell slightly.
| 16 | 2006 iSHARES ANNUAL REPORTTO SHAREHOLDERS |
Table of Contents
Management’s Discussion of Fund Performance
iSHARES® MSCI SWEDEN INDEX FUND
Performance as of August 31, 2006
Average Annual Total Returns
| Year Ended 8/31/06 | Five Years Ended 8/31/06 | Ten Years Ended 8/31/06 | |||||||||||||||||||||||
| NAV | MARKET | INDEX | NAV | MARKET | INDEX | NAV | MARKET | INDEX | |||||||||||||||||
| 22.16 | % | 20.80 | % | 22.18 | % | 16.24 | % | 16.26 | % | 16.00 | % | 10.39 | % | 10.38 | % | 11.79 | % | ||||||||
| Cumulative Total Returns | |||||||||||||||||||||||||
| Year Ended 8/31/06 | Five Years Ended 8/31/06 | Ten Years Ended 8/31/06 | |||||||||||||||||||||||
| NAV | MARKET | INDEX | NAV | MARKET | INDEX | NAV | MARKET | INDEX | |||||||||||||||||
| 22.16 | % | 20.80 | % | 22.18 | % | 112.20 | % | 112.40 | % | 110.02 | % | 168.69 | % | 168.58 | % | 204.71 | % | ||||||||
“Average annual total returns” represent the average annual change in value of an investment over the periods indicated. “Cumulative total returns” represent the total change in value of an investment over the periods indicated.
The Fund’s per share net asset value or “NAV” is the value of one share of the Fund as calculated in accordance with the standard formula for valuing mutual fund shares. The NAV return is based on the NAV of the Fund, and the market return is based on the market price per share of the Fund. The price used to calculate market return (“Market Price”) is determined by using the midpoint between the highest bid and the lowest offer on the stock exchange on which the shares of the Fund are listed for trading, as of the time that the Fund’s NAV is calculated. Market and NAV returns assume that dividends and capital gain distributions have been reinvested in the Fund at Market Price and NAV, respectively.
An index is a statistical composite that tracks a specified financial market or sector. Unlike the Fund, an index does not actually hold a portfolio of securities and therefore does not incur the expenses incurred by the Fund. These expenses negatively impact the performance of the Fund. Also, market returns do not include brokerage commissions that may be payable on secondary market transactions. If brokerage commissions were included, market returns would be lower. The returns shown in the tables above do not reflect the deduction of taxes that a shareholder would pay on fund distributions or the redemption or sale of fund shares. The investment return and principal value of shares of the Fund will vary with changes in market conditions. Shares of the Fund may be worth more or less than their original cost when they are redeemed or sold in the market. The Fund’s past performance is no guarantee of future results.
GROWTH OF $10,000 INVESTMENT
(AT NET ASSET VALUE)
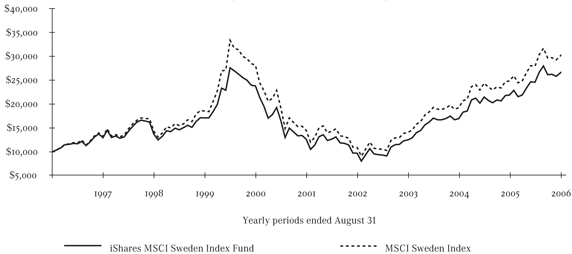
Performance figures assume reinvestment of all dividends and capital gain distributions and do not reflect the deduction of taxes that a shareholder would pay on fund distributions or the redemption of fund shares. An index is a statistical composite that tracks a specified financial market or sector. Unlike the Fund, an index does not actually hold a portfolio of securities and therefore does not incur the expenses incurred by the Fund. These expenses negatively impact the performance of the Fund. The Fund’s past performance is no guarantee of future results.
| MANAGEMENT’S DISCUSSIONSOF FUND PERFORMANCE | 17 |
Table of Contents
Management’s Discussion of Fund Performance (Continued)
iSHARES® MSCI SWEDEN INDEX FUND
PORTFOLIO ALLOCATION
As of 8/31/06
Sector | Percentage of Net Assets | ||
Communications | 25.47 | % | |
Financial | 21.78 | ||
Consumer Cyclical | 17.68 | ||
Industrial | 17.54 | ||
Consumer Non-Cyclical | 8.28 | ||
Basic Materials | 7.62 | ||
Energy | 0.90 | ||
Technology | 0.58 | ||
Short-Term and Other Net Assets | 0.15 | ||
TOTAL | 100.00 | % | |
TOP TEN FUND HOLDINGS
As of 8/31/06
Security | Percentage of Net Assets | ||
Telefonaktiebolaget LM Ericsson Class B | 18.28 | % | |
Nordea Bank AB | 9.68 | ||
Hennes & Mauritz AB Class B | 6.84 | ||
Svenska Handelsbanken AB Class A | 4.90 | ||
Volvo AB Class B | 4.59 | ||
Skandinaviska Enskilda Banken AB Class A | 4.45 | ||
TeliaSonera AB | 4.29 | ||
Sandvik AB | 4.09 | ||
Atlas Copco AB Class A | 3.20 | ||
Svenska Cellulosa AB Class B | 2.97 | ||
TOTAL | 63.29 | % | |
The iShares MSCI Sweden Index Fund (the “Fund”) seeks to provide investment results that correspond generally to the price and yield performance, before fees and expenses, of publicly traded securities in the aggregate in the Swedish market, as measured by the MSCI Sweden Index (the “Index”). The Fund invests in a representative sample of securities in the Index, which has a similar investment profile as the Index. Due to the use of representative sampling, the Fund may or may not hold all of the securities that are included in the Index. For the twelve-month period ended August 31, 2006 (the “reporting period”), the Fund returned 22.16%, while the Index returned 22.18%.
Sweden’s stock market delivered strong gains for the reporting period, though it lagged the broad performance of European equities. Improving economic conditions, both in Sweden and across Europe, appeared to provide the impetus for the rally in the Swedish stock market. Exports surged as economic activity in the Euro zone – particularly among Sweden’s main trading partners – increased. Unemployment remained well below the levels in most European countries, and better-than-expected manufacturing growth boosted consumer confidence. By the second quarter of 2006, the Swedish economy was growing at its fastest rate in six years. This level of growth led the Riksbank, the Swedish central bank, to raise its benchmark interest rate three times in an effort to keep inflation below its 2% target.
Currency fluctuations enhanced Swedish stock returns for U.S. investors; for the reporting period, the U.S. dollar declined by 4.2% against the Swedish krona. In local-currency terms, the Index returned 16.38%.
The ten largest Fund holdings represented approximately 63% of the net assets of the Fund as of August 31, 2006. All but one of the Fund’s ten largest holdings as of August 31, 2006, posted double-digit gains for the reporting period. The top performer was the Class A shares of industrial equipment maker Atlas Copco AB, which benefited from the increased investment in plants and equipment by manufacturing companies around the world. Other strong performers among the ten largest holdings included the Class A shares of financial services provider Skandinaviska Enskilda Banken AB and the Class B shares of automaker Volvo AB. The Fund’s largest holding, the Class B shares of wireless telecommunications firm Telefonaktiebolaget LM Ericsson, was the only holding in the top ten to decline during the reporting period.
| 18 | 2006 iSHARES ANNUAL REPORTTO SHAREHOLDERS |
Table of Contents
Management’s Discussion of Fund Performance
iSHARES® MSCI SWITZERLAND INDEX FUND
Performance as of August 31, 2006
Average Annual Total Returns
| Year Ended 8/31/06 | Five Years Ended 8/31/06 | Ten Years Ended 8/31/06 | ||||||||||||||||||||||
| NAV | MARKET | INDEX | NAV | MARKET | INDEX | NAV | MARKET | INDEX | ||||||||||||||||
| 28.36% | 28.41 | % | 29.11 | % | 12.08 | % | 12.13 | % | 13.17 | % | 8.07 | % | 8.22 | % | 9.47 | % | ||||||||
| Cumulative Total Returns | ||||||||||||||||||||||||
| Year Ended 8/31/06 | Five Years Ended 8/31/06 | Ten Years Ended 8/31/06 | ||||||||||||||||||||||
| NAV | MARKET | INDEX | NAV | MARKET | INDEX | NAV | MARKET | INDEX | ||||||||||||||||
| 28.36% | 28.41 | % | 29.11 | % | 76.84 | % | 77.29 | % | 85.64 | % | 117.23 | % | 120.39 | % | 147.09 | % | ||||||||
“Average annual total returns” represent the average annual change in value of an investment over the periods indicated. “Cumulative total returns” represent the total change in value of an investment over the periods indicated.
The Fund’s per share net asset value or “NAV” is the value of one share of the Fund as calculated in accordance with the standard formula for valuing mutual fund shares. The NAV return is based on the NAV of the Fund, and the market return is based on the market price per share of the Fund. The price used to calculate market return (“Market Price”) is determined by using the midpoint between the highest bid and the lowest offer on the stock exchange on which the shares of the Fund are listed for trading, as of the time that the Fund’s NAV is calculated. Market and NAV returns assume that dividends and capital gain distributions have been reinvested in the Fund at Market Price and NAV, respectively.
An index is a statistical composite that tracks a specified financial market or sector. Unlike the Fund, an index does not actually hold a portfolio of securities and therefore does not incur the expenses incurred by the Fund. These expenses negatively impact the performance of the Fund. Also, market returns do not include brokerage commissions that may be payable on secondary market transactions. If brokerage commissions were included, market returns would be lower. The returns shown in the tables above do not reflect the deduction of taxes that a shareholder would pay on fund distributions or the redemption or sale of fund shares. The investment return and principal value of shares of the Fund will vary with changes in market conditions. Shares of the Fund may be worth more or less than their original cost when they are redeemed or sold in the market. The Fund’s past performance is no guarantee of future results.
GROWTH OF $10,000 INVESTMENT
(AT NET ASSET VALUE)
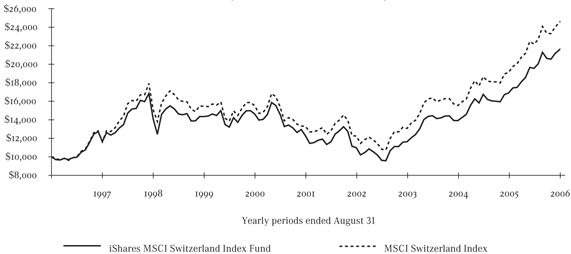
Performance figures assume reinvestment of all dividends and capital gain distributions and do not reflect the deduction of taxes that a shareholder would pay on fund distributions or the redemption of fund shares. An index is a statistical composite that tracks a specified financial market or sector. Unlike the Fund, an index does not actually hold a portfolio of securities and therefore does not incur the expenses incurred by the Fund. These expenses negatively impact the performance of the Fund. The Fund’s past performance is no guarantee of future results.
| MANAGEMENT’S DISCUSSIONSOF FUND PERFORMANCE | 19 |
Table of Contents
Management’s Discussion of Fund Performance (Continued)
iSHARES® MSCI SWITZERLAND INDEX FUND
PORTFOLIO ALLOCATION
As of 8/31/06
Sector | Percentage of Net Assets | ||
Consumer Non-Cyclical | 46.88 | % | |
Financial | 27.90 | ||
Industrial | 9.14 | ||
Basic Materials | 6.40 | ||
Consumer Cyclical | 6.04 | ||
Communications | 2.69 | ||
Technology | 0.56 | ||
Short-Term and Other Net Assets | 0.39 | ||
TOTAL | 100.00 | % | |
TOP TEN FUND HOLDINGS
As of 8/31/06
Security | Percentage of Net Assets | ||
Roche Holding AG Genusschein | 13.54 | % | |
Nestle SA Registered | 12.81 | ||
Novartis AG | 12.28 | ||
UBS AG Registered | 10.44 | ||
Credit Suisse Group | 4.81 | ||
Zurich Financial Services AG | 4.75 | ||
Swiss Reinsurance Co. | 4.33 | ||
Compagnie Financiere Richemont AG Class A | 3.72 | ||
ABB Ltd. | 3.25 | ||
Syngenta AG | 3.15 | ||
TOTAL | 73.08 | % | |
The iShares MSCI Switzerland Index Fund (the “Fund”) seeks to provide investment results that correspond generally to the price and yield performance, before fees and expenses, of publicly traded securities in the aggregate in the Swiss market, as measured by the MSCI Switzerland Index (the “Index”). The Fund invests in a representative sample of securities in the Index, which has a similar investment profile as the Index. Due to the use of representative sampling, the Fund may or may not hold all of the securities that are included in the Index. For the twelve-month period ended August 31, 2006 (the “reporting period”), the Fund returned 28.36%, while the Index returned 29.11%.
Switzerland’s stock market posted strong returns and outpaced the broad performance of European equities during the reporting period. The Swiss economy, which is largely dependent on exports to other European countries, showed substantial improvement as economic activity in the Euro zone increased. This export-led recovery boosted the Swiss economy to its fastest growth rate in five years (as of the fourth quarter 2005), and manufacturing growth in Switzerland reached an all-time high in August 2006. Although the upbeat economic environment provided a lift to Switzerland’s stock market, it also led to the highest year-over-year inflation figures since 2000. As a result, the Swiss National Bank raised its benchmark interest rate three times during the reporting period. Nonetheless, Swiss interest rates remain the lowest in Europe.
Currency fluctuations enhanced Swiss stock returns for U.S. investors; for the reporting period, the U.S. dollar declined by 1.7% against the Swiss franc. The Swiss currency also fell 2% against the euro, which made Swiss exports to Euro zone countries less expensive.
The ten largest Fund holdings accounted for approximately 73% of Fund net assets as of August 31, 2006. Each of the Fund’s ten largest holdings as of August 31, 2006 posted double-digit gains for the reporting period. With manufacturing activity in high gear, the top performer among the ten largest holdings was industrial equipment maker ABB Ltd. Financial conglomerate UBS AG and agricultural chemicals manufacturer Syngenta AG also posted strong returns as both companies reported better-than-expected earnings. The lowest return among the Fund’s ten largest holdings came from pharmaceutical company Novartis AG, though it still performed well for the reporting period.
| 20 | 2006 iSHARES ANNUAL REPORTTO SHAREHOLDERS |
Table of Contents
Management’s Discussion of Fund Performance
iSHARES® MSCI UNITED KINGDOM INDEX FUND
Performance as of August 31, 2006
Average Annual Total Returns
| Year Ended 8/31/06 | Five Years Ended 8/31/06 | Ten Years Ended 8/31/06 | |||||||||||||||||||||||
| NAV | MARKET | INDEX | NAV | MARKET | INDEX | NAV | MARKET | INDEX | |||||||||||||||||
| 20.61 | % | 20.41 | % | 21.36 | % | 10.34 | % | 10.36 | % | 11.15 | % | 8.68 | % | 8.70 | % | 9.40 | % | ||||||||
| Cumulative Total Returns | |||||||||||||||||||||||||
| Year Ended 8/31/06 | Five Years Ended 8/31/06 | Ten Years Ended 8/31/06 | |||||||||||||||||||||||
| NAV | MARKET | INDEX | NAV | MARKET | INDEX | NAV | MARKET | INDEX | |||||||||||||||||
| 20.61 | % | 20.41 | % | 21.36 | % | 63.52 | % | 63.73 | % | 69.63 | % | 129.96 | % | 130.33 | % | 145.46 | % | ||||||||
“Average annual total returns” represent the average annual change in value of an investment over the periods indicated. “Cumulative total returns” represent the total change in value of an investment over the periods indicated.
The Fund’s per share net asset value or “NAV” is the value of one share of the Fund as calculated in accordance with the standard formula for valuing mutual fund shares. The NAV return is based on the NAV of the Fund, and the market return is based on the market price per share of the Fund. The price used to calculate market return (“Market Price”) is determined by using the midpoint between the highest bid and the lowest offer on the stock exchange on which the shares of the Fund are listed for trading, as of the time that the Fund’s NAV is calculated. Market and NAV returns assume that dividends and capital gain distributions have been reinvested in the Fund at Market Price and NAV, respectively.
An index is a statistical composite that tracks a specified financial market or sector. Unlike the Fund, an index does not actually hold a portfolio of securities and therefore does not incur the expenses incurred by the Fund. These expenses negatively impact the performance of the Fund. Also, market returns do not include brokerage commissions that may be payable on secondary market transactions. If brokerage commissions were included, market returns would be lower. The returns shown in the tables above do not reflect the deduction of taxes that a shareholder would pay on fund distributions or the redemption or sale of fund shares. The investment return and principal value of shares of the Fund will vary with changes in market conditions. Shares of the Fund may be worth more or less than their original cost when they are redeemed or sold in the market. The Fund’s past performance is no guarantee of future results.
GROWTH OF $10,000 INVESTMENT
(AT NET ASSET VALUE)
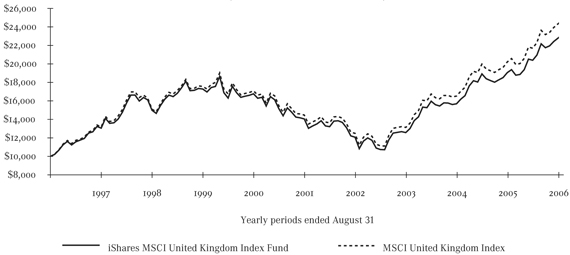
Performance figures assume reinvestment of all dividends and capital gain distributions and do not reflect the deduction of taxes that a shareholder would pay on fund distributions or the redemption of fund shares. An index is a statistical composite that tracks a specified financial market or sector. Unlike the Fund, an index does not actually hold a portfolio of securities and therefore does not incur the expenses incurred by the Fund. These expenses negatively impact the performance of the Fund. The Fund’s past performance is no guarantee of future results.
| MANAGEMENT’S DISCUSSIONSOF FUND PERFORMANCE | 21 |
Table of Contents
Management’s Discussion of Fund Performance (Continued)
iSHARES® MSCI UNITED KINGDOM INDEX FUND
PORTFOLIO ALLOCATION
As of 8/31/06
Sector | Percentage of Net Assets | ||
Financial | 26.78 | % | |
Consumer Non-Cyclical | 21.98 | ||
Energy | 17.74 | ||
Communications | 8.84 | ||
Basic Materials | 7.68 | �� | |
Consumer Cyclical | 7.15 | ||
Utilities | 4.42 | ||
Industrial | 3.64 | ||
Technology | 0.63 | ||
Diversified | 0.16 | ||
Short-Term and Other Net Assets | 0.98 | ||
TOTAL | 100.00 | % | |
TOP TEN FUND HOLDINGS
As of 8/31/06
Security | Percentage of Net Assets | ||
BP PLC | 7.97 | % | |
HSBC Holdings PLC | 7.32 | ||
GlaxoSmithKline PLC | 5.79 | ||
Royal Dutch Shell PLC Class A | 4.69 | ||
Vodafone Group PLC | 4.01 | ||
Royal Bank of Scotland Group PLC | 3.81 | ||
AstraZeneca PLC | 3.57 | ||
Royal Dutch Shell PLC Class B | 3.47 | ||
Barclays PLC | 2.86 | ||
HBOS PLC | 2.56 | ||
TOTAL | 46.05 | % | |
The iShares MSCI United Kingdom Index Fund (the “Fund”) seeks to provide investment results that correspond generally to the price and yield performance, before fees and expenses, of publicly traded securities in the aggregate in the British market, as measured by the MSCI United Kingdom Index (the “Index”). The Fund invests in a representative sample of securities in the Index, which has a similar investment profile as the Index. Due to the use of representative sampling, the Fund may or may not hold all of the securities that are included in the Index. For the twelve-month period ended August 31, 2006 (the “reporting period”), the Fund returned 20.61%, while the Index returned 21.36%.
The United Kingdom’s stock market enjoyed a strong return for the reporting period, though it modestly trailed the broad performance of European equities. Economic conditions in the United Kingdom (“U.K.”), which were sluggish as the reporting period began, showed significant signs of improvement as the reporting period progressed. The housing market picked up as mortgage approvals reached record levels, consumer spending surged, and exports increased. Although the upbeat economic environment provided a lift to the stock market, it also led to the highest monthly inflation figures since 1997. The Bank of England (“BOE”) raised its benchmark interest rate in August 2006 — for the first time in two years — after inflation came in above the BOE’s 2% target for three straight months.
Currency fluctuations enhanced U.K. stock returns for U.S. investors; for the reporting period, the U.S. dollar declined by 4.7% against the British pound. In local-currency terms, the Index returned just 14.75%.
The ten largest Fund holdings represented approximately 46% of the net assets of the Fund as of August 31, 2006. Among the Fund’s ten largest holdings as of August 31, 2006, the top performer for the reporting period was pharmaceutical company AstraZeneca PLC. Favorable news regarding the company’s cholesterol drug, as well as efforts to cut the time and costs of drug development, helped boost AstraZeneca’s stock price. Several financial stocks in the top ten also posted strong returns during the reporting period—Barclays PLC, HBOS PLC, and Royal Bank of Scotland Group PLC all rose sharply after reporting better-than-expected profits. The only stock among the Fund’s ten largest holdings to decline for the reporting period was telecommunications services provider Vodafone Group PLC.
| 22 | 2006 iSHARES ANNUAL REPORTTO SHAREHOLDERS |
Table of Contents
Shareholder Expenses (Unaudited)
iSHARES®, INC.
As a shareholder of an iShares Fund, you incur two types of costs: (1) transaction costs, including brokerage commissions on purchases and sales of fund shares and (2) ongoing costs, including management fees and other fund expenses. The following Example is intended to help you understand your ongoing costs (in dollars and cents) of investing in a Fund and to compare these costs with the ongoing costs of investing in other funds.
The Example is based on an investment of $1,000 invested at the beginning of the period and held for the entire period from March 1, 2006 to August 31, 2006.
ACTUAL EXPENSES
The first line under each Fund in the table below provides information about actual account values and actual expenses. You may use the information in this line, together with the amount you invested, to estimate the expenses that you paid over the period. Simply divide your account value by $1,000 (for example, an $8,600 account value divided by $1,000 = 8.6), then multiply the result by the number in the first line for your Fund under the heading entitled “Expenses Paid During Period” to estimate the expenses you paid on your account during this period.
HYPOTHETICAL EXAMPLE FOR COMPARISON PURPOSES
The second line under each Fund in the table below provides information about hypothetical account values and hypothetical expenses based on each Fund’s actual expense ratio and an assumed rate of return of 5% per year before expenses, which is not the Fund’s actual return. The hypothetical account values and expenses may not be used to estimate the actual ending account balance or expenses you paid for the period. You may use this information to compare the ongoing costs of investing in your Fund and other funds. To do so, compare this 5% hypothetical example with the 5% hypothetical examples that appear in the shareholder reports of the other funds.
Please note that the expenses shown in the table are meant to highlight your ongoing costs only and do not reflect any transactional costs, such as brokerage commissions paid on purchases and sales of fund shares. Therefore, the second line under each Fund in the table is useful in comparing ongoing costs only and will not help you determine the relative total costs of owning different funds. In addition, if these transactional costs were included, your costs would have been higher.
iShares MSCI Index Fund | Beginning Account Value (3/1/06) | Ending Account Value (8/31/06) | Annualized Expense Ratio | Expenses Paid During Period a (3/1/06 to 8/31/06) | ||||||||
Austria | ||||||||||||
Actual | $ | 1,000.00 | $ | 1,036.30 | 0.52 | % | $ | 2.67 | ||||
Hypothetical (5% return before expenses) | 1,000.00 | 1,022.58 | 0.52 | 2.65 | ||||||||
Belgium | ||||||||||||
Actual | 1,000.00 | 1,107.20 | 0.52 | 2.76 | ||||||||
Hypothetical (5% return before expenses) | 1,000.00 | 1,022.58 | 0.52 | 2.65 | ||||||||
EMU | ||||||||||||
Actual | 1,000.00 | 1,106.30 | 0.53 | 2.81 | ||||||||
Hypothetical (5% return before expenses) | 1,000.00 | 1,022.53 | 0.53 | 2.70 | ||||||||
France | ||||||||||||
Actual | 1,000.00 | 1,127.80 | 0.52 | 2.79 | ||||||||
Hypothetical (5% return before expenses) | 1,000.00 | 1,022.58 | 0.52 | 2.65 | ||||||||
| SHAREHOLDER EXPENSES | 23 |
Table of Contents
Shareholder Expenses (Unaudited) (Continued)
iSHARES®, INC.
iShares MSCI Index Fund | Beginning Account Value (3/1/06) | Ending Account Value (8/31/06) | Annualized Expense Ratio | Expenses Paid During Period a (3/1/06 to 8/31/06) | ||||||||
Germany | ||||||||||||
Actual | $ | 1,000.00 | $ | 1,074.40 | 0.52 | % | $ | 2.72 | ||||
Hypothetical (5% return before expenses) | 1,000.00 | 1,022.58 | 0.52 | 2.65 | ||||||||
Italy | ||||||||||||
Actual | 1,000.00 | 1,121.40 | 0.52 | 2.78 | ||||||||
Hypothetical (5% return before expenses) | 1,000.00 | 1,022.58 | 0.52 | 2.65 | ||||||||
Netherlands | ||||||||||||
Actual | 1,000.00 | 1,113.80 | 0.52 | 2.77 | ||||||||
Hypothetical (5% return before expenses) | 1,000.00 | 1,022.58 | 0.52 | 2.65 | ||||||||
Spain | ||||||||||||
Actual | 1,000.00 | 1,125.60 | 0.52 | 2.79 | ||||||||
Hypothetical (5% return before expenses) | 1,000.00 | 1,022.58 | 0.52 | 2.65 | ||||||||
Sweden | ||||||||||||
Actual | 1,000.00 | 1,089.20 | 0.52 | 2.74 | ||||||||
Hypothetical (5% return before expenses) | 1,000.00 | 1,022.58 | 0.52 | 2.65 | ||||||||
Switzerland | ||||||||||||
Actual | 1,000.00 | 1,109.50 | 0.52 | 2.76 | ||||||||
Hypothetical (5% return before expenses) | 1,000.00 | 1,022.58 | 0.52 | 2.65 | ||||||||
United Kingdom | ||||||||||||
Actual | 1,000.00 | 1,127.00 | 0.52 | 2.79 | ||||||||
Hypothetical (5% return before expenses) | 1,000.00 | 1,022.58 | 0.52 | 2.65 | ||||||||
| a | Expenses are calculated using each Fund’s annualized expense ratio (as disclosed in the table), multiplied by the average account value for the period, multiplied by the number of days in the period (184 days) and divided by the number of days in the year (365 days). |
| 24 | 2006 iSHARES ANNUAL REPORTTO SHAREHOLDERS |
Table of Contents
iSHARES® MSCI AUSTRIA INDEX FUND
August 31, 2006
Security | Shares | Value | ||||
COMMON STOCKS – 99.79% | ||||||
BANKS – 23.52% | ||||||
Erste Bank der Oesterreichischen Sparkassen AG | 1,209,852 | $ | 73,097,274 | |||
Raiffeisen International Bank Holding AG | 210,798 | 18,996,171 | ||||
| 92,093,445 | ||||||
BUILDING MATERIALS – 4.98% | ||||||
Wienerberger Baustoffindustrie AG | 406,728 | 19,508,088 | ||||
| 19,508,088 | ||||||
CHEMICALS – 0.15% | ||||||
Lenzing AG | 2,750 | 605,358 | ||||
| 605,358 | ||||||
DIVERSIFIED FINANCIAL SERVICES – 0.01% | ||||||
GHV-Split Vermoegensverwaltung1 | 39,564 | 50,644 | ||||
| 50,644 | ||||||
ELECTRIC – 5.63% | ||||||
EVN AG | 29,549 | �� | 3,249,477 | |||
Oesterreichische Elektrizitaetswirtschafts AG Class A | 373,212 | 18,784,344 | ||||
| 22,033,821 | ||||||
ENGINEERING & CONSTRUCTION – 1.56% | ||||||
Flughafen Wien AG2 | 75,439 | 6,111,643 | ||||
| 6,111,643 | ||||||
ENTERTAINMENT – 1.36% | ||||||
bwin Interactive Entertainment AG2,3 | 142,744 | 5,308,000 | ||||
| 5,308,000 | ||||||
ENVIRONMENTAL CONTROL – 0.23% | ||||||
BWT AG | 13,986 | 538,516 | ||||
Christ Water Technology AG3 | 21,798 | 344,038 | ||||
| 882,554 | ||||||
FOREST PRODUCTS & PAPER – 1.19% | ||||||
Mayr-Melnhof Karton AG | 26,495 | 4,646,006 | ||||
| 4,646,006 | ||||||
INSURANCE – 3.47% | ||||||
Wiener Staedtische Allgemeine Versicherung AG | 222,162 | 13,604,666 | ||||
| 13,604,666 | ||||||
Security | Shares or Principal | Value | ||||
IRON & STEEL – 8.94% | ||||||
Boehler-Uddeholm AG2 | 290,178 | $ | 15,600,579 | |||
Voestalpine AG | 512,316 | 19,398,271 | ||||
| 34,998,850 | ||||||
MACHINERY – 3.14% | ||||||
Andritz AG | 78,120 | 12,313,693 | ||||
| 12,313,693 | ||||||
MACHINERY – CONSTRUCTION & MINING – 0.07% | ||||||
Palfinger AG | 2,772 | 273,219 | ||||
| 273,219 | ||||||
MANUFACTURING – 1.46% | ||||||
RHI AG3 | 166,320 | 5,707,793 | ||||
| 5,707,793 | ||||||
OIL & GAS – 14.52% | ||||||
OMV AG | 1,067,472 | 56,870,298 | ||||
| 56,870,298 | ||||||
REAL ESTATE – 15.46% | ||||||
CA Immobilien Anlagen AG3 | 598,719 | 16,515,710 | ||||
Immoeast Immobilien Anlagen AG3 | 889,688 | 10,477,375 | ||||
Immofinanz Immobilien Anlagen AG3 | 1,237,314 | 14,333,605 | ||||
Meinl European Land Ltd.3 | 891,954 | 19,238,415 | ||||
| 60,565,105 | ||||||
TELECOMMUNICATIONS – 14.10% | ||||||
Telekom Austria AG | 2,256,156 | 55,218,416 | ||||
| 55,218,416 | ||||||
TOTAL COMMON STOCKS | 390,791,599 | |||||
SHORT-TERM INVESTMENTS – 2.77% | ||||||
CERTIFICATES OF DEPOSIT4 – 0.12% | ||||||
Credit Suisse First Boston NY | ||||||
5.28% - 5.43%, 04/23/07 - 08/21/07 | $ | 63,189 | 63,189 | |||
Societe Generale | ||||||
5.33%, 12/08/06 | 90,270 | 90,270 | ||||
Washington Mutual Bank | ||||||
5.36%, 11/13/06 | 225,675 | 225,675 | ||||
Wells Fargo Bank N.A. | ||||||
4.78%, 12/05/06 | 72,216 | 72,216 | ||||
| 451,350 | ||||||
| SCHEDULESOF INVESTMENTS | 25 |
Table of Contents
Schedule of Investments (Continued)
iSHARES® MSCI AUSTRIA INDEX FUND
August 31, 2006
Security | Principal | Value | ||||
COMMERCIAL PAPER4 – 0.45% | ||||||
Amstel Funding Corp. | ||||||
5.20%, 11/21/06 - 11/22/065 | $ | 26,339 | $ | 26,029 | ||
Amsterdam Funding Corp. | ||||||
5.27%, 09/15/065 | 90,270 | 90,085 | ||||
Atlantis One Funding | ||||||
5.30%, 11/14/065 | 123,858 | 122,508 | ||||
Barton Capital Corp. | ||||||
5.27%, 09/06/065 | 45,496 | 45,463 | ||||
Cancara Asset Securitisation Ltd. | ||||||
5.30%, 11/14/065 | 45,760 | 45,261 | ||||
CC USA Inc. | ||||||
5.03%, 10/24/065 | 18,054 | 17,920 | ||||
Charta LLC | ||||||
5.30%, 11/06/065 | 90,270 | 89,393 | ||||
Concord Minutemen Capital Co. LLC | ||||||
5.27% - 5.29%, 09/13/06 - 11/16/065 | 158,542 | 157,839 | ||||
Curzon Funding LLC | ||||||
5.29%, 11/17/065 | 90,270 | 89,249 | ||||
Edison Asset Securitization LLC | ||||||
5.22%, 12/11/065 | 66,594 | 65,619 | ||||
Falcon Asset Securitization Corp. | ||||||
5.30%, 11/06/065 | 90,270 | 89,393 | ||||
Five Finance Inc. | ||||||
5.19%, 12/01/065 | 40,622 | 40,089 | ||||
General Electric Capital Services Inc. | ||||||
5.22%, 12/11/06 | 9,027 | 8,895 | ||||
Giro Funding Corp. | ||||||
5.28% - 5.34%, 09/11/06 - 10/10/065 | 90,270 | 89,943 | ||||
Grampian Funding LLC | ||||||
5.03% - 5.30%, 10/17/06 - 11/16/065 | 43,330 | 42,971 | ||||
KKR Pacific Funding Trust | ||||||
5.29%, 09/14/065 | 90,270 | 90,098 | ||||
Landale Funding LLC | ||||||
5.31%, 11/15/065 | 70,411 | 69,632 | ||||
Lexington Parker Capital Co. LLC | ||||||
5.19% - 5.27%, 09/15/06 - 11/15/065 | 117,010 | 116,339 | ||||
Security | Shares or Principal | Value | ||||
Liberty Street Funding Corp. | ||||||
5.27%, 09/08/06 - 09/11/065 | $ | 80,340 | $ | 80,243 | ||
Mont Blanc Capital Corp. | ||||||
5.29%, 11/15/065 | 58,224 | 57,582 | ||||
Monument Gardens Funding LLC | ||||||
5.28%, 09/21/065 | 45,363 | 45,230 | ||||
Nestle Capital Corp. | ||||||
5.19%, 08/09/07 | 54,162 | 51,492 | ||||
Park Granada LLC | ||||||
5.30%, 09/01/065 | 20,629 | 20,628 | ||||
Regency Markets LLC | ||||||
5.28%, 09/15/06 | 45,135 | 45,042 | ||||
Solitaire Funding Ltd. | ||||||
5.27%, 09/05/065 | 67,703 | 67,663 | ||||
Sydney Capital Corp. | ||||||
5.27%, 09/12/065 | 20,654 | 20,621 | ||||
Tulip Funding Corp. | ||||||
5.29%, 11/15/065 | 47,610 | 47,086 | ||||
White Pine Finance LLC | ||||||
5.12%, 10/27/065 | 17,061 | 16,925 | ||||
| 1,749,238 | ||||||
MEDIUM-TERM NOTES4 – 0.10% | ||||||
Bank of America N.A. | ||||||
5.28%, 04/20/07 | 22,568 | 22,568 | ||||
Cullinan Finance Corp. | ||||||
5.71%, 06/28/075 | 67,703 | 67,702 | ||||
K2 USA LLC | ||||||
5.39%, 06/04/075 | 67,703 | 67,702 | ||||
Marshall & Ilsley Bank | ||||||
5.18%, 12/15/06 | 90,270 | 90,359 | ||||
Sigma Finance Inc. | ||||||
5.13% - 5.51%, 03/30/07 - 06/18/075 | 105,616 | 105,615 | ||||
US Bank N.A. | ||||||
2.85%, 11/15/06 | 18,054 | 17,986 | ||||
| 371,932 | ||||||
MONEY MARKET FUNDS – 0.02% | ||||||
Barclays Global Investors Funds Institutional Money Market Fund, Institutional Shares | ||||||
5.30%6,7 | 97,265 | 97,265 | ||||
| 97,265 | ||||||
| 26 | 2006 iSHARES ANNUAL REPORTTO SHAREHOLDERS |
Table of Contents
Schedule of Investments (Continued)
iSHARES® MSCI AUSTRIA INDEX FUND
August 31, 2006
Security | Principal | Value | ||||
REPURCHASE AGREEMENTS4 – 0.56% | ||||||
Banc of America Securities LLC Repurchase Agreement, 5.30%, due 9/1/06, maturity value $112,855 (collateralized by U.S. Government obligations, value $115,204, 5.50% to 6.50%, 1/1/33 to 7/1/36). | $ | 112,838 | $ | 112,838 | ||
Banc of America Securities LLC Repurchase Agreement, 5.36%, due 9/1/06, maturity value $180,567 (collateralized by non-U.S. Government debt securities, value $186,133, 3.80% to 9.13%, 11/1/06 to 6/15/26). | 180,540 | 180,540 | ||||
Bear Stearns Companies Inc. (The) Repurchase Agreement, 5.37%, due 9/1/06, maturity value $135,425 (collateralized by non-U.S. Government debt securities, value $149,089, 0.08% to 6.43%, 9/25/20 to 7/25/36). | 135,405 | 135,405 | ||||
Citigroup Global Markets Holdings Inc. Repurchase Agreement, 5.36%, due 9/1/06, maturity value $270,850 (collateralized by non-U.S. Government debt securities, value $282,977, 4.35% to 7.50%, 9/15/08 to 8/25/35). | 270,810 | 270,810 | ||||
Citigroup Global Markets Holdings Inc. Repurchase Agreement, 5.46%, due 9/1/06, maturity value $54,170 (collateralized by non-U.S. Government debt securities, value $66,117, 0.00% to 10.00%, 6/1/28 to 8/24/36). | 54,162 | 54,162 | ||||
Goldman Sachs & Co. Repurchase Agreement, 5.35%, due 9/1/06, maturity value $180,567 (collateralized by non-U.S. Government debt securities, value $184,326, 0.00% to 8.57%, 11/15/06 to 2/15/38). | 180,540 | 180,540 | ||||
Goldman Sachs Group Inc. Repurchase Agreement, 5.36%, due 9/1/06, maturity value $90,283 (collateralized by non-U.S. Government debt securities, value $94,873, 5.36% to 9.01%, 10/27/10 to 2/18/20). | 90,270 | 90,270 | ||||
JP Morgan Securities Inc. Repurchase Agreement, 5.41%, due 9/1/06, maturity value $22,571 (collateralized by non-U.S. Government debt securities, value $23,719, 6.63% to 10.50%, 1/15/07 to 4/15/16). | 22,568 | 22,568 | ||||
Lehman Brothers Holdings Inc. Repurchase Agreement, 5.36%, due 9/1/06, maturity value $180,567 (collateralized by non-U.S. Government debt securities, value $189,748, 0.51% to 8.89%, 8/5/18 to 9/25/46). | 180,540 | 180,540 | ||||
Lehman Brothers Holdings Inc. Repurchase Agreement, 5.38%, due 9/1/06, maturity value $90,283 (collateralized by non-U.S. Government debt securities, value $94,876, 4.11% to 9.79%, 4/28/31 to 9/25/46). | 90,270 | 90,270 | ||||
| SCHEDULESOF INVESTMENTS | 27 |
Table of Contents
Schedule of Investments (Continued)
iSHARES® MSCI AUSTRIA INDEX FUND
August 31, 2006
Security | Principal | Value | ||||
Lehman Brothers Holdings Inc. Repurchase Agreement, 5.46%, due 9/1/06, maturity value $99,312 (collateralized by non-U.S. Government debt securities, value $104,361, 3.44% to 15.15%, 12/1/08 to 3/1/36). | $ | 99,297 | $ | 99,297 | ||
Merrill Lynch & Co. Inc. Repurchase Agreement, 5.33%, due 9/1/06, maturity value $180,567 (collateralized by non-U.S. Government debt securities, value $189,750, 6.38% to 10.25%, 5/1/07 to 10/15/16). | 180,540 | 180,540 | ||||
Merrill Lynch & Co. Inc. Repurchase Agreement, 5.36%, due 9/1/06, maturity value $180,567 (collateralized by non-U.S. Government debt securities, value $186,166, 0.00% to 10.13%, 10/15/06 to 7/1/26). | 180,540 | 180,540 | ||||
Morgan Stanley Repurchase Agreement, 5.36%, due 9/1/06, maturity value $90,283 (collateralized by non-U.S. Government debt securities, value $94,917, 4.05% to 7.24%, 6/20/29 to 1/14/41). | 90,270 | 90,270 | ||||
Morgan Stanley Repurchase Agreement, 5.46%, due 9/1/06, maturity value $31,600 (collateralized by non-U.S. Government debt securities, value $48,453, 0.00% to 10.00%, 9/1/06 to 8/31/36). | 31,595 | 31,594 | ||||
Morgan Stanley Repurchase Agreement, 5.51%, due 6/4/07, maturity value $65,868 (collateralized by non-U.S. Government debt securities, value $98,375, 0.00% to 10.00%, 9/1/06 to 8/31/36).8 | 63,189 | 63,189 | ||||
Wachovia Capital Repurchase Agreement, 5.38%, due 9/1/06, maturity value $234,737 (collateralized by non-U.S. Government debt securities, value $246,671, 0.06% to 7.68%, 10/15/11 to 3/15/45). | 234,702 | 234,702 | ||||
| 2,198,075 | ||||||
TIME DEPOSITS4 – 0.00% | ||||||
KBC Bank | ||||||
5.31%, 09/01/06 | 19,048 | 19,048 | ||||
| 19,048 | ||||||
VARIABLE & FLOATING RATE NOTES 4 – 1.52% | ||||||
Allstate Life Global Funding II | ||||||
5.34% - 5.47%, 09/04/07 - 09/27/075 | 231,091 | 231,121 | ||||
American Express Bank | ||||||
5.30%, 02/28/07 | 90,270 | 90,270 | ||||
American Express Centurion Bank | ||||||
5.42%, 07/19/07 | 99,297 | 99,398 | ||||
American Express Credit Corp. | ||||||
5.51%, 07/05/07 | 27,081 | 27,096 | ||||
ASIF Global Financing | ||||||
5.51%, 05/03/075 | 9,027 | 9,030 | ||||
Australia & New Zealand Banking Group Ltd. | ||||||
5.32%, 09/21/075 | 58,676 | 58,676 | ||||
Bank of Ireland | ||||||
5.30% - 5.31%, 08/14/07 - 08/20/075 | 130,892 | 130,897 | ||||
Beta Finance Inc. | ||||||
5.29% - 5.48%, 04/25/07 - 07/25/075 | 230,189 | 230,200 | ||||
| 28 | 2006 iSHARES ANNUAL REPORTTO SHAREHOLDERS |
Table of Contents
Schedule of Investments (Continued)
iSHARES® MSCI AUSTRIA INDEX FUND
August 31, 2006
Security | Principal | Value | ||||
BMW US Capital LLC | ||||||
5.33%, 09/14/075 | $ | 90,270 | $ | 90,270 | ||
BNP Paribas | ||||||
5.36%, 05/18/075 | 167,000 | 167,000 | ||||
Carlyle Loan Investment Ltd. | ||||||
5.38%, 04/13/07 - 07/15/075 | 65,897 | 65,897 | ||||
CC USA Inc. | ||||||
5.48%, 07/30/075 | 45,135 | 45,141 | ||||
Commodore CDO Ltd. | ||||||
5.38%, 06/12/075 | 22,568 | 22,568 | ||||
Credit Agricole SA | ||||||
5.48%, 07/23/07 | 90,270 | 90,270 | ||||
Credit Suisse First Boston NY | ||||||
5.51%, 04/24/07 | 45,135 | 45,137 | ||||
Cullinan Finance Corp. | ||||||
5.36%, 04/25/075 | 22,568 | 22,568 | ||||
DEPFA Bank PLC | ||||||
5.37%, 06/15/07 | 90,270 | 90,270 | ||||
Dorada Finance Inc. | ||||||
5.41% - 5.47%, 06/27/07 - 07/17/075 | 103,811 | 103,817 | ||||
Eli Lilly Services Inc. | ||||||
5.37%, 08/31/075 | 90,270 | 90,270 | ||||
Fifth Third Bancorp | ||||||
5.30%, 09/21/075 | 180,540 | 180,540 | ||||
Five Finance Inc. | ||||||
5.37% - 5.45%, 12/01/06 - 07/13/075 | 90,270 | 90,263 | ||||
General Electric Capital Corp. | ||||||
5.29% - 5.49%, 07/09/07 - 09/24/07 | 94,784 | 94,806 | ||||
Granite Master Issuer PLC | ||||||
5.30%, 09/20/06 | 315,945 | 315,945 | ||||
Harrier Finance Funding LLC | ||||||
5.33%, 7/25/075 | 27,081 | 27,086 | ||||
Hartford Life Global Funding Trusts | ||||||
5.35% - 5.55%, 07/13/07 - 09/17/07 | 135,405 | 135,426 | ||||
HBOS Treasury Services PLC | ||||||
5.53%, 07/24/075 | 90,270 | 90,270 | ||||
Holmes Financing PLC | ||||||
5.40%, 07/16/075 | 157,973 | 157,973 | ||||
JP Morgan Chase & Co. | ||||||
5.36%, 08/02/07 | 67,703 | 67,702 | ||||
K2 USA LLC | ||||||
5.20% - 5.46%, 04/02/07 - 06/28/075 | 67,703 | 67,699 | ||||
Kestrel Funding | ||||||
LLC 5.31%, 07/11/075 | 36,108 | 36,105 | ||||
Kommunalkredit Austria AG | ||||||
5.33%, 09/09/075 | 54,162 | 54,162 | ||||
Leafs LLC | ||||||
5.33%, 01/22/07 - 02/20/075 | 94,185 | 94,185 | ||||
Lexington Parker Capital Co. LLC | ||||||
5.46%, 01/10/075 | 112,838 | 112,812 | ||||
Links Finance LLC | ||||||
5.33% - 5.35%, 05/10/07 - 05/16/075 | 99,297 | 99,290 | ||||
Lothian Mortgages Master Issuer PLC | ||||||
5.30%, 04/24/075 | 39,775 | 39,775 | ||||
Marshall & Ilsley Bank | ||||||
5.31%, 09/14/07 | 49,649 | 49,648 | ||||
Metropolitan Life Global Funding I | ||||||
5.42%, 08/06/075 | 135,405 | 135,405 | ||||
Metropolitan Life Insurance Funding Agreement | ||||||
5.57%, 08/01/075,8 | 9,027 | 9,027 | ||||
Monumental Global Funding II | ||||||
5.49%, 12/27/065 | 18,054 | 18,056 | ||||
Mound Financing PLC | ||||||
5.39%, 05/08/075 | 84,854 | 84,854 | ||||
Natexis Banques Populaires | ||||||
5.31% - 5.40%, 02/05/07 - 09/14/075 | 270,810 | 270,805 | ||||
National City Bank of Indiana | ||||||
5.37%, 05/21/07 | 45,135 | 45,138 | ||||
Nationwide Building Society | ||||||
5.44% - 5.62%, 07/06/07 - 07/27/075 | 297,891 | 297,961 | ||||
Newcastle Ltd. | ||||||
5.35%, 04/24/075 | 31,820 | 31,814 | ||||
Northern Rock PLC | ||||||
5.43%, 08/03/075 | 108,324 | 108,327 | ||||
| SCHEDULESOF INVESTMENTS | 29 |
Table of Contents
Schedule of Investments (Continued)
iSHARES® MSCI AUSTRIA INDEX FUND
August 31, 2006
Security | Principal | Value | |||||
Principal Life Global Funding I | |||||||
5.80%, 02/08/07 | $ | 40,622 | $ | 40,705 | |||
Sedna Finance Inc. | |||||||
5.30% - 5.37%, 09/20/06 - 08/21/075 | 157,973 | 157,970 | |||||
Skandinaviska Enskilda Bank NY | |||||||
5.33%, 09/18/075 | 90,270 | 90,270 | |||||
Strips III LLC | |||||||
5.38%, 07/24/075 | 21,950 | 21,950 | |||||
SunTrust Bank | |||||||
5.37%, 05/01/07 | 90,270 | 90,274 | |||||
Tango Finance Corp. | |||||||
5.22% - 5.48%, 04/25/07 - 07/16/075 | 220,259 | 220,240 | |||||
Union Hamilton Special Funding LLC | |||||||
5.42% - 5.49%, 09/28/06 - 12/21/065 | 126,378 | 126,378 | |||||
US Bank N.A. | |||||||
5.26%, 09/29/06 | 40,622 | 40,621 | |||||
Wachovia Asset Securitization Inc. | |||||||
5.31%, 09/25/065 | 134,702 | 134,702 | |||||
Wachovia Bank N.A. | |||||||
5.36%, 05/22/07 | 180,540 | 180,540 | |||||
Wells Fargo & Co. | |||||||
5.34%, 09/14/075 | 45,135 | 45,138 | |||||
WhistleJacket Capital Ltd. | |||||||
5.29% - 5.35%, 04/18/07 - 06/13/075 | 67,703 | 67,702 | |||||
White Pine Finance LLC | |||||||
5.29% - 5.35%, 05/22/07 - 08/20/075 | 270,810 | 270,753 | |||||
Wind Master Trust | |||||||
5.31% - 5.32%, 09/25/06 - 07/25/075 | 57,250 | 57,250 | |||||
| 5,969,463 | |||||||
TOTAL SHORT-TERM INVESTMENTS | 10,856,371 | ||||||
TOTAL INVESTMENTS IN SECURITIES – 102.56% | 401,647,970 | ||||||
Other Assets, Less Liabilities – (2.56)% | (10,010,581 | ) | |||||
NET ASSETS – 100.00% | $ | 391,637,389 | |||||
| 1 | Security valued at fair value in accordance with procedures approved by the Board of Directors. See Note 1. |
| 2 | All or a portion of this security represents a security on loan. See Note 5. |
| 3 | Non-income earning security. |
| 4 | All or a portion of this security (these securities) represent(s) an investment of securities lending collateral. See Note 5. |
| 5 | This security or a portion of these securities may be resold to qualified institutional buyers under Rule 144A or pursuant to Section 4(2) of the Securities Act of 1933. |
| 6 | Affiliated issuer. See Note 2. |
| 7 | The rate quoted is the annualized seven-day yield of the fund at period end. |
| 8 | The investment adviser has determined that this security or a portion of these securities is illiquid. |
See notes to the financial statements.
| 30 | 2006 iSHARES ANNUAL REPORTTO SHAREHOLDERS |
Table of Contents
iSHARES® MSCI BELGIUM INDEX FUND
August 31, 2006
Security | Shares | Value | ||||
COMMON STOCKS – 99.38% | ||||||
BANKS – 48.89% | ||||||
Banque Nationale de Belgique | 167 | $ | 675,722 | |||
Dexia Group | 561,788 | 14,418,290 | ||||
Fortis | 966,596 | 37,588,907 | ||||
KBC Groupe | 203,239 | 21,866,119 | ||||
| 74,549,038 | ||||||
BEVERAGES – 4.97% | ||||||
InBev | 146,125 | 7,581,027 | ||||
| 7,581,027 | ||||||
CHEMICALS – 4.85% | ||||||
Solvay SA | 61,122 | 7,397,518 | ||||
| 7,397,518 | ||||||
ELECTRICAL COMPONENTS & EQUIPMENT – 1.22% | ||||||
Bekaert NV | 19,038 | 1,866,711 | ||||
| 1,866,711 | ||||||
ELECTRONICS – 0.71% | ||||||
Barco NV | 12,191 | 1,075,191 | ||||
| 1,075,191 | ||||||
FOOD – 6.85% | ||||||
Colruyt SA | 25,885 | 4,396,894 | ||||
Delhaize Group | 79,492 | 6,049,259 | ||||
| 10,446,153 | ||||||
HOLDING COMPANIES – DIVERSIFIED – 8.08% | ||||||
Groupe Bruxelles Lambert SA | 70,308 | 7,375,316 | ||||
Sofina SA | 51,654 | 4,939,142 | ||||
| 12,314,458 | ||||||
MANUFACTURING – 1.49% | ||||||
AGFA-Gevaert NV | 96,860 | 2,270,177 | ||||
| 2,270,177 | ||||||
MINING – 4.17% | ||||||
Umicore | 43,754 | 6,356,829 | ||||
| 6,356,829 | ||||||
PHARMACEUTICALS – 5.12% | ||||||
Omega Pharma SA | 28,128 | 1,619,876 | ||||
UCB SA | 105,544 | 6,182,249 | ||||
| 7,802,125 | ||||||
REAL ESTATE INVESTMENT TRUSTS – 4.19% | ||||||
Cofinimmo1 | 36,573 | 6,385,603 | ||||
| 6,385,603 | ||||||
Security | Shares or Principal | Value | ||||
RETAIL – 1.13% | ||||||
SA D’Ieteren NV | 5,177 | $ | 1,726,286 | |||
| 1,726,286 | ||||||
TELECOMMUNICATIONS – 6.85% | ||||||
Belgacom SA | 212,091 | 7,484,899 | ||||
Mobistar SA | 36,046 | 2,962,232 | ||||
| 10,447,131 | ||||||
TRANSPORTATION – 0.86% | ||||||
Compagnie Maritime Belge SA | 16,118 | 545,300 | ||||
Euronav SA | 22,232 | 770,645 | ||||
| 1,315,945 | ||||||
TOTAL COMMON STOCKS | 151,534,192 | |||||
SHORT-TERM INVESTMENTS – 0.08% | ||||||
CERTIFICATES OF DEPOSIT2– 0.00% | ||||||
Credit Suisse First Boston NY | ||||||
5.28% - 5.43%, 04/23/07 - 08/21/07 | $ | 366 | 366 | |||
Societe Generale | ||||||
5.33%, 12/08/06 | 523 | 523 | ||||
Washington Mutual Bank | ||||||
5.36%, 11/13/06 | 1,309 | 1,309 | ||||
Wells Fargo Bank N.A. | ||||||
4.78%, 12/05/06 | 419 | 419 | ||||
| 2,617 | ||||||
COMMERCIAL PAPER2 – 0.01% | ||||||
Amstel Funding Corp. | ||||||
5.20%, 11/21/06 - 11/22/063 | 153 | 151 | ||||
Amsterdam Funding Corp. | ||||||
5.27%, 09/15/063 | 523 | 522 | ||||
Atlantis One Funding | ||||||
5.30%, 11/14/063 | 718 | 710 | ||||
Barton Capital Corp. | ||||||
5.27%, 09/06/063 | 264 | 264 | ||||
Cancara Asset Securitisation Ltd. | ||||||
5.30%, 11/14/063 | 265 | 262 | ||||
CC USA Inc. | ||||||
5.03%, 10/24/063 | 105 | 104 | ||||
Charta LLC | ||||||
5.30%, 11/06/063 | 523 | 518 | ||||
| SCHEDULESOF INVESTMENTS | 31 |
Table of Contents
Schedule of Investments (Continued)
iSHARES® MSCI BELGIUM INDEX FUND
August 31, 2006
Security | Principal | Value | ||||
Concord Minutemen Capital Co. LLC | ||||||
5.27% - 5.29%, 09/13/06 - 11/16/063 | $ | 919 | $ | 915 | ||
Curzon Funding LLC | ||||||
5.29%, 11/17/063 | 523 | 517 | ||||
Edison Asset Securitization LLC | ||||||
5.22%, 12/11/063 | 386 | 380 | ||||
Falcon Asset Securitization Corp. | ||||||
5.30%, 11/06/063 | 523 | 518 | ||||
Five Finance Inc. | ||||||
5.19%, 12/01/063 | 236 | 232 | ||||
General Electric Capital Services Inc. | ||||||
5.22%, 12/11/06 | 52 | 52 | ||||
Giro Funding Corp. | ||||||
5.28% - 5.34%, 09/11/06 - 10/10/063 | 523 | 521 | ||||
Grampian Funding LLC | ||||||
5.03% - 5.30%, 10/17/06 - 11/16/063 | 251 | 249 | ||||
KKR Pacific Funding Trust | ||||||
5.29%, 09/14/063 | 523 | 522 | ||||
Landale Funding LLC | ||||||
5.31%, 11/15/063 | 408 | 404 | ||||
Lexington Parker Capital Co. LLC | ||||||
5.19% - 5.27%, 09/15/06 - 11/15/063 | 678 | 675 | ||||
Liberty Street Funding Corp. | ||||||
5.27%, 09/08/06 - 09/11/063 | 466 | 465 | ||||
Mont Blanc Capital Corp. | ||||||
5.29%, 11/15/063 | 338 | 334 | ||||
Monument Gardens Funding LLC | ||||||
5.28%, 09/21/063 | 263 | 262 | ||||
Nestle Capital Corp. | ||||||
5.19%, 08/09/07 | 314 | 299 | ||||
Park Granada LLC | ||||||
5.30%, 09/01/063 | 120 | 120 | ||||
Regency Markets LLC | ||||||
5.28%, 09/15/06 | 262 | 261 | ||||
Solitaire Funding Ltd. | ||||||
5.27%, 09/05/063 | 393 | 392 | ||||
Sydney Capital Corp. | ||||||
5.27%, 09/12/063 | 120 | 120 | ||||
Tulip Funding Corp. | ||||||
5.29%, 11/15/063 | 276 | 273 | ||||
Security | Shares or Principal | Value | ||||
White Pine Finance LLC | ||||||
5.12%, 10/27/063 | $ | 99 | $ | 98 | ||
| 10,140 | ||||||
MEDIUM-TERM NOTES2 – 0.00% | ||||||
Bank of America N.A. | ||||||
5.28%, 04/20/07 | 131 | 131 | ||||
Cullinan Finance Corp. | ||||||
5.71%, 06/28/073 | 393 | 393 | ||||
K2 USA LLC | ||||||
5.39%, 06/04/073 | 393 | 393 | ||||
Marshall & Ilsley Bank | ||||||
5.18%, 12/15/06 | 523 | 524 | ||||
Sigma Finance Inc. | ||||||
5.13% - 5.51%, 03/30/07 - 06/18/073 | 612 | 612 | ||||
US Bank N.A. | ||||||
2.85%, 11/15/06 | 105 | 104 | ||||
| 2,157 | ||||||
MONEY MARKET FUNDS – 0.04% | ||||||
Barclays Global Investors Funds Institutional Money Market Fund, Institutional Shares 5.30%4,5 | 61,136 | 61,136 | ||||
| 61,136 | ||||||
REPURCHASE AGREEMENTS2– 0.01% | ||||||
Banc of America Securities LLC Repurchase Agreement, 5.30%, due 9/1/06, maturity value $654 (collateralized by U.S. Government obligations, value $668, 5.50% to 6.50%, 1/1/33 to 7/1/36). | $ | 654 | 654 | |||
Banc of America Securities LLC Repurchase Agreement, 5.36%, due 9/1/06, maturity value $1,047 (collateralized by non-U.S. Government debt securities, value $1,079, 3.80% to 9.13%, 11/1/06 to 6/15/26). | 1,047 | 1,047 | ||||
| 32 | 2006 iSHARES ANNUAL REPORTTO SHAREHOLDERS |
Table of Contents
Schedule of Investments (Continued)
iSHARES® MSCI BELGIUM INDEX FUND
August 31, 2006
Security | Principal | Value | ||||
Bear Stearns Companies Inc. (The) Repurchase Agreement, 5.37%, due 9/1/06, maturity value $785 (collateralized by non-U.S. Government debt securities, value $864, 0.08% to 6.43%, 9/25/20 to 7/25/36). | $ | 785 | $ | 785 | ||
Citigroup Global Markets Holdings Inc. Repurchase Agreement, 5.36%, due 9/1/06, maturity value $1,570 (collateralized by non-U.S. Government debt securities, value $1,641, 4.35% to 7.50%, 9/15/08 to 8/25/35). | 1,570 | 1,570 | ||||
Citigroup Global Markets Holdings Inc. Repurchase Agreement, 5.46%, due 9/1/06, maturity value $314 (collateralized by non-U.S. Government debt securities, value $383, 0.00% to 10.00%, 6/1/28 to 8/24/36). | 314 | 314 | ||||
Goldman Sachs & Co. Repurchase Agreement, 5.35%, due 9/1/06, maturity value $1,047 (collateralized by non-U.S. Government debt securities, value $1,069, 0.00% to 8.57%, 11/15/06 to 2/15/38). | 1,047 | 1,047 | ||||
Goldman Sachs Group Inc. Repurchase Agreement, 5.36%, due 9/1/06, maturity value $523 (collateralized by non-U.S. Government debt securities, value $550, 5.36% to 9.01%, 10/27/10 to 2/18/20). | 523 | 523 | ||||
JP Morgan Securities Inc. Repurchase Agreement, 5.41%, due 9/1/06, maturity value $131 (collateralized by non-U.S. Government debt securities, value $138, 6.63% to 10.50%, 1/15/07 to 4/15/16). | 131 | 131 | ||||
Lehman Brothers Holdings Inc. Repurchase Agreement, 5.36%, due 9/1/06, maturity value $1,047 (collateralized by non-U.S. Government debt securities, value $1,100, 0.51% to 8.89%, 8/5/18 to 9/25/46). | 1,047 | 1,047 | ||||
Lehman Brothers Holdings Inc. Repurchase Agreement, 5.38%, due 9/1/06, maturity value $523 (collateralized by non-U.S. Government debt securities, value $550, 4.11% to 9.79%, 4/28/31 to 9/25/46). | 523 | 523 | ||||
Lehman Brothers Holdings Inc. Repurchase Agreement, 5.46%, due 9/1/06, maturity value $576 (collateralized by non-U.S. Government debt securities, value $605, 3.44% to 15.15%, 12/1/08 to 3/1/36). | 576 | 576 | ||||
Merrill Lynch & Co. Inc. Repurchase Agreement, 5.33%, due 9/1/06, maturity value $1,047 (collateralized by non-U.S. Government debt securities, value $1,100, 6.38% to 10.25%, 5/1/07 to 10/15/16). | 1,047 | 1,047 | ||||
| SCHEDULESOF INVESTMENTS | 33 |
Table of Contents
Schedule of Investments (Continued)
iSHARES® MSCI BELGIUM INDEX FUND
August 31, 2006
Security | Principal | Value | ||||
Merrill Lynch & Co. Inc. Repurchase Agreement, 5.36%, due 9/1/06, maturity value $1,047 (collateralized by non-U.S. Government debt securities, value $1,079, 0.00% to 10.13%, 10/15/06 to 7/1/26). | $ | 1,047 | $ | 1,047 | ||
Morgan Stanley Repurchase Agreement, 5.36%, due 9/1/06, maturity value $ 523 (collateralized by non-U.S. Government debt securities, value $550, 4.05% to 7.24%, 6/20/29 to 1/14/41). | 523 | 523 | ||||
Morgan Stanley Repurchase Agreement, 5.46%, due 9/1/06, maturity value $183 (collateralized by non-U.S. Government debt securities, value $281, 0.00% to 10.00%, 9/1/06 to 8/31/36). | 183 | 183 | ||||
Morgan Stanley Repurchase Agreement, 5.51%, due 6/4/07, maturity value $382 (collateralized by non-U.S. Government debt securities, value $570, 0.00% to 10.00%, 9/1/06 to 8/31/36).6 | 366 | 366 | ||||
Wachovia Capital Repurchase Agreement, 5.38%, due 9/1/06, maturity value $1,361 (collateralized by non-U.S. Government debt securities, value $1,430, 0.06% to 7.68%, 10/15/11 to 3/15/45). | 1,361 | 1,361 | ||||
| 12,744 | ||||||
TIME DEPOSITS2 – 0.00% | ||||||
KBC Bank | ||||||
5.31%, 09/01/06 | 110 | 110 | ||||
| 110 | ||||||
VARIABLE & FLOATING RATE NOTES2 – 0.02% | ||||||
Allstate Life Global Funding II | ||||||
5.34% - 5.47%, 09/04/07 - 09/27/073 | 1,340 | 1,347 | ||||
American Express Bank | ||||||
5.30%, 02/28/07 | 523 | 524 | ||||
American Express Centurion Bank | ||||||
5.42%, 07/19/07 | 576 | 576 | ||||
American Express Credit Corp. | ||||||
5.51%, 07/05/07 | 157 | 157 | ||||
ASIF Global Financing | ||||||
5.51%, 05/03/073 | 52 | 52 | ||||
Australia & New Zealand Banking Group Ltd. | ||||||
5.32%, 09/21/073 | 340 | 340 | ||||
Bank of Ireland | ||||||
5.30% - 5.31%, 08/14/07 - 08/20/073 | 759 | 759 | ||||
Beta Finance Inc. | ||||||
5.29% - 5.48%, 04/25/07 - 07/25/073 | 1,335 | 1,335 | ||||
BMW US Capital LLC | ||||||
5.33%, 09/14/073 | 523 | 523 | ||||
BNP Paribas | ||||||
5.36%, 05/18/073 | 968 | 968 | ||||
Carlyle Loan Investment Ltd. | ||||||
5.38%, 04/13/07 - 07/15/073 | 382 | 382 | ||||
CC USA Inc. | ||||||
5.48%, 07/30/073 | 262 | 262 | ||||
Commodore CDO Ltd. | ||||||
5.38%, 06/12/073 | 131 | 131 | ||||
Credit Agricole SA | ||||||
5.48%, 07/23/07 | 523 | 523 | ||||
Credit Suisse First Boston NY | ||||||
5.51%, 04/24/07 | 262 | 262 | ||||
Cullinan Finance Corp. | ||||||
5.36%, 04/25/073 | 131 | 131 | ||||
| 34 | 2006 iSHARES ANNUAL REPORTTO SHAREHOLDERS |
Table of Contents
Schedule of Investments (Continued)
iSHARES® MSCI BELGIUM INDEX FUND
August 31, 2006
Security | Principal | Value | ||||
DEPFA Bank PLC | ||||||
5.37%, 06/15/07 | $ | 523 | $ | 523 | ||
Dorada Finance Inc. | ||||||
5.41% - 5.47%, 06/27/07 - 07/17/073 | 602 | 602 | ||||
Eli Lilly Services Inc. | ||||||
5.37%, 08/31/073 | 523 | 523 | ||||
Fifth Third Bancorp | ||||||
5.30%, 09/21/073 | 1,047 | 1,047 | ||||
Five Finance Inc. | ||||||
5.37% - 5.45%, 12/01/06 - 07/13/073 | 523 | 523 | ||||
General Electric Capital Corp. | ||||||
5.29% - 5.49%, 07/09/07 - 09/24/07 | 550 | 550 | ||||
Granite Master Issuer PLC | ||||||
5.30%, 09/20/06 | 1,832 | 1,832 | ||||
Harrier Finance Funding LLC | ||||||
5.33%, 07/25/073 | 157 | 157 | ||||
Hartford Life Global Funding Trusts | ||||||
5.35% - 5.55%, 07/13/07 - 09/17/07 | 785 | 785 | ||||
HBOS Treasury Services PLC | ||||||
5.53%, 07/24/073 | 523 | 523 | ||||
Holmes Financing PLC | ||||||
5.40%, 07/16/073 | 916 | 916 | ||||
JP Morgan Chase & Co. | ||||||
5.36%, 08/02/07 | 393 | 393 | ||||
K2 USA LLC | ||||||
5.20% - 5.46%, 04/02/07 - 06/28/073 | 393 | 392 | ||||
Kestrel Funding LLC | ||||||
5.31%, 07/11/073 | 209 | 209 | ||||
Kommunalkredit Austria AG | ||||||
5.33%, 09/09/073 | 314 | 314 | ||||
Leafs LLC | ||||||
5.33%, 01/22/07 - 02/20/073 | 546 | 546 | ||||
Lexington Parker Capital Co. LLC | ||||||
5.46%, 01/10/073 | 654 | 654 | ||||
Links Finance LLC | ||||||
5.33% - 5.35%, 05/10/07 - 05/16/073 | 576 | 576 | ||||
Lothian Mortgages Master Issuer PLC | ||||||
5.30%, 04/24/073 | 231 | 231 | ||||
Marshall & Ilsley Bank | ||||||
5.31%, 09/14/07 | 288 | 288 | ||||
Metropolitan Life Global Funding I | ||||||
5.42%, 08/06/073 | 785 | 785 | ||||
Metropolitan Life Insurance Funding Agreement | ||||||
5.57%, 08/01/073,6 | 52 | 52 | ||||
Monumental Global Funding II | ||||||
5.49%, 12/27/063 | 105 | 105 | ||||
Mound Financing PLC | ||||||
5.39%, 05/08/073 | 492 | 492 | ||||
Natexis Banques Populaires | ||||||
5.31% - 5.40%, 02/05/07 - 09/14/073 | 1,570 | 1,571 | ||||
National City Bank of Indiana | ||||||
5.37%, 05/21/07 | 262 | 262 | ||||
Nationwide Building Society | ||||||
5.44% - 5.62%, 07/06/07 - 07/27/073 | 1,727 | 1,727 | ||||
Newcastle Ltd. | ||||||
5.35%, 04/24/073 | 185 | 184 | ||||
Northern Rock PLC | ||||||
5.43%, 08/03/073 | 628 | 628 | ||||
Principal Life Global Funding I | ||||||
5.80%, 02/08/07 | 236 | 236 | ||||
Sedna Finance Inc. | ||||||
5.30% - 5.37%, 09/20/06 - 08/21/073 | 916 | 916 | ||||
Skandinaviska Enskilda Bank NY | ||||||
5.33%, 09/18/073 | 523 | 523 | ||||
Strips III LLC | ||||||
5.38%, 07/24/073 | 127 | 127 | ||||
SunTrust Bank | ||||||
5.37%, 05/01/07 | 523 | 523 | ||||
Tango Finance Corp. | ||||||
5.22% - 5.48%, 04/25/07 - 07/16/073 | 1,277 | 1,276 | ||||
Union Hamilton Special Funding LLC | ||||||
5.42% - 5.49%, 09/28/06 - 12/21/063 | 733 | 732 | ||||
| SCHEDULESOF INVESTMENTS | 35 |
Table of Contents
Schedule of Investments (Continued)
iSHARES® MSCI BELGIUM INDEX FUND
August 31, 2006
Security | Principal | Value | ||||
US Bank N.A. | ||||||
5.26%, 09/29/06 | $ | 236 | $ | 236 | ||
Wachovia Asset Securitization Inc. | ||||||
5.31%, 09/25/063 | 781 | 781 | ||||
Wachovia Bank N.A. | ||||||
5.36%, 05/22/07 | 1,047 | 1,047 | ||||
Wells Fargo & Co. | ||||||
5.34%, 09/14/073 | 262 | 262 | ||||
WhistleJacket Capital Ltd. | ||||||
5.29% - 5.35%, 04/18/07 - 06/13/073 | 393 | 392 | ||||
White Pine Finance LLC | ||||||
5.29% - 5.35%, 05/22/07 - 08/20/073 | 1,570 | 1,571 | ||||
Wind Master Trust | ||||||
5.31% - 5.32%, 09/25/06 - 07/25/073 | 332 | 332 | ||||
| 34,616 | ||||||
TOTAL SHORT-TERM INVESTMENTS | 123,520 | |||||
TOTAL INVESTMENTS IN SECURITIES – 99.46% | 151,657,712 | |||||
Other Assets, Less Liabilities – 0.54% | 826,498 | |||||
NET ASSETS – 100.00% | $ | 152,484,210 | ||||
| 1 | All or a portion of this security represents a security on loan. See Note 5. |
| 2 | All or a portion of this security (these securities) represent(s) an investment of securities lending collateral. See Note 5. |
| 3 | This security or a portion of these securities may be resold to qualified institutional buyers under Rule 144A or pursuant to Section 4(2) of the Securities Act of 1933. |
| 4 | Affiliated issuer. See Note 2. |
| 5 | The rate quoted is the annualized seven-day yield of the fund at period end. |
| 6 | The investment adviser has determined that this security or a portion of these securities is illiquid. |
See notes to the financial statements.
| 36 | 2006 iSHARES ANNUAL REPORTTO SHAREHOLDERS |
Table of Contents
iSHARES® MSCI EMU INDEX FUND
August 31, 2006
Security | Shares | Value | |||
COMMON STOCKS – 98.32% | |||||
AUSTRIA – 1.72% | |||||
Andritz AG | 5,124 | $ | 807,672 | ||
Boehler-Uddeholm AG | 19,355 | 1,040,565 | |||
Erste Bank der Oesterreichischen Sparkassen AG | 92,582 | 5,593,653 | |||
Flughafen Wien AG1 | 5,057 | 409,690 | |||
Immoeast Immobilien Anlagen AG2 | 129,148 | 1,520,906 | |||
Immofinanz Immobilien Anlagen AG2 | 228,732 | 2,649,735 | |||
Mayr-Melnhof Karton AG | 4,357 | 764,018 | |||
Meinl European Land Ltd.2 | 67,005 | 1,445,220 | |||
Oesterreichische Elektrizitaetswirtschafts AG Class A | 38,900 | 1,957,898 | |||
OMV AG | 81,730 | 4,354,221 | |||
Raiffeisen International Bank Holding AG | 21,006 | 1,892,967 | |||
RHI AG2 | 16,590 | 569,338 | |||
Telekom Austria AG | 160,657 | 3,932,009 | |||
Voestalpine AG | 41,278 | 1,562,945 | |||
Wiener Staedtische Allgemeine Versicherung AG | 14,220 | 870,799 | |||
Wienerberger Baustoffindustrie AG | 32,294 | 1,548,932 | |||
| 30,920,568 | |||||
BELGIUM – 3.69% | |||||
AGFA-Gevaert NV | 40,915 | 958,954 | |||
Barco NV | 6,238 | 550,163 | |||
Bekaert NV | 7,400 | 725,584 | |||
Belgacom SA | 60,295 | 2,127,870 | |||
Cofinimmo | 4,010 | 700,141 | |||
Colruyt SA | 7,800 | 1,324,929 | |||
Compagnie Maritime Belge SA | 11,712 | 396,237 | |||
Delhaize Group | 36,566 | 2,782,635 | |||
Dexia Group | 271,911 | 6,978,596 | |||
Euronav SA | 10,851 | 376,136 | |||
Fortis | 555,621 | 21,606,944 | |||
Groupe Bruxelles Lambert SA | 34,621 | 3,631,746 | |||
InBev | 83,635 | 4,339,019 | |||
KBC Groupe | 88,303 | 9,500,361 | |||
Mobistar SA | 14,782 | 1,214,773 | |||
Omega Pharma SA | 10,693 | 615,804 | |||
SA D’Ieteren NV | 1,215 | 405,145 | |||
Solvay SA | 31,509 | 3,813,494 | |||
UCB SA | 41,190 | 2,412,708 | |||
Umicore | 12,448 | 1,808,516 | |||
| 66,269,755 | |||||
FINLAND – 4.48% | |||||
Amer Group OYJ | 29,250 | 649,609 | |||
Cargotec Corp. Class B | 20,329 | 880,849 | |||
Elisa OYJ Class A | 71,965 | 1,458,241 | |||
Fortum OYJ | 205,781 | 5,531,609 | |||
KCI Konecranes OYJ | 32,760 | 649,984 | |||
Kesko OYJ Class B | 30,342 | 1,283,250 | |||
Kone OYJ | 38,220 | 1,732,871 | |||
Metso OYJ | 57,961 | 2,154,564 | |||
Neste Oil OYJ1 | 68,853 | 2,168,128 | |||
Nokia OYJ | 1,952,002 | 40,853,094 | |||
Nokian Renkaat OYJ1 | 64,574 | 1,129,934 | |||
OKO Bank Class A | 36,177 | 587,190 | |||
Oriola-KD OYJ2 | 2,080 | 5,006 | |||
Orion OYJ2 | 40,456 | 736,911 | |||
Outokumpu OYJ | 56,405 | 1,433,194 | |||
Rautaruukki OYJ | 42,401 | 1,237,479 | |||
Sampo OYJ Class A | 185,979 | 3,844,708 | |||
SanomaWSOY OYJ | 15,171 | 376,353 | |||
Stora Enso OYJ Class R | 297,196 | 4,511,849 | |||
UPM-Kymmene OYJ1 | 250,905 | 5,941,662 | |||
Uponor OYJ | 34,621 | 941,285 | |||
Wartsila OYJ Class B | 28,528 | 1,178,047 | |||
YIT OYJ | 53,040 | 1,150,801 | |||
| 80,436,618 | |||||
FRANCE – 28.50% | |||||
Accor SA | 96,861 | 6,193,147 | |||
Air France - KLM | 54,071 | 1,474,249 | |||
Alcatel SA Class A2 | 300,000 | 3,759,507 | |||
Alstom2 | 52,904 | 4,984,175 | |||
AXA | 787,725 | 29,241,494 | |||
BNP Paribas SA | 389,009 | 41,305,033 | |||
Bouygues SA1 | 95,694 | 5,034,467 | |||
Cap Gemini SA | 61,073 | 3,342,827 | |||
Carrefour SA | 292,917 | 18,057,515 | |||
Casino Guichard Perrachon SA | 19,404 | 1,662,910 | |||
CNP Assurances | 15,840 | 1,635,259 | |||
| SCHEDULESOF INVESTMENTS | 37 |
Table of Contents
Schedule of Investments (Continued)
iSHARES® MSCI EMU INDEX FUND
August 31, 2006
Security | Shares | Value | |||
Compagnie de Saint-Gobain | 144,411 | $ | 10,712,249 | ||
Compagnie Generale des Etablissements Michelin Class B | 70,053 | 4,752,581 | |||
Compagnie Generale d’Optique Essilor International SA | 45,124 | 4,667,087 | |||
Credit Agricole SA | 293,695 | 11,921,193 | |||
Dassault Systemes SA1 | 26,854 | 1,485,664 | |||
France Telecom | 788,503 | 16,724,487 | |||
Gaz de France | 93,127 | 3,461,778 | |||
Gecina SA | 3,523 | 459,079 | |||
Groupe Danone | 107,753 | 14,813,599 | |||
Hermes International | 30,342 | 2,571,160 | |||
Imerys SA | 16,138 | 1,227,052 | |||
Klepierre | 10,198 | 1,432,018 | |||
Lafarge SA | 78,967 | 10,158,712 | |||
Lagardere S.C.A. | 54,600 | 3,997,750 | |||
L’Air Liquide SA | 56,056 | 11,817,963 | |||
L’Oreal SA | 138,095 | 14,441,987 | |||
LVMH Moet Hennessy Louis Vuitton SA | 112,032 | 11,522,717 | |||
M6-Metropole Television | 28,786 | 899,448 | |||
Neopost SA | 14,393 | 1,681,168 | |||
PagesJaunes SA | 57,961 | 1,661,181 | |||
Pernod Ricard SA | 34,232 | 7,462,320 | |||
PPR SA | 31,898 | 4,401,586 | |||
PSA Peugeot Citroen SA | 72,698 | 4,101,025 | |||
Publicis Groupe | 64,194 | 2,532,527 | |||
Renault SA | 85,969 | 10,003,056 | |||
Sanofi-Aventis | 477,303 | 42,798,568 | |||
Schneider Electric SA | 105,808 | 11,275,341 | |||
SCOR | 416,880 | 997,883 | |||
Societe BIC SA | 11,426 | 709,939 | |||
Societe des Autoroutes Paris-Rhin-Rhone | 13,654 | 995,361 | |||
Societe Generale Class A | 167,055 | 26,943,683 | |||
Societe Television Francaise1 | 56,016 | 1,790,431 | |||
Sodexho Alliance SA | 49,595 | 2,641,573 | |||
STMicroelectronics NV | 324,815 | 5,342,766 | |||
Suez SA | 488,973 | 20,892,872 | |||
Technip SA | 42,401 | 2,444,564 | |||
Thales SA | 68,853 | 2,989,549 | |||
Total SA | 1,027,349 | 69,303,561 | |||
Unibail Holding | 21,395 | 4,173,728 | |||
Valeo SA | 34,514 | 1,261,771 | |||
Vallourec SA | 16,727 | 3,746,994 | |||
Veolia Environnement | 133,038 | 7,450,419 | |||
Vinci SA | 92,582 | 10,014,060 | |||
Vivendi Universal SA | 536,820 | 18,450,150 | |||
Zodiac SA | 27,619 | 1,676,826 | |||
| 511,500,009 | |||||
GERMANY – 20.44% | |||||
Adidas-Salomon AG | 93,360 | 4,445,603 | |||
Allianz AG | 194,500 | 32,956,122 | |||
ALTANA AG | 33,150 | 1,956,192 | |||
BASF AG | 248,182 | 20,436,700 | |||
Bayer AG | 337,263 | 16,694,361 | |||
Beiersdorf AG | 25,285 | 1,398,214 | |||
Bilfinger Berger AG | 15,560 | 852,472 | |||
Celesio AG | 33,540 | 1,700,142 | |||
Commerzbank AG | 293,306 | 10,249,685 | |||
Continental AG | 62,629 | 6,694,049 | |||
DaimlerChrysler AG | 424,010 | 22,361,465 | |||
Deutsche Bank AG | 253,239 | 28,898,738 | |||
Deutsche Boerse AG | 49,792 | 7,550,833 | |||
Deutsche Lufthansa AG | 106,197 | 2,101,593 | |||
Deutsche Post AG | 329,094 | 8,336,672 | |||
Deutsche Postbank AG | 26,841 | 2,093,078 | |||
Deutsche Telekom AG | 1,259,971 | 18,370,087 | |||
Douglas Holding AG | 13,650 | 608,748 | |||
E.ON AG | 289,027 | 36,686,127 | |||
Fresenius Medical Care AG & Co. KGaA | 29,564 | 3,897,113 | |||
Heidelberger Druckmaschinen AG | 30,342 | 1,216,446 | |||
Hochtief AG | 24,896 | 1,415,901 | |||
Hypo Real Estate Holding AG | 65,352 | 4,048,845 | |||
Infineon Technologies AG2 | 363,715 | 4,269,308 | |||
IVG Immobilien AG | 41,623 | 1,346,906 | |||
KarstadtQuelle AG1,2 | 31,509 | 697,763 | |||
Linde AG | 50,548 | 4,457,456 | |||
MAN AG | 65,741 | 5,024,702 | |||
Merck KGaA | 23,340 | 2,315,120 | |||
METRO AG | 73,162 | 4,296,709 | |||
| 38 | 2006 iSHARES ANNUAL REPORTTO SHAREHOLDERS |
Table of Contents
Schedule of Investments (Continued)
iSHARES® MSCI EMU INDEX FUND
August 31, 2006
Security | Shares | Value | |||
Muenchener Rueckversicherungs-Gesellschaft AG | 93,360 | $ | 14,051,453 | ||
Puma AG | 5,835 | 2,022,107 | |||
Rheinmetall AG | 16,338 | 1,095,865 | |||
RWE AG | 204,614 | 18,737,481 | |||
Salzgitter AG | 21,006 | 1,880,329 | |||
SAP AG | 110,087 | 21,009,295 | |||
Siemens AG | 393,668 | 33,349,076 | |||
Solarworld AG1 | 17,116 | 1,011,992 | |||
Suedzucker AG | 29,953 | 745,739 | |||
ThyssenKrupp AG | 170,428 | 5,798,596 | |||
TUI AG1 | 113,588 | 2,215,870 | |||
Volkswagen AG | 83,246 | 6,643,956 | |||
Wincor Nixdorf AG | 6,630 | 922,847 | |||
| 366,861,756 | |||||
GREECE – 1.43% | |||||
Coca-Cola Hellenic Bottling SA ADR | 141,985 | 4,753,658 | |||
Hellenic Telecommunications Organization SA ADR2 | 689,706 | 7,931,619 | |||
National Bank of Greece SA ADR | 1,553,346 | 12,923,839 | |||
| 25,609,116 | |||||
IRELAND – 2.72% | |||||
Allied Irish Banks PLC | 416,619 | 10,879,180 | |||
Bank of Ireland | 465,633 | 8,821,296 | |||
C&C Group PLC | 143,152 | 1,597,868 | |||
CRH PLC | 253,628 | 8,788,452 | |||
DCC PLC | 39,780 | 998,040 | |||
DEPFA Bank PLC | 176,217 | 3,275,227 | |||
Elan Corp. PLC2 | 198,001 | 3,294,865 | |||
Fyffes PLC | 152,976 | 321,140 | |||
Grafton Group PLC | 101,643 | 1,389,555 | |||
Greencore Group PLC | 94,233 | 493,348 | |||
IAWS Group PLC | 57,572 | 1,163,645 | |||
Independent News & Media PLC | 287,085 | 918,708 | |||
Irish Life & Permanent PLC | 132,696 | 3,414,136 | |||
Kerry Group PLC Class A | 59,517 | 1,325,614 | |||
Kingspan Group PLC | 58,353 | 1,044,233 | |||
Paddy Power PLC | 48,625 | 886,955 | |||
Ryanair Holdings PLC2 | 21,760 | 208,904 | |||
| 48,821,166 | |||||
ITALY – 11.25% | |||||
Alleanza Assicurazioni SpA1 | 185,820 | 2,248,956 | |||
Arnoldo Mondadori Editore SpA | 48,352 | 467,601 | |||
Assicurazioni Generali SpA | 476,136 | 17,924,745 | |||
Autogrill SpA | 79,750 | 1,207,654 | |||
Autostrade SpA | 139,438 | 3,944,576 | |||
Autostrade SpA Rights2,3 | 138,364 | 167 | |||
Banca Fideuram SpA1 | 147,723 | 947,355 | |||
Banca Intesa SpA | 1,842,693 | 12,336,206 | |||
Banca Monte dei Paschi di Siena SpA1 | 544,989 | 3,311,919 | |||
Banca Popolare di Milano Scrl | 205,392 | 2,860,483 | |||
Banca Popolare di Verona e Novara Scrl | 176,217 | 5,233,144 | |||
Banche Popolari Unite Scrl | 156,767 | 4,420,751 | |||
Benetton Group SpA | 25,620 | 383,044 | |||
Bulgari SpA1 | 69,729 | 873,376 | |||
Capitalia SpA | 803,674 | 7,005,739 | |||
Enel SpA | 2,076,284 | 18,524,499 | |||
ENI SpA | 1,229,935 | 37,627,641 | |||
Fiat SpA1,2 | 255,962 | 3,663,062 | |||
Finmeccanica SpA | 175,080 | 3,872,641 | |||
Fondiaria-Sai SpA | 35,010 | 1,480,673 | |||
Gruppo Editoriale L’Espresso SpA1 | 76,461 | 406,421 | |||
Italcementi SpA | 41,748 | 1,029,245 | |||
Lottomatica SpA | 37,733 | 1,458,664 | |||
Luxottica Group SpA | 60,392 | 1,747,861 | |||
Mediaset SpA | 351,267 | 4,055,747 | |||
Mediobanca SpA | 229,060 | 4,990,404 | |||
Mediolanum SpA | 128,474 | 924,227 | |||
Pirelli SpA | 1,248,468 | 1,087,508 | |||
Sanpaolo IMI SpA | 524,761 | 10,989,344 | |||
Seat Pagine Gialle SpA1 | 1,951,224 | 910,399 | |||
Snam Rete Gas SpA | 453,185 | 2,120,264 | |||
Telecom Italia SpA | 4,774,586 | 13,201,291 | |||
Terna SpA | 514,160 | 1,462,740 | |||
Tiscali SpA1,2 | 139,397 | 407,724 | |||
UniCredito Italiano SpA | 3,621,201 | 28,831,680 | |||
| 201,957,751 | |||||
NETHERLANDS – 11.12% | |||||
ABN AMRO Holding NV | 846,075 | 24,107,987 | |||
Aegon NV | 671,803 | 11,987,584 | |||
| SCHEDULESOF INVESTMENTS | 39 |
Table of Contents
Schedule of Investments (Continued)
iSHARES® MSCI EMU INDEX FUND
August 31, 2006
Security | Shares | Value | |||
Akzo Nobel NV | 127,203 | $ | 7,320,666 | ||
ASML Holding NV2 | 231,844 | 5,062,929 | |||
Buhrmann NV | 53,607 | 728,741 | |||
Corio NV | 18,672 | 1,256,002 | |||
Euronext NV | 41,623 | 3,740,222 | |||
Fugro NV | 24,896 | 1,099,450 | |||
Hagemeyer NV1,2 | 253,239 | 1,280,426 | |||
Heineken NV | 105,030 | 4,868,205 | |||
ING Groep NV2 | 905,981 | 39,139,908 | |||
Koninklijke Ahold NV1,2 | 728,719 | 6,986,648 | |||
Koninklijke DSM NV | 73,132 | 2,890,758 | |||
Koninklijke KPN NV | 886,531 | 10,928,163 | |||
Koninklijke Numico NV | 79,434 | 3,686,898 | |||
Koninklijke Philips Electronics NV | 579,999 | 19,763,426 | |||
Mittal Steel Co. NV French1 | 322,229 | 10,744,823 | |||
Oce NV | 43,179 | 748,926 | |||
QIAGEN NV2 | 79,758 | 1,141,413 | |||
Randstad Holdings NV | 22,125 | 1,188,070 | |||
Reed Elsevier NV | 323,259 | 5,180,622 | |||
Rodamco Europe NV | 20,228 | 2,184,062 | |||
SBM Offshore NV | 59,041 | 1,618,070 | |||
TNT NV | 192,555 | 7,234,189 | |||
Unilever NV | 791,226 | 18,858,501 | |||
Vedior NV | 78,578 | 1,452,430 | |||
Wereldhave NV | 9,725 | 1,020,776 | |||
Wolters Kluwer NV CVA | 131,871 | 3,332,141 | |||
| 199,552,036 | |||||
PORTUGAL – 1.06% | |||||
Banco BPI SA Registered | 186,720 | 1,398,214 | |||
Banco Comercial Portugues SA Class R | 1,138,992 | 3,499,120 | |||
Banco Espirito Santo SA | 121,757 | 1,868,702 | |||
Brisa-Auto Estradas de Portugal SA | 153,655 | 1,581,356 | |||
CIMPOR-Cimentos de Portugal SGPS SA | 114,763 | 778,583 | |||
Energias de Portugal SA | 849,187 | 3,413,186 | |||
Jeronimo Martins SGPS SA | 20,106 | 359,284 | |||
Portugal Telecom SGPS SA | 354,379 | 4,450,040 | |||
PT Multimedia Servicos de Telecomunicacoes e Multimedia SGPS SA | 44,612 | 551,069 | |||
Sonae Industria SGPS SA2 | 65,352 | 557,135 | |||
Sonae SGPS SA | 411,453 | 684,685 | |||
| 19,141,374 | |||||
SPAIN – 11.91% | |||||
Abertis Infraestructuras SA1 | 117,478 | 2,864,696 | |||
Acciona SA | 13,226 | 2,019,742 | |||
Acerinox SA | 95,305 | 1,793,329 | |||
Actividades de Construcciones y Servicios SA | 111,643 | 5,003,231 | |||
Altadis SA | 122,535 | 5,803,484 | |||
Antena 3 de Television SA1 | 39,289 | 903,242 | |||
Banco Bilbao Vizcaya Argentaria SA | 1,589,065 | 36,288,035 | |||
Banco Popular Espanol SA | 412,729 | 6,471,844 | |||
Banco Santander Central Hispano SA | 2,781,350 | 43,114,834 | |||
Cintra Concesiones de Infraestructuras de Transporte SA1 | 110,865 | 1,471,635 | |||
Corporacion Mapfre SA | 54,992 | 1,100,939 | |||
Ebro Puleva SA | 39,289 | 842,389 | |||
Endesa SA | 441,904 | 15,363,304 | |||
Fadesa SA | 24,118 | 777,363 | |||
Fomento de Construcciones y Contratas SA | 20,280 | 1,580,928 | |||
Gamesa Corporacion Tecnologica SA | 92,582 | 1,949,483 | |||
Gas Natural SDG SA | 88,773 | 2,969,253 | |||
Grupo Ferrovial SA | 29,640 | 2,302,999 | |||
Iberdrola SA | 376,941 | 13,982,946 | |||
Iberia Lineas Aereas de Espana SA | 210,939 | 526,524 | |||
Inditex SA | 104,252 | 4,698,696 | |||
Indra Sistemas SA | 63,796 | 1,325,375 | |||
Inmobiliaria Colonial SA | 16,727 | 1,343,565 | |||
Metrovacesa SA | 26,466 | 2,503,570 | |||
NH Hoteles SA1 | 61,073 | 1,325,873 | |||
Promotora de Informaciones SA | 38,610 | 638,048 | |||
Repsol YPF SA | 435,291 | 12,503,439 | |||
Sacyr Vallehermoso SA1 | 55,338 | 2,133,563 | |||
Sociedad General de Aguas de Barcelona SA Class B | 30,869 | 865,354 | |||
Sogecable SA1,2 | 23,729 | 779,708 | |||
Telefonica SA | 2,035,248 | 34,909,937 | |||
Union Fenosa SA | 68,464 | 2,989,310 | |||
Zeltia SA1,2 | 81,764 | 611,226 | |||
| 213,757,864 | |||||
TOTAL COMMON STOCKS | 1,764,828,013 | ||||
| 40 | 2006 iSHARES ANNUAL REPORTTO SHAREHOLDERS |
Table of Contents
Schedule of Investments (Continued)
iSHARES® MSCI EMU INDEX FUND
August 31, 2006
Security | Shares or Principal | Value | ||||
PREFERRED STOCKS – 1.31% | ||||||
GERMANY – 0.73% | ||||||
Henkel KGaA | 27,619 | $ | 3,524,410 | |||
Porsche AG | 3,900 | 3,994,804 | ||||
ProSiebenSat.1 Media AG | 41,234 | 1,106,302 | ||||
RWE AG | 18,672 | 1,542,099 | ||||
Volkswagen AG | 51,870 | 2,944,007 | ||||
| 13,111,622 | ||||||
ITALY – 0.58% | ||||||
Banca Intesa SpA RNC | 454,741 | 2,894,449 | ||||
Telecom Italia SpA RNC | 2,707,051 | 6,653,108 | ||||
Unipol SpA | 277,357 | 836,985 | ||||
| 10,384,542 | ||||||
TOTAL PREFERRED STOCKS | 23,496,164 | |||||
SHORT-TERM INVESTMENTS – 2.19% | ||||||
CERTIFICATES OF DEPOSIT4 – 0.09% | ||||||
Credit Suisse First Boston NY | ||||||
5.28% - 5.43%, 04/23/07 - 08/21/07 | $ | 224,877 | 224,877 | |||
Societe Generale | ||||||
5.33%, 12/08/06 | 321,258 | 321,258 | ||||
Washington Mutual Bank | ||||||
5.36%, 11/13/06 | 803,145 | 803,145 | ||||
Wells Fargo Bank N.A. | ||||||
4.78%, 12/05/06 | 257,006 | 257,006 | ||||
| 1,606,286 | ||||||
COMMERCIAL PAPER4 – 0.35% | ||||||
Amstel Funding Corp. | ||||||
5.20%, 11/21/06 - 11/22/065 | 93,737 | 92,635 | ||||
Amsterdam Funding Corp. | ||||||
5.27%, 09/15/065 | 321,258 | 320,600 | ||||
Atlantis One Funding | ||||||
5.30%, 11/14/065 | 440,792 | 435,990 | ||||
Barton Capital Corp. | ||||||
5.27%, 09/06/065 | 161,914 | 161,796 | ||||
Cancara Asset Securitisation Ltd. | ||||||
5.30%, 11/14/065 | 162,852 | 161,078 | ||||
CC USA Inc. | ||||||
5.03%, 10/24/065 | 64,252 | 63,776 | ||||
Security | Principal | Value | ||||
Charta LLC | ||||||
5.30%, 11/06/065 | $ | 321,258 | $ | 318,136 | ||
Concord Minutemen Capital Co. LLC | ||||||
5.27% - 5.29%, 09/13/06 - 11/16/065 | 564,229 | 561,726 | ||||
Curzon Funding LLC | ||||||
5.29%, 11/17/065 | 321,258 | 317,623 | ||||
Edison Asset Securitization LLC | ||||||
5.22%, 12/11/065 | 236,998 | 233,528 | ||||
Falcon Asset Securitization Corp. | ||||||
5.30%, 11/06/065 | 321,258 | 318,136 | ||||
Five Finance Inc. | ||||||
5.19%, 12/01/065 | 144,566 | 142,670 | ||||
General Electric Capital Services Inc. | ||||||
5.22%, 12/11/06 | 32,126 | 31,655 | ||||
Giro Funding Corp. | ||||||
5.28% - 5.34%, 09/11/06 - 10/10/065 | 321,258 | 320,094 | ||||
Grampian Funding LLC | ||||||
5.03% - 5.30%, 10/17/06 - 11/16/065 | 154,204 | 152,932 | ||||
KKR Pacific Funding Trust | ||||||
5.29%, 09/14/065 | 321,258 | 320,644 | ||||
Landale Funding LLC | ||||||
5.31%, 11/15/065 | 250,581 | 247,812 | ||||
Lexington Parker Capital Co. LLC | ||||||
5.19% - 5.27%, 09/15/06 - 11/15/065 | 416,421 | 414,032 | ||||
Liberty Street Funding Corp. | ||||||
5.27%, 09/08/06 - 09/11/065 | 285,920 | 285,572 | ||||
Mont Blanc Capital Corp. | ||||||
5.29%, 11/15/065 | 207,211 | 204,928 | ||||
Monument Gardens Funding LLC | ||||||
5.28%, 09/21/065 | 161,442 | 160,968 | ||||
Nestle Capital Corp. | ||||||
5.19%, 08/09/07 | 192,755 | 183,251 | ||||
Park Granada LLC | ||||||
5.30%, 09/01/065 | 73,414 | 73,414 | ||||
Regency Markets LLC | ||||||
5.28%, 09/15/06 | 160,629 | 160,300 | ||||
Solitaire Funding Ltd. | ||||||
5.27%, 09/05/065 | 240,944 | 240,802 | ||||
| SCHEDULESOF INVESTMENTS | 41 |
Table of Contents
Schedule of Investments (Continued)
iSHARES® MSCI EMU INDEX FUND
August 31, 2006
Security | Shares or Principal | Value | ||||
Sydney Capital Corp. | ||||||
5.27%, 09/12/065 | $ | 73,504 | $ | 73,385 | ||
Tulip Funding Corp. | ||||||
5.29%, 11/15/065 | 169,438 | 167,571 | ||||
White Pine Finance LLC | ||||||
5.12%, 10/27/065 | 60,718 | 60,234 | ||||
| 6,225,288 | ||||||
MEDIUM-TERM NOTES4 – 0.07% | ||||||
Bank of America N.A. | ||||||
5.28%, 04/20/07 | 80,315 | 80,315 | ||||
Cullinan Finance Corp. | ||||||
5.71%, 06/28/075 | 240,944 | 240,944 | ||||
K2 USA LLC | ||||||
5.39%, 06/04/075 | 240,944 | 240,944 | ||||
Marshall & Ilsley Bank | ||||||
5.18%, 12/15/06 | 321,258 | 321,576 | ||||
Sigma Finance Inc. | ||||||
5.13% - 5.51%, | ||||||
03/30/07 - 06/18/075 | 375,872 | 375,872 | ||||
US Bank N.A. | ||||||
2.85%, 11/15/06 | 64,252 | 64,009 | ||||
| 1,323,660 | ||||||
MONEY MARKET FUNDS – 0.05% | ||||||
Barclays Global Investors Funds Institutional Money Market Fund, Institutional Shares 5.30%6,7 | 946,384 | 946,384 | ||||
| 946,384 | ||||||
REPURCHASE AGREEMENTS4 – 0.44% | ||||||
Banc of America Securities LLC Repurchase Agreement, 5.30%, due 9/1/06, maturity value $401,632 (collateralized by U.S. Government obligations, value $409,993, 5.50% to 6.50%, 1/1/33 to 7/1/36). | $ | 401,573 | 401,573 | |||
Banc of America Securities LLC Repurchase Agreement, 5.36%, due 9/1/06, maturity value $642,612 (collateralized by non-U.S. Government debt securities, value $662,420, 3.80% to 9.13%, 11/1/06 to 6/15/26). | 642,516 | 642,516 | ||||
Security | Principal | Value | ||||
Bear Stearns Companies Inc. (The) Repurchase Agreement, 5.37%, due 9/1/06, maturity value $481,959 (collateralized by non-U.S. Government debt securities, value $530,588, 0.08% to 6.43%, 9/25/20 to 7/25/36). | $ | 481,887 | $ | 481,887 | ||
Citigroup Global Markets Holdings Inc. Repurchase Agreement, 5.36%, due 9/1/06, maturity value $963,917 (collateralized by non-U.S. Government debt securities, value $1,007,076, 4.35% to 7.50%, 9/15/08 to 8/25/35). | 963,774 | 963,774 | ||||
Citigroup Global Markets Holdings Inc. Repurchase Agreement, 5.46%, due 9/1/06, maturity value $192,784 (collateralized by non-U.S. Government debt securities, value $235,302, 0.00% to 10.00%, 6/1/28 to 8/24/36). | 192,755 | 192,755 | ||||
Goldman Sachs & Co. Repurchase Agreement, 5.35%, due 9/1/06, maturity value $642,611 (collateralized by non-U.S. Government debt securities, value $655,989, 0.00% to 8.57%, 11/15/06 to 2/15/38). | 642,516 | 642,516 | ||||
Goldman Sachs Group Inc. Repurchase Agreement, 5.36%, due 9/1/06, maturity value $321,306 (collateralized by non-U.S. Government debt securities, value $337,641, 5.36% to 9.01%, 10/27/10 to 2/18/20). | 321,258 | 321,258 | ||||
| 42 | 2006 iSHARES ANNUAL REPORTTO SHAREHOLDERS |
Table of Contents
Schedule of Investments (Continued)
iSHARES® MSCI EMU INDEX FUND
August 31, 2006
Security | Principal | Value | ||||
JP Morgan Securities Inc. Repurchase Agreement, 5.41%, due 9/1/06, maturity value $80,327 (collateralized by non-U.S. Government debt securities, value $84,413, 6.63% to 10.50%, 1/15/07 to 4/15/16). | $ | 80,315 | $ | 80,315 | ||
Lehman Brothers Holdings Inc. Repurchase Agreement, 5.36%, due 9/1/06, maturity value $642,612 (collateralized by non-U.S. Government debt securities, value $675,285, 0.51% to 8.89%, 8/5/18 to 9/25/46). | 642,516 | 642,516 | ||||
Lehman Brothers Holdings Inc. Repurchase Agreement, 5.38%, due 9/1/06, maturity value $321,306 (collateralized by non-U.S. Government debt securities, value $337,651, 4.11% to 9.79%, 4/28/31 to 9/25/46). | 321,258 | 321,258 | ||||
Lehman Brothers Holdings Inc. Repurchase Agreement, 5.46%, due 9/1/06, maturity value $353,438 (collateralized by non-U.S. Government debt securities, value $371,405, 3.44% to 15.15%, 12/1/08 to 3/1/36). | 353,384 | 353,384 | ||||
Merrill Lynch & Co. Inc. Repurchase Agreement, 5.33%, due 9/1/06, maturity value $642,611 (collateralized by non-U.S. Government debt securities, value $675,294, 6.38% to 10.25%, 5/1/07 to 10/15/16). | 642,516 | 642,516 | ||||
Merrill Lynch & Co. Inc. Repurchase Agreement, 5.36%, due 9/1/06, maturity value $642,612 (collateralized by non-U.S. Government debt securities, value $662,540, 0.00% to 10.13%, 10/15/06 to 7/1/26). | 642,516 | 642,516 | ||||
Morgan Stanley Repurchase Agreement, 5.36%, due 9/1/06, maturity value $321,306 (collateralized by non-U.S. Government debt securities, value $337,797, 4.05% to 7.24%, 6/20/29 to 1/14/41). | 321,258 | 321,258 | ||||
Morgan Stanley Repurchase Agreement, 5.46%, due 9/1/06, maturity value $112,457 (collateralized by non-U.S. Government debt securities, value $172,438, 0.00% to 10.00%, 9/1/06 to 8/31/36). | 112,440 | 112,440 | ||||
Morgan Stanley Repurchase Agreement, 5.51%, due 6/4/07, maturity value $234,415 (collateralized by non-U.S. Government debt securities, value $350,102, 0.00% to 10.00%, 9/1/06 to 8/31/36).8 | 224,881 | 224,881 | ||||
Wachovia Capital Repurchase Agreement, 5.38%, due 9/1/06, maturity value $835,396 (collateralized by non-U.S. Government debt securities, value $877,867, 0.06% to 7.68%, 10/15/11 to 3/15/45). | 835,271 | 835,271 | ||||
| 7,822,634 | ||||||
| SCHEDULESOF INVESTMENTS | 43 |
Table of Contents
Schedule of Investments (Continued)
iSHARES® MSCI EMU INDEX FUND
August 31, 2006
Security | Principal | Value | |||
TIME DEPOSITS4 – 0.01% | |||||
KBC Bank | |||||
5.31%, 09/01/06 | $ | 67,789 $ | 67,789 | ||
| 67,789 | |||||
VARIABLE & FLOATING RATE NOTES4 – 1.18% | |||||
Allstate Life Global Funding II | |||||
5.34% - 5.47%, 09/04/07 - 09/27/075 | 822,421 | 822,527 | |||
American Express Bank | |||||
5.30%, 02/28/07 | 321,258 | 321,257 | |||
American Express Centurion Bank | |||||
5.42%, 07/19/07 | 353,384 | 353,742 | |||
American Express Credit Corp. | |||||
5.51%, 07/05/07 | 96,377 | 96,431 | |||
ASIF Global Financing | |||||
5.51%, 05/03/075 | 32,126 | 32,138 | |||
Australia & New Zealand Banking Group Ltd. | |||||
5.32%, 09/21/075 | 208,818 | 208,818 | |||
Bank of Ireland | |||||
5.30% - 5.31%, 08/14/07 - 08/20/075 | 465,824 | 465,844 | |||
Beta Finance Inc. | |||||
5.29% - 5.48%, 04/25/07 - 07/25/075 | 819,208 | 819,250 | |||
BMW US Capital LLC | |||||
5.33%, 09/14/075 | 321,258 | 321,258 | |||
BNP Paribas | |||||
5.36%, 05/18/075 | 594,327 | 594,327 | |||
Carlyle Loan Investment Ltd. | |||||
5.38%, 04/13/07 - 07/15/075 | 234,518 | 234,519 | |||
CC USA Inc. | |||||
5.48%, 07/30/075 | 160,629 | 160,650 | |||
Commodore CDO Ltd. | |||||
5.38%, 06/12/075 | 80,315 | 80,315 | |||
Credit Agricole SA | |||||
5.48%, 07/23/07 | 321,258 | 321,258 | |||
Credit Suisse First Boston NY | |||||
5.51%, 04/24/07 | 160,629 | 160,636 | |||
Cullinan Finance Corp. | |||||
5.36%, 04/25/075 | 80,315 | 80,315 | |||
DEPFA Bank PLC | |||||
5.37%, 06/15/07 | 321,258 | 321,258 | |||
Dorada Finance Inc. | |||||
5.41% - 5.47%, 06/27/07 - 07/17/075 | 369,447 | 369,470 | |||
Eli Lilly Services Inc. | |||||
5.37%, 08/31/075 | 321,258 | 321,258 | |||
Fifth Third Bancorp | |||||
5.30%, 09/21/075 | 642,516 | 642,516 | |||
Five Finance Inc. | |||||
5.37% - 5.45%, 12/01/06 - 07/13/075 | 321,258 | 321,234 | |||
General Electric Capital Corp. | |||||
5.29% - 5.49%, 07/09/07 - 09/24/07 | 337,321 | 337,400 | |||
Granite Master Issuer PLC | |||||
5.30%, 09/20/06 | 1,124,403 | 1,124,403 | |||
Harrier Finance Funding LLC | |||||
5.33%, 07/25/075 | 96,377 | 96,395 | |||
Hartford Life Global Funding Trusts | |||||
5.35% - 5.55%, 07/13/07 - 09/17/07 | 481,887 | 481,962 | |||
HBOS Treasury Services PLC | |||||
5.53%, 07/24/075 | 321,258 | 321,258 | |||
Holmes Financing PLC | |||||
5.40%, 07/16/075 | 562,202 | 562,202 | |||
JP Morgan Chase & Co. | |||||
5.36%, 08/02/07 | 240,944 | 240,944 | |||
K2 USA LLC | |||||
5.20% - 5.46%, 04/02/07 - 06/28/075 | 240,944 | 240,933 | |||
Kestrel Funding LLC | |||||
5.31%, 07/11/075 | 128,503 | 128,491 | |||
Kommunalkredit Austria AG | |||||
5.33%, 09/09/075 | 192,755 | 192,755 | |||
Leafs LLC | |||||
5.33%, 01/22/07 - 02/20/075 | 335,192 | 335,193 | |||
Lexington Parker Capital Co. LLC | |||||
5.46%, 01/10/075 | 401,573 | 401,483 | |||
Links Finance LLC | |||||
5.33% - 5.35%, 05/10/07 - 05/16/075 | 353,384 | 353,359 | |||
| 44 | 2006 iSHARES ANNUAL REPORTTO SHAREHOLDERS |
Table of Contents
Schedule of Investments (Continued)
iSHARES® MSCI EMU INDEX FUND
August 31, 2006
Security | Principal | Value | |||||
Lothian Mortgages Master Issuer PLC | |||||||
5.30%, 04/24/075 | $ | 141,555 | $ | 141,555 | |||
Marshall & Ilsley Bank | |||||||
5.31%, 09/14/07 | 176,692 | 176,692 | |||||
Metropolitan Life Global Funding I | |||||||
5.42%, 08/06/075 | 481,887 | 481,887 | |||||
Metropolitan Life Insurance Funding Agreement | |||||||
5.57%, 08/01/075,8 | 32,126 | 32,126 | |||||
Monumental Global Funding II | |||||||
5.49%, 12/27/065 | 64,252 | 64,258 | |||||
Mound Financing PLC | |||||||
5.39%, 05/08/075 | 301,983 | 301,983 | |||||
Natexis Banques Populaires | |||||||
5.31% - 5.40%, 02/05/07 - 09/14/075 | 963,774 | 963,759 | |||||
National City Bank of Indiana | |||||||
5.37%, 05/21/07 | 160,629 | 160,639 | |||||
Nationwide Building Society | |||||||
5.44% - 5.62%, 07/06/07 - 07/27/075 | 1,060,152 | 1,060,398 | |||||
Newcastle Ltd. | |||||||
5.35%, 04/24/075 | 113,243 | 113,222 | |||||
Northern Rock PLC | |||||||
5.43%, 08/03/075 | 385,510 | 385,519 | |||||
Principal Life Global Funding I | |||||||
5.80%, 02/08/07 | 144,566 | 144,862 | |||||
Sedna Finance Inc. | |||||||
5.30% - 5.37%, 09/20/06 - 08/21/075 | 562,202 | 562,191 | |||||
Skandinaviska Enskilda Bank NY | |||||||
5.33%, 09/18/075 | 321,258 | 321,258 | |||||
Strips III LLC | |||||||
5.38%, 07/24/075 | 78,117 | 78,117 | |||||
SunTrust Bank | |||||||
5.37%, 05/01/07 | 321,258 | 321,271 | |||||
Tango Finance Corp. | |||||||
5.22% - 5.48%, 04/25/07 - 07/16/075 | 783,870 | 783,801 | |||||
Union Hamilton Special Funding LLC | |||||||
5.42% - 5.49%, 09/28/06 - 12/21/065 | 449,761 | 449,761 | |||||
US Bank N.A. | |||||||
5.26%, 09/29/06 | 144,566 | 144,563 | |||||
Wachovia Asset Securitization Inc. | |||||||
5.31%, 09/25/065 | 479,385 | 479,385 | |||||
Wachovia Bank N.A. | |||||||
5.36%, 05/22/07 | 642,516 | 642,516 | |||||
Wells Fargo & Co. | |||||||
5.34%, 09/14/075 | 160,629 | 160,639 | |||||
WhistleJacket Capital Ltd. | |||||||
5.29% - 5.35%, 04/18/07 - 06/13/075 | 240,944 | 240,942 | |||||
White Pine Finance LLC | |||||||
5.29% - 5.35%, 05/22/07 - 08/20/075 | 963,774 | 963,576 | |||||
Wind Master Trust | |||||||
5.31% - 5.32%, 09/25/06 - 07/25/075 | 203,745 | 203,745 | |||||
| 21,244,464 | |||||||
TOTAL SHORT-TERM INVESTMENTS | 39,236,505 | ||||||
TOTAL INVESTMENTS IN SECURITIES – 101.82% | 1,827,560,682 | ||||||
Other Assets, Less Liabilities – (1.82)% | (32,639,695 | ) | |||||
NET ASSETS – 100.00% | $ | 1,794,920,987 | |||||
ADR – American Depositary Receipts
| 1 | All or a portion of this security represents a security on loan. See Note 5. |
| 2 | Non-income earning security. |
| 3 | Security valued at fair value in accordance with procedures approved by the Board of Directors. See Note 1. |
| 4 | All or a portion of this security (these securities) represent(s) an investment of securities lending collateral. See Note 5. |
| 5 | This security or a portion of these securities may be resold to qualified institutional buyers under Rule 144A or pursuant to Section 4(2) of the Securities Act of 1933. |
| 6 | Affiliated issuer. See Note 2. |
| 7 | The rate quoted is the annualized seven-day yield of the fund at period end. |
| 8 | The investment adviser has determined that this security or a portion of these securities is illiquid. |
See notes to the financial statements.
| SCHEDULESOF INVESTMENTS | 45 |
Table of Contents
iSHARES® MSCI FRANCE INDEX FUND
August 31, 2006
Security | Shares | Value | |||
COMMON STOCKS – 99.78% | |||||
ADVERTISING – 0.78% | |||||
PagesJaunes SA | 22,916 | $ | 656,780 | ||
Publicis Groupe | 25,137 | 991,683 | |||
| 1,648,463 | |||||
AEROSPACE & DEFENSE – 1.71% | |||||
European Aeronautic Defense and Space Co. | 60,395 | 1,819,845 | |||
Safran SA | 30,464 | 664,092 | |||
Thales SA | 15,708 | 682,030 | |||
Zodiac SA | 7,514 | 456,196 | |||
| 3,622,163 | |||||
AIRLINES – 0.28% | |||||
Air France - KLM | 22,134 | 603,485 | |||
| 603,485 | |||||
APPAREL – 0.48% | |||||
Hermes International | 11,882 | 1,006,872 | |||
| 1,006,872 | |||||
AUTO MANUFACTURERS – 2.62% | |||||
PSA Peugeot Citroen SA | 28,196 | 1,590,587 | |||
Renault SA | 34,000 | 3,956,123 | |||
| 5,546,710 | |||||
AUTO PARTS & EQUIPMENT – 1.07% | |||||
Compagnie Generale des Etablissements Michelin Class B | 26,478 | 1,796,338 | |||
Valeo SA | 12,716 | 464,874 | |||
| 2,261,212 | |||||
BANKS – 14.63% | |||||
BNP Paribas SA | 153,068 | 16,252,783 | |||
Credit Agricole SA | 110,264 | 4,475,658 | |||
Societe Generale Class A | 63,735 | 10,279,582 | |||
| 31,008,023 | |||||
BEVERAGES – 1.42% | |||||
Pernod Ricard SA | 13,787 | 3,005,463 | |||
| 3,005,463 | |||||
BUILDING MATERIALS – 3.88% | |||||
Compagnie de Saint-Gobain | 57,274 | 4,248,522 | |||
Imerys SA | 5,780 | 439,482 | |||
Lafarge SA | 27,527 | 3,541,212 | |||
| 8,229,216 | |||||
CHEMICALS – 2.20% | |||||
L’Air Liquide SA | 22,066 | 4,652,048 | |||
| 4,652,048 | |||||
COMMERCIAL SERVICES – 0.14% | |||||
Societe des Autoroutes Paris-Rhin-Rhone | 4,046 | 294,949 | |||
| 294,949 | |||||
COMPUTERS – 0.90% | |||||
Atos Origin SA1 | 12,308 | 645,792 | |||
Cap Gemini SA | 23,162 | 1,267,771 | |||
| 1,913,563 | |||||
COSMETICS & PERSONAL CARE – 2.62% | |||||
L’Oreal SA | 53,023 | 5,545,150 | |||
| 5,545,150 | |||||
DIVERSIFIED FINANCIAL SERVICES – 0.71% | |||||
Euronext NV | 16,678 | 1,498,677 | |||
| 1,498,677 | |||||
ENGINEERING & CONSTRUCTION – 2.93% | |||||
Bouygues SA | 37,357 | 1,965,354 | |||
Vinci SA | 39,272 | 4,247,825 | |||
| 6,213,179 | |||||
FOOD – 6.38% | |||||
Carrefour SA | 110,333 | 6,801,721 | |||
Casino Guichard Perrachon SA | 7,956 | 681,824 | |||
Groupe Danone2 | 43,918 | 6,037,731 | |||
| 13,521,276 | |||||
FOOD SERVICE – 0.44% | |||||
Sodexho Alliance SA | 17,360 | 924,644 | |||
| 924,644 | |||||
GAS – 0.64% | |||||
Gaz de France | 36,458 | 1,355,241 | |||
| 1,355,241 | |||||
HAND & MACHINE TOOLS – 2.09% | |||||
Schneider Electric SA | 41,637 | 4,437,012 | |||
| 4,437,012 | |||||
HEALTH CARE – PRODUCTS – 0.88% | |||||
Compagnie Generale d’Optique Essilor International SA | 18,033 | 1,865,118 | |||
| 1,865,118 | |||||
| 46 | 2006 iSHARES ANNUAL REPORTTO SHAREHOLDERS |
Table of Contents
Schedule of Investments (Continued)
iSHARES® MSCI FRANCE INDEX FUND
August 31, 2006
Security | Shares | Value | ||||
HOLDING COMPANIES – DIVERSIFIED – 2.19% | ||||||
LVMH Moet Hennessy Louis Vuitton SA | 45,101 | $ | 4,638,729 | |||
| 4,638,729 | ||||||
HOME FURNISHINGS – 0.37% | ||||||
Thomson | 48,427 | 774,242 | ||||
| 774,242 | ||||||
HOUSEHOLD PRODUCTS & WARES – 0.15% | ||||||
Societe BIC SA | 5,032 | 312,656 | ||||
| 312,656 | ||||||
INSURANCE – 5.90% | ||||||
AXA | 306,102 | 11,362,950 | ||||
CNP Assurances | 7,570 | 781,497 | ||||
SCOR | 150,348 | 359,887 | ||||
| 12,504,334 | ||||||
IRON & STEEL – 2.02% | ||||||
Mittal Steel Co. NV French | 128,177 | 4,274,101 | ||||
| 4,274,101 | ||||||
LODGING – 1.15% | ||||||
Accor SA | 37,984 | 2,428,640 | ||||
| 2,428,640 | ||||||
MACHINERY – 0.90% | ||||||
Alstom1 | 20,274 | 1,910,048 | ||||
| 1,910,048 | ||||||
MEDIA – 4.72% | ||||||
Lagardere S.C.A. | 22,358 | 1,637,027 | ||||
M6-Metropole Television | 12,036 | 376,077 | ||||
Societe Television Francaise 1 | 21,488 | 686,818 | ||||
Vivendi Universal SA | 212,412 | 7,300,461 | ||||
| 10,000,383 | ||||||
METAL FABRICATE & HARDWARE – 0.72% | ||||||
Vallourec SA | 6,780 | 1,518,779 | ||||
| 1,518,779 | ||||||
OFFICE & BUSINESS EQUIPMENT – 0.32% | ||||||
Neopost SA | 5,882 | 687,044 | ||||
| 687,044 | ||||||
OIL & GAS – 12.95% | ||||||
Total SA | 406,708 | 27,435,967 | ||||
| 27,435,967 | ||||||
Security | Shares or Principal | Value | ||||
OIL & GAS SERVICES – 0.53% | ||||||
Technip SA | 19,382 | $ | 1,117,439 | |||
| 1,117,439 | ||||||
PHARMACEUTICALS – 7.91% | ||||||
Sanofi-Aventis | 186,966 | 16,764,774 | ||||
| 16,764,774 | ||||||
REAL ESTATE – 1.14% | ||||||
Gecina SA | 2,278 | 296,844 | ||||
Klepierre | 3,366 | 472,659 | ||||
Unibail Holding | 8,424 | 1,643,351 | ||||
| 2,412,854 | ||||||
RETAIL – 0.79% | ||||||
PPR SA | 12,209 | 1,684,712 | ||||
| 1,684,712 | ||||||
SEMICONDUCTORS – 0.97% | ||||||
STMicroelectronics NV | 125,546 | 2,065,061 | ||||
| 2,065,061 | ||||||
SOFTWARE – 0.50% | ||||||
Business Objects SA1 | 17,408 | 485,549 | ||||
Dassault Systemes SA | 10,440 | 577,580 | ||||
| 1,063,129 | ||||||
TELECOMMUNICATIONS – 4.59% | ||||||
Alcatel SA Class A1 | 249,479 | 3,126,393 | ||||
France Telecom | 311,308 | 6,602,976 | ||||
| 9,729,369 | ||||||
WATER – 5.16% | ||||||
Suez SA | 187,276 | 8,001,942 | ||||
Veolia Environnement | 52,530 | 2,941,795 | ||||
| 10,943,737 | ||||||
TOTAL COMMON STOCKS | 211,418,462 | |||||
SHORT-TERM INVESTMENTS – 1.28% | ||||||
CERTIFICATES OF DEPOSIT3 – 0.05% | ||||||
Credit Suisse First Boston NY | ||||||
5.28% - 5.43%, 04/23/07 - 08/21/07 | $ | 15,018 | 15,018 | |||
Societe Generale | ||||||
5.33%, 12/08/06 | 21,454 | 21,454 | ||||
| SCHEDULESOF INVESTMENTS | 47 |
Table of Contents
Schedule of Investments (Continued)
iSHARES® MSCI FRANCE INDEX FUND
August 31, 2006
Security | Principal | Value | ||||
Washington Mutual Bank | ||||||
5.36%, 11/13/06 | $ | 53,636 | $ | 53,636 | ||
Wells Fargo Bank N.A. | ||||||
4.78%, 12/05/06 | 17,164 | 17,164 | ||||
| 107,272 | ||||||
COMMERCIAL PAPER3 – 0.20% | ||||||
Amstel Funding Corp. | ||||||
5.20%, 11/21/06 - 11/22/064 | 6,261 | 6,187 | ||||
Amsterdam Funding Corp. | ||||||
5.27%, 09/15/064 | 21,454 | 21,410 | ||||
Atlantis One Funding | ||||||
5.30%, 11/14/064 | 29,437 | 29,116 | ||||
Barton Capital Corp. | ||||||
5.27%, 09/06/064 | 10,813 | 10,805 | ||||
Cancara Asset Securitisation Ltd. | ||||||
5.30%, 11/14/064 | 10,876 | 10,757 | ||||
CC USA Inc. | ||||||
5.03%, 10/24/064 | 4,291 | 4,259 | ||||
Charta LLC | ||||||
5.30%, 11/06/064 | 21,454 | 21,246 | ||||
Concord Minutemen Capital Co. LLC | ||||||
5.27% - 5.29%, 09/13/06 - 11/16/064 | 37,681 | 37,513 | ||||
Curzon Funding LLC | ||||||
5.29%, 11/17/064 | 21,454 | 21,212 | ||||
Edison Asset Securitization LLC | ||||||
5.22%, 12/11/064 | 15,827 | 15,596 | ||||
Falcon Asset Securitization Corp. | ||||||
5.30%, 11/06/064 | 21,454 | 21,246 | ||||
Five Finance Inc. | ||||||
5.19%, 12/01/064 | 9,654 | 9,528 | ||||
General Electric Capital Services Inc. | ||||||
5.22%, 12/11/06 | 2,145 | 2,114 | ||||
Giro Funding Corp. | ||||||
5.28% - 5.34%, 09/11/06 - 10/10/064 | 21,454 | 21,376 | ||||
Grampian Funding LLC | ||||||
5.03% - 5.30%, 10/17/06 - 11/16/064 | 10,298 | 10,213 | ||||
KKR Pacific Funding Trust | ||||||
5.29%, 09/14/064 | 21,454 | 21,413 | ||||
Landale Funding LLC | ||||||
5.31%, 11/15/064 | 16,734 | 16,549 | ||||
Lexington Parker Capital Co. LLC | ||||||
5.19% - 5.27%, 09/15/06 - 11/15/064 | 27,810 | 27,650 | ||||
Liberty Street Funding Corp. | ||||||
5.27%, 09/08/06 - 09/11/064 | 19,094 | 19,071 | ||||
Mont Blanc Capital Corp. | ||||||
5.29%, 11/15/064 | 13,838 | 13,686 | ||||
Monument Gardens Funding LLC | ||||||
5.28%, 09/21/064 | 10,781 | 10,750 | ||||
Nestle Capital Corp. | ||||||
5.19%, 08/09/07 | 12,873 | 12,238 | ||||
Park Granada LLC | ||||||
5.30%, 09/01/064 | 4,903 | 4,903 | ||||
Regency Markets LLC | ||||||
5.28%, 09/15/06 | 10,727 | 10,705 | ||||
Solitaire Funding Ltd. | ||||||
5.27%, 09/05/064 | 16,091 | 16,081 | ||||
Sydney Capital Corp. | ||||||
5.27%, 09/12/064 | 4,909 | 4,901 | ||||
Tulip Funding Corp. | ||||||
5.29%, 11/15/064 | 11,315 | 11,191 | ||||
White Pine Finance LLC | ||||||
5.12%, 10/27/064 | 4,055 | 4,023 | ||||
| 415,739 | ||||||
MEDIUM-TERM NOTES3 – 0.04% | ||||||
Bank of America N.A. | ||||||
5.28%, 04/20/07 | 5,364 | 5,364 | ||||
Cullinan Finance Corp. | ||||||
5.71%, 06/28/074 | 16,091 | 16,091 | ||||
K2 USA LLC | ||||||
5.39%, 06/04/074 | 16,091 | 16,091 | ||||
Marshall & Ilsley Bank | ||||||
5.18%, 12/15/06 | 21,454 | 21,476 | ||||
Sigma Finance Inc. | ||||||
5.13% - 5.51%, 03/30/07 - 06/18/074 | 25,102 | 25,102 | ||||
US Bank N.A. | ||||||
2.85%, 11/15/06 | 4,291 | 4,275 | ||||
| 88,399 | ||||||
| 48 | 2006 iSHARES ANNUAL REPORTTO SHAREHOLDERS |
Table of Contents
Schedule of Investments (Continued)
iSHARES® MSCI FRANCE INDEX FUND
August 31, 2006
Security | Shares or Principal | Value | ||||
MONEY MARKET FUNDS – 0.07% | ||||||
Barclays Global Investors Funds Institutional Money Market Fund, Institutional Shares 5.30%5,6 | 160,863 | $ | 160,863 | |||
| 160,863 | ||||||
REPURCHASE AGREEMENTS3 – 0.25% | ||||||
Banc of America Securities LLC Repurchase Agreement, 5.30%, due 9/1/06, maturity value $26,822 (collateralized by U.S. Government obligations, value $27,380, 5.50% to 6.50%, 1/1/33 to 7/1/36). | $ | 26,818 | 26,818 | |||
Banc of America Securities LLC Repurchase Agreement, 5.36%, due 9/1/06, maturity value $42,915 (collateralized by non-U.S. Government debt securities, value $44,238, 3.80% to 9.13%, 11/1/06 to 6/15/26). | 42,909 | 42,909 | ||||
Bear Stearns Companies Inc. (The) Repurchase Agreement, 5.37%, due 9/1/06, maturity value $32,187 (collateralized by non-U.S. Government debt securities, value $35,434, 0.08% to 6.43%, 9/25/20 to 7/25/36). | 32,182 | 32,182 | ||||
Citigroup Global Markets Holdings Inc. Repurchase Agreement, 5.36%, due 9/1/06, maturity value $64,373 (collateralized by non-U.S. Government debt securities, value $67,255, 4.35% to 7.50%, 9/15/08 to 8/25/35). | 64,363 | 64,363 | ||||
Security | Principal | Value | ||||
Citigroup Global Markets Holdings Inc. Repurchase Agreement, 5.46%, due 9/1/06, maturity value $12,875 (collateralized by non-U.S. Government debt securities, value $15,714, 0.00% to 10.00%, 6/1/28 to 8/24/36). | $ | 12,873 | $ | 12,873 | ||
Goldman Sachs & Co. Repurchase Agreement, 5.35%, due 9/1/06, maturity value $42,915 (collateralized by non-U.S. Government debt securities, value $43,808, 0.00% to 8.57%, 11/15/06 to 2/15/38). | 42,909 | 42,909 | ||||
Goldman Sachs Group Inc. Repurchase Agreement, 5.36%, due 9/1/06, maturity value $21,457 (collateralized by non-U.S. Government debt securities, value $22,548, 5.36% to 9.01%, 10/27/10 to 2/18/20). | 21,454 | 21,454 | ||||
JP Morgan Securities Inc. Repurchase Agreement, 5.41%, due 9/1/06, maturity value $5,365 (collateralized by non-U.S. Government debt securities, value $5,637, 6.63% to 10.50%, 1/15/07 to 4/15/16). | 5,364 | 5,364 | ||||
Lehman Brothers Holdings Inc. Repurchase Agreement, 5.36%, due 9/1/06, maturity value $42,915 (collateralized by non-U.S. Government debt securities, value $45,097, 0.51% to 8.89%, 8/5/18 to 9/25/46). | 42,909 | 42,909 | ||||
| SCHEDULESOF INVESTMENTS | 49 |
Table of Contents
Schedule of Investments (Continued)
iSHARES® MSCI FRANCE INDEX FUND
August 31, 2006
Security | Principal | Value | ||||
Lehman Brothers Holdings Inc. Repurchase Agreement, 5.38%, due 9/1/06, maturity value $21,457 (collateralized by non-U.S. Government debt securities, value $22,549, 4.11% to 9.79%, 4/28/31 to 9/25/46). | $ | 21,454 | $ | 21,454 | ||
Lehman Brothers Holdings Inc. Repurchase Agreement, 5.46%, due 9/1/06, maturity value $23,604 (collateralized by non-U.S. Government debt securities, value $24,803, 3.44% to 15.15%, 12/1/08 to 3/1/36). | 23,600 | 23,600 | ||||
Merrill Lynch & Co. Inc. Repurchase Agreement, 5.33%, due 9/1/06, maturity value $42,915 (collateralized by non-U.S. Government debt securities, value $45,098, 6.38% to 10.25%, 5/1/07 to 10/15/16). | 42,909 | 42,909 | ||||
Merrill Lynch & Co. Inc. Repurchase Agreement, 5. 36%, due 9/1/06, maturity value $42,915 (collateralized by non-U.S. Government debt securities, value $44,246, 0.00% to 10.13%, 10/15/06 to 7/1/26). | 42,909 | 42,909 | ||||
Morgan Stanley Repurchase Agreement, 5.36%, due 9/1/06, maturity value $21,457 (collateralized by non-U.S. Government debt securities, value $22,559, 4.05% to 7.24%, 6/20/29 to 1/14/41). | 21,454 | 21,454 | ||||
Morgan Stanley Repurchase Agreement, 5.46%, due 9/1/06, maturity value $7,510 (collateralized by non-U.S. Government debt securities, value $11,516, 0.00% to 10.00%, 9/1/06 to 8/31/36). | 7,509 | 7,509 | ||||
Morgan Stanley Repurchase Agreement, 5.51%, due 6/4/07, maturity value $15,655 (collateralized by non-U.S. Government debt securities, value $23,381, 0.00% to 10.00%, 9/1/06 to 8/31/36).7 | 15,018 | 15,018 | ||||
Wachovia Capital Repurchase Agreement, 5.38%, due 9/1/06, maturity value $55,789 (collateralized by non-U.S. Government debt securities, value $58,626, 0.06% to 7.68%, 10/15/11 to 3/15/45). | 55,781 | 55,781 | ||||
| 522,415 | ||||||
TIME DEPOSITS3 – 0.00% | ||||||
KBC Bank | ||||||
5.31%, 09/01/06 | 4,527 | 4,527 | ||||
| 4,527 | ||||||
VARIABLE & FLOATING RATE NOTES3 – 0.67% | ||||||
Allstate Life Global Funding II | ||||||
5.34% - 5.47%, 09/04/07 - 09/27/074 | 54,923 | 54,931 | ||||
American Express Bank | ||||||
5.30%, 02/28/07 | 21,454 | 21,454 | ||||
American Express Centurion Bank | ||||||
5.42%, 07/19/07 | 23,600 | 23,624 | ||||
American Express Credit Corp. | ||||||
5.51%, 07/05/07 | 6,436 | 6,440 | ||||
ASIF Global Financing | ||||||
5.51%, 05/03/074 | 2,145 | 2,146 | ||||
| 50 | 2006 iSHARES ANNUAL REPORTTO SHAREHOLDERS |
Table of Contents
Schedule of Investments (Continued)
iSHARES® MSCI FRANCE INDEX FUND
August 31, 2006
Security | Principal | Value | ||||
Australia & New Zealand Banking Group Ltd. | ||||||
5.32%, 09/21/074 | $ | 13,945 | $ | 13,945 | ||
Bank of Ireland | ||||||
5.30% - 5.31%, 08/14/07 - 08/20/074 | 31,109 | 31,110 | ||||
Beta Finance Inc. | ||||||
5.29% - 5.48%, 04/25/07 - 07/25/074 | 54,709 | 54,712 | ||||
BMW US Capital LLC | ||||||
5.33%, 09/14/074 | 21,454 | 21,454 | ||||
BNP Paribas | ||||||
5.36%, 05/18/074 | 39,691 | 39,691 | ||||
Carlyle Loan Investment Ltd. | ||||||
5.38%, 04/13/07 - 07/15/074 | 15,662 | 15,661 | ||||
CC USA Inc. | ||||||
5.48%, 07/30/074 | 10,727 | 10,729 | ||||
Commodore CDO Ltd. | ||||||
5.38%, 06/12/074 | 5,364 | 5,364 | ||||
Credit Agricole SA | ||||||
5.48%, 07/23/07 | 21,454 | 21,454 | ||||
Credit Suisse First Boston NY | ||||||
5.51%, 04/24/07 | 10,727 | 10,728 | ||||
Cullinan Finance Corp. | ||||||
5.36%, 04/25/074 | 5,364 | 5,364 | ||||
DEPFA Bank PLC | ||||||
5.37%, 06/15/07 | 21,454 | 21,454 | ||||
Dorada Finance Inc. | ||||||
5.41% - 5.47%, 06/27/07 - 07/17/074 | 24,673 | 24,674 | ||||
Eli Lilly Services Inc. | ||||||
5.37%, 08/31/074 | 21,454 | 21,454 | ||||
Fifth Third Bancorp | ||||||
5.30%, 09/21/074 | 42,909 | 42,909 | ||||
Five Finance Inc. | ||||||
5.37% - 5.45%, 12/01/06 - 07/13/074 | 21,454 | 21,452 | ||||
General Electric Capital Corp. | ||||||
5.29% - 5.49%, 07/09/07 - 09/24/07 | 22,527 | 22,533 | ||||
Granite Master Issuer PLC | ||||||
5.30%, 09/20/06 | 75,090 | 75,090 | ||||
Harrier Finance Funding LLC | ||||||
5.33%, 07/25/074 | 6,436 | 6,438 | ||||
Hartford Life Global Funding Trusts | ||||||
5.35% - 5.55%, 07/13/07 - 09/17/07 | 32,182 | 32,186 | ||||
HBOS Treasury Services PLC | ||||||
5.53%, 07/24/074 | 21,454 | 21,454 | ||||
Holmes Financing PLC | ||||||
5.40%, 07/16/074 | 37,545 | 37,545 | ||||
JP Morgan Chase & Co. | ||||||
5.36%, 08/02/07 | 16,091 | 16,091 | ||||
K2 USA LLC | ||||||
5.20% - 5.46%, 04/02/07 - 06/28/074 | 16,091 | 16,090 | ||||
Kestrel Funding LLC | �� | |||||
5.31%, 07/11/074 | 8,582 | 8,581 | ||||
Kommunalkredit Austria AG | ||||||
5.33%, 09/09/074 | 12,873 | 12,873 | ||||
Leafs LLC | ||||||
5.33%, 01/22/07 - 02/20/074 | 22,385 | 22,385 | ||||
Lexington Parker Capital Co. LLC | ||||||
5.46%, 01/10/074 | 26,818 | 26,812 | ||||
Links Finance LLC | ||||||
5.33% - 5.35%, 05/10/07 - 05/16/074 | 23,600 | 23,598 | ||||
Lothian Mortgages Master Issuer PLC | ||||||
5.30%, 04/24/074 | 9,453 | 9,453 | ||||
Marshall & Ilsley Bank | ||||||
5.31%, 09/14/07 | 11,800 | 11,800 | ||||
Metropolitan Life Global Funding I | ||||||
5.42%, 08/06/074 | 32,182 | 32,182 | ||||
Metropolitan Life Insurance Funding Agreement | ||||||
5.57%, 08/01/074,7 | 2,145 | 2,145 | ||||
Monumental Global Funding II | ||||||
5.49%, 12/27/064 | 4,291 | 4,291 | ||||
Mound Financing PLC | ||||||
5.39%, 05/08/074 | 20,167 | 20,167 | ||||
Natexis Banques Populaires | ||||||
5.31% - 5.40%, 02/05/07 - 09/14/074 | 64,363 | 64,363 | ||||
| SCHEDULESOF INVESTMENTS | 51 |
Table of Contents
Schedule of Investments (Continued)
iSHARES® MSCI FRANCE INDEX FUND
August 31, 2006
Security | Principal | Value | |||||
National City Bank of Indiana | |||||||
5.37%, 05/21/07 | $ | 10,727 | $ | 10,728 | |||
Nationwide Building Society | |||||||
5.44% - 5.62%, 07/06/07 - 07/27/074 | 70,799 | 70,815 | |||||
Newcastle Ltd. | |||||||
5.35%, 04/24/074 | 7,563 | 7,561 | |||||
Northern Rock PLC | |||||||
5.43%, 08/03/074 | 25,745 | 25,746 | |||||
Principal Life Global Funding I | |||||||
5.80%, 02/08/07 | 9,654 | 9,674 | |||||
Sedna Finance Inc. | |||||||
5.30% - 5.37%, 09/20/06 - 08/21/074 | 37,545 | 37,544 | |||||
Skandinaviska Enskilda Bank NY | |||||||
5.33%, 09/18/074 | 21,454 | 21,454 | |||||
Strips III LLC | |||||||
5.38%, 07/24/074 | 5,217 | 5,217 | |||||
SunTrust Bank | |||||||
5.37%, 05/01/07 | 21,454 | 21,455 | |||||
Tango Finance Corp. | |||||||
5.22% - 5.48%, 04/25/07 - 07/16/074 | 52,349 | 52,343 | |||||
Union Hamilton Special Funding LLC | |||||||
5.42% - 5.49%, 09/28/06 - 12/21/064 | 30,036 | 30,036 | |||||
US Bank N.A. | |||||||
5.26%, 09/29/06 | 9,654 | 9,654 | |||||
Wachovia Asset Securitization Inc. | |||||||
5.31%, 09/25/064 | 32,014 | 32,015 | |||||
Wachovia Bank N.A. | |||||||
5.36%, 05/22/07 | 42,909 | 42,909 | |||||
Wells Fargo & Co. | |||||||
5.34%, 09/14/074 | 10,727 | 10,728 | |||||
WhistleJacket Capital Ltd. | |||||||
5.29% - 5.35%, 04/18/07 - 06/13/074 | 16,091 | 16,091 | |||||
White Pine Finance LLC | |||||||
5.29% - 5.35%, 05/22/07 - 08/20/074 | 64,363 | 64,350 | |||||
Wind Master Trust | |||||||
5.31% - 5.32%, 09/25/06 - 07/25/074 | 13,607 | 13,607 | |||||
| 1,418,754 | |||||||
TOTAL SHORT-TERM INVESTMENTS | 2,717,969 | ||||||
TOTAL INVESTMENTS IN SECURITIES – 101.06% | 214,136,431 | ||||||
Other Assets, Less Liabilities – (1.06)% | (2,250,670 | ) | |||||
NET ASSETS – 100.00% | $ | 211,885,761 | |||||
| 1 | Non-income earning security. |
| 2 | All or a portion of this security represents a security on loan. See Note 5. |
| 3 | All or a portion of this security (these securities) represent(s) an investment of securities lending collateral. See Note 5. |
| 4 | This security or a portion of these securities may be resold to qualified institutional buyers under Rule 144A or pursuant to Section 4(2) of the Securities Act of 1933. |
| 5 | Affiliated issuer. See Note 2. |
| 6 | The rate quoted is the annualized seven-day yield of the fund at period end. |
| 7 | The investment adviser has determined that this security or a portion of these securities is illiquid. |
See notes to the financial statements.
| 52 | 2006 iSHARES ANNUAL REPORTTO SHAREHOLDERS |
Table of Contents
iSHARES® MSCI GERMANY INDEX FUND
August 31, 2006
Security | Shares | Value | |||
COMMON STOCKS – 96.26% | |||||
AIRLINES – 0.59% | |||||
Deutsche Lufthansa AG | 237,639 | $ | 4,702,774 | ||
| 4,702,774 | |||||
APPAREL – 1.75% | |||||
Adidas-Salomon AG | 206,564 | 9,836,136 | |||
Puma AG | 12,091 | 4,190,111 | |||
| 14,026,247 | |||||
AUTO MANUFACTURERS – 7.51% | |||||
DaimlerChrysler AG | 881,174 | 46,471,407 | |||
Volkswagen AG | 173,229 | 13,825,600 | |||
| 60,297,007 | |||||
AUTO PARTS & EQUIPMENT – 1.80% | |||||
Continental AG | 135,600 | 14,493,494 | |||
| 14,493,494 | |||||
BANKS – 12.32% | |||||
Commerzbank AG | 624,664 | 21,829,111 | |||
DEPFA Bank PLC | 362,052 | 6,729,216 | |||
Deutsche Bank AG | 498,556 | 56,893,445 | |||
Deutsche Postbank AG | 62,715 | 4,890,556 | |||
Hypo Real Estate Holding AG | 138,086 | 8,555,038 | |||
| 98,897,366 | |||||
BIOTECHNOLOGY – 0.27% | |||||
QIAGEN NV1,2 | 151,011 | 2,161,112 | |||
| 2,161,112 | |||||
CHEMICALS – 9.20% | |||||
BASF AG | 471,888 | 38,857,908 | |||
Bayer AG | 707,380 | 35,014,980 | |||
| 73,872,888 | |||||
COMPUTERS – 0.28% | |||||
Wincor Nixdorf AG | 15,933 | 2,217,756 | |||
| 2,217,756 | |||||
COSMETICS & PERSONAL CARE – 0.41% | |||||
Beiersdorf AG | 60,003 | 3,318,056 | |||
| 3,318,056 | |||||
DIVERSIFIED FINANCIAL SERVICES – 2.11% | |||||
Deutsche Boerse AG | 104,412 | 15,833,821 | |||
MLP AG2 | 64,523 | 1,106,742 | |||
| �� | 16,940,563 | ||||
ELECTRIC – 14.50% | |||||
E.ON AG | 602,742 | 76,505,896 | |||
RWE AG | 436,180 | 39,943,086 | |||
| 116,448,982 | |||||
ENERGY – ALTERNATE SOURCES – 0.26% | |||||
Solarworld AG2 | 34,804 | 2,057,804 | |||
| 2,057,804 | |||||
ENGINEERING & CONSTRUCTION – 1.87% | |||||
Bilfinger Berger AG | 36,838 | 2,018,212 | |||
Hochtief AG | 44,070 | 2,506,376 | |||
Linde AG | 119,328 | 10,522,659 | |||
| 15,047,247 | |||||
FOOD – 1.43% | |||||
METRO AG | 160,234 | 9,410,334 | |||
Suedzucker AG | 83,846 | 2,087,512 | |||
| 11,497,846 | |||||
HEALTH CARE – PRODUCTS – 1.06% | |||||
Fresenius Medical Care AG & Co. KGaA | 64,297 | 8,475,602 | |||
| 8,475,602 | |||||
INSURANCE – 12.05% | |||||
Allianz AG | 396,517 | 67,185,927 | |||
Muenchener Rueckversicherungs-Gesellschaft AG | 196,281 | 29,541,916 | |||
| 96,727,843 | |||||
IRON & STEEL – 1.98% | |||||
Salzgitter AG | 39,550 | 3,540,275 | |||
ThyssenKrupp AG | 362,843 | 12,345,272 | |||
| 15,885,547 | |||||
LEISURE TIME – 0.57% | |||||
TUI AG2 | 235,040 | 4,585,151 | |||
| 4,585,151 | |||||
MACHINERY – DIVERSIFIED – 1.85% | |||||
Heidelberger Druckmaschinen AG | 60,116 | 2,410,121 | |||
MAN AG | 128,707 | 9,837,306 | |||
Rheinmetall AG | 38,759 | 2,599,745 | |||
| 14,847,172 | |||||
MANUFACTURING – 8.73% | |||||
Siemens AG | 826,934 | 70,052,646 | |||
| 70,052,646 | |||||
| SCHEDULESOF INVESTMENTS | 53 |
Table of Contents
Schedule of Investments (Continued)
iSHARES® MSCI GERMANY INDEX FUND
August 31, 2006
Security | Shares | Value | |||
MEDIA – 0.10% | |||||
Premiere AG1 | 61,133 | $ | 768,447 | ||
| 768,447 | |||||
PHARMACEUTICALS – 1.87% | |||||
ALTANA AG | 76,501 | 4,514,347 | |||
Celesio AG 2 | 102,830 | 5,212,451 | |||
Merck KGaA | 53,449 | 5,301,664 | |||
| 15,028,462 | |||||
REAL ESTATE – 0.37% | |||||
IVG Immobilien AG | 92,434 | 2,991,133 | |||
| 2,991,133 | |||||
RETAIL – 0.35% | |||||
Douglas Holding AG | 32,205 | 1,436,245 | |||
KarstadtQuelle AG1,2 | 62,941 | 1,393,820 | |||
| 2,830,065 | |||||
SEMICONDUCTORS – 1.10% | |||||
Infineon Technologies AG1 | 755,744 | 8,870,967 | |||
| 8,870,967 | |||||
SOFTWARE – 4.82% | |||||
SAP AG | 202,722 | 38,688,005 | |||
| 38,688,005 | |||||
TELECOMMUNICATIONS – 4.73% | |||||
Deutsche Telekom AG | 2,604,085 | 37,966,959 | |||
| 37,966,959 | |||||
TRANSPORTATION – 2.38% | |||||
Deutsche Post AG | 753,032 | 19,075,949 | |||
| 19,075,949 | |||||
TOTAL COMMON STOCKS | 772,773,090 | ||||
PREFERRED STOCKS – 3.46% | |||||
AUTO MANUFACTURERS – 1.81% | |||||
Porsche AG | 8,023 | 8,218,030 | |||
Volkswagen AG | 110,966 | 6,298,143 | |||
| 14,516,173 | |||||
ELECTRIC – 0.32% | |||||
RWE AG | 30,962 | 2,557,115 | |||
| 2,557,115 | |||||
Security | Shares or Principal | Value | ||||
HOUSEHOLD PRODUCTS & WARES – 1.05% | ||||||
Henkel KGaA | 65,879 | $ | 8,406,700 | |||
| 8,406,700 | ||||||
MEDIA – 0.28% | ||||||
ProSiebenSat.1 Media AG | 84,411 | 2,264,734 | ||||
| 2,264,734 | ||||||
TOTAL PREFERRED STOCKS | 27,744,722 | |||||
SHORT-TERM INVESTMENTS – 1.38% | ||||||
CERTIFICATES OF DEPOSIT3 – 0.0 6% | ||||||
Credit Suisse First Boston NY | ||||||
5.28% - 5.43%, 04/23/07 - 08/21/07 | $ | 65,105 | 65,105 | |||
Societe Generale | ||||||
5.33%, 12/08/06 | 93,007 | 93,007 | ||||
Washington Mutual Bank | ||||||
5.36%, 11/13/06 | 232,518 | 232,518 | ||||
Wells Fargo Bank N.A. | ||||||
4.78%, 12/05/06 | 74,406 | 74,406 | ||||
| 465,036 | ||||||
COMMERCIAL PAPER3 – 0.22% | ||||||
Amstel Funding Corp. | ||||||
5.20%, 11/21/06 - 11/22/064 | 27,138 | 26,819 | ||||
Amsterdam Funding Corp. | ||||||
5.27%, 09/15/064 | 93,007 | 92,816 | ||||
Atlantis One Funding | ||||||
5.30%, 11/14/064 | 127,613 | 126,223 | ||||
Barton Capital Corp. | ||||||
5.27%, 09/06/064 | 46,876 | 46,841 | ||||
Cancara Asset Securitisation Ltd. | ||||||
5.30%, 11/14/064 | 47,147 | 46,634 | ||||
CC USA Inc. | ||||||
5.03%, 10/24/064 | 18,601 | 18,464 | ||||
Charta LLC | ||||||
5.30%, 11/06/064 | 93,007 | 92,103 | ||||
Concord Minutemen Capital Co. LLC | ||||||
5.27% - 5.29%, 09/13/06 - 11/16/064 | 163,349 | 162,624 | ||||
Curzon Funding LLC | ||||||
5.29%, 11/17/064 | 93,007 | 91,955 | ||||
| 54 | 2006 iSHARES ANNUAL REPORTTO SHAREHOLDERS |
Table of Contents
Schedule of Investments (Continued)
iSHARES® MSCI GERMANY INDEX FUND
August 31, 2006
Security | Principal | Value | ||||
Edison Asset Securitization LLC | ||||||
5.22%, 12/11/064 | $ | 68,613 | $ | 67,608 | ||
Falcon Asset Securitization Corp. | ||||||
5.30%, 11/06/064 | 93,007 | 92,103 | ||||
Five Finance Inc. | ||||||
5.19%, 12/01/064 | 41,853 | 41,304 | ||||
General Electric Capital Services Inc. | ||||||
5.22%, 12/11/06 | 9,301 | 9,164 | ||||
Giro Funding Corp. | ||||||
5.28% - 5.34%, 09/11/06 - 10/10/064 | 93,007 | 92,670 | ||||
Grampian Funding LLC | ||||||
5.03% - 5.30%, 10/17/06 - 11/16/064 | 44,643 | 44,274 | ||||
KKR Pacific Funding Trust | ||||||
5.29%, 09/14/064 | 93,007 | 92,829 | ||||
Landale Funding LLC | ||||||
5.31%, 11/15/064 | 72,546 | 71,744 | ||||
Lexington Parker Capital Co. LLC | ||||||
5.19% - 5.27%, 09/15/06 - 11/15/064 | 120,558 | 119,866 | ||||
Liberty Street Funding Corp. | ||||||
5.27%, 09/08/06 - 09/11/064 | 82,776 | 82,676 | ||||
Mont Blanc Capital Corp. | ||||||
5.29%, 11/15/064 | 59,990 | 59,328 | ||||
Monument Gardens Funding LLC | ||||||
5.28%, 09/21/064 | 46,739 | 46,602 | ||||
Nestle Capital Corp. | ||||||
5.19%, 08/09/07 | 55,804 | 53,053 | ||||
Park Granada LLC | ||||||
5.30%, 09/01/064 | 21,254 | 21,254 | ||||
Regency Markets LLC | ||||||
5.28%, 09/15/06 | 46,504 | 46,408 | ||||
Solitaire Funding Ltd. | ||||||
5.27%, 09/05/064 | 69,755 | 69,714 | ||||
Sydney Capital Corp. | ||||||
5.27%, 09/12/064 | 21,280 | 21,246 | ||||
Tulip Funding Corp. | ||||||
5.29%, 11/15/064 | 49,054 | 48,513 | ||||
White Pine Finance LLC | ||||||
5.12%, 10/27/064 | 17,578 | 17,438 | ||||
| 1,802,273 | ||||||
MEDIUM-TERM NOTES3 – 0.05% | ||||||
Bank of America N.A. | ||||||
5.28%, 04/20/07 | 23,252 | 23,252 | ||||
Security | Shares or Principal | Value | ||||
Cullinan Finance Corp. | ||||||
5.71%, 06/28/074 | $ | 69,755 | $ | 69,755 | ||
K2 USA LLC | ||||||
5.39%, 06/04/074 | 69,755 | 69,755 | ||||
Marshall & Ilsley Bank | ||||||
5.18%, 12/15/06 | 93,007 | 93,099 | ||||
Sigma Finance Inc. | ||||||
5.13% - 5.51%, 03/30/07 - 06/18/074 | 108,818 | 108,818 | ||||
US Bank N.A. | ||||||
2.85%, 11/15/06 | 18,601 | 18,531 | ||||
| 383,210 | ||||||
MONEY MARKET FUNDS – 0.00% | ||||||
Barclays Global Investors Funds Institutional Money Market Fund, Institutional Shares 5.30%5,6 | 19,872 | 19,872 | ||||
| 19,872 | ||||||
REPURCHASE AGREEMENTS3 – 0.28% | ||||||
Banc of America Securities LLC Repurchase Agreement, 5.30%, due 9/1/06, maturity value $116,276 (collateralized by U.S. Government obligations, value $118,697, 5.50% to 6.50%, 1/1/33 to 7/1/36). | $ | 116,259 | 116,259 | |||
Banc of America Securities LLC Repurchase Agreement, 5.36%, due 9/1/06, maturity value $186,042 (collateralized by non-U.S. Government debt securities, value $191,777, 3.80% to 9.13%, 11/1/06 to 6/15/26). | 186,014 | 186,014 | ||||
Bear Stearns Companies Inc. (The) Repurchase Agreement, 5.37%, due 9/1/06, maturity value $139,532 (collateralized by non-U.S. Government debt securities, value $153,610, 0.08% to 6.43%, 9/25/20 to 7/25/36). | 139,511 | 139,511 | ||||
| SCHEDULESOF INVESTMENTS | 55 |
Table of Contents
Schedule of Investments (Continued)
iSHARES® MSCI GERMANY INDEX FUND
August 31, 2006
Security | Principal | Value | ||||
Citigroup Global Markets Holdings Inc. Repurchase Agreement, 5.36%, due 9/1/06, maturity value $279,063 (collateralized by non-U.S. Government debt securities, value $291,558, 4.35% to 7.50%, 9/15/08 to 8/25/35). | $ | 279,021 | $ | 279,021 | ||
Citigroup Global Markets Holdings Inc. Repurchase Agreement, 5.46%, due 9/1/06, maturity value $55,812 (collateralized by non-U.S. Government debt securities, value $68,122, 0.00% to 10.00%, 6/1/28 to 8/24/36). | 55,804 | 55,804 | ||||
Goldman Sachs & Co. Repurchase Agreement, 5.35%, due 9/1/06, maturity value $186,042 (collateralized by non-U.S. Government debt securities, value $189,915, 0.00% to 8.57%, 11/15/06 to 2/15/38). | 186,014 | 186,014 | ||||
Goldman Sachs Group Inc. Repurchase Agreement, 5.36%, due 9/1/06, maturity value $93,021 (collateralized by non-U.S. Government debt securities, value $97,750, 5.36% to 9.01%, 10/27/10 to 2/18/20). | 93,007 | 93,007 | ||||
JP Morgan Securities Inc. Repurchase Agreement, 5.41%, due 9/1/06, maturity value $23,255 (collateralized by non-U.S. Government debt securities, value $24,438, 6.63% to 10.50%, 1/15/07 to 4/15/16). | 23,252 | 23,252 | ||||
Lehman Brothers Holdings Inc. Repurchase Agreement, 5.36%, due 9/1/06, maturity value $186,042 (collateralized by non-U.S. Government debt securities, value $195,501, 0.51% to 8.89%, 8/5/18 to 9/25/46). | 186,014 | 186,014 | ||||
Lehman Brothers Holdings Inc. Repurchase Agreement, 5.38%, due 9/1/06, maturity value $93,021 (collateralized by non-U.S. Government debt securities, value $97,753, 4.11% to 9.79%, 4/28/31 to 9/25/46). | 93,007 | 93,007 | ||||
Lehman Brothers Holdings Inc. Repurchase Agreement, 5.46%, due 9/1/06, maturity value $102,324 (collateralized by non-U.S. Government debt securities, value $107,525, 3.44% to 15.15%, 12/1/08 to 3/1/36). | 102,308 | 102,308 | ||||
Merrill Lynch & Co. Inc. Repurchase Agreement, 5.33%, due 9/1/06, maturity value $186,043 (collateralized by non-U.S. Government debt securities, value $195,504, 6.38% to 10.25%, 5/1/07 to 10/15/16). | 186,015 | 186,015 | ||||
Merrill Lynch & Co. Inc. Repurchase Agreement, 5.36%, due 9/1/06, maturity value $186,042 (collateralized by non-U.S. Government debt securities, value $191,811, 0.00% to 10.13%, 10/15/06 to 7/1/26). | 186,014 | 186,014 | ||||
| 56 | 2006 iSHARES ANNUAL REPORTTO SHAREHOLDERS |
Table of Contents
Schedule of Investments (Continued)
iSHARES® MSCI GERMANY INDEX FUND
August 31, 2006
Security | Principal | Value | ||||
Morgan Stanley Repurchase Agreement, 5.36%, due 9/1/06, maturity value $93,021 (collateralized by non-U.S. Government debt securities, value $97,795, 4.05% to 7.24%, 6/20/29 to 1/14/41). | $ | 93,007 | $ | 93,007 | ||
Morgan Stanley Repurchase Agreement, 5.46%, due 9/1/06, maturity value $32,557 (collateralized by non-U.S. Government debt securities, value $49,922, 0.00% to 10.00%, 9/1/06 to 8/31/36). | 32,552 | 32,552 | ||||
Morgan Stanley Repurchase Agreement, 5.51%, due 6/4/07, maturity value $67,865 (collateralized by non-U.S. Government debt securities, value $101,358, 0.00% to 10.00%, 9/1/06 to 8/31/36).7 | 65,105 | 65,105 | ||||
Wachovia Capital Repurchase Agreement, 5.38%, due 9/1/06, maturity value $241,854 (collateralized by non-U.S. Government debt securities, value $254,150, 0.06% to 7.68%, 10/15/11 to 3/15/45). | 241,818 | 241,818 | ||||
| 2,264,722 | ||||||
TIME DEPOSITS3 – 0.00% | ||||||
KBC Bank | ||||||
5.31%, 09/01/06 | 19,625 | 19,625 | ||||
| 19,625 | ||||||
VARIABLE & FLOATING RATE NOTES 3 – 0.77% | ||||||
Allstate Life Global Funding II | ||||||
5.34% - 5.47%, 09/04/07 - 09/27/074 | 238,098 | 238,134 | ||||
American Express Bank | ||||||
5.30%, 02/28/07 | 93,007 | 93,007 | ||||
American Express Centurion Bank | ||||||
5.42%, 07/19/07 | 102,308 | 102,411 | ||||
American Express Credit Corp. | ||||||
5.51%, 07/05/07 | 27,902 | 27,918 | ||||
ASIF Global Financing | ||||||
5.51%, 05/03/074 | 9,301 | 9,304 | ||||
Australia & New Zealand Banking Group Ltd. | ||||||
5.32%, 09/21/074 | 60,455 | 60,455 | ||||
Bank of Ireland | ||||||
5.30% - 5.31%, 08/14/07 - 08/20/074 | 134,860 | 134,866 | ||||
Beta Finance Inc. | ||||||
5.29% - 5.48%, 04/25/07 - 07/25/074 | 237,168 | 237,185 | ||||
BMW US Capital LLC | ||||||
5.33%, 09/14/074 | 93,007 | 93,007 | ||||
BNP Paribas | ||||||
5.36%, 05/18/074 | 172,063 | 172,063 | ||||
Carlyle Loan Investment Ltd. | ||||||
5.38%, 04/13/07 - 07/15/074 | 67,895 | 67,896 | ||||
CC USA Inc. | ||||||
5.48%, 07/30/074 | 46,504 | 46,510 | ||||
Commodore CDO Ltd. | ||||||
5.38%, 06/12/074 | 23,252 | 23,252 | ||||
Credit Agricole SA | ||||||
5.48%, 07/23/07 | 93,007 | 93,007 | ||||
Credit Suisse First Boston NY | ||||||
5.51%, 04/24/07 | 46,504 | 46,506 | ||||
Cullinan Finance Corp. | ||||||
5.36%, 04/25/074 | 23,252 | 23,252 | ||||
DEPFA Bank PLC | ||||||
5.37%, 06/15/07 | 93,007 | 93,007 | ||||
Dorada Finance Inc. | ||||||
5.41% - 5.47%, 06/27/07 - 07/17/074 | 106,958 | 106,965 | ||||
Eli Lilly Services Inc. | ||||||
5.37%, 08/31/074 | 93,007 | 93,007 | ||||
Fifth Third Bancorp | ||||||
5.30%, 09/21/074 | 186,014 | 186,014 | ||||
| SCHEDULESOF INVESTMENTS | 57 |
Table of Contents
Schedule of Investments (Continued)
iSHARES® MSCI GERMANY INDEX FUND
August 31, 2006
Security | Principal | Value | ||||
Five Finance Inc. | ||||||
5.37% - 5.45%, 12/01/06 - 07/13/074 | $ | 93,007 | $ | 93,000 | ||
General Electric Capital Corp. | ||||||
5.29% - 5.49%, 07/09/07 - 09/24/07 | 97,657 | 97,680 | ||||
Granite Master Issuer PLC | ||||||
5.30%, 09/20/06 | 325,525 | 325,525 | ||||
Harrier Finance Funding LLC | ||||||
5.33%, 07/25/074 | 27,902 | 27,907 | ||||
Hartford Life Global Funding Trusts | ||||||
5.35% - 5.55%, 07/13/07 - 09/17/07 | 139,511 | 139,532 | ||||
HBOS Treasury Services PLC | ||||||
5.53%, 07/24/074 | 93,007 | 93,007 | ||||
Holmes Financing PLC | ||||||
5.40%, 07/16/074 | 162,762 | 162,762 | ||||
JP Morgan Chase & Co. | ||||||
5.36%, 08/02/07 | 69,755 | 69,755 | ||||
K2 USA LLC | ||||||
5.20% - 5.46%, 04/02/07 - 06/28/074 | 69,755 | 69,752 | ||||
Kestrel Funding LLC | ||||||
5.31%, 07/11/074 | 37,203 | 37,199 | ||||
Kommunalkredit Austria AG | ||||||
5.33%, 09/09/074 | 55,804 | 55,804 | ||||
Leafs LLC | ||||||
5.33%, 01/22/07 - 02/20/074 | 97,041 | 97,041 | ||||
Lexington Parker Capital Co. LLC | ||||||
5.46%, 01/10/074 | 116,259 | 116,233 | ||||
Links Finance LLC | ||||||
5.33% - 5.35%, 05/10/07 - 05/16/074 | 102,308 | 102,300 | ||||
Lothian Mortgages Master Issuer PLC | ||||||
5.30%, 04/24/074 | 40,982 | 40,982 | ||||
Marshall & Ilsley Bank | ||||||
5.31%, 09/14/07 | 51,154 | 51,154 | ||||
Metropolitan Life Global Funding I | ||||||
5.42%, 08/06/074 | 139,511 | 139,511 | ||||
Metropolitan Life Insurance Funding Agreement | ||||||
5.57%, 08/01/074,7 | 9,301 | 9,301 | ||||
Monumental Global Funding II | ||||||
5.49%, 12/27/064 | 18,601 | 18,603 | ||||
Mound Financing PLC | ||||||
5.39%, 05/08/074 | 87,427 | 87,427 | ||||
Natexis Banques Populaires | ||||||
5.31% - 5.40%, 02/05/07 - 09/14/074 | 279,021 | 279,016 | ||||
National City Bank of Indiana | ||||||
5.37%, 05/21/07 | 46,504 | 46,506 | ||||
Nationwide Building Society | ||||||
5.44% - 5.62%, 07/06/07 - 07/27/074 | 306,923 | 306,995 | ||||
Newcastle Ltd. | ||||||
5.35%, 04/24/074 | 32,785 | 32,779 | ||||
Northern Rock PLC | ||||||
5.43%, 08/03/074 | 111,609 | 111,611 | ||||
Principal Life Global Funding I | ||||||
5.80%, 02/08/07 | 41,853 | 41,939 | ||||
Sedna Finance Inc. | ||||||
5.30% - 5.37%, 09/20/06 - 08/21/074 | 162,762 | 162,759 | ||||
Skandinaviska Enskilda Bank NY | ||||||
5.33%, 09/18/074 | 93,007 | 93,007 | ||||
Strips III LLC | ||||||
5.38%, 07/24/074 | 22,615 | 22,615 | ||||
SunTrust Bank | ||||||
5.37%, 05/01/07 | 93,007 | 93,011 | ||||
Tango Finance Corp. | ||||||
5.22% - 5.48%, 04/25/07 - 07/16/074 | 226,937 | 226,917 | ||||
Union Hamilton Special Funding LLC | ||||||
5.42% - 5.49%, 09/28/06 - 12/21/064 | 130,210 | 130,210 | ||||
US Bank N.A. | ||||||
5.26%, 09/29/06 | 41,853 | 41,852 | ||||
Wachovia Asset Securitization Inc. | ||||||
5.31%, 09/25/064 | 138,786 | 138,786 | ||||
Wachovia Bank N.A. | ||||||
5.36%, 05/22/07 | 186,014 | 186,014 | ||||
Wells Fargo & Co. | ||||||
5.34%, 09/14/074 | 46,504 | 46,506 | ||||
| 58 | 2006 iSHARES ANNUAL REPORTTO SHAREHOLDERS |
Table of Contents
Schedule of Investments (Continued)
iSHARES® MSCI GERMANY INDEX FUND
August 31, 2006
Security | Principal | Value | |||||
WhistleJacket Capital Ltd. | |||||||
5.29% - 5.35%, 04/18/07 - 06/13/074 | $ | 69,755 | $ | 69,755 | |||
White Pine Finance LLC | |||||||
5.29% - 5.35%, 05/22/07 - 08/20/074 | 279,021 | 278,964 | |||||
Wind Master Trust | |||||||
5.31% - 5.32%, 09/25/06 - 07/25/074 | 58,986 | 58,986 | |||||
| 6,150,469 | |||||||
TOTAL SHORT-TERM INVESTMENTS | 11,105,207 | ||||||
TOTAL INVESTMENTS IN SECURITIES – 101.10% | 811,623,019 | ||||||
Other Assets, Less Liabilities – (1.10)% | (8,828,425 | ) | |||||
NET ASSETS – 100.00% | $ | 802,794,594 | |||||
| 1 | Non-income earning security. |
| 2 | All or a portion of this security represents a security on loan. See Note 5. |
| 3 | All or a portion of this security (these securities) represent(s) an investment of securities lending collateral. See Note 5. |
| 4 | This security or a portion of these securities may be resold to qualified institutional buyers under Rule 144A or pursuant to Section 4(2) of the Securities Act of 1933. |
| 5 | Affiliated issuer. See Note 2. |
| 6 | The rate quoted is the annualized seven-day yield of the fund at period end. |
| 7 | The investment adviser has determined that this security or a portion of these securities is illiquid. |
See notes to the financial statements.
| SCHEDULESOF INVESTMENTS | 59 |
Table of Contents
iSHARES® MSCI ITALY INDEX FUND
August 31, 2006
Security | Shares | Value | |||
COMMON STOCKS – 94.31% | |||||
AEROSPACE & DEFENSE – 1.83% | |||||
Finmeccanica SpA | 121,056 | $ | 2,677,670 | ||
| 2,677,670 | |||||
APPAREL – 0.35% | |||||
Benetton Group SpA | 34,592 | 517,184 | |||
| 517,184 | |||||
AUTO MANUFACTURERS – 1.75% | |||||
Fiat SpA1,2 | 179,136 | 2,563,608 | |||
| 2,563,608 | |||||
AUTO PARTS & EQUIPMENT – 0.66% | |||||
Pirelli SpA | 1,111,776 | 968,439 | |||
| 968,439 | |||||
BANKS – 36.02% | |||||
Banca Intesa SpA | 1,030,176 | 6,896,680 | |||
Banca Monte dei Paschi di Siena SpA2 | 445,600 | 2,707,928 | |||
Banca Popolare di Milano Scrl | 167,328 | 2,330,368 | |||
Banca Popolare di Verona e Novara Scrl | 166,080 | 4,932,104 | |||
Banche Popolari Unite Scrl | 163,232 | 4,603,061 | |||
Capitalia SpA | 576,896 | 5,028,883 | |||
Sanpaolo IMI SpA | 342,592 | 7,174,431 | |||
UniCredito Italiano SpA | 2,390,784 | 19,035,209 | |||
| 52,708,664 | |||||
BUILDING MATERIALS – 0.86% | |||||
Italcementi SpA | 51,264 | 1,263,851 | |||
| 1,263,851 | |||||
COMMERCIAL SERVICES – 2.85% | |||||
Autostrade SpA | 147,104 | 4,161,440 | |||
Autostrade SpA Rights1,3 | 147,104 | 177 | |||
| 4,161,617 | |||||
DIVERSIFIED FINANCIAL SERVICES – 3.63% | |||||
Banca Fideuram SpA2 | 132,864 | 852,064 | |||
Mediobanca SpA | 204,736 | 4,460,471 | |||
| 5,312,535 | |||||
ELECTRIC – 9.65% | |||||
Enel SpA | 1,372,896 | 12,248,907 | |||
Terna SpA | 658,656 | 1,873,818 | |||
| 14,122,725 | |||||
ENTERTAINMENT – 0.45% | |||||
Lottomatica SpA | 16,960 | 655,631 | |||
| 655,631 | |||||
HEALTH CARE – PRODUCTS – 1.31% | |||||
Luxottica Group SpA | 66,080 | 1,912,483 | |||
| 1,912,483 | |||||
INSURANCE – 6.29% | |||||
Assicurazioni Generali SpA | 184,640 | 6,951,007 | |||
Fondiaria-Sai SpA | 36,576 | 1,546,903 | |||
Mediolanum SpA | 98,688 | 709,950 | |||
| 9,207,860 | |||||
MEDIA – 3.46% | |||||
Arnoldo Mondadori Editore SpA | 63,520 | 614,288 | |||
Gruppo Editoriale L’Espresso SpA2 | 54,592 | 290,179 | |||
Mediaset SpA | 303,904 | 3,508,891 | |||
Seat Pagine Gialle SpA2 | 1,376,740 | 642,357 | |||
| 5,055,715 | |||||
OIL & GAS – 17.29% | |||||
ENI SpA | 826,720 | 25,292,006 | |||
| 25,292,006 | |||||
RETAIL – 1.08% | |||||
Autogrill SpA | 60,576 | 917,302 | |||
Bulgari SpA | 52,544 | 658,129 | |||
| 1,575,431 | |||||
TELECOMMUNICATIONS – 6.83% | |||||
Telecom Italia SpA | 3,547,872 | 9,809,540 | |||
Tiscali SpA 1,2 | 64,049 | 187,338 | |||
| 9,996,878 | |||||
TOTAL COMMON STOCKS | 137,992,297 | ||||
PREFERRED STOCKS – 5.57% | |||||
BANKS – 0.32% | |||||
Banca Intesa SpA RNC | 72,608 | 462,153 | |||
| 462,153 | |||||
INSURANCE – 1.99% | |||||
Unipol SpA | 964,928 | 2,911,881 | |||
| 2,911,881 | |||||
| 60 | 2006 iSHARES ANNUAL REPORTTO SHAREHOLDERS |
Table of Contents
Schedule of Investments (Continued)
iSHARES® MSCI ITALY INDEX FUND
August 31, 2006
Security | Shares or Principal | Value | ||||
TELECOMMUNICATIONS – 3.26% | ||||||
Telecom Italia SpA RNC | 1,943,264 | $ | 4,775,952 | |||
| 4,775,952 | ||||||
TOTAL PREFERRED STOCKS | 8,149,986 | |||||
SHORT-TERM INVESTMENTS – 2.20% | ||||||
CERTIFICATES OF DEPOSIT4– 0.09% | ||||||
Credit Suisse First Boston NY | ||||||
5.28% - 5.43%, 04/23/07 - 08/21/07 | $ | 18,921 | 18,921 | |||
Societe Generale | ||||||
5.33%, 12/08/06 | 27,029 | 27,029 | ||||
Washington Mutual Bank | ||||||
5.36%, 11/13/06 | 67,574 | 67,574 | ||||
Wells Fargo Bank N.A. | ||||||
4.78%, 12/05/06 | 21,624 | 21,624 | ||||
| 135,148 | ||||||
COMMERCIAL PAPER4 – 0.36% | ||||||
Amstel Funding Corp. | ||||||
5.20%, 11/21/06 - 11/22/065 | 7,887 | 7,800 | ||||
Amsterdam Funding Corp. | ||||||
5.27%, 09/15/065 | 27,029 | 26,974 | ||||
Atlantis One Funding | ||||||
5.30%, 11/14/065 | 37,087 | 36,683 | ||||
Barton Capital Corp. | ||||||
5.27%, 09/06/065 | 13,623 | 13,613 | ||||
Cancara Asset Securitisation Ltd. | ||||||
5.30%, 11/14/065 | 13,702 | 13,552 | ||||
CC USA Inc. | ||||||
5.03%, 10/24/065 | 5,406 | 5,366 | ||||
Charta LLC | ||||||
5.30%, 11/06/065 | 27,029 | 26,767 | ||||
Concord Minutemen Capital Co. LLC | ||||||
5.27% - 5.29%, 09/13/06 - 11/16/065 | 47,472 | 47,262 | ||||
Curzon Funding LLC | ||||||
5.29%, 11/17/065 | 27,029 | 26,724 | ||||
Edison Asset Securitization LLC | ||||||
5.22%, 12/11/065 | 19,940 | 19,648 | ||||
Security | Principal | Value | ||||
Falcon Asset Securitization Corp. | ||||||
5.30%, 11/06/065 | $ | 27,029 | $ | 26,767 | ||
Five Finance Inc. | ||||||
5.19%, 12/01/065 | 12,163 | 12,004 | ||||
General Electric Capital Services Inc. | ||||||
5.22%, 12/11/06 | 2,703 | 2,663 | ||||
Giro Funding Corp. | �� | |||||
5.28% - 5.34%, 09/11/06 - 10/10/065 | 27,029 | 26,932 | ||||
Grampian Funding LLC | ||||||
5.03% - 5.30%, 10/17/06 - 11/16/065 | 12,974 | 12,867 | ||||
KKR Pacific Funding Trust | ||||||
5.29%, 09/14/065 | 27,029 | 26,978 | ||||
Landale Funding LLC | ||||||
5.31%, 11/15/065 | 21,083 | 20,850 | ||||
Lexington Parker Capital Co. LLC | ||||||
5.19% - 5.27%, 09/15/06 - 11/15/065 | 35,036 | 34,836 | ||||
Liberty Street Funding Corp. | ||||||
5.27%, 09/08/06 - 09/11/065 | 24,056 | 24,027 | ||||
Mont Blanc Capital Corp. | ||||||
5.29%, 11/15/065 | 17,434 | 17,242 | ||||
Monument Gardens Funding LLC | ||||||
5.28%, 09/21/065 | 13,583 | 13,543 | ||||
Nestle Capital Corp. | ||||||
5.19%, 08/09/07 | 16,218 | 15,418 | ||||
Park Granada LLC | ||||||
5.30%, 09/01/065 | 6,177 | 6,177 | ||||
Regency Markets LLC | ||||||
5.28%, 09/15/06 | 13,515 | 13,487 | ||||
Solitaire Funding Ltd. | ||||||
5.27%, 09/05/065 | 20,272 | 20,260 | ||||
Sydney Capital Corp. | ||||||
5.27%, 09/12/065 | 6,184 | 6,174 | ||||
Tulip Funding Corp. | ||||||
5.29%, 11/15/065 | 14,256 | 14,099 | ||||
White Pine Finance LLC | ||||||
5.12%, 10/27/065 | 5,109 | 5,068 | ||||
| 523,781 | ||||||
| SCHEDULESOF INVESTMENTS | 61 |
Table of Contents
Schedule of Investments (Continued)
iSHARES® MSCI ITALY INDEX FUND
August 31, 2006
Security | Shares or Principal | Value | ||||
MEDIUM-TERM NOTES4 – 0.08% | ||||||
Bank of America N.A. | ||||||
5.28%, 04/20/07 | $ | 6,757 | $ | 6,757 | ||
Cullinan Finance Corp. | ||||||
5.71%, 06/28/075 | 20,272 | 20,272 | ||||
K2 USA LLC | ||||||
5.39%, 06/04/075 | 20,272 | 20,272 | ||||
Marshall & Ilsley Bank | ||||||
5.18%, 12/15/06 | 27,029 | 27,056 | ||||
Sigma Finance Inc. | ||||||
5.13% - 5.51%, | ||||||
03/30/07 - 06/18/075 | 31,624 | 31,624 | ||||
US Bank N.A. | ||||||
2.85%, 11/15/06 | 5,406 | 5,385 | ||||
| 111,366 | ||||||
MONEY MARKET FUNDS – 0.00% | ||||||
Barclays Global Investors Funds Institutional Money Market Fund, Institutional Shares 5.30%6,7 | 1,089 | 1,089 | ||||
| 1,089 | ||||||
REPURCHASE AGREEMENTS4 – 0.45% | ||||||
Banc of America Securities LLC Repurchase Agreement, 5.30%, due 9/1/06, maturity value $33,792 (collateralized by U.S. Government obligations, value $34,495, 5.50% to 6.50%, 1/1/33 to 7/1/36). | $ | 33,787 | 33,787 | |||
Banc of America Securities LLC Repurchase Agreement, 5.36%, due 9/1/06, maturity value $54,067 (collateralized bynon-U.S. Government debtsecurities, value $55,734, 3.80% to 9.13%, 11/1/06 to 6/15/26). | 54,059 | 54,059 | ||||
Security | Principal | Value | ||||
Bear Stearns Companies Inc. (The) Repurchase Agreement, 5.37%, due 9/1/06, maturity value $40,550 (collateralized bynon-U.S. Government debtsecurities, value $44,642, 0.08% to 6.43%, 9/25/20 to 7/25/36). | $ | 40,544 | $ | 40,544 | ||
Citigroup Global Markets Holdings Inc. Repurchase Agreement, 5.36%, due 9/1/06, maturity value $81,100 (collateralized bynon-U.S. Government debtsecurities, value $84,732, 4.35% to 7.50%, 9/15/08 to 8/25/35). | 81,088 | 81,088 | ||||
Citigroup Global Markets Holdings Inc. Repurchase Agreement, 5.46%, due 9/1/06, maturity value $16,220 (collateralized bynon-U.S. Government debtsecurities, value $19,797, 0.00% to 10.00%, 6/1/28 to 8/24/36). | 16,218 | 16,218 | ||||
Goldman Sachs & Co. Repurchase Agreement, 5.35%, due 9/1/06, maturity value $54,067 (collateralized bynon-U.S. Government debtsecurities, value $55,192, 0.00% to 8.57%, 11/15/06 to 2/15/38). | 54,059 | 54,059 | ||||
Goldman Sachs Group Inc. Repurchase Agreement, 5.36%, due 9/1/06, maturity value $27,033 (collateralized bynon-U.S. Government debtsecurities, value $28,408, 5.36% to 9.01%, 10/27/10 to 2/18/20). | 27,029 | 27,029 | ||||
| 62 | 2006 iSHARES ANNUAL REPORTTO SHAREHOLDERS |
Table of Contents
Schedule of Investments (Continued)
iSHARES® MSCI ITALY INDEX FUND
August 31, 2006
Security | Principal | Value | ||||
JP Morgan Securities Inc. Repurchase Agreement, 5.41%, due 9/1/06, maturity value $6,758 (collateralized by non-U.S. Government debt securities, value $7,102, 6.63% to 10.50%, 1/15/07 to 4/15/16). | $ | 6,757 | $ | 6,757 | ||
Lehman Brothers Holdings Inc. Repurchase Agreement, 5.36%, due 9/1/06, maturity value $54,067 (collateralized by non-U.S. Government debt securities, value $56,816, 0.51% to 8.89%, 8/5/18 to 9/25/46). | 54,059 | 54,059 | ||||
Lehman Brothers Holdings Inc. Repurchase Agreement, 5.38%, due 9/1/06, maturity value $27,033 (collateralized by non-U.S. Government debt securities, value $28,409, 4.11% to 9.79%, 4/28/31 to 9/25/46). | 27,029 | 27,029 | ||||
Lehman Brothers Holdings Inc. Repurchase Agreement, 5.46%, due 9/1/06, maturity value $29,737 (collateralized by non-U.S. Government debt securities, value $31,249, 3.44% to 15.15%, 12/1/08 to 3/1/36). | 29,732 | 29,732 | ||||
Merrill Lynch & Co. Inc. Repurchase Agreement, 5.33%, due 9/1/06, maturity value $54,067 (collateralized by non-U.S. Government debt securities, value $56,817, 6.38% to 10.25%, 5/1/07 to 10/15/16). | 54,059 | 54,059 | ||||
Merrill Lynch & Co. Inc. Repurchase Agreement, 5.36%, due 9/1/06, maturity value $54,067 (collateralized by non-U.S. Government debt securities, value $55,744, 0.00% to 10.13%, 10/15/06 to 7/1/26). | 54,059 | 54,059 | ||||
Morgan Stanley Repurchase Agreement, 5.36%, due 9/1/06, maturity value $27,033 (collateralized by non-U.S. Government debt securities, value $28,421, 4.05% to 7.24%, 6/20/29 to 1/14/41). | 27,029 | 27,029 | ||||
Morgan Stanley Repurchase Agreement, 5.46%, due 9/1/06, maturity value $9,461 (collateralized by non-U.S. Government debt securities, value $14,508, 0.00% to 10.00%, 9/1/06 to 8/31/36). | 9,460 | 9,460 | ||||
Morgan Stanley Repurchase Agreement, 5.51%, due 6/4/07, maturity value $19,723 (collateralized by non-U.S. Government debt securities, value $29,456, 0.00% to 10.00%, 9/1/06 to 8/31/36).8 | 18,921 | 18,921 | ||||
Wachovia Capital Repurchase Agreement, 5.38%, due 9/1/06, maturity value $70,288 (collateralized by non-U.S. Government debt securities, value $73,860, 0.06% to 7.68%, 10/15/11 to 3/15/45). | 70,277 | 70,277 | ||||
| 658,166 | ||||||
| SCHEDULESOF INVESTMENTS | 63 |
Table of Contents
Schedule of Investments (Continued)
iSHARES® MSCI ITALY INDEX FUND
August 31, 2006
Security | Principal | Value | ||||
TIME DEPOSITS4 – 0.00% | ||||||
KBC Bank | ||||||
5.31%, 09/01/06 | $ | 5,703 | $ | 5,703 | ||
| 5,703 | ||||||
VARIABLE & FLOATING RATE NOTES4 – 1.22% | ||||||
Allstate Life Global Funding II | ||||||
5.34% - 5.47%, 09/04/07 - 09/27/075 | 69,195 | 69,204 | ||||
American Express Bank | ||||||
5.30%, 02/28/07 | 27,029 | 27,030 | ||||
American Express Centurion Bank | ||||||
5.42%, 07/19/07 | 29,732 | 29,763 | ||||
American Express Credit Corp. | ||||||
5.51%, 07/05/07 | 8,109 | 8,113 | ||||
ASIF Global Financing | ||||||
5.51%, 05/03/075 | 2,703 | 2,704 | ||||
Australia & New Zealand Banking Group Ltd. | ||||||
5.32%, 09/21/075 | 17,569 | 17,569 | ||||
Bank of Ireland | ||||||
5.30% - 5.31%, 08/14/07 - 08/20/075 | 39,193 | 39,195 | ||||
Beta Finance Inc. | ||||||
5.29% - 5.48%, 04/25/07 - 07/25/075 | 68,925 | 68,928 | ||||
BMW US Capital LLC | ||||||
5.33%, 09/14/075 | 27,029 | 27,029 | ||||
BNP Paribas | ||||||
5.36%, 05/18/075 | 50,004 | 50,004 | ||||
Carlyle Loan Investment Ltd. | ||||||
5.38%, 04/13/07 - 07/15/075 | 19,731 | 19,731 | ||||
CC USA Inc. | ||||||
5.48%, 07/30/075 | 13,515 | 13,516 | ||||
Commodore CDO Ltd. | ||||||
5.38%, 06/12/075 | 6,757 | 6,757 | ||||
Credit Agricole SA | ||||||
5.48%, 07/23/07 | 27,029 | 27,029 | ||||
Credit Suisse First Boston NY | ||||||
5.51%, 04/24/07 | 13,515 | 13,515 | ||||
Cullinan Finance Corp. | ||||||
5.36%, 04/25/075 | 6,757 | 6,757 | ||||
DEPFA Bank PLC | ||||||
5.37%, 06/15/07 | 27,029 | 27,029 | ||||
Dorada Finance Inc. | ||||||
5.41% - 5.47%, 06/27/07 - 07/17/075 | 31,084 | 31,086 | ||||
Eli Lilly Services Inc. | ||||||
5.37%, 08/31/075 | 27,029 | 27,029 | ||||
Fifth Third Bancorp | ||||||
5.30%, 09/21/075 | 54,059 | 54,059 | ||||
Five Finance Inc. | ||||||
5.37% - 5.45%, 12/01/06 - 07/13/075 | 27,029 | 27,027 | ||||
General Electric Capital Corp. | ||||||
5.29% - 5.49%, 07/09/07 - 09/24/07 | 28,381 | 28,388 | ||||
Granite Master Issuer PLC | ||||||
5.30%, 09/20/06 | 94,603 | 94,603 | ||||
Harrier Finance Funding LLC | ||||||
5.33%, 07/25/075 | 8,109 | 8,110 | ||||
Hartford Life Global Funding Trusts | ||||||
5.35% - 5.55%, 07/13/07 - 09/17/07 | 40,544 | 40,550 | ||||
HBOS Treasury Services PLC | ||||||
5.53%, 07/24/075 | 27,029 | 27,029 | ||||
Holmes Financing PLC | ||||||
5.40%, 07/16/075 | 47,302 | 47,302 | ||||
JP Morgan Chase & Co. | ||||||
5.36%, 08/02/07 | 20,272 | 20,272 | ||||
K2 USA LLC | ||||||
5.20% - 5.46%, 04/02/07 - 06/28/075 | 20,272 | 20,271 | ||||
Kestrel Funding LLC | ||||||
5.31%, 07/11/075 | 10,812 | 10,811 | ||||
Kommunalkredit Austria AG | ||||||
5.33%, 09/09/075 | 16,218 | 16,218 | ||||
Leafs LLC | ||||||
5.33%, 01/22/07 - 02/20/075 | 28,202 | 28,201 | ||||
Lexington Parker Capital Co. LLC | ||||||
5.46%, 01/10/075 | 33,787 | 33,779 | ||||
Links Finance LLC | ||||||
5.33% - 5.35%, 05/10/07 - 05/16/075 | 29,732 | 29,730 | ||||
| 64 | 2006 iSHARES ANNUAL REPORTTO SHAREHOLDERS |
Table of Contents
Schedule of Investments (Continued)
iSHARES® MSCI ITALY INDEX FUND
August 31, 2006
Security | Principal | Value | |||||
Lothian Mortgages Master Issuer PLC | |||||||
5.30%, 04/24/075 | $ | 11,910 | $ | 11,910 | |||
Marshall & Ilsley Bank | |||||||
5.31%, 09/14/07 | 14,866 | 14,866 | |||||
Metropolitan Life Global Funding I | |||||||
5.42%, 08/06/075 | 40,544 | 40,544 | |||||
Metropolitan Life Insurance Funding Agreement | |||||||
5.57%, 08/01/075,8 | 2,703 | 2,703 | |||||
Monumental Global Funding II | |||||||
5.49%, 12/27/065 | 5,406 | 5,406 | |||||
Mound Financing PLC | |||||||
5.39%, 05/08/075 | 25,408 | 25,408 | |||||
Natexis Banques Populaires | |||||||
5.31% - 5.40%, | |||||||
02/05/07 - 09/14/075 | 81,088 | 81,087 | |||||
National City Bank of Indiana | |||||||
5.37%, 05/21/07 | 13,515 | 13,516 | |||||
Nationwide Building Society | |||||||
5.44% - 5.62%, 07/06/07 - 07/27/075 | 89,197 | 89,217 | |||||
Newcastle Ltd. | |||||||
5.35%, 04/24/075 | 9,528 | 9,526 | |||||
Northern Rock PLC | |||||||
5.43%, 08/03/075 | 32,435 | 32,436 | |||||
Principal Life Global Funding I | |||||||
5.80%, 02/08/07 | 12,163 | 12,188 | |||||
Sedna Finance Inc. | |||||||
5.30% - 5.37%, 09/20/06 - 08/21/075 | 47,302 | 47,300 | |||||
Skandinaviska Enskilda Bank NY | |||||||
5.33%, 09/18/075 | 27,029 | 27,029 | |||||
Strips III LLC | |||||||
5.38%, 07/24/075 | 6,572 | 6,572 | |||||
SunTrust Bank | |||||||
5.37%, 05/01/07 | 27,029 | 27,031 | |||||
Tango Finance Corp. | |||||||
5.22% - 5.48%, 04/25/07 - 07/16/075 | 65,952 | 65,946 | |||||
Union Hamilton Special Funding LLC | |||||||
5.42% - 5.49%, 09/28/06 - 12/21/065 | 37,841 | 37,841 | |||||
US Bank N.A. | |||||||
5.26%, 09/29/06 | 12,163 | 12,163 | |||||
Wachovia Asset Securitization Inc. | |||||||
5.31%, 09/25/065 | 40,334 | 40,334 | |||||
Wachovia Bank N.A. | |||||||
5.36%, 05/22/07 | 54,059 | 54,059 | |||||
Wells Fargo & Co. | |||||||
5.34%, 09/14/075 | 13,515 | 13,516 | |||||
WhistleJacket Capital Ltd. | |||||||
5.29% - 5.35%, 04/18/07 - 06/13/075 | 20,272 | 20,272 | |||||
White Pine Finance LLC | |||||||
5.29% - 5.35%, 05/22/07 - 08/20/075 | 81,088 | 81,073 | |||||
Wind Master Trust | |||||||
5.31% - 5.32%, 09/25/06 - 07/25/075 | 17,142 | 17,143 | |||||
| 1,787,424 | |||||||
TOTAL SHORT-TERM INVESTMENTS | |||||||
(Cost: $3,222,677) | 3,222,677 | ||||||
TOTAL INVESTMENTS | |||||||
IN SECURITIES – 102.08% | |||||||
(Cost: $127,970,941) | 149,364,960 | ||||||
Other Assets, Less Liabilities – (2.08)% | (3,041,246 | ) | |||||
NET ASSETS – 100.00% | $ | 146,323,714 | |||||
| 1 | Non-income earning security. |
| 2 | All or a portion of this security represents a security on loan. See Note 5. |
| 3 | Security valued at fair value in accordance with procedures approved by the Board of Directors. See Note 1. |
| 4 | All or a portion of this security (these securities) represent(s) an investment of securities lending collateral. See Note 5. |
| 5 | This security or a portion of these securities may be resold to qualified institutional buyers under Rule 144A or pursuant to Section 4(2) of the Securities Act of 1933. |
| 6 | Affiliated issuer. See Note 2. |
| 7 | The rate quoted is the annualized seven-day yield of the fund at period end. |
| 8 | The investment adviser has determined that this security or a portion of these securities is illiquid. |
See notes to the financial statements.
| SCHEDULESOF INVESTMENTS | 65 |
Table of Contents
iSHARES® MSCI NETHERLANDS INDEX FUND
August 31, 2006
Security | Shares | Value | ||||
COMMON STOCKS – 99.58% | ||||||
BANKS – 11.98% | ||||||
ABN AMRO Holding NV | 462,462 | $ | 13,177,352 | |||
| 13,177,352 | ||||||
BEVERAGES – 3.97% | ||||||
Heineken NV | 94,148 | 4,363,817 | ||||
| 4,363,817 | ||||||
CHEMICALS – 6.53% | ||||||
Akzo Nobel NV | 87,360 | 5,027,660 | ||||
Koninklijke DSM NV | 54,418 | 2,151,032 | ||||
| 7,178,692 | ||||||
COMMERCIAL SERVICES – 1.68% | ||||||
Randstad Holdings NV | 16,471 | 884,461 | ||||
Vedior NV | 52,325 | 967,171 | ||||
| 1,851,632 | ||||||
COMPUTERS – 0.27% | ||||||
Getronics NV1 | 43,225 | 297,123 | ||||
| 297,123 | ||||||
DISTRIBUTION & WHOLESALE – 1.17% | ||||||
Buhrmann NV | 35,126 | 477,507 | ||||
Hagemeyer NV2 | 159,615 | 807,045 | ||||
| 1,284,552 | ||||||
ELECTRONICS – 9.52% | ||||||
Koninklijke Philips Electronics NV | 307,307 | 10,471,465 | ||||
| 10,471,465 | ||||||
FOOD – 14.83% | ||||||
Koninklijke Ahold NV2 | 459,368 | 4,404,225 | ||||
Koninklijke Numico NV | 49,868 | 2,314,604 | ||||
Unilever NV | 402,311 | 9,588,894 | ||||
| 16,307,723 | ||||||
INSURANCE – 23.97% | ||||||
Aegon NV | 291,746 | 5,205,886 | ||||
ING Groep NV2 | 489,762 | 21,158,545 | ||||
| 26,364,431 | ||||||
MEDIA – 6.22% | ||||||
Reed Elsevier NV | 277,104 | 4,440,931 | ||||
Wolters Kluwer NV CVA1 | 95,004 | 2,400,579 | ||||
| 6,841,510 | ||||||
Security | Shares or Principal | Value | ||||
OFFICE & BUSINESS EQUIPMENT – 0.49% | ||||||
Oce NV | 30,940 | $ | 536,644 | |||
| 536,644 | ||||||
OIL & GAS SERVICES – 1.61% | ||||||
Fugro NV | 16,016 | 707,294 | ||||
SBM Offshore NV | 38,948 | 1,067,404 | ||||
| 1,774,698 | ||||||
REAL ESTATE INVESTMENT TRUSTS – 5.10% | ||||||
Corio NV | 23,653 | 1,591,057 | ||||
Rodamco Europe NV | 26,936 | 2,908,340 | ||||
Wereldhave NV | 10,556 | 1,108,001 | ||||
| 5,607,398 | ||||||
SEMICONDUCTORS – 2.82% | ||||||
ASML Holding NV2 | 142,233 | 3,106,035 | ||||
| 3,106,035 | ||||||
TELECOMMUNICATIONS – 4.87% | ||||||
Koninklijke KPN NV | 434,798 | 5,359,703 | ||||
| 5,359,703 | ||||||
TRANSPORTATION – 4.55% | ||||||
TNT NV | 133,315 | 5,008,574 | ||||
| 5,008,574 | ||||||
TOTAL COMMON STOCKS | 109,531,349 | |||||
SHORT-TERM INVESTMENTS – 1.89% | ||||||
CERTIFICATES OF DEPOSIT3 – 0.08% | ||||||
Credit Suisse First Boston NY | ||||||
5.28% - 5.43%, 04/23/07 - 08/21/07 | $ | 12,189 | 12,189 | |||
Societe Generale | ||||||
5.33%, 12/08/06 | 17,414 | 17,414 | ||||
Washington Mutual Bank | ||||||
5.36%, 11/13/06 | 43,534 | 43,534 | ||||
Wells Fargo Bank N.A. | ||||||
4.78%, 12/05/06 | 13,931 | 13,931 | ||||
| 87,068 | ||||||
COMMERCIAL PAPER3 – 0.31% | ||||||
Amstel Funding Corp. | ||||||
5.20%, 11/21/06 - 11/22/064 | 5,081 | 5,021 | ||||
| 66 | 2006 iSHARES ANNUAL REPORTTO SHAREHOLDERS |
Table of Contents
Schedule of Investments (Continued)
iSHARES® MSCI NETHERLANDS INDEX FUND
August 31, 2006
Security | Principal | Value | ||||
Amsterdam Funding Corp. | ||||||
5.27%, 09/15/064 | $ | 17,414 | $ | 17,378 | ||
Atlantis One Funding | ||||||
5.30%, 11/14/064 | 23,893 | 23,632 | ||||
Barton Capital Corp. | ||||||
5.27%, 09/06/064 | 8,776 | 8,770 | ||||
Cancara Asset Securitisation Ltd. | ||||||
5.30%, 11/14/064 | 8,827 | 8,731 | ||||
CC USA Inc. | ||||||
5.03%, 10/24/064 | 3,483 | 3,457 | ||||
Charta LLC | ||||||
5.30%, 11/06/064 | 17,414 | 17,244 | ||||
Concord Minutemen Capital Co. LLC | ||||||
5.27% - 5.29%, 09/13/06 - 11/16/064 | 30,584 | 30,448 | ||||
Curzon Funding LLC | ||||||
5.29%, 11/17/064 | 17,414 | 17,217 | ||||
Edison Asset Securitization LLC | ||||||
5.22%, 12/11/064 | 12,846 | 12,658 | ||||
Falcon Asset Securitization Corp. | ||||||
5.30%, 11/06/064 | 17,414 | 17,244 | ||||
Five Finance Inc. | ||||||
5.19%, 12/01/064 | 7,836 | 7,733 | ||||
General Electric Capital Services Inc. | ||||||
5.22%, 12/11/06 | 1,741 | 1,716 | ||||
Giro Funding Corp. | ||||||
5.28% - 5.34%, 09/11/06 - 10/10/064 | 17,414 | 17,350 | ||||
Grampian Funding LLC | ||||||
5.03% - 5.30%, 10/17/06 - 11/16/064 | 8,358 | 8,290 | ||||
KKR Pacific Funding Trust | ||||||
5.29%, 09/14/064 | 17,414 | 17,380 | ||||
Landale Funding LLC | ||||||
5.31%, 11/15/064 | 13,583 | 13,432 | ||||
Lexington Parker Capital Co. LLC | ||||||
5.19% - 5.27%, 09/15/06 - 11/15/064 | 22,572 | 22,442 | ||||
Liberty Street Funding Corp. | ||||||
5.27%, 09/08/06 - 09/11/064 | 15,498 | 15,479 | ||||
Security | Shares or Principal | Value | ||||
Mont Blanc Capital Corp. | ||||||
5.29%, 11/15/064 | $ | 11,232 | $ | 11,108 | ||
Monument Gardens Funding LLC | ||||||
5.28%, 09/21/064 | 8,751 | 8,725 | ||||
Nestle Capital Corp. | ||||||
5.19%, 08/09/07 | 10,448 | 9,933 | ||||
Park Granada LLC | ||||||
5.30%, 09/01/064 | 3,979 | 3,979 | ||||
Regency Markets LLC | ||||||
5.28%, 09/15/06 | 8,707 | 8,689 | ||||
Solitaire Funding Ltd. | ||||||
5.27%, 09/05/064 | 13,060 | 13,053 | ||||
Sydney Capital Corp. | ||||||
5.27%, 09/12/064 | 3,984 | 3,978 | ||||
Tulip Funding Corp. | ||||||
5.29%, 11/15/064 | 9,184 | 9,083 | ||||
White Pine Finance LLC | ||||||
5.12%, 10/27/064 | 3,291 | 3,265 | ||||
| 337,435 | ||||||
MEDIUM-TERM NOTES3 – 0.06% | ||||||
Bank of America N.A. | ||||||
5.28%, 04/20/07 | 4,353 | 4,353 | ||||
Cullinan Finance Corp. | ||||||
5.71%, 06/28/074 | 13,060 | 13,060 | ||||
K2 USA LLC | ||||||
5.39%, 06/04/074 | 13,060 | 13,060 | ||||
Marshall & Ilsley Bank | ||||||
5.18%, 12/15/06 | 17,414 | 17,431 | ||||
Sigma Finance Inc. | ||||||
5.13% - 5.51%, 03/30/07 - 06/18/074 | 20,374 | 20,374 | ||||
US Bank N.A. | ||||||
2.85%, 11/15/06 | 3,483 | 3,470 | ||||
| 71,748 | ||||||
MONEY MARKET FUNDS – 0.01% | ||||||
Barclays Global Investors Funds Institutional Money Market Fund, Institutional Shares 5.30%5,6 | 6,254 | 6,254 | ||||
| 6,254 | ||||||
| SCHEDULESOF INVESTMENTS | 67 |
Table of Contents
Schedule of Investments (Continued)
iSHARES® MSCI NETHERLANDS INDEX FUND
August 31, 2006
Security | Principal | Value | ||||
REPURCHASE AGREEMENTS3 – 0.38% | ||||||
Banc of America Securities LLC Repurchase Agreement, 5.30%, due 9/1/06, maturity value $21,770 (collateralized by U.S. Government obligations, value $22,223, 5.50% to 6.50%, 1/1/33 to 7/1/36). | $ | 21,767 | $ | 21,767 | ||
Banc of America Securities LLC Repurchase Agreement, 5.36%, due 9/1/06, maturity value $34,832 (collateralized by non-U.S. Government debt securities, value $35,906, 3.80% to 9.13%, 11/1/06 to 6/15/26). | 34,827 | 34,827 | ||||
Bear Stearns Companies Inc. (The) Repurchase Agreement, 5.37%, due 9/1/06, maturity value $26,124 (collateralized by non-U.S. Government debt securities, value $28,760, 0.08% to 6.43%, 9/25/20 to 7/25/36). | 26,120 | 26,120 | ||||
Citigroup Global Markets Holdings Inc. Repurchase Agreement, 5.36%, due 9/1/06, maturity value $52,249 (collateralized by non-U.S. Government debt securities, value $54,588, 4.35% to 7.50%, 9/15/08 to 8/25/35). | 52,241 | 52,241 | ||||
Citigroup Global Markets Holdings Inc. Repurchase Agreement, 5.46%, due 9/1/06, maturity value $10,450 (collateralized by non-U.S. Government debt securities, value $12,754, 0.00% to 10.00%, 6/1/28 to 8/24/36). | 10,448 | 10,448 | ||||
Goldman Sachs & Co. Repurchase Agreement, 5.35%, due 9/1/06, maturity value $34,832 (collateralized by non-U.S. Government debt securities, value $35,557, 0.00% to 8.57%, 11/15/06 to 2/15/38). | 34,827 | 34,827 | ||||
Goldman Sachs Group Inc. Repurchase Agreement, 5.36%, due 9/1/06, maturity value $17,417 (collateralized by non-U.S. Government debt securities, value $18,302, 5.36% to 9.01%, 10/27/10 to 2/18/20). | 17,414 | 17,414 | ||||
JP Morgan Securities Inc. Repurchase Agreement, 5.41%, due 9/1/06, maturity value $4,354 (collateralized by non-U.S. Government debt securities, value $4,576, 6.63% to 10.50%, 1/15/07 to 4/15/16). | 4,353 | 4,353 | ||||
Lehman Brothers Holdings Inc. Repurchase Agreement, 5.36%, due 9/1/06, maturity value $34,832 (collateralized by non-U.S. Government debt securities, value $36,603, 0.51% to 8.89%, 8/5/18 to 9/25/46). | 34,827 | 34,827 | ||||
Lehman Brothers Holdings Inc. Repurchase Agreement, 5.38%, due 9/1/06, maturity value $17,417 (collateralized by non-U.S. Government debt securities, value $18,302, 4.11% to 9.79%, 4/28/31 to 9/25/46). | 17,414 | 17,414 | ||||
| 68 | 2006 iSHARES ANNUAL REPORTTO SHAREHOLDERS |
Table of Contents
Schedule of Investments (Continued)
iSHARES® MSCI NETHERLANDS INDEX FUND
August 31, 2006
Security | Principal | Value | ||||
Lehman Brothers Holdings Inc. Repurchase Agreement, 5.46%, due 9/1/06, maturity value $19,158 (collateralized by non-U.S. Government debt securities, value $20,132, 3.44% to 15.15%, 12/1/08 to 3/1/36). | $ | 19,155 | $ | 19,155 | ||
Merrill Lynch & Co. Inc. Repurchase Agreement, 5.33%, due 9/1/06, maturity value $34,832 (collateralized by non-U.S. Government debt securities, value $36,604, 6.38% to 10.25%, 5/1/07 to 10/15/16). | 34,827 | 34,827 | ||||
Merrill Lynch & Co. Inc. Repurchase Agreement, 5.36%, due 9/1/06, maturity value $34,832 (collateralized by non-U.S. Government debt securities, value $35,912, 0.00% to 10.13%, 10/15/06 to 7/1/26). | 34,827 | 34,827 | ||||
Morgan Stanley Repurchase Agreement, 5.36%, due 9/1/06, maturity value $17,417 (collateralized by non-U.S. Government debt securities, value $18,310, 4.05% to 7.24%, 6/20/29 to 1/14/41). | 17,414 | 17,414 | ||||
Morgan Stanley Repurchase Agreement, 5.46%, due 9/1/06, maturity value $6,096 (collateralized by non-U.S. Government debt securities, value $9,347, 0.00% to 10.00%, 9/1/06 to 8/31/36). | 6,095 | 6,095 | ||||
Morgan Stanley Repurchase Agreement, 5.51%, due 6/4/07, maturity value $12,706 (collateralized by non-U.S. Government debt securities, value $18,977, 0.00% to 10.00%, 9/1/06 to 8/31/36).7 | 12,189 | 12,189 | ||||
Wachovia Capital Repurchase Agreement, 5.38%, due 9/1/06, maturity value $45,282 (collateralized by non-U.S. Government debt securities, value $47,584, 0.06% to 7.68%, 10/15/11 to 3/15/45). | 45,275 | 45,275 | ||||
| 424,020 | ||||||
TIME DEPOSITS3 – 0.00% | ||||||
KBC Bank | ||||||
5.31%, 09/01/06 | 3,674 | 3,674 | ||||
| 3,674 | ||||||
VARIABLE & FLOATING RATE NOTES 3 – 1.05% | ||||||
Allstate Life Global Funding II | ||||||
5.34% - 5.47%, 09/04/07 - 09/27/074 | 44,579 | 44,588 | ||||
American Express Bank | ||||||
5.30%, 02/28/07 | 17,414 | 17,414 | ||||
American Express Centurion Bank | ||||||
5.42%, 07/19/07 | 19,155 | 19,174 | ||||
American Express Credit Corp. | ||||||
5.51%, 07/05/07 | 5,224 | 5,227 | ||||
ASIF Global Financing | ||||||
5.51%, 05/03/074 | 1,741 | 1,742 | ||||
Australia & New Zealand Banking Group Ltd. | ||||||
5.32%, 09/21/074 | 11,319 | 11,319 | ||||
Bank of Ireland | ||||||
5.30% - 5.31%, 08/14/07 - 08/20/074 | 25,250 | 25,250 | ||||
| SCHEDULESOF INVESTMENTS | 69 |
Table of Contents
Schedule of Investments (Continued)
iSHARES® MSCI NETHERLANDS INDEX FUND
August 31, 2006
Security | Principal | Value | ||||
Beta Finance Inc. | ||||||
5.29% - 5.48%, 04/25/07 - 07/25/074 | $ | 44,405 | $ | 44,407 | ||
BMW US Capital LLC | ||||||
5.33%, 09/14/074 | 17,414 | 17,414 | ||||
BNP Paribas | ||||||
5.36%, 05/18/074 | 32,215 | 32,215 | ||||
Carlyle Loan Investment Ltd. | ||||||
5.38%, 04/13/07 - 07/15/074 | 12,712 | 12,711 | ||||
CC USA Inc. | ||||||
5.48%, 07/30/074 | 8,707 | 8,708 | ||||
Commodore CDO Ltd. | ||||||
5.38%, 06/12/074 | 4,353 | 4,353 | ||||
Credit Agricole SA | ||||||
5.48%, 07/23/07 | 17,414 | 17,414 | ||||
Credit Suisse First Boston NY | ||||||
5.51%, 04/24/07 | 8,707 | 8,707 | ||||
Cullinan Finance Corp. | ||||||
5.36%, 04/25/074 | 4,353 | 4,353 | ||||
DEPFA Bank PLC | ||||||
5.37%, 06/15/07 | 17,414 | 17,414 | ||||
Dorada Finance Inc. | ||||||
5.41% - 5.47%, 06/27/07 - 07/17/074 | 20,026 | 20,027 | ||||
Eli Lilly Services Inc. | ||||||
5.37%, 08/31/074 | 17,414 | 17,414 | ||||
Fifth Third Bancorp | ||||||
5.30%, 09/21/074 | 34,827 | 34,827 | ||||
Five Finance Inc. | ||||||
5.37% - 5.45%, 12/01/06 - 07/13/074 | 17,414 | 17,412 | ||||
General Electric Capital Corp. | ||||||
5.29% - 5.49%, 07/09/07 - 09/24/07 | 18,284 | 18,288 | ||||
Granite Master Issuer PLC | ||||||
5.30%, 09/20/06 | 60,947 | 60,947 | ||||
Harrier Finance Funding LLC | ||||||
5.33%, 07/25/074 | 5,224 | 5,225 | ||||
Hartford Life Global Funding Trusts | ||||||
5.35% - 5.55%, 07/13/07 - 09/17/07 | 26,120 | 26,125 | ||||
HBOS Treasury Services PLC | ||||||
5.53%, 07/24/074 | 17,414 | 17,414 | ||||
Holmes Financing PLC | ||||||
5.40%, 07/16/074 | 30,474 | 30,474 | ||||
JP Morgan Chase & Co. | ||||||
5.36%, 08/02/07 | 13,060 | 13,060 | ||||
K2 USA LLC | ||||||
5.20% - 5.46%, 04/02/07 - 06/28/074 | 13,060 | 13,060 | ||||
Kestrel Funding LLC | ||||||
5.31%, 07/11/074 | 6,965 | 6,965 | ||||
Kommunalkredit Austria AG | ||||||
5.33%, 09/09/074 | 10,448 | 10,448 | ||||
Leafs LLC | ||||||
5.33%, 01/22/07 - 02/20/074 | 18,169 | 18,168 | ||||
Lexington Parker Capital Co. LLC | ||||||
5.46%, 01/10/074 | 21,767 | 21,762 | ||||
Links Finance LLC | ||||||
5.33% - 5.35%, 05/10/07 - 05/16/074 | 19,155 | 19,154 | ||||
Lothian Mortgages Master Issuer PLC | ||||||
5.30%, 04/24/074 | 7,673 | 7,673 | ||||
Marshall & Ilsley Bank | ||||||
5.31%, 09/14/07 | 9,577 | 9,577 | ||||
Metropolitan Life Global Funding I | ||||||
5.42%, 08/06/074 | 26,120 | 26,120 | ||||
Metropolitan Life Insurance Funding Agreement | ||||||
5.57%, 08/01/074,7 | 1,741 | 1,741 | ||||
Monumental Global Funding II | ||||||
5.49%, 12/27/064 | 3,483 | 3,483 | ||||
Mound Financing PLC | ||||||
5.39%, 05/08/074 | 16,369 | 16,369 | ||||
Natexis Banques Populaires | ||||||
5.31% - 5.40%, 02/05/07 - 09/14/074 | 52,241 | 52,240 | ||||
National City Bank of Indiana | ||||||
5.37%, 05/21/07 | 8,707 | 8,707 | ||||
Nationwide Building Society | ||||||
5.44% - 5.62%, 07/06/07 - 07/27/074 | 57,465 | 57,478 | ||||
Newcastle Ltd. | ||||||
5.35%, 04/24/074 | 6,138 | 6,137 | ||||
Northern Rock PLC | ||||||
5.43%, 08/03/074 | 20,896 | 20,897 | ||||
| 70 | 2006 iSHARES ANNUAL REPORTTO SHAREHOLDERS |
Table of Contents
Schedule of Investments (Continued)
iSHARES® MSCI NETHERLANDS INDEX FUND
August 31, 2006
Security | Principal | Value | |||||
Principal Life Global Funding I | |||||||
5.80%, 02/08/07 | $ | 7,836 | $ | 7,852 | |||
Sedna Finance Inc. | |||||||
5.30% - 5.37%, 09/20/06 - 08/21/074 | 30,474 | 30,474 | |||||
Skandinaviska Enskilda Bank NY | |||||||
5.33%, 09/18/074 | 17,414 | 17,414 | |||||
Strips III LLC | |||||||
5.38%, 07/24/074 | 4,234 | 4,234 | |||||
SunTrust Bank | |||||||
5.37%, 05/01/07 | 17,414 | 17,414 | |||||
Tango Finance Corp. | |||||||
5.22% - 5.48%, 04/25/07 - 07/16/074 | 42,489 | 42,485 | |||||
Union Hamilton Special Funding LLC | |||||||
5.42% - 5.49%, 09/28/06 - 12/21/064 | 24,379 | 24,379 | |||||
US Bank N.A. | |||||||
5.26%, 09/29/06 | 7,836 | 7,836 | |||||
Wachovia Asset Securitization Inc. | |||||||
5.31%, 09/25/064 | 25,985 | 25,984 | |||||
Wachovia Bank N.A. | |||||||
5.36%, 05/22/07 | 34,827 | 34,827 | |||||
Wells Fargo & Co. | |||||||
5.34%, 09/14/074 | 8,707 | 8,707 | |||||
WhistleJacket Capital Ltd. | |||||||
5.29% - 5.35%, 04/18/07 - 06/13/074 | 13,060 | 13,061 | |||||
White Pine Finance LLC | |||||||
5.29% - 5.35%, 05/22/07 - 08/20/074 | 52,241 | 52,229 | |||||
Wind Master Trust | |||||||
5.31% - 5.32%, 09/25/06 - 07/25/074 | 11,044 | 11,043 | |||||
| 1,151,541 | |||||||
TOTAL SHORT-TERM INVESTMENTS | 2,081,740 | ||||||
TOTAL INVESTMENTS IN SECURITIES – 101.47% | 111,613,089 | ||||||
Other Assets, Less Liabilities – (1.47)% | (1,621,804 | ) | |||||
NET ASSETS – 100.00% | $ | 109,991,285 | |||||
| 1 | All or a portion of this security represents a security on loan. See Note 5. |
| 2 | Non-income earning security. |
| 3 | All or a portion of this security (these securities) represent(s) an investment of securities lending collateral. See Note 5. |
| 4 | This security or a portion of these securities may be resold to qualified institutional buyers under Rule 144A or pursuant to Section 4(2) of the Securities Act of 1933. |
| 5 | Affiliated issuer. See Note 2. |
| 6 | The rate quoted is the annualized seven-day yield of the fund at period end. |
| 7 | The investment adviser has determined that this security or a portion of these securities is illiquid. |
See notes to the financial statements.
| SCHEDULESOF INVESTMENTS | 71 |
Table of Contents
iSHARES® MSCI SPAIN INDEX FUND
August 31, 2006
Security | Shares | Value | |||
COMMON STOCKS – 99.87% | |||||
AGRICULTURE – 3.27% | |||||
Altadis SA | 123,119 | $ | 5,831,144 | ||
| 5,831,144 | |||||
AIRLINES – 0.25% | |||||
Iberia Lineas Aereas de Espana SA | 179,935 | 449,135 | |||
| 449,135 | |||||
BANKS – 38.84% | |||||
Banco Bilbao Vizcaya Argentaria SA | 1,156,778 | 26,416,289 | |||
Banco Popular Espanol SA | 524,064 | 8,217,645 | |||
Banco Santander Central Hispano SA | 2,132,561 | 33,057,693 | |||
Bankinter SA | 22,048 | 1,495,795 | |||
| 69,187,422 | |||||
BIOTECHNOLOGY – 0.27% | |||||
Zeltia SA1,2 | 63,867 | 477,437 | |||
| 477,437 | |||||
COMMERCIAL SERVICES – 2.36% | |||||
Abertis Infraestructuras SA2 | 132,299 | 3,226,105 | |||
Cintra Concesiones de Infraestructurasde Transporte SA2 | 73,140 | 970,869 | |||
| 4,196,974 | |||||
COMPUTERS – 0.70% | |||||
Indra Sistemas SA | 59,943 | 1,245,328 | |||
| 1,245,328 | |||||
ELECTRIC – 11.70% | |||||
Endesa SA | 247,563 | 8,606,814 | |||
Iberdrola SA | 236,062 | 8,756,920 | |||
Union Fenosa SA | 79,522 | 3,472,130 | |||
| 20,835,864 | |||||
ENERGY – ALTERNATE SOURCES – 0.77% | |||||
Gamesa Corporacion Tecnologica SA | 65,614 | 1,381,622 | |||
| 1,381,622 | |||||
ENGINEERING & CONSTRUCTION – 7.66% | |||||
Acciona SA | 13,621 | 2,080,062 | |||
Actividades de Construcciones y Servicios SA | 122,854 | 5,505,647 | |||
Fomento de Construcciones y Contratas SA | 28,461 | 2,218,679 | |||
Grupo Ferrovial SA2 | 24,645 | 1,914,893 | |||
Sacyr Vallehermoso SA2 | 50,032 | 1,928,989 | |||
| 13,648,270 | |||||
FOOD – 0.98% | |||||
Ebro Puleva SA | 72,080 | 1,545,456 | |||
Viscofan SA | 13,250 | 193,860 | |||
| 1,739,316 | |||||
FOREST PRODUCTS & PAPER – 0.38% | |||||
Grupo Empresarial ENCE SA | 15,476 | 682,456 | |||
| 682,456 | |||||
GAS – 2.40% | |||||
Gas Natural SDG SA | 128,048 | 4,282,912 | |||
| 4,282,912 | |||||
INSURANCE – 0.86% | |||||
Corporacion Mapfre SA | 76,744 | 1,536,413 | |||
| 1,536,413 | |||||
IRON & STEEL – 0.99% | |||||
Acerinox SA | 93,386 | 1,757,220 | |||
| 1,757,220 | |||||
LODGING – 0.31% | |||||
NH Hoteles SA2 | 25,566 | 555,029 | |||
| 555,029 | |||||
MEDIA – 1.04% | |||||
Antena 3 de Television SA | 37,789 | 868,758 | |||
Promotora de Informaciones SA | 36,146 | 597,329 | |||
Sogecable SA1,2 | 11,713 | 384,876 | |||
| 1,850,963 | |||||
OIL & GAS – 4.82% | |||||
Repsol YPF SA | 298,867 | 8,584,752 | |||
| 8,584,752 | |||||
PHARMACEUTICALS – 0.71% | |||||
FAES FARMA SA2 | 46,428 | 1,271,805 | |||
| 1,271,805 | |||||
REAL ESTATE – 2.20% | |||||
Fadesa SA | 7,261 | 234,034 | |||
Inmobiliaria Colonial SA | 20,352 | 1,634,736 | |||
Metrovacesa SA2 | 21,620 | 2,045,159 | |||
| 3,913,929 | |||||
| 72 | 2006 iSHARES ANNUAL REPORTTO SHAREHOLDERS |
Table of Contents
Schedule of Investments (Continued)
iSHARES® MSCI SPAIN INDEX FUND
August 31, 2006
Security | Shares or Principal | Value | ||||
RETAIL – 2.52% | ||||||
Inditex SA | 99,640 | $ | 4,490,831 | |||
| 4,490,831 | ||||||
TELECOMMUNICATIONS – 15.84% | ||||||
Telefonica SA | 1,644,802 | 28,212,746 | ||||
| 28,212,746 | ||||||
WATER – 1.00% | ||||||
Sociedad General de Aguas de Barcelona SA Class B | 63,282 | 1,773,990 | ||||
| 1,773,990 | ||||||
TOTAL COMMON STOCKS | 177,905,558 | |||||
SHORT-TERM INVESTMENTS – 4.18% | ||||||
CERTIFICATES OF DEPOSIT3 – 0.17% | ||||||
Credit Suisse First Boston NY | ||||||
5.28% - 5.43%, 04/23/07 - 08/21/07 | $ | 42,748 | 42,748 | |||
Societe Generale | ||||||
5.33%, 12/08/06 | 61,068 | 61,068 | ||||
Washington Mutual Bank | ||||||
5.36%, 11/13/06 | 152,670 | 152,670 | ||||
Wells Fargo Bank N.A. | ||||||
4.78%, 12/05/06 | 48,854 | 48,854 | ||||
| 305,340 | ||||||
COMMERCIAL PAPER3 – 0.66% | ||||||
Amstel Funding Corp. | ||||||
5.20%, 11/21/06 - 11/22/064 | 17,818 | 17,609 | ||||
Amsterdam Funding Corp. | ||||||
5.27%, 09/15/064 | 61,068 | 60,943 | ||||
Atlantis One Funding | ||||||
5.30%, 11/14/064 | 83,790 | 82,877 | ||||
Barton Capital Corp. | ||||||
5.27%, 09/06/064 | 30,778 | 30,756 | ||||
Cancara Asset Securitisation Ltd. | ||||||
5.30%, 11/14/064 | 30,957 | 30,619 | ||||
CC USA Inc. | ||||||
5.03%, 10/24/064 | 12,214 | 12,123 | ||||
Charta LLC | ||||||
5.30%, 11/06/064 | 61,068 | 60,475 | ||||
Security | Principal | Value | ||||
Concord Minutemen Capital Co. LLC | ||||||
5.27% - 5.29%, 09/13/06 - 11/16/064 | $ | 107,254 | $ | 106,779 | ||
Curzon Funding LLC | ||||||
5.29%, 11/17/064 | 61,068 | 60,377 | ||||
Edison Asset Securitization LLC | ||||||
5.22%, 12/11/064 | 45,051 | 44,391 | ||||
Falcon Asset Securitization Corp. | ||||||
5.30%, 11/06/064 | 61,068 | 60,475 | ||||
Five Finance Inc. | ||||||
5.19%, 12/01/064 | 27,481 | 27,120 | ||||
General Electric Capital Services Inc. | ||||||
5.22%, 12/11/06 | 6,107 | 6,017 | ||||
Giro Funding Corp. | ||||||
5.28% - 5.34%, | ||||||
09/11/06 - 10/10/064 | 61,068 | 60,847 | ||||
Grampian Funding LLC | ||||||
5.03% - 5.30%, | ||||||
10/17/06 - 11/16/064 | 29,313 | 29,071 | ||||
KKR Pacific Funding Trust | ||||||
5.29%, 09/14/064 | 61,068 | 60,951 | ||||
Landale Funding LLC | ||||||
5.31%, 11/15/064 | 47,633 | 47,107 | ||||
Lexington Parker Capital Co. LLC | ||||||
5.19% - 5.27%, | ||||||
09/15/06 - 11/15/064 | 79,158 | 78,703 | ||||
Liberty Street Funding Corp. | ||||||
5.27%, 09/08/06 - 09/11/064 | 54,350 | 54,285 | ||||
Mont Blanc Capital Corp. | ||||||
5.29%, 11/15/064 | 39,389 | 38,955 | ||||
Monument Gardens Funding LLC | ||||||
5.28%, 09/21/064 | 30,688 | 30,598 | ||||
Nestle Capital Corp. | ||||||
5.19%, 08/09/07 | 36,641 | 34,834 | ||||
Park Granada LLC | ||||||
5.30%, 09/01/064 | 13,955 | 13,955 | ||||
Regency Markets LLC | ||||||
5.28%, 09/15/06 | 30,534 | 30,471 | ||||
Solitaire Funding Ltd. | ||||||
5.27%, 09/05/064 | 45,801 | 45,774 | ||||
Sydney Capital Corp. | ||||||
5.27%, 09/12/064 | 13,972 | 13,950 | ||||
| SCHEDULESOF INVESTMENTS | 73 |
Table of Contents
Schedule of Investments (Continued)
iSHARES® MSCI SPAIN INDEX FUND
August 31, 2006
Security | Shares or Principal | Value | ||||
Tulip Funding Corp. | ||||||
5.29%, 11/15/064 | $ | 32,208 | $ | 31,853 | ||
White Pine Finance LLC | ||||||
5.12%, 10/27/064 | 11,542 | 11,450 | ||||
| 1,183,365 | ||||||
MEDIUM-TERM NOTES3 – 0.14% | ||||||
Bank of America N.A. | ||||||
5.28%, 04/20/07 | 15,267 | 15,267 | ||||
Cullinan Finance Corp. | ||||||
5.71%, 06/28/074 | 45,801 | 45,801 | ||||
K2 USA LLC | ||||||
5.39%, 06/04/074 | 45,801 | 45,801 | ||||
Marshall & Ilsley Bank | ||||||
5.18%, 12/15/06 | 61,068 | 61,128 | ||||
Sigma Finance Inc. | ||||||
5.13% - 5.51%, | ||||||
03/30/07 - 06/18/074 | 71,450 | 71,450 | ||||
US Bank N.A. | ||||||
2.85%, 11/15/06 | 12,214 | 12,167 | ||||
| 251,614 | ||||||
MONEY MARKET FUNDS – 0.09% | ||||||
Barclays Global Investors Funds Institutional Money Market Fund, Institutional Shares 5.30%5,6 | 160,146 | 160,146 | ||||
| 160,146 | ||||||
REPURCHASE AGREEMENTS3– 0.84% | ||||||
Banc of America Securities LLC Repurchase Agreement, 5.30%, due 9/1/06, maturity value $76,346 (collateralized by U.S. Government obligations, value $77,936, 5.50% to 6.50%, 1/1/33 to 7/1/36). | $ | 76,335 | 76,335 | |||
Security | Principal | Value | ||||
Banc of America Securities LLC Repurchase Agreement, 5.36%, due 9/1/06, maturity value $122,154 (collateralized by non-U.S. Government debt securities, value $125,919, 3.80% to 9.13%, 11/1/06 to 6/15/26). | $ | 122,136 | $ | 122,136 | ||
Bear Stearns Companies Inc. (The) Repurchase Agreement, 5.37%, due 9/1/06, maturity value $91,616 (collateralized by non-U.S. Government debt securities, value $100,859, 0.08% to 6.43%, 9/25/20 to 7/25/36). | 91,602 | 91,602 | ||||
Citigroup Global Markets Holdings Inc. Repurchase Agreement, 5.36%, due 9/1/06, maturity value $183,231 (collateralized by non-U.S. Government debt securities, value $191,435, 4.35% to 7.50%, 9/15/08 to 8/15/35). | 183,204 | 183,204 | ||||
Citigroup Global Markets Holdings Inc. Repurchase Agreement, 5.46%, due 9/1/06, maturity value $36,647 (collateralized by non-U.S. Government debt securities, value $44,729, 0.00% to 10.00%, 6/1/28 to 8/24/36). | 36,641 | 36,641 | ||||
Goldman Sachs & Co. Repurchase Agreement, 5.35%, due 9/1/06, maturity value $122,154 (collateralized by non-U.S. Government debt securities, value $124,697, 0.00% to 8.57%, 11/15/06 to 2/15/38). | 122,136 | 122,136 | ||||
| 74 | 2006 iSHARES ANNUAL REPORTTO SHAREHOLDERS |
Table of Contents
Schedule of Investments (Continued)
iSHARES® MSCI SPAIN INDEX FUND
August 31, 2006
Security | Principal | Value | ||||
Goldman Sachs Group Inc. Repurchase Agreement, 5.36%, due 9/1/06, maturity value $61,077 (collateralized by non-U.S. Government debt securities, value $64,182, 5.36% to 9.01%, 10/27/10 to 2/18/20). | $ | 61,068 | $ | 61,068 | ||
JP Morgan Securities Inc. Repurchase Agreement, 5.41%, due 9/1/06, maturity value $15,269 (collateralized by non-U.S. Government debt securities, value $16,046, 6.63% to 10.50%, 1/15/07 to 4/15/16). | 15,267 | 15,267 | ||||
Lehman Brothers Holdings Inc. Repurchase Agreement, 5.36%, due 9/1/06, maturity value $122,154 (collateralized by non-U.S. Government debt securities, value $128,365, 0.51% to 8.89%, 8/5/18 to 9/25/46). | 122,136 | 122,136 | ||||
Lehman Brothers Holdings Inc. Repurchase Agreement, 5.38%, due 9/1/06, maturity value $61,077 (collateralized by non-U.S. Government debt securities, value $64,184, 4.11% to 9.79%, 4/28/31 to 9/25/46). | 61,068 | 61,068 | ||||
Lehman Brothers Holdings Inc. Repurchase Agreement, 5.46%, due 9/1/06, maturity value $67,185 (collateralized by non-U.S. Government debt securities, value $70,600, 3.44% to 15.15%, 12/1/08 to 3/1/36). | 67,175 | 67,175 | ||||
Merrill Lynch & Co. Inc. Repurchase Agreement, 5.33%, due 9/1/06, maturity value $122,154 (collateralized by non-U.S. Government debt securities, value $128,367, 6.38% to 10.25%, 5/1/07 to 10/15/16). | 122,136 | 122,136 | ||||
Merrill Lynch & Co. Inc. Repurchase Agreement, 5.36%, due 9/1/06, maturity value $122,154 (collateralized by non-U.S. Government debt securities, value $125,942, 0.00% to 10.13%, 10/15/06 to 7/1/26). | 122,136 | 122,136 | ||||
Morgan Stanley Repurchase Agreement, 5.36%, due 9/1/06, maturity value $61,077 (collateralized by non-U.S. Government debt securities, value $64,212, 4.05% to 7.24%, 6/20/29 to 1/14/41). | 61,068 | 61,068 | ||||
Morgan Stanley Repurchase Agreement, 5.46%, due 9/1/06, maturity value $21,377 (collateralized by non-U.S. Government debt securities, value $32,779, 0.00% to 10.00%, 9/1/06 to 8/31/36). | 21,374 | 21,374 | ||||
Morgan Stanley Repurchase Agreement, 5.51%, due 6/4/07, maturity value $44,560 (collateralized by non-U.S. Government debt securities, value $66,551, 0.00% to 10.00%, 9/1/06 to 8/31/36).7 | 42,748 | 42,748 | ||||
| SCHEDULESOF INVESTMENTS | 75 |
Table of Contents
Schedule of Investments (Continued)
iSHARES® MSCI SPAIN INDEX FUND
August 31, 2006
Security | Principal | Value | ||||
Wachovia Capital Repurchase Agreement, 5.38%, due 9/1/06, maturity value $158,801 (collateralized by non-U.S. Government debt securities, value $166,874, 0.06% to 7.68%, 10/15/11 to 3/15/45). | $ | 158,777 | $ | 158,777 | ||
| 1,487,007 | ||||||
TIME DEPOSITS3 – 0.01% | ||||||
KBC Bank | ||||||
5.31%, 09/01/06 | 12,886 | 12,886 | ||||
| 12,886 | ||||||
VARIABLE & FLOATING RATE NOTES 3 – 2.27% | ||||||
Allstate Life Global Funding II | ||||||
5.34% - 5.47%, 09/04/07 - 09/27/074 | 156,334 | 156,352 | ||||
American Express Bank | ||||||
5.30%, 02/28/07 | 61,068 | 61,068 | ||||
American Express Centurion Bank | ||||||
5.42%, 07/19/07 | 67,175 | 67,243 | ||||
American Express Credit Corp. | ||||||
5.51%, 07/05/07 | 18,320 | 18,331 | ||||
ASIF Global Financing | ||||||
5.51%, 05/03/074 | 6,107 | 6,109 | ||||
Australia & New Zealand Banking Group Ltd. | ||||||
5.32%, 09/21/074 | 39,694 | 39,694 | ||||
Bank of Ireland | ||||||
5.30% - 5.31%, 08/14/07 - 08/20/074 | 88,549 | 88,553 | ||||
Beta Finance Inc. | ||||||
5.29% - 5.48%, 04/25/07 - 07/25/074 | 155,723 | 155,731 | ||||
BMW US Capital LLC | ||||||
5.33%, 09/14/074 | 61,068 | 61,068 | ||||
BNP Paribas | ||||||
5.36%, 05/18/074 | 112,976 | 112,976 | ||||
Carlyle Loan Investment Ltd. | ||||||
5.38%, 04/13/07 - 07/15/074 | 44,580 | 44,579 | ||||
CC USA Inc. | ||||||
5.48%, 07/30/074 | 30,534 | 30,538 | ||||
Commodore CDO Ltd. | ||||||
5.38%, 06/12/074 | 15,267 | 15,267 | ||||
Credit Agricole SA | ||||||
5.48%, 07/23/07 | 61,068 | 61,068 | ||||
Credit Suisse First Boston NY | ||||||
5.51%, 04/24/07 | 30,534 | 30,535 | ||||
Cullinan Finance Corp. | ||||||
5.36%, 04/25/074 | 15,267 | 15,267 | ||||
DEPFA Bank PLC | ||||||
5.37%, 06/15/07 | 61,068 | 61,068 | ||||
Dorada Finance Inc. | ||||||
5.41% - 5.47%, 06/27/07 - 07/17/074 | 70,228 | 70,233 | ||||
Eli Lilly Services Inc. | ||||||
5.37%, 08/31/074 | 61,068 | 61,068 | ||||
Fifth Third Bancorp | ||||||
5.30%, 09/21/074 | 122,136 | 122,136 | ||||
Five Finance Inc. | ||||||
5.37% - 5.45%, 12/01/06 - 07/13/074 | 61,068 | 61,063 | ||||
General Electric Capital Corp. | ||||||
5.29% - 5.49%, 07/09/07 - 09/24/07 | 64,121 | 64,137 | ||||
Granite Master Issuer PLC | ||||||
5.30%, 09/20/06 | 213,738 | 213,738 | ||||
Harrier Finance Funding LLC | ||||||
5.33%, 07/25/074 | 18,320 | 18,324 | ||||
Hartford Life Global Funding Trusts | ||||||
5.35% - 5.55%, 07/13/07 - 09/17/07 | 91,602 | 91,616 | ||||
HBOS Treasury Services PLC | ||||||
5.53%, 07/24/074 | 61,068 | 61,068 | ||||
Holmes Financing PLC | ||||||
5.40%, 07/16/074 | 106,869 | 106,869 | ||||
JP Morgan Chase & Co. | ||||||
5.36%, 08/02/07 | 45,801 | 45,801 | ||||
K2 USA LLC | ||||||
5.20% - 5.46%, 04/02/07 - 06/28/074 | 45,801 | 45,799 | ||||
| 76 | 2006 iSHARES ANNUAL REPORTTO SHAREHOLDERS |
Table of Contents
Schedule of Investments (Continued)
iSHARES® MSCI SPAIN INDEX FUND
August 31, 2006
Security | Principal | Value | |||||
Kestrel Funding LLC | |||||||
5.31%, 07/11/074 | $ | 24,427 | $ | 24,425 | |||
Kommunalkredit Austria AG | |||||||
5.33%, 09/09/074 | 36,641 | 36,641 | |||||
Leafs LLC | |||||||
5.33%, 01/22/07 - 02/20/074 | 63,717 | 63,717 | |||||
Lexington Parker Capital Co. LLC | |||||||
5.46%, 01/10/074 | 76,335 | 76,318 | |||||
Links Finance LLC | |||||||
5.33% - 5.35%, 05/10/07 - 05/16/074 | 67,175 | 67,170 | |||||
Lothian Mortgages Master Issuer PLC | |||||||
5.30%, 04/24/074 | 26,908 | 26,908 | |||||
Marshall & Ilsley Bank | |||||||
5.31%, 09/14/07 | 33,587 | 33,587 | |||||
Metropolitan Life Global Funding I | |||||||
5.42%, 08/06/074 | 91,602 | 91,602 | |||||
Metropolitan Life Insurance Funding Agreement | |||||||
5.57%, 08/01/074,7 | 6,107 | 6,107 | |||||
Monumental Global Funding II | |||||||
5.49%, 12/27/064 | 12,214 | 12,215 | |||||
Mound Financing PLC | |||||||
5.39%, 05/08/074 | 57,404 | 57,404 | |||||
Natexis Banques Populaires | |||||||
5.31% - 5.40%, 02/05/07 - 09/14/074 | 183,204 | 183,201 | |||||
National City Bank of Indiana | |||||||
5.37%, 05/21/07 | 30,534 | 30,536 | |||||
Nationwide Building Society | |||||||
5.44% - 5.62%, 07/06/07 - 07/27/074 | 201,524 | 201,571 | |||||
Newcastle Ltd. | |||||||
5.35%, 04/24/074 | 21,526 | 21,522 | |||||
Northern Rock PLC | |||||||
5.43%, 08/03/074 | 73,282 | 73,283 | |||||
Principal Life Global Funding I | |||||||
5.80%, 02/08/07 | 27,481 | 27,537 | |||||
Sedna Finance Inc. | |||||||
5.30% - 5.37%, 09/20/06 - 08/21/074 | 106,869 | 106,867 | |||||
Skandinaviska Enskilda Bank NY | |||||||
5.33%, 09/18/074 | 61,068 | 61,068 | |||||
Strips III LLC | |||||||
5.38%, 07/24/074 | 14,849 | 14,849 | |||||
SunTrust Bank | |||||||
5.37%, 05/01/07 | 61,068 | 61,070 | |||||
Tango Finance Corp. | |||||||
5.22% - 5.48%, 04/25/07 - 07/16/074 | 149,006 | 148,992 | |||||
Union Hamilton Special Funding LLC | |||||||
5.42% - 5.49%, 09/28/06 - 12/21/064 | 85,495 | 85,495 | |||||
US Bank N.A. | |||||||
5.26%, 09/29/06 | 27,481 | 27,480 | |||||
Wachovia Asset Securitization Inc. | |||||||
5.31%, 09/25/064 | 91,126 | 91,126 | |||||
Wachovia Bank N.A. | |||||||
5.36%, 05/22/07 | 122,136 | 122,136 | |||||
Wells Fargo & Co. | |||||||
5.34%, 09/14/074 | 30,534 | 30,536 | |||||
WhistleJacket Capital Ltd. | |||||||
5.29% - 5.35%, 04/18/07 - 06/13/074 | 45,801 | 45,801 | |||||
White Pine Finance LLC | |||||||
5.29% - 5.35%, 05/22/07 - 08/20/074 | 183,204 | 183,166 | |||||
Wind Master Trust | |||||||
5.31% - 5.32%, 09/25/06 - 07/25/074 | 38,730 | 38,730 | |||||
| 4,038,359 | |||||||
TOTAL SHORT-TERM INVESTMENTS | 7,438,717 | ||||||
TOTAL INVESTMENTS IN SECURITIES – 104.05% | 185,344,275 | ||||||
Other Assets, Less Liabilities – (4.05)% | (7,214,218 | ) | |||||
NET ASSETS – 100.00% | $ | 178,130,057 | |||||
| SCHEDULESOF INVESTMENTS | 77 |
Table of Contents
Schedule of Investments (Continued)
iSHARES® MSCI SPAIN INDEX FUND
August 31, 2006
| 1 | Non-income earning security. |
| 2 | All or a portion of this security represents a security on loan. See Note 5. |
| 3 | All or a portion of this security (these securities) represent(s) an investment of securities lending collateral. See Note 5. |
| 4 | This security or a portion of these securities may be resold to qualified institutional buyers under Rule 144A or pursuant to Section 4(2) of the Securities Act of 1933. |
| 5 | Affiliated issuer. See Note 2. |
| 6 | The rate quoted is the annualized seven-day yield of the fund at period end. |
| 7 | The investment adviser has determined that this security or a portion of these securities is illiquid. |
See notes to the financial statements.
| 78 | 2006 iSHARES ANNUAL REPORTTO SHAREHOLDERS |
Table of Contents
Schedule of Investments
iSHARES® MSCI SWEDEN INDEX FUND
August 31, 2006
Security | Shares | Value | |||
COMMON STOCKS – 99.85% | |||||
AGRICULTURE – 1.89% | |||||
Swedish Match AB | 169,106 | $ | 2,863,984 | ||
| 2,863,984 | |||||
AIRLINES – 0.34% | |||||
SAS AB1 | 41,502 | 507,794 | |||
| 507,794 | |||||
AUTO MANUFACTURERS – 8.39% | |||||
Scania AB Class B | 56,082 | 2,667,212 | |||
Volvo AB Class A | 53,173 | 3,091,240 | |||
Volvo AB Class B | 121,992 | 6,948,709 | |||
| 12,707,161 | |||||
BANKS – 19.03% | |||||
Nordea Bank AB | 1,164,678 | 14,652,873 | |||
Skandinaviska Enskilda Banken AB Class A | 260,106 | 6,742,597 | |||
Svenska Handelsbanken AB Class A | 284,108 | 7,423,707 | |||
| 28,819,177 | |||||
COMMERCIAL SERVICES – 2.05% | |||||
Securitas AB Class B | 175,812 | 3,099,090 | |||
| 3,099,090 | |||||
COMPUTERS – 0.41% | |||||
WM-Data AB Class B | 174,985 | 614,483 | |||
| 614,483 | |||||
COSMETICS & PERSONAL CARE – 0.53% | |||||
Oriflame Cosmetics SA SDR | 23,339 | 806,674 | |||
| 806,674 | |||||
DIVERSIFIED FINANCIAL SERVICES – 0.85% | |||||
D Carnegie AB | 35,256 | 628,779 | |||
OMHEX AB | 43,566 | 662,546 | |||
| 1,291,325 | |||||
ENGINEERING & CONSTRUCTION – 2.20% | |||||
Skanska AB Class B | 211,152 | 3,327,941 | |||
| 3,327,941 | |||||
FOOD – 0.34% | |||||
Axfood AB | 16,986 | 520,164 | |||
| 520,164 | |||||
FOREST PRODUCTS & PAPER – 4.05% | |||||
Billerud AB | 23,952 | 370,882 | |||
Holmen AB Class B | 29,850 | 1,252,502 | |||
Svenska Cellulosa AB Class B | 104,910 | 4,503,540 | |||
| 6,126,924 | |||||
HAND & MACHINE TOOLS – 4.09% | |||||
Sandvik AB | 565,032 | 6,190,815 | |||
| 6,190,815 | |||||
HEALTH CARE – PRODUCTS – 1.78% | |||||
Elekta AB Class B | 48,774 | 863,125 | |||
Getinge AB Class B | 100,305 | 1,830,510 | |||
| 2,693,635 | |||||
HEALTH CARE – SERVICES – 0.61% | |||||
Capio AB1 | 54,288 | 919,423 | |||
| 919,423 | |||||
HOME FURNISHINGS – 2.11% | |||||
Electrolux AB Series B | 151,488 | 2,345,696 | |||
Nobia AB | 27,528 | 856,313 | |||
| 3,202,009 | |||||
HOUSEHOLD PRODUCTS & WARES – 1.08% | |||||
Husqvarna AB1 | 151,045 | 1,634,053 | |||
| 1,634,053 | |||||
IRON & STEEL – 1.56% | |||||
SSAB Svenskt Stal AB Class A | 84,789 | 1,635,269 | |||
SSAB Svenskt Stal AB Class B | 39,849 | 727,222 | |||
| 2,362,491 | |||||
MACHINERY – 5.08% | |||||
Atlas Copco AB Class A | 188,196 | 4,852,491 | |||
Atlas Copco AB Class B | 117,208 | 2,835,769 | |||
| 7,688,260 | |||||
MANUFACTURING – 1.75% | |||||
Alfa Laval AB | 53,205 | 1,761,706 | |||
Trelleborg AB Class B | 45,322 | 883,494 | |||
| 2,645,200 | |||||
MEDIA – 1.74% | |||||
Eniro AB2 | 97,362 | 1,140,788 | |||
Modern Times Group MTG AB Class B1 | 28,576 | 1,493,375 | |||
| 2,634,163 | |||||
| SCHEDULESOF INVESTMENTS | 79 |
Table of Contents
Schedule of Investments (Continued)
iSHARES® MSCI SWEDEN INDEX FUND
August 31, 2006
Security | Shares or Principal | Value | ||||
METAL FABRICATE & HARDWARE – 4.42% | ||||||
Assa Abloy AB Class B | 175,266 | $ | 3,077,350 | |||
Hoganas AB Class B2 | 14,364 | 369,372 | ||||
SKF AB | 226,989 | 3,248,035 | ||||
| 6,694,757 | ||||||
MINING – 2.01% | ||||||
Boliden AB | 162,162 | 3,049,043 | ||||
| 3,049,043 | ||||||
OIL & GAS – 0.90% | ||||||
Lundin Petroleum AB1,2 | 123,006 | 1,364,730 | ||||
| 1,364,730 | ||||||
REAL ESTATE – 1.90% | ||||||
Castellum AB | 87,282 | 941,228 | ||||
Fabege AB | 45,006 | 896,001 | ||||
Kungsleden AB | 76,511 | 743,097 | ||||
Wihlborgs Fastigheter AB | 18,780 | 298,586 | ||||
| 2,878,912 | ||||||
RETAIL – 6.84% | ||||||
Hennes & Mauritz AB Class B | 266,058 | 10,354,527 | ||||
| 10,354,527 | ||||||
SOFTWARE – 0.17% | ||||||
Telelogic AB1 | 138,430 | 262,196 | ||||
| 262,196 | ||||||
TELECOMMUNICATIONS – 23.73% | ||||||
Tele2 AB Class B2 | 178,248 | 1,768,162 | ||||
Telefonaktiebolaget LM Ericsson Class B2 | 8,308,170 | 27,682,031 | ||||
TeliaSonera AB | 1,047,852 | 6,490,132 | ||||
| 35,940,325 | ||||||
TOTAL COMMON STOCKS | 151,199,256 | |||||
SHORT-TERM INVESTMENTS – 2.82% | ||||||
CERTIFICATES OF DEPOSIT3 – 0.12% | ||||||
Credit Suisse First Boston NY | ||||||
5.28% - 5.43%, 04/23/07 - 08/21/07 | $ | 24,918 | 24,918 | |||
Societe Generale | ||||||
5.33%, 12/08/06 | 35,597 | 35,597 | ||||
Security | Principal | Value | ||||
Washington Mutual Bank | ||||||
5.36%, 11/13/06 | $ | 88,993 | $ | 88,993 | ||
Wells Fargo Bank N.A. | ||||||
4.78%, 12/05/06 | 28,478 | 28,478 | ||||
| 177,986 | ||||||
COMMERCIAL PAPER3 – 0.46% | ||||||
Amstel Funding Corp. | ||||||
5.20%, 11/21/06 - 11/22/064 | 10,387 | 10,265 | ||||
Amsterdam Funding Corp. | ||||||
5.27%, 09/15/064 | 35,597 | 35,524 | ||||
Atlantis One Funding | ||||||
5.30%, 11/14/064 | 48,842 | 48,310 | ||||
Barton Capital Corp. | ||||||
5.27%, 09/06/064 | 17,941 | 17,928 | ||||
Cancara Asset Securitisation Ltd. | ||||||
5.30%, 11/14/064 | 18,045 | 17,848 | ||||
CC USA Inc. | ||||||
5.03%, 10/24/064 | 7,119 | 7,067 | ||||
Charta LLC | ||||||
5.30%, 11/06/064 | 35,597 | 35,251 | ||||
Concord Minutemen Capital Co. LLC | ||||||
5.27% - 5.29%, 09/13/06 - 11/16/064 | 62,520 | 62,242 | ||||
Curzon Funding LLC | ||||||
5.29%, 11/17/064 | 35,597 | 35,194 | ||||
Edison Asset Securitization LLC | ||||||
5.22%, 12/11/064 | 26,261 | 25,876 | ||||
Falcon Asset Securitization Corp. | ||||||
5.30%, 11/06/064 | 35,597 | 35,251 | ||||
Five Finance Inc. | ||||||
5.19%, 12/01/064 | 16,019 | 15,809 | ||||
General Electric Capital Services Inc. | ||||||
5.22%, 12/11/06 | 3,560 | 3,508 | ||||
Giro Funding Corp. | ||||||
5.28% - 5.34%, 09/11/06 - 10/10/064 | 35,597 | 35,468 | ||||
Grampian Funding LLC | ||||||
5.03% - 5.30%, 10/17/06 - 11/16/064 | 17,087 | 16,946 | ||||
KKR Pacific Funding Trust | ||||||
5.29%, 09/14/064 | 35,597 | 35,529 | ||||
| 80 | 2006 iSHARES ANNUAL REPORTTO SHAREHOLDERS |
Table of Contents
Schedule of Investments (Continued)
iSHARES® MSCI SWEDEN INDEX FUND
August 31, 2006
Security | Principal | Value | ||||
Landale Funding LLC | ||||||
5.31%, 11/15/064 | $ | 27,766 | $ | 27,459 | ||
Lexington Parker Capital Co. LLC | ||||||
5.19% - 5.27%, 09/15/06 - 11/15/064 | 46,142 | 45,877 | ||||
Liberty Street Funding Corp. | ||||||
5.27%, 09/08/06 - 09/11/064 | 31,681 | 31,643 | ||||
Mont Blanc Capital Corp. | ||||||
5.29%, 11/15/064 | 22,960 | 22,707 | ||||
Monument Gardens Funding LLC | ||||||
5.28%, 09/21/064 | 17,889 | 17,836 | ||||
Nestle Capital Corp. | ||||||
5.19%, 08/09/07 | 21,358 | 20,305 | ||||
Park Granada LLC | ||||||
5.30%, 09/01/064 | 8,135 | 8,135 | ||||
Regency Markets LLC | ||||||
5.28%, 09/15/06 | 17,799 | 17,762 | ||||
Solitaire Funding Ltd. | ||||||
5.27%, 09/05/064 | 26,698 | 26,682 | ||||
Sydney Capital Corp. | ||||||
5.27%, 09/12/064 | 8,145 | 8,132 | ||||
Tulip Funding Corp. | ||||||
5.29%, 11/15/064 | 18,775 | 18,568 | ||||
White Pine Finance LLC | ||||||
5.12%, 10/27/064 | 6,728 | 6,674 | ||||
| 689,796 | ||||||
MEDIUM-TERM NOTES3 – 0.10% | ||||||
Bank of America N.A. | ||||||
5.28%, 04/20/07 | 8,899 | 8,899 | ||||
Cullinan Finance Corp. | ||||||
5.71%, 06/28/074 | 26,698 | 26,698 | ||||
K2 USA LLC | ||||||
5.39%, 06/04/074 | 26,698 | 26,698 | ||||
Marshall & Ilsley Bank | ||||||
5.18%, 12/15/06 | 35,597 | 35,632 | ||||
Sigma Finance Inc. | ||||||
5.13% - 5.51%, 03/30/07 - 06/18/074 | 41,649 | 41,649 | ||||
US Bank N.A. | ||||||
2.85%, 11/15/06 | 7,119 | 7,092 | ||||
| 146,668 | ||||||
Security | Shares or Principal | Value | ||||
MONEY MARKET FUNDS – 0.02% | ||||||
Barclays Global Investors Funds Institutional Money Market Fund, Institutional Shares 5.30%5,6 | 24,228 | $ | 24,228 | |||
| 24,228 | ||||||
REPURCHASE AGREEMENTS3 – 0.57% | ||||||
Banc of America Securities LLC Repurchase Agreement, 5.30%, due 9/1/06, maturity value $44,503 (collateralized by U.S. Government obligations, value $45,429, 5.50% to 6.50%, 1/1/33 to 7/1/36). | $ | 44,496 | 44,496 | |||
Banc of America Securities LLC Repurchase Agreement, 5.36%, due 9/1/06, maturity value $71,205 (collateralized by non-U.S. Government debt securities, value $73,400, 3.80% to 9.13%, 11/1/06 to 6/15/26). | 71,194 | 71,194 | ||||
Bear Stearns Companies Inc. (The) Repurchase Agreement, 5.37%, due 9/1/06, maturity value $53,404 (collateralized by non-U.S. Government debt securities, value $58,792, 0.08% to 6.43%, 9/25/20 to 7/25/36). | 53,396 | 53,396 | ||||
Citigroup Global Markets Holdings Inc. Repurchase Agreement, 5.36%, due 9/1/06, maturity value $106,807 (collateralized by non-U.S. Government debt securities, value $111,589, 4.35% to 7.50%, 9/15/08 to 8/25/35). | 106,791 | 106,791 | ||||
| SCHEDULESOF INVESTMENTS | 81 |
Table of Contents
Schedule of Investments (Continued)
iSHARES® MSCI SWEDEN INDEX FUND
August 31, 2006
Security | Principal | Value | ||||
Citigroup Global Markets Holdings Inc. Repurchase Agreement, 5.46%, due 9/1/06, maturity value $21,361 (collateralized by non-U.S. Government debt securities, value $26,073, 0.00% to 10.00%, 6/1/28 to 8/24/36). | $ | 21,358 | $ | 21,358 | ||
Goldman Sachs & Co. Repurchase Agreement, 5.35%, due 9/1/06, maturity value $71,205 (collateralized by non-U.S. Government debt securities, value $72,687, 0.00% to 8.57%, 11/15/06 to 2/15/38). | 71,194 | 71,194 | ||||
Goldman Sachs Group Inc. Repurchase Agreement, 5.36%, due 9/1/06, maturity value $35,602 (collateralized by non-U.S. Government debt securities, value $37,412, 5.36% to 9.01%, 10/27/10 to 2/18/20). | 35,597 | 35,597 | ||||
JP Morgan Securities Inc. Repurchase Agreement, 5.41%, due 9/1/06, maturity value $8,900 (collateralized by non-U.S. Government debt securities, value $9,353, 6.63% to 10.50%, 1/15/07 to 4/15/16). | 8,899 | 8,899 | ||||
Lehman Brothers Holdings Inc. Repurchase Agreement, 5.36%, due 9/1/06, maturity value $71,205 (collateralized by non-U.S. Government debt securities, value $74,825, 0.51% to 8.89%, 8/5/18 to 9/25/46). | 71,194 | 71,194 | ||||
Lehman Brothers Holdings Inc. Repurchase Agreement, 5.38%, due 9/1/06, maturity value $35,602 (collateralized by non-U.S. Government debt securities, value $37,414, 4.11% to 9.79%, 4/28/31 to 9/25/46). | 35,597 | 35,597 | ||||
Lehman Brothers Holdings Inc. Repurchase Agreement, 5.46%, due 9/1/06, maturity value $39,163 (collateralized by non-U.S. Government debt securities, value $41,154, 3.44% to 15.15%, 12/1/08 to 3/1/36). | 39,157 | 39,157 | ||||
Merrill Lynch & Co. Inc. Repurchase Agreement, 5.33%, due 9/1/06, maturity value $71,206 (collateralized by non-U.S. Government debt securities, value $74,826, 6.38% to 10.25%, 5/1/07 to 10/15/16). | 71,194 | 71,195 | ||||
Merrill Lynch & Co. Inc. Repurchase Agreement, 5.36%, due 9/1/06, maturity value $71,205 (collateralized by non-U.S. Government debt securities, value $73,413, 0.00% to 10.13%, 10/15/06 to 7/1/26). | 71,194 | 71,194 | ||||
Morgan Stanley Repurchase Agreement, 5.36%, due 9/1/06, maturity value $35,602 (collateralized by non-U.S. Government debt securities, value $37,430, 4.05% to 7.24%, 6/20/29 to 1/14/41). | 35,597 | 35,597 | ||||
| 82 | 2006 iSHARES ANNUAL REPORTTO SHAREHOLDERS |
Table of Contents
Schedule of Investments (Continued)
iSHARES® MSCI SWEDEN INDEX FUND
August 31, 2006
Security | Principal | Value | ||||
Morgan Stanley Repurchase Agreement, 5.46%, due 9/1/06, maturity value $12,461 (collateralized by non-U.S. Government debt securities, value $19,107, 0.00% to 10.00%, 9/1/06 to 8/31/36). | $ | 12,459 | $ | 12,459 | ||
Morgan Stanley Repurchase Agreement, 5.51%, due 6/4/07, maturity value $25,974 (collateralized by non-U.S. Government debt securities, value $38,793, 0.00% to 10.00%, 9/1/06 to 8/31/36).7 | 24,918 | 24,918 | ||||
Wachovia Capital Repurchase Agreement, 5.38%, due 9/1/06, maturity value $92,567 (collateralized by non-U.S. Government debt securities, value $97,272, 0.06% to 7.68%, 10/15/11 to 3/15/45). | 92,553 | 92,552 | ||||
| 866,788 | ||||||
TIME DEPOSITS3 – 0.00% | ||||||
KBC Bank | ||||||
5.31%, 09/01/06 | 7,511 | 7,511 | ||||
| 7,511 | ||||||
VARIABLE & FLOATING RATE NOTES 3 – 1.55% | ||||||
Allstate Life Global Funding II | ||||||
5.34% - 5.47%, | ||||||
09/04/07 - 09/27/074 | 91,132 | 91,143 | ||||
American Express Bank | ||||||
5.30%, 02/28/07 | 35,597 | 35,597 | ||||
American Express Centurion Bank | ||||||
5.42%, 07/19/07 | 39,157 | 39,196 | ||||
American Express Credit Corp. | ||||||
5.51%, 07/05/07 | 10,679 | 10,685 | ||||
ASIF Global Financing | ||||||
5.51%, 05/03/074 | 3,560 | 3,561 | ||||
Australia & New Zealand Banking Group Ltd. | ||||||
5.32%, 09/21/074 | 23,138 | 23,138 | ||||
Bank of Ireland | ||||||
5.30% - 5.31%, 08/14/07 - 08/20/074 | 51,616 | 51,618 | ||||
Beta Finance Inc. | ||||||
5.29% - 5.48%, 04/25/07 - 07/25/074 | 90,773 | 90,777 | ||||
BMW US Capital LLC | ||||||
5.33%, 09/14/074 | 35,597 | 35,597 | ||||
BNP Paribas | ||||||
5.36%, 05/18/074 | 65,855 | 65,855 | ||||
Carlyle Loan Investment Ltd. | ||||||
5.38%, 04/13/07 - 07/15/074 | 25,986 | 25,986 | ||||
CC USA Inc. | ||||||
5.48%, 07/30/074 | 17,799 | 17,801 | ||||
Commodore CDO Ltd. | ||||||
5.38%, 06/12/074 | 8,899 | 8,899 | ||||
Credit Agricole SA | ||||||
5.48%, 07/23/07 | 35,597 | 35,597 | ||||
Credit Suisse First Boston NY | ||||||
5.51%, 04/24/07 | 17,799 | 17,799 | ||||
Cullinan Finance Corp. | ||||||
5.36%, 04/25/074 | 8,899 | 8,899 | ||||
DEPFA Bank PLC | ||||||
5.37%, 06/15/07 | 35,597 | 35,597 | ||||
Dorada Finance Inc. | ||||||
5.41% - 5.47%, 06/27/07 - 07/17/074 | 40,937 | 40,939 | ||||
Eli Lilly Services Inc. | ||||||
5.37%, 08/31/074 | 35,597 | 35,597 | ||||
Fifth Third Bancorp | ||||||
5.30%, 09/21/074 | 71,194 | 71,194 | ||||
Five Finance Inc. | ||||||
5.37% - 5.45%, 12/01/06 - 07/13/074 | 35,597 | 35,594 | ||||
General Electric Capital Corp. | ||||||
5.29% - 5.49%, | ||||||
07/09/07 - 09/24/07 | 37,377 | 37,385 | ||||
| SCHEDULESOF INVESTMENTS | 83 |
Table of Contents
Schedule of Investments (Continued)
iSHARES® MSCI SWEDEN INDEX FUND
August 31, 2006
Security | Principal | Value | ||||
Granite Master Issuer PLC | ||||||
5.30%, 09/20/06 | $ | 124,590 | $ | 124,590 | ||
Harrier Finance Funding LLC | ||||||
5.33%, 07/25/074 | 10,679 | 10,681 | ||||
Hartford Life Global Funding Trusts | ||||||
5.35% - 5.55%, 07/13/07 - 09/17/07 | 53,396 | 53,404 | ||||
HBOS Treasury Services PLC | ||||||
5.53%, 07/24/074 | 35,597 | 35,597 | ||||
Holmes Financing PLC | ||||||
5.40%, 07/16/074 | 62,295 | 62,295 | ||||
JP Morgan Chase & Co. | ||||||
5.36%, 08/02/07 | 26,698 | 26,698 | ||||
K2 USA LLC | ||||||
5.20% - 5.46%, 04/02/07 - 06/28/074 | 26,698 | 26,697 | ||||
Kestrel Funding LLC | ||||||
5.31%, 07/11/074 | 14,239 | 14,238 | ||||
Kommunalkredit Austria AG | ||||||
5.33%, 09/09/074 | 21,358 | 21,358 | ||||
Leafs LLC | ||||||
5.33%, 01/22/07 - 02/20/074 | 37,141 | 37,141 | ||||
Lexington Parker Capital Co. LLC | ||||||
5.46%, 01/10/074 | 44,496 | 44,486 | ||||
Links Finance LLC | ||||||
5.33% - 5.35%, 05/10/07 - 05/16/074 | 39,157 | 39,154 | ||||
Lothian Mortgages Master Issuer PLC | ||||||
5.30%, 04/24/074 | 15,685 | 15,685 | ||||
Marshall & Ilsley Bank | ||||||
5.31%, 09/14/07 | 19,578 | 19,578 | ||||
Metropolitan Life Global Funding I | ||||||
5.42%, 08/06/074 | 53,396 | 53,396 | ||||
Metropolitan Life Insurance Funding Agreement | ||||||
5.57%, 08/01/074,7 | 3,560 | 3,560 | ||||
Monumental Global Funding II | ||||||
5.49%, 12/27/064 | 7,119 | 7,120 | ||||
Mound Financing PLC | ||||||
5.39%, 05/08/074 | 33,461 | 33,461 | ||||
Natexis Banques Populaires | ||||||
5.31% - 5.40%, 02/05/07 - 09/14/074 | 106,791 | 106,790 | ||||
National City Bank of Indiana | ||||||
5.37%, 05/21/07 | 17,799 | 17,800 | ||||
Nationwide Building Society | ||||||
5.44% - 5.62%, 07/06/07 - 07/27/074 | 117,470 | 117,498 | ||||
Newcastle Ltd. | ||||||
5.35%, 04/24/074 | 12,548 | 12,546 | ||||
Northern Rock PLC | ||||||
5.43%, 08/03/074 | 42,717 | 42,718 | ||||
Principal Life Global Funding I | ||||||
5.80%, 02/08/07 | 16,019 | 16,052 | ||||
Sedna Finance Inc. | ||||||
5.30% - 5.37%, 09/20/06 - 08/21/074 | 62,295 | 62,294 | ||||
Skandinaviska Enskilda Bank NY | ||||||
5.33%, 09/18/074 | 35,597 | 35,597 | ||||
Strips III LLC | ||||||
5.38%, 07/24/074 | 8,656 | 8,656 | ||||
SunTrust Bank | ||||||
5.37%, 05/01/07 | 35,597 | 35,599 | ||||
Tango Finance Corp. | ||||||
5.22% - 5.48%, 04/25/07 - 07/16/074 | 86,857 | 86,849 | ||||
Union Hamilton Special Funding LLC | ||||||
5.42% - 5.49%, 09/28/06 - 12/21/064 | 49,836 | 49,836 | ||||
US Bank N.A. | ||||||
5.26%, 09/29/06 | 16,019 | 16,018 | ||||
Wachovia Asset Securitization Inc. | ||||||
5.31%, 09/25/064 | 53,118 | 53,118 | ||||
Wachovia Bank N.A. | ||||||
5.36%, 05/22/07 | 71,194 | 71,194 | ||||
Wells Fargo & Co. | ||||||
5.34%, 09/14/074 | 17,799 | 17,800 | ||||
WhistleJacket Capital Ltd. | ||||||
5.29% - 5.35%, | ||||||
04/18/07 - 06/13/074 | 26,698 | 26,698 | ||||
| 84 | 2006 iSHARES ANNUAL REPORTTO SHAREHOLDERS |
Table of Contents
Schedule of Investments (Continued)
iSHARES® MSCI SWEDEN INDEX FUND
August 31, 2006
Security | Principal | Value | |||||
White Pine Finance LLC | |||||||
5.29% - 5.35%, | |||||||
05/22/07 - 08/20/074 | $ | 106,791 | $ | 106,770 | |||
Wind Master Trust | |||||||
5.31% - 5.32%, | |||||||
09/25/06 - 07/25/074 | 22,576 | 22,576 | |||||
| 2,354,002 | |||||||
TOTAL SHORT-TERM INVESTMENTS | 4,266,979 | ||||||
TOTAL INVESTMENTS IN SECURITIES – 102.67% | 155,466,235 | ||||||
Other Assets, Less Liabilities – (2.67)% | (4,039,674 | ) | |||||
NET ASSETS – 100.00% | $ | 151,426,561 | |||||
SDR - Swedish Depositary Receipts
| 1 | Non-income earning security. |
| 2 | All or a portion of this security represents a security on loan. See Note 5. |
| 3 | All or a portion of this security (these securities) represent(s) an investment of securities lending collateral. See Note 5. |
| 4 | This security or a portion of these securities may be resold to qualified institutional buyers under Rule 144A or pursuant to Section 4(2) of the Securities Act of 1933. |
| 5 | Affiliated issuer. See Note 2. |
| 6 | The rate quoted is the annualized seven-day yield of the fund at period end. |
| 7 | The investment adviser has determined that this security or a portion of these securities is illiquid. |
See notes to the financial statements.
| SCHEDULESOF INVESTMENTS | 85 |
Table of Contents
iSHARES® MSCI SWITZERLAND INDEX FUND
August 31, 2006
Security | Shares | Value | |||
COMMON STOCKS – 99.61% | |||||
BANKS – 6.95% | |||||
Banque Cantonale Vaudoise | 1,541 | $ | 582,742 | ||
Credit Suisse Group | 162,676 | 9,057,713 | |||
Julius Baer Holding AG | 24,254 | 2,327,141 | |||
Vontobel Holding AG Registered | 28,207 | 1,118,717 | |||
| 13,086,313 | |||||
BUILDING MATERIALS – 3.65% | |||||
Geberit AG Registered | 938 | 1,090,954 | |||
Holcim Ltd. Registered | 71,500 | 5,781,702 | |||
| 6,872,656 | |||||
CHEMICALS – 6.40% | |||||
Ciba Specialty Chemicals AG Registered | 23,450 | 1,311,389 | |||
Clariant AG Registered1 | 43,062 | 523,890 | |||
Givaudan SA Registered | 4,489 | 3,613,555 | |||
Lonza Group AG Registered | 10,454 | 680,852 | |||
Syngenta AG1,2 | 40,468 | 5,930,952 | |||
| 12,060,638 | |||||
COMMERCIAL SERVICES – 1.79% | |||||
Adecco SA Registered | 30,485 | 1,778,982 | |||
SGS SA | 1,742 | 1,589,481 | |||
| 3,368,463 | |||||
COMPUTERS – 0.34% | |||||
Logitech International SA1 | 29,815 | 643,237 | |||
| 643,237 | |||||
DIVERSIFIED FINANCIAL SERVICES – 10.44% | |||||
UBS AG Registered | 348,065 | 19,662,377 | |||
| 19,662,377 | |||||
ENGINEERING & CONSTRUCTION – 3.25% | |||||
ABB Ltd. | 461,764 | 6,123,396 | |||
| 6,123,396 | |||||
FOOD – 12.81% | |||||
Nestle SA Registered | 70,283 | 24,126,915 | |||
| 24,126,915 | |||||
HAND & MACHINE TOOLS – 0.91% | |||||
Schindler Holding AG Participation Certificates | 25,996 | 1,353,618 | |||
Schindler Holding AG Registered | 6,700 | 355,935 | |||
| 1,709,553 | |||||
HEALTH CARE – PRODUCTS – 5.00% | |||||
Nobel Biocare Holding AG | 11,904 | 2,896,468 | |||
Phonak Holding AG Registered | 22,847 | 1,361,981 | |||
Straumann Holding AG Registered | 5,494 | 1,138,503 | |||
Synthes Inc. | 36,850 | 4,016,903 | |||
| 9,413,855 | |||||
INSURANCE – 9.08% | |||||
Swiss Reinsurance Co.2 | 107,066 | 8,154,019 | |||
Zurich Financial Services AG | 39,329 | 8,947,471 | |||
| 17,101,490 | |||||
LEISURE TIME – 0.05% | |||||
Kuoni Reisen Holding AG Registered1 | 187 | 97,826 | |||
| 97,826 | |||||
MACHINERY – 0.22% | |||||
Rieter Holding AG | 967 | 415,678 | |||
| 415,678 | |||||
MANUFACTURING – 0.49% | |||||
Sulzer AG Registered | 1,139 | 921,029 | |||
| 921,029 | |||||
PHARMACEUTICALS – 27.28% | |||||
Novartis AG | 405,886 | 23,126,235 | |||
Roche Holding AG Genusschein | 138,556 | 25,498,484 | |||
Serono SA | 3,953 | 2,750,861 | |||
| 51,375,580 | |||||
REAL ESTATE – 1.43% | |||||
PSP Swiss Property AG1 | 52,059 | 2,700,169 | |||
| 2,700,169 | |||||
RETAIL – 5.99% | |||||
Compagnie Financiere Richemont AG Class A | 147,266 | 6,999,300 | |||
Swatch Group (The) AG Class B | 13,070 | 2,546,262 | |||
Swatch Group (The) AG Registered | 43,820 | 1,727,282 | |||
| 11,272,844 | |||||
SEMICONDUCTORS – 0.22% | |||||
Unaxis Holding AG Class R1,2 | 1,398 | 411,593 | |||
| 411,593 | |||||
| 86 | 2006 iSHARES ANNUAL REPORTTO SHAREHOLDERS |
Table of Contents
Schedule of Investments (Continued)
iSHARES® MSCI SWITZERLAND INDEX FUND
August 31, 2006
Security | Shares or Principal | Value | ||||
TELECOMMUNICATIONS – 2.69% | ||||||
Swisscom AG Registered | 15,008 | $ | 5,024,171 | |||
Swisscom AG Warrants (Expires 9/13/06)1 | 15,008 | 38,100 | ||||
| 5,062,271 | ||||||
TRANSPORTATION – 0.62% | ||||||
Kuehne & Nagel International AG Registered | 16,501 | 1,158,329 | ||||
| 1,158,329 | ||||||
TOTAL COMMON STOCKS | 187,584,212 | |||||
SHORT-TERM INVESTMENTS – 1.90% | ||||||
CERTIFICATES OF DEPOSIT3 – 0.08% | ||||||
Credit Suisse First Boston NY | ||||||
5.28% - 5.43%, 04/23/07 - 08/21/07 | $ | 20,906 | 20,906 | |||
Societe Generale | ||||||
5.33%, 12/08/06 | 29,866 | 29,866 | ||||
Washington Mutual Bank | ||||||
5.36%, 11/13/06 | 74,664 | 74,664 | ||||
Wells Fargo Bank N.A. | ||||||
4.78%, 12/05/06 | 23,892 | 23,892 | ||||
| 149,328 | ||||||
COMMERCIAL PAPER3 – 0.31% | ||||||
Amstel Funding Corp. | ||||||
5.20%, 11/21/06 - 11/22/064 | 8,714 | 8,612 | ||||
Amsterdam Funding Corp. | ||||||
5.27%, 09/15/064 | 29,866 | 29,804 | ||||
Atlantis One Funding | ||||||
5.30%, 11/14/064 | 40,978 | 40,532 | ||||
Barton Capital Corp. | ||||||
5.27%, 09/06/064 | 15,052 | 15,041 | ||||
Cancara Asset Securitisation Ltd. | ||||||
5.30%, 11/14/064 | 15,139 | 14,975 | ||||
CC USA Inc. | ||||||
5.03%, 10/24/064 | 5,973 | 5,929 | ||||
Charta LLC | ||||||
5.30%, 11/06/064 | 29,866 | 29,575 | ||||
Security | Principal | Value | ||||
Concord Minutemen Capital Co. LLC | ||||||
5.27% - 5.29%, 09/13/06 - 11/16/064 | $ | 52,453 | $ | 52,221 | ||
Curzon Funding LLC | ||||||
5.29%, 11/17/064 | 29,866 | 29,528 | ||||
Edison Asset Securitization LLC | ||||||
5.22%, 12/11/064 | 22,032 | 21,710 | ||||
Falcon Asset Securitization Corp. | ||||||
5.30%, 11/06/064 | 29,866 | 29,575 | ||||
Five Finance Inc. | ||||||
5.19%, 12/01/064 | 13,440 | 13,263 | ||||
General Electric Capital Services Inc. | ||||||
5.22%, 12/11/06 | 2,987 | 2,943 | ||||
Giro Funding Corp. | ||||||
5.28% - 5.34%, 09/11/06 - 10/10/064 | 29,866 | 29,757 | ||||
Grampian Funding LLC | ||||||
5.03% - 5.30%, 10/17/06 - 11/16/064 | 14,335 | 14,217 | ||||
KKR Pacific Funding Trust | ||||||
5.29%, 09/14/064 | 29,866 | 29,809 | ||||
Landale Funding LLC | ||||||
5.31%, 11/15/064 | 23,295 | 23,038 | ||||
Lexington Parker Capital Co. LLC | ||||||
5.19% - 5.27%, 09/15/06 - 11/15/064 | 38,712 | 38,490 | ||||
Liberty Street Funding Corp. | ||||||
5.27%, 09/08/06 - 09/11/064 | 26,580 | 26,549 | ||||
Mont Blanc Capital Corp. | ||||||
5.29%, 11/15/064 | 19,263 | 19,051 | ||||
Monument Gardens Funding LLC | ||||||
5.28%, 09/21/064 | 15,008 | 14,964 | ||||
Nestle Capital Corp. | ||||||
5.19%, 08/09/07 | 17,919 | 17,036 | ||||
Park Granada LLC | ||||||
5.30%, 09/01/064 | 6,825 | 6,825 | ||||
Regency Markets LLC | ||||||
5.28%, 09/15/06 | 14,933 | 14,902 | ||||
| SCHEDULESOF INVESTMENTS | 87 |
Table of Contents
Schedule of Investments (Continued)
iSHARES® MSCI SWITZERLAND INDEX FUND
August 31, 2006
Security | Shares or Principal | Value | ||||
Solitaire Funding Ltd. | ||||||
5.27%, 09/05/064 | $ | 22,399 | $ | 22,386 | ||
Sydney Capital Corp. | ||||||
5.27%, 09/12/064 | 6,833 | 6,822 | ||||
Tulip Funding Corp. | ||||||
5.29%, 11/15/064 | 15,752 | 15,578 | ||||
White Pine Finance LLC | ||||||
5.12%, 10/27/064 | 5,645 | 5,600 | ||||
| 578,732 | ||||||
MEDIUM-TERM NOTES3 – 0.06% | ||||||
Bank of America N.A. | ||||||
5.28%, 04/20/07 | 7,466 | 7,466 | ||||
Cullinan Finance Corp. | ||||||
5.71%, 06/28/074 | 22,399 | 22,399 | ||||
K2 USA LLC | ||||||
5.39%, 06/04/074 | 22,399 | 22,399 | ||||
Marshall & Ilsley Bank | ||||||
5.18%, 12/15/06 | 29,866 | 29,895 | ||||
Sigma Finance Inc. | ||||||
5.13% - 5.51%, 03/30/07 - 06/18/074 | 34,943 | 34,943 | ||||
US Bank N.A. | ||||||
2.85%, 11/15/06 | 5,973 | 5,951 | ||||
| 123,053 | ||||||
MONEY MARKET FUNDS – 0.01% | ||||||
Barclays Global Investors Funds Institutional Money Market Fund, Institutional Shares 5.30%5,6 | 22,983 | 22,983 | ||||
| 22,983 | ||||||
REPURCHASE AGREEMENTS3 – 0.39% | ||||||
Banc of America Securities LLC Repurchase Agreement, 5.30%, due 9/1/06, maturity value $37,337 (collateralized by U.S. Government obligations, value $38,115, 5.50% to 6.50%, 1/1/33 to 7/1/36). | $ | 37,332 | 37,332 | |||
Security | Principal | Value | ||||
Banc of America Securities LLC Repurchase Agreement, 5.36%, due 9/1/06, maturity value $59,740 (collateralized by non-U.S. Government debt securities, value $61,582, 3.80% to 9.13%, 11/1/06 to 6/15/26). | $ | 59,731 | $ | 59,731 | ||
Bear Stearns Companies Inc. (The) Repurchase Agreement, 5.37%, due 9/1/06, maturity value $44,805 (collateralized by non-U.S. Government debt securities, value $49,326, 0.08% to 6.43%, 9/25/20 to 7/25/36). | 44,798 | 44,798 | ||||
Citigroup Global Markets Holdings Inc. Repurchase Agreement, 5.36%, due 9/1/06, maturity value $89,610 (collateralized by non-U.S. Government debt securities, value $93,622, 4.35% to 7.50%, 9/15/08 to 8/25/35). | 89,597 | 89,597 | ||||
Citigroup Global Markets Holdings Inc. Repurchase Agreement, 5.46%, due 9/1/06, maturity value $17,922 (collateralized by non-U.S. Government debt securities, value $21,875, 0.00% to 10.00%, 6/1/28 to 8/24/36). | 17,919 | 17,919 | ||||
Goldman Sachs & Co. Repurchase Agreement, 5.35%, due 9/1/06, maturity value $59,740 (collateralized by non-U.S. Government debt securities, value $60,984, 0.00% to 8.57%, 11/15/06 to 2/15/38). | 59,731 | 59,731 | ||||
| 88 | 2006 iSHARES ANNUAL REPORTTO SHAREHOLDERS |
Table of Contents
Schedule of Investments (Continued)
iSHARES® MSCI SWITZERLAND INDEX FUND
August 31, 2006
Security | Principal | Value | ||||
Goldman Sachs Group Inc. Repurchase Agreement, 5.36%, due 9/1/06, maturity value $29,870 (collateralized by non-U.S. Government debt securities, value $31,389, 5.36% to 9.01%, 10/27/10 to 2/18/20). | $ | 29,866 | $ | 29,866 | ||
JP Morgan Securities Inc. Repurchase Agreement, 5.41%, due 9/1/06, maturity value $7,467 (collateralized by non-U.S. Government debt securities, value $7,847, 6.63% to 10.50%, 1/15/07 to 4/15/16). | 7,466 | 7,466 | ||||
Lehman Brothers Holdings Inc. Repurchase Agreement, 5.36%, due 9/1/06, maturity value $59,740 (collateralized by non-U.S. Government debt securities, value $62,778, 0.51% to 8.89%, 8/5/18 to 9/25/46). | 59,731 | 59,731 | ||||
Lehman Brothers Holdings Inc. Repurchase Agreement, 5.38%, due 9/1/06, maturity value $29,870 (collateralized by non-U.S. Government debt securities, value $31,390, 4.11% to 9.79%, 4/28/31 to 9/25/46). | 29,866 | 29,866 | ||||
Lehman Brothers Holdings Inc. Repurchase Agreement, 5.46%, due 9/1/06, maturity value $32,857 (collateralized by non-U.S. Government debt securities, value $34,528, 3.44% to 15.15%, 12/1/08 to 3/1/36). | 32,852 | 32,852 | ||||
Merrill Lynch & Co. Inc. Repurchase Agreement, 5.33%, due 9/1/06, maturity value $59,740 (collateralized by non-U.S. Government debt securities, value $62,778, 6.38% to 10.25%, 5/1/07 to 10/15/16). | 59,731 | 59,731 | ||||
Merrill Lynch & Co. Inc. Repurchase Agreement, 5.36%, due 9/1/06, maturity value $59,740 (collateralized by non-U.S. Government debt securities, value $61,593, 0.00% to 10.13%, 10/15/06 to 7/1/26). | 59,731 | 59,731 | ||||
Morgan Stanley Repurchase Agreement, 5.36%, due 9/1/06, maturity value $29,870 (collateralized by non-U.S. Government debt securities, value $31,403, 4.05% to 7.24%, 6/20/29 to 1/14/41). | 29,866 | 29,866 | ||||
Morgan Stanley Repurchase Agreement, 5.46%, due 9/1/06, maturity value $10,455 (collateralized by non-U.S. Government debt securities, value $16,031, 0.00% to 10.00%, 9/1/06 to 8/31/36). | 10,453 | 10,453 | ||||
Morgan Stanley Repurchase Agreement, 5.51%, due 6/4/07, maturity value $21,792 (collateralized by non-U.S. Government debt securities, value $32,547, 0.00% to 10.00%, 9/1/06 to 8/31/36).7 | 20,906 | 20,906 | ||||
| SCHEDULESOF INVESTMENTS | 89 |
Table of Contents
Schedule of Investments (Continued)
iSHARES® MSCI SWITZERLAND INDEX FUND
August 31, 2006
Security | Principal | Value | ||||
Wachovia Capital Repurchase Agreement, 5.38%, due 9/1/06, maturity value $77,663 (collateralized by non-U.S. Government debt securities, value $81,611, 0.06% to 7.68%, 10/15/11 to 3/15/45). | $ | 77,651 | $ | 77,651 | ||
| 727,227 | ||||||
TIME DEPOSITS3 – 0.00% | ||||||
KBC Bank | ||||||
5.31%, 09/01/06 | 6,302 | 6,302 | ||||
| 6,302 | ||||||
VARIABLE & FLOATING RATE NOTES 3 – 1.05% | ||||||
Allstate Life Global Funding II | ||||||
5.34% - 5.47%, 09/04/07 - 09/27/074 | 76,456 | 76,461 | ||||
American Express Bank | ||||||
5.30%, 02/28/07 | 29,866 | 29,866 | ||||
American Express Centurion Bank | ||||||
5.42%, 07/19/07 | 32,852 | 32,885 | ||||
American Express Credit Corp. | ||||||
5.51%, 07/05/07 | 8,960 | 8,965 | ||||
ASIF Global Financing | ||||||
5.51%, 05/03/074 | 2,987 | 2,988 | ||||
Australia & New Zealand Banking | ||||||
Group Ltd. | ||||||
5.32%, 09/21/074 | 19,413 | 19,413 | ||||
Bank of Ireland | ||||||
5.30% - 5.31%, 08/14/07 - 08/20/074 | 43,305 | 43,307 | ||||
Beta Finance Inc. | ||||||
5.29% - 5.48%, 04/25/07 - 07/25/074 | 76,157 | 76,161 | ||||
BMW US Capital LLC | ||||||
5.33%, 09/14/074 | 29,866 | 29,866 | ||||
BNP Paribas | ||||||
5.36%, 05/18/074 | 55,251 | 55,251 | ||||
Carlyle Loan Investment Ltd. | ||||||
5.38%, 04/13/07 - 07/15/074 | 21,802 | 21,802 | ||||
CC USA Inc. | ||||||
5.48%, 07/30/074 | 14,933 | 14,935 | ||||
Commodore CDO Ltd. | ||||||
5.38%, 06/12/074 | 7,466 | 7,466 | ||||
Credit Agricole SA | ||||||
5.48%, 07/23/07 | 29,866 | 29,866 | ||||
Credit Suisse First Boston NY | ||||||
5.51%, 04/24/07 | 14,933 | 14,933 | ||||
Cullinan Finance Corp. | ||||||
5.36%, 04/25/074 | 7,466 | 7,466 | ||||
DEPFA Bank PLC | ||||||
5.37%, 06/15/07 | 29,866 | 29,866 | ||||
Dorada Finance Inc. | ||||||
5.41% - 5.47%, 06/27/07 - 07/17/074 | 34,345 | 34,348 | ||||
Eli Lilly Services Inc. | ||||||
5.37%, 08/31/074 | 29,866 | 29,866 | ||||
Fifth Third Bancorp | ||||||
5.30%, 09/21/074 | 59,731 | 59,731 | ||||
Five Finance Inc. | ||||||
5.37% - 5.45%, 12/01/06 - 07/13/074 | 29,866 | 29,863 | ||||
General Electric Capital Corp. | ||||||
5.29% - 5.49%, 07/09/07 - 09/24/07 | 31,359 | 31,366 | ||||
Granite Master Issuer PLC | ||||||
5.30%, 09/20/06 | 104,530 | 104,530 | ||||
Harrier Finance Funding LLC | ||||||
5.33%, 07/25/074 | 8,960 | 8,961 | ||||
Hartford Life Global Funding Trusts | ||||||
5.35% - 5.55%, 07/13/07 - 09/17/07 | 44,798 | 44,806 | ||||
HBOS Treasury Services PLC | ||||||
5.53%, 07/24/074 | 29,866 | 29,866 | ||||
Holmes Financing PLC | ||||||
5.40%, 07/16/074 | 52,265 | 52,265 | ||||
JP Morgan Chase & Co. | ||||||
5.36%, 08/02/07 | 22,399 | 22,399 | ||||
K2 USA LLC | ||||||
5.20% - 5.46%, 04/02/07 - 06/28/074 | 22,399 | 22,398 | ||||
Kestrel Funding LLC | ||||||
5.31%, 07/11/074 | 11,946 | 11,945 | ||||
| 90 | 2006 iSHARES ANNUAL REPORTTO SHAREHOLDERS |
Table of Contents
Schedule of Investments (Continued)
iSHARES® MSCI SWITZERLAND INDEX FUND
August 31, 2006
Security | Principal | Value | |||||
Kommunalkredit Austria AG | |||||||
5.33%, 09/09/074 | $ | 17,919 | $ | 17,919 | |||
Leafs LLC | |||||||
5.33%, 01/22/07 - 02/20/074 | 31,161 | 31,161 | |||||
Lexington Parker Capital Co. LLC | |||||||
5.46%, 01/10/074 | 37,332 | 37,324 | |||||
Links Finance LLC | |||||||
5.33% - 5.35%, 05/10/07 - 05/16/074 | 32,852 | 32,850 | |||||
Lothian Mortgages Master Issuer PLC | |||||||
5.30%, 04/24/074 | 13,160 | 13,160 | |||||
Marshall & Ilsley Bank | |||||||
5.31%, 09/14/07 | 16,426 | 16,426 | |||||
Metropolitan Life Global Funding I | |||||||
5.42%, 08/06/074 | 44,798 | 44,798 | |||||
Metropolitan Life Insurance | |||||||
Funding Agreement | |||||||
5.57%, 08/01/074,7 | 2,987 | 2,987 | |||||
Monumental Global Funding II | |||||||
5.49%, 12/27/064 | 5,973 | 5,974 | |||||
Mound Financing PLC | |||||||
5.39%, 05/08/074 | 28,074 | 28,074 | |||||
Natexis Banques Populaires | |||||||
5.31% - 5.40%, 02/05/07 - 09/14/074 | 89,597 | 89,595 | |||||
National City Bank of Indiana | |||||||
5.37%, 05/21/07 | 14,933 | 14,934 | |||||
Nationwide Building Society | |||||||
5.44% - 5.62%, 07/06/07 - 07/27/074 | 98,556 | 98,580 | |||||
Newcastle Ltd. | |||||||
5.35%, 04/24/074 | 10,528 | 10,526 | |||||
Northern Rock PLC | |||||||
5.43%, 08/03/074 | 35,839 | 35,840 | |||||
Principal Life Global Funding I | |||||||
5.80%, 02/08/07 | 13,440 | 13,467 | |||||
Sedna Finance Inc. | |||||||
5.30% - 5.37%, 09/20/06 - 08/21/074 | 52,265 | 52,265 | |||||
Skandinaviska Enskilda Bank NY | |||||||
5.33%, 09/18/074 | 29,866 | 29,866 | |||||
Strips III LLC | |||||||
5.38%, 07/24/074 | 7,262 | 7,262 | |||||
SunTrust Bank | |||||||
5.37%, 05/01/07 | 29,866 | 29,867 | |||||
Tango Finance Corp. | |||||||
5.22% - 5.48%, 04/25/07 - 07/16/074 | 72,872 | 72,866 | |||||
Union Hamilton Special Funding LLC | |||||||
5.42% - 5.49%, 09/28/06 - 12/21/064 | 41,812 | 41,812 | |||||
US Bank N.A. | |||||||
5.26%, 09/29/06 | 13,440 | 13,439 | |||||
Wachovia Asset Securitization Inc. | |||||||
5.31%, 09/25/064 | 44,566 | 44,566 | |||||
Wachovia Bank N.A. | |||||||
5.36%, 05/22/07 | 59,731 | 59,731 | |||||
Wells Fargo & Co. | |||||||
5.34%, 09/14/074 | 14,933 | 14,934 | |||||
WhistleJacket Capital Ltd. | |||||||
5.29% - 5.35%, 04/18/07 - 06/13/074 | 22,399 | 22,399 | |||||
White Pine Finance LLC | |||||||
5.29% - 5.35%, 05/22/07 - 08/20/074 | 89,597 | 89,578 | |||||
Wind Master Trust | |||||||
5.31% - 5.32%, 09/25/06 - 07/25/074 | 18,941 | 18,941 | |||||
| 1,974,982 | |||||||
TOTAL SHORT-TERM INVESTMENTS | 3,582,607 | ||||||
TOTAL INVESTMENTS | |||||||
IN SECURITIES – 101.51% | 191,166,819 | ||||||
Other Assets, Less Liabilities – (1.51)% | (2,847,664 | ) | |||||
NET ASSETS – 100.00% | $ | 188,319,155 | |||||
| SCHEDULESOF INVESTMENTS | 91 |
Table of Contents
Schedule of Investments (Continued)
iSHARES® MSCI SWITZERLAND INDEX FUND
August 31, 2006
| 1 | Non-income earning security. |
| 2 | All or a portion of this security represents a security on loan. See Note 5. |
| 3 | All or a portion of this security (these securities) represent(s) an investment of securities lending collateral. See Note 5. |
| 4 | This security or a portion of these securities may be resold to qualified institutional buyers under Rule 144A or pursuant to Section 4(2) of the Securities Act of 1933. |
| 5 | Affiliated issuer. See Note 2. |
| 6 | The rate quoted is the annualized seven-day yield of the fund at period end. |
| 7 | The investment adviser has determined that this security or a portion of these securities is illiquid. |
See notes to the financial statements.
| 92 | 2006 iSHARES ANNUAL REPORTTO SHAREHOLDERS |
Table of Contents
iSHARES® MSCI UNITED KINGDOM INDEX FUND
August 31, 2006
Security | Shares | Value | |||
COMMON STOCKS – 99.02% | |||||
ADVERTISING – 0.58% | |||||
Aegis Group PLC | 254,123 | $ | 617,518 | ||
WPP Group PLC | 365,441 | 4,448,791 | |||
| 5,066,309 | |||||
AEROSPACE & DEFENSE – 1.54% | |||||
BAE Systems PLC | 990,091 | 6,977,632 | |||
Cobham PLC | 352,628 | 1,152,015 | |||
Meggitt PLC | 130,345 | 779,138 | |||
Rolls-Royce Group PLC1 | 540,882 | 4,488,309 | |||
| 13,397,094 | |||||
AGRICULTURE – 2.75% | |||||
British American Tobacco PLC | 481,011 | 13,175,353 | |||
Gallaher Group PLC | 200,194 | 3,457,655 | |||
Imperial Tobacco Group PLC | 213,504 | 7,350,711 | |||
| 23,983,719 | |||||
AIRLINES – 0.16% | |||||
British Airways PLC1 | 177,154 | 1,384,119 | |||
| 1,384,119 | |||||
APPAREL – 0.14% | |||||
Burberry Group PLC | 132,223 | 1,203,466 | |||
| 1,203,466 | |||||
AUTO PARTS & EQUIPMENT – 0.15% | |||||
GKN PLC | 223,419 | 1,296,178 | |||
TI Automotive Ltd. Class A1,2 | 52,283 | 1 | |||
| 1,296,179 | |||||
BANKS – 18.50% | |||||
Barclays PLC3 | 1,993,229 | 24,928,590 | |||
HBOS PLC | 1,169,262 | 22,307,840 | |||
HSBC Holdings PLC | 3,522,578 | 63,855,496 | |||
Lloyds TSB Group PLC | 1,720,456 | 17,066,428 | |||
Royal Bank of Scotland Group PLC | 980,952 | 33,250,656 | |||
| 161,409,010 | |||||
BEVERAGES – 2.68% | |||||
Diageo PLC | 864,834 | 15,381,161 | |||
SABMiller PLC | 275,341 | 5,418,089 | |||
Scottish & Newcastle PLC | 244,372 | 2,558,901 | |||
| 23,358,151 | |||||
BUILDING MATERIALS – 0.45% | |||||
Hanson PLC | 219,656 | 2,765,960 | |||
Travis Perkins PLC | 36,019 | 1,155,138 | |||
| 3,921,098 | |||||
CHEMICALS – 1.04% | |||||
BOC Group PLC | 156,621 | 4,811,354 | |||
Imperial Chemical Industries PLC | 365,165 | 2,585,643 | |||
Johnson Matthey PLC | 68,174 | 1,713,035 | |||
| 9,110,032 | |||||
COMMERCIAL SERVICES – 1.56% | |||||
Aggreko PLC | 76,615 | 410,968 | |||
Brambles Industries PLC | 210,144 | 1,838,737 | |||
Bunzl PLC | 108,584 | 1,347,694 | |||
Capita Group PLC | 200,461 | 2,085,749 | |||
Davis Service Group PLC | 51,342 | 472,919 | |||
De La Rue PLC | 49,750 | 508,174 | |||
Group 4 Securicor PLC | 358,200 | 1,185,549 | |||
Hays PLC | 446,954 | 1,158,361 | |||
Intertek Group PLC | 46,765 | 614,672 | |||
Michael Page International PLC | 107,659 | 707,015 | |||
Rank Group PLC | 188,055 | 763,708 | |||
Rentokil Initial PLC | 561,777 | 1,605,548 | |||
Serco Group PLC | 140,693 | 942,020 | |||
| 13,641,114 | |||||
COMPUTERS – 0.12% | |||||
LogicaCMG PLC | 359,934 | 1,066,340 | |||
| 1,066,340 | |||||
DISTRIBUTION & WHOLESALE – 0.61% | |||||
Inchcape PLC | 142,990 | 1,350,423 | |||
Wolseley PLC | 183,876 | 4,004,749 | |||
| 5,355,172 | |||||
DIVERSIFIED FINANCIAL SERVICES – 1.62% | |||||
AMVESCAP PLC | 226,513 | 2,335,270 | |||
Cattles PLC | 98,704 | 616,758 | |||
Close Brothers Group PLC | 39,402 | 685,029 | |||
Collins Stewart Tullett PLC | 67,265 | 998,635 | |||
ICAP PLC | 146,066 | 1,285,702 | |||
Investec PLC | 21,094 | 1,074,519 | |||
London Stock Exchange Group PLC | 51,130 | 1,121,372 | |||
Man Group PLC | 540,882 | 4,344,271 | |||
| SCHEDULESOF INVESTMENTS | 93 |
Table of Contents
Schedule of Investments (Continued)
iSHARES® MSCI UNITED KINGDOM INDEX FUND
August 31, 2006
Security | Shares | Value | |||
Provident Financial PLC | 81,324 | $ | 1,013,222 | ||
Schroders PLC | 37,213 | 643,433 | |||
| 14,118,211 | |||||
ELECTRIC – 2.79% | |||||
International Power PLC | 460,212 | 2,779,370 | |||
National Grid PLC | 835,368 | 10,137,790 | |||
Scottish & Southern Energy PLC | 263,024 | 6,023,746 | |||
Scottish Power PLC | 454,861 | 5,368,652 | |||
| 24,309,558 | |||||
ELECTRONICS – 0.11% | |||||
Electrocomponents PLC | 130,743 | 594,376 | |||
Premier Farnell PLC | 109,052 | 389,456 | |||
| 983,832 | |||||
ENGINEERING & CONSTRUCTION – 0.18% | |||||
AMEC PLC | 99,898 | 613,768 | |||
Balfour Beatty PLC | 135,992 | 965,512 | |||
| 1,579,280 | |||||
ENTERTAINMENT – 0.59% | |||||
EMI Group PLC | 246,461 | 1,255,227 | |||
Ladbrokes PLC | 192,035 | 1,396,280 | |||
PartyGaming PLC | 300,490 | 653,027 | |||
Sportingbet PLC | 114,027 | 549,290 | |||
William Hill PLC | 109,848 | 1,327,861 | |||
| 5,181,685 | |||||
FOOD – 4.41% | |||||
Cadbury Schweppes PLC | 643,435 | 6,841,656 | |||
J Sainsbury PLC | 449,939 | 3,051,111 | |||
Tate & Lyle PLC | 150,842 | 2,101,719 | |||
Tesco PLC | 2,428,393 | 17,425,810 | |||
Unilever PLC | 379,084 | 9,056,697 | |||
| 38,476,993 | |||||
FOOD SERVICE – 0.37% | |||||
Compass Group PLC | 658,889 | 3,199,063 | |||
| 3,199,063 | |||||
GAS – 0.72% | |||||
Centrica PLC | 1,115,007 | 6,256,686 | |||
| 6,256,686 | |||||
HEALTH CARE – PRODUCTS – 0.32% | |||||
Smith & Nephew PLC | 288,229 | 2,495,930 | |||
SSL International PLC | 56,914 | 314,492 | |||
| 2,810,422 | |||||
HOLDING COMPANIES – DIVERSIFIED – 0.16% | |||||
Tomkins PLC | 262,680 | 1,421,524 | |||
| 1,421,524 | |||||
HOME BUILDERS – 0.90% | |||||
Barratt Developments PLC | 75,421 | 1,425,296 | |||
Bellway PLC | 34,029 | 786,448 | |||
Berkeley Group Holdings (The) PLC1 | 27,263 | 664,824 | |||
Bovis Homes Group PLC | 35,820 | 570,631 | |||
Persimmon PLC | 86,167 | 2,040,587 | |||
Taylor Woodrow PLC | 180,692 | 1,178,902 | |||
Wimpey (George) PLC | 124,176 | 1,183,369 | |||
| 7,850,057 | |||||
HOME FURNISHINGS – 0.03% | |||||
MFI Furniture Group PLC | 178,702 | 287,231 | |||
| 287,231 | |||||
HOUSEHOLD PRODUCTS & WARES – 0.90% | |||||
Reckitt Benckiser PLC | 188,270 | 7,806,968 | |||
| 7,806,968 | |||||
INSURANCE – 4.49% | |||||
Aviva PLC | 781,566 | 10,971,520 | |||
Friends Provident PLC | 519,589 | 1,838,305 | |||
Legal & General Group PLC | 1,996,015 | 4,992,687 | |||
Old Mutual PLC | 1,596,854 | 4,973,834 | |||
Prudential PLC | 744,044 | 8,343,095 | |||
Resolution PLC | 211,871 | 2,397,912 | |||
Royal & Sun Alliance Insurance Group PLC | 901,669 | 2,375,427 | |||
Standard Life PLC1 | 649,138 | 3,247,413 | |||
| 39,140,193 | |||||
IRON & STEEL – 0.23% | |||||
Corus Group PLC | 273,414 | 2,039,992 | |||
| 2,039,992 | |||||
LEISURE TIME – 0.33% | |||||
Carnival PLC | 52,649 | 2,256,296 | |||
First Choice Holidays PLC | 150,643 | 608,193 | |||
| 2,864,489 | |||||
LODGING – 0.23% | |||||
InterContinental Hotels Group PLC | 116,664 | 2,039,375 | |||
| 2,039,375 | |||||
| 94 | 2006 iSHARES ANNUAL REPORTTO SHAREHOLDERS |
Table of Contents
Schedule of Investments (Continued)
iSHARES® MSCI UNITED KINGDOM INDEX FUND
August 31, 2006
Security | Shares | Value | |||
MANUFACTURING – 0.82% | |||||
BBA Group PLC | 146,265 | $ | 741,451 | ||
Charter PLC1 | 49,551 | 722,924 | |||
Cookson Group PLC | 57,113 | 593,704 | |||
FKI PLC | 175,120 | 322,279 | |||
IMI PLC | 107,951 | 1,038,502 | |||
Invensys PLC1 | 238,535 | 921,071 | |||
Smiths Group PLC | 174,247 | 2,850,418 | |||
| 7,190,349 | |||||
MEDIA – 2.68% | |||||
British Sky Broadcasting Group PLC | 359,792 | 3,835,941 | |||
Daily Mail & General Trust PLC Class A | 91,739 | 1,005,128 | |||
EMAP PLC | 77,411 | 1,054,291 | |||
ITV PLC | 1,265,640 | 2,545,865 | |||
Pearson PLC | 248,551 | 3,531,676 | |||
Reed Elsevier PLC | 383,793 | 4,113,730 | |||
Reuters Group PLC | 402,378 | 3,092,149 | |||
Trinity Mirror PLC | 86,366 | 749,122 | |||
United Business Media PLC | 87,560 | 1,027,627 | |||
Yell Group PLC | 237,805 | 2,397,406 | |||
| 23,352,935 | |||||
MINING – 6.41% | |||||
Anglo American PLC | 438,878 | 18,966,924 | |||
BHP Billiton PLC | 750,024 | 14,280,848 | |||
Rio Tinto PLC | 322,710 | 16,309,804 | |||
Xstrata PLC | 140,889 | 6,319,252 | |||
| 55,876,828 | |||||
OIL & GAS – 17.74% | |||||
BG Group PLC | 1,070,785 | 13,982,589 | |||
BP PLC | 6,125,757 | 69,563,089 | |||
Royal Dutch Shell PLC Class A | 1,182,607 | 40,940,825 | |||
Royal Dutch Shell PLC Class B | 847,472 | 30,305,955 | |||
| 154,792,458 | |||||
PACKAGING & CONTAINERS – 0.20% | |||||
Rexam PLC | 171,529 | 1,771,667 | |||
| 1,771,667 | |||||
PHARMACEUTICALS – 9.36% | |||||
AstraZeneca PLC | 481,238 | 31,159,769 | |||
GlaxoSmithKline PLC | 1,785,258 | 50,529,928 | |||
| 81,689,697 | |||||
REAL ESTATE – 1.87% | |||||
British Land Co. PLC | 160,195 | 4,159,359 | |||
Brixton PLC | 76,814 | 769,278 | |||
Great Portland Estates PLC | 48,755 | 523,977 | |||
Hammerson PLC | 87,661 | 2,120,988 | |||
Land Securities Group PLC | 144,239 | 5,196,458 | |||
Liberty International PLC | 78,406 | 1,695,721 | |||
Slough Estates PLC | 143,877 | 1,798,049 | |||
| 16,263,830 | |||||
RETAIL – 3.64% | |||||
Boots Group PLC | 253,869 | 3,723,135 | |||
Carphone Warehouse Group PLC | 119,400 | 638,766 | |||
DSG International PLC | 562,573 | 2,193,701 | |||
Enterprise Inns PLC | 96,913 | 1,887,673 | |||
GUS PLC | 267,674 | 4,966,818 | |||
HMV Group PLC | 120,594 | 348,670 | |||
Kesa Electricals PLC | 159,001 | 936,064 | |||
Kingfisher PLC | 723,698 | 3,248,734 | |||
Marks & Spencer Group PLC | 516,643 | 5,822,690 | |||
Mitchells & Butlers PLC | 152,552 | 1,624,990 | |||
Next PLC | 71,043 | 2,252,691 | |||
Punch Taverns PLC | 81,789 | 1,438,290 | |||
Signet Group PLC | 544,457 | 1,108,134 | |||
Whitbread PLC | 67,660 | 1,575,281 | |||
| 31,765,637 | |||||
SEMICONDUCTORS – 0.22% | |||||
ARM Holdings PLC | 439,095 | 991,829 | |||
CSR PLC1 | 40,910 | 912,015 | |||
| 1,903,844 | |||||
SOFTWARE – 0.29% | |||||
Misys PLC | 152,633 | 717,843 | |||
Sage Group PLC | 397,801 | 1,810,350 | |||
| 2,528,193 | |||||
TELECOMMUNICATIONS – 5.58% | |||||
BT Group PLC | 2,558,665 | 11,997,068 | |||
Cable & Wireless PLC | 724,562 | 1,691,772 | |||
Vodafone Group PLC | 16,174,018 | 34,995,652 | |||
| 48,684,492 | |||||
| SCHEDULESOF INVESTMENTS | 95 |
Table of Contents
Schedule of Investments (Continued)
iSHARES® MSCI UNITED KINGDOM INDEX FUND
August 31, 2006
Security | Shares | Value | |||
TRANSPORTATION – 0.34% | |||||
Arriva PLC | 59,103 | $ | 668,916 | ||
FirstGroup PLC | 123,498 | 1,097,038 | |||
National Express Group PLC | 40,795 | 639,797 | |||
Stagecoach Group PLC | 243,576 | 537,449 | |||
| 2,943,200 | |||||
VENTURE CAPITAL – 0.30% | |||||
3i Group PLC | 142,456 | 2,578,305 | |||
| 2,578,305 | |||||
WATER – 0.91% | |||||
Kelda Group PLC | 109,450 | 1,717,570 | |||
Severn Trent PLC | 106,508 | 2,664,114 | |||
United Utilities PLC | 270,640 | 3,534,087 | |||
| 7,915,771 | |||||
TOTAL COMMON STOCKS | 863,814,568 | ||||
SHORT-TERM INVESTMENTS – 0.01% | |||||
MONEY MARKET FUNDS – 0.01% | |||||
Barclays Global Investors Funds Institutional Money Market Fund, Institutional Shares 5.30%3,4 | 116,892 | 116,892 | |||
| 116,892 | |||||
TOTAL SHORT-TERM INVESTMENTS | 116,892 | ||||
TOTAL INVESTMENTS | 863,931,460 | ||||
Other Assets, Less Liabilities – 0.97% | 8,477,480 | ||||
NET ASSETS – 100.00% | $ | 872,408,940 | |||
| 1 | Non-income earning security. |
| 2 | Security valued at fair value in accordance with procedures approved by the Board of Directors. See Note 1. |
| 3 | Affiliated issuer. See Note 2. |
| 4 | The rate quoted is the annualized seven-day yield of the fund at period end. |
See notes to the financial statements.
| 96 | 2006 iSHARES ANNUAL REPORTTO SHAREHOLDERS |
Table of Contents
Statements of Assets and Liabilities
iSHARES®, INC.
August 31, 2006
| iShares MSCI | ||||||||||||||||||||||||
Austria Index Fund | Belgium Index Fund | EMU Index Fund | France Index Fund | Germany Index Fund | Italy Index Fund | |||||||||||||||||||
ASSETS | ||||||||||||||||||||||||
Investments, at cost: | ||||||||||||||||||||||||
Unaffiliated issuers | $ | 367,217,656 | $ | 138,375,953 | $ | 1,647,598,762 | $ | 206,467,890 | $ | 747,185,277 | $ | 127,969,852 | ||||||||||||
Affiliated issuersa | $ | 97,265 | $ | 61,136 | $ | 946,384 | $ | 160,863 | $ | 19,872 | $ | 1,089 | ||||||||||||
Foreign currencies, at cost | $ | 714,082 | $ | 132,348 | $ | 3,269,663 | $ | 82,407 | $ | 469,753 | $ | 16,403 | ||||||||||||
Investments in securities, at value (including securities on loanb) (Note 1): | ||||||||||||||||||||||||
Unaffiliated issuers | $ | 401,550,705 | $ | 151,596,576 | $ | 1,826,614,298 | $ | 213,975,568 | $ | 811,603,147 | $ | 149,363,871 | ||||||||||||
Affiliated issuersa | 97,265 | 61,136 | 946,384 | 160,863 | 19,872 | 1,089 | ||||||||||||||||||
Foreign currencies, at value | 716,364 | 131,759 | 3,269,663 | 82,414 | 472,431 | 16,698 | ||||||||||||||||||
Receivables: | ||||||||||||||||||||||||
Investment securities sold | 16,492,746 | 1,628,258 | — | 503,566 | 6,740,593 | 1,662,957 | ||||||||||||||||||
Dividends and interest | 740,088 | 782,030 | 3,169,472 | 309,442 | 1,388,037 | 67,713 | ||||||||||||||||||
Capital shares sold | 33,991 | 35,009 | — | — | — | — | ||||||||||||||||||
Total Assets | 419,631,159 | 154,234,768 | 1,833,999,817 | 215,031,853 | 820,224,080 | 151,112,328 | ||||||||||||||||||
LIABILITIES | ||||||||||||||||||||||||
Payables: | ||||||||||||||||||||||||
Investment securities purchased | 17,059,915 | 1,625,711 | — | 501,626 | 5,991,199 | 1,502,649 | ||||||||||||||||||
Collateral for securities on loan (Note 5) | 10,759,106 | 62,384 | 38,290,121 | 2,557,106 | 11,085,335 | 3,221,588 | ||||||||||||||||||
Investment advisory fees (Note 2) | 174,749 | 62,463 | 788,709 | 87,360 | 352,952 | 64,377 | ||||||||||||||||||
Total Liabilities | 27,993,770 | 1,750,558 | 39,078,830 | 3,146,092 | 17,429,486 | 4,788,614 | ||||||||||||||||||
NET ASSETS | $ | 391,637,389 | $ | 152,484,210 | $ | 1,794,920,987 | $ | 211,885,761 | $ | 802,794,594 | $ | 146,323,714 | ||||||||||||
Net assets consist of: | ||||||||||||||||||||||||
Paid-in capital | $ | 359,428,584 | $ | 138,689,270 | $ | 1,596,450,918 | $ | 208,253,187 | $ | 758,089,375 | $ | 126,915,465 | ||||||||||||
Undistributed net investment income | 5,185,808 | 3,029,133 | 35,261,892 | 2,255,565 | 16,624,623 | 3,319,519 | ||||||||||||||||||
Accumulated net realized loss | (7,315,983 | ) | (2,461,379 | ) | (15,825,317 | ) | (6,131,530 | ) | (36,358,888 | ) | (5,324,156 | ) | ||||||||||||
Net unrealized appreciation on investments and translation of assets and liabilities in foreign currencies | 34,338,980 | 13,227,186 | 179,033,494 | 7,508,539 | 64,439,484 | 21,412,886 | ||||||||||||||||||
NET ASSETS | $ | 391,637,389 | $ | 152,484,210 | $ | 1,794,920,987 | $ | 211,885,761 | $ | 802,794,594 | $ | 146,323,714 | ||||||||||||
Shares outstanding | 12,600,000 | 6,680,000 | 19,450,000 | 6,800,000 | 33,900,000 | 4,800,000 | ||||||||||||||||||
Net asset value per share | $ | 31.08 | $ | 22.83 | $ | 92.28 | $ | 31.16 | $ | 23.68 | $ | 30.48 | ||||||||||||
| a | See Note 2. |
| b | Securities on loan with market values of $10,412,559, $60,062, $35,631,227, $2,431,150, $10,603,063 and $3,059,139, respectively. See Note 5. |
See notes to the financial statements.
| FINANCIAL STATEMENTS | 97 |
Table of Contents
Statements of Assets and Liabilities (Continued)
iSHARES®, INC.
August 31, 2006
| iShares MSCI | ||||||||||||||||||||
| Netherlands Index Fund | Spain Index Fund | Sweden Index Fund | Switzerland Index Fund | United Kingdom Index Fund | ||||||||||||||||
ASSETS | ||||||||||||||||||||
Investments, at cost: | ||||||||||||||||||||
Unaffiliated issuers | $ | 98,646,157 | $ | 155,993,947 | $ | 152,749,859 | $ | 154,627,297 | $ | 716,553,377 | ||||||||||
Affiliated issuersa | $ | 6,254 | $ | 160,146 | $ | 24,228 | $ | 22,983 | $ | 20,483,992 | ||||||||||
Foreign currencies, at cost | $ | 149,651 | $ | 112,342 | $ | 183,124 | $ | 67,499 | $ | 2,943,414 | ||||||||||
Investments in securities, at value (including securities on loanb) (Note 1): | ||||||||||||||||||||
Unaffiliated issuers | $ | 111,606,835 | $ | 185,184,129 | $ | 155,442,007 | $ | 191,143,836 | $ | 838,885,978 | ||||||||||
Affiliated issuersa | 6,254 | 160,146 | 24,228 | 22,983 | 25,045,482 | |||||||||||||||
Foreign currencies, at value | 149,107 | 113,880 | 181,861 | 67,707 | 2,965,031 | |||||||||||||||
Receivables: | ||||||||||||||||||||
Investment securities sold | — | 943,966 | 920,183 | 3,906,712 | 4,608,920 | |||||||||||||||
Dividends and interest | 352,633 | 6,965 | 1,387 | 528,972 | 5,957,699 | |||||||||||||||
Capital shares sold | — | 921,068 | — | — | — | |||||||||||||||
Total Assets | 112,114,829 | 187,330,154 | 156,569,666 | 195,670,210 | 877,463,110 | |||||||||||||||
LIABILITIES | ||||||||||||||||||||
Payables: | ||||||||||||||||||||
Investment securities purchased | — | 1,852,814 | 833,967 | 3,708,973 | 4,663,142 | |||||||||||||||
Collateral for securities on loan (Note 5) | 2,075,486 | 7,278,571 | 4,242,751 | 3,559,624 | — | |||||||||||||||
Investment advisory fees (Note 2) | 48,058 | 68,712 | 66,387 | 82,458 | 391,028 | |||||||||||||||
Total Liabilities | 2,123,544 | 9,200,097 | 5,143,105 | 7,351,055 | 5,054,170 | |||||||||||||||
NET ASSETS | $ | 109,991,285 | $ | 178,130,057 | $ | 151,426,561 | $ | 188,319,155 | $ | 872,408,940 | ||||||||||
Net assets consist of: | ||||||||||||||||||||
Paid-in capital | $ | 103,683,759 | $ | 150,183,746 | $ | 152,218,155 | $ | 157,037,300 | $ | 759,238,462 | ||||||||||
Undistributed net investment income | 2,661,198 | 2,334,982 | 3,601,501 | 1,891,106 | 28,709,755 | |||||||||||||||
Accumulated net realized loss | (9,315,389 | ) | (3,580,470 | ) | (7,084,055 | ) | (7,135,226 | ) | (42,464,193 | ) | ||||||||||
Net unrealized appreciation on investments and translation of assets and liabilities in foreign currencies | 12,961,717 | 29,191,799 | 2,690,960 | 36,525,975 | 126,924,916 | |||||||||||||||
NET ASSETS | $ | 109,991,285 | $ | 178,130,057 | $ | 151,426,561 | $ | 188,319,155 | $ | 872,408,940 | ||||||||||
Shares outstanding | 4,550,000 | 3,975,000 | 5,850,000 | 8,375,000 | 39,800,000 | |||||||||||||||
Net asset value per share | $ | 24.17 | $ | 44.81 | $ | 25.88 | $ | 22.49 | $ | 21.92 | ||||||||||
| a | See Note 2. |
| b | Securities on loan with market values of $2,014,187, $6,915,318, $4,003,482, $3,379,793 and $–, respectively. See Note 5. |
See notes to the financial statements.
| 98 | 2006 iSHARES ANNUAL REPORTTO SHAREHOLDERS |
Table of Contents
Statements of Operations
iSHARES®, INC.
Year ended August 31, 2006
| iShares MSCI | ||||||||||||||||||||||
Austria Index Fund | Belgium Index Fund | EMU Index Fund | France Index Fund | Germany Index Fund | Italy Index Fund | |||||||||||||||||
NET INVESTMENT INCOME | ||||||||||||||||||||||
Dividends from unaffiliated issuersa | $ | 6,212,692 | $ | 3,699,496 | $ | 42,378,450 | $ | 2,829,359 | $ | 19,896,564 | $ | 3,716,259 | ||||||||||
Interest from affiliated issuersb | 5,972 | 2,125 | 34,819 | 2,712 | 9,458 | 1,006 | ||||||||||||||||
Securities lending incomec | 21,742 | 11,942 | 161,203 | 22,425 | 74,921 | 23,331 | ||||||||||||||||
Total investment income | 6,240,406 | 3,713,563 | 42,574,472 | 2,854,496 | 19,980,943 | 3,740,596 | ||||||||||||||||
EXPENSES | ||||||||||||||||||||||
Investment advisory fees | 1,657,316 | 479,965 | 6,044,452 | 615,785 | 3,393,583 | 454,018 | ||||||||||||||||
Proxy fees | 9,121 | 4,737 | 23,188 | 3,804 | 7,967 | 3,368 | ||||||||||||||||
Total expenses | 1,666,437 | 484,702 | 6,067,640 | 619,589 | 3,401,550 | 457,386 | ||||||||||||||||
Net investment income | 4,573,969 | 3,228,861 | 36,506,832 | 2,234,907 | 16,579,393 | 3,283,210 | ||||||||||||||||
NET REALIZED AND UNREALIZED GAIN (LOSS) | ||||||||||||||||||||||
Net realized gain (loss) from: | ||||||||||||||||||||||
Investments in unaffiliated issuers | (1,767,172 | ) | 215,637 | 2,199,810 | 634,187 | (12,662,686 | ) | 603,096 | ||||||||||||||
In-kind redemptions | 36,185,954 | 2,357,672 | 81,329,252 | 24,291,016 | 55,824,978 | 1,576,609 | ||||||||||||||||
Foreign currency transactions | 95,729 | (16,948 | ) | 310,136 | 21,314 | 100,546 | 37,349 | |||||||||||||||
Net realized gain | 34,514,511 | 2,556,361 | 83,839,198 | 24,946,517 | 43,262,838 | 2,217,054 | ||||||||||||||||
Net change in unrealized appreciation (depreciation) on: | ||||||||||||||||||||||
Investments | (8,478,971 | ) | 12,278,509 | 101,401,242 | (236,735 | ) | 55,929,496 | 13,027,183 | ||||||||||||||
Translation of assets and liabilities in foreign currencies | (55,913 | ) | 8,644 | 8,495 | (201 | ) | 22,169 | 2,548 | ||||||||||||||
Net change in unrealized appreciation (depreciation) | (8,534,884 | ) | 12,287,153 | 101,409,737 | (236,936 | ) | 55,951,665 | 13,029,731 | ||||||||||||||
Net realized and unrealized gain | 25,979,627 | 14,843,514 | 185,248,935 | 24,709,581 | 99,214,503 | 15,246,785 | ||||||||||||||||
NET INCREASE IN NET ASSETS RESULTING FROM OPERATIONS | $ | 30,553,596 | $ | 18,072,375 | $ | 221,755,767 | $ | 26,944,488 | $ | 115,793,896 | $ | 18,529,995 | ||||||||||
| a | Net of foreign withholding tax of $1,096,345, $637,505, $6,673,782, $427,381, $3,325,509 and $591,525, respectively. |
| b | See Note 2. |
| c | Includes income earned from affiliated issuer. See Note 2. |
See notes to the financial statements.
| FINANCIAL STATEMENTS | 99 |
Table of Contents
Statements of Operations (Continued)
iSHARES®, INC.
Year ended August 31, 2006
| iShares MSCI | |||||||||||||||||||
| Netherlands Index Fund | Spain Index Fund | Sweden Index Fund | Switzerland Index Fund | United Kingdom Index Fund | |||||||||||||||
NET INVESTMENT INCOME | |||||||||||||||||||
Dividends from unaffiliated issuersa | $ | 2,932,533 | $ | 3,354,121 | $ | 4,104,707 | $ | 2,593,804 | $ | 33,910,912 | |||||||||
Dividends from affiliated issuersb | — | — | — | — | 864,528 | ||||||||||||||
Interest from affiliated issuersb | 1,308 | 1,178 | 1,417 | 3,020 | 14,531 | ||||||||||||||
Securities lending incomec | 6,081 | 29,975 | 22,082 | 6,709 | 2,520 | ||||||||||||||
Total investment income | 2,939,922 | 3,385,274 | 4,128,206 | 2,603,533 | 34,792,491 | ||||||||||||||
EXPENSES | |||||||||||||||||||
Investment advisory fees (Note 2) | 475,006 | 564,200 | 601,452 | 743,036 | 3,483,995 | ||||||||||||||
Proxy fees | 3,950 | 4,339 | 4,272 | 4,249 | 21,875 | ||||||||||||||
Total expenses | 478,956 | 568,539 | 605,724 | 747,285 | 3,505,870 | ||||||||||||||
Net investment income | 2,460,966 | 2,816,735 | 3,522,482 | 1,856,248 | 31,286,621 | ||||||||||||||
NET REALIZED AND UNREALIZED GAIN (LOSS) | |||||||||||||||||||
Net realized gain (loss) from: | |||||||||||||||||||
Investments in unaffiliated issuers | (827,424 | ) | 522,494 | (10,654 | ) | (143,788 | ) | (6,158,845 | ) | ||||||||||
Investments in affiliated issuersb | — | — | — | — | 336,803 | ||||||||||||||
In-kind redemptions | 8,776,610 | 6,611,529 | 18,200,594 | 6,343,889 | 11,468,021 | ||||||||||||||
Foreign currency transactions | 52,929 | 20,139 | 78,203 | 36,394 | 451,592 | ||||||||||||||
Net realized gain | 8,002,115 | 7,154,162 | 18,268,143 | 6,236,495 | 6,097,571 | ||||||||||||||
Net change in unrealized appreciation (depreciation) on: | |||||||||||||||||||
Investments | 11,681,890 | 15,104,399 | (9,542,737 | ) | 25,586,381 | 85,769,779 | |||||||||||||
Translation of assets and liabilities in foreign currencies | (341 | ) | 1,558 | (398 | ) | 8,124 | 23,468 | ||||||||||||
Net change in unrealized appreciation (depreciation) | 11,681,549 | 15,105,957 | (9,543,135 | ) | 25,594,505 | 85,793,247 | |||||||||||||
Net realized and unrealized gain | 19,683,664 | 22,260,119 | 8,725,008 | 31,831,000 | 91,890,818 | ||||||||||||||
NET INCREASE IN NET ASSETS RESULTING FROM OPERATIONS | $ | 22,144,630 | $ | 25,076,854 | $ | 12,247,490 | $ | 33,687,248 | $ | 123,177,439 | |||||||||
| a | Net of foreign withholding tax of $513,491, $534,296, $688,006, $488,944 and $186,239, respectively. |
| b | See Note 2. |
| c | Includes income earned from affiliated issuers. See Note 2. |
See notes to the financial statements.
| 100 | 2006 iSHARES ANNUAL REPORTTO SHAREHOLDERS |
Table of Contents
Statements of Changes in Net Assets
iSHARES®, INC.
| iShares MSCI Austria Index Fund | iShares MSCI Belgium Index Fund | iShares MSCI EMU Index Fund | ||||||||||||||||||||||
| Year ended August 31, 2006 | Year ended August 31, 2005 | Year ended August 31, 2006 | Year ended August 31, 2005 | Year ended August 31, 2006 | Year ended August 31, 2005 | |||||||||||||||||||
INCREASE (DECREASE) IN NET ASSETS | ||||||||||||||||||||||||
OPERATIONS: | ||||||||||||||||||||||||
Net investment income | $ | 4,573,969 | $ | 1,963,799 | $ | 3,228,861 | $ | 2,019,162 | $ | 36,506,832 | $ | 11,759,160 | ||||||||||||
Net realized gain | 34,514,511 | 22,454,551 | 2,556,361 | 6,943,446 | 83,839,198 | 11,776,485 | ||||||||||||||||||
Net change in unrealized appreciation (depreciation) | (8,534,884 | ) | 30,930,253 | 12,287,153 | (4,222 | ) | 101,409,737 | 76,359,243 | ||||||||||||||||
Net increase in net assets resulting from operations | 30,553,596 | 55,348,603 | 18,072,375 | 8,958,386 | 221,755,767 | 99,894,888 | ||||||||||||||||||
DISTRIBUTIONS TO SHAREHOLDERS: | ||||||||||||||||||||||||
From net investment income | (2,357,719 | ) | (642,119 | ) | (2,145,588 | ) | (821,720 | ) | (12,287,252 | ) | (7,926,598 | ) | ||||||||||||
Total distributions to shareholders | (2,357,719 | ) | (642,119 | ) | (2,145,588 | ) | (821,720 | ) | (12,287,252 | ) | (7,926,598 | ) | ||||||||||||
CAPITAL SHARE TRANSACTIONS: | ||||||||||||||||||||||||
Proceeds from shares sold | 289,063,151 | 143,898,493 | 103,356,773 | 45,733,499 | 1,281,531,733 | 174,100,562 | ||||||||||||||||||
Cost of shares redeemed | (122,573,813 | ) | (59,573,023 | ) | (13,758,909 | ) | (31,723,211 | ) | (243,363,438 | ) | (45,390,429 | ) | ||||||||||||
Net increase in net assets from capital share transactions | 166,489,338 | 84,325,470 | 89,597,864 | 14,010,288 | 1,038,168,295 | 128,710,133 | ||||||||||||||||||
INCREASE IN NET ASSETS | 194,685,215 | 139,031,954 | 105,524,651 | 22,146,954 | 1,247,636,810 | 220,678,423 | ||||||||||||||||||
NET ASSETS | ||||||||||||||||||||||||
Beginning of year | 196,952,174 | 57,920,220 | 46,959,559 | 24,812,605 | 547,284,177 | 326,605,754 | ||||||||||||||||||
End of year | $ | 391,637,389 | $ | 196,952,174 | $ | 152,484,210 | $ | 46,959,559 | $ | 1,794,920,987 | $ | 547,284,177 | ||||||||||||
Undistributed net investment income included in net assets at end of year | $ | 5,185,808 | $ | 1,903,837 | $ | 3,029,133 | $ | 1,784,303 | $ | 35,261,892 | $ | 10,321,106 | ||||||||||||
SHARES ISSUED AND REDEEMED | ||||||||||||||||||||||||
Shares sold | 9,400,000 | 6,600,000 | 4,880,000 | 2,560,000 | 15,050,000 | 2,450,000 | ||||||||||||||||||
Shares redeemed | (4,200,000 | ) | (2,600,000 | ) | (680,000 | ) | (1,760,000 | ) | (2,900,000 | ) | (650,000 | ) | ||||||||||||
Net increase in shares outstanding | 5,200,000 | 4,000,000 | 4,200,000 | 800,000 | 12,150,000 | 1,800,000 | ||||||||||||||||||
See notes to the financial statements.
| FINANCIAL STATEMENTS | 101 |
Table of Contents
Statements of Changes in Net Assets (Continued)
iSHARES®, INC.
| iShares MSCI France Index Fund | iShares MSCI Germany Index Fund | iShares MSCI Italy Index Fund | ||||||||||||||||||||||
| Year ended August 31, 2006 | Year ended August 31, 2005 | Year ended August 31, 2006 | Year ended August 31, 2005 | Year ended August 31, 2006 | Year ended August 31, 2005 | |||||||||||||||||||
INCREASE (DECREASE) IN NET ASSETS | ||||||||||||||||||||||||
OPERATIONS: | ||||||||||||||||||||||||
Net investment income | $ | 2,234,907 | $ | 1,242,600 | $ | 16,579,393 | $ | 2,593,698 | $ | 3,283,210 | $ | 1,168,264 | ||||||||||||
Net realized gain (loss) | 24,946,517 | 5,071,907 | 43,262,838 | (4,797,168 | ) | 2,217,054 | (764,798 | ) | ||||||||||||||||
Net change in unrealized appreciation (depreciation) | (236,936 | ) | 9,136,196 | 55,951,665 | 40,534,750 | 13,029,731 | 7,988,683 | |||||||||||||||||
Net increase in net assets resulting from operations | 26,944,488 | 15,450,703 | 115,793,896 | 38,331,280 | 18,529,995 | 8,392,149 | ||||||||||||||||||
DISTRIBUTIONS TO SHAREHOLDERS: | ||||||||||||||||||||||||
From net investment income | (1,093,386 | ) | (838,342 | ) | (2,745,191 | ) | (1,573,473 | ) | (1,062,571 | ) | (869,122 | ) | ||||||||||||
Total distributions to shareholders | (1,093,386 | ) | (838,342 | ) | (2,745,191 | ) | (1,573,473 | ) | (1,062,571 | ) | (869,122 | ) | ||||||||||||
CAPITAL SHARE TRANSACTIONS: | ||||||||||||||||||||||||
Proceeds from shares sold | 193,944,708 | 23,987,143 | 611,158,486 | 179,271,889 | 90,441,632 | 7,723,603 | ||||||||||||||||||
Cost of shares redeemed | (89,235,841 | ) | (18,474,473 | ) | (236,206,028 | ) | — | (4,111,384 | ) | — | ||||||||||||||
Net increase in net assets from capital share transactions | 104,708,867 | 5,512,670 | 374,952,458 | 179,271,889 | 86,330,248 | 7,723,603 | ||||||||||||||||||
INCREASE IN NET ASSETS | 130,559,969 | 20,125,031 | 488,001,163 | 216,029,696 | 103,797,672 | 15,246,630 | ||||||||||||||||||
NET ASSETS | ||||||||||||||||||||||||
Beginning of year | 81,325,792 | 61,200,761 | 314,793,431 | 98,763,735 | 42,526,042 | 27,279,412 | ||||||||||||||||||
End of year | $ | 211,885,761 | $ | 81,325,792 | $ | 802,794,594 | $ | 314,793,431 | $ | 146,323,714 | $ | 42,526,042 | ||||||||||||
Undistributed net investment income included in net assets at end of year | $ | 2,255,565 | $ | 1,092,730 | $ | 16,624,623 | $ | 2,547,987 | $ | 3,319,519 | $ | 1,061,531 | ||||||||||||
SHARES ISSUED AND REDEEMED | ||||||||||||||||||||||||
Shares sold | 6,800,000 | 1,000,000 | 28,500,000 | 9,900,000 | 3,300,000 | 300,000 | ||||||||||||||||||
Shares redeemed | (3,200,000 | ) | (800,000 | ) | (11,100,000 | ) | — | (150,000 | ) | — | ||||||||||||||
Net increase in shares outstanding | 3,600,000 | 200,000 | 17,400,000 | 9,900,000 | 3,150,000 | 300,000 | ||||||||||||||||||
See notes to the financial statements.
| 102 | 2006 iSHARES ANNUAL REPORTTO SHAREHOLDERS |
Table of Contents
Statements of Changes in Net Assets (Continued)
iSHARES®, INC.
| iShares MSCI Netherland Index Fund | iShares MSCI Spain Index Fund | iShares MSCI Sweden Index Fund | ||||||||||||||||||||||
| Year ended August 31, 2006 | Year ended August 31, 2005 | Year ended August 31, 2006 | Year ended August 31, 2005 | Year ended August 31, 2006 | Year ended August 31, 2005 | |||||||||||||||||||
INCREASE (DECREASE) IN NET ASSETS | ||||||||||||||||||||||||
OPERATIONS: | ||||||||||||||||||||||||
Net investment income | $ | 2,460,966 | $ | 1,468,147 | $ | 2,816,735 | $ | 1,393,949 | $ | 3,522,482 | $ | 1,249,124 | ||||||||||||
Net realized gain | 8,002,115 | 1,088,579 | 7,154,162 | 7,090,342 | 18,268,143 | 1,298,242 | ||||||||||||||||||
Net change in unrealized appreciation (depreciation) | 11,681,549 | 4,968,136 | 15,105,957 | 5,676,241 | (9,543,135 | ) | 7,896,047 | |||||||||||||||||
Net increase in net assets resulting from operations | 22,144,630 | 7,524,862 | 25,076,854 | 14,160,532 | 12,247,490 | 10,443,413 | ||||||||||||||||||
DISTRIBUTIONS TO SHAREHOLDERS: | ||||||||||||||||||||||||
From net investment income | (1,617,341 | ) | (561,271 | ) | (1,611,053 | ) | (1,053,358 | ) | (1,227,638 | ) | (420,504 | ) | ||||||||||||
Total distributions to shareholders | (1,617,341 | ) | (561,271 | ) | (1,611,053 | ) | (1,053,358 | ) | (1,227,638 | ) | (420,504 | ) | ||||||||||||
CAPITAL SHARE TRANSACTIONS: | ||||||||||||||||||||||||
Proceeds from shares sold | 63,102,133 | 29,691,702 | 102,462,370 | 23,479,415 | 133,924,232 | 26,763,849 | ||||||||||||||||||
Cost of shares redeemed | (37,612,147 | ) | (946,288 | ) | (14,743,172 | ) | (15,097,858 | ) | (55,030,029 | ) | (3,032,449 | ) | ||||||||||||
Net increase in net assets from capital share transactions | 25,489,986 | 28,745,414 | 87,719,198 | 8,381,557 | 78,894,203 | 23,731,400 | ||||||||||||||||||
INCREASE IN NET ASSETS | 46,017,275 | 35,709,005 | 111,184,999 | 21,488,731 | 89,914,055 | 33,754,309 | ||||||||||||||||||
NET ASSETS | ||||||||||||||||||||||||
Beginning of year | 63,974,010 | 28,265,005 | 66,945,058 | 45,456,327 | 61,512,506 | 27,758,197 | ||||||||||||||||||
End of year | $ | 109,991,285 | $ | 63,974,010 | $ | 178,130,057 | $ | 66,945,058 | $ | 151,426,561 | $ | 61,512,506 | ||||||||||||
Undistributed net investment income included in net assets at end of year | $ | 2,661,198 | $ | 1,453,405 | $ | 2,334,982 | $ | 1,109,161 | $ | 3,601,501 | $ | 1,228,454 | ||||||||||||
SHARES ISSUED AND REDEEMED | ||||||||||||||||||||||||
Shares sold | 2,850,000 | 1,600,000 | 2,475,000 | 675,000 | 5,250,000 | 1,350,000 | ||||||||||||||||||
Shares redeemed | (1,650,000 | ) | (50,000 | ) | (375,000 | ) | (450,000 | ) | (2,250,000 | ) | (150,000 | ) | ||||||||||||
Net increase in shares outstanding | 1,200,000 | 1,550,000 | 2,100,000 | 225,000 | 3,000,000 | 1,200,000 | ||||||||||||||||||
See notes to the financial statements.
| FINANCIAL STATEMENTS | 103 |
Table of Contents
Statements of Changes in Net Assets (Continued)
iSHARES®, INC.
iShares MSCI Switzerland Index Fund | iShares MSCI United Kingdom Index Fund | |||||||||||||||
Year ended August 31, 2006 | Year ended August 31, 2005 | Year ended August 31, 2006 | Year ended August 31, 2005 | |||||||||||||
INCREASE (DECREASE) IN NET ASSETS | ||||||||||||||||
OPERATIONS: | ||||||||||||||||
Net investment income | $ | 1,856,248 | $ | 773,878 | $ | 31,286,621 | $ | 17,268,103 | ||||||||
Net realized gain | 6,236,495 | 1,299,897 | 6,097,571 | 37,482,537 | ||||||||||||
Net change in unrealized appreciation | 25,594,505 | 7,731,463 | 85,793,247 | 44,274,754 | ||||||||||||
Net increase in net assets resulting from operations | 33,687,248 | 9,805,238 | 123,177,439 | 99,025,394 | ||||||||||||
DISTRIBUTIONS TO SHAREHOLDERS: | ||||||||||||||||
From net investment income | (773,209 | ) | (269,799 | ) | (16,085,262 | ) | (10,962,863 | ) | ||||||||
Total distributions to shareholders | (773,209 | ) | (269,799 | ) | (16,085,262 | ) | (10,962,863 | ) | ||||||||
CAPITAL SHARE TRANSACTIONS: | ||||||||||||||||
Proceeds from shares sold | 94,447,210 | 31,861,760 | 344,797,700 | 96,935,420 | ||||||||||||
Cost of shares redeemed | (18,366,262 | ) | (3,993,200 | ) | (44,331,266 | ) | (173,017,720 | ) | ||||||||
Net increase (decrease) in net assets from capital share transactions | 76,080,948 | 27,868,560 | 300,466,434 | (76,082,300 | ) | |||||||||||
INCREASE IN NET ASSETS | 108,994,987 | 37,403,999 | 407,558,611 | 11,980,231 | ||||||||||||
NET ASSETS | ||||||||||||||||
Beginning of year | 79,324,168 | 41,920,169 | 464,850,329 | 452,870,098 | ||||||||||||
End of year | $ | 188,319,155 | $ | 79,324,168 | $ | 872,408,940 | $ | 464,850,329 | ||||||||
Undistributed net investment income included in net assets at end of year | $ | 1,891,106 | $ | 771,673 | $ | 28,709,755 | $ | 13,056,804 | ||||||||
SHARES ISSUED AND REDEEMED | ||||||||||||||||
Shares sold | 4,750,000 | 1,875,000 | 17,200,000 | 5,600,000 | ||||||||||||
Shares redeemed | (875,000 | ) | (250,000 | ) | (2,200,000 | ) | (9,600,000 | ) | ||||||||
Net increase (decrease) in shares outstanding | 3,875,000 | 1,625,000 | 15,000,000 | (4,000,000 | ) | |||||||||||
See notes to the financial statements.
| 104 | 2006 iSHARES ANNUAL REPORTTO SHAREHOLDERS |
Table of Contents
iSHARES®, INC.
(For a share outstanding throughout each period)
| iShares MSCI Austria Index Fund | ||||||||||||||||||||
Year ended Aug. 31, 2006 | Year ended Aug. 31, 2005 | Year ended Aug. 31, 2004 | Year ended Aug. 31, 2003 | Year ended Aug. 31, 2002 | ||||||||||||||||
Net asset value, beginning of year | $ | 26.62 | $ | 17.04 | $ | 10.61 | $ | 8.19 | $ | 8.18 | ||||||||||
Income from investment operations: | ||||||||||||||||||||
Net investment incomea | 0.44 | 0.29 | 0.21 | 0.09 | 0.13 | |||||||||||||||
Net realized and unrealized gain (loss)b | 4.31 | 9.38 | 6.39 | 2.43 | (0.12 | ) | ||||||||||||||
Total from investment operations | 4.75 | 9.67 | 6.60 | 2.52 | 0.01 | |||||||||||||||
Less distributions from: | ||||||||||||||||||||
Net investment income | (0.29 | ) | (0.09 | ) | (0.17 | ) | (0.10 | ) | — | |||||||||||
Total distributions | (0.29 | ) | (0.09 | ) | (0.17 | ) | (0.10 | ) | — | |||||||||||
Net asset value, end of year | $ | 31.08 | $ | 26.62 | $ | 17.04 | $ | 10.61 | $ | 8.19 | ||||||||||
Total return | 18.00 | % | 56.82 | % | 62.70 | % | 31.15 | % | 0.12 | % | ||||||||||
Ratios/Supplemental data: | ||||||||||||||||||||
Net assets, end of year (000s) | $ | 391,637 | $ | 196,952 | $ | 57,920 | $ | 22,288 | $ | 14,740 | ||||||||||
Ratio of expenses to average net assets | 0.54 | % | 0.57 | % | 0.77 | % | 0.84 | % | 0.84 | % | ||||||||||
Ratio of net investment income to average net assets | 1.48 | % | 1.26 | % | 1.37 | % | 0.98 | % | 1.57 | % | ||||||||||
Portfolio turnover ratec | 32 | % | 21 | % | 11 | % | 26 | % | 32 | % | ||||||||||
| a | Based on average shares outstanding throughout each period. |
| b | The amounts reported may not accord with the change in aggregate gains and losses in securities due to the timing of capital share transactions. |
| c | Portfolio turnover rates exclude portfolio securities received or delivered as a result of processing capital share transactions in Creation Units. |
See notes to the financial statements.
FINANCIAL HIGHLIGHTS | 105 |
Table of Contents
Financial Highlights (Continued)
iSHARES®, INC.
(For a share outstanding throughout each period)
| iShares MSCI Belgium Index Fund | ||||||||||||||||||||
Year ended Aug. 31, 2006 | Year ended Aug. 31, 2005 | Year ended Aug. 31, 2004 | Year ended Aug. 31, 2003 | Year ended Aug. 31, 2002 | ||||||||||||||||
Net asset value, beginning of year | $ | 18.94 | $ | 14.77 | $ | 11.16 | $ | 10.43 | $ | 11.81 | ||||||||||
Income from investment operations: | ||||||||||||||||||||
Net investment incomea | 0.75 | 0.71 | 0.37 | 0.41 | 0.25 | |||||||||||||||
Net realized and unrealized gain (loss)b | 3.95 | 3.75 | 4.25 | 0.43 | (1.56 | ) | ||||||||||||||
Total from investment operations | 4.70 | 4.46 | 4.62 | 0.84 | (1.31 | ) | ||||||||||||||
Less distributions from: | ||||||||||||||||||||
Net investment income | (0.81 | ) | (0.29 | ) | (1.01 | ) | (0.11 | ) | (0.07 | ) | ||||||||||
Total distributions | (0.81 | ) | (0.29 | ) | (1.01 | ) | (0.11 | ) | (0.07 | ) | ||||||||||
Net asset value, end of year | $ | 22.83 | $ | 18.94 | $ | 14.77 | $ | 11.16 | $ | 10.43 | ||||||||||
Total return | 25.66 | % | 30.22 | % | 42.88 | % | 8.25 | % | (11.10 | )% | ||||||||||
Ratios/Supplemental data: | ||||||||||||||||||||
Net assets, end of year (000s) | $ | 152,484 | $ | 46,960 | $ | 24,813 | $ | 21,871 | $ | 10,427 | ||||||||||
Ratio of expenses to average net assets | 0.54 | % | 0.57 | % | 0.78 | % | 0.84 | % | 0.84 | % | ||||||||||
Ratio of net investment income to average net assets | 3.60 | % | 3.89 | % | 2.79 | % | 4.10 | % | 2.26 | % | ||||||||||
Portfolio turnover ratec | 10 | % | 10 | % | 21 | % | 8 | % | 18 | % | ||||||||||
| a | Based on average shares outstanding throughout each period. |
| b | The amounts reported may not accord with the change in aggregate gains and losses in securities due to the timing of capital share transactions. |
| c | Portfolio turnover rates exclude portfolio securities received or delivered as a result of processing capital share transactions in Creation Units. |
See notes to the financial statements.
| 106 | 2006 iSHARES ANNUAL REPORTTO SHAREHOLDERS |
Table of Contents
Financial Highlights (Continued)
iSHARES®, INC.
(For a share outstanding throughout each period)
| iShares MSCI EMU Index Fund | ||||||||||||||||||||
Year ended Aug. 31, 2006 | Year ended Aug. 31, 2005 | Year ended Aug. 31, 2004 | Year ended Aug. 31, 2003 | Year ended Aug. 31, 2002 | ||||||||||||||||
Net asset value, beginning of year | $ | 74.97 | $ | 59.38 | $ | 50.12 | $ | 46.02 | $ | 56.74 | ||||||||||
Income from investment operations: | ||||||||||||||||||||
Net investment incomea | 2.73 | 1.76 | 1.36 | 0.93 | 0.75 | |||||||||||||||
Net realized and unrealized gain (loss)b | 15.90 | 15.13 | 8.69 | 3.62 | (11.47 | ) | ||||||||||||||
Total from investment operations | 18.63 | 16.89 | 10.05 | 4.55 | (10.72 | ) | ||||||||||||||
Less distributions from: | ||||||||||||||||||||
Net investment income | (1.32 | ) | (1.30 | ) | (0.79 | ) | (0.45 | ) | – | |||||||||||
Total distributions | (1.32 | ) | (1.30 | ) | (0.79 | ) | (0.45 | ) | – | |||||||||||
Net asset value, end of year | $ | 92.28 | $ | 74.97 | $ | 59.38 | $ | 50.12 | $ | 46.02 | ||||||||||
Total return | 25.18 | % | 28.54 | % | 20.07 | % | 10.05 | % | (18.89 | )% | ||||||||||
Ratios/Supplemental data: | ||||||||||||||||||||
Net assets, end of year (000s) | $ | 1,794,921 | $ | 547,284 | $ | 326,606 | $ | 165,388 | $ | 131,168 | ||||||||||
Ratio of expenses to average net assets | 0.54 | % | 0.58 | % | 0.79 | % | 0.84 | % | 0.84 | % | ||||||||||
Ratio of expenses to average net assets exclusive of foreign taxes | n/a | 0.57 | % | 0.79 | % | n/a | n/a | |||||||||||||
Ratio of net investment income to average net assets | 3.23 | % | 2.50 | % | 2.29 | % | 2.08 | % | 1.44 | % | ||||||||||
Portfolio turnover ratec | 8 | % | 8 | % | 11 | % | 7 | % | 3 | % | ||||||||||
| a | Based on average shares outstanding throughout each period. |
| b | The amounts reported may not accord with the change in aggregate gains and losses in securities due to the timing of capital share transactions. |
| c | Portfolio turnover rates exclude portfolio securities received or delivered as a result of processing capital share transactions in Creation Units. |
See notes to the financial statements.
| FINANCIAL HIGHLIGHTS | 107 |
Table of Contents
Financial Highlights (Continued)
iSHARES®, INC.
(For a share outstanding throughout each period)
| iShares MSCI France Index Fund | ||||||||||||||||||||
| Year ended Aug. 31, 2006 | Year ended Aug. 31, 2005 | Year ended Aug. 31, 2004 | Year ended Aug. 31, 2003 | Year ended Aug. 31, 2002 | ||||||||||||||||
Net asset value, beginning of year | $ | 25.41 | $ | 20.40 | $ | 16.90 | $ | 15.52 | $ | 19.53 | ||||||||||
Income from investment operations: | ||||||||||||||||||||
Net investment incomea | 0.55 | 0.47 | 0.24 | 0.23 | 0.18 | |||||||||||||||
Net realized and unrealized gain (loss)b | 5.52 | 4.84 | 3.54 | 1.33 | (4.19 | ) | ||||||||||||||
Total from investment operations | 6.07 | 5.31 | 3.78 | 1.56 | (4.01 | ) | ||||||||||||||
Less distributions from: | ||||||||||||||||||||
Net investment income | (0.32 | ) | (0.30 | ) | (0.28 | ) | (0.18 | ) | — | |||||||||||
Total distributions | (0.32 | ) | (0.30 | ) | (0.28 | ) | (0.18 | ) | — | |||||||||||
Net asset value, end of year | $ | 31.16 | $ | 25.41 | $ | 20.40 | $ | 16.90 | $ | 15.52 | ||||||||||
Total return | 24.13 | % | 26.13 | % | 22.44 | % | 10.22 | % | (20.53 | )% | ||||||||||
Ratios/Supplemental data: | ||||||||||||||||||||
Net assets, end of year (000s) | $ | 211,886 | $ | 81,326 | $ | 61,201 | $ | 54,075 | $ | 49,674 | ||||||||||
Ratio of expenses to average net assets | 0.54 | % | 0.57 | % | 0.79 | % | 0.84 | % | 0.84 | % | ||||||||||
Ratio of net investment income to average net assets | 1.95 | % | 1.98 | % | 1.23 | % | 1.56 | % | 1.00 | % | ||||||||||
Portfolio turnover ratec | 10 | % | 7 | % | 9 | % | 9 | % | 3 | % | ||||||||||
| a | Based on average shares outstanding throughout each period. |
| b | The amounts reported may not accord with the change in aggregate gains and losses in securities due to the timing of capital share transactions. |
| c | Portfolio turnover reates exclude portfolio securities received or delivered as a result of processing capital share transactions in Creation Units. |
See notes to the financial statements.
| 108 | 2006 iSHARES ANNUAL REPORTTO SHAREHOLDERS |
Table of Contents
Financial Highlights (Continued)
iSHARES®, INC.
(For a share outstanding throughout each period)
| iShares MSCI Germany Index Fund | ||||||||||||||||||||
| Year ended Aug. 31, 2006 | Year ended Aug. 31, 2005 | Year ended Aug. 31, 2004 | Year ended Aug. 31, 2003 | Year ended Aug. 31, 2002 | ||||||||||||||||
Net asset value, beginning of year | $ | 19.08 | $ | 14.96 | $ | 12.57 | $ | 12.07 | $ | 15.19 | ||||||||||
Income from investment operations: | ||||||||||||||||||||
Net investment incomea | 0.57 | 0.28 | 0.19 | 0.21 | 0.11 | |||||||||||||||
Net realized and unrealized gain (loss)b | 4.15 | 4.03 | 2.40 | 0.41 | (3.23 | ) | ||||||||||||||
Total from investment operations | 4.72 | 4.31 | 2.59 | 0.62 | (3.12 | ) | ||||||||||||||
Less distributions from: | ||||||||||||||||||||
Net investment income | (0.12 | ) | (0.19 | ) | (0.20 | ) | (0.12 | ) | — | |||||||||||
Total distributions | (0.12 | ) | (0.19 | ) | (0.20 | ) | (0.12 | ) | — | |||||||||||
Net asset value, end of year | $ | 23.68 | $ | 19.08 | $ | 14.96 | $ | 12.57 | $ | 12.07 | ||||||||||
Total return | 24.82 | % | 28.89 | % | 20.55 | % | 5.39 | % | (20.54 | )% | ||||||||||
Ratios/Supplemental data: | ||||||||||||||||||||
Net assets, end of year (000s) | $ | 802,795 | $ | 314,793 | $ | 98,764 | $ | 101,800 | $ | 94,160 | ||||||||||
Ratio of expenses to average net assets | 0.54 | % | 0.57 | % | 0.80 | % | 0.84 | % | 0.84 | % | ||||||||||
Ratio of net investment income to average net assets | 2.62 | % | 1.54 | % | 1.27 | % | 1.98 | % | 0.77 | % | ||||||||||
Portfolio turnover ratec | 12 | % | 9 | % | 9 | % | 11 | % | 9 | % | ||||||||||
| a | Based on average shares outstanding throughout each period. |
| b | The amounts reported may not accord with the change in aggregate gains and losses in securities due to the timing of capital share transactions. |
| c | Portfolio turnover rates exclude portfolio securities received or delivered as a result of processing capital share transactions in Creation Units. |
See notes to the financial statements.
| FINANCIAL HIGHLIGHTS | 109 |
Table of Contents
Financial Highlights (Continued)
iSHARES®, INC.
(For a share outstanding throughout each period)
| iShares MSCI Italy Index Fund | ||||||||||||||||||||
| Year ended Aug. 31, 2006 | Year ended Aug. 31, 2005 | Year ended Aug. 31, 2004 | Year ended Aug. 31, 2003 | Year ended Aug. 31, 2002 | ||||||||||||||||
Net asset value, beginning of year | $ | 25.77 | $ | 20.21 | $ | 16.67 | $ | 15.15 | $ | 17.79 | ||||||||||
Income from investment operations: | �� | |||||||||||||||||||
Net investment incomea | 1.07 | 0.78 | 0.56 | 0.43 | 0.37 | |||||||||||||||
Net realized and unrealized gain (loss)b | 4.15 | 5.42 | 3.59 | 1.47 | (3.01 | ) | ||||||||||||||
Total from investment operations | 5.22 | 6.20 | 4.15 | 1.90 | (2.64 | ) | ||||||||||||||
Less distributions from: | ||||||||||||||||||||
Net investment income | (0.51 | ) | (0.64 | ) | (0.61 | ) | (0.38 | ) | — | |||||||||||
Total distributions | (0.51 | ) | (0.64 | ) | (0.61 | ) | (0.38 | ) | — | |||||||||||
Net asset value, end of year | $ | 30.48 | $ | 25.77 | $ | 20.21 | $ | 16.67 | $ | 15.15 | ||||||||||
Total return | 20.61 | % | 30.74 | % | 25.09 | % | 12.79 | % | (14.84 | )% | ||||||||||
Ratios/Supplemental data: | ||||||||||||||||||||
Net assets, end of year (000s) | $ | 146,324 | $ | 42,526 | $ | 27,279 | $ | 29,997 | $ | 29,538 | ||||||||||
Ratio of expenses to average net assets | 0.54 | % | 0.57 | % | 0.83 | % | 0.84 | % | 0.84 | % | ||||||||||
Ratio of expenses to average net assets exclusive of foreign taxes | n/a | n/a | 0.79 | % | n/a | n/a | ||||||||||||||
Ratio of net investment income to average net assets | 3.87 | % | 3.18 | % | 2.85 | % | 2.84 | % | 2.34 | % | ||||||||||
Portfolio turnover ratec | 15 | % | 18 | % | 9 | % | 22 | % | 10 | % | ||||||||||
| a | Based on average shares outstanding throughout the period. |
| b | The amounts reported may not accord with the change in aggregate gains and losses in securities due to the timing of capital share transactions. |
| c | Portfolio turnover rates exclude portfolio securities received or delivered as a result of processing capital share transactions in Creation Units. |
See notes to the financial statements.
| 110 | 2006 iSHARES ANNUAL REPORTTO SHAREHOLDERS |
Table of Contents
Financial Highlights (Continued)
iSHARES®, INC.
(For a share outstanding throughout each period)
| iShares MSCI Netherlands Index Fund | ||||||||||||||||||||
| Year ended Aug. 31, 2006 | Year ended Aug. 31, 2005 | Year ended Aug. 31, 2004 | Year ended Aug. 31, 2003 | Year ended Aug. 31, 2002 | ||||||||||||||||
Net asset value, beginning of year | $ | 19.10 | $ | 15.70 | $ | 14.31 | $ | 14.69 | $ | 18.59 | ||||||||||
Income from investment operations: | �� | |||||||||||||||||||
Net investment incomea | 0.60 | 0.57 | 0.39 | 0.30 | 0.25 | |||||||||||||||
Net realized and unrealized gain (loss)b | 4.95 | 3.09 | 1.37 | (0.43 | ) | (4.11 | ) | |||||||||||||
Total from investment operations | 5.55 | 3.66 | 1.76 | (0.13 | ) | (3.86 | ) | |||||||||||||
Less distributions from: | ||||||||||||||||||||
Net investment income | (0.48 | ) | (0.26 | ) | (0.37 | ) | (0.25 | ) | (0.04 | ) | ||||||||||
Total distributions | (0.48 | ) | (0.26 | ) | (0.37 | ) | (0.25 | ) | (0.04 | ) | ||||||||||
Net asset value, end of year | $ | 24.17 | $ | 19.10 | $ | 15.70 | $ | 14.31 | $ | 14.69 | ||||||||||
Total return | 29.53 | % | 23.40 | % | 12.28 | % | (0.78 | )% | (20.79 | )% | ||||||||||
Ratios/Supplemental data: | ||||||||||||||||||||
Net assets, end of year (000s) | $ | 109,991 | $ | 63,974 | $ | 28,265 | $ | 18,599 | $ | 19,103 | ||||||||||
Ratio of expenses to average net assets | 0.54 | % | 0.57 | % | 0.78 | % | 0.84 | % | 0.84 | % | ||||||||||
Ratio of net investment income to average net assets | 2.78 | % | 3.13 | % | 2.45 | % | 2.37 | % | 1.48 | % | ||||||||||
Portfolio turnover ratec | 17 | % | 6 | % | 9 | % | 18 | % | 15 | % | ||||||||||
| a | Based on average shares outstanding throughout each period. |
| b | The amounts reported may not accord with the change in aggregate gains and losses in securities due to the timing of capital share transactions. |
| c | Portfolio turnover rates exclude portfolio securities received or delivered as a result of processing capital share transactions in Creation Units. |
See notes to the financial statements.
| FINANCIAL HIGHLIGHTS | 111 |
Table of Contents
Financial Highlights (Continued)
iSHARES®, INC.
(For a share outstanding throughout each period)
| iShares MSCI Spain Index Fund | ||||||||||||||||||||
| Year ended Aug. 31, 2006 | Year ended Aug. 31, 2005 | Year ended Aug. 31, 2004 | Year ended Aug. 31, 2003 | Year ended Aug. 31, 2002 | ||||||||||||||||
Net asset value, beginning of year | $ | 35.70 | $ | 27.55 | $ | 22.39 | $ | 17.95 | $ | 21.33 | ||||||||||
Income from investment operations: | ||||||||||||||||||||
Net investment incomea | 1.07 | 0.79 | 0.44 | 0.24 | 0.17 | |||||||||||||||
Net realized and unrealized gain (loss)b | 8.78 | 7.97 | 4.99 | 4.36 | (3.55 | ) | ||||||||||||||
Total from investment operations | 9.85 | 8.76 | 5.43 | 4.60 | (3.38 | ) | ||||||||||||||
Less distributions from: | ||||||||||||||||||||
Net investment income | (0.74 | ) | (0.61 | ) | (0.27 | ) | (0.16 | ) | — | |||||||||||
Total distributions | (0.74 | ) | (0.61 | ) | (0.27 | ) | (0.16 | ) | — | |||||||||||
Net asset value, end of year | $ | 44.81 | $ | 35.70 | $ | 27.55 | $ | 22.39 | $ | 17.95 | ||||||||||
Total return | 28.09 | % | 31.85 | % | 24.28 | % | 25.81 | % | (15.85 | )% | ||||||||||
Ratios/Supplemental data: | ||||||||||||||||||||
Net assets, end of year (000s) | $ | 178,130 | $ | 66,945 | $ | 45,456 | $ | 50,372 | $ | 18,850 | ||||||||||
Ratio of expenses to average net assets | 0.54 | % | 0.57 | % | 0.80 | % | 0.84 | % | 0.84 | % | ||||||||||
Ratio of net investment income to average net assets | 2.67 | % | 2.33 | % | 1.64 | % | 1.22 | % | 0.85 | % | ||||||||||
Portfolio turnover ratec | 6 | % | 8 | % | 6 | % | 17 | % | 14 | % | ||||||||||
| a | Based on average shares outstanding throughout each period. |
| b | The amounts reported may not accord with the change in aggregate gains and losses in securities due to the timing of capital share transactions. |
| c | Portfolio turnover rates exclude portfolio securities received or delivered as a result of processing capital share transactions in Creation Units. |
See notes to the financial statements.
| 112 | 2006 iSHARES ANNUAL REPORTTO SHAREHOLDERS |
Table of Contents
Financial Highlights (Continued)
iSHARES®, INC.
(For a share outstanding throughout each period)
| iShares MSCI Sweden Index Fund | ||||||||||||||||||||
| Year ended Aug. 31, 2006 | Year ended Aug. 31, 2005 | Year ended Aug. 31, 2004 | Year ended Aug. 31, 2003 | Year ended Aug. 31, 2002 | ||||||||||||||||
Net asset value, beginning of year | $ | 21.58 | $ | 16.82 | $ | 12.59 | $ | 9.88 | $ | 12.88 | ||||||||||
Income from investment operations: | ||||||||||||||||||||
Net investment incomea | 0.76 | 0.46 | 0.28 | 0.25 | 0.12 | |||||||||||||||
Net realized and unrealized gain (loss)b | 3.96 | 4.45 | 4.20 | 2.58 | (3.12 | ) | ||||||||||||||
Total from investment operations | 4.72 | 4.91 | 4.48 | 2.83 | (3.00 | ) | ||||||||||||||
Less distributions from: | ||||||||||||||||||||
Net investment income | (0.42 | ) | (0.15 | ) | (0.25 | ) | (0.12 | ) | — | |||||||||||
Total distributions | (0.42 | ) | (0.15 | ) | (0.25 | ) | (0.12 | ) | — | |||||||||||
Net asset value, end of year | $ | 25.88 | $ | 21.58 | $ | 16.82 | $ | 12.59 | $ | 9.88 | ||||||||||
Total return | 22.16 | % | 29.21 | % | 35.81 | % | 29.04 | % | (23.29 | )% | ||||||||||
Ratios/Supplemental data: | ||||||||||||||||||||
Net assets, end of year (000s) | $ | 151,427 | $ | 61,513 | $ | 27,758 | $ | 16,992 | $ | 8,154 | ||||||||||
Ratio of expenses to average net assets | 0.54 | % | 0.58 | % | 0.92 | % | 0.84 | % | 0.84 | % | ||||||||||
Ratio of expenses to average net assets exclusive of foreign taxes | n/a | 0.57 | % | 0.79 | % | n/a | n/a | |||||||||||||
Ratio of net investment income to average net assets | 3.13 | % | 2.28 | % | 1.74 | % | 2.44 | % | 0.98 | % | ||||||||||
Portfolio turnover ratec | 14 | % | 6 | % | 9 | % | 12 | % | 31 | % | ||||||||||
| a | Based on average shares outstanding throughout each period. |
| b | The amounts reported may not accord with the change in aggregate gains and losses in securities due to the timing of capital share transactions. |
| c | Portfolio turnover rates exclude portfolio securities received or delivered as a result of processing capital share transactions in Creation Units. |
See notes to the financial statements.
FINANCIAL HIGHLIGHTS | 113 |
Table of Contents
Financial Highlights (Continued)
iSHARES®, INC.
(For a share outstanding throughout each period)
| iShares MSCI Switzerland Index Fund | ||||||||||||||||||||
| Year ended Aug. 31, 2006 | Year ended Aug. 31, 2005 | Year ended Aug. 31, 2004 | Year ended Aug. 31, 2003 | Year ended Aug. 31, 2002 | ||||||||||||||||
Net asset value, beginning of year | $ | 17.63 | $ | 14.58 | $ | 12.23 | $ | 11.59 | $ | 12.95 | ||||||||||
Income from investment operations: | ||||||||||||||||||||
Net investment incomea | 0.27 | 0.22 | 0.09 | 0.05 | 0.03 | |||||||||||||||
Net realized and unrealized gain (loss)b | 4.71 | 2.92 | 2.31 | 0.62 | (1.38 | ) | ||||||||||||||
Total from investment operations | 4.98 | 3.14 | 2.40 | 0.67 | (1.35 | ) | ||||||||||||||
Less distributions from: | ||||||||||||||||||||
Net investment income | (0.12 | ) | (0.09 | ) | (0.05 | ) | (0.03 | ) | (0.01 | ) | ||||||||||
Total distributions | (0.12 | ) | (0.09 | ) | (0.05 | ) | (0.03 | ) | (0.01 | ) | ||||||||||
Net asset value, end of year | $ | 22.49 | $ | 17.63 | $ | 14.58 | $ | 12.23 | $ | 11.59 | ||||||||||
Total return | 28.36 | % | 21.54 | % | 19.56 | % | 5.89 | % | (10.47 | )% | ||||||||||
Ratios/Supplemental data: | ||||||||||||||||||||
Net assets, end of year (000s) | $ | 188,319 | $ | 79,324 | $ | 41,920 | $ | 33,643 | $ | 31,883 | ||||||||||
Ratio of expenses to average net assets | 0.54 | % | 0.57 | % | 0.79 | % | 0.84 | % | 0.84 | % | ||||||||||
Ratio of net investment income to average net assets | 1.34 | % | 1.34 | % | 0.64 | % | 0.43 | % | 0.20 | % | ||||||||||
Portfolio turnover ratec | 11 | % | 5 | % | 4 | % | 10 | % | 12 | % | ||||||||||
| a | Based on average shares outstanding throughout each period. |
| b | The amounts reported may not accord with the change in aggregate gains and losses in securities due to the timing of capital share transactions. |
| c | Portfolio turnover rates exclude portfolio securities received or delivered as a result of processing capitail share transactions in Creation Units. |
See notes to the financial statements.
| 114 | 2006 iSHARES ANNUAL REPORTTO SHAREHOLDERS |
Table of Contents
Financial Highlights (Continued)
iSHARES®, INC.
(For a share outstanding throughout each period)
| iShares MSCI United Kingdom Index Fund | ||||||||||||||||||||
| Year ended Aug. 31, 2006 | Year ended Aug. 31, 2005 | Year ended Aug. 31, 2004 | Year ended Aug. 31, 2003 | Year ended Aug. 31, 2002 | ||||||||||||||||
Net asset value, beginning of year | $ | 18.74 | $ | 15.72 | $ | 13.00 | $ | 12.77 | $ | 15.11 | ||||||||||
Income from investment operations: | ||||||||||||||||||||
Net investment incomea | 0.97 | 0.60 | 0.48 | 0.39 | 0.48 | |||||||||||||||
Net realized and unrealized gain (loss)b | 2.79 | 2.76 | 2.72 | 0.12 | (2.60 | ) | ||||||||||||||
Total from investment operations | 3.76 | 3.36 | 3.20 | 0.51 | (2.12 | ) | ||||||||||||||
Less distributions from: | ||||||||||||||||||||
Net investment income | (0.58 | ) | (0.34 | ) | (0.48 | ) | (0.28 | ) | (0.22 | ) | ||||||||||
Total distributions | (0.58 | ) | (0.34 | ) | (0.48 | ) | (0.28 | ) | (0.22 | ) | ||||||||||
Net asset value, end of year | $ | 21.92 | $ | 18.74 | $ | 15.72 | $ | 13.00 | $ | 12.77 | ||||||||||
Total return | 20.61 | % | 21.53 | % | 24.77 | % | 4.20 | % | (14.19 | )% | ||||||||||
Ratios/Supplemental data: | ||||||||||||||||||||
Net assets, end of year (000s) | $ | 872,409 | $ | 464,850 | $ | 452,870 | $ | 150,809 | $ | 120,067 | ||||||||||
Ratio of expenses to average net assets | 0.54 | % | 0.57 | % | 0.77 | % | 0.84 | % | 0.84 | % | ||||||||||
Ratio of net investment income to average net assets | 4.81 | % | 3.39 | % | 3.11 | % | 3.23 | % | 3.39 | % | ||||||||||
Portfolio turnover ratec | 10 | % | 11 | % | 6 | % | 6 | % | 14 | % | ||||||||||
| a | Based on average shares outstanding throughout each period. |
| b | The amounts reported may not accord with the change in aggregate gains and losses in securities due to the timing of capital share transactions. |
| c | Portfolio turnover rates exclude portfolio securities received or delivered as a result of processing capital share transactions in Creation Units. |
See notes to the financial statements.
| FINANCIAL HIGHLIGHTS | 115 |
Table of Contents
Notes to the Financial Statements
iSHARES®, INC.
iShares, Inc. (the “Company”), is registered under the Investment Company Act of 1940, as amended (the “1940 Act”), as an open-end management investment company. The Company was incorporated under the laws of the State of Maryland on September 1, 1994 pursuant to amended and restated Articles of Incorporation. As of August 31, 2006, the Company offered 24 investment portfolios or funds.
These financial statements relate only to the iShares MSCI Austria, iShares MSCI Belgium, iShares MSCI EMU, iShares MSCI France, iShares MSCI Germany, iShares MSCI Italy, iShares MSCI Netherlands, iShares MSCI Spain, iShares MSCI Sweden, iShares MSCI Switzerland and iShares MSCI United Kingdom Index Funds (each, a “Fund,” collectively, the “Funds”).
The investment objective of each Fund is to seek investment results that correspond generally to the price and yield performance, before fees and expenses, of publicly traded equity securities in the aggregate in a particular market, as measured by a particular equity securities index compiled by Morgan Stanley Capital International Inc. (“MSCI”). The investment adviser uses a “passive” or index approach to achieve each Fund’s investment objective. Each of the Funds is classified as a non-diversified fund under the 1940 Act. Non-diversified funds generally hold securities of fewer companies than diversified funds and may be more susceptible to the risks associated with these particular companies, or to a single economic, political or regulatory occurrence affecting these companies.
Each Fund invests in the securities of foreign issuers of a single country or region, which may involve certain considerations and risks not typically associated with securities of U.S. issuers. Such risks include, but are not limited to: generally less liquid and less efficient securities markets; generally greater price volatility; exchange rate fluctuations and exchange controls; imposition of restrictions on the expatriation of funds or other assets of the Fund; less publicly available information about issuers; the imposition of withholding or other taxes; higher transaction and custody costs; settlement delays and risk of loss attendant in settlement procedures; difficulties in enforcing contractual obligations; less regulation of securities markets; different accounting, disclosure and reporting requirements; more substantial governmental involvement in the economy; higher inflation rates; greater social, economic and political uncertainties; the risk of nationalization or expropriation of assets and the risk of war.
Under the Company’s organizational documents, the Funds’ officers and directors are indemnified against certain liabilities that may arise out of the performance of their duties to the Funds. Additionally, in the normal course of business, the Funds enter into contracts with service providers that contain general indemnification clauses. The Funds’ maximum exposure under these arrangements is unknown as this would involve future claims that may be made against the Funds that have not yet occurred.
| 1. | SIGNIFICANT ACCOUNTING POLICIES |
The following significant accounting policies are consistently followed by the Company in the preparation of its financial statements in conformity with accounting principles generally accepted in the United States of America (“U.S. GAAP”) for investment companies. The preparation of the financial statements in conformity with U.S. GAAP requires management to make certain estimates and assumptions that affect the reported amounts of assets and liabilities and disclosures of contingent assets and liabilities at the date of the financial statements and the reported amounts of revenue and expenses during the reporting period. Actual results could differ from those estimates.
SECURITY VALUATION
The securities and other assets of each Fund are generally valued using market valuations. A market valuation generally means a valuation (i) obtained from an exchange, a pricing service or a major market maker (or dealer), (ii) based on a price quotation or other equivalent indication of value supplied by an exchange, a pricing service or a major market maker (or dealer) or (iii) based on amortized cost. In the case of shares of funds that are not traded on an exchange, a market valuation means such fund’s published net asset value per share. The investment adviser may use various pricing services or discontinue the use of any pricing service. A price obtained from a pricing service based on such pricing service’s valuation matrix may be considered a market valuation. In the event that current market valuations are not readily available or such valuations
| 116 | 2006 iSHARES ANNUAL REPORTTO SHAREHOLDERS |
Table of Contents
Notes to the Financial Statements (Continued)
iSHARES®, INC.
do not reflect current market values, the affected investments will be valued using fair value pricing pursuant to the pricing policy and procedures approved by the Board of Directors of the Company (the “Board”).
SECURITY TRANSACTIONS AND INCOME RECOGNITION
Security transactions are accounted for on trade date. Dividend income is recognized on the ex-dividend date, net of any foreign taxes withheld at source, and interest income is accrued daily. Realized gains and losses on investment transactions are determined using the specific identification method.
FOREIGN CURRENCY TRANSLATION
The accounting records of the Funds are maintained in U.S. dollars. Foreign currencies, as well as investment securities and other assets and liabilities denominated in foreign currencies are translated into U.S. dollars using exchange rates deemed appropriate by the investment adviser. Any use of a different rate from the rates used by MSCI may adversely affect a Fund’s ability to track its underlying index. Purchases and sales of securities, income receipts and expense payments are translated into U.S. dollars on the respective dates of such transactions.
Each Fund does not isolate the effect of fluctuations in foreign exchange rates from the effect of fluctuations in the market prices of securities. Such fluctuations are reflected by the Funds as a component of realized and unrealized gains and losses from investments for financial reporting purposes.
FOREIGN TAXES
Italy may levy taxes on stock dividends at a rate of 27.0%, based on the par value of stock dividends received by the iShares MSCI Italy Index Fund. These taxes are paid by the Fund receiving the stock dividends and, if any, are disclosed in the Statements of Operations.
The iShares MSCI EMU Index Fund and iShares MSCI Sweden Index Fund may pay foreign taxes on certain taxable corporate events (i.e., spin-offs and tender offers) by Swedish companies whose securities are held by the Funds. The foreign taxes paid by the Funds, if any, are disclosed in their respective Statement of Operations.
DISTRIBUTIONS TO SHAREHOLDERS
Distributions to shareholders from net investment income, if any, including any net foreign currency gains, are declared and distributed at least annually by each Fund. Distributions of net realized capital gains, if any, generally are declared and distributed once a year. Distributions are determined on a tax basis and may differ from net investment income and net realized capital gains for financial reporting purposes. Dividends and distributions are paid in U.S. dollars and cannot be automatically reinvested in additional shares of the Funds.
NOTESTOTHE FINANCIAL STATEMENTS | 117 |
Table of Contents
Notes to the Financial Statements (Continued)
iSHARES®, INC.
As of August 31, 2006, the tax year-end of the Funds, the components of net distributable earnings (accumulated losses) on a tax basis were as follows:
iShares MSCI Index Fund | Undistributed Ordinary Income | Unrealized Appreciation | Capital and Other Losses | Net Distributable Earnings (Accumulated Losses) | ||||||||||
Austria | $ | 8,422,066 | $ | 27,134,667 | $ | (3,347,928 | ) | $ | 32,208,805 | |||||
Belgium | 3,751,320 | 12,108,101 | (2,064,481 | ) | 13,794,940 | |||||||||
EMU | 36,694,677 | 167,686,962 | (5,911,570 | ) | 198,470,069 | |||||||||
France | 2,255,571 | 6,597,389 | (5,220,386 | ) | 3,632,574 | |||||||||
Germany | 17,227,480 | 56,757,848 | (29,280,109 | ) | 44,705,219 | |||||||||
Italy | 3,319,814 | 20,681,938 | (4,593,503 | ) | 19,408,249 | |||||||||
Netherlands | 3,061,890 | 11,301,130 | (8,055,494 | ) | 6,307,526 | |||||||||
Spain | 2,336,743 | 28,955,727 | (3,346,159 | ) | 27,946,311 | |||||||||
Sweden | 3,600,238 | 1,898,617 | (6,290,449 | ) | (791,594 | ) | ||||||||
Switzerland | 1,891,314 | 35,601,342 | (6,210,801 | ) | 31,281,855 | |||||||||
United Kingdom | 28,754,432 | 115,300,323 | (30,884,277 | ) | 113,170,478 | |||||||||
For the years ended August 31, 2006 and August 31, 2005, the tax characterization of distributions paid for each Fund represents ordinary income. The total distributions and distributions per share are disclosed in the accompanying Statements of Changes in Net Assets and the Financial Highlights for all Funds.
FEDERAL INCOME TAXES
Each Fund is treated as a separate entity for federal income tax purposes. It is the policy of each Fund to qualify as a regulated investment company by complying with the provisions applicable to regulated investment companies, as defined under Subchapter M of the Internal Revenue Code of 1986, as amended, and to annually distribute substantially all of its net income and any net gains (taking into account any capital loss carryforwards) sufficient to relieve it from all, or substantially all, federal income and excise taxes. Accordingly, no provision for federal income taxes was required for the year ended August 31, 2006.
From November 1, 2005 to August 31, 2006, certain Funds incurred net realized capital losses. As permitted by tax regulations, these Funds have elected to defer these losses and treat them as arising in the year ending August 31, 2007, as follows:
iShares MSCI Index Fund | Deferred Net Realized Capital Losses | ||
France | $ | 146,138 | |
Germany | 4,212,074 | ||
Netherlands | 260,715 | ||
Sweden | 17,347 | ||
Switzerland | 187,183 | ||
United Kingdom | 1,615,947 | ||
| 118 | 2006 iSHARES ANNUAL REPORTTO SHAREHOLDERS |
Table of Contents
Notes to the Financial Statements (Continued)
iSHARES®, INC.
The Funds had tax basis net capital loss carryforwards as of August 31, 2006, the tax year-end of the Funds, as follows:
iShares MSCI Index Fund | Expiring 2008 | Expiring 2009 | Expiring 2010 | Expiring 2011 | Expiring 2012 | Expiring 2013 | Expiring 2014 | Total | ||||||||||||||||
Austria | $ | 491,457 | $ | 336,553 | $ | 1,291,324 | $ | 370,948 | $ | 855,364 | $ | — | $ | — | $ | 3,345,646 | ||||||||
Belgium | — | 59,876 | 1,677,678 | 117,767 | 175,781 | 33,969 | — | 2,065,071 | ||||||||||||||||
EMU | — | — | — | — | 4,037,607 | 1,873,963 | — | 5,911,570 | ||||||||||||||||
France | — | — | 2,436,748 | 236,944 | 2,400,550 | — | — | 5,074,242 | ||||||||||||||||
Germany | — | — | 8,697,227 | 5,469,732 | 8,656,712 | 2,241,687 | — | 25,065,358 | ||||||||||||||||
Italy | — | — | 2,675,493 | 848,408 | 541,980 | 527,327 | — | 4,593,208 | ||||||||||||||||
Netherlands | — | 60,885 | 3,222,792 | 1,497,810 | 2,481,175 | 129,137 | 403,525 | 7,795,324 | ||||||||||||||||
Spain | — | — | 1,083,394 | 678,910 | 1,582,094 | — | — | 3,344,398 | ||||||||||||||||
Sweden | — | 89,443 | 3,350,244 | 1,577,551 | 1,149,514 | — | 107,613 | 6,274,365 | ||||||||||||||||
Switzerland | — | — | 2,501,682 | 1,018,305 | 2,149,171 | 354,252 | — | 6,023,410 | ||||||||||||||||
United Kingdom | — | — | 9,945,254 | 6,448,554 | 4,272,059 | 1,517,783 | 7,063,063 | 29,246,713 | ||||||||||||||||
Net capital loss carryforwards may be applied against any net realized taxable gains in each succeeding year or until their respective expiration dates, whichever occurs first.
The Funds may own shares in certain foreign investment entities, referred to, under U.S. tax law, as “passive foreign investment companies.” The Funds may elect to mark-to-market annually the shares of each passive foreign investment company and would be required to distribute to shareholders any such mark-to-market gains.
Each Fund reclassifies at the end of its tax year certain amounts to paid-in-capital from accumulated net realized gain (loss) on investments and foreign currency transactions and accumulated net investment income (loss), respectively, as a result of permanent book and tax differences primarily attributed to net investment loss, return of capital, passive foreign investment companies, realized foreign currency gains and losses and gains and losses on in-kind redemptions. These reclassifications have no effect on net assets or net asset values per share.
As of August 31, 2006, gross unrealized appreciation and gross unrealized depreciation based on cost for federal income tax purposes were as follows:
iShares MSCI Index Fund | Tax Cost | Gross Unrealized Appreciation | Gross Unrealized Depreciation | Net Unrealized Appreciation | |||||||||
Austria | $ | 374,519,234 | $ | 36,135,232 | $ | (9,006,496 | ) | $ | 27,128,736 | ||||
Belgium | 139,556,174 | 12,112,182 | (10,644 | ) | 12,101,538 | ||||||||
EMU | 1,659,891,678 | 180,712,586 | (13,043,582 | ) | 167,669,004 | ||||||||
France | 207,539,903 | 14,396,235 | (7,799,707 | ) | 6,596,528 | ||||||||
Germany | 754,886,785 | 71,526,066 | (14,789,832 | ) | 56,736,234 | ||||||||
Italy | 128,701,889 | 21,381,785 | (718,714 | ) | 20,663,071 | ||||||||
Netherlands | 100,312,998 | 11,553,517 | (253,426 | ) | 11,300,091 | ||||||||
Spain | 156,390,165 | 29,040,184 | (86,074 | ) | 28,954,110 | ||||||||
Sweden | 153,566,430 | 6,480,583 | (4,580,778 | ) | 1,899,805 | ||||||||
Switzerland | 155,574,913 | 35,979,071 | (387,165 | ) | 35,591,906 | ||||||||
United Kingdom | 748,661,962 | 128,059,190 | (12,789,692 | ) | 115,269,498 | ||||||||
NOTESTOTHE FINANCIAL STATEMENTS | 119 |
Table of Contents
Notes to the Financial Statements (Continued)
iSHARES®, INC.
REPURCHASE AGREEMENTS
Each Fund may enter into repurchase agreements with banks and securities dealers. These transactions involve the purchase of securities with a simultaneous commitment to resell the securities to the bank or the dealer at an agreed-upon date and price. A repurchase agreement is accounted for as an investment by the Fund, collateralized by securities, which are delivered to the Fund’s custodian or to an agent bank under a tri-party agreement. The securities are marked-to-market daily and additional securities are acquired as needed, to ensure that their value equals or exceeds the repurchase price plus accrued interest.
| 2. | AGREEMENTS AND OTHER TRANSACTIONS WITH AFFILIATES |
Pursuant to an Investment Advisory Agreement with the Company, Barclays Global Fund Advisors (“BGFA”) manages the investment of each Fund’s assets. BGFA is a California corporation indirectly owned by Barclays Bank PLC. Under the Investment Advisory Agreement, BGFA is responsible for all expenses (“Covered Expenses”) of each of the Funds, including the cost of transfer agency, custody, fund administration, legal, audit and other services, except interest, taxes, brokerage commissions and other expenses connected with the execution of portfolio transactions, distribution fees and extraordinary expenses.
For its investment advisory services to each Fund, BGFA is entitled to an annual investment advisory fee based on each Fund’s allocable portion of the aggregate of the average daily net assets of all the funds offered by the Company (except for the iShares MSCI Brazil, iShares MSCI Emerging Markets, iShares MSCI Pacific ex-Japan, iShares MSCI South Africa, iShares MSCI South Korea and iShares MSCI Taiwan Index Funds) as follows:
Investment Advisory Fee | Aggregate Average Daily Net Assets | |
0.59% | First $7 billion | |
0.54 | Over $7 billion, up to and including $11 billion | |
0.49 | Over $11 billion |
The Board approved a change to the investment advisory fee rates for each Fund effective September 1, 2006. For its investment advisory services to each Fund, BGFA will be entitled to be paid annual investment advisory fees based on each Fund’s allocable portion of the aggregate of the average daily net assets of all the Funds offered by the Company (except for the iShares MSCI Brazil, iShares MSCI Emerging Markets, iShares MSCI Pacific ex-Japan, iShares MSCI South Africa, iShares MSCI South Korea and iShares MSCI Taiwan Index Funds) as follows:
Investment Advisory Fee | Aggregate Average Daily Net Assets | |
0.59% | First $7 billion | |
0.54 | Over $7 billion, up to and including $11 billion | |
0.49 | Over $11 billion, up to and including $24 billion | |
0.44 | Over $24 billion |
Investors Bank & Trust Company (“Investors Bank”) serves as administrator, custodian and transfer agent for the Company. As compensation for its services, Investors Bank receives certain out-of-pocket costs, transaction fees and asset-based fees, which are accrued daily and paid monthly. These fees and expenses are Covered Expenses as defined above.
SEI Investments Distribution Co. (“SEI”) serves as each Fund’s underwriter and distributor of the shares of each Fund, pursuant to a Distribution Agreement with the Company. SEI does not currently receive a fee from the Funds for its distribution services.
| 120 | 2006 iSHARES ANNUAL REPORTTO SHAREHOLDERS |
Table of Contents
Notes to the Financial Statements (Continued)
iSHARES®, INC.
Pursuant to an exemptive order issued by the U.S. Securities and Exchange Commission (“SEC”), the Funds are permitted to lend portfolio securities to Barclays Capital, Inc. (“BarCap”). Pursuant to the same exemptive order, Barclays Global Investors, N.A. (“BGI”) serves as securities lending agent for the Company. BarCap and BGI are affiliates of BGFA, the Funds’ investment adviser. As securities lending agent, BGI receives, as fees, a share of the income earned on investment of the cash collateral received for the loan of securities. For the year ended August 31, 2006, BGI earned securities lending agent fees as follows:
iShares MSCI Index Fund | Securities Lending Agent Fees | ||
Austria | $ | 21,742 | |
Belgium | 11,942 | ||
EMU | 161,203 | ||
France | 22,425 | ||
Germany | 74,921 | ||
Italy | 23,331 | ||
iShares MSCI Index Fund | Securities Lending Agent Fees | ||
Netherlands | $ | 6,081 | |
Spain | 29,975 | ||
Sweden | 22,082 | ||
Switzerland | 6,709 | ||
United Kingdom | 2,520 | ||
Cross trades for the year ended August 31, 2006, if any, were executed by the Funds pursuant to Rule 17a-7 under the 1940 Act. Cross trading is the buying or selling of portfolio securities between funds to which BGFA (or an affiliate) serves as investment adviser. At its regularly scheduled quarterly meetings, the Board reviews such transactions as of the most recent calendar quarter, for compliance with the requirements and restrictions set forth by Rule 17a-7.
Each Fund may invest in the Institutional Shares of certain money market funds managed by BGFA, the Funds’ investment adviser, including the Government Money Market Fund (“GMMF”), Institutional Money Market Fund (“IMMF”), Prime Money Market Fund (“PMMF”) and Treasury Money Market Fund (“TMMF”) of Barclays Global Investors Funds. The GMMF, IMMF, PMMF and TMMF are feeder funds in a master/feeder fund structure that invest substantially all of their assets in the Government Money Market Master Portfolio, Money Market Master Portfolio, Prime Money Market Master Portfolio and Treasury Money Market Master Portfolio (collectively, the “Master Portfolios”), respectively, which are also managed by BGFA. While the GMMF, IMMF, PMMF and TMMF do not directly charge an investment advisory fee, the Master Portfolios in which they invest do charge an investment advisory fee. Income distributions from the GMMF, IMMF, PMMF and TMMF are declared daily and paid monthly from net investment income. Income distributions earned by the Funds from temporary cash investments are recorded as interest from affiliated issuers in the accompanying Statements of Operations. Income distributions earned by the Funds from the investment of securities lending collateral are included in securities lending income in the accompanying Statements of Operations.
| NOTESTOTHE FINANCIAL STATEMENTS | 121 |
Table of Contents
Notes to the Financial Statements (Continued)
iSHARES®, INC.
The following table provides information about the direct investment by each Fund (exclusive of investments of securities lending collateral) in issuers of which BGFA is an affiliate, for the year ended August 31, 2006.
iShares MSCI Index Fund and | Number of Shares Held Beginning of Year (in 000s) | Gross Additions (in 000s) | Gross Reductions (in 000s) | Number of Shares Held End of Year (in 000s) | Value at End of Year | Dividend and Interest Income | Net Realized Gain | ||||||||||
Austria | |||||||||||||||||
IMMF | 2 | 30,725 | 30,630 | 97 | $ | 97,265 | $ | 5,972 | $ | — | |||||||
Belgium | |||||||||||||||||
IMMF | 3 | 12,342 | 12,284 | 61 | 61,136 | 2,125 | — | ||||||||||
EMU | |||||||||||||||||
IMMF | 12 | 180,589 | 179,655 | 946 | 946,384 | 34,819 | — | ||||||||||
France | |||||||||||||||||
IMMF | 150 | 14,954 | 14,943 | 161 | 160,863 | 2,712 | — | ||||||||||
Germany | |||||||||||||||||
IMMF | 34 | 52,923 | 52,937 | 20 | 19,872 | 9,458 | — | ||||||||||
Italy | |||||||||||||||||
IMMF | 4 | 5,633 | 5,636 | 1 | 1,089 | 1,006 | — | ||||||||||
Netherlands | |||||||||||||||||
IMMF | 2 | 8,496 | 8,492 | 6 | 6,254 | 1,308 | — | ||||||||||
Spain | |||||||||||||||||
IMMF | 6 | 6,330 | 6,176 | 160 | 160,146 | 1,178 | — | ||||||||||
Sweden | |||||||||||||||||
IMMF | 7 | 7,592 | 7,575 | 24 | 24,228 | 1,417 | — | ||||||||||
Switzerland | |||||||||||||||||
IMMF | 42 | 17,323 | 17,342 | 23 | 22,983 | 3,020 | — | ||||||||||
United Kingdom | |||||||||||||||||
Barclays PLC | 1,224 | 949 | 180 | 1,993 | 24,928,590 | 864,528 | 336,803 | ||||||||||
IMMF | 28 | 76,753 | 76,664 | 117 | 116,892 | 14,531 | — | ||||||||||
As of August 31, 2006, certain directors and officers of the Company are also officers of BGI and/or BGFA.
| 122 | 2006 iSHARES ANNUAL REPORTTO SHAREHOLDERS |
Table of Contents
Notes to the Financial Statements (Continued)
iSHARES®, INC.
| 3. | INVESTMENT PORTFOLIO TRANSACTIONS |
Purchases and sales of investments (excluding in-kind transactions and short-term investments) for the year ended August 31, 2006, were as follows:
iShares MSCI Index Fund | Purchases | Sales | ||||
Austria | $ | 118,513,092 | $ | 97,652,694 | ||
Belgium | 22,280,587 | 9,266,707 | ||||
EMU | 147,088,682 | 86,617,708 | ||||
France | 16,928,146 | 11,928,197 | ||||
Germany | 86,732,155 | 73,914,939 | ||||
Italy | 18,261,552 | 13,201,117 | ||||
Netherlands | 15,105,650 | 16,375,379 | ||||
Spain | 8,914,610 | 6,817,782 | ||||
Sweden | 17,900,969 | 15,353,455 | ||||
Switzerland | 17,197,127 | 15,168,552 | ||||
United Kingdom | 78,171,122 | 65,323,757 | ||||
In-kind transactions (see Note 4) for the year ended August 31, 2006, were as follows:
iShares MSCI Index Fund | In-kind Purchases | In-kind Sales | ||||
Austria | $ | 270,508,973 | $ | 122,033,737 | ||
Belgium | 90,596,166 | 13,508,179 | ||||
EMU | 1,232,848,319 | 236,280,696 | ||||
France | 186,916,549 | 86,357,327 | ||||
Germany | 609,121,722 | 235,124,080 | ||||
Italy | 87,535,369 | 4,098,602 | ||||
Netherlands | 57,654,446 | 30,167,078 | ||||
Spain | 101,235,495 | 14,567,347 | ||||
Sweden | 133,207,842 | 54,695,231 | ||||
Switzerland | 89,229,052 | 14,556,116 | ||||
United Kingdom | 342,024,021 | 43,764,903 | ||||
| 4. | CAPITAL SHARE TRANSACTIONS |
The Company has authorized 10.9 billion shares of $.001 par value capital stock. The number of shares authorized to each Fund are as follows:
iShares MSCI Index Fund | Authorized Shares | |
Austria | 19,800,000 | |
Belgium | 136,200,000 | |
EMU | 500,000,000 | |
France | 340,200,000 | |
Germany | 382,200,000 | |
Italy | 63,600,000 |
iShares MSCI Index Fund | Authorized Shares | |
Netherlands | 255,000,000 | |
Spain | 127,800,000 | |
Sweden | 63,600,000 | |
Switzerland | 318,625,000 | |
United Kingdom | 943,200,000 |
| NOTESTOTHE FINANCIAL STATEMENTS | 123 |
Table of Contents
Notes to the Financial Statements (Continued)
iSHARES®, INC.
The Company issues and redeems capital shares of each Fund only in aggregations of a specified number of shares (each, a “Creation Unit”) at net asset value. Except when aggregated in Creation Units, shares of each Fund are not redeemable. Transactions in capital shares for each Fund are disclosed in detail in the Statements of Changes in Net Assets.
The consideration for the purchase of Creation Units of a Fund generally consists of the in-kind contribution of a designated portfolio of equity securities constituting a portfolio sampling representation of the corresponding MSCI Index and an amount of cash. Investors purchasing and redeeming Creation Units pay a purchase transaction fee and a redemption transaction fee directly to Investors Bank, the administrator, to offset transfer and other transaction costs associated with the issuance and redemption of Creation Units.
| 5. | LOANS OF PORTFOLIO SECURITIES |
Each Fund may lend its investment securities to approved borrowers, such as brokers, dealers and other financial institutions. The borrower pledges and maintains with the Fund collateral consisting of cash, an irrevocable letter of credit issued by a bank, or securities issued or guaranteed by the U.S. Government. The initial collateral received by each Fund is required to have a value of at least 102% of the market value of the loaned securities for securities traded on U.S. exchanges and a value of at least 105% for all other securities. The collateral is maintained thereafter, at a value equal to at least 100% of the current market value of the securities on loan. The risks to the Funds of securities lending are that the borrower may not provide additional collateral when required or may not return the securities when due.
As of August 31, 2006, certain Funds had loaned securities which were collateralized by cash. Pursuant to an exemptive order issued by the SEC, the cash collateral received was invested in a joint account with other investment funds managed by BGFA. The joint account invests in securities with remaining maturities of 397 days or less, repurchase agreements and money market mutual funds, including money market funds managed by BGFA. Repurchase agreements held in the joint account are fully collateralized by U.S. Government securities or non-U.S. Government debt securities. The market value of the securities on loan as of August 31, 2006 and the value of the related collateral are disclosed in the Statements of Assets and Liabilities. Securities lending income, as disclosed in the Funds’ Statements of Operations, represents the income earned from the investment of the cash collateral, net of rebates paid to, or fees paid by, borrowers and less the fees paid to BGI as securities lending agent.
| 6. | RECENTLY ISSUED ACCOUNTING PRONOUNCEMENT |
In June 2006, the Financial Accounting Standards Board (“FASB”) issued FASB Interpretation No. 48, (“FIN 48”) “Accounting for Uncertainty in Income Taxes - an interpretation of FASB Statement No. 109.” FIN 48 clarifies the accounting for uncertainty in income taxes recognized in accordance with FASB Statement No. 109, “Accounting for Income Taxes.” This interpretation prescribes a recognition threshold and measurement attribute for the financial statement recognition and measurement of a tax position taken or expected to be taken in a tax return. It also provides guidance on de-recognition, classification, interest and penalties, accounting in interim periods, disclosure and transition. FIN 48 is effective for fiscal years beginning after December 15, 2006. The Company is currently evaluating the impact of applying the various provisions of FIN 48.
| 124 | 2006 iSHARES ANNUAL REPORTTO SHAREHOLDERS |
Table of Contents
Report of Independent Registered Public Accounting Firm
To the Shareholders and Board of Directors of
iShares, Inc.
In our opinion, the accompanying statements of assets and liabilities, including the schedules of investments, and the related statements of operations and of changes in net assets and the financial highlights present fairly, in all material respects, the financial position of the iShares MSCI Austria Index Fund, iShares MSCI Belgium Index Fund, iShares MSCI EMU Index Fund, iShares MSCI France Index Fund, iShares MSCI Germany Index Fund, iShares MSCI Italy Index Fund, iShares MSCI Netherlands Index Fund, iShares MSCI Spain Index Fund, iShares MSCI Sweden Index Fund, iShares MSCI Switzerland Index Fund and iShares MSCI United Kingdom Index Fund, each a portfolio of the iShares MSCI Fund Series (the “Funds”) at August 31, 2006, the results of each of their operations for the year then ended and the changes in each of their net assets and the financial highlights for each of the periods presented, in conformity with accounting principles generally accepted in the United States of America. These financial statements and financial highlights (hereafter referred to as “financial statements”) are the responsibility of the Funds’ management. Our responsibility is to express an opinion on these financial statements based on our audits. We conducted our audits of these financial statements in accordance with the standards of the Public Company Accounting Oversight Board (United States). Those standards require that we plan and perform the audits to obtain reasonable assurance about whether the financial statements are free of material misstatement. An audit includes examining, on a test basis, evidence supporting the amounts and disclosures in the financial statements, assessing the accounting principles used and significant estimates made by management, and evaluating the overall financial statement presentation. We believe that our audits, which included confirmation of securities at August 31, 2006 by correspondence with the custodian and brokers, provide a reasonable basis for our opinion.
PricewaterhouseCoopers LLP
San Francisco, California
October 23, 2006
| REPORTOF INDEPENDENT REGISTERED PUBLIC ACCOUNTING FIRM | 125 |
Table of Contents
iSHARES®, INC.
For the fiscal year ended August 31, 2006, the Funds earned foreign source income and paid foreign taxes which they intend to pass through to their shareholders pursuant to Section 853 of the Internal Revenue Code (the “Code”) as follows:
iShares MSCI Index Fund | Foreign Source Income Earned | Foreign Taxes Paid | ||||
Austria | $ | 7,309,037 | $ | 1,086,360 | ||
Belgium | 4,337,002 | 637,505 | ||||
EMU | 49,052,232 | 6,137,955 | ||||
France | 3,256,740 | 328,514 | ||||
Germany | 23,222,073 | 3,320,588 | ||||
Italy | 4,307,784 | 590,430 | ||||
Netherlands | 3,446,024 | 462,295 | ||||
Spain | 3,888,418 | 534,296 | ||||
Sweden | 4,792,713 | 640,272 | ||||
Switzerland | 3,065,137 | 260,004 | ||||
Under Section 854(b)(2) of the Code, the Funds hereby designate the following maximum amounts as qualified dividend income for purposes of the maximum rate under Section 1(h)(11) of the Code for the fiscal year ended August 31, 2006:
iShares MSCI Index Fund | Qualified Dividend Income | ||
Austria | $ | 7,034,145 | |
Belgium | 3,113,815 | ||
EMU | 43,885,591 | ||
France | 2,584,085 | ||
Germany | 20,548,068 | ||
Italy | 3,910,244 | ||
iShares MSCI Index Fund | Qualified Dividend Income | ||
Netherlands | $ | 3,242,904 | |
Spain | 3,372,688 | ||
Sweden | 4,240,510 | ||
Switzerland | 2,111,318 | ||
United Kingdom | 31,757,730 | ||
In January 2007, shareholders will receive Form 1099-DIV which will include their share of qualified dividend income distributed during the calendar year 2006. Shareholders are advised to check with their tax advisers for information on the treatment of these amounts on their income tax returns.
| 126 | 2006 iSHARES ANNUAL REPORTTO SHAREHOLDERS |
Table of Contents
Board Review and Approval of Investment Advisory Contracts* (Unaudited)
iSHARES®, INC.
Under Section 15(c) of the Investment Company Act of 1940 (the “1940 Act”), the Company’s Board of Directors (the “Board”), including a majority of Directors who are not interested persons of the Company (as that term is defined in the 1940 Act) (the “Independent Directors”), is required annually to consider the Investment Advisory Contract between the Company and BGFA (the “Advisory Contract”) on behalf of the Funds. As required by Section 15(c), the Board requested and BGFA provided such information as the Board deemed reasonably necessary to evaluate the terms of the Advisory Contract. At a meeting held on June 14-15, 2006, the Board approved the selection of BGFA and the continuance of the Advisory Contract, based on its review of qualitative and quantitative information provided by BGFA. In selecting BGFA and approving the Advisory Contract for the Funds, the Board, including the Independent Directors, advised by their independent counsel, considered the following factors, none of which was controlling, and made the following conclusions:
NATURE, EXTENT AND QUALITY OF SERVICES PROVIDED BY BGFA
The Board determined that there would be no diminution in the scope of services required of BGFA under the Advisory Contract for the coming year as compared to the scope of services provided by BGFA over the past year. In reviewing the scope of these services, the Board considered BGFA’s investment philosophy and experience, noting that BGFA and its affiliates have committed significant resources over time, including over the past year, to the support of the Funds. The Board also considered BGFA’s compliance program and its compliance record with respect to the Funds. In that regard, the Board noted that BGFA reports to the Board about portfolio management and compliance matters on a periodic basis in connection with regularly scheduled meetings of the Board, and has made appropriate officers available as needed to provide further assistance with these matters. The Board also reviewed the background and experience of the persons responsible for the day-to-day management of the Funds. In addition to the above considerations, the Board reviewed and considered BGFA’s investment processes and strategies, and matters related to BGFA’s portfolio transaction policies and procedures. The Board further noted that BGFA does not serve as investment adviser for any other series of registered investment companies with substantially similar investment objectives and strategies as the Funds; therefore, no comparative performance information was available. However, the Board also noted that the Funds had met their investment objectives consistently since their respective inception dates. Based on this review, the Board concluded that the nature, extent and quality of services to be provided by BGFA to the Funds under the Advisory Contract were appropriate and mitigated in favor of the Board’s approval of the Advisory Contract for the coming year.
FUNDS’ EXPENSES AND PERFORMANCE OF THE FUNDS
The Board reviewed statistical information prepared by Lipper Inc. (“Lipper”), an independent provider of investment company data, regarding the expense ratio components, including advisory fees, waivers/reimbursements, and gross and net total expenses of each Fund in comparison with the same information for other registered funds objectively selected solely by Lipper as comprising each Fund’s applicable peer group (the “Lipper Peer Group”). In addition, the Board reviewed statistical information prepared by Lipper regarding the performance of each Fund for the one-, three- and five-year, and “last quarter” periods ended March 31, 2006, as applicable, and a comparison of each Fund’s performance to that of the funds in its Lipper Peer Group for the same periods. Because there are few, if any, exchange traded funds or index funds that track indices similar to those tracked by the Funds, the Lipper Peer Groups included mutual funds, closed-end funds, exchange traded funds, and funds with differing investment objective classifications, investment focuses and other characteristics (e.g., actively managed funds and funds sponsored by “at cost” service providers). In support of its review of the statistical information, the Board was provided with a detailed description of the methodology used by Lipper to determine the applicable Lipper Peer Groups and to prepare this information. The Board further noted that due to the limitations in providing comparable funds in the various Lipper Peer Groups, the statistical information may or may not provide meaningful direct comparisons to the Funds. The Board noted that most of the Funds generally performed in line with the funds in their respective Lipper Peer Groups over relevant periods; however, certain of the Funds may have underperformed or outperformed funds in their respective Lipper Peer Groups over relevant periods, but any such Funds also performed in line with their relevant benchmarks over such periods. The Board also noted that the investment advisory fees and overall expenses for the Funds were generally lower than or in line with the investment advisory fee rates and overall expenses of the funds in their respective Lipper Peer Groups. The Board also reviewed statistical information from Lipper displaying the effects of the proposed extension of breakpoints in the investment advisory fee rates for certain of the Funds (as discussed below) at various
BOARD REVIEWAND APPROVALOF INVESTMENT ADVISORY CONTRACTS | 127 |
Table of Contents
Board Review and Approval of Investment Advisory Contracts* (Unaudited) (Continued)
iSHARES®, INC.
assets levels of such Funds as compared to their Lipper Peer Groups. Based on this review, the Board concluded that the investment advisory fees and expense levels and the historical performance of each Fund, as managed by BGFA, as compared to the investment advisory fees and expense levels and performance of the funds in the relevant Lipper Peer Group, were satisfactory for the purposes of approving the Advisory Contract for the coming year.
COSTS OF SERVICES PROVIDED TO FUNDS AND PROFITS REALIZED BY BGFA AND AFFILIATES
The Board reviewed information about the profitability to BGFA of the Funds based on the fees payable to BGFA and its affiliates (including fees under the Advisory Contract), and all other sources of revenue and expense to BGFA and its affiliates for the last calendar year. The Board discussed the sources of direct and ancillary revenue with management, including the revenues to BGI from securities lending by the Company (including any securities lending by the Funds). The Board also discussed BGFA’s profit margin as reflected in the Funds’ profitability analysis and reviewed information regarding economies of scale (as discussed below). Based on this review, the Board concluded that the profits to be realized by BGFA and its affiliates under the Advisory Contract and from other relationships between the Funds and BGFA and/or its affiliates, if any, were within the range the Board considered reasonable and appropriate.
ECONOMIES OF SCALE
In connection with its review of the Funds’ profitability analysis, the Board reviewed information regarding economies of scale or other efficiencies that may result from increases in the Funds’ assets. The Board was also presented with materials regarding the proposed extension of breakpoints in the investment advisory fee rates at certain asset levels of the Funds on an aggregated basis with certain other iShares funds. The Board noted that the Advisory Contract already provided for breakpoints in the Funds’ investment advisory fee rates as the assets of the Funds, on an aggregated basis with the assets of certain other iShares funds, increase. The Board also discussed the substantial growth in assets of certain iShares funds, including the iShares funds in the group with which the Funds’ assets are aggregated for the purpose of applying breakpoints in the investment advisory fee rates, over the last few years. The Board further noted that as of July 1, 2004, Fund shareholders were no longer paying distribution fees pursuant to the Funds’ distribution plan under 12b-1 of the 1940 Act because such plan had been terminated as of that date, benefiting the Funds’ shareholders by lowering the Funds’ overall expenses. The Board also reviewed BGFA’s historic profitability as investment adviser to the iShares fund complex and noted that BGFA had made a significant investment in the iShares funds and had incurred operating losses during earlier years when the iShares funds, including the Funds, had not yet reached scale. In light of this history, the Board determined that the proposed extension of breakpoints was appropriate and warranted at this juncture for the Funds. Based on this review, the Board, recognizing its responsibility to consider this issue at least annually, concluded that the structure of the investment advisory fees, with the proposed extension of breakpoints for the Funds, reflects the current sharing and potential further sharing of economies of scale with the Funds’ shareholders.
FEES AND SERVICES PROVIDED FOR OTHER COMPARABLE FUNDS/ACCOUNTS MANAGED BY BGFA AND ITS AFFILIATES
The Board considered the Funds’ annual investment advisory fee rates under the Advisory Contract in comparison to the investment advisory/management fee rates for other funds/accounts for which BGFA (or its affiliate, BGI) provides investment advisory/management services, including other funds registered under the 1940 Act, collective funds and separate accounts (together, the “Other Accounts”). The Board noted that comparative investment advisory/management fee information was not available, as BGFA and its affiliates do not manage any Other Accounts with substantially similar investment objectives and strategies as the Funds. However, the Board noted that BGFA provided the Board with general information regarding how the level of services provided to the Other Accounts differed from the level of services provided to the Funds. Based on this review, the Board determined that the investment advisory fee rates under the Advisory Contract, with the proposed extension of breakpoints, do not constitute fees that are so disproportionately large as to bear no reasonable relationship to the services rendered
| 128 | 2006 iSHARES ANNUAL REPORTTO SHAREHOLDERS |
Table of Contents
Board Review and Approval of Investment Advisory Contracts* (Unaudited) (Continued)
iSHARES®, INC.
and that could not have been the product of arm’s-length bargaining, and concluded that the investment advisory fee rates under the Advisory Contract, with the proposed extension of breakpoints, are fair and reasonable.
OTHER BENEFITS TO BGFA AND/OR ITS AFFILIATES
The Board reviewed any ancillary revenue received by BGFA and/or its affiliates in connection with the services provided to the Funds by BGFA, such as any payment of revenue to BGI, the Company’s securities lending agent, for loaning any portfolio securities, and payment of advisory fees and/or administration fees to BGFA and BGI in connection with any investments by the Funds in other funds for which BGFA provides investment advisory services and/or BGI provides administration services. The Board noted that BGFA does not use soft dollars or consider the value of research or other services that may be provided to BGFA (including its affiliates) in selecting brokers for portfolio transactions for the Funds. The Board further noted that any portfolio transactions on behalf of the Funds placed through a BGFA affiliate are reported to the Board pursuant to Rule 17e-1 under the 1940 Act. The Board concluded that any such ancillary benefits would not be disadvantageous to the Funds’ shareholders.
Based on this analysis, the Board determined that the Advisory Contract, including the investment advisory fee rates, with the proposed extension of breakpoints, are fair and reasonable in light of all relevant circumstances, and concluded that it is in the best interest of the Funds and their shareholders to approve the Advisory Contract, with the fee schedule to the Advisory Contract as proposed to be amended to reflect the extension of breakpoints, for the coming year.
| * | Denotes the Board’s approval of Investment Advisory Contracts for all series of the Company, including the Funds. |
BOARD REVIEWAND APPROVALOF INVESTMENT ADVISORY CONTRACTS | 129 |
Table of Contents
Supplemental Information (Unaudited)
iSHARES®, INC.
The tables that follow present information about the differences between the daily market price on secondary markets for shares of an iShares Fund and that Fund’s net asset value. Net asset value, or “NAV”, is the price per share at which each Fund issues and redeems shares. It is calculated in accordance with the standard formula for valuing mutual fund shares. The “Market Price” of each iShares Fund generally is determined using the midpoint between the highest bid and the lowest offer on the stock exchange on which the shares of such Fund is listed for trading, as of the time that the Fund’s NAV is calculated. Each Fund’s Market Price may be at, above or below its NAV. The NAV of each Fund will fluctuate with changes in the market value of its portfolio holdings. The Market Price of each Fund will fluctuate in accordance with changes in its NAV, as well as market supply and demand.
Premiums or discounts are the differences (expressed as a percentage) between the NAV and Market Price of a Fund on a given day, generally at the time NAV is calculated. A premium is the amount that a Fund is trading above the reported NAV, expressed as a percentage of the NAV. A discount is the amount that a Fund is trading below the reported NAV, expressed as a percentage of the NAV.
The following information shows the frequency distributions of premiums and discounts for each of the iShares Funds included in this report. The information shown for each Fund is for five calendar years (or for each full calendar quarter completed after the inception date of such Fund if less than five years) through the date of the most recent calendar quarter-end. The specific periods covered for each Fund are disclosed in the table for such Fund.
Each line in the table shows the number of trading days in which the iShares Fund traded within the premium/discount range indicated. The number of trading days in each premium/discount range is also shown as a percentage of the total number of trading days in the period covered by each table. All data presented here represents past performance, which cannot be used to predict future results.
iShares MSCI Austria Index Fund
Period Covered: January 1, 2001 through June 30, 2006
Premium/Discount Range | Number of Days | Percentage of Total Days | |||
Greater than 2.5% | 3 | 0.21 | % | ||
Greater than 2.0% and Less than 2.5% | 2 | 0.14 | |||
Greater than 1.5% and Less than 2.0% | 24 | 1.74 | |||
Greater than 1.0% and Less than 1.5% | 64 | 4.63 | |||
Greater than 0.5% and Less than 1.0% | 231 | 16.74 | |||
Between 0.5% and –0.5% | 803 | 58.16 | |||
Less than –0.5% and Greater than –1.0% | 170 | 12.31 | |||
Less than –1.0% and Greater than –1.5% | 62 | 4.49 | |||
Less than –1.5% and Greater than –2.0% | 11 | 0.80 | |||
Less than –2.0% and Greater than –2.5% | 6 | 0.43 | |||
Less than –2.5% and Greater than –3.0% | 2 | 0.14 | |||
Less than –3.0% and Greater than –3.5% | 1 | 0.07 | |||
Less than –3.5% and Greater than –4.0% | 2 | 0.14 | |||
| 1,381 | 100.00 | % | |||
| 130 | 2006 iSHARES ANNUAL REPORTTO SHAREHOLDERS |
Table of Contents
Supplemental Information (Unaudited) (Continued)
iSHARES®, INC.
iShares MSCI Belgium Index Fund
Period Covered: January 1, 2001 through June 30, 2006
Premium/Discount Range | Number of Days | Percentage of Total Days | |||
Greater than 3.0% | 1 | 0.07 | % | ||
Greater than 2.5% and Less than 3.0% | 4 | 0.29 | |||
Greater than 2.0% and Less than 2.5% | 11 | 0.80 | |||
Greater than 1.5% and Less than 2.0% | 19 | 1.38 | |||
Greater than 1.0% and Less than 1.5% | 70 | 5.07 | |||
Greater than 0.5% and Less than 1.0% | 201 | 14.55 | |||
Between 0.5% and –0.5% | 817 | 59.17 | |||
Less than –0.5% and Greater than –1.0% | 188 | 13.61 | |||
Less than –1.0% and Greater than –1.5% | 49 | 3.55 | |||
Less than –1.5% and Greater than –2.0% | 9 | 0.65 | |||
Less than –2.0% and Greater than –2.5% | 8 | 0.58 | |||
Less than –2.5% and Greater than –3.0% | 2 | 0.14 | |||
Less than –3.0% | 2 | 0.14 | |||
| 1,381 | 100.00 | % | |||
iShares MSCI EMU Index Fund
Period Covered: January 1, 2001 through June 30, 2006
Premium/Discount Range | Number of Days | Percentage of Total Days | |||
Greater than 3.5% | 2 | 0.14 | % | ||
Greater than 3.0% and Less than 3.5% | 2 | 0.14 | |||
Greater than 2.5% and Less than 3.0% | 3 | 0.21 | |||
Greater than 2.0% and Less than 2.5% | 8 | 0.58 | |||
Greater than 1.5% and Less than 2.0% | 27 | 1.96 | |||
Greater than 1.0% and Less than 1.5% | 84 | 6.08 | |||
Greater than 0.5% and Less than 1.0% | 329 | 23.82 | |||
Between 0.5% and –0.5% | 789 | 57.15 | |||
Less than –0.5% and Greater than –1.0% | 100 | 7.24 | |||
Less than –1.0% and Greater than –1.5% | 28 | 2.03 | |||
Less than –1.5% and Greater than –2.0% | 8 | 0.58 | |||
Less than –2.0% and Greater than –2.5% | 1 | 0.07 | |||
| 1,381 | 100.00 | % | |||
| SUPPLEMENTAL INFORMATION | 131 |
Table of Contents
Supplemental Information (Unaudited) (Continued)
iSHARES®, INC.
iShares MSCI France Index Fund
Period Covered: January 1, 2001 through June 30, 2006
Premium/Discount Range | Number of Days | Percentage of Total Days | |||
Greater than 2.5% | 1 | 0.07 | % | ||
Greater than 2.0% and Less than 2.5% | 2 | 0.14 | |||
Greater than 1.5% and Less than 2.0% | 9 | 0.65 | |||
Greater than 1.0% and Less than 1.5% | 26 | 1.88 | |||
Greater than 0.5% and Less than 1.0% | 125 | 9.05 | |||
Between 0.5% and –0.5% | 1,065 | 77.14 | |||
Less than –0.5% and Greater than –1.0% | 121 | 8.76 | |||
Less than –1.0% and Greater than –1.5% | 24 | 1.74 | |||
Less than –1.5% and Greater than –2.0% | 4 | 0.29 | |||
Less than –2.0% and Greater than –2.5% | 1 | 0.07 | |||
Less than –2.5% and Greater than –3.0% | 2 | 0.14 | |||
Less than –3.0% | 1 | 0.07 | |||
| 1,381 | 100.00 | % | |||
iShares MSCI Germany Index Fund
Period Covered: January 1, 2001 through June 30, 2006
Premium/Discount Range | Number of Days | Percentage of Total Days | |||
Greater than 2.5% | 1 | 0.07 | % | ||
Greater than 2.0% and Less than 2.5% | 2 | 0.14 | |||
Greater than 1.5% and Less than 2.0% | 15 | 1.09 | |||
Greater than 1.0% and Less than 1.5% | 37 | 2.68 | |||
Greater than 0.5% and Less than 1.0% | 162 | 11.73 | |||
Between 0.5% and –0.5% | 937 | 67.87 | |||
Less than –0.5% and Greater than –1.0% | 155 | 11.22 | |||
Less than –1.0% and Greater than –1.5% | 52 | 3.77 | |||
Less than –1.5% and Greater than –2.0% | 10 | 0.72 | |||
Less than –2.0% and Greater than –2.5% | 3 | 0.21 | |||
Less than –2.5% and Greater than –3.0% | 3 | 0.21 | |||
Less than –3.0% | 4 | 0.29 | |||
| 1,381 | 100.00 | % | |||
| 132 | 2006 iSHARES ANNUAL REPORTTO SHAREHOLDERS |
Table of Contents
Supplemental Information (Unaudited) (Continued)
iSHARES®, INC.
iShares MSCI Italy Index Fund
Period Covered: January 1, 2001 through June 30, 2006
Premium/Discount Range | Number of Days | Percentage of Total Days | |||
Greater than 2.5% | 1 | 0.07 | % | ||
Greater than 2.0% and Less than 2.5% | 3 | 0.21 | |||
Greater than 1.5% and Less than 2.0% | 7 | 0.51 | |||
Greater than 1.0% and Less than 1.5% | 21 | 1.52 | |||
Greater than 0.5% and Less than 1.0% | 124 | 8.98 | |||
Between 0.5% and –0.5% | 1,071 | 77.57 | |||
Less than –0.5% and Greater than –1.0% | 124 | 8.98 | |||
Less than –1.0% and Greater than –1.5% | 20 | 1.45 | |||
Less than –1.5% and Greater than –2.0% | 4 | 0.29 | |||
Less than –2.0% and Greater than –2.5% | 3 | 0.21 | |||
Less than –2.5% and Greater than –3.0% | 1 | 0.07 | |||
Less than –3.0% and Greater than –3.5% | 1 | 0.07 | |||
Less than –3.5% | 1 | 0.07 | |||
| 1,381 | 100.00 | % | |||
iShares MSCI Netherlands Index Fund
Period Covered: January 1, 2001 through June 30, 2006
Premium/Discount Range | Number of Days | Percentage of Total Days | |||
Greater than 4.0% | 2 | 0.14 | % | ||
Greater than 3.5% and Less than 4.0% | 1 | 0.07 | |||
Greater than 3.0% and Less than 3.5% | 1 | 0.07 | |||
Greater than 2.5% and Less than 3.0% | 3 | 0.21 | |||
Greater than 2.0% and Less than 2.5% | 5 | 0.35 | |||
Greater than 1.5% and Less than 2.0% | 10 | 0.72 | |||
Greater than 1.0% and Less than 1.5% | 41 | 2.97 | |||
Greater than 0.5% and Less than 1.0% | 208 | 15.08 | |||
Between 0.5% and –0.5% | 911 | 65.99 | |||
Less than –0.5% and Greater than –1.0% | 136 | 9.85 | |||
Less than –1.0% and Greater than –1.5% | 45 | 3.26 | |||
Less than –1.5% and Greater than –2.0% | 12 | 0.87 | |||
Less than –2.0% and Greater than –2.5% | 3 | 0.21 | |||
Less than –2.5% | 3 | 0.21 | |||
| 1,381 | 100.00 | % | |||
SUPPLEMENTAL INFORMATION | 133 |
Table of Contents
Supplemental Information (Unaudited) (Continued)
iSHARES®, INC.
iShares MSCI Spain Index Fund
Period Covered: January 1, 2001 through June 30, 2006
Premium/Discount Range | Number of Days | Percentage of Total Days | |||
Greater than 3.0% | 3 | 0.21 | % | ||
Greater than 2.5% and Less than 3.0% | 2 | 0.14 | |||
Greater than 2.0% and Less than 2.5% | 4 | 0.29 | |||
Greater than 1.5% and Less than 2.0% | 8 | 0.58 | |||
Greater than 1.0% and Less than 1.5% | 38 | 2.75 | |||
Greater than 0.5% and Less than 1.0% | 164 | 11.89 | |||
Between 0.5% and –0.5% | 967 | 70.03 | |||
Less than –0.5% and Greater than –1.0% | 147 | 10.64 | |||
Less than –1.0% and Greater than –1.5% | 35 | 2.53 | |||
Less than –1.5% and Greater than –2.0% | 8 | 0.58 | |||
Less than –2.0% and Greater than –2.5% | 4 | 0.29 | |||
Less than –2.5% | 1 | 0.07 | |||
| 1,381 | 100.00 | % | |||
iShares MSCI Sweden Index Fund
Period Covered: January 1, 2001 through June 30, 2006
Premium/Discount Range | Number of Days | Percentage of Total Days | |||
Greater than 3.5% | 5 | 0.35 | % | ||
Greater than 3.0% and Less than 3.5% | 2 | 0.14 | |||
Greater than 2.5% and Less than 3.0% | 4 | 0.29 | |||
Greater than 2.0% and Less than 2.5% | 20 | 1.45 | |||
Greater than 1.5% and Less than 2.0% | 32 | 2.32 | |||
Greater than 1.0% and Less than 1.5% | 79 | 5.72 | |||
Greater than 0.5% and Less than 1.0% | 237 | 17.18 | |||
Between 0.5% and –0.5% | 770 | 55.78 | |||
Less than –0.5% and Greater than –1.0% | 138 | 9.99 | |||
Less than –1.0% and Greater than –1.5% | 58 | 4.20 | |||
Less than –1.5% and Greater than –2.0% | 13 | 0.94 | |||
Less than –2.0% and Greater than –2.5% | 14 | 1.01 | |||
Less than –2.5% and Greater than –3.0% | 5 | 0.35 | |||
Less than –3.0% and Greater than –3.5% | 1 | 0.07 | |||
Less than –3.5% | 3 | 0.21 | |||
| 1,381 | 100.00 | % | |||
| 134 | 2006 iSHARES ANNUAL REPORTTO SHAREHOLDERS |
Table of Contents
Supplemental Information (Unaudited) (Continued)
iSHARES®, INC.
iShares MSCI Switzerland Index Fund
Period Covered: January 1, 2001 through June 30, 2006
Premium/Discount Range | Number of Days | Percentage of Total Days | |||
Greater than 3.0% | 2 | 0.14 | % | ||
Greater than 2.5% and Less than 3.0% | 5 | 0.35 | |||
Greater than 2.0% and Less than 2.5% | 7 | 0.51 | |||
Greater than 1.5% and Less than 2.0% | 36 | 2.61 | |||
Greater than 1.0% and Less than 1.5% | 93 | 6.73 | |||
Greater than 0.5% and Less than 1.0% | 269 | 19.50 | |||
Between 0.5% and –0.5% | 819 | 59.32 | |||
Less than –0.5% and Greater than –1.0% | 101 | 7.31 | |||
Less than –1.0% and Greater than –1.5% | 27 | 1.96 | |||
Less than –1.5% and Greater than –2.0% | 14 | 1.01 | |||
Less than –2.0% and Greater than –2.5% | 3 | 0.21 | |||
Less than –2.5% and Greater than –3.0% | 1 | 0.07 | |||
Less than –3.0% and Greater than –3.5% | 1 | 0.07 | |||
Less than –3.5% and Greater than –4.0% | 1 | 0.07 | |||
Less than –4.0% | 2 | 0.14 | |||
| 1,381 | 100.00 | % | |||
iShares MSCI United Kingdom Index Fund
Period Covered: January 1, 2001 through June 30, 2006
Premium/Discount Range | Number of Days | Percentage of Total Days | |||
Greater than 4.0% and Less than 4.5% | 2 | 0.14 | % | ||
Greater than 3.5% and Less than 4.0% | 4 | 0.29 | |||
Greater than 3.0% and Less than 3.5% | 2 | 0.14 | |||
Greater than 2.5% and Less than 3.0% | 1 | 0.07 | |||
Greater than 2.0% and Less than 2.5% | 8 | 0.58 | |||
Greater than 1.5% and Less than 2.0% | 45 | 3.26 | |||
Greater than 1.0% and Less than 1.5% | 168 | 12.18 | |||
Greater than 0.5% and Less than 1.0% | 348 | 25.21 | |||
Between 0.5% and –0.5% | 696 | 50.41 | |||
Less than –0.5% and Greater than –1.0% | 83 | 6.01 | |||
Less than –1.0% and Greater than –1.5% | 14 | 1.01 | |||
Less than –1.5% and Greater than –2.0% | 5 | 0.35 | |||
Less than –2.0% and Greater than –2.5% | 2 | 0.14 | |||
Less than –2.5% | 3 | 0.21 | |||
| 1,381 | 100.00 | % | |||
SUPPLEMENTAL INFORMATION | 135 |
Table of Contents
Director and Officer Information (Unaudited)
iSHARES®, INC.
The Board of Directors has responsibility for the overall management and operations of the Company, including general supervision of the duties performed by BGFA and other service providers. Each Director serves until his or her successor is duly elected or appointed and qualified.
iShares, Inc., iShares Trust, Barclays Global Investors Funds and Master Investment Portfolio are considered to be members of the same fund complex, as defined in Form N-1A under the 1940 Act. Each Director of iShares, Inc. also serves as a Trustee for iShares Trust and oversees 111 portfolios within the fund complex. In addition, Lee T. Kranefuss and Richard K. Lyons each serves as a Trustee for Barclays Global Investors Funds and Master Investment Portfolio and oversees an additional 25 portfolios within the fund complex.
Unless otherwise noted in the tables below, the address for each Director and Officer is c/o Barclays Global Investors, N.A., 45 Fremont Street, San Francisco, California 94105. The Board has designated George G.C. Parker as its Lead Director. Additional information about the Funds’ Directors and Officers may be found in the Funds’ combined Statement of Additional Information, which is available without charge, upon request, by calling toll-free 1-800-474-2737.
Interested Directors and Officers
Name, Year of Birth | Position(s), Length of Service | Principal Occupation(s) During Past 5 Years | Other Directorships Held | |||
*Lee T. Kranefuss, 1961 | Director, Chairman and President (since 2003). | Chief Executive Officer, Global Index and Markets Group of BGI (since 2005); Chief Executive Officer of Intermediary Investor and Exchange Traded Products Business of BGI (since 2003); Chief Executive Officer of the Individual Investor Business of BGI (1999-2003). | Trustee (since 2003) of iShares Trust; Trustee (since 2001) of Barclays Global Investors Funds and Master Investment Portfolio; Director (since 2003) of BGI Cayman Prime Money Market Fund, Ltd. | |||
*John E. Martinez, 1962 | Director (since 2003). | Co-Chief Executive Officer of Global Index and Markets Group of BGI (2001-2003); Chairman of Barclays Global Investors Services (2000-2003); Chief Executive Officer of Capital Markets Group of BGI (1996-2001). | Trustee (since 2003) of iShares Trust; Director (since 2005) of Real Estate Equity Exchange; Director (since 2003) of Larkin Street Youth Services. | |||
| * | Lee T. Kranefuss and John E. Martinez are considered to be “interested persons” (as defined in the 1940 Act) of the Company due to their affiliations with BGFA, the Funds’ investment adviser, BGI, the parent company of BGFA, and Barclays Global Investors Services, an affiliate of BGFA and BGI. |
| 136 | 2006 iSHARES ANNUAL REPORTTO SHAREHOLDERS |
Table of Contents
Director and Officer Information (Unaudited) (Continued)
iSHARES®, INC.
Independent Directors
Name, Year of Birth | Position(s), Length of Service | Principal Occupation(s) During Past 5 Years | Other Directorships Held | |||
Richard K. Lyons, 1961 | Director (since 2002). | Executive Associate Dean (since 2005); Sylvan Coleman Chair in Finance (since 2004); Acting Dean (2004-2005) and Professor (since 1993), University of California, Berkeley: Haas School of Business; Consultant for IMF World Bank, Federal Reserve Bank and Citibank N.A. (since 2000). | Trustee (since 2000) of iShares Trust; Trustee (since 2001) of Barclays Global Investors Funds and Master Investment Portfolio; Director (since 2003) of BGI Cayman Prime Money Market Fund, Ltd.; Trustee (since 1995) and Chairman of Matthews Asian Funds (oversees 8 portfolios). | |||
George G. C. Parker, 1939 | Director (since 2002). | Dean Witter Distinguished Professor of Finance (since 1994); Formerly Senior Associate Dean for Academic Affairs, Director of MBA Program, Stanford University: Graduate School of Business (1993-2001). | Trustee (since 2000) of iShares Trust; Director (since 1996) of Continental Airlines, Inc.; Director (since 1995) of Community First Financial Group; Director (since 1999) of Tejon Ranch Company; Director (since 2003) of First Republic Bank; Director (since 2004) of Threshold Pharmaceuticals. | |||
Cecilia H. Herbert, 1949 | Director (since 2005). | Member of Finance Council, Archdiocese of San Francisco (since 1991); Chair of Investment Committee, Archdiocese of San Francisco (1994-2005). | Trustee (since 2005) of iShares Trust; Trustee (2004-2005) of Pacific Select Funds; Trustee (1992-2003) of the Montgomery Funds; Trustee (since 2005) of the Thacher School; Director (since 1998) of Catholic Charities CYO; Director (since 2005) of Women’s Forum West (professional association). | |||
Charles A. Hurty, 1943 | Director (since 2005). | Partner, KPMG LLP (1968-2001). | Trustee (since 2005) of iShares Trust; Director (since 2002) of GMAM Absolute Return Strategy Fund (1 portfolio); Director (since 2002) of Citigroup Alternative Investments Multi-Adviser Hedge Fund Portfolios LLC (2 portfolios); Director (since 2005) of CSFB Alternative Investments Fund (15 portfolios). | |||
John E. Kerrigan, 1955 | Director (since 2005). | Chief Investment Officer, Santa Clara University (since 2002); Managing Director, Merrill Lynch (1994-2002). | Trustee (since 2005) of iShares Trust; Member (since 2004) of Advisory Council for Commonfund Distressed Debt Partners II. | |||
| DIRECTORAND OFFICER INFORMATION | 137 |
Table of Contents
Director and Officer Information (Unaudited) (Continued)
iSHARES®, INC.
Officer
Name, Year of Birth | Position(s), Length of Service | Principal Occupation(s) During Past 5 Years | Other Directorships Held | |||
Michael A. Latham, 1965 | Secretary, Treasurer and Principal Financial Officer (since 2002). | Chief Operating Officer of the Intermediary Investor and Exchange Traded Products Business of BGI (since 2003); Director of Mutual Fund Delivery in the U.S. Individual Investor Business of BGI (2000-2003). | None. |
| 138 | 2006 iSHARES ANNUAL REPORTTO SHAREHOLDERS |
Table of Contents
Notes:
| NOTES | 139 |
Table of Contents
The following is a list of iShares Funds being offered, along with their respective exchange trading symbols. Please call 1-800-iShares (1-800-474-2737) to obtain a prospectus for any iShares Fund. The prospectus contains more complete information, including charges, expenses, investment objectives and risk factors that should be carefully considered to determine if the Fund(s) are an appropriate investment for you. Read the prospectus(es) carefully before investing. Investing involves risk, including possible loss of principal.
iShares S&P Domestic Index Funds
iShares S&P 1500 (ISI)
iShares S&P 100 (OEF)
iShares S&P 500 (IVV)
iShares S&P 500 Growth (IVW)
iShares S&P 500 Value (IVE)
iShares S&P MidCap 400 (IJH)
iShares S&P MidCap 400 Growth (IJK)
iShares S&P MidCap 400 Value (IJJ)
iShares S&P SmallCap 600 (IJR)
iShares S&P SmallCap 600 Growth (IJT)
iShares S&P SmallCap 600 Value (IJS)
iShares Domestic Sector Index Funds
iShares Cohen & Steers Realty Majors (ICF)
iShares Dow Jones U.S. Basic Materials Sector (IYM)
iShares Dow Jones U.S. Consumer Services Sector (IYC)
iShares Dow Jones U.S. Consumer Goods Sector (IYK)
iShares Dow Jones U.S. Energy Sector (IYE)
iShares Dow Jones U.S. Financial Sector (IYF)
iShares Dow Jones U.S. Financial Services (IYG)
iShares Dow Jones U.S. Healthcare Sector (IYH)
iShares Dow Jones U.S. Industrial Sector (IYJ)
iShares Dow Jones U.S. Real Estate (IYR)
iShares Dow Jones U.S. Technology Sector (IYW)
iShares Dow Jones U.S. Telecommunications Sector (IYZ)
iShares Dow Jones Transportation Average (IYT)
iShares Dow Jones U.S. Utilities Sector (IDU)
iShares Dow Jones U.S. Total Market (IYY)
iShares Goldman Sachs Natural Resources (IGE)
iShares Goldman Sachs Networking (IGN)
iShares Goldman Sachs Semiconductor (IGW)
iShares Goldman Sachs Software (IGV)
iShares Goldman Sachs Technology (IGM)
iShares Nasdaq Biotechnology (IBB)
iShares Domestic Subsector Index Funds
iShares Dow Jones U.S. Aerospace & Defense (ITA)
iShares Dow Jones U.S. Broker-Dealers (IAI)
iShares Dow Jones U.S. Health Care Providers (IHF)
iShares Dow Jones U.S. Home Construction (ITB)
iShares Dow Jones U.S. Insurance (IAK)
iShares Dow Jones U.S. Medical Devices (IHI)
iShares Dow Jones U.S. Oil & Gas Exploration & Production (IEO)
iShares Dow Jones U.S. Oil Equipment & Services (IEZ)
iShares Dow Jones U.S. Pharmaceuticals (IHE)
iShares Dow Jones U.S. Regional Banks (IAT)
iShares Global Index Funds
iShares S&P Global 100 (IOO)
iShares S&P Global Consumer Discretionary Sector (RXI)
iShares S&P Global Consumer Staples Sector (KXI)
iShares S&P Global Energy Sector (IXC)
iShares S&P Global Financials Sector (IXG)
iShares S&P Global Healthcare Sector (IXJ)
iShares S&P Global Industrials Sector (EXI)
iShares S&P Global Materials Sector (JXI)
iShares S&P Global Technology Sector (IXN)
iShares S&P Global Telecommunications Sector (IXP)
iShares S&P Global Utilities Sector (MXI)
iShares Russell Index Funds
iShares Russell 3000 (IWV)
iShares Russell 3000 Growth (IWZ)
iShares Russell 3000 Value (IWW)
iShares Russell 1000 (IWB)
iShares Russell 1000 Growth (IWF)
iShares Russell 1000 Value (IWD)
iShares Russell Midcap (IWR)
iShares Russell Midcap Growth (IWP)
iShares Russell Midcap Value (IWS)
iShares Russell 2000 (IWM)
iShares Russell 2000 Growth (IWO)
iShares Russell 2000 Value (IWN)
iShares Russell Microcap™ (IWC)
iShares International Country Index Funds
iShares FTSE/Xinhua China 25 (FXI)
iShares MSCI Australia (EWA)
iShares MSCI Austria (EWO)
iShares MSCI Belgium (EWK)
iShares MSCI Brazil (EWZ)
iShares MSCI Canada (EWC)
iShares MSCI France (EWQ)
iShares MSCI Germany (EWG)
iShares MSCI Hong Kong (EWH)
iShares MSCI Italy (EWI)
iShares MSCI Japan (EWJ)
iShares MSCI Malaysia (EWM)
iShares MSCI Mexico (EWW)
iShares MSCI Netherlands (EWN)
iShares MSCI Singapore (EWS)
iShares MSCI South Africa (EZA)
iShares MSCI South Korea (EWY)
iShares MSCI Spain (EWP)
iShares MSCI Sweden (EWD)
iShares MSCI Switzerland (EWL)
iShares MSCI Taiwan (EWT)
iShares MSCI United Kingdom (EWU)
iShares S&P/TOPIX 150 (ITF)
iShares Bond Funds
iShares Lehman Aggregate (AGG)
iShares Lehman TIPS (TIP)
iShares Lehman 1-3 Year Treasury (SHY)
iShares Lehman 7-10 Year Treasury (IEF)
iShares Lehman 20+ Year Treasury (TLT)
iShares GS $ InvesTop™ Corporate (LQD)
iShares Specialty Index Funds
iShares KLD Select SocialSM (KLD)
iShares Dow Jones Select Dividend (DVY)
iShares International Index Funds
iShares MSCI EAFE (EFA)
iShares MSCI EAFE Growth (EFG)
iShares MSCI EAFE Value (EFV)
iShares MSCI Emerging Markets (EEM)
iShares MSCI EMU (EZU)
iShares MSCI Pacific ex-Japan (EPP)
iShares S&P Europe 350 (IEV)
iShares S&P Latin America 40 (ILF)
iShares Morningstar Index Funds
iShares Morningstar Large Core (JKD)
iShares Morningstar Large Growth (JKE)
iShares Morningstar Large Value (JKF)
iShares Morningstar Mid Core (JKG)
iShares Morningstar Mid Growth (JKH)
iShares Morningstar Mid Value (JKI)
iShares Morningstar Small Core (JKJ)
iShares Morningstar Small Growth (JKK)
iShares Morningstar Small Value (JKL)
iShares NYSE Index Funds
iShares NYSE Composite (NYC)
iShares NYSE 100 (NY)
iShares® is a registered trademark of Barclays Global Investors, N.A. The iShares Funds are not sponsored, endorsed or issued by Goldman, Sachs & Co. or Lehman Brothers, nor are they sponsored, endorsed, issued, sold or promoted by Cohen & Steers Capital Management, Inc., Dow Jones & Company, Inc., FTSE/Xinhua Index Limited, KLD Research & Analytics, Inc., Morgan Stanley Capital International, Morningstar, Inc., The Nasdaq Stock Market, Inc., New York Stock Exchange, Inc., Frank Russell Company, or Standard & Poor’s. None of these companies make any representation regarding the advisability of investing in the iShares Funds. Neither SEI nor BGI, nor any of their affiliates, are affiliated with the companies listed above. “GS $ InvesTop™” and “Goldman Sachs®” are trademarks of Goldman, Sachs & Co.
An investment in the Fund(s) is not a deposit of a bank and it is not insured or guaranteed by the Federal Deposit Insurance Corporation or any other government agency.
This advertising section does not constitute part of the 2006 Annual Report.
3467-iS-0906
| 140 | 2006 iSHARES ANNUAL REPORTTO SHAREHOLDERS |
Table of Contents
Table of Contents
Table of Contents
| 1 | ||
| 27 | ||
| 29 | ||
| 29 | ||
| 36 | ||
| 38 | ||
| 41 | ||
| 51 | ||
| 58 | ||
| 60 | ||
| 66 | ||
| 74 | ||
| 80 | ||
| 82 | ||
| 90 | ||
| 93 | ||
| 101 | ||
| 113 | ||
| 122 | ||
| 123 | ||
Board Review and Approval of Investment Advisory Contracts (Unaudited) | 124 | |
| 127 | ||
| 134 | ||
| 140 |
Table of Contents
Management’s Discussion of Fund Performance
iSHARES® MSCI AUSTRALIA INDEX FUND
Performance as of August 31, 2006
| Average Annual Total Returns | |||||||||||||||||||||||||
| Year Ended 8/31/06 | Five Years Ended 8/31/06 | Ten Years Ended 8/31/06 | |||||||||||||||||||||||
| NAV | MARKET | INDEX | NAV | MARKET | INDEX | NAV | MARKET | INDEX | |||||||||||||||||
| 22.35 | % | 20.56 | % | 21.71 | % | 21.77 | % | 21.42 | % | 21.32 | % | 10.85 | % | 10.85 | % | 11.01 | % | ||||||||
| Cumulative Total Returns | |||||||||||||||||||||||||
| Year Ended 8/31/06 | Five Years Ended 8/31/06 | Ten Years Ended 8/31/06 | |||||||||||||||||||||||
| NAV | MARKET | INDEX | NAV | MARKET | INDEX | NAV | MARKET | INDEX | |||||||||||||||||
| 22.35 | % | 20.56 | % | 21.71 | % | 167.74 | % | 163.94 | % | 162.87 | % | 180.17 | % | 180.14 | % | 184.18 | % | ||||||||
“Average annual total returns” represent the average annual change in value of an investment over the periods indicated. “Cumulative total returns” represent the total change in value of an investment over the periods indicated.
The Fund’s per share net asset value or “NAV” is the value of one share of the Fund as calculated in accordance with the standard formula for valuing mutual fund shares. The NAV return is based on the NAV of the Fund, and the market return is based on the market price per share of the Fund. The price used to calculate market return (“Market Price”) is determined by using the midpoint between the highest bid and the lowest offer on the stock exchange on which the shares of the Fund are listed for trading, as of the time that the Fund’s NAV is calculated. Market and NAV returns assume that dividends and capital gain distributions have been reinvested in the Fund at Market Price and NAV, respectively.
An index is a statistical composite that tracks a specified financial market or sector. Unlike the Fund, an index does not actually hold a portfolio of securities and therefore does not incur the expenses incurred by the Fund. These expenses negatively impact the performance of the Fund. Also, market returns do not include brokerage commissions that may be payable on secondary market transactions. If brokerage commissions were included, market returns would be lower. The returns shown in the tables above do not reflect the deduction of taxes that a shareholder would pay on fund distributions or the redemption or sale of fund shares. The investment return and principal value of shares of the Fund will vary with changes in market conditions. Shares of the Fund may be worth more or less than their original cost when they are redeemed or sold in the market. The Fund’s past performance is no guarantee of future results.
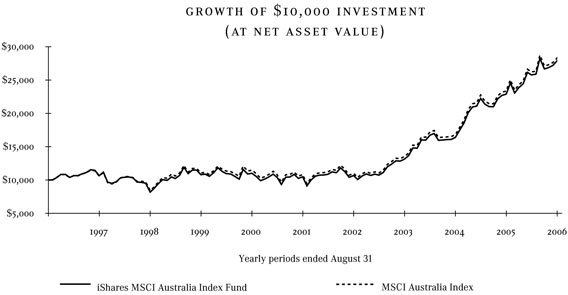
Performance figures assume reinvestment of all dividends and capital gain distributions and do not reflect the deduction of taxes that a shareholder would pay on fund distributions or the redemption of fund shares. An index is a statistical composite that tracks a specified financial market or sector. Unlike the Fund, an index does not actually hold a portfolio of securities and therefore does not incur the expenses incurred by the Fund. These expenses negatively impact the performance of the Fund. The Fund’s past performance is no guarantee of future results.
| MANAGEMENT’S DISCUSSIONSOF FUND PERFORMANCE | 1 |
Table of Contents
Management’s Discussion of Fund Performance (Continued)
iSHARES® MSCI AUSTRALIA INDEX FUND
PORTFOLIO ALLOCATION
As of 8/31/06
Sector | Percentage of Net Assets | ||
Financial | 49.15 | % | |
Basic Materials | 18.39 | ||
Consumer Non-Cyclical | 10.61 | ||
Industrial | 8.27 | ||
Consumer Cyclical | 4.71 | ||
Energy | 4.27 | ||
Communications | 1.88 | ||
Utilities | 1.48 | ||
Technology | 0.43 | ||
Short-Term and Other Net Assets | 0.81 | ||
TOTAL | 100.00 | % | |
TOP TEN FUND HOLDINGS
As of 8/31/06
Security | Percentage of Net Assets | ||
BHP Billiton Ltd. | 11.86 | % | |
Commonwealth Bank of Australia | 7.22 | ||
National Australia Bank Ltd. | 7.15 | ||
Australia & New Zealand Banking Group Ltd. | 6.12 | ||
Westpac Banking Corp. Ltd. | 5.25 | ||
Westfield Group | 3.35 | ||
Woolworths Ltd. | 2.99 | ||
Rio Tinto Ltd. | 2.56 | ||
Woodside Petroleum Ltd. | 2.42 | ||
QBE Insurance Group Ltd. | 2.34 | ||
TOTAL | 51.26 | % | |
The iShares MSCI Australia Index Fund (the “Fund”) seeks to provide investment results that correspond generally to the price and yield performance, before fees and expenses, of publicly traded securities in the aggregate in the Australian market, as measured by the MSCI Australia Index (the “Index”). The Fund invests in a representative sample of securities in the Index, which has a similar investment profile as the Index. Due to the use of representative sampling, the Fund may or may not hold all of the securities that are included in the Index. For the twelve-month period ended August 31, 2006 (the “reporting period”), the Fund returned 22.35%, while the Index returned 21.71%.
The Australian market posted sound gains for the reporting period. Australia’s economy continued to appear strong during the reporting period: now in its 15th year of uninterrupted expansion, the longest expansion in Australia since 1945, the Australian economy grew at an annualized rate of 2.6% in the second quarter of 2006. Export trade remained healthy for most of the reporting period, due in part to demand from China for coal and iron ore.
Inflation levels rose during the reporting period, reaching 4.0% for the second quarter of 2006, compared with 2.5% for the second quarter of 2005. In response, the Reserve Bank of Australia increased short-term interest rates twice during the reporting period, bringing the rate to 6.00% in August 2006.
The Fund’s ten largest holdings accounted for approximately 51% of the Fund’s net assets as of August 31, 2006. All of the Fund’s ten largest holdings as of August 31, 2006 delivered gains for the reporting period. Metals and mining company Rio Tinto Ltd. posted the strongest gains, followed by QBE Insurance Group Ltd. BHP Billiton Ltd., a metals and mining company that represents the Fund’s largest holding at almost 12% of Fund net assets, performed well. Woodside Petroleum Ltd. and retailer Woolworths Ltd. also contributed to positive Fund performance. Real estate conglomerate Westfield Group delivered the most modest gains among the ten largest holdings.
| 2 | 2006 iSHARES ANNUAL REPORTTO SHAREHOLDERS |
Table of Contents
Management’s Discussion of Fund Performance
iSHARES® MSCI BRAZIL INDEX FUND
Performance as of August 31, 2006
| Average Annual Total Returns | |||||||||||||||||||||||||
| Year Ended 8/31/06 | Five Years Ended 8/31/06 | Inception to 8/31/06 | |||||||||||||||||||||||
| NAV | MARKET | INDEX | NAV | MARKET | INDEX | NAV | MARKET | INDEX | |||||||||||||||||
| 41.13 | % | 42.51 | % | 43.63 | % | 30.17 | % | 30.57 | % | 32.64 | % | 13.93 | % | 14.05 | % | 16.55 | % | ||||||||
| Cumulative Total Returns | |||||||||||||||||||||||||
| Year Ended 8/31/06 | Five Years Ended 8/31/06 | Inception to 8/31/06 | |||||||||||||||||||||||
| NAV | MARKET | INDEX | NAV | MARKET | INDEX | NAV | MARKET | INDEX | |||||||||||||||||
| 41.13 | % | 42.51 | % | 43.63 | % | 273.69 | % | 279.44 | % | 310.62 | % | 122.92 | % | 124.37 | % | 156.42 | % | ||||||||
Total returns for the periods since inception are calculated from the inception date of the Fund (7/10/00). “Average annual total returns” represent the average annual change in value of an investment over the periods indicated. “Cumulative total returns” represent the total change in value of an investment over the periods indicated.
Certain sectors and markets performed exceptionally well based on market conditions during the one-year period. Investors should not expect that such exceptional returns will be repeated.
The Fund’s per share net asset value or “NAV” is the value of one share of the Fund as calculated in accordance with the standard formula for valuing mutual fund shares. The NAV return is based on the NAV of the Fund, and the market return is based on the market price per share of the Fund. The price used to calculate market return (“Market Price”) is determined by using the midpoint between the highest bid and the lowest offer on the stock exchange on which the shares of the Fund are listed for trading, as of the time that the Fund’s NAV is calculated. Since shares of the Fund did not trade in the secondary market until several days after the Fund’s inception, for the period from inception to the first day of secondary market trading in shares of the Fund (7/14/00), the NAV of the Fund is used as a proxy for secondary market trading price to calculate market returns. Market and NAV returns assume that dividends and capital gain distributions have been reinvested in the Fund at Market Price and NAV, respectively.
An index is a statistical composite that tracks a specified financial market or sector. Unlike the Fund, an index does not actually hold a portfolio of securities and therefore does not incur the expenses incurred by the Fund. These expenses negatively impact the performance of the Fund. Also, market returns do not include brokerage commissions that may be payable on secondary market transactions. If brokerage commissions were included, market returns would be lower. The returns shown in the tables above do not reflect the deduction of taxes that a shareholder would pay on fund distributions or the redemption or sale of fund shares. The investment return and principal value of shares of the Fund will vary with changes in market conditions. Shares of the Fund may be worth more or less than their original cost when they are redeemed or sold in the market. The Fund’s past performance is no guarantee of future results.
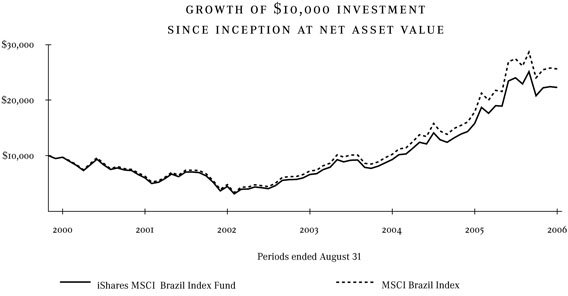
Performance figures assume reinvestment of all dividends and capital gain distributions and do not reflect the deduction of taxes that a shareholder would pay on fund distributions or the redemption of fund shares. An index is a statistical composite that tracks a specified financial market or sector. Unlike the Fund, an index does not actually hold a portfolio of securities and therefore does not incur the expenses incurred by the Fund. These expenses negatively impact the performance of the Fund. The Fund’s past performance is no guarantee of future results.
| MANAGEMENT’S DISCUSSIONSOF FUND PERFORMANCE | 3 |
Table of Contents
Management’s Discussion of Fund Performance (Continued)
iSHARES® MSCI BRAZIL INDEX FUND
PORTFOLIO ALLOCATION
As of 8/31/06
Sector | Percentage of Net Assets | ||
Basic Materials | 25.41 | % | |
Energy | 23.83 | ||
Financial | 18.35 | ||
Consumer Non-Cyclical | 9.86 | ||
Utilities | 7.74 | ||
Communications | 6.08 | ||
Industrial | 4.71 | ||
Consumer Cyclical | 3.66 | ||
Short-Term and Other Net Assets | 0.36 | ||
TOTAL | 100.00 | % | |
TOP TEN FUND HOLDINGS
As of 8/31/06
Security | Percentage of Net Assets | ||
Petroleo Brasileiro SA Preferred | 13.42 | % | |
Petroleo Brasileiro SA | 10.41 | ||
Companhia Vale do Rio Doce Class A Preferred | 8.62 | ||
Banco Bradesco SA Preferred | 7.52 | ||
Companhia Vale do Rio Doce ADR | 7.02 | ||
Banco Itau Holding Financeira SA Preferred | 4.93 | ||
Companhia de Bebidas das Americas Preferred | 4.79 | ||
Unibanco Uniao de Bancos Brasileiros SA | 4.33 | ||
Gerdau SA Preferred | 2.33 | ||
Companhia Energetica de Minas Gerais Preferred | 2.11 | ||
TOTAL | 65.48 | % | |
The iShares MSCI Brazil Index Fund (the “Fund”) seeks to provide investment results that correspond generally to the price and yield performance, before fees and expenses, of publicly traded securities in the aggregate in the Brazilian market, as measured by the MSCI Brazil Index (the “Index”). The Fund invests in a representative sample of securities in the Index, which has a similar investment profile as the Index. Due to the use of representative sampling, the Fund may or may not hold all of the securities that are included in the Index. For the twelve-month period ended August 31, 2006 (the “reporting period”), the Fund returned 41.13%, while the Index returned 43.63%.
Brazil’s market delivered robust gains for the reporting period, fueled largely by escalating oil prices and a strengthening currency. Oil prices, which continued to climb during the reporting period, reached a high of $77.03 per barrel on August 7th following news of increased violence in the Middle East and the shutdown of BP’s largest oil field in the U.S. The increase in oil prices benefited the Brazilian market whose largest company, oil company Petroleo Brasileiro SA, represented more than 27% of the Index as of August 31, 2006. The Brazilian currency, the real, continued to appreciate against the U.S. dollar during the reporting period, largely because Brazil’s high interest rate levels continued to attract strong currency inflows. The real dipped in July, however, as the Brazilian central bank cut its benchmark rate to a 20-year low of 14.75%.
The Fund’s ten largest holdings accounted for approximately 65% of the Fund’s net assets as of August 31, 2006. Performance among the Fund’s ten largest holdings as of August 31, 2006 was strong for the reporting period. Gerdau SA and Unibanco Uniao de Bancos Brasilieros SA delivered the strongest gains among the ten largest holdings. Oil company Petroleo Brasileiro SA, whose preferred and common shares are the two largest Fund holdings, performed well, as did Banco Bradesco SA and Banco Itau Holding Financeira SA. Companhia Vale do Rio Doce, the world’s largest iron ore producer, also contributed positively to Fund performance for the reporting period.
| 4 | 2006 iSHARES ANNUAL REPORTTO SHAREHOLDERS |
Table of Contents
Management’s Discussion of Fund Performance
iSHARES® MSCI CANADA INDEX FUND
Performance as of August 31, 2006
| Average Annual Total Returns | |||||||||||||||||||||||||
| Year Ended 8/31/06 | Five Years Ended 8/31/06 | Ten Years Ended 8/31/06 | |||||||||||||||||||||||
| NAV | MARKET | INDEX | NAV | MARKET | INDEX | NAV | MARKET | INDEX | |||||||||||||||||
| 22.46 | % | 22.16 | % | 22.84 | % | 19.09 | % | 18.97 | % | 19.58 | % | 13.86 | % | 13.92 | % | 14.46 | % | ||||||||
| Cumulative Total Returns | |||||||||||||||||||||||||
| Year Ended 8/31/06 | Five Years Ended 8/31/06 | Ten Years Ended 8/31/06 | |||||||||||||||||||||||
| NAV | MARKET | INDEX | NAV | MARKET | INDEX | NAV | MARKET | INDEX | |||||||||||||||||
| 22.46 | % | 22.16 | % | 22.84 | % | 139.50 | % | 138.31 | % | 144.48 | % | 266.28 | % | 268.05 | % | 285.82 | % | ||||||||
“Average annual total returns” represent the average annual change in value of an investment over the periods indicated. “Cumulative total returns” represent the total change in value of an investment over the periods indicated.
The Fund’s per share net asset value or “NAV” is the value of one share of the Fund as calculated in accordance with the standard formula for valuing mutual fund shares. The NAV return is based on the NAV of the Fund, and the market return is based on the market price per share of the Fund. The price used to calculate market return (“Market Price”) is determined by using the midpoint between the highest bid and the lowest offer on the stock exchange on which the shares of the Fund are listed for trading, as of the time that the Fund’s NAV is calculated. Market and NAV returns assume that dividends and capital gain distributions have been reinvested in the Fund at Market Price and NAV, respectively.
An index is a statistical composite that tracks a specified financial market or sector. Unlike the Fund, an index does not actually hold a portfolio of securities and therefore does not incur the expenses incurred by the Fund. These expenses negatively impact the performance of the Fund. Also, market returns do not include brokerage commissions that may be payable on secondary market transactions. If brokerage commissions were included, market returns would be lower. The returns shown in the tables above do not reflect the deduction of taxes that a shareholder would pay on fund distributions or the redemption or sale of fund shares. The investment return and principal value of shares of the Fund will vary with changes in market conditions. Shares of the Fund may be worth more or less than their original cost when they are redeemed or sold in the market. The Fund’s past performance is no guarantee of future results.
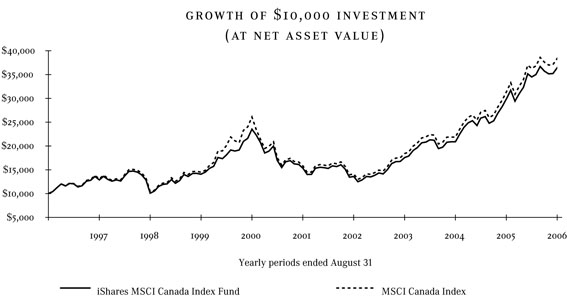
Performance figures assume reinvestment of all dividends and capital gain distributions and do not reflect the deduction of taxes that a shareholder would pay on fund distributions or the redemption of fund shares. An index is a statistical composite that tracks a specified financial market or sector. Unlike the Fund, an index does not actually hold a portfolio of securities and therefore does not incur the expenses incurred by the Fund. These expenses negatively impact the performance of the Fund. The Fund’s past performance is no guarantee of future results.
| MANAGEMENT’S DISCUSSIONSOF FUND PERFORMANCE | 5 |
Table of Contents
Management’s Discussion of Fund Performance (Continued)
iSHARES® MSCI CANADA INDEX FUND
PORTFOLIO ALLOCATION
As of 8/31/06
Sector | Percentage of Net Assets | ||
Financial | 30.11 | % | |
Energy | 29.74 | ||
Basic Materials | 17.38 | ||
Communications | 6.24 | ||
Industrial | 4.79 | ||
Consumer Cyclical | 3.77 | ||
Technology | 2.68 | ||
Consumer Non-Cyclical | 2.20 | ||
Diversified | 1.99 | ||
Utilities | 0.72 | ||
Short-Term and Other Net Assets | 0.38 | ||
TOTAL | 100.00 | % | |
TOP TEN FUND HOLDINGS
As of 8/31/06
Security | Percentage of Net Assets | ||
Royal Bank of Canada | 6.10 | % | |
Manulife Financial Corp. | 5.51 | ||
EnCana Corp. | 4.75 | ||
Bank of Nova Scotia | 4.51 | ||
Suncor Energy Inc. | 3.80 | ||
Bank of Montreal | 3.25 | ||
Barrick Gold Corp. | 3.08 | ||
Canadian Natural Resources Ltd. | 3.01 | ||
Canadian Imperial Bank of Commerce | 2.60 | ||
Sun Life Financial Inc. | 2.56 | ||
TOTAL | 39.17 | % | |
The iShares MSCI Canada Index Fund (the “Fund”) seeks to provide investment results that correspond generally to the price and yield performance, before fees and expenses, of publicly traded securities in the aggregate in the Canadian market, as measured by the MSCI Canada Index (the “Index”). The Fund invests in a representative sample of securities in the Index, which has a similar investment profile as the Index. Due to the use of representative sampling, the Fund may or may not hold all of the securities that are included in the Index. For the twelve-month period ended August 31, 2006 (the “reporting period”), the Fund returned 22.46%, while the Index returned 22.84%.
The Canadian market generally delivered healthy gains for the reporting period, fueled by rising oil prices and continued economic growth in the U.S. Oil companies represent a relatively large part of the Canadian economy, accounting for more than 20% of the Index. During the reporting period, oil prices continued to escalate, reaching a high of $77.03 per barrel on August 7th following news of increased violence in the Middle East and the shutdown of BP’s largest oil field in the U.S. The Canadian economy and market also benefited from the expansion of the U.S. economy during the reporting period, as the U.S. subsequently increased its demand for Canadian exports.
The Fund’s ten largest holdings accounted for approximately 39% of the Fund’s net assets as of August 31, 2006. All of the Fund’s ten largest holdings as of August 31, 2006 had positive returns for the reporting period. Royal Bank of Canada, the Fund’s largest holding, posted the strongest returns, followed by oil and gas exploration company Suncor Energy Inc., Manulife Financial Corp., and mining company Barrack Gold Corp. Bank of Montreal, Bank of Nova Scotia, and Canadian Imperial Bank of Commerce also performed well. Canadian Natural Resources Ltd. delivered a modest gain.
| 6 | 2006 iSHARES ANNUAL REPORTTO SHAREHOLDERS |
Table of Contents
Management’s Discussion of Fund Performance
iSHARES® MSCI EMERGING MARKETS INDEX FUND
Performance as of August 31, 2006
| Average Annual Total Returns | Cumulative Total Returns | ||||||||||||||||||||||||
| Year Ended 8/31/06 | Inception to 8/31/06 | Inception to 8/31/06 | |||||||||||||||||||||||
| NAV | MARKET | INDEX | NAV | MARKET | INDEX | NAV | MARKET | INDEX | |||||||||||||||||
| 26.44 | % | 26.28 | % | 30.58 | % | 37.70 | % | 37.76 | % | 37.35 | % | 197.01 | % | 197.48 | % | 194.17 | % | ||||||||
Total returns for the periods since inception are calculated from the inception date of the Fund (4/7/03). “Average annual total returns” represent the average annual change in value of an investment over the periods indicated. “Cumulative total returns” represent the total change in value of an investment over the periods indicated.
The Fund’s per share net asset value or “NAV” is the value of one share of the Fund as calculated in accordance with the standard formula for valuing mutual fund shares. The NAV return is based on the NAV of the Fund, and the market return is based on the market price per share of the Fund. The price used to calculate market return (“Market Price”) is determined by using the midpoint between the highest bid and the lowest offer on the stock exchange on which the shares of the Fund are listed for trading, as of the time that the Fund’s NAV is calculated. Since shares of the Fund did not trade in the secondary market until several days after the Fund’s inception, for the period from inception to the first day of secondary market trading in shares of the Fund (4/11/03), the NAV of the Fund is used as a proxy for secondary market trading price to calculate market returns. Market and NAV returns assume that dividends and capital gain distributions have been reinvested in the Fund at Market Price and NAV, respectively.
An index is a statistical composite that tracks a specified financial market or sector. Unlike the Fund, an index does not actually hold a portfolio of securities and therefore does not incur the expenses incurred by the Fund. These expenses negatively impact the performance of the Fund. Also, market returns do not include brokerage commissions that may be payable on secondary market transactions. If brokerage commissions were included, market returns would be lower. The returns shown in the tables above do not reflect the deduction of taxes that a shareholder would pay on fund distributions or the redemption or sale of fund shares. The investment return and principal value of shares of the Fund will vary with changes in market conditions. Shares of the Fund may be worth more or less than their original cost when they are redeemed or sold in the market. The Fund’s past performance is no guarantee of future results.
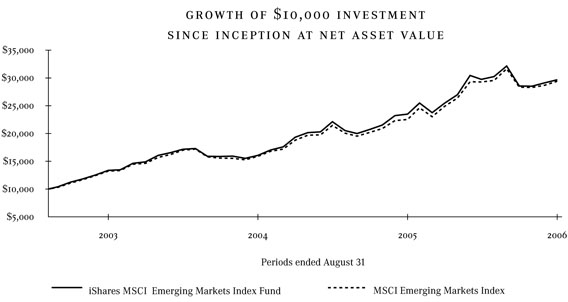
Performance figures assume reinvestment of all dividends and capital gain distributions and do not reflect the deduction of taxes that a shareholder would pay on fund distributions or the redemption of fund shares. An index is a statistical composite that tracks a specified financial market or sector. Unlike the Fund, an index does not actually hold a portfolio of securities and therefore does not incur the expenses incurred by the Fund. These expenses negatively impact the performance of the Fund. The Fund’s past performance is no guarantee of future results.
| MANAGEMENT’S DISCUSSIONSOF FUND PERFORMANCE | 7 |
Table of Contents
Management’s Discussion of Fund Performance (Continued)
iSHARES® MSCI EMERGING MARKETS INDEX FUND
PORTFOLIO ALLOCATION
As of 8/31/06
Sector | Percentage of Net Assets | ||
Financial | 18.76 | % | |
Energy | 18.10 | ||
Communications | 13.54 | ||
Basic Materials | 12.12 | ||
Industrial | 10.79 | ||
Technology | 10.14 | ||
Consumer Non-Cyclical | 4.88 | ||
Utilities | 4.70 | ||
Consumer Cyclical | 3.92 | ||
Diversified | 2.25 | ||
Exchange-Traded Funds | 0.57 | ||
Short-Term and Other Net Assets | 0.23 | ||
TOTAL | 100.00 | % | |
TOP TEN FUND HOLDINGS
As of 8/31/06
Security | Percentage of Net Assets | ||
Samsung Electronics Co. Ltd. GDR (South Korea) | 5.54 | % | |
OAO Gazprom ADR (Russia) | 5.42 | ||
Taiwan Semiconductor Manufacturing Co. Ltd. ADR (Taiwan) | 3.53 | ||
Kookmin Bank ADR (South Korea) | 3.15 | ||
POSCO ADR (South Korea) | 2.61 | ||
LUKOIL ADR (Russia) | 2.45 | ||
United Microelectronics Corp. ADR (Taiwan) | 2.05 | ||
Korea Electric Power Corp. ADR (South Korea) | 1.95 | ||
Petroleo Brasileiro SA Preferred ADR (Brazil) | 1.70 | ||
Chunghwa Telecom Co. Ltd. ADR (Taiwan) | 1.70 | ||
TOTAL | 30.10 | % | |
The iShares MSCI Emerging Markets Index Fund (the “Fund”) seeks to provide investment results that correspond generally to the price and yield performance, before fees and expenses, of the MSCI Emerging Markets Index (the “Index”). The Index is designed to measure equity market performance in the global emerging markets. The Fund invests in a representative sample of securities in the Index, which has a similar investment profile as the Index. Due to the use of representative sampling, the Fund may or may not hold all of the securities that are included in the Index. For the twelve-month period ended August 31, 2006 (the “reporting period”), the Fund returned 26.44%, while the Index returned 30.58%.
Emerging markets, as represented by the Index, delivered strong gains for the reporting period. Constituent markets generally benefited for much of the reporting period from rising commodities prices and strong export growth. Although rising interest rates in the U.S. and higher oil prices led to a pullback in market strength toward the end of the reporting period, emerging markets as a group overcame the setbacks to deliver healthy returns for the reporting period.
The Russian market delivered exceptional returns during the reporting period, as the Russian economy surged. According to the Economy Ministry, Russia’s economy grew at a 5.5% annualized pace in the first quarter of 2006 and a 7.1% pace in the second quarter of 2006. Because oil and gas exports represent more than 60% of Russia’s export trade, the rise in oil and gas prices during the reporting period played a large role in supporting economic growth and strong market returns. Another major factor benefiting returns for Russia was the liberalization of shares of gas company OAO Gazprom, whose market capitalization grew as MSCI removed the limited investability factor from Gazprom shares. Towards the end of the reporting period, Russia catapulted into the top five emerging markets in terms of market capitalization for the first time.
The South Korean market delivered very strong gains for the reporting period. Because South Korea depends heavily on exports for its economic health, it is sensitive to the economic cycles of its export markets, particularly the U.S., China and Japan. During much of the reporting period, this relationship benefited South Korea, as export demand from each of these countries continued to be strong. In May 2006, higher global inflation and rising oil prices appeared to lead to concerns that economic growth would slow globally, dampening export demand. As a result, the South Korean market dropped 7.63% in May 2006, its largest monthly decline for the year to date. However, South Korea overcame this setback in the final months of the reporting period as its export demand increased. In August 2006, exports rose 18.7% from a year earlier, driven largely by demand for computer and electronic products in the U.S., Japan and China.
The Taiwanese market delivered modest gains for the reporting period. Because Taiwan’s exports account for almost half of its output, it is sensitive to the economic cycles of its two major export markets, China and the U.S. For much of the reporting period, ongoing economic growth in China and the U.S. translated into strong demand for exports from Taiwan. In May 2006, however, concerns surfaced that higher interest rates in the U.S. and
| 8 | 2006 iSHARES ANNUAL REPORTTO SHAREHOLDERS |
Table of Contents
Management’s Discussion of Fund Performance (Continued)
iSHARES® MSCI EMERGING MARKETS INDEX FUND
rising oil prices would slow demand for exports, which led to declines among many emerging markets that are dependent on export activity. Although Taiwan participated in the general decline, its 6.69% drop in the month of May 2006 was less than the decline of the overall emerging markets for the month of May. As the reporting period came to a close, the Taiwanese market appeared to be driven higher by one of its leading technology constituents, Hon Hai Precision Industry Co. Ltd., which makes Apple’s iPod music players. Taiwan’s broad market received a further boost when the U.S. Federal Reserve Board suggested that it would hold off further interest rate increases in the U.S., a pause that could help export growth in Taiwan.
The Fund’s ten largest holdings accounted for approximately 30% of the Fund’s net assets as of August 31, 2006. Performance was mostly positive among the Fund’s ten largest holdings as of August 31, 2006. The strongest performer was the ADR shares of integrated oil and gas company LUKOIL (Russia). Kookmin Bank ADR (South Korea) also performed well, as did Samsung Electronics Co, Ltd. GDR (South Korea), the Fund’s largest holding. The ADR shares of oil company Petroleo Brasileiro SA (Brazil) delivered strong gains. United Microelectonics Corp. ADR (Taiwan) and Chunghwa Telecom Co. Ltd. ADR (Taiwan) were the only securities among the Fund’s ten largest holdings to post losses for the reporting period.
| MANAGEMENT’S DISCUSSIONSOF FUND PERFORMANCE | 9 |
Table of Contents
Management’s Discussion of Fund Performance
iSHARES® MSCI HONG KONG INDEX FUND
Performance as of August 31, 2006
| Average Annual Total Returns | |||||||||||||||||||||||||
| Year Ended 8/31/06 | Five Years Ended 8/31/06 | Ten Years Ended 8/31/06 | |||||||||||||||||||||||
| NAV | MARKET | INDEX | NAV | MARKET | INDEX | NAV | MARKET | INDEX | |||||||||||||||||
| 12.20 | % | 11.43 | % | 12.82 | % | 11.73 | % | 11.52 | % | 12.60 | % | 3.56 | % | 3.63 | % | 5.41 | % | ||||||||
| Cumulative Total Returns | |||||||||||||||||||||||||
| Year Ended 8/31/06 | Five Years Ended 8/31/06 | Ten Years Ended 8/31/06 | |||||||||||||||||||||||
| NAV | MARKET | INDEX | NAV | MARKET | INDEX | NAV | MARKET | INDEX | |||||||||||||||||
| 12.20 | % | 11.43 | % | 12.82 | % | 74.11 | % | 72.50 | % | 80.99 | % | 41.84 | % | 42.80 | % | 69.32 | % | ||||||||
“Average annual total returns” represent the average annual change in value of an investment over the periods indicated. “Cumulative total returns” represent the total change in value of an investment over the periods indicated.
The Fund’s per share net asset value or “NAV” is the value of one share of the Fund as calculated in accordance with the standard formula for valuing mutual fund shares. The NAV return is based on the NAV of the Fund, and the market return is based on the market price per share of the Fund. The price used to calculate market return (“Market Price”) is determined by using the midpoint between the highest bid and the lowest offer on the stock exchange on which the shares of the Fund are listed for trading, as of the time that the Fund’s NAV is calculated. Market and NAV returns assume that dividends and capital gain distributions have been reinvested in the Fund at Market Price and NAV, respectively.
An index is a statistical composite that tracks a specified financial market or sector. Unlike the Fund, an index does not actually hold a portfolio of securities and therefore does not incur the expenses incurred by the Fund. These expenses negatively impact the performance of the Fund. Also, market returns do not include brokerage commissions that may be payable on secondary market transactions. If brokerage commissions were included, market returns would be lower. The returns shown in the tables above do not reflect the deduction of taxes that a shareholder would pay on fund distributions or the redemption or sale of fund shares. The investment return and principal value of shares of the Fund will vary with changes in market conditions. Shares of the Fund may be worth more or less than their original cost when they are redeemed or sold in the market. The Fund’s past performance is no guarantee of future results.
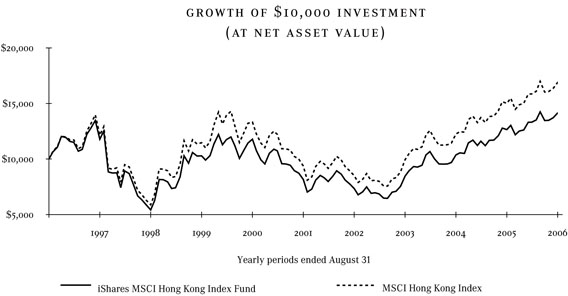
Performance figures assume reinvestment of all dividends and capital gain distributions and do not reflect the deduction of taxes that a shareholder would pay on fund distributions or the redemption of fund shares. An index is a statistical composite that tracks a specified financial market or sector. Unlike the Fund, an index does not actually hold a portfolio of securities and therefore does not incur the expenses incurred by the Fund. These expenses negatively impact the performance of the Fund. The Fund’s past performance is no guarantee of future results.
| 10 | 2006 iSHARES ANNUAL REPORTTO SHAREHOLDERS |
Table of Contents
Management’s Discussion of Fund Performance (Continued)
iSHARES® MSCI HONG KONG INDEX FUND
PORTFOLIO ALLOCATION
As of 8/31/06
Sector | Percentage of Net Assets | ||
Financial | 43.63 | % | |
Diversified | 18.17 | ||
Utilities | 13.32 | ||
Consumer Cyclical | 10.22 | ||
Industrial | 6.69 | ||
Communications | 6.12 | ||
Basic Materials | 0.91 | ||
Technology | 0.69 | ||
Short-Term and Other Net Assets | 0.25 | ||
TOTAL | 100.00 | % | |
TOP TEN FUND HOLDINGS
As of 8/31/06
Security | Percentage of Net Assets | ||
Hutchison Whampoa Ltd. | 9.85 | % | |
Cheung Kong Holdings Ltd. | 8.36 | ||
Sun Hung Kai Properties Ltd. | 7.62 | ||
CLP Holdings Ltd. | 5.73 | ||
Swire Pacific Ltd. Class A | 5.19 | ||
Hang Seng Bank Ltd. | 5.00 | ||
Hong Kong & China Gas Co. Ltd. | 4.22 | ||
Esprit Holdings Ltd. | 4.18 | ||
BOC Hong Kong Holdings Ltd. | 4.12 | ||
Hong Kong Exchanges & Clearing Ltd. | 3.83 | ||
TOTAL | 58.10 | % | |
The iShares MSCI Hong Kong Index Fund (the “Fund”) seeks to provide investment results that correspond generally to the price and yield performance, before fees and expenses, of publicly traded securities in the aggregate in the Hong Kong market, as measured by the MSCI Hong Kong Index (the “Index”). The Fund invests in a representative sample of securities in the Index, which has a similar investment profile as the Index. Due to the use of representative sampling, the Fund may or may not hold all of the securities that are included in the Index. For the twelve-month period ended August 31, 2006 (the “reporting period”), the Fund returned 12.20%, while the Index returned 12.82%.
The Hong Kong market delivered positive returns for the reporting period. Hong Kong’s economy continued to expand during the reporting period, albeit at a more moderate pace than in previous years, with an annualized gross domestic product (GDP) growth of 5.2% for the second quarter of 2006. A major contributor to Hong Kong’s economic state and its market returns is mainland China, which is Hong Kong’s main trading partner and its leading source of tourists. As the Chinese economy continued to expand during the reporting period, Hong Kong’s economy benefited. A strong real estate market also contributed positively to market returns during the reporting period.
The Fund’s ten largest holdings accounted for approximately 58% of the Fund’s net assets as of August 31, 2006. Performance among the Fund’s ten largest holdings as of August 31, 2006 was mostly positive for the reporting period. Hong Kong Exchanges & Clearing Ltd. was the strongest performer among the Fund’s ten largest holdings. Real estate development company Swire Pacific Ltd. performed well, as did Hong Kong & China Gas Co. Ltd. and retail clothing company Esprit Holdings Ltd. The largest Fund holding at almost 10% of the Fund’s net assets, Hutchison Whampoa Ltd., detracted from Fund performance with a modest decline. Hang Seng Bank Ltd. also declined for the reporting period.
| MANAGEMENT’S DISCUSSIONSOF FUND PERFORMANCE | 11 |
Table of Contents
Management’s Discussion of Fund Performance
iSHARES® MSCI MALAYSIA INDEX FUND
Performance as of August 31, 2006
| Average Annual Total Returns | |||||||||||||||||||||||||
| Year Ended 8/31/06 | Five Years Ended 8/31/06 | Ten Years Ended 8/31/06 | |||||||||||||||||||||||
| NAV | MARKET | INDEX | NAV | MARKET | INDEX | NAV | MARKET | INDEX | |||||||||||||||||
| 12.35 | % | 11.12 | % | 13.07 | % | 10.98 | % | 11.56 | % | 11.95 | % | (3.37 | )% | (3.64 | )% | (2.29 | )% | ||||||||
| Cumulative Total Returns | |||||||||||||||||||||||||
| Year Ended 8/31/06 | Five Years Ended 8/31/06 | Ten Years Ended 8/31/06 | |||||||||||||||||||||||
| NAV | MARKET | INDEX | NAV | MARKET | INDEX | NAV | MARKET | INDEX | |||||||||||||||||
| 12.35 | % | 11.12 | % | 13.07 | % | 68.32 | % | 72.82 | % | 75.82 | % | (29.02 | )% | (30.99 | )% | (20.68 | )% | ||||||||
“Average annual total returns” represent the average annual change in value of an investment over the periods indicated. “Cumulative total returns” represent the total change in value of an investment over the periods indicated.
The Fund’s per share net asset value or “NAV” is the value of one share of the Fund as calculated in accordance with the standard formula for valuing mutual fund shares. The NAV return is based on the NAV of the Fund, and the market return is based on the market price per share of the Fund. The price used to calculate market return (“Market Price”) is determined by using the midpoint between the highest bid and the lowest offer on the stock exchange on which the shares of the Fund are listed for trading, as of the time that the Fund’s NAV is calculated. As the Fund has a NAV which is determined prior to the opening of the regular trading day on the stock exchange on which it is listed, the market return is calculated using the midpoint of the bid/ask spread as of the opening of regular trading on the exchange. Market and NAV returns assume that dividends and capital gain distributions have been reinvested in the Fund at Market Price and NAV, respectively.
An index is a statistical composite that tracks a specified financial market or sector. Unlike the Fund, an index does not actually hold a portfolio of securities and therefore does not incur the expenses incurred by the Fund. These expenses negatively impact the performance of the Fund. Also, market returns do not include brokerage commissions that may be payable on secondary market transactions. If brokerage commissions were included, market returns would be lower. The returns shown in the tables above do not reflect the deduction of taxes that a shareholder would pay on fund distributions or the redemption or sale of fund shares. The investment return and principal value of shares of the Fund will vary with changes in market conditions. Shares of the Fund may be worth more or less than their original cost when they are redeemed or sold in the market. The Fund’s past performance is no guarantee of future results.
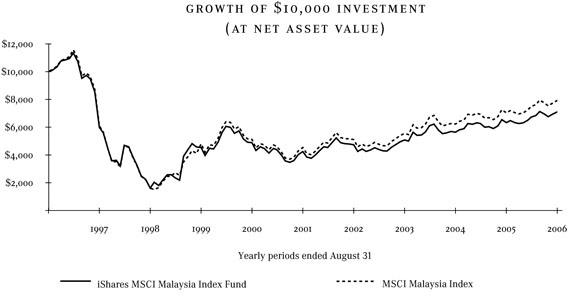
Performance figures assume reinvestment of all dividends and capital gain distributions and do not reflect the deduction of taxes that a shareholder would pay on fund distributions or the redemption of fund shares. An index is a statistical composite that tracks a specified financial market or sector. Unlike the Fund, an index does not actually hold a portfolio of securities and therefore does not incur the expenses incurred by the Fund. These expenses negatively impact the performance of the Fund. The Fund’s past performance is no guarantee of future results.
| 12 | 2006 iSHARES ANNUAL REPORTTO SHAREHOLDERS |
Table of Contents
Management’s Discussion of Fund Performance (Continued)
iSHARES® MSCI MALAYSIA INDEX FUND
PORTFOLIO ALLOCATION
As of 8/31/06
Sector | Percentage of Net Assets | ||
Financial | 29.53 | % | |
Consumer Non-Cyclical | 14.88 | ||
Consumer Cyclical | 14.34 | ||
Industrial | 14.22 | ||
Communications | 10.18 | ||
Utilities | 9.17 | ||
Diversified | 5.22 | ||
Energy | 1.63 | ||
Technology | 0.42 | ||
Short-Term and Other Net Assets | 0.41 | ||
TOTAL | 100.00 | % | |
TOP TEN FUND HOLDINGS
As of 8/31/06
Security | Percentage of Net Assets | ||
Malayan Banking Bhd | 10.81 | % | |
Bumiputra-Commerce Holdings Bhd | 7.18 | ||
IOI Corp. Bhd | 5.69 | ||
Malaysia International Shipping Corp. Bhd | 4.82 | ||
Tenaga Nasional Bhd | 4.70 | ||
Sime Darby Bhd | 4.48 | ||
Genting Bhd | 4.43 | ||
Telekom Malaysia Bhd | 3.91 | ||
Maxis Communications Bhd | 3.91 | ||
Public Bank Bhd | 3.53 | ||
TOTAL | 53.46 | % | |
The iShares MSCI Malaysia Index Fund (the “Fund”) seeks to provide investment results that correspond generally to the price and yield performance, before fees and expenses, of publicly traded securities in the aggregate in the Malaysian market, as measured by the MSCI Malaysia Index (the “Index”). The Fund invests in a representative sample of securities in the Index, which has a similar investment profile as the Index. Due to the use of representative sampling, the Fund may or may not hold all of the securities included in the Index. For the twelve-month period ended August 31, 2006 (the “reporting period”), the Fund returned 12.35%, while the Index returned 13.07%.
The Malaysian market delivered positive returns for the reporting period due, in part, to the expansion of the Malaysian economy. For the second quarter of 2006, gross domestic product (GDP) growth was 5.9%, rising from 4.1% in the second quarter of 2005. Exports play an important role in Malaysia’s economy, and the country experienced rising foreign demand for some of its leading export commodities during the reporting period. In particular, demand rose for crude petroleum and natural gas as increased violence in the Middle East and the shutdown of BP’s largest oil field in the U.S. curtailed supply. Oil prices, which continued to climb during the reporting period, reached a high of $77.03 per barrel on August 7th.
The Fund’s ten largest holdings accounted for approximately 53% of the Fund’s net assets as of August 31, 2006. Among the Fund’s ten largest holdings as of August 31, 2006, performance was mostly positive for the reporting period. Agriculture company IOI Corp. Bhd was the strongest performer, followed by casino and gaming company Genting Bhd. Bumiputra-Commerce Holdings Bhd also performed well. Malayan Banking Bhd, the Fund’s largest holding at almost 11% of Fund net assets, also contributed positively to Fund performance. Telecommunications companies Telekom Malaysia Bhd and Maxis Communications Bhd both declined for the reporting period.
| MANAGEMENT’S DISCUSSIONSOF FUND PERFORMANCE | 13 |
Table of Contents
Management’s Discussion of Fund Performance
iSHARES® MSCI MEXICO INDEX FUND
Performance as of August 31, 2006
| Average Annual Total Returns | |||||||||||||||||||||||||
| Year Ended 8/31/06 | Five Years Ended 8/31/06 | Ten Years Ended 8/31/06 | |||||||||||||||||||||||
| NAV | MARKET | INDEX | NAV | MARKET | INDEX | NAV | MARKET | INDEX | |||||||||||||||||
| 44.11 | % | 43.28 | % | 43.06 | % | 23.88 | % | 23.92 | % | 23.86 | % | 15.92 | % | 15.92 | % | 17.54 | % | ||||||||
| Cumulative Total Returns | |||||||||||||||||||||||||
| Year Ended 8/31/06 | Five Years Ended 8/31/06 | Ten Years Ended 8/31/06 | |||||||||||||||||||||||
| NAV | MARKET | INDEX | NAV | MARKET | INDEX | NAV | MARKET | INDEX | |||||||||||||||||
| 44.11 | % | 43.28 | % | 43.06 | % | 191.71 | % | 192.19 | % | 191.51 | % | 338.04 | % | 338.01 | % | 403.40 | % | ||||||||
“Average annual total returns” represent the average annual change in value of an investment over the periods indicated. “Cumulative total returns” represent the total change in value of an investment over the periods indicated.
Certain sectors and markets performed exceptionally well based on market conditions during the one-year period. Investors should not expect that such exceptional returns will be repeated.
The Fund’s per share net asset value or “NAV” is the value of one share of the Fund as calculated in accordance with the standard formula for valuing mutual fund shares. The NAV return is based on the NAV of the Fund, and the market return is based on the market price per share of the Fund. The price used to calculate market return (“Market Price”) is determined by using the midpoint between the highest bid and the lowest offer on the stock exchange on which the shares of the Fund are listed for trading, as of the time that the Fund’s NAV is calculated. Market and NAV returns assume that dividends and capital gain distributions have been reinvested in the Fund at Market Price and NAV, respectively.
An index is a statistical composite that tracks a specified financial market or sector. Unlike the Fund, an index does not actually hold a portfolio of securities and therefore does not incur the expenses incurred by the Fund. These expenses negatively impact the performance of the Fund. Also, market returns do not include brokerage commissions that may be payable on secondary market transactions. If brokerage commissions were included, market returns would be lower. The returns shown in the tables above do not reflect the deduction of taxes that a shareholder would pay on fund distributions or the redemption or sale of fund shares. The investment return and principal value of shares of the Fund will vary with changes in market conditions. Shares of the Fund may be worth more or less than their original cost when they are redeemed or sold in the market. The Fund’s past performance is no guarantee of future results.
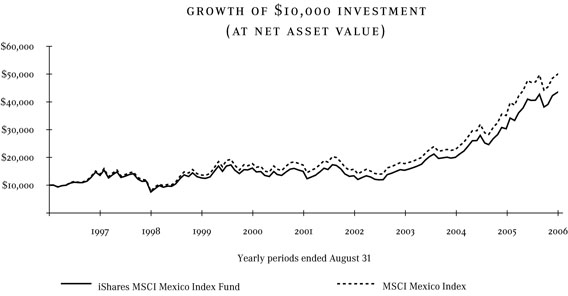
Performance figures assume reinvestment of all dividends and capital gain distributions and do not reflect the deduction of taxes that a shareholder would pay on fund distributions or the redemption of fund shares. An index is a statistical composite that tracks a specified financial market or sector. Unlike the Fund, an index does not actually hold a portfolio of securities and therefore does not incur the expenses incurred by the Fund. These expenses negatively impact the performance of the Fund. The Fund’s past performance is no guarantee of future results.
| 14 | 2006 iSHARES ANNUAL REPORTTO SHAREHOLDERS |
Table of Contents
Management’s Discussion of Fund Performance (Continued)
iSHARES® MSCI MEXICO INDEX FUND
PORTFOLIO ALLOCATION
As of 8/31/06
Sector | Percentage of Net Assets | ||
Communications | 45.81 | % | |
Industrial | 17.83 | ||
Consumer Cyclical | 10.34 | ||
Consumer Non-Cyclical | 9.66 | ||
Basic Materials | 6.44 | ||
Financial | 5.47 | ||
Diversified | 4.40 | ||
Short-Term and Other Net Assets | 0.05 | ||
TOTAL | 100.00 | % | |
TOP TEN FUND HOLDINGS
As of 8/31/06
Security | Percentage of Net Assets | ||
America Movil SA de CV Series L | 24.52 | % | |
Cemex SA de CV Series CPO | 14.62 | ||
Telefonos de Mexico SA de CV Series L | 9.07 | ||
Wal-Mart de Mexico SA de CV Series V | 4.86 | ||
Fomento Economico Mexicano SA de CV Class UBD | 4.77 | ||
Grupo Televisa SA Series CPO | 4.71 | ||
America Telecom SA de CV Series A1 | 4.19 | ||
Grupo Financiero Banorte SA de CV Series O | 4.03 | ||
Grupo Carso SA de CV Series A1 | 3.05 | ||
Grupo Mexico SA de CV Series B | 2.98 | ||
TOTAL | 76.80 | % | |
The iShares MSCI Mexico Index Fund (the “Fund”) seeks to provide investment results that correspond generally to the price and yield performance, before fees and expenses, of publicly traded securities in the aggregate in the Mexican market, as measured by the MSCI Mexico Index (the “Index”). The Fund invests in a representative sample of securities in the Index, which has a similar investment profile as the Index. Due to the use of representative sampling, the Fund may or may not hold all of the securities that are included in the Index. For the twelve-month period ended August 31, 2006 (the “reporting period”), the Fund returned 44.11%, while the Index returned 43.06%.
Mexico’s market posted robust gains for the reporting period, fueled by continued economic expansion in the U.S. and escalating oil prices. Mexico relies on the U.S. for approximately 80% of its exports, so its economic health is closely tied to the economic cycle of the U.S. This benefited the Mexican economy during the reporting period, as continued economic growth in the U.S. translated into ongoing demand for exports from Mexico. Rising oil prices also provided a boost to economic growth, with oil accounting for approximately 15% of Mexico’s export earnings. Oil prices continued to climb during the reporting period, reaching a high of $77.03 per barrel on August 7th following news of increased violence in the Middle East and the shutdown of BP’s largest oil field in the U.S.
The Fund’s ten largest holdings accounted for approximately 77% of the Fund’s net assets as of August 31, 2006. All of the Fund’s ten largest holdings as of August 31, 2006 posted strong gains for the reporting period. The Series A1 shares of America Telecom SA de CV and Series B shares of Grupo Mexico SA de CV delivered the strongest returns, followed by largest Fund holding America Movil SA de CV Series L, the wireless telephone carrier. The Series V shares of Wal-Mart de Mexico SA de CV and Series O shares of diversified bank Grupo Financiero Banorte SA de CV also performed well. The most modest gains, albeit double-digit gains, among the Fund’s ten largest holdings came from Grupo Televisa SA Series CPO.
| MANAGEMENT’S DISCUSSIONSOF FUND PERFORMANCE | 15 |
Table of Contents
Management’s Discussion of Fund Performance
iSHARES® MSCI PACIFIC EX-JAPAN INDEX FUND
Performance as of August 31, 2006
| Average Annual Total Returns | Cumulative Total Returns | ||||||||||||||||||||||||
| Year Ended 8/31/06 | Inception to 8/31/06 | Inception to 8/31/06 | |||||||||||||||||||||||
| NAV | MARKET | INDEX | NAV | MARKET | INDEX | NAV | MARKET | INDEX | |||||||||||||||||
| 19.17 | % | 17.49 | % | 19.01 | % | 20.90 | % | 20.83 | % | 20.82 | % | 151.10 | % | 150.43 | % | 150.26 | % | ||||||||
Total returns for the periods since inception are calculated from the inception date of the Fund (10/25/01). “Average annual total returns” represent the average annual change in value of an investment over the periods indicated. “Cumulative total returns” represent the total change in value of an investment over the periods indicated.
The Fund’s per share net asset value or “NAV” is the value of one share of the Fund as calculated in accordance with the standard formula for valuing mutual fund shares. The NAV return is based on the NAV of the Fund, and the market return is based on the market price per share of the Fund. The price used to calculate market return (“Market Price”) is determined by using the midpoint between the highest bid and the lowest offer on the stock exchange on which the shares of the Fund are listed for trading, as of the time that the Fund’s NAV is calculated. Since shares of the Fund did not trade in the secondary market until one day after the Fund’s inception, for the period from inception to the first day of secondary market trading in shares of the Fund (10/26/01), the NAV of the Fund is used as a proxy for secondary market trading price to calculate market returns. Market and NAV returns assume that dividends and capital gain distributions have been reinvested in the Fund at Market Price and NAV, respectively.
An index is a statistical composite that tracks a specified financial market or sector. Unlike the Fund, an index does not actually hold a portfolio of securities and therefore does not incur the expenses incurred by the Fund. These expenses negatively impact the performance of the Fund. Also, market returns do not include brokerage commissions that may be payable on secondary market transactions. If brokerage commissions were included, market returns would be lower. The returns shown in the tables above do not reflect the deduction of taxes that a shareholder would pay on fund distributions or the redemption or sale of fund shares. The investment return and principal value of shares of the Fund will vary with changes in market conditions. Shares of the Fund may be worth more or less than their original cost when they are redeemed or sold in the market. The Fund’s past performance is no guarantee of future results.

Performance figures assume reinvestment of all dividends and capital gain distributions and do not reflect the deduction of taxes that a shareholder would pay on fund distributions or the redemption of fund shares. An index is a statistical composite that tracks a specified financial market or sector. Unlike the Fund, an index does not actually hold a portfolio of securities and therefore does not incur the expenses incurred by the Fund. These expenses negatively impact the performance of the Fund. The Fund’s past performance is no guarantee of future results.
| 16 | 2006 iSHARES ANNUAL REPORTTO SHAREHOLDERS |
Table of Contents
Management’s Discussion of Fund Performance (Continued)
iSHARES® MSCI PACIFIC EX-JAPAN INDEX FUND
PORTFOLIO ALLOCATION
As of 8/31/06
Sector | Percentage of Net Assets | ||
Financial | 47.44 | % | |
Basic Materials | 12.50 | ||
Industrial | 8.39 | ||
Consumer Non-Cyclical | 7.16 | ||
Consumer Cyclical | 6.21 | ||
Communications | 5.29 | ||
Diversified | 4.56 | ||
Utilities | 3.98 | ||
Energy | 2.91 | ||
Technology | 0.74 | ||
Short-Term and Other Net Assets | 0.82 | ||
TOTAL | 100.00 | % | |
TOP TEN FUND HOLDINGS
As of 8/31/06
Security | Percentage of Net Assets | ||
BHP Billiton Ltd. (Australia) | 7.93 | % | |
Commonwealth Bank of Australia (Australia) | 4.83 | ||
National Australia Bank Ltd. (Australia) | 4.77 | ||
Australia & New Zealand Banking Group Ltd. (Australia) | 4.09 | ||
Westpac Banking Corp. Ltd. (Australia) | 3.52 | ||
Westfield Group (Australia) | 2.22 | ||
Hutchison Whampoa Ltd. (Hong Kong) | 2.11 | ||
Woolworths Ltd. (Australia) | 2.00 | ||
Cheung Kong Holdings Ltd. (Hong Kong) | 1.77 | ||
Rio Tinto Ltd. (Australia) | 1.71 | ||
TOTAL | 34.95 | % | |
The iShares MSCI Pacific ex-Japan Index Fund (the “Fund”) seeks to provide investment results that correspond generally to the price and yield performance, before fees and expenses, of publicly traded securities in the aggregate in the Australia, Hong Kong, New Zealand and Singapore markets, as measured by the MSCI Pacific ex-Japan Index (the “Index”). The Fund invests in a representative sample of securities in the Index, which has a similar investment profile as the Index. Due to the use of representative sampling, the Fund may or may not hold all of the securities that are included in the Index. For the twelve-month period ended August 31, 2006 (the “reporting period”), the Fund returned 19.17%, while the Index returned 19.01%.
The markets comprising the Index — Australia, Hong Kong, New Zealand and Singapore, all delivered gains for the reporting period.
Australia’s economy continued to appear strong during the reporting period: now in its 15th year of uninterrupted expansion, the longest expansion in Australia since 1945, the Australian economy grew at an annualized rate of 2.6% in the second quarter of 2006. Export trade remained healthy for most of the reporting period, due in part to demand from China for coal and iron ore. Inflation levels rose during the reporting period, reaching 4.0% for the second quarter of 2006, compared with 2.5% for the second quarter of 2005. In response, the Reserve Bank of Australia increased short-term interest rates twice during the reporting period, bringing the rate to 6.00% in August 2006.
Hong Kong’s economy continued to expand during the reporting period, albeit at a more moderate pace than in previous years, with an annualized gross domestic product (“GDP”) growth of 5.2% for the second quarter of 2006. A major contributor to Hong Kong’s economic state and its market returns is mainland China, which is Hong Kong’s main trading partner and its leading source of tourists. As the Chinese economy continued to expand during the reporting period, Hong Kong’s economy benefited. A strong real estate market also contributed positively to market returns during the reporting period.
Singapore’s market posted solid gains for the reporting period, although it gave back some of those gains in the final months of the reporting period. The Singaporean economy, which depends heavily on exports, continued to benefit from strong export trade to the U.S. and to its Asian neighbors for much of the reporting period. By May 2006, however, global inflation and interest rate concerns hampered export growth and weighed on market performance. During the month of May alone, the Singapore market suffered its largest single-month loss in more than three years. For the second quarter of 2006, annualized GDP growth was reported at 8.1%, exceeding many analysts’ expectations, but down in comparison from the heady 14% for the second quarter of 2005.
| MANAGEMENT’S DISCUSSIONSOF FUND PERFORMANCE | 17 |
Table of Contents
Management’s Discussion of Fund Performance (Continued)
iSHARES® MSCI PACIFIC EX-JAPAN INDEX FUND
The Fund’s ten largest holdings accounted for approximately 35% of the Fund’s net assets as of August 31, 2006. Nine of the Fund’s ten largest holdings as of August 31, 2006 posted gains for the reporting period. Metals and mining companies were some of the strongest performers, with Rio Tinto Ltd. (Australia) delivering the best return, followed by BHP Billiton Ltd. (Australia), the Fund’s largest holding. Retailer Woolworths Ltd. (Australia) also performed well. Banks as a group performed well: Australia & New Zealand Banking Group Ltd. (Australia), Commonwealth Bank of Australia (Australia), and National Australia Bank Ltd. (Australia) all contributed positively to Fund performance. Detracting from Fund performance, Hutchison Whampoa Ltd. (Hong Kong) declined for the reporting period.
| 18 | 2006 iSHARES ANNUAL REPORTTO SHAREHOLDERS |
Table of Contents
Management’s Discussion of Fund Performance
iSHARES® MSCI SINGAPORE INDEX FUND
Performance as of August 31, 2006
| Average Annual Total Returns | |||||||||||||||||||||||||
| Year Ended 8/31/06 | Five Years Ended 8/31/06 | Ten Years Ended 8/31/06 | |||||||||||||||||||||||
| NAV | MARKET | INDEX | NAV | MARKET | INDEX | NAV | MARKET | INDEX | |||||||||||||||||
| 21.61 | % | 20.41 | % | 21.55 | % | 14.00 | % | 14.12 | % | 13.68 | % | (0.07 | )% | (0.11 | )% | 0.46 | % | ||||||||
| Cumulative Total Returns | |||||||||||||||||||||||||
| Year Ended 8/31/06 | Five Years Ended 8/31/06 | Ten Years Ended 8/31/06 | |||||||||||||||||||||||
| NAV | MARKET | INDEX | NAV | MARKET | INDEX | NAV | MARKET | INDEX | |||||||||||||||||
| 21.61 | % | 20.41 | % | 21.55 | % | 92.56 | % | 93.57 | % | 89.83 | % | (0.73 | )% | (1.11 | )% | 4.65 | % | ||||||||
“Average annual total returns” represent the average annual change in value of an investment over the periods indicated. “Cumulative total returns” represent the total change in value of an investment over the periods indicated.
The Fund’s per share net asset value or “NAV” is the value of one share of the Fund as calculated in accordance with the standard formula for valuing mutual fund shares. The NAV return is based on the NAV of the Fund, and the market return is based on the market price per share of the Fund. The price used to calculate market return (“Market Price”) is determined by using the midpoint between the highest bid and the lowest offer on the stock exchange on which the shares of the Fund are listed for trading, as of the time that the Fund’s NAV is calculated. Market and NAV returns assume that dividends and capital gain distributions have been reinvested in the Fund at Market Price and NAV, respectively.
An index is a statistical composite that tracks a specified financial market or sector. Unlike the Fund, an index does not actually hold a portfolio of securities and therefore does not incur the expenses incurred by the Fund. These expenses negatively impact the performance of the Fund. Also, market returns do not include brokerage commissions that may be payable on secondary market transactions. If brokerage commissions were included, market returns would be lower. The returns shown in the tables above do not reflect the deduction of taxes that a shareholder would pay on fund distributions or the redemption or sale of fund shares. The investment return and principal value of shares of the Fund will vary with changes in market conditions. Shares of the Fund may be worth more or less than their original cost when they are redeemed or sold in the market. The Fund’s past performance is no guarantee of future results.
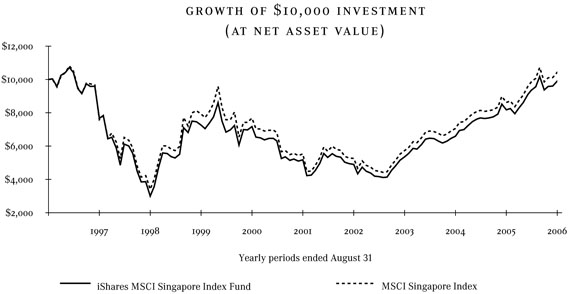
Performance figures assume reinvestment of all dividends and capital gain distributions and do not reflect the deduction of taxes that a shareholder would pay on fund distributions or the redemption of fund shares. An index is a statistical composite that tracks a specified financial market or sector. Unlike the Fund, an index does not actually hold a portfolio of securities and therefore does not incur the expenses incurred by the Fund. These expenses negatively impact the performance of the Fund. The Fund’s past performance is no guarantee of future results.
| MANAGEMENT’S DISCUSSIONSOF FUND PERFORMANCE | 19 |
Table of Contents
Management’s Discussion of Fund Performance (Continued)
iSHARES® MSCI SINGAPORE INDEX FUND
PORTFOLIO ALLOCATION
As of 8/31/06
Sector | Percentage of Net Assets | ||
Financial | 52.05 | % | |
Communications | 15.90 | ||
Industrial | 11.77 | ||
Diversified | 5.84 | ||
Consumer Cyclical | 5.54 | ||
Consumer Non-Cyclical | 4.96 | ||
Technology | 2.13 | ||
Energy | 0.34 | ||
Short-Term and Other Net Assets | 1.47 | ||
TOTAL | 100.00 | % | |
TOP TEN FUND HOLDINGS
As of 8/31/06
Security | Percentage of Net Assets | ||
DBS Group Holdings Ltd. | 13.36 | % | |
United Overseas Bank Ltd. | 11.98 | ||
Singapore Telecommunications Ltd. | 11.73 | ||
Oversea-Chinese Banking Corp. | 10.36 | ||
Keppel Corp. Ltd. | 4.75 | ||
Singapore Airlines Ltd. | 4.68 | ||
Singapore Press Holdings Ltd. | 4.17 | ||
CapitaLand Ltd. | 3.85 | ||
City Developments Ltd. | 3.19 | ||
Fraser and Neave Ltd. | 2.78 | ||
TOTAL | 70.85 | % | |
The iShares MSCI Singapore Index Fund (the “Fund”) seeks to provide investment results that correspond generally to the price and yield performance, before fees and expenses, of publicly traded securities in the aggregate in the Singaporean market, as measured by the MSCI Singapore Index (the “Index”). The Fund invests in a representative sample of securities in the Index, which has a similar investment profile as the Index. Due to the use of representative sampling, the Fund may or may not hold all of the securities that are included in the Index. For the twelve-month period ended August 31, 2006 (the “reporting period”), the Fund returned 21.61%, while the Index returned 21.55%.
Singapore’s market posted solid gains for the reporting period, although it gave back some of those gains in the final months of the reporting period. The Singaporean economy, which depends heavily on exports, continued to benefit from strong export trade to the U.S. and to its Asian neighbors for much of the reporting period. By May 2006, however, global inflation and interest rate concerns hampered export growth and weighed on market performance. During the month of May alone, the Singapore market suffered its largest single-month loss in more than three years. For the second quarter of 2006, annualized gross domestic product (GDP) growth was reported at 8.1%, exceeding many analysts’ expectations, but down in comparison from the heady 14% for the second quarter of 2005.
The Fund’s ten largest holdings accounted for approximately 71% of the Fund’s net assets as of August 31, 2006. CapitaLand Ltd. was the strongest performer among the Fund’s ten largest holdings, followed by industrial conglomerate Keppel Corp. Ltd. and beverage producer and distributor Fraser and Neave Ltd. Banking company DBS Group Holdings Ltd., the Fund’s largest holding, also performed well, as did City Developments Ltd., which operates hotels and resorts. Singapore Press Holdings Ltd. posted a slight decline.
| 20 | 2006 iSHARES ANNUAL REPORTTO SHAREHOLDERS |
Table of Contents
Management’s Discussion of Fund Performance
iSHARES® MSCI SOUTH AFRICA INDEX FUND
Performance as of August 31, 2006
| Average Annual Total Returns | Cumulative Total Returns | ||||||||||||||||||||||||
| Year Ended 8/31/06 | Inception to 8/31/06 | Inception to 8/31/06 | |||||||||||||||||||||||
| NAV | MARKET | INDEX | NAV | MARKET | INDEX | NAV | MARKET | INDEX | |||||||||||||||||
| 20.06 | % | 18.94 | % | 21.61 | % | 31.74 | % | 32.11 | % | 33.32 | % | 167.94 | % | 170.62 | % | 179.96 | % | ||||||||
Total returns for the periods since inception are calculated from the inception date of the Fund (2/3/03). “Average annual total returns” represent the average annual change in value of an investment over the periods indicated. “Cumulative total returns” represent the total change in value of an investment over the periods indicated.
The Fund’s per share net asset value or “NAV” is the value of one share of the Fund as calculated in accordance with the standard formula for valuing mutual fund shares. The NAV return is based on the NAV of the Fund, and the market return is based on the market price per share of the Fund. The price used to calculate market return (“Market Price”) is determined by using the midpoint between the highest bid and the lowest offer on the stock exchange on which the shares of the Fund are listed for trading, as of the time that the Fund’s NAV is calculated. Since shares of the Fund did not trade in the secondary market until several days after the Fund’s inception, for the period from inception to the first day of secondary market trading in shares of the Fund (2/7/03), the NAV of the Fund is used as a proxy for secondary market trading price to calculate market returns. Market and NAV returns assume that dividends and capital gain distributions have been reinvested in the Fund at Market Price and NAV, respectively.
An index is a statistical composite that tracks a specified financial market or sector. Unlike the Fund, an index does not actually hold a portfolio of securities and therefore does not incur the expenses incurred by the Fund. These expenses negatively impact the performance of the Fund. Also, market returns do not include brokerage commissions that may be payable on secondary market transactions. If brokerage commissions were included, market returns would be lower. The returns shown in the tables above do not reflect the deduction of taxes that a shareholder would pay on fund distributions or the redemption or sale of fund shares. The investment return and principal value of shares of the Fund will vary with changes in market conditions. Shares of the Fund may be worth more or less than their original cost when they are redeemed or sold in the market. The Fund’s past performance is no guarantee of future results.
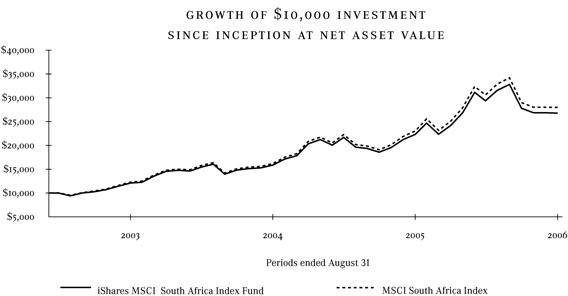
Performance figures assume reinvestment of all dividends and capital gain distributions and do not reflect the deduction of taxes that a shareholder would pay on fund distributions or the redemption of fund shares. An index is a statistical composite that tracks a specified financial market or sector. Unlike the Fund, an index does not actually hold a portfolio of securities and therefore does not incur the expenses incurred by the Fund. These expenses negatively impact the performance of the Fund. The Fund’s past performance is no guarantee of future results.
| MANAGEMENT’S DISCUSSIONSOF FUND PERFORMANCE | 21 |
Table of Contents
Management’s Discussion of Fund Performance (Continued)
iSHARES® MSCI SOUTH AFRICA INDEX FUND
PORTFOLIO ALLOCATION
As of 8/31/06
Sector | Percentage of Net Assets | ||
Basic Materials | 27.55 | % | |
Financial | 20.75 | ||
Communications | 12.77 | ||
Energy | 12.00 | ||
Consumer Cyclical | 8.87 | ||
Diversified | 7.82 | ||
Consumer Non-Cyclical | 5.28 | ||
Industrial | 4.83 | ||
Short-Term and Other Net Assets | 0.13 | ||
TOTAL | 100.00 | % | |
TOP TEN FUND HOLDINGS
As of 8/31/06
Security | Percentage of Net Assets | ||
Sasol Ltd. | 12.00 | % | |
Standard Bank Group Ltd. | 7.86 | ||
Impala Platinum Holdings Ltd. | 7.05 | ||
MTN Group Ltd. | 6.32 | ||
Gold Fields Ltd. | 5.73 | ||
Anglo Platinum Ltd. | 4.39 | ||
FirstRand Ltd. | 4.15 | ||
AngloGold Ashanti Ltd. | 4.09 | ||
Telkom South Africa Ltd. | 3.37 | ||
Naspers Ltd. | 3.08 | ||
TOTAL | 58.04 | % | |
The iShares MSCI South Africa Index Fund (the “Fund”) seeks to provide investment results that correspond generally to the price and yield performance, before fees and expenses, of publicly traded securities in the aggregate in the South African market, as measured by the MSCI South Africa Index (the “Index”). The Fund invests in a representative sample of securities in the Index, which has a similar investment profile as the Index. Due to the use of representative sampling, the Fund may or may not hold all of the securities that are included in the Index. For the twelve-month period ended August 31, 2006 (the “reporting period”), the Fund returned 20.06%, while the Index returned 21.61%.
The South African market logged robust gains through April 2006, followed by a loss of almost half of those gains in the final four months of the reporting period. For much of the reporting period, the South African market benefited from its exposure to commodities, particularly precious metals and oil, as escalating oil prices and gold prices during the reporting period boosted share prices for some of the major constituents of the Index. In the final months of the reporting period, however, the market lost ground as some international investors took profits, evidently concerned about South Africa’s ability to continue attracting the level of foreign investment needed to finance its current account deficit.
The South African currency, the rand, depreciated sharply, losing approximately 10% in the final three weeks of May 2006 alone. Concerned with the potential impact of a weaker rand and higher oil prices on inflation, the South African Reserve Bank raised short-term interest rates in both June and August 2006, bringing the rate to 8.00% by the end of the reporting period.
The Fund’s ten largest holdings accounted for approximately 58% of the Fund’s net assets as of August 31, 2006. All of the Fund’s ten largest holdings as of August 31, 2006 posted positive results for the reporting period. Metals companies Anglo Platinum Ltd. and Impala Platinum Holdings Ltd. both delivered strong gains. Gold Fields Ltd. and AngloGold Ashanti Ltd. also performed well. The most modest gains among the Fund’s ten largest holdings as of August 31, 2006 came from Telkom South Africa Ltd.
| 22 | 2006 iSHARES ANNUAL REPORTTO SHAREHOLDERS |
Table of Contents
Management’s Discussion of Fund Performance
iSHARES® MSCI SOUTH KOREA INDEX FUND
Performance as of August 31, 2006
| Average Annual Total Returns | |||||||||||||||||||||||||
| Year Ended 8/31/06 | Five Years Ended 8/31/06 | Inception to 8/31/06 | |||||||||||||||||||||||
| NAV | MARKET | INDEX | NAV | MARKET | INDEX | NAV | MARKET | INDEX | |||||||||||||||||
| 33.16 | % | 33.95 | % | 34.88 | % | 28.76 | % | 28.59 | % | 31.08 | % | 14.26 | % | 14.18 | % | 15.01 | % | ||||||||
| Cumulative Total Returns | |||||||||||||||||||||||||
| Year Ended 8/31/06 | Five Years Ended 8/31/06 | Inception to 8/31/06 | |||||||||||||||||||||||
| NAV | MARKET | INDEX | NAV | MARKET | INDEX | NAV | MARKET | INDEX | |||||||||||||||||
| 33.16 | % | 33.95 | % | 34.88 | % | 253.88 | % | 251.56 | % | 286.90 | % | 132.04 | % | 131.04 | % | 142.02 | % | ||||||||
Total returns for the periods since inception are calculated from the inception date of the Fund (5/9/00). “Average annual total returns” represent the average annual change in value of an investment over the periods indicated. “Cumulative total returns” represent the total change in value of an investment over the periods indicated.
The Fund’s per share net asset value or “NAV” is the value of one share of the Fund as calculated in accordance with the standard formula for valuing mutual fund shares. The NAV return is based on the NAV of the Fund, and the market return is based on the market price per share of the Fund. The price used to calculate market return (“Market Price”) is determined by using the midpoint between the highest bid and the lowest offer on the stock exchange on which the shares of the Fund are listed for trading, as of the time that the Fund’s NAV is calculated. As the Fund has a NAV which is determined prior to the opening of the regular trading day on the stock exchange on which it is listed, the market return is calculated using the midpoint of the bid/ask spread as of the opening of regular trading on the exchange. Since shares of the Fund did not trade in the secondary market until several days after the Fund’s inception, for the period from inception to the first day of secondary market trading in shares of the Fund (5/12/00), the NAV of the Fund is used as a proxy for secondary market trading price to calculate market returns. Market and NAV returns assume that dividends and capital gain distributions have been reinvested in the Fund at Market Price and NAV, respectively.
An index is a statistical composite that tracks a specified financial market or sector. Unlike the Fund, an index does not actually hold a portfolio of securities and therefore does not incur the expenses incurred by the Fund. These expenses negatively impact the performance of the Fund. Also, market returns do not include brokerage commissions that may be payable on secondary market transactions. If brokerage commissions were included, market returns would be lower. The returns shown in the tables above do not reflect the deduction of taxes that a shareholder would pay on fund distributions or the redemption or sale of fund shares. The investment return and principal value of shares of the Fund will vary with changes in market conditions. Shares of the Fund may be worth more or less than their original cost when they are redeemed or sold in the market. The Fund’s past performance is no guarantee of future results.
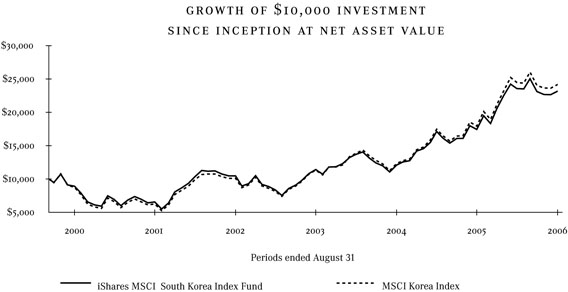
Performance figures assume reinvestment of all dividends and capital gain distributions and do not reflect the deduction of taxes that a shareholder would pay on fund distributions or the redemption of fund shares. An index is a statistical composite that tracks a specified financial market or sector. Unlike the Fund, an index does not actually hold a portfolio of securities and therefore does not incur the expenses incurred by the Fund. These expenses negatively impact the performance of the Fund. The Fund’s past performance is no guarantee of future results.
| MANAGEMENT’S DISCUSSIONSOF FUND PERFORMANCE | 23 |
Table of Contents
Management’s Discussion of Fund Performance (Continued)
iSHARES® MSCI SOUTH KOREA INDEX FUND
PORTFOLIO ALLOCATION
As of 8/31/06
Sector | Percentage of Net Assets | ||
Industrial | 39.40 | % | |
Financial | 20.12 | ||
Consumer Cyclical | 14.38 | ||
Basic Materials | 7.53 | ||
Communications | 6.86 | ||
Consumer Non-Cyclical | 5.23 | ||
Utilities | 2.95 | ||
Energy | 2.94 | ||
Technology | 0.50 | ||
Short-Term and Other Net Assets | 0.09 | ||
TOTAL | 100.00 | % | |
TOP TEN FUND HOLDINGS
As of 8/31/06
Security | Percentage of Net Assets | ||
Samsung Electronics Co. Ltd. | 22.05 | % | |
Kookmin Bank | 8.09 | ||
POSCO | 5.46 | ||
Hyundai Motor Co. Ltd. | 3.81 | ||
Shinhan Financial Group Ltd. | 2.98 | ||
Korea Electric Power Corp. | 2.95 | ||
Shinsegae Co. Ltd. | 2.16 | ||
SK Corp. | 2.04 | ||
LG Electronics Inc. | 2.04 | ||
KT&G Corp. | 1.99 | ||
TOTAL | 53.57 | % | |
The iShares MSCI South Korea Index Fund (the “Fund”) seeks to provide investment results that correspond generally to the price and yield performance, before fees and expenses, of publicly traded securities in the aggregate in the South Korean market, as measured by the MSCI Korea Index (the “Index”). The Fund invests in a representative sample of securities in the Index, which has a similar investment profile as the Index. Due to the use of representative sampling, the Fund may or may not hold all of the securities that are included in the Index. For the twelve-month period ended August 31, 2006 (the “reporting period”), the Fund returned 33.16%, while the Index returned 34.88%.
The South Korean market delivered very strong gains for the reporting period. Because South Korea depends heavily on exports for its economic health, it is sensitive to the economic cycles of its export markets, particularly the U.S., China and Japan. During much of the reporting period, this relationship benefited South Korea, as export demand from each of these countries continued to be strong. In May 2006, higher global inflation and rising oil prices appeared to lead to concerns that economic growth would slow globally, dampening export demand. As a result, many emerging markets that rely on exports suffered market declines and South Korea was no exception. The South Korean market dropped 7.63% in May 2006, its largest monthly decline for the year to date. However, South Korea overcame this setback in the final months of the reporting period as its export demand increased. In August 2006, exports rose 18.7% from a year earlier, driven largely by demand for computer and electronic products in the U.S., Japan and China.
The Fund’s ten largest holdings accounted for approximately 54% of the Fund’s net assets as of August 31, 2006. All of the Fund’s ten largest holdings as of August 31, 2006 posted double-digit gains for the reporting period. The strongest performer among the Fund’s ten largest holdings was Kookmin Bank, followed by Shinhan Financial Group Ltd., Shinsegae Co. Ltd. and KT&G Corp. The common shares of Samsung Electronics Co. Ltd., the largest Fund holding, also contributed positively to Fund performance. The most modest gains among the ten largest holdings came from LG Electronics Inc.
| 24 | 2006 iSHARES ANNUAL REPORTTO SHAREHOLDERS |
Table of Contents
Management’s Discussion of Fund Performance
iSHARES® MSCI TAIWAN INDEX FUND
Performance as of August 31, 2006
| Average Annual Total Returns | |||||||||||||||||||||||||
| Year Ended 8/31/06 | Five Years Ended 8/31/06 | Inception to 8/31/06 | |||||||||||||||||||||||
| NAV | MARKET | INDEX | NAV | MARKET | INDEX | NAV | MARKET | INDEX | |||||||||||||||||
| 9.84 | % | 10.14 | % | 11.79 | % | 7.31 | % | 7.40 | % | 8.50 | % | (5.88 | )% | (5.93 | )% | (4.87 | )% | ||||||||
| Cumulative Total Returns | |||||||||||||||||||||||||
| Year Ended 8/31/06 | Five Years Ended 8/31/06 | Inception to 8/31/06 | |||||||||||||||||||||||
| NAV | MARKET | INDEX | NAV | MARKET | INDEX | NAV | MARKET | INDEX | |||||||||||||||||
| 9.84 | % | 10.14 | % | 11.79 | % | 42.30 | % | 42.89 | % | 50.38 | % | (31.33 | )% | (31.53 | )% | (26.62 | )% | ||||||||
Total returns for the periods since inception are calculated from the inception date of the Fund (6/20/00). “Average annual total returns” represent the average annual change in value of an investment over the periods indicated. “Cumulative total returns” represent the total change in value of an investment over the periods indicated.
The Fund’s per share net asset value or “NAV” is the value of one share of the Fund as calculated in accordance with the standard formula for valuing mutual fund shares. The NAV return is based on the NAV of the Fund, and the market return is based on the market price per share of the Fund. The price used to calculate market return (“Market Price”) is determined by using the midpoint between the highest bid and the lowest offer on the stock exchange on which the shares of the Fund are listed for trading, as of the time that the Fund’s NAV is calculated. As the Fund has a NAV which is determined prior to the opening of the regular trading day on the stock exchange on which it is listed, the market return is calculated using the midpoint of the bid/ask spread as of the opening of regular trading on the exchange. Since shares of the Fund did not trade in the secondary market until several days after the Fund’s inception, for the period from inception to the first day of secondary market trading in shares of the Fund (6/23/00), the NAV of the Fund is used as a proxy for secondary market trading price to calculate market returns. Market and NAV returns assume that dividends and capital gain distributions have been reinvested in the Fund at Market Price and NAV, respectively.
An index is a statistical composite that tracks a specified financial market or sector. Unlike the Fund, an index does not actually hold a portfolio of securities and therefore does not incur the expenses incurred by the Fund. These expenses negatively impact the performance of the Fund. Also, market returns do not include brokerage commissions that may be payable on secondary market transactions. If brokerage commissions were included, market returns would be lower. The returns shown in the tables above do not reflect the deduction of taxes that a shareholder would pay on fund distributions or the redemption or sale of fund shares. The investment return and principal value of shares of the Fund will vary with changes in market conditions. Shares of the Fund may be worth more or less than their original cost when they are redeemed or sold in the market. The Fund’s past performance is no guarantee of future results.
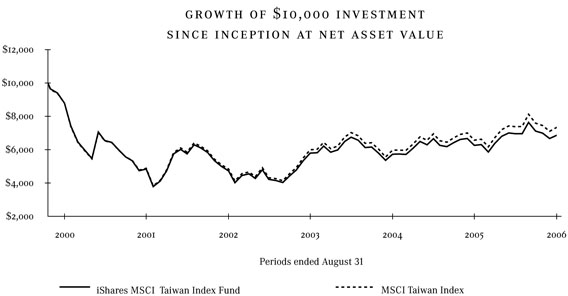
Performance figures assume reinvestment of all dividends and capital gain distributions and do not reflect the deduction of taxes that a shareholder would pay on fund distributions or the redemption of fund shares. An index is a statistical composite that tracks a specified financial market or sector. Unlike the Fund, an index does not actually hold a portfolio of securities and therefore does not incur the expenses incurred by the Fund. These expenses negatively impact the performance of the Fund. The Fund’s past performance is no guarantee of future results.
| MANAGEMENT’S DISCUSSIONSOF FUND PERFORMANCE | 25 |
Table of Contents
Management’s Discussion of Fund Performance (Continued)
iSHARES® MSCI TAIWAN INDEX FUND
PORTFOLIO ALLOCATION
As of 8/31/06
Sector | Percentage of Net Assets | ||
Technology | 35.82 | % | |
Industrial | 25.08 | ||
Financial | 17.84 | ||
Basic Materials | 9.90 | ||
Communications | 4.02 | ||
Consumer Cyclical | 3.49 | ||
Energy | 1.26 | ||
Consumer Non-Cyclical | 1.13 | ||
Short-Term and Other Net Assets | 1.46 | ||
TOTAL | 100.00 | % | |
TOP TEN FUND HOLDINGS
As of 8/31/06
Security | Percentage of Net Assets | ||
Taiwan Semiconductor Manufacturing Co. Ltd. | 14.04 | % | |
Hon Hai Precision Industry Co. Ltd. | 8.61 | ||
Cathay Financial Holding Co. Ltd. | 3.95 | ||
United Microelectronics Corp. | 3.74 | ||
AU Optronics Corp. | 3.15 | ||
MediaTek Inc. | 2.90 | ||
High Tech Computer Corp. | 2.68 | ||
Chunghwa Telecom Co. Ltd. | 2.61 | ||
Nan Ya Plastic Corp. | 2.58 | ||
China Steel Corp. | 2.58 | ||
TOTAL | 46.84 | % | |
The iShares MSCI Taiwan Index Fund (the “Fund”) seeks to provide investment results that correspond generally to the price and yield performance, before fees and expenses, of publicly traded securities in the aggregate in the Taiwanese market, as measured by the MSCI Taiwan Index (the “Index”). The Fund invests in a representative sample of securities in the Index, which has a similar investment profile as the Index. Due to the use of representative sampling, the Fund may or may not hold all of the securities that are included in the Index. For the twelve-month period ended August 31, 2006 (the “reporting period”), the Fund returned 9.84%, while the Index returned 11.79%.
The Taiwanese market delivered gains for the reporting period, although its returns were generally more moderate than other Asian markets. Because Taiwan’s exports account for almost half of its output, it is sensitive to the economic cycles of its two major export markets, China and the U.S. For much of the reporting period, ongoing economic growth in China and the U.S. translated into strong demand for exports from Taiwan. In May 2006, however, concerns surfaced that higher interest rates in the U.S. and rising oil prices would slow demand for exports, which led to declines among many emerging markets that are dependent on export activity. Although Taiwan participated in the general decline, its 6.69% drop in the month of May 2006 was less than the decline of the overall emerging markets. As the reporting period came to a close, the Taiwanese market appeared to be driven higher by one of its leading technology constituents, Hon Hai Precision Industry Co. Ltd., which makes Apple’s iPod music players. Taiwan’s broad market received a further boost when the U.S. Federal Reserve Board suggested that it would hold off further interest rate increases in the U.S., a pause that could help export growth in Taiwan.
The Fund’s ten largest holdings accounted for approximately 47% of the Fund’s net assets as of August 31, 2006. Eight of the Fund’s ten largest holdings as of August 31, 2006 delivered gains for the reporting period. High Tech Computer Corp. was the strongest performer, followed by electronics manufacturer Hon Hai Precision Industry Co. Ltd. Semiconductor company MediaTek Inc. performed well, as did Nan Ya Plastic Corp. The Fund’s largest holding, Taiwan Semiconductor Manufacturing Co Ltd., also contributed positively to Fund performance. On the negative side, United Microelectronics Corp. and Chunghwa Telecom Co. Ltd. both declined for the reporting period.
| 26 | 2006 iSHARES ANNUAL REPORTTO SHAREHOLDERS |
Table of Contents
Shareholder Expenses (Unaudited)
iSHARES®, INC.
As a shareholder of an iShares Fund, you incur two types of costs: (1) transaction costs, including brokerage commissions on purchases and sales of fund shares and (2) ongoing costs, including management fees and other fund expenses. The following Example is intended to help you understand your ongoing costs (in dollars and cents) of investing in a Fund and to compare these costs with the ongoing costs of investing in other funds.
The Example is based on an investment of $1,000 invested at the beginning of the period and held for the entire period from March 1, 2006 to August 31, 2006.
ACTUAL EXPENSES
The first line under each Fund in the table below provides information about actual account values and actual expenses. You may use the information in this line, together with the amount you invested, to estimate the expenses that you paid over the period. Simply divide your account value by $1,000 (for example, an $8,600 account value divided by $1,000 = 8.6), then multiply the result by the number in the first line for your Fund under the heading entitled “Expenses Paid During Period” to estimate the expenses you paid on your account during this period.
HYPOTHETICAL EXAMPLE FOR COMPARISON PURPOSES
The second line under each Fund in the table below provides information about hypothetical account values and hypothetical expenses based on each Fund’s actual expense ratio and an assumed rate of return of 5% per year before expenses, which is not the Fund’s actual return. The hypothetical account values and expenses may not be used to estimate the actual ending account balance or expenses you paid for the period. You may use this information to compare the ongoing costs of investing in your Fund and other funds. To do so, compare this 5% hypothetical example with the 5% hypothetical examples that appear in the shareholder reports of the other funds.
Please note that the expenses shown in the table are meant to highlight your ongoing costs only and do not reflect any transactional costs, such as brokerage commissions paid on purchases and sales of fund shares. Therefore, the second line under each Fund in the table is useful in comparing ongoing costs only and will not help you determine the relative total costs of owning different funds. In addition, if these transactional costs were included, your costs would have been higher.
iShares MSCI Index Fund | Beginning Account Value (3/1/06) | Ending Account Value (8/31/06) | Annualized Expense Ratio | Expenses Paid During Period a (3/1/06 to 8/31/06) | ||||||||
Australia | ||||||||||||
Actual | $ | 1,000.00 | $ | 1,086.60 | 0.52 | % | $ | 2.73 | ||||
Hypothetical (5% return before expenses) | 1,000.00 | 1,022.58 | 0.52 | 2.65 | ||||||||
Brazil | ||||||||||||
Actual | 1,000.00 | 928.30 | 0.68 | 3.31 | ||||||||
Hypothetical (5% return before expenses) | 1,000.00 | 1,021.78 | 0.68 | 3.47 | ||||||||
Canada | ||||||||||||
Actual | 1,000.00 | 1,061.50 | 0.52 | 2.70 | ||||||||
Hypothetical (5% return before expenses) | 1,000.00 | 1,022.58 | 0.52 | 2.65 | ||||||||
Emerging Markets | ||||||||||||
Actual | 1,000.00 | 998.20 | 0.75 | 3.78 | ||||||||
Hypothetical (5% return before expenses) | 1,000.00 | 1,021.42 | 0.75 | 3.82 | ||||||||
| SHAREHOLDER EXPENSES | 27 |
Table of Contents
Shareholder Expenses (Unaudited) (Continued)
iSHARES®, INC.
iShares MSCI Index Fund | Beginning Account Value (3/1/06) | Ending Account Value (8/31/06) | Annualized Expense Ratio | Expenses Paid During Period a (3/1/06 to 8/31/06) | ||||||||
Hong Kong | ||||||||||||
Actual | $ | 1,000.00 | $ | 1,065.30 | 0.52 | % | $ | 2.71 | ||||
Hypothetical (5% return before expenses) | 1,000.00 | 1,022.58 | 0.52 | 2.65 | ||||||||
Malaysia | ||||||||||||
Actual | 1,000.00 | 1,057.30 | 0.52 | 2.70 | ||||||||
Hypothetical (5% return before expenses) | 1,000.00 | 1,022.58 | 0.52 | 2.65 | ||||||||
Mexico | ||||||||||||
Actual | 1,000.00 | 1,077.50 | 0.52 | 2.72 | ||||||||
Hypothetical (5% return before expenses) | 1,000.00 | 1,022.58 | 0.52 | 2.65 | ||||||||
Pacific ex-Japan | ||||||||||||
Actual | 1,000.00 | 1,076.70 | 0.50 | 2.62 | ||||||||
Hypothetical (5% return before expenses) | 1,000.00 | 1,022.68 | 0.50 | 2.55 | ||||||||
Singapore | ||||||||||||
Actual | 1,000.00 | 1,063.00 | 0.52 | 2.70 | ||||||||
Hypothetical (5% return before expenses) | 1,000.00 | 1,022.58 | 0.52 | 2.65 | ||||||||
South Africa | ||||||||||||
Actual | 1,000.00 | 911.50 | 0.68 | 3.28 | ||||||||
Hypothetical (5% return before expenses) | 1,000.00 | 1,021.78 | 0.68 | 3.47 | ||||||||
South Korea | ||||||||||||
Actual | 1,000.00 | 983.80 | 0.68 | 3.40 | ||||||||
Hypothetical (5% return before expenses) | 1,000.00 | 1,021.78 | 0.68 | 3.47 | ||||||||
Taiwan | ||||||||||||
Actual | 1,000.00 | 987.40 | 0.91 | 4.56 | ||||||||
Hypothetical (5% return before expenses) | 1,000.00 | 1,020.62 | 0.91 | 4.63 | ||||||||
| a | Expenses are calculated using each Fund’s annualized expense ratio (as disclosed in the table), multiplied by the average account value for the period, multiplied by the number of days in the period (184 days) and divided by the number of days in the year (365 days). |
| 28 | 2006 iSHARES ANNUAL REPORTTO SHAREHOLDERS |
Table of Contents
iSHARES® MSCI AUSTRALIA INDEX FUND
August 31, 2006
Security | Shares | Value | |||
COMMON STOCKS – 99.19% | |||||
AIRLINES – 0.40% | |||||
Qantas Airways Ltd. | 1,039,065 | $ | 2,729,578 | ||
| 2,729,578 | |||||
APPAREL – 0.30% | |||||
Billabong International Ltd. | 183,804 | 2,077,356 | |||
| 2,077,356 | |||||
BANKS – 27.46% | |||||
Australia & New Zealand Banking Group Ltd. | 2,017,074 | 41,974,226 | |||
Commonwealth Bank of Australia | 1,419,075 | 49,545,695 | |||
Macquarie Office Trust | 2,117,244 | 2,312,072 | |||
National Australia Bank Ltd. | 1,768,557 | 49,052,287 | |||
Suncorp-Metway Ltd. | 612,786 | 9,593,058 | |||
Westpac Banking Corp. Ltd. | 2,018,982 | 36,031,763 | |||
| 188,509,101 | |||||
BEVERAGES – 2.18% | |||||
Coca-Cola Amatil Ltd. | 574,149 | 2,871,840 | |||
Foster’s Group Ltd. | 2,225,841 | 10,113,593 | |||
Lion Nathan Ltd. | 325,950 | 1,986,316 | |||
| 14,971,749 | |||||
BIOTECHNOLOGY – 0.39% | |||||
Sonic Healthcare Ltd. | 292,401 | 2,699,601 | |||
| 2,699,601 | |||||
BUILDING MATERIALS – 2.73% | |||||
Boral Ltd. | 646,971 | 3,359,604 | |||
CSR Ltd. | 1,017,759 | 2,448,217 | |||
James Hardie Industries NV | 511,662 | 2,617,896 | |||
Rinker Group Ltd. | 981,507 | 10,343,484 | |||
| 18,769,201 | |||||
COMMERCIAL SERVICES – 2.52% | |||||
ABC Learning Centres Ltd. | 392,730 | 1,946,405 | |||
Brambles Industries Ltd.1 | 1,074,840 | 9,808,579 | |||
Sydney Roads Group2 | 1,028,094 | 812,583 | |||
Transurban Group | 882,609 | 4,711,290 | |||
| 17,278,857 | |||||
COMPUTERS – 0.43% | |||||
Computershare Ltd. | 494,490 | 2,945,415 | |||
| 2,945,415 | |||||
DIVERSIFIED FINANCIAL SERVICES – 3.67% | |||||
Australian Stock Exchange Ltd. | 190,164 | 4,792,218 | |||
Babcock & Brown Ltd. | 224,826 | 3,450,936 | |||
Challenger Financial Services Group Ltd. | 441,702 | 1,183,943 | |||
Macquarie Bank Ltd. | 268,233 | 13,273,381 | |||
Perpetual Ltd. | 44,679 | 2,484,554 | |||
| 25,185,032 | |||||
ENGINEERING & CONSTRUCTION – 1.13% | |||||
Downer EDI Ltd. | 330,134 | 1,419,361 | |||
Leighton Holdings Ltd. | 155,979 | 2,359,636 | |||
Multiplex Group | 694,512 | 1,792,631 | |||
WorleyParsons Ltd. | 156,615 | 2,162,351 | |||
| 7,733,979 | |||||
ENTERTAINMENT – 1.75% | |||||
Aristocrat Leisure Ltd. | 388,278 | 3,884,261 | |||
TABCORP Holdings Ltd. | 577,965 | 6,682,235 | |||
UNiTAB Ltd. | 137,217 | 1,472,240 | |||
| 12,038,736 | |||||
FOOD – 3.26% | |||||
Goodman Fielder Ltd.2 | 1,161,336 | 1,880,131 | |||
Woolworths Ltd. | 1,298,076 | 20,519,408 | |||
| 22,399,539 | |||||
FOREST PRODUCTS & PAPER – 0.19% | |||||
PaperlinX Ltd. | 490,515 | 1,288,561 | |||
| 1,288,561 | |||||
GAS – 1.48% | |||||
Alinta Ltd. | 288,744 | 2,429,903 | |||
Australian Gas Light Co. Ltd. | 502,758 | 7,743,891 | |||
| 10,173,794 | |||||
HEALTH CARE – PRODUCTS – 0.34% | |||||
Cochlear Ltd. | 60,579 | 2,326,936 | |||
| 2,326,936 | |||||
HEALTH CARE – SERVICES – 0.14% | |||||
DCA Group Ltd. | 480,975 | 929,260 | |||
| 929,260 | |||||
HOUSEHOLD PRODUCTS & WARES – 0.15% | |||||
Pacific Brands Ltd. | 553,797 | 1,023,435 | |||
| 1,023,435 | |||||
| SCHEDULESOF INVESTMENTS | 29 |
Table of Contents
Schedule of Investments (Continued)
iSHARES® MSCI AUSTRALIA INDEX FUND
August 31, 2006
Security | Shares | Value | |||
INSURANCE – 6.17% | |||||
AMP Ltd. | 2,060,799 | $ | 14,242,249 | ||
AXA Asia Pacific Holdings Ltd. | 957,021 | 4,786,931 | |||
Insurance Australia Group Ltd. | 1,757,586 | 7,207,509 | |||
QBE Insurance Group Ltd. | 883,404 | 16,096,230 | |||
| 42,332,919 | |||||
INVESTMENT COMPANIES – 1.44% | |||||
Macquarie Airports | 737,919 | 1,679,265 | |||
Macquarie Communications Infrastructure Group | 352,821 | 1,624,673 | |||
Macquarie Infrastructure Group | 2,725,419 | 6,555,989 | |||
| 9,859,927 | |||||
IRON & STEEL – 0.88% | |||||
BlueScope Steel Ltd. | 765,744 | 3,970,523 | |||
OneSteel Ltd. | 635,523 | 2,067,451 | |||
| 6,037,974 | |||||
MANUFACTURING – 2.76% | |||||
Ansell Ltd. | 177,126 | 1,274,171 | |||
Futuris Corp. Ltd. | 673,842 | 1,101,200 | |||
Orica Ltd. | 343,917 | 5,901,346 | |||
Wesfarmers Ltd. | 416,898 | 10,693,852 | |||
| 18,970,569 | |||||
MEDIA – 0.95% | |||||
APN News & Media Ltd. | 319,749 | 1,218,440 | |||
John Fairfax Holdings Ltd. | 1,033,659 | 3,188,989 | |||
Publishing & Broadcasting Ltd. | 149,301 | 2,093,292 | |||
| 6,500,721 | |||||
MINING – 17.32% | |||||
Alumina Ltd. | 1,285,992 | 6,236,003 | |||
BHP Billiton Ltd. | 3,847,323 | 81,382,827 | |||
Iluka Resources Ltd. | 255,036 | 1,423,683 | |||
Newcrest Mining Ltd. | 365,223 | 5,438,599 | |||
Paladin Resources Ltd.2 | 472,548 | 1,912,565 | |||
Rio Tinto Ltd. | 315,615 | 17,582,365 | |||
Zinifex Ltd. | 543,462 | 4,938,676 | |||
| 118,914,718 | |||||
OIL & GAS – 4.27% | |||||
Caltex Australia Ltd. | 150,573 | 2,632,008 | |||
Origin Energy Ltd. | 870,684 | 4,434,869 | |||
Santos Ltd. | 654,126 | 5,589,666 | |||
Woodside Petroleum Ltd. | 515,001 | 16,620,034 | |||
| 29,276,577 | |||||
PACKAGING & CONTAINERS – 0.73% | |||||
Amcor Ltd. | 972,285 | 4,982,077 | |||
| 4,982,077 | |||||
PHARMACEUTICALS – 1.63% | |||||
CSL Ltd. | 199,863 | 7,761,001 | |||
Mayne Pharma Ltd.2 | 702,144 | 1,646,110 | |||
Symbion Health Ltd. | 721,860 | 1,791,557 | |||
| 11,198,668 | |||||
REAL ESTATE – 10.41% | |||||
Centro Properties Group | 907,254 | 5,307,036 | |||
CFS Retail Property Trust | 1,489,035 | 2,160,493 | |||
Commonwealth Property Office Fund | 1,585,230 | 1,718,996 | |||
DB RREEF Trust | 2,908,905 | 3,476,468 | |||
GPT Group | 2,142,843 | 7,478,266 | |||
ING Industrial Fund3 | 911,388 | 1,579,878 | |||
Investa Property Group | 1,673,316 | 3,028,452 | |||
Lend Lease Corp. Ltd. | 396,705 | 4,759,247 | |||
Macquarie Goodman Group | 1,520,040 | 7,359,336 | |||
Mirvac Group | 980,394 | 3,421,458 | |||
Stockland Trust Group | 1,483,311 | 8,200,968 | |||
Westfield Group | 1,646,922 | 22,977,667 | |||
| 71,468,265 | |||||
RETAIL – 2.26% | |||||
Coles Myer Ltd. | 1,309,524 | 13,990,252 | |||
Harvey Norman Holdings Ltd. | 587,664 | 1,543,767 | |||
| 15,534,019 | |||||
TELECOMMUNICATIONS – 0.93% | |||||
Telstra Corp. Ltd.1 | 2,334,120 | 6,416,823 | |||
| 6,416,823 | |||||
TRANSPORTATION – 0.92% | |||||
Toll Holdings Ltd. | 576,375 | 6,289,726 | |||
| 6,289,726 | |||||
TOTAL COMMON STOCKS | 680,863,113 | ||||
| 30 | 2006 iSHARES ANNUAL REPORTTO SHAREHOLDERS |
Table of Contents
Schedule of Investments (Continued)
iSHARES® MSCI AUSTRALIA INDEX FUND
August 31, 2006
Security | Principal | Value | ||||
SHORT-TERM INVESTMENTS – 1.78% | ||||||
CERTIFICATES OF DEPOSIT4 – 0.08% | ||||||
Credit Suisse First Boston NY | ||||||
5.28% - 5.43%, 04/23/07 - 08/21/07 | $ | 71,279 | $ | 71,279 | ||
Societe Generale | ||||||
5.33%, 12/08/06 | 101,827 | 101,827 | ||||
Washington Mutual Bank | ||||||
5.36%, 11/13/06 | 254,569 | 254,569 | ||||
Wells Fargo Bank N.A. | ||||||
4.78%, 12/05/06 | 81,462 | 81,462 | ||||
| 509,137 | ||||||
COMMERCIAL PAPER4 – 0.29% | ||||||
Amstel Funding Corp. | ||||||
5.20%, 11/21/06 - 11/22/065 | 29,711 | 29,362 | ||||
Amsterdam Funding Corp. | ||||||
5.27%, 09/15/065 | 101,827 | 101,619 | ||||
Atlantis One Funding | ||||||
5.30%, 11/14/065 | 139,715 | 138,193 | ||||
Barton Capital Corp. | ||||||
5.27%, 09/06/065 | 51,321 | 51,282 | ||||
Cancara Asset Securitisation Ltd. | ||||||
5.30%, 11/14/065 | 51,618 | 51,056 | ||||
CC USA Inc. | ||||||
5.03%, 10/24/065 | 20,365 | 20,215 | ||||
Charta LLC | ||||||
5.30%, 11/06/065 | 101,827 | 100,838 | ||||
Concord Minutemen Capital Co. LLC | ||||||
5.27% - 5.29%, 09/13/06 - 11/16/065 | 178,841 | 178,047 | ||||
Curzon Funding LLC | ||||||
5.29%, 11/17/065 | 101,827 | 100,675 | ||||
Edison Asset Securitization LLC | ||||||
5.22%, 12/11/065 | 75,120 | 74,020 | ||||
Falcon Asset Securitization Corp. | ||||||
5.30%, 11/06/065 | 101,827 | 100,838 | ||||
Five Finance Inc. | ||||||
5.19%, 12/01/065 | 45,822 | 45,221 | ||||
General Electric Capital Services Inc. | ||||||
5.22%, 12/11/06 | 10,183 | 10,034 | ||||
Giro Funding Corp. | ||||||
5.28% - 5.34%, 09/11/06 - 10/10/065 | 101,827 | 101,458 | ||||
Grampian Funding LLC | ||||||
5.03% - 5.30%, 10/17/06 - 11/16/065 | 48,877 | 48,474 | ||||
KKR Pacific Funding Trust | ||||||
5.29%, 09/14/065 | 101,827 | 101,633 | ||||
Landale Funding LLC | ||||||
5.31%, 11/15/065 | 79,425 | 78,548 | ||||
Lexington Parker Capital Co. LLC | ||||||
5.19% - 5.27%, 09/15/06 - 11/15/065 | 131,991 | 131,233 | ||||
Liberty Street Funding Corp. | ||||||
5.27%, 09/08/06 - 09/11/065 | 90,626 | 90,517 | ||||
Mont Blanc Capital Corp. | ||||||
5.29%, 11/15/065 | 65,679 | 64,955 | ||||
Monument Gardens Funding LLC | ||||||
5.28%, 09/21/065 | 51,171 | 51,021 | ||||
Nestle Capital Corp. | ||||||
5.19%, 08/09/07 | 61,096 | 58,084 | ||||
Park Granada LLC | ||||||
5.30%, 09/01/065 | 23,270 | 23,270 | ||||
Regency Markets LLC | ||||||
5.28%, 09/15/06 | 50,914 | 50,809 | ||||
Solitaire Funding Ltd. | ||||||
5.27%, 09/05/065 | 76,371 | 76,326 | ||||
Sydney Capital Corp. | ||||||
5.27%, 09/12/065 | 23,298 | 23,261 | ||||
Tulip Funding Corp. | ||||||
5.29%, 11/15/065 | 53,706 | 53,114 | ||||
White Pine Finance LLC | ||||||
5.12%, 10/27/065 | 19,245 | 19,092 | ||||
| 1,973,195 | ||||||
MEDIUM-TERM NOTES4 – 0.06% | ||||||
Bank of America N.A. | ||||||
5.28%, 04/20/07 | 25,457 | 25,457 | ||||
Cullinan Finance Corp. | ||||||
5.71%, 06/28/075 | 76,371 | 76,371 | ||||
K2 USA LLC | ||||||
5.39%, 06/04/075 | 76,371 | 76,371 | ||||
| SCHEDULESOF INVESTMENTS | 31 |
Table of Contents
Schedule of Investments (Continued)
iSHARES® MSCI AUSTRALIA INDEX FUND
August 31, 2006
Security | Shares or Principal | Value | ||||
Marshall & Ilsley Bank | ||||||
5.18%, 12/15/06 | $ | 101,827 | $ | 101,928 | ||
Sigma Finance Inc. | ||||||
5.13% - 5.51%, 03/30/07 - 06/18/075 | 119,138 | 119,139 | ||||
US Bank N.A. | ||||||
2.85%, 11/15/06 | 20,365 | 20,288 | ||||
| 419,554 | ||||||
MONEY MARKET FUNDS – 0.01% | ||||||
Barclays Global Investors Funds Institutional Money Market Fund, Institutional Shares 5.30%6,7 | 31,715 | 31,715 | ||||
| 31,715 | ||||||
REPURCHASE AGREEMENTS4 – 0.36% | ||||||
Banc of America Securities LLC Repurchase Agreement, 5.30%, due 9/1/06, maturity value $127,303 (collateralized by U.S. Government obligations, value $129,953, 5.50% to 6.50%, 1/1/33 to 7/1/36). | $ | 127,284 | 127,284 | |||
Banc of America Securities LLC Repurchase Agreement, 5.36%, due 9/1/06, maturity value $203,685 (collateralized by non-U.S. Government debt securities, value $209,964, 3.80% to 9.13%, 11/1/06 to 6/15/26). | 203,655 | 203,655 | ||||
Bear Stearns Companies Inc. (The) Repurchase Agreement, 5.37%, due 9/1/06, maturity value $152,764 (collateralized by non-U.S. Government debt securities, value $168,178, 0.08% to 6.43%, 9/25/20 to 7/25/36). | 152,741 | 152,741 | ||||
Security | Principal | Value | ||||
Citigroup Global Markets Holdings Inc. Repurchase Agreement, 5.36%, due 9/1/06, maturity value $305,527 (collateralized by non-U.S. Government debt securities, value $319,208, 4.35% to 7.50%, 9/15/08 to 8/25/35). | $ | 305,482 | $ | 305,482 | ||
Citigroup Global Markets Holdings Inc. Repurchase Agreement, 5.46%, due 9/1/06, maturity value $61,105 (collateralized by non-U.S. Government debt securities, value $74,582, 0.00% to 10.00%, 6/1/28 to 8/24/36). | 61,096 | 61,096 | ||||
Goldman Sachs & Co. Repurchase Agreement, 5.35%, due 9/1/06, maturity value $ 203,685 (collateralized by non-U.S. Government debt securities, value $207,925, 0.00% to 8.57%, 11/15/06 to 2/15/38). | 203,655 | 203,655 | ||||
Goldman Sachs Group Inc. Repurchase Agreement, 5.36%, due 9/1/06, maturity value $101,842 (collateralized by non-U.S. Government debt securities, value $107,020, 5.36% to 9.01%, 10/27/10 to 2/18/20). | 101,827 | 101,827 | ||||
JP Morgan Securities Inc. Repurchase Agreement, 5.41%, due 9/1/06, maturity value $25,461 (collateralized by non-U.S. Government debt securities, value $26,756, 6.63% to 10.50%, 1/15/07 to 4/15/16). | 25,457 | 25,457 | ||||
| 32 | 2006 iSHARES ANNUAL REPORTTO SHAREHOLDERS |
Table of Contents
Schedule of Investments (Continued)
iSHARES® MSCI AUSTRALIA INDEX FUND
August 31, 2006
Security | Principal | Value | ||||
Lehman Brothers Holdings Inc. Repurchase Agreement, 5.36%, due 9/1/06, maturity value $203,685 (collateralized by non-U.S. Government debt securities, value $214,042, 0.51% to 8.89%, 8/5/18 to 9/25/46). | $ | 203,655 | $ | 203,655 | ||
Lehman Brothers Holdings Inc. Repurchase Agreement, 5.38%, due 9/1/06, maturity value $101,842 (collateralized by non-U.S. Government debt securities, value $107,023, 4.11% to 9.79%, 4/28/31 to 9/25/46). | 101,827 | 101,827 | ||||
Lehman Brothers Holdings Inc. Repurchase Agreement, 5.46%, due 9/1/06, maturity value $112,027 (collateralized by non-U.S. Government debt securities, value $117,722, 3.44% to 15.15%, 12/1/08 to 3/1/36). | 112,010 | 112,010 | ||||
Merrill Lynch & Co. Inc. Repurchase Agreement, 5.33%, due 9/1/06, maturity value $ 203,685 (collateralized by non-U.S. Government debt securities, value $214,045, 6.38% to 10.25%, 5/1/07 to 10/15/16). | 203,655 | 203,655 | ||||
Merrill Lynch & Co. Inc. Repurchase Agreement, 5.36%, due 9/1/06, maturity value $ 203,685 (collateralized by non-U.S. Government debt securities, value $210,002, 0.00% to 10.13%, 10/15/06 to 7/1/26). | 203,655 | 203,655 | ||||
Morgan Stanley Repurchase Agreement, 5.36%, due 9/1/06, maturity value $ 101,842 (collateralized by non-U.S. Government debt securities, value $107,070, 4.05% to 7.24%, 6/20/29 to 1/14/41). | 101,827 | 101,827 | ||||
Morgan Stanley Repurchase Agreement, 5.46%, due 9/1/06, maturity value $ 35,645 (collateralized by non-U.S. Government debt securities, value $54,657, 0.00% to 10.00%, 9/1/06 to 8/31/36). | 35,640 | 35,640 | ||||
Morgan Stanley Repurchase Agreement, 5.51%, due 6/4/07, maturity value $ 74,301 (collateralized by non-U.S. Government debt securities, value $110,970, 0.00% to 10.00%, 9/1/06 to 8/31/36).8 | 71,279 | 71,279 | ||||
Wachovia Capital Repurchase Agreement, 5.38%, due 9/1/06, maturity value $ 264,791 (collateralized by non-U.S. Government debt securities, value $278,253, 0.06% to 7.68%, 10/15/11 to 3/15/45). | 264,751 | 264,751 | ||||
| 2,479,496 | ||||||
TIME DEPOSITS4 – 0.00% | ||||||
KBC Bank | ||||||
5.31%, 09/01/06 | 21,487 | 21,487 | ||||
| 21,487 | ||||||
VARIABLE & FLOATING RATE NOTES 4 – 0.98% | ||||||
Allstate Life Global Funding II | ||||||
5.34% - 5.47%, 09/04/07 - 09/27/075 | 260,678 | 260,712 | ||||
American Express Bank | ||||||
5.30%, 02/28/07 | 101,827 | 101,827 | ||||
American Express Centurion Bank | ||||||
5.42%, 07/19/07 | 112,010 | 112,124 | ||||
| SCHEDULESOF INVESTMENTS | 33 |
Table of Contents
Schedule of Investments (Continued)
iSHARES® MSCI AUSTRALIA INDEX FUND
August 31, 2006
Security | Principal | Value | ||||
American Express Credit Corp. | ||||||
5.51%, 07/05/07 | $ | 30,548 | $ | 30,565 | ||
ASIF Global Financing | ||||||
5.51%, 05/03/075 | 10,183 | 10,187 | ||||
Australia & New Zealand Banking Group Ltd. | ||||||
5.32%, 09/21/075 | 66,188 | 66,188 | ||||
Bank of Ireland | ||||||
5.30% - 5.31%, 08/14/07 - 08/20/075 | 147,650 | 147,656 | ||||
Beta Finance Inc. | ||||||
5.29% - 5.48%, 04/25/07 - 07/25/075 | 259,660 | 259,674 | ||||
BMW US Capital LLC | ||||||
5.33%, 09/14/075 | 101,827 | 101,827 | ||||
BNP Paribas | ||||||
5.36%, 05/18/075 | 188,381 | 188,381 | ||||
Carlyle Loan Investment Ltd. | ||||||
5.38%, 04/13/07 - 07/15/075 | 74,334 | 74,334 | ||||
CC USA Inc. | ||||||
5.48%, 07/30/075 | 50,914 | 50,920 | ||||
Commodore CDO Ltd. | ||||||
5.38%, 06/12/075 | 25,457 | 25,457 | ||||
Credit Agricole SA | ||||||
5.48%, 07/23/07 | 101,827 | 101,827 | ||||
Credit Suisse First Boston NY | ||||||
5.51%, 04/24/07 | 50,914 | 50,916 | ||||
Cullinan Finance Corp. | ||||||
5.36%, 04/25/075 | 25,457 | 25,457 | ||||
DEPFA Bank PLC | ||||||
5.37%, 06/15/07 | 101,827 | 101,827 | ||||
Dorada Finance Inc. | ||||||
5.41% - 5.47%, 06/27/07 - 07/17/075 | 117,102 | 117,109 | ||||
Eli Lilly Services Inc. | ||||||
5.37%, 08/31/075 | 101,827 | 101,827 | ||||
Fifth Third Bancorp | ||||||
5.30%, 09/21/075 | 203,655 | 203,655 | ||||
Five Finance Inc. | ||||||
5.37% - 5.45%, 12/01/06 - 07/13/075 | 101,827 | 101,819 | ||||
General Electric Capital Corp. | ||||||
5.29% - 5.49%, 07/09/07 - 09/24/07 | 106,919 | 106,943 | ||||
Granite Master Issuer PLC | ||||||
5.30%, 09/20/06 | 356,396 | 356,396 | ||||
Harrier Finance Funding LLC | ||||||
5.33%, 07/25/075 | 30,548 | 30,554 | ||||
Hartford Life Global Funding Trusts | ||||||
5.35% - 5.55%, 07/13/07 - 09/17/07 | 152,741 | 152,765 | ||||
HBOS Treasury Services PLC | ||||||
5.53%, 07/24/075 | 101,827 | 101,827 | ||||
Holmes Financing PLC | ||||||
5.40%, 07/16/075 | 178,198 | 178,198 | ||||
JP Morgan Chase & Co. | ||||||
5.36%, 08/02/07 | 76,371 | 76,371 | ||||
K2 USA LLC | ||||||
5.20% - 5.46%, 04/02/07 - 06/28/075 | 76,371 | 76,368 | ||||
Kestrel Funding LLC | ||||||
5.31%, 07/11/075 | 40,731 | 40,727 | ||||
Kommunalkredit Austria AG | ||||||
5.33%, 09/09/075 | 61,096 | 61,096 | ||||
Leafs LLC | ||||||
5.33%, 01/22/07 - 02/20/075 | 106,244 | 106,244 | ||||
Lexington Parker Capital Co. LLC | ||||||
5.46%, 01/10/075 | 127,284 | 127,256 | ||||
Links Finance LLC | ||||||
5.33% - 5.35%, 05/10/07 - 05/16/075 | 112,010 | 112,002 | ||||
Lothian Mortgages Master Issuer PLC | ||||||
5.30%, 04/24/075 | 44,868 | 44,868 | ||||
Marshall & Ilsley Bank | ||||||
5.31%, 09/14/07 | 56,005 | 56,005 | ||||
Metropolitan Life Global Funding I | ||||||
5.42%, 08/06/075 | 152,741 | 152,741 | ||||
Metropolitan Life Insurance Funding Agreement | ||||||
5.57%, 08/01/075,8 | 10,183 | 10,183 | ||||
Monumental Global Funding II | ||||||
5.49%, 12/27/065 | 20,365 | 20,368 | ||||
| 34 | 2006 iSHARES ANNUAL REPORTTO SHAREHOLDERS |
Table of Contents
Schedule of Investments (Continued)
iSHARES® MSCI AUSTRALIA INDEX FUND
August 31, 2006
Security | Principal | Value | |||||
Mound Financing PLC | |||||||
5.39%, 05/08/075 | $ | 95,718 | $ | 95,718 | |||
Natexis Banques Populaires | |||||||
5.31% - 5.40%, 02/05/07 - 09/14/075 | 305,482 | 305,478 | |||||
National City Bank of Indiana | |||||||
5.37%, 05/21/07 | 50,914 | 50,917 | |||||
Nationwide Building Society | |||||||
5.44% - 5.62%, 07/06/07 - 07/27/075 | 336,031 | 336,108 | |||||
Newcastle Ltd. | |||||||
5.35%, 04/24/075 | 35,894 | 35,887 | |||||
Northern Rock PLC | |||||||
5.43%, 08/03/075 | 122,193 | 122,196 | |||||
Principal Life Global Funding I | |||||||
5.80%, 02/08/07 | 45,822 | 45,916 | |||||
Sedna Finance Inc. | |||||||
5.30% - 5.37%, 09/20/06 - 08/21/075 | 178,198 | 178,194 | |||||
Skandinaviska Enskilda Bank NY | |||||||
5.33%, 09/18/075 | 101,827 | 101,827 | |||||
Strips III LLC | |||||||
5.38%, 07/24/075 | 24,760 | 24,760 | |||||
SunTrust Bank | |||||||
5.37%, 05/01/07 | 101,827 | 101,832 | |||||
Tango Finance Corp. | |||||||
5.22% - 5.48%, 04/25/07 - 07/16/075 | 248,459 | 248,438 | |||||
Union Hamilton Special Funding LLC | |||||||
5.42% - 5.49%, 09/28/06 - 12/21/065 | 142,558 | 142,558 | |||||
US Bank N.A. | |||||||
5.26%, 09/29/06 | 45,822 | 45,821 | |||||
Wachovia Asset Securitization Inc. | |||||||
5.31%, 09/25/065 | 151,948 | 151,948 | |||||
Wachovia Bank N.A. | |||||||
5.36%, 05/22/07 | 203,655 | 203,655 | |||||
Wells Fargo & Co. | |||||||
5.34%, 09/14/075 | 50,914 | 50,917 | |||||
WhistleJacket Capital Ltd. | |||||||
5.29% - 5.35%, 04/18/07 - 06/13/075 | 76,371 | 76,370 | |||||
White Pine Finance LLC | |||||||
5.29% - 5.35%, 05/22/07 - 08/20/075 | 305,482 | 305,427 | |||||
Wind Master Trust | |||||||
5.31% - 5.32%, 09/25/06 - 07/25/075 | 64,580 | 64,580 | |||||
| 6,733,748 | |||||||
TOTAL SHORT-TERM INVESTMENTS | 12,168,332 | ||||||
TOTAL INVESTMENTS IN SECURITIES – 100.97% | 693,031,445 | ||||||
Other Assets, Less Liabilities – (0.97)% | (6,624,439 | ) | |||||
NET ASSETS – 100.00% | $ | 686,407,006 | |||||
| 1 | All or a portion of this security represents a security on loan. See Note 5. |
| 2 | Non-income earning security. |
| 3 | Security valued at fair value in accordance with procedures approved by the Board of Directors. See Note 1. |
| 4 | All or a portion of this security (these securities) represent(s) an investment of securities lending collateral. See Note 5. |
| 5 | This security or a portion of these securities may be resold to qualified institutional buyers under Rule 144A or pursuant to Section 4(2) of the Securities Act of 1933. |
| 6 | Affiliated issuer. See Note 2. |
| 7 | The rate quoted is the annualized seven-day yield of the fund at period end. |
| 8 | The investment adviser has determined that this security or a portion of these securities is illiquid. |
See notes to the financial statements.
| SCHEDULESOF INVESTMENTS | 35 |
Table of Contents
Schedule of Investments
iSHARES® MSCI BRAZIL INDEX FUND
August 31, 2006
Security | Shares | Value | |||
COMMON STOCKS – 38.85% | |||||
AEROSPACE & DEFENSE – 1.87% | |||||
Empresa Brasileira de Aeronautica SA | 4,702,149 | $ | 46,056,046 | ||
| 46,056,046 | |||||
AGRICULTURE – 0.84% | |||||
Souza Cruz SA | 1,263,000 | 20,657,093 | |||
| 20,657,093 | |||||
BANKS – 4.84% | |||||
Banco Nossa Caixa SA | 631,500 | 12,677,149 | |||
Unibanco Uniao de Bancos Brasileiros SA | 14,903,420 | 106,820,593 | |||
| 119,497,742 | |||||
CHEMICALS – 0.47% | |||||
Braskem SA Class A | 1,768,236 | 11,510,449 | |||
| 11,510,449 | |||||
COMMERCIAL SERVICES – 0.77% | |||||
Cia de Concessoes Rodoviarias | 1,955,700 | 19,064,196 | |||
| 19,064,196 | |||||
COSMETICS & PERSONAL CARE – 0.89% | |||||
Natura Cosmeticos SA | 1,768,200 | 22,030,303 | |||
| 22,030,303 | |||||
ELECTRIC – 2.26% | |||||
Centrais Eletricas Brasileiras SA | 1,515,600,000 | 33,098,491 | |||
EDP - Energias do Brasil SA | 802,600 | 10,149,538 | |||
Tractebel Energia SA | 1,389,300 | 12,512,128 | |||
| 55,760,157 | |||||
FOOD – 0.89% | |||||
Cosan SA Industria e Comercio1 | 270,230 | 14,249,179 | |||
Perdigao SA | 740,200 | 7,771,582 | |||
| 22,020,761 | |||||
HEALTH CARE – SERVICES – 0.44% | |||||
Diagnosticos da America SA1 | 562,200 | 10,782,277 | |||
| 10,782,277 | |||||
INTERNET – 0.35% | |||||
Submarino SA | 428,130 | 8,750,394 | |||
| 8,750,394 | |||||
IRON & STEEL – 2.41% | |||||
Companhia Siderurgica Nacional SA | 1,784,584 | 52,130,172 | |||
Gerdau SA | 623,800 | 7,396,527 | |||
| 59,526,699 | |||||
MINING – 7.02% | |||||
Companhia Vale do Rio Doce ADR | 8,085,726 | 173,357,965 | |||
| 173,357,965 | |||||
OIL & GAS – 10.41% | |||||
Petroleo Brasileiro SA | 11,591,200 | 257,029,316 | |||
| 257,029,316 | |||||
REAL ESTATE – 1.06% | |||||
Cyrela Brazil Realty SA | 1,010,400 | 17,822,268 | |||
Gafisa SA1 | 631,500 | 8,251,050 | |||
| 26,073,318 | |||||
RETAIL – 0.64% | |||||
Lojas Renner SA | 263,620 | 15,695,416 | |||
| 15,695,416 | |||||
TELECOMMUNICATIONS – 1.16% | |||||
Brasil Telecom Participacoes SA | 884,100,000 | 8,638,851 | |||
Tele Norte Leste Participacoes SA | 794,138 | 19,973,886 | |||
| 28,612,737 | |||||
TRANSPORTATION – 1.63% | |||||
All America Latina Logistica SA | 480,080 | 40,321,792 | |||
| 40,321,792 | |||||
WATER – 0.90% | |||||
Companhia de Saneamento Basico do Estado de Sao Paulo | 202,080,000 | 22,161,849 | |||
| 22,161,849 | |||||
TOTAL COMMON STOCKS | 958,908,510 | ||||
PREFERRED STOCKS – 60.79% | |||||
AIRLINES – 1.70% | |||||
Gol Linhas Aereas Inteligentes SA | 594,500 | 20,531,472 | |||
Tam SA | 687,900 | 21,343,197 | |||
| 41,874,669 | |||||
BANKS – 12.45% | |||||
Banco Bradesco SA | 5,719,500 | 185,516,773 | |||
Banco Itau Holding Financeira SA | 4,041,570 | 121,662,007 | |||
| 307,178,780 | |||||
BEVERAGES – 4.79% | |||||
Companhia de Bebidas das Americas | 263,250,000 | 118,296,663 | |||
| 118,296,663 | |||||
| 36 | 2006 iSHARES ANNUAL REPORTTO SHAREHOLDERS |
Table of Contents
Schedule of Investments (Continued)
iSHARES® MSCI BRAZIL INDEX FUND
August 31, 2006
Security | Shares | Value | |||
BUILDING MATERIALS – 0.65% | |||||
Duratex SA | 1,596,920 | $ | 16,021,363 | ||
| 16,021,363 | |||||
ELECTRIC – 4.29% | |||||
Centrais Eletricas Brasileiras SA Class B | 1,263,000,000 | 25,224,636 | |||
Companhia Energetica de Minas Gerais | 1,263,000,000 | 52,158,427 | |||
Companhia Paranaense de Energia Class B | 2,020,800,000 | 21,735,624 | |||
Eletropaulo Metropolitana de Sao Paulo SA1 | 151,560,000 | 6,717,298 | |||
| 105,835,985 | |||||
FOOD – 1.24% | |||||
Companhia Brasileira de Distribuicao Grupo Pao de Acucar | 454,680,000 | 12,305,851 | |||
Sadia SA | 6,791,000 | 18,221,302 | |||
| 30,527,153 | |||||
FOREST PRODUCTS & PAPER – 2.75% | |||||
Aracruz Celulose SA Class B | 6,315,000 | 32,562,179 | |||
Klabin SA | 7,754,000 | 15,413,924 | |||
Votorantim Celulose e Papel SA | 1,227,800 | 19,966,790 | |||
| 67,942,893 | |||||
GAS – 0.29% | |||||
Cia de Gas de Sao Paulo Class A | 50,520,000 | 7,237,350 | |||
| 7,237,350 | |||||
IRON & STEEL – 4.14% | |||||
Gerdau SA | 3,983,273 | 57,527,904 | |||
Usinas Siderurgicas de Minas Gerais SA Class A | 1,425,400 | 44,710,867 | |||
| 102,238,771 | |||||
MACHINERY – 0.56% | |||||
Weg SA | 3,283,800 | 13,944,274 | |||
| 13,944,274 | |||||
MINING – 8.62% | |||||
Companhia Vale do Rio Doce Class A | 11,448,400 | 212,727,619 | |||
| 212,727,619 | |||||
OIL & GAS – 13.42% | |||||
Petroleo Brasileiro SA | 16,506,700 | 331,212,366 | |||
| 331,212,366 | |||||
RETAIL – 1.13% | |||||
Lojas Americanas SA | 631,500,000 | 27,994,635 | |||
| 27,994,635 | |||||
TELECOMMUNICATIONS – 4.57% | |||||
Brasil Telecom Participacoes SA | 2,904,900,000 | 17,377,896 | |||
Embratel Participacoes SA | 4,546,800,000 | 14,300,232 | |||
Tele Norte Leste Participacoes SA | 3,099,939 | 40,213,861 | |||
Telemig Celular Participacoes SA | 2,652,300,000 | 4,418,440 | |||
Telesp Celular Participacoes SA1 | 5,052,083 | 15,842,276 | |||
TIM Participacoes SA | 7,199,100,000 | 20,693,669 | |||
| 112,846,374 | |||||
TEXTILES – 0.19% | |||||
Companhia de Tecidos Norte de Minas | 50,520,400 | 4,573,004 | |||
| 4,573,004 | |||||
TOTAL PREFERRED STOCKS | 1,500,451,899 | ||||
SHORT-TERM INVESTMENTS – 0.20% | |||||
MONEY MARKET FUNDS – 0.20% | |||||
Barclays Global Investors Funds Institutional Money Market Fund, Institutional Shares 5.30%2,3 | 4,889,243 | 4,889,243 | |||
| 4,889,243 | |||||
TOTAL SHORT-TERM INVESTMENTS | 4,889,243 | ||||
TOTAL INVESTMENTS IN SECURITIES – 99.84% | 2,464,249,652 | ||||
Other Assets, Less Liabilities – 0.16% | 4,045,272 | ||||
NET ASSETS – 100.00% | $ | 2,468,294,924 | |||
ADR – American Depositary Receipts
| 1 | Non-income earning security. |
| 2 | Affiliated issuer. See Note 2. |
| 3 | The rate quoted is the annualized seven-day yield of the fund at period end. |
See notes to the financial statements.
| SCHEDULESOF INVESTMENTS | 37 |
Table of Contents
Schedule of Investments
iSHARES® MSCI CANADA INDEX FUND
August 31, 2006
Security | Shares | Value | |||
COMMON STOCKS – 99.62% | |||||
AEROSPACE & DEFENSE – 0.23% | |||||
CAE Inc. | 294,806 | $ | 2,515,713 | ||
| 2,515,713 | |||||
AIRLINES – 0.23% | |||||
ACE Aviation Holdings Inc. Class A1 | 96,782 | 2,590,156 | |||
| 2,590,156 | |||||
APPAREL – 0.32% | |||||
Gildan Activewear Inc.1 | 70,468 | 3,526,099 | |||
| 3,526,099 | |||||
AUTO PARTS & EQUIPMENT – 0.86% | |||||
Magna International Inc. Class A | 132,016 | 9,435,917 | |||
| 9,435,917 | |||||
BANKS – 17.43% | |||||
Bank of Montreal | 592,734 | 35,742,969 | |||
Bank of Nova Scotia | 1,166,736 | 49,697,329 | |||
Canadian Imperial Bank of Commerce | 396,048 | 28,668,201 | |||
National Bank of Canada | 196,240 | 10,604,652 | |||
Royal Bank of Canada | 1,522,198 | 67,183,832 | |||
| 191,896,983 | |||||
BEVERAGES – 0.15% | |||||
Cott Corp.1 | 96,336 | 1,625,060 | |||
| 1,625,060 | |||||
CHEMICALS – 2.03% | |||||
Agrium Inc. | 160,560 | 3,713,967 | |||
Methanex Corp. | 137,814 | 3,273,509 | |||
NOVA Chemicals Corp. | 102,580 | 3,258,342 | |||
Potash Corp. of Saskatchewan Inc. | 123,988 | 12,143,506 | |||
| 22,389,324 | |||||
COMMERCIAL SERVICES – 0.27% | |||||
Quebecor World Inc. | 115,960 | 1,287,342 | |||
Ritchie Bros. Auctioneers Inc. | 34,788 | 1,699,040 | |||
| 2,986,382 | |||||
COMPUTERS – 1.67% | |||||
CGI Group Inc.1 | 351,894 | 2,219,651 | |||
Research In Motion Ltd.1 | 197,132 | 16,212,875 | |||
| 18,432,526 | |||||
DIVERSIFIED FINANCIAL SERVICES – 1.09% | |||||
CI Financial Income Fund | 76,180 | 2,069,680 | |||
IGM Financial Inc. | 140,490 | 6,291,825 | |||
TSX Group Inc. | 81,618 | 3,647,896 | |||
| 12,009,401 | |||||
ELECTRIC – 0.72% | |||||
Fortis Inc. | 120,866 | 2,735,890 | |||
TransAlta Corp. | 235,488 | 5,152,195 | |||
| 7,888,085 | |||||
ENGINEERING & CONSTRUCTION – 0.44% | |||||
SNC-Lavalin Group Inc. | 177,954 | 4,889,225 | |||
| 4,889,225 | |||||
ENTERTAINMENT – 0.19% | |||||
Intrawest Corp. | 59,584 | 2,055,843 | |||
| 2,055,843 | |||||
FOOD – 1.12% | |||||
George Weston Ltd. | 61,102 | 4,316,645 | |||
Loblaw Companies Ltd. | 129,340 | 5,984,779 | |||
Saputo Inc. | 58,872 | 2,002,629 | |||
| 12,304,053 | |||||
FOREST PRODUCTS & PAPER – 0.27% | |||||
Canfor Corp.1 | 120,420 | 1,233,769 | |||
Domtar Inc.1 | 276,966 | 1,759,505 | |||
| 2,993,274 | |||||
HAND & MACHINE TOOLS – 0.35% | |||||
Finning International Inc. | 106,594 | 3,816,156 | |||
| 3,816,156 | |||||
HEALTH CARE – SERVICES – 0.32% | |||||
MDS Inc. | 173,940 | 3,493,690 | |||
| 3,493,690 | |||||
HOLDING COMPANIES – DIVERSIFIED – 1.99% | |||||
Brookfield Asset Management Inc. Class A | 415,672 | 18,503,444 | |||
Onex Corp. | 152,532 | 3,386,698 | |||
| 21,890,142 | |||||
INSURANCE – 10.96% | |||||
Fairfax Financial Holdings Ltd. | 21,408 | 2,568,574 | |||
Great-West Lifeco Inc. | 317,998 | 8,387,296 | |||
Manulife Financial Corp. | 1,869,632 | 60,684,068 | |||
Power Corp. of Canada | 403,184 | 11,800,330 | |||
Power Financial Corp. | 294,360 | 9,169,656 | |||
| 38 | 2006 iSHARES ANNUAL REPORTTO SHAREHOLDERS |
Table of Contents
Schedule of Investments (Continued)
iSHARES® MSCI CANADA INDEX FUND
August 31, 2006
Security | Shares | Value | |||
Sun Life Financial Inc. | 685,948 | $ | 28,136,385 | ||
| 120,746,309 | |||||
IRON & STEEL – 0.61% | |||||
Algoma Steel Inc.1 | 45,046 | 1,495,783 | |||
IPSCO Inc. | 57,088 | 5,238,875 | |||
| 6,734,658 | |||||
LODGING – 0.19% | |||||
Four Seasons Hotels Inc. | 33,450 | 2,104,208 | |||
| 2,104,208 | |||||
MANUFACTURING – 0.47% | |||||
Bombardier Inc. Class B1 | 1,705,950 | 5,165,120 | |||
| 5,165,120 | |||||
MEDIA – 3.33% | |||||
Astral Media Inc. Class A | 58,872 | 2,019,605 | |||
Rogers Communications Inc. Class B | 258,680 | 13,286,560 | |||
Shaw Communications Inc. Class B | 206,498 | 6,177,728 | |||
Thomson Corp. | 281,426 | 11,284,935 | |||
Yellow Pages Income Fund | 296,590 | 3,909,990 | |||
| 36,678,818 | |||||
MINING – 14.47% | |||||
Aber Diamond Corp. | 72,252 | 2,595,147 | |||
Agnico-Eagle Mines Ltd. | 137,368 | 5,196,403 | |||
Alcan Inc. | 442,432 | 19,818,243 | |||
Barrick Gold Corp. | 1,017,772 | 33,933,376 | |||
Bema Gold Corp.1 | 539,660 | 2,912,875 | |||
Cameco Corp. | 414,334 | 16,890,714 | |||
Eldorado Gold Corp.1 | 403,184 | 1,987,309 | |||
First Quantum Minerals Ltd. | 76,747 | 4,156,337 | |||
Glamis Gold Ltd.1 | 194,456 | 8,883,910 | |||
Goldcorp Inc. | 429,944 | 11,835,809 | |||
Inco Ltd. | 225,676 | 17,527,384 | |||
Ivanhoe Mines Ltd.1 | 290,346 | 1,813,109 | |||
Kinross Gold Corp.1 | 409,428 | 5,718,526 | |||
Meridian Gold Inc.1 | 117,298 | 3,455,257 | |||
Novelis Inc. | 94,998 | 1,975,719 | |||
Pan American Silver Corp.1 | 87,416 | 2,000,781 | |||
Teck Cominco Ltd. Class B | 235,488 | 15,617,857 | |||
Yamana Gold Inc.1 | 299,712 | 3,057,211 | |||
| 159,375,967 | |||||
OIL & GAS – 26.63% | |||||
ARC Energy Trust | 113,104 | 2,966,846 | |||
Canadian Natural Resources Ltd. | 632,874 | 33,093,650 | |||
Canadian Oil Sands Trust | 267,154 | 8,136,792 | |||
Canetic Resources Trust | 237,718 | 4,868,962 | |||
Duvernay Oil Corp.1 | 49,506 | 1,838,826 | |||
EnCana Corp. | 1,000,378 | 52,283,779 | |||
Enerplus Resources Fund | 143,612 | 8,314,549 | |||
Ensign Resource Service Group | 149,856 | 3,085,569 | |||
First Calgary Petroleums Ltd.1 | 264,032 | 2,374,444 | |||
Harvest Energy Trust | 122,204 | 3,771,558 | |||
Husky Energy Inc. | 149,856 | 10,327,539 | |||
Imperial Oil Ltd. | 411,658 | 15,427,670 | |||
Nexen Inc. | 307,740 | 17,855,714 | |||
Niko Resources Ltd. | 41,924 | 2,389,073 | |||
OPTI Canada Inc.1 | 186,874 | 3,423,427 | |||
Penn West Energy Trust | 276,520 | 11,449,510 | |||
Petro-Canada | 608,790 | 25,893,118 | |||
Precision Drilling Trust | 71,360 | 2,587,544 | |||
PrimeWest Energy Trust | 97,228 | 2,953,418 | |||
Provident Energy Trust | 232,366 | 3,036,096 | |||
Shell Canada Ltd. | 247,084 | 7,993,076 | |||
Suncor Energy Inc. | 541,890 | 41,822,824 | |||
Talisman Energy Inc. | 1,300,536 | 22,735,209 | |||
Western Oil Sands Inc. Class A1 | 175,278 | 4,659,339 | |||
| 293,288,532 | |||||
OIL & GAS SERVICES – 0.25% | |||||
Trican Well Service Ltd. | 136,030 | 2,761,663 | |||
| 2,761,663 | |||||
PHARMACEUTICALS – 0.34% | |||||
Biovail Corp. | 173,494 | 2,817,177 | |||
QLT Inc.1 | 119,974 | 914,602 | |||
| 3,731,779 | |||||
PIPELINES – 2.86% | |||||
Enbridge Inc. | 392,926 | 12,884,503 | |||
TransCanada Corp. | 574,002 | 18,589,441 | |||
| 31,473,944 | |||||
REAL ESTATE – 0.63% | |||||
Brookfield Properties Corp. | 138,260 | 4,835,207 | |||
MI Developments Inc. Class A | 62,440 | 2,134,691 | |||
| 6,969,898 | |||||
| SCHEDULESOF INVESTMENTS | 39 |
Table of Contents
Schedule of Investments (Continued)
iSHARES® MSCI CANADA INDEX FUND
August 31, 2006
Security | Shares | Value | |||
RETAIL – 1.98% | |||||
Alimentation Couche Tard Inc. Class B | 166,358 | $ | 3,500,301 | ||
Canadian Tire Corp. Class A | 93,660 | 5,848,739 | |||
RONA Inc.1 | 145,842 | 2,858,359 | |||
Shoppers Drug Mart Corp. | 227,906 | 9,576,262 | |||
| 21,783,661 | |||||
SEMICONDUCTORS – 0.59% | |||||
ATI Technologies Inc.1 | 302,834 | 6,464,643 | |||
| 6,464,643 | |||||
SOFTWARE – 0.42% | |||||
Cognos Inc. 1 | 113,284 | 3,623,863 | |||
Open Text Corp.1 | 61,994 | 1,006,652 | |||
| 4,630,515 | |||||
TELECOMMUNICATIONS – 2.91% | |||||
BCE Inc. | 342,087 | 8,498,616 | |||
Nortel Networks Corp.1 | 5,134,352 | 10,687,410 | |||
TELUS Corp. | 71,806 | 3,510,228 | |||
TELUS Corp. NVS | 197,132 | 9,357,886 | |||
| 32,054,140 | |||||
TRANSPORTATION – 3.30% | |||||
Canadian National Railway Co. | 639,118 | 27,154,236 | |||
Canadian Pacific Railway Ltd. | 186,874 | 9,143,734 | |||
| 36,297,970 | |||||
TOTAL COMMON STOCKS | 1,096,999,854 | ||||
SHORT-TERM INVESTMENTS – 0.04% | |||||
MONEY MARKET FUNDS – 0.04% | |||||
Barclays Global Investors Funds Institutional Money Market Fund, Institutional Shares 5.30%2,3 | 400,763 | 400,763 | |||
| 400,763 | |||||
TOTAL SHORT-TERM INVESTMENTS | 400,763 | ||||
TOTAL INVESTMENTS IN SECURITIES – 99.66% | 1,097,400,617 | ||||
Other Assets, Less Liabilities – 0.34% | 3,760,118 | ||||
NET ASSETS – 100.00% | $ | 1,101,160,735 | |||
NVS – Non-Voting Shares
| 1 | Non-income earning security. |
| 2 | Affiliated issuer. See Note 2. |
| 3 | The rate quoted is the annualized seven-day yield of the fund at period end. |
See notes to the financial statements.
| 40 | 2006 iSHARES ANNUAL REPORTTO SHAREHOLDERS |
Table of Contents
Schedule of Investments
iSHARES® MSCI EMERGING MARKETS INDEX FUND
August 31, 2006
Security | Shares | Value | |||
COMMON STOCKS – 97.50% | |||||
ARGENTINA – 1.05% | |||||
BBVA Banco Frances SA ADR | 887,223 | $ | 6,529,958 | ||
Petrobras Energia Participaciones SA ADR1 | 1,669,311 | 17,477,686 | |||
Tenaris SA ADR | 2,778,867 | 102,012,208 | |||
| 126,019,852 | |||||
BRAZIL – 8.56% | |||||
Aracruz Celulose SA ADR | 543,844 | 28,241,819 | |||
Banco Bradesco SA ADR | 5,014,737 | 164,082,195 | |||
Banco Itau Holding Financiera SA ADR | 5,584,761 | 170,000,125 | |||
Brasil Telecom Participacoes SA ADR | 654,544 | 19,767,229 | |||
Companhia Brasileira de Distribuicao Grupo Pao de Acucar ADR | 797,012 | 21,965,651 | |||
Companhia de Bebidas das Americas ADR | 858,312 | 38,503,876 | |||
Companhia Vale do Rio Doce ADR | 5,472,558 | 117,331,644 | |||
Companhia Vale do Rio Doce Sponsored ADR | 7,502,859 | 135,051,462 | |||
Empresa Brasileira de Aeronautica SA ADR | 1,118,754 | 43,183,904 | |||
Gerdau SA Sponsored ADR | 1,599,591 | 23,226,061 | |||
Petroleo Brasileiro SA ADR | 2,119,572 | 190,040,826 | |||
Tele Norte Leste Participacoes SA ADR | 1,726,452 | 22,253,966 | |||
Uniao de Bancos Brasileiros SA ADR | 535,626 | 38,752,541 | |||
Votorantim Celulose e Papel ADR2 | 755,118 | 12,180,053 | |||
| 1,024,581,352 | |||||
CHILE – 1.88% | |||||
Banco Santander Chile SA ADR | 1,622,512 | 70,676,623 | |||
Compania de Telecomunicaciones de Chile SA ADR | 1,959,516 | 14,382,847 | |||
Enersis SA Chile ADR | 4,772,130 | 58,983,527 | |||
LAN Airlines SA Sponsored ADR | 439,914 | 15,335,402 | |||
Sociedad Quimica y Minera de Chile SA ADR | 594,894 | 65,438,340 | |||
| 224,816,739 | |||||
CHINA – 5.91% | |||||
Aluminum Corp. of China Ltd. Class H2 | 16,380,000 | 11,689,845 | |||
Angang New Steel Co. Ltd. Class H2 | 14,742,000 | 12,113,207 | |||
Bank of China Ltd. Class H1,2 | 131,859,000 | 57,140,172 | |||
Bank of Communications Co. Ltd. Class H2 | 38,599,000 | 24,320,584 | |||
Beijing Capital International Airport Co. Ltd. Class H | 13,108,000 | 8,579,383 | |||
China Construction Bank Class H2 | 164,619,000 | 71,336,488 | |||
China Eastern Airlines Corp. Ltd. Class H1,2 | 57,330,000 | 7,740,573 | |||
China Life Insurance Co. Ltd. Class H | 49,959,000 | 88,653,254 | |||
China Petroleum and Chemical Corp. Class H | 134,316,000 | 79,966,963 | |||
China Shipping Development Co. Ltd. Class H | 14,760,000 | 13,076,980 | |||
Cofco International Ltd.2 | 4,920,000 | 3,315,112 | |||
COSCO Pacific Ltd. | 6,552,000 | 14,693,397 | |||
Datang International Power Generation Co. Ltd. Class H | 6,560,000 | 4,377,972 | |||
Guangshen Railway Co. Ltd. Class H | 52,486,363 | 21,394,769 | |||
Huadian Power International Corp. Ltd. | 27,880,000 | 6,919,137 | |||
Huaneng Power International Inc. Class H2 | 19,656,000 | 13,067,351 | |||
Hunan Non-Ferrous Metal Corp. Ltd. Class H1,2 | 22,960,000 | 8,296,216 | |||
Jiangsu Expressway Co. Ltd. Class H | 4,920,000 | 2,872,254 | |||
Jiangxi Copper Co. Ltd. | 16,398,000 | 15,561,415 | |||
Maanshan Iron & Steel Co. Ltd. Class H2 | 18,018,000 | 5,606,913 | |||
PetroChina Co. Ltd. Class H | 122,864,000 | 138,556,245 | |||
| SCHEDULESOF INVESTMENTS | 41 |
Table of Contents
Schedule of Investments (Continued)
iSHARES® MSCI EMERGING MARKETS INDEX FUND
August 31, 2006
Security | Shares | Value | |||
Ping An Insurance (Group) Co. of China Ltd. Class H | 9,418,500 | $ | 30,822,751 | ||
Shanghai Forte Land Co. Class H | 4,914,000 | 1,592,346 | |||
Sinopec Shanghai Petrochemical Co. Ltd. Class H | 19,680,000 | 9,287,376 | |||
Sinotrans Ltd. | 19,656,000 | 6,217,733 | |||
Travelsky Technology Ltd. Class H | 1,640,000 | 1,919,054 | |||
Tsingtao Brewery Co. Ltd. Class H2 | 3,280,000 | 3,922,461 | |||
Weichai Power Co. Ltd. Class H | 3,277,000 | 8,040,011 | |||
Xinao Gas Holdings Ltd. | 3,288,000 | 3,128,711 | |||
Yanzhou Coal Mining Co. Ltd. Class H2 | 19,656,800 | 13,876,726 | |||
Zhejiang Expressway Co. Ltd. Class H | 19,680,000 | 12,678,407 | |||
Zijin Mining Group Co. Ltd. Class H | 14,760,000 | 6,984,512 | |||
| 707,748,318 | |||||
CZECH REPUBLIC – 2.11% | |||||
CEZ AS | 4,519,426 | 168,641,719 | |||
Komercni Banka AS | 232,268 | 34,813,461 | |||
Philip Morris CR AS | 30,988 | 12,984,466 | |||
Unipetrol AS1 | 3,444,900 | 31,976,446 | |||
Zentiva NV | 84,285 | 4,480,969 | |||
| 252,897,061 | |||||
EGYPT – 0.29% | |||||
Orascom Telecom Holding SAE GDR | 645,372 | 34,527,402 | |||
| 34,527,402 | |||||
HONG KONG – 4.42% | |||||
Air China Ltd. | 24,570,000 | 8,783,181 | |||
Beijing Enterprises Holdings Ltd. | 3,280,000 | 5,288,996 | |||
Brilliance China Automotive Holdings Ltd.1,2 | 21,198,000 | 3,216,465 | |||
Chaoda Modern Agriculture2 | 1,638,000 | 827,767 | |||
China Everbright Pacific Ltd.1,2 | 18,246,000 | 11,566,886 | |||
China Mengniu Dairy Co. Ltd. | 3,276,000 | 4,195,707 | |||
China Merchants Holdings International Co. Ltd. | 6,552,000 | 19,293,510 | |||
China Mobile Ltd. | 29,895,000 | 201,049,089 | |||
China Overseas Land & Investment Ltd. | 26,208,000 | 18,029,743 | |||
China Resources Enterprises Ltd. | 11,480,000 | 26,128,652 | |||
China Resources Land Ltd.2 | 26,240,000 | 15,757,328 | |||
China Resources Power Holdings Co. | 4,914,000 | 4,353,677 | |||
China Travel International Investment Hong Kong Ltd. | 57,616,951 | 14,076,858 | |||
Citic Pacific Ltd. | 9,020,000 | 28,822,708 | |||
CNOOC Ltd. | 101,556,000 | 88,800,695 | |||
Denway Motors Ltd. | 31,122,000 | 9,924,784 | |||
Global Bio-Chem Technology Group Co. Ltd.2 | 19,656,000 | 6,546,313 | |||
GOME Electrical Appliances Holdings Ltd.2 | 7,295,000 | 5,609,554 | |||
Guangdong Investment Ltd. | 11,470,110 | 4,454,269 | |||
Guangzhou Investment Co. Ltd. | 27,846,000 | 5,191,976 | |||
Lenovo Group Ltd.2 | 34,398,000 | 14,375,350 | |||
Shanghai Industrial Holdings Ltd. | 3,280,000 | 6,402,469 | |||
Shenzhen Investment Ltd. | 26,230,000 | 9,309,133 | |||
Sinochem Hong Kong Holding Ltd.2 | 27,702,000 | 10,152,146 | |||
TPV Technology Ltd. | 6,588,000 | 7,039,738 | |||
| 529,196,994 | |||||
HUNGARY – 2.02% | |||||
BorsodChem Rt | 686,827 | 9,033,738 | |||
Gedeon Richter Rt2 | 391,578 | 83,309,489 | |||
Magyar Telekom Telecommunications PLC1 | 2,916,459 | 11,871,339 | |||
Mol Magyar Olaj-es Gazipari Rt | 584,225 | 59,047,227 | |||
OTP Bank Rt2 | 2,699,269 | 77,857,677 | |||
| 241,119,470 | |||||
INDIA – 5.21% | |||||
HDFC Bank Ltd. ADR | 2,076,165 | 118,092,265 | |||
ICICI Bank Ltd. ADR | 3,325,140 | 88,747,987 | |||
Infosys Technologies Ltd. ADR | 3,297,684 | 147,901,127 | |||
Mahanagar Telephone Nigam Ltd. ADR | 4,907,623 | 32,537,540 | |||
Satyam Computer Services Ltd. ADR2 | 2,402,974 | 91,721,518 | |||
Videsh Sanchar Nigam Ltd. ADR2 | 4,781,322 | 85,442,224 | |||
| 42 | 2006 iSHARES ANNUAL REPORTTO SHAREHOLDERS |
Table of Contents
Schedule of Investments (Continued)
iSHARES® MSCI EMERGING MARKETS INDEX FUND
August 31, 2006
Security | Shares | Value | |||
Wipro Ltd. ADR2 | 4,663,746 | $ | 59,136,299 | ||
| 623,578,960 | |||||
INDONESIA – 2.59% | |||||
PT Aneka Tambang Tbk | 53,683,455 | 31,866,622 | |||
PT Astra Agro Lestari Tbk | 2,047,500 | 2,070,683 | |||
PT Astra International Inc. Tbk | 22,552,730 | 27,518,446 | |||
PT Bank Central Asia Tbk | 41,000,000 | 20,506,760 | |||
PT Bank Danamon Indonesia Tbk | 12,705,487 | 6,843,672 | |||
PT Bank Internasional Indonesia Tbk | 115,069,500 | 2,340,096 | |||
PT Bank Mandiri Tbk | 43,050,000 | 9,937,892 | |||
PT Bank Pan Indonesia Tbk1 | 207,281,522 | 10,481,422 | |||
PT Bank Pan Indonesia Tbk Warrants (Expires 7/10/09)1 | 41,987,604 | 807,720 | |||
PT Bank Rakyat Indonesia Tbk | 37,705,061 | 18,029,792 | |||
PT Berlian Laju Tanker Tbk | 21,730,000 | 4,753,512 | |||
PT Bumi Resources Tbk3 | 118,063,500 | 9,733,717 | |||
PT Indosat Tbk | 1,228,500 | 594,196 | |||
PT Kalbe Farma Tbk1 | 249,077,156 | 30,665,759 | |||
PT Perusahaan Gas Negara Tbk | 22,946,500 | 31,908,676 | |||
PT Ramayana Lestari Sentosa Tbk | 82,009,870 | 7,031,736 | |||
PT Semen Gresik (Persero) Tbk | 425,500 | 1,185,712 | |||
PT Telekomunikasi Indonesia Tbk | 96,234,500 | 83,571,788 | |||
PT United Tractors Tbk | 16,034,271 | 10,134,886 | |||
| 309,983,087 | |||||
ISRAEL – 3.85% | |||||
AudioCodes Ltd.1,2 | 702,712 | 6,984,957 | |||
Bank Hapoalim Ltd. | 9,512,852 | 41,874,860 | |||
Bank Leumi Le-Israel | 12,454,688 | 44,436,181 | |||
Check Point Software Technologies Ltd.1 | 1,325,961 | 24,649,615 | |||
Clal Industries and Investments Ltd. | 446,355 | 2,214,387 | |||
Clal Insurance Co. Ltd. | 81,081 | 1,473,170 | |||
ECI Telecom Ltd.1 | 402,129 | 2,875,222 | |||
Elbit Systems Ltd. | 627,354 | 18,041,459 | |||
Elite Industries Ltd. | 184,275 | 1,776,455 | |||
Israel Chemicals Ltd. | 6,698,601 | 32,019,436 | |||
Israel Corp. Ltd. (The) | 9,009 | 3,596,168 | |||
Israel Discount Bank Class A1 | 14,061,871 | 22,968,153 | |||
Koor Industries Ltd.1 | 265,413 | 13,386,206 | |||
Makhteshim-Agan Industries Ltd. | 2,879,728 | 14,735,180 | |||
Mizrahi Tefahot Bank Ltd. | 4,481,740 | 25,006,959 | |||
msystems Ltd.1 | 550,281 | 24,421,471 | |||
NICE Systems Ltd.1 | 164,000 | 4,118,790 | |||
Orbotech Ltd.1 | 553,581 | 13,291,480 | |||
Super-Sol Ltd.1 | 1,609,478 | 4,838,761 | |||
Teva Pharmaceutical Industries Ltd. | 4,542,174 | 157,997,712 | |||
| 460,706,622 | |||||
MEXICO – 7.29% | |||||
Alfa SA de CV Class A2 | 3,521,700 | 17,169,972 | |||
America Movil SA de CV Series L2 | 102,538,800 | 191,418,916 | |||
Carso Infraestructura y Construccion SA de CV1,2 | 2,767,200 | 2,026,250 | |||
Cemex SA de CV Series CPO1,2 | 39,434,342 | 113,694,357 | |||
Consorcio Ara SA de CV | 5,740,000 | 26,743,794 | |||
Controladora Comercial Mexicana SA de CV2 | 9,172,800 | 17,241,426 | |||
Corporacion GEO SA de CV Series B1,2 | 5,480,700 | 22,290,968 | |||
Desarrolladora Homex SA de CV1,2 | 1,059,900 | 6,545,848 | |||
Empresas ICA Sociedad Controladora SA de CV1,2 | 5,043,600 | 17,129,774 | |||
Fomento Economico Mexicano SA de CV Class UBD2 | 5,002,000 | 47,133,195 | |||
Grupo Carso SA de CV Series A12 | 738,741 | 2,161,706 | |||
Grupo Financiero Banorte SA de CV Series O2 | 9,844,456 | 28,870,034 | |||
Grupo Mexico SA de CV Series B | 11,070,000 | 35,314,839 | |||
Grupo Modelo SA de CV Series C2 | 10,756,198 | 45,334,391 | |||
Grupo Televisa SA Series CPO2 | 16,953,300 | 64,555,146 | |||
Industrias Penoles SA de CV Series CP2 | 738,988 | 6,286,825 | |||
Kimberly-Clark de Mexico SA de CV Class A2 | 6,060,600 | 22,833,301 | |||
Telefonos de Mexico SA de CV Series L2 | 63,851,100 | 77,358,035 | |||
TV Azteca SA de CV Series CPO2 | 10,237,500 | 6,736,339 | |||
Urbi Desarrollos Urbanos SA de CV1,2 | 3,336,300 | 8,854,606 | |||
| SCHEDULESOF INVESTMENTS | 43 |
Table of Contents
Schedule of Investments (Continued)
iSHARES® MSCI EMERGING MARKETS INDEX FUND
August 31, 2006
Security | Shares | Value | |||
Wal-Mart de Mexico SA de CV Series V2 | 32,760,000 | $ | 112,104,695 | ||
| 871,804,417 | |||||
PERU – 0.34% | |||||
Companhia de Minas Buenaventura SA ADR | 1,449,632 | 40,517,214 | |||
| 40,517,214 | |||||
PHILIPPINE ISLANDS – 1.42% | |||||
Ayala Corp. | 2,481,570 | 21,500,262 | |||
Ayala Land Inc. Class B | 30,303,000 | 8,055,341 | |||
Bank of the Philippine Islands | 19,461,300 | 20,310,109 | |||
Equitable PCI Bank1 | 9,599,600 | 14,932,921 | |||
Filinvest Land Inc.1 | 254,921,500 | 6,826,686 | |||
Globe Telecom Inc. | 475,020 | 9,213,246 | |||
Jollibee Foods Corp. | 32,186,700 | 20,281,075 | |||
Manila Electric Co. Class B1 | 9,090,900 | 4,833,205 | |||
Megaworld Corp. | 168,028,600 | 5,558,492 | |||
Metropolitan Bank & Trust Co. | 40 | 30 | |||
Petron Corp. | 164,619,000 | 12,965,954 | |||
Philippine Long Distance Telephone Co. | 647,010 | 24,333,742 | |||
SM Investments Corp. | 1,564,290 | 6,838,090 | |||
SM Prime Holdings Inc. | 91,728,000 | 14,269,000 | |||
| 169,918,153 | |||||
RUSSIA – 10.65% | |||||
JSC MMC Norilsk Nickel ADR | 511,056 | 69,759,144 | |||
LUKOIL ADR | 3,504,704 | 293,343,725 | |||
Mobile Telesystems OJSC ADR | 737,100 | 26,977,860 | |||
OAO Gazprom ADR | 13,771,997 | 648,661,059 | |||
Polyus Gold ADR1 | 464,607 | 19,745,798 | |||
Rostelecom ADR2 | 586,379 | 16,917,034 | |||
Surgutneftegaz ADR2 | 1,743,708 | 132,521,808 | |||
Tatneft ADR | 215,397 | 22,377,594 | |||
Vimpel-Communications Sponsored ADR1 | 819,000 | 44,488,080 | |||
| 1,274,792,102 | |||||
SOUTH AFRICA – 9.85% | |||||
African Bank Investments Ltd. | 7,972,241 | 28,118,459 | |||
Alexander Forbes Ltd.1 | 7,922,327 | 15,515,015 | |||
Anglo Platinum Ltd. | 431,614 | 48,369,502 | |||
AngloGold Ashanti Ltd. | 902,580 | 40,921,550 | |||
AVI Ltd. | 3,302,608 | 7,333,531 | |||
Barloworld Ltd. | 1,729,932 | 32,571,188 | |||
Bidvest Group Ltd. | 2,043,599 | 30,923,252 | |||
Consol Ltd. | 3,302,608 | 7,054,114 | |||
Edgars Consolidated Stores Ltd. | 3,464,370 | 13,617,232 | |||
FirstRand Ltd. | 21,645,363 | 53,588,035 | |||
Foschini Ltd. | 4,727,528 | 29,506,069 | |||
Gold Fields Ltd. | 2,698,651 | 52,400,990 | |||
Impala Platinum Holdings Ltd. | 387,436 | 71,737,456 | |||
Imperial Holdings Ltd.1 | 1,969,357 | 38,922,798 | |||
Investec Ltd. | 718,292 | 35,067,793 | |||
JD Group Ltd. | 2,329,324 | 21,516,363 | |||
Liberty Group Ltd. | 606,861 | 5,975,182 | |||
Metropolitan Holdings Ltd. | 7,255,688 | 12,146,484 | |||
Mittal Steel South Africa Ltd. | 2,941,228 | 31,125,616 | |||
MTN Group Ltd. | 8,547,132 | 67,808,037 | |||
Nampak Ltd. | 5,671,848 | 13,499,156 | |||
Naspers Ltd. | 2,821,833 | 48,726,520 | |||
Nedbank Group Ltd. | 2,581,489 | 39,545,833 | |||
Network Healthcare Holdings Ltd.1 | 14,170,482 | 22,995,096 | |||
Pick’n Pay Stores Ltd. | 3,754,310 | 15,829,545 | |||
Reunert Ltd. | 1,299,753 | 13,015,557 | |||
Sanlam Ltd. | 13,116,285 | 27,560,571 | |||
Sappi Ltd. | 335,465 | 4,268,920 | |||
Sasol Ltd. | 3,520,466 | 122,068,863 | |||
Shoprite Holdings Ltd. | 9,545,446 | 32,700,765 | |||
SPAR Group Ltd. (The) | 1,317,076 | 6,831,989 | |||
Standard Bank Group Ltd. | 7,364,530 | 79,498,109 | |||
Steinhoff International Holdings Ltd. | 1,376,739 | 4,493,019 | |||
Telkom South Africa Ltd. | 991,960 | 18,711,035 | |||
Tiger Brands Ltd. | 1,264,289 | 26,741,203 | |||
Tongaat-Hulett Group Ltd. | 1,191,834 | 15,497,148 | |||
Truworths International Ltd. | 7,319,406 | 23,267,793 | |||
Woolworths Holdings Ltd. | 10,639,793 | 19,523,504 | |||
| 1,178,993,292 | |||||
SOUTH KOREA – 16.09% | |||||
Kookmin Bank ADR | 4,686,348 | 377,625,922 | |||
Korea Electric Power Corp. ADR2 | 12,045,852 | 233,930,446 | |||
KT Corp. ADR | 5,794,425 | 128,056,793 | |||
| 44 | 2006 iSHARES ANNUAL REPORTTO SHAREHOLDERS |
Table of Contents
Schedule of Investments (Continued)
iSHARES® MSCI EMERGING MARKETS INDEX FUND
August 31, 2006
Security | Shares | Value | |||
LG.Philips LCD Co. Ltd. ADR1,2 | 4,828,824 | $ | 95,948,733 | ||
POSCO ADR | 5,022,108 | 311,923,128 | |||
Samsung Electronics Co. Ltd. GDR | 1,951,677 | 663,570,180 | |||
SK Telecom Co. Ltd. ADR2 | 5,251,584 | 115,009,690 | |||
| 1,926,064,892 | |||||
TAIWAN – 10.41% | |||||
AU Optronics Corp. ADR2 | 12,112,491 | 176,600,123 | |||
Chunghwa Telecom Co. Ltd. ADR | 11,769,856 | 203,736,207 | |||
Siliconware Precision Industries Co. ADR2,4 | 33,801,769 | 198,416,383 | |||
Taiwan Semiconductor Manufacturing Co. Ltd. ADR | 45,356,544 | 422,269,425 | |||
United Microelectronics Corp. ADR2 | 80,353,802 | 245,079,097 | |||
| 1,246,101,235 | |||||
THAILAND – 2.50% | |||||
Advanced Info Service PCL | 6,314,000 | 15,201,304 | |||
Aromatics Thailand PCL | 8,271,900 | 6,656,690 | |||
Bangkok Bank PCL | 7,705,800 | 22,549,561 | |||
Bangkok Expressway PCL | 15,252,000 | 8,642,395 | |||
Banpu PCL | 2,460,000 | 9,554,669 | |||
Charoen Pokphand Foods PCL | 28,000 | 3,710 | |||
Electricity Generating PCL | 3,310,700 | 6,869,769 | |||
Kasikornbank PCL | 11,726,000 | 20,276,403 | |||
Kiatnakin Bank PCL | 6,145,600 | 4,659,473 | |||
Krung Thai Bank PCL | 14,018,400 | 4,251,390 | |||
PTT Chemical PCL | 5,005,568 | 10,320,072 | |||
PTT Exploration & Production PCL | 13,120,000 | 37,346,103 | |||
PTT PCL | 11,138,400 | 69,929,832 | |||
Ratchaburi Electricity Generating Holding PCL | 27,038,800 | 23,917,002 | |||
Siam Cement PCL | 2,460,000 | 15,313,648 | |||
Siam City Cement PCL | 492,000 | 3,062,730 | |||
Siam Makro PCL | 10,902,700 | 20,302,979 | |||
Thai Airways International PCL | 2,293,200 | 2,684,246 | |||
Thai Union Frozen Products PCL | 9,840,000 | 6,387,231 | |||
Thanachart Capital PCL | 14,754,500 | 5,573,660 | |||
Tisco Bank PCL | 6,217,200 | 3,440,217 | |||
United Broadcasting Corp. PCL1,3 | 5,658,800 | 2,709,721 | |||
| 299,652,805 | |||||
TURKEY – 1.06% | |||||
Adana Cimento TAS Class A | 2,729,732 | 17,509,027 | |||
Akbank TAS | 3,193,281 | 17,431,764 | |||
Akcansa Cimento AS | 429,167 | 2,313,492 | |||
Arcelik AS | 769,596 | 4,962,594 | |||
Dogan Yayin Holding AS1 | 2,228,483 | 7,329,436 | |||
Eregli Demir ve Celik Fabrikalari TAS | 1,425,472 | 6,954,708 | |||
Hurriyet Gazetecilik ve Matbaacilik AS | 1,777,237 | 4,220,256 | |||
Ihlas Holding1 | 9,705,866 | 4,039,971 | |||
Tofas Turk Otomobil Fabrik | 5,802,952 | 15,838,832 | |||
Trakya Cam Sanayii AS | 137,672 | 336,312 | |||
Tupras-Turkiye Petrol Rafinerileri AS | 707,726 | 12,918,233 | |||
Turk Sise ve Cam Fabrikalari AS1 | 2,692,243 | 8,230,125 | |||
Turkiye Garanti Bankasi AS | 3,862,404 | 11,280,170 | |||
Yapi ve Kredi Bankasi AS1 | 7,132,672 | 13,919,783 | |||
| 127,284,703 | |||||
TOTAL COMMON STOCKS | 11,670,304,670 | ||||
PREFERRED STOCKS – 1.70% | |||||
BRAZIL – 1.70% | |||||
Petroleo Brasileiro SA ADR | 2,530,710 | 204,025,840 | |||
| 204,025,840 | |||||
TOTAL PREFERRED STOCKS | 204,025,840 | ||||
EXCHANGE-TRADED FUNDS – 0.57% | |||||
iShares MSCI Malaysia Index Fund2,4 | 1,039,160 | 8,011,924 | |||
iShares MSCI South Korea Index Fund2,4 | 545,647 | 25,023,371 | |||
iShares MSCI Taiwan Index Fund2,4 | 2,811,594 | 35,144,925 | |||
TOTAL EXCHANGE-TRADED FUNDS | 68,180,220 | ||||
| SCHEDULESOF INVESTMENTS | 45 |
Table of Contents
Schedule of Investments (Continued)
iSHARES® MSCI EMERGING MARKETS INDEX FUND
August 31, 2006
Security | Principal | Value | ||||
SHORT-TERM INVESTMENTS – 5.97% | ||||||
CERTIFICATES OF DEPOSIT5 – 0.25% | ||||||
Credit Suisse First Boston NY | ||||||
5.28% - 5.43%, 04/23/07 - 08/21/07 | $ | 4,159,989 | $ | 4,159,989 | ||
Societe Generale | ||||||
5.33%, 12/08/06 | 5,942,846 | 5,942,846 | ||||
Washington Mutual Bank | ||||||
5.36%, 11/13/06 | 14,857,115 | 14,857,115 | ||||
Wells Fargo Bank N.A. | ||||||
4.78%, 12/05/06 | 4,754,277 | 4,754,277 | ||||
| 29,714,227 | ||||||
COMMERCIAL PAPER5 – 0.96% | ||||||
Amstel Funding Corp. | ||||||
5.20%, 11/21/06 - 11/22/066 | 1,734,004 | 1,713,630 | ||||
Amsterdam Funding Corp. | ||||||
5.27%, 09/15/066 | 5,942,846 | 5,930,666 | ||||
Atlantis One Funding | ||||||
5.30%, 11/14/066 | 8,154,060 | 8,065,226 | ||||
Barton Capital Corp. | ||||||
5.27%, 09/06/066 | 2,995,194 | 2,993,002 | ||||
Cancara Asset Securitisation Ltd. | ||||||
5.30%, 11/14/066 | 3,012,548 | 2,979,727 | ||||
CC USA Inc. | ||||||
5.03%, 10/24/066 | 1,188,569 | 1,179,768 | ||||
Charta LLC | ||||||
5.30%, 11/06/066 | 5,942,846 | 5,885,101 | ||||
Concord Minutemen Capital Co. LLC | ||||||
5.27% - 5.29%, 09/13/06 - 11/16/066 | 10,437,480 | 10,391,181 | ||||
Curzon Funding LLC | ||||||
5.29%, 11/17/066 | 5,942,846 | 5,875,604 | ||||
Edison Asset Securitization LLC | ||||||
5.22%, 12/11/066 | 4,384,156 | 4,319,950 | ||||
Falcon Asset Securitization Corp. | ||||||
5.30%, 11/06/066 | 5,942,846 | 5,885,101 | ||||
Five Finance Inc. | ||||||
5.19%, 12/01/066 | 2,674,281 | 2,639,196 | ||||
General Electric Capital Services Inc. | ||||||
5.22%, 12/11/06 | 594,285 | 585,581 | ||||
Giro Funding Corp. | ||||||
5.28% - 5.34%, 09/11/06 - 10/10/066 | 5,942,846 | 5,921,314 | ||||
Grampian Funding LLC | ||||||
5.03% - 5.30%, 10/17/06 - 11/16/066 | 2,852,566 | 2,829,032 | ||||
KKR Pacific Funding Trust | ||||||
5.29%, 09/14/066 | 5,942,846 | 5,931,494 | ||||
Landale Funding LLC | ||||||
5.31%, 11/15/066 | 4,635,420 | 4,584,189 | ||||
Lexington Parker Capital Co. LLC | ||||||
5.19% - 5.27%, 09/15/06 - 11/15/066 | 7,703,236 | 7,659,037 | ||||
Liberty Street Funding Corp. | ||||||
5.27%, 09/08/06 - 09/11/066 | 5,289,133 | 5,282,698 | ||||
Mont Blanc Capital Corp. | ||||||
5.29%, 11/15/066 | 3,833,136 | 3,790,891 | ||||
Monument Gardens Funding LLC | ||||||
5.28%, 09/21/066 | 2,986,458 | 2,977,698 | ||||
Nestle Capital Corp. | ||||||
5.19%, 08/09/07 | 3,565,708 | 3,389,900 | ||||
Park Granada LLC | ||||||
5.30%, 09/01/066 | 1,358,059 | 1,358,059 | ||||
Regency Markets LLC | ||||||
5.28%, 09/15/06 | 2,971,423 | 2,965,327 | ||||
Solitaire Funding Ltd. | ||||||
5.27%, 09/05/066 | 4,457,135 | 4,454,525 | ||||
Sydney Capital Corp. | ||||||
5.27%, 09/12/066 | 1,359,723 | 1,357,534 | ||||
Tulip Funding Corp. | ||||||
5.29%, 11/15/066 | 3,134,376 | 3,099,832 | ||||
White Pine Finance LLC | ||||||
5.12%, 10/27/066 | 1,123,198 | 1,114,252 | ||||
| 115,159,515 | ||||||
MEDIUM-TERM NOTES5 – 0.21% | ||||||
Bank of America N.A. | ||||||
5.28%, 04/20/07 | 1,485,712 | 1,485,712 | ||||
Cullinan Finance Corp. | ||||||
5.71%, 06/28/076 | 4,457,135 | 4,457,135 | ||||
K2 USA LLC | ||||||
5.39%, 06/04/076 | 4,457,135 | 4,457,135 | ||||
| 46 | 2006 iSHARES ANNUAL REPORTTO SHAREHOLDERS |
Table of Contents
Schedule of Investments (Continued)
iSHARES® MSCI EMERGING MARKETS INDEX FUND
August 31, 2006
Security | Shares or Principal | Value | ||||
Marshall & Ilsley Bank | ||||||
5.18%, 12/15/06 | $ | 5,942,846 | $ | 5,948,729 | ||
Sigma Finance Inc. | ||||||
5.13% - 5.51%, 03/30/07 - 06/18/076 | 6,953,130 | 6,953,130 | ||||
US Bank N.A. | ||||||
2.85%, 11/15/06 | 1,188,569 | 1,184,075 | ||||
| 24,485,916 | ||||||
MONEY MARKET FUNDS – 0.05% | ||||||
Barclays Global Investors Funds Institutional Money Market Fund, Institutional Shares 5.30%4,7 | 5,823,368 | 5,823,368 | ||||
| 5,823,368 | ||||||
REPURCHASE AGREEMENTS5 – 1.21% | ||||||
Banc of America Securities LLC Repurchase Agreement, 5.30%, due 9/1/06, maturity value $7,429,652 (collateralized by U.S. Government obligations, value $7,584,322, 5.50% to 6.50%, 1/1/33 to 7/1/36). | $ | 7,428,558 | 7,428,558 | |||
Banc of America Securities LLC Repurchase Agreement, 5.36%, due 9/1/06, maturity value $11,887,462 (collateralized by non-U.S. Government debt securities, value $12,253,885, 3.80% to 9.13%, 11/1/06 to 6/15/26). | 11,885,692 | 11,885,692 | ||||
Bear Stearns Companies Inc. (The) Repurchase Agreement, 5.37%, due 9/1/06, maturity value $8,915,599 (collateralized by non-U.S. Government debt securities, value $9,815,163, 0.08% to 6.43%, 9/25/20 to 7/25/36). | 8,914,269 | 8,914,269 | ||||
Security | Principal | Value | ||||
Citigroup Global Markets Holdings Inc. Repurchase Agreement, 5.36%, due 9/1/06, maturity value $17,831,192 (collateralized by non-U.S. Government debt securities, value $18,629,571, 4.35% to 7.50%, 9/15/08 to 8/25/35). | $ | 17,828,538 | $ | 17,828,538 | ||
Citigroup Global Markets Holdings Inc. Repurchase Agreement, 5.46%, due 9/1/06, maturity value $3,566,249 (collateralized by non-U.S. Government debt securities, value $4,352,771, 0.00% to 10.00%, 6/1/28 to 8/24/36). | 3,565,708 | 3,565,708 | ||||
Goldman Sachs & Co. Repurchase Agreement, 5.35%, due 9/1/06, maturity value $11,887,458 (collateralized by non-U.S. Government debt securities, value $12,134,915, 0.00% to 8.57%, 11/15/06 to 2/15/38). | 11,885,692 | 11,885,692 | ||||
Goldman Sachs Group Inc. Repurchase Agreement, 5.36%, due 9/1/06, maturity value $5,943,731 (collateralized by non-U.S. Government debt securities, value $6,245,912, 5.36% to 9.01%, 10/27/10 to 2/18/20). | 5,942,846 | 5,942,846 | ||||
JP Morgan Securities Inc. Repurchase Agreement, 5.41%, due 9/1/06, maturity value $1,485,935 (collateralized by non-U.S. Government debt securities, value $1,561,528, 6.63% to 10.50%, 1/15/07 to 4/15/16). | 1,485,712 | 1,485,712 | ||||
| SCHEDULESOF INVESTMENTS | 47 |
Table of Contents
Schedule of Investments (Continued)
iSHARES® MSCI EMERGING MARKETS INDEX FUND
August 31, 2006
Security | Principal | Value | ||||
Lehman Brothers Holdings Inc. Repurchase Agreement, 5.36%, due 9/1/06, maturity value $11,887,462 (collateralized by non-U.S. Government debt securities, value $12,491,872, 0.51% to 8.89%, 8/5/18 to 9/25/46). | $ | 11,885,692 | $ | 11,885,692 | ||
Lehman Brothers Holdings Inc. Repurchase Agreement, 5.38%, due 9/1/06, maturity value $5,943,734 (collateralized by non-U.S. Government debt securities, value $6,246,090, 4.11% to 9.79%, 4/28/31 to 9/25/46). | 5,942,846 | 5,942,846 | ||||
Lehman Brothers Holdings Inc. Repurchase Agreement, 5.46%, due 9/1/06, maturity value $6,538,122 (collateralized by non-U.S. Government debt securities, value $6,870,503, 3.44% to 15.15%, 12/1/08 to 3/1/36). | 6,537,131 | 6,537,131 | ||||
Merrill Lynch & Co. Inc. Repurchase Agreement, 5.33%, due 9/1/06, maturity value $11,887,452 (collateralized by non-U.S. Government debt securities, value $12,492,048, 6.38% to 10.25%, 5/1/07 to 10/15/16). | 11,885,692 | 11,885,692 | ||||
Merrill Lynch & Co. Inc. Repurchase Agreement, 5.36%, due 9/1/06, maturity value $11,887,462 (collateralized by non-U.S. Government debt securities, value $12,256,100, 0.00% to 10.13%, 10/15/06 to 7/1/26). | 11,885,692 | 11,885,692 | ||||
Morgan Stanley Repurchase Agreement, 5.36%, due 9/1/06, maturity value $ 5,943,731 (collateralized by non-U.S. Government debt securities, value $6,248,793, 4.05% to 7.24%, 6/20/29 to 1/14/41). | 5,942,846 | 5,942,846 | ||||
Morgan Stanley Repurchase Agreement, 5.46%, due 9/1/06, maturity value $ 2,080,311 (collateralized by non-U.S. Government debt securities, value $3,189,877, 0.00% to 10.00%, 9/1/06 to 8/31/36). | 2,079,996 | 2,079,996 | ||||
Morgan Stanley Repurchase Agreement, 5.51%, due 6/4/07, maturity value $ 4,336,361 (collateralized by non-U.S. Government debt securities, value $6,476,416, 0.00% to 10.00%, 9/1/06 to 8/31/36).8 | 4,159,992 | 4,159,992 | ||||
Wachovia Capital Repurchase Agreement, 5.38%, due 9/1/06, maturity value $ 15,453,709 (collateralized by non-U.S. Government debt securities, value $16,239,372, 0.06% to 7.68%, 10/15/11 to 3/15/45). | 15,451,400 | 15,451,400 | ||||
| 144,708,302 | ||||||
TIME DEPOSITS5 – 0.01% | ||||||
KBC Bank | ||||||
5.31%, 09/01/06 | 1,254,000 | 1,254,000 | ||||
| 1,254,000 | ||||||
VARIABLE & FLOATING RATE NOTES5 – 3.28% | ||||||
Allstate Life Global Funding II | ||||||
5.34% - 5.47%, 09/04/07 - 09/27/076 | 15,213,686 | 15,215,653 | ||||
American Express Bank | ||||||
5.30%, 02/28/07 | 5,942,846 | 5,942,824 | ||||
American Express Centurion Bank | ||||||
5.42%, 07/19/07 | 6,537,131 | 6,543,754 | ||||
| 48 | 2006 iSHARES ANNUAL REPORTTO SHAREHOLDERS |
Table of Contents
Schedule of Investments (Continued)
iSHARES® MSCI EMERGING MARKETS INDEX FUND
August 31, 2006
Security | Principal | Value | ||||
American Express Credit Corp. | ||||||
5.51%, 07/05/07 | $ | 1,782,854 | $ | 1,783,848 | ||
ASIF Global Financing | ||||||
5.51%, 05/03/076 | 594,285 | 594,508 | ||||
Australia & New Zealand Banking Group Ltd. | ||||||
5.32%, 09/21/076 | 3,862,850 | 3,862,850 | ||||
Bank of Ireland | ||||||
5.30% - 5.31%, 08/14/07 - 08/20/076 | 8,617,127 | 8,617,481 | ||||
Beta Finance Inc. | ||||||
5.29% - 5.48%, 04/25/07 - 07/25/076 | 15,154,257 | 15,155,030 | ||||
BMW US Capital LLC | ||||||
5.33%, 09/14/076 | 5,942,846 | 5,942,846 | ||||
BNP Paribas | ||||||
5.36%, 05/18/076 | 10,994,265 | 10,994,265 | ||||
Carlyle Loan Investment Ltd. | ||||||
5.38%, 04/13/07 - 07/15/076 | 4,338,278 | 4,338,278 | ||||
CC USA Inc. | ||||||
5.48%, 07/30/076 | 2,971,423 | 2,971,812 | ||||
Commodore CDO Ltd. | ||||||
5.38%, 06/12/076 | 1,485,712 | 1,485,712 | ||||
Credit Agricole SA | ||||||
5.48%, 07/23/07 | 5,942,846 | 5,942,846 | ||||
Credit Suisse First Boston NY | ||||||
5.51%, 04/24/07 | 2,971,423 | 2,971,556 | ||||
Cullinan Finance Corp. | ||||||
5.36%, 04/25/076 | 1,485,712 | 1,485,712 | ||||
DEPFA Bank PLC | ||||||
5.37%, 06/15/07 | 5,942,846 | 5,942,846 | ||||
Dorada Finance Inc. | ||||||
5.41% - 5.47%, 06/27/07 - 07/17/076 | 6,834,273 | 6,834,711 | ||||
Eli Lilly Services Inc. | ||||||
5.37%, 08/31/076 | 5,942,846 | 5,942,846 | ||||
Fifth Third Bancorp | ||||||
5.30%, 09/21/076 | 11,885,692 | 11,885,692 | ||||
Five Finance Inc. | ||||||
5.37% - 5.45%, 12/01/06 - 07/13/076 | 5,942,846 | 5,942,395 | ||||
General Electric Capital Corp. | ||||||
5.29% - 5.49%, 07/09/07 - 09/24/07 | 6,239,988 | 6,241,453 | ||||
Granite Master Issuer PLC | ||||||
5.30%, 09/20/06 | 20,799,961 | 20,799,961 | ||||
Harrier Finance Funding LLC | ||||||
5.33%, 07/25/076 | 1,782,854 | 1,783,183 | ||||
Hartford Life Global Funding Trusts | ||||||
5.35% - 5.55%, 07/13/07 - 09/17/07 | 8,914,269 | 8,915,662 | ||||
HBOS Treasury Services PLC | ||||||
5.53%, 07/24/076 | 5,942,846 | 5,942,846 | ||||
Holmes Financing PLC | ||||||
5.40%, 07/16/076 | 10,399,981 | 10,399,981 | ||||
JP Morgan Chase & Co. | ||||||
5.36%, 08/02/07 | 4,457,135 | 4,457,135 | ||||
K2 USA LLC | ||||||
5.20% - 5.46%, 04/02/07 - 06/28/076 | 4,457,135 | 4,456,939 | ||||
Kestrel Funding LLC | ||||||
5.31%, 07/11/076 | 2,377,138 | 2,376,921 | ||||
Kommunalkredit Austria AG | ||||||
5.33%, 09/09/076 | 3,565,708 | 3,565,708 | ||||
Leafs LLC | ||||||
5.33%, 01/22/07 - 02/20/076 | 6,200,608 | 6,200,608 | ||||
Lexington Parker Capital Co. LLC | ||||||
5.46%, 01/10/076 | 7,428,558 | 7,426,901 | ||||
Links Finance LLC | ||||||
5.33% - 5.35%, 05/10/07 - 05/16/076 | 6,537,131 | 6,536,671 | ||||
Lothian Mortgages Master Issuer PLC | ||||||
5.30%, 04/24/076 | 2,618,583 | 2,618,583 | ||||
Marshall & Ilsley Bank | ||||||
5.31%, 09/14/07 | 3,268,565 | 3,268,565 | ||||
Metropolitan Life Global Funding I | ||||||
5.42%, 08/06/076 | 8,914,269 | 8,914,269 | ||||
Metropolitan Life Insurance Funding Agreement | ||||||
5.57%, 08/01/076,8 | 594,285 | 594,285 | ||||
| SCHEDULESOF INVESTMENTS | 49 |
Table of Contents
Schedule of Investments (Continued)
iSHARES® MSCI EMERGING MARKETS INDEX FUND
August 31, 2006
Security | Principal | Value | |||||
Monumental Global Funding II | |||||||
5.49%, 12/27/066 | $ | 1,188,569 | $ | 1,188,696 | |||
Mound Financing PLC | |||||||
5.39%, 05/08/076 | 5,586,275 | 5,586,275 | |||||
Natexis Banques Populaires | |||||||
5.31% - 5.40%, 02/05/07 - 09/14/076 | 17,828,538 | 17,828,254 | |||||
National City Bank of Indiana | |||||||
5.37%, 05/21/07 | 2,971,423 | 2,971,603 | |||||
Nationwide Building Society | |||||||
5.44% - 5.62%, 07/06/07 - 07/27/076 | 19,611,392 | 19,615,963 | |||||
Newcastle Ltd. | |||||||
5.35%, 04/24/076 | 2,094,853 | 2,094,454 | |||||
Northern Rock PLC | |||||||
5.43%, 08/03/076 | 7,131,415 | 7,131,584 | |||||
Principal Life Global Funding I | |||||||
5.80%, 02/08/07 | 2,674,281 | 2,679,761 | |||||
Sedna Finance Inc. | |||||||
5.30% - 5.37%, 09/20/06 - 08/21/076 | 10,399,981 | 10,399,786 | |||||
Skandinaviska Enskilda Bank NY | |||||||
5.33%, 09/18/076 | 5,942,846 | 5,942,846 | |||||
Strips III LLC | |||||||
5.38%, 07/24/076 | 1,445,052 | 1,445,052 | |||||
SunTrust Bank | |||||||
5.37%, 05/01/07 | 5,942,846 | 5,943,089 | |||||
Tango Finance Corp. | |||||||
5.22% - 5.48%, 04/25/07 - 07/16/076 | 14,500,544 | 14,499,259 | |||||
Union Hamilton Special Funding LLC | |||||||
5.42% - 5.49%, 09/28/06 - 12/21/066 | 8,319,984 | 8,319,984 | |||||
US Bank N.A. | |||||||
5.26%, 09/29/06 | 2,674,281 | 2,674,227 | |||||
Wachovia Asset Securitization Inc. | |||||||
5.31%, 09/25/066 | 8,867,986 | 8,867,987 | |||||
Wachovia Bank N.A. | |||||||
5.36%, 05/22/07 | 11,885,692 | 11,885,692 | |||||
Wells Fargo & Co. | |||||||
5.34%, 09/14/076 | 2,971,423 | 2,971,605 | |||||
WhistleJacket Capital Ltd. | |||||||
5.29% - 5.35%, 04/18/07 - 06/13/076 | 4,457,135 | 4,457,108 | |||||
White Pine Finance LLC | |||||||
5.29% - 5.35%, 05/22/07 - 08/20/076 | 17,828,538 | 17,824,878 | |||||
Wind Master Trust | |||||||
5.31% - 5.32%, 09/25/06 - 07/25/076 | 3,769,012 | 3,769,012 | |||||
| 392,994,251 | |||||||
TOTAL SHORT-TERM INVESTMENTS | 714,139,579 | ||||||
TOTAL INVESTMENTS IN SECURITIES – 105.74% | 12,656,650,309 | ||||||
Other Assets, Less Liabilities – (5.74)% | (687,270,151 | ) | |||||
NET ASSETS – 100.00% | $ | 11,969,380,158 | |||||
ADR – American Depositary Receipts
GDR – Global Depositary Receipts
| 1 | Non-income earning security. |
| 2 | All or a portion of this security represents a security on loan. See Note 5. |
| 3 | Security valued at fair value in accordance with procedures approved by the Board of Directors. See Note 1. |
| 4 | Affiliated issuer. See Note 2. |
| 5 | All or a portion of this security (these securities) represent(s) an investment of securities lending collateral. See Note 5. |
| 6 | This security or a portion of these securities may be resold to qualified institutional buyers under Rule 144A or pursuant to Section 4(2) of the Securities Act of 1933. |
| 7 | The rate quoted is the annualized seven-day yield of the fund at period end. |
| 8 | The investment adviser has determined that this security or a portion of these securities is illiquid. |
See notes to the financial statements.
| 50 | 2006 iSHARES ANNUAL REPORTTO SHAREHOLDERS |
Table of Contents
Schedule of Investments
iSHARES® MSCI HONG KONG INDEX FUND
August 31, 2006
Security | Shares | Value | |||
COMMON STOCKS – 99.75% | |||||
AIRLINES – 1.05% | |||||
Cathay Pacific Airways Ltd. | 4,974,000 | $ | 9,286,975 | ||
| 9,286,975 | |||||
APPAREL – 0.68% | |||||
Yue Yuen Industrial Holdings Ltd. | 2,072,500 | 5,996,239 | |||
| 5,996,239 | |||||
BANKS – 13.28% | |||||
Bank of East Asia Ltd. | 6,466,300 | 28,769,599 | |||
BOC Hong Kong Holdings Ltd. | 16,580,000 | 36,371,852 | |||
Hang Seng Bank Ltd. | 3,481,800 | 44,100,338 | |||
Wing Hang Bank Ltd. | 829,000 | 7,963,005 | |||
| 117,204,794 | |||||
CHEMICALS – 0.91% | |||||
Kingboard Chemical Holdings Co. Ltd. | 2,487,000 | 8,026,965 | |||
| 8,026,965 | |||||
DISTRIBUTION & WHOLESALE – 6.53% | |||||
Esprit Holdings Ltd. | 4,438,500 | 36,926,859 | |||
Li & Fung Ltd. | 8,723,000 | 20,751,021 | |||
| 57,677,880 | |||||
DIVERSIFIED FINANCIAL SERVICES – 3.83% | |||||
Hong Kong Exchanges & Clearing Ltd. | 4,974,000 | 33,770,817 | |||
| 33,770,817 | |||||
ELECTRIC – 9.10% | |||||
CLP Holdings Ltd. | 8,000,700 | 50,616,831 | |||
Hongkong Electric Holdings Ltd. | 6,217,500 | 29,741,344 | |||
| 80,358,175 | |||||
ELECTRICAL COMPONENTS & EQUIPMENT – 0.60% | |||||
Johnson Electric Holdings Ltd. | 7,046,500 | 5,255,370 | |||
| 5,255,370 | |||||
ENGINEERING & CONSTRUCTION – 3.10% | |||||
Cheung Kong Infrastructure Holdings Ltd. | 2,053,000 | 6,507,403 | |||
New World Development Co. Ltd. | 11,606,800 | 20,835,301 | |||
| 27,342,704 | |||||
GAS – 4.22% | |||||
Hong Kong & China Gas Co. Ltd. | 16,051,663 | 37,276,887 | |||
| 37,276,887 | |||||
HAND & MACHINE TOOLS – 0.76% | |||||
Techtronic Industries Co. Ltd. | 4,559,500 | 6,718,986 | |||
| 6,718,986 | |||||
HOLDING COMPANIES – DIVERSIFIED – 18.17% | |||||
Hutchison Whampoa Ltd. | 9,574,800 | 86,984,874 | |||
Melco International Development Ltd. | 3,316,000 | 7,990,721 | |||
Swire Pacific Ltd. Class A | 4,188,500 | 45,834,230 | |||
Wharf Holdings Ltd. (The) | 5,803,000 | 19,625,023 | |||
| 160,434,848 | |||||
LODGING – 1.28% | |||||
Shangri-La Asia Ltd. | 5,726,000 | 11,338,978 | |||
| 11,338,978 | |||||
MEDIA – 0.80% | |||||
Television Broadcasts Ltd. | 1,240,000 | 7,039,702 | |||
| 7,039,702 | |||||
REAL ESTATE – 24.28% | |||||
Cheung Kong Holdings Ltd. | 6,682,000 | 73,807,670 | |||
Hang Lung Properties Ltd. | 8,290,000 | 17,674,247 | |||
Henderson Land Development Co. Ltd. | 3,316,000 | 18,740,245 | |||
Hopewell Holdings Ltd. | 2,804,000 | 8,004,475 | |||
Hysan Development Co. Ltd. | 2,613,000 | 7,089,633 | |||
Kerry Properties Ltd.1 | 2,072,500 | 7,781,785 | |||
Shun Tak Holdings Ltd. | 4,127,000 | 5,014,968 | |||
Sino Land Co. Ltd.1 | 5,334,000 | 8,998,885 | |||
Sun Hung Kai Properties Ltd. | 6,168,000 | 67,257,711 | |||
| 214,369,619 | |||||
REAL ESTATE INVESTMENT TRUSTS – 2.24% | |||||
Link REIT (The) | 9,533,500 | 19,785,989 | |||
| 19,785,989 | |||||
RETAIL – 0.43% | |||||
Giordano International Ltd. | 6,632,000 | 3,760,841 | |||
| 3,760,841 | |||||
SEMICONDUCTORS – 0.69% | |||||
ASM Pacific Technology Ltd.1 | 829,000 | 4,295,971 | |||
Solomon Systech International Ltd. | 8,290,000 | 1,758,897 | |||
| 6,054,868 | |||||
| SCHEDULESOF INVESTMENTS | 51 |
Table of Contents
Schedule of Investments (Continued)
iSHARES® MSCI HONG KONG INDEX FUND
August 31, 2006
Security | Shares or Principal | Value | ||||
TELECOMMUNICATIONS – 5.32% | ||||||
Foxconn International Holdings Ltd.1,2 | 9,408,000 | $ | 24,860,565 | |||
Hutchinson Telecommunications International Ltd.2 | 6,632,000 | 11,700,394 | ||||
PCCW Ltd. | 16,600,576 | 10,395,706 | ||||
| 46,956,665 | ||||||
TEXTILES – 0.25% | ||||||
Texwinca Holdings Ltd. | 3,316,000 | 2,166,108 | ||||
| 2,166,108 | ||||||
TRANSPORTATION – 2.23% | ||||||
MTR Corp. Ltd. | 6,217,583 | 15,894,243 | ||||
Orient Overseas International Ltd.1 | 940,200 | 3,802,268 | ||||
| 19,696,511 | ||||||
TOTAL COMMON STOCKS | 880,519,921 | |||||
SHORT-TERM INVESTMENTS – 3.78% | ||||||
CERTIFICATES OF DEPOSIT3 – 0.15% | ||||||
Credit Suisse First Boston NY | ||||||
5.28% - 5.43%, 04/23/07 - 08/21/07 | $ | 191,621 | 191,621 | |||
Societe Generale | ||||||
5.33%, 12/08/06 | 273,744 | 273,744 | ||||
Washington Mutual Bank | ||||||
5.36%, 11/13/06 | 684,361 | 684,361 | ||||
Wells Fargo Bank N.A. | ||||||
4.78%, 12/05/06 | 218,995 | 218,995 | ||||
| 1,368,721 | ||||||
COMMERCIAL PAPER3 – 0.60% | ||||||
Amstel Funding Corp. | ||||||
5.20%, 11/21/06 - 11/22/064 | 79,873 | 78,934 | ||||
Amsterdam Funding Corp. | ||||||
5.27%, 09/15/064 | 273,744 | 273,183 | ||||
Atlantis One Funding | ||||||
5.30%, 11/14/064 | 375,599 | 371,507 | ||||
Barton Capital Corp. | ||||||
5.27%, 09/06/064 | 137,967 | 137,866 | ||||
Cancara Asset Securitisation Ltd. | ||||||
5.30%, 11/14/064 | 138,766 | 137,255 | ||||
Security | Principal | Value | ||||
CC USA Inc. | ||||||
5.03%, 10/24/064 | $ | 54,749 | $ | 54,343 | ||
Charta LLC | ||||||
5.30%, 11/06/064 | 273,744 | 271,084 | ||||
Concord Minutemen Capital Co. LLC | ||||||
5.27% - 5.29%, 09/13/06 - 11/16/064 | 480,780 | 478,648 | ||||
Curzon Funding LLC | ||||||
5.29%, 11/17/064 | 273,744 | 270,647 | ||||
Edison Asset Securitization LLC | ||||||
5.22%, 12/11/064 | 201,947 | 198,989 | ||||
Falcon Asset Securitization Corp. | ||||||
5.30%, 11/06/064 | 273,744 | 271,084 | ||||
Five Finance Inc. | ||||||
5.19%, 12/01/064 | 123,185 | 121,569 | ||||
General Electric Capital Services Inc. | ||||||
5.22%, 12/11/06 | 27,374 | 26,974 | ||||
Giro Funding Corp. | ||||||
5.28% - 5.34%, 09/11/06 - 10/10/064 | 273,744 | 272,752 | ||||
Grampian Funding LLC | ||||||
5.03% - 5.30%, 10/17/06 - 11/16/064 | 131,397 | 130,313 | ||||
KKR Pacific Funding Trust | ||||||
5.29%, 09/14/064 | 273,744 | 273,221 | ||||
Landale Funding LLC | ||||||
5.31%, 11/15/064 | 213,521 | 211,161 | ||||
Lexington Parker Capital Co. LLC | ||||||
5.19% - 5.27%, 09/15/06 - 11/15/064 | 354,833 | 352,796 | ||||
Liberty Street Funding Corp. | ||||||
5.27%, 09/08/06 - 09/11/064 | 243,632 | 243,336 | ||||
Mont Blanc Capital Corp. | ||||||
5.29%, 11/15/064 | 176,565 | 174,619 | ||||
Monument Gardens Funding LLC | ||||||
5.28%, 09/21/064 | 137,565 | 137,161 | ||||
Nestle Capital Corp. | ||||||
5.19%, 08/09/07 | 164,247 | 156,148 | ||||
Park Granada LLC | ||||||
5.30%, 09/01/064 | 62,556 | 62,556 | ||||
| 52 | 2006 iSHARES ANNUAL REPORTTO SHAREHOLDERS |
Table of Contents
Schedule of Investments (Continued)
iSHARES® MSCI HONG KONG INDEX FUND
August 31, 2006
Security | Shares or Principal | Value | ||||
Regency Markets LLC | ||||||
5.28%, 09/15/06 | $ | 136,872 | $ | 136,591 | ||
Solitaire Funding Ltd. | ||||||
5.27%, 09/05/064 | 205,308 | 205,188 | ||||
Sydney Capital Corp. | ||||||
5.27%, 09/12/064 | 62,633 | 62,532 | ||||
Tulip Funding Corp. | ||||||
5.29%, 11/15/064 | 144,378 | 142,787 | ||||
White Pine Finance LLC | ||||||
5.12%, 10/27/064 | 51,738 | 51,326 | ||||
| 5,304,570 | ||||||
MEDIUM-TERM NOTES3 – 0.13% | ||||||
Bank of America N.A. | ||||||
5.28%, 04/20/07 | 68,436 | 68,436 | ||||
Cullinan Finance Corp. | ||||||
5.71%, 06/28/074 | 205,308 | 205,308 | ||||
K2 USA LLC | ||||||
5.39%, 06/04/074 | 205,308 | 205,308 | ||||
Marshall & Ilsley Bank | ||||||
5.18%, 12/15/06 | 273,744 | 274,015 | ||||
Sigma Finance Inc. | ||||||
5.13% - 5.51%, 03/30/07 - 06/18/074 | 320,281 | 320,280 | ||||
US Bank N.A. | ||||||
2.85%, 11/15/06 | 54,749 | 54,542 | ||||
| 1,127,889 | ||||||
MONEY MARKET FUNDS – 0.08% | ||||||
Barclays Global Investors Funds Institutional Money Market Fund, Institutional Shares 5.30%5,6 | 697,658 | 697,658 | ||||
| 697,658 | ||||||
Security | Principal | Value | ||||
REPURCHASE AGREEMENTS3 – 0.76% | ||||||
Banc of America Securities LLC Repurchase Agreement, 5.30%, due 9/1/06, maturity value $342,230 (collateralized by U.S. Government obligations, value $349,355, 5.50% to 6.50%, 1/1/33 to 7/1/36). | $ | 342,180 | $ | 342,180 | ||
Banc of America Securities LLC Repurchase Agreement, 5.36%, due 9/1/06, maturity value $547,571 (collateralized by non-U.S. Government debt securities, value $564,449, 3.80% to 9.13%, 11/1/06 to 6/15/26). | 547,489 | 547,489 | ||||
Bear Stearns Companies Inc. (The) Repurchase Agreement, 5.37%, due 9/1/06, maturity value $410,677 (collateralized by non-U.S. Government debt securities, value $452,114, 0.08% to 6.43%, 9/25/20 to 7/25/36). | 410,616 | 410,616 | ||||
Citigroup Global Markets Holdings Inc. Repurchase Agreement, 5.36%, due 9/1/06, maturity value $821,355 (collateralized by non-U.S. Government debt securities, value $858,131, 4.35% to 7.50%, 9/15/08 to 8/25/35). | 821,233 | 821,233 | ||||
Citigroup Global Markets Holdings Inc. Repurchase Agreement, 5.46%, due 9/1/06, maturity value $164,272 (collateralized by non-U.S. Government debt securities, value $200,501, 0.00% to 10.00%, 6/1/28 to 8/24/36). | 164,247 | 164,247 | ||||
| SCHEDULESOF INVESTMENTS | 53 |
Table of Contents
Schedule of Investments (Continued)
iSHARES® MSCI HONG KONG INDEX FUND
August 31, 2006
Security | Principal | Value | ||||
Goldman Sachs & Co. Repurchase Agreement, 5.35%, due 9/1/06, maturity value $ 547,570 (collateralized by non-U.S. Government debt securities, value $558,968, 0.00% to 8.57%, 11/15/06 to 2/15/38). | $ | 547,489 | $ | 547,489 | ||
Goldman Sachs Group Inc. Repurchase Agreement, 5.36%, due 9/1/06, maturity value $273,785 (collateralized by non-U.S. Government debt securities, value $287,704, 5.36% to 9.01%, 10/27/10 to 2/18/20). | 273,744 | 273,744 | ||||
JP Morgan Securities Inc. Repurchase Agreement, 5.41%, due 9/1/06, maturity value $68,446 (collateralized by non-U.S. Government debt securities, value $71,928, 6.63% to 10.50%, 1/15/07 to 4/15/16). | 68,436 | 68,436 | ||||
Lehman Brothers Holdings Inc. Repurchase Agreement, 5.36%, due 9/1/06, maturity value $547,571 (collateralized by non-U.S. Government debt securities, value $575,411, 0.51% to 8.89%, 8/5/18 to 9/25/46). | 547,489 | 547,489 | ||||
Lehman Brothers Holdings Inc. Repurchase Agreement, 5.38%, due 9/1/06, maturity value $273,785 (collateralized by non-U.S. Government debt securities, value $287,713, 4.11% to 9.79%, 4/28/31 to 9/25/46). | 273,744 | 273,744 | ||||
Lehman Brothers Holdings Inc. Repurchase Agreement, 5.46%, due 9/1/06, maturity value $301,165 (collateralized by non-U.S. Government debt securities, value $316,475, 3.44% to 15.15%, 12/1/08 to 3/1/36). | 301,119 | 301,119 | ||||
Merrill Lynch & Co. Inc. Repurchase Agreement, 5.33%, due 9/1/06, maturity value $ 547,569 (collateralized by non-U.S. Government debt securities, value $575,419, 6.38% to 10.25%, 5/1/07 to 10/15/16). | 547,488 | 547,488 | ||||
Merrill Lynch & Co. Inc. Repurchase Agreement, 5.36%, due 9/1/06, maturity value $547,571 (collateralized by non-U.S. Government debt securities, value $564,551, 0.00% to 10.13%, 10/15/06 to 7/1/26). | 547,489 | 547,489 | ||||
Morgan Stanley Repurchase Agreement, 5.36%, due 9/1/06, maturity value $273,785 (collateralized by non-U.S. Government debt securities, value $287,837, 4.05% to 7.24%, 6/20/29 to 1/14/41). | 273,744 | 273,744 | ||||
Morgan Stanley Repurchase Agreement, 5.46%, due 9/1/06, maturity value $ 95,825 (collateralized by non-U.S. Government debt securities, value $146,935, 0.00% to 10.00%, 9/1/06 to 8/31/36). | 95,810 | 95,810 | ||||
| 54 | 2006 iSHARES ANNUAL REPORTTO SHAREHOLDERS |
Table of Contents
Schedule of Investments (Continued)
iSHARES® MSCI HONG KONG INDEX FUND
August 31, 2006
Security | Principal | Value | ||||
Morgan Stanley Repurchase Agreement, 5.51%, due 6/4/07, maturity value $199,745 (collateralized by non-U.S. Government debt securities, value $298,322, 0.00% to 10.00%, 9/1/06 to 8/31/36).7 | $ | 191,621 | $ | 191,621 | ||
Wachovia Capital Repurchase Agreement, 5.38%, due 9/1/06, maturity value $711,841 (collateralized by non-U.S. Government debt securities, value $748,031, 0.06% to 7.68%, 10/15/11 to 3/15/45). | 711,735 | 711,735 | ||||
| 6,665,673 | ||||||
TIME DEPOSITS3 – 0.01% | ||||||
KBC Bank | ||||||
5.31%, 09/01/06 | 57,763 | 57,763 | ||||
| 57,763 | ||||||
VARIABLE & FLOATING RATE NOTES3 – 2.05% | ||||||
Allstate Life Global Funding II | ||||||
5.34% - 5.47%, 09/04/07 - 09/27/074 | 700,794 | 700,886 | ||||
American Express Bank | ||||||
5.30%, 02/28/07 | 273,744 | 273,743 | ||||
American Express Centurion Bank | ||||||
5.42%, 07/19/07 | 301,119 | 301,424 | ||||
American Express Credit Corp. | ||||||
5.51%, 07/05/07 | 82,123 | 82,169 | ||||
ASIF Global Financing | ||||||
5.51%, 05/03/074 | 27,374 | 27,385 | ||||
Australia & New Zealand Banking Group Ltd. | ||||||
5.32%, 09/21/074 | 177,934 | 177,934 | ||||
Bank of Ireland | ||||||
5.30% - 5.31%, 08/14/07 - 08/20/074 | 396,929 | 396,946 | ||||
Beta Finance Inc. | ||||||
5.29% - 5.48%, 04/25/07 - 07/25/074 | 698,048 | 698,083 | ||||
BMW US Capital LLC | ||||||
5.33%, 09/14/074 | 273,744 | 273,744 | ||||
BNP Paribas | ||||||
5.36%, 05/18/074 | 506,427 | 506,427 | ||||
Carlyle Loan Investment Ltd. | ||||||
5.38%, 04/13/07 - 07/15/074 | 199,833 | 199,833 | ||||
CC USA Inc. | ||||||
5.48%, 07/30/074 | 136,872 | 136,890 | ||||
Commodore CDO Ltd. | ||||||
5.38%, 06/12/074 | 68,436 | 68,436 | ||||
Credit Agricole SA | ||||||
5.48%, 07/23/07 | 273,744 | 273,744 | ||||
Credit Suisse First Boston NY | ||||||
5.51%, 04/24/07 | 136,872 | 136,878 | ||||
Cullinan Finance Corp. | ||||||
5.36%, 04/25/074 | 68,436 | 68,436 | ||||
DEPFA Bank PLC | ||||||
5.37%, 06/15/07 | 273,744 | 273,744 | ||||
Dorada Finance Inc. | ||||||
5.41% - 5.47%, 06/27/07 - 07/17/074 | 314,806 | 314,826 | ||||
Eli Lilly Services Inc. | ||||||
5.37%, 08/31/074 | 273,744 | 273,744 | ||||
Fifth Third Bancorp | ||||||
5.30%, 09/21/074 | 547,489 | 547,489 | ||||
Five Finance Inc. | ||||||
5.37% - 5.45%, 12/01/06 - 07/13/074 | 273,744 | 273,724 | ||||
General Electric Capital Corp. | ||||||
5.29% - 5.49%, 07/09/07 - 09/24/07 | 287,431 | 287,499 | ||||
Granite Master Issuer PLC | ||||||
5.30%, 09/20/06 | 958,105 | 958,105 | ||||
Harrier Finance Funding LLC | ||||||
5.33%, 07/25/074 | 82,123 | 82,138 | ||||
Hartford Life Global Funding Trusts | ||||||
5.35% - 5.55%, 07/13/07 - 09/17/07 | 410,616 | 410,680 | ||||
HBOS Treasury Services PLC | ||||||
5.53%, 07/24/074 | 273,744 | 273,744 | ||||
Holmes Financing PLC | ||||||
5.40%, 07/16/074 | 479,052 | 479,052 | ||||
| SCHEDULESOF INVESTMENTS | 55 |
Table of Contents
Schedule of Investments (Continued)
iSHARES® MSCI HONG KONG INDEX FUND
August 31, 2006
Security | Principal | Value | |||||
JP Morgan Chase & Co. | |||||||
5.36%, 08/02/07 | $ | 205,308 | $ | 205,308 | |||
K2 USA LLC | |||||||
5.20% - 5.46%, 04/02/07 - 06/28/074 | 205,308 | 205,299 | |||||
Kestrel Funding LLC | |||||||
5.31%, 07/11/074 | 109,498 | 109,488 | |||||
Kommunalkredit Austria AG | |||||||
5.33%, 09/09/074 | 164,247 | 164,247 | |||||
Leafs LLC | |||||||
5.33%, 01/22/07 - 02/20/074 | 285,618 | 285,617 | |||||
Lexington Parker Capital Co. LLC | |||||||
5.46%, 01/10/074 | 342,180 | 342,104 | |||||
Links Finance LLC | |||||||
5.33% - 5.35%, 05/10/07 - 05/16/074 | 301,119 | 301,097 | |||||
Lothian Mortgages Master Issuer PLC | |||||||
5.30%, 04/24/074 | 120,619 | 120,619 | |||||
Marshall & Ilsley Bank | |||||||
5.31%, 09/14/07 | 150,559 | 150,559 | |||||
Metropolitan Life Global Funding I | |||||||
5.42%, 08/06/074 | 410,616 | 410,616 | |||||
Metropolitan Life Insurance Funding Agreement | |||||||
5.57%, 08/01/074,7 | 27,374 | 27,374 | |||||
Monumental Global Funding II | |||||||
5.49%, 12/27/064 | 54,749 | 54,755 | |||||
Mound Financing PLC | |||||||
5.39%, 05/08/074 | 257,320 | 257,320 | |||||
Natexis Banques Populaires | |||||||
5.31% - 5.40%, 02/05/07 - 09/14/074 | 821,233 | 821,220 | |||||
National City Bank of Indiana | |||||||
5.37%, 05/21/07 | 136,872 | 136,880 | |||||
Nationwide Building Society | |||||||
5.44% - 5.62%, 07/06/07 - 07/27/074 | 903,356 | 903,566 | |||||
Newcastle Ltd. | |||||||
5.35%, 04/24/074 | 96,495 | 96,476 | |||||
Northern Rock PLC | |||||||
5.43%, 08/03/074 | 328,493 | 328,501 | |||||
Principal Life Global Funding I | |||||||
5.80%, 02/08/07 | 123,185 | 123,437 | |||||
Sedna Finance Inc. | |||||||
5.30% - 5.37%, 09/20/06 - 08/21/074 | 479,052 | 479,043 | |||||
Skandinaviska Enskilda Bank NY | |||||||
5.33%, 09/18/074 | 273,744 | 273,744 | |||||
Strips III LLC | |||||||
5.38%, 07/24/074 | 66,563 | 66,563 | |||||
SunTrust Bank | |||||||
5.37%, 05/01/07 | 273,744 | 273,755 | |||||
Tango Finance Corp. | |||||||
5.22% - 5.48%, 04/25/07 - 07/16/074 | 667,936 | 667,877 | |||||
Union Hamilton Special Funding LLC | |||||||
5.42% - 5.49%, 09/28/06 - 12/21/064 | 383,242 | 383,242 | |||||
US Bank N.A. | |||||||
5.26%, 09/29/06 | 123,185 | 123,182 | |||||
Wachovia Asset Securitization Inc. | |||||||
5.31%, 09/25/064 | 408,485 | 408,485 | |||||
Wachovia Bank N.A. | |||||||
5.36%, 05/22/07 | 547,489 | 547,489 | |||||
Wells Fargo & Co. | |||||||
5.34%, 09/14/074 | 136,872 | 136,881 | |||||
WhistleJacket Capital Ltd. | |||||||
5.29% - 5.35%, 04/18/07 - 06/13/074 | 205,308 | 205,307 | |||||
White Pine Finance LLC | |||||||
5.29% - 5.35%, 05/22/07 - 08/20/074 | 821,233 | 821,064 | |||||
Wind Master Trust | |||||||
5.31% - 5.32%, 09/25/06 - 07/25/074 | 173,611 | 173,612 | |||||
| 18,102,430 | |||||||
TOTAL SHORT-TERM INVESTMENTS | 33,324,704 | ||||||
TOTAL INVESTMENTS IN SECURITIES – 103.53% | 913,844,625 | ||||||
Other Assets, Less Liabilities – (3.53)% | (31,132,646 | ) | |||||
NET ASSETS – 100.00% | $ | 882,711,979 | |||||
| 56 | 2006 iSHARES ANNUAL REPORTTO SHAREHOLDERS |
Table of Contents
Schedule of Investments (Continued)
iSHARES® MSCI HONG KONG INDEX FUND
August 31, 2006
| 1 | All or a portion of this security represents a security on loan. See Note 5. |
| 2 | Non-income earning security. |
| 3 | All or a portion of this security (these securities) represent(s) an investment of securities lending collateral. See Note 5. |
| 4 | This security or a portion of these securities may be resold to qualified institutional buyers under Rule 144A or pursuant to Section 4(2) of the Securities Act of 1933. |
| 5 | Affiliated issuer. See Note 2. |
| 6 | The rate quoted is the annualized seven-day yield of the fund at period end. |
| 7 | The investment adviser has determined that this security or a portion of these securities is illiquid. |
See notes to the financial statements.
| SCHEDULESOF INVESTMENTS | 57 |
Table of Contents
Schedule of Investments
iSHARES® MSCI MALAYSIA INDEX FUND
August 31, 2006
Security | Shares | Value | |||
COMMON STOCKS – 99.59% | |||||
AGRICULTURE – 11.22% | |||||
British American Tobacco (Malaysia) Bhd | 901,600 | $ | 10,164,738 | ||
Golden Hope Plantations Bhd | 2,962,400 | 3,862,950 | |||
Highlands & Lowlands Bhd | 1,030,400 | 1,321,241 | |||
IOI Corp. Bhd | 4,636,800 | 21,288,215 | |||
Kuala Lumpur Kepong Bhd | 1,738,800 | 5,385,037 | |||
| 42,022,181 | |||||
AIRLINES – 0.94% | |||||
AirAsia Bhd1 | 5,731,600 | 2,102,054 | |||
Malaysian Airline System Bhd | 1,738,800 | 1,426,562 | |||
| 3,528,616 | |||||
AUTO MANUFACTURERS – 1.30% | |||||
DRB-Hicom Bhd | 4,186,000 | 1,694,415 | |||
Proton Holdings Bhd | 1,738,800 | 2,333,516 | |||
Tan Chong Motor Holdings Bhd | 2,318,400 | 856,567 | |||
| 4,884,498 | |||||
AUTO PARTS & EQUIPMENT – 0.77% | |||||
UMW Holdings Bhd | 1,416,800 | 2,867,471 | |||
| 2,867,471 | |||||
BANKS – 25.42% | |||||
AMMB Holdings Bhd | 9,660,000 | 6,429,503 | |||
Bumiputra-Commerce Holdings Bhd | 15,456,032 | 26,872,753 | |||
Hong Leong Bank Bhd | 3,348,800 | 4,867,177 | |||
Malayan Banking Bhd | 13,299,600 | 40,466,047 | |||
Public Bank Bhd | 7,212,800 | 13,226,406 | |||
RHB Capital Bhd | 4,443,600 | 3,307,651 | |||
| 95,169,537 | |||||
BEVERAGES – 0.40% | |||||
Guinness Anchor Bhd | 966,000 | 1,482,722 | |||
| 1,482,722 | |||||
BUILDING MATERIALS – 2.46% | |||||
Lafarge Malayan Cement Bhd | 8,050,000 | 1,760,459 | |||
OYL Industries Bhd | 4,894,430 | 7,446,022 | |||
| 9,206,481 | |||||
COMMERCIAL SERVICES – 2.15% | |||||
PLUS Expressways Bhd | 10,497,200 | 8,041,865 | |||
| 8,041,865 | |||||
DIVERSIFIED FINANCIAL SERVICES – 1.66% | |||||
Bursa Malaysia Bhd | 2,189,600 | 3,509,546 | |||
Hong Leong Credit Bhd | 1,481,200 | 1,826,854 | |||
TA Enterprise Bhd | 4,701,200 | 874,850 | |||
| 6,211,250 | |||||
ELECTRIC – 7.38% | |||||
Malakoff Bhd | 3,799,600 | 10,012,529 | |||
Tenaga Nasional Bhd | 7,084,050 | 17,609,089 | |||
| 27,621,618 | |||||
ENGINEERING & CONSTRUCTION – 5.93% | |||||
Gamuda Bhd | 3,928,400 | 4,332,873 | |||
IJM Corp. Bhd | 2,447,200 | 3,955,675 | |||
Malaysian Resources Corp. Bhd1 | 5,280,800 | 1,083,131 | |||
MMC Corp. Bhd | 2,157,800 | 1,875,838 | |||
Road Builder (Malaysia) Holdings Bhd | 2,769,200 | 1,730,280 | |||
Transmile Group Bhd | 901,600 | 2,963,695 | |||
YTL Corp. Bhd | 4,379,288 | 6,245,928 | |||
| 22,187,420 | |||||
ENTERTAINMENT – 6.90% | |||||
Berjaya Sports Toto Bhd | 4,701,200 | 5,747,188 | |||
Magnum Corp. Bhd | 5,989,200 | 3,498,174 | |||
Resorts World Bhd | 3,413,200 | 11,034,252 | |||
Tanjong PLC | 1,545,600 | 5,542,494 | |||
| 25,822,108 | |||||
FOOD – 1.11% | |||||
PPB Group Bhd | 3,348,866 | 4,166,750 | |||
| 4,166,750 | |||||
GAS – 1.79% | |||||
Petronas Gas Bhd | 2,769,200 | 6,695,431 | |||
| 6,695,431 | |||||
HOLDING COMPANIES – DIVERSIFIED – 5.22% | |||||
Mulpha International Bhd1 | 5,280,800 | 1,750,224 | |||
Multi-Purpose Holdings Bhd1 | 4,057,200 | 1,025,046 | |||
Sime Darby Bhd | 10,368,400 | 16,759,571 | |||
| 19,534,841 | |||||
INSURANCE – 0.22% | |||||
Kurnia Asia Bhd | 2,640,431 | 817,737 | |||
| 817,737 | |||||
| 58 | 2006 iSHARES ANNUAL REPORTTO SHAREHOLDERS |
Table of Contents
Schedule of Investments (Continued)
iSHARES® MSCI MALAYSIA INDEX FUND
August 31, 2006
Security | Shares | Value | |||
LODGING – 4.43% | |||||
Genting Bhd | 2,481,900 | $ | 16,586,455 | ||
| 16,586,455 | |||||
MEDIA – 2.36% | |||||
Astro All Asia Networks PLC | 3,348,800 | 4,330,423 | |||
Media Prima Bhd | 3,413,200 | 1,594,867 | |||
Star Publications (Malaysia) Bhd | 3,091,360 | 2,905,761 | |||
| 8,831,051 | |||||
OIL & GAS – 1.37% | |||||
Petronas Dagangan Bhd | 1,738,800 | 1,993,408 | |||
Shell Refining Co. | 1,056,400 | 3,128,161 | |||
| 5,121,569 | |||||
OIL & GAS SERVICES – 0.26% | |||||
Scomi Group Bhd | 4,186,000 | 989,356 | |||
| 989,356 | |||||
REAL ESTATE – 2.23% | |||||
IGB Corp. Bhd | 4,636,800 | 1,801,309 | |||
IOI Properties Bhd | 579,650 | 1,322,755 | |||
KLCC Property Holdings Bhd | 2,962,400 | 1,770,519 | |||
SP Setia Bhd | 3,348,800 | 3,438,866 | |||
| 8,333,449 | |||||
SEMICONDUCTORS – 0.42% | |||||
Malaysian Pacific Industries Bhd | 579,600 | 1,590,318 | |||
| 1,590,318 | |||||
TELECOMMUNICATIONS – 7.82% | |||||
Maxis Communications Bhd | 6,118,000 | 14,626,026 | |||
Telekom Malaysia Bhd | 5,924,800 | 14,647,020 | |||
| 29,273,046 | |||||
TRANSPORTATION – 5.83% | |||||
Malaysia International Shipping Corp. Bhd | 7,856,800 | 18,035,849 | |||
Malaysian Bulk Carriers Bhd | 1,674,400 | 1,082,606 | |||
Pos Malaysia & Services Holdings Bhd | 2,189,600 | 2,712,463 | |||
| 21,830,918 | |||||
TOTAL COMMON STOCKS | 372,816,688 | ||||
SHORT-TERM INVESTMENTS – 0.00% | |||||
MONEY MARKET FUNDS – 0.00% | |||||
Barclays Global Investors Funds Institutional Money Market Fund, Institutional Shares 5.30%2,3 | 463 | 463 | |||
| 463 | |||||
TOTAL SHORT-TERM INVESTMENTS | 463 | ||||
TOTAL INVESTMENTS IN SECURITIES – 99.59% | 372,817,151 | ||||
Other Assets, Less Liabilities – 0.41% | 1,516,791 | ||||
NET ASSETS – 100.00% | $ | 374,333,942 | |||
| 1 | Non-income earning security. |
| 2 | Affiliated issuer. See Note 2. |
| 3 | The rate quoted is the annualized seven-day yield of the fund at period end. |
See notes to the financial statements.
| SCHEDULESOF INVESTMENTS | 59 |
Table of Contents
Schedule of Investments
iSHARES® MSCI MEXICO INDEX FUND
August 31, 2006
Security | Shares | Value | |||
COMMON STOCKS – 99.95% | |||||
BEVERAGES – 8.40% | |||||
Coca-Cola Femsa SA de CV ADR | 222,000 | $ | 6,553,440 | ||
Fomento Economico Mexicano SA de CV Class UBD | 3,866,536 | 36,433,865 | |||
Grupo Modelo SA de CV Series C | 5,032,000 | 21,208,484 | |||
| 64,195,789 | |||||
BUILDING MATERIALS – 14.62% | |||||
Cemex SA de CV Series CPO1,2 | 38,757,476 | 111,742,864 | |||
| 111,742,864 | |||||
DIVERSIFIED FINANCIAL SERVICES – 4.03% | |||||
Grupo Financiero Banorte SA de CV Series O2 | 10,489,500 | 30,761,702 | |||
| 30,761,702 | |||||
ENGINEERING & CONSTRUCTION – 3.67% | |||||
Carso Infraestructura y Construccion SA de CV1,2 | 4,791,500 | 3,508,519 | |||
Empresas ICA Sociedad Controladora SA de CV1 | 1,979,974 | 6,724,663 | |||
Grupo Aeroportuario del Pacifico SA de CV Class H2 | 3,052,500 | 10,333,755 | |||
Grupo Aeroportuario del Sureste SA de CV ADR | 210,900 | 7,451,097 | |||
| 28,018,034 | |||||
FOOD – 1.26% | |||||
Grupo Bimbo SA de CV Series A2 | 2,923,000 | 9,619,441 | |||
| 9,619,441 | |||||
FOREST PRODUCTS & PAPER – 2.24% | |||||
Kimberly-Clark de Mexico SA de CV Class A | 4,532,500 | 17,076,186 | |||
| 17,076,186 | |||||
HOLDING COMPANIES – DIVERSIFIED – 4.40% | |||||
Alfa SA de CV Class A2 | 2,127,500 | 10,372,580 | |||
Grupo Carso SA de CV Series A12 | 7,955,030 | 23,278,036 | |||
| 33,650,616 | |||||
HOME BUILDERS – 3.07% | |||||
Corporacion GEO SA de CV Series B1,2 | 3,126,500 | 12,716,023 | |||
Desarrolladora Homex SA de CV1,2 | 333,030 | 2,056,764 | |||
Urbi Desarrollos Urbanos SA de CV1 | 3,274,500 | 8,690,588 | |||
| 23,463,375 | |||||
MEDIA – 5.58% | |||||
Grupo Televisa SA Series CPO2 | 9,453,500 | 35,997,244 | |||
TV Azteca SA de CV Series CPO2 | 10,045,500 | 6,610,002 | |||
| 42,607,246 | |||||
MINING – 3.74% | |||||
Grupo Mexico SA de CV Series B | 7,141,000 | 22,780,783 | |||
Industrias Penoles SA de CV Series CP | 684,500 | 5,823,276 | |||
| 28,604,059 | |||||
REAL ESTATE – 1.44% | |||||
Consorcio Ara SA de CV | 2,368,000 | 11,032,980 | |||
| 11,032,980 | |||||
RETAIL – 7.27% | |||||
Controladora Comercial Mexicana SA de CV | 4,033,000 | 7,580,528 | |||
Grupo Sanborns SA de CV Series B11,2 | 1,406,093 | 3,311,714 | |||
Organizacion Soriana SA de CV Series B2 | 1,591,006 | 7,579,031 | |||
Wal-Mart de Mexico SA de CV Series V | 10,841,000 | 37,097,894 | |||
| 55,569,167 | |||||
TELECOMMUNICATIONS – 40.23% | |||||
America Movil SA de CV Series L2 | 100,362,500 | 187,356,210 | |||
America Telecom SA de CV Series A11,2 | 4,699,000 | 32,035,064 | |||
Carso Global Telecom SA de CV Class A11,2 | 6,706,435 | 18,714,775 | |||
Telefonos de Mexico SA de CV Series L2 | 57,183,500 | 69,279,984 | |||
| 307,386,033 | |||||
TOTAL COMMON STOCKS | 763,727,492 | ||||
| 60 | 2006 iSHARES ANNUAL REPORTTO SHAREHOLDERS |
Table of Contents
Schedule of Investments (Continued)
iSHARES® MSCI MEXICO INDEX FUND
August 31, 2006
Security | Principal | Value | ||||
SHORT-TERM INVESTMENTS – 10.30% | ||||||
CERTIFICATES OF DEPOSIT3 – 0.43% | ||||||
Credit Suisse First Boston NY | ||||||
5.28% - 5.43%, 04/23/07 - 08/21/07 | $ | 458,520 | $ | 458,520 | ||
Societe Generale | ||||||
5.33%, 12/08/06 | 655,029 | 655,029 | ||||
Washington Mutual Bank | ||||||
5.36%, 11/13/06 | 1,637,573 | 1,637,573 | ||||
Wells Fargo Bank N.A. | ||||||
4.78%, 12/05/06 | 524,023 | 524,023 | ||||
| 3,275,145 | ||||||
COMMERCIAL PAPER3 – 1.66% | ||||||
Amstel Funding Corp. | ||||||
5.20%, 11/21/06 - 11/22/064 | 191,124 | 188,879 | ||||
Amsterdam Funding Corp. | ||||||
5.27%, 09/15/064 | 655,029 | 653,687 | ||||
Atlantis One Funding | ||||||
5.30%, 11/14/064 | 898,752 | 888,961 | ||||
Barton Capital Corp. | ||||||
5.27%, 09/06/064 | 330,135 | 329,893 | ||||
Cancara Asset Securitisation Ltd. | ||||||
5.30%, 11/14/064 | 332,047 | 328,430 | ||||
CC USA Inc. | ||||||
5.03%, 10/24/064 | 131,006 | 130,036 | ||||
Charta LLC | ||||||
5.30%, 11/06/064 | 655,029 | 648,664 | ||||
Concord Minutemen Capital Co. LLC | ||||||
5.27% - 5.29%, 09/13/06 - 11/16/064 | 1,150,434 | 1,145,331 | ||||
Curzon Funding LLC | ||||||
5.29%, 11/17/064 | 655,029 | 647,618 | ||||
Edison Asset Securitization LLC | ||||||
5.22%, 12/11/064 | 483,228 | 476,151 | ||||
Falcon Asset Securitization Corp. | ||||||
5.30%, 11/06/064 | 655,029 | 648,664 | ||||
Five Finance Inc. | ||||||
5.19%, 12/01/064 | 294,763 | 290,896 | ||||
General Electric Capital Services Inc. | ||||||
5.22%, 12/11/06 | 65,503 | 64,544 | ||||
Giro Funding Corp. | ||||||
5.28% - 5.34%, 09/11/06 - 10/10/064 | 655,029 | 652,656 | ||||
Grampian Funding LLC | ||||||
5.03% - 5.30%, 10/17/06 - 11/16/064 | 314,414 | 311,820 | ||||
KKR Pacific Funding Trust | ||||||
5.29%, 09/14/064 | 655,029 | 653,778 | ||||
Landale Funding LLC | ||||||
5.31%, 11/15/064 | 510,923 | 505,276 | ||||
Lexington Parker Capital Co. LLC | ||||||
5.19% - 5.27%, 09/15/06 - 11/15/064 | 849,062 | 844,190 | ||||
Liberty Street Funding Corp. | ||||||
5.27%, 09/08/06 - 09/11/064 | 582,976 | 582,266 | ||||
Mont Blanc Capital Corp. | ||||||
5.29%, 11/15/064 | 422,494 | 417,837 | ||||
Monument Gardens Funding LLC | ||||||
5.28%, 09/21/064 | 329,172 | 328,206 | ||||
Nestle Capital Corp. | ||||||
5.19%, 08/09/07 | 393,017 | 373,640 | ||||
Park Granada LLC | ||||||
5.30%, 09/01/064 | 149,687 | 149,687 | ||||
Regency Markets LLC | ||||||
5.28%, 09/15/06 | 327,515 | 326,843 | ||||
Solitaire Funding Ltd. | ||||||
5.27%, 09/05/064 | 491,272 | 490,984 | ||||
Sydney Capital Corp. | ||||||
5.27%, 09/12/064 | 149,871 | 149,629 | ||||
Tulip Funding Corp. | ||||||
5.29%, 11/15/064 | 345,475 | 341,668 | ||||
White Pine Finance LLC | ||||||
5.12%, 10/27/064 | 123,800 | 122,814 | ||||
| 12,693,048 | ||||||
MEDIUM-TERM NOTES3 – 0.35% | ||||||
Bank of America N.A. | ||||||
5.28%, 04/20/07 | 163,757 | 163,757 | ||||
Cullinan Finance Corp. | ||||||
5.71%, 06/28/074 | 491,272 | 491,272 | ||||
K2 USA LLC | ||||||
5.39%, 06/04/074 | 491,272 | 491,272 | ||||
| SCHEDULESOF INVESTMENTS | 61 |
Table of Contents
Schedule of Investments (Continued)
iSHARES® MSCI MEXICO INDEX FUND
August 31, 2006
Security | Shares or Principal | Value | ||||
Marshall & Ilsley Bank | ||||||
5.18%, 12/15/06 | $ | 655,029 | $ | 655,677 | ||
Sigma Finance Inc. | ||||||
5.13% - 5.51%, 03/30/07 - 06/18/074 | 766,384 | 766,384 | ||||
US Bank N.A. | ||||||
2.85%, 11/15/06 | 131,006 | 130,510 | ||||
| 2,698,872 | ||||||
MONEY MARKET FUNDS – 0.08% | ||||||
Barclays Global Investors Funds Institutional Money Market Fund, Institutional Shares 5.30%5,6 | 592,868 | 592,868 | ||||
| 592,868 | ||||||
REPURCHASE AGREEMENTS3 – 2.09% | ||||||
Banc of America Securities LLC Repurchase Agreement, 5.30%, due 9/1/06, maturity value $818,907 (collateralized by U.S. Government obligations, value $835,955, 5.50% to 6.50%, 1/1/33 to 7/1/36). | $ | 818,786 | 818,786 | |||
Banc of America Securities LLC Repurchase Agreement, 5.36%, due 9/1/06, maturity value $1,310,253 (collateralized by non-U.S. Government debt securities, value $1,350,641, 3.80% to 9.13%, 11/1/06 to 6/15/26). | 1,310,058 | 1,310,058 | ||||
Bear Stearns Companies Inc. (The) Repurchase Agreement, 5.37%, due 9/1/06, maturity value $982,691 (collateralized by non-U.S. Government debt securities, value $1,081,841, 0.08% to 6.43%, 9/25/20 to 7/25/36). | 982,544 | 982,544 | ||||
Security | Principal | Value | ||||
Citigroup Global Markets Holdings Inc. Repurchase Agreement, 5.36%, due 9/1/06, maturity value $1,965,380 (collateralized by non-U.S. Government debt securities, value $2,053,378, 4.35% to 7.50%, 9/15/08 to 8/25/35). | $ | 1,965,087 | $ | 1,965,087 | ||
Citigroup Global Markets Holdings Inc. Repurchase Agreement, 5.46%, due 9/1/06, maturity value $393,077 (collateralized by non-U.S. Government debt securities, value $479,769, 0.00% to 10.00%, 6/1/28 to 8/24/36). | 393,017 | 393,017 | ||||
Goldman Sachs & Co. Repurchase Agreement, 5.35%, due 9/1/06, maturity value $ 1,310,253 (collateralized by non-U.S. Government debt securities, value $1,337,528, 0.00% to 8.57%, 11/15/06 to 2/15/38). | 1,310,058 | 1,310,058 | ||||
Goldman Sachs Group Inc. Repurchase Agreement, 5.36%, due 9/1/06, maturity value $655,127 (collateralized by non-U.S. Government debt securities, value $688,433, 5.36% to 9.01%, 10/27/10 to 2/18/20). | 655,029 | 655,029 | ||||
JP Morgan Securities Inc. Repurchase Agreement, 5.41%, due 9/1/06, maturity value $163,782 (collateralized by non-U.S. Government debt securities, value $172,114, 6.63% to 10.50%, 1/15/07 to 4/15/16). | 163,757 | 163,757 | ||||
| 62 | 2006 iSHARES ANNUAL REPORTTO SHAREHOLDERS |
Table of Contents
Schedule of Investments (Continued)
iSHARES® MSCI MEXICO INDEX FUND
August 31, 2006
Security | Principal | Value | ||||
Lehman Brothers Holdings Inc. Repurchase Agreement, 5.36%, due 9/1/06, maturity value $1,310,253 (collateralized by non-U.S. Government debt securities, value $1,376,872, 0.51% to 8.89%, 8/5/18 to 9/25/46). | $ | 1,310,058 | $ | 1,310,058 | ||
Lehman Brothers Holdings Inc. Repurchase Agreement, 5.38%, due 9/1/06, maturity value $655,127 (collateralized by non-U.S. Government debt securities, value $688,453, 4.11% to 9.79%, 4/28/31 to 9/25/46). | 655,029 | 655,029 | ||||
Lehman Brothers Holdings Inc. Repurchase Agreement, 5.46%, due 9/1/06, maturity value $720,641 (collateralized by non-U.S. Government debt securities, value $757,277, 3.44% to 15.15%, 12/1/08 to 3/1/36). | 720,532 | 720,532 | ||||
Merrill Lynch & Co. Inc. Repurchase Agreement, 5.33%, due 9/1/06, maturity value $ 1,310,253 (collateralized by non-U.S. Government debt securities, value $1,376,891, 6.38% to 10.25%, 5/1/07 to 10/15/16). | 1,310,058 | 1,310,058 | ||||
Merrill Lynch & Co. Inc. Repurchase Agreement, 5.36%, due 9/1/06, maturity value $ 1,310,253 (collateralized by non-U.S. Government debt securities, value $1,350,885, 0.00% to 10.13%, 10/15/06 to 7/1/26). | 1,310,058 | 1,310,058 | ||||
Morgan Stanley Repurchase Agreement, 5.36%, due 9/1/06, maturity value $ 655,127 (collateralized by non-U.S. Government debt securities, value $688,751, 4.05% to 7.24%, 6/20/29 to 1/14/41). | 655,029 | 655,029 | ||||
Morgan Stanley Repurchase Agreement, 5.46%, due 9/1/06, maturity value $ 229,295 (collateralized by non-U.S. Government debt securities, value $351,593, 0.00% to 10.00%, 9/1/06 to 8/31/36). | 229,260 | 229,260 | ||||
Morgan Stanley Repurchase Agreement, 5.51%, due 6/4/07, maturity value $ 477,960 (collateralized by non-U.S. Government debt securities, value $713,840, 0.00% to 10.00%, 9/1/06 to 8/31/36).7 | 458,520 | 458,520 | ||||
Wachovia Capital Repurchase Agreement, 5.38%, due 9/1/06, maturity value $ 1,703,330 (collateralized by non-U.S. Government debt securities, value $1,789,927, 0.06% to 7.68%, 10/15/11 to 3/15/45). | 1,703,075 | 1,703,075 | ||||
| 15,949,955 | ||||||
TIME DEPOSITS3 – 0.02% | ||||||
KBC Bank | ||||||
5.31%, 09/01/06 | 138,218 | 138,218 | ||||
| 138,218 | ||||||
VARIABLE & FLOATING RATE NOTES3 – 5.67% | ||||||
Allstate Life Global Funding II | ||||||
5.34% - 5.47%, 09/04/07 - 09/27/074 | 1,676,874 | 1,677,090 | ||||
American Express Bank | ||||||
5.30%, 02/28/07 | 655,029 | 655,026 | ||||
American Express Centurion Bank | ||||||
5.42%, 07/19/07 | 720,532 | 721,262 | ||||
| SCHEDULESOF INVESTMENTS | 63 |
Table of Contents
Schedule of Investments (Continued)
iSHARES® MSCI MEXICO INDEX FUND
August 31, 2006
Security | Principal | Value | ||||
American Express Credit Corp. | ||||||
5.51%, 07/05/07 | $ | 196,509 | $ | 196,618 | ||
ASIF Global Financing | ||||||
5.51%, 05/03/074 | 65,503 | 65,528 | ||||
Australia & New Zealand Banking Group Ltd. | ||||||
5.32%, 09/21/074 | 425,769 | 425,769 | ||||
Bank of Ireland | ||||||
5.30% - 5.31%, 08/14/07 - 08/20/074 | 949,792 | 949,831 | ||||
Beta Finance Inc. | ||||||
5.29% - 5.48%, 04/25/07 - 07/25/074 | 1,670,324 | 1,670,408 | ||||
BMW US Capital LLC | ||||||
5.33%, 09/14/074 | 655,029 | 655,029 | ||||
BNP Paribas | ||||||
5.36%, 05/18/074 | 1,211,804 | 1,211,804 | ||||
Carlyle Loan Investment Ltd. | ||||||
5.38%, 04/13/07 - 07/15/074 | 478,171 | 478,171 | ||||
CC USA Inc. | ||||||
5.48%, 07/30/074 | 327,515 | 327,557 | ||||
Commodore CDO Ltd. | ||||||
5.38%, 06/12/074 | 163,757 | 163,757 | ||||
Credit Agricole SA | ||||||
5.48%, 07/23/07 | 655,029 | 655,029 | ||||
Credit Suisse First Boston NY | ||||||
5.51%, 04/24/07 | 327,515 | 327,529 | ||||
Cullinan Finance Corp. | ||||||
5.36%, 04/25/074 | 163,757 | 163,757 | ||||
DEPFA Bank PLC | ||||||
5.37%, 06/15/07 | 655,029 | 655,029 | ||||
Dorada Finance Inc. | ||||||
5.41% - 5.47%, 06/27/07 - 07/17/074 | 753,283 | 753,331 | ||||
Eli Lilly Services Inc. | ||||||
5.37%, 08/31/074 | 655,029 | 655,029 | ||||
Fifth Third Bancorp | ||||||
5.30%, 09/21/074 | 1,310,058 | 1,310,058 | ||||
Five Finance Inc. | ||||||
5.37% - 5.45%, 12/01/06 - 07/13/074 | 655,029 | 654,979 | ||||
General Electric Capital Corp. | ||||||
5.29% - 5.49%, 07/09/07 - 09/24/07 | 687,780 | 687,941 | ||||
Granite Master Issuer PLC | ||||||
5.30%, 09/20/06 | 2,292,602 | 2,292,602 | ||||
Harrier Finance Funding LLC | ||||||
5.33%, 07/25/074 | 196,509 | 196,545 | ||||
Hartford Life Global Funding Trusts | ||||||
5.35% - 5.55%, 07/13/07 - 09/17/07 | 982,544 | 982,697 | ||||
HBOS Treasury Services PLC | ||||||
5.53%, 07/24/074 | 655,029 | 655,029 | ||||
Holmes Financing PLC | ||||||
5.40%, 07/16/074 | 1,146,301 | 1,146,301 | ||||
JP Morgan Chase & Co. | ||||||
5.36%, 08/02/07 | 491,272 | 491,272 | ||||
K2 USA LLC | ||||||
5.20% - 5.46%, 04/02/07 - 06/28/074 | 491,272 | 491,250 | ||||
Kestrel Funding LLC | ||||||
5.31%, 07/11/074 | 262,012 | 261,988 | ||||
Kommunalkredit Austria AG | ||||||
5.33%, 09/09/074 | 393,017 | 393,017 | ||||
Leafs LLC | ||||||
5.33%, 01/22/07 - 02/20/074 | 683,440 | 683,439 | ||||
Lexington Parker Capital Co. LLC | ||||||
5.46%, 01/10/074 | 818,786 | 818,604 | ||||
Links Finance LLC | ||||||
5.33% - 5.35%, 05/10/07 - 05/16/074 | 720,532 | 720,481 | ||||
Lothian Mortgages Master Issuer PLC | ||||||
5.30%, 04/24/074 | 288,624 | 288,624 | ||||
Marshall & Ilsley Bank | ||||||
5.31%, 09/14/07 | 360,266 | 360,266 | ||||
Metropolitan Life Global Funding I | ||||||
5.42%, 08/06/074 | 982,544 | 982,544 | ||||
Metropolitan Life Insurance Funding Agreement | ||||||
5.57%, 08/01/074,7 | 65,503 | 65,503 | ||||
Monumental Global Funding II | ||||||
5.49%, 12/27/064 | 131,006 | 131,020 | ||||
| 64 | 2006 iSHARES ANNUAL REPORTTO SHAREHOLDERS |
Table of Contents
Schedule of Investments (Continued)
iSHARES® MSCI MEXICO INDEX FUND
August 31, 2006
Security | Principal | Value | |||||
Mound Financing PLC | |||||||
5.39%, 05/08/074 | $ | 615,727 | $ | 615,727 | |||
Natexis Banques Populaires | |||||||
5.31% - 5.40%, 02/05/07 - 09/14/074 | 1,965,087 | 1,965,059 | |||||
National City Bank of Indiana | |||||||
5.37%, 05/21/07 | 327,515 | 327,534 | |||||
Nationwide Building Society | |||||||
5.44% - 5.62%, 07/06/07 - 07/27/074 | 2,161,596 | 2,162,100 | |||||
Newcastle Ltd. | |||||||
5.35%, 04/24/074 | 230,898 | 230,854 | |||||
Northern Rock PLC | |||||||
5.43%, 08/03/074 | 786,035 | 786,053 | |||||
Principal Life Global Funding I | |||||||
5.80%, 02/08/07 | 294,763 | 295,367 | |||||
Sedna Finance Inc. | |||||||
5.30% - 5.37%, 09/20/06 - 08/21/074 | 1,146,301 | 1,146,280 | |||||
Skandinaviska Enskilda Bank NY | |||||||
5.33%, 09/18/074 | 655,029 | 655,029 | |||||
Strips III LLC | |||||||
5.38%, 07/24/074 | 159,276 | 159,276 | |||||
SunTrust Bank | |||||||
5.37%, 05/01/07 | 655,029 | 655,056 | |||||
Tango Finance Corp. | |||||||
5.22% - 5.48%, 04/25/07 - 07/16/074 | 1,598,271 | 1,598,130 | |||||
Union Hamilton Special Funding LLC | |||||||
5.42% - 5.49%, 09/28/06 - 12/21/064 | 917,041 | 917,041 | |||||
US Bank N.A. | |||||||
5.26%, 09/29/06 | 294,763 | 294,757 | |||||
Wachovia Asset Securitization Inc. | |||||||
5.31%, 09/25/064 | 977,442 | 977,442 | |||||
Wachovia Bank N.A. | |||||||
5.36%, 05/22/07 | 1,310,058 | 1,310,058 | |||||
Wells Fargo & Co. | |||||||
5.34%, 09/14/074 | 327,515 | 327,535 | |||||
WhistleJacket Capital Ltd. | |||||||
5.29% - 5.35%, 04/18/07 - 06/13/074 | 491,272 | 491,269 | |||||
White Pine Finance LLC | |||||||
5.29% - 5.35%, 05/22/07 - 08/20/074 | 1,965,087 | 1,964,684 | |||||
Wind Master Trust | |||||||
5.31% - 5.32%, 09/25/06 - 07/25/074 | 415,426 | 415,426 | |||||
| 43,316,391 | |||||||
TOTAL SHORT-TERM INVESTMENTS | 78,664,497 | ||||||
TOTAL INVESTMENTS IN SECURITIES – 110.25% | 842,391,989 | ||||||
Other Assets, Less Liabilities – (10.25)% | (78,284,837 | ) | |||||
NET ASSETS – 100.00% | $ | 764,107,152 | |||||
ADR – American Depositary Receipts
| 1 | Non-income earning security. |
| 2 | All or a portion of this security represents a security on loan. See Note 5. |
| 3 | All or a portion of this security (these securities) represent(s) an investment of securities lending collateral. See Note 5. |
| 4 | This security or a portion of these securities may be resold to qualified institutional buyers under Rule 144A or pursuant to Section 4(2) of the Securities Act of 1933. |
| 5 | Affiliated issuer. See Note 2. |
| 6 | The rate quoted is the annualized seven-day yield of the fund at period end. |
| 7 | The investment adviser has determined that this security or a portion of these securities is illiquid. |
See notes to the financial statements.
| SCHEDULESOF INVESTMENTS | 65 |
Table of Contents
Schedule of Investments
iSHARES® MSCI PACIFIC EX-JAPAN INDEX FUND
August 31, 2006
Security | Shares | Value | |||
COMMON STOCKS – 99.18% | |||||
AUSTRALIA – 66.23% | |||||
ABC Learning Centres Ltd. | 796,059 | $ | 3,945,339 | ||
Alinta Ltd. | 589,885 | 4,964,132 | |||
Alumina Ltd. | 2,597,056 | 12,593,585 | |||
Amcor Ltd. | 1,973,785 | 10,113,855 | |||
AMP Ltd. | 4,214,232 | 29,124,694 | |||
Ansell Ltd. | 370,073 | 2,662,151 | |||
APN News & Media Ltd. | 629,442 | 2,398,560 | |||
Aristocrat Leisure Ltd. | 787,457 | 7,877,574 | |||
Australia & New Zealand Banking Group Ltd. | 4,120,732 | 85,750,218 | |||
Australian Gas Light Co. Ltd. | 1,025,508 | 15,795,716 | |||
Australian Stock Exchange Ltd. | 396,692 | 9,996,817 | |||
AXA Asia Pacific Holdings Ltd. | 1,955,272 | 9,780,090 | |||
Babcock & Brown Ltd. | 466,377 | 7,158,591 | |||
BHP Billiton Ltd. | 7,857,366 | 166,207,688 | |||
Billabong International Ltd. | 365,398 | 4,129,736 | |||
BlueScope Steel Ltd. | 1,560,702 | 8,092,526 | |||
Boral Ltd. | 1,323,025 | 6,870,231 | |||
Brambles Industries Ltd.1 | 2,192,388 | 20,006,894 | |||
Caltex Australia Ltd. | 308,924 | 5,399,975 | |||
Centro Properties Group | 1,844,381 | 10,788,815 | |||
CFS Retail Property Trust | 3,025,660 | 4,390,036 | |||
Challenger Financial Services Group Ltd. | 962,302 | 2,579,365 | |||
Coca-Cola Amatil Ltd. | 1,169,311 | 5,848,786 | |||
Cochlear Ltd. | 124,542 | 4,783,857 | |||
Coles Myer Ltd. | 2,661,945 | 28,438,792 | |||
Commonwealth Bank of Australia | 2,899,061 | 101,218,042 | |||
Commonwealth Property Office Fund | 3,144,779 | 3,410,145 | |||
Computershare Ltd. | 1,002,881 | 5,973,631 | |||
CSL Ltd. | 409,343 | 15,895,445 | |||
CSR Ltd. | 2,065,789 | 4,969,250 | |||
DB RREEF Trust | 6,012,050 | 7,185,075 | |||
Downer EDI Ltd. | 660,297 | 2,838,848 | |||
Foster’s Group Ltd. | 4,543,165 | 20,642,858 | |||
Futuris Corp. Ltd. | 1,319,472 | 2,156,296 | |||
Goodman Fielder Ltd.2 | 2,419,593 | 3,917,171 | |||
GPT Group | 4,350,555 | 15,182,917 | |||
Harvey Norman Holdings Ltd. | 1,211,573 | 3,182,749 | |||
Iluka Resources Ltd. | 572,220 | 3,194,293 | |||
ING Industrial Fund3 | 1,681,130 | 2,914,214 | |||
Insurance Australia Group Ltd. | 3,598,254 | 14,755,722 | |||
Investa Property Group | 3,402,278 | 6,157,614 | |||
James Hardie Industries NV | 1,070,201 | 5,475,635 | |||
John Fairfax Holdings Ltd. | 2,154,614 | 6,647,299 | |||
Leighton Holdings Ltd. | 312,851 | 4,732,781 | |||
Lend Lease Corp. Ltd. | 806,531 | 9,675,905 | |||
Lion Nathan Ltd. | 666,655 | 4,062,547 | |||
Macquarie Airports | 1,523,863 | 3,467,820 | |||
Macquarie Bank Ltd. | 548,284 | 27,131,571 | |||
Macquarie Communications Infrastructure Group | 740,554 | 3,410,110 | |||
Macquarie Goodman Group | 3,050,157 | 14,767,460 | |||
Macquarie Infrastructure Group | 5,574,844 | 13,410,273 | |||
Macquarie Office Trust | 4,299,691 | 4,695,346 | |||
Mayne Pharma Ltd.2 | 1,410,167 | 3,306,003 | |||
Mirvac Group | 1,963,874 | 6,853,686 | |||
Multiplex Group | 1,401,752 | 3,618,114 | |||
National Australia Bank Ltd. | 3,603,864 | 99,955,936 | |||
Newcrest Mining Ltd. | 745,569 | 11,102,399 | |||
OneSteel Ltd. | 1,294,788 | 4,212,138 | |||
Orica Ltd. | 702,933 | 12,061,779 | |||
Origin Energy Ltd. | 1,777,435 | 9,053,446 | |||
Pacific Brands Ltd. | 1,122,374 | 2,074,184 | |||
Paladin Resources Ltd.2 | 972,961 | 3,937,909 | |||
PaperlinX Ltd. | 992,970 | 2,608,489 | |||
Perpetual Ltd. | 93,874 | 5,220,239 | |||
Publishing & Broadcasting Ltd. | 312,851 | 4,386,363 | |||
Qantas Airways Ltd. | 2,140,589 | 5,623,233 | |||
QBE Insurance Group Ltd. | 1,787,159 | 32,563,268 | |||
Rinker Group Ltd. | 2,062,797 | 21,738,518 | |||
Rio Tinto Ltd. | 641,784 | 35,752,675 | |||
Santos Ltd. | 1,336,676 | 11,422,222 | |||
Sonic Healthcare Ltd. | 593,912 | 5,483,310 | |||
Stockland Trust Group | 3,037,254 | 16,792,449 | |||
Suncorp-Metway Ltd. | 1,240,184 | 19,414,863 | |||
Sydney Roads Group2 | 1,808,023 | 1,429,021 | |||
Symbion Health Ltd. | 1,436,721 | 3,565,744 | |||
TABCORP Holdings Ltd. | 1,177,913 | 13,618,631 | |||
Telstra Corp. Ltd.1 | 4,855,642 | 13,348,840 | |||
| 66 | 2006 iSHARES ANNUAL REPORTTO SHAREHOLDERS |
Table of Contents
Schedule of Investments (Continued)
iSHARES® MSCI PACIFIC EX-JAPAN INDEX FUND
August 31, 2006
Security | Shares | Value | |||
Toll Holdings Ltd. | 1,181,582 | $ | 12,894,083 | ||
Transurban Group | 1,792,208 | 9,566,651 | |||
UNiTAB Ltd. | 266,101 | 2,855,073 | |||
Wesfarmers Ltd. | 845,801 | 21,695,644 | |||
Westfield Group | 3,325,982 | 46,403,720 | |||
Westpac Banking Corp. Ltd. | 4,131,765 | 73,737,546 | |||
Woodside Petroleum Ltd. | 1,050,753 | 33,909,742 | |||
Woolworths Ltd. | 2,650,163 | 41,892,597 | |||
WorleyParsons Ltd. | 324,267 | 4,477,087 | |||
Zinifex Ltd. | 1,103,487 | 10,027,866 | |||
| 1,387,372,508 | |||||
HONG KONG – 21.05% | |||||
ASM Pacific Technology Ltd.1 | 467,500 | 2,422,638 | |||
Bank of East Asia Ltd. | 3,216,400 | 14,310,276 | |||
BOC Hong Kong Holdings Ltd. | 8,228,000 | 18,049,916 | |||
Cathay Pacific Airways Ltd. | 2,244,000 | 4,189,781 | |||
Cheung Kong Holdings Ltd. | 3,366,000 | 37,179,979 | |||
Cheung Kong Infrastructure Holdings Ltd. | 935,000 | 2,963,674 | |||
CLP Holdings Ltd. | 4,020,500 | 25,435,895 | |||
Esprit Holdings Ltd. | 2,150,500 | 17,891,452 | |||
Foxconn International Holdings Ltd.2 | 4,675,000 | 12,353,650 | |||
Giordano International Ltd. | 3,366,000 | 1,908,774 | |||
Hang Lung Properties Ltd. | 4,114,736 | 8,772,601 | |||
Hang Seng Bank Ltd. | 1,701,700 | 21,553,663 | |||
Henderson Land Development Co. Ltd. | 1,683,000 | 9,511,409 | |||
Hong Kong & China Gas Co. Ltd. | 8,041,836 | 18,675,611 | |||
Hong Kong Exchanges & Clearing Ltd. | 2,337,500 | 15,870,383 | |||
Hongkong Electric Holdings Ltd. | 3,085,500 | 14,759,456 | |||
Hopewell Holdings Ltd. | 1,496,000 | 4,270,576 | |||
Hutchinson Telecommunications International Ltd.2 | 3,179,000 | 5,608,497 | |||
Hutchison Whampoa Ltd. | 4,862,000 | 44,170,161 | |||
Hysan Development Co. Ltd. | 1,496,000 | 4,058,971 | |||
Kerry Properties Ltd.1 | 1,122,000 | 4,212,865 | |||
Kingboard Chemical Holdings Co. Ltd. | 1,309,000 | 4,224,888 | |||
Li & Fung Ltd. | 4,525,600 | 10,765,886 | |||
Link REIT (The) | 4,675,000 | 9,702,575 | |||
Melco International Development Ltd. | 1,587,000 | 3,824,268 | |||
MTR Corp. Ltd. | 3,085,500 | 7,887,580 | |||
New World Development Co. Ltd. | 5,797,941 | 10,407,851 | |||
Noble Group Ltd.1 | 2,244,000 | 1,541,091 | |||
Orient Overseas International Ltd. | 561,000 | 2,268,743 | |||
PCCW Ltd. | 8,415,845 | 5,270,218 | |||
Shangri-La Asia Ltd. | 2,992,000 | 5,924,943 | |||
Shun Tak Holdings Ltd. | 1,870,000 | 2,272,350 | |||
Sino Land Co. Ltd.1 | 2,992,000 | 5,047,743 | |||
Solomon Systech International Ltd. | 5,984,000 | 1,269,631 | |||
Sun Hung Kai Properties Ltd. | 3,179,000 | 34,664,764 | |||
Swire Pacific Ltd. Class A | 2,150,500 | 23,532,652 | |||
Techtronic Industries Co. Ltd. | 2,524,500 | 3,720,162 | |||
Television Broadcasts Ltd. | 561,000 | 3,184,897 | |||
Texwinca Holdings Ltd. | 1,496,000 | 977,231 | |||
Wharf Holdings Ltd. (The) | 2,805,000 | 9,486,161 | |||
Wing Hang Bank Ltd. | 374,000 | 3,592,478 | |||
Yue Yuen Industrial Holdings Ltd. | 1,122,000 | 3,246,215 | |||
| 440,982,555 | |||||
NEW ZEALAND – 1.79% | |||||
Auckland International Airport Ltd. | 2,219,129 | 2,803,385 | |||
Contact Energy Ltd. | 631,686 | 2,832,270 | |||
Fisher & Paykel Appliances Holdings Ltd. | 561,561 | 1,323,251 | |||
Fisher & Paykel Healthcare Corp. Ltd. | 1,130,789 | 3,005,041 | |||
Fletcher Building Ltd. | 1,061,225 | 6,022,397 | |||
Kiwi Income Property Trust | 1,326,204 | 1,215,294 | |||
Sky City Entertainment Group Ltd. | 967,538 | 3,293,170 | |||
Sky Network Television Ltd. New | 443,196 | 1,621,625 | |||
Telecom Corp. of New Zealand Ltd. | 4,488,000 | 12,279,253 | |||
Tower Ltd.2 | 631,312 | 1,363,643 | |||
Vector Ltd. | 574,519 | 827,313 | |||
Warehouse Group Ltd. (The) | 293,964 | 962,071 | |||
| 37,548,713 | |||||
SINGAPORE – 10.11% | |||||
Allgreen Properties Ltd. | 1,122,000 | 1,041,663 | |||
Ascendas Real Estate Investment Trust | 2,057,000 | 2,694,531 | |||
CapitaLand Ltd. | 2,618,000 | 7,924,253 | |||
| SCHEDULESOF INVESTMENTS | 67 |
Table of Contents
Schedule of Investments (Continued)
iSHARES® MSCI PACIFIC EX-JAPAN INDEX FUND
August 31, 2006
Security | Shares | Value | ||||
CapitaMall Trust Management Ltd.1 | 1,870,000 | $ | 2,806,308 | |||
Chartered Semiconductor Manufacturing Ltd.1,2 | 2,618,000 | 2,130,891 | ||||
City Developments Ltd. | 1,122,000 | 7,027,661 | ||||
ComfortDelGro Corp. Ltd. | 4,114,000 | 3,924,075 | ||||
COSCO Corp. (Singapore) Ltd. | 1,870,000 | 1,819,344 | ||||
Creative Technology Ltd. | 205,700 | 1,347,266 | ||||
DBS Group Holdings Ltd. | 2,431,000 | 27,825,257 | ||||
Fraser and Neave Ltd. | 1,874,150 | 4,743,175 | ||||
Haw Par Corp. Ltd. | 187,397 | 703,067 | ||||
Jardine Cycle & Carriage Ltd. | 374,000 | 2,663,614 | ||||
Keppel Corp. Ltd. | 1,309,000 | 12,485,693 | ||||
Keppel Land Ltd. | 748,000 | 2,111,866 | ||||
Neptune Orient Lines Ltd. | 1,122,000 | 1,376,994 | ||||
Olam International Ltd. | 1,496,000 | 1,522,065 | ||||
Oversea-Chinese Banking Corp. | 5,610,600 | 23,011,808 | ||||
Parkway Holdings Ltd. | 1,371,000 | 2,092,331 | ||||
SembCorp Industries Ltd. | 1,870,240 | 4,138,646 | ||||
SembCorp Marine Ltd. | 1,122,000 | 2,468,600 | ||||
Singapore Airlines Ltd. | 1,309,000 | 10,987,409 | ||||
Singapore Exchange Ltd. | 1,683,000 | 4,259,405 | ||||
Singapore Land Ltd. | 374,000 | 1,664,759 | ||||
Singapore Petroleum Co. Ltd. | 374,000 | 1,151,062 | ||||
Singapore Post Ltd. | 3,366,000 | 2,183,213 | ||||
Singapore Press Holdings Ltd. | 3,366,517 | 8,520,118 | ||||
Singapore Technologies Engineering Ltd. | 2,992,000 | 5,555,539 | ||||
Singapore Telecommunications Ltd. | 15,989,327 | 25,316,943 | ||||
SMRT Corp. Ltd. | 1,496,000 | 1,017,881 | ||||
STATS ChipPAC Ltd.2 | 3,740,000 | 2,402,009 | ||||
Suntec REIT | 1,870,000 | 1,545,848 | ||||
United Overseas Bank Ltd. | 2,618,000 | 25,970,241 | ||||
United Overseas Land Ltd. | 1,194,000 | 2,384,052 | ||||
Want Want Holdings Ltd. | 1,122,000 | 1,683,000 | ||||
Wing Tai Holdings Ltd. | 1,122,333 | 1,298,897 | ||||
| 211,799,484 | ||||||
TOTAL COMMON STOCKS | 2,077,703,260 | |||||
Security | Principal | Value | ||||
SHORT-TERM INVESTMENTS – 2.11% | ||||||
CERTIFICATES OF DEPOSIT4 – 0.09% | ||||||
Credit Suisse First Boston NY | ||||||
5.28% - 5.43%, 04/23/07 - 08/21/07 | $ | 258,749 | $ | 258,749 | ||
Societe Generale | ||||||
5.33%, 12/08/06 | 369,642 | 369,642 | ||||
Washington Mutual Bank | ||||||
5.36%, 11/13/06 | 924,105 | 924,105 | ||||
Wells Fargo Bank N.A. | ||||||
4.78%, 12/05/06 | 295,714 | 295,714 | ||||
| 1,848,210 | ||||||
COMMERCIAL PAPER4 – 0.34% | ||||||
Amstel Funding Corp. | ||||||
5.20%, 11/21/06 - 11/22/065 | 107,854 | 106,588 | ||||
Atlantis One Funding | ||||||
5.30%, 11/14/065 | 507,178 | 501,655 | ||||
Bank of America N.A. | ||||||
5.27%, 09/15/065 | 369,642 | 368,884 | ||||
Barton Capital Corp. | ||||||
5.27%, 09/06/065 | 186,300 | 186,163 | ||||
Cancara Asset Securitisation Ltd. | ||||||
5.30%, 11/14/065 | 187,379 | 185,338 | ||||
CC USA Inc. | ||||||
5.03%, 10/24/065 | 73,928 | 73,381 | ||||
Charta LLC | ||||||
5.30%, 11/06/065 | 369,642 | 366,050 | ||||
Concord Minutemen Capital Co. LLC | ||||||
5.27% - 5.29%, 09/13/06 - 11/16/065 | 649,206 | 646,326 | ||||
Curzon Funding LLC | ||||||
5.29%, 11/17/065 | 369,642 | 365,460 | ||||
Edison Asset Securitization LLC | ||||||
5.22%, 12/11/065 | 272,692 | 268,699 | ||||
Falcon Asset Securitization Corp. | ||||||
5.30%, 11/06/065 | 369,642 | 366,050 | ||||
Five Finance Inc. | ||||||
5.19%, 12/01/065 | 166,339 | 164,157 | ||||
General Electric Capital Services Inc. | ||||||
5.22%, 12/11/06 | 36,964 | 36,423 | ||||
| 68 | 2006 iSHARES ANNUAL REPORTTO SHAREHOLDERS |
Table of Contents
Schedule of Investments (Continued)
iSHARES® MSCI PACIFIC EX-JAPAN INDEX FUND
August 31, 2006
Security | Principal | Value | ||||
Giro Funding Corp. | ||||||
5.28% - 5.34%, 09/11/06 - 10/10/065 | $ | 369,642 | $ | 368,303 | ||
Grampian Funding LLC | ||||||
5.03% - 5.30%, 10/17/06 - 11/16/065 | 177,428 | 175,965 | ||||
KKR Pacific Funding Trust | ||||||
5.29%, 09/14/065 | 369,642 | 368,936 | ||||
Landale Funding LLC | ||||||
5.31%, 11/15/065 | 288,321 | 285,134 | ||||
Lexington Parker Capital Co. LLC | ||||||
5.19% - 5.27%, 09/15/06 - 11/15/065 | 479,137 | 476,388 | ||||
Liberty Street Funding Corp. | ||||||
5.27%, 09/08/06 - 09/11/065 | 328,981 | 328,581 | ||||
Mont Blanc Capital Corp. | ||||||
5.29%, 11/15/065 | 238,419 | 235,791 | ||||
Monument Gardens Funding LLC | ||||||
5.28%, 09/21/065 | 185,756 | 185,211 | ||||
Nestle Capital Corp. | ||||||
5.19%, 08/09/07 | 221,785 | 210,850 | ||||
Park Granada LLC | ||||||
5.30%, 09/01/065 | 84,471 | 84,471 | ||||
Regency Markets LLC | ||||||
5.28%, 09/15/06 | 184,821 | 184,442 | ||||
Solitaire Funding Ltd. | ||||||
5.27%, 09/05/065 | 277,231 | 277,069 | ||||
Sydney Capital Corp. | ||||||
5.27%, 09/12/065 | 84,574 | 84,438 | ||||
Tulip Funding Corp. | ||||||
5.29%, 11/15/065 | 194,957 | 192,808 | ||||
White Pine Finance LLC | ||||||
5.12%, 10/27/065 | 69,862 | 69,306 | ||||
| 7,162,867 | ||||||
MEDIUM-TERM NOTES4 – 0.07% | ||||||
Bank of America N.A. | ||||||
5.28%, 04/20/07 | 92,410 | 92,410 | ||||
Cullinan Finance Corp. | ||||||
5.71%, 06/28/075 | 277,231 | 277,231 | ||||
K2 USA LLC | ||||||
5.39%, 06/04/075 | 277,231 | 277,231 | ||||
Security | Shares or Principal | Value | ||||
Marshall & Ilsley Bank | ||||||
5.18%, 12/15/06 | $ | 369,642 | $ | 370,008 | ||
Sigma Finance Inc. | ||||||
5.13% - 5.51%, 03/30/07 - 06/18/075 | 432,481 | 432,481 | ||||
US Bank N.A. | ||||||
2.85%, 11/15/06 | 73,928 | 73,649 | ||||
| 1,523,010 | ||||||
MONEY MARKET FUNDS – 0.01% | ||||||
Barclays Global Investors Funds Institutional Money Market Fund, Institutional Shares 5.30%6,7 | 177,436 | 177,436 | ||||
| 177,436 | ||||||
REPURCHASE AGREEMENTS4 – 0.43% | ||||||
Banc of America Securities LLC Repurchase Agreement, 5.30%, due 9/1/06, maturity value $462,120 (collateralized by U.S. Government obligations, value $471,741, 5.50% to 6.50%, 1/1/33 to 7/1/36). | $ | 462,052 | 462,052 | |||
Banc of America Securities LLC Repurchase Agreement, 5.36%, due 9/1/06, maturity value $739,394 (collateralized by non-U.S. Government debt securities, value $762,185, 3.80% to 9.13%, 11/1/06 to 6/15/26). | 739,284 | 739,284 | ||||
Bear Stearns Companies Inc. (The) Repurchase Agreement, 5.37%, due 9/1/06, maturity value $554,546 (collateralized by non-U.S. Government debt securities, value $610,498, 0.08% to 6.43%, 9/25/20 to 7/25/36). | 554,463 | 554,463 | ||||
| SCHEDULESOF INVESTMENTS | 69 |
Table of Contents
Schedule of Investments (Continued)
iSHARES® MSCI PACIFIC EX-JAPAN INDEX FUND
August 31, 2006
Security | Principal | Value | ||||
Citigroup Global Markets Holdings Inc. Repurchase Agreement, 5.36%, due 9/1/06, maturity value $1,109,091 (collateralized by non-U.S. Government debt securities, value $1,158,750, 4.35% to 7.50%, 9/15/08 to 8/25/35). | $ | 1,108,926 | $ | 1,108,926 | ||
Citigroup Global Markets Holdings Inc. Repurchase Agreement, 5.46%, due 9/1/06, maturity value $221,819 (collateralized by non-U.S. Government debt securities, value $270,740, 0.00% to 10.00%, 6/1/28 to 8/24/36). | 221,785 | 221,785 | ||||
Goldman Sachs & Co. Repurchase Agreement, 5.35%, due 9/1/06, maturity value $739,394 (collateralized by non-U.S. Government debt securities, value $754,785, 0.00% to 8.57%, 11/15/06 to 2/15/38). | 739,284 | 739,284 | ||||
Goldman Sachs Group Inc. Repurchase Agreement, 5.36%, due 9/1/06, maturity value $369,697 (collateralized by non-U.S. Government debt securities, value $388,492, 5.36% to 9.01%, 10/27/10 to 2/18/20). | 369,642 | 369,642 | ||||
JP Morgan Securities Inc. Repurchase Agreement, 5.41%, due 9/1/06, maturity value $92,424 (collateralized by non-U.S. Government debt securities, value $97,126, 6.63% to 10.50%, 1/15/07 to 4/15/16). | 92,410 | 92,410 | ||||
Lehman Brothers Holdings Inc. Repurchase Agreement, 5.36%, due 9/1/06, maturity value $739,394 (collateralized by non-U.S. Government debt securities, value $776,988, 0.51% to 8.89%, 8/5/18 to 9/25/46). | 739,284 | 739,284 | ||||
Lehman Brothers Holdings Inc. Repurchase Agreement, 5.38%, due 9/1/06, maturity value $369,697 (collateralized by non-U.S. Government debt securities, value $388,504, 4.11% to 9.79%, 4/28/31 to 9/25/46). | 369,642 | 369,642 | ||||
Lehman Brothers Holdings Inc. Repurchase Agreement, 5.46%, due 9/1/06, maturity value $406,668 (collateralized by non-U.S. Government debt securities, value $427,342, 3.44% to 15.15%, 12/1/08 to 3/1/36). | 406,606 | 406,606 | ||||
Merrill Lynch & Co. Inc. Repurchase Agreement, 5.33%, due 9/1/06, maturity value $739,393 (collateralized by non-U.S. Government debt securities, value $776,999, 6.38% to 10.25%, 5/1/07 to 10/15/16). | 739,284 | 739,284 | ||||
Merrill Lynch & Co. Inc. Repurchase Agreement, 5.36%, due 9/1/06, maturity value $739,394 (collateralized by non-U.S. Government debt securities, value $762,323, 0.00% to 10.13%, 10/15/06 to 7/1/26). | 739,284 | 739,284 | ||||
| 70 | 2006 iSHARES ANNUAL REPORTTO SHAREHOLDERS |
Table of Contents
Schedule of Investments (Continued)
iSHARES® MSCI PACIFIC EX-JAPAN INDEX FUND
August 31, 2006
Security | Principal | Value | ||||
Morgan Stanley Repurchase Agreement, 5.36%, due 9/1/06, maturity value $369,697 (collateralized by non-U.S. Government debt securities, value $388,672, 4.05% to 7.24%, 6/20/29 to 1/14/41). | $ | 369,642 | $ | 369,642 | ||
Morgan Stanley Repurchase Agreement, 5.46%, due 9/1/06, maturity value $129,395 (collateralized by non-U.S. Government debt securities, value $198,409, 0.00% to 10.00%, 9/1/06 to 8/31/36). | 129,375 | 129,375 | ||||
Morgan Stanley Repurchase Agreement, 5.51%, due 6/4/07, maturity value $269,719 (collateralized by non-U.S. Government debt securities, value $402,830, 0.00% to 10.00%, 9/1/06 to 8/31/36).8 | 258,749 | 258,749 | ||||
Wachovia Capital Repurchase Agreement, 5.38%, due 9/1/06, maturity value $961,213 (collateralized by non-U.S. Government debt securities, value $1,010,080, 0.06% to 7.68%, 10/15/11 to 3/15/45). | 961,069 | 961,069 | ||||
| 9,000,781 | ||||||
TIME DEPOSITS4 – 0.00% | ||||||
KBC Bank | ||||||
5.31%, 09/01/06 | 77,998 | 77,998 | ||||
| 77,998 | ||||||
VARIABLE & FLOATING RATE NOTES4 – 1.17% | ||||||
Allstate Life Global Funding II | ||||||
5.34% - 5.47%, 09/04/07 - 09/27/075 | 946,283 | 946,405 | ||||
American Express Bank | ||||||
5.30%, 02/28/07 | 369,642 | 369,641 | ||||
American Express Centurion Bank | ||||||
5.42%, 07/19/07 | 406,606 | 407,018 | ||||
American Express Credit Corp. | ||||||
5.51%, 07/05/07 | 110,893 | 110,954 | ||||
ASIF Global Financing | ||||||
5.51%, 05/03/075 | 36,964 | 36,978 | ||||
Australia & New Zealand Banking Group Ltd. | ||||||
5.32%, 09/21/075 | 240,267 | 240,267 | ||||
Bank of Ireland | ||||||
5.30% - 5.31%, 08/14/07 - 08/20/075 | 535,981 | 536,003 | ||||
Beta Finance Inc. | ||||||
5.29% - 5.48%, 04/25/07 - 07/25/075 | 942,587 | 942,635 | ||||
BMW US Capital LLC | ||||||
5.33%, 09/14/075 | 369,642 | 369,642 | ||||
BNP Paribas | ||||||
5.36%, 05/18/075 | 683,838 | 683,838 | ||||
Carlyle Loan Investment Ltd. | ||||||
5.38%, 04/13/07 - 07/15/075 | 269,839 | 269,838 | ||||
CC USA Inc. | ||||||
5.48%, 07/30/075 | 184,821 | 184,845 | ||||
Commodore CDO Ltd. | ||||||
5.38%, 06/12/075 | 92,410 | 92,410 | ||||
Credit Agricole SA | ||||||
5.48%, 07/23/07 | 369,642 | 369,642 | ||||
Credit Suisse First Boston NY | ||||||
5.51%, 04/24/07 | 184,821 | 184,829 | ||||
Cullinan Finance Corp. | ||||||
5.36%, 04/25/075 | 92,410 | 92,410 | ||||
DEPFA Bank PLC | ||||||
5.37%, 06/15/07 | 369,642 | 369,642 | ||||
Dorada Finance Inc. | ||||||
5.41% - 5.47%, 06/27/07 - 07/17/075 | 425,088 | 425,115 | ||||
Eli Lilly Services Inc. | ||||||
5.37%, 08/31/075 | 369,642 | 369,642 | ||||
| SCHEDULESOF INVESTMENTS | 71 |
Table of Contents
Schedule of Investments (Continued)
iSHARES® MSCI PACIFIC EX-JAPAN INDEX FUND
August 31, 2006
Security | Principal | Value | ||||
Fifth Third Bancorp | ||||||
5.30%, 09/21/075 | $ | 739,284 | $ | 739,284 | ||
Five Finance Inc. | ||||||
5.37% - 5.45%, 12/01/06 - 07/13/075 | 369,642 | 369,614 | ||||
General Electric Capital Corp. | ||||||
5.29% - 5.49%, 07/09/07 - 09/24/07 | 388,124 | 388,215 | ||||
Granite Master Issuer PLC | ||||||
5.30%, 09/20/06 | 1,293,747 | 1,293,747 | ||||
Harrier Finance Funding LLC | ||||||
5.33%, 07/25/075 | 110,893 | 110,913 | ||||
Hartford Life Global Funding Trusts | ||||||
5.35% - 5.55%, 07/13/07 - 09/17/07 | 554,463 | 554,550 | ||||
HBOS Treasury Services PLC | ||||||
5.53%, 07/24/075 | 369,642 | 369,642 | ||||
Holmes Financing PLC | ||||||
5.40%, 07/16/075 | 646,873 | 646,873 | ||||
JP Morgan Chase & Co. | ||||||
5.36%, 08/02/07 | 277,231 | 277,231 | ||||
K2 USA LLC | ||||||
5.20% - 5.46%, 04/02/07 - 06/28/075 | 277,231 | 277,220 | ||||
Kestrel Funding LLC | ||||||
5.31%, 07/11/075 | 147,857 | 147,843 | ||||
Kommunalkredit Austria AG | ||||||
5.33%, 09/09/075 | 221,785 | 221,785 | ||||
Leafs LLC | ||||||
5.33%, 01/22/07 - 02/20/075 | 385,675 | 385,675 | ||||
Lexington Parker Capital Co. LLC | ||||||
5.46%, 01/10/075 | 462,052 | 461,949 | ||||
Links Finance LLC | ||||||
5.33% - 5.35%, 05/10/07 - 05/16/075 | 406,606 | 406,577 | ||||
Lothian Mortgages Master Issuer PLC | ||||||
5.30%, 04/24/075 | 162,874 | 162,874 | ||||
Marshall & Ilsley Bank | ||||||
5.31%, 09/14/07 | 203,303 | 203,303 | ||||
Metropolitan Life Global Funding I | ||||||
5.42%, 08/06/075 | 554,463 | 554,463 | ||||
Metropolitan Life Insurance Funding Agreement | ||||||
5.57%, 08/01/075,8 | 36,964 | 36,964 | ||||
Monumental Global Funding II | ||||||
5.49%, 12/27/065 | 73,928 | 73,936 | ||||
Mound Financing PLC | ||||||
5.39%, 05/08/075 | 347,463 | 347,463 | ||||
Natexis Banques Populaires | ||||||
5.31% - 5.40%, 02/05/07 - 09/14/075 | 1,108,926 | 1,108,908 | ||||
National City Bank of Indiana | ||||||
5.37%, 05/21/07 | 184,821 | 184,832 | ||||
Nationwide Building Society | ||||||
5.44% - 5.62%, 07/06/07 - 07/27/075 | 1,219,818 | 1,220,103 | ||||
Newcastle Ltd. | ||||||
5.35%, 04/24/075 | 130,299 | 130,274 | ||||
Northern Rock PLC | ||||||
5.43%, 08/03/075 | 443,570 | 443,581 | ||||
Principal Life Global Funding I | ||||||
5.80%, 02/08/07 | 166,339 | 166,680 | ||||
Sedna Finance Inc. | ||||||
5.30% - 5.37%, 09/20/06 - 08/21/075 | 646,873 | 646,862 | ||||
Skandinaviska Enskilda Bank NY | ||||||
5.33%, 09/18/075 | 369,642 | 369,642 | ||||
Strips III LLC | ||||||
5.38%, 07/24/075 | 89,881 | 89,881 | ||||
SunTrust Bank | ||||||
5.37%, 05/01/07 | 369,642 | 369,657 | ||||
Tango Finance Corp. | ||||||
5.22% - 5.48%, 04/25/07 - 07/16/075 | 901,926 | 901,846 | ||||
Union Hamilton Special Funding LLC | ||||||
5.42% - 5.49%, 09/28/06 - 12/21/065 | 517,499 | 517,499 | ||||
US Bank N.A. | ||||||
5.26%, 09/29/06 | 166,339 | 166,336 | ||||
Wachovia Asset Securitization Inc. | ||||||
5.31%, 09/25/065 | 551,584 | 551,584 | ||||
| 72 | 2006 iSHARES ANNUAL REPORTTO SHAREHOLDERS |
Table of Contents
Schedule of Investments (Continued)
iSHARES® MSCI PACIFIC EX-JAPAN INDEX FUND
August 31, 2006
Security | Principal | Value | |||||
Wachovia Bank N.A. | |||||||
5.36%, 05/22/07 | $ | 739,284 | $ | 739,284 | |||
Wells Fargo & Co. | |||||||
5.34%, 09/14/075 | 184,821 | 184,832 | |||||
WhistleJacket Capital Ltd. | |||||||
5.29% - 5.35%, 04/18/07 - 06/13/075 | 277,231 | 277,230 | |||||
White Pine Finance LLC | |||||||
5.29% - 5.35%, 05/22/07 - 08/20/075 | 1,108,926 | 1,108,698 | |||||
Wind Master Trust | |||||||
5.31% - 5.32%, 09/25/06 - 07/25/075 | 234,431 | 234,431 | |||||
| 24,444,035 | |||||||
TOTAL SHORT-TERM INVESTMENTS | 44,234,337 | ||||||
TOTAL INVESTMENTS IN SECURITIES – 101.29% | 2,121,937,597 | ||||||
Other Assets, Less Liabilities – (1.29)% | (27,006,675 | ) | |||||
NET ASSETS – 100.00% | $ | 2,094,930,922 | |||||
| 1 | All or a portion of this security represents a security on loan. See Note 5. |
| 2 | Non-income earning security. |
| 3 | Security valued at fair value in accordance with procedures approved by the Board of Directors. See Note 1. |
| 4 | All or a portion of this security (these securities) represent(s) an investment of securities lending collateral. See Note 5. |
| 5 | This security or a portion of these securities may be resold to qualified institutional buyers under Rule 144A or pursuant to Section 4(2) of the Securities Act of 1933. |
| 6 | Affiliated issuer. See Note 2. |
| 7 | The rate quoted is the annualized seven-day yield of the fund at period end. |
| 8 | The investment adviser has determined that this security or a portion of these securities is illiquid. |
See notes to the financial statements.
| SCHEDULESOF INVESTMENTS | 73 |
Table of Contents
Schedule of Investments
iSHARES® MSCI SINGAPORE INDEX FUND
August 31, 2006
Security | Shares | Value | |||
COMMON STOCKS – 98.53% | |||||
AIRLINES – 4.68% | |||||
Singapore Airlines Ltd. | 3,202,000 | $ | 26,876,765 | ||
| 26,876,765 | |||||
BANKS – 35.70% | |||||
DBS Group Holdings Ltd. | 6,707,000 | 76,768,409 | |||
Oversea-Chinese Banking Corp. | 14,513,000 | 59,524,895 | |||
United Overseas Bank Ltd. | 6,941,000 | 68,853,873 | |||
| 205,147,177 | |||||
BEVERAGES – 2.78% | |||||
Fraser and Neave Ltd. | 6,310,000 | 15,969,605 | |||
| 15,969,605 | |||||
COMPUTERS – 0.39% | |||||
Creative Technology Ltd.1 | 347,050 | 2,273,060 | |||
| 2,273,060 | |||||
DISTRIBUTION & WHOLESALE – 0.86% | |||||
Jardine Cycle & Carriage Ltd. | 694,000 | 4,942,643 | |||
| 4,942,643 | |||||
DIVERSIFIED FINANCIAL SERVICES – 2.00% | |||||
Singapore Exchange Ltd. | 4,546,000 | 11,505,202 | |||
| 11,505,202 | |||||
ELECTRONICS – 1.77% | |||||
Venture Corp. Ltd. | 1,382,000 | 10,194,074 | |||
| 10,194,074 | |||||
ENGINEERING & CONSTRUCTION – 4.39% | |||||
SembCorp Industries Ltd. | 5,048,000 | 11,170,698 | |||
Singapore Technologies Engineering Ltd. | 7,572,000 | 14,059,672 | |||
| 25,230,370 | |||||
FOOD – 1.34% | |||||
Olam International Ltd. | 3,786,000 | 3,851,965 | |||
Want Want Holdings Ltd. | 2,570,000 | 3,855,000 | |||
| 7,706,965 | |||||
HEALTH CARE – SERVICES – 0.84% | |||||
Parkway Holdings Ltd. | 3,155,000 | 4,814,956 | |||
| 4,814,956 | |||||
HOLDING COMPANIES – DIVERSIFIED – 5.84% | |||||
Haw Par Corp. Ltd. | 631,000 | 2,367,353 | |||
Keppel Corp. Ltd. | 2,862,000 | 27,298,741 | |||
Noble Group Ltd.1 | 5,679,000 | 3,900,114 | |||
| 33,566,208 | |||||
MEDIA – 4.17% | |||||
Singapore Press Holdings Ltd. | 9,465,000 | 23,954,407 | |||
| 23,954,407 | |||||
OIL & GAS – 0.34% | |||||
Singapore Petroleum Co. Ltd. | 631,000 | 1,942,032 | |||
| 1,942,032 | |||||
REAL ESTATE – 11.01% | |||||
Allgreen Properties Ltd.1 | 2,524,000 | 2,343,279 | |||
CapitaLand Ltd. | 7,304,000 | 22,107,999 | |||
City Developments Ltd. | 2,929,000 | 18,345,829 | |||
Keppel Land Ltd.1 | 1,994,000 | 5,629,760 | |||
Singapore Land Ltd. | 1,262,000 | 5,617,449 | |||
UOL Group Ltd. | 3,155,000 | 6,299,568 | |||
Wing Tai Holdings Ltd. | 2,524,000 | 2,921,073 | |||
| 63,264,957 | |||||
REAL ESTATE INVESTMENT TRUSTS – 3.34% | |||||
Ascendas Real Estate Investment Trust | 5,679,000 | 7,439,107 | |||
CapitaMall Trust Management Ltd.1 | 5,048,000 | 7,575,531 | |||
Suntec REIT | 5,048,000 | 4,172,962 | |||
| 19,187,600 | |||||
SEMICONDUCTORS – 1.74% | |||||
Chartered Semiconductor Manufacturing Ltd.1,2 | 6,310,000 | 5,135,953 | |||
STATS ChipPAC Ltd.2 | 7,572,000 | 4,863,106 | |||
| 9,999,059 | |||||
SHIPBUILDING – 1.21% | |||||
SembCorp Marine Ltd. | 3,155,000 | 6,941,562 | |||
| 6,941,562 | |||||
TELECOMMUNICATIONS – 11.73% | |||||
Singapore Telecommunications Ltd. | 42,561,567 | 67,390,501 | |||
| 67,390,501 | |||||
TRANSPORTATION – 4.40% | |||||
ComfortDelGro Corp. Ltd. | 10,096,000 | 9,629,912 | |||
COSCO Corp. (Singapore) Ltd. | 4,417,000 | 4,297,348 | |||
Neptune Orient Lines Ltd. | 3,155,000 | 3,872,027 | |||
| 74 | 2006 iSHARES ANNUAL REPORTTO SHAREHOLDERS |
Table of Contents
Schedule of Investments (Continued)
iSHARES® MSCI SINGAPORE INDEX FUND
August 31, 2006
Security | Shares or Principal | Value | ||||
Singapore Post Ltd. | 87,572,000 | $ | 4,911,255 | |||
SMRT Corp. Ltd. | 3,786,000 | 2,576,001 | ||||
| 25,286,543 | ||||||
TOTAL COMMON STOCKS | 566,193,686 | |||||
SHORT-TERM INVESTMENTS – 1.63% | ||||||
CERTIFICATES OF DEPOSIT3 – 0.07% | ||||||
Credit Suisse First Boston NY | ||||||
5.28% - 5.43%, 04/23/07 - 08/21/07 | $ | 53,012 | 53,012 | |||
Societe Generale | ||||||
5.33%, 12/08/06 | 75,731 | 75,731 | ||||
Washington Mutual Bank | ||||||
5.36%, 11/13/06 | 189,328 | 189,328 | ||||
Wells Fargo Bank N.A. | ||||||
4.78%, 12/05/06 | 60,585 | 60,585 | ||||
| 378,656 | ||||||
COMMERCIAL PAPER3 – 0.26% | ||||||
Amstel Funding Corp. | ||||||
5.20%, 11/21/06 - 11/22/064 | 22,097 | 21,843 | ||||
Amsterdam Funding Corp. | ||||||
5.27%, 09/15/064 | 75,731 | 75,576 | ||||
Atlantis One Funding | ||||||
5.30%, 11/14/064 | 103,909 | 102,777 | ||||
Barton Capital Corp. | ||||||
5.27%, 09/06/064 | 38,169 | 38,141 | ||||
Cancara Asset Securitisation Ltd. | ||||||
5.30%, 11/14/064 | 38,390 | 37,971 | ||||
CC USA Inc. | ||||||
5.03%, 10/24/064 | 15,146 | 15,034 | ||||
Charta LLC | ||||||
5.30%, 11/06/064 | 75,731 | 74,995 | ||||
Concord Minutemen Capital Co. LLC | ||||||
5.27% - 5.29%, 09/13/06 - 11/16/064 | 133,007 | 132,418 | ||||
Curzon Funding LLC | ||||||
5.29%, 11/17/064 | 75,731 | 74,874 | ||||
Edison Asset Securitization LLC | ||||||
5.22%, 12/11/064 | 55,868 | 55,050 | ||||
Security | Principal | Value | ||||
Falcon Asset Securitization Corp. | ||||||
5.30%, 11/06/064 | $ | 75,731 | $ | 74,995 | ||
Five Finance Inc. | ||||||
5.19%, 12/01/064 | 34,079 | 33,632 | ||||
General Electric Capital Services Inc. | ||||||
5.22%, 12/11/06 | 7,573 | 7,462 | ||||
Giro Funding Corp. | ||||||
5.28% - 5.34%, 09/11/06 - 10/10/064 | 75,731 | 75,457 | ||||
Grampian Funding LLC | ||||||
5.03% - 5.30%, 10/17/06 - 11/16/064 | 36,351 | 36,052 | ||||
KKR Pacific Funding Trust | ||||||
5.29%, 09/14/064 | 75,731 | 75,586 | ||||
Landale Funding LLC | ||||||
5.31%, 11/15/064 | 59,070 | 58,417 | ||||
Lexington Parker Capital Co. LLC | ||||||
5.19% - 5.27%, 09/15/06 - 11/15/064 | 98,164 | 97,601 | ||||
Liberty Street Funding Corp. | ||||||
5.27%, 09/08/06 - 09/11/064 | 67,401 | 67,319 | ||||
Mont Blanc Capital Corp. | ||||||
5.29%, 11/15/064 | 48,847 | 48,308 | ||||
Monument Gardens Funding LLC | ||||||
5.28%, 09/21/064 | 38,057 | 37,946 | ||||
Nestle Capital Corp. | ||||||
5.19%, 08/09/07 | 45,439 | 43,198 | ||||
Park Granada LLC | ||||||
5.30%, 09/01/064 | 17,306 | 17,306 | ||||
Regency Markets LLC | ||||||
5.28%, 09/15/06 | 37,866 | 37,788 | ||||
Solitaire Funding Ltd. | ||||||
5.27%, 09/05/064 | 56,798 | 56,765 | ||||
Sydney Capital Corp. | ||||||
5.27%, 09/12/064 | 17,327 | 17,299 | ||||
Tulip Funding Corp. | ||||||
5.29%, 11/15/064 | 39,942 | 39,502 | ||||
| SCHEDULESOF INVESTMENTS | 75 |
Table of Contents
Schedule of Investments (Continued)
iSHARES® MSCI SINGAPORE INDEX FUND
August 31, 2006
Security | Shares or Principal | Value | ||||
White Pine Finance LLC | ||||||
5.12%, 10/27/064 | $ | 14,313 | $ | 14,199 | ||
| 1,467,511 | ||||||
MEDIUM-TERM NOTES3 – 0.05% | ||||||
Bank of America N.A. | ||||||
5.28%, 04/20/07 | 18,933 | 18,933 | ||||
Cullinan Finance Corp. | ||||||
5.71%, 06/28/074 | 56,798 | 56,798 | ||||
K2 USA LLC | ||||||
5.39%, 06/04/074 | 56,798 | 56,798 | ||||
Marshall & Ilsley Bank | ||||||
5.18%, 12/15/06 | 75,731 | 75,806 | ||||
Sigma Finance Inc. | ||||||
5.13% - 5.51%, 03/30/07 - 06/18/074 | 88,605 | 88,606 | ||||
US Bank N.A. | ||||||
2.85%, 11/15/06 | 15,146 | 15,089 | ||||
| 312,030 | ||||||
MONEY MARKET FUNDS – 0.06% | ||||||
Barclays Global Investors Funds Institutional Money Market Fund, Institutional Shares | ||||||
5.30%5,6 | 345,991 | 345,991 | ||||
| 345,991 | ||||||
REPURCHASE AGREEMENTS3 – 0.32% | ||||||
Banc of America Securities LLC Repurchase Agreement, 5.30%, due 9/1/06, maturity value $94,678 (collateralized by U.S. Government obligations, value $96,649, 5.50% to 6.50%, 1/1/33 to 7/1/36). | $ | 94,664 | 94,664 | |||
Banc of America Securities LLC Repurchase Agreement, 5.36%, due 9/1/06, maturity value $151,485 (collateralized by non-U.S. Government debt securities, value $156,154, 3.80% to 9.13%, 11/1/06 to 6/15/26). | 151,462 | 151,462 | ||||
Security | Principal | Value | ||||
Bear Stearns Companies Inc. (The) Repurchase Agreement, 5.37%, due 9/1/06, maturity value $113,614 (collateralized by non-U.S. Government debt securities, value $125,077, 0.08% to 6.43%, 9/25/20 to 7/25/36). | $ | 113,597 | $ | 113,597 | ||
Citigroup Global Markets Holdings Inc. Repurchase Agreement, 5.36%, due 9/1/06, maturity value $227,227 (collateralized by non-U.S. Government debt securities, value $237,401, 4.35% to 7.50%, 9/15/08 to 8/25/35). | 227,193 | 227,193 | ||||
Citigroup Global Markets Holdings Inc. Repurchase Agreement, 5.46%, due 9/1/06, maturity value $45,446 (collateralized by non-U.S. Government debt securities, value $55,468, 0.00% to 10.00%, 6/1/28 to 8/24/36). | 45,439 | 45,439 | ||||
Goldman Sachs & Co. Repurchase Agreement, 5.35%, due 9/1/06, maturity value $151,485 (collateralized by non-U.S. Government debt securities, value $154,638, 0.00% to 8.57%, 11/15/06 to 2/15/38). | 151,462 | 151,462 | ||||
Goldman Sachs Group Inc. Repurchase Agreement, 5.36%, due 9/1/06, maturity value $75,742 (collateralized by non-U.S. Government debt securities, value $79,593, 5.36% to 9.01%, 10/27/10 to 2/18/20). | 75,731 | 75,731 | ||||
| 76 | 2006 iSHARES ANNUAL REPORTTO SHAREHOLDERS |
Table of Contents
Schedule of Investments (Continued)
iSHARES® MSCI SINGAPORE INDEX FUND
August 31, 2006
Security | Principal | Value | ||||
JP Morgan Securities Inc. Repurchase Agreement, 5.41%, due 9/1/06, maturity value $18,936 (collateralized by non-U.S. Government debt securities, value $19,899, 6.63% to 10.50%, 1/15/07 to 4/15/16). | $ | 18,933 | $ | 18,933 | ||
Lehman Brothers Holdings Inc. Repurchase Agreement, 5.36%, due 9/1/06, maturity value $151,485 (collateralized by non-U.S. Government debt securities, value $159,187, 0.51% to 8.89%, 8/5/18 to 9/25/46). | 151,462 | 151,462 | ||||
Lehman Brothers Holdings Inc. Repurchase Agreement, 5.38%, due 9/1/06, maturity value $75,742 (collateralized by non-U.S. Government debt securities, value $79,595, 4.11% to 9.79%, 4/28/31 to 9/25/46). | 75,731 | 75,731 | ||||
Lehman Brothers Holdings Inc. Repurchase Agreement, 5.46%, due 9/1/06, maturity value $83,317 (collateralized by non-U.S. Government debt securities, value $87,553, 3.44% to 15.15%, 12/1/08 to 3/1/36). | 83,304 | 83,304 | ||||
Merrill Lynch & Co. Inc. Repurchase Agreement, 5.33%, due 9/1/06, maturity value $151,485 (collateralized by non-U.S. Government debt securities, value $159,189, 6.38% to 10.25%, 5/1/07 to 10/15/16). | 151,463 | 151,463 | ||||
Merrill Lynch & Co. Inc. Repurchase Agreement, 5.36%, due 9/1/06, maturity value $151,485 (collateralized by non-U.S. Government debt securities, value $156,183, 0.00% to 10.13%, 10/15/06 to 7/1/26). | 151,462 | 151,462 | ||||
Morgan Stanley Repurchase Agreement, 5.36%, due 9/1/06, maturity value $75,742 (collateralized by non-U.S. Government debt securities, value $79,630, 4.05% to 7.24%, 6/20/29 to 1/14/41). | 75,731 | 75,731 | ||||
Morgan Stanley Repurchase Agreement, 5.46%, due 9/1/06, maturity value $26,510 (collateralized by non-U.S. Government debt securities, value $40,649, 0.00% to 10.00%, 9/1/06 to 8/31/36). | 26,506 | 26,506 | ||||
Morgan Stanley Repurchase Agreement, 5.51%, due 6/4/07, maturity value $55,260 (collateralized by non-U.S. Government debt securities, value $82,531, 0.00% to 10.00%, 9/1/06 to 8/31/36).7 | 53,012 | 53,012 | ||||
Wachovia Capital Repurchase Agreement, 5.38%, due 9/1/06, maturity value $196,930 (collateralized by non-U.S. Government debt securities, value $206,942, 0.06% to 7.68%, 10/15/11 to 3/15/45). | 196,901 | 196,901 | ||||
| 1,844,053 | ||||||
| SCHEDULESOF INVESTMENTS | 77 |
Table of Contents
Schedule of Investments (Continued)
iSHARES® MSCI SINGAPORE INDEX FUND
August 31, 2006
Security | Principal | Value | ||||
TIME DEPOSITS3 – 0.00% | ||||||
KBC Bank | ||||||
5.31%, 09/01/06 | $ | 15,980 | $ | 15,980 | ||
| 15,980 | ||||||
VARIABLE & FLOATING RATE NOTES3 – 0.87% | ||||||
Allstate Life Global Funding II | ||||||
5.34% - 5.47%, 09/04/07 - 09/27/074 | 193,872 | 193,896 | ||||
American Express Bank | ||||||
5.30%, 02/28/07 | 75,731 | 75,731 | ||||
American Express Centurion Bank | ||||||
5.42%, 07/19/07 | 83,304 | 83,389 | ||||
American Express Credit Corp. | ||||||
5.51%, 07/05/07 | 22,719 | 22,732 | ||||
ASIF Global Financing | ||||||
5.51%, 05/03/074 | 7,573 | 7,576 | ||||
Australia & New Zealand Banking Group Ltd. | ||||||
5.32%, 09/21/074 | 49,225 | 49,225 | ||||
Bank of Ireland | ||||||
5.30% - 5.31%, 08/14/07 - 08/20/074 | 109,810 | 109,815 | ||||
Beta Finance Inc. | ||||||
5.29% - 5.48%, 04/25/07 - 07/25/074 | 193,114 | 193,124 | ||||
BMW US Capital LLC | ||||||
5.33%, 09/14/074 | 75,731 | 75,731 | ||||
BNP Paribas | ||||||
5.36%, 05/18/074 | 140,103 | 140,103 | ||||
Carlyle Loan Investment Ltd. | ||||||
5.38%, 04/13/07 - 07/15/074 | 55,284 | 55,283 | ||||
CC USA Inc. | ||||||
5.48%, 07/30/074 | 37,866 | 37,871 | ||||
Commodore CDO Ltd. | ||||||
5.38%, 06/12/074 | 18,933 | 18,933 | ||||
Credit Agricole SA | ||||||
5.48%, 07/23/07 | 75,731 | 75,731 | ||||
Credit Suisse First Boston NY | ||||||
5.51%, 04/24/07 | 37,866 | 37,867 | ||||
Cullinan Finance Corp. | ||||||
5.36%, 04/25/074 | 18,933 | 18,933 | ||||
DEPFA Bank PLC | ||||||
5.37%, 06/15/07 | 75,731 | 75,731 | ||||
Dorada Finance Inc. | ||||||
5.41% - 5.47%, 06/27/07 - 07/17/074 | 87,091 | 87,096 | ||||
Eli Lilly Services Inc. | ||||||
5.37%, 08/31/074 | 75,731 | 75,731 | ||||
Fifth Third Bancorp | ||||||
5.30%, 09/21/074 | 151,462 | 151,462 | ||||
Five Finance Inc. | ||||||
5.37% - 5.45%, 12/01/06 - 07/13/074 | 75,731 | 75,725 | ||||
General Electric Capital Corp. | ||||||
5.29% - 5.49%, 07/09/07 - 09/24/07 | 79,518 | 79,537 | ||||
Granite Master Issuer PLC | ||||||
5.30%, 09/20/06 | 265,059 | 265,059 | ||||
Harrier Finance Funding LLC | ||||||
5.33%, 07/25/074 | 22,719 | 22,724 | ||||
Hartford Life Global Funding Trusts | ||||||
5.35% - 5.55%, 07/13/07 - 09/17/07 | 113,597 | 113,614 | ||||
HBOS Treasury Services PLC | ||||||
5.53%, 07/24/074 | 75,731 | 75,731 | ||||
Holmes Financing PLC | ||||||
5.40%, 07/16/074 | 132,530 | 132,530 | ||||
JP Morgan Chase & Co. | ||||||
5.36%, 08/02/07 | 56,798 | 56,798 | ||||
K2 USA LLC | ||||||
5.20% - 5.46%, 04/02/07 - 06/28/074 | 56,798 | 56,796 | ||||
Kestrel Funding LLC | ||||||
5.31%, 07/11/074 | 30,292 | 30,290 | ||||
Kommunalkredit Austria AG | ||||||
5.33%, 09/09/074 | 45,439 | 45,439 | ||||
Leafs LLC | ||||||
5.33%, 01/22/07 - 02/20/074 | 79,016 | 79,016 | ||||
Lexington Parker Capital Co. LLC | ||||||
5.46%, 01/10/074 | 94,664 | 94,643 | ||||
Links Finance LLC | ||||||
5.33% - 5.35%, 05/10/07 - 05/16/074 | 83,304 | 83,299 | ||||
| 78 | 2006 iSHARES ANNUAL REPORTTO SHAREHOLDERS |
Table of Contents
Schedule of Investments (Continued)
iSHARES® MSCI SINGAPORE INDEX FUND
August 31, 2006
Security | Principal | Value | |||||
Lothian Mortgages Master Issuer PLC | |||||||
5.30%, 04/24/074 | $ | 33,369 | $ | 33,369 | |||
Marshall & Ilsley Bank | |||||||
5.31%, 09/14/07 | 41,652 | 41,652 | |||||
Metropolitan Life Global Funding I | |||||||
5.42%, 08/06/074 | 113,597 | 113,597 | |||||
Metropolitan Life Insurance Funding Agreement | |||||||
5.57%, 08/01/074,7 | 7,573 | 7,573 | |||||
Monumental Global Funding II | |||||||
5.49%, 12/27/064 | 15,146 | 15,148 | |||||
Mound Financing PLC | |||||||
5.39%, 05/08/074 | 71,187 | 71,187 | |||||
Natexis Banques Populaires | |||||||
5.31% - 5.40%, 02/05/07 - 09/14/074 | 227,193 | 227,189 | |||||
National City Bank of Indiana | |||||||
5.37%, 05/21/07 | 37,866 | 37,868 | |||||
Nationwide Building Society | |||||||
5.44% - 5.62%, 07/06/07 - 07/27/074 | 249,913 | 249,971 | |||||
Newcastle Ltd. | |||||||
5.35%, 04/24/074 | 26,695 | 26,690 | |||||
Northern Rock PLC | |||||||
5.43%, 08/03/074 | 90,877 | 90,880 | |||||
Principal Life Global Funding I | |||||||
5.80%, 02/08/07 | 34,079 | 34,149 | |||||
Sedna Finance Inc. | |||||||
5.30% - 5.37%, 09/20/06 - 8/21/074 | 132,530 | 132,527 | |||||
Skandinaviska Enskilda Bank NY | |||||||
5.33%, 09/18/074 | 75,731 | 75,731 | |||||
Strips III LLC | |||||||
5.38%, 07/24/074 | 18,415 | 18,415 | |||||
SunTrust Bank | |||||||
5.37%, 05/01/07 | 75,731 | 75,734 | |||||
Tango Finance Corp. | |||||||
5.22% - 5.48%, 04/25/07 - 07/16/074 | 184,784 | 184,767 | |||||
Union Hamilton Special Funding LLC | |||||||
5.42% - 5.49%, 09/28/06 - 12/21/064 | 106,024 | 106,023 | |||||
US Bank N.A. | |||||||
5.26%, 09/29/06 | 34,079 | 34,078 | |||||
Wachovia Asset Securitization Inc. | |||||||
5.31%, 09/25/064 | 113,007 | 113,007 | |||||
Wachovia Bank N.A. | |||||||
5.36%, 05/22/07 | 151,462 | 151,462 | |||||
Wells Fargo & Co. | |||||||
5.34%, 09/14/074 | 37,866 | 37,868 | |||||
WhistleJacket Capital Ltd. | |||||||
5.29% - 5.35%, 04/18/07 - 06/13/074 | 56,798 | 56,798 | |||||
White Pine Finance LLC | |||||||
5.29% - 5.35%, 05/22/07 - 08/20/074 | 227,193 | 227,147 | |||||
Wind Master Trust | |||||||
5.31% - 5.32%, 09/25/06 - 07/25/074 | 48,029 | 48,029 | |||||
| 5,008,020 | |||||||
TOTAL SHORT-TERM INVESTMENTS | 9,372,241 | ||||||
TOTAL INVESTMENTS IN SECURITIES – 100.16% | 575,565,927 | ||||||
Other Assets, Less Liabilities – (0.16)% | (946,164 | ) | |||||
NET ASSETS – 100.00% | $ | 574,619,763 | |||||
| 1 | All or a portion of this security represents a security on loan. See Note 5. |
| 2 | Non-income earning security. |
| 3 | All or a portion of this security (these securities) represent(s) an investment of securities lending collateral. See Note 5. |
| 4 | This security or a portion of these securities may be resold to qualified institutional buyers under Rule 144A or pursuant to Section 4(2) of the Securities Act of 1933. |
| 5 | Affiliated issuer. See Note 2. |
| 6 | The rate quoted is the annualized seven-day yield of the fund at period end. |
| 7 | The investment adviser has determined that this security or a portion of these securities is illiquid. |
See notes to the financial statements.
| SCHEDULESOF INVESTMENTS | 79 |
Table of Contents
Schedule of Investments
iSHARES® MSCI SOUTH AFRICA INDEX FUND
August 31, 2006
Security | Shares | Value | |||
COMMON STOCKS – 99.87% | |||||
BANKS – 13.84% | |||||
FirstRand Ltd. | 4,992,667 | $ | 12,360,486 | ||
Nedbank Group Ltd. | 355,508 | 5,446,027 | |||
Standard Bank Group Ltd. | 2,170,319 | 23,428,007 | |||
| 41,234,520 | |||||
BUILDING MATERIALS – 0.44% | |||||
Pretoria Portland Cement Co. Ltd. | 24,278 | 1,309,867 | |||
| 1,309,867 | |||||
DIVERSIFIED FINANCIAL SERVICES – 2.37% | |||||
African Bank Investments Ltd. | 841,861 | 2,969,282 | |||
Alexander Forbes Ltd.1 | 627,446 | 1,228,785 | |||
Investec Ltd. | 58,438 | 2,853,006 | |||
| 7,051,073 | |||||
ELECTRONICS – 1.04% | |||||
Reunert Ltd. | 310,917 | 3,113,482 | |||
| 3,113,482 | |||||
ENGINEERING & CONSTRUCTION – 1.61% | |||||
Aveng Ltd. | 708,698 | 2,624,443 | |||
Murray & Roberts Holdings Ltd. | 534,909 | 2,162,635 | |||
| 4,787,078 | |||||
FOOD – 3.46% | |||||
Shoprite Holdings Ltd. | 770,308 | 2,638,919 | |||
SPAR Group Ltd. (The) | 303,536 | 1,574,514 | |||
Tiger Brands Ltd. | 288,591 | 6,104,040 | |||
| 10,317,473 | |||||
FOREST PRODUCTS & PAPER – 1.55% | |||||
Sappi Ltd. | 363,072 | 4,620,230 | |||
| 4,620,230 | |||||
HEALTH CARE – PRODUCTS – 0.59% | |||||
Aspen Pharmacare Holdings Ltd.1 | 379,542 | 1,754,526 | |||
| 1,754,526 | |||||
HEALTH CARE – SERVICES – 1.23% | |||||
Network Healthcare Holdings Ltd.1 | 2,259,562 | 3,666,696 | |||
| 3,666,696 | |||||
HOLDING COMPANIES – DIVERSIFIED – 7.82% | |||||
AVI Ltd. | 546,987 | 1,214,599 | |||
Barloworld Ltd. | 388,143 | 7,307,963 | |||
Bidvest Group Ltd. | 460,123 | 6,962,471 | |||
Imperial Holdings Ltd.1 | 332,999 | 6,581,464 | |||
Tongaat-Hulett Group Ltd. | 93,696 | 1,218,308 | |||
| 23,284,805 | |||||
HOME FURNISHINGS – 2.15% | |||||
Lewis Group Ltd. | 168,299 | 1,161,286 | |||
Steinhoff International Holdings Ltd. | 1,608,204 | 5,248,411 | |||
| 6,409,697 | |||||
INSURANCE – 4.09% | |||||
Liberty Group Ltd. | 198,372 | 1,953,180 | |||
Metropolitan Holdings Ltd. | 1,004,365 | 1,681,371 | |||
Sanlam Ltd. | 4,067,907 | 8,547,682 | |||
| 12,182,233 | |||||
IRON & STEEL – 1.27% | |||||
Mittal Steel South Africa Ltd. | 357,033 | 3,778,310 | |||
| 3,778,310 | |||||
MEDIA – 3.08% | |||||
Naspers Ltd. | 531,920 | 9,185,026 | |||
| 9,185,026 | |||||
MINING – 24.73% | |||||
Anglo Platinum Ltd. | 116,754 | 13,084,221 | |||
AngloGold Ashanti Ltd. | 268,888 | 12,190,957 | |||
Gold Fields Ltd. | 878,522 | 17,058,680 | |||
Harmony Gold Mining Co. Ltd.1 | 597,617 | 8,122,950 | |||
Impala Platinum Holdings Ltd. | 113,399 | 20,996,902 | |||
Kumba Resources Ltd. | 109,373 | 2,206,726 | |||
| 73,660,436 | |||||
OIL & GAS – 12.00% | |||||
Sasol Ltd. | 1,031,266 | 35,758,183 | |||
| 35,758,183 | |||||
PACKAGING & CONTAINERS – 1.14% | |||||
Consol Ltd. | 557,906 | 1,191,644 | |||
Nampak Ltd. | 927,139 | 2,206,617 | |||
| 3,398,261 | |||||
REAL ESTATE – 0.45% | |||||
Allan Gray Property Trust | 1,806,515 | 1,330,457 | |||
| 1,330,457 | |||||
RETAIL – 6.72% | |||||
Edgars Consolidated Stores Ltd. | 889,502 | 3,496,323 | |||
Ellerine Holdings Ltd. | 187,575 | 1,743,069 | |||
| 80 | 2006 iSHARES ANNUAL REPORTTO SHAREHOLDERS |
Table of Contents
Schedule of Investments (Continued)
iSHARES® MSCI SOUTH AFRICA INDEX FUND
August 31, 2006
Security | Shares | Value | |||
Foschini Ltd. | 364,353 | $ | 2,274,048 | ||
JD Group Ltd. | 318,176 | 2,939,046 | |||
Massmart Holdings Ltd. | 355,447 | 2,716,877 | |||
Pick’n Pay Stores Ltd. | 388,082 | 1,636,296 | |||
Truworths International Ltd. | 831,979 | 2,644,793 | |||
Woolworths Holdings Ltd. | 1,402,756 | 2,573,989 | |||
| 20,024,441 | |||||
TELECOMMUNICATIONS – 9.69% | |||||
MTN Group Ltd. | 2,372,595 | 18,822,806 | |||
Telkom South Africa Ltd. | 532,042 | 10,035,744 | |||
| 28,858,550 | |||||
| TRANSPORTATION – 0.60% | |||||
Grindrod Ltd. | 583,709 | 1,041,933 | |||
Super Group Ltd.1 | 500,871 | 756,517 | |||
| 1,798,450 | |||||
TOTAL COMMON STOCKS | 297,523,794 | ||||
SHORT-TERM INVESTMENTS – 0.04% | |||||
MONEY MARKET FUNDS – 0.04% | |||||
Barclays Global Investors Funds Institutional Money Market Fund, Institutional Shares 5.30%2,3 | 115,792 | 115,792 | |||
| 115,792 | |||||
TOTAL SHORT-TERM INVESTMENTS | 115,792 | ||||
TOTAL INVESTMENTS IN SECURITIES – 99.91% | 297,639,586 | ||||
Other Assets, Less Liabilities – 0.09% | 258,282 | ||||
NET ASSETS – 100.00% | $ | 297,897,868 | |||
| 1 | Non-income earning security. |
| 2 | Affiliated issuer. See Note 2. |
| 3 | The rate quoted is the annualized seven-day yield of the fund at period end. |
See notes to the financial statements.
SCHEDULESOF INVESTMENTS | 81 |
Table of Contents
Schedule of Investments
iSHARES® MSCI SOUTH KOREA INDEX FUND
August 31, 2006
Security | Shares | Value | |||
COMMON STOCKS – 97.16% | |||||
ADVERTISING – 0.26% | |||||
Cheil Communications Inc. | 21,150 | $ | 4,256,396 | ||
| 4,256,396 | |||||
AEROSPACE & DEFENSE – 0.39% | |||||
Hanjin Heavy Industries & Construction Co. Ltd. | 232,650 | 6,339,501 | |||
| 6,339,501 | |||||
AGRICULTURE – 1.99% | |||||
KT&G Corp.1 | 549,900 | 32,256,225 | |||
| 32,256,225 | |||||
AIRLINES – 0.51% | |||||
Asiana Airlines2 | 437,100 | 2,759,435 | |||
Korean Air Co. Ltd. | 176,250 | 5,554,212 | |||
| 8,313,647 | |||||
AUTO MANUFACTURERS – 4.70% | |||||
Hyundai Motor Co. Ltd. | 733,200 | 61,767,239 | |||
Kia Motors Corp.1 | 902,400 | 14,359,563 | |||
| 76,126,802 | |||||
AUTO PARTS & EQUIPMENT – 1.97% | |||||
Hankook Tire Co. Ltd. | 507,600 | 6,757,442 | |||
Hyundai Mobis | 274,956 | 25,193,576 | |||
| 31,951,018 | |||||
BANKS – 9.47% | |||||
Daegu Bank | 585,150 | 9,798,143 | |||
Kookmin Bank | 1,621,509 | 131,204,784 | |||
Korea Exchange Bank2 | 465,300 | 5,637,800 | |||
Pusan Bank | 535,800 | 6,882,091 | |||
| 153,522,818 | |||||
BEVERAGES – 0.30% | |||||
Hite Brewery Co. Ltd. | 42,300 | 4,795,320 | |||
| 4,795,320 | |||||
CHEMICALS – 1.78% | |||||
Hanwha Chemical Corp. | 232,650 | 2,359,165 | |||
Honam Petrochemical Corp. | 63,450 | 3,292,933 | |||
KCC Corp. | 21,150 | 5,367,239 | |||
Korea Zinc Co. Ltd. | 63,450 | 5,477,223 | |||
LG Chem Ltd. | 211,500 | 8,611,779 | |||
LG Petrochemical Co. Ltd. | 98,715 | 2,145,755 | |||
Samsung Fine Chemicals Co. Ltd.1 | 63,450 | 1,583,775 | |||
| 28,837,869 | |||||
COMMERCIAL SERVICES – 0.25% | |||||
S1 Corp. | 98,700 | 4,029,095 | |||
| 4,029,095 | |||||
COSMETICS & PERSONAL CARE – 0.61% | |||||
AmorePacific Corp.1,2 | 19,350 | 8,412,168 | |||
Pacific Corp.1 | 11,729 | 1,518,732 | |||
| 9,930,900 | |||||
DISTRIBUTION & WHOLESALE – 2.00% | |||||
Daewoo International Corp.1 | 204,450 | 7,973,869 | |||
Hyosung Corp.2 | 5 | 91 | |||
LG International Corp. | 260,850 | 5,846,404 | |||
Samsung Corp. | 655,650 | 18,547,769 | |||
| 32,368,133 | |||||
DIVERSIFIED FINANCIAL SERVICES – 8.27% | |||||
Daewoo Securities Co. Ltd.1 | 564,000 | 9,825,273 | |||
Daishin Securities Co. Ltd.1 | 176,250 | 3,574,493 | |||
Hana Financial Group Inc. | 542,851 | 23,402,157 | |||
Hyundai Securities Co. Ltd. | 542,850 | 7,085,562 | |||
Korea Investment Holdings Co. Ltd.1 | 176,255 | 7,130,858 | |||
Mirae Asset Securities Co. Ltd. | 63,450 | 3,992,434 | |||
Samsung Securities Co. | 267,900 | 15,630,983 | |||
Shinhan Financial Group Ltd. | 1,071,600 | 48,313,947 | |||
Tong Yang Investment Bank2 | 387,750 | 5,343,409 | |||
Woori Investment & Securities Co.1 | 451,200 | 9,854,602 | |||
| 134,153,718 | |||||
ELECTRIC – 2.95% | |||||
Korea Electric Power Corp. | 1,247,850 | 47,759,626 | |||
| 47,759,626 | |||||
ELECTRICAL COMPONENTS & EQUIPMENT – 24.27% | |||||
LG Electronics Inc. | 493,506 | 33,054,380 | |||
LS Cable Ltd. | 91,650 | 3,069,298 | |||
Samsung Electronics Co. Ltd.1 | 528,750 | 357,449,298 | |||
| 393,572,976 | |||||
ELECTRONICS – 3.79% | |||||
Daeduck Electronics Co. Ltd. | 458,251 | 3,941,483 | |||
Hyundai Autonet Co. Ltd.1,2 | 479,400 | 5,434,696 | |||
LG.Philips LCD Co. Ltd.1,2 | 465,300 | 18,631,357 | |||
| 82 | 2006 iSHARES ANNUAL REPORTTO SHAREHOLDERS |
Table of Contents
Schedule of Investments (Continued)
iSHARES® MSCI SOUTH KOREA INDEX FUND
August 31, 2006
Security | Shares | Value | |||
Samsung Electro-Mechanics Co. Ltd.1,2 | 458,250 | $ | 17,610,335 | ||
Samsung SDI Co. Ltd. | 190,350 | 15,758,565 | |||
| 61,376,436 | |||||
ENGINEERING & CONSTRUCTION – 3.06% | |||||
Daelim Industrial Co. Ltd.1 | 119,850 | 7,678,378 | |||
Daewoo Engineering & Construction Co. Ltd. | 733,200 | 13,421,030 | |||
GS Engineering & Construction Corp. | 169,200 | 11,579,158 | |||
Hyundai Engineering & Construction Co. Inc.1,2 | 183,300 | 9,684,493 | |||
Samsung Engineering Co. Ltd. | 155,100 | 7,202,512 | |||
| 49,565,571 | |||||
ENVIRONMENTAL CONTROL – 0.28% | |||||
Woongjin Coway Co. Ltd.1 | 197,400 | 4,516,693 | |||
| 4,516,693 | |||||
FOOD – 1.27% | |||||
CJ Corp.1 | 91,650 | 9,627,301 | |||
Lotte Confectionery Co. Ltd. | 3,500 | 4,393,656 | |||
Nong Shim Co. Ltd.1 | 14,102 | 3,395,333 | |||
ORION Corp. | 14,109 | 3,110,877 | |||
| 20,527,167 | |||||
HOLDING COMPANIES – DIVERSIFIED – 0.00% | |||||
GS Holdings Corp. | 2 | 65 | |||
LG Corp. | 3 | 89 | |||
| 154 | |||||
HOME BUILDERS – 0.78% | |||||
Hyundai Development Co. | 310,217 | 12,711,960 | |||
| 12,711,960 | |||||
HOUSEHOLD PRODUCTS & WARES – 0.27% | |||||
LG Household & Health Care Ltd.1 | 56,400 | 4,334,852 | |||
| 4,334,852 | |||||
INSURANCE – 2.38% | |||||
Dongbu Insurance Co. Ltd. | 183,300 | 4,127,348 | |||
Hyundai Marine & Fire Insurance Co. Ltd.2 | 345,450 | 4,598,814 | |||
Korean Reinsurance Co. | 352,500 | 4,179,407 | |||
Samsung Fire & Marine Insurance Co. Ltd. | 183,300 | 25,736,349 | |||
| 38,641,918 | |||||
INTERNET – 1.49% | |||||
Daum Communications Corp.1,2 | 56,643 | 2,939,663 | |||
NCsoft Corp.1,2 | 70,500 | 3,908,112 | |||
NHN Corp.2 | 184,005 | 17,376,655 | |||
| 24,224,430 | |||||
IRON & STEEL – 5.63% | |||||
Dongkuk Steel Mill Co. Ltd. | 162,161 | 2,816,525 | |||
POSCO | 352,500 | 88,537,442 | |||
| 91,353,967 | |||||
LODGING – 0.59% | |||||
Kangwon Land Inc. | 507,602 | 9,608,275 | |||
| 9,608,275 | |||||
MACHINERY – DIVERSIFIED – 0.32% | |||||
Doosan Infracore Co. Ltd.1 | 303,150 | 5,233,791 | |||
| 5,233,791 | |||||
MANUFACTURING – 0.52% | |||||
Cheil Industries Inc.1 | 218,550 | 8,387,410 | |||
| 8,387,410 | |||||
MINING – 0.12% | |||||
Poongsan Corp.1 | 91,668 | 1,997,342 | |||
| 1,997,342 | |||||
MULTIPLE UTILITIES – 0.82% | |||||
KT Freetel | 458,250 | 13,273,284 | |||
| 13,273,284 | |||||
OIL & GAS – 2.94% | |||||
SK Corp. | 514,650 | 33,132,434 | |||
S-Oil Corp. | 211,500 | 14,451,950 | |||
| 47,584,384 | |||||
PHARMACEUTICALS – 0.54% | |||||
Dong-A Pharmaceutical Co. Ltd. | 9 | 658 | |||
Hanmi Pharm Co. Ltd.1 | 28,200 | 3,314,197 | |||
Yuhan Corp.1 | 35,259 | 5,482,289 | |||
| 8,797,144 | |||||
RETAIL – 3.24% | |||||
Hyundai Department Store Co. Ltd. | 70,500 | 5,484,555 | |||
Lotte Shopping Co. Ltd. | 35,250 | 12,006,630 | |||
SCHEDULESOF INVESTMENTS | 83 |
Table of Contents
Schedule of Investments (Continued)
iSHARES® MSCI SOUTH KOREA INDEX FUND
August 31, 2006
Security | Shares | Value | ||||
Shinsegae Co. Ltd. | 70,500 | $ | 34,975,039 | |||
| 52,466,224 | ||||||
SEMICONDUCTORS – 0.50% | ||||||
Samsung Techwin Co. Ltd. | 232,650 | 8,154,243 | ||||
| 8,154,243 | ||||||
SHIPBUILDING – 4.28% | ||||||
Daewoo Shipbuilding & Marine Engineering Co. Ltd. | 472,350 | 14,590,530 | ||||
Hyundai Heavy Industries Co. Ltd. | 225,600 | 28,625,273 | ||||
Hyundai Mipo Dockyard | 56,400 | 5,807,176 | ||||
Samsung Heavy Industries Co. Ltd.1 | 853,050 | 20,405,772 | ||||
| 69,428,751 | ||||||
TELECOMMUNICATIONS – 4.29% | ||||||
KT Corp. | 472,361 | 20,608,990 | ||||
KT Corp. ADR | 423,000 | 9,348,300 | ||||
SK Telecom Co. Ltd. | 125,020 | 24,314,862 | ||||
SK Telecom Co. Ltd. ADR | 699,360 | 15,315,984 | ||||
| 69,588,136 | ||||||
TRANSPORTATION – 0.33% | ||||||
Hanjin Shipping Co. Ltd. | 232,650 | 5,323,245 | ||||
| 5,323,245 | ||||||
TOTAL COMMON STOCKS | 1,575,309,421 | |||||
PREFERRED STOCKS – 2.75% | ||||||
AUTO MANUFACTURERS – 0.59% | ||||||
Hyundai Motor Co. Ltd. | 190,350 | 9,522,449 | ||||
| 9,522,449 | ||||||
ELECTRICAL COMPONENTS & EQUIPMENT – 2.16% | ||||||
LG Electronics Inc. | 148,050 | 5,735,686 | ||||
Samsung Electronics Co. Ltd. | 56,400 | 29,329,173 | ||||
| 35,064,859 | ||||||
TOTAL PREFERRED STOCKS | 44,587,308 | |||||
Security | Principal | Value | ||||
SHORT-TERM INVESTMENTS – 6.73% | ||||||
CERTIFICATES OF DEPOSIT3 – 0.28% | ||||||
Credit Suisse First Boston NY | ||||||
5.28% - 5.43%, 04/23/07 - 08/21/07 | $ | 626,931 | $ | 626,931 | ||
Societe Generale | ||||||
5.33%, 12/08/06 | 895,615 | 895,615 | ||||
Washington Mutual Bank | ||||||
5.36%, 11/13/06 | 2,239,038 | 2,239,038 | ||||
Wells Fargo Bank N.A. | ||||||
4.78%, 12/05/06 | 716,492 | 716,492 | ||||
| 4,478,076 | ||||||
COMMERCIAL PAPER3 – 1.07% | ||||||
Amstel Funding Corp. | ||||||
5.20%, 11/21/06 - 11/22/064 | 261,323 | 258,252 | ||||
Amsterdam Funding Corp. | ||||||
5.27%, 09/15/064 | 895,615 | 893,780 | ||||
Atlantis One Funding | ||||||
5.30%, 11/14/064 | 1,228,856 | 1,215,468 | ||||
Barton Capital Corp. | ||||||
5.27%, 09/06/064 | 451,390 | 451,060 | ||||
Cancara Asset Securitisation Ltd. | ||||||
5.30%, 11/14/064 | 454,005 | 449,059 | ||||
CC USA Inc. | ||||||
5.03%, 10/24/064 | 179,123 | 177,797 | ||||
Charta LLC | ||||||
5.30%, 11/06/064 | 895,615 | 886,913 | ||||
Concord Minutemen Capital Co. LLC | ||||||
5.27% - 5.29%, 09/13/06 - 11/16/064 | 1,572,978 | 1,566,001 | ||||
Curzon Funding LLC | ||||||
5.29%, 11/17/064 | 895,615 | 885,482 | ||||
Edison Asset Securitization LLC | ||||||
5.22%, 12/11/064 | 660,713 | 651,037 | ||||
Falcon Asset Securitization Corp. | ||||||
5.30%, 11/06/064 | 895,615 | 886,913 | ||||
Five Finance Inc. | ||||||
5.19%, 12/01/064 | 403,027 | 397,739 | ||||
General Electric Capital Services Inc. | ||||||
5.22%, 12/11/06 | 89,562 | 88,250 | ||||
| 84 | 2006 iSHARES ANNUAL REPORTTO SHAREHOLDERS |
Table of Contents
Schedule of Investments (Continued)
iSHARES® MSCI SOUTH KOREA INDEX FUND
August 31, 2006
Security | Principal | Value | ||||
Giro Funding Corp. | ||||||
5.28% - 5.34%, 09/11/06 - 10/10/064 | $ | 895,615 | $ | 892,370 | ||
Grampian Funding LLC | ||||||
5.03% - 5.30%, 10/17/06 - 11/16/064 | 429,895 | 426,349 | ||||
KKR Pacific Funding Trust | ||||||
5.29%, 09/14/064 | 895,615 | 893,904 | ||||
Landale Funding LLC | ||||||
5.31%, 11/15/064 | 698,580 | 690,859 | ||||
Lexington Parker Capital Co. LLC | ||||||
5.19% - 5.27%, 09/15/06 - 11/15/064 | 1,160,914 | 1,154,254 | ||||
Liberty Street Funding Corp. | ||||||
5.27%, 09/08/06 - 09/11/064 | 797,098 | 796,128 | ||||
Mont Blanc Capital Corp. | ||||||
5.29%, 11/15/064 | 577,672 | 571,305 | ||||
Monument Gardens Funding LLC | ||||||
5.28%, 09/21/064 | 450,073 | 448,753 | ||||
Nestle Capital Corp. | ||||||
5.19%, 08/09/07 | 537,369 | 510,874 | ||||
Park Granada LLC | ||||||
5.30%, 09/01/064 | 204,666 | 204,666 | ||||
Regency Markets LLC | ||||||
5.28%, 09/15/06 | 447,808 | 446,889 | ||||
Solitaire Funding Ltd. | ||||||
5.27%, 09/05/064 | 671,711 | 671,318 | ||||
Sydney Capital Corp. | ||||||
5.27%, 09/12/064 | 204,917 | 204,587 | ||||
Tulip Funding Corp. | ||||||
5.29%, 11/15/064 | 472,365 | 467,160 | ||||
White Pine Finance LLC | ||||||
5.12%, 10/27/064 | 169,271 | 167,923 | ||||
| 17,355,090 | ||||||
MEDIUM-TERM NOTES3 – 0.23% | ||||||
Bank of America N.A. | ||||||
5.28%, 04/20/07 | 223,904 | 223,904 | ||||
Cullinan Finance Corp. | ||||||
5.71%, 06/28/074 | 671,711 | 671,711 | ||||
K2 USA LLC | ||||||
5.39%, 06/04/074 | 671,711 | 671,711 | ||||
Security | Shares or Principal | Value | ||||
Marshall & Ilsley Bank | ||||||
5.18%, 12/15/06 | $ | 895,615 | $ | 896,502 | ||
Sigma Finance Inc. | ||||||
5.13% - 5.51%, 03/30/07 - 06/18/074 | 1,047,870 | 1,047,869 | ||||
US Bank N.A. | ||||||
2.85%, 11/15/06 | 179,123 | 178,446 | ||||
| 3,690,143 | ||||||
MONEY MARKET FUNDS – 0.14% | ||||||
Barclays Global Investors Funds Institutional Money Market Fund, Institutional Shares 5.30%5,6 | 2,285,879 | 2,285,879 | ||||
| 2,285,879 | ||||||
REPURCHASE AGREEMENTS3 – 1.35% | ||||||
Banc of America Securities LLC Repurchase Agreement, 5.30%, due 9/1/06, maturity value $1,119,684 (collateralized by U.S. Government obligations, value $1,142,993, 5.50% to 6.50%, 1/1/33 to 7/1/36). | $ | 1,119,519 | 1,119,519 | |||
Banc of America Securities LLC Repurchase Agreement, 5.36%, due 9/1/06, maturity value $1,791,497 (collateralized by non-U.S. Government debt securities, value $1,846,719, 3.80% to 9.13%, 11/1/06 to 6/15/26). | 1,791,230 | 1,791,230 | ||||
Bear Stearns Companies Inc. (The) Repurchase Agreement, 5.37%, due 9/1/06, maturity value $1,343,623 (collateralized by non-U.S. Government debt securities, value $1,479,192, 0.08% to 6.43%, 9/25/20 to 7/25/36). | 1,343,423 | 1,343,423 | ||||
| SCHEDULESOF INVESTMENTS | 85 |
Table of Contents
Schedule of Investments (Continued)
iSHARES® MSCI SOUTH KOREA INDEX FUND
August 31, 2006
Security | Principal | Value | ||||
Citigroup Global Markets Holdings Inc. Repurchase Agreement, 5.36%, due 9/1/06, maturity value $2,687,245 (collateralized by non-U.S. Government debt securities, value $2,807,565, 4.35% to 7.50%, 9/15/08 to 8/25/35). | $ | 2,686,845 | $ | 2,686,845 | ||
Citigroup Global Markets Holdings Inc. Repurchase Agreement, 5.46%, due 9/1/06, maturity value $537,451 (collateralized by non-U.S. Government debt securities, value $655,983, 0.00% to 10.00%, 6/1/28 to 8/24/36). | 537,369 | 537,369 | ||||
Goldman Sachs & Co. Repurchase Agreement, 5.35%, due 9/1/06, maturity value $1,791,496 (collateralized by non-U.S. Government debt securities, value $1,828,789, 0.00% to 8.57%, 11/15/06 to 2/15/38). | 1,791,230 | 1,791,230 | ||||
Goldman Sachs Group Inc. Repurchase Agreement, 5.36%, due 9/1/06, maturity value $895,748 (collateralized by non-U.S. Government debt securities, value $941,289, 5.36% to 9.01%, 10/27/10 to 2/18/20). | 895,615 | 895,615 | ||||
JP Morgan Securities Inc. Repurchase Agreement, 5.41%, due 9/1/06, maturity value $223,938 (collateralized by non-U.S. Government debt securities, value $235,330, 6.63% to 10.50%, 1/15/07 to 4/15/16). | 223,904 | 223,904 | ||||
Lehman Brothers Holdings Inc. Repurchase Agreement, 5.36%, due 9/1/06, maturity value $1,791,497 (collateralized by non-U.S. Government debt securities, value $1,882,585, 0.51% to 8.89%, 8/5/18 to 9/25/46). | 1,791,230 | 1,791,230 | ||||
Lehman Brothers Holdings Inc. Repurchase Agreement, 5.38%, due 9/1/06, maturity value $895,749 (collateralized by non-U.S. Government debt securities, value $941,316, 4.11% to 9.79%, 4/28/31 to 9/25/46). | 895,615 | 895,615 | ||||
Lehman Brothers Holdings Inc. Repurchase Agreement, 5.46%, due 9/1/06, maturity value $985,326 (collateralized by non-U.S. Government debt securities, value $1,035,418, 3.44% to 15.15%, 12/1/08 to 3/1/36). | 985,177 | 985,177 | ||||
Merrill Lynch & Co. Inc. Repurchase Agreement, 5.33%, due 9/1/06, maturity value $1,791,496 (collateralized by non-U.S. Government debt securities, value $1,882,611, 6.38% to 10.25%, 5/1/07 to 10/15/16). | 1,791,231 | 1,791,231 | ||||
Merrill Lynch & Co. Inc. Repurchase Agreement, 5.36%, due 9/1/06, maturity value $1,791,497 (collateralized by non-U.S. Government debt securities, value $1,847,053, 0.00% to 10.13%, 10/15/06 to 7/1/26). | 1,791,230 | 1,791,230 | ||||
| 86 | 2006 iSHARES ANNUAL REPORTTO SHAREHOLDERS |
Table of Contents
Schedule of Investments (Continued)
iSHARES® MSCI SOUTH KOREA INDEX FUND
August 31, 2006
Security | Principal | Value | ||||
Morgan Stanley Repurchase Agreement, 5.36%, due 9/1/06, maturity value $895,748 (collateralized by non-U.S. Government debt securities, value $941,723, 4.05% to 7.24%, 6/20/29 to 1/14/41). | $ | 895,615 | $ | 895,615 | ||
Morgan Stanley Repurchase Agreement, 5.46%, due 9/1/06, maturity value $313,513 (collateralized by non-U.S. Government debt securities, value $480,730, 0.00% to 10.00%, 9/1/06 to 8/31/36). | 313,465 | 313,465 | ||||
Morgan Stanley Repurchase Agreement, 5.51%, due 6/4/07, maturity value $653,511 (collateralized by non-U.S. Government debt securities, value $976,027, 0.00% to 10.00%, 9/1/06 to 8/31/36).7 | 626,931 | 626,931 | ||||
Wachovia Capital Repurchase Agreement, 5.38%, due 9/1/06, maturity value $2,328,947 (collateralized by non-U.S. Government debt securities, value $2,447,351, 0.06% to 7.68%, 10/15/11 to 3/15/45). | 2,328,599 | 2,328,599 | ||||
| 21,808,228 | ||||||
TIME DEPOSITS3 – 0.01% | ||||||
KBC Bank | ||||||
5.31%, 09/01/06 | 188,984 | 188,984 | ||||
| 188,984 | ||||||
VARIABLE & FLOATING RATE NOTES3 – 3.65% | ||||||
Allstate Life Global Funding II | ||||||
5.34% - 5.47%, 09/04/07 - 09/27/074 | 2,292,778 | 2,293,075 | ||||
American Express Bank | ||||||
5.30%, 02/28/07 | 895,615 | 895,612 | ||||
American Express Centurion Bank | ||||||
5.42%, 07/19/07 | 985,177 | 986,175 | ||||
American Express Credit Corp. | ||||||
5.51%, 07/05/07 | 268,685 | 268,834 | ||||
ASIF Global Financing | ||||||
5.51%, 05/03/074 | 89,562 | 89,595 | ||||
Australia & New Zealand Banking Group Ltd. | ||||||
5.32%, 09/21/074 | 582,150 | 582,150 | ||||
Bank of Ireland | ||||||
5.30% - 5.31%, 08/14/07 - 08/20/074 | 1,298,642 | 1,298,696 | ||||
Beta Finance Inc. | ||||||
5.29% - 5.48%, 04/25/07 - 07/25/074 | 2,283,819 | 2,283,935 | ||||
BMW US Capital LLC | ||||||
5.33%, 09/14/074 | 895,615 | 895,615 | ||||
BNP Paribas | ||||||
5.36%, 05/18/074 | 1,656,888 | 1,656,888 | ||||
Carlyle Loan Investment Ltd. | ||||||
5.38%, 04/13/07 - 07/15/074 | 653,799 | 653,799 | ||||
CC USA Inc. | ||||||
5.48%, 07/30/074 | 447,808 | 447,866 | ||||
Commodore CDO Ltd. | ||||||
5.38%, 06/12/074 | 223,904 | 223,904 | ||||
Credit Agricole SA | ||||||
5.48%, 07/23/07 | 895,615 | 895,615 | ||||
Credit Suisse First Boston NY | ||||||
5.51%, 04/24/07 | 447,808 | 447,828 | ||||
Cullinan Finance Corp. | ||||||
5.36%, 04/25/074 | 223,904 | 223,904 | ||||
DEPFA Bank PLC | ||||||
5.37%, 06/15/07 | 895,615 | 895,615 | ||||
Dorada Finance Inc. | ||||||
5.41% - 5.47%, 06/27/07 - 07/17/074 | 1,029,957 | 1,030,024 | ||||
Eli Lilly Services Inc. | ||||||
5.37%, 08/31/074 | 895,615 | 895,615 | ||||
Fifth Third Bancorp | ||||||
5.30%, 09/21/074 | 1,791,230 | 1,791,230 | ||||
| SCHEDULESOF INVESTMENTS | 87 |
Table of Contents
Schedule of Investments (Continued)
iSHARES® MSCI SOUTH KOREA INDEX FUND
August 31, 2006
Security | Principal | Value | ||||
Five Finance Inc. | ||||||
5.37% - 5.45%, 12/01/06 - 07/13/074 | $ | 895,615 | $ | 895,547 | ||
General Electric Capital Corp. | ||||||
5.29% - 5.49%, 07/09/07 - 09/24/07 | 940,396 | 940,616 | ||||
Granite Master Issuer PLC | ||||||
5.30%, 09/20/06 | 3,134,653 | 3,134,653 | ||||
Harrier Finance Funding LLC | ||||||
5.33%, 07/25/074 | 268,685 | 268,734 | ||||
Hartford Life Global Funding Trusts | ||||||
5.35% - 5.55%, 07/13/07 - 09/17/07 | 1,343,423 | 1,343,633 | ||||
HBOS Treasury Services PLC | ||||||
5.53%, 07/24/074 | 895,615 | 895,615 | ||||
Holmes Financing PLC | ||||||
5.40%, 07/16/074 | 1,567,327 | 1,567,327 | ||||
JP Morgan Chase & Co. | ||||||
5.36%, 08/02/07 | 671,711 | 671,711 | ||||
K2 USA LLC | ||||||
5.20% - 5.46%, 04/02/07 - 06/28/074 | 671,711 | 671,682 | ||||
Kestrel Funding LLC | ||||||
5.31%, 07/11/074 | 358,246 | 358,213 | ||||
Kommunalkredit Austria AG | ||||||
5.33%, 09/09/074 | 537,369 | 537,369 | ||||
Leafs LLC | ||||||
5.33%, 01/22/07 - 02/20/074 | 934,461 | 934,461 | ||||
Lexington Parker Capital Co. LLC | ||||||
5.46%, 01/10/074 | 1,119,519 | 1,119,269 | ||||
Links Finance LLC | ||||||
5.33% - 5.35%, 05/10/07 - 05/16/074 | 985,177 | 985,107 | ||||
Lothian Mortgages Master Issuer PLC | ||||||
5.30%, 04/24/074 | 394,633 | 394,633 | ||||
Marshall & Ilsley Bank | ||||||
5.31%, 09/14/07 | 492,588 | 492,588 | ||||
Metropolitan Life Global Funding I | ||||||
5.42%, 08/06/074 | 1,343,423 | 1,343,423 | ||||
Metropolitan Life Insurance Funding Agreement | ||||||
5.57%, 08/01/074,7 | 89,562 | 89,562 | ||||
Monumental Global Funding II | ||||||
5.49%, 12/27/064 | 179,123 | 179,142 | ||||
Mound Financing PLC | ||||||
5.39%, 05/08/074 | 841,878 | 841,878 | ||||
Natexis Banques Populaires | ||||||
5.31% - 5.40%, 02/05/07 - 09/14/074 | 2,686,846 | 2,686,802 | ||||
National City Bank of Indiana | ||||||
5.37%, 05/21/07 | 447,808 | 447,835 | ||||
Nationwide Building Society | ||||||
5.44% - 5.62%, 07/06/07 - 07/27/074 | 2,955,530 | 2,956,218 | ||||
Newcastle Ltd. | ||||||
5.35%, 04/24/074 | 315,704 | 315,644 | ||||
Northern Rock PLC | ||||||
5.43%, 08/03/074 | 1,074,738 | 1,074,764 | ||||
Principal Life Global Funding I | ||||||
5.80%, 02/08/07 | 403,027 | 403,853 | ||||
Sedna Finance Inc. | ||||||
5.30% - 5.37%, 09/20/06 - 08/21/074 | 1,567,327 | 1,567,297 | ||||
Skandinaviska Enskilda Bank NY | ||||||
5.33%, 09/18/074 | 895,615 | 895,615 | ||||
Strips III LLC | ||||||
5.38%, 07/24/074 | 217,776 | 217,776 | ||||
SunTrust Bank | ||||||
5.37%, 05/01/07 | 895,615 | 895,652 | ||||
Tango Finance Corp. | ||||||
5.22% - 5.48%, 04/25/07 - 07/16/074 | 2,185,301 | 2,185,107 | ||||
Union Hamilton Special Funding LLC | ||||||
5.42% - 5.49%, 09/28/06 - 12/21/064 | 1,253,861 | 1,253,861 | ||||
US Bank N.A. | ||||||
5.26%, 09/29/06 | 403,027 | 403,019 | ||||
Wachovia Asset Securitization Inc. | ||||||
5.31%, 09/25/064 | 1,336,448 | 1,336,448 | ||||
Wachovia Bank N.A. | ||||||
5.36%, 05/22/07 | 1,791,230 | 1,791,230 | ||||
Wells Fargo & Co. | ||||||
5.34%, 09/14/074 | 447,808 | 447,835 | ||||
| 88 | 2006 iSHARES ANNUAL REPORTTO SHAREHOLDERS |
Table of Contents
Schedule of Investments (Continued)
iSHARES® MSCI SOUTH KOREA INDEX FUND
August 31, 2006
Security | Principal | Value | |||||
WhistleJacket Capital Ltd. | |||||||
5.29% - 5.35%, 04/18/07 - 06/13/074 | $ | 671,711 | $ | 671,707 | |||
White Pine Finance LLC | |||||||
5.29% - 5.35%, 05/22/07 - 08/20/074 | 2,686,846 | 2,686,295 | |||||
Wind Master Trust | |||||||
5.31% - 5.32%, 09/25/06 - 07/25/074 | 568,008 | 568,008 | |||||
| 59,226,104 | |||||||
TOTAL SHORT-TERM INVESTMENTS | 109,032,504 | ||||||
TOTAL INVESTMENTS IN SECURITIES – 106.64% | 1,728,929,233 | ||||||
Other Assets, Less Liabilities – (6.64)% | (107,595,545 | ) | |||||
NET ASSETS – 100.00% | $ | 1,621,333,688 | |||||
ADR – American Depositary Receipts
| 1 | All or a portion of this security represents a security on loan. See Note 5. |
| 2 | Non-income earning security. |
| 3 | All or a portion of this security (these securities) represent(s) an investment of securities lending collateral. See Note 5. |
| 4 | This security or a portion of these securities may be resold to qualified institutional buyers under Rule 144A or pursuant to Section 4(2) of the Securities Act of 1933. |
| 5 | Affiliated issuer. See Note 2. |
| 6 | The rate quoted is the annualized seven-day yield of the fund at period end. |
| 7 | The investment adviser has determined that this security or a portion of these securities is illiquid. |
See notes to the financial statements.
| SCHEDULESOF INVESTMENTS | 89 |
Table of Contents
Schedule of Investments
iSHARES® MSCI TAIWAN INDEX FUND
August 31, 2006
Security | Shares | Value | |||
COMMON STOCKS – 98.54% | |||||
AIRLINES – 0.39% | |||||
China Airlines1 | 9,039,907 | $ | 3,803,242 | ||
EVA Airways Corp. | 9,039,396 | 3,542,169 | |||
| 7,345,411 | |||||
APPAREL – 0.49% | |||||
Pou Chen Corp. | 12,654,541 | 9,244,888 | |||
| 9,244,888 | |||||
AUTO MANUFACTURERS – 0.43% | |||||
China Motor Co. Ltd. | 3,071,759 | 2,323,414 | |||
Yulon Motor Co. Ltd. | 6,026,483 | 5,812,298 | |||
| 8,135,712 | |||||
AUTO PARTS & EQUIPMENT – 0.15% | |||||
Cheng Shin Rubber Industry Co. Ltd. | 3,427,039 | 2,878,421 | |||
| 2,878,421 | |||||
BANKS – 8.02% | |||||
Chang Hwa Commercial Bank Ltd.1 | 30,130,446 | 17,847,621 | |||
Chinatrust Financial Holding Co. Ltd. | 43,867,566 | 28,716,465 | |||
E.Sun Financial Holding Co. Ltd. | 21,091,378 | 12,557,443 | |||
First Financial Holding Co. Ltd. | 30,882,867 | 19,794,304 | |||
Hua Nan Financial Holdings Co. Ltd. | 24,104,965 | 15,157,132 | |||
Mega Financial Holding Co. Ltd. | 63,273,136 | 41,996,295 | |||
Taishin Financial Holdings Co. Ltd.1 | 33,143,439 | 15,806,561 | |||
| 151,875,821 | |||||
BUILDING MATERIALS – 1.21% | |||||
Asia Cement Corp. | 9,761,860 | 6,479,242 | |||
Taiwan Cement Corp. | 18,361,156 | 12,242,630 | |||
Taiwan Glass Industrial Corp. | 6,026,288 | 4,164,582 | |||
| 22,886,454 | |||||
CHEMICALS – 7.16% | |||||
Eternal Chemical Co. Ltd. | 3,319,911 | 4,396,966 | |||
Formosa Chemicals & Fibre Co. | 21,091,393 | 30,400,565 | |||
Formosa Plastic Co. | 30,130,111 | 41,003,310 | |||
Nan Ya Plastic Corp. | 36,156,447 | 48,874,906 | |||
Oriental Union Chemical Corp. | 3,465,063 | 1,852,525 | |||
Taiwan Fertilizer Co. Ltd. | 6,026,000 | 9,060,966 | |||
| 135,589,238 | |||||
COMMERCIAL SERVICES – 0.28% | |||||
Taiwan Secom Co. Ltd. | 3,013,610 | 5,346,137 | |||
| 5,346,137 | |||||
COMPUTERS – 10.47% | |||||
Acer Inc. | 18,078,663 | 27,897,815 | |||
Advantech Co. Ltd. | 3,057,733 | 8,638,189 | |||
Benq Corp.1 | 15,065,019 | 7,802,508 | |||
CMC Magnetics Corp.1 | 21,091,400 | 5,228,002 | |||
Compal Electronics Inc. | 24,104,547 | 21,087,818 | |||
Foxconn Technology Co. Ltd. | 3,013,065 | 22,790,194 | |||
High Tech Computer Corp. | 2,011,200 | 50,707,655 | |||
Inventec Co. Ltd. | 12,052,284 | 7,322,165 | |||
Lite-On Technology Corp.1 | 15,065,011 | 18,693,976 | |||
Mitac International | 6,618,059 | 6,734,659 | |||
Quanta Computer Inc. | 12,291,075 | 17,622,683 | |||
Ritek Corp.1 | 18,078,389 | 3,811,179 | |||
| 198,336,843 | |||||
DIVERSIFIED FINANCIAL SERVICES – 3.37% | |||||
Fubon Financial Holding Co. Ltd. | 27,117,000 | 20,181,242 | |||
Fuhwa Financial Holdings Co. Ltd.1 | 12,052,821 | 5,107,438 | |||
Polaris Securities Co. Ltd.1 | 9,499,156 | 4,039,738 | |||
SinoPac Financial Holdings Co. Ltd. | 42,182,193 | 18,451,506 | |||
Waterland Financial Holdings | 12,052,000 | 3,404,727 | |||
Yuanta Core Pacific Securities Co. Ltd. | 18,279,644 | 12,549,209 | |||
| 63,733,860 | |||||
ELECTRICAL COMPONENTS & EQUIPMENT – 2.40% | |||||
Delta Electronics Inc. | 9,512,834 | 26,440,593 | |||
Pacific Electric Wire & Cable Co. Ltd.1,2 | 986 | — | |||
Phoenixtec Power Co. Ltd. | 3,013,438 | 3,084,838 | |||
Tatung Co. Ltd.1 | 27,117,120 | 8,566,770 | |||
Walsin Lihwa Corp.1 | 18,078,069 | 7,358,631 | |||
| 45,450,832 | |||||
ELECTRONICS – 19.01% | |||||
Asustek Computer Inc. | 18,078,556 | 40,528,476 | |||
AU Optronics Corp. | 40,340,127 | 59,676,919 | |||
Cheng Uei Precision Industry Co. Ltd. | 1,003,000 | 3,701,838 | |||
Chi Mei Optoelectronics Corp. | 25,265,216 | 29,931,453 | |||
| 90 | 2006 iSHARES ANNUAL REPORTTO SHAREHOLDERS |
Table of Contents
Schedule of Investments (Continued)
iSHARES® MSCI TAIWAN INDEX FUND
August 31, 2006
Security | Shares | Value | |||
Chunghwa Picture Tubes Ltd.1 | 45,195,105 | $ | 8,937,428 | ||
Compeq Manufacturing Co. Ltd.1 | 6,026,200 | 2,654,310 | |||
Gigabyte Technology Co. Ltd. | 3,013,017 | 1,876,271 | |||
HannStar Display Corp.1 | 36,156,000 | 4,843,498 | |||
Hon Hai Precision Industry Co. Ltd. | 28,923,376 | 162,979,534 | |||
Micro-Star International Co. Ltd. | 3,344,429 | 1,564,526 | |||
Nan Ya Printed Circuit Board Corp. | 450,000 | 3,711,270 | |||
Optimax Technology Corp.1 | 3,013,157 | 2,425,536 | |||
Phoenix Precision Technology Corp. | 3,437,814 | 5,096,152 | |||
Quanta Display Inc.1 | 24,104,541 | 10,031,355 | |||
Synnex Technology International Corp. | 6,026,946 | 5,345,894 | |||
Wintek Corp. | 6,663,537 | 5,556,321 | |||
Ya Hsin Industrial Co. Ltd. | 6,327,461 | 4,930,115 | |||
Yageo Corp.1 | 18,078,100 | 6,232,881 | |||
| 360,023,777 | |||||
FOOD – 0.85% | |||||
Uni-President Enterprises Co. | 21,091,637 | 16,081,412 | |||
| 16,081,412 | |||||
FOREST PRODUCTS & PAPER – 0.16% | |||||
Yuen Foong Yu Paper Manufacturing Co. Ltd. | 9,039,360 | 3,116,547 | |||
| 3,116,547 | |||||
HOME FURNISHINGS – 0.38% | |||||
Nien Made Enterprise Co. Ltd. | 3,013,443 | 2,361,690 | |||
Teco Electric and Machinery Co. Ltd. | 15,065,092 | 4,850,850 | |||
| 7,212,540 | |||||
INSURANCE – 4.83% | |||||
Cathay Financial Holding Co. Ltd. | 39,169,905 | 74,841,647 | |||
Shin Kong Financial Holding Co. Ltd. | 19,220,832 | 16,640,149 | |||
| 91,481,796 | |||||
INVESTMENT COMPANIES – 1.35% | |||||
China Development Financial Holding Co.1 | 66,286,338 | 25,572,190 | |||
| 25,572,190 | |||||
IRON & STEEL – 2.58% | |||||
China Steel Corp. | 60,260,467 | 48,874,680 | |||
| 48,874,680 | |||||
LEISURE TIME – 0.22% | |||||
Giant Manufacturing Co. Ltd. | 3,013,914 | 4,261,777 | |||
| 4,261,777 | |||||
MANUFACTURING – 0.63% | |||||
Largan Precision Co. Ltd. | 320,000 | 6,629,405 | |||
Premier Image Technology Corp. | 3,183,879 | 5,222,645 | |||
| 11,852,050 | |||||
METAL FABRICATE & HARDWARE – 1.05% | |||||
Catcher Technology Co. Ltd. | 2,113,707 | 16,565,504 | |||
Yieh Phui Enterprise | 9,039,078 | 3,349,840 | |||
| 19,915,344 | |||||
MULTIPLE UTILITIES – 0.28% | |||||
Fu Sheng Industrial Co. Ltd. | 6,026,292 | 5,290,396 | |||
| 5,290,396 | |||||
OFFICE & BUSINESS EQUIPMENT – 0.16% | |||||
Kinpo Electronics Inc. | 9,039,181 | 3,047,841 | |||
| 3,047,841 | |||||
OIL & GAS – 1.26% | |||||
Formosa Petrochemical Corp. | 12,052,000 | 23,796,476 | |||
| 23,796,476 | |||||
REAL ESTATE – 0.27% | |||||
Cathay Real Estate Development Co. Ltd.1 | 9,039,493 | 5,066,180 | |||
| 5,066,180 | |||||
RETAIL – 0.32% | |||||
President Chain Store Corp. | 3,013,640 | 6,133,471 | |||
| 6,133,471 | |||||
SEMICONDUCTORS – 25.19% | |||||
Advanced Semiconductor Engineering Inc. | 24,104,690 | 24,749,044 | |||
Macronix International Co. Ltd.1 | 21,091,492 | 6,060,921 | |||
MediaTek Inc. | 6,026,462 | 54,919,156 | |||
Novatek Microelectronics Corp. Ltd. | 3,013,284 | 14,828,433 | |||
Realtek Semiconductor Corp. | 6,026,903 | 7,616,013 | |||
Siliconware Precision Industries Co. Ltd. | 16,508,240 | 19,557,150 | |||
Taiwan Semiconductor Manufacturing Co. Ltd. | 150,650,136 | 265,880,101 | |||
United Microelectronics Corp. | 129,559,262 | 70,840,422 | |||
| SCHEDULESOF INVESTMENTS | 91 |
Table of Contents
Schedule of Investments (Continued)
iSHARES® MSCI TAIWAN INDEX FUND
August 31, 2006
Security | Shares | Value | |||
Via Technologies Inc.1 | 6,160,861 | $ | 4,978,096 | ||
Winbond Electronics Corp.1 | 27,117,280 | 7,520,679 | |||
| 476,950,015 | |||||
TELECOMMUNICATIONS – 4.02% | |||||
Accton Technology Corp.1 | 6,026,259 | 2,947,229 | |||
Chunghwa Telecom Co. Ltd. | 30,130,800 | 49,424,763 | |||
D-Link Corp. | 3,317,001 | 3,254,530 | |||
Taiwan Cellular Corp. | 18,078,920 | 16,804,828 | |||
Zyxel Communications Corp. | 3,013,250 | 3,702,490 | |||
| 76,133,840 | |||||
TEXTILES – 0.83% | |||||
Far Eastern Textile Ltd. | 18,078,612 | 12,685,782 | |||
Formosa Taffeta Co. Ltd. | 6,026,515 | 2,983,967 | |||
| 15,669,749 | |||||
TRANSPORTATION – 0.78% | |||||
Evergreen Marine Corp. Ltd. | 6,447,467 | 3,574,310 | |||
U-Ming Marine Transport Corp. | 3,013,800 | 3,172,180 | |||
Wan Hai Lines Ltd. | 6,628,794 | 3,574,152 | |||
Yang Ming Marine Transport Corp. | 9,039,667 | 4,544,547 | |||
| 14,865,189 | |||||
TOTAL COMMON STOCKS | 1,866,168,887 | ||||
SHORT-TERM INVESTMENTS – 0.03% | |||||
MONEY MARKET FUNDS – 0.03% | |||||
Barclays Global Investors Funds Institutional Money Market Fund, Institutional Shares | |||||
5.30%3,4 | 482,401 | 482,401 | |||
| 482,401 | |||||
TOTAL SHORT-TERM INVESTMENTS | 482,401 | ||||
TOTAL INVESTMENTS IN SECURITIES – 98.57% | 1,866,651,288 | ||||
Other Assets, Less Liabilities – 1.43% | 27,099,277 | ||||
NET ASSETS – 100.00% | $ | 1,893,750,565 | |||
| 1 | Non-income earning security. |
| 2 | Security valued at fair value in accordance with procedures approved by the Board of Directors. See Note 1. |
| 3 | Affiliated issuer. See Note 2. |
| 4 | The rate quoted is the annualized seven-day yield of the fund at period end. |
See notes to the financial statements.
| 92 | 2006 iSHARES ANNUAL REPORTTO SHAREHOLDERS |
Table of Contents
Statements of Assets and Liabilities
iSHARES®, INC.
August 31, 2006
| iShares MSCI | ||||||||||||||||||||||||
Australia Index Fund | Brazil Index Fund | Canada Index Fund | Emerging Markets Index Fund | Hong Kong Index Fund | Malaysia Index Fund | |||||||||||||||||||
ASSETS | ||||||||||||||||||||||||
Investments, at cost: | ||||||||||||||||||||||||
Unaffiliated issuers | $ | 608,082,471 | $ | 1,966,158,506 | $ | 934,915,744 | $ | 10,653,117,183 | $ | 808,618,799 | $ | 267,510,586 | ||||||||||||
Affiliated issuersa | $ | 31,715 | $ | 4,889,243 | $ | 400,763 | $ | 226,386,802 | $ | 697,658 | $ | 463 | ||||||||||||
Foreign currencies, at cost | $ | 1,377,659 | $ | — | $ | 2,592,348 | $ | 25,227,070 | $ | 965,384 | $ | 805,517 | ||||||||||||
Investments in securities, at value (including securities on loanb) | ||||||||||||||||||||||||
Unaffiliated issuers | $ | 692,999,730 | $ | 2,459,360,409 | $ | 1,096,999,854 | $ | 12,384,230,338 | $ | 913,146,967 | $ | 372,816,688 | ||||||||||||
Affiliated issuersa | 31,715 | 4,889,243 | 400,763 | 272,419,971 | 697,658 | 463 | ||||||||||||||||||
Foreign currencies, at value | 1,384,278 | — | 2,596,172 | 25,471,147 | 965,545 | 805,103 | ||||||||||||||||||
Receivables: | ||||||||||||||||||||||||
Investment securities sold | 905,182 | 14,119,254 | 3,492,243 | 282,865,328 | — | 9,889,460 | ||||||||||||||||||
Dividends and interest | 4,927,604 | 4,006,534 | 1,319,783 | 37,501,039 | 905,872 | 1,209,423 | ||||||||||||||||||
Total Assets | 700,248,509 | 2,482,375,440 | 1,104,808,815 | 13,002,487,823 | 915,716,042 | 384,721,137 | ||||||||||||||||||
LIABILITIES | ||||||||||||||||||||||||
Payables: | ||||||||||||||||||||||||
Investment securities purchased | 1,403,197 | 12,668,088 | 3,161,430 | 317,027,569 | — | 984,284 | ||||||||||||||||||
Collateral for securities on loan (Note 5) | 12,136,617 | — | — | 708,316,211 | 32,627,046 | — | ||||||||||||||||||
Capital shares redeemed | — | — | — | — | — | 9,226,127 | ||||||||||||||||||
Investment advisory fees (Note 2) | 301,689 | 1,412,428 | 486,650 | 7,763,885 | 377,017 | 176,784 | ||||||||||||||||||
Total Liabilities | 13,841,503 | 14,080,516 | 3,648,080 | 1,033,107,665 | 33,004,063 | 10,387,195 | ||||||||||||||||||
NET ASSETS | $ | 686,407,006 | $ | 2,468,294,924 | $ | 1,101,160,735 | $ | 11,969,380,158 | $ | 882,711,979 | $ | 374,333,942 | ||||||||||||
Net assets consist of: | ||||||||||||||||||||||||
Paid-in capital | $ | 600,363,943 | $ | 2,008,012,075 | $ | 943,118,491 | $ | 10,162,065,498 | $ | 785,437,675 | $ | 321,892,491 | ||||||||||||
Undistributed net investment income | 13,312,374 | 35,080,996 | 7,159,513 | 156,423,079 | 14,227,248 | 5,608,095 | ||||||||||||||||||
Accumulated net realized loss | (12,212,302 | ) | (68,013,321 | ) | (11,212,421 | ) | (126,514,429 | ) | (21,481,264 | ) | (58,471,267 | ) | ||||||||||||
Net unrealized appreciation on investments and translation of assets and liabilities in foreign currencies | 84,942,991 | 493,215,174 | 162,095,152 | 1,777,406,010 | 104,528,320 | 105,304,623 | ||||||||||||||||||
NET ASSETS | $ | 686,407,006 | $ | 2,468,294,924 | $ | 1,101,160,735 | $ | 11,969,380,158 | $ | 882,711,979 | $ | 374,333,942 | ||||||||||||
Shares outstanding | 31,800,000 | 63,150,000 | 44,600,000 | 122,850,000 | 62,175,000 | 48,300,000 | ||||||||||||||||||
Net asset value per share | $ | 21.59 | $ | 39.09 | $ | 24.69 | $ | 97.43 | $ | 14.20 | $ | 7.75 | ||||||||||||
| a | See Note 2. |
| b | Securities on loan with market values of $11,576,861, $–, $–, $658,306,726, $30,792,281 and $–, respectively. See Note 5. |
See notes to the financial statements.
| FINANCIAL STATEMENTS | 93 |
Table of Contents
Statements of Assets and Liabilities (Continued)
iSHARES®, INC.
August 31, 2006
| iShares MSCI | ||||||||||||||||||||||||
Mexico Index Fund | Pacific ex-Japan Index Fund | Singapore Index Fund | South Africa Index Fund | South Korea Index Fund | Taiwan Index Fund | |||||||||||||||||||
ASSETS | ||||||||||||||||||||||||
Investments, at cost: | ||||||||||||||||||||||||
Unaffiliated issuers | $ | 821,808,172 | $ | 1,670,533,843 | $ | 503,020,086 | $ | 340,521,315 | $ | 1,209,722,672 | $ | 1,685,586,827 | ||||||||||||
Affiliated issuersa | $ | 592,868 | $ | 177,436 | $ | 345,991 | $ | 115,792 | $ | 2,285,879 | $ | 482,401 | ||||||||||||
Foreign currencies, at cost | $ | 145,060 | $ | 7,548,634 | $ | 4,952,678 | $ | 694,584 | $ | — | $ | 7,835,150 | ||||||||||||
Investments in securities, at value (including securities on loanb) (Note 1): | ||||||||||||||||||||||||
Unaffiliated issuers | $ | 841,799,121 | $ | 2,121,760,161 | $ | 575,219,936 | $ | 297,523,794 | $ | 1,726,643,354 | $ | 1,866,168,887 | ||||||||||||
Affiliated issuersa | 592,868 | 177,436 | 345,991 | 115,792 | 2,285,879 | 482,401 | ||||||||||||||||||
Foreign currencies, at value | 145,060 | 7,600,093 | 4,964,977 | 685,087 | — | 7,821,519 | ||||||||||||||||||
Receivables: | ||||||||||||||||||||||||
Investment securities sold | 1,437,186 | — | 1,909,696 | — | — | 34,747,586 | ||||||||||||||||||
Dividends and interest | 82,719 | 13,116,287 | 5,438,507 | 122,742 | 88,769 | 23,289,787 | ||||||||||||||||||
Total Assets | 844,056,954 | 2,142,653,977 | 587,879,107 | 298,447,415 | 1,729,018,002 | 1,932,510,180 | ||||||||||||||||||
LIABILITIES | ||||||||||||||||||||||||
Payables: | ||||||||||||||||||||||||
Investment securities purchased | 1,542,549 | 2,800,790 | 3,973,655 | 377,219 | — | 35,973,859 | ||||||||||||||||||
Collateral for securities on loan (Note 5) | 78,071,629 | 44,056,901 | 9,026,250 | — | 106,746,625 | — | ||||||||||||||||||
Foreign taxes | — | — | — | — | — | 1,686,725 | ||||||||||||||||||
Investment advisory fees (Note 2) | 335,624 | 865,364 | 259,439 | 172,328 | 937,689 | 1,099,031 | ||||||||||||||||||
Total Liabilities | 79,949,802 | 47,723,055 | 13,259,344 | 549,547 | 107,684,314 | 38,759,615 | ||||||||||||||||||
NET ASSETS | $ | 764,107,152 | $ | 2,094,930,922 | $ | 574,619,763 | $ | 297,897,868 | $ | 1,621,333,688 | $ | 1,893,750,565 | ||||||||||||
Net assets consist of: | ||||||||||||||||||||||||
Paid-in capital | $ | 747,007,096 | $ | 1,623,444,288 | $ | 501,165,285 | $ | 339,314,380 | $ | 1,180,880,055 | $ | 1,827,014,735 | ||||||||||||
Undistributed net investment income | 5,968,807 | 37,257,104 | 18,893,779 | 6,243,135 | 10,954,387 | 44,460,389 | ||||||||||||||||||
Accumulated net realized loss | (8,859,746 | ) | (17,110,244 | ) | (17,661,261 | ) | (4,652,374 | ) | (87,421,436 | ) | (158,180,336 | ) | ||||||||||||
Net unrealized appreciation (depreciation) on investments and translation of assets and liabilities in foreign currencies | 19,990,995 | 451,339,774 | 72,221,960 | (43,007,273 | ) | 516,920,682 | 180,455,777 | |||||||||||||||||
NET ASSETS | $ | 764,107,152 | $ | 2,094,930,922 | $ | 574,619,763 | $ | 297,897,868 | $ | 1,621,333,688 | $ | 1,893,750,565 | ||||||||||||
Shares outstanding | 18,500,000 | 18,700,000 | 63,100,000 | 3,050,000 | 35,250,000 | 150,650,000 | ||||||||||||||||||
Net asset value per share | $ | 41.30 | $ | 112.03 | $ | 9.11 | $ | 97.67 | $ | 46.00 | $ | 12.57 | ||||||||||||
| a | See Note 2. |
| b | Securities on loan with market values of $71,552,227, $41,641,179, $8,310,276, $–, $102,468,841 and $–, respectively. See Note 5. |
See notes to the financial statements.
| 94 | 2006 iSHARES ANNUAL REPORTTO SHAREHOLDERS |
Table of Contents
Statements of Operations
iSHARES®, INC.
Year ended August 31, 2006
| iShares MSCI | ||||||||||||||||||||||||
| Australia Index Fund | Brazil Index Fund | Canada Index Fund | Emerging Markets Index Fund | Hong Kong Index Fund | Malaysia Index Fund | |||||||||||||||||||
NET INVESTMENT INCOME | ||||||||||||||||||||||||
Dividends from unaffiliated issuersa | $ | 23,010,336 | $ | 54,486,448 | $ | 13,601,025 | $ | 262,059,590 | $ | 25,264,722 | $ | 16,579,922 | ||||||||||||
Dividends from affiliated issuersb | — | — | — | 7,010,601 | — | — | ||||||||||||||||||
Interest from affiliated issuersb | 5,946 | 165,134 | 19,579 | 533,655 | 22,999 | 8,001 | ||||||||||||||||||
Securities lending incomec | 42,933 | 1,515 | — | 6,885,228 | 155,076 | — | ||||||||||||||||||
Total investment income | 23,059,215 | 54,653,097 | 13,620,604 | 276,489,074 | 25,442,797 | 16,587,923 | ||||||||||||||||||
EXPENSES | ||||||||||||||||||||||||
Investment advisory fees (Note 2) | 2,886,094 | 11,373,859 | 4,487,238 | 81,638,096 | 4,007,032 | 2,225,756 | ||||||||||||||||||
Proxy fees | 16,687 | 17,643 | 14,588 | 174,862 | 26,612 | 13,719 | ||||||||||||||||||
Foreign taxes (Note 1) | — | — | — | 2,163,076 | — | — | ||||||||||||||||||
Total expenses | 2,902,781 | 11,391,502 | 4,501,826 | 83,976,034 | 4,033,644 | 2,239,475 | ||||||||||||||||||
Less investment advisory fees waived | — | — | — | (409,336 | ) | — | — | |||||||||||||||||
Net expenses | 2,902,781 | 11,391,502 | 4,501,826 | 83,566,698 | 4,033,644 | 2,239,475 | ||||||||||||||||||
Net investment income | 20,156,434 | 43,261,595 | 9,118,778 | 192,922,376 | 21,409,153 | 14,348,448 | ||||||||||||||||||
NET REALIZED AND UNREALIZED GAIN (LOSS) | ||||||||||||||||||||||||
Net realized gain (loss) from: | ||||||||||||||||||||||||
Investments in unaffiliated issuers | (1,619,920 | ) | (13,430,737 | ) | 3,124,230 | (119,106,460 | ) | (7,551,550 | ) | (17,321,675 | ) | |||||||||||||
Investments in affiliated issuersb | — | — | — | 25,127,083 | — | — | ||||||||||||||||||
In-kind redemptions | 31,951,923 | — | 84,894,055 | 1,437,153,843 | 52,783,229 | — | ||||||||||||||||||
Foreign currency transactions | (77,745 | ) | (24,163 | ) | 286,027 | (2,231,351 | ) | (2,928 | ) | (21,741 | ) | |||||||||||||
Net realized gain (loss) | 30,254,258 | (13,454,900 | ) | 88,304,312 | 1,340,943,115 | 45,228,751 | (17,343,416 | ) | ||||||||||||||||
Net change in unrealized appreciation (depreciation) on: | ||||||||||||||||||||||||
Investments | 40,764,723 | 276,526,476 | 43,750,543 | 666,730,555 | 17,114,498 | 40,248,157 | ||||||||||||||||||
Translation of assets and liabilities in foreign currencies | 70,590 | (36,886 | ) | (10,151 | ) | 283,659 | 252 | 975 | ||||||||||||||||
Net change in unrealized appreciation (depreciation) | 40,835,313 | 276,489,590 | 43,740,392 | 667,014,214 | 17,114,750 | 40,249,132 | ||||||||||||||||||
Net realized and unrealized gain | 71,089,571 | 263,034,690 | 132,044,704 | 2,007,957,329 | 62,343,501 | 22,905,716 | ||||||||||||||||||
NET INCREASE IN NET ASSETS RESULTING FROM OPERATIONS | $ | 91,246,005 | $ | 306,296,285 | $ | 141,163,482 | $ | 2,200,879,705 | $ | 83,752,654 | $ | 37,254,164 | ||||||||||||
| a | Net of foreign withholding tax of $981,062, $4,538,128, $2,245,643, $26,396,985, $– and $–, respectively. |
| b | See Note 2. |
| c | Includes income earned from affiliated issuers. See Note 2. |
See notes to the financial statements.
| FINANCIAL STATEMENTS | 95 |
Table of Contents
Statements of Operations (Continued)
iSHARES®, INC.
Year ended August 31, 2006
| iShares MSCI | |||||||||||||||||||||||
Mexico Index Fund | Pacific ex-Japan Index Fund | Singapore Index Fund | South Africa Index Fund | South Korea Index Fund | Taiwan Index Fund | ||||||||||||||||||
NET INVESTMENT INCOME | |||||||||||||||||||||||
Dividends from unaffiliated issuersa | $ | 11,494,982 | $ | 76,262,269 | $ | 25,295,985 | $ | 10,217,204 | $ | 19,798,242 | $ | 59,059,225 | |||||||||||
Interest from affiliated issuersb | 17,739 | 21,949 | 11,895 | 6,525 | 138,813 | 48,544 | |||||||||||||||||
Securities lending incomec | 311,946 | 291,724 | 129,743 | — | 656,131 | — | |||||||||||||||||
Total investment income | 11,824,667 | 76,575,942 | 25,437,623 | 10,223,729 | 20,593,186 | 59,107,769 | |||||||||||||||||
EXPENSES | |||||||||||||||||||||||
Investment advisory fees (Note 2) | 2,439,770 | 9,175,781 | 2,583,523 | 2,039,466 | 10,213,486 | 11,442,524 | |||||||||||||||||
Proxy fees | 9,395 | 53,661 | 13,072 | 6,679 | 24,989 | 33,056 | |||||||||||||||||
Foreign taxes (Note 1) | — | — | — | — | 4,088 | 2,559,242 | |||||||||||||||||
Total expenses | 2,449,165 | 9,229,442 | 2,596,595 | 2,046,145 | 10,242,563 | 14,034,822 | |||||||||||||||||
Net investment income | 9,375,502 | 67,346,500 | 22,841,028 | 8,177,584 | 10,350,623 | 45,072,947 | |||||||||||||||||
NET REALIZED AND UNREALIZED GAIN (LOSS) | |||||||||||||||||||||||
Net realized gain (loss) from: | |||||||||||||||||||||||
Investments in unaffiliated issuers | (1,573,090 | ) | (7,555,835 | ) | 855,163 | (2,444,721 | ) | (55,305,596 | ) | (75,767,167 | ) | ||||||||||||
In-kind redemptions | 130,166,917 | 79,033,066 | 30,956,975 | 101,819,127 | — | — | |||||||||||||||||
Foreign currency transactions | 20,000 | (235,437 | ) | 14,423 | (70,927 | ) | 603,764 | (416,985 | ) | ||||||||||||||
Net realized gain (loss) | 128,613,827 | 71,241,794 | 31,826,561 | 99,303,479 | (54,701,832 | ) | (76,184,152 | ) | |||||||||||||||
Net change in unrealized appreciation (depreciation) on: | |||||||||||||||||||||||
Investments | (14,766,061 | ) | 162,853,032 | 28,353,863 | (94,996,383 | ) | 299,045,492 | 122,954,816 | |||||||||||||||
Translation of assets and liabilities in foreign currencies | (1,299 | ) | 259,420 | 56,529 | (12,787 | ) | — | 138,689 | |||||||||||||||
Net change in unrealized appreciation (depreciation) | (14,767,360 | ) | 163,112,452 | 28,410,392 | (95,009,170 | ) | 299,045,492 | 123,093,505 | |||||||||||||||
Net realized and unrealized gain | 113,846,467 | 234,354,246 | 60,236,953 | 4,294,309 | 244,343,660 | 46,909,353 | |||||||||||||||||
NET INCREASE IN NET ASSETS RESULTING FROM OPERATIONS | $ | 123,221,969 | $ | 301,700,746 | $ | 83,077,981 | $ | 12,471,893 | $ | 254,694,283 | $ | 91,982,300 | |||||||||||
| a | Net of foreign withholding tax of $296, $3,974,278, $–, $–, $3,572,689 and $14,426,026, respectively. |
| b | See Note 2. |
| c | Includes income earned from affiliated issuers. See Note 2. |
See notes to the financial statements.
| 96 | 2006 iSHARES ANNUAL REPORTTO SHAREHOLDERS |
Table of Contents
Statements of Changes in Net Assets
iSHARES®, INC.
iShares MSCI Australia Index Fund | iShares MSCI Brazil Index Fund | iShares MSCI Canada Index Fund | ||||||||||||||||||||||
| Year ended August 31, 2006 | Year ended August 31, 2005 | Year ended August 31, 2006 | Year ended August 31, 2005 | Year ended August 31, 2006 | Year ended August 31, 2005 | |||||||||||||||||||
INCREASE (DECREASE) IN NET ASSETS | ||||||||||||||||||||||||
OPERATIONS: | ||||||||||||||||||||||||
Net investment income | $ | 20,156,434 | $ | 12,124,245 | $ | 43,261,595 | $ | 15,454,311 | $ | 9,118,778 | $ | 3,368,699 | ||||||||||||
Net realized gain (loss) | 30,254,258 | 41,358,189 | (13,454,900 | ) | 5,767,383 | 88,304,312 | 65,992,553 | |||||||||||||||||
Net change in unrealized appreciation (depreciation) | 40,835,313 | 25,410,296 | 276,489,590 | 178,499,755 | 43,740,392 | 56,852,456 | ||||||||||||||||||
Net increase in net assets resulting from operations | 91,246,005 | 78,892,730 | 306,296,285 | 199,721,449 | 141,163,482 | 126,213,708 | ||||||||||||||||||
DISTRIBUTIONS TO SHAREHOLDERS: | ||||||||||||||||||||||||
From net investment income | (16,397,050 | ) | (9,320,851 | ) | (20,219,476 | ) | (8,052,116 | ) | (4,108,502 | ) | (3,453,495 | ) | ||||||||||||
Total distributions to shareholders | (16,397,050 | ) | (9,320,851 | ) | (20,219,476 | ) | (8,052,116 | ) | (4,108,502 | ) | (3,453,495 | ) | ||||||||||||
CAPITAL SHARE TRANSACTIONS: | ||||||||||||||||||||||||
Proceeds from shares sold | 336,128,324 | 231,751,585 | 1,649,177,320 | 274,248,148 | 727,046,964 | 141,711,605 | ||||||||||||||||||
Cost of shares redeemed | (93,925,541 | ) | (110,966,622 | ) | (19,244,643 | ) | (123,135,627 | ) | (183,241,984 | ) | (169,468,858 | ) | ||||||||||||
Net increase (decrease) in net assets from capital share transactions | 242,202,783 | 120,784,963 | 1,629,932,677 | 151,112,521 | 543,804,980 | (27,757,253 | ) | |||||||||||||||||
INCREASE IN NET ASSETS | 317,051,738 | 190,356,842 | 1,916,009,486 | 342,781,854 | 680,859,960 | 95,002,960 | ||||||||||||||||||
NET ASSETS | ||||||||||||||||||||||||
Beginning of year | 369,355,268 | 178,998,426 | 552,285,438 | 209,503,584 | 420,300,775 | 325,297,815 | ||||||||||||||||||
End of year | $ | 686,407,006 | $ | 369,355,268 | $ | 2,468,294,924 | $ | 552,285,438 | $ | 1,101,160,735 | $ | 420,300,775 | ||||||||||||
Undistributed net investment income included in net assets at end of year | $ | 13,312,374 | $ | 8,105,304 | $ | 35,080,996 | $ | 12,063,040 | $ | 7,159,513 | $ | 1,859,540 | ||||||||||||
SHARES ISSUED AND REDEEMED | ||||||||||||||||||||||||
Shares sold | 16,200,000 | 13,800,000 | 44,050,000 | 12,300,000 | 31,900,000 | 7,900,000 | ||||||||||||||||||
Shares redeemed | (4,600,000 | ) | (6,800,000 | ) | (500,000 | ) | (5,050,000 | ) | (8,000,000 | ) | (9,900,000 | ) | ||||||||||||
Net increase (decrease) in shares outstanding | 11,600,000 | 7,000,000 | 43,550,000 | 7,250,000 | 23,900,000 | (2,000,000 | ) | |||||||||||||||||
See notes to the financial statements.
| FINANCIAL STATEMENTS | 97 |
Table of Contents
Statements of Changes in Net Assets (Continued)
iSHARES®, INC.
iShares MSCI Emerging Markets Index Fund | iShares MSCI Hong Kong Index Fund | iShares MSCI Malaysia Index Fund | ||||||||||||||||||||||
Year ended August 31, 2006 | Year ended August 31, 2005 | Year ended August 31, 2006 | Year ended August 31, 2005 | Year ended August 31, 2006 | Year ended August 31, 2005 | |||||||||||||||||||
INCREASE (DECREASE) IN NET ASSETS | ||||||||||||||||||||||||
OPERATIONS: | ||||||||||||||||||||||||
Net investment income | $ | 192,922,376 | $ | 101,750,954 | $ | 21,409,153 | $ | 15,897,761 | $ | 14,348,448 | $ | 8,621,591 | ||||||||||||
Net realized gain (loss) | 1,340,943,115 | 270,957,406 | 45,228,751 | 41,822,193 | (17,343,416 | ) | (5,786,512 | ) | ||||||||||||||||
Net change in unrealized appreciation (depreciation) | 667,014,214 | 1,082,325,240 | 17,114,750 | 51,243,020 | 40,249,132 | 24,392,465 | ||||||||||||||||||
Net increase in net assets resulting from operations | 2,200,879,705 | 1,455,033,600 | 83,752,654 | 108,962,974 | 37,254,164 | 27,227,544 | ||||||||||||||||||
DISTRIBUTIONS TO SHAREHOLDERS: | ||||||||||||||||||||||||
From net investment income | (113,762,995 | ) | (45,604,575 | ) | (17,872,090 | ) | (14,195,028 | ) | (14,088,338 | ) | (6,156,574 | ) | ||||||||||||
Total distributions to shareholders | (113,762,995 | ) | (45,604,575 | ) | (17,872,090 | ) | (14,195,028 | ) | (14,088,338 | ) | (6,156,574 | ) | ||||||||||||
CAPITAL SHARE TRANSACTIONS: | ||||||||||||||||||||||||
Proceeds from shares sold | 6,532,568,942 | 4,407,630,562 | 385,690,233 | 251,633,472 | 210,424,492 | 155,029,612 | ||||||||||||||||||
Cost of shares redeemed | (3,651,163,544 | ) | (774,797,887 | ) | (206,843,656 | ) | (158,339,373 | ) | (246,831,356 | ) | (12,743,715 | ) | ||||||||||||
Net increase (decrease) in net assets from capital share transactions | 2,881,405,398 | 3,632,832,675 | 178,846,577 | 93,294,099 | (36,406,864 | ) | 142,285,897 | |||||||||||||||||
INCREASE (DECREASE) IN NET ASSETS | 4,968,522,108 | 5,042,261,700 | 244,727,141 | 188,062,045 | (13,241,038 | ) | 163,356,867 | |||||||||||||||||
NET ASSETS | ||||||||||||||||||||||||
Beginning of year | 7,000,858,050 | 1,958,596,350 | 637,984,838 | 449,922,793 | 387,574,980 | 224,218,113 | ||||||||||||||||||
End of year | $ | 11,969,380,158 | $ | 7,000,858,050 | $ | 882,711,979 | $ | 637,984,838 | $ | 374,333,942 | $ | 387,574,980 | ||||||||||||
Undistributed net investment income included in net assets at end of year | $ | 156,423,079 | $ | 79,495,049 | $ | 14,227,248 | $ | 10,655,366 | $ | 5,608,095 | $ | 5,217,709 | ||||||||||||
SHARES ISSUED AND REDEEMED | ||||||||||||||||||||||||
Shares sold | 71,850,000 | 64,200,000 | 28,575,000 | 21,225,000 | 27,900,000 | 21,525,000 | ||||||||||||||||||
Shares redeemed | (38,850,000 | ) | (10,650,000 | ) | (15,450,000 | ) | (13,425,000 | ) | (33,525,000 | ) | (1,875,000 | ) | ||||||||||||
Net increase (decrease) in shares outstanding | 33,000,000 | 53,550,000 | 13,125,000 | 7,800,000 | (5,625,000 | ) | 19,650,000 | |||||||||||||||||
See notes to the financial statements.
| 98 | 2006 iSHARES ANNUAL REPORTTO SHAREHOLDERS |
Table of Contents
Statements of Changes in Net Assets (Continued)
iSHARES®, INC.
iShares MSCI Mexico Index Fund | iShares MSCI Pacific ex-Japan Index Fund | iShares MSCI Singapore Index Fund | ||||||||||||||||||||||
| Year ended August 31, 2006 | Year ended August 31, 2005 | Year ended August 31, 2006 | Year ended August 31, 2005 | Year ended August 31, 2006 | Year ended August 31, 2005 | |||||||||||||||||||
INCREASE (DECREASE) IN NET ASSETS | ||||||||||||||||||||||||
OPERATIONS: | ||||||||||||||||||||||||
Net investment income | $ | 9,375,502 | $ | 3,735,218 | $ | 67,346,500 | $ | 45,282,099 | $ | 22,841,028 | $ | 12,623,106 | ||||||||||||
Net realized gain (loss) | 128,613,827 | 37,753,990 | 71,241,794 | (1,734,816 | ) | 31,826,561 | 9,360,636 | |||||||||||||||||
Net change in unrealized appreciation (depreciation) | (14,767,360 | ) | 42,547,925 | 163,112,452 | 222,348,152 | 28,410,392 | 23,676,470 | |||||||||||||||||
Net increase in net assets resulting from operations | 123,221,969 | 84,037,133 | 301,700,746 | 265,895,435 | 83,077,981 | 45,660,212 | ||||||||||||||||||
DISTRIBUTIONS TO SHAREHOLDERS: | ||||||||||||||||||||||||
From net investment income | (6,377,728 | ) | (2,048,280 | ) | (62,872,256 | ) | (31,933,222 | ) | (14,378,298 | ) | (7,420,067 | ) | ||||||||||||
Total distributions to shareholders | (6,377,728 | ) | (2,048,280 | ) | (62,872,256 | ) | (31,933,222 | ) | (14,378,298 | ) | (7,420,067 | ) | ||||||||||||
CAPITAL SHARE TRANSACTIONS: | ||||||||||||||||||||||||
Proceeds from shares sold | 939,038,789 | 229,047,163 | 508,919,684 | 636,895,214 | 245,347,020 | 156,094,475 | ||||||||||||||||||
Cost of shares redeemed | (547,333,327 | ) | (185,101,346 | ) | (174,924,729 | ) | — | (80,563,776 | ) | (23,244,294 | ) | |||||||||||||
Net increase in net assets from capital share transactions | 391,705,462 | 43,945,817 | 333,994,955 | 636,895,214 | 164,783,244 | 132,850,181 | ||||||||||||||||||
INCREASE IN NET ASSETS | 508,549,703 | 125,934,670 | 572,823,445 | 870,857,427 | 233,482,927 | 171,090,326 | ||||||||||||||||||
NET ASSETS | ||||||||||||||||||||||||
Beginning of year | 255,557,449 | 129,622,779 | 1,522,107,477 | 651,250,050 | 341,136,836 | 170,046,510 | ||||||||||||||||||
End of year | $ | 764,107,152 | $ | 255,557,449 | $ | 2,094,930,922 | $ | 1,522,107,477 | $ | 574,619,763 | $ | 341,136,836 | ||||||||||||
Undistributed net investment income included in net assets at end of year | $ | 5,968,807 | $ | 2,951,033 | $ | 37,257,104 | $ | 28,176,254 | $ | 18,893,779 | $ | 9,519,613 | ||||||||||||
SHARES ISSUED AND REDEEMED | ||||||||||||||||||||||||
Shares sold | 24,400,000 | 9,500,000 | 4,800,000 | 7,000,000 | 28,700,000 | 21,000,000 | ||||||||||||||||||
Shares redeemed | (14,700,000 | ) | (7,400,000 | ) | (1,700,000 | ) | — | (9,500,000 | ) | (3,200,000 | ) | |||||||||||||
Net increase in shares outstanding | 9,700,000 | 2,100,000 | 3,100,000 | 7,000,000 | 19,200,000 | 17,800,000 | ||||||||||||||||||
See notes to the financial statements.
| FINANCIAL STATEMENTS | 99 |
Table of Contents
Statements of Changes in Net Assets (Continued)
iSHARES®, INC.
iShares MSCI South Africa Index Fund | iShares MSCI South Korea Index Fund | iShares MSCI Taiwan Index Fund | ||||||||||||||||||||||
| Year ended August 31, 2006 | Year ended August 31, 2005 | Year ended August 31, 2006 | Year ended August 31, 2005 | Year ended August 31, 2006 | Year ended August 31, 2005 | |||||||||||||||||||
INCREASE (DECREASE) IN NET ASSETS | ||||||||||||||||||||||||
OPERATIONS: | ||||||||||||||||||||||||
Net investment income | $ | 8,177,584 | $ | 3,396,007 | $ | 10,350,623 | $ | 7,696,168 | $ | 45,072,947 | $ | 15,942,474 | ||||||||||||
Net realized gain (loss) | 99,303,479 | 11,282,685 | (54,701,832 | ) | (9,230,908 | ) | (76,184,152 | ) | (22,426,083 | ) | ||||||||||||||
Net change in unrealized appreciation (depreciation) | (95,009,170 | ) | 25,755,064 | 299,045,492 | 167,580,084 | 123,093,505 | 48,276,152 | |||||||||||||||||
Net increase in net assets resulting from operations | 12,471,893 | 40,433,756 | 254,694,283 | 166,045,344 | 91,982,300 | 41,792,543 | ||||||||||||||||||
DISTRIBUTIONS TO SHAREHOLDERS: | ||||||||||||||||||||||||
From net investment income | (4,618,354 | ) | (2,053,497 | ) | (7,841,332 | ) | (1,677,739 | ) | (16,050,567 | ) | (4,632,113 | ) | ||||||||||||
Total distributions to shareholders | (4,618,354 | ) | (2,053,497 | ) | (7,841,332 | ) | (1,677,739 | ) | (16,050,567 | ) | (4,632,113 | ) | ||||||||||||
CAPITAL SHARE TRANSACTIONS: | ||||||||||||||||||||||||
Proceeds from shares sold | 395,411,010 | 37,191,402 | 1,159,560,093 | 331,095,006 | 1,391,773,216 | 391,736,531 | ||||||||||||||||||
Cost of shares redeemed | (258,896,840 | ) | (14,923,708 | ) | (483,534,641 | ) | (112,471,028 | ) | (326,594,755 | ) | (66,484,667 | ) | ||||||||||||
Net increase in net assets from capital share transactions | 136,514,170 | 22,267,694 | 676,025,452 | 218,623,978 | 1,065,178,461 | 325,251,864 | ||||||||||||||||||
INCREASE IN NET ASSETS | 144,367,709 | 60,647,953 | 922,878,403 | 382,991,583 | 1,141,110,194 | 362,412,294 | ||||||||||||||||||
NET ASSETS | ||||||||||||||||||||||||
Beginning of year | 153,530,159 | 92,882,206 | 698,455,285 | 315,463,702 | 752,640,371 | 390,228,077 | ||||||||||||||||||
End of year | $ | 297,897,868 | $ | 153,530,159 | $ | 1,621,333,688 | $ | 698,455,285 | $ | 1,893,750,565 | $ | 752,640,371 | ||||||||||||
Undistributed net investment income included in net assets at end of year | $ | 6,243,135 | $ | 2,645,723 | $ | 10,954,387 | $ | 7,841,332 | $ | 44,460,389 | $ | 15,854,994 | ||||||||||||
SHARES ISSUED AND REDEEMED | ||||||||||||||||||||||||
Shares sold | 3,650,000 | 500,000 | 26,100,000 | 10,700,000 | 111,950,000 | 34,150,000 | ||||||||||||||||||
Shares redeemed | (2,450,000 | ) | (200,000 | ) | (10,950,000 | ) | (3,650,000 | ) | (26,350,000 | ) | (5,700,000 | ) | ||||||||||||
Net increase in shares outstanding | 1,200,000 | 300,000 | 15,150,000 | 7,050,000 | 85,600,000 | 28,450,000 | ||||||||||||||||||
See notes to the financial statements.
| 100 | 2006 iSHARES ANNUAL REPORTTO SHAREHOLDERS |
Table of Contents
iSHARES®, INC.
(For a share outstanding throughout each period)
| iShares MSCI Australia Index Fund | ||||||||||||||||||||
Year ended Aug. 31, 2006 | Year ended Aug. 31, 2005 | Year ended Aug. 31, 2004 | Year ended Aug. 31, 2003 | Year ended Aug. 31, 2002 | ||||||||||||||||
Net asset value, beginning of year | $ | 18.28 | $ | 13.56 | $ | 11.22 | $ | 9.36 | $ | 9.24 | ||||||||||
Income from investment operations: | ||||||||||||||||||||
Net investment incomea | 0.75 | 0.70 | 0.45 | 0.32 | 0.23 | |||||||||||||||
Net realized and unrealized gain (loss)b | 3.23 | 4.60 | 2.32 | 1.81 | (0.07 | ) | ||||||||||||||
Total from investment operations | 3.98 | 5.30 | 2.77 | 2.13 | 0.16 | |||||||||||||||
Less distributions from: | ||||||||||||||||||||
Net investment income | (0.67 | ) | (0.58 | ) | (0.43 | ) | (0.27 | ) | (0.04 | ) | ||||||||||
Total distributions | (0.67 | ) | (0.58 | ) | (0.43 | ) | (0.27 | ) | (0.04 | ) | ||||||||||
Net asset value, end of year | $ | 21.59 | $ | 18.28 | $ | 13.56 | $ | 11.22 | $ | 9.36 | ||||||||||
Total return | 22.35 | % | 39.58 | % | 24.95 | % | 23.33 | % | 1.74 | % | ||||||||||
Ratios/Supplemental data: | ||||||||||||||||||||
Net assets, end of year (000s) | $ | 686,407 | $ | 369,355 | $ | 178,998 | $ | 87,541 | $ | 76,731 | ||||||||||
Ratio of expenses to average net assets | 0.54 | % | 0.57 | % | 0.79 | % | 0.84 | % | 0.84 | % | ||||||||||
Ratio of net investment income to average net assets | 3.75 | % | 4.13 | % | 3.37 | % | 3.21 | % | 2.47 | % | ||||||||||
Portfolio turnover ratec | 7 | % | 17 | % | 9 | % | 8 | % | 5 | % | ||||||||||
| a | Based on average shares outstanding throughout each period. |
| b | The amounts reported may not accord with the change in aggregate gains and losses in securities due to the timing of capital share transactions. |
| c | Portfolio turnover rates exclude portfolio securities received or delivered as a result of processing capital share transactions in Creation Units. |
See notes to the financial statements.
| FINANCIAL HIGHLIGHTS | 101 |
Table of Contents
Financial Highlights (Continued)
iSHARES®, INC.
(For a share outstanding throughout each period)
| iShares MSCI Brazil Index Fund | ||||||||||||||||||||
Year ended Aug. 31, 2006 | Year ended Aug. 31, 2005 | Year ended Aug. 31, 2004 | Year ended Aug. 31, 2003 | Year ended Aug. 31, 2002 | ||||||||||||||||
Net asset value, beginning of year | $ | 28.18 | $ | 16.96 | $ | 12.19 | $ | 8.30 | $ | 11.20 | ||||||||||
Income from investment operations: | ||||||||||||||||||||
Net investment incomea | 1.00 | 0.89 | 0.55 | 0.32 | 0.38 | |||||||||||||||
Net realized and unrealized gain (loss)b | 10.49 | 10.79 | 4.49 | 3.68 | (3.28 | ) | ||||||||||||||
Total from investment operations | 11.49 | 11.68 | 5.04 | 4.00 | (2.90 | ) | ||||||||||||||
Less distributions from: | ||||||||||||||||||||
Net investment income | (0.58 | ) | (0.46 | ) | (0.27 | ) | (0.11 | ) | — | |||||||||||
Total distributions | (0.58 | ) | (0.46 | ) | (0.27 | ) | (0.11 | ) | — | |||||||||||
Net asset value, end of year | $ | 39.09 | $ | 28.18 | $ | 16.96 | $ | 12.19 | $ | 8.30 | ||||||||||
Total return | 41.13 | % | 69.72 | % | 41.42 | % | 48.85 | % | (25.89 | )% | ||||||||||
Ratios/Supplemental data: | ||||||||||||||||||||
Net assets, end of year (000s) | $ | 2,468,295 | $ | 552,285 | $ | 209,504 | $ | 103,035 | $ | 83,788 | ||||||||||
Ratio of expenses to average net assets | 0.70 | % | 0.74 | % | 0.96 | % | 0.99 | % | 0.99 | % | ||||||||||
Ratio of net investment income to average net assets | 2.65 | % | 3.94 | % | 3.59 | % | 3.59 | % | 3.50 | % | ||||||||||
Portfolio turnover ratec | 15 | % | 48 | % | 106 | % | 85 | % | 103 | % | ||||||||||
| a | Based on average shares outstanding throughout each period. |
| b | The amounts reported may not accord with the change in aggregate gains and losses in securities due to the timing of capital share transactions. |
| c | Portfolio turnover rates include portfolio transactions that are executed as a result of the Fund processing capital share transactions in Creation Units solely for cash in U.S. dollars. Excluding such transactions, the portfolio turnover rate for the years ended August 31, 2006 and August 31, 2005 would have been 13% and 9%, respectively. See Note 4. |
See notes to the financial statements.
| 102 | 2006 iSHARES ANNUAL REPORTTO SHAREHOLDERS |
Table of Contents
Financial Highlights (Continued)
iSHARES®, INC.
(For a share outstanding throughout each period)
| iShares MSCI Canada Index Fund | ||||||||||||||||||||
Year ended Aug. 31, 2006 | Year ended Aug. 31, 2005 | Year ended Aug. 31, 2004 | Year ended Aug. 31, 2003 | Year ended Aug. 31, 2002 | ||||||||||||||||
Net asset value, beginning of year | $ | 20.30 | $ | 14.33 | $ | 12.25 | $ | 9.49 | $ | 10.70 | ||||||||||
Income from investment operations: | ||||||||||||||||||||
Net investment incomea | 0.25 | 0.17 | 0.11 | 0.10 | 0.07 | |||||||||||||||
Net realized and unrealized gain (loss)b | 4.29 | 6.00 | 2.17 | 2.69 | (1.27 | ) | ||||||||||||||
Total from investment operations | 4.54 | 6.17 | 2.28 | 2.79 | (1.20 | ) | ||||||||||||||
Less distributions from: | ||||||||||||||||||||
Net investment income | (0.15 | ) | (0.20 | ) | (0.20 | ) | (0.03 | ) | (0.01 | ) | ||||||||||
Total distributions | (0.15 | ) | (0.20 | ) | (0.20 | ) | (0.03 | ) | (0.01 | ) | ||||||||||
Net asset value, end of year | $ | 24.69 | $ | 20.30 | $ | 14.33 | $ | 12.25 | $ | 9.49 | ||||||||||
Total return | 22.46 | % | 43.35 | % | 18.70 | % | 29.47 | % | (11.23 | )% | ||||||||||
Ratios/Supplemental data: | ||||||||||||||||||||
Net assets, end of year (000s) | $ | 1,101,161 | $ | 420,301 | $ | 325,298 | $ | 503,407 | $ | 66,420 | ||||||||||
Ratio of expenses to average net assets | 0.54 | % | 0.57 | % | 0.70 | %c | 0.84 | % | 0.84 | % | ||||||||||
Ratio of net investment income to average net assets | 1.09 | % | 1.00 | % | 0.81 | % | 0.98 | % | 0.70 | % | ||||||||||
Portfolio turnover rated | 20 | % | 9 | % | 10 | % | 10 | % | 5 | % | ||||||||||
| a | Based on average shares outstanding throughout each period. |
| b | The amounts reported may not accord with the change in aggregate gains and losses in securities due to the timing of capital share transactions. |
| c | Ratio of expenses to average net assets prior to voluntary reimbursed distribution fees for the year ended August 31, 2004 was 0.80%. |
| d | Portfolio turnover rates exclude portfolio securities received or delivered as a result of processing capital share transactions in Creation Units. |
See notes to the financial statements.
| FINANCIAL HIGHLIGHTS | 103 |
Table of Contents
Financial Highlights (Continued)
iSHARES®, INC.
(For a share outstanding throughout each period)
| iShares MSCI Emerging Markets Index Fund | ||||||||||||||||
Year ended Aug. 31, 2006 | Year ended Aug. 31, 2005b | Year ended Aug. 31, 2004b | Period from Apr. 7, 2003a to Aug. 31, 2003b | |||||||||||||
Net asset value, beginning of period | $ | 77.92 | $ | 53.96 | $ | 45.13 | $ | 33.75 | ||||||||
Income from investment operations: | ||||||||||||||||
Net investment incomec | 1.65 | 1.65 | 1.13 | 0.26 | ||||||||||||
Net realized and unrealized gaind | 18.85 | 24.72 | 7.97 | 11.12 | ||||||||||||
Total from investment operations | 20.50 | 26.37 | 9.10 | 11.38 | ||||||||||||
Less distributions from: | ||||||||||||||||
Net investment income | (0.99 | ) | (2.41 | ) | (0.27 | ) | — | |||||||||
Total distributions | (0.99 | ) | (2.41 | ) | (0.27 | ) | — | |||||||||
Net asset value, end of period | $ | 97.43 | $ | 77.92 | $ | 53.96 | $ | 45.13 | ||||||||
Total return | 26.44 | % | 46.17 | % | 20.21 | % | 33.72 | %e | ||||||||
Ratios/Supplemental data: | ||||||||||||||||
Net assets, end of period (000s) | $ | 11,969,380 | $ | 7,000,858 | $ | 1,958,596 | $ | 297,846 | ||||||||
Ratio of expenses to average net assets prior to | 0.77 | % | 0.78 | % | 0.77 | % | 0.78 | % | ||||||||
Ratio of expenses to average net assets after | 0.77 | % | 0.77 | % | 0.76 | % | 0.78 | % | ||||||||
Ratio of expenses to average net assets after waived fees and exclusive of foreign taxesf | 0.75 | % | 0.74 | % | 0.74 | % | 0.72 | % | ||||||||
Ratio of net investment income to average net assetsf | 1.77 | % | 2.40 | % | 2.10 | % | 1.58 | % | ||||||||
Portfolio turnover rateg | 12 | % | 9 | % | 8 | % | 10 | % | ||||||||
| a | Commencement of operations. |
| b | Per share amounts were adjusted to reflect a three-for-one stock split effective June 9, 2005. |
| c | Based on average shares outstanding throughout each period. |
| d | The amounts reported may not accord with the change in aggregate gains and losses in securities due to the timing of capital share transactions. |
| e | Not annualized. |
| f | Annualized for periods less than one year. |
| g | Portfolio turnover rates exclude portfolio securities received or delivered as a result of processing capital share transactions in Creation Units. |
See notes to the financial statements.
| 104 | 2006 iSHARES ANNUAL REPORTTO SHAREHOLDERS |
Table of Contents
Financial Highlights (Continued)
iSHARES®, INC.
(For a share outstanding throughout each period)
| iShares MSCI Hong Kong Index Fund | ||||||||||||||||||||
Year ended Aug. 31, 2006 | Year ended Aug. 31, 2005 | Year ended Aug. 31, 2004 | Year ended Aug. 31, 2003 | Year ended Aug. 31, 2002 | ||||||||||||||||
Net asset value, beginning of year | $ | 13.01 | $ | 10.91 | $ | 9.03 | $ | 7.99 | $ | 8.93 | ||||||||||
Income from investment operations: | ||||||||||||||||||||
Net investment incomea | 0.38 | 0.33 | 0.28 | 0.23 | 0.23 | |||||||||||||||
Net realized and unrealized gain (loss)b | 1.17 | 2.04 | 1.75 | 0.95 | (1.11 | ) | ||||||||||||||
Total from investment operations | 1.55 | 2.37 | 2.03 | 1.18 | (0.88 | ) | ||||||||||||||
Less distributions from: | ||||||||||||||||||||
Net investment income | (0.36 | ) | (0.27 | ) | (0.15 | ) | (0.14 | ) | (0.06 | ) | ||||||||||
Total distributions | (0.36 | ) | (0.27 | ) | (0.15 | ) | (0.14 | ) | (0.06 | ) | ||||||||||
Net asset value, end of year | $ | 14.20 | $ | 13.01 | $ | 10.91 | $ | 9.03 | $ | 7.99 | ||||||||||
Total return | 12.20 | % | 21.96 | % | 22.69 | % | 15.14 | % | (9.94 | )% | ||||||||||
Ratios/Supplemental data: | ||||||||||||||||||||
Net assets, end of year (000s) | $ | 882,712 | $ | 637,985 | $ | 449,923 | $ | 250,627 | $ | 99,502 | ||||||||||
Ratio of expenses to average net assets | 0.54 | % | 0.57 | % | 0.80 | % | 0.84 | % | 0.84 | % | ||||||||||
Ratio of net investment income to average net assets | 2.87 | % | 2.75 | % | 2.78 | % | 3.06 | % | 2.56 | % | ||||||||||
Portfolio turnover ratec | 10 | % | 6 | % | 5 | % | 10 | % | 15 | % | ||||||||||
| a | Based on average shares outstanding throughout each period. |
| b | The amounts reported may not accord with the change in aggregate gains and losses due to the timing of capital share transactions. |
| c | Portfolio turnover rates exclude portfolio securities received or delivered as a result of processing capital share transactions in Creation Units. |
See notes to the financial statements.
| FINANCIAL HIGHLIGHTS | 105 |
Table of Contents
Financial Highlights (Continued)
iSHARES®, INC.
(For a share outstanding throughout each period)
| iShares MSCI Malaysia Index Fund | ||||||||||||||||||||
Year ended Aug. 31, 2006 | Year ended Aug. 31, 2005 | Year ended Aug. 31, 2004 | Year ended Aug. 31, 2003 | Year ended Aug. 31, 2002 | ||||||||||||||||
Net asset value, beginning of year | $ | 7.19 | $ | 6.54 | $ | 5.99 | $ | 5.68 | $ | 5.11 | ||||||||||
Income from investment operations: | ||||||||||||||||||||
Net investment incomea | 0.26 | 0.20 | 0.13 | 0.10 | 0.08 | |||||||||||||||
Net realized and unrealized gainb | 0.59 | 0.61 | 0.52 | 0.30 | 0.52 | |||||||||||||||
Total from investment operations | 0.85 | 0.81 | 0.65 | 0.40 | 0.60 | |||||||||||||||
Less distributions from: | ||||||||||||||||||||
Net investment income | (0.29 | ) | (0.16 | ) | (0.10 | ) | (0.09 | ) | (0.03 | ) | ||||||||||
Total distributions | (0.29 | ) | (0.16 | ) | (0.10 | ) | (0.09 | ) | (0.03 | ) | ||||||||||
Net asset value, end of year | $ | 7.75 | $ | 7.19 | $ | 6.54 | $ | 5.99 | $ | 5.68 | ||||||||||
Total return | 12.35 | % | 12.39 | % | 11.01 | % | 7.39 | % | 11.82 | % | ||||||||||
Ratios/Supplemental data: | ||||||||||||||||||||
Net assets, end of year (000s) | $ | 374,334 | $ | 387,575 | $ | 224,218 | $ | 99,730 | $ | 93,262 | ||||||||||
Ratio of expenses to average net assets | 0.54 | % | 0.57 | % | 0.79 | % | 0.84 | % | 0.84 | % | ||||||||||
Ratio of net investment income to average net assets | 3.46 | % | 2.85 | % | 1.97 | % | 1.91 | % | 1.53 | % | ||||||||||
Portfolio turnover ratec | 60 | % | 15 | % | 39 | % | 35 | % | 37 | % | ||||||||||
| a | Based on average shares outstanding throughout each period. |
| b | The amounts reported may not accord with the change in aggregate gains and losses in securities due to the timing of capital share transactions. |
| c | Portfolio turnover rates include portfolio transactions that are executed as a result of the Fund processing capital share transactions in Creation Units solely for cash in U.S. dollars. Excluding such transactions, the portfolio turnover rate for the years ended August 31, 2006 and August 31, 2005 would have been 9% and 9%, respectively. See Note 4. |
See notes to the financial statements.
| 106 | 2006 iSHARES ANNUAL REPORTTO SHAREHOLDERS |
Table of Contents
Financial Highlights (Continued)
iSHARES®, INC.
(For a share outstanding throughout each period)
| iShares MSCI Mexico Index Fund | ||||||||||||||||||||
Year ended Aug. 31, 2006 | Year ended Aug. 31, 2005 | Year ended Aug. 31, 2004 | Year ended Aug. 31, 2003 | Year ended Aug. 31, 2002 | ||||||||||||||||
Net asset value, beginning of year | $ | 29.04 | $ | 19.35 | $ | 15.04 | $ | 13.65 | $ | 15.35 | ||||||||||
Income from investment operations: | ||||||||||||||||||||
Net investment incomea | 0.76 | 0.42 | 0.26 | 0.19 | 0.32 | |||||||||||||||
Net realized and unrealized gain (loss)b | 11.98 | 9.55 | 4.26 | 1.72 | (1.95 | ) | ||||||||||||||
Total from investment operations | 12.74 | 9.97 | 4.52 | 1.91 | (1.63 | ) | ||||||||||||||
Less distributions from: | ||||||||||||||||||||
Net investment income | (0.48 | ) | (0.28 | ) | (0.21 | ) | (0.52 | ) | (0.07 | ) | ||||||||||
Total distributions | (0.48 | ) | (0.28 | ) | (0.21 | ) | (0.52 | ) | (0.07 | ) | ||||||||||
Net asset value, end of year | $ | 41.30 | $ | 29.04 | $ | 19.35 | $ | 15.04 | $ | 13.65 | ||||||||||
Total return | 44.11 | % | 51.77 | % | 30.28 | % | 14.60 | % | (10.67 | )% | ||||||||||
Ratios/Supplemental data: | ||||||||||||||||||||
Net assets, end of year (000s) | $ | 764,107 | $ | 255,557 | $ | 129,623 | $ | 60,155 | $ | 70,994 | ||||||||||
Ratio of expenses to average net assets | 0.54 | % | 0.57 | % | 0.78 | % | 0.84 | % | 0.84 | % | ||||||||||
Ratio of net investment income to average net assets | 2.06 | % | 1.70 | % | 1.40 | % | 1.43 | % | 2.05 | % | ||||||||||
Portfolio turnover ratec | 12 | % | 9 | % | 12 | % | 13 | % | 8 | % | ||||||||||
| a | Based on average shares outstanding throughout each period. |
| b | The amounts reported may not accord with the change in aggregate gains and losses in securities due to the timing of capital share transaction. |
| c | Portfolio turnover rates exclude portfolio securities received or delivered as a result of processing capital share transactions in Creation Units. |
See notes to the financial statements.
| FINANCIAL HIGHLIGHTS | 107 |
Table of Contents
Financial Highlights (Continued)
iSHARES®, INC.
(For a share outstanding throughout each period)
| iShares MSCI Pacific ex-Japan Index Fund | ||||||||||||||||||||
Year ended Aug. 31, 2006 | Year ended Aug. 31, 2005 | Year ended Aug. 31, 2004 | Year ended Aug. 31, 2003 | Period from Oct. 25, 2001a to Aug. 31, 2002 | ||||||||||||||||
Net asset value, beginning of period | $ | 97.57 | $ | 75.73 | $ | 62.03 | $ | 52.51 | $ | 50.03 | ||||||||||
Income from investment operations: | ||||||||||||||||||||
Net investment incomeb | 3.83 | 3.70 | 2.68 | 1.87 | 1.35 | |||||||||||||||
Net realized and unrealized gainc | 14.33 | 21.15 | 12.53 | 8.53 | 1.40 | |||||||||||||||
Total from investment operations | 18.16 | 24.85 | 15.21 | 10.40 | 2.75 | |||||||||||||||
Less distributions from: | ||||||||||||||||||||
Net investment income | (3.70 | ) | (3.01 | ) | (1.51 | ) | (0.88 | ) | (0.27 | ) | ||||||||||
Total distributions | (3.70 | ) | (3.01 | ) | (1.51 | ) | (0.88 | ) | (0.27 | ) | ||||||||||
Net asset value, end of period | $ | 112.03 | $ | 97.57 | $ | 75.73 | $ | 62.03 | $ | 52.51 | ||||||||||
Total return | 19.17 | % | 33.27 | % | 24.74 | % | 20.15 | % | 5.51 | %d | ||||||||||
Ratios/Supplemental data: | ||||||||||||||||||||
Net assets, end of period (000s) | $ | 2,094,931 | $ | 1,522,107 | $ | 651,250 | $ | 223,298 | $ | 105,029 | ||||||||||
Ratio of expenses to average net assetse | 0.50 | % | 0.50 | % | 0.50 | % | 0.50 | % | 0.50 | % | ||||||||||
Ratio of net investment income to average net assetse | 3.67 | % | 4.09 | % | 3.68 | % | 3.47 | % | 2.87 | % | ||||||||||
Portfolio turnover ratef | 8 | % | 16 | % | 8 | % | 8 | % | 5 | % | ||||||||||
| a | Commencement of operations. |
| b | Based on average shares outstanding throughout each period. |
| c | The amounts reported may not accord with the change in aggregate gains and losses in securities due to the timing of capital share transactions. |
| d | Not annualized. |
| e | Annualized for periods of less than one year. |
| f | Portfolio turnover rates exclude portfolio securities received or delivered as a result of processing capital share transactions in Creation Units. |
See notes to the financial statements.
| 108 | 2006 iSHARES ANNUAL REPORTTO SHAREHOLDERS |
Table of Contents
Financial Highlights (Continued)
iSHARES®, INC.
(For a share outstanding throughout each period)
| iShares MSCI Singapore Index Fund | ||||||||||||||||||||
Year ended Aug. 31, 2006 | Year ended Aug. 31, 2005 | Year ended Aug. 31, 2004 | Year ended Aug. 31, 2003 | Year ended Aug. 31, 2002 | ||||||||||||||||
Net asset value, beginning of year | $ | 7.77 | $ | 6.52 | $ | 5.38 | $ | 5.01 | $ | 5.34 | ||||||||||
Income from investment operations: | ||||||||||||||||||||
Net investment incomea | 0.40 | 0.38 | 0.22 | 0.12 | 0.07 | |||||||||||||||
Net realized and unrealized gain (loss)b | 1.23 | 1.15 | 1.04 | 0.33 | (0.36 | ) | ||||||||||||||
Total from investment operations | 1.63 | 1.53 | 1.26 | 0.45 | (0.29 | ) | ||||||||||||||
Less distributions from: | ||||||||||||||||||||
Net investment income | (0.29 | ) | (0.28 | ) | (0.12 | ) | (0.08 | ) | (0.04 | ) | ||||||||||
Total distributions | (0.29 | ) | (0.28 | ) | (0.12 | ) | (0.08 | ) | (0.04 | ) | ||||||||||
Net asset value, end of year | $ | 9.11 | $ | 7.77 | $ | 6.52 | $ | 5.38 | $ | 5.01 | ||||||||||
Total return | 21.61 | % | 24.06 | % | 23.47 | % | 9.30 | % | (5.42 | )% | ||||||||||
Ratios/Supplemental data: | ||||||||||||||||||||
Net assets, end of year (000s) | $ | 574,620 | $ | 341,137 | $ | 170,047 | $ | 108,202 | $ | 88,126 | ||||||||||
Ratio of expenses to average net assets | 0.54 | % | 0.57 | % | 0.79 | % | 0.84 | % | 0.84 | % | ||||||||||
Ratio of net investment income to average net assets | 4.74 | % | 5.19 | % | 3.50 | % | 2.67 | % | 1.44 | % | ||||||||||
Portfolio turnover ratec | 6 | % | 8 | % | 9 | % | 14 | % | 9 | % | ||||||||||
| a | Based on average shares outstanding throughout each period. |
| b | The amounts reported may not accord with the change in aggregate gains and losses in securities due to the timing of capital share transactions. |
| c | Portfolio turnover rates exclude portfolio securities received or delivered as a result of processing capital share transactions in Creation Units. |
See notes to the financial statements.
| FINANCIAL HIGHLIGHTS | 109 |
Table of Contents
Financial Highlights (Continued)
iSHARES®, INC.
(For a share outstanding throughout each period)
| iShares MSCI South Africa Index Fund | ||||||||||||||||
Year ended Aug. 31, 2006 | Year ended Aug. 31, 2005 | Year ended Aug. 31, 2004 | Period from Feb. 3, 2003a to Aug. 31, 2003 | |||||||||||||
Net asset value, beginning of period | $ | 82.99 | $ | 59.92 | $ | 46.81 | $ | 38.72 | ||||||||
Income from investment operations: | ||||||||||||||||
Net investment incomeb | 2.87 | 1.92 | 1.23 | 0.89 | ||||||||||||
Net realized and unrealized gainc | 13.78 | 22.36 | 13.24 | 7.20 | ||||||||||||
Total from investment operations | 16.65 | 24.28 | 14.47 | 8.09 | ||||||||||||
Less distributions from: | ||||||||||||||||
Net investment income | (1.97 | ) | (1.21 | ) | (1.36 | ) | — | |||||||||
Total distributions | (1.97 | ) | (1.21 | ) | (1.36 | ) | — | |||||||||
Net asset value, end of period | $ | 97.67 | $ | 82.99 | $ | 59.92 | $ | 46.81 | ||||||||
Total return | 20.06 | % | 40.62 | % | 31.30 | % | 20.89 | %d | ||||||||
Ratios/Supplemental data: | ||||||||||||||||
Net assets, end of period (000s) | $ | 297,898 | $ | 153,530 | $ | 92,882 | $ | 81,914 | ||||||||
Ratio of expenses to average net assetse | 0.70 | % | 0.74 | % | 0.95 | % | 0.99 | % | ||||||||
Ratio of net investment income to average net assetse | 2.79 | % | 2.62 | % | 2.23 | % | 3.86 | % | ||||||||
Portfolio turnover ratef | 7 | % | 32 | % | 13 | % | 17 | % | ||||||||
| a | Commencement of operations. |
| b | Based on average shares outstanding throughout each period. |
| c | The amounts reported may not accord with the change in aggregate gains and losses in securities due to the timing of capital share transactions. |
| d | Not annualized. |
| e | Annualized for periods of less than one year. |
| f | Portfolio turnover rates exclude portfolio securities received or delivered as a result of processing capital share transactions in Creation Units. |
See notes to the financial statements.
| 110 | 2006 iSHARES ANNUAL REPORTTO SHAREHOLDERS |
Table of Contents
Financial Highlights (Continued)
iSHARES®, INC.
(For a share outstanding throughout each period)
| iShares MSCI South Korea Index Fund | ||||||||||||||||||||
| Year ended Aug. 31, 2006 | Year ended Aug. 31, 2005 | Year ended Aug. 31, 2004 | Year ended Aug. 31, 2003 | Year ended Aug. 31, 2002 | ||||||||||||||||
Net asset value, beginning of year | $ | 34.75 | $ | 24.17 | $ | 23.06 | $ | 21.17 | $ | 13.25 | ||||||||||
Income from investment operations: | ||||||||||||||||||||
Net investment income (loss)a | 0.31 | 0.46 | 0.22 | 0.19 | (0.00 | )b | ||||||||||||||
Net realized and unrealized gainc | 11.20 | 10.22 | 1.13 | 1.70 | 7.92 | |||||||||||||||
Total from investment operations | 11.51 | 10.68 | 1.35 | 1.89 | 7.92 | |||||||||||||||
Less distributions from: | ||||||||||||||||||||
Net investment income | (0.26 | ) | (0.10 | ) | (0.24 | ) | — | — | ||||||||||||
Total distributions | (0.26 | ) | (0.10 | ) | (0.24 | ) | — | — | ||||||||||||
Net asset value, end of year | $ | 46.00 | $ | 34.75 | $ | 24.17 | $ | 23.06 | $ | 21.17 | ||||||||||
Total return | 33.16 | % | 44.29 | % | 5.83 | % | 8.93 | % | 59.77 | % | ||||||||||
Ratios/Supplemental data: | ||||||||||||||||||||
Net assets, end of year (000s) | $ | 1,621,334 | $ | 698,455 | $ | 315,464 | $ | 154,486 | $ | 96,336 | ||||||||||
Ratio of expenses to average net assets | 0.70 | % | 0.74 | % | 0.94 | % | 0.99 | % | 1.00 | % | ||||||||||
Ratio of expenses to average net assets exclusive of foreign taxes | 0.70 | % | 0.74 | % | 0.94 | % | 0.99 | % | 0.99 | % | ||||||||||
Ratio of net investment income (loss) to average net assets | 0.71 | % | 1.49 | % | 0.87 | % | 0.98 | % | (0.01 | )% | ||||||||||
Portfolio turnover rated | 47 | % | 30 | % | 29 | % | 39 | % | 25 | % | ||||||||||
| a | Based on average shares outstanding throughout each period. |
| b | Rounds to less than $0.01. |
| c | The amounts reported may not accord with the change in aggregate gains and losses in securities due to the timing of capital share transactions. |
| d | Portfolio turnover rates include portfolio transactions that are executed as a result of the Fund processing capital share transactions in Creation Units solely for cash in U.S. dollars. Excluding such transactions, the portfolio turnover rate for the years ended August 31, 2006 and August 31, 2005 would have been 14% and 9%, respectively. See Note 4. |
See notes to the financial statements.
| FINANCIAL HIGHLIGHTS | 111 |
Table of Contents
Financial Highlights (Continued)
iSHARES®, INC.
(For a share outstanding throughout each period)
| iShares MSCI Taiwan Index Fund | ||||||||||||||||||||
| Year ended Aug. 31, 2006 | Year ended Aug. 31, 2005 | Year ended Aug. 31, 2004 | Year ended Aug. 31, 2003 | Year ended Aug. 31, 2002 | ||||||||||||||||
Net asset value, beginning of year | $ | 11.57 | $ | 10.66 | $ | 10.79 | $ | 8.82 | $ | 9.01 | ||||||||||
Income from investment operations: | ||||||||||||||||||||
Net investment income (loss)a | 0.34 | 0.27 | 0.14 | 0.04 | (0.03 | ) | ||||||||||||||
Net realized and unrealized gain (loss)b | 0.80 | 0.72 | (0.25 | ) | 1.93 | (0.16 | ) | |||||||||||||
Total from investment operations | 1.14 | 0.99 | (0.11 | ) | 1.97 | (0.19 | ) | |||||||||||||
Less distributions from: | ||||||||||||||||||||
Net investment income | (0.14 | ) | (0.08 | ) | (0.02 | ) | – | – | ||||||||||||
Total distributions | (0.14 | ) | (0.08 | ) | (0.02 | ) | – | – | ||||||||||||
Net asset value, end of year | $ | 12.57 | $ | 11.57 | $ | 10.66 | $ | 10.79 | $ | 8.82 | ||||||||||
Total return | 9.84 | % | 9.28 | % | (1.10 | )% | 22.45 | % | (2.11 | )% | ||||||||||
Ratios/Supplemental data: | ||||||||||||||||||||
Net assets, end of year (000s) | $ | 1,893,751 | $ | 752,640 | $ | 390,228 | $ | 234,727 | $ | 142,043 | ||||||||||
Ratio of expenses to average net assets | 0.85 | % | 1.03 | % | 1.19 | %c | 1.31 | % | 1.33 | % | ||||||||||
Ratio of expenses to average net assets exclusive of foreign taxes | 0.70 | % | 0.74 | % | 0.92 | % | 0.99 | % | 0.99 | % | ||||||||||
Ratio of net investment income (loss) to average net assets | 2.74 | % | 2.34 | % | 1.23 | % | 0.43 | % | (0.28 | )% | ||||||||||
Portfolio turnover rated | 29 | % | 20 | % | 19 | % | 15 | % | 11 | % | ||||||||||
| a | Based on average shares outstanding throughout each period. |
| b | The amounts reported may not accord with the change in aggregate gains and losses in securities due to the timing of capital share transactions. |
| c | Ratio of expenses to average net assets prior to voluntary reimbursed distribution fees for the year ended August 31, 2004 was 1.22%. |
| d | Portfolio turnover rates include portfolio transactions that are executed as a result of the Fund processing capital share transactions in Creation Units solely for cash in U.S. dollars. Excluding such transactions, the portfolio turnover rate for the years ended August 31, 2006 and August 31, 2005 would have been 10% and 10%, respectively. See Note 4. |
See notes to the financial statements.
| 112 | 2006 iSHARES ANNUAL REPORTTO SHAREHOLDERS |
Table of Contents
Notes to the Financial Statements
iSHARES®, INC.
iShares, Inc. (the “Company”), is registered under the Investment Company Act of 1940, as amended (the “1940 Act”), as an open-end management investment company. The Company was incorporated under the laws of the State of Maryland on September 1, 1994 pursuant to amended and restated Articles of Incorporation. As of August 31, 2006, the Company offered 24 investment portfolios or funds.
These financial statements relate only to the iShares MSCI Australia, iShares MSCI Brazil, iShares MSCI Canada, iShares MSCI Emerging Markets, iShares MSCI Hong Kong, iShares MSCI Malaysia, iShares MSCI Mexico, iShares MSCI Pacific ex-Japan, iShares MSCI Singapore, iShares MSCI South Africa, iShares MSCI South Korea and iShares MSCI Taiwan Index Funds (each, a “Fund,” collectively, the “Funds”).
The investment objective of each Fund is to seek investment results that correspond generally to the price and yield performance, before fees and expenses, of publicly traded equity securities in the aggregate in a particular market, as measured by a particular equity securities index compiled by Morgan Stanley Capital International Inc. (“MSCI”). The investment adviser uses a “passive” or index approach to achieve each Fund’s investment objective. Each of the Funds is classified as a non-diversified fund under the 1940 Act. Non-diversified funds generally hold securities of fewer companies than diversified funds and may be more susceptible to the risks associated with these particular companies, or to a single economic, political or regulatory occurrence affecting these companies.
Each Fund invests in the securities of foreign issuers of a single country or region, which may involve certain considerations and risks not typically associated with securities of U.S. issuers. Such risks include, but are not limited to: generally less liquid and less efficient securities markets; generally greater price volatility; exchange rate fluctuations and exchange controls; imposition of restrictions on the expatriation of funds or other assets of the Fund; less publicly available information about issuers; the imposition of withholding or other taxes; higher transaction and custody costs; settlement delays and risk of loss attendant in settlement procedures; difficulties in enforcing contractual obligations; less regulation of securities markets; different accounting, disclosure and reporting requirements; more substantial governmental involvement in the economy; higher inflation rates; greater social, economic and political uncertainties; the risk of nationalization or expropriation of assets and the risk of war.
Under the Company’s organizational documents, the Funds’ officers and directors are indemnified against certain liabilities that may arise out of the performance of their duties to the Funds. Additionally, in the normal course of business, the Funds enter into contracts with service providers that contain general indemnification clauses. The Funds’ maximum exposure under these arrangements is unknown as this would involve future claims that may be made against the Funds that have not yet occurred.
1. SIGNIFICANT ACCOUNTING POLICIES
The following significant accounting policies are consistently followed by the Company in the preparation of its financial statements in conformity with accounting principles generally accepted in the United States of America (“U.S. GAAP”) for investment companies. The preparation of the financial statements in conformity with U.S. GAAP requires management to make certain estimates and assumptions that affect the reported amounts of assets and liabilities and disclosures of contingent assets and liabilities at the date of the financial statements and the reported amounts of revenue and expenses during the reporting period. Actual results could differ from those estimates.
SECURITY VALUATION
The securities and other assets of each Fund are generally valued using market valuations. A market valuation generally means a valuation (i) obtained from an exchange, a pricing service or a major market maker (or dealer), (ii) based on a price quotation or other equivalent indication of value supplied by an exchange, a pricing service or a major market maker (or dealer) or (iii) based on amortized cost. In the case of shares of funds that are not traded on an exchange, a market valuation means such fund’s published net asset value per share. The investment adviser may use various pricing services or discontinue the use of any pricing service. A price obtained from a pricing service based on such pricing service’s valuation matrix may be considered a market valuation. In the event that current market valuations are not readily available or such valuations do not reflect current market values, the affected investments will be valued using fair value pricing pursuant to the pricing policy and procedures approved by the Board of Directors of the Company (the “Board”).
| NOTESTOTHE FINANCIAL STATEMENTS | 113 |
Table of Contents
Notes to the Financial Statements (Continued)
iSHARES®, INC.
SECURITY TRANSACTIONS AND INCOME RECOGNITION
Security transactions are accounted for on trade date. Dividend income is recognized on the ex-dividend date, net of any foreign taxes withheld at source, and interest income is accrued daily. Realized gains and losses on investment transactions are determined using the specific identification method.
FOREIGN CURRENCY TRANSLATION
The accounting records of the Funds are maintained in U.S. dollars. Foreign currencies, as well as investment securities and other assets and liabilities denominated in foreign currencies are translated into U.S. dollars using exchange rates deemed appropriate by the investment adviser. Any use of a different rate from the rates used by MSCI may adversely affect a Fund’s ability to track its underlying index. Purchases and sales of securities, income receipts and expense payments are translated into U.S. dollars on the respective dates of such transactions.
Each Fund does not isolate the effect of fluctuations in foreign exchange rates from the effect of fluctuations in the market prices of securities. Such fluctuations are reflected by the Funds as a component of realized and unrealized gains and losses from investments for financial reporting purposes.
FOREIGN TAXES
South Korea and Taiwan may levy taxes on stock dividends at rates of 16.50% and up to 20.00%, respectively, based on the par value of stock dividends received by the iShares MSCI Emerging Markets, iShares MSCI South Korea and iShares MSCI Taiwan Index Funds. These taxes are paid by the Funds receiving the stock dividends and, if any, are disclosed in their respective Statements of Operations. Foreign taxes payable as of August 31, 2006, if any, are reflected in their Statements of Assets and Liabilities.
The iShares MSCI Emerging Markets Index Fund may pay foreign taxes on certain taxable corporate events (i.e. tender offers) by Thai companies whose securities are held by the Fund. The foreign taxes paid by the Fund, if any, are disclosed in its Statement of Operations.
DISTRIBUTIONS TO SHAREHOLDERS
Distributions to shareholders from net investment income, if any, including any net foreign currency gains, are declared and distributed at least annually by each Fund. Distributions of net realized capital gains, if any, generally are declared and distributed once a year. Distributions are determined on a tax basis and may differ from net investment income and net realized capital gains for financial reporting purposes. Dividends and distributions are paid in U.S. dollars and cannot be automatically reinvested in additional shares of the Funds.
As of August 31, 2006, the tax year-end of the Funds, the components of net distributable earnings (accumulated losses) on a tax basis were as follows:
iShares MSCI Index Fund | Undistributed Ordinary Income | Unrealized Appreciation (Depreciation) | Capital and Other Losses | Net Distributable Earnings (Accumulated Losses) | |||||||||||
Australia | $ | 22,888,627 | $ | 70,460,017 | $ | (7,305,581 | ) | $ | 86,043,063 | ||||||
Brazil | 35,107,628 | 470,342,244 | (45,167,023 | ) | 460,282,849 | ||||||||||
Canada | 7,180,499 | 153,797,217 | (2,935,472 | ) | 158,042,244 | ||||||||||
Emerging Markets | 167,842,041 | 1,733,589,217 | (94,116,598 | ) | 1,807,314,660 | ||||||||||
Hong Kong | 16,247,956 | 99,224,411 | (18,198,063 | ) | 97,274,304 | ||||||||||
Malaysia | 7,440,216 | 91,578,282 | (46,577,047 | ) | 52,441,451 | ||||||||||
Mexico | 5,968,807 | 18,692,731 | (7,561,482 | ) | 17,100,056 | ||||||||||
Pacific ex-Japan | 69,125,733 | 409,001,081 | (6,640,180 | ) | 471,486,634 | ||||||||||
Singapore | 21,199,384 | 67,252,881 | (14,997,787 | ) | 73,454,478 | ||||||||||
South Africa | 6,238,449 | (45,028,414 | ) | (2,626,547 | ) | (41,416,512 | ) | ||||||||
South Korea | 10,954,387 | 493,150,219 | (63,650,973 | ) | 440,453,633 | ||||||||||
Taiwan | 44,460,389 | 144,697,642 | (122,422,201 | ) | 66,735,830 | ||||||||||
| 114 | 2006 iSHARES ANNUAL REPORTTO SHAREHOLDERS |
Table of Contents
Notes to the Financial Statements (Continued)
iSHARES®, INC.
For the years ended August 31, 2006 and August 31, 2005, the tax characterization of distributions paid for each Fund represents ordinary income. The total distributions and distributions per share are disclosed in the accompanying Statements of Changes in Net Assets and the Financial Highlights for all Funds.
FEDERAL INCOME TAXES
Each Fund is treated as a separate entity for federal income tax purposes. It is the policy of each Fund to qualify as a regulated investment company by complying with the provisions applicable to regulated investment companies, as defined under Subchapter M of the Internal Revenue Code of 1986, as amended, and to annually distribute substantially all of its net income and any net gains (taking into account any capital loss carryforwards) sufficient to relieve it from all, or substantially all, federal income and excise taxes. Accordingly, no provision for federal income taxes was required for the year ended August 31, 2006.
From November 1, 2005 to August 31, 2006, certain Funds incurred net realized capital losses and net foreign currency losses. As permitted by tax regulations, these Funds have elected to defer these losses and treat them as arising in the year ending August 31, 2007, as follows:
iShares MSCI Index Fund | Deferred Net Realized Capital/Net Foreign Currency Losses | ||
Emerging Markets | $ | 61,598,277 | |
Hong Kong | 3,045,214 | ||
Malaysia | 16,065,921 | ||
Mexico | 131,311 | ||
Pacific ex-Japan | 1,673,327 | ||
South Africa | 1,847,693 | ||
South Korea | 43,797,425 | ||
Taiwan | 65,611,598 | ||
The Funds had tax basis net capital loss carryforwards as of August 31, 2006, the tax year-end of the Funds, as follows:
iShares MSCI Index | Expiring 2007 | Expiring 2008 | Expiring 2009 | Expiring 2010 | Expiring 2011 | Expiring 2012 | Expiring 2013 | Expiring 2014 | Total | ||||||||||||||||||
Australia | $ | — | $ | 71,019 | $ | 1,971,994 | $ | 3,625,203 | $ | 650,082 | $ | 596,240 | $ | 384,424 | $ | — | $ | 7,298,962 | |||||||||
Brazil | — | — | — | — | 45,165,910 | — | — | — | 45,165,910 | ||||||||||||||||||
Canada | — | — | — | — | — | — | 2,931,648 | — | 2,931,648 | ||||||||||||||||||
Emerging Markets | — | — | — | — | — | 840,778 | 20,296,564 | 11,239,258 | 32,376,600 | ||||||||||||||||||
Hong Kong | 4,085,707 | — | — | 4,971,970 | 2,870,602 | 2,330,414 | 468,716 | 425,440 | 15,152,849 | ||||||||||||||||||
Malaysia | 8,654,333 | — | — | 9,819,029 | 2,898,105 | 775,477 | 6,820,474 | 1,543,708 | 30,511,126 | ||||||||||||||||||
Mexico | — | — | — | 1,319,032 | 2,329,290 | 3,136,171 | 12,912 | 632,766 | 7,430,171 | ||||||||||||||||||
Pacific ex-Japan | — | — | — | — | 329,461 | 2,563,114 | 1,175,692 | 853,529 | 4,921,796 | ||||||||||||||||||
Singapore | — | — | — | 3,754,702 | 4,428,316 | 4,256,421 | 2,558,348 | — | 14,997,787 | ||||||||||||||||||
South Africa | — | — | — | — | — | 527,613 | — | 260,738 | 788,351 | ||||||||||||||||||
South Korea | — | — | 556,540 | 666,642 | 504,041 | 3,363,449 | 11,590,303 | 3,172,573 | 19,853,548 | ||||||||||||||||||
Taiwan | — | — | — | 12,532,361 | 8,689,663 | 9,129,874 | 12,022,719 | 14,435,986 | 56,810,603 | ||||||||||||||||||
Net capital loss carryforwards may be applied against any net realized taxable gains in each succeeding year or until their respective expiration dates, whichever occurs first.
| NOTESTOTHE FINANCIAL STATEMENTS | 115 |
Table of Contents
Notes to the Financial Statements (Continued)
iSHARES®, INC.
The Funds may own shares in certain foreign investment entities, referred to, under U.S. tax law, as “passive foreign investment companies.” The Funds may elect to mark-to-market annually the shares of each passive foreign investment company and would be required to distribute to shareholders any such mark-to-market gains.
Each Fund reclassifies at the end of its tax year certain amounts to paid-in-capital from accumulated net realized gain (loss) on investments and foreign currency transactions and accumulated net investment income (loss), respectively, as a result of permanent book and tax differences primarily attributed to net investment loss, return of capital, passive foreign investment companies, realized foreign currency gains and losses and gains and losses on in-kind redemptions. These reclassifications have no effect on net assets or net asset values per share.
As of August 31, 2006, gross unrealized appreciation and gross unrealized depreciation based on cost for federal income tax purposes were as follows:
iShares MSCI Index Fund | Tax Cost | Gross Unrealized Appreciation | Gross Unrealized Depreciation | Net Unrealized Appreciation (Depreciation) | ||||||||||
Australia | $ | 622,597,160 | $ | 79,197,719 | $ | (8,763,434 | ) | $ | 70,434,285 | |||||
Brazil | 1,993,920,679 | 491,032,674 | (20,703,701 | ) | 470,328,973 | |||||||||
Canada | 943,614,442 | 168,296,260 | (14,510,085 | ) | 153,786,175 | |||||||||
Emerging Markets | 10,923,320,778 | 1,946,687,342 | (213,357,811 | ) | 1,733,329,531 | |||||||||
Hong Kong | 814,620,366 | 111,476,602 | (12,252,343 | ) | 99,224,259 | |||||||||
Malaysia | 281,237,390 | 92,941,263 | (1,361,502 | ) | 91,579,761 | |||||||||
Mexico | 823,699,304 | 30,833,456 | (12,140,771 | ) | 18,692,685 | |||||||||
Pacific ex-Japan | 1,713,049,972 | 422,794,147 | (13,906,522 | ) | 408,887,625 | |||||||||
Singapore | 508,335,156 | 77,143,515 | (9,912,744 | ) | 67,230,771 | |||||||||
South Africa | 342,658,248 | 3,380,744 | (48,399,406 | ) | (45,018,662 | ) | ||||||||
South Korea | 1,235,779,014 | 503,686,338 | (10,536,119 | ) | 493,150,219 | |||||||||
Taiwan | 1,721,827,363 | 194,645,856 | (49,821,931 | ) | 144,823,925 | |||||||||
REPURCHASE AGREEMENTS
Each Fund may enter into repurchase agreements with banks and securities dealers. These transactions involve the purchase of securities with a simultaneous commitment to resell the securities to the bank or the dealer at an agreed-upon date and price. A repurchase agreement is accounted for as an investment by the Fund, collateralized by securities, which are delivered to the Fund’s custodian or to an agent bank under a tri-party agreement. The securities are marked-to-market daily and additional securities are acquired as needed, to ensure that their value equals or exceeds the repurchase price plus accrued interest.
2. AGREEMENTS AND OTHER TRANSACTIONS WITH AFFILIATES
Pursuant to an Investment Advisory Agreement with the Company, Barclays Global Fund Advisors (“BGFA”) manages the investment of each Fund’s assets. BGFA is a California corporation indirectly owned by Barclays Bank PLC. Under the Investment Advisory Agreement, BGFA is responsible for all expenses (“Covered Expenses”) of each of the Funds, including the cost of transfer agency, custody, fund administration, legal, audit and other services, except interest, taxes, brokerage commissions and other expenses connected with the execution of portfolio transactions, distribution fees and extraordinary expenses.
For its investment advisory services to the iShares MSCI Australia, iShares MSCI Canada, iShares MSCI Hong Kong, iShares MSCI Malaysia, iShares MSCI Mexico and iShares MSCI Singapore Index Funds, BGFA is entitled to an annual investment advisory fee based on each Fund’s allocable portion of the aggregate of the average daily net assets of all the funds offered by the Company (except for the iShares MSCI Brazil, iShares
| 116 | 2006 iSHARES ANNUAL REPORTTO SHAREHOLDERS |
Table of Contents
Notes to the Financial Statements (Continued)
iSHARES®, INC.
MSCI Emerging Markets, iShares MSCI Pacific ex-Japan, iShares MSCI South Africa, iShares MSCI South Korea and iShares MSCI Taiwan Index Funds) as follows:
| Investment Advisory Fee | Aggregate Average Daily Net Assets | |
| 0.59% | First $7 billion | |
| 0.54 | Over $7 billion, up to and including $11 billion | |
| 0.49 | Over $11 billion |
For its investment advisory services to the iShares MSCI Brazil, iShares MSCI South Africa, iShares MSCI South Korea and iShares MSCI Taiwan Index Funds, BGFA is entitled to an annual investment advisory fee based on each Fund’s allocable portion of the aggregate of the average daily net assets of these four Funds as follows:
| Investment Advisory Fee | Aggregate Average Daily Net Assets | |
| 0.74% | First $2 billion | |
| 0.69 | Over $2 billion, up to and including $4 billion | |
| 0.64 | Over $4 billion |
For its investment advisory services to the iShares MSCI Pacific ex-Japan Index Fund, BGFA is entitled to an annual investment advisory fee based on the average daily net assets of the Fund of 0.50%. For its investment advisory services to the iShares MSCI Emerging Markets Index Fund, BGFA is entitled to an annual investment advisory fee based on the average daily net assets of the Fund excluding any investments in other iShares MSCI Index Funds, of 0.75%. BGFA voluntarily waived its advisory fees for the iShares MSCI Emerging Markets Index Fund in an amount equal to the investment advisory fees payable on the amount of the Fund’s investment in other iShares MSCI Index Funds.
The Board approved a change to the investment advisory fee rates for the iShares MSCI Australia, iShares MSCI Canada, iShares MSCI Hong Kong, iShares MSCI Malaysia, iShares MSCI Mexico and iShares MSCI Singapore Index Funds effective September 1, 2006. For its investment advisory services to each Fund, BGFA will be entitled to be paid annual investment advisory fees based on each Fund’s allocable portion of the aggregate of the average daily net assets of all the funds offered by the Company (except for the iShares MSCI Brazil, iShares MSCI Emerging Markets, iShares MSCI Pacific ex-Japan, iShares MSCI South Africa, iShares MSCI South Korea and iShares MSCI Taiwan Index Funds) as follows:
| Investment Advisory Fee | Aggregate Average Daily Net Assets | |
| 0.59% | First $7 billion | |
| 0.54 | Over $7 billion, up to and including $11 billion | |
| 0.49 | Over $11 billion, up to and including $24 billion | |
| 0.44 | Over $24 billion |
The Board approved a change to the investment advisory fee structure for the iShares MSCI Emerging Markets Index Fund effective September 1, 2006. For its investment advisory services to the Fund, BGFA will be entitled to be paid annual investment advisory fees based on the average daily net assets of the Fund excluding any investments in other iShares MSCI Index Funds, as follows:
| Investment Advisory Fee | Average Daily Net Assets | |
| 0.75% | First $14 billion | |
| 0.68 | Over $14 billion, up to and including $28 billion | |
| 0.61 | Over $28 billion |
| NOTESTOTHE FINANCIAL STATEMENTS | 117 |
Table of Contents
Notes to the Financial Statements (Continued)
iSHARES®, INC.
BGFA intends to continue to voluntarily waive its advisory fees for the iShares MSCI Emerging Markets Index Fund in an amount equal to the investment advisory fees payable on the amount of the Fund’s investment in other iShares MSCI Index Funds.
Investors Bank & Trust Company (“Investors Bank”) serves as administrator, custodian and transfer agent for the Company. As compensation for its services, Investors Bank receives certain out-of-pocket costs, transaction fees and asset-based fees, which are accrued daily and paid monthly. These fees and expenses are Covered Expenses as defined above.
SEI Investments Distribution Co. (“SEI”) serves as each Fund’s underwriter and distributor of the shares of each Fund, pursuant to a Distribution Agreement with the Company. SEI does not currently receive a fee from the Funds for its distribution services.
Pursuant to an exemptive order issued by the U.S. Securities and Exchange Commission (“SEC”), the Funds are permitted to lend portfolio securities to Barclays Capital, Inc. (“BarCap”). Pursuant to the same exemptive order, Barclays Global Investors, N.A. (“BGI”) serves as securities lending agent for the Company. BarCap and BGI are affiliates of BGFA, the Funds’ investment adviser. As securities lending agent, BGI receives, as fees, a share of the income earned on investment of the cash collateral received for the loan of securities. For the year ended August 31, 2006, BGI earned securities lending agent fees as follows:
iShares MSCI Index Fund | Securities Lending Agent Fees | ||
Australia | $ | 42,933 | |
Brazil | 1,515 | ||
Emerging Markets | 6,885,228 | ||
Hong Kong | 155,076 | ||
Mexico | 311,946 | ||
Pacific ex-Japan | 291,724 | ||
Singapore | 129,743 | ||
South Korea | 656,131 | ||
Cross trades for the year ended August 31, 2006, if any, were executed by the Funds pursuant to Rule 17a-7 under the 1940 Act. Cross trading is the buying or selling of portfolio securities between funds to which BGFA (or an affiliate) serves as investment adviser. At its regularly scheduled quarterly meetings, the Board reviews such transactions as of the most recent calendar quarter, for compliance with the requirements and restrictions set forth by Rule 17a-7.
Each Fund may invest in the Institutional Shares of certain money market funds managed by BGFA, the Funds’ investment adviser, including the Government Money Market Fund (“GMMF”), Institutional Money Market Fund (“IMMF”), Prime Money Market Fund (“PMMF”) and Treasury Money Market Fund (“TMMF”) of Barclays Global Investors Funds. The GMMF, IMMF, PMMF and TMMF are feeder funds in a master/feeder fund structure that invest substantially all of their assets in the Government Money Market Master Portfolio, Money Market Master Portfolio, Prime Money Market Master Portfolio and Treasury Money Market Master Portfolio (collectively, the “Master Portfolios”), respectively, which are also managed by BGFA. While the GMMF, IMMF, PMMF and TMMF do not directly charge an investment advisory fee, the Master Portfolios in which they invest do charge an investment advisory fee. Income distributions from the GMMF, IMMF, PMMF and TMMF are declared daily and paid monthly from net investment income. Income distributions earned by the Funds from temporary cash investments are recorded as interest from affiliated issuers in the accompanying Statements of Operations. Income distributions earned by the Funds from the investment of securities lending collateral are included in securities lending income in the accompanying Statements of Operations.
The iShares MSCI Emerging Markets Index Fund, in order to improve its portfolio liquidity and its ability to track the MSCI Emerging Markets Index, may invest in shares of other iShares MSCI Index Funds that invest in securities in the Fund’s benchmark index. As of August 31, 2006, the iShares MSCI Emerging Markets Index Fund held shares of the iShares MSCI Malaysia, iShares MSCI South Korea and iShares MSCI Taiwan Index Funds.
| 118 | 2006 iSHARES ANNUAL REPORTTO SHAREHOLDERS |
Table of Contents
Notes to the Financial Statements (Continued)
iSHARES®, INC.
The following table provides information about the direct investment by each Fund (exclusive of investments of securities lending collateral) in issuers of which BGFA is an affiliate or issuers of which a Fund owns 5% or more of the outstanding voting securities, for the year ended August 31, 2006.
iShares MSCI Index Fund and Name of Affiliated Issuer | Number of (in 000s) | Gross Additions (in 000s) | Gross Reductions (in 000s) | Number of Shares Held End of Year (in 000s) | Value at End of Year | Dividend and Interest | Net Realized Gain | ||||||||||
Australia | |||||||||||||||||
IMMF | 108 | 33,322 | 33,398 | 32 | $ | 31,715 | $ | 5,946 | $ | — | |||||||
Brazil | |||||||||||||||||
IMMF | 1,112 | 894,918 | 891,141 | 4,889 | 4,889,243 | 165,134 | — | ||||||||||
Canada | |||||||||||||||||
IMMF | 39 | 110,454 | 110,092 | 401 | 400,763 | 19,579 | — | ||||||||||
Emerging Markets | |||||||||||||||||
IMMF | 4,035 | 2,992,165 | 2,990,377 | 5,823 | 5,823,368 | 533,655 | — | ||||||||||
Siliconware Precision Industries Co. ADR | 26,306 | 23,592 | 16,096 | 33,802 | 198,416,383 | 6,315,069 | 19,892,644 | ||||||||||
iShares MSCI Malaysia Index Fund | 1,180 | 34 | 175 | 1,039 | 8,011,924 | 350,401 | 76,325 | ||||||||||
iShares MSCI South Korea Index Fund | 402 | 316 | 172 | 546 | 25,023,371 | 133,907 | 3,621,587 | ||||||||||
iShares MSCI Taiwan Index Fund | 1,516 | 2,037 | 741 | 2,812 | 35,144,925 | 211,224 | 1,536,527 | ||||||||||
Hong Kong | |||||||||||||||||
IMMF | 23 | 119,874 | 119,199 | 698 | 697,658 | 22,999 | — | ||||||||||
Malaysia | |||||||||||||||||
IMMF | 401 | 54,293 | 54,694 | — | 463 | 8,001 | — | ||||||||||
Mexico | |||||||||||||||||
IMMF | 17 | 95,196 | 94,620 | 593 | 592,868 | 17,739 | — | ||||||||||
Pacific ex-Japan | |||||||||||||||||
IMMF | 816 | 124,509 | 125,148 | 177 | 177,436 | 21,949 | — | ||||||||||
Singapore | |||||||||||||||||
IMMF | 52 | 64,886 | 64,592 | 346 | 345,991 | 11,895 | — | ||||||||||
South Africa | |||||||||||||||||
IMMF | 5 | 35,962 | 35,851 | 116 | 115,792 | 6,525 | — | ||||||||||
South Korea | |||||||||||||||||
IMMF | 1,393 | 721,596 | 720,703 | 2,286 | 2,285,879 | 138,813 | — | ||||||||||
Taiwan | |||||||||||||||||
IMMF | 70 | 277,754 | 277,342 | 482 | 482,401 | 48,544 | — | ||||||||||
As of August 31, 2006, certain directors and officers of the Company are also officers of BGI and/or BGFA.
| NOTESTOTHE FINANCIAL STATEMENTS | 119 |
Table of Contents
Notes to the Financial Statements (Continued)
iSHARES®, INC.
3. INVESTMENT PORTFOLIO TRANSACTIONS
Purchases and sales of investments (excluding in-kind transactions and short-term investments) for the year ended August 31, 2006, were as follows:
iShares MSCI Index Fund | Purchases | Sales | ||||
Australia | $ | 40,006,500 | $ | 38,140,342 | ||
Brazil | 1,897,083,809 | 249,661,100 | ||||
Canada | 166,319,274 | 163,140,738 | ||||
Emerging Markets | 1,430,092,582 | 1,315,795,291 | ||||
Hong Kong | 76,173,353 | 71,232,546 | ||||
Malaysia | 245,520,892 | 282,687,853 | ||||
Mexico | 55,935,760 | 52,974,079 | ||||
Pacific ex-Japan | 153,730,864 | 151,205,267 | ||||
Singapore | 36,451,690 | 29,412,786 | ||||
South Africa | 24,166,180 | 19,448,454 | ||||
South Korea | 1,353,003,811 | 674,512,118 | ||||
Taiwan | 1,534,904,792 | 462,700,047 | ||||
In-kind transactions (see Note 4) for the year ended August 31, 2006, were as follows:
iShares MSCI Index Fund | In-kind Purchases | In-kind Sales | ||||
Australia | $ | 334,544,005 | $ | 93,072,824 | ||
Canada | 723,483,446 | 180,787,533 | ||||
Emerging Markets | 6,463,573,882 | 3,610,426,189 | ||||
Hong Kong | 378,266,291 | 201,804,853 | ||||
Mexico | 937,426,542 | 545,844,568 | ||||
Pacific ex-Japan | 504,319,584 | 173,419,251 | ||||
Singapore | 239,978,837 | 78,865,483 | ||||
South Africa | 392,268,611 | 257,122,073 | ||||
4. CAPITAL SHARE TRANSACTIONS
The Company has authorized 10.9 billion shares of $.001 par value capital stock. The number of shares authorized to each Fund are as follows:
iShares MSCI Index Fund | Authorized Shares | |
Australia | 127,800,000 | |
Brazil | 500,000,000 | |
Canada | 340,200,000 | |
Emerging Markets | 500,000,000 | |
Hong Kong | 191,400,000 | |
Malaysia | 127,800,000 | |
Mexico | 255,000,000 | |
Pacific ex-Japan | 500,000,000 | |
Singapore | 191,400,000 | |
South Africa | 200,000,000 | |
South Korea | 200,000,000 | |
Taiwan | 200,000,000 |
| 120 | 2006 iSHARES ANNUAL REPORTTO SHAREHOLDERS |
Table of Contents
Notes to the Financial Statements (Continued)
iSHARES®, INC.
The Company issues and redeems capital shares of each Fund only in aggregations of a specified number of shares (each, a “Creation Unit”) at net asset value. Except when aggregated in Creation Units, shares of each Fund are not redeemable. Transactions in capital shares for each Fund are disclosed in detail in the Statements of Changes in Net Assets.
The consideration for the purchase of Creation Units of a Fund generally consists of the in-kind contribution of a designated portfolio of equity securities constituting a portfolio sampling representation of the corresponding MSCI Index and an amount of cash (except for the iShares MSCI Brazil, iShares MSCI Malaysia, iShares MSCI South Korea and iShares MSCI Taiwan Index Funds which are offered in Creation Units solely for cash in U.S. dollars). Investors purchasing and redeeming Creation Units pay a purchase transaction fee and a redemption transaction fee directly to Investors Bank, the administrator, to offset transfer and other transaction costs associated with the issuance and redemption of Creation Units, including Creation Units for cash. Investors transacting in Creation Units for cash pay an additional variable charge to compensate the relevant Fund for brokerage and market impact expenses relating to investing in portfolio securities.
5. LOANS OF PORTFOLIO SECURITIES
Each Fund may lend its investment securities to approved borrowers, such as brokers, dealers and other financial institutions. The borrower pledges and maintains with the Fund collateral consisting of cash, an irrevocable letter of credit issued by a bank, or securities issued or guaranteed by the U.S. Government. The initial collateral received by each Fund is required to have a value of at least 102% of the market value of the loaned securities for securities traded on U.S. exchanges and a value of at least 105% for all other securities. The collateral is maintained thereafter, at a value equal to at least 100% of the current market value of the securities on loan. The risks to the Funds of securities lending are that the borrower may not provide additional collateral when required or may not return the securities when due.
As of August 31, 2006, certain Funds had loaned securities which were collateralized by cash. Pursuant to an exemptive order issued by the SEC, the cash collateral received was invested in a joint account with other investment funds managed by BGFA. The joint account invests in securities with remaining maturities of 397 days or less, repurchase agreements and money market mutual funds, including money market funds managed by BGFA. Repurchase agreements held in the joint account are fully collateralized by U.S. Government securities or non-U.S. Government debt securities. The market value of the securities on loan as of August 31, 2006 and the value of the related collateral are disclosed in the Statements of Assets and Liabilities. Securities lending income, as disclosed in the Funds’ Statements of Operations, represents the income earned from the investment of the cash collateral, net of rebates paid to, or fees paid by, borrowers and less the fees paid to BGI as securities lending agent.
6. RECENTLY ISSUED ACCOUNTING PRONOUNCEMENT
In June 2006, the Financial Accounting Standards Board (“FASB”) issued FASB Interpretation No. 48, (“FIN 48”) “Accounting for Uncertainty in Income Taxes — an interpretation of FASB Statement No. 109.” FIN 48 clarifies the accounting for uncertainty in income taxes recognized in accordance with FASB Statement No. 109, “Accounting for Income Taxes.” This interpretation prescribes a recognition threshold and measurement attribute for the financial statement recognition and measurement of a tax position taken or expected to be taken in a tax return. It also provides guidance on de-recognition, classification, interest and penalties, accounting in interim periods, disclosure and transition. FIN 48 is effective for fiscal years beginning after December 15, 2006. The Company is currently evaluating the impact of applying the various provisions of FIN 48.
| NOTESTOTHE FINANCIAL STATEMENTS | 121 |
Table of Contents
Report of Independent Registered Public Accounting Firm
To the Shareholders and Board of Directors of
iShares, Inc.
In our opinion, the accompanying statements of assets and liabilities, including the schedules of investments, and the related statements of operations and of changes in net assets and the financial highlights present fairly, in all material respects, the financial position of the iShares MSCI Australia Index Fund, iShares MSCI Brazil Index Fund, iShares MSCI Canada Index Fund, iShares MSCI Emerging Markets Index Fund, iShares MSCI Hong Kong Index Fund, iShares MSCI Malaysia Index Fund, iShares MSCI Mexico Index Fund, iShares MSCI Pacific ex-Japan Index Fund, iShares MSCI Singapore Index Fund, iShares MSCI South Africa Index Fund, iShares MSCI South Korea Index Fund and iShares MSCI Taiwan Index Fund, each a portfolio of the iShares MSCI Series (the “Funds”), at August 31, 2006, the results of each of their operations for the year then ended and the changes in each of their net assets and the financial highlights for each of the periods presented, in conformity with accounting principles generally accepted in the United States of America. These financial statements and financial highlights (hereafter referred to as “financial statements”) are the responsibility of the Funds’ management. Our responsibility is to express an opinion on these financial statements based on our audits. We conducted our audits of these financial statements in accordance with the standards of the Public Company Accounting Oversight Board (United States). Those standards require that we plan and perform the audits to obtain reasonable assurance about whether the financial statements are free of material misstatement. An audit includes examining, on a test basis, evidence supporting the amounts and disclosures in the financial statements, assessing the accounting principles used and significant estimates made by management, and evaluating the overall financial statement presentation. We believe that our audits, which included confirmation of securities at August 31, 2006 by correspondence with the custodian and brokers, provide a reasonable basis for our opinion.
PricewaterhouseCoopers LLP
San Francisco, California
October 23, 2006
| 122 | 2006 iSHARES ANNUAL REPORTTO SHAREHOLDERS |
Table of Contents
iSHARES®, INC.
For the fiscal year ended August 31, 2006, certain Funds earned foreign source income and paid foreign taxes which they intend to pass through to their shareholders pursuant to Section 853 of the Internal Revenue Code (the “Code”) as follows:
iShares MSCI Index Fund | Foreign Source Income Earned | Foreign Taxes Paid | ||||
Australia | $ | 23,991,398 | $ | 976,663 | ||
Brazil | 59,024,576 | 4,228,850 | ||||
Canada | 15,846,668 | 2,164,450 | ||||
Emerging Markets | 294,771,644 | 27,816,041 | ||||
Mexico | 11,495,278 | 296 | ||||
Pacific ex-Japan | 80,236,548 | 3,967,523 | ||||
South Korea | 23,370,932 | 3,572,900 | ||||
Taiwan | 73,485,251 | 16,910,239 | ||||
Under Section 854(b)(2) of the Code, certain Funds hereby designate the following maximum amounts as qualified dividend income for purposes of the maximum rate under Section 1(h)(11) of the Code for the fiscal year ended August 31, 2006:
iShares MSCI Index Fund | Qualified Dividend Income | ||
Australia | $ | 18,973,890 | |
Brazil | 2,621,285 | ||
Canada | 11,575,231 | ||
Emerging Markets | 214,998,474 | ||
Malaysia | 291,621 | ||
Mexico | 9,395,798 | ||
Pacific ex-Japan | 43,813,084 | ||
South Africa | 8,101,179 | ||
South Korea | 14,523,199 | ||
In January 2007, shareholders will receive Form 1099-DIV which will include their share of qualified dividend income distributed during the calendar year 2006. Shareholders are advised to check with their tax advisers for information on the treatment of these amounts on their income tax returns.
| TAX INFORMATION | 123 |
Table of Contents
Board Review and Approval of Investment Advisory Contracts (Unaudited)
iSHARES®, INC.
Under Section 15(c) of the Investment Company Act of 1940 (the “1940 Act”), the Company’s Board of Directors (the “Board”), including a majority of Directors who are not interested persons of the Company (as that term is defined in the 1940 Act) (the “Independent Directors”), is required annually to consider the Investment Advisory Contract between the Company and BGFA (the “Advisory Contract”) on behalf of the Funds. As required by Section 15(c), the Board requested and BGFA provided such information as the Board deemed reasonably necessary to evaluate the terms of the Advisory Contract. At a meeting held on June 14-15, 2006, the Board approved the selection of BGFA and the continuance of the Advisory Contract, based on its review of qualitative and quantitative information provided by BGFA. In selecting BGFA and approving the Advisory Contract for the Funds, the Board, including the Independent Directors, advised by their independent counsel, considered the following factors, none of which was controlling, and made the following conclusions:
NATURE, EXTENT AND QUALITY OF SERVICES PROVIDED BY BGFA
The Board determined that there would be no diminution in the scope of services required of BGFA under the Advisory Contract for the coming year as compared to the scope of services provided by BGFA over the past year. In reviewing the scope of these services, the Board considered BGFA’s investment philosophy and experience, noting that BGFA and its affiliates have committed significant resources over time, including over the past year, to the support of the Funds. The Board also considered BGFA’s compliance program and its compliance record with respect to the Funds. In that regard, the Board noted that BGFA reports to the Board about portfolio management and compliance matters on a periodic basis in connection with regularly scheduled meetings of the Board, and has made appropriate officers available as needed to provide further assistance with these matters. The Board also reviewed the background and experience of the persons responsible for the day-to-day management of the Funds. In addition to the above considerations, the Board reviewed and considered BGFA’s investment processes and strategies, and matters related to BGFA’s portfolio transaction policies and procedures. The Board further noted that BGFA does not serve as investment adviser for any other series of registered investment companies with substantially similar investment objectives and strategies as the Funds; therefore, no comparative performance information was available. However, the Board also noted that the Funds had met their investment objectives consistently since their respective inception dates. Based on this review, the Board concluded that the nature, extent and quality of services to be provided by BGFA to the Funds under the Advisory Contract were appropriate and mitigated in favor of the Board’s approval of the Advisory Contract for the coming year.
FUNDS’ EXPENSES AND PERFORMANCE OF THE FUNDS
The Board reviewed statistical information prepared by Lipper Inc. (“Lipper”), an independent provider of investment company data, regarding the expense ratio components, including advisory fees, waivers/reimbursements, and gross and net total expenses of each Fund in comparison with the same information for other registered funds objectively selected solely by Lipper as comprising each Fund’s applicable peer group (the “Lipper Peer Group”). In addition, the Board reviewed statistical information prepared by Lipper regarding the performance of each Fund for the one-, three- and five-year, and “last quarter” periods ended March 31, 2006, as applicable, and a comparison of each Fund’s performance to that of the funds in its Lipper Peer Group for the same periods. Because there are few, if any, exchange traded funds or index funds that track indices similar to those tracked by the Funds, the Lipper Peer Groups included mutual funds, closed-end funds, exchange traded funds, and funds with differing investment objective classifications, investment focuses and other characteristics (e.g., actively managed funds and funds sponsored by “at cost” service providers). In support of its review of the statistical information, the Board was provided with a detailed description of the methodology used by Lipper to determine the applicable Lipper Peer Groups and to prepare this information. The Board further noted that due to the limitations in providing comparable funds in the various Lipper Peer Groups, the statistical information may or may not provide meaningful direct comparisons to the Funds. The Board noted that most of the Funds generally performed in line with the funds in their respective Lipper Peer Groups over relevant periods, however, certain of the Funds may have underperformed or outperformed funds in their respective Lipper Peer Groups over relevant periods, but any such Funds also performed in line with their relevant benchmarks over such periods. The Board also noted that the investment advisory fees and overall expenses for the Funds were generally lower than or in line with the investment advisory fee rates and overall expenses of the funds in their respective Lipper Peer Groups. The Board also reviewed statistical information from Lipper displaying the effects of the proposed extension/addition of breakpoints in the investment advisory fee rates for certain of the Funds (as discussed below)
| 124 | 2006 iSHARES ANNUAL REPORTTO SHAREHOLDERS |
Table of Contents
Board Review and Approval of Investment Advisory Contracts (Unaudited) (Continued)
iSHARES®, INC.
at various assets levels of such Funds as compared to their respective Lipper Peer Groups. Based on this review, the Board concluded that the investment advisory fees and expense levels and the historical performance of each Fund, as managed by BGFA, as compared to the investment advisory fees and expense levels and performance of the funds in the relevant Lipper Peer Group, were satisfactory for the purposes of approving the Advisory Contract for the coming year.
COSTS OF SERVICES PROVIDED TO FUNDS AND PROFITS REALIZED BY BGFA AND AFFILIATES
The Board reviewed information about the profitability to BGFA of the Funds based on the fees payable to BGFA and its affiliates (including fees under the Advisory Contract), and all other sources of revenue and expense to BGFA and its affiliates for the last calendar year. The Board discussed the sources of direct and ancillary revenue with management, including the revenues to BGI from securities lending by the Company (including any securities lending by the Funds). The Board also discussed BGFA’s profit margin as reflected in the Funds’ profitability analysis and reviewed information regarding economies of scale (as discussed below). Based on this review, the Board concluded that the profits to be realized by BGFA and its affiliates under the Advisory Contract and from other relationships between the Funds and BGFA and/or its affiliates, if any, were within the range the Board considered reasonable and appropriate.
ECONOMIES OF SCALE
In connection with its review of the Funds’ profitability analysis, the Board reviewed information regarding economies of scale or other efficiencies that may result from increases in the Funds’ assets. The Board was also presented with materials regarding the proposed extension of breakpoints in the investment advisory fee rates at certain asset levels of certain Funds on an aggregated basis with certain other iShares funds and the addition of breakpoints in the investment advisory fee rates for the iShares MSCI Emerging Markets Index Fund. The Board noted that the Advisory Contract already provided for breakpoints in the investment advisory fee rates for most of the Funds as the assets of such Funds, on an aggregated basis with the assets of certain other iShares funds, increased, but also noted that the Advisory Contract did not currently provide for any breakpoints in the investment advisory fee rates for the iShares MSCI Pacific Ex-Japan Index Fund and the iShares MSCI Emerging Markets Index Fund. The Board discussed the substantial growth in assets of certain iShares funds, including the iShares Emerging Markets Index Fund and the iShares funds in the group with which most of the other Funds’ assets are aggregated for the purpose of applying breakpoints in the investment advisory fee rates, over the last few years. However, the Board generally noted that possible future economies of scale for the Funds had been taken into consideration by fixing the investment advisory fees at rates at the lower end of the marketplace, effectively giving Fund shareholders, from inception, the benefits of the lower average fee shareholders would have received from a fee structure with declining breakpoints where the initial fee was higher. In addition, the Board noted that as of July 1, 2004, Fund shareholders were no longer paying distribution fees pursuant to the Funds’ distribution plan under 12b-1 of the 1940 Act because such plan had been terminated as of that date, benefiting the Funds’ shareholders by lowering the Funds’ overall expenses. The Board also reviewed BGFA’s historic profitability as investment adviser to the iShares fund complex and noted that BGFA had made a significant investment in the iShares funds and had incurred operating losses during earlier years when the iShares funds, including the Funds, had not yet reached scale. In light of this history, the Board determined that the proposed extension/addition of breakpoints was appropriate and warranted at this juncture for certain of the Funds but that reductions in fee rates or further extensions/additions of breakpoints were not warranted at this juncture for the other Funds. Based on this review, the Board, recognizing its responsibility to consider this issue at least annually, concluded that the structure of the investment advisory fees, with the proposed extension/addition of breakpoints for certain of the Funds, reflects the current sharing and potential further sharing of economies of scale with the Funds’ shareholders.
| BOARD REVIEWAND APPROVALOF INVESTMENT ADVISORY CONTRACTS | 125 |
Table of Contents
Board Review and Approval of Investment Advisory Contracts (Unaudited) (Continued)
iSHARES®, INC.
FEES AND SERVICES PROVIDED FOR OTHER COMPARABLE FUNDS/ACCOUNTS MANAGED BY BGFA AND ITS AFFILIATES
The Board considered the Funds’ annual investment advisory fee rates under the Advisory Contract in comparison to the investment advisory/management fee rates for other funds/accounts for which BGFA (or its affiliate, BGI) provides investment advisory/management services, including other funds registered under the 1940 Act, collective funds and separate accounts (together, the “Other Accounts”). The Board noted that comparative investment advisory/management fee information was not available, as BGFA and its affiliates do not manage any Other Accounts with substantially similar investment objectives and strategies as the Funds. However, the Board noted that BGFA provided the Board with general information regarding how the level of services provided to the Other Accounts differed from the level of services provided to the Funds. Based on this review, the Board determined that the investment advisory fee rates under the Advisory Contracts, with the proposed extension/addition of breakpoints, do not constitute fees that are so disproportionately large as to bear no reasonable relationship to the services rendered and that could not have been the product of arm’s-length bargaining, and concluded that the investment advisory fee rates under the Advisory Contracts, with the proposed extension/addition of breakpoints, are fair and reasonable.
OTHER BENEFITS TO BGFA AND/OR ITS AFFILIATES
The Board reviewed any ancillary revenue received by BGFA and/or its affiliates in connection with the services provided to the Funds by BGFA, such as any payment of revenue to BGI, the Company’s securities lending agent, for loaning any portfolio securities, and payment of advisory fees and/or administration fees to BGFA and BGI in connection with any investments by the Funds in other funds for which BGFA provides investment advisory services and/or BGI provides administration services. The Board noted that BGFA does not use soft dollars or consider the value of research or other services that may be provided to BGFA (including its affiliates) in selecting brokers for portfolio transactions for the Funds. The Board further noted that any portfolio transactions on behalf of the Funds placed through a BGFA affiliate are reported to the Board pursuant to Rule 17e-1 under the 1940 Act. The Board concluded that any such ancillary benefits would not be disadvantageous to the Funds’ shareholders.
Based on this analysis, the Board determined that the Advisory Contract, including the investment advisory fee rates, with the proposed extension/addition of breakpoints, are fair and reasonable in light of all relevant circumstances, and concluded that it is in the best interest of the Funds and their shareholders to approve the Advisory Contract, with the fee schedule to the Advisory Contract as proposed to be amended to reflect the extension/addition of breakpoints, for the coming year.
| 126 | 2006 iSHARES ANNUAL REPORTTO SHAREHOLDERS |
Table of Contents
Supplemental Information (Unaudited)
iSHARES®, INC.
The tables that follow present information about the differences between the daily market price on secondary markets for shares of an iShares Fund and that Fund’s net asset value. Net asset value, or “NAV”, is the price per share at which each Fund issues and redeems shares. It is calculated in accordance with the standard formula for valuing mutual fund shares. The “Market Price” of each iShares Fund generally is determined using the midpoint between the highest bid and the lowest offer on the stock exchange on which the shares of such Fund is listed for trading (the “Exchange”), as of the time that the Fund’s NAV is calculated. In the case of the iShares MSCI Malaysia, iShares MSCI South Korea and iShares MSCI Taiwan Index Funds, the NAVs of which are determined prior to the opening of the regular trading day on the Exchange, the Market Price is determined using the midpoint of the bid/ask spread as of the opening of regular trading on the Exchange. Each Fund’s Market Price may be at, above or below its NAV. The NAV of each Fund will fluctuate with changes in the market value of its portfolio holdings. The Market Price of each Fund will fluctuate in accordance with changes in its NAV, as well as market supply and demand.
Premiums or discounts are the differences (expressed as a percentage) between the NAV and Market Price of a Fund on a given day, generally at the time NAV is calculated. A premium is the amount that a Fund is trading above the reported NAV, expressed as a percentage of the NAV. A discount is the amount that a Fund is trading below the reported NAV, expressed as a percentage of the NAV.
The following information shows the frequency distributions of premiums and discounts for each of the iShares Funds included in this report. The information shown for each Fund is for five calendar years (or for each full calendar quarter completed after the inception date of such Fund if less than five years) through the date of the most recent calendar quarter-end. The specific periods covered for each Fund are disclosed in the table for such Fund.
Each line in the table shows the number of trading days in which the iShares Fund traded within the premium/discount range indicated. The number of trading days in each premium/discount range is also shown as a percentage of the total number of trading days in the period covered by each table. All data presented here represents past performance, which cannot be used to predict future results.
iShares MSCI Australia Index Fund
Period Covered: January 1, 2001 through June 30, 2006
Premium/Discount Range | Number of Days | Percentage of Total Days | |||
Greater than 3.5% | 2 | 0.14 | % | ||
Greater than 3.0% and Less than 3.5% | 2 | 0.14 | |||
Greater than 2.5% and Less than 3.0% | 2 | 0.14 | |||
Greater than 2.0% and Less than 2.5% | 7 | 0.51 | |||
Greater than 1.5% and Less than 2.0% | 36 | 2.61 | |||
Greater than 1.0% and Less than 1.5% | 124 | 8.98 | |||
Greater than 0.5% and Less than 1.0% | 334 | 24.19 | |||
Between 0.5% and – 0.5% | 695 | 50.33 | |||
Less than –0.5% and Greater than –1.0% | 104 | 7.53 | |||
Less than –1.0% and Greater than –1.5% | 40 | 2.90 | |||
Less than –1.5% and Greater than –2.0% | 21 | 1.52 | |||
Less than –2.0% and Greater than –2.5% | 7 | 0.51 | |||
Less than –2.5% and Greater than –3.0% | 4 | 0.29 | |||
Less than –3.0% and Greater than –3.5% | 3 | 0.21 | |||
| 1,381 | 100.00 | % | |||
| SUPPLEMENTAL INFORMATION | 127 |
Table of Contents
Supplemental Information (Unaudited) (Continued)
iSHARES®, INC.
iShares MSCI Brazil Index Fund
Period Covered: January 1, 2001 through June 30, 2006
Premium/Discount Range | Number of Days | Percentage of Total Days | |||
Greater than 3.5% | 2 | 0.14 | % | ||
Greater than 3.0% and Less than 3.5% | 4 | 0.29 | |||
Greater than 2.5% and Less than 3.0% | 13 | 0.94 | |||
Greater than 2.0% and Less than 2.5% | 22 | 1.59 | |||
Greater than 1.5% and Less than 2.0% | 38 | 2.75 | |||
Greater than 1.0% and Less than 1.5% | 91 | 6.59 | |||
Greater than 0.5% and Less than 1.0% | 189 | 13.69 | |||
Between 0.5% and –0.5% | 732 | 53.02 | |||
Less than –0.5% and Greater than –1.0% | 144 | 10.43 | |||
Less than –1.0% and Greater than –1.5% | 41 | 2.97 | |||
Less than –1.5% and Greater than –2.0% | 38 | 2.75 | |||
Less than –2.0% and Greater than –2.5% | 25 | 1.81 | |||
Less than –2.5% and Greater than –3.0% | 12 | 0.87 | |||
Less than –3.0% and Greater than –3.5% | 8 | 0.58 | |||
Less than –3.5% and Greater than –4.0% | 7 | 0.51 | |||
Less than –4.0% and Greater than –4.5% | 6 | 0.43 | |||
Less than –4.5% and Greater than –5.0% | 6 | 0.43 | |||
Less than –5.0% | 3 | 0.21 | |||
| 1,381 | 100.00 | % | |||
iShares MSCI Canada Index Fund
Period Covered: January 1, 2001 through June 30, 2006
Premium/Discount Range | Number of Days | Percentage of Total Days | |||
Greater than 3.5% | 1 | 0.07 | % | ||
Greater than 3.0% and Less than 3.5% | 4 | 0.29 | |||
Greater than 2.5% and Less than 3.0% | 9 | 0.65 | |||
Greater than 2.0% and Less than 2.5% | 15 | 1.09 | |||
Greater than 1.5% and Less than 2.0% | 30 | 2.17 | |||
Greater than 1.0% and Less than 1.5% | 89 | 6.44 | |||
Greater than 0.5% and Less than 1.0% | 239 | 17.31 | |||
Between 0.5% and –0.5% | 884 | 64.03 | |||
Less than –0.5% and Greater than –1.0% | 78 | 5.65 | |||
Less than –1.0% and Greater than –1.5% | 20 | 1.45 | |||
Less than –1.5% and Greater than –2.0% | 6 | 0.43 | |||
Less than –2.0% and Greater than –2.5% | 5 | 0.35 | |||
Less than –2.5% and Greater than –3.0% | 1 | 0.07 | |||
| 1,381 | 100.00 | % | |||
| 128 | 2006 iSHARES ANNUAL REPORTTO SHAREHOLDERS |
Table of Contents
Supplemental Information (Unaudited) (Continued)
iSHARES®, INC.
iShares MSCI Emerging Markets Index Fund
Period Covered: July 1, 2003 through June 30, 2006
Premium/Discount Range | Number of Days | Percentage of Total Days | |||
Greater than 2.0% and Less than 2.5% | 1 | 0.13 | % | ||
Greater than 1.5% and Less than 2.0% | 17 | 2.25 | |||
Greater than 1.0% and Less than 1.5% | 47 | 6.22 | |||
Greater than 0.5% and Less than 1.0% | 209 | 27.65 | |||
Between 0.5% and –0.5% | 379 | 50.13 | |||
Less than –0.5% and Greater than –1.0% | 67 | 8.86 | |||
Less than –1.0% and Greater than –1.5% | 19 | 2.51 | |||
Less than –1.5% and Greater than –2.0% | 13 | 1.72 | |||
Less than –2.0% and Greater than –2.5% | 4 | 0.53 | |||
| 756 | 100.00 | % | |||
iShares MSCI Hong Kong Index Fund
Period Covered: January 1, 2001 through June 30, 2006
Premium/Discount Range | Number of Days | Percentage of Total Days | |||
Greater than 4.0% | 3 | 0.21 | % | ||
Greater than 3.5% and Less than 4.0% | 2 | 0.14 | |||
Greater than 3.0% and Less than 3.5% | 4 | 0.29 | |||
Greater than 2.5% and Less than 3.0% | 4 | 0.29 | |||
Greater than 2.0% and Less than 2.5% | 21 | 1.52 | |||
Greater than 1.5% and Less than 2.0% | 54 | 3.91 | |||
Greater than 1.0% and Less than 1.5% | 118 | 8.54 | |||
Greater than 0.5% and Less than 1.0% | 248 | 17.97 | |||
Between 0.5% and –0.5% | 589 | 42.66 | |||
Less than –0.5% and Greater than –1.0% | 157 | 11.37 | |||
Less than –1.0% and Greater than –1.5% | 74 | 5.36 | |||
Less than –1.5% and Greater than –2.0% | 62 | 4.49 | |||
Less than –2.0% and Greater than –2.5% | 17 | 1.23 | |||
Less than –2.5% and Greater than –3.0% | 12 | 0.87 | |||
Less than –3.0% and Greater than –3.5% | 6 | 0.43 | |||
Less than –3.5% and Greater than –4.0% | 6 | 0.43 | |||
Less than –4.0% | 4 | 0.29 | |||
| 1,381 | 100.00 | % | |||
| SUPPLEMENTAL INFORMATION | 129 |
Table of Contents
Supplemental Information (Unaudited) (Continued)
iSHARES®, INC .
iShares MSCI Malaysia Index Fund
Period Covered: January 1, 2001 through June 30, 2006
Premium/Discount Range | Number of Days | Percentage of Total Days | |||
Greater than 3.5% | 1 | 0.07 | % | ||
Greater than 3.0% and Less than 3.5% | 2 | 0.14 | |||
Greater than 2.5% and Less than 3.0% | 9 | 0.65 | |||
Greater than 2.0% and Less than 2.5% | 34 | 2.46 | |||
Greater than 1.5% and Less than 2.0% | 65 | 4.71 | |||
Greater than 1.0% and Less than 1.5% | 125 | 9.05 | |||
Greater than 0.5% and Less than 1.0% | 183 | 13.26 | |||
Between 0.5% and –0.5% | 368 | 26.66 | |||
Less than –0.5% and Greater than –1.0% | 143 | 10.35 | |||
Less than –1.0% and Greater than –1.5% | 128 | 9.27 | |||
Less than –1.5% and Greater than –2.0% | 85 | 6.15 | |||
Less than –2.0% and Greater than –2.5% | 75 | 5.43 | |||
Less than –2.5% and Greater than –3.0% | 55 | 3.98 | |||
Less than –3.0% and Greater than –3.5% | 40 | 2.90 | |||
Less than –3.5% and Greater than –4.0% | 24 | 1.74 | |||
Less than –4.0% and Greater than –4.5% | 24 | 1.74 | |||
Less than –4.5% and Greater than –5.0% | 9 | 0.65 | |||
Less than –5.0% and Greater than –5.5% | 1 | 0.07 | |||
Less than –5.5% and Greater than –6.0% | 4 | 0.29 | |||
Less than –6.0% | 6 | 0.43 | |||
| 1,381 | 100.00 | % | |||
iShares MSCI Mexico Index Fund
Period Covered: January 1, 2001 through June 30, 2006
Premium/Discount Range | Number of Days | Percentage of Total Days | |||
Greater than 2.5% and Less than 3.0% | 1 | 0.07 | % | ||
Greater than 2.0% and Less than 2.5% | 6 | 0.43 | |||
Greater than 1.5% and Less than 2.0% | 25 | 1.81 | |||
Greater than 1.0% and Less than 1.5% | 69 | 5.00 | |||
Greater than 0.5% and Less than 1.0% | 194 | 14.05 | |||
Between 0.5% and –0.5% | 794 | 57.51 | |||
Less than –0.5% and Greater than –1.0% | 182 | 13.18 | |||
Less than –1.0% and Greater than –1.5% | 78 | 5.65 | |||
Less than –1.5% and Greater than –2.0% | 23 | 1.67 | |||
Less than –2.0% and Greater than –2.5% | 5 | 0.35 | |||
Less than –2.5% and Greater than –3.0% | 3 | 0.21 | |||
Less than –3.0% | 1 | 0.07 | |||
| 1,381 | 100.00 | % | |||
| 130 | 2006 iSHARES ANNUAL REPORTTO SHAREHOLDERS |
Table of Contents
Supplemental Information (Unaudited) (Continued)
iSHARES®, INC.
iShares MSCI Pacific ex-Japan Index Fund
Period Covered: January 1, 2002 through June 30, 2006
Premium/Discount Range | Number of Days | Percentage of Total Days | |||
Greater than 3.5% and Less than 4.0% | 2 | 0.18 | % | ||
Greater than 3.0% and Less than 3.5% | 2 | 0.18 | |||
Greater than 2.5% and Less than 3.0% | 7 | 0.62 | |||
Greater than 2.0% and Less than 2.5% | 10 | 0.88 | |||
Greater than 1.5% and Less than 2.0% | 61 | 5.39 | |||
Greater than 1.0% and Less than 1.5% | 198 | 17.49 | |||
Greater than 0.5% and Less than 1.0% | 285 | 25.18 | |||
Between 0.5% and –0.5% | 495 | 43.72 | |||
Less than –0.5% and Greater than –1.0% | 48 | 4.24 | |||
Less than –1.0% and Greater than –1.5% | 16 | 1.41 | |||
Less than –1.5% and Greater than –2.0% | 7 | 0.62 | |||
Less than –2.0% | 1 | 0.09 | |||
| 1,132 | 100.00 | % | |||
iShares MSCI Singapore Index Fund
Period Covered: January 1, 2001 through June 30, 2006
Premium/Discount Range | Number of Days | Percentage of Total Days | |||
Greater than 4.0% and Less than 4.5% | 1 | 0.07 | % | ||
Greater than 3.5% and Less than 4.0% | 2 | 0.14 | |||
Greater than 3.0% and Less than 3.5% | 2 | 0.14 | |||
Greater than 2.5% and Less than 3.0% | 8 | 0.58 | |||
Greater than 2.0% and Less than 2.5% | 24 | 1.74 | |||
Greater than 1.5% and Less than 2.0% | 67 | 4.85 | |||
Greater than 1.0% and Less than 1.5% | 174 | 12.60 | |||
Greater than 0.5% and Less than 1.0% | 223 | 16.15 | |||
Between 0.5% and –0.5% | 479 | 34.70 | |||
Less than –0.5% and Greater than –1.0% | 148 | 10.72 | |||
Less than –1.0% and Greater than –1.5% | 119 | 8.62 | |||
Less than –1.5% and Greater than –2.0% | 50 | 3.62 | |||
Less than –2.0% and Greater than –2.5% | 33 | 2.39 | |||
Less than –2.5% and Greater than –3.0% | 20 | 1.45 | |||
Less than –3.0% and Greater than –3.5% | 10 | 0.72 | |||
Less than –3.5% and Greater than –4.0% | 10 | 0.72 | |||
Less than –4.0% and Greater than –4.5% | 4 | 0.29 | |||
Less than –4.5% and Greater than –5.0% | 4 | 0.29 | |||
Less than –5.0% and Greater than –5.5% | 1 | 0.07 | |||
Less than –5.5% | 2 | 0.14 | |||
| 1,381 | 100.00 | % | |||
| SUPPLEMENTAL INFORMATION | 131 |
Table of Contents
Supplemental Information (Unaudited) (Continued)
iSHARES®, INC.
iShares MSCI South Africa Index Fund
Period Covered: April 1, 2003 through June 30, 2006
Premium/Discount Range | Number of Days | Percentage of Total Days | |||
Greater than 3.0% | 2 | 0.24 | % | ||
Greater than 2.5% and Less than 3.0% | 3 | 0.37 | |||
Greater than 2.0% and Less than 2.5% | 7 | 0.85 | |||
Greater than 1.5% and Less than 2.0% | 18 | 2.20 | |||
Greater than 1.0% and Less than 1.5% | 64 | 7.81 | |||
Greater than 0.5% and Less than 1.0% | 157 | 19.17 | |||
Between 0.5% and –0.5% | 472 | 57.64 | |||
Less than –0.5% and Greater than –1.0% | 52 | 6.35 | |||
Less than –1.0% and Greater than –1.5% | 25 | 3.05 | |||
Less than –1.5% and Greater than –2.0% | 9 | 1.10 | |||
Less than –2.0% and Greater than –2.5% | 2 | 0.24 | |||
Less than –2.5% and Greater than –3.0% | 3 | 0.37 | |||
Less than –3.0% and Greater than –3.5% | 3 | 0.37 | |||
Less than –3.5% | 2 | 0.24 | |||
| 819 | 100.00 | % | |||
iShares MSCI South Korea Index Fund
Period Covered: January 1, 2001 through June 30, 2006
Premium/Discount Range | Number of Days | Percentage of Total Days | |||
Greater than 5.5% | 2 | 0.14 | % | ||
Greater than 5.0% and Less than 5.5% | 2 | 0.14 | |||
Greater than 4.5% and Less than 5.0% | 3 | 0.21 | |||
Greater than 4.0% and Less than 4.5% | 2 | 0.14 | |||
Greater than 3.5% and Less than 4.0% | 7 | 0.51 | |||
Greater than 3.0% and Less than 3.5% | 5 | 0.35 | |||
Greater than 2.5% and Less than 3.0% | 16 | 1.16 | |||
Greater than 2.0% and Less than 2.5% | 45 | 3.26 | |||
Greater than 1.5% and Less than 2.0% | 92 | 6.66 | |||
Greater than 1.0% and Less than 1.5% | 158 | 11.44 | |||
Greater than 0.5% and Less than 1.0% | 250 | 18.12 | |||
Between 0.5% and –0.5% | 468 | 33.93 | |||
Less than –0.5% and Greater than –1.0% | 137 | 9.92 | |||
Less than –1.0% and Greater than –1.5% | 82 | 5.94 | |||
Less than –1.5% and Greater than –2.0% | 49 | 3.55 | |||
Less than –2.0% and Greater than –2.5% | 26 | 1.88 | |||
Less than –2.5% and Greater than –3.0% | 18 | 1.30 | |||
Less than –3.0% and Greater than –3.5% | 8 | 0.58 | |||
Less than –3.5% and Greater than –4.0% | 5 | 0.35 | |||
Less than –4.0% and Greater than –4.5% | 3 | 0.21 | |||
Less than –4.5% | 3 | 0.21 | |||
| 1,381 | 100.00 | % | |||
| 132 | 2006 iSHARES ANNUAL REPORTTO SHAREHOLDERS |
Table of Contents
Supplemental Information (Unaudited) (Continued)
iSHARES®, INC.
iShares MSCI Taiwan Index Fund
Period Covered: January 1, 2001 through June 30, 2006
Premium/Discount Range | Number of Days | Percentage of Total Days | |||
Greater than 6.0% | 9 | 0.65 | % | ||
Greater than 5.5% and Less than 6.0% | 3 | 0.21 | |||
Greater than 5.0% and Less than 5.5% | 1 | 0.07 | |||
Greater than 4.5% and Less than 5.0% | 12 | 0.87 | |||
Greater than 4.0% and Less than 4.5% | 3 | 0.21 | |||
Greater than 3.5% and Less than 4.0% | 19 | 1.38 | |||
Greater than 3.0% and Less than 3.5% | 23 | 1.67 | |||
Greater than 2.5% and Less than 3.0% | 37 | 2.68 | |||
Greater than 2.0% and Less than 2.5% | 55 | 3.98 | |||
Greater than 1.5% and Less than 2.0% | 124 | 8.98 | |||
Greater than 1.0% and Less than 1.5% | 150 | 10.87 | |||
Greater than 0.5% and Less than 1.0% | 215 | 15.58 | |||
Between 0.5% and –0.5% | 367 | 26.59 | |||
Less than –0.5% and Greater than –1.0% | 139 | 10.07 | |||
Less than –1.0% and Greater than –1.5% | 93 | 6.73 | |||
Less than –1.5% and Greater than –2.0% | 60 | 4.34 | |||
Less than –2.0% and Greater than –2.5% | 18 | 1.30 | |||
Less than –2.5% and Greater than –3.0% | 28 | 2.03 | |||
Less than –3.0% and Greater than –3.5% | 13 | 0.94 | |||
Less than –3.5% and Greater than –4.0% | 4 | 0.29 | |||
Less than –4.0% and Greater than –4.5% | 1 | 0.07 | |||
Less than –4.5% and Greater than –5.0% | 3 | 0.21 | |||
Less than –5.0% and Greater than –5.5% | 1 | 0.07 | |||
Less than –5.5% | 3 | 0.21 | |||
| 1,381 | 100.00 | % | |||
| SUPPLEMENTAL INFORMATION | 133 |
Table of Contents
Director and Officer Information (Unaudited)
iSHARES®, INC.
The Board of Directors has responsibility for the overall management and operations of the Company, including general supervision of the duties performed by BGFA and other service providers. Each Director serves until his or her successor is duly elected or appointed and qualified.
iShares, Inc., iShares Trust, Barclays Global Investors Funds and Master Investment Portfolio are considered to be members of the same fund complex, as defined in Form N-1A under the 1940 Act. Each Director of iShares, Inc. also serves as a Trustee for iShares Trust and oversees 111 portfolios within the fund complex. In addition, Lee T. Kranefuss and Richard K. Lyons each serves as a Trustee for Barclays Global Investors Funds and Master Investment Portfolio and oversees an additional 25 portfolios within the fund complex.
Unless otherwise noted in the tables below, the address for each Director and Officer is c/o Barclays Global Investors, N.A., 45 Fremont Street, San Francisco, California 94105. The Board has designated George G.C. Parker as its Lead Director. Additional information about the Funds’ Directors and Officers may be found in the Funds’ combined Statement of Additional Information, which is available without charge, upon request, by calling toll-free 1-800-474-2737.
Interested Directors and Officers
Name, Year of Birth | Position(s), Length of Service | Principal Occupation(s) During Past 5 Years | Other Directorships Held | |||
| *Lee T. Kranefuss, 1961 | Director, Chairman and President (since 2003). | Chief Executive Officer, Global Index and Markets Group of BGI (since 2005); Chief Executive Officer of Intermediary Investor and Exchange Traded Products Business of BGI (since 2003); Chief Executive Officer of the Individual Investor Business of BGI (1999-2003). | Trustee (since 2003) of iShares Trust; Trustee (since 2001) of Barclays Global Investors Funds and Master Investment Portfolio; Director (since 2003) of BGI Cayman Prime Money Market Fund, Ltd. | |||
| *John E. Martinez, 1962 | Director (since 2003). | Co-Chief Executive Officer of Global Index and Markets Group of BGI (2001-2003); Chairman of Barclays Global Investors Services (2000-2003); Chief Executive Officer of Capital Markets Group of BGI (1996-2001). | Trustee (since 2003) of iShares Trust; Director (since 2005) of Real Estate Equity Exchange; Director (since 2003) of Larkin Street Youth Services. | |||
| * | Lee T. Kranefuss and John E. Martinez are considered to be “interested persons” (as defined in the 1940 Act) of the Company due to their affiliations with BGFA, the Funds’ investment adviser, BGI, the parent company of BGFA, and Barclays Global Investors Services, an affiliate of BGFA and BGI. |
| 134 | 2006 iSHARES ANNUAL REPORTTO SHAREHOLDERS |
Table of Contents
Director and Officer Information (Unaudited) (Continued)
iSHARES®, INC.
Independent Directors
Name, Year of Birth | Position(s), Length of Service | Principal Occupation(s) During Past 5 Years | Other Directorships Held | |||
| Richard K. Lyons, 1961 | Director (since 2002). | Executive Associate Dean (since 2005); Sylvan Coleman Chair in Finance (since 2004); Acting Dean (2004-2005) and Professor (since 1993), University of California, Berkeley: Haas School of Business; Consultant for IMF World Bank, Federal Reserve Bank and Citibank N.A. (since 2000). | Trustee (since 2000) of iShares Trust; Trustee (since 2001) of Barclays Global Investors Funds and Master Investment Portfolio; Director (since 2003) of BGI Cayman Prime Money Market Fund, Ltd.; Trustee (since 1995) and Chairman of Matthews Asian Funds (oversees 8 portfolios). | |||
| George G. C. Parker, 1939 | Director (since 2002). | Dean Witter Distinguished Professor of Finance (since 1994); Formerly Senior Associate Dean for Academic Affairs, Director of MBA Program, Stanford University: Graduate School of Business (1993-2001). | Trustee (since 2000) of iShares Trust; Director (since 1996) of Continental Airlines, Inc.; Director (since 1995) of Community First Financial Group; Director (since 1999) of Tejon Ranch Company; Director (since 2003) of First Republic Bank; Director (since 2004) of Threshold Pharmaceuticals. | |||
| Cecilia H. Herbert, 1949 | Director (since 2005). | Member of Finance Council, Archdiocese of San Francisco (since 1991); Chair of Investment Committee, Archdiocese of San Francisco (1994-2005). | Trustee (since 2005) of iShares Trust; Trustee (2004-2005) of Pacific Select Funds; Trustee (1992-2003) of the Montgomery Funds; Trustee (since 2005) of the Thacher School; Director (since 1998) of Catholic Charities CYO; Director (since 2005) of Women’s Forum West (professional association). | |||
| Charles A. Hurty, 1943 | Director (since 2005). | Partner, KPMG LLP (1968-2001). | Trustee (since 2005) of iShares Trust; Director (since 2002) of GMAM Absolute Return Strategy Fund (1 portfolio); Director (since 2002) of Citigroup Alternative Investments Multi-Adviser Hedge Fund Portfolios LLC (2 portfolios); Director (since 2005) of CSFB Alternative Investments Fund (15 portfolios). | |||
| DIRECTORAND OFFICER INFORMATION | 135 |
Table of Contents
Director and Officer Information (Unaudited) (Continued)
iSHARES®, INC.
Independent Directors (Continued)
Name, Year of Birth | Position(s), Length of Service | Principal Occupation(s) During Past 5 Years | Other Directorships Held | |||
| John E. Kerrigan, 1955 | Director (since 2005) | Chief Investment Officer, Santa Clara University (since 2002); Managing Director, Merrill Lynch (1994-2002). | Trustee (since 2005) of iShares Trust; Member (since 2004) of Advisory Council for Commonfund Distressed Debt Partners II. |
Officer
Name, Year of Birth | Position(s), Length of Service | Principal Occupation(s) During Past 5 Years | Other Directorships Held | |||
| Michael A. Latham, 1965 | Secretary, Treasurer and Principal Financial Officer (since 2002). | Chief Operating Officer of the Intermediary Investor and Exchange Traded Products Business of BGI (since 2003); Director of Mutual Fund Delivery in the U.S. Individual Investor Business of BGI (2000-2003). | None. |
| 136 | 2006 iSHARES ANNUAL REPORTTO SHAREHOLDERS |
Table of Contents
Notes:
| NOTES | 137 |
Table of Contents
Notes:
| 138 | 2006 iSHARES ANNUAL REPORTTO SHAREHOLDERS |
Table of Contents
Notes:
| NOTES | 139 |
Table of Contents
The following is a list of iShares Funds being offered, along with their respective exchange trading symbols. Please call 1-800-iShares (1-800-474-2737) to obtain a prospectus for any iShares Fund. The prospectus contains more complete information, including charges, expenses, investment objectives and risk factors that should be carefully considered to determine if the Fund(s) are an appropriate investment for you. Read the prospectus(es) carefully before investing. Investing involves risk, including possible loss of principal.
iShares S&P Domestic Index Funds iShares S&P 1500 (ISI) iShares S&P 100 (OEF) iShares S&P 500 (IVV) iShares S&P 500 Growth (IVW) iShares S&P 500 Value (IVE) iShares S&P MidCap 400 (IJH) iShares S&P MidCap 400 Growth (IJK) iShares S&P MidCap 400 Value (IJJ) iShares S&P SmallCap 600 (IJR) iShares S&P SmallCap 600 Growth (IJT) iShares S&P SmallCap 600 Value (IJS)
iShares Domestic Sector Index Funds iShares Cohen & Steers Realty Majors (ICF) iShares Dow Jones U.S. Basic Materials Sector (IYM) iShares Dow Jones U.S. Consumer Services Sector (IYC) iShares Dow Jones U.S. Consumer Goods Sector (IYK) iShares Dow Jones U.S. Energy Sector (IYE) iShares Dow Jones U.S. Financial Sector (IYF) iShares Dow Jones U.S. Financial Services (IYG) iShares Dow Jones U.S. Healthcare Sector (IYH) iShares Dow Jones U.S. Industrial Sector (IYJ) iShares Dow Jones U.S. Real Estate (IYR) iShares Dow Jones U.S. Technology Sector (IYW) iShares Dow Jones U.S. Telecommunications Sector (IYZ) iShares Dow Jones Transportation Average (IYT) iShares Dow Jones U.S. Utilities Sector (IDU) iShares Dow Jones U.S. Total Market (IYY) iShares Goldman Sachs Natural Resources (IGE) iShares Goldman Sachs Networking (IGN) iShares Goldman Sachs Semiconductor (IGW) iShares Goldman Sachs Software (IGV) iShares Goldman Sachs Technology (IGM) iShares Nasdaq Biotechnology (IBB)
iShares Domestic Subsector Index Funds iShares Dow Jones U.S. Aerospace & Defense (ITA) iShares Dow Jones U.S. Broker-Dealers (IAI) iShares Dow Jones U.S. Health Care Providers (IHF) iShares Dow Jones U.S. Home Construction (ITB) iShares Dow Jones U.S. Insurance (IAK) iShares Dow Jones U.S. Medical Devices (IHI) iShares Dow Jones U.S. Oil & Gas Exploration & Production (IEO) iShares Dow Jones U.S. Oil Equipment & Services (IEZ) iShares Dow Jones U.S. Pharmaceuticals (IHE) iShares Dow Jones U.S. Regional Banks (IAT) | iShares Global Index Funds iShares S&P Global 100 (IOO) iShares S&P Global Consumer Discretionary Sector (RXI) iShares S&P Global Consumer Staples Sector (KXI) iShares S&P Global Energy Sector (IXC) iShares S&P Global Financials Sector (IXG) iShares S&P Global Healthcare Sector (IXJ) iShares S&P Global Industrials Sector (EXI) iShares S&P Global Materials Sector (JXI) iShares S&P Global Technology Sector (IXN) iShares S&P Global Telecommunications Sector (IXP) iShares S&P Global Utilities Sector (MXI)
iShares Russell Index Funds iShares Russell 3000 (IWV) iShares Russell 3000 Growth (IWZ) iShares Russell 3000 Value (IWW) iShares Russell 1000 (IWB) iShares Russell 1000 Growth (IWF) iShares Russell 1000 Value (IWD) iShares Russell Midcap (IWR) iShares Russell Midcap Growth (IWP) iShares Russell Midcap Value (IWS) iShares Russell 2000 (IWM) iShares Russell 2000 Growth (IWO) iShares Russell 2000 Value (IWN) iShares Russell Microcap™ (IWC)
iShares International Country Index Funds iShares FTSE/Xinhua China 25 (FXI) iShares MSCI Australia (EWA) iShares MSCI Austria (EWO) iShares MSCI Belgium (EWK) iShares MSCI Brazil (EWZ) iShares MSCI Canada (EWC) iShares MSCI France (EWQ) iShares MSCI Germany (EWG) iShares MSCI Hong Kong (EWH) iShares MSCI Italy (EWI) iShares MSCI Japan (EWJ) iShares MSCI Malaysia (EWM) iShares MSCI Mexico (EWW) iShares MSCI Netherlands (EWN) iShares MSCI Singapore (EWS) iShares MSCI South Africa (EZA) iShares MSCI South Korea (EWY) iShares MSCI Spain (EWP) iShares MSCI Sweden (EWD) iShares MSCI Switzerland (EWL) iShares MSCI Taiwan (EWT) iShares MSCI United Kingdom (EWU) iShares S&P/TOPIX 150 (ITF) | iShares Bond Funds iShares Lehman Aggregate (AGG) iShares Lehman TIPS (TIP) iShares Lehman 1-3 Year Treasury (SHY) iShares Lehman 7-10 Year Treasury (IEF) iShares Lehman 20+ Year Treasury (TLT) iShares GS $ InvesTop™ Corporate (LQD)
iShares Specialty Index Funds iShares KLD Select SocialSM (KLD) iShares Dow Jones Select Dividend (DVY) iShares International Index Funds iShares MSCI EAFE (EFA) iShares MSCI EAFE Growth (EFG) iShares MSCI EAFE Value (EFV) iShares MSCI Emerging Markets (EEM) iShares MSCI EMU (EZU) iShares MSCI Pacific ex-Japan (EPP) iShares S&P Europe 350 (IEV) iShares S&P Latin America 40 (ILF)
iShares Morningstar Index Funds iShares Morningstar Large Core (JKD) iShares Morningstar Large Growth (JKE) iShares Morningstar Large Value (JKF) iShares Morningstar Mid Core (JKG) iShares Morningstar Mid Growth (JKH) iShares Morningstar Mid Value (JKI) iShares Morningstar Small Core (JKJ) iShares Morningstar Small Growth (JKK) iShares Morningstar Small Value (JKL)
iShares NYSE Index Funds iShares NYSE Composite (NYC) iShares NYSE 100 (NY) |
iShares® is a registered trademark of Barclays Global Investors, N.A. The iShares Funds are not sponsored, endorsed or issued by Goldman, Sachs & Co. or Lehman Brothers, nor are they sponsored, endorsed, issued, sold or promoted by Cohen & Steers Capital Management, Inc., Dow Jones & Company, Inc., FTSE/Xinhua Index Limited, KLD Research & Analytics, Inc., Morgan Stanley Capital International, Morningstar, Inc., The Nasdaq Stock Market, Inc., New York Stock Exchange, Inc., Frank Russell Company, or Standard & Poor’s. None of these companies make any representation regarding the advisability of investing in the iShares Funds. Neither SEI nor BGI, nor any of their affiliates, are affiliated with the companies listed above. “GS $ InvesTop™” and “Goldman Sachs®” are trademarks of Goldman, Sachs & Co.
An investment in the Fund(s) is not a deposit of a bank and it is not insured or guaranteed by the Federal Deposit Insurance Corporation or any other government agency.
This advertising section does not constitute part of the 2006 Annual Report.
3467-iS-0906
| 140 | 2006 iSHARES ANNUAL REPORTTO SHAREHOLDERS |
Table of Contents
Table of Contents

Table of Contents
| 1 | ||
| 3 | ||
| 4 | ||
| 15 | ||
| 18 | ||
| 19 | ||
| 25 | ||
| 26 | ||
Board Review and Approval of Investment Advisory Contracts (Unaudited) | 27 | |
| 30 | ||
| 31 | ||
| 36 |
Table of Contents
Management’s Discussion of Fund Performance
iSHARES® MSCI JAPAN INDEX FUND
Performance as of August 31, 2006
| Average Annual Total Returns | |||||||||||||||||||||||||
| Year Ended 8/31/06 | Five Years Ended 8/31/06 | Ten Years Ended 8/31/06 | |||||||||||||||||||||||
| NAV | MARKET | INDEX | NAV | MARKET | INDEX | NAV | MARKET | INDEX | |||||||||||||||||
| 26.10 | % | 23.64 | % | 26.94 | % | 8.94 | % | 8.73 | % | 9.59 | % | 0.16 | % | 0.14 | % | 0.92 | % | ||||||||
| Cumulative Total Returns | |||||||||||||||||||||||||
| Year Ended 8/31/06 | Five Years Ended 8/31/06 | Ten Years Ended 8/31/06 | |||||||||||||||||||||||
| NAV | MARKET | INDEX | NAV | MARKET | INDEX | NAV | MARKET | INDEX | |||||||||||||||||
| 26.10 | % | 23.64 | % | 26.94 | % | 53.45 | % | 51.94 | % | 58.06 | % | 1.57 | % | 1.46 | % | 9.54 | % | ||||||||
“Average annual total returns” represent the average annual change in value of an investment over the periods indicated. “Cumulative total returns” represent the total change in value of an investment over the periods indicated.
The Fund’s per share net asset value or “NAV” is the value of one share of the Fund as calculated in accordance with the standard formula for valuing mutual fund shares. The NAV return is based on the NAV of the Fund, and the market return is based on the market price per share of the Fund. The price used to calculate market return (“Market Price”) is determined by using the midpoint between the highest bid and the lowest offer on the stock exchange on which the shares of the Fund are listed for trading, as of the time that the Fund’s NAV is calculated. Market and NAV returns assume that dividends and capital gain distributions have been reinvested in the Fund at Market Price and NAV, respectively.
An index is a statistical composite that tracks a specified financial market or sector. Unlike the Fund, an index does not actually hold a portfolio of securities and therefore does not incur the expenses incurred by the Fund. These expenses negatively impact the performance of the Fund. Also, market returns do not include brokerage commissions that may be payable on secondary market transactions. If brokerage commissions were included, market returns would be lower. The returns shown in the tables above do not reflect the deduction of taxes that a shareholder would pay on fund distributions or the redemption or sale of fund shares. The investment return and principal value of shares of the Fund will vary with changes in market conditions. Shares of the Fund may be worth more or less than their original cost when they are redeemed or sold in the market. The Fund’s past performance is no guarantee of future results.
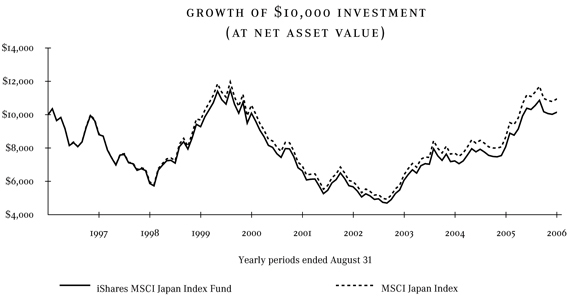
Performance figures assume reinvestment of all dividends and capital gain distributions and do not reflect the deduction of taxes that a shareholder would pay on fund distributions or the redemption of fund shares. An index is a statistical composite that tracks a specified financial market or sector. Unlike the Fund, an index does not actually hold a portfolio of securities and therefore does not incur the expenses incurred by the Fund. These expenses negatively impact the performance of the Fund. The Fund’s past performance is no guarantee of future results.
| MANAGEMENT’S DISCUSSIONOF FUND PERFORMANCE | 1 |
Table of Contents
Management’s Discussion of Fund Performance (Continued)
iSHARES® MSCI JAPAN INDEX FUND
PORTFOLIO ALLOCATION
As of 8/31/06
Sector | Percentage of Net Assets | ||
Consumer Cyclical | 24.78 | % | |
Financial | 22.51 | ||
Industrial | 20.01 | ||
Consumer Non-Cyclical | 10.07 | ||
Basic Materials | 7.99 | ||
Technology | 4.96 | ||
Communications | 4.35 | ||
Utilities | 4.26 | ||
Energy | 1.00 | ||
Short-Term and Other Net Assets | 0.07 | ||
TOTAL | 100.00 | % | |
TOP TEN FUND HOLDINGS
As of 8/31/06
Security | Percentage of Net Assets | ||
Toyota Motor Corp. | 5.57 | % | |
Mitsubishi UFJ Financial Group | 4.24 | ||
Mizuho Financial Group Inc. | 2.78 | ||
Sumitomo Mitsui Financial Group Inc. | 2.44 | ||
Takeda Pharmaceutical Co. Ltd. | 2.08 | ||
Canon Inc. | 1.89 | ||
Honda Motor Co. Ltd. | 1.89 | ||
Sony Corp. | 1.57 | ||
Matsushita Electric Industrial Co. Ltd. | 1.55 | ||
Nomura Holdings Inc. | 1.24 | ||
TOTAL | 25.25 | % | |
The iShares MSCI Japan Index Fund (the “Fund”) seeks to provide investment results that correspond generally to the price and yield performance, before fees and expenses, of publicly traded securities in the aggregate in the Japanese market, as measured by the MSCI Japan Index (the “Index”). The Fund invests in a representative sample of securities in the Index, which has a similar investment profile as the Index. Due to the use of representative sampling, the Fund may or may not hold all of the securities that are included in the Index. For the twelve-month period ended August 31, 2006 (the “reporting period”), the Fund returned 26.10%, while the Index returned 26.94%.
The Japanese stock market rallied sharply for the reporting period, overcoming a series of challenges that included computer glitches at the Tokyo Stock Exchange, financial fraud and insider trading scandals, and North Korean missile testing in the Sea of Japan. The strong stock market performance was due to the Japanese economy, which appeared to turn the corner after a decade-long downturn. Economic growth repeatedly surpassed expectations as industrial production increased, spare manufacturing capacity shrunk to its lowest levels since 1991, consumer confidence hit a 15-year high, and retail sales surged to their highest level in more than a decade. In local employment markets, the job vacancies per applicant ratio climbed to its highest level in the past 14 years, indicating that there are more jobs available than there are applicants.
All of this economic activity produced an end to Japan’s decade-long battle against deflation, as consumer prices rose for nine consecutive months. As a result, the Bank of Japan raised interest rates for the first time in six years and only the second time since 1990, boosting rates from 0% to 0.25% in July 2006. Nonetheless, Japanese interest rates remained well below those of other developed nations, and that continued to weigh on the Japanese currency. For the reporting period, the U.S. dollar strengthened by 5.9% against the Japanese yen, hurting returns for U.S. investors. In local-currency terms, the Index returned 33.97%.
As of August 31, 2006, the ten largest Fund holdings accounted for approximately 25% of Fund net assets. Each of the Fund’s ten largest holdings as of August 31, 2006, produced double-digit returns for the reporting period. The top performer was Canon Inc., which makes cameras, printers, and copiers. Canon enjoyed robust sales and increasing profit margins, especially in its camera division, and boosted capital spending to automate all of its manufacturing processes. The financial stocks amongst the Fund’s ten largest holdings also performed well, led by Mizuho Financial Group Inc. and Nomura Holdings Inc. Both companies reported strong profit growth; in particular, Nomura reported the highest profits in the 81-year history of the company, tripling its earnings from the previous year. The lowest returns came from electronics manufacturer Matsushita Electric Industrial Co. Ltd. and drug maker Takeda Pharmaceutical Co. Ltd., though both produced strong gains for the reporting period.
2 | 2006 iSHARES ANNUAL REPORTTO SHAREHOLDERS |
Table of Contents
Shareholder Expenses (Unaudited)
iSHARES® MSCI JAPAN INDEX FUND
As a shareholder of the Fund, you incur two types of costs: (1) transaction costs, including brokerage commissions on purchases and sales of fund shares and (2) ongoing costs, including management fees and other fund expenses. The following Example is intended to help you understand your ongoing costs (in dollars and cents) of investing in the Fund and to compare these costs with the ongoing costs of investing in other funds.
The Example is based on an investment of $1,000 invested at the beginning of the period and held for the entire period from March 1, 2006 to August 31, 2006.
ACTUAL EXPENSES
The first line in the table below provides information about actual account values and actual expenses. You may use the information in this line, together with the amount you invested, to estimate the expenses that you paid over the period. Simply divide your account value by $1,000 (for example, an $8,600 account value divided by $1,000 = 8.6), then multiply the result by the number in the first line under the heading entitled “Expenses Paid During Period” to estimate the expenses you paid on your account during this period.
HYPOTHETICAL EXAMPLE FOR COMPARISON PURPOSES
The second line in the table below provides information about hypothetical account values and hypothetical expenses based on the Fund’s actual expense ratio and an assumed rate of return of 5% per year before expenses, which is not the Fund’s actual return. The hypothetical account values and expenses may not be used to estimate the actual ending account balance or expenses you paid for the period. You may use this information to compare the ongoing costs of investing in your Fund and other funds. To do so, compare this 5% hypothetical example with the 5% hypothetical examples that appear in the shareholder reports of the other funds.
Please note that the expenses shown in the table are meant to highlight your ongoing costs only and do not reflect any transactional costs, such as brokerage commissions paid on purchases and sales of fund shares. Therefore, the second line in the table is useful in comparing ongoing costs only and will not help you determine the relative total costs of owning different funds. In addition, if these transactional costs were included, your costs would have been higher.
| Beginning Account Value (3/1/06) | Ending Account Value (8/31/06) | Annualized Expense Ratio | Expenses Paid During Period a (3/1/06 to 8/31/06) | |||||||||
Actual | $ | 1,000.00 | $ | 985.00 | 0.52 | % | $ | 2.60 | ||||
Hypothetical (5% return before expenses) | 1,000.00 | 1,022.58 | 0.52 | 2.65 | ||||||||
| a | Expenses are calculated using the Fund’s annualized expense ratio (as disclosed in the table), multiplied by the average account value for the period, multiplied by the number of days in the period (184 days) and divided by the number of days in the year (365 days). |
SHAREHOLDER EXPENSES | 3 |
Table of Contents
iSHARES® MSCI JAPAN INDEX FUND
August 31, 2006
Security | Shares | Value | |||
COMMON STOCKS – 99.93% | |||||
ADVERTISING – 0.30% | |||||
Asatsu-DK Inc. | 165,500 | $ | 5,348,040 | ||
Dentsu Inc. | 8,285 | 24,088,204 | |||
Hakuhodo DY Holdings Inc. | 165,500 | 11,091,188 | |||
| 40,527,432 | |||||
AGRICULTURE – 0.64% | |||||
Japan Tobacco Inc. | 23,170 | 88,306,178 | |||
| 88,306,178 | |||||
AIRLINES – 0.14% | |||||
All Nippon Airways Co. Ltd.1 | 3,310,000 | 12,953,831 | |||
Japan Airlines System Corp.1,2 | 3,314,000 | 6,301,079 | |||
| 19,254,910 | |||||
APPAREL – 0.23% | |||||
Asics Corp. | 461,000 | 5,766,185 | |||
Gunze Ltd. | 1,655,000 | 9,736,540 | |||
Onward Kashiyama Co. Ltd. | 1,105,000 | 15,460,673 | |||
| 30,963,398 | |||||
AUTO MANUFACTURERS – 8.45% | |||||
Hino Motors Ltd. | 1,655,000 | 8,918,105 | |||
Honda Motor Co. Ltd. | 7,622,200 | 259,304,924 | |||
Nissan Motor Co. Ltd. | 11,088,500 | 126,120,637 | |||
Toyota Motor Corp. | 14,084,500 | 764,959,404 | |||
| 1,159,303,070 | |||||
AUTO PARTS & EQUIPMENT – 1.79% | |||||
Aisin Seiki Co. Ltd. | 993,000 | 30,140,939 | |||
Bridgestone Corp. | 3,144,500 | 67,026,901 | |||
Denso Corp. | 2,648,000 | 92,341,903 | |||
JTEKT Corp. | 497,100 | 9,917,841 | |||
NGK Spark Plug Co. Ltd. | 629,000 | 12,817,581 | |||
NHK Spring Co. Ltd. | 406,000 | 4,520,919 | |||
NOK Corp. | 497,100 | 13,054,253 | |||
Sumitomo Rubber Industries Inc. | 497,100 | 5,297,992 | |||
Tokai Rika Co. Ltd. | 165,700 | 3,242,371 | |||
Toyoda Gosei Co. Ltd. | 331,000 | 7,055,464 | |||
| 245,416,164 | |||||
BANKS – 13.06% | |||||
Bank of Fukuoka Ltd. | 3,310,000 | 25,484,333 | |||
Bank of Kyoto Ltd. (The) | 433,000 | 4,507,763 | |||
Bank of Yokohama Ltd. (The) | 6,620,000 | 52,379,759 | |||
Chiba Bank Ltd. (The) | 3,314,000 | 30,883,762 | |||
Gunma Bank Ltd. | 1,657,000 | 12,743,437 | |||
Hokuhoku Financial Group Inc. | 4,971,000 | 19,581,379 | |||
Joyo Bank Ltd. | 3,314,000 | 20,061,730 | |||
Mitsubishi UFJ Financial Group | 42,678 | 582,212,559 | |||
Mitsubishi UFJ Securities Co. Ltd. | 1,655,000 | 22,224,709 | |||
Mitsui Trust Holdings Inc. | 2,774,000 | 32,497,557 | |||
Mizuho Financial Group Inc. | 47,072 | 380,878,441 | |||
Nishi-Nippon City Bank Ltd. (The) | 3,310,000 | 16,086,456 | |||
Resona Holdings Inc. | 23,170 | 73,094,598 | |||
Sapporo Hokuyo Holdings Inc. | 1,128 | 12,406,702 | |||
77 Bank Ltd. (The) | 1,655,000 | 12,135,397 | |||
Shinsei Bank Ltd. | 6,628,000 | 40,858,115 | |||
Shizuoka Bank Ltd. (The) | 3,310,000 | 37,930,170 | |||
Sumitomo Mitsui Financial Group Inc. | 29,790 | 335,275,611 | |||
Sumitomo Trust & Banking Co. Ltd. (The) | 6,620,000 | 70,611,075 | |||
Suruga Bank Ltd. (The) | 776,000 | 9,845,146 | |||
| 1,791,698,699 | |||||
BEVERAGES – 0.80% | |||||
Asahi Breweries Ltd. | 1,657,000 | 24,328,379 | |||
Coca-Cola West Japan Co. Ltd. | 331,000 | 6,448,693 | |||
Ito En Ltd. | 331,000 | 11,034,745 | |||
Kirin Brewery Co. Ltd. | 4,296,000 | 59,741,450 | |||
Sapporo Holdings Ltd.1 | 1,655,000 | 8,283,114 | |||
| 109,836,381 | |||||
BUILDING MATERIALS – 1.32% | |||||
Asahi Glass Co. Ltd. | 4,965,000 | 65,192,480 | |||
Daikin Industries Ltd. | 1,159,900 | 35,503,611 | |||
JS Group Corp. | 1,489,500 | 31,305,090 | |||
Matsushita Electric Works Ltd. | 1,657,000 | 17,688,229 | |||
Nippon Sheet Glass Co. Ltd.1 | 1,657,000 | 8,010,564 | |||
Sumitomo Osaka Cement Co. Ltd. | 1,657,000 | 4,704,617 | |||
Taiheiyo Cement Corp. | 4,965,000 | 18,711,088 | |||
| 181,115,679 | |||||
CHEMICALS – 3.93% | |||||
Asahi Kasei Corp. | 6,620,000 | 43,800,316 | |||
Daicel Chemical Industries Ltd. | 1,655,000 | 12,558,724 | |||
Dainippon Ink & Chemical Inc. | 3,310,000 | 12,332,950 | |||
4 | 2006 iSHARES ANNUAL REPORTTO SHAREHOLDERS |
Table of Contents
Schedule of Investments (Continued)
iSHARES® MSCI JAPAN INDEX FUND
August 31, 2006
Security | Shares | Value | |||
Denki Kagaku Kogyo Kabushiki Kaisha | 3,310,000 | $ | 12,699,834 | ||
Hitachi Chemical Co. Ltd. | 331,400 | 8,024,692 | |||
JSR Corp. | 993,000 | 23,664,024 | |||
Kaneka Corp. | 1,655,000 | 15,070,469 | |||
Mitsubishi Chemical Holdings Corp. | 5,370,000 | 35,255,148 | |||
Mitsubishi Gas Chemical Co. Inc. | 1,657,000 | 18,097,941 | |||
Mitsui Chemicals Inc. | 3,310,000 | 23,283,029 | |||
Nippon Kayaku Co. Ltd.1 | 1,655,000 | 14,336,702 | |||
Nissan Chemical Industries Ltd. | 1,103,000 | 14,322,965 | |||
Nitto Denko Corp. | 827,500 | 59,477,555 | |||
Shin-Etsu Chemical Co. Ltd. | 1,986,000 | 113,282,517 | |||
Showa Denko K.K. | 4,971,000 | 21,361,504 | |||
Sumitomo Chemical Co. Ltd. | 6,628,000 | 52,217,010 | |||
Taiyo Nippon Sanso Corp. | 1,655,000 | 14,435,478 | |||
Tokuyama Corp. | 908,000 | 12,595,950 | |||
Tosoh Corp. | 3,310,000 | 12,643,390 | |||
Ube Industries Ltd. | 4,965,000 | 13,588,822 | |||
Zeon Corp. | 566,000 | 6,519,726 | |||
| 539,568,746 | |||||
COMMERCIAL SERVICES – 0.97% | |||||
Benesse Corp. | 331,000 | 12,332,950 | |||
Dai Nippon Printing Co. Ltd. | 3,310,000 | 49,331,799 | |||
Goodwill Group Inc. (The)1 | 6,620 | 4,696,116 | |||
Kamigumi Co. Ltd. | 1,655,000 | 13,264,272 | |||
KK DaVinci Advisors2 | 4,971 | 4,492,697 | |||
Park 24 Co. Ltd.1 | 165,700 | 5,086,072 | |||
TIS Inc. | 331,000 | 6,984,909 | |||
Toppan Printing Co. Ltd. | 3,310,000 | 37,478,620 | |||
| 133,667,435 | |||||
COMPUTERS – 1.26% | |||||
CSK Corp. | 331,000 | 14,223,814 | |||
Fujitsu Ltd. | 9,930,000 | 79,670,291 | |||
Itochu Techno-Science Corp. | 165,500 | 8,000,895 | |||
Meitec Corp.1 | 165,700 | 5,354,503 | |||
Net One Systems Co. Ltd.1 | 3,310 | 4,995,268 | |||
Obic Co. Ltd. | 16,570 | 3,332,790 | |||
Otsuka Corp. | 62,000 | 6,063,350 | |||
TDK Corp. | 662,000 | 51,307,328 | |||
| 172,948,239 | |||||
COSMETICS & PERSONAL CARE – 0.81% | |||||
Aderans Co. Ltd. | 165,700 | 4,294,906 | |||
Kao Corp. | 2,587,000 | 69,039,605 | |||
Shiseido Co. Ltd. | 1,657,000 | 32,918,191 | |||
Uni-Charm Corp. | 88,300 | 4,946,336 | |||
| 111,199,038 | |||||
DISTRIBUTION & WHOLESALE – 3.35% | |||||
Canon Marketing Japan Inc. | 165,700 | 3,934,642 | |||
Hitachi High-Technologies Corp. | 165,700 | 4,379,673 | |||
Itochu Corp. | 8,275,000 | 69,496,313 | |||
Marubeni Corp. | 6,632,000 | 35,454,355 | |||
Mitsubishi Corp. | 6,620,000 | 134,900,456 | |||
Mitsui & Co. Ltd. | 7,947,000 | 115,120,885 | |||
Sojitz Corp.2 | 1,986,000 | 7,010,308 | |||
Sumitomo Corp. | 4,971,000 | 67,263,307 | |||
Toyota Tsusho Corp. | 828,500 | 21,827,727 | |||
| 459,387,666 | |||||
DIVERSIFIED FINANCIAL SERVICES – 4.00% | |||||
ACOM Co. Ltd. | 380,650 | 17,038,943 | |||
Aeon Credit Service Co. Ltd. | 496,570 | 11,897,188 | |||
AIFUL Corp. | 331,400 | 13,280,300 | |||
Credit Saison Co. Ltd. | 827,500 | 37,323,400 | |||
Daiwa Securities Group Inc. | 6,620,000 | 78,964,744 | |||
Nikko Cordial Corp. | 4,137,500 | 52,563,201 | |||
Nomura Holdings Inc. | 8,771,500 | 169,768,555 | |||
ORIX Corp. | 414,250 | 110,021,635 | |||
Promise Co. Ltd. | 413,750 | 18,520,591 | |||
SFCG Co. Ltd. | 16,570 | 3,283,342 | |||
Shinko Securities Co. Ltd. | 1,657,000 | 6,710,790 | |||
Takefuji Corp. | 546,150 | 29,476,314 | |||
| 548,849,003 | |||||
ELECTRIC – 3.54% | |||||
Chubu Electric Power Co. Inc. | 3,310,000 | 89,745,492 | |||
Electric Power Development Co. Ltd. | 827,500 | 30,902,929 | |||
Hokkaido Electric Power Co. Inc. | 497,100 | 12,291,342 | |||
Kansai Electric Power Co. Inc. (The) | 3,806,500 | 91,361,193 | |||
Kyushu Electric Power Co. Inc. | 1,986,000 | 47,412,713 | |||
Tohoku Electric Power Co. Inc. | 2,151,500 | 48,795,584 | |||
Tokyo Electric Power Co. Inc. (The) | 5,799,500 | 165,650,552 | |||
| 486,159,805 | |||||
SCHEDULEOF INVESTMENTS | 5 |
Table of Contents
Schedule of Investments (Continued)
iSHARES® MSCI JAPAN INDEX FUND
August 31, 2006
Security | Shares | Value | |||
ELECTRICAL COMPONENTS & EQUIPMENT – 3.88% | |||||
Casio Computer Co. Ltd. | 1,324,000 | $ | 25,456,111 | ||
Fujikura Ltd. | 1,657,000 | 19,595,506 | |||
Furukawa Electric Co. Ltd. | 3,310,000 | 22,944,367 | |||
Hitachi Cable Ltd. | 1,655,000 | 7,944,451 | |||
Hitachi Ltd. | 16,550,000 | 105,126,401 | |||
Mitsubishi Electric Corp. | 9,930,000 | 81,956,261 | |||
SANYO Electric Co. Ltd.1 | 6,628,000 | 13,901,931 | |||
Sharp Corp. | 4,965,000 | 88,898,837 | |||
Stanley Electric Co. Ltd. | 664,000 | 14,521,550 | |||
Sumitomo Electric Industries Ltd. | 3,314,000 | 42,807,776 | |||
Toshiba Corp. | 14,895,000 | 106,170,610 | |||
Ushio Inc. | 165,700 | 3,729,786 | |||
| 533,053,587 | |||||
ELECTRONICS – 4.28% | |||||
Advantest Corp. | 331,400 | 31,561,905 | |||
Alps Electric Co. Ltd. | 828,500 | 9,303,274 | |||
Dainippon Screen Manufacturing Co. Ltd. | 815,000 | 6,858,550 | |||
Fanuc Ltd. | 828,500 | 65,765,741 | |||
Hirose Electric Co. Ltd. | 165,500 | 21,476,830 | |||
IBIDEN Co. Ltd. | 662,000 | 33,922,667 | |||
Keyence Corp. | 182,192 | 42,081,948 | |||
Kyocera Corp. | 827,500 | 71,542,396 | |||
Mabuchi Motor Co. Ltd. | 165,500 | 10,540,862 | |||
Minebea Co. Ltd. | 1,657,000 | 9,366,850 | |||
Murata Manufacturing Co. Ltd. | 993,000 | 68,409,771 | |||
NEC Corp. | 9,942,000 | 57,896,458 | |||
NGK Insulators Ltd. | 1,655,000 | 22,605,705 | |||
Nippon Electric Glass Co. Ltd. | 1,259,000 | 30,593,426 | |||
Omron Corp. | 1,158,500 | 26,965,980 | |||
Secom Co. Ltd. | 830,500 | 41,282,475 | |||
Tokyo Seimitsu Co. Ltd.1 | 165,700 | 8,010,564 | |||
Yaskawa Electric Corp. | 1,142,000 | 13,174,114 | |||
Yokogawa Electric Corp. | 1,158,500 | 16,495,673 | |||
| 587,855,189 | |||||
ENGINEERING & CONSTRUCTION – 1.03% | |||||
Chiyoda Corp. | 609,000 | 13,370,636 | |||
JGC Corp. | 1,202,000 | 21,624,419 | |||
Kajima Corp. | 4,965,000 | 23,029,032 | |||
Nishimatsu Construction Co. Ltd.1 | 1,655,000 | 6,180,586 | |||
Obayashi Corp. | 3,310,000 | 22,944,367 | |||
Okumura Corp. | 1,655,000 | 9,073,325 | |||
Shimizu Corp. | 3,310,000 | 19,642,410 | |||
Taisei Corp. | 4,965,000 | 17,864,433 | |||
Toda Corp. | 1,655,000 | 7,958,563 | |||
| 141,687,771 | |||||
ENTERTAINMENT – 0.24% | |||||
Oriental Land Co. Ltd. | 331,000 | 18,965,085 | |||
Toho Co. Ltd. | 664,000 | 13,389,266 | |||
| 32,354,351 | |||||
ENVIRONMENTAL CONTROL – 0.04% | |||||
Kurita Water Industries Ltd. | 331,400 | 5,891,367 | |||
| 5,891,367 | |||||
FOOD – 0.99% | |||||
Ajinomoto Co. Inc. | 3,310,000 | 35,926,419 | |||
Katokichi Co. Ltd. | 993,000 | 8,542,755 | |||
Kikkoman Corp. | 1,655,000 | 20,178,624 | |||
Meiji Dairies Corp. | 1,655,000 | 10,399,753 | |||
Meiji Seika Kaisha Ltd. | 1,655,000 | 8,339,558 | |||
Nichirei Corp. | 1,655,000 | 9,284,990 | |||
Nippon Meat Packers Inc. | 1,118,000 | 12,515,957 | |||
Nisshin Seifun Group Inc. | 830,500 | 8,879,626 | |||
Nissin Food Products Co. Ltd. | 496,500 | 16,763,781 | |||
Yakult Honsha Co. Ltd. | 165,700 | 4,520,953 | |||
| 135,352,416 | |||||
FOREST PRODUCTS & PAPER – 0.27% | |||||
Nippon Paper Group Inc. | 4,965 | 18,457,092 | |||
OJI Paper Co. Ltd. | 3,314,000 | 18,818,468 | |||
| 37,275,560 | |||||
GAS – 0.72% | |||||
Osaka Gas Co. Ltd. | 9,930,000 | 36,575,521 | |||
Tokyo Gas Co. Ltd. | 11,585,000 | 61,735,303 | |||
| 98,310,824 | |||||
HAND & MACHINE TOOLS – 0.96% | |||||
Fuji Electric Holdings Co. Ltd. | 3,310,000 | 16,820,224 | |||
Makita Corp. | 331,400 | 9,748,305 | |||
Nidec Corp. | 545,900 | 39,609,575 | |||
OSG Corp. | 331,400 | 5,340,376 | |||
SMC Corp. | 331,000 | 44,280,087 | |||
THK Co. Ltd. | 662,000 | 16,086,456 | |||
| 131,885,023 | |||||
6 | 2006 iSHARES ANNUAL REPORTTO SHAREHOLDERS |
Table of Contents
Schedule of Investments (Continued)
iSHARES® MSCI JAPAN INDEX FUND
August 31, 2006
Security | Shares | Value | |||
HEALTH CARE – PRODUCTS – 0.80% | |||||
Hoya Corp. | 2,151,500 | $ | 78,329,752 | ||
Terumo Corp. | 827,500 | 31,044,038 | |||
| 109,373,790 | |||||
HOME BUILDERS – 0.88% | |||||
Daiwa House Industry Co. Ltd. | 2,643,000 | 43,086,635 | |||
Haseko Corp.1,2 | 3,314,000 | 11,867,502 | |||
Sekisui Chemical Co. Ltd. | 2,633,000 | 23,123,076 | |||
Sekisui House Ltd. | 2,915,000 | 43,295,648 | |||
| 121,372,861 | |||||
HOME FURNISHINGS – 3.38% | |||||
Matsushita Electric Industrial Co. Ltd. | 9,930,015 | 212,510,872 | |||
Pioneer Corp.1 | 827,500 | 15,839,515 | |||
Sony Corp. | 4,965,000 | 215,050,518 | |||
Yamaha Corp. | 993,000 | 20,616,064 | |||
| 464,016,969 | |||||
HOUSEWARES – 0.12% | |||||
Toto Ltd. | 1,655,000 | 16,862,557 | |||
| 16,862,557 | |||||
INSURANCE – 2.56% | |||||
Millea Holdings Inc. | 7,267 | 133,833,994 | |||
Mitsui Sumitomo Insurance Co. Ltd. | 6,117,000 | 74,685,970 | |||
Sompo Japan Insurance Inc. | 4,303,000 | 56,903,721 | |||
T&D Holdings Inc. | 1,158,500 | 86,034,318 | |||
| 351,458,003 | |||||
INTERNET – 1.21% | |||||
Access Co. Ltd.1,2 | 995 | 6,676,600 | |||
E*Trade Securities Co. Ltd. | 6,628 | 8,081,204 | |||
eAccess Ltd.1 | 4,971 | 2,971,114 | |||
Index Corp.1 | 5,773 | 4,503,811 | |||
Matsui Securities Co. Ltd.1 | 497,100 | 4,420,645 | |||
Rakuten Inc. | 31,483 | 13,663,168 | |||
SBI Holdings Inc. | 49,650 | 18,943,919 | |||
SoftBank Corp.1 | 3,641,000 | 63,329,838 | |||
Trend Micro Inc. | 533,500 | 15,374,770 | |||
Yahoo! Japan Corp. | 76,130 | 28,592,970 | |||
| 166,558,039 | |||||
IRON & STEEL – 2.93% | |||||
Daido Steel Co. Ltd. | 1,657,000 | 12,743,437 | |||
JFE Holdings Inc. | 2,813,550 | 114,667,425 | |||
Kobe Steel Ltd. | 13,256,000 | 42,383,937 | |||
Nippon Steel Corp. | 29,826,000 | 124,608,774 | |||
Nisshin Steel Co. Ltd. | 4,965,000 | 14,901,138 | |||
Sumitomo Metal Industries Ltd. | 19,884,000 | 81,885,766 | |||
Tokyo Steel Manufacturing Co. Ltd. | 662,000 | 10,769,459 | |||
| 401,959,936 | |||||
LEISURE TIME – 0.81% | |||||
Namco Bandai Holdings Inc. | 1,158,598 | 18,265,317 | |||
Round One Corp. | 1,657 | 6,640,150 | |||
Sankyo Co. Ltd. | 331,000 | 17,920,876 | |||
Sega Sammy Holdings Inc. | 828,500 | 28,326,598 | |||
Shimano Inc. | 496,500 | 13,969,817 | |||
Yamaha Motor Co. Ltd. | 993,000 | 26,500,320 | |||
| 111,623,078 | |||||
MACHINERY – 0.17% | |||||
Hitachi Construction Machinery Co. Ltd. | 331,400 | 7,318,293 | |||
Japan Steel Works Ltd. (The) | 1,655,000 | 11,754,402 | |||
Okuma Corp. | 493,000 | 4,880,189 | |||
| 23,952,884 | |||||
MACHINERY – CONSTRUCTION & MINING – 0.61% | |||||
Komatsu Ltd. | 4,589,100 | 83,929,057 | |||
| 83,929,057 | |||||
MACHINERY – DIVERSIFIED – 0.98% | |||||
Amada Co. Ltd. | 1,657,000 | 17,320,902 | |||
Ebara Corp.1 | 1,657,000 | 6,654,278 | |||
Kubota Corp. | 4,971,000 | 40,942,882 | |||
Sumitomo Heavy Industries Ltd. | 3,310,000 | 28,616,958 | |||
Toyota Industries Corp. | 993,000 | 41,401,458 | |||
| 134,936,478 | |||||
MANUFACTURING – 2.29% | |||||
ARRK Corp. | 165,700 | 1,999,109 | |||
Fuji Photo Film Co. Ltd. | 2,482,500 | 91,015,475 | |||
Glory Ltd. | 165,700 | 3,079,899 | |||
Ishikawajima-Harima Heavy Industries Co. Ltd. | 6,620,000 | 19,303,748 | |||
Kawasaki Heavy Industries Ltd. | 8,275,000 | 26,175,768 | |||
Konica Minolta Holdings Inc.2 | 2,467,500 | 32,294,091 | |||
Mitsubishi Heavy Industries Ltd. | 16,550,000 | 69,425,758 | |||
SCHEDULEOF INVESTMENTS | 7 |
Table of Contents
Schedule of Investments (Continued)
iSHARES® MSCI JAPAN INDEX FUND
August 31, 2006
Security | Shares | Value | |||
Nikon Corp. | 1,655,000 | $ | 29,985,719 | ||
Olympus Corp. | 1,368,000 | 40,590,357 | |||
| 313,869,924 | |||||
MEDIA – 0.05% | |||||
Fuji Television Network Inc. | 1,655 | 3,711,173 | |||
Tokyo Broadcasting System Inc. | 165,700 | 3,722,722 | |||
| 7,433,895 | |||||
METAL FABRICATE & HARDWARE – 0.29% | |||||
NSK Ltd. | 3,310,000 | 26,500,320 | |||
NTN Corp. | 1,657,000 | 12,701,053 | |||
| 39,201,373 | |||||
MINING – 0.86% | |||||
Dowa Mining Co. Ltd. | 1,655,000 | 15,098,692 | |||
Mitsubishi Materials Corp. | 4,965,000 | 21,632,051 | |||
Mitsui Mining & Smelting Co. Ltd. | 3,310,000 | 18,626,423 | |||
Nippon Light Metal Co. Ltd. | 1,657,000 | 4,266,650 | |||
Sumitomo Metal Mining Co. Ltd. | 2,864,000 | 40,413,693 | |||
Sumitomo Titanium Corp. | 39,200 | 8,004,775 | |||
Toho Titanium Co. Ltd.1 | 165,500 | 10,272,754 | |||
| 118,315,038 | |||||
OFFICE & BUSINESS EQUIPMENT – 2.50% | |||||
Canon Inc. | 5,219,950 | 259,918,216 | |||
Ricoh Co. Ltd. | 3,310,000 | 65,051,370 | |||
Seiko Epson Corp. | 662,800 | 18,253,349 | |||
| 343,222,935 | |||||
OIL & GAS – 1.00% | |||||
INPEX Holdings Inc.2 | 4,012 | 35,575,564 | |||
Nippon Mining Holdings Inc. | 4,142,500 | 30,375,154 | |||
Nippon Oil Corp. | 6,620,500 | 50,351,588 | |||
Showa Shell Sekiyu K.K. | 497,100 | 5,556,534 | |||
TonenGeneral Sekiyu K.K.1 | 1,655,000 | 14,957,582 | |||
| 136,816,422 | |||||
PACKAGING & CONTAINERS – 0.15% | |||||
Toyo Seikan Kaisha Ltd. | 993,000 | 20,235,068 | |||
| 20,235,068 | |||||
PHARMACEUTICALS – 5.06% | |||||
Astellas Pharma Inc. | 2,648,030 | 107,470,033 | |||
Chugai Pharmaceutical Co. Ltd. | 1,489,500 | 33,019,568 | |||
Daiichi Sankyo Co. Ltd. | 3,314,069 | 91,551,209 | |||
Eisai Co. Ltd. | 1,324,000 | 63,104,063 | |||
Kyowa Hakko Kogyo Co. Ltd. | 1,655,000 | 12,135,397 | |||
Mediceo Paltac Holdings Co. Ltd. | 662,800 | 12,347,854 | |||
Santen Pharmaceutical Co. Ltd. | 165,700 | 4,090,050 | |||
Shionogi & Co. Ltd. | 1,655,000 | 29,774,055 | |||
Suzuken Co. Ltd. | 331,400 | 12,376,110 | |||
Taisho Pharmaceutical Co. Ltd. | 1,098,000 | 21,485,356 | |||
Takeda Pharmaceutical Co. Ltd. | 4,308,200 | 285,413,429 | |||
Tanabe Seiyaku Co. Ltd. | 1,655,000 | 21,109,946 | |||
| 693,877,070 | |||||
REAL ESTATE – 2.52% | |||||
Daito Trust Construction Co. Ltd. | 496,500 | 25,822,995 | |||
Leopalace21 Corp. | 662,000 | 23,480,582 | |||
Mitsubishi Estate Co. Ltd. | 5,270,000 | 113,681,204 | |||
Mitsui Fudosan Co. Ltd. | 4,418,000 | 99,069,276 | |||
NTT Urban Development Corp. | 819 | 6,389,436 | |||
Sumitomo Realty & Development Co. Ltd. | 1,657,000 | 48,882,807 | |||
Tokyo Tatemono Co. Ltd. | 1,257,000 | 13,611,204 | |||
Tokyu Land Corp. | 1,657,000 | 14,467,050 | |||
| 345,404,554 | |||||
REAL ESTATE INVESTMENT TRUSTS – 0.31% | |||||
Japan Real Estate Investment Corp. | 1,655 | 14,252,036 | |||
Nippon Building Fund Inc. | 2,435 | 23,875,602 | |||
Nomura Real Estate Office Fund Inc. | 520 | 4,056,785 | |||
| 42,184,423 | |||||
RETAIL – 3.53% | |||||
Aeon Co. Ltd. | 2,979,000 | 75,056,018 | |||
Aoyama Trading Co. Ltd. | 331,000 | 10,780,748 | |||
Autobacs Seven Co. Ltd. | 165,500 | 6,843,800 | |||
Citizen Watch Co. Ltd. | 1,986,000 | 16,425,118 | |||
Daimaru Inc. (The) | 1,365,000 | 16,863,921 | |||
EDION Corp. | 331,400 | 5,905,495 | |||
FamilyMart Co. Ltd. | 331,000 | 9,369,655 | |||
Fast Retailing Co. Ltd. | 274,900 | 25,665,302 | |||
Isetan Co. Ltd. | 1,158,500 | 19,557,744 | |||
Lawson Inc. | 331,000 | 11,570,960 | |||
Marui Co. Ltd. | 1,655,000 | 24,665,900 | |||
Mitsukoshi Ltd.1 | 1,657,000 | 7,812,772 | |||
Nitori Co. Ltd. | 165,700 | 7,728,004 | |||
Ryohin Keikaku Co. Ltd. | 91,300 | 6,655,710 | |||
Seven & I Holdings Co. Ltd. | 3,976,880 | 140,717,500 | |||
8 | 2006 iSHARES ANNUAL REPORTTO SHAREHOLDERS |
Table of Contents
Schedule of Investments (Continued)
iSHARES® MSCI JAPAN INDEX FUND
August 31, 2006
Security | Shares | Value | ||||
Shimachu Co. Ltd. | 331,000 | $ | 9,341,433 | |||
Shimamura Co. Ltd. | 47,700 | 4,709,605 | ||||
Takashimaya Co. Ltd. | 1,655,000 | 20,884,171 | ||||
UNY Co. Ltd. | 1,245,000 | 17,716,715 | ||||
USS Co. Ltd. | 148,950 | 10,109,068 | ||||
Yamada Denki Co. Ltd. | 331,400 | 35,602,507 | ||||
| 483,982,146 | ||||||
SEMICONDUCTORS – 1.03% | ||||||
Elpida Memory Inc.2 | 331,400 | 14,664,842 | ||||
NEC Electronics Corp.1,2 | 165,700 | 5,594,680 | ||||
Rohm Co. Ltd. | 497,500 | 46,193,247 | ||||
Sanken Electric Co. Ltd. | 332,000 | 4,387,603 | ||||
Shinko Electric Industries Co. Ltd. | 165,700 | 4,817,641 | ||||
Sumco Corp.1 | 165,700 | 11,019,824 | ||||
Tokyo Electron Ltd. | 827,552 | 54,471,598 | ||||
| 141,149,435 | ||||||
SHIPBUILDING – 0.11% | ||||||
Mitsui Engineering & Shipbuilding Co. Ltd. | 4,965,000 | 15,197,468 | ||||
| 15,197,468 | ||||||
SOFTWARE – 0.17% | ||||||
Fuji Soft ABC Inc. | 165,500 | 4,882,381 | ||||
Konami Corp. | 496,500 | 12,657,501 | ||||
Nomura Research Institute Ltd. | 42,000 | 5,597,135 | ||||
| 23,137,017 | ||||||
STORAGE & WAREHOUSING – 0.04% | ||||||
Mitsubishi Logistics Corp. | 319,000 | 5,140,555 | ||||
| 5,140,555 | ||||||
TELECOMMUNICATIONS – 2.79% | ||||||
Hikari Tsushin Inc. | 165,500 | 9,143,880 | ||||
KDDI Corp. | 11,599 | 76,644,285 | ||||
Nippon Telegraph & Telephone Corp. | 24,855 | 125,668,372 | ||||
NTT Data Corp. | 6,620 | 30,592,489 | ||||
NTT DoCoMo Inc. | 86,167 | 133,711,847 | ||||
Oki Electric Industry Co. Ltd.1 | 3,310,000 | 7,309,460 | ||||
| 383,070,333 | ||||||
TEXTILES – 1.08% | ||||||
Kuraray Co. Ltd. | 1,657,000 | 18,988,004 | ||||
Mitsubishi Rayon Co. Ltd. | 3,310,000 | 22,859,701 | ||||
Nisshinbo Industries Inc. | 1,655,000 | 18,061,986 | ||||
Teijin Ltd. | 4,965,000 | 26,669,651 | ||||
Toray Industries Inc. | 6,620,000 | 52,831,308 | ||||
Toyobo Co. Ltd. | 3,310,000 | 8,805,218 | ||||
| 148,215,868 | ||||||
TOYS, GAMES & HOBBIES – 0.74% | ||||||
Nintendo Co. Ltd. | 496,500 | 101,937,332 | ||||
| 101,937,332 | ||||||
TRANSPORTATION – 3.90% | ||||||
Central Japan Railway Co. | 8,275 | 89,604,382 | ||||
East Japan Railway Co. | 16,570 | 122,489,577 | ||||
Hanshin Electric Railway Co. Ltd.1 | 677,000 | 5,258,533 | ||||
Kawasaki Kisen Kaisha Ltd.1 | 3,310,000 | 21,533,273 | ||||
Keihin Electric Express Railway Co. Ltd.1 | 1,661,000 | 11,442,964 | ||||
Keio Corp. | 3,310,000 | 21,561,495 | ||||
Kintetsu Corp. | 8,275,000 | 26,740,205 | ||||
Mitsui O.S.K. Lines Ltd. | 4,971,000 | 37,933,623 | ||||
Nippon Express Co. Ltd. | 4,965,000 | 26,965,980 | ||||
Nippon Yusen Kabushiki Kaisha | 4,971,000 | 30,813,122 | ||||
Seino Holdings Co. Ltd. | 1,243,000 | 14,254,465 | ||||
Tobu Railway Co. Ltd. | 4,965,000 | 25,568,999 | ||||
Tokyu Corp. | 4,971,000 | 33,101,855 | ||||
West Japan Railway Co. | 9,930 | 42,417,445 | ||||
Yamato Holdings Co. Ltd. | 1,657,000 | 25,825,946 | ||||
| 535,511,864 | ||||||
VENTURE CAPITAL – 0.06% | ||||||
JAFCO Co. Ltd. | 165,700 | 8,561,555 | ||||
| 8,561,555 | ||||||
TOTAL COMMON STOCKS | 13,714,375,858 | |||||
SHORT-TERM INVESTMENTS – 1.52% | ||||||
CERTIFICATES OF DEPOSIT3 – 0.06% | ||||||
Credit Suisse First Boston NY | ||||||
5.28% - 5.43%, 04/23/07 - 08/21/07 | $ | 1,218,425 | 1,218,425 | |||
Societe Generale | ||||||
5.33%, 12/08/06 | 1,740,607 | 1,740,607 | ||||
Washington Mutual Bank | ||||||
5.36%, 11/13/06 | 4,351,517 | 4,351,517 | ||||
SCHEDULEOF INVESTMENTS | 9 |
Table of Contents
Schedule of Investments (Continued)
iSHARES® MSCI JAPAN INDEX FUND
August 31, 2006
Security | Principal | Value | ||||
Wells Fargo Bank N.A. | ||||||
4.78%, 12/05/06 | $ | 1,392,485 | $ | 1,392,485 | ||
| 8,703,034 | ||||||
COMMERCIAL PAPER3 – 0.25% | ||||||
Amstel Funding Corp. | ||||||
5.20%, 11/21/06 - 11/22/064 | 507,874 | 501,906 | ||||
Amsterdam Funding Corp. | ||||||
5.27%, 09/15/064 | 1,740,607 | 1,737,039 | ||||
Atlantis One Funding | ||||||
5.30%, 11/14/064 | 2,388,252 | 2,362,233 | ||||
Barton Capital Corp. | ||||||
5.27%, 09/06/064 | 877,266 | 876,624 | ||||
Cancara Asset Securitisation Ltd. | ||||||
5.30%, 11/14/064 | 882,348 | 872,736 | ||||
CC USA Inc. | ||||||
5.03%, 10/24/064 | 348,121 | 345,543 | ||||
Charta LLC | ||||||
5.30%, 11/06/064 | 1,740,607 | 1,723,694 | ||||
Concord Minutemen Capital Co. LLC | ||||||
5.27% - 5.29%, 09/13/06 - 11/16/064 | 3,057,045 | 3,043,484 | ||||
Curzon Funding LLC | ||||||
5.29%, 11/17/064 | 1,740,607 | 1,720,912 | ||||
Edison Asset Securitization LLC | ||||||
5.22%, 12/11/064 | 1,284,080 | 1,265,275 | ||||
Falcon Asset Securitization Corp. | ||||||
5.30%, 11/06/064 | 1,740,607 | 1,723,694 | ||||
Five Finance Inc. | ||||||
5.19%, 12/01/064 | 783,273 | 772,997 | ||||
General Electric Capital Services Inc. | ||||||
5.22%, 12/11/06 | 174,061 | 171,512 | ||||
Giro Funding Corp. | ||||||
5.28% - 5.34%, 09/11/06 - 10/10/064 | 1,740,607 | 1,734,300 | ||||
Grampian Funding LLC | ||||||
5.03% - 5.30%, 10/17/06 - 11/16/064 | 835,491 | 828,598 | ||||
KKR Pacific Funding Trust | ||||||
5.29%, 09/14/064 | 1,740,607 | 1,737,282 | ||||
Landale Funding LLC | ||||||
5.31%, 11/15/064 | 1,357,673 | 1,342,668 | ||||
Lexington Parker Capital Co. LLC | ||||||
5.19% - 5.27%, 09/15/06 - 11/15/064 | 2,256,209 | 2,243,264 | ||||
Liberty Street Funding Corp. | ||||||
5.27%, 09/08/06 - 09/11/064 | 1,549,140 | 1,547,255 | ||||
Mont Blanc Capital Corp. | ||||||
5.29%, 11/15/064 | 1,122,691 | 1,110,318 | ||||
Monument Gardens Funding LLC | ||||||
5.28%, 09/21/064 | 874,707 | 872,141 | ||||
Nestle Capital Corp. | ||||||
5.19%, 08/09/07 | 1,044,364 | 992,872 | ||||
Park Granada LLC | ||||||
5.30%, 09/01/064 | 397,763 | 397,763 | ||||
Regency Markets LLC | ||||||
5.28%, 09/15/06 | 870,303 | 868,518 | ||||
Solitaire Funding Ltd. | ||||||
5.27%, 09/05/064 | 1,305,455 | 1,304,691 | ||||
Sydney Capital Corp. | ||||||
5.27%, 09/12/064 | 398,251 | 397,610 | ||||
Tulip Funding Corp. | ||||||
5.29%, 11/15/064 | 918,031 | 907,913 | ||||
White Pine Finance LLC | ||||||
5.12%, 10/27/064 | 328,975 | 326,355 | ||||
| 33,729,197 | ||||||
MEDIUM-TERM NOTES3 – 0.05% | ||||||
Bank of America N.A. | ||||||
5.28%, 04/20/07 | 435,152 | 435,152 | ||||
Cullinan Finance Corp. | ||||||
5.71%, 06/28/074 | 1,305,455 | 1,305,455 | ||||
K2 USA LLC | ||||||
5.39%, 06/04/074 | 1,305,455 | 1,305,455 | ||||
Marshall & Ilsley Bank | ||||||
5.18%, 12/15/06 | 1,740,607 | 1,742,330 | ||||
Sigma Finance Inc. | ||||||
5.13% - 5.51%, 03/30/07 - 06/18/074 | 2,036,510 | 2,036,509 | ||||
US Bank N.A. | ||||||
2.85%, 11/15/06 | 348,121 | 346,805 | ||||
| 7,171,706 | ||||||
10 | 2006 iSHARES ANNUAL REPORTTO SHAREHOLDERS |
Table of Contents
Schedule of Investments (Continued)
iSHARES® MSCI JAPAN INDEX FUND
August 31, 2006
Security | Shares or Principal | Value | ||||
MONEY MARKET FUNDS – 0.01% | ||||||
Barclays Global Investors Funds Institutional Money Market Fund, Institutional Shares 5.30%5,6 | 1,368,550 | $ | 1,368,550 | |||
| 1,368,550 | ||||||
REPURCHASE AGREEMENTS3 – 0.31% | ||||||
Banc of America Securities LLC Repurchase Agreement, 5.30%, due 9/1/06, maturity value $2,176,078 (collateralized by U.S. Government obligations, value $2,221,380, 5.50% to 6.50%, 1/1/33 to 7/1/36). | $ | 2,175,758 | 2,175,758 | |||
Banc of America Securities LLC Repurchase Agreement, 5.36%, due 9/1/06, maturity value $3,481,731 (collateralized by non-U.S. Government debt securities, value $3,589,054, 3.80% to 9.13%, 11/1/06 to 6/15/26). | 3,481,213 | 3,481,213 | ||||
Bear Stearns Companies Inc. (The) Repurchase Agreement, 5.37%, due 9/1/06, maturity value $2,611,299 (collateralized by non-U.S. Government debt securities, value $2,874,774, 0.08% to 6.43%, 9/25/20 to 7/25/36). | 2,610,910 | 2,610,910 | ||||
Citigroup Global Markets Holdings Inc. Repurchase Agreement, 5.36%, due 9/1/06, maturity value $5,222,597 (collateralized by non-U.S. Government debt securities, value $5,456,435, 4.35% to 7.50%, 9/15/08 to 8/25/35). | 5,221,820 | 5,221,820 | ||||
Security | Principal | Value | ||||
Citigroup Global Markets Holdings Inc. Repurchase Agreement, 5.46%, due 9/1/06, maturity value $1,044,522 (collateralized by non-U.S. Government debt securities, value $1,274,888, 0.00% to 10.00%, 6/1/28 to 8/24/36). | $ | 1,044,364 | $ | 1,044,364 | ||
Goldman Sachs & Co. Repurchase Agreement, 5.35%, due 9/1/06, maturity value $3,481,730 (collateralized by non-U.S. Government debt securities, value $3,554,209, 0.00% to 8.57%, 11/15/06 to 2/15/38). | 3,481,213 | 3,481,213 | ||||
Goldman Sachs Group Inc. Repurchase Agreement, 5.36%, due 9/1/06, maturity value $1,740,866 (collateralized by non-U.S. Government debt securities, value $1,829,372, 5.36% to 9.01%, 10/27/10 to 2/18/20). | 1,740,607 | 1,740,607 | ||||
JP Morgan Securities Inc. Repurchase Agreement, 5.41%, due 9/1/06, maturity value $435,217 (collateralized by non-U.S. Government debt securities, value $457,358, 6.63% to 10.50%, 1/15/07 to 4/15/16). | 435,152 | 435,152 | ||||
Lehman Brothers Holdings Inc. Repurchase Agreement, 5.36%, due 9/1/06, maturity value $3,481,731 (collateralized by non-U.S. Government debt securities, value $3,658,758, 0.51% to 8.89%, 8/5/18 to 9/25/46). | 3,481,213 | 3,481,213 | ||||
SCHEDULEOF INVESTMENTS | 11 |
Table of Contents
Schedule of Investments (Continued)
iSHARES® MSCI JAPAN INDEX FUND
August 31, 2006
Security | Principal | Value | ||||
Lehman Brothers Holdings Inc. Repurchase Agreement, 5.38%, due 9/1/06, maturity value $1,740,867 (collateralized by non-U.S. Government debt securities, value $1,829,424, 4.11% to 9.79%, 4/28/31 to 9/25/46). | $ | 1,740,607 | $ | 1,740,607 | ||
Lehman Brothers Holdings Inc. Repurchase Agreement, 5.46%, due 9/1/06, maturity value $1,914,957 (collateralized by non-U.S. Government debt securities, value $2,012,309, 3.44% to 15.15%, 12/1/08 to 3/1/36). | 1,914,667 | 1,914,667 | ||||
Merrill Lynch & Co. Inc. Repurchase Agreement, 5.33%, due 9/1/06, maturity value $3,481,728 (collateralized by non-U.S. Government debt securities, value $3,658,810, 6.38% to 10.25%, 5/1/07 to 10/15/16). | 3,481,213 | 3,481,213 | ||||
Merrill Lynch & Co. Inc. Repurchase Agreement, 5.36%, due 9/1/06, maturity value $3,481,731 (collateralized by non-U.S. Government debt securities, value $3,589,703, 0.00% to 10.13%, 10/15/06 to 7/1/26). | 3,481,213 | 3,481,213 | ||||
Morgan Stanley Repurchase Agreement, 5.36%, due 9/1/06, maturity value $1,740,866 (collateralized by non-U.S. Government debt securities, value $1,830,216, 4.05% to 7.24%, 6/20/29 to 1/14/41). | 1,740,607 | 1,740,607 | ||||
Morgan Stanley Repurchase Agreement, 5.46%, due 9/1/06, maturity value $609,304 (collateralized by non-U.S. Government debt securities, value $934,286, 0.00% to 10.00%, 9/1/06 to 8/31/36). | 609,212 | 609,212 | ||||
Morgan Stanley Repurchase Agreement, 5.51%, due 6/4/07, maturity value $1,270,082 (collateralized by non-U.S. Government debt securities, value $1,896,885, 0.00% to 10.00%, 9/1/06 to 8/31/36).7 | 1,218,425 | 1,218,425 | ||||
Wachovia Capital Repurchase Agreement, 5.38%, due 9/1/06, maturity value $4,526,253 (collateralized by non-U.S. Government debt securities, value $4,756,367, 0.06% to 7.68%, 10/15/11 to 3/15/45). | 4,525,577 | 4,525,577 | ||||
| 42,383,771 | ||||||
TIME DEPOSITS3 – 0.00% | ||||||
KBC Bank | ||||||
5.31%, 09/01/06 | 367,285 | 367,285 | ||||
| 367,285 | ||||||
VARIABLE & FLOATING RATE NOTES3 – 0.84% | ||||||
Allstate Life Global Funding II | ||||||
5.34% - 5.47%, 09/04/07 - 09/27/074 | 4,455,953 | 4,456,529 | ||||
American Express Bank | ||||||
5.30%, 02/28/07 | 1,740,607 | 1,740,600 | ||||
American Express Centurion Bank | ||||||
5.42%, 07/19/07 | 1,914,667 | 1,916,607 | ||||
American Express Credit Corp. | ||||||
5.51%, 07/05/07 | 522,182 | 522,473 | ||||
ASIF Global Financing | ||||||
5.51%, 05/03/074 | 174,061 | 174,126 | ||||
12 | 2006 iSHARES ANNUAL REPORTTO SHAREHOLDERS |
Table of Contents
Schedule of Investments (Continued)
iSHARES® MSCI JAPAN INDEX FUND
August 31, 2006
Security | Principal | Value | ||||
Australia & New Zealand Banking Group Ltd. | ||||||
5.32%, 09/21/074 | $ | 1,131,394 | $ | 1,131,394 | ||
Bank of Ireland | ||||||
5.30% - 5.31%, 08/14/07 - 08/20/074 | 2,523,880 | 2,523,984 | ||||
Beta Finance Inc. | ||||||
5.29% - 5.48%, 04/25/07 - 07/25/074 | 4,438,547 | 4,438,774 | ||||
BMW US Capital LLC | ||||||
5.33%, 09/14/074 | 1,740,607 | 1,740,607 | ||||
BNP Paribas | ||||||
5.36%, 05/18/074 | 3,220,122 | 3,220,122 | ||||
Carlyle Loan Investment Ltd. | ||||||
5.38%, 04/13/07 - 07/15/074 | 1,270,643 | 1,270,644 | ||||
CC USA Inc. | ||||||
5.48%, 07/30/074 | 870,303 | 870,417 | ||||
Commodore CDO Ltd. | ||||||
5.38%, 06/12/074 | 435,152 | 435,152 | ||||
Credit Agricole SA | ||||||
5.48%, 07/23/07 | 1,740,607 | 1,740,607 | ||||
Credit Suisse First Boston NY | ||||||
5.51%, 04/24/07 | 870,303 | 870,342 | ||||
Cullinan Finance Corp. | ||||||
5.36%, 04/25/074 | 435,152 | 435,152 | ||||
DEPFA Bank PLC | ||||||
5.37%, 06/15/07 | 1,740,607 | 1,740,607 | ||||
Dorada Finance Inc. | ||||||
5.41% - 5.47%, 06/27/07 - 07/17/074 | 2,001,698 | 2,001,825 | ||||
Eli Lilly Services Inc. | ||||||
5.37%, 08/31/074 | 1,740,607 | 1,740,607 | ||||
Fifth Third Bancorp | ||||||
5.30%, 09/21/074 | 3,481,213 | 3,481,213 | ||||
Five Finance Inc. | ||||||
5.37% - 5.45%, 12/01/06 - 07/13/074 | 1,740,607 | 1,740,475 | ||||
General Electric Capital Corp. | ||||||
5.29% - 5.49%, 07/09/07 - 09/24/07 | 1,827,637 | 1,828,066 | ||||
Granite Master Issuer PLC | ||||||
5.30%, 09/20/06 | 6,092,123 | 6,092,123 | ||||
Harrier Finance Funding LLC | ||||||
5.33%, 07/25/074 | 522,182 | 522,278 | ||||
Hartford Life Global Funding Trusts | ||||||
5.35% - 5.55%, 07/13/07 - 09/17/07 | 2,610,910 | 2,611,318 | ||||
HBOS Treasury Services PLC | ||||||
5.53%, 07/24/074 | 1,740,607 | 1,740,607 | ||||
Holmes Financing PLC | ||||||
5.40%, 07/16/074 | 3,046,062 | 3,046,062 | ||||
JP Morgan Chase & Co. | ||||||
5.36%, 08/02/07 | 1,305,455 | 1,305,455 | ||||
K2 USA LLC | ||||||
5.20% - 5.46%, 04/02/07 - 06/28/074 | 1,305,455 | 1,305,397 | ||||
Kestrel Funding LLC | ||||||
5.31%, 07/11/074 | 696,243 | 696,179 | ||||
Kommunalkredit Austria AG | ||||||
5.33%, 09/09/074 | 1,044,364 | 1,044,364 | ||||
Leafs LLC | ||||||
5.33%, 01/22/07 - 02/20/074 | 1,816,103 | 1,816,103 | ||||
Lexington Parker Capital Co. LLC | ||||||
5.46%, 01/10/074 | 2,175,758 | 2,175,273 | ||||
Links Finance LLC | ||||||
5.33% - 5.35%, 05/10/07 - 05/16/074 | 1,914,667 | 1,914,533 | ||||
Lothian Mortgages Master Issuer PLC | ||||||
5.30%, 04/24/074 | 766,960 | 766,960 | ||||
Marshall & Ilsley Bank | ||||||
5.31%, 09/14/07 | 957,334 | 957,334 | ||||
Metropolitan Life Global Funding I | ||||||
5.42%, 08/06/074 | 2,610,910 | 2,610,910 | ||||
Metropolitan Life Insurance Funding Agreement | ||||||
5.57%, 08/01/074,7 | 174,061 | 174,061 | ||||
Monumental Global Funding II | ||||||
5.49%, 12/27/064 | 348,121 | 348,158 | ||||
Mound Financing PLC | ||||||
5.39%, 05/08/074 | 1,636,170 | 1,636,170 | ||||
SCHEDULEOF INVESTMENTS | 13 |
Table of Contents
Schedule of Investments (Continued)
iSHARES® MSCI JAPAN INDEX FUND
August 31, 2006
Security | Principal | Value | |||||
Natexis Banques Populaires | |||||||
5.31% - 5.40%, 02/05/07 - 09/14/074 | $ | 5,221,820 | $ | 5,221,736 | |||
National City Bank of Indiana | |||||||
5.37%, 05/21/07 | 870,303 | 870,356 | |||||
Nationwide Building Society | |||||||
5.44% - 5.62%, 07/06/07 - 07/27/074 | 5,744,002 | 5,745,341 | |||||
Newcastle Ltd. | |||||||
5.35%, 04/24/074 | 613,564 | 613,447 | |||||
Northern Rock PLC | |||||||
5.43%, 08/03/074 | 2,088,728 | 2,088,777 | |||||
Principal Life Global Funding I | |||||||
5.80%, 02/08/07 | 783,273 | 784,878 | |||||
Sedna Finance Inc. | |||||||
5.30% - 5.37%, 09/20/06 - 08/21/074 | 3,046,062 | 3,046,005 | |||||
Skandinaviska Enskilda Bank NY | |||||||
5.33%, 09/18/074 | 1,740,607 | 1,740,607 | |||||
Strips III LLC | |||||||
5.38%, 07/24/074 | 423,243 | 423,243 | |||||
SunTrust Bank | |||||||
5.37%, 05/01/07 | 1,740,607 | 1,740,678 | |||||
Tango Finance Corp. | |||||||
5.22% - 5.48%, 04/25/07 - 07/16/074 | 4,247,080 | 4,246,703 | |||||
Union Hamilton Special Funding LLC | |||||||
5.42% - 5.49%, 09/28/06 - 12/21/064 | 2,436,849 | 2,436,850 | |||||
US Bank N.A. | |||||||
5.26%, 09/29/06 | 783,273 | 783,257 | |||||
Wachovia Asset Securitization Inc. | |||||||
5.31%, 09/25/064 | 2,597,354 | 2,597,355 | |||||
Wachovia Bank N.A. | |||||||
5.36%, 05/22/07 | 3,481,213 | 3,481,213 | |||||
Wells Fargo & Co. | |||||||
5.34%, 09/14/074 | 870,303 | 870,357 | |||||
WhistleJacket Capital Ltd. | |||||||
5.29% - 5.35%, 04/18/07 - 06/13/074 | 1,305,455 | 1,305,447 | |||||
White Pine Finance LLC | |||||||
5.29% - 5.35%, 05/22/07 - 08/20/074 | 5,221,820 | 5,220,748 | |||||
Wind Master Trust | |||||||
5.31% - 5.32%, 09/25/06 - 07/25/074 | 1,103,910 | 1,103,910 | |||||
| 115,104,516 | |||||||
TOTAL SHORT-TERM INVESTMENTS | 208,828,059 | ||||||
TOTAL INVESTMENTS IN SECURITIES – 101.45% | 13,923,203,917 | ||||||
Other Assets, Less Liabilities – (1.45)% | (198,613,508 | ) | |||||
NET ASSETS – 100.00% | $ | 13,724,590,409 | |||||
| 1 | All or a portion of this security represents a security on loan. See Note 5. |
| 2 | Non-income earning security. |
| 3 | All or a portion of this security (these securities) represent(s) an investment of securities lending collateral. See Note 5. |
| 4 | This security or a portion of these securities may be resold to qualified institutional buyers under Rule 144A or pursuant to Section 4(2) of the Securities Act of 1933. |
| 5 | Affiliated issuer. See Note 2. |
| 6 | The rate quoted is the annualized seven-day yield of the fund at period end. |
| 7 | The investment adviser has determined that this security or a portion of these securities is illiquid. |
See notes to the financial statements.
14 | 2006 iSHARES ANNUAL REPORTTO SHAREHOLDERS |
Table of Contents
Statement of Assets and Liabilities
iSHARES®, INC.
August 31, 2006
| iShares MSCI Japan Index Fund | ||||
ASSETS | ||||
Investments, at cost: | ||||
Unaffiliated issuers | $ | 11,195,544,370 | ||
Affiliated issuersa | $ | 1,368,550 | ||
Foreign currency, at cost | $ | 9,748,028 | ||
Investments in securities, at value (including securities on loanb) (Note 1): | ||||
Unaffiliated issuers | $ | 13,921,835,367 | ||
Affiliated issuersa | 1,368,550 | |||
Foreign currency, at value | 9,540,626 | |||
Receivables: | ||||
Investment securities sold | 9,237,605 | |||
Dividends and interest | 4,668,793 | |||
Total Assets | 13,946,650,941 | |||
LIABILITIES | ||||
Payables: | ||||
Investment securities purchased | 8,486,916 | |||
Collateral for securities on loan (Note 5) | 207,459,509 | |||
Investment advisory fees (Note 2) | 6,114,107 | |||
Total Liabilities | 222,060,532 | |||
NET ASSETS | $ | 13,724,590,409 | ||
Net assets consist of: | ||||
Paid-in capital | $ | 11,196,635,749 | ||
Undistributed net investment income | 29,465,062 | |||
Accumulated net realized loss | (227,565,085 | ) | ||
Net unrealized appreciation on investments and translation of assets and liabilities in foreign currencies | 2,726,054,683 | |||
NET ASSETS | $ | 13,724,590,409 | ||
Shares outstanding | 994,200,000 | |||
Net asset value per share | $ | 13.80 | ||
| a | See Note 2. |
| b | Securities on loan with market value of $196,512,225. See Note 5. |
See notes to the financial statements.
FINANCIAL STATEMENTS | 15 |
Table of Contents
Statement of Operations
iSHARES®, INC.
Year ended August 31, 2006
| iShares MSCI Japan Index Fund | ||||
NET INVESTMENT INCOME | ||||
Dividends from unaffiliated issuersa | $ | 125,980,438 | ||
Interest from affiliated issuersb | 309,395 | |||
Securities lending incomec | 1,897,151 | |||
Total investment income | 128,186,984 | |||
EXPENSES | ||||
Investment advisory fees (Note 2) | 67,470,595 | |||
Proxy fees | 267,453 | |||
Total expenses | 67,738,048 | |||
Net investment income | 60,448,936 | |||
NET REALIZED AND UNREALIZED GAIN (LOSS) | ||||
Net realized gain (loss) from: | ||||
Investments in unaffiliated issuers | (33,121,854 | ) | ||
In-kind redemptions | 482,452,139 | |||
Foreign currency transactions | (487,960 | ) | ||
Net realized gain | 448,842,325 | |||
Net change in unrealized appreciation (depreciation) on: | ||||
Investments | 1,877,509,737 | |||
Translation of assets and liabilities in foreign currencies | (202,136 | ) | ||
Net change in unrealized appreciation (depreciation) | 1,877,307,601 | |||
Net realized and unrealized gain | 2,326,149,926 | |||
NET INCREASE IN NET ASSETS RESULTING FROM OPERATIONS | $ | 2,386,598,862 | ||
| a | Net of foreign withholding tax of $8,233,961. |
| b | See Note 2. |
| c | Includes income earned from affiliated issuers. See Note 2. |
See notes to the financial statements.
16 | 2006 iSHARES ANNUAL REPORTTO SHAREHOLDERS |
Table of Contents
Statements of Changes in Net Assets
iSHARES®, INC.
iShares MSCI Japan Index Fund | ||||||||
Year ended August 31, 2006 | Year ended August 31, 2005 | |||||||
INCREASE (DECREASE) IN NET ASSETS | ||||||||
OPERATIONS: | ||||||||
Net investment income | $ | 60,448,936 | $ | 37,668,587 | ||||
Net realized gain | 448,842,325 | 63,663,962 | ||||||
Net change in unrealized appreciation (depreciation) | 1,877,307,601 | 584,158,197 | ||||||
Net increase in net assets resulting from operations | 2,386,598,862 | 685,490,746 | ||||||
DISTRIBUTIONS TO SHAREHOLDERS: | ||||||||
From net investment income | (55,636,178 | ) | (26,096,423 | ) | ||||
Total distributions to shareholders | (55,636,178 | ) | (26,096,423 | ) | ||||
CAPITAL SHARE TRANSACTIONS: | ||||||||
Proceeds from shares sold | 5,381,707,859 | 1,159,930,120 | ||||||
Cost of shares redeemed | (1,236,187,530 | ) | (434,548,691 | ) | ||||
Net increase in net assets from capital share transactions | 4,145,520,329 | 725,381,429 | ||||||
INCREASE IN NET ASSETS | 6,476,483,013 | 1,384,775,752 | ||||||
NET ASSETS | ||||||||
Beginning of year | 7,248,107,396 | 5,863,331,644 | ||||||
End of year | $ | 13,724,590,409 | $ | 7,248,107,396 | ||||
Undistributed net investment income included in net assets at end of year | $ | 29,465,062 | $ | 21,558,909 | ||||
SHARES ISSUED AND REDEEMED | ||||||||
Shares sold | 426,600,000 | 109,200,000 | ||||||
Shares redeemed | (91,800,000 | ) | (42,600,000 | ) | ||||
Net increase in shares outstanding | 334,800,000 | 66,600,000 | ||||||
See notes to the financial statements.
FINANCIAL STATEMENTS | 17 |
Table of Contents
iSHARES®, INC.
(For a share outstanding throughout each period)
| iShares MSCI Japan Index Fund | ||||||||||||||||||||
| Year ended Aug. 31, 2006 | Year ended Aug. 31, 2005 | Year ended Aug. 31, 2004 | Year ended Aug. 31, 2003 | Year ended Aug. 31, 2002 | ||||||||||||||||
Net asset value, beginning of year | $ | 10.99 | $ | 9.89 | $ | 8.29 | $ | 7.77 | $ | 9.07 | ||||||||||
Income from investment operations: | ||||||||||||||||||||
Net investment income (loss)a | 0.06 | 0.06 | 0.03 | 0.00b | (0.01 | ) | ||||||||||||||
Net realized and unrealized gain (loss)c | 2.81 | 1.08 | 1.57 | 0.52 | (1.29 | ) | ||||||||||||||
Total from investment operations | 2.87 | 1.14 | 1.60 | 0.52 | (1.30 | ) | ||||||||||||||
Less distributions from: | ||||||||||||||||||||
Net investment income | (0.06 | ) | (0.04 | ) | (0.00 | )b | — | — | ||||||||||||
Total distributions | (0.06 | ) | (0.04 | ) | (0.00 | )b | — | — | ||||||||||||
Net asset value, end of year | $ | 13.80 | $ | 10.99 | $ | 9.89 | $ | 8.29 | $ | 7.77 | ||||||||||
Total return | 26.10 | % | 11.58 | % | 19.32 | % | 6.69 | % | (14.33 | )% | ||||||||||
Ratios/Supplemental data: | ||||||||||||||||||||
Net assets, end of year (000s) | $ | 13,724,590 | $ | 7,248,107 | $ | 5,863,332 | $ | 1,726,855 | $ | 666,376 | ||||||||||
Ratio of expenses to average net assets | 0.54 | % | 0.57 | % | 0.64 | %d | 0.84 | % | 0.84 | % | ||||||||||
Ratio of net investment income (loss) to average net assets | 0.48 | % | 0.59 | % | 0.28 | % | 0.03 | % | (0.12 | )% | ||||||||||
Portfolio turnover ratee | 8 | % | 6 | % | 5 | % | 2 | % | 2 | % | ||||||||||
| a | Based on average shares outstanding throughout each period. |
| b | Rounds to less than $0.01. |
| c | The amounts reported may not accord with the change in aggregate gains and losses in securities due to the timing of capital share transactions. |
| d | Ratio of expenses to average net assets prior to voluntarily reimbursed distribution fees for the year ended August 31, 2004 was 0.78%. |
| e | Portfolio turnover rates exclude portfolio securities received or delivered as a result of processing capital share transactions in Creation Units. |
See notes to the financial statements.
18 | 2006 iSHARES ANNUAL REPORTTO SHAREHOLDERS |
Table of Contents
Notes to the Financial Statements
iSHARES®, INC.
iShares, Inc. (the “Company”), is registered under the Investment Company Act of 1940, as amended (the “1940 Act”), as an open-end management investment company. The Company was incorporated under the laws of the State of Maryland on September 1, 1994 pursuant to amended and restated Articles of Incorporation. As of August 31, 2006, the Company offered 24 investment portfolios or funds.
These financial statements relate only to the iShares MSCI Japan Index Fund (the “Fund”).
The Fund’s investment objective is to seek investment results that correspond generally to the price and yield performance, before fees and expenses, of publicly traded equity securities in the aggregate in the Japanese equity market, as measured by the MSCI Japan Index compiled by Morgan Stanley Capital International Inc. (“MSCI”). The investment adviser uses a “passive” or index approach to achieve the Fund’s investment objective. The Fund is classified as a non-diversified fund under the 1940 Act. Non-diversified funds generally hold securities of fewer companies than diversified funds and may be more susceptible to the risks associated with these particular companies, or to a single economic, political or regulatory occurrence affecting these companies.
The Fund invests in the securities of foreign issuers of a single country, which may involve certain considerations and risks not typically associated with securities of U.S. issuers. Such risks include, but are not limited to: generally less liquid and less efficient securities markets; generally greater price volatility; exchange rate fluctuations and exchange controls; imposition of restrictions on the expatriation of funds or other assets of the Fund; less publicly available information about issuers; the imposition of withholding or other taxes; higher transaction and custody costs; settlement delays and risk of loss attendant in settlement procedures; difficulties in enforcing contractual obligations; less regulation of securities markets; different accounting, disclosure and reporting requirements; more substantial governmental involvement in the economy; higher inflation rates; greater social, economic and political uncertainties; the risk of nationalization or expropriation of assets and the risk of war.
Under the Company’s organizational documents, the Fund’s officers and directors are indemnified against certain liabilities that may arise out of the performance of their duties to the Fund. Additionally, in the normal course of business, the Fund enters into contracts with service providers that contain general indemnification clauses. The Fund’s maximum exposure under these arrangements is unknown as this would involve future claims that may be made against the Fund that have not yet occurred.
1. SIGNIFICANT ACCOUNTING POLICIES
The following significant accounting policies are consistently followed by the Company in the preparation of its financial statements in conformity with accounting principles generally accepted in the United States of America (“U.S. GAAP”) for investment companies. The preparation of financial statements in conformity with U.S. GAAP requires management to make certain estimates and assumptions that affect the reported amounts of assets and liabilities and disclosures of contingent assets and liabilities at the date of the financial statements and the reported amounts of revenue and expenses during the reporting period. Actual results could differ from those estimates.
SECURITY VALUATION
The securities and other assets of the Fund are generally valued using market valuations. A market valuation generally means a valuation (i) obtained from an exchange, a pricing service or a major market maker (or dealer), (ii) based on a price quotation or other equivalent indication of value supplied by an exchange, a pricing service or a major market maker (or dealer) or (iii) based on amortized cost. In the case of shares of funds that are not traded on an exchange, a market valuation means such fund’s published net asset value per share. The investment adviser may use various pricing services or discontinue the use of any pricing service. A price obtained from a pricing service based on such pricing service’s valuation matrix may be considered a market valuation. In the event that current market valuations are not readily available or such valuations do not reflect current market values, the affected investments will be valued using fair value pricing pursuant to the pricing policy and procedures approved by the Board of Directors of the Company (the “Board”).
NOTESTOTHE FINANCIAL STATEMENTS | 19 |
Table of Contents
Notes to the Financial Statements (Continued)
iSHARES®, INC.
SECURITY TRANSACTIONS AND INCOME RECOGNITION
Security transactions are accounted for on trade date. Dividend income is recognized on the ex-dividend date, net of any foreign taxes withheld at source, and interest income is accrued daily. Realized gains and losses on investment transactions are determined using the specific identification method.
FOREIGN CURRENCY TRANSLATION
The accounting records of the Fund are maintained in U.S. dollars. Foreign currencies, as well as investment securities and other assets and liabilities denominated in foreign currencies are translated into U.S. dollars using exchange rates deemed appropriate by the investment adviser. Any use of a different rate from the rates used by MSCI may adversely affect the Fund’s ability to track its underlying index. Purchases and sales of securities, income receipts and expense payments are translated into U.S. dollars on the respective date of such transactions.
The Fund does not isolate the effect of fluctuations in foreign exchange rates from the effect of fluctuations in the market prices of securities. Such fluctuations are reflected by the Fund as a component of realized and unrealized gains and losses from investments for financial reporting purposes.
DISTRIBUTIONS TO SHAREHOLDERS
Distributions to shareholders from net investment income, if any, including any net foreign currency gains, are declared and distributed at least annually by the Fund. Distributions of net realized capital gains, if any, generally are declared and distributed once a year. Distributions are determined on a tax basis and may differ from net investment income and net realized capital gains for financial reporting purposes. Dividends and distributions are paid in U.S. dollars and cannot be automatically reinvested in additional shares of the Fund.
As of August 31, 2006, the tax year-end of the Fund, the components of net distributable earnings on a tax basis consisted of undistributed ordinary income of $49,104,975, unrealized appreciation of $2,651,432,248, and capital and other losses of $172,582,563, for net distributable earnings of $2,527,954,660.
For the years ended August 31, 2006 and August 31, 2005, the tax characterization of distributions paid for the Fund represents ordinary income. The total distributions and distributions per share are disclosed in the accompanying Statements of Changes in Net Assets and the Financial Highlights for the Fund.
FEDERAL INCOME TAXES
The Fund is treated as an entity separate from the Company’s other funds for federal income tax purposes. It is the policy of the Fund to qualify as a regulated investment company by complying with the provisions applicable to regulated investment companies, as defined under Subchapter M of the Internal Revenue Code of 1986, as amended, and to annually distribute substantially all of its net income and any net gains (taking into account any capital loss carryforwards) sufficient to relieve it from all, or substantially all, federal income and excise taxes. Accordingly, no provision for federal income taxes was required for the year ended August 31, 2006.
From November 1, 2005 to August 31, 2006, the Fund incurred net realized capital losses and net foreign currency losses of $21,186,379. As permitted by tax regulations, the Fund has elected to defer those losses and treat them as arising in the year ending August 31, 2007.
As of August 31, 2006, the tax year-end of the Fund, the Fund had tax basis net capital loss carryforwards of $2,959,030, $62,572,173, $3,621,148, $5,594,562, $8,733,802 and $68,122,871 expiring in 2009, 2010, 2011, 2012, 2013 and 2014, respectively. Such losses may be applied against any net realized taxable gains in each succeeding year or until their respective expiration dates, whichever occurs first.
20 | 2006 iSHARES ANNUAL REPORTTO SHAREHOLDERS |
Table of Contents
Notes to the Financial Statements (Continued)
iSHARES®, INC.
The Fund may own shares in certain foreign investment entities, referred to, under U.S. tax law, as “passive foreign investment companies.” The Fund may elect to mark-to-market annually the shares of each passive foreign investment company and would be required to distribute to shareholders any such mark-to-market gains.
The Fund reclassifies at the end of its tax year certain amounts to paid-in-capital from accumulated net realized gain (loss) on investments and foreign currency transactions and accumulated net investment income (loss), respectively, as a result of permanent book and tax differences primarily attributed to net investment loss, return of capital, passive foreign investment companies, realized foreign currency gains and losses and gains and losses on in-kind redemptions. These reclassifications have no effect on net assets or net asset value per share.
As of August 31, 2006, the cost of investments for federal income tax purposes was $11,271,535,355. Net unrealized appreciation was $2,651,668,562, of which $2,873,877,135 represented gross unrealized appreciation on securities and $222,208,573 represented gross unrealized depreciation on securities.
REPURCHASE AGREEMENTS
The Fund may enter into repurchase agreements with banks and securities dealers. These transactions involve the purchase of securities with a simultaneous commitment to resell the securities to the bank or the dealer at an agreed-upon date and price. A repurchase agreement is accounted for as an investment by the Fund, collateralized by securities, which are delivered to the Fund’s custodian or to an agent bank under a tri-party agreement. The securities are marked-to-market daily and additional securities are acquired as needed, to ensure that their value equals or exceeds the repurchase price plus accrued interest.
2. AGREEMENTS AND OTHER TRANSACTIONS WITH AFFILIATES
Pursuant to an Investment Advisory Agreement with the Company, Barclays Global Fund Advisors (“BGFA”) manages the investment of the Fund’s assets. BGFA is a California corporation indirectly owned by Barclays Bank PLC. Under the Investment Advisory Agreement, BGFA is responsible for all expenses (“Covered Expenses”) of the Company, including the cost of transfer agency, custody, fund administration, legal, audit and other services, except interest, taxes, brokerage commissions and other expenses connected with the execution of portfolio transactions, distribution fees and extraordinary expenses.
For its investment advisory services to the Fund, BGFA is entitled to an annual investment advisory fee based on the Fund’s allocable portion of the aggregate of the average daily net assets of all the funds offered by the Company (except for the iShares MSCI Brazil, iShares MSCI Emerging Markets, iShares MSCI Pacific ex-Japan, iShares MSCI South Africa, iShares MSCI South Korea and iShares MSCI Taiwan Index Funds) as follows:
| Investment Advisory Fee | Aggregate Average Daily Net Assets | |
| 0.59% | First $7 billion | |
| 0.54 | Over $7 billion, up to and including $11 billion | |
| 0.49 | Over $11 billion |
NOTESTOTHE FINANCIAL STATEMENTS | 21 |
Table of Contents
Notes to the Financial Statements (Continued)
iSHARES®, INC.
The Board approved a change to the investment advisory fee rates for the Fund effective September 1, 2006. For its investment advisory services to the Fund, BGFA will be entitled to be paid annual investment advisory fees based on the Fund’s allocable portion of the aggregate of the average daily net assets of all the funds offered by the Company (except for the iShares MSCI Brazil, iShares MSCI Emerging Markets, iShares MSCI Pacific ex-Japan, iShares MSCI South Africa, iShares MSCI South Korea and iShares MSCI Taiwan Index Funds) as follows:
Investment Advisory Fee | Aggregate Average Daily Net Assets | |
| 0.59% | First $7 billion | |
| 0.54 | Over $7 billion, up to and including $11 billion | |
| 0.49 | Over $11 billion, up to and including $24 billion | |
| 0.44 | Over $24 billion |
Investors Bank & Trust Company (“Investors Bank”) serves as administrator, custodian and transfer agent for the Company. As compensation for its services, Investors Bank receives certain out-of-pocket costs, transaction fees and asset-based fees, which are accrued daily and paid monthly. These fees and expenses are Covered Expenses as defined above.
SEI Investments Distribution Co. (“SEI”) serves as the Fund’s underwriter and distributor of the shares of the Fund, pursuant to a Distribution Agreement with the Company. SEI does not receive a fee from the Fund for its distribution services.
Pursuant to an exemptive order issued by the U.S. Securities and Exchange Commission (“SEC”), the Fund is permitted to lend portfolio securities to Barclays Capital, Inc. (“BarCap”). Pursuant to the same exemptive order, Barclays Global Investors, N.A. (“BGI”) serves as securities lending agent for the Company. BarCap and BGI are affiliates of BGFA, the Fund’s investment adviser. As securities lending agent, BGI receives, as fees, a share of the income earned on investment of the cash collateral received for the loan of securities. For the year ended August 31, 2006, BGI earned securities lending agent fees of $1,897,151.
Cross trades for the year ended August 31, 2006 were executed by the Fund pursuant to Rule 17a-7 under the 1940 Act. Cross trading is the buying or selling of portfolio securities between funds to which BGFA (or an affiliate) serves as investment adviser. At its regularly scheduled quarterly meetings, the Board reviews such transactions as of the most recent calendar quarter, for compliance with the requirements and restrictions set forth by Rule 17a-7.
The Fund may invest in the Institutional Shares of certain money market funds managed by BGFA, the Fund’s investment adviser, including the Government Money Market Fund (“GMMF”), Institutional Money Market Fund (“IMMF”), Prime Money Market Fund (“PMMF”) and Treasury Money Market Fund (“TMMF”) of Barclays Global Investors Funds. The GMMF, IMMF, PMMF and TMMF are feeder funds in a master/feeder fund structure that invest substantially all of their assets in the Government Money Market Master Portfolio, Money Market Master Portfolio, Prime Money Market Master Portfolio and Treasury Money Market Master Portfolio (collectively, the “Master Portfolios”), respectively, which are also managed by BGFA. While the GMMF, IMMF, PMMF and TMMF do not directly charge an investment advisory fee, the Master Portfolios in which they invest do charge an investment advisory fee. Income distributions from the GMMF, IMMF, PMMF and TMMF are declared daily and paid monthly from net investment income. Income distributions earned by the Fund from temporary cash investments are recorded as interest from affiliated issuers in the accompanying Statement of Operations. Income distributions earned by the Fund from the investment of securities lending collateral are included in securities lending income in the accompanying Statement of Operations.
22 | 2006 iSHARES ANNUAL REPORTTO SHAREHOLDERS |
Table of Contents
Notes to the Financial Statements (Continued)
iSHARES®, INC.
The following table provides information about the direct investment by the Fund (exclusive of investments of securities lending collateral) in issuers of which BGFA is an affiliate, for the year ended August 31, 2006.
Name of Affiliated Issuer | Number of (in 000s) | Gross Additions (in 000s) | Gross Reductions (in 000s) | Number of Shares Held End of Year (in 000s) | Value at End of Year | Interest Income | ||||||||
IMMF | 694 | 1,756,261 | 1,755,586 | 1,369 | $ | 1,368,550 | $ | 309,395 | ||||||
As of August 31, 2006, certain directors and officers of the Company are also officers of BGI and/or BGFA.
3. INVESTMENT PORTFOLIO TRANSACTIONS
Purchases and sales of investments (excluding in-kind transactions and short-term investments) for the year ended August 31, 2006, aggregated $1,011,331,752 and $963,888,644, respectively.
In-kind purchases and sales (see Note 4) for the year ended August 31, 2006, aggregated $5,304,346,344 and $1,209,690,820, respectively.
4. CAPITAL SHARE TRANSACTIONS
The Company has authorized 10.9 billion shares of $.001 par value capital stock. As of August 31, 2006, 2,124,600,000 shares were authorized to the Fund.
The Company issues and redeems capital shares of the Fund only in aggregations of a specified number of shares (each, a “Creation Unit”) at net asset value. Except when aggregated in Creation Units, shares of the Fund are not redeemable. Transactions in capital shares for the Fund are disclosed in detail in the Statements of Changes in Net Assets.
The consideration for the purchase of Creation Units of the Fund generally consists of the in-kind contribution of a designated portfolio of equity securities constituting a portfolio sampling representation of the securities involved in the MSCI Japan Index and an amount of cash. Investors purchasing and redeeming Creation Units pay a purchase transaction fee and a redemption transaction fee directly to Investors Bank, the administrator, to offset transfer and other transaction costs associated with the issuance and redemption of Creation Units.
5. LOANS OF PORTFOLIO SECURITIES
The Fund may lend its investment securities to approved borrowers, such as brokers, dealers and other financial institutions. The borrower pledges and maintains with the Fund collateral consisting of cash, an irrevocable letter of credit issued by a bank, or securities issued or guaranteed by the U.S. Government. The initial collateral received by the Fund is required to have a value of at least 102% of the market value of the loaned securities for securities traded on U.S. exchanges and a value of at least 105% for all other securities. The collateral is maintained thereafter, at a value equal to at least 100% of the current market value of the securities on loan. The risks to the Fund of securities lending are that the borrower may not provide additional collateral when required or may not return the securities when due.
NOTESTOTHE FINANCIAL STATEMENTS | 23 |
Table of Contents
Notes to the Financial Statements (Continued)
iSHARES®, INC.
As of August 31, 2006, the Fund had loaned securities which were collateralized by cash. Pursuant to an exemptive order issued by the SEC, the cash collateral received was invested in a joint account with other investment funds managed by BGFA. The joint account invests in securities with remaining maturities of 397 days or less, repurchase agreements and money market mutual funds, including money market funds managed by BGFA. Repurchase agreements held in the joint account are fully collateralized by U.S. Government securities or non-U.S. Government debt securities. The market value of the securities on loan as of August 31, 2006 and the value of the related collateral are disclosed in the Statement of Assets and Liabilities. Securities lending income, as disclosed in the Fund’s Statement of Operations, represents the income earned from the investment of the cash collateral, net of rebates paid to, or fees paid by, borrowers and less the fees paid to BGI as securities lending agent.
6. RECENTLY ISSUED ACCOUNTING PRONOUNCEMENT
In June 2006, the Financial Accounting Standards Board (“FASB”) issued FASB Interpretation No. 48, (“FIN 48”) “Accounting for Uncertainty in Income Taxes - an interpretation of FASB Statement No. 109.” FIN 48 clarifies the accounting for uncertainty in income taxes recognized in accordance with FASB Statement No. 109, “Accounting for Income Taxes.” This interpretation prescribes a recognition threshold and measurement attribute for the financial statement recognition and measurement of a tax position taken or expected to be taken in a tax return. It also provides guidance on de-recognition, classification, interest and penalties, accounting in interim periods, disclosure and transition. FIN 48 is effective for fiscal years beginning after December 15, 2006. The Company is currently evaluating the impact of applying the various provisions of FIN 48.
24 | 2006 iSHARES ANNUAL REPORTTO SHAREHOLDERS |
Table of Contents
Report of Independent Registered Public Accounting Firm
To the Shareholders and Board of Directors of
iShares, Inc.
In our opinion, the accompanying statement of assets and liabilities, including the schedule of investments, and the related statements of operations and of changes in net assets and the financial highlights present fairly, in all material respects, the financial position of the iShares MSCI Japan Index Fund, a portfolio of the iShares MSCI Series (the “Fund”) at August 31, 2006, the results of its operations for the year then ended and the changes in its net assets and the financial highlights for each of the periods presented, in conformity with accounting principles generally accepted in the United States of America. These financial statements and financial highlights (hereafter referred to as “financial statements”) are the responsibility of the Fund’s management; our responsibility is to express an opinion on these financial statements based on our audits. We conducted our audits of these financial statements in accordance with standards of the Public Company Accounting Oversight Board (United States). Those standards require that we plan and perform the audits to obtain reasonable assurance about whether the financial statements are free of material misstatement. An audit includes examining, on a test basis, evidence supporting the amounts and disclosures in the financial statements, assessing the accounting principles used and significant estimates made by management, and evaluating the overall financial statement presentation. We believe that our audits, which included confirmation of securities at August 31, 2006 by correspondence with the custodian and brokers, provide a reasonable basis for our opinion.
PricewaterhouseCoopers LLP
San Francisco, California
October 23, 2006
REPORTOF INDEPENDENT REGISTERED PUBLIC ACCOUNTING FIRM | 25 |
Table of Contents
iSHARES®, INC.
For the fiscal year ended August 31, 2006, the Fund earned foreign source income of $134,214,398 and paid foreign taxes of $8,201,533 which it intends to pass through to its shareholders pursuant to Section 853 of the Internal Revenue Code (the “Code”).
Under Section 854(b)(2) of the Code, the Fund hereby designates the maximum amount of $83,820,853 as qualified dividends for purposes of the maximum rate under Section 1(h)(11) of the Code for the fiscal year ended August 31, 2006.
In January 2007, shareholders will receive Form 1099-DIV which will include their share of qualified dividend income distributed during the calendar year 2006. Shareholders are advised to check with their tax advisers for information on the treatment of these amounts on their income tax returns.
26 | 2006 iSHARES ANNUAL REPORTTO SHAREHOLDERS |
Table of Contents
Board Review and Approval of Investment Advisory Contracts (Unaudited)
iSHARES®, INC.
Under Section 15(c) of the Investment Company Act of 1940 (the “1940 Act”), the Company’s Board of Directors (the “Board”), including a majority of Directors who are not interested persons of the Company (as that term is defined in the 1940 Act) (the “Independent Directors”), is required annually to consider the Investment Advisory Contract between the Company and BGFA (the “Advisory Contract”) on behalf of the Fund. As required by Section 15(c), the Board requested and BGFA provided such information as the Board deemed reasonably necessary to evaluate the terms of the Advisory Contract. At a meeting held on June 14-15, 2006, the Board approved the selection of BGFA and the continuance of the Advisory Contract, based on its review of qualitative and quantitative information provided by BGFA. In selecting BGFA and approving the Advisory Contract for the Fund, the Board, including the Independent Directors, advised by their independent counsel, considered the following factors, none of which was controlling, and made the following conclusions:
NATURE, EXTENT AND QUALITY OF SERVICES PROVIDED BY BGFA
The Board determined that there would be no diminution in the scope of services required of BGFA under the Advisory Contract for the coming year as compared to the scope of services provided by BGFA over the past year. In reviewing the scope of these services, the Board considered BGFA’s investment philosophy and experience, noting that BGFA and its affiliates have committed significant resources over time, including over the past year, to the support of the Fund. The Board also considered BGFA’s compliance program and its compliance record with respect to the Fund. In that regard, the Board noted that BGFA reports to the Board about portfolio management and compliance matters on a periodic basis in connection with regularly scheduled meetings of the Board, and has made appropriate officers available as needed to provide further assistance with these matters. The Board also reviewed the background and experience of the persons responsible for the day-to-day management of the Fund. In addition to the above considerations, the Board reviewed and considered BGFA’s investment processes and strategies, and matters related to BGFA’s portfolio transaction policies and procedures. The Board further noted that BGFA does not serve as investment adviser for any other series of registered investment companies with substantially similar investment objectives and strategies as the Fund; therefore, no comparative performance information was available. However, the Board also noted that the Fund had met its investment objective consistently since its inception date. Based on this review, the Board concluded that the nature, extent and quality of services to be provided by BGFA to the Fund under the Advisory Contract were appropriate and mitigated in favor of the Board’s approval of the Advisory Contract for the coming year.
FUNDS’ EXPENSES AND PERFORMANCE OF THE FUND
The Board reviewed statistical information prepared by Lipper Inc. (“Lipper”), an independent provider of investment company data, regarding the expense ratio components, including advisory fees, waivers/reimbursements, and gross and net total expenses of the Fund in comparison with the same information for other registered funds objectively selected solely by Lipper as comprising the Fund’s peer group (the “Lipper Peer Group”). In addition, the Board reviewed statistical information prepared by Lipper regarding the performance of the Fund for the one-, three- and five-year, and “last quarter” periods ended March 31, 2006 and a comparison of the Fund’s performance to that of the funds in its Lipper Peer Group for the same periods. Because there are few, if any, exchange traded funds or index funds that track indices similar to those tracked by the Fund, the Lipper Peer Group included mutual funds, closed-end funds, exchange traded funds, and funds with differing investment objective classifications, investment focuses and other characteristics (e.g., actively managed funds and funds sponsored by “at cost” service providers). In support of its review of the statistical information, the Board was provided with a detailed description of the methodology used by Lipper to determine the Lipper Peer Group and to prepare this information. The Board further noted that due to the limitations in providing comparable funds in the Lipper Peer Group, the statistical information may or may not provide meaningful direct comparisons to the Fund. The Board noted that the Fund generally performed in line with the funds in its Lipper Peer Group over relevant periods. The Board also noted that the investment advisory fees and overall expenses for the Fund were generally lower than or in line with the investment advisory fee rates and overall expenses of the funds in its respective Lipper Peer Group. The Board also reviewed statistical information from Lipper displaying the effects of the proposed extension of breakpoints in the investment advisory fee rates for the Fund (as discussed below) at various assets levels of the Funds as compared to its Lipper Peer Group. Based on this review, the Board concluded that the investment advisory fees and expense levels and the historical performance of the Fund, as managed by BGFA, as compared to the investment advisory fees and expense levels and performance of the funds in its Lipper Peer Group, were satisfactory for the purposes of approving the Advisory Contract for the coming year.
BOARD REVIEW AND APPROVAL OF INVESTMENT ADVISORY CONTRACTS | 27 |
Table of Contents
Board Review and Approval of Investment Advisory Contracts (Unaudited) (Continued)
iSHARES®, INC.
COSTS OF SERVICES PROVIDED TO THE FUND AND PROFITS REALIZED BY BGFA AND AFFILIATES
The Board reviewed information about the profitability to BGFA of the Fund based on the fees payable to BGFA and its affiliates (including fees under the Advisory Contract), and all other sources of revenue and expense to BGFA and its affiliates for the last calendar year. The Board discussed the sources of direct and ancillary revenue with management, including the revenues to BGI from securities lending by the Company (including any securities lending by the Fund). The Board also discussed BGFA’s profit margin as reflected in the Fund’s profitability analysis and reviewed information regarding economies of scale (as discussed below). Based on this review, the Board concluded that the profits to be realized by BGFA and its affiliates under the Advisory Contract and from other relationships between the Fund and BGFA and/or its affiliates, if any, were within the range the Board considered reasonable and appropriate.
ECONOMIES OF SCALE
In connection with its review of the Fund’s profitability analysis, the Board reviewed information regarding economies of scale or other efficiencies that may result from increases in the Fund’s assets. The Board was also presented with materials regarding the proposed extension of breakpoints in the investment advisory fee rates at certain asset levels of the Fund on an aggregated basis with certain other iShares funds. The Board noted that the Advisory Contract already provided for breakpoints in the Fund’s investment advisory fee rates as the assets of the Fund, on an aggregated basis with the assets of certain other iShares funds, increase. The Board also discussed the substantial growth in assets of certain iShares funds, including the Fund, over the last few years. The Board further noted that as of July 1, 2004, Fund shareholders were no longer paying distribution fees pursuant to the Fund’s distribution plan under 12b-1 of the 1940 Act because such plan had been terminated as of that date, benefiting the Fund’s shareholders by lowering the Fund’s overall expenses. The Board also reviewed BGFA’s historic profitability as investment adviser to the iShares fund complex and noted that BGFA had made a significant investment in the iShares funds and had incurred operating losses during earlier years when the iShares funds, including the Fund, had not yet reached scale. In light of this history, the Board determined that the proposed extension of breakpoints was appropriate and warranted at this juncture for the Fund. Based on this review, the Board, recognizing its responsibility to consider this issue at least annually, concluded that the structure of the investment advisory fees, with the proposed extension of breakpoints for the Fund, reflects the current sharing and potential further sharing of economies of scale with the Fund’s shareholders.
FEES AND SERVICES PROVIDED FOR OTHER COMPARABLE FUNDS/ACCOUNTS MANAGED BY BGFA AND ITS AFFILIATES
The Board considered the Fund’s annual investment advisory fee rates under the Advisory Contract in comparison to the investment advisory/management fee rates for other funds/accounts for which BGFA (or its affiliate, BGI) provides investment advisory/management services, including other funds registered under the 1940 Act, collective funds and separate accounts (together, the “Other Accounts”). The Board noted that comparative investment advisory/management fee information was not available, as BGFA and its affiliates do not manage any Other Accounts with substantially similar investment objectives and strategies as the Funds. However, the Board noted that BGFA provided the Board with general information regarding how the level of services provided to the Other Accounts differed from the level of services provided to the Funds. Based on this review, the Board determined that the investment advisory fee rates under the Advisory Contract, with the proposed extension of breakpoints, do not constitute fees that are so disproportionately large as to bear no reasonable relationship to the services rendered and that could not have been the product of arm’s-length bargaining, and concluded that the investment advisory fee rates under the Advisory Contract, with the proposed extension of breakpoints, are fair and reasonable.
28 | 2006 iSHARES ANNUAL REPORTTO SHAREHOLDERS |
Table of Contents
Board Review and Approval of Investment Advisory Contracts (Unaudited) (Continued)
iSHARES®, INC.
OTHER BENEFITS TO BGFA AND/OR ITS AFFILIATES
The Board reviewed any ancillary revenue received by BGFA and/or its affiliates in connection with the services provided to the Fund by BGFA, such as any payment of revenue to BGI, the Company’s securities lending agent, for loaning any portfolio securities, and payment of advisory fees and/or administration fees to BGFA and BGI in connection with any investments by the Fund in other funds for which BGFA provides investment advisory services and/or BGI provides administration services. The Board noted that BGFA does not use soft dollars or consider the value of research or other services that may be provided to BGFA (including its affiliates) in selecting brokers for portfolio transactions for the Fund. The Board further noted that any portfolio transactions on behalf of the Fund placed through a BGFA affiliate are reported to the Board pursuant to Rule 17e-1 under the 1940 Act. The Board concluded that any such ancillary benefits would not be disadvantageous to the Fund’s shareholders.
Based on this analysis, the Board determined that the Advisory Contract, including the investment advisory fee rates, with the proposed extension of breakpoints, are fair and reasonable in light of all relevant circumstances, and concluded that it is in the best interest of the Fund and its shareholders to approve the Advisory Contract, with the fee schedule to the Advisory Contract as proposed to be amended to reflect the extension of breakpoints, for the coming year.
BOARD REVIEWAND APPROVALOF INVESTMENT ADVISORY CONTRACTS | 29 |
Table of Contents
Supplemental Information (Unaudited)
iSHARES®, INC.
The table that follows presents information about the differences between the daily market price on secondary markets for shares of the iShares MSCI Japan Index Fund (the “Fund”) and the Fund’s net asset value. Net asset value, or “NAV”, is the price per share at which the Fund issues and redeems shares. It is calculated in accordance with the standard formula for valuing mutual fund shares. The “Market Price” of the Fund generally is determined using the midpoint between the highest bid and the lowest offer on the stock exchange on which the shares of the Fund is listed for trading, as of the time that the Fund’s NAV is calculated. The Fund’s Market Price may be at, above or below its NAV. The NAV of the Fund will fluctuate with changes in the market value of its portfolio holdings. The Market Price of the Fund will fluctuate in accordance with changes in its NAV, as well as market supply and demand.
Premiums or discounts are the differences (expressed as a percentage) between the NAV and Market Price of the Fund on a given day, generally at the time NAV is calculated. A premium is the amount that the Fund is trading above the reported NAV, expressed as a percentage of the NAV. A discount is the amount that the Fund is trading below the reported NAV, expressed as a percentage of the NAV.
The following information shows the frequency distributions of premiums and discounts for the Fund. The information shown for the Fund is for five calendar years through the date of the most recent calendar quarter-end.
Each line in the table shows the number of trading days in which the Fund traded within the premium/discount range indicated. The number of trading days in each premium/discount range is also shown as a percentage of the total number of trading days in the period covered by the table. All data presented here represents past performance, which cannot be used to predict future results.
iShares MSCI Japan Index Fund
Period Covered: January 1, 2001 through June 30, 2006
Premium/Discount Range | Number of Days | Percentage of Total Days | |||
Greater than 3.5% and Less than 4.0% | 2 | 0.14 | % | ||
Greater than 3.0% and Less than 3.5% | 4 | 0.29 | |||
Greater than 2.5% and Less than 3.0% | 8 | 0.58 | |||
Greater than 2.0% and Less than 2.5% | 19 | 1.38 | |||
Greater than 1.5% and Less than 2.0% | 47 | 3.40 | |||
Greater than 1.0% and Less than 1.5% | 142 | 10.28 | |||
Greater than 0.5% and Less than 1.0% | 256 | 18.54 | |||
Between 0.5% and –0.5% | 628 | 45.48 | |||
Less than –0.5% and Greater than –1.0% | 160 | 11.59 | |||
Less than –1.0% and Greater than –1.5% | 64 | 4.63 | |||
Less than –1.5% and Greater than –2.0% | 36 | 2.61 | |||
Less than –2.0% and Greater than –2.5% | 6 | 0.43 | |||
Less than –2.5% and Greater than –3.0% | 4 | 0.29 | |||
Less than –3.0% | 5 | 0.36 | |||
| 1,381 | 100.00 | % | |||
30 | 2006 iSHARES ANNUAL REPORTTO SHAREHOLDERS |
Table of Contents
Director and Officer Information (Unaudited)
iSHARES®, INC.
The Board of Directors has responsibility for the overall management and operations of the Company, including general supervision of the duties performed by BGFA and other service providers. Each Director serves until his or her successor is duly elected or appointed and qualified.
iShares, Inc., iShares Trust, Barclays Global Investors Funds and Master Investment Portfolio are considered to be members of the same fund complex, as defined in Form N-1A under the 1940 Act. Each Director of iShares, Inc. also serves as a Trustee for iShares Trust and oversees 111 portfolios within the fund complex. In addition, Lee T. Kranefuss and Richard K. Lyons each serves as a Trustee for Barclays Global Investors Funds and Master Investment Portfolio and oversees an additional 25 portfolios within the fund complex.
Unless otherwise noted in the tables below, the address for each Director and Officer is c/o Barclays Global Investors, N.A., 45 Fremont Street, San Francisco, California 94105. The Board has designated George G.C. Parker as its Lead Director. Additional information about the Funds’ Directors and Officers may be found in the Funds’ combined Statement of Additional Information, which is available without charge, upon request, by calling toll-free 1-800-474-2737.
Interested Directors and Officers
Name, Year of Birth | Position(s), Length of Service | Principal Occupation(s) During Past 5 Years | Other Directorships Held | |||
| *Lee T. Kranefuss, 1961 | Director, Chairman and President (since 2003). | Chief Executive Officer, Global Index and Markets Group of BGI (since 2005); Chief Executive Officer of Intermediary Investor and Exchange Traded Products Business of BGI (since 2003); Chief Executive Officer of the Individual Investor Business of BGI (1999-2003). | Trustee (since 2003) of iShares Trust; Trustee (since 2001) of Barclays Global Investors Funds and Master Investment Portfolio; Director (since 2003) of BGI Cayman Prime Money Market Fund, Ltd. | |||
| *John E. Martinez, 1962 | Director (since 2003). | Co-Chief Executive Officer of Global Index and Markets Group of BGI (2001-2003); Chairman of Barclays Global Investors Services (2000-2003); Chief Executive Officer of Capital Markets Group of BGI (1996-2001). | Trustee (since 2003) of iShares Trust; Director (since 2005) of Real Estate Equity Exchange; Director (since 2003) of Larkin Street Youth Services. | |||
| * | Lee T. Kranefuss and John E. Martinez are considered to be “interested persons” (as defined in the 1940 Act) of the Company due to their affiliations with BGFA, the Funds’ investment adviser, BGI, the parent company of BGFA, and Barclays Global Investors Services, an affiliate of BGFA and BGI. |
| DIRECTORAND OFFICER INFORMATION | 31 |
Table of Contents
Director and Officer Information (Unaudited) (Continued)
iSHARES®, INC.
Independent Directors | ||||||
Name, Year of Birth | Position(s), Length of Service | Principal Occupation(s) During Past 5 Years | Other Directorships Held | |||
| Richard K. Lyons, 1961 | Director (since 2002). | Executive Associate Dean (since 2005); Sylvan Coleman Chair in Finance (since 2004); Acting Dean (2004-2005) and Professor (since 1993), University of California, Berkeley: Haas School of Business; Consultant for IMF World Bank, Federal Reserve Bank and Citibank N.A. (since 2000). | Trustee (since 2000) of iShares Trust; Trustee (since 2001) of Barclays Global Investors Funds and Master Investment Portfolio; Director (since 2003) of BGI Cayman Prime Money Market Fund, Ltd.; Trustee (since 1995) and Chairman of Matthews Asian Funds (oversees 8 portfolios). | |||
| George G. C. Parker, 1939 | Director (since 2002). | Dean Witter Distinguished Professor of Finance (since 1994); Formerly Senior Associate Dean for Academic Affairs, Director of MBA Program, Stanford University: Graduate School of Business (1993-2001). | Trustee (since 2000) of iShares Trust; Director (since 1996) of Continental Airlines, Inc.; Director (since 1995) of Community First Financial Group; Director (since 1999) of Tejon Ranch Company; Director (since 2003) of First Republic Bank; Director (since 2004) of Threshold Pharmaceuticals. | |||
| Cecilia H. Herbert, 1949 | Director (since 2005). | Member of Finance Council, Archdiocese of San Francisco (since 1991); Chair of Investment Committee, Archdiocese of San Francisco (1994-2005). | Trustee (since 2005) of iShares Trust; Trustee (2004-2005) of Pacific Select Funds; Trustee (1992-2003) of the Montgomery Funds; Trustee (since 2005) of the Thacher School; Director (since 1998) of Catholic Charities CYO; Director (since 2005) of Women’s Forum West (professional association). | |||
| Charles A. Hurty, 1943 | Director (since 2005). | Partner, KPMG LLP (1968-2001). | Trustee (since 2005) of iShares Trust; Director (since 2002) of GMAM Absolute Return Strategy Fund (1 portfolio); Director (since 2002) of Citigroup Alternative Investments Multi-Adviser Hedge Fund Portfolios LLC (2 portfolios); Director (since 2005) of CSFB Alternative Investments Fund (15 portfolios). | |||
| John E. Kerrigan, 1955 | Director (since 2005). | Chief Investment Officer, Santa Clara University (since 2002); Managing Director, Merrill Lynch (1994-2002). | Trustee (since 2005) of iShares Trust; Member (since 2004) of Advisory Council for Commonfund Distressed Debt Partners II. | |||
32 | 2006 iSHARES ANNUAL REPORTTO SHAREHOLDERS |
Table of Contents
Director and Officer Information (Unaudited) (Continued)
iSHARES®, INC.
Officer | ||||||
Name, Year of Birth | Position(s), Length of Service | Principal Occupation(s) During Past 5 Years | Other Directorships Held | |||
| Michael A. Latham, 1965 | Secretary, Treasurer and Principal Financial Officer (since 2002). | Chief Operating Officer of the Intermediary Investor and Exchange Traded Products Business of BGI (since 2003); Director of Mutual Fund Delivery in the U.S. Individual Investor Business of BGI (2000-2003). | None. | |||
DIRECTORAND OFFICER INFORMATION | 33 |
Table of Contents
Notes:
34 | 2006 iSHARES ANNUAL REPORTTO SHAREHOLDERS |
Table of Contents
Notes:
NOTES | 35 |
Table of Contents
The following is a list of iShares Funds being offered, along with their respective exchange trading symbols. Please call 1-800-iShares (1-800-474-2737) to obtain a prospectus for any iShares Fund. The prospectus contains more complete information, including charges, expenses, investment objectives and risk factors that should be carefully considered to determine if the Fund(s) are an appropriate investment for you. Read the prospectus(es) carefully before investing. Investing involves risk, including possible loss of principal.
| iShares S&P Domestic Index Funds | iShares Global Index Funds | iShares Bond Funds | ||
iShares S&P 1500 (ISI) iShares S&P 100 (OEF) iShares S&P 500 (IVV) iShares S&P 500 Growth (IVW) iShares S&P 500 Value (IVE) iShares S&P MidCap 400 (IJH) iShares S&P MidCap 400 Growth (IJK) iShares S&P MidCap 400 Value (IJJ) iShares S&P SmallCap 600 (IJR) iShares S&P SmallCap 600 Growth (IJT) iShares S&P SmallCap 600 Value (IJS)
iShares Domestic Sector Index Funds iShares Cohen & Steers Realty Majors (ICF) iShares Dow Jones U.S. Basic Materials Sector (IYM) iShares Dow Jones U.S. Consumer Services Sector (IYC) iShares Dow Jones U.S. Consumer Goods Sector (IYK) iShares Dow Jones U.S. Energy Sector (IYE) iShares Dow Jones U.S. Financial Sector (IYF) iShares Dow Jones U.S. Financial Services (IYG) iShares Dow Jones U.S. Healthcare Sector (IYH) iShares Dow Jones U.S. Industrial Sector (IYJ) iShares Dow Jones U.S. Real Estate (IYR) iShares Dow Jones U.S. Technology Sector (IYW) iShares Dow Jones U.S. Telecommunications Sector (IYZ) iShares Dow Jones Transportation Average (IYT) iShares Dow Jones U.S. Utilities Sector (IDU) iShares Dow Jones U.S. Total Market (IYY) iShares Goldman Sachs Natural Resources (IGE) iShares Goldman Sachs Networking (IGN) iShares Goldman Sachs Semiconductor (IGW) iShares Goldman Sachs Software (IGV) iShares Goldman Sachs Technology (IGM) iShares Nasdaq Biotechnology (IBB)
iShares Domestic Subsector Index Funds iShares Dow Jones U.S. Aerospace & Defense (ITA) iShares Dow Jones U.S. Broker-Dealers (IAI) iShares Dow Jones U.S. Health Care Providers (IHF) iShares Dow Jones U.S. Home Construction (ITB) iShares Dow Jones U.S. Insurance (IAK) iShares Dow Jones U.S. Medical Devices (IHI) iShares Dow Jones U.S. Oil & Gas Exploration & Production (IEO) iShares Dow Jones U.S. Oil Equipment & Services (IEZ) iShares Dow Jones U.S. Pharmaceuticals (IHE) iShares Dow Jones U.S. Regional Banks (IAT) | iShares S&P Global 100 (IOO) iShares S&P Global Consumer Discretionary Sector (RXI) iShares S&P Global Consumer Staples Sector (KXI) iShares S&P Global Energy Sector (IXC) iShares S&P Global Financials Sector (IXG) iShares S&P Global Healthcare Sector (IXJ) iShares S&P Global Industrials Sector (EXI) iShares S&P Global Materials Sector (JXI) iShares S&P Global Technology Sector (IXN) iShares S&P Global Telecommunications Sector (IXP) iShares S&P Global Utilities Sector (MXI)
iShares Russell Index Funds iShares Russell 3000 (IWV) iShares Russell 3000 Growth (IWZ) iShares Russell 3000 Value (IWW) iShares Russell 1000 (IWB) iShares Russell 1000 Growth (IWF) iShares Russell 1000 Value (IWD) iShares Russell Midcap (IWR) iShares Russell Midcap Growth (IWP) iShares Russell Midcap Value (IWS) iShares Russell 2000 (IWM) iShares Russell 2000 Growth (IWO) iShares Russell 2000 Value (IWN) iShares Russell Microcap™ (IWC)
iShares International Country Index Funds iShares FTSE/Xinhua China 25 (FXI) iShares MSCI Australia (EWA) iShares MSCI Austria (EWO) iShares MSCI Belgium (EWK) iShares MSCI Brazil (EWZ) iShares MSCI Canada (EWC) iShares MSCI France (EWQ) iShares MSCI Germany (EWG) iShares MSCI Hong Kong (EWH) iShares MSCI Italy (EWI) iShares MSCI Japan (EWJ) iShares MSCI Malaysia (EWM) iShares MSCI Mexico (EWW) iShares MSCI Netherlands (EWN) iShares MSCI Singapore (EWS) iShares MSCI South Africa (EZA) iShares MSCI South Korea (EWY) iShares MSCI Spain (EWP) iShares MSCI Sweden (EWD) iShares MSCI Switzerland (EWL) iShares MSCI Taiwan (EWT) iShares MSCI United Kingdom (EWU) iShares S&P/TOPIX 150 (ITF) | iShares Lehman Aggregate (AGG) iShares Lehman TIPS (TIP) iShares Lehman 1-3 Year Treasury (SHY) iShares Lehman 7-10 Year Treasury (IEF) iShares Lehman 20+ Year Treasury (TLT) iShares GS $ InvesTopTM Corporate (LQD)
iShares Specialty Index Funds iShares KLD Select SocialSM (KLD) iShares Dow Jones Select Dividend (DVY)
iShares International Index Funds iShares MSCI EAFE (EFA) iShares MSCI EAFE Growth (EFG) iShares MSCI EAFE Value (EFV) iShares MSCI Emerging Markets (EEM) iShares MSCI EMU (EZU) iShares MSCI Pacific ex-Japan (EPP) iShares S&P Europe 350 (IEV) iShares S&P Latin America 40 (ILF)
iShares Morningstar Index Funds iShares Morningstar Large Core (JKD) iShares Morningstar Large Growth (JKE) iShares Morningstar Large Value (JKF) iShares Morningstar Mid Core (JKG) iShares Morningstar Mid Growth (JKH) iShares Morningstar Mid Value (JKI) iShares Morningstar Small Core (JKJ) iShares Morningstar Small Growth (JKK) iShares Morningstar Small Value (JKL)
iShares NYSE Index Funds iShares NYSE Composite (NYC) iShares NYSE 100 (NY) |
iShares® is a registered trademark of Barclays Global Investors, N.A. The iShares Funds are not sponsored, endorsed or issued by Goldman, Sachs & Co. or Lehman Brothers, nor are they sponsored, endorsed, issued, sold or promoted by Cohen & Steers Capital Management, Inc., Dow Jones & Company, Inc., FTSE/Xinhua Index Limited, KLD Research & Analytics, Inc., Morgan Stanley Capital International, Morningstar, Inc., The Nasdaq Stock Market, Inc., New York Stock Exchange, Inc., Frank Russell Company, or Standard & Poor’s. None of these companies make any representation regarding the advisability of investing in the iShares Funds. Neither SEI nor BGI, nor any of their affiliates, are affiliated with the companies listed above. “GS $ InvesTop™” and “Goldman Sachs®” are trademarks of Goldman, Sachs & Co.
An investment in the Fund(s) is not a deposit of a bank and it is not insured or guaranteed by the Federal Deposit Insurance Corporation or any other government agency.
This advertising section does not constitute part of the 2006 Annual Report.
3467-iS-0906
36 | 2006 iSHARES ANNUAL REPORTTO SHAREHOLDERS |
Table of Contents
Table of Contents
| Item 2. | Code of Ethics. |
As of August 31, 2006, iShares, Inc. (the “Registrant”) had adopted a code of ethics that applies to persons appointed by the Registrant’s Board of Directors as the President and Chief Executive Officer, Chief Financial Officer, Treasurer and/or Chief Accounting Officer, and any persons performing similar functions. For the fiscal year ended August 31, 2006, there were no amendments to any provision of this code of ethics, nor were there any waivers granted from any provision of this code of ethics. A copy of this code of ethics is filed with this Form N-CSR under Item 12(a)(1).
| Item 3. | Audit Committee Financial Expert. |
The Registrant’s Board of Directors has determined that the Registrant has more than one audit committee financial expert, as that term is defined under Item 3(b) and 3(c), serving on its audit committee. The audit committee financial experts serving on the Registrant’s audit committee are Richard K. Lyons, George G.C. Parker, Cecilia H. Herbert, Charles A. Hurty and John E. Kerrigan, all of whom are independent, as that term is defined under Item 3(a)(2). Richard K. Lyons holds a PhD in Economics and qualifies as an audit committee financial expert through his many years of university-level (graduate) teaching of accounting and finance-related subjects, his many years of research in the same subjects (including mutual funds), and his extensive experience serving as independent director and audit committee member of various mutual fund boards.
| Item 4. | Principal Accountant Fees and Services. |
| (a) | Audit Fees – The aggregate fees billed for each of the last two fiscal years for professional services rendered by the principal accountant for the audit of the Funds’ annual financial statements or services that are normally provided by the accountant in connection with statutory and regulatory filings or engagements for those fiscal years, were $348,000 for the fiscal year ended August 31, 2005 and $374,100 for the fiscal year ended August 31, 2006. |
| (b) | Audit-Related Fees – There were no fees billed for the fiscal years ended August 31, 2005 and August 31, 2006 for assurance and related services by the principal accountant that were reasonably related to the performance of the audit of the Funds’ financial statements and are not reported under (a) of this Item. |
| (c) | Tax Fees – The aggregate fees billed in each of the last two fiscal years for professional services rendered by the principal accountant for the review of the Funds’ tax returns and excise tax calculations, were $166,800 for the fiscal year ended August 31, 2005 and $179,310 for the fiscal year ended August 31, 2006. |
| (d) | All Other Fees – There were no other fees billed for the fiscal years ended August 31, 2005 and August 31, 2006 for products and services provided by the principal accountant, other than the services reported in (a) through (c) of this Item. |
| (e) | (1) The Registrant’s audit committee charter, as amended in June 2005, provides that the audit committee is responsible for the approval, prior to appointment, of the engagement of the principal accountant to annually audit and provide their opinion on the Registrant’s financial statements. The audit committee must also approve, prior to appointment, the engagement of the principal accountant to provide non-audit services to the Registrant or to any entity controlling, controlled by or under common control with the Registrant’s investment adviser (“Adviser Affiliate”) that provides services to the Registrant, if the engagement relates directly to the operations and financial reporting of the Registrant. |
| (2) There were no services described in (b) through (d) above (including services required by the audit committee pursuant to paragraph (c)(7)(ii) of Rule 2-01 of Regulation S-X) that were approved by the audit committee pursuant to paragraph (c)(7)(i)(C) of Rule 2-01 of Regulation S-X. |
| (f) | None of the hours expended on the principal accountant’s engagement to audit the Funds’ financial statements for the fiscal year ended August 31, 2006 were attributable to work performed by persons other than the principal accountant’s full-time, permanent employees. |
| (g) | The aggregate non-audit fees billed by the Registrant’s principal accountant for services rendered to the Funds, and rendered to the Registrant’s investment adviser, and any Adviser Affiliate that provides ongoing services to the Registrant for the last two fiscal years, were $705,969 for the year ended August 31, 2005 and $1,866,533 for the year ended August 31, 2006. |
| (h) | The Registrant’s audit committee has considered whether the provision of non-audit services rendered to the Registrant’s investment adviser and any Adviser Affiliate that were not pre-approved pursuant to paragraph (c)(7)(ii) of Rule 2-01 of Regulation S-X, if any, are compatible with maintaining the principal accountant’s independence, and has determined that the provision of these services do not compromise the principal accountant’s independence. |
| Item 5. | Audit Committee of Listed Registrants. |
The Registrant is a listed issuer as defined in Rule 10A-3 under the Exchange Act and has a separately-designated standing audit committee established in accordance with Section 3(a)(58)(A) of the Exchange Act. The Registrant’s audit committee members are Richard K. Lyons, George G.C. Parker, Cecilia H. Herbert, Charles A. Hurty and John E. Kerrigan.
Table of Contents
| Item 6. | Schedule of Investments. |
The Funds’ full schedules of investments are included as part of the reports to shareholders filed under Item 1 of this Form.
| Item 7. | Disclosure of Proxy Voting Policies and Procedures for Closed-End Management Investment Companies. |
Not applicable to the Registrant.
| Item 8. | Portfolio Managers of Closed-End Management Investment Companies. |
Not applicable to the Registrant.
| Item 9. | Purchases of Equity Securities by Closed-End Management Investment Company and Affiliated Purchasers. |
Not applicable to the Registrant.
| Item 10. | Submission of Matters to a Vote of Security Holders. |
There were no material changes to the procedures by which shareholders may recommend nominees to the Registrant’s Board of Directors.
| Item 11. | Controls and Procedures. |
(a) The Principal Executive Officer and Principal Financial Officer have concluded that, based on their evaluation as of a date within 90 days of the filing date of this report, the disclosure controls and procedures of the Registrant (as defined in Rule 30a-3(c) under the Investment Company Act of 1940) are reasonably designed to achieve the purposes described in Section 4(a) of the attached certification.
(b) There were no changes in the Registrant’s internal control over financial reporting (as defined in Rule 30a-3(d) under the Investment Company Act of 1940) that occurred during the Registrant’s second fiscal quarter of the period covered by this report that have materially affected, or are reasonably likely to materially affect, the Registrant’s internal control over financial reporting.
| Item 12. | Exhibits. |
(a) (1) Code of Ethics for Senior Officers that is the subject of Item 2 is attached.
(a) (2) Section 302 Certifications are attached.
(a) (3) Not applicable to the Registrant.
(b) Section 906 Certifications are attached.
Table of Contents
Pursuant to the requirements of the Securities Exchange Act of 1934 and the Investment Company Act of 1940, the Registrant has duly caused this report to be signed on its behalf by the undersigned, thereunto duly authorized.
| iShares, Inc. | ||
| By: | /s/ Lee T. Kranefuss | |
Lee T. Kranefuss, President and Principal Executive Officer | ||
Date: | November 9, 2006 | |
Pursuant to the requirements of the Securities Exchange Act of 1934 and the Investment Company Act of 1940, this report has been signed below by the following persons on behalf of the Registrant and in the capacities and on the dates indicated.
| By: | /s/ Lee T. Kranefuss | |
Lee T. Kranefuss, President and Principal Executive Officer | ||
Date: | November 9, 2006 | |
| By: | /s/ Michael A. Latham | |
Michael A. Latham, Principal Financial Officer | ||
Date: | November 9, 2006 | |