Table of Contents
UNITED STATES
SECURITIES AND EXCHANGE COMMISSION
Washington, D.C. 20549
FORM N-CSR
CERTIFIED SHAREHOLDER REPORT OF REGISTERED
MANAGEMENT INVESTMENT COMPANIES
Investment Company Act file number 811-09102
iShares, Inc.
(Exact name of registrant as specified in charter)
c/o: State Street Bank and Trust Company
1 Iron Street, Boston, MA 02210
(Address of principal executive offices) (Zip code)
The Corporation Trust Incorporated
351 West Camden Street, Baltimore, MD 21201
(Name and address of agent for service)
Registrant’s telephone number, including area code: (415) 670-2000
Date of fiscal year end: August 31, 2017
Date of reporting period: August 31, 2017
Explanatory Note:
The Registrant is filing this amendment to its Form N-CSR for the period ended August 31, 2017, filed with the Securities and Exchange Commission on November 9, 2017 (Accession Number 0001193125-17-338581). The sole purpose of this amendment is to correct the fund market total returns presented in the Management’s Discussion of Fund Performance and the premium/discount range presented within the Supplemental Information section for the iShares Edge MSCI Min Vol Global ETF, iShares Currency Hedged MSCI Emerging Markets ETF, iShares Edge MSCI Min Vol EM Currency Hedged ETF, iShares Edge MSCI Min Vol Emerging Markets ETF, iShares MSCI Global Metals & Mining Producers ETF, iShares MSCI Global Silver Miners ETF, iShares MSCI Chile Capped ETF, iShares Edge MSCI Multifactor Emerging Markets ETF, and iShares MSCI Eurozone ETF within Item 1, Reports to Stockholders. Except as set forth above, this amendment does not amend, update or change any other items or disclosures found in the original Form N-CSR filing.
Table of Contents
| Item 1. | Reports to Stockholders. |
Table of Contents
AUGUST 31, 2017
2017 ANNUAL REPORT |  |
iShares, Inc.
| Ø | iShares MSCI Austria Capped ETF | EWO | NYSE Arca |
| Ø | iShares MSCI Belgium Capped ETF | EWK | NYSE Arca |
| Ø | iShares MSCI France ETF | EWQ | NYSE Arca |
| Ø | iShares MSCI Netherlands ETF | EWN | NYSE Arca |
| Ø | iShares MSCI Sweden Capped ETF | EWD | NYSE Arca |
Table of Contents
| 5 | ||||
| 16 | ||||
| 16 | ||||
| 17 | ||||
| 17 | ||||
| 19 | ||||
| 22 | ||||
| 25 | ||||
| 28 | ||||
| 31 | ||||
| 38 | ||||
| 43 | ||||
| 55 | ||||
| 56 | ||||
| 57 | ||||
| 64 | ||||
| 68 |
Table of Contents
Management’s Discussion of Fund Performance
iSHARES®, INC.
GLOBAL EQUITY MARKET OVERVIEW
Global equity markets posted strong returns for the 12 months ended August 31, 2017 (the “reporting period”). The MSCI ACWI, a broad global equity index that includes both developed and emerging markets, returned 17.11% in U.S. dollar terms for the reporting period.
The primary factor behind the robust performance of global equity markets was improving global economic growth, driven largely by the continuation of accommodative monetary policies from many of the world’s central banks. Signs of stronger economic activity in Europe emerged as the European Central Bank (“ECB”) maintained policies such as quantitative easing and negative interest rates. Economic growth rates in China and Japan, the largest economies in Asia, also increased during the reporting period, reflecting efforts by the People’s Bank of China (“PBOC”) and the Bank of Japan (“BOJ”) to stimulate economic activity. Stronger economic growth led several central banks to consider reducing their economic stimulus measures. For example, late in the reporting period, the ECB discussed the possibility of tapering its quantitative easing program, while the PBOC increased short-term interest rates during the first half of 2017.
On a regional basis, European equity markets posted the best returns among developed markets, advancing by approximately 20% in U.S. dollar terms for the reporting period. European stocks benefited from improving economic conditions and stronger corporate earnings. In addition, election outcomes in France and the Netherlands eased investor concerns about nationalist presidential candidates and their opposition to the European Union (“E.U.”). Currency fluctuations also contributed meaningfully to European equity performance in U.S. dollar terms as the euro appreciated by approximately 6% against the U.S. dollar during the reporting period. The best-performing European stock markets included Austria, Italy, and Spain, while Ireland and Belgium posted the weakest returns.
Equity markets in the Asia-Pacific region gained about 16% in U.S. dollar terms for the reporting period, led by Singapore and Hong Kong. Japanese stocks also posted strong returns, benefiting from improving consumer spending and employment trends that contributed to the ongoing recovery in the Japanese economy. However, equity market returns in Japan were hindered by a decline in the Japanese yen, which depreciated by approximately 6% against the U.S. dollar.
The U.S. stock market returned approximately 15% for the reporting period. Despite mixed U.S. economic data, U.S. stocks advanced initially in anticipation of pro-business fiscal policies from the new presidential administration. Although the administration struggled to implement its fiscal agenda, stocks continued to move higher as better global economic conditions led to a notable improvement in corporate earnings growth, particularly for multinational companies with significant operations outside of the U.S. U.S. stocks advanced despite three short-term interest rate increases by the U.S. Federal Reserve Bank (the “Fed”) during the reporting period, which increased the short-term interest rate target to its highest level since October 2008. The Fed also unveiled a plan to start reducing the amount of U.S. Treasury bonds and mortgage-backed securities on its balance sheet before the end of 2017.
Emerging markets stocks outperformed those in developed markets, returning more than 23% in U.S. dollar terms for the reporting period. Emerging markets in Eastern Europe were the best performers, led by Poland, Greece, and Hungary. Equity markets in the Middle East trailed for the reporting period amid continued geopolitical conflict in the region.
MANAGEMENT’S DISCUSSIONSOF FUND PERFORMANCE | 5 |
Table of Contents
Management’s Discussion of Fund Performance
iSHARES® MSCI AUSTRIA CAPPED ETF
Performance as of August 31, 2017
| Average Annual Total Returns | Cumulative Total Returns | |||||||||||||||||||||||||||
| NAV | MARKET | INDEX | NAV | MARKET | INDEX | |||||||||||||||||||||||
1 Year | 49.52% | 49.60% | 49.95% | 49.52% | 49.60% | 49.95% | ||||||||||||||||||||||
5 Years | 11.92% | 12.09% | 12.12% | 75.58% | 76.96% | 77.15% | ||||||||||||||||||||||
10 Years | (1.99)% | (1.94)% | (2.40)% | (18.24)% | (17.81)% | (21.58)% | ||||||||||||||||||||||
GROWTH OF $10,000 INVESTMENT
(AT NET ASSET VALUE)
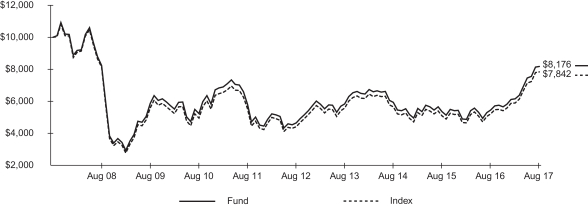
Index performance through January 31, 2008 reflects the performance of the MSCI Austria Index. Index performance beginning on February 1, 2008 through February 11, 2013 reflects the performance of the MSCI Austria Investable Market Index. Index performance beginning on February 12, 2013 reflects the performance of the MSCI Austria IMI 25/50 Index.
Certain sectors and markets performed exceptionally well based on market conditions during the one-year period. Achieving such exceptional returns involves the risk of volatility and investors should not expect that such exceptional returns will be repeated.
Past performance is no guarantee of future results. Performance results do not reflect the deduction of taxes that a shareholder would pay on fund distributions or on the redemption or sale of fund shares. See “About Fund Performance” on page 16 for more information.
| Shareholder Expenses | ||||||||||||||||||||||||||
| Actual | Hypothetical 5% Return | |||||||||||||||||||||||||
| Beginning Account Value (3/1/17) | Ending Account Value (8/31/17) | Expenses Paid During Period a | Beginning Account Value (3/1/17) | Ending Account Value (8/31/17) | Expenses Paid During Period a | Annualized Expense Ratio | ||||||||||||||||||||
| $ | 1,000.00 | $ | 1,327.40 | $ | 2.82 | $ | 1,000.00 | $ | 1,022.80 | $ | 2.45 | 0.48% | ||||||||||||||
| a | Expenses are calculated using the Fund’s annualized expense ratio (as disclosed in the table), multiplied by the average account value for the period, multiplied by the number of days in the period (184 days) and divided by the number of days in the year (365 days). See “Shareholder Expenses” on page 16 for more information. |
| 6 | 2017 iSHARES ANNUAL REPORTTO SHAREHOLDERS |
Table of Contents
Management’s Discussion of Fund Performance (Continued)
iSHARES® MSCI AUSTRIA CAPPED ETF
The iShares MSCI Austria Capped ETF (the “Fund”) seeks to track the investment results of a broad-based index composed of Austrian equities, as represented by the MSCI Austria IMI 25/50 Index (the “Index”). The Fund invests in a representative sample of securities included in the Index that collectively has an investment profile similar to the Index. Due to the use of representative sampling, the Fund may or may not hold all of the securities that are included in the Index. For the 12-month reporting period ended August 31, 2017, the total return for the Fund was 49.52%, net of fees, while the total return for the Index was 49.95%.
Broad-based growth in Austria’s economy was driven by robust domestic demand and a favorable trading environment for exports, such as automobiles, machinery, and paper products. Austrian exports reached a record high during the reporting period. Rising confidence from consumers and businesses encouraged solid levels of industrial production and retail sales growth. Austria’s unemployment rate declined, due in part to rising immigration and the availability of more jobs for women and seniors.
From a sector perspective, financials, which represented about 31% of the Index on average, was the largest contributor to the Index’s return for the reporting period. Austrian bank profits improved on decreased loan loss provisions and increased income from fees and commissions. The energy sector, led by the oil, gas, and consumable fuels industry, also contributed meaningfully to the Index’s performance, reflecting cost-saving efforts amid falling oil prices.
The materials sector also contributed significantly to the Index’s return during the reporting period. Within the sector, metals and mining companies contributed the most, followed by the construction materials industry also contributed. The real estate sector, led by real estate management and development companies, further increased the Index’s return. The industrials sector also helped support the Index’s performance, led by the air freight and logistics, aerospace and defense, and industrial machinery industries.
In contrast, the consumer discretionary sector detracted fractionally from the Index’s return for the reporting period.
The euro, which appreciated about 6% relative to the U.S. dollar during the reporting period, was a contributor to the Index’s performance, as returns on Austrian investments were higher when translated back into U.S. dollars.
ALLOCATION BY SECTOR
As of 8/31/17
| Sector | Percentage of Total Investments* |
Financials | 30.89 | % | ||
Materials | 19.88 | |||
Energy | 15.81 | |||
Real Estate | 14.78 | |||
Industrials | 11.50 | |||
Telecommunication Services | 2.78 | |||
Information Technology | 2.03 | |||
Utilities | 1.45 | |||
Consumer Discretionary | 0.88 | |||
|
| |||
TOTAL | 100.00 | % | ||
|
|
TEN LARGEST FUND HOLDINGS
As of 8/31/17
| Security | Percentage of Total Investments* |
Erste Group Bank AG | 21.24 | % | ||
OMV AG | 14.05 | |||
Voestalpine AG | 9.80 | |||
BUWOG AG | 4.64 | |||
Raiffeisen Bank International AG | 4.57 | |||
Andritz AG | 4.49 | |||
Wienerberger AG | 4.37 | |||
IMMOFINANZ AG | 4.15 | |||
CA Immobilien Anlagen AG | 4.13 | |||
Lenzing AG | 3.62 | |||
|
| |||
TOTAL | 75.06 | % | ||
|
|
| * | Excludes money market funds. |
MANAGEMENT’S DISCUSSIONSOF FUND PERFORMANCE | 7 |
Table of Contents
Management’s Discussion of Fund Performance
iSHARES® MSCI BELGIUM CAPPED ETF
Performance as of August 31, 2017
| Average Annual Total Returns | Cumulative Total Returns | |||||||||||||||||||||||||||
| NAV | MARKET | INDEX | NAV | MARKET | INDEX | |||||||||||||||||||||||
1 Year | 16.44% | 16.61% | 16.43% | 16.44% | 16.61% | 16.43% | ||||||||||||||||||||||
5 Years | 14.30% | 14.33% | 13.79% | 95.08% | 95.35% | 90.80% | ||||||||||||||||||||||
10 Years | 1.17% | 1.19% | 1.48% | 12.35% | 12.55% | 15.82% | ||||||||||||||||||||||
GROWTH OF $10,000 INVESTMENT
(AT NET ASSET VALUE)
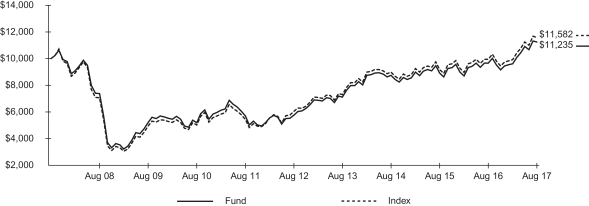
Index performance through November 30, 2007 reflects the performance of the MSCI Belgium Index. Index performance beginning on December 1, 2007 through November 8, 2012 reflects the performance of the MSCI Belgium Investable Market Index. Index performance beginning on November 9, 2012 reflects the performance of the MSCI Belgium IMI 25/50 Index.
Past performance is no guarantee of future results. Performance results do not reflect the deduction of taxes that a shareholder would pay on fund distributions or on the redemption or sale of fund shares. See “About Fund Performance” on page 16 for more information.
| Shareholder Expenses | ||||||||||||||||||||||||||
| Actual | Hypothetical 5% Return | |||||||||||||||||||||||||
| Beginning Account Value (3/1/17) | Ending Account Value (8/31/17) | Expenses Paid During Period a | Beginning Account Value (3/1/17) | Ending Account Value (8/31/17) | Expenses Paid During Period a | Annualized Expense Ratio | ||||||||||||||||||||
| $ | 1,000.00 | $ | 1,168.60 | $ | 2.68 | $ | 1,000.00 | $ | 1,022.70 | $ | 2.50 | 0.49% | ||||||||||||||
| a | Expenses are calculated using the Fund’s annualized expense ratio (as disclosed in the table), multiplied by the average account value for the period, multiplied by the number of days in the period (184 days) and divided by the number of days in the year (365 days). See “Shareholder Expenses” on page 16 for more information. |
| 8 | 2017 iSHARES ANNUAL REPORTTO SHAREHOLDERS |
Table of Contents
Management’s Discussion of Fund Performance (Continued)
iSHARES® MSCI BELGIUM CAPPED ETF
The iShares MSCI Belgium Capped ETF (the “Fund”) seeks to track the investment results of a broad-based index composed of Belgian equities, as represented by the MSCI Belgium IMI 25/50 Index (the “Index”). The Fund invests in a representative sample of securities included in the Index that collectively has an investment profile similar to the Index. Due to the use of representative sampling, the Fund may or may not hold all of the securities that are included in the Index. For the 12-month reporting period ended August 31, 2017, the total return for the Fund was 16.44%, net of fees, while the total return for the Index was 16.43%.
Belgium posted a solid rate of economic growth during the reporting period. Healthy demand on the domestic front contributed to economic growth, as lower inflation encouraged consumers to spend more. The business environment also was strong; credit was easily accessible, and past structural reforms contributed to an increase in companies’ profitability. In an effort to increase the strength of its economy and establish the nation as a more compelling place to do business, the Belgian government introduced multiple reforms, including a plan to lower its corporate tax rate and decrease its sizable public debt burden.
From a sector perspective, the financials sector, which constituted approximately 23% of the Index on average, was the largest contributor to the Index’s return for the reporting period. Multiple industries in the sector performed well, including banks, insurers, and diversified financial services, in an environment of robust economic growth, low interest rates and inflation, and a strengthening euro.
The materials sector was also a solid contributor to the Index’s return for the reporting period. Standouts in the sector were chemical companies with applications in automotive end markets focused on electric vehicles and other green technologies. The healthcare and consumer discretionary sectors also contributed to the Index’s return. The energy sector was the only sector that detracted from the Index’s performance during the reporting period.
The euro, which appreciated about 6% relative to the U.S. dollar during the reporting period, was a contributor to the Index’s performance, as returns on Belgian investments were higher when translated back into U.S. dollars.
ALLOCATION BY SECTOR
As of 8/31/17
| Sector | Percentage of Total Investments* |
Consumer Staples | 27.25 | % | ||
Financials | 24.51 | |||
Materials | 12.83 | |||
Health Care | 10.19 | |||
Real Estate | 6.62 | |||
Consumer Discretionary | 4.99 | |||
Information Technology | 4.13 | |||
Telecommunication Services | 3.93 | |||
Industrials | 2.91 | |||
Utilities | 1.44 | |||
Energy | 1.20 | |||
|
| |||
TOTAL | 100.00 | % | ||
|
|
TEN LARGEST FUND HOLDINGS
As of 8/31/17
| Security | Percentage of Total Investments* |
Anheuser-Busch InBev SA/NV | 22.87 | % | ||
KBC Group NV | 9.70 | |||
Solvay SA | 5.59 | |||
Ageas | 4.28 | |||
Groupe Bruxelles Lambert SA | 4.25 | |||
UCB SA | 4.10 | |||
Umicore SA | 3.95 | |||
Proximus SADP | 3.00 | |||
Galapagos NV | 2.48 | |||
Ackermans & van Haaren NV | 2.42 | |||
|
| |||
TOTAL | 62.64 | % | ||
|
|
| * | Excludes money market funds. |
MANAGEMENT’S DISCUSSIONSOF FUND PERFORMANCE | 9 |
Table of Contents
Management’s Discussion of Fund Performance
iSHARES® MSCI FRANCE ETF
Performance as of August 31, 2017
| Average Annual Total Returns | Cumulative Total Returns | |||||||||||||||||||||||||||
| NAV | MARKET | INDEX | NAV | MARKET | INDEX | |||||||||||||||||||||||
1 Year | 26.93% | 27.06% | 26.78% | 26.93% | 27.06% | 26.78% | ||||||||||||||||||||||
5 Years | 10.26% | 10.40% | 10.22% | 62.98% | 64.03% | 62.69% | ||||||||||||||||||||||
10 Years | 1.03% | 1.05% | 1.05% | 10.82% | 10.99% | 11.02% | ||||||||||||||||||||||
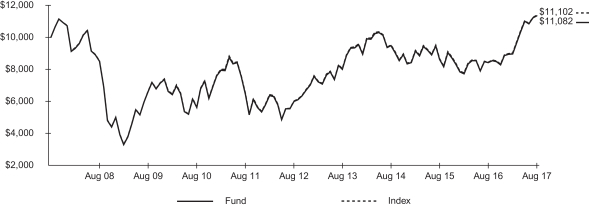
GROWTH OF $10,000 INVESTMENT
(AT NET ASSET VALUE)
Past performance is no guarantee of future results. Performance results do not reflect the deduction of taxes that a shareholder would pay on fund distributions or on the redemption or sale of fund shares. See “About Fund Performance” on page 16 for more information.
| Shareholder Expenses | ||||||||||||||||||||||||||
| Actual | Hypothetical 5% Return | |||||||||||||||||||||||||
Beginning Account Value (3/1/17) | Ending Account Value (8/31/17) | Expenses Paid During Period a | Beginning Account Value (3/1/17) | Ending Account Value (8/31/17) | Expenses Paid During Period a | Annualized Expense Ratio | ||||||||||||||||||||
| $ | 1,000.00 | $ | 1,207.60 | $ | 2.67 | $ | 1,000.00 | $ | 1,022.80 | $ | 2.45 | 0.48% | ||||||||||||||
| a | Expenses are calculated using the Fund’s annualized expense ratio (as disclosed in the table), multiplied by the average account value for the period, multiplied by the number of days in the period (184 days) and divided by the number of days in the year (365 days). See “Shareholder Expenses” on page 16 for more information. |
| 10 | 2017 iSHARES ANNUAL REPORTTO SHAREHOLDERS |
Table of Contents
Management’s Discussion of Fund Performance (Continued)
iSHARES® MSCI FRANCE ETF
The iShares MSCI France ETF (the “Fund”) seeks to track the investment results of an index composed of French equities, as represented by the MSCI France Index (the “Index”). The Fund invests in a representative sample of securities included in the Index that collectively has an investment profile similar to the Index. Due to the use of representative sampling, the Fund may or may not hold all of the securities that are included in the Index. For the 12-month reporting period ended August 31, 2017, the total return for the Fund was 26.93%, net of fees, while the total return for the Index was 26.78%.
France’s economy grew steadily during the reporting period, its annual growth rate accelerating to its highest level in nearly six years. The economic momentum was driven by the external sector, which benefited from a sharp increase in exports for transportation equipment and refined petroleum products. Domestic economic growth was more modest, reflecting a slowdown in the tourism industry since the 2016 terrorist attacks. Domestic reaction to the election of President Emmanuel Macron was mixed as business sentiment increased close to a 10-year high, but consumer confidence decreased slightly, as consumers wait to gauge the success of the new president’s labor reforms.
From a sector perspective, the financials sector contributed the most to the Index’s return during the reporting period. Bank stocks, which are generally perceived to be risky during times of political uncertainty, rose sharply after the election of new President Emmanuel Macron, thereby alleviating doubt France would back away from the euro. The consumer discretionary sector was also a strong contributor to the Index’s return as luxury-brand companies benefited from increased demand from China.
The industrials sector, which represented roughly 19% of the Index on average, was also a solid contributor to the Index’s performance for the reporting period. The aerospace and defense industry contributed as solid global economic growth and relatively lower fuel prices encouraged strong passenger travel demand. The healthcare sector, in particular pharmaceuticals companies with strong product pipelines, also contributed to the Index’s return.
The euro, which appreciated about 6% relative to the U.S. dollar during the reporting period, contributed to the Index’s performance, as returns on French investments were higher when translated back into U.S. dollars.
ALLOCATION BY SECTOR
As of 8/31/17
| Sector | Percentage of Total Investments* |
Industrials | 19.94 | % | ||
Consumer Discretionary | 17.80 | |||
Financials | 15.55 | |||
Health Care | 9.94 | |||
Consumer Staples | 9.81 | |||
Energy | 8.21 | |||
Materials | 5.10 | |||
Information Technology | 4.16 | |||
Utilities | 3.53 | |||
Real Estate | 3.22 | |||
Telecommunication Services | 2.74 | |||
|
| |||
TOTAL | 100.00 | % | ||
|
|
TEN LARGEST FUND HOLDINGS
As of 8/31/17
| Security | Percentage of Total Investments* |
Total SA | 8.20 | % | ||
Sanofi | 7.42 | |||
BNP Paribas SA | 5.74 | |||
LVMH Moet Hennessy Louis Vuitton SE | 4.92 | |||
AXA SA | 3.79 | |||
L’Oreal SA | 3.58 | |||
Airbus SE | 3.29 | |||
Air Liquide SA | 3.20 | |||
Danone SA | 3.13 | |||
Vinci SA | 3.12 | |||
|
| |||
TOTAL | 46.39 | % | ||
|
|
| * | Excludes money market funds. |
MANAGEMENT’S DISCUSSIONSOF FUND PERFORMANCE | 11 |
Table of Contents
Management’s Discussion of Fund Performance
iSHARES® MSCI NETHERLANDS ETF
Performance as of August 31, 2017
| Average Annual Total Returns | Cumulative Total Returns | |||||||||||||||||||||||||||
| NAV | MARKET | INDEX | NAV | MARKET | INDEX | |||||||||||||||||||||||
1 Year | 26.44% | 26.51% | 27.10% | 26.44% | 26.51% | 27.10% | ||||||||||||||||||||||
5 Years | 13.09% | 13.21% | 13.29% | 84.99% | 85.94% | 86.64% | ||||||||||||||||||||||
10 Years | 3.12% | 3.16% | 3.58% | 35.94% | 36.46% | 42.12% | ||||||||||||||||||||||
GROWTH OF $10,000 INVESTMENT
(AT NET ASSET VALUE)
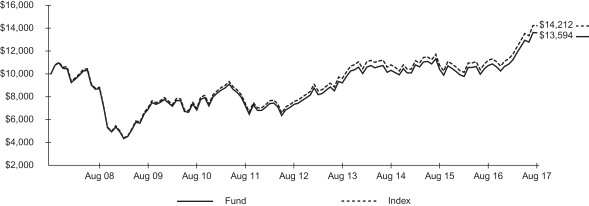
Index performance through January 31, 2008 reflects the performance of the MSCI Netherlands Index. Index performance beginning on February 1, 2008 reflects the performance of the MSCI Netherlands Investable Market Index.
Past performance is no guarantee of future results. Performance results do not reflect the deduction of taxes that a shareholder would pay on fund distributions or on the redemption or sale of fund shares. See “About Fund Performance” on page 16 for more information.
| Shareholder Expenses | ||||||||||||||||||||||||||
| Actual | Hypothetical 5% Return | |||||||||||||||||||||||||
Beginning Account Value (3/1/17) | Ending Account Value (8/31/17) | Expenses Paid During Period a | Beginning Account Value (3/1/17) | Ending Account Value (8/31/17) | Expenses Paid During Period a | Annualized Expense Ratio | ||||||||||||||||||||
| $ | 1,000.00 | $ | 1,212.60 | $ | 2.73 | $ | 1,000.00 | $ | 1,022.70 | $ | 2.50 | 0.49% | ||||||||||||||
| a | Expenses are calculated using the Fund’s annualized expense ratio (as disclosed in the table), multiplied by the average account value for the period, multiplied by the number of days in the period (184 days) and divided by the number of days in the year (365 days). See “Shareholder Expenses” on page 16 for more information. |
| 12 | 2017 iSHARES ANNUAL REPORTTO SHAREHOLDERS |
Table of Contents
Management’s Discussion of Fund Performance (Continued)
iSHARES® MSCI NETHERLANDS ETF
The iShares MSCI Netherlands ETF (the “Fund”) seeks to track the investment results of a broad-based index composed of Dutch equities, as represented by the MSCI Netherlands Investable Market Index (the “Index”). The Fund invests in a representative sample of securities included in the Index that collectively has an investment profile similar to the Index. Due to the use of representative sampling, the Fund may or may not hold all of the securities that are included in the Index. For the 12-month reporting period ended August 31, 2017, the total return for the Fund was 26.44%, net of fees, while the total return for the Index was 27.10%.
The economy of the Netherlands strengthened considerably on an annualized basis during the reporting period. Growth was driven largely by increased private consumption, as household spending for goods and services increased. Fixed investment increased as well, benefiting from increased investment in residential property and automobiles. The domestic sector was further helped by a decline in the unemployment rate, a strong housing market, and high consumer confidence. Strong external demand for such exports as chemicals, machinery, and equipment also benefited the Netherlands’ economy.
The financials sector, which represented 19% of the Index on average during the reporting period, was the largest contributor to the Index’s return. The strength of the sector was primarily driven by Dutch banks, which successfully reduced costs to counteract low interest rates, expanded their domestic customer base amid the improving Dutch economy, and bolstered their digital banking products and services. The information technology sector also enhanced the Index’s performance, due in part to favorable developments in the semiconductor and semiconductor equipment industry.
The largest sector in the Index, consumer staples, which represented about 30% of the Index on average for the reporting period, was a notable contributor to the Index’s return. The personal products industry within the sector was particularly strong. The strength of capital goods stocks within the industrials sector also contributed to the Index’s return.
The euro, which appreciated about 6% relative to the U.S. dollar during the reporting period, contributed to the Index’s performance as returns on Dutch investments were higher when translated into U.S. dollars.
Special note: Effective September 1, 2017, the Fund will begin to track a new underlying index, the MSCI Netherlands IMI 25/50 Index, and will cease to track the Index. The change to a capped benchmark is being implemented to seek to reduce tracking error and improve the investor experience.
ALLOCATION BY SECTOR
As of 8/31/17
| Sector | Percentage of Total Investments* |
Consumer Staples | 27.50 | % | ||
Information Technology | 19.27 | |||
Financials | 18.79 | |||
Industrials | 13.83 | |||
Materials | 7.71 | |||
Health Care | 4.41 | |||
Consumer Discretionary | 2.86 | |||
Telecommunication Services | 2.30 | |||
Energy | 1.77 | |||
Real Estate | 1.56 | |||
|
| |||
TOTAL | 100.00 | % | ||
|
|
TEN LARGEST FUND HOLDINGS
As of 8/31/17
| Security | Percentage of Total Investments* |
Unilever NV CVA | 16.82 | % | ||
ING Groep NV | 11.78 | |||
ASML Holding NV | 9.85 | |||
NXP Semiconductors NV | 6.40 | |||
Koninklijke Philips NV | 4.41 | |||
Akzo Nobel NV | 4.22 | |||
RELX NV | 3.74 | |||
Koninklijke Ahold Delhaize NV | 3.56 | |||
Heineken NV | 3.54 | |||
Koninklijke DSM NV | 2.59 | |||
|
| |||
TOTAL | 66.91 | % | ||
|
|
| * | Excludes money market funds. |
MANAGEMENT’S DISCUSSIONSOF FUND PERFORMANCE | 13 |
Table of Contents
Management’s Discussion of Fund Performance
iSHARES® MSCI SWEDEN CAPPED ETF
Performance as of August 31, 2017
| Average Annual Total Returns | Cumulative Total Returns | |||||||||||||||||||||||||||
| 1 Year | 5 Years | 10 Years | 1 Year | 5 Years | 10 Years | |||||||||||||||||||||||
Fund NAV | 24.30% | 8.57% | 3.86% | 24.30% | 50.87% | 46.08% | ||||||||||||||||||||||
Fund Market | 24.31% | 8.67% | 3.86% | 24.31% | 51.51% | 46.09% | ||||||||||||||||||||||
Indexa | 23.60% | 7.96% | 3.53% | 23.60% | 46.67% | 41.48% | ||||||||||||||||||||||
MSCI Sweden Index | 23.07% | 7.87% | 3.49% | 23.07% | 46.04% | 40.87% | ||||||||||||||||||||||
MSCI Sweden 25/50 Indexb | 24.94% | n/a | n/a | 24.94% | n/a | n/a | ||||||||||||||||||||||
GROWTH OF $10,000 INVESTMENT
(AT NET ASSET VALUE)
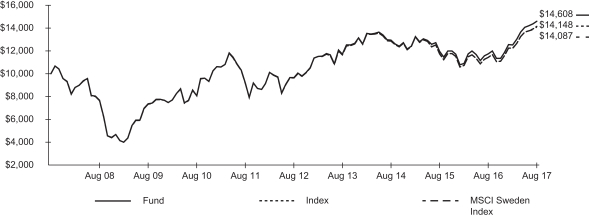
| a | Index performance through November 30, 2016 reflects the performance of the MSCI Sweden Index. Index performance beginning on December 1, 2016 reflects the performance of the MSCI Sweden 25/50 Index, which, effective as of December 1, 2016, replaced the MSCI Sweden Index as the underlying index of the Fund. |
| b | The inception date for the MSCI Sweden 25/50 Index was July 20, 2016. |
Past performance is no guarantee of future results. Performance results do not reflect the deduction of taxes that a shareholder would pay on fund distributions or on the redemption or sale of fund shares. See “About Fund Performance” on page 16 for more information.
| Shareholder Expenses | ||||||||||||||||||||||||||
| Actual | Hypothetical 5% Return | |||||||||||||||||||||||||
Beginning Account Value (3/1/17) | Ending Account Value (8/31/17) | Expenses Paid During Period a | Beginning Account Value (3/1/17) | Ending Account Value (8/31/17) | Expenses Paid During Period a | Annualized Expense Ratio | ||||||||||||||||||||
| $ | 1,000.00 | $ | 1,166.00 | $ | 2.62 | $ | 1,000.00 | $ | 1,022.80 | $ | 2.45 | 0.48% | ||||||||||||||
| a | Expenses are calculated using the Fund’s annualized expense ratio (as disclosed in the table), multiplied by the average account value for the period, multiplied by the number of days in the period (184 days) and divided by the number of days in the year (365 days). See “Shareholder Expenses” on page 16 for more information. |
| 14 | 2017 iSHARES ANNUAL REPORTTO SHAREHOLDERS |
Table of Contents
Management’s Discussion of Fund Performance (Continued)
iSHARES® MSCI SWEDEN CAPPED ETF
The iShares MSCI Sweden Capped ETF (the “Fund”) (formerly the iShares MSCI Sweden ETF) seeks to track the investment results of an index composed of Swedish equities, as represented by the MSCI Sweden 25/50 Index (the “Index”). The Fund invests in a representative sample of securities included in the Index that collectively has an investment profile similar to the Index. Due to the use of representative sampling, the Fund may or may not hold all of the securities that are included in the Index. For the 12-month reporting period ended August 31, 2017, the total return for the Fund was 24.30%, net of fees, while the total return for the Index was 23.60%.
The Swedish economy grew appreciably on an annualized basis during the reporting period. In the second quarter of 2017, Sweden posted its highest quarterly economic growth rate since 2010. An improved domestic economy was the primary source of growth, strengthened by increased household consumption due to low inflation, low unemployment, and higher levels of disposable income. An increase in real estate investment amid an environment of historically low interest rates further led to growth in the domestic economy.
The two largest sectors in the Index were the largest contributors to the Index’s performance during the reporting period. The financials sector, representing about 34% of the Index on average, was the largest contributor. Despite a decline in profits due to particularly low interest rates, many Swedish banks benefited from a strong increase in commission fees, as well as higher net interest income driven by rising mortgage loan volumes. The stocks of diversified financial companies also contributed to the Index’s performance. The industrials sector, which comprised approximately 32% of the Index on average, also made a solid contribution to the Index’s return, due to increased sales of industrial machinery, Sweden’s largest export.
The telecommunication services and materials sectors contributed modestly to the Index’s return during the reporting period, while the information technology and consumer discretionary sectors slightly detracted from the Index’s performance.
The Swedish krona, which appreciated about 7% relative to the U.S. dollar during the reporting period, contributed to the Index’s performance as returns on Swedish investments were higher when translated into U.S. dollars.
ALLOCATION BY SECTOR
As of 8/31/17
| Sector | Percentage of Total Investments* |
Financials | 34.07 | % | ||
Industrials | 32.42 | |||
Consumer Discretionary | 9.36 | |||
Information Technology | 7.24 | |||
Consumer Staples | 6.42 | |||
Telecommunication Services | 5.67 | |||
Materials | 2.54 | |||
Energy | 1.17 | |||
Health Care | 1.11 | |||
|
| |||
TOTAL | 100.00 | % | ||
|
|
TEN LARGEST FUND HOLDINGS
As of 8/31/17
| Security | Percentage of Total Investments* |
Nordea Bank AB | 9.87 | % | ||
Volvo AB Class B | 6.39 | |||
Atlas Copco AB Class A | 6.34 | |||
Swedbank AB Class A | 5.89 | |||
Hennes & Mauritz AB Class B | 5.79 | |||
Svenska Handelsbanken AB Class A | 5.49 | |||
Assa Abloy AB Class B | 4.57 | |||
Skandinaviska Enskilda Banken AB Class A | 4.53 | |||
Investor AB Class B | 4.48 | |||
Sandvik AB | 4.43 | |||
|
| |||
TOTAL | 57.78 | % | ||
|
|
| * | Excludes money market funds. |
MANAGEMENT’S DISCUSSIONSOF FUND PERFORMANCE | 15 |
Table of Contents
Past performance is no guarantee of future results. Current performance may be lower or higher than the performance data quoted. Performance data current to the most recent month-end is available at www.ishares.com. Performance results assume reinvestment of all dividends and capital gain distributions and do not reflect the deduction of taxes that a shareholder would pay on fund distributions or on the redemption or sale of fund shares. The investment return and principal value of shares will vary with changes in market conditions. Shares may be worth more or less than their original cost when they are redeemed or sold in the market. Performance for certain funds may reflect a waiver of a portion of investment advisory fees. Without such a waiver, performance would have been lower.
Net asset value or “NAV” is the value of one share of a fund as calculated in accordance with the standard formula for valuing mutual fund shares. The price used to calculate market return (“Market Price”) is determined by using the midpoint between the highest bid and the lowest offer on the primary stock exchange on which shares of a fund are listed for trading, as of the time that such fund’s NAV is calculated. Certain funds may have a NAV which is determined prior to the opening of regular trading on its listed exchange and their market returns are calculated using the midpoint of the bid/ask spread as of the opening of regular trading on the exchange. Market and NAV returns assume that dividends and capital gain distributions have been reinvested at Market Price and NAV, respectively.
An index is a statistical composite that tracks a specified financial market or sector. Unlike a fund, an index does not actually hold a portfolio of securities and therefore does not incur the expenses incurred by a fund. These expenses negatively impact fund performance. Also, market returns do not include brokerage commissions that may be payable on secondary market transactions. If brokerage commissions were included, market returns would be lower.
As a shareholder of a Fund, you incur two types of costs: (1) transaction costs, including brokerage commissions on purchases and sales of fund shares and (2) ongoing costs, including management fees and other fund expenses. The expense example, which is based on an investment of $1,000 invested on March 1, 2017 and held through August 31, 2017, is intended to help you understand your ongoing costs (in dollars and cents) of investing in a Fund and to compare these costs with the ongoing costs of investing in other funds.
Actual Expenses — The table provides information about actual account values and actual expenses. Annualized expense ratios reflect contractual and voluntary fee waivers, if any. To estimate the expenses that you paid on your account over the period, simply divide your account value by $1,000 (for example, an $8,600 account value divided by $1,000 = 8.6), then multiply the result by the number corresponding to your Fund under the heading entitled “Expenses Paid During Period.”
Hypothetical Example for Comparison Purposes — The table also provides information about hypothetical account values and hypothetical expenses based on each Fund’s actual expense ratio and an assumed rate of return of 5% per year before expenses. You may use this information to compare the ongoing costs of investing in your Fund and other funds. To do so, compare this 5% hypothetical example with the 5% hypothetical examples that appear in the shareholder reports of the other funds.
Please note that the expenses shown in the table are meant to highlight your ongoing costs only and do not reflect any transactional costs, such as brokerage commissions paid on purchases and sales of fund shares. Therefore, the hypothetical examples are useful in comparing ongoing costs only and will not help you determine the relative total costs of owning different funds. In addition, if these transactional costs were included, your costs would have been higher.
| 16 | 2017 iSHARES ANNUAL REPORTTO SHAREHOLDERS |
Table of Contents
iSHARES® MSCI AUSTRIA CAPPED ETF
August 31, 2017
| Security | Shares | Value | ||||||
COMMON STOCKS — 99.66% |
| |||||||
AEROSPACE & DEFENSE — 1.05% |
| |||||||
FACC AGa | 202,145 | $ | 2,448,964 | |||||
|
| |||||||
| 2,448,964 | ||||||||
AIR FREIGHT & LOGISTICS — 3.05% |
| |||||||
Oesterreichische Post AG | 158,710 | 7,102,300 | ||||||
|
| |||||||
| 7,102,300 | ||||||||
BANKS — 25.72% |
| |||||||
Erste Group Bank AG | 1,170,167 | 49,381,033 | ||||||
Raiffeisen Bank International AGa | 324,506 | 10,632,786 | ||||||
|
| |||||||
| 60,013,819 | ||||||||
CHEMICALS — 3.61% |
| |||||||
Lenzing AG | 53,397 | 8,411,586 | ||||||
|
| |||||||
| 8,411,586 | ||||||||
CONSTRUCTION & ENGINEERING — 0.69% |
| |||||||
Porr AG | 56,664 | 1,613,459 | ||||||
|
| |||||||
| 1,613,459 | ||||||||
CONSTRUCTION MATERIALS — 6.44% |
| |||||||
RHI AG | 133,206 | 4,865,082 | ||||||
Wienerberger AG | 471,227 | 10,157,179 | ||||||
|
| |||||||
| 15,022,261 | ||||||||
DIVERSIFIED TELECOMMUNICATION SERVICES — 2.77% |
| |||||||
Telekom Austria AG | 673,134 | 6,469,534 | ||||||
|
| |||||||
| 6,469,534 | ||||||||
ELECTRIC UTILITIES — 1.45% |
| |||||||
EVN AG | 218,918 | 3,383,529 | ||||||
|
| |||||||
| 3,383,529 | ||||||||
ELECTRICAL EQUIPMENT — 1.28% |
| |||||||
Zumtobel Group AG | 165,552 | 2,986,815 | ||||||
|
| |||||||
| 2,986,815 | ||||||||
ELECTRONIC EQUIPMENT, INSTRUMENTS & COMPONENTS — 2.03% |
| |||||||
Austria Technologie & Systemtechnik AGb | 183,439 | 2,533,121 | ||||||
Kapsch TrafficCom AG | 41,781 | 2,199,539 | ||||||
|
| |||||||
| 4,732,660 | ||||||||
ENERGY EQUIPMENT & SERVICES — 1.75% |
| |||||||
Schoeller-Bleckmann Oilfield Equipment AGa,b | 58,765 | 4,087,142 | ||||||
|
| |||||||
| 4,087,142 | ||||||||
| Security | Shares | Value | ||||||
HOTELS, RESTAURANTS & LEISURE — 0.87% |
| |||||||
DO & CO AG | 38,631 | $ | 2,038,990 | |||||
|
| |||||||
| 2,038,990 | ||||||||
INSURANCE — 5.06% |
| |||||||
UNIQA Insurance Group AG | 610,228 | 6,184,885 | ||||||
Vienna Insurance Group AG Wiener Versicherung Gruppe | 190,908 | 5,628,867 | ||||||
|
| |||||||
| 11,813,752 | ||||||||
MACHINERY — 5.39% |
| |||||||
Andritz AG | 192,265 | 10,448,564 | ||||||
Semperit AG Holdingb | 71,570 | 2,131,067 | ||||||
|
| |||||||
| 12,579,631 | ||||||||
METALS & MINING — 9.77% |
| |||||||
Voestalpine AG | 439,757 | 22,790,023 | ||||||
|
| |||||||
| 22,790,023 | ||||||||
OIL, GAS & CONSUMABLE FUELS — 14.00% |
| |||||||
OMV AG | 569,061 | 32,670,905 | ||||||
|
| |||||||
| 32,670,905 | ||||||||
REAL ESTATE MANAGEMENT & DEVELOPMENT — 14.73% |
| |||||||
BUWOG AG | 351,040 | 10,788,530 | ||||||
CA Immobilien Anlagen AG | 337,549 | 9,613,425 | ||||||
IMMOFINANZ AGb | 3,649,871 | 9,655,009 | ||||||
S IMMO AG | 263,902 | 4,304,690 | ||||||
|
| |||||||
| 34,361,654 | ||||||||
|
| |||||||
TOTAL COMMON STOCKS |
| |||||||
(Cost: $201,487,117) |
| 232,527,024 | ||||||
SHORT-TERM INVESTMENTS — 2.89% |
| |||||||
MONEY MARKET FUNDS — 2.89% |
| |||||||
BlackRock Cash Funds: Institutional, |
| |||||||
1.32%c,d,e | 6,611,731 | 6,613,715 | ||||||
BlackRock Cash Funds: Treasury, SL Agency Shares | ||||||||
0.96%c,d | 135,114 | 135,114 | ||||||
|
| |||||||
| 6,748,829 | ||||||||
|
| |||||||
TOTAL SHORT-TERM INVESTMENTS |
| |||||||
(Cost: $6,748,307) |
| 6,748,829 | ||||||
|
| |||||||
SCHEDULESOF INVESTMENTS | 17 |
Table of Contents
Schedule of Investments (Continued)
iSHARES® MSCI AUSTRIA CAPPED ETF
August 31, 2017
| Value | ||||||
TOTAL INVESTMENTS | ||||||
(Cost: $208,235,424)f | $ | 239,275,853 | ||||
Other Assets, Less Liabilities — (2.55)% | (5,953,855 | ) | ||||
|
| |||||
NET ASSETS — 100.00% | $ | 233,321,998 | ||||
|
| |||||
| a | Non-income earning security. |
| b | All or a portion of this security represents a security on loan. See Note 1. |
| c | Affiliated issuer. See Schedule 1. |
| d | The rate quoted is the annualized seven-day yield of the fund at period end. |
| e | All or a portion of this security represents an investment of securities lending collateral. See Note 1. |
| f | The cost of investments (including short positions and derivatives, if any) for federal income tax purposes was $220,363,807. Net unrealized appreciation was $18,912,046, of which $33,971,871 represented gross unrealized appreciation on investments and $15,059,825 represented gross unrealized depreciation on investments. |
Schedule 1 — Affiliates (Note 2)
Investments in issuers considered to be affiliates of the Fund during the year ended August 31, 2017, for purposes of Section 2(a)(3) of the 1940 Act, and/or related parties of the Fund were as follows:
| Affiliated issuer | Shares held at 08/31/16 | Shares purchased | Shares sold | Shares held at 08/31/17 | Value at 08/31/17 | Net realized gain (loss)a | Change in unrealized appreciation (depreciation) | Income | ||||||||||||||||||||||||
BlackRock Cash Funds: Institutional, | 1,619,284 | 4,992,447 | b | — | 6,611,731 | $ | 6,613,715 | $ | (221 | ) | $ | 522 | $ | — | c | |||||||||||||||||
BlackRock Cash Funds: Treasury, | 35,791 | 99,323 | b | — | 135,114 | 135,114 | 2 | — | 648 | |||||||||||||||||||||||
|
|
|
|
|
|
|
| |||||||||||||||||||||||||
| $ | 6,748,829 | $ | (219 | ) | $ | 522 | $ | 648 | ||||||||||||||||||||||||
|
|
|
|
|
|
|
| |||||||||||||||||||||||||
| a | Includes realized capital gain distributions from an affiliated fund, if any. |
| b | Net of shares purchased and sold. |
| c | Does not include income earned on investment of securities lending cash collateral which is not direct income of the Fund and is reflected as a component of securities lending income in the statement of operations. |
Schedule 2 — Fair Value Measurements
Various inputs are used in determining the fair value of financial instruments. For description of the input levels and information about the Fund’s policy regarding valuation of financial instruments, see Note 1.
The following table summarizes the value of the Fund’s investments according to the fair value hierarchy as of August 31, 2017. The breakdown of the Fund’s investments into major categories is disclosed in the schedule of investments above.
| Level 1 | Level 2 | Level 3 | Total | |||||||||||||
Investments: | ||||||||||||||||
Assets: | ||||||||||||||||
Common stocks | $ | 232,527,024 | $ | — | $ | — | $ | 232,527,024 | ||||||||
Money market funds | 6,748,829 | — | — | 6,748,829 | ||||||||||||
|
|
|
|
|
|
|
| |||||||||
Total | $ | 239,275,853 | $ | — | $ | — | $ | 239,275,853 | ||||||||
|
|
|
|
|
|
|
| |||||||||
See notes to financial statements.
| 18 | 2017 iSHARES ANNUAL REPORTTO SHAREHOLDERS |
Table of Contents
Schedule of Investments
iSHARES® MSCI BELGIUM CAPPED ETF
August 31, 2017
| Security | Shares | Value | ||||||
COMMON STOCKS — 99.69% |
| |||||||
AIR FREIGHT & LOGISTICS — 1.87% |
| |||||||
bpost SA | 49,625 | $ | 1,383,530 | |||||
|
| |||||||
| 1,383,530 | ||||||||
BANKS — 9.66% |
| |||||||
KBC Group NV | 87,299 | 7,164,606 | ||||||
|
| |||||||
| 7,164,606 | ||||||||
BEVERAGES — 22.80% |
| |||||||
Anheuser-Busch InBev SA/NV | 142,829 | 16,899,424 | ||||||
|
| |||||||
| 16,899,424 | ||||||||
BIOTECHNOLOGY — 3.40% |
| |||||||
Ablynx NVa,b | 48,228 | 688,059 | ||||||
Galapagos NVa,b | 19,924 | 1,830,343 | ||||||
|
| |||||||
| 2,518,402 | ||||||||
CAPITAL MARKETS — 1.10% |
| |||||||
Gimv NV | 13,685 | 816,759 | ||||||
|
| |||||||
| 816,759 | ||||||||
CHEMICALS — 10.66% |
| |||||||
Solvay SA | 28,501 | 4,128,866 | ||||||
Tessenderlo Group SAa | 19,543 | 855,500 | ||||||
Umicore SA | 39,139 | 2,919,904 | ||||||
|
| |||||||
| 7,904,270 | ||||||||
COMMUNICATIONS EQUIPMENT — 0.74% |
| |||||||
EVS Broadcast Equipment SA | 15,592 | 545,183 | ||||||
|
| |||||||
| 545,183 | ||||||||
CONSTRUCTION & ENGINEERING — 1.03% |
| |||||||
Cie. d’Entreprises CFE | 5,454 | 765,142 | ||||||
|
| |||||||
| 765,142 | ||||||||
DISTRIBUTORS — 1.10% |
| |||||||
D’ieteren SA/NV | 17,721 | 813,665 | ||||||
|
| |||||||
| 813,665 | ||||||||
DIVERSIFIED FINANCIAL SERVICES — 9.39% |
| |||||||
Ackermans & van Haaren NV | 10,644 | 1,786,836 | ||||||
Groupe Bruxelles Lambert SA | 30,879 | 3,139,245 | ||||||
KBC Ancora | 20,249 | 1,100,063 | ||||||
Sofina SA | 6,458 | 937,857 | ||||||
|
| |||||||
| 6,964,001 | ||||||||
DIVERSIFIED TELECOMMUNICATION SERVICES — 2.99% |
| |||||||
Proximus SADP | 63,018 | 2,218,817 | ||||||
|
| |||||||
| 2,218,817 | ||||||||
| Security | Shares | Value | ||||||
ELECTRIC UTILITIES — 1.44% |
| |||||||
Elia System Operator SA/NV | 17,909 | $ | 1,063,961 | |||||
|
| |||||||
| 1,063,961 | ||||||||
ELECTRONIC EQUIPMENT, INSTRUMENTS & COMPONENTS — 1.01% |
| |||||||
Barco NV | 7,692 | 748,428 | ||||||
|
| |||||||
| 748,428 | ||||||||
EQUITY REAL ESTATE INVESTMENT TRUSTS (REITS) — 6.59% |
| |||||||
Aedifica SA | 10,510 | 1,020,244 | ||||||
Befimmo SA | 13,972 | 876,745 | ||||||
Cofinimmo SA | 10,440 | 1,345,473 | ||||||
Intervest Offices & Warehouses NV | 19,896 | 525,599 | ||||||
Warehouses De Pauw CVA | 9,921 | 1,120,532 | ||||||
|
| |||||||
| 4,888,593 | ||||||||
FOOD & STAPLES RETAILING — 2.14% |
| |||||||
Colruyt SA | 28,643 | 1,589,454 | ||||||
|
| |||||||
| 1,589,454 | ||||||||
FOOD PRODUCTS — 0.48% |
| |||||||
Greenyard NV | 14,562 | 355,950 | ||||||
|
| |||||||
| 355,950 | ||||||||
HEALTH CARE EQUIPMENT & SUPPLIES — 0.95% |
| |||||||
Biocartis NVa,b,c | 22,863 | 277,255 | ||||||
Ion Beam Applicationsb | 15,206 | 424,119 | ||||||
|
| |||||||
| 701,374 | ||||||||
HEALTH CARE PROVIDERS & SERVICES — 0.86% |
| |||||||
Fagrona | 41,911 | 634,808 | ||||||
|
| |||||||
| 634,808 | ||||||||
HEALTH CARE TECHNOLOGY — 0.86% |
| |||||||
AGFA-Gevaert NVa | 144,538 | 638,562 | ||||||
|
| |||||||
| 638,562 | ||||||||
INSURANCE — 4.27% |
| |||||||
Ageas | 68,236 | 3,164,715 | ||||||
|
| |||||||
| 3,164,715 | ||||||||
IT SERVICES — 0.93% |
| |||||||
Econocom Group SA/NV | 93,608 | 686,885 | ||||||
|
| |||||||
| 686,885 | ||||||||
MEDIA — 3.26% |
| |||||||
Kinepolis Group NV | 12,625 | 730,905 | ||||||
Telenet Group Holding NVa | 24,878 | 1,682,069 | ||||||
|
| |||||||
| 2,412,974 | ||||||||
METALS & MINING — 2.13% |
| |||||||
Bekaert SA | 21,238 | 1,011,004 | ||||||
SCHEDULESOF INVESTMENTS | 19 |
Table of Contents
Schedule of Investments (Continued)
iSHARES® MSCI BELGIUM CAPPED ETF
August 31, 2017
| Security | Shares | Value | ||||||
Nyrstar NVa,b | 79,217 | $ | 569,230 | |||||
|
| |||||||
| 1,580,234 | ||||||||
OIL, GAS & CONSUMABLE FUELS — 1.20% |
| |||||||
Euronav NV | 76,797 | 587,358 | ||||||
Exmar NVb | 49,950 | 298,709 | ||||||
|
| |||||||
| 886,067 | ||||||||
PERSONAL PRODUCTS — 1.75% |
| |||||||
Ontex Group NV | 37,967 | 1,293,682 | ||||||
|
| |||||||
| 1,293,682 | ||||||||
PHARMACEUTICALS — 4.09% |
| |||||||
UCB SA | 44,071 | 3,033,204 | ||||||
|
| |||||||
| 3,033,204 | ||||||||
SEMICONDUCTORS & SEMICONDUCTOR EQUIPMENT — 1.44% |
| |||||||
Melexis NV | 11,690 | 1,070,859 | ||||||
|
| |||||||
| 1,070,859 | ||||||||
TEXTILES, APPAREL & LUXURY GOODS — 0.63% |
| |||||||
Sioen Industries NV | 8,145 | 268,090 | ||||||
Van de Velde NV | 3,872 | 196,290 | ||||||
|
| |||||||
| 464,380 | ||||||||
WIRELESS TELECOMMUNICATION SERVICES — 0.92% |
| |||||||
Orange Belgium SA | 28,557 | 685,649 | ||||||
|
| |||||||
| 685,649 | ||||||||
TOTAL COMMON STOCKS |
| |||||||
(Cost: $74,144,399) |
| 73,893,578 | ||||||
SHORT-TERM INVESTMENTS — 4.76% |
| |||||||
MONEY MARKET FUNDS — 4.76% |
| |||||||
BlackRock Cash Funds: Institutional, SL Agency Shares | ||||||||
1.32%d,e,f | 3,505,275 | 3,506,326 | ||||||
BlackRock Cash Funds: Treasury, SL Agency Shares | ||||||||
0.96%d,e | 25,070 | 25,070 | ||||||
|
| |||||||
| 3,531,396 | ||||||||
|
| |||||||
TOTAL SHORT-TERM INVESTMENTS |
| |||||||
(Cost: $3,531,069) |
| 3,531,396 | ||||||
|
| |||||||
| Value | ||||||
TOTAL INVESTMENTS | ||||||
(Cost: $77,675,468)g | $ | 77,424,974 | ||||
Other Assets, Less Liabilities — (4.45)% | (3,297,428 | ) | ||||
|
| |||||
NET ASSETS — 100.00% | $ | 74,127,546 | ||||
|
| |||||
| a | Non-income earning security. |
| b | All or a portion of this security represents a security on loan. See Note 1. |
| c | This security may be resold to qualified institutional buyers under Rule 144A of the Securities Act of 1933. |
| d | Affiliated issuer. See Schedule 1. |
| e | The rate quoted is the annualized seven-day yield of the fund at period end. |
| f | All or a portion of this security represents an investment of securities lending collateral. See Note 1. |
| g | The cost of investments (including short positions and derivatives, if any) for federal income tax purposes was $78,280,507. Net unrealized depreciation was $855,533, of which $6,042,724 represented gross unrealized appreciation on investments and $6,898,257 represented gross unrealized depreciation on investments. |
| 20 | 2017 iSHARES ANNUAL REPORTTO SHAREHOLDERS |
Table of Contents
Schedule of Investments (Continued)
iSHARES® MSCI BELGIUM CAPPED ETF
August 31, 2017
Schedule 1 — Affiliates (Note 2)
Investments in issuers considered to be affiliates of the Fund during the year ended August 31, 2017, for purposes of Section 2(a)(3) of the 1940 Act, and/or related parties of the Fund were as follows:
| Affiliated issuer | Shares held at 08/31/16 | Shares purchased | Shares sold | Shares held at 08/31/17 | Value at 08/31/17 | Net realized gain (loss)a | Change in unrealized appreciation (depreciation) | Income | ||||||||||||||||||||||||
BlackRock Cash Funds: Institutional, | 4,526,272 | — | (1,020,997 | )b | 3,505,275 | $ | 3,506,326 | $ | 1,193 | $ | 327 | $ | —c | |||||||||||||||||||
BlackRock Cash Funds: Treasury, | 5,116 | 19,954b | — | 25,070 | 25,070 | 1 | — | 292 | ||||||||||||||||||||||||
|
|
|
|
|
|
|
| |||||||||||||||||||||||||
| $ | 3,531,396 | $ | 1,194 | $ | 327 | $ | 292 | |||||||||||||||||||||||||
|
|
|
|
|
|
|
| |||||||||||||||||||||||||
| a | Includes realized capital gain distributions from an affiliated fund, if any. |
| b | Net of shares purchased and sold. |
| c | Does not include income earned on investment of securities lending cash collateral which is not direct income of the Fund and is reflected as a component of securities lending income in the statement of operations. |
Schedule 2 — Fair Value Measurements
Various inputs are used in determining the fair value of financial instruments. For description of the input levels and information about the Fund’s policy regarding valuation of financial instruments, see Note 1.
The following table summarizes the value of the Fund’s investments according to the fair value hierarchy as of August 31, 2017. The breakdown of the Fund’s investments into major categories is disclosed in the schedule of investments above.
| Level 1 | Level 2 | Level 3 | Total | |||||||||||||
Investments: |
| |||||||||||||||
Assets: |
| |||||||||||||||
Common stocks | $ | 73,893,578 | $ | — | $ | — | $ | 73,893,578 | ||||||||
Money market funds | 3,531,396 | — | — | 3,531,396 | ||||||||||||
|
|
|
|
|
|
|
| |||||||||
Total | $ | 77,424,974 | $ | — | $ | — | $ | 77,424,974 | ||||||||
|
|
|
|
|
|
|
| |||||||||
See notes to financial statements.
SCHEDULESOF INVESTMENTS | 21 |
Table of Contents
Schedule of Investments
August 31, 2017
| Security | Shares | Value | ||||||
COMMON STOCKS — 99.91% |
| |||||||
AEROSPACE & DEFENSE — 6.76% |
| |||||||
Airbus SE | 250,367 | $ | 21,017,856 | |||||
Dassault Aviation SA | 1,055 | 1,609,629 | ||||||
Safran SA | 134,765 | 13,072,516 | ||||||
Thales SA | 45,598 | 5,041,664 | ||||||
Zodiac Aerospace | 88,079 | 2,545,149 | ||||||
|
| |||||||
| 43,286,814 | ||||||||
AIR FREIGHT & LOGISTICS — 0.27% |
| |||||||
Bollore SA | 375,424 | 1,741,624 | ||||||
|
| |||||||
| 1,741,624 | ||||||||
AUTO COMPONENTS — 2.64% |
| |||||||
Cie. Generale des Etablissements Michelin Class B | 73,706 | 10,033,523 | ||||||
Valeo SA | 103,057 | 6,883,422 | ||||||
|
| |||||||
| 16,916,945 | ||||||||
AUTOMOBILES — 1.79% |
| |||||||
Peugeot SA | 222,010 | 4,681,110 | ||||||
Renault SA | 76,465 | 6,759,099 | ||||||
|
| |||||||
| 11,440,209 | ||||||||
BANKS — 9.98% |
| |||||||
BNP Paribas SA | 483,643 | 36,748,436 | ||||||
Credit Agricole SA | 490,571 | 8,637,779 | ||||||
Societe Generale SA | 330,658 | 18,488,392 | ||||||
|
| |||||||
| 63,874,607 | ||||||||
BEVERAGES — 2.12% |
| |||||||
Pernod Ricard SA | 91,496 | 12,487,892 | ||||||
Remy Cointreau SA | 9,620 | 1,097,172 | ||||||
|
| |||||||
| 13,585,064 | ||||||||
BUILDING PRODUCTS — 1.84% |
| |||||||
Cie. de Saint-Gobain | 215,363 | 11,797,272 | ||||||
|
| |||||||
| 11,797,272 | ||||||||
CAPITAL MARKETS — 0.48% |
| |||||||
Natixis SA | 405,587 | 3,041,731 | ||||||
|
| |||||||
| 3,041,731 | ||||||||
CHEMICALS — 3.69% |
| |||||||
Air Liquide SA | 167,722 | 20,448,941 | ||||||
Arkema SA | 29,245 | 3,173,748 | ||||||
|
| |||||||
| 23,622,689 | ||||||||
COMMERCIAL SERVICES & SUPPLIES — 0.63% |
| |||||||
Edenred | 95,617 | 2,582,787 | ||||||
Societe BIC SA | 12,228 | 1,467,597 | ||||||
|
| |||||||
| 4,050,384 | ||||||||
| Security | Shares | Value | ||||||
CONSTRUCTION & ENGINEERING — 4.27% |
| |||||||
Bouygues SA | 91,749 | $ | 4,155,415 | |||||
Eiffage SA | 31,651 | 3,266,272 | ||||||
Vinci SA | 216,866 | 19,943,296 | ||||||
|
| |||||||
| 27,364,983 | ||||||||
CONSTRUCTION MATERIALS — 0.21% |
| |||||||
Imerys SA | 15,372 | 1,350,579 | ||||||
|
| |||||||
| 1,350,579 | ||||||||
DIVERSIFIED FINANCIAL SERVICES — 0.54% |
| |||||||
Eurazeo SA | 18,847 | 1,557,075 | ||||||
Wendel SA | 12,146 | 1,922,736 | ||||||
|
| |||||||
| 3,479,811 | ||||||||
DIVERSIFIED TELECOMMUNICATION SERVICES — 2.74% |
| |||||||
Iliad SA | 11,383 | 2,936,037 | ||||||
Orange SA | 859,747 | 14,591,231 | ||||||
|
| |||||||
| 17,527,268 | ||||||||
ELECTRIC UTILITIES — 0.39% |
| |||||||
Electricite de France SA | 236,344 | 2,500,804 | ||||||
|
| |||||||
| 2,500,804 | ||||||||
ELECTRICAL EQUIPMENT — 4.31% |
| |||||||
Legrand SA | 115,172 | 8,062,317 | ||||||
Schneider Electric SE | 242,544 | 19,530,652 | ||||||
|
| |||||||
| 27,592,969 | ||||||||
ELECTRONIC EQUIPMENT, INSTRUMENTS & COMPONENTS — 0.39% |
| |||||||
Ingenico Group SA | 25,168 | 2,495,513 | ||||||
|
| |||||||
| 2,495,513 | ||||||||
EQUITY REAL ESTATE INVESTMENT TRUSTS (REITS) — 3.21% |
| |||||||
Fonciere des Regions | 14,368 | 1,419,011 | ||||||
Gecina SA | 20,249 | 3,151,290 | ||||||
ICADE | 14,409 | 1,278,989 | ||||||
Klepierre SA | 94,830 | 3,816,362 | ||||||
Unibail-Rodamco SE | 42,937 | 10,901,253 | ||||||
|
| |||||||
| 20,566,905 | ||||||||
FOOD & STAPLES RETAILING — 0.98% |
| |||||||
Carrefour SA | 244,387 | 4,921,944 | ||||||
Casino Guichard Perrachon SA | 23,981 | 1,361,828 | ||||||
|
| |||||||
| 6,283,772 | ||||||||
FOOD PRODUCTS — 3.13% |
| |||||||
Danone SA | 254,378 | 20,005,736 | ||||||
|
| |||||||
| 20,005,736 | ||||||||
| 22 | 2017 iSHARES ANNUAL REPORTTO SHAREHOLDERS |
Table of Contents
Schedule of Investments (Continued)
iSHARES® MSCI FRANCE ETF
August 31, 2017
| Security | Shares | Value | ||||||
HEALTH CARE EQUIPMENT & SUPPLIES — 1.76% |
| |||||||
Essilor International SA | 89,399 | $ | 11,271,675 | |||||
|
| |||||||
| 11,271,675 | ||||||||
HOTELS, RESTAURANTS & LEISURE — 1.30% |
| |||||||
Accor SA | 79,778 | 3,689,588 | ||||||
Sodexo SA | 39,728 | 4,630,212 | ||||||
|
| |||||||
| 8,319,800 | ||||||||
HOUSEHOLD DURABLES — 0.28% |
| |||||||
SEB SA | 9,721 | 1,763,643 | ||||||
|
| |||||||
| 1,763,643 | ||||||||
INSURANCE — 4.54% |
| |||||||
AXA SA | 836,074 | 24,228,943 | ||||||
CNP Assurances | 74,222 | 1,720,729 | ||||||
SCOR SE | 74,375 | 3,112,539 | ||||||
|
| |||||||
| 29,062,211 | ||||||||
IT SERVICES — 2.18% |
| |||||||
Atos SE | 40,668 | 6,266,182 | ||||||
Capgemini SE | 69,253 | 7,667,845 | ||||||
|
| |||||||
| 13,934,027 | ||||||||
LIFE SCIENCES TOOLS & SERVICES — 0.42% |
| |||||||
Eurofins Scientific SE | 4,726 | 2,697,557 | ||||||
|
| |||||||
| 2,697,557 | ||||||||
MACHINERY — 0.37% |
| |||||||
Alstom SA | 66,216 | 2,351,885 | ||||||
|
| |||||||
| 2,351,885 | ||||||||
MEDIA — 3.83% |
| |||||||
Eutelsat Communications SA | 75,179 | 2,182,219 | ||||||
JCDecaux SA | 31,925 | 1,043,969 | ||||||
Lagardere SCA | 50,663 | 1,625,695 | ||||||
Publicis Groupe SA | 87,609 | 5,905,775 | ||||||
SES SA | 157,211 | 3,589,570 | ||||||
Vivendi SA | 443,731 | 10,168,556 | ||||||
|
| |||||||
| 24,515,784 | ||||||||
METALS & MINING — 1.19% |
| |||||||
ArcelorMittala | 286,433 | 7,641,719 | ||||||
|
| |||||||
| 7,641,719 | ||||||||
MULTI-UTILITIES — 3.14% |
| |||||||
Engie SA | 734,596 | 12,244,519 | ||||||
Suez | 158,594 | 3,004,581 | ||||||
Veolia Environnement SA | 206,356 | 4,835,583 | ||||||
|
| |||||||
| 20,084,683 | ||||||||
OIL, GAS & CONSUMABLE FUELS — 8.20% |
| |||||||
Total SA | 1,016,135 | 52,485,139 | ||||||
|
| |||||||
| 52,485,139 | ||||||||
| Security | Shares | Value | ||||||
PERSONAL PRODUCTS — 3.58% |
| |||||||
L’Oreal SA | 108,553 | $ | 22,888,544 | |||||
|
| |||||||
| 22,888,544 | ||||||||
PHARMACEUTICALS — 7.75% |
| |||||||
Ipsen SA | 16,177 | 2,170,424 | ||||||
Sanofi | 488,831 | 47,458,418 | ||||||
|
| |||||||
| 49,628,842 | ||||||||
PROFESSIONAL SERVICES — 0.42% |
| |||||||
Bureau Veritas SA | 114,187 | 2,711,743 | ||||||
|
| |||||||
| 2,711,743 | ||||||||
SEMICONDUCTORS & SEMICONDUCTOR EQUIPMENT — 0.74% |
| |||||||
STMicroelectronics NV | 275,018 | 4,759,030 | ||||||
|
| |||||||
| 4,759,030 | ||||||||
SOFTWARE — 0.85% |
| |||||||
Dassault Systemes SE | 55,423 | 5,452,594 | ||||||
|
| |||||||
| 5,452,594 | ||||||||
TEXTILES, APPAREL & LUXURY GOODS — 7.96% |
| |||||||
Hermes International | 13,622 | 7,195,522 | ||||||
Kering | 32,648 | 12,238,430 | ||||||
LVMH Moet Hennessy Louis Vuitton SE | 120,276 | 31,494,885 | ||||||
|
| |||||||
| 50,928,837 | ||||||||
TRADING COMPANIES & DISTRIBUTORS — 0.30% |
| |||||||
Rexel SA | 130,419 | 1,945,941 | ||||||
|
| |||||||
| 1,945,941 | ||||||||
TRANSPORTATION INFRASTRUCTURE — 0.73% |
| |||||||
Aeroports de Paris | 12,788 | 2,278,267 | ||||||
Groupe Eurotunnel SE Registered | 201,366 | 2,397,630 | ||||||
|
| |||||||
| 4,675,897 | ||||||||
|
| |||||||
TOTAL COMMON STOCKS |
| |||||||
(Cost: $635,137,666) |
| 639,645,230 | ||||||
SHORT-TERM INVESTMENTS — 0.04% |
| |||||||
MONEY MARKET FUNDS — 0.04% |
| |||||||
BlackRock Cash Funds: Treasury, |
| |||||||
0.96%b,c | 218,501 | 218,501 | ||||||
|
| |||||||
| 218,501 | ||||||||
|
| |||||||
TOTAL SHORT-TERM INVESTMENTS |
| |||||||
(Cost: $218,501) |
| 218,501 | ||||||
|
| |||||||
SCHEDULESOF INVESTMENTS | 23 |
Table of Contents
Schedule of Investments (Continued)
iSHARES® MSCI FRANCE ETF
August 31, 2017
| Value | ||||||
TOTAL INVESTMENTS | ||||||
(Cost: $635,356,167)d | $ | 639,863,731 | ||||
Other Assets, Less Liabilities — 0.05% | 336,916 | |||||
|
| |||||
NET ASSETS — 100.00% | $ | 640,200,647 | ||||
|
| |||||
| a | Non-income earning security. |
| b | Affiliated issuer. See Schedule 1. |
| c | The rate quoted is the annualized seven-day yield of the fund at period end. |
| d | The cost of investments (including short positions and derivatives, if any) for federal income tax purposes was $646,041,334. Net unrealized depreciation was $6,177,603, of which $35,643,921 represented gross unrealized appreciation on investments and $41,821,524 represented gross unrealized depreciation on investments. |
Schedule 1 — Affiliates (Note 2)
Investments in issuers considered to be affiliates of the Fund during the year ended August 31, 2017, for purposes of Section 2(a)(3) of the 1940 Act, and/or related parties of the Fund were as follows:
| Affiliated issuer | Shares held at 08/31/16 | Shares purchased | Shares sold | Shares held at 08/31/17 | Value at 08/31/17 | Net realized gain (loss)a | Change in unrealized appreciation (depreciation) | Income | ||||||||||||||||||||||||
BlackRock Cash Funds: Institutional, | 144,475 | — | (144,475 | )b | — | $ | — | $ | (123 | ) | $ | — | $ | — | c | |||||||||||||||||
BlackRock Cash Funds: Treasury, | 19,022 | 199,479 | b | — | 218,501 | 218,501 | 1 | — | 1,705 | |||||||||||||||||||||||
|
|
|
|
|
|
|
| |||||||||||||||||||||||||
| $ | 218,501 | $ | (122 | ) | $ | — | $ | 1,705 | ||||||||||||||||||||||||
|
|
|
|
|
|
|
| |||||||||||||||||||||||||
| a | Includes realized capital gain distributions from an affiliated fund, if any. |
| b | Net of shares purchased and sold. |
| c | Does not include income earned on investment of securities lending cash collateral which is not direct income of the Fund and is reflected as a component of securities lending income in the statement of operations. |
Schedule 2 — Fair Value Measurements
Various inputs are used in determining the fair value of financial instruments. For description of the input levels and information about the Fund’s policy regarding valuation of financial instruments, see Note 1.
The following table summarizes the value of the Fund’s investments according to the fair value hierarchy as of August 31, 2017. The breakdown of the Fund’s investments into major categories is disclosed in the schedule of investments above.
| Level 1 | Level 2 | Level 3 | Total | |||||||||||||
Investments: |
| |||||||||||||||
Assets: |
| |||||||||||||||
Common stocks | $ | 639,645,230 | $ | — | $ | — | $ | 639,645,230 | ||||||||
Money market funds | 218,501 | — | — | 218,501 | ||||||||||||
|
|
|
|
|
|
|
| |||||||||
Total | $ | 639,863,731 | $ | — | $ | — | $ | 639,863,731 | ||||||||
|
|
|
|
|
|
|
| |||||||||
See notes to financial statements.
| 24 | 2017 iSHARES ANNUAL REPORTTO SHAREHOLDERS |
Table of Contents
Schedule of Investments
August 31, 2017
| Security | Shares | Value | ||||||
COMMON STOCKS — 99.66% |
| |||||||
AIR FREIGHT & LOGISTICS — 0.42% |
| |||||||
PostNL NV | 201,767 | $ | 802,161 | |||||
|
| |||||||
| 802,161 | ||||||||
BANKS — 13.76% |
| |||||||
ABN AMRO Group NVa | 139,209 | 3,895,999 | ||||||
ING Groep NV | 1,276,031 | 22,604,382 | ||||||
|
| |||||||
| 26,500,381 | ||||||||
BEVERAGES — 6.67% |
| |||||||
Coca-Cola European Partners PLC | 80,976 | 3,462,916 | ||||||
Heineken Holding NV | 20,214 | 1,993,249 | ||||||
Heineken NV | 64,788 | 6,788,338 | ||||||
Refresco Group NVa | 30,637 | 594,991 | �� | |||||
|
| |||||||
| 12,839,494 | ||||||||
CAPITAL MARKETS — 0.40% |
| |||||||
BinckBank NV | 61,029 | 308,079 | ||||||
Flow Tradersa | 17,159 | 465,025 | ||||||
|
| |||||||
| 773,104 | ||||||||
CHEMICALS — 7.62% |
| |||||||
Akzo Nobel NV | 88,614 | 8,091,121 | ||||||
Corbion NV | 29,710 | 894,358 | ||||||
Koninklijke DSM NV | 65,635 | 4,973,070 | ||||||
OCI NVb,c | 37,464 | 709,760 | ||||||
|
| |||||||
| 14,668,309 | ||||||||
CONSTRUCTION & ENGINEERING — 1.41% |
| |||||||
Arcadis NV | 40,527 | 879,331 | ||||||
Boskalis Westminster | 38,809 | 1,266,543 | ||||||
Koninklijke BAM Groep NV | 93,580 | 560,514 | ||||||
|
| |||||||
| 2,706,388 | ||||||||
DIVERSIFIED FINANCIAL SERVICES — 0.00% |
| |||||||
SNS REAAL NVb,c,d | 68,952 | 1 | ||||||
|
| |||||||
| 1 | ||||||||
DIVERSIFIED TELECOMMUNICATION SERVICES — 2.29% |
| |||||||
Koninklijke KPN NV | 1,249,575 | 4,413,774 | ||||||
|
| |||||||
| 4,413,774 | ||||||||
ELECTRICAL EQUIPMENT — 0.93% |
| |||||||
Kendrion NV | 12,570 | 533,742 | ||||||
Philips Lighting NVa | 1,703 | 62,765 | ||||||
SIF Holding NVc | 3,208 | 60,261 | ||||||
TKH Group NV | 19,127 | 1,126,089 | ||||||
|
| |||||||
| 1,782,857 | ||||||||
ENERGY EQUIPMENT & SERVICES — 0.89% |
| |||||||
Fugro NV CVAb,c | 38,083 | 482,878 | ||||||
| Security | Shares | Value | ||||||
SBM Offshore NV | 77,091 | $ | 1,232,280 | |||||
|
| |||||||
| 1,715,158 | ||||||||
EQUITY REAL ESTATE INVESTMENT TRUSTS (REITS) — 1.55% |
| |||||||
Eurocommercial Properties NV | 22,276 | 953,421 | ||||||
NSI NV | 13,286 | 511,781 | ||||||
VastNed Retail NV | 12,349 | 570,605 | ||||||
Wereldhave NV | 19,566 | 956,534 | ||||||
|
| |||||||
| 2,992,341 | ||||||||
FOOD & STAPLES RETAILING — 3.55% |
| |||||||
Koninklijke Ahold Delhaize NV | 380,658 | 6,833,718 | ||||||
|
| |||||||
| 6,833,718 | ||||||||
FOOD PRODUCTS — 0.43% |
| |||||||
ForFarmers NV | 6,267 | 77,898 | ||||||
Wessanen | 42,931 | 748,001 | ||||||
|
| |||||||
| 825,899 | ||||||||
HEALTH CARE EQUIPMENT & SUPPLIES — 4.39% |
| |||||||
Koninklijke Philips NV | 223,780 | 8,455,130 | ||||||
|
| |||||||
| 8,455,130 | ||||||||
HOTELS, RESTAURANTS & LEISURE — 0.05% |
| |||||||
Basic-Fit NVa,b | 4,614 | 86,755 | ||||||
|
| |||||||
| 86,755 | ||||||||
HOUSEHOLD DURABLES — 0.33% |
| |||||||
TomTom NVb,c | 60,718 | 632,652 | ||||||
|
| |||||||
| 632,652 | ||||||||
INSURANCE — 4.55% |
| |||||||
Aegon NV | 654,355 | 3,731,107 | ||||||
ASR Nederland NV | 16,929 | 655,231 | ||||||
NN Group NV | 110,607 | 4,383,573 | ||||||
|
| |||||||
| 8,769,911 | ||||||||
INTERNET SOFTWARE & SERVICES — 0.04% |
| |||||||
Takeaway.com Holding BVa,b | 1,605 | 74,419 | ||||||
|
| |||||||
| 74,419 | ||||||||
IT SERVICES — 0.82% |
| |||||||
InterXion Holding NVb | 30,495 | 1,581,166 | ||||||
|
| |||||||
| 1,581,166 | ||||||||
LEISURE PRODUCTS — 0.28% |
| |||||||
Accell Group | 17,351 | 532,012 | ||||||
|
| |||||||
| 532,012 | ||||||||
MACHINERY — 0.96% |
| |||||||
Aalberts Industries NV | 41,407 | 1,839,925 | ||||||
|
| |||||||
| 1,839,925 | ||||||||
SCHEDULESOF INVESTMENTS | 25 |
Table of Contents
Schedule of Investments (Continued)
iSHARES® MSCI NETHERLANDS ETF
August 31, 2017
| Security | Shares | Value | ||||||
MEDIA — 2.20% |
| |||||||
Altice NV Class Ab | 139,536 | $ | 3,213,372 | |||||
Altice NV Class Bb | 44,028 | 1,016,799 | ||||||
|
| |||||||
| 4,230,171 | ||||||||
METALS & MINING — 0.07% |
| |||||||
AMG Advanced Metallurgical Group NV | 3,723 | 133,740 | ||||||
|
| |||||||
| 133,740 | ||||||||
OIL, GAS & CONSUMABLE FUELS — 0.87% |
| |||||||
Koninklijke Vopak NV | 30,418 | 1,285,809 | ||||||
VTTI Energy Partners LP | 20,406 | 395,876 | ||||||
|
| |||||||
| 1,681,685 | ||||||||
PERSONAL PRODUCTS — 16.76% |
| |||||||
Unilever NV CVA | 542,802 | 32,273,304 | ||||||
|
| |||||||
| 32,273,304 | ||||||||
PROFESSIONAL SERVICES — 7.93% |
| |||||||
Brunel International NVc | 20,333 | 270,748 | ||||||
Intertrust NVa | 24,652 | 395,668 | ||||||
Randstad Holding NV | 45,485 | 2,655,456 | ||||||
RELX NV | 342,034 | 7,171,168 | ||||||
Wolters Kluwer NV | 109,322 | 4,769,354 | ||||||
|
| |||||||
| 15,262,394 | ||||||||
SEMICONDUCTORS & SEMICONDUCTOR EQUIPMENT — 17.44% |
| |||||||
ASM International NV | 21,250 | 1,247,542 | ||||||
ASML Holding NV | 121,823 | 18,901,007 | ||||||
BE Semiconductor Industries NV | 17,773 | 1,150,545 | ||||||
NXP Semiconductors NVb | 108,771 | 12,286,772 | ||||||
|
| |||||||
| 33,585,866 | ||||||||
SOFTWARE — 0.90% |
| |||||||
Gemalto NV | 32,270 | 1,741,615 | ||||||
|
| |||||||
| 1,741,615 | ||||||||
TRADING COMPANIES & DISTRIBUTORS — 2.15% |
| |||||||
AerCap Holdings NVb | 55,961 | 2,814,838 | ||||||
IMCD Group NV | 22,640 | 1,329,819 | ||||||
|
| |||||||
| 4,144,657 | ||||||||
|
| |||||||
TOTAL COMMON STOCKS |
| |||||||
(Cost: $167,448,235) |
| 191,878,987 | ||||||
SHORT-TERM INVESTMENTS — 0.65% |
| |||||||
MONEY MARKET FUNDS — 0.65% |
| |||||||
BlackRock Cash Funds: Institutional, |
| |||||||
1.32%e,f,g | 1,224,613 | 1,224,980 | ||||||
| Security | Shares | Value | ||||||
BlackRock Cash Funds: Treasury, |
| |||||||
0.96%e,f | 32,493 | $ | 32,493 | |||||
|
| |||||||
| 1,257,473 | ||||||||
|
| |||||||
TOTAL SHORT-TERM INVESTMENTS |
| |||||||
(Cost: $1,257,248) |
| 1,257,473 | ||||||
|
| |||||||
TOTAL INVESTMENTS |
| |||||||
(Cost: $168,705,483)h | 193,136,460 | |||||||
Other Assets, Less Liabilities — (0.31)% |
| (596,784 | ) | |||||
|
| |||||||
NET ASSETS — 100.00% |
| $ | 192,539,676 | |||||
|
| |||||||
| a | This security may be resold to qualified institutional buyers under Rule 144A of the Securities Act of 1933. |
| b | Non-income earning security. |
| c | All or a portion of this security represents a security on loan. See Note 1. |
| d | Security is valued using significant unobservable inputs and is classified as Level 3 in the fair value hierarchy. |
| e | Affiliated issuer. See Schedule 1. |
| f | The rate quoted is the annualized seven-day yield of the fund at period end. |
| g | All or a portion of this security represents an investment of securities lending collateral. See Note 1. |
| h | The cost of investments (including short positions and derivatives, if any) for federal income tax purposes was $171,742,276. Net unrealized appreciation was $21,394,184, of which $32,093,559 represented gross unrealized appreciation on investments and $10,699,375 represented gross unrealized depreciation on investments. |
| 26 | 2017 iSHARES ANNUAL REPORTTO SHAREHOLDERS |
Table of Contents
Schedule of Investments (Continued)
iSHARES® MSCI NETHERLANDS ETF
August 31, 2017
Schedule 1 — Affiliates (Note 2)
Investments in issuers considered to be affiliates of the Fund during the year ended August 31, 2017, for purposes of Section 2(a)(3) of the 1940 Act, and/or related parties of the Fund were as follows:
| Affiliated issuer | Shares held at 08/31/16 | Shares purchased | Shares sold | Shares held at 08/31/17 | Value at 08/31/17 | Net realized gain (loss)a | Change in unrealized appreciation (depreciation) | Income | ||||||||||||||||||||||||
BlackRock Cash Funds: Institutional, | 863,112 | 361,501 | b | — | 1,224,613 | $ | 1,224,980 | $ | 1,251 | $ | 225 | $ | —c | |||||||||||||||||||
BlackRock Cash Funds: Treasury, | 13,498 | 18,995 | b | — | 32,493 | 32,493 | 3 | — | 824 | |||||||||||||||||||||||
|
|
|
|
|
|
|
| |||||||||||||||||||||||||
| $ | 1,257,473 | $ | 1,254 | $ | 225 | $ | 824 | |||||||||||||||||||||||||
|
|
|
|
|
|
|
| |||||||||||||||||||||||||
| a | Includes realized capital gain distributions from an affiliated fund, if any. |
| b | Net of shares purchased and sold. |
| c | Does not include income earned on investment of securities lending cash collateral which is not direct income of the Fund and is reflected as a component of securities lending income in the statement of operations. |
Schedule 2 — Fair Value Measurements
Various inputs are used in determining the fair value of financial instruments. For description of the input levels and information about the Fund’s policy regarding valuation of financial instruments, see Note 1.
The following table summarizes the value of the Fund’s investments according to the fair value hierarchy as of August 31, 2017. The breakdown of the Fund’s investments into major categories is disclosed in the schedule of investments above.
| Level 1 | Level 2 | Level 3 | Total | |||||||||||||
Investments: | ||||||||||||||||
Assets: | ||||||||||||||||
Common stocks | $ | 191,878,986 | $ | — | $ | 1 | $ | 191,878,987 | ||||||||
Money market funds | 1,257,473 | — | — | 1,257,473 | ||||||||||||
|
|
|
|
|
|
|
| |||||||||
Total | $ | 193,136,459 | $ | — | $ | 1 | $ | 193,136,460 | ||||||||
|
|
|
|
|
|
|
| |||||||||
See notes to financial statements.
SCHEDULESOF INVESTMENTS | 27 |
Table of Contents
Schedule of Investments
iSHARES® MSCI SWEDEN CAPPED ETF
August 31, 2017
| Security | Shares | Value | ||||||
COMMON STOCKS — 99.11% |
| |||||||
BANKS — 25.56% |
| |||||||
Nordea Bank AB | 3,352,977 | $ | 45,044,298 | |||||
Skandinaviska Enskilda Banken AB Class A | 1,592,065 | 20,687,732 | ||||||
Svenska Handelsbanken AB Class A | 1,678,225 | 25,055,217 | ||||||
Swedbank AB Class A | 995,523 | 26,873,059 | ||||||
|
| |||||||
| 117,660,306 | ||||||||
BUILDING PRODUCTS — 4.53% |
| |||||||
Assa Abloy AB Class B | 966,577 | 20,868,496 | ||||||
|
| |||||||
| 20,868,496 | ||||||||
COMMERCIAL SERVICES & SUPPLIES — 1.44% |
| |||||||
Securitas AB Class B | 404,073 | 6,631,848 | ||||||
|
| |||||||
| 6,631,848 | ||||||||
COMMUNICATIONS EQUIPMENT — 3.91% |
| |||||||
Telefonaktiebolaget LM Ericsson Class B | 3,073,272 | 17,986,173 | ||||||
|
| |||||||
| 17,986,173 | ||||||||
CONSTRUCTION & ENGINEERING — 2.03% |
| |||||||
Skanska AB Class B | 413,470 | 9,326,957 | ||||||
|
| |||||||
| 9,326,957 | ||||||||
DIVERSIFIED FINANCIAL SERVICES — 8.21% |
| |||||||
Industrivarden AB Class C | 224,511 | 5,309,930 | ||||||
Investor AB Class B | 437,700 | 20,440,137 | ||||||
Kinnevik AB Class B | 291,737 | 8,766,023 | ||||||
L E Lundbergforetagen AB Class B | 42,447 | 3,283,270 | ||||||
|
| |||||||
| 37,799,360 | ||||||||
DIVERSIFIED TELECOMMUNICATION SERVICES — 3.20% |
| |||||||
Telia Co. AB | 3,098,195 | 14,756,369 | ||||||
|
| |||||||
| 14,756,369 | ||||||||
ELECTRONIC EQUIPMENT, INSTRUMENTS & COMPONENTS — 3.27% |
| |||||||
Hexagon AB Class B | 307,327 | 15,058,631 | ||||||
|
| |||||||
| 15,058,631 | ||||||||
FOOD & STAPLES RETAILING — 0.98% |
| |||||||
ICA Gruppen ABa | 112,877 | 4,493,887 | ||||||
|
| |||||||
| 4,493,887 | ||||||||
HEALTH CARE EQUIPMENT & SUPPLIES — 1.08% |
| |||||||
Getinge AB Class B | 267,645 | 4,964,517 | ||||||
|
| |||||||
| 4,964,517 | ||||||||
| Security | Shares | Value | ||||||
HOUSEHOLD DURABLES — 3.55% |
| |||||||
Electrolux AB Class B | 294,435 | $ | 10,689,774 | |||||
Husqvarna AB Class B | 559,150 | 5,632,009 | ||||||
|
| |||||||
| 16,321,783 | ||||||||
HOUSEHOLD PRODUCTS — 3.62% |
| |||||||
Essity AB Class Bb | 601,100 | 16,664,173 | ||||||
|
| |||||||
| 16,664,173 | ||||||||
MACHINERY — 24.14% |
| |||||||
Alfa Laval AB | 367,459 | 8,312,142 | ||||||
Atlas Copco AB Class A | 738,819 | 28,912,670 | ||||||
Atlas Copco AB Class B | 425,950 | 15,180,860 | ||||||
Sandvik AB | 1,226,417 | 20,236,455 | ||||||
SKF AB Class B | 466,593 | 9,311,513 | ||||||
Volvo AB Class B | 1,710,454 | 29,169,084 | ||||||
|
| |||||||
| 111,122,724 | ||||||||
METALS & MINING — 2.52% |
| |||||||
Boliden AB | 331,714 | 11,588,845 | ||||||
|
| |||||||
| 11,588,845 | ||||||||
OIL, GAS & CONSUMABLE FUELS — 1.16% |
| |||||||
Lundin Petroleum ABb | 249,346 | 5,342,670 | ||||||
|
| |||||||
| 5,342,670 | ||||||||
SPECIALTY RETAIL — 5.73% |
| |||||||
Hennes & Mauritz AB Class B | 1,045,037 | 26,397,285 | ||||||
|
| |||||||
| 26,397,285 | ||||||||
TOBACCO — 1.77% |
| |||||||
Swedish Match AB | 228,614 | 8,139,185 | ||||||
|
| |||||||
| 8,139,185 | ||||||||
WIRELESS TELECOMMUNICATION SERVICES — 2.41% |
| |||||||
Millicom International Cellular SA SDR | 88,476 | 5,511,578 | ||||||
Tele2 AB Class B | 481,449 | 5,596,591 | ||||||
|
| |||||||
| 11,108,169 | ||||||||
|
| |||||||
TOTAL COMMON STOCKS | ||||||||
(Cost: $465,732,396) | 456,231,378 | |||||||
RIGHTS — 0.02% |
| |||||||
HEALTH CARE EQUIPMENT & SUPPLIES — 0.02% |
| |||||||
Getinge AB (Expires 09/14/17)b | 274,747 | 101,511 | ||||||
|
| |||||||
| 101,511 | ||||||||
|
| |||||||
TOTAL RIGHTS |
| |||||||
(Cost: $0) |
| 101,511 | ||||||
| 28 | 2017 iSHARES ANNUAL REPORTTO SHAREHOLDERS |
Table of Contents
Schedule of Investments (Continued)
iSHARES® MSCI SWEDEN CAPPED ETF
August 31, 2017
| Security | Shares | Value | ||||||
SHORT-TERM INVESTMENTS — 0.81% |
| |||||||
MONEY MARKET FUNDS — 0.81% |
| |||||||
BlackRock Cash Funds: Institutional, |
| |||||||
1.32%c,d,e | 3,689,579 | $ | 3,690,686 | |||||
BlackRock Cash Funds: Treasury, |
| |||||||
0.96%c,d | 5,596 | 5,596 | ||||||
|
| |||||||
| 3,696,282 | ||||||||
|
| |||||||
TOTAL SHORT-TERM INVESTMENTS |
| |||||||
(Cost: $3,696,548) |
| 3,696,282 | ||||||
|
| |||||||
| Value | ||||||||
TOTAL INVESTMENTS |
| |||||||
(Cost: $469,428,944)f | $ | 460,029,171 | ||||||
Other Assets, Less Liabilities — 0.06% |
| 286,168 | ||||||
|
| |||||||
NET ASSETS — 100.00% |
| $ | 460,315,339 | |||||
|
| |||||||
SDR — Swedish Depositary Receipts
| a | All or a portion of this security represents a security on loan. See Note 1. |
| b | Non-income earning security. |
| c | Affiliated issuer. See Schedule 1. |
| d | The rate quoted is the annualized seven-day yield of the fund at period end. |
| e | All or a portion of this security represents an investment of securities lending collateral. See Note 1. |
| f | The cost of investments (including short positions and derivatives, if any) for federal income tax purposes was $478,903,931. Net unrealized depreciation was $18,874,760, of which $32,157,507 represented gross unrealized appreciation on investments and $51,032,267 represented gross unrealized depreciation on investments. |
Schedule 1 — Affiliates (Note 2)
Investments in issuers considered to be affiliates of the Fund during the year ended August 31, 2017, for purposes of Section 2(a)(3) of the 1940 Act, and/or related parties of the Fund were as follows:
| Affiliated issuer | Shares held at 08/31/16 | Shares purchased | Shares sold | Shares held at 08/31/17 | Value at 08/31/17 | Net realized gain (loss)a | Change in unrealized appreciation (depreciation) | Income | ||||||||||||||||||||||||
BlackRock Cash Funds: Institutional, | — | 3,689,579 | b | — | 3,689,579 | $ | 3,690,686 | $ | 85 | $ | (266 | ) | $ | — | c | |||||||||||||||||
BlackRock Cash Funds: Treasury, | 3,595 | 2,001 | b | — | 5,596 | 5,596 | 4 | — | 1,395 | |||||||||||||||||||||||
|
|
|
|
|
|
|
| |||||||||||||||||||||||||
| $ | 3,696,282 | $ | 89 | $ | (266 | ) | $ | 1,395 | ||||||||||||||||||||||||
|
|
|
|
|
|
|
| |||||||||||||||||||||||||
| a | Includes realized capital gain distributions from an affiliated fund, if any. |
| b | Net of shares purchased and sold. |
| c | Does not include income earned on investment of securities lending cash collateral which is not direct income of the Fund and is reflected as a component of securities lending income in the statement of operations. |
SCHEDULESOF INVESTMENTS | 29 |
Table of Contents
Schedule of Investments (Continued)
iSHARES® MSCI SWEDEN CAPPED ETF
August 31, 2017
Schedule 2 — Fair Value Measurements
Various inputs are used in determining the fair value of financial instruments. For description of the input levels and information about the Fund’s policy regarding valuation of financial instruments, see Note 1.
The following table summarizes the value of the Fund’s investments according to the fair value hierarchy as of August 31, 2017. The breakdown of the Fund’s investments into major categories is disclosed in the schedule of investments above.
| Level 1 | Level 2 | Level 3 | Total | |||||||||||||
Investments: | ||||||||||||||||
Assets: | ||||||||||||||||
Common stocks | $ | 456,231,378 | $ | — | $ | — | $ | 456,231,378 | ||||||||
Rights | 101,511 | — | — | 101,511 | ||||||||||||
Money market funds | 3,696,282 | — | — | 3,696,282 | ||||||||||||
|
|
|
|
|
|
|
| |||||||||
Total | $ | 460,029,171 | $ | — | $ | — | $ | 460,029,171 | ||||||||
|
|
|
|
|
|
|
| |||||||||
See notes to financial statements.
| 30 | 2017 iSHARES ANNUAL REPORTTO SHAREHOLDERS |
Table of Contents
Statements of Assets and Liabilities
iSHARES®, INC.
August 31, 2017
iShares MSCI Austria Capped ETF | iShares MSCI Belgium Capped ETF | iShares MSCI France ETF | ||||||||||
ASSETS | ||||||||||||
Investments in securities, at cost: | ||||||||||||
Unaffiliated | $ | 201,487,117 | $ | 74,144,399 | $ | 635,137,666 | ||||||
Affiliated (Note 2) | 6,748,307 | 3,531,069 | 218,501 | |||||||||
|
|
|
|
|
| |||||||
Total cost of investments in securities | $ | 208,235,424 | $ | 77,675,468 | $ | 635,356,167 | ||||||
|
|
|
|
|
| |||||||
Investments in securities, at fair value (including securities on loana) (Note 1): | ||||||||||||
Unaffiliated | $ | 232,527,024 | $ | 73,893,578 | $ | 639,645,230 | ||||||
Affiliated (Note 2) | 6,748,829 | 3,531,396 | 218,501 | |||||||||
Foreign currency, at valueb | 49,448 | 102,161 | 478,521 | |||||||||
Receivables: | ||||||||||||
Investment securities sold | 4,176,123 | 748,809 | 1,186,790 | |||||||||
Dividends and interest | 8,167 | 27,914 | 14,775 | |||||||||
Tax reclaims | 645,392 | 132,723 | — | |||||||||
|
|
|
|
|
| |||||||
Total Assets | 244,154,983 | 78,436,581 | 641,543,817 | |||||||||
|
|
|
|
|
| |||||||
LIABILITIES | ||||||||||||
Payables: | ||||||||||||
Investment securities purchased | 4,127,068 | 773,761 | 1,094,264 | |||||||||
Collateral for securities on loan (Note 1) | 6,613,414 | 3,504,806 | — | |||||||||
Investment advisory fees (Note 2) | 92,503 | 30,468 | 248,906 | |||||||||
|
|
|
|
|
| |||||||
Total Liabilities | 10,832,985 | 4,309,035 | 1,343,170 | |||||||||
|
|
|
|
|
| |||||||
NET ASSETS | $ | 233,321,998 | $ | 74,127,546 | $ | 640,200,647 | ||||||
|
|
|
|
|
| |||||||
Net assets consist of: | ||||||||||||
Paid-in capital | $ | 277,854,695 | $ | 118,877,221 | $ | 686,176,655 | ||||||
Undistributed net investment income | 304,157 | 20,272 | 560,868 | |||||||||
Accumulated net realized loss | (75,914,540 | ) | (44,530,472 | ) | (51,058,704 | ) | ||||||
Net unrealized appreciation (depreciation) | 31,077,686 | (239,475 | ) | 4,521,828 | ||||||||
|
|
|
|
|
| |||||||
NET ASSETS | $ | 233,321,998 | $ | 74,127,546 | $ | 640,200,647 | ||||||
|
|
|
|
|
| |||||||
Shares outstandingc | 10,200,000 | 3,600,000 | 21,600,000 | |||||||||
|
|
|
|
|
| |||||||
Net asset value per share | $ | 22.87 | $ | 20.59 | $ | 29.64 | ||||||
|
|
|
|
|
| |||||||
| a | Securities on loan with values of $6,354,994, $3,352,243 and $ —, respectively. See Note 1. |
| b | Cost of foreign currency: $49,638, $100,618 and $464,198, respectively. |
| c | $0.001 par value, number of shares authorized: 100 million, 136.2 million and 340.2 million, respectively. |
See notes to financial statements.
FINANCIAL STATEMENTS | 31 |
Table of Contents
Statements of Assets and Liabilities (Continued)
iSHARES®, INC.
August 31, 2017
iShares MSCI Netherlands ETF | iShares MSCI Sweden Capped ETF | |||||||
ASSETS | ||||||||
Investments in securities, at cost: | ||||||||
Unaffiliated | $ | 167,448,235 | $ | 465,732,396 | ||||
Affiliated (Note 2) | 1,257,248 | 3,696,548 | ||||||
|
|
|
| |||||
Total cost of investments in securities | $ | 168,705,483 | $ | 469,428,944 | ||||
|
|
|
| |||||
Investments in securities, at fair value (including securities on loana) (Note 1): | ||||||||
Unaffiliated | $ | 191,878,987 | $ | 456,332,889 | ||||
Affiliated (Note 2) | 1,257,473 | 3,696,282 | ||||||
Foreign currency, at valueb | 228,838 | 989,134 | ||||||
Receivables: | ||||||||
Investment securities sold | 9,471,216 | 3,942,408 | ||||||
Dividends and interest | 481,531 | 1,728 | ||||||
Tax reclaims | — | 1,685,045 | ||||||
Foreign withholding tax claims (Note 7) | — | 11,396,643 | ||||||
|
|
|
| |||||
Total Assets | 203,318,045 | 478,044,129 | ||||||
|
|
|
| |||||
LIABILITIES | ||||||||
Payables: | ||||||||
Investment securities purchased | 9,327,678 | 3,899,861 | ||||||
Collateral for securities on loan (Note 1) | 1,223,503 | 3,691,027 | ||||||
Securities related to in-kind transactions (Note 4) | 145,987 | — | ||||||
IRS compliance fee for foreign withholding tax claims (Note 7) | — | 8,773,929 | ||||||
Professional fees (Note 7) | — | 1,179,664 | ||||||
Investment advisory fees (Note 2) | 81,201 | 184,309 | ||||||
|
|
|
| |||||
Total Liabilities | 10,778,369 | 17,728,790 | ||||||
|
|
|
| |||||
NET ASSETS | $ | 192,539,676 | $ | 460,315,339 | ||||
|
|
|
| |||||
Net assets consist of: | ||||||||
Paid-in capital | $ | 209,046,329 | $ | 511,485,787 | ||||
Undistributed (distributions in excess of) net investment income | 890,011 | (31,879 | ) | |||||
Accumulated net realized loss | (41,831,343 | ) | (42,562,115 | ) | ||||
Net unrealized appreciation (depreciation) | 24,434,679 | (8,576,454 | ) | |||||
|
|
|
| |||||
NET ASSETS | $ | 192,539,676 | $ | 460,315,339 | ||||
|
|
|
| |||||
Shares outstandingc | 6,300,000 | 13,275,000 | ||||||
|
|
|
| |||||
Net asset value per share | $ | 30.56 | $ | 34.68 | ||||
|
|
|
| |||||
| a | Securities on loan with values of $1,186,570 and $3,527,046, respectively. See Note 1. |
| b | Cost of foreign currency: $227,139 and $977,049, respectively. |
| c | $0.001 par value, number of shares authorized: 255 million and 63.6 million, respectively. |
See notes to financial statements.
| 32 | 2017 iSHARES ANNUAL REPORTTO SHAREHOLDERS |
Table of Contents
Statements of Operations
iSHARES®, INC.
Year ended August 31, 2017
| iShares MSCI Austria Capped ETF | iShares MSCI Belgium Capped ETF | iShares ETF | ||||||||||
NET INVESTMENT INCOME | ||||||||||||
Dividends — unaffiliateda | $ | 3,872,802 | $ | 2,464,136 | $ | 11,741,618 | ||||||
Dividends — affiliated (Note 2) | 648 | 292 | 1,705 | |||||||||
Securities lending income — affiliated — net (Note 2) | 80,110 | 78,025 | 158,583 | |||||||||
|
|
|
|
|
| |||||||
Total investment income | 3,953,560 | 2,542,453 | 11,901,906 | |||||||||
|
|
|
|
|
| |||||||
EXPENSES | ||||||||||||
Investment advisory fees (Note 2) | 591,323 | 442,656 | 1,888,632 | |||||||||
Proxy fees | 2,971 | 1,937 | 8,278 | |||||||||
|
|
|
|
|
| |||||||
Total expenses | 594,294 | 444,593 | 1,896,910 | |||||||||
|
|
|
|
|
| |||||||
Net investment income | 3,359,266 | 2,097,860 | 10,004,996 | |||||||||
|
|
|
|
|
| |||||||
NET REALIZED AND UNREALIZED GAIN (LOSS) | ||||||||||||
Net realized gain (loss) from: | ||||||||||||
Investments — unaffiliated | (7,201,674 | ) | (1,443,698 | ) | (4,652,843 | ) | ||||||
Investments — affiliated (Note 2) | (221 | ) | 1,193 | (123 | ) | |||||||
In-kind redemptions — unaffiliated | 2,695,958 | (489,021 | ) | 7,571,026 | ||||||||
Foreign currency transactions | (10,461 | ) | 6,641 | 161,297 | ||||||||
Realized gain distributions from affiliated funds | 2 | 1 | 1 | |||||||||
|
|
|
|
|
| |||||||
Net realized gain (loss) | (4,516,396 | ) | (1,924,884 | ) | 3,079,358 | |||||||
|
|
|
|
|
| |||||||
Net change in unrealized appreciation/depreciation on: | ||||||||||||
Investments — unaffiliated | 52,901,602 | 12,537,384 | 76,286,554 | |||||||||
Investments — affiliated (Note 2) | 522 | 327 | — | |||||||||
Translation of assets and liabilities in foreign currencies | 76,169 | 13,771 | 12,695 | |||||||||
|
|
|
|
|
| |||||||
Net change in unrealized appreciation/depreciation | 52,978,293 | 12,551,482 | 76,299,249 | |||||||||
|
|
|
|
|
| |||||||
Net realized and unrealized gain | 48,461,897 | 10,626,598 | 79,378,607 | |||||||||
|
|
|
|
|
| |||||||
NET INCREASE IN NET ASSETS RESULTING FROM OPERATIONS | $ | 51,821,163 | $ | 12,724,458 | $ | 89,383,603 | ||||||
|
|
|
|
|
| |||||||
| a | Net of foreign withholding tax of $402,976, $432,010 and $1,599,319, respectively. |
See notes to financial statements.
FINANCIAL STATEMENTS | 33 |
Table of Contents
Statements of Operations (Continued)
iSHARES®, INC.
Year ended August 31, 2017
iShares ETF | iShares Capped ETF | |||||||
NET INVESTMENT INCOME | ||||||||
Dividends — unaffiliateda | $ | 3,972,089 | $ | 11,073,214 | ||||
Dividends — affiliated (Note 2) | 824 | 1,395 | ||||||
Securities lending income — affiliated — net (Note 2) | 18,323 | 11,464 | ||||||
|
|
|
| |||||
Total investment income | 3,991,236 | 11,086,073 | ||||||
|
|
|
| |||||
EXPENSES | ||||||||
Investment advisory fees (Note 2) | 869,772 | 1,664,642 | ||||||
Proxy fees | 3,804 | 7,863 | ||||||
|
|
|
| |||||
Total expenses | 873,576 | 1,672,505 | ||||||
|
|
|
| |||||
Net investment income | 3,117,660 | 9,413,568 | ||||||
|
|
|
| |||||
NET REALIZED AND UNREALIZED GAIN (LOSS) | ||||||||
Net realized gain (loss) from: | ||||||||
Investments — unaffiliated | (1,912,461 | ) | (9,659,953 | ) | ||||
Investments — affiliated (Note 2) | 1,251 | 85 | ||||||
In-kind redemptions — unaffiliated | 5,669,639 | 8,997,642 | ||||||
Foreign currency transactions | 46,806 | (8,102 | ) | |||||
Realized gain distributions from affiliated funds | 3 | 4 | ||||||
|
|
|
| |||||
Net realized gain (loss) | 3,805,238 | (670,324 | ) | |||||
|
|
|
| |||||
Net change in unrealized appreciation/depreciation on: | ||||||||
Investments — unaffiliated | 35,465,221 | 63,408,851 | ||||||
Investments — affiliated (Note 2) | 225 | (266 | ) | |||||
Translation of assets and liabilities in foreign currencies | 11,252 | 925,414 | ||||||
|
|
|
| |||||
Net change in unrealized appreciation/depreciation | 35,476,698 | 64,333,999 | ||||||
|
|
|
| |||||
Net realized and unrealized gain | 39,281,936 | 63,663,675 | ||||||
|
|
|
| |||||
NET INCREASE IN NET ASSETS RESULTING FROM OPERATIONS | $ | 42,399,596 | $ | 73,077,243 | ||||
|
|
|
| |||||
| a | Net of foreign withholding tax of $683,611 and $191,908, respectively. |
See notes to financial statements.
| 34 | 2017 iSHARES ANNUAL REPORTTO SHAREHOLDERS |
Table of Contents
Statements of Changes in Net Assets
iSHARES®, INC.
| iShares MSCI Austria Capped ETF | iShares MSCI Belgium Capped ETF | |||||||||||||||
Year ended August 31, 2017 | Year ended August 31, 2016 | Year ended August 31, 2017 | Year ended August 31, 2016 | |||||||||||||
INCREASE (DECREASE) IN NET ASSETS | ||||||||||||||||
OPERATIONS: | ||||||||||||||||
Net investment income | $ | 3,359,266 | $ | 1,511,969 | $ | 2,097,860 | $ | 3,586,837 | ||||||||
Net realized gain (loss) | (4,516,396 | ) | (3,384,444 | ) | (1,924,884 | ) | 1,193,969 | |||||||||
Net change in unrealized appreciation/depreciation | 52,978,293 | 1,994,024 | 12,551,482 | (1,399,047 | ) | |||||||||||
|
|
|
|
|
|
|
| |||||||||
Net increase in net assets resulting from operations | 51,821,163 | 121,549 | 12,724,458 | 3,381,759 | ||||||||||||
|
|
|
|
|
|
|
| |||||||||
DISTRIBUTIONS TO SHAREHOLDERS: | ||||||||||||||||
From net investment income | (3,029,256 | ) | (1,345,976 | ) | (2,204,067 | ) | (3,766,140 | ) | ||||||||
|
|
|
|
|
|
|
| |||||||||
Total distributions to shareholders | (3,029,256 | ) | (1,345,976 | ) | (2,204,067 | ) | (3,766,140 | ) | ||||||||
|
|
|
|
|
|
|
| |||||||||
CAPITAL SHARE TRANSACTIONS: | ||||||||||||||||
Proceeds from shares sold | 135,197,556 | 48,261,666 | 14,586,717 | 307,240,550 | ||||||||||||
Cost of shares redeemed | (11,447,909 | ) | (42,386,794 | ) | (83,182,138 | ) | (328,312,366 | ) | ||||||||
|
|
|
|
|
|
|
| |||||||||
Net increase (decrease) in net assets from capital share transactions | 123,749,647 | 5,874,872 | (68,595,421 | ) | (21,071,816 | ) | ||||||||||
|
|
|
|
|
|
|
| |||||||||
INCREASE (DECREASE) IN NET ASSETS | 172,541,554 | 4,650,445 | (58,075,030 | ) | (21,456,197 | ) | ||||||||||
NET ASSETS | ||||||||||||||||
Beginning of year | 60,780,444 | 56,129,999 | 132,202,576 | 153,658,773 | ||||||||||||
|
|
|
|
|
|
|
| |||||||||
End of year | $ | 233,321,998 | $ | 60,780,444 | $ | 74,127,546 | $ | 132,202,576 | ||||||||
|
|
|
|
|
|
|
| |||||||||
Undistributed (distributions in excess of) net investment income included in net assets at end of year | $ | 304,157 | $ | (15,415 | ) | $ | 20,272 | $ | 50,163 | |||||||
|
|
|
|
|
|
|
| |||||||||
SHARES ISSUED AND REDEEMED | ||||||||||||||||
Shares sold | 6,900,000 | 3,100,000 | 800,000 | 17,280,000 | ||||||||||||
Shares redeemed | (600,000 | ) | (2,800,000 | ) | (4,480,000 | ) | (19,040,000 | ) | ||||||||
|
|
|
|
|
|
|
| |||||||||
Net increase (decrease) in shares outstanding | 6,300,000 | 300,000 | (3,680,000 | ) | (1,760,000 | ) | ||||||||||
|
|
|
|
|
|
|
| |||||||||
See notes to financial statements.
FINANCIAL STATEMENTS | 35 |
Table of Contents
Statements of Changes in Net Assets (Continued)
iSHARES®, INC.
| iShares MSCI France ETF | iShares MSCI Netherlands ETF | |||||||||||||||
Year ended August 31, 2017 | Year ended August 31, 2016 | Year ended August 31, 2017 | Year ended August 31, 2016 | |||||||||||||
INCREASE (DECREASE) IN NET ASSETS | ||||||||||||||||
OPERATIONS: | ||||||||||||||||
Net investment income | $ | 10,004,996 | $ | 10,101,361 | $ | 3,117,660 | $ | 5,525,960 | ||||||||
Net realized gain (loss) | 3,079,358 | (5,468,375 | ) | 3,805,238 | (9,005,653 | ) | ||||||||||
Net change in unrealized appreciation/depreciation | 76,299,249 | (10,982,251 | ) | 35,476,698 | 10,379,782 | |||||||||||
|
|
|
|
|
|
|
| |||||||||
Net increase (decrease) in net assets resulting from operations | 89,383,603 | (6,349,265 | ) | 42,399,596 | 6,900,089 | |||||||||||
|
|
|
|
|
|
|
| |||||||||
DISTRIBUTIONS TO SHAREHOLDERS: | ||||||||||||||||
From net investment income | (9,786,674 | ) | (10,111,706 | ) | (4,373,491 | ) | (4,368,474 | ) | ||||||||
|
|
|
|
|
|
|
| |||||||||
Total distributions to shareholders | (9,786,674 | ) | (10,111,706 | ) | (4,373,491 | ) | (4,368,474 | ) | ||||||||
|
|
|
|
|
|
|
| |||||||||
CAPITAL SHARE TRANSACTIONS: | ||||||||||||||||
Proceeds from shares sold | 409,375,231 | 117,552,844 | 13,981,115 | 108,170,576 | ||||||||||||
Cost of shares redeemed | (177,825,168 | ) | (122,177,212 | ) | (44,054,461 | ) | (102,397,515 | ) | ||||||||
|
|
|
|
|
|
|
| |||||||||
Net increase (decrease) in net assets from capital share transactions | 231,550,063 | (4,624,368 | ) | (30,073,346 | ) | 5,773,061 | ||||||||||
|
|
|
|
|
|
|
| |||||||||
INCREASE (DECREASE) IN NET ASSETS | 311,146,992 | (21,085,339 | ) | 7,952,759 | 8,304,676 | |||||||||||
NET ASSETS | ||||||||||||||||
Beginning of year | 329,053,655 | 350,138,994 | 184,586,917 | 176,282,241 | ||||||||||||
|
|
|
|
|
|
|
| |||||||||
End of year | $ | 640,200,647 | $ | 329,053,655 | $ | 192,539,676 | $ | 184,586,917 | ||||||||
|
|
|
|
|
|
|
| |||||||||
Undistributed net investment income included in net assets at end of year | $ | 560,868 | $ | 181,248 | $ | 890,011 | $ | 2,099,033 | ||||||||
|
|
|
|
|
|
|
| |||||||||
SHARES ISSUED AND REDEEMED | ||||||||||||||||
Shares sold | 14,800,000 | 4,800,000 | 500,000 | 4,550,000 | ||||||||||||
Shares redeemed | (7,000,000 | ) | (5,000,000 | ) | (1,650,000 | ) | (4,300,000 | ) | ||||||||
|
|
|
|
|
|
|
| |||||||||
Net increase (decrease) in shares outstanding | 7,800,000 | (200,000 | ) | (1,150,000 | ) | 250,000 | ||||||||||
|
|
|
|
|
|
|
| |||||||||
See notes to financial statements.
| 36 | 2017 iSHARES ANNUAL REPORTTO SHAREHOLDERS |
Table of Contents
Statements of Changes in Net Assets (Continued)
iSHARES®, INC.
| iShares MSCI Sweden Capped ETF | ||||||||
Year ended August 31, 2017 | Year ended August 31, 2016 | |||||||
INCREASE (DECREASE) IN NET ASSETS | ||||||||
OPERATIONS: | ||||||||
Net investment income | $ | 9,413,568 | $ | 11,883,219 | ||||
Net realized loss | (670,324 | ) | (9,199,802 | ) | ||||
Net change in unrealized appreciation/depreciation | 64,333,999 | (13,928,238 | ) | |||||
|
|
|
| |||||
Net increase (decrease) in net assets resulting from operations | 73,077,243 | (11,244,821 | ) | |||||
|
|
|
| |||||
DISTRIBUTIONS TO SHAREHOLDERS: | ||||||||
From net investment income | (9,859,546 | ) | (12,154,414 | ) | ||||
|
|
|
| |||||
Total distributions to shareholders | (9,859,546 | ) | (12,154,414 | ) | ||||
|
|
|
| |||||
CAPITAL SHARE TRANSACTIONS: | ||||||||
Proceeds from shares sold | 206,461,394 | 49,435,762 | ||||||
Cost of shares redeemed | (94,072,500 | ) | (72,714,714 | ) | ||||
|
|
|
| |||||
Net increase (decrease) in net assets from capital share transactions | 112,388,894 | (23,278,952 | ) | |||||
|
|
|
| |||||
INCREASE (DECREASE) IN NET ASSETS | 175,606,591 | (46,678,187 | ) | |||||
NET ASSETS | ||||||||
Beginning of year | 284,708,748 | 331,386,935 | ||||||
|
|
|
| |||||
End of year | $ | 460,315,339 | $ | 284,708,748 | ||||
|
|
|
| |||||
Undistributed (distributions in excess of) net investment income included in net assets at end of year | $ | (31,879 | ) | $ | 190,625 | |||
|
|
|
| |||||
SHARES ISSUED AND REDEEMED | ||||||||
Shares sold | 6,300,000 | 1,650,000 | ||||||
Shares redeemed | (3,000,000 | ) | (2,625,000 | ) | ||||
|
|
|
| |||||
Net increase (decrease) in shares outstanding | 3,300,000 | (975,000 | ) | |||||
|
|
|
| |||||
See notes to financial statements.
FINANCIAL STATEMENTS | 37 |
Table of Contents
iSHARES®, INC.
(For a share outstanding throughout each period)
| iShares MSCI Austria Capped ETF | ||||||||||||||||||||
Year ended Aug. 31, 2017 | Year ended Aug. 31, 2016 | Year ended Aug. 31, 2015 | Year ended Aug. 31, 2014 | Year ended Aug. 31, 2013 | ||||||||||||||||
Net asset value, beginning of year | $ | 15.58 | $ | 15.59 | $ | 17.55 | $ | 17.87 | $ | 14.53 | ||||||||||
|
|
|
|
|
|
|
|
|
| |||||||||||
Income from investment operations: | ||||||||||||||||||||
Net investment incomea | 0.53 | 0.38 | 0.25 | 0.52 | 0.32 | |||||||||||||||
Net realized and unrealized gain (loss)b | 7.13 | (0.06 | ) | (1.96 | ) | (0.18 | ) | 3.36 | ||||||||||||
|
|
|
|
|
|
|
|
|
| |||||||||||
Total from investment operations | 7.66 | 0.32 | (1.71 | ) | 0.34 | 3.68 | ||||||||||||||
|
|
|
|
|
|
|
|
|
| |||||||||||
Less distributions from: | ||||||||||||||||||||
Net investment income | (0.37 | ) | (0.33 | ) | (0.25 | ) | (0.66 | ) | (0.34 | ) | ||||||||||
|
|
|
|
|
|
|
|
|
| |||||||||||
Total distributions | (0.37 | ) | (0.33 | ) | (0.25 | ) | (0.66 | ) | (0.34 | ) | ||||||||||
|
|
|
|
|
|
|
|
|
| |||||||||||
Net asset value, end of year | $ | 22.87 | $ | 15.58 | $ | 15.59 | $ | 17.55 | $ | 17.87 | ||||||||||
|
|
|
|
|
|
|
|
|
| |||||||||||
Total return | 49.52 | % | 2.11 | % | (9.76 | )% | 1.56 | % | 25.49 | % | ||||||||||
|
|
|
|
|
|
|
|
|
| |||||||||||
Ratios/Supplemental data: | ||||||||||||||||||||
Net assets, end of year (000s) | $ | 233,322 | $ | 60,780 | $ | 56,130 | $ | 63,170 | $ | 82,223 | ||||||||||
Ratio of expenses to average net assets | 0.49 | % | 0.48 | % | 0.48 | % | 0.48 | % | 0.51 | % | ||||||||||
Ratio of net investment income to average net assets | 2.75 | % | 2.47 | % | 1.54 | % | 2.64 | % | 1.82 | % | ||||||||||
Portfolio turnover ratec | 18 | % | 15 | % | 18 | % | 30 | % | 26 | % | ||||||||||
| a | Based on average shares outstanding throughout each period. |
| b | The amounts reported for a share outstanding may not accord with the change in aggregate gains and losses in securities for the fiscal period due to the timing of capital share transactions in relation to the fluctuating market values of the Fund’s underlying securities. |
| c | Portfolio turnover rates exclude portfolio securities received or delivered as a result of processing capital share transactions in Creation Units. |
See notes to financial statements.
| 38 | 2017 iSHARES ANNUAL REPORTTO SHAREHOLDERS |
Table of Contents
Financial Highlights (Continued)
iSHARES®, INC.
(For a share outstanding throughout each period)
| iShares MSCI Belgium Capped ETF | ||||||||||||||||||||
Year ended Aug. 31, 2017 | Year ended Aug. 31, 2016 | Year ended Aug. 31, 2015 | Year ended Aug. 31, 2014 | Year ended Aug. 31, 2013 | ||||||||||||||||
Net asset value, beginning of year | $ | 18.16 | $ | 17.00 | $ | 17.02 | $ | 14.36 | $ | 11.97 | ||||||||||
|
|
|
|
|
|
|
|
|
| |||||||||||
Income from investment operations: | ||||||||||||||||||||
Net investment incomea | 0.43 | 0.34 | 0.34 | 0.32 | 0.42 | |||||||||||||||
Net realized and unrealized gain (loss)b | 2.51 | 1.05 | (0.00 | )c | 2.95 | 2.36 | ||||||||||||||
|
|
|
|
|
|
|
|
|
| |||||||||||
Total from investment operations | 2.94 | 1.39 | 0.34 | 3.27 | 2.78 | |||||||||||||||
|
|
|
|
|
|
|
|
|
| |||||||||||
Less distributions from: | ||||||||||||||||||||
Net investment income | (0.51 | ) | (0.23 | ) | (0.36 | ) | (0.61 | ) | (0.39 | ) | ||||||||||
|
|
|
|
|
|
|
|
|
| |||||||||||
Total distributions | (0.51 | ) | (0.23 | ) | (0.36 | ) | (0.61 | ) | (0.39 | ) | ||||||||||
|
|
|
|
|
|
|
|
|
| |||||||||||
Net asset value, end of year | $ | 20.59 | $ | 18.16 | $ | 17.00 | $ | 17.02 | $ | 14.36 | ||||||||||
|
|
|
|
|
|
|
|
|
| |||||||||||
Total return | 16.44 | % | 8.20 | % | 1.95 | % | 23.05 | % | 23.43 | % | ||||||||||
|
|
|
|
|
|
|
|
|
| |||||||||||
Ratios/Supplemental data: | ||||||||||||||||||||
Net assets, end of year (000s) | $ | 74,128 | $ | 132,203 | $ | 153,659 | $ | 164,765 | $ | 71,216 | ||||||||||
Ratio of expenses to average net assets | 0.49 | % | 0.48 | % | 0.48 | % | 0.48 | % | 0.50 | % | ||||||||||
Ratio of net investment income to average net assets | 2.31 | % | 1.92 | % | 2.01 | % | 1.90 | % | 3.01 | % | ||||||||||
Portfolio turnover rated | 8 | % | 19 | % | 7 | % | 13 | % | 24 | % | ||||||||||
| a | Based on average shares outstanding throughout each period. |
| b | The amounts reported for a share outstanding may not accord with the change in aggregate gains and losses in securities for the fiscal period due to the timing of capital share transactions in relation to the fluctuating market values of the Fund’s underlying securities. |
| c | Rounds to less than $0.01. |
| d | Portfolio turnover rates exclude portfolio securities received or delivered as a result of processing capital share transactions in Creation Units. |
See notes to financial statements.
FINANCIAL HIGHLIGHTS | 39 |
Table of Contents
Financial Highlights (Continued)
iSHARES®, INC.
(For a share outstanding throughout each period)
| iShares MSCI France ETF | ||||||||||||||||||||
Year ended Aug. 31, 2017 | Year ended Aug. 31, 2016 | Year ended Aug. 31, 2015 | Year ended Aug. 31, 2014 | Year ended Aug. 31, 2013 | ||||||||||||||||
Net asset value, beginning of year | $ | 23.84 | $ | 25.01 | $ | 27.64 | $ | 24.85 | $ | 20.70 | ||||||||||
|
|
|
|
|
|
|
|
|
| |||||||||||
Income from investment operations: | ||||||||||||||||||||
Net investment incomea | 0.69 | 0.67 | 0.74 | 0.66 | 0.69 | |||||||||||||||
Net realized and unrealized gain (loss)b | 5.69 | (1.14 | ) | (2.69 | ) | 2.86 | 4.14 | |||||||||||||
|
|
|
|
|
|
|
|
|
| |||||||||||
Total from investment operations | 6.38 | (0.47 | ) | (1.95 | ) | 3.52 | 4.83 | |||||||||||||
|
|
|
|
|
|
|
|
|
| |||||||||||
Less distributions from: | ||||||||||||||||||||
Net investment income | (0.58 | ) | (0.70 | ) | (0.68 | ) | (0.73 | ) | (0.68 | ) | ||||||||||
|
|
|
|
|
|
|
|
|
| |||||||||||
Total distributions | (0.58 | ) | (0.70 | ) | (0.68 | ) | (0.73 | ) | (0.68 | ) | ||||||||||
|
|
|
|
|
|
|
|
|
| |||||||||||
Net asset value, end of year | $ | 29.64 | $ | 23.84 | $ | 25.01 | $ | 27.64 | $ | 24.85 | ||||||||||
|
|
|
|
|
|
|
|
|
| |||||||||||
Total return | 26.93 | % | (1.87 | )% | (7.17 | )% | 14.07 | % | 23.56 | % | ||||||||||
|
|
|
|
|
|
|
|
|
| |||||||||||
Ratios/Supplemental data: | ||||||||||||||||||||
Net assets, end of year (000s) | $ | 640,201 | $ | 329,054 | $ | 350,139 | $ | 281,923 | $ | 526,839 | ||||||||||
Ratio of expenses to average net assets | 0.49 | % | 0.48 | % | 0.48 | % | 0.48 | % | 0.51 | % | ||||||||||
Ratio of net investment income to average net assets | 2.57 | % | 2.77 | % | 2.85 | % | 2.36 | % | 2.94 | % | ||||||||||
Portfolio turnover ratec | 6 | % | 6 | % | 6 | % | 6 | % | 5 | % | ||||||||||
| a | Based on average shares outstanding throughout each period. |
| b | The amounts reported for a share outstanding may not accord with the change in aggregate gains and losses in securities for the fiscal period due to the timing of capital share transactions in relation to the fluctuating market values of the Fund’s underlying securities. |
| c | Portfolio turnover rates exclude portfolio securities received or delivered as a result of processing capital share transactions in Creation Units. |
See notes to financial statements.
| 40 | 2017 iSHARES ANNUAL REPORTTO SHAREHOLDERS |
Table of Contents
Financial Highlights (Continued)
iSHARES®, INC.
(For a share outstanding throughout each period)
| iShares MSCI Netherlands ETF | ||||||||||||||||||||
| Year ended Aug. 31, 2017 | Year ended Aug. 31, 2016 | Year ended Aug. 31, 2015 | Year ended Aug. 31, 2014 | Year ended Aug. 31, 2013 | ||||||||||||||||
Net asset value, beginning of year | $ | 24.78 | $ | 24.48 | $ | 24.64 | $ | 22.52 | $ | 18.23 | ||||||||||
|
|
|
|
|
|
|
|
|
| |||||||||||
Income from investment operations: | ||||||||||||||||||||
Net investment incomea | 0.46 | 0.71 | 0.50 | 0.45 | 0.44 | |||||||||||||||
Net realized and unrealized gain (loss)b | 5.98 | 0.08 | (0.27 | ) | 2.22 | 4.19 | ||||||||||||||
|
|
|
|
|
|
|
|
|
| |||||||||||
Total from investment operations | 6.44 | 0.79 | 0.23 | 2.67 | 4.63 | |||||||||||||||
|
|
|
|
|
|
|
|
|
| |||||||||||
Less distributions from: | ||||||||||||||||||||
Net investment income | (0.66 | ) | (0.49 | ) | (0.39 | ) | (0.55 | ) | (0.34 | ) | ||||||||||
|
|
|
|
|
|
|
|
|
| |||||||||||
Total distributions | (0.66 | ) | (0.49 | ) | (0.39 | ) | (0.55 | ) | (0.34 | ) | ||||||||||
|
|
|
|
|
|
|
|
|
| |||||||||||
Net asset value, end of year | $ | 30.56 | $ | 24.78 | $ | 24.48 | $ | 24.64 | $ | 22.52 | ||||||||||
|
|
|
|
|
|
|
|
|
| |||||||||||
Total return | 26.44 | % | 3.32 | % | 0.87 | % | 11.80 | % | 25.57 | % | ||||||||||
|
|
|
|
|
|
|
|
|
| |||||||||||
Ratios/Supplemental data: | ||||||||||||||||||||
Net assets, end of year (000s) | $ | 192,540 | $ | 184,587 | $ | 176,282 | $ | 165,092 | $ | 253,390 | ||||||||||
Ratio of expenses to average net assets | 0.49 | % | 0.48 | % | 0.48 | % | 0.48 | % | 0.50 | % | ||||||||||
Ratio of net investment income to average net assets | 1.74 | % | 2.97 | % | 2.01 | % | 1.78 | % | 2.09 | % | ||||||||||
Portfolio turnover ratec | 14 | % | 24 | % | 6 | % | 7 | % | 11 | % | ||||||||||
| a | Based on average shares outstanding throughout each period. |
| b | The amounts reported for a share outstanding may not accord with the change in aggregate gains and losses in securities for the fiscal period due to the timing of capital share transactions in relation to the fluctuating market values of the Fund’s underlying securities. |
| c | Portfolio turnover rates exclude portfolio securities received or delivered as a result of processing capital share transactions in Creation Units. |
See notes to financial statements.
FINANCIAL HIGHLIGHTS | 41 |
Table of Contents
Financial Highlights (Continued)
iSHARES®, INC.
(For a share outstanding throughout each period)
| iShares MSCI Sweden Capped ETF | ||||||||||||||||||||
| Year ended Aug. 31, 2017 | Year ended Aug. 31, 2016 | Year ended Aug. 31, 2015 | Year ended Aug. 31, 2014 | Year ended Aug. 31, 2013 | ||||||||||||||||
Net asset value, beginning of year | $ | 28.54 | $ | 30.26 | $ | 34.11 | $ | 31.97 | $ | 27.32 | ||||||||||
|
|
|
|
|
|
|
|
|
| |||||||||||
Income from investment operations: | ||||||||||||||||||||
Net investment incomea | 0.86 | 1.05 | 1.30 | b | 1.04 | 0.97 | ||||||||||||||
Net realized and unrealized gain (loss)c | 6.04 | (1.63 | ) | (3.75 | ) | 2.33 | 4.70 | |||||||||||||
|
|
|
|
|
|
|
|
|
| |||||||||||
Total from investment operations | 6.90 | (0.58 | ) | (2.45 | ) | 3.37 | 5.67 | |||||||||||||
|
|
|
|
|
|
|
|
|
| |||||||||||
Less distributions from: | ||||||||||||||||||||
Net investment income | (0.76 | ) | (1.14 | ) | (1.40 | ) | (1.23 | ) | (1.02 | ) | ||||||||||
|
|
|
|
|
|
|
|
|
| |||||||||||
Total distributions | (0.76 | ) | (1.14 | ) | (1.40 | ) | (1.23 | ) | (1.02 | ) | ||||||||||
|
|
|
|
|
|
|
|
|
| |||||||||||
Net asset value, end of year | $ | 34.68 | $ | 28.54 | $ | 30.26 | $ | 34.11 | $ | 31.97 | ||||||||||
|
|
|
|
|
|
|
|
|
| |||||||||||
Total return | 24.30 | % | (1.91 | )% | (7.46 | )%b | 10.49 | % | 21.02 | % | ||||||||||
|
|
|
|
|
|
|
|
|
| |||||||||||
Ratios/Supplemental data: | ||||||||||||||||||||
Net assets, end of year (000s) | $ | 460,315 | $ | 284,709 | $ | 331,387 | $ | 404,256 | $ | 434,006 | ||||||||||
Ratio of expenses to average net assets | 0.49 | % | 0.48 | % | 0.92 | % | 0.48 | % | 0.51 | % | ||||||||||
Ratio of expenses to average net assets excluding professional fees for foreign withholding tax claims (Note 7) | n/a | n/a | 0.48 | % | n/a | n/a | ||||||||||||||
Ratio of net investment income to average net assets | 2.74 | % | 3.65 | % | 3.97 | %b | 2.97 | % | 3.13 | % | ||||||||||
Portfolio turnover rated | 9 | % | 7 | % | 4 | % | 7 | % | 7 | % | ||||||||||
| a | Based on average shares outstanding throughout each period. |
| b | Reflects the one-time, positive effect of foreign withholding tax claims, net of the associated IRS compliance fees and professional fees (See Note 7), which resulted in the following increases: |
| • | Net investment income per share by $0.42 |
| • | Total return by 1.14% |
| • | Ratio of net investment income to average net assets by 1.31% |
| c | The amounts reported for a share outstanding may not accord with the change in aggregate gains and losses in securities for the fiscal period due to the timing of capital share transactions in relation to the fluctuating market values of the Fund’s underlying securities. |
| d | Portfolio turnover rates exclude portfolio securities received or delivered as a result of processing capital share transactions in Creation Units. |
See notes to financial statements.
| 42 | 2017 iSHARES ANNUAL REPORTTO SHAREHOLDERS |
Table of Contents
iSHARES®, INC.
iShares, Inc. (the “Company”) is registered under the Investment Company Act of 1940, as amended (the “1940 Act”), as an open-end management investment company. The Company was incorporated under the laws of the State of Maryland on September 1, 1994 pursuant to Articles of Incorporation as subsequently amended and restated.
These financial statements relate only to the following funds (each, a “Fund,” and collectively, the “Funds”):
| iShares ETF | Diversification Classification | |
MSCI Austria Capped | Non-diversified | |
MSCI Belgium Capped | Non-diversified | |
MSCI France | Non-diversified | |
MSCI Netherlands | Non-diversified | |
MSCI Sweden Cappeda | Non-diversified |
| a | Formerly the iShares MSCI Sweden ETF. |
The investment objective of each Fund is to seek investment results that correspond generally to the price and yield performance, before fees and expenses, of its underlying index. The investment adviser uses a “passive” or index approach to try to achieve each Fund’s investment objective.
Pursuant to the Company’s organizational documents, the Funds’ officers and directors are indemnified against certain liabilities that may arise out of the performance of their duties to the Funds. Additionally, in the normal course of business, the Funds enter into contracts with service providers that contain general indemnification clauses. The Funds’ maximum exposure under these arrangements is unknown as this would involve future claims that may be made against the Funds that have not yet occurred.
| 1. | SIGNIFICANT ACCOUNTING POLICIES |
The following significant accounting policies are consistently followed by each Fund in the preparation of its financial statements in conformity with accounting principles generally accepted in the United States of America (“U.S. GAAP”). The preparation of financial statements in conformity with U.S. GAAP requires management to make certain estimates and assumptions that affect the reported amounts of assets and liabilities and disclosures of contingent assets and liabilities at the date of the financial statements and the reported amounts of revenue and expenses during the reporting period. Actual results could differ from those estimates. Each Fund is considered an investment company under U.S. GAAP and follows the accounting and reporting guidance applicable to investment companies.
SECURITY VALUATION
Each Fund’s investments are valued at fair value each day that the Fund’s listing exchange is open and, for financial reporting purposes, as of the report date should the reporting period end on a day that the Fund’s listing exchange is not open. U.S. GAAP defines fair value as the price a fund would receive to sell an asset or pay to transfer a liability in an orderly transaction between market participants at the measurement date. The BlackRock Global Valuation Methodologies Committee (the “Global Valuation Committee”) provides oversight of the valuation of investments for the Funds. The investments of each Fund are valued pursuant to policies and procedures developed by the Global Valuation Committee and approved by the Board of Directors of the Company (the “Board”).
| • | Equity investments traded on a recognized securities exchange are valued at that day’s last reported trade price or the official closing price, as applicable, on the exchange where the stock is primarily traded. Equity investments traded on a recognized exchange for which there were no sales on that day are valued at the last traded price. |
NOTESTO FINANCIAL STATEMENTS | 43 |
Table of Contents
Notes to Financial Statements (Continued)
iSHARES®, INC.
| • | Open-end U.S. mutual funds (including money market funds) are valued at that day’s published net asset value (“NAV”). |
In the event that application of these methods of valuation results in a price for an investment which is deemed not to be representative of the fair value of such investment or if a price is not available, the investment will be valued by the Global Valuation Committee, in accordance with policies approved by the Board. The fair valuation approaches that may be utilized by the Global Valuation Committee to determine fair value include market approach, income approach and the cost approach. The valuation techniques used under these approaches take into consideration inputs that include but are not limited to (i) attributes specific to the investment; (ii) the principal market for the investment; (iii) the customary participants in the principal market for the investment; (iv) data assumptions by market participants for the investment, if reasonably available; (v) quoted prices for similar investments in active markets; and (vi) other inputs, such as future cash flows, interest rates, yield curves, volatilities, prepayment speeds, loss severities, credit risks and/or default rates. Valuations based on such inputs are reported to the Board on a quarterly basis.
The Global Valuation Committee employs various methods for calibrating valuation approaches for investments where an active market does not exist, including regular due diligence of the Company’s pricing vendors, a regular review of key inputs and assumptions, transactional back-testing or disposition analysis to compare unrealized gains and losses to realized gains and losses, reviews of missing or stale prices, reviews of large movements in market values, and reviews of market related activity.
Fair value pricing could result in a difference between the prices used to calculate a Fund’s NAV and the prices used by the Fund’s underlying index, which in turn could result in a difference between the Fund’s performance and the performance of the Fund’s underlying index.
Various inputs are used in determining the fair value of financial instruments. Inputs may be based on independent market data (“observable inputs”) or they may be internally developed (“unobservable inputs”). These inputs to valuation techniques are categorized into a fair value hierarchy consisting of three broad levels for financial reporting purposes as follows:
| • | Level 1 — Unadjusted quoted prices in active markets for identical assets or liabilities; |
| • | Level 2 — Inputs other than quoted prices included within Level 1 that are observable for the asset or liability either directly or indirectly, including quoted prices for similar assets or liabilities in active markets, quoted prices for identical or similar assets or liabilities in markets that are not considered to be active, inputs other than quoted prices that are observable for the asset or liability (such as exchange rates, financing terms, interest rates, yield curves, volatilities, prepayment speeds, loss severities, credit risks and default rates) or other market-corroborated inputs; and |
| • | Level 3 — Unobservable inputs for the asset or liability based on the best information available in the circumstances, to the extent observable inputs are not available, including the Global Valuation Committee’s assumptions used in determining the fair value of investments. |
The hierarchy gives the highest priority to unadjusted quoted prices in active markets for identical assets or liabilities (Level 1 measurements) and the lowest priority to unobservable inputs (Level 3 measurements). Accordingly, the degree of judgement exercised in determining fair value is greatest for instruments categorized in Level 3. The inputs used to measure fair value may fall into different levels of the fair value hierarchy. In such cases, for disclosure purposes, the fair value hierarchy classification is determined based on the lowest level input that is significant to the fair value measurement in its entirety. The fair value hierarchy for each Fund’s investments is included in its schedule of investments.
Changes in valuation techniques may result in transfers in or out of an assigned level within the fair value hierarchy. In accordance with the Company’s policy, transfers between different levels of the fair value hierarchy are deemed to have occurred
| 44 | 2017 iSHARES ANNUAL REPORTTO SHAREHOLDERS |
Table of Contents
Notes to Financial Statements (Continued)
iSHARES®, INC.
as of the beginning of the reporting period. The categorization of values determined for financial instruments are based on the pricing transparency of the financial instruments and are not necessarily an indication of the risks associated with investing in those securities.
SECURITY TRANSACTIONS AND INCOME RECOGNITION
Security transactions are accounted for on trade date. Realized gains and losses on investment transactions are determined using the specific identification method. Dividend income and capital gain distributions, if any, are recognized on the ex-dividend date, net of any foreign taxes withheld at source. Any taxes withheld that are reclaimable from foreign tax authorities as of August 31, 2017 are reflected in tax reclaims receivable. Upon notification from issuers, some of the dividend income received from a real estate investment trust may be re-designated as a reduction of cost of the related investment and/or realized gain. Non-cash dividends received, if any, are recognized on the ex-dividend date and recorded as non-cash dividend income at fair value. Distributions received by the Funds may include a return of capital that is estimated by management. Such amounts are recorded as a reduction of the cost of investments or reclassified to capital gains. Interest income is accrued daily.
FOREIGN CURRENCY TRANSLATION
The accounting records of the Funds are maintained in U.S. dollars. Foreign currencies, as well as investment securities and other assets and liabilities denominated in foreign currencies, are translated into U.S. dollars using exchange rates deemed appropriate by the investment adviser. Purchases and sales of securities, income receipts and expense payments are translated into U.S. dollars on the respective dates of such transactions.
Each Fund does not isolate the effect of fluctuations in foreign exchange rates from the effect of fluctuations in the market prices of securities. Such fluctuations are reflected by the Funds as a component of realized and unrealized gains and losses from investments for financial reporting purposes. Each Fund reports realized currency gains (losses) on foreign currency related transactions as components of net realized gain (loss) for financial reporting purposes, whereas such components are generally treated as ordinary income for U.S. federal income tax purposes.
FOREIGN TAXES
The Funds may be subject to foreign taxes (a portion of which may be reclaimable) on income, stock dividends, capital gains on investments, or certain foreign currency transactions. All foreign taxes are recorded in accordance with the applicable foreign tax regulations and rates that exist in the foreign jurisdictions in which the Funds invest. These foreign taxes, if any, are paid by the Funds and are reflected in their statements of operations as follows: foreign taxes withheld at source are presented as a reduction of income, foreign taxes on securities lending income are presented as a reduction of securities lending income, foreign taxes on stock dividends are presented as “other foreign taxes”, and foreign taxes on capital gains from sales of investments and foreign taxes on foreign currency transactions are included in their respective net realized gain (loss) categories. Foreign taxes payable or deferred as of August 31, 2017, if any, are disclosed in the Funds’ statements of assets and liabilities.
DISTRIBUTIONS TO SHAREHOLDERS
Dividends and distributions paid by each Fund are recorded on the ex-dividend dates. Distributions are determined on a tax basis and may differ from net investment income and net realized capital gains for financial reporting purposes. Dividends and distributions are paid in U.S. dollars and cannot be automatically reinvested in additional shares of the Funds.
NOTESTO FINANCIAL STATEMENTS | 45 |
Table of Contents
Notes to Financial Statements (Continued)
iSHARES®, INC.
LOANS OF PORTFOLIO SECURITIES
Each Fund may lend its investment securities to approved borrowers, such as brokers, dealers and other financial institutions. The borrower pledges and maintains with the Fund collateral consisting of cash, an irrevocable letter of credit issued by an approved bank, or securities issued or guaranteed by the U.S. government. The initial collateral received by each Fund is required to have a value of at least 102% of the current value of the loaned securities for securities traded on U.S. exchanges and a value of at least 105% for all other securities. The collateral is maintained thereafter at a value equal to at least 100% of the current value of the securities on loan. The market value of the loaned securities is determined at the close of each business day of the Funds. Any additional required collateral is delivered to the Funds and any excess collateral is returned by the Funds on the next business day. During the term of the loan, each Fund is entitled to all distributions made on or in respect of the loaned securities but does not receive interest income on securities received as collateral. Loans of securities are terminable at any time and the borrower, after notice, is required to return borrowed securities within the standard time period for settlement of securities transactions.
Cash received as collateral for securities on loan may be reinvested in certain short-term instruments either directly on behalf of a fund or through one or more joint accounts or money market funds, including those managed by BlackRock Fund Advisors (“BFA”), the Funds’ investment adviser, or its affiliates. As of August 31, 2017, any securities on loan were collateralized by cash and/or U.S. government obligations. Cash collateral received was invested in money market funds managed by BFA and is disclosed in the schedules of investments. Any non-cash collateral received cannot be sold, re-invested or pledged by the Fund, except in the event of borrower default. The securities on loan for each Fund are also disclosed in its schedule of investments. The total value of any securities on loan as of August 31, 2017 and the total value of the related cash collateral are disclosed in the statements of assets and liabilities. Income earned by the Funds from securities lending is disclosed in the statements of operations.
The risks of securities lending include the risk that the borrower may not provide additional collateral when required or may not return the securities when due. To mitigate these risks, the Funds benefit from a borrower default indemnity provided by BlackRock, Inc. (“BlackRock”). BlackRock’s indemnity allows for full replacement of securities loaned if the collateral received does not cover the value of the securities loaned in the event of borrower default. Each Fund could incur a loss if the value of an investment purchased with cash collateral falls below the value of the loaned securities or if the value of an investment purchased with cash collateral falls below the value of the original cash collateral received.
Securities lending transactions are entered into by the Funds under Master Securities Lending Agreements (“MSLA”) which provide the right, in the event of default (including bankruptcy or insolvency) for the non-defaulting party to liquidate the collateral and calculate a net exposure to the defaulting party or request additional collateral. In the event that a borrower defaults, a Fund, as lender, would offset the market value of the collateral received against the market value of the securities loaned. The value of the collateral is typically greater than that of the market value of the securities loaned, leaving the lender with a net amount payable to the defaulting party. However, bankruptcy or insolvency laws of a particular jurisdiction may impose restrictions on or prohibitions against such a right of offset in the event of an MSLA counterparty’s bankruptcy or insolvency. Under the MSLA, the borrower can resell or re-pledge the loaned securities, and a Fund can reinvest cash collateral, or, upon an event of default, resell or re-pledge the collateral.
| 46 | 2017 iSHARES ANNUAL REPORTTO SHAREHOLDERS |
Table of Contents
Notes to Financial Statements (Continued)
iSHARES®, INC.
The following table is a summary of securities lending agreements which are subject to offset under an MSLA as of August 31, 2017:
| iShares ETF and Counterparty | Market Value of Securities on Loan | Cash Collateral Received a | Net Amount | |||||||||
MSCI Austria Capped | ||||||||||||
Credit Suisse Securities (USA) LLC | $ | 419,420 | $ | 419,420 | $ | — | ||||||
Deutsche Bank Securities Inc. | 40,793 | 40,793 | — | |||||||||
Goldman Sachs & Co. | 4,731,820 | 4,731,820 | — | |||||||||
Morgan Stanley & Co. LLC | 160,171 | 160,171 | — | |||||||||
State Street Bank & Trust Company | 696,450 | 696,450 | — | |||||||||
UBS Securities LLC | 306,340 | 306,340 | — | |||||||||
|
|
|
|
|
| |||||||
| $ | 6,354,994 | $ | 6,354,994 | $ | — | |||||||
|
|
|
|
|
| |||||||
MSCI Belgium Capped | ||||||||||||
Citigroup Global Markets Inc. | $ | 354,102 | $ | 354,102 | $ | — | ||||||
Deutsche Bank Securities Inc. | 157,039 | 157,039 | — | |||||||||
Goldman Sachs & Co. | 200,230 | 200,230 | — | |||||||||
JPMorgan Securities LLC | 116,171 | 116,171 | — | |||||||||
Morgan Stanley & Co. LLC | 2,457,744 | 2,457,744 | — | |||||||||
Nomura Securities International Inc. | 23,376 | 23,376 | — | |||||||||
State Street Bank & Trust Company | 17,770 | 17,770 | — | |||||||||
UBS AG | 25,811 | 25,811 | — | |||||||||
|
|
|
|
|
| |||||||
| $ | 3,352,243 | $ | 3,352,243 | $ | — | |||||||
|
|
|
|
|
| |||||||
MSCI Netherlands | ||||||||||||
Credit Suisse Securities (USA) LLC | $ | 55,584 | $ | 55,584 | $ | — | ||||||
HSBC Bank PLC | 128,550 | 128,550 | — | |||||||||
Merrill Lynch, Pierce, Fenner & Smith | 822,022 | 822,022 | — | |||||||||
State Street Bank & Trust Company | 180,414 | 180,414 | — | |||||||||
|
|
|
|
|
| |||||||
| $ | 1,186,570 | $ | 1,186,570 | $ | — | |||||||
|
|
|
|
|
| |||||||
MSCI Sweden Capped | ||||||||||||
HSBC Bank PLC | $ | 283,025 | $ | 283,025 | $ | — | ||||||
Morgan Stanley & Co. LLC | 3,244,021 | 3,244,021 | — | |||||||||
|
|
|
|
|
| |||||||
| $ | 3,527,046 | $ | 3,527,046 | $ | — | |||||||
|
|
|
|
|
| |||||||
| a | Collateral received in excess of the market value of securities on loan is not presented in this table. The total cash collateral received by each Fund is disclosed in the Fund’s statement of assets and liabilities. |
| 2. | INVESTMENT ADVISORY AGREEMENT AND OTHER TRANSACTIONS WITH AFFILIATES |
Pursuant to an Investment Advisory Agreement with the Company, BFA manages the investment of each Fund’s assets. BFA is a California corporation indirectly owned by BlackRock. Under the Investment Advisory Agreement, BFA is responsible for substantially all expenses of the Funds, except (i) interest and taxes; (ii) brokerage commissions and other expenses connected with the execution of portfolio transactions; (iii) distribution fees; (iv) the advisory fee payable to BFA; and (v) litigation expenses and any extraordinary expenses (in each case as determined by a majority of the independent directors).
NOTESTO FINANCIAL STATEMENTS | 47 |
Table of Contents
Notes to Financial Statements (Continued)
iSHARES®, INC.
For its investment advisory services to each Fund, BFA is entitled to an annual investment advisory fee, accrued daily and paid monthly by the Funds, based on each Fund’s allocable portion of the aggregate of the average daily net assets of the Fund and certain other iShares funds, as follows:
| Investment Advisory Fee | Aggregate Average Daily Net Assets | ||||
| 0.59 | % | First $7 billion | |||
| 0.54 | Over $7 billion, up to and including $11 billion | ||||
| 0.49 | Over $11 billion, up to and including $24 billion | ||||
| 0.44 | Over $24 billion, up to and including $48 billion | ||||
| 0.40 | Over $48 billion, up to and including $72 billion | ||||
| 0.36 | Over $72 billion, up to and including $96 billiona | ||||
| 0.32 | Over $96 billiona | ||||
| a | Break level added or amended effective July 1, 2017. |
The U.S. Securities and Exchange Commission has issued an exemptive order which permits BlackRock Institutional Trust Company, N.A. (“BTC”), an affiliate of BFA, to serve as securities lending agent for the Funds, subject to applicable conditions. As securities lending agent, BTC bears all operational costs directly related to securities lending. Each Fund is responsible for fees in connection with the investment of cash collateral received for securities on loan in a money market fund managed by BFA, however, BTC has agreed to reduce the amount of securities lending income it receives in order to effectively limit the collateral investment fees each Fund bears to an annual rate of 0.04% (the “collateral investment fees”). Securities lending income is equal to the total of income earned from the reinvestment of cash collateral, net of fees and other payments to and from borrowers of securities, and less the collateral investment fees. The Funds retain a portion of securities lending income and remit the remaining portion to BTC as compensation for its services as securities lending agent.
Pursuant to a securities lending agreement, each Fund retains 80% of securities lending income and the amount retained can never be less than 70% of the total of securities lending income plus the collateral investment fees. In addition, commencing the business day following the date that the aggregate securities lending income plus the collateral investment fees generated across all 1940 Act iShares exchange-traded funds (the “iShares ETF Complex”) in a given calendar year exceeds the aggregate securities lending income generated across the iShares ETF Complex in the calendar year 2013, each Fund, pursuant to a securities lending agreement, will retain for the remainder of that calendar year 85% of securities lending income and the amount retained can never be less than 70% of the total of securities lending income plus the collateral investment fees.
For the year ended August 31, 2017, the total of securities lending agent services and collateral investment fees paid were as follows:
| iShares ETF | Fees Paid to BTC | |||
MSCI Austria Capped | $ | 20,983 | ||
MSCI Belgium Capped | 18,915 | |||
MSCI France | 35,371 | |||
MSCI Netherlands | 4,913 | |||
MSCI Sweden Capped | 3,517 | |||
BlackRock Investments, LLC, an affiliate of BFA, is the distributor for each Fund. Pursuant to the distribution agreement, BFA is responsible for any fees or expenses for distribution services provided to the Funds.
| 48 | 2017 iSHARES ANNUAL REPORTTO SHAREHOLDERS |
Table of Contents
Notes to Financial Statements (Continued)
iSHARES®, INC.
Cross trading is the buying or selling of portfolio securities between funds to which BFA (or an affiliate) serves as investment adviser. At its regularly scheduled quarterly meetings, the Board reviews such transactions as of the most recent calendar quarter for compliance with the requirements and restrictions set forth by Rule 17a-7.
For the year ended August 31, 2017, transactions executed by the Funds pursuant to Rule 17a-7 under the 1940 Act were as follows:
| iShares ETF | Purchases | Sales | ||||||
MSCI Austria Capped | $ | 325,356 | $ | 835,092 | ||||
MSCI Belgium Capped | 3,062,593 | 170,454 | ||||||
MSCI France | 2,036,537 | 2,446,980 | ||||||
MSCI Netherlands | 2,525,705 | 5,647,845 | ||||||
MSCI Sweden Capped | 8,312,879 | 6,368,226 | ||||||
Each Fund may invest its positive cash balances in certain money market funds managed by BFA or an affiliate. The income earned on these temporary cash investments is included in “Dividends – affiliated” in the statements of operations.
The PNC Financial Services Group, Inc. is the largest stockholder of BlackRock and is considered to be an affiliate of the Funds for 1940 Act purposes.
Certain directors and officers of the Company are also officers of BTC and/or BFA.
| 3. | INVESTMENT PORTFOLIO TRANSACTIONS |
Purchases and sales of investments (excluding in-kind transactions and short-term investments) for the year ended August 31, 2017 were as follows:
| iShares ETF | Purchases | Sales | ||||||
MSCI Austria Capped | $ | 25,048,089 | $ | 22,134,129 | ||||
MSCI Belgium Capped | 7,192,537 | 7,431,981 | ||||||
MSCI France | 30,638,707 | 22,504,526 | ||||||
MSCI Netherlands | 25,098,232 | 24,536,663 | ||||||
MSCI Sweden Capped | 36,463,829 | 30,744,473 | ||||||
In-kind transactions (see Note 4) for the year ended August 31, 2017 were as follows:
| iShares ETF | In-kind Purchases | In-kind Sales | ||||||
MSCI Austria Capped | $ | 132,326,954 | $ | 11,385,729 | ||||
MSCI Belgium Capped | 14,431,357 | 82,815,891 | ||||||
MSCI France | 400,403,605 | 176,952,212 | ||||||
MSCI Netherlands | 11,950,433 | 43,879,914 | ||||||
MSCI Sweden Capped | 197,504,454 | 93,671,140 | ||||||
NOTESTO FINANCIAL STATEMENTS | 49 |
Table of Contents
Notes to Financial Statements (Continued)
iSHARES®, INC.
| 4. | CAPITAL SHARE TRANSACTIONS |
Capital shares are issued and redeemed by each Fund only in aggregations of a specified number of shares or multiples thereof (“Creation Units”) at NAV. Except when aggregated in Creation Units, shares of each Fund are not redeemable. Transactions in capital shares for each Fund are disclosed in detail in the statements of changes in net assets.
The consideration for the purchase of Creation Units of a fund in the Company generally consists of the in-kind deposit of a designated portfolio of securities and a specified amount of cash. Certain funds in the Company may be offered in Creation Units solely or partially for cash in U.S. dollars. Investors purchasing and redeeming Creation Units may pay a purchase transaction fee and a redemption transaction fee directly to State Street Bank and Trust Company, the Company’s administrator, to offset transfer and other transaction costs associated with the issuance and redemption of Creation Units, including Creation Units for cash. Investors transacting in Creation Units for cash may also pay an additional variable charge to compensate the relevant fund for certain transaction costs (i.e., stamp taxes, taxes on currency or other financial transactions, and brokerage costs) and market impact expenses relating to investing in portfolio securities. Such variable charges, if any, are included in “Proceeds from shares sold” in the statements of changes in net assets.
From time to time, settlement of securities related to in-kind contributions or in-kind redemptions may be delayed. In such cases, securities related to in-kind contributions are reflected as “Due from custodian” and securities related to in-kind redemptions are reflected as “Securities related to in-kind transactions” in the statements of assets and liabilities.
| 5. | PRINCIPAL RISKS |
In the normal course of business, each Fund invests in securities or other instruments and may enter into certain transactions, and such activities subject the Fund to various risks, including, among others, fluctuations in the market (market risk) or failure of an issuer to meet all of its obligations. The value of securities or other instruments may also be affected by various factors, including, without limitation: (i) the general economy; (ii) the overall market as well as local, regional or global political and/or social instability; (iii) regulation, taxation or international tax treaties between various countries; or (iv) currency, interest rate or price fluctuations. Each Fund’s prospectus provides details of the risks to which the Fund is subject.
BFA uses a “passive” or index approach to try to achieve each Fund’s investment objective following the securities included in its underlying index during upturns as well as downturns. BFA does not take steps to reduce market exposure or to lessen the effects of a declining market. Divergence from the underlying index and the composition of the portfolio is monitored by BFA.
MARKET RISK
Market risk arises mainly from uncertainty about future values of financial instruments influenced by price, currency and interest rate movements. It represents the potential loss a fund may suffer through holding market positions in the face of market movements. A fund is exposed to market risk by its investment in equity, fixed income and/or financial derivative instruments or by its investment in underlying funds. The fair value of securities held by a fund may decline due to general market conditions, economic trends or events that are not specifically related to the issuers of the securities including local, regional or global political, social or economic instability or to factors that affect a particular industry or group of industries. The extent of a fund’s exposure to market risk is the market value of the investments held as shown in the fund’s schedule of investments.
A diversified portfolio, where this is appropriate and consistent with a fund’s objectives, minimizes the risk that a price change of a particular investment will have a material impact on the NAV of a fund. The investment concentrations within each Fund’s portfolio are disclosed in its schedule of investments.
| 50 | 2017 iSHARES ANNUAL REPORTTO SHAREHOLDERS |
Table of Contents
Notes to Financial Statements (Continued)
iSHARES®, INC.
Investing in the securities of non-U.S. issuers involves certain considerations and risks not typically associated with securities of U.S. issuers. Such risks include, but are not limited to: differences in accounting, auditing and financial reporting standards; more substantial governmental involvement in the economy; higher inflation rates, greater social, economic and political uncertainties; possible nationalization or expropriation of assets; less availability of public information about issuers; imposition of withholding or other taxes; higher transaction and custody costs and delays in settlement procedures; and lower level of regulation of the securities markets and issuers. Non-U.S. securities may be less liquid, more difficult to value, and have greater price volatility due to exchange rate fluctuations. These and other risks are heightened for investments in issuers from countries with less developed capital markets.
The economies and markets of European countries are often closely connected and interdependent, and events in one country in Europe can have an adverse impact on other European countries. The European financial markets have experienced volatility and adverse trends in recent years due to concerns about economic downturns or rising government debt levels in several European countries. These events have adversely affected the exchange rate of the euro and may continue to significantly affect European countries. The occurrence of terrorist incidents throughout Europe also could impact financial markets. In addition, the United Kingdom has voted to withdraw from the European Union. The referendum may introduce significant new uncertainties and instability in the financial markets as the United Kingdom negotiates its exit from the European Union.
When a fund concentrates its investments in issuers located in a single country, it assumes the risk that economic, political and social conditions in that country may have a significant impact on its investment performance.
CREDIT RISK
Credit risk is the risk that an issuer or guarantor of debt instruments or the counterparty to a financial transaction, including derivatives contracts, repurchase agreements or loans of portfolio securities, is unable or unwilling to make timely interest and/or principal payments or to otherwise honor its obligations. BFA and its affiliates manage counterparty credit risk by entering into transactions only with counterparties that they believe have the financial resources to honor their obligations and by monitoring the financial stability of those counterparties. Financial assets, which potentially expose a fund to issuer and counterparty credit risks, consist principally of financial instruments and receivables due from counterparties. The extent of a fund’s exposure to credit and counterparty risks with respect to those financial assets is approximated by their value recorded in its statement of assets and liabilities.
| 6. | INCOME TAX INFORMATION |
Each Fund is treated as an entity separate from the Company’s other funds for federal income tax purposes. It is the policy of each Fund to qualify as a regulated investment company by complying with the provisions applicable to regulated investment companies, as defined under Subchapter M of the Internal Revenue Code of 1986, as amended, and to annually distribute substantially all of its ordinary income and any net capital gains (taking into account any capital loss carryforwards) sufficient to relieve it from all, or substantially all, federal income and excise taxes. Accordingly, no provision for federal income taxes is required.
U.S. GAAP requires that certain components of net assets be adjusted to reflect permanent differences between financial and tax reporting. These reclassifications have no effect on net assets or NAV per share. The following permanent differences as of
NOTESTO FINANCIAL STATEMENTS | 51 |
Table of Contents
Notes to Financial Statements (Continued)
iSHARES®, INC.
August 31, 2017, attributable to passive foreign investment companies, the expiration of capital loss carryforwards, foreign currency transactions and realized gains (losses) from in-kind redemptions, were reclassified to the following accounts:
| iShares ETF | Paid-in Capital | Undistributed Net Investment Income/Distributions in Excess of Net Investment Income | Undistributed Net Realized Gain/Accumulated Net Realized Loss | |||||||||
MSCI Austria Capped | $ | (4,914,676 | ) | $ | (10,438 | ) | $ | 4,925,114 | ||||
MSCI Belgium Capped | (9,021,870 | ) | 76,316 | 8,945,554 | ||||||||
MSCI France | (3,831,720 | ) | 161,298 | 3,670,422 | ||||||||
MSCI Netherlands | (2,215,416 | ) | 46,809 | 2,168,607 | ||||||||
MSCI Sweden Capped | (9,514,386 | ) | 223,474 | 9,290,912 | ||||||||
The tax character of distributions paid during the years ended August 31, 2017 and August 31, 2016 was as follows:
| iShares ETF | 2017 | 2016 | ||||||
MSCI Austria Capped | ||||||||
Ordinary income | $ | 3,029,256 | $ | 1,345,976 | ||||
|
|
|
| |||||
MSCI Belgium Capped | ||||||||
Ordinary income | $ | 2,204,067 | $ | 3,766,140 | ||||
|
|
|
| |||||
MSCI France | ||||||||
Ordinary income | $ | 9,786,674 | $ | 10,111,706 | ||||
|
|
|
| |||||
MSCI Netherlands | ||||||||
Ordinary income | $ | 4,373,491 | $ | 4,368,474 | ||||
|
|
|
| |||||
MSCI Sweden Capped | ||||||||
Ordinary income | $ | 9,859,546 | $ | 12,154,414 | ||||
|
|
|
| |||||
As of August 31, 2017, the tax components of accumulated net earnings (losses) were as follows:
| iShares ETF | Undistributed Ordinary Income | Capital Loss | Net Unrealized Gains (Losses) a | Total | ||||||||||||
MSCI Austria Capped | $ | 1,765,330 | $ | (65,247,330 | ) | $ | 18,949,303 | $ | (44,532,697 | ) | ||||||
MSCI Belgium Capped | 372,616 | (44,277,777 | ) | (844,514 | ) | (44,749,675 | ) | |||||||||
MSCI France | 560,868 | (40,373,537 | ) | (6,163,339 | ) | (45,976,008 | ) | |||||||||
MSCI Netherlands | 890,011 | (38,794,550 | ) | 21,397,886 | (16,506,653 | ) | ||||||||||
MSCI Sweden Capped | 2,672,020 | (36,595,951 | ) | (17,246,517 | ) | (51,170,448 | ) | |||||||||
| a | The difference between book-basis and tax-basis unrealized gains (losses) was attributable primarily to the tax deferral of losses on wash sales, foreign withholding tax reclaims and the realization for tax purposes of unrealized gains on investments in passive foreign investment companies. |
| 52 | 2017 iSHARES ANNUAL REPORTTO SHAREHOLDERS |
Table of Contents
Notes to Financial Statements (Continued)
iSHARES®, INC.
As of August 31, 2017, the Funds had capital loss carryforwards available to offset future realized capital gains through the indicated expiration dates as follows:
| iShares ETF | Non- Expiring a | Expiring 2018 | Expiring 2019 | Total | ||||||||||||
MSCI Austria Capped | $ | 34,763,382 | 16,657,011 | $ | 13,826,937 | $ | 65,247,330 | |||||||||
MSCI Belgium Capped | 14,428,086 | 10,826,174 | 19,023,517 | 44,277,777 | ||||||||||||
MSCI France | 30,506,193 | 7,008,530 | 2,858,814 | 40,373,537 | ||||||||||||
MSCI Netherlands | 14,209,375 | 22,256,170 | 2,329,005 | 38,794,550 | ||||||||||||
MSCI Sweden Capped | 22,867,464 | 8,483,510 | 5,244,977 | 36,595,951 | ||||||||||||
| a | Must be utilized prior to losses subject to expiration. |
The Funds may own shares in certain foreign investment entities, referred to, under U.S. tax law, as “passive foreign investment companies.” The Funds may elect to mark-to-market annually the shares of each passive foreign investment company and would be required to distribute to shareholders any such marked-to-market gains.
Management has analyzed tax laws and regulations and their application to the Funds as of August 31, 2017, inclusive of the open tax return years, and does not believe there are any uncertain tax positions that require recognition of a tax liability in the Funds’ financial statements.
| 7. | FOREIGN WITHHOLDING TAX CLAIMS |
The iShares MSCI Sweden ETF has filed claims to recover taxes withheld by Sweden on dividend income on the basis that Sweden had purportedly violated certain provisions in the Treaty on the Functioning of the European Union. The Fund has recorded a receivable for all recoverable taxes withheld by Sweden based upon favorable determinations issued by the Swedish Tax Authority. The Fund continues to evaluate developments in Sweden for potential impacts to the receivables recorded. Swedish tax claims receivable are disclosed in the statement of assets and liabilities. Professional fees associated with the filing of tax claims in Sweden that result in the recovery of foreign withholding taxes have been approved by the Board as appropriate expenses of the Fund.
The Fund, under the approval of the Board, is seeking a closing agreement with the Internal Revenue Service (“IRS”) to address any prior years’ U.S. income tax liabilities attributable to Fund shareholders resulting from the recovery of foreign taxes. The closing agreement would result in the Fund paying a compliance fee to the IRS, on behalf of its shareholders, representing the estimated tax savings generated from foreign tax credits claimed by Fund shareholders on their tax returns in prior years. The Fund has accrued a liability for the estimated IRS compliance fee related to foreign withholding tax claims, which is disclosed in the statement of assets and liabilities. The actual IRS compliance fee may differ from the estimate and that difference may be material.
| 8. | LEGAL PROCEEDINGS |
On June 16, 2016, investors (the “Plaintiffs”) in certain iShares funds (iShares Core S&P Small-Cap ETF, iShares Russell 1000 Growth ETF, iShares Core S&P 500 ETF, iShares Russell Mid-Cap Growth ETF, iShares Russell Mid-Cap ETF, iShares Russell Mid-Cap Value ETF, iShares Select Dividend ETF, iShares Morningstar Mid-Cap ETF, iShares Morningstar Large-Cap ETF, iShares U.S. Aerospace & Defense ETF and iShares U.S. Preferred Stock ETF) filed a putative class action lawsuit against iShares Trust, BlackRock, Inc. and certain of its advisory affiliates, and certain directors/trustees and officers of the Funds (collectively, “Defendants”). The lawsuit alleges the Defendants violated federal securities laws by failing to adequately disclose in
NOTESTO FINANCIAL STATEMENTS | 53 |
Table of Contents
Notes to Financial Statements (Continued)
iSHARES®, INC.
the prospectuses issued by the funds noted above the risks of using stop-loss orders in the event of a ‘flash crash’, such as the one that occurred on May 6, 2010. On September 18, 2017, the Court issued a Statement of Decision holding that the Plaintiffs lack standing to assert their claims. On October 11, 2017, the Court entered final judgment dismissing all of Plaintiffs’ claims with prejudice.
| 9. | SUBSEQUENT EVENTS |
Management has evaluated the impact of all subsequent events on the Funds through the date the financial statements were available to be issued and has determined that there were no subsequent events requiring adjustment or disclosure in the financial statements, except as noted below.
Effective September 1, 2017, the iShares MSCI Netherlands ETF will track a new underlying index, the MSCI Netherlands IMI 25/50 Index, and will cease to track the MSCI Netherlands Investable Market Index. The change to a capped benchmark is being implemented to seek to reduce tracking error and improve the investor experience.
| 54 | 2017 iSHARES ANNUAL REPORTTO SHAREHOLDERS |
Table of Contents
Report of Independent Registered Public Accounting Firm
To the Board of Directors of iShares, Inc. and
Shareholders of the iShares MSCI Austria Capped ETF, iShares MSCI Belgium Capped ETF,
iShares MSCI France ETF, iShares MSCI Netherlands ETF and iShares MSCI Sweden Capped ETF
In our opinion, the accompanying statements of assets and liabilities, including the schedules of investments, and the related statements of operations and of changes in net assets and the financial highlights present fairly, in all material respects, the financial position of iShares MSCI Austria Capped ETF, iShares MSCI Belgium Capped ETF, iShares MSCI France ETF, iShares MSCI Netherlands ETF and iShares MSCI Sweden Capped ETF (constituting funds of iShares, Inc., hereafter referred to as the “Funds”) as of August 31, 2017, and the results of each of their operations, the changes in each of their net assets and the financial highlights for each of the periods indicated, in conformity with accounting principles generally accepted in the United States of America. These financial statements and financial highlights (hereafter referred to as “financial statements”) are the responsibility of the Funds’ management. Our responsibility is to express an opinion on these financial statements based on our audits. We conducted our audits of these financial statements in accordance with the standards of the Public Company Accounting Oversight Board (United States). Those standards require that we plan and perform the audit to obtain reasonable assurance about whether the financial statements are free of material misstatement. An audit includes examining, on a test basis, evidence supporting the amounts and disclosures in the financial statements, assessing the accounting principles used and significant estimates made by management, and evaluating the overall financial statement presentation. We believe that our audits, which included confirmation of securities as of August 31, 2017 by correspondence with the custodian, transfer agent and brokers, or by other appropriate auditing procedures where replies were not received, provide a reasonable basis for our opinion.
PricewaterhouseCoopers LLP
San Francisco, California
October 23, 2017
REPORTOF INDEPENDENT REGISTERED PUBLIC ACCOUNTING FIRM | 55 |
Table of Contents
iSHARES®, INC.
The following maximum amounts are hereby designated as qualified dividend income for individuals for the fiscal year ended August 31, 2017:
| iShares ETF | Qualified Dividend Income | |||
MSCI Austria Capped | $ | 3,953,705 | ||
MSCI Belgium Capped | 2,629,632 | |||
MSCI France | 13,282,122 | |||
MSCI Netherlands | 4,619,683 | |||
MSCI Sweden Capped | 10,615,738 | |||
For the fiscal year ended August 31, 2017, the following Funds earned foreign source income and paid foreign taxes which they intend to pass through to their shareholders:
| iShares ETF | Foreign Source Income Earned | Foreign Taxes Paid | ||||||
MSCI Austria Capped | $ | 4,275,778 | $ | 402,717 | ||||
MSCI Belgium Capped | 2,896,146 | 431,458 | ||||||
MSCI France | 13,340,937 | 1,598,141 | ||||||
MSCI Netherlands | 4,655,700 | 683,611 | ||||||
MSCI Sweden Capped | 11,265,122 | 30,853 | ||||||
| 56 | 2017 iSHARES ANNUAL REPORTTO SHAREHOLDERS |
Table of Contents
Board Review and Approval of Investment Advisory
Contract
iSHARES®, INC.
I. iShares MSCI Austria Capped ETF, iShares MSCI Belgium Capped ETF and iShares MSCI Netherlands ETF
Under Section 15(c) of the Investment Company Act of 1940 (the “1940 Act”), the Company’s Board of Directors (the “Board”), including a majority of Directors who are not “interested persons” of the Company (as that term is defined in the 1940 Act) (the “Independent Directors”), is required annually to consider and approve the Investment Advisory Contract between the Company and BFA (the “Advisory Contract”) on behalf of the Funds. The Independent Directors requested, and BFA provided, such information as the Independent Directors, with advice from independent counsel, deemed reasonably necessary to evaluate the Advisory Contract. A committee of all of the Independent Directors (the “15(c) Committee”), with independent counsel, met with management on May 5, 2017 and May 12, 2017. At these meetings, the 15(c) Committee reviewed and discussed information provided in response to the 15(c) Committee’s initial requests, and requested certain additional information, which management agreed to provide. At a meeting held on May 18, 2017, management presented information to the Board relating to the continuance of the Advisory Contract, including information requested by the 15(c) Committee during its meetings. The Board, including the Independent Directors, reviewed and discussed such information at length. The Independent Directors requested from management certain additional information, which management agreed to provide. At a meeting held on June 19-21, 2017, the Board, including the Independent Directors, reviewed the additional information provided by management in response to these requests. After extensive discussions, the Board, including all of the Independent Directors, approved the continuance of the Advisory Contract for the Funds, based on a review of qualitative and quantitative information provided by BFA. The Board noted its satisfaction with the extent and quality of information provided and its frequent interactions with management, as well as the detailed responses and other information provided by BFA. The Board also noted that the Board and BFA agreed to discuss potential further enhancements to the 15(c) process for the coming year. The Independent Directors were advised by their independent counsel throughout the process, including about the legal standards applicable to their review. In approving the Advisory Contract for the Funds, the Board, including the Independent Directors, considered the following factors, no one of which was controlling, and reached the following conclusions:
Expenses and Performance of the Funds — The Board reviewed statistical information prepared by Broadridge Financial Solutions Inc. (“Broadridge”), an independent provider of investment company data, regarding the expense ratio components, including gross and net total expenses, waivers/reimbursements (if any), and underlying fund fees and expenses (if any) of each Fund in comparison with the same information for other exchange traded funds (“ETFs”) (including, where applicable, funds sponsored by an “at cost” service provider) and, in the limited instances where no comparable ETFs existed and the comparison group would not otherwise be reasonable in Broadridge’s judgment, pure index institutional mutual funds, objectively selected by Broadridge as comprising such Fund’s applicable peer group pursuant to Broadridge’s proprietary ETF methodology (the “Peer Group”). The Board was provided with a detailed description of the proprietary ETF methodology used by Broadridge to determine the applicable Peer Groups. The Board further noted that due to the limitations in providing comparable funds in the various Peer Groups, the statistical information provided in Broadridge’s report may or may not provide meaningful direct comparisons to the Funds in all instances.
The Board also noted that the investment advisory fee rates and overall expenses (net of waivers and reimbursements) for the Funds were lower than the median of the investment advisory fee rates and overall expenses (net of waivers and reimbursements) of the funds in their respective Peer Group, excluding iShares funds.
In addition, to the extent that any of the comparison funds included in the Peer Group, excluding iShares funds, track the same index as any particular Fund, Broadridge also provided, and the Board reviewed, a comparison of such Fund’s performance for the one-, three-, five-, ten-year, and since inception periods, as applicable, and for the quarter ended December 31, 2016, to that of relevant comparison funds for the same periods.
BOARD REVIEWAND APPROVALOF INVESTMENT ADVISORY CONTRACT | 57 |
Table of Contents
Board Review and Approval of Investment Advisory
Contract (Continued)
iSHARES®, INC.
The Board noted that each Fund seeks to track its own underlying index and that, during the year, the Board received periodic reports on each Fund’s short- and longer-term performance in comparison with its underlying index. Such periodic comparative performance information, including any additional detailed information requested by the Boards, was also considered. The Board noted that each Fund generally performed in line with its underlying index over the relevant periods.
Based on this review, the other factors considered at the meeting, and their general knowledge of ETF pricing, the Board concluded that the investment advisory fee rate and the historical performance of each Fund supported the Board’s approval of the continuance of the Advisory Contract for the coming year.
Nature, Extent and Quality of Services Provided by BFA — Based on management’s representations, including information about recent and proposed enhancements to the iShares business, including with respect to capital markets support and analysis, technology, product design, compliance and risk management, and other services, the Board expected that there would be no diminution in the scope of services required of or provided by BFA under the Advisory Contract for the coming year as compared to the scope of services provided by BFA during prior years. In reviewing the scope of these services, the Board considered BFA’s investment philosophy and experience, noting that BFA and its affiliates have committed significant resources over time, including during the past year, to supporting the iShares funds and their shareholders. The Board also considered BFA’s compliance program and its compliance record with respect to the Funds. In that regard, the Board noted that BFA reports to the Board about portfolio management and compliance matters on a periodic basis in connection with regularly scheduled meetings of the Board, and on other occasions as necessary and appropriate, and has provided information and made appropriate officers available as needed to provide further assistance with these matters. The Board also reviewed the background and experience of the persons responsible for the day-to-day management of the Funds, as well as the resources available to them in managing the Funds. In addition to the above considerations, the Board reviewed and considered detailed presentations regarding BFA’s investment performance, investment and risk management processes and strategies provided at the June 19-21, 2017 meeting and throughout the previous year, and matters related to BFA’s portfolio compliance policies and procedures. The Board noted that each Fund had met its investment objective consistently since its respective inception date.
Based on review of this information, and the performance information discussed above, the Board concluded that the nature, extent and quality of services provided by BFA to the Funds under the Advisory Contract supported the Board’s approval of the continuance of the Advisory Contract for the coming year.
Costs of Services Provided to Funds and Profits Realized by BFA and Affiliates — The Board reviewed information about the profitability of the Funds to BlackRock, on a Fund-by-Fund basis and in the aggregate, based on the fees payable to BFA and its affiliates (including fees under the Advisory Contract), and other sources of revenue and expense to BFA and its affiliates from the Funds’ operations for the last calendar year. The Board reviewed BlackRock’s profitability methodology for the iShares funds, including supplemental information that was responsive to requests of the 15(c) Committee. The Board noted that the 15(c) Committee had focused on the methodology and profitability presentation during its meetings. The Board discussed the sources of direct and ancillary revenue with management, including the revenues to BTC, a BFA affiliate, from securities lending by the Funds. The Board also discussed BFA’s profit margin as reflected in the Funds’ profitability analyses and reviewed information regarding potential economies of scale (as discussed below). Based on this review, the Board concluded that the profits realized by BFA and its affiliates under the Advisory Contract and from other relationships between the Funds and BFA and/or its affiliates, if any, were within a reasonable range in light of the factors considered.
Economies of Scale — The Board reviewed information regarding potential economies of scale or other efficiencies that may result from increases in the Funds’ assets, noting that the issue of economies of scale had been focused on by the 15(c) Committee during its meetings and addressed by management, including through supplemental information. The Board and the 15(c) Committee reviewed information provided by BFA regarding scale benefits shared with the iShares funds through relatively
| 58 | 2017 iSHARES ANNUAL REPORTTO SHAREHOLDERS |
Table of Contents
Board Review and Approval of Investment Advisory
Contract (Continued)
iSHARES®, INC.
low fee rates established at inception, breakpoints and waivers or other fee reductions, as well as through additional investment in the iShares business and the provision of improved or additional infrastructure and services to the iShares funds and their shareholders. The Board and the 15(c) Committee received information regarding BlackRock’s historical profitability, including BFA’s and its affiliates’ costs in providing services. The cost information distinguished, among other things, between fixed and variable costs, and explained how the level of fixed and variable costs, as well as the nature of such costs, may impact the existence or size of scale benefits. The Board noted that the Advisory Contract for the Funds already provided for breakpoints in the Funds’ investment advisory fee rates and that, following negotiations, BFA and the Board had agreed to revise the Advisory Contract for the Funds to provide for an additional breakpoint as the assets of the Funds, on an aggregated basis with the assets of certain other iShares funds, increase. The Board noted that it would continue to monitor the sharing of economies of scale to determine the appropriateness of adding new or revised breakpoints in the future.
Based on this review, as well as the other factors considered at the meeting, the Board, recognizing its responsibility to consider the Advisory Contract at least annually, determined to approve the continuance of the Advisory Contract for the coming year.
Fees and Services Provided for Other Comparable Funds/Accounts Managed by BFA and its Affiliates — The Board received and considered information regarding the investment advisory/management fee rates for other funds/accounts in the U.S. for which BFA (or its affiliates) provides investment advisory/management services, including open-end funds registered under the 1940 Act (including sub-advised funds), collective trust funds, and institutional separate accounts (together, the “Other Accounts”), and acknowledged BFA’s assertion that the iShares funds are fundamentally different investment vehicles from the Other Accounts. The Board noted that BFA and its affiliates do not manage Other Accounts with substantially the same investment objectives and strategies as the Funds and that track the same index as the Funds. The Board further noted that BFA provided the Board with detailed information regarding how the Other Accounts (particularly institutional clients) generally differ from the Funds, including in terms of the different and generally more extensive services provided to the Funds, as well as other significant differences. In that regard, the Board considered that the pricing of services to institutional clients is typically based on a number of factors beyond the nature and extent of the specific services to be provided and often depends on the overall relationship between the client and its affiliates and the adviser and its affiliates. In addition, the Board considered the relative complexity and inherent risks and challenges of managing and providing other services to the Funds, as publicly traded ETFs, as compared to the Other Accounts that are institutional clients in light of differing regulatory requirements and client-imposed mandates. The Board also acknowledged BFA’s expressed business purpose for launching a suite of iShares “Core” ETFs that generally are subject to lower investment advisory fees than iShares non-Core ETFs that may provide a similar investment exposure. The Board also considered the “all-inclusive” nature of the Funds’ advisory fee structure, and the Fund expenses borne by BFA under this arrangement. The Board noted that the investment advisory fee rates under the Advisory Contract for the Funds were generally higher than the investment advisory/management fee rates for certain of the Other Accounts (particularly institutional clients) and concluded that the differences appeared to be consistent with the factors discussed.
Other Benefits to BFA and/or its Affiliates — The Board reviewed the “fallout” benefits or ancillary revenue received by BFA and/or its affiliates in connection with the services provided to the Funds by BFA, such as payment of revenue to BTC, the Funds’ securities lending agent, for loaning portfolio securities (which was included in the profit margins reviewed by the Board pursuant to BFA’s profitability methodology), and payment of advisory fees and/or administration fees to BFA and BTC (or their affiliates) in connection with any investments by the Funds in other funds for which BFA (or its affiliates) provides investment advisory services and/or administration services. The Board also noted the revenue received by BFA and/or its affiliates pursuant to an agreement that permits a service provider to use certain portions of BlackRock’s technology platform to service accounts managed by BFA and/or its affiliates, including the iShares funds. The Board noted that BFA generally does not use soft dollars or consider the value of research or other services that may be provided to BFA (including its affiliates) in selecting brokers for portfolio transactions for the Funds. The Board further noted that any portfolio transactions on behalf of the Funds placed through a BFA affiliate or purchased from an underwriting syndicate in which a BFA affiliate participates, are reported to the Board
BOARD REVIEWAND APPROVALOF INVESTMENT ADVISORY CONTRACT | 59 |
Table of Contents
Board Review and Approval of Investment Advisory
Contract (Continued)
iSHARES®, INC.
pursuant to Rule 17e-1 or Rule 10f-3, as applicable, under the 1940 Act. The Board concluded that any such ancillary benefits would not be disadvantageous to the Funds’ shareholders and thus would not alter the Board’s conclusion with respect to the appropriateness of approving the continuance of the Advisory Contract for the coming year.
Conclusion — Based on the considerations described above, the Board determined that each Fund’s investment advisory fee rate under the Advisory Contract does not constitute a fee that is so disproportionately large as to bear no reasonable relationship to the services rendered and that could not have been the product of arm’s-length bargaining, and concluded to approve the continuance of the Advisory Contract for the coming year.
II. iShares MSCI France ETF and iShares MSCI Sweden Capped ETF
Under Section 15(c) of the Investment Company Act of 1940 (the “1940 Act”), the Company’s Board of Directors (the “Board”), including a majority of Directors who are not “interested persons” of the Company (as that term is defined in the 1940 Act) (the “Independent Directors”), is required annually to consider and approve the Investment Advisory Contract between the Company and BFA (the “Advisory Contract”) on behalf of the Funds. The Independent Directors requested, and BFA provided, such information as the Independent Directors, with advice from independent counsel, deemed reasonably necessary to evaluate the Advisory Contract. A committee of all of the Independent Directors (the “15(c) Committee”), with independent counsel, met with management on May 5, 2017 and May 12, 2017. At these meetings, the 15(c) Committee reviewed and discussed information provided in response to the 15(c) Committee’s initial requests, and requested certain additional information, which management agreed to provide. At a meeting held on May 18, 2017, management presented information to the Board relating to the continuance of the Advisory Contract, including information requested by the 15(c) Committee during its meetings. The Board, including the Independent Directors, reviewed and discussed such information at length. The Independent Directors requested from management certain additional information, which management agreed to provide. At a meeting held on June 19-21, 2017, the Board, including the Independent Directors, reviewed the additional information provided by management in response to these requests. After extensive discussions, the Board, including all of the Independent Directors, approved the continuance of the Advisory Contract for the Funds, based on a review of qualitative and quantitative information provided by BFA. The Board noted its satisfaction with the extent and quality of information provided and its frequent interactions with management, as well as the detailed responses and other information provided by BFA. The Board also noted that the Board and BFA agreed to discuss potential further enhancements to the 15(c) process for the coming year. The Independent Directors were advised by their independent counsel throughout the process, including about the legal standards applicable to their review. In approving the Advisory Contract for the Funds, the Board, including the Independent Directors, considered the following factors, no one of which was controlling, and reached the following conclusions:
Expenses and Performance of the Funds — The Board reviewed statistical information prepared by Broadridge Financial Solutions Inc. (“Broadridge”), an independent provider of investment company data, regarding the expense ratio components, including gross and net total expenses, waivers/reimbursements (if any), and underlying fund fees and expenses (if any) of each Fund in comparison with the same information for other exchange traded funds (“ETFs”) (including, where applicable, funds sponsored by an “at cost” service provider) and, in the limited instances where no comparable ETFs existed and the comparison group would not otherwise be reasonable in Broadridge’s judgment, pure index institutional mutual funds, objectively selected by Broadridge as comprising such Fund’s applicable peer group pursuant to Broadridge’s proprietary ETF methodology (the “Peer Group”). The Board was provided with a detailed description of the proprietary ETF methodology used by Broadridge to determine the applicable Peer Groups. The Board further noted that due to the limitations in providing comparable funds in the various Peer Groups, the statistical information provided in Broadridge’s report may or may not provide meaningful direct comparisons to the Funds in all instances.
| 60 | 2017 iSHARES ANNUAL REPORTTO SHAREHOLDERS |
Table of Contents
Board Review and Approval of Investment Advisory
Contract (Continued)
iSHARES®, INC.
The Board also noted that the investment advisory fee rates and overall expenses (net of waivers and reimbursements) for the Funds were lower than the median of the investment advisory fee rates and overall expenses (net of waivers and reimbursements) of the funds in their respective Peer Group, excluding iShares funds.
In addition, to the extent that any of the comparison funds included in the Peer Group, excluding iShares funds, track the same index as any particular Fund, Broadridge also provided, and the Board reviewed, a comparison of such Fund’s performance for the one-, three-, five-, ten-year, and since inception periods, as applicable, and for the quarter ended December 31, 2016, to that of relevant comparison funds for the same periods.
The Board noted that each Fund seeks to track its own underlying index and that, during the year, the Board received periodic reports on each Fund’s short- and longer-term performance in comparison with its underlying index. Such periodic comparative performance information, including any additional detailed information requested by the Boards, was also considered. The Board noted that each Fund generally performed in line with its underlying index over the relevant periods.
Based on this review, the other factors considered at the meeting, and their general knowledge of ETF pricing, the Board concluded that the investment advisory fee rate and the historical performance of each Fund supported the Board’s approval of the continuance of the Advisory Contract for the coming year.
Nature, Extent and Quality of Services Provided by BFA — Based on management’s representations, including information about recent and proposed enhancements to the iShares business, including with respect to capital markets support and analysis, technology, product design, compliance and risk management, and other services, the Board expected that there would be no diminution in the scope of services required of or provided by BFA under the Advisory Contract for the coming year as compared to the scope of services provided by BFA during prior years. In reviewing the scope of these services, the Board considered BFA’s investment philosophy and experience, noting that BFA and its affiliates have committed significant resources over time, including during the past year, to supporting the iShares funds and their shareholders. The Board also considered BFA’s compliance program and its compliance record with respect to the Funds. In that regard, the Board noted that BFA reports to the Board about portfolio management and compliance matters on a periodic basis in connection with regularly scheduled meetings of the Board, and on other occasions as necessary and appropriate, and has provided information and made appropriate officers available as needed to provide further assistance with these matters. The Board also reviewed the background and experience of the persons responsible for the day-to-day management of the Funds, as well as the resources available to them in managing the Funds. In addition to the above considerations, the Board reviewed and considered detailed presentations regarding BFA’s investment performance, investment and risk management processes and strategies provided at the June 19-21, 2017 meeting and throughout the previous year, and matters related to BFA’s portfolio compliance policies and procedures. The Board noted that each Fund had met its investment objective consistently since its respective inception date.
Based on review of this information, and the performance information discussed above, the Board concluded that the nature, extent and quality of services provided by BFA to the Funds under the Advisory Contract supported the Board’s approval of the continuance of the Advisory Contract for the coming year.
Costs of Services Provided to Funds and Profits Realized by BFA and Affiliates — The Board reviewed information about the profitability of the Funds to BlackRock, on a Fund-by-Fund basis and in the aggregate, based on the fees payable to BFA and its affiliates (including fees under the Advisory Contract), and other sources of revenue and expense to BFA and its affiliates from the Funds’ operations for the last calendar year. The Board reviewed BlackRock’s profitability methodology for the iShares funds, including supplemental information that was responsive to requests of the 15(c) Committee. The Board noted that the 15(c) Committee had focused on the methodology and profitability presentation during its meetings. The Board discussed the sources of direct and ancillary revenue with management, including the revenues to BTC, a BFA affiliate, from securities lending by the
BOARD REVIEWAND APPROVALOF INVESTMENT ADVISORY CONTRACT | 61 |
Table of Contents
Board Review and Approval of Investment Advisory
Contract (Continued)
iSHARES®, INC.
Funds. The Board also discussed BFA’s profit margin as reflected in the Funds’ profitability analyses and reviewed information regarding potential economies of scale (as discussed below). Based on this review, the Board concluded that the profits realized by BFA and its affiliates under the Advisory Contract and from other relationships between the Funds and BFA and/or its affiliates, if any, were within a reasonable range in light of the factors considered.
Economies of Scale — The Board reviewed information regarding potential economies of scale or other efficiencies that may result from increases in the Funds’ assets, noting that the issue of economies of scale had been focused on by the 15(c) Committee during its meetings and addressed by management, including through supplemental information. The Board and the 15(c) Committee reviewed information provided by BFA regarding scale benefits shared with the iShares funds through relatively low fee rates established at inception, breakpoints and waivers or other fee reductions, as well as through additional investment in the iShares business and the provision of improved or additional infrastructure and services to the iShares funds and their shareholders. The Board and the 15(c) Committee received information regarding BlackRock’s historical profitability, including BFA’s and its affiliates’ costs in providing services. The cost information distinguished, among other things, between fixed and variable costs, and explained how the level of fixed and variable costs, as well as the nature of such costs, may impact the existence or size of scale benefits. The Board noted that the Advisory Contract for the Funds already provided for breakpoints in the Funds’ investment advisory fee rates and that, following negotiations, BFA and the Board had agreed to revise the Advisory Contract for the Funds to provide for an additional breakpoint as the assets of the Funds, on an aggregated basis with the assets of certain other iShares funds, increase. The Board noted that it would continue to monitor the sharing of economies of scale to determine the appropriateness of adding new or revised breakpoints in the future.
Based on this review, as well as the other factors considered at the meeting, the Board, recognizing its responsibility to consider the Advisory Contract at least annually, determined to approve the continuance of the Advisory Contract for the coming year.
Fees and Services Provided for Other Comparable Funds/Accounts Managed by BFA and its Affiliates — The Board received and considered information regarding the investment advisory/management fee rates for other funds/accounts in the U.S. for which BFA (or its affiliates) provides investment advisory/management services, including open-end funds registered under the 1940 Act (including sub-advised funds), collective trust funds, and institutional separate accounts (together, the “Other Accounts”), and acknowledged BFA’s assertion that the iShares funds are fundamentally different investment vehicles from the Other Accounts. The Board noted that BFA and its affiliates do manage Other Accounts with substantially the same investment objectives and strategies as the Funds and that track the same index as the Funds. The Board further noted that BFA provided the Board with detailed information regarding how the Other Accounts (particularly institutional clients) generally differ from the Funds, including in terms of the different and generally more extensive services provided to the Funds, as well as other significant differences. In that regard, the Board considered that the pricing of services to institutional clients is typically based on a number of factors beyond the nature and extent of the specific services to be provided and often depends on the overall relationship between the client and its affiliates and the adviser and its affiliates. In addition, the Board considered the relative complexity and inherent risks and challenges of managing and providing other services to the Funds, as publicly traded ETFs, as compared to the Other Accounts that are institutional clients in light of differing regulatory requirements and client-imposed mandates. The Board also acknowledged BFA’s expressed business purpose for launching a suite of iShares “Core” ETFs that generally are subject to lower investment advisory fees than iShares non-Core ETFs that may provide a similar investment exposure. The Board also considered the “all-inclusive” nature of the Funds’ advisory fee structure, and the Fund expenses borne by BFA under this arrangement. The Board noted that the investment advisory fee rates under the Advisory Contract for the Funds were generally higher than the investment advisory/management fee rates for certain of the Other Accounts (particularly institutional clients) and concluded that the differences appeared to be consistent with the factors discussed.
Other Benefits to BFA and/or its Affiliates — The Board reviewed the “fallout” benefits or ancillary revenue received by BFA and/or its affiliates in connection with the services provided to the Funds by BFA, such as payment of revenue to BTC, the Funds’
| 62 | 2017 iSHARES ANNUAL REPORTTO SHAREHOLDERS |
Table of Contents
Board Review and Approval of Investment Advisory
Contract (Continued)
iSHARES®, INC.
securities lending agent, for loaning portfolio securities (which was included in the profit margins reviewed by the Board pursuant to BFA’s profitability methodology), and payment of advisory fees and/or administration fees to BFA and BTC (or their affiliates) in connection with any investments by the Funds in other funds for which BFA (or its affiliates) provides investment advisory services and/or administration services. The Board also noted the revenue received by BFA and/or its affiliates pursuant to an agreement that permits a service provider to use certain portions of BlackRock’s technology platform to service accounts managed by BFA and/or its affiliates, including the iShares funds. The Board noted that BFA generally does not use soft dollars or consider the value of research or other services that may be provided to BFA (including its affiliates) in selecting brokers for portfolio transactions for the Funds. The Board further noted that any portfolio transactions on behalf of the Funds placed through a BFA affiliate or purchased from an underwriting syndicate in which a BFA affiliate participates, are reported to the Board pursuant to Rule 17e-1 or Rule 10f-3, as applicable, under the 1940 Act. The Board concluded that any such ancillary benefits would not be disadvantageous to the Funds’ shareholders and thus would not alter the Board’s conclusion with respect to the appropriateness of approving the continuance of the Advisory Contract for the coming year.
Conclusion — Based on the considerations described above, the Board determined that each Fund’s investment advisory fee rate under the Advisory Contract does not constitute a fee that is so disproportionately large as to bear no reasonable relationship to the services rendered and that could not have been the product of arm’s-length bargaining, and concluded to approve the continuance of the Advisory Contract for the coming year.
BOARD REVIEWAND APPROVALOF INVESTMENT ADVISORY CONTRACT | 63 |
Table of Contents
Supplemental Information (Unaudited)
iSHARES®, INC.
Proxy Results
A special meeting of the shareholders of each series of iShares, Inc. (the “Company”) was held on June 19, 2017, to elect five Directors to the Board of Directors of the Company. The five nominees were Jane D. Carlin, Richard L. Fagnani, Drew E. Lawton, Madhav V. Rajan and Mark Wiedman, all of whom were elected as Directors at the special meeting. The other Directors whose terms of office as Directors continued after the special meeting are Cecilia H. Herbert, Charles A. Hurty, John E. Kerrigan, John E. Martinez and Robert S. Kapito.
| Director | Votes For | Votes Withheld | ||||||
Jane D. Carlin | 1,911,835,929 | 49,339,171 | ||||||
Richard L. Fagnani | 1,911,725,344 | 49,449,755 | ||||||
Drew E. Lawton | 1,911,790,083 | 49,385,017 | ||||||
Madhav V. Rajan | 1,902,999,095 | 58,176,004 | ||||||
Mark Wiedman | 1,908,143,500 | 53,031,599 | ||||||
Section 19(a) Notices
The amounts and sources of distributions reported are estimates and are provided pursuant to regulatory requirements and are not being provided for tax reporting purposes. The actual amounts and sources for tax reporting purposes will depend upon each Fund’s investment experience during the year and may be subject to changes based on the tax regulations. Shareholders will receive a Form 1099-DIV each calendar year that will inform them how to report these distributions for federal income tax purposes.
| Total Cumulative Distributions for the Fiscal Year | % Breakdown of the Total Cumulative Distributions for the Fiscal Year | |||||||||||||||||||||||||||||||
| iShares ETF | Net Investment Income | Net Realized Capital Gains | Return of Capital | Total Per Share | Net Investment Income | Net Realized Capital Gains | Return of Capital | Total Per Share | ||||||||||||||||||||||||
MSCI Austria Capped | $ | 0.368112 | $ | — | $ | — | $ | 0.368112 | 100 | % | — | % | — | % | 100 | % | ||||||||||||||||
MSCI Belgium Capped | 0.506019 | — | — | 0.506019 | 100 | — | — | 100 | ||||||||||||||||||||||||
MSCI France | 0.584890 | — | — | 0.584890 | 100 | — | — | 100 | ||||||||||||||||||||||||
Premium/Discount Information
The Premium/Discount Information section is intended to present information about the differences between the daily market price on secondary markets for shares of a fund and that fund’s NAV. NAV is the price at which a fund issues and redeems shares. It is calculated in accordance with the standard formula for valuing mutual fund shares. The “Market Price” of a fund generally is determined using the midpoint between the highest bid and the lowest ask on the primary securities exchange on which shares of such fund are listed for trading, as of the time that the fund’s NAV is calculated. A fund’s Market Price may be at, above or below its NAV. The NAV of a fund will fluctuate with changes in the value of its portfolio holdings. The Market Price of a fund will fluctuate in accordance with changes in its NAV, as well as market supply and demand.
Premiums or discounts are the differences (expressed as a percentage) between the NAV and Market Price of a fund on a given day, generally at the time the NAV is calculated. A premium is the amount that a fund is trading above the reported NAV, expressed as a percentage of the NAV. A discount is the amount that a fund is trading below the reported NAV, expressed as a percentage of the NAV.
| 64 | 2017 iSHARES ANNUAL REPORTTO SHAREHOLDERS |
Table of Contents
Supplemental Information (Unaudited) (Continued)
iSHARES®, INC.
Premium/discount information for the Funds covering the most recently completed calendar year and the most recently completed calendar quarters since that year (or the life of the Fund, if shorter) is publicly accessible, free of charge, at www.iShares.com.
The following information shows the frequency of distributions of premiums and discounts for the Funds for the immediately preceding five calendar years (or from the inception date of the Fund, if less than five years) through the date of the most recent calendar quarter-end. Each line in each table shows the number of trading days in which the Fund traded within the premium/discount range indicated. The number of trading days in each premium/discount range is also shown as a percentage of the total number of trading days in the period covered by each table. All data presented here represents past performance, which cannot be used to predict future results.
iShares MSCI Austria Capped ETF
Period Covered: January 1, 2012 through June 30, 2017
Premium/Discount Range | Number of Days | Percentage of Total Days | ||||||
Greater than 2.5% and Less than 3.0% | 2 | 0.14 | % | |||||
Greater than 2.0% and Less than 2.5% | 3 | 0.22 | ||||||
Greater than 1.5% and Less than 2.0% | 8 | 0.58 | ||||||
Greater than 1.0% and Less than 1.5% | 21 | 1.52 | ||||||
Greater than 0.5% and Less than 1.0% | 137 | 9.91 | ||||||
Greater than 0.0% and Less than 0.5% | 538 | 38.91 | ||||||
At NAV | 15 | 1.08 | ||||||
Less than 0.0% and Greater than –0.5% | 509 | 36.80 | ||||||
Less than –0.5% and Greater than –1.0% | 116 | 8.39 | ||||||
Less than –1.0% and Greater than –1.5% | 26 | 1.88 | ||||||
Less than –1.5% and Greater than –2.0% | 4 | 0.29 | ||||||
Less than –2.0% and Greater than –2.5% | 2 | 0.14 | ||||||
Less than –2.5% | 2 | 0.14 | ||||||
|
|
|
| |||||
| 1,383 | 100.00 | % | ||||||
|
|
|
| |||||
SUPPLEMENTAL INFORMATION | 65 |
Table of Contents
Supplemental Information (Unaudited) (Continued)
iSHARES®, INC.
iShares MSCI Belgium Capped ETF
Period Covered: January 1, 2012 through June 30, 2017
Premium/Discount Range | Number of Days | Percentage of Total Days | ||||||
Greater than 2.5% and Less than 3.0% | 1 | 0.07 | % | |||||
Greater than 2.0% and Less than 2.5% | 3 | 0.22 | ||||||
Greater than 1.5% and Less than 2.0% | 3 | 0.22 | ||||||
Greater than 1.0% and Less than 1.5% | 18 | 1.30 | ||||||
Greater than 0.5% and Less than 1.0% | 139 | 10.05 | ||||||
Greater than 0.0% and Less than 0.5% | 613 | 44.33 | ||||||
At NAV | 15 | 1.08 | ||||||
Less than 0.0% and Greater than –0.5% | 486 | 35.15 | ||||||
Less than –0.5% and Greater than –1.0% | 82 | 5.93 | ||||||
Less than –1.0% and Greater than –1.5% | 18 | 1.30 | ||||||
Less than –1.5% and Greater than –2.0% | 2 | 0.14 | ||||||
Less than –2.0% and Greater than –2.5% | 1 | 0.07 | ||||||
Less than –2.5% | 2 | 0.14 | ||||||
|
|
|
| |||||
| 1,383 | 100.00 | % | ||||||
|
|
|
| |||||
iShares MSCI France ETF
Period Covered: January 1, 2012 through June 30, 2017
Premium/Discount Range | Number of Days | Percentage of Total Days | ||||||
Greater than 3.0% and Less than 3.5% | 1 | 0.07 | % | |||||
Greater than 2.5% and Less than 3.0% | 1 | 0.07 | ||||||
Greater than 2.0% and Less than 2.5% | 2 | 0.14 | ||||||
Greater than 1.5% and Less than 2.0% | 7 | 0.51 | ||||||
Greater than 1.0% and Less than 1.5% | 44 | 3.18 | ||||||
Greater than 0.5% and Less than 1.0% | 171 | 12.36 | ||||||
Greater than 0.0% and Less than 0.5% | 614 | 44.40 | ||||||
At NAV | 16 | 1.16 | ||||||
Less than 0.0% and Greater than –0.5% | 425 | 30.74 | ||||||
Less than –0.5% and Greater than –1.0% | 75 | 5.42 | ||||||
Less than –1.0% and Greater than –1.5% | 20 | 1.45 | ||||||
Less than –1.5% and Greater than –2.0% | 4 | 0.29 | ||||||
Less than –2.0% and Greater than –2.5% | 1 | 0.07 | ||||||
Less than –2.5% | 2 | 0.14 | ||||||
|
|
|
| |||||
| 1,383 | 100.00 | % | ||||||
|
|
|
| |||||
| 66 | 2017 iSHARES ANNUAL REPORTTO SHAREHOLDERS |
Table of Contents
Supplemental Information (Unaudited) (Continued)
iSHARES®, INC.
iShares MSCI Netherlands ETF
Period Covered: January 1, 2012 through June 30, 2017
Premium/Discount Range | Number of Days | Percentage of Total Days | ||||||
Greater than 2.5% and Less than 3.0% | 1 | 0.07 | % | |||||
Greater than 2.0% and Less than 2.5% | 1 | 0.07 | ||||||
Greater than 1.5% and Less than 2.0% | 6 | 0.43 | ||||||
Greater than 1.0% and Less than 1.5% | 18 | 1.30 | ||||||
Greater than 0.5% and Less than 1.0% | 123 | 8.89 | ||||||
Greater than 0.0% and Less than 0.5% | 635 | 45.92 | ||||||
At NAV | 17 | 1.23 | ||||||
Less than 0.0% and Greater than –0.5% | 480 | 34.72 | ||||||
Less than –0.5% and Greater than –1.0% | 81 | 5.86 | ||||||
Less than –1.0% and Greater than –1.5% | 17 | 1.23 | ||||||
Less than –1.5% and Greater than –2.0% | 2 | 0.14 | ||||||
Less than –2.0% and Greater than –2.5% | 1 | 0.07 | ||||||
Less than –2.5% and Greater than –3.0% | 1 | 0.07 | ||||||
|
|
|
| |||||
| 1,383 | 100.00 | % | ||||||
|
|
|
| |||||
iShares MSCI Sweden Capped ETF
Period Covered: January 1, 2012 through June 30, 2017
Premium/Discount Range | Number of Days | Percentage of Total Days | ||||||
Greater than 3.0% and Less than 3.5% | 2 | 0.14 | % | |||||
Greater than 2.5% and Less than 3.0% | 1 | 0.07 | ||||||
Greater than 2.0% and Less than 2.5% | 1 | 0.07 | ||||||
Greater than 1.5% and Less than 2.0% | 9 | 0.65 | ||||||
Greater than 1.0% and Less than 1.5% | 36 | 2.60 | ||||||
Greater than 0.5% and Less than 1.0% | 152 | 10.99 | ||||||
Greater than 0.0% and Less than 0.5% | 564 | 40.79 | ||||||
At NAV | 12 | 0.87 | ||||||
Less than 0.0% and Greater than –0.5% | 457 | 33.04 | ||||||
Less than –0.5% and Greater than –1.0% | 111 | 8.03 | ||||||
Less than –1.0% and Greater than –1.5% | 26 | 1.88 | ||||||
Less than –1.5% and Greater than –2.0% | 7 | 0.51 | ||||||
Less than –2.0% and Greater than –2.5% | 2 | 0.14 | ||||||
Less than –2.5% | 3 | 0.22 | ||||||
|
|
|
| |||||
| 1,383 | 100.00 | % | ||||||
|
|
|
| |||||
SUPPLEMENTAL INFORMATION | 67 |
Table of Contents
Director and Officer Information
iSHARES®, INC.
The Board of Directors has responsibility for the overall management and operations of the Funds, including general supervision of the duties performed by BFA and other service providers. Each Director serves until he or she resigns, is removed, dies, retires or becomes incapacitated. Each officer shall hold office until his or her successor is elected and qualifies or until his or her death, resignation or removal. Directors who are not “interested persons” (as defined in the 1940 Act) of the Company are referred to as independent directors (“Independent Directors”).
The registered investment companies advised by BFA or its affiliates (the “BlackRock-advised Funds”) are organized into one complex of closed-end funds, two complexes of open-end funds and one complex of exchange-traded funds (“Exchange-Traded Fund Complex”) (each, a “BlackRock Fund Complex”). Each Fund is included in the BlackRock Fund Complex referred to as the Exchange-Traded Fund Complex. Each Director also serves as a Trustee of iShares Trust and a Trustee of iShares U.S. ETF Trust and, as a result, oversees a total of 344 funds (as of August 31, 2017) within the Exchange-Traded Fund Complex. Drew E. Lawton, from October 2016 to June 2017, and Richard L. Fagnani, from April 2017 to June 2017, served as Advisory Board Members for iShares Trust, iShares Inc. and iShares U.S. ETF Trust with respect to all funds within the Exchange-Traded Fund Complex. With the exception of Robert S. Kapito, Mark K. Wiedman, Charles Park, Martin Small and Benjamin Archibald, the address of each Director, and officer is c/o BlackRock, Inc., 400 Howard Street, San Francisco, CA 94105. The address of Mr. Kapito, Mr. Wiedman, Mr. Park, Mr. Small and Mr. Archibald is c/o BlackRock, Inc., Park Avenue Plaza, 55 East 52nd Street, New York, NY 10055. The Board has designated Cecilia H. Herbert as its Independent Board Chair. Additional information about the Funds’ Directors and officers may be found in the Funds’ combined Statement of Additional Information, which is available without charge, upon request, by calling toll-free 1-800-iShares (1-800-474-2737).
Interested Directors
| Name (Age) | Position(s) | Principal Occupation(s) During the Past 5 Years | Other Directorships Held by Director | |||
Robert S. Kapitoa (60) | Director (since 2009). | President, BlackRock, Inc. (since 2006); Vice Chairman of BlackRock, Inc. and Head of BlackRock’s Portfolio Management Group (since its formation in 1998) and BlackRock, Inc.’s predecessor entities (since 1988); Trustee, University of Pennsylvania (since 2009); President of Board of Directors, Hope & Heroes Children’s Cancer Fund (since 2002). | Director of BlackRock, Inc. (since 2006); Trustee of iShares Trust (since 2009); Trustee of iShares U.S. ETF Trust (since 2011). | |||
Mark K. Wiedmanb (46) | Director (since 2013). | Senior Managing Director, BlackRock, Inc. (since 2014); Managing Director, BlackRock, Inc. (2007-2014); Global Head of BlackRock’s ETF and Index Investments Business (since 2016); Global Head of iShares (2011-2016); Head of Corporate Strategy, BlackRock, Inc. (2009-2011). | Trustee of iShares Trust (since 2013); Trustee of iShares U.S. ETF Trust (since 2013); Director of PennyMac Financial Services, Inc. (since 2008). | |||
| a | Robert S. Kapito is deemed to be an “interested person” (as defined in the 1940 Act) of the Company due to his affiliations with BlackRock, Inc. and its affiliates. |
| b | Mark K. Wiedman is deemed to be an “interested person” (as defined in the 1940 Act) of the Company due to his affiliations with BlackRock, Inc. and its affiliates. |
| 68 | 2017 iSHARES ANNUAL REPORTTO SHAREHOLDERS |
Table of Contents
Director and Officer Information (Continued)
iSHARES®, INC.
Independent Directors
| Name (Age) | Position(s) | Principal Occupation(s) During the Past 5 Years | Other Directorships Held by Director | |||
Cecilia H. Herbert (68) | Director (since 2005); Independent Board Chair (since 2016). | Trustee and Member of the Finance, Technology and Quality Committee of Stanford Health Care (since 2016); Trustee and Member of the Investment Committee, WNET, a New York public media company (since 2011); Chair (1994-2005) and Member (since 1992) of the Investment Committee, Archdiocese of San Francisco; Director (1998-2013) and President (2007-2011) of the Board of Directors, Catholic Charities CYO; Trustee (2002-2011) and Chair of the Finance and Investment Committee (2006-2010) of the Thacher School. | Trustee of iShares Trust (since 2005); Trustee of iShares U.S. ETF Trust (since 2011); Independent Board Chair of iShares Trust and iShares U.S. ETF Trust (since 2016); Trustee of Forward Funds (14 portfolios) (since 2009); Trustee of Salient MF Trust (4 portfolios) (since 2015). | |||
Jane D. Carlin (61) | Director (since 2015); Risk Committee Chair (since 2016). | Consultant (since 2012); Managing Director and Global Head of Financial Holding Company Governance & Assurance and the Global Head of Operational Risk Management of Morgan Stanley (2006-2012). | Trustee of iShares Trust (since 2015); Trustee of iShares U.S. ETF Trust (since 2015); Director of PHH Corporation (mortgage solutions) (since 2012); Director of The Hanover Insurance Group, Inc. (since 2016). | |||
Richard L. Fagnani (62) | Director (since 2017); Equity Plus Committee Chair (since 2017). | Partner, KPMG LLP (2002-2016). | Trustee of iShares Trust (since 2017); Trustee of iShares U.S. ETF Trust (since 2017). | |||
Charles A. Hurty (73) | Director (since 2005); Audit Committee Chair (since 2006). | Retired; Partner, KPMG LLP (1968-2001). | Trustee of iShares Trust (since 2005); Trustee of iShares U.S. ETF Trust (since 2011); Director of SkyBridge Alternative Investments Multi-Adviser Hedge Fund Portfolios LLC (2 portfolios) (since 2002). | |||
John E. Kerrigan (62) | Director (since 2005); Securities Lending Committee Chair (since 2016). | Chief Investment Officer, Santa Clara University (since 2002). | Trustee of iShares Trust (since 2005); Trustee of iShares U.S. ETF Trust (since 2011). | |||
Drew E. Lawton (58) | Director (since 2017); 15(c) Committee Chair (since 2017). | Senior Managing Director of New York Life Insurance Company (2010-2015). | Trustee of iShares Trust (since 2017); Trustee of iShares U.S. ETF Trust (since 2017). | |||
DIRECTORAND OFFICER INFORMATION | 69 |
Table of Contents
Director and Officer Information (Continued)
iSHARES®, INC.
Independent Directors (Continued)
| Name (Age) | Position(s) | Principal Occupation(s) During the Past 5 Years | Other Directorships Held by Director | |||
John E. Martinez (56) | Director (since 2003); Fixed Income Plus Committee Chair (since 2016). | Director of Real Estate Equity Exchange, Inc. (since 2005). | Trustee of iShares Trust (since 2003); Trustee of iShares U.S. ETF Trust (since 2011). | |||
Madhav V. Rajan (53) | Director (since 2011); Nominating and Governance Committee Chair (since 2017). | Dean, and George Pratt Shultz Professor of Accounting, University of Chicago Booth School of Business (since 2017); Robert K. Jaedicke Professor of Accounting, Stanford University Graduate School of Business (2001-2017); Professor of Law (by courtesy), Stanford Law School (2005-2017); Senior Associate Dean for Academic Affairs and Head of MBA Program, Stanford University Graduate School of Business (2010-2016) . | Trustee of iShares Trust (since 2011); Trustee of iShares U.S. ETF Trust (since 2011); Director, Cavium, Inc. (since 2013). | |||
| 70 | 2017 iSHARES ANNUAL REPORTTO SHAREHOLDERS |
Table of Contents
Director and Officer Information (Continued)
iSHARES®, INC.
Officersc
| Name (Age) | Position(s) | Principal Occupation(s) During the Past 5 Years | ||
Martin Small (42) | President (since 2016). | Managing Director, BlackRock, Inc. (since 2010); Head of U.S. iShares (since 2015); Co-Head of the U.S. Financial Markets Advisory Group, BlackRock, Inc. (2008-2014). | ||
Jack Gee (57) | Treasurer and Chief Financial Officer (since 2008). | Managing Director, BlackRock, Inc. (since 2009); Senior Director of Fund Administration of Intermediary Investor Business, BGI (2009). | ||
Benjamin Archibald (42) | Secretary (since 2015). | Managing Director, BlackRock, Inc. (since 2014); Director, BlackRock, Inc. (2010-2013); Secretary of the BlackRock-advised Mutual Funds (since 2012). | ||
Alan Mason (56) | Executive Vice President (since 2016). | Managing Director, BlackRock, Inc. (since 2009). | ||
Steve Messinger (55) | Executive Vice President (since 2016). | Managing Director, BlackRock, Inc. (2007-2014 and since 2016); Managing Director, Beacon Consulting Group (2014-2016). | ||
Charles Park (49) | Chief Compliance Officer (since 2006). | Chief Compliance Officer of BlackRock Advisors, LLC and the BlackRock-advised Funds in the Equity-Bond Complex, the Equity-Liquidity Complex and the Closed-End Complex (since 2014); Chief Compliance Officer of BFA (since 2006). | ||
Scott Radell (48) | Executive Vice President (since 2012). | Managing Director, BlackRock, Inc. (since 2009); Head of Portfolio Solutions, BlackRock, Inc. (since 2009). | ||
| c | Manish Mehta served as President until October 15, 2016. |
DIRECTORAND OFFICER INFORMATION | 71 |
Table of Contents
Notes:
| 72 | 2017 iSHARES ANNUAL REPORTTO SHAREHOLDERS |
Table of Contents
Notes:
NOTES | 73 |
Table of Contents
Notes:
| 74 | 2017 iSHARES ANNUAL REPORTTO SHAREHOLDERS |
Table of Contents
For more information visit www.iShares.com or call 1-800-474-2737
This report is intended for the Funds’ shareholders. It may not be distributed to prospective investors unless it is preceded or accompanied by the current prospectus.
Investing involves risk, including possible loss of principal.
The iShares Funds are distributed by BlackRock Investments, LLC (together with its affiliates, “BlackRock”).
The iShares Funds are not sponsored, endorsed, issued, sold or promoted by MSCI Inc., nor does this company make any representation regarding the advisability of investing in the iShares Funds. BlackRock is not affiliated with the company listed above.
A description of the policies that the Funds use to determine how to vote proxies relating to portfolio securities and information about how the Funds voted proxies relating to portfolio securities during the most recent twelve-month period ending June 30 is available without charge, upon request, by calling toll-free 1-800-474-2737; on the Funds’ website at www.iShares.com; and on the U.S. Securities and Exchange Commission (SEC) website at www.sec.gov.
The Funds file their complete schedules of portfolio holdings with the SEC for the first and third quarters of each fiscal year on Form N-Q. The Funds’ Forms N-Q are available on the SEC’s website or may be reviewed and copied at the SEC’s Public Reference Room in Washington, D.C. Information on the operation of the Public Reference Room may be obtained by calling 1-800-SEC-0330. The Funds also disclose their complete schedules of portfolio holdings on a daily basis on the Funds’ website.
©2017 BlackRock, Inc. All rights reserved. iSHARES and BLACKROCK are registered trademarks of BlackRock, Inc. or its subsidiaries. All other marks are the property of their respective owners.
iS-AR-802-0817
 |  |
Table of Contents
AUGUST 31, 2017
2017 ANNUAL REPORT | |
iShares, Inc.
| Ø | iShares MSCI Eurozone ETF | EZU | BATS |
| Ø | iShares MSCI Germany ETF | EWG | NYSE Arca |
| Ø | iShares MSCI Italy Capped ETF | EWI | NYSE Arca |
| Ø | iShares MSCI Spain Capped ETF | EWP | NYSE Arca |
| Ø | iShares MSCI Switzerland Capped ETF | EWL | NYSE Arca |
Table of Contents
| 5 | ||||
| 16 | ||||
| 16 | ||||
| 17 | ||||
| 17 | ||||
| 22 | ||||
| 26 | ||||
| 28 | ||||
| 30 | ||||
| 32 | ||||
| 39 | ||||
| 44 | ||||
| 57 | ||||
| 58 | ||||
| 59 | ||||
| 69 | ||||
| 74 |
Table of Contents
Management’s Discussion of Fund Performance
iSHARES®, INC.
GLOBAL EQUITY MARKET OVERVIEW
Global equity markets posted strong returns for the 12 months ended August 31, 2017 (the “reporting period”). The MSCI ACWI, a broad global equity index that includes both developed and emerging markets, returned 17.11% in U.S. dollar terms for the reporting period.
The primary factor behind the robust performance of global equity markets was improving global economic growth, driven largely by the continuation of accommodative monetary policies from many of the world’s central banks. Signs of stronger economic activity in Europe emerged as the European Central Bank (“ECB”) maintained policies such as quantitative easing and negative interest rates. Economic growth rates in China and Japan, the largest economies in Asia, also increased during the reporting period, reflecting efforts by the People’s Bank of China (“PBOC”) and the Bank of Japan (“BOJ”) to stimulate economic activity. Stronger economic growth led several central banks to consider reducing their economic stimulus measures. For example, late in the reporting period, the ECB discussed the possibility of tapering its quantitative easing program, while the PBOC increased short-term interest rates during the first half of 2017.
On a regional basis, European equity markets posted the best returns among developed markets, advancing by approximately 20% in U.S. dollar terms for the reporting period. European stocks benefited from improving economic conditions and stronger corporate earnings. In addition, election outcomes in France and the Netherlands eased investor concerns about nationalist presidential candidates and their opposition to the European Union (“E.U.”). Currency fluctuations also contributed meaningfully to European equity performance in U.S. dollar terms as the euro appreciated by approximately 6% against the U.S. dollar during the reporting period. The best-performing European stock markets included Austria, Italy, and Spain, while Ireland and Belgium posted the weakest returns.
Equity markets in the Asia-Pacific region gained about 16% in U.S. dollar terms for the reporting period, led by Singapore and Hong Kong. Japanese stocks also posted strong returns, benefiting from improving consumer spending and employment trends that contributed to the ongoing recovery in the Japanese economy. However, equity market returns in Japan were hindered by a decline in the Japanese yen, which depreciated by approximately 6% against the U.S. dollar.
The U.S. stock market returned approximately 15% for the reporting period. Despite mixed U.S. economic data, U.S. stocks advanced initially in anticipation of pro-business fiscal policies from the new presidential administration. Although the administration struggled to implement its fiscal agenda, stocks continued to move higher as better global economic conditions led to a notable improvement in corporate earnings growth, particularly for multinational companies with significant operations outside of the U.S. U.S. stocks advanced despite three short-term interest rate increases by the U.S. Federal Reserve Bank (the “Fed”) during the reporting period, which increased the short-term interest rate target to its highest level since October 2008. The Fed also unveiled a plan to start reducing the amount of U.S. Treasury bonds and mortgage-backed securities on its balance sheet before the end of 2017.
Emerging markets stocks outperformed those in developed markets, returning more than 23% in U.S. dollar terms for the reporting period. Emerging markets in Eastern Europe were the best performers, led by Poland, Greece, and Hungary. Equity markets in the Middle East trailed for the reporting period amid continued geopolitical conflict in the region.
MANAGEMENT’S DISCUSSIONS OF FUND PERFORMANCE | 5 |
Table of Contents
Management’s Discussion of Fund Performance
iSHARES® MSCI EUROZONE ETF
Performance as of August 31, 2017
| Average Annual Total Returns | Cumulative Total Returns | |||||||||||||||||||||||||||
| NAV | MARKET | INDEX | NAV | MARKET | INDEX | |||||||||||||||||||||||
1 Year | 24.72% | 24.95% | 24.91% | 24.72% | 24.95% | 24.91% | ||||||||||||||||||||||
5 Years | 10.16% | 10.28% | 10.29% | 62.26% | 63.08% | 63.22% | ||||||||||||||||||||||
10 Years | 0.12% | 0.15% | 0.23% | 1.25% | 1.51% | 2.32% | ||||||||||||||||||||||
GROWTH OF $10,000 INVESTMENT
(AT NET ASSET VALUE)
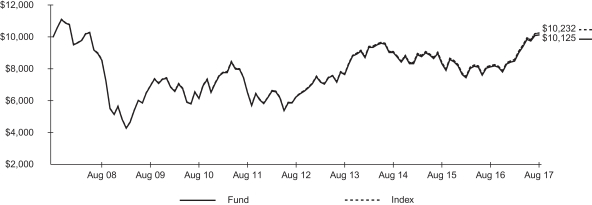
Past performance is no guarantee of future results. Performance results do not reflect the deduction of taxes that a shareholder would pay on fund distributions or on the redemption or sale of fund shares. See “About Fund Performance” on page 16 for more information.
| Shareholder Expenses | ||||||||||||||||||||||||||
| Actual | Hypothetical 5% Return | |||||||||||||||||||||||||
| Beginning Account Value (3/1/17) | Ending Account Value (8/31/17) | Expenses Paid During Period a | Beginning Account Value (3/1/17) | Ending Account Value (8/31/17) | Expenses Paid During Period a | Annualized Expense Ratio | ||||||||||||||||||||
| $ | 1,000.00 | $ | 1,193.10 | $ | 2.65 | $ | 1,000.00 | $ | 1,022.80 | $ | 2.45 | 0.48% | ||||||||||||||
| a | Expenses are calculated using the Fund’s annualized expense ratio (as disclosed in the table), multiplied by the average account value for the period, multiplied by the number of days in the period (184 days) and divided by the number of days in the year (365 days). See “Shareholder Expenses” on page 16 for more information. |
| 6 | 2017 iSHARES ANNUAL REPORTTO SHAREHOLDERS |
Table of Contents
Management’s Discussion of Fund Performance (Continued)
iSHARES® MSCI EUROZONE ETF
The iShares MSCI Eurozone ETF (the “Fund”) seeks to track the investment results of an index composed of large- and mid-capitalization equities from developed market countries that use the euro as their official currency, as represented by the MSCI EMU Index (the “Index”). The Fund invests in a representative sample of securities included in the Index that collectively has an investment profile similar to the Index. Due to the use of representative sampling, the Fund may or may not hold all of the securities that are included in the Index. For the 12-month reporting period ended August 31, 2017, the total return for the Fund was 24.72%, net of fees, while the total return for the Index was 24.91%.
The Eurozone economy posted strong growth during the reporting period, though inflation remained low enough for the ECB to keep interest rates at zero percent, stating that a considerable amount of monetary accommodation remained necessary. Household consumption, which historically accounts for more than half of the Eurozone’s average economic growth, was the largest driver of the economy, as consumer spending reached a record high in the second quarter of 2017. A declining unemployment rate helped increase consumer spending.
The equity markets in France and Germany, which together represented approximately 62% of the Index on average during the reporting period, were the leading contributors to the Index’s return. French stocks rose significantly after the election of the country’s new president, Emmanuel Macron, while the German market was helped by a combination of low interest rates, low unemployment, and stable public finances.
Spain, the Netherlands, and Italy also contributed to the Index’s performance. In Spain, household consumption increased thanks to a combination of robust job creation and credit growth. The Netherlands’ economy benefited from strong employment growth and increased consumer optimism. Italy’s economic acceleration was strengthened by business and consumer confidence levels that approached multi-year highs.
From a sector standpoint, the financials sector, representing about 20% of the Index on average, contributed the most to the Index’s return for the reporting period. Banks and insurance stocks contributed the most to the sector, as many companies in these industries restructured and streamlined in order to increase income in the low interest rate environment. The industrials and consumer discretionary sectors were also strong contributors to the Index’s return.
From a currency perspective, the euro appreciated about 6% relative to the U.S. dollar during the reporting period, making it a relatively large contributor to the Index’s performance, as returns on Eurozone investments were higher when translated back into U.S. dollars.
ALLOCATION BY SECTOR
As of 8/31/17
| Sector | Percentage of Total Investments* |
Financials | 20.84 | % | ||
Industrials | 14.53 | |||
Consumer Discretionary | 13.36 | |||
Consumer Staples | 10.38 | |||
Health Care | 8.51 | |||
Materials | 8.14 | |||
Information Technology | 7.89 | |||
Utilities | 5.29 | |||
Energy | 5.08 | |||
Telecommunication Services | 4.18 | |||
Real Estate | 1.80 | |||
|
| |||
TOTAL | 100.00 | % | ||
|
|
TEN LARGEST COUNTRIES
As of 8/31/17
| Country | Percentage of Total Investments* |
France | 31.90 | % | ||
Germany | 28.91 | |||
Netherlands | 11.43 | |||
Spain | 10.75 | |||
Italy | 7.48 | |||
Belgium | 3.63 | |||
Finland | 3.10 | |||
Ireland | 1.34 | |||
Austria | 0.78 | |||
Portugal | 0.48 | |||
|
| |||
TOTAL | 99.80 | % | ||
|
|
| * | Excludes money market funds. |
MANAGEMENT’S DISCUSSIONS OF FUND PERFORMANCE | 7 |
Table of Contents
Management’s Discussion of Fund Performance
iSHARES® MSCI GERMANY ETF
Performance as of August 31, 2017
| Average Annual Total Returns | Cumulative Total Returns | |||||||||||||||||||||||||||
| NAV | MARKET | INDEX | NAV | MARKET | INDEX | |||||||||||||||||||||||
1 Year | 19.63% | 19.72% | 19.89% | 19.63% | 19.72% | 19.89% | ||||||||||||||||||||||
5 Years | 9.69% | 9.84% | 9.88% | 58.76% | 59.88% | 60.18% | ||||||||||||||||||||||
10 Years | 2.10% | 2.09% | 2.20% | 23.10% | 23.01% | 24.28% | ||||||||||||||||||||||
GROWTH OF $10,000 INVESTMENT
(AT NET ASSET VALUE)
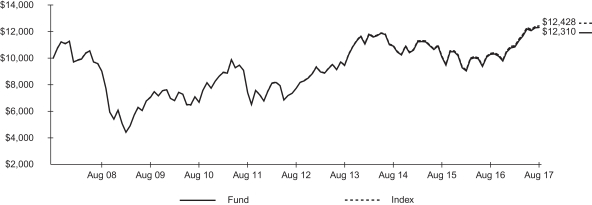
Past performance is no guarantee of future results. Performance results do not reflect the deduction of taxes that a shareholder would pay on fund distributions or on the redemption or sale of fund shares. See “About Fund Performance” on page 16 for more information.
| Shareholder Expenses | ||||||||||||||||||||||||||
| Actual | Hypothetical 5% Return | |||||||||||||||||||||||||
| Beginning Account Value (3/1/17) | Ending Account Value (8/31/17) | Expenses Paid During Period a | Beginning Account Value (3/1/17) | Ending Account Value (8/31/17) | Expenses Paid During Period a | Annualized Expense Ratio | ||||||||||||||||||||
| $ | 1,000.00 | $ | 1,133.90 | $ | 2.64 | $ | 1,000.00 | $ | 1,022.70 | $ | 2.50 | 0.49% | ||||||||||||||
| a | Expenses are calculated using the Fund’s annualized expense ratio (as disclosed in the table), multiplied by the average account value for the period, multiplied by the number of days in the period (184 days) and divided by the number of days in the year (365 days). See “Shareholder Expenses” on page 16 for more information. |
| 8 | 2017 iSHARES ANNUAL REPORTTO SHAREHOLDERS |
Table of Contents
Management’s Discussion of Fund Performance (Continued)
iSHARES® MSCI GERMANY ETF
The iShares MSCI Germany ETF (the “Fund”) seeks to track the investment results of an index composed of German equities, as represented by the MSCI Germany Index (the “Index”). The Fund invests in a representative sample of securities included in the Index that collectively has an investment profile similar to the Index. Due to the use of representative sampling, the Fund may or may not hold all of the securities that are included in the Index. For the 12-month reporting period ended August 31, 2017, the total return for the Fund was 19.63%, net of fees, while the total return for the Index was 19.89%.
The German economy expanded solidly on an annual basis through the second quarter of 2017, due to healthy domestic demand and government spending. Net trade negatively affected the economy, however, as sales to countries outside the E.U. declined. The unemployment rate declined to 3.7%, the nation’s lowest jobless rate in 37 years, which helped consumer spending increase. Inflation was volatile but remained low, while the ECB’s benchmark interest rate remained at zero percent throughout the reporting period.
The financials sector, representing about 15% of the Index on average, was the largest contributor to the Index’s return during the reporting period. The insurance industry was the main contributor to the sector, as companies restructured, streamlined, and introduced digital applications to consumers to boost their bottom lines amid low interest rates. The materials and industrials sectors, each representing approximately 14% of the Index on average, also contributed to the Index’s performance. Better-than-expected earnings for chemical companies boosted the materials sector. Within the industrials sector, transportation-related companies benefited from increased shipping demand amid the improved global economy.
The information technology and healthcare sectors were notable contributors to the Index’s performance as well during the reporting period, as was the consumer discretionary sector, the largest sector in the Index, comprising approximately 19% of the Index on average.
In currency terms, the euro, which appreciated about 6% relative to the U.S. dollar during the reporting period, was a contributor to the Index’s return, as returns on German investments were higher when translated back into U.S. dollars.
ALLOCATION BY SECTOR
As of 8/31/17
| Sector | Percentage of Total Investments* |
Consumer Discretionary | 18.08 | % | ||
Financials | 15.32 | |||
Materials | 14.13 | |||
Industrials | 14.06 | |||
Health Care | 13.68 | |||
Information Technology | 10.25 | |||
Telecommunication Services | 4.74 | |||
Consumer Staples | 3.81 | |||
Utilities | 3.30 | |||
Real Estate | 2.63 | |||
|
| |||
TOTAL | 100.00 | % | ||
|
|
TEN LARGEST FUND HOLDINGS
As of 8/31/17
| Security | Percentage of Total Investments* |
Bayer AG Registered | 7.95 | % | ||
SAP SE | 7.74 | |||
Siemens AG Registered | 7.51 | |||
Allianz SE Registered | 7.34 | |||
BASF SE | 6.68 | |||
Daimler AG Registered | 5.27 | |||
Deutsche Telekom AG Registered | 4.44 | |||
adidas AG | 3.17 | |||
Deutsche Post AG Registered | 3.02 | |||
Linde AG | 2.67 | |||
|
| |||
TOTAL | 55.79 | % | ||
|
|
| * | Excludes money market funds. |
MANAGEMENT’S DISCUSSIONS OF FUND PERFORMANCE | 9 |
Table of Contents
Management’s Discussion of Fund Performance
iSHARES® MSCI ITALY CAPPED ETF
Performance as of August 31, 2017
| Average Annual Total Returns | Cumulative Total Returns | |||||||||||||||||||||||||||
| NAV | MARKET | INDEX | NAV | MARKET | INDEX | |||||||||||||||||||||||
1 Year | 37.37% | 37.89% | 37.57% | 37.37% | 37.89% | 37.57% | ||||||||||||||||||||||
5 Years | 7.81% | 7.94% | 7.77% | 45.65% | 46.55% | 45.40% | ||||||||||||||||||||||
10 Years | (4.50)% | (4.49)% | (4.52)% | (36.90)% | (36.83)% | (37.03)% | ||||||||||||||||||||||
GROWTH OF $10,000 INVESTMENT
(AT NET ASSET VALUE)
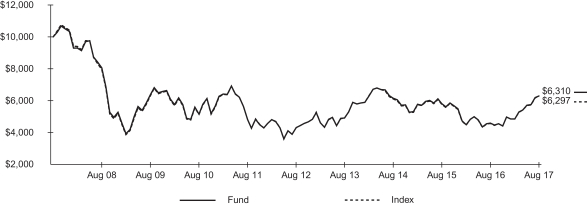
Index performance through February 11, 2013 reflects the performance of the MSCI Italy Index. Index performance beginning on February 12, 2013 reflects the performance of the MSCI Italy 25/50 Index.
Certain sectors and markets performed exceptionally well based on market conditions during the one-year period. Achieving such exceptional returns involves the risk of volatility and investors should not expect that such exceptional returns will be repeated.
Past performance is no guarantee of future results. Performance results do not reflect the deduction of taxes that a shareholder would pay on fund distributions or on the redemption or sale of fund shares. See “About Fund Performance” on page 16 for more information.
| Shareholder Expenses | ||||||||||||||||||||||||||
| Actual | Hypothetical 5% Return | |||||||||||||||||||||||||
| Beginning Account Value (3/1/17) | Ending Account Value (8/31/17) | Expenses Paid During Period a | Beginning Account Value (3/1/17) | Ending Account Value (8/31/17) | Expenses Paid During Period a | Annualized Expense Ratio | ||||||||||||||||||||
| $ | 1,000.00 | $ | 1,297.90 | $ | 2.78 | $ | 1,000.00 | $ | 1,022.80 | $ | 2.45 | 0.48% | ||||||||||||||
| a | Expenses are calculated using the Fund’s annualized expense ratio (as disclosed in the table), multiplied by the average account value for the period, multiplied by the number of days in the period (184 days) and divided by the number of days in the year (365 days). See “Shareholder Expenses” on page 16 for more information. |
| 10 | 2017 iSHARES ANNUAL REPORTTO SHAREHOLDERS |
Table of Contents
Management’s Discussion of Fund Performance (Continued)
iSHARES® MSCI ITALY CAPPED ETF
The iShares MSCI Italy Capped ETF (the “Fund”) seeks to track the investment results of an index composed of Italian equities, as represented by the MSCI Italy 25/50 Index (the “Index”). The Fund invests in a representative sample of securities included in the Index that collectively has an investment profile similar to the Index. Due to the use of representative sampling, the Fund may or may not hold all of the securities that are included in the Index. For the 12-month reporting period ended August 31, 2017, the total return for the Fund was 37.37%, net of fees, while the total return for the Index was 37.57%.
Italy posted a moderate level of economic growth during the reporting period, though its rate of growth trailed most other countries in the Eurozone. Nevertheless, Italy’s recent increase in consumer confidence led to more willingness to spend generally and higher retail sales specifically. Business confidence also increased, due to expectations for growth amid the improving economies of its major trading partners. However, demand for Italy’s exports generally did not affect the nation’s economic growth in the second quarter of 2017. Italy also continued to have one of the highest jobless rates of any developed nation in the world.
The financials sector, representing about 33% of the Index on average, was the most significant contributor to the Index’s performance during the reporting period. The stock prices of Italian banks, which had been low due to bad loans and insufficient capital, increased sharply after a taxpayer bailout package helped instill new optimism about the country’s financial system. The consumer discretionary sector also contributed to the Index’s performance, due largely to the strong sales of luxury Italian sports cars amid low global interest rates and the strong global economy.
The utilities sector, particularly electric utilities, also was a notable contributor to the Index’s return for the reporting period, as was the industrials sector, driven by the strong performance of machinery and transportation infrastructure stocks.
The euro, which appreciated about 6% relative to the U.S. dollar during the reporting period, contributed to the Index’s performance, as returns on Italian investments were higher when translated back into U.S. dollars.
ALLOCATION BY SECTOR
As of 8/31/17
| Sector | Percentage of Total Investments* |
Financials | 34.59 | % | ||
Energy | 17.42 | |||
Utilities | 16.04 | |||
Industrials | 13.17 | |||
Consumer Discretionary | 12.69 | |||
Telecommunication Services | 4.51 | |||
Health Care | 1.58 | |||
|
| |||
TOTAL | 100.00 | % | ||
|
|
TEN LARGEST FUND HOLDINGS
As of 8/31/17
| Security | Percentage of Total Investments* |
Enel SpA | 12.76 | % | ||
Intesa Sanpaolo SpA | 10.87 | |||
UniCredit SpA | 10.36 | |||
Eni SpA | 10.09 | |||
Fiat Chrysler Automobiles NV | 4.64 | |||
Ferrari NV | 4.55 | |||
Atlantia SpA | 4.53 | |||
Assicurazioni Generali SpA | 4.49 | |||
Snam SpA | 4.11 | |||
CNH Industrial NV | 4.11 | |||
|
| |||
TOTAL | 70.51 | % | ||
|
|
| * | Excludes money market funds. |
MANAGEMENT’S DISCUSSIONS OF FUND PERFORMANCE | 11 |
Table of Contents
Management’s Discussion of Fund Performance
iSHARES® MSCI SPAIN CAPPED ETF
Performance as of August 31, 2017
| Average Annual Total Returns | Cumulative Total Returns | |||||||||||||||||||||||||||
| NAV | MARKET | INDEX | NAV | MARKET | INDEX | |||||||||||||||||||||||
1 Year | 31.48% | 31.59% | 32.07% | 31.48% | 31.59% | 32.07% | ||||||||||||||||||||||
5 Years | 9.16% | 9.29% | 9.63% | 54.99% | 55.91% | 58.38% | ||||||||||||||||||||||
10 Years | (0.53)% | (0.53)% | (0.65)% | (5.16)% | (5.20)% | (6.34)% | ||||||||||||||||||||||
GROWTH OF $10,000 INVESTMENT
(AT NET ASSET VALUE)
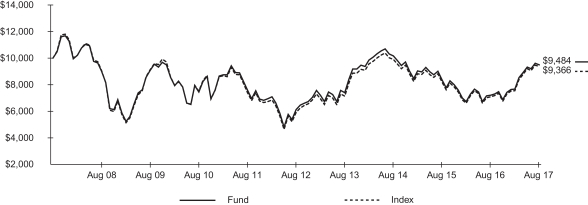
Index performance through February 11, 2013 reflects the performance of the MSCI Spain Index. Index performance beginning on February 12, 2013 reflects the performance of the MSCI Spain 25/50 Index.
Past performance is no guarantee of future results. Performance results do not reflect the deduction of taxes that a shareholder would pay on fund distributions or on the redemption or sale of fund shares. See “About Fund Performance” on page 16 for more information.
| Shareholder Expenses | ||||||||||||||||||||||||||
| Actual | Hypothetical 5% Return | |||||||||||||||||||||||||
| Beginning Account Value (3/1/17) | Ending Account Value (8/31/17) | Expenses Paid During Period a | Beginning Account Value (3/1/17) | Ending Account Value (8/31/17) | Expenses Paid During Period a | Annualized Expense Ratio | ||||||||||||||||||||
| $ | 1,000.00 | $ | 1,237.70 | $ | 2.71 | $ | 1,000.00 | $ | 1,022.80 | $ | 2.45 | 0.48% | ||||||||||||||
| a | Expenses are calculated using the Fund’s annualized expense ratio (as disclosed in the table), multiplied by the average account value for the period, multiplied by the number of days in the period (184 days) and divided by the number of days in the year (365 days). See “Shareholder Expenses” on page 16 for more information. |
| 12 | 2017 iSHARES ANNUAL REPORTTO SHAREHOLDERS |
Table of Contents
Management’s Discussion of Fund Performance (Continued)
iSHARES® MSCI SPAIN CAPPED ETF
The iShares MSCI Spain Capped ETF (the “Fund”) seeks to track the investment results of an index composed of Spanish equities, as represented by the MSCI Spain 25/50 Index (the “Index”). The Fund invests in a representative sample of securities included in the Index that collectively has an investment profile similar to the Index. Due to the use of representative sampling, the Fund may or may not hold all of the securities that are included in the Index. For the 12-month reporting period ended August 31, 2017, the total return for the Fund was 31.48%, net of fees, while the total return for the Index was 32.07%.
Spain’s economy increased at a 3.1% annualized rate in the second quarter of 2017 due to the strong performance of both its domestic and external sectors. Household consumption solidly increased, as households benefited from an employment growth rate that topped 60% in the first half of 2017. Amid this environment, robust household spending outweighed the negative consequences of higher inflation and a decrease in wage growth. Export levels increased amid strong global demand for energy and chemical products, as well as food, beverages, and consumer goods. Tourism revenues increased during the second half of the reporting period, which also benefited the Spanish economy.
The financials sector, which comprised about 41% of the Index on average during the reporting period, was the most significant contributor to the Index’s return. The sector primarily benefited from the Spanish banks industry. Despite ultra-low interest rates and capital constraints caused by bad loans, bank stocks increased after the ECB arranged a rescue of one bank by another, which investors felt could reduce competitive pressures in the industry and increase its overall profitability. The industrials sector also contributed to the Index’s return. Transportation companies were strong contributors to the sector, reflective of the growing confidence in Spain’s economic recovery. The utilities and energy sectors also contributed meaningfully to the Index’s return.
From a currency perspective, the euro, which appreciated about 6% relative to the U.S. dollar during the reporting period, contributed to the Index’s performance, as returns on Spanish investments were higher when translated back into U.S. dollars.
ALLOCATION BY SECTOR
As of 8/31/17
| Sector | Percentage of Total Investments* |
Financials | 42.54 | % | ||
Industrials | 18.16 | |||
Utilities | 10.58 | |||
Telecommunication Services | 8.57 | |||
Consumer Discretionary | 5.55 | |||
Energy | 5.53 | |||
Information Technology | 4.96 | |||
Health Care | 2.41 | |||
Consumer Staples | 1.70 | |||
|
| |||
TOTAL | 100.00 | % | ||
|
|
TEN LARGEST FUND HOLDINGS
As of 8/31/17
| Security | Percentage of Total Investments* |
Banco Santander SA | 19.07 | % | ||
Banco Bilbao Vizcaya Argentaria SA | 10.15 | |||
Telefonica SA | 8.57 | |||
Industria de Diseno Textil SA | 5.56 | |||
Amadeus IT Group SA | 4.96 | |||
Iberdrola SA | 4.68 | |||
Repsol SA | 4.58 | |||
CaixaBank SA | 4.46 | |||
Abertis Infraestructuras SA | 4.35 | |||
Aena SA | 4.12 | |||
|
| |||
TOTAL | 70.50 | % | ||
|
|
| * | Excludes money market funds. |
MANAGEMENT’S DISCUSSIONS OF FUND PERFORMANCE | 13 |
Table of Contents
Management’s Discussion of Fund Performance
iSHARES® MSCI SWITZERLAND CAPPED ETF
Performance as of August 31, 2017
| Average Annual Total Returns | Cumulative Total Returns | |||||||||||||||||||||||||||
| NAV | MARKET | INDEX | NAV | MARKET | INDEX | |||||||||||||||||||||||
1 Year | 15.90% | 16.33% | 16.13% | 15.90% | 16.33% | 16.13% | ||||||||||||||||||||||
5 Years | 10.02% | 10.16% | 10.26% | 61.21% | 62.26% | 62.99% | ||||||||||||||||||||||
10 Years | 5.25% | 5.29% | 4.99% | 66.80% | 67.41% | 62.75% | ||||||||||||||||||||||
GROWTH OF $10,000 INVESTMENT
(AT NET ASSET VALUE)
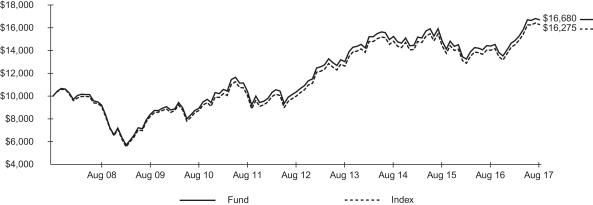
Index performance through February 11, 2013 reflects the performance of the MSCI Switzerland Index. Index performance beginning on February 12, 2013 reflects the performance of the MSCI Switzerland 25/50 Index.
Past performance is no guarantee of future results. Performance results do not reflect the deduction of taxes that a shareholder would pay on fund distributions or on the redemption or sale of fund shares. See “About Fund Performance” on page 16 for more information.
| Shareholder Expenses | ||||||||||||||||||||||||||
| Actual | Hypothetical 5% Return | |||||||||||||||||||||||||
| Beginning Account Value (3/1/17) | Ending Account Value (8/31/17) | Expenses Paid During Period a | Beginning Account Value (3/1/17) | Ending Account Value (8/31/17) | Expenses Paid During Period a | Annualized Expense Ratio | ||||||||||||||||||||
| $ | 1,000.00 | $ | 1,122.90 | $ | 2.62 | $ | 1,000.00 | $ | 1,022.70 | $ | 2.50 | 0.49% | ||||||||||||||
| a | Expenses are calculated using the Fund’s annualized expense ratio (as disclosed in the table), multiplied by the average account value for the period, multiplied by the number of days in the period (184 days) and divided by the number of days in the year (365 days). See “Shareholder Expenses” on page 16 for more information. |
| 14 | 2017 iSHARES ANNUAL REPORTTO SHAREHOLDERS |
Table of Contents
Management’s Discussion of Fund Performance (Continued)
iSHARES® MSCI SWITZERLAND CAPPED ETF
The iShares MSCI Switzerland Capped ETF (the “Fund”) seeks to track the investment results of an index composed of Swiss equities, as represented by the MSCI Switzerland 25/50 Index (the “Index”). The Fund invests in a representative sample of securities included in the Index that collectively has an investment profile similar to the Index. Due to the use of representative sampling, the Fund may or may not hold all of the securities that are included in the Index. For the 12-month reporting period ended August 31, 2017, the total return for the Fund was 15.90%, net of fees, while the total return for the Index was 16.13%.
The Swiss economy grew modestly during the reporting period. Expansion was mainly due to domestic demand, which increased amid the nation’s lowest unemployment rate in nearly three years and increased consumer spending on healthcare and housing. The country’s export activity in the second quarter of 2017 was positive, attributable to higher sales of chemical and pharmaceutical products, metals, and watches, particularly to non-Eurozone countries such as Singapore, Hong Kong, and the U.S. The strength of the Swiss franc remained a concern, however, as it tends to reduce export growth and corporate profit margins. The healthcare sector, the Index’s largest sector, comprising about 31% of the Index on average, was the largest contributor to the Index’s return for the reporting period. Within the sector, the pharmaceuticals industry was the most significant contributor, as foreign demand helped increase Swiss pharmaceutical exports to record highs in the first half of 2017.
The financials sector was also a notable contributor to the Index’s return, as companies in the capital markets and insurance industries performed better than expected amid the negative interest rate policy of the Swiss central bank.
Other contributions to the Index’s return during the reporting period came from the consumer discretionary and consumer staples sectors. The former benefited from luxury jewelers and watchmakers, while, for the latter, food products companies helped the most.
From a currency perspective, the Swiss franc, which appreciated about 2% relative to the U.S. dollar during the reporting period, contributed to the Index’s performance, as returns on Swiss investments were higher when translated back into U.S. dollars.
ALLOCATION BY SECTOR
As of 8/31/17
| Sector | Percentage of Total Investments* |
Health Care | 30.22 | % | ||
Consumer Staples | 21.94 | |||
Financials | 20.18 | |||
Industrials | 11.46 | |||
Consumer Discretionary | 7.07 | |||
Materials | 6.86 | |||
Telecommunication Services | 1.42 | |||
Real Estate | 0.85 | |||
|
| |||
TOTAL | 100.00 | % | ||
|
|
TEN LARGEST FUND HOLDINGS
As of 8/31/17
| Security | Percentage of Total Investments* |
Nestle SA Registered | 19.68 | % | ||
Novartis AG Registered | 13.18 | |||
Roche Holding AG | 12.46 | |||
UBS Group AG | 4.42 | |||
Cie. Financiere Richemont SA Class A Registered | 4.31 | |||
ABB Ltd. Registered | 4.25 | |||
Zurich Insurance Group AG | 4.16 | |||
Credit Suisse Group AG Registered | 3.34 | |||
Swiss Re AG | 2.80 | |||
LafargeHolcim Ltd. Registered | 2.58 | |||
|
| |||
TOTAL | 71.18 | % | ||
|
|
| * | Excludes money market funds. |
MANAGEMENT’S DISCUSSIONSOF FUND PERFORMANCE | 15 |
Table of Contents
Past performance is no guarantee of future results. Current performance may be lower or higher than the performance data quoted. Performance data current to the most recent month-end is available at www.ishares.com. Performance results assume reinvestment of all dividends and capital gain distributions and do not reflect the deduction of taxes that a shareholder would pay on fund distributions or on the redemption or sale of fund shares. The investment return and principal value of shares will vary with changes in market conditions. Shares may be worth more or less than their original cost when they are redeemed or sold in the market. Performance for certain funds may reflect a waiver of a portion of investment advisory fees. Without such a waiver, performance would have been lower.
Net asset value or “NAV” is the value of one share of a fund as calculated in accordance with the standard formula for valuing mutual fund shares. The price used to calculate market return (“Market Price”) is determined by using the midpoint between the highest bid and the lowest offer on the primary stock exchange on which shares of a fund are listed for trading, as of the time that such fund’s NAV is calculated. Certain funds may have a NAV which is determined prior to the opening of regular trading on its listed exchange and their market returns are calculated using the midpoint of the bid/ask spread as of the opening of regular trading on the exchange. Market and NAV returns assume that dividends and capital gain distributions have been reinvested at Market Price and NAV, respectively.
An index is a statistical composite that tracks a specified financial market or sector. Unlike a fund, an index does not actually hold a portfolio of securities and therefore does not incur the expenses incurred by a fund. These expenses negatively impact fund performance. Also, market returns do not include brokerage commissions that may be payable on secondary market transactions. If brokerage commissions were included, market returns would be lower.
As a shareholder of a Fund, you incur two types of costs: (1) transaction costs, including brokerage commissions on purchases and sales of fund shares and (2) ongoing costs, including management fees and other fund expenses. The expense example, which is based on an investment of $1,000 invested on March 1, 2017 and held through August 31, 2017, is intended to help you understand your ongoing costs (in dollars and cents) of investing in a Fund and to compare these costs with the ongoing costs of investing in other funds.
Actual Expenses — The table provides information about actual account values and actual expenses. Annualized expense ratios reflect contractual and voluntary fee waivers, if any. To estimate the expenses that you paid on your account over the period, simply divide your account value by $1,000 (for example, an $8,600 account value divided by $1,000 = 8.6), then multiply the result by the number corresponding to your Fund under the heading entitled “Expenses Paid During Period.”
Hypothetical Example for Comparison Purposes — The table also provides information about hypothetical account values and hypothetical expenses based on each Fund’s actual expense ratio and an assumed rate of return of 5% per year before expenses. You may use this information to compare the ongoing costs of investing in your Fund and other funds. To do so, compare this 5% hypothetical example with the 5% hypothetical examples that appear in the shareholder reports of the other funds.
Please note that the expenses shown in the table are meant to highlight your ongoing costs only and do not reflect any transactional costs, such as brokerage commissions paid on purchases and sales of fund shares. Therefore, the hypothetical examples are useful in comparing ongoing costs only and will not help you determine the relative total costs of owning different funds. In addition, if these transactional costs were included, your costs would have been higher.
| 16 | 2017 iSHARES ANNUAL REPORTTO SHAREHOLDERS |
Table of Contents
August 31, 2017
| Security | Shares | Value | ||||||
COMMON STOCKS — 98.05% |
| |||||||
AUSTRIA — 0.78% |
| |||||||
Andritz AG | 210,915 | $ | 11,462,090 | |||||
Erste Group Bank AG | 862,804 | 36,410,318 | ||||||
OMV AG | 435,150 | 24,982,813 | ||||||
Raiffeisen Bank International AGa | 416,682 | 13,653,031 | ||||||
Voestalpine AG | 327,185 | 16,956,078 | ||||||
|
| |||||||
| 103,464,330 | ||||||||
BELGIUM — 3.62% |
| |||||||
Ageas | 552,470 | 25,622,989 | ||||||
Anheuser-Busch InBev SA/NV | 2,196,292 | 259,863,681 | ||||||
Colruyt SA | 176,885 | 9,815,682 | ||||||
Groupe Bruxelles Lambert SA | 228,962 | 23,276,917 | ||||||
KBC Group NV | 721,300 | 59,196,897 | ||||||
Proximus SADP | 443,512 | 15,615,728 | ||||||
Solvay SA | 214,897 | 31,131,570 | ||||||
Telenet Group Holding NVa | 154,333 | 10,434,873 | ||||||
UCB SA | 365,053 | 25,124,915 | ||||||
Umicore SA | 276,172 | 20,603,382 | ||||||
|
| |||||||
| 480,686,634 | ||||||||
FINLAND — 3.09% |
| |||||||
Elisa OYJ | 412,147 | 17,983,050 | ||||||
Fortum OYJ | 1,297,316 | 23,259,065 | ||||||
Kone OYJ Class B | 974,116 | 52,787,383 | ||||||
Metso OYJ | 322,236 | 10,665,677 | ||||||
Neste OYJ | 380,931 | 16,774,996 | ||||||
Nokia OYJ | 16,800,343 | 103,964,249 | ||||||
Nokian Renkaat OYJ | 332,657 | 14,044,054 | ||||||
Orion OYJ Class B | 295,425 | 13,971,954 | ||||||
Sampo OYJ Class A | 1,283,805 | 67,676,812 | ||||||
Stora Enso OYJ Class R | 1,583,660 | 20,786,251 | ||||||
UPM-Kymmene OYJ | 1,535,332 | 39,902,269 | ||||||
Wartsila OYJ Abp | 426,671 | 29,396,235 | ||||||
|
| |||||||
| 411,211,995 | ||||||||
FRANCE — 31.82% |
| |||||||
Accor SA | 529,011 | 24,465,801 | ||||||
Aeroports de Paris | 86,008 | 15,322,892 | ||||||
Air Liquide SA | 1,119,645 | 136,508,957 | ||||||
Airbus SE | 1,672,678 | 140,418,295 | ||||||
Alstom SA | 443,128 | 15,739,185 | ||||||
Arkema SA | 195,955 | 21,265,574 | ||||||
Atos SE | 271,461 | 41,827,084 | ||||||
AXA SA | 5,581,411 | 161,746,081 | ||||||
| Security | Shares | Value | ||||||
BNP Paribas SA | 3,228,399 | $ | 245,302,040 | |||||
Bollore SA | 2,477,108 | 11,491,516 | ||||||
Bouygues SA | 611,363 | 27,689,319 | ||||||
Bureau Veritas SA | 767,732 | 18,232,305 | ||||||
Capgemini SE | 463,416 | 51,310,443 | ||||||
Carrefour SA | 1,632,354 | 32,875,540 | ||||||
Casino Guichard Perrachon SA | 158,605 | 9,006,826 | ||||||
Cie. de Saint-Gobain | 1,440,370 | 78,901,371 | ||||||
Cie. Generale des Etablissements Michelin Class B | 493,690 | 67,205,521 | ||||||
CNP Assurances | 485,313 | 11,251,273 | ||||||
Credit Agricole SA | 3,256,779 | 57,344,066 | ||||||
Danone SA | 1,702,987 | 133,932,606 | ||||||
Dassault Aviation SA | 7,016 | 10,704,414 | ||||||
Dassault Systemes SE | 370,478 | 36,448,156 | ||||||
Edenred | 636,294 | 17,187,444 | ||||||
Eiffage SA | 210,881 | 21,762,176 | ||||||
Electricite de France SA | 1,602,040 | 16,951,514 | ||||||
Engie SA | 4,945,651 | 82,435,944 | ||||||
Essilor International SA | 598,492 | 75,459,541 | ||||||
Eurazeo SA | 121,730 | 10,056,922 | ||||||
Eurofins Scientific SE | 31,622 | 18,049,542 | ||||||
Eutelsat Communications SA | 502,591 | 14,588,699 | ||||||
Fonciere des Regions | 96,594 | 9,539,805 | ||||||
Gecina SA | 136,363 | 21,221,757 | ||||||
Groupe Eurotunnel SE Registered | 1,335,603 | 15,902,796 | ||||||
Hermes International | 90,766 | 47,945,146 | ||||||
ICADE | 102,200 | 9,071,603 | ||||||
Iliad SA | 76,021 | 19,608,229 | ||||||
Imerys SA | 102,162 | 8,975,920 | ||||||
Ingenico Group SA | 168,023 | 16,660,189 | ||||||
Ipsen SA | 108,017 | 14,492,350 | ||||||
JCDecaux SA | 216,935 | 7,093,922 | ||||||
Kering | 218,132 | 81,768,963 | ||||||
Klepierre SA | 638,232 | 25,685,167 | ||||||
L’Oreal SA | 725,083 | 152,884,710 | ||||||
Lagardere SCA | 342,970 | 11,005,358 | ||||||
Legrand SA | 771,219 | 53,987,182 | ||||||
LVMH Moet Hennessy Louis Vuitton SE | 802,722 | 210,196,859 | ||||||
Natixis SA | 2,681,813 | 20,112,466 | ||||||
Orange SA | 5,748,154 | 97,555,026 | ||||||
Pernod Ricard SA | 613,151 | 83,686,319 | ||||||
SCHEDULESOF INVESTMENTS | 17 |
Table of Contents
Schedule of Investments (Continued)
iSHARES® MSCI EUROZONE ETF
August 31, 2017
| Security | Shares | Value | ||||||
Peugeot SA | 1,477,770 | $ | 31,158,976 | |||||
Publicis Groupe SA | 584,632 | 39,410,394 | ||||||
Remy Cointreau SA | 64,045 | 7,304,404 | ||||||
Renault SA | 511,770 | 45,237,744 | ||||||
Rexel SA | 875,440 | 13,062,168 | ||||||
Safran SA | 902,763 | 87,570,095 | ||||||
Sanofi | 3,275,001 | 317,955,214 | ||||||
Schneider Electric SE | 1,620,545 | 130,493,028 | ||||||
SCOR SE | 488,497 | 20,443,239 | ||||||
SEB SA | 64,629 | 11,725,385 | ||||||
SES SA | 1,053,231 | 24,048,228 | ||||||
Societe BIC SA | 83,595 | 10,033,022 | ||||||
Societe Generale SA | 2,206,789 | 123,390,274 | ||||||
Sodexo SA | 264,724 | 30,853,004 | ||||||
STMicroelectronics NV | 1,839,738 | 31,835,621 | ||||||
Suez | 1,111,783 | 21,062,855 | ||||||
Thales SA | 305,472 | 33,775,322 | ||||||
Total SA | 6,816,131 | 352,065,013 | ||||||
Unibail-Rodamco SE | 287,235 | 72,925,946 | ||||||
Valeo SA | 686,481 | 45,851,695 | ||||||
Veolia Environnement SA | 1,407,361 | 32,978,984 | ||||||
Vinci SA | 1,450,562 | 133,395,676 | ||||||
Vivendi SA | 2,962,967 | 67,899,463 | ||||||
Wendel SA | 81,813 | 12,951,159 | ||||||
Zodiac Aerospace | 587,507 | 16,976,721 | ||||||
|
| |||||||
| 4,227,278,444 | ||||||||
GERMANY — 27.30% |
| |||||||
adidas AG | 542,765 | 121,670,000 | ||||||
Allianz SE Registered | 1,315,877 | 281,209,076 | ||||||
Axel Springer SE | 137,323 | 8,489,689 | ||||||
BASF SE | 2,646,530 | 256,027,300 | ||||||
Bayer AG Registered | 2,381,950 | 304,429,156 | ||||||
Bayerische Motoren Werke AG | 952,727 | 88,350,338 | ||||||
Beiersdorf AG | 292,016 | 31,134,894 | ||||||
Brenntag AG | 444,897 | 23,545,667 | ||||||
Commerzbank AGa | 3,059,862 | 37,979,346 | ||||||
Continental AG | 316,701 | 71,370,438 | ||||||
Covestro AGb | 322,404 | 25,302,026 | ||||||
Daimler AG Registered | 2,773,571 | 201,905,749 | ||||||
Deutsche Bank AG Registeredc | 5,958,362 | 95,420,045 | ||||||
Deutsche Boerse AG | 555,657 | 59,317,099 | ||||||
Deutsche Lufthansa AG Registered | 678,434 | 16,994,848 | ||||||
Deutsche Post AG Registered | 2,805,854 | 116,238,682 | ||||||
| Security | Shares | Value | ||||||
Deutsche Telekom AG Registered | 9,427,325 | $ | 169,915,430 | |||||
Deutsche Wohnen SE Bearer | 1,025,572 | 43,504,696 | ||||||
E.ON SE | 6,362,251 | 71,820,910 | ||||||
Evonik Industries AG | 469,814 | 15,209,633 | ||||||
Fraport AG Frankfurt Airport Services Worldwide | 119,848 | 11,810,766 | ||||||
Fresenius Medical Care AG & Co. KGaA | 619,706 | 57,836,299 | ||||||
Fresenius SE & Co. KGaA | 1,195,812 | 101,068,672 | ||||||
GEA Group AGc | 528,802 | 23,261,620 | ||||||
Hannover Rueck SE | 172,718 | 20,904,054 | ||||||
HeidelbergCement AG | 428,089 | 41,047,204 | ||||||
Henkel AG & Co. KGaA | 296,810 | 35,887,617 | ||||||
HOCHTIEF AG | 55,728 | 9,809,051 | ||||||
HUGO BOSS AG | 182,287 | 15,411,025 | ||||||
Infineon Technologies AG | 3,266,237 | 75,218,116 | ||||||
Innogy SEb | 409,994 | 18,047,527 | ||||||
K+S AG Registeredc | 550,262 | 13,097,208 | ||||||
KION Group AG | 199,930 | 18,212,319 | ||||||
Lanxess AG | 264,078 | 19,669,732 | ||||||
Linde AG | 535,289 | 102,492,995 | ||||||
MAN SE | 104,477 | 11,714,495 | ||||||
Merck KGaA | 371,480 | 40,746,849 | ||||||
METRO AGa,c | 507,414 | 9,905,599 | ||||||
Muenchener Rueckversicherungs-Gesellschaft AG in Muenchen Registered | 449,209 | 92,606,758 | ||||||
Osram Licht AG | 242,411 | 19,880,195 | ||||||
ProSiebenSat.1 Media SE Registered | 672,010 | 22,514,477 | ||||||
QIAGEN NV | 624,296 | 20,006,680 | ||||||
RTL Group SAa | 112,474 | 8,524,668 | ||||||
RWE AGa | 1,500,217 | 37,375,489 | ||||||
SAP SE | 2,831,600 | 296,587,573 | ||||||
Siemens AG Registered | 2,204,357 | 287,759,327 | ||||||
Symrise AG | 356,255 | 26,006,055 | ||||||
Telefonica Deutschland Holding AG | 2,133,944 | 11,533,406 | ||||||
thyssenkrupp AG | 1,055,989 | 31,625,158 | ||||||
United Internet AG Registeredc,d | 353,512 | 20,951,468 | ||||||
Volkswagen AG | 92,216 | 14,214,250 | ||||||
Vonovia SE | 1,348,969 | 56,942,512 | ||||||
| 18 | 2017 iSHARES ANNUAL REPORTTO SHAREHOLDERS |
Table of Contents
Schedule of Investments (Continued)
iSHARES® MSCI EUROZONE ETF
August 31, 2017
| Security | Shares | Value | ||||||
Zalando SEa,b,c | 318,818 | $ | 15,080,208 | |||||
|
| |||||||
| 3,627,584,394 | ||||||||
IRELAND — 1.33% |
| |||||||
Bank of Ireland Group PLCa | 2,628,787 | 21,877,545 | ||||||
CRH PLC | 2,389,027 | 83,320,581 | ||||||
Irish Bank Resolution Corp. Ltd.a,e | 446,666 | 5 | ||||||
Kerry Group PLC Class A | 461,636 | 42,935,659 | ||||||
Paddy Power Betfair PLC | 231,152 | 20,278,709 | ||||||
Ryanair Holdings PLCa | 42,432 | 900,738 | ||||||
Ryanair Holdings PLC ADRa | 68,498 | 7,788,223 | ||||||
|
| |||||||
| 177,101,460 | ||||||||
ITALY — 7.29% |
| |||||||
Assicurazioni Generali SpA | 3,595,729 | 64,295,404 | ||||||
Atlantia SpA | 1,307,392 | 41,967,657 | ||||||
CNH Industrial NV | 2,949,966 | 33,423,740 | ||||||
Enel SpA | 23,672,850 | 143,115,490 | ||||||
Eni SpA | 7,344,565 | 114,999,775 | ||||||
EXOR NV | 313,988 | 20,120,879 | ||||||
Ferrari NV | 354,963 | 40,555,673 | ||||||
Fiat Chrysler Automobiles NVa | 3,081,663 | 46,346,913 | ||||||
Intesa Sanpaolo SpA | 36,475,456 | 122,984,986 | ||||||
Leonardo SpA | 873,382 | 14,755,144 | ||||||
Luxottica Group SpA | 489,282 | 28,125,539 | ||||||
Mediobanca SpA | 1,631,107 | 16,716,096 | ||||||
Poste Italiane SpAb | 1,527,593 | 11,087,623 | ||||||
Prysmian SpA | 592,442 | 18,609,032 | ||||||
Recordati SpA | 300,169 | 12,840,210 | ||||||
Saipem SpAa,c | 1,779,092 | 6,595,074 | ||||||
Snam SpA | 6,801,880 | 33,074,814 | ||||||
Telecom Italia SpA/Milanoa | 33,092,350 | 31,651,828 | ||||||
Tenaris SA | 1,377,701 | 18,394,156 | ||||||
Terna Rete Elettrica Nazionale SpA | 4,293,406 | 25,317,964 | ||||||
UniCredit SpAa | 5,764,346 | 117,121,666 | ||||||
UnipolSai Assicurazioni SpA | 3,013,219 | 6,831,665 | ||||||
|
| |||||||
| 968,931,328 | ||||||||
NETHERLANDS — 11.41% |
| |||||||
ABN AMRO Group NVb | 1,077,351 | 30,151,493 | ||||||
Aegon NV | 5,075,558 | 28,940,638 | ||||||
AerCap Holdings NVa | 426,685 | 21,462,255 | ||||||
Akzo Nobel NV | 728,219 | 66,491,842 | ||||||
Altice NV Class Aa,c | 1,313,874 | 30,257,182 | ||||||
Altice NV Class Ba | 312,606 | 7,219,439 | ||||||
ArcelorMittala | 1,913,329 | 51,045,521 | ||||||
| Security | Shares | Value | ||||||
ASML Holding NV | 1,075,282 | $ | 166,831,489 | |||||
Boskalis Westminster | 261,609 | 8,537,686 | ||||||
Gemalto NVc | 234,154 | 12,637,313 | ||||||
Heineken Holding NV | 290,208 | 28,616,634 | ||||||
Heineken NV | 665,803 | 69,761,315 | ||||||
ING Groep NV | 11,182,489 | 198,093,345 | ||||||
Koninklijke Ahold Delhaize NV | 3,691,413 | 66,269,657 | ||||||
Koninklijke DSM NV | 523,713 | 39,680,982 | ||||||
Koninklijke KPN NV | 9,862,453 | 34,836,357 | ||||||
Koninklijke Philips NV | 2,679,857 | 101,253,642 | ||||||
Koninklijke Vopak NV | 216,589 | 9,155,503 | ||||||
NN Group NV | 898,600 | 35,613,283 | ||||||
NXP Semiconductors NVa | 997,931 | 112,726,286 | ||||||
Randstad Holding NV | 344,241 | 20,097,103 | ||||||
RELX NV | 2,794,327 | 58,586,537 | ||||||
Unilever NV CVA | 4,695,252 | 279,164,956 | ||||||
Wolters Kluwer NV | 871,313 | 38,012,482 | ||||||
|
| |||||||
| 1,515,442,940 | ||||||||
PORTUGAL — 0.48% |
| |||||||
EDP – Energias de Portugal SA | 6,861,632 | 26,308,875 | ||||||
Galp Energia SGPS SA | 1,338,162 | 22,129,977 | ||||||
Jeronimo Martins SGPS SA | 770,015 | 15,343,285 | ||||||
|
| |||||||
| 63,782,137 | ||||||||
SPAIN — 10.73% |
| |||||||
Abertis Infraestructuras SA | 2,052,412 | 41,481,897 | ||||||
ACS Actividades de Construccion y Servicios SA | 720,688 | 27,212,781 | ||||||
Aena SAb | 199,167 | 38,845,325 | ||||||
Amadeus IT Group SA | 1,279,517 | 79,209,774 | ||||||
Banco Bilbao Vizcaya Argentaria SA | 19,272,325 | 170,059,226 | ||||||
Banco de Sabadell SA | 15,555,404 | 34,158,070 | ||||||
Banco Santander SA | 46,332,958 | 300,710,270 | ||||||
Bankia SA | 2,979,705 | 14,485,568 | ||||||
Bankinter SA | 2,062,681 | 19,643,086 | ||||||
CaixaBank SA | 10,405,303 | 53,664,788 | ||||||
Distribuidora Internacional de Alimentacion SA | 1,873,442 | 11,840,509 | ||||||
Enagas SA | 428,279 | 12,604,768 | ||||||
Endesa SA | 914,714 | 22,038,248 | ||||||
Ferrovial SA | 1,443,648 | 32,859,566 | ||||||
Gas Natural SDG SA | 1,009,747 | 24,513,958 | ||||||
Grifols SA | 868,699 | 24,528,900 | ||||||
Iberdrola SA | 16,833,566 | 137,312,060 | ||||||
Industria de Diseno Textil SA | 3,170,036 | 120,282,980 | ||||||
SCHEDULESOF INVESTMENTS | 19 |
Table of Contents
Schedule of Investments (Continued)
iSHARES® MSCI EUROZONE ETF
August 31, 2017
| Security | Shares | Value | ||||||
International Consolidated Airlines Group SA | 1,874,240 | $ | 14,811,397 | |||||
Mapfre SA | 3,298,097 | 11,657,448 | ||||||
Red Electrica Corp. SA | 825,969 | 18,525,319 | ||||||
Repsol SA | 3,626,681 | 62,218,685 | ||||||
Siemens Gamesa Renewable Energy SA | 720,385 | 10,744,358 | ||||||
Telefonica SA | 13,150,790 | 141,637,170 | ||||||
|
| |||||||
| 1,425,046,151 | ||||||||
UNITED KINGDOM — 0.20% | ||||||||
Coca-Cola European Partners PLC | 626,836 | 26,806,463 | ||||||
|
| |||||||
| 26,806,463 | ||||||||
TOTAL COMMON STOCKS | ||||||||
(Cost: $12,625,912,854) | 13,027,336,276 | |||||||
PREFERRED STOCKS — 1.70% |
| |||||||
GERMANY — 1.54% | ||||||||
Bayerische Motoren Werke AG, Preference Shares | 158,457 | 13,128,860 | ||||||
Fuchs Petrolub SE, Preference Shares | 199,411 | 11,071,619 | ||||||
Henkel AG & Co. KGaA, Preference Shares | 515,650 | 68,999,455 | ||||||
Porsche Automobil Holding SE, Preference Shares | 439,750 | 24,891,391 | ||||||
Schaeffler AG, Preference Shares | 477,485 | 6,721,351 | ||||||
Volkswagen AG, Preference Shares | 535,497 | 79,804,342 | ||||||
|
| |||||||
| 204,617,018 | ||||||||
ITALY — 0.16% | ||||||||
Intesa Sanpaolo SpA, Preference Shares | 2,747,985 | 8,670,825 | ||||||
Telecom Italia SpA/Milano, Preference Shares | 17,072,075 | 13,243,780 | ||||||
|
| |||||||
| 21,914,605 | ||||||||
|
| |||||||
TOTAL PREFERRED STOCKS |
| |||||||
(Cost: $274,012,140) | 226,531,623 | |||||||
SHORT-TERM INVESTMENTS — 0.44% |
| |||||||
MONEY MARKET FUNDS — 0.44% |
| |||||||
BlackRock Cash Funds: Institutional, |
| |||||||
1.32%f,g,h | 57,577,483 | 57,594,756 | ||||||
| Security | Shares | Value | ||||||
BlackRock Cash Funds: Treasury, |
| |||||||
0.96%f,g | 489,933 | $ | 489,933 | |||||
|
| |||||||
| 58,084,689 | ||||||||
|
| |||||||
TOTAL SHORT-TERM INVESTMENTS |
| |||||||
(Cost: $58,075,651) |
| 58,084,689 | ||||||
|
| |||||||
TOTAL INVESTMENTS |
| |||||||
(Cost: $12,958,000,645)i |
| 13,311,952,588 | ||||||
Other Assets, Less Liabilities — (0.19)% |
| (25,736,664 | ) | |||||
|
| |||||||
NET ASSETS — 100.00% |
| $ | 13,286,215,924 | |||||
|
| |||||||
ADR — American Depositary Receipts
| a | Non-income earning security. |
| b | This security may be resold to qualified institutional buyers under Rule 144A of the Securities Act of 1933. |
| c | All or a portion of this security represents a security on loan. See Note 1. |
| d | This security may be resold to qualified foreign investors and foreign institutional buyers under Regulation S of the Securities Act of 1933. |
| e | Security is valued using significant unobservable inputs and is classified as Level 3 in the fair value hierarchy. |
| f | Affiliated issuer. See Schedule 1. |
| g | The rate quoted is the annualized seven-day yield of the fund at period end. |
| h | All or a portion of this security represents an investment of securities lending collateral. See Note 1. |
| i | The cost of investments (including short positions and derivatives, if any) for federal income tax purposes was $13,117,873,982. Net unrealized appreciation was $194,078,606, of which $1,110,203,700 represented gross unrealized appreciation on investments and $916,125,094 represented gross unrealized depreciation on investments. |
| 20 | 2017 iSHARES ANNUAL REPORTTO SHAREHOLDERS |
Table of Contents
Schedule of Investments (Continued)
iSHARES® MSCI EUROZONE ETF
August 31, 2017
Schedule 1 — Affiliates (Note 2)
Investments in issuers considered to be affiliates of the Fund during the year ended August 31, 2017, for purposes of Section 2(a)(3) of the 1940 Act, and/or related parties of the Fund were as follows:
| Affiliated issuer | Shares held at 08/31/16 | Shares purchased | Shares sold | Shares held at 08/31/17 | Value at 08/31/17 | Net realized gain (loss)a | Change in unrealized appreciation (depreciation) | Income | ||||||||||||||||||||||||
BlackRock Cash Funds: Institutional, | 19,587,492 | 37,989,991 | b | — | 57,577,483 | $ | 57,594,756 | $ | (2,246 | ) | $ | 9,038 | $ | — | c | |||||||||||||||||
BlackRock Cash Funds: Treasury, | 326,934 | 162,999 | b | — | 489,933 | 489,933 | 117 | — | 44,595 | |||||||||||||||||||||||
|
|
|
|
|
|
|
| |||||||||||||||||||||||||
| $ | 58,084,689 | $ | (2,129 | ) | $ | 9,038 | $ | 44,595 | ||||||||||||||||||||||||
|
|
|
|
|
|
|
| |||||||||||||||||||||||||
| a | Includes realized capital gain distributions from an affiliated fund, if any. |
| b | Net of shares purchased and sold. |
| c | Does not include income earned on the investment of securities lending cash collateral which is not direct income of the Fund and is reflected as a component of securities lending income in the statement of operations. |
Schedule 2 — Fair Value Measurements
Various inputs are used in determining the fair value of financial instruments. For description of the input levels and information about the Fund’s policy regarding valuation of financial instruments, see Note 1.
The following table summarizes the value of the Fund’s investments according to the fair value hierarchy as of August 31, 2017. The breakdown of the Fund’s investments into major categories is disclosed in the schedule of investments above.
| Level 1 | Level 2 | Level 3 | Total | |||||||||||||
Investments: | ||||||||||||||||
Assets: | ||||||||||||||||
Common stocks | $ | 13,027,336,271 | $ | — | $ | 5 | $ | 13,027,336,276 | ||||||||
Preferred stocks | 226,531,623 | — | — | 226,531,623 | ||||||||||||
Money market funds | 58,084,689 | — | — | 58,084,689 | ||||||||||||
|
|
|
|
|
|
|
| |||||||||
Total | $ | 13,311,952,583 | $ | — | $ | 5 | $ | 13,311,952,588 | ||||||||
|
|
|
|
|
|
|
| |||||||||
See notes to financial statements.
SCHEDULESOF INVESTMENTS | 21 |
Table of Contents
Schedule of Investments
August 31, 2017
| Security | Shares | Value | ||||||
COMMON STOCKS — 94.06% |
| |||||||
AIR FREIGHT & LOGISTICS — 3.01% |
| |||||||
Deutsche Post AG Registered | 3,488,236 | $ | 144,507,859 | |||||
|
| |||||||
| 144,507,859 | ||||||||
AIRLINES — 0.44% |
| |||||||
Deutsche Lufthansa AG Registered | 842,240 | 21,098,206 | ||||||
|
| |||||||
| 21,098,206 | ||||||||
AUTO COMPONENTS — 1.85% |
| |||||||
Continental AG | 395,248 | 89,071,468 | ||||||
|
| |||||||
| 89,071,468 | ||||||||
AUTOMOBILES — 7.91% |
| |||||||
Bayerische Motoren Werke AG | 1,189,649 | 110,321,100 | ||||||
Daimler AG Registered | 3,459,579 | 251,844,604 | ||||||
Volkswagen AG | 117,035 | 18,039,871 | ||||||
|
| |||||||
| 380,205,575 | ||||||||
BANKS — 0.99% |
| |||||||
Commerzbank AGa | 3,824,809 | 47,473,952 | ||||||
|
| |||||||
| 47,473,952 | ||||||||
CAPITAL MARKETS — 4.01% |
| |||||||
Deutsche Bank AG Registeredb | 7,425,992 | 118,923,371 | ||||||
Deutsche Boerse AG | 693,457 | 74,027,426 | ||||||
|
| |||||||
| 192,950,797 | ||||||||
CHEMICALS — 11.87% |
| |||||||
BASF SE | 3,300,137 | 319,257,732 | ||||||
Covestro AGc | 400,176 | 31,405,514 | ||||||
Evonik Industries AG | 588,042 | 19,037,115 | ||||||
K+S AG Registeredb | 690,152 | 16,426,837 | ||||||
Lanxess AG | 328,846 | 24,493,947 | ||||||
Linde AG | 667,349 | 127,778,822 | ||||||
Symrise AG | 443,103 | 32,345,823 | ||||||
|
| |||||||
| 570,745,790 | ||||||||
CONSTRUCTION & ENGINEERING — 0.25% |
| |||||||
HOCHTIEF AG | 69,458 | 12,225,759 | ||||||
|
| |||||||
| 12,225,759 | ||||||||
CONSTRUCTION MATERIALS — 1.07% |
| |||||||
HeidelbergCement AG | 534,691 | 51,268,709 | ||||||
|
| |||||||
| 51,268,709 | ||||||||
DIVERSIFIED TELECOMMUNICATION SERVICES — 4.71% |
| |||||||
Deutsche Telekom AG Registered | 11,763,033 | 212,013,568 | ||||||
Telefonica Deutschland Holding AG | 2,677,229 | 14,469,719 | ||||||
|
| |||||||
| 226,483,287 | ||||||||
| Security | Shares | Value | ||||||
ELECTRICAL EQUIPMENT — 0.51% |
| |||||||
Osram Licht AG | 301,366 | $ | 24,715,112 | |||||
|
| |||||||
| 24,715,112 | ||||||||
FOOD & STAPLES RETAILING — 0.26% |
| |||||||
METRO AGa | 642,570 | 12,544,078 | ||||||
|
| |||||||
| 12,544,078 | ||||||||
HEALTH CARE PROVIDERS & SERVICES — 4.12% |
| |||||||
Fresenius Medical Care AG & Co. KGaA | 772,748 | 72,119,496 | ||||||
Fresenius SE & Co. KGaA | 1,491,984 | 126,100,793 | ||||||
|
| |||||||
| 198,220,289 | ||||||||
HOUSEHOLD PRODUCTS — 0.94% |
| |||||||
Henkel AG & Co. KGaA | 373,385 | 45,146,383 | ||||||
|
| |||||||
| 45,146,383 | ||||||||
INDUSTRIAL CONGLOMERATES — 7.46% |
| |||||||
Siemens AG Registered | 2,748,681 | 358,816,015 | ||||||
|
| |||||||
| 358,816,015 | ||||||||
INSURANCE — 10.23% |
| |||||||
Allianz SE Registered | 1,642,023 | 350,908,003 | ||||||
Hannover Rueck SE | 216,656 | 26,221,869 | ||||||
Muenchener Rueckversicherungs-Gesellschaft AG in Muenchen Registered | 556,939 | 114,815,854 | ||||||
|
| |||||||
| 491,945,726 | ||||||||
INTERNET & DIRECT MARKETING RETAIL — 0.39% |
| |||||||
Zalando SEa,b,c | 400,557 | 18,946,493 | ||||||
|
| |||||||
| 18,946,493 | ||||||||
INTERNET SOFTWARE & SERVICES — 0.55% |
| |||||||
United Internet AG Registeredb,d | 441,943 | 26,192,476 | ||||||
|
| |||||||
| 26,192,476 | ||||||||
LIFE SCIENCES TOOLS & SERVICES — 0.51% |
| |||||||
QIAGEN NV | 770,958 | 24,706,726 | ||||||
|
| |||||||
| 24,706,726 | ||||||||
MACHINERY — 1.38% |
| |||||||
GEA Group AG | 657,062 | 28,903,685 | ||||||
KION Group AG | 256,161 | 23,334,597 | ||||||
MAN SE | 126,852 | 14,223,294 | ||||||
|
| |||||||
| 66,461,576 | ||||||||
MEDIA — 1.03% |
| |||||||
Axel Springer SE | 175,087 | 10,824,364 | ||||||
ProSiebenSat.1 Media SE Registered | 837,180 | 28,048,198 | ||||||
RTL Group SAa | 139,660 | 10,585,159 | ||||||
|
| |||||||
| 49,457,721 | ||||||||
| 22 | 2017 iSHARES ANNUAL REPORTTO SHAREHOLDERS |
Table of Contents
Schedule of Investments (Continued)
iSHARES® MSCI GERMANY ETF
August 31, 2017
| Security | Shares | Value | ||||||
METALS & MINING — 0.82% |
| |||||||
thyssenkrupp AG | 1,321,737 | $ | 39,583,879 | |||||
|
| |||||||
| 39,583,879 | ||||||||
MULTI-UTILITIES — 3.28% |
| |||||||
E.ON SE | 7,908,644 | 89,277,524 | ||||||
Innogy SEc | 499,034 | 21,966,979 | ||||||
RWE AGa | 1,861,812 | 46,384,046 | ||||||
|
| |||||||
| 157,628,549 | ||||||||
PERSONAL PRODUCTS — 0.80% |
| |||||||
Beiersdorf AG | 362,179 | 38,615,708 | ||||||
|
| |||||||
| 38,615,708 | ||||||||
PHARMACEUTICALS — 8.95% |
| |||||||
Bayer AG Registered | 2,971,262 | 379,747,175 | ||||||
Merck KGaA | 464,374 | 50,936,193 | ||||||
|
| |||||||
| 430,683,368 | ||||||||
REAL ESTATE MANAGEMENT & DEVELOPMENT — 2.61% |
| |||||||
Deutsche Wohnen SE Bearer | 1,274,316 | 54,056,400 | ||||||
Vonovia SE | 1,693,315 | 71,478,003 | ||||||
|
| |||||||
| 125,534,403 | ||||||||
SEMICONDUCTORS & SEMICONDUCTOR EQUIPMENT — 1.95% |
| |||||||
Infineon Technologies AG | 4,079,495 | 93,946,621 | ||||||
|
| |||||||
| 93,946,621 | ||||||||
SOFTWARE — 7.69% |
| |||||||
SAP SE | 3,531,259 | 369,871,287 | ||||||
|
| |||||||
| 369,871,287 | ||||||||
TEXTILES, APPAREL & LUXURY GOODS — 3.55% |
| |||||||
adidas AG | 676,553 | 151,660,855 | ||||||
HUGO BOSS AG | 228,114 | 19,285,360 | ||||||
|
| |||||||
| 170,946,215 | ||||||||
TRADING COMPANIES & DISTRIBUTORS — 0.61% |
| |||||||
Brenntag AG | 555,125 | 29,379,358 | ||||||
|
| |||||||
| 29,379,358 | ||||||||
TRANSPORTATION INFRASTRUCTURE — 0.31% |
| |||||||
Fraport AG Frankfurt Airport Services Worldwide | 149,822 | 14,764,640 | ||||||
|
| |||||||
| 14,764,640 | ||||||||
|
| |||||||
TOTAL COMMON STOCKS |
| |||||||
(Cost: $4,602,259,050) | 4,524,138,025 | |||||||
| Security | Shares | Value | ||||||
PREFERRED STOCKS — 5.30% |
| |||||||
AUTO COMPONENTS — 0.18% |
| |||||||
Schaeffler AG, Preference Shares | 595,179 | $ | 8,378,079 | |||||
|
| |||||||
| 8,378,079 | ||||||||
AUTOMOBILES — 3.05% |
| |||||||
Bayerische Motoren Werke AG, Preference Shares | 197,714 | 16,381,476 | ||||||
Porsche Automobil Holding SE, Preference Shares | 550,186 | 31,142,455 | ||||||
Volkswagen AG, Preference Shares | 666,816 | 99,374,622 | ||||||
|
| |||||||
| 146,898,553 | ||||||||
CHEMICALS — 0.29% |
| |||||||
Fuchs Petrolub SE, Preference Shares | 250,125 | 13,887,342 | ||||||
|
| |||||||
| 13,887,342 | ||||||||
HOUSEHOLD PRODUCTS — 1.78% |
| |||||||
Henkel AG & Co. KGaA, Preference Shares | 640,148 | 85,658,611 | ||||||
|
| |||||||
| 85,658,611 | ||||||||
|
| |||||||
TOTAL PREFERRED STOCKS |
| |||||||
(Cost: $322,283,034) | 254,822,585 | |||||||
SHORT-TERM INVESTMENTS — 1.46% |
| |||||||
MONEY MARKET FUNDS — 1.46% |
| |||||||
BlackRock Cash Funds: Institutional, |
| |||||||
1.32%e,f,g | 69,810,722 | 69,831,666 | ||||||
BlackRock Cash Funds: Treasury, SL Agency Shares | ||||||||
0.96%e,f | 589,306 | 589,306 | ||||||
|
| |||||||
| 70,420,972 | ||||||||
|
| |||||||
TOTAL SHORT-TERM INVESTMENTS |
| |||||||
(Cost: $70,420,972) |
| 70,420,972 | ||||||
|
| |||||||
SCHEDULESOF INVESTMENTS | 23 |
Table of Contents
Schedule of Investments (Continued)
iSHARES® MSCI GERMANY ETF
August 31, 2017
| Value | ||||||
TOTAL INVESTMENTS |
| |||||
(Cost: $4,994,963,056)h | $ | 4,849,381,582 | ||||
Other Assets, Less Liabilities — (0.82)% | (39,482,086 | ) | ||||
|
| |||||
NET ASSETS — 100.00% | $ | 4,809,899,496 | ||||
|
| |||||
| a | Non-income earning security. |
| b | All or a portion of this security represents a security on loan. See Note 1. |
| c | This security may be resold to qualified institutional buyers under Rule 144A of the Securities Act of 1933. |
| d | This security may be resold to qualified foreign investors and foreign institutional buyers under Regulation S of the Securities Act of 1933. |
| e | Affiliated issuer. See Schedule 1. |
| f | The rate quoted is the annualized seven-day yield of the fund at period end. |
| g | All or a portion of this security represents an investment of securities lending collateral. See Note 1. |
| h | The cost of investments (including short positions and derivatives, if any) for federal income tax purposes was $5,074,662,756. Net unrealized depreciation was $225,281,174, of which $436,471,892 represented gross unrealized appreciation on investments and $661,753,066 represented gross unrealized depreciation on investments. |
Schedule 1 — Affiliates (Note 2)
Investments in issuers considered to be affiliates of the Fund during the year ended August 31, 2017, for purposes of Section 2(a)(3) of the 1940 Act, and/or related parties of the Fund were as follows:
| Affiliated issuer | Shares held at 08/31/16 | Shares purchased | Shares sold | Shares held at 08/31/17 | Value at 08/31/17 | Net realized gain (loss) a | Change in unrealized appreciation (depreciation) | Income | ||||||||||||||||||||||||
BlackRock Cash Funds: Institutional, | — | 69,810,722 | b | — | 69,810,722 | $ | 69,831,666 | $ | (9,056 | ) | $ | — | $ | — | c | |||||||||||||||||
BlackRock Cash Funds: Treasury, | 33,859 | 555,447 | b | — | 589,306 | 589,306 | 97 | — | 18,373 | |||||||||||||||||||||||
|
|
|
|
|
|
|
| |||||||||||||||||||||||||
| $ | 70,420,972 | $ | (8,959 | ) | $ | — | $ | 18,373 | ||||||||||||||||||||||||
|
|
|
|
|
|
|
| |||||||||||||||||||||||||
| a | Includes realized capital gain distributions from an affiliated fund, if any. |
| b | Net of shares purchased and sold. |
| c | Does not include income earned on the investment of securities lending cash collateral which is not direct income of the Fund and is reflected as a component of securities lending income in the statement of operations. |
Schedule 2 — Futures Contracts (Note 5)
Futures contracts outstanding as of August 31, 2017 were as follows:
| Description | Number of contracts | Expiration date | Notional amount (000) | Value / unrealized appreciation (depreciation) | ||||||||||||
Long Contracts: | ||||||||||||||||
DAX Index | 2,125 | Sep 2017 | $ | 30,484 | $ | (1,550,396 | ) | |||||||||
|
| |||||||||||||||
| 24 | 2017 iSHARES ANNUAL REPORTTO SHAREHOLDERS |
Table of Contents
Schedule of Investments (Continued)
iSHARES® MSCI GERMANY ETF
August 31, 2017
Schedule 3 — Fair Value Measurements
Various inputs are used in determining the fair value of financial instruments. For description of the input levels and information about the Fund’s policy regarding valuation of financial instruments, see Note 1.
The following table summarizes the value of the Fund’s investments according to the fair value hierarchy as of August 31, 2017. The breakdown of the Fund’s investments into major categories is disclosed in the schedule of investments above.
| Level 1 | Level 2 | Level 3 | Total | |||||||||||||
Investments: | ||||||||||||||||
Assets: | ||||||||||||||||
Common stocks | $ | 4,524,138,025 | $ | — | $ | — | $ | 4,524,138,025 | ||||||||
Preferred stocks | 254,822,585 | — | — | 254,822,585 | ||||||||||||
Money market funds | 70,420,972 | — | — | 70,420,972 | ||||||||||||
|
|
|
|
|
|
|
| |||||||||
Total | $ | 4,849,381,582 | $ | — | $ | — | $ | 4,849,381,582 | ||||||||
|
|
|
|
|
|
|
| |||||||||
Derivative financial instrumentsa: | ||||||||||||||||
Liabilities: | ||||||||||||||||
Futures contracts | $ | (1,550,396 | ) | $ | — | $ | — | $ | (1,550,396 | ) | ||||||
|
|
|
|
|
|
|
| |||||||||
Total | $ | (1,550,396 | ) | $ | — | $ | — | $ | (1,550,396 | ) | ||||||
|
|
|
|
|
|
|
| |||||||||
| a | Shown at the unrealized appreciation (depreciation) on the contracts. |
See notes to financial statements.
SCHEDULESOF INVESTMENTS | 25 |
Table of Contents
Schedule of Investments
iSHARES® MSCI ITALY CAPPED ETF
August 31, 2017
| Security | Shares | Value | ||||||
COMMON STOCKS — 97.86% |
| |||||||
AEROSPACE & DEFENSE — 2.05% |
| |||||||
Leonardo SpA | 1,020,041 | $ | 17,232,840 | |||||
|
| |||||||
| 17,232,840 | ||||||||
AUTOMOBILES — 9.18% | ||||||||
Ferrari NV | 334,176 | 38,180,691 | ||||||
Fiat Chrysler Automobiles NVa | 2,591,796 | 38,979,519 | ||||||
|
| |||||||
| 77,160,210 | ||||||||
BANKS — 23.58% | ||||||||
Intesa Sanpaolo SpA | 27,069,073 | 91,269,306 | ||||||
Mediobanca SpA | 1,953,964 | 20,024,836 | ||||||
UniCredit SpAa | 4,279,599 | 86,954,143 | ||||||
|
| |||||||
| 198,248,285 | ||||||||
DIVERSIFIED FINANCIAL SERVICES — 2.78% |
| |||||||
EXOR NV | 365,043 | 23,392,570 | ||||||
|
| |||||||
| 23,392,570 | ||||||||
DIVERSIFIED TELECOMMUNICATION SERVICES — 3.18% |
| |||||||
Telecom Italia SpA/Milanoa | 27,952,870 | 26,736,071 | ||||||
|
| |||||||
| 26,736,071 | ||||||||
ELECTRIC UTILITIES — 16.02% | ||||||||
Enel SpA | 17,713,055 | 107,085,228 | ||||||
Terna Rete Elettrica Nazionale SpA | 4,675,802 | 27,572,931 | ||||||
|
| |||||||
| 134,658,159 | ||||||||
ELECTRICAL EQUIPMENT — 2.47% |
| |||||||
Prysmian SpA | 661,609 | 20,781,618 | ||||||
|
| |||||||
| 20,781,618 | ||||||||
ENERGY EQUIPMENT & SERVICES — 3.22% |
| |||||||
Saipem SpAa | 2,090,205 | 7,748,366 | ||||||
Tenaris SA | 1,444,369 | 19,284,263 | ||||||
|
| |||||||
| 27,032,629 | ||||||||
INSURANCE — 7.50% | ||||||||
Assicurazioni Generali SpA | 2,105,921 | 37,656,075 | ||||||
Poste Italiane SpAb | 1,973,164 | 14,321,681 | ||||||
UnipolSai Assicurazioni SpA | 4,889,293 | 11,085,158 | ||||||
|
| |||||||
| 63,062,914 | ||||||||
MACHINERY — 4.11% |
| |||||||
CNH Industrial NV | 3,045,323 | 34,504,155 | ||||||
|
| |||||||
| 34,504,155 | ||||||||
OIL, GAS & CONSUMABLE FUELS — 14.18% |
| |||||||
Eni SpA | 5,410,221 | 84,712,192 | ||||||
Snam SpA | 7,099,481 | 34,521,928 | ||||||
|
| |||||||
| 119,234,120 | ||||||||
| Security | Shares | Value | ||||||
PHARMACEUTICALS — 1.58% | ||||||||
Recordati SpA | 309,405 | $ | 13,235,295 | |||||
|
| |||||||
| 13,235,295 | ||||||||
TEXTILES, APPAREL & LUXURY GOODS — 3.49% |
| |||||||
Luxottica Group SpA | 510,794 | 29,362,120 | ||||||
|
| |||||||
| 29,362,120 | ||||||||
TRANSPORTATION INFRASTRUCTURE — 4.52% |
| |||||||
Atlantia SpA | 1,184,445 | 38,021,023 | ||||||
|
| |||||||
| 38,021,023 | ||||||||
TOTAL COMMON STOCKS |
| |||||||
(Cost: $816,852,478) |
| 822,662,009 | ||||||
PREFERRED STOCKS — 2.00% |
| |||||||
BANKS — 0.67% |
| |||||||
Intesa Sanpaolo SpA, Preference Shares | 1,791,276 | 5,652,084 | ||||||
|
| |||||||
| 5,652,084 | ||||||||
DIVERSIFIED TELECOMMUNICATION SERVICES — 1.33% |
| |||||||
Telecom Italia SpA/Milano, Preference Shares | 14,335,370 | 11,120,762 | ||||||
|
| |||||||
| 11,120,762 | ||||||||
|
| |||||||
TOTAL PREFERRED STOCKS |
| |||||||
(Cost: $17,698,041) |
| 16,772,846 | ||||||
SHORT-TERM INVESTMENTS — 0.12% |
| |||||||
MONEY MARKET FUNDS — 0.12% |
| |||||||
BlackRock Cash Funds: Treasury, |
| |||||||
0.96%c,d | 998,621 | 998,621 | ||||||
|
| |||||||
| 998,621 | ||||||||
|
| |||||||
TOTAL SHORT-TERM INVESTMENTS |
| |||||||
(Cost: $998,621) |
| 998,621 | ||||||
|
| |||||||
| 26 | 2017 iSHARES ANNUAL REPORTTO SHAREHOLDERS |
Table of Contents
Schedule of Investments (Continued)
iSHARES® MSCI ITALY CAPPED ETF
August 31, 2017
| Value | ||||||||
TOTAL INVESTMENTS | ||||||||
(Cost: $835,549,140)e |
| $ | 840,433,476 | |||||
Other Assets, Less Liabilities — 0.02% |
| 196,951 | ||||||
|
| |||||||
NET ASSETS — 100.00% |
| $ | 840,630,427 | |||||
|
| |||||||
| a | Non-income earning security. |
| b | This security may be resold to qualified institutional buyers under Rule 144A of the Securities Act of 1933. |
| c | Affiliated issuer. See Schedule 1. |
| d | The rate quoted is the annualized seven-day yield of the fund at period end. |
| e | The cost of investments (including short positions and derivatives, if any) for federal income tax purposes was $862,509,205. Net unrealized depreciation was $22,075,729, of which $73,325,109 represented gross unrealized appreciation on investments and $95,400,838 represented gross unrealized depreciation on investments. |
Schedule 1 — Affiliates (Note 2)
Investments in issuers considered to be affiliates of the Fund during the year ended August 31, 2017, for purposes of Section 2(a)(3) of the 1940 Act, and/or related parties of the Fund were as follows:
| Affiliated issuer | Shares held at 08/31/16 | Shares purchased | Shares sold | Shares held at 08/31/17 | Value at 08/31/17 | Net realized gain (loss) a | Change in unrealized appreciation (depreciation) | Income | ||||||||||||||||||||||||
BlackRock Cash Funds: Institutional, | 14,628,660 | — | (14,628,660 | )b | — | $ | — | $ | 2,698 | $ | — | $ | — | c | ||||||||||||||||||
BlackRock Cash Funds: Treasury, | 160,632 | 837,989 | b | — | 998,621 | 998,621 | 26 | — | 2,965 | |||||||||||||||||||||||
|
|
|
|
|
|
|
| |||||||||||||||||||||||||
| $ | 998,621 | $ | 2,724 | $ | — | $ | 2,965 | |||||||||||||||||||||||||
|
|
|
|
|
|
|
| |||||||||||||||||||||||||
| a | Includes realized capital gain distributions from an affiliated fund, if any. |
| b | Net of shares purchased and sold. |
| c | Does not include income earned on the investment of securities lending cash collateral which is not direct income of the Fund and is reflected as a component of securities lending income in the statement of operations. |
Schedule 2 — Fair Value Measurements
Various inputs are used in determining the fair value of financial instruments. For description of the input levels and information about the Fund’s policy regarding valuation of financial instruments, see Note 1.
The following table summarizes the value of the Fund’s investments according to the fair value hierarchy as of August 31, 2017. The breakdown of the Fund’s investments into major categories is disclosed in the schedule of investments above.
| Level 1 | Level 2 | Level 3 | Total | |||||||||||||
Investments: | ||||||||||||||||
Assets: | ||||||||||||||||
Common stocks | $ | 822,662,009 | $ | — | $ | — | $ | 822,662,009 | ||||||||
Preferred stocks | 16,772,846 | — | — | 16,772,846 | ||||||||||||
Money market funds | 998,621 | — | — | 998,621 | ||||||||||||
|
|
|
|
|
|
|
| |||||||||
Total | $ | 840,433,476 | $ | — | $ | — | $ | 840,433,476 | ||||||||
|
|
|
|
|
|
|
| |||||||||
See notes to financial statements.
SCHEDULESOF INVESTMENTS | 27 |
Table of Contents
Schedule of Investments
iSHARES® MSCI SPAIN CAPPED ETF
August 31, 2017
| Security | Shares | Value | ||||||
COMMON STOCKS — 100.53% |
| |||||||
AIRLINES — 1.97% |
| |||||||
International Consolidated Airlines Group SA | 3,813,639 | $ | 30,137,720 | |||||
|
| |||||||
| 30,137,720 | ||||||||
BANKS — 41.18% | ||||||||
Banco Bilbao Vizcaya Argentaria SA | 17,676,186 | 155,974,877 | ||||||
Banco de Sabadell SA | 21,932,076 | 48,160,587 | ||||||
Banco Santander SA | 45,156,706 | 293,076,156 | ||||||
Bankia SA | 5,615,320 | 27,298,373 | ||||||
Bankinter SA | 3,822,157 | 36,398,725 | ||||||
CaixaBank SA | 13,283,984 | 68,511,430 | ||||||
|
| |||||||
| 629,420,148 | ||||||||
BIOTECHNOLOGY — 2.43% |
| |||||||
Grifols SA | 1,313,306 | 37,082,985 | ||||||
|
| |||||||
| 37,082,985 | ||||||||
CONSTRUCTION & ENGINEERING — 6.30% |
| |||||||
ACS Actividades de Construccion y Servicios SA | 1,129,208 | 42,638,270 | ||||||
Ferrovial SA | 2,356,596 | 53,639,614 | ||||||
|
| |||||||
| 96,277,884 | ||||||||
DIVERSIFIED TELECOMMUNICATION SERVICES — 8.62% |
| |||||||
Telefonica SA | 12,229,692 | 131,716,723 | ||||||
|
| |||||||
| 131,716,723 | ||||||||
ELECTRIC UTILITIES — 8.17% |
| |||||||
Endesa SA | 1,386,270 | 33,399,470 | ||||||
Iberdrola SA | 8,813,106 | 71,888,852 | ||||||
Red Electrica Corp. SA | 873,821 | 19,598,572 | ||||||
|
| |||||||
| 124,886,894 | ||||||||
ELECTRICAL EQUIPMENT — 1.47% |
| |||||||
Siemens Gamesa Renewable Energy SA | 1,503,589 | 22,425,645 | ||||||
|
| |||||||
| 22,425,645 | ||||||||
FOOD & STAPLES RETAILING — 1.71% |
| |||||||
Distribuidora Internacional de Alimentacion SAa | 4,139,080 | 26,159,771 | ||||||
|
| |||||||
| 26,159,771 | ||||||||
GAS UTILITIES — 2.46% | ||||||||
Gas Natural SDG SA | 1,550,505 | 37,642,118 | ||||||
|
| |||||||
| 37,642,118 | ||||||||
INSURANCE — 1.58% |
| |||||||
Mapfre SA | 6,842,370 | 24,185,028 | ||||||
|
| |||||||
| 24,185,028 | ||||||||
| Security | Shares | Value | ||||||
IT SERVICES — 4.99% | ||||||||
Amadeus IT Group SA | 1,231,641 | $ | 76,245,963 | |||||
|
| |||||||
| 76,245,963 | ||||||||
OIL, GAS & CONSUMABLE FUELS — 5.56% |
| |||||||
Enagas SA | 495,005 | 14,568,594 | ||||||
Repsol SA | 4,103,988 | 70,407,278 | ||||||
|
| |||||||
| 84,975,872 | ||||||||
SPECIALTY RETAIL — 5.58% | ||||||||
Industria de Diseno Textil SA | 2,249,043 | 85,337,074 | ||||||
|
| |||||||
| 85,337,074 | ||||||||
TRANSPORTATION INFRASTRUCTURE — 8.51% |
| |||||||
Abertis Infraestructuras SA | 3,305,546 | 66,809,353 | ||||||
Aena SAb | 324,748 | 63,338,512 | ||||||
|
| |||||||
| 130,147,865 | ||||||||
|
| |||||||
TOTAL COMMON STOCKS |
| |||||||
(Cost: $1,548,878,599) |
| 1,536,641,690 | ||||||
SHORT-TERM INVESTMENTS — 0.76% |
| |||||||
MONEY MARKET FUNDS — 0.76% |
| |||||||
BlackRock Cash Funds: Institutional, |
| |||||||
1.32%c,d,e | 10,256,664 | 10,259,741 | ||||||
BlackRock Cash Funds: Treasury, |
| |||||||
0.96%c,d | 1,301,695 | 1,301,695 | ||||||
|
| |||||||
| 11,561,436 | ||||||||
|
| |||||||
TOTAL SHORT-TERM INVESTMENTS |
| |||||||
(Cost: $11,561,436) |
| 11,561,436 | ||||||
|
| |||||||
TOTAL INVESTMENTS |
| |||||||
(Cost: $1,560,440,035)f |
| 1,548,203,126 | ||||||
Other Assets, Less Liabilities — (1.29)% |
| (19,669,635 | ) | |||||
|
| |||||||
NET ASSETS — 100.00% |
| $ | 1,528,533,491 | |||||
|
| |||||||
| a | All or a portion of this security represents a security on loan. See Note 1. |
| b | This security may be resold to qualified institutional buyers under Rule 144A of the Securities Act of 1933. |
| c | Affiliated issuer. See Schedule 1. |
| d | The rate quoted is the annualized seven-day yield of the fund at period end. |
| e | All or a portion of this security represents an investment of securities lending collateral. See Note 1. |
| f | The cost of investments (including short positions and derivatives, if any) for federal income tax purposes was $1,588,881,971. Net unrealized depreciation was $40,678,845, of which $91,694,062 represented gross unrealized appreciation on investments and $132,372,907 represented gross unrealized depreciation on investments. |
| 28 | 2017 iSHARES ANNUAL REPORTTO SHAREHOLDERS |
Table of Contents
Schedule of Investments (Continued)
iSHARES® MSCI SPAIN CAPPED ETF
August 31, 2017
Schedule 1 — Affiliates (Note 2)
Investments in issuers considered to be affiliates of the Fund during the year ended August 31, 2017, for purposes of Section 2(a)(3) of the 1940 Act, and/or related parties of the Fund were as follows:
| Affiliated issuer | Shares held at 08/31/16 | Shares purchased | Shares sold | Shares held at 08/31/17 | Value at 08/31/17 | Net realized gain (loss) a | Change in unrealized appreciation (depreciation) | Income | ||||||||||||||||||||||||
BlackRock Cash Funds: Institutional, | 61,979 | 10,194,685 | b | — | 10,256,664 | $ | 10,259,741 | $ | 144 | $ | — | $ | — | c | ||||||||||||||||||
BlackRock Cash Funds: Treasury, | 7,135 | 1,294,560 | b | — | 1,301,695 | 1,301,695 | 1 | — | 5,263 | |||||||||||||||||||||||
|
|
|
|
|
|
|
| |||||||||||||||||||||||||
| $ | 11,561,436 | $ | 145 | $ | — | $ | 5,263 | |||||||||||||||||||||||||
|
|
|
|
|
|
|
| |||||||||||||||||||||||||
| a | Includes realized capital gain distributions from an affiliated fund, if any. |
| b | Net of shares purchased and sold. |
| c | Does not include income earned on the investment of securities lending cash collateral which is not direct income of the Fund and is reflected as a component of securities lending income in the statement of operations. |
Schedule 2 — Fair Value Measurements
Various inputs are used in determining the fair value of financial instruments. For description of the input levels and information about the Fund’s policy regarding valuation of financial instruments, see Note 1.
The following table summarizes the value of the Fund’s investments according to the fair value hierarchy as of August 31, 2017. The breakdown of the Fund’s investments into major categories is disclosed in the schedule of investments above.
| Level 1 | Level 2 | Level 3 | Total | |||||||||||||
Investments: | ||||||||||||||||
Assets: | ||||||||||||||||
Common stocks | $ | 1,536,641,690 | $ | — | $ | — | $ | 1,536,641,690 | ||||||||
Money market funds | 11,561,436 | — | — | 11,561,436 | ||||||||||||
|
|
|
|
|
|
|
| |||||||||
Total | $ | 1,548,203,126 | $ | — | $ | — | $ | 1,548,203,126 | ||||||||
|
|
|
|
|
|
|
| |||||||||
See notes to financial statements.
SCHEDULESOF INVESTMENTS | 29 |
Table of Contents
Schedule of Investments
iSHARES® MSCI SWITZERLAND CAPPED ETF
August 31, 2017
| Security | Shares | Value | ||||||
COMMON STOCKS — 98.66% |
| |||||||
BUILDING PRODUCTS — 1.71% | ||||||||
Geberit AG Registered | 47,311 | $ | 21,568,105 | |||||
|
| |||||||
| 21,568,105 | ||||||||
CAPITAL MARKETS — 10.26% | ||||||||
Credit Suisse Group AG Registered | 2,831,569 | 41,545,393 | ||||||
Julius Baer Group Ltd. | 305,216 | 17,023,494 | ||||||
Partners Group Holding AG | 24,259 | 15,701,455 | ||||||
UBS Group AG | 3,338,440 | 54,887,983 | ||||||
|
| |||||||
| 129,158,325 | ||||||||
CHEMICALS — 4.23% | ||||||||
EMS-Chemie Holding AG Registered | 13,847 | 9,445,066 | ||||||
Givaudan SA Registered | 11,610 | 23,679,084 | ||||||
Sika AG Bearer | 2,842 | 20,109,886 | ||||||
|
| |||||||
| 53,234,036 | ||||||||
CONSTRUCTION MATERIALS — 2.54% |
| |||||||
LafargeHolcim Ltd. Registered | 546,272 | 32,031,662 | ||||||
|
| |||||||
| 32,031,662 | ||||||||
DIVERSIFIED FINANCIAL SERVICES — 0.55% |
| |||||||
Pargesa Holding SA Bearer | 85,233 | 6,891,367 | ||||||
|
| |||||||
| 6,891,367 | ||||||||
DIVERSIFIED TELECOMMUNICATION SERVICES — 1.40% |
| |||||||
Swisscom AG Registered | 35,050 | 17,638,064 | ||||||
|
| |||||||
| 17,638,064 | ||||||||
ELECTRICAL EQUIPMENT — 4.19% |
| |||||||
ABB Ltd. Registered | 2,283,322 | 52,746,877 | ||||||
|
| |||||||
| 52,746,877 | ||||||||
FOOD PRODUCTS — 21.64% | ||||||||
Barry Callebaut AG Registered | 4,850 | 6,964,620 | ||||||
Chocoladefabriken Lindt & Spruengli AG Participation Certificates | 1,731 | 9,906,868 | ||||||
Chocoladefabriken Lindt & Spruengli AG Registered | 161 | 11,176,181 | ||||||
Nestle SA Registered | 2,888,768 | 244,538,269 | ||||||
|
| |||||||
| 272,585,938 | ||||||||
HEALTH CARE EQUIPMENT & SUPPLIES — 1.87% |
| |||||||
Sonova Holding AG Registered | 76,973 | 12,983,687 | ||||||
Straumann Holding AG Registered | 16,510 | 10,557,123 | ||||||
|
| |||||||
| 23,540,810 | ||||||||
INSURANCE — 9.11% |
| |||||||
Baloise Holding AG Registered | 76,326 | 12,127,971 | ||||||
Swiss Life Holding AG Registered | 44,789 | 15,995,406 | ||||||
| Security | Shares | Value | ||||||
Swiss Re AG | 385,213 | $ | 34,813,474 | |||||
Zurich Insurance Group AG | 173,333 | 51,747,386 | ||||||
|
| |||||||
| 114,684,237 | ||||||||
LIFE SCIENCES TOOLS & SERVICES — 1.95% |
| |||||||
Lonza Group AG Registered | 97,094 | 24,531,138 | ||||||
|
| |||||||
| 24,531,138 | ||||||||
MACHINERY — 1.67% | ||||||||
Schindler Holding AG Participation Certificates | 60,182 | 12,863,041 | ||||||
Schindler Holding AG Registered | 38,829 | 8,141,565 | ||||||
|
| |||||||
| 21,004,606 | ||||||||
MARINE — 1.14% | ||||||||
Kuehne + Nagel International AG Registered | 79,270 | 14,327,991 | ||||||
|
| |||||||
| 14,327,991 | ||||||||
PHARMACEUTICALS — 26.00% |
| |||||||
Novartis AG Registered | 1,945,630 | 163,789,248 | ||||||
Roche Holding AG | 610,815 | 154,769,461 | ||||||
Vifor Pharma AG | 87,570 | 8,829,899 | ||||||
|
| |||||||
| 327,388,608 | ||||||||
PROFESSIONAL SERVICES — 2.60% |
| |||||||
Adecco Group AG Registered | 223,105 | 16,135,065 | ||||||
SGS SA Registered | 7,448 | 16,608,808 | ||||||
|
| |||||||
| 32,743,873 | ||||||||
REAL ESTATE MANAGEMENT & DEVELOPMENT — 0.83% |
| |||||||
Swiss Prime Site AG Registered | 116,080 | 10,484,645 | ||||||
|
| |||||||
| 10,484,645 | ||||||||
SPECIALTY RETAIL — 0.74% | ||||||||
Dufry AG Registereda | 60,372 | 9,285,100 | ||||||
|
| |||||||
| 9,285,100 | ||||||||
TEXTILES, APPAREL & LUXURY GOODS — 6.23% |
| |||||||
Cie. Financiere Richemont SA Class A Registered | 599,474 | 53,491,046 | ||||||
Swatch Group AG (The) Bearer | 42,068 | 16,757,160 | ||||||
Swatch Group AG (The) Registered | 106,695 | 8,254,707 | ||||||
|
| |||||||
| 78,502,913 | ||||||||
|
| |||||||
TOTAL COMMON STOCKS |
| |||||||
(Cost: $1,238,439,696) |
| 1,242,348,295 | ||||||
| 30 | 2017 iSHARES ANNUAL REPORTTO SHAREHOLDERS |
Table of Contents
Schedule of Investments (Continued)
iSHARES® MSCI SWITZERLAND CAPPED ETF
August 31, 2017
| Security | Shares | Value | ||||||
SHORT-TERM INVESTMENTS — 0.05% |
| |||||||
MONEY MARKET FUNDS — 0.05% |
| |||||||
BlackRock Cash Funds: Treasury, |
| |||||||
0.96%b,c | 609,567 | $ | 609,567 | |||||
|
| |||||||
| 609,567 | ||||||||
|
| |||||||
TOTAL SHORT-TERM INVESTMENTS |
| |||||||
(Cost: $609,567) |
| 609,567 | ||||||
|
| |||||||
| Value | ||||||
TOTAL INVESTMENTS | $ | 1,242,957,862 | ||||
(Cost: $1,239,049,263)d | ||||||
Other Assets, Less Liabilities — 1.29% | 16,299,801 | |||||
|
| |||||
NET ASSETS — 100.00% | $ | 1,259,257,663 | ||||
|
| |||||
| a | Non-income earning security. |
| b | Affiliated issuer. See Schedule 1. |
| c | The rate quoted is the annualized seven-day yield of the fund at period end. |
| d | The cost of investments (including short positions and derivatives, if any) for federal income tax purposes was $1,249,460,071. Net unrealized depreciation was $6,502,209, of which $83,840,333 represented gross unrealized appreciation on investments and $90,342,542 represented gross unrealized depreciation on investments. |
Schedule 1 — Affiliates (Note 2)
Investments in issuers considered to be affiliates of the Fund during the year ended August 31, 2017, for purposes of Section 2(a)(3) of the 1940 Act, and/or related parties of the Fund were as follows:
| Affiliated issuer | Shares held at 08/31/16 | Shares purchased | Shares sold | Shares held at 08/31/17 | Value at 08/31/17 | Net realized gain (loss) a | Change in unrealized appreciation (depreciation) | Income | ||||||||||||||||||||||||
BlackRock Cash Funds: Institutional, SL Agency Shares | 4,549,701 | — | (4,549,701 | )b | — | $ | — | $ | 2,101 | $ | — | $ | — | c | ||||||||||||||||||
BlackRock Cash Funds: Treasury, SL Agency Shares | 51,921 | 557,646 | b | — | 609,567 | 609,567 | — | — | 21,271 | |||||||||||||||||||||||
|
|
|
|
|
|
|
| |||||||||||||||||||||||||
| $ | 609,567 | $ | 2,101 | $ | — | $ | 21,271 | |||||||||||||||||||||||||
|
|
|
|
|
|
|
| |||||||||||||||||||||||||
| a | Includes realized capital gain distributions from an affiliated fund, if any. |
| b | Net of shares purchased and sold. |
| c | Does not include income earned on the investment of securities lending cash collateral which is not direct income of the Fund and is reflected as a component of securities lending income in the statement of operations. |
Schedule 2 — Fair Value Measurements
Various inputs are used in determining the fair value of financial instruments. For description of the input levels and information about the Fund’s policy regarding valuation of financial instruments, see Note 1.
The following table summarizes the value of the Fund’s investments according to the fair value hierarchy as of August 31, 2017. The breakdown of the Fund’s investments into major categories is disclosed in the schedule of investments above.
| Level 1 | Level 2 | Level 3 | Total | |||||||||||||
Investments: | ||||||||||||||||
Assets: | ||||||||||||||||
Common stocks | $ | 1,242,348,295 | $ | — | $ | — | $ | 1,242,348,295 | ||||||||
Money market funds | 609,567 | — | — | 609,567 | ||||||||||||
|
|
|
|
|
|
|
| |||||||||
Total | $ | 1,242,957,862 | $ | — | $ | — | $ | 1,242,957,862 | ||||||||
|
|
|
|
|
|
|
| |||||||||
See notes to financial statements.
SCHEDULESOF INVESTMENTS | 31 |
Table of Contents
Statements of Assets and Liabilities
iSHARES®, INC.
August 31, 2017
| iShares MSCI Eurozone ETF | iShares MSCI Germany ETF | iShares MSCI Italy Capped ETF | ||||||||||
ASSETS | ||||||||||||
Investments in securities, at cost: | ||||||||||||
Unaffiliated | $ | 12,899,924,994 | $ | 4,924,542,084 | $ | 834,550,519 | ||||||
Affiliated (Note 2) | 58,075,651 | 70,420,972 | 998,621 | |||||||||
|
|
|
|
|
| |||||||
Total cost of investments in securities | $ | 12,958,000,645 | $ | 4,994,963,056 | $ | 835,549,140 | ||||||
|
|
|
|
|
| |||||||
Investments in securities, at fair value (including securities on | ||||||||||||
Unaffiliated | $ | 13,253,867,899 | $ | 4,778,960,610 | $ | 839,434,855 | ||||||
Affiliated (Note 2) | 58,084,689 | 70,420,972 | 998,621 | |||||||||
Foreign currency, at valueb | 13,350,004 | 7,355,329 | 614,079 | |||||||||
Foreign currency pledged to broker for futures contracts, at valueb | — | 3,881,772 | — | |||||||||
Cash | 40,000 | — | — | |||||||||
Receivables: | ||||||||||||
Investment securities sold | 30,144,142 | 22,567,773 | 11,360,727 | |||||||||
Dividends and interest | 4,341,528 | 27,143 | 680 | |||||||||
Capital shares sold | — | — | 202,127 | |||||||||
Tax reclaims | 17,201,312 | 23,295,580 | — | |||||||||
Foreign withholding tax claims (Note 8) | 4,043,205 | — | — | |||||||||
|
|
|
|
|
| |||||||
Total Assets | 13,381,072,779 | 4,906,509,179 | 852,611,089 | |||||||||
|
|
|
|
|
| |||||||
LIABILITIES | ||||||||||||
Payables: | ||||||||||||
Investment securities purchased | 31,804,018 | 23,106,865 | 11,660,502 | |||||||||
Collateral for securities on loan (Note 1) | 57,587,964 | 69,840,663 | — | |||||||||
Capital shares redeemed | — | 127,225 | — | |||||||||
Futures variation margin | — | 1,550,396 | — | |||||||||
Professional fees (Note 8) | 40,432 | — | — | |||||||||
Investment advisory fees (Note 2) | 5,424,441 | 1,984,534 | 320,160 | |||||||||
|
|
|
|
|
| |||||||
Total Liabilities | 94,856,855 | 96,609,683 | 11,980,662 | |||||||||
|
|
|
|
|
| |||||||
NET ASSETS | $ | 13,286,215,924 | $ | 4,809,899,496 | $ | 840,630,427 | ||||||
|
|
|
|
|
| |||||||
Net assets consist of: | ||||||||||||
Paid-in capital | $ | 13,410,843,727 | $ | 5,155,615,683 | $ | 1,069,525,658 | ||||||
Undistributed net investment income | 39,606,657 | 11,828,547 | 1,810,109 | |||||||||
Accumulated net realized loss | (519,745,406 | ) | (212,047,338 | ) | (235,594,712 | ) | ||||||
Net unrealized appreciation (depreciation) | 355,510,946 | (145,497,396 | ) | 4,889,372 | ||||||||
|
|
|
|
|
| |||||||
NET ASSETS | $ | 13,286,215,924 | $ | 4,809,899,496 | $ | 840,630,427 | ||||||
|
|
|
|
|
| |||||||
Shares outstandingc | 318,500,000 | 156,600,000 | 27,825,000 | d | ||||||||
|
|
|
|
|
| |||||||
Net asset value per share | $ | 41.71 | $ | 30.71 | $ | 30.21 | d | |||||
|
|
|
|
|
| |||||||
| a | Securities on loan with values of $55,007,154, $66,582,730 and $ —, respectively. See Note 1. |
| b | Cost of foreign currency including currency pledged to broker for futures contracts: $13,179,255, $11,108,942 and $609,043, respectively. |
| c | $0.001 par value, number of shares authorized: 1 billion, 482.2 million and 295.4 million, respectively. |
| d | Shares outstanding and net asset value per share reflect a one-for-two reverse stock split effective after the close of trading on November 4, 2016. See Note 4. |
See notes to financial statements.
| 32 | 2017 iSHARES ANNUAL REPORTTO SHAREHOLDERS |
Table of Contents
Statements of Assets and Liabilities (Continued)
iSHARES®, INC.
August 31, 2017
iShares MSCI Spain | iShares MSCI Switzerland Capped ETF | |||||||
ASSETS | ||||||||
Investments in securities, at cost: | ||||||||
Unaffiliated | $ | 1,548,878,599 | $ | 1,238,439,696 | ||||
Affiliated (Note 2) | 11,561,436 | 609,567 | ||||||
|
|
|
| |||||
Total cost of investments in securities | $ | 1,560,440,035 | $ | 1,239,049,263 | ||||
|
|
|
| |||||
Investments in securities, at fair value (including securities on loana) (Note 1): | ||||||||
Unaffiliated | $ | 1,536,641,690 | $ | 1,242,348,295 | ||||
Affiliated (Note 2) | 11,561,436 | 609,567 | ||||||
Foreign currency, at valueb | 972,456 | 498,655 | ||||||
Receivables: | ||||||||
Investment securities sold | 35,253,025 | 5,328,072 | ||||||
Due from custodian (Note 4) | 3,143,236 | — | ||||||
Dividends and interest | 3,716 | 706 | ||||||
Tax reclaims | 163,483 | 16,460,233 | ||||||
|
|
|
| |||||
Total Assets | 1,587,739,042 | 1,265,245,528 | ||||||
|
|
|
| |||||
LIABILITIES | ||||||||
Payables: | ||||||||
Investment securities purchased | 48,334,156 | 5,475,947 | ||||||
Collateral for securities on loan (Note 1) | 10,259,596 | — | ||||||
Investment advisory fees (Note 2) | 611,799 | 511,918 | ||||||
|
|
|
| |||||
Total Liabilities | 59,205,551 | 5,987,865 | ||||||
|
|
|
| |||||
NET ASSETS | $ | 1,528,533,491 | $ | 1,259,257,663 | ||||
|
|
|
| |||||
Net assets consist of: | ||||||||
Paid-in capital | $ | 1,725,159,411 | $ | 1,327,263,770 | ||||
Undistributed (distributions in excess of) net investment income | 9,343,831 | (369,308 | ) | |||||
Accumulated net realized loss | (193,739,741 | ) | (71,485,412 | ) | ||||
Net unrealized appreciation (depreciation) | (12,230,010 | ) | 3,848,613 | |||||
|
|
|
| |||||
NET ASSETS | $ | 1,528,533,491 | $ | 1,259,257,663 | ||||
|
|
|
| |||||
Shares outstandingc | 45,450,000 | 36,750,000 | ||||||
|
|
|
| |||||
Net asset value per share | $ | 33.63 | $ | 34.27 | ||||
|
|
|
| |||||
| a | Securities on loan with values of $9,678,000 and $ —, respectively. See Note 1. |
| b | Cost of foreign currency: $967,256 and $492,153, respectively. |
| c | $0.001 par value, number of shares authorized: 127.8 million and 318.625 million, respectively. |
See notes to financial statements.
FINANCIAL STATEMENTS | 33 |
Table of Contents
Statements of Operations
iSHARES®, INC.
Year ended August 31, 2017
| iShares MSCI Eurozone ETF | iShares MSCI Germany ETF | iShares MSCI Italy Capped ETF | ||||||||||
NET INVESTMENT INCOME | ||||||||||||
Dividends — unaffiliateda | $ | 268,906,708 | $ | 110,229,901 | $ | 17,275,840 | ||||||
Dividends — affiliated (Note 2) | 44,595 | 18,373 | 2,965 | |||||||||
Miscellaneous income | 48,171 | — | — | |||||||||
Securities lending income — affiliated — net (Note 2) | 1,778,062 | 194,790 | 92,308 | |||||||||
Non-cash dividends — unaffiliated | 25,509,129 | — | — | |||||||||
|
|
|
|
|
| |||||||
Total investment income | 296,286,665 | 110,443,064 | 17,371,113 | |||||||||
|
|
|
|
|
| |||||||
EXPENSES | ||||||||||||
Investment advisory fees (Note 2) | 46,002,461 | 20,888,860 | 2,740,989 | |||||||||
Proxy fees | 227,864 | 102,578 | 12,588 | |||||||||
Professional fees (Note 8) | 16,921 | — | — | |||||||||
|
|
|
|
|
| |||||||
Total expenses | 46,247,246 | 20,991,438 | 2,753,577 | |||||||||
|
|
|
|
|
| |||||||
Net investment income | 250,039,419 | 89,451,626 | 14,617,536 | |||||||||
|
|
|
|
|
| |||||||
NET REALIZED AND UNREALIZED GAIN (LOSS) | ||||||||||||
Net realized gain (loss) from: | ||||||||||||
Investments — unaffiliated | (89,475,613 | ) | (44,627,794 | ) | (59,844,908 | ) | ||||||
Investments — affiliated (Note 2) | (2,246 | ) | (9,056 | ) | 2,698 | |||||||
In-kind redemptions — unaffiliated | (21,163,911 | ) | 119,852,645 | 15,443,907 | ||||||||
Futures contracts | — | 5,815,831 | — | |||||||||
Foreign currency transactions | 3,109,868 | 963,220 | (263,288 | ) | ||||||||
Realized gain distributions from affiliated funds | 117 | 97 | 26 | |||||||||
|
|
|
|
|
| |||||||
Net realized gain (loss) | (107,531,785 | ) | 81,994,943 | (44,661,565 | ) | |||||||
|
|
|
|
|
| |||||||
Net change in unrealized appreciation/depreciation on: | ||||||||||||
Investments — unaffiliated | 1,979,399,835 | 641,599,657 | 222,000,159 | |||||||||
Investments — affiliated (Note 2) | 9,038 | — | — | |||||||||
Futures contracts | — | (3,577,429 | ) | — | ||||||||
Translation of assets and liabilities in foreign currencies | 1,842,017 | 1,949,104 | 5,218 | |||||||||
|
|
|
|
|
| |||||||
Net change in unrealized appreciation/depreciation | 1,981,250,890 | 639,971,332 | 222,005,377 | |||||||||
|
|
|
|
|
| |||||||
Net realized and unrealized gain | 1,873,719,105 | 721,966,275 | 177,343,812 | |||||||||
|
|
|
|
|
| |||||||
NET INCREASE IN NET ASSETS RESULTING FROM OPERATIONS | $ | 2,123,758,524 | $ | 811,417,901 | $ | 191,961,348 | ||||||
|
|
|
|
|
| |||||||
| a | Net of foreign withholding tax of $38,237,983, $15,988,544 and $2,869,734, respectively. |
See notes to financial statements.
| 34 | 2017 iSHARES ANNUAL REPORTTO SHAREHOLDERS |
Table of Contents
Statements of Operations (Continued)
iSHARES®, INC.
Year ended August 31, 2017
| iShares MSCI Spain Capped ETF | iShares MSCI Switzerland Capped ETF | |||||||
NET INVESTMENT INCOME | ||||||||
Dividends — unaffiliateda | $ | 21,640,607 | $ | 29,207,979 | ||||
Dividends — affiliated (Note 2) | 5,263 | 21,271 | ||||||
Securities lending income — affiliated — net (Note 2) | 170,247 | 44,579 | ||||||
Non-cash dividends — unaffiliated | 12,507,166 | — | ||||||
|
|
|
| |||||
Total investment income | 34,323,283 | 29,273,829 | ||||||
|
|
|
| |||||
EXPENSES | ||||||||
Investment advisory fees (Note 2) | 4,632,509 | 5,322,718 | ||||||
Proxy fees | 27,036 | 24,153 | ||||||
|
|
|
| |||||
Total expenses | 4,659,545 | 5,346,871 | ||||||
|
|
|
| |||||
Net investment income | 29,663,738 | 23,926,958 | ||||||
|
|
|
| |||||
NET REALIZED AND UNREALIZED GAIN (LOSS) | ||||||||
Net realized gain (loss) from: | ||||||||
Investments — unaffiliated | (78,244,658 | ) | 13,177,537 | |||||
Investments — affiliated (Note 2) | 144 | 2,101 | ||||||
In-kind redemptions — unaffiliated | 656,425 | 17,133,923 | ||||||
Foreign currency transactions | 648,061 | (10,194 | ) | |||||
Realized gain distributions from affiliated funds | 1 | — | ||||||
|
|
|
| |||||
Net realized gain (loss) | (76,940,027 | ) | 30,303,367 | |||||
|
|
|
| |||||
Net change in unrealized appreciation/depreciation on: | ||||||||
Investments — unaffiliated | 304,897,126 | 106,435,804 | ||||||
Translation of assets and liabilities in foreign currencies | 11,817 | 448,170 | ||||||
|
|
|
| |||||
Net change in unrealized appreciation/depreciation | 304,908,943 | 106,883,974 | ||||||
|
|
|
| |||||
Net realized and unrealized gain | 227,968,916 | 137,187,341 | ||||||
|
|
|
| |||||
NET INCREASE IN NET ASSETS RESULTING FROM OPERATIONS | $ | 257,632,654 | $ | 161,114,299 | ||||
|
|
|
| |||||
| a | Net of foreign withholding tax of $3,792,832 and $5,392,231, respectively. |
See notes to financial statements.
FINANCIAL STATEMENTS | 35 |
Table of Contents
Statements of Changes in Net Assets
iSHARES®, INC.
| iShares MSCI Eurozone ETF | iShares MSCI Germany ETF | |||||||||||||||
| Year ended August 31, 2017 | Year ended August 31, 2016 | Year ended August 31, 2017 | Year ended August 31, 2016 | |||||||||||||
INCREASE (DECREASE) IN NET ASSETS | ||||||||||||||||
OPERATIONS: | ||||||||||||||||
Net investment income | $ | 250,039,419 | $ | 313,780,162 | $ | 89,451,626 | $ | 96,825,243 | ||||||||
Net realized gain (loss) | (107,531,785 | ) | (353,696,400 | ) | 81,994,943 | (202,576,200 | ) | |||||||||
Net change in unrealized appreciation/depreciation | 1,981,250,890 | (558,972,719 | ) | 639,971,332 | 36,790,914 | |||||||||||
|
|
|
|
|
|
|
| |||||||||
Net increase (decrease) in net assets resulting from operations | 2,123,758,524 | (598,888,957 | ) | 811,417,901 | (68,960,043 | ) | ||||||||||
|
|
|
|
|
|
|
| |||||||||
DISTRIBUTIONS TO SHAREHOLDERS: | ||||||||||||||||
From net investment income | (251,508,888 | ) | (293,025,178 | ) | (101,663,169 | ) | (97,625,093 | ) | ||||||||
|
|
|
|
|
|
|
| |||||||||
Total distributions to shareholders | (251,508,888 | ) | (293,025,178 | ) | (101,663,169 | ) | (97,625,093 | ) | ||||||||
|
|
|
|
|
|
|
| |||||||||
CAPITAL SHARE TRANSACTIONS: | ||||||||||||||||
Proceeds from shares sold | 5,075,719,442 | 5,702,626,726 | 1,344,475,553 | 800,372,366 | ||||||||||||
Cost of shares redeemed | (1,955,344,002 | ) | (6,651,737,571 | ) | (841,232,745 | ) | (3,643,941,594 | ) | ||||||||
|
|
|
|
|
|
|
| |||||||||
Net increase (decrease) in net assets from capital share transactions | 3,120,375,440 | (949,110,845 | ) | 503,242,808 | (2,843,569,228 | ) | ||||||||||
|
|
|
|
|
|
|
| |||||||||
INCREASE (DECREASE) IN NET ASSETS | 4,992,625,076 | (1,841,024,980 | ) | 1,212,997,540 | (3,010,154,364 | ) | ||||||||||
NET ASSETS | ||||||||||||||||
Beginning of year | 8,293,590,848 | 10,134,615,828 | 3,596,901,956 | 6,607,056,320 | ||||||||||||
|
|
|
|
|
|
|
| |||||||||
End of year | $ | 13,286,215,924 | $ | 8,293,590,848 | $ | 4,809,899,496 | $ | 3,596,901,956 | ||||||||
|
|
|
|
|
|
|
| |||||||||
Undistributed net investment income included in net assets at end of year | $ | 39,606,657 | $ | 25,909,364 | $ | 11,828,547 | $ | — | ||||||||
|
|
|
|
|
|
|
| |||||||||
SHARES ISSUED AND REDEEMED | ||||||||||||||||
Shares sold | 130,800,000 | 161,500,000 | 47,700,000 | 32,400,000 | ||||||||||||
Shares redeemed | (54,800,000 | ) | (200,200,000 | ) | (28,500,000 | ) | (145,800,000 | ) | ||||||||
|
|
|
|
|
|
|
| |||||||||
Net increase (decrease) in shares outstanding | 76,000,000 | (38,700,000 | ) | 19,200,000 | (113,400,000 | ) | ||||||||||
|
|
|
|
|
|
|
| |||||||||
See notes to financial statements.
| 36 | 2017 iSHARES ANNUAL REPORTTO SHAREHOLDERS |
Table of Contents
Statements of Changes in Net Assets (Continued)
iSHARES®, INC
| iShares MSCI Italy Capped ETF | iShares MSCI Spain Capped ETF | |||||||||||||||
| Year ended August 31, 2017a | Year ended August 31, 2016a | Year ended August 31, 2017 | Year ended August 31, 2016 | |||||||||||||
INCREASE (DECREASE) IN NET ASSETS | ||||||||||||||||
OPERATIONS: | ||||||||||||||||
Net investment income | $ | 14,617,536 | $ | 22,596,515 | $ | 29,663,738 | $ | 38,911,804 | ||||||||
Net realized loss | (44,661,565 | ) | (168,394,983 | ) | (76,940,027 | ) | (282,574,356 | ) | ||||||||
Net change in unrealized appreciation/depreciation | 222,005,377 | (101,942,406 | ) | 304,908,943 | 22,989,683 | |||||||||||
|
|
|
|
|
|
|
| |||||||||
Net increase (decrease) in net assets resulting from operations | 191,961,348 | (247,740,874 | ) | 257,632,654 | (220,672,869 | ) | ||||||||||
|
|
|
|
|
|
|
| |||||||||
DISTRIBUTIONS TO SHAREHOLDERS: | ||||||||||||||||
From net investment income | (15,689,552 | ) | (22,347,848 | ) | (28,748,503 | ) | (41,241,786 | ) | ||||||||
Return of capital | — | (780,522 | ) | — | — | |||||||||||
|
|
|
|
|
|
|
| |||||||||
Total distributions to shareholders | (15,689,552 | ) | (23,128,370 | ) | (28,748,503 | ) | (41,241,786 | ) | ||||||||
|
|
|
|
|
|
|
| |||||||||
CAPITAL SHARE TRANSACTIONS: | ||||||||||||||||
Proceeds from shares sold | 478,934,035 | 265,361,545 | 827,558,231 | 42,497,240 | ||||||||||||
Cost of shares redeemed | (275,606,026 | ) | (610,898,923 | ) | (127,852,787 | ) | (846,729,289 | ) | ||||||||
|
|
|
|
|
|
|
| |||||||||
Net increase (decrease) in net assets from capital share transactions | 203,328,009 | (345,537,378 | ) | 699,705,444 | (804,232,049 | ) | ||||||||||
|
|
|
|
|
|
|
| |||||||||
INCREASE (DECREASE) IN NET ASSETS | 379,599,805 | (616,406,622 | ) | 928,589,595 | (1,066,146,704 | ) | ||||||||||
NET ASSETS | ||||||||||||||||
Beginning of year | 461,030,622 | 1,077,437,244 | 599,943,896 | 1,666,090,600 | ||||||||||||
|
|
|
|
|
|
|
| |||||||||
End of year | $ | 840,630,427 | $ | 461,030,622 | $ | 1,528,533,491 | $ | 599,943,896 | ||||||||
|
|
|
|
|
|
|
| |||||||||
Undistributed net investment income included in net assets at end of year | $ | 1,810,109 | $ | — | $ | 9,343,831 | $ | 7,780,534 | ||||||||
|
|
|
|
|
|
|
| |||||||||
SHARES ISSUED AND REDEEMED | ||||||||||||||||
Shares sold | 20,625,000 | 8,925,000 | 27,300,000 | 1,500,000 | ||||||||||||
Shares redeemed | (13,200,000 | ) | (25,050,000 | ) | (4,500,000 | ) | (30,975,000 | ) | ||||||||
|
|
|
|
|
|
|
| |||||||||
Net increase (decrease) in shares outstanding | 7,425,000 | (16,125,000 | ) | 22,800,000 | (29,475,000 | ) | ||||||||||
|
|
|
|
|
|
|
| |||||||||
| a | Share transactions reflect a one-for-two reverse stock split effective after the close of trading on November 4, 2016. See Note 4. |
See notes to financial statements.
FINANCIAL STATEMENTS | 37 |
Table of Contents
Statements of Changes in Net Assets (Continued)
iSHARES®, INC.
| iShares MSCI Switzerland Capped ETF | ||||||||
| Year ended August 31, 2017 | Year ended August 31, 2016 | |||||||
INCREASE (DECREASE) IN NET ASSETS | ||||||||
OPERATIONS: | ||||||||
Net investment income | $ | 23,926,958 | $ | 30,735,996 | ||||
Net realized gain (loss) | 30,303,367 | (11,354,929 | ) | |||||
Net change in unrealized appreciation/depreciation | 106,883,974 | (51,909,400 | ) | |||||
|
|
|
| |||||
Net increase (decrease) in net assets resulting from operations | 161,114,299 | (32,528,333 | ) | |||||
|
|
|
| |||||
DISTRIBUTIONS TO SHAREHOLDERS: | ||||||||
From net investment income | (25,105,668 | ) | (29,917,479 | ) | ||||
|
|
|
| |||||
Total distributions to shareholders | (25,105,668 | ) | (29,917,479 | ) | ||||
|
|
|
| |||||
CAPITAL SHARE TRANSACTIONS: | ||||||||
Proceeds from shares sold | 196,663,250 | 179,880,379 | ||||||
Cost of shares redeemed | (165,149,192 | ) | (225,863,531 | ) | ||||
|
|
|
| |||||
Net increase (decrease) in net assets from capital share transactions | 31,514,058 | (45,983,152 | ) | |||||
|
|
|
| |||||
INCREASE (DECREASE) IN NET ASSETS | 167,522,689 | (108,428,964 | ) | |||||
NET ASSETS | ||||||||
Beginning of year | 1,091,734,974 | 1,200,163,938 | ||||||
|
|
|
| |||||
End of year | $ | 1,259,257,663 | $ | 1,091,734,974 | ||||
|
|
|
| |||||
Undistributed (distributions in excess of) net investment income included in net assets | $ | (369,308 | ) | $ | 510,619 | |||
|
|
|
| |||||
SHARES ISSUED AND REDEEMED | ||||||||
Shares sold | 5,875,000 | 5,875,000 | ||||||
Shares redeemed | (5,250,000 | ) | (7,375,000 | ) | ||||
|
|
|
| |||||
Net increase (decrease) in shares outstanding | 625,000 | (1,500,000 | ) | |||||
|
|
|
| |||||
See notes to financial statements.
| 38 | 2017 iSHARES ANNUAL REPORTTO SHAREHOLDERS |
Table of Contents
iSHARES®, INC.
(For a share outstanding throughout each period)
| iShares MSCI Eurozone ETF | ||||||||||||||||||||
| Year ended Aug. 31, 2017 | Year ended Aug. 31, 2016 | Year ended Aug. 31, 2015 | Year ended Aug. 31, 2014 | Year ended Aug. 31, 2013 | ||||||||||||||||
Net asset value, beginning of year | $ | 34.20 | $ | 36.04 | $ | 39.98 | $ | 34.64 | $ | 29.09 | ||||||||||
|
|
|
|
|
|
|
|
|
| |||||||||||
Income from investment operations: | ||||||||||||||||||||
Net investment incomea | 0.99 | 0.92 | b | 0.96 | 1.18 | 0.92 | ||||||||||||||
Net realized and unrealized gain (loss)c | 7.38 | (1.84 | ) | (3.95 | ) | 5.10 | 5.55 | |||||||||||||
|
|
|
|
|
|
|
|
|
| |||||||||||
Total from investment operations | 8.37 | (0.92 | ) | (2.99 | ) | 6.28 | 6.47 | |||||||||||||
|
|
|
|
|
|
|
|
|
| |||||||||||
Less distributions from: | ||||||||||||||||||||
Net investment income | (0.86 | ) | (0.92 | ) | (0.95 | ) | (0.94 | ) | (0.92 | ) | ||||||||||
|
|
|
|
|
|
|
|
|
| |||||||||||
Total distributions | (0.86 | ) | (0.92 | ) | (0.95 | ) | (0.94 | ) | (0.92 | ) | ||||||||||
|
|
|
|
|
|
|
|
|
| |||||||||||
Net asset value, end of year | $ | 41.71 | $ | 34.20 | $ | 36.04 | $ | 39.98 | $ | 34.64 | ||||||||||
|
|
|
|
|
|
|
|
|
| |||||||||||
Total return | 24.72 | % | (2.53 | )%b | (7.62 | )% | 18.02 | % | 22.43 | % | ||||||||||
|
|
|
|
|
|
|
|
|
| |||||||||||
Ratios/Supplemental data: | ||||||||||||||||||||
Net assets, end of year (000s) | $ | 13,286,216 | $ | 8,293,591 | $ | 10,134,616 | $ | 8,702,637 | $ | 3,539,980 | ||||||||||
Ratio of expenses to average net assets | 0.49 | % | 0.48 | % | 0.48 | % | 0.48 | % | 0.50 | % | ||||||||||
Ratio of expenses to average net assets excluding professional fees for foreign withholding tax claims (Note 8) | 0.49 | % | 0.48 | % | n/a | n/a | n/a | |||||||||||||
Ratio of net investment income to average net assets | 2.63 | % | 2.69 | %b | 2.50 | % | 2.89 | % | 2.74 | % | ||||||||||
Portfolio turnover rated | 4 | % | 4 | % | 5 | % | 7 | % | 5 | % | ||||||||||
| a | Based on average shares outstanding throughout each period. |
| b | Reflects the positive effect of foreign withholding tax claims, net of the associated professional fees (See Note 8), which resulted in the following increases for the year ended August 31, 2016: |
| • | Net investment income per share by $0.02. |
| • | Total return by 0.08%. |
| • | Ratio of net investment income to average net assets by 0.06%. |
| c | The amounts reported for a share outstanding may not accord with the change in aggregate gains and losses in securities for the fiscal period due to the timing of capital share transactions in relation to the fluctuating market values of the Fund’s underlying securities. |
| d | Portfolio turnover rates exclude portfolio securities received or delivered as a result of processing capital share transactions in Creation Units. |
See notes to financial statements.
FINANCIAL STATEMENTS | 39 |
Table of Contents
Financial Highlights (Continued)
iSHARES®, INC.
(For a share outstanding throughout each period)
| iShares MSCI Germany ETF | ||||||||||||||||||||
| Year ended Aug. 31, 2017 | Year ended Aug. 31, 2016 | Year ended Aug. 31, 2015 | Year ended Aug. 31, 2014 | Year ended Aug. 31, 2013 | ||||||||||||||||
Net asset value, beginning of year | $ | 26.18 | $ | 26.34 | $ | 28.97 | $ | 25.61 | $ | 21.34 | ||||||||||
|
|
|
|
|
|
|
|
|
| |||||||||||
Income from investment operations: | ||||||||||||||||||||
Net investment incomea | 0.59 | 0.49 | 0.58 | 0.59 | 0.46 | |||||||||||||||
Net realized and unrealized gain (loss)b | 4.54 | (0.04 | ) | (2.70 | ) | 3.40 | 4.24 | |||||||||||||
|
|
|
|
|
|
|
|
|
| |||||||||||
Total from investment operations | 5.13 | 0.45 | (2.12 | ) | 3.99 | 4.70 | ||||||||||||||
|
|
|
|
|
|
|
|
|
| |||||||||||
Less distributions from: | ||||||||||||||||||||
Net investment income | (0.60 | ) | (0.61 | ) | (0.51 | ) | (0.63 | ) | (0.43 | ) | ||||||||||
|
|
|
|
|
|
|
|
|
| |||||||||||
Total distributions | (0.60 | ) | (0.61 | ) | (0.51 | ) | (0.63 | ) | (0.43 | ) | ||||||||||
|
|
|
|
|
|
|
|
|
| |||||||||||
Net asset value, end of year | $ | 30.71 | $ | 26.18 | $ | 26.34 | $ | 28.97 | $ | 25.61 | ||||||||||
|
|
|
|
|
|
|
|
|
| |||||||||||
Total return | 19.63 | % | 1.81 | % | (7.50 | )% | 15.41 | % | 22.11 | % | ||||||||||
|
|
|
|
|
|
|
|
|
| |||||||||||
Ratios/Supplemental data: | ||||||||||||||||||||
Net assets, end of year (000s) | $ | 4,809,899 | $ | 3,596,902 | $ | 6,607,056 | $ | 4,797,434 | $ | 4,655,875 | ||||||||||
Ratio of expenses to average net assets | 0.49 | % | 0.48 | % | 0.48 | % | 0.48 | % | 0.51 | % | ||||||||||
Ratio of net investment income to average net assets | 2.08 | % | 1.90 | % | 2.03 | % | 1.95 | % | 1.88 | % | ||||||||||
Portfolio turnover ratec | 3 | % | 3 | % | 3 | % | 6 | % | 4 | % | ||||||||||
| a | Based on average shares outstanding throughout each period. |
| b | The amounts reported for a share outstanding may not accord with the change in aggregate gains and losses in securities for the fiscal period due to the timing of capital share transactions in relation to the fluctuating market values of the Fund’s underlying securities. |
| c | Portfolio turnover rates exclude portfolio securities received or delivered as a result of processing capital share transactions in Creation Units. |
See notes to financial statements.
| 40 | 2017 iSHARES ANNUAL REPORTTO SHAREHOLDERS |
Table of Contents
Financial Highlights (Continued)
iSHARES®, INC.
(For a share outstanding throughout each period)
| iShares MSCI Italy Capped ETF | ||||||||||||||||||||
| Year ended Aug. 31, 2017a | Year ended Aug. 31, 2016a | Year ended Aug. 31, 2015a | Year ended Aug. 31, 2014a | Year ended Aug. 31, 2013a | ||||||||||||||||
Net asset value, beginning of year | $ | 22.60 | $ | 29.50 | $ | 32.03 | $ | 26.12 | $ | 23.57 | ||||||||||
|
|
|
|
|
|
|
|
|
| |||||||||||
Income from investment operations: | ||||||||||||||||||||
Net investment incomeb | 0.57 | 0.66 | 0.70 | 0.82 | 0.72 | |||||||||||||||
Net realized and unrealized gain (loss)c | 7.76 | (6.82 | ) | (2.49 | ) | 5.77 | 2.45 | |||||||||||||
|
|
|
|
|
|
|
|
|
| |||||||||||
Total from investment operations | 8.33 | (6.16 | ) | (1.79 | ) | 6.59 | 3.17 | |||||||||||||
|
|
|
|
|
|
|
|
|
| |||||||||||
Less distributions from: | ||||||||||||||||||||
Net investment income | (0.72 | ) | (0.72 | ) | (0.74 | ) | (0.68 | ) | (0.60 | ) | ||||||||||
Return of capital | — | (0.02 | ) | — | — | (0.02 | ) | |||||||||||||
|
|
|
|
|
|
|
|
|
| |||||||||||
Total distributions | (0.72 | ) | (0.74 | ) | (0.74 | ) | (0.68 | ) | (0.62 | ) | ||||||||||
|
|
|
|
|
|
|
|
|
| |||||||||||
Net asset value, end of year | $ | 30.21 | $ | 22.60 | $ | 29.50 | $ | 32.03 | $ | 26.12 | ||||||||||
|
|
|
|
|
|
|
|
|
| |||||||||||
Total return | 37.37 | % | (20.97 | )% | (5.66 | )% | 25.20 | % | 13.58 | % | ||||||||||
|
|
|
|
|
|
|
|
|
| |||||||||||
Ratios/Supplemental data: | ||||||||||||||||||||
Net assets, end of year (000s) | $ | 840,630 | $ | 461,031 | $ | 1,077,437 | $ | 1,556,860 | $ | 717,122 | ||||||||||
Ratio of expenses to average net assets | 0.49 | % | 0.48 | % | 0.48 | % | 0.48 | % | 0.50 | % | ||||||||||
Ratio of net investment income to average net assets | 2.59 | % | 2.54 | % | 2.34 | % | 2.49 | % | 2.78 | % | ||||||||||
Portfolio turnover rated | 18 | % | 16 | % | 22 | % | 24 | % | 45 | % | ||||||||||
| a | Per share amounts reflect a one-for-two reverse stock split effective after the close of trading on November 4, 2016. See Note 4. |
| b | Based on average shares outstanding throughout each period. |
| c | The amounts reported for a share outstanding may not accord with the change in aggregate gains and losses in securities for the fiscal period due to the timing of capital share transactions in relation to the fluctuating market values of the Fund’s underlying securities. |
| d | Portfolio turnover rates exclude portfolio securities received or delivered as a result of processing capital share transactions in Creation Units. |
See notes to financial statements.
FINANCIAL STATEMENTS | 41 |
Table of Contents
Financial Highlights (Continued)
iSHARES®, INC.
(For a share outstanding throughout each period)
| iShares MSCI Spain Capped ETF | ||||||||||||||||||||
| Year ended Aug. 31, 2017 | Year ended Aug. 31, 2016 | Year ended Aug. 31, 2015 | Year ended Aug. 31, 2014 | Year ended Aug. 31, 2013 | ||||||||||||||||
Net asset value, beginning of year | $ | 26.49 | $ | 31.96 | $ | 40.61 | $ | 30.44 | $ | 26.28 | ||||||||||
|
|
|
|
|
|
|
|
|
| |||||||||||
Income from investment operations: | ||||||||||||||||||||
Net investment incomea | 0.94 | 1.00 | 1.32 | 1.80 | 1.33 | |||||||||||||||
Net realized and unrealized gain (loss)b | 7.19 | (5.40 | ) | (8.35 | ) | 9.53 | 4.07 | |||||||||||||
|
|
|
|
|
|
|
|
|
| |||||||||||
Total from investment operations | 8.13 | (4.40 | ) | (7.03 | ) | 11.33 | 5.40 | |||||||||||||
|
|
|
|
|
|
|
|
|
| |||||||||||
Less distributions from: | ||||||||||||||||||||
Net investment income | (0.99 | ) | (1.07 | ) | (1.62 | ) | (1.16 | ) | (1.24 | ) | ||||||||||
|
|
|
|
|
|
|
|
|
| |||||||||||
Total distributions | (0.99 | ) | (1.07 | ) | (1.62 | ) | (1.16 | ) | (1.24 | ) | ||||||||||
|
|
|
|
|
|
|
|
|
| |||||||||||
Net asset value, end of year | $ | 33.63 | $ | 26.49 | $ | 31.96 | $ | 40.61 | $ | 30.44 | ||||||||||
|
|
|
|
|
|
|
|
|
| |||||||||||
Total return | 31.48 | % | (13.82 | )% | (17.63 | )% | 37.39 | % | 20.88 | % | ||||||||||
|
|
|
|
|
|
|
|
|
| |||||||||||
Ratios/Supplemental data: | ||||||||||||||||||||
Net assets, end of year (000s) | $ | 1,528,533 | $ | 599,944 | $ | 1,666,091 | $ | 2,473,038 | $ | 417,778 | ||||||||||
Ratio of expenses to average net assets | 0.49 | % | 0.48 | % | 0.48 | % | 0.48 | % | 0.51 | % | ||||||||||
Ratio of net investment income to average net assets | 3.10 | % | 3.53 | % | 3.70 | % | 4.48 | % | 4.45 | % | ||||||||||
Portfolio turnover ratec | 16 | % | 9 | % | 15 | % | 15 | % | 24 | % | ||||||||||
| a | Based on average shares outstanding throughout each period. |
| b | The amounts reported for a share outstanding may not accord with the change in aggregate gains and losses in securities for the fiscal period due to the timing of capital share transactions in relation to the fluctuating market values of the Fund’s underlying securities. |
| c | Portfolio turnover rates exclude portfolio securities received or delivered as a result of processing capital share transactions in Creation Units. |
See notes to financial statements.
| 42 | 2017 iSHARES ANNUAL REPORTTO SHAREHOLDERS |
Table of Contents
Financial Highlights (Continued)
iSHARES®, INC.
(For a share outstanding throughout each period)
| iShares MSCI Switzerland Capped ETF | ||||||||||||||||||||
| Year ended Aug. 31, 2017 | Year ended Aug. 31, 2016 | Year ended Aug. 31, 2015 | Year ended Aug. 31, 2014 | Year ended Aug. 31, 2013 | ||||||||||||||||
Net asset value, beginning of year | $ | 30.22 | $ | 31.90 | $ | 33.64 | $ | 29.36 | $ | 23.85 | ||||||||||
|
|
|
|
|
|
|
|
|
| |||||||||||
Income from investment operations: | ||||||||||||||||||||
Net investment incomea | 0.69 | 0.81 | 0.83 | 0.80 | 0.67 | |||||||||||||||
Net realized and unrealized gain (loss)b | 4.11 | (1.70 | ) | (1.77 | ) | 4.27 | 5.44 | |||||||||||||
|
|
|
|
|
|
|
|
|
| |||||||||||
Total from investment operations | 4.80 | (0.89 | ) | (0.94 | ) | 5.07 | 6.11 | |||||||||||||
|
|
|
|
|
|
|
|
|
| |||||||||||
Less distributions from: | ||||||||||||||||||||
Net investment income | (0.75 | ) | (0.79 | ) | (0.80 | ) | (0.79 | ) | (0.60 | ) | ||||||||||
|
|
|
|
|
|
|
|
|
| |||||||||||
Total distributions | (0.75 | ) | (0.79 | ) | (0.80 | ) | (0.79 | ) | (0.60 | ) | ||||||||||
|
|
|
|
|
|
|
|
|
| |||||||||||
Net asset value, end of year | $ | 34.27 | $ | 30.22 | $ | 31.90 | $ | 33.64 | $ | 29.36 | ||||||||||
|
|
|
|
|
|
|
|
|
| |||||||||||
Total return | 15.90 | % | (2.76 | )% | (2.92 | )% | 17.21 | % | 25.71 | % | ||||||||||
|
|
|
|
|
|
|
|
|
| |||||||||||
Ratios/Supplemental data: | ||||||||||||||||||||
Net assets, end of year (000s) | $ | 1,259,258 | $ | 1,091,735 | $ | 1,200,164 | $ | 1,072,157 | $ | 902,860 | ||||||||||
Ratio of expenses to average net assets | 0.49 | % | 0.48 | % | 0.48 | % | 0.48 | % | 0.51 | % | ||||||||||
Ratio of net investment income to average net assets | 2.18 | % | 2.68 | % | 2.49 | % | 2.41 | % | 2.38 | % | ||||||||||
Portfolio turnover ratec | 13 | % | 6 | % | 7 | % | 5 | % | 13 | % | ||||||||||
| a | Based on average shares outstanding throughout each period. |
| b | The amounts reported for a share outstanding may not accord with the change in aggregate gains and losses in securities for the fiscal period due to the timing of capital share transactions in relation to the fluctuating market values of the Fund’s underlying securities. |
| c | Portfolio turnover rates exclude portfolio securities received or delivered as a result of processing capital share transactions in Creation Units. |
See notes to financial statements.
FINANCIAL STATEMENTS | 43 |
Table of Contents
iSHARES®, INC.
iShares, Inc. (the “Company”) is registered under the Investment Company Act of 1940, as amended (the “1940 Act”), as an open-end management investment company. The Company was incorporated under the laws of the State of Maryland on September 1, 1994 pursuant to Articles of Incorporation as subsequently amended and restated.
These financial statements relate only to the following funds (each, a “Fund,” and collectively, the “Funds”):
| iShares ETF | Diversification Classification | |
MSCI Eurozone | Diversified | |
MSCI Germany | Non-diversified | |
MSCI Italy Capped | Non-diversified | |
MSCI Spain Capped | Non-diversified | |
MSCI Switzerland Capped | Non-diversified |
The investment objective of each Fund is to seek investment results that correspond generally to the price and yield performance, before fees and expenses, of its underlying index. The investment adviser uses a “passive” or index approach to try to achieve each Fund’s investment objective.
Pursuant to the Company’s organizational documents, the Funds’ officers and directors are indemnified against certain liabilities that may arise out of the performance of their duties to the Funds. Additionally, in the normal course of business, the Funds enter into contracts with service providers that contain general indemnification clauses. The Funds’ maximum exposure under these arrangements is unknown as this would involve future claims that may be made against the Funds that have not yet occurred.
| 1. | SIGNIFICANT ACCOUNTING POLICIES |
The following significant accounting policies are consistently followed by each Fund in the preparation of its financial statements in conformity with accounting principles generally accepted in the United States of America (“U.S. GAAP”). The preparation of financial statements in conformity with U.S. GAAP requires management to make certain estimates and assumptions that affect the reported amounts of assets and liabilities and disclosures of contingent assets and liabilities at the date of the financial statements and the reported amounts of revenue and expenses during the reporting period. Actual results could differ from those estimates. Each Fund is considered an investment company under U.S. GAAP and follows the accounting and reporting guidance applicable to investment companies.
SECURITY VALUATION
Each Fund’s investments are valued at fair value each day that the Fund’s listing exchange is open and, for financial reporting purposes, as of the report date should the reporting period end on a day that the Fund’s listing exchange is not open. U.S. GAAP defines fair value as the price a fund would receive to sell an asset or pay to transfer a liability in an orderly transaction between market participants at the measurement date. The BlackRock Global Valuation Methodologies Committee (the “Global Valuation Committee”) provides oversight of the valuation of investments for the Funds. The investments of each Fund are valued pursuant to policies and procedures developed by the Global Valuation Committee and approved by the Board of Directors of the Company (the “Board”).
| • | Equity investments traded on a recognized securities exchange are valued at that day’s last reported trade price or the official closing price, as applicable, on the exchange where the stock is primarily traded. Equity investments traded on a recognized exchange for which there were no sales on that day are valued at the last traded price. |
| 44 | 2017 iSHARES ANNUAL REPORTTO SHAREHOLDERS |
Table of Contents
Notes to Financial Statements (Continued)
iSHARES®, INC.
| • | Open-end U.S. mutual funds (including money market funds) are valued at that day’s published net asset value (“NAV”). |
| • | Futures contract notional values are determined based on that day’s last reported settlement price on the exchange where the contract is traded. |
In the event that application of these methods of valuation results in a price for an investment which is deemed not to be representative of the fair value of such investment or if a price is not available, the investment will be valued by the Global Valuation Committee, in accordance with policies approved by the Board. The fair valuation approaches that may be utilized by the Global Valuation Committee to determine fair value include market approach, income approach and the cost approach. The valuation techniques used under these approaches take into consideration inputs that include but are not limited to (i) attributes specific to the investment; (ii) the principal market for the investment; (iii) the customary participants in the principal market for the investment; (iv) data assumptions by market participants for the investment, if reasonably available; (v) quoted prices for similar investments in active markets; and (vi) other inputs, such as future cash flows, interest rates, yield curves, volatilities, prepayment speeds, loss severities, credit risks and/or default rates. Valuations based on such inputs are reported to the Board on a quarterly basis.
The Global Valuation Committee employs various methods for calibrating valuation approaches for investments where an active market does not exist, including regular due diligence of the Company’s pricing vendors, a regular review of key inputs and assumptions, transactional back-testing or disposition analysis to compare unrealized gains and losses to realized gains and losses, reviews of missing or stale prices, reviews of large movements in market values, and reviews of market related activity.
Fair value pricing could result in a difference between the prices used to calculate a Fund’s NAV and the prices used by the Fund’s underlying index, which in turn could result in a difference between the Fund’s performance and the performance of the Fund’s underlying index.
Various inputs are used in determining the fair value of financial instruments. Inputs may be based on independent market data (“observable inputs”) or they may be internally developed (“unobservable inputs”). These inputs to valuation techniques are categorized into a fair value hierarchy consisting of three broad levels for financial reporting purposes as follows:
| • | Level 1 — Unadjusted quoted prices in active markets for identical assets or liabilities; |
| • | Level 2 — Inputs other than quoted prices included within Level 1 that are observable for the asset or liability either directly or indirectly, including quoted prices for similar assets or liabilities in active markets, quoted prices for identical or similar assets or liabilities in markets that are not considered to be active, inputs other than quoted prices that are observable for the asset or liability (such as exchange rates, financing terms, interest rates, yield curves, volatilities, prepayment speeds, loss severities, credit risks and default rates) or other market-corroborated inputs; and |
| • | Level 3 — Unobservable inputs for the asset or liability based on the best information available in the circumstances, to the extent observable inputs are not available, including the Global Valuation Committee’s assumptions used in determining the fair value of investments. |
The hierarchy gives the highest priority to unadjusted quoted prices in active markets for identical assets or liabilities (Level 1 measurements) and the lowest priority to unobservable inputs (Level 3 measurements). Accordingly, the degree of judgement exercised in determining fair value is greatest for instruments categorized in Level 3. The inputs used to measure fair value may fall into different levels of the fair value hierarchy. In such cases, for disclosure purposes, the fair value hierarchy classification is determined based on the lowest level input that is significant to the fair value measurement in its entirety. The fair value hierarchy for each Fund’s investments is included in its schedule of investments.
NOTESTO FINANCIAL STATEMENTS | 45 |
Table of Contents
Notes to Financial Statements (Continued)
iSHARES®, INC.
Changes in valuation techniques may result in transfers in or out of an assigned level within the fair value hierarchy. In accordance with the Company’s policy, transfers between different levels of the fair value hierarchy are deemed to have occurred as of the beginning of the reporting period. The categorization of values determined for financial instruments are based on the pricing transparency of the financial instruments and are not necessarily an indication of the risks associated with investing in those securities.
SECURITY TRANSACTIONS AND INCOME RECOGNITION
Security transactions are accounted for on trade date. Realized gains and losses on investment transactions are determined using the specific identification method. Dividend income and capital gain distributions, if any, are recognized on the ex-dividend date, net of any foreign taxes withheld at source. Any taxes withheld that are reclaimable from foreign tax authorities as of August 31, 2017 are reflected in tax reclaims receivable. Upon notification from issuers, some of the dividend income received from a real estate investment trust may be re-designated as a reduction of cost of the related investment and/or realized gain. Non-cash dividends received, if any, are recognized on the ex-dividend date and recorded as non-cash dividend income at fair value. Distributions received by the Funds may include a return of capital that is estimated by management. Such amounts are recorded as a reduction of the cost of investments or reclassified to capital gains. Interest income is accrued daily.
FOREIGN CURRENCY TRANSLATION
The accounting records of the Funds are maintained in U.S. dollars. Foreign currencies, as well as investment securities and other assets and liabilities denominated in foreign currencies, are translated into U.S. dollars using exchange rates deemed appropriate by the investment adviser. Purchases and sales of securities, income receipts and expense payments are translated into U.S. dollars on the respective dates of such transactions.
Each Fund does not isolate the effect of fluctuations in foreign exchange rates from the effect of fluctuations in the market prices of securities. Such fluctuations are reflected by the Funds as a component of realized and unrealized gains and losses from investments for financial reporting purposes. Each Fund reports realized currency gains (losses) on foreign currency related transactions as components of net realized gain (loss) for financial reporting purposes, whereas such components are generally treated as ordinary income for U.S. federal income tax purposes.
FOREIGN TAXES
The Funds may be subject to foreign taxes (a portion of which may be reclaimable) on income, stock dividends, capital gains on investments, or certain foreign currency transactions. All foreign taxes are recorded in accordance with the applicable foreign tax regulations and rates that exist in the foreign jurisdictions in which the Funds invest. These foreign taxes, if any, are paid by the Funds and are reflected in their statements of operations as follows: foreign taxes withheld at source are presented as a reduction of income, foreign taxes on securities lending income are presented as a reduction of securities lending income, foreign taxes on stock dividends are presented as “other foreign taxes”, and foreign taxes on capital gains from sales of investments and foreign taxes on foreign currency transactions are included in their respective net realized gain (loss) categories. Foreign taxes payable or deferred as of August 31, 2017, if any, are disclosed in the Funds’ statements of assets and liabilities.
DISTRIBUTIONS TO SHAREHOLDERS
Dividends and distributions paid by each Fund are recorded on the ex-dividend dates. Distributions are determined on a tax basis and may differ from net investment income and net realized capital gains for financial reporting purposes. Dividends and distributions are paid in U.S. dollars and cannot be automatically reinvested in additional shares of the Funds.
| 46 | 2017 iSHARES ANNUAL REPORTTO SHAREHOLDERS |
Table of Contents
Notes to Financial Statements (Continued)
iSHARES®, INC.
LOANS OF PORTFOLIO SECURITIES
Each Fund may lend its investment securities to approved borrowers, such as brokers, dealers and other financial institutions. The borrower pledges and maintains with the Fund collateral consisting of cash, an irrevocable letter of credit issued by an approved bank, or securities issued or guaranteed by the U.S. government. The initial collateral received by each Fund is required to have a value of at least 102% of the current value of the loaned securities for securities traded on U.S. exchanges and a value of at least 105% for all other securities. The collateral is maintained thereafter at a value equal to at least 100% of the current value of the securities on loan. The market value of the loaned securities is determined at the close of each business day of the Funds. Any additional required collateral is delivered to the Funds and any excess collateral is returned by the Funds on the next business day. During the term of the loan, each Fund is entitled to all distributions made on or in respect of the loaned securities but does not receive interest income on securities received as collateral. Loans of securities are terminable at any time and the borrower, after notice, is required to return borrowed securities within the standard time period for settlement of securities transactions.
Cash received as collateral for securities on loan may be reinvested in certain short-term instruments either directly on behalf of a fund or through one or more joint accounts or money market funds, including those managed by BlackRock Fund Advisors (“BFA”), the Funds’ investment adviser, or its affiliates. As of August 31, 2017, any securities on loan were collateralized by cash and/or U.S. government obligations. Cash collateral received was invested in money market funds managed by BFA and is disclosed in the schedules of investments. Any non-cash collateral received cannot be sold, re-invested or pledged by the Fund, except in the event of borrower default. The securities on loan for each Fund are also disclosed in its schedule of investments. The total value of any securities on loan as of August 31, 2017 and the total value of the related cash collateral are disclosed in the statements of assets and liabilities. Income earned by the Funds from securities lending is disclosed in the statements of operations.
The risks of securities lending include the risk that the borrower may not provide additional collateral when required or may not return the securities when due. To mitigate these risks, the Funds benefit from a borrower default indemnity provided by BlackRock, Inc. (“BlackRock”). BlackRock’s indemnity allows for full replacement of securities loaned if the collateral received does not cover the value of the securities loaned in the event of borrower default. Each Fund could incur a loss if the value of an investment purchased with cash collateral falls below the value of the loaned securities or if the value of an investment purchased with cash collateral falls below the value of the original cash collateral received.
Securities lending transactions are entered into by the Funds under Master Securities Lending Agreements (“MSLA”) which provide the right, in the event of default (including bankruptcy or insolvency) for the non-defaulting party to liquidate the collateral and calculate a net exposure to the defaulting party or request additional collateral. In the event that a borrower defaults, a Fund, as lender, would offset the market value of the collateral received against the market value of the securities loaned. The value of the collateral is typically greater than that of the market value of the securities loaned, leaving the lender with a net amount payable to the defaulting party. However, bankruptcy or insolvency laws of a particular jurisdiction may impose restrictions on or prohibitions against such a right of offset in the event of an MSLA counterparty’s bankruptcy or insolvency. Under the MSLA, the borrower can resell or re-pledge the loaned securities, and a Fund can reinvest cash collateral, or, upon an event of default, resell or re-pledge the collateral.
NOTESTO FINANCIAL STATEMENTS | 47 |
Table of Contents
Notes to Financial Statements (Continued)
iSHARES®, INC.
The following table is a summary of securities lending agreements which are subject to offset under an MSLA as of August 31, 2017:
| iShares ETF and Counterparty | Market Value of Securities on Loan | Cash Collateral Received a | Net Amount b | |||||||||
MSCI Eurozone | ||||||||||||
Goldman Sachs & Co. | $ | 1,526,182 | $ | 1,526,182 | $ | — | ||||||
Morgan Stanley & Co. LLC | 42,095,238 | 42,095,238 | — | |||||||||
State Street Bank & Trust Company | 7,850,371 | 7,850,371 | — | |||||||||
UBS AG | 3,535,363 | 3,529,114 | (6,249 | ) | ||||||||
|
|
|
|
|
| |||||||
| $ | 55,007,154 | $ | 55,000,905 | $ | (6,249 | ) | ||||||
|
|
|
|
|
| |||||||
MSCI Germany | ||||||||||||
Credit Suisse Securities (USA) LLC | $ | 5,227,163 | $ | 5,227,163 | $ | — | ||||||
Goldman Sachs & Co. | 3,460,164 | 3,460,164 | — | |||||||||
Morgan Stanley & Co. LLC | 43,226,851 | 43,226,851 | — | |||||||||
State Street Bank & Trust Company | 14,668,552 | 14,668,552 | — | |||||||||
|
|
|
|
|
| |||||||
| $ | 66,582,730 | $ | 66,582,730 | $ | — | |||||||
|
|
|
|
|
| |||||||
MSCI Spain Capped | ||||||||||||
Morgan Stanley & Co. LLC | $ | 9,678,000 | $ | 9,678,000 | $ | — | ||||||
|
|
|
|
|
| |||||||
| a | Collateral received in excess of the market value of securities on loan is not presented in this table. The total cash collateral received by each Fund is disclosed in the Fund’s statement of assets and liabilities. |
| b | Additional collateral is delivered to the Funds on the next business day in accordance with the MSLA. The net amount would be subject to the borrower default indemnity in the event of default by a counterparty. |
| 2. | INVESTMENT ADVISORY AGREEMENT AND OTHER TRANSACTIONS WITH AFFILIATES |
Pursuant to an Investment Advisory Agreement with the Company, BFA manages the investment of each Fund’s assets. BFA is a California corporation indirectly owned by BlackRock. Under the Investment Advisory Agreement, BFA is responsible for substantially all expenses of the Funds, except (i) interest and taxes; (ii) brokerage commissions and other expenses connected with the execution of portfolio transactions; (iii) distribution fees; (iv) the advisory fee payable to BFA; and (v) litigation expenses and any extraordinary expenses (in each case as determined by a majority of the independent directors).
For its investment advisory services to each Fund, BFA is entitled to an annual investment advisory fee, accrued daily and paid monthly by the Funds, based on each Fund’s allocable portion of the aggregate of the average daily net assets of the Fund and certain other iShares funds, as follows:
| Investment Advisory Fee | Aggregate Average Daily Net Assets | ||||
| 0.59 | % | First $7 billion | |||
| 0.54 | Over $7 billion, up to and including $11 billion | ||||
| 0.49 | Over $11 billion, up to and including $24 billion | ||||
| 0.44 | Over $24 billion, up to and including $48 billion | ||||
| 0.40 | Over $48 billion, up to and including $72 billion | ||||
| 0.36 | Over $72 billion, up to and including $96 billiona | ||||
| 0.32 | Over $96 billiona | ||||
| a | Break level added or amended effective July 1, 2017. |
| 48 | 2017 iSHARES ANNUAL REPORTTO SHAREHOLDERS |
Table of Contents
Notes to Financial Statements (Continued)
iSHARES®, INC.
The U.S. Securities and Exchange Commission has issued an exemptive order which permits BlackRock Institutional Trust Company, N.A. (“BTC”), an affiliate of BFA, to serve as securities lending agent for the Funds, subject to applicable conditions. As securities lending agent, BTC bears all operational costs directly related to securities lending. Each Fund is responsible for fees in connection with the investment of cash collateral received for securities on loan in a money market fund managed by BFA, however, BTC has agreed to reduce the amount of securities lending income it receives in order to effectively limit the collateral investment fees each Fund bears to an annual rate of 0.04% (the “collateral investment fees”). Securities lending income is equal to the total of income earned from the reinvestment of cash collateral, net of fees and other payments to and from borrowers of securities, and less the collateral investment fees. The Funds retain a portion of securities lending income and remit the remaining portion to BTC as compensation for its services as securities lending agent.
Pursuant to a securities lending agreement, each Fund retains 80% of securities lending income and the amount retained can never be less than 70% of the total of securities lending income plus the collateral investment fees. In addition, commencing the business day following the date that the aggregate securities lending income plus the collateral investment fees generated across all 1940 Act iShares exchange-traded funds (the “iShares ETF Complex”) in a given calendar year exceeds the aggregate securities lending income generated across the iShares ETF Complex in the calendar year 2013, each Fund, pursuant to a securities lending agreement, will retain for the remainder of that calendar year 85% of securities lending income and the amount retained can never be less than 70% of the total of securities lending income plus the collateral investment fees.
For the year ended August 31, 2017, the total of securities lending agent services and collateral investment fees paid were as follows:
| iShares ETF | Fees Paid to BTC | |||
MSCI Eurozone | $ | 420,546 | ||
MSCI Germany | 55,921 | |||
MSCI Italy Capped | 22,778 | |||
MSCI Spain Capped | 44,670 | |||
MSCI Switzerland Capped | 12,899 | |||
BlackRock Investments, LLC, an affiliate of BFA, is the distributor for each Fund. Pursuant to the distribution agreement, BFA is responsible for any fees or expenses for distribution services provided to the Funds.
Cross trading is the buying or selling of portfolio securities between funds to which BFA (or an affiliate) serves as investment adviser. At its regularly scheduled quarterly meetings, the Board reviews such transactions as of the most recent calendar quarter for compliance with the requirements and restrictions set forth by Rule 17a-7.
For the year ended August 31, 2017, transactions executed by the Funds pursuant to Rule 17a-7 under the 1940 Act were as follows:
| iShares ETF | Purchases | Sales | ||||||
MSCI Eurozone | $ | 32,483,149 | $ | 32,053,832 | ||||
MSCI Germany | 10,960,175 | 8,747,614 | ||||||
MSCI Italy Capped | 17,070,650 | 15,636,016 | ||||||
MSCI Spain Capped | 22,565,872 | 17,961,307 | ||||||
MSCI Switzerland Capped | 42,184,408 | 16,731,878 | ||||||
NOTESTO FINANCIAL STATEMENTS | 49 |
Table of Contents
Notes to Financial Statements (Continued)
iSHARES®, INC.
Each Fund may invest its positive cash balances in certain money market funds managed by BFA or an affiliate. The income earned on these temporary cash investments is included in “Dividends – affiliated” in the statements of operations.
It is possible that, from time to time, BlackRock and/or funds or other accounts managed by BFA or an affiliate (collectively, “Affiliates”) may purchase and hold shares of a Fund. Affiliates reserve the right, subject to compliance with applicable law, to sell into the market or redeem in Creation Units through an authorized participant at any time some or all of the shares of a Fund acquired for their own accounts. A large sale or redemption of shares of a Fund by Affiliates could significantly reduce the asset size of the Fund, which might have an adverse effect on the Fund. As of August 31, 2017, the number of affiliated accounts that individually represent more than 10% ownership of a Fund’s total shares outstanding and the aggregate percentage of net assets represented by such holdings were as follows:
| iShares ETF | Number of Affiliated | Aggregate Affiliated Ownership Percentage | ||||||
MSCI Eurozone | 1 | 13 | % | |||||
MSCI Germany | 1 | 16 | % | |||||
The PNC Financial Services Group, Inc. is the largest stockholder of BlackRock and is considered an affiliate of the Funds for 1940 Act purposes.
Certain directors and officers of the Company are also officers of BTC and/or BFA.
| 3. | INVESTMENT PORTFOLIO TRANSACTIONS |
Purchases and sales of investments (excluding in-kind transactions and short-term investments) for the year ended August 31, 2017 were as follows:
| iShares ETF | Purchases | Sales | ||||||
MSCI Eurozone | $ | 625,139,044 | $ | 333,900,736 | ||||
MSCI Germany | 236,258,732 | 138,590,140 | ||||||
MSCI Italy Capped | 103,596,757 | 107,459,025 | ||||||
MSCI Spain Capped | 185,519,032 | 156,744,297 | ||||||
MSCI Switzerland Capped | 135,464,757 | 138,611,441 | ||||||
In-kind transactions (see Note 4) for the year ended August 31, 2017 were as follows:
| iShares ETF | In-kind Purchases | In-kind Sales | ||||||
MSCI Eurozone | $ | 4,753,914,667 | $ | 1,916,011,413 | ||||
MSCI Germany | 1,233,707,047 | 822,064,401 | ||||||
MSCI Italy Capped | 451,672,925 | 266,593,760 | ||||||
MSCI Spain Capped | 788,493,196 | 119,916,770 | ||||||
MSCI Switzerland Capped | 187,993,815 | 158,245,156 | ||||||
| 50 | 2017 iSHARES ANNUAL REPORTTO SHAREHOLDERS |
Table of Contents
Notes to Financial Statements (Continued)
iSHARES®, INC.
| 4. | CAPITAL SHARE TRANSACTIONS |
Capital shares are issued and redeemed by each Fund only in aggregations of a specified number of shares or multiples thereof (“Creation Units”) at NAV. Except when aggregated in Creation Units, shares of each Fund are not redeemable. Transactions in capital shares for each Fund are disclosed in detail in the statements of changes in net assets.
The consideration for the purchase of Creation Units of a fund in the Company generally consists of the in-kind deposit of a designated portfolio of securities and a specified amount of cash. Certain funds in the Company may be offered in Creation Units solely or partially for cash in U.S. dollars. Investors purchasing and redeeming Creation Units may pay a purchase transaction fee and a redemption transaction fee directly to State Street Bank and Trust Company, the Company’s administrator, to offset transfer and other transaction costs associated with the issuance and redemption of Creation Units, including Creation Units for cash. Investors transacting in Creation Units for cash may also pay an additional variable charge to compensate the relevant fund for certain transaction costs (i.e., stamp taxes, taxes on currency or other financial transactions, and brokerage costs) and market impact expenses relating to investing in portfolio securities. Such variable charges, if any, are included in “Proceeds from shares sold” in the statements of changes in net assets.
From time to time, settlement of securities related to in-kind contributions or in-kind redemptions may be delayed. In such cases, securities related to in-kind contributions are reflected as “Due from custodian” and securities related to in-kind redemptions are reflected as “Securities related to in-kind transactions” in the statements of assets and liabilities.
The Board authorized a one-for-two reverse stock split for the iShares MSCI Italy Capped ETF, effective after the close of trading on November 4, 2016. The impact of the stock split was to decrease the number of shares outstanding by a factor of two, while increasing the NAV per share by a factor of two, resulting in no effect on the net assets of the Fund. The financial statements for the Fund have been adjusted to reflect the reverse stock split.
| 5. | FUTURES CONTRACTS |
Each Fund’s use of futures contracts is generally limited to cash equitization. This involves the use of available cash to invest in index futures contracts in order to gain exposure to the equity markets represented in or by the Fund’s underlying index and is intended to allow the Fund to better track its underlying index. Futures contracts are standardized, exchange-traded agreements to buy or sell a financial instrument at a set price on a future date. Upon entering into a futures contract, a fund is required to pledge to the executing broker which holds segregated from its own assets, an amount of cash, U.S. government securities or other high-quality debt and equity securities equal to the minimum initial margin requirements of the exchange on which the contract is traded.
Pursuant to the contract, the fund agrees to receive from or pay to the broker an amount of cash equal to the daily fluctuation in notional value of the contract. Such receipts or payments are known as margin variation and are recorded by the fund as unrealized appreciation or depreciation. When the contract is closed, the fund records a realized gain or loss equal to the difference between the notional value of the contract at the time it was opened and the notional value at the time it was closed. Losses may arise if the notional value of a futures contract decreases due to an unfavorable change in the market rates or values of the underlying instrument during the term of the contract or if the counterparty does not perform under the contract. The use of futures contracts also involves the risk of an imperfect correlation in the movements in the price of futures contracts and the assets underlying such contracts.
NOTESTO FINANCIAL STATEMENTS | 51 |
Table of Contents
Notes to Financial Statements (Continued)
iSHARES®, INC.
The following table shows the value of futures contracts held by the iShares MSCI Germany ETF as of August 31, 2017 and the related locations in the statements of assets and liabilities, presented by risk exposure category:
| Liabilities | ||||
Equity contracts: | ||||
Variation margin/Net assets consist of — net unrealized appreciation (depreciation)a | $ | 1,550,396 | ||
|
| |||
| a | Represents cumulative depreciation of futures contracts as reported in the schedule of investments. |
The following table shows the realized and unrealized gains (losses) on futures contracts held by the iShares MSCI Germany ETF during the year ended August 31, 2017 and the related locations in the statements of operations, presented by risk exposure category:
| Net Realized Gain (Loss) | Net Change in Unrealized Appreciation/Depreciation | |||||||
Equity contracts: | ||||||||
Futures contracts | $ | 5,815,831 | $ | (3,577,429 | ) | |||
|
|
|
| |||||
The following table shows the average quarter-end balances of open futures contracts for the iShares MSCI Germany ETF for the year ended August 31, 2017:
Average value of contracts purchased | $ | 25,230,168 | ||
| 6. | PRINCIPAL RISKS |
In the normal course of business, each Fund invests in securities or other instruments and may enter into certain transactions, and such activities subject the Fund to various risks, including, among others, fluctuations in the market (market risk) or failure of an issuer to meet all of its obligations. The value of securities or other instruments may also be affected by various factors, including, without limitation: (i) the general economy; (ii) the overall market as well as local, regional or global political and/or social instability; (iii) regulation, taxation or international tax treaties between various countries; or (iv) currency, interest rate or price fluctuations. Each Fund’s prospectus provides details of the risks to which the Fund is subject.
BFA uses a “passive” or index approach to try to achieve each Fund’s investment objective following the securities included in its underlying index during upturns as well as downturns. BFA does not take steps to reduce market exposure or to lessen the effects of a declining market. Divergence from the underlying index and the composition of the portfolio is monitored by BFA.
MARKET RISK
Market risk arises mainly from uncertainty about future values of financial instruments influenced by price, currency and interest rate movements. It represents the potential loss a fund may suffer through holding market positions in the face of market movements. A fund is exposed to market risk by its investment in equity, fixed income and/or financial derivative instruments or by its investment in underlying funds. The fair value of securities held by a fund may decline due to general market conditions, economic trends or events that are not specifically related to the issuers of the securities including local, regional or global political, social or economic instability or to factors that affect a particular industry or group of industries. The extent of a fund’s exposure to market risk is the market value of the investments held as shown in the fund’s schedule of investments.
| 52 | 2017 iSHARES ANNUAL REPORTTO SHAREHOLDERS |
Table of Contents
Notes to Financial Statements (Continued)
iSHARES®, INC.
A diversified portfolio, where this is appropriate and consistent with a fund’s objectives, minimizes the risk that a price change of a particular investment will have a material impact on the NAV of a fund. The investment concentrations within each Fund’s portfolio are disclosed in its schedule of investments.
Investing in the securities of non-U.S. issuers involves certain considerations and risks not typically associated with securities of U.S. issuers. Such risks include, but are not limited to: differences in accounting, auditing and financial reporting standards; more substantial governmental involvement in the economy; higher inflation rates, greater social, economic and political uncertainties; possible nationalization or expropriation of assets; less availability of public information about issuers; imposition of withholding or other taxes; higher transaction and custody costs and delays in settlement procedures; and lower level of regulation of the securities markets and issuers. Non-U.S. securities may be less liquid, more difficult to value, and have greater price volatility due to exchange rate fluctuations. These and other risks are heightened for investments in issuers from countries with less developed capital markets.
The economies and markets of European countries are often closely connected and interdependent, and events in one country in Europe can have an adverse impact on other European countries. The European financial markets have experienced volatility and adverse trends in recent years due to concerns about economic downturns or rising government debt levels in several European countries. These events have adversely affected the exchange rate of the euro and may continue to significantly affect European countries. The occurrence of terrorist incidents throughout Europe also could impact financial markets. In addition, the United Kingdom has voted to withdraw from the European Union. The referendum may introduce significant new uncertainties and instability in the financial markets as the United Kingdom negotiates its exit from the European Union.
When a fund concentrates its investments in issuers located in a single country, it assumes the risk that economic, political and social conditions in that country may have a significant impact on its investment performance.
CREDIT RISK
Credit risk is the risk that an issuer or guarantor of debt instruments or the counterparty to a financial transaction, including derivatives contracts, repurchase agreements or loans of portfolio securities, is unable or unwilling to make timely interest and/or principal payments or to otherwise honor its obligations. BFA and its affiliates manage counterparty credit risk by entering into transactions only with counterparties that they believe have the financial resources to honor their obligations and by monitoring the financial stability of those counterparties. Financial assets, which potentially expose a fund to issuer and counterparty credit risks, consist principally of financial instruments and receivables due from counterparties. The extent of a fund’s exposure to credit and counterparty risks with respect to those financial assets is approximated by their value recorded in its statement of assets and liabilities.
| 7. | INCOME TAX INFORMATION |
Each Fund is treated as an entity separate from the Company’s other funds for federal income tax purposes. It is the policy of each Fund to qualify as a regulated investment company by complying with the provisions applicable to regulated investment companies, as defined under Subchapter M of the Internal Revenue Code of 1986, as amended, and to annually distribute substantially all of its ordinary income and any net capital gains (taking into account any capital loss carryforwards) sufficient to relieve it from all, or substantially all, federal income and excise taxes. Accordingly, no provision for federal income taxes is required.
U.S. GAAP requires that certain components of net assets be adjusted to reflect permanent differences between financial and tax reporting. These reclassifications have no effect on net assets or NAV per share. The following permanent differences as of
NOTESTO FINANCIAL STATEMENTS | 53 |
Table of Contents
Notes to Financial Statements (Continued)
iSHARES®, INC.
August 31, 2017, attributable to the characterization of corporate actions, passive foreign investment companies, the expiration of capital loss carryforwards, distributions paid in excess of taxable income, foreign currency transactions and realized gains (losses) from in-kind redemptions, were reclassified to the following accounts:
| iShares ETF | Paid-in Capital | Undistributed Net Investment Income/Distributions in Excess of Net Investment Income | Undistributed Net Realized | |||||||||
MSCI Eurozone | $ | (82,145,714 | ) | $ | 15,166,762 | $ | 66,978,952 | |||||
MSCI Germany | 73,561,932 | 24,040,090 | (97,602,022 | ) | ||||||||
MSCI Italy Capped | (7,670,214 | ) | 2,882,125 | 4,788,089 | ||||||||
MSCI Spain Capped | (15,818,812 | ) | 648,062 | 15,170,750 | ||||||||
MSCI Switzerland Capped | 11,015,648 | 298,783 | (11,314,431 | ) | ||||||||
The tax character of distributions paid during the years ended August 31, 2017 and August 31, 2016 was as follows:
| iShares ETF | 2017 | 2016 | ||||||
MSCI Eurozone | ||||||||
Ordinary income | $ | 251,508,888 | $ | 293,025,178 | ||||
|
|
|
| |||||
MSCI Germany | ||||||||
Ordinary income | $ | 101,663,169 | $ | 97,625,093 | ||||
|
|
|
| |||||
MSCI Italy Capped | ||||||||
Ordinary income | $ | 15,689,552 | $ | 22,347,848 | ||||
Return of capital | — | 780,522 | ||||||
|
|
|
| |||||
| $ | 15,689,552 | $ | 23,128,370 | |||||
|
|
|
| |||||
MSCI Spain Capped | ||||||||
Ordinary income | $ | 28,748,503 | $ | 41,241,786 | ||||
|
|
|
| |||||
MSCI Switzerland Capped | ||||||||
Ordinary income | $ | 25,105,668 | $ | 29,917,479 | ||||
|
|
|
| |||||
As of August 31, 2017, the tax components of accumulated net earnings (losses) were as follows:
| iShares ETF | Undistributed Ordinary Income | Capital Loss | Net Unrealized Gains (Losses) a | Total | ||||||||||||
MSCI Eurozone | $ | 38,174,397 | $ | (362,189,568 | ) | $ | 199,387,368 | $ | (124,627,803 | ) | ||||||
MSCI Germany | 11,828,547 | (133,898,034 | ) | (223,646,700 | ) | (345,716,187 | ) | |||||||||
MSCI Italy Capped | 1,810,109 | (208,634,647 | ) | (22,070,693 | ) | (228,895,231 | ) | |||||||||
MSCI Spain Capped | 9,343,831 | (165,297,805 | ) | (40,671,946 | ) | (196,625,920 | ) | |||||||||
MSCI Switzerland Capped | — | (61,443,912 | ) | (6,562,195 | ) | (68,006,107 | ) | |||||||||
| a | The difference between book-basis and tax-basis unrealized gains (losses) was attributable primarily to the tax deferral of losses on wash sales, the realization for tax purposes of unrealized gains (losses) on certain futures contracts, the characterization of corporate actions, the foreign withholding tax reclaims, and the realization for tax purposes of unrealized gains on investments in passive foreign investment companies. |
| 54 | 2017 iSHARES ANNUAL REPORTTO SHAREHOLDERS |
Table of Contents
Notes to Financial Statements (Continued)
iSHARES®, INC.
As of August 31, 2017, the following Funds had capital loss carryforwards available to offset future realized capital gains through the indicated expiration dates as follows:
| iShares ETF | Non- Expiring a | Expiring 2018 | Expiring 2019 | Total | ||||||||||||
MSCI Eurozone | $ | 263,923,287 | $ | 68,035,542 | $ | 30,230,739 | $ | 362,189,568 | ||||||||
MSCI Germany | 73,191,131 | 28,490,949 | 32,215,954 | 133,898,034 | ||||||||||||
MSCI Italy Capped | 181,005,358 | 18,169,627 | 9,459,662 | 208,634,647 | ||||||||||||
MSCI Spain Capped | 141,557,230 | 15,120,672 | 8,619,903 | 165,297,805 | ||||||||||||
MSCI Switzerland Capped | 31,918,774 | 22,569,380 | 6,955,758 | 61,443,912 | ||||||||||||
| a | Must be utilized prior to losses subject to expiration. |
The Funds may own shares in certain foreign investment entities, referred to, under U.S. tax law, as “passive foreign investment companies.” The Funds may elect to mark-to-market annually the shares of each passive foreign investment company and would be required to distribute to shareholders any such marked-to-market gains.
Management has analyzed tax laws and regulations and their application to the Funds as of August 31, 2017, inclusive of the open tax return years, and does not believe there are any uncertain tax positions that require recognition of a tax liability in the Funds’ financial statements.
| 8. | FOREIGN WITHHOLDING TAX CLAIMS |
The iShares MSCI Eurozone ETF has filed claims to recover taxes withheld by Finland on dividend income on the basis that Finland had purportedly violated certain provisions in the Treaty on the Functioning of the European Union. The Fund has recorded a receivable for all recoverable taxes withheld by Finland based upon favorable determinations issued by the Finnish Tax Authority. The Fund continues to evaluate developments in Finland for potential impact to the receivables recorded. Finnish tax claims receivable are disclosed in the statement of assets and liabilities. Professional fees associated with the filing of tax claims in Finland that result in the recovery of foreign withholding taxes have been approved by the Board as appropriate expenses of the Fund.
The Internal Revenue Service has issued guidance to address U.S. income tax liabilities attributable to fund shareholders resulting from the recovery of foreign taxes withheld in prior years. These withheld foreign taxes were passed through to shareholders in the form of foreign tax credits in the year the taxes were withheld. Assuming there are sufficient foreign taxes paid which the Fund is able to pass through to its shareholders as a foreign tax credit in the current year, the Fund will be able to offset the prior years’ withholding taxes recovered against the foreign taxes paid in the current year. Accordingly, no federal income tax liability is recorded by the Fund.
| 9. | LEGAL PROCEEDINGS |
On June 16, 2016, investors (the “Plaintiffs”) in certain iShares funds (iShares Core S&P Small-Cap ETF, iShares Russell 1000 Growth ETF, iShares Core S&P 500 ETF, iShares Russell Mid-Cap Growth ETF, iShares Russell Mid-Cap ETF, iShares Russell Mid-Cap Value ETF, iShares Select Dividend ETF, iShares Morningstar Mid-Cap ETF, iShares Morningstar Large-Cap ETF, iShares U.S. Aerospace & Defense ETF and iShares U.S. Preferred Stock ETF) filed a putative class action lawsuit against iShares Trust, BlackRock, Inc. and certain of its advisory affiliates, and certain directors/trustees and officers of the Funds (collectively, “Defendants”). The lawsuit alleges the Defendants violated federal securities laws by failing to adequately disclose in
NOTESTO FINANCIAL STATEMENTS | 55 |
Table of Contents
Notes to Financial Statements (Continued)
iSHARES®, INC.
the prospectuses issued by the funds noted above the risks of using stop-loss orders in the event of a ‘flash crash’, such as the one that occurred on May 6, 2010. On September 18, 2017, the Court issued a Statement of Decision holding that the Plaintiffs lack standing to assert their claims. On October 11, 2017, the Court entered final judgment dismissing all of Plaintiffs’ claims with prejudice.
| 10. | SUBSEQUENT EVENTS |
Management has evaluated the impact of all subsequent events on the Funds through the date the financial statements were available to be issued and has determined that there were no subsequent events requiring adjustment or disclosure in the financial statements.
| 56 | 2017 iSHARES ANNUAL REPORTTO SHAREHOLDERS |
Table of Contents
Report of Independent Registered Public Accounting Firm
To the Board of Directors of iShares, Inc. and
Shareholders of the iShares MSCI Eurozone ETF, iShares MSCI Germany ETF,
iShares MSCI Italy Capped ETF, iShares MSCI Spain Capped ETF and
iShares MSCI Switzerland Capped ETF
In our opinion, the accompanying statements of assets and liabilities, including the schedules of investments, and the related statements of operations and of changes in net assets and the financial highlights present fairly, in all material respects, the financial position of iShares MSCI Eurozone ETF, iShares MSCI Germany ETF, iShares MSCI Italy Capped ETF, iShares MSCI Spain Capped ETF and iShares MSCI Switzerland Capped ETF (constituting funds of iShares, Inc., hereafter referred to as the “Funds”) as of August 31, 2017, and the results of each of their operations, the changes in each of their net assets and the financial highlights for each of the periods indicated, in conformity with accounting principles generally accepted in the United States of America. These financial statements and financial highlights (hereafter referred to as “financial statements”) are the responsibility of the Funds’ management. Our responsibility is to express an opinion on these financial statements based on our audits. We conducted our audits of these financial statements in accordance with the standards of the Public Company Accounting Oversight Board (United States). Those standards require that we plan and perform the audit to obtain reasonable assurance about whether the financial statements are free of material misstatement. An audit includes examining, on a test basis, evidence supporting the amounts and disclosures in the financial statements, assessing the accounting principles used and significant estimates made by management, and evaluating the overall financial statement presentation. We believe that our audits, which included confirmation of securities as of August 31, 2017 by correspondence with the custodian, transfer agent and brokers, or by other appropriate auditing procedures where replies were not received, provide a reasonable basis for our opinion.
PricewaterhouseCoopers LLP
San Francisco, California
October 23, 2017
REPORTOF INDEPENDENT REGISTERED PUBLIC ACCOUNTING FIRM | 57 |
Table of Contents
iSHARES® , INC.
The following maximum amounts are hereby designated as qualified dividend income for individuals for the fiscal year ended August 31, 2017:
| iShares ETF | Qualified Dividend Income | |||
MSCI Eurozone | $ | 335,447,139 | ||
MSCI Germany | 148,261,495 | |||
MSCI Italy Capped | 23,173,900 | |||
MSCI Spain Capped | 37,867,968 | |||
MSCI Switzerland Capped | 34,329,631 | |||
For the fiscal year ended August 31, 2017, the following Funds earned foreign source income and paid foreign taxes which they intend to pass through to their shareholders:
| iShares ETF | Foreign Source Income Earned | Foreign Taxes Paid | ||||||
MSCI Eurozone | $ | 344,620,471 | $ | 38,224,687 | ||||
MSCI Germany | 149,306,420 | 15,988,544 | ||||||
MSCI Italy Capped | 23,292,583 | 2,871,355 | ||||||
MSCI Spain Capped | 37,940,605 | 3,792,112 | ||||||
MSCI Switzerland Capped | 34,600,207 | 5,390,443 | ||||||
| 58 | 2017 iSHARES ANNUAL REPORTTO SHAREHOLDERS |
Table of Contents
Board Review and Approval of Investment Advisory
Contract
iSHARES® INC.
I. iShares MSCI Eurozone ETF
Under Section 15(c) of the Investment Company Act of 1940 (the “1940 Act”), the Company’s Board of Directors (the “Board”), including a majority of Directors who are not “interested persons” of the Company (as that term is defined in the 1940 Act) (the “Independent Directors”), is required annually to consider and approve the Investment Advisory Contract between the Company and BFA (the “Advisory Contract”) on behalf of the Fund. The Independent Directors requested, and BFA provided, such information as the Independent Directors, with advice from independent counsel, deemed reasonably necessary to evaluate the Advisory Contract. A committee of all of the Independent Directors (the “15(c) Committee”), with independent counsel, met with management on May 5, 2017 and May 12, 2017. At these meetings, the 15(c) Committee reviewed and discussed information provided in response to the 15(c) Committee’s initial requests, and requested certain additional information, which management agreed to provide. At a meeting held on May 18, 2017, management presented information to the Board relating to the continuance of the Advisory Contract, including information requested by the 15(c) Committee during its meetings. The Board, including the Independent Directors, reviewed and discussed such information at length. The Independent Directors requested from management certain additional information, which management agreed to provide. At a meeting held on June 19-21, 2017, the Board, including the Independent Directors, reviewed the additional information provided by management in response to these requests. After extensive discussions, the Board, including all of the Independent Directors, approved the continuance of the Advisory Contract for the Fund, based on a review of qualitative and quantitative information provided by BFA. The Board noted its satisfaction with the extent and quality of information provided and its frequent interactions with management, as well as the detailed responses and other information provided by BFA. The Board also noted that the Board and BFA agreed to discuss potential further enhancements to the 15(c) process for the coming year. The Independent Directors were advised by their independent counsel throughout the process, including about the legal standards applicable to their review. In approving the Advisory Contract for the Fund, the Board, including the Independent Directors, considered the following factors, no one of which was controlling, and reached the following conclusions:
Expenses and Performance of the Fund — The Board reviewed statistical information prepared by Broadridge Financial Solutions Inc. (“Broadridge”), an independent provider of investment company data, regarding the expense ratio components, including gross and net total expenses, waivers/reimbursements (if any), and underlying fund fees and expenses (if any) of the Fund in comparison with the same information for other exchange traded funds (“ETFs”) (including, where applicable, funds sponsored by an “at cost” service provider) and, in the limited instances where no comparable ETFs existed and the comparison group would not otherwise be reasonable in Broadridge’s judgment, pure index institutional mutual funds, objectively selected by Broadridge as comprising the Fund’s applicable peer group pursuant to Broadridge’s proprietary ETF methodology (the “Peer Group”). The Board was provided with a detailed description of the proprietary ETF methodology used by Broadridge to determine the Fund’s Peer Group. The Board further noted that due to the limitations in providing comparable funds in the Peer Group, the statistical information provided in Broadridge’s report may or may not provide meaningful direct comparisons to the Fund in all instances.
The Board also noted that the investment advisory fee rate and overall expenses (net of waivers and reimbursements) for the Fund were higher than the median of the investment advisory fee rates and overall expenses (net of waivers and reimbursements) of the funds in its Peer Group, excluding iShares funds.
In addition, to the extent that any of the comparison funds included in the Peer Group, excluding iShares funds, track the same index as the Fund, Broadridge also provided, and the Board reviewed, a comparison of the Fund’s performance for the one-, three-, five-, ten-year, and since inception periods, as applicable, and for the quarter ended December 31, 2016, to that of relevant comparison funds for the same periods.
BOARD REVIEWAND APPROVALOF INVESTMENT ADVISORY CONTRACT | 59 |
Table of Contents
Board Review and Approval of Investment Advisory
Contract (Continued)
iSHARES® INC.
The Board noted that the Fund seeks to track its specified underlying index and that, during the year, the Board received periodic reports on the Fund’s short- and longer-term performance in comparison with its underlying index. Such periodic comparative performance information, including any additional detailed information requested by the Boards, was also considered. The Board noted that the Fund generally performed in line with its underlying index over the relevant periods.
Based on this review, the other factors considered at the meeting, and their general knowledge of ETF pricing, the Board concluded that the investment advisory fee rate and the historical performance of the Fund supported the Board’s approval of the continuance of the Advisory Contract for the coming year.
Nature, Extent and Quality of Services Provided by BFA — Based on management’s representations, including information about recent and proposed enhancements to the iShares business, including with respect to capital markets support and analysis, technology, product design, compliance and risk management, and other services, the Board expected that there would be no diminution in the scope of services required of or provided by BFA under the Advisory Contract for the coming year as compared to the scope of services provided by BFA during prior years. In reviewing the scope of these services, the Board considered BFA’s investment philosophy and experience, noting that BFA and its affiliates have committed significant resources over time, including during the past year, to supporting the iShares funds and their shareholders. The Board also considered BFA’s compliance program and its compliance record with respect to the Fund. In that regard, the Board noted that BFA reports to the Board about portfolio management and compliance matters on a periodic basis in connection with regularly scheduled meetings of the Board, and on other occasions as necessary and appropriate, and has provided information and made appropriate officers available as needed to provide further assistance with these matters. The Board also reviewed the background and experience of the persons responsible for the day-to-day management of the Fund, as well as the resources available to them in managing the Fund. In addition to the above considerations, the Board reviewed and considered detailed presentations regarding BFA’s investment performance, investment and risk management processes and strategies provided at the June 19-21, 2017 meeting and throughout the previous year, and matters related to BFA’s portfolio compliance policies and procedures. The Board noted that the Fund had met its investment objective consistently since its inception date.
Based on review of this information, and the performance information discussed above, the Board concluded that the nature, extent and quality of services provided by BFA to the Fund under the Advisory Contract supported the Board’s approval of the continuance of the Advisory Contract for the coming year.
Costs of Services Provided to Fund and Profits Realized by BFA and Affiliates — The Board reviewed information about the profitability of the Fund to BlackRock, based on the fees payable to BFA and its affiliates (including fees under the Advisory Contract), and other sources of revenue and expense to BFA and its affiliates from the Fund’s operations for the last calendar year. The Board reviewed BlackRock’s profitability methodology for the iShares funds, including supplemental information that was responsive to requests of the 15(c) Committee. The Board noted that the 15(c) Committee had focused on the methodology and profitability presentation during its meetings. The Board discussed the sources of direct and ancillary revenue with management, including the revenues to BTC, a BFA affiliate, from securities lending by the Fund. The Board also discussed BFA’s profit margin as reflected in the Fund’s profitability analysis and reviewed information regarding potential economies of scale (as discussed below). Based on this review, the Board concluded that the profits realized by BFA and its affiliates under the Advisory Contract and from other relationships between the Fund and BFA and/or its affiliates, if any, were within a reasonable range in light of the factors considered.
Economies of Scale — The Board reviewed information regarding potential economies of scale or other efficiencies that may result from increases in the Fund’s assets, noting that the issue of economies of scale had been focused on by the 15(c) Committee during its meetings and addressed by management, including through supplemental information. The Board and the 15(c) Committee reviewed information provided by BFA regarding scale benefits shared with the iShares funds through relatively
| 60 | 2017 iSHARES ANNUAL REPORTTO SHAREHOLDERS |
Table of Contents
Board Review and Approval of Investment Advisory
Contract (Continued)
iSHARES® INC.
low fee rates established at inception, breakpoints and waivers or other fee reductions, as well as through additional investment in the iShares business and the provision of improved or additional infrastructure and services to the iShares funds and their shareholders. The Board and the 15(c) Committee received information regarding BlackRock’s historical profitability, including BFA’s and its affiliates’ costs in providing services. The cost information distinguished, among other things, between fixed and variable costs, and explained how the level of fixed and variable costs, as well as the nature of such costs, may impact the existence or size of scale benefits. The Board noted that the Advisory Contract for the Fund already provided for breakpoints in the Fund’s investment advisory fee rate, and that, following negotiations, BFA and the Board had agreed to revise the Advisory Contract for the Fund to provide for an additional breakpoint as the assets of the Fund, on an aggregated basis with the assets of certain other iShares funds, increase. The Board noted that it would continue to monitor the sharing of economies of scale to determine the appropriateness of adding new or revised breakpoints in the future.
Based on this review, as well as the other factors considered at the meeting, the Board, recognizing its responsibility to consider the Advisory Contract at least annually, determined to approve the continuance of the Advisory Contract for the coming year.
Fees and Services Provided for Other Comparable Funds/Accounts Managed by BFA and its Affiliates — The Board received and considered information regarding the investment advisory/management fee rates for other funds/accounts in the U.S. for which BFA (or its affiliates) provides investment advisory/management services, including open-end funds registered under the 1940 Act (including sub-advised funds), collective trust funds, and institutional separate accounts (together, the “Other Accounts”), and acknowledged BFA’s assertion that the iShares funds are fundamentally different investment vehicles from the Other Accounts. The Board noted that BFA and its affiliates do manage Other Accounts with substantially the same investment objective and strategy as the Fund and that track the same index as the Fund. The Board further noted that BFA provided the Board with detailed information regarding how the Other Accounts (particularly institutional clients) generally differ from the Fund, including in terms of the different and generally more extensive services provided to the Fund, as well as other significant differences. In that regard, the Board considered that the pricing of services to institutional clients is typically based on a number of factors beyond the nature and extent of the specific services to be provided and often depends on the overall relationship between the client and its affiliates and the adviser and its affiliates. In addition, the Board considered the relative complexity and inherent risks and challenges of managing and providing other services to the Fund, as a publicly traded ETF, as compared to the Other Accounts that are institutional clients, in light of differing regulatory requirements and client-imposed mandates. The Board also acknowledged BFA’s expressed business purpose for launching a suite of iShares “Core” ETFs that generally are subject to lower investment advisory fees than iShares non-Core ETFs that may provide a similar investment exposure. The Board also considered the “all-inclusive” nature of the Fund’s advisory fee structure, and the Fund expenses borne by BFA under this arrangement. The Board noted that the investment advisory fee rate under the Advisory Contract for the Fund was generally higher than the investment advisory/management fee rates for certain of the Other Accounts (particularly institutional clients) and concluded that the differences appeared to be consistent with the factors discussed.
Other Benefits to BFA and/or its Affiliates — The Board reviewed the “fallout” benefits or ancillary revenue received by BFA and/or its affiliates in connection with the services provided to the Fund by BFA, such as payment of revenue to BTC, the Fund’s securities lending agent, for loaning portfolio securities (which was included in the profit margins reviewed by the Board pursuant to BFA’s profitability methodology), and payment of advisory fees and/or administration fees to BFA and BTC (or their affiliates) in connection with any investments by the Fund in other funds for which BFA (or its affiliates) provides investment advisory services and/or administration services. The Board also noted the revenue received by BFA and/or its affiliates pursuant to an agreement that permits a service provider to use certain portions of BlackRock’s technology platform to service accounts managed by BFA and/or its affiliates, including the iShares funds. The Board noted that BFA generally does not use soft dollars or consider the value of research or other services that may be provided to BFA (including its affiliates) in selecting brokers for portfolio transactions for the Fund. The Board further noted that any portfolio transactions on behalf of the Fund placed through a BFA affiliate or purchased from an underwriting syndicate in which a BFA affiliate participates, are reported to the Board pursuant to
BOARD REVIEWAND APPROVALOF INVESTMENT ADVISORY CONTRACT | 61 |
Table of Contents
Board Review and Approval of Investment Advisory
Contract (Continued)
iSHARES® INC.
Rule 17e-1 or Rule 10f-3, as applicable, under the 1940 Act. The Board concluded that any such ancillary benefits would not be disadvantageous to the Fund’s shareholders and thus would not alter the Board’s conclusion with respect to the appropriateness of approving the continuance of the Advisory Contract for the coming year.
Conclusion — Based on the considerations described above, the Board determined that the Fund’s investment advisory fee rate under the Advisory Contract does not constitute a fee that is so disproportionately large as to bear no reasonable relationship to the services rendered and that could not have been the product of arm’s-length bargaining, and concluded to approve the continuance of the Advisory Contract for the coming year.
II. iShares MSCI Germany ETF
Under Section 15(c) of the Investment Company Act of 1940 (the “1940 Act”), the Company’s Board of Directors (the “Board”), including a majority of Directors who are not “interested persons” of the Company (as that term is defined in the 1940 Act) (the “Independent Directors”), is required annually to consider and approve the Investment Advisory Contract between the Company and BFA (the “Advisory Contract”) on behalf of the Fund. The Independent Directors requested, and BFA provided, such information as the Independent Directors, with advice from independent counsel, deemed reasonably necessary to evaluate the Advisory Contract. A committee of all of the Independent Directors (the “15(c) Committee”), with independent counsel, met with management on May 5, 2017 and May 12, 2017. At these meetings, the 15(c) Committee reviewed and discussed information provided in response to the 15(c) Committee’s initial requests, and requested certain additional information, which management agreed to provide. At a meeting held on May 18, 2017, management presented information to the Board relating to the continuance of the Advisory Contract, including information requested by the 15(c) Committee during its meetings. The Board, including the Independent Directors, reviewed and discussed such information at length. The Independent Directors requested from management certain additional information, which management agreed to provide. At a meeting held on June 19-21, 2017, the Board, including the Independent Directors, reviewed the additional information provided by management in response to these requests. After extensive discussions, the Board, including all of the Independent Directors, approved the continuance of the Advisory Contract for the Fund, based on a review of qualitative and quantitative information provided by BFA. The Board noted its satisfaction with the extent and quality of information provided and its frequent interactions with management, as well as the detailed responses and other information provided by BFA. The Board also noted that the Board and BFA agreed to discuss potential further enhancements to the 15(c) process for the coming year. The Independent Directors were advised by their independent counsel throughout the process, including about the legal standards applicable to their review. In approving the Advisory Contract for the Fund, the Board, including the Independent Directors, considered the following factors, no one of which was controlling, and reached the following conclusions:
Expenses and Performance of the Fund — The Board reviewed statistical information prepared by Broadridge Financial Solutions Inc. (“Broadridge”), an independent provider of investment company data, regarding the expense ratio components, including gross and net total expenses, waivers/reimbursements (if any), and underlying fund fees and expenses (if any) of the Fund in comparison with the same information for other exchange traded funds (“ETFs”) (including, where applicable, funds sponsored by an “at cost” service provider) and, in the limited instances where no comparable ETFs existed and the comparison group would not otherwise be reasonable in Broadridge’s judgment, pure index institutional mutual funds, objectively selected by Broadridge as comprising the Fund’s applicable peer group pursuant to Broadridge’s proprietary ETF methodology (the “Peer Group”). The Board was provided with a detailed description of the proprietary ETF methodology used by Broadridge to determine the Fund’s Peer Group. The Board further noted that due to the limitations in providing comparable funds in the Peer Group, the statistical information provided in Broadridge’s report may or may not provide meaningful direct comparisons to the Fund in all instances.
| 62 | 2017 iSHARES ANNUAL REPORTTO SHAREHOLDERS |
Table of Contents
Board Review and Approval of Investment Advisory
Contract (Continued)
iSHARES® INC.
The Board also noted that the investment advisory fee rate and overall expenses (net of waivers and reimbursements) for the Fund were lower than the median of the investment advisory fee rates and overall expenses (net of waivers and reimbursements) of the funds in its Peer Group, excluding iShares funds.
In addition, to the extent that any of the comparison funds included in the Peer Group, excluding iShares funds, track the same index as the Fund, Broadridge also provided, and the Board reviewed, a comparison of the Fund’s performance for the one-, three-, five-, ten-year, and since inception periods, as applicable, and for the quarter ended December 31, 2016, to that of relevant comparison funds for the same periods.
The Board noted that the Fund seeks to track its specified underlying index and that, during the year, the Board received periodic reports on the Fund’s short- and longer-term performance in comparison with its underlying index. Such periodic comparative performance information, including any additional detailed information requested by the Boards, was also considered. The Board noted that the Fund generally performed in line with its underlying index over the relevant periods.
Based on this review, the other factors considered at the meeting, and their general knowledge of ETF pricing, the Board concluded that the investment advisory fee rate and the historical performance of the Fund supported the Board’s approval of the continuance of the Advisory Contract for the coming year.
Nature, Extent and Quality of Services Provided by BFA — Based on management’s representations, including information about recent and proposed enhancements to the iShares business, including with respect to capital markets support and analysis, technology, product design, compliance and risk management, and other services, the Board expected that there would be no diminution in the scope of services required of or provided by BFA under the Advisory Contract for the coming year as compared to the scope of services provided by BFA during prior years. In reviewing the scope of these services, the Board considered BFA’s investment philosophy and experience, noting that BFA and its affiliates have committed significant resources over time, including during the past year, to supporting the iShares funds and their shareholders. The Board also considered BFA’s compliance program and its compliance record with respect to the Fund. In that regard, the Board noted that BFA reports to the Board about portfolio management and compliance matters on a periodic basis in connection with regularly scheduled meetings of the Board, and on other occasions as necessary and appropriate, and has provided information and made appropriate officers available as needed to provide further assistance with these matters. The Board also reviewed the background and experience of the persons responsible for the day-to-day management of the Fund, as well as the resources available to them in managing the Fund. In addition to the above considerations, the Board reviewed and considered detailed presentations regarding BFA’s investment performance, investment and risk management processes and strategies provided at the June 19-21, 2017 meeting and throughout the previous year, and matters related to BFA’s portfolio compliance policies and procedures. The Board noted that the Fund had met its investment objective consistently since its inception date.
Based on review of this information, and the performance information discussed above, the Board concluded that the nature, extent and quality of services provided by BFA to the Fund under the Advisory Contract supported the Board’s approval of the continuance of the Advisory Contract for the coming year.
Costs of Services Provided to Fund and Profits Realized by BFA and Affiliates — The Board reviewed information about the profitability of the Fund to BlackRock, based on the fees payable to BFA and its affiliates (including fees under the Advisory Contract), and other sources of revenue and expense to BFA and its affiliates from the Fund’s operations for the last calendar year. The Board reviewed BlackRock’s profitability methodology for the iShares funds, including supplemental information that was responsive to requests of the 15(c) Committee. The Board noted that the 15(c) Committee had focused on the methodology and profitability presentation during its meetings. The Board discussed the sources of direct and ancillary revenue with management, including the revenues to BTC, a BFA affiliate, from securities lending by the Fund. The Board also discussed
BOARD REVIEWAND APPROVALOF INVESTMENT ADVISORY CONTRACT | 63 |
Table of Contents
Board Review and Approval of Investment Advisory
Contract (Continued)
iSHARES® INC.
BFA’s profit margin as reflected in the Fund’s profitability analysis and reviewed information regarding potential economies of scale (as discussed below). Based on this review, the Board concluded that the profits realized by BFA and its affiliates under the Advisory Contract and from other relationships between the Fund and BFA and/or its affiliates, if any, were within a reasonable range in light of the factors considered.
Economies of Scale — The Board reviewed information regarding potential economies of scale or other efficiencies that may result from increases in the Fund’s assets, noting that the issue of economies of scale had been focused on by the 15(c) Committee during its meetings and addressed by management, including through supplemental information. The Board and the 15(c) Committee reviewed information provided by BFA regarding scale benefits shared with the iShares funds through relatively low fee rates established at inception, breakpoints and waivers or other fee reductions, as well as through additional investment in the iShares business and the provision of improved or additional infrastructure and services to the iShares funds and their shareholders. The Board and the 15(c) Committee received information regarding BlackRock’s historical profitability, including BFA’s and its affiliates’ costs in providing services. The cost information distinguished, among other things, between fixed and variable costs, and explained how the level of fixed and variable costs, as well as the nature of such costs, may impact the existence or size of scale benefits. The Board noted that the Advisory Contract for the Fund already provided for breakpoints in the Fund’s investment advisory fee rate, and that, following negotiations, BFA and the Board had agreed to revise the Advisory Contract for the Fund to provide for an additional breakpoint as the assets of the Fund, on an aggregated basis with the assets of certain other iShares funds, increase. The Board noted that it would continue to monitor the sharing of economies of scale to determine the appropriateness of adding new or revised breakpoints in the future.
Based on this review, as well as the other factors considered at the meeting, the Board, recognizing its responsibility to consider the Advisory Contract at least annually, determined to approve the continuance of the Advisory Contract for the coming year.
Fees and Services Provided for Other Comparable Funds/Accounts Managed by BFA and its Affiliates — The Board received and considered information regarding the investment advisory/management fee rates for other funds/accounts in the U.S. for which BFA (or its affiliates) provides investment advisory/management services, including open-end funds registered under the 1940 Act (including sub-advised funds), collective trust funds, and institutional separate accounts (together, the “Other Accounts”), and acknowledged BFA’s assertion that the iShares funds are fundamentally different investment vehicles from the Other Accounts. The Board noted that BFA and its affiliates do manage Other Accounts with substantially the same investment objective and strategy as the Fund and that track the same index as the Fund. The Board further noted that BFA provided the Board with detailed information regarding how the Other Accounts (particularly institutional clients) generally differ from the Fund, including in terms of the different and generally more extensive services provided to the Fund, as well as other significant differences. In that regard, the Board considered that the pricing of services to institutional clients is typically based on a number of factors beyond the nature and extent of the specific services to be provided and often depends on the overall relationship between the client and its affiliates and the adviser and its affiliates. In addition, the Board considered the relative complexity and inherent risks and challenges of managing and providing other services to the Fund, as a publicly traded ETF, as compared to the Other Accounts that are institutional clients, in light of differing regulatory requirements and client-imposed mandates. The Board also acknowledged BFA’s expressed business purpose for launching a suite of iShares “Core” ETFs that generally are subject to lower investment advisory fees than iShares non-Core ETFs that may provide a similar investment exposure. The Board also considered the “all-inclusive” nature of the Fund’s advisory fee structure, and the Fund expenses borne by BFA under this arrangement. The Board noted that the investment advisory fee rate under the Advisory Contract for the Fund was generally higher than the investment advisory/management fee rates for certain of the Other Accounts (particularly institutional clients) and concluded that the differences appeared to be consistent with the factors discussed.
| 64 | 2017 iSHARES ANNUAL REPORTTO SHAREHOLDERS |
Table of Contents
Board Review and Approval of Investment Advisory
Contract (Continued)
iSHARES® INC.
Other Benefits to BFA and/or its Affiliates — The Board reviewed the “fallout” benefits or ancillary revenue received by BFA and/or its affiliates in connection with the services provided to the Fund by BFA, such as payment of revenue to BTC, the Fund’s securities lending agent, for loaning portfolio securities (which was included in the profit margins reviewed by the Board pursuant to BFA’s profitability methodology), and payment of advisory fees and/or administration fees to BFA and BTC (or their affiliates) in connection with any investments by the Fund in other funds for which BFA (or its affiliates) provides investment advisory services and/or administration services. The Board also noted the revenue received by BFA and/or its affiliates pursuant to an agreement that permits a service provider to use certain portions of BlackRock’s technology platform to service accounts managed by BFA and/or its affiliates, including the iShares funds. The Board noted that BFA generally does not use soft dollars or consider the value of research or other services that may be provided to BFA (including its affiliates) in selecting brokers for portfolio transactions for the Fund. The Board further noted that any portfolio transactions on behalf of the Fund placed through a BFA affiliate or purchased from an underwriting syndicate in which a BFA affiliate participates, are reported to the Board pursuant to Rule 17e-1 or Rule 10f-3, as applicable, under the 1940 Act. The Board concluded that any such ancillary benefits would not be disadvantageous to the Fund’s shareholders and thus would not alter the Board’s conclusion with respect to the appropriateness of approving the continuance of the Advisory Contract for the coming year.
Conclusion — Based on the considerations described above, the Board determined that the Fund’s investment advisory fee rate under the Advisory Contract does not constitute a fee that is so disproportionately large as to bear no reasonable relationship to the services rendered and that could not have been the product of arm’s-length bargaining, and concluded to approve the continuance of the Advisory Contract for the coming year.
III. iShares MSCI Italy Capped ETF, iShares MSCI Spain Capped ETF and iShares MSCI Switzerland Capped ETF
Under Section 15(c) of the Investment Company Act of 1940 (the “1940 Act”), the Company’s Board of Directors (the “Board”), including a majority of Directors who are not “interested persons” of the Company (as that term is defined in the 1940 Act) (the “Independent Directors”), is required annually to consider and approve the Investment Advisory Contract between the Company and BFA (the “Advisory Contract”) on behalf of the Funds. The Independent Directors requested, and BFA provided, such information as the Independent Directors, with advice from independent counsel, deemed reasonably necessary to evaluate the Advisory Contract. A committee of all of the Independent Directors (the “15(c) Committee”), with independent counsel, met with management on May 5, 2017 and May 12, 2017. At these meetings, the 15(c) Committee reviewed and discussed information provided in response to the 15(c) Committee’s initial requests, and requested certain additional information, which management agreed to provide. At a meeting held on May 18, 2017, management presented information to the Board relating to the continuance of the Advisory Contract, including information requested by the 15(c) Committee during its meetings. The Board, including the Independent Directors, reviewed and discussed such information at length. The Independent Directors requested from management certain additional information, which management agreed to provide. At a meeting held on June 19-21, 2017, the Board, including the Independent Directors, reviewed the additional information provided by management in response to these requests. After extensive discussions, the Board, including all of the Independent Directors, approved the continuance of the Advisory Contract for the Funds, based on a review of qualitative and quantitative information provided by BFA. The Board noted its satisfaction with the extent and quality of information provided and its frequent interactions with management, as well as the detailed responses and other information provided by BFA. The Board also noted that the Board and BFA agreed to discuss potential further enhancements to the 15(c) process for the coming year. The Independent Directors were advised by their
BOARD REVIEWAND APPROVALOF INVESTMENT ADVISORY CONTRACT | 65 |
Table of Contents
Board Review and Approval of Investment Advisory
Contract (Continued)
iSHARES® INC.
independent counsel throughout the process, including about the legal standards applicable to their review. In approving the Advisory Contract for the Funds, the Board, including the Independent Directors, considered the following factors, no one of which was controlling, and reached the following conclusions:
Expenses and Performance of the Funds — The Board reviewed statistical information prepared by Broadridge Financial Solutions Inc. (“Broadridge”), an independent provider of investment company data, regarding the expense ratio components, including gross and net total expenses, waivers/reimbursements (if any), and underlying fund fees and expenses (if any) of each Fund in comparison with the same information for other exchange traded funds (“ETFs”) (including, where applicable, funds sponsored by an “at cost” service provider) and, in the limited instances where no comparable ETFs existed and the comparison group would not otherwise be reasonable in Broadridge’s judgment, pure index institutional mutual funds, objectively selected by Broadridge as comprising such Fund’s applicable peer group pursuant to Broadridge’s proprietary ETF methodology (the “Peer Group”). The Board was provided with a detailed description of the proprietary ETF methodology used by Broadridge to determine the applicable Peer Groups. The Board further noted that due to the limitations in providing comparable funds in the various Peer Groups, the statistical information provided in Broadridge’s report may or may not provide meaningful direct comparisons to the Funds in all instances.
The Board also noted that the investment advisory fee rates and overall expenses (net of waivers and reimbursements) for the Funds were lower than the median of the investment advisory fee rates and overall expenses (net of waivers and reimbursements) of the funds in their respective Peer Group, excluding iShares funds.
In addition, to the extent that any of the comparison funds included in the Peer Group, excluding iShares funds, track the same index as any particular Fund, Broadridge also provided, and the Board reviewed, a comparison of such Fund’s performance for the one-, three-, five-, ten-year, and since inception periods, as applicable, and for the quarter ended December 31, 2016, to that of relevant comparison funds for the same periods.
The Board noted that each Fund seeks to track its own underlying index and that, during the year, the Board received periodic reports on each Fund’s short- and longer-term performance in comparison with its underlying index. Such periodic comparative performance information, including any additional detailed information requested by the Boards, was also considered. The Board noted that each Fund generally performed in line with its underlying index over the relevant periods.
Based on this review, the other factors considered at the meeting, and their general knowledge of ETF pricing, the Board concluded that the investment advisory fee rate and the historical performance of each Fund supported the Board’s approval of the continuance of the Advisory Contract for the coming year.
Nature, Extent and Quality of Services Provided by BFA — Based on management’s representations, including information about recent and proposed enhancements to the iShares business, including with respect to capital markets support and analysis, technology, product design, compliance and risk management, and other services, the Board expected that there would be no diminution in the scope of services required of or provided by BFA under the Advisory Contract for the coming year as compared to the scope of services provided by BFA during prior years. In reviewing the scope of these services, the Board considered BFA’s investment philosophy and experience, noting that BFA and its affiliates have committed significant resources over time, including during the past year, to supporting the iShares funds and their shareholders. The Board also considered BFA’s compliance program and its compliance record with respect to the Funds. In that regard, the Board noted that BFA reports to the Board about portfolio management and compliance matters on a periodic basis in connection with regularly scheduled meetings of the Board, and on other occasions as necessary and appropriate, and has provided information and made appropriate officers available as needed to provide further assistance with these matters. The Board also reviewed the background and experience of the persons responsible for the day-to-day management of the Funds, as well as the resources
| 66 | 2017 iSHARES ANNUAL REPORTTO SHAREHOLDERS |
Table of Contents
Board Review and Approval of Investment Advisory
Contract (Continued)
iSHARES® INC.
available to them in managing the Funds. In addition to the above considerations, the Board reviewed and considered detailed presentations regarding BFA’s investment performance, investment and risk management processes and strategies provided at the June 19-21, 2017 meeting and throughout the previous year, and matters related to BFA’s portfolio compliance policies and procedures. The Board noted that each Fund had met its investment objective consistently since its respective inception date.
Based on review of this information, and the performance information discussed above, the Board concluded that the nature, extent and quality of services provided by BFA to the Funds under the Advisory Contract supported the Board’s approval of the continuance of the Advisory Contract for the coming year.
Costs of Services Provided to Funds and Profits Realized by BFA and Affiliates — The Board reviewed information about the profitability of the Funds to BlackRock, on a Fund-by-Fund basis and in the aggregate, based on the fees payable to BFA and its affiliates (including fees under the Advisory Contract), and other sources of revenue and expense to BFA and its affiliates from the Funds’ operations for the last calendar year. The Board reviewed BlackRock’s profitability methodology for the iShares funds, including supplemental information that was responsive to requests of the 15(c) Committee. The Board noted that the 15(c) Committee had focused on the methodology and profitability presentation during its meetings. The Board discussed the sources of direct and ancillary revenue with management, including the revenues to BTC, a BFA affiliate, from securities lending by the Funds. The Board also discussed BFA’s profit margin as reflected in the Funds’ profitability analyses and reviewed information regarding potential economies of scale (as discussed below). Based on this review, the Board concluded that the profits realized by BFA and its affiliates under the Advisory Contract and from other relationships between the Funds and BFA and/or its affiliates, if any, were within a reasonable range in light of the factors considered.
Economies of Scale — The Board reviewed information regarding potential economies of scale or other efficiencies that may result from increases in the Funds’ assets, noting that the issue of economies of scale had been focused on by the 15(c) Committee during its meetings and addressed by management, including through supplemental information. The Board and the 15(c) Committee reviewed information provided by BFA regarding scale benefits shared with the iShares funds through relatively low fee rates established at inception, breakpoints and waivers or other fee reductions, as well as through additional investment in the iShares business and the provision of improved or additional infrastructure and services to the iShares funds and their shareholders. The Board and the 15(c) Committee received information regarding BlackRock’s historical profitability, including BFA’s and its affiliates’ costs in providing services. The cost information distinguished, among other things, between fixed and variable costs, and explained how the level of fixed and variable costs, as well as the nature of such costs, may impact the existence or size of scale benefits. The Board noted that the Advisory Contract for the Funds already provided for breakpoints in the Funds’ investment advisory fee rates and that, following negotiations, BFA and the Board had agreed to revise the Advisory Contract for the Funds to provide for an additional breakpoint as the assets of the Funds, on an aggregated basis with the assets of certain other iShares funds, increase. The Board noted that it would continue to monitor the sharing of economies of scale to determine the appropriateness of adding new or revised breakpoints in the future.
Based on this review, as well as the other factors considered at the meeting, the Board, recognizing its responsibility to consider the Advisory Contract at least annually, determined to approve the continuance of the Advisory Contract for the coming year.
Fees and Services Provided for Other Comparable Funds/Accounts Managed by BFA and its Affiliates — The Board received and considered information regarding the investment advisory/management fee rates for other funds/accounts in the U.S. for which BFA (or its affiliates) provides investment advisory/management services, including open-end funds registered under the 1940 Act (including sub-advised funds), collective trust funds, and institutional separate accounts (together, the “Other Accounts”), and acknowledged BFA’s assertion that the iShares funds are fundamentally different investment vehicles from the Other Accounts. The Board noted that BFA and its affiliates do not manage Other Accounts with substantially the same investment objectives and strategies as the Funds and that track the same index as the Funds. The Board further noted that BFA
BOARD REVIEWAND APPROVALOF INVESTMENT ADVISORY CONTRACT | 67 |
Table of Contents
Board Review and Approval of Investment Advisory
Contract (Continued)
iSHARES® INC.
provided the Board with detailed information regarding how the Other Accounts (particularly institutional clients) generally differ from the Funds, including in terms of the different and generally more extensive services provided to the Funds, as well as other significant differences. In that regard, the Board considered that the pricing of services to institutional clients is typically based on a number of factors beyond the nature and extent of the specific services to be provided and often depends on the overall relationship between the client and its affiliates and the adviser and its affiliates. In addition, the Board considered the relative complexity and inherent risks and challenges of managing and providing other services to the Funds, as publicly traded ETFs, as compared to the Other Accounts that are institutional clients in light of differing regulatory requirements and client-imposed mandates. The Board also acknowledged BFA’s expressed business purpose for launching a suite of iShares “Core” ETFs that generally are subject to lower investment advisory fees than iShares non-Core ETFs that may provide a similar investment exposure. The Board also considered the “all-inclusive” nature of the Funds’ advisory fee structure, and the Fund expenses borne by BFA under this arrangement. The Board noted that the investment advisory fee rates under the Advisory Contract for the Funds were generally higher than the investment advisory/management fee rates for certain of the Other Accounts (particularly institutional clients) and concluded that the differences appeared to be consistent with the factors discussed.
Other Benefits to BFA and/or its Affiliates — The Board reviewed the “fallout” benefits or ancillary revenue received by BFA and/or its affiliates in connection with the services provided to the Funds by BFA, such as payment of revenue to BTC, the Funds’ securities lending agent, for loaning portfolio securities (which was included in the profit margins reviewed by the Board pursuant to BFA’s profitability methodology), and payment of advisory fees and/or administration fees to BFA and BTC (or their affiliates) in connection with any investments by the Funds in other funds for which BFA (or its affiliates) provides investment advisory services and/or administration services. The Board also noted the revenue received by BFA and/or its affiliates pursuant to an agreement that permits a service provider to use certain portions of BlackRock’s technology platform to service accounts managed by BFA and/or its affiliates, including the iShares funds. The Board noted that BFA generally does not use soft dollars or consider the value of research or other services that may be provided to BFA (including its affiliates) in selecting brokers for portfolio transactions for the Funds. The Board further noted that any portfolio transactions on behalf of the Funds placed through a BFA affiliate or purchased from an underwriting syndicate in which a BFA affiliate participates, are reported to the Board pursuant to Rule 17e-1 or Rule 10f-3, as applicable, under the 1940 Act. The Board concluded that any such ancillary benefits would not be disadvantageous to the Funds’ shareholders and thus would not alter the Board’s conclusion with respect to the appropriateness of approving the continuance of the Advisory Contract for the coming year.
Conclusion — Based on the considerations described above, the Board determined that each Fund’s investment advisory fee rate under the Advisory Contract does not constitute a fee that is so disproportionately large as to bear no reasonable relationship to the services rendered and that could not have been the product of arm’s-length bargaining, and concluded to approve the continuance of the Advisory Contract for the coming year.
| 68 | 2017 iSHARES ANNUAL REPORTTO SHAREHOLDERS |
Table of Contents
Supplemental Information (Unaudited)
iSHARES®, INC.
Proxy Results
A special meeting of the shareholders of each series of iShares, Inc. (the “Company”) was held on June 19, 2017, to elect five Directors to the Board of Directors of the Company. The five nominees were Jane D. Carlin, Richard L. Fagnani, Drew E. Lawton, Madhav V. Rajan and Mark Wiedman, all of whom were elected as Directors at the special meeting. The other Directors whose terms of office as Directors continued after the special meeting are Cecilia H. Herbert, Charles A. Hurty, John E. Kerrigan, John E. Martinez and Robert S. Kapito.
| Director | Votes For | Votes Withheld | ||||||
Jane D. Carlin | 1,911,835,929 | 49,339,171 | ||||||
Richard L. Fagnani | 1,911,725,344 | 49,449,755 | ||||||
Drew E. Lawton | 1,911,790,083 | 49,385,017 | ||||||
Madhav V. Rajan | 1,902,999,095 | 58,176,004 | ||||||
Mark Wiedman | 1,908,143,500 | 53,031,599 | ||||||
Section 19(a) Notices
The amounts and sources of distributions reported are estimates and are provided pursuant to regulatory requirements and are not being provided for tax reporting purposes. The actual amounts and sources for tax reporting purposes will depend upon each Fund’s investment experience during the year and may be subject to changes based on the tax regulations. Shareholders will receive a Form 1099-DIV each calendar year that will inform them how to report these distributions for federal income tax purposes.
| Total Cumulative Distributions for the Fiscal Year | % Breakdown of the Total Cumulative Distributions for the Fiscal Year | |||||||||||||||||||||||||||||||
| iShares ETF | Net Investment Income | Net Realized Capital Gains | Return of Capital | Total Per Share | Net Investment Income | Net Realized Capital Gains | Return of Capital | Total Per Share | ||||||||||||||||||||||||
MSCI Eurozone | $ | 0.860852 | $ | — | $ | — | $ | 0.860852 | 100 | % | — | % | — | % | 100 | % | ||||||||||||||||
MSCI Spain Capped | 0.992706 | — | — | 0.992706 | 100 | — | — | 100 | ||||||||||||||||||||||||
MSCI Switzerland Capped | 0.746434 | — | — | 0.746434 | 100 | — | — | 100 | ||||||||||||||||||||||||
Premium/Discount Information
The Premium/Discount Information section is intended to present information about the differences between the daily market price on secondary markets for shares of a fund and that fund’s NAV. NAV is the price at which a fund issues and redeems shares. It is calculated in accordance with the standard formula for valuing mutual fund shares. The “Market Price” of a fund generally is determined using the midpoint between the highest bid and the lowest ask on the primary securities exchange on which shares of such fund are listed for trading, as of the time that the fund’s NAV is calculated. A fund’s Market Price may be at, above or below its NAV. The NAV of a fund will fluctuate with changes in the value of its portfolio holdings. The Market Price of a fund will fluctuate in accordance with changes in its NAV, as well as market supply and demand.
Premiums or discounts are the differences (expressed as a percentage) between the NAV and Market Price of a fund on a given day, generally at the time the NAV is calculated. A premium is the amount that a fund is trading above the reported NAV, expressed as a percentage of the NAV. A discount is the amount that a fund is trading below the reported NAV, expressed as a percentage of the NAV.
SUPPLEMENTAL INFORMATION | 69 |
Table of Contents
Supplemental Information (Unaudited) (Continued)
iSHARES®, INC.
Premium/discount information for the Funds covering the most recently completed calendar year and the most recently completed calendar quarters since that year (or the life of the Fund, if shorter) is publicly accessible, free of charge, at www.iShares.com.
The following information shows the frequency of distributions of premiums and discounts for the Funds for the immediately preceding five calendar years (or from the inception date of the Fund, if less than five years) through the date of the most recent calendar quarter-end. Each line in each table shows the number of trading days in which the Fund traded within the premium/discount range indicated. The number of trading days in each premium/discount range is also shown as a percentage of the total number of trading days in the period covered by each table. All data presented here represents past performance, which cannot be used to predict future results.
iShares MSCI Eurozone ETF
Period Covered: January 1, 2012 through June 30, 2017
Premium/Discount Range | Number of Days | Percentage of Total Days | ||||||
Greater than 3.0% and Less than 3.5% | 1 | 0.07 | % | |||||
Greater than 2.5% and Less than 3.0% | 1 | 0.07 | ||||||
Greater than 2.0% and Less than 2.5% | 2 | 0.14 | ||||||
Greater than 1.5% and Less than 2.0% | 6 | 0.43 | ||||||
Greater than 1.0% and Less than 1.5% | 34 | 2.46 | ||||||
Greater than 0.5% and Less than 1.0% | 173 | 12.51 | ||||||
Greater than 0.0% and Less than 0.5% | 638 | 46.14 | ||||||
At NAV | 17 | 1.23 | ||||||
Less than 0.0% and Greater than –0.5% | 409 | 29.58 | ||||||
Less than –0.5% and Greater than –1.0% | 78 | 5.64 | ||||||
Less than –1.0% and Greater than –1.5% | 16 | 1.16 | ||||||
Less than –1.5% and Greater than –2.0% | 6 | 0.43 | ||||||
Less than –2.0% and Greater than –2.5% | 1 | 0.07 | ||||||
Less than –2.5% | 1 | 0.07 | ||||||
|
|
|
| |||||
| 1,383 | 100.00 | % | ||||||
|
|
|
| |||||
| 70 | 2017 iSHARES ANNUAL REPORTTO SHAREHOLDERS |
Table of Contents
Supplemental Information (Unaudited) (Continued)
iSHARES®, INC.
iShares MSCI Germany ETF
Period Covered: January 1, 2012 through June 30, 2017
Premium/Discount Range | Number of Days | Percentage of Total Days | ||||||
Greater than 2.5% and Less than 3.0% | 1 | 0.07 | % | |||||
Greater than 2.0% and Less than 2.5% | 1 | 0.07 | ||||||
Greater than 1.5% and Less than 2.0% | 6 | 0.43 | ||||||
Greater than 1.0% and Less than 1.5% | 29 | 2.10 | ||||||
Greater than 0.5% and Less than 1.0% | 138 | 9.98 | ||||||
Greater than 0.0% and Less than 0.5% | 620 | 44.84 | ||||||
At NAV | 13 | 0.94 | ||||||
Less than 0.0% and Greater than –0.5% | 461 | 33.33 | ||||||
Less than –0.5% and Greater than –1.0% | 89 | 6.44 | ||||||
Less than –1.0% and Greater than –1.5% | 18 | 1.30 | ||||||
Less than –1.5% and Greater than –2.0% | 5 | 0.36 | ||||||
Less than –2.0% and Greater than –2.5% | 1 | 0.07 | ||||||
Less than –2.5% and Greater than –3.0% | 1 | 0.07 | ||||||
|
|
|
| |||||
| 1,383 | 100.00 | % | ||||||
|
|
|
| |||||
iShares MSCI Italy Capped ETF
Period Covered:January 1, 2012 through June 30, 2017
Premium/Discount Range | Number of Days | Percentage of Total Days | ||||||
Greater than 3.0% and Less than 3.5% | 3 | 0.22 | % | |||||
Greater than 2.5% and Less than 3.0% | 1 | 0.07 | ||||||
Greater than 2.0% and Less than 2.5% | 1 | 0.07 | ||||||
Greater than 1.5% and Less than 2.0% | 10 | 0.72 | ||||||
Greater than 1.0% and Less than 1.5% | 58 | 4.19 | ||||||
Greater than 0.5% and Less than 1.0% | 210 | 15.18 | ||||||
Greater than 0.0% and Less than 0.5% | 545 | 39.42 | ||||||
At NAV | 7 | 0.51 | ||||||
Less than 0.0% and Greater than –0.5% | 398 | 28.78 | ||||||
Less than –0.5% and Greater than –1.0% | 108 | 7.81 | ||||||
Less than –1.0% and Greater than –1.5% | 27 | 1.95 | ||||||
Less than –1.5% and Greater than –2.0% | 8 | 0.58 | ||||||
Less than –2.0% and Greater than –2.5% | 2 | 0.14 | ||||||
Less than –2.5% and Greater than –3.0% | 1 | 0.07 | ||||||
Less than –3.0% | 4 | 0.29 | ||||||
|
|
|
| |||||
| 1,383 | 100.00 | % | ||||||
|
|
|
| |||||
SUPPLEMENTAL INFORMATION | 71 |
Table of Contents
Supplemental Information (Unaudited) (Continued)
iSHARES®, INC.
iShares MSCI Spain Capped ETF
Period Covered: January 1, 2012 through June 30, 2017
Premium/Discount Range | Number of Days | Percentage of Total Days | ||||||
Greater than 3.5% | 1 | 0.07 | % | |||||
Greater than 3.0% and Less than 3.5% | 2 | 0.14 | ||||||
Greater than 2.5% and Less than 3.0% | 1 | 0.07 | ||||||
Greater than 2.0% and Less than 2.5% | 3 | 0.22 | ||||||
Greater than 1.5% and Less than 2.0% | 7 | 0.51 | ||||||
Greater than 1.0% and Less than 1.5% | 45 | 3.25 | ||||||
Greater than 0.5% and Less than 1.0% | 176 | 12.73 | ||||||
Greater than 0.0% and Less than 0.5% | 551 | 39.84 | ||||||
At NAV | 13 | 0.94 | ||||||
Less than 0.0% and Greater than –0.5% | 419 | 30.30 | ||||||
Less than –0.5% and Greater than –1.0% | 121 | 8.75 | ||||||
Less than –1.0% and Greater than –1.5% | 30 | 2.17 | ||||||
Less than –1.5% and Greater than –2.0% | 9 | 0.65 | ||||||
Less than –2.0% and Greater than –2.5% | 4 | 0.29 | ||||||
Less than –2.5% | 1 | 0.07 | ||||||
|
|
|
| |||||
| 1,383 | 100.00 | % | ||||||
|
|
|
| |||||
iShares MSCI Switzerland Capped ETF
Period Covered: January 1, 2012 through June 30, 2017
Premium/Discount Range | Number of Days | Percentage of Total Days | ||||||
Greater than 2.5% and Less than 3.0% | 1 | 0.07 | % | |||||
Greater than 2.0% and Less than 2.5% | 1 | 0.07 | ||||||
Greater than 1.5% and Less than 2.0% | 5 | 0.36 | ||||||
Greater than 1.0% and Less than 1.5% | 17 | 1.23 | ||||||
Greater than 0.5% and Less than 1.0% | 112 | 8.10 | ||||||
Greater than 0.0% and Less than 0.5% | 656 | 47.43 | ||||||
At NAV | 21 | 1.52 | ||||||
Less than 0.0% and Greater than –0.5% | 477 | 34.49 | ||||||
Less than –0.5% and Greater than –1.0% | 78 | 5.64 | ||||||
Less than –1.0% and Greater than –1.5% | 11 | 0.80 | ||||||
Less than –1.5% and Greater than –2.0% | 3 | 0.22 | ||||||
Less than –2.0% | 1 | 0.07 | ||||||
|
|
|
| |||||
| 1,383 | 100.00 | % | ||||||
|
|
|
| |||||
Regulation under the Alternative Investment Fund Managers Directive
The Alternative Investment Fund Managers Directive (“AIFMD”) imposes obligations on fund managers established in the European Union (the “EU”). These do not currently apply to managers established outside the EU, such as BFA. Rather, non-EU managers are only required to comply with certain disclosure, reporting and transparency obligations of AIFMD if such managers market a fund to EU investors.
| 72 | 2017 iSHARES ANNUAL REPORTTO SHAREHOLDERS |
Table of Contents
Supplemental Information (Unaudited) (Continued)
iSHARES®, INC.
BFA has registered the iShares MSCI Germany ETF (the “Fund”) for marketing to investors in the United Kingdom, the Netherlands, Finland, Sweden and Luxembourg.
Report on Remuneration
BFA is required under AIFMD to make quantitative disclosures of remuneration. These disclosures are made in line with BlackRock’s interpretation of currently available regulatory guidance on quantitative remuneration disclosures. As market or regulatory practice develops BlackRock may consider it appropriate to make changes to the way in which quantitative remuneration disclosures are calculated. Where such changes are made, this may result in disclosures in relation to a fund not being comparable to the disclosures made in the prior year, or in relation to other BlackRock fund disclosures in that same year.
Disclosures are provided in relation to both (a) the staff of BFA; (b) staff who are senior management; and (c) staff who have the ability to materially affect the risk profile of the Fund.
All individuals included in the aggregated figures disclosed are rewarded in line with BlackRock’s remuneration policy for their responsibilities across the relevant BlackRock business area. As all individuals have a number of areas of responsibilities, only the portion of remuneration for those individuals’ services attributable to the Fund is included in the aggregate figures disclosed.
BlackRock has a clear and well defined pay-for-performance philosophy, and compensation programs which support that philosophy. For senior management, a significant percentage of variable remuneration is deferred over time. All employees are subject to a claw-back policy.
Compensation decisions for employees are made based on BlackRock’s full-year financial results and other non-financial goals and objectives. Alongside financial performance, individual compensation is also based on strategic and operating results and other considerations such as management and leadership capabilities. No set formulas are established and no fixed benchmarks are used in determining annual incentive awards.
Bonus pools are reviewed by BlackRock’s independent compensation committee, taking into account both actual and projected financial information together with information provided by the Operational Risk and Regulatory Compliance departments in relation to any activities, incidents or events that warrant consideration in making compensation decisions.
Functions such as Finance, Operational Risk, Legal & Compliance, and Human Resources each have their own organizational structures which are independent of the business units. Functional bonus pools are determined with reference to the performance of each individual function and the remuneration of the senior members of control functions is directly overseen by BlackRock’s independent compensation committee. No individual is involved in setting his or her own remuneration.
Members of staff and senior management of BFA typically provide both AIFMD and non-AIFMD related services in respect of multiple funds, clients and functions of BFA and across the broader BlackRock group. Therefore, the figures disclosed are a sum of each individual’s portion of remuneration attributable to the Fund according to an objective apportionment methodology which acknowledges the multiple-service nature of BFA. Accordingly the figures are not representative of any individual’s actual remuneration or their remuneration structure.
The amount of the total remuneration awarded by BFA to its staff which has been attributed to the Fund in respect of BFA’s financial year ending December 31, 2016 was USD 420.44 thousand. This figure is comprised of fixed remuneration of USD 165.40 thousand and variable remuneration of USD 255.05 thousand. There were a total of 325 beneficiaries of the remuneration described above.
The amount of the aggregate remuneration awarded by BFA, which has been attributed to the Fund in respect of BFA’s financial year ending December 31, 2016, to its senior management was USD 58.15 thousand, and to members of its staff whose actions have a material impact on the risk profile of the Fund was USD 14.01 thousand.
SUPPLEMENTAL INFORMATION | 73 |
Table of Contents
Director and Officer Information
iSHARES®, INC.
The Board of Directors has responsibility for the overall management and operations of the Funds, including general supervision of the duties performed by BFA and other service providers. Each Director serves until he or she resigns, is removed, dies, retires or becomes incapacitated. Each officer shall hold office until his or her successor is elected and qualifies or until his or her death, resignation or removal. Directors who are not “interested persons” (as defined in the 1940 Act) of the Company are referred to as independent directors (“Independent Directors”).
The registered investment companies advised by BFA or its affiliates (the “BlackRock-advised Funds”) are organized into one complex of closed-end funds, two complexes of open-end funds and one complex of exchange-traded funds (“Exchange-Traded Fund Complex”) (each, a “BlackRock Fund Complex”). Each Fund is included in the BlackRock Fund Complex referred to as the Exchange-Traded Fund Complex. Each Director also serves as a Trustee of iShares Trust and a Trustee of iShares U.S. ETF Trust and, as a result, oversees a total of 344 funds (as of August 31, 2017) within the Exchange-Traded Fund Complex. Drew E. Lawton, from October 2016 to June 2017, and Richard L. Fagnani, from April 2017 to June 2017, served as Advisory Board Members for iShares Trust, iShares Inc. and iShares U.S. ETF Trust with respect to all funds within the Exchange-Traded Fund Complex. With the exception of Robert S. Kapito, Mark K. Wiedman, Charles Park, Martin Small and Benjamin Archibald, the address of each Director, and officer is c/o BlackRock, Inc., 400 Howard Street, San Francisco, CA 94105. The address of Mr. Kapito, Mr. Wiedman, Mr. Park, Mr. Small and Mr. Archibald is c/o BlackRock, Inc., Park Avenue Plaza, 55 East 52nd Street, New York, NY 10055. The Board has designated Cecilia H. Herbert as its Independent Board Chair. Additional information about the Funds’ Directors and officers may be found in the Funds’ combined Statement of Additional Information, which is available without charge, upon request, by calling toll-free 1-800-iShares (1-800-474-2737).
Interested Directors
| Name (Age) | Position(s) | Principal Occupation(s) During the Past 5 Years | Other Directorships Held by Director | |||
Robert S. Kapitoa (60) | Director (since 2009). | President, BlackRock, Inc. (since 2006); Vice Chairman of BlackRock, Inc. and Head of BlackRock’s Portfolio Management Group (since its formation in 1998) and BlackRock, Inc.’s predecessor entities (since 1988); Trustee, University of Pennsylvania (since 2009); President of Board of Directors, Hope & Heroes Children’s Cancer Fund (since 2002). | Director of BlackRock, Inc. (since 2006); Trustee of iShares Trust (since 2009); Trustee of iShares U.S. ETF Trust (since 2011). | |||
Mark K. Wiedmanb (46) | Director (since 2013). | Senior Managing Director, BlackRock, Inc. (since 2014); Managing Director, BlackRock, Inc. (2007-2014); Global Head of BlackRock’s ETF and Index Investments Business (since 2016); Global Head of iShares (2011-2016); Head of Corporate Strategy, BlackRock, Inc. (2009-2011). | Trustee of iShares Trust (since 2013); Trustee of iShares U.S. ETF Trust (since 2013); Director of PennyMac Financial Services, Inc. (since 2008). | |||
| a | Robert S. Kapito is deemed to be an “interested person” (as defined in the 1940 Act) of the Company due to his affiliations with BlackRock, Inc. and its affiliates. |
| b | Mark K. Wiedman is deemed to be an “interested person” (as defined in the 1940 Act) of the Company due to his affiliations with BlackRock, Inc. and its affiliates. |
| 74 | 2017 iSHARES ANNUAL REPORTTO SHAREHOLDERS |
Table of Contents
Director and Officer Information (Continued)
iSHARES®, INC.
Independent Directors
| Name (Age) | Position(s) | Principal Occupation(s) During the Past 5 Years | Other Directorships Held by Director | |||
Cecilia H. Herbert (68) | Director (since 2005); Independent Board Chair (since 2016). | Trustee and Member of the Finance, Technology and Quality Committee of Stanford Health Care (since 2016); Trustee and Member of the Investment Committee, WNET, a New York public media company (since 2011); Chair (1994-2005) and Member (since 1992) of the Investment Committee, Archdiocese of San Francisco; Director (1998-2013) and President (2007-2011) of the Board of Directors, Catholic Charities CYO; Trustee (2002-2011) and Chair of the Finance and Investment Committee (2006-2010) of the Thacher School. | Trustee of iShares Trust (since 2005); Trustee of iShares U.S. ETF Trust (since 2011); Independent Board Chair of iShares Trust and iShares U.S. ETF Trust (since 2016); Trustee of Forward Funds (14 portfolios) (since 2009); Trustee of Salient MF Trust (4 portfolios) (since 2015). | |||
Jane D. Carlin (61) | Director (since 2015); Risk Committee Chair (since 2016). | Consultant (since 2012); Managing Director and Global Head of Financial Holding Company Governance & Assurance and the Global Head of Operational Risk Management of Morgan Stanley (2006-2012). | Trustee of iShares Trust (since 2015); Trustee of iShares U.S. ETF Trust (since 2015); Director of PHH Corporation (mortgage solutions) (since 2012); Director of The Hanover Insurance Group, Inc. (since 2016). | |||
Richard L. Fagnani (62) | Director (since 2017); Equity Plus Committee Chair (since 2017). | Partner, KPMG LLP (2002-2016). | Trustee of iShares Trust (since 2017); Trustee of iShares U.S. ETF Trust (since 2017). | |||
Charles A. Hurty (73) | Director (since 2005); Audit Committee Chair (since 2006). | Retired; Partner, KPMG LLP (1968-2001). | Trustee of iShares Trust (since 2005); Trustee of iShares U.S. ETF Trust (since 2011); Director of SkyBridge Alternative Investments Multi-Adviser Hedge Fund Portfolios LLC (2 portfolios) (since 2002). | |||
John E. Kerrigan (62) | Director (since 2005); Securities Lending Committee Chair (since 2016). | Chief Investment Officer, Santa Clara University (since 2002). | Trustee of iShares Trust (since 2005); Trustee of iShares U.S. ETF Trust (since 2011). | |||
Drew E. Lawton (58) | Director (since 2017); 15(c) Committee Chair (since 2017). | Senior Managing Director of New York Life Insurance Company (2010-2015). | Trustee of iShares Trust (since 2017); Trustee of iShares U.S. ETF Trust (since 2017). | |||
John E. Martinez (56) | Director (since 2003); Fixed Income Plus Committee Chair (since 2016). | Director of Real Estate Equity Exchange, Inc. (since 2005). | Trustee of iShares Trust (since 2003); Trustee of iShares U.S. ETF Trust (since 2011). | |||
DIRECTORAND OFFICER INFORMATION | 75 |
Table of Contents
Director and Officer Information (Continued)
iSHARES®, INC.
Independent Directors (Continued)
| Name (Age) | Position(s) | Principal Occupation(s) During the Past 5 Years | Other Directorships Held by Director | |||
Madhav V. Rajan (53) | Director (since 2011); Nominating and Governance Committee Chair (since 2017). | Dean, and George Pratt Shultz Professor of Accounting, University of Chicago Booth School of Business (since 2017); Robert K. Jaedicke Professor of Accounting, Stanford University Graduate School of Business (2001-2017); Professor of Law (by courtesy), Stanford Law School (2005-2017); Senior Associate Dean for Academic Affairs and Head of MBA Program, Stanford University Graduate School of Business (2010-2016) . | Trustee of iShares Trust (since 2011); Trustee of iShares U.S. ETF Trust (since 2011); Director, Cavium, Inc. (since 2013). | |||
| 76 | 2017 iSHARES ANNUAL REPORTTO SHAREHOLDERS |
Table of Contents
Director and Officer Information (Continued)
iSHARES®, INC.
Officersc
| Name (Age) | Position(s) | Principal Occupation(s) During the Past 5 Years | ||
Martin Small (42) | President (since 2016). | Managing Director, BlackRock, Inc. (since 2010); Head of U.S. iShares (since 2015); Co-Head of the U.S. Financial Markets Advisory Group, BlackRock, Inc. (2008-2014). | ||
Jack Gee (57) | Treasurer and Chief Financial Officer (since 2008). | Managing Director, BlackRock, Inc. (since 2009); Senior Director of Fund Administration of Intermediary Investor Business, BGI (2009). | ||
Benjamin Archibald (42) | Secretary (since 2015). | Managing Director, BlackRock, Inc. (since 2014); Director, BlackRock, Inc. (2010-2013); Secretary of the BlackRock-advised Mutual Funds (since 2012). | ||
Alan Mason (56) | Executive Vice President (since 2016). | Managing Director, BlackRock, Inc. (since 2009). | ||
Steve Messinger (55) | Executive Vice President (since 2016). | Managing Director, BlackRock, Inc. (2007-2014 and since 2016); Managing Director, Beacon Consulting Group (2014-2016). | ||
Charles Park (49) | Chief Compliance Officer (since 2006). | Chief Compliance Officer of BlackRock Advisors, LLC and the BlackRock-advised Funds in the Equity-Bond Complex, the Equity-Liquidity Complex and the Closed-End Complex (since 2014); Chief Compliance Officer of BFA (since 2006). | ||
Scott Radell (48) | Executive Vice President (since 2012). | Managing Director, BlackRock, Inc. (since 2009); Head of Portfolio Solutions, BlackRock, Inc. (since 2009). | ||
| c | Manish Mehta served as President until October 15, 2016. |
DIRECTORAND OFFICER INFORMATION | 77 |
Table of Contents
Notes:
| 78 | 2017 iSHARES ANNUAL REPORTTO SHAREHOLDERS |
Table of Contents
For more information visit www.iShares.com or call 1-800-474-2737
This report is intended for the Funds’ shareholders. It may not be distributed to prospective investors unless it is preceded or accompanied by the current prospectus.
Investing involves risk, including possible loss of principal.
The iShares Funds are distributed by BlackRock Investments, LLC (together with its affiliates, “BlackRock”).
The iShares Funds are not sponsored, endorsed, issued, sold or promoted by MSCI Inc., nor does this company make any representation regarding the advisability of investing in the iShares Funds. BlackRock is not affiliated with the company listed above.
A description of the policies that the Funds use to determine how to vote proxies relating to portfolio securities and information about how the Funds voted proxies relating to portfolio securities during the most recent twelve-month period ending June 30 is available without charge, upon request, by calling toll-free 1-800-474-2737; on the Funds’ website at www.iShares.com; and on the U.S. Securities and Exchange Commission (SEC) website at www.sec.gov.
The Funds file their complete schedules of portfolio holdings with the SEC for the first and third quarters of each fiscal year on Form N-Q. The Funds’ Forms N-Q are available on the SEC’s website or may be reviewed and copied at the SEC’s Public Reference Room in Washington, D.C. Information on the operation of the Public Reference Room may be obtained by calling 1-800-SEC-0330. The Funds also disclose their complete schedules of portfolio holdings on a daily basis on the Funds’ website.
©2017 BlackRock, Inc. All rights reserved. iSHARES and BLACKROCK are registered trademarks of BlackRock, Inc. or its subsidiaries. All other marks are the property of their respective owners.
iS-AR-807-0817
| |
Table of Contents
AUGUST 31, 2017
2017 ANNUAL REPORT | |
iShares, Inc.
| Ø | iShares MSCI Hong Kong ETF | EWH | NYSE Arca |
| Ø | iShares MSCI Japan Small-Cap ETF | SCJ | NYSE Arca |
| Ø | iShares MSCI Malaysia ETF | EWM | NYSE Arca |
| Ø | iShares MSCI Pacific ex Japan ETF | EPP | NYSE Arca |
| Ø | iShares MSCI Singapore Capped ETF | EWS | NYSE Arca |
| Ø | iShares MSCI Taiwan Capped ETF | EWT | NYSE Arca |
| Ø | iShares MSCI Thailand Capped ETF | THD | NYSE Arca |
Table of Contents
| 5 | ||||
| 20 | ||||
| 20 | ||||
| 21 | ||||
| 21 | ||||
| 24 | ||||
| 37 | ||||
| 40 | ||||
| 44 | ||||
| 47 | ||||
| 51 | ||||
| 55 | ||||
| 65 | ||||
| 72 | ||||
| 87 | ||||
| 88 | ||||
| 89 | ||||
| 108 | ||||
| 116 |
Table of Contents
Management’s Discussion of Fund Performance
iSHARES®, INC.
GLOBAL EQUITY MARKET OVERVIEW
Global equity markets posted strong returns for the 12 months ended August 31, 2017 (the “reporting period”). The MSCI ACWI, a broad global equity index that includes both developed and emerging markets, returned 17.11% in U.S. dollar terms for the reporting period.
The primary factor behind the robust performance of global equity markets was improving global economic growth, driven largely by the continuation of accommodative monetary policies from many of the world’s central banks. Signs of stronger economic activity in Europe emerged as the European Central Bank (“ECB”) maintained policies such as quantitative easing and negative interest rates. Economic growth rates in China and Japan, the largest economies in Asia, also increased during the reporting period, reflecting efforts by the People’s Bank of China (“PBOC”) and the Bank of Japan (“BOJ”) to stimulate economic activity. Stronger economic growth led several central banks to consider reducing their economic stimulus measures. For example, late in the reporting period, the ECB discussed the possibility of tapering its quantitative easing program, while the PBOC increased short-term interest rates during the first half of 2017.
On a regional basis, European equity markets posted the best returns among developed markets, advancing by approximately 20% in U.S. dollar terms for the reporting period. European stocks benefited from improving economic conditions and stronger corporate earnings. In addition, election outcomes in France and the Netherlands eased investor concerns about nationalist presidential candidates and their opposition to the European Union (“E.U.”). Currency fluctuations also contributed meaningfully to European equity performance in U.S. dollar terms as the euro appreciated by approximately 6% against the U.S. dollar during the reporting period. The best-performing European stock markets included Austria, Italy, and Spain, while Ireland and Belgium posted the weakest returns.
Equity markets in the Asia-Pacific region gained about 16% in U.S. dollar terms for the reporting period, led by Singapore and Hong Kong. Japanese stocks also posted strong returns, benefiting from improving consumer spending and employment trends that contributed to the ongoing recovery in the Japanese economy. However, equity market returns in Japan were hindered by a decline in the Japanese yen, which depreciated by approximately 6% against the U.S. dollar.
The U.S. stock market returned approximately 15% for the reporting period. Despite mixed U.S. economic data, U.S. stocks advanced initially in anticipation of pro-business fiscal policies from the new presidential administration. Although the administration struggled to implement its fiscal agenda, stocks continued to move higher as better global economic conditions led to a notable improvement in corporate earnings growth, particularly for multinational companies with significant operations outside of the U.S. U.S. stocks advanced despite three short-term interest rate increases by the U.S. Federal Reserve Bank (the “Fed”) during the reporting period, which increased the short-term interest rate target to its highest level since October 2008. The Fed also unveiled a plan to start reducing the amount of U.S. Treasury bonds and mortgage-backed securities on its balance sheet before the end of 2017.
Emerging markets stocks outperformed those in developed markets, returning more than 23% in U.S. dollar terms for the reporting period. Emerging markets in Eastern Europe were the best performers, led by Poland, Greece, and Hungary. Equity markets in the Middle East trailed for the reporting period amid continued geopolitical conflict in the region.
| 5 |
Table of Contents
Management’s Discussion of Fund Performance
iSHARES® MSCI HONG KONG ETF
Performance as of August 31, 2017
| Average Annual Total Returns | Cumulative Total Returns | |||||||||||||||||||||||||||
| NAV | MARKET | INDEX | NAV | MARKET | INDEX | |||||||||||||||||||||||
1 Year | 20.38% | 20.67% | 20.98% | 20.38% | 20.67% | 20.98% | ||||||||||||||||||||||
5 Years | 11.01% | 10.96% | 11.66% | 68.56% | 68.18% | 73.57% | ||||||||||||||||||||||
10 Years | 6.32% | 6.25% | 6.91% | 84.54% | 83.32% | 95.08% | ||||||||||||||||||||||
GROWTH OF $10,000 INVESTMENT
(AT NET ASSET VALUE)
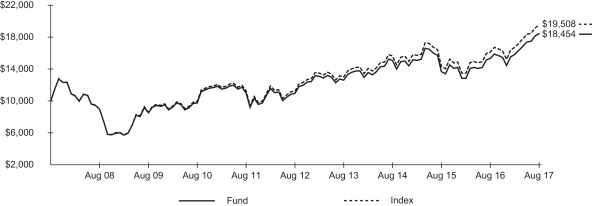
Past performance is no guarantee of future results. Performance results do not reflect the deduction of taxes that a shareholder would pay on fund distributions or on the redemption or sale of fund shares. See “About Fund Performance” on page 20 for more information.
| Shareholder Expenses | ||||||||||||||||||||||||||
| Actual | Hypothetical 5% Return | |||||||||||||||||||||||||
| Beginning Account Value (3/1/17) | Ending Account Value (8/31/17) | Expenses Paid During Period a | Beginning Account Value (3/1/17) | Ending Account Value (8/31/17) | Expenses Paid During Period a | Annualized Expense Ratio | ||||||||||||||||||||
| $ | 1,000.00 | $ | 1,164.10 | $ | 2.67 | $ | 1,000.00 | $ | 1,022.70 | $ | 2.50 | 0.49% | ||||||||||||||
| a | Expenses are calculated using the Fund’s annualized expense ratio (as disclosed in the table), multiplied by the average account value for the period, multiplied by the number of days in the period (184 days) and divided by the number of days in the year (365 days). See “Shareholder Expenses” on page 20 for more information. |
| 6 | 2017 iSHARES ANNUAL REPORTTO SHAREHOLDERS |
Table of Contents
Management’s Discussion of Fund Performance (Continued)
iSHARES® MSCI HONG KONG ETF
The iShares MSCI Hong Kong ETF (the “Fund”) seeks to track the investment results of an index composed of Hong Kong equities, as represented by the MSCI Hong Kong Index (the “Index”). The Fund invests in a representative sample of securities included in the Index that collectively has an investment profile similar to the Index. Due to the use of representative sampling, the Fund may or may not hold all of the securities that are included in the Index. For the 12-month reporting period ended August 31, 2017, the total return for the Fund was 20.38%, net of fees, while the total return for the Index was 20.98%.
Hong Kong’s economy expanded throughout the reporting period, driven by solid export levels, a robust real estate market, and declining unemployment. Reflecting the economic momentum, Hong Kong’s stock market posted its eighth consecutive month of gains in August 2017, its longest such advance in a decade.
The financials sector represented about 33% of the Index on average during the reporting period, and contributed the most to the Index’s return. The insurance industry led sector gains as mainland Chinese companies eager to participate in Hong Kong’s financial sector bought insurance companies as a means to acquire the licenses needed to operate a broad range of financial services. Demand for Hong Kong insurance products was strong among mainland Chinese individuals, largely due to more competitive rates and greater choices. Banks also contributed to the sector’s advance.
Another significant contributor to the Index’s performance was the real estate sector. Real estate prices rose during the reporting period, with average residential prices rising 20% in April 2017 compared with a year earlier and surpassing the peaks reached in the 1997 and 2015 property bubbles. Within the sector, real estate management and development companies led the advance.
The consumer discretionary sector was also a meaningful contributor to the Index’s return. The sector’s strength reflected increased consumer confidence and consumer spending levels for the reporting period as unemployment levels declined. The hotels, restaurants, and leisure industry drove gains for the sector.
The industrials and utilities sectors advanced. The industrial conglomerates industry supported strength in the industrials sector, while electric utilities stocks benefited the utilities sector.
ALLOCATION BY SECTOR
As of 8/31/17
| Sector | Percentage of Total Investments* |
Financials | 33.59 | % | ||
Real Estate | 27.07 | |||
Industrials | 14.17 | |||
Utilities | 10.76 | |||
Consumer Discretionary | 10.62 | |||
Consumer Staples | 1.68 | |||
Telecommunication Services | 1.45 | |||
Information Technology | 0.66 | |||
|
| |||
TOTAL | 100.00 | % | ||
|
|
TEN LARGEST FUND HOLDINGS
As of 8/31/17
| Security | Percentage of Total Investments* |
AIA Group Ltd. | 18.50 | % | ||
CK Hutchison Holdings Ltd. | 7.06 | |||
Hong Kong Exchanges & Clearing Ltd. | 6.34 | |||
Sun Hung Kai Properties Ltd. | 4.83 | |||
Cheung Kong Property Holdings Ltd. | 4.58 | |||
BOC Hong Kong Holdings Ltd. | 3.76 | |||
Link REIT | 3.65 | |||
Hang Seng Bank Ltd. | 3.51 | |||
CLP Holdings Ltd. | 3.47 | |||
Hong Kong & China Gas Co. Ltd. | 3.17 | |||
|
| |||
TOTAL | 58.87 | % | ||
|
|
| * | Excludes money market funds. |
MANAGEMENT’S DISCUSSIONSOF FUND PERFORMANCE | 7 |
Table of Contents
Management’s Discussion of Fund Performance
iSHARES® MSCI JAPAN SMALL-CAP ETF
Performance as of August 31, 2017
| Average Annual Total Returns | Cumulative Total Returns | |||||||||||||||||||||||||||
| NAV | MARKET | INDEX | NAV | MARKET | INDEX | |||||||||||||||||||||||
1 Year | 22.81% | 23.31% | 23.15% | 22.81% | 23.31% | 23.15% | ||||||||||||||||||||||
5 Years | 13.68% | 13.70% | 14.12% | 89.89% | 90.01% | 93.52% | ||||||||||||||||||||||
Since Inception | 6.40% | 6.44% | 6.75% | 82.55% | 83.26% | 88.43% | ||||||||||||||||||||||
GROWTH OF $10,000 INVESTMENT
(SINCE INCEPTION AT NET ASSET VALUE)
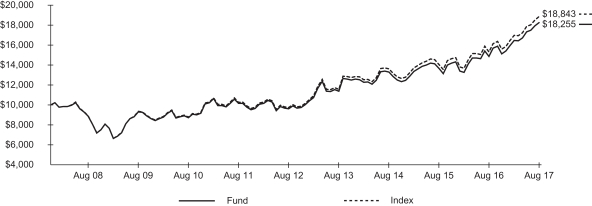
The inception date of the Fund was 12/20/07. The first day of secondary market trading was 12/21/07.
Past performance is no guarantee of future results. Performance results do not reflect the deduction of taxes that a shareholder would pay on fund distributions or on the redemption or sale of fund shares. See “About Fund Performance” on page 20 for more information.
| Shareholder Expenses | ||||||||||||||||||||||||||
| Actual | Hypothetical 5% Return | |||||||||||||||||||||||||
| Beginning Account Value (3/1/17) | Ending Account Value (8/31/17) | Expenses Paid During Period a | Beginning Account Value (3/1/17) | Ending Account Value (8/31/17) | Expenses Paid During Period a | Annualized Expense Ratio | ||||||||||||||||||||
| $ | 1,000.00 | $ | 1,109.70 | $ | 2.55 | $ | 1,000.00 | $ | 1,022.80 | $ | 2.45 | 0.48% | ||||||||||||||
| a | Expenses are calculated using the Fund’s annualized expense ratio (as disclosed in the table), multiplied by the average account value for the period, multiplied by the number of days in the period (184 days) and divided by the number of days in the year (365 days). See “Shareholder Expenses” on page 20 for more information. |
| 8 | 2017 iSHARES ANNUAL REPORTTO SHAREHOLDERS |
Table of Contents
Management’s Discussion of Fund Performance (Continued)
iSHARES® MSCI JAPAN SMALL-CAP ETF
The iShares MSCI Japan Small-Cap ETF (the “Fund”) seeks to track the investment results of an index composed of small-capitalization Japanese equities, as represented by the MSCI Japan Small Cap Index (the “Index”). The Fund invests in a representative sample of securities included in the Index that collectively has an investment profile similar to the Index. Due to the use of representative sampling, the Fund may or may not hold all of the securities that are included in the Index. For the 12-month reporting period ended August 31, 2017, the total return for the Fund was 22.81%, net of fees, while the total return for the Index was 23.15%.
The Japanese economy posted its longest span of sustained growth in a decade, boosted by consumer spending and exports. Private consumption, representing more than half of economic growth, increased during the reporting period. Although wages did not increase for much of the reporting period, rising stock prices added to the wealth effect, driving up spending. A weaker yen and a global recovery in the manufacturing sector supported export demand, particularly to other Asian countries.
The industrials sector, which represented about 24% of the Index on average during the reporting period, was the largest contributor to the Index’s return. Accelerating manufacturing activity supported the sector, driven by increased export demand. From an industry perspective, machinery led the sector’s advance, followed by construction and engineering.
Another significant contributor to the Index’s return for the reporting period was the consumer discretionary sector. Consumer spending, which has been a soft spot in the Japanese economy for several years, improved during the reporting period. Small-capitalization auto components companies contributed to the sector’s return amid strong global car sales. Increased exports of auto parts included Japanese automakers in the U.S.
Small-capitalization companies in the information technology sector generally benefited from increased demand as global economic growth strengthened during the reporting period. Increased shipments included flat panels, semiconductor manufacturing equipment, and electronics to Asian neighbors. The materials and consumer staples sectors also contributed meaningfully to the Index’s returns.
The Japanese yen, which depreciated approximately 6% relative to the U.S. dollar for the reporting period, detracted from the Index’s performance as returns on Japanese investments were lower when translated into U.S. dollars.
ALLOCATION BY SECTOR
As of 8/31/17
| Sector | Percentage of Total Investments* |
Industrials | 25.16 | % | ||
Consumer Discretionary | 17.05 | |||
Information Technology | 12.15 | |||
Consumer Staples | 10.77 | |||
Materials | 10.74 | |||
Real Estate | 9.14 | |||
Financials | 7.45 | |||
Health Care | 5.82 | |||
Utilities | 0.96 | |||
Energy | 0.74 | |||
Telecommunication Services | 0.02 | |||
|
| |||
TOTAL | 100.00 | % | ||
|
|
TEN LARGEST FUND HOLDINGS
As of 8/31/17
| Security | Percentage of Total Investments* |
Daifuku Co. Ltd. | 0.60 | % | ||
Pigeon Corp. | 0.59 | |||
Furukawa Electric Co. Ltd. | 0.52 | |||
Orix JREIT Inc. | 0.50 | |||
Nippon Shinyaku Co. Ltd. | 0.48 | |||
Showa Denko KK | 0.47 | |||
Haseko Corp. | 0.46 | |||
Advance Residence Investment Corp. | 0.46 | |||
Sojitz Corp. | 0.45 | |||
CyberAgent Inc. | 0.45 | |||
|
| |||
TOTAL | 4.98 | % | ||
|
|
| * | Excludes money market funds. |
MANAGEMENT’S DISCUSSIONSOF FUND PERFORMANCE | 9 |
Table of Contents
Management’s Discussion of Fund Performance
iSHARES® MSCI MALAYSIA ETF
Performance as of August 31, 2017
| Average Annual Total Returns | Cumulative Total Returns | |||||||||||||||||||||||||||
| NAV | MARKET | INDEX | NAV | MARKET | INDEX | |||||||||||||||||||||||
1 Year | 2.14% | 3.02% | 2.50% | 2.14% | 3.02% | 2.50% | ||||||||||||||||||||||
5 Years | (2.43)% | (2.57)% | (2.15)% | (11.57)% | (12.19)% | (10.29)% | ||||||||||||||||||||||
10 Years | 3.41% | 3.16% | 3.81% | 39.88% | 36.52% | 45.34% | ||||||||||||||||||||||
GROWTH OF $10,000 INVESTMENT
(AT NET ASSET VALUE)
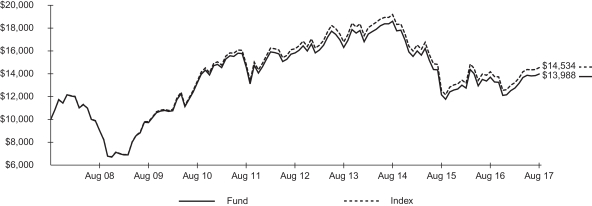
Past performance is no guarantee of future results. Performance results do not reflect the deduction of taxes that a shareholder would pay on fund distributions or on the redemption or sale of fund shares. See “About Fund Performance” on page 20 for more information.
| Shareholder Expenses | ||||||||||||||||||||||||||
| Actual | Hypothetical 5% Return | |||||||||||||||||||||||||
| Beginning Account Value (3/1/17) | Ending Account Value (8/31/17) | Expenses Paid During Period a | Beginning Account Value (3/1/17) | Ending Account Value (8/31/17) | Expenses Paid During Period a | Annualized Expense Ratio | ||||||||||||||||||||
| $ | 1,000.00 | $ | 1,096.20 | $ | 2.54 | $ | 1,000.00 | $ | 1,022.80 | $ | 2.45 | 0.48% | ||||||||||||||
| a | Expenses are calculated using the Fund’s annualized expense ratio (as disclosed in the table), multiplied by the average account value for the period, multiplied by the number of days in the period (184 days) and divided by the number of days in the year (365 days). See “Shareholder Expenses” on page 20 for more information. |
| 10 | 2017 iSHARES ANNUAL REPORTTO SHAREHOLDERS |
Table of Contents
Management’s Discussion of Fund Performance (Continued)
iSHARES® MSCI MALAYSIA ETF
The iShares MSCI Malaysia ETF (the “Fund”) seeks to track the investment results of an index composed of Malaysian equities, as represented by the MSCI Malaysia Index (the “Index”). The Fund invests in a representative sample of securities included in the Index that collectively has an investment profile similar to the Index. Due to the use of representative sampling, the Fund may or may not hold all of the securities that are included in the Index. For the 12-month reporting period ended August 31, 2017, the total return for the Fund was 2.14%, net of fees, while the total return for the Index was 2.50%.
Malaysia’s economy strengthened to its fastest pace in two years, boosted by an increase in exports and consumer spending. A recovery in global trade and a weak currency supported rising export levels. Improvement in export levels largely reflected robust Chinese demand, but also included increased shipments to Singapore and the European Union. Shipments of electronics and electrical goods, representing more than a third of Malaysian exports, rose 28% in July 2017 compared with a year earlier, while exports of palm oil and palm-based products increased 13%. Consumer spending reached an all-time high in the second quarter of 2017, further supporting economic growth.
The financials sector represented about 29% of the Index on average during the reporting period, and was the largest contributor to the Index’s return. Improving economic conditions, both domestically and globally, supported sector strength. From an industry perspective, banks led the advance in the sector. Higher banking income and net interest income, as well as loan growth, generally boosted earnings within the industry.
The consumer discretionary and industrials sectors also contributed meaningfully to the Index’s performance. The consumer discretionary sector’s strength reflected growth in consumer spending during the reporting period. In terms of industries, the key driver was the hotels, restaurants, and leisure industry. Gains among industrial conglomerates led the advance in the industrials sector.
On the downside, the utilities, telecommunication services, consumer staples, and healthcare sectors detracted from the Index’s performance for the reporting period. These sectors are considered defensive sectors and tend to lag economically sensitive sectors in periods of strong economic growth.
The Malaysian ringgit depreciated by about 5% relative to the U.S. dollar. Consequently, returns on Malaysian investments were lower when translated back into U.S. dollars.
ALLOCATION BY SECTOR
As of 8/31/17
| Sector | Percentage of Total Investments* |
Financials | 31.41 | % | ||
Industrials | 14.92 | |||
Utilities | 14.56 | |||
Consumer Discretionary | 9.62 | |||
Telecommunication Services | 9.61 | |||
Consumer Staples | 8.51 | |||
Energy | 3.66 | |||
Materials | 3.56 | |||
Health Care | 3.47 | |||
Real Estate | 0.68 | |||
|
| |||
TOTAL | 100.00 | % | ||
|
|
TEN LARGEST FUND HOLDINGS
As of 8/31/17
| Security | Percentage of Total Investments* |
Public Bank Bhd | 12.41 | % | ||
Tenaga Nasional Bhd | 10.03 | |||
Malayan Banking Bhd | 7.04 | |||
CIMB Group Holdings Bhd | 5.97 | |||
Genting Bhd | 4.56 | |||
Sime Darby Bhd | 4.43 | |||
Genting Malaysia Bhd | 3.61 | |||
Petronas Chemicals Group Bhd | 3.56 | |||
DiGi.Com Bhd | 3.12 | |||
Axiata Group Bhd | 2.75 | |||
|
| |||
TOTAL | 57.48 | % | ||
|
|
| * | Excludes money market funds. |
MANAGEMENT’S DISCUSSIONSOF FUND PERFORMANCE | 11 |
Table of Contents
Management’s Discussion of Fund Performance
iSHARES® MSCI PACIFIC ex JAPAN ETF
Performance as of August 31, 2017
| Average Annual Total Returns | Cumulative Total Returns | |||||||||||||||||||||||||||
| NAV | MARKET | INDEX | NAV | MARKET | INDEX | |||||||||||||||||||||||
1 Year | 18.06% | 19.16% | 18.51% | 18.06% | 19.16% | 18.51% | ||||||||||||||||||||||
5 Years | 5.80% | 5.82% | 6.26% | 32.59% | 32.71% | 35.46% | ||||||||||||||||||||||
10 Years | 3.88% | 3.83% | 4.18% | 46.40% | 45.63% | 50.53% | ||||||||||||||||||||||
GROWTH OF $10,000 INVESTMENT
(AT NET ASSET VALUE)
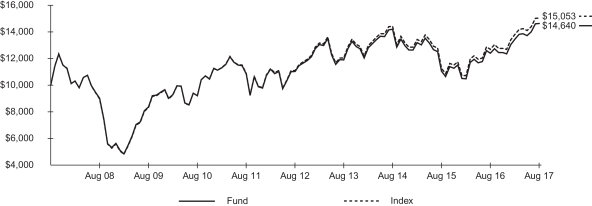
Past performance is no guarantee of future results. Performance results do not reflect the deduction of taxes that a shareholder would pay on fund distributions or on the redemption or sale of fund shares. See “About Fund Performance” on page 20 for more information.
| Shareholder Expenses | ||||||||||||||||||||||||||
| Actual | Hypothetical 5% Return | |||||||||||||||||||||||||
| Beginning Account Value (3/1/17) | Ending Account Value (8/31/17) | Expenses Paid During Period a | Beginning Account Value (3/1/17) | Ending Account Value (8/31/17) | Expenses Paid During Period a | Annualized Expense Ratio | ||||||||||||||||||||
| $ | 1,000.00 | $ | 1,087.60 | $ | 2.58 | $ | 1,000.00 | $ | 1,022.70 | $ | 2.50 | 0.49% | ||||||||||||||
| a | Expenses are calculated using the Fund’s annualized expense ratio (as disclosed in the table), multiplied by the average account value for the period, multiplied by the number of days in the period (184 days) and divided by the number of days in the year (365 days). See “Shareholder Expenses” on page 20 for more information. |
| 12 | 2017 iSHARES ANNUAL REPORTTO SHAREHOLDERS |
Table of Contents
Management’s Discussion of Fund Performance (Continued)
iSHARES® MSCI PACIFIC ex JAPAN ETF
The iShares MSCI Pacific ex Japan ETF (the “Fund”) seeks to track the investment results of an index composed of Pacific region developed market equities, excluding Japan, as represented by the MSCI Pacific ex Japan Index (the “Index”). The Fund invests in a representative sample of securities included in the Index that collectively has an investment profile similar to the Index. Due to the use of representative sampling, the Fund may or may not hold all of the securities that are included in the Index. For the 12-month reporting period ended August 31, 2017, the total return for the Fund was 18.06%, net of fees, while the total return for the Index was 18.51%.
Australia, the largest country weight at about 60% of the Index on average, was the principal contributor to the Index’s performance for the reporting period. As a resource-rich country, Australia is a major commodities exporter. Rising commodities prices amid strengthening global demand supported Australia’s mineral exports, pushing the country’s trade surplus to a record high for the reporting period. Improving economic growth in China helped Australia’s economy, as China purchased approximately 32% of Australia’s exports.
Hong Kong contributed significantly to the Index’s return as its stock market finished the reporting period with the longest span of consecutive monthly advances in a decade. Improving global economic growth, declining unemployment, and a robust property market helped Hong Kong’s economy to expand throughout the reporting period and grow at its fastest rate in six years.
In Singapore, rising manufacturing and exports supported market strength. Global economic growth benefited Singapore’s exports during the reporting period, with Chinese demand for electronics and other manufactured goods particularly strong.
From a sector perspective, the financials sector was the largest contributor to the Index’s performance for the reporting period. Improving global economic conditions supported the sector. Strength in the materials sector reflected gains in the metals and mining industry, which benefited from rising commodities prices amid a rebound in global demand.
Strong property markets in the Pacific region supported the real estate sector’s gains during the reporting period. Other contributing sectors included consumer discretionary and industrials, both economically sensitive sectors that benefited from improving global economic conditions.
During the reporting period, the overall effect of currencies on the Index’s performance was significantly positive. Relative to the U.S. dollar, the Australian dollar appreciated about 5%, the New Zealand dollar depreciated approximately 1%, the Singapore dollar was flat, and the Hong Kong dollar depreciated about 1%, near the lower end of its tightly pegged trading range against the U.S. dollar.
ALLOCATION BY SECTOR
As of 8/31/17
| Sector | Percentage of Total Investments* |
Financials | 39.17 | % | ||
Real Estate | 14.91 | |||
Materials | 10.36 | |||
Industrials | 9.35 | |||
Consumer Discretionary | 5.42 | |||
Consumer Staples | 5.37 | |||
Utilities | 4.94 | |||
Health Care | 4.28 | |||
Telecommunication Services | 2.90 | |||
Energy | 2.80 | |||
Information Technology | 0.50 | |||
|
| |||
TOTAL | 100.00 | % | ||
|
|
ALLOCATION BY COUNTRY
As of 8/31/17
| Country | Percentage of Total Investments* |
Australia | 58.50 | % | ||
Hong Kong | 29.32 | |||
Singapore | 10.79 | |||
New Zealand | 1.39 | |||
|
| |||
TOTAL | 100.00 | % | ||
|
|
| * | Excludes money market funds. |
MANAGEMENT’S DISCUSSIONSOF FUND PERFORMANCE | 13 |
Table of Contents
Management’s Discussion of Fund Performance
iSHARES® MSCI SINGAPORE CAPPED ETF
Performance as of August 31, 2017
| Average Annual Total Returns | Cumulative Total Returns | |||||||||||||||||||||||||||
| 1 Year | 5 Years | 10 Years | 1 Year | 5 Years | 10 Years | |||||||||||||||||||||||
Fund NAV | 21.51% | 2.54% | 3.27% | 21.51% | 13.38% | 37.92% | ||||||||||||||||||||||
Fund Market | 22.09% | 2.56% | 3.29% | 22.09% | 13.49% | 38.26% | ||||||||||||||||||||||
Indexa | 22.07% | 2.98% | 3.53% | 22.07% | 15.79% | 41.47% | ||||||||||||||||||||||
MSCI Singapore Index | 22.26% | 3.01% | 3.55% | 22.26% | 15.97% | 41.70% | ||||||||||||||||||||||
MSCI Singapore 25/50 Indexb | n/a | n/a | n/a | 15.59% | n/a | n/a | ||||||||||||||||||||||
GROWTH OF $10,000 INVESTMENT
(AT NET ASSET VALUE)
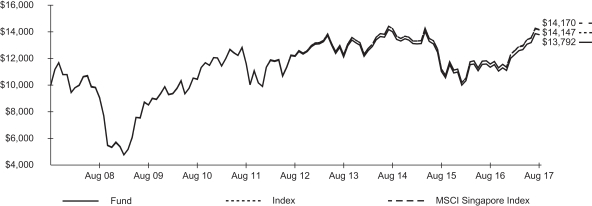
| a | Index performance through November 30, 2016 reflects the performance of the MSCI Singapore Index. Index performance beginning on December 1, 2016 reflects the performance of the MSCI Singapore 25/50 Index, which, effective as of December 1, 2016, replaced the MSCI Singapore Index as the underlying index of the Fund. |
b The inception date for the MSCI Singapore 25/50 Index was July 20, 2016.
Past performance is no guarantee of future results. Performance results do not reflect the deduction of taxes that a shareholder would pay on fund distributions or on the redemption or sale of fund shares. See “About Fund Performance” on page 20 for more information.
| Shareholder Expenses | ||||||||||||||||||||||||||
| Actual | Hypothetical 5% Return | |||||||||||||||||||||||||
| Beginning Account Value (3/1/17) | Ending Account Value (8/31/17) | Expenses Paid During Period a | Beginning Account Value (3/1/17) | Ending Account Value (8/31/17) | Expenses Paid During Period a | Annualized Expense Ratio | ||||||||||||||||||||
| $ | 1,000.00 | $ | 1,119.80 | $ | 2.62 | $ | 1,000.00 | $ | 1,022.70 | $ | 2.50 | 0.49% | ||||||||||||||
| a | Expenses are calculated using the Fund’s annualized expense ratio (as disclosed in the table), multiplied by the average account value for the period, multiplied by the number of days in the period (184 days) and divided by the number of days in the year (365 days). See “Shareholder Expenses” on page 20 for more information. |
| 14 | 2017 iSHARES ANNUAL REPORTTO SHAREHOLDERS |
Table of Contents
Management’s Discussion of Fund Performance (Continued)
iSHARES® MSCI SINGAPORE CAPPED ETF
The iShares MSCI Singapore Capped ETF (the “Fund”) (formerly the iShares MSCI Singapore ETF) seeks to track the investment results of an index composed of Singaporean equities, as represented by the MSCI Singapore 25/50 Index (the “Index”). The Fund invests in a representative sample of securities included in the Index that collectively has an investment profile similar to the Index. Due to the use of representative sampling, the Fund may or may not hold all of the securities that are included in the Index. For the 12-month reporting period ended August 31, 2017, the total return for the Fund was 21.51%, net of fees, while the total return for the Index was 22.07%.
Singapore’s economy expanded during the reporting period, driven largely by growth in manufacturing. The improving global economic environment supported manufacturing levels as global demand increased for semiconductors and other electronics equipment, key exports for Singapore. Chinese demand for electronics and other manufactured goods was particularly strong.
From a sector perspective, the financials sector represented about 38% of the Index on average during the reporting period, and was the largest contributor to the Index’s performance. In terms of industries, banks drove the advance amid strong loan growth and increasing income from wealth management.
The real estate sector was also a significant contributor to the Index’s return for the reporting period. Gains among real estate developers and real estate investment trusts reflected an apparent rebound in the country’s property market.
Another meaningful contributor to the Index’s performance for the reporting period was the industrials sector, reflecting increased manufacturing activity. Within the sector, the industrial conglomerates and machinery industries benefited from rising manufacturing levels. Increased defense spending in the region amid escalating geopolitical tensions and terrorism supported companies in the aerospace and defense industry.
The consumer discretionary sector contributed to the Index’s performance for the reporting period, although a weak labor market weighed down some areas of the sector. The hotels, restaurants, and leisure industry led gains within the sector. The consumer staples sector also advanced, reflecting strength in the food products industry. In contrast, the telecommunication services sector detracted from the Index’s return, in part due to increased competition within the sector.
ALLOCATION BY SECTOR
As of 8/31/17
| Sector | Percentage of Total Investments* |
Financials | 37.79 | % | ||
Real Estate | 21.18 | |||
Industrials | 18.29 | |||
Telecommunication Services | 11.01 | |||
Consumer Discretionary | 7.36 | |||
Consumer Staples | 4.37 | |||
|
| |||
TOTAL | 100.00 | % | ||
|
|
TEN LARGEST FUND HOLDINGS
As of 8/31/17
| Security | Percentage of Total Investments* |
DBS Group Holdings Ltd. | 12.64 | % | ||
Oversea-Chinese Banking Corp. Ltd. | 11.84 | |||
United Overseas Bank Ltd. | 10.53 | |||
Singapore Telecommunications Ltd. | 10.03 | |||
Global Logistic Properties Ltd. | 4.41 | |||
Keppel Corp. Ltd. | 4.02 | |||
CapitaLand Ltd. | 3.50 | |||
Genting Singapore PLC | 3.33 | |||
Ascendas REIT | 3.01 | |||
Wilmar International Ltd. | 2.88 | |||
|
| |||
TOTAL | 66.19 | % | ||
|
|
| * | Excludes money market funds. |
MANAGEMENT’S DISCUSSIONSOF FUND PERFORMANCE | 15 |
Table of Contents
Management’s Discussion of Fund Performance
iSHARES® MSCI TAIWAN CAPPED ETF
Performance as of August 31, 2017
| Average Annual Total Returns | Cumulative Total Returns | |||||||||||||||||||||||||||
| 1 Year | 5 Years | 10 Years | 1 Year | 5 Years | 10 Years | |||||||||||||||||||||||
Fund NAV | 26.17% | 10.69% | 4.63% | 26.17% | 66.13% | 57.27% | ||||||||||||||||||||||
Fund Market | 27.52% | 10.62% | 4.61% | 27.52% | 65.63% | 56.95% | ||||||||||||||||||||||
Indexa | 27.12% | 11.41% | 5.24% | 27.12% | 71.64% | 66.60% | ||||||||||||||||||||||
MSCI Taiwan Index | 27.64% | 11.50% | 5.28% | 27.64% | 72.33% | 67.27% | ||||||||||||||||||||||
MSCI Taiwan 25/50 Indexb | n/a | n/a | n/a | 27.46% | n/a | n/a | ||||||||||||||||||||||
GROWTH OF $10,000 INVESTMENT
(AT NET ASSET VALUE)
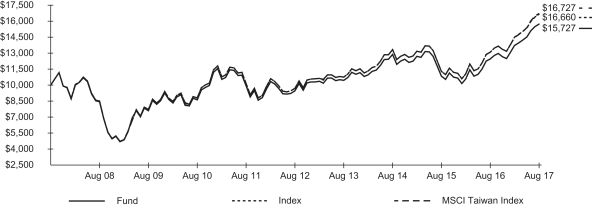
| a | Index performance through November 30, 2016 reflects the performance of the MSCI Taiwan Index. Index performance beginning on December 1, 2016 reflects the performance of the MSCI Taiwan 25/50 Index, which, effective as of December 1, 2016, replaced the MSCI Taiwan Index as the underlying index of the Fund. |
| b | The inception date for the MSCI Taiwan 25/50 Index was July 20, 2016. |
Past performance is no guarantee of future results. Performance results do not reflect the deduction of taxes that a shareholder would pay on fund distributions or on the redemption or sale of fund shares. See “About Fund Performance” on page 20 for more information.
| Shareholder Expenses | ||||||||||||||||||||||||||
| Actual | Hypothetical 5% Return | |||||||||||||||||||||||||
| Beginning Account Value (3/1/17) | Ending Account Value (8/31/17) | Expenses Paid During Period a | Beginning Account Value (3/1/17) | Ending Account Value (8/31/17) | Expenses Paid During Period a | Annualized Expense Ratio | ||||||||||||||||||||
| $ | 1,000.00 | $ | 1,145.40 | $ | 3.30 | $ | 1,000.00 | $ | 1,022.10 | $ | 3.11 | 0.61% | ||||||||||||||
| a | Expenses are calculated using the Fund’s annualized expense ratio (as disclosed in the table), multiplied by the average account value for the period, multiplied by the number of days in the period (184 days) and divided by the number of days in the year (365 days). See “Shareholder Expenses” on page 20 for more information. |
| 16 | 2017 iSHARES ANNUAL REPORTTO SHAREHOLDERS |
Table of Contents
Management’s Discussion of Fund Performance (Continued)
iSHARES® MSCI TAIWAN CAPPED ETF
The iShares MSCI Taiwan Capped ETF (the “Fund”) (formerly the iShares MSCI Taiwan ETF) seeks to track the investment results of an index composed of Taiwanese equities, as represented by the MSCI Taiwan 25/50 Index (the “Index”). The Fund invests in a representative sample of securities included in the Index that collectively has an investment profile similar to the Index. Due to the use of representative sampling, the Fund may or may not hold all of the securities that are included in the Index. For the 12-month reporting period ended August 31, 2017, the total return for the Fund was 26.17%, net of fees, while the total return for the Index was 27.12%.
Taiwan’s technology-heavy stock market rose to its highest level in 27 years as its economy expanded. Exports represent approximately 70% of Taiwan’s economy, and about one third of its exports are electronics. Growing global demand for smartphones and other electronic devices during the reporting period was a key driver of rising exports, which increased 12.7% in August 2017 compared with a year before. Taiwan’s main trading partners include China, Hong Kong, and the U.S., and improving economic conditions in those countries benefited Taiwan’s export trade.
The largest contribution to the Index’s performance for the reporting period came from the information technology sector, which represented about 58% of the Index on average. From an industry standpoint, the technology hardware and equipment industry and the semiconductors and semiconductor equipment industry were both drivers of the sector’s advance.
Another significant contributor to the Index’s performance for the reporting period was the financials sector. Banks led the gains in the sector amid expectations of improved asset quality and loan growth as economic conditions strengthened.
The materials sector also contributed to the Index’s gain for the reporting period. Within the sector, strength in the chemicals and the metals and mining industries reflected solid growth in chemicals and metals exports. The industrials and consumer staples sectors were also contributors to the Index’s performance.
The Taiwan new dollar appreciated by approximately 5% relative to the U.S. dollar during the reporting period. This had a positive impact on the Index’s performance, as returns on Taiwanese investments were higher when translated back into U.S. dollars.
ALLOCATION BY SECTOR
As of 8/31/17
| Sector | Percentage of Total Investments* |
Information Technology | 58.01 | % | ||
Financials | 16.94 | |||
Materials | 9.38 | |||
Telecommunication Services | 4.22 | |||
Consumer Discretionary | 4.10 | |||
Consumer Staples | �� | 3.04 | ||
Industrials | 2.54 | |||
Energy | 0.86 | |||
Real Estate | 0.52 | |||
Health Care | 0.39 | |||
|
| |||
TOTAL | 100.00 | % | ||
|
|
TEN LARGEST FUND HOLDINGS
As of 8/31/17
| Security | Percentage of Total Investments* |
Taiwan Semiconductor Manufacturing Co. Ltd. | 22.29 | % | ||
Hon Hai Precision Industry Co. Ltd. | 10.41 | |||
Largan Precision Co. Ltd. | 3.32 | |||
Chunghwa Telecom Co. Ltd. | 2.35 | |||
Cathay Financial Holding Co. Ltd. | 2.33 | |||
MediaTek Inc. | 2.30 | |||
Formosa Plastics Corp. | 2.27 | |||
Nan Ya Plastics Corp. | 2.11 | |||
CTBC Financial Holding Co. Ltd. | 1.98 | |||
Fubon Financial Holding Co. Ltd. | 1.87 | |||
|
| |||
TOTAL | 51.23 | % | ||
|
|
| * | Excludes money market funds. |
MANAGEMENT’S DISCUSSIONSOF FUND PERFORMANCE | 17 |
Table of Contents
Management’s Discussion of Fund Performance
iSHARES® MSCI THAILAND CAPPED ETF
Performance as of August 31, 2017
| Average Annual Total Returns | Cumulative Total Returns | |||||||||||||||||||||||||||
| NAV | MARKET | INDEX | NAV | MARKET | INDEX | |||||||||||||||||||||||
1 Year | 12.01% | 12.62% | 12.22% | 12.01% | 12.62% | 12.22% | ||||||||||||||||||||||
5 Years | 5.94% | 5.89% | 6.10% | 33.43% | 33.12% | 34.48% | ||||||||||||||||||||||
Since Inception | 8.38% | 8.38% | 8.71% | 113.65% | 113.73% | 119.76% | ||||||||||||||||||||||
GROWTH OF $10,000 INVESTMENT
(SINCE INCEPTION AT NET ASSET VALUE)
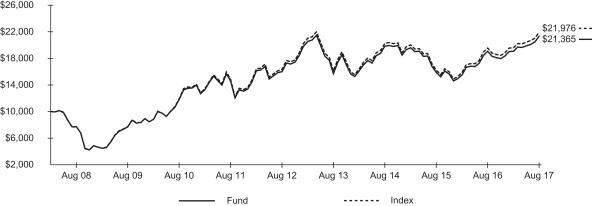
The inception date of the Fund was 3/26/08. The first day of secondary market trading was 3/28/08.
Index performance through February 11, 2013 reflects the performance of the MSCI Thailand Investable Market Index. Index performance beginning on February 12, 2013 reflects the performance of the MSCI Thailand IMI 25/50 Index.
Past performance is no guarantee of future results. Performance results do not reflect the deduction of taxes that a shareholder would pay on fund distributions or on the redemption or sale of fund shares. See “About Fund Performance” on page 20 for more information.
| Shareholder Expenses | ||||||||||||||||||||||||||
| Actual | Hypothetical 5% Return | |||||||||||||||||||||||||
| Beginning Account Value (3/1/17) | Ending Account Value (8/31/17) | Expenses Paid During Period a | Beginning Account Value (3/1/17) | Ending Account Value (8/31/17) | Expenses Paid During Period a | Annualized Expense Ratio | ||||||||||||||||||||
| $ | 1,000.00 | $ | 1,117.90 | $ | 3.26 | $ | 1,000.00 | $ | 1,022.10 | $ | 3.11 | 0.61% | ||||||||||||||
| a | Expenses are calculated using the Fund’s annualized expense ratio (as disclosed in the table), multiplied by the average account value for the period, multiplied by the number of days in the period (184 days) and divided by the number of days in the year (365 days). See “Shareholder Expenses” on page 20 for more information. |
| 18 | 2017 iSHARES ANNUAL REPORTTO SHAREHOLDERS |
Table of Contents
Management’s Discussion of Fund Performance (Continued)
iSHARES® MSCI THAILAND CAPPED ETF
The iShares MSCI Thailand Capped ETF (the “Fund”) seeks to track the investment results of a broad-based index composed of Thai equities, as represented by the MSCI Thailand IMI 25/50 Index (the “Index”). The Fund invests in a representative sample of securities included in the Index that collectively has an investment profile similar to the Index. Due to the use of representative sampling, the Fund may or may not hold all of the securities that are included in the Index. For the 12-month reporting period ended August 31, 2017, the total return for the Fund was 12.01%, net of fees, while the total return for the Index was 12.22%.
Thailand’s economy expanded during the reporting period, growing in the second quarter of 2017 at its fastest pace in four years. Thailand is heavily reliant on exports, which represent approximately 65% of the economy. Key exports include manufactured goods, particularly electronics, machinery, and equipment. A recovery in exports led the economy’s expansion, as improving economic conditions in the key export markets of the U.S., the European Union, and China drove demand, particularly for electronics.
Tempering the growth in exports, private investment and consumption remained tepid during the reporting period. Thailand’s economy has trailed those of many Asian neighbors since 2014, when the country’s military junta seized power in a coup. The junta has increased spending and investment in an effort to stimulate domestic economic activity, but has failed to implement proposed infrastructure projects.
From a sector perspective, the energy sector was the largest contributor to the Index’s return for the reporting period. The country’s energy sector has diversified amid increasing demand for energy sources. During the reporting period, energy companies performed well due to growing industrial capacity, urbanization, and population growth, which have contributed to higher domestic energy demand. Within the sector, the oil, gas, and consumable fuels industry drove performance.
The financials and industrials sectors contributed meaningfully to the Index’s performance for the reporting period. Banks led the advance in the financials sector, while transportation companies were the largest contributors in the industrials sector. The materials sector also gained, reflecting strength among chemicals companies.
The Thai baht appreciated about 4% relative to the U.S. dollar during the reporting period, which contributed to the Index’s performance as investments in Thailand were worth more when translated back into U.S. dollar terms.
ALLOCATION BY SECTOR
As of 8/31/17
| Sector | Percentage of Total Investments* |
Financials | 20.90 | % | ||
Energy | 17.68 | |||
Industrials | 11.64 | |||
Consumer Staples | 10.61 | |||
Materials | 9.86 | |||
Consumer Discretionary | 6.75 | |||
Telecommunication Services | 6.12 | |||
Real Estate | 5.64 | |||
Health Care | 4.78 | |||
Utilities | 3.43 | |||
Information Technology | 2.59 | |||
|
| |||
TOTAL | 100.00 | % | ||
|
|
TEN LARGEST FUND HOLDINGS
As of 8/31/17
| Security | Percentage of Total Investments* |
PTT PCL NVDR | 9.40 | % | ||
CP ALL PCL NVDR | 6.82 | |||
Siam Commercial Bank PCL (The) NVDR | 5.92 | |||
Kasikornbank PCL Foreign | 5.51 | |||
Airports of Thailand PCL NVDR | 5.20 | |||
Advanced Info Service PCL NVDR | 4.34 | |||
PTT Global Chemical PCL NVDR | 3.69 | |||
Siam Cement PCL (The) Foreign | 3.32 | |||
PTT Exploration & Production PCL NVDR | 2.71 | |||
Kasikornbank PCL NVDR | 2.58 | |||
|
| |||
TOTAL | 49.49 | % | ||
|
|
| * | Excludes money market funds. |
MANAGEMENT’S DISCUSSIONSOF FUND PERFORMANCE | 19 |
Table of Contents
Past performance is no guarantee of future results. Current performance may be lower or higher than the performance data quoted. Performance data current to the most recent month-end is available at www.ishares.com. Performance results assume reinvestment of all dividends and capital gain distributions and do not reflect the deduction of taxes that a shareholder would pay on fund distributions or on the redemption or sale of fund shares. The investment return and principal value of shares will vary with changes in market conditions. Shares may be worth more or less than their original cost when they are redeemed or sold in the market. Performance for certain funds may reflect a waiver of a portion of investment advisory fees. Without such a waiver, performance would have been lower.
Net asset value or “NAV” is the value of one share of a fund as calculated in accordance with the standard formula for valuing mutual fund shares. The price used to calculate market return (“Market Price”) is determined by using the midpoint between the highest bid and the lowest offer on the primary stock exchange on which shares of a fund are listed for trading, as of the time that such fund’s NAV is calculated. Certain funds may have a NAV which is determined prior to the opening of regular trading on its listed exchange and their market returns are calculated using the midpoint of the bid/ask spread as of the opening of regular trading on the exchange. Market and NAV returns assume that dividends and capital gain distributions have been reinvested at Market Price and NAV, respectively.
An index is a statistical composite that tracks a specified financial market or sector. Unlike a fund, an index does not actually hold a portfolio of securities and therefore does not incur the expenses incurred by a fund. These expenses negatively impact fund performance. Also, market returns do not include brokerage commissions that may be payable on secondary market transactions. If brokerage commissions were included, market returns would be lower.
As a shareholder of a Fund, you incur two types of costs: (1) transaction costs, including brokerage commissions on purchases and sales of fund shares and (2) ongoing costs, including management fees and other fund expenses. The expense example, which is based on an investment of $1,000 invested on March 1, 2017 and held through August 31, 2017, is intended to help you understand your ongoing costs (in dollars and cents) of investing in a Fund and to compare these costs with the ongoing costs of investing in other funds.
Actual Expenses — The table provides information about actual account values and actual expenses. Annualized expense ratios reflect contractual and voluntary fee waivers, if any. To estimate the expenses that you paid on your account over the period, simply divide your account value by $1,000 (for example, an $8,600 account value divided by $1,000 = 8.6), then multiply the result by the number corresponding to your Fund under the heading entitled “Expenses Paid During Period.”
Hypothetical Example for Comparison Purposes — The table also provides information about hypothetical account values and hypothetical expenses based on each Fund’s actual expense ratio and an assumed rate of return of 5% per year before expenses. You may use this information to compare the ongoing costs of investing in your Fund and other funds. To do so, compare this 5% hypothetical example with the 5% hypothetical examples that appear in the shareholder reports of the other funds.
Please note that the expenses shown in the table are meant to highlight your ongoing costs only and do not reflect any transactional costs, such as brokerage commissions paid on purchases and sales of fund shares. Therefore, the hypothetical examples are useful in comparing ongoing costs only and will not help you determine the relative total costs of owning different funds. In addition, if these transactional costs were included, your costs would have been higher.
| 20 | 2017 iSHARES ANNUAL REPORTTO SHAREHOLDERS |
Table of Contents
August 31, 2017
| Security | Shares | Value | ||||||
COMMON STOCKS — 99.51% |
| |||||||
BANKS — 8.36% | ||||||||
Bank of East Asia Ltd. (The)a | 4,519,610 | $ | 20,702,624 | |||||
BOC Hong Kong Holdings Ltd. | 13,647,000 | 69,486,542 | ||||||
Hang Seng Bank Ltd. | 2,820,300 | 64,863,891 | ||||||
|
| |||||||
| 155,053,057 | ||||||||
CAPITAL MARKETS — 6.31% |
| |||||||
Hong Kong Exchanges & Clearing Ltd. | 4,289,400 | 117,066,594 | ||||||
|
| |||||||
| 117,066,594 | ||||||||
DIVERSIFIED FINANCIAL SERVICES — 0.35% |
| |||||||
First Pacific Co. Ltd./Hong Kong | 7,954,999 | 6,393,313 | ||||||
|
| |||||||
| 6,393,313 | ||||||||
DIVERSIFIED TELECOMMUNICATION SERVICES — 1.44% |
| |||||||
HKT Trust & HKT Ltd. | 13,971,500 | 18,030,160 | ||||||
PCCW Ltd. | 15,628,169 | 8,706,223 | ||||||
|
| |||||||
| 26,736,383 | ||||||||
ELECTRIC UTILITIES — 7.55% |
| |||||||
CK Infrastructure Holdings Ltd. | 2,444,000 | 22,140,255 | ||||||
CLP Holdings Ltd. | 6,056,200 | 63,955,552 | ||||||
HK Electric Investments & HK Electric Investments Ltd.b | 9,755,000 | 8,949,256 | ||||||
Power Assets Holdings Ltd. | 5,116,000 | 45,103,974 | ||||||
|
| |||||||
| 140,149,037 | ||||||||
EQUITY REAL ESTATE INVESTMENT TRUSTS |
| |||||||
Link REIT | 8,161,500 | 67,365,523 | ||||||
|
| |||||||
| 67,365,523 | ||||||||
FOOD PRODUCTS — 1.67% |
| |||||||
WH Group Ltd.b | 29,717,500 | 31,059,951 | ||||||
|
| |||||||
| 31,059,951 | ||||||||
GAS UTILITIES — 3.15% |
| |||||||
Hong Kong & China Gas Co. Ltd.a | 30,950,802 | 58,528,691 | ||||||
|
| |||||||
| 58,528,691 | ||||||||
HOTELS, RESTAURANTS & LEISURE — 7.98% |
| |||||||
Galaxy Entertainment Group Ltd. | 8,677,000 | 54,436,009 | ||||||
Melco Resorts & Entertainment Ltd. ADR | 907,174 | 19,912,469 | ||||||
MGM China Holdings Ltd. | 3,503,488 | 7,019,107 | ||||||
Sands China Ltd.a | 8,931,200 | 39,997,516 | ||||||
Shangri-La Asia Ltd. | 4,618,000 | 7,729,660 | ||||||
SJM Holdings Ltd. | 7,304,000 | 6,374,068 | ||||||
Wynn Macau Ltd. | 5,748,000 | 12,617,552 | ||||||
|
| |||||||
| 148,086,381 | ||||||||
| Security | Shares | Value | ||||||
HOUSEHOLD DURABLES — 1.41% |
| |||||||
Techtronic Industries Co. Ltd. | 5,070,147 | $ | 26,236,794 | |||||
|
| |||||||
| 26,236,794 | ||||||||
INDUSTRIAL CONGLOMERATES — 12.39% |
| |||||||
CK Hutchison Holdings Ltd. | 9,958,767 | 130,298,889 | ||||||
Jardine Matheson Holdings Ltd. | 802,200 | 52,712,562 | ||||||
Jardine Strategic Holdings Ltd. | 817,000 | 35,825,450 | ||||||
NWS Holdings Ltd. | 5,729,000 | 11,009,354 | ||||||
|
| |||||||
| 229,846,255 | ||||||||
INSURANCE — 18.41% |
| |||||||
AIA Group Ltd. | 44,527,400 | 341,645,365 | ||||||
|
| |||||||
| 341,645,365 | ||||||||
MEDIA — 0.01% |
| |||||||
I-CABLE Communications Ltd.c | 3,523,935 | 130,575 | ||||||
|
| |||||||
| 130,575 | ||||||||
REAL ESTATE MANAGEMENT & DEVELOPMENT — 23.31% |
| |||||||
Cheung Kong Property Holdings Ltd. | 9,638,767 | 84,608,385 | ||||||
Hang Lung Group Ltd. | 3,255,000 | 12,268,972 | ||||||
Hang Lung Properties Ltd. | 7,468,000 | 18,167,971 | ||||||
Henderson Land Development Co. Ltd. | 4,426,862 | 27,432,975 | ||||||
Hongkong Land Holdings Ltd. | 4,338,400 | 32,147,544 | ||||||
Hysan Development Co. Ltd. | 2,307,000 | 10,670,662 | ||||||
Kerry Properties Ltd. | 2,391,000 | 9,470,577 | ||||||
New World Development Co. Ltd. | 21,755,066 | 29,742,630 | ||||||
Sino Land Co. Ltd. | 11,646,000 | 20,147,939 | ||||||
Sun Hung Kai Properties Ltd. | 5,340,000 | 89,108,600 | ||||||
Swire Pacific Ltd. Class A | 1,832,500 | 18,649,404 | ||||||
Swire Properties Ltd.a | 4,314,800 | 14,940,500 | ||||||
Wharf Holdings Ltd. (The) | 4,475,150 | 42,627,556 | ||||||
Wheelock & Co. Ltd. | 3,008,357 | 22,505,645 | ||||||
|
| |||||||
| 432,489,360 | ||||||||
ROAD & RAIL — 1.72% |
| |||||||
MTR Corp. Ltd. | 5,449,083 | 31,852,953 | ||||||
|
| |||||||
| 31,852,953 | ||||||||
SEMICONDUCTORS & SEMICONDUCTOR EQUIPMENT — 0.65% |
| |||||||
ASM Pacific Technology Ltd.a | 978,800 | 12,106,107 | ||||||
|
| |||||||
| 12,106,107 | ||||||||
TEXTILES, APPAREL & LUXURY GOODS — 1.17% |
| |||||||
Li & Fung Ltd. | 21,696,000 | 9,785,647 | ||||||
Yue Yuen Industrial Holdings Ltd. | 2,729,000 | 11,820,570 | ||||||
|
| |||||||
| 21,606,217 | ||||||||
|
| |||||||
TOTAL COMMON STOCKS |
| |||||||
(Cost: $1,735,128,032) | 1,846,352,556 | |||||||
SCHEDULESOF INVESTMENTS | 21 |
Table of Contents
Schedule of Investments (Continued)
iSHARES® MSCI HONG KONG ETF
August 31, 2017
| Security | Shares | Value | ||||||
SHORT-TERM INVESTMENTS — 1.81% |
| |||||||
MONEY MARKET FUNDS — 1.81% |
| |||||||
BlackRock Cash Funds: Institutional, |
| |||||||
1.32%d,e,f | 33,422,824 | $ | 33,432,851 | |||||
BlackRock Cash Funds: Treasury, |
| |||||||
0.96%d,e | 109,004 | 109,004 | ||||||
|
| |||||||
| 33,541,855 | ||||||||
|
| |||||||
TOTAL SHORT-TERM INVESTMENTS |
| 33,541,855 | ||||||
|
| |||||||
TOTAL INVESTMENTS |
| 1,879,894,411 | ||||||
Other Assets, Less Liabilities — (1.32)% |
| (24,447,181 | ) | |||||
|
| |||||||
NET ASSETS — 100.00% | $ | 1,855,447,230 | ||||||
|
| |||||||
ADR — American Depositary Receipts
| a | All or a portion of this security represents a security on loan. See Note 1. |
| b | This security may be resold to qualified institutional buyers under Rule 144A of the Securities Act of 1933. |
| c | Non-income earning security. |
| d | Affiliated issuer. See Schedule 1. |
| e | The rate quoted is the annualized seven-day yield of the fund at period end. |
| f | All or a portion of this security represents an investment of securities lending collateral. See Note 1. |
| g | The cost of investments (including short positions and derivatives, if any) for federal income tax purposes was $1,789,678,603. Net unrealized appreciation was $90,322,310, of which $215,773,465 represented gross unrealized appreciation on investments and $125,451,155 represented gross unrealized depreciation on investments. |
Schedule 1 — Affiliates (Note 2)
Investments in issuers considered to be affiliates of the Fund during the year ended August 31, 2017, for purposes of Section 2(a)(3) of the 1940 Act, and/or related parties of the Fund were as follows:
| Affiliated issuer | Shares held at 08/31/16 | Shares purchased | Shares sold | Shares held at 08/31/17 | Value at 08/31/17 | Net realized gain (loss) a | Change in unrealized appreciation (depreciation) | Income | ||||||||||||||||||||||||
BlackRock Cash | ||||||||||||||||||||||||||||||||
Funds: Institutional, | ||||||||||||||||||||||||||||||||
SL Agency Shares | 34,450,945 | — | (1,028,121 | )b | 33,422,824 | $ | 33,432,851 | $ | 25,964 | $ | 5,744 | $ | — | c | ||||||||||||||||||
BlackRock Cash | ||||||||||||||||||||||||||||||||
Funds: Treasury, | ||||||||||||||||||||||||||||||||
SL Agency Shares | 69,762 | 39,242 | b | — | 109,004 | 109,004 | 8 | — | 9,080 | |||||||||||||||||||||||
|
|
|
|
|
|
|
| |||||||||||||||||||||||||
| $ | 33,541,855 | $ | 25,972 | $ | 5,744 | $ | 9,080 | |||||||||||||||||||||||||
|
|
|
|
|
|
|
| |||||||||||||||||||||||||
| a | Includes realized capital gain distributions from an affiliated fund, if any. |
| b | Net of shares purchased and sold. |
| c | Does not include income earned on the investment of securities lending cash collateral which is not direct income of the Fund and is reflected as a component of securities lending income in the statement of operations. |
| 22 | 2017 iSHARES ANNUAL REPORTTO SHAREHOLDERS |
Table of Contents
Schedule of Investments (Continued)
iSHARES® MSCI HONG KONG ETF
August 31, 2017
Schedule 2 — Futures Contracts (Note 5)
Futures contracts outstanding as of August 31, 2017 were as follows:
| Description | Number of Contracts | Expiration Date | Notional Amount (000) | Value/ Unrealized Appreciation (Depreciation) | ||||||||||||
Long Contracts: | ||||||||||||||||
Hang Seng Index | 2,500 | Sep 2017 | $ | 8,924 | $ | 106,502 | ||||||||||
|
| |||||||||||||||
Schedule 3 — Fair Value Measurements
Various inputs are used in determining the fair value of financial instruments. For description of the input levels and information about the Fund’s policy regarding valuation of financial instruments, see Note 1.
The following table summarizes the value of the Fund’s investments according to the fair value hierarchy as of August 31, 2017. The breakdown of the Fund’s investments into major categories is disclosed in the schedule of investments above.
| Level 1 | Level 2 | Level 3 | Total | |||||||||||||
Investments: | ||||||||||||||||
Assets: | ||||||||||||||||
Common stocks | $ | 1,846,352,556 | $ | — | $ | — | $ | 1,846,352,556 | ||||||||
Money market funds | 33,541,855 | — | — | 33,541,855 | ||||||||||||
|
|
|
|
|
|
|
| |||||||||
Total | $ | 1,879,894,411 | $ | — | $ | — | $ | 1,879,894,411 | ||||||||
|
|
|
|
|
|
|
| |||||||||
Derivative financial instrumentsa: | ||||||||||||||||
Assets: | ||||||||||||||||
Futures contracts | $ | 106,502 | $ | — | $ | — | $ | 106,502 | ||||||||
|
|
|
|
|
|
|
| |||||||||
Total | $ | 106,502 | $ | — | $ | — | $ | 106,502 | ||||||||
|
|
|
|
|
|
|
| |||||||||
| a | Shown at the unrealized appreciation (depreciation) on the contracts. |
See notes to financial statements.
SCHEDULESOF INVESTMENTS | 23 |
Table of Contents
Schedule of Investments
iSHARES® MSCI JAPAN SMALL-CAP ETF
August 31, 2017
| Security | Shares | Value | ||||||
COMMON STOCKS — 99.77% | ||||||||
AEROSPACE & DEFENSE — 0.03% |
| |||||||
Jamco Corp.a | 2,600 | $ | 57,027 | |||||
|
| |||||||
| 57,027 | ||||||||
AIR FREIGHT & LOGISTICS — 0.21% |
| |||||||
Kintetsu World Express Inc. | 10,400 | 168,388 | ||||||
Konoike Transport Co. Ltd. | 7,800 | 110,558 | ||||||
Mitsui-Soko Holdings Co. Ltd. | 26,000 | 74,887 | ||||||
Yusen Logistics Co. Ltd. | 5,200 | 49,184 | ||||||
|
| |||||||
| 403,017 | ||||||||
AUTO COMPONENTS — 3.61% |
| |||||||
Aisan Industry Co. Ltd. | 10,400 | 92,982 | ||||||
Akebono Brake Industry Co. Ltd.b | 26,000 | 82,682 | ||||||
Daido Metal Co. Ltd. | 7,800 | 67,823 | ||||||
Daikyonishikawa Corp. | 10,400 | 162,057 | ||||||
Eagle Industry Co. Ltd. | 5,200 | 92,415 | ||||||
Exedy Corp. | 7,800 | 233,518 | ||||||
FCC Co. Ltd. | 7,800 | 168,672 | ||||||
Futaba Industrial Co. Ltd. | 15,600 | 154,923 | ||||||
G-Tekt Corp. | 5,200 | 100,116 | ||||||
Kasai Kogyo Co. Ltd. | 7,800 | 111,550 | ||||||
Keihin Corp. | 10,400 | 171,128 | ||||||
KYB Corp. | 52,000 | 288,206 | ||||||
Mitsuba Corp. | 7,800 | 113,109 | ||||||
Musashi Seimitsu Industry Co. Ltd. | 5,200 | 150,718 | ||||||
NHK Spring Co. Ltd. | 52,000 | 519,244 | ||||||
Nifco Inc./Japan | 10,400 | 596,256 | ||||||
Nippon Seiki Co. Ltd. | 8,000 | 162,457 | ||||||
Nissin Kogyo Co. Ltd. | 10,400 | 179,822 | ||||||
Pacific Industrial Co. Ltd. | 10,400 | 131,252 | ||||||
Piolax Inc. | 7,800 | 207,934 | ||||||
Press Kogyo Co. Ltd. | 23,400 | 122,677 | ||||||
Riken Corp. | 2,600 | 123,078 | ||||||
Sanden Holdings Corp.b | 26,000 | 81,501 | ||||||
Showa Corp.b | 13,000 | 147,765 | ||||||
Sumitomo Riko Co. Ltd. | 10,400 | 99,691 | ||||||
Tachi-S Co. Ltd. | 7,800 | 133,307 | ||||||
Taiho Kogyo Co. Ltd. | 5,200 | 74,272 | ||||||
Tokai Rika Co. Ltd. | 13,000 | 245,094 | ||||||
Topre Corp. | 7,800 | 225,368 | ||||||
Toyo Tire & Rubber Co. Ltd. | 26,000 | 500,818 | ||||||
Toyota Boshoku Corp. | 18,200 | 359,667 | ||||||
TPR Co. Ltd. | 5,200 | 157,569 | ||||||
TS Tech Co. Ltd. | 13,000 | 406,324 | ||||||
Unipres Corp. | 10,400 | 266,095 | ||||||
Yorozu Corp. | 5,200 | 102,668 | ||||||
|
| |||||||
| 6,832,758 | ||||||||
| Security | Shares | Value | ||||||
AUTOMOBILES — 0.12% |
| |||||||
Nissan Shatai Co. Ltd. | 20,800 | $ | 234,912 | |||||
|
| |||||||
| 234,912 | ||||||||
BANKS — 4.88% |
| |||||||
77 Bank Ltd. (The) | 78,000 | 363,565 | ||||||
Aichi Bank Ltd. (The) | 2,600 | 146,465 | ||||||
Akita Bank Ltd. (The) | 52,000 | 157,805 | ||||||
Aomori Bank Ltd. (The) | 52,000 | 191,823 | ||||||
Awa Bank Ltd. (The) | 52,000 | 320,334 | ||||||
Bank of Iwate Ltd. (The) | 5,200 | 203,398 | ||||||
Bank of Nagoya Ltd. (The)a | 2,600 | 99,809 | ||||||
Bank of Okinawa Ltd. (The) | 5,200 | 210,249 | ||||||
Bank of Saga Ltd. (The) | 26,000 | 62,602 | ||||||
Bank of the Ryukyus Ltd. | 10,400 | 154,686 | ||||||
Chiba Kogyo Bank Ltd. (The) | 13,000 | 64,965 | ||||||
Chukyo Bank Ltd. (The) | 2,600 | 55,114 | ||||||
Daishi Bank Ltd. (The) | 78,000 | 352,935 | ||||||
Ehime Bank Ltd. (The) | 7,800 | 99,219 | ||||||
Eighteenth Bank Ltd. (The) | 52,000 | 124,259 | ||||||
Gunma Bank Ltd. (The) | 91,000 | 532,473 | ||||||
Hokkoku Bank Ltd. (The) | 52,000 | 225,368 | ||||||
Hokuetsu Bank Ltd. (The) | 5,200 | 121,094 | ||||||
Hokuhoku Financial Group Inc. | 31,200 | 478,801 | ||||||
Hyakugo Bank Ltd. (The) | 52,000 | 216,391 | ||||||
Hyakujushi Bank Ltd. (The) | 52,000 | 180,956 | ||||||
Iyo Bank Ltd. (The) | 62,400 | 472,281 | ||||||
Jimoto Holdings Inc. | 41,600 | 74,083 | ||||||
Juroku Bank Ltd. (The) | 78,000 | 239,542 | ||||||
Kansai Urban Banking Corp. | 7,800 | 94,045 | ||||||
Keiyo Bank Ltd. (The) | 52,000 | 228,203 | ||||||
Kiyo Bank Ltd. (The) | 15,600 | 252,866 | ||||||
Mie Bank Ltd. (The) | 2,600 | 59,744 | ||||||
Minato Bank Ltd. (The) | 5,200 | 96,762 | ||||||
Miyazaki Bank Ltd. (The) | 26,000 | 88,116 | ||||||
Musashino Bank Ltd. (The) | 7,800 | 221,824 | ||||||
Nanto Bank Ltd. (The) | 7,800 | 217,218 | ||||||
Nishi-Nippon Financial Holdings Inc. | 36,400 | 390,591 | ||||||
North Pacific Bank Ltd. | 78,000 | 234,581 | ||||||
Ogaki Kyoritsu Bank Ltd. (The) | 78,000 | 210,485 | ||||||
Oita Bank Ltd. (The) | 26,000 | 98,982 | ||||||
San-in Godo Bank Ltd. (The) | 36,400 | 302,286 | ||||||
Senshu Ikeda Holdings Inc. | 62,400 | 232,455 | ||||||
Shiga Bank Ltd. (The) | 52,000 | 273,560 | ||||||
Shikoku Bank Ltd. (The) | 52,000 | 152,608 | ||||||
Tochigi Bank Ltd. (The) | 26,000 | 102,053 | ||||||
| 24 | 2017 iSHARES ANNUAL REPORTTO SHAREHOLDERS |
Table of Contents
Schedule of Investments (Continued)
iSHARES® MSCI JAPAN SMALL-CAP ETF
August 31, 2017
| Security | Shares | Value | ||||||
Toho Bank Ltd. (The) | 52,000 | $ | 182,373 | |||||
Tokyo TY Financial Group Inc. | 5,230 | 121,840 | ||||||
TOMONY Holdings Inc. | 36,400 | 163,380 | ||||||
Towa Bank Ltd. (The) | 78,000 | 77,249 | ||||||
Tsukuba Bank Ltd. | 20,800 | 68,792 | ||||||
Yamagata Bank Ltd. (The) | 26,000 | 123,078 | ||||||
Yamanashi Chuo Bank Ltd. (The) | 26,000 | 101,817 | ||||||
|
| |||||||
| 9,243,125 | ||||||||
BEVERAGES — 0.71% |
| |||||||
Ito EN Ltd. | 13,000 | 478,376 | ||||||
Sapporo Holdings Ltd. | 15,600 | 452,862 | ||||||
Takara Holdings Inc. | 41,600 | 402,922 | ||||||
|
| |||||||
| 1,334,160 | ||||||||
BIOTECHNOLOGY — 0.70% |
| |||||||
GNI Group Ltd.a,b | 26,000 | 113,629 | ||||||
HEALIOS KKb | 2,600 | 35,081 | ||||||
Japan Tissue Engineering Co. Ltd.b | 5,200 | 56,554 | ||||||
NanoCarrier Co. Ltd.a,b | 10,400 | 65,012 | ||||||
OncoTherapy Science Inc.a,b | 36,400 | 84,336 | ||||||
PeptiDream Inc.a,b | 20,800 | 724,768 | ||||||
SanBio Co. Ltd.b | 5,200 | 69,595 | ||||||
Takara Bio Inc. | 13,000 | 176,231 | ||||||
|
| |||||||
| 1,325,206 | ||||||||
BUILDING PRODUCTS — 1.80% |
| |||||||
Aica Kogyo Co. Ltd. | 13,000 | 428,176 | ||||||
Bunka Shutter Co. Ltd. | 13,000 | 98,628 | ||||||
Central Glass Co. Ltd. | 52,000 | 218,281 | ||||||
Maeda Kosen Co. Ltd. | 5,200 | 78,525 | ||||||
Nichias Corp. | 26,000 | 304,270 | ||||||
Nichiha Corp. | 7,800 | 283,836 | ||||||
Nippon Sheet Glass Co. Ltd.b | 23,400 | 177,105 | ||||||
Nitto Boseki Co. Ltd. | 52,000 | 275,450 | ||||||
Noritz Corp. | 7,800 | 136,426 | ||||||
Okabe Co. Ltd. | 10,400 | 94,966 | ||||||
Sankyo Tateyama Inc. | 7,800 | 111,904 | ||||||
Sanwa Holdings Corp. | 52,000 | 579,248 | ||||||
Sekisui Jushi Corp. | 7,800 | 142,804 | ||||||
Sinko Industries Ltd. | 5,200 | 81,737 | ||||||
Takara Standard Co. Ltd. | 10,400 | 180,105 | ||||||
Takasago Thermal Engineering Co. Ltd. | 13,000 | 214,383 | ||||||
|
| |||||||
| 3,405,844 | ||||||||
CAPITAL MARKETS — 0.86% |
| |||||||
Ichiyoshi Securities Co. Ltd. | 10,400 | 97,707 | ||||||
| Security | Shares | Value | ||||||
Jafco Co. Ltd. | 7,800 | $ | 357,187 | |||||
kabu.com Securities Co. Ltd. | 36,400 | 112,448 | ||||||
Kyokuto Securities Co. Ltd. | 5,200 | 74,697 | ||||||
Marusan Securities Co. Ltd. | 13,000 | 109,849 | ||||||
Matsui Securities Co. Ltd. | 28,600 | 218,800 | ||||||
Monex Group Inc. | 52,000 | 137,016 | ||||||
Okasan Securities Group Inc. | 26,000 | 149,773 | ||||||
SPARX Group Co. Ltd. | 28,600 | 51,972 | ||||||
Tokai Tokyo Financial Holdings Inc. | 54,600 | 314,027 | ||||||
|
| |||||||
| 1,623,476 | ||||||||
CHEMICALS — 6.64% |
| |||||||
Achilles Corp. | 5,200 | 103,424 | ||||||
ADEKA Corp. | 23,400 | 397,796 | ||||||
Chugoku Marine Paints Ltd. | 18,200 | 151,143 | ||||||
Dainichiseika Color & Chemicals Manufacturing Co. Ltd. | 26,000 | 254,897 | ||||||
Denka Co. Ltd. | 104,000 | 660,512 | ||||||
DIC Corp. | 20,800 | 734,218 | ||||||
Fujimi Inc. | 5,200 | 112,306 | ||||||
Fujimori Kogyo Co. Ltd. | 5,200 | 184,027 | ||||||
Fuso Chemical Co. Ltd. | 5,200 | 161,821 | ||||||
Ishihara Sangyo Kaisha Ltd.b | 10,400 | 140,229 | ||||||
JSP Corp. | 2,600 | 78,194 | ||||||
Kanto Denka Kogyo Co. Ltd.a | 10,400 | 100,919 | ||||||
KH Neochem Co. Ltd. | 5,200 | 133,898 | ||||||
Koatsu Gas Kogyo Co. Ltd. | 7,800 | 58,610 | ||||||
Konishi Co. Ltd. | 7,800 | 135,717 | ||||||
Kumiai Chemical Industry Co. Ltd.a | 22,049 | 131,621 | ||||||
Kureha Corp. | 2,600 | 133,473 | ||||||
Lintec Corp. | 13,000 | 347,501 | ||||||
Nihon Nohyaku Co. Ltd. | 13,000 | 74,296 | ||||||
Nihon Parkerizing Co. Ltd. | 23,400 | 341,241 | ||||||
Nippon Kayaku Co. Ltd. | 32,000 | 512,884 | ||||||
Nippon Shokubai Co. Ltd. | 5,800 | 413,156 | ||||||
Nippon Soda Co. Ltd. | 26,000 | 149,064 | ||||||
NOF Corp. | 33,000 | 467,145 | ||||||
Okamoto Industries Inc. | 26,000 | 269,780 | ||||||
Osaka Soda Co. Ltd. | 26,000 | 125,204 | ||||||
Sakai Chemical Industry Co. Ltd. | 26,000 | 125,204 | ||||||
Sakata INX Corp. | 10,400 | 184,358 | ||||||
Sanyo Chemical Industries Ltd. | 2,600 | 136,307 | ||||||
Sekisui Plastics Co. Ltd. | 5,200 | 54,051 | ||||||
Shikoku Chemicals Corp. | 6,000 | 80,792 | ||||||
Shin-Etsu Polymer Co. Ltd. | 10,400 | 97,329 | ||||||
Showa Denko KK | 33,800 | 897,054 | ||||||
SCHEDULESOF INVESTMENTS | 25 |
Table of Contents
Schedule of Investments (Continued)
iSHARES® MSCI JAPAN SMALL-CAP ETF
August 31, 2017
| Security | Shares | Value | ||||||
Stella Chemifa Corp. | 2,600 | $ | 112,684 | |||||
Sumitomo Bakelite Co. Ltd. | 52,000 | 382,228 | ||||||
Sumitomo Seika Chemicals Co. Ltd. | 2,600 | 123,315 | ||||||
Taiyo Holdings Co. Ltd. | 5,200 | 259,858 | ||||||
Takasago International Corp. | 2,600 | 92,368 | ||||||
Tenma Corp. | 5,200 | 100,825 | ||||||
Toagosei Co. Ltd. | 28,600 | 359,384 | ||||||
Tokai Carbon Co. Ltd. | 52,000 | 375,141 | ||||||
Tokuyama Corp.b | 78,000 | 344,430 | ||||||
Tokyo Ohka Kogyo Co. Ltd. | 10,400 | 363,802 | ||||||
Toyo Ink SC Holdings Co. Ltd. | 52,000 | 295,766 | ||||||
Toyobo Co. Ltd. | 208,000 | 376,086 | ||||||
Ube Industries Ltd. | 286,000 | 815,955 | ||||||
W-Scope Corp.a | 7,800 | 165,553 | ||||||
Zeon Corp. | 35,000 | 440,760 | ||||||
|
| |||||||
| 12,556,326 | ||||||||
COMMERCIAL SERVICES & SUPPLIES — 1.60% |
| |||||||
Aeon Delight Co. Ltd. | 5,200 | 184,736 | ||||||
Bell System24 Holdings Inc. | 7,800 | 81,855 | ||||||
Daiseki Co. Ltd. | 10,460 | 249,478 | ||||||
Duskin Co. Ltd. | 10,400 | 300,018 | ||||||
Itoki Corp. | 10,400 | 80,887 | ||||||
Kokuyo Co. Ltd. | 20,800 | 330,351 | ||||||
Kyodo Printing Co. Ltd. | 26,000 | 87,407 | ||||||
Matsuda Sangyo Co. Ltd. | 5,260 | 78,092 | ||||||
Mitsubishi Pencil Co. Ltd. | 10,400 | 272,804 | ||||||
Nippon Kanzai Co. Ltd. | 5,200 | 92,320 | ||||||
Nippon Parking Development Co. Ltd. | 49,400 | 74,508 | ||||||
Okamura Corp. | 18,200 | 184,712 | ||||||
Oyo Corp. | 5,200 | 75,784 | ||||||
Pilot Corp.a | 10,400 | 455,461 | ||||||
Prestige International Inc. | 10,400 | 111,503 | ||||||
Relia Inc. | 10,400 | 115,944 | ||||||
Sato Holdings Corp. | 5,200 | 124,070 | ||||||
Toppan Forms Co. Ltd. | 13,000 | 136,898 | ||||||
|
| |||||||
| 3,036,828 | ||||||||
COMMUNICATIONS EQUIPMENT — 0.28% |
| |||||||
Denki Kogyo Co. Ltd. | 26,000 | 134,890 | ||||||
Hitachi Kokusai Electric Inc. | 13,000 | 330,138 | ||||||
Icom Inc. | 2,600 | 59,862 | ||||||
|
| |||||||
| 524,890 | ||||||||
CONSTRUCTION & ENGINEERING — 5.00% |
| |||||||
Chiyoda Corp.a | 37,000 | 192,295 | ||||||
Chudenko Corp. | 7,800 | 212,611 | ||||||
| Security | Shares | Value | ||||||
COMSYS Holdings Corp. | 26,000 | $ | 558,459 | |||||
Daiho Corp. | 26,000 | 118,354 | ||||||
Fudo Tetra Corp. | 46,800 | 78,241 | ||||||
Fukuda Corp. | 2,600 | 142,450 | ||||||
Hazama Ando Corp. | 44,200 | 311,239 | ||||||
Hibiya Engineering Ltd. | 5,200 | 106,589 | ||||||
Kandenko Co. Ltd. | 26,000 | 278,285 | ||||||
Kinden Corp. | 33,800 | 551,561 | ||||||
Kumagai Gumi Co. Ltd. | 104,000 | 325,059 | ||||||
Kyowa Exeo Corp. | 23,400 | 440,105 | ||||||
Kyudenko Corp. | 10,400 | 421,915 | ||||||
Maeda Corp. | 26,000 | 317,263 | ||||||
Maeda Road Construction Co. Ltd. | 26,000 | 522,079 | ||||||
Mirait Holdings Corp. | 15,600 | 185,539 | ||||||
Nippo Corp. | 10,000 | 198,074 | ||||||
Nippon Densetsu Kogyo Co. Ltd. | 7,800 | 159,175 | ||||||
Nippon Koei Co. Ltd. | 2,600 | 81,147 | ||||||
Nippon Road Co. Ltd. (The) | 26,000 | 144,576 | ||||||
Nishimatsu Construction Co. Ltd. | 78,000 | 429,475 | ||||||
Okumura Corp. | 52,000 | 388,842 | ||||||
OSJB Holdings Corp.a | 33,800 | 91,825 | ||||||
Penta-Ocean Construction Co. Ltd. | 70,200 | 420,970 | ||||||
Raito Kogyo Co. Ltd. | 10,400 | 103,565 | ||||||
Sanki Engineering Co. Ltd. | 10,400 | 115,188 | ||||||
Shinnihon Corp. | 7,800 | 57,051 | ||||||
SHO-BOND Holdings Co. Ltd. | 5,200 | 287,734 | ||||||
Sumitomo Densetsu Co. Ltd. | 5,200 | 89,013 | ||||||
Sumitomo Mitsui Construction Co. Ltd. | 208,000 | 230,565 | ||||||
Taihei Dengyo Kaisha Ltd. | 5,000 | 66,827 | ||||||
Taikisha Ltd. | 7,800 | 197,729 | ||||||
Takamatsu Construction Group Co. Ltd. | 2,600 | 67,776 | ||||||
Tekken Corp. | 26,000 | 85,045 | ||||||
Toa Corp./Tokyob | 2,600 | 48,168 | ||||||
Toda Corp. | 52,000 | 373,251 | ||||||
Tokyu Construction Co. Ltd. | 20,840 | 168,901 | ||||||
Toshiba Plant Systems & Services Corp. | 13,000 | 223,478 | ||||||
Totetsu Kogyo Co. Ltd. | 7,800 | 254,779 | ||||||
Toyo Construction Co. Ltd. | 18,200 | 81,525 | ||||||
Toyo Engineering Corp. | 52,000 | 131,347 | ||||||
Yahagi Construction Co. Ltd. | 7,800 | 67,185 | ||||||
Yokogawa Bridge Holdings Corp. | 7,800 | 139,260 | ||||||
|
| |||||||
| 9,464,515 | ||||||||
| 26 | 2017 iSHARES ANNUAL REPORTTO SHAREHOLDERS |
Table of Contents
Schedule of Investments (Continued)
iSHARES® MSCI JAPAN SMALL-CAP ETF
August 31, 2017
| Security | Shares | Value | ||||||
CONSTRUCTION MATERIALS — 0.25% |
| |||||||
Sumitomo Osaka Cement Co. Ltd. | 104,000 | $ | 465,855 | |||||
|
| |||||||
| 465,855 | ||||||||
CONSUMER FINANCE — 0.56% |
| |||||||
Aiful Corp.a,b | 83,200 | 288,773 | ||||||
Hitachi Capital Corp. | 13,000 | 301,672 | ||||||
J Trust Co. Ltd. | 18,200 | 160,073 | ||||||
Jaccs Co. Ltd. | 26,000 | 128,748 | ||||||
Orient Corp.a | 114,400 | 185,019 | ||||||
|
| |||||||
| 1,064,285 | ||||||||
CONTAINERS & PACKAGING — 0.50% |
| |||||||
FP Corp. | 5,200 | 268,835 | ||||||
Fuji Seal International Inc. | 10,400 | 314,665 | ||||||
Pack Corp. (The) | 2,600 | 88,706 | ||||||
Rengo Co. Ltd. | 46,800 | 270,016 | ||||||
|
| |||||||
| 942,222 | ||||||||
DISTRIBUTORS — 0.38% |
| |||||||
Canon Marketing Japan Inc. | 13,000 | 298,010 | ||||||
Doshisha Co. Ltd. | 5,200 | 107,014 | ||||||
PALTAC Corp. | 7,800 | 308,641 | ||||||
|
| |||||||
| 713,665 | ||||||||
DIVERSIFIED CONSUMER SERVICES — 0.04% |
| |||||||
Meiko Network Japan Co. Ltd. | 5,200 | 70,823 | ||||||
|
| |||||||
| 70,823 | ||||||||
DIVERSIFIED FINANCIAL SERVICES — 1.06% |
| |||||||
Financial Products Group Co. Ltd. | 18,200 | 200,587 | ||||||
Fuyo General Lease Co. Ltd. | 5,200 | 314,665 | ||||||
IBJ Leasing Co. Ltd. | 7,800 | 198,863 | ||||||
Japan Securities Finance Co. Ltd. | 23,400 | 121,826 | ||||||
Ricoh Leasing Co. Ltd. | 5,200 | 181,428 | ||||||
Tokyo Century Corp. | 10,480 | 453,727 | ||||||
Zenkoku Hosho Co. Ltd. | 13,000 | 527,394 | ||||||
|
| |||||||
| 1,998,490 | ||||||||
ELECTRIC UTILITIES — 0.81% |
| |||||||
Hokkaido Electric Power Co. Inc. | 46,800 | 356,337 | ||||||
Hokuriku Electric Power Co. | 44,200 | 420,474 | ||||||
Okinawa Electric Power Co. Inc. (The) | 8,430 | 187,963 | ||||||
Shikoku Electric Power Co. Inc. | 44,200 | 575,090 | ||||||
|
| |||||||
| 1,539,864 | ||||||||
ELECTRICAL EQUIPMENT — 1.86% |
| |||||||
Chiyoda Integre Co. Ltd. | 2,600 | 54,523 | ||||||
Cosel Co. Ltd. | 5,200 | 69,311 | ||||||
Daihen Corp. | 26,000 | 225,604 | ||||||
| Security | Shares | Value | ||||||
Denyo Co. Ltd. | 5,200 | $ | 89,344 | |||||
Fujikura Ltd. | 65,000 | 527,985 | ||||||
Furukawa Electric Co. Ltd. | 18,200 | 985,572 | ||||||
Futaba Corp. | 7,800 | 144,150 | ||||||
GS Yuasa Corp. | 78,000 | 386,953 | ||||||
Idec Corp./Japan | 7,800 | 137,063 | ||||||
Nissin Electric Co. Ltd. | 13,000 | 144,103 | ||||||
Nitto Kogyo Corp. | 7,800 | 140,253 | ||||||
Sanyo Denki Co. Ltd. | 8,000 | 92,386 | ||||||
Tatsuta Electric Wire and Cable Co. Ltd. | 10,400 | 68,414 | ||||||
Toyo Tanso Co. Ltd. | 2,600 | 58,799 | ||||||
Ushio Inc. | 28,600 | 387,968 | ||||||
|
| |||||||
| 3,512,428 | ||||||||
ELECTRONIC EQUIPMENT, INSTRUMENTS & COMPONENTS — 4.47% |
| |||||||
Ai Holdings Corp. | 10,400 | 263,449 | ||||||
Amano Corp. | 15,600 | 364,699 | ||||||
Anritsu Corp. | 36,400 | 289,388 | ||||||
Azbil Corp. | 15,600 | 649,173 | ||||||
Canon Electronics Inc. | 5,200 | 104,132 | ||||||
Citizen Watch Co. Ltd. | 72,800 | 515,275 | ||||||
CONEXIO Corp. | 2,600 | 44,294 | ||||||
Daiwabo Holdings Co. Ltd. | 52,000 | 208,832 | ||||||
Dexerials Corp. | 13,000 | 178,830 | ||||||
Elematec Corp. | 2,600 | 47,790 | ||||||
Enplas Corp. | 2,600 | 112,212 | ||||||
HORIBA Ltd. | 10,400 | 636,889 | ||||||
Hosiden Corp. | 15,600 | 261,228 | ||||||
Ibiden Co. Ltd. | 28,600 | 473,202 | ||||||
Iriso Electronics Co. Ltd. | 5,200 | 255,606 | ||||||
Japan Aviation Electronics Industry Ltd. | 8,000 | 132,219 | ||||||
Japan Cash Machine Co. Ltd. | 5,200 | 55,043 | ||||||
Japan Display Inc.a,b | 96,200 | 173,066 | ||||||
Kaga Electronics Co. Ltd. | 5,200 | 138,670 | ||||||
Koa Corp. | 7,800 | 145,213 | ||||||
Macnica Fuji Electronics Holdings Inc. | 7,800 | 136,993 | ||||||
Maruwa Co. Ltd./Aichi | 2,600 | 141,032 | ||||||
Nichicon Corp. | 13,000 | 151,545 | ||||||
Nippon Ceramic Co. Ltd. | 5,200 | 137,819 | ||||||
Nippon Chemi-Con Corp. | 26,000 | 97,565 | ||||||
Nippon Signal Co. Ltd. | 13,000 | 137,725 | ||||||
Nissha Printing Co. Ltd.a | 7,800 | 211,761 | ||||||
Nohmi Bosai Ltd. | 5,200 | 79,091 | ||||||
SCHEDULESOF INVESTMENTS | 27 |
Table of Contents
Schedule of Investments (Continued)
iSHARES® MSCI JAPAN SMALL-CAP ETF
August 31, 2017
| Security | Shares | Value | ||||||
Oki Electric Industry Co. Ltd. | 20,800 | $ | 285,372 | |||||
Optex Group Co. Ltd. | 2,600 | 99,927 | ||||||
Ryosan Co. Ltd. | 7,800 | 326,358 | ||||||
Ryoyo Electro Corp. | 5,200 | 87,549 | ||||||
SIIX Corp. | 5,200 | 215,210 | ||||||
SMK Corp. | 26,000 | 107,723 | ||||||
Taiyo Yuden Co. Ltd. | 28,600 | 432,144 | ||||||
Topcon Corp. | 26,000 | 458,532 | ||||||
Toyo Corp./Chuo-ku | 7,800 | 73,138 | ||||||
UKC Holdings Corp. | 5,200 | 91,092 | ||||||
V Technology Co. Ltd.a | 800 | 137,670 | ||||||
|
| |||||||
| 8,457,456 | ||||||||
ENERGY EQUIPMENT & SERVICES — 0.16% |
| |||||||
Modec Inc. | 5,200 | 115,235 | ||||||
Shinko Plantech Co. Ltd. | 13,000 | 110,322 | ||||||
Toyo Kanetsu KK | 26,000 | 78,902 | ||||||
|
| |||||||
| 304,459 | ||||||||
EQUITY REAL ESTATE INVESTMENT TRUSTS (REITS) — 7.36% |
| |||||||
Activia Properties Inc. | 156 | 684,608 | ||||||
Advance Residence Investment Corp. | 338 | 864,501 | ||||||
AEON REIT Investment Corp. | 338 | 365,455 | ||||||
Comforia Residential REIT Inc. | 130 | 281,710 | ||||||
Daiwa Office Investment Corp. | 78 | 389,079 | ||||||
Frontier Real Estate Investment Corp. | 130 | 558,105 | ||||||
Fukuoka REIT Corp. | 182 | 271,694 | ||||||
Global One Real Estate Investment Corp. | 52 | 180,483 | ||||||
GLP J-REIT | 650 | 693,349 | ||||||
Hankyu REIT Inc. | 130 | 163,002 | ||||||
Heiwa Real Estate REIT Inc. | 234 | 196,878 | ||||||
Hoshino Resorts REIT Inc. | 52 | 270,253 | ||||||
Hulic Reit Inc. | 234 | 353,998 | ||||||
Ichigo Office REIT Investment | 338 | 233,093 | ||||||
Industrial & Infrastructure Fund Investment Corp. | 78 | 349,746 | ||||||
Invesco Office J-Reit Inc. | 208 | 201,650 | ||||||
Invincible Investment Corp. | 884 | 377,102 | ||||||
Japan Excellent Inc. | 312 | 374,479 | ||||||
Japan Hotel REIT Investment Corp. | 988 | 679,553 | ||||||
Japan Logistics Fund Inc. | 208 | 423,522 | ||||||
Japan Rental Housing Investments Inc. | 416 | 311,074 | ||||||
Kenedix Office Investment Corp. | 104 | 594,367 | ||||||
Kenedix Residential Investment Corp. | 78 | 199,500 | ||||||
| Security | Shares | Value | ||||||
Kenedix Retail REIT Corp. | 130 | $ | 286,080 | |||||
LaSalle Logiport REIT | 286 | 278,048 | ||||||
MCUBS MidCity Investment Corp. | 78 | 231,746 | ||||||
Mitsui Fudosan Logistics Park Inc. | 52 | 148,828 | ||||||
Mori Hills REIT Investment Corp. | 390 | 498,219 | ||||||
Mori Trust Hotel Reit Inc. | 78 | 104,605 | ||||||
MORI TRUST Sogo REIT Inc. | 260 | 423,805 | ||||||
Nippon Accommodations Fund Inc. | 130 | 527,394 | ||||||
NIPPON REIT Investment Corp. | 104 | 302,853 | ||||||
Orix JREIT Inc. | 650 | 936,671 | ||||||
Premier Investment Corp. | 338 | 328,910 | ||||||
Sekisui House Reit Inc.a | 234 | 287,450 | ||||||
Sekisui House SI Residential Investment Corp. | 260 | 270,725 | ||||||
TOKYU REIT Inc. | 234 | 290,640 | ||||||
|
| |||||||
| 13,933,175 | ||||||||
FOOD & STAPLES RETAILING — 3.26% |
| |||||||
Ain Holdings Inc. | 5,200 | 382,228 | ||||||
Arcs Co. Ltd. | 10,400 | 232,833 | ||||||
Axial Retailing Inc. | 2,600 | 106,188 | ||||||
Belc Co. Ltd. | 2,600 | 125,677 | ||||||
Cawachi Ltd. | 2,600 | 63,075 | ||||||
Cocokara fine Inc. | 5,200 | 287,262 | ||||||
Cosmos Pharmaceutical Corp. | 2,600 | 588,933 | ||||||
Create SD Holdings Co. Ltd. | 7,800 | 202,406 | ||||||
Daikokutenbussan Co. Ltd. | 2,600 | 125,913 | ||||||
Heiwado Co. Ltd. | 7,800 | 181,924 | ||||||
Kansai Super Market Ltd. | 2,600 | 33,640 | ||||||
Kato Sangyo Co. Ltd. | 5,200 | 153,080 | ||||||
Kobe Bussan Co. Ltd. | 2,600 | 133,709 | ||||||
Kusuri no Aoki Holdings Co. Ltd. | 2,900 | 163,629 | ||||||
Life Corp. | 2,600 | 65,555 | ||||||
Matsumotokiyoshi Holdings Co. Ltd. | 10,400 | 706,814 | ||||||
Ministop Co. Ltd. | 5,200 | 106,211 | ||||||
Mitsubishi Shokuhin Co. Ltd. | 2,600 | 77,958 | ||||||
Qol Co. Ltd. | 5,200 | 92,462 | ||||||
San-A Co. Ltd. | 5,200 | 228,439 | ||||||
Shoei Foods Corp. | 2,600 | 126,149 | ||||||
Sogo Medical Co. Ltd. | 2,600 | 119,299 | ||||||
Sugi Holdings Co. Ltd. | 10,400 | 549,010 | ||||||
United Super Markets Holdings Inc. | 13,000 | 131,228 | ||||||
Valor Holdings Co. Ltd. | 10,400 | 224,707 | ||||||
Welcia Holdings Co. Ltd. | 13,000 | 509,677 | ||||||
Yakuodo Co. Ltd.a | 2,600 | 71,815 | ||||||
Yaoko Co. Ltd. | 5,200 | 247,574 | ||||||
Yokohama Reito Co. Ltd. | 13,000 | 125,204 | ||||||
|
| |||||||
| 6,162,599 | ||||||||
| 28 | 2017 iSHARES ANNUAL REPORTTO SHAREHOLDERS |
Table of Contents
Schedule of Investments (Continued)
iSHARES® MSCI JAPAN SMALL-CAP ETF
August 31, 2017
| Security | Shares | Value | ||||||
FOOD PRODUCTS — 4.91% |
| |||||||
Ariake Japan Co. Ltd. | 5,200 | $ | 381,755 | |||||
DyDo Group Holdings Inc. | 2,600 | 131,346 | ||||||
Ezaki Glico Co. Ltd. | 10,400 | 551,844 | ||||||
Fuji Oil Holdings Inc. | 15,600 | 437,979 | ||||||
Fujicco Co. Ltd. | 5,200 | 128,323 | ||||||
Fujiya Co. Ltd. | 2,600 | 57,405 | ||||||
Hokuto Corp. | 5,200 | 93,029 | ||||||
House Foods Group Inc. | 15,600 | 474,123 | ||||||
Itoham Yonekyu Holdings Inc. | 36,400 | 326,760 | ||||||
J-Oil Mills Inc. | 2,600 | 94,258 | ||||||
Kagome Co. Ltd. | 20,800 | 655,788 | ||||||
Kameda Seika Co. Ltd. | 2,600 | 118,354 | ||||||
Kenko Mayonnaise Co. Ltd. | 2,600 | 67,350 | ||||||
Kewpie Corp. | 28,600 | 684,726 | ||||||
KEY Coffee Inc. | 5,200 | 104,888 | ||||||
Kotobuki Spirits Co. Ltd. | 5,200 | 172,924 | ||||||
Marudai Food Co. Ltd. | 26,000 | 123,551 | ||||||
Maruha Nichiro Corp. | 10,400 | 301,436 | ||||||
MEGMILK SNOW BRAND Co. Ltd. | 13,000 | 381,519 | ||||||
Mitsui Sugar Co. Ltd. | 5,200 | 176,467 | ||||||
Morinaga & Co. Ltd./Japan | 10,400 | 595,312 | ||||||
Morinaga Milk Industry Co. Ltd. | 52,000 | 410,104 | ||||||
Nichirei Corp. | 31,200 | 824,081 | ||||||
Nippon Beet Sugar Manufacturing Co. Ltd. | 5,200 | 113,393 | ||||||
Nippon Flour Mills Co. Ltd. | 13,000 | 206,233 | ||||||
Nippon Suisan Kaisha Ltd. | 72,800 | 409,442 | ||||||
Nisshin OilliO Group Ltd. (The) | 26,000 | 186,153 | ||||||
Prima Meat Packers Ltd. | 26,000 | 160,876 | ||||||
Riken Vitamin Co. Ltd. | 2,600 | 100,164 | ||||||
Rock Field Co. Ltd. | 7,800 | 142,804 | ||||||
Rokko Butter Co. Ltd. | 2,600 | 55,681 | ||||||
S Foods Inc. | 2,600 | 99,573 | ||||||
Sakata Seed Corp.a | 7,800 | 241,668 | ||||||
Showa Sangyo Co. Ltd. | 26,000 | 144,103 | ||||||
Warabeya Nichiyo Holdings Co. Ltd. | 5,200 | 130,213 | ||||||
|
| |||||||
| 9,283,625 | ||||||||
GAS UTILITIES — 0.10% |
| |||||||
K&O Energy Group Inc. | 5,200 | 83,958 | ||||||
Shizuoka Gas Co. Ltd. | 13,000 | 103,116 | ||||||
|
| |||||||
| 187,074 | ||||||||
HEALTH CARE EQUIPMENT & SUPPLIES — 1.72% |
| |||||||
Asahi Intecc Co. Ltd. | 13,000 | 680,356 | ||||||
Eiken Chemical Co. Ltd. | 5,200 | 173,869 | ||||||
| Security | Shares | Value | ||||||
Fukuda Denshi Co. Ltd. | 2,600 | $ | 197,256 | |||||
Hogy Medical Co. Ltd. | 2,600 | 183,318 | ||||||
JEOL Ltd. | 26,000 | 122,606 | ||||||
Mani Inc. | 5,200 | 120,385 | ||||||
Menicon Co. Ltd. | 2,600 | 98,510 | ||||||
Nagaileben Co. Ltd. | 5,200 | 129,835 | ||||||
Nakanishi Inc. | 5,200 | 224,423 | ||||||
Nihon Kohden Corp. | 20,800 | 481,919 | ||||||
Nikkiso Co. Ltd. | 15,600 | 142,308 | ||||||
Nipro Corp. | 36,400 | 480,879 | ||||||
Paramount Bed Holdings Co. Ltd. | 5,200 | 227,730 | ||||||
|
| |||||||
| 3,263,394 | ||||||||
HEALTH CARE PROVIDERS & SERVICES — 0.80% |
| |||||||
AS ONE Corp. | 2,600 | 142,450 | ||||||
BML Inc. | 5,200 | 111,219 | ||||||
Japan Lifeline Co. Ltd. | 5,200 | 265,055 | ||||||
NichiiGakkan Co. Ltd. | 10,400 | 111,975 | ||||||
Ship Healthcare Holdings Inc. | 10,400 | 317,500 | ||||||
Toho Holdings Co. Ltd. | 13,000 | 254,425 | ||||||
Tokai Corp./Gifu | 2,600 | 114,692 | ||||||
Tsukui Corp. | 15,600 | 106,306 | ||||||
Vital KSK Holdings Inc. | 10,400 | 84,950 | ||||||
|
| |||||||
| 1,508,572 | ||||||||
HOTELS, RESTAURANTS & LEISURE — 3.27% |
| |||||||
Atom Corp.a | 23,400 | 174,766 | ||||||
BRONCO BILLY Co. Ltd.a | 2,600 | 64,894 | ||||||
Colowide Co. Ltd. | 15,600 | 286,033 | ||||||
Create Restaurants Holdings Inc. | 13,000 | 132,291 | ||||||
Doutor Nichires Holdings Co. Ltd. | 7,800 | 169,239 | ||||||
Fuji Kyuko Co. Ltd.a | 8,000 | 87,370 | ||||||
Fujita Kanko Inc. | 2,600 | 86,108 | ||||||
Hiday Hidaka Corp. | 5,216 | 150,234 | ||||||
Hiramatsu Inc. | 7,800 | 43,798 | ||||||
HIS Co. Ltd.a | 10,400 | 347,738 | ||||||
Ichibanya Co. Ltd. | 2,600 | 106,306 | ||||||
Kappa Create Co. Ltd.a,b | 7,800 | 90,147 | ||||||
Kisoji Co. Ltd. | 5,200 | 131,252 | ||||||
KNT-CT Holdings Co. Ltd.b | 26,000 | 52,444 | ||||||
Komeda Holdings Co. Ltd. | 7,800 | 130,614 | ||||||
Koshidaka Holdings Co. Ltd.a | 2,600 | 76,894 | ||||||
Kura Corp. | 2,600 | 142,686 | ||||||
Kyoritsu Maintenance Co. Ltd. | 7,880 | 219,088 | ||||||
Matsuya Foods Co. Ltd. | 2,600 | 96,148 | ||||||
MOS Food Services Inc. | 7,800 | 248,755 | ||||||
Ohsho Food Service Corp. | 2,600 | 103,116 | ||||||
SCHEDULESOF INVESTMENTS | 29 |
Table of Contents
Schedule of Investments (Continued)
iSHARES® MSCI JAPAN SMALL-CAP ETF
August 31, 2017
| Security | Shares | Value | ||||||
Plenus Co. Ltd. | 5,200 | $ | 116,227 | |||||
Resorttrust Inc. | 20,800 | 388,748 | ||||||
Ringer Hut Co. Ltd.a | 5,200 | 118,070 | ||||||
Round One Corp. | 18,200 | 207,863 | ||||||
Royal Holdings Co. Ltd. | 7,800 | 197,516 | ||||||
Saizeriya Co. Ltd. | 7,800 | 220,761 | ||||||
Skylark Co. Ltd. | 26,000 | 381,047 | ||||||
St. Marc Holdings Co. Ltd. | 5,200 | 155,442 | ||||||
Tokyo Dome Corp. | 23,400 | 221,541 | ||||||
Tokyotokeiba Co. Ltd. | 5,200 | 158,041 | ||||||
Toridoll Holdings Corp. | 5,200 | 162,766 | ||||||
Tosho Co. Ltd. | 2,600 | 128,275 | ||||||
WATAMI Co. Ltd. | 5,200 | 73,186 | ||||||
Yoshinoya Holdings Co. Ltd.a | 15,600 | 265,481 | ||||||
Zensho Holdings Co. Ltd. | 23,400 | 443,720 | ||||||
|
| |||||||
| 6,178,605 | ||||||||
HOUSEHOLD DURABLES — 2.03% |
| |||||||
Alpine Electronics Inc. | 10,400 | 191,823 | ||||||
Chofu Seisakusho Co. Ltd. | 5,200 | 127,047 | ||||||
Clarion Co. Ltd. | 26,000 | 101,108 | ||||||
Cleanup Corp. | 5,200 | 41,719 | ||||||
Foster Electric Co. Ltd. | 5,200 | 109,235 | ||||||
France Bed Holdings Co. Ltd. | 7,800 | 72,288 | ||||||
Fujitsu General Ltd. | 15,600 | 326,004 | ||||||
Funai Electric Co. Ltd.a | 5,200 | 39,735 | ||||||
Haseko Corp. | 70,200 | 868,730 | ||||||
JVC Kenwood Corp. | 33,800 | 89,675 | ||||||
Misawa Homes Co. Ltd. | 7,800 | 67,398 | ||||||
Pioneer Corp.b | 83,200 | 154,970 | ||||||
Pressance Corp. | 10,400 | 133,520 | ||||||
Sangetsu Corp. | 13,000 | 232,101 | ||||||
Starts Corp. Inc. | 7,800 | 194,397 | ||||||
Sumitomo Forestry Co. Ltd. | 33,800 | 526,378 | ||||||
Tamron Co. Ltd. | 5,200 | 93,029 | ||||||
Token Corp. | 2,620 | 361,363 | ||||||
Zojirushi Corp. | 10,400 | 103,565 | ||||||
|
| |||||||
| 3,834,085 | ||||||||
HOUSEHOLD PRODUCTS — 0.65% |
| |||||||
Earth Chemical Co. Ltd. | 2,600 | 124,496 | ||||||
Pigeon Corp. | 28,600 | 1,105,697 | ||||||
|
| |||||||
| 1,230,193 | ||||||||
INDEPENDENT POWER AND RENEWABLE ELECTRICITY PRODUCERS — 0.04% |
| |||||||
eRex Co. Ltd.a | 7,800 | 74,343 | ||||||
|
| |||||||
| 74,343 | ||||||||
| Security | Shares | Value | ||||||
INDUSTRIAL CONGLOMERATES — 0.31% |
| |||||||
Katakura Industries Co. Ltd. | 5,200 | $ | 59,484 | |||||
Nisshinbo Holdings Inc. | 33,800 | 358,085 | ||||||
TOKAI Holdings Corp. | 20,800 | 161,395 | ||||||
|
| |||||||
| 578,964 | ||||||||
INSURANCE — 0.07% |
| |||||||
Anicom Holdings Inc. | 5,200 | 136,024 | ||||||
|
| |||||||
| 136,024 | ||||||||
INTERNET & DIRECT MARKETING RETAIL — 0.18% |
| |||||||
ASKUL Corp.a | 5,200 | 156,624 | ||||||
Belluna Co. Ltd. | 13,000 | 133,236 | ||||||
Senshukai Co. Ltd. | 7,800 | 48,334 | ||||||
|
| |||||||
| 338,194 | ||||||||
INTERNET SOFTWARE & SERVICES — 0.97% |
| |||||||
Ateam Inc. | 2,600 | 68,012 | ||||||
COOKPAD Inc.a | 15,600 | 108,999 | ||||||
CROOZ Inc.a | 2,600 | 55,279 | ||||||
Dip Corp. | 7,800 | 163,569 | ||||||
F@N Communications Inc. | 10,400 | 108,951 | ||||||
GMO Internet Inc. | 18,200 | 235,810 | ||||||
Gree Inc. | 28,600 | 208,406 | ||||||
Gurunavi Inc. | 7,800 | 116,157 | ||||||
Infomart Corp.a | 23,400 | 170,727 | ||||||
Internet Initiative Japan Inc. | 7,800 | 145,710 | ||||||
Istyle Inc.a | 10,400 | 60,854 | ||||||
SMS Co. Ltd. | 7,800 | 251,944 | ||||||
UNITED Inc./Japan | 2,600 | 63,405 | ||||||
ZIGExN Co. Ltd.b | 5,200 | 81,832 | ||||||
|
| |||||||
| 1,839,655 | ||||||||
IT SERVICES — 2.06% |
| |||||||
Digital Garage Inc.a | 10,400 | 207,320 | ||||||
DTS Corp. | 5,200 | 146,229 | ||||||
GMO Payment Gateway Inc.a | 5,274 | 336,394 | ||||||
Hearts United Group Co. Ltd.a | 2,600 | 36,404 | ||||||
Ines Corp. | 7,800 | 70,800 | ||||||
Infocom Corp. | 2,600 | 65,224 | ||||||
Information Services International-Dentsu Ltd. | 2,600 | 57,736 | ||||||
Itochu Techno-Solutions Corp. | 13,000 | 483,100 | ||||||
Kanematsu Electronics Ltd. | 5,200 | 146,229 | ||||||
NEC Networks & System Integration Corp. | 5,200 | 121,188 | ||||||
NET One Systems Co. Ltd. | 20,800 | 212,044 | ||||||
Nihon Unisys Ltd. | 18,200 | 285,584 | ||||||
| 30 | 2017 iSHARES ANNUAL REPORTTO SHAREHOLDERS |
Table of Contents
Schedule of Investments (Continued)
iSHARES® MSCI JAPAN SMALL-CAP ETF
August 31, 2017
| Security | Shares | Value | ||||||
NS Solutions Corp. | 10,400 | $ | 223,100 | |||||
SCSK Corp. | 13,056 | 564,661 | ||||||
TIS Inc. | 20,848 | 614,681 | ||||||
TKC Corp. | 5,200 | 152,135 | ||||||
Transcosmos Inc. | 7,800 | 167,609 | ||||||
|
| |||||||
| 3,890,438 | ||||||||
LEISURE PRODUCTS — 0.56% |
| |||||||
Fields Corp. | 5,200 | 53,436 | ||||||
Heiwa Corp. | 13,016 | 259,232 | ||||||
Mars Engineering Corp. | 2,600 | 54,334 | ||||||
Mizuno Corp. | 26,000 | 159,695 | ||||||
Tomy Co. Ltd. | 20,800 | 277,623 | ||||||
Universal Entertainment Corp. | 5,200 | 133,709 | ||||||
Yonex Co. Ltd.a | 15,600 | 122,748 | ||||||
|
| |||||||
| 1,060,777 | ||||||||
LIFE SCIENCES TOOLS & SERVICES — 0.10% |
| |||||||
EPS Holdings Inc. | 7,800 | 152,726 | ||||||
Linical Co. Ltd. | 2,600 | 38,506 | ||||||
|
| |||||||
| 191,232 | ||||||||
MACHINERY — 7.04% |
| |||||||
Aichi Corp. | 7,800 | 53,153 | ||||||
Aida Engineering Ltd. | 13,000 | 138,788 | ||||||
Anest Iwata Corp. | 10,400 | 98,274 | ||||||
Asahi Diamond Industrial Co. Ltd. | 13,000 | 113,983 | ||||||
Bando Chemical Industries Ltd. | 10,400 | 102,620 | ||||||
CKD Corp. | 13,000 | 219,935 | ||||||
Daifuku Co. Ltd. | 26,000 | 1,130,383 | ||||||
Daiwa Industries Ltd. | 7,800 | 84,265 | ||||||
DMG Mori Co. Ltd. | 28,600 | 466,446 | ||||||
Ebara Corp. | 26,000 | 804,379 | ||||||
Fuji Machine Manufacturing Co. Ltd. | 18,200 | 320,476 | ||||||
Fujitec Co. Ltd. | 13,000 | 187,570 | ||||||
Fukushima Industries Corp. | 2,600 | 96,856 | ||||||
Furukawa Co. Ltd. | 78,000 | 133,945 | ||||||
Giken Ltd. | 2,600 | 70,705 | ||||||
Glory Ltd. | 15,600 | 530,111 | ||||||
Harmonic Drive Systems Inc.a | 7,800 | 342,304 | ||||||
Hirata Corp. | 2,600 | 266,945 | ||||||
Hitachi Zosen Corp. | 41,600 | 205,997 | ||||||
Iseki & Co. Ltd. | 5,200 | 107,298 | ||||||
Japan Steel Works Ltd. (The) | 15,600 | 316,507 | ||||||
Kato Works Co. Ltd. | 2,600 | 82,564 | ||||||
Kitz Corp. | 20,800 | 167,065 | ||||||
Komori Corp. | 13,000 | 160,285 | ||||||
Kyokuto Kaihatsu Kogyo Co. Ltd. | 7,800 | 118,850 | ||||||
| Security | Shares | Value | ||||||
Makino Milling Machine Co. Ltd. | 26,000 | $ | 204,343 | |||||
Max Co. Ltd. | 4,000 | 52,408 | ||||||
Meidensha Corp. | 52,000 | 188,988 | ||||||
METAWATER Co. Ltd. | 2,600 | 71,579 | ||||||
Mitsubishi Nichiyu Forklift Co. Ltd. | 7,800 | 52,232 | ||||||
Mitsuboshi Belting Ltd. | 7,000 | 80,774 | ||||||
Mitsui Engineering & Shipbuilding Co. Ltd. | 182,000 | 228,203 | ||||||
Miura Co. Ltd. | 23,400 | 527,276 | ||||||
Morita Holdings Corp. | 7,800 | 120,338 | ||||||
Nachi-Fujikoshi Corp. | 52,000 | 275,450 | ||||||
Namura Shipbuilding Co. Ltd. | 13,000 | 77,603 | ||||||
Nippon Sharyo Ltd.a,b | 26,000 | 69,453 | ||||||
Nippon Thompson Co. Ltd. | 15,600 | 88,872 | ||||||
Nitta Corp. | 5,200 | 184,972 | ||||||
Nitto Kohki Co. Ltd. | 2,600 | 63,311 | ||||||
Noritake Co. Ltd./Nagoya Japan | 2,600 | 115,637 | ||||||
NTN Corp. | 104,000 | 419,553 | ||||||
Obara Group Inc. | 2,600 | 143,867 | ||||||
Oiles Corp. | 5,296 | 96,287 | ||||||
OKUMA Corp. | 26,000 | 239,070 | ||||||
OSG Corp. | 20,800 | 437,696 | ||||||
Ryobi Ltd. | 26,000 | 130,638 | ||||||
Shibuya Corp. | 5,200 | 171,506 | ||||||
Shima Seiki Manufacturing Ltd. | 5,200 | 263,638 | ||||||
Shinmaywa Industries Ltd. | 26,000 | 224,896 | ||||||
Sintokogio Ltd. | 10,400 | 110,558 | ||||||
Sodick Co. Ltd. | 10,400 | 126,811 | ||||||
Star Micronics Co. Ltd. | 10,400 | 172,924 | ||||||
Tadano Ltd. | 26,000 | 303,325 | ||||||
Takeuchi Manufacturing Co. Ltd. | 7,800 | 147,127 | ||||||
Takuma Co. Ltd. | 20,800 | 235,857 | ||||||
Teikoku Sen-I Co. Ltd. | 5,200 | 101,770 | ||||||
Tocalo Co. Ltd. | 5,200 | 190,405 | ||||||
Toshiba Machine Co. Ltd. | 26,000 | 125,204 | ||||||
Tsubaki Nakashima Co. Ltd.a | 5,200 | 116,983 | ||||||
Tsubakimoto Chain Co. | 26,000 | 204,107 | ||||||
Tsugami Corp. | 26,000 | 210,013 | ||||||
Tsukishima Kikai Co. Ltd. | 7,800 | 95,179 | ||||||
Tsurumi Manufacturing Co. Ltd. | 5,200 | 93,218 | ||||||
Union Tool Co. | 2,600 | 84,100 | ||||||
YAMABIKO Corp. | 7,800 | 89,438 | ||||||
Yushin Precision Equipment Co. Ltd.a | 2,600 | 70,870 | ||||||
|
| |||||||
| 13,326,183 | ||||||||
SCHEDULESOF INVESTMENTS | 31 |
Table of Contents
Schedule of Investments (Continued)
iSHARES® MSCI JAPAN SMALL-CAP ETF
August 31, 2017
| Security | Shares | Value | ||||||
MARINE — 0.42% |
| |||||||
Iino Kaiun Kaisha Ltd. | 23,400 | $ | 103,754 | |||||
Kawasaki Kisen Kaisha Ltd.a,b | 234,000 | 633,582 | ||||||
NS United Kaiun Kaisha Ltd. | 26,000 | 55,515 | ||||||
|
| |||||||
| 792,851 | ||||||||
MEDIA — 1.89% |
| |||||||
Amuse Inc. | 2,600 | 67,398 | ||||||
Asatsu-DK Inc. | 7,800 | 210,343 | ||||||
Avex Group Holdings Inc. | 7,800 | 106,802 | ||||||
CyberAgent Inc. | 26,000 | 849,264 | ||||||
D.A. Consortium Holdings Inc. | 5,200 | 79,328 | ||||||
Daiichikosho Co. Ltd. | 10,400 | 503,652 | ||||||
Kadokawa Dwangoa,b | 13,008 | 151,756 | ||||||
Lifull Co. Ltd. | 13,000 | 107,251 | ||||||
Septeni Holdings Co. Ltd.a | 26,000 | 68,272 | ||||||
Shochiku Co. Ltd. | 2,600 | 368,290 | ||||||
SKY Perfect JSAT Holdings Inc. | 41,600 | 188,988 | ||||||
Toei Co. Ltd. | 26,000 | 309,704 | ||||||
Tokyo Broadcasting System Holdings Inc. | 10,400 | 199,382 | ||||||
TV Asahi Holdings Corp. | 5,200 | 104,841 | ||||||
Vector Inc. | 7,800 | 108,361 | ||||||
Zenrin Co. Ltd. | 5,200 | 159,222 | ||||||
|
| |||||||
| 3,582,854 | ||||||||
METALS & MINING — 2.68% |
| |||||||
Aichi Steel Corp. | 2,600 | 101,699 | ||||||
Asahi Holdings Inc. | 7,800 | 163,144 | ||||||
Daido Steel Co. Ltd. | 78,000 | 463,493 | ||||||
Dowa Holdings Co. Ltd. | 78,000 | 588,225 | ||||||
Godo Steel Ltd. | 2,600 | 49,468 | ||||||
Kyoei Steel Ltd. | 5,200 | 79,517 | ||||||
Mitsubishi Steel Manufacturing Co. Ltd. | 26,000 | 69,689 | ||||||
Mitsui Mining & Smelting Co. Ltd. | 156,000 | 827,767 | ||||||
Nakayama Steel Works Ltd. | 5,200 | 33,593 | ||||||
Neturen Co. Ltd. | 7,800 | 76,044 | ||||||
Nippon Denko Co. Ltd. | 28,600 | 118,235 | ||||||
Nippon Light Metal Holdings Co. Ltd. | 150,800 | 443,932 | ||||||
Nisshin Steel Co. Ltd. | 13,000 | 168,908 | ||||||
Nittetsu Mining Co. Ltd. | 2,600 | 181,901 | ||||||
Osaka Steel Co. Ltd. | 2,600 | 58,444 | ||||||
OSAKA Titanium Technologies Co. Ltd.a | 5,200 | 75,501 | ||||||
Pacific Metals Co. Ltd.b | 26,000 | 73,705 | ||||||
Sanyo Special Steel Co. Ltd. | 26,000 | 140,323 | ||||||
| Security | Shares | Value | ||||||
Toho Titanium Co. Ltd.a | 7,800 | $ | 57,901 | |||||
Toho Zinc Co. Ltd. | 26,000 | 119,298 | ||||||
Tokyo Rope Manufacturing Co. Ltd.a | 5,200 | 74,745 | ||||||
Tokyo Steel Manufacturing Co. Ltd. | 26,000 | 219,935 | ||||||
Topy Industries Ltd. | 5,200 | 175,995 | ||||||
Toyo Kohan Co. Ltd. | 13,000 | 63,547 | ||||||
UACJ Corp. | 78,140 | 210,863 | ||||||
Yamato Kogyo Co. Ltd. | 10,400 | 293,876 | ||||||
Yodogawa Steel Works Ltd. | 5,200 | 145,284 | ||||||
|
| |||||||
| 5,075,032 | ||||||||
MULTILINE RETAIL — 0.97% |
| |||||||
Fuji Co. Ltd./Ehime | 5,200 | 129,126 | ||||||
H2O Retailing Corp. | 20,835 | 375,583 | ||||||
Izumi Co. Ltd. | 10,400 | 544,285 | ||||||
Kintetsu Department Store Co. Ltd.b | 2,600 | 87,288 | ||||||
Matsuya Co. Ltd. | 7,800 | 67,894 | ||||||
Parco Co. Ltd. | 5,200 | 63,878 | ||||||
Seria Co. Ltd.a | 10,400 | 568,853 | ||||||
|
| |||||||
| 1,836,907 | ||||||||
OIL, GAS & CONSUMABLE FUELS — 0.58% |
| |||||||
Cosmo Energy Holdings Co. Ltd. | 15,600 | 322,460 | ||||||
ITOCHU Enex Co. Ltd. | 13,000 | 129,929 | ||||||
Japan Petroleum Exploration Co. Ltd. | 7,800 | 149,537 | ||||||
Nippon Gas Co. Ltd. | 10,400 | 348,683 | ||||||
San-Ai Oil Co. Ltd. | 13,000 | 144,339 | ||||||
|
| |||||||
| 1,094,948 | ||||||||
PAPER & FOREST PRODUCTS — 0.65% |
| |||||||
Daiken Corp. | 5,200 | 119,346 | ||||||
Daio Paper Corp. | 18,200 | 222,911 | ||||||
Hokuetsu Kishu Paper Co. Ltd. | 33,800 | 224,494 | ||||||
Mitsubishi Paper Mills Ltd.b | 10,400 | 69,170 | ||||||
Nippon Paper Industries Co. Ltd. | 26,000 | 497,510 | ||||||
Tokushu Tokai Paper Co. Ltd. | 2,600 | 100,518 | ||||||
|
| |||||||
| 1,233,949 | ||||||||
PERSONAL PRODUCTS — 1.23% |
| |||||||
Ci:z Holdings Co. Ltd. | 7,800 | 306,160 | ||||||
Euglena Co. Ltd.a,b | 18,200 | 190,334 | ||||||
Fancl Corp. | 10,400 | 244,456 | ||||||
Kobayashi Pharmaceutical Co. Ltd. | 13,000 | 806,742 | ||||||
Mandom Corp. | 5,200 | 311,357 | ||||||
Milbon Co. Ltd. | 2,600 | 157,096 | ||||||
Noevir Holdings Co. Ltd. | 5,200 | 310,413 | ||||||
|
| |||||||
| 2,326,558 | ||||||||
| 32 | 2017 iSHARES ANNUAL REPORTTO SHAREHOLDERS |
Table of Contents
Schedule of Investments (Continued)
iSHARES® MSCI JAPAN SMALL-CAP ETF
August 31, 2017
| Security | Shares | Value | ||||||
PHARMACEUTICALS — 2.48% |
| |||||||
ASKA Pharmaceutical Co. Ltd. | 5,200 | $ | 80,839 | |||||
JCR Pharmaceuticals Co. Ltd. | 2,600 | 77,249 | ||||||
Kaken Pharmaceutical Co. Ltd. | 7,800 | 411,757 | ||||||
Kissei Pharmaceutical Co. Ltd. | 7,800 | 197,516 | ||||||
KYORIN Holdings Inc. | 10,400 | 218,281 | ||||||
Mochida Pharmaceutical Co. Ltd. | 2,600 | 198,673 | ||||||
Nichi-Iko Pharmaceutical Co. Ltd.a | 10,450 | 161,887 | ||||||
Nippon Shinyaku Co. Ltd. | 13,000 | 903,598 | ||||||
Rohto Pharmaceutical Co. Ltd. | 26,000 | 602,871 | ||||||
Sawai Pharmaceutical Co. Ltd. | 7,800 | 425,931 | ||||||
Seikagaku Corp. | 10,400 | 183,885 | ||||||
Sosei Group Corp.a,b | 3,800 | 313,502 | ||||||
Torii Pharmaceutical Co. Ltd. | 2,600 | 69,855 | ||||||
Towa Pharmaceutical Co. Ltd. | 2,600 | 123,787 | ||||||
Tsumura & Co. | 15,600 | 587,516 | ||||||
ZERIA Pharmaceutical Co. Ltd. | 7,800 | 142,946 | ||||||
|
| |||||||
| 4,700,093 | ||||||||
PROFESSIONAL SERVICES — 1.86% |
| |||||||
Benefit One Inc.a | 5,200 | 219,698 | ||||||
en-japan Inc. | 5,200 | 181,901 | ||||||
Funai Soken Holdings Inc. | 5,200 | 165,837 | ||||||
JAC Recruitment Co. Ltd. | 2,600 | 38,790 | ||||||
Link And Motivation Inc.a | 7,800 | 54,995 | ||||||
Meitec Corp. | 7,800 | 360,022 | ||||||
Nihon M&A Center Inc. | 15,600 | 721,461 | ||||||
Nomura Co. Ltd. | 10,400 | 224,801 | ||||||
Outsourcing Inc. | 2,600 | 170,798 | ||||||
Persol Holdings Co. Ltd. | 41,600 | 844,398 | ||||||
Tanseisha Co. Ltd. | 10,400 | 107,723 | ||||||
TechnoPro Holdings Inc. | 7,800 | 355,061 | ||||||
Yumeshin Holdings Co. Ltd.a | 10,400 | 73,894 | ||||||
|
| |||||||
| 3,519,379 | ||||||||
REAL ESTATE MANAGEMENT & DEVELOPMENT — 1.76% |
| |||||||
Ardepro Co. Ltd.a | 39,000 | 48,192 | ||||||
Daibiru Corp. | 13,000 | 136,307 | ||||||
Daikyo Inc. | 78,000 | 152,371 | ||||||
Goldcrest Co. Ltd. | 5,200 | 118,495 | ||||||
Heiwa Real Estate Co. Ltd. | 10,400 | 178,783 | ||||||
Ichigo Inc. | 59,800 | 192,886 | ||||||
Japan Asset Marketing Co. Ltd.b | 33,800 | 39,002 | ||||||
Kenedix Inc. | 65,000 | 311,830 | ||||||
Leopalace21 Corp. | 65,000 | 476,013 | ||||||
NTT Urban Development Corp. | 31,200 | 301,625 | ||||||
Open House Co. Ltd. | 7,800 | 240,960 | ||||||
| Security | Shares | Value | ||||||
Relo Group Inc. | 28,600 | $ | 649,386 | |||||
Sun Frontier Fudousan Co. Ltd. | 5,200 | 51,735 | ||||||
Takara Leben Co. Ltd. | 20,800 | 100,731 | ||||||
TOC Co. Ltd. | 15,600 | 138,906 | ||||||
Tosei Corp. | 7,800 | 64,350 | ||||||
Unizo Holdings Co. Ltd. | 5,200 | 122,133 | ||||||
|
| |||||||
| 3,323,705 | ||||||||
ROAD & RAIL — 2.10% |
| |||||||
Fukuyama Transporting Co. Ltd. | 26,000 | 159,222 | ||||||
Hitachi Transport System Ltd. | 13,000 | 313,838 | ||||||
Nankai Electric Railway Co. Ltd. | 130,000 | 666,182 | ||||||
Nikkon Holdings Co. Ltd. | 15,600 | 366,542 | ||||||
Nishi-Nippon Railroad Co. Ltd. | 78,000 | 377,739 | ||||||
Sakai Moving Service Co. Ltd. | 2,600 | 136,544 | ||||||
Sankyu Inc. | 78,000 | 610,194 | ||||||
Seino Holdings Co. Ltd. | 39,000 | 529,757 | ||||||
Senko Group Holdings Co. Ltd. | 26,000 | 187,807 | ||||||
Sotetsu Holdings Inc. | 104,000 | 504,597 | ||||||
Trancom Co. Ltd. | 2,600 | 130,638 | ||||||
|
| |||||||
| 3,983,060 | ||||||||
SEMICONDUCTORS & SEMICONDUCTOR |
| |||||||
Advantest Corp. | 41,600 | 692,829 | ||||||
Japan Material Co. Ltd.a | 5,200 | 127,425 | ||||||
Lasertec Corp. | 10,400 | 188,043 | ||||||
Megachips Corp.a | 5,200 | 171,979 | ||||||
Micronics Japan Co. Ltd.a | 7,800 | 73,138 | ||||||
Mimasu Semiconductor Industry Co. Ltd. | 2,600 | 41,790 | ||||||
Mitsui High-Tec Inc. | 5,200 | 91,234 | ||||||
Sanken Electric Co. Ltd. | 26,000 | 132,528 | ||||||
SCREEN Holdings Co. Ltd. | 10,400 | 671,852 | ||||||
Shindengen Electric Manufacturing Co. Ltd. | 26,000 | 170,325 | ||||||
Shinko Electric Industries Co. Ltd. | 18,200 | 127,000 | ||||||
Sumco Corp. | 57,200 | 839,862 | ||||||
Tokyo Seimitsu Co. Ltd. | 10,400 | 356,714 | ||||||
ULVAC Inc. | 10,400 | 571,688 | ||||||
|
| |||||||
| 4,256,407 | ||||||||
SOFTWARE — 1.47% |
| |||||||
Broadleaf Co. Ltd. | 10,400 | 77,296 | ||||||
Capcom Co. Ltd. | 10,400 | 258,063 | ||||||
COLOPL Inc.a | 13,000 | 160,167 | ||||||
Fuji Soft Inc. | 5,200 | 155,442 | ||||||
GungHo Online Entertainment Inc. | 98,800 | 295,341 | ||||||
SCHEDULESOF INVESTMENTS | 33 |
Table of Contents
Schedule of Investments (Continued)
iSHARES® MSCI JAPAN SMALL-CAP ETF
August 31, 2017
| Security | Shares | Value | ||||||
Justsystems Corp. | 7,800 | $ | 174,129 | |||||
Koei Tecmo Holdings Co. Ltd. | 10,440 | 221,966 | ||||||
Marvelous Inc.a | 7,800 | 70,729 | ||||||
Miroku Jyoho Service Co. Ltd. | 5,200 | 117,456 | ||||||
MTI Ltd. | 7,800 | 52,090 | ||||||
NSD Co. Ltd. | 10,400 | 191,917 | ||||||
OBIC Business Consultants Co. Ltd. | 2,600 | 133,000 | ||||||
Square Enix Holdings Co. Ltd. | 23,400 | 821,743 | ||||||
Systena Corp. | 2,600 | 60,641 | ||||||
|
| |||||||
| 2,789,980 | ||||||||
SPECIALTY RETAIL — 2.83% |
| |||||||
Adastria Co. Ltd. | 5,200 | 114,668 | ||||||
Alpen Co. Ltd. | 5,200 | 103,707 | ||||||
AOKI Holdings Inc. | 10,400 | 138,339 | ||||||
Aoyama Trading Co. Ltd. | 13,000 | 476,013 | ||||||
Arcland Sakamoto Co. Ltd. | 5,200 | 73,753 | ||||||
Asahi Co. Ltd. | 5,200 | 58,161 | ||||||
Autobacs Seven Co. Ltd. | 18,200 | 299,971 | ||||||
BIC Camera Inc. | 23,400 | 278,733 | ||||||
Chiyoda Co. Ltd. | 5,200 | 131,772 | ||||||
DCM Holdings Co. Ltd. | 26,000 | 233,873 | ||||||
EDION Corp.a | 18,200 | 174,790 | ||||||
Geo Holdings Corp. | 7,800 | 110,345 | ||||||
IDOM Inc.a | 15,600 | 101,628 | ||||||
JINS Inc. | 2,600 | 152,372 | ||||||
Joshin Denki Co. Ltd. | 6,000 | 93,222 | ||||||
Joyful Honda Co. Ltd. | 7,800 | 217,572 | ||||||
K’s Holdings Corp. | 20,800 | 464,532 | ||||||
Keiyo Co. Ltd. | 7,800 | 53,224 | ||||||
Kohnan Shoji Co. Ltd. | 7,800 | 145,993 | ||||||
Komeri Co. Ltd. | 7,800 | 226,431 | ||||||
Laox Co. Ltd.a,b | 7,800 | 34,939 | ||||||
Nishimatsuya Chain Co. Ltd. | 13,000 | 136,189 | ||||||
Nojima Corp. | 7,800 | 149,041 | ||||||
PAL GROUP Holdings Co. Ltd. | 2,600 | 82,800 | ||||||
PC Depot Corp.a | 10,440 | 76,076 | ||||||
Right On Co. Ltd.a | 2,600 | 21,497 | ||||||
Sac’s Bar Holdings Inc. | 5,200 | 61,610 | ||||||
Sanrio Co. Ltd. | 13,000 | 237,062 | ||||||
Shimachu Co. Ltd. | 10,400 | 267,890 | ||||||
T-Gaia Corp. | 5,200 | 102,006 | ||||||
United Arrows Ltd. | 5,200 | 173,396 | ||||||
VT Holdings Co. Ltd. | 20,800 | 114,149 | ||||||
Xebio Holdings Co. Ltd. | 5,200 | 102,479 | ||||||
Yellow Hat Ltd. | 5,200 | 144,103 | ||||||
|
| |||||||
| 5,352,336 | ||||||||
| Security | Shares | Value | ||||||
TECHNOLOGY HARDWARE, STORAGE & PERIPHERALS — 0.62% |
| |||||||
Eizo Corp. | 5,200 | $ | 216,864 | |||||
Elecom Co. Ltd. | 2,600 | 54,381 | ||||||
Hitachi Maxell Ltd. | 10,400 | 248,235 | ||||||
MCJ Co. Ltd. | 7,800 | 91,068 | ||||||
Melco Holdings Inc. | 2,600 | 83,273 | ||||||
Riso Kagaku Corp. | 5,200 | 98,510 | ||||||
Roland DG Corp. | 2,600 | 64,350 | ||||||
Toshiba TEC Corp. | 26,000 | 146,466 | ||||||
Wacom Co. Ltd. | 36,400 | 168,341 | ||||||
|
| |||||||
| 1,171,488 | ||||||||
TEXTILES, APPAREL & LUXURY GOODS — 1.14% |
| |||||||
Descente Ltd. | 10,400 | 133,142 | ||||||
Fujibo Holdings Inc. | 2,600 | 79,375 | ||||||
Goldwin Inc. | 1,000 | 71,506 | ||||||
Gunze Ltd. | 52,000 | 231,983 | ||||||
Japan Wool Textile Co. Ltd. (The) | 18,200 | 156,269 | ||||||
Kurabo Industries Ltd. | 52,000 | 133,709 | ||||||
Onward Holdings Co. Ltd. | 26,000 | 190,642 | ||||||
Seiko Holdings Corp. | 26,000 | 117,881 | ||||||
Seiren Co. Ltd. | 13,000 | 230,565 | ||||||
TSI Holdings Co. Ltd. | 18,200 | 131,961 | ||||||
Tsutsumi Jewelry Co. Ltd. | 2,600 | 44,932 | ||||||
Unitika Ltd.b | 156,000 | 114,810 | ||||||
Wacoal Holdings Corp. | 26,000 | 370,416 | ||||||
Yondoshi Holdings Inc. | 5,200 | 145,048 | ||||||
|
| |||||||
| 2,152,239 | ||||||||
TRADING COMPANIES & DISTRIBUTORS — 2.54% |
| |||||||
Hanwa Co. Ltd. | 52,000 | 349,155 | ||||||
Inaba Denki Sangyo Co. Ltd. | 7,800 | 318,208 | ||||||
Inabata & Co. Ltd. | 10,400 | 149,112 | ||||||
Iwatani Corp. | 52,000 | 315,137 | ||||||
Japan Pulp & Paper Co. Ltd. | 26,000 | 109,141 | ||||||
Kamei Corp. | 5,200 | 77,013 | ||||||
Kanamoto Co. Ltd. | 7,800 | 277,812 | ||||||
Kanematsu Corp. | 104,000 | 244,739 | ||||||
Kuroda Electric Co. Ltd. | 7,800 | 137,134 | ||||||
MonotaRO Co. Ltd.a | 15,600 | 476,958 | ||||||
Nagase & Co. Ltd. | 28,600 | 477,879 | ||||||
Nippon Steel & Sumikin Bussan Corp. | 2,744 | 147,846 | ||||||
Nishio Rent All Co. Ltd. | 5,200 | 175,759 | ||||||
Sojitz Corp. | 319,800 | 857,178 | ||||||
Trusco Nakayama Corp. | 10,400 | 243,794 | ||||||
Wakita & Co. Ltd. | 10,400 | 120,763 | ||||||
| 34 | 2017 iSHARES ANNUAL REPORTTO SHAREHOLDERS |
Table of Contents
Schedule of Investments (Continued)
iSHARES® MSCI JAPAN SMALL-CAP ETF
August 31, 2017
| Security | Shares | Value | ||||||
Yamazen Corp. | 15,600 | $ | 158,183 | |||||
Yuasa Trading Co. Ltd. | 5,200 | 175,286 | ||||||
|
| |||||||
| 4,811,097 | ||||||||
TRANSPORTATION INFRASTRUCTURE — 0.32% |
| |||||||
Mitsubishi Logistics Corp.a | 26,000 | 314,192 | ||||||
Nissin Corp. | 26,000 | 127,331 | ||||||
Sumitomo Warehouse Co. Ltd. (The) | 26,000 | 171,270 | ||||||
|
| |||||||
| 612,793 | ||||||||
WIRELESS TELECOMMUNICATION SERVICES — 0.02% |
| |||||||
Japan Communications Inc.a,b | 31,200 | 40,538 | ||||||
|
| |||||||
| 40,538 | ||||||||
|
| |||||||
TOTAL COMMON STOCKS |
| 188,784,977 | ||||||
SHORT-TERM INVESTMENTS — 5.01% |
| |||||||
MONEY MARKET FUNDS — 5.01% |
| |||||||
BlackRock Cash Funds: Institutional, |
| |||||||
1.32%c,d,e | 9,394,924 | 9,397,742 | ||||||
| Security | Shares | Value | ||||||
BlackRock Cash Funds: Treasury, |
| |||||||
0.96%c,d | 78,081 | $ | 78,081 | |||||
|
| |||||||
| 9,475,823 | ||||||||
|
| |||||||
TOTAL SHORT-TERM INVESTMENTS |
| 9,475,823 | ||||||
|
| |||||||
TOTAL INVESTMENTS | 198,260,800 | |||||||
Other Assets, Less Liabilities — (4.78)% |
| (9,044,838 | ) | |||||
|
| |||||||
NET ASSETS — 100.00% | $ | 189,215,962 | ||||||
|
| |||||||
| a | All or a portion of this security represents a security on loan. See Note 1. |
| b | Non-income earning security. |
| c | Affiliated issuer. See Schedule 1. |
| d | The rate quoted is the annualized seven-day yield of the fund at period end. |
| e | All or a portion of this security represents an investment of securities lending collateral. See Note 1. |
| f | The cost of investments (including short positions and derivatives, if any) for federal income tax purposes was $186,365,090. Net unrealized appreciation was $11,895,710, of which $22,546,731 represented gross unrealized appreciation on investments and $10,651,021 represented gross unrealized depreciation on investments. |
Schedule 1 — Affiliates (Note 2)
Investments in issuers considered to be affiliates of the Fund during the year ended August 31, 2017, for purposes of Section 2(a)(3) of the 1940 Act, and/or related parties of the Fund were as follows:
| Affiliated issuer | Shares held at 08/31/16 | Shares purchased | Shares sold | Shares held at 08/31/17 | Value at 08/31/17 | Net realized gain (loss) a | Change in unrealized appreciation (depreciation) | Income | ||||||||||||||||||||||||
BlackRock Cash | ||||||||||||||||||||||||||||||||
Funds: Institutional, | ||||||||||||||||||||||||||||||||
SL Agency Shares | 6,934,592 | 2,460,332b | — | 9,394,924 | $ | 9,397,742 | $ | 279 | $ | 1,228 | $ | —c | ||||||||||||||||||||
BlackRock Cash | ||||||||||||||||||||||||||||||||
Funds: Treasury, | ||||||||||||||||||||||||||||||||
SL Agency Shares | 14,128 | 63,953b | — | 78,081 | 78,081 | 1 | — | 436 | ||||||||||||||||||||||||
|
|
|
|
|
|
|
| |||||||||||||||||||||||||
| $ | 9,475,823 | $ | 280 | $ | 1,228 | $ | 436 | |||||||||||||||||||||||||
|
|
|
|
|
|
|
| |||||||||||||||||||||||||
| a | Includes realized capital gain distributions from an affiliated fund, if any. |
| b | Net of shares purchased and sold. |
| c | Does not include income earned on the investment of securities lending cash collateral which is not direct income of the Fund and is reflected as a component of securities lending income in the statement of operations. |
SCHEDULESOF INVESTMENTS | 35 |
Table of Contents
Schedule of Investments (Continued)
iSHARES® MSCI JAPAN SMALL-CAP ETF
August 31, 2017
Schedule 2 — Fair Value Measurements
Various inputs are used in determining the fair value of financial instruments. For description of the input levels and information about the Fund’s policy regarding valuation of financial instruments, see Note 1.
The following table summarizes the value of the Fund’s investments according to the fair value hierarchy as of August 31, 2017. The breakdown of the Fund’s investments into major categories is disclosed in the schedule of investments above.
| Level 1 | Level 2 | Level 3 | Total | |||||||||||||
Investments: | ||||||||||||||||
Assets: | ||||||||||||||||
Common stocks | $ | 188,784,977 | $ | — | $ | — | $ | 188,784,977 | ||||||||
Money market funds | 9,475,823 | — | — | 9,475,823 | ||||||||||||
|
|
|
|
|
|
|
| |||||||||
Total | $ | 198,260,800 | $ | — | $ | — | $ | 198,260,800 | ||||||||
|
|
|
|
|
|
|
| |||||||||
See notes to financial statements.
| 36 | 2017 iSHARES ANNUAL REPORTTO SHAREHOLDERS |
Table of Contents
Schedule of Investments
August 31, 2017
| Security | Shares | Value | ||||||
COMMON STOCKS — 99.73% |
| |||||||
AIRLINES — 1.03% |
| |||||||
AirAsia Bhd | 5,793,700 | $ | 4,504,176 | |||||
|
| |||||||
| 4,504,176 | ||||||||
AUTOMOBILES — 0.58% |
| |||||||
UMW Holdings Bhda | 1,795,400 | 2,556,148 | ||||||
|
| |||||||
| 2,556,148 | ||||||||
BANKS — 31.33% |
| |||||||
Alliance Financial Group Bhd | 3,873,300 | 3,482,841 | ||||||
AMMB Holdings Bhd | 6,385,437 | 6,399,642 | ||||||
CIMB Group Holdings Bhd | 15,700,212 | 26,029,154 | ||||||
Hong Leong Bank Bhd | 2,504,840 | 9,056,253 | ||||||
Hong Leong Financial Group Bhd | 887,400 | 3,511,781 | ||||||
Malayan Banking Bhd | 13,858,881 | 30,700,155 | ||||||
Public Bank Bhd | 11,222,080 | 54,132,970 | ||||||
RHB Bank Bhd | 3,091,802 | 3,656,152 | ||||||
RHB Bank Bhd Newa,b | 1,621,200 | 4 | ||||||
|
| |||||||
| 136,968,952 | ||||||||
CHEMICALS — 3.55% |
| |||||||
Petronas Chemicals Group Bhd | 9,250,300 | 15,509,226 | ||||||
|
| |||||||
| 15,509,226 | ||||||||
CONSTRUCTION & ENGINEERING — 3.88% |
| |||||||
Gamuda Bhd | 6,573,300 | 8,219,511 | ||||||
IJM Corp. Bhd | 11,156,180 | 8,725,358 | ||||||
|
| |||||||
| 16,944,869 | ||||||||
DIVERSIFIED TELECOMMUNICATION SERVICES — 1.49% |
| |||||||
Telekom Malaysia Bhd | 4,342,400 | 6,538,258 | ||||||
|
| |||||||
| 6,538,258 | ||||||||
ELECTRIC UTILITIES — 10.01% |
| |||||||
Tenaga Nasional Bhd | 13,086,812 | 43,760,608 | ||||||
|
| |||||||
| 43,760,608 | ||||||||
ENERGY EQUIPMENT & SERVICES — 2.40% |
| |||||||
Dialog Group Bhd | 11,722,754 | 5,627,361 | ||||||
Sapura Energy Bhd | 15,001,700 | 4,847,757 | ||||||
|
| |||||||
| 10,475,118 | ||||||||
FOOD PRODUCTS — 7.18% |
| |||||||
Felda Global Ventures Holdings Bhdc | 5,606,600 | 2,034,944 | ||||||
Genting Plantations Bhd | 929,000 | 2,314,614 | ||||||
IOI Corp. Bhd | 8,716,930 | 9,267,033 | ||||||
Kuala Lumpur Kepong Bhd | 1,852,100 | 10,642,907 | ||||||
PPB Group Bhd | 1,826,466 | 7,133,931 | ||||||
|
| |||||||
| 31,393,429 | ||||||||
| Security | Shares | Value | ||||||
GAS UTILITIES — 2.63% |
| |||||||
Petronas Gas Bhd | 2,669,900 | $ | 11,503,608 | |||||
|
| |||||||
| 11,503,608 | ||||||||
HEALTH CARE EQUIPMENT & SUPPLIES — 0.92% |
| |||||||
Hartalega Holdings Bhd | 2,532,900 | 4,027,255 | ||||||
|
| |||||||
| 4,027,255 | ||||||||
HEALTH CARE PROVIDERS & SERVICES — 2.54% |
| |||||||
IHH Healthcare Bhd | 7,931,000 | 11,124,386 | ||||||
|
| |||||||
| 11,124,386 | ||||||||
HOTELS, RESTAURANTS & LEISURE — 8.14% |
| |||||||
Genting Bhd | 8,739,100 | 19,870,428 | ||||||
Genting Malaysia Bhd | 11,443,400 | 15,729,483 | ||||||
|
| |||||||
| 35,599,911 | ||||||||
INDUSTRIAL CONGLOMERATES — 5.59% |
| |||||||
HAP Seng Consolidated Bhd | 2,399,000 | 5,100,789 | ||||||
Sime Darby Bhd | 9,174,355 | 19,334,784 | ||||||
|
| |||||||
| 24,435,573 | ||||||||
MARINE — 2.05% |
| |||||||
MISC Bhd | 5,158,020 | 8,986,224 | ||||||
|
| |||||||
| 8,986,224 | ||||||||
MEDIA — 0.86% |
| |||||||
Astro Malaysia Holdings Bhd | 6,024,000 | 3,780,429 | ||||||
|
| |||||||
| 3,780,429 | ||||||||
MULTI-UTILITIES — 1.88% |
| |||||||
YTL Corp. Bhd | 16,830,912 | 5,635,922 | ||||||
YTL Power International Bhd | 7,826,800 | 2,584,191 | ||||||
|
| |||||||
| 8,220,113 | ||||||||
OIL, GAS & CONSUMABLE FUELS — 1.26% |
| |||||||
Petronas Dagangan Bhd | 962,200 | 5,497,642 | ||||||
|
| |||||||
| 5,497,642 | ||||||||
REAL ESTATE MANAGEMENT & DEVELOPMENT — 0.68% |
| |||||||
IOI Properties Group Bhd | 6,378,825 | 2,972,453 | ||||||
|
| |||||||
| 2,972,453 | ||||||||
TOBACCO — 1.31% |
| |||||||
British American Tobacco Malaysia Bhd | 553,100 | 5,722,037 | ||||||
|
| |||||||
| 5,722,037 | ||||||||
TRANSPORTATION INFRASTRUCTURE — 2.33% |
| |||||||
Malaysia Airports Holdings Bhd | 3,195,500 | 6,734,457 | ||||||
Westports Holdings Bhd | 3,938,000 | 3,458,026 | ||||||
|
| |||||||
| 10,192,483 | ||||||||
WIRELESS TELECOMMUNICATION SERVICES — 8.09% |
| |||||||
Axiata Group Bhd | 10,378,500 | 11,981,268 | ||||||
SCHEDULESOF INVESTMENTS | 37 |
Table of Contents
Schedule of Investments (Continued)
iSHARES® MSCI MALAYSIA ETF
August 31, 2017
| Security | Shares | Value | ||||||
DiGi.Com Bhdc | 11,986,800 | $ | 13,585,321 | |||||
Maxis Bhdc | 7,232,200 | 9,788,576 | ||||||
|
| |||||||
| 35,355,165 | ||||||||
|
| |||||||
TOTAL COMMON STOCKS |
| |||||||
(Cost: $298,898,242) |
| 436,068,063 | ||||||
SHORT-TERM INVESTMENTS — 2.98% |
| |||||||
MONEY MARKET FUNDS — 2.98% |
| |||||||
BlackRock Cash Funds: Institutional, |
| |||||||
1.32%d,e,f | 12,721,787 | 12,725,604 | ||||||
BlackRock Cash Funds: Treasury, |
| |||||||
0.96%d,e | 290,485 | 290,485 | ||||||
|
| |||||||
| 13,016,089 | ||||||||
|
| |||||||
TOTAL SHORT-TERM INVESTMENTS |
| |||||||
(Cost: $13,013,454) |
| 13,016,089 | ||||||
|
| |||||||
| Value | ||||||||
TOTAL INVESTMENTS |
| |||||||
(Cost: $311,911,696)g | $ | 449,084,152 | ||||||
Other Assets, Less Liabilities — (2.71)% |
| (11,860,277 | ) | |||||
|
| |||||||
NET ASSETS — 100.00% | $ | 437,223,875 | ||||||
|
| |||||||
| a | Non-income earning security. |
| b | Security is valued using significant unobservable inputs and is classified as Level 3 in the fair value hierarchy. |
| c | All or a portion of this security represents a security on loan. See Note 1. |
| d | Affiliated issuer. See Schedule 1. |
| e | The rate quoted is the annualized seven-day yield of the fund at period end. |
| f | All or a portion of this security represents an investment of securities lending collateral. See Note 1. |
| g | The cost of investments (including short positions and derivatives, if any) for federal income tax purposes was $338,581,758. Net unrealized appreciation was $110,502,394, of which $140,542,968 represented gross unrealized appreciation on investments and $30,040,574 represented gross unrealized depreciation on investments. |
Schedule 1 — Affiliates (Note 2)
Investments in issuers considered to be affiliates of the Fund during the year ended August 31, 2017, for purposes of Section 2(a)(3) of the 1940 Act, and/or related parties of the Fund were as follows:
| Affiliated issuer | Shares held at 08/31/16 | Shares purchased | Shares sold | Shares held at 08/31/17 | Value at 08/31/17 | Net realized gain (loss) a | Change in unrealized appreciation (depreciation) | Income | ||||||||||||||||||||||||
BlackRock Cash | ||||||||||||||||||||||||||||||||
Funds: Institutional, | ||||||||||||||||||||||||||||||||
SL Agency Shares | 25,872,953 | — | (13,151,166 | )b | 12,721,787 | $ | 12,725,604 | $ | 768 | $ | 2,635 | $ | —c | |||||||||||||||||||
BlackRock Cash | ||||||||||||||||||||||||||||||||
Funds: Treasury, | ||||||||||||||||||||||||||||||||
SL Agency Shares | 228,825 | 61,660 | b | — | 290,485 | 290,485 | 5 | — | 1,824 | |||||||||||||||||||||||
|
|
|
|
|
|
|
| |||||||||||||||||||||||||
| $ | 13,016,089 | $ | 773 | $ | 2,635 | $ | 1,824 | |||||||||||||||||||||||||
|
|
|
|
|
|
|
| |||||||||||||||||||||||||
| a | Includes realized capital gain distributions from an affiliated fund, if any. |
| b | Net of shares purchased and sold. |
| c | Does not include income earned on the investment of securities lending cash collateral which is not direct income of the Fund and is reflected as a component of securities lending income in the statement of operations. |
| 38 | 2017 iSHARES ANNUAL REPORTTO SHAREHOLDERS |
Table of Contents
Schedule of Investments (Continued)
iSHARES® MSCI MALAYSIA ETF
August 31, 2017
Schedule 2 — Fair Value Measurements
Various inputs are used in determining the fair value of financial instruments. For description of the input levels and information about the Fund’s policy regarding valuation of financial instruments, see Note 1.
The following table summarizes the value of the Fund’s investments according to the fair value hierarchy as of August 31, 2017. The breakdown of the Fund’s investments into major categories is disclosed in the schedule of investments above.
| Level 1 | Level 2 | Level 3 | Total | |||||||||||||
Investments: | ||||||||||||||||
Assets: | ||||||||||||||||
Common stocks | $ | 436,068,059 | $ | — | $ | 4 | $ | 436,068,063 | ||||||||
Money market funds | 13,016,089 | — | — | 13,016,089 | ||||||||||||
|
|
|
|
|
|
|
| |||||||||
Total | $ | 449,084,148 | $ | — | $ | 4 | $ | 449,084,152 | ||||||||
|
|
|
|
|
|
|
| |||||||||
See notes to financial statements.
SCHEDULESOF INVESTMENTS | 39 |
Table of Contents
Schedule of Investments
iSHARES® MSCI PACIFIC ex JAPAN ETF
August 31, 2017
| Security | Shares | Value | ||||||
COMMON STOCKS — 99.21% |
| |||||||
AUSTRALIA — 58.03% |
| |||||||
AGL Energy Ltd. | 1,217,740 | $ | 23,170,745 | |||||
Alumina Ltd. | 4,459,150 | 7,497,960 | ||||||
Amcor Ltd./Australia | 2,099,562 | 26,827,452 | ||||||
AMP Ltd. | 5,355,473 | 21,663,229 | ||||||
APA Group | 2,019,281 | 14,190,107 | ||||||
Aristocrat Leisure Ltd. | 981,997 | 16,488,692 | ||||||
ASX Ltd. | 350,720 | 15,210,525 | ||||||
Aurizon Holdings Ltd. | 3,732,353 | 14,683,161 | ||||||
AusNet Services | 3,254,667 | 4,491,702 | ||||||
Australia & New Zealand Banking Group Ltd. | 5,321,857 | 124,098,265 | ||||||
Bank of Queensland Ltd. | 704,533 | 7,035,294 | ||||||
Bendigo & Adelaide Bank Ltd. | 864,292 | 8,191,880 | ||||||
BGP Holdings PLCa,b | 27,004,595 | 321 | ||||||
BHP Billiton Ltd. | 5,821,043 | 126,412,328 | ||||||
BlueScope Steel Ltd. | 1,038,006 | 8,949,208 | ||||||
Boral Ltd. | 2,117,601 | 11,202,763 | ||||||
Brambles Ltd. | 2,886,027 | 21,311,070 | ||||||
Caltex Australia Ltd. | 473,866 | 12,549,521 | ||||||
Challenger Ltd./Australia | 1,051,235 | 10,455,686 | ||||||
CIMIC Group Ltd. | 175,824 | 5,864,072 | ||||||
Coca-Cola Amatil Ltd. | 1,039,209 | 6,635,199 | ||||||
Cochlear Ltd. | 103,666 | 12,844,002 | ||||||
Commonwealth Bank of Australia | 3,136,515 | 188,569,631 | ||||||
Computershare Ltd. | 841,023 | 9,372,153 | ||||||
Crown Resorts Ltd. | 723,297 | 6,654,721 | ||||||
CSL Ltd. | 825,597 | 84,157,728 | ||||||
Dexus | 1,838,863 | 13,986,954 | ||||||
Domino’s Pizza Enterprises Ltd.c | 113,072 | 3,869,823 | ||||||
Flight Centre Travel Group Ltd.c | 100,911 | 3,869,815 | ||||||
Fortescue Metals Group Ltd. | 2,816,636 | 13,426,424 | ||||||
Goodman Group | 3,234,814 | 21,269,585 | ||||||
GPT Group (The) | 3,265,072 | 12,948,455 | ||||||
Harvey Norman Holdings Ltd. | 1,015,495 | 3,286,193 | ||||||
Healthscope Ltd. | 3,173,067 | 4,379,088 | ||||||
Incitec Pivot Ltd. | 3,056,016 | 8,071,515 | ||||||
Insurance Australia Group Ltd. | 4,293,791 | 21,830,019 | ||||||
James Hardie Industries PLC | 797,712 | 11,192,552 | ||||||
LendLease Group | 998,072 | 13,125,068 | ||||||
Macquarie Group Ltd. | 586,694 | 40,391,181 | ||||||
| Security | Shares | Value | ||||||
Medibank Pvt Ltd. | 4,992,646 | $ | 12,038,144 | |||||
Mirvac Group | 6,691,342 | 12,312,788 | ||||||
National Australia Bank Ltd. | 4,850,002 | 116,172,688 | ||||||
Newcrest Mining Ltd. | 1,389,645 | 25,185,191 | ||||||
Oil Search Ltd. | 2,492,535 | 13,265,358 | ||||||
Orica Ltd. | 678,815 | 10,945,711 | ||||||
Origin Energy Ltd.b | 3,181,011 | 19,301,088 | ||||||
Qantas Airways Ltd. | 831,944 | 3,774,377 | ||||||
QBE Insurance Group Ltd. | 2,486,545 | 20,589,794 | ||||||
Ramsay Health Care Ltd. | 257,091 | 13,929,205 | ||||||
REA Group Ltd.c | 95,834 | 5,039,510 | ||||||
Rio Tinto Ltd. | 769,176 | 41,387,266 | ||||||
Santos Ltd.b | 3,403,458 | 10,149,939 | ||||||
Scentre Group | 9,657,673 | 29,567,525 | ||||||
Seek Ltd. | 597,316 | 7,935,497 | ||||||
Sonic Healthcare Ltd. | 715,532 | 12,428,776 | ||||||
South32 Ltd. | 9,649,118 | 22,347,330 | ||||||
Stockland | 4,372,660 | 15,364,011 | ||||||
Suncorp Group Ltd. | 2,340,971 | 24,193,329 | ||||||
Sydney Airport | 1,996,006 | 11,715,174 | ||||||
Tabcorp Holdings Ltd. | 1,537,620 | 5,012,403 | ||||||
Tatts Group Ltd. | 2,399,970 | 7,823,531 | ||||||
Telstra Corp. Ltd. | 7,559,139 | 22,003,591 | ||||||
TPG Telecom Ltd.c | 677,165 | 2,948,642 | ||||||
Transurban Group | 3,722,298 | 35,900,450 | ||||||
Treasury Wine Estates Ltd. | 1,335,161 | 15,334,068 | ||||||
Vicinity Centres | 6,100,974 | 12,678,143 | ||||||
Wesfarmers Ltd. | 2,055,826 | 69,495,227 | ||||||
Westfield Corp. | 3,587,564 | 21,141,882 | ||||||
Westpac Banking Corp. | 6,084,658 | 150,910,421 | ||||||
Woodside Petroleum Ltd. | 1,374,861 | 31,438,268 | ||||||
Woolworths Ltd. | 2,346,975 | 48,399,067 | ||||||
|
| |||||||
| 1,810,902,481 | ||||||||
HONG KONG — 29.09% |
| |||||||
AIA Group Ltd. | 21,892,014 | 167,970,848 | ||||||
ASM Pacific Technology Ltd. | 485,800 | 6,008,527 | ||||||
Bank of East Asia Ltd. (The)c | 2,185,320 | 10,010,122 | ||||||
BOC Hong Kong Holdings Ltd. | 6,709,500 | 34,162,816 | ||||||
Cheung Kong Property Holdings Ltd. | 4,738,732 | 41,596,239 | ||||||
CK Hutchison Holdings Ltd. | 4,892,232 | 64,009,169 | ||||||
CK Infrastructure Holdings Ltd. | 1,206,708 | 10,931,597 | ||||||
CLP Holdings Ltd. | 2,981,500 | 31,485,664 | ||||||
First Pacific Co. Ltd./Hong Kong | 3,970,500 | 3,191,031 | ||||||
| 40 | 2017 iSHARES ANNUAL REPORTTO SHAREHOLDERS |
Table of Contents
Schedule of Investments (Continued)
iSHARES® MSCI PACIFIC ex JAPAN ETF
August 31, 2017
| Security | Shares | Value | ||||||
Galaxy Entertainment Group Ltd. | 4,259,000 | $ | 26,719,253 | |||||
Hang Lung Group Ltd. | 1,590,000 | 5,993,139 | ||||||
Hang Lung Properties Ltd. | 3,631,736 | 8,835,200 | ||||||
Hang Seng Bank Ltd. | 1,396,800 | 32,124,910 | ||||||
Henderson Land Development Co. Ltd. | 2,180,002 | 13,509,330 | ||||||
HK Electric Investments & HK Electric Investments Ltd.d | 4,861,500 | 4,459,949 | ||||||
HKT Trust & HKT Ltd. | 6,802,338 | 8,778,388 | ||||||
Hong Kong & China Gas Co. Ltd. | 15,217,237 | 28,776,151 | ||||||
Hong Kong Exchanges & Clearing Ltd. | 2,108,800 | 57,553,511 | ||||||
Hongkong Land Holdings Ltd. | 2,140,900 | 15,864,069 | ||||||
Hysan Development Co. Ltd. | 1,139,830 | 5,272,102 | ||||||
I-CABLE Communications Ltd.b | 1,750,368 | 64,858 | ||||||
Jardine Matheson Holdings Ltd. | 393,200 | 25,837,172 | ||||||
Jardine Strategic Holdings Ltd. | 401,700 | 17,614,545 | ||||||
Kerry Properties Ltd. | 1,168,500 | 4,628,344 | ||||||
Li & Fung Ltd. | 10,739,200 | 4,843,751 | ||||||
Link REIT | 4,009,086 | 33,091,243 | ||||||
Melco Resorts & Entertainment Ltd. ADR | 448,354 | 9,841,370 | ||||||
MGM China Holdings Ltd.c | 1,707,200 | 3,420,311 | ||||||
MTR Corp. Ltd. | 2,675,286 | 15,638,551 | ||||||
New World Development Co. Ltd. | 10,607,921 | 14,502,713 | ||||||
NWS Holdings Ltd. | 2,771,000 | 5,324,999 | ||||||
PCCW Ltd. | 7,854,867 | 4,375,831 | ||||||
Power Assets Holdings Ltd. | 2,523,000 | 22,243,418 | ||||||
Sands China Ltd.c | 4,384,400 | 19,635,112 | ||||||
Shangri-La Asia Ltd. | 2,287,000 | 3,828,006 | ||||||
Sino Land Co. Ltd. | 5,724,800 | 9,904,081 | ||||||
SJM Holdings Ltd. | 3,532,000 | 3,082,312 | ||||||
Sun Hung Kai Properties Ltd. | 2,622,000 | 43,753,324 | ||||||
Swire Pacific Ltd. Class A | 902,500 | 9,184,768 | ||||||
Swire Properties Ltd. | 2,102,200 | 7,279,114 | ||||||
Techtronic Industries Co. Ltd. | 2,472,207 | 12,793,078 | ||||||
WH Group Ltd.d | 14,674,000 | 15,336,879 | ||||||
Wharf Holdings Ltd. (The) | 2,227,600 | 21,218,762 | ||||||
Wheelock & Co. Ltd. | 1,474,000 | 11,027,056 | ||||||
Wynn Macau Ltd. | 2,827,200 | 6,206,044 | ||||||
Yue Yuen Industrial Holdings Ltd. | 1,324,000 | 5,734,861 | ||||||
|
| |||||||
| 907,662,518 | ||||||||
| Security | Shares | Value | ||||||
NEW ZEALAND — 1.38% |
| |||||||
Auckland International Airport Ltd. | 1,725,961 | $ | 8,393,345 | |||||
Contact Energy Ltd. | 1,287,323 | 5,144,653 | ||||||
Fletcher Building Ltd. | 1,251,604 | 7,314,614 | ||||||
Mercury NZ Ltd. | 1,268,113 | 3,124,285 | ||||||
Meridian Energy Ltd. | 2,304,581 | 4,869,096 | ||||||
Ryman Healthcare Ltd. | 728,771 | 4,739,268 | ||||||
Spark New Zealand Ltd. | 3,318,987 | 9,306,184 | ||||||
|
| |||||||
| 42,891,445 | ||||||||
SINGAPORE — 10.71% |
| |||||||
Ascendas REIT | 4,526,225 | 8,865,802 | ||||||
CapitaLand Commercial Trust | 3,817,700 | 4,891,604 | ||||||
CapitaLand Ltd. | 4,679,600 | 13,025,691 | ||||||
CapitaLand Mall Trust | 4,568,900 | 7,300,820 | ||||||
City Developments Ltd. | 751,000 | 6,475,854 | ||||||
ComfortDelGro Corp. Ltd. | 3,950,900 | 6,662,416 | ||||||
DBS Group Holdings Ltd. | 3,225,900 | 48,982,370 | ||||||
Genting Singapore PLC | 10,976,600 | 9,578,256 | ||||||
Global Logistic Properties Ltd. | 4,834,200 | 11,533,732 | ||||||
Golden Agri-Resources Ltd. | 12,876,587 | 3,745,399 | ||||||
Hutchison Port Holdings Trustc | 9,516,700 | 4,330,098 | ||||||
Jardine Cycle & Carriage Ltd. | 176,400 | 5,186,783 | ||||||
Keppel Corp. Ltd. | 2,651,600 | 12,320,763 | ||||||
Oversea-Chinese Banking Corp. Ltd.c | 5,700,024 | 46,884,586 | ||||||
SATS Ltd. | 1,237,500 | 4,401,418 | ||||||
SembCorp Industries Ltd. | 1,811,840 | 3,975,908 | ||||||
Singapore Airlines Ltd. | 972,000 | 7,379,470 | ||||||
Singapore Exchange Ltd. | 1,471,400 | 8,126,289 | ||||||
Singapore Press Holdings Ltd.c | 2,364,117 | 4,804,833 | ||||||
Singapore Technologies Engineering Ltd. | 2,846,100 | 7,649,680 | ||||||
Singapore Telecommunications Ltd. | 14,856,028 | 40,476,659 | ||||||
StarHub Ltd.c | 1,075,300 | 2,066,666 | ||||||
Suntec REIT | 4,459,200 | 6,222,521 | ||||||
United Overseas Bank Ltd. | 2,382,000 | 42,149,823 | ||||||
UOL Group Ltd. | 879,700 | 5,298,929 | ||||||
Wilmar International Ltd. | 2,934,600 | 7,174,427 | ||||||
Yangzijiang Shipbuilding Holdings Ltd. | 4,216,400 | 4,641,766 | ||||||
|
| |||||||
| 334,152,563 | ||||||||
|
| |||||||
TOTAL COMMON STOCKS |
| |||||||
(Cost: $2,981,636,898) |
| 3,095,609,007 | ||||||
SCHEDULESOF INVESTMENTS | 41 |
Table of Contents
Schedule of Investments (Continued)
iSHARES® MSCI PACIFIC ex JAPAN ETF
August 31, 2017
| Security | Shares | Value | ||||||
SHORT-TERM INVESTMENTS — 1.46% |
| |||||||
MONEY MARKET FUNDS — 1.46% |
| |||||||
BlackRock Cash Funds: Institutional, |
| |||||||
1.32%e,f,g | 44,795,138 | $ | 44,808,577 | |||||
BlackRock Cash Funds: Treasury, |
| |||||||
0.96%e,f | 800,222 | 800,222 | ||||||
|
| |||||||
| 45,608,799 | ||||||||
|
| |||||||
TOTAL SHORT-TERM INVESTMENTS |
| |||||||
(Cost: $45,604,344) |
| 45,608,799 | ||||||
|
| |||||||
TOTAL INVESTMENTS |
| |||||||
(Cost: $3,027,241,242)h | 3,141,217,806 | |||||||
Other Assets, Less Liabilities — (0.67)% |
| (20,791,550 | ) | |||||
|
| |||||||
NET ASSETS — 100.00% | $ | 3,120,426,256 | ||||||
|
| |||||||
ADR — American Depositary Receipts
| a | Security is valued using significant unobservable inputs and is classified as Level 3 in the fair value hierarchy. |
| b | Non-income earning security. |
| c | All or a portion of this security represents a security on loan. See Note 1. |
| d | This security may be resold to qualified institutional buyers under Rule 144A of the Securities Act of 1933. |
| e | Affiliated issuer. See Schedule 1. |
| f | The rate quoted is the annualized seven-day yield of the fund at period end. |
| g | All or a portion of this security represents an investment of securities lending collateral. See Note 1. |
| h | The cost of investments (including short positions and derivatives, if any) for federal income tax purposes was $3,104,951,882. Net unrealized appreciation was $36,265,924, of which $370,963,150 represented gross unrealized appreciation on investments and $334,697,226 represented gross unrealized depreciation on investments. |
Schedule 1 — Affiliates (Note 2)
Investments in issuers considered to be affiliates of the Fund during the year ended August 31, 2017, for purposes of Section 2(a)(3) of the 1940 Act, and/or related parties of the Fund were as follows:
| Affiliated issuer | Shares held at 08/31/16 | Shares purchased | Shares sold | Shares held at 08/31/17 | Value at 08/31/17 | Net realized gain (loss) a | Change in unrealized appreciation (depreciation) | Income | ||||||||||||||||||||||||
BlackRock Cash | ||||||||||||||||||||||||||||||||
Funds: Institutional, | ||||||||||||||||||||||||||||||||
SL Agency Shares | 38,660,645 | 6,134,493 | b | — | 44,795,138 | $ | 44,808,577 | $ | 12,531 | $ | 4,455 | $ | —c | |||||||||||||||||||
BlackRock Cash | ||||||||||||||||||||||||||||||||
Funds: Treasury, | ||||||||||||||||||||||||||||||||
SL Agency Shares | 1,504,324 | — | (704,102 | )b | 800,222 | 800,222 | 30 | — | 12,555 | |||||||||||||||||||||||
|
|
|
|
|
|
|
| |||||||||||||||||||||||||
| $ | 45,608,799 | $ | 12,561 | $ | 4,455 | $ | 12,555 | |||||||||||||||||||||||||
|
|
|
|
|
|
|
| |||||||||||||||||||||||||
| a | Includes realized capital gain distributions from an affiliated fund, if any. |
| b | Net of shares purchased and sold. |
| c | Does not include income earned on the investment of securities lending cash collateral which is not direct income of the Fund and is reflected as a component of securities lending income in the statement of operations. |
| 42 | 2017 iSHARES ANNUAL REPORTTO SHAREHOLDERS |
Table of Contents
Schedule of Investments (Continued)
iSHARES® MSCI PACIFIC ex JAPAN ETF
August 31, 2017
Schedule 2 — Fair Value Measurements
Various inputs are used in determining the fair value of financial instruments. For description of the input levels and information about the Fund’s policy regarding valuation of financial instruments, see Note 1.
The following table summarizes the value of the Fund’s investments according to the fair value hierarchy as of August 31, 2017. The breakdown of the Fund’s investments into major categories is disclosed in the schedule of investments above.
| Level 1 | Level 2 | Level 3 | Total | |||||||||||||
Investments: | ||||||||||||||||
Assets: | ||||||||||||||||
Common stocks | $ | 3,095,608,686 | $ | — | $ | 321 | $ | 3,095,609,007 | ||||||||
Money market funds | 45,608,799 | — | — | 45,608,799 | ||||||||||||
|
|
|
|
|
|
|
| |||||||||
Total | $ | 3,141,217,485 | $ | — | $ | 321 | $ | 3,141,217,806 | ||||||||
|
|
|
|
|
|
|
| |||||||||
See notes to financial statements.
SCHEDULESOF INVESTMENTS | 43 |
Table of Contents
Schedule of Investments
iSHARES® MSCI SINGAPORE CAPPED ETF
August 31, 2017
| Security | Shares | Value | ||||||
COMMON STOCKS — 99.33% |
| |||||||
AEROSPACE & DEFENSE — 2.63% |
| |||||||
Singapore Technologies Engineering Ltd. | 5,871,200 | $ | 15,780,471 | |||||
|
| |||||||
| 15,780,471 | ||||||||
AIRLINES — 2.59% |
| |||||||
Singapore Airlines Ltd. | 2,044,567 | 15,522,449 | ||||||
|
| |||||||
| 15,522,449 | ||||||||
BANKS — 34.78% |
| |||||||
DBS Group Holdings Ltd. | 4,964,600 | 75,382,954 | ||||||
Oversea-Chinese Banking Corp. Ltd.a | 8,579,950 | 70,572,932 | ||||||
United Overseas Bank Ltd. | 3,549,600 | 62,810,669 | ||||||
|
| |||||||
| 208,766,555 | ||||||||
CAPITAL MARKETS — 2.76% |
| |||||||
Singapore Exchange Ltd. | 2,996,100 | 16,546,944 | ||||||
|
| |||||||
| 16,546,944 | ||||||||
DISTRIBUTORS — 2.06% |
| |||||||
Jardine Cycle & Carriage Ltd. | 421,444 | 12,391,943 | ||||||
|
| |||||||
| 12,391,943 | ||||||||
DIVERSIFIED TELECOMMUNICATION SERVICES — 9.97% |
| |||||||
Singapore Telecommunications Ltd. | 21,953,668 | 59,814,854 | ||||||
|
| |||||||
| 59,814,854 | ||||||||
EQUITY REAL ESTATE INVESTMENT TRUSTS (REITS) — 8.85% |
| |||||||
Ascendas REIT | 9,161,181 | 17,944,581 | ||||||
CapitaLand Commercial Trust | 5,000,500 | 6,407,121 | ||||||
CapitaLand Mall Trust | 9,521,300 | 15,214,449 | ||||||
Suntec REIT | 9,700,300 | 13,536,133 | ||||||
|
| |||||||
| 53,102,284 | ||||||||
FOOD PRODUCTS — 4.34% |
| |||||||
Golden Agri-Resources Ltd. | 30,530,328 | 8,880,324 | ||||||
Wilmar International Ltd. | 7,016,600 | 17,153,985 | ||||||
|
| |||||||
| 26,034,309 | ||||||||
HOTELS, RESTAURANTS & LEISURE — 3.31% |
| |||||||
Genting Singapore PLC | 22,758,400 | 19,859,134 | ||||||
|
| |||||||
| 19,859,134 | ||||||||
INDUSTRIAL CONGLOMERATES — 5.51% |
| |||||||
Keppel Corp. Ltd. | 5,161,600 | 23,983,576 | ||||||
SembCorp Industries Ltd. | 4,149,300 | 9,105,238 | ||||||
|
| |||||||
| 33,088,814 | ||||||||
| Security | Shares | Value | ||||||
MACHINERY — 1.79% |
| |||||||
Yangzijiang Shipbuilding Holdings Ltd. | 9,762,500 | $ | 10,747,377 | |||||
|
| |||||||
| 10,747,377 | ||||||||
MEDIA — 1.94% |
| |||||||
Singapore Press Holdings Ltd.a | 5,734,200 | 11,654,192 | ||||||
|
| |||||||
| 11,654,192 | ||||||||
REAL ESTATE MANAGEMENT & DEVELOPMENT — 12.18% |
| |||||||
CapitaLand Ltd. | 7,488,900 | 20,845,392 | ||||||
City Developments Ltd. | 1,627,000 | 14,029,580 | ||||||
Global Logistic Properties Ltd. | 11,016,100 | 26,282,889 | ||||||
UOL Group Ltd. | 1,989,200 | 11,982,074 | ||||||
|
| |||||||
| 73,139,935 | ||||||||
ROAD & RAIL — 2.32% |
| |||||||
ComfortDelGro Corp. Ltd. | 8,272,900 | 13,950,619 | ||||||
|
| |||||||
| 13,950,619 | ||||||||
TRANSPORTATION INFRASTRUCTURE — 3.33% |
| |||||||
Hutchison Port Holdings Trusta | 22,052,800 | 10,034,024 | ||||||
SATS Ltd. | 2,789,900 | 9,922,840 | ||||||
|
| |||||||
| 19,956,864 | ||||||||
WIRELESS TELECOMMUNICATION SERVICES — 0.97% |
| |||||||
StarHub Ltd.a | 3,042,000 | 5,846,554 | ||||||
|
| |||||||
| 5,846,554 | ||||||||
|
| |||||||
TOTAL COMMON STOCKS |
| |||||||
(Cost: $610,608,617) | 596,203,298 | |||||||
SHORT-TERM INVESTMENTS — 2.92% |
| |||||||
MONEY MARKET FUNDS — 2.92% |
| |||||||
BlackRock Cash Funds: Institutional, |
| |||||||
1.32%b,c,d | 17,309,109 | 17,314,302 | ||||||
BlackRock Cash Funds: Treasury, |
| |||||||
0.96%b,c | 226,142 | 226,142 | ||||||
|
| |||||||
| 17,540,444 | ||||||||
|
| |||||||
TOTAL SHORT-TERM INVESTMENTS |
| 17,540,444 | ||||||
|
| |||||||
| 44 | 2017 iSHARES ANNUAL REPORTTO SHAREHOLDERS |
Table of Contents
Schedule of Investments (Continued)
iSHARES® MSCI SINGAPORE CAPPED ETF
August 31, 2017
| Value | ||||||||
TOTAL INVESTMENTS | $ | 613,743,742 | ||||||
Other Assets, Less Liabilities — (2.25)% |
| (13,476,082 | ) | |||||
|
| |||||||
NET ASSETS — 100.00% | $ | 600,267,660 | ||||||
|
| |||||||
| a | All or a portion of this security represents a security on loan. See Note 1. |
| b | Affiliated issuer. See Schedule 1. |
| c | The rate quoted is the annualized seven-day yield of the fund at period end. |
| d | All or a portion of this security represents an investment of securities lending collateral. See Note 1. |
| e | The cost of investments (including short positions and derivatives, if any) for federal income tax purposes was $643,194,593. Net unrealized depreciation was $29,421,895, of which $43,071,866 represented gross unrealized appreciation on investments and $72,493,761 represented gross unrealized depreciation on investments. |
Schedule 1 — Affiliates (Note 2)
Investments in issuers considered to be affiliates of the Fund during the year ended August 31, 2017, for purposes of Section 2(a)(3) of the 1940 Act, and/or related parties of the Fund were as follows:
| Affiliated issuer | Shares held at 08/31/16 | Shares purchased | Shares sold | Shares held at 08/31/17 | Value at 08/31/17 | Net realized gain (loss) a | Change in unrealized appreciation (depreciation) | Income | ||||||||||||||||||||||||
BlackRock Cash | ||||||||||||||||||||||||||||||||
Funds: Institutional, | ||||||||||||||||||||||||||||||||
SL Agency Shares | 51,547,511 | — | (34,238,402 | )b | 17,309,109 | $ | 17,314,302 | $ | 1,512 | $ | 4,176 | $ | —c | |||||||||||||||||||
BlackRock Cash | ||||||||||||||||||||||||||||||||
Funds: Treasury, | ||||||||||||||||||||||||||||||||
SL Agency Shares | 748,216 | — | (522,074 | )b | 226,142 | 226,142 | 4 | — | 2,510 | |||||||||||||||||||||||
|
|
|
|
|
|
|
| |||||||||||||||||||||||||
| $ | 17,540,444 | $ | 1,516 | $ | 4,176 | $ | 2,510 | |||||||||||||||||||||||||
|
|
|
|
|
|
|
| |||||||||||||||||||||||||
| a | Includes realized capital gain distributions from an affiliated fund, if any. |
| b | Net of shares purchased and sold. |
| c | Does not include income earned on the investment of securities lending cash collateral which is not direct income of the Fund and is reflected as a component of securities lending income in the statement of operations. |
Schedule 2 — Futures Contracts (Note 5)
Futures contracts outstanding as of August 31, 2017 were as follows:
| Description | Number of Contracts | Expiration Date | Notional Amount (000) | Value/ Unrealized Appreciation (Depreciation) | ||||||||||||
Long Contracts: | ||||||||||||||||
MSCI Singapore Index | 146 | Sep 2017 | $ | 3,927 | $ | 28,956 | ||||||||||
|
| |||||||||||||||
SCHEDULESOF INVESTMENTS | 45 |
Table of Contents
Schedule of Investments (Continued)
iSHARES® MSCI SINGAPORE CAPPED ETF
August 31, 2017
Schedule 3 — Fair Value Measurements
Various inputs are used in determining the fair value of financial instruments. For description of the input levels and information about the Fund’s policy regarding valuation of financial instruments, see Note 1.
The following table summarizes the value of the Fund’s investments according to the fair value hierarchy as of August 31, 2017. The breakdown of the Fund’s investments into major categories is disclosed in the schedule of investments above.
| Level 1 | Level 2 | Level 3 | Total | |||||||||||||
Investments: | ||||||||||||||||
Assets: | ||||||||||||||||
Common stocks | $ | 596,203,298 | $ | — | $ | — | $ | 596,203,298 | ||||||||
Money market funds | 17,540,444 | — | — | 17,540,444 | ||||||||||||
|
|
|
|
|
|
|
| |||||||||
Total | $ | 613,743,742 | $ | — | $ | — | $ | 613,743,742 | ||||||||
|
|
|
|
|
|
|
| |||||||||
Derivative financial instrumentsa: | ||||||||||||||||
Assets: | ||||||||||||||||
Futures contracts | $ | 28,956 | $ | — | $ | — | $ | 28,956 | ||||||||
|
|
|
|
|
|
|
| |||||||||
Total | $ | 28,956 | $ | — | $ | — | $ | 28,956 | ||||||||
|
|
|
|
|
|
|
| |||||||||
| a | Shown at the unrealized appreciation (depreciation) on the contracts. |
See notes to financial statements.
| 46 | 2017 iSHARES ANNUAL REPORTTO SHAREHOLDERS |
Table of Contents
Schedule of Investments
iSHARES® MSCI TAIWAN CAPPED ETF
August 31, 2017
| Security | Shares | Value | ||||||
COMMON STOCKS — 99.18% |
| |||||||
AIRLINES — 0.52% |
| |||||||
China Airlines Ltd. | 24,192,761 | $ | 10,261,020 | |||||
EVA Airways Corp. | 17,650,278 | 9,182,192 | ||||||
|
| |||||||
| 19,443,212 | ||||||||
AUTO COMPONENTS — 0.70% |
| |||||||
Cheng Shin Rubber Industry Co. Ltd.a | 13,104,670 | 26,357,847 | ||||||
|
| |||||||
| 26,357,847 | ||||||||
AUTOMOBILES — 0.18% |
| |||||||
Yulon Motor Co. Ltd.a | 8,064,362 | 6,947,659 | ||||||
|
| |||||||
| 6,947,659 | ||||||||
BANKS — 10.17% |
| |||||||
Chang Hwa Commercial Bank Ltd. | 37,046,848 | 20,254,912 | ||||||
China Development Financial Holding Corp. | 95,760,508 | 29,890,453 | ||||||
CTBC Financial Holding Co. Ltd. | 113,904,325 | 73,787,387 | ||||||
E.Sun Financial Holding Co. Ltd. | 61,659,058 | 38,001,872 | ||||||
First Financial Holding Co. Ltd.a | 66,528,171 | 43,207,268 | ||||||
Hua Nan Financial Holdings Co. Ltd. | 52,920,746 | 29,547,519 | ||||||
Mega Financial Holding Co. Ltd. | 71,568,271 | 57,507,889 | ||||||
SinoPac Financial Holdings Co. Ltd. | 71,568,118 | 23,003,106 | ||||||
Taishin Financial Holding Co. Ltd. | 65,181,469 | 28,941,704 | ||||||
Taiwan Business Bank | 35,273,697 | 9,747,925 | ||||||
Taiwan Cooperative Financial Holding Co. Ltd. | 55,027,014 | 28,991,336 | ||||||
|
| |||||||
| 382,881,371 | ||||||||
BIOTECHNOLOGY — 0.39% |
| |||||||
TaiMed Biologics Inc.a,b | 2,016,000 | 14,495,908 | ||||||
|
| |||||||
| 14,495,908 | ||||||||
CAPITAL MARKETS — 0.78% |
| |||||||
Yuanta Financial Holding Co. Ltd. | 67,536,248 | 29,315,910 | ||||||
|
| |||||||
| 29,315,910 | ||||||||
CHEMICALS — 6.36% |
| |||||||
Formosa Chemicals & Fibre Corp. | 21,168,610 | 66,566,191 | ||||||
Formosa Plastics Corp. | 27,216,518 | 84,682,430 | ||||||
| Security | Shares | Value | ||||||
Nan Ya Plastics Corp. | 31,248,938 | $ | 78,901,523 | |||||
Taiwan Fertilizer Co. Ltd. | 7,056,000 | 9,410,650 | ||||||
|
| |||||||
| 239,560,794 | ||||||||
CONSTRUCTION MATERIALS — 1.12% |
| |||||||
Asia Cement Corp. | 17,136,136 | 15,529,783 | ||||||
Taiwan Cement Corp. | 23,184,504 | 26,772,920 | ||||||
|
| |||||||
| 42,302,703 | ||||||||
DIVERSIFIED FINANCIAL SERVICES — 2.36% |
| |||||||
Chailease Holding Co. Ltd.a | 7,056,937 | 19,221,320 | ||||||
Fubon Financial Holding Co. Ltd. | 43,344,515 | 69,658,007 | ||||||
|
| |||||||
| 88,879,327 | ||||||||
DIVERSIFIED TELECOMMUNICATION SERVICES — 2.51% |
| |||||||
Asia Pacific Telecom Co. Ltd.b | 20,160,000 | 6,913,947 | ||||||
Chunghwa Telecom Co. Ltd. | 25,200,648 | 87,679,116 | ||||||
|
| |||||||
| 94,593,063 | ||||||||
ELECTRICAL EQUIPMENT — 0.35% |
| |||||||
Teco Electric and Machinery Co. Ltd. | 14,112,092 | 13,186,686 | ||||||
Ya Hsin Industrial Co. Ltd.b,c | 6,845,461 | 2 | ||||||
|
| |||||||
| 13,186,688 | ||||||||
ELECTRONIC EQUIPMENT, INSTRUMENTS & COMPONENTS — 18.26% |
| |||||||
AU Optronics Corp.a | 60,480,830 | 24,850,469 | ||||||
Delta Electronics Inc. | 12,542,180 | 68,780,635 | ||||||
General Interface Solution Holding Ltd. | 1,008,000 | 12,074,356 | ||||||
Hon Hai Precision Industry Co. Ltd. | 99,792,003 | 388,533,760 | ||||||
Innolux Corp.a | 62,496,873 | 30,441,832 | ||||||
Largan Precision Co. Ltd. | 641,794 | 123,982,207 | ||||||
Pacific Electric Wire & Cable Co. Ltd.b,c | 197 | — | ||||||
Synnex Technology International Corp. | 11,088,364 | 12,382,049 | ||||||
WPG Holdings Ltd.a | 13,104,744 | 17,065,391 | ||||||
Zhen Ding Technology Holding Ltd.a | 4,032,072 | 9,339,005 | ||||||
|
| |||||||
| 687,449,704 | ||||||||
FOOD & STAPLES RETAILING — 0.90% |
| |||||||
President Chain Store Corp. | 4,032,215 | 33,736,515 | ||||||
|
| |||||||
| 33,736,515 | ||||||||
FOOD PRODUCTS — 2.12% |
| |||||||
Standard Foods Corp.a | 5,242,056 | 13,392,177 | ||||||
Uni-President Enterprises Corp. | 31,248,189 | 66,474,494 | ||||||
|
| |||||||
| 79,866,671 | ||||||||
SCHEDULESOF INVESTMENTS | 47 |
Table of Contents
Schedule of Investments (Continued)
iSHARES® MSCI TAIWAN CAPPED ETF
August 31, 2017
| Security | Shares | Value | ||||||
HOUSEHOLD DURABLES — 0.29% |
| |||||||
Nien Made Enterprise Co. Ltd. | 1,008,000 | $ | 10,838,530 | |||||
|
| |||||||
| 10,838,530 | ||||||||
INDUSTRIAL CONGLOMERATES — 0.49% |
| |||||||
Far Eastern New Century Corp. | 23,184,843 | 18,553,099 | ||||||
|
| |||||||
| 18,553,099 | ||||||||
INSURANCE — 3.48% |
| |||||||
Cathay Financial Holding Co. Ltd. | 53,424,483 | 87,184,989 | ||||||
China Life Insurance Co. Ltd./Taiwana | 24,192,193 | 26,694,060 | ||||||
Shin Kong Financial Holding Co. Ltd.a | 59,472,205 | 17,282,588 | ||||||
|
| |||||||
| 131,161,637 | ||||||||
LEISURE PRODUCTS — 0.51% |
| |||||||
Giant Manufacturing Co. Ltd.a | 2,016,590 | 10,190,198 | ||||||
Merida Industry Co. Ltd.a | 2,016,100 | 8,851,627 | ||||||
|
| |||||||
| 19,041,825 | ||||||||
MACHINERY — 0.48% |
| |||||||
Hiwin Technologies Corp.a | 2,056,862 | 18,231,571 | ||||||
|
| |||||||
| 18,231,571 | ||||||||
MARINE — 0.35% |
| |||||||
Evergreen Marine Corp. Taiwan Ltd.b | 17,136,673 | 13,060,190 | ||||||
|
| |||||||
| 13,060,190 | ||||||||
METALS & MINING — 1.82% |
| |||||||
China Steel Corp.a | 81,648,977 | 68,448,892 | ||||||
|
| |||||||
| 68,448,892 | ||||||||
OIL, GAS & CONSUMABLE FUELS — 0.85% |
| |||||||
Formosa Petrochemical Corp. | 9,072,950 | 32,017,932 | ||||||
|
| |||||||
| 32,017,932 | ||||||||
REAL ESTATE MANAGEMENT & DEVELOPMENT — 0.52% |
| |||||||
Highwealth Construction Corp.a | 7,056,790 | 11,223,895 | ||||||
Ruentex Development Co. Ltd.a,b | 8,468,127 | 8,291,632 | ||||||
|
| |||||||
| 19,515,527 | ||||||||
SEMICONDUCTORS & SEMICONDUCTOR EQUIPMENT — 30.14% |
| |||||||
Advanced Semiconductor Engineering Inc.a | 43,344,864 | 52,279,832 | ||||||
Globalwafers Co. Ltd.a | 1,308,000 | 10,380,265 | ||||||
MediaTek Inc. | 9,603,175 | 86,075,047 | ||||||
Nanya Technology Corp.a | 6,048,000 | 12,966,155 | ||||||
Novatek Microelectronics Corp. | 4,892,544 | 19,048,806 | ||||||
Phison Electronics Corp. | 1,008,698 | 13,603,502 | ||||||
| Security | Shares | Value | ||||||
Powertech Technology Inc. | 5,040,036 | $ | 15,297,634 | |||||
Realtek Semiconductor Corp. | 3,932,063 | 15,244,089 | ||||||
Siliconware Precision Industries Co. Ltd. | 15,120,834 | 23,949,629 | ||||||
Taiwan Semiconductor Manufacturing Co. Ltd. | 116,010,882 | 832,246,130 | ||||||
United Microelectronics Corp.a | 81,648,501 | 40,717,384 | ||||||
Vanguard International Semiconductor Corp.a | 7,056,000 | 12,742,371 | ||||||
|
| |||||||
| 1,134,550,844 | ||||||||
SPECIALTY RETAIL — 0.63% |
| |||||||
Hotai Motor Co. Ltd.a | 2,016,000 | 23,747,904 | ||||||
|
| |||||||
| 23,747,904 | ||||||||
TECHNOLOGY HARDWARE, STORAGE & PERIPHERALS — 9.14% |
| |||||||
Acer Inc.a | 23,184,737 | 11,677,259 | ||||||
Advantech Co. Ltd. | 2,218,614 | 16,357,123 | ||||||
Asustek Computer Inc. | 4,658,857 | 38,593,534 | ||||||
Catcher Technology Co. Ltd.a | 4,409,743 | 56,109,921 | ||||||
Chicony Electronics Co. Ltd. | 4,053,050 | 10,179,966 | ||||||
Compal Electronics Inc.a | 30,240,554 | 21,744,260 | ||||||
Foxconn Technology Co. Ltd.a | 7,109,499 | 22,568,342 | ||||||
HTC Corp.a,b | 5,040,884 | 11,475,156 | ||||||
Inventec Corp. | 19,152,868 | 15,199,681 | ||||||
Lite-On Technology Corp. | 15,173,071 | 22,448,644 | ||||||
Micro-Star International Co. Ltd.a | 5,040,000 | 11,473,144 | ||||||
Pegatron Corp.a | 13,104,037 | 41,249,992 | ||||||
Quanta Computer Inc. | 18,144,240 | 41,303,863 | ||||||
Transcend Information Inc.a | 2,016,905 | 6,014,827 | ||||||
Wistron Corp. | 18,683,130 | 17,643,699 | ||||||
|
| |||||||
| 344,039,411 | ||||||||
TEXTILES, APPAREL & LUXURY GOODS — 1.76% |
| |||||||
Eclat Textile Co. Ltd.a | 1,400,601 | 17,171,622 | ||||||
Feng TAY Enterprise Co. Ltd.a | 3,024,476 | 14,331,160 | ||||||
Formosa Taffeta Co. Ltd. | 7,056,515 | 7,014,661 | ||||||
Pou Chen Corp. | 15,120,103 | 19,614,700 | ||||||
Ruentex Industries Ltd.a | 5,040,262 | 8,108,443 | ||||||
|
| |||||||
| 66,240,586 | ||||||||
TRANSPORTATION INFRASTRUCTURE — 0.33% |
| |||||||
Taiwan High Speed Rail Corp. | 13,992,000 | 12,332,655 | ||||||
|
| |||||||
| 12,332,655 | ||||||||
| 48 | 2017 iSHARES ANNUAL REPORTTO SHAREHOLDERS |
Table of Contents
Schedule of Investments (Continued)
iSHARES® MSCI TAIWAN CAPPED ETF
August 31, 2017
| Security | Shares | Value | ||||||
WIRELESS TELECOMMUNICATION SERVICES — 1.67% |
| |||||||
Far EasTone Telecommunications Co. Ltd. | 11,088,259 | $ | 26,894,879 | |||||
Taiwan Mobile Co. Ltd. | 10,080,609 | 36,074,946 | ||||||
|
| |||||||
| 62,969,825 | ||||||||
|
| |||||||
TOTAL COMMON STOCKS |
| |||||||
(Cost: $1,856,365,909) |
| 3,733,767,800 | ||||||
SHORT-TERM INVESTMENTS — 5.30% |
| |||||||
MONEY MARKET FUNDS — 5.30% |
| |||||||
BlackRock Cash Funds: Institutional, |
| |||||||
1.32%d,e,f | 176,501,828 | 176,554,778 | ||||||
BlackRock Cash Funds: Treasury, |
| |||||||
0.96%d,e | 22,826,941 | 22,826,941 | ||||||
|
| |||||||
| 199,381,719 | ||||||||
|
| |||||||
TOTAL SHORT-TERM INVESTMENTS |
| |||||||
(Cost: $199,349,974) | 199,381,719 | |||||||
|
| |||||||
| Value | ||||||||
TOTAL INVESTMENTS |
| |||||||
(Cost: $2,055,715,883)g | $ | 3,933,149,519 | ||||||
Other Assets, Less Liabilities — (4.48)% |
| (168,659,122 | ) | |||||
|
| |||||||
NET ASSETS — 100.00% | $ | 3,764,490,397 | ||||||
|
| |||||||
| a | All or a portion of this security represents a security on loan. See Note 1. |
| b | Non-income earning security. |
| c | Security is valued using significant unobservable inputs and is classified as Level 3 in the fair value hierarchy. |
| d | Affiliated issuer. See Schedule 1. |
| e | The rate quoted is the annualized seven-day yield of the fund at period end. |
| f | All or a portion of this security represents an investment of securities lending collateral. See Note 1. |
| g | The cost of investments (including short positions and derivatives, if any) for federal income tax purposes was $2,267,494,080. Net unrealized appreciation was $1,665,778,027, of which $1,893,173,110 represented gross unrealized appreciation on investments and $227,395,083 represented gross unrealized depreciation on investments. |
Schedule 1 — Affiliates (Note 2)
Investments in issuers considered to be affiliates of the Fund during the year ended August 31, 2017, for purposes of Section 2(a)(3) of the 1940 Act, and/or related parties of the Fund were as follows:
| Affiliated issuer | Shares held at 08/31/16 | Shares purchased | Shares sold | Shares held at 08/31/17 | Value at 08/31/17 | Net realized gain (loss) a | Change in unrealized appreciation (depreciation) | Income | ||||||||||||||||||||||||
BlackRock Cash |
| |||||||||||||||||||||||||||||||
Funds: Institutional, | ||||||||||||||||||||||||||||||||
SL Agency Shares | 116,215,500 | 60,286,328b | — | 176,501,828 | $ | 176,554,778 | $ | (13,787 | ) | $ | 31,745 | $ | —c | |||||||||||||||||||
BlackRock Cash | ||||||||||||||||||||||||||||||||
Funds: Treasury, | ||||||||||||||||||||||||||||||||
SL Agency Shares | 19,070,044 | 3,756,897b | — | 22,826,941 | 22,826,941 | 1,930 | — | 46,830 | ||||||||||||||||||||||||
|
|
|
|
|
|
|
| |||||||||||||||||||||||||
| $ | 199,381,719 | $ | (11,857 | ) | $ | 31,745 | $ | 46,830 | ||||||||||||||||||||||||
|
|
|
|
|
|
|
| |||||||||||||||||||||||||
| a | Includes realized capital gain distributions from an affiliated fund, if any. |
| b | Net of shares purchased and sold. |
| c | �� | Does not include income earned on the investment of securities lending cash collateral which is not direct income of the Fund and is reflected as a component of securities lending income in the statement of operations. |
SCHEDULESOF INVESTMENTS | 49 |
Table of Contents
Schedule of Investments (Continued)
iSHARES® MSCI TAIWAN CAPPED ETF
August 31, 2017
Schedule 2 — Futures Contracts (Note 5)
Futures contracts outstanding as of August 31, 2017 were as follows:
| Description | Number of Contracts | Expiration Date | Notional Amount (000) | Value/ Unrealized Appreciation (Depreciation) | ||||||||||||
Long Contracts: | ||||||||||||||||
MSCI Taiwan Index | 712 | Sep 2017 | $ | 28,209 | $ | 122,588 | ||||||||||
|
| |||||||||||||||
Schedule 3 — Fair Value Measurements
Various inputs are used in determining the fair value of financial instruments. For description of the input levels and information about the Fund’s policy regarding valuation of financial instruments, see Note 1.
The following table summarizes the value of the Fund’s investments according to the fair value hierarchy as of August 31, 2017. The breakdown of the Fund’s investments into major categories is disclosed in the schedule of investments above.
| Level 1 | Level 2 | Level 3 | Total | |||||||||||||
Investments: | ||||||||||||||||
Assets: | ||||||||||||||||
Common stocks | $ | 3,733,767,798 | $ | — | $ | 2 | $ | 3,733,767,800 | ||||||||
Money market funds | 199,381,719 | — | — | 199,381,719 | ||||||||||||
|
|
|
|
|
|
|
| |||||||||
Total | $ | 3,933,149,517 | $ | — | $ | 2 | $ | 3,933,149,519 | ||||||||
|
|
|
|
|
|
|
| |||||||||
Derivative financial instrumentsa: | ||||||||||||||||
Assets: | ||||||||||||||||
Futures contracts | $ | 122,588 | $ | — | $ | — | $ | 122,588 | ||||||||
|
|
|
|
|
|
|
| |||||||||
Total | $ | 122,588 | $ | — | $ | — | $ | 122,588 | ||||||||
|
|
|
|
|
|
|
| |||||||||
| a | Shown at the unrealized appreciation (depreciation) on the contracts. |
See notes to financial statements.
| 50 | 2017 iSHARES ANNUAL REPORTTO SHAREHOLDERS |
Table of Contents
Schedule of Investments
iSHARES® MSCI THAILAND CAPPED ETF
August 31, 2017
| Security | Shares | Value | ||||||
COMMON STOCKS — 99.27% |
| |||||||
AIRLINES — 0.56% |
| |||||||
Bangkok Airways PCLa | 1,908,500 | $ | 1,069,059 | |||||
Thai Airways International PCL NVDRb | 1,715,066 | 934,880 | ||||||
|
| |||||||
| 2,003,939 | ||||||||
AUTO COMPONENTS — 0.17% |
| |||||||
Sri Trang Agro-Industry PCL NVDRa | 1,642,871 | 588,772 | ||||||
|
| |||||||
| 588,772 | ||||||||
BANKS — 18.95% |
| |||||||
Bangkok Bank PCL Foreign | 647,000 | 3,653,441 | ||||||
Kasikornbank PCL Foreign | 3,063,000 | 19,463,725 | ||||||
Kasikornbank PCL NVDR | 1,505,000 | 9,110,224 | ||||||
Kiatnakin Bank PCL NVDR | 971,873 | 2,056,139 | ||||||
Krung Thai Bank PCL NVDR | 9,116,000 | 5,133,841 | ||||||
LH Financial Group PCL NVDR | 10,926,319 | 589,011 | ||||||
Siam Commercial Bank PCL (The) NVDR | 4,611,700 | 20,902,299 | ||||||
Thanachart Capital PCL NVDR | 1,541,300 | 2,170,028 | ||||||
Tisco Financial Group PCL NVDR | 834,810 | 1,879,297 | ||||||
TMB Bank PCL NVDR | 34,276,600 | 2,436,163 | ||||||
|
| |||||||
| 67,394,168 | ||||||||
BUILDING PRODUCTS — 0.30% |
| |||||||
Dynasty Ceramic PCL NVDR | 5,982,240 | 709,833 | ||||||
Vanachai Group PCL NVDR | 1,021,400 | 344,517 | ||||||
|
| |||||||
| 1,054,350 | ||||||||
CAPITAL MARKETS — 0.06% |
| |||||||
AIRA Capital Co. Ltd.a | 2,989,040 | 217,843 | ||||||
|
| |||||||
| 217,843 | ||||||||
CHEMICALS — 5.16% |
| |||||||
Eastern Polymer Group PCLa | 2,566,300 | 888,795 | ||||||
Indorama Ventures PCL NVDR | 3,766,710 | 4,424,083 | ||||||
PTT Global Chemical PCL NVDR | 5,649,407 | 13,015,499 | ||||||
|
| |||||||
| 18,328,377 | ||||||||
CONSTRUCTION & ENGINEERING — 1.07% |
| |||||||
CH Karnchang PCL NVDRa | 1,109,600 | 960,729 | ||||||
Italian-Thai Development PCL NVDRa | 4,423,348 | 556,832 | ||||||
Sino-Thai Engineering & Construction PCL NVDR | 1,944,428 | 1,522,515 | ||||||
Unique Engineering & Construction PCLa | 1,387,200 | 760,338 | ||||||
|
| |||||||
| 3,800,414 | ||||||||
| Security | Shares | Value | ||||||
CONSTRUCTION MATERIALS — 4.47% |
| |||||||
Siam Cement PCL (The) Foreign | 778,800 | $ | 11,727,149 | |||||
Siam Cement PCL (The) NVDR | 277,500 | 4,178,588 | ||||||
|
| |||||||
| 15,905,737 | ||||||||
CONSUMER FINANCE — 1.63% |
| |||||||
Group Lease PCLa | 998,600 | 589,446 | ||||||
Krungthai Card PCL NVDRa | 270,700 | 970,134 | ||||||
Muangthai Leasing PCLa | 1,657,100 | 1,696,775 | ||||||
Ratchthani Leasing PCL NVDR | 2,201,600 | 407,765 | ||||||
Srisawad Corp PCL NVDRa | 1,389,286 | 2,144,283 | ||||||
|
| |||||||
| 5,808,403 | ||||||||
CONTAINERS & PACKAGING — 0.08% |
| |||||||
Polyplex Thailand PCL NVDRa | 823,700 | 297,678 | ||||||
|
| |||||||
| 297,678 | ||||||||
DIVERSIFIED TELECOMMUNICATION SERVICES — 1.77% |
| |||||||
Jasmine International PCL NVDR | 5,813,768 | 1,365,680 | ||||||
Thaicom PCL NVDRa | 1,148,400 | 511,860 | ||||||
True Corp. PCL NVDRb | 26,103,518 | 4,402,340 | ||||||
|
| |||||||
| 6,279,880 | ||||||||
ELECTRICAL EQUIPMENT — 0.20% |
| |||||||
Gunkul Engineering PCL NVDRa | 5,827,168 | 723,022 | ||||||
|
| |||||||
| 723,022 | ||||||||
ELECTRONIC EQUIPMENT, INSTRUMENTS & COMPONENTS — 2.47% |
| |||||||
Cal-Comp Electronics Thailand PCL NVDR | 4,758,812 | 461,478 | ||||||
Delta Electronics Thailand PCL NVDR | 1,300,244 | 3,485,069 | ||||||
Hana Microelectronics PCL NVDR | 1,469,200 | 1,935,778 | ||||||
KCE Electronics PCL NVDR | 687,700 | 1,812,189 | ||||||
Samart Corp. PCL NVDR | 1,291,337 | 528,902 | ||||||
SVI PCL NVDR | 3,560,215 | 557,540 | ||||||
|
| |||||||
| 8,780,956 | ||||||||
FOOD & STAPLES RETAILING — 6.77% |
| |||||||
CP ALL PCL NVDR | 12,896,100 | 24,079,452 | ||||||
|
| |||||||
| 24,079,452 | ||||||||
FOOD PRODUCTS — 3.77% |
| |||||||
Charoen Pokphand Foods PCL NVDR | 7,867,100 | 6,456,211 | ||||||
GFPT PCL NVDR | 1,314,100 | 759,847 | ||||||
Ichitan Group PCL NVDRa | 1,202,000 | 280,545 | ||||||
Khon Kaen Sugar Industry PCL NVDR | 4,042,078 | 542,920 | ||||||
Malee Group PCLa | 292,700 | 357,005 | ||||||
SCHEDULESOF INVESTMENTS | 51 |
Table of Contents
Schedule of Investments (Continued)
iSHARES® MSCI THAILAND CAPPED ETF
August 31, 2017
| Security | Shares | Value | ||||||
Taokaenoi Food & Marketing PCLa | 903,200 | $ | 530,414 | |||||
Thai Union Group PCL NVDR | 4,982,100 | 2,970,805 | ||||||
Thai Vegetable Oil PCL NVDRa | 1,027,853 | 882,211 | ||||||
Thaifoods Group PCL NVDRa,b | 3,344,700 | 619,482 | ||||||
|
| |||||||
| 13,399,440 | ||||||||
GAS UTILITIES — 0.04% |
| |||||||
Scan Inter PCLa | 925,300 | 139,331 | ||||||
|
| |||||||
| 139,331 | ||||||||
HEALTH CARE PROVIDERS & SERVICES — 4.50% |
| |||||||
Bangkok Chain Hospital PCL NVDR | 3,176,525 | 1,415,828 | ||||||
Bangkok Dusit Medical Services PCL NVDR | 10,108,500 | 6,362,525 | ||||||
Bumrungrad Hospital PCL NVDR | 932,076 | 6,119,337 | ||||||
Chularat Hospital PCL NVDR | 12,960,300 | 960,167 | ||||||
Vibhavadi Medical Center PCL NVDR | 13,785,800 | 1,154,179 | ||||||
|
| |||||||
| 16,012,036 | ||||||||
HOTELS, RESTAURANTS & LEISURE — 2.07% |
| |||||||
Erawan Group PCL (The) NVDR | 3,204,300 | 588,653 | ||||||
Minor International PCL NVDRa | 5,641,110 | 6,753,023 | ||||||
|
| |||||||
| 7,341,676 | ||||||||
INDEPENDENT POWER AND RENEWABLE ELECTRICITY PRODUCERS — 2.89% |
| |||||||
BCPG PCL NVDR | 1,564,100 | 734,828 | ||||||
CK Power PCL NVDRa | 4,816,460 | 498,979 | ||||||
Electricity Generating PCL NVDR | 343,800 | 2,422,804 | ||||||
Global Power Synergy PCL NVDR | 972,600 | 1,142,340 | ||||||
Glow Energy PCL NVDR | 1,338,000 | 3,455,308 | ||||||
Inter Far East Energy Corp.a,b,c | 3,184,500 | 1 | ||||||
SPCG PCL NVDR | 968,400 | 597,868 | ||||||
Superblock PCLb | 28,381,350 | 1,145,340 | ||||||
Thai Solar Energy PCL | 1,900,800 | 286,222 | ||||||
|
| |||||||
| 10,283,690 | ||||||||
INDUSTRIAL CONGLOMERATES — 1.30% |
| |||||||
Berli Jucker PCL NVDR | 3,122,300 | 4,631,028 | ||||||
|
| |||||||
| 4,631,028 | ||||||||
INSURANCE — 0.10% |
| |||||||
Thai Reinsurance PCL NVDRa | 6,577,140 | 352,577 | ||||||
|
| |||||||
| 352,577 | ||||||||
IT SERVICES — 0.10% |
| |||||||
Forth Smart Service PCL NVDR | 623,500 | 351,135 | ||||||
|
| |||||||
| 351,135 | ||||||||
| Security | Shares | Value | ||||||
MARINE — 0.31% |
| |||||||
Precious Shipping PCL NVDRa,b | 1,420,200 | $ | 436,261 | |||||
Thoresen Thai Agencies PCL NVDRa | 2,339,089 | 648,083 | ||||||
|
| |||||||
| 1,084,344 | ||||||||
MEDIA — 1.40% |
| |||||||
BEC World PCL NVDR | 2,548,300 | 1,327,679 | ||||||
Major Cineplex Group PCL NVDRa | 1,137,800 | 1,027,978 | ||||||
Plan B Media PCL | 2,756,400 | 485,618 | ||||||
RS PCL NVDRa,b | 1,180,300 | 547,406 | ||||||
VGI Global Media PCL NVDRa | 4,493,240 | 744,250 | ||||||
Workpoint Entertainment PCL | 384,400 | 850,878 | ||||||
|
| |||||||
| 4,983,809 | ||||||||
METALS & MINING — 0.08% |
| |||||||
STP & I PCL NVDRa | 1,289,710 | 266,060 | ||||||
|
| |||||||
| 266,060 | ||||||||
MULTILINE RETAIL — 0.64% |
| |||||||
Robinson PCL NVDRa | 1,303,400 | 2,257,055 | ||||||
|
| |||||||
| 2,257,055 | ||||||||
OIL, GAS & CONSUMABLE FUELS — 17.55% |
| |||||||
Bangchak Corp. PCL NVDR | 902,500 | 1,032,826 | ||||||
Banpu PCL NVDR | 5,279,200 | 2,798,191 | ||||||
Energy Absolute PCL NVDRa | 2,921,000 | 3,320,818 | ||||||
Energy Earth PCL NVDR | 4,419,400 | 194,318 | ||||||
Esso Thailand PCL NVDRb | 3,172,600 | 1,156,105 | ||||||
IRPC PCL NVDR | 26,106,300 | 4,677,985 | ||||||
PTT Exploration & Production PCL NVDR | 3,627,084 | 9,557,893 | ||||||
PTT PCL NVDR | 2,760,400 | 33,169,691 | ||||||
Siamgas & Petrochemicals PCL NVDR | 957,300 | 461,280 | ||||||
Thai Oil PCL NVDR | 2,130,200 | 6,046,419 | ||||||
|
| |||||||
| 62,415,526 | ||||||||
PHARMACEUTICALS — 0.24% |
| |||||||
Mega Lifesciences PCL NVDR | 906,700 | 853,316 | ||||||
|
| |||||||
| 853,316 | ||||||||
REAL ESTATE MANAGEMENT & DEVELOPMENT — 5.60% |
| |||||||
Amata Corp. PCL NVDR | 1,369,000 | 758,609 | ||||||
Ananda Development PCL NVDR | 3,927,300 | 609,113 | ||||||
AP Thailand PCL NVDRa | �� | 2,471,086 | 584,190 | |||||
Bangkok Land PCL NVDR | 26,333,400 | 1,435,430 | ||||||
Central Pattana PCL NVDR | 3,514,600 | 7,620,876 | ||||||
Golden Land Property Development PCL NVDR | 1,217,000 | 278,548 | ||||||
| 52 | 2017 iSHARES ANNUAL REPORTTO SHAREHOLDERS |
Table of Contents
Schedule of Investments (Continued)
iSHARES® MSCI THAILAND CAPPED ETF
August 31, 2017
| Security | Shares | Value | ||||||
LPN Development PCL NVDRa | 1,506,847 | $ | 490,105 | |||||
Platinum Group PCL (The) NVDR | 2,195,600 | 512,450 | ||||||
Quality Houses PCL NVDRa | 11,221,331 | 811,058 | ||||||
Sansiri PCL NVDR | 14,586,637 | 913,724 | ||||||
SC Asset Corp. PCL NVDR | 3,792,904 | 367,811 | ||||||
Siam Future Development PCL NVDR | 2,263,428 | 408,992 | ||||||
Singha Estate PCLa,b | 6,273,200 | 770,807 | ||||||
Supalai PCL NVDR | 1,560,800 | 1,186,876 | ||||||
TICON Industrial Connection PCL NVDRa | 1,201,291 | 535,435 | ||||||
U City PCL NVDRb | 720,084,900 | 433,721 | ||||||
Univentures PCL NVDRa | 1,747,100 | 460,386 | ||||||
WHA Corp. PCL NVDR | 18,270,940 | 1,749,784 | ||||||
|
| |||||||
| 19,927,915 | ||||||||
ROAD & RAIL — 1.12% |
| |||||||
BTS Group Holdings PCL NVDR | 15,278,900 | 3,980,198 | ||||||
|
| |||||||
| 3,980,198 | ||||||||
SPECIALTY RETAIL — 2.31% |
| |||||||
Beauty Community PCLa | 4,689,700 | 1,949,040 | ||||||
Big Camera Corp. PCL NVDR | 2,289,500 | 249,601 | ||||||
Com7 PCL NVDR | 934,200 | 371,373 | ||||||
Home Product Center PCL NVDR | 10,298,071 | 3,101,361 | ||||||
PTG Energy PCLa | 1,530,800 | 968,131 | ||||||
Siam Global House PCL NVDRa | 3,497,403 | 1,579,914 | ||||||
|
| |||||||
| 8,219,420 | ||||||||
TEXTILES, APPAREL & LUXURY GOODS — 0.11% |
| |||||||
MC Group PCL NVDR | 943,300 | 400,558 | ||||||
|
| |||||||
| 400,558 | ||||||||
TRANSPORTATION INFRASTRUCTURE — 6.70% |
| |||||||
Airports of Thailand PCL NVDR | 11,194,100 | 18,373,090 | ||||||
Bangkok Aviation Fuel Services PCL NVDRa | 501,100 | 671,554 | ||||||
Bangkok Expressway & Metro PCL | 19,529,453 | 4,587,554 | ||||||
Namyong Terminal PCL NVDR | 1,136,200 | 174,510 | ||||||
|
| |||||||
| 23,806,708 | ||||||||
WATER UTILITIES — 0.47% |
| |||||||
Eastern Water Resources Development and Management PCL NVDR | 1,307,300 | 496,069 | ||||||
TTW PCL NVDRa | 3,627,166 | 1,190,668 | ||||||
|
| |||||||
| 1,686,737 | ||||||||
| Security | Shares | Value | ||||||
WIRELESS TELECOMMUNICATION SERVICES — 4.31% |
| |||||||
Advanced Info Service PCL NVDR | 2,716,419 | $ | 15,338,912 | |||||
|
| |||||||
| 15,338,912 | ||||||||
|
| |||||||
TOTAL COMMON STOCKS |
| |||||||
(Cost: $368,490,414) |
| 352,994,462 | ||||||
WARRANTS — 0.02% |
| |||||||
INDEPENDENT POWER AND RENEWABLE ELECTRICITY PRODUCERS — 0.00% |
| |||||||
Superblock PCL NVDR (Expires 08/31/20)b | 6,394,650 | 2 | ||||||
|
| |||||||
| 2 | ||||||||
MEDIA — 0.02% |
| |||||||
RS PCL NVDR (Expires 05/23/20)a,b | 317,620 | 55,001 | ||||||
|
| |||||||
| 55,001 | ||||||||
|
| |||||||
TOTAL WARRANTS |
| |||||||
(Cost: $0) |
| 55,003 | ||||||
SHORT-TERM INVESTMENTS — 4.57% |
| |||||||
MONEY MARKET FUNDS — 4.57% |
| |||||||
BlackRock Cash Funds: Institutional, |
| |||||||
1.32%d,e,f | 15,082,493 | 15,087,018 | ||||||
BlackRock Cash Funds: Treasury, |
| |||||||
0.96%d,e | 1,168,228 | 1,168,228 | ||||||
|
| |||||||
| 16,255,246 | ||||||||
|
| |||||||
TOTAL SHORT-TERM INVESTMENTS |
| |||||||
(Cost: $16,250,721) | 16,255,246 | |||||||
|
| |||||||
TOTAL INVESTMENTS |
| |||||||
(Cost: $384,741,135)g | 369,304,711 | |||||||
Other Assets, Less Liabilities — (3.86)% |
| (13,714,684 | ) | |||||
|
| |||||||
NET ASSETS — 100.00% | $ | 355,590,027 | ||||||
|
| |||||||
NVDR — Non-Voting Depositary Receipts
| a | All or a portion of this security represents a security on loan. See Note 1. |
| b | Non-income earning security. |
| c | Security is valued using significant unobservable inputs and is classified as Level 3 in the fair value hierarchy. |
| d | Affiliated issuer. See Schedule 1. |
| e | The rate quoted is the annualized seven-day yield of the fund at period end. |
| f | All or a portion of this security represents an investment of securities lending collateral. See Note 1. |
| g | The cost of investments (including short positions and derivatives, if any) for federal income tax purposes was $394,743,847. Net unrealized depreciation was $25,439,136, of which $26,524,834 represented gross unrealized appreciation on investments and $51,963,970 represented gross unrealized depreciation on investments. |
SCHEDULESOF INVESTMENTS | 53 |
Table of Contents
Schedule of Investments (Continued)
iSHARES® MSCI THAILAND CAPPED ETF
August 31, 2017
Schedule 1 — Affiliates (Note 2)
Investments in issuers considered to be affiliates of the Fund during the year ended August 31, 2017, for purposes of Section 2(a)(3) of the 1940 Act, and/or related parties of the Fund were as follows:
| Affiliated issuer | Shares held at 08/31/16 | Shares purchased | Shares sold | Shares held at 08/31/17 | Value at 08/31/17 | Net realized gain (loss) a | Change in unrealized appreciation (depreciation) | Income | ||||||||||||||||||||||||
BlackRock Cash | ||||||||||||||||||||||||||||||||
Funds: Institutional, | ||||||||||||||||||||||||||||||||
SL Agency Shares | 31,029,897 | — | (15,947,404 | )b | 15,082,493 | $ | 15,087,018 | $ | 5,852 | $ | 4,525 | $ | —c | |||||||||||||||||||
BlackRock Cash | ||||||||||||||||||||||||||||||||
Funds: Treasury, | ||||||||||||||||||||||||||||||||
SL Agency Shares | 1,099,513 | 68,715b | — | 1,168,228 | 1,168,228 | 68 | — | 4,660 | ||||||||||||||||||||||||
|
|
|
|
|
|
|
| |||||||||||||||||||||||||
| $ | 16,255,246 | $ | 5,920 | $ | 4,525 | $ | 4,660 | |||||||||||||||||||||||||
|
|
|
|
|
|
|
| |||||||||||||||||||||||||
| a | Includes realized capital gain distributions from an affiliated fund, if any. |
| b | Net of shares purchased and sold. |
| c | Does not include income earned on the investment of securities lending cash collateral which is not direct income of the Fund and is reflected as a component of securities lending income in the statement of operations. |
Schedule 2 — Fair Value Measurements
Various inputs are used in determining the fair value of financial instruments. For description of the input levels and information about the Fund’s policy regarding valuation of financial instruments, see Note 1.
The following table summarizes the value of the Fund’s investments according to the fair value hierarchy as of August 31, 2017. The breakdown of the Fund’s investments into major categories is disclosed in the schedule of investments above.
| Level 1 | Level 2 | Level 3 | Total | |||||||||||||
Investments: | ||||||||||||||||
Assets: | ||||||||||||||||
Common stocks | $ | 352,800,143 | $ | 194,318 | $ | 1 | $ | 352,994,462 | ||||||||
Warrants | 55,001 | 2 | — | 55,003 | ||||||||||||
Money market funds | 16,255,246 | — | — | 16,255,246 | ||||||||||||
|
|
|
|
|
|
|
| |||||||||
Total | $ | 369,110,390 | $ | 194,320 | $ | 1 | $ | 369,304,711 | ||||||||
|
|
|
|
|
|
|
| |||||||||
See notes to financial statements.
| 54 | 2017 iSHARES ANNUAL REPORTTO SHAREHOLDERS |
Table of Contents
Statements of Assets and Liabilities
iSHARES®, INC.
August 31, 2017
| iShares MSCI Hong Kong ETF | iShares MSCI Japan Small-Cap ETF | iShares MSCI Malaysia ETF | ||||||||||
ASSETS | ||||||||||||
Investments in securities, at cost: | ||||||||||||
Unaffiliated | $ | 1,735,128,032 | $ | 174,812,962 | $ | 298,898,242 | ||||||
Affiliated (Note 2) | 33,536,111 | 9,474,595 | 13,013,454 | |||||||||
|
|
|
|
|
| |||||||
Total cost of investments in securities | $ | 1,768,664,143 | $ | 184,287,557 | $ | 311,911,696 | ||||||
|
|
|
|
|
| |||||||
Investments in securities, at fair value (including securities on loana) (Note 1): | ||||||||||||
Unaffiliated | $ | 1,846,352,556 | $ | 188,784,977 | $ | 436,068,063 | ||||||
Affiliated (Note 2) | 33,541,855 | 9,475,823 | 13,016,089 | |||||||||
Foreign currency, at valueb | 11,433,330 | 111,494 | 698,875 | |||||||||
Foreign currency pledged to broker for futures contracts, at valueb | 552,256 | — | — | |||||||||
Receivables: | ||||||||||||
Investment securities sold | 1,499,526 | — | — | |||||||||
Dividends and interest | 3,814,052 | 312,006 | 878,330 | |||||||||
Futures variation margin | 106,502 | — | — | |||||||||
Tax reclaims | — | 4,051 | — | |||||||||
|
|
|
|
|
| |||||||
Total Assets | 1,897,300,077 | 198,688,351 | 450,661,357 | |||||||||
|
|
|
|
|
| |||||||
LIABILITIES | ||||||||||||
Payables: | ||||||||||||
Investment securities purchased | 7,710,106 | — | 538,887 | |||||||||
Collateral for securities on loan (Note 1) | 33,401,143 | 9,396,236 | 12,722,201 | |||||||||
Investment advisory fees (Note 2) | 741,598 | 76,153 | 176,394 | |||||||||
|
|
|
|
|
| |||||||
Total Liabilities | 41,852,847 | 9,472,389 | 13,437,482 | |||||||||
|
|
|
|
|
| |||||||
NET ASSETS | $ | 1,855,447,230 | $ | 189,215,962 | $ | 437,223,875 | ||||||
|
|
|
|
|
| |||||||
Net assets consist of: | ||||||||||||
Paid-in capital | $ | 2,227,105,443 | $ | 180,119,214 | $ | 337,230,689 | ||||||
Undistributed (distributions in excess of) net investment income | 12,327,044 | (591,075 | ) | (8,211,868 | ) | |||||||
Accumulated net realized loss | (495,312,848 | ) | (4,288,088 | ) | (28,971,709 | ) | ||||||
Net unrealized appreciation | 111,327,591 | 13,975,911 | 137,176,763 | |||||||||
|
|
|
|
|
| |||||||
NET ASSETS | $ | 1,855,447,230 | $ | 189,215,962 | $ | 437,223,875 | ||||||
|
|
|
|
|
| |||||||
Shares outstandingc | 75,150,000 | 2,600,000 | 13,650,000 | d | ||||||||
|
|
|
|
|
| |||||||
Net asset value per share | $ | 24.69 | $ | 72.78 | $ | 32.03 | d | |||||
|
|
|
|
|
| |||||||
| a | Securities on loan with values of $31,742,786, $8,973,435 and $12,017,350, respectively. See Note 1. |
| b | Cost of foreign currency including currency pledged to broker for futures contracts: $11,994,416, $110,647 and $695,311, respectively. |
| c | $0.001 par value, number of shares authorized: 375 million, 500 million and 300 million, respectively. |
| d | Shares outstanding and net asset value per share reflect a one-for-four reverse stock split effective after the close of trading on November 4, 2016. See Note 4. |
See notes to financial statements.
FINANCIAL STATEMENTS | 55 |
Table of Contents
Statements of Assets and Liabilities (Continued)
iSHARES®, INC.
August 31, 2017
| iShares MSCI Pacific ex Japan ETF | iShares MSCI Singapore Capped ETF | iShares MSCI Taiwan Capped ETF | ||||||||||
ASSETS | ||||||||||||
Investments in securities, at cost: | ||||||||||||
Unaffiliated | $ | 2,981,636,898 | $ | 610,608,617 | $ | 1,856,365,909 | ||||||
Affiliated (Note 2) | 45,604,344 | 17,536,267 | 199,349,974 | |||||||||
|
|
|
|
|
| |||||||
Total cost of investments in securities | $ | 3,027,241,242 | $ | 628,144,884 | $ | 2,055,715,883 | ||||||
|
|
|
|
|
| |||||||
Investments in securities, at fair value (including securities on loana) (Note 1): | ||||||||||||
Unaffiliated | $ | 3,095,609,007 | $ | 596,203,298 | $ | 3,733,767,800 | ||||||
Affiliated (Note 2) | 45,608,799 | 17,540,444 | 199,381,719 | |||||||||
Foreign currency, at valueb | 9,589,069 | 3,086,269 | 2,369,361 | |||||||||
Foreign currency pledged to broker for futures contracts, at valueb | — | 179,374 | — | |||||||||
Cash pledged to broker for futures contracts | — | — | 1,596,000 | |||||||||
Receivables: | ||||||||||||
Investment securities sold | 1,065,470 | 808,685 | 18,876,474 | |||||||||
Dividends and interest | 18,466,638 | 2,783,988 | 21,617,442 | |||||||||
Futures variation margin | — | 28,956 | 75,932 | |||||||||
|
|
|
|
|
| |||||||
Total Assets | 3,170,338,983 | 620,631,014 | 3,977,684,728 | |||||||||
|
|
|
|
|
| |||||||
LIABILITIES | ||||||||||||
Payables: | ||||||||||||
Investment securities purchased | 3,852,622 | 2,811,001 | 33,584,291 | |||||||||
Collateral for securities on loan (Note 1) | 44,791,591 | 17,308,614 | 176,536,820 | |||||||||
Foreign taxes (Note 1) | — | — | 1,178,029 | |||||||||
Investment advisory fees (Note 2) | 1,268,514 | 243,739 | 1,895,191 | |||||||||
|
|
|
|
|
| |||||||
Total Liabilities | 49,912,727 | 20,363,354 | 213,194,331 | |||||||||
|
|
|
|
|
| |||||||
NET ASSETS | $ | 3,120,426,256 | $ | 600,267,660 | $ | 3,764,490,397 | ||||||
|
|
|
|
|
| |||||||
Net assets consist of: | ||||||||||||
Paid-in capital | $ | 3,518,515,326 | $ | 872,884,594 | $ | 2,713,173,601 | ||||||
Undistributed (distributions in excess of) net investment income | 11,406,465 | (2,880,416 | ) | 84,691,293 | ||||||||
Accumulated net realized loss | (523,566,582 | ) | (255,377,916 | ) | (910,990,758 | ) | ||||||
Net unrealized appreciation (depreciation) | 114,071,047 | (14,358,602 | ) | 1,877,616,261 | ||||||||
|
|
|
|
|
| |||||||
NET ASSETS | $ | 3,120,426,256 | $ | 600,267,660 | $ | 3,764,490,397 | ||||||
|
|
|
|
|
| |||||||
Shares outstandingc | 67,200,000 | 24,300,000 | d | 100,800,000 | d | |||||||
|
|
|
|
|
| |||||||
Net asset value per share | $ | 46.43 | $ | 24.70 | d | $ | 37.35 | d | ||||
|
|
|
|
|
| |||||||
| a | Securities on loan with values of $42,597,622, $16,438,697 and $164,671,871, respectively. See Note 1. |
| b | Cost of foreign currency including currency pledged to broker for futures contracts: $9,585,093, $3,259,861 and $2,369,530, respectively. |
| c | $0.001 par value, number of shares authorized: 1 billion, 300 million and 900 million, respectively. |
| d | Shares outstanding and net asset value per share reflect a one-for-two reverse stock split effective after the close of trading on November 4, 2016. See Note 4. |
See notes to financial statements.
| 56 | 2017 iSHARES ANNUAL REPORTTO SHAREHOLDERS |
Table of Contents
Statements of Assets and Liabilities (Continued)
iSHARES®, INC.
August 31, 2017
| iShares MSCI Thailand Capped ETF | ||||
ASSETS | ||||
Investments in securities, at cost: | ||||
Unaffiliated | $ | 368,490,414 | ||
Affiliated (Note 2) | 16,250,721 | |||
|
| |||
Total cost of investments in securities | $ | 384,741,135 | ||
|
| |||
Investments in securities, at fair value (including securities on loana) (Note 1): | ||||
Unaffiliated | $ | 353,049,465 | ||
Affiliated (Note 2) | 16,255,246 | |||
Foreign currency, at valueb | 82 | |||
Receivables: | ||||
Investment securities sold | 153,893 | |||
Dividends and interest | 1,541,761 | |||
|
| |||
Total Assets | 371,000,447 | |||
|
| |||
LIABILITIES | ||||
Payables: | ||||
Investment securities purchased | 149,097 | |||
Collateral for securities on loan (Note 1) | 15,076,641 | |||
Investment advisory fees (Note 2) | 184,682 | |||
|
| |||
Total Liabilities | 15,410,420 | |||
|
| |||
NET ASSETS | $ | 355,590,027 | ||
|
| |||
Net assets consist of: | ||||
Paid-in capital | $ | 419,847,008 | ||
Undistributed net investment income | 2,034,256 | |||
Accumulated net realized loss | (50,856,199 | ) | ||
Net unrealized depreciation | (15,435,038 | ) | ||
|
| |||
NET ASSETS | $ | 355,590,027 | ||
|
| |||
Shares outstandingc | 4,300,000 | |||
|
| |||
Net asset value per share | $ | 82.70 | ||
|
| |||
| a | Securities on loan with a value of $13,717,548. See Note 1. |
| b | Cost of foreign currency: $82. |
| c | $0.001 par value, number of shares authorized: 200 million. |
See notes to financial statements.
FINANCIAL STATEMENTS | 57 |
Table of Contents
Statements of Operations
iSHARES®, INC.
Year ended August 31, 2017
| iShares MSCI Hong Kong ETF | iShares MSCI Japan Small-Cap ETF | iShares MSCI Malaysia ETF | ||||||||||
NET INVESTMENT INCOME | ||||||||||||
Dividends — unaffiliateda | $ | 62,797,401 | $ | 2,761,660 | $ | 9,146,214 | ||||||
Dividends — affiliated (Note 2) | 9,080 | 436 | 1,824 | |||||||||
Securities lending income — affiliated — net (Note 2) | 438,276 | 197,523 | 335,894 | |||||||||
Non-cash dividends — unaffiliated | — | — | 1,377,918 | |||||||||
|
|
|
|
|
| |||||||
Total investment income | 63,244,757 | 2,959,619 | 10,861,850 | |||||||||
|
|
|
|
|
| |||||||
EXPENSES | ||||||||||||
Investment advisory fees (Note 2) | 8,623,265 | 711,455 | 1,638,179 | |||||||||
Proxy fees | 36,665 | 2,774 | 8,170 | |||||||||
|
|
|
|
|
| |||||||
Total expenses | 8,659,930 | 714,229 | 1,646,349 | |||||||||
|
|
|
|
|
| |||||||
Net investment income | 54,584,827 | 2,245,390 | 9,215,501 | |||||||||
|
|
|
|
|
| |||||||
NET REALIZED AND UNREALIZED GAIN (LOSS) | ||||||||||||
Net realized gain (loss) from: | ||||||||||||
Investments — unaffiliated | (31,512,511 | ) | 353,153 | (4,862,885 | ) | |||||||
Investments — affiliated (Note 2) | 25,964 | 279 | 768 | |||||||||
In-kind redemptions — unaffiliated | 24,487,621 | 11,692,637 | — | |||||||||
Futures contracts | 2,141,274 | — | — | |||||||||
Foreign currency transactions | (76,566 | ) | (114,451 | ) | (318,322 | ) | ||||||
Realized gain distributions from affiliated funds | 8 | 1 | 5 | |||||||||
|
|
|
|
|
| |||||||
Net realized gain (loss) | (4,934,210 | ) | 11,931,619 | (5,180,434 | ) | |||||||
|
|
|
|
|
| |||||||
Net change in unrealized appreciation/depreciation on: | ||||||||||||
Investments — unaffiliated | 243,718,961 | 19,299,117 | 3,224,921 | |||||||||
Investments — affiliated (Note 2) | 5,744 | 1,228 | 2,635 | |||||||||
Futures contracts | 62,593 | — | — | |||||||||
Translation of assets and liabilities in foreign currencies | (7,869 | ) | 3,534 | 19,598 | ||||||||
|
|
|
|
|
| |||||||
Net change in unrealized appreciation/depreciation | 243,779,429 | 19,303,879 | 3,247,154 | |||||||||
|
|
|
|
|
| |||||||
Net realized and unrealized gain (loss) | 238,845,219 | 31,235,498 | (1,933,280 | ) | ||||||||
|
|
|
|
|
| |||||||
NET INCREASE IN NET ASSETS RESULTING FROM OPERATIONS | $ | 293,430,046 | $ | 33,480,888 | $ | 7,282,221 | ||||||
|
|
|
|
|
| |||||||
| a | Net of foreign withholding tax of $ —, $295,013 and $ —, respectively. |
See notes to financial statements.
| 58 | 2017 iSHARES ANNUAL REPORTTO SHAREHOLDERS |
Table of Contents
Statements of Operations (Continued)
iSHARES®, INC.
Year ended August 31, 2017
| iShares MSCI Pacific ex Japan ETF | iShares MSCI Singapore Capped ETF | iShares MSCI Taiwan Capped ETF | ||||||||||
NET INVESTMENT INCOME | ||||||||||||
Dividends — unaffiliateda | $ | 108,992,394 | $ | 19,273,628 | $ | 116,693,068 | ||||||
Dividends — affiliated (Note 2) | 12,555 | 2,510 | 46,830 | |||||||||
Interest — unaffiliated | — | — | 2,047 | |||||||||
Securities lending income — affiliated — net (Note 2)b | 318,039 | 309,564 | 2,230,197 | |||||||||
|
|
|
|
|
| |||||||
| 109,322,988 | 19,585,702 | 118,972,142 | ||||||||||
Less: Other foreign taxes (Note 1) | — | — | (2,263,362 | ) | ||||||||
|
|
|
|
|
| |||||||
Total investment income | 109,322,988 | 19,585,702 | 116,708,780 | |||||||||
|
|
|
|
|
| |||||||
EXPENSES | ||||||||||||
Investment advisory fees (Note 2) | 12,707,117 | 2,726,470 | 19,279,639 | |||||||||
Proxy fees | 63,145 | 11,396 | 73,420 | |||||||||
|
|
|
|
|
| |||||||
Total expenses | 12,770,262 | 2,737,866 | 19,353,059 | |||||||||
|
|
|
|
|
| |||||||
Net investment income | 96,552,726 | 16,847,836 | 97,355,721 | |||||||||
|
|
|
|
|
| |||||||
NET REALIZED AND UNREALIZED GAIN (LOSS) |
| |||||||||||
Net realized gain (loss) from: | ||||||||||||
Investments — unaffiliated | (37,353,593 | ) | (37,735,348 | ) | 5,642,647 | |||||||
Investments — affiliated (Note 2) | 12,531 | 1,512 | (13,787 | ) | ||||||||
In-kind redemptions — unaffiliated | 39,188,412 | 10,885,821 | — | |||||||||
Futures contracts | — | 85,847 | 1,278,858 | |||||||||
Foreign currency transactions | (109,994 | ) | (92,065 | ) | 194,024 | |||||||
Realized gain distributions from affiliated funds | 30 | 4 | 1,930 | |||||||||
|
|
|
|
|
| |||||||
Net realized gain (loss) | 1,737,386 | (26,854,229 | ) | 7,103,672 | ||||||||
|
|
|
|
|
| |||||||
Net change in unrealized appreciation/depreciation on: | ||||||||||||
Investments — unaffiliated | 333,394,389 | 116,614,308 | 636,430,973 | |||||||||
Investments — affiliated (Note 2) | 4,455 | 4,176 | 31,745 | |||||||||
Futures contracts | — | 161,329 | 493,191 | |||||||||
Translation of assets and liabilities in foreign currencies | 268,424 | 104,031 | 137,107 | |||||||||
|
|
|
|
|
| |||||||
Net change in unrealized appreciation/depreciation | 333,667,268 | 116,883,844 | 637,093,016 | |||||||||
|
|
|
|
|
| |||||||
Net realized and unrealized gain | 335,404,654 | 90,029,615 | 644,196,688 | |||||||||
|
|
|
|
|
| |||||||
NET INCREASE IN NET ASSETS RESULTING FROM OPERATIONS | $ | 431,957,380 | $ | 106,877,451 | $ | 741,552,409 | ||||||
|
|
|
|
|
| |||||||
| a | Net of foreign withholding tax of $1,396,064, $221,429 and $28,253,001, respectively. |
| b | Net of securities lending income tax paid of $ —, $ — and $532,992, respectively. |
See notes to financial statements.
FINANCIAL STATEMENTS | 59 |
Table of Contents
Statements of Operations (Continued)
iSHARES®, INC.
Year ended August 31, 2017
| iShares MSCI Thailand Capped ETF | ||||
NET INVESTMENT INCOME | ||||
Dividends — unaffiliateda | $ | 11,344,791 | ||
Dividends — affiliated (Note 2) | 4,660 | |||
Securities lending income — affiliated — net (Note 2) | 1,398,939 | |||
|
| |||
Total investment income | 12,748,390 | |||
|
| |||
EXPENSES | ||||
Investment advisory fees (Note 2) | 2,413,235 | |||
Proxy fees | 9,309 | |||
|
| |||
Total expenses | 2,422,544 | |||
|
| |||
Net investment income | 10,325,846 | |||
|
| |||
NET REALIZED AND UNREALIZED GAIN (LOSS) | ||||
Net realized gain (loss) from: |
| |||
Investments — unaffiliated | (7,514,983 | ) | ||
Investments — affiliated (Note 2) | 5,852 | |||
In-kind redemptions — unaffiliated | 26,009,569 | |||
Foreign currency transactions | 756 | |||
Realized gain distributions from affiliated funds | 68 | |||
|
| |||
Net realized gain | 18,501,262 | |||
|
| |||
Net change in unrealized appreciation/depreciation on: | ||||
Investments — unaffiliated | 8,456,477 | |||
Investments — affiliated (Note 2) | 4,525 | |||
Translation of assets and liabilities in foreign currencies | 1,390 | |||
|
| |||
Net change in unrealized appreciation/depreciation | 8,462,392 | |||
|
| |||
Net realized and unrealized gain | 26,963,654 | |||
|
| |||
NET INCREASE IN NET ASSETS RESULTING FROM OPERATIONS | $ | 37,289,500 | ||
|
| |||
| a | Net of foreign withholding tax of $1,212,071. |
See notes to financial statements.
| 60 | 2017 iSHARES ANNUAL REPORTTO SHAREHOLDERS |
Table of Contents
Statements of Changes in Net Assets
iSHARES®, INC.
| iShares MSCI Hong Kong ETF | iShares MSCI Japan Small-Cap ETF | |||||||||||||||
| Year ended August 31, 2017 | Year ended August 31, 2016 | Year ended August 31, 2017 | Year ended August 31, 2016 | |||||||||||||
INCREASE (DECREASE) IN NET ASSETS | ||||||||||||||||
OPERATIONS: | ||||||||||||||||
Net investment income | $ | 54,584,827 | $ | 55,962,839 | $ | 2,245,390 | $ | 2,594,375 | ||||||||
Net realized gain (loss) | (4,934,210 | ) | (112,618,836 | ) | 11,931,619 | 1,760,658 | ||||||||||
Net change in unrealized appreciation/depreciation | 243,779,429 | 206,987,041 | 19,303,879 | 10,466,590 | ||||||||||||
|
|
|
|
|
|
|
| |||||||||
Net increase in net assets resulting from operations | 293,430,046 | 150,331,044 | 33,480,888 | 14,821,623 | ||||||||||||
|
|
|
|
|
|
|
| |||||||||
DISTRIBUTIONS TO SHAREHOLDERS: | ||||||||||||||||
From net investment income | (47,903,550 | ) | (57,946,909 | ) | (4,653,375 | ) | (3,054,464 | ) | ||||||||
|
|
|
|
|
|
|
| |||||||||
Total distributions to shareholders | (47,903,550 | ) | (57,946,909 | ) | (4,653,375 | ) | (3,054,464 | ) | ||||||||
|
|
|
|
|
|
|
| |||||||||
CAPITAL SHARE TRANSACTIONS: | ||||||||||||||||
Proceeds from shares sold | 465,624,058 | 22,375,546 | 116,995,181 | 45,471,321 | ||||||||||||
Cost of shares redeemed | (452,279,138 | ) | (1,240,407,729 | ) | (121,160,138 | ) | (51,689,221 | ) | ||||||||
|
|
|
|
|
|
|
| |||||||||
Net increase (decrease) in net assets from capital share transactions | 13,344,920 | (1,218,032,183 | ) | (4,164,957 | ) | (6,217,900 | ) | |||||||||
|
|
|
|
|
|
|
| |||||||||
INCREASE (DECREASE) IN NET ASSETS | 258,871,416 | (1,125,648,048 | ) | 24,662,556 | 5,549,259 | |||||||||||
NET ASSETS | ||||||||||||||||
Beginning of year | 1,596,575,814 | 2,722,223,862 | 164,553,406 | 159,004,147 | ||||||||||||
|
|
|
|
|
|
|
| |||||||||
End of year | $ | 1,855,447,230 | $ | 1,596,575,814 | $ | 189,215,962 | $ | 164,553,406 | ||||||||
|
|
|
|
|
|
|
| |||||||||
Undistributed (distributions in excess of) net investment income included in net assets at end of year | $ | 12,327,044 | $ | 5,722,325 | $ | (591,075 | ) | $ | 378,670 | |||||||
|
|
|
|
|
|
|
| |||||||||
SHARES ISSUED AND REDEEMED | ||||||||||||||||
Shares sold | 21,225,000 | 1,125,000 | 1,800,000 | 800,000 | ||||||||||||
Shares redeemed | (21,825,000 | ) | (65,550,000 | ) | (1,900,000 | ) | (900,000 | ) | ||||||||
|
|
|
|
|
|
|
| |||||||||
Net decrease in shares outstanding | (600,000 | ) | (64,425,000 | ) | (100,000 | ) | (100,000 | ) | ||||||||
|
|
|
|
|
|
|
| |||||||||
See notes to financial statements.
FINANCIAL STATEMENTS | 61 |
Table of Contents
Statements of Changes in Net Assets (Continued)
iSHARES®, INC.
| iShares MSCI Malaysia ETF | iShares MSCI Pacific ex Japan ETF | |||||||||||||||
| Year ended August 31, 2017a | Year ended August 31, 2016a | Year ended August 31, 2017 | Year ended August 31, 2016 | |||||||||||||
INCREASE (DECREASE) IN NET ASSETS | ||||||||||||||||
OPERATIONS: | ||||||||||||||||
Net investment income | $ | 9,215,501 | $ | 8,018,748 | $ | 96,552,726 | $ | 79,688,773 | ||||||||
Net realized gain (loss) | (5,180,434 | ) | 2,274,635 | 1,737,386 | (45,760,650 | ) | ||||||||||
Net change in unrealized appreciation/depreciation | 3,247,154 | 8,119,136 | 333,667,268 | 190,272,573 | ||||||||||||
|
|
|
|
|
|
|
| |||||||||
Net increase in net assets resulting from operations | 7,282,221 | 18,412,519 | 431,957,380 | 224,200,696 | ||||||||||||
|
|
|
|
|
|
|
| |||||||||
DISTRIBUTIONS TO SHAREHOLDERS: | ||||||||||||||||
From net investment income | (15,799,041 | ) | (12,913,175 | ) | (98,968,999 | ) | (80,779,861 | ) | ||||||||
From net realized gain | — | (61,020,000 | ) | — | — | |||||||||||
|
|
|
|
|
|
|
| |||||||||
Total distributions to shareholders | (15,799,041 | ) | (73,933,175 | ) | (98,968,999 | ) | (80,779,861 | ) | ||||||||
|
|
|
|
|
|
|
| |||||||||
CAPITAL SHARE TRANSACTIONS: | ||||||||||||||||
Proceeds from shares sold | 158,537,129 | 235,390,658 | 627,289,205 | 430,991,170 | ||||||||||||
Cost of shares redeemed | (48,251,620 | ) | (107,993,581 | ) | (197,813,415 | ) | (200,654,534 | ) | ||||||||
|
|
|
|
|
|
|
| |||||||||
Net increase in net assets from capital share transactions | 110,285,509 | 127,397,077 | 429,475,790 | 230,336,636 | ||||||||||||
|
|
|
|
|
|
|
| |||||||||
INCREASE IN NET ASSETS | 101,768,689 | 71,876,421 | 762,464,171 | 373,757,471 | ||||||||||||
NET ASSETS | ||||||||||||||||
Beginning of year | 335,455,186 | 263,578,765 | 2,357,962,085 | 1,984,204,614 | ||||||||||||
|
|
|
|
|
|
|
| |||||||||
End of year | $ | 437,223,875 | $ | 335,455,186 | $ | 3,120,426,256 | $ | 2,357,962,085 | ||||||||
|
|
|
|
|
|
|
| |||||||||
Undistributed (distributions in excess of) net investment income included in net assets at end of year | $ | (8,211,868 | ) | $ | (1,310,602 | ) | $ | 11,406,465 | $ | 11,915,309 | ||||||
|
|
|
|
|
|
|
| |||||||||
SHARES ISSUED AND REDEEMED | ||||||||||||||||
Shares sold | 6,900,000 | 6,506,250 | 14,400,000 | 10,800,000 | ||||||||||||
Shares redeemed | (3,375,000 | ) | (2,850,000 | ) | (4,800,000 | ) | (5,400,000 | ) | ||||||||
|
|
|
|
|
|
|
| |||||||||
Net increase in shares outstanding | 3,525,000 | 3,656,250 | 9,600,000 | 5,400,000 | ||||||||||||
|
|
|
|
|
|
|
| |||||||||
a Share transactions reflect a one-for-four reverse stock split effective after the close of trading on November 4, 2016. See Note 4.
See notes to financial statements.
| 62 | 2017 iSHARES ANNUAL REPORTTO SHAREHOLDERS |
Table of Contents
Statements of Changes in Net Assets (Continued)
iSHARES®, INC.
| iShares MSCI Singapore Capped ETF | iShares MSCI Taiwan Capped ETF | |||||||||||||||
| Year ended August 31, 2017a | Year ended August 31, 2016a | Year ended August 31, 2017a | Year ended August 31, 2016a | |||||||||||||
INCREASE (DECREASE) IN NET ASSETS | ||||||||||||||||
OPERATIONS: | ||||||||||||||||
Net investment income | $ | 16,847,836 | $ | 21,958,456 | $ | 97,355,721 | $ | 65,261,790 | ||||||||
Net realized gain (loss) | (26,854,229 | ) | (29,896,748 | ) | 7,103,672 | (131,209,842 | ) | |||||||||
Net change in unrealized appreciation/depreciation | 116,883,844 | 14,050,396 | 637,093,016 | 327,822,256 | ||||||||||||
|
|
|
|
|
|
|
| |||||||||
Net increase in net assets resulting from operations | 106,877,451 | 6,112,104 | 741,552,409 | 261,874,204 | ||||||||||||
|
|
|
|
|
|
|
| |||||||||
DISTRIBUTIONS TO SHAREHOLDERS: | ||||||||||||||||
From net investment income | (23,963,560 | ) | (16,842,459 | ) | (64,888,894 | ) | (85,498,003 | ) | ||||||||
|
|
|
|
|
|
|
| |||||||||
Total distributions to shareholders | (23,963,560 | ) | (16,842,459 | ) | (64,888,894 | ) | (85,498,003 | ) | ||||||||
|
|
|
|
|
|
|
| |||||||||
CAPITAL SHARE TRANSACTIONS: | ||||||||||||||||
Proceeds from shares sold | 74,734,333 | 117,265,015 | 500,883,331 | 512,970,562 | ||||||||||||
Cost of shares redeemed | (119,799,002 | ) | (154,043,146 | ) | (69,945,562 | ) | (1,308,867,457 | ) | ||||||||
|
|
|
|
|
|
|
| |||||||||
Net increase (decrease) in net assets from capital share transactions | (45,064,669 | ) | (36,778,131 | ) | 430,937,769 | (795,896,895 | ) | |||||||||
|
|
|
|
|
|
|
| |||||||||
INCREASE (DECREASE) IN NET ASSETS | 37,849,222 | (47,508,486 | ) | 1,107,601,284 | (619,520,694 | ) | ||||||||||
NET ASSETS | ||||||||||||||||
Beginning of year | 562,418,438 | 609,926,924 | 2,656,889,113 | 3,276,409,807 | ||||||||||||
|
|
|
|
|
|
|
| |||||||||
End of year | $ | 600,267,660 | $ | 562,418,438 | $ | 3,764,490,397 | $ | 2,656,889,113 | ||||||||
|
|
|
|
|
|
|
| |||||||||
Undistributed (distributions in excess of) net investment income included in net assets at end of year | $ | (2,880,416 | ) | $ | 3,947,970 | $ | 84,691,293 | $ | 52,002,232 | |||||||
|
|
|
|
|
|
|
| |||||||||
SHARES ISSUED AND REDEEMED | ||||||||||||||||
Shares sold | 3,400,000 | 5,350,000 | 15,300,000 | 17,900,000 | ||||||||||||
Shares redeemed | (5,600,000 | ) | (7,550,000 | ) | (2,200,000 | ) | (50,800,000 | ) | ||||||||
|
|
|
|
|
|
|
| |||||||||
Net increase (decrease) in shares outstanding | (2,200,000 | ) | (2,200,000 | ) | 13,100,000 | (32,900,000 | ) | |||||||||
|
|
|
|
|
|
|
| |||||||||
| a | Share transactions reflect a one-for-two reverse stock split effective after the close of trading on November 4, 2016. See Note 4. |
See notes to financial statements.
FINANCIAL STATEMENTS | 63 |
Table of Contents
Statements of Changes in Net Assets (Continued)
iSHARES®, INC.
| iShares MSCI Thailand Capped ETF | ||||||||
| Year ended August 31, 2017 | Year ended August 31, 2016 | |||||||
INCREASE (DECREASE) IN NET ASSETS | ||||||||
OPERATIONS: | ||||||||
Net investment income | $ | 10,325,846 | $ | 8,989,630 | ||||
Net realized gain (loss) | 18,501,262 | (27,016,412 | ) | |||||
Net change in unrealized appreciation/depreciation | 8,462,392 | 81,712,344 | ||||||
|
|
|
| |||||
Net increase in net assets resulting from operations | 37,289,500 | 63,685,562 | ||||||
|
|
|
| |||||
DISTRIBUTIONS TO SHAREHOLDERS: | ||||||||
From net investment income | (10,761,008 | ) | (7,604,719 | ) | ||||
|
|
|
| |||||
Total distributions to shareholders | (10,761,008 | ) | (7,604,719 | ) | ||||
|
|
|
| |||||
CAPITAL SHARE TRANSACTIONS: | ||||||||
Proceeds from shares sold | 125,837,713 | 240,640,360 | ||||||
Cost of shares redeemed | (244,851,266 | ) | (85,949,624 | ) | ||||
|
|
|
| |||||
Net increase (decrease) in net assets from capital share transactions | (119,013,553 | ) | 154,690,736 | |||||
|
|
|
| |||||
INCREASE (DECREASE) IN NET ASSETS | (92,485,061 | ) | 210,771,579 | |||||
NET ASSETS | ||||||||
Beginning of year | 448,075,088 | 237,303,509 | ||||||
|
|
|
| |||||
End of year | $ | 355,590,027 | $ | 448,075,088 | ||||
|
|
|
| |||||
Undistributed net investment income included in net assets at end of year | $ | 2,034,256 | $ | 2,416,276 | ||||
|
|
|
| |||||
SHARES ISSUED AND REDEEMED | ||||||||
Shares sold | 1,700,000 | 3,550,000 | ||||||
Shares redeemed | (3,300,000 | ) | (1,300,000 | ) | ||||
|
|
|
| |||||
Net increase (decrease) in shares outstanding | (1,600,000 | ) | 2,250,000 | |||||
|
|
|
| |||||
See notes to financial statements.
| 64 | 2017 iSHARES ANNUAL REPORTTO SHAREHOLDERS |
Table of Contents
iSHARES®, INC.
(For a share outstanding throughout each period)
| iShares MSCI Hong Kong ETF | ||||||||||||||||||||
| Year ended Aug. 31, 2017 | Year ended Aug. 31, 2016 | Year ended Aug. 31, 2015 | Year ended Aug. 31, 2014 | Year ended Aug. 31, 2013 | ||||||||||||||||
Net asset value, beginning of year | $ | 21.08 | $ | 19.42 | $ | 21.89 | $ | 18.91 | $ | 16.94 | ||||||||||
|
|
|
|
|
|
|
|
|
| |||||||||||
Income from investment operations: | ||||||||||||||||||||
Net investment incomea | 0.68 | 0.54 | 0.52 | 0.66 | 0.48 | |||||||||||||||
Net realized and unrealized gain (loss)b | 3.54 | 1.72 | (2.50 | ) | 3.04 | 2.05 | ||||||||||||||
|
|
|
|
|
|
|
|
|
| |||||||||||
Total from investment operations | 4.22 | 2.26 | (1.98 | ) | 3.70 | 2.53 | ||||||||||||||
|
|
|
|
|
|
|
|
|
| |||||||||||
Less distributions from: | ||||||||||||||||||||
Net investment income | (0.61 | ) | (0.60 | ) | (0.49 | ) | (0.72 | ) | (0.56 | ) | ||||||||||
|
|
|
|
|
|
|
|
|
| |||||||||||
Total distributions | (0.61 | ) | (0.60 | ) | (0.49 | ) | (0.72 | ) | (0.56 | ) | ||||||||||
|
|
|
|
|
|
|
|
|
| |||||||||||
Net asset value, end of year | $ | 24.69 | $ | 21.08 | $ | 19.42 | $ | 21.89 | $ | 18.91 | ||||||||||
|
|
|
|
|
|
|
|
|
| |||||||||||
Total return | 20.38 | % | 11.94 | % | (9.29 | )% | 19.87 | % | 15.04 | % | ||||||||||
|
|
|
|
|
|
|
|
|
| |||||||||||
Ratios/Supplemental data: | ||||||||||||||||||||
Net assets, end of year (000s) | $ | 1,855,447 | $ | 1,596,576 | $ | 2,722,224 | $ | 3,221,312 | $ | 2,124,856 | ||||||||||
Ratio of expenses to average net assets | 0.49 | % | 0.48 | % | 0.48 | % | 0.48 | % | 0.51 | %�� | ||||||||||
Ratio of net investment income to average net assets | 3.08 | % | 2.73 | % | 2.36 | % | 3.24 | % | 2.47 | % | ||||||||||
Portfolio turnover ratec | 8 | % | 9 | % | 7 | % | 6 | % | 12 | % | ||||||||||
| a | Based on average shares outstanding throughout each period. |
| b | The amounts reported for a share outstanding may not accord with the change in aggregate gains and losses in securities for the fiscal period due to the timing of capital share transactions in relation to the fluctuating market values of the Fund’s underlying securities. |
| c | Portfolio turnover rates exclude portfolio securities received or delivered as a result of processing capital share transactions in Creation Units. |
See notes to financial statements.
FINANCIAL HIGHLIGHTS | 65 |
Table of Contents
Financial Highlights (Continued)
iSHARES®, INC.
(For a share outstanding throughout each period)
| iShares MSCI Japan Small-Cap ETF | ||||||||||||||||||||
| Year ended Aug. 31, 2017 | Year ended Aug. 31, 2016 | Year ended Aug. 31, 2015 | Year ended Aug. 31, 2014 | Year ended Aug. 31, 2013 | ||||||||||||||||
Net asset value, beginning of year | $ | 60.95 | $ | 56.79 | $ | 56.61 | $ | 49.44 | $ | 42.82 | ||||||||||
|
|
|
|
|
|
|
|
|
| |||||||||||
Income from investment operations: | ||||||||||||||||||||
Net investment incomea | 1.02 | 0.84 | 0.70 | 0.70 | 0.65 | |||||||||||||||
Net realized and unrealized gainb | 12.62 | 4.29 | 0.71 | 7.61 | 6.97 | |||||||||||||||
|
|
|
|
|
|
|
|
|
| |||||||||||
Total from investment operations | 13.64 | 5.13 | 1.41 | 8.31 | 7.62 | |||||||||||||||
|
|
|
|
|
|
|
|
|
| |||||||||||
Less distributions from: | ||||||||||||||||||||
Net investment income | (1.81 | ) | (0.97 | ) | (1.23 | ) | (1.14 | ) | (1.00 | ) | ||||||||||
|
|
|
|
|
|
|
|
|
| |||||||||||
Total distributions | (1.81 | ) | (0.97 | ) | (1.23 | ) | (1.14 | ) | (1.00 | ) | ||||||||||
|
|
|
|
|
|
|
|
|
| |||||||||||
Net asset value, end of year | $ | 72.78 | $ | 60.95 | $ | 56.79 | $ | 56.61 | $ | 49.44 | ||||||||||
|
|
|
|
|
|
|
|
|
| |||||||||||
Total return | 22.81 | % | 9.10 | % | 2.63 | % | 16.94 | % | 18.07 | % | ||||||||||
|
|
|
|
|
|
|
|
|
| |||||||||||
Ratios/Supplemental data: | ||||||||||||||||||||
Net assets, end of year (000s) | $ | 189,216 | $ | 164,553 | $ | 159,004 | $ | 169,837 | $ | 88,988 | ||||||||||
Ratio of expenses to average net assets | 0.49 | % | 0.48 | % | 0.48 | % | 0.48 | % | 0.50 | % | ||||||||||
Ratio of net investment income to average net assets | 1.53 | % | 1.44 | % | 1.26 | % | 1.31 | % | 1.36 | % | ||||||||||
Portfolio turnover ratec | 8 | % | 12 | % | 10 | % | 14 | % | 17 | % | ||||||||||
| a | Based on average shares outstanding throughout each period. |
| b | The amounts reported for a share outstanding may not accord with the change in aggregate gains and losses in securities for the fiscal period due to the timing of capital share transactions in relation to the fluctuating market values of the Fund’s underlying securities. |
| c | Portfolio turnover rates exclude portfolio securities received or delivered as a result of processing capital share transactions in Creation Units. |
See notes to financial statements.
| 66 | 2017 iSHARES ANNUAL REPORTTO SHAREHOLDERS |
Table of Contents
Financial Highlights (Continued)
iSHARES®, INC.
(For a share outstanding throughout each period)
| iShares MSCI Malaysia ETF | ||||||||||||||||||||
| Year ended Aug. 31, 2017a | Year ended Aug. 31, 2016a | Year ended Aug. 31, 2015a | Year ended Aug. 31, 2014a | Year ended Aug. 31, 2013a | ||||||||||||||||
Net asset value, beginning of year | $ | 33.13 | $ | 40.75 | $ | 64.53 | $ | 58.40 | $ | 58.09 | ||||||||||
|
|
|
|
|
|
|
|
|
| |||||||||||
Income from investment operations: | ||||||||||||||||||||
Net investment incomeb | 0.56 | 1.00 | 1.44 | 2.16 | 1.64 | |||||||||||||||
Net realized and unrealized gain (loss)c | (0.05 | ) | 2.79 | (23.47 | ) | 6.06 | 0.15 | |||||||||||||
|
|
|
|
|
|
|
|
|
| |||||||||||
Total from investment operations | 0.51 | 3.79 | (22.03 | ) | 8.22 | 1.79 | ||||||||||||||
|
|
|
|
|
|
|
|
|
| |||||||||||
Less distributions from: | ||||||||||||||||||||
Net investment income | (1.61 | ) | (1.81 | ) | (1.57 | ) | (2.09 | ) | (1.48 | ) | ||||||||||
Net realized gain | — | (9.60 | ) | (0.18 | ) | — | — | |||||||||||||
|
|
|
|
|
|
|
|
|
| |||||||||||
Total distributions | (1.61 | ) | (11.41 | ) | (1.75 | ) | (2.09 | ) | (1.48 | ) | ||||||||||
|
|
|
|
|
|
|
|
|
| |||||||||||
Net asset value, end of year | $ | 32.03 | $ | 33.13 | $ | 40.75 | $ | 64.53 | $ | 58.40 | ||||||||||
|
|
|
|
|
|
|
|
|
| |||||||||||
Total return | 2.14 | % | 12.58 | % | (34.62 | )% | 14.17 | % | 3.02 | % | ||||||||||
|
|
|
|
|
|
|
|
|
| |||||||||||
Ratios/Supplemental data: | ||||||||||||||||||||
Net assets, end of year (000s) | $ | 437,224 | $ | 335,455 | $ | 263,579 | $ | 786,461 | $ | 809,138 | ||||||||||
Ratio of expenses to average net assets | 0.49 | % | 0.48 | % | 0.48 | % | 0.48 | % | 0.51 | % | ||||||||||
Ratio of net investment income to average net assets | 2.73 | % | 2.86 | % | 2.61 | % | 3.48 | % | 2.71 | % | ||||||||||
Portfolio turnover rated | 24 | % | 72 | % | 24 | % | 16 | % | 17 | % | ||||||||||
| a | Per share amounts reflect a one-for-four reverse stock split effective after the close of trading on November 4, 2016. See Note 4. |
| b | Based on average shares outstanding throughout each period. |
| c | The amounts reported for a share outstanding may not accord with the change in aggregate gains and losses in securities for the fiscal period due to the timing of capital share transactions in relation to the fluctuating market values of the Fund’s underlying securities. |
| d | Portfolio turnover rates include portfolio transactions that are executed as a result of the Fund processing capital share transactions in Creation Units solely for cash in U.S. dollars. Excluding such cash transactions, the portfolio turnover rates for the years ended August 31, 2017, August 31, 2016, August 31, 2015, August 31, 2014 and August 31, 2013 were 10%, 17%, 5%, 10%, and 8%, respectively. See Note 4. |
See notes to financial statements.
FINANCIAL HIGHLIGHTS | 67 |
Table of Contents
Financial Highlights (Continued)
iSHARES®, INC.
(For a share outstanding throughout each period)
| iShares MSCI Pacific ex Japan ETF | ||||||||||||||||||||
| Year ended Aug. 31, 2017 | Year ended Aug. 31, 2016 | Year ended Aug. 31, 2015 | Year ended Aug. 31, 2014 | Year ended Aug. 31, 2013 | ||||||||||||||||
Net asset value, beginning of year | $ | 40.94 | $ | 38.01 | $ | 51.21 | $ | 44.56 | $ | 43.21 | ||||||||||
|
|
|
|
|
|
|
|
|
| |||||||||||
Income from investment operations: | ||||||||||||||||||||
Net investment incomea | 1.60 | 1.54 | 1.97 | 1.88 | 1.69 | |||||||||||||||
Net realized and unrealized gain (loss)b | 5.55 | 2.98 | (13.09 | ) | 6.51 | 1.71 | ||||||||||||||
|
|
|
|
|
|
|
|
|
| |||||||||||
Total from investment operations | 7.15 | 4.52 | (11.12 | ) | 8.39 | 3.40 | ||||||||||||||
|
|
|
|
|
|
|
|
|
| |||||||||||
Less distributions from: | ||||||||||||||||||||
Net investment income | (1.66 | ) | (1.59 | ) | (2.08 | ) | (1.74 | ) | (2.05 | ) | ||||||||||
|
|
|
|
|
|
|
|
|
| |||||||||||
Total distributions | (1.66 | ) | (1.59 | ) | (2.08 | ) | (1.74 | ) | (2.05 | ) | ||||||||||
|
|
|
|
|
|
|
|
|
| |||||||||||
Net asset value, end of year | $ | 46.43 | $ | 40.94 | $ | 38.01 | $ | 51.21 | $ | 44.56 | ||||||||||
|
|
|
|
|
|
|
|
|
| |||||||||||
Total return | 18.06 | % | 12.20 | % | (22.19 | )% | 19.25 | % | 7.87 | % | ||||||||||
|
|
|
|
|
|
|
|
|
| |||||||||||
Ratios/Supplemental data: | ||||||||||||||||||||
Net assets, end of year (000s) | $ | 3,120,426 | $ | 2,357,962 | $ | 1,984,205 | $ | 3,472,048 | $ | 3,008,067 | ||||||||||
Ratio of expenses to average net assets | 0.49 | % | 0.49 | % | 0.49 | % | 0.49 | % | 0.50 | % | ||||||||||
Ratio of net investment income to average net assets | 3.69 | % | 4.00 | % | 4.31 | % | 3.90 | % | 3.59 | % | ||||||||||
Portfolio turnover ratec | 3 | % | 6 | % | 7 | % | 8 | % | 8 | % | ||||||||||
| a | Based on average shares outstanding throughout each period. |
| b | The amounts reported for a share outstanding may not accord with the change in aggregate gains and losses in securities for the fiscal period due to the timing of capital share transactions in relation to the fluctuating market values of the Fund’s underlying securities. |
| c | Portfolio turnover rates exclude portfolio securities received or delivered as a result of processing capital share transactions in Creation Units. |
See notes to financial statements.
| 68 | 2017 iSHARES ANNUAL REPORTTO SHAREHOLDERS |
Table of Contents
Financial Highlights (Continued)
iSHARES®, INC.
(For a share outstanding throughout each period)
| iShares MSCI Singapore Capped ETF | ||||||||||||||||||||
| Year ended Aug. 31, 2017a | Year ended Aug. 31, 2016a | Year ended Aug. 31, 2015a | Year ended Aug. 31, 2014a | Year ended Aug. 31, 2013a | ||||||||||||||||
Net asset value, beginning of year | $ | 21.22 | $ | 21.25 | $ | 27.93 | $ | 24.98 | $ | 26.19 | ||||||||||
|
|
|
|
|
|
|
|
|
| |||||||||||
Income from investment operations: | ||||||||||||||||||||
Net investment incomeb | 0.56 | 0.84 | 0.82 | 0.80 | 0.88 | |||||||||||||||
Net realized and unrealized gain (loss)c | 3.84 | (0.24 | ) | (6.64 | ) | 3.05 | (0.92 | ) | ||||||||||||
|
|
|
|
|
|
|
|
|
| |||||||||||
Total from investment operations | 4.40 | 0.60 | (5.82 | ) | 3.85 | (0.04 | ) | |||||||||||||
|
|
|
|
|
|
|
|
|
| |||||||||||
Less distributions from: | ||||||||||||||||||||
Net investment income | (0.92 | ) | (0.63 | ) | (0.86 | ) | (0.90 | ) | (1.17 | ) | ||||||||||
|
|
|
|
|
|
|
|
|
| |||||||||||
Total distributions | (0.92 | ) | (0.63 | ) | (0.86 | ) | (0.90 | ) | (1.17 | ) | ||||||||||
|
|
|
|
|
|
|
|
|
| |||||||||||
Net asset value, end of year | $ | 24.70 | $ | 21.22 | $ | 21.25 | $ | 27.93 | $ | 24.98 | ||||||||||
|
|
|
|
|
|
|
|
|
| |||||||||||
Total return | 21.51 | % | 2.87 | % | (21.27 | )% | 15.65 | % | (0.38 | )% | ||||||||||
|
|
|
|
|
|
|
|
|
| |||||||||||
Ratios/Supplemental data: | ||||||||||||||||||||
Net assets, end of year (000s) | $ | 600,268 | $ | 562,418 | $ | 609,927 | $ | 984,455 | $ | 1,135,477 | ||||||||||
Ratio of expenses to average net assets | 0.49 | % | 0.48 | % | 0.48 | % | 0.48 | % | 0.51 | % | ||||||||||
Ratio of net investment income to average net assets | 3.00 | % | 3.96 | % | 3.15 | % | 2.99 | % | 3.23 | % | ||||||||||
Portfolio turnover rated | 12 | % | 7 | % | 10 | % | 4 | % | 10 | % | ||||||||||
| a | Per share amounts reflect a one-for-two reverse stock split effective after the close of trading on November 4, 2016. See Note 4. |
| b | Based on average shares outstanding throughout each period. |
| c | The amounts reported for a share outstanding may not accord with the change in aggregate gains and losses in securities for the fiscal period due to the timing of capital share transactions in relation to the fluctuating market values of the Fund’s underlying securities. |
| d | Portfolio turnover rates exclude portfolio securities received or delivered as a result of processing capital share transactions in Creation Units. |
See notes to financial statements.
FINANCIAL HIGHLIGHTS | 69 |
Table of Contents
Financial Highlights (Continued)
iSHARES®, INC.
(For a share outstanding throughout each period)
| iShares MSCI Taiwan Capped ETF | ||||||||||||||||||||
| Year ended Aug. 31, 2017a | Year ended Aug. 31, 2016a | Year ended Aug. 31, 2015a | Year ended Aug. 31, 2014a | Year ended Aug. 31, 2013a | ||||||||||||||||
Net asset value, beginning of year | $ | 30.30 | $ | 27.17 | $ | 32.89 | $ | 27.21 | $ | 25.16 | ||||||||||
|
|
|
|
|
|
|
|
|
| |||||||||||
Income from investment operations: | ||||||||||||||||||||
Net investment incomeb | 0.87 | 0.68 | 0.74 | 0.58 | 0.48 | |||||||||||||||
Net realized and unrealized gain (loss)c | 6.88 | 3.25 | (5.88 | ) | 5.62 | 2.11 | ||||||||||||||
|
|
|
|
|
|
|
|
|
| |||||||||||
Total from investment operations | 7.75 | 3.93 | (5.14 | ) | 6.20 | 2.59 | ||||||||||||||
|
|
|
|
|
|
|
|
|
| |||||||||||
Less distributions from: | ||||||||||||||||||||
Net investment income | (0.70 | ) | (0.80 | ) | (0.58 | ) | (0.52 | ) | (0.54 | ) | ||||||||||
|
|
|
|
|
|
|
|
|
| |||||||||||
Total distributions | (0.70 | ) | (0.80 | ) | (0.58 | ) | (0.52 | ) | (0.54 | ) | ||||||||||
|
|
|
|
|
|
|
|
|
| |||||||||||
Net asset value, end of year | $ | 37.35 | $ | 30.30 | $ | 27.17 | $ | 32.89 | $ | 27.21 | ||||||||||
|
|
|
|
|
|
|
|
|
| |||||||||||
Total return | 26.17 | % | 15.02 | % | (15.79 | )% | 23.24 | % | 10.30 | % | ||||||||||
|
|
|
|
|
|
|
|
|
| |||||||||||
Ratios/Supplemental data: | ||||||||||||||||||||
Net assets, end of year (000s) | $ | 3,764,490 | $ | 2,656,889 | $ | 3,276,410 | $ | 3,298,664 | $ | 2,641,997 | ||||||||||
Ratio of expenses to average net assets | 0.62 | % | 0.64 | % | 0.62 | % | 0.62 | % | 0.61 | % | ||||||||||
Ratio of net investment income to average net assets | 3.10 | % | 2.51 | % | 2.36 | % | 1.98 | % | 1.80 | % | ||||||||||
Portfolio turnover rated | 11 | % | 27 | % | 14 | % | 11 | % | 21 | % | ||||||||||
| a | Per share amounts reflect a one-for-two reverse stock split effective after the close of trading on November 4, 2016. See Note 4. |
| b | Based on average shares outstanding throughout each period. |
| c | The amounts reported for a share outstanding may not accord with the change in aggregate gains and losses in securities for the fiscal period due to the timing of capital share transactions in relation to the fluctuating market values of the Fund’s underlying securities. |
| d | Portfolio turnover rates include portfolio transactions that are executed as a result of the Fund processing capital share transactions in Creation Units solely for cash in U.S. dollars. Excluding such cash transactions, the portfolio turnover rates for the years ended August 31, 2017, August 31, 2016, August 31, 2015, August 31, 2014 and August 31, 2013 were 8%, 9%, 4%, 4% and 6% respectively. See Note 4. |
See notes to financial statements.
| 70 | 2017 iSHARES ANNUAL REPORTTO SHAREHOLDERS |
Table of Contents
Financial Highlights (Continued)
iSHARES®, INC.
(For a share outstanding throughout each period)
| iShares MSCI Thailand Capped ETF | ||||||||||||||||||||
| Year ended Aug. 31, 2017 | Year ended Aug. 31, 2016 | Year ended Aug. 31, 2015 | Year ended Aug. 31, 2014 | Year ended Aug. 31, 2013 | ||||||||||||||||
Net asset value, beginning of year | $ | 75.94 | $ | 65.01 | $ | 83.41 | $ | 67.73 | $ | 70.53 | ||||||||||
|
|
|
|
|
|
|
|
|
| |||||||||||
Income from investment operations: | ||||||||||||||||||||
Net investment incomea | 1.99 | 2.05 | 1.66 | 1.67 | 1.84 | |||||||||||||||
Net realized and unrealized gain (loss)b | 6.90 | 10.54 | (17.98 | ) | 15.84 | (2.75 | ) | |||||||||||||
|
|
|
|
|
|
|
|
|
| |||||||||||
Total from investment operations | 8.89 | 12.59 | (16.32 | ) | 17.51 | (0.91 | ) | |||||||||||||
|
|
|
|
|
|
|
|
|
| |||||||||||
Less distributions from: | ||||||||||||||||||||
Net investment income | (2.13 | ) | (1.66 | ) | (2.08 | ) | (1.83 | ) | (1.89 | ) | ||||||||||
|
|
|
|
|
|
|
|
|
| |||||||||||
Total distributions | (2.13 | ) | (1.66 | ) | (2.08 | ) | (1.83 | ) | (1.89 | ) | ||||||||||
|
|
|
|
|
|
|
|
|
| |||||||||||
Net asset value, end of year | $ | 82.70 | $ | 75.94 | $ | 65.01 | $ | 83.41 | $ | 67.73 | ||||||||||
|
|
|
|
|
|
|
|
|
| |||||||||||
Total return | 12.01 | % | 19.87 | % | (19.92 | )% | 26.18 | % | (1.65 | )% | ||||||||||
|
|
|
|
|
|
|
|
|
| |||||||||||
Ratios/Supplemental data: | ||||||||||||||||||||
Net assets, end of year (000s) | $ | 355,590 | $ | 448,075 | $ | 237,304 | $ | 571,370 | $ | 541,873 | ||||||||||
Ratio of expenses to average net assets | 0.62 | % | 0.63 | % | 0.62 | % | 0.62 | % | 0.61 | % | ||||||||||
Ratio of net investment income to average net assets | 2.63 | % | 3.08 | % | 2.09 | % | 2.24 | % | 2.22 | % | ||||||||||
Portfolio turnover ratec | 7 | % | 16 | % | 13 | % | 9 | % | 24 | % | ||||||||||
| a | Based on average shares outstanding throughout each period. |
| b | The amounts reported for a share outstanding may not accord with the change in aggregate gains and losses in securities for the fiscal period due to the timing of capital share transactions in relation to the fluctuating market values of the Fund’s underlying securities. |
| c | Portfolio turnover rates exclude portfolio securities received or delivered as a result of processing capital share transactions in Creation Units. |
See notes to financial statements.
FINANCIAL HIGHLIGHTS | 71 |
Table of Contents
iSHARES®, INC.
iShares, Inc. (the “Company”) is registered under the Investment Company Act of 1940, as amended (the “1940 Act”), as an open-end management investment company. The Company was incorporated under the laws of the State of Maryland on September 1, 1994 pursuant to Articles of Incorporation as subsequently amended and restated.
These financial statements relate only to the following funds (each, a “Fund,” and collectively, the “Funds”):
| iShares ETF | Diversification Classification | |
MSCI Hong Kong | Non-diversified | |
MSCI Japan Small-Cap | Diversified | |
MSCI Malaysia | Non-diversified | |
MSCI Pacific ex-Japan | Diversified | |
MSCI Singapore Cappeda | Non-diversified | |
MSCI Taiwan Cappedb | Non-diversified | |
MSCI Thailand Capped | Non-diversified |
| a | Formerly the iShares MSCI Singapore ETF. |
| b | Formerly the iShares MSCI Taiwan ETF. |
The investment objective of each Fund is to seek investment results that correspond generally to the price and yield performance, before fees and expenses, of its underlying index. The investment adviser uses a “passive” or index approach to try to achieve each Fund’s investment objective.
Pursuant to the Company’s organizational documents, the Funds’ officers and directors are indemnified against certain liabilities that may arise out of the performance of their duties to the Funds. Additionally, in the normal course of business, the Funds enter into contracts with service providers that contain general indemnification clauses. The Funds’ maximum exposure under these arrangements is unknown as this would involve future claims that may be made against the Funds that have not yet occurred.
| 1. | SIGNIFICANT ACCOUNTING POLICIES |
The following significant accounting policies are consistently followed by each Fund in the preparation of its financial statements in conformity with accounting principles generally accepted in the United States of America (“U.S. GAAP”). The preparation of financial statements in conformity with U.S. GAAP requires management to make certain estimates and assumptions that affect the reported amounts of assets and liabilities and disclosures of contingent assets and liabilities at the date of the financial statements and the reported amounts of revenue and expenses during the reporting period. Actual results could differ from those estimates. Each Fund is considered an investment company under U.S. GAAP and follows the accounting and reporting guidance applicable to investment companies.
SECURITY VALUATION
Each Fund’s investments are valued at fair value each day that the Fund’s listing exchange is open and, for financial reporting purposes, as of the report date should the reporting period end on a day that the Fund’s listing exchange is not open. U.S. GAAP defines fair value as the price a fund would receive to sell an asset or pay to transfer a liability in an orderly transaction between market participants at the measurement date. The BlackRock Global Valuation Methodologies Committee (the “Global Valuation Committee”) provides oversight of the valuation of investments for the Funds. The investments of each Fund are valued pursuant
| 72 | 2017 iSHARES ANNUAL REPORTTO SHAREHOLDERS |
Table of Contents
Notes to Financial Statements (Continued)
iSHARES®, INC.
to policies and procedures developed by the Global Valuation Committee and approved by the Board of Directors of the Company (the “Board”).
| • | Equity investments traded on a recognized securities exchange are valued at that day’s last reported trade price or the official closing price, as applicable, on the exchange where the stock is primarily traded. Equity investments traded on a recognized exchange for which there were no sales on that day are valued at the last traded price. |
| • | Open-end U.S. mutual funds (including money market funds) are valued at that day’s published net asset value (“NAV”). |
| • | Futures contract notional values are determined based on that day’s last reported settlement price on the exchange where the contract is traded. |
In the event that application of these methods of valuation results in a price for an investment which is deemed not to be representative of the fair value of such investment or if a price is not available, the investment will be valued by the Global Valuation Committee, in accordance with policies approved by the Board. The fair valuation approaches that may be utilized by the Global Valuation Committee to determine fair value include market approach, income approach and the cost approach. The valuation techniques used under these approaches take into consideration inputs that include but are not limited to (i) attributes specific to the investment; (ii) the principal market for the investment; (iii) the customary participants in the principal market for the investment; (iv) data assumptions by market participants for the investment, if reasonably available; (v) quoted prices for similar investments in active markets; and (vi) other inputs, such as future cash flows, interest rates, yield curves, volatilities, prepayment speeds, loss severities, credit risks and/or default rates. Valuations based on such inputs are reported to the Board on a quarterly basis.
The Global Valuation Committee employs various methods for calibrating valuation approaches for investments where an active market does not exist, including regular due diligence of the Company’s pricing vendors, a regular review of key inputs and assumptions, transactional back-testing or disposition analysis to compare unrealized gains and losses to realized gains and losses, reviews of missing or stale prices, reviews of large movements in market values, and reviews of market related activity.
Fair value pricing could result in a difference between the prices used to calculate a Fund’s NAV and the prices used by the Fund’s underlying index, which in turn could result in a difference between the Fund’s performance and the performance of the Fund’s underlying index.
Various inputs are used in determining the fair value of financial instruments. Inputs may be based on independent market data (“observable inputs”) or they may be internally developed (“unobservable inputs”). These inputs to valuation techniques are categorized into a fair value hierarchy consisting of three broad levels for financial reporting purposes as follows:
| • | Level 1 — Unadjusted quoted prices in active markets for identical assets or liabilities; |
| • | Level 2 — Inputs other than quoted prices included within Level 1 that are observable for the asset or liability either directly or indirectly, including quoted prices for similar assets or liabilities in active markets, quoted prices for identical or similar assets or liabilities in markets that are not considered to be active, inputs other than quoted prices that are observable for the asset or liability (such as exchange rates, financing terms, interest rates, yield curves, volatilities, prepayment speeds, loss severities, credit risks and default rates) or other market-corroborated inputs; and |
| • | Level 3 — Unobservable inputs for the asset or liability based on the best information available in the circumstances, to the extent observable inputs are not available, including the Global Valuation Committee’s assumptions used in determining the fair value of investments. |
NOTESTO FINANCIAL STATEMENTS | 73 |
Table of Contents
Notes to Financial Statements (Continued)
iSHARES®, INC.
The hierarchy gives the highest priority to unadjusted quoted prices in active markets for identical assets or liabilities (Level 1 measurements) and the lowest priority to unobservable inputs (Level 3 measurements). Accordingly, the degree of judgement exercised in determining fair value is greatest for instruments categorized in Level 3. The inputs used to measure fair value may fall into different levels of the fair value hierarchy. In such cases, for disclosure purposes, the fair value hierarchy classification is determined based on the lowest level input that is significant to the fair value measurement in its entirety. The fair value hierarchy for each Fund’s investments is included in its schedule of investments.
Changes in valuation techniques may result in transfers in or out of an assigned level within the fair value hierarchy. In accordance with the Company’s policy, transfers between different levels of the fair value hierarchy are deemed to have occurred as of the beginning of the reporting period. The categorization of values determined for financial instruments are based on the pricing transparency of the financial instruments and are not necessarily an indication of the risks associated with investing in those securities.
SECURITY TRANSACTIONS AND INCOME RECOGNITION
Security transactions are accounted for on trade date. Realized gains and losses on investment transactions are determined using the specific identification method. Dividend income and capital gain distributions, if any, are recognized on the ex-dividend date, net of any foreign taxes withheld at source. Any taxes withheld that are reclaimable from foreign tax authorities as of August 31, 2017 are reflected in tax reclaims receivable. Upon notification from issuers, some of the dividend income received from a real estate investment trust may be re-designated as a reduction of cost of the related investment and/or realized gain. Non-cash dividends received, if any, are recognized on the ex-dividend date and recorded as non-cash dividend income at fair value. Distributions received by the Funds may include a return of capital that is estimated by management. Such amounts are recorded as a reduction of the cost of investments or reclassified to capital gains. Interest income is accrued daily.
FOREIGN CURRENCY TRANSLATION
The accounting records of the Funds are maintained in U.S. dollars. Foreign currencies, as well as investment securities and other assets and liabilities denominated in foreign currencies, are translated into U.S. dollars using exchange rates deemed appropriate by the investment adviser. Purchases and sales of securities, income receipts and expense payments are translated into U.S. dollars on the respective dates of such transactions.
Each Fund does not isolate the effect of fluctuations in foreign exchange rates from the effect of fluctuations in the market prices of securities. Such fluctuations are reflected by the Funds as a component of realized and unrealized gains and losses from investments for financial reporting purposes. Each Fund reports realized currency gains (losses) on foreign currency related transactions as components of net realized gain (loss) for financial reporting purposes, whereas such components are generally treated as ordinary income for U.S. federal income tax purposes.
FOREIGN TAXES
The Funds may be subject to foreign taxes (a portion of which may be reclaimable) on income, stock dividends, capital gains on investments, or certain foreign currency transactions. All foreign taxes are recorded in accordance with the applicable foreign tax regulations and rates that exist in the foreign jurisdictions in which the Funds invest. These foreign taxes, if any, are paid by the Funds and are reflected in their statements of operations as follows: foreign taxes withheld at source are presented as a reduction of income, foreign taxes on securities lending income are presented as a reduction of securities lending income, foreign taxes on stock dividends are presented as “other foreign taxes”, and foreign taxes on capital gains from sales of investments and foreign taxes on foreign currency transactions are included in their respective net realized gain (loss) categories. Foreign taxes payable or deferred as of August 31, 2017, if any, are disclosed in the Funds’ statements of assets and liabilities.
| 74 | 2017 iSHARES ANNUAL REPORTTO SHAREHOLDERS |
Table of Contents
Notes to Financial Statements (Continued)
iSHARES®, INC.
DISTRIBUTIONS TO SHAREHOLDERS
Dividends and distributions paid by each Fund are recorded on the ex-dividend dates. Distributions are determined on a tax basis and may differ from net investment income and net realized capital gains for financial reporting purposes. Dividends and distributions are paid in U.S. dollars and cannot be automatically reinvested in additional shares of the Funds.
LOANS OF PORTFOLIO SECURITIES
Each Fund may lend its investment securities to approved borrowers, such as brokers, dealers and other financial institutions. The borrower pledges and maintains with the Fund collateral consisting of cash, an irrevocable letter of credit issued by an approved bank, or securities issued or guaranteed by the U.S. government. The initial collateral received by each Fund is required to have a value of at least 102% of the current value of the loaned securities for securities traded on U.S. exchanges and a value of at least 105% for all other securities. The collateral is maintained thereafter at a value equal to at least 100% of the current value of the securities on loan. The market value of the loaned securities is determined at the close of each business day of the Funds. Any additional required collateral is delivered to the Funds and any excess collateral is returned by the Funds on the next business day. During the term of the loan, each Fund is entitled to all distributions made on or in respect of the loaned securities but does not receive interest income on securities received as collateral. Loans of securities are terminable at any time and the borrower, after notice, is required to return borrowed securities within the standard time period for settlement of securities transactions.
Cash received as collateral for securities on loan may be reinvested in certain short-term instruments either directly on behalf of a fund or through one or more joint accounts or money market funds, including those managed by BlackRock Fund Advisors (“BFA”), the Funds’ investment adviser, or its affiliates. As of August 31, 2017, any securities on loan were collateralized by cash and/or U.S. government obligations. Cash collateral received was invested in money market funds managed by BFA and is disclosed in the schedules of investments. Any non-cash collateral received cannot be sold, re-invested or pledged by the Fund, except in the event of borrower default. The securities on loan for each Fund are also disclosed in its schedule of investments. The total value of any securities on loan as of August 31, 2017 and the total value of the related cash collateral are disclosed in the statements of assets and liabilities. Income earned by the Funds from securities lending is disclosed in the statements of operations.
The risks of securities lending include the risk that the borrower may not provide additional collateral when required or may not return the securities when due. To mitigate these risks, the Funds benefit from a borrower default indemnity provided by BlackRock, Inc. (“BlackRock”). BlackRock’s indemnity allows for full replacement of securities loaned if the collateral received does not cover the value of the securities loaned in the event of borrower default. Each Fund could incur a loss if the value of an investment purchased with cash collateral falls below the value of the loaned securities or if the value of an investment purchased with cash collateral falls below the value of the original cash collateral received.
Securities lending transactions are entered into by the Funds under Master Securities Lending Agreements (“MSLA”) which provide the right, in the event of default (including bankruptcy or insolvency) for the non-defaulting party to liquidate the collateral and calculate a net exposure to the defaulting party or request additional collateral. In the event that a borrower defaults, a Fund, as lender, would offset the market value of the collateral received against the market value of the securities loaned. The value of the collateral is typically greater than that of the market value of the securities loaned, leaving the lender with a net amount payable to the defaulting party. However, bankruptcy or insolvency laws of a particular jurisdiction may impose restrictions on or prohibitions against such a right of offset in the event of an MSLA counterparty’s bankruptcy or insolvency. Under the MSLA, the borrower can resell or re-pledge the loaned securities, and a Fund can reinvest cash collateral, or, upon an event of default, resell or re-pledge the collateral.
NOTESTO FINANCIAL STATEMENTS | 75 |
Table of Contents
Notes to Financial Statements (Continued)
iSHARES®, INC.
The following table is a summary of securities lending agreements which are subject to offset under an MSLA as of August 31, 2017:
| iShares ETF and Counterparty | Market Value of Securities on Loan | Cash Collateral Received a | Net Amount | |||||||||
MSCI Hong Kong | ||||||||||||
Goldman Sachs & Co. | $ | 14,100 | $ | 14,100 | $ | — | ||||||
Morgan Stanley & Co. LLC | 31,728,686 | 31,728,686 | — | |||||||||
|
|
|
|
|
| |||||||
| $ | 31,742,786 | $ | 31,742,786 | $ | — | |||||||
|
|
|
|
|
| |||||||
MSCI Japan Small-Cap | ||||||||||||
Barclays Capital Inc. | $ | 611,844 | $ | 611,844 | $ | — | ||||||
BMO Capital Markets | 72,937 | 72,937 | — | |||||||||
Citigroup Global Markets Inc. | 617,079 | 617,079 | — | |||||||||
Credit Suisse Securities (USA) LLC | 329,291 | 329,291 | — | |||||||||
Deutsche Bank Securities Inc. | 278,221 | 278,221 | — | |||||||||
Goldman Sachs & Co. | 204,447 | 204,447 | — | |||||||||
JPMorgan Securities LLC | 1,933,035 | 1,933,035 | — | |||||||||
Macquarie Bank Limited | 142,093 | 142,093 | — | |||||||||
Merrill Lynch, Pierce, Fenner & Smith | 764,765 | 764,765 | — | |||||||||
Morgan Stanley & Co. LLC | 1,428,733 | 1,428,733 | — | |||||||||
State Street Bank & Trust Company | 1,652,098 | 1,652,098 | — | |||||||||
UBS AG | 214,124 | 214,124 | — | |||||||||
UBS Securities LLC | 724,768 | 724,768 | — | |||||||||
|
|
|
|
|
| |||||||
| $ | 8,973,435 | $ | 8,973,435 | $ | — | |||||||
|
|
|
|
|
| |||||||
MSCI Malaysia | ||||||||||||
Morgan Stanley & Co. International PLC | $ | 11,471,979 | $ | 11,471,979 | $ | — | ||||||
UBS AG | 545,371 | 545,371 | — | |||||||||
|
|
|
|
|
| |||||||
| $ | 12,017,350 | $ | 12,017,350 | $ | — | |||||||
|
|
|
|
|
| |||||||
MSCI Pacific ex Japan | ||||||||||||
Barclays Capital Inc. | $ | 102,673 | $ | 102,673 | $ | — | ||||||
Deutsche Bank Securities Inc. | 1,128,797 | 1,128,797 | — | |||||||||
Goldman Sachs & Co. | 12,173,506 | 12,173,506 | — | |||||||||
JPMorgan Securities LLC | 1,894,864 | 1,894,864 | — | |||||||||
Merrill Lynch, Pierce, Fenner & Smith | 1,206,827 | 1,206,827 | — | |||||||||
Morgan Stanley & Co. LLC | 21,488,662 | 21,488,662 | — | |||||||||
State Street Bank & Trust Company | 102,673 | 102,673 | — | |||||||||
UBS AG | 1,810,373 | 1,810,373 | — | |||||||||
UBS Securities LLC | 2,689,247 | 2,689,247 | — | |||||||||
|
|
|
|
|
| |||||||
| $ | 42,597,622 | $ | 42,597,622 | $ | — | |||||||
|
|
|
|
|
| |||||||
| 76 | 2017 iSHARES ANNUAL REPORTTO SHAREHOLDERS |
Table of Contents
Notes to Financial Statements (Continued)
iSHARES®, INC.
| iShares ETF and Counterparty | Market Value of Securities on Loan | Cash Collateral Received a | Net Amount | |||||||||
MSCI Singapore Capped | ||||||||||||
Goldman Sachs & Co. | $ | 4,470,355 | $ | 4,470,355 | $ | — | ||||||
JPMorgan Securities LLC | 14,065 | 14,065 | — | |||||||||
Merrill Lynch, Pierce, Fenner & Smith | 3,695,831 | 3,695,831 | — | |||||||||
Morgan Stanley & Co. LLC | 8,003,788 | 8,003,788 | — | |||||||||
State Street Bank & Trust Company | 254,658 | 254,658 | — | |||||||||
|
|
|
|
|
| |||||||
| $ | 16,438,697 | $ | 16,438,697 | $ | — | |||||||
|
|
|
|
|
| |||||||
MSCI Taiwan Capped | ||||||||||||
Citigroup Global Markets Ltd. | $ | 5,560,158 | $ | 5,560,158 | $ | — | ||||||
Credit Suisse Securities (Europe) Ltd. | 60,695,872 | 60,695,872 | — | |||||||||
Deutsche Bank AG | 6,344,146 | 6,344,146 | — | |||||||||
JPMorgan Securities PLC | 22,386,156 | 22,386,156 | — | |||||||||
Morgan Stanley & Co. International PLC | 59,142,796 | 59,142,796 | — | |||||||||
UBS Ltd. | 10,542,743 | 10,542,743 | — | |||||||||
|
|
|
|
|
| |||||||
| $ | 164,671,871 | $ | 164,671,871 | $ | — | |||||||
|
|
|
|
|
| |||||||
MSCI Thailand Capped | ||||||||||||
Credit Suisse Securities (USA) LLC | $ | 2,313,434 | $ | 2,313,434 | $ | — | ||||||
Deutsche Bank Securities Inc. | 131,564 | 131,564 | — | |||||||||
Goldman Sachs & Co. | 1,663,283 | 1,663,283 | — | |||||||||
Merrill Lynch, Pierce, Fenner & Smith | 371,986 | 371,986 | — | |||||||||
Morgan Stanley & Co. LLC | 2,893,395 | 2,893,395 | — | |||||||||
UBS AG | 5,388,075 | 5,388,075 | — | |||||||||
UBS Securities LLC | 955,811 | 955,811 | — | |||||||||
|
|
|
|
|
| |||||||
| $ | 13,717,548 | $ | 13,717,548 | $ | — | |||||||
|
|
|
|
|
| |||||||
| a | Collateral received in excess of the market value of securities on loan is not presented in this table. The total cash collateral received by each Fund is disclosed in the Fund’s statement of assets and liabilities. |
| 2. | INVESTMENT ADVISORY AGREEMENT AND OTHER TRANSACTIONS WITH AFFILIATES |
Pursuant to an Investment Advisory Agreement with the Company, BFA manages the investment of each Fund’s assets. BFA is a California corporation indirectly owned by BlackRock. Under the Investment Advisory Agreement, BFA is responsible for substantially all expenses of the Funds, except (i) interest and taxes; (ii) brokerage commissions and other expenses connected with the execution of portfolio transactions; (iii) distribution fees; (iv) the advisory fee payable to BFA; and (v) litigation expenses and any extraordinary expenses (in each case as determined by a majority of the independent directors).
For its investment advisory services to each of the iShares MSCI Hong Kong, iShares MSCI Japan Small-Cap, iShares MSCI Malaysia and iShares MSCI Singapore Capped ETFs, BFA is entitled to an annual investment advisory fee, accrued daily and
NOTESTO FINANCIAL STATEMENTS | 77 |
Table of Contents
Notes to Financial Statements (Continued)
iSHARES®, INC.
paid monthly by the Funds, based on each Fund’s allocable portion of the aggregate of the average daily net assets of the Fund and certain other iShares funds, as follows:
| Investment Advisory Fee | Aggregate Average Daily Net Assets | ||||
| 0.59 | % | First $7 billion | |||
| 0.54 | Over $7 billion, up to and including $11 billion | ||||
| 0.49 | Over $11 billion, up to and including $24 billion | ||||
| 0.44 | Over $24 billion, up to and including $48 billion | ||||
| 0.40 | Over $48 billion, up to and including $72 billion | ||||
| 0.36 | Over $72 billion, up to and including $96 billiona | ||||
| 0.32 | Over $96 billiona | ||||
| a | Break level added or amended effective July 1, 2017. |
For its investment advisory services to the iShares MSCI Pacific ex Japan ETF, BFA is entitled to an annual investment advisory fee, accrued daily and paid monthly by the Fund, based on the Fund’s allocable portion of the aggregate of the average daily net assets of the Fund and certain other iShares funds, as follows:
| Investment Advisory Fee | Aggregate Average Daily Net Assets | ||||
| 0.5000 | % | First $46 billion | |||
| 0.4750 | a | Over $46 billion, up to and including $81 billion | |||
| 0.4513 | a | Over $81 billion, up to and including $111 billion | |||
| 0.4287 | a | Over $111 billion, up to and including $141 billion | |||
| 0.4073 | a | Over $141 billion | |||
| a | Investment advisory fee level reflects a 5% reduction (rounded to the fourth decimal place) from the investment advisory fee at the prior aggregate average daily net asset level. |
For its investment advisory services to each of the iShares MSCI Taiwan Capped and iShares MSCI Thailand Capped ETFs, BFA is entitled to an annual investment advisory fee, accrued daily and paid monthly by the Funds, based on each Fund’s allocable portion of the aggregate of the average daily net assets of the Fund and certain other iShares funds, as follows:
| Investment Advisory Fee | Aggregate Average Daily Net Assets | ||||
| 0.74 | % | First $2 billion | |||
| 0.69 | Over $2 billion, up to and including $4 billion | ||||
| 0.64 | Over $4 billion, up to and including $8 billion | ||||
| 0.57 | Over $8 billion, up to and including $16 billion | ||||
| 0.51 | Over $16 billion, up to and including $24 billion | ||||
| 0.48 | Over $24 billion, up to and including $32 billion | ||||
| 0.45 | Over $32 billion | ||||
The U.S. Securities and Exchange Commission has issued an exemptive order which permits BlackRock Institutional Trust Company, N.A. (“BTC”), an affiliate of BFA, to serve as securities lending agent for the Funds, subject to applicable conditions. As securities lending agent, BTC bears all operational costs directly related to securities lending. Each Fund is responsible for fees in connection with the investment of cash collateral received for securities on loan in a money market fund managed by BFA, however, BTC has agreed to reduce the amount of securities lending income it receives in order to effectively limit the collateral investment fees each Fund bears to an annual rate of 0.04% (the “collateral investment fees”). Securities lending income is equal to the total of income earned from the reinvestment of cash collateral, net of fees and other payments to and from borrowers of
| 78 | 2017 iSHARES ANNUAL REPORTTO SHAREHOLDERS |
Table of Contents
Notes to Financial Statements (Continued)
iSHARES®, INC.
securities, and less the collateral investment fees. The Funds retain a portion of securities lending income and remit the remaining portion to BTC as compensation for its services as securities lending agent.
Pursuant to a securities lending agreement, each Fund retains 80% of securities lending income and the amount retained can never be less than 70% of the total of securities lending income plus the collateral investment fees. In addition, commencing the business day following the date that the aggregate securities lending income plus the collateral investment fees generated across all 1940 Act iShares exchange-traded funds (the “iShares ETF Complex”) in a given calendar year exceeds the aggregate securities lending income generated across the iShares ETF Complex in the calendar year 2013, each Fund, pursuant to a securities lending agreement, will retain for the remainder of that calendar year 85% of securities lending income and the amount retained can never be less than 70% of the total of securities lending income plus the collateral investment fees.
For the year ended August 31, 2017, the total of securities lending agent services and collateral investment fees paid were as follows:
| iShares ETF | Fees Paid to BTC | |||
MSCI Hong Kong | $ | 122,127 | ||
MSCI Japan Small-Cap | 47,145 | |||
MSCI Malaysia | 79,940 | |||
MSCI Pacific ex Japan | 84,057 | |||
MSCI Singapore Capped | 81,218 | |||
MSCI Taiwan Capped | 662,346 | |||
MSCI Thailand Capped | 322,522 | |||
For the year ended August 31, 2017, BTC, the Funds’ securities lending agent, has agreed to voluntarily reimburse the iShares MSCI Taiwan Capped ETF in the amount of $98,235, related to the foreign tax on the securities lending income. Such reimbursement is included in “Securities lending income – affiliated – net” in the Fund’s statement of operations.
BlackRock Investments, LLC, an affiliate of BFA, is the distributor for each Fund. Pursuant to the distribution agreement, BFA is responsible for any fees or expenses for distribution services provided to the Funds.
Cross trading is the buying or selling of portfolio securities between funds to which BFA (or an affiliate) serves as investment adviser. At its regularly scheduled quarterly meetings, the Board reviews such transactions as of the most recent calendar quarter for compliance with the requirements and restrictions set forth by Rule 17a-7.
For the year ended August 31, 2017, transactions executed by the Funds pursuant to Rule 17a-7 under the 1940 Act were as follows:
| iShares ETF | Purchases | Sales | ||||||
MSCI Hong Kong | $ | 14,527,782 | $ | 13,728,701 | ||||
MSCI Japan Small-Cap | 1,799,755 | 5,318,610 | ||||||
MSCI Pacific ex Japan | 5,279,625 | 8,329,594 | ||||||
MSCI Singapore Capped | 10,475,447 | 22,195,480 | ||||||
MSCI Taiwan Capped | 32,300,443 | 5,985,482 | ||||||
Each Fund may invest its positive cash balances in certain money market funds managed by BFA or an affiliate. The income earned on these temporary cash investments is included in “Dividends – affiliated” in the statements of operations.
NOTESTO FINANCIAL STATEMENTS | 79 |
Table of Contents
Notes to Financial Statements (Continued)
iSHARES®, INC.
The PNC Financial Services Group, Inc. is the largest stockholder of BlackRock and is considered to be an affiliate of the Funds for 1940 Act purposes.
Certain directors and officers of the Company are also officers of BTC and/or BFA.
| 3. | INVESTMENT PORTFOLIO TRANSACTIONS |
Purchases and sales of investments (excluding in-kind transactions and short-term investments) for the year ended August 31, 2017 were as follows:
| iShares ETF | Purchases | Sales | ||||||
MSCI Hong Kong | $ | 165,104,948 | $ | 138,697,860 | ||||
MSCI Japan Small-Cap | 11,177,859 | 13,582,193 | ||||||
MSCI Malaysia | 184,296,428 | 80,947,192 | ||||||
MSCI Pacific ex Japan | 137,912,517 | 91,033,188 | ||||||
MSCI Singapore Capped | 65,965,673 | 65,572,364 | ||||||
MSCI Taiwan Capped | 817,535,879 | 330,373,254 | ||||||
MSCI Thailand Capped | 28,559,956 | 26,105,331 | ||||||
In-kind transactions (see Note 4) for the year ended August 31, 2017 were as follows:
| iShares ETF | In-kind Purchases | In-kind Sales | ||||||
MSCI Hong Kong | $ | 432,047,304 | $ | 436,591,050 | ||||
MSCI Japan Small-Cap | 115,246,006 | 119,551,480 | ||||||
MSCI Pacific ex Japan | 579,630,424 | 195,236,398 | ||||||
MSCI Singapore Capped | 65,603,517 | 115,592,916 | ||||||
MSCI Thailand Capped | 121,513,849 | 243,497,906 | ||||||
| 4. | CAPITAL SHARE TRANSACTIONS |
Capital shares are issued and redeemed by each Fund only in aggregations of a specified number of shares or multiples thereof (“Creation Units”) at NAV. Except when aggregated in Creation Units, shares of each Fund are not redeemable. Transactions in capital shares for each Fund are disclosed in detail in the statements of changes in net assets.
The consideration for the purchase of Creation Units of a fund in the Company generally consists of the in-kind deposit of a designated portfolio of securities and a specified amount of cash. Certain funds in the Company may be offered in Creation Units solely or partially for cash in U.S. dollars. Investors purchasing and redeeming Creation Units may pay a purchase transaction fee and a redemption transaction fee directly to State Street Bank and Trust Company, the Company’s administrator, to offset transfer and other transaction costs associated with the issuance and redemption of Creation Units, including Creation Units for cash. Investors transacting in Creation Units for cash may also pay an additional variable charge to compensate the relevant fund for certain transaction costs (i.e., stamp taxes, taxes on currency or other financial transactions, and brokerage costs) and market impact expenses relating to investing in portfolio securities. Such variable charges, if any, are included in “Proceeds from shares sold” in the statements of changes in net assets.
The Board authorized a one-for-four reverse stock split for the iShares MSCI Malaysia ETF (“EWM”) and a one-for-two reverse stock split for each of the iShares MSCI Singapore Capped ETF (“EWS”) and iShares MSCI Taiwan Capped ETF (“EWT”),
| 80 | 2017 iSHARES ANNUAL REPORTTO SHAREHOLDERS |
Table of Contents
Notes to Financial Statements (Continued)
iSHARES®, INC.
effective after the close of trading on November 4, 2016. The impact of the stock splits was to decrease the number of shares outstanding by a factor of four for EWM and a factor of two for EWS and EWT, while increasing the NAV per share by factors of four, two and two, respectively, resulting in no effect on the net assets of the Funds. The financial statements for the Funds have been adjusted to reflect the reverse stock splits.
| 5. | FUTURES CONTRACTS |
Each Fund’s use of futures contracts is generally limited to cash equitization. This involves the use of available cash to invest in index futures contracts in order to gain exposure to the equity markets represented in or by the Fund’s underlying index and is intended to allow the Fund to better track its underlying index. Futures contracts are standardized, exchange-traded agreements to buy or sell a financial instrument at a set price on a future date. Upon entering into a futures contract, a fund is required to pledge to the executing broker which holds segregated from its own assets, an amount of cash, U.S. government securities or other high-quality debt and equity securities equal to the minimum initial margin requirements of the exchange on which the contract is traded.
Pursuant to the contract, the fund agrees to receive from or pay to the broker an amount of cash equal to the daily fluctuation in notional value of the contract. Such receipts or payments are known as margin variation and are recorded by the fund as unrealized appreciation or depreciation. When the contract is closed, the fund records a realized gain or loss equal to the difference between the notional value of the contract at the time it was opened and the notional value at the time it was closed. Losses may arise if the notional value of a futures contract decreases due to an unfavorable change in the market rates or values of the underlying instrument during the term of the contract or if the counterparty does not perform under the contract. The use of futures contracts also involves the risk of an imperfect correlation in the movements in the price of futures contracts and the assets underlying such contracts.
The following table shows the value of futures contracts held as of August 31, 2017 and the related locations in the statements of assets and liabilities, presented by risk exposure category:
| Assets | ||||||||||||
iShares MSCI Hong Kong | iShares MSCI Singapore Capped ETF | iShares MSCI Taiwan Capped ETF | ||||||||||
Equity contracts: | ||||||||||||
Variation margin /Net assets consist of – net unrealized appreciation (depreciation)a | $ | 106,502 | $ | 28,956 | $ | 122,588 | ||||||
|
|
|
|
|
| |||||||
| a | Represents cumulative appreciation of futures contracts as reported in the schedules of investments. Only current day’s variation margin is reported separately within the statements of assets and liabilities for the iShares MSCI Taiwan Capped ETF. |
NOTESTO FINANCIAL STATEMENTS | 81 |
Table of Contents
Notes to Financial Statements (Continued)
iSHARES®, INC.
The following table shows the realized and unrealized gains (losses) on futures contracts held during the year ended August 31, 2017 and the related locations in the statements of operations, presented by risk exposure category:
| Net Realized Gain (Loss) | ||||||||||||
iShares MSCI Hong Kong | iShares MSCI Singapore Capped ETF | iShares MSCI Taiwan Capped ETF | ||||||||||
Equity contracts: | ||||||||||||
Futures contracts | $ | 2,141,274 | $ | 85,847 | $ | 1,278,858 | ||||||
|
|
|
|
|
| |||||||
| Net Change in Unrealized Appreciation/Depreciation | ||||||||||||
iShares MSCI Hong Kong | iShares MSCI Singapore Capped ETF | iShares MSCI Taiwan Capped ETF | ||||||||||
Equity contracts: | ||||||||||||
Futures contracts | $ | 62,593 | $ | 161,329 | $ | 493,191 | ||||||
|
|
|
|
|
| |||||||
The following table shows the average quarter-end balances of open futures contracts for the year ended August 31, 2017:
| iShares MSCI Hong Kong ETF | iShares MSCI Singapore Capped ETF | iShares MSCI Taiwan Capped ETF | ||||||||||
Average value of contracts purchased | $ | 9,155,431 | $ | 4,354,962 | $ | 18,818,238 | ||||||
| 6. | PRINCIPAL RISKS |
In the normal course of business, each Fund invests in securities or other instruments and may enter into certain transactions, and such activities subject the Fund to various risks, including, among others, fluctuations in the market (market risk) or failure of an issuer to meet all of its obligations. The value of securities or other instruments may also be affected by various factors, including, without limitation: (i) the general economy; (ii) the overall market as well as local, regional or global political and/or social instability; (iii) regulation, taxation or international tax treaties between various countries; or (iv) currency, interest rate or price fluctuations. Each Fund’s prospectus provides details of the risks to which the Fund is subject.
BFA uses a “passive” or index approach to try to achieve each Fund’s investment objective following the securities included in its underlying index during upturns as well as downturns. BFA does not take steps to reduce market exposure or to lessen the effects of a declining market. Divergence from the underlying index and the composition of the portfolio is monitored by BFA.
MARKET RISK
Market risk arises mainly from uncertainty about future values of financial instruments influenced by price, currency and interest rate movements. It represents the potential loss a fund may suffer through holding market positions in the face of market movements. A fund is exposed to market risk by its investment in equity, fixed income and/or financial derivative instruments or by its investment in underlying funds. The fair value of securities held by a fund may decline due to general market conditions, economic trends or events that are not specifically related to the issuers of the securities including local, regional or global
| 82 | 2017 iSHARES ANNUAL REPORTTO SHAREHOLDERS |
Table of Contents
Notes to Financial Statements (Continued)
iSHARES®, INC.
political, social or economic instability or to factors that affect a particular industry or group of industries. The extent of a fund’s exposure to market risk is the market value of the investments held as shown in the fund’s schedule of investments.
A diversified portfolio, where this is appropriate and consistent with a fund’s objectives, minimizes the risk that a price change of a particular investment will have a material impact on the NAV of a fund. The investment concentrations within each Fund’s portfolio are disclosed in its schedule of investments.
Investing in the securities of non-U.S. issuers involves certain considerations and risks not typically associated with securities of U.S. issuers. Such risks include, but are not limited to: differences in accounting, auditing and financial reporting standards; more substantial governmental involvement in the economy; higher inflation rates, greater social, economic and political uncertainties; possible nationalization or expropriation of assets; less availability of public information about issuers; imposition of withholding or other taxes; higher transaction and custody costs and delays in settlement procedures; and lower level of regulation of the securities markets and issuers. Non-U.S. securities may be less liquid, more difficult to value, and have greater price volatility due to exchange rate fluctuations. These and other risks are heightened for investments in issuers from countries with less developed capital markets.
When a fund concentrates its investments in issuers located in a single country, it assumes the risk that economic, political and social conditions in that country may have a significant impact on its investment performance.
CREDIT RISK
Credit risk is the risk that an issuer or guarantor of debt instruments or the counterparty to a financial transaction, including derivatives contracts, repurchase agreements or loans of portfolio securities, is unable or unwilling to make timely interest and/or principal payments or to otherwise honor its obligations. BFA and its affiliates manage counterparty credit risk by entering into transactions only with counterparties that they believe have the financial resources to honor their obligations and by monitoring the financial stability of those counterparties. Financial assets, which potentially expose a fund to issuer and counterparty credit risks, consist principally of financial instruments and receivables due from counterparties. The extent of a fund’s exposure to credit and counterparty risks with respect to those financial assets is approximated by their value recorded in its statement of assets and liabilities.
| 7. | INCOME TAX INFORMATION |
Each Fund is treated as an entity separate from the Company’s other funds for federal income tax purposes. It is the policy of each Fund to qualify as a regulated investment company by complying with the provisions applicable to regulated investment companies, as defined under Subchapter M of the Internal Revenue Code of 1986, as amended, and to annually distribute substantially all of its ordinary income and any net capital gains (taking into account any capital loss carryforwards) sufficient to relieve it from all, or substantially all, federal income and excise taxes. Accordingly, no provision for federal income taxes is required.
U.S. GAAP requires that certain components of net assets be adjusted to reflect permanent differences between financial and tax reporting. These reclassifications have no effect on net assets or NAV per share. The following permanent differences as of
NOTESTO FINANCIAL STATEMENTS | 83 |
Table of Contents
Notes to Financial Statements (Continued)
iSHARES®, INC.
August 31, 2017, attributable to passive foreign investment companies, the expiration of capital loss carryforwards, foreign currency transactions and realized gains (losses) from in-kind redemptions, were reclassified to the following accounts:
| iShares ETF | Paid-in Capital | Undistributed Net Investment Income/Distributions | Undistributed Net Realized Gain/Accumulated Net Realized Loss | |||||||||
MSCI Hong Kong | $ | (10,161,288 | ) | $ | (76,558 | ) | $ | 10,237,846 | ||||
MSCI Japan Small-Cap | 9,440,555 | 1,438,240 | (10,878,795 | ) | ||||||||
MSCI Malaysia | — | (317,726 | ) | 317,726 | ||||||||
MSCI Pacific ex Japan | (41,571,769 | ) | 1,907,429 | 39,664,340 | ||||||||
MSCI Singapore Capped | (11,160,099 | ) | 287,338 | 10,872,761 | ||||||||
MSCI Taiwan Capped | (343,375,145 | ) | 222,234 | 343,152,911 | ||||||||
MSCI Thailand Capped | 17,144,055 | 53,142 | (17,197,197 | ) | ||||||||
The tax character of distributions paid during the years ended August 31, 2017 and August 31, 2016 was as follows:
| iShares ETF | 2017 | 2016 | ||||||
MSCI Hong Kong | ||||||||
Ordinary income | $ | 47,903,550 | $ | 57,946,909 | ||||
|
|
|
| |||||
MSCI Japan Small-Cap | ||||||||
Ordinary income | $ | 4,653,375 | $ | 3,054,464 | ||||
|
|
|
| |||||
MSCI Malaysia | ||||||||
Ordinary income | $ | 15,799,041 | $ | 12,913,175 | ||||
Long-term capital gain | — | 61,020,000 | ||||||
|
|
|
| |||||
| $ | 15,799,041 | $ | 73,933,175 | |||||
|
|
|
| |||||
MSCI Pacific ex Japan | ||||||||
Ordinary income | $ | 98,968,999 | $ | 80,779,861 | ||||
|
|
|
| |||||
MSCI Singapore Capped | ||||||||
Ordinary income | $ | 23,963,560 | $ | 16,842,459 | ||||
|
|
|
| |||||
MSCI Taiwan Capped | ||||||||
Ordinary income | $ | 64,888,894 | $ | 85,498,003 | ||||
|
|
|
| |||||
MSCI Thailand Capped | ||||||||
Ordinary income | $ | 10,761,008 | $ | 7,604,719 | ||||
|
|
|
| |||||
| 84 | 2017 iSHARES ANNUAL REPORTTO SHAREHOLDERS |
Table of Contents
Notes to Financial Statements (Continued)
iSHARES®, INC.
As of August 31, 2017, the tax components of accumulated net earnings (losses) were as follows:
| iShares ETF | Undistributed Ordinary Income | Capital Loss Carryforwards | Net Unrealized Gains (Losses) a | Total | ||||||||||||
MSCI Hong Kong | $ | 12,327,044 | $ | (474,298,388 | ) | $ | 90,313,131 | $ | (371,658,213 | ) | ||||||
MSCI Japan Small-Cap | 800,065 | (3,601,695 | ) | 11,898,378 | 9,096,748 | |||||||||||
MSCI Malaysia | 3,893,000 | (14,406,515 | ) | 110,506,701 | 99,993,186 | |||||||||||
MSCI Pacific ex Japan | 29,281,825 | (463,731,302 | ) | 36,360,407 | (398,089,070 | ) | ||||||||||
MSCI Singapore Capped | 2,184,139 | (245,392,762 | ) | (29,408,311 | ) | (272,616,934 | ) | |||||||||
MSCI Taiwan Capped | 103,758,395 | (718,279,663 | ) | 1,665,838,064 | 1,051,316,796 | |||||||||||
MSCI Thailand Capped | 2,034,256 | (40,853,487 | ) | (25,437,750 | ) | (64,256,981 | ) | |||||||||
| a | The difference between book-basis and tax-basis unrealized gains (losses) was attributable primarily to the tax deferral of losses on wash sales and the realization for tax purposes of unrealized gains on investments in passive foreign investment companies. |
As of August 31, 2017, the following Funds had capital loss carryforwards available to offset future realized capital gains through the indicated expiration dates as follows:
| iShares ETF | Non- Expiring a | Expiring 2018 | Expiring 2019 | Total | ||||||||||||
MSCI Hong Kong | $ | 324,895,525 | $ | 114,836,904 | $ | 34,565,959 | $ | 474,298,388 | ||||||||
MSCI Japan Small-Cap | 2,856,676 | 541,322 | 203,697 | 3,601,695 | ||||||||||||
MSCI Malaysia | 14,406,515 | — | — | 14,406,515 | ||||||||||||
MSCI Pacific ex Japan | 322,330,812 | 104,799,503 | 36,600,987 | 463,731,302 | ||||||||||||
MSCI Singapore Capped | 101,383,410 | 132,420,824 | 11,588,528 | 245,392,762 | ||||||||||||
MSCI Taiwan Capped | 335,557,692 | 363,052,013 | 19,669,958 | 718,279,663 | ||||||||||||
MSCI Thailand Capped | 37,227,149 | 2,321,428 | 1,304,910 | 40,853,487 | ||||||||||||
| a | Must be utilized prior to losses subject to expiration. |
For the year ended August 31, 2017, the iShares MSCI Japan Small-Cap ETF utilized $284,141 of its capital loss carryfowards.
The Funds may own shares in certain foreign investment entities, referred to, under U.S. tax law, as “passive foreign investment companies.” The Funds may elect to mark-to-market annually the shares of each passive foreign investment company and would be required to distribute to shareholders any such marked-to-market gains.
Management has analyzed tax laws and regulations and their application to the Funds as of August 31, 2017, inclusive of the open tax return years, and does not believe there are any uncertain tax positions that require recognition of a tax liability in the Funds’ financial statements.
| 8. | LEGAL PROCEEDINGS |
On June 16, 2016, investors (the “Plaintiffs”) in certain iShares funds (iShares Core S&P Small-Cap ETF, iShares Russell 1000 Growth ETF, iShares Core S&P 500 ETF, iShares Russell Mid-Cap Growth ETF, iShares Russell Mid-Cap ETF, iShares Russell Mid-Cap Value ETF, iShares Select Dividend ETF, iShares Morningstar Mid-Cap ETF, iShares Morningstar Large-Cap ETF, iShares U.S. Aerospace & Defense ETF and iShares U.S. Preferred Stock ETF) filed a putative class action lawsuit against iShares Trust, BlackRock, Inc. and certain of its advisory affiliates, and certain directors/trustees and officers of the Funds
NOTESTO FINANCIAL STATEMENTS | 85 |
Table of Contents
Notes to Financial Statements (Continued)
iSHARES®, INC.
(collectively, “Defendants”). The lawsuit alleges the Defendants violated federal securities laws by failing to adequately disclose in the prospectuses issued by the funds noted above the risks of using stop-loss orders in the event of a ‘flash crash’, such as the one that occurred on May 6, 2010. On September 18, 2017, the Court issued a Statement of Decision holding that the Plaintiffs lack standing to assert their claims. On October 11, 2017, the Court entered final judgment dismissing all of Plaintiffs’ claims with prejudice.
| 9. | SUBSEQUENT EVENTS |
Management has evaluated the impact of all subsequent events on the Funds through the date the financial statements were available to be issued and has determined that there were no subsequent events requiring adjustment or disclosure in the financial statements.
| 86 | 2017 iSHARES ANNUAL REPORTTO SHAREHOLDERS |
Table of Contents
Report of Independent Registered Public Accounting Firm
To the Board of Directors of iShares, Inc. and
Shareholders of the iShares MSCI Hong Kong ETF, iShares MSCI Japan Small-Cap ETF,
iShares MSCI Malaysia ETF, iShares MSCI Pacific ex Japan ETF, iShares MSCI Singapore Capped ETF,
iShares MSCI Taiwan Capped ETF and iShares MSCI Thailand Capped ETF
In our opinion, the accompanying statements of assets and liabilities, including the schedules of investments, and the related statements of operations and of changes in net assets and the financial highlights present fairly, in all material respects, the financial position of iShares MSCI Hong Kong ETF, iShares MSCI Japan Small-Cap ETF, iShares MSCI Malaysia ETF, iShares MSCI Pacific ex Japan ETF, iShares MSCI Singapore Capped ETF, iShares MSCI Taiwan Capped ETF and iShares MSCI Thailand Capped ETF (constituting funds of iShares, Inc., hereafter referred to as the “Funds”) as of August 31, 2017, and the results of each of their operations, the changes in each of their net assets and the financial highlights for each of the periods indicated, in conformity with accounting principles generally accepted in the United States of America. These financial statements and financial highlights (hereafter referred to as “financial statements”) are the responsibility of the Funds’ management. Our responsibility is to express an opinion on these financial statements based on our audits. We conducted our audits of these financial statements in accordance with the standards of the Public Company Accounting Oversight Board (United States). Those standards require that we plan and perform the audit to obtain reasonable assurance about whether the financial statements are free of material misstatement. An audit includes examining, on a test basis, evidence supporting the amounts and disclosures in the financial statements, assessing the accounting principles used and significant estimates made by management, and evaluating the overall financial statement presentation. We believe that our audits, which included confirmation of securities as of August 31, 2017 by correspondence with the custodian, transfer agent and brokers, or by other appropriate auditing procedures where replies were not received, provide a reasonable basis for our opinion.
PricewaterhouseCoopers LLP
San Francisco, California
October 23, 2017
REPORTOF INDEPENDENT REGISTERED PUBLIC ACCOUNTING FIRM | 87 |
Table of Contents
iSHARES®, INC.
The following maximum amounts are hereby designated as qualified dividend income for individuals for the fiscal year ended August 31, 2017:
| iShares ETF | Qualified Dividend | |||
MSCI Hong Kong | $ | 1,186,761 | ||
MSCI Japan Small-Cap | 2,428,743 | |||
MSCI Pacific ex Japan | 65,919,101 | |||
MSCI Thailand Capped | 12,166,919 | |||
For the fiscal year ended August 31, 2017, the following Funds earned foreign source income and paid foreign taxes which they intend to pass through to their shareholders:
| iShares ETF | Foreign Source Income Earned | Foreign Taxes Paid | ||||||
MSCI Hong Kong | $ | 62,797,502 | $ | — | ||||
MSCI Japan Small-Cap | 3,056,673 | 295,003 | ||||||
MSCI Malaysia | 10,524,132 | — | ||||||
MSCI Pacific ex Japan | 110,388,458 | 1,396,064 | ||||||
MSCI Singapore Capped | 19,495,099 | 221,429 | ||||||
MSCI Taiwan Capped | 144,946,070 | 31,047,858 | ||||||
MSCI Thailand Capped | 12,556,862 | 1,211,988 | ||||||
| 88 | 2017 iSHARES ANNUAL REPORTTO SHAREHOLDERS |
Table of Contents
Board Review and Approval of Investment Advisory
Contract
iSHARES®, INC.
I. iShares MSCI Hong Kong ETF and iShares MSCI Singapore Capped ETF
Under Section 15(c) of the Investment Company Act of 1940 (the “1940 Act”), the Company’s Board of Directors (the “Board”), including a majority of Directors who are not “interested persons” of the Company (as that term is defined in the 1940 Act) (the “Independent Directors”), is required annually to consider and approve the Investment Advisory Contract between the Company and BFA (the “Advisory Contract”) on behalf of the Funds. The Independent Directors requested, and BFA provided, such information as the Independent Directors, with advice from independent counsel, deemed reasonably necessary to evaluate the Advisory Contract. A committee of all of the Independent Directors (the “15(c) Committee”), with independent counsel, met with management on May 5, 2017 and May 12, 2017. At these meetings, the 15(c) Committee reviewed and discussed information provided in response to the 15(c) Committee’s initial requests, and requested certain additional information, which management agreed to provide. At a meeting held on May 18, 2017, management presented information to the Board relating to the continuance of the Advisory Contract, including information requested by the 15(c) Committee during its meetings. The Board, including the Independent Directors, reviewed and discussed such information at length. The Independent Directors requested from management certain additional information, which management agreed to provide. At a meeting held on June 19-21, 2017, the Board, including the Independent Directors, reviewed the additional information provided by management in response to these requests. After extensive discussions, the Board, including all of the Independent Directors, approved the continuance of the Advisory Contract for the Funds, based on a review of qualitative and quantitative information provided by BFA. The Board noted its satisfaction with the extent and quality of information provided and its frequent interactions with management, as well as the detailed responses and other information provided by BFA. The Board also noted that the Board and BFA agreed to discuss potential further enhancements to the 15(c) process for the coming year. The Independent Directors were advised by their independent counsel throughout the process, including about the legal standards applicable to their review. In approving the Advisory Contract for the Funds, the Board, including the Independent Directors, considered the following factors, no one of which was controlling, and reached the following conclusions:
Expenses and Performance of the Funds — The Board reviewed statistical information prepared by Broadridge Financial Solutions Inc. (“Broadridge”), an independent provider of investment company data, regarding the expense ratio components, including gross and net total expenses, waivers/reimbursements (if any), and underlying fund fees and expenses (if any) of each Fund in comparison with the same information for other exchange traded funds (“ETFs”) (including, where applicable, funds sponsored by an “at cost” service provider) and, in the limited instances where no comparable ETFs existed and the comparison group would not otherwise be reasonable in Broadridge’s judgment, pure index institutional mutual funds, objectively selected by Broadridge as comprising such Fund’s applicable peer group pursuant to Broadridge’s proprietary ETF methodology (the “Peer Group”). The Board was provided with a detailed description of the proprietary ETF methodology used by Broadridge to determine the applicable Peer Groups. The Board further noted that due to the limitations in providing comparable funds in the various Peer Groups, the statistical information provided in Broadridge’s report may or may not provide meaningful direct comparisons to the Funds in all instances.
The Board also noted that the investment advisory fee rates and overall expenses (net of waivers and reimbursements) for the Funds were lower than the median of the investment advisory fee rates and overall expenses (net of waivers and reimbursements) of the funds in their respective Peer Group, excluding iShares funds.
In addition, to the extent that any of the comparison funds included in the Peer Group, excluding iShares funds, track the same index as any particular Fund, Broadridge also provided, and the Board reviewed, a comparison of such Fund’s performance for the one-, three-, five-, ten-year, and since inception periods, as applicable, and for the quarter ended December 31, 2016, to that of relevant comparison funds for the same periods.
BOARD REVIEWAND APPROVALOF INVESTMENT ADVISORY CONTRACT | 89 |
Table of Contents
Board Review and Approval of Investment Advisory
Contract (Continued)
iSHARES®, INC.
The Board noted that each Fund seeks to track its own underlying index and that, during the year, the Board received periodic reports on each Fund’s short- and longer-term performance in comparison with its underlying index. Such periodic comparative performance information, including any additional detailed information requested by the Boards, was also considered. The Board noted that each Fund generally performed in line with its underlying index over the relevant periods.
Based on this review, the other factors considered at the meeting, and their general knowledge of ETF pricing, the Board concluded that the investment advisory fee rate and the historical performance of each Fund supported the Board’s approval of the continuance of the Advisory Contract for the coming year.
Nature, Extent and Quality of Services Provided by BFA — Based on management’s representations, including information about recent and proposed enhancements to the iShares business, including with respect to capital markets support and analysis, technology, product design, compliance and risk management, and other services, the Board expected that there would be no diminution in the scope of services required of or provided by BFA under the Advisory Contract for the coming year as compared to the scope of services provided by BFA during prior years. In reviewing the scope of these services, the Board considered BFA’s investment philosophy and experience, noting that BFA and its affiliates have committed significant resources over time, including during the past year, to supporting the iShares funds and their shareholders. The Board also considered BFA’s compliance program and its compliance record with respect to the Funds. In that regard, the Board noted that BFA reports to the Board about portfolio management and compliance matters on a periodic basis in connection with regularly scheduled meetings of the Board, and on other occasions as necessary and appropriate, and has provided information and made appropriate officers available as needed to provide further assistance with these matters. The Board also reviewed the background and experience of the persons responsible for the day-to-day management of the Funds, as well as the resources available to them in managing the Funds. In addition to the above considerations, the Board reviewed and considered detailed presentations regarding BFA’s investment performance, investment and risk management processes and strategies provided at the June 19-21, 2017 meeting and throughout the previous year, and matters related to BFA’s portfolio compliance policies and procedures. The Board noted that each Fund had met its investment objective consistently since its respective inception date.
Based on review of this information, and the performance information discussed above, the Board concluded that the nature, extent and quality of services provided by BFA to the Funds under the Advisory Contract supported the Board’s approval of the continuance of the Advisory Contract for the coming year.
Costs of Services Provided to Funds and Profits Realized by BFA and Affiliates — The Board reviewed information about the profitability of the Funds to BlackRock, on a Fund-by-Fund basis and in the aggregate, based on the fees payable to BFA and its affiliates (including fees under the Advisory Contract), and other sources of revenue and expense to BFA and its affiliates from the Funds’ operations for the last calendar year. The Board reviewed BlackRock’s profitability methodology for the iShares funds, including supplemental information that was responsive to requests of the 15(c) Committee. The Board noted that the 15(c) Committee had focused on the methodology and profitability presentation during its meetings. The Board discussed the sources of direct and ancillary revenue with management, including the revenues to BTC, a BFA affiliate, from securities lending by the Funds. The Board also discussed BFA’s profit margin as reflected in the Funds’ profitability analyses and reviewed information regarding potential economies of scale (as discussed below). Based on this review, the Board concluded that the profits realized by BFA and its affiliates under the Advisory Contract and from other relationships between the Funds and BFA and/or its affiliates, if any, were within a reasonable range in light of the factors considered.
Economies of Scale — The Board reviewed information regarding potential economies of scale or other efficiencies that may result from increases in the Funds’ assets, noting that the issue of economies of scale had been focused on by the 15(c) Committee during its meetings and addressed by management, including through supplemental information. The Board and the 15(c) Committee reviewed information provided by BFA regarding scale benefits shared with the iShares funds through
| 90 | 2017 iSHARES ANNUAL REPORTTO SHAREHOLDERS |
Table of Contents
Board Review and Approval of Investment Advisory
Contract (Continued)
iSHARES®, INC.
relatively low fee rates established at inception, breakpoints and waivers or other fee reductions, as well as through additional investment in the iShares business and the provision of improved or additional infrastructure and services to the iShares funds and their shareholders. The Board and the 15(c) Committee received information regarding BlackRock’s historical profitability, including BFA’s and its affiliates’ costs in providing services. The cost information distinguished, among other things, between fixed and variable costs, and explained how the level of fixed and variable costs, as well as the nature of such costs, may impact the existence or size of scale benefits. The Board noted that the Advisory Contract for the Funds already provided for breakpoints in the Funds’ investment advisory fee rates and that, following negotiations, BFA and the Board had agreed to revise the Advisory Contract for the Funds to provide for an additional breakpoint as the assets of the Funds, on an aggregated basis with the assets of certain other iShares funds, increase. The Board noted that it would continue to monitor the sharing of economies of scale to determine the appropriateness of adding new or revised breakpoints in the future.
Based on this review, as well as the other factors considered at the meeting, the Board, recognizing its responsibility to consider the Advisory Contract at least annually, determined to approve the continuance of the Advisory Contract for the coming year.
Fees and Services Provided for Other Comparable Funds/Accounts Managed by BFA and its Affiliates — The Board received and considered information regarding the investment advisory/management fee rates for other funds/accounts in the U.S. for which BFA (or its affiliates) provides investment advisory/management services, including open-end funds registered under the 1940 Act (including sub-advised funds), collective trust funds, and institutional separate accounts (together, the “Other Accounts”), and acknowledged BFA’s assertion that the iShares funds are fundamentally different investment vehicles from the Other Accounts. The Board noted that BFA and its affiliates do manage Other Accounts with substantially the same investment objectives and strategies as the Funds and that track the same index as the Funds. The Board further noted that BFA provided the Board with detailed information regarding how the Other Accounts (particularly institutional clients) generally differ from the Funds, including in terms of the different and generally more extensive services provided to the Funds, as well as other significant differences. In that regard, the Board considered that the pricing of services to institutional clients is typically based on a number of factors beyond the nature and extent of the specific services to be provided and often depends on the overall relationship between the client and its affiliates and the adviser and its affiliates. In addition, the Board considered the relative complexity and inherent risks and challenges of managing and providing other services to the Funds, as publicly traded ETFs, as compared to the Other Accounts that are institutional clients in light of differing regulatory requirements and client-imposed mandates. The Board also acknowledged BFA’s expressed business purpose for launching a suite of iShares “Core” ETFs that generally are subject to lower investment advisory fees than iShares non-Core ETFs that may provide a similar investment exposure. The Board also considered the “all-inclusive” nature of the Funds’ advisory fee structure, and the Fund expenses borne by BFA under this arrangement. The Board noted that the investment advisory fee rates under the Advisory Contract for the Funds were generally higher than the investment advisory/management fee rates for certain of the Other Accounts (particularly institutional clients) and concluded that the differences appeared to be consistent with the factors discussed.
Other Benefits to BFA and/or its Affiliates — The Board reviewed the “fallout” benefits or ancillary revenue received by BFA and/or its affiliates in connection with the services provided to the Funds by BFA, such as payment of revenue to BTC, the Funds’ securities lending agent, for loaning portfolio securities (which was included in the profit margins reviewed by the Board pursuant to BFA’s profitability methodology), and payment of advisory fees and/or administration fees to BFA and BTC (or their affiliates) in connection with any investments by the Funds in other funds for which BFA (or its affiliates) provides investment advisory services and/or administration services. The Board also noted the revenue received by BFA and/or its affiliates pursuant to an agreement that permits a service provider to use certain portions of BlackRock’s technology platform to service accounts managed by BFA and/or its affiliates, including the iShares funds. The Board noted that BFA generally does not use soft dollars or consider the value of research or other services that may be provided to BFA (including its affiliates) in selecting brokers for portfolio transactions for the Funds. The Board further noted that any portfolio transactions on behalf of the Funds placed through a BFA affiliate or purchased from an underwriting syndicate in which a BFA affiliate participates, are reported to the Board
BOARD REVIEWAND APPROVALOF INVESTMENT ADVISORY CONTRACT | 91 |
Table of Contents
Board Review and Approval of Investment Advisory
Contract (Continued)
iSHARES®, INC.
pursuant to Rule 17e-1 or Rule 10f-3, as applicable, under the 1940 Act. The Board concluded that any such ancillary benefits would not be disadvantageous to the Funds’ shareholders and thus would not alter the Board’s conclusion with respect to the appropriateness of approving the continuance of the Advisory Contract for the coming year.
Conclusion — Based on the considerations described above, the Board determined that each Fund’s investment advisory fee rate under the Advisory Contract does not constitute a fee that is so disproportionately large as to bear no reasonable relationship to the services rendered and that could not have been the product of arm’s-length bargaining, and concluded to approve the continuance of the Advisory Contract for the coming year.
II. iShares MSCI Japan Small-Cap ETF
Under Section 15(c) of the Investment Company Act of 1940 (the “1940 Act”), the Company’s Board of Directors (the “Board”), including a majority of Directors who are not “interested persons” of the Company (as that term is defined in the 1940 Act) (the “Independent Directors”), is required annually to consider and approve the Investment Advisory Contract between the Company and BFA (the “Advisory Contract”) on behalf of the Fund. The Independent Directors requested, and BFA provided, such information as the Independent Directors, with advice from independent counsel, deemed reasonably necessary to evaluate the Advisory Contract. A committee of all of the Independent Directors (the “15(c) Committee”), with independent counsel, met with management on May 5, 2017 and May 12, 2017. At these meetings, the 15(c) Committee reviewed and discussed information provided in response to the 15(c) Committee’s initial requests, and requested certain additional information, which management agreed to provide. At a meeting held on May 18, 2017, management presented information to the Board relating to the continuance of the Advisory Contract, including information requested by the 15(c) Committee during its meetings. The Board, including the Independent Directors, reviewed and discussed such information at length. The Independent Directors requested from management certain additional information, which management agreed to provide. At a meeting held on June 19-21, 2017, the Board, including the Independent Directors, reviewed the additional information provided by management in response to these requests. After extensive discussions, the Board, including all of the Independent Directors, approved the continuance of the Advisory Contract for the Fund, based on a review of qualitative and quantitative information provided by BFA. The Board noted its satisfaction with the extent and quality of information provided and its frequent interactions with management, as well as the detailed responses and other information provided by BFA. The Board also noted that the Board and BFA agreed to discuss potential further enhancements to the 15(c) process for the coming year. The Independent Directors were advised by their independent counsel throughout the process, including about the legal standards applicable to their review. In approving the Advisory Contract for the Fund, the Board, including the Independent Directors, considered the following factors, no one of which was controlling, and reached the following conclusions:
Expenses and Performance of the Fund — The Board reviewed statistical information prepared by Broadridge Financial Solutions Inc. (“Broadridge”), an independent provider of investment company data, regarding the expense ratio components, including gross and net total expenses, waivers/reimbursements (if any), and underlying fund fees and expenses (if any) of the Fund in comparison with the same information for other exchange traded funds (“ETFs”) (including, where applicable, funds sponsored by an “at cost” service provider) and, in the limited instances where no comparable ETFs existed and the comparison group would not otherwise be reasonable in Broadridge’s judgment, pure index institutional mutual funds, objectively selected by Broadridge as comprising the Fund’s applicable peer group pursuant to Broadridge’s proprietary ETF methodology (the “Peer Group”). The Board was provided with a detailed description of the proprietary ETF methodology used by Broadridge to determine the Fund’s Peer Group. The Board further noted that due to the limitations in providing comparable funds in the Peer Group, the statistical information provided in Broadridge’s report may or may not provide meaningful direct comparisons to the Fund in all instances.
| 92 | 2017 iSHARES ANNUAL REPORTTO SHAREHOLDERS |
Table of Contents
Board Review and Approval of Investment Advisory
Contract (Continued)
iSHARES®, INC.
The Board also noted that the investment advisory fee rate and overall expenses (net of waivers and reimbursements) for the Fund were higher than the median of the investment advisory fee rates and overall expenses (net of waivers and reimbursements) of the funds in its Peer Group, excluding iShares funds.
In addition, to the extent that any of the comparison funds included in the Peer Group, excluding iShares funds, track the same index as the Fund, Broadridge also provided, and the Board reviewed, a comparison of the Fund’s performance for the one-, three-, five-, ten-year, and since inception periods, as applicable, and for the quarter ended December 31, 2016, to that of relevant comparison funds for the same periods.
The Board noted that the Fund seeks to track its specified underlying index and that, during the year, the Board received periodic reports on the Fund’s short- and longer-term performance in comparison with its underlying index. Such periodic comparative performance information, including any additional detailed information requested by the Boards, was also considered. The Board noted that the Fund generally performed in line with its underlying index over the relevant periods.
Based on this review, the other factors considered at the meeting, and their general knowledge of ETF pricing, the Board concluded that the investment advisory fee rate and the historical performance of the Fund supported the Board’s approval of the continuance of the Advisory Contract for the coming year.
Nature, Extent and Quality of Services Provided by BFA — Based on management’s representations, including information about recent and proposed enhancements to the iShares business, including with respect to capital markets support and analysis, technology, product design, compliance and risk management, and other services, the Board expected that there would be no diminution in the scope of services required of or provided by BFA under the Advisory Contract for the coming year as compared to the scope of services provided by BFA during prior years. In reviewing the scope of these services, the Board considered BFA’s investment philosophy and experience, noting that BFA and its affiliates have committed significant resources over time, including during the past year, to supporting the iShares funds and their shareholders. The Board also considered BFA’s compliance program and its compliance record with respect to the Fund. In that regard, the Board noted that BFA reports to the Board about portfolio management and compliance matters on a periodic basis in connection with regularly scheduled meetings of the Board, and on other occasions as necessary and appropriate, and has provided information and made appropriate officers available as needed to provide further assistance with these matters. The Board also reviewed the background and experience of the persons responsible for the day-to-day management of the Fund, as well as the resources available to them in managing the Fund. In addition to the above considerations, the Board reviewed and considered detailed presentations regarding BFA’s investment performance, investment and risk management processes and strategies provided at the June 19-21, 2017 meeting and throughout the previous year, and matters related to BFA’s portfolio compliance policies and procedures. The Board noted that the Fund had met its investment objective consistently since its inception date.
Based on review of this information, and the performance information discussed above, the Board concluded that the nature, extent and quality of services provided by BFA to the Fund under the Advisory Contract supported the Board’s approval of the continuance of the Advisory Contract for the coming year.
Costs of Services Provided to Fund and Profits Realized by BFA and Affiliates — The Board reviewed information about the profitability of the Fund to BlackRock, based on the fees payable to BFA and its affiliates (including fees under the Advisory Contract), and other sources of revenue and expense to BFA and its affiliates from the Fund’s operations for the last calendar year. The Board reviewed BlackRock’s profitability methodology for the iShares funds, including supplemental information that was responsive to requests of the 15(c) Committee. The Board noted that the 15(c) Committee had focused on the methodology and profitability presentation during its meetings. The Board discussed the sources of direct and ancillary revenue with management, including the revenues to BTC, a BFA affiliate, from securities lending by the Fund. The Board also discussed
BOARD REVIEWAND APPROVALOF INVESTMENT ADVISORY CONTRACT | 93 |
Table of Contents
Board Review and Approval of Investment Advisory
Contract (Continued)
iSHARES®, INC.
BFA’s profit margin as reflected in the Fund’s profitability analysis and reviewed information regarding potential economies of scale (as discussed below). Based on this review, the Board concluded that the profits realized by BFA and its affiliates under the Advisory Contract and from other relationships between the Fund and BFA and/or its affiliates, if any, were within a reasonable range in light of the factors considered.
Economies of Scale — The Board reviewed information regarding potential economies of scale or other efficiencies that may result from increases in the Fund’s assets, noting that the issue of economies of scale had been focused on by the 15(c) Committee during its meetings and addressed by management, including through supplemental information. The Board and the 15(c) Committee reviewed information provided by BFA regarding scale benefits shared with the iShares funds through relatively low fee rates established at inception, breakpoints and waivers or other fee reductions, as well as through additional investment in the iShares business and the provision of improved or additional infrastructure and services to the iShares funds and their shareholders. The Board and the 15(c) Committee received information regarding BlackRock’s historical profitability, including BFA’s and its affiliates’ costs in providing services. The cost information distinguished, among other things, between fixed and variable costs, and explained how the level of fixed and variable costs, as well as the nature of such costs, may impact the existence or size of scale benefits. The Board noted that the Advisory Contract for the Fund already provided for breakpoints in the Fund’s investment advisory fee rate, and that, following negotiations, BFA and the Board had agreed to revise the Advisory Contract for the Fund to provide for an additional breakpoint as the assets of the Fund, on an aggregated basis with the assets of certain other iShares funds, increase. The Board noted that it would continue to monitor the sharing of economies of scale to determine the appropriateness of adding new or revised breakpoints in the future.
Based on this review, as well as the other factors considered at the meeting, the Board, recognizing its responsibility to consider the Advisory Contract at least annually, determined to approve the continuance of the Advisory Contract for the coming year.
Fees and Services Provided for Other Comparable Funds/Accounts Managed by BFA and its Affiliates — The Board received and considered information regarding the investment advisory/management fee rates for other funds/accounts in the U.S. for which BFA (or its affiliates) provides investment advisory/management services, including open-end funds registered under the 1940 Act (including sub-advised funds), collective trust funds, and institutional separate accounts (together, the “Other Accounts”), and acknowledged BFA’s assertion that the iShares funds are fundamentally different investment vehicles from the Other Accounts. The Board noted that BFA and its affiliates do not manage Other Accounts with substantially the same investment objective and strategy as the Fund and that track the same index as the Fund. The Board further noted that BFA provided the Board with detailed information regarding how the Other Accounts (particularly institutional clients) generally differ from the Fund, including in terms of the different and generally more extensive services provided to the Fund, as well as other significant differences. In that regard, the Board considered that the pricing of services to institutional clients is typically based on a number of factors beyond the nature and extent of the specific services to be provided and often depends on the overall relationship between the client and its affiliates and the adviser and its affiliates. In addition, the Board considered the relative complexity and inherent risks and challenges of managing and providing other services to the Fund, as a publicly traded ETF, as compared to the Other Accounts that are institutional clients, in light of differing regulatory requirements and client-imposed mandates. The Board also acknowledged BFA’s expressed business purpose for launching a suite of iShares “Core” ETFs that generally are subject to lower investment advisory fees than iShares non-Core ETFs that may provide a similar investment exposure. The Board also considered the “all-inclusive” nature of the Fund’s advisory fee structure, and the Fund expenses borne by BFA under this arrangement. The Board noted that the investment advisory fee rate under the Advisory Contract for the Fund was generally higher than the investment advisory/management fee rates for certain of the Other Accounts (particularly institutional clients) and concluded that the differences appeared to be consistent with the factors discussed.
Other Benefits to BFA and/or its Affiliates — The Board reviewed the “fallout” benefits or ancillary revenue received by BFA and/or its affiliates in connection with the services provided to the Fund by BFA, such as payment of revenue to BTC, the Fund’s
| 94 | 2017 iSHARES ANNUAL REPORTTO SHAREHOLDERS |
Table of Contents
Board Review and Approval of Investment Advisory
Contract (Continued)
iSHARES®, INC.
securities lending agent, for loaning portfolio securities (which was included in the profit margins reviewed by the Board pursuant to BFA’s profitability methodology), and payment of advisory fees and/or administration fees to BFA and BTC (or their affiliates) in connection with any investments by the Fund in other funds for which BFA (or its affiliates) provides investment advisory services and/or administration services. The Board also noted the revenue received by BFA and/or its affiliates pursuant to an agreement that permits a service provider to use certain portions of BlackRock’s technology platform to service accounts managed by BFA and/or its affiliates, including the iShares funds. The Board noted that BFA generally does not use soft dollars or consider the value of research or other services that may be provided to BFA (including its affiliates) in selecting brokers for portfolio transactions for the Fund. The Board further noted that any portfolio transactions on behalf of the Fund placed through a BFA affiliate or purchased from an underwriting syndicate in which a BFA affiliate participates, are reported to the Board pursuant to Rule 17e-1 or Rule 10f-3, as applicable, under the 1940 Act. The Board concluded that any such ancillary benefits would not be disadvantageous to the Fund’s shareholders and thus would not alter the Board’s conclusion with respect to the appropriateness of approving the continuance of the Advisory Contract for the coming year.
Conclusion — Based on the considerations described above, the Board determined that the Fund’s investment advisory fee rate under the Advisory Contract does not constitute a fee that is so disproportionately large as to bear no reasonable relationship to the services rendered and that could not have been the product of arm’s-length bargaining, and concluded to approve the continuance of the Advisory Contract for the coming year.
III. iShares MSCI Malaysia ETF
Under Section 15(c) of the Investment Company Act of 1940 (the “1940 Act”), the Company’s Board of Directors (the “Board”), including a majority of Directors who are not “interested persons” of the Company (as that term is defined in the 1940 Act) (the “Independent Directors”), is required annually to consider and approve the Investment Advisory Contract between the Company and BFA (the “Advisory Contract”) on behalf of the Fund. The Independent Directors requested, and BFA provided, such information as the Independent Directors, with advice from independent counsel, deemed reasonably necessary to evaluate the Advisory Contract. A committee of all of the Independent Directors (the “15(c) Committee”), with independent counsel, met with management on May 5, 2017 and May 12, 2017. At these meetings, the 15(c) Committee reviewed and discussed information provided in response to the 15(c) Committee’s initial requests, and requested certain additional information, which management agreed to provide. At a meeting held on May 18, 2017, management presented information to the Board relating to the continuance of the Advisory Contract, including information requested by the 15(c) Committee during its meetings. The Board, including the Independent Directors, reviewed and discussed such information at length. The Independent Directors requested from management certain additional information, which management agreed to provide. At a meeting held on June 19-21, 2017, the Board, including the Independent Directors, reviewed the additional information provided by management in response to these requests. After extensive discussions, the Board, including all of the Independent Directors, approved the continuance of the Advisory Contract for the Fund, based on a review of qualitative and quantitative information provided by BFA. The Board noted its satisfaction with the extent and quality of information provided and its frequent interactions with management, as well as the detailed responses and other information provided by BFA. The Board also noted that the Board and BFA agreed to discuss potential further enhancements to the 15(c) process for the coming year. The Independent Directors were advised by their independent counsel throughout the process, including about the legal standards applicable to their review. In approving the Advisory Contract for the Fund, the Board, including the Independent Directors, considered the following factors, no one of which was controlling, and reached the following conclusions:
Expenses and Performance of the Fund — The Board reviewed statistical information prepared by Broadridge Financial Solutions Inc. (“Broadridge”), an independent provider of investment company data, regarding the expense ratio components, including gross and net total expenses, waivers/reimbursements (if any), and underlying fund fees and expenses (if any) of the Fund in comparison with the same information for other exchange traded funds (“ETFs”) (including, where applicable, funds
BOARD REVIEWAND APPROVALOF INVESTMENT ADVISORY CONTRACT | 95 |
Table of Contents
Board Review and Approval of Investment Advisory
Contract (Continued)
iSHARES®, INC.
sponsored by an “at cost” service provider) and, in the limited instances where no comparable ETFs existed and the comparison group would not otherwise be reasonable in Broadridge’s judgment, pure index institutional mutual funds, objectively selected by Broadridge as comprising the Fund’s applicable peer group pursuant to Broadridge’s proprietary ETF methodology (the “Peer Group”). The Board was provided with a detailed description of the proprietary ETF methodology used by Broadridge to determine the Fund’s Peer Group. The Board further noted that due to the limitations in providing comparable funds in the Peer Group, the statistical information provided in Broadridge’s report may or may not provide meaningful direct comparisons to the Fund in all instances.
The Board also noted that the investment advisory fee rate and overall expenses (net of waivers and reimbursements) for the Fund were lower than the median of the investment advisory fee rates and overall expenses (net of waivers and reimbursements) of the funds in its Peer Group, excluding iShares funds.
In addition, to the extent that any of the comparison funds included in the Peer Group, excluding iShares funds, track the same index as the Fund, Broadridge also provided, and the Board reviewed, a comparison of the Fund’s performance for the one-, three-, five-, ten-year, and since inception periods, as applicable, and for the quarter ended December 31, 2016, to that of relevant comparison funds for the same periods.
The Board noted that the Fund seeks to track its specified underlying index and that, during the year, the Board received periodic reports on the Fund’s short- and longer-term performance in comparison with its underlying index. Such periodic comparative performance information, including any additional detailed information requested by the Boards, was also considered. The Board noted that the Fund generally performed in line with its underlying index over the relevant periods.
Based on this review, the other factors considered at the meeting, and their general knowledge of ETF pricing, the Board concluded that the investment advisory fee rate and the historical performance of the Fund supported the Board’s approval of the continuance of the Advisory Contract for the coming year.
Nature, Extent and Quality of Services Provided by BFA — Based on management’s representations, including information about recent and proposed enhancements to the iShares business, including with respect to capital markets support and analysis, technology, product design, compliance and risk management, and other services, the Board expected that there would be no diminution in the scope of services required of or provided by BFA under the Advisory Contract for the coming year as compared to the scope of services provided by BFA during prior years. In reviewing the scope of these services, the Board considered BFA’s investment philosophy and experience, noting that BFA and its affiliates have committed significant resources over time, including during the past year, to supporting the iShares funds and their shareholders. The Board also considered BFA’s compliance program and its compliance record with respect to the Fund. In that regard, the Board noted that BFA reports to the Board about portfolio management and compliance matters on a periodic basis in connection with regularly scheduled meetings of the Board, and on other occasions as necessary and appropriate, and has provided information and made appropriate officers available as needed to provide further assistance with these matters. The Board also reviewed the background and experience of the persons responsible for the day-to-day management of the Fund, as well as the resources available to them in managing the Fund. In addition to the above considerations, the Board reviewed and considered detailed presentations regarding BFA’s investment performance, investment and risk management processes and strategies provided at the June 19-21, 2017 meeting and throughout the previous year, and matters related to BFA’s portfolio compliance policies and procedures. The Board noted that the Fund had met its investment objective consistently since its inception date.
Based on review of this information, and the performance information discussed above, the Board concluded that the nature, extent and quality of services provided by BFA to the Fund under the Advisory Contract supported the Board’s approval of the continuance of the Advisory Contract for the coming year.
| 96 | 2017 iSHARES ANNUAL REPORTTO SHAREHOLDERS |
Table of Contents
Board Review and Approval of Investment Advisory
Contract (Continued)
iSHARES®, INC.
Costs of Services Provided to Fund and Profits Realized by BFA and Affiliates — The Board reviewed information about the profitability of the Fund to BlackRock, based on the fees payable to BFA and its affiliates (including fees under the Advisory Contract), and other sources of revenue and expense to BFA and its affiliates from the Fund’s operations for the last calendar year. The Board reviewed BlackRock’s profitability methodology for the iShares funds, including supplemental information that was responsive to requests of the 15(c) Committee. The Board noted that the 15(c) Committee had focused on the methodology and profitability presentation during its meetings. The Board discussed the sources of direct and ancillary revenue with management, including the revenues to BTC, a BFA affiliate, from securities lending by the Fund. The Board also discussed BFA’s profit margin as reflected in the Fund’s profitability analysis and reviewed information regarding potential economies of scale (as discussed below). Based on this review, the Board concluded that the profits realized by BFA and its affiliates under the Advisory Contract and from other relationships between the Fund and BFA and/or its affiliates, if any, were within a reasonable range in light of the factors considered.
Economies of Scale — The Board reviewed information regarding potential economies of scale or other efficiencies that may result from increases in the Fund’s assets, noting that the issue of economies of scale had been focused on by the 15(c) Committee during its meetings and addressed by management, including through supplemental information. The Board and the 15(c) Committee reviewed information provided by BFA regarding scale benefits shared with the iShares funds through relatively low fee rates established at inception, breakpoints and waivers or other fee reductions, as well as through additional investment in the iShares business and the provision of improved or additional infrastructure and services to the iShares funds and their shareholders. The Board and the 15(c) Committee received information regarding BlackRock’s historical profitability, including BFA’s and its affiliates’ costs in providing services. The cost information distinguished, among other things, between fixed and variable costs, and explained how the level of fixed and variable costs, as well as the nature of such costs, may impact the existence or size of scale benefits. The Board noted that the Advisory Contract for the Fund already provided for breakpoints in the Fund’s investment advisory fee rate, and that, following negotiations, BFA and the Board had agreed to revise the Advisory Contract for the Fund to provide for an additional breakpoint as the assets of the Fund, on an aggregated basis with the assets of certain other iShares funds, increase. The Board noted that it would continue to monitor the sharing of economies of scale to determine the appropriateness of adding new or revised breakpoints in the future.
Based on this review, as well as the other factors considered at the meeting, the Board, recognizing its responsibility to consider the Advisory Contract at least annually, determined to approve the continuance of the Advisory Contract for the coming year.
Fees and Services Provided for Other Comparable Funds/Accounts Managed by BFA and its Affiliates — The Board received and considered information regarding the investment advisory/management fee rates for other funds/accounts in the U.S. for which BFA (or its affiliates) provides investment advisory/management services, including open-end funds registered under the 1940 Act (including sub-advised funds), collective trust funds, and institutional separate accounts (together, the “Other Accounts”), and acknowledged BFA’s assertion that the iShares funds are fundamentally different investment vehicles from the Other Accounts. The Board noted that BFA and its affiliates do not manage Other Accounts with substantially the same investment objective and strategy as the Fund and that track the same index as the Fund. The Board further noted that BFA provided the Board with detailed information regarding how the Other Accounts (particularly institutional clients) generally differ from the Fund, including in terms of the different and generally more extensive services provided to the Fund, as well as other significant differences. In that regard, the Board considered that the pricing of services to institutional clients is typically based on a number of factors beyond the nature and extent of the specific services to be provided and often depends on the overall relationship between the client and its affiliates and the adviser and its affiliates. In addition, the Board considered the relative complexity and inherent risks and challenges of managing and providing other services to the Fund, as a publicly traded ETF, as compared to the Other Accounts that are institutional clients, in light of differing regulatory requirements and client-imposed mandates. The Board also acknowledged BFA’s expressed business purpose for launching a suite of iShares “Core” ETFs that generally are subject to lower investment advisory fees than iShares non-Core ETFs that may provide a similar investment
BOARD REVIEWAND APPROVALOF INVESTMENT ADVISORY CONTRACT | 97 |
Table of Contents
Board Review and Approval of Investment Advisory
Contract (Continued)
iSHARES®, INC.
exposure. The Board also considered the “all-inclusive” nature of the Fund’s advisory fee structure, and the Fund expenses borne by BFA under this arrangement. The Board noted that the investment advisory fee rate under the Advisory Contract for the Fund was generally higher than the investment advisory/management fee rates for certain of the Other Accounts (particularly institutional clients) and concluded that the differences appeared to be consistent with the factors discussed.
Other Benefits to BFA and/or its Affiliates — The Board reviewed the “fallout” benefits or ancillary revenue received by BFA and/or its affiliates in connection with the services provided to the Fund by BFA, such as payment of revenue to BTC, the Fund’s securities lending agent, for loaning portfolio securities (which was included in the profit margins reviewed by the Board pursuant to BFA’s profitability methodology), and payment of advisory fees and/or administration fees to BFA and BTC (or their affiliates) in connection with any investments by the Fund in other funds for which BFA (or its affiliates) provides investment advisory services and/or administration services. The Board also noted the revenue received by BFA and/or its affiliates pursuant to an agreement that permits a service provider to use certain portions of BlackRock’s technology platform to service accounts managed by BFA and/or its affiliates, including the iShares funds. The Board noted that BFA generally does not use soft dollars or consider the value of research or other services that may be provided to BFA (including its affiliates) in selecting brokers for portfolio transactions for the Fund. The Board further noted that any portfolio transactions on behalf of the Fund placed through a BFA affiliate or purchased from an underwriting syndicate in which a BFA affiliate participates, are reported to the Board pursuant to Rule 17e-1 or Rule 10f-3, as applicable, under the 1940 Act. The Board concluded that any such ancillary benefits would not be disadvantageous to the Fund’s shareholders and thus would not alter the Board’s conclusion with respect to the appropriateness of approving the continuance of the Advisory Contract for the coming year.
Conclusion — Based on the considerations described above, the Board determined that the Fund’s investment advisory fee rate under the Advisory Contract does not constitute a fee that is so disproportionately large as to bear no reasonable relationship to the services rendered and that could not have been the product of arm’s-length bargaining, and concluded to approve the continuance of the Advisory Contract for the coming year.
IV. iShares MSCI Pacific ex Japan ETF
Under Section 15(c) of the Investment Company Act of 1940 (the “1940 Act”), the Company’s Board of Directors (the “Board”), including a majority of Directors who are not “interested persons” of the Company (as that term is defined in the 1940 Act) (the “Independent Directors”), is required annually to consider and approve the Investment Advisory Contract between the Company and BFA (the “Advisory Contract”) on behalf of the Fund. The Independent Directors requested, and BFA provided, such information as the Independent Directors, with advice from independent counsel, deemed reasonably necessary to evaluate the Advisory Contract. A committee of all of the Independent Directors (the “15(c) Committee”), with independent counsel, met with management on May 5, 2017 and May 12, 2017. At these meetings, the 15(c) Committee reviewed and discussed information provided in response to the 15(c) Committee’s initial requests, and requested certain additional information, which management agreed to provide. At a meeting held on May 18, 2017, management presented information to the Board relating to the continuance of the Advisory Contract, including information requested by the 15(c) Committee during its meetings. The Board, including the Independent Directors, reviewed and discussed such information at length. The Independent Directors requested from management certain additional information, which management agreed to provide. At a meeting held on June 19-21, 2017, the Board, including the Independent Directors, reviewed the additional information provided by management in response to these requests. After extensive discussions, the Board, including all of the Independent Directors, approved the continuance of the Advisory Contract for the Fund, based on a review of qualitative and quantitative information provided by BFA. The Board noted its satisfaction with the extent and quality of information provided and its frequent interactions with management, as well as the detailed responses and other information provided by BFA. The Board also noted that the Board and BFA agreed to discuss potential further enhancements to the 15(c) process for the coming year. The Independent Directors were advised by their independent counsel throughout the process, including about the legal standards applicable to their review. In approving the
| 98 | 2017 iSHARES ANNUAL REPORTTO SHAREHOLDERS |
Table of Contents
Board Review and Approval of Investment Advisory
Contract (Continued)
iSHARES®, INC.
Advisory Contract for the Fund, the Board, including the Independent Directors, considered the following factors, no one of which was controlling, and reached the following conclusions:
Expenses and Performance of the Fund — The Board reviewed statistical information prepared by Broadridge Financial Solutions Inc. (“Broadridge”), an independent provider of investment company data, regarding the expense ratio components, including gross and net total expenses, waivers/reimbursements (if any), and underlying fund fees and expenses (if any) of the Fund in comparison with the same information for other exchange traded funds (“ETFs”) (including, where applicable, funds sponsored by an “at cost” service provider) and, in the limited instances where no comparable ETFs existed and the comparison group would not otherwise be reasonable in Broadridge’s judgment, pure index institutional mutual funds, objectively selected by Broadridge as comprising the Fund’s applicable peer group pursuant to Broadridge’s proprietary ETF methodology (the “Peer Group”). The Board was provided with a detailed description of the proprietary ETF methodology used by Broadridge to determine the Fund’s Peer Group. The Board further noted that due to the limitations in providing comparable funds in the Peer Group, the statistical information provided in Broadridge’s report may or may not provide meaningful direct comparisons to the Fund in all instances.
The Board also noted that the investment advisory fee rate and overall expenses (net of waivers and reimbursements) for the Fund were within range of the median of the investment advisory fee rates and overall expenses (net of waivers and reimbursements) of the funds in its Peer Group, excluding iShares funds.
In addition, to the extent that any of the comparison funds included in the Peer Group, excluding iShares funds, track the same index as the Fund, Broadridge also provided, and the Board reviewed, a comparison of the Fund’s performance for the one-, three-, five-, ten-year, and since inception periods, as applicable, and for the quarter ended December 31, 2016, to that of relevant comparison funds for the same periods.
The Board noted that the Fund seeks to track its specified underlying index and that, during the year, the Board received periodic reports on the Fund’s short- and longer-term performance in comparison with its underlying index. Such periodic comparative performance information, including any additional detailed information requested by the Boards, was also considered. The Board noted that the Fund generally performed in line with its underlying index over the relevant periods.
Based on this review, the other factors considered at the meeting, and their general knowledge of ETF pricing, the Board concluded that the investment advisory fee rate and the historical performance of the Fund supported the Board’s approval of the continuance of the Advisory Contract for the coming year.
Nature, Extent and Quality of Services Provided by BFA — Based on management’s representations, including information about recent and proposed enhancements to the iShares business, including with respect to capital markets support and analysis, technology, product design, compliance and risk management, and other services, the Board expected that there would be no diminution in the scope of services required of or provided by BFA under the Advisory Contract for the coming year as compared to the scope of services provided by BFA during prior years. In reviewing the scope of these services, the Board considered BFA’s investment philosophy and experience, noting that BFA and its affiliates have committed significant resources over time, including during the past year, to supporting the iShares funds and their shareholders. The Board also considered BFA’s compliance program and its compliance record with respect to the Fund. In that regard, the Board noted that BFA reports to the Board about portfolio management and compliance matters on a periodic basis in connection with regularly scheduled meetings of the Board, and on other occasions as necessary and appropriate, and has provided information and made appropriate officers available as needed to provide further assistance with these matters. The Board also reviewed the background and experience of the persons responsible for the day-to-day management of the Fund, as well as the resources available to them in managing the Fund. In addition to the above considerations, the Board reviewed and considered detailed
BOARD REVIEWAND APPROVALOF INVESTMENT ADVISORY CONTRACT | 99 |
Table of Contents
Board Review and Approval of Investment Advisory
Contract (Continued)
iSHARES®, INC.
presentations regarding BFA’s investment performance, investment and risk management processes and strategies provided at the June 19-21, 2017 meeting and throughout the previous year, and matters related to BFA’s portfolio compliance policies and procedures. The Board noted that the Fund had met its investment objective consistently since its inception date.
Based on review of this information, and the performance information discussed above, the Board concluded that the nature, extent and quality of services provided by BFA to the Fund under the Advisory Contract supported the Board’s approval of the continuance of the Advisory Contract for the coming year.
Costs of Services Provided to Fund and Profits Realized by BFA and Affiliates — The Board reviewed information about the profitability of the Fund to BlackRock, based on the fees payable to BFA and its affiliates (including fees under the Advisory Contract), and other sources of revenue and expense to BFA and its affiliates from the Fund’s operations for the last calendar year. The Board reviewed BlackRock’s profitability methodology for the iShares funds, including supplemental information that was responsive to requests of the 15(c) Committee. The Board noted that the 15(c) Committee had focused on the methodology and profitability presentation during its meetings. The Board discussed the sources of direct and ancillary revenue with management, including the revenues to BTC, a BFA affiliate, from securities lending by the Fund. The Board also discussed BFA’s profit margin as reflected in the Fund’s profitability analysis and reviewed information regarding potential economies of scale (as discussed below). Based on this review, the Board concluded that the profits realized by BFA and its affiliates under the Advisory Contract and from other relationships between the Fund and BFA and/or its affiliates, if any, were within a reasonable range in light of the factors considered.
Economies of Scale — The Board reviewed information regarding potential economies of scale or other efficiencies that may result from increases in the Fund’s assets, noting that the issue of economies of scale had been focused on by the 15(c) Committee during its meetings and addressed by management, including through supplemental information. The Board and the 15(c) Committee reviewed information provided by BFA regarding scale benefits shared with the iShares funds through relatively low fee rates established at inception, breakpoints and waivers or other fee reductions, as well as through additional investment in the iShares business and the provision of improved or additional infrastructure and services to the iShares funds and their shareholders. The Board and the 15(c) Committee received information regarding BlackRock’s historical profitability, including BFA’s and its affiliates’ costs in providing services. The cost information distinguished, among other things, between fixed and variable costs, and explained how the level of fixed and variable costs, as well as the nature of such costs, may impact the existence or size of scale benefits. The Board noted that the Advisory Contract for the Fund already provided for breakpoints in the Fund’s investment advisory fee rate as the assets of the Fund, on an aggregated basis with the assets of certain other iShares funds, increase. The Board noted that it would continue to monitor the sharing of economies of scale to determine the appropriateness of adding new or revised breakpoints in the future.
Based on this review, as well as the other factors considered at the meeting, the Board, recognizing its responsibility to consider the Advisory Contract at least annually, determined to approve the continuance of the Advisory Contract for the coming year.
Fees and Services Provided for Other Comparable Funds/Accounts Managed by BFA and its Affiliates — The Board received and considered information regarding the investment advisory/management fee rates for other funds/accounts in the U.S. for which BFA (or its affiliates) provides investment advisory/management services, including open-end funds registered under the 1940 Act (including sub-advised funds), collective trust funds, and institutional separate accounts (together, the “Other Accounts”), and acknowledged BFA’s assertion that the iShares funds are fundamentally different investment vehicles from the Other Accounts. The Board noted that BFA and its affiliates do manage Other Accounts with substantially the same investment objective and strategy as the Fund and that track the same index as the Fund. The Board further noted that BFA provided the Board with detailed information regarding how the Other Accounts (particularly institutional clients) generally differ from the Fund, including in terms of the different and generally more extensive services provided to the Fund, as well as other significant
| 100 | 2017 iSHARES ANNUAL REPORTTO SHAREHOLDERS |
Table of Contents
Board Review and Approval of Investment Advisory
Contract (Continued)
iSHARES®, INC.
differences. In that regard, the Board considered that the pricing of services to institutional clients is typically based on a number of factors beyond the nature and extent of the specific services to be provided and often depends on the overall relationship between the client and its affiliates and the adviser and its affiliates. In addition, the Board considered the relative complexity and inherent risks and challenges of managing and providing other services to the Fund, as a publicly traded ETF, as compared to the Other Accounts that are institutional clients, in light of differing regulatory requirements and client-imposed mandates. The Board also acknowledged BFA’s expressed business purpose for launching a suite of iShares “Core” ETFs that generally are subject to lower investment advisory fees than iShares non-Core ETFs that may provide a similar investment exposure. The Board also considered the “all-inclusive” nature of the Fund’s advisory fee structure, and the Fund expenses borne by BFA under this arrangement. The Board noted that the investment advisory fee rate under the Advisory Contract for the Fund was generally higher than the investment advisory/management fee rates for certain of the Other Accounts (particularly institutional clients) and concluded that the differences appeared to be consistent with the factors discussed.
Other Benefits to BFA and/or its Affiliates — The Board reviewed the “fallout” benefits or ancillary revenue received by BFA and/or its affiliates in connection with the services provided to the Fund by BFA, such as payment of revenue to BTC, the Fund’s securities lending agent, for loaning portfolio securities (which was included in the profit margins reviewed by the Board pursuant to BFA’s profitability methodology), and payment of advisory fees and/or administration fees to BFA and BTC (or their affiliates) in connection with any investments by the Fund in other funds for which BFA (or its affiliates) provides investment advisory services and/or administration services. The Board also noted the revenue received by BFA and/or its affiliates pursuant to an agreement that permits a service provider to use certain portions of BlackRock’s technology platform to service accounts managed by BFA and/or its affiliates, including the iShares funds. The Board noted that BFA generally does not use soft dollars or consider the value of research or other services that may be provided to BFA (including its affiliates) in selecting brokers for portfolio transactions for the Fund. The Board further noted that any portfolio transactions on behalf of the Fund placed through a BFA affiliate or purchased from an underwriting syndicate in which a BFA affiliate participates, are reported to the Board pursuant to Rule 17e-1 or Rule 10f-3, as applicable, under the 1940 Act. The Board concluded that any such ancillary benefits would not be disadvantageous to the Fund’s shareholders and thus would not alter the Board’s conclusion with respect to the appropriateness of approving the continuance of the Advisory Contract for the coming year.
Conclusion — Based on the considerations described above, the Board determined that the Fund’s investment advisory fee rate under the Advisory Contract does not constitute a fee that is so disproportionately large as to bear no reasonable relationship to the services rendered and that could not have been the product of arm’s-length bargaining, and concluded to approve the continuance of the Advisory Contract for the coming year.
V. iShares MSCI Taiwan Capped ETF
Under Section 15(c) of the Investment Company Act of 1940 (the “1940 Act”), the Company’s Board of Directors (the “Board”), including a majority of Directors who are not “interested persons” of the Company (as that term is defined in the 1940 Act) (the “Independent Directors”), is required annually to consider and approve the Investment Advisory Contract between the Company and BFA (the “Advisory Contract”) on behalf of the Fund. The Independent Directors requested, and BFA provided, such information as the Independent Directors, with advice from independent counsel, deemed reasonably necessary to evaluate the Advisory Contract. A committee of all of the Independent Directors (the “15(c) Committee”), with independent counsel, met with management on May 5, 2017 and May 12, 2017. At these meetings, the 15(c) Committee reviewed and discussed information provided in response to the 15(c) Committee’s initial requests, and requested certain additional information, which management agreed to provide. At a meeting held on May 18, 2017, management presented information to the Board relating to the continuance of the Advisory Contract, including information requested by the 15(c) Committee during its meetings. The Board, including the Independent Directors, reviewed and discussed such information at length. The Independent Directors requested from management certain additional information, which management agreed to provide. At a meeting held on June 19-21, 2017,
BOARD REVIEWAND APPROVALOF INVESTMENT ADVISORY CONTRACT | 101 |
Table of Contents
Board Review and Approval of Investment Advisory
Contract (Continued)
iSHARES®, INC.
the Board, including the Independent Directors, reviewed the additional information provided by management in response to these requests. After extensive discussions, the Board, including all of the Independent Directors, approved the continuance of the Advisory Contract for the Fund, based on a review of qualitative and quantitative information provided by BFA. The Board noted its satisfaction with the extent and quality of information provided and its frequent interactions with management, as well as the detailed responses and other information provided by BFA. The Board also noted that the Board and BFA agreed to discuss potential further enhancements to the 15(c) process for the coming year. The Independent Directors were advised by their independent counsel throughout the process, including about the legal standards applicable to their review. In approving the Advisory Contract for the Fund, the Board, including the Independent Directors, considered the following factors, no one of which was controlling, and reached the following conclusions:
Expenses and Performance of the Fund — The Board reviewed statistical information prepared by Broadridge Financial Solutions Inc. (“Broadridge”), an independent provider of investment company data, regarding the expense ratio components, including gross and net total expenses, waivers/reimbursements (if any), and underlying fund fees and expenses (if any) of the Fund in comparison with the same information for other exchange traded funds (“ETFs”) (including, where applicable, funds sponsored by an “at cost” service provider) and, in the limited instances where no comparable ETFs existed and the comparison group would not otherwise be reasonable in Broadridge’s judgment, pure index institutional mutual funds, objectively selected by Broadridge as comprising the Fund’s applicable peer group pursuant to Broadridge’s proprietary ETF methodology (the “Peer Group”). The Board was provided with a detailed description of the proprietary ETF methodology used by Broadridge to determine the Fund’s Peer Group. The Board further noted that due to the limitations in providing comparable funds in the Peer Group, the statistical information provided in Broadridge’s report may or may not provide meaningful direct comparisons to the Fund in all instances.
The Board also noted that the investment advisory fee rate and overall expenses (net of waivers and reimbursements) for the Fund were lower than the median of the investment advisory fee rates and overall expenses (net of waivers and reimbursements) of the funds in its Peer Group, excluding iShares funds.
In addition, to the extent that any of the comparison funds included in the Peer Group, excluding iShares funds, track the same index as the Fund, Broadridge also provided, and the Board reviewed, a comparison of the Fund’s performance for the one-, three-, five-, ten-year, and since inception periods, as applicable, and for the quarter ended December 31, 2016, to that of relevant comparison funds for the same periods.
The Board noted that the Fund seeks to track its specified underlying index and that, during the year, the Board received periodic reports on the Fund’s short- and longer-term performance in comparison with its underlying index. Such periodic comparative performance information, including any additional detailed information requested by the Boards, was also considered. The Board noted that the Fund generally performed in line with its underlying index over the relevant periods.
Based on this review, the other factors considered at the meeting, and their general knowledge of ETF pricing, the Board concluded that the investment advisory fee rate and the historical performance of the Fund supported the Board’s approval of the continuance of the Advisory Contract for the coming year.
Nature, Extent and Quality of Services Provided by BFA — Based on management’s representations, including information about recent and proposed enhancements to the iShares business, including with respect to capital markets support and analysis, technology, product design, compliance and risk management, and other services, the Board expected that there would be no diminution in the scope of services required of or provided by BFA under the Advisory Contract for the coming year as compared to the scope of services provided by BFA during prior years. In reviewing the scope of these services, the Board considered BFA’s investment philosophy and experience, noting that BFA and its affiliates have committed significant resources
| 102 | 2017 iSHARES ANNUAL REPORTTO SHAREHOLDERS |
Table of Contents
Board Review and Approval of Investment Advisory
Contract (Continued)
iSHARES®, INC.
over time, including during the past year, to supporting the iShares funds and their shareholders. The Board also considered BFA’s compliance program and its compliance record with respect to the Fund. In that regard, the Board noted that BFA reports to the Board about portfolio management and compliance matters on a periodic basis in connection with regularly scheduled meetings of the Board, and on other occasions as necessary and appropriate, and has provided information and made appropriate officers available as needed to provide further assistance with these matters. The Board also reviewed the background and experience of the persons responsible for the day-to-day management of the Fund, as well as the resources available to them in managing the Fund. In addition to the above considerations, the Board reviewed and considered detailed presentations regarding BFA’s investment performance, investment and risk management processes and strategies provided at the June 19-21, 2017 meeting and throughout the previous year, and matters related to BFA’s portfolio compliance policies and procedures. The Board noted that the Fund had met its investment objective consistently since its inception date.
Based on review of this information, and the performance information discussed above, the Board concluded that the nature, extent and quality of services provided by BFA to the Fund under the Advisory Contract supported the Board’s approval of the continuance of the Advisory Contract for the coming year.
Costs of Services Provided to Fund and Profits Realized by BFA and Affiliates — The Board reviewed information about the profitability of the Fund to BlackRock, based on the fees payable to BFA and its affiliates (including fees under the Advisory Contract), and other sources of revenue and expense to BFA and its affiliates from the Fund’s operations for the last calendar year. The Board reviewed BlackRock’s profitability methodology for the iShares funds, including supplemental information that was responsive to requests of the 15(c) Committee. The Board noted that the 15(c) Committee had focused on the methodology and profitability presentation during its meetings. The Board discussed the sources of direct and ancillary revenue with management, including the revenues to BTC, a BFA affiliate, from securities lending by the Fund. The Board also discussed BFA’s profit margin as reflected in the Fund’s profitability analysis and reviewed information regarding potential economies of scale (as discussed below). Based on this review, the Board concluded that the profits realized by BFA and its affiliates under the Advisory Contract and from other relationships between the Fund and BFA and/or its affiliates, if any, were within a reasonable range in light of the factors considered.
Economies of Scale — The Board reviewed information regarding potential economies of scale or other efficiencies that may result from increases in the Fund’s assets, noting that the issue of economies of scale had been focused on by the 15(c) Committee during its meetings and addressed by management, including through supplemental information. The Board and the 15(c) Committee reviewed information provided by BFA regarding scale benefits shared with the iShares funds through relatively low fee rates established at inception, breakpoints and waivers or other fee reductions, as well as through additional investment in the iShares business and the provision of improved or additional infrastructure and services to the iShares funds and their shareholders. The Board and the 15(c) Committee received information regarding BlackRock’s historical profitability, including BFA’s and its affiliates’ costs in providing services. The cost information distinguished, among other things, between fixed and variable costs, and explained how the level of fixed and variable costs, as well as the nature of such costs, may impact the existence or size of scale benefits. The Board noted that the Advisory Contract for the Fund already provided for breakpoints in the Fund’s investment advisory fee rate as the assets of the Fund, on an aggregated basis with the assets of certain other iShares funds, increase. The Board noted that it would continue to monitor the sharing of economies of scale to determine the appropriateness of adding new or revised breakpoints in the future.
Based on this review, as well as the other factors considered at the meeting, the Board, recognizing its responsibility to consider the Advisory Contract at least annually, determined to approve the continuance of the Advisory Contract for the coming year.
Fees and Services Provided for Other Comparable Funds/Accounts Managed by BFA and its Affiliates — The Board received and considered information regarding the investment advisory/management fee rates for other funds/accounts in the
BOARD REVIEWAND APPROVALOF INVESTMENT ADVISORY CONTRACT | 103 |
Table of Contents
Board Review and Approval of Investment Advisory
Contract (Continued)
iSHARES®, INC.
U.S. for which BFA (or its affiliates) provides investment advisory/management services, including open-end funds registered under the 1940 Act (including sub-advised funds), collective trust funds, and institutional separate accounts (together, the “Other Accounts”), and acknowledged BFA’s assertion that the iShares funds are fundamentally different investment vehicles from the Other Accounts. The Board noted that BFA and its affiliates do manage Other Accounts with substantially the same investment objective and strategy as the Fund and that track the same index as the Fund. The Board further noted that BFA provided the Board with detailed information regarding how the Other Accounts (particularly institutional clients) generally differ from the Fund, including in terms of the different and generally more extensive services provided to the Fund, as well as other significant differences. In that regard, the Board considered that the pricing of services to institutional clients is typically based on a number of factors beyond the nature and extent of the specific services to be provided and often depends on the overall relationship between the client and its affiliates and the adviser and its affiliates. In addition, the Board considered the relative complexity and inherent risks and challenges of managing and providing other services to the Fund, as a publicly traded ETF, as compared to the Other Accounts that are institutional clients, in light of differing regulatory requirements and client-imposed mandates. The Board also acknowledged BFA’s expressed business purpose for launching a suite of iShares “Core” ETFs that generally are subject to lower investment advisory fees than iShares non-Core ETFs that may provide a similar investment exposure. The Board also considered the “all-inclusive” nature of the Fund’s advisory fee structure, and the Fund expenses borne by BFA under this arrangement. The Board noted that the investment advisory fee rate under the Advisory Contract for the Fund was generally higher than the investment advisory/management fee rates for certain of the Other Accounts (particularly institutional clients) and concluded that the differences appeared to be consistent with the factors discussed.
Other Benefits to BFA and/or its Affiliates — The Board reviewed the “fallout” benefits or ancillary revenue received by BFA and/or its affiliates in connection with the services provided to the Fund by BFA, such as payment of revenue to BTC, the Fund’s securities lending agent, for loaning portfolio securities (which was included in the profit margins reviewed by the Board pursuant to BFA’s profitability methodology), and payment of advisory fees and/or administration fees to BFA and BTC (or their affiliates) in connection with any investments by the Fund in other funds for which BFA (or its affiliates) provides investment advisory services and/or administration services. The Board also noted the revenue received by BFA and/or its affiliates pursuant to an agreement that permits a service provider to use certain portions of BlackRock’s technology platform to service accounts managed by BFA and/or its affiliates, including the iShares funds. The Board noted that BFA generally does not use soft dollars or consider the value of research or other services that may be provided to BFA (including its affiliates) in selecting brokers for portfolio transactions for the Fund. The Board further noted that any portfolio transactions on behalf of the Fund placed through a BFA affiliate or purchased from an underwriting syndicate in which a BFA affiliate participates, are reported to the Board pursuant to Rule 17e-1 or Rule 10f-3, as applicable, under the 1940 Act. The Board concluded that any such ancillary benefits would not be disadvantageous to the Fund’s shareholders and thus would not alter the Board’s conclusion with respect to the appropriateness of approving the continuance of the Advisory Contract for the coming year.
Conclusion — Based on the considerations described above, the Board determined that the Fund’s investment advisory fee rate under the Advisory Contract does not constitute a fee that is so disproportionately large as to bear no reasonable relationship to the services rendered and that could not have been the product of arm’s-length bargaining, and concluded to approve the continuance of the Advisory Contract for the coming year.
VI. iShares MSCI Thailand Capped ETF
Under Section 15(c) of the Investment Company Act of 1940 (the “1940 Act”), the Company’s Board of Directors (the “Board”), including a majority of Directors who are not “interested persons” of the Company (as that term is defined in the 1940 Act) (the “Independent Directors”), is required annually to consider and approve the Investment Advisory Contract between the Company and BFA (the “Advisory Contract”) on behalf of the Fund. The Independent Directors requested, and BFA provided, such information as the Independent Directors, with advice from independent counsel, deemed reasonably necessary to evaluate the
| 104 | 2017 iSHARES ANNUAL REPORTTO SHAREHOLDERS |
Table of Contents
Board Review and Approval of Investment Advisory
Contract (Continued)
iSHARES®, INC.
Advisory Contract. A committee of all of the Independent Directors (the “15(c) Committee”), with independent counsel, met with management on May 5, 2017 and May 12, 2017. At these meetings, the 15(c) Committee reviewed and discussed information provided in response to the 15(c) Committee’s initial requests, and requested certain additional information, which management agreed to provide. At a meeting held on May 18, 2017, management presented information to the Board relating to the continuance of the Advisory Contract, including information requested by the 15(c) Committee during its meetings. The Board, including the Independent Directors, reviewed and discussed such information at length. The Independent Directors requested from management certain additional information, which management agreed to provide. At a meeting held on June 19-21, 2017, the Board, including the Independent Directors, reviewed the additional information provided by management in response to these requests. After extensive discussions, the Board, including all of the Independent Directors, approved the continuance of the Advisory Contract for the Fund, based on a review of qualitative and quantitative information provided by BFA. The Board noted its satisfaction with the extent and quality of information provided and its frequent interactions with management, as well as the detailed responses and other information provided by BFA. The Board also noted that the Board and BFA agreed to discuss potential further enhancements to the 15(c) process for the coming year. The Independent Directors were advised by their independent counsel throughout the process, including about the legal standards applicable to their review. In approving the Advisory Contract for the Fund, the Board, including the Independent Directors, considered the following factors, no one of which was controlling, and reached the following conclusions:
Expenses and Performance of the Fund — The Board reviewed statistical information prepared by Broadridge Financial Solutions Inc. (“Broadridge”), an independent provider of investment company data, regarding the expense ratio components, including gross and net total expenses, waivers/reimbursements (if any), and underlying fund fees and expenses (if any) of the Fund in comparison with the same information for other exchange traded funds (“ETFs”) (including, where applicable, funds sponsored by an “at cost” service provider) and, in the limited instances where no comparable ETFs existed and the comparison group would not otherwise be reasonable in Broadridge’s judgment, pure index institutional mutual funds, objectively selected by Broadridge as comprising the Fund’s applicable peer group pursuant to Broadridge’s proprietary ETF methodology (the “Peer Group”). The Board was provided with a detailed description of the proprietary ETF methodology used by Broadridge to determine the Fund’s Peer Group. The Board further noted that due to the limitations in providing comparable funds in the Peer Group, the statistical information provided in Broadridge’s report may or may not provide meaningful direct comparisons to the Fund in all instances.
The Board also noted that the investment advisory fee rate and overall expenses (net of waivers and reimbursements) for the Fund were lower than the median of the investment advisory fee rates and overall expenses (net of waivers and reimbursements) of the funds in its Peer Group, excluding iShares funds.
In addition, to the extent that any of the comparison funds included in the Peer Group, excluding iShares funds, track the same index as the Fund, Broadridge also provided, and the Board reviewed, a comparison of the Fund’s performance for the one-, three-, five-, ten-year, and since inception periods, as applicable, and for the quarter ended December 31, 2016, to that of relevant comparison funds for the same periods.
The Board noted that the Fund seeks to track its specified underlying index and that, during the year, the Board received periodic reports on the Fund’s short- and longer-term performance in comparison with its underlying index. Such periodic comparative performance information, including any additional detailed information requested by the Boards, was also considered. The Board noted that the Fund generally performed in line with its underlying index over the relevant periods.
Based on this review, the other factors considered at the meeting, and their general knowledge of ETF pricing, the Board concluded that the investment advisory fee rate and the historical performance of the Fund supported the Board’s approval of the continuance of the Advisory Contract for the coming year.
BOARD REVIEWAND APPROVALOF INVESTMENT ADVISORY CONTRACT | 105 |
Table of Contents
Board Review and Approval of Investment Advisory
Contract (Continued)
iSHARES®, INC.
Nature, Extent and Quality of Services Provided by BFA — Based on management’s representations, including information about recent and proposed enhancements to the iShares business, including with respect to capital markets support and analysis, technology, product design, compliance and risk management, and other services, the Board expected that there would be no diminution in the scope of services required of or provided by BFA under the Advisory Contract for the coming year as compared to the scope of services provided by BFA during prior years. In reviewing the scope of these services, the Board considered BFA’s investment philosophy and experience, noting that BFA and its affiliates have committed significant resources over time, including during the past year, to supporting the iShares funds and their shareholders. The Board also considered BFA’s compliance program and its compliance record with respect to the Fund. In that regard, the Board noted that BFA reports to the Board about portfolio management and compliance matters on a periodic basis in connection with regularly scheduled meetings of the Board, and on other occasions as necessary and appropriate, and has provided information and made appropriate officers available as needed to provide further assistance with these matters. The Board also reviewed the background and experience of the persons responsible for the day-to-day management of the Fund, as well as the resources available to them in managing the Fund. In addition to the above considerations, the Board reviewed and considered detailed presentations regarding BFA’s investment performance, investment and risk management processes and strategies provided at the June 19-21, 2017 meeting and throughout the previous year, and matters related to BFA’s portfolio compliance policies and procedures. The Board noted that the Fund had met its investment objective consistently since its inception date.
Based on review of this information, and the performance information discussed above, the Board concluded that the nature, extent and quality of services provided by BFA to the Fund under the Advisory Contract supported the Board’s approval of the continuance of the Advisory Contract for the coming year.
Costs of Services Provided to Fund and Profits Realized by BFA and Affiliates — The Board reviewed information about the profitability of the Fund to BlackRock, based on the fees payable to BFA and its affiliates (including fees under the Advisory Contract), and other sources of revenue and expense to BFA and its affiliates from the Fund’s operations for the last calendar year. The Board reviewed BlackRock’s profitability methodology for the iShares funds, including supplemental information that was responsive to requests of the 15(c) Committee. The Board noted that the 15(c) Committee had focused on the methodology and profitability presentation during its meetings. The Board discussed the sources of direct and ancillary revenue with management, including the revenues to BTC, a BFA affiliate, from securities lending by the Fund. The Board also discussed BFA’s profit margin as reflected in the Fund’s profitability analysis and reviewed information regarding potential economies of scale (as discussed below). Based on this review, the Board concluded that the profits realized by BFA and its affiliates under the Advisory Contract and from other relationships between the Fund and BFA and/or its affiliates, if any, were within a reasonable range in light of the factors considered.
Economies of Scale — The Board reviewed information regarding potential economies of scale or other efficiencies that may result from increases in the Fund’s assets, noting that the issue of economies of scale had been focused on by the 15(c) Committee during its meetings and addressed by management, including through supplemental information. The Board and the 15(c) Committee reviewed information provided by BFA regarding scale benefits shared with the iShares funds through relatively low fee rates established at inception, breakpoints and waivers or other fee reductions, as well as through additional investment in the iShares business and the provision of improved or additional infrastructure and services to the iShares funds and their shareholders. The Board and the 15(c) Committee received information regarding BlackRock’s historical profitability, including BFA’s and its affiliates’ costs in providing services. The cost information distinguished, among other things, between fixed and variable costs, and explained how the level of fixed and variable costs, as well as the nature of such costs, may impact the existence or size of scale benefits. The Board noted that the Advisory Contract for the Fund already provided for breakpoints in the Fund’s investment advisory fee rate as the assets of the Fund, on an aggregated basis with the assets of certain other iShares funds, increase. The Board noted that it would continue to monitor the sharing of economies of scale to determine the appropriateness of adding new or revised breakpoints in the future.
| 106 | 2017 iSHARES ANNUAL REPORTTO SHAREHOLDERS |
Table of Contents
Board Review and Approval of Investment Advisory
Contract (Continued)
iSHARES®, INC.
Based on this review, as well as the other factors considered at the meeting, the Board, recognizing its responsibility to consider the Advisory Contract at least annually, determined to approve the continuance of the Advisory Contract for the coming year.
Fees and Services Provided for Other Comparable Funds/Accounts Managed by BFA and its Affiliates — The Board received and considered information regarding the investment advisory/management fee rates for other funds/accounts in the U.S. for which BFA (or its affiliates) provides investment advisory/management services, including open-end funds registered under the 1940 Act (including sub-advised funds), collective trust funds, and institutional separate accounts (together, the “Other Accounts”), and acknowledged BFA’s assertion that the iShares funds are fundamentally different investment vehicles from the Other Accounts. The Board noted that BFA and its affiliates do not manage Other Accounts with substantially the same investment objective and strategy as the Fund and that track the same index as the Fund. The Board further noted that BFA provided the Board with detailed information regarding how the Other Accounts (particularly institutional clients) generally differ from the Fund, including in terms of the different and generally more extensive services provided to the Fund, as well as other significant differences. In that regard, the Board considered that the pricing of services to institutional clients is typically based on a number of factors beyond the nature and extent of the specific services to be provided and often depends on the overall relationship between the client and its affiliates and the adviser and its affiliates. In addition, the Board considered the relative complexity and inherent risks and challenges of managing and providing other services to the Fund, as a publicly traded ETF, as compared to the Other Accounts that are institutional clients, in light of differing regulatory requirements and client-imposed mandates. The Board also acknowledged BFA’s expressed business purpose for launching a suite of iShares “Core” ETFs that generally are subject to lower investment advisory fees than iShares non-Core ETFs that may provide a similar investment exposure. The Board also considered the “all-inclusive” nature of the Fund’s advisory fee structure, and the Fund expenses borne by BFA under this arrangement. The Board noted that the investment advisory fee rate under the Advisory Contract for the Fund was generally higher than the investment advisory/management fee rates for certain of the Other Accounts (particularly institutional clients) and concluded that the differences appeared to be consistent with the factors discussed.
Other Benefits to BFA and/or its Affiliates — The Board reviewed the “fallout” benefits or ancillary revenue received by BFA and/or its affiliates in connection with the services provided to the Fund by BFA, such as payment of revenue to BTC, the Fund’s securities lending agent, for loaning portfolio securities (which was included in the profit margins reviewed by the Board pursuant to BFA’s profitability methodology), and payment of advisory fees and/or administration fees to BFA and BTC (or their affiliates) in connection with any investments by the Fund in other funds for which BFA (or its affiliates) provides investment advisory services and/or administration services. The Board also noted the revenue received by BFA and/or its affiliates pursuant to an agreement that permits a service provider to use certain portions of BlackRock’s technology platform to service accounts managed by BFA and/or its affiliates, including the iShares funds. The Board noted that BFA generally does not use soft dollars or consider the value of research or other services that may be provided to BFA (including its affiliates) in selecting brokers for portfolio transactions for the Fund. The Board further noted that any portfolio transactions on behalf of the Fund placed through a BFA affiliate or purchased from an underwriting syndicate in which a BFA affiliate participates, are reported to the Board pursuant to Rule 17e-1 or Rule 10f-3, as applicable, under the 1940 Act. The Board concluded that any such ancillary benefits would not be disadvantageous to the Fund’s shareholders and thus would not alter the Board’s conclusion with respect to the appropriateness of approving the continuance of the Advisory Contract for the coming year.
Conclusion — Based on the considerations described above, the Board determined that the Fund’s investment advisory fee rate under the Advisory Contract does not constitute a fee that is so disproportionately large as to bear no reasonable relationship to the services rendered and that could not have been the product of arm’s-length bargaining, and concluded to approve the continuance of the Advisory Contract for the coming year.
BOARD REVIEWAND APPROVALOF INVESTMENT ADVISORY CONTRACT | 107 |
Table of Contents
Supplemental Information (Unaudited)
iSHARES®, INC.
Proxy Results
A special meeting of the shareholders of each series of iShares, Inc. (the “Company”) was held on June 19, 2017, to elect five Directors to the Board of Directors of the Company. The five nominees were Jane D. Carlin, Richard L. Fagnani, Drew E. Lawton, Madhav V. Rajan and Mark Wiedman, all of whom were elected as Directors at the special meeting. The other Directors whose terms of office as Directors continued after the special meeting are Cecilia H. Herbert, Charles A. Hurty, John E. Kerrigan, John E. Martinez and Robert S. Kapito.
| Director | Votes For | Votes Withheld | ||||||
Jane D. Carlin | 1,911,835,929 | 49,339,171 | ||||||
Richard L. Fagnani | 1,911,725,344 | 49,449,755 | ||||||
Drew E. Lawton | 1,911,790,083 | 49,385,017 | ||||||
Madhav V. Rajan | 1,902,999,095 | 58,176,004 | ||||||
Mark Wiedman | 1,908,143,500 | 53,031,599 | ||||||
Section 19(a) Notices
The amounts and sources of distributions reported are estimates and are provided pursuant to regulatory requirements and are not being provided for tax reporting purposes. The actual amounts and sources for tax reporting purposes will depend upon each Fund’s investment experience during the year and may be subject to changes based on the tax regulations. Shareholders will receive a Form 1099-DIV each calendar year that will inform them how to report these distributions for federal income tax purposes.
| Total Cumulative Distributions for the Fiscal Year | % Breakdown of the Total Cumulative Distributions for the Fiscal Year | |||||||||||||||||||||||||||||||
| iShares ETF | Net Investment Income | Net Realized Capital Gains | Return of Capital | Total Per Share | Net Investment Income | Net Realized Capital Gains | Return of Capital | Total Per Share | ||||||||||||||||||||||||
MSCI Japan Small-Cap | $ | 1.814104 | $ | — | $ | — | $ | 1.814104 | 100 | % | — | % | — | % | 100 | % | ||||||||||||||||
MSCI Malaysia | 1.606802 | — | — | 1.606802 | 100 | — | — | 100 | ||||||||||||||||||||||||
MSCI Pacific ex Japan | 1.662226 | — | — | 1.662226 | 100 | — | — | 100 | ||||||||||||||||||||||||
MSCI Singapore Capped | 0.552296 | — | 0.367101 | 0.919397 | 60 | — | 40 | 100 | ||||||||||||||||||||||||
MSCI Thailand Capped | 2.132485 | — | — | 2.132485 | 100 | — | — | 100 | ||||||||||||||||||||||||
Premium/Discount Information
The Premium/Discount Information section is intended to present information about the differences between the daily market price on secondary markets for shares of a fund and that fund’s NAV. NAV is the price at which a fund issues and redeems shares. It is calculated in accordance with the standard formula for valuing mutual fund shares. The “Market Price” of a fund generally is determined using the midpoint between the highest bid and the lowest ask on the primary securities exchange on which shares of such fund are listed for trading, as of the time that the fund’s NAV is calculated. A fund’s Market Price may be at, above or below its NAV. The NAV of a fund will fluctuate with changes in the value of its portfolio holdings. The Market Price of a fund will fluctuate in accordance with changes in its NAV, as well as market supply and demand.
| 108 | 2017 iSHARES ANNUAL REPORTTO SHAREHOLDERS |
Table of Contents
Supplemental Information (Unaudited) (Continued)
iSHARES®, INC.
Premiums or discounts are the differences (expressed as a percentage) between the NAV and Market Price of a fund on a given day, generally at the time the NAV is calculated. A premium is the amount that a fund is trading above the reported NAV, expressed as a percentage of the NAV. A discount is the amount that a fund is trading below the reported NAV, expressed as a percentage of the NAV.
Premium/discount information for the Funds covering the most recently completed calendar year and the most recently completed calendar quarters since that year (or the life of the Fund, if shorter) is publicly accessible, free of charge, at www.iShares.com.
The following information shows the frequency of distributions of premiums and discounts for the Funds for the immediately preceding five calendar years (or from the inception date of the Fund, if less than five years) through the date of the most recent calendar quarter-end. Each line in each table shows the number of trading days in which the Fund traded within the premium/discount range indicated. The number of trading days in each premium/discount range is also shown as a percentage of the total number of trading days in the period covered by each table. All data presented here represents past performance, which cannot be used to predict future results.
iShares MSCI Hong Kong ETF
Period Covered: January 1, 2012 through June 30, 2017
Premium/Discount Range | Number of Days | Percentage of Total Days | ||||||
Greater than 2.5% | 1 | 0.07 | % | |||||
Greater than 2.0% and Less than 2.5% | 3 | 0.22 | ||||||
Greater than 1.5% and Less than 2.0% | 7 | 0.51 | ||||||
Greater than 1.0% and Less than 1.5% | 41 | 2.96 | ||||||
Greater than 0.5% and Less than 1.0% | 204 | 14.75 | ||||||
Greater than 0.0% and Less than 0.5% | 489 | 35.37 | ||||||
At NAV | 13 | 0.94 | ||||||
Less than 0.0% and Greater than –0.5% | 375 | 27.11 | ||||||
Less than –0.5% and Greater than –1.0% | 169 | 12.22 | ||||||
Less than –1.0% and Greater than –1.5% | 54 | 3.90 | ||||||
Less than –1.5% and Greater than –2.0% | 20 | 1.45 | ||||||
Less than –2.0% and Greater than –2.5% | 1 | 0.07 | ||||||
Less than –2.5% and Greater than –3.0% | 2 | 0.14 | ||||||
Less than –3.0% and Greater than –3.5% | 3 | 0.22 | ||||||
Less than –3.5% and Greater than –4.0% | 1 | 0.07 | ||||||
|
|
|
| |||||
| 1,383 | 100.00 | % | ||||||
|
|
|
| |||||
SUPPLEMENTAL INFORMATION | 109 |
Table of Contents
Supplemental Information (Unaudited) (Continued)
iSHARES®, INC.
iShares MSCI Japan Small-Cap ETF
Period Covered: January 1, 2012 through June 30, 2017
Premium/Discount Range | Number of Days | Percentage of Total Days | ||||||
Greater than 5.0% | 1 | 0.07 | % | |||||
Greater than 4.5% and Less than 5.0% | 1 | 0.07 | ||||||
Greater than 4.0% and Less than 4.5% | 1 | 0.07 | ||||||
Greater than 3.5% and Less than 4.0% | 5 | 0.36 | ||||||
Greater than 3.0% and Less than 3.5% | 1 | 0.07 | ||||||
Greater than 2.5% and Less than 3.0% | 4 | 0.29 | ||||||
Greater than 2.0% and Less than 2.5% | 12 | 0.87 | ||||||
Greater than 1.5% and Less than 2.0% | 38 | 2.75 | ||||||
Greater than 1.0% and Less than 1.5% | 90 | 6.51 | ||||||
Greater than 0.5% and Less than 1.0% | 218 | 15.76 | ||||||
Greater than 0.0% and Less than 0.5% | 371 | 26.84 | ||||||
At NAV | 5 | 0.36 | ||||||
Less than 0.0% and Greater than –0.5% | 335 | 24.22 | ||||||
Less than –0.5% and Greater than –1.0% | 164 | 11.86 | ||||||
Less than –1.0% and Greater than –1.5% | 75 | 5.42 | ||||||
Less than –1.5% and Greater than –2.0% | 38 | 2.75 | ||||||
Less than –2.0% and Greater than –2.5% | 14 | 1.01 | ||||||
Less than –2.5% and Greater than –3.0% | 5 | 0.36 | ||||||
Less than –3.0% and Greater than –3.5% | 1 | 0.07 | ||||||
Less than –3.5% and Greater than –4.0% | 3 | 0.22 | ||||||
Less than –4.0% and Greater than –4.5% | 1 | 0.07 | ||||||
|
|
|
| |||||
| 1,383 | 100.00 | % | ||||||
|
|
|
| |||||
| 110 | 2017 iSHARES ANNUAL REPORTTO SHAREHOLDERS |
Table of Contents
Supplemental Information (Unaudited) (Continued)
iSHARES®, INC.
iShares MSCI Malaysia ETF
Period Covered: January 1, 2012 through June 30, 2017
Premium/Discount Range | Number of Days | Percentage of Total Days | ||||||
Greater than 4.0% | 2 | 0.14 | % | |||||
Greater than 3.5% and Less than 4.0% | 3 | 0.22 | ||||||
Greater than 3.0% and Less than 3.5% | 1 | 0.07 | ||||||
Greater than 2.5% and Less than 3.0% | 4 | 0.29 | ||||||
Greater than 2.0% and Less than 2.5% | 9 | 0.65 | ||||||
Greater than 1.5% and Less than 2.0% | 27 | 1.95 | ||||||
Greater than 1.0% and Less than 1.5% | 78 | 5.64 | ||||||
Greater than 0.5% and Less than 1.0% | 226 | 16.34 | ||||||
Greater than 0.0% and Less than 0.5% | 397 | 28.71 | ||||||
At NAV | 7 | 0.51 | ||||||
Less than 0.0% and Greater than –0.5% | 334 | 24.15 | ||||||
Less than –0.5% and Greater than –1.0% | 183 | 13.23 | ||||||
Less than –1.0% and Greater than –1.5% | 56 | 4.05 | ||||||
Less than –1.5% and Greater than –2.0% | 38 | 2.75 | ||||||
Less than –2.0% and Greater than –2.5% | 9 | 0.65 | ||||||
Less than –2.5% and Greater than –3.0% | 4 | 0.29 | ||||||
Less than –3.0% and Greater than –3.5% | 2 | 0.14 | ||||||
Less than –3.5% | 3 | 0.22 | ||||||
|
|
|
| |||||
| 1,383 | 100.00 | % | ||||||
|
|
|
| |||||
iShares MSCI Pacific ex Japan ETF
Period Covered: January 1, 2012 through June 30, 2017
Premium/Discount Range | Number of Days | Percentage of Total Days | ||||||
Greater than 2.5% and Less than 3.0% | 1 | 0.07 | % | |||||
Greater than 2.0% and Less than 2.5% | 3 | 0.22 | ||||||
Greater than 1.5% and Less than 2.0% | 9 | 0.65 | ||||||
Greater than 1.0% and Less than 1.5% | 57 | 4.12 | ||||||
Greater than 0.5% and Less than 1.0% | 188 | 13.59 | ||||||
Greater than 0.0% and Less than 0.5% | 526 | 38.04 | ||||||
At NAV | 16 | 1.16 | ||||||
Less than 0.0% and Greater than –0.5% | 358 | 25.89 | ||||||
Less than –0.5% and Greater than –1.0% | 149 | 10.77 | ||||||
Less than –1.0% and Greater than –1.5% | 49 | 3.54 | ||||||
Less than –1.5% and Greater than –2.0% | 17 | 1.23 | ||||||
Less than –2.0% and Greater than –2.5% | 6 | 0.43 | ||||||
Less than –2.5% and Greater than –3.0% | 3 | 0.22 | ||||||
Less than –3.0% | 1 | 0.07 | ||||||
|
|
|
| |||||
| 1,383 | 100.00 | % | ||||||
|
|
|
| |||||
SUPPLEMENTAL INFORMATION | 111 |
Table of Contents
Supplemental Information (Unaudited) (Continued)
iSHARES®, INC.
iShares MSCI Singapore Capped ETF
Period Covered: January 1, 2012 through June 30, 2017
Premium/Discount Range | Number of Days | Percentage of Total Days | ||||||
Greater than 2.0% | 1 | 0.07 | % | |||||
Greater than 1.5% and Less than 2.0% | 7 | 0.51 | ||||||
Greater than 1.0% and Less than 1.5% | 31 | 2.24 | ||||||
Greater than 0.5% and Less than 1.0% | 183 | 13.23 | ||||||
Greater than 0.0% and Less than 0.5% | 559 | 40.43 | ||||||
At NAV | 14 | 1.01 | ||||||
Less than 0.0% and Greater than –0.5% | 409 | 29.57 | ||||||
Less than –0.5% and Greater than –1.0% | 131 | 9.47 | ||||||
Less than –1.0% and Greater than –1.5% | 29 | 2.10 | ||||||
Less than –1.5% and Greater than –2.0% | 13 | 0.94 | ||||||
Less than –2.0% and Greater than –2.5% | 1 | 0.07 | ||||||
Less than –2.5% and Greater than –3.0% | 1 | 0.07 | ||||||
Less than –3.0% | 4 | 0.29 | ||||||
|
|
|
| |||||
| 1,383 | 100.00 | % | ||||||
|
|
|
| |||||
iShares MSCI Taiwan Capped ETF
Period Covered: January 1, 2012 through June 30, 2017
Premium/Discount Range | Number of Days | Percentage of Total Days | ||||||
Greater than 3.5% and Less than 4.0% | 3 | 0.22 | % | |||||
Greater than 3.0% and Less than 3.5% | 3 | 0.22 | ||||||
Greater than 2.5% and Less than 3.0% | 6 | 0.43 | ||||||
Greater than 2.0% and Less than 2.5% | 7 | 0.51 | ||||||
Greater than 1.5% and Less than 2.0% | 22 | 1.59 | ||||||
Greater than 1.0% and Less than 1.5% | 84 | 6.07 | ||||||
Greater than 0.5% and Less than 1.0% | 230 | 16.63 | ||||||
Greater than 0.0% and Less than 0.5% | 351 | 25.38 | ||||||
At NAV | 8 | 0.58 | ||||||
Less than 0.0% and Greater than –0.5% | 359 | 25.95 | ||||||
Less than –0.5% and Greater than –1.0% | 180 | 13.02 | ||||||
Less than –1.0% and Greater than –1.5% | 74 | 5.35 | ||||||
Less than –1.5% and Greater than –2.0% | 27 | 1.95 | ||||||
Less than –2.0% and Greater than –2.5% | 16 | 1.16 | ||||||
Less than –2.5% and Greater than –3.0% | 5 | 0.36 | ||||||
Less than –3.0% and Greater than –3.5% | 3 | 0.22 | ||||||
Less than –3.5% and Greater than –4.0% | 2 | 0.14 | ||||||
Less than –4.0% | 3 | 0.22 | ||||||
|
|
|
| |||||
| 1,383 | 100.00 | % | ||||||
|
|
|
| |||||
| 112 | 2017 iSHARES ANNUAL REPORTTO SHAREHOLDERS |
Table of Contents
Supplemental Information (Unaudited) (Continued)
iSHARES®, INC.
iShares MSCI Thailand Capped ETF
Period Covered: January 1, 2012 through June 30, 2017
Premium/Discount Range | Number of Days | Percentage of Total Days | ||||||
Greater than 3.0% | 2 | 0.14 | % | |||||
Greater than 2.5% and Less than 3.0% | 3 | 0.22 | ||||||
Greater than 2.0% and Less than 2.5% | 10 | 0.72 | ||||||
Greater than 1.5% and Less than 2.0% | 28 | 2.02 | ||||||
Greater than 1.0% and Less than 1.5% | 79 | 5.71 | ||||||
Greater than 0.5% and Less than 1.0% | 236 | 17.07 | ||||||
Greater than 0.0% and Less than 0.5% | 417 | 30.16 | ||||||
At NAV | 10 | 0.72 | ||||||
Less than 0.0% and Greater than –0.5% | 278 | 20.11 | ||||||
Less than –0.5% and Greater than –1.0% | 191 | 13.81 | ||||||
Less than –1.0% and Greater than –1.5% | 79 | 5.71 | ||||||
Less than –1.5% and Greater than –2.0% | 30 | 2.17 | ||||||
Less than –2.0% and Greater than –2.5% | 14 | 1.01 | ||||||
Less than –2.5% and Greater than –3.0% | 1 | 0.07 | ||||||
Less than –3.0% and Greater than –3.5% | 4 | 0.29 | ||||||
Less than –3.5% | 1 | 0.07 | ||||||
|
|
|
| |||||
| 1,383 | 100.00 | % | ||||||
|
|
|
| |||||
Regulation under the Alternative Investment Fund Managers Directive
The Alternative Investment Fund Managers Directive (“AIFMD”) imposes obligations on fund managers established in the European Union (the “EU”). These do not currently apply to managers established outside the EU, such as BFA. Rather, non-EU managers are only required to comply with certain disclosure, reporting and transparency obligations of AIFMD if such managers market a fund to EU investors.
BFA has registered the iShares MSCI Hong Kong ETF, iShares MSCI Japan Small-Cap ETF, iShares MSCI Malaysia ETF, iShares MSCI Taiwan Capped ETF and iShares MSCI Thailand Capped ETF (each a “Fund”, collectively the “Funds”) for marketing to investors in the United Kingdom, the Netherlands, Finland, Sweden and Luxembourg.
Report on Remuneration
BFA is required under AIFMD to make quantitative disclosures of remuneration. These disclosures are made in line with BlackRock’s interpretation of currently available regulatory guidance on quantitative remuneration disclosures. As market or regulatory practice develops BlackRock may consider it appropriate to make changes to the way in which quantitative remuneration disclosures are calculated. Where such changes are made, this may result in disclosures in relation to a fund not being comparable to the disclosures made in the prior year, or in relation to other BlackRock fund disclosures in that same year.
Disclosures are provided in relation to both (a) the staff of BFA; (b) staff who are senior management; and (c) staff who have the ability to materially affect the risk profile of the Funds.
All individuals included in the aggregated figures disclosed are rewarded in line with BlackRock’s remuneration policy for their responsibilities across the relevant BlackRock business area. As all individuals have a number of areas of responsibilities, only the portion of remuneration for those individuals’ services attributable to each Fund is included in the aggregate figures disclosed.
SUPPLEMENTAL INFORMATION | 113 |
Table of Contents
Supplemental Information (Unaudited) (Continued)
iSHARES®, INC.
BlackRock has a clear and well defined pay-for-performance philosophy, and compensation programs which support that philosophy. For senior management, a significant percentage of variable remuneration is deferred over time. All employees are subject to a claw-back policy.
Compensation decisions for employees are made based on BlackRock’s full-year financial results and other non-financial goals and objectives. Alongside financial performance, individual compensation is also based on strategic and operating results and other considerations such as management and leadership capabilities. No set formulas are established and no fixed benchmarks are used in determining annual incentive awards.
Bonus pools are reviewed by BlackRock’s independent compensation committee, taking into account both actual and projected financial information together with information provided by the Operational Risk and Regulatory Compliance departments in relation to any activities, incidents or events that warrant consideration in making compensation decisions.
Functions such as Finance, Operational Risk, Legal & Compliance, and Human Resources each have their own organizational structures which are independent of the business units. Functional bonus pools are determined with reference to the performance of each individual function and the remuneration of the senior members of control functions is directly overseen by BlackRock’s independent compensation committee. No individual is involved in setting his or her own remuneration.
Members of staff and senior management of BFA typically provide both AIFMD and non-AIFMD related services in respect of multiple funds, clients and functions of BFA and across the broader BlackRock group. Therefore, the figures disclosed are a sum of each individual’s portion of remuneration attributable to each Fund according to an objective apportionment methodology which acknowledges the multiple-service nature of BFA. Accordingly the figures are not representative of any individual’s actual remuneration or their remuneration structure.
The amount of the total remuneration awarded by BFA to its staff which has been attributed to the iShares MSCI Hong Kong ETF in respect of BFA’s financial year ending December 31, 2016 was USD 177.22 thousand. This figure is comprised of fixed remuneration of USD 69.72 thousand and variable remuneration of USD 107.50 thousand. There were a total of 325 beneficiaries of the remuneration described above.
The amount of the aggregate remuneration awarded by BFA, which has been attributed to the iShares MSCI Hong Kong ETF in respect of BFA’s financial year ending December 31, 2016, to its senior management was USD 24.51 thousand, and to members of its staff whose actions have a material impact on the risk profile of the Fund was USD 5.90 thousand.
The amount of the total remuneration awarded by BFA to its staff which has been attributed to the iShares MSCI Japan Small-Cap ETF in respect of BFA’s financial year ending December 31, 2016 was USD 16.52 thousand. This figure is comprised of fixed remuneration of USD 6.50 thousand and variable remuneration of USD 10.02 thousand. There were a total of 325 beneficiaries of the remuneration described above.
The amount of the aggregate remuneration awarded by BFA, which has been attributed to the iShares MSCI Japan Small-Cap ETF in respect of the BFA’s financial year ending December 31, 2016, to its senior management was USD 2.28 thousand, and to members of its staff whose actions have a material impact on the risk profile of the Fund was USD 0.55 thousand.
The amount of the total remuneration awarded by BFA to its staff which has been attributed to the iShares MSCI Malaysia ETF in respect of BFA’s financial year ending December 31, 2016 was USD 26.09 thousand. This figure is comprised of fixed remuneration of USD 10.26 thousand and variable remuneration of USD 15.83 thousand. There were a total of 325 beneficiaries of the remuneration described above.
| 114 | 2017 iSHARES ANNUAL REPORTTO SHAREHOLDERS |
Table of Contents
Supplemental Information (Unaudited) (Continued)
iSHARES®, INC.
The amount of the aggregate remuneration awarded by BFA, which has been attributed to the iShares MSCI Malaysia ETF in respect of the BFA’s financial year ending December 31, 2016, to its senior management was USD 3.61 thousand, and to members of its staff whose actions have a material impact on the risk profile of the Fund was USD 0.87 thousand.
The amount of the total remuneration awarded by BFA to its staff which has been attributed to the iShares MSCI Taiwan Capped ETF in respect of BFA’s financial year ending December 31, 2016 was USD 292.86 thousand. This figure is comprised of fixed remuneration of USD 115.21 thousand and variable remuneration of USD 177.65 thousand. There were a total of 325 beneficiaries of the remuneration described above.
The amount of the aggregate remuneration awarded by BFA, which has been attributed to the iShares MSCI Taiwan Capped ETF in respect of the BFA’s financial year ending December 31, 2016, to its senior management was USD 40.50 thousand, and to members of its staff whose actions have a material impact on the risk profile of the Fund was USD 9.76 thousand.
The amount of the total remuneration awarded by BFA to its staff which has been attributed to the iShares MSCI Thailand Capped ETF in respect of BFA’s financial year ending December 31, 2016 was USD 39.41 thousand. This figure is comprised of fixed remuneration of USD 15.50 thousand and variable remuneration of USD 23.91 thousand. There were a total of 325 beneficiaries of the remuneration described above.
The amount of the aggregate remuneration awarded by BFA, which has been attributed to the iShares MSCI Thailand Capped ETF in respect of the BFA’s financial year ending December 31, 2016, to its senior management was USD 5.45 thousand, and to members of its staff whose actions have a material impact on the risk profile of the Fund was USD 1.31 thousand.
SUPPLEMENTAL INFORMATION | 115 |
Table of Contents
Director and Officer Information
iSHARES®, INC.
The Board of Directors has responsibility for the overall management and operations of the Funds, including general supervision of the duties performed by BFA and other service providers. Each Director serves until he or she resigns, is removed, dies, retires or becomes incapacitated. Each officer shall hold office until his or her successor is elected and qualifies or until his or her death, resignation or removal. Directors who are not “interested persons” (as defined in the 1940 Act) of the Company are referred to as independent directors (“Independent Directors”).
The registered investment companies advised by BFA or its affiliates (the “BlackRock-advised Funds”) are organized into one complex of closed-end funds, two complexes of open-end funds and one complex of exchange-traded funds (“Exchange-Traded Fund Complex”) (each, a “BlackRock Fund Complex”). Each Fund is included in the BlackRock Fund Complex referred to as the Exchange-Traded Fund Complex. Each Director also serves as a Trustee of iShares Trust and a Trustee of iShares U.S. ETF Trust and, as a result, oversees a total of 344 funds (as of August 31, 2017) within the Exchange-Traded Fund Complex. Drew E. Lawton, from October 2016 to June 2017, and Richard L. Fagnani, from April 2017 to June 2017, served as Advisory Board Members for iShares Trust, iShares Inc. and iShares U.S. ETF Trust with respect to all funds within the Exchange-Traded Fund Complex. With the exception of Robert S. Kapito, Mark K. Wiedman, Charles Park, Martin Small and Benjamin Archibald, the address of each Director, and officer is c/o BlackRock, Inc., 400 Howard Street, San Francisco, CA 94105. The address of Mr. Kapito, Mr. Wiedman, Mr. Park, Mr. Small and Mr. Archibald is c/o BlackRock, Inc., Park Avenue Plaza, 55 East 52nd Street, New York, NY 10055. The Board has designated Cecilia H. Herbert as its Independent Board Chair. Additional information about the Funds’ Directors and officers may be found in the Funds’ combined Statement of Additional Information, which is available without charge, upon request, by calling toll-free 1-800-iShares (1-800-474-2737).
Interested Directors
| Name (Age) | Position(s) | Principal Occupation(s) During the Past 5 Years | Other Directorships Held by Director | |||
Robert S. Kapitoa (60) | Director (since 2009). | President, BlackRock, Inc. (since 2006); Vice Chairman of BlackRock, Inc. and Head of BlackRock’s Portfolio Management Group (since its formation in 1998) and BlackRock, Inc.’s predecessor entities (since 1988); Trustee, University of Pennsylvania (since 2009); President of Board of Directors, Hope & Heroes Children’s Cancer Fund (since 2002). | Director of BlackRock, Inc. (since 2006); Trustee of iShares Trust (since 2009); Trustee of iShares U.S. ETF Trust (since 2011). | |||
Mark K. Wiedmanb (46) | Director | Senior Managing Director, BlackRock, Inc. (since 2014); Managing Director, BlackRock, Inc. (2007-2014); Global Head of BlackRock’s ETF and Index Investments Business (since 2016); Global Head of iShares (2011-2016); Head of Corporate Strategy, BlackRock, Inc. (2009-2011). | Trustee of iShares Trust (since 2013); Trustee of iShares U.S. ETF Trust (since 2013); Director of PennyMac Financial Services, Inc. (since 2008). | |||
| a | Robert S. Kapito is deemed to be an “interested person” (as defined in the 1940 Act) of the Company due to his affiliations with BlackRock, Inc. and its affiliates. |
| b | Mark K. Wiedman is deemed to be an “interested person” (as defined in the 1940 Act) of the Company due to his affiliations with BlackRock, Inc. and its affiliates. |
| 116 | 2017 iSHARES ANNUAL REPORTTO SHAREHOLDERS |
Table of Contents
Director and Officer Information (Continued)
iSHARES®, INC.
Independent Directors
| Name (Age) | Position(s) | Principal Occupation(s) During the Past 5 Years | Other Directorships Held by Director | |||
Cecilia H. Herbert (68) | Director (since 2005); Independent Board Chair (since 2016). | Trustee and Member of the Finance, Technology and Quality Committee of Stanford Health Care (since 2016); Trustee and Member of the Investment Committee, WNET, a New York public media company (since 2011); Chair (1994-2005) and Member (since 1992) of the Investment Committee, Archdiocese of San Francisco; Director (1998-2013) and President (2007-2011) of the Board of Directors, Catholic Charities CYO; Trustee (2002-2011) and Chair of the Finance and Investment Committee (2006-2010) of the Thacher School. | Trustee of iShares Trust (since 2005); Trustee of iShares U.S. ETF Trust (since 2011); Independent Board Chair of iShares Trust and iShares U.S. ETF Trust (since 2016); Trustee of Forward Funds (14 portfolios) (since 2009); Trustee of Salient MF Trust (4 portfolios) (since 2015). | |||
Jane D. Carlin (61) | Director (since 2015); Risk Committee Chair (since 2016). | Consultant (since 2012); Managing Director and Global Head of Financial Holding Company Governance & Assurance and the Global Head of Operational Risk Management of Morgan Stanley (2006-2012). | Trustee of iShares Trust (since 2015); Trustee of iShares U.S. ETF Trust (since 2015); Director of PHH Corporation (mortgage solutions) (since 2012); Director of The Hanover Insurance Group, Inc. (since 2016). | |||
Richard L. Fagnani (62) | Director (since 2017); Equity Plus Committee Chair (since 2017). | Partner, KPMG LLP (2002-2016). | Trustee of iShares Trust (since 2017); Trustee of iShares U.S. ETF Trust (since 2017). | |||
Charles A. Hurty (73) | Director (since 2005); Audit Committee Chair (since 2006). | Retired; Partner, KPMG LLP (1968-2001). | Trustee of iShares Trust (since 2005); Trustee of iShares U.S. ETF Trust (since 2011); Director of SkyBridge Alternative Investments Multi-Adviser Hedge Fund Portfolios LLC (2 portfolios) (since 2002). | |||
John E. Kerrigan (62) | Director (since 2005); Securities Lending Committee Chair (since 2016). | Chief Investment Officer, Santa Clara University (since 2002). | Trustee of iShares Trust (since 2005); Trustee of iShares U.S. ETF Trust (since 2011). | |||
Drew E. Lawton (58) | Director (since 2017); 15(c) Committee Chair (since 2017). | Senior Managing Director of New York Life Insurance Company (2010-2015). | Trustee of iShares Trust (since 2017); Trustee of iShares U.S. ETF Trust (since 2017). | |||
DIRECTORAND OFFICER INFORMATION | 117 |
Table of Contents
Director and Officer Information (Continued)
iSHARES®, INC.
Independent Directors (Continued)
| Name (Age) | Position(s) | Principal Occupation(s) During the Past 5 Years | Other Directorships Held by Director | |||
John E. Martinez (56) | Director (since 2003); Fixed Income Plus Committee Chair (since 2016). | Director of Real Estate Equity Exchange, Inc. (since 2005). | Trustee of iShares Trust (since 2003); Trustee of iShares U.S. ETF Trust (since 2011). | |||
Madhav V. Rajan (53) | Director (since 2011); Nominating and Governance Committee Chair (since 2017). | Dean, and George Pratt Shultz Professor of Accounting, University of Chicago Booth School of Business (since 2017); Robert K. Jaedicke Professor of Accounting, Stanford University Graduate School of Business (2001-2017); Professor of Law (by courtesy), Stanford Law School (2005-2017); Senior Associate Dean for Academic Affairs and Head of MBA Program, Stanford University Graduate School of Business (2010-2016) . | Trustee of iShares Trust (since 2011); Trustee of iShares U.S. ETF Trust (since 2011); Director, Cavium, Inc. (since 2013). | |||
| 118 | 2017 iSHARES ANNUAL REPORTTO SHAREHOLDERS |
Table of Contents
Director and Officer Information (Continued)
iSHARES®, INC.
Officersc
| Name (Age) | Position(s) | Principal Occupation(s) During the Past 5 Years | ||
Martin Small (42) | President (since 2016). | Managing Director, BlackRock, Inc. (since 2010); Head of U.S. iShares (since 2015); Co-Head of the U.S. Financial Markets Advisory Group, BlackRock, Inc. (2008-2014). | ||
Jack Gee (57) | Treasurer and Chief Financial Officer (since 2008). | Managing Director, BlackRock, Inc. (since 2009); Senior Director of Fund Administration of Intermediary Investor Business, BGI (2009). | ||
Benjamin Archibald (42) | Secretary (since 2015). | Managing Director, BlackRock, Inc. (since 2014); Director, BlackRock, Inc. (2010-2013); Secretary of the BlackRock-advised Mutual Funds (since 2012). | ||
Alan Mason (56) | Executive Vice President (since 2016). | Managing Director, BlackRock, Inc. (since 2009). | ||
Steve Messinger (55) | Executive Vice President (since 2016). | Managing Director, BlackRock, Inc. (2007-2014 and since 2016); Managing Director, Beacon Consulting Group (2014-2016). | ||
Charles Park (49) | Chief Compliance Officer (since 2006). | Chief Compliance Officer of BlackRock Advisors, LLC and the BlackRock-advised Funds in the Equity-Bond Complex, the Equity-Liquidity Complex and the Closed-End Complex (since 2014); Chief Compliance Officer of BFA (since 2006). | ||
Scott Radell (48) | Executive Vice President (since 2012). | Managing Director, BlackRock, Inc. (since 2009); Head of Portfolio Solutions, BlackRock, Inc. (since 2009). | ||
| c | Manish Mehta served as President until October 15, 2016. |
DIRECTORAND OFFICER INFORMATION | 119 |
Table of Contents
Notes:
| 120 | 2017 iSHARES ANNUAL REPORTTO SHAREHOLDERS |
Table of Contents
Notes:
NOTES | 121 |
Table of Contents
Notes:
| 122 | 2017 iSHARES ANNUAL REPORTTO SHAREHOLDERS |
Table of Contents
For more information visit www.iShares.com or call 1-800-474-2737
This report is intended for the Funds’ shareholders. It may not be distributed to prospective investors unless it is preceded or accompanied by the current prospectus.
Investing involves risk, including possible loss of principal.
The iShares Funds are distributed by BlackRock Investments, LLC (together with its affiliates, “BlackRock”).
The iShares Funds are not sponsored, endorsed, issued, sold or promoted by MSCI Inc., nor does this company make any representation regarding the advisability of investing in the iShares Funds. BlackRock is not affiliated with the company listed above.
A description of the policies that the Funds use to determine how to vote proxies relating to portfolio securities and information about how the Funds voted proxies relating to portfolio securities during the most recent twelve-month period ending June 30 is available without charge, upon request, by calling toll-free 1-800-474-2737; on the Funds’ website at www.iShares.com; and on the U.S. Securities and Exchange Commission (SEC) website at www.sec.gov.
The Funds file their complete schedules of portfolio holdings with the SEC for the first and third quarters of each fiscal year on Form N-Q. The Funds’ Forms N-Q are available on the SEC’s website or may be reviewed and copied at the SEC’s Public Reference Room in Washington, D.C. Information on the operation of the Public Reference Room may be obtained by calling 1-800-SEC-0330. The Funds also disclose their complete schedules of portfolio holdings on a daily basis on the Funds’ website.
Certain financial information required by regulations or listing exchange rules in jurisdictions outside the U.S. in which iShares Funds are cross-listed may be publicly filed in those jurisdictions. This information is available upon request by calling 1-800-474-2737.
©2017 BlackRock, Inc. All rights reserved. iSHARES and BLACKROCK are registered trademarks of BlackRock, Inc. or its subsidiaries. All other marks are the property of their respective owners.
iS-AR-803-0817
| |
Table of Contents
AUGUST 31, 2017
2017 ANNUAL REPORT | |
iShares, Inc.
| Ø | iShares MSCI Brazil Capped ETF | EWZ | NYSE Arca |
| Ø | iShares MSCI Chile Capped ETF | ECH | BATS |
| Ø | iShares MSCI Colombia Capped ETF | ICOL | NYSE Arca |
| Ø | iShares MSCI Israel Capped ETF | EIS | NYSE Arca |
| Ø | iShares MSCI Russia Capped ETF | ERUS | NYSE Arca |
| Ø | iShares MSCI South Africa ETF | EZA | NYSE Arca |
| Ø | iShares MSCI Turkey ETF | TUR | NASDAQ |
| Ø | iShares MSCI USA Equal Weighted ETF | EUSA | NYSE Arca |
Table of Contents
| 5 | ||||
| 22 | ||||
| 22 | ||||
| 23 | ||||
| 23 | ||||
| 26 | ||||
| 28 | ||||
| 30 | ||||
| 33 | ||||
| 35 | ||||
| 38 | ||||
| 41 | ||||
| 52 | ||||
| 62 | ||||
| 70 | ||||
| 83 | ||||
| 84 | ||||
| 85 | ||||
| 98 | ||||
| 106 |
Table of Contents
Management’s Discussion of Fund Performance
iSHARES®, INC.
GLOBAL EQUITY MARKET OVERVIEW
Global equity markets posted strong returns for the 12 months ended August 31, 2017 (the “reporting period”). The MSCI ACWI, a broad global equity index that includes both developed and emerging markets, returned 17.11% in U.S. dollar terms for the reporting period.
The primary factor behind the robust performance of global equity markets was improving global economic growth, driven largely by the continuation of accommodative monetary policies from many of the world’s central banks. Signs of stronger economic activity in Europe emerged as the European Central Bank (“ECB”) maintained policies such as quantitative easing and negative interest rates. Economic growth rates in China and Japan, the largest economies in Asia, also increased during the reporting period, reflecting efforts by the People’s Bank of China (“PBOC”) and the Bank of Japan (“BOJ”) to stimulate economic activity. Stronger economic growth led several central banks to consider reducing their economic stimulus measures. For example, late in the reporting period, the ECB discussed the possibility of tapering its quantitative easing program, while the PBOC increased short-term interest rates during the first half of 2017.
On a regional basis, European equity markets posted the best returns among developed markets, advancing by approximately 20% in U.S. dollar terms for the reporting period. European stocks benefited from improving economic conditions and stronger corporate earnings. In addition, election outcomes in France and the Netherlands eased investor concerns about nationalist presidential candidates and their opposition to the European Union (“E.U.”). Currency fluctuations also contributed meaningfully to European equity performance in U.S. dollar terms as the euro appreciated by approximately 6% against the U.S. dollar during the reporting period. The best-performing European stock markets included Austria, Italy, and Spain, while Ireland and Belgium posted the weakest returns.
Equity markets in the Asia-Pacific region gained about 16% in U.S. dollar terms for the reporting period, led by Singapore and Hong Kong. Japanese stocks also posted strong returns, benefiting from improving consumer spending and employment trends that contributed to the ongoing recovery in the Japanese economy. However, equity market returns in Japan were hindered by a decline in the Japanese yen, which depreciated by approximately 6% against the U.S. dollar.
The U.S. stock market returned approximately 15% for the reporting period. Despite mixed U.S. economic data, U.S. stocks advanced initially in anticipation of pro-business fiscal policies from the new presidential administration. Although the administration struggled to implement its fiscal agenda, stocks continued to move higher as better global economic conditions led to a notable improvement in corporate earnings growth, particularly for multinational companies with significant operations outside of the U.S. U.S. stocks advanced despite three short-term interest rate increases by the U.S. Federal Reserve Bank (the “Fed”) during the reporting period, which increased the short-term interest rate target to its highest level since October 2008. The Fed also unveiled a plan to start reducing the amount of U.S. Treasury bonds and mortgage-backed securities on its balance sheet before the end of 2017.
Emerging markets stocks outperformed those in developed markets, returning more than 23% in U.S. dollar terms for the reporting period. Emerging markets in Eastern Europe were the best performers, led by Poland, Greece, and Hungary. Equity markets in the Middle East trailed for the reporting period amid continued geopolitical conflict in the region.
MANAGEMENT’S DISCUSSIONSOF FUND PERFORMANCE | 5 |
Table of Contents
Management’s Discussion of Fund Performance
iSHARES® MSCI BRAZIL CAPPED ETF
Performance as of August 31, 2017
| Average Annual Total Returns | Cumulative Total Returns | |||||||||||||||||||||||||||
| NAV | MARKET | INDEX | NAV | MARKET | INDEX | |||||||||||||||||||||||
1 Year | 22.03% | 21.89% | 22.96% | 22.03% | 21.89% | 22.96% | ||||||||||||||||||||||
5 Years | (2.78)% | (2.84)% | (2.12)% | (13.16)% | (13.41)% | (10.16)% | ||||||||||||||||||||||
10 Years | (1.08)% | (1.06)% | (0.46)% | (10.33)% | (10.12)% | (4.49)% | ||||||||||||||||||||||
GROWTH OF $10,000 INVESTMENT
(AT NET ASSET VALUE)
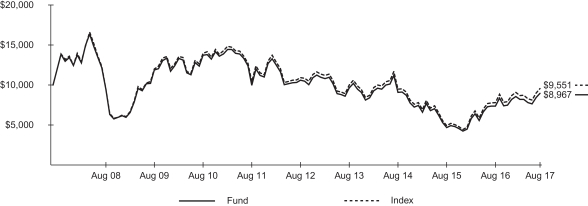
Index performance through February 11, 2013 reflects the performance of the MSCI Brazil Index. Index performance beginning on February 12, 2013 reflects the performance of the MSCI Brazil 25/50 Index.
Past performance is no guarantee of future results. Performance results do not reflect the deduction of taxes that a shareholder would pay on fund distributions or on the redemption or sale of fund shares. See “About Fund Performance” on page 22 for more information.
| Shareholder Expenses | ||||||||||||||||||||||||||
| Actual | Hypothetical 5% Return | |||||||||||||||||||||||||
| Beginning Account Value (3/1/17) | Ending Account Value (8/31/17) | Expenses Paid During Period a | Beginning Account Value (3/1/17) | Ending Account Value (8/31/17) | Expenses Paid During Period a | Annualized Expense Ratio | ||||||||||||||||||||
| $ | 1,000.00 | $ | 1,048.70 | $ | 3.15 | $ | 1,000.00 | $ | 1,022.10 | $ | 3.11 | 0.61% | ||||||||||||||
| a | Expenses are calculated using the Fund’s annualized expense ratio (as disclosed in the table), multiplied by the average account value for the period, multiplied by the number of days in the period (184 days) and divided by the number of days in the year (365 days). See “Shareholder Expenses” on page 22 for more information. |
| 6 | 2017 iSHARES ANNUAL REPORTTO SHAREHOLDERS |
Table of Contents
Management’s Discussion of Fund Performance (Continued)
iSHARES® MSCI BRAZIL CAPPED ETF
The iShares MSCI Brazil Capped ETF (the “Fund”) seeks to track the investment results of an index composed of Brazilian equities, as represented by the MSCI Brazil 25/50 Index (the “Index”). The Fund invests in a representative sample of securities included in the Index that collectively has an investment profile similar to the Index. Due to the use of representative sampling, the Fund may or may not hold all of the securities that are included in the Index. For the 12-month reporting period ended August 31, 2017, the total return for the Fund was 22.03%, net of fees, while the total return for the Index was 22.96%.
Brazil’s stock market benefited from a rebound in economic activity as the Brazilian economy grew for the first time in more than three years in the second quarter of 2017. Consumer spending drove economic growth, supported by falling inflation, which hit an all-time low in June 2017. Exports, an important component of Brazil’s economy, increased significantly, particularly for some of the country’s main export products, including oil, iron ore, and soybeans. The growth in exports was led by demand from Brazil’s largest trading partners, including China, the U.S., and Argentina. To stimulate economic growth, the country’s central bank made its seventh consecutive interest rate cut in July 2017, which brought borrowing costs to their lowest level since September 2013.
From a sector perspective, financials, which represented about 36% of the Index on average, contributed the most to the Index’s performance for the reporting period. Brazilian banks led the advance in the financials sector amid improving asset quality due to fewer non-performing loans. The materials sector also contributed significantly to the Index’s return as steel producers benefited from a rebound in steel prices, driven by improved demand in China. Other sectors that contributed to the Index’s performance included industrials, consumer discretionary, and healthcare.
In contrast, the information technology sector detracted from the Index’s return for the reporting period due to weakness in the software and services industry.
The Brazilian real appreciated by about 3% relative to the U.S. dollar for the reporting period, making returns on Brazilian investments higher when translated into U.S. dollars.
ALLOCATION BY SECTOR
As of 8/31/17
| Sector | Percentage of Total Investments* |
Financials | 36.83 | % | ||
Materials | 14.34 | |||
Consumer Staples | 14.28 | |||
Energy | 7.32 | |||
Utilities | 6.17 | |||
Consumer Discretionary | 5.93 | |||
Industrials | 5.91 | |||
Telecommunication Services | 2.85 | |||
Information Technology | 2.45 | |||
Health Care | 2.18 | |||
Real Estate | 1.74 | |||
|
| |||
TOTAL | 100.00 | % | ||
|
|
TEN LARGEST FUND HOLDINGS
As of 8/31/17
| Security | Percentage of Total Investments* |
Itau Unibanco Holding SA (Preferred) | 11.52 | % | ||
Banco Bradesco SA (Preferred) | 8.94 | |||
Ambev SA | 8.17 | |||
Vale SA | 8.16 | |||
B3 SA–Brasil Bolsa Balcao | 4.23 | |||
Itausa–Investimentos Itau SA (Preferred) | 3.54 | |||
Petroleo Brasileiro SA (Preferred) | 2.71 | |||
Banco Bradesco SA | 2.60 | |||
Cielo SA | 2.45 | |||
Ultrapar Participacoes SA | 2.39 | |||
|
| |||
TOTAL | 54.71 | % | ||
|
|
| * | Excludes money market funds. |
MANAGEMENT’S DISCUSSIONSOF FUND PERFORMANCE | 7 |
Table of Contents
Management’s Discussion of Fund Performance
iSHARES® MSCI CHILE CAPPED ETF
Performance as of August 31, 2017
| Average Annual Total Returns | Cumulative Total Returns | |||||||||||||||||||||||||||
| NAV | MARKET | INDEX | NAV | MARKET | INDEX | |||||||||||||||||||||||
1 Year | 32.65% | 33.96% | 32.78% | 32.65% | 33.96% | 32.78% | ||||||||||||||||||||||
5 Years | (2.88)% | (2.76)% | (2.66)% | (13.60)% | (13.07)% | (12.61)% | ||||||||||||||||||||||
Since Inception | 1.35% | 1.38% | 1.86% | 14.04% | 14.39% | 19.81% | ||||||||||||||||||||||
GROWTH OF $10,000 INVESTMENT
(SINCE INCEPTION AT NET ASSET VALUE)
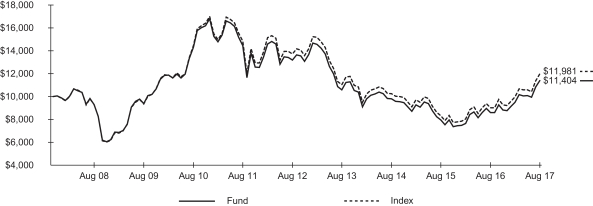
The inception date of the Fund was 11/12/07. The first day of secondary market trading was 11/16/07.
Index performance through February 11, 2013 reflects the performance of the MSCI Chile Investable Market Index. Index performance beginning on February 12, 2013 reflects the performance of the MSCI Chile IMI 25/50 Index.
Past performance is no guarantee of future results. Performance results do not reflect the deduction of taxes that a shareholder would pay on fund distributions or on the redemption or sale of fund shares. See “About Fund Performance” on page 22 for more information.
| Shareholder Expenses | ||||||||||||||||||||||||||
| Actual | Hypothetical 5% Return | |||||||||||||||||||||||||
| Beginning Account Value (3/1/17) | Ending Account Value (8/31/17) | Expenses Paid During Period a | Beginning Account Value (3/1/17) | Ending Account Value (8/31/17) | Expenses Paid During Period a | Annualized Expense Ratio | ||||||||||||||||||||
| $ | 1,000.00 | $ | 1,203.00 | $ | 3.39 | $ | 1,000.00 | $ | 1,022.10 | $ | 3.11 | 0.61% | ||||||||||||||
| a | Expenses are calculated using the Fund’s annualized expense ratio (as disclosed in the table), multiplied by the average account value for the period, multiplied by the number of days in the period (184 days) and divided by the number of days in the year (365 days). See “Shareholder Expenses” on page 22 for more information. |
| 8 | 2017 iSHARES ANNUAL REPORTTO SHAREHOLDERS |
Table of Contents
Management’s Discussion of Fund Performance (Continued)
iSHARES® MSCI CHILE CAPPED ETF
The iShares MSCI Chile Capped ETF (the “Fund”) seeks to track the investment results of a broad-based index composed of Chilean equities, as represented by the MSCI Chile IMI 25/50 Index (the “Index”). The Fund invests in a representative sample of securities included in the Index that collectively has an investment profile similar to the Index. Due to the use of representative sampling, the Fund may or may not hold all of the securities that are included in the Index. For the 12-month reporting period ended August 31, 2017, the total return for the Fund was 32.65%, net of fees, while the total return for the Index was 32.78%.
Chile’s stock market hit record highs during the reporting period, supported by improving economic activity. Chile’s economy is largely dependent on exports, particularly copper. During the reporting period, copper exports rose substantially, due in large part to increased demand from China, Chile’s largest trading partner. In addition to export levels, copper prices also increased significantly, benefiting Chile’s mining industry. Other exports also increased, including pulp and paper products, chemicals, and agricultural products. Domestically, inflation remained benign, which helped support consumer spending.
The financials sector, which represented about 18% of the Index on average for the reporting period, was the largest contributor to the Index’s performance. Chilean banks led the advance in the financials sector as recurring operating income and better risk management supported the industry.
The materials sector also contributed significantly to the Index’s return for the reporting period, led by chemicals and steel producers, which benefited from the increase in exports. Utilities, the largest sector weight in the Index at about 26% on average, contributed to the Index’s return due to strength among electric utilities.
In the consumer discretionary sector, department store retailers contributed to the Index’s performance for the reporting period amid higher consumer spending. Other sectors that contributed meaningfully to the Index’s return included industrials, energy, and consumer staples.
The Chilean peso increased by about 8% relative to the U.S. dollar during the reporting period, which contributed to the Index’s performance as Chilean investments were worth more when translated into U.S. dollars.
ALLOCATION BY SECTOR
As of 8/31/17
| Sector | Percentage of Total Investments* | |||
Utilities | 25.76 | % | ||
Financials | 18.34 | |||
Consumer Discretionary | 12.31 | |||
Materials | 11.65 | |||
Consumer Staples | 11.07 | |||
Energy | 7.89 | |||
Industrials | 6.21 | |||
Real Estate | 2.66 | |||
Telecommunication Services | 2.54 | |||
Information Technology | 1.57 | |||
|
| |||
TOTAL | 100.00 | % | ||
|
| |||
TEN LARGEST FUND HOLDINGS
As of 8/31/17
| Security | Percentage of Total Investments* | |||
SACI Falabella | 10.05 | % | ||
Enel Americas SA | 8.57 | |||
Empresas COPEC SA | 7.89 | |||
Banco Santander Chile | 6.51 | |||
Sociedad Quimica y Minera de Chile SA Series B (Preferred) | 5.41 | |||
LATAM Airlines Group SA | 4.58 | |||
Empresas CMPC SA | 4.54 | |||
Cencosud SA | 4.48 | |||
Banco de Chile | 3.92 | |||
Banco de Credito e Inversiones | 3.70 | |||
|
| |||
TOTAL | 59.65 | % | ||
|
| |||
| * | Excludes money market funds. |
MANAGEMENT’S DISCUSSIONSOF FUND PERFORMANCE | 9 |
Table of Contents
Management’s Discussion of Fund Performance
iSHARES® MSCI COLOMBIA CAPPED ETF
Performance as of August 31, 2017
| Average Annual Total Returns | Cumulative Total Returns | |||||||||||||||||||||||||||
| NAV | MARKET | INDEX | NAV | MARKET | INDEX | |||||||||||||||||||||||
1 Year | 12.05% | 12.92% | 11.97% | 12.05% | 12.92% | 11.97% | ||||||||||||||||||||||
Since Inception | (10.59)% | (10.48)% | (10.33)% | (37.53)% | (37.21)% | (36.74)% | ||||||||||||||||||||||
GROWTH OF $10,000 INVESTMENT
(SINCE INCEPTION AT NET ASSET VALUE)
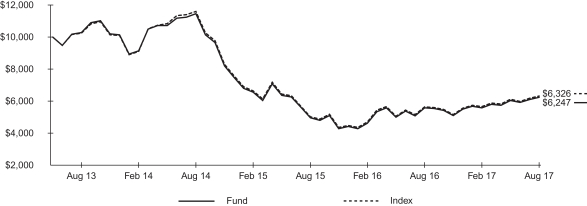
The inception date of the Fund was 6/18/13. The first day of secondary market trading was 6/20/13.
Past performance is no guarantee of future results. Performance results do not reflect the deduction of taxes that a shareholder would pay on fund distributions or on the redemption or sale of fund shares. See “About Fund Performance” on page 22 for more information.
| Shareholder Expenses | ||||||||||||||||||||||||||
| Actual | Hypothetical 5% Return | |||||||||||||||||||||||||
| Beginning Account Value (3/1/17) | Ending Account Value (8/31/17) | Expenses Paid During Period a | Beginning Account Value (3/1/17) | Ending Account Value (8/31/17) | Expenses Paid During Period a | Annualized Expense Ratio | ||||||||||||||||||||
| $ | 1,000.00 | $ | 1,117.10 | $ | 3.26 | $ | 1,000.00 | $ | 1,022.10 | $ | 3.11 | 0.61% | ||||||||||||||
| a | Expenses are calculated using the Fund’s annualized expense ratio (as disclosed in the table), multiplied by the average account value for the period, multiplied by the number of days in the period (184 days) and divided by the number of days in the year (365 days). See “Shareholder Expenses” on page 22 for more information. |
| 10 | 2017 iSHARES ANNUAL REPORTTO SHAREHOLDERS |
Table of Contents
Management’s Discussion of Fund Performance (Continued)
iSHARES® MSCI COLOMBIA CAPPED ETF
The iShares MSCI Colombia Capped ETF (the “Fund”) seeks to track the investment results of a broad-based index composed of Colombian equities, as represented by the MSCI All Colombia Capped Index (the “Index”). The Fund invests in a representative sample of securities included in the Index that collectively has an investment profile similar to the Index. Due to the use of representative sampling, the Fund may or may not hold all of the securities that are included in the Index. For the 12-month reporting period ended August 31, 2017, the total return for the Fund was 12.05%, net of fees, while the total return for the Index was 11.97%.
Colombia’s stock market advanced for the reporting period despite relatively weak economic growth. Although Colombia’s economic growth improved somewhat late in the reporting period, it remained well below its growth rate before crude oil prices collapsed in 2014. Nonetheless, several key drivers of Colombian economic growth, including energy and mining, showed signs of improvement during the reporting period, particularly as export growth increased.
The November 2016 peace accord between the Colombian government and the Revolutionary Armed Forces of Colombia, which earned Colombian President Juan Manuel Santos the Nobel Peace Prize, contributed to increased investor confidence. The agreement was expected to provide greater political stability and economic benefits, including increased development, improved transportation and infrastructure, and a shift from military spending to employment programs.
Within the Index, the financials sector, which represented about 41% of the Index on average during the reporting period, contributed the most to the Index’s performance, led by strength among Colombian banks. Diversified financial services companies also supported performance in the sector.
The utilities sector was another significant contributor to the Index’s return for the reporting period as electric utilities performed well. The energy sector also had a positive effect on the Index’s performance as strengthening fuel exports provides support for the sector. Other sectors that contributed to the Index’s return included consumer staples and materials.
On the downside, the telecommunication services sector, a small weight in the Index at approximately 2% on average during the reporting period, detracted from the Index’s return amid challenges in privatizing government-owned telecommunications companies.
ALLOCATION BY SECTOR
As of 8/31/17
| Sector | Percentage of Total Investments* | |||
Financials | 43.52 | % | ||
Materials | 18.45 | |||
Utilities | 12.29 | |||
Energy | 10.43 | |||
Consumer Staples | 8.92 | |||
Industrials | 4.52 | |||
Telecommunication Services | 1.87 | |||
|
| |||
TOTAL | 100.00 | % | ||
|
| |||
TEN LARGEST FUND HOLDINGS
As of 8/31/17
| Security | Percentage of Total Investments* | |||
Bancolombia SA (Preferred) | 13.89 | % | ||
Grupo de Inversiones Suramericana SA | 8.86 | |||
Bancolombia SA | 5.73 | |||
Grupo Argos SA/Colombia | 5.10 | |||
Ecopetrol SA | 4.62 | |||
Grupo Nutresa SA | 4.60 | |||
Interconexion Electrica SA ESP | 4.48 | |||
Banco Davivienda SA (Preferred) | 4.43 | |||
Cementos Argos SA | 4.42 | |||
Almacenes Exito SA | 4.33 | |||
|
| |||
TOTAL | 60.46 | % | ||
|
| |||
| * | Excludes money market funds. |
MANAGEMENT’S DISCUSSIONSOF FUND PERFORMANCE | 11 |
Table of Contents
Management’s Discussion of Fund Performance
iSHARES® MSCI ISRAEL CAPPED ETF
Performance as of August 31, 2017
| Average Annual Total Returns | Cumulative Total Returns | |||||||||||||||||||||||||||
| NAV | MARKET | INDEX | NAV | MARKET | INDEX | |||||||||||||||||||||||
1 Year | (0.77)% | (0.27)% | (0.79)% | (0.77)% | (0.27)% | (0.79)% | ||||||||||||||||||||||
5 Years | 7.46% | 7.63% | 7.73% | 43.29% | 44.42% | 45.08% | ||||||||||||||||||||||
Since Inception | 1.89% | 1.94% | 2.33% | 19.35% | 19.86% | 24.23% | ||||||||||||||||||||||
GROWTH OF $10,000 INVESTMENT
(SINCE INCEPTION AT NET ASSET VALUE)
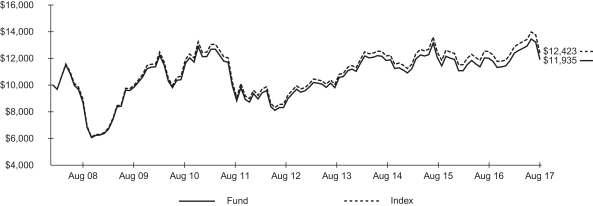
The inception date of the Fund was 3/26/08. The first day of secondary market trading was 3/28/08.
Past performance is no guarantee of future results. Performance results do not reflect the deduction of taxes that a shareholder would pay on fund distributions or on the redemption or sale of fund shares. See “About Fund Performance” on page 22 for more information.
| Shareholder Expenses | ||||||||||||||||||||||||||
| Actual | Hypothetical 5% Return | |||||||||||||||||||||||||
| Beginning Account Value (3/1/17) | Ending Account Value (8/31/17) | Expenses Paid During Period a | Beginning Account Value (3/1/17) | Ending Account Value (8/31/17) | Expenses Paid During Period a | Annualized Expense Ratio | ||||||||||||||||||||
| $ | 1,000.00 | $ | 962.20 | $ | 3.02 | $ | 1,000.00 | $ | 1,022.10 | $ | 3.11 | 0.61% | ||||||||||||||
| a | Expenses are calculated using the Fund’s annualized expense ratio (as disclosed in the table), multiplied by the average account value for the period, multiplied by the number of days in the period (184 days) and divided by the number of days in the year (365 days). See “Shareholder Expenses” on page 22 for more information. |
| 12 | 2017 iSHARES ANNUAL REPORTTO SHAREHOLDERS |
Table of Contents
Management’s Discussion of Fund Performance (Continued)
iSHARES® MSCI ISRAEL CAPPED ETF
The iShares MSCI Israel Capped ETF (the “Fund”) seeks to track the investment results of a broad-based index composed of Israeli equities, as represented by the MSCI Israel Capped Investable Market Index (the “Index”). The Fund invests in a representative sample of securities included in the Index that collectively has an investment profile similar to the Index. Due to the use of representative sampling, the Fund may or may not hold all of the securities that are included in the Index. For the 12-month reporting period ended August 31, 2017, the total return for the Fund was -0.77%, net of fees, while the total return for the Index was -0.79%.
The reporting period for Israel was characterized by slow but steady economic growth, declining unemployment, and improving business confidence. While most Israeli stocks performed well, the Index’s performance was bogged down by a single pharmaceutical company that lost more than half of its value during the reporting period. However, stock market conditions in Israel generally remained positive due to high levels of government spending, regulatory reforms, and strong capital inflows.
The healthcare sector was the largest detractor from the Index’s returns, due entirely to the aforementioned pharmaceutical stock. The company reported poor sales and announced a large dividend cut during the reporting period, in addition to writing off more than $6 billion of goodwill from its balance sheet. Following these announcements, the company lost more than half its value, which had an outsized effect on the relatively small Israeli equity market.
The information technology sector was the largest contributor to the Index’s return for the reporting period. The software industry was the strongest performer within the sector as demand for cybersecurity software from corporations and governments eager to prevent data breaches is expected to continue to grow. In addition, the sector benefited from merger and acquisition activity.
The financials sector also contributed to the Index’s return for the reporting period. The banks and insurance industries were both sources of strength for the sector. The real estate, industrials, and materials sectors also contributed moderately to the Index’s return.
The Israeli shekel appreciated by approximately 5% against the U.S. dollar during the reporting period, which contributed notably to the Index’s return.
ALLOCATION BY SECTOR
As of 8/31/17
| Sector | Percentage of Total Investments* |
Information Technology | 27.98 | % | ||
Financials | 22.46 | |||
Health Care | 15.83 | |||
Real Estate | 9.80 | |||
Industrials | 6.16 | |||
Materials | 6.01 | |||
Telecommunication Services | 4.60 | |||
Energy | 3.71 | |||
Consumer Staples | 1.77 | |||
Consumer Discretionary | 1.35 | |||
Utilities | 0.33 | |||
|
| |||
TOTAL | 100.00 | % | ||
|
|
TEN LARGEST FUND HOLDINGS
As of 8/31/17
| Security | Percentage of Total Investments* |
Check Point Software Technologies Ltd. | 13.74 | % | ||
Teva Pharmaceutical Industries Ltd. ADR | 13.62 | |||
Bank Leumi Le-Israel BM | 6.85 | |||
Bank Hapoalim BM | 6.48 | |||
Nice Ltd. | 4.52 | |||
Elbit Systems Ltd. | 3.27 | |||
Bezeq The Israeli Telecommunication Corp. Ltd. | 3.08 | |||
Frutarom Industries Ltd. | 3.00 | |||
Israel Discount Bank Ltd. Class A | 2.83 | |||
Tower Semiconductor Ltd. | 2.62 | |||
|
| |||
TOTAL | 60.01 | % | ||
|
|
| * | Excludes money market funds. |
MANAGEMENT’S DISCUSSIONSOF FUND PERFORMANCE | 13 |
Table of Contents
Management’s Discussion of Fund Performance
iSHARES® MSCI RUSSIA CAPPED ETF
Performance as of August 31, 2017
| Average Annual Total Returns | Cumulative Total Returns | |||||||||||||||||||||||||||
| NAV | MARKET | INDEX | NAV | MARKET | INDEX | |||||||||||||||||||||||
1 Year | 18.73% | 19.06% | 19.03% | 18.73% | 19.06% | 19.03% | ||||||||||||||||||||||
5 Years | (2.24)% | (2.26)% | (1.62)% | (10.69)% | (10.81)% | (7.83)% | ||||||||||||||||||||||
Since Inception | (3.51)% | (3.54)% | (2.95)% | (21.61)% | (21.77)% | (18.42)% | ||||||||||||||||||||||
GROWTH OF $10,000 INVESTMENT
(SINCE INCEPTION AT NET ASSET VALUE)
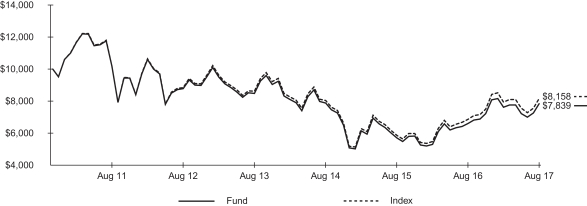
The inception date of the Fund was 11/9/10. The first day of secondary market trading was 11/10/10.
Past performance is no guarantee of future results. Performance results do not reflect the deduction of taxes that a shareholder would pay on fund distributions or on the redemption or sale of fund shares. See “About Fund Performance” on page 22 for more information.
| Shareholder Expenses | ||||||||||||||||||||||||||
| Actual | Hypothetical 5% Return | |||||||||||||||||||||||||
| Beginning Account Value (3/1/17) | Ending Account Value (8/31/17) | Expenses Paid During Period a | Beginning Account Value (3/1/17) | Ending Account Value (8/31/17) | Expenses Paid During Period a | Annualized Expense Ratio | ||||||||||||||||||||
| $ | 1,000.00 | $ | 1,029.00 | $ | 3.12 | $ | 1,000.00 | $ | 1,022.10 | $ | 3.11 | 0.61% | ||||||||||||||
| a | Expenses are calculated using the Fund’s annualized expense ratio (as disclosed in the table), multiplied by the average account value for the period, multiplied by the number of days in the period (184 days) and divided by the number of days in the year (365 days). See “Shareholder Expenses” on page 22 for more information. |
| 14 | 2017 iSHARES ANNUAL REPORTTO SHAREHOLDERS |
Table of Contents
Management’s Discussion of Fund Performance (Continued)
iSHARES® MSCI RUSSIA CAPPED ETF
The iShares MSCI Russia Capped ETF (the “Fund”) seeks to track the investment results of an index composed of Russian equities, as represented by the MSCI Russia 25/50 Index (the “Index”). The Fund invests in a representative sample of securities included in the Index that collectively has an investment profile similar to the Index. Due to the use of representative sampling, the Fund may or may not hold all of the securities that are included in the Index. For the 12-month reporting period ended August 31, 2017, the total return for the Fund was 18.73%, net of fees, while the total return for the Index was 19.03%.
Economic conditions improved in Russia during the reporting period as growth and industrial production picked up following a period of economic contraction. Much of the movement in Russian stocks, however, was due to political factors in the U.S., as investors assessed the odds of an improvement in relations with Russia and a possible easing of U.S. sanctions. The result of the U.S. presidential election in November 2016 preceded a large increase in Russian stock prices, although some of those gains receded in 2017 as the outlook for better relations dimmed.
The financials sector was the principal contributor to the Index’s performance for the reporting period, led by the banks industry, which gained following the U.S. presidential election. Russian banks are particularly sensitive to the effects of U.S. sanctions and stand to gain significantly if those sanctions are eliminated or reduced.
The energy sector was also a solid contributor to the Index’s performance. With oil prices mostly stable for the reporting period, the main driver of stock prices in the energy sector was speculation about the possible lifting of U.S. sanctions. Russian energy stocks rose following the U.S. presidential election but later declined for the reporting period as relations between Russia and the U.S. deteriorated and the U.S. Congress considered additional sanctions. The materials sector was an additional source of strength as the metals and mining industry made gains.
Currency fluctuations had a meaningful impact on the Index’s return as the Russian ruble appreciated approximately 11% against the U.S. dollar for the reporting period, causing ruble-denominated assets to appreciate in U.S. dollar terms.
ALLOCATION BY SECTOR
As of 8/31/17
| Sector | Percentage of Total Investments* |
Energy | 44.70 | % | ||
Financials | 24.93 | |||
Materials | 15.32 | |||
Telecommunication Services | 6.32 | |||
Consumer Staples | 4.89 | |||
Utilities | 3.84 | |||
|
| |||
TOTAL | 100.00 | % | ||
|
|
TEN LARGEST FUND HOLDINGS
As of 8/31/17
| Security | Percentage of Total Investments* |
Sberbank of Russia PJSC ADR | 11.04 | % | ||
Lukoil PJSC | 10.12 | |||
Gazprom PJSC | 9.45 | |||
Sberbank of Russia PJSC | 6.95 | |||
Magnit PJSC GDR | 4.90 | |||
MMC Norilsk Nickel PJSC | 4.88 | |||
Novatek PJSC GDR | 4.58 | |||
Tatneft PJSC Class S | 4.54 | |||
Mobile TeleSystems PJSC ADR | 3.76 | |||
Gazprom PJSC ADR | 3.47 | |||
|
| |||
TOTAL | 63.69 | % | ||
|
|
| * | Excludes money market funds. |
MANAGEMENT’S DISCUSSIONSOF FUND PERFORMANCE | 15 |
Table of Contents
Management’s Discussion of Fund Performance
iSHARES® MSCI SOUTH AFRICA ETF
Performance as of August 31, 2017
| Average Annual Total Returns | Cumulative Total Returns | |||||||||||||||||||||||||||
| NAV | MARKET | INDEX | NAV | MARKET | INDEX | |||||||||||||||||||||||
1 Year | 20.91% | 21.21% | 21.68% | 20.91% | 21.21% | 21.68% | ||||||||||||||||||||||
5 Years | 2.19% | 2.08% | 2.85% | 11.42% | 10.86% | 15.06% | ||||||||||||||||||||||
10 Years | 3.37% | 3.30% | 4.16% | 39.32% | 38.31% | 50.35% | ||||||||||||||||||||||
GROWTH OF $10,000 INVESTMENT
(AT NET ASSET VALUE)
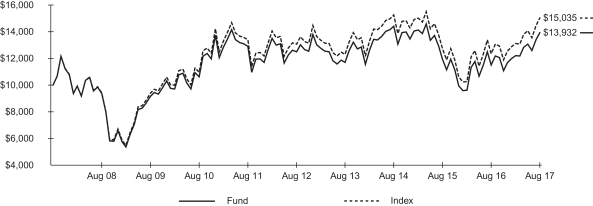
Past performance is no guarantee of future results. Performance results do not reflect the deduction of taxes that a shareholder would pay on fund distributions or on the redemption or sale of fund shares. See “About Fund Performance” on page 22 for more information.
| Shareholder Expenses | ||||||||||||||||||||||||||
| Actual | Hypothetical 5% Return | |||||||||||||||||||||||||
| Beginning Account Value (3/1/17) | Ending Account Value (8/31/17) | Expenses Paid During Period a | Beginning Account Value (3/1/17) | Ending Account Value (8/31/17) | Expenses Paid During Period a | Annualized Expense Ratio | ||||||||||||||||||||
| $ | 1,000.00 | $ | 1,140.70 | $ | 3.29 | $ | 1,000.00 | $ | 1,022.10 | $ | 3.11 | 0.61% | ||||||||||||||
| a | Expenses are calculated using the Fund’s annualized expense ratio (as disclosed in the table), multiplied by the average account value for the period, multiplied by the number of days in the period (184 days) and divided by the number of days in the year (365 days). See “Shareholder Expenses” on page 22 for more information. |
| 16 | 2017 iSHARES ANNUAL REPORTTO SHAREHOLDERS |
Table of Contents
Management’s Discussion of Fund Performance (Continued)
iSHARES® MSCI SOUTH AFRICA ETF
The iShares MSCI South Africa ETF (the “Fund”) seeks to track the investment results of an index composed of South African equities, as represented by the MSCI South Africa Index (the “Index”). The Fund invests in a representative sample of securities included in the Index that collectively has an investment profile similar to the Index. Due to the use of representative sampling, the Fund may or may not hold all of the securities that are included in the Index. For the 12-month reporting period ended August 31, 2017, the total return for the Fund was 20.91%, net of fees, while the total return for the Index was 21.68%.
South African markets posted solid returns during the reporting period despite economic and political troubles. The economy went into recession in early 2017 amid political wrangling between potential successors to current president Jacob Zuma and regulatory conflict between the government and the mining industry. Allegations of political corruption also contributed to the uncertain economic environment. Despite these challenges, rising commodities prices helped limit the damage to the economy, which is heavily reliant on mineral extraction.
The consumer discretionary sector was the principal contributor to the Index’s returns for the reporting period. This was almost entirely due to the performance of one company, a technology and media conglomerate. The company was a major investor in a Chinese internet company and benefited when that stock rose sharply during the reporting period. The rest of the consumer discretionary sector posted flat returns as consumer spending slowed due to rising unemployment.
The financials sector also contributed to the Index’s performance for the reporting period, despite a surprise interest rate cut from the South African central bank. The banks industry, which benefited from an influx of foreign capital, and the diversified financials industry led the advance in the financials sector. The telecommunication services, consumer staples, and real estate sectors also contributed to the Index’s return, while the healthcare and materials sectors detracted modestly from the Index’s performance.
A strengthening South African rand, which appreciated by approximately 12% against the U.S. dollar during the reporting period, contributed substantially to the Index’s return as rand-denominated assets appreciated in U.S. dollar terms.
Special note: Effective September 1, 2017, the Fund will begin to track a new underlying index, the MSCI South Africa 25/50 Index, and will cease to track the Index. The change to a capped benchmark is being implemented to seek to reduce tracking error and improve the investor experience.
ALLOCATION BY SECTOR
As of 8/31/17
| Sector | Percentage of Total Investments* |
Consumer Discretionary | 31.79 | % | ||
Financials | 25.79 | |||
Materials | 12.03 | |||
Consumer Staples | 8.78 | |||
Telecommunication Services | 7.81 | |||
Real Estate | 7.40 | |||
Health Care | 4.24 | |||
Industrials | 1.42 | |||
Energy | 0.74 | |||
|
| |||
TOTAL | 100.00 | % | ||
|
|
TEN LARGEST FUND HOLDINGS
As of 8/31/17
| Security | Percentage of Total Investments* |
Naspers Ltd. Class N | 22.10 | % | ||
MTN Group Ltd. | 5.06 | |||
Standard Bank Group Ltd. | 5.00 | |||
Sasol Ltd. | 5.00 | |||
Steinhoff International Holdings NV Class H | 4.39 | |||
FirstRand Ltd. | 4.33 | |||
Remgro Ltd. | 2.71 | |||
Aspen Pharmacare Holdings Ltd. | 2.65 | |||
Barclays Africa Group Ltd. | 2.45 | |||
Shoprite Holdings Ltd. | 2.41 | |||
|
| |||
TOTAL | 56.10 | % | ||
|
|
| * | Excludes money market funds. |
MANAGEMENT’S DISCUSSIONSOF FUND PERFORMANCE | 17 |
Table of Contents
Management’s Discussion of Fund Performance
iSHARES® MSCI TURKEY ETF
Performance as of August 31, 2017
| Average Annual Total Returns | Cumulative Total Returns | |||||||||||||||||||||||||||
| NAV | MARKET | INDEX | NAV | MARKET | INDEX | |||||||||||||||||||||||
1 Year | 24.23% | 25.07% | 24.47% | 24.23% | 25.07% | 24.47% | ||||||||||||||||||||||
5 Years | (1.76)% | (1.61)% | (1.39)% | (8.47)% | (7.79)% | (6.76)% | ||||||||||||||||||||||
Since Inception | 1.28% | 1.29% | 1.63% | 12.73% | 12.90% | 16.49% | ||||||||||||||||||||||
GROWTH OF $10,000 INVESTMENT
(SINCE INCEPTION AT NET ASSET VALUE)
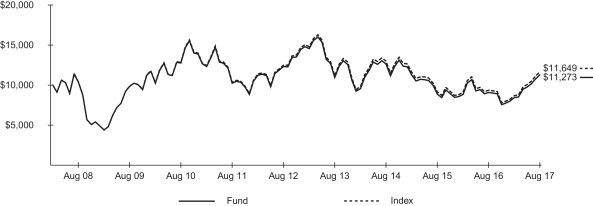
The inception date of the Fund was 3/26/08. The first day of secondary market trading was 3/28/08.
Past performance is no guarantee of future results. Performance results do not reflect the deduction of taxes that a shareholder would pay on fund distributions or on the redemption or sale of fund shares. See “About Fund Performance” on page 22 for more information.
| Shareholder Expenses | ||||||||||||||||||||||||||
| Actual | Hypothetical 5% Return | |||||||||||||||||||||||||
| Beginning Account Value (3/1/17) | Ending Account Value (8/31/17) | Expenses Paid During Period a | Beginning Account Value (3/1/17) | Ending Account Value (8/31/17) | Expenses Paid During Period a | Annualized Expense Ratio | ||||||||||||||||||||
| $ | 1,000.00 | $ | 1,336.30 | $ | 3.59 | $ | 1,000.00 | $ | 1,022.10 | $ | 3.11 | 0.61% | ||||||||||||||
| a | Expenses are calculated using the Fund’s annualized expense ratio (as disclosed in the table), multiplied by the average account value for the period, multiplied by the number of days in the period (184 days) and divided by the number of days in the year (365 days). See “Shareholder Expenses” on page 22 for more information. |
| 18 | 2017 iSHARES ANNUAL REPORTTO SHAREHOLDERS |
Table of Contents
Management’s Discussion of Fund Performance (Continued)
iSHARES® MSCI TURKEY ETF
The iShares MSCI Turkey ETF (the “Fund”) seeks to track the investment results of a broad-based index composed of Turkish equities, as represented by the MSCI Turkey Investable Market Index (the “Index”). The Fund invests in a representative sample of securities included in the Index that collectively has an investment profile similar to the Index. Due to the use of representative sampling, the Fund may or may not hold all of the securities that are included in the Index. For the 12-month reporting period ended August 31, 2017, the total return for the Fund was 24.23%, net of fees, while the total return for the Index was 24.47%.
The Turkish economy slowed during the reporting period as political turmoil, the threat of terrorism, and a steep drop in the important tourist trade were challenges to the country’s economic environment. However, the Turkish economy showed signs of improvement toward the end of the reporting period as the government increased spending and loosened credit. Despite the unevenness of growth, Turkey’s stock market hit record highs during the reporting period. Investors generally attributed the disconnect between economic and market performance to a combination of the government’s credit policies and heavy levels of algorithmic trading in the market.
The financials sector was the leading contributor to the Index’s return for the reporting period, with the banks industry delivering virtually all of the returns. Despite an increase in borrowing costs, Turkish banks benefited from government credit guarantees intended to stimulate the economy. Banks were also helped by tax incentives and reduced regulation as the Turkish government used policy in an attempt to increase interest rates.
The industrials sector posted a solid contribution to the Index’s performance for the reporting period, led by strong returns in the capital goods and transportation industries. The materials, energy, and consumer staples sectors also contributed to the Index’s return, while the real estate sector detracted modestly from the Index’s performance.
The Turkish lira, which depreciated by approximately 17% against the U.S. dollar during the reporting period, detracted substantially from the Index’s return as lira-denominated assets depreciated in U.S. dollar terms.
ALLOCATION BY SECTOR
As of 8/31/17
| Sector | Percentage of Total Investments* |
Financials | 37.66 | % | ||
Industrials | 16.58 | |||
Consumer Staples | 11.74 | |||
Materials | 9.79 | |||
Consumer Discretionary | 6.98 | |||
Telecommunication Services | 6.89 | |||
Energy | 6.01 | |||
Real Estate | 2.52 | |||
Utilities | 1.28 | |||
Information Technology | 0.35 | |||
Health Care | 0.20 | |||
|
| |||
TOTAL | 100.00 | % | ||
|
|
TEN LARGEST FUND HOLDINGS
As of 8/31/17
| Security | Percentage of Total Investments* |
Turkiye Garanti Bankasi AS | 10.15 | % | ||
Akbank TAS | 9.30 | |||
BIM Birlesik Magazalar AS | 6.65 | |||
Tupras Turkiye Petrol Rafinerileri AS | 6.01 | |||
KOC Holding AS | 5.61 | |||
Turkcell Iletisim Hizmetleri AS | 5.35 | |||
Turkiye Is Bankasi Class C | 4.83 | |||
Eregli Demir ve Celik Fabrikalari TAS | 4.71 | |||
Haci Omer Sabanci Holding AS | 3.98 | |||
Turkiye Halk Bankasi AS | 3.79 | |||
|
| |||
TOTAL | 60.38 | % | ||
|
|
| * | Excludes money market funds. |
MANAGEMENT’S DISCUSSIONSOF FUND PERFORMANCE | 19 |
Table of Contents
Management’s Discussion of Fund Performance (Continued)
iSHARES® MSCI USA EQUAL WEIGHTED ETF
Performance as of August 31, 2017
| Average Annual Total Returns | Cumulative Total Returns | |||||||||||||||||||||||||||
| NAV | MARKET | INDEX | NAV | MARKET | INDEX | |||||||||||||||||||||||
1 Year | 13.22% | 13.24% | 13.41% | 13.22% | 13.24% | 13.41% | ||||||||||||||||||||||
5 Years | 13.31% | 13.30% | 13.48% | 86.82% | 86.73% | 88.16% | ||||||||||||||||||||||
Since Inception | 12.46% | 12.47% | 12.65% | 136.42% | 136.46% | 139.09% | ||||||||||||||||||||||
GROWTH OF $10,000 INVESTMENT
(SINCE INCEPTION AT NET ASSET VALUE)
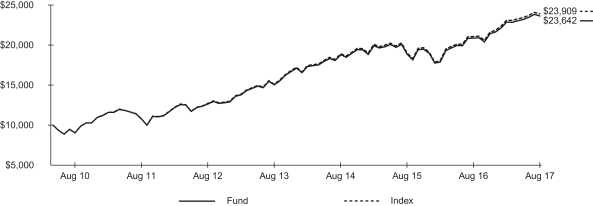
The inception date of the Fund was 5/5/10. The first day of secondary market trading was 5/7/10.
Index performance through August 31, 2015 reflects the performance of the MSCI USA Index. Index performance beginning on September 1, 2015 reflects the performance of the MSCI USA Equal Weighted Index.
Past performance is no guarantee of future results. Performance results do not reflect the deduction of taxes that a shareholder would pay on fund distributions or on the redemption or sale of fund shares. See “About Fund Performance” on page 22 for more information.
| Shareholder Expenses | ||||||||||||||||||||||||||
| Actual | Hypothetical 5% Return | |||||||||||||||||||||||||
| Beginning Account Value (3/1/17) | Ending Account Value (8/31/17) | Expenses Paid During Period a | Beginning Account Value (3/1/17) | Ending Account Value (8/31/17) | Expenses Paid During Period a | Annualized Expense Ratio | ||||||||||||||||||||
| $ | 1,000.00 | $ | 1,033.40 | $ | 0.77 | $ | 1,000.00 | $ | 1,024.40 | $ | 0.77 | 0.15% | ||||||||||||||
| a | Expenses are calculated using the Fund’s annualized expense ratio (as disclosed in the table), multiplied by the average account value for the period, multiplied by the number of days in the period (184 days) and divided by the number of days in the year (365 days). See “Shareholder Expenses” on page 22 for more information. |
| 20 | 2017 iSHARES ANNUAL REPORTTO SHAREHOLDERS |
Table of Contents
Management’s Discussion of Fund Performance (Continued)
iSHARES® MSCI USA EQUAL WEIGHTED ETF
The iShares MSCI USA Equal Weighted ETF (the “Fund”) seeks to track the investment results of an index composed of equal weighted U.S. equities, as represented by the MSCI USA Equal Weighted Index (the “Index”). The Fund invests in a representative sample of securities included in the Index that collectively has an investment profile similar to the Index. Due to the use of representative sampling, the Fund may or may not hold all of the securities that are included in the Index. For the 12-month reporting period ended August 31, 2017, the total return for the Fund was 13.22%, net of fees, while the total return for the Index was 13.41%.
The information technology sector made the largest contribution to the Index’s return for the reporting period. Sector gains reflected strength among several dominant technology companies with strong profits, significant market share, and high barriers to entry. From an industry standpoint, the software and services industry contributed the most to the Index’s performance, followed by the semiconductors and semiconductor equipment and technology hardware and equipment industries.
The financials sector was also a meaningful contributor to the Index’s return for the reporting period, led by the capital markets and insurance industries. Within the capital markets industry, financial market gains and increased assets under management supported strength. Insurers benefited from the prospect of a higher interest-rate environment, which would translate into increased profits on their underlying investment portfolio.
Other noteworthy contributors to the Index’s return during the reporting period included the industrials and healthcare sectors. The aerospace and defense industry led gains in the industrials sector as an increase in the defense budget under President Trump and higher global defense spending supported companies in the industry. The healthcare sector advanced despite ongoing uncertainty regarding healthcare reform and the medical device excise tax, as merger and acquisition activity remained solid. From an industry standpoint, healthcare equipment and supplies companies led the sector’s advance.
The energy sector detracted from the Index’s performance. Despite an agreement from OPEC to reduce output, an ongoing glut of supply kept oil prices low as OPEC output rose and shale output in the U.S. increased. The telecommunication services and consumer staples sectors also detracted fractionally from the Index’s return during the reporting period.
ALLOCATION BY SECTOR
As of 8/31/17
| Sector | Percentage of Total Investments* | |||
Consumer Discretionary | 15.91 | % | ||
Information Technology | 15.70 | |||
Financials | 14.16 | |||
Industrials | 12.86 | |||
Health Care | 11.89 | |||
Energy | 6.68 | |||
Real Estate | 6.18 | |||
Consumer Staples | 5.84 | |||
Utilities | 4.88 | |||
Materials | 4.80 | |||
Telecommunication Services | 1.10 | |||
|
| |||
TOTAL | 100.00 | % | ||
|
| |||
TEN LARGEST FUND HOLDINGS
As of 8/31/17
| Security | Percentage of Total Investments* | |||
Gilead Sciences Inc. | 0.18 | % | ||
Incyte Corp. | 0.18 | |||
Biogen Inc. | 0.18 | |||
Seattle Genetics Inc. | 0.18 | |||
United Rentals Inc. | 0.17 | |||
BioMarin Pharmaceutical Inc. | 0.17 | |||
Martin Marietta Materials Inc. | 0.17 | |||
Vulcan Materials Co. | 0.17 | |||
Celgene Corp. | 0.17 | |||
Plains GP Holdings LP Class A | 0.17 | |||
|
| |||
TOTAL | 1.74 | % | ||
|
| |||
| * | Excludes money market funds. |
MANAGEMENT’S DISCUSSIONSOF FUND PERFORMANCE | 21 |
Table of Contents
Past performance is no guarantee of future results. Current performance may be lower or higher than the performance data quoted. Performance data current to the most recent month-end is available at www.ishares.com. Performance results assume reinvestment of all dividends and capital gain distributions and do not reflect the deduction of taxes that a shareholder would pay on fund distributions or on the redemption or sale of fund shares. The investment return and principal value of shares will vary with changes in market conditions. Shares may be worth more or less than their original cost when they are redeemed or sold in the market. Performance for certain funds may reflect a waiver of a portion of investment advisory fees. Without such a waiver, performance would have been lower.
Net asset value or “NAV” is the value of one share of a fund as calculated in accordance with the standard formula for valuing mutual fund shares. The price used to calculate market return (“Market Price”) is determined by using the midpoint between the highest bid and the lowest offer on the primary stock exchange on which shares of a fund are listed for trading, as of the time that such fund’s NAV is calculated. Certain funds may have a NAV which is determined prior to the opening of regular trading on its listed exchange and their market returns are calculated using the midpoint of the bid/ask spread as of the opening of regular trading on the exchange. Market and NAV returns assume that dividends and capital gain distributions have been reinvested at Market Price and NAV, respectively.
An index is a statistical composite that tracks a specified financial market or sector. Unlike a fund, an index does not actually hold a portfolio of securities and therefore does not incur the expenses incurred by a fund. These expenses negatively impact fund performance. Also, market returns do not include brokerage commissions that may be payable on secondary market transactions. If brokerage commissions were included, market returns would be lower.
As a shareholder of a Fund, you incur two types of costs: (1) transaction costs, including brokerage commissions on purchases and sales of fund shares and (2) ongoing costs, including management fees and other fund expenses. The expense example, which is based on an investment of $1,000 invested on March 1, 2017 and held through August 31, 2017, is intended to help you understand your ongoing costs (in dollars and cents) of investing in a Fund and to compare these costs with the ongoing costs of investing in other funds.
Actual Expenses — The table provides information about actual account values and actual expenses. Annualized expense ratios reflect contractual and voluntary fee waivers, if any. To estimate the expenses that you paid on your account over the period, simply divide your account value by $1,000 (for example, an $8,600 account value divided by $1,000 = 8.6), then multiply the result by the number corresponding to your Fund under the heading entitled “Expenses Paid During Period.”
Hypothetical Example for Comparison Purposes — The table also provides information about hypothetical account values and hypothetical expenses based on each Fund’s actual expense ratio and an assumed rate of return of 5% per year before expenses. You may use this information to compare the ongoing costs of investing in your Fund and other funds. To do so, compare this 5% hypothetical example with the 5% hypothetical examples that appear in the shareholder reports of the other funds.
Please note that the expenses shown in the table are meant to highlight your ongoing costs only and do not reflect any transactional costs, such as brokerage commissions paid on purchases and sales of fund shares. Therefore, the hypothetical examples are useful in comparing ongoing costs only and will not help you determine the relative total costs of owning different funds. In addition, if these transactional costs were included, your costs would have been higher.
| 22 | 2017 iSHARES ANNUAL REPORTTO SHAREHOLDERS |
Table of Contents
iSHARES® MSCI BRAZIL CAPPED ETF
August 31, 2017
| Security | Shares | Value | ||||||
COMMON STOCKS — 63.94% |
| |||||||
AEROSPACE & DEFENSE — 1.09% |
| |||||||
Embraer SA | 12,103,087 | $ | 68,969,267 | |||||
|
| |||||||
| 68,969,267 | ||||||||
BANKS — 5.98% |
| |||||||
Banco Bradesco SA | 16,031,286 | 164,315,013 | ||||||
Banco do Brasil SA | 14,985,287 | 146,211,861 | ||||||
Banco Santander Brasil SA Units | 7,602,975 | 67,754,905 | ||||||
|
| |||||||
| 378,281,779 | ||||||||
BEVERAGES — 8.14% |
| |||||||
Ambev SA | 81,631,955 | 515,250,720 | ||||||
|
| |||||||
| 515,250,720 | ||||||||
CAPITAL MARKETS — 4.22% |
| |||||||
B3 SA – Brasil Bolsa Balcao | 38,014,977 | 267,250,804 | ||||||
|
| |||||||
| 267,250,804 | ||||||||
CONTAINERS & PACKAGING — 0.88% |
| |||||||
Klabin SA Units | 10,189,100 | 55,439,429 | ||||||
|
| |||||||
| 55,439,429 | ||||||||
DIVERSIFIED CONSUMER SERVICES — 2.21% |
| |||||||
Kroton Educacional SA | 24,518,719 | 140,031,267 | ||||||
|
| |||||||
| 140,031,267 | ||||||||
ELECTRIC UTILITIES — 2.98% |
| |||||||
Centrais Eletricas Brasileiras SAa | 4,206,000 | 23,553,440 | ||||||
CPFL Energia SA | 5,080,993 | 43,745,841 | ||||||
EDP – Energias do Brasil SA | 7,627,045 | 36,942,003 | ||||||
Equatorial Energia SA | 3,585,700 | 69,652,460 | ||||||
Transmissora Alianca de Energia Eletrica SA Units | 2,012,600 | 14,391,934 | ||||||
|
| |||||||
| 188,285,678 | ||||||||
FOOD & STAPLES RETAILING — 1.51% |
| |||||||
Raia Drogasil SA | 4,349,600 | 95,868,283 | ||||||
|
| |||||||
| 95,868,283 | ||||||||
FOOD PRODUCTS — 3.02% |
| |||||||
BRF SAa | 8,610,750 | 116,362,596 | ||||||
JBS SA | 14,128,507 | 38,930,908 | ||||||
M. Dias Branco SA | 2,301,600 | 35,916,210 | ||||||
|
| |||||||
| 191,209,714 | ||||||||
HEALTH CARE PROVIDERS & SERVICES — 1.15% |
| |||||||
Odontoprev SA | 5,225,965 | 24,614,661 | ||||||
Qualicorp SA | 4,329,805 | 47,956,810 | ||||||
|
| |||||||
| 72,571,471 | ||||||||
| Security | Shares | Value | ||||||
INDEPENDENT POWER AND RENEWABLE ELECTRICITY PRODUCERS — 0.60% |
| |||||||
Engie Brasil Energia SA | 3,332,475 | $ | 38,234,311 | |||||
|
| |||||||
| 38,234,311 | ||||||||
INSURANCE — 2.59% | ||||||||
BB Seguridade Participacoes SA | 12,263,895 | 108,044,040 | ||||||
Porto Seguro SA | 2,536,120 | 28,009,398 | ||||||
Sul America SA | 4,853,249 | 27,733,292 | ||||||
|
| |||||||
| 163,786,730 | ||||||||
IT SERVICES — 2.45% | ||||||||
Cielo SA | 21,708,696 | 154,754,104 | ||||||
|
| |||||||
| 154,754,104 | ||||||||
MACHINERY — 1.11% | ||||||||
WEG SA | 10,815,170 | 70,326,361 | ||||||
|
| |||||||
| 70,326,361 | ||||||||
METALS & MINING — 8.78% | ||||||||
Cia. Siderurgica Nacional SAa | 14,733,969 | 40,692,905 | ||||||
Vale SA | 46,170,619 | 514,759,592 | ||||||
|
| |||||||
| 555,452,497 | ||||||||
MULTILINE RETAIL — 2.40% | ||||||||
Lojas Americanas SA | 4,933,310 | 22,640,435 | ||||||
Lojas Renner SA | 13,271,990 | 129,073,367 | ||||||
|
| |||||||
| 151,713,802 | ||||||||
OIL, GAS & CONSUMABLE FUELS — 4.60% |
| |||||||
Cosan SA Industria e Comercio | 2,683,050 | 32,906,577 | ||||||
Petroleo Brasileiro SAa | 24,199,969 | 107,446,032 | ||||||
Ultrapar Participacoes SA | 6,447,755 | 150,514,899 | ||||||
|
| |||||||
| 290,867,508 | ||||||||
PAPER & FOREST PRODUCTS — 1.27% |
| |||||||
Duratex SA | 6,238,061 | 17,050,112 | ||||||
Fibria Celulose SA | 4,765,251 | 63,290,324 | ||||||
|
| |||||||
| 80,340,436 | ||||||||
PERSONAL PRODUCTS — 0.52% |
| |||||||
Natura Cosmeticos SA | 3,480,765 | 32,634,419 | ||||||
|
| |||||||
| 32,634,419 | ||||||||
PHARMACEUTICALS — 1.03% |
| |||||||
Hypermarcas SA | 6,958,000 | 65,257,856 | ||||||
|
| |||||||
| 65,257,856 | ||||||||
REAL ESTATE MANAGEMENT & DEVELOPMENT — 1.73% |
| |||||||
BR Malls Participacoes SA | 15,570,938 | 67,302,756 | ||||||
Multiplan Empreendimentos Imobiliarios SA | 1,815,646 | 42,176,283 | ||||||
|
| |||||||
| 109,479,039 | ||||||||
SCHEDULESOF INVESTMENTS | 23 |
Table of Contents
Schedule of Investments (Continued)
iSHARES® MSCI BRAZIL CAPPED ETF
August 31, 2017
| Security | Shares | Value | ||||||
ROAD & RAIL — 1.74% | ||||||||
Localiza Rent A Car SA | 3,227,577 | $ | 61,085,417 | |||||
Rumo SAa | 14,959,290 | 49,112,322 | ||||||
|
| |||||||
| 110,197,739 | ||||||||
TRANSPORTATION INFRASTRUCTURE — 1.95% |
| |||||||
CCR SA | 22,248,165 | 123,457,535 | ||||||
|
| |||||||
| 123,457,535 | ||||||||
WATER UTILITIES — 1.09% | ||||||||
Cia. de Saneamento Basico do Estado de Sao Paulo | 6,763,800 | 69,111,592 | ||||||
|
| |||||||
| 69,111,592 | ||||||||
WIRELESS TELECOMMUNICATION SERVICES — 0.90% |
| |||||||
TIM Participacoes SA | 15,918,325 | 57,067,078 | ||||||
|
| |||||||
| 57,067,078 | ||||||||
|
| |||||||
TOTAL COMMON STOCKS |
| |||||||
(Cost: $2,680,565,968) |
| 4,045,839,419 | ||||||
PREFERRED STOCKS — 35.78% |
| |||||||
BANKS — 23.93% |
| |||||||
Banco Bradesco SA, Preference Shares | 52,854,818 | 564,084,854 | ||||||
Itau Unibanco Holding SA, Preference Shares | 56,698,798 | 727,104,038 | ||||||
Itausa-Investimentos Itau SA, Preference Shares | 68,889,892 | 223,323,713 | ||||||
|
| |||||||
| 1,514,512,605 | ||||||||
CHEMICALS — 0.69% | ||||||||
Braskem SA Class A, Preference Shares | 3,597,456 | 43,572,613 | ||||||
|
| |||||||
| 43,572,613 | ||||||||
DIVERSIFIED TELECOMMUNICATION SERVICES — 1.94% |
| |||||||
Telefonica Brasil SA, Preference Shares | 7,920,364 | 122,941,912 | ||||||
|
| |||||||
| 122,941,912 | ||||||||
ELECTRIC UTILITIES — 1.48% |
| |||||||
Centrais Eletricas Brasileiras SA Class B, Preference Shares | 5,394,346 | 35,197,102 | ||||||
Cia. Energetica de Minas Gerais, Preference Shares | 14,051,220 | 37,422,881 | ||||||
Cia. Paranaense de Energia Class B, Preference Shares | 2,301,160 | 21,019,034 | ||||||
|
| |||||||
| 93,639,017 | ||||||||
| Security | Shares | Value | ||||||
FOOD & STAPLES RETAILING — 1.04% |
| |||||||
Cia. Brasileira de Distribuicao, Preference Shares | 2,884,764 | $ | 66,002,689 | |||||
|
| |||||||
| 66,002,689 | ||||||||
METALS & MINING — 2.02% |
| |||||||
Gerdau SA, Preference Shares | 16,536,126 | 62,277,517 | ||||||
Vale SA, Preference Shares | 6,299,530 | 65,208,629 | ||||||
|
| |||||||
| 127,486,146 | ||||||||
MULTILINE RETAIL — 1.31% |
| |||||||
Lojas Americanas SA, Preference Shares | 14,621,617 | 82,577,551 | ||||||
|
| |||||||
| 82,577,551 | ||||||||
OIL, GAS & CONSUMABLE FUELS — 2.70% |
| |||||||
Petroleo Brasileiro SA, Preference Shares | 39,387,583 | 170,872,096 | ||||||
|
| |||||||
| 170,872,096 | ||||||||
PAPER & FOREST PRODUCTS — 0.67% |
| |||||||
Suzano Papel e Celulose SA Class A, Preference Shares | 7,667,330 | 42,644,337 | ||||||
|
| |||||||
| 42,644,337 | ||||||||
|
| |||||||
TOTAL PREFERRED STOCKS |
| |||||||
(Cost: $1,407,506,824) |
| 2,264,248,966 | ||||||
SHORT-TERM INVESTMENTS — 0.00% |
| |||||||
MONEY MARKET FUNDS — 0.00% |
| |||||||
BlackRock Cash Funds: Treasury, |
| |||||||
0.96%b,c | 16,859 | 16,859 | ||||||
|
| |||||||
| 16,859 | ||||||||
|
| |||||||
TOTAL SHORT-TERM INVESTMENTS |
| |||||||
(Cost: $16,859) |
| 16,859 | ||||||
|
| |||||||
TOTAL INVESTMENTS | ||||||||
(Cost: $4,088,089,651)d |
| 6,310,105,244 | ||||||
Other Assets, Less Liabilities — 0.28% |
| 17,813,792 | ||||||
|
| |||||||
NET ASSETS — 100.00% |
| $ | 6,327,919,036 | |||||
|
| |||||||
| a | Non-income earning security. |
| b | Affiliated issuer. See Schedule 1. |
| c | The rate quoted is the annualized seven-day yield of the fund at period end. |
| d | The cost of investments (including short positions and derivatives, if any) for federal income tax purposes was $4,592,623,315. Net unrealized appreciation was $1,717,481,929, of which $2,227,618,744 represented gross unrealized appreciation on investments and $510,136,815 represented gross unrealized depreciation on investments. |
| 24 | 2017 iSHARES ANNUAL REPORTTO SHAREHOLDERS |
Table of Contents
Schedule of Investments (Continued)
iSHARES® MSCI BRAZIL CAPPED ETF
August 31, 2017
Schedule 1 — Affiliates (Note 2)
Investments in issuers considered to be affiliates of the Fund during the year ended August 31, 2017, for purposes of Section 2(a)(3) of the 1940 Act, and/or related parties of the Fund were as follows:
| Affiliated issuer | Shares held at | Shares purchased | Shares sold | Shares held at 08/31/17 | Value at 08/31/17 | Net realized gain(loss) a | Change in unrealized appreciation (depreciation) | Income | ||||||||||||||||||||||||
BlackRock Cash Funds: Treasury, | 1,839,027 | — | (1,822,168 | )b | 16,859 | $ | 16,859 | $ | 124 | $ | — | $ | 12,902 | |||||||||||||||||||
|
|
|
|
|
|
|
| |||||||||||||||||||||||||
| a | Includes realized capital gain distributions from an affiliated fund, if any. |
| b | Net of shares purchased and sold. |
Schedule 2 — Fair Value Measurements
Various inputs are used in determining the fair value of financial instruments. For description of the input levels and information about the Fund’s policy regarding valuation of financial instruments, see Note 1.
The following table summarizes the value of the Fund’s investments according to the fair value hierarchy as of August 31, 2017. The breakdown of the Fund’s investments into major categories is disclosed in the schedule of investments above.
| Level 1 | Level 2 | Level 3 | Total | |||||||||||||
Investments: | ||||||||||||||||
Assets: | ||||||||||||||||
Common stocks | $ | 4,045,839,419 | $ | — | $ | — | $ | 4,045,839,419 | ||||||||
Preferred stocks | 2,264,248,966 | — | — | 2,264,248,966 | ||||||||||||
Money market funds | 16,859 | — | — | 16,859 | ||||||||||||
|
|
|
|
|
|
|
| |||||||||
Total | $ | 6,310,105,244 | $ | — | $ | — | $ | 6,310,105,244 | ||||||||
|
|
|
|
|
|
|
| |||||||||
See notes to financial statements.
SCHEDULESOF INVESTMENTS | 25 |
Table of Contents
Schedule of Investments
iSHARES® MSCI CHILE CAPPED ETF
August 31, 2017
| Security | Shares | Value | ||||||
COMMON STOCKS — 92.46% |
| |||||||
AIRLINES — 4.58% |
| |||||||
LATAM Airlines Group SA | 1,708,298 | $ | 21,419,508 | |||||
|
| |||||||
| 21,419,508 | ||||||||
BANKS — 16.50% | ||||||||
Banco de Chile | 125,642,686 | 18,301,399 | ||||||
Banco de Credito e Inversiones | 266,459 | 17,279,725 | ||||||
Banco Santander Chile | 416,136,924 | 30,426,917 | ||||||
Itau CorpBanca | 1,166,531,941 | 11,146,687 | ||||||
|
| |||||||
| 77,154,728 | ||||||||
BEVERAGES — 4.54% | ||||||||
Cia. Cervecerias Unidas SA | 1,078,883 | 14,707,343 | ||||||
Vina Concha y Toro SA | 3,845,310 | 6,520,825 | ||||||
|
| |||||||
| 21,228,168 | ||||||||
CAPITAL MARKETS — 0.78% |
| |||||||
Sociedad de Inversiones Oro Blanco SA | 366,739,579 | 3,656,075 | ||||||
|
| |||||||
| 3,656,075 | ||||||||
CONSTRUCTION & ENGINEERING — 1.17% |
| |||||||
SalfaCorp SA | 3,612,373 | 5,466,557 | ||||||
|
| |||||||
| 5,466,557 | ||||||||
DIVERSIFIED FINANCIAL SERVICES — 1.05% |
| |||||||
Inversiones La Construccion SA | 340,000 | 4,894,736 | ||||||
|
| |||||||
| 4,894,736 | ||||||||
ELECTRIC UTILITIES — 13.40% |
| |||||||
Enel Americas SA | 185,528,025 | 40,022,969 | ||||||
Enel Chile SA | 117,648,210 | 13,851,427 | ||||||
Engie Energia Chile SA | 4,180,708 | 8,791,967 | ||||||
|
| |||||||
| 62,666,363 | ||||||||
FOOD & STAPLES RETAILING — 4.48% |
| |||||||
Cencosud SA | 6,971,345 | 20,957,076 | ||||||
|
| |||||||
| 20,957,076 | ||||||||
INDEPENDENT POWER AND RENEWABLE ELECTRICITY PRODUCERS — 8.37% |
| |||||||
AES Gener SA | 23,519,276 | 8,229,726 | ||||||
Colbun SA | 58,169,749 | 14,012,982 | ||||||
Enel Generacion Chile SA | 19,911,875 | 16,879,024 | ||||||
|
| |||||||
| 39,121,732 | ||||||||
IT SERVICES — 1.56% | ||||||||
SONDA SA | 3,952,966 | 7,309,125 | ||||||
|
| |||||||
| 7,309,125 | ||||||||
| Security | Shares | Value | ||||||
MARINE — 0.46% | ||||||||
Cia. Sud Americana de Vapores SAa | 41,129,979 | $ | 2,143,414 | |||||
|
| |||||||
| 2,143,414 | ||||||||
METALS & MINING — 1.70% |
| |||||||
CAP SA | 677,989 | 7,959,175 | ||||||
|
| |||||||
| 7,959,175 | ||||||||
MULTILINE RETAIL — 11.45% |
| |||||||
Ripley Corp. SA | 6,866,604 | 6,585,795 | ||||||
SACI Falabella | 4,668,742 | 46,939,266 | ||||||
|
| |||||||
| 53,525,061 | ||||||||
OIL, GAS & CONSUMABLE FUELS — 7.89% |
| |||||||
Empresas COPEC SA | 2,888,773 | 36,876,398 | ||||||
|
| |||||||
| 36,876,398 | ||||||||
PAPER & FOREST PRODUCTS — 4.53% |
| |||||||
Empresas CMPC SA | 8,122,840 | 21,201,538 | ||||||
|
| |||||||
| 21,201,538 | ||||||||
REAL ESTATE MANAGEMENT & DEVELOPMENT — 2.65% |
| |||||||
Parque Arauco SA | 4,557,152 | 12,413,170 | ||||||
|
| |||||||
| 12,413,170 | ||||||||
TEXTILES, APPAREL & LUXURY GOODS — 0.85% |
| |||||||
Forus SA | 961,794 |
| 3,978,090
|
| ||||
|
| |||||||
| 3,978,090 | ||||||||
WATER UTILITIES — 3.97% |
| |||||||
Aguas Andinas SA Series A | 19,485,307 | 12,445,122 | ||||||
Inversiones Aguas Metropolitanas SA | 3,461,208 | 6,137,691 | ||||||
|
| |||||||
| 18,582,813 | ||||||||
WIRELESS TELECOMMUNICATION SERVICES — 2.53% |
| |||||||
Empresa Nacional de Telecomunicaciones SA | 1,133,842 | 11,846,848 | ||||||
|
| |||||||
| 11,846,848 | ||||||||
|
| |||||||
TOTAL COMMON STOCKS |
| |||||||
(Cost: $291,745,101) |
| 432,400,575 | ||||||
PREFERRED STOCKS — 7.45% |
| |||||||
BEVERAGES — 2.04% |
| |||||||
Embotelladora Andina SA Class B, Preference Shares | 2,026,764 | 9,550,405 | ||||||
|
| |||||||
| 9,550,405 | ||||||||
| 26 | 2017 iSHARES ANNUAL REPORTTO SHAREHOLDERS |
Table of Contents
Schedule of Investments (Continued)
iSHARES® MSCI CHILE CAPPED ETF
August 31, 2017
| Security | Shares | Value | ||||||
CHEMICALS — 5.41% | ||||||||
Sociedad Quimica y Minera de Chile SA Series B, Preference Shares | 540,685 | $ | 25,267,069 | |||||
|
| |||||||
| 25,267,069 | ||||||||
|
| |||||||
TOTAL PREFERRED STOCKS |
| |||||||
(Cost: $16,928,654) |
| 34,817,474 | ||||||
SHORT-TERM INVESTMENTS — 0.05% |
| |||||||
MONEY MARKET FUNDS — 0.05% |
| |||||||
BlackRock Cash Funds: Treasury, | 227,709 | 227,709 | ||||||
|
| |||||||
| 227,709 | ||||||||
|
| |||||||
TOTAL SHORT-TERM INVESTMENTS |
| |||||||
(Cost: $227,709) |
| 227,709 | ||||||
|
| |||||||
| Value | ||||||||
TOTAL INVESTMENTS IN | ||||||||
(Cost: $308,901,464)d |
| $ | 467,445,758 | |||||
Other Assets, Less Liabilities — 0.04% |
| 199,290 | ||||||
|
| |||||||
NET ASSETS — 100.00% |
| $ | 467,645,048 | |||||
|
| |||||||
| a | Non-income earning security. |
| b | Affiliated issuer. See Schedule 1. |
| c | The rate quoted is the annualized seven-day yield of the fund at period end. |
| d | The cost of investments (including short positions and derivatives, if any) for federal income tax purposes was $357,550,061. Net unrealized appreciation was $109,895,697, of which $159,405,608 represented gross unrealized appreciation on investments and $49,509,911 represented gross unrealized depreciation on investments. |
Schedule 1 — Affiliates (Note 2)
Investments in issuers considered to be affiliates of the Fund during the year ended August 31, 2017, for purposes of Section 2(a)(3) of the 1940 Act, and/or related parties of the Fund were as follows:
| Affiliated issuer | Shares held at 08/31/16 | Shares purchased | Shares sold | Shares held at 08/31/17 | Value at 08/31/17 | Net realized gain (loss) a | Change in unrealized appreciation (depreciation) | Income | ||||||||||||||||||||||||
BlackRock Cash Funds: Treasury, SL Agency Shares | 345,371 | — | (117,662 | )b | 227,709 | $ | 227,709 | $ | 61 | $ | — | $ | 4,952 | |||||||||||||||||||
|
|
|
|
|
|
|
| |||||||||||||||||||||||||
| a | Includes realized capital gain distributions from an affiliated fund, if any. |
| b | Net of shares purchased and sold. |
Schedule 2 — Fair Value Measurements
Various inputs are used in determining the fair value of financial instruments. For description of the input levels and information about the Fund’s policy regarding valuation of financial instruments, see Note 1.
The following table summarizes the value of the Fund’s investments according to the fair value hierarchy as of August 31, 2017. The breakdown of the Fund’s investments into major categories is disclosed in the schedule of investments above.
| Level 1 | Level 2 | Level 3 | Total | |||||||||||||
Investments: | ||||||||||||||||
Assets: | ||||||||||||||||
Common stocks | $ | 432,400,575 | $ | — | $ | — | $ | 432,400,575 | ||||||||
Preferred stocks | 34,817,474 | — | — | 34,817,474 | ||||||||||||
Money market funds | 227,709 | — | — | 227,709 | ||||||||||||
|
|
|
|
|
|
|
| |||||||||
Total | $ | 467,445,758 | $ | — | $ | — | $ | 467,445,758 | ||||||||
|
|
|
|
|
|
|
| |||||||||
See notes to financial statements.
SCHEDULESOF INVESTMENTS | 27 |
Table of Contents
Schedule of Investments
iSHARES® MSCI COLOMBIA CAPPED ETF
August 31, 2017
| Security | Shares | Value | ||||||
COMMON STOCKS — 69.46% |
| |||||||
BANKS — 6.85% |
| |||||||
Banco de Bogota SA | 7,407 | $ | 173,504 | |||||
Bancolombia SA | 115,436 | 1,293,600 | ||||||
Grupo Aval Acciones y Valores SA | 179,112 | 79,679 | ||||||
|
| |||||||
| 1,546,783 | ||||||||
CAPITAL MARKETS — 2.41% |
| |||||||
Bolsa de Valores de Colombia | 61,903,125 | 544,449 | ||||||
|
| |||||||
| 544,449 | ||||||||
CONSTRUCTION & ENGINEERING — 2.01% |
| |||||||
Construcciones El Condor SA | 533,882 | 203,053 | ||||||
Constructora Conconcreto SA | 715,380 | 250,218 | ||||||
|
| |||||||
| 453,271 | ||||||||
CONSTRUCTION MATERIALS — 12.96% |
| |||||||
Cementos Argos SA | 245,802 | 998,301 | ||||||
Cemex Latam Holdings SAa | 204,568 | 778,038 | ||||||
Grupo Argos SA/Colombia | 161,581 | 1,151,173 | ||||||
|
| |||||||
| 2,927,512 | ||||||||
DIVERSIFIED FINANCIAL SERVICES — 9.81% |
| |||||||
Corp. Financiera Colombiana SA | 22,233 | 217,287 | ||||||
Grupo de Inversiones Suramericana SA | 141,871 | 1,999,340 | ||||||
|
| |||||||
| 2,216,627 | ||||||||
DIVERSIFIED TELECOMMUNICATION SERVICES — 1.87% |
| |||||||
Empresa de Telecomunicaciones de Bogotaa | 2,256,002 | 422,120 | ||||||
|
| |||||||
| 422,120 | ||||||||
ELECTRIC UTILITIES — 8.08% |
| |||||||
Celsia SA ESP | 120,402 | 192,166 | ||||||
Enel Americas SA | 2,876,676 | 620,570 | ||||||
Interconexion Electrica SA ESP | 223,049 | 1,011,933 | ||||||
|
| |||||||
| 1,824,669 | ||||||||
FOOD & STAPLES RETAILING — 4.32% |
| |||||||
Almacenes Exito SA | 187,271 | 976,802 | ||||||
|
| |||||||
| 976,802 | ||||||||
FOOD PRODUCTS — 4.59% |
| |||||||
Grupo Nutresa SA | 112,577 | 1,037,539 | ||||||
|
| |||||||
| 1,037,539 | ||||||||
GAS UTILITIES — 4.20% |
| |||||||
Empresa de Energia de Bogota SA ESP | 1,434,618 | 949,983 | ||||||
|
| |||||||
| 949,983 | ||||||||
| Security | Shares | Value | ||||||
METALS & MINING — 1.94% |
| |||||||
Mineros SA | 488,591 | $ | 438,020 | |||||
|
| |||||||
| 438,020 | ||||||||
OIL, GAS & CONSUMABLE FUELS — 10.42% |
| |||||||
Canacol Energy Ltd.a,b | 204,061 | 683,594 | ||||||
Ecopetrol SA | 2,243,987 | 1,043,965 | ||||||
Empresas COPEC SA | 49,148 | 627,395 | ||||||
|
| |||||||
| 2,354,954 | ||||||||
|
| |||||||
TOTAL COMMON STOCKS |
| |||||||
(Cost: $13,422,343) |
| 15,692,729 | ||||||
PREFERRED STOCKS — 30.46% |
| |||||||
AIRLINES — 2.51% |
| |||||||
Avianca Holdings SA, Preference Shares | 593,065 | 565,918 | ||||||
|
| |||||||
| 565,918 | ||||||||
BANKS — 21.16% |
| |||||||
Banco Davivienda SA, Preference Shares | 89,201 | 999,605 | ||||||
Bancolombia SA, Preference Shares | 274,815 | 3,135,629 | ||||||
Grupo Aval Acciones y Valores SA, Preference Shares | 1,441,209 | 646,020 | ||||||
|
| |||||||
| 4,781,254 | ||||||||
CONSTRUCTION MATERIALS — 3.54% |
| |||||||
Cementos Argos SA, Preference Shares | 77,646 | 279,492 | ||||||
Grupo Argos SA/Colombia, Preference Shares | 82,370 | 520,268 | ||||||
|
| |||||||
| 799,760 | ||||||||
DIVERSIFIED FINANCIAL SERVICES — 3.25% |
| |||||||
Grupo de Inversiones Suramericana SA, Preference Shares | 53,732 | 734,237 | ||||||
|
| |||||||
| 734,237 | ||||||||
|
| |||||||
TOTAL PREFERRED STOCKS |
| |||||||
(Cost: $5,689,240) |
| 6,881,169 | ||||||
SHORT-TERM INVESTMENTS — 0.51% |
| |||||||
MONEY MARKET FUNDS — 0.51% |
| |||||||
BlackRock Cash Funds: Institutional, SL Agency Shares | 59,106 | 59,124 | ||||||
| 28 | 2017 iSHARES ANNUAL REPORTTO SHAREHOLDERS |
Table of Contents
Schedule of Investments (Continued)
iSHARES® MSCI COLOMBIA CAPPED ETF
August 31, 2017
| Security | Shares | Value | ||||||
BlackRock Cash Funds: Treasury, | 57,311 | $ | 57,311 | |||||
|
| |||||||
| 116,435 | ||||||||
|
| |||||||
TOTAL SHORT-TERM INVESTMENTS |
| |||||||
(Cost: $116,439) |
| 116,435 | ||||||
|
| |||||||
TOTAL INVESTMENTS IN SECURITIES —100.43% | ||||||||
(Cost: $19,228,022)f |
| 22,690,333 | ||||||
Other Assets, Less Liabilities — (0.43)% |
| (96,450 | ) | |||||
|
| |||||||
NET ASSETS — 100.00% |
| $ | 22,593,883 | |||||
|
| |||||||
| a | Non-income earning security. |
| b | All or a portion of this security represents a security on loan. See Note 1. |
| c | Affiliated issuer. See Schedule 1. |
| d | The rate quoted is the annualized seven-day yield of the fund at period end. |
| e | All or a portion of this security represents an investment of securities lending collateral. See Note 1. |
| f | The cost of investments (including short positions and derivatives, if any) for federal income tax purposes was $23,407,794. Net unrealized depreciation was $717,461, of which $3,532,300 represented gross unrealized appreciation on investments and $4,249,761 represented gross unrealized depreciation on investments. |
Schedule 1 — Affiliates (Note 2)
Investments in issuers considered to be affiliates of the Fund during the year ended August 31, 2017, for purposes of Section 2(a)(3) of the 1940 Act, and/or related parties of the Fund were as follows:
| Affiliated issuer | Shares held at 08/31/16 | Shares purchased | Shares sold | Shares held at 08/31/17 | Value at 08/31/17 | Net realized gain (loss) a | Change in unrealized appreciation (depreciation) | Income | ||||||||||||||||||||||||
BlackRock Cash Funds: Institutional, | — | 59,106 | b | — | 59,106 | $ | 59,124 | $ | 186 | $ | (4 | ) | $ | — | c | |||||||||||||||||
BlackRock Cash Funds: Treasury, | 10,146 | 47,165 | b | — | 57,311 | 57,311 | 3 | — | 190 | |||||||||||||||||||||||
|
|
|
|
|
|
|
| |||||||||||||||||||||||||
| $ | 116,435 | $ | 189 | $ | (4 | ) | $ | 190 | ||||||||||||||||||||||||
|
|
|
|
|
|
|
| |||||||||||||||||||||||||
| a | Includes realized capital gain distributions from an affiliated fund, if any. |
| b | Net of shares purchased and sold. |
| c | Does not include income earned on the investment of securities lending cash collateral which is not direct income of the Fund and is reflected as a component of securities lending income in the statement of operations. |
Schedule 2 — Fair Value Measurements
Various inputs are used in determining the fair value of financial instruments. For description of the input levels and information about the Fund’s policy regarding valuation of financial instruments, see Note 1.
The following table summarizes the value of the Fund’s investments according to the fair value hierarchy as of August 31, 2017. The breakdown of the Fund’s investments into major categories is disclosed in the schedule of investments above.
| Level 1 | Level 2 | Level 3 | Total | |||||||||||||
Investments: | ||||||||||||||||
Assets: | ||||||||||||||||
Common stocks | $ | 15,692,729 | $ | — | $ | — | $ | 15,692,729 | ||||||||
Preferred stocks | 6,881,169 | — | — | 6,881,169 | ||||||||||||
Money market funds | 116,435 | — | — | 116,435 | ||||||||||||
|
|
|
|
|
|
|
| |||||||||
Total | $ | 22,690,333 | $ | — | $ | — | $ | 22,690,333 | ||||||||
|
|
|
|
|
|
|
| |||||||||
See notes to financial statements.
SCHEDULESOF INVESTMENTS | 29 |
Table of Contents
Schedule of Investments
iSHARES® MSCI ISRAEL CAPPED ETF
August 31, 2017
| Security | Shares | Value | ||||||
COMMON STOCKS — 99.80% |
| |||||||
AEROSPACE & DEFENSE — 3.27% |
| |||||||
Elbit Systems Ltd. | 21,163 | $ | 2,911,893 | |||||
|
| |||||||
| 2,911,893 | ||||||||
AIRLINES — 0.17% |
| |||||||
El Al Israel Airlines | 229,008 | 150,686 | ||||||
|
| |||||||
| 150,686 | ||||||||
BANKS — 19.52% |
| |||||||
Bank Hapoalim BM | 856,208 | 5,760,333 | ||||||
Bank Leumi Le-Israel BM | 1,164,574 | 6,097,807 | ||||||
First International Bank of Israel Ltd. | 42,268 | 771,905 | ||||||
Israel Discount Bank Ltd. Class Aa | 1,011,715 | 2,521,213 | ||||||
Mizrahi Tefahot Bank Ltd. | 126,486 | 2,252,778 | ||||||
|
| |||||||
| 17,404,036 | ||||||||
BUILDING PRODUCTS — 0.73% |
| |||||||
Caesarstone Ltd.a | 22,372 | 648,229 | ||||||
|
| |||||||
| 648,229 | ||||||||
CHEMICALS — 6.00% |
| |||||||
Frutarom Industries Ltd. | 34,820 | 2,671,703 | ||||||
Israel Chemicals Ltd. | 466,448 | 2,010,591 | ||||||
Israel Corp. Ltd. (The)a | 3,507 | 669,201 | ||||||
|
| |||||||
| 5,351,495 | ||||||||
COMMUNICATIONS EQUIPMENT — 1.50% |
| |||||||
Ituran Location and Control Ltd. | 17,401 | 581,193 | ||||||
Radware Ltd.a | 43,008 | 757,371 | ||||||
|
| |||||||
| 1,338,564 | ||||||||
CONSTRUCTION & ENGINEERING — 1.43% |
| |||||||
Electra Ltd./Israel | 1,996 | 436,303 | ||||||
Shapir Engineering and Industry Ltd. | 106,367 | 344,310 | ||||||
Shikun & Binui Ltd. | 216,584 | 498,971 | ||||||
|
| |||||||
| 1,279,584 | ||||||||
DIVERSIFIED TELECOMMUNICATION SERVICES — 3.35% |
| |||||||
B Communications Ltd.a | 16,613 | 246,695 | ||||||
Bezeq The Israeli Telecommunication Corp. Ltd. | 1,862,099 | 2,741,244 | ||||||
|
| |||||||
| 2,987,939 | ||||||||
ELECTRONIC EQUIPMENT, INSTRUMENTS & COMPONENTS — 1.88% |
| |||||||
Orbotech Ltd.a | 42,123 | 1,673,968 | ||||||
|
| |||||||
| 1,673,968 | ||||||||
| Security | Shares | Value | ||||||
EQUITY REAL ESTATE INVESTMENT TRUSTS |
| |||||||
REIT 1 Ltd. | 166,882 | $ | 650,005 | |||||
|
| |||||||
| 650,005 | ||||||||
FOOD & STAPLES RETAILING — 0.85% |
| |||||||
Rami Levy Chain Stores Hashikma Marketing 2006 Ltd. | 7,227 | 350,605 | ||||||
Shufersal Ltd. | 75,995 | 412,112 | ||||||
|
| |||||||
| 762,717 | ||||||||
FOOD PRODUCTS — 0.91% | ||||||||
Strauss Group Ltd. | 43,891 | 810,478 | ||||||
|
| |||||||
| 810,478 | ||||||||
HEALTH CARE EQUIPMENT & SUPPLIES — 0.31% |
| |||||||
Mazor Robotics Ltd.a | 11,432 | 276,919 | ||||||
|
| |||||||
| 276,919 | ||||||||
HOUSEHOLD DURABLES — 0.59% | ||||||||
SodaStream International Ltd.a | 8,682 | 522,917 | ||||||
|
| |||||||
| 522,917 | ||||||||
INDEPENDENT POWER AND RENEWABLE ELECTRICITY PRODUCERS — 0.33% |
| |||||||
Kenon Holdings Ltd./Singaporea | 20,772 | 291,311 | ||||||
|
| |||||||
| 291,311 | ||||||||
INSURANCE — 2.90% | ||||||||
Clal Insurance Enterprises Holdings Ltd.a | 22,800 | 352,872 | ||||||
Harel Insurance Investments & Financial Services Ltd. | 108,505 | 667,370 | ||||||
IDI Insurance Co. Ltd. | 7,311 | 462,511 | ||||||
Menora Mivtachim Holdings Ltd. | 29,680 | 360,051 | ||||||
Migdal Insurance & Financial Holding Ltd. | 410,261 | 403,552 | ||||||
Phoenix Holdings Ltd. (The)a | 75,615 | 335,208 | ||||||
|
| |||||||
| 2,581,564 | ||||||||
INTERNET SOFTWARE & SERVICES — 1.86% |
| |||||||
Wix.com Ltd.a,b | 25,528 | 1,661,873 | ||||||
|
| |||||||
| 1,661,873 | ||||||||
IT SERVICES — 0.62% | ||||||||
Formula Systems 1985 Ltd. | 4,318 | 168,186 | ||||||
Matrix IT Ltd. | 38,281 | 387,971 | ||||||
|
| |||||||
| 556,157 | ||||||||
MACHINERY — 0.55% | ||||||||
Kornit Digital Ltd.a | 28,905 | 491,385 | ||||||
|
| |||||||
| 491,385 | ||||||||
| 30 | 2017 iSHARES ANNUAL REPORTTO SHAREHOLDERS |
Table of Contents
Schedule of Investments (Continued)
iSHARES® MSCI ISRAEL CAPPED ETF
August 31, 2017
| Security | Shares | Value | ||||||
OIL, GAS & CONSUMABLE FUELS — 3.71% |
| |||||||
Delek Group Ltd. | 4,183 | $ | 801,927 | |||||
Jerusalem Oil Explorationa | 9,218 | 475,744 | ||||||
Naphtha Israel Petroleum Corp. Ltd.a | 43,381 | 292,699 | ||||||
Oil Refineries Ltd. | 1,417,788 | 658,563 | ||||||
Paz Oil Co. Ltd. | 6,769 | 1,076,125 | ||||||
|
| |||||||
| 3,305,058 | ||||||||
PHARMACEUTICALS — 15.48% | ||||||||
Neuroderm Ltd.a,b | 16,199 | 627,711 | ||||||
Taro Pharmaceutical Industries Ltd.a,b | 10,088 | 1,057,626 | ||||||
Teva Pharmaceutical Industries Ltd. ADR | 764,140 | 12,119,260 | ||||||
|
| |||||||
| 13,804,597 | ||||||||
REAL ESTATE MANAGEMENT & DEVELOPMENT — 9.05% |
| |||||||
Africa Israel Properties Ltd.a | 15,474 | 333,705 | ||||||
Airport City Ltd.a | 67,164 | 862,332 | ||||||
Alony Hetz Properties & Investments Ltd. | 100,249 | 1,039,762 | ||||||
Amot Investments Ltd. | 125,972 | 677,864 | ||||||
Azrieli Group Ltd. | 38,587 | 2,223,783 | ||||||
Bayside Land Corp. | 823 | 360,485 | ||||||
Big Shopping Centers Ltd. | 2,377 | 167,407 | ||||||
Blue Square Real Estate Ltd. | 3,699 | 155,214 | ||||||
Gazit-Globe Ltd. | 94,644 | 921,464 | ||||||
Jerusalem Economy Ltd.a | 69,233 | 165,986 | ||||||
Melisron Ltd. | 17,317 | 876,297 | ||||||
Norstar Holdings Inc. | 15,223 | 283,608 | ||||||
|
| |||||||
| 8,067,907 | ||||||||
SEMICONDUCTORS & SEMICONDUCTOR EQUIPMENT — 2.62% |
| |||||||
Tower Semiconductor Ltd.a | 78,975 | 2,334,020 | ||||||
|
| |||||||
| 2,334,020 | ||||||||
SOFTWARE — 19.44% | ||||||||
Check Point Software Technologies Ltd.a,b | 109,264 | 12,223,364 | ||||||
CyberArk Software Ltd.a | 18,994 | 759,950 | ||||||
Nice Ltd. | 51,903 | 4,017,195 | ||||||
Sapiens International Corp. NVa | 29,913 | 333,103 | ||||||
|
| |||||||
| 17,333,612 | ||||||||
SPECIALTY RETAIL — 0.38% | ||||||||
Delek Automotive Systems Ltd. | 44,517 | 335,865 | ||||||
|
| |||||||
| 335,865 | ||||||||
| Security | Shares | Value | ||||||
TEXTILES, APPAREL & LUXURY GOODS — 0.38% |
| |||||||
Delta-Galil Industries Ltd.b | 10,763 | $ | 338,796 | |||||
|
| |||||||
| 338,796 | ||||||||
WIRELESS TELECOMMUNICATION SERVICES — 1.24% |
| |||||||
Cellcom Israel Ltd.a | 59,152 | 524,949 | ||||||
Partner Communications Co. Ltd.a | 115,933 | 580,853 | ||||||
|
| |||||||
| 1,105,802 | ||||||||
|
| |||||||
TOTAL COMMON STOCKS |
| |||||||
(Cost: $101,895,252) |
| 88,977,377 | ||||||
SHORT-TERM INVESTMENTS — 17.47% |
| |||||||
MONEY MARKET FUNDS — 17.47% |
| |||||||
BlackRock Cash Funds: Institutional, |
| |||||||
1.32%c,d,e | 15,525,641 | 15,530,299 | ||||||
BlackRock Cash Funds: Treasury, SL Agency Shares | ||||||||
0.96%c,d | 40,997 | 40,997 | ||||||
|
| |||||||
| 15,571,296 | ||||||||
|
| |||||||
TOTAL SHORT-TERM INVESTMENTS |
| |||||||
(Cost: $15,570,750) |
| 15,571,296 | ||||||
|
| |||||||
TOTAL INVESTMENTS |
| |||||||
(Cost: $117,466,002)f |
| 104,548,673 | ||||||
Other Assets, Less Liabilities — (17.27)% |
| (15,396,683 | ) | |||||
|
| |||||||
NET ASSETS — 100.00% |
| $ | 89,151,990 | |||||
|
| |||||||
ADR — American Depositary Receipts |
| a | Non-income earning security. |
| b | All or a portion of this security represents a security on loan. See Note 1. |
| c | Affiliated issuer. See Schedule 1. |
| d | The rate quoted is the annualized seven-day yield of the fund at period end. |
| e | All or a portion of this security represents an investment of securities lending collateral. See Note 1. |
| f | The cost of investments (including short positions and derivatives, if any) for federal income tax purposes was $120,153,167. Net unrealized depreciation was $15,604,494, of which $15,531,405 represented gross unrealized appreciation on investments and $31,135,899 represented gross unrealized depreciation on investments. |
SCHEDULESOF INVESTMENTS | 31 |
Table of Contents
Schedule of Investments (Continued)
iSHARES® MSCI ISRAEL CAPPED ETF
August 31, 2017
Schedule 1 — Affiliates (Note 2)
Investments in issuers considered to be affiliates of the Fund during the year ended August 31, 2017, for purposes of Section 2(a)(3) of the 1940 Act, and/or related parties of the Fund were as follows:
| Affiliated issuer | Shares held at 08/31/16 | Shares purchased | Shares sold | Shares held at 08/31/17 | Value at 08/31/17 | Net realized gain (loss) a | Change in unrealized appreciation (depreciation) | Income | ||||||||||||||||||||||||
BlackRock Cash Funds: Institutional, SL Agency Shares | 13,438,272 | 2,087,369 | b | — | 15,525,641 | $ | 15,530,299 | $ | 2,928 | $ | 546 | $ | — | c | ||||||||||||||||||
BlackRock Cash Funds: Treasury, SL Agency Shares | 31,046 | 9,951 | b | — | 40,997 | 40,997 | 1 | — | 454 | |||||||||||||||||||||||
|
|
|
|
|
|
|
| |||||||||||||||||||||||||
| $ | 15,571,296 | $ | 2,929 | $ | 546 | $ | 454 | |||||||||||||||||||||||||
|
|
|
|
|
|
|
| |||||||||||||||||||||||||
| a | Includes realized capital gain distributions from an affiliated fund, if any. |
| b | Net of shares purchased and sold. |
| c | Does not include income earned on the investment of securities lending cash collateral which is not direct income of the Fund and is reflected as a component of securities lending income in the statement of operations. |
Schedule 2 — Fair Value Measurements
Various inputs are used in determining the fair value of financial instruments. For description of the input levels and information about the Fund’s policy regarding valuation of financial instruments, see Note 1.
The following table summarizes the value of the Fund’s investments according to the fair value hierarchy as of August 31, 2017. The breakdown of the Fund’s investments into major categories is disclosed in the schedule of investments above.
| Level 1 | Level 2 | Level 3 | Total | |||||||||||||
Investments: | ||||||||||||||||
Assets: | ||||||||||||||||
Common stocks | $ | 88,977,377 | $ | — | $ | — | $ | 88,977,377 | ||||||||
Money market funds | 15,571,296 | — | — | 15,571,296 | ||||||||||||
|
|
|
|
|
|
|
| |||||||||
Total | $ | 104,548,673 | $ | — | $ | — | $ | 104,548,673 | ||||||||
|
|
|
|
|
|
|
| |||||||||
See notes to financial statements.
| 32 | 2017 iSHARES ANNUAL REPORTTO SHAREHOLDERS |
Table of Contents
Schedule of Investments
iSHARES® MSCI RUSSIA CAPPED ETF
August 31, 2017
| Security | Shares | Value | ||||||
COMMON STOCKS — 96.15% |
| |||||||
BANKS — 22.37% |
| |||||||
Sberbank of Russia PJSC | 11,591,520 | $ | 36,703,652 | |||||
Sberbank of Russia PJSC ADR | 4,270,972 | 58,298,768 | ||||||
VTB Bank PJSC | 7,757,295,000 | 8,655,579 | ||||||
VTB Bank PJSC GDRa | 6,681,851 | 14,927,255 | ||||||
|
| |||||||
| 118,585,254 | ||||||||
CAPITAL MARKETS — 2.47% |
| |||||||
Moscow Exchange MICEX-RTS PJSC | 7,228,180 | 13,093,492 | ||||||
|
| |||||||
| 13,093,492 | ||||||||
CHEMICALS — 1.80% |
| |||||||
PhosAgro PJSC GDRa | 686,602 | 9,543,768 | ||||||
|
| |||||||
| 9,543,768 | ||||||||
DIVERSIFIED TELECOMMUNICATION SERVICES — 1.51% |
| |||||||
Rostelecom PJSC | 6,986,700 | 7,994,252 | ||||||
|
| |||||||
| 7,994,252 | ||||||||
ELECTRIC UTILITIES — 3.82% |
| |||||||
Inter RAO UES PJSC | 153,452,000 | 10,223,087 | ||||||
RusHydro PJSC | 706,031,000 | 10,049,165 | ||||||
|
| |||||||
| 20,272,252 | ||||||||
FOOD & STAPLES RETAILING — 4.88% |
| |||||||
Magnit PJSC GDRa | 618,739 | 25,857,103 | ||||||
|
| |||||||
| 25,857,103 | ||||||||
METALS & MINING — 13.47% |
| |||||||
Alrosa PJSC | 12,220,500 | 16,991,913 | ||||||
MMC Norilsk Nickel PJSC | 153,164 | 25,793,266 | ||||||
Novolipetsk Steel PJSC | 5,426,221 | 12,847,273 | ||||||
Severstal PJSC | 1,006,195 | 15,783,791 | ||||||
| �� |
|
| ||||||
| 71,416,243 | ||||||||
OIL, GAS & CONSUMABLE FUELS — 41.04% |
| |||||||
Gazprom PJSC | 24,639,727 | 49,945,564 | ||||||
Gazprom PJSC ADR | 4,596,412 | 18,339,684 | ||||||
Lukoil PJSC | 1,059,726 | 53,465,298 | ||||||
Lukoil PJSC ADR | 286,204 | 14,381,751 | ||||||
Novatek PJSC GDRa | 228,796 | 24,183,737 | ||||||
Rosneft Oil Co. PJSC | 1,363,360 | 7,174,220 | ||||||
Rosneft Oil Co. PJSC GDRa | 2,688,808 | 13,981,802 | ||||||
Surgutneftegas OJSC | 18,900,900 | 8,743,395 | ||||||
Surgutneftegas OJSC ADR | 727,240 | 3,326,396 | ||||||
Tatneft PJSC Class S | 3,629,815 | 24,000,843 | ||||||
|
| |||||||
| 217,542,690 | ||||||||
| Security | Shares | Value | ||||||
WIRELESS TELECOMMUNICATION SERVICES — 4.79% |
| |||||||
Mobile TeleSystems PJSC ADR | 1,989,701 | $ | 19,877,113 | |||||
Sistema PJSC FC GDRa | 1,324,883 | 5,498,264 | ||||||
|
| |||||||
| 25,375,377 | ||||||||
|
| |||||||
TOTAL COMMON STOCKS |
| |||||||
(Cost: $511,995,234) |
| 509,680,431 | ||||||
|
| |||||||
PREFERRED STOCKS — 3.51% |
| |||||||
OIL, GAS & CONSUMABLE FUELS — 3.51% |
| |||||||
Surgutneftegas OJSC, Preference Shares | 24,906,100 | 12,295,444 | ||||||
Transneft PJSC, Preference Shares | 2,064 | 6,324,387 | ||||||
|
| |||||||
| 18,619,831 | ||||||||
TOTAL PREFERRED STOCKS |
| |||||||
(Cost: $19,003,290) |
| 18,619,831 | ||||||
SHORT-TERM INVESTMENTS — 0.20% |
| |||||||
MONEY MARKET FUNDS — 0.20% |
| |||||||
BlackRock Cash Funds: Treasury, |
| |||||||
0.96%b,c | 1,026,049 | 1,026,049 | ||||||
|
| |||||||
| 1,026,049 | ||||||||
|
| |||||||
TOTAL SHORT-TERM INVESTMENTS |
| |||||||
(Cost: $1,026,049) |
| 1,026,049 | ||||||
|
| |||||||
TOTAL INVESTMENTS | ||||||||
(Cost: $532,024,573)d | 529,326,311 | |||||||
Other Assets, Less Liabilities — 0.14% |
| 750,138 | ||||||
|
| |||||||
NET ASSETS — 100.00% |
| $ | 530,076,449 | |||||
|
| |||||||
ADR — American Depositary Receipts
GDR — Global Depositary Receipts
| a | This security may be resold to qualified foreign investors and foreign institutional buyers under Regulation S of the Securities Act of 1933. |
| b | Affiliated issuer. See Schedule 1. |
| c | The rate quoted is the annualized seven-day yield of the fund at period end. |
| d | The cost of investments (including short positions and derivatives, if any) for federal income tax purposes was $570,200,939. Net unrealized depreciation was $40,874,628, of which $44,317,515 represented gross unrealized appreciation on investments and $85,192,143 represented gross unrealized depreciation on investments. |
SCHEDULESOF INVESTMENTS | 33 |
Table of Contents
Schedule of Investments (Continued)
iSHARES® MSCI RUSSIA CAPPED ETF
August 31, 2017
Schedule 1 — Affiliates (Note 2)
Investments in issuers considered to be affiliates of the Fund during the year ended August 31, 2017, for purposes of Section 2(a)(3) of the 1940 Act, and/or related parties of the Fund were as follows:
| Affiliated issuer | Shares held at 08/31/16 | Shares purchased | Shares sold | Shares held at 08/31/17 | Value at 08/31/17 | Net realized gain (loss)a | Change in unrealized appreciation (depreciation) | Income | ||||||||||||||||||||||||
BlackRock Cash Funds: Treasury, SL Agency Shares | 749,898 | 276,151b | — | 1,026,049 | $ | 1,026,049 | $ | 103 | $ | — | $ | 7,954 | ||||||||||||||||||||
|
|
|
|
|
|
|
| |||||||||||||||||||||||||
| a | Includes realized capital gain distributions from an affiliated fund, if any. |
| b | Net of shares purchased and sold. |
Schedule 2 — Fair Value Measurements
Various inputs are used in determining the fair value of financial instruments. For description of the input levels and information about the Fund’s policy regarding valuation of financial instruments, see Note 1.
The following table summarizes the value of the Fund’s investments according to the fair value hierarchy as of August 31, 2017. The breakdown of the Fund’s investments into major categories is disclosed in the schedule of investments above.
| Level 1 | Level 2 | Level 3 | Total | |||||||||||||
Investments: | ||||||||||||||||
Assets: | ||||||||||||||||
Common stocks | $ | 509,680,431 | $ | — | $ | — | $ | 509,680,431 | ||||||||
Preferred stocks | 18,619,831 | — | — | 18,619,831 | ||||||||||||
Money market funds | 1,026,049 | — | — | 1,026,049 | ||||||||||||
|
|
|
|
|
|
|
| |||||||||
Total | $ | 529,326,311 | $ | — | $ | — | $ | 529,326,311 | ||||||||
|
|
|
|
|
|
|
| |||||||||
See notes to financial statements.
| 34 | 2017 iSHARES ANNUAL REPORTTO SHAREHOLDERS |
Table of Contents
Schedule of Investments
iSHARES® MSCI SOUTH AFRICA ETF
August 31, 2017
| Security | Shares | Value | ||||||
COMMON STOCKS — 99.85% |
| |||||||
BANKS — 9.62% |
| |||||||
Barclays Africa Group Ltd. | 898,350 | $ | 10,255,601 | |||||
Capitec Bank Holdings Ltd. | 57,494 | 3,983,331 | ||||||
Nedbank Group Ltd. | 305,773 | 5,172,557 | ||||||
Standard Bank Group Ltd. | 1,627,457 | 20,964,426 | ||||||
|
| |||||||
| 40,375,915 | ||||||||
CAPITAL MARKETS — 1.81% | ||||||||
Brait SEa | 567,430 | 2,512,015 | ||||||
Coronation Fund Managers Ltd. | 375,692 | 2,033,463 | ||||||
Investec Ltd. | 400,271 | 3,050,960 | ||||||
|
| |||||||
| 7,596,438 | ||||||||
CHEMICALS — 4.99% | ||||||||
Sasol Ltd. | 694,454 | 20,938,075 | ||||||
|
| |||||||
| 20,938,075 | ||||||||
DISTRIBUTORS — 0.85% | ||||||||
Imperial Holdings Ltd. | 221,363 | 3,553,048 | ||||||
|
| |||||||
| 3,553,048 | ||||||||
DIVERSIFIED FINANCIAL SERVICES — 8.85% |
| |||||||
FirstRand Ltd. | 4,245,252 | 18,137,245 | ||||||
PSG Group Ltd. | 139,671 | 2,714,437 | ||||||
Remgro Ltd. | 677,760 | 11,333,805 | ||||||
RMB Holdings Ltd. | 965,226 | 4,934,739 | ||||||
|
| |||||||
| 37,120,226 | ||||||||
DIVERSIFIED TELECOMMUNICATION SERVICES — 0.50% |
| |||||||
Telkom SA SOC Ltd. | 430,340 | 2,077,949 | ||||||
|
| |||||||
| 2,077,949 | ||||||||
EQUITY REAL ESTATE INVESTMENT TRUSTS |
| |||||||
Fortress Income Fund Ltd. | 1,166,313 | 3,536,403 | ||||||
Fortress Income Fund Ltd. Class A | 1,695,329 | 2,287,830 | ||||||
Growthpoint Properties Ltd. | 2,932,713 | 5,674,763 | ||||||
Hyprop Investments Ltd. | 365,666 | 3,210,884 | ||||||
Redefine Properties Ltd. | 6,877,387 | 5,640,542 | ||||||
Resilient REIT Ltd. | 420,307 | 4,044,131 | ||||||
|
| |||||||
| 24,394,553 | ||||||||
FOOD & STAPLES RETAILING — 6.68% |
| |||||||
Bid Corp. Ltd. | 433,393 | 9,851,251 | ||||||
Massmart Holdings Ltd. | 189,609 | 1,774,790 | ||||||
Pick n Pay Stores Ltd. | 554,159 | 2,727,839 | ||||||
Shoprite Holdings Ltd. | 581,914 | 10,090,986 | ||||||
SPAR Group Ltd. (The) | 275,852 | 3,587,827 | ||||||
|
| |||||||
| 28,032,693 | ||||||||
| Security | Shares | Value | ||||||
FOOD PRODUCTS — 2.09% |
| |||||||
Pioneer Foods Group Ltd. | 209,711 | $ | 2,043,462 | |||||
Tiger Brands Ltd. | 216,518 | 6,713,349 | ||||||
|
| |||||||
| 8,756,811 | ||||||||
HEALTH CARE PROVIDERS & SERVICES — 1.58% |
| |||||||
Life Healthcare Group Holdings Ltd. | 1,868,148 | 3,790,195 | ||||||
Netcare Ltd. | 1,531,735 | 2,841,326 | ||||||
|
| |||||||
| 6,631,521 | ||||||||
HOUSEHOLD DURABLES — 4.38% |
| |||||||
Steinhoff International Holdings NV Class H | 3,799,281 | 18,374,518 | ||||||
|
| |||||||
| 18,374,518 | ||||||||
INDUSTRIAL CONGLOMERATES — 1.41% |
| |||||||
Bidvest Group Ltd. (The) | 449,550 | 5,930,013 | ||||||
|
| |||||||
| 5,930,013 | ||||||||
INSURANCE — 5.47% | ||||||||
Discovery Ltd. | 484,726 | 5,616,444 | ||||||
Liberty Holdings Ltd. | 222,334 | 1,772,172 | ||||||
MMI Holdings Ltd./South Africa | 1,470,832 | 2,354,916 | ||||||
Rand Merchant Investment Holdings Ltd. | 990,970 | 3,174,001 | ||||||
Sanlam Ltd. | 1,816,786 | 10,036,179 | ||||||
|
| |||||||
| 22,953,712 | ||||||||
MEDIA — 22.07% | ||||||||
Naspers Ltd. Class N | 409,180 | 92,585,967 | ||||||
|
| |||||||
| 92,585,967 | ||||||||
METALS & MINING — 4.74% | ||||||||
Anglo American Platinum Ltd.a | 87,365 | 2,369,391 | ||||||
AngloGold Ashanti Ltd. | 559,122 | 5,663,705 | ||||||
Gold Fields Ltd. | 1,139,428 | 5,084,580 | ||||||
Impala Platinum Holdings Ltd.a | 939,301 | 2,905,166 | ||||||
Sibanye Gold Ltd. | 2,430,508 | 3,883,951 | ||||||
|
| |||||||
| 19,906,793 | ||||||||
MULTILINE RETAIL — 1.45% | ||||||||
Woolworths Holdings Ltd./South Africa | 1,328,321 | 6,064,441 | ||||||
|
| |||||||
| 6,064,441 | ||||||||
OIL, GAS & CONSUMABLE FUELS — 0.74% |
| |||||||
Exxaro Resources Ltd. | 309,237 | 3,113,664 | ||||||
|
| |||||||
| 3,113,664 | ||||||||
SCHEDULESOF INVESTMENTS | 35 |
Table of Contents
Schedule of Investments (Continued)
iSHARES® MSCI SOUTH AFRICA ETF
August 31, 2017
| Security | Shares | Value | ||||||
PAPER & FOREST PRODUCTS — 2.28% |
| |||||||
Mondi Ltd. | 164,259 | $ | 4,482,858 | |||||
Sappi Ltd. | 756,763 | 5,088,755 | ||||||
|
| |||||||
| 9,571,613 | ||||||||
PHARMACEUTICALS — 2.65% | ||||||||
Aspen Pharmacare Holdings Ltd. | 498,553 | 11,120,254 | ||||||
|
| |||||||
| 11,120,254 | ||||||||
REAL ESTATE MANAGEMENT & DEVELOPMENT — 1.57% |
| |||||||
NEPI Rockcastle PLCa | 455,257 | 6,602,496 | ||||||
|
| |||||||
| 6,602,496 | ||||||||
SPECIALTY RETAIL — 3.00% | ||||||||
Foschini Group Ltd. (The) | 326,800 | 3,853,713 | ||||||
Mr. Price Group Ltd. | 340,033 | 4,741,757 | ||||||
Truworths International Ltd. | 624,362 | 3,988,519 | ||||||
|
| |||||||
| 12,583,989 | ||||||||
WIRELESS TELECOMMUNICATION SERVICES — 7.31% |
| |||||||
MTN Group Ltd. | 2,132,452 | 21,202,291 | ||||||
Vodacom Group Ltd. | 676,696 | 9,454,220 | ||||||
|
| |||||||
| 30,656,511 | ||||||||
TOTAL COMMON STOCKS |
| |||||||
(Cost: $478,404,363) |
| 418,941,200 | ||||||
| Security | Shares | Value | ||||||
SHORT-TERM INVESTMENTS — 0.05% |
| |||||||
MONEY MARKET FUNDS — 0.05% |
| |||||||
BlackRock Cash Funds: Treasury, |
| |||||||
0.96%b,c | 225,602 | $ | 225,602 | |||||
|
| |||||||
| 225,602 | ||||||||
|
| |||||||
TOTAL SHORT-TERM INVESTMENTS |
| |||||||
(Cost: $225,602) |
| 225,602 | ||||||
|
| |||||||
TOTAL INVESTMENTS IN SECURITIES — 99.90% | ||||||||
(Cost: $478,629,965)d | 419,166,802 | |||||||
Other Assets, Less Liabilities — 0.10% |
| 419,908 | ||||||
|
| |||||||
NET ASSETS — 100.00% |
| $ | 419,586,710 | |||||
|
| |||||||
| a | Non-income earning security. |
| b | Affiliated issuer. See Schedule 1. |
| c | The rate quoted is the annualized seven-day yield of the fund at period end. |
| d | The cost of investments (including short positions and derivatives, if any) for federal income tax purposes was $496,795,224. Net unrealized depreciation was $77,628,422, of which $50,255,926 represented gross unrealized appreciation on investments and $127,884,348 represented gross unrealized depreciation on investments. |
Schedule 1 — Affiliates (Note 2)
Investments in issuers considered to be affiliates of the Fund during the year ended August 31, 2017, for purposes of Section 2(a)(3) of the 1940 Act, and/or related parties of the Fund were as follows:
| Affiliated issuer | Shares held at 08/31/16 | Shares purchased | Shares sold | Shares held at 08/31/17 | Value at 08/31/17 | Net realized gain (loss)a | Change in unrealized appreciation (depreciation) | Income | ||||||||||||||||||||||||
BlackRock Cash Funds: Institutional, | 3,684,420 | — | (3,684,420 | )b | — | $ | — | $ | 932 | $ | — | $ | — | c | ||||||||||||||||||
BlackRock Cash Funds: Treasury, | 122,367 | 103,235 | b | — | 225,602 | 225,602 | 14 | — | 1,058 | |||||||||||||||||||||||
|
|
|
|
|
|
|
| |||||||||||||||||||||||||
| $ | 225,602 | $ | 946 | $ | — | $ | 1,058 | |||||||||||||||||||||||||
|
|
|
|
|
|
|
| |||||||||||||||||||||||||
| a | Includes realized capital gain distributions from an affiliated fund, if any. |
| b | Net of shares purchased and sold. |
| c | Does not include income earned on the investment of securities lending cash collateral which is not direct income of the Fund and is reflected as a component of securities lending income in the statement of operations. |
| 36 | 2017 iSHARES ANNUAL REPORTTO SHAREHOLDERS |
Table of Contents
Schedule of Investments (Continued)
iSHARES® MSCI SOUTH AFRICA ETF
August 31, 2017
Schedule 2 — Fair Value Measurements
Various inputs are used in determining the fair value of financial instruments. For description of the input levels and information about the Fund’s policy regarding valuation of financial instruments, see Note 1.
The following table summarizes the value of the Fund’s investments according to the fair value hierarchy as of August 31, 2017. The breakdown of the Fund’s investments into major categories is disclosed in the schedule of investments above.
| Level 1 | Level 2 | Level 3 | Total | |||||||||||||
Investments: | ||||||||||||||||
Assets: | ||||||||||||||||
Common stocks | $ | 418,941,200 | $ | — | $ | — | $ | 418,941,200 | ||||||||
Money market funds | 225,602 | — | — | 225,602 | ||||||||||||
|
|
|
|
|
|
|
| |||||||||
Total | $ | 419,166,802 | $ | — | $ | — | $ | 419,166,802 | ||||||||
|
|
|
|
|
|
|
| |||||||||
See notes to financial statements.
SCHEDULESOF INVESTMENTS | 37 |
Table of Contents
Schedule of Investments
August 31, 2017
| Security | Shares | Value | ||||||
COMMON STOCKS — 99.93% |
| |||||||
AEROSPACE & DEFENSE — 2.21% |
| |||||||
Aselsan Elektronik Sanayi ve TAS | 1,198,520 | $ | 9,372,794 | |||||
|
| |||||||
| 9,372,794 | ||||||||
AIRLINES — 2.61% |
| |||||||
Pegasus Hava Tasimaciligi ASa | 214,335 | 1,740,729 | ||||||
Turk Hava Yollari AOa | 3,308,398 | 9,352,497 | ||||||
|
| |||||||
| 11,093,226 | ||||||||
AUTO COMPONENTS — 0.35% |
| |||||||
Goodyear Lastikleri TASb | 488,737 | 692,220 | ||||||
Kordsa Teknik Tekstil ASb | 352,031 | 780,014 | ||||||
|
| |||||||
| 1,472,234 | ||||||||
AUTOMOBILES — 2.98% |
| |||||||
Ford Otomotiv Sanayi AS | 420,566 | 5,790,997 | ||||||
Tofas Turk Otomobil Fabrikasi AS | 749,000 | 6,855,339 | ||||||
|
| |||||||
| 12,646,336 | ||||||||
BANKS — 32.84% |
| |||||||
Akbank Turk AS | 13,187,954 | 39,496,443 | ||||||
Albaraka Turk Katilim Bankasi AS | 1,900,140 | 820,034 | ||||||
Turkiye Garanti Bankasi AS | 13,846,536 | 43,073,032 | ||||||
Turkiye Halk Bankasi AS | 3,746,352 | 16,081,139 | ||||||
Turkiye Is Bankasi Class C | 9,442,270 | 20,484,164 | ||||||
Turkiye Sinai Kalkinma Bankasi AS | 6,438,769 | 2,834,696 | ||||||
Turkiye Vakiflar Bankasi Tao Class D | 4,495,747 | 9,375,499 | ||||||
Yapi ve Kredi Bankasi ASa | 5,209,481 | 7,333,153 | ||||||
|
| |||||||
| 139,498,160 | ||||||||
BEVERAGES — 3.05% |
| |||||||
Anadolu Efes Biracilik ve Malt Sanayii AS | 1,242,166 | 7,627,382 | ||||||
Coca-Cola Icecek AS | 457,248 | 5,316,052 | ||||||
|
| |||||||
| 12,943,434 | ||||||||
BUILDING PRODUCTS — 0.59% |
| |||||||
Trakya Cam Sanayii AS | 2,366,186 | 2,522,068 | ||||||
|
| |||||||
| 2,522,068 | ||||||||
CAPITAL MARKETS — 0.15% |
| |||||||
Verusa Holding ASb | 147,818 | 645,637 | ||||||
|
| |||||||
| 645,637 | ||||||||
CHEMICALS — 2.66% |
| |||||||
Gubre Fabrikalari TASa,b | 503,767 | 733,936 | ||||||
Petkim Petrokimya Holding AS | 4,043,373 | 7,307,830 | ||||||
Soda Sanayii AS | 2,156,408 | 3,254,083 | ||||||
|
| |||||||
| 11,295,849 | ||||||||
| Security | Shares | Value | ||||||
CONSTRUCTION & ENGINEERING — 0.77% |
| |||||||
Tekfen Holding AS | 886,718 | $ | 3,289,991 | |||||
|
| |||||||
| 3,289,991 | ||||||||
CONSTRUCTION MATERIALS — 0.68% |
| |||||||
Adana Cimento Sanayii TAS Class Ab | 319,215 | 586,182 | ||||||
Akcansa Cimento AS | 288,711 | 932,391 | ||||||
Cimsa Cimento Sanayi VE Ticaret AS | 325,943 | 1,352,845 | ||||||
|
| |||||||
| 2,871,418 | ||||||||
CONTAINERS & PACKAGING — 0.17% |
| |||||||
Anadolu Cam Sanayii AS | 1,131,040 | 730,538 | ||||||
|
| |||||||
| 730,538 | ||||||||
DIVERSIFIED FINANCIAL SERVICES — 3.98% |
| |||||||
Haci Omer Sabanci Holding AS | 5,503,320 | 16,896,263 | ||||||
|
| |||||||
| 16,896,263 | ||||||||
DIVERSIFIED TELECOMMUNICATION SERVICES — 1.54% |
| |||||||
Turk Telekomunikasyon ASa | 3,146,496 | 6,543,523 | ||||||
|
| |||||||
| 6,543,523 | ||||||||
EQUITY REAL ESTATE INVESTMENT TRUSTS (REITS) — 2.52% |
| |||||||
Emlak Konut Gayrimenkul Yatirim Ortakligi ASa | 11,384,128 | 9,694,092 | ||||||
Is Gayrimenkul Yatirim Ortakligi AS | 2,448,303 | 1,006,963 | ||||||
|
| |||||||
| 10,701,055 | ||||||||
FOOD & STAPLES RETAILING — 7.07% |
| |||||||
BIM Birlesik Magazalar AS | 1,274,038 | 28,229,542 | ||||||
Migros Ticaret ASa | 212,989 | 1,782,851 | ||||||
|
| |||||||
| 30,012,393 | ||||||||
FOOD PRODUCTS — 1.30% |
| |||||||
Ulker Biskuvi Sanayi AS | 922,169 | 5,512,902 | ||||||
|
| |||||||
| 5,512,902 | ||||||||
GAS UTILITIES — 0.48% |
| |||||||
Aygaz AS | 448,874 | 2,035,993 | ||||||
|
| |||||||
| 2,035,993 | ||||||||
HEALTH CARE PROVIDERS & SERVICES — 0.20% |
| |||||||
Selcuk Ecza Deposu Ticaret ve Sanayi AS | 749,244 | 852,856 | ||||||
|
| |||||||
| 852,856 | ||||||||
HOTELS, RESTAURANTS & LEISURE — 0.28% |
| |||||||
NET Holding ASa,b | 1,544,391 | 1,176,449 | ||||||
|
| |||||||
| 1,176,449 | ||||||||
| 38 | 2017 iSHARES ANNUAL REPORTTO SHAREHOLDERS |
Table of Contents
Schedule of Investments (Continued)
iSHARES® MSCI TURKEY ETF
August 31, 2017
| Security | Shares | Value | ||||||
HOUSEHOLD DURABLES — 2.61% |
| |||||||
Arcelik AS | 1,417,629 | $ | 9,854,483 | |||||
Vestel Elektronik Sanayi ve Ticaret ASa,b | 505,885 | 1,224,951 | ||||||
|
| |||||||
| 11,079,434 | ||||||||
INDEPENDENT POWER AND RENEWABLE ELECTRICITY PRODUCERS — 0.80% |
| |||||||
Aksa Enerji Uretim ASa,b | 924,689 | 993,641 | ||||||
Zorlu Enerji Elektrik Uretim ASa,b | 4,786,435 | 2,412,245 | ||||||
|
| |||||||
| 3,405,886 | ||||||||
INDUSTRIAL CONGLOMERATES — 8.12% |
| |||||||
Alarko Holding ASb | 471,851 | 922,505 | ||||||
Dogan Sirketler Grubu Holding ASa,b | 7,837,924 | 2,088,569 | ||||||
Enka Insaat ve Sanayi AS | 1 | 2 | ||||||
KOC Holding AS | 4,559,930 | 23,826,199 | ||||||
Turkiye Sise ve Cam Fabrikalari AS | 4,718,911 | 6,068,548 | ||||||
Yazicilar Holding ASb | 239,788 | 1,566,847 | ||||||
|
| |||||||
| 34,472,670 | ||||||||
INSURANCE — 0.65% |
| |||||||
Anadolu Anonim Turk Sigorta Sirketi | 1,055,703 | 892,862 | ||||||
Anadolu Hayat Emeklilik AS | 518,769 | 1,021,746 | ||||||
AvivaSA Emeklilik ve Hayat ASb | 142,364 | 857,677 | ||||||
|
| |||||||
| 2,772,285 | ||||||||
MACHINERY — 0.85% |
| |||||||
Otokar Otomotiv Ve Savunma Sanayi ASb | 50,290 | 1,682,378 | ||||||
Turk Traktor ve Ziraat Makineleri AS | 79,699 | 1,915,980 | ||||||
|
| |||||||
| 3,598,358 | ||||||||
MEDIA — 0.38% |
| |||||||
Besiktas Futbol Yatirimlari Sanayi ve Ticaret ASa,b | 723,861 | 991,691 | ||||||
Fenerbahce Futbol ASa,b | 59,723 | 624,120 | ||||||
|
| |||||||
| 1,615,811 | ||||||||
METALS & MINING — 6.27% |
| |||||||
Borusan Mannesmann Boru Sanayi ve Ticaret ASb | 256,573 | 889,539 | ||||||
Eregli Demir ve Celik Fabrikalari TAS | 8,392,914 | 19,982,262 | ||||||
Kardemir Karabuk Demir Celik Sanayi ve Ticaret AS Class Da | 4,673,739 | 3,221,821 | ||||||
| Security | Shares | Value | ||||||
Koza Altin Isletmeleri ASa | 274,196 | $ | 2,552,507 | |||||
|
| |||||||
| 26,646,129 | ||||||||
OIL, GAS & CONSUMABLE FUELS — 6.00% |
| |||||||
Tupras Turkiye Petrol Rafinerileri AS | 750,541 | 25,499,547 | ||||||
|
| |||||||
| 25,499,547 | ||||||||
PERSONAL PRODUCTS — 0.32% |
| |||||||
EIS Eczacibasi Ilac ve Sinai ve Finansal Yatirimlar Sanayi ve Ticaret ASb | 1,033,404 | 1,361,889 | ||||||
|
| |||||||
| 1,361,889 | ||||||||
SOFTWARE — 0.35% |
| |||||||
Logo Yazilim Sanayi Ve Ticaret ASa,b | 89,878 | 1,504,670 | ||||||
|
| |||||||
| 1,504,670 | ||||||||
TEXTILES, APPAREL & LUXURY GOODS — 0.38% |
| |||||||
Aksa Akrilik Kimya Sanayii AS | 443,637 | 1,611,333 | ||||||
|
| |||||||
| 1,611,333 | ||||||||
TRANSPORTATION INFRASTRUCTURE — 1.42% |
| |||||||
TAV Havalimanlari Holding AS | 979,948 | 6,022,939 | ||||||
|
| |||||||
| 6,022,939 | ||||||||
WIRELESS TELECOMMUNICATION SERVICES — 5.35% |
| |||||||
Turkcell Iletisim Hizmetleri AS | 5,934,340 | 22,705,719 | ||||||
|
| |||||||
| 22,705,719 | ||||||||
|
| |||||||
TOTAL COMMON STOCKS | ||||||||
(Cost: $534,548,881) | 424,409,789 | |||||||
SHORT-TERM INVESTMENTS — 3.78% |
| |||||||
MONEY MARKET FUNDS — 3.78% |
| |||||||
BlackRock Cash Funds: Institutional, |
| |||||||
1.32%c,d,e | 15,951,030 | 15,955,815 | ||||||
BlackRock Cash Funds: Treasury, |
| |||||||
0.96%c,d | 100,988 | 100,988 | ||||||
|
| |||||||
| 16,056,803 | ||||||||
|
| |||||||
TOTAL SHORT-TERM INVESTMENTS |
| |||||||
(Cost: $16,052,873) | 16,056,803 | |||||||
|
| |||||||
SCHEDULESOF INVESTMENTS | 39 |
Table of Contents
Schedule of Investments (Continued)
iSHARES® MSCI TURKEY ETF
August 31, 2017
| Value | ||||||||
TOTAL INVESTMENTS |
| |||||||
(Cost: $550,601,754)f | $ | 440,466,592 | ||||||
Other Assets, Less Liabilities — (3.71)% |
| (15,740,009 | ) | |||||
|
| |||||||
NET ASSETS — 100.00% |
| $ | 424,726,583 | |||||
|
| |||||||
| a | Non-income earning security. |
| b | All or a portion of this security represents a security on loan. See Note 1. |
| c | Affiliated issuer. See Schedule 1. |
| d | The rate quoted is the annualized seven-day yield of the fund at period end. |
| e | All or a portion of this security represents an investment of securities lending collateral. See Note 1. |
| f | The cost of investments (including short positions and derivatives, if any) for federal income tax purposes was $561,032,448. Net unrealized depreciation was $120,565,856, of which $22,047,299 represented gross unrealized appreciation on investments and $142,613,155 represented gross unrealized depreciation on investments. |
Schedule 1 — Affiliates (Note 2)
Investments in issuers considered to be affiliates of the Fund during the year ended August 31, 2017, for purposes of Section 2(a)(3) of the 1940 Act, and/or related parties of the Fund were as follows:
| Affiliated issuer | Shares held at 08/31/16 | Shares purchased | Shares sold | Shares held at 08/31/17 | Value at 08/31/17 | Net realized gain (loss) a | Change in unrealized appreciation (depreciation) | Income | ||||||||||||||||||||||||
BlackRock Cash Funds: Institutional, SL Agency Shares | 36,614,575 | — | (20,663,545 | )b | 15,951,030 | $ | 15,955,815 | $ | 7,747 | $ | 3,930 | $ | — | c | ||||||||||||||||||
BlackRock Cash Funds: Treasury, SL Agency Shares | 284,911 | — | (183,923 | )b | 100,988 | 100,988 | 21 | — | 1,782 | |||||||||||||||||||||||
|
|
|
|
|
|
|
| |||||||||||||||||||||||||
| $ | 16,056,803 | $ | 7,768 | $ | 3,930 | $ | 1,782 | |||||||||||||||||||||||||
|
|
|
|
|
|
|
| |||||||||||||||||||||||||
| a | Includes realized capital gain distributions from an affiliated fund, if any. |
| b | Net of shares purchased and sold. |
| c | Does not include income earned on the investment of securities lending cash collateral which is not direct income of the Fund and is reflected as a component of securities lending income in the statement of operations. |
Schedule 2 — Fair Value Measurements
Various inputs are used in determining the fair value of financial instruments. For description of the input levels and information about the Fund’s policy regarding valuation of financial instruments, see Note 1.
The following table summarizes the value of the Fund’s investments according to the fair value hierarchy as of August 31, 2017. The breakdown of the Fund’s investments into major categories is disclosed in the schedule of investments above.
| Level 1 | Level 2 | Level 3 | Total | |||||||||||||
Investments: | ||||||||||||||||
Assets: | ||||||||||||||||
Common stocks | $ | 424,409,789 | $ | — | $ | — | $ | 424,409,789 | ||||||||
Money market funds | 16,056,803 | — | — | 16,056,803 | ||||||||||||
|
|
|
|
|
|
|
| |||||||||
Total | $ | 440,466,592 | $ | — | $ | — | $ | 440,466,592 | ||||||||
|
|
|
|
|
|
|
| |||||||||
See notes to financial statements.
| 40 | 2017 iSHARES ANNUAL REPORTTO SHAREHOLDERS |
Table of Contents
Schedule of Investments
iSHARES® MSCI USA EQUAL WEIGHTED ETF
August 31, 2017
| Security | Shares | Value | ||||||
COMMON STOCKS — 99.83% | ||||||||
AEROSPACE & DEFENSE — 1.92% |
| |||||||
Arconic Inc. | 8,510 | $ | 216,750 | |||||
Boeing Co. (The) | 909 | 217,851 | ||||||
General Dynamics Corp. | 1,079 | 217,257 | ||||||
Huntington Ingalls Industries Inc. | 1,028 | 219,951 | ||||||
L3 Technologies Inc. | 1,198 | 217,413 | ||||||
Lockheed Martin Corp. | 709 | 216,521 | ||||||
Northrop Grumman Corp. | 798 | 217,223 | ||||||
Raytheon Co. | 1,206 | 219,504 | ||||||
Rockwell Collins Inc. | 1,664 | 218,067 | ||||||
Textron Inc. | 4,452 | 218,549 | ||||||
TransDigm Group Inc. | 794 | 206,964 | ||||||
United Technologies Corp. | 1,867 | 223,517 | ||||||
|
| |||||||
| 2,609,567 | ||||||||
AIR FREIGHT & LOGISTICS — 0.64% |
| |||||||
CH Robinson Worldwide Inc. | 3,110 | 219,659 | ||||||
Expeditors International of Washington Inc. | 3,903 | 218,958 | ||||||
FedEx Corp. | 1,034 | 221,669 | ||||||
United Parcel Service Inc. Class B | 1,891 | 216,255 | ||||||
|
| |||||||
| 876,541 | ||||||||
AIRLINES — 0.63% |
| |||||||
American Airlines Group Inc. | 4,739 | 212,023 | ||||||
Delta Air Lines Inc. | 4,594 | 216,791 | ||||||
Southwest Airlines Co. | 4,079 | 212,679 | ||||||
United Continental Holdings Inc.a | 3,391 | 210,106 | ||||||
|
| |||||||
| 851,599 | ||||||||
AUTO COMPONENTS — 0.81% |
| |||||||
Autoliv Inc.b | 2,026 | 220,064 | ||||||
BorgWarner Inc. | 4,856 | 225,367 | ||||||
Delphi Automotive PLC | 2,275 | 219,310 | ||||||
Goodyear Tire & Rubber Co. (The) | 7,131 | 216,069 | ||||||
Lear Corp. | 1,484 | 221,918 | ||||||
|
| |||||||
| 1,102,728 | ||||||||
AUTOMOBILES — 0.64% |
| |||||||
Ford Motor Co. | 19,858 | 219,034 | ||||||
General Motors Co. | 6,036 | 220,555 | ||||||
Harley-Davidson Inc. | 4,502 | 211,639 | ||||||
Tesla Inc.a,b | 617 | 219,590 | ||||||
|
| |||||||
| 870,818 | ||||||||
BANKS — 3.42% |
| |||||||
Bank of America Corp. | 9,021 | 215,512 | ||||||
BB&T Corp. | 4,656 | 214,595 | ||||||
CIT Group Inc. | 4,757 | 213,351 | ||||||
| Security | Shares | Value | ||||||
Citigroup Inc. | 3,167 | $ | 215,451 | |||||
Citizens Financial Group Inc. | 6,335 | 209,879 | ||||||
Comerica Inc. | 3,056 | 208,572 | ||||||
East West Bancorp. Inc. | 3,869 | 214,227 | ||||||
Fifth Third Bancorp. | 8,040 | 210,085 | ||||||
First Republic Bank/CA | 2,185 | 212,054 | ||||||
Huntington Bancshares Inc./OH | 16,840 | 212,016 | ||||||
JPMorgan Chase & Co. | 2,338 | 212,501 | ||||||
KeyCorp | 12,216 | 210,237 | ||||||
M&T Bank Corp. | 1,397 | 206,560 | ||||||
People’s United Financial Inc. | 12,752 | 212,958 | ||||||
PNC Financial Services Group Inc. (The)c | 1,677 | 210,313 | ||||||
Regions Financial Corp. | 14,839 | 209,378 | ||||||
Signature Bank/New York NYa | 1,637 | 210,093 | ||||||
SunTrust Banks Inc. | 3,809 | 209,876 | ||||||
SVB Financial Groupa | 1,264 | 214,046 | ||||||
U.S. Bancorp. | 4,125 | 211,406 | ||||||
Wells Fargo & Co. | 4,142 | 211,532 | ||||||
Zions BanCorp. | 4,797 | 209,437 | ||||||
|
| |||||||
| 4,654,079 | ||||||||
BEVERAGES — 1.12% |
| |||||||
Brown-Forman Corp. Class B | 4,254 | 225,632 | ||||||
Coca-Cola Co. (The) | 4,727 | 215,315 | ||||||
Constellation Brands Inc. Class A | 1,083 | 216,708 | ||||||
Dr Pepper Snapple Group Inc. | 2,374 | 216,153 | ||||||
Molson Coors Brewing Co. Class B | 2,361 | 211,900 | ||||||
Monster Beverage Corp.a | 3,891 | 217,196 | ||||||
PepsiCo Inc. | 1,851 | 214,216 | ||||||
|
| |||||||
| 1,517,120 | ||||||||
BIOTECHNOLOGY — 2.35% |
| |||||||
AbbVie Inc. | 2,964 | 223,189 | ||||||
Alexion Pharmaceuticals Inc.a | 1,559 | 222,017 | ||||||
Alkermes PLCa | 4,253 | 215,967 | ||||||
Amgen Inc. | 1,266 | 225,057 | ||||||
Biogen Inc.a | 754 | 238,686 | ||||||
BioMarin Pharmaceutical Inc.a | 2,619 | 236,208 | ||||||
Celgene Corp.a | 1,656 | 230,068 | ||||||
Gilead Sciences Inc. | 2,906 | 243,261 | ||||||
Incyte Corp.a | 1,765 | 242,529 | ||||||
Regeneron Pharmaceuticals Inc.a | 449 | 223,108 | ||||||
Seattle Genetics Inc.a | 4,543 | 238,644 | ||||||
TESARO Inc.a,b | 1,697 | 219,151 | ||||||
United Therapeutics Corp.a,b | 1,672 | 218,698 | ||||||
Vertex Pharmaceuticals Inc.a | 1,399 | 224,595 | ||||||
|
| |||||||
| 3,201,178 | ||||||||
SCHEDULESOF INVESTMENTS | 41 |
Table of Contents
Schedule of Investments (Continued)
iSHARES® MSCI USA EQUAL WEIGHTED ETF
August 31, 2017
| Security | Shares | Value | ||||||
BUILDING PRODUCTS — 0.96% |
| |||||||
Allegion PLC | 2,763 | $ | 217,476 | |||||
AO Smith Corp. | 3,986 | 221,980 | ||||||
Fortune Brands Home & Security Inc. | 3,446 | 215,479 | ||||||
Johnson Controls International PLC | 5,534 | 219,091 | ||||||
Lennox International Inc. | 1,325 | 219,592 | ||||||
Masco Corp. | 5,917 | 217,568 | ||||||
|
| |||||||
| 1,311,186 | ||||||||
CAPITAL MARKETS — 3.80% |
| |||||||
Affiliated Managers Group Inc. | 1,229 | 217,152 | ||||||
Ameriprise Financial Inc. | 1,547 | 214,275 | ||||||
Bank of New York Mellon Corp. (The) | 4,073 | 212,936 | ||||||
BlackRock Inc.c | 515 | 215,790 | ||||||
CBOE Holdings Inc. | 2,153 | 217,216 | ||||||
Charles Schwab Corp. (The) | 5,418 | 216,178 | ||||||
CME Group Inc. | 1,691 | 212,728 | ||||||
E*TRADE Financial Corp.a | 5,221 | 214,113 | ||||||
Eaton Vance Corp. NVS | 4,572 | 217,536 | ||||||
Franklin Resources Inc. | 5,036 | 217,706 | ||||||
Goldman Sachs Group Inc. (The) | 966 | 216,133 | ||||||
Intercontinental Exchange Inc. | 3,285 | 212,441 | ||||||
Invesco Ltd. | 6,557 | 214,939 | ||||||
Moody’s Corp. | 1,620 | 217,129 | ||||||
Morgan Stanley | 4,668 | 212,394 | ||||||
MSCI Inc. | 1,877 | 215,123 | ||||||
Nasdaq Inc. | 2,831 | 213,401 | ||||||
Northern Trust Corp. | 2,390 | 211,515 | ||||||
Raymond James Financial Inc. | 2,723 | 213,265 | ||||||
S&P Global Inc. | 1,418 | 218,840 | ||||||
SEI Investments Co. | 3,750 | 219,225 | ||||||
State Street Corp. | 2,299 | 212,635 | ||||||
T Rowe Price Group Inc. | 2,556 | 215,624 | ||||||
TD Ameritrade Holding Corp. | 4,979 | 215,690 | ||||||
|
| |||||||
| 5,163,984 | ||||||||
CHEMICALS — 2.70% |
| |||||||
Air Products & Chemicals Inc. | 1,469 | 213,548 | ||||||
Albemarle Corp. | 1,869 | 217,290 | ||||||
Axalta Coating Systems Ltd.a | 7,373 | 217,651 | ||||||
Celanese Corp. Series A | 2,188 | 212,280 | ||||||
CF Industries Holdings Inc. | 7,415 | 214,961 | ||||||
Dow Chemical Co. (The) | 3,329 | 221,878 | ||||||
Eastman Chemical Co. | 2,527 | 217,827 | ||||||
Ecolab Inc. | 1,636 | 218,079 | ||||||
| Security | Shares | Value | ||||||
FMC Corp. | 2,544 | $ | 219,344 | |||||
International Flavors & Fragrances Inc. | 1,578 | 215,949 | ||||||
LyondellBasell Industries NV Class A | 2,376 | 215,242 | ||||||
Monsanto Co. | 1,843 | 216,000 | ||||||
Mosaic Co. (The) | 10,527 | 210,329 | ||||||
PPG Industries Inc. | 2,071 | 216,047 | ||||||
Praxair Inc. | 1,630 | 214,410 | ||||||
Sherwin-Williams Co. (The) | 633 | 214,758 | ||||||
WR Grace & Co. | 3,012 | 215,298 | ||||||
|
| |||||||
| 3,670,891 | ||||||||
COMMERCIAL SERVICES & SUPPLIES — 0.96% |
| |||||||
Cintas Corp. | 1,605 | 216,691 | ||||||
Republic Services Inc. | 3,338 | 217,771 | ||||||
Rollins Inc. | 4,791 | 212,768 | ||||||
Stericycle Inc.a | 2,990 | 214,951 | ||||||
Waste Connections Inc. | 3,311 | 220,811 | ||||||
Waste Management Inc. | 2,831 | 218,299 | ||||||
|
| |||||||
| 1,301,291 | ||||||||
COMMUNICATIONS EQUIPMENT — 1.29% |
| |||||||
Arista Networks Inc.a,b | 1,237 | 217,897 | ||||||
Cisco Systems Inc. | 6,836 | 220,188 | ||||||
CommScope Holding Co. Inc.a | 6,531 | 215,915 | ||||||
F5 Networks Inc.a | 1,827 | 218,107 | ||||||
Harris Corp. | 1,792 | 220,237 | ||||||
Juniper Networks Inc. | 7,786 | 215,906 | ||||||
Motorola Solutions Inc. | 2,473 | 217,921 | ||||||
Palo Alto Networks Inc.a,b | 1,667 | 221,194 | ||||||
|
| |||||||
| 1,747,365 | ||||||||
CONSTRUCTION & ENGINEERING — 0.33% |
| |||||||
Fluor Corp. | 5,689 | 219,425 | ||||||
Jacobs Engineering Group Inc. | 4,136 | 225,370 | ||||||
|
| |||||||
| 444,795 | ||||||||
CONSTRUCTION MATERIALS — 0.34% |
| |||||||
Martin Marietta Materials Inc. | 1,097 | 232,553 | ||||||
Vulcan Materials Co. | 1,899 | 230,273 | ||||||
|
| |||||||
| 462,826 | ||||||||
CONSUMER FINANCE — 0.94% |
| |||||||
Ally Financial Inc. | 9,445 | 213,457 | ||||||
American Express Co. | 2,509 | 216,025 | ||||||
Capital One Financial Corp. | 2,637 | 209,932 | ||||||
Discover Financial Services | 3,592 | 211,748 | ||||||
Navient Corp. | 15,732 | 207,662 | ||||||
| 42 | 2017 iSHARES ANNUAL REPORTTO SHAREHOLDERS |
Table of Contents
Schedule of Investments (Continued)
iSHARES® MSCI USA EQUAL WEIGHTED ETF
August 31, 2017
| Security | Shares | Value | ||||||
Synchrony Financial | 7,036 | $ | 216,639 | |||||
|
| |||||||
| 1,275,463 | ||||||||
CONTAINERS & PACKAGING — 1.12% |
| |||||||
Avery Dennison Corp. | 2,294 | 216,233 | ||||||
Ball Corp. | 5,467 | 218,625 | ||||||
Crown Holdings Inc.a | 3,756 | 221,717 | ||||||
International Paper Co. | 3,928 | 211,601 | ||||||
Packaging Corp. of America | 1,943 | 218,413 | ||||||
Sealed Air Corp. | 4,794 | 212,758 | ||||||
WestRock Co. | 3,885 | 221,095 | ||||||
|
| |||||||
| 1,520,442 | ||||||||
DISTRIBUTORS — 0.32% |
| |||||||
Genuine Parts Co. | 2,579 | 213,618 | ||||||
LKQ Corp.a | 6,264 | 217,048 | ||||||
|
| |||||||
| 430,666 | ||||||||
DIVERSIFIED CONSUMER SERVICES — 0.14% |
| |||||||
H&R Block Inc. | 7,232 | 193,384 | ||||||
|
| |||||||
| 193,384 | ||||||||
DIVERSIFIED FINANCIAL SERVICES — 0.47% |
| |||||||
Berkshire Hathaway Inc. Class Ba | 1,194 | 216,305 | ||||||
Leucadia National Corp. | 8,850 | 209,568 | ||||||
Voya Financial Inc. | 5,643 | 215,732 | ||||||
|
| |||||||
| 641,605 | ||||||||
DIVERSIFIED TELECOMMUNICATION SERVICES — 0.78% |
| |||||||
AT&T Inc. | 5,656 | 211,874 | ||||||
CenturyLink Inc. | 10,621 | 209,446 | ||||||
Level 3 Communications Inc.a | 3,950 | 214,998 | ||||||
Verizon Communications Inc. | 4,405 | 211,308 | ||||||
Zayo Group Holdings Inc.a,b | 6,250 | 213,563 | ||||||
|
| |||||||
| 1,061,189 | ||||||||
ELECTRIC UTILITIES — 2.52% |
| |||||||
Alliant Energy Corp. | 5,002 | 213,786 | ||||||
American Electric Power Co. Inc. | 2,915 | 214,631 | ||||||
Duke Energy Corp. | 2,463 | 215,020 | ||||||
Edison International | 2,672 | 214,241 | ||||||
Entergy Corp. | 2,691 | 213,046 | ||||||
Eversource Energy | 3,406 | 214,578 | ||||||
Exelon Corp. | 5,599 | 212,034 | ||||||
FirstEnergy Corp. | 6,573 | 214,148 | ||||||
NextEra Energy Inc. | 1,429 | 215,079 | ||||||
OGE Energy Corp. | 5,932 | 211,891 | ||||||
PG&E Corp. | 3,060 | 215,363 | ||||||
Pinnacle West Capital Corp. | 2,382 | 214,309 | ||||||
PPL Corp. | 5,427 | 212,956 | ||||||
| Security | Shares | Value | ||||||
Southern Co. (The) | 4,439 | $ | 214,226 | |||||
Westar Energy Inc. | 4,156 | 213,244 | ||||||
Xcel Energy Inc. | 4,352 | 215,424 | ||||||
|
| |||||||
| 3,423,976 | ||||||||
ELECTRICAL EQUIPMENT — 0.96% |
| |||||||
Acuity Brands Inc. | 1,216 | 214,977 | ||||||
AMETEK Inc. | 3,430 | 216,948 | ||||||
Eaton Corp. PLC | 3,033 | 217,648 | ||||||
Emerson Electric Co. | 3,662 | 216,204 | ||||||
Rockwell Automation Inc. | 1,350 | 221,481 | ||||||
Sensata Technologies Holding NVa,b | 4,852 | 216,690 | ||||||
|
| |||||||
| 1,303,948 | ||||||||
ELECTRONIC EQUIPMENT, INSTRUMENTS & COMPONENTS — 1.45% |
| |||||||
Amphenol Corp. Class A | 2,693 | 217,972 | ||||||
Arrow Electronics Inc.a | 2,793 | 221,848 | ||||||
Avnet Inc. | 5,735 | 221,199 | ||||||
CDW Corp./DE | 3,457 | 219,243 | ||||||
Corning Inc. | 7,482 | 215,182 | ||||||
Flex Ltd.a,b | 13,645 | 222,004 | ||||||
FLIR Systems Inc. | 5,665 | 215,270 | ||||||
TE Connectivity Ltd. | 2,749 | 218,820 | ||||||
Trimble Inc.a | 5,624 | 217,536 | ||||||
|
| |||||||
| 1,969,074 | ||||||||
ENERGY EQUIPMENT & SERVICES — 1.25% |
| |||||||
Baker Hughes a GE Co. | 6,447 | 218,553 | ||||||
Core Laboratories NVb | 2,393 | 211,015 | ||||||
Halliburton Co. | 5,497 | 214,218 | ||||||
Helmerich & Payne Inc. | 4,798 | 203,147 | ||||||
National Oilwell Varco Inc. | 7,026 | 215,488 | ||||||
Schlumberger Ltd. | 3,357 | 213,203 | ||||||
TechnipFMC PLCa | 8,324 | 215,009 | ||||||
Weatherford International PLCa,b | 54,124 | 207,295 | ||||||
|
| |||||||
| 1,697,928 | ||||||||
EQUITY REAL ESTATE INVESTMENT TRUSTS |
| |||||||
Alexandria Real Estate Equities Inc.b | 1,780 | 215,932 | ||||||
American Tower Corp. | 1,487 | 220,150 | ||||||
AvalonBay Communities Inc. | 1,135 | 213,074 | ||||||
Boston Properties Inc. | 1,769 | 213,341 | ||||||
Brixmor Property Group Inc. | 11,151 | 208,747 | ||||||
Camden Property Trust | 2,377 | 212,694 | ||||||
Colony NorthStar Inc. Class Ab | 16,567 | 217,193 | ||||||
Crown Castle International Corp. | 2,008 | 217,748 | ||||||
Digital Realty Trust Inc.b | 1,820 | 215,379 | ||||||
SCHEDULESOF INVESTMENTS | 43 |
Table of Contents
Schedule of Investments (Continued)
iSHARES® MSCI USA EQUAL WEIGHTED ETF
August 31, 2017
| Security | Shares | Value | ||||||
Duke Realty Corp. | 7,313 | $ | 217,342 | |||||
Equinix Inc. | 460 | 215,469 | ||||||
Equity Residential | 3,163 | 212,395 | ||||||
Essex Property Trust Inc. | 809 | 215,170 | ||||||
Extra Space Storage Inc.b | 2,794 | 216,898 | ||||||
Federal Realty Investment Trust | 1,676 | 212,735 | ||||||
GGP Inc. | 10,218 | 212,023 | ||||||
HCP Inc. | 7,259 | 216,391 | ||||||
Host Hotels & Resorts Inc. | 12,139 | 219,959 | ||||||
Iron Mountain Inc. | 5,574 | 219,727 | ||||||
Kimco Realty Corp.b | 10,825 | 212,386 | ||||||
Liberty Property Trust | 5,086 | 216,664 | ||||||
Macerich Co. (The)b | 3,952 | 208,547 | ||||||
Mid-America Apartment Communities Inc. | 2,006 | 213,559 | ||||||
National Retail Properties Inc. | 5,169 | 216,219 | ||||||
Prologis Inc. | 3,433 | 217,515 | ||||||
Public Storage | 1,052 | 216,018 | ||||||
Realty Income Corp. | 3,702 | 213,087 | ||||||
Regency Centers Corp. | 3,268 | 210,198 | ||||||
SBA Communications Corp.a | 1,410 | 216,505 | ||||||
Simon Property Group Inc.b | 1,351 | 211,904 | ||||||
SL Green Realty Corp. | 2,196 | 211,650 | ||||||
UDR Inc. | 5,504 | 213,665 | ||||||
Ventas Inc. | 3,177 | 217,434 | ||||||
VEREIT Inc. | 25,161 | 212,359 | ||||||
Vornado Realty Trust | 2,876 | 214,233 | ||||||
Welltower Inc. | 2,987 | 218,708 | ||||||
Weyerhaeuser Co. | 6,778 | 221,031 | ||||||
|
| |||||||
| 7,954,049 | ||||||||
FOOD & STAPLES RETAILING — 0.96% |
| |||||||
Costco Wholesale Corp. | 1,407 | 220,533 | ||||||
CVS Health Corp. | 2,846 | 220,110 | ||||||
Kroger Co. (The) | 9,883 | 216,141 | ||||||
Sysco Corp. | 4,107 | 216,316 | ||||||
Wal-Mart Stores Inc. | 2,745 | 214,302 | ||||||
Walgreens Boots Alliance Inc. | 2,658 | 216,627 | ||||||
|
| |||||||
| 1,304,029 | ||||||||
FOOD PRODUCTS — 2.17% |
| |||||||
Archer-Daniels-Midland Co. | 5,136 | 212,219 | ||||||
Bunge Ltd. | 2,839 | 211,875 | ||||||
Campbell Soup Co. | 4,172 | 192,746 | ||||||
Conagra Brands Inc. | 6,484 | 210,471 | ||||||
General Mills Inc. | 3,905 | 207,980 | ||||||
Hershey Co. (The) | 2,043 | 214,352 | ||||||
| Security | Shares | Value | ||||||
Hormel Foods Corp. | 6,842 | $ | 210,323 | |||||
Ingredion Inc. | 1,756 | 217,428 | ||||||
JM Smucker Co. (The) | 2,043 | 214,025 | ||||||
Kellogg Co. | 3,167 | 207,312 | ||||||
Kraft Heinz Co. (The) | 2,596 | 209,627 | ||||||
McCormick & Co. Inc./MD NVS | 2,264 | 215,374 | ||||||
Mondelez International Inc. Class A | 5,180 | 210,619 | ||||||
Tyson Foods Inc. Class A | 3,397 | 215,030 | ||||||
|
| |||||||
| 2,949,381 | ||||||||
GAS UTILITIES — 0.31% |
| |||||||
Atmos Energy Corp. | 2,424 | 213,409 | ||||||
UGI Corp. | 4,350 | 214,933 | ||||||
|
| |||||||
| 428,342 | ||||||||
HEALTH CARE EQUIPMENT & SUPPLIES — 3.22% |
| |||||||
Abbott Laboratories | 4,345 | 221,334 | ||||||
Align Technology Inc.a | 1,243 | 219,688 | ||||||
Baxter International Inc. | 3,486 | 216,271 | ||||||
Becton Dickinson and Co. | 1,080 | 215,395 | ||||||
Boston Scientific Corp.a | 8,025 | 221,089 | ||||||
Cooper Companies Inc. (The) | 872 | 218,724 | ||||||
CR Bard Inc. | 673 | 215,905 | ||||||
Danaher Corp. | 2,610 | 217,726 | ||||||
DENTSPLY SIRONA Inc. | 3,913 | 221,358 | ||||||
DexCom Inc.a | 2,845 | 212,265 | ||||||
Edwards Lifesciences Corp.a | 1,919 | 218,114 | ||||||
Hologic Inc.a | 5,668 | 218,785 | ||||||
IDEXX Laboratories Inc.a | 1,422 | 221,022 | ||||||
Intuitive Surgical Inc.a,b | 219 | 220,023 | ||||||
Medtronic PLC | 2,718 | 219,125 | ||||||
ResMed Inc. | 2,890 | 224,206 | ||||||
Stryker Corp. | 1,533 | 216,720 | ||||||
Teleflex Inc. | 1,036 | 219,373 | ||||||
Varian Medical Systems Inc.a,b | 2,106 | 223,763 | ||||||
Zimmer Biomet Holdings Inc. | 1,898 | 216,885 | ||||||
|
| |||||||
| 4,377,771 | ||||||||
HEALTH CARE PROVIDERS & SERVICES — 3.21% |
| |||||||
Aetna Inc. | 1,374 | 216,680 | ||||||
AmerisourceBergen Corp. | 2,746 | 220,366 | ||||||
Anthem Inc. | 1,113 | 218,193 | ||||||
Cardinal Health Inc. | 3,245 | 218,908 | ||||||
Centene Corp.a | 2,501 | 222,214 | ||||||
Cigna Corp. | 1,196 | 217,744 | ||||||
DaVita Inc.a | 3,747 | 219,424 | ||||||
Envision Healthcare Corp.a | 4,120 | 215,929 | ||||||
Express Scripts Holding Co.a | 3,534 | 222,006 | ||||||
| 44 | 2017 iSHARES ANNUAL REPORTTO SHAREHOLDERS |
Table of Contents
Schedule of Investments (Continued)
iSHARES® MSCI USA EQUAL WEIGHTED ETF
August 31, 2017
| Security | Shares | Value | ||||||
HCA Healthcare Inc.a | 2,697 | $ | 212,146 | |||||
Henry Schein Inc.a | 1,250 | 217,100 | ||||||
Humana Inc. | 848 | 218,462 | ||||||
Laboratory Corp. of America Holdingsa | 1,388 | 217,736 | ||||||
McKesson Corp. | 1,453 | 216,947 | ||||||
MEDNAX Inc.a | 4,859 | 217,926 | ||||||
Patterson Companies Inc. | 5,692 | 219,142 | ||||||
Quest Diagnostics Inc. | 2,004 | 217,133 | ||||||
UnitedHealth Group Inc. | 1,105 | 219,785 | ||||||
Universal Health Services Inc. Class B | 1,972 | 213,232 | ||||||
VCA Inc.a | 2,326 | 216,225 | ||||||
|
| |||||||
| 4,357,298 | ||||||||
HEALTH CARE TECHNOLOGY — 0.33% |
| |||||||
Cerner Corp.a | 3,297 | 223,471 | ||||||
Veeva Systems Inc. Class Aa | 3,850 | 229,075 | ||||||
|
| |||||||
| 452,546 | ||||||||
HOTELS, RESTAURANTS & LEISURE — 2.74% |
| |||||||
Aramark | 5,369 | 218,465 | ||||||
Carnival Corp. | 3,152 | 219,001 | ||||||
Chipotle Mexican Grill Inc.a,b | 695 | 220,113 | ||||||
Darden Restaurants Inc. | 2,567 | 210,725 | ||||||
Domino’s Pizza Inc. | 1,200 | 218,712 | ||||||
Hilton Worldwide Holdings Inc. | 3,378 | 217,307 | ||||||
Las Vegas Sands Corp. | 3,567 | 221,903 | ||||||
Marriott International Inc./MD Class A | 2,134 | 221,040 | ||||||
McDonald’s Corp. | 1,353 | 216,439 | ||||||
MGM Resorts International | 6,756 | 222,678 | ||||||
Norwegian Cruise Line Holdings Ltd.a | 3,715 | 220,894 | ||||||
Royal Caribbean Cruises Ltd. | 1,784 | 222,037 | ||||||
Starbucks Corp. | 3,945 | 216,423 | ||||||
Vail Resorts Inc. | 969 | 220,883 | ||||||
Wyndham Worldwide Corp. | 2,211 | 220,392 | ||||||
Wynn Resorts Ltd. | 1,595 | 221,689 | ||||||
Yum! Brands Inc. | 2,828 | 217,247 | ||||||
|
| |||||||
| 3,725,948 | ||||||||
HOUSEHOLD DURABLES — 1.60% |
| |||||||
DR Horton Inc. | 5,993 | 216,647 | ||||||
Garmin Ltd. | 4,082 | 210,223 | ||||||
Leggett & Platt Inc. | 4,741 | 217,944 | ||||||
Lennar Corp. Class A | 4,155 | 215,063 | ||||||
Mohawk Industries Inc.a | 868 | 219,708 | ||||||
| Security | Shares | Value | ||||||
Newell Brands Inc. | 4,465 | $ | 215,570 | |||||
NVR Inc.a | 80 | 217,668 | ||||||
PulteGroup Inc. | 8,472 | 218,747 | ||||||
Toll Brothers Inc. | 5,696 | 221,916 | ||||||
Whirlpool Corp. | 1,273 | 218,472 | ||||||
|
| |||||||
| 2,171,958 | ||||||||
HOUSEHOLD PRODUCTS — 0.95% |
| |||||||
Church & Dwight Co. Inc. | 4,311 | 216,283 | ||||||
Clorox Co. (The) | 1,560 | 216,106 | ||||||
Colgate-Palmolive Co. | 3,014 | 215,923 | ||||||
Kimberly-Clark Corp. | 1,765 | 217,607 | ||||||
Procter & Gamble Co. (The) | 2,318 | 213,882 | ||||||
Spectrum Brands Holdings Inc. | 1,973 | 216,951 | ||||||
|
| |||||||
| 1,296,752 | ||||||||
INDEPENDENT POWER AND RENEWABLE ELECTRICITY PRODUCERS — 0.15% |
| |||||||
AES Corp./VA | 18,760 | 207,110 | ||||||
|
| |||||||
| 207,110 | ||||||||
INDUSTRIAL CONGLOMERATES — 0.64% |
| |||||||
3M Co. | 1,061 | 216,784 | ||||||
General Electric Co. | 8,756 | 214,960 | ||||||
Honeywell International Inc. | 1,570 | 217,084 | ||||||
Roper Technologies Inc. | 931 | 214,744 | ||||||
|
| |||||||
| 863,572 | ||||||||
INSURANCE — 5.03% |
| |||||||
Aflac Inc. | 2,655 | 219,170 | ||||||
Alleghany Corp.a | 275 | 154,762 | ||||||
Allstate Corp. (The) | 2,335 | 211,317 | ||||||
American Financial Group Inc./OH | 2,098 | 213,597 | ||||||
American International Group Inc. | 3,528 | 213,373 | ||||||
Aon PLC | 1,556 | 216,533 | ||||||
Arch Capital Group Ltd.a | 2,206 | 214,732 | ||||||
Arthur J Gallagher & Co. | 3,673 | 212,667 | ||||||
Assurant Inc. | 2,182 | 206,614 | ||||||
Athene Holding Ltd. Class Aa | 4,029 | 215,592 | ||||||
Axis Capital Holdings Ltd. | 3,418 | 205,900 | ||||||
Brighthouse Financial Inc.a | 3,861 | 220,347 | ||||||
Chubb Ltd. | 1,496 | 211,564 | ||||||
Cincinnati Financial Corp. | 2,774 | 213,154 | ||||||
Everest Re Group Ltd. | 824 | 208,044 | ||||||
FNF Group | 4,463 | 215,295 | ||||||
Hartford Financial Services Group Inc. (The) | 3,897 | 210,711 | ||||||
Lincoln National Corp. | 3,145 | 213,420 | ||||||
Loews Corp. | 4,526 | 210,821 | ||||||
SCHEDULESOF INVESTMENTS | 45 |
Table of Contents
Schedule of Investments (Continued)
iSHARES® MSCI USA EQUAL WEIGHTED ETF
August 31, 2017
| Security | Shares | Value | ||||||
Markel Corp.a | 203 | $ | 213,554 | |||||
Marsh & McLennan Companies Inc. | 2,790 | 217,843 | ||||||
MetLife Inc. | 4,478 | 209,705 | ||||||
Principal Financial Group Inc. | 3,386 | 211,693 | ||||||
Progressive Corp. (The) | 4,439 | 206,325 | ||||||
Prudential Financial Inc. | 2,089 | 213,245 | ||||||
Reinsurance Group of America Inc. | 1,568 | 210,818 | ||||||
RenaissanceRe Holdings Ltd. | 759 | 105,622 | ||||||
Torchmark Corp. | 2,760 | 212,437 | ||||||
Travelers Companies Inc. (The) | 1,699 | 205,885 | ||||||
Unum Group | 4,417 | 212,811 | ||||||
Willis Towers Watson PLC | 1,443 | 214,242 | ||||||
WR Berkley Corp. | 3,184 | 212,182 | ||||||
XL Group Ltd. | 4,996 | 204,636 | ||||||
|
| |||||||
| 6,838,611 | ||||||||
INTERNET & DIRECT MARKETING RETAIL — 0.97% |
| |||||||
Amazon.com Inc.a | 227 | 222,596 | ||||||
Expedia Inc. | 1,437 | 213,193 | ||||||
Liberty Interactive Corp. QVC Group Series Aa | 9,809 | 216,975 | ||||||
Netflix Inc.a | 1,295 | 226,250 | ||||||
Priceline Group Inc. (The)a | 120 | 222,250 | ||||||
TripAdvisor Inc.a | 5,140 | 219,632 | ||||||
|
| |||||||
| 1,320,896 | ||||||||
INTERNET SOFTWARE & SERVICES — 1.47% |
| |||||||
Akamai Technologies Inc.a | 4,777 | 225,236 | ||||||
Alphabet Inc. Class Aa | 114 | 108,897 | ||||||
Alphabet Inc. Class Ca | 119 | 111,780 | ||||||
CoStar Group Inc.a,b | 758 | 217,258 | ||||||
eBay Inc.a | 6,183 | 223,392 | ||||||
Facebook Inc. Class Aa | 1,292 | 222,185 | ||||||
MercadoLibre Inc. | 872 | 225,386 | ||||||
Twitter Inc.a,b | 12,904 | 218,207 | ||||||
VeriSign Inc.a,b | 2,114 | 219,327 | ||||||
Zillow Group Inc. Class Ca,b | 5,655 | 224,051 | ||||||
|
| |||||||
| 1,995,719 | ||||||||
IT SERVICES — 3.68% |
| |||||||
Accenture PLC Class A | 1,660 | 217,062 | ||||||
Alliance Data Systems Corp. | 966 | 217,833 | ||||||
Automatic Data Processing Inc. | 2,054 | 218,689 | ||||||
Broadridge Financial Solutions Inc. | 2,795 | 218,373 | ||||||
Cognizant Technology Solutions Corp. Class A | 3,073 | 217,476 | ||||||
DXC Technology Co. | 2,531 | 215,135 | ||||||
| Security | Shares | Value | ||||||
Fidelity National Information Services Inc. | 2,348 | $ | 218,176 | |||||
First Data Corp. Class Aa | 11,808 | 217,385 | ||||||
Fiserv Inc.a,b | 1,753 | 216,864 | ||||||
FleetCor Technologies Inc.a | 1,514 | 217,668 | ||||||
Gartner Inc.a | 1,811 | 218,388 | ||||||
Global Payments Inc. | 2,297 | 219,341 | ||||||
International Business Machines Corp. | 1,492 | 213,401 | ||||||
Jack Henry & Associates Inc. | 2,143 | 220,879 | ||||||
Leidos Holdings Inc. | 3,839 | 223,890 | ||||||
MasterCard Inc. Class A | 1,618 | 215,679 | ||||||
Paychex Inc. | 3,822 | 217,969 | ||||||
PayPal Holdings Inc.a | 3,576 | 220,568 | ||||||
Sabre Corp. | 11,709 | 215,914 | ||||||
Total System Services Inc. | 3,236 | 223,672 | ||||||
Vantiv Inc. Class Aa | 3,011 | 212,848 | ||||||
Visa Inc. Class A | 2,075 | 214,804 | ||||||
Western Union Co. (The) | 11,286 | 213,531 | ||||||
|
| |||||||
| 5,005,545 | ||||||||
LEISURE PRODUCTS — 0.47% |
| |||||||
Hasbro Inc. | 2,257 | 221,750 | ||||||
Mattel Inc. | 13,047 | 211,623 | ||||||
Polaris Industries Inc.b | 2,270 | 211,632 | ||||||
|
| |||||||
| 645,005 | ||||||||
LIFE SCIENCES TOOLS & SERVICES — 0.97% |
| |||||||
Agilent Technologies Inc. | 3,409 | 220,631 | ||||||
Illumina Inc.a | 1,116 | 228,177 | ||||||
Mettler-Toledo International Inc.a | 364 | 220,253 | ||||||
Quintiles IMS Holdings Inc.a | 2,170 | 208,385 | ||||||
Thermo Fisher Scientific Inc. | 1,210 | 226,439 | ||||||
Waters Corp.a | 1,203 | 220,727 | ||||||
|
| |||||||
| 1,324,612 | ||||||||
MACHINERY — 3.06% |
| |||||||
AGCO Corp. | 3,212 | 219,861 | ||||||
Caterpillar Inc. | 1,859 | 218,414 | ||||||
Cummins Inc. | 1,410 | 224,726 | ||||||
Deere & Co. | 1,855 | 215,050 | ||||||
Dover Corp. | 2,515 | 213,473 | ||||||
Flowserve Corp. | 5,583 | 219,300 | ||||||
Fortive Corp. | 3,315 | 215,376 | ||||||
IDEX Corp. | 1,873 | 220,227 | ||||||
Illinois Tool Works Inc. | 1,570 | 215,891 | ||||||
Ingersoll-Rand PLC | 2,534 | 216,378 | ||||||
| 46 | 2017 iSHARES ANNUAL REPORTTO SHAREHOLDERS |
Table of Contents
Schedule of Investments (Continued)
iSHARES® MSCI USA EQUAL WEIGHTED ETF
August 31, 2017
| Security | Shares | Value | ||||||
Middleby Corp. (The)a | 1,832 | $ | 222,954 | |||||
PACCAR Inc. | 3,350 | 222,206 | ||||||
Parker-Hannifin Corp. | 1,366 | 219,776 | ||||||
Pentair PLC | 3,486 | 216,306 | ||||||
Snap-on Inc. | 1,480 | 218,404 | ||||||
Stanley Black & Decker Inc. | 1,545 | 222,480 | ||||||
WABCO Holdings Inc.a | 1,539 | 221,031 | ||||||
Wabtec Corp./DEb | 3,060 | 215,944 | ||||||
Xylem Inc./NY | 3,552 | 220,473 | ||||||
|
| |||||||
| 4,158,270 | ||||||||
MEDIA — 2.70% |
| |||||||
CBS Corp. Class B NVS | 3,363 | 215,434 | ||||||
Charter Communications Inc. Class Aa | 552 | 219,994 | ||||||
Comcast Corp. Class A | 5,334 | 216,614 | ||||||
Discovery Communications Inc. Class Aa,b | 4,100 | 91,061 | ||||||
Discovery Communications Inc. Class C NVSa | 5,702 | 119,799 | ||||||
DISH Network Corp. Class Aa | 3,786 | 216,900 | ||||||
Interpublic Group of Companies Inc. (The) | 10,638 | 214,249 | ||||||
Liberty Broadband Corp. Class Ca | 2,165 | 219,812 | ||||||
Liberty Global PLC Series Aa | 1,763 | 59,942 | ||||||
Liberty Global PLC Series C NVSa | 4,745 | 156,727 | ||||||
Liberty Media Corp.-Liberty SiriusXM Class Aa | 1,696 | 75,811 | ||||||
Liberty Media Corp.-Liberty SiriusXM Class Ca | 3,272 | 145,964 | ||||||
News Corp. Class A | 15,978 | 213,626 | ||||||
Omnicom Group Inc. | 2,938 | 212,652 | ||||||
Scripps Networks Interactive Inc. Class A | 2,487 | 213,012 | ||||||
Sirius XM Holdings Inc.b | 38,506 | 221,409 | ||||||
Time Warner Inc. | 2,118 | 214,130 | ||||||
Twenty-First Century Fox Inc. Class A | 5,593 | 154,311 | ||||||
Twenty-First Century Fox Inc. Class B | 2,351 | 63,712 | ||||||
Viacom Inc. Class B NVS | 7,346 | 210,096 | ||||||
Walt Disney Co. (The) | 2,094 | 211,913 | ||||||
|
| |||||||
| 3,667,168 | ||||||||
METALS & MINING — 0.63% |
| |||||||
Freeport-McMoRan Inc.a | 14,024 | 207,275 | ||||||
Newmont Mining Corp. | 5,797 | 222,257 | ||||||
| Security | Shares | Value | ||||||
Nucor Corp. | 3,927 | $ | 216,417 | |||||
Steel Dynamics Inc. | 6,188 | 213,176 | ||||||
|
| |||||||
| 859,125 | ||||||||
MORTGAGE REAL ESTATE INVESTMENT — 0.32% |
| |||||||
AGNC Investment Corp. | 9,909 | 213,440 | ||||||
Annaly Capital Management Inc. | 17,356 | 216,950 | ||||||
|
| |||||||
| 430,390 | ||||||||
MULTI-UTILITIES — 1.73% |
| |||||||
Ameren Corp. | 3,552 | 213,084 | ||||||
CenterPoint Energy Inc. | 7,227 | 214,064 | ||||||
CMS Energy Corp. | 4,430 | 215,032 | ||||||
Consolidated Edison Inc. | 2,543 | 214,298 | ||||||
Dominion Energy Inc. | 2,678 | 210,946 | ||||||
DTE Energy Co. | 1,927 | 216,441 | ||||||
NiSource Inc. | 7,926 | 212,972 | ||||||
Public Service Enterprise Group Inc. | 4,543 | 212,794 | ||||||
SCANA Corp. | 3,569 | 215,496 | ||||||
Sempra Energy | 1,805 | 212,864 | ||||||
WEC Energy Group Inc. | 3,294 | 214,835 | ||||||
|
| |||||||
| 2,352,826 | ||||||||
MULTILINE RETAIL — 0.93% |
| |||||||
Dollar General Corp. | 2,761 | 200,338 | ||||||
Dollar Tree Inc.a | 2,673 | 212,878 | ||||||
Kohl’s Corp. | 5,494 | 218,551 | ||||||
Macy’s Inc. | 10,158 | 210,982 | ||||||
Nordstrom Inc. | 4,739 | 211,454 | ||||||
Target Corp. | 3,898 | 212,558 | ||||||
|
| |||||||
| 1,266,761 | ||||||||
OIL, GAS & CONSUMABLE FUELS — 5.42% |
| |||||||
Anadarko Petroleum Corp. | 5,062 | 207,188 | ||||||
Andeavor | 2,246 | 224,937 | ||||||
Antero Resources Corp.a,b | 10,896 | 214,542 | ||||||
Apache Corp. | 5,353 | 207,910 | ||||||
Cabot Oil & Gas Corp. | 8,629 | 220,471 | ||||||
Cheniere Energy Inc.a | 5,209 | 222,893 | ||||||
Chevron Corp. | 1,985 | 213,626 | ||||||
Cimarex Energy Co. | 2,154 | 214,732 | ||||||
Concho Resources Inc.a | 1,963 | 217,834 | ||||||
ConocoPhillips | 4,930 | 215,244 | ||||||
Continental Resources Inc./OKa | 6,376 | 216,274 | ||||||
Devon Energy Corp. | 6,895 | 216,503 | ||||||
Diamondback Energy Inc.a | 2,421 | 219,803 | ||||||
EOG Resources Inc. | 2,542 | 216,044 | ||||||
EQT Corp.b | 3,512 | 218,938 | ||||||
SCHEDULESOF INVESTMENTS | 47 |
Table of Contents
Schedule of Investments (Continued)
iSHARES® MSCI USA EQUAL WEIGHTED ETF
August 31, 2017
| Security | Shares | Value | ||||||
Exxon Mobil Corp. | 2,795 | $ | 213,342 | |||||
Hess Corp. | 5,581 | 217,101 | ||||||
HollyFrontier Corp. | 7,254 | 227,123 | ||||||
Kinder Morgan Inc./DE | 11,209 | 216,670 | ||||||
Marathon Oil Corp. | 19,405 | 215,784 | ||||||
Marathon Petroleum Corp. | 4,146 | 217,458 | ||||||
Murphy Oil Corp. | 9,282 | 210,330 | ||||||
Newfield Exploration Co.a,b | 8,472 | 221,373 | ||||||
Noble Energy Inc. | 9,067 | 215,523 | ||||||
Occidental Petroleum Corp. | 3,621 | 216,174 | ||||||
ONEOK Inc. | 3,996 | 216,423 | ||||||
Parsley Energy Inc. Class Aa | 8,550 | 214,177 | ||||||
Phillips 66 | 2,575 | 215,811 | ||||||
Pioneer Natural Resources Co. | 1,660 | 215,219 | ||||||
Plains GP Holdings LP Class A | 10,211 | 229,543 | ||||||
Range Resources Corp. | 11,801 | 204,865 | ||||||
Targa Resources Corp. | 4,873 | 217,190 | ||||||
Valero Energy Corp. | 3,169 | 215,809 | ||||||
Williams Companies Inc. (The) | 7,296 | 216,910 | ||||||
|
| |||||||
| 7,363,764 | ||||||||
PERSONAL PRODUCTS — 0.32% |
| |||||||
Coty Inc. Class A | 13,075 | 216,783 | ||||||
Estee Lauder Companies Inc. (The) Class A | 2,017 | 215,799 | ||||||
|
| |||||||
| 432,582 | ||||||||
PHARMACEUTICALS — 1.78% |
| |||||||
Allergan PLC | 967 | 221,907 | ||||||
Bristol-Myers Squibb Co. | 3,674 | 222,204 | ||||||
Eli Lilly & Co. | 2,726 | 221,597 | ||||||
Jazz Pharmaceuticals PLCa,b | 1,469 | 219,410 | ||||||
Johnson & Johnson | 1,631 | 215,895 | ||||||
Mallinckrodt PLCa | 5,497 | 225,817 | ||||||
Merck & Co. Inc. | 3,407 | 217,571 | ||||||
Mylan NVa,b | 7,038 | 221,556 | ||||||
Perrigo Co. PLC | 2,770 | 218,719 | ||||||
Pfizer Inc. | 6,422 | 217,834 | ||||||
Zoetis Inc. | 3,503 | 219,638 | ||||||
|
| |||||||
| 2,422,148 | ||||||||
PROFESSIONAL SERVICES — 0.96% |
| |||||||
Equifax Inc. | 1,524 | 217,124 | ||||||
IHS Markit Ltd.a | 4,619 | 216,354 | ||||||
ManpowerGroup Inc. | 1,966 | 219,229 | ||||||
Nielsen Holdings PLC | 5,430 | 210,955 | ||||||
Robert Half International Inc. | 4,869 | 220,566 | ||||||
Verisk Analytics Inc. Class Aa | 2,697 | 218,592 | ||||||
|
| |||||||
| 1,302,820 | ||||||||
| Security | Shares | Value | ||||||
REAL ESTATE MANAGEMENT & DEVELOPMENT — 0.32% |
| |||||||
CBRE Group Inc. Class Aa | 6,077 | $ | 219,258 | |||||
Jones Lang LaSalle Inc. | 1,796 | 218,951 | ||||||
|
| |||||||
| 438,209 | ||||||||
ROAD & RAIL — 0.96% |
| |||||||
AMERCO | 603 | 225,046 | ||||||
CSX Corp. | 4,398 | 220,780 | ||||||
JB Hunt Transport Services Inc. | 2,196 | 217,162 | ||||||
Kansas City Southern | 2,058 | 212,859 | ||||||
Norfolk Southern Corp. | 1,814 | 218,623 | ||||||
Union Pacific Corp. | 2,041 | 214,917 | ||||||
|
| |||||||
| 1,309,387 | ||||||||
SEMICONDUCTORS & SEMICONDUCTOR |
| |||||||
Advanced Micro Devices Inc.a,b | 17,251 | 224,263 | ||||||
Analog Devices Inc. | 2,721 | 227,666 | ||||||
Applied Materials Inc. | 4,951 | 223,389 | ||||||
Broadcom Ltd. | 875 | 220,561 | ||||||
Intel Corp. | 6,185 | 216,908 | ||||||
KLA-Tencor Corp. | 2,370 | 222,045 | ||||||
Lam Research Corp. | 1,361 | 225,899 | ||||||
Marvell Technology Group Ltd. | 12,610 | 225,845 | ||||||
Maxim Integrated Products Inc. | 4,761 | 222,148 | ||||||
Microchip Technology Inc. | 2,595 | 225,246 | ||||||
Micron Technology Inc.a,b | 7,093 | 226,763 | ||||||
NVIDIA Corp. | 1,309 | 221,797 | ||||||
Qorvo Inc.a | 3,029 | 221,784 | ||||||
QUALCOMM Inc. | 4,130 | 215,875 | ||||||
Skyworks Solutions Inc. | 2,103 | 221,572 | ||||||
Texas Instruments Inc. | 2,661 | 220,384 | ||||||
Xilinx Inc. | 3,312 | 218,791 | ||||||
|
| |||||||
| 3,780,936 | ||||||||
SOFTWARE — 3.90% |
| |||||||
Activision Blizzard Inc. | 3,433 | 225,068 | ||||||
Adobe Systems Inc.a | 1,416 | 219,707 | ||||||
ANSYS Inc.a | 1,682 | 216,675 | ||||||
Autodesk Inc.a | 1,876 | 214,727 | ||||||
CA Inc. | 6,598 | 218,922 | ||||||
Cadence Design Systems Inc.a | 5,745 | 225,721 | ||||||
CDK Global Inc. | 3,420 | 220,590 | ||||||
Citrix Systems Inc.a | 2,845 | 222,507 | ||||||
Dell Technologies Inc. Class Va | 2,989 | 223,966 | ||||||
Electronic Arts Inc.a | 1,834 | 222,831 | ||||||
Fortinet Inc.a | 5,779 | 220,758 | ||||||
Intuit Inc. | 1,564 | 221,228 | ||||||
| 48 | 2017 iSHARES ANNUAL REPORTTO SHAREHOLDERS |
Table of Contents
Schedule of Investments (Continued)
iSHARES® MSCI USA EQUAL WEIGHTED ETF
August 31, 2017
| Security | Shares | Value | ||||||
Microsoft Corp. | 2,945 | $ | 220,198 | |||||
Nuance Communications Inc.a | 13,546 | 217,684 | ||||||
Oracle Corp. | 4,355 | 219,187 | ||||||
Red Hat Inc.a | 2,036 | 218,870 | ||||||
salesforce.com Inc.a | 2,279 | 217,622 | ||||||
ServiceNow Inc.a | 1,939 | 225,292 | ||||||
Splunk Inc.a | 3,286 | 220,458 | ||||||
SS&C Technologies Holdings Inc. | 5,699 | 220,608 | ||||||
Symantec Corp. | 7,276 | 218,134 | ||||||
Synopsys Inc.a | 2,732 | 219,707 | ||||||
VMware Inc. Class Aa,b | 2,091 | 226,037 | ||||||
Workday Inc. Class Aa,b | 2,074 | 227,497 | ||||||
|
| |||||||
| 5,303,994 | ||||||||
SPECIALTY RETAIL — 3.16% |
| |||||||
Advance Auto Parts Inc. | 2,243 | 219,590 | ||||||
AutoNation Inc.a,b | 5,008 | 227,213 | ||||||
AutoZone Inc.a | 406 | 214,547 | ||||||
Bed Bath & Beyond Inc. | 7,690 | 212,167 | ||||||
Best Buy Co. Inc. | 3,488 | 189,259 | ||||||
CarMax Inc.a,b | 3,340 | 224,281 | ||||||
Dick’s Sporting Goods Inc. | 7,976 | 210,247 | ||||||
Foot Locker Inc. | 5,989 | 210,992 | ||||||
Gap Inc. (The) | 9,021 | 213,076 | ||||||
Home Depot Inc. (The) | 1,433 | 214,764 | ||||||
L Brands Inc. | 5,865 | 212,430 | ||||||
Lowe’s Companies Inc. | 2,929 | 216,424 | ||||||
O’Reilly Automotive Inc.a | 1,062 | 208,290 | ||||||
Ross Stores Inc. | 3,619 | 211,531 | ||||||
Signet Jewelers Ltd.b | 3,421 | 215,762 | ||||||
Staples Inc. | 20,981 | 214,321 | ||||||
Tiffany & Co. | 2,437 | 222,742 | ||||||
TJX Companies Inc. (The) | 2,992 | 216,322 | ||||||
Tractor Supply Co. | 3,599 | 214,176 | ||||||
Ulta Salon Cosmetics & | 1,010 | 223,220 | ||||||
|
| |||||||
| 4,291,354 | ||||||||
TECHNOLOGY HARDWARE, STORAGE & |
| |||||||
Apple Inc. | 1,344 | 220,416 | ||||||
Hewlett Packard Enterprise Co. | 11,946 | 215,745 | ||||||
HP Inc. | 11,127 | 212,303 | ||||||
NetApp Inc. | 5,564 | 215,104 | ||||||
Seagate Technology PLC | 6,862 | 216,359 | ||||||
Western Digital Corp. | 2,376 | 209,729 | ||||||
Xerox Corp. | 6,647 | 214,499 | ||||||
|
| |||||||
| 1,504,155 | ||||||||
| Security | Shares | Value | ||||||
TEXTILES, APPAREL & LUXURY GOODS — 1.40% |
| |||||||
Coach Inc. | 5,120 | $ | 213,504 | |||||
Hanesbrands Inc. | 8,835 | 214,337 | ||||||
lululemon athletica Inc.a,b | 3,569 | 205,396 | ||||||
Michael Kors Holdings Ltd.a | 5,081 | 214,520 | ||||||
NIKE Inc. Class B | 3,986 | 210,501 | ||||||
PVH Corp. | 1,707 | 214,894 | ||||||
Ralph Lauren Corp. | 2,459 | 216,121 | ||||||
Under Armour Inc. Class Aa,b | 6,445 | 104,087 | ||||||
Under Armour Inc. Class Ca | 6,535 | 98,678 | ||||||
VF Corp. | 3,388 | 213,004 | ||||||
|
| |||||||
| 1,905,042 | ||||||||
THRIFTS & MORTGAGE FINANCE — 0.16% |
| |||||||
New York Community Bancorp. Inc. | 17,692 | 213,189 | ||||||
|
| |||||||
| 213,189 | ||||||||
TOBACCO — 0.32% |
| |||||||
Altria Group Inc. | 3,353 | 212,580 | ||||||
Philip Morris International Inc. | 1,868 | 218,425 | ||||||
|
| |||||||
| 431,005 | ||||||||
TRADING COMPANIES & DISTRIBUTORS — 0.66% |
| |||||||
Fastenal Co. | 5,172 | 220,689 | ||||||
HD Supply Holdings Inc.a | 6,803 | 226,540 | ||||||
United Rentals Inc.a | 2,003 | 236,474 | ||||||
WW Grainger Inc. | 1,342 | 218,169 | ||||||
|
| |||||||
| 901,872 | ||||||||
TRANSPORTATION INFRASTRUCTURE — 0.16% |
| |||||||
Macquarie Infrastructure Corp. | 2,942 | 219,120 | ||||||
|
| |||||||
| 219,120 | ||||||||
WATER UTILITIES — 0.16% |
| |||||||
American Water Works Co. Inc. | 2,621 | 212,039 | ||||||
|
| |||||||
| 212,039 | ||||||||
WIRELESS TELECOMMUNICATION SERVICES — 0.31% |
| |||||||
Sprint Corp.a,b | 25,436 | 209,847 | ||||||
T-Mobile U.S. Inc.a | 3,371 | 218,137 | ||||||
|
| |||||||
| 427,984 | ||||||||
|
| |||||||
TOTAL COMMON STOCKS | ||||||||
(Cost: $122,705,020) | 135,716,927 | |||||||
SHORT-TERM INVESTMENTS — 5.55% |
| |||||||
MONEY MARKET FUNDS — 5.55% |
| |||||||
BlackRock Cash Funds: Institutional, |
| |||||||
1.32%c,d,e | 7,464,215 | 7,466,455 | ||||||
SCHEDULESOF INVESTMENTS | 49 |
Table of Contents
Schedule of Investments (Continued)
iSHARES® MSCI USA EQUAL WEIGHTED ETF
August 31, 2017
| Security | Shares | Value | ||||||
BlackRock Cash Funds: Treasury, |
| |||||||
0.96%c,d | 69,879 | $ | 69,879 | |||||
|
| |||||||
| 7,536,334 | ||||||||
|
| |||||||
TOTAL SHORT-TERM INVESTMENTS |
| |||||||
(Cost: $7,535,636) | 7,536,334 | |||||||
|
| |||||||
TOTAL INVESTMENTS |
| |||||||
(Cost: $130,240,656)f |
| 143,253,261 | ||||||
Other Assets, Less Liabilities — (5.38)% |
| (7,308,066 | ) | |||||
|
| |||||||
NET ASSETS — 100.00% |
| $ | 135,945,195 | |||||
|
| |||||||
NVS — Non-Voting Shares
| a | Non-income earning security. |
| b | All or a portion of this security represents a security on loan. See Note 1. |
| c | Affiliated issuer. See Schedule 1. |
| d | The rate quoted is the annualized seven-day yield of the fund at period end. |
| e | All or a portion of this security represents an investment of securities lending collateral. See Note 1. |
| f | The cost of investments (including short positions and derivatives, if any) for federal income tax purposes was $131,476,371. Net unrealized appreciation was $11,776,890, of which $18,351,879 represented gross unrealized appreciation on investments and $6,574,989 represented gross unrealized depreciation on investments. |
Schedule 1 — Affiliates (Note 2)
Investments in issuers considered to be affiliates of the Fund during the year ended August 31, 2017, for purposes of Section 2(a)(3) of the 1940 Act, and/or related parties of the Fund were as follows:
| Affiliated issuer | Shares held at 08/31/16 | Shares purchased | Shares sold | Shares held at 08/31/17 | Value at 08/31/17 | Net realized gain (loss)a | Change in unrealized appreciation (depreciation) | Income | ||||||||||||||||||||||||
BlackRock Cash Funds: Institutional, SL Agency Shares | 2,263,088 | 5,201,127 | b | — | 7,464,215 | $ | 7,466,455 | $ | (369 | ) | $ | 698 | $ | — | c | |||||||||||||||||
BlackRock Cash Funds: Treasury, | 59,159 | 10,720 | b | — | 69,879 | 69,879 | 6 | — | 783 | |||||||||||||||||||||||
BlackRock Inc. | 326 | 264 | (75 | ) | 515 | 215,790 | 3,415 | 20,314 | 4,749 | |||||||||||||||||||||||
PNC Financial Services Group Inc. (The) | 1,397 | 1,009 | (729 | ) | 1,677 | 210,313 | 10,020 | 43,093 | 3,773 | |||||||||||||||||||||||
|
|
|
|
|
|
|
| |||||||||||||||||||||||||
| $ | 7,962,437 | $ | 13,072 | $ | 64,105 | $ | 9,305 | |||||||||||||||||||||||||
|
|
|
|
|
|
|
| |||||||||||||||||||||||||
| a | Includes realized capital gain distributions from an affiliated fund, if any. |
| b | Net of shares purchased and sold. |
| c | Does not include income earned on the investment of securities lending cash collateral which is not direct income of the Fund and is reflected as a component of securities lending income in the statement of operations. |
| 50 | 2017 iSHARES ANNUAL REPORTTO SHAREHOLDERS |
Table of Contents
Schedule of Investments (Continued)
iSHARES® MSCI USA EQUAL WEIGHTED ETF
August 31, 2017
Schedule 2 — Fair Value Measurements
Various inputs are used in determining the fair value of financial instruments. For description of the input levels and information about the Fund’s policy regarding valuation of financial instruments, see Note 1.
The following table summarizes the value of the Fund’s investments according to the fair value hierarchy as of August 31, 2017. The breakdown of the Fund’s investments into major categories is disclosed in the schedule of investments above.
| Level 1 | Level 2 | Level 3 | Total | |||||||||||||
Investments: | ||||||||||||||||
Assets: | ||||||||||||||||
Common stocks | $ | 135,716,927 | $ | — | $ | — | $ | 135,716,927 | ||||||||
Money market funds | 7,536,334 | — | — | 7,536,334 | ||||||||||||
|
|
|
|
|
|
|
| |||||||||
Total | $ | 143,253,261 | $ | — | $ | — | $ | 143,253,261 | ||||||||
|
|
|
|
|
|
|
| |||||||||
See notes to financial statements.
SCHEDULESOF INVESTMENTS | 51 |
Table of Contents
Statements of Assets and Liabilities
iSHARES®, INC.
August 31, 2017
iShares Capped ETF | iShares MSCI Chile Capped ETF | iShares MSCI Colombia Capped ETF | ||||||||||
ASSETS | ||||||||||||
Investments in securities, at cost: | ||||||||||||
Unaffiliated | $ | 4,088,072,792 | $ | 308,673,755 | $ | 19,111,583 | ||||||
Affiliated (Note 2) | 16,859 | 227,709 | 116,439 | |||||||||
|
|
|
|
|
| |||||||
Total cost of investments in securities | $ | 4,088,089,651 | $ | 308,901,464 | $ | 19,228,022 | ||||||
|
|
|
|
|
| |||||||
Investments in securities, at fair value (including securities on loana) (Note 1): | ||||||||||||
Unaffiliated | $ | 6,310,088,385 | $ | 467,218,049 | $ | 22,573,898 | ||||||
Affiliated (Note 2) | 16,859 | 227,709 | 116,435 | |||||||||
Foreign currency, at valueb | 21,265,398 | 1,318 | 852 | |||||||||
Receivables: | ||||||||||||
Investment securities sold | 246,633,831 | 27,165,810 | 274,377 | |||||||||
Dividends | 15,731,446 | 72,425 | 4,029 | |||||||||
|
|
|
|
|
| |||||||
Total Assets | 6,593,735,919 | 494,685,311 | 22,969,591 | |||||||||
|
|
|
|
|
| |||||||
LIABILITIES | ||||||||||||
Payables: | ||||||||||||
Investment securities purchased | 262,656,795 | 10,028,968 | 305,675 | |||||||||
Collateral for securities on loan (Note 1) | — | — | 59,136 | |||||||||
Capital shares redeemed | — | 16,772,841 | — | |||||||||
Investment advisory fees (Note 2) | 3,160,088 | 238,454 | 10,897 | |||||||||
|
|
|
|
|
| |||||||
Total Liabilities | 265,816,883 | 27,040,263 | 375,708 | |||||||||
|
|
|
|
|
| |||||||
NET ASSETS | $ | 6,327,919,036 | $ | 467,645,048 | $ | 22,593,883 | ||||||
|
|
|
|
|
| |||||||
Net assets consist of: | ||||||||||||
Paid-in capital | $ | 6,919,787,415 | $ | 520,916,867 | $ | 31,551,317 | ||||||
Undistributed (distributions in excess of) net investment income | 27,321,455 | (78,356 | ) | 47,324 | ||||||||
Accumulated net realized loss | (2,841,582,148 | ) | (211,737,942 | ) | (12,467,111 | ) | ||||||
Net unrealized appreciation | 2,222,392,314 | 158,544,479 | 3,462,353 | |||||||||
|
|
|
|
|
| |||||||
NET ASSETS | $ | 6,327,919,036 | $ | 467,645,048 | $ | 22,593,883 | ||||||
|
|
|
|
|
| |||||||
Shares outstandingc | 157,950,000 | 9,750,000 | 1,550,000 | |||||||||
|
|
|
|
|
| |||||||
Net asset value per share | $ | 40.06 | $ | 47.96 | $ | 14.58 | ||||||
|
|
|
|
|
| |||||||
| a | Securities on loan with values of $ —, $ — and $56,601, respectively. See Note 1. |
| b | Cost of foreign currency: $21,217,521, $1,261 and $792, respectively. |
| c | $0.001 par value, number of shares authorized: 500 million, 200 million and 25 million, respectively. |
See notes to financial statements.
| 52 | 2017 iSHARES ANNUAL REPORTTO SHAREHOLDERS |
Table of Contents
Statements of Assets and Liabilities (Continued)
iSHARES®, INC.
August 31, 2017
| iShares MSCI Israel Capped ETF | iShares MSCI Russia Capped ETF | iShares MSCI South Africa ETF | ||||||||||
ASSETS | ||||||||||||
Investments in securities, at cost: | ||||||||||||
Unaffiliated | $ | 101,895,252 | $ | 530,998,524 | $ | 478,404,363 | ||||||
Affiliated (Note 2) | 15,570,750 | 1,026,049 | 225,602 | |||||||||
|
|
|
|
|
| |||||||
Total cost of investments in securities | $ | 117,466,002 | $ | 532,024,573 | $ | 478,629,965 | ||||||
|
|
|
|
|
| |||||||
Investments in securities, at fair value (including securities on loana) (Note 1): | ||||||||||||
Unaffiliated | $ | 88,977,377 | $ | 528,300,262 | $ | 418,941,200 | ||||||
Affiliated (Note 2) | 15,571,296 | 1,026,049 | 225,602 | |||||||||
Foreign currency, at valueb | 86,556 | — | 532,321 | |||||||||
Cash | — | 1,063,604 | — | |||||||||
Receivables: | ||||||||||||
Investment securities sold | 1,353,055 | 10,545,290 | 14,219,868 | |||||||||
Dividends and interest | 115,379 | 18,705 | 132,446 | |||||||||
Tax reclaims | — | — | 26,944 | |||||||||
|
|
|
|
|
| |||||||
Total Assets | 106,103,663 | 540,953,910 | 434,078,381 | |||||||||
|
|
|
|
|
| |||||||
LIABILITIES | ||||||||||||
Payables: | ||||||||||||
Investment securities purchased | 1,339,562 | 10,625,096 | 14,277,567 | |||||||||
Collateral for securities on loan (Note 1) | 15,526,825 | — | — | |||||||||
Deferred foreign capital gains taxes (Note 1) | 39,524 | — | — | |||||||||
Investment advisory fees (Note 2) | 45,762 | 252,365 | 214,104 | |||||||||
|
|
|
|
|
| |||||||
Total Liabilities | 16,951,673 | 10,877,461 | 14,491,671 | |||||||||
|
|
|
|
|
| |||||||
NET ASSETS | $ | 89,151,990 | $ | 530,076,449 | $ | 419,586,710 | ||||||
|
|
|
|
|
| |||||||
Net assets consist of: | ||||||||||||
Paid-in capital | $ | 155,010,821 | $ | 629,077,214 | $ | 581,412,583 | ||||||
Undistributed (distributions in excess of) net investment income | (39,108 | ) | 12,788,323 | 448,826 | ||||||||
Accumulated net realized loss | (52,862,993 | ) | (109,091,108 | ) | (102,817,103 | ) | ||||||
Net unrealized depreciation | (12,956,730 | ) | (2,697,980 | ) | (59,457,596 | ) | ||||||
|
|
|
|
|
| |||||||
NET ASSETS | $ | 89,151,990 | $ | 530,076,449 | $ | 419,586,710 | ||||||
|
|
|
|
|
| |||||||
Shares outstandingc | 1,850,000 | 16,500,000 | d | 6,700,000 | ||||||||
|
|
|
|
|
| |||||||
Net asset value per share | $ | 48.19 | $ | 32.13 | d | $ | 62.62 | |||||
|
|
|
|
|
| |||||||
| a | Securities on loan with values of $15,449,691, $ — and $ —, respectively. See Note 1. |
| b | Cost of foreign currency: $86,589, $ — and $527,558, respectively. |
| c | $0.001 par value, number of shares authorized: 500 million, 1 billion and 400 million, respectively. |
| d | Shares outstanding and net asset value per share reflect a one-for-two reverse stock split effective after the close of trading on November 4, 2016. See Note 4. |
See notes to financial statements.
FINANCIAL STATEMENTS | 53 |
Table of Contents
Statements of Assets and Liabilities (Continued)
iSHARES®, INC.
August 31, 2017
| iShares MSCI Turkey ETF | iShares MSCI USA Equal Weighted ETF | |||||||
ASSETS | ||||||||
Investments in securities, at cost: | ||||||||
Unaffiliated | $ | 534,548,881 | $ | 122,362,478 | ||||
Affiliated (Note 2) | 16,052,873 | 7,878,178 | ||||||
|
|
|
| |||||
Total cost of investments in securities | $ | 550,601,754 | $ | 130,240,656 | ||||
|
|
|
| |||||
Investments in securities, at fair value (including securities on loana) (Note 1): | ||||||||
Unaffiliated | $ | 424,409,789 | $ | 135,290,824 | ||||
Affiliated (Note 2) | 16,056,803 | 7,962,437 | ||||||
Foreign currency, at valueb | 366,692 | — | ||||||
Receivables: | ||||||||
Investment securities sold | 2,359,804 | 5,348,020 | ||||||
Dividends and interest | 96,163 | 233,660 | ||||||
|
|
|
| |||||
Total Assets | 443,289,251 | 148,834,941 | ||||||
|
|
|
| |||||
LIABILITIES | ||||||||
Payables: | ||||||||
Investment securities purchased | 2,407,856 | 5,406,426 | ||||||
Collateral for securities on loan (Note 1) | 15,944,138 | 7,466,125 | ||||||
Investment advisory fees (Note 2) | 210,674 | 17,195 | ||||||
|
|
|
| |||||
Total Liabilities | 18,562,668 | 12,889,746 | ||||||
|
|
|
| |||||
NET ASSETS | $ | 424,726,583 | $ | 135,945,195 | ||||
|
|
|
| |||||
Net assets consist of: | ||||||||
Paid-in capital | $ | 625,503,993 | $ | 124,655,818 | ||||
Undistributed (distributions in excess of) net investment income | (167,293 | ) | 397,508 | |||||
Accumulated net realized loss | (90,482,074 | ) | (2,120,736 | ) | ||||
Net unrealized appreciation (depreciation) | (110,128,043 | ) | 13,012,605 | |||||
|
|
|
| |||||
NET ASSETS | $ | 424,726,583 | $ | 135,945,195 | ||||
|
|
|
| |||||
Shares outstandingc | 9,200,000 | 2,650,000 | ||||||
|
|
|
| |||||
Net asset value per share | $ | 46.17 | $ | 51.30 | ||||
|
|
|
| |||||
| a | Securities on loan with values of $14,900,015 and $7,363,927, respectively. See Note 1. |
| b | Cost of foreign currency: $359,598 and $ —, respectively. |
| c | $0.001 par value, number of shares authorized: 200 million and 500 million, respectively. |
See notes to financial statements.
| 54 | 2017 iSHARES ANNUAL REPORTTO SHAREHOLDERS |
Table of Contents
Statements of Operations
iSHARES®, INC.
Year ended August 31, 2017
| iShares MSCI Brazil Capped ETF | iShares MSCI Chile Capped ETF | iShares MSCI Colombia Capped ETF | ||||||||||
NET INVESTMENT INCOME | ||||||||||||
Dividends — unaffiliateda | $ | 135,466,966 | $ | 9,554,292 | $ | 409,818 | ||||||
Dividends — affiliated (Note 2) | 12,902 | 4,952 | 190 | |||||||||
Securities lending income — affiliated — net (Note 2) | — | — | 9,028 | |||||||||
|
|
|
|
|
| |||||||
Total investment income | 135,479,868 | 9,559,244 | 419,036 | |||||||||
|
|
|
|
|
| |||||||
EXPENSES | ||||||||||||
Investment advisory fees (Note 2) | 30,600,776 | 2,558,275 | 109,356 | |||||||||
Proxy fees | 121,945 | 10,731 | 396 | |||||||||
Commitment fees (Note 7) | — | — | 84 | |||||||||
|
|
|
|
|
| |||||||
Total expenses | 30,722,721 | 2,569,006 | 109,836 | |||||||||
|
|
|
|
|
| |||||||
Net investment income | 104,757,147 | 6,990,238 | 309,200 | |||||||||
|
|
|
|
|
| |||||||
NET REALIZED AND UNREALIZED GAIN (LOSS) | ||||||||||||
Net realized gain (loss) from: | ||||||||||||
Investments — unaffiliatedb | (59,655,921 | ) | (1,122,426 | ) | (130,679 | ) | ||||||
Investments — affiliated (Note 2) | — | — | 186 | |||||||||
Foreign currency transactions | 1,698,672 | (76,746 | ) | (21,015 | ) | |||||||
Realized gain distributions from affiliated funds | 124 | 61 | 3 | |||||||||
|
|
|
|
|
| |||||||
Net realized loss | (57,957,125 | ) | (1,199,111 | ) | (151,505 | ) | ||||||
|
|
|
|
|
| |||||||
Net change in unrealized appreciation/depreciation on: | ||||||||||||
Investments — unaffiliated | 984,337,455 | 110,031,523 | 1,966,318 | |||||||||
Investments — affiliated (Note 2) | — | — | (4 | ) | ||||||||
Translation of assets and liabilities in foreign currencies | 101,252 | 185 | 130 | |||||||||
|
|
|
|
|
| |||||||
Net change in unrealized appreciation/depreciation | 984,438,707 | 110,031,708 | 1,966,444 | |||||||||
|
|
|
|
|
| |||||||
Net realized and unrealized gain | 926,481,582 | 108,832,597 | 1,814,939 | |||||||||
|
|
|
|
|
| |||||||
NET INCREASE IN NET ASSETS RESULTING FROM OPERATIONS | $ | 1,031,238,729 | $ | 115,822,835 | $ | 2,124,139 | ||||||
|
|
|
|
|
| |||||||
| a | Net of foreign withholding tax of $14,682,062, $2,085,538 and $1,848, respectively. |
| b | Net of foreign capital gains taxes of $ —, $2,698 and $ —, respectively. |
See notes to financial statements.
FINANCIAL STATEMENTS | 55 |
Table of Contents
Statements of Operations (Continued)
iSHARES®, INC.
Year ended August 31, 2017
| iShares MSCI Israel Capped ETF | iShares MSCI Russia Capped ETF | iShares MSCI South Africa ETF | ||||||||||
NET INVESTMENT INCOME | ||||||||||||
Dividends — unaffiliateda | $ | 1,643,754 | $ | 21,518,784 | $ | 10,352,006 | ||||||
Dividends — affiliated (Note 2) | 454 | 7,954 | 1,058 | |||||||||
Securities lending income — affiliated — net (Note 2) | 193,878 | — | 20,545 | |||||||||
|
|
|
|
|
| |||||||
Total investment income | 1,838,086 | 21,526,738 | 10,373,609 | |||||||||
|
|
|
|
|
| |||||||
EXPENSES | ||||||||||||
Investment advisory fees (Note 2) | 605,776 | 2,709,785 | 2,525,075 | |||||||||
Proxy fees | 2,186 | 11,187 | 9,424 | |||||||||
|
|
|
|
|
| |||||||
Total expenses | 607,962 | 2,720,972 | 2,534,499 | |||||||||
|
|
|
|
|
| |||||||
Net investment income | 1,230,124 | 18,805,766 | 7,839,110 | |||||||||
|
|
|
|
|
| |||||||
NET REALIZED AND UNREALIZED GAIN (LOSS) | ||||||||||||
Net realized gain (loss) from: | ||||||||||||
Investments — unaffiliatedb | (968,119 | ) | (26,476,747 | ) | (12,801,051 | ) | ||||||
Investments — affiliated (Note 2) | 2,928 | — | 932 | |||||||||
In-kind redemptions — unaffiliated | 2,927,927 | 4,583,575 | 15,649,810 | |||||||||
Foreign currency transactions | 48,241 | (185,378 | ) | (69,566 | ) | |||||||
Realized gain distributions from affiliated funds | 1 | 103 | 14 | |||||||||
|
|
|
|
|
| |||||||
Net realized gain (loss) | 2,010,978 | (22,078,447 | ) | 2,780,139 | ||||||||
|
|
|
|
|
| |||||||
Net change in unrealized appreciation/depreciation on: | ||||||||||||
Investments — unaffiliatedc | (2,511,856 | ) | 66,059,558 | 67,073,555 | ||||||||
Investments — affiliated (Note 2) | 546 | — | — | |||||||||
Translation of assets and liabilities in foreign currencies | (1,636 | ) | 3,749 | 38,776 | ||||||||
|
|
|
|
|
| |||||||
Net change in unrealized appreciation/depreciation | (2,512,946 | ) | 66,063,307 | 67,112,331 | ||||||||
|
|
|
|
|
| |||||||
Net realized and unrealized gain (loss) | (501,968 | ) | 43,984,860 | 69,892,470 | ||||||||
|
|
|
|
|
| |||||||
NET INCREASE IN NET ASSETS RESULTING FROM OPERATIONS | $ | 728,156 | $ | 62,790,626 | $ | 77,731,580 | ||||||
|
|
|
|
|
| |||||||
| a | Net of foreign withholding tax of $410,359, $2,668,372 and $1,790,681, respectively. |
| b | Net of foreign capital gains taxes of $28,464, $ — and $ —, respectively. |
| c | Net of deferred foreign capital gains taxes of $39,524, $ — and $ —, respectively. |
See notes to financial statements.
| 56 | 2017 iSHARES ANNUAL REPORTTO SHAREHOLDERS |
Table of Contents
Statements of Operations (Continued)
iSHARES®, INC.
Year ended August 31, 2017
| iShares MSCI Turkey ETF | iShares MSCI USA Equal Weighted ETF | |||||||
NET INVESTMENT INCOME | ||||||||
Dividends — unaffiliateda | $ | 10,333,393 | $ | 2,046,114 | ||||
Dividends — affiliated (Note 2) | 1,782 | 9,305 | ||||||
Securities lending income — affiliated — net (Note 2) | 1,653,107 | 26,730 | ||||||
|
|
|
| |||||
Total investment income | 11,988,282 | 2,082,149 | ||||||
|
|
|
| |||||
EXPENSES | ||||||||
Investment advisory fees (Note 2) | 2,304,918 | 166,612 | ||||||
Proxy fees | 8,737 | 2,768 | ||||||
|
|
|
| |||||
Total expenses | 2,313,655 | 169,380 | ||||||
|
|
|
| |||||
Net investment income | 9,674,627 | 1,912,769 | ||||||
|
|
|
| |||||
NET REALIZED AND UNREALIZED GAIN (LOSS) | ||||||||
Net realized gain (loss) from: | ||||||||
Investments — unaffiliated | (18,406,027 | ) | 585,392 | |||||
Investments — affiliated (Note 2) | 7,747 | 5,007 | ||||||
In-kind redemptions — unaffiliated | 18,089,171 | 2,416,329 | ||||||
In-kind redemptions — affiliated (Note 2) | — | 8,059 | ||||||
Foreign currency transactions | (64,036 | ) | — | |||||
Realized gain distributions from affiliated funds | 21 | 6 | ||||||
|
|
|
| |||||
Net realized gain (loss) | (373,124 | ) | 3,014,793 | |||||
|
|
|
| |||||
Net change in unrealized appreciation/depreciation on: | ||||||||
Investments — unaffiliated | 90,138,152 | 8,613,661 | ||||||
Investments — affiliated (Note 2) | 3,930 | 64,105 | ||||||
Translation of assets and liabilities in foreign currencies | 9,207 | — | ||||||
|
|
|
| |||||
Net change in unrealized appreciation/depreciation | 90,151,289 | 8,677,766 | ||||||
|
|
|
| |||||
Net realized and unrealized gain | 89,778,165 | 11,692,559 | ||||||
|
|
|
| |||||
NET INCREASE IN NET ASSETS RESULTING FROM OPERATIONS | $ | 99,452,792 | $ | 13,605,328 | ||||
|
|
|
| |||||
| a | Net of foreign withholding tax of $1,709,898 and $761, respectively. |
See notes to financial statements.
FINANCIAL STATEMENTS | 57 |
Table of Contents
Statements of Changes in Net Assets
iSHARES®, INC.
| iShares MSCI Brazil Capped ETF | iShares MSCI Chile Capped ETF | |||||||||||||||
| Year ended August 31, 2017 | Year ended August 31, 2016 | Year ended August 31, 2017 | Year ended August 31, 2016 | |||||||||||||
INCREASE (DECREASE) IN NET ASSETS | ||||||||||||||||
OPERATIONS: | ||||||||||||||||
Net investment income | $ | 104,757,147 | $ | 61,636,375 | $ | 6,990,238 | $ | 6,005,783 | ||||||||
Net realized loss | (57,957,125 | ) | (257,295,439 | ) | (1,199,111 | ) | (31,725,027 | ) | ||||||||
Net change in unrealized appreciation/depreciation | 984,438,707 | 1,230,865,300 | 110,031,708 | 42,114,948 | ||||||||||||
|
|
|
|
|
|
|
| |||||||||
Net increase in net assets resulting from operations | 1,031,238,729 | 1,035,206,236 | 115,822,835 | 16,395,704 | ||||||||||||
|
|
|
|
|
|
|
| |||||||||
DISTRIBUTIONS TO SHAREHOLDERS: | ||||||||||||||||
From net investment income | (93,579,029 | ) | (44,455,957 | ) | (6,944,133 | ) | (6,349,056 | ) | ||||||||
Return of capital | — | — | (462,190 | ) | (332,847 | ) | ||||||||||
|
|
|
|
|
|
|
| |||||||||
Total distributions to shareholders | (93,579,029 | ) | (44,455,957 | ) | (7,406,323 | ) | (6,681,903 | ) | ||||||||
|
|
|
|
|
|
|
| |||||||||
CAPITAL SHARE TRANSACTIONS: | ||||||||||||||||
Proceeds from shares sold | 1,830,568,929 | 1,270,213,076 | 222,913,747 | 244,807,233 | ||||||||||||
Cost of shares redeemed | (339,939,142 | ) | (350,468,855 | ) | (190,929,443 | ) | (161,813,177 | ) | ||||||||
|
|
|
|
|
|
|
| |||||||||
Net increase in net assets from capital share transactions | 1,490,629,787 | 919,744,221 | 31,984,304 | 82,994,056 | ||||||||||||
|
|
|
|
|
|
|
| |||||||||
INCREASE IN NET ASSETS | 2,428,289,487 | 1,910,494,500 | 140,400,816 | 92,707,857 | ||||||||||||
NET ASSETS | ||||||||||||||||
Beginning of year | 3,899,629,549 | 1,989,135,049 | 327,244,232 | 234,536,375 | ||||||||||||
|
|
|
|
|
|
|
| |||||||||
End of year | $ | 6,327,919,036 | $ | 3,899,629,549 | $ | 467,645,048 | $ | 327,244,232 | ||||||||
|
|
|
|
|
|
|
| |||||||||
Undistributed (distributions in excess of) net investment income included in net assets at end of year | $ | 27,321,455 | $ | 13,940,149 | $ | (78,356 | ) | $ | (45,076 | ) | ||||||
|
|
|
|
|
|
|
| |||||||||
SHARES ISSUED AND REDEEMED | ||||||||||||||||
Shares sold | 50,950,000 | 50,800,000 | 5,400,000 | 7,000,000 | ||||||||||||
Shares redeemed | (9,350,000 | ) | (14,950,000 | ) | (4,550,000 | ) | (4,850,000 | ) | ||||||||
|
|
|
|
|
|
|
| |||||||||
Net increase in shares outstanding | 41,600,000 | 35,850,000 | 850,000 | 2,150,000 | ||||||||||||
|
|
|
|
|
|
|
| |||||||||
See notes to financial statements.
| 58 | 2017 iSHARES ANNUAL REPORTTO SHAREHOLDERS |
Table of Contents
Statements of Changes in Net Assets (Continued)
iSHARES®, INC.
| iShares MSCI Colombia Capped ETF | iShares MSCI Israel Capped ETF | |||||||||||||||
| Year ended August 31, 2017 | Year ended August 31, 2016 | Year ended August 31, 2017 | Year ended August 31, 2016 | |||||||||||||
INCREASE (DECREASE) IN NET ASSETS | ||||||||||||||||
OPERATIONS: | ||||||||||||||||
Net investment income | $ | 309,200 | $ | 344,029 | $ | 1,230,124 | $ | 1,606,791 | ||||||||
Net realized gain (loss) | (151,505 | ) | (5,180,842 | ) | 2,010,978 | (18,092,057 | ) | |||||||||
Net change in unrealized appreciation/depreciation | 1,966,444 | 7,790,295 | (2,512,946 | ) | 16,513,428 | |||||||||||
|
|
|
|
|
|
|
| |||||||||
Net increase in net assets resulting from operations | 2,124,139 | 2,953,482 | 728,156 | 28,162 | ||||||||||||
|
|
|
|
|
|
|
| |||||||||
DISTRIBUTIONS TO SHAREHOLDERS: | ||||||||||||||||
From net investment income | (229,358 | ) | (224,626 | ) | (1,597,362 | ) | (2,029,827 | ) | ||||||||
|
|
|
|
|
|
|
| |||||||||
Total distributions to shareholders | (229,358 | ) | (224,626 | ) | (1,597,362 | ) | (2,029,827 | ) | ||||||||
|
|
|
|
|
|
|
| |||||||||
CAPITAL SHARE TRANSACTIONS: | ||||||||||||||||
Proceeds from shares sold | 3,562,888 | 6,132,574 | 14,260,227 | 117,163,288 | ||||||||||||
Cost of shares redeemed | — | (5,975,872 | ) | (18,031,594 | ) | (147,653,928 | ) | |||||||||
|
|
|
|
|
|
|
| |||||||||
Net increase (decrease) in net assets from capital share transactions | 3,562,888 | 156,702 | (3,771,367 | ) | (30,490,640 | ) | ||||||||||
|
|
|
|
|
|
|
| |||||||||
INCREASE (DECREASE) IN NET ASSETS | 5,457,669 | 2,885,558 | (4,640,573 | ) | (32,492,305 | ) | ||||||||||
NET ASSETS | ||||||||||||||||
Beginning of year | 17,136,214 | 14,250,656 | 93,792,563 | 126,284,868 | ||||||||||||
|
|
|
|
|
|
|
| |||||||||
End of year | $ | 22,593,883 | $ | 17,136,214 | $ | 89,151,990 | $ | 93,792,563 | ||||||||
|
|
|
|
|
|
|
| |||||||||
Undistributed (distributions in excess of) net investment income included in net assets at end of year | $ | 47,324 | $ | (11,506 | ) | $ | (39,108 | ) | $ | 5,368 | ||||||
|
|
|
|
|
|
|
| |||||||||
SHARES ISSUED AND REDEEMED | ||||||||||||||||
Shares sold | 250,000 | 550,000 | 300,000 | 2,400,000 | ||||||||||||
Shares redeemed | — | (450,000 | ) | (350,000 | ) | (3,000,000 | ) | |||||||||
|
|
|
|
|
|
|
| |||||||||
Net increase (decrease) in shares outstanding | 250,000 | 100,000 | (50,000 | ) | (600,000 | ) | ||||||||||
|
|
|
|
|
|
|
| |||||||||
See notes to financial statements.
FINANCIAL STATEMENTS | 59 |
Table of Contents
Statements of Changes in Net Assets (Continued)
iSHARES®, INC.
| iShares MSCI Russia Capped ETF | iShares MSCI South Africa ETF | |||||||||||||||
| Year ended August 31, 2017a | Year ended August 31, 2016a | Year ended August 31, 2017 | Year ended August 31, 2016 | |||||||||||||
INCREASE (DECREASE) IN NET ASSETS | ||||||||||||||||
OPERATIONS: | ||||||||||||||||
Net investment income | $ | 18,805,766 | $ | 10,560,615 | $ | 7,839,110 | $ | 7,053,263 | ||||||||
Net realized gain (loss) | (22,078,447 | ) | (29,630,473 | ) | 2,780,139 | (46,182,845 | ) | |||||||||
Net change in unrealized appreciation/depreciation | 66,063,307 | 57,964,293 | 67,112,331 | 2,637,086 | ||||||||||||
|
|
|
|
|
|
|
| |||||||||
Net increase (decrease) in net assets resulting from operations | 62,790,626 | 38,894,435 | 77,731,580 | (36,492,496 | ) | |||||||||||
|
|
|
|
|
|
|
| |||||||||
DISTRIBUTIONS TO SHAREHOLDERS: | ||||||||||||||||
From net investment income | (13,531,335 | ) | (7,677,207 | ) | (7,473,325 | ) | (15,854,819 | ) | ||||||||
|
|
|
|
|
|
|
| |||||||||
Total distributions to shareholders | (13,531,335 | ) | (7,677,207 | ) | (7,473,325 | ) | (15,854,819 | ) | ||||||||
|
|
|
|
|
|
|
| |||||||||
CAPITAL SHARE TRANSACTIONS: | ||||||||||||||||
Proceeds from shares sold | 189,716,789 | 139,225,914 | 87,244,010 | 340,977,105 | ||||||||||||
Cost of shares redeemed | (28,528,183 | ) | (61,726,895 | ) | (144,358,566 | ) | (255,533,050 | ) | ||||||||
|
|
|
|
|
|
|
| |||||||||
Net increase (decrease) in net assets from capital share transactions | 161,188,606 | 77,499,019 | (57,114,556 | ) | 85,444,055 | |||||||||||
|
|
|
|
|
|
|
| |||||||||
INCREASE IN NET ASSETS | 210,447,897 | 108,716,247 | 13,143,699 | 33,096,740 | ||||||||||||
NET ASSETS | ||||||||||||||||
Beginning of year | 319,628,552 | 210,912,305 | 406,443,011 | 373,346,271 | ||||||||||||
|
|
|
|
|
|
|
| |||||||||
End of year | $ | 530,076,449 | $ | 319,628,552 | $ | 419,586,710 | $ | 406,443,011 | ||||||||
|
|
|
|
|
|
|
| |||||||||
Undistributed (distributions in excess of) net investment income included in net assets at end of year | $ | 12,788,323 | $ | 7,695,156 | $ | 448,826 | $ | (6,378,230 | ) | |||||||
|
|
|
|
|
|
|
| |||||||||
SHARES ISSUED AND REDEEMED | ||||||||||||||||
Shares sold | 6,000,000 | 5,375,000 | 1,600,000 | 6,500,000 | ||||||||||||
Shares redeemed | (950,000 | ) | (2,350,000 | ) | (2,600,000 | ) | (5,300,000 | ) | ||||||||
|
|
|
|
|
|
|
| |||||||||
Net increase (decrease) in shares outstanding | 5,050,000 | 3,025,000 | (1,000,000 | ) | 1,200,000 | |||||||||||
|
|
|
|
|
|
|
| |||||||||
| a | Share transactions reflect a one-for-two reverse stock split effective after the close of trading on November 4, 2016. See Note 4. |
See notes to financial statements.
| 60 | 2017 iSHARES ANNUAL REPORTTO SHAREHOLDERS |
Table of Contents
Statements of Changes in Net Assets (Continued)
iSHARES®, INC.
| iShares MSCI Turkey ETF | iShares MSCI USA Equal Weighted ETF | |||||||||||||||
| Year ended August 31, 2017 | Year ended August 31, 2016 | Year ended August 31, 2017 | Year ended August 31, 2016 | |||||||||||||
INCREASE (DECREASE) IN NET ASSETS | ||||||||||||||||
OPERATIONS: | ||||||||||||||||
Net investment income | $ | 9,674,627 | $ | 8,419,377 | $ | 1,912,769 | $ | 884,610 | ||||||||
Net realized gain (loss) | (373,124 | ) | (56,753,736 | ) | 3,014,793 | 101,408 | ||||||||||
Net change in unrealized appreciation/depreciation | 90,151,289 | 45,103,244 | 8,677,766 | 4,112,797 | ||||||||||||
|
|
|
|
|
|
|
| |||||||||
Net increase (decrease) in net assets resulting from operations | 99,452,792 | (3,231,115 | ) | 13,605,328 | 5,098,815 | |||||||||||
|
|
|
|
|
|
|
| |||||||||
DISTRIBUTIONS TO SHAREHOLDERS: | ||||||||||||||||
From net investment income | (10,121,626 | ) | (8,065,957 | ) | (1,736,320 | ) | (944,600 | ) | ||||||||
|
|
|
|
|
|
|
| |||||||||
Total distributions to shareholders | (10,121,626 | ) | (8,065,957 | ) | (1,736,320 | ) | (944,600 | ) | ||||||||
|
|
|
|
|
|
|
| |||||||||
CAPITAL SHARE TRANSACTIONS: | ||||||||||||||||
Proceeds from shares sold | 103,777,923 | 189,059,577 | 60,481,105 | 39,301,537 | ||||||||||||
Cost of shares redeemed | (136,607,007 | ) | (180,762,552 | ) | (10,078,303 | ) | (14,414,232 | ) | ||||||||
|
|
|
|
|
|
|
| |||||||||
Net increase (decrease) in net assets from capital share transactions | (32,829,084 | ) | 8,297,025 | 50,402,802 | 24,887,305 | |||||||||||
|
|
|
|
|
|
|
| |||||||||
INCREASE (DECREASE) IN NET ASSETS | 56,502,082 | (3,000,047 | ) | 62,271,810 | 29,041,520 | |||||||||||
NET ASSETS | ||||||||||||||||
Beginning of year | 368,224,501 | 371,224,548 | 73,673,385 | 44,631,865 | ||||||||||||
|
|
|
|
|
|
|
| |||||||||
End of year | $ | 424,726,583 | $ | 368,224,501 | $ | 135,945,195 | $ | 73,673,385 | ||||||||
|
|
|
|
|
|
|
| |||||||||
Undistributed (distributions in excess of) net investment income included in net assets at end of year | $ | (167,293 | ) | $ | 173,958 | $ | 397,508 | $ | 163,769 | |||||||
|
|
|
|
|
|
|
| |||||||||
SHARES ISSUED AND REDEEMED | ||||||||||||||||
Shares sold | 3,150,000 | 4,600,000 | 1,250,000 | 900,000 | ||||||||||||
Shares redeemed | (3,600,000 | ) | (4,650,000 | ) | (200,000 | ) | (350,000 | ) | ||||||||
|
|
|
|
|
|
|
| |||||||||
Net increase (decrease) in shares outstanding | (450,000 | ) | (50,000 | ) | 1,050,000 | 550,000 | ||||||||||
|
|
|
|
|
|
|
| |||||||||
See notes to financial statements.
FINANCIAL STATEMENTS | 61 |
Table of Contents
iSHARES®, INC.
(For a share outstanding throughout each period)
| iShares MSCI Brazil Capped ETF | ||||||||||||||||||||
| Year ended Aug. 31, 2017 | Year ended Aug. 31, 2016 | Year ended Aug. 31, 2015 | Year ended Aug. 31, 2014 | Year ended Aug. 31, 2013 | ||||||||||||||||
Net asset value, beginning of year | $ | 33.52 | $ | 24.71 | $ | 53.61 | $ | 42.52 | $ | 52.61 | ||||||||||
|
|
|
|
|
|
|
|
|
| |||||||||||
Income from investment operations: | ||||||||||||||||||||
Net investment incomea | 0.76 | 0.63 | 1.00 | 1.56 | 1.59 | |||||||||||||||
Net realized and unrealized gain (loss)b | 6.45 | 8.62 | (28.87 | ) | 11.08 | (10.32 | ) | |||||||||||||
|
|
|
|
|
|
|
|
|
| |||||||||||
Total from investment operations | 7.21 | 9.25 | (27.87 | ) | 12.64 | (8.73 | ) | |||||||||||||
|
|
|
|
|
|
|
|
|
| |||||||||||
Less distributions from: | ||||||||||||||||||||
Net investment income | (0.67 | ) | (0.44 | ) | (1.03 | ) | (1.55 | ) | (1.36 | ) | ||||||||||
|
|
|
|
|
|
|
|
|
| |||||||||||
Total distributions | (0.67 | ) | (0.44 | ) | (1.03 | ) | (1.55 | ) | (1.36 | ) | ||||||||||
|
|
|
|
|
|
|
|
|
| |||||||||||
Net asset value, end of year | $ | 40.06 | $ | 33.52 | $ | 24.71 | $ | 53.61 | $ | 42.52 | ||||||||||
|
|
|
|
|
|
|
|
|
| |||||||||||
Total return | 22.03 | % | 38.22 | % | (52.49 | )% | 30.33 | % | (16.85 | )% | ||||||||||
|
|
|
|
|
|
|
|
|
| |||||||||||
Ratios/Supplemental data: | ||||||||||||||||||||
Net assets, end of year (000s) | $ | 6,327,919 | $ | 3,899,630 | $ | 1,989,135 | $ | 5,449,685 | $ | 4,983,630 | ||||||||||
Ratio of expenses to average net assets | 0.62 | % | 0.63 | % | 0.62 | % | 0.62 | % | 0.61 | % | ||||||||||
Ratio of net investment income to average net assets | 2.10 | % | 2.41 | % | 2.73 | % | 3.37 | % | 3.02 | % | ||||||||||
Portfolio turnover ratec | 20 | % | 18 | % | 63 | % | 54 | % | 56 | % | ||||||||||
| a | Based on average shares outstanding throughout each period. |
| b | The amounts reported for a share outstanding may not accord with the change in aggregate gains and losses in securities for the fiscal period due to the timing of capital share transactions in relation to the fluctuating market values of the Fund’s underlying securities. |
| c | Portfolio turnover rates include portfolio transactions that are executed as a result of the Fund processing capital share transactions in Creation Units solely for cash in U.S. dollars. Excluding such cash transactions, the portfolio turnover rates for the years ended August 31, 2017, August 31, 2016, August 31, 2015, August 31, 2014 and August 31, 2013 were 13%, 4%, 48%, 11% and 20%, respectively. See Note 4. |
See notes to financial statements.
| 62 | 2017 iSHARES ANNUAL REPORTTO SHAREHOLDERS |
Table of Contents
Financial Highlights (Continued)
iSHARES®, INC.
(For a share outstanding throughout each period)
| iShares MSCI Chile Capped ETF | ||||||||||||||||||||
| Year ended Aug. 31, 2017 | Year ended Aug. 31, 2016 | Year ended Aug. 31, 2015 | Year ended Aug. 31, 2014 | Year ended Aug. 31, 2013 | ||||||||||||||||
Net asset value, beginning of year | $ | 36.77 | $ | 34.75 | $ | 43.52 | $ | 47.70 | $ | 60.31 | ||||||||||
|
|
|
|
|
|
|
|
|
| |||||||||||
Income from investment operations: | ||||||||||||||||||||
Net investment incomea | 0.69 | 0.78 | 0.66 | 0.69 | 0.68 | |||||||||||||||
Net realized and unrealized gain (loss)b | 11.21 | 2.03 | (8.81 | ) | (4.18 | ) | (12.58 | ) | ||||||||||||
|
|
|
|
|
|
|
|
|
| |||||||||||
Total from investment operations | 11.90 | 2.81 | (8.15 | ) | (3.49 | ) | (11.90 | ) | ||||||||||||
|
|
|
|
|
|
|
|
|
| |||||||||||
Less distributions from: | ||||||||||||||||||||
Net investment income | (0.67 | ) | (0.75 | ) | (0.62 | ) | (0.69 | ) | (0.68 | ) | ||||||||||
Return of capital | (0.04 | ) | (0.04 | ) | — | — | (0.03 | ) | ||||||||||||
|
|
|
|
|
|
|
|
|
| |||||||||||
Total distributions | (0.71 | ) | (0.79 | ) | (0.62 | ) | (0.69 | ) | (0.71 | ) | ||||||||||
|
|
|
|
|
|
|
|
|
| |||||||||||
Net asset value, end of year | $ | 47.96 | $ | 36.77 | $ | 34.75 | $ | 43.52 | $ | 47.70 | ||||||||||
|
|
|
|
|
|
|
|
|
| |||||||||||
Total return | 32.65 | % | 8.17 | % | (18.85 | )% | (7.40 | )% | (19.87 | )% | ||||||||||
|
|
|
|
|
|
|
|
|
| |||||||||||
Ratios/Supplemental data: | ||||||||||||||||||||
Net assets, end of year (000s) | $ | 467,645 | $ | 327,244 | $ | 234,536 | $ | 352,499 | $ | 364,890 | ||||||||||
Ratio of expenses to average net assets | 0.62 | % | 0.64 | % | 0.62 | % | 0.62 | % | 0.61 | % | ||||||||||
Ratio of net investment income to average net assets | 1.68 | % | 2.20 | % | 1.64 | % | 1.49 | % | 1.12 | % | ||||||||||
Portfolio turnover ratec | 54 | % | 73 | % | 71 | % | 91 | % | 34 | % | ||||||||||
| a | Based on average shares outstanding throughout each period. |
| b | The amounts reported for a share outstanding may not accord with the change in aggregate gains and losses in securities for the fiscal period due to the timing of capital share transactions in relation to the fluctuating market values of the Fund’s underlying securities. |
| c | Portfolio turnover rates include portfolio transactions that are executed as a result of the Fund processing capital share transactions in Creation Units solely for cash in U.S. dollars. Excluding such cash transactions, the portfolio turnover rates for the years ended August 31, 2017, August 31, 2016, August 31, 2015, August 31, 2014 and August 31, 2013 were 8%, 11%, 10%, 11% and 16% respectively. See Note 4. |
See notes to financial statements.
FINANCIAL HIGHLIGHTS | 63 |
Table of Contents
Financial Highlights (Continued)
iSHARES®, INC.
(For a share outstanding throughout each period)
| iShares MSCI Colombia Capped ETF | ||||||||||||||||||||
| Year ended Aug. 31, 2017 | Year ended Aug. 31, 2016 | Year ended Aug. 31, 2015 | Year ended Aug. 31, 2014 | Period from to Aug. 31, | ||||||||||||||||
Net asset value, beginning of period | $ | 13.18 | $ | 11.88 | $ | 28.22 | $ | 25.98 | $ | 25.28 | ||||||||||
|
|
|
|
|
|
|
|
|
| |||||||||||
Income from investment operations: | ||||||||||||||||||||
Net investment incomeb | 0.23 | 0.25 | 0.46 | c | 0.67 | 0.03 | ||||||||||||||
Net realized and unrealized gain (loss)d | 1.34 | 1.23 | (16.34 | ) | 2.24 | 0.67 | ||||||||||||||
|
|
|
|
|
|
|
|
|
| |||||||||||
Total from investment operations | 1.57 | 1.48 | (15.88 | ) | 2.91 | 0.70 | ||||||||||||||
|
|
|
|
|
|
|
|
|
| |||||||||||
Less distributions from: | ||||||||||||||||||||
Net investment income | (0.17 | ) | (0.18 | ) | (0.45 | ) | (0.63 | ) | — | |||||||||||
Net realized gain | — | — | — | (0.03 | ) | — | ||||||||||||||
Return of capital | — | — | (0.01 | ) | (0.01 | ) | — | |||||||||||||
|
|
|
|
|
|
|
|
|
| |||||||||||
Total distributions | (0.17 | ) | (0.18 | ) | (0.46 | ) | (0.67 | ) | — | |||||||||||
|
|
|
|
|
|
|
|
|
| |||||||||||
Net asset value, end of period | $ | 14.58 | $ | 13.18 | $ | 11.88 | $ | 28.22 | $ | 25.98 | ||||||||||
|
|
|
|
|
|
|
|
|
| |||||||||||
Total return | 12.05 | % | 12.49 | % | (56.73 | )% | 11.44 | % | 2.77 | %e | ||||||||||
|
|
|
|
|
|
|
|
|
| |||||||||||
Ratios/Supplemental data: | ||||||||||||||||||||
Net assets, end of period (000s) | $ | 22,594 | $ | 17,136 | $ | 14,251 | $ | 25,396 | $ | 18,188 | ||||||||||
Ratio of expenses to average net assetsf | 0.61 | % | 0.61 | % | 0.61 | % | 0.61 | % | 0.61 | % | ||||||||||
Ratio of net investment income to average net assetsf | 1.72 | % | 2.16 | % | 2.60 | %c | 2.54 | % | 0.61 | % | ||||||||||
Portfolio turnover rateg | 14 | % | 68 | % | 86 | % | 34 | % | 2 | %e | ||||||||||
| a | Commencement of operations. |
| b | Based on average shares outstanding throughout each period. |
| c | Includes a distribution from Ecopetrol SA. Excluding such distribution, the net investment income would have been $0.33 per share and 1.87% of average net assets. |
| d | The amounts reported for a share outstanding may not accord with the change in aggregate gains and losses in securities for the fiscal period due to the timing of capital share transactions in relation to the fluctuating market values of the Fund’s underlying securities. |
| e | Not annualized. |
| f | Annualized for periods of less than one year. |
| g | Portfolio turnover rates include portfolio transactions that are executed as a result of the Fund processing capital share transactions in Creation Units solely for cash in U.S. dollars. Excluding such cash transactions, the portfolio turnover rates for the years ended August 31, 2017, August 31, 2016, August 31, 2015, August 31, 2014 and for the period ended August 31, 2013 were 14%, 32%, 49%, 33% and 2%, respectively. See Note 4. |
See notes to financial statements.
| 64 | 2017 iSHARES ANNUAL REPORTTO SHAREHOLDERS |
Table of Contents
Financial Highlights (Continued)
iSHARES®, INC.
(For a share outstanding throughout each period)
| iShares MSCI Israel Capped ETF | ||||||||||||||||||||
| Year ended Aug. 31, 2017 | Year ended Aug. 31, 2016 | Year ended Aug. 31, 2015 | Year ended Aug. 31, 2014 | Year ended Aug. 31, 2013 | ||||||||||||||||
Net asset value, beginning of year | $ | 49.36 | $ | 50.51 | $ | 50.69 | $ | 42.85 | $ | 37.25 | ||||||||||
|
|
|
|
|
|
|
|
|
| |||||||||||
Income from investment operations: | ||||||||||||||||||||
Net investment incomea | 0.62 | 0.71 | 1.23 | 0.87 | 0.95 | |||||||||||||||
Net realized and unrealized gain (loss)b | (0.98 | ) | (0.87 | ) | (0.34 | ) | 7.95 | 5.68 | ||||||||||||
|
|
|
|
|
|
|
|
|
| |||||||||||
Total from investment operations | (0.36 | ) | (0.16 | ) | 0.89 | 8.82 | 6.63 | |||||||||||||
|
|
|
|
|
|
|
|
|
| |||||||||||
Less distributions from: | ||||||||||||||||||||
Net investment income | (0.81 | ) | (0.99 | ) | (1.07 | ) | (0.98 | ) | (1.03 | ) | ||||||||||
|
|
|
|
|
|
|
|
|
| |||||||||||
Total distributions | (0.81 | ) | (0.99 | ) | (1.07 | ) | (0.98 | ) | (1.03 | ) | ||||||||||
|
|
|
|
|
|
|
|
|
| |||||||||||
Net asset value, end of year | $ | 48.19 | $ | 49.36 | $ | 50.51 | $ | 50.69 | $ | 42.85 | ||||||||||
|
|
|
|
|
|
|
|
|
| |||||||||||
Total return | (0.77 | )% | (0.23 | )% | 1.80 | % | 20.67 | % | 17.82 | % | ||||||||||
|
|
|
|
|
|
|
|
|
| |||||||||||
Ratios/Supplemental data: | ||||||||||||||||||||
Net assets, end of year (000s) | $ | 89,152 | $ | 93,793 | $ | 126,285 | $ | 121,645 | $ | 70,710 | ||||||||||
Ratio of expenses to average net assets | 0.62 | % | 0.64 | % | 0.62 | % | 0.62 | % | 0.61 | % | ||||||||||
Ratio of net investment income to average net assets | 1.25 | % | 1.46 | % | 2.45 | % | 1.74 | % | 2.20 | % | ||||||||||
Portfolio turnover ratec | 28 | % | 46 | % | 14 | % | 15 | % | 14 | % | ||||||||||
| a | Based on average shares outstanding throughout each period. |
| b | The amounts reported for a share outstanding may not accord with the change in aggregate gains and losses in securities for the fiscal period due to the timing of capital share transactions in relation to the fluctuating market values of the Fund’s underlying securities. |
| c | Portfolio turnover rates exclude portfolio securities received or delivered as a result of processing capital share transactions in Creation Units. |
See notes to financial statements.
FINANCIAL HIGHLIGHTS | 65 |
Table of Contents
Financial Highlights (Continued)
iSHARES®, INC.
(For a share outstanding throughout each period)
| iShares MSCI Russia Capped ETF | ||||||||||||||||||||
| Year ended Aug. 31, 2017 a | Year ended Aug. 31, 2016 a | Year ended Aug. 31, 2015 a | Year ended Aug. 31, 2014 a | Year ended Aug. 31, 2013 a | ||||||||||||||||
Net asset value, beginning of year | $ | 27.92 | $ | 25.03 | $ | 36.68 | $ | 39.68 | $ | 42.31 | ||||||||||
|
|
|
|
|
|
|
|
|
| |||||||||||
Income from investment operations: | ||||||||||||||||||||
Net investment incomeb | 1.14 | 1.06 | 0.94 | 1.26 | 1.24 | |||||||||||||||
Net realized and unrealized gain (loss)c | 4.07 | 2.65 | (11.27 | ) | (4.01 | ) | (2.71 | ) | ||||||||||||
|
|
|
|
|
|
|
|
|
| |||||||||||
Total from investment operations | 5.21 | 3.71 | (10.33 | ) | (2.75 | ) | (1.47 | ) | ||||||||||||
|
|
|
|
|
|
|
|
|
| |||||||||||
Less distributions from: | ||||||||||||||||||||
Net investment income | (1.00 | ) | (0.82 | ) | (1.32 | ) | (0.25 | ) | (1.16 | ) | ||||||||||
|
|
|
|
|
|
|
|
|
| |||||||||||
Total distributions | (1.00 | ) | (0.82 | ) | (1.32 | ) | (0.25 | ) | (1.16 | ) | ||||||||||
|
|
|
|
|
|
|
|
|
| |||||||||||
Net asset value, end of year | $ | 32.13 | $ | 27.92 | $ | 25.03 | $ | 36.68 | $ | 39.68 | ||||||||||
|
|
|
|
|
|
|
|
|
| |||||||||||
Total return | 18.73 | % | 15.62 | % | (27.57 | )% | (7.00 | )% | (3.40 | )% | ||||||||||
|
|
|
|
|
|
|
|
|
| |||||||||||
Ratios/Supplemental data: | ||||||||||||||||||||
Net assets, end of year (000s) | $ | 530,076 | $ | 319,629 | $ | 210,912 | $ | 289,775 | $ | 310,511 | ||||||||||
Ratio of expenses to average net assets | 0.62 | % | 0.64 | % | 0.62 | % | 0.62 | % | 0.61 | % | ||||||||||
Ratio of net investment income to average net assets | 4.27 | % | 4.17 | % | 3.33 | % | 3.14 | % | 2.87 | % | ||||||||||
Portfolio turnover rated | 18 | % | 23 | % | 19 | % | 15 | % | 14 | % | ||||||||||
| a | Per share amounts reflect a one-for-two reverse stock split effective after the close of trading on November 4, 2016. See Note 4. |
| b | Based on average shares outstanding throughout each period. |
| c | The amounts reported for a share outstanding may not accord with the change in aggregate gains and losses in securities for the fiscal period due to the timing of capital share transactions in relation to the fluctuating market values of the Fund’s underlying securities. |
| d | Portfolio turnover rates exclude portfolio securities received or delivered as a result of processing capital share transactions in Creation Units. |
See notes to financial statements.
| 66 | 2017 iSHARES ANNUAL REPORTTO SHAREHOLDERS |
Table of Contents
Financial Highlights (Continued)
iSHARES®, INC.
(For a share outstanding throughout each period)
| iShares MSCI South Africa ETF | ||||||||||||||||||||
| Year ended Aug. 31, 2017 | Year ended Aug. 31, 2016 | Year ended Aug. 31, 2015 | Year ended Aug. 31, 2014 | Year ended Aug. 31, 2013 | ||||||||||||||||
Net asset value, beginning of year | $ | 52.78 | $ | 57.44 | $ | 70.77 | $ | 58.88 | $ | 64.65 | ||||||||||
|
|
|
|
|
|
|
|
|
| |||||||||||
Income from investment operations: | ||||||||||||||||||||
Net investment incomea | 1.07 | 1.02 | 1.28 | 1.57 | 1.32 | |||||||||||||||
Net realized and unrealized gain (loss)b | 9.79 | (3.24 | ) | (13.24 | ) | 11.86 | (5.31 | ) | ||||||||||||
|
|
|
|
|
|
|
|
|
| |||||||||||
Total from investment operations | 10.86 | (2.22 | ) | (11.96 | ) | 13.43 | (3.99 | ) | ||||||||||||
|
|
|
|
|
|
|
|
|
| |||||||||||
Less distributions from: | ||||||||||||||||||||
Net investment income | (1.02 | ) | (2.44 | ) | (1.37 | ) | (1.54 | ) | (1.78 | ) | ||||||||||
|
|
|
|
|
|
|
|
|
| |||||||||||
Total distributions | (1.02 | ) | (2.44 | ) | (1.37 | ) | (1.54 | ) | (1.78 | ) | ||||||||||
|
|
|
|
|
|
|
|
|
| |||||||||||
Net asset value, end of year | $ | 62.62 | $ | 52.78 | $ | 57.44 | $ | 70.77 | $ | 58.88 | ||||||||||
|
|
|
|
|
|
|
|
|
| |||||||||||
Total return | 20.91 | % | (3.64 | )% | (17.07 | )% | 23.13 | % | (6.35 | )% | ||||||||||
|
|
|
|
|
|
|
|
|
| |||||||||||
Ratios/Supplemental data: | ||||||||||||||||||||
Net assets, end of year (000s) | $ | 419,587 | $ | 406,443 | $ | 373,346 | $ | 587,396 | $ | 547,569 | ||||||||||
Ratio of expenses to average net assets | 0.62 | % | 0.64 | % | 0.62 | % | 0.62 | % | 0.61 | % | ||||||||||
Ratio of net investment income to average net assets | 1.91 | % | 1.96 | % | 1.94 | % | 2.40 | % | 2.08 | % | ||||||||||
Portfolio turnover ratec | 13 | % | 12 | % | 9 | % | 6 | % | 5 | % | ||||||||||
| a | Based on average shares outstanding throughout each period. |
| b | The amounts reported for a share outstanding may not accord with the change in aggregate gains and losses in securities for the fiscal period due to the timing of capital share transactions in relation to the fluctuating market values of the Fund’s underlying securities. |
| c | Portfolio turnover rates exclude portfolio securities received or delivered as a result of processing capital share transactions in Creation Units. |
See notes to financial statements.
FINANCIAL HIGHLIGHTS | 67 |
Table of Contents
Financial Highlights (Continued)
iSHARES®, INC.
(For a share outstanding throughout each period)
| iShares MSCI Turkey ETF | ||||||||||||||||||||
| Year ended Aug. 31, 2017 | Year ended Aug. 31, 2016 | Year ended Aug. 31, 2015 | Year ended Aug. 31, 2014 | Year ended Aug. 31, 2013 | ||||||||||||||||
Net asset value, beginning of year | $ | 38.16 | $ | 38.27 | $ | 55.72 | $ | 49.00 | $ | 56.13 | ||||||||||
|
|
|
|
|
|
|
|
|
| |||||||||||
Income from investment operations: | ||||||||||||||||||||
Net investment incomea | 0.97 | 0.96 | 1.13 | b | 0.85 | 1.07 | ||||||||||||||
Net realized and unrealized gain (loss)c | 8.12 | (0.17 | ) | (17.49 | ) | 6.75 | (7.08 | ) | ||||||||||||
|
|
|
|
|
|
|
|
|
| |||||||||||
Total from investment operations | 9.09 | 0.79 | (16.36 | ) | 7.60 | (6.01 | ) | |||||||||||||
|
|
|
|
|
|
|
|
|
| |||||||||||
Less distributions from: | ||||||||||||||||||||
Net investment income | (1.08 | ) | (0.90 | ) | (1.09 | ) | (0.88 | ) | (1.12 | ) | ||||||||||
|
|
|
|
|
|
|
|
|
| |||||||||||
Total distributions | (1.08 | ) | (0.90 | ) | (1.09 | ) | (0.88 | ) | (1.12 | ) | ||||||||||
|
|
|
|
|
|
|
|
|
| |||||||||||
Net asset value, end of year | $ | 46.17 | $ | 38.16 | $ | 38.27 | $ | 55.72 | $ | 49.00 | ||||||||||
|
|
|
|
|
|
|
|
|
| |||||||||||
Total return | 24.23 | % | 1.98 | % | (29.69 | )% | 15.52 | % | (11.05 | )% | ||||||||||
|
|
|
|
|
|
|
|
|
| |||||||||||
Ratios/Supplemental data: | ||||||||||||||||||||
Net assets, end of year (000s) | $ | 424,727 | $ | 368,225 | $ | 371,225 | $ | 515,367 | $ | 436,076 | ||||||||||
Ratio of expenses to average net assets | 0.62 | % | 0.64 | % | 0.62 | % | 0.62 | % | 0.61 | % | ||||||||||
Ratio of net investment income to average net assets | 2.58 | % | 2.45 | % | 2.31 | %b | 1.64 | % | 1.67 | % | ||||||||||
Portfolio turnover rated | 6 | % | 6 | % | 6 | % | 8 | % | 9 | % | ||||||||||
| a | Based on average shares outstanding throughout each period. |
| b | Includes a special distribution from Turkcell Iletisim Hizmetleri AS. Excluding such special distribution, the net investment income would have been $0.76 per share and 1.55% of average net assets. |
| c | The amounts reported for a share outstanding may not accord with the change in aggregate gains and losses in securities for the fiscal period due to the timing of capital share transactions in relation to the fluctuating market values of the Fund’s underlying securities. |
| d | Portfolio turnover rates exclude portfolio securities received or delivered as a result of processing capital share transactions in Creation Units. |
See notes to financial statements.
| 68 | 2017 iSHARES ANNUAL REPORTTO SHAREHOLDERS |
Table of Contents
Financial Highlights (Continued)
iSHARES®, INC.
(For a share outstanding throughout each period)
| iShares MSCI USA Equal Weighted ETF | ||||||||||||||||||||
| Year ended Aug. 31, 2017 | Year ended Aug. 31, 2016 | Year ended Aug. 31, 2015 | Year ended Aug. 31, 2014 | Year ended Aug. 31, 2013 | ||||||||||||||||
Net asset value, beginning of year | $ | 46.05 | $ | 42.51 | $ | 43.08 | $ | 35.26 | $ | 30.31 | ||||||||||
|
|
|
|
|
|
|
|
|
| |||||||||||
Income from investment operations: | ||||||||||||||||||||
Net investment incomea | 0.85 | 0.77 | 0.80 | 0.71 | 0.69 | |||||||||||||||
Net realized and unrealized gain (loss)b | 5.18 | 3.63 | (0.57 | ) | 8.01 | 4.96 | ||||||||||||||
|
|
|
|
|
|
|
|
|
| |||||||||||
Total from investment operations | 6.03 | 4.40 | 0.23 | 8.72 | 5.65 | |||||||||||||||
|
|
|
|
|
|
|
|
|
| |||||||||||
Less distributions from: | ||||||||||||||||||||
Net investment income | (0.78 | ) | (0.86 | ) | (0.80 | ) | (0.90 | ) | (0.70 | ) | ||||||||||
|
|
|
|
|
|
|
|
|
| |||||||||||
Total distributions | (0.78 | ) | (0.86 | ) | (0.80 | ) | (0.90 | ) | (0.70 | ) | ||||||||||
|
|
|
|
|
|
|
|
|
| |||||||||||
Net asset value, end of year | $ | 51.30 | $ | 46.05 | $ | 42.51 | $ | 43.08 | $ | 35.26 | ||||||||||
|
|
|
|
|
|
|
|
|
| |||||||||||
Total return | 13.22 | % | 10.54 | % | 0.48 | % | 24.98 | % | 18.85 | % | ||||||||||
|
|
|
|
|
|
|
|
|
| |||||||||||
Ratios/Supplemental data: | ||||||||||||||||||||
Net assets, end of year (000s) | $ | 135,945 | $ | 73,673 | $ | 44,632 | $ | 47,391 | $ | 179,830 | ||||||||||
Ratio of expenses to average net assets | 0.15 | % | 0.15 | % | 0.15 | % | 0.15 | % | 0.15 | % | ||||||||||
Ratio of net investment income to average net assets | 1.72 | % | 1.79 | % | 1.82 | % | 1.82 | % | 2.10 | % | ||||||||||
Portfolio turnover ratec | 27 | % | 28 | % | 39 | % | 6 | % | 5 | % | ||||||||||
| a | Based on average shares outstanding throughout each period. |
| b | The amounts reported for a share outstanding may not accord with the change in aggregate gains and losses in securities for the fiscal period due to the timing of capital share transactions in relation to the fluctuating market values of the Fund’s underlying securities. |
| c | Portfolio turnover rates exclude portfolio securities received or delivered as a result of processing capital share transactions in Creation Units. |
See notes to financial statements.
FINANCIAL HIGHLIGHTS | 69 |
Table of Contents
iSHARES®, INC.
iShares, Inc. (the “Company”) is registered under the Investment Company Act of 1940, as amended (the “1940 Act”), as an open-end management investment company. The Company was incorporated under the laws of the State of Maryland on September 1, 1994 pursuant to Articles of Incorporation as subsequently amended and restated.
These financial statements relate only to the following funds (each, a “Fund,” and collectively, the “Funds”):
| iShares ETF | Diversification Classification | |||
MSCI Brazil Capped | Non-diversified | |||
MSCI Chile Capped | Non-diversified | |||
MSCI Colombia Capped | Non-diversified | |||
MSCI Israel Capped | Non-diversified | |||
| iShares ETF | Diversification Classification | |||
MSCI Russia Capped | Non-diversified | |||
MSCI South Africa | Non-diversified | |||
MSCI Turkey | Non-diversified | |||
MSCI USA Equal Weighted | Diversified | |||
The investment objective of each Fund is to seek investment results that correspond generally to the price and yield performance, before fees and expenses, of its underlying index. The investment adviser uses a “passive” or index approach to try to achieve each Fund’s investment objective.
Pursuant to the Company’s organizational documents, the Funds’ officers and directors are indemnified against certain liabilities that may arise out of the performance of their duties to the Funds. Additionally, in the normal course of business, the Funds enter into contracts with service providers that contain general indemnification clauses. The Funds’ maximum exposure under these arrangements is unknown as this would involve future claims that may be made against the Funds that have not yet occurred.
| 1. | SIGNIFICANT ACCOUNTING POLICIES |
The following significant accounting policies are consistently followed by each Fund in the preparation of its financial statements in conformity with accounting principles generally accepted in the United States of America (“U.S. GAAP”). The preparation of financial statements in conformity with U.S. GAAP requires management to make certain estimates and assumptions that affect the reported amounts of assets and liabilities and disclosures of contingent assets and liabilities at the date of the financial statements and the reported amounts of revenue and expenses during the reporting period. Actual results could differ from those estimates. Each Fund is considered an investment company under U.S. GAAP and follows the accounting and reporting guidance applicable to investment companies.
SECURITY VALUATION
Each Fund’s investments are valued at fair value each day that the Fund’s listing exchange is open and, for financial reporting purposes, as of the report date should the reporting period end on a day that the Fund’s listing exchange is not open. U.S. GAAP defines fair value as the price a fund would receive to sell an asset or pay to transfer a liability in an orderly transaction between market participants at the measurement date. The BlackRock Global Valuation Methodologies Committee (the “Global Valuation Committee”) provides oversight of the valuation of investments for the Funds. The investments of each Fund are valued pursuant to policies and procedures developed by the Global Valuation Committee and approved by the Board of Directors of the Company (the “Board”).
| • | Equity investments traded on a recognized securities exchange are valued at that day’s last reported trade price or the official closing price, as applicable, on the exchange where the stock is primarily traded. Equity investments traded on a recognized exchange for which there were no sales on that day are valued at the last traded price. |
| • | Open-end U.S. mutual funds (including money market funds) are valued at that day’s published net asset value (“NAV”). |
| 70 | 2017 iSHARES ANNUAL REPORTTO SHAREHOLDERS |
Table of Contents
Notes to Financial Statements (Continued)
iSHARES®, INC.
In the event that application of these methods of valuation results in a price for an investment which is deemed not to be representative of the fair value of such investment or if a price is not available, the investment will be valued by the Global Valuation Committee, in accordance with policies approved by the Board. The fair valuation approaches that may be utilized by the Global Valuation Committee to determine fair value include market approach, income approach and the cost approach. The valuation techniques used under these approaches take into consideration inputs that include but are not limited to (i) attributes specific to the investment; (ii) the principal market for the investment; (iii) the customary participants in the principal market for the investment; (iv) data assumptions by market participants for the investment, if reasonably available; (v) quoted prices for similar investments in active markets; and (vi) other inputs, such as future cash flows, interest rates, yield curves, volatilities, prepayment speeds, loss severities, credit risks and/or default rates. Valuations based on such inputs are reported to the Board on a quarterly basis.
The Global Valuation Committee employs various methods for calibrating valuation approaches for investments where an active market does not exist, including regular due diligence of the Company’s pricing vendors, a regular review of key inputs and assumptions, transactional back-testing or disposition analysis to compare unrealized gains and losses to realized gains and losses, reviews of missing or stale prices, reviews of large movements in market values, and reviews of market related activity.
Fair value pricing could result in a difference between the prices used to calculate a Fund’s NAV and the prices used by the Fund’s underlying index, which in turn could result in a difference between the Fund’s performance and the performance of the Fund’s underlying index.
Various inputs are used in determining the fair value of financial instruments. Inputs may be based on independent market data (“observable inputs”) or they may be internally developed (“unobservable inputs”). These inputs to valuation techniques are categorized into a fair value hierarchy consisting of three broad levels for financial reporting purposes as follows:
| • | Level 1 — Unadjusted quoted prices in active markets for identical assets or liabilities; |
| • | Level 2 — Inputs other than quoted prices included within Level 1 that are observable for the asset or liability either directly or indirectly, including quoted prices for similar assets or liabilities in active markets, quoted prices for identical or similar assets or liabilities in markets that are not considered to be active, inputs other than quoted prices that are observable for the asset or liability (such as exchange rates, financing terms, interest rates, yield curves, volatilities, prepayment speeds, loss severities, credit risks and default rates) or other market-corroborated inputs; and |
| • | Level 3 — Unobservable inputs for the asset or liability based on the best information available in the circumstances, to the extent observable inputs are not available, including the Global Valuation Committee’s assumptions used in determining the fair value of investments. |
The hierarchy gives the highest priority to unadjusted quoted prices in active markets for identical assets or liabilities (Level 1 measurements) and the lowest priority to unobservable inputs (Level 3 measurements). Accordingly, the degree of judgement exercised in determining fair value is greatest for instruments categorized in Level 3. The inputs used to measure fair value may fall into different levels of the fair value hierarchy. In such cases, for disclosure purposes, the fair value hierarchy classification is determined based on the lowest level input that is significant to the fair value measurement in its entirety. The fair value hierarchy for each Fund’s investments is included in its schedule of investments.
Changes in valuation techniques may result in transfers in or out of an assigned level within the fair value hierarchy. In accordance with the Company’s policy, transfers between different levels of the fair value hierarchy are deemed to have occurred as of the beginning of the reporting period. The categorization of values determined for financial instruments are based on the pricing transparency of the financial instruments and are not necessarily an indication of the risks associated with investing in those securities.
NOTESTO FINANCIAL STATEMENTS | 71 |
Table of Contents
Notes to Financial Statements (Continued)
iSHARES®, INC.
SECURITY TRANSACTIONS AND INCOME RECOGNITION
Security transactions are accounted for on trade date. Realized gains and losses on investment transactions are determined using the specific identification method. Dividend income and capital gain distributions, if any, are recognized on the ex-dividend date, net of any foreign taxes withheld at source. Any taxes withheld that are reclaimable from foreign tax authorities as of August 31, 2017 are reflected in tax reclaims receivable. Upon notification from issuers, some of the dividend income received from a real estate investment trust may be re-designated as a reduction of cost of the related investment and/or realized gain. Non-cash dividends received, if any, are recognized on the ex-dividend date and recorded as non-cash dividend income at fair value. Distributions received by the Funds may include a return of capital that is estimated by management. Such amounts are recorded as a reduction of the cost of investments or reclassified to capital gains. Interest income is accrued daily.
FOREIGN CURRENCY TRANSLATION
The accounting records of the Funds are maintained in U.S. dollars. Foreign currencies, as well as investment securities and other assets and liabilities denominated in foreign currencies, are translated into U.S. dollars using exchange rates deemed appropriate by the investment adviser. Purchases and sales of securities, income receipts and expense payments are translated into U.S. dollars on the respective dates of such transactions.
Each Fund does not isolate the effect of fluctuations in foreign exchange rates from the effect of fluctuations in the market prices of securities. Such fluctuations are reflected by the Funds as a component of realized and unrealized gains and losses from investments for financial reporting purposes. Each Fund reports realized currency gains (losses) on foreign currency related transactions as components of net realized gain (loss) for financial reporting purposes, whereas such components are generally treated as ordinary income for U.S. federal income tax purposes.
FOREIGN TAXES
The Funds may be subject to foreign taxes (a portion of which may be reclaimable) on income, stock dividends, capital gains on investments, or certain foreign currency transactions. All foreign taxes are recorded in accordance with the applicable foreign tax regulations and rates that exist in the foreign jurisdictions in which the Funds invest. These foreign taxes, if any, are paid by the Funds and are reflected in their statements of operations as follows: foreign taxes withheld at source are presented as a reduction of income, foreign taxes on securities lending income are presented as a reduction of securities lending income, foreign taxes on stock dividends are presented as “other foreign taxes”, and foreign taxes on capital gains from sales of investments and foreign taxes on foreign currency transactions are included in their respective net realized gain (loss) categories. Foreign taxes payable or deferred as of August 31, 2017, if any, are disclosed in the Funds’ statements of assets and liabilities.
DISTRIBUTIONS TO SHAREHOLDERS
Dividends and distributions paid by each Fund are recorded on the ex-dividend dates. Distributions are determined on a tax basis and may differ from net investment income and net realized capital gains for financial reporting purposes. Dividends and distributions are paid in U.S. dollars and cannot be automatically reinvested in additional shares of the Funds.
LOANS OF PORTFOLIO SECURITIES
Each Fund may lend its investment securities to approved borrowers, such as brokers, dealers and other financial institutions. The borrower pledges and maintains with the Fund collateral consisting of cash, an irrevocable letter of credit issued by an approved bank, or securities issued or guaranteed by the U.S. government. The initial collateral received by each Fund is
| 72 | 2017 iSHARES ANNUAL REPORTTO SHAREHOLDERS |
Table of Contents
Notes to Financial Statements (Continued)
iSHARES®, INC.
required to have a value of at least 102% of the current value of the loaned securities for securities traded on U.S. exchanges and a value of at least 105% for all other securities. The collateral is maintained thereafter at a value equal to at least 100% of the current value of the securities on loan. The market value of the loaned securities is determined at the close of each business day of the Funds. Any additional required collateral is delivered to the Funds and any excess collateral is returned by the Funds on the next business day. During the term of the loan, each Fund is entitled to all distributions made on or in respect of the loaned securities but does not receive interest income on securities received as collateral. Loans of securities are terminable at any time and the borrower, after notice, is required to return borrowed securities within the standard time period for settlement of securities transactions.
Cash received as collateral for securities on loan may be reinvested in certain short-term instruments either directly on behalf of a fund or through one or more joint accounts or money market funds, including those managed by BlackRock Fund Advisors (“BFA”), the Funds’ investment adviser, or its affiliates. As of August 31, 2017, any securities on loan were collateralized by cash and/or U.S. government obligations. Cash collateral received was invested in money market funds managed by BFA and is disclosed in the schedules of investments. Any non-cash collateral received cannot be sold, re-invested or pledged by the Fund, except in the event of borrower default. The securities on loan for each Fund are also disclosed in its schedule of investments. The total value of any securities on loan as of August 31, 2017 and the total value of the related cash collateral are disclosed in the statements of assets and liabilities. Income earned by the Funds from securities lending is disclosed in the statements of operations.
The risks of securities lending include the risk that the borrower may not provide additional collateral when required or may not return the securities when due. To mitigate these risks, the Funds benefit from a borrower default indemnity provided by BlackRock, Inc. (“BlackRock”). BlackRock’s indemnity allows for full replacement of securities loaned if the collateral received does not cover the value of the securities loaned in the event of borrower default. Each Fund could incur a loss if the value of an investment purchased with cash collateral falls below the value of the loaned securities or if the value of an investment purchased with cash collateral falls below the value of the original cash collateral received.
Securities lending transactions are entered into by the Funds under Master Securities Lending Agreements (“MSLA”) which provide the right, in the event of default (including bankruptcy or insolvency) for the non-defaulting party to liquidate the collateral and calculate a net exposure to the defaulting party or request additional collateral. In the event that a borrower defaults, a Fund, as lender, would offset the market value of the collateral received against the market value of the securities loaned. The value of the collateral is typically greater than that of the market value of the securities loaned, leaving the lender with a net amount payable to the defaulting party. However, bankruptcy or insolvency laws of a particular jurisdiction may impose restrictions on or prohibitions against such a right of offset in the event of an MSLA counterparty’s bankruptcy or insolvency. Under the MSLA, the borrower can resell or re-pledge the loaned securities, and a Fund can reinvest cash collateral, or, upon an event of default, resell or re-pledge the collateral.
NOTESTO FINANCIAL STATEMENTS | 73 |
Table of Contents
Notes to Financial Statements (Continued)
iSHARES®, INC.
The following table is a summary of securities lending agreements which are subject to offset under an MSLA as of August 31, 2017:
| iShares ETF and Counterparty | Market Value of Securities on Loan | Cash Collateral Received a | Net Amount b | |||||||||
MSCI Colombia Capped | ||||||||||||
Citigroup Global Markets Inc. | $ | 56,601 | $ | 56,601 | $ | — | ||||||
|
|
|
|
|
| |||||||
MSCI Israel Capped | ||||||||||||
Barclays Capital Inc. | $ | 627,711 | $ | 627,711 | $ | — | ||||||
Citigroup Global Markets Inc. | 12,156,577 | 12,156,577 | — | |||||||||
Deutsche Bank Securities Inc. | 1,230,390 | 1,230,390 | — | |||||||||
Goldman Sachs & Co. | 12,790 | 12,740 | (50 | ) | ||||||||
JPMorgan Securities LLC | 418,590 | 418,590 | — | |||||||||
Morgan Stanley & Co. LLC (U.S. Equity Securities Lending) | 1,003,633 | 1,000,602 | (3,031 | ) | ||||||||
|
|
|
|
|
| |||||||
| $ | 15,449,691 | $ | 15,446,610 | $ | (3,081 | ) | ||||||
|
|
|
|
|
| |||||||
MSCI Turkey | ||||||||||||
Citigroup Global Markets Inc. | $ | 208,077 | $ | 208,077 | $ | — | ||||||
Credit Suisse Securities (USA) LLC | 2,232,660 | 2,232,660 | — | |||||||||
Deutsche Bank Securities Inc. | 6,025,677 | 6,025,677 | — | |||||||||
JPMorgan Securities LLC | 1,748,698 | 1,748,698 | — | |||||||||
Merrill Lynch, Pierce, Fenner & Smith | 459,513 | 459,513 | — | |||||||||
Morgan Stanley & Co. LLC | 1,681,177 | 1,681,177 | — | |||||||||
UBS AG | 993,070 | 993,070 | — | |||||||||
UBS Securities LLC | 1,551,143 | 1,551,143 | — | |||||||||
|
|
|
|
|
| |||||||
| $ | 14,900,015 | $ | 14,900,015 | $ | — | |||||||
|
|
|
|
|
| |||||||
MSCI USA Equal Weighted | ||||||||||||
Barclays Capital Inc. | $ | 264,975 | $ | 264,975 | $ | — | ||||||
BNP Paribas New York Branch | 5,641 | 5,641 | — | |||||||||
BNP Paribas Prime Brokerage International Ltd. | 171,871 | 171,871 | — | |||||||||
Citigroup Global Markets Inc. | 538,583 | 538,583 | — | |||||||||
Credit Suisse Securities (USA) LLC | 229,478 | 229,478 | — | |||||||||
Deutsche Bank Securities Inc. | 295,615 | 295,615 | — | |||||||||
Goldman Sachs & Co. | 1,322,038 | 1,322,038 | — | |||||||||
HSBC Bank PLC | 603,205 | 603,205 | — | |||||||||
Merrill Lynch, Pierce, Fenner & Smith | 1,462,691 | 1,462,691 | — | |||||||||
Morgan Stanley & Co. LLC (U.S. Equity Securities Lending) | 655,812 | 655,812 | — | |||||||||
National Financial Services LLC | 370,637 | 370,637 | — | |||||||||
Nomura Securities International Inc. | 68,334 | 68,334 | — | |||||||||
State Street Bank & Trust Company | 941,690 | 941,690 | — | |||||||||
UBS Securities LLC | 433,357 | 433,357 | — | |||||||||
|
|
|
|
|
| |||||||
| $ | 7,363,927 | $ | 7,363,927 | $ | — | |||||||
|
|
|
|
|
| |||||||
| a | Collateral received in excess of the market value of securities on loan is not presented in this table. The total cash collateral received by each Fund is disclosed in the Fund’s statement of assets and liabilities. |
| b | Additional collateral is delivered to the Funds on the next business day in accordance with the MSLA. The net amount would be subject to the borrower default indemnity in the event of default by a counterparty. |
| 74 | 2017 iSHARES ANNUAL REPORTTO SHAREHOLDERS |
Table of Contents
Notes to Financial Statements (Continued)
iSHARES®, INC.
| 2. | INVESTMENT ADVISORY AGREEMENT AND OTHER TRANSACTIONS WITH AFFILIATES |
Pursuant to an Investment Advisory Agreement with the Company, BFA manages the investment of each Fund’s assets. BFA is a California corporation indirectly owned by BlackRock. Under the Investment Advisory Agreement, BFA is responsible for substantially all expenses of the Funds, except (i) interest and taxes; (ii) brokerage commissions and other expenses connected with the execution of portfolio transactions; (iii) distribution fees; (iv) the advisory fee payable to BFA; and (v) litigation expenses and any extraordinary expenses (in each case as determined by a majority of the independent directors).
For its investment advisory services to each of the iShares MSCI Brazil Capped, iShares MSCI Chile Capped, iShares MSCI Israel Capped, iShares MSCI Russia Capped, iShares MSCI South Africa and iShares MSCI Turkey ETFs, BFA is entitled to an annual investment advisory fee, accrued daily and paid monthly by the Funds, based on each Fund’s allocable portion of the aggregate of the average daily net assets of the Fund and certain other iShares funds, as follows:
| Investment Advisory Fee | Aggregate Average Daily Net Assets | ||||
| 0.74 | % | First $2 billion | |||
| 0.69 | Over $2 billion, up to and including $4 billion | ||||
| 0.64 | Over $4 billion, up to and including $8 billion | ||||
| 0.57 | Over $8 billion, up to and including $16 billion | ||||
| 0.51 | Over $16 billion, up to and including $24 billion | ||||
| 0.48 | Over $24 billion, up to and including $32 billion | ||||
| 0.45 | Over $32 billion | ||||
For its investment advisory services to each of the following Funds, BFA is entitled to an annual investment advisory fee, accrued daily and paid monthly by the Funds, based on the average daily net assets of each Fund as follows:
| iShares ETF | Investment Advisory Fee | |||
MSCI Colombia Capped | 0.61 | % | ||
MSCI USA Equal Weighted | 0.15 | |||
The U.S. Securities and Exchange Commission has issued an exemptive order which permits BlackRock Institutional Trust Company, N.A. (“BTC”), an affiliate of BFA, to serve as securities lending agent for the Funds, subject to applicable conditions. As securities lending agent, BTC bears all operational costs directly related to securities lending. Each Fund is responsible for fees in connection with the investment of cash collateral received for securities on loan in a money market fund managed by BFA, however, BTC has agreed to reduce the amount of securities lending income it receives in order to effectively limit the collateral investment fees each Fund bears to an annual rate of 0.04% (the “collateral investment fees”). Securities lending income is equal to the total of income earned from the reinvestment of cash collateral, net of fees and other payments to and from borrowers of securities, and less the collateral investment fees. The Funds retain a portion of securities lending income and remit the remaining portion to BTC as compensation for its services as securities lending agent.
Pursuant to a securities lending agreement, the iShares MSCI USA Equal Weighted ETF (the “Group 1 Fund”), retains 71.5% of securities lending income and the amount retained can never be less than 65% of the total of securities lending income plus the collateral investment fees.
Pursuant to a securities lending agreement, the iShares MSCI Brazil Capped, iShares MSCI Chile Capped, iShares MSCI Colombia Capped, iShares MSCI Israel Capped, iShares MSCI Russia Capped, iShares MSCI South Africa and iShares MSCI
NOTESTO FINANCIAL STATEMENTS | 75 |
Table of Contents
Notes to Financial Statements (Continued)
iSHARES®, INC.
Turkey ETFs (the “Group 2 Funds”), retain 80% of securities lending income and the amount retained can never be less than 70% of the total of securities lending income plus the collateral investment fees.
In addition, commencing the business day following the date that the aggregate securities lending income plus the collateral investment fees generated across all 1940 Act iShares exchange-traded funds (the “iShares ETF Complex”) in a given calendar year exceeds the aggregate securities lending income generated across the iShares ETF Complex in the calendar year 2013, the Group 1 Fund, pursuant to a securities lending agreement, will retain for the remainder of that calendar year 75% of securities lending income and the amount retained can never be less than 65% of the total of securities lending income plus the collateral investment fees. Each Group 2 Fund will receive for the remainder of that calendar year 85% of securities lending income and the amount retained can never be less than 70% of the total of securities lending income plus the collateral investment fees.
For the year ended August 31, 2017, the total of securities lending agent services and collateral investment fees paid were as follows:
| iShares ETF | Fees Paid to BTC | |||
MSCI Colombia Capped | $ | 2,104 | ||
MSCI Israel Capped | 47,134 | |||
MSCI South Africa | 5,542 | |||
MSCI Turkey | 376,745 | |||
MSCI USA Equal Weighted | 11,893 | |||
BlackRock Investments, LLC, an affiliate of BFA, is the distributor for each Fund. Pursuant to the distribution agreement, BFA is responsible for any fees or expenses for distribution services provided to the Funds.
Cross trading is the buying or selling of portfolio securities between funds to which BFA (or an affiliate) serves as investment adviser. At its regularly scheduled quarterly meetings, the Board reviews such transactions as of the most recent calendar quarter for compliance with the requirements and restrictions set forth by Rule 17a-7.
For the year ended August 31, 2017, transactions executed by the Funds pursuant to Rule 17a-7 under the 1940 Act were as follows:
| iShares ETF | Purchases | Sales | ||||||
MSCI Israel Capped | $ | 4,680,959 | $ | 1,246,452 | ||||
MSCI Russia Capped | 7,340,128 | 1,340,006 | ||||||
MSCI USA Equal Weighted | 5,482,902 | 7,618,733 | ||||||
Each Fund may invest its positive cash balances in certain money market funds managed by BFA or an affiliate. The income earned on these temporary cash investments is included in “Dividends — affiliated” in the statements of operations.
The PNC Financial Services Group, Inc. is the largest stockholder of BlackRock and is considered to be an affiliate of the Funds for 1940 Act purposes.
Certain directors and officers of the Company are also officers of BTC and/or BFA.
| 76 | 2017 iSHARES ANNUAL REPORTTO SHAREHOLDERS |
Table of Contents
Notes to Financial Statements (Continued)
iSHARES®, INC.
| 3. | INVESTMENT PORTFOLIO TRANSACTIONS |
Purchases and sales of investments (excluding in-kind transactions and short-term investments) for the year ended August 31, 2017 were as follows:
| iShares ETF | Purchases | Sales | ||||||
MSCI Brazil Capped | $ | 2,473,612,349 | $ | 975,509,050 | ||||
MSCI Chile Capped | 254,796,638 | 223,332,134 | ||||||
MSCI Colombia Capped | 5,939,973 | 2,438,972 | ||||||
MSCI Israel Capped | 27,283,249 | 27,507,882 | ||||||
MSCI Russia Capped | 114,442,853 | 78,717,786 | ||||||
MSCI South Africa | 53,026,719 | 52,983,356 | ||||||
MSCI Turkey | 28,460,743 | 21,079,454 | ||||||
MSCI USA Equal Weighted | 30,642,205 | 29,467,059 | ||||||
In-kind transactions (see Note 4) for the year ended August 31, 2017 were as follows:
| iShares ETF | In-kind Purchases | In-kind Sales | ||||||
MSCI Colombia Capped | $ | 108,767 | $ | — | ||||
MSCI Israel Capped | 14,218,380 | 17,991,184 | ||||||
MSCI Russia Capped | 154,512,184 | 24,632,609 | ||||||
MSCI South Africa | 86,940,108 | 143,699,048 | ||||||
MSCI Turkey | 95,431,831 | 136,072,211 | ||||||
MSCI USA Equal Weighted | 59,987,720 | 10,045,281 | ||||||
| 4. | CAPITAL SHARE TRANSACTIONS |
Capital shares are issued and redeemed by each Fund only in aggregations of a specified number of shares or multiples thereof (“Creation Units”) at NAV. Except when aggregated in Creation Units, shares of each Fund are not redeemable. Transactions in capital shares for each Fund are disclosed in detail in the statements of changes in net assets.
The consideration for the purchase of Creation Units of a fund in the Company generally consists of the in-kind deposit of a designated portfolio of securities and a specified amount of cash. Certain funds in the Company may be offered in Creation Units solely or partially for cash in U.S. dollars. Investors purchasing and redeeming Creation Units may pay a purchase transaction fee and a redemption transaction fee directly to State Street Bank and Trust Company, the Company’s administrator, to offset transfer and other transaction costs associated with the issuance and redemption of Creation Units, including Creation Units for cash. Investors transacting in Creation Units for cash may also pay an additional variable charge to compensate the relevant fund for certain transaction costs (i.e., stamp taxes, taxes on currency or other financial transactions, and brokerage costs) and market impact expenses relating to investing in portfolio securities. Such variable charges, if any, are included in “Proceeds from shares sold” in the statements of changes in net assets.
The Board authorized a one-for-two reverse stock split for the iShares MSCI Russia Capped ETF, effective after the close of trading on November 4, 2016. The impact of the stock split was to decrease the number of shares outstanding by a factor of two, while increasing the NAV per share by a factor of two, resulting in no effect on the net assets of the Fund. The financial statements for the Fund have been adjusted to reflect the reverse stock split.
NOTESTO FINANCIAL STATEMENTS | 77 |
Table of Contents
Notes to Financial Statements (Continued)
iSHARES®, INC.
| 5. | PRINCIPAL RISKS |
In the normal course of business, each Fund invests in securities or other instruments and may enter into certain transactions, and such activities subject the Fund to various risks, including, among others, fluctuations in the market (market risk) or failure of an issuer to meet all of its obligations. The value of securities or other instruments may also be affected by various factors, including, without limitation: (i) the general economy; (ii) the overall market as well as local, regional or global political and/or social instability; (iii) regulation, taxation or international tax treaties between various countries; or (iv) currency, interest rate or price fluctuations. Each Fund’s prospectus provides details of the risks to which the Fund is subject.
BFA uses a “passive” or index approach to try to achieve each Fund’s investment objective following the securities included in its underlying index during upturns as well as downturns. BFA does not take steps to reduce market exposure or to lessen the effects of a declining market. Divergence from the underlying index and the composition of the portfolio is monitored by BFA.
MARKET RISK
Market risk arises mainly from uncertainty about future values of financial instruments influenced by price, currency and interest rate movements. It represents the potential loss a fund may suffer through holding market positions in the face of market movements. A fund is exposed to market risk by its investment in equity, fixed income and/or financial derivative instruments or by its investment in underlying funds. The fair value of securities held by a fund may decline due to general market conditions, economic trends or events that are not specifically related to the issuers of the securities including local, regional or global political, social or economic instability or to factors that affect a particular industry or group of industries. The extent of a fund’s exposure to market risk is the market value of the investments held as shown in the fund’s schedule of investments.
A diversified portfolio, where this is appropriate and consistent with a fund’s objectives, minimizes the risk that a price change of a particular investment will have a material impact on the NAV of a fund. The investment concentrations within each Fund’s portfolio are disclosed in its schedule of investments.
Investing in the securities of non-U.S. issuers involves certain considerations and risks not typically associated with securities of U.S. issuers. Such risks include, but are not limited to: differences in accounting, auditing and financial reporting standards; more substantial governmental involvement in the economy; higher inflation rates, greater social, economic and political uncertainties; possible nationalization or expropriation of assets; less availability of public information about issuers; imposition of withholding or other taxes; higher transaction and custody costs and delays in settlement procedures; and lower level of regulation of the securities markets and issuers. Non-U.S. securities may be less liquid, more difficult to value, and have greater price volatility due to exchange rate fluctuations. These and other risks are heightened for investments in issuers from countries with less developed capital markets.
When a fund concentrates its investments in issuers located in a single country, it assumes the risk that economic, political and social conditions in that country may have a significant impact on its investment performance.
The United States and the European Union, along with the regulatory bodies of a number of countries including Japan, Australia, Norway, Switzerland and Canada, have imposed economic sanctions, which consist of asset freezes and sectorial sanctions, on certain Russian individuals and Russian corporate entities. Broader sanctions on Russia could also be instituted. These sanctions, or even the threat of further sanctions, may result in the decline of the value and liquidity of Russian securities, a weakening of the ruble or other adverse consequences to the Russian economy. Current or future sanctions may result in Russia taking counter measures or retaliatory actions, which may further impair the value and liquidity of Russian securities. These retaliatory measures may include the immediate freeze of Russian assets held by a fund.
| 78 | 2017 iSHARES ANNUAL REPORTTO SHAREHOLDERS |
Table of Contents
Notes to Financial Statements (Continued)
iSHARES®, INC.
CREDIT RISK
Credit risk is the risk that an issuer or guarantor of debt instruments or the counterparty to a financial transaction, including derivatives contracts, repurchase agreements or loans of portfolio securities, is unable or unwilling to make timely interest and/or principal payments or to otherwise honor its obligations. BFA and its affiliates manage counterparty credit risk by entering into transactions only with counterparties that they believe have the financial resources to honor their obligations and by monitoring the financial stability of those counterparties. Financial assets, which potentially expose a fund to issuer and counterparty credit risks, consist principally of financial instruments and receivables due from counterparties. The extent of a fund’s exposure to credit and counterparty risks with respect to those financial assets is approximated by their value recorded in its statement of assets and liabilities.
| 6. | INCOME TAX INFORMATION |
Each Fund is treated as an entity separate from the Company’s other funds for federal income tax purposes. It is the policy of each Fund to qualify as a regulated investment company by complying with the provisions applicable to regulated investment companies, as defined under Subchapter M of the Internal Revenue Code of 1986, as amended, and to annually distribute substantially all of its ordinary income and any net capital gains (taking into account any capital loss carryforwards) sufficient to relieve it from all, or substantially all, federal income and excise taxes. Accordingly, no provision for federal income taxes is required.
U.S. GAAP requires that certain components of net assets be adjusted to reflect permanent differences between financial and tax reporting. These reclassifications have no effect on net assets or NAV per share. The following permanent differences as of August 31, 2017, attributable to the characterization of corporate actions, passive foreign investment companies, the expiration of capital loss carryforwards, distributions paid in excess of taxable income, foreign currency transactions and realized gains (losses) from in-kind redemptions, were reclassified to the following accounts:
| iShares ETF | Paid-in Capital | Undistributed Net Investment Income/Distributions in Excess of Net Investment Income | Undistributed Net Realized Gain/Accumulated Net Realized Loss | |||||||||
MSCI Brazil Capped | $ | — | $ | 2,203,188 | $ | (2,203,188 | ) | |||||
MSCI Chile Capped | (1,886,881 | ) | (79,385 | ) | 1,966,266 | |||||||
MSCI Colombia Capped | — | (21,012 | ) | 21,012 | ||||||||
MSCI Israel Capped | 1,311,387 | 322,762 | (1,634,149 | ) | ||||||||
MSCI Russia Capped | 1,916,352 | (181,264 | ) | (1,735,088 | ) | |||||||
MSCI South Africa | (14,307,212 | ) | 6,461,271 | 7,845,941 | ||||||||
MSCI Turkey | 13,304,350 | 105,748 | (13,410,098 | ) | ||||||||
MSCI USA Equal Weighted | 2,297,194 | 57,290 | (2,354,484 | ) | ||||||||
NOTESTO FINANCIAL STATEMENTS | 79 |
Table of Contents
Notes to Financial Statements (Continued)
iSHARES®, INC.
The tax character of distributions paid during the years ended August 31, 2017 and August 31, 2016 was as follows:
| iShares ETF | 2017 | 2016 | ||||||
MSCI Brazil Capped | ||||||||
Ordinary income | $ | 93,579,029 | $ | 44,455,957 | ||||
|
|
|
| |||||
MSCI Chile Capped | ||||||||
Ordinary income | $ | 6,944,133 | $ | 6,349,056 | ||||
Return of Capital | 462,190 | 332,847 | ||||||
|
|
|
| |||||
| $ | 7,406,323 | $ | 6,681,903 | |||||
|
|
|
| |||||
MSCI Colombia Capped | ||||||||
Ordinary income | $ | 229,358 | $ | 224,626 | ||||
|
|
|
| |||||
MSCI Israel Capped | ||||||||
Ordinary income | $ | 1,597,362 | $ | 2,029,827 | ||||
|
|
|
| |||||
MSCI Russia Capped | ||||||||
Ordinary income | $ | 13,531,335 | $ | 7,677,207 | ||||
|
|
|
| |||||
MSCI South Africa | ||||||||
Ordinary income | $ | 7,473,325 | $ | 15,854,819 | ||||
|
|
|
| |||||
MSCI Turkey | ||||||||
Ordinary income | $ | 10,121,626 | $ | 8,065,957 | ||||
|
|
|
| |||||
MSCI USA Equal Weighted | ||||||||
Ordinary income | $ | 1,736,320 | $ | 944,600 | ||||
|
|
|
| |||||
As of August 31, 2017, the tax components of accumulated net earnings (losses) were as follows:
| iShares ETF | Undistributed Ordinary Income | Capital Loss Carryforwards | Net Unrealized Gains (Losses) a | Qualified Late-Year Losses b | Total | |||||||||||||||
MSCI Brazil Capped | $ | 30,231,710 | $ | (2,339,958,739 | ) | $ | 1,717,858,650 | $ | — | $ | (591,868,379 | ) | ||||||||
MSCI Chile Capped | — | (163,089,345 | ) | 109,895,882 | (78,356 | ) | (53,271,819 | ) | ||||||||||||
MSCI Colombia Capped | 47,324 | (8,287,339 | ) | (717,419 | ) | — | (8,957,434 | ) | ||||||||||||
MSCI Israel Capped | 844,692 | (51,059,628 | ) | (15,643,895 | ) | — | (65,858,831 | ) | ||||||||||||
MSCI Russia Capped | 12,860,778 | (70,987,197 | ) | (40,874,346 | ) | — | (99,000,765 | ) | ||||||||||||
MSCI South Africa | 779,091 | (84,982,109 | ) | (77,622,855 | ) | — | (161,825,873 | ) | ||||||||||||
MSCI Turkey | — | (80,218,673 | ) | (120,558,737 | ) | — | (200,777,410 | ) | ||||||||||||
MSCI USA Equal Weighted | 397,508 | (885,021 | ) | 11,776,890 | — | 11,289,377 | ||||||||||||||
| a | The difference between book-basis and tax-basis unrealized gains (losses) was attributable primarily to the characterization of corporate actions, the tax deferral of losses on wash sales and the realization for tax purposes of unrealized gains on investments in passive foreign investment companies. |
| b | The Funds have elected to defer certain qualified late-year losses and recognize such losses in the next taxable year. |
| 80 | 2017 iSHARES ANNUAL REPORTTO SHAREHOLDERS |
Table of Contents
Notes to Financial Statements (Continued)
iSHARES®, INC.
As of August 31, 2017, the following Funds had capital loss carryforwards available to offset future realized capital gains through the indicated expiration dates as follows:
| iShares ETF | Non- Expiring a | Expiring 2018 | Expiring 2019 | Total | ||||||||||||
MSCI Brazil Capped | $ | 2,141,732,429 | $ | 198,226,310 | $ | — | $ | 2,339,958,739 | ||||||||
MSCI Chile Capped | 150,400,264 | 11,712,090 | 976,991 | 163,089,345 | ||||||||||||
MSCI Colombia Capped | 8,287,339 | — | — | 8,287,339 | ||||||||||||
MSCI Israel Capped | 33,128,188 | 10,801,191 | 7,130,249 | 51,059,628 | ||||||||||||
MSCI Russia Capped | 70,987,197 | — | — | 70,987,197 | ||||||||||||
MSCI South Africa | 63,988,602 | 14,856,365 | 6,137,142 | 84,982,109 | ||||||||||||
MSCI Turkey | 70,376,752 | 5,982,737 | 3,859,184 | 80,218,673 | ||||||||||||
MSCI USA Equal Weighted | 885,021 | — | — | 885,021 | ||||||||||||
| a | Must be utilized prior to losses subject to expiration. |
For the year ended August 31, 2017, the iShares MSCI USA Equal Weighted ETF utilized $769,402 of its capital loss carryforwards.
The Funds may own shares in certain foreign investment entities, referred to, under U.S. tax law, as “passive foreign investment companies.” The Funds may elect to mark-to-market annually the shares of each passive foreign investment company and would be required to distribute to shareholders any such marked-to-market gains.
Management has analyzed tax laws and regulations and their application to the Funds as of August 31, 2017, inclusive of the open tax return years, and does not believe there are any uncertain tax positions that require recognition of a tax liability in the Funds’ financial statements.
| 7. | LINE OF CREDIT |
The iShares MSCI Colombia Capped ETF, along with certain other iShares funds, is a party to a $250 million credit agreement with State Street Bank and Trust Company, which expires on October 25, 2017. The line of credit may be used for temporary or emergency purposes, including redemptions, settlement of trades and rebalancing of portfolio holdings. The credit agreement has the following terms: a commitment fee of 0.20% per annum on the unused portion of the credit agreement and interest at a rate equal to the higher of (a) the one-month LIBOR (not less than zero) plus 1.00% per annum or (b) the U.S. Federal Funds rate (not less than zero) plus 1.00% per annum on amounts borrowed. The commitment fee is allocated to each fund participating in the credit agreement based on each fund’s pro-rata share of the aggregate average daily value of assets invested in local securities of certain foreign markets.
The Fund did not borrow under the credit agreement during the year ended August 31, 2017.
At a meeting held on September 14-15, 2017, the Board approved the amendment of certain terms of the credit agreement including (i) increasing the maximum borrowing amount to $275 million and (ii) extending the expiration date to October 24, 2018. These changes to the credit agreement are expected to be effective on or around October 25, 2017.
| 8. | LEGAL PROCEEDINGS |
On June 16, 2016, investors (the “Plaintiffs”) in certain iShares funds (iShares Core S&P Small-Cap ETF, iShares Russell 1000 Growth ETF, iShares Core S&P 500 ETF, iShares Russell Mid-Cap Growth ETF, iShares Russell Mid-Cap ETF, iShares Russell
NOTESTO FINANCIAL STATEMENTS | 81 |
Table of Contents
Notes to Financial Statements (Continued)
iSHARES®, INC.
Mid-Cap Value ETF, iShares Select Dividend ETF, iShares Morningstar Mid-Cap ETF, iShares Morningstar Large-Cap ETF, iShares U.S. Aerospace & Defense ETF and iShares U.S. Preferred Stock ETF) filed a putative class action lawsuit against iShares Trust, BlackRock, Inc. and certain of its advisory affiliates, and certain directors/trustees and officers of the Funds (collectively, “Defendants”). The lawsuit alleges the Defendants violated federal securities laws by failing to adequately disclose in the prospectuses issued by the funds noted above the risks of using stop-loss orders in the event of a ‘flash crash’, such as the one that occurred on May 6, 2010. On September 18, 2017, the Court issued a Statement of Decision holding that the Plaintiffs lack standing to assert their claims. On October 11, 2017, the Court entered final judgment dismissing all of Plaintiffs’ claims with prejudice.
| 9. | SUBSEQUENT EVENTS |
Management has evaluated the impact of all subsequent events on the Funds through the date the financial statements were available to be issued and has determined that there were no subsequent events requiring adjustment or disclosure in the financial statements, except as noted below.
Effective September 1, 2017, the iShares MSCI South Africa ETF will track a new underlying index, the MSCI South Africa 25/50 Index, and will cease to track the MSCI South Africa Index. The change to a capped benchmark is being implemented to seek to reduce tracking error and improve the investor experience.
| 82 | 2017 iSHARES ANNUAL REPORTTO SHAREHOLDERS |
Table of Contents
Report of Independent Registered Public Accounting Firm
To the Board of Directors of iShares, Inc. and
Shareholders of the iShares MSCI Brazil Capped ETF, iShares MSCI Chile Capped ETF,
iShares MSCI Colombia Capped ETF, iShares MSCI Israel Capped ETF,
iShares MSCI Russia Capped ETF, iShares MSCI South Africa ETF, iShares MSCI Turkey ETF and
iShares USA Equal Weighted ETF
In our opinion, the accompanying statements of assets and liabilities, including the schedules of investments, and the related statements of operations and of changes in net assets and the financial highlights present fairly, in all material respects, the financial position of iShares MSCI Brazil Capped ETF, iShares MSCI Chile Capped ETF, iShares MSCI Colombia Capped ETF, iShares MSCI Israel Capped ETF, iShares MSCI Russia Capped ETF, iShares MSCI South Africa ETF, iShares MSCI Turkey ETF and iShares USA Equal Weighted ETF (constituting funds of iShares, Inc., hereafter referred to as the “Funds”) as of August 31, 2017, and the results of each of their operations, the changes in each of their net assets and the financial highlights for each of the periods indicated, in conformity with accounting principles generally accepted in the United States of America. These financial statements and financial highlights (hereafter referred to as “financial statements”) are the responsibility of the Funds’ management. Our responsibility is to express an opinion on these financial statements based on our audits. We conducted our audits of these financial statements in accordance with the standards of the Public Company Accounting Oversight Board (United States). Those standards require that we plan and perform the audit to obtain reasonable assurance about whether the financial statements are free of material misstatement. An audit includes examining, on a test basis, evidence supporting the amounts and disclosures in the financial statements, assessing the accounting principles used and significant estimates made by management, and evaluating the overall financial statement presentation. We believe that our audits, which included confirmation of securities as of August 31, 2017 by correspondence with the custodian, transfer agent and brokers, or by other appropriate auditing procedures where replies were not received, provide a reasonable basis for our opinion.
PricewaterhouseCoopers LLP
San Francisco, California
October 23, 2017
REPORTOF INDEPENDENT REGISTERED PUBLIC ACCOUNTING FIRM | 83 |
Table of Contents
iSHARES®, INC.
The following maximum amounts are hereby designated as qualified dividend income for individuals for the fiscal year ended August 31, 2017:
| iShares ETF | Qualified Dividend Income | |||
MSCI Israel Capped | $ | 1,900,955 | ||
MSCI Russia Capped | 23,760,751 | |||
MSCI South Africa | 11,654,971 | |||
MSCI Turkey | 11,851,615 | |||
MSCI USA Equal Weighted | 1,869,398 | |||
For corporate shareholders, the percentage of income dividends paid by the iShares MSCI USA Equal Weighted ETF during the fiscal year ended August 31, 2017 that qualified for the dividends-received deduction was 89.10%.
For the fiscal year ended August 31, 2017, the following Funds earned foreign source income and paid foreign taxes which they intend to pass through to their shareholders:
| iShares ETF | Foreign Source Income Earned | Foreign Taxes Paid | ||||||
MSCI Brazil Capped | $ | 150,149,028 | $ | 14,681,602 | ||||
MSCI Chile Capped | 11,639,830 | 2,082,885 | ||||||
MSCI Colombia Capped | 411,666 | 1,848 | ||||||
MSCI Israel Capped | 2,054,113 | 378,111 | ||||||
| MSCI Russia Capped | 24,187,156 | 2,667,744 | ||||||
| MSCI South Africa | 12,142,687 | 1,789,611 | ||||||
MSCI Turkey | 12,043,291 | 1,709,898 | ||||||
| 84 | 2017 iSHARES ANNUAL REPORTTO SHAREHOLDERS |
Table of Contents
Board Review and Approval of Investment Advisory
Contract
iSHARES®, INC.
I. iShares MSCI Brazil Capped ETF, iShares MSCI Chile Capped ETF and iShares MSCI Russia Capped ETF
Under Section 15(c) of the Investment Company Act of 1940 (the “1940 Act”), the Company’s Board of Directors (the “Board”), including a majority of Directors who are not “interested persons” of the Company (as that term is defined in the 1940 Act) (the “Independent Directors”), is required annually to consider and approve the Investment Advisory Contract between the Company and BFA (the “Advisory Contract”) on behalf of the Funds. The Independent Directors requested, and BFA provided, such information as the Independent Directors, with advice from independent counsel, deemed reasonably necessary to evaluate the Advisory Contract. A committee of all of the Independent Directors (the “15(c) Committee”), with independent counsel, met with management on May 5, 2017 and May 12, 2017. At these meetings, the 15(c) Committee reviewed and discussed information provided in response to the 15(c) Committee’s initial requests, and requested certain additional information, which management agreed to provide. At a meeting held on May 18, 2017, management presented information to the Board relating to the continuance of the Advisory Contract, including information requested by the 15(c) Committee during its meetings. The Board, including the Independent Directors, reviewed and discussed such information at length. The Independent Directors requested from management certain additional information, which management agreed to provide. At a meeting held on June 19-21, 2017, the Board, including the Independent Directors, reviewed the additional information provided by management in response to these requests. After extensive discussions, the Board, including all of the Independent Directors, approved the continuance of the Advisory Contract for the Funds, based on a review of qualitative and quantitative information provided by BFA. The Board noted its satisfaction with the extent and quality of information provided and its frequent interactions with management, as well as the detailed responses and other information provided by BFA. The Board also noted that the Board and BFA agreed to discuss potential further enhancements to the 15(c) process for the coming year. The Independent Directors were advised by their independent counsel throughout the process, including about the legal standards applicable to their review. In approving the Advisory Contract for the Funds, the Board, including the Independent Directors, considered the following factors, no one of which was controlling, and reached the following conclusions:
Expenses and Performance of the Funds — The Board reviewed statistical information prepared by Broadridge Financial Solutions Inc. (“Broadridge”), an independent provider of investment company data, regarding the expense ratio components, including gross and net total expenses, waivers/reimbursements (if any), and underlying fund fees and expenses (if any) of each Fund in comparison with the same information for other exchange traded funds (“ETFs”) (including, where applicable, funds sponsored by an “at cost” service provider) and, in the limited instances where no comparable ETFs existed and the comparison group would not otherwise be reasonable in Broadridge’s judgment, pure index institutional mutual funds, objectively selected by Broadridge as comprising such Fund’s applicable peer group pursuant to Broadridge’s proprietary ETF methodology (the “Peer Group”). The Board was provided with a detailed description of the proprietary ETF methodology used by Broadridge to determine the applicable Peer Groups. The Board further noted that due to the limitations in providing comparable funds in the various Peer Groups, the statistical information provided in Broadridge’s report may or may not provide meaningful direct comparisons to the Funds in all instances.
The Board also noted that the investment advisory fee rates and overall expenses (net of waivers and reimbursements) for the Funds were higher than the median of the investment advisory fee rates and overall expenses (net of waivers and reimbursements) of the funds in their respective Peer Group, excluding iShares funds. The Board further noted that the Peer Group for each of iShares MSCI Brazil Capped ETF and iShares MSCI Chile Capped ETF contained only four comparison funds identified by Broadridge, excluding iShares funds. In addition, the Board noted that the Peer Group for iShares MSCI Russia Capped ETF contained only three comparison funds identified by Broadridge, excluding iShares funds.
In addition, to the extent that any of the comparison funds included in the Peer Group, excluding iShares funds, track the same index as any particular Fund, Broadridge also provided, and the Board reviewed, a comparison of such Fund’s performance for
BOARD REVIEWAND APPROVALOF INVESTMENT ADVISORY CONTRACT | 85 |
Table of Contents
Board Review and Approval of Investment Advisory
Contract (Continued)
iSHARES®, INC.
the one-, three-, five-, ten-year, and since inception periods, as applicable, and for the quarter ended December 31, 2016, to that of relevant comparison funds for the same periods.
The Board noted that each Fund seeks to track its own underlying index and that, during the year, the Board received periodic reports on each Fund’s short- and longer-term performance in comparison with its underlying index. Such periodic comparative performance information, including any additional detailed information requested by the Boards, was also considered. The Board noted that each Fund generally performed in line with its underlying index over the relevant periods.
Based on this review, the other factors considered at the meeting, and their general knowledge of ETF pricing, the Board concluded that the investment advisory fee rate and the historical performance of each Fund supported the Board’s approval of the continuance of the Advisory Contract for the coming year.
Nature, Extent and Quality of Services Provided by BFA — Based on management’s representations, including information about recent and proposed enhancements to the iShares business, including with respect to capital markets support and analysis, technology, product design, compliance and risk management, and other services, the Board expected that there would be no diminution in the scope of services required of or provided by BFA under the Advisory Contract for the coming year as compared to the scope of services provided by BFA during prior years. In reviewing the scope of these services, the Board considered BFA’s investment philosophy and experience, noting that BFA and its affiliates have committed significant resources over time, including during the past year, to supporting the iShares funds and their shareholders. The Board also considered BFA’s compliance program and its compliance record with respect to the Funds. In that regard, the Board noted that BFA reports to the Board about portfolio management and compliance matters on a periodic basis in connection with regularly scheduled meetings of the Board, and on other occasions as necessary and appropriate, and has provided information and made appropriate officers available as needed to provide further assistance with these matters. The Board also reviewed the background and experience of the persons responsible for the day-to-day management of the Funds, as well as the resources available to them in managing the Funds. In addition to the above considerations, the Board reviewed and considered detailed presentations regarding BFA’s investment performance, investment and risk management processes and strategies provided at the June 19-21, 2017 meeting and throughout the previous year, and matters related to BFA’s portfolio compliance policies and procedures. The Board noted that each Fund had met its investment objective consistently since its respective inception date.
Based on review of this information, and the performance information discussed above, the Board concluded that the nature, extent and quality of services provided by BFA to the Funds under the Advisory Contract supported the Board’s approval of the continuance of the Advisory Contract for the coming year.
Costs of Services Provided to Funds and Profits Realized by BFA and Affiliates — The Board reviewed information about the profitability of the Funds to BlackRock, on a Fund-by-Fund basis and in the aggregate, based on the fees payable to BFA and its affiliates (including fees under the Advisory Contract), and other sources of revenue and expense to BFA and its affiliates from the Funds’ operations for the last calendar year. The Board reviewed BlackRock’s profitability methodology for the iShares funds, including supplemental information that was responsive to requests of the 15(c) Committee. The Board noted that the 15(c) Committee had focused on the methodology and profitability presentation during its meetings. The Board discussed the sources of direct and ancillary revenue with management, including the revenues to BTC, a BFA affiliate, from securities lending by the Funds. The Board also discussed BFA’s profit margin as reflected in the Funds’ profitability analyses and reviewed information regarding potential economies of scale (as discussed below). Based on this review, the Board concluded that the profits realized by BFA and its affiliates under the Advisory Contract and from other relationships between the Funds and BFA and/or its affiliates, if any, were within a reasonable range in light of the factors considered.
| 86 | 2017 iSHARES ANNUAL REPORTTO SHAREHOLDERS |
Table of Contents
Board Review and Approval of Investment Advisory
Contract (Continued)
iSHARES®, INC.
Economies of Scale — The Board reviewed information regarding potential economies of scale or other efficiencies that may result from increases in the Funds’ assets, noting that the issue of economies of scale had been focused on by the 15(c) Committee during its meetings and addressed by management, including through supplemental information. The Board and the 15(c) Committee reviewed information provided by BFA regarding scale benefits shared with the iShares funds through relatively low fee rates established at inception, breakpoints and waivers or other fee reductions, as well as through additional investment in the iShares business and the provision of improved or additional infrastructure and services to the iShares funds and their shareholders. The Board and the 15(c) Committee received information regarding BlackRock’s historical profitability, including BFA’s and its affiliates’ costs in providing services. The cost information distinguished, among other things, between fixed and variable costs, and explained how the level of fixed and variable costs, as well as the nature of such costs, may impact the existence or size of scale benefits. The Board noted that the Advisory Contract for the Funds already provided for breakpoints in the Funds’ investment advisory fee rates as the assets of the Funds, on an aggregated basis with the assets of certain other iShares funds, increase. The Board noted that it would continue to monitor the sharing of economies of scale to determine the appropriateness of adding new or revised breakpoints in the future.
Based on this review, as well as the other factors considered at the meeting, the Board, recognizing its responsibility to consider the Advisory Contract at least annually, determined to approve the continuance of the Advisory Contract for the coming year.
Fees and Services Provided for Other Comparable Funds/Accounts Managed by BFA and its Affiliates — The Board received and considered information regarding the investment advisory/management fee rates for other funds/accounts in the U.S. for which BFA (or its affiliates) provides investment advisory/management services, including open-end funds registered under the 1940 Act (including sub-advised funds), collective trust funds, and institutional separate accounts (together, the “Other Accounts”), and acknowledged BFA’s assertion that the iShares funds are fundamentally different investment vehicles from the Other Accounts. The Board noted that BFA and its affiliates do not manage Other Accounts with substantially the same investment objectives and strategies as the Funds and that track the same index as the Funds. The Board further noted that BFA provided the Board with detailed information regarding how the Other Accounts (particularly institutional clients) generally differ from the Funds, including in terms of the different and generally more extensive services provided to the Funds, as well as other significant differences. In that regard, the Board considered that the pricing of services to institutional clients is typically based on a number of factors beyond the nature and extent of the specific services to be provided and often depends on the overall relationship between the client and its affiliates and the adviser and its affiliates. In addition, the Board considered the relative complexity and inherent risks and challenges of managing and providing other services to the Funds, as publicly traded ETFs, as compared to the Other Accounts that are institutional clients in light of differing regulatory requirements and client-imposed mandates. The Board also acknowledged BFA’s expressed business purpose for launching a suite of iShares “Core” ETFs that generally are subject to lower investment advisory fees than iShares non-Core ETFs that may provide a similar investment exposure. The Board also considered the “all-inclusive” nature of the Funds’ advisory fee structure, and the Fund expenses borne by BFA under this arrangement. The Board noted that the investment advisory fee rates under the Advisory Contract for the Funds were generally higher than the investment advisory/management fee rates for certain of the Other Accounts (particularly institutional clients) and concluded that the differences appeared to be consistent with the factors discussed.
Other Benefits to BFA and/or its Affiliates — The Board reviewed the “fallout” benefits or ancillary revenue received by BFA and/or its affiliates in connection with the services provided to the Funds by BFA, such as payment of revenue to BTC, the Funds’ securities lending agent, for loaning portfolio securities (which was included in the profit margins reviewed by the Board pursuant to BFA’s profitability methodology), and payment of advisory fees and/or administration fees to BFA and BTC (or their affiliates) in connection with any investments by the Funds in other funds for which BFA (or its affiliates) provides investment advisory services and/or administration services. The Board also noted the revenue received by BFA and/or its affiliates pursuant to an agreement that permits a service provider to use certain portions of BlackRock’s technology platform to service accounts managed by BFA and/or its affiliates, including the iShares funds. The Board noted that BFA generally does not use soft dollars
BOARD REVIEWAND APPROVALOF INVESTMENT ADVISORY CONTRACT | 87 |
Table of Contents
Board Review and Approval of Investment Advisory
Contract (Continued)
iSHARES®, INC.
or consider the value of research or other services that may be provided to BFA (including its affiliates) in selecting brokers for portfolio transactions for the Funds. The Board further noted that any portfolio transactions on behalf of the Funds placed through a BFA affiliate or purchased from an underwriting syndicate in which a BFA affiliate participates, are reported to the Board pursuant to Rule 17e-1 or Rule 10f-3, as applicable, under the 1940 Act. The Board concluded that any such ancillary benefits would not be disadvantageous to the Funds’ shareholders and thus would not alter the Board’s conclusion with respect to the appropriateness of approving the continuance of the Advisory Contract for the coming year.
Conclusion — Based on the considerations described above, the Board determined that each Fund’s investment advisory fee rate under the Advisory Contract does not constitute a fee that is so disproportionately large as to bear no reasonable relationship to the services rendered and that could not have been the product of arm’s-length bargaining, and concluded to approve the continuance of the Advisory Contract for the coming year.
II. iShares MSCI Colombia Capped ETF
Under Section 15(c) of the Investment Company Act of 1940 (the “1940 Act”), the Company’s Board of Directors (the “Board”), including a majority of Directors who are not “interested persons” of the Company (as that term is defined in the 1940 Act) (the “Independent Directors”), is required annually to consider and approve the Investment Advisory Contract between the Company and BFA (the “Advisory Contract”) on behalf of the Fund. The Independent Directors requested, and BFA provided, such information as the Independent Directors, with advice from independent counsel, deemed reasonably necessary to evaluate the Advisory Contract. A committee of all of the Independent Directors (the “15(c) Committee”), with independent counsel, met with management on May 5, 2017 and May 12, 2017. At these meetings, the 15(c) Committee reviewed and discussed information provided in response to the 15(c) Committee’s initial requests, and requested certain additional information, which management agreed to provide. At a meeting held on May 18, 2017, management presented information to the Board relating to the continuance of the Advisory Contract, including information requested by the 15(c) Committee during its meetings. The Board, including the Independent Directors, reviewed and discussed such information at length. The Independent Directors requested from management certain additional information, which management agreed to provide. At a meeting held on June 19-21, 2017, the Board, including the Independent Directors, reviewed the additional information provided by management in response to these requests. After extensive discussions, the Board, including all of the Independent Directors, approved the continuance of the Advisory Contract for the Fund, based on a review of qualitative and quantitative information provided by BFA. The Board noted its satisfaction with the extent and quality of information provided and its frequent interactions with management, as well as the detailed responses and other information provided by BFA. The Board also noted that the Board and BFA agreed to discuss potential further enhancements to the 15(c) process for the coming year. The Independent Directors were advised by their independent counsel throughout the process, including about the legal standards applicable to their review. In approving the Advisory Contract for the Fund, the Board, including the Independent Directors, considered the following factors, no one of which was controlling, and reached the following conclusions:
Expenses and Performance of the Fund — The Board reviewed statistical information prepared by Broadridge Financial Solutions Inc. (“Broadridge”), an independent provider of investment company data, regarding the expense ratio components, including gross and net total expenses, waivers/reimbursements (if any), and underlying fund fees and expenses (if any) of the Fund in comparison with the same information for other exchange traded funds (“ETFs”) (including, where applicable, funds sponsored by an “at cost” service provider) and, in the limited instances where no comparable ETFs existed and the comparison group would not otherwise be reasonable in Broadridge’s judgment, pure index institutional mutual funds, objectively selected by Broadridge as comprising the Fund’s applicable peer group pursuant to Broadridge’s proprietary ETF methodology (the “Peer Group”). The Board was provided with a detailed description of the proprietary ETF methodology used by Broadridge to
| 88 | 2017 iSHARES ANNUAL REPORTTO SHAREHOLDERS |
Table of Contents
Board Review and Approval of Investment Advisory
Contract (Continued)
iSHARES®, INC.
determine the Fund’s Peer Group. The Board further noted that due to the limitations in providing comparable funds in the Peer Group, the statistical information provided in Broadridge’s report may or may not provide meaningful direct comparisons to the Fund in all instances.
The Board also noted that the investment advisory fee rate and overall expenses (net of waivers and reimbursements) for the Fund were lower than the median of the investment advisory fee rates and overall expenses (net of waivers and reimbursements) of the funds in its Peer Group, excluding iShares funds.
In addition, to the extent that any of the comparison funds included in the Peer Group, excluding iShares funds, track the same index as the Fund, Broadridge also provided, and the Board reviewed, a comparison of the Fund’s performance for the one-, three-, five-, ten-year, and since inception periods, as applicable, and for the quarter ended December 31, 2016, to that of relevant comparison funds for the same periods.
The Board noted that the Fund seeks to track its specified underlying index and that, during the year, the Board received periodic reports on the Fund’s short- and longer-term performance in comparison with its underlying index. Such periodic comparative performance information, including any additional detailed information requested by the Boards, was also considered. The Board noted that the Fund generally performed in line with its underlying index over the relevant periods.
Based on this review, the other factors considered at the meeting, and their general knowledge of ETF pricing, the Board concluded that the investment advisory fee rate and the historical performance of the Fund supported the Board’s approval of the continuance of the Advisory Contract for the coming year.
Nature, Extent and Quality of Services Provided by BFA — Based on management’s representations, including information about recent and proposed enhancements to the iShares business, including with respect to capital markets support and analysis, technology, product design, compliance and risk management, and other services, the Board expected that there would be no diminution in the scope of services required of or provided by BFA under the Advisory Contract for the coming year as compared to the scope of services provided by BFA during prior years. In reviewing the scope of these services, the Board considered BFA’s investment philosophy and experience, noting that BFA and its affiliates have committed significant resources over time, including during the past year, to supporting the iShares funds and their shareholders. The Board also considered BFA’s compliance program and its compliance record with respect to the Fund. In that regard, the Board noted that BFA reports to the Board about portfolio management and compliance matters on a periodic basis in connection with regularly scheduled meetings of the Board, and on other occasions as necessary and appropriate, and has provided information and made appropriate officers available as needed to provide further assistance with these matters. The Board also reviewed the background and experience of the persons responsible for the day-to-day management of the Fund, as well as the resources available to them in managing the Fund. In addition to the above considerations, the Board reviewed and considered detailed presentations regarding BFA’s investment performance, investment and risk management processes and strategies provided at the June 19-21, 2017 meeting and throughout the previous year, and matters related to BFA’s portfolio compliance policies and procedures. The Board noted that the Fund had met its investment objective consistently since its inception date.
Based on review of this information, and the performance information discussed above, the Board concluded that the nature, extent and quality of services provided by BFA to the Fund under the Advisory Contract supported the Board’s approval of the continuance of the Advisory Contract for the coming year.
Costs of Services Provided to Fund and Profits Realized by BFA and Affiliates — The Board reviewed information about the profitability of the Fund to BlackRock, based on the fees payable to BFA and its affiliates (including fees under the Advisory Contract), and other sources of revenue and expense to BFA and its affiliates from the Fund’s operations for the last calendar
BOARD REVIEWAND APPROVALOF INVESTMENT ADVISORY CONTRACT | 89 |
Table of Contents
Board Review and Approval of Investment Advisory
Contract (Continued)
iSHARES®, INC.
year. The Board reviewed BlackRock’s profitability methodology for the iShares funds, including supplemental information that was responsive to requests of the 15(c) Committee. The Board noted that the 15(c) Committee had focused on the methodology and profitability presentation during its meetings. The Board discussed the sources of direct and ancillary revenue with management, including the revenues to BTC, a BFA affiliate, from securities lending by the Fund. The Board also discussed BFA’s profit margin as reflected in the Fund’s profitability analysis and reviewed information regarding potential economies of scale (as discussed below). Based on this review, the Board concluded that the profits realized by BFA and its affiliates under the Advisory Contract and from other relationships between the Fund and BFA and/or its affiliates, if any, were within a reasonable range in light of the factors considered.
Economies of Scale — The Board reviewed information regarding potential economies of scale or other efficiencies that may result from increases in the Fund’s assets, noting that the issue of economies of scale had been focused on by the 15(c) Committee during its meetings and addressed by management, including through supplemental information. The Board and the 15(c) Committee reviewed information provided by BFA regarding scale benefits shared with the iShares funds through relatively low fee rates established at inception, breakpoints and waivers or other fee reductions, as well as through additional investment in the iShares business and the provision of improved or additional infrastructure and services to the iShares funds and their shareholders. The Board and the 15(c) Committee received information regarding BlackRock’s historical profitability, including BFA’s and its affiliates’ costs in providing services. The cost information distinguished, among other things, between fixed and variable costs, and explained how the level of fixed and variable costs, as well as the nature of such costs, may impact the existence or size of scale benefits. The Board noted that the Advisory Contract for the Fund did not provide for any breakpoints in the Fund’s investment advisory fee rate as the assets of the Fund increase. However, the Board noted that should material economies of scale be identified in the future that are not otherwise shared, a breakpoint structure for the Fund may be appropriate, and that it would continue to monitor the sharing of economies of scale to determine the appropriateness of adding breakpoints in the future.
Based on this review, as well as the other factors considered at the meeting, the Board, recognizing its responsibility to consider the Advisory Contract at least annually, determined to approve the continuance of the Advisory Contract for the coming year.
Fees and Services Provided for Other Comparable Funds/Accounts Managed by BFA and its Affiliates — The Board received and considered information regarding the investment advisory/management fee rates for other funds/accounts in the U.S. for which BFA (or its affiliates) provides investment advisory/management services, including open-end funds registered under the 1940 Act (including sub-advised funds), collective trust funds, and institutional separate accounts (together, the “Other Accounts”), and acknowledged BFA’s assertion that the iShares funds are fundamentally different investment vehicles from the Other Accounts. The Board noted that BFA and its affiliates do not manage Other Accounts with substantially the same investment objective and strategy as the Fund and that track the same index as the Fund. The Board further noted that BFA provided the Board with detailed information regarding how the Other Accounts (particularly institutional clients) generally differ from the Fund, including in terms of the different and generally more extensive services provided to the Fund, as well as other significant differences. In that regard, the Board considered that the pricing of services to institutional clients is typically based on a number of factors beyond the nature and extent of the specific services to be provided and often depends on the overall relationship between the client and its affiliates and the adviser and its affiliates. In addition, the Board considered the relative complexity and inherent risks and challenges of managing and providing other services to the Fund, as a publicly traded ETF, as compared to the Other Accounts that are institutional clients, in light of differing regulatory requirements and client-imposed mandates. The Board also acknowledged BFA’s expressed business purpose for launching a suite of iShares “Core” ETFs that generally are subject to lower investment advisory fees than iShares non-Core ETFs that may provide a similar investment exposure. The Board also considered the “all-inclusive” nature of the Fund’s advisory fee structure, and the Fund expenses borne
| 90 | 2017 iSHARES ANNUAL REPORTTO SHAREHOLDERS |
Table of Contents
Board Review and Approval of Investment Advisory
Contract (Continued)
iSHARES®, INC.
by BFA under this arrangement. The Board noted that the investment advisory fee rate under the Advisory Contract for the Fund was generally higher than the investment advisory/management fee rates for certain of the Other Accounts (particularly institutional clients) and concluded that the differences appeared to be consistent with the factors discussed.
Other Benefits to BFA and/or its Affiliates — The Board reviewed the “fallout” benefits or ancillary revenue received by BFA and/or its affiliates in connection with the services provided to the Fund by BFA, such as payment of revenue to BTC, the Fund’s securities lending agent, for loaning portfolio securities (which was included in the profit margins reviewed by the Board pursuant to BFA’s profitability methodology), and payment of advisory fees and/or administration fees to BFA and BTC (or their affiliates) in connection with any investments by the Fund in other funds for which BFA (or its affiliates) provides investment advisory services and/or administration services. The Board also noted the revenue received by BFA and/or its affiliates pursuant to an agreement that permits a service provider to use certain portions of BlackRock’s technology platform to service accounts managed by BFA and/or its affiliates, including the iShares funds. The Board noted that BFA generally does not use soft dollars or consider the value of research or other services that may be provided to BFA (including its affiliates) in selecting brokers for portfolio transactions for the Fund. The Board further noted that any portfolio transactions on behalf of the Fund placed through a BFA affiliate or purchased from an underwriting syndicate in which a BFA affiliate participates, are reported to the Board pursuant to Rule 17e-1 or Rule 10f-3, as applicable, under the 1940 Act. The Board concluded that any such ancillary benefits would not be disadvantageous to the Fund’s shareholders and thus would not alter the Board’s conclusion with respect to the appropriateness of approving the continuance of the Advisory Contract for the coming year.
Conclusion — Based on the considerations described above, the Board determined that the Fund’s investment advisory fee rate under the Advisory Contract does not constitute a fee that is so disproportionately large as to bear no reasonable relationship to the services rendered and that could not have been the product of arm’s-length bargaining, and concluded to approve the continuance of the Advisory Contract for the coming year.
III. iShares MSCI Israel Capped ETF, iShares MSCI South Africa ETF and iShares MSCI Turkey ETF
Under Section 15(c) of the Investment Company Act of 1940 (the “1940 Act”), the Company’s Board of Directors (the “Board”), including a majority of Directors who are not “interested persons” of the Company (as that term is defined in the 1940 Act) (the “Independent Directors”), is required annually to consider and approve the Investment Advisory Contract between the Company and BFA (the “Advisory Contract”) on behalf of the Funds. The Independent Directors requested, and BFA provided, such information as the Independent Directors, with advice from independent counsel, deemed reasonably necessary to evaluate the Advisory Contract. A committee of all of the Independent Directors (the “15(c) Committee”), with independent counsel, met with management on May 5, 2017 and May 12, 2017. At these meetings, the 15(c) Committee reviewed and discussed information provided in response to the 15(c) Committee’s initial requests, and requested certain additional information, which management agreed to provide. At a meeting held on May 18, 2017, management presented information to the Board relating to the continuance of the Advisory Contract, including information requested by the 15(c) Committee during its meetings. The Board, including the Independent Directors, reviewed and discussed such information at length. The Independent Directors requested from management certain additional information, which management agreed to provide. At a meeting held on June 19-21, 2017, the Board, including the Independent Directors, reviewed the additional information provided by management in response to these requests. After extensive discussions, the Board, including all of the Independent Directors, approved the continuance of the Advisory Contract for the Funds, based on a review of qualitative and quantitative information provided by BFA. The Board noted its satisfaction with the extent and quality of information provided and its frequent interactions with management, as well as the detailed responses and other information provided by BFA. The Board also noted that the Board and BFA agreed to discuss potential further enhancements to the 15(c) process for the coming year. The Independent Directors were advised by their
BOARD REVIEWAND APPROVALOF INVESTMENT ADVISORY CONTRACT | 91 |
Table of Contents
Board Review and Approval of Investment Advisory
Contract (Continued)
iSHARES®, INC.
independent counsel throughout the process, including about the legal standards applicable to their review. In approving the Advisory Contract for the Funds, the Board, including the Independent Directors, considered the following factors, no one of which was controlling, and reached the following conclusions:
Expenses and Performance of the Funds — The Board reviewed statistical information prepared by Broadridge Financial Solutions Inc. (“Broadridge”), an independent provider of investment company data, regarding the expense ratio components, including gross and net total expenses, waivers/reimbursements (if any), and underlying fund fees and expenses (if any) of each Fund in comparison with the same information for other exchange traded funds (“ETFs”) (including, where applicable, funds sponsored by an “at cost” service provider) and, in the limited instances where no comparable ETFs existed and the comparison group would not otherwise be reasonable in Broadridge’s judgment, pure index institutional mutual funds, objectively selected by Broadridge as comprising such Fund’s applicable peer group pursuant to Broadridge’s proprietary ETF methodology (the “Peer Group”). The Board was provided with a detailed description of the proprietary ETF methodology used by Broadridge to determine the applicable Peer Groups. The Board further noted that due to the limitations in providing comparable funds in the various Peer Groups, the statistical information provided in Broadridge’s report may or may not provide meaningful direct comparisons to the Funds in all instances.
The Board also noted that the investment advisory fee rates and overall expenses (net of waivers and reimbursements) for the Funds were lower than the median of the investment advisory fee rates and overall expenses (net of waivers and reimbursements) of the funds in their respective Peer Group, excluding iShares funds.
In addition, to the extent that any of the comparison funds included in the Peer Group, excluding iShares funds, track the same index as any particular Fund, Broadridge also provided, and the Board reviewed, a comparison of such Fund’s performance for the one-, three-, five-, ten-year, and since inception periods, as applicable, and for the quarter ended December 31, 2016, to that of relevant comparison funds for the same periods.
The Board noted that each Fund seeks to track its own underlying index and that, during the year, the Board received periodic reports on each Fund’s short- and longer-term performance in comparison with its underlying index. Such periodic comparative performance information, including any additional detailed information requested by the Boards, was also considered. The Board noted that each Fund generally performed in line with its underlying index over the relevant periods.
Based on this review, the other factors considered at the meeting, and their general knowledge of ETF pricing, the Board concluded that the investment advisory fee rate and the historical performance of each Fund supported the Board’s approval of the continuance of the Advisory Contract for the coming year.
Nature, Extent and Quality of Services Provided by BFA — Based on management’s representations, including information about recent and proposed enhancements to the iShares business, including with respect to capital markets support and analysis, technology, product design, compliance and risk management, and other services, the Board expected that there would be no diminution in the scope of services required of or provided by BFA under the Advisory Contract for the coming year as compared to the scope of services provided by BFA during prior years. In reviewing the scope of these services, the Board considered BFA’s investment philosophy and experience, noting that BFA and its affiliates have committed significant resources over time, including during the past year, to supporting the iShares funds and their shareholders. The Board also considered BFA’s compliance program and its compliance record with respect to the Funds. In that regard, the Board noted that BFA reports to the Board about portfolio management and compliance matters on a periodic basis in connection with regularly scheduled meetings of the Board, and on other occasions as necessary and appropriate, and has provided information and made appropriate officers available as needed to provide further assistance
| 92 | 2017 iSHARES ANNUAL REPORTTO SHAREHOLDERS |
Table of Contents
Board Review and Approval of Investment Advisory
Contract (Continued)
iSHARES®, INC.
with these matters. The Board also reviewed the background and experience of the persons responsible for the day-to-day management of the Funds, as well as the resources available to them in managing the Funds. In addition to the above considerations, the Board reviewed and considered detailed presentations regarding BFA’s investment performance, investment and risk management processes and strategies provided at the June 19-21, 2017 meeting and throughout the previous year, and matters related to BFA’s portfolio compliance policies and procedures. The Board noted that each Fund had met its investment objective consistently since its respective inception date.
Based on review of this information, and the performance information discussed above, the Board concluded that the nature, extent and quality of services provided by BFA to the Funds under the Advisory Contract supported the Board’s approval of the continuance of the Advisory Contract for the coming year.
Costs of Services Provided to Funds and Profits Realized by BFA and Affiliates — The Board reviewed information about the profitability of the Funds to BlackRock, on a Fund-by-Fund basis and in the aggregate, based on the fees payable to BFA and its affiliates (including fees under the Advisory Contract), and other sources of revenue and expense to BFA and its affiliates from the Funds’ operations for the last calendar year. The Board reviewed BlackRock’s profitability methodology for the iShares funds, including supplemental information that was responsive to requests of the 15(c) Committee. The Board noted that the 15(c) Committee had focused on the methodology and profitability presentation during its meetings. The Board discussed the sources of direct and ancillary revenue with management, including the revenues to BTC, a BFA affiliate, from securities lending by the Funds. The Board also discussed BFA’s profit margin as reflected in the Funds’ profitability analyses and reviewed information regarding potential economies of scale (as discussed below). Based on this review, the Board concluded that the profits realized by BFA and its affiliates under the Advisory Contract and from other relationships between the Funds and BFA and/or its affiliates, if any, were within a reasonable range in light of the factors considered.
Economies of Scale — The Board reviewed information regarding potential economies of scale or other efficiencies that may result from increases in the Funds’ assets, noting that the issue of economies of scale had been focused on by the 15(c) Committee during its meetings and addressed by management, including through supplemental information. The Board and the 15(c) Committee reviewed information provided by BFA regarding scale benefits shared with the iShares funds through relatively low fee rates established at inception, breakpoints and waivers or other fee reductions, as well as through additional investment in the iShares business and the provision of improved or additional infrastructure and services to the iShares funds and their shareholders. The Board and the 15(c) Committee received information regarding BlackRock’s historical profitability, including BFA’s and its affiliates’ costs in providing services. The cost information distinguished, among other things, between fixed and variable costs, and explained how the level of fixed and variable costs, as well as the nature of such costs, may impact the existence or size of scale benefits. The Board noted that the Advisory Contract for the Funds already provided for breakpoints in the Funds’ investment advisory fee rates as the assets of the Funds, on an aggregated basis with the assets of certain other iShares funds, increase. The Board noted that it would continue to monitor the sharing of economies of scale to determine the appropriateness of adding new or revised breakpoints in the future.
Based on this review, as well as the other factors considered at the meeting, the Board, recognizing its responsibility to consider the Advisory Contract at least annually, determined to approve the continuance of the Advisory Contract for the coming year.
Fees and Services Provided for Other Comparable Funds/Accounts Managed by BFA and its Affiliates — The Board received and considered information regarding the investment advisory/management fee rates for other funds/accounts in the U.S. for which BFA (or its affiliates) provides investment advisory/management services, including open-end funds registered under the 1940 Act (including sub-advised funds), collective trust funds, and institutional separate accounts (together, the “Other Accounts”), and acknowledged BFA’s assertion that the iShares funds are fundamentally different investment vehicles from the Other Accounts. The Board noted that BFA and its affiliates do not manage Other Accounts with substantially the same
BOARD REVIEWAND APPROVALOF INVESTMENT ADVISORY CONTRACT | 93 |
Table of Contents
Board Review and Approval of Investment Advisory
Contract (Continued)
iSHARES®, INC.
investment objectives and strategies as the Funds and that track the same index as the Funds. The Board further noted that BFA provided the Board with detailed information regarding how the Other Accounts (particularly institutional clients) generally differ from the Funds, including in terms of the different and generally more extensive services provided to the Funds, as well as other significant differences. In that regard, the Board considered that the pricing of services to institutional clients is typically based on a number of factors beyond the nature and extent of the specific services to be provided and often depends on the overall relationship between the client and its affiliates and the adviser and its affiliates. In addition, the Board considered the relative complexity and inherent risks and challenges of managing and providing other services to the Funds, as publicly traded ETFs, as compared to the Other Accounts that are institutional clients in light of differing regulatory requirements and client-imposed mandates. The Board also acknowledged BFA’s expressed business purpose for launching a suite of iShares “Core” ETFs that generally are subject to lower investment advisory fees than iShares non-Core ETFs that may provide a similar investment exposure. The Board also considered the “all-inclusive” nature of the Funds’ advisory fee structure, and the Fund expenses borne by BFA under this arrangement. The Board noted that the investment advisory fee rates under the Advisory Contract for the Funds were generally higher than the investment advisory/management fee rates for certain of the Other Accounts (particularly institutional clients) and concluded that the differences appeared to be consistent with the factors discussed.
Other Benefits to BFA and/or its Affiliates — The Board reviewed the “fallout” benefits or ancillary revenue received by BFA and/or its affiliates in connection with the services provided to the Funds by BFA, such as payment of revenue to BTC, the Funds’ securities lending agent, for loaning portfolio securities (which was included in the profit margins reviewed by the Board pursuant to BFA’s profitability methodology), and payment of advisory fees and/or administration fees to BFA and BTC (or their affiliates) in connection with any investments by the Funds in other funds for which BFA (or its affiliates) provides investment advisory services and/or administration services. The Board also noted the revenue received by BFA and/or its affiliates pursuant to an agreement that permits a service provider to use certain portions of BlackRock’s technology platform to service accounts managed by BFA and/or its affiliates, including the iShares funds. The Board noted that BFA generally does not use soft dollars or consider the value of research or other services that may be provided to BFA (including its affiliates) in selecting brokers for portfolio transactions for the Funds. The Board further noted that any portfolio transactions on behalf of the Funds placed through a BFA affiliate or purchased from an underwriting syndicate in which a BFA affiliate participates, are reported to the Board pursuant to Rule 17e-1 or Rule 10f-3, as applicable, under the 1940 Act. The Board concluded that any such ancillary benefits would not be disadvantageous to the Funds’ shareholders and thus would not alter the Board’s conclusion with respect to the appropriateness of approving the continuance of the Advisory Contract for the coming year.
Conclusion — Based on the considerations described above, the Board determined that each Fund’s investment advisory fee rate under the Advisory Contract does not constitute a fee that is so disproportionately large as to bear no reasonable relationship to the services rendered and that could not have been the product of arm’s-length bargaining, and concluded to approve the continuance of the Advisory Contract for the coming year.
IV. iShares MSCI USA Equal Weighted ETF
Under Section 15(c) of the Investment Company Act of 1940 (the “1940 Act”), the Company’s Board of Directors (the “Board”), including a majority of Directors who are not “interested persons” of the Company (as that term is defined in the 1940 Act) (the “Independent Directors”), is required annually to consider and approve the Investment Advisory Contract between the Company and BFA (the “Advisory Contract”) on behalf of the Fund. The Independent Directors requested, and BFA provided, such information as the Independent Directors, with advice from independent counsel, deemed reasonably necessary to evaluate the Advisory Contract. A committee of all of the Independent Directors (the “15(c) Committee”), with independent counsel, met with management on May 5, 2017 and May 12, 2017. At these meetings, the 15(c) Committee reviewed and discussed information provided in response to the 15(c) Committee’s initial requests, and requested certain additional information, which management agreed to provide. At a meeting held on May 18, 2017, management presented information to the Board relating to the
| 94 | 2017 iSHARES ANNUAL REPORTTO SHAREHOLDERS |
Table of Contents
Board Review and Approval of Investment Advisory
Contract (Continued)
iSHARES®, INC.
continuance of the Advisory Contract, including information requested by the 15(c) Committee during its meetings. The Board, including the Independent Directors, reviewed and discussed such information at length. The Independent Directors requested from management certain additional information, which management agreed to provide. At a meeting held on June 19-21, 2017, the Board, including the Independent Directors, reviewed the additional information provided by management in response to these requests. After extensive discussions, the Board, including all of the Independent Directors, approved the continuance of the Advisory Contract for the Fund, based on a review of qualitative and quantitative information provided by BFA. The Board noted its satisfaction with the extent and quality of information provided and its frequent interactions with management, as well as the detailed responses and other information provided by BFA. The Board also noted that the Board and BFA agreed to discuss potential further enhancements to the 15(c) process for the coming year. The Independent Directors were advised by their independent counsel throughout the process, including about the legal standards applicable to their review. In approving the Advisory Contract for the Fund, the Board, including the Independent Directors, considered the following factors, no one of which was controlling, and reached the following conclusions:
Expenses and Performance of the Fund — The Board reviewed statistical information prepared by Broadridge Financial Solutions Inc. (“Broadridge”), an independent provider of investment company data, regarding the expense ratio components, including gross and net total expenses, waivers/reimbursements (if any), and underlying fund fees and expenses (if any) of the Fund in comparison with the same information for other exchange traded funds (“ETFs”) (including, where applicable, funds sponsored by an “at cost” service provider) and, in the limited instances where no comparable ETFs existed and the comparison group would not otherwise be reasonable in Broadridge’s judgment, pure index institutional mutual funds, objectively selected by Broadridge as comprising the Fund’s applicable peer group pursuant to Broadridge’s proprietary ETF methodology (the ���Peer Group”). The Board was provided with a detailed description of the proprietary ETF methodology used by Broadridge to determine the Fund’s Peer Group. The Board further noted that due to the limitations in providing comparable funds in the Peer Group, the statistical information provided in Broadridge’s report may or may not provide meaningful direct comparisons to the Fund in all instances.
The Board also noted that the investment advisory fee rate and overall expenses (net of waivers and reimbursements) for the Fund were lower than the median of the investment advisory fee rates and overall expenses (net of waivers and reimbursements) of the funds in its Peer Group, excluding iShares funds.
In addition, to the extent that any of the comparison funds included in the Peer Group, excluding iShares funds, track the same index as the Fund, Broadridge also provided, and the Board reviewed, a comparison of the Fund’s performance for the one-, three-, five-, ten-year, and since inception periods, as applicable, and for the quarter ended December 31, 2016, to that of relevant comparison funds for the same periods.
The Board noted that the Fund seeks to track its specified underlying index and that, during the year, the Board received periodic reports on the Fund’s short- and longer-term performance in comparison with its underlying index. Such periodic comparative performance information, including any additional detailed information requested by the Boards, was also considered. The Board noted that the Fund generally performed in line with its underlying index over the relevant periods.
Based on this review, the other factors considered at the meeting, and their general knowledge of ETF pricing, the Board concluded that the investment advisory fee rate and the historical performance of the Fund supported the Board’s approval of the continuance of the Advisory Contract for the coming year.
Nature, Extent and Quality of Services Provided by BFA — Based on management’s representations, including information about recent and proposed enhancements to the iShares business, including with respect to capital markets support and analysis, technology, product design, compliance and risk management, and other services, the Board expected that there would
BOARD REVIEWAND APPROVALOF INVESTMENT ADVISORY CONTRACT | 95 |
Table of Contents
Board Review and Approval of Investment Advisory
Contract (Continued)
iSHARES®, INC.
be no diminution in the scope of services required of or provided by BFA under the Advisory Contract for the coming year as compared to the scope of services provided by BFA during prior years. In reviewing the scope of these services, the Board considered BFA’s investment philosophy and experience, noting that BFA and its affiliates have committed significant resources over time, including during the past year, to supporting the iShares funds and their shareholders. The Board also considered BFA’s compliance program and its compliance record with respect to the Fund. In that regard, the Board noted that BFA reports to the Board about portfolio management and compliance matters on a periodic basis in connection with regularly scheduled meetings of the Board, and on other occasions as necessary and appropriate, and has provided information and made appropriate officers available as needed to provide further assistance with these matters. The Board also reviewed the background and experience of the persons responsible for the day-to-day management of the Fund, as well as the resources available to them in managing the Fund. In addition to the above considerations, the Board reviewed and considered detailed presentations regarding BFA’s investment performance, investment and risk management processes and strategies provided at the June 19-21, 2017 meeting and throughout the previous year, and matters related to BFA’s portfolio compliance policies and procedures. The Board noted that the Fund had met its investment objective consistently since its inception date.
Based on review of this information, and the performance information discussed above, the Board concluded that the nature, extent and quality of services provided by BFA to the Fund under the Advisory Contract supported the Board’s approval of the continuance of the Advisory Contract for the coming year.
Costs of Services Provided to Fund and Profits Realized by BFA and Affiliates — The Board reviewed information about the profitability of the Fund to BlackRock, based on the fees payable to BFA and its affiliates (including fees under the Advisory Contract), and other sources of revenue and expense to BFA and its affiliates from the Fund’s operations for the last calendar year. The Board reviewed BlackRock’s profitability methodology for the iShares funds, including supplemental information that was responsive to requests of the 15(c) Committee. The Board noted that the 15(c) Committee had focused on the methodology and profitability presentation during its meetings. The Board discussed the sources of direct and ancillary revenue with management, including the revenues to BTC, a BFA affiliate, from securities lending by the Fund. The Board also discussed BFA’s profit margin as reflected in the Fund’s profitability analysis and reviewed information regarding potential economies of scale (as discussed below). Based on this review, the Board concluded that the profits realized by BFA and its affiliates under the Advisory Contract and from other relationships between the Fund and BFA and/or its affiliates, if any, were within a reasonable range in light of the factors considered.
Economies of Scale — The Board reviewed information regarding potential economies of scale or other efficiencies that may result from increases in the Fund’s assets, noting that the issue of economies of scale had been focused on by the 15(c) Committee during its meetings and addressed by management, including through supplemental information. The Board and the 15(c) Committee reviewed information provided by BFA regarding scale benefits shared with the iShares funds through relatively low fee rates established at inception, breakpoints and waivers or other fee reductions, as well as through additional investment in the iShares business and the provision of improved or additional infrastructure and services to the iShares funds and their shareholders. The Board and the 15(c) Committee received information regarding BlackRock’s historical profitability, including BFA’s and its affiliates’ costs in providing services. The cost information distinguished, among other things, between fixed and variable costs, and explained how the level of fixed and variable costs, as well as the nature of such costs, may impact the existence or size of scale benefits. The Board noted that the Advisory Contract for the Fund did not provide for any breakpoints in the Fund’s investment advisory fee rate as the assets of the Fund increase. However, the Board noted that should material economies of scale be identified in the future that are not otherwise shared, a breakpoint structure for the Fund may be appropriate, and that it would continue to monitor the sharing of economies of scale to determine the appropriateness of adding breakpoints in the future.
| 96 | 2017 iSHARES ANNUAL REPORTTO SHAREHOLDERS |
Table of Contents
Board Review and Approval of Investment Advisory
Contract (Continued)
iSHARES®, INC.
Based on this review, as well as the other factors considered at the meeting, the Board, recognizing its responsibility to consider the Advisory Contract at least annually, determined to approve the continuance of the Advisory Contract for the coming year.
Fees and Services Provided for Other Comparable Funds/Accounts Managed by BFA and its Affiliates — The Board received and considered information regarding the investment advisory/management fee rates for other funds/accounts in the U.S. for which BFA (or its affiliates) provides investment advisory/management services, including open-end funds registered under the 1940 Act (including sub-advised funds), collective trust funds, and institutional separate accounts (together, the “Other Accounts”), and acknowledged BFA’s assertion that the iShares funds are fundamentally different investment vehicles from the Other Accounts. The Board noted that BFA and its affiliates do not manage Other Accounts with substantially the same investment objective and strategy as the Fund and that track the same index as the Fund. The Board further noted that BFA provided the Board with detailed information regarding how the Other Accounts (particularly institutional clients) generally differ from the Fund, including in terms of the different and generally more extensive services provided to the Fund, as well as other significant differences. In that regard, the Board considered that the pricing of services to institutional clients is typically based on a number of factors beyond the nature and extent of the specific services to be provided and often depends on the overall relationship between the client and its affiliates and the adviser and its affiliates. In addition, the Board considered the relative complexity and inherent risks and challenges of managing and providing other services to the Fund, as a publicly traded ETF, as compared to the Other Accounts that are institutional clients, in light of differing regulatory requirements and client-imposed mandates. The Board also acknowledged BFA’s expressed business purpose for launching a suite of iShares “Core” ETFs that generally are subject to lower investment advisory fees than iShares non-Core ETFs that may provide a similar investment exposure. The Board also considered the “all-inclusive” nature of the Fund’s advisory fee structure, and the Fund expenses borne by BFA under this arrangement. The Board noted that the investment advisory fee rate under the Advisory Contract for the Fund was generally higher than the investment advisory/management fee rates for certain of the Other Accounts (particularly institutional clients) and concluded that the differences appeared to be consistent with the factors discussed.
Other Benefits to BFA and/or its Affiliates — The Board reviewed the “fallout” benefits or ancillary revenue received by BFA and/or its affiliates in connection with the services provided to the Fund by BFA, such as payment of revenue to BTC, the Fund’s securities lending agent, for loaning portfolio securities (which was included in the profit margins reviewed by the Board pursuant to BFA’s profitability methodology), and payment of advisory fees and/or administration fees to BFA and BTC (or their affiliates) in connection with any investments by the Fund in other funds for which BFA (or its affiliates) provides investment advisory services and/or administration services. The Board also noted the revenue received by BFA and/or its affiliates pursuant to an agreement that permits a service provider to use certain portions of BlackRock’s technology platform to service accounts managed by BFA and/or its affiliates, including the iShares funds. The Board noted that BFA generally does not use soft dollars or consider the value of research or other services that may be provided to BFA (including its affiliates) in selecting brokers for portfolio transactions for the Fund. The Board further noted that any portfolio transactions on behalf of the Fund placed through a BFA affiliate or purchased from an underwriting syndicate in which a BFA affiliate participates, are reported to the Board pursuant to Rule 17e-1 or Rule 10f-3, as applicable, under the 1940 Act. The Board concluded that any such ancillary benefits would not be disadvantageous to the Fund’s shareholders and thus would not alter the Board’s conclusion with respect to the appropriateness of approving the continuance of the Advisory Contract for the coming year.
Conclusion — Based on the considerations described above, the Board determined that the Fund’s investment advisory fee rate under the Advisory Contract does not constitute a fee that is so disproportionately large as to bear no reasonable relationship to the services rendered and that could not have been the product of arm’s-length bargaining, and concluded to approve the continuance of the Advisory Contract for the coming year.
BOARD REVIEWAND APPROVALOF INVESTMENT ADVISORY CONTRACT | 97 |
Table of Contents
Supplemental Information (Unaudited)
iSHARES®, INC.
Proxy Results
A special meeting of the shareholders of each series of iShares, Inc. (the “Company”) was held on June 19, 2017, to elect five Directors to the Board of Directors of the Company. The five nominees were Jane D. Carlin, Richard L. Fagnani, Drew E. Lawton, Madhav V. Rajan and Mark Wiedman, all of whom were elected as Directors at the special meeting. The other Directors whose terms of office as Directors continued after the special meeting are Cecilia H. Herbert, Charles A. Hurty, John E. Kerrigan, John E. Martinez and Robert S. Kapito.
| Director | Votes For | Votes Withheld | ||||||
Jane D. Carlin | 1,911,835,929 | 49,339,171 | ||||||
Richard L. Fagnani | 1,911,725,344 | 49,449,755 | ||||||
Drew E. Lawton | 1,911,790,083 | 49,385,017 | ||||||
Madhav V. Rajan | 1,902,999,095 | 58,176,004 | ||||||
Mark Wiedman | 1,908,143,500 | 53,031,599 | ||||||
Section 19(a) Notices
The amounts and sources of distributions reported are estimates and are provided pursuant to regulatory requirements and are not being provided for tax reporting purposes. The actual amounts and sources for tax reporting purposes will depend upon each Fund’s investment experience during the year and may be subject to changes based on the tax regulations. Shareholders will receive a Form 1099-DIV each calendar year that will inform them how to report these distributions for federal income tax purposes.
| Total Cumulative Distributions for the Fiscal Year | % Breakdown of the Total Cumulative Distributions for the Fiscal Year | |||||||||||||||||||||||||||||||
| iShares ETF | Net Investment Income | Net Realized Capital Gains | Return of Capital | Total Per | Net Investment Income | Net Realized Capital Gains | Return of Capital | Total Per Share | ||||||||||||||||||||||||
MSCI Brazil Capped | $ | 0.672146 | $ | — | $ | — | $ | 0.672146 | 100 | % | — | % | — | % | 100 | % | ||||||||||||||||
MSCI Colombia Capped | 0.172443 | — | — | 0.172443 | 100 | — | — | 100 | ||||||||||||||||||||||||
MSCI Israel Capped | 0.796507 | — | 0.015775 | 0.812282 | 98 | — | 2 | 100 | ||||||||||||||||||||||||
MSCI Russia Capped | 0.998857 | — | — | 0.998857 | 100 | — | — | 100 | ||||||||||||||||||||||||
MSCI South Africa | 0.991919 | — | 0.023139 | 1.015058 | 98 | — | 2 | 100 | ||||||||||||||||||||||||
MSCI Turkey | 1.079239 | — | — | 1.079239 | 100 | — | — | 100 | ||||||||||||||||||||||||
MSCI USA Equal Weighted | 0.765491 | — | 0.018603 | 0.784094 | 98 | — | 2 | 100 | ||||||||||||||||||||||||
Premium/Discount Information
The Premium/Discount Information section is intended to present information about the differences between the daily market price on secondary markets for shares of a fund and that fund’s NAV. NAV is the price at which a fund issues and redeems shares. It is calculated in accordance with the standard formula for valuing mutual fund shares. The “Market Price” of a fund generally is determined using the midpoint between the highest bid and the lowest ask on the primary securities exchange on which shares of such fund are listed for trading, as of the time that the fund’s NAV is calculated. A fund’s Market Price may be at, above or below its NAV. The NAV of a fund will fluctuate with changes in the value of its portfolio holdings. The Market Price of a fund will fluctuate in accordance with changes in its NAV, as well as market supply and demand.
| 98 | 2017 iSHARES ANNUAL REPORTTO SHAREHOLDERS |
Table of Contents
Supplemental Information (Unaudited) (Continued)
iSHARES®, INC.
Premiums or discounts are the differences (expressed as a percentage) between the NAV and Market Price of a fund on a given day, generally at the time the NAV is calculated. A premium is the amount that a fund is trading above the reported NAV, expressed as a percentage of the NAV. A discount is the amount that a fund is trading below the reported NAV, expressed as a percentage of the NAV.
Premium/discount information for the Funds covering the most recently completed calendar year and the most recently completed calendar quarters since that year (or the life of the Fund, if shorter) is publicly accessible, free of charge, at www.iShares.com.
The following information shows the frequency of distributions of premiums and discounts for the Funds for the immediately preceding five calendar years (or from the inception date of the Fund, if less than five years) through the date of the most recent calendar quarter-end. Each line in each table shows the number of trading days in which the Fund traded within the premium/discount range indicated. The number of trading days in each premium/discount range is also shown as a percentage of the total number of trading days in the period covered by each table. All data presented here represents past performance, which cannot be used to predict future results.
iShares MSCI Brazil Capped ETF
Period Covered: January 1, 2012 through June 30, 2017
Premium/Discount Range | Number of Days | Percentage of Total Days | ||||||
Greater than 4.5% | 1 | 0.07 | % | |||||
Greater than 4.0% and Less than 4.5% | 1 | 0.07 | ||||||
Greater than 3.5% and Less than 4.0% | 1 | 0.07 | ||||||
Greater than 3.0% and Less than 3.5% | 1 | 0.07 | ||||||
Greater than 2.5% and Less than 3.0% | 2 | 0.14 | ||||||
Greater than 2.0% and Less than 2.5% | 8 | 0.58 | ||||||
Greater than 1.5% and Less than 2.0% | 17 | 1.23 | ||||||
Greater than 1.0% and Less than 1.5% | 52 | 3.76 | ||||||
Greater than 0.5% and Less than 1.0% | 154 | 11.14 | ||||||
Greater than 0.0% and Less than 0.5% | 401 | 28.99 | ||||||
At NAV | 13 | 0.94 | ||||||
Less than 0.0% and Greater than –0.5% | 475 | 34.35 | ||||||
Less than –0.5% and Greater than –1.0% | 182 | 13.16 | ||||||
Less than –1.0% and Greater than –1.5% | 50 | 3.62 | ||||||
Less than –1.5% and Greater than –2.0% | 11 | 0.80 | ||||||
Less than –2.0% and Greater than –2.5% | 11 | 0.80 | ||||||
Less than –2.5% and Greater than –3.0% | 2 | 0.14 | ||||||
Less than –3.0% and Greater than –3.5% | 1 | 0.07 | ||||||
|
|
|
| |||||
| 1,383 | 100.00 | % | ||||||
|
|
|
| |||||
SUPPLEMENTAL INFORMATION | 99 |
Table of Contents
Supplemental Information (Unaudited) (Continued)
iSHARES®, INC.
iShares MSCI Chile Capped ETF
Period Covered: January 1, 2012 through June 30, 2017
Premium/Discount Range | Number of Days | Percentage of Total Days | ||||||
Greater than 2.0% | 3 | 0.22 | % | |||||
Greater than 1.5% and Less than 2.0% | 6 | 0.43 | ||||||
Greater than 1.0% and Less than 1.5% | 23 | 1.66 | ||||||
Greater than 0.5% and Less than 1.0% | 127 | 9.18 | ||||||
Greater than 0.0% and Less than 0.5% | 453 | 32.75 | ||||||
At NAV | 9 | 0.65 | ||||||
Less than 0.0% and Greater than –0.5% | 507 | 36.67 | ||||||
Less than –0.5% and Greater than –1.0% | 216 | 15.62 | ||||||
Less than –1.0% and Greater than –1.5% | 27 | 1.95 | ||||||
Less than –1.5% and Greater than –2.0% | 11 | 0.80 | ||||||
Less than –2.0% | 1 | 0.07 | ||||||
|
|
|
| |||||
| 1,383 | 100.00 | % | ||||||
|
|
|
| |||||
iShares MSCI Columbia Capped ETF
Period Covered: June 18, 2013 through June 30, 2017
Premium/Discount Range | Number of Days | Percentage of Total Days | ||||||
Greater than 3.5% and Less than 4.0% | 1 | 0.10 | % | |||||
Greater than 3.0% and Less than 3.5% | 1 | 0.10 | ||||||
Greater than 2.5% and Less than 3.0% | 5 | 0.49 | ||||||
Greater than 2.0% and Less than 2.5% | 15 | 1.47 | ||||||
Greater than 1.5% and Less than 2.0% | 36 | 3.54 | ||||||
Greater than 1.0% and Less than 1.5% | 107 | 10.51 | ||||||
Greater than 0.5% and Less than 1.0% | 239 | 23.48 | ||||||
Greater than 0.0% and Less than 0.5% | 311 | 30.54 | ||||||
At NAV | 12 | 1.18 | ||||||
Less than 0.0% and Greater than –0.5% | 198 | 19.45 | ||||||
Less than –0.5% and Greater than –1.0% | 67 | 6.58 | ||||||
Less than –1.0% and Greater than –1.5% | 18 | 1.77 | ||||||
Less than –1.5% and Greater than –2.0% | 6 | 0.59 | ||||||
Less than –2.0% and Greater than –2.5% | 2 | 0.20 | ||||||
|
|
|
| |||||
| 1,018 | 100.00 | % | ||||||
|
|
|
| |||||
| 100 | 2017 iSHARES ANNUAL REPORTTO SHAREHOLDERS |
Table of Contents
Supplemental Information (Unaudited) (Continued)
iSHARES®, INC.
iShares MSCI Israel Capped ETF
Period Covered: January 1, 2012 through June 30, 2017
Premium/Discount Range | Number of Days | Percentage of Total Days | ||||||
Greater than 3.0% | 1 | 0.07 | % | |||||
Greater than 2.5% and Less than 3.0% | 1 | 0.07 | ||||||
Greater than 2.0% and Less than 2.5% | 2 | 0.14 | ||||||
Greater than 1.5% and Less than 2.0% | 7 | 0.51 | ||||||
Greater than 1.0% and Less than 1.5% | 34 | 2.46 | ||||||
Greater than 0.5% and Less than 1.0% | 136 | 9.83 | ||||||
Greater than 0.0% and Less than 0.5% | 456 | 32.98 | ||||||
At NAV | 8 | 0.58 | ||||||
Less than 0.0% and Greater than –0.5% | 498 | 36.01 | ||||||
Less than –0.5% and Greater than –1.0% | 174 | 12.58 | ||||||
Less than –1.0% and Greater than –1.5% | 44 | 3.18 | ||||||
Less than –1.5% and Greater than –2.0% | 14 | 1.01 | ||||||
Less than –2.0% and Greater than –2.5% | 4 | 0.29 | ||||||
Less than –2.5% and Greater than –3.0% | 4 | 0.29 | ||||||
|
|
|
| |||||
| 1,383 | 100.00 | % | ||||||
|
|
|
| |||||
iShares MSCI Russia Capped ETF
Period Covered: January 1, 2012 through June 30, 2017
Premium/Discount Range | Number of Days | Percentage of Total Days | ||||||
Greater than 5.0% | 2 | 0.14 | % | |||||
Greater than 4.5% and Less than 5.0% | 2 | 0.14 | ||||||
Greater than 4.0% and Less than 4.5% | 4 | 0.29 | ||||||
Greater than 3.5% and Less than 4.0% | 5 | 0.36 | ||||||
Greater than 3.0% and Less than 3.5% | 4 | 0.29 | ||||||
Greater than 2.5% and Less than 3.0% | 9 | 0.65 | ||||||
Greater than 2.0% and Less than 2.5% | 15 | 1.08 | ||||||
Greater than 1.5% and Less than 2.0% | 41 | 2.96 | ||||||
Greater than 1.0% and Less than 1.5% | 93 | 6.72 | ||||||
Greater than 0.5% and Less than 1.0% | 222 | 16.06 | ||||||
Greater than 0.0% and Less than 0.5% | 389 | 28.14 | ||||||
At NAV | 14 | 1.01 | ||||||
Less than 0.0% and Greater than –0.5% | 288 | 20.83 | ||||||
Less than –0.5% and Greater than –1.0% | 148 | 10.71 | ||||||
Less than –1.0% and Greater than –1.5% | 78 | 5.64 | ||||||
Less than –1.5% and Greater than –2.0% | 36 | 2.60 | ||||||
Less than –2.0% and Greater than –2.5% | 19 | 1.37 | ||||||
Less than –2.5% and Greater than –3.0% | 4 | 0.29 | ||||||
Less than –3.0% and Greater than –3.5% | 6 | 0.43 | ||||||
Less than –3.5% | 4 | 0.29 | ||||||
|
|
|
| |||||
| 1,383 | 100.00 | % | ||||||
|
|
|
| |||||
SUPPLEMENTAL INFORMATION | 101 |
Table of Contents
Supplemental Information (Unaudited) (Continued)
iSHARES®, INC.
iShares MSCI South Africa ETF
Period Covered: January 1, 2012 through June 30, 2017
Premium/Discount Range | Number of Days | Percentage of Total Days | ||||||
Greater than 5.0% | 1 | 0.07 | % | |||||
Greater than 4.5% and Less than 5.0% | 2 | 0.14 | ||||||
Greater than 4.0% and Less than 4.5% | 1 | 0.07 | ||||||
Greater than 3.5% and Less than 4.0% | 2 | 0.14 | ||||||
Greater than 3.0% and Less than 3.5% | 3 | 0.22 | ||||||
Greater than 2.5% and Less than 3.0% | 2 | 0.14 | ||||||
Greater than 2.0% and Less than 2.5% | 12 | 0.87 | ||||||
Greater than 1.5% and Less than 2.0% | 30 | 2.17 | ||||||
Greater than 1.0% and Less than 1.5% | 95 | 6.87 | ||||||
Greater than 0.5% and Less than 1.0% | 256 | 18.52 | ||||||
Greater than 0.0% and Less than 0.5% | 377 | 27.27 | ||||||
At NAV | 9 | 0.65 | ||||||
Less than 0.0% and Greater than –0.5% | 293 | 21.20 | ||||||
Less than –0.5% and Greater than –1.0% | 179 | 12.94 | ||||||
Less than –1.0% and Greater than –1.5% | 70 | 5.06 | ||||||
Less than –1.5% and Greater than –2.0% | 28 | 2.02 | ||||||
Less than –2.0% and Greater than –2.5% | 14 | 1.01 | ||||||
Less than –2.5% and Greater than –3.0% | 4 | 0.29 | ||||||
Less than –3.0% and Greater than –3.5% | 1 | 0.07 | ||||||
Less than –3.5% and Greater than –4.0% | 2 | 0.14 | ||||||
Less than –4.0% and Greater than –4.5% | 1 | 0.07 | ||||||
Less than –4.5% and Greater than –5.0% | 1 | 0.07 | ||||||
|
|
|
| |||||
| 1,383 | 100.00 | % | ||||||
|
|
|
| |||||
| 102 | 2017 iSHARES ANNUAL REPORTTO SHAREHOLDERS |
Table of Contents
Supplemental Information (Unaudited) (Continued)
iSHARES®, INC.
iShares MSCI Turkey ETF
Period Covered: January 1, 2012 through June 30, 2017
Premium/Discount Range | Number of Days | Percentage of Total Days | ||||||
Greater than 4.0% | 1 | 0.07 | % | |||||
Greater than 3.5% and Less than 4.0% | 1 | 0.07 | ||||||
Greater than 3.0% and Less than 3.5% | 1 | 0.07 | ||||||
Greater than 2.5% and Less than 3.0% | 7 | 0.51 | ||||||
Greater than 2.0% and Less than 2.5% | 6 | 0.43 | ||||||
Greater than 1.5% and Less than 2.0% | 30 | 2.17 | ||||||
Greater than 1.0% and Less than 1.5% | 56 | 4.05 | ||||||
Greater than 0.5% and Less than 1.0% | 227 | 16.41 | ||||||
Greater than 0.0% and Less than 0.5% | 446 | 32.26 | ||||||
At NAV | 4 | 0.29 | ||||||
Less than 0.0% and Greater than –0.5% | 337 | 24.37 | ||||||
Less than –0.5% and Greater than –1.0% | 141 | 10.20 | ||||||
Less than –1.0% and Greater than –1.5% | 78 | 5.64 | ||||||
Less than –1.5% and Greater than –2.0% | 26 | 1.88 | ||||||
Less than –2.0% and Greater than –2.5% | 15 | 1.08 | ||||||
Less than –2.5% and Greater than –3.0% | 3 | 0.22 | ||||||
Less than –3.0% and Greater than –3.5% | 1 | 0.07 | ||||||
Less than –3.5% and Greater than –4.0% | 1 | 0.07 | ||||||
Less than –4.0% and Greater than –4.5% | 1 | 0.07 | ||||||
Less than –4.5% and Greater than –5.0% | 1 | 0.07 | ||||||
|
|
|
| |||||
| 1,383 | 100.00 | % | ||||||
|
|
|
| |||||
iShares MSCI USA Equal Weighted ETF
Period Covered: January 1, 2012 through June 30, 2017
Premium/Discount Range | Number of Days | Percentage of Total Days | ||||||
Greater than 0.0% and Less than 0.5% | 768 | 55.54 | % | |||||
At NAV | 123 | 8.89 | ||||||
Less than 0.0% and Greater than –0.5% | 492 | 35.57 | ||||||
|
|
|
| |||||
| 1,383 | 100.00 | % | ||||||
|
|
|
| |||||
Regulation under the Alternative Investment Fund Managers Directive
The Alternative Investment Fund Managers Directive (“AIFMD”) imposes obligations on fund managers established in the European Union (the “EU”). These do not currently apply to managers established outside the EU, such as BFA. Rather, non-EU managers are only required to comply with certain disclosure, reporting and transparency obligations of AIFMD if such managers market a fund to EU investors.
BFA has registered the iShares MSCI Brazil Capped ETF and iShares MSCI USA Equal Weighted ETF (each a “Fund”, collectively the “Funds”) for marketing to investors in the United Kingdom, the Netherlands, Finland, Sweden and Luxembourg.
SUPPLEMENTAL INFORMATION | 103 |
Table of Contents
Supplemental Information (Unaudited) (Continued)
iSHARES®, INC.
Report on Remuneration
BFA is required under AIFMD to make quantitative disclosures of remuneration. These disclosures are made in line with BlackRock’s interpretation of currently available regulatory guidance on quantitative remuneration disclosures. As market or regulatory practice develops BlackRock may consider it appropriate to make changes to the way in which quantitative remuneration disclosures are calculated. Where such changes are made, this may result in disclosures in relation to a fund not being comparable to the disclosures made in the prior year, or in relation to other BlackRock fund disclosures in that same year.
Disclosures are provided in relation to both (a) the staff of BFA; (b) staff who are senior management; and (c) staff who have the ability to materially affect the risk profile of the Funds.
All individuals included in the aggregated figures disclosed are rewarded in line with BlackRock’s remuneration policy for their responsibilities across the relevant BlackRock business area. As all individuals have a number of areas of responsibilities, only the portion of remuneration for those individuals’ services attributable to each Fund is included in the aggregate figures disclosed.
BlackRock has a clear and well defined pay-for-performance philosophy, and compensation programs which support that philosophy. For senior management, a significant percentage of variable remuneration is deferred over time. All employees are subject to a claw-back policy.
Compensation decisions for employees are made based on BlackRock’s full-year financial results and other non-financial goals and objectives. Alongside financial performance, individual compensation is also based on strategic and operating results and other considerations such as management and leadership capabilities. No set formulas are established and no fixed benchmarks are used in determining annual incentive awards.
Bonus pools are reviewed by BlackRock’s independent compensation committee, taking into account both actual and projected financial information together with information provided by the Operational Risk and Regulatory Compliance departments in relation to any activities, incidents or events that warrant consideration in making compensation decisions.
Functions such as Finance, Operational Risk, Legal & Compliance, and Human Resources each have their own organizational structures which are independent of the business units. Functional bonus pools are determined with reference to the performance of each individual function and the remuneration of the senior members of control functions is directly overseen by BlackRock’s independent compensation committee. No individual is involved in setting his or her own remuneration.
Members of staff and senior management of BFA typically provide both AIFMD and non-AIFMD related services in respect of multiple funds, clients and functions of BFA and across the broader BlackRock group. Therefore, the figures disclosed are a sum of each individual’s portion of remuneration attributable to each Fund according to an objective apportionment methodology which acknowledges the multiple-service nature of BFA. Accordingly the figures are not representative of any individual’s actual remuneration or their remuneration structure.
The amount of the total remuneration awarded by BFA to its staff which has been attributed to the iShares MSCI Brazil Capped ETF in respect of BFA’s financial year ending December 31, 2016 was USD 450.48 thousand. This figure is comprised of fixed remuneration of USD 177.21 thousand and variable remuneration of USD 273.27 thousand. There were a total of 325 beneficiaries of the remuneration described above.
The amount of the aggregate remuneration awarded by BFA, which has been attributed to the iShares MSCI Brazil Capped ETF in respect of BFA’s financial year ending December 31, 2016, to its senior management was USD 62.30 thousand, and to members of its staff whose actions have a material impact on the risk profile of the Fund was USD 15.01 thousand.
| 104 | 2017 iSHARES ANNUAL REPORTTO SHAREHOLDERS |
Table of Contents
Supplemental Information (Unaudited) (Continued)
iSHARES®, INC.
The amount of the total remuneration awarded by BFA to its staff which has been attributed to the iShares MSCI USA Equal Weighted ETF in respect of BFA’s financial year ending December 31, 2016 was USD 10.11 thousand. This figure is comprised of fixed remuneration of USD 3.98 thousand and variable remuneration of USD 6.13 thousand. There were a total of 325 beneficiaries of the remuneration described above.
The amount of the aggregate remuneration awarded by BFA, which has been attributed to the iShares MSCI USA Equal Weighted ETF in respect of the BFA’s financial year ending December 31, 2016, to its senior management was USD 1.40 thousand, and to members of its staff whose actions have a material impact on the risk profile of the Fund was USD 0.34 thousand.
SUPPLEMENTAL INFORMATION | 105 |
Table of Contents
Director and Officer Information
iSHARES®, INC.
The Board of Directors has responsibility for the overall management and operations of the Funds, including general supervision of the duties performed by BFA and other service providers. Each Director serves until he or she resigns, is removed, dies, retires or becomes incapacitated. Each officer shall hold office until his or her successor is elected and qualifies or until his or her death, resignation or removal. Directors who are not “interested persons” (as defined in the 1940 Act) of the Company are referred to as independent directors (“Independent Directors”).
The registered investment companies advised by BFA or its affiliates (the “BlackRock-advised Funds”) are organized into one complex of closed-end funds, two complexes of open-end funds and one complex of exchange-traded funds (“Exchange-Traded Fund Complex”) (each, a “BlackRock Fund Complex”). Each Fund is included in the BlackRock Fund Complex referred to as the Exchange-Traded Fund Complex. Each Director also serves as a Trustee of iShares Trust and a Trustee of iShares U.S. ETF Trust and, as a result, oversees a total of 344 funds (as of August 31, 2017) within the Exchange-Traded Fund Complex. Drew E. Lawton, from October 2016 to June 2017, and Richard L. Fagnani, from April 2017 to June 2017, served as Advisory Board Members for iShares Trust, iShares Inc. and iShares U.S. ETF Trust with respect to all funds within the Exchange-Traded Fund Complex. With the exception of Robert S. Kapito, Mark K. Wiedman, Charles Park, Martin Small and Benjamin Archibald, the address of each Director, and officer is c/o BlackRock, Inc., 400 Howard Street, San Francisco, CA 94105. The address of Mr. Kapito, Mr. Wiedman, Mr. Park, Mr. Small and Mr. Archibald is c/o BlackRock, Inc., Park Avenue Plaza, 55 East 52nd Street, New York, NY 10055. The Board has designated Cecilia H. Herbert as its Independent Board Chair. Additional information about the Funds’ Directors and officers may be found in the Funds’ combined Statement of Additional Information, which is available without charge, upon request, by calling toll-free 1-800-iShares (1-800-474-2737).
Interested Directors
| Name (Age) | Position(s) | Principal Occupation(s) During the Past 5 Years | Other Directorships Held by Director | |||
Robert S. Kapitoa (60) | Director (since 2009). | President, BlackRock, Inc. (since 2006); Vice Chairman of BlackRock, Inc. and Head of BlackRock’s Portfolio Management Group (since its formation in 1998) and BlackRock, Inc.’s predecessor entities (since 1988); Trustee, University of Pennsylvania (since 2009); President of Board of Directors, Hope & Heroes Children’s Cancer Fund (since 2002). | Director of BlackRock, Inc. (since 2006); Trustee of iShares Trust (since 2009); Trustee of iShares U.S. ETF Trust (since 2011). | |||
Mark K. Wiedmanb (46) | Director (since 2013). | Senior Managing Director, BlackRock, Inc. (since 2014); Managing Director, BlackRock, Inc. (2007-2014); Global Head of BlackRock’s ETF and Index Investments Business (since 2016); Global Head of iShares (2011-2016); Head of Corporate Strategy, BlackRock, Inc. (2009-2011). | Trustee of iShares Trust (since 2013); Trustee of iShares U.S. ETF Trust (since 2013); Director of PennyMac Financial Services, Inc. (since 2008). | |||
| a | Robert S. Kapito is deemed to be an “interested person” (as defined in the 1940 Act) of the Company due to his affiliations with BlackRock, Inc. and its affiliates. |
| b | Mark K. Wiedman is deemed to be an “interested person” (as defined in the 1940 Act) of the Company due to his affiliations with BlackRock, Inc. and its affiliates. |
| 106 | 2017 iSHARES ANNUAL REPORTTO SHAREHOLDERS |
Table of Contents
Director and Officer Information (Continued)
iSHARES®, INC.
Independent Directors
| Name (Age) | Position(s) | Principal Occupation(s) During the Past 5 Years | Other Directorships Held by Director | |||
Cecilia H. Herbert (68) | Director (since 2005); Independent Board Chair (since 2016). | Trustee and Member of the Finance, Technology and Quality Committee of Stanford Health Care (since 2016); Trustee and Member of the Investment Committee, WNET, a New York public media company (since 2011); Chair (1994-2005) and Member (since 1992) of the Investment Committee, Archdiocese of San Francisco; Director (1998-2013) and President (2007-2011) of the Board of Directors, Catholic Charities CYO; Trustee (2002-2011) and Chair of the Finance and Investment Committee (2006-2010) of the Thacher School. | Trustee of iShares Trust (since 2005); Trustee of iShares U.S. ETF Trust (since 2011); Independent Board Chair of iShares Trust and iShares U.S. ETF Trust (since 2016); Trustee of Forward Funds (14 portfolios) (since 2009); Trustee of Salient MF Trust (4 portfolios) (since 2015). | |||
Jane D. Carlin (61) | Director (since 2015); Risk Committee Chair (since 2016). | Consultant (since 2012); Managing Director and Global Head of Financial Holding Company Governance & Assurance and the Global Head of Operational Risk Management of Morgan Stanley (2006-2012). | Trustee of iShares Trust (since 2015); Trustee of iShares U.S. ETF Trust (since 2015); Director of PHH Corporation (mortgage solutions) (since 2012); Director of The Hanover Insurance Group, Inc. (since 2016). | |||
Richard L. Fagnani (62) | Director (since 2017); Equity Plus Committee Chair (since 2017). | Partner, KPMG LLP (2002-2016). | Trustee of iShares Trust (since 2017); Trustee of iShares U.S. ETF Trust (since 2017). | |||
Charles A. Hurty (73) | Director (since 2005); Audit Committee Chair (since 2006). | Retired; Partner, KPMG LLP (1968-2001). | Trustee of iShares Trust (since 2005); Trustee of iShares U.S. ETF Trust (since 2011); Director of SkyBridge Alternative Investments Multi-Adviser Hedge Fund Portfolios LLC (2 portfolios) (since 2002). | |||
John E. Kerrigan (62) | Director (since 2005); Securities Lending Committee Chair (since 2016). | Chief Investment Officer, Santa Clara University (since 2002). | Trustee of iShares Trust (since 2005); Trustee of iShares U.S. ETF Trust (since 2011). | |||
Drew E. Lawton (58) | Director (since 2017); 15(c) Committee Chair (since 2017). | Senior Managing Director of New York Life Insurance Company (2010-2015). | Trustee of iShares Trust (since 2017); Trustee of iShares U.S. ETF Trust (since 2017). | |||
DIRECTORAND OFFICER INFORMATION | 107 |
Table of Contents
Director and Officer Information (Continued)
iSHARES®, INC.
Independent Directors (Continued)
| Name (Age) | Position(s) | Principal Occupation(s) During the Past 5 Years | Other Directorships Held by Director | |||
John E. Martinez (56) | Director (since 2003); Fixed Income Plus Committee Chair (since 2016). | Director of Real Estate Equity Exchange, Inc. (since 2005). | Trustee of iShares Trust (since 2003); Trustee of iShares U.S. ETF Trust (since 2011). | |||
Madhav V. Rajan (53) | Director (since 2011); Nominating and Governance Committee Chair (since 2017). | Dean, and George Pratt Shultz Professor of Accounting, University of Chicago Booth School of Business (since 2017); Robert K. Jaedicke Professor of Accounting, Stanford University Graduate School of Business (2001-2017); Professor of Law (by courtesy), Stanford Law School (2005-2017); Senior Associate Dean for Academic Affairs and Head of MBA Program, Stanford University Graduate School of Business (2010-2016) . | Trustee of iShares Trust (since 2011); Trustee of iShares U.S. ETF Trust (since 2011); Director, Cavium, Inc. (since 2013). | |||
| 108 | 2017 iSHARES ANNUAL REPORTTO SHAREHOLDERS |
Table of Contents
Director and Officer Information (Continued)
iSHARES®, INC.
Officersc
| Name (Age) | Position(s) | Principal Occupation(s) During the Past 5 Years | ||
Martin Small (42) | President (since 2016). | Managing Director, BlackRock, Inc. (since 2010); Head of U.S. iShares (since 2015); Co-Head of the U.S. Financial Markets Advisory Group, BlackRock, Inc. (2008-2014). | ||
Jack Gee (57) | Treasurer and Chief Financial Officer (since 2008). | Managing Director, BlackRock, Inc. (since 2009); Senior Director of Fund Administration of Intermediary Investor Business, BGI (2009). | ||
Benjamin Archibald (42) | Secretary (since 2015). | Managing Director, BlackRock, Inc. (since 2014); Director, BlackRock, Inc. (2010-2013); Secretary of the BlackRock-advised Mutual Funds (since 2012). | ||
Alan Mason (56) | Executive Vice President (since 2016). | Managing Director, BlackRock, Inc. (since 2009). | ||
Steve Messinger (55) | Executive Vice President (since 2016). | Managing Director, BlackRock, Inc. (2007-2014 and since 2016); Managing Director, Beacon Consulting Group (2014-2016). | ||
Charles Park (49) | Chief Compliance Officer (since 2006). | Chief Compliance Officer of BlackRock Advisors, LLC and the BlackRock-advised Funds in the Equity-Bond Complex, the Equity-Liquidity Complex and the Closed-End Complex (since 2014); Chief Compliance Officer of BFA (since 2006). | ||
Scott Radell (48) | Executive Vice President (since 2012). | Managing Director, BlackRock, Inc. (since 2009); Head of Portfolio Solutions, BlackRock, Inc. (since 2009). | ||
| c | Manish Mehta served as President until October 15, 2016. |
DIRECTORAND OFFICER INFORMATION | 109 |
Table of Contents
Notes:
| 110 | 2017 iSHARES ANNUAL REPORTTO SHAREHOLDERS |
Table of Contents
For more information visit www.iShares.com or call 1-800-474-2737
This report is intended for the Funds’ shareholders. It may not be distributed to prospective investors unless it is preceded or accompanied by the current prospectus.
Investing involves risk, including possible loss of principal.
The iShares Funds are distributed by BlackRock Investments, LLC (together with its affiliates, “BlackRock”).
The iShares Funds are not sponsored, endorsed, issued, sold or promoted by MSCI Inc., nor does this company make any representation regarding the advisability of investing in the iShares Funds. BlackRock is not affiliated with the company listed above.
A description of the policies that the Funds use to determine how to vote proxies relating to portfolio securities and information about how the Funds voted proxies relating to portfolio securities during the most recent twelve-month period ending June 30 is available without charge, upon request, by calling toll-free 1-800-474-2737; on the Funds’ website at www.iShares.com; and on the U.S. Securities and Exchange Commission (SEC) website at www.sec.gov.
The Funds file their complete schedules of portfolio holdings with the SEC for the first and third quarters of each fiscal year on Form N-Q. The Funds’ Forms N-Q are available on the SEC’s website or may be reviewed and copied at the SEC’s Public Reference Room in Washington, D.C. Information on the operation of the Public Reference Room may be obtained by calling 1-800-SEC-0330. The Funds also disclose their complete schedules of portfolio holdings on a daily basis on the Funds’ website.
©2017 BlackRock, Inc. All rights reserved. iSHARES and BLACKROCK are registered trademarks of BlackRock, Inc. or its subsidiaries. All other marks are the property of their respective owners.
iS-AR-804-0817
 | |
Table of Contents
AUGUST 31, 2017
2017 ANNUAL REPORT | |
iShares, Inc.
| Ø | iShares Edge MSCI Min Vol Global ETF | ACWV | BATS |
| Ø | iShares MSCI Australia ETF | EWA | NYSE Arca |
| Ø | iShares MSCI Canada ETF | EWC | NYSE Arca |
| Ø | iShares MSCI Japan ETF | EWJ | NYSE Arca |
| Ø | iShares MSCI Mexico Capped ETF | EWW | NYSE Arca |
| Ø | iShares MSCI South Korea Capped ETF | EWY | NYSE Arca |
Table of Contents
| 5 | ||||
| 18 | ||||
| 18 | ||||
| 19 | ||||
| 19 | ||||
| 26 | ||||
| 29 | ||||
| 33 | ||||
| 40 | ||||
| 43 | ||||
| 47 | ||||
| 54 | ||||
| 60 | ||||
| 75 | ||||
| 76 | ||||
| 77 | ||||
| 93 | ||||
| 100 |
Table of Contents
Management’s Discussion of Fund Performance
iSHARES®, INC.
GLOBAL EQUITY MARKET OVERVIEW
Global equity markets posted strong returns for the 12 months ended August 31, 2017 (the “reporting period”). The MSCI ACWI, a broad global equity index that includes both developed and emerging markets, returned 17.11% in U.S. dollar terms for the reporting period.
The primary factor behind the robust performance of global equity markets was improving global economic growth, driven largely by the continuation of accommodative monetary policies from many of the world’s central banks. Signs of stronger economic activity in Europe emerged as the European Central Bank (“ECB”) maintained policies such as quantitative easing and negative interest rates. Economic growth rates in China and Japan, the largest economies in Asia, also increased during the reporting period, reflecting efforts by the People’s Bank of China (“PBOC”) and the Bank of Japan (“BOJ”) to stimulate economic activity. Stronger economic growth led several central banks to consider reducing their economic stimulus measures. For example, late in the reporting period, the ECB discussed the possibility of tapering its quantitative easing program, while the PBOC increased short-term interest rates during the first half of 2017.
On a regional basis, European equity markets posted the best returns among developed markets, advancing by approximately 20% in U.S. dollar terms for the reporting period. European stocks benefited from improving economic conditions and stronger corporate earnings. In addition, election outcomes in France and the Netherlands eased investor concerns about nationalist presidential candidates and their opposition to the European Union (“E.U.”). Currency fluctuations also contributed meaningfully to European equity performance in U.S. dollar terms as the euro appreciated by approximately 6% against the U.S. dollar during the reporting period. The best-performing European stock markets included Austria, Italy, and Spain, while Ireland and Belgium posted the weakest returns.
Equity markets in the Asia-Pacific region gained about 16% in U.S. dollar terms for the reporting period, led by Singapore and Hong Kong. Japanese stocks also posted strong returns, benefiting from improving consumer spending and employment trends that contributed to the ongoing recovery in the Japanese economy. However, equity market returns in Japan were hindered by a decline in the Japanese yen, which depreciated by approximately 6% against the U.S. dollar.
The U.S. stock market returned approximately 15% for the reporting period. Despite mixed U.S. economic data, U.S. stocks advanced initially in anticipation of pro-business fiscal policies from the new presidential administration. Although the administration struggled to implement its fiscal agenda, stocks continued to move higher as better global economic conditions led to a notable improvement in corporate earnings growth, particularly for multinational companies with significant operations outside of the U.S. U.S. stocks advanced despite three short-term interest rate increases by the U.S. Federal Reserve Bank (the “Fed”) during the reporting period, which increased the short-term interest rate target to its highest level since October 2008. The Fed also unveiled a plan to start reducing the amount of U.S. Treasury bonds and mortgage-backed securities on its balance sheet before the end of 2017.
Emerging markets stocks outperformed those in developed markets, returning more than 23% in U.S. dollar terms for the reporting period. Emerging markets in Eastern Europe were the best performers, led by Poland, Greece, and Hungary. Equity markets in the Middle East trailed for the reporting period amid continued geopolitical conflict in the region.
MANAGEMENT’S DISCUSSIONSOF FUND PERFORMANCE | 5 |
Table of Contents
Management’s Discussion of Fund Performance
iSHARES® EDGE MSCI MIN VOL GLOBAL ETF
Performance as of August 31, 2017
| Average Annual Total Returns | Cumulative Total Returns | |||||||||||||||||||||||||||
| NAV | MARKET | INDEX | NAV | MARKET | INDEX | |||||||||||||||||||||||
1 Year | 9.75% | 9.83% | 9.47% | 9.75% | 9.83% | 9.47% | ||||||||||||||||||||||
5 Years | 10.48% | 10.37% | 10.18% | 64.58% | 63.76% | 62.39% | ||||||||||||||||||||||
Since Inception | 11.04% | 11.05% | 10.76% | 84.99% | 85.08% | 82.19% | ||||||||||||||||||||||
GROWTH OF $10,000 INVESTMENT
(SINCE INCEPTION AT NET ASSET VALUE)
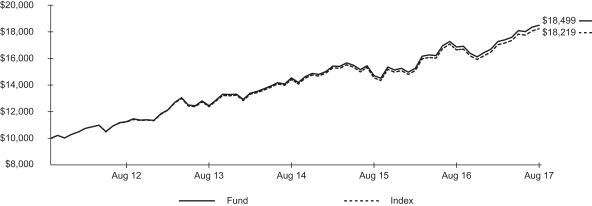
The inception date of the Fund was 10/18/11. The first day of secondary market trading was 10/20/11.
Past performance is no guarantee of future results. Performance results do not reflect the deduction of taxes that a shareholder would pay on fund distributions or on the redemption or sale of fund shares. See “About Fund Performance” on page 18 for more information.
| Shareholder Expenses | ||||||||||||||||||||||||||
| Actual | Hypothetical 5% Return | |||||||||||||||||||||||||
Beginning Account Value (3/1/17) | Ending (8/31/17) | Expenses Paid During Period a | Beginning Account Value (3/1/17) | Ending Account Value (8/31/17) | Expenses Paid During Period a | Annualized Expense Ratio | ||||||||||||||||||||
| $ | 1,000.00 | $ | 1,071.50 | $ | 1.04 | $ | 1,000.00 | $ | 1,024.20 | $ | 1.02 | 0.20% | ||||||||||||||
| a | Expenses are calculated using the Fund’s annualized expense ratio (as disclosed in the table), multiplied by the average account value for the period, multiplied by the number of days in the period (184 days) and divided by the number of days in the year (365 days). See “Shareholder Expenses” on page 18 for more information. |
The iShares Edge MSCI Min Vol Global ETF (the “Fund”) seeks to track the investment results of an index composed of developed and emerging market equities that, in the aggregate, have lower volatility characteristics relative to the broader developed and emerging equity markets, as represented by the MSCI ACWI Minimum Volatility (USD) Index (the “Index”). The Fund invests in a representative sample of securities included in the Index that collectively has an investment profile similar to the Index. Due to the use of representative sampling, the Fund may or may not hold all of the securities that are included in the Index. For the 12-month reporting period ended August 31, 2017, the total return for the Fund was 9.75%, net of fees, while the total return for the Index was 9.47%.
Low-volatility stocks in the U.S., the largest country weight in the Index during the reporting period, contributed the most to the Index’s return. U.S. stocks rose initially due to optimism about potentially stimulative fiscal policies from the new presidential
| 6 | 2017 iSHARES ANNUAL REPORTTO SHAREHOLDERS |
Table of Contents
Management’s Discussion of Fund Performance (Continued)
iSHARES® EDGE MSCI MIN VOL GLOBAL ETF
administration, and they sustained their advance as corporate earnings growth improved, particularly among multinational companies with significant operations outside of the U.S.
Low-volatility stocks in Japan and Taiwan also contributed meaningfully to the Index’s return for the reporting period. A weaker Japanese yen, which bolstered export growth, and increased consumer spending domestically helped Japan’s economy expand throughout the reporting period. Taiwan’s technology-heavy stock market rose to its highest level in 27 years.
Other noteworthy contributors to the Index’s return for the reporting period included Switzerland, Hong Kong, and Denmark. On the downside, low-volatility stocks in the U.K. and Singapore detracted fractionally from the Index’s return.
From a sector perspective, the financials sector contributed the most to the Index’s return for the reporting period, benefiting from improving global economic conditions, the Fed’s interest rate increases, and expectations of less stringent regulatory policies in the U.S. Insurers and banks led the advance in the financials sector.
The information technology sector also contributed meaningfully to the Index’s return for the reporting period, led by software and services companies. Other contributors to the Index’s performance included the healthcare and industrials sectors, while the real estate and consumer staples sectors detracted from the Index’s return.
The Index seeks lower volatility than the broader market with returns in line with the market over the long term. For the reporting period, the Index trailed the broader market, as represented by the MSCI ACWI Index. As the broader market rose sharply, stocks with relatively low volatility characteristics underperformed.
Relative to the broader market, the Index’s lack of exposure to France detracted from performance as the French equity market generated strong returns for the reporting period. In contrast, an overweight allocation in the Index to Japan benefited relative performance. On a sector basis, overweight allocations in the Index to the telecommunication services and consumer staples sectors weighed on relative performance as these sectors underperformed during the reporting period. On the positive side, an underweight allocation in the Index to the energy sector benefited relative performance.
ALLOCATION BY SECTOR
As of 8/31/17
| Sector | Percentage of Total Investments* | |||
Health Care | 16.64 | % | ||
Financials | 13.73 | |||
Consumer Staples | 13.12 | |||
Information Technology | 12.46 | |||
Industrials | 9.79 | |||
Consumer Discretionary | 9.06 | |||
Utilities | 8.25 | |||
Telecommunication Services | 8.24 | |||
Real Estate | 4.33 | |||
Materials | 2.75 | |||
Energy | 1.63 | |||
|
| |||
TOTAL | 100.00 | % | ||
|
| |||
TEN LARGEST COUNTRIES
As of 8/31/17
| Country | Percentage of Total Investments* | |||
United States | 56.64 | % | ||
Japan | 12.69 | |||
Switzerland | 5.06 | |||
Taiwan | 4.04 | |||
Canada | 3.61 | |||
Hong Kong | 3.46 | |||
China | 3.23 | |||
United Kingdom | 1.56 | |||
Denmark | 1.33 | |||
Singapore | 0.90 | |||
|
| |||
TOTAL | 92.52 | % | ||
|
| |||
| * | Excludes money market funds. |
MANAGEMENT’S DISCUSSIONSOF FUND PERFORMANCE | 7 |
Table of Contents
Management’s Discussion of Fund Performance
iSHARES® MSCI AUSTRALIA ETF
Performance as of August 31, 2017
| Average Annual Total Returns | Cumulative Total Returns | |||||||||||||||||||||||||||
| NAV | MARKET | INDEX | NAV | MARKET | INDEX | |||||||||||||||||||||||
1 Year | 16.70% | 17.71% | 17.08% | 16.70% | 17.71% | 17.08% | ||||||||||||||||||||||
5 Years | 4.28% | 4.27% | 4.67% | 23.30% | 23.24% | 25.65% | ||||||||||||||||||||||
10 Years | 2.95% | 2.87% | 3.17% | 33.71% | 32.72% | 36.64% | ||||||||||||||||||||||
GROWTH OF $10,000 INVESTMENT
(AT NET ASSET VALUE)
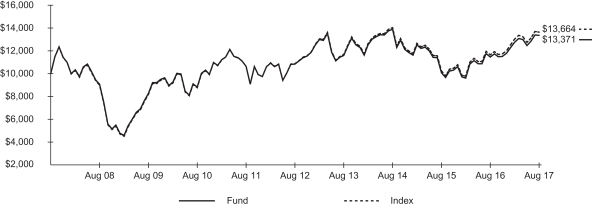
Past performance is no guarantee of future results. Performance results do not reflect the deduction of taxes that a shareholder would pay on fund distributions or on the redemption or sale of fund shares. See “About Fund Performance” on page 18 for more information.
| Shareholder Expenses | ||||||||||||||||||||||||||
| Actual | Hypothetical 5% Return | |||||||||||||||||||||||||
| Beginning Account Value (3/1/17) | Ending Account Value (8/31/17) | Expenses Paid During Period a | Beginning Account Value (3/1/17) | Ending Account Value (8/31/17) | Expenses Paid During Period a | Annualized Expense Ratio | ||||||||||||||||||||
| $ | 1,000.00 | $ | 1,047.30 | $ | 2.53 | $ | 1,000.00 | $ | 1,022.70 | $ | 2.50 | 0.49% | ||||||||||||||
| a | Expenses are calculated using the Fund’s annualized expense ratio (as disclosed in the table), multiplied by the average account value for the period, multiplied by the number of days in the period (184 days) and divided by the number of days in the year (365 days). See “Shareholder Expenses” on page 18 for more information. |
| 8 | 2017 iSHARES ANNUAL REPORTTO SHAREHOLDERS |
Table of Contents
Management’s Discussion of Fund Performance (Continued)
iSHARES® MSCI AUSTRALIA ETF
The iShares MSCI Australia ETF (the “Fund”) seeks to track the investment results of an index composed of Australian equities, as represented by the MSCI Australia Index (the “Index”). The Fund invests in a representative sample of securities included in the Index that collectively has an investment profile similar to the Index. Due to the use of representative sampling, the Fund may or may not hold all of the securities that are included in the Index. For the 12-month reporting period ended August 31, 2017, the total return for the Fund was 16.70%, net of fees, while the total return for the Index was 17.08%.
As a resource-rich country, Australia is a key exporter of commodities. During the reporting period, rising commodities prices amid strengthening global demand drove up Australia’s mineral export levels, in turn pushing the country’s trade surplus to a record high. Improving economic growth in China was beneficial, as China takes in approximately 32% of Australia’s exports. Heavy flooding in the wake of Cyclone Debbie, however, temporarily constrained coal production as mines were damaged and roads and ports were closed.
During the reporting period, the largest contributor to the Index’s performance from a sector standpoint was financials. Banks were strong performers despite the dual challenges of margin erosion and increased capital requirements. In the first half of 2017, major banks increased their return on equity and reduced their average cost-to-income ratio, while increased competition and low interest rates modestly decreased margins.
Another key contributor to the Index’s performance was the materials sector. The metals and mining industry led sector gains, reflecting the rebound in global demand amid rising prices. Increasing steel production in China supported demand for metallurgical coal and iron ore, both used in steel production. The consumer staples and healthcare sectors also contributed to the Index’s performance during the reporting period.
On the downside, the telecommunication services sector detracted modestly from the Index’s return for the reporting period. Although rising mobile broadband use offset a decline in revenues, increased usage required additional investment in mobile infrastructure.
The Australian dollar rose about 5% relative to the U.S. dollar during the reporting period, which made Australian investments worth more when translated back into U.S. dollars.
ALLOCATION BY SECTOR As of 8/31/17
| Sector | Percentage of Total Investments* | |||
Financials | 42.05 | % | ||
Materials | 17.31 | |||
Real Estate | 8.43 | |||
Consumer Staples | 7.72 | |||
Health Care | 7.05 | |||
Industrials | 5.59 | |||
Energy | 4.79 | |||
Consumer Discretionary | 2.87 | |||
Utilities | 2.29 | |||
Telecommunication Services | 1.38 | |||
Information Technology | 0.52 | |||
|
| |||
TOTAL | 100.00 | % | ||
|
| |||
TEN LARGEST FUND HOLDINGS As of 8/31/17
| Security | Percentage of Total Investments* | |||
Commonwealth Bank of Australia | 10.42 | % | ||
Westpac Banking Corp. | 8.34 | |||
BHP Billiton Ltd. | 6.99 | |||
Australia & New Zealand Banking Group Ltd. | 6.86 | |||
National Australia Bank Ltd. | 6.42 | |||
CSL Ltd. | 4.64 | |||
Wesfarmers Ltd. | 3.83 | |||
Woolworths Ltd. | 2.67 | |||
Rio Tinto Ltd. | 2.29 | |||
Macquarie Group Ltd. | 2.23 | |||
|
| |||
TOTAL | 54.69 | % | ||
|
| |||
| * | Excludes money market funds. |
MANAGEMENT’S DISCUSSIONSOF FUND PERFORMANCE | 9 |
Table of Contents
Management’s Discussion of Fund Performance
iSHARES® MSCI CANADA ETF
Performance as of August 31, 2017
| Average Annual Total Returns | Cumulative Total Returns | |||||||||||||||||||||||||||
| NAV | MARKET | INDEX | NAV | MARKET | INDEX | |||||||||||||||||||||||
1 Year | 11.88% | 12.08% | 12.08% | 11.88% | 12.08% | 12.08% | ||||||||||||||||||||||
5 Years | 2.39% | 2.42% | 2.56% | 12.51% | 12.71% | 13.49% | ||||||||||||||||||||||
10 Years | 1.32% | 1.30% | 1.52% | 14.03% | 13.76% | 16.32% | ||||||||||||||||||||||
GROWTH OF $10,000 INVESTMENT
(AT NET ASSET VALUE)
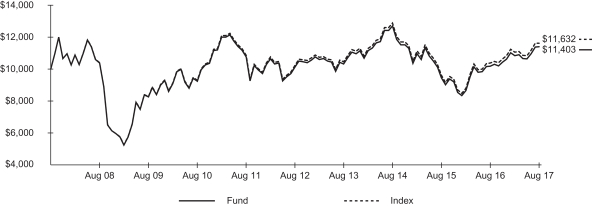
Past performance is no guarantee of future results. Performance results do not reflect the deduction of taxes that a shareholder would pay on fund distributions or on the redemption or sale of fund shares. See “About Fund Performance” on page 18 for more information.
| Shareholder Expenses | ||||||||||||||||||||||||||
| Actual | Hypothetical 5% Return | |||||||||||||||||||||||||
| Beginning Account Value (3/1/17) | Ending Account Value | Expenses Paid During Period a | Beginning Account Value (3/1/17) | Ending Account Value (8/31/17) | Expenses Paid During Period a | Annualized Expense Ratio | ||||||||||||||||||||
| $ | 1,000.00 | $ | 1,050.90 | $ | 2.53 | $ | 1,000.00 | $ | 1,022.70 | $ | 2.50 | 0.49% | ||||||||||||||
| a | Expenses are calculated using the Fund’s annualized expense ratio (as disclosed in the table), multiplied by the average account value for the period, multiplied by the number of days in the period (184 days) and divided by the number of days in the year (365 days). See “Shareholder Expenses” on page 18 for more information. |
| 10 | 2017 iSHARES ANNUAL REPORTTO SHAREHOLDERS |
Table of Contents
Management’s Discussion of Fund Performance (Continued)
iSHARES® MSCI Canada ETF
The iShares MSCI Canada ETF (the “Fund”) seeks to track the investment results of an index composed of Canadian equities, as represented by the MSCI Canada Index (the “Index”). The Fund invests in a representative sample of securities included in the Index that collectively has an investment profile similar to the Index. Due to the use of representative sampling, the Fund may or may not hold all of the securities that are included in the Index. For the 12-month reporting period ended August 31, 2017, the total return for the Fund was 11.88%, net of fees, while the total return for the Index was 12.08%.
Canada’s economy grew steadily during the reporting period, reaching an annualized pace of 4.5% for the second quarter of 2017. Household spending was a key driver of strength, supported by strong wages, low unemployment, and inexpensive credit. Exports also contributed to economic momentum, with energy products experiencing the largest increase. As a sign that the Canadian export market was diversifying, shipments to non-U.S. trade partners grew 15% during the reporting period. Real estate prices continued their multi-year boom, rising throughout the reporting period. Citing strong economic conditions, Canada’s central bank raised its key interest rate in July 2017, from 0.50% to 0.75%.
The financials sector, which represented about 42% of the Index on average during the reporting period, made the largest contribution to the Index’s return. Banks led sector gains, reflecting solid earnings among large banks despite low interest rates. Insurers and diversified financial companies also contributed, benefiting from economic growth and the prospect of rising interest rates.
Another meaningful contributor to the Index’s performance for the reporting period was the industrials sector. The road and rail industry led strength in the sector, partly due to a boost from a government infrastructure plan.
Additionally, the materials and consumer discretionary sectors contributed to the Index’s performance, with the metals and mining industry and strong consumer spending levels, respectively, supporting gains in the sectors. On the downside, the healthcare sector detracted modestly from the Index’s performance during the reporting period.
The Canadian dollar rose about 5% relative to the U.S. dollar during the reporting period, which made Canadian investments worth more when translated back into U.S. dollars.
Special note: Effective September 1, 2017, the Fund will begin to track a new underlying index, the MSCI Canada Custom Capped Index, and will cease to track the Index. The change to a capped benchmark is being implemented to seek to reduce tracking error and improve the investor experience.
ALLOCATION BY SECTOR
As of 8/31/17
| Sector | Percentage of Total Investments* |
Financials | 42.30 | % | ||
Energy | 21.18 | |||
Materials | 10.86 | |||
Industrials | 7.67 | |||
Consumer Discretionary | 5.27 | |||
Consumer Staples | 4.29 | |||
Information Technology | 2.74 | |||
Telecommunication Services | 2.50 | |||
Utilities | 2.17 | |||
Real Estate | 0.69 | |||
Health Care | 0.33 | |||
|
| |||
TOTAL | 100.00 | % | ||
|
|
TEN LARGEST FUND HOLDINGS
As of 8/31/17
| Security | Percentage of Total Investments* |
Royal Bank of Canada | 8.17 | % | ||
Toronto-Dominion Bank (The) | 7.42 | |||
Bank of Nova Scotia (The) | 5.60 | |||
Canadian National Railway Co. | 4.63 | |||
Enbridge Inc. | 4.36 | |||
Suncor Energy Inc. | 3.89 | |||
Bank of Montreal | 3.45 | |||
TransCanada Corp. | 3.27 | |||
Manulife Financial Corp. | 2.89 | |||
Canadian Imperial Bank of Commerce | 2.69 | |||
|
| |||
TOTAL | 46.37 | % | ||
|
|
| * | Excludes money market funds. |
MANAGEMENT’S DISCUSSIONSOF FUND PERFORMANCE | 11 |
Table of Contents
Management’s Discussion of Fund Performance
iSHARES® MSCI JAPAN ETF
Performance as of August 31, 2017
| Average Annual Total Returns | Cumulative Total Returns | |||||||||||||||||||||||||||
| NAV | MARKET | INDEX | NAV | MARKET | INDEX | |||||||||||||||||||||||
1 Year | 13.31% | 13.43% | 13.69% | 13.31% | 13.43% | 13.69% | ||||||||||||||||||||||
5 Years | 10.23% | 10.17% | 10.68% | 62.78% | 62.27% | 66.10% | ||||||||||||||||||||||
10 Years | 1.25% | 1.29% | 1.72% | 13.26% | 13.68% | 18.65% | ||||||||||||||||||||||
GROWTH OF $10,000 INVESTMENT
(AT NET ASSET VALUE)
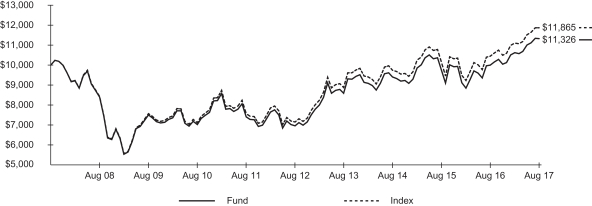
Past performance is no guarantee of future results. Performance results do not reflect the deduction of taxes that a shareholder would pay on fund distributions or on the redemption or sale of fund shares. See “About Fund Performance” on page 18 for more information.
| Shareholder Expenses | ||||||||||||||||||||||||||
| Actual | Hypothetical 5% Return | |||||||||||||||||||||||||
| Beginning Account Value (3/1/17) | Ending Account Value (8/31/17) | Expenses Paid During Period a | Beginning (3/1/17) | Ending Account Value | Expenses Paid During Period a | Annualized Expense Ratio | ||||||||||||||||||||
| $ | 1,000.00 | $ | 1,067.30 | $ | 2.55 | $ | 1,000.00 | $ | 1,022.70 | $ | 2.50 | 0.49% | ||||||||||||||
| a | Expenses are calculated using the Fund’s annualized expense ratio (as disclosed in the table), multiplied by the average account value for the period, multiplied by the number of days in the period (184 days) and divided by the number of days in the year (365 days). See “Shareholder Expenses” on page 18 for more information. |
| 12 | 2017 iSHARES ANNUAL REPORTTO SHAREHOLDERS |
Table of Contents
Management’s Discussion of Fund Performance (Continued)
iSHARES® MSCI Japan ETF
The iShares MSCI Japan ETF (the “Fund”) seeks to track the investment results of an index composed of Japanese equities, as represented by the MSCI Japan Index (the “Index”). The Fund invests in a representative sample of securities included in the Index that collectively has an investment profile similar to the Index. Due to the use of representative sampling, the Fund may or may not hold all of the securities that are included in the Index. For the 12-month reporting period ended August 31, 2017, the total return for the Fund was 13.31%, net of fees, while the total return for the Index was 13.69%.
Japan’s economy expanded for the reporting period, reaching its longest period of sustained growth since 2006. Consumer spending and exports were dual drivers of growth. Private consumption, which represented more than half of the country’s gross domestic product, rose as demand for clothing and mobile phones climbed. A weaker Japanese yen and global economic growth supported export demand.
Every sector contributed to the Index’s performance for the reporting period. The information technology sector was the largest sector contributor to the Index’s gain. Companies in the sector generally benefited from rising demand as global economic growth strengthened. Increased shipments included those of flat panels, semiconductor manufacturing equipment, and electronics to Asian neighbors. The technology hardware and equipment industry and the software and services industry were the leading contributors in the sector.
Another significant contributor to the Index’s return for the reporting period was the industrials sector. Accelerating manufacturing activity supported the sector, driven by increased export demand, particularly for cars. Trading companies and distributors led the sector’s gains, followed by machinery companies.
Consumer discretionary stocks also contributed to the Index’s performance. Consumer spending, which has been a soft spot in the Japanese economy for several years, trended upward during the reporting period. The consumer durables industry supported the sector the most. Autos and components companies also contributed to the sector’s return amid strong global car sales.
The Japanese yen declined about 6% relative to the U.S. dollar during the reporting period, which made Japanese investments worth less when translated back into U.S. dollars.
ALLOCATION BY SECTOR As of 8/31/17
| Sector | Percentage of Total Investments* |
Industrials | 20.56 | % | ||
Consumer Discretionary | 20.07 | |||
Information Technology | 12.70 | |||
Financials | 12.30 | |||
Consumer Staples | 7.85 | |||
Health Care | 7.29 | |||
Materials | 6.73 | |||
Telecommunication Services | 5.55 | |||
Real Estate | 4.11 | |||
Utilities | 1.94 | |||
Energy | 0.90 | |||
|
| |||
TOTAL | 100.00 | % | ||
|
|
TEN LARGEST FUND HOLDINGS As of 8/31/17
| Security | Percentage of Total Investments* |
Toyota Motor Corp. | 4.47 | % | ||
Mitsubishi UFJ Financial Group Inc. | 2.25 | |||
SoftBank Group Corp. | 2.04 | |||
Sumitomo Mitsui Financial Group Inc. | 1.56 | |||
Keyence Corp. | 1.54 | |||
Sony Corp. | 1.51 | |||
KDDI Corp. | 1.49 | |||
Honda Motor Co. Ltd. | 1.47 | |||
Mizuho Financial Group Inc. | 1.26 | |||
Takeda Pharmaceutical Co. Ltd. | 1.22 | |||
|
| |||
TOTAL | 18.81 | % | ||
|
|
| * | Excludes money market funds. |
MANAGEMENT’S DISCUSSIONSOF FUND PERFORMANCE | 13 |
Table of Contents
Management’s Discussion of Fund Performance
iSHARES® MSCI MEXICO CAPPED ETF
Performance as of August 31, 2017
| Average Annual Total Returns | Cumulative Total Returns | |||||||||||||||||||||||||||
| NAV | MARKET | INDEX | NAV | MARKET | INDEX | |||||||||||||||||||||||
1 Year | 14.03% | 13.60% | 14.26% | 14.03% | 13.60% | 14.26% | ||||||||||||||||||||||
5 Years | 0.22% | 0.01% | 0.29% | 1.10% | 0.05% | 1.46% | ||||||||||||||||||||||
10 Years | 1.46% | 1.44% | 1.25% | 15.54% | 15.33% | 13.22% | ||||||||||||||||||||||
GROWTH OF $10,000 INVESTMENT
(AT NET ASSET VALUE)
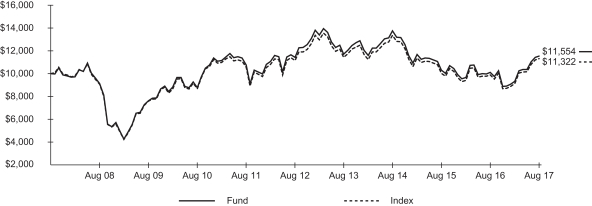
Index performance through November 30, 2007 reflects the performance of the MSCI Mexico Index. Index performance beginning on December 1, 2007 through February 11, 2013 reflects the performance of the MSCI Mexico Investable Market Index. Index performance beginning on February 12, 2013 reflects the performance of the MSCI Mexico IMI 25/50 Index.
Past performance is no guarantee of future results. Performance results do not reflect the deduction of taxes that a shareholder would pay on fund distributions or on the redemption or sale of fund shares. See “About Fund Performance” on page 18 for more information.
| Shareholder Expenses | ||||||||||||||||||||||||||
| Actual | Hypothetical 5% Return | |||||||||||||||||||||||||
| Beginning Account Value (3/1/17) | Ending Account Value (8/31/17) | Expenses Paid During Period a | Beginning Account Value (3/1/17) | Ending Account Value (8/31/17) | Expenses Paid During Period a | Annualized Expense Ratio | ||||||||||||||||||||
| $ | 1,000.00 | $ | 1,236.30 | $ | 2.76 | $ | 1,000.00 | $ | 1,022.70 | $ | 2.50 | 0.49% | ||||||||||||||
| a | Expenses are calculated using the Fund’s annualized expense ratio (as disclosed in the table), multiplied by the average account value for the period, multiplied by the number of days in the period (184 days) and divided by the number of days in the year (365 days). See “Shareholder Expenses” on page 18 for more information. |
| 14 | 2017 iSHARES ANNUAL REPORTTO SHAREHOLDERS |
Table of Contents
Management’s Discussion of Fund Performance (Continued)
iSHARES® MSCI MEXICO CAPPED ETF
The iShares MSCI Mexico Capped ETF (the “Fund”) seeks to track the investment results of a broad-based index composed of Mexican equities, as represented by the MSCI Mexico IMI 25/50 Index (the “Index”). The Fund invests in a representative sample of securities included in the Index that collectively has an investment profile similar to the Index. Due to the use of representative sampling, the Fund may or may not hold all of the securities that are included in the Index. For the 12-month reporting period ended August 31, 2017, the total return for the Fund was 14.03%, net of fees, while the total return for the Index was 14.26%.
Mexico is an export-driven economy, with manufactured goods representing 83% of shipments. The Mexican economy expanded during the reporting period, despite higher interest rates, rising inflation, and uncertainty about trade relations with the U.S. The U.S. presidential election temporarily raised the possibility of recession in Mexico amid concerns U.S. President Trump may end NAFTA, impose a 20% tax on Mexican imports, and pursue other policies that would be damaging to Mexican exports. Slow progress on the policies, however, alleviated such concerns. Manufacturing output increased, reflecting a rise in the country’s automobile industry. Declining unemployment and solid remittance inflows helped the Mexican economy to retain its positive momentum.
Within the Index, the telecommunication services sector made the largest contribution to the Index’s return during the reporting period. Due to major reforms implemented in 2014 to improve competition, revenues within the sector grew 10.9% for 2016, exceeding many analysts’ expectations. Within the sector, wireless telecommunication services companies contributed the most to performance.
Another significant contributor to the Index’s performance for the reporting period was the materials sector. Gains in the sector were supported by strength among metals and mining companies and construction materials suppliers.
The financials and consumer staples sectors also contributed significantly to the Index’s performance for the reporting period. Financials companies benefited from improving global economic conditions. From an industry perspective, banks led the financial sector’s advance. Food, beverage, and tobacco companies and food and staples retailers supported performance in the consumer staples sector.
In terms of currency performance, the Mexican peso appreciated against the U.S. dollar by approximately 6% during the reporting period, as the Mexican peso recovered following a steep drop after the U.S. presidential election.
ALLOCATION BY SECTOR As of 8/31/17
| Sector | Percentage of Total Investments* |
Consumer Staples | 26.12 | % | ||
Financials | 16.02 | |||
Telecommunication Services | 15.77 | |||
Materials | 14.97 | |||
Industrials | 11.41 | |||
Consumer Discretionary | 7.66 | |||
Real Estate | 5.93 | |||
Utilities | 1.47 | |||
Health Care | 0.65 | |||
|
| |||
TOTAL | 100.00 | % | ||
|
|
TEN LARGEST FUND HOLDINGS As of 8/31/17
| Security | Percentage of Total Investments* |
America Movil SAB de CV Series L | 14.84 | % | ||
Fomento Economico Mexicano SAB de CV | 9.08 | |||
Grupo Financiero Banorte SAB de CV Series O | 7.89 | |||
Cemex SAB de CV CPO | 6.17 | |||
Wal-Mart de Mexico SAB de CV | 5.76 | |||
Grupo Televisa SAB | 4.50 | |||
Grupo Mexico SAB de CV Series B | 4.46 | |||
Fibra Uno Administracion SA de CV | 2.46 | |||
Grupo Aeroportuario del Sureste SAB de CV Series B | 2.28 | |||
Alfa SAB de CV | 2.14 | |||
|
| |||
TOTAL | 59.58 | % | ||
|
|
| * | Excludes money market funds. |
MANAGEMENT’S DISCUSSIONSOF FUND PERFORMANCE | 15 |
Table of Contents
Management’s Discussion of Fund Performance
iSHARES® MSCI SOUTH KOREA CAPPED ETF
Performance as of August 31, 2017
| Average Annual Total Returns | Cumulative Total Returns | |||||||||||||||||||||||||||
| NAV | MARKET | INDEX | NAV | MARKET | INDEX | |||||||||||||||||||||||
1 Year | 21.28% | 22.88% | 21.96% | 21.28% | 22.88% | 21.96% | ||||||||||||||||||||||
5 Years | 5.45% | 5.39% | 6.13% | 30.38% | 30.02% | 34.63% | ||||||||||||||||||||||
10 Years | 1.93% | 1.87% | 2.46% | 21.04% | 20.33% | 27.51% | ||||||||||||||||||||||
GROWTH OF $10,000 INVESTMENT
(AT NET ASSET VALUE)
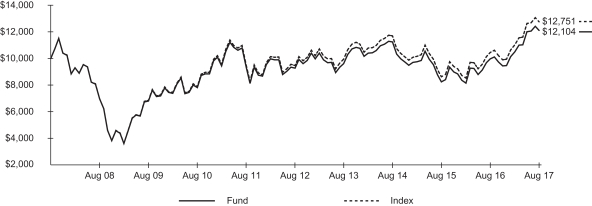
Index performance through February 11, 2013 reflects the performance of the MSCI Korea Index. Index performance beginning on February 12, 2013 reflects the performance of the MSCI Korea 25/50 Index.
Past performance is no guarantee of future results. Performance results do not reflect the deduction of taxes that a shareholder would pay on fund distributions or on the redemption or sale of fund shares. See “About Fund Performance” on page 18 for more information.
| Shareholder Expenses | ||||||||||||||||||||||||||
| Actual | Hypothetical 5% Return | |||||||||||||||||||||||||
| Beginning Account Value (3/1/17) | Ending Account Value (8/31/17) | Expenses Paid During Period a | Beginning (3/1/17) | Ending Account Value | Expenses Paid During Period a | Annualized Expense Ratio | ||||||||||||||||||||
| $ | 1,000.00 | $ | 1,153.00 | $ | 3.31 | $ | 1,000.00 | $ | 1,022.10 | $ | 3.11 | 0.61% | ||||||||||||||
| a | Expenses are calculated using the Fund’s annualized expense ratio (as disclosed in the table), multiplied by the average account value for the period, multiplied by the number of days in the period (184 days) and divided by the number of days in the year (365 days). See “Shareholder Expenses” on page 18 for more information. |
| 16 | 2017 iSHARES ANNUAL REPORTTO SHAREHOLDERS |
Table of Contents
Management’s Discussion of Fund Performance (Continued)
iSHARES® MSCI SOUTH KOREA CAPPED ETF
The iShares MSCI South Korea Capped ETF (the “Fund”) seeks to track the investment results of an index composed of South Korean equities, as represented by the MSCI Korea 25/50 Index (the “Index”). The Fund invests in a representative sample of securities included in the Index that collectively has an investment profile similar to the Index. Due to the use of representative sampling, the Fund may or may not hold all of the securities that are included in the Index. For the 12-month reporting period ended August 31, 2017, the total return for the Fund was 21.28%, net of fees, while the total return for the Index was 21.96%.
South Korea’s stock market neared an all-time high during the reporting period, driven up largely by foreign demand for technology stocks. By contrast, the country’s economic growth was tepid. Exports surged, hitting the eighth consecutive month of significant increases in August 2017. However, weak domestic demand limited economic growth and led the South Korean government to initiate a fiscal stimulus package aimed at creating public sector jobs and increasing social welfare subsidies.
The information technology sector was the largest sector at about 36% of the Index on average, and it was also the most significant contributor to the Index’s performance. Information technology stocks generally benefited from growing demand in an improving global economic environment during the reporting period. Within the sector, the technology hardware and equipment industry was the largest contributor to performance. Gains in the semiconductors and semiconductor equipment industry reflected a surge in semiconductor chip exports, up 58% in July 2017 compared with a year earlier.
Another meaningful contributor to the Index’s return for the reporting period was the financials sector. An improvement in global economic conditions, as well as expectations of a more lenient regulatory environment in the U.S., supported strength in the sector. From an industry standpoint, banks led the financial sector’s advance.
The materials and energy sectors were also meaningful contributors to the Index’s performance for the reporting period. Strength within the chemicals and the metals and mining industries supported the materials sector, while the oil, gas, and consumable fuels industry led energy sector gains. On the downside, the consumer staples and utilities sectors detracted modestly from the Index’s return.
ALLOCATION BY SECTOR
As of 8/31/17
| Sector | Percentage of Total Investments* |
Information Technology | 36.79 | % | ||
Financials | 14.95 | |||
Consumer Discretionary | 12.34 | |||
Industrials | 10.47 | |||
Materials | 9.35 | |||
Consumer Staples | 7.66 | |||
Health Care | 3.10 | |||
Energy | 2.87 | |||
Utilities | 1.62 | |||
Telecommunication Services | 0.85 | |||
|
| |||
TOTAL | 100.00 | % | ||
|
|
TEN LARGEST FUND HOLDINGS
As of 8/31/17
| Security | Percentage of Total Investments* |
Samsung Electronics Co. Ltd. | 22.26 | % | ||
SK Hynix Inc. | 5.00 | |||
POSCO | 3.20 | |||
Shinhan Financial Group Co. Ltd. | 2.79 | |||
KB Financial Group Inc. | 2.77 | |||
Hyundai Motor Co. | 2.70 | |||
NAVER Corp. | 2.64 | |||
LG Chem Ltd. | 2.21 | |||
Hyundai Mobis Co. Ltd. | 2.02 | |||
Hana Financial Group Inc. | 1.86 | |||
|
| |||
TOTAL | 47.45 | % | ||
|
|
| * | Excludes money market funds. |
MANAGEMENT’S DISCUSSIONSOF FUND PERFORMANCE | 17 |
Table of Contents
Past performance is no guarantee of future results. Current performance may be lower or higher than the performance data quoted. Performance data current to the most recent month-end is available at www.ishares.com. Performance results assume reinvestment of all dividends and capital gain distributions and do not reflect the deduction of taxes that a shareholder would pay on fund distributions or on the redemption or sale of fund shares. The investment return and principal value of shares will vary with changes in market conditions. Shares may be worth more or less than their original cost when they are redeemed or sold in the market. Performance for certain funds may reflect a waiver of a portion of investment advisory fees. Without such a waiver, performance would have been lower.
Net asset value or “NAV” is the value of one share of a fund as calculated in accordance with the standard formula for valuing mutual fund shares. The price used to calculate market return (“Market Price”) is determined by using the midpoint between the highest bid and the lowest offer on the primary stock exchange on which shares of a fund are listed for trading, as of the time that such fund’s NAV is calculated. Certain funds may have a NAV which is determined prior to the opening of regular trading on its listed exchange and their market returns are calculated using the midpoint of the bid/ask spread as of the opening of regular trading on the exchange. Market and NAV returns assume that dividends and capital gain distributions have been reinvested at Market Price and NAV, respectively.
An index is a statistical composite that tracks a specified financial market or sector. Unlike a fund, an index does not actually hold a portfolio of securities and therefore does not incur the expenses incurred by a fund. These expenses negatively impact fund performance. Also, market returns do not include brokerage commissions that may be payable on secondary market transactions. If brokerage commissions were included, market returns would be lower.
As a shareholder of a Fund, you incur two types of costs: (1) transaction costs, including brokerage commissions on purchases and sales of fund shares and (2) ongoing costs, including management fees and other fund expenses. The expense example, which is based on an investment of $1,000 invested on March 1, 2017 and held through August 31, 2017, is intended to help you understand your ongoing costs (in dollars and cents) of investing in a Fund and to compare these costs with the ongoing costs of investing in other funds.
Actual Expenses — The table provides information about actual account values and actual expenses. Annualized expense ratios reflect contractual and voluntary fee waivers, if any. To estimate the expenses that you paid on your account over the period, simply divide your account value by $1,000 (for example, an $8,600 account value divided by $1,000 = 8.6), then multiply the result by the number under the heading entitled “Expenses Paid During Period.”
Hypothetical Example for Comparison Purposes — The table also provides information about hypothetical account values and hypothetical expenses based on each Fund’s actual expense ratio and an assumed rate of return of 5% per year before expenses. You may use this information to compare the ongoing costs of investing in your Fund and other funds. To do so, compare this 5% hypothetical example with the 5% hypothetical examples that appear in the shareholder reports of the other funds.
Please note that the expenses shown in the table are meant to highlight your ongoing costs only and do not reflect any transactional costs, such as brokerage commissions paid on purchases and sales of fund shares. Therefore, the hypothetical examples are useful in comparing ongoing costs only and will not help you determine the relative total costs of owning different funds. In addition, if these transactional costs were included, your costs would have been higher.
| 18 | 2017 iSHARES ANNUAL REPORTTO SHAREHOLDERS |
Table of Contents
iSHARES® EDGE MSCI MIN VOL GLOBAL ETF
August 31, 2017
| Security | Shares | Value | ||||||
COMMON STOCKS — 99.45% |
| |||||||
BELGIUM — 0.30% |
| |||||||
Colruyt SA | 32,616 | $ | 1,809,923 | |||||
Proximus SADP | 153,567 | 5,406,980 | ||||||
UCB SA | 56,172 | 3,866,060 | ||||||
|
| |||||||
| 11,082,963 | ||||||||
CANADA — 3.60% |
| |||||||
Agnico Eagle Mines Ltd. | 226,047 | 11,540,792 | ||||||
Barrick Gold Corp. | 107,361 | 1,925,861 | ||||||
BCE Inc. | 264,552 | 12,542,350 | ||||||
Fairfax Financial Holdings Ltd. | 13,137 | 6,801,168 | ||||||
First Capital Realty Inc. | 169,422 | 2,741,832 | ||||||
Franco-Nevada Corp.a | 296,715 | 24,177,391 | ||||||
Goldcorp Inc.a | 580,746 | 7,948,635 | ||||||
Intact Financial Corp. | 228,312 | 18,745,713 | ||||||
RioCan REIT | 105,549 | 2,003,642 | ||||||
Rogers Communications Inc. Class B | 92,865 | 4,828,610 | ||||||
Shaw Communications Inc. Class B | 680,859 | 15,129,597 | ||||||
TELUS Corp. | 309,842 | 11,172,847 | ||||||
Thomson Reuters Corp. | 227,406 | 10,356,836 | ||||||
Wheaton Precious Metals Corp. | 112,797 | 2,333,762 | ||||||
|
| |||||||
| 132,249,036 | ||||||||
CHILE — 0.50% |
| |||||||
Banco de Chile | 51,040,232 | 7,434,636 | ||||||
SACI Falabella | 1,075,422 | 10,812,232 | ||||||
|
| |||||||
| 18,246,868 | ||||||||
CHINA — 3.21% |
| |||||||
Agricultural Bank of China Ltd. Class H | 7,701,000 | 3,621,013 | ||||||
ANTA Sports Products Ltd.a | 906,000 | 3,565,448 | ||||||
China Construction Bank Corp. Class H | 8,607,000 | 7,544,164 | ||||||
China Huishan Dairy Holdings Co. Ltd.a,b | 5,760,000 | 7 | ||||||
China Mobile Ltd. | 2,355,000 | 24,974,925 | ||||||
China Telecom Corp. Ltd. Class H | 9,060,000 | 4,653,604 | ||||||
China Unicom Hong Kong Ltd.c | 2,718,000 | 3,959,036 | ||||||
COSCO SHIPPING Ports Ltd.a | 1,812,000 | 2,141,584 | ||||||
CSPC Pharmaceutical Group Ltd. | 7,248,000 | 11,316,824 | ||||||
Fullshare Holdings Ltd.a | 1,132,500 | 451,469 | ||||||
| Security | Shares | Value | ||||||
Guangdong Investment Ltd.a | 5,436,000 | $ | 8,029,203 | |||||
Industrial & Commercial Bank of China Ltd. Class H | 2,718,000 | 2,035,084 | ||||||
Jiangsu Expressway Co. Ltd. Class H | 1,884,000 | 2,888,666 | ||||||
Shandong Weigao Group Medical Polymer Co. Ltd. Class H | 3,768,000 | 3,009,027 | ||||||
Shenzhou International Group Holdings Ltd.a | 942,000 | 7,546,640 | ||||||
Sihuan Pharmaceutical Holdings Group Ltd. | 4,077,000 | 1,567,987 | ||||||
Tencent Holdings Ltd. | 90,600 | 3,808,547 | ||||||
Yum China Holdings Inc.c | 665,910 | 23,546,578 | ||||||
Zijin Mining Group Co. Ltd. Class H | 9,060,000 | 3,322,349 | ||||||
|
| |||||||
| 117,982,155 | ||||||||
CZECH REPUBLIC — 0.06% |
| |||||||
Komercni Banka AS | 53,907 | 2,371,618 | ||||||
|
| |||||||
| 2,371,618 | ||||||||
DENMARK — 1.32% |
| |||||||
Chr Hansen Holding A/S | 47,112 | 4,047,778 | ||||||
Coloplast A/S Class B | 161,721 | 13,222,659 | ||||||
DONG Energy A/Sd | 256,398 | 13,328,212 | ||||||
H Lundbeck A/S | 118,686 | 7,548,839 | ||||||
ISS A/S | 120,498 | 4,682,433 | ||||||
William Demant Holding A/Sa,c | 219,252 | 5,793,262 | ||||||
|
| |||||||
| 48,623,183 | ||||||||
FINLAND — 0.05% |
| |||||||
Orion OYJ Class B | 40,317 | 1,906,769 | ||||||
|
| |||||||
| 1,906,769 | ||||||||
GERMANY — 0.19% |
| |||||||
MAN SE | 62,514 | 7,009,389 | ||||||
|
| |||||||
| 7,009,389 | ||||||||
HONG KONG — 3.45% |
| |||||||
CK Infrastructure Holdings Ltd. | 942,000 | 8,533,601 | ||||||
CLP Holdings Ltd. | 2,491,500 | 26,311,096 | ||||||
Hang Seng Bank Ltd. | 1,313,700 | 30,213,698 | ||||||
HK Electric Investments & HK Electric Investments Ltd.a,d | 4,983,000 | 4,571,414 | ||||||
HKT Trust & HKT Ltd. | 6,727,000 | 8,681,164 | ||||||
Hong Kong & China Gas Co. Ltd.a | 4,878,852 | 9,226,023 | ||||||
Link REIT | 1,186,500 | 9,793,444 | ||||||
SCHEDULESOF INVESTMENTS | 19 |
Table of Contents
Schedule of Investments (Continued)
iSHARES® EDGE MSCI MIN VOL GLOBAL ETF
August 31, 2017
| Security | Shares | Value | ||||||
MTR Corp. Ltd. | 2,590,500 | $ | 15,142,929 | |||||
Power Assets Holdings Ltd.a | 942,000 | 8,304,915 | ||||||
Yue Yuen Industrial Holdings Ltd. | 1,359,000 | 5,886,462 | ||||||
|
| |||||||
| 126,664,746 | ||||||||
INDIA — 0.32% |
| |||||||
Wipro Ltd. ADRa | 1,962,849 | 11,659,323 | ||||||
|
| |||||||
| 11,659,323 | ||||||||
INDONESIA — 0.85% |
| |||||||
Bank Central Asia Tbk PT | 9,694,200 | 13,768,932 | ||||||
Hanjaya Mandala Sampoerna Tbk PT | 14,450,700 | 3,942,478 | ||||||
Kalbe Farma Tbk PT | 16,625,100 | 2,130,784 | ||||||
Telekomunikasi Indonesia Persero Tbk PT | 22,468,800 | 7,898,267 | ||||||
Unilever Indonesia Tbk PT | 906,000 | 3,432,641 | ||||||
|
| |||||||
| 31,173,102 | ||||||||
IRELAND — 0.47% |
| |||||||
Kerry Group PLC Class A | 101,925 | 9,479,800 | ||||||
Paddy Power Betfair PLC | 22,197 | 1,947,318 | ||||||
Ryanair Holdings PLC ADRc | 51,642 | 5,871,696 | ||||||
|
| |||||||
| 17,298,814 | ||||||||
ISRAEL — 0.69% |
| |||||||
Azrieli Group Ltd. | 73,839 | 4,255,370 | ||||||
Bank Hapoalim BM | 647,337 | 4,355,106 | ||||||
Bank Leumi Le-Israel BM | 770,553 | 4,034,680 | ||||||
Check Point Software Technologies Ltd.a,c | 33,522 | 3,750,106 | ||||||
Mizrahi Tefahot Bank Ltd.a | 253,227 | 4,510,097 | ||||||
Nice Ltd. | 60,249 | 4,663,160 | ||||||
|
| |||||||
| 25,568,519 | ||||||||
ITALY — 0.63% |
| |||||||
Luxottica Group SpA | 69,309 | 3,984,109 | ||||||
Recordati SpA | 38,052 | 1,627,735 | ||||||
Snam SpA | 3,590,025 | 17,456,852 | ||||||
|
| |||||||
| 23,068,696 | ||||||||
JAPAN — 12.63% |
| |||||||
ABC-Mart Inc. | 47,100 | 2,417,908 | ||||||
Ajinomoto Co. Inc. | 181,200 | 3,575,103 | ||||||
ANA Holdings Inc. | 2,265,000 | 8,392,395 | ||||||
Astellas Pharma Inc. | 860,700 | 10,819,357 | ||||||
Benesse Holdings Inc. | 141,300 | 5,430,665 | ||||||
Canon Inc. | 634,200 | 22,207,948 | ||||||
Chugai Pharmaceutical Co. Ltd. | 94,200 | 3,825,859 | ||||||
| Security | Shares | Value | ||||||
Daiichi Sankyo Co. Ltd. | 271,800 | $ | 6,418,392 | |||||
Daiwa House REIT Investment Corp. | 906 | 2,212,728 | ||||||
Eisai Co. Ltd. | 94,200 | 4,873,476 | ||||||
FamilyMart UNY Holdings Co. Ltd. | 92,400 | 5,003,671 | ||||||
FUJIFILM Holdings Corp. | 94,200 | 3,699,186 | ||||||
Japan Airlines Co. Ltd. | 226,500 | 7,775,005 | ||||||
Japan Prime Realty Investment Corp. | 1,413 | 5,071,188 | ||||||
Japan Real Estate Investment Corp. | 1,413 | 7,317,918 | ||||||
Japan Retail Fund Investment Corp. | 2,718 | 4,995,924 | ||||||
Kajima Corp. | 453,000 | 4,152,980 | ||||||
KDDI Corp. | 45,300 | 1,221,198 | ||||||
Keikyu Corp. | 942,000 | 9,996,874 | ||||||
Kintetsu Group Holdings Co. Ltd. | 471,000 | 1,775,986 | ||||||
Kirin Holdings Co. Ltd. | 181,200 | 4,110,174 | ||||||
Konami Holdings Corp. | 135,900 | 7,075,295 | ||||||
Kyowa Hakko Kirin Co. Ltd. | 90,600 | 1,589,575 | ||||||
Kyushu Railway Co. | 218,500 | 6,829,366 | ||||||
Lawson Inc. | 90,600 | 6,083,355 | ||||||
McDonald’s Holdings Co. Japan Ltd.a | 141,300 | 6,271,584 | ||||||
MEIJI Holdings Co. Ltd. | 90,600 | 7,211,121 | ||||||
Miraca Holdings Inc. | 94,200 | 4,275,204 | ||||||
Mitsubishi Tanabe Pharma Corp. | 407,700 | 10,001,726 | ||||||
Nagoya Railroad Co. Ltd. | 1,359,000 | 6,075,123 | ||||||
NH Foods Ltd. | 150,000 | 4,402,144 | ||||||
Nippon Building Fund Inc. | 838 | 4,454,207 | ||||||
Nippon Prologis REIT Inc. | 2,784 | 6,040,516 | ||||||
Nippon Telegraph & Telephone Corp. | 453,000 | 22,505,942 | ||||||
Nissin Foods Holdings Co. Ltd. | 94,200 | 5,802,980 | ||||||
Nitori Holdings Co. Ltd. | 100,300 | 15,474,232 | ||||||
Nomura Real Estate Master Fund Inc. | 4,983 | 6,578,502 | ||||||
Nomura Research Institute Ltd. | 227,030 | 8,828,715 | ||||||
NTT Data Corp. | 1,180,500 | 12,742,450 | ||||||
NTT DOCOMO Inc. | 815,400 | 18,918,080 | ||||||
Obayashi Corp. | 226,500 | 2,669,185 | ||||||
Oracle Corp. Japan | 47,100 | 3,479,220 | ||||||
Oriental Land Co. Ltd./Japan | 141,300 | 10,603,277 | ||||||
Otsuka Corp. | 94,200 | 6,230,929 | ||||||
| 20 | 2017 iSHARES ANNUAL REPORTTO SHAREHOLDERS |
Table of Contents
Schedule of Investments (Continued)
iSHARES® EDGE MSCI MIN VOL GLOBAL ETF
August 31, 2017
| Security | Shares | Value | ||||||
Otsuka Holdings Co. Ltd. | 518,100 | $ | 20,849,218 | |||||
Park24 Co. Ltd. | 186,600 | 4,481,045 | ||||||
Recruit Holdings Co. Ltd. | 1,766,700 | 35,170,268 | ||||||
Sankyo Co. Ltd. | 94,200 | 3,072,669 | ||||||
Santen Pharmaceutical Co. Ltd. | 226,500 | 3,510,894 | ||||||
Secom Co. Ltd. | 235,500 | 17,464,574 | ||||||
Shimadzu Corp. | 135,900 | 2,495,493 | ||||||
Shionogi & Co. Ltd. | 47,100 | 2,479,961 | ||||||
Suntory Beverage & Food Ltd. | 235,500 | 10,869,889 | ||||||
Taisho Pharmaceutical Holdings Co. Ltd. | 47,100 | 3,671,797 | ||||||
Takeda Pharmaceutical Co. Ltd. | 271,800 | 15,007,529 | ||||||
Terumo Corp. | 181,200 | 6,997,093 | ||||||
Tobu Railway Co. Ltd. | 1,413,000 | 7,805,779 | ||||||
Toho Co. Ltd./Tokyo | 90,600 | 3,362,720 | ||||||
Toyo Suisan Kaisha Ltd. | 141,300 | 5,218,831 | ||||||
United Urban Investment Corp. | 4,983 | 7,511,173 | ||||||
USS Co. Ltd. | 141,300 | 2,774,389 | ||||||
Yamada Denki Co. Ltd. | 362,400 | 1,959,186 | ||||||
|
| |||||||
| 464,139,171 | ||||||||
MALAYSIA — 0.80% |
| |||||||
Hong Leong Bank Bhda | 1,177,800 | 4,258,338 | ||||||
IHH Healthcare Bhda | 2,536,800 | 3,558,233 | ||||||
Malayan Banking Bhd | 2,536,800 | 5,619,512 | ||||||
Maxis Bhda | 3,005,300 | 4,067,588 | ||||||
Petronas Dagangan Bhd | 317,100 | 1,811,788 | ||||||
Public Bank Bhd | 1,498,060 | 7,226,328 | ||||||
Telekom Malaysia Bhda | 1,857,300 | 2,796,497 | ||||||
|
| |||||||
| 29,338,284 | ||||||||
PHILIPPINES — 0.39% |
| |||||||
Aboitiz Equity Ventures Inc. | 2,228,760 | 3,242,744 | ||||||
Bank of the Philippine Islands | 1,363,539 | 2,821,942 | ||||||
BDO Unibank Inc. | 3,415,629 | 8,484,003 | ||||||
|
| |||||||
| 14,548,689 | ||||||||
QATAR — 0.22% |
| |||||||
Qatar National Bank QPSC | 227,188 | 8,148,508 | ||||||
|
| |||||||
| 8,148,508 | ||||||||
SINGAPORE — 0.90% |
| |||||||
SATS Ltd. | 1,268,400 | 4,511,320 | ||||||
Singapore Airlines Ltd.a | 996,600 | 7,566,234 | ||||||
Singapore Press Holdings Ltd.a | 1,439,500 | 2,925,641 | ||||||
Singapore Telecommunications Ltd.a | 6,613,800 | 18,019,926 | ||||||
|
| |||||||
| 33,023,121 | ||||||||
| Security | Shares | Value | ||||||
SOUTH KOREA — 0.76% |
| |||||||
Dongbu Insurance Co. Ltd. | 29,445 | $ | 1,963,696 | |||||
Kangwon Land Inc. | 110,079 | 3,367,972 | ||||||
KT&G Corp. | 19,479 | 1,977,958 | ||||||
NAVER Corp. | 2,718 | 1,819,874 | ||||||
S-1 Corp. | 28,992 | 2,306,299 | ||||||
Samsung Biologics Co. Ltd.a,c,d | 28,888 | 7,250,181 | ||||||
Samsung Fire & Marine Insurance Co. Ltd. | 15,855 | 3,887,822 | ||||||
SK Telecom Co. Ltd. | 24,462 | 5,499,394 | ||||||
|
| |||||||
| 28,073,196 | ||||||||
SPAIN — 0.06% |
| |||||||
Amadeus IT Group SA | 36,693 | 2,271,517 | ||||||
|
| |||||||
| 2,271,517 | ||||||||
SWITZERLAND — 5.04% |
| |||||||
Chocoladefabriken Lindt & Spruengli AG Registered | 146 | 10,134,922 | ||||||
EMS-Chemie Holding AG Registered | 12,684 | 8,651,781 | ||||||
Givaudan SA Registered | 1,359 | 2,771,738 | ||||||
Kuehne + Nagel International AG Registered | 93,771 | 16,949,035 | ||||||
Nestle SA Registered | 455,265 | 38,538,822 | ||||||
Novartis AG Registered | 229,671 | 19,334,426 | ||||||
Partners Group Holding AG | 14,043 | 9,089,226 | ||||||
Roche Holding AG | 86,070 | 21,808,579 | ||||||
Schindler Holding AG Registered | 35,334 | 7,408,742 | ||||||
Sika AG Bearer | 453 | 3,205,411 | ||||||
Sonova Holding AG Registered | 82,899 | 13,983,276 | ||||||
Straumann Holding AG Registered | 11,778 | 7,531,302 | ||||||
Swiss Prime Site AG Registered | 65,685 | 5,932,839 | ||||||
Swisscom AG Registered | 39,411 | 19,832,632 | ||||||
|
| |||||||
| 185,172,731 | ||||||||
TAIWAN — 4.02% |
| |||||||
Asustek Computer Inc. | 942,000 | 7,803,440 | ||||||
Chang Hwa Commercial Bank Ltd. | 8,077,361 | 4,416,199 | ||||||
Chicony Electronics Co. Ltd. | 954,956 | 2,398,544 | ||||||
Chunghwa Telecom Co. Ltd. | 6,795,000 | 23,641,439 | ||||||
E.Sun Financial Holding Co. Ltd. | 8,754,557 | 5,395,631 | ||||||
Far EasTone Telecommunications Co. Ltd. | 2,826,000 | 6,854,541 | ||||||
First Financial Holding Co. Ltd. | 15,702,894 | 10,198,374 | ||||||
SCHEDULESOF INVESTMENTS | 21 |
Table of Contents
Schedule of Investments (Continued)
iSHARES® EDGE MSCI MIN VOL GLOBAL ETF
August 31, 2017
| Security | Shares | Value | ||||||
Formosa Petrochemical Corp. | 2,265,000 | $ | 7,993,058 | |||||
Hon Hai Precision Industry Co. Ltd. | 3,095,400 | 12,051,741 | ||||||
Hua Nan Financial Holdings Co. Ltd. | 11,891,261 | 6,639,310 | ||||||
Mega Financial Holding Co. Ltd. | 15,402,000 | 12,376,106 | ||||||
Quanta Computer Inc. | 942,000 | 2,144,385 | ||||||
Siliconware Precision Industries Co. Ltd. | 3,624,000 | 5,739,991 | ||||||
Synnex Technology International Corp. | 3,171,250 | 3,541,242 | ||||||
Taiwan Cooperative Financial Holding Co. Ltd. | 13,996,454 | 7,374,122 | ||||||
Taiwan Mobile Co. Ltd. | 2,718,000 | 9,726,764 | ||||||
Taiwan Semiconductor Manufacturing Co. Ltd. | 2,355,000 | 16,894,447 | ||||||
WPG Holdings Ltd. | 1,884,000 | 2,453,401 | ||||||
|
| |||||||
| 147,642,735 | ||||||||
THAILAND — 0.78% |
| |||||||
Advanced Info Service PCL NVDR | 1,087,600 | 6,141,394 | ||||||
Bangkok Dusit Medical Services PCL NVDRa | 6,830,800 | 4,299,465 | ||||||
BTS Group Holdings PCL NVDR | 10,604,400 | 2,762,477 | ||||||
Bumrungrad Hospital PCL NVDRa | 612,600 | 4,021,888 | ||||||
CP ALL PCL NVDR | 1,041,900 | 1,945,424 | ||||||
Home Product Center PCL NVDR | 7,146,800 | 2,152,327 | ||||||
Krung Thai Bank PCL NVDR | 6,071,400 | 3,419,219 | ||||||
Siam Cement PCL (The) Foreign | 271,800 | 4,092,757 | ||||||
|
| |||||||
| 28,834,951 | ||||||||
UNITED ARAB EMIRATES — 0.28% |
| |||||||
Emirates Telecommunications Group Co. PJSC | 1,580,064 | 7,743,092 | ||||||
First Abu Dhabi Bank PJSC | 849,375 | 2,404,917 | ||||||
|
| |||||||
| 10,148,009 | ||||||||
UNITED KINGDOM — 1.55% |
| |||||||
AstraZeneca PLC | 25,821 | 1,510,866 | ||||||
Compass Group PLC | 469,972 | 10,004,223 | ||||||
ConvaTec Group PLCc,d | 2,032,535 | 7,513,978 | ||||||
GlaxoSmithKline PLC | 546,633 | 10,801,423 | ||||||
Kingfisher PLC | 1,419,184 | 5,465,954 | ||||||
Randgold Resources Ltd. | 65,685 | 6,694,899 | ||||||
Reckitt Benckiser Group PLC | 79,728 | 7,532,422 | ||||||
| Security | Shares | Value | ||||||
TUI AG | 443,487 | $ | 7,474,635 | |||||
|
| |||||||
| 56,998,400 | ||||||||
UNITED STATES — 56.38% |
| |||||||
3M Co. | 26,727 | 5,460,861 | ||||||
Abbott Laboratories | 246,885 | 12,576,322 | ||||||
Accenture PLC Class A | 31,257 | 4,087,165 | ||||||
Adobe Systems Inc.c | 25,821 | 4,006,386 | ||||||
Aetna Inc. | 76,104 | 12,001,601 | ||||||
AGNC Investment Corp. | 612,909 | 13,202,060 | ||||||
Alleghany Corp.c | 18,384 | 10,345,964 | ||||||
Allstate Corp. (The) | 187,089 | 16,931,554 | ||||||
Altria Group Inc. | 460,248 | 29,179,723 | ||||||
American Tower Corp. | 22,650 | 3,353,333 | ||||||
American Water Works Co. Inc. | 90,600 | 7,329,540 | ||||||
Annaly Capital Management Inc. | 1,757,640 | 21,970,500 | ||||||
ANSYS Inc.c | 147,225 | 18,965,524 | ||||||
Aon PLC | 70,668 | 9,834,159 | ||||||
Aramark | 113,250 | 4,608,143 | ||||||
Arch Capital Group Ltd.c | 225,594 | 21,959,320 | ||||||
AT&T Inc. | 1,005,660 | 37,672,024 | ||||||
Athene Holding Ltd. Class Ac | 187,995 | 10,059,612 | ||||||
Automatic Data Processing Inc. | 401,358 | 42,732,586 | ||||||
AutoZone Inc.c | 22,650 | 11,969,166 | ||||||
AvalonBay Communities Inc. | 116,874 | 21,940,756 | ||||||
Axis Capital Holdings Ltd. | 156,738 | 9,441,897 | ||||||
Baxter International Inc. | 214,722 | 13,321,353 | ||||||
Becton Dickinson and Co. | 161,721 | 32,253,636 | ||||||
Berkshire Hathaway Inc. Class Bc | 145,413 | 26,343,019 | ||||||
Boston Scientific Corp.c | 136,353 | 3,756,525 | ||||||
Broadridge Financial Solutions Inc. | 109,173 | 8,529,686 | ||||||
Campbell Soup Co. | 130,464 | 6,027,437 | ||||||
CH Robinson Worldwide Inc. | 155,379 | 10,974,419 | ||||||
Charter Communications Inc. Class Ac | 42,129 | 16,790,092 | ||||||
Chipotle Mexican Grill Inc.c | 4,077 | 1,291,227 | ||||||
Chubb Ltd. | 127,746 | 18,065,839 | ||||||
Church & Dwight Co. Inc. | 443,940 | 22,272,470 | ||||||
Cigna Corp. | 11,325 | 2,061,830 | ||||||
Cincinnati Financial Corp. | 108,267 | 8,319,236 | ||||||
Cintas Corp. | 115,062 | 15,534,521 | ||||||
Cisco Systems Inc. | 201,585 | 6,493,053 | ||||||
Clorox Co. (The) | 191,619 | 26,544,980 | ||||||
CMS Energy Corp. | 34,881 | 1,693,124 | ||||||
Coca-Cola Co. (The) | 523,215 | 23,832,443 | ||||||
| 22 | 2017 iSHARES ANNUAL REPORTTO SHAREHOLDERS |
Table of Contents
Schedule of Investments (Continued)
iSHARES® EDGE MSCI MIN VOL GLOBAL ETF
August 31, 2017
| Security | Shares | Value | ||||||
Colgate-Palmolive Co. | 144,960 | $ | 10,384,934 | |||||
Comcast Corp. Class A | 380,973 | 15,471,314 | ||||||
Consolidated Edison Inc. | 503,283 | 42,411,658 | ||||||
Constellation Brands Inc. Class A | 34,428 | 6,889,043 | ||||||
Cooper Companies Inc. (The) | 9,060 | 2,272,520 | ||||||
Costco Wholesale Corp. | 42,129 | 6,603,299 | ||||||
Crown Castle International Corp. | 119,592 | 12,968,556 | ||||||
CVS Health Corp. | 53,907 | 4,169,167 | ||||||
Danaher Corp. | 72,933 | 6,084,071 | ||||||
Darden Restaurants Inc. | 40,770 | 3,346,809 | ||||||
Dell Technologies Inc. Class Vc | 373,725 | 28,003,214 | ||||||
Dominion Energy Inc. | 279,501 | 22,016,294 | ||||||
Dr Pepper Snapple Group Inc. | 115,968 | 10,558,886 | ||||||
Duke Energy Corp. | 329,784 | 28,790,143 | ||||||
eBay Inc.c | 101,472 | 3,666,183 | ||||||
Ecolab Inc. | 34,428 | 4,589,252 | ||||||
Edison International | 32,163 | 2,578,829 | ||||||
Eli Lilly & Co. | 290,826 | 23,641,246 | ||||||
Equity Residential | 132,276 | 8,882,333 | ||||||
Essex Property Trust Inc. | 14,043 | 3,735,017 | ||||||
Everest Re Group Ltd. | 71,121 | 17,956,630 | ||||||
Eversource Energy | 77,010 | 4,851,630 | ||||||
Expeditors International of Washington Inc. | 239,184 | 13,418,222 | ||||||
Exxon Mobil Corp. | 348,357 | 26,590,090 | ||||||
F5 Networks Inc.c | 15,402 | 1,838,691 | ||||||
Facebook Inc. Class Ac | 42,582 | 7,322,827 | ||||||
Federal Realty Investment Trust | 17,667 | 2,242,472 | ||||||
Fidelity National Information Services Inc. | 137,259 | 12,754,106 | ||||||
Fiserv Inc.c | 105,549 | 13,057,467 | ||||||
FNF Group | 125,934 | 6,075,056 | ||||||
Gartner Inc.c | 108,267 | 13,055,918 | ||||||
General Mills Inc. | 402,264 | 21,424,581 | ||||||
Genuine Parts Co. | 38,052 | 3,151,847 | ||||||
Henry Schein Inc.c | 71,121 | 12,352,295 | ||||||
Hershey Co. (The) | 62,967 | 6,606,498 | ||||||
Home Depot Inc. (The) | 53,907 | 8,079,042 | ||||||
Hormel Foods Corp. | 141,336 | 4,344,669 | ||||||
Humana Inc. | 23,103 | 5,951,795 | ||||||
Intel Corp. | 94,224 | 3,304,436 | ||||||
International Business Machines Corp. | 81,993 | 11,727,459 | ||||||
Intuitive Surgical Inc.c | 33,522 | 33,678,548 | ||||||
Jack Henry & Associates Inc. | 130,464 | 13,446,924 | ||||||
| Security | Shares | Value | ||||||
JM Smucker Co. (The) | 70,668 | $ | 7,403,180 | |||||
Johnson & Johnson | 419,931 | 55,586,266 | ||||||
Kellogg Co. | 356,058 | 23,307,557 | ||||||
Kimberly-Clark Corp. | 107,361 | 13,236,538 | ||||||
Laboratory Corp. of America Holdingsc | 88,335 | 13,857,111 | ||||||
Liberty Broadband Corp. Class Cc | 27,180 | 2,759,585 | ||||||
Lockheed Martin Corp. | 35,787 | 10,928,992 | ||||||
Lowe’s Companies Inc. | 25,821 | 1,907,914 | ||||||
Markel Corp.c | 24,462 | 25,733,779 | ||||||
Marsh & McLennan Companies Inc. | 305,775 | 23,874,912 | ||||||
MasterCard Inc. Class A | 45,488 | 6,063,550 | ||||||
McCormick & Co. Inc./MD NVS | 194,337 | 18,487,279 | ||||||
McDonald’s Corp. | 298,527 | 47,755,364 | ||||||
Medtronic PLC | 170,328 | 13,731,843 | ||||||
Merck & Co. Inc. | 410,871 | 26,238,222 | ||||||
Microsoft Corp. | 36,693 | 2,743,536 | ||||||
Monsanto Co. | 69,309 | 8,123,015 | ||||||
Motorola Solutions Inc. | 164,439 | 14,490,365 | ||||||
Newmont Mining Corp. | 114,156 | 4,376,741 | ||||||
NextEra Energy Inc. | 37,833 | 5,694,245 | ||||||
Northrop Grumman Corp. | 54,360 | 14,797,336 | ||||||
O’Reilly Automotive Inc.c | 28,086 | 5,508,507 | ||||||
Occidental Petroleum Corp. | 95,583 | 5,706,305 | ||||||
Oracle Corp. | 66,138 | 3,328,726 | ||||||
Patterson Companies Inc. | 39,411 | 1,517,324 | ||||||
Paychex Inc. | 472,932 | 26,971,312 | ||||||
PepsiCo Inc. | 298,980 | 34,600,955 | ||||||
Pfizer Inc. | 650,508 | 22,065,231 | ||||||
PG&E Corp. | 380,067 | 26,749,115 | ||||||
Procter & Gamble Co. (The) | 469,761 | 43,344,847 | ||||||
Progressive Corp. (The) | 139,524 | 6,485,076 | ||||||
Public Storage | 70,215 | 14,417,948 | ||||||
Raytheon Co. | 71,574 | 13,027,184 | ||||||
Realty Income Corp.a | 108,720 | 6,257,923 | ||||||
RenaissanceRe Holdings Ltd. | 57,768 | 8,038,995 | ||||||
Republic Services Inc. | 411,324 | 26,834,778 | ||||||
Rollins Inc. | 41,223 | 1,830,713 | ||||||
Ross Stores Inc. | 63,420 | 3,706,899 | ||||||
SCANA Corp. | 40,317 | 2,434,340 | ||||||
Sherwin-Williams Co. (The) | 7,701 | 2,612,718 | ||||||
Southern Co. (The) | 637,824 | 30,781,386 | ||||||
Starbucks Corp. | 209,739 | 11,506,282 | ||||||
SCHEDULESOF INVESTMENTS | 23 |
Table of Contents
Schedule of Investments (Continued)
iSHARES® EDGE MSCI MIN VOL GLOBAL ETF
August 31, 2017
| Security | Shares | Value | ||||||
Stryker Corp. | 211,551 | $ | 29,906,965 | |||||
Synopsys Inc.c | 232,389 | 18,688,723 | ||||||
Sysco Corp. | 137,259 | 7,229,432 | ||||||
Time Warner Inc. | 100,566 | 10,167,223 | ||||||
TJX Companies Inc. (The) | 318,459 | 23,024,586 | ||||||
Travelers Companies Inc. (The) | 116,421 | 14,107,897 | ||||||
UDR Inc. | 274,518 | 10,656,789 | ||||||
Ulta Salon Cosmetics & Fragrance Inc.c | 5,889 | 1,301,528 | ||||||
United Parcel Service Inc. Class B | 135,900 | 15,541,524 | ||||||
UnitedHealth Group Inc. | 93,771 | 18,651,052 | ||||||
Vantiv Inc. Class Ac | 65,685 | 4,643,273 | ||||||
Varian Medical Systems Inc.c | 150,849 | 16,027,706 | ||||||
Verizon Communications Inc. | 682,218 | 32,725,997 | ||||||
Visa Inc. Class A | 290,826 | 30,106,308 | ||||||
VMware Inc. Class Aa,c | 73,839 | 7,981,996 | ||||||
Wal-Mart Stores Inc. | 288,108 | 22,492,592 | ||||||
Walt Disney Co. (The) | 40,317 | 4,080,080 | ||||||
Waste Management Inc. | 451,188 | 34,791,107 | ||||||
Waters Corp.c | 18,120 | 3,324,658 | ||||||
WEC Energy Group Inc. | 340,656 | 22,217,584 | ||||||
Welltower Inc. | 60,702 | 4,444,600 | ||||||
Westar Energy Inc. | 50,283 | 2,580,021 | ||||||
WR Berkley Corp. | 168,063 | 11,199,718 | ||||||
Xcel Energy Inc. | 472,479 | 23,387,710 | ||||||
|
| |||||||
| 2,072,130,020 | ||||||||
|
| |||||||
TOTAL COMMON STOCKS |
| |||||||
(Cost: $3,174,791,046) |
| 3,655,374,513 | ||||||
PREFERRED STOCKS — 0.08% |
| |||||||
COLOMBIA — 0.08% |
| |||||||
Grupo Aval Acciones y Valores SA, Preference Shares | 6,274,956 | 2,812,740 | ||||||
|
| |||||||
| 2,812,740 | ||||||||
|
| |||||||
TOTAL PREFERRED STOCKS |
| |||||||
(Cost: $2,588,844) |
| 2,812,740 | ||||||
| Security | Shares | Value | ||||||
SHORT-TERM INVESTMENTS — 1.62% |
| |||||||
MONEY MARKET FUNDS — 1.62% |
| |||||||
BlackRock Cash Funds: Institutional, |
| |||||||
1.32%e,f,g | 56,910,361 | $ | 56,927,434 | |||||
BlackRock Cash Funds: Treasury, |
| |||||||
0.96%e,f | 2,465,143 | 2,465,143 | ||||||
|
| |||||||
| 59,392,577 | ||||||||
|
| |||||||
TOTAL SHORT-TERM INVESTMENTS |
| |||||||
(Cost: $59,378,772) |
| 59,392,577 | ||||||
|
| |||||||
TOTAL INVESTMENTS |
| |||||||
(Cost: $3,236,758,662)h |
| 3,717,579,830 | ||||||
Other Assets, Less Liabilities — (1.15)% |
| (42,205,898 | ) | |||||
|
| |||||||
NET ASSETS — 100.00% |
| $ | 3,675,373,932 | |||||
|
| |||||||
ADR — American Depositary Receipts
NVDR — Non-Voting Depositary Receipts
NVS — Non-Voting Shares
| a | All or a portion of this security represents a security on loan. See Note 1. |
| b | Security is valued using significant unobservable inputs and is classified as Level 3 in the fair value hierarchy. |
| c | Non-income earning security. |
| d | This security may be resold to qualified institutional buyers under Rule 144A of the Securities Act of 1933. |
| e | Affiliated issuer. See Schedule 1. |
| f | The rate quoted is the annualized seven-day yield of the fund at period end. |
| g | All or a portion of this security represents an investment of securities lending collateral. See Note 1. |
| h | The cost of investments (including short positions and derivatives, if any) for federal income tax purposes was $3,257,880,160. Net unrealized appreciation was $459,699,670, of which $525,135,558 represented gross unrealized appreciation on investments and $65,435,888 represented gross unrealized depreciation on investments. |
| 24 | 2017 iSHARES ANNUAL REPORTTO SHAREHOLDERS |
Table of Contents
Schedule of Investments (Continued)
iSHARES® EDGE MSCI MIN VOL GLOBAL ETF
August 31, 2017
Schedule 1 — Affiliates (Note 2)
Investments in issuers considered to be affiliates of the Fund during the year ended August 31, 2017, for purposes of Section 2(a)(3) of the 1940 Act, and/or related parties of the Fund were as follows:
| Affiliated issuer | Shares held at 08/31/16 | Shares purchased | Shares sold | Shares held at 08/31/17 | Value at 08/31/17 | Net realized gain (loss) a | Change in unrealized appreciation (depreciation) | Income | ||||||||||||||||||||||||
BlackRock Cash Funds: Institutional, SL Agency Shares | 88,500,685 | — | (31,590,324 | )b | 56,910,361 | $ | 56,927,434 | $ | 16,088 | $ | 13,805 | $ | — | c | ||||||||||||||||||
BlackRock Cash Funds: Treasury, SL Agency Shares | 2,334,558 | 130,585 | b | — | 2,465,143 | 2,465,143 | 242 | — | 29,119 | |||||||||||||||||||||||
|
|
|
|
|
|
|
| |||||||||||||||||||||||||
| $ | 59,392,577 | $ | 16,330 | $ | 13,805 | $ | 29,119 | |||||||||||||||||||||||||
|
|
|
|
|
|
|
| |||||||||||||||||||||||||
| a | Includes realized capital gain distributions from an affiliated fund, if any. |
| b | Net of shares purchased and sold. |
| c | Does not include income earned on investment of securities lending cash collateral which is not direct income of the Fund and is reflected as a component of securities lending income in the statement of operations. |
Schedule 2 — Fair Value Measurements
Various inputs are used in determining the fair value of financial instruments. For description of the input levels and information about the Fund’s policy regarding valuation of financial instruments, see Note 1.
The following table summarizes the value of the Fund’s investments according to the fair value hierarchy as of August 31, 2017. The breakdown of the Fund’s investments into major categories is disclosed in the schedule of investments above.
| Level 1 | Level 2 | Level 3 | Total | |||||||||||||
Investments: | ||||||||||||||||
Assets: | ||||||||||||||||
Common stocks | $ | 3,648,956,114 | $ | 6,418,392 | $ | 7 | $ | 3,655,374,513 | ||||||||
Preferred stocks | 2,812,740 | — | — | 2,812,740 | ||||||||||||
Money market funds | 59,392,577 | — | — | 59,392,577 | ||||||||||||
|
|
|
|
|
|
|
| |||||||||
Total | $ | 3,711,161,431 | $ | 6,418,392 | $ | 7 | $ | 3,717,579,830 | ||||||||
|
|
|
|
|
|
|
| |||||||||
See notes to financial statements.
SCHEDULESOF INVESTMENTS | 25 |
Table of Contents
Schedule of Investments
August 31, 2017
| Security | Shares | Value | ||||||
COMMON STOCKS — 98.86% |
| |||||||
AIRLINES — 0.20% |
| |||||||
Qantas Airways Ltd. | 795,638 | $ | 3,609,664 | |||||
|
| |||||||
| 3,609,664 | ||||||||
BANKS — 32.51% |
| |||||||
Australia & New Zealand Banking Group Ltd. | 5,136,385 | 119,773,317 | ||||||
Bank of Queensland Ltd. | 678,490 | 6,775,235 | ||||||
Bendigo & Adelaide Bank Ltd. | 826,886 | 7,837,341 | ||||||
Commonwealth Bank of Australia | 3,025,804 | 181,913,603 | ||||||
National Australia Bank Ltd. | 4,680,461 | 112,111,652 | ||||||
Westpac Banking Corp. | 5,872,157 | 145,640,016 | ||||||
|
| |||||||
| 574,051,164 | ||||||||
BEVERAGES — 1.20% |
| |||||||
Coca-Cola Amatil Ltd. | 1,002,107 | 6,398,308 | ||||||
Treasury Wine Estates Ltd. | 1,293,430 | 14,854,795 | ||||||
|
| |||||||
| 21,253,103 | ||||||||
BIOTECHNOLOGY — 4.58% |
| |||||||
CSL Ltd. | 793,934 | 80,930,141 | ||||||
|
| |||||||
| 80,930,141 | ||||||||
CAPITAL MARKETS — 3.04% |
| |||||||
ASX Ltd. | 339,114 | 14,707,180 | ||||||
Macquarie Group Ltd. | 565,648 | 38,942,261 | ||||||
|
| |||||||
| 53,649,441 | ||||||||
CHEMICALS — 1.04% |
| |||||||
Incitec Pivot Ltd. | 2,950,223 | 7,792,095 | ||||||
Orica Ltd. | 656,702 | 10,589,145 | ||||||
|
| |||||||
| 18,381,240 | ||||||||
COMMERCIAL SERVICES & SUPPLIES — 1.16% |
| |||||||
Brambles Ltd. | 2,779,285 | 20,522,863 | ||||||
|
| |||||||
| 20,522,863 | ||||||||
CONSTRUCTION & ENGINEERING — 0.32% |
| |||||||
CIMIC Group Ltd. | 170,731 | 5,694,211 | ||||||
|
| |||||||
| 5,694,211 | ||||||||
CONSTRUCTION MATERIALS — 1.22% |
| |||||||
Boral Ltd. | 2,046,106 | 10,824,532 | ||||||
James Hardie Industries PLC | 769,365 | 10,794,821 | ||||||
|
| |||||||
| 21,619,353 | ||||||||
CONTAINERS & PACKAGING — 1.47% |
| |||||||
Amcor Ltd./Australia | 2,026,083 | 25,888,563 | ||||||
|
| |||||||
| 25,888,563 | ||||||||
| Security | Shares | Value | ||||||
DIVERSIFIED FINANCIAL SERVICES — 1.74% |
| |||||||
AMP Ltd. | 5,120,899 | $ | 20,714,362 | |||||
Challenger Ltd./Australia | 998,027 | 9,926,474 | ||||||
|
| |||||||
| 30,640,836 | ||||||||
DIVERSIFIED TELECOMMUNICATION SERVICES — 1.36% |
| |||||||
Telstra Corp. Ltd. | 7,282,264 | 21,197,647 | ||||||
TPG Telecom Ltd. | 650,270 | 2,831,531 | ||||||
|
| |||||||
| 24,029,178 | ||||||||
ELECTRIC UTILITIES — 0.25% |
| |||||||
AusNet Services | 3,156,555 | 4,356,300 | ||||||
|
| |||||||
| 4,356,300 | ||||||||
EQUITY REAL ESTATE INVESTMENT TRUSTS (REITS) — 7.61% |
| |||||||
BGP Holdings PLCa,b | 18,888,372 | 225 | ||||||
Dexus | 1,781,857 | 13,553,349 | ||||||
Goodman Group | 3,130,760 | 20,585,408 | ||||||
GPT Group (The) | 3,142,646 | 12,462,944 | ||||||
Mirvac Group | 6,467,658 | 11,901,185 | ||||||
Scentre Group | 9,314,476 | 28,516,808 | ||||||
Stockland | 4,236,023 | 14,883,916 | ||||||
Vicinity Centres | 5,872,401 | 12,203,156 | ||||||
Westfield Corp. | 3,453,703 | 20,353,026 | ||||||
|
| |||||||
| 134,460,017 | ||||||||
FOOD & STAPLES RETAILING — 6.43% |
| |||||||
Wesfarmers Ltd. | 1,978,497 | 66,881,194 | ||||||
Woolworths Ltd. | 2,263,486 | 46,677,366 | ||||||
|
| |||||||
| 113,558,560 | ||||||||
GAS UTILITIES — 0.78% |
| |||||||
APA Group | 1,951,961 | 13,717,028 | ||||||
|
| |||||||
| 13,717,028 | ||||||||
HEALTH CARE EQUIPMENT & SUPPLIES — 0.71% |
| |||||||
Cochlear Ltd. | 100,652 | 12,470,573 | ||||||
|
| |||||||
| 12,470,573 | ||||||||
HEALTH CARE PROVIDERS & SERVICES — 1.68% |
| |||||||
Healthscope Ltd. | 3,044,518 | 4,201,680 | ||||||
Ramsay Health Care Ltd. | 247,774 | 13,424,410 | ||||||
Sonic Healthcare Ltd. | 693,089 | 12,038,941 | ||||||
|
| |||||||
| 29,665,031 | ||||||||
HOTELS, RESTAURANTS & LEISURE — 2.39% |
| |||||||
Aristocrat Leisure Ltd. | 950,225 | 15,955,209 | ||||||
Crown Resorts Ltd. | 701,348 | 6,452,778 | ||||||
Domino’s Pizza Enterprises Ltd.c | 109,355 | 3,742,610 | ||||||
| 26 | 2017 iSHARES ANNUAL REPORTTO SHAREHOLDERS |
Table of Contents
Schedule of Investments (Continued)
iSHARES® MSCI AUSTRALIA ETF
August 31, 2017
| Security | Shares | Value | ||||||
Flight Centre Travel Group Ltd.c | 96,527 | $ | 3,701,694 | |||||
Tabcorp Holdings Ltd. | 1,466,532 | 4,780,667 | ||||||
Tatts Group Ltd. | 2,312,037 | 7,536,883 | ||||||
|
| |||||||
| 42,169,841 | ||||||||
INSURANCE — 4.29% |
| |||||||
Insurance Australia Group Ltd. | 4,141,812 | 21,057,344 | ||||||
Medibank Pvt Ltd. | 4,807,338 | 11,591,334 | ||||||
QBE Insurance Group Ltd. | 2,399,497 | 19,868,994 | ||||||
Suncorp Group Ltd. | 2,257,106 | 23,326,606 | ||||||
|
| |||||||
| 75,844,278 | ||||||||
IT SERVICES — 0.51% |
| |||||||
Computershare Ltd. | 811,281 | 9,040,716 | ||||||
|
| |||||||
| 9,040,716 | ||||||||
MEDIA — 0.28% |
| |||||||
REA Group Ltd. | 92,560 | 4,867,344 | ||||||
|
| |||||||
| 4,867,344 | ||||||||
METALS & MINING — 13.39% |
| |||||||
Alumina Ltd. | 4,285,441 | 7,205,872 | ||||||
BHP Billiton Ltd. | 5,618,621 | 122,016,443 | ||||||
BlueScope Steel Ltd. | 999,529 | 8,617,477 | ||||||
Fortescue Metals Group Ltd. | 2,717,191 | 12,952,387 | ||||||
Newcrest Mining Ltd. | 1,341,433 | 24,311,422 | ||||||
Rio Tinto Ltd. | 742,091 | 39,929,896 | ||||||
South32 Ltd. | 9,212,311 | 21,335,687 | ||||||
|
| |||||||
| 236,369,184 | ||||||||
MULTI-UTILITIES — 1.24% |
| |||||||
AGL Energy Ltd. | 1,151,342 | 21,907,346 | ||||||
|
| |||||||
| 21,907,346 | ||||||||
MULTILINE RETAIL — 0.18% |
| |||||||
Harvey Norman Holdings Ltd. | 966,353 | 3,127,168 | ||||||
|
| |||||||
| 3,127,168 | ||||||||
OIL, GAS & CONSUMABLE FUELS — 4.73% |
| |||||||
Caltex Australia Ltd. | 455,174 | 12,054,496 | ||||||
Oil Search Ltd. | 2,401,745 | 12,782,170 | ||||||
Origin Energy Ltd.b | 3,072,430 | 18,642,262 | ||||||
Santos Ltd.b | 3,272,268 | 9,758,698 | ||||||
Woodside Petroleum Ltd. | 1,326,416 | 30,330,500 | ||||||
|
| |||||||
| 83,568,126 | ||||||||
PROFESSIONAL SERVICES — 0.43% |
| |||||||
Seek Ltd. | 577,917 | 7,677,776 | ||||||
|
| |||||||
| 7,677,776 | ||||||||
| Security | Shares | Value | ||||||
REAL ESTATE MANAGEMENT & DEVELOPMENT — 0.72% |
| |||||||
LendLease Group | 970,469 | $ | 12,762,077 | |||||
|
| |||||||
| 12,762,077 | ||||||||
ROAD & RAIL — 0.80% |
| |||||||
Aurizon Holdings Ltd. | 3,592,987 | 14,134,892 | ||||||
|
| |||||||
| 14,134,892 | ||||||||
TRANSPORTATION INFRASTRUCTURE — 2.60% |
| |||||||
Sydney Airport | 1,924,369 | 11,294,714 | ||||||
Transurban Group | 3,590,318 | 34,627,543 | ||||||
|
| |||||||
| 45,922,257 | ||||||||
|
| |||||||
TOTAL COMMON STOCKS |
| |||||||
(Cost: $1,913,517,259) |
| 1,745,888,271 | ||||||
SHORT-TERM INVESTMENTS — 0.41% |
| |||||||
MONEY MARKET FUNDS — 0.41% |
| |||||||
BlackRock Cash Funds: Institutional, SL Agency Shares |
| |||||||
1.32%d,e,f | 6,985,447 | 6,987,543 | ||||||
BlackRock Cash Funds: Treasury, |
| |||||||
0.96%d,e | 183,299 | 183,299 | ||||||
|
| |||||||
| 7,170,842 | ||||||||
|
| |||||||
TOTAL SHORT-TERM INVESTMENTS |
| |||||||
(Cost: $7,170,523) |
| 7,170,842 | ||||||
|
| |||||||
TOTAL INVESTMENTS |
| |||||||
(Cost: $1,920,687,782)g |
| 1,753,059,113 | ||||||
Other Assets, Less Liabilities — 0.73% |
| 12,853,213 | ||||||
|
| |||||||
NET ASSETS — 100.00% |
| $ | 1,765,912,326 | |||||
|
| |||||||
| a | Security is valued using significant unobservable inputs and is classified as Level 3 in the fair value hierarchy. |
| b | Non-income earning security. |
| c | All or a portion of this security represents a security on loan. See Note 1. |
| d | Affiliated issuer. See Schedule 1. |
| e | The rate quoted is the annualized seven-day yield of the fund at period end. |
| f | All or a portion of this security represents an investment of securities lending collateral. See Note 1. |
| g | The cost of investments (including short positions and derivatives, if any) for federal income tax purposes was $1,979,016,818. Net unrealized depreciation was $226,038,358, of which $96,246,139 represented gross unrealized appreciation on investments and $322,284,497 represented gross unrealized depreciation on investments. |
SCHEDULESOF INVESTMENTS | 27 |
Table of Contents
Schedule of Investments (Continued)
iSHARES® MSCI AUSTRALIA ETF
August 31, 2017
Schedule 1 — Affiliates (Note 2)
Investments in issuers considered to be affiliates of the Fund during the year ended August 31, 2017, for purposes of Section 2(a)(3) of the 1940 Act, and/or related parties of the Fund were as follows:
| Affiliated issuer | Shares held at 08/31/16 | Shares purchased | Shares sold | Shares held at 08/31/17 | Value at 08/31/17 | Net realized gain (loss) a | Change in unrealized appreciation (depreciation) | Income | ||||||||||||||||||||||||
BlackRock Cash Funds: Institutional, SL Agency Shares | 2,407,298 | 4,578,149 | b | — | 6,985,447 | $ | 6,987,543 | $ | (190 | ) | $ | 319 | $ | — | c | |||||||||||||||||
BlackRock Cash Funds: Treasury, SL Agency Shares | 532,214 | — | (348,915 | )b | 183,299 | 183,299 | 53 | — | 7,465 | |||||||||||||||||||||||
|
|
|
|
|
|
|
| |||||||||||||||||||||||||
| $ | 7,170,842 | $ | (137 | ) | $ | 319 | $ | 7,465 | ||||||||||||||||||||||||
|
|
|
|
|
|
|
| |||||||||||||||||||||||||
| a | Includes realized capital gain distributions from an affiliated fund, if any. |
| b | Net of shares purchased and sold. |
| c | Does not include income earned on investment of securities lending cash collateral which is not direct income of the Fund and is reflected as a component of securities lending income in the statement of operations. |
Schedule 2 — Futures Contracts (Note 5)
Futures contracts outstanding as of August 31, 2017 were as follows:
| Description | Number of contracts | Expiration date | Notional amount (000) | Value/ unrealized appreciation (depreciation) | ||||||||||||
Long Contracts: | ||||||||||||||||
ASX SPI 200 Index | 4,450 | Sep 2017 | $ | 20,076 | $ | (80,653 | ) | |||||||||
|
| |||||||||||||||
Total |
| $ | (80,653 | ) | ||||||||||||
|
| |||||||||||||||
Schedule 3 — Fair Value Measurements
Various inputs are used in determining the fair value of financial instruments. For description of the input levels and information about the Fund’s policy regarding valuation of financial instruments, see Note 1.
The following table summarizes the value of the Fund’s investments according to the fair value hierarchy as of August 31, 2017. The breakdown of the Fund’s investments into major categories is disclosed in the schedule of investments above.
| Level 1 | Level 2 | Level 3 | Total | |||||||||||||
Investments: | ||||||||||||||||
Assets: | ||||||||||||||||
Common stocks | $ | 1,745,888,046 | $ | — | $ | 225 | $ | 1,745,888,271 | ||||||||
Money market funds | 7,170,842 | — | — | 7,170,842 | ||||||||||||
|
|
|
|
|
|
|
| |||||||||
Total | $ | 1,753,058,888 | $ | — | $ | 225 | $ | 1,753,059,113 | ||||||||
|
|
|
|
|
|
|
| |||||||||
Derivative financial instrumentsa: | ||||||||||||||||
Liabilities: | ||||||||||||||||
Futures contracts | $ | (80,653 | ) | $ | — | $ | — | $ | (80,653 | ) | ||||||
|
|
|
|
|
|
|
| |||||||||
Total | $ | (80,653 | ) | $ | — | $ | — | $ | (80,653 | ) | ||||||
|
|
|
|
|
|
|
| |||||||||
| a | Shown at the unrealized appreciation (depreciation) on the contracts. |
See notes to financial statements.
| 28 | 2017 iSHARES ANNUAL REPORTTO SHAREHOLDERS |
Table of Contents
Schedule of Investments
August 31, 2017
| Security | Shares | Value | ||||||
COMMON STOCKS — 99.51% |
| |||||||
AEROSPACE & DEFENSE — 0.63% |
| |||||||
Bombardier Inc. Class Ba | 4,586,075 | $ | 9,144,716 | |||||
CAE Inc. | 635,487 | 10,446,570 | ||||||
|
| |||||||
| 19,591,286 | ||||||||
AUTO COMPONENTS — 1.58% |
| |||||||
Linamar Corp. | 116,222 | 6,454,666 | ||||||
Magna International Inc. Class A | 898,493 | 43,063,166 | ||||||
|
| |||||||
| 49,517,832 | ||||||||
BANKS — 28.36% |
| |||||||
Bank of Montreal | 1,503,829 | 107,484,041 | ||||||
Bank of Nova Scotia (The) | 2,810,128 | 174,132,677 | ||||||
Canadian Imperial Bank of Commerce | 1,001,528 | 83,804,828 | ||||||
National Bank of Canada | 791,798 | 36,301,136 | ||||||
Royal Bank of Canada | 3,441,879 | 254,431,382 | ||||||
Toronto-Dominion Bank (The) | 4,319,918 | 231,061,776 | ||||||
|
| |||||||
| 887,215,840 | ||||||||
CAPITAL MARKETS — 4.35% |
| |||||||
Brookfield Asset Management Inc. Class A | 2,057,061 | 81,035,488 | ||||||
CI Financial Corp. | 581,160 | 12,673,112 | ||||||
IGM Financial Inc. | 224,733 | 7,329,477 | ||||||
Thomson Reuters Corp. | 772,755 | 35,193,867 | ||||||
|
| |||||||
| 136,231,944 | ||||||||
CHEMICALS — 2.40% |
| |||||||
Agrium Inc. | 308,443 | 30,132,083 | ||||||
Methanex Corp. | 213,464 | 10,864,317 | ||||||
Potash Corp. of Saskatchewan Inc. | 1,964,196 | 34,043,453 | ||||||
|
| |||||||
| 75,039,853 | ||||||||
CONSTRUCTION & ENGINEERING — 0.49% |
| |||||||
SNC-Lavalin Group Inc. | 354,824 | 15,438,205 | ||||||
|
| |||||||
| 15,438,205 | ||||||||
CONTAINERS & PACKAGING — 0.49% |
| |||||||
CCL Industries Inc. Class B | 329,438 | 15,221,809 | ||||||
|
| |||||||
| 15,221,809 | ||||||||
DIVERSIFIED FINANCIAL SERVICES — 0.71% |
| |||||||
Element Fleet Management Corp. | 917,285 | 6,848,086 | ||||||
Onex Corp. | 194,085 | 15,457,138 | ||||||
|
| |||||||
| 22,305,224 | ||||||||
| Security | Shares | Value | ||||||
DIVERSIFIED TELECOMMUNICATION SERVICES — 1.08% |
| |||||||
BCE Inc. | 360,275 | $ | 17,080,555 | |||||
TELUS Corp. | 462,189 | 16,666,452 | ||||||
|
| |||||||
| 33,747,007 | ||||||||
ELECTRIC UTILITIES — 1.66% | ||||||||
Emera Inc. | 124,065 | 4,745,888 | ||||||
Fortis Inc./Canada | 936,259 | 34,119,780 | ||||||
Hydro One Ltd.b | 703,400 | 12,999,225 | ||||||
|
| |||||||
| 51,864,893 | ||||||||
EQUITY REAL ESTATE INVESTMENT TRUSTS (REITS) — 0.52% |
| |||||||
H&R REIT | 326,686 | 5,565,713 | ||||||
RioCan REIT | 375,533 | 7,128,762 | ||||||
Smart REIT | 152,955 | 3,712,400 | ||||||
|
| |||||||
| 16,406,875 | ||||||||
FOOD & STAPLES RETAILING — 3.62% |
| |||||||
Alimentation Couche-Tard Inc. Class B | 981,498 | 46,681,336 | ||||||
Empire Co. Ltd. Class A | 395,550 | 6,622,209 | ||||||
George Weston Ltd. | 121,653 | 10,530,808 | ||||||
Jean Coutu Group PJC Inc. (The) Class A | 191,749 | 3,405,982 | ||||||
Loblaw Companies Ltd. | 520,265 | 28,105,722 | ||||||
Metro Inc. | 547,505 | 18,000,523 | ||||||
|
| |||||||
| 113,346,580 | ||||||||
FOOD PRODUCTS — 0.64% | ||||||||
Saputo Inc. | 596,323 | 20,052,624 | ||||||
|
| |||||||
| 20,052,624 | ||||||||
HOTELS, RESTAURANTS & LEISURE — 1.01% |
| |||||||
Restaurant Brands International Inc. | 521,201 | 31,689,852 | ||||||
|
| |||||||
| 31,689,852 | ||||||||
INSURANCE — 8.66% | ||||||||
Fairfax Financial Holdings Ltd. | 65,951 | 34,143,549 | ||||||
Great-West Lifeco Inc. | 695,403 | 19,185,635 | ||||||
Industrial Alliance Insurance & Financial Services Inc. | 246,017 | 10,515,694 | ||||||
Intact Financial Corp. | 307,901 | 25,280,422 | ||||||
Manulife Financial Corp. | 4,596,917 | 89,940,079 | ||||||
Power Corp. of Canada | 874,096 | 21,278,094 | ||||||
Power Financial Corp. | 588,256 | 15,816,638 | ||||||
Sun Life Financial Inc. | 1,430,666 | 54,716,199 | ||||||
|
| |||||||
| 270,876,310 | ||||||||
SCHEDULESOF INVESTMENTS | 29 |
Table of Contents
Schedule of Investments (Continued)
iSHARES® MSCI CANADA ETF
August 31, 2017
| Security | Shares | Value | ||||||
INTERNET SOFTWARE & SERVICES — 0.13% |
| |||||||
Shopify Inc. Class Aa,c | 35,840 | $ | 3,944,901 | |||||
|
| |||||||
| 3,944,901 | ||||||||
IT SERVICES — 0.83% |
| |||||||
CGI Group Inc. Class Aa | 510,257 | 25,855,734 | ||||||
|
| |||||||
| 25,855,734 | ||||||||
MEDIA — 0.70% | ||||||||
Shaw Communications Inc. Class B | 982,876 | 21,840,818 | ||||||
|
| |||||||
| 21,840,818 | ||||||||
METALS & MINING — 7.66% | ||||||||
Agnico Eagle Mines Ltd. | 529,693 | 27,043,389 | ||||||
Barrick Gold Corp. | 2,721,747 | 48,823,202 | ||||||
First Quantum Minerals Ltd. | 1,626,515 | 19,524,667 | ||||||
Franco-Nevada Corp. | 418,216 | 34,077,724 | ||||||
Goldcorp Inc. | 2,024,742 | 27,712,521 | ||||||
Kinross Gold Corp.a | 2,952,942 | 13,401,587 | ||||||
Teck Resources Ltd. Class B | 1,330,422 | 32,980,671 | ||||||
Turquoise Hill Resources Ltd.a,c | 2,384,856 | 8,008,170 | ||||||
Wheaton Precious Metals Corp. | 1,037,971 | 21,475,548 | ||||||
Yamana Gold Inc. | 2,247,772 | 6,615,576 | ||||||
|
| |||||||
| 239,663,055 | ||||||||
MULTI-UTILITIES — 0.51% | ||||||||
Atco Ltd./Canada Class I | 179,451 | 6,585,476 | ||||||
Canadian Utilities Ltd. Class A | 297,136 | 9,223,955 | ||||||
|
| |||||||
| 15,809,431 | ||||||||
MULTILINE RETAIL — 1.43% | ||||||||
Canadian Tire Corp. Ltd. Class Ac | 160,295 | 18,896,591 | ||||||
Dollarama Inc. | 261,904 | 25,708,894 | ||||||
|
| |||||||
| 44,605,485 | ||||||||
OIL, GAS & CONSUMABLE FUELS — 21.08% |
| |||||||
AltaGas Ltd. | 393,670 | 8,694,494 | ||||||
ARC Resources Ltd. | 831,657 | 10,878,704 | ||||||
Cameco Corp. | 938,503 | 9,371,930 | ||||||
Canadian Natural Resources Ltd. | 2,577,575 | 79,090,178 | ||||||
Cenovus Energy Inc. | 2,391,799 | 18,638,386 | ||||||
Crescent Point Energy Corp. | 1,275,591 | 8,719,294 | ||||||
Enbridge Inc. | 3,410,546 | 135,796,177 | ||||||
Encana Corp. | 2,274,915 | 21,138,791 | ||||||
Husky Energy Inc.a,c | 832,588 | 9,702,182 | ||||||
Imperial Oil Ltd. | 698,555 | 20,537,378 | ||||||
Inter Pipeline Ltd. | 855,200 | 15,599,939 | ||||||
Keyera Corp. | 437,178 | 12,636,754 | ||||||
Pembina Pipeline Corp. | 927,294 | 29,769,558 | ||||||
Peyto Exploration & Development Corp. | 389,659 | 6,660,333 | ||||||
| Security | Shares | Value | ||||||
PrairieSky Royalty Ltd. | 491,292 | $ | 11,497,115 | |||||
Seven Generations Energy Ltd. Class Aa | 571,223 | 8,661,176 | ||||||
Suncor Energy Inc. | 3,874,849 | 120,935,467 | ||||||
Tourmaline Oil Corp.a | 509,741 | 9,904,120 | ||||||
TransCanada Corp. | 2,012,336 | 101,776,451 | ||||||
Veresen Inc. | 738,923 | 10,367,023 | ||||||
Vermilion Energy Inc. | 274,534 | 8,912,091 | ||||||
|
| |||||||
| 659,287,541 | ||||||||
PAPER & FOREST PRODUCTS — 0.26% |
| |||||||
West Fraser Timber Co. Ltd. | 157,217 | 8,124,498 | ||||||
|
| |||||||
| 8,124,498 | ||||||||
PHARMACEUTICALS — 0.33% | ||||||||
Valeant Pharmaceuticals International Inc.a,c | 770,884 | 10,323,543 | ||||||
|
| |||||||
| 10,323,543 | ||||||||
REAL ESTATE MANAGEMENT & DEVELOPMENT — 0.16% |
| |||||||
First Capital Realty Inc. | 317,895 | 5,144,638 | ||||||
|
| |||||||
| 5,144,638 | ||||||||
ROAD & RAIL — 6.22% | ||||||||
Canadian National Railway Co. | 1,785,075 | 144,115,886 | ||||||
Canadian Pacific Railway Ltd. | 325,023 | 50,373,056 | ||||||
|
| |||||||
| 194,488,942 | ||||||||
SOFTWARE — 1.43% | ||||||||
Constellation Software Inc./Canada | 44,999 | 24,921,639 | ||||||
Open Text Corp. | 614,943 | 19,707,605 | ||||||
|
| |||||||
| 44,629,244 | ||||||||
TECHNOLOGY HARDWARE, STORAGE & PERIPHERALS — 0.35% |
| |||||||
BlackBerry Ltd.a,c | 1,179,708 | 10,886,717 | ||||||
|
| |||||||
| 10,886,717 | ||||||||
TEXTILES, APPAREL & LUXURY GOODS — 0.52% |
| |||||||
Gildan Activewear Inc. | 524,471 | 16,360,567 | ||||||
|
| |||||||
| 16,360,567 | ||||||||
TRADING COMPANIES & DISTRIBUTORS — 0.29% |
| |||||||
Finning International Inc. | 399,138 | 9,095,412 | ||||||
|
| |||||||
| 9,095,412 | ||||||||
WIRELESS TELECOMMUNICATION SERVICES — 1.41% |
| |||||||
Rogers Communications Inc. Class B | 846,793 | 44,029,859 | ||||||
|
| |||||||
| 44,029,859 | ||||||||
TOTAL COMMON STOCKS |
| |||||||
(Cost: $3,497,459,111) | 3,112,636,519 | |||||||
| 30 | 2017 iSHARES ANNUAL REPORTTO SHAREHOLDERS |
Table of Contents
Schedule of Investments (Continued)
iSHARES® MSCI CANADA ETF
August 31, 2017
| Security | Shares | Value | ||||||
SHORT-TERM INVESTMENTS — 1.42% |
| |||||||
MONEY MARKET FUNDS — 1.42% |
| |||||||
BlackRock Cash Funds: Institutional, |
| |||||||
1.32%d,e,f | 43,796,579 | $ | 43,809,718 | |||||
BlackRock Cash Funds: Treasury, |
| |||||||
0.96%d,e | 412,255 | 412,255 | ||||||
|
| |||||||
| 44,221,973 | ||||||||
|
| |||||||
TOTAL SHORT-TERM INVESTMENTS |
| |||||||
(Cost: $44,219,286) | 44,221,973 | |||||||
|
| |||||||
| Value | ||||||||
TOTAL INVESTMENTS |
| |||||||
(Cost: $3,541,678,397)g | $ | 3,156,858,492 | ||||||
Other Assets, Less Liabilities — (0.93)% |
| (28,938,790 | ) | |||||
|
| |||||||
NET ASSETS — 100.00% |
| $ | 3,127,919,702 | |||||
|
| |||||||
| a | Non-income earning security. |
| b | This security may be resold to qualified institutional buyers under Rule 144A of the Securities Act of 1933. |
| c | All or a portion of this security represents a security on loan. See Note 1. |
| d | Affiliated issuer. See Schedule 1. |
| e | The rate quoted is the annualized seven-day yield of the fund at period end. |
| f | All or a portion of this security represents an investment of securities lending collateral. See Note 1. |
| g | The cost of investments (including short positions and derivatives, if any) for federal income tax purposes was $3,616,475,008. Net unrealized depreciation was $459,569,244, of which $243,684,593 represented gross unrealized appreciation on investments and $703,253,837 represented gross unrealized depreciation on investments. |
Schedule 1 — Affiliates (Note 2)
Investments in issuers considered to be affiliates of the Fund during the year ended August 31, 2017, for purposes of Section 2(a)(3) of the 1940 Act, and/or related parties of the Fund were as follows:
| Affiliated issuer | Shares held at 08/31/16 | Shares purchased | Shares sold | Shares held at 08/31/17 | Value at 08/31/17 | Net realized gain (loss) a | Change in unrealized appreciation (depreciation) | Income | ||||||||||||||||||||||||
BlackRock Cash Funds: Institutional, SL Agency Shares | 7,205,616 | 36,590,963 | b | — | 43,796,579 | $ | 43,809,718 | $ | (2,561 | ) | $ | 2,687 | $ | — | c | |||||||||||||||||
BlackRock Cash Funds: Treasury, SL Agency Shares | 1,204,076 | — | (791,821 | )b | 412,255 | 412,255 | 288 | — | 8,519 | |||||||||||||||||||||||
|
|
|
|
|
|
|
| |||||||||||||||||||||||||
| $ | 44,221,973 | $ | (2,273 | ) | $ | 2,687 | $ | 8,519 | ||||||||||||||||||||||||
|
|
|
|
|
|
|
| |||||||||||||||||||||||||
| a | Includes realized capital gain distributions from an affiliated fund, if any. |
| b | Net of shares purchased and sold. |
| c | Does not include income earned on investment of securities lending cash collateral which is not direct income of the Fund and is reflected as a component of securities lending income in the statement of operations. |
Schedule 2 — Futures Contracts (Note 5)
Futures contracts outstanding as of August 31, 2017 were as follows:
| Description | Number of | Expiration date | Notional amount (000) | Value/ unrealized appreciation (depreciation) | ||||||||||||
Long Contracts: | ||||||||||||||||
S&P/TSX 60 Index | 20,400 | Sep 2017 | $ | 14,498 | $ | 47,272 | ||||||||||
|
| |||||||||||||||
Total |
| $ | 47,272 | |||||||||||||
|
| |||||||||||||||
SCHEDULESOF INVESTMENTS | 31 |
Table of Contents
Schedule of Investments (Continued)
iSHARES® MSCI CANADA ETF
August 31, 2017
Schedule 3 — Fair Value Measurements
Various inputs are used in determining the fair value of financial instruments. For description of the input levels and information about the Fund’s policy regarding valuation of financial instruments, see Note 1.
The following table summarizes the value of the Fund’s investments according to the fair value hierarchy as of August 31, 2017. The breakdown of the Fund’s investments into major categories is disclosed in the schedule of investments above.
| Level 1 | Level 2 | Level 3 | Total | |||||||||||||
Investments: | ||||||||||||||||
Assets: | ||||||||||||||||
Common stocks | $ | 3,112,636,519 | $ | — | $ | — | $ | 3,112,636,519 | ||||||||
Money market funds | 44,221,973 | — | — | 44,221,973 | ||||||||||||
|
|
|
|
|
|
|
| |||||||||
Total | $ | 3,156,858,492 | $ | — | $ | — | $ | 3,156,858,492 | ||||||||
|
|
|
|
|
|
|
| |||||||||
Derivative financial instrumentsa: | ||||||||||||||||
Assets: | ||||||||||||||||
Futures contracts | $ | 47,272 | $ | — | $ | — | $ | 47,272 | ||||||||
|
|
|
|
|
|
|
| |||||||||
Total | $ | 47,272 | $ | — | $ | — | $ | 47,272 | ||||||||
|
|
|
|
|
|
|
| |||||||||
| a | Shown at the unrealized appreciation (depreciation) on the contracts. |
See notes to financial statements.
| 32 | 2017 iSHARES ANNUAL REPORTTO SHAREHOLDERS |
Table of Contents
Schedule of Investments
August 31, 2017
| Security | Shares | Value | ||||||
COMMON STOCKS — 99.70% |
| |||||||
AIR FREIGHT & LOGISTICS — 0.23% |
| |||||||
Yamato Holdings Co. Ltd. | 1,761,300 | $ | 37,511,241 | |||||
|
| |||||||
| 37,511,241 | ||||||||
AIRLINES — 0.26% |
| |||||||
ANA Holdings Inc. | 5,871,000 | 21,753,532 | ||||||
Japan Airlines Co. Ltd. | 587,100 | 20,153,224 | ||||||
|
| |||||||
| 41,906,756 | ||||||||
AUTO COMPONENTS — 3.19% |
| |||||||
Aisin Seiki Co. Ltd. | 819,100 | 41,155,942 | ||||||
Bridgestone Corp. | 3,131,200 | 134,255,250 | ||||||
Denso Corp. | 2,348,400 | 113,856,645 | ||||||
Koito Manufacturing Co. Ltd. | 587,100 | 36,540,387 | ||||||
NGK Spark Plug Co. Ltd. | 782,800 | 14,900,654 | ||||||
NOK Corp. | 391,400 | 8,798,143 | ||||||
Stanley Electric Co. Ltd. | 782,800 | 25,960,567 | ||||||
Sumitomo Electric Industries Ltd. | 3,718,300 | 58,176,564 | ||||||
Sumitomo Rubber Industries Ltd. | 978,500 | 16,207,573 | ||||||
Toyoda Gosei Co. Ltd. | 391,400 | 9,114,648 | ||||||
Toyota Industries Corp. | 782,800 | 41,679,157 | ||||||
Yokohama Rubber Co. Ltd. (The) | 587,100 | 10,855,429 | ||||||
|
| |||||||
| 511,500,959 | ||||||||
AUTOMOBILES — 8.71% |
| |||||||
Honda Motor Co. Ltd. | 8,416,500 | 235,609,999 | ||||||
Isuzu Motors Ltd. | 2,740,200 | 35,802,359 | ||||||
Mazda Motor Corp. | 2,739,800 | 40,302,891 | ||||||
Mitsubishi Motors Corp. | 3,326,900 | 24,545,183 | ||||||
Nissan Motor Co. Ltd. | 11,350,600 | 112,722,204 | ||||||
Subaru Corp. | 2,957,600 | 103,620,803 | ||||||
Suzuki Motor Corp. | 1,761,300 | 88,433,071 | ||||||
Toyota Motor Corp. | 12,720,500 | 714,617,949 | ||||||
Yamaha Motor Co. Ltd. | 1,369,900 | 38,709,695 | ||||||
|
| |||||||
| 1,394,364,154 | ||||||||
BANKS — 7.37% |
| |||||||
Aozora Bank Ltd. | 5,871,000 | 22,190,950 | ||||||
Bank of Kyoto Ltd. (The) | 1,543,000 | 14,257,959 | ||||||
Chiba Bank Ltd. (The) | 3,484,000 | 23,298,419 | ||||||
Chugoku Bank Ltd. (The) | 782,800 | 10,540,701 | ||||||
Concordia Financial Group Ltd. | 5,871,700 | 28,056,760 | ||||||
Fukuoka Financial Group Inc. | 3,914,000 | 17,176,649 | ||||||
Hachijuni Bank Ltd. (The) | 1,957,000 | 11,913,411 | ||||||
| Security | Shares | Value | ||||||
Hiroshima Bank Ltd. (The) | 2,454,000 | $ | 9,855,243 | |||||
Japan Post Bank Co. Ltd. | 1,957,000 | 24,893,694 | ||||||
Kyushu Financial Group Inc. | 1,761,400 | 10,722,679 | ||||||
Mebuki Financial Group Inc. | 4,813,880 | 17,058,088 | ||||||
Mitsubishi UFJ Financial Group Inc. | 58,577,080 | 358,775,301 | ||||||
Mizuho Financial Group Inc. | 117,224,380 | 201,409,506 | ||||||
Resona Holdings Inc. | 10,763,500 | 53,651,246 | ||||||
Seven Bank Ltd. | 2,739,800 | 10,380,671 | ||||||
Shinsei Bank Ltd. | 7,828,000 | 12,517,972 | ||||||
Shizuoka Bank Ltd. (The) | 2,551,000 | 22,274,314 | ||||||
Sumitomo Mitsui Financial Group Inc. | 6,653,800 | 248,716,457 | ||||||
Sumitomo Mitsui Trust Holdings Inc. | 1,589,432 | 54,964,367 | ||||||
Suruga Bank Ltd. | 782,800 | 16,728,563 | ||||||
Yamaguchi Financial Group Inc. | 922,000 | 10,421,297 | ||||||
|
| |||||||
| 1,179,804,247 | ||||||||
BEVERAGES — 1.44% |
| |||||||
Asahi Group Holdings Ltd. | 1,957,000 | 85,154,216 | ||||||
Coca-Cola Bottlers Japan Inc. | 587,100 | 20,110,549 | ||||||
Kirin Holdings Co. Ltd. | 4,190,300 | 95,048,918 | ||||||
Suntory Beverage & Food Ltd. | 657,600 | 30,352,608 | ||||||
|
| |||||||
| 230,666,291 | ||||||||
BUILDING PRODUCTS — 1.39% |
| |||||||
Asahi Glass Co. Ltd. | 984,200 | 38,362,875 | ||||||
Daikin Industries Ltd. | 1,185,500 | 118,431,515 | ||||||
LIXIL Group Corp. | 1,369,900 | 35,896,707 | ||||||
TOTO Ltd. | 782,800 | 29,765,746 | ||||||
|
| |||||||
| 222,456,843 | ||||||||
CAPITAL MARKETS — 1.23% |
| |||||||
Daiwa Securities Group Inc. | 7,828,000 | 42,802,929 | ||||||
Japan Exchange Group Inc. | 2,544,100 | 43,295,469 | ||||||
Nomura Holdings Inc. | 17,613,000 | 98,018,922 | ||||||
SBI Holdings Inc./Japan | 978,510 | 13,584,983 | ||||||
|
| |||||||
| 197,702,303 | ||||||||
CHEMICALS — 4.86% |
| |||||||
Air Water Inc. | 782,800 | 14,424,118 | ||||||
Asahi Kasei Corp. | 6,007,000 | 71,880,965 | ||||||
Daicel Corp. | 1,369,900 | 17,438,033 | ||||||
Hitachi Chemical Co. Ltd. | 587,100 | 15,875,065 | ||||||
JSR Corp. | 978,500 | 19,043,676 | ||||||
Kaneka Corp. | 1,370,000 | 10,655,279 | ||||||
SCHEDULESOF INVESTMENTS | 33 |
Table of Contents
Schedule of Investments (Continued)
iSHARES® MSCI JAPAN ETF
August 31, 2017
| Security | Shares | Value | ||||||
Kansai Paint Co. Ltd. | 978,500 | $ | 24,795,898 | |||||
Kuraray Co. Ltd. | 1,761,300 | 33,414,450 | ||||||
Mitsubishi Chemical Holdings Corp. | 7,054,100 | 65,567,366 | ||||||
Mitsubishi Gas Chemical Co. Inc. | 811,300 | 20,116,643 | ||||||
Mitsui Chemicals Inc. | 4,239,000 | 25,343,104 | ||||||
Nippon Paint Holdings Co. Ltd. | 782,800 | 26,671,815 | ||||||
Nissan Chemical Industries Ltd. | 587,100 | 19,657,128 | ||||||
Nitto Denko Corp. | 792,400 | 69,822,780 | ||||||
Shin-Etsu Chemical Co. Ltd. | 1,897,700 | 167,665,226 | ||||||
Sumitomo Chemical Co. Ltd. | 7,828,000 | 46,871,270 | ||||||
Taiyo Nippon Sanso Corp. | 587,100 | 6,843,988 | ||||||
Teijin Ltd. | 978,500 | 19,843,831 | ||||||
Toray Industries Inc. | 7,240,900 | 68,882,630 | ||||||
Tosoh Corp. | 2,797,000 | 32,783,300 | ||||||
|
| |||||||
| 777,596,565 | ||||||||
COMMERCIAL SERVICES & SUPPLIES — 1.00% |
| |||||||
Dai Nippon Printing Co. Ltd. | 2,545,000 | 30,014,628 | ||||||
Park24 Co. Ltd. | 587,100 | 14,098,722 | ||||||
Secom Co. Ltd. | 986,300 | 73,143,563 | ||||||
Sohgo Security Services Co. Ltd. | 391,400 | 17,087,743 | ||||||
Toppan Printing Co. Ltd. | 2,602,000 | 26,029,457 | ||||||
|
| |||||||
| 160,374,113 | ||||||||
CONSTRUCTION & ENGINEERING — 1.05% |
| |||||||
JGC Corp. | 978,500 | 15,709,699 | ||||||
Kajima Corp. | 4,220,000 | 38,687,807 | ||||||
Obayashi Corp. | 3,131,200 | 36,899,568 | ||||||
Shimizu Corp. | 2,605,100 | 26,888,911 | ||||||
Taisei Corp. | 4,992,000 | 50,028,857 | ||||||
|
| |||||||
| 168,214,842 | ||||||||
CONSTRUCTION MATERIALS — 0.14% |
| |||||||
Taiheiyo Cement Corp. | 5,871,000 | 22,617,699 | ||||||
|
| |||||||
| 22,617,699 | ||||||||
CONSUMER FINANCE — 0.22% |
| |||||||
Acom Co. Ltd.a | 1,957,000 | 8,001,544 | ||||||
AEON Financial Service Co. Ltd. | 587,170 | 12,435,883 | ||||||
Credit Saison Co. Ltd. | 782,800 | 14,189,406 | ||||||
|
| |||||||
| 34,626,833 | ||||||||
| Security | Shares | Value | ||||||
CONTAINERS & PACKAGING — 0.08% |
| |||||||
Toyo Seikan Group Holdings Ltd. | 782,800 | $ | 12,894,934 | |||||
|
| |||||||
| 12,894,934 | ||||||||
DIVERSIFIED CONSUMER SERVICES — 0.09% |
| |||||||
Benesse Holdings Inc. | 391,400 | 15,042,904 | ||||||
|
| |||||||
| 15,042,904 | ||||||||
DIVERSIFIED FINANCIAL SERVICES — 0.71% |
| |||||||
Mitsubishi UFJ Lease & Finance Co. Ltd. | 2,152,700 | 10,874,988 | ||||||
ORIX Corp. | 6,458,100 | 103,243,930 | ||||||
|
| |||||||
| 114,118,918 | ||||||||
DIVERSIFIED TELECOMMUNICATION SERVICES — 1.05% |
| |||||||
Nippon Telegraph & Telephone Corp. | 3,381,900 | 168,019,528 | ||||||
|
| |||||||
| 168,019,528 | ||||||||
ELECTRIC UTILITIES — 1.18% |
| |||||||
Chubu Electric Power Co. Inc. | 3,131,200 | 40,882,559 | ||||||
Chugoku Electric Power Co. Inc. (The) | 1,369,900 | 15,782,602 | ||||||
Kansai Electric Power Co. Inc. (The) | 3,522,600 | 49,289,515 | ||||||
Kyushu Electric Power Co. Inc. | 2,152,700 | 25,270,656 | ||||||
Tohoku Electric Power Co. Inc. | 2,152,700 | 29,417,234 | ||||||
Tokyo Electric Power Co. Holdings Inc.a | 7,045,200 | 28,485,499 | ||||||
|
| |||||||
| 189,128,065 | ||||||||
ELECTRICAL EQUIPMENT — 1.84% |
| |||||||
Fuji Electric Co. Ltd. | 2,424,000 | 13,346,756 | ||||||
Mabuchi Motor Co. Ltd. | 218,900 | 10,322,470 | ||||||
Mitsubishi Electric Corp. | 9,393,600 | 138,864,139 | ||||||
Nidec Corp. | 1,174,200 | 132,932,328 | ||||||
|
| |||||||
| 295,465,693 | ||||||||
ELECTRONIC EQUIPMENT, INSTRUMENTS & COMPONENTS — 5.72% |
| |||||||
Alps Electric Co. Ltd. | 979,200 | 26,868,835 | ||||||
Hamamatsu Photonics KK | 782,800 | 24,218,009 | ||||||
Hirose Electric Co. Ltd. | 195,760 | 27,071,299 | ||||||
Hitachi High-Technologies Corp. | 391,400 | 13,958,250 | ||||||
Hitachi Ltd. | 23,484,000 | 161,524,514 | ||||||
Keyence Corp. | 473,152 | 246,162,852 | ||||||
Kyocera Corp. | 1,565,600 | 93,884,790 | ||||||
Murata Manufacturing Co. Ltd. | 928,100 | 142,006,215 | ||||||
| 34 | 2017 iSHARES ANNUAL REPORTTO SHAREHOLDERS |
Table of Contents
Schedule of Investments (Continued)
iSHARES® MSCI JAPAN ETF
August 31, 2017
| Security | Shares | Value | ||||||
Nippon Electric Glass Co. Ltd. | 391,500 | $ | 14,868,890 | |||||
Omron Corp. | 978,500 | 49,076,140 | ||||||
Shimadzu Corp. | 1,174,900 | 21,574,350 | ||||||
TDK Corp. | 605,900 | 40,573,169 | ||||||
Yaskawa Electric Corp. | 1,174,200 | 35,526,858 | ||||||
Yokogawa Electric Corp. | 1,179,000 | 18,350,236 | ||||||
|
| |||||||
| 915,664,407 | ||||||||
EQUITY REAL ESTATE INVESTMENT TRUSTS (REITS) — 1.12% |
| |||||||
Daiwa House REIT Investment Corp. | 6,265 | 15,301,036 | ||||||
Japan Prime Realty Investment Corp. | 3,914 | 14,047,156 | ||||||
Japan Real Estate Investment Corp. | 5,871 | 30,405,869 | ||||||
Japan Retail Fund Investment Corp. | 12,106 | 22,251,897 | ||||||
Nippon Building Fund Inc. | 6,278 | 33,369,344 | ||||||
Nippon Prologis REIT Inc. | 7,828 | 16,984,612 | ||||||
Nomura Real Estate Master Fund Inc. | 17,613 | 23,252,489 | ||||||
United Urban Investment Corp. | 15,663 | 23,609,774 | ||||||
|
| |||||||
| 179,222,177 | ||||||||
FOOD & STAPLES RETAILING — 1.67% |
| |||||||
Aeon Co. Ltd. | 2,935,900 | 43,267,579 | ||||||
FamilyMart UNY Holdings Co. Ltd. | 391,400 | 21,195,203 | ||||||
Lawson Inc. | 239,700 | 16,094,703 | ||||||
Seven & I Holdings Co. Ltd. | 3,718,380 | 147,471,640 | ||||||
Sundrug Co. Ltd. | 391,400 | 16,198,683 | ||||||
Tsuruha Holdings Inc. | 195,700 | 23,275,604 | ||||||
|
| |||||||
| 267,503,412 | ||||||||
FOOD PRODUCTS — 1.56% |
| |||||||
Ajinomoto Co. Inc. | 2,739,800 | 54,056,657 | ||||||
Calbee Inc.b | 393,200 | 13,432,964 | ||||||
Kikkoman Corp. | 706,900 | 22,126,753 | ||||||
MEIJI Holdings Co. Ltd. | 587,156 | 46,733,478 | ||||||
NH Foods Ltd. | 854,000 | 25,062,875 | ||||||
Nisshin Seifun Group Inc. | 978,575 | 16,991,249 | ||||||
Nissin Foods Holdings Co. Ltd. | 278,000 | 17,125,568 | ||||||
Toyo Suisan Kaisha Ltd. | 391,400 | 14,456,124 | ||||||
Yakult Honsha Co. Ltd. | 412,700 | 28,573,269 | ||||||
Yamazaki Baking Co. Ltd. | 587,100 | 11,116,813 | ||||||
|
| |||||||
| 249,675,750 | ||||||||
| Security | Shares | Value | ||||||
GAS UTILITIES — 0.62% |
| |||||||
Osaka Gas Co. Ltd. | 8,892,000 | $ | 34,748,766 | |||||
Toho Gas Co. Ltd. | 1,957,000 | 12,891,378 | ||||||
Tokyo Gas Co. Ltd. | 9,785,000 | 51,850,009 | ||||||
|
| |||||||
| 99,490,153 | ||||||||
HEALTH CARE EQUIPMENT & SUPPLIES — 1.71% |
| |||||||
CYBERDYNE Inc.a,b | 391,400 | 5,142,326 | ||||||
Hoya Corp. | 1,957,000 | 111,932,718 | ||||||
Olympus Corp. | 1,376,200 | 47,453,017 | ||||||
Sysmex Corp. | 782,800 | 48,222,642 | ||||||
Terumo Corp. | 1,565,600 | 60,456,115 | ||||||
|
| |||||||
| 273,206,818 | ||||||||
HEALTH CARE PROVIDERS & SERVICES — 0.37% |
| |||||||
Alfresa Holdings Corp. | 978,500 | 18,394,662 | ||||||
Medipal Holdings Corp. | 782,800 | 13,791,107 | ||||||
Miraca Holdings Inc. | 274,300 | 12,448,923 | ||||||
Suzuken Co. Ltd./Aichi Japan | 391,440 | 14,244,205 | ||||||
|
| |||||||
| 58,878,897 | ||||||||
HEALTH CARE TECHNOLOGY — 0.16% |
| |||||||
M3 Inc. | 978,500 | 25,400,459 | ||||||
|
| |||||||
| 25,400,459 | ||||||||
HOTELS, RESTAURANTS & LEISURE — 0.59% |
| |||||||
McDonald’s Holdings Co. Japan Ltd. | 391,400 | 17,372,243 | ||||||
Oriental Land Co. Ltd./Japan | 1,026,600 | 77,036,974 | ||||||
|
| |||||||
| 94,409,217 | ||||||||
HOUSEHOLD DURABLES — 3.52% |
| |||||||
Casio Computer Co. Ltd. | 978,900 | 13,821,648 | ||||||
Iida Group Holdings Co. Ltd. | 782,880 | 13,294,591 | ||||||
Nikon Corp. | 1,565,600 | 25,789,867 | ||||||
Panasonic Corp. | 10,763,515 | 143,321,200 | ||||||
Rinnai Corp. | 195,700 | 16,981,056 | ||||||
Sekisui Chemical Co. Ltd. | 1,964,000 | 36,581,865 | ||||||
Sekisui House Ltd. | 2,935,500 | 50,783,137 | ||||||
Sharp Corp./Japana,b | 7,294,000 | 21,870,071 | ||||||
Sony Corp. | 6,115,500 | 240,986,039 | ||||||
|
| |||||||
| 563,429,474 | ||||||||
HOUSEHOLD PRODUCTS — 0.42% |
| |||||||
Lion Corp. | 1,100,600 | 21,860,000 | ||||||
Unicharm Corp. | 1,957,000 | 45,999,991 | ||||||
|
| |||||||
| 67,859,991 | ||||||||
SCHEDULESOF INVESTMENTS | 35 |
Table of Contents
Schedule of Investments (Continued)
iSHARES® MSCI JAPAN ETF
August 31, 2017
| Security | Shares | Value | ||||||
INDEPENDENT POWER AND RENEWABLE ELECTRICITY PRODUCERS — 0.13% |
| |||||||
Electric Power Development Co. Ltd. | 782,800 | $ | 21,408,577 | |||||
|
| |||||||
| 21,408,577 | ||||||||
INDUSTRIAL CONGLOMERATES — 0.52% |
| |||||||
Keihan Holdings Co. Ltd. | 1,957,000 | 11,788,943 | ||||||
Seibu Holdings Inc. | 979,200 | 16,824,161 | ||||||
Toshiba Corp.a,b | 19,570,000 | 54,410,503 | ||||||
|
| |||||||
| 83,023,607 | ||||||||
INSURANCE — 2.73% |
| |||||||
Dai-ichi Life Holdings Inc. | 5,285,000 | 84,994,094 | ||||||
Japan Post Holdings Co. Ltd. | 2,152,700 | 26,718,047 | ||||||
MS&AD Insurance Group Holdings Inc. | 2,348,440 | 77,434,933 | ||||||
Sompo Holdings Inc. | 1,761,350 | 66,174,653 | ||||||
Sony Financial Holdings Inc. | 782,800 | 12,389,947 | ||||||
T&D Holdings Inc. | 2,739,800 | 37,552,138 | ||||||
Tokio Marine Holdings Inc. | 3,326,900 | 132,701,172 | ||||||
|
| |||||||
| 437,964,984 | ||||||||
INTERNET & DIRECT MARKETING RETAIL — 0.52% |
| |||||||
Rakuten Inc. | 4,501,100 | 53,390,751 | ||||||
Start Today Co. Ltd. | 979,200 | 30,427,621 | ||||||
|
| |||||||
| 83,818,372 | ||||||||
INTERNET SOFTWARE & SERVICES — 0.39% |
| |||||||
DeNA Co. Ltd. | 520,300 | 11,118,895 | ||||||
Kakaku.com Inc. | 696,100 | 8,658,558 | ||||||
Mixi Inc. | 200,800 | 10,691,332 | ||||||
Yahoo Japan Corp. | 6,849,500 | 31,366,055 | ||||||
|
| |||||||
| 61,834,840 | ||||||||
IT SERVICES — 1.04% |
| |||||||
Fujitsu Ltd. | 9,785,000 | 72,467,322 | ||||||
Nomura Research Institute Ltd. | 620,004 | 24,110,641 | ||||||
NTT Data Corp. | 2,935,500 | 31,686,116 | ||||||
Obic Co. Ltd. | 391,400 | 24,502,508 | ||||||
Otsuka Corp. | 219,700 | 14,532,219 | ||||||
|
| |||||||
| 167,298,806 | ||||||||
LEISURE PRODUCTS — 0.81% |
| |||||||
Bandai Namco Holdings Inc. | 978,598 | 32,765,161 | ||||||
Sankyo Co. Ltd. | 195,700 | 6,383,454 | ||||||
Sega Sammy Holdings Inc. | 782,800 | 11,237,725 | ||||||
Shimano Inc. | 391,400 | 52,845,757 | ||||||
Yamaha Corp. | 782,800 | 27,240,814 | ||||||
|
| |||||||
| 130,472,911 | ||||||||
| Security | Shares | Value | ||||||
MACHINERY — 5.48% |
| |||||||
Amada Holdings Co. Ltd. | 1,565,600 | $ | 17,169,537 | |||||
FANUC Corp. | 942,300 | 182,706,542 | ||||||
Hino Motors Ltd. | 1,174,200 | 13,474,601 | ||||||
Hitachi Construction Machinery Co. Ltd. | 587,100 | 16,563,197 | ||||||
Hoshizaki Corp. | 250,200 | 21,755,533 | ||||||
IHI Corp.a | 7,828,000 | 25,889,442 | ||||||
JTEKT Corp. | 1,174,900 | 15,703,052 | ||||||
Kawasaki Heavy Industries Ltd. | 7,828,000 | 24,040,196 | ||||||
Komatsu Ltd. | 4,501,100 | 121,667,931 | ||||||
Kubota Corp. | 5,088,200 | 88,024,103 | ||||||
Kurita Water Industries Ltd. | 391,400 | 11,255,506 | ||||||
Makita Corp. | 1,174,200 | 47,102,426 | ||||||
MINEBEA MITSUMI Inc. | 1,957,000 | 32,130,647 | ||||||
Mitsubishi Heavy Industries Ltd. | 15,656,000 | 59,872,891 | ||||||
Nabtesco Corp. | 587,100 | 20,510,626 | ||||||
NGK Insulators Ltd. | 1,204,000 | 22,458,768 | ||||||
NSK Ltd. | 1,890,000 | 22,410,049 | ||||||
SMC Corp./Japan | 278,200 | 95,320,026 | ||||||
Sumitomo Heavy Industries Ltd. | 2,637,000 | 19,646,920 | ||||||
THK Co. Ltd. | 587,700 | 19,597,120 | ||||||
|
| |||||||
| 877,299,113 | ||||||||
MARINE — 0.21% |
| |||||||
Mitsui OSK Lines Ltd. | 5,871,000 | 18,830,302 | ||||||
Nippon Yusen KKa | 7,828,000 | 15,505,215 | ||||||
|
| |||||||
| 34,335,517 | ||||||||
MEDIA — 0.51% |
| |||||||
Dentsu Inc. | 1,035,400 | 43,274,941 | ||||||
Hakuhodo DY Holdings Inc. | 1,174,900 | 15,980,604 | ||||||
Toho Co. Ltd./Tokyo | 587,100 | 21,790,873 | ||||||
|
| |||||||
| 81,046,418 | ||||||||
METALS & MINING — 1.50% |
| |||||||
Hitachi Metals Ltd. | 978,500 | 13,060,299 | ||||||
JFE Holdings Inc. | 2,544,150 | 50,208,012 | ||||||
Kobe Steel Ltd.a | 1,571,200 | 18,901,225 | ||||||
Maruichi Steel Tube Ltd. | 242,600 | 7,174,841 | ||||||
Mitsubishi Materials Corp. | 587,100 | 21,044,062 | ||||||
Nippon Steel & Sumitomo Metal Corp. | 3,718,770 | 88,678,102 | ||||||
Sumitomo Metal Mining Co. Ltd. | 2,429,000 | 41,822,233 | ||||||
|
| |||||||
| 240,888,774 | ||||||||
| 36 | 2017 iSHARES ANNUAL REPORTTO SHAREHOLDERS |
Table of Contents
Schedule of Investments (Continued)
iSHARES® MSCI JAPAN ETF
August 31, 2017
| Security | Shares | Value | ||||||
MULTILINE RETAIL — 0.72% |
| |||||||
Don Quijote Holdings Co. Ltd. | 587,100 | $ | 22,270,966 | |||||
Isetan Mitsukoshi Holdings Ltd. | 1,565,660 | 16,103,281 | ||||||
J Front Retailing Co. Ltd. | 1,174,200 | 16,376,495 | ||||||
Marui Group Co. Ltd. | 978,500 | 13,682,641 | ||||||
Ryohin Keikaku Co. Ltd. | 117,400 | 32,534,072 | ||||||
Takashimaya Co. Ltd. | 1,522,000 | 13,953,280 | ||||||
|
| |||||||
| 114,920,735 | ||||||||
OIL, GAS & CONSUMABLE FUELS — 0.89% |
| |||||||
Idemitsu Kosan Co. Ltd. | 587,100 | 14,328,099 | ||||||
INPEX Corp. | 4,696,800 | 44,851,325 | ||||||
JXTG Holdings Inc. | 15,124,895 | 73,164,584 | ||||||
Showa Shell Sekiyu KK | 991,900 | 10,859,890 | ||||||
|
| |||||||
| 143,203,898 | ||||||||
PAPER & FOREST PRODUCTS — 0.13% |
| |||||||
Oji Holdings Corp. | 3,914,000 | 20,519,517 | ||||||
|
| |||||||
| 20,519,517 | ||||||||
PERSONAL PRODUCTS — 1.60% |
| |||||||
Kao Corp. | 2,388,700 | 148,930,214 | ||||||
Kose Corp. | 145,400 | 18,231,147 | ||||||
Pola Orbis Holdings Inc. | 410,800 | 13,194,421 | ||||||
Shiseido Co. Ltd. | 1,825,900 | 75,634,001 | ||||||
|
| |||||||
| 255,989,783 | ||||||||
PHARMACEUTICALS — 5.04% |
| |||||||
Astellas Pharma Inc. | 9,980,750 | 125,462,181 | ||||||
Chugai Pharmaceutical Co. Ltd. | 1,174,200 | 47,689,206 | ||||||
Daiichi Sankyo Co. Ltd. | 2,740,269 | 64,709,787 | ||||||
Eisai Co. Ltd. | 1,369,900 | 70,872,348 | ||||||
Hisamitsu Pharmaceutical Co. Inc. | 256,300 | 12,318,980 | ||||||
Kyowa Hakko Kirin Co. Ltd. | 1,174,200 | 20,601,310 | ||||||
Mitsubishi Tanabe Pharma Corp. | 1,174,200 | 28,805,561 | ||||||
Ono Pharmaceutical Co. Ltd. | 1,965,900 | 40,028,911 | ||||||
Otsuka Holdings Co. Ltd. | 1,957,000 | 78,752,980 | ||||||
Santen Pharmaceutical Co. Ltd. | 1,761,300 | 27,301,270 | ||||||
Shionogi & Co. Ltd. | 1,411,700 | 74,330,379 | ||||||
Sumitomo Dainippon Pharma Co. Ltd. | 782,800 | 10,626,051 | ||||||
Taisho Pharmaceutical Holdings Co. Ltd. | 142,700 | 11,124,532 | ||||||
Takeda Pharmaceutical Co. Ltd. | 3,522,600 | 194,501,546 | ||||||
|
| |||||||
| 807,125,042 | ||||||||
| Security | Shares | Value | ||||||
PROFESSIONAL SERVICES — 0.66% |
| |||||||
Recruit Holdings Co. Ltd. | 5,283,900 | $ | 105,188,305 | |||||
|
| |||||||
| 105,188,305 | ||||||||
REAL ESTATE MANAGEMENT & DEVELOPMENT — 2.98% |
| |||||||
Aeon Mall Co. Ltd. | 587,100 | 10,540,701 | ||||||
Daito Trust Construction Co. Ltd. | 333,100 | 58,971,956 | ||||||
Daiwa House Industry Co. Ltd. | 2,739,800 | 95,766,042 | ||||||
Hulic Co. Ltd. | 1,369,900 | 13,554,617 | ||||||
Mitsubishi Estate Co. Ltd. | 6,117,300 | 105,271,363 | ||||||
Mitsui Fudosan Co. Ltd. | 4,360,900 | 94,223,335 | ||||||
Nomura Real Estate Holdings Inc. | 587,100 | 12,114,339 | ||||||
Sumitomo Realty & Development Co. Ltd. | 1,957,000 | 59,158,086 | ||||||
Tokyo Tatemono Co. Ltd. | 978,500 | 12,037,879 | ||||||
Tokyu Fudosan Holdings Corp. | 2,553,000 | 15,216,864 | ||||||
|
| |||||||
| 476,855,182 | ||||||||
ROAD & RAIL — 3.90% |
| |||||||
Central Japan Railway Co. | 702,400 | 118,896,166 | ||||||
East Japan Railway Co. | 1,610,400 | 147,563,911 | ||||||
Hankyu Hanshin Holdings Inc. | 1,174,200 | 44,701,963 | ||||||
Keikyu Corp. | 2,111,000 | 22,402,762 | ||||||
Keio Corp. | 2,788,000 | 23,178,448 | ||||||
Keisei Electric Railway Co. Ltd. | 609,400 | 16,583,255 | ||||||
Kintetsu Group Holdings Co. Ltd. | 8,862,000 | 33,415,682 | ||||||
Kyushu Railway Co. | 782,800 | 24,466,945 | ||||||
Nagoya Railroad Co. Ltd. | 4,514,000 | 20,178,884 | ||||||
Nippon Express Co. Ltd. | 3,914,000 | 26,991,877 | ||||||
Odakyu Electric Railway Co. Ltd. | 1,369,900 | 26,511,784 | ||||||
Tobu Railway Co. Ltd. | 4,665,000 | 25,770,671 | ||||||
Tokyu Corp. | 2,568,900 | 37,345,448 | ||||||
West Japan Railway Co. | 782,800 | 56,835,860 | ||||||
|
| |||||||
| 624,843,656 | ||||||||
SEMICONDUCTORS & SEMICONDUCTOR EQUIPMENT — 1.21% |
| |||||||
Disco Corp. | 133,300 | 23,871,915 | ||||||
Renesas Electronics Corp.a | 2,544,100 | 25,635,171 | ||||||
Rohm Co. Ltd. | 437,500 | 34,026,894 | ||||||
Tokyo Electron Ltd. | 782,852 | 109,966,309 | ||||||
|
| |||||||
| 193,500,289 | ||||||||
SCHEDULESOF INVESTMENTS | 37 |
Table of Contents
Schedule of Investments (Continued)
iSHARES® MSCI JAPAN ETF
August 31, 2017
| Security | Shares | Value | ||||||
SOFTWARE — 1.75% |
| |||||||
Konami Holdings Corp. | 444,300 | $ | 23,131,374 | |||||
LINE Corp.a,b | 196,600 | 6,930,838 | ||||||
Nexon Co. Ltd.a | 979,200 | 24,404,376 | ||||||
Nintendo Co. Ltd. | 554,400 | 184,564,928 | ||||||
Oracle Corp. Japan | 195,700 | 14,456,124 | ||||||
Trend Micro Inc./Japan | 587,100 | 27,151,908 | ||||||
|
| |||||||
| 280,639,548 | ||||||||
SPECIALTY RETAIL — 1.28% |
| |||||||
ABC-Mart Inc. | 195,700 | 10,046,384 | ||||||
Fast Retailing Co. Ltd. | 258,300 | 73,856,996 | ||||||
Hikari Tsushin Inc. | 93,100 | 11,538,107 | ||||||
Nitori Holdings Co. Ltd. | 391,400 | 60,384,990 | ||||||
Shimamura Co. Ltd. | 108,100 | 13,181,010 | ||||||
USS Co. Ltd. | 978,500 | 19,212,598 | ||||||
Yamada Denki Co. Ltd. | 3,131,200 | 16,927,712 | ||||||
|
| |||||||
| 205,147,797 | ||||||||
TECHNOLOGY HARDWARE, STORAGE & PERIPHERALS — 2.56% |
| |||||||
Brother Industries Ltd. | 1,174,200 | 27,802,700 | ||||||
Canon Inc. | 5,283,950 | 185,029,469 | ||||||
FUJIFILM Holdings Corp. | 1,957,000 | 76,850,391 | ||||||
Konica Minolta Inc. | 2,349,100 | 18,739,867 | ||||||
NEC Corp. | 12,373,000 | 32,714,365 | ||||||
Ricoh Co. Ltd. | 3,326,900 | 33,281,091 | ||||||
Seiko Epson Corp. | 1,369,900 | 35,112,556 | ||||||
|
| |||||||
| 409,530,439 | ||||||||
TEXTILES, APPAREL & LUXURY GOODS — 0.07% |
| |||||||
Asics Corp. | 782,800 | 11,785,386 | ||||||
|
| |||||||
| 11,785,386 | ||||||||
TOBACCO — 1.14% |
| |||||||
Japan Tobacco Inc. | 5,341,600 | 182,680,196 | ||||||
|
| |||||||
| 182,680,196 | ||||||||
TRADING COMPANIES & DISTRIBUTORS — 3.83% |
| |||||||
ITOCHU Corp. | 7,240,900 | 118,159,698 | ||||||
Marubeni Corp. | 8,023,700 | 52,154,779 | ||||||
MISUMI Group Inc. | 1,369,900 | 35,112,556 | ||||||
Mitsubishi Corp. | 7,436,600 | 171,860,732 | ||||||
Mitsui & Co. Ltd. | 8,219,400 | 122,813,041 | ||||||
Sumitomo Corp. | 5,871,000 | 83,029,361 | ||||||
Toyota Tsusho Corp. | 978,500 | 30,094,698 | ||||||
|
| |||||||
| 613,224,865 | ||||||||
| Security | Shares | Value | ||||||
TRANSPORTATION INFRASTRUCTURE — 0.12% |
| |||||||
Japan Airport Terminal Co. Ltd. | 195,700 | $ | 7,094,703 | |||||
Kamigumi Co. Ltd. | 1,106,000 | 12,229,711 | ||||||
|
| |||||||
| 19,324,414 | ||||||||
WIRELESS TELECOMMUNICATION SERVICES — 4.48% |
| |||||||
KDDI Corp. | 8,806,500 | 237,405,829 | ||||||
NTT DOCOMO Inc. | 6,653,800 | 154,374,689 | ||||||
SoftBank Group Corp. | 4,022,800 | 326,107,774 | ||||||
|
| |||||||
| 717,888,292 | ||||||||
|
| |||||||
TOTAL COMMON STOCKS |
| |||||||
(Cost: $15,934,505,938) |
| 15,970,512,906 | ||||||
SHORT-TERM INVESTMENTS — 0.29% |
| |||||||
MONEY MARKET FUNDS — 0.29% |
| |||||||
BlackRock Cash Funds: Institutional, |
| |||||||
1.32%c,d,e | 40,539,970 | 40,552,132 | ||||||
BlackRock Cash Funds: Treasury, |
| |||||||
0.96%c,d | 5,281,032 | 5,281,032 | ||||||
|
| |||||||
| 45,833,164 | ||||||||
|
| |||||||
TOTAL SHORT-TERM INVESTMENTS |
| |||||||
(Cost: $45,826,352) |
| 45,833,164 | ||||||
|
| |||||||
TOTAL INVESTMENTS |
| |||||||
(Cost: $15,980,332,290)f |
| 16,016,346,070 | ||||||
Other Assets, Less Liabilities — 0.01% |
| 1,342,829 | ||||||
|
| |||||||
NET ASSETS — 100.00% |
| $ | 16,017,688,899 | |||||
|
| |||||||
| a | Non-income earning security. |
| b | All or a portion of this security represents a security on loan. See Note 1. |
| c | Affiliated issuer. See Schedule 1. |
| d | The rate quoted is the annualized seven-day yield of the fund at period end. |
| e | All or a portion of this security represents an investment of securities lending collateral. See Note 1. |
| f | The cost of investments (including short positions and derivatives, if any) for federal income tax purposes was $16,201,644,044. Net unrealized depreciation was $184,655,742, of which $1,514,855,596 represented gross unrealized appreciation on investments and $1,699,511,338 represented gross unrealized depreciation on investments. |
| 38 | 2017 iSHARES ANNUAL REPORTTO SHAREHOLDERS |
Table of Contents
Schedule of Investments (Continued)
iSHARES® MSCI JAPAN ETF
August 31, 2017
Schedule 1 — Affiliates (Note 2)
Investments in issuers considered to be affiliates of the Fund during the year ended August 31, 2017, for purposes of Section 2(a)(3) of the 1940 Act, and/or related parties of the Fund were as follows:
| Affiliated issuer | Shares held at 08/31/16 | Shares purchased | Shares sold | Shares held at 08/31/17 | Value at 08/31/17 | Net realized gain (loss)a | Change in unrealized appreciation (depreciation) | Income | ||||||||||||||||||||||||
BlackRock Cash Funds: Institutional, SL Agency Shares | 50,929,509 | — | (10,389,539 | )b | 40,539,970 | $ | 40,552,132 | $ | 1,589 | $ | 6,812 | $ | — | c | ||||||||||||||||||
BlackRock Cash Funds: Treasury, SL Agency Shares | 1,192,177 | 4,088,855 | b | — | 5,281,032 | 5,281,032 | 122 | — | 43,064 | |||||||||||||||||||||||
|
|
|
|
|
|
|
| |||||||||||||||||||||||||
| $ | 45,833,164 | $ | 1,711 | $ | 6,812 | $ | 43,064 | |||||||||||||||||||||||||
|
|
|
|
|
|
|
| |||||||||||||||||||||||||
| a | Includes realized capital gain distributions from an affiliated fund, if any. |
| b | Net of shares purchased and sold. |
| c | Does not include income earned on investment of securities lending cash collateral which is not direct income of the Fund and is reflected as a component of securities lending income in the statement of operations. |
Schedule 2 — Futures Contracts (Note 5)
Futures contracts outstanding as of August 31, 2017 were as follows:
| Description | Number of contracts | Expiration date | Notional amount (000) | Value/ unrealized appreciation (depreciation) | ||||||||||||
Long Contracts: | ||||||||||||||||
TOPIX Index | 3,060,000 | Sep 2017 | $ | 45,069 | $ | 642,232 | ||||||||||
|
| |||||||||||||||
Total |
| $ | 642,232 | |||||||||||||
|
| |||||||||||||||
Schedule 3 — Fair Value Measurements
Various inputs are used in determining the fair value of financial instruments. For description of the input levels and information about the Fund’s policy regarding valuation of financial instruments, see Note 1.
The following table summarizes the value of the Fund’s investments according to the fair value hierarchy as of August 31, 2017. The breakdown of the Fund’s investments into major categories is disclosed in the schedule of investments above.
| Level 1 | Level 2 | Level 3 | Total | |||||||||||||
Investments: | ||||||||||||||||
Assets: | ||||||||||||||||
Common stocks | $ | 15,905,803,119 | $ | 64,709,787 | $ | — | $ | 15,970,512,906 | ||||||||
Money market funds | 45,833,164 | — | — | 45,833,164 | ||||||||||||
|
|
|
|
|
|
|
| |||||||||
Total | $ | 15,951,636,283 | $ | 64,709,787 | $ | — | $ | 16,016,346,070 | ||||||||
|
|
|
|
|
|
|
| |||||||||
Derivative financial instrumentsa: | ||||||||||||||||
Assets: | ||||||||||||||||
Futures contracts | $ | 642,232 | $ | — | $ | — | $ | 642,232 | ||||||||
|
|
|
|
|
|
|
| |||||||||
Total | $ | 642,232 | $ | — | $ | — | $ | 642,232 | ||||||||
|
|
|
|
|
|
|
| |||||||||
| a | Shown at the unrealized appreciation (depreciation) on the contracts. |
See notes to financial statements.
SCHEDULESOF INVESTMENTS | 39 |
Table of Contents
Schedule of Investments
iSHARES® MSCI MEXICO CAPPED ETF
August 31, 2017
| Security | Shares | Value | ||||||
COMMON STOCKS — 99.81% |
| |||||||
AIRLINES — 0.85% |
| |||||||
Controladora Vuela Cia. de Aviacion SAB de CV Class Aa,b | 5,083,700 | $ | 6,414,971 | |||||
Grupo Aeromexico SAB de CVa | 2,404,043 | 4,873,438 | ||||||
|
| |||||||
| 11,288,409 | ||||||||
AUTO COMPONENTS — 0.24% |
| |||||||
Rassini SAB de CV | 678,499 | 3,148,709 | ||||||
|
| |||||||
| 3,148,709 | ||||||||
BANKS — 13.33% | ||||||||
Banregio Grupo Financiero SAB de CV | 1,813,000 | 11,732,837 | ||||||
Grupo Financiero Banorte SAB de CV Series O | 15,208,478 | 104,036,562 | ||||||
Grupo Financiero Inbursa SAB de CV Series Ob | 16,392,192 | 27,500,052 | ||||||
Grupo Financiero Interacciones SA de CV Series O | 955,800 | 5,728,016 | ||||||
Grupo Financiero Santander Mexico SAB de CV Series B | 13,104,650 | 27,080,235 | ||||||
|
| |||||||
| 176,077,702 | ||||||||
BEVERAGES — 12.25% | ||||||||
Arca Continental SAB de CV | 3,079,729 | 22,601,931 | ||||||
Coca-Cola Femsa SAB de CV Series L | 2,373,447 | 19,513,329 | ||||||
Fomento Economico Mexicano SAB de CV | 11,925,510 | 119,725,155 | ||||||
|
| |||||||
| 161,840,415 | ||||||||
BUILDING PRODUCTS — 0.36% |
| |||||||
Elementia SAB de CVa,b,c | 3,350,190 | 4,716,234 | ||||||
|
| |||||||
| 4,716,234 | ||||||||
CAPITAL MARKETS — 0.46% | ||||||||
Bolsa Mexicana de Valores SAB de CV | 3,481,687 | 6,038,291 | ||||||
|
| |||||||
| 6,038,291 | ||||||||
CHEMICALS — 1.55% | ||||||||
Mexichem SAB de CV | 7,664,418 | 20,478,298 | ||||||
|
| |||||||
| 20,478,298 | ||||||||
CONSTRUCTION MATERIALS — 6.16% |
| |||||||
Cemex SAB de CV CPOa | 86,737,029 | 81,321,668 | ||||||
|
| |||||||
| 81,321,668 | ||||||||
| Security | Shares | Value | ||||||
CONSUMER FINANCE — 1.59% |
| |||||||
Credito Real SAB de CV SOFOM ERb | 2,230,174 | $ | 4,174,362 | |||||
Gentera SAB de CV | 7,532,706 | 11,593,167 | ||||||
Unifin Financiera SAB de CV SOFOM ENR | 1,519,348 | 5,244,437 | ||||||
|
| |||||||
| 21,011,966 | ||||||||
DIVERSIFIED TELECOMMUNICATION SERVICES — 0.93% |
| |||||||
Axtel SAB de CV CPOa,b | 11,390,777 | 2,658,716 | ||||||
Telesites SAB de CVa,b | 12,110,146 | 9,668,956 | ||||||
|
| |||||||
| 12,327,672 | ||||||||
EQUITY REAL ESTATE INVESTMENT TRUSTS |
| |||||||
Concentradora Fibra Danhos SA de CV | 2,340,790 | 4,099,034 | ||||||
Concentradora Fibra Hotelera Mexicana SA de CV | 5,020,290 | 4,120,960 | ||||||
Fibra Uno Administracion SA | 18,113,700 | 32,410,593 | ||||||
Macquarie Mexico Real Estate Management SA de CV | 6,716,100 | 9,043,857 | ||||||
PLA Administradora Industrial S. de RL de CVb | 6,621,500 | 11,294,194 | ||||||
Prologis Property Mexico SA de CV | 3,320,800 | 6,782,181 | ||||||
|
| |||||||
| 67,750,819 | ||||||||
FOOD & STAPLES RETAILING — 6.59% |
| |||||||
Grupo Comercial Chedraui SA de CV | 2,943,000 | 6,324,327 | ||||||
La Comer SAB de CVa,b | 4,837,855 | 4,828,965 | ||||||
Wal-Mart de Mexico SAB de CV | 31,111,233 | 75,915,755 | ||||||
|
| |||||||
| 87,069,047 | ||||||||
FOOD PRODUCTS — 5.59% | ||||||||
Gruma SAB de CV Series B | 1,564,450 | 23,017,216 | ||||||
Grupo Bimbo SAB de CV Series A | 11,579,104 | 28,157,179 | ||||||
Grupo Herdez SAB de CV | 2,207,044 | 5,421,407 | ||||||
Grupo Lala SAB de CVb | 4,935,800 | 8,790,018 | ||||||
Industrias Bachoco SAB de CV Series B | 1,587,400 | 8,451,467 | ||||||
|
| |||||||
| 73,837,287 | ||||||||
GAS UTILITIES — 1.47% | ||||||||
Infraestructura Energetica Nova SAB de CV | 3,549,400 | 19,347,419 | ||||||
|
| |||||||
| 19,347,419 | ||||||||
| 40 | 2017 iSHARES ANNUAL REPORTTO SHAREHOLDERS |
Table of Contents
Schedule of Investments (Continued)
iSHARES® MSCI MEXICO CAPPED ETF
August 31, 2017
| Security | Shares | Value | ||||||
HOTELS, RESTAURANTS & LEISURE — 1.49% |
| |||||||
Alsea SAB de CV | 4,127,966 | $ | 15,066,372 | |||||
Hoteles City Express SAB de CVa,b | 3,715,200 | 4,590,128 | ||||||
|
| |||||||
| 19,656,500 | ||||||||
HOUSEHOLD DURABLES — 0.24% |
| |||||||
Consorcio ARA SAB de CV | 9,121,819 | 3,116,908 | ||||||
|
| |||||||
| 3,116,908 | ||||||||
HOUSEHOLD PRODUCTS — 1.64% |
| |||||||
Kimberly-Clark de Mexico SAB de CV Series A | 10,987,654 | 21,639,009 | ||||||
|
| |||||||
| 21,639,009 | ||||||||
INDUSTRIAL CONGLOMERATES — 3.20% |
| |||||||
Alfa SAB de CV | 20,073,651 | 28,191,131 | ||||||
Grupo Carso SAB de CV Series A1 | 3,471,833 | 14,074,143 | ||||||
|
| |||||||
| 42,265,274 | ||||||||
INSURANCE — 0.32% | ||||||||
Qualitas Controladora SAB de CV | 2,400,000 | 4,194,639 | ||||||
|
| |||||||
| 4,194,639 | ||||||||
MACHINERY — 0.23% | ||||||||
Grupo Rotoplas SAB de CVb | 1,850,600 | 3,088,011 | ||||||
|
| |||||||
| 3,088,011 | ||||||||
MEDIA — 4.72% | ||||||||
Grupo Televisa SAB | 11,448,647 | 59,379,890 | ||||||
TV Azteca SAB de CV CPOb | 15,341,939 | 2,943,958 | ||||||
|
| |||||||
| 62,323,848 | ||||||||
METALS & MINING — 7.23% | ||||||||
Grupo Mexico SAB de CV Series B | 17,795,886 | 58,851,161 | ||||||
Industrias CH SAB de CV Series Ba,b | 1,283,783 | 6,160,775 | ||||||
Industrias Penoles SAB de CV | 998,293 | 26,019,388 | ||||||
Minera Frisco SAB de CV Series A1a,b | 6,437,803 | 4,453,752 | ||||||
|
| |||||||
| 95,485,076 | ||||||||
MORTGAGE REAL ESTATE INVESTMENT — 0.29% |
| |||||||
Concentradora Hipotecaria SAPI de CV | 3,105,700 | 3,891,110 | ||||||
|
| |||||||
| 3,891,110 | ||||||||
MULTILINE RETAIL — 0.96% | ||||||||
El Puerto de Liverpool SAB de CV Series C1b | 1,417,810 | 12,742,411 | ||||||
|
| |||||||
| 12,742,411 | ||||||||
| Security | Shares | Value | ||||||
PHARMACEUTICALS — 0.65% |
| |||||||
Genomma Lab Internacional SAB de CV Series Ba | 6,671,193 | $ | 8,575,390 | |||||
|
| |||||||
| 8,575,390 | ||||||||
REAL ESTATE MANAGEMENT & DEVELOPMENT — 0.79% |
| |||||||
Corp Inmobiliaria Vesta SAB | 4,549,149 | 6,707,811 | ||||||
Grupo GICSA SA de CVa,b | 5,458,566 | 3,662,984 | ||||||
|
| |||||||
| 10,370,795 | ||||||||
TRANSPORTATION INFRASTRUCTURE — 6.74% |
| |||||||
Grupo Aeroportuario del Centro Norte SAB de CV | 2,015,492 | 12,229,050 | ||||||
Grupo Aeroportuario del Pacifico SAB de CV Series B | 2,541,449 | 28,121,315 | ||||||
Grupo Aeroportuario del Sureste SAB de CV Series B | 1,466,555 | 30,010,367 | ||||||
Promotora y Operadora de Infraestructura SAB de CV | 1,696,025 | 18,642,929 | ||||||
|
| |||||||
| 89,003,661 | ||||||||
WIRELESS TELECOMMUNICATION SERVICES — 14.81% |
| |||||||
America Movil SAB de CV Series L | 209,703,018 | 195,551,425 | ||||||
|
| |||||||
| 195,551,425 | ||||||||
|
| |||||||
TOTAL COMMON STOCKS | ||||||||
(Cost: $1,567,368,302) | 1,318,157,993 | |||||||
SHORT-TERM INVESTMENTS — 2.13% |
| |||||||
MONEY MARKET FUNDS — 2.13% |
| |||||||
BlackRock Cash Funds: Institutional, |
| |||||||
1.32%d,e,f | 27,657,667 | 27,665,964 | ||||||
BlackRock Cash Funds: Treasury, |
| |||||||
0.96%d,e | 431,254 | 431,254 | ||||||
|
| |||||||
| 28,097,218 | ||||||||
|
| |||||||
TOTAL SHORT-TERM INVESTMENTS |
| |||||||
(Cost: $28,090,746) | 28,097,218 | |||||||
|
| |||||||
SCHEDULESOF INVESTMENTS | 41 |
Table of Contents
Schedule of Investments (Continued)
iSHARES® MSCI MEXICO CAPPED ETF
August 31, 2017
| Value | ||||||||
TOTAL INVESTMENTS |
| |||||||
(Cost: $1,595,459,048)g | $ | 1,346,255,211 | ||||||
Other Assets, Less Liabilities — (1.94)% |
| (25,613,616 | ) | |||||
|
| |||||||
NET ASSETS — 100.00% |
| $ | 1,320,641,595 | |||||
|
| |||||||
CPO — Certificates of Participation (Ordinary)
| a | Non-income earning security. |
| b | All or a portion of this security represents a security on loan. See Note 1. |
| c | This security may be resold to qualified institutional buyers under Rule 144A of the Securities Act of 1933. |
| d | Affiliated issuer. See Schedule 1. |
| e | The rate quoted is the annualized seven-day yield of the fund at period end. |
| f | All or a portion of this security represents an investment of securities lending collateral. See Note 1. |
| g | The cost of investments (including short positions and derivatives, if any) for federal income tax purposes was $1,637,442,968. Net unrealized depreciation was $291,187,757, of which $14,486,443 represented gross unrealized appreciation on investments and $305,674,200 represented gross unrealized depreciation on investments. |
Schedule 1 — Affiliates (Note 2)
Investments in issuers considered to be affiliates of the Fund during the year ended August 31, 2017, for purposes of Section 2(a)(3) of the 1940 Act, and/or related parties of the Fund were as follows:
| Affiliated issuer | Shares held at 08/31/16 | Shares purchased | Shares sold | Shares held at 08/31/17 | Value at 08/31/17 | Net realized gain (loss) a | Change in unrealized appreciation (depreciation) | Income | ||||||||||||||||||||||||
BlackRock Cash Funds: Institutional, SL Agency Shares | 19,391,449 | 8,266,218 | b | — | 27,657,667 | $ | 27,665,964 | $ | (2,087 | ) | $ | 6,472 | $ | — | c | |||||||||||||||||
BlackRock Cash Funds: Treasury, SL Agency Shares | 1,875,747 | — | (1,444,493 | )b | 431,254 | 431,254 | 61 | — | 4,023 | |||||||||||||||||||||||
|
| |||||||||||||||||||||||||||||||
| $ | 28,097,218 | $ | (2,026 | ) | $ | 6,472 | $ | 4,023 | ||||||||||||||||||||||||
|
| |||||||||||||||||||||||||||||||
| a | Includes realized capital gain distributions from an affiliated fund, if any. |
| b | Net of shares purchased and sold. |
| c | Does not include income earned on investment of securities lending cash collateral which is not direct income of the Fund and is reflected as a component of securities lending income in the statement of operations. |
Schedule 2 — Fair Value Measurements
Various inputs are used in determining the fair value of financial instruments. For description of the input levels and information about the Fund’s policy regarding valuation of financial instruments, see Note 1.
The following table summarizes the value of the Fund’s investments according to the fair value hierarchy as of August 31, 2017. The breakdown of the Fund’s investments into major categories is disclosed in the schedule of investments above.
| Level 1 | Level 2 | Level 3 | Total | |||||||||||||
Investments: | ||||||||||||||||
Assets: | ||||||||||||||||
Common stocks | $ | 1,318,157,993 | $ | — | $ | — | $ | 1,318,157,993 | ||||||||
Money market funds | 28,097,218 | — | — | 28,097,218 | ||||||||||||
|
|
|
|
|
|
|
| |||||||||
Total | $ | 1,346,255,211 | $ | — | $ | — | $ | 1,346,255,211 | ||||||||
|
|
|
|
|
|
|
| |||||||||
See notes to financial statements.
| 42 | 2017 iSHARES ANNUAL REPORTTO SHAREHOLDERS |
Table of Contents
Schedule of Investments
iSHARES® MSCI SOUTH KOREA CAPPED ETF
August 31, 2017
| Security | Shares | Value | ||||||
COMMON STOCKS — 98.12% |
| |||||||
AEROSPACE & DEFENSE — 0.67% |
| |||||||
Hanwha Techwin Co. Ltd.a,b | 256,207 | $ | 8,815,919 | |||||
Korea Aerospace Industries Ltd. Class A | 402,973 | 16,528,469 | ||||||
|
| |||||||
| 25,344,388 | ||||||||
AIR FREIGHT & LOGISTICS — 0.42% |
| |||||||
Hyundai Glovis Co. Ltd. | 115,346 | 15,855,472 | ||||||
|
| |||||||
| 15,855,472 | ||||||||
AIRLINES — 0.26% |
| |||||||
Korean Air Lines Co. Ltd.a | 331,823 | 9,769,886 | ||||||
|
| |||||||
| 9,769,886 | ||||||||
AUTO COMPONENTS — 3.17% |
| |||||||
Hankook Tire Co. Ltd. | 433,669 | 22,691,088 | ||||||
Hanon Systems | 1,284,402 | 13,156,122 | ||||||
Hyundai Mobis Co. Ltd. | 364,802 | 76,350,898 | ||||||
Hyundai Wia Corp.b | 125,637 | 7,799,388 | ||||||
|
| |||||||
| 119,997,496 | ||||||||
AUTOMOBILES — 3.90% |
| |||||||
Hyundai Motor Co. | 819,622 | 102,125,657 | ||||||
Kia Motors Corp. | 1,441,239 | 45,310,325 | ||||||
|
| |||||||
| 147,435,982 | ||||||||
BANKS — 9.51% |
| |||||||
BNK Financial Group Inc. | 1,668,095 | 14,586,216 | ||||||
DGB Financial Group Inc. | 1,137,245 | 11,094,089 | ||||||
Hana Financial Group Inc. | 1,616,273 | 70,235,347 | ||||||
Industrial Bank of Korea | 1,529,944 | 20,284,376 | ||||||
KB Financial Group Inc. | 2,133,507 | 104,821,114 | ||||||
Shinhan Financial Group Co. Ltd. | 2,284,419 | 105,347,453 | ||||||
Woori Bank | 2,025,297 | 33,407,701 | ||||||
|
| |||||||
| 359,776,296 | ||||||||
BEVERAGES — 0.18% |
| |||||||
Lotte Chilsung Beverage Co. Ltd.b | 5,063 | 6,946,134 | ||||||
|
| |||||||
| 6,946,134 | ||||||||
BIOTECHNOLOGY — 1.53% |
| |||||||
Celltrion Inc.a,b | 440,870 | 45,001,895 | ||||||
Medy-Tox Inc. | 25,407 | 12,822,919 | ||||||
|
| |||||||
| 57,824,814 | ||||||||
BUILDING PRODUCTS — 0.36% |
| |||||||
KCC Corp. | 38,266 | 13,438,574 | ||||||
|
| |||||||
| 13,438,574 | ||||||||
| Security | Shares | Value | ||||||
CAPITAL MARKETS — 1.63% |
| |||||||
Korea Investment Holdings Co. Ltd. | 261,112 | $ | 15,213,780 | |||||
Mirae Asset Daewoo Co. Ltd. | 2,332,625 | 20,996,935 | ||||||
NH Investment & Securities Co. Ltd. | 963,839 | 11,795,830 | ||||||
Samsung Securities Co. Ltd. | 419,669 | 13,603,141 | ||||||
|
| |||||||
| 61,609,686 | ||||||||
CHEMICALS — 4.57% |
| |||||||
Hanwha Chemical Corp. | 661,900 | 20,750,413 | ||||||
Hyosung Corp. | 130,458 | 18,337,702 | ||||||
Kumho Petrochemical Co. Ltd.b | 130,450 | 9,116,229 | ||||||
LG Chem Ltd. | 248,303 | 83,457,642 | ||||||
Lotte Chemical Corp. | 87,520 | 31,007,662 | ||||||
OCI Co. Ltd.b | 115,748 | 10,090,483 | ||||||
|
| |||||||
| 172,760,131 | ||||||||
COMMERCIAL SERVICES & SUPPLIES — 0.45% |
| |||||||
KEPCO Plant Service & Engineering Co. Ltd. | 165,419 | 6,711,528 | ||||||
S-1 Corp. | 129,839 | 10,328,626 | ||||||
|
| |||||||
| 17,040,154 | ||||||||
CONSTRUCTION & ENGINEERING — 1.52% |
| |||||||
Daelim Industrial Co. Ltd. | 178,386 | 13,257,136 | ||||||
Daewoo Engineering & Construction Co. Ltd.a | 1,092,520 | 6,811,295 | ||||||
GS Engineering & Construction Corp.a,b | 352,143 | 8,900,386 | ||||||
Hyundai Development Co. Engineering & Construction | 368,601 | 12,307,403 | ||||||
Hyundai Engineering & Construction Co. Ltd. | 451,995 | 16,294,428 | ||||||
|
| |||||||
| 57,570,648 | ||||||||
CONSUMER FINANCE — 0.21% |
| |||||||
Samsung Card Co. Ltd. | 246,544 | 8,111,726 | ||||||
|
| |||||||
| 8,111,726 | ||||||||
DIVERSIFIED TELECOMMUNICATION SERVICES — 0.15% |
| |||||||
KT Corp. | 205,716 | 5,692,036 | ||||||
|
| |||||||
| 5,692,036 | ||||||||
ELECTRIC UTILITIES — 1.41% |
| |||||||
Korea Electric Power Corp. | 1,398,226 | 53,196,076 | ||||||
|
| |||||||
| 53,196,076 | ||||||||
ELECTRICAL EQUIPMENT — 0.17% |
| |||||||
Doosan Heavy Industries & Construction Co. Ltd.b | 395,357 | 6,311,126 | ||||||
|
| |||||||
| 6,311,126 | ||||||||
SCHEDULESOF INVESTMENTS | 43 |
Table of Contents
Schedule of Investments (Continued)
iSHARES® MSCI SOUTH KOREA CAPPED ETF
August 31, 2017
| Security | Shares | Value | ||||||
ELECTRONIC EQUIPMENT, INSTRUMENTS & COMPONENTS — 3.59% |
| |||||||
LG Display Co. Ltd. | 1,305,800 | $ | 36,072,783 | |||||
LG Innotek Co. Ltd. | 96,870 | 15,850,049 | ||||||
Samsung Electro-Mechanics Co. Ltd. | 337,318 | 30,213,833 | ||||||
Samsung SDI Co. Ltd. | 308,349 | 53,734,106 | ||||||
|
| |||||||
| 135,870,771 | ||||||||
FOOD & STAPLES RETAILING — 1.30% |
| |||||||
BGF retail Co. Ltd. | 151,486 | 12,252,149 | ||||||
Dongsuh Cos. Inc. | 288,891 | 6,789,297 | ||||||
E-MART Inc. | 116,853 | 23,213,083 | ||||||
GS Retail Co. Ltd. | 194,342 | 6,954,327 | ||||||
|
| |||||||
| 49,208,856 | ||||||||
FOOD PRODUCTS — 1.10% |
| |||||||
CJ CheilJedang Corp. | 48,779 | 15,681,436 | ||||||
Lotte Confectionery Co. Ltd.b | 43,156 | 7,558,806 | ||||||
Orion Corp./Republic of Koreaa | 149,224 | 11,553,082 | ||||||
Ottogi Corp.b | 10,082 | 6,804,188 | ||||||
|
| |||||||
| 41,597,512 | ||||||||
GAS UTILITIES — 0.21% |
| |||||||
Korea Gas Corp.a | 201,310 | 8,087,392 | ||||||
|
| |||||||
| 8,087,392 | ||||||||
HOTELS, RESTAURANTS & LEISURE — 0.56% |
| |||||||
Kangwon Land Inc. | 691,285 | 21,150,525 | ||||||
|
| |||||||
| 21,150,525 | ||||||||
HOUSEHOLD DURABLES — 2.12% |
| |||||||
Coway Co. Ltd. | 308,582 | 27,037,869 | ||||||
Hanssem Co. Ltd. | 67,730 | 10,211,156 | ||||||
LG Electronics Inc. | 596,725 | 43,129,734 | ||||||
|
| |||||||
| 80,378,759 | ||||||||
INDUSTRIAL CONGLOMERATES — 4.62% |
| |||||||
CJ Corp. | 91,663 | 14,388,392 | ||||||
Hanwha Corp. | 310,836 | 13,548,767 | ||||||
LG Corp. | 536,667 | 39,978,741 | ||||||
Samsung C&T Corp. | 416,572 | 47,656,782 | ||||||
SK Holdings Co. Ltd. | 250,389 | 59,399,661 | ||||||
|
| |||||||
| 174,972,343 | ||||||||
INSURANCE — 3.59% |
| |||||||
Dongbu Insurance Co. Ltd. | 302,825 | 20,195,495 | ||||||
Hanwha Life Insurance Co. Ltd. | 1,631,360 | 10,590,240 | ||||||
Hyundai Marine & Fire Insurance Co. Ltd. | 411,974 | 16,879,389 | ||||||
| Security | Shares | Value | ||||||
Samsung Fire & Marine Insurance Co. Ltd. | 183,694 | $ | 45,043,802 | |||||
Samsung Life Insurance Co. Ltd. | 421,324 | 43,156,192 | ||||||
|
| |||||||
| 135,865,118 | ||||||||
INTERNET SOFTWARE & SERVICES — 3.20% |
| |||||||
Kakao Corp.b | 192,719 | 21,022,027 | ||||||
NAVER Corp. | 149,294 | 99,961,839 | ||||||
|
| |||||||
| 120,983,866 | ||||||||
IT SERVICES — 0.79% |
| |||||||
Samsung SDS Co. Ltd. | 202,144 | 30,027,598 | ||||||
|
| |||||||
| 30,027,598 | ||||||||
LIFE SCIENCES TOOLS & SERVICES — 0.68% |
| |||||||
Samsung Biologics Co. Ltd.a,b,c | 102,741 | 25,785,476 | ||||||
|
| |||||||
| 25,785,476 | ||||||||
MACHINERY — 1.22% |
| |||||||
Doosan Bobcat Inc. | 242,001 | 8,187,601 | ||||||
Hyundai Heavy Industries Co. Ltd.a,b | 175,100 | 23,059,906 | ||||||
Samsung Heavy Industries Co. Ltd.a,b | 1,575,018 | 14,945,630 | ||||||
|
| |||||||
| 46,193,137 | ||||||||
MARINE — 0.22% |
| |||||||
Pan Ocean Co. Ltd.a | 1,440,351 | 8,213,424 | ||||||
|
| |||||||
| 8,213,424 | ||||||||
MEDIA — 0.46% |
| |||||||
Cheil Worldwide Inc. | 501,070 | 8,443,003 | ||||||
CJ E&M Corp. | 133,328 | 8,986,279 | ||||||
|
| |||||||
| 17,429,282 | ||||||||
METALS & MINING — 4.43% |
| |||||||
Hyundai Steel Co. | 459,107 | 23,492,793 | ||||||
Korea Zinc Co. Ltd. | 50,582 | 23,146,783 | ||||||
POSCO | 397,510 | 121,093,194 | ||||||
|
| |||||||
| 167,732,770 | ||||||||
MULTILINE RETAIL — 0.92% |
| |||||||
Hyundai Department Store Co. Ltd. | 107,100 | 9,175,115 | ||||||
Lotte Shopping Co. Ltd.b | 72,819 | 16,596,739 | ||||||
Shinsegae Inc. | 52,983 | 9,068,570 | ||||||
|
| |||||||
| 34,840,424 | ||||||||
OIL, GAS & CONSUMABLE FUELS — 2.87% |
| |||||||
GS Holdings Corp. | 316,617 | 19,823,661 | ||||||
S-Oil Corp. | 266,313 | 29,640,193 | ||||||
SK Innovation Co. Ltd. | 354,173 | 59,206,820 | ||||||
|
| |||||||
| 108,670,674 | ||||||||
| 44 | 2017 iSHARES ANNUAL REPORTTO SHAREHOLDERS |
Table of Contents
Schedule of Investments (Continued)
iSHARES® MSCI SOUTH KOREA CAPPED ETF
August 31, 2017
| Security | Shares | Value | ||||||
PERSONAL PRODUCTS — 2.89% |
| |||||||
AmorePacific Corp.b | 176,557 | $ | 45,094,374 | |||||
AmorePacific Groupb | 168,180 | 19,985,917 | ||||||
LG Household & Health Care Ltd. | 51,990 | 44,262,504 | ||||||
|
| |||||||
| 109,342,795 | ||||||||
PHARMACEUTICALS — 0.89% |
| |||||||
Hanmi Pharm Co. Ltd.a,b | 38,151 | 13,635,024 | ||||||
Hanmi Science Co. Ltd.a,b | 110,150 | 8,742,839 | ||||||
Yuhan Corp. | 55,780 | 11,179,744 | ||||||
|
| |||||||
| 33,557,607 | ||||||||
ROAD & RAIL — 0.21% |
| |||||||
CJ Logistics Corp.a,b | 54,230 | 8,127,767 | ||||||
|
| |||||||
| 8,127,767 | ||||||||
SEMICONDUCTORS & SEMICONDUCTOR EQUIPMENT — 5.57% |
| |||||||
Hyundai Robotics Co. Ltd.a | 55,160 | 21,670,699 | ||||||
SK Hynix Inc. | 3,107,210 | 189,033,882 | ||||||
|
| |||||||
| 210,704,581 | ||||||||
SOFTWARE — 1.27% |
| |||||||
NCsoft Corp. | 100,278 | 34,193,766 | ||||||
Netmarble Games Corp.a,b,c | 101,935 | 13,966,795 | ||||||
|
| |||||||
| 48,160,561 | ||||||||
SPECIALTY RETAIL — 0.33% |
| |||||||
Hotel Shilla Co. Ltd.b | 230,326 | 12,643,827 | ||||||
|
| |||||||
| 12,643,827 | ||||||||
TECHNOLOGY HARDWARE, STORAGE & PERIPHERALS — 22.24% |
| |||||||
Samsung Electronics Co. Ltd. | 409,781 | 841,657,322 | ||||||
|
| |||||||
| 841,657,322 | ||||||||
TOBACCO — 1.70% |
| |||||||
KT&G Corp. | 633,494 | 64,326,945 | ||||||
|
| |||||||
| 64,326,945 | ||||||||
TRADING COMPANIES & DISTRIBUTORS — 0.34% |
| |||||||
Posco Daewoo Corp. | 346,554 | 6,500,193 | ||||||
SK Networks Co. Ltd.b | 1,020,734 | 6,345,641 | ||||||
|
| |||||||
| 12,845,834 | ||||||||
WIRELESS TELECOMMUNICATION SERVICES — 0.69% |
| |||||||
SK Telecom Co. Ltd. | 116,876 | 26,275,334 | ||||||
|
| |||||||
| 26,275,334 | ||||||||
|
| |||||||
TOTAL COMMON STOCKS | ||||||||
(Cost: $1,670,622,208) | 3,713,331,125 | |||||||
| Security | Shares | Value | ||||||
PREFERRED STOCKS — 1.79% |
| |||||||
AUTOMOBILES — 0.86% | ||||||||
Hyundai Motor Co., Preference Shares | 145,830 | $ | 12,467,198 | |||||
Hyundai Motor Co. Series 2, Preference Shares | 222,581 | 20,134,145 | ||||||
|
| |||||||
| 32,601,343 | ||||||||
CHEMICALS — 0.34% |
| |||||||
LG Chem Ltd., Preference Shares | 55,687 | 12,988,366 | ||||||
|
| |||||||
| 12,988,366 | ||||||||
PERSONAL PRODUCTS — 0.49% |
| |||||||
AmorePacific Corp., Preference Shares | 64,159 | 9,758,131 | ||||||
LG Household & Health Care Ltd., Preference Shares | 16,176 | 8,607,307 | ||||||
|
| |||||||
| 18,365,438 | ||||||||
TECHNOLOGY HARDWARE, STORAGE & PERIPHERALS — 0.10% |
| |||||||
Samsung Electronics Co. Ltd., Preference Shares | 2,164 | 3,617,542 | ||||||
|
| |||||||
| 3,617,542 | ||||||||
|
| |||||||
TOTAL PREFERRED STOCKS |
| |||||||
(Cost: $38,534,692) | 67,572,689 | |||||||
SHORT-TERM INVESTMENTS — 3.85% |
| |||||||
MONEY MARKET FUNDS — 3.85% |
| |||||||
BlackRock Cash Funds: Institutional, |
| |||||||
1.32%d,e,f | 140,876,705 | 140,918,968 | ||||||
BlackRock Cash Funds: Treasury, |
| |||||||
0.96%d,e | 4,974,415 | 4,974,415 | ||||||
|
| |||||||
| 145,893,383 | ||||||||
|
| |||||||
TOTAL SHORT-TERM INVESTMENTS |
| |||||||
(Cost: $145,873,542) | 145,893,383 | |||||||
|
| |||||||
SCHEDULESOF INVESTMENTS | 45 |
Table of Contents
Schedule of Investments (Continued)
iSHARES® MSCI SOUTH KOREA CAPPED ETF
August 31, 2017
| Value | ||||||||
TOTAL INVESTMENTS |
| |||||||
(Cost: $1,855,030,442)g |
| $ | 3,926,797,197 | |||||
Other Assets, Less Liabilities — (3.76)% |
| (142,159,434 | ) | |||||
|
| |||||||
NET ASSETS — 100.00% | $ | 3,784,637,763 | ||||||
|
| |||||||
| a | Non-income earning security. |
| b | All or a portion of this security represents a security on loan. See Note 1. |
| c | This security may be resold to qualified institutional buyers under Rule 144A of the Securities Act of 1933. |
| d | Affiliated issuer. See Schedule 1. |
| e | The rate quoted is the annualized seven-day yield of the fund at period end. |
| f | All or a portion of this security represents an investment of securities lending collateral. See Note 1. |
| g | The cost of investments (including short positions and derivatives, if any) for federal income tax purposes was $2,410,993,429. Net unrealized appreciation was $1,515,803,768, of which $2,123,134,609 represented gross unrealized appreciation on investments and $607,330,841 represented gross unrealized depreciation on investments. |
Schedule 1 — Affiliates (Note 2)
Investments in issuers considered to be affiliates of the Fund during the year ended August 31, 2017, for purposes of Section 2(a)(3) of the 1940 Act, and/or related parties of the Fund were as follows:
| Affiliated issuer | Shares held at | Shares purchased | Shares sold | Shares held at 08/31/17 | Value at 08/31/17 | Net realized gain (loss) a | Change in unrealized appreciation (depreciation) | Income | ||||||||||||||||||||||||
BlackRock Cash Funds: Institutional, SL Agency Shares | 129,185,165 | 11,691,540 | b | — | 140,876,705 | $ | 140,918,968 | $ | 4,709 | $ | 19,841 | $ | — | c | ||||||||||||||||||
BlackRock Cash Funds: Treasury, SL Agency Shares | 4,717,300 | 257,115 | b | — | 4,974,415 | 4,974,415 | 57 | — | 41,681 | |||||||||||||||||||||||
|
|
|
|
|
|
|
| |||||||||||||||||||||||||
| $ | 145,893,383 | $ | 4,766 | $ | 19,841 | $ | 41,681 | |||||||||||||||||||||||||
|
|
|
|
|
|
|
| |||||||||||||||||||||||||
| a | Includes realized capital gain distributions from an affiliated fund, if any. |
| b | Net of shares purchased and sold. |
| c | Does not include income earned on investment of securities lending cash collateral which is not direct income of the Fund and is reflected as a component of securities lending income in the statement of operations. |
Schedule 2 — Fair Value Measurements
Various inputs are used in determining the fair value of financial instruments. For description of the input levels and information about the Fund’s policy regarding valuation of financial instruments, see Note 1.
The following table summarizes the value of the Fund’s investments according to the fair value hierarchy as of August 31, 2017. The breakdown of the Fund’s investments into major categories is disclosed in the schedule of investments above.
| Level 1 | Level 2 | Level 3 | Total | |||||||||||||
Investments: | ||||||||||||||||
Assets: | ||||||||||||||||
Common stocks | $ | 3,713,331,125 | $ | — | $ | — | $ | 3,713,331,125 | ||||||||
Preferred stocks | 67,572,689 | — | — | 67,572,689 | ||||||||||||
Money market funds | 145,893,383 | — | — | 145,893,383 | ||||||||||||
|
|
|
|
|
|
|
| |||||||||
Total | $ | 3,926,797,197 | $ | — | $ | — | $ | 3,926,797,197 | ||||||||
|
|
|
|
|
|
|
| |||||||||
See notes to financial statements.
| 46 | 2017 iSHARES ANNUAL REPORTTO SHAREHOLDERS |
Table of Contents
Statements of Assets and Liabilities
iSHARES®, INC.
August 31, 2017
| iShares Edge MSCI Min Vol Global ETF | iShares MSCI Australia ETF | iShares MSCI Canada ETF | ||||||||||
ASSETS | ||||||||||||
Investments in securities, at cost: | ||||||||||||
Unaffiliated | $ | 3,177,379,890 | $ | 1,913,517,259 | $ | 3,497,459,111 | ||||||
Affiliated (Note 2) | 59,378,772 | 7,170,523 | 44,219,286 | |||||||||
|
|
|
|
|
| |||||||
Total cost of investments in securities | $ | 3,236,758,662 | $ | 1,920,687,782 | $ | 3,541,678,397 | ||||||
|
|
|
|
|
| |||||||
Investments in securities, at fair value (including securities on loana) (Note 1): |
| |||||||||||
Unaffiliated | $ | 3,658,187,253 | $ | 1,745,888,271 | $ | 3,112,636,519 | ||||||
Affiliated (Note 2) | 59,392,577 | 7,170,842 | 44,221,973 | |||||||||
Foreign currency, at valueb | 4,297,134 | 5,152,054 | 8,742,512 | |||||||||
Cash pledged to broker for futures contracts | — | 1,098,053 | 581,383 | |||||||||
Receivables: | ||||||||||||
Investment securities sold | — | 1,203,195 | 32,332,006 | |||||||||
Dividends and interest | 9,129,572 | 14,063,402 | 5,827,597 | |||||||||
Futures variation margin | — | — | 47,272 | |||||||||
Tax reclaims | 2,023,250 | — | — | |||||||||
|
|
|
|
|
| |||||||
Total Assets | 3,733,029,786 | 1,774,575,817 | 3,204,389,262 | |||||||||
|
|
|
|
|
| |||||||
LIABILITIES | ||||||||||||
Payables: | ||||||||||||
Investment securities purchased | — | 879,928 | 31,222,452 | |||||||||
Collateral for securities on loan (Note 1) | 56,897,542 | 6,987,414 | 43,809,592 | |||||||||
Capital shares redeemed | — | — | 170,758 | |||||||||
Futures variation margin | — | 80,653 | — | |||||||||
Foreign taxes (Note 1) | 147,771 | — | — | |||||||||
Investment advisory fees (Note 2) | 610,541 | 715,496 | 1,266,758 | |||||||||
|
|
|
|
|
| |||||||
Total Liabilities | 57,655,854 | 8,663,491 | 76,469,560 | |||||||||
|
|
|
|
|
| |||||||
NET ASSETS | $ | 3,675,373,932 | $ | 1,765,912,326 | $ | 3,127,919,702 | ||||||
|
|
|
|
|
| |||||||
Net assets consist of: | ||||||||||||
Paid-in capital | $ | 3,288,648,124 | $ | 2,169,727,056 | $ | 4,043,163,286 | ||||||
Undistributed (distributions in excess of) net investment income | 12,801,276 | 6,908,701 | 7,575,046 | |||||||||
Accumulated net realized loss | (106,957,724 | ) | (243,234,009 | ) | (538,045,474 | ) | ||||||
Net unrealized appreciation (depreciation) | 480,882,256 | (167,489,422 | ) | (384,773,156 | ) | |||||||
|
|
|
|
|
| |||||||
NET ASSETS | $ | 3,675,373,932 | $ | 1,765,912,326 | $ | 3,127,919,702 | ||||||
|
|
|
|
|
| |||||||
Shares outstandingc | 45,300,000 | 78,200,000 | 112,400,000 | |||||||||
|
|
|
|
|
| |||||||
Net asset value per share | $ | 81.13 | $ | 22.58 | $ | 27.83 | ||||||
|
|
|
|
|
| |||||||
| a | Securities on loan with values of $54,508,615, $6,689,886 and $42,238,300, respectively. See Note 1. |
| b | Cost of foreign currency: $4,292,028, $6,118,630 and $9,348,081, respectively. |
| c | $0.001 par value, number of shares authorized: 500 million, 627.8 million and 340.2 million, respectively. |
See notes to financial statements.
FINANCIAL STATEMENTS | 47 |
Table of Contents
Statements of Assets and Liabilities (Continued)
iSHARES®, INC.
August 31, 2017
| iShares MSCI Japan ETF | iShares MSCI Mexico Capped ETF | iShares MSCI South Korea Capped ETF | ||||||||||
ASSETS | ||||||||||||
Investments in securities, at cost: | ||||||||||||
Unaffiliated | $ | 15,934,505,938 | $ | 1,567,368,302 | $ | 1,709,156,900 | ||||||
Affiliated (Note 2) | 45,826,352 | 28,090,746 | 145,873,542 | |||||||||
|
|
|
|
|
| |||||||
Total cost of investments in securities | $ | 15,980,332,290 | $ | 1,595,459,048 | $ | 1,855,030,442 | ||||||
|
|
|
|
|
| |||||||
Investments in securities, at fair value (including securities on loana) (Note 1): |
| |||||||||||
Unaffiliated | $ | 15,970,512,906 | $ | 1,318,157,993 | $ | 3,780,903,814 | ||||||
Affiliated (Note 2) | 45,833,164 | 28,097,218 | 145,893,383 | |||||||||
Foreign currency, at valueb | 21,522,724 | 2,700,659 | — | |||||||||
Foreign currency pledged to broker for futures contracts, at valueb | 658,726 | — | — | |||||||||
Receivables: | ||||||||||||
Investment securities sold | 35,366,705 | 15,203,004 | 20,228,474 | |||||||||
Due from custodian (Note 4) | — | 71,708 | — | |||||||||
Dividends and interest | 20,598,466 | 715,400 | 546,506 | |||||||||
Futures variation margin | 642,232 | — | — | |||||||||
|
|
|
|
|
| |||||||
Total Assets | 16,095,134,923 | 1,364,945,982 | 3,947,572,177 | |||||||||
|
|
|
|
|
| |||||||
LIABILITIES | ||||||||||||
Payables: | ||||||||||||
Investment securities purchased | 30,291,956 | 16,103,186 | 20,111,823 | |||||||||
Collateral for securities on loan (Note 1) | 40,543,731 | 27,661,580 | 140,894,418 | |||||||||
Investment advisory fees (Note 2) | 6,610,337 | 539,621 | 1,928,173 | |||||||||
|
|
|
|
|
| |||||||
Total Liabilities | 77,446,024 | 44,304,387 | 162,934,414 | |||||||||
|
|
|
|
|
| |||||||
NET ASSETS | $ | 16,017,688,899 | $ | 1,320,641,595 | $ | 3,784,637,763 | ||||||
|
|
|
|
|
| |||||||
Net assets consist of: | ||||||||||||
Paid-in capital | $ | 17,199,504,435 | $ | 1,848,477,134 | $ | 2,862,052,603 | ||||||
Undistributed (distributions in excess of) net investment income | (26,048,656 | ) | 7,154,017 | (81,351,030 | ) | |||||||
Accumulated net realized loss | (1,192,558,997 | ) | (285,622,096 | ) | (1,067,833,954 | ) | ||||||
Net unrealized appreciation (depreciation) | 36,792,117 | (249,367,460 | ) | 2,071,770,144 | ||||||||
|
|
|
|
|
| |||||||
NET ASSETS | $ | 16,017,688,899 | $ | 1,320,641,595 | $ | 3,784,637,763 | ||||||
|
|
|
|
|
| |||||||
Shares outstandingc | 293,550,000 | d | 23,300,000 | 55,500,000 | ||||||||
|
|
|
|
|
| |||||||
Net asset value per share | $ | 54.57 | d | $ | 56.68 | $ | 68.19 | |||||
|
|
|
|
|
| |||||||
| a | Securities on loan with values of $38,716,306, $26,031,757 and $133,746,749, respectively. See Note 1. |
| b | Cost of foreign currency including currency pledged to broker for futures contracts: $22,281,027, $2,696,900 and $ —, respectively. |
| c | $0.001 par value, number of shares authorized: 2.5246 billion, 255 million and 200 million, respectively. |
| d | Shares outstanding and net asset value per share reflect a one-for-four reverse stock split effective after the close of trading on November 4, 2016. See Note 4. |
See notes to financial statements.
| 48 | 2017 iSHARES ANNUAL REPORTTO SHAREHOLDERS |
Table of Contents
Statements of Operations
iSHARES®, INC.
Year ended August 31, 2017
| iShares Edge MSCI Min Vol Global ETF | iShares MSCI Australia ETF | iShares MSCI Canada ETF | ||||||||||
NET INVESTMENT INCOME | ||||||||||||
Dividends — unaffiliateda | $ | 83,299,846 | $ | 79,030,390 | $ | 77,883,650 | ||||||
Dividends — affiliated (Note 2) | 29,119 | 7,465 | 8,519 | |||||||||
Interest — unaffiliated | — | 835 | 27 | |||||||||
Securities lending income — affiliated — net (Note 2) | 950,471 | 32,559 | 82,904 | |||||||||
|
|
|
|
|
| |||||||
| 84,279,436 | 79,071,249 | 77,975,100 | ||||||||||
Less: Other foreign taxes (Note 1) | (188,016 | ) | — | (30,490 | ) | |||||||
|
|
|
|
|
| |||||||
Total investment income | 84,091,420 | 79,071,249 | 77,944,610 | |||||||||
|
|
|
|
|
| |||||||
EXPENSES | ||||||||||||
Investment advisory fees (Note 2) | 10,283,210 | 8,765,631 | 15,654,293 | |||||||||
Proxy fees | 67,310 | 41,422 | 66,762 | |||||||||
|
|
|
|
|
| |||||||
Total expenses | 10,350,520 | 8,807,053 | 15,721,055 | |||||||||
Less investment advisory fees waived (Note 2) | (3,893,046 | ) | — | — | ||||||||
|
|
|
|
|
| |||||||
Net expenses | 6,457,474 | 8,807,053 | 15,721,055 | |||||||||
|
|
|
|
|
| |||||||
Net investment income | 77,633,946 | 70,264,196 | 62,223,555 | |||||||||
|
|
|
|
|
| |||||||
NET REALIZED AND UNREALIZED GAIN (LOSS) | ||||||||||||
Net realized gain (loss) from: | ||||||||||||
Investments — unaffiliated | (26,626,733 | ) | (23,621,694 | ) | (113,329,778 | ) | ||||||
Investments — affiliated (Note 2) | 16,088 | (190 | ) | (2,561 | ) | |||||||
In-kind redemptions — unaffiliated | 101,489,581 | 101,252,528 | 251,306,238 | |||||||||
Futures contracts | — | 1,617,158 | 993,580 | |||||||||
Foreign currency transactions | (488,591 | ) | (252,344 | ) | 327,225 | |||||||
Realized gain distributions from affiliated funds | 242 | 53 | 288 | |||||||||
|
|
|
|
|
| |||||||
Net realized gain | 74,390,587 | 78,995,511 | 139,294,992 | |||||||||
|
|
|
|
|
| |||||||
Net change in unrealized appreciation/depreciation on: | ||||||||||||
Investments — unaffiliated | 141,378,809 | 126,918,481 | 156,860,561 | |||||||||
Investments — affiliated (Note 2) | 13,805 | 319 | 2,687 | |||||||||
Futures contracts | — | (236,915 | ) | (318,333 | ) | |||||||
Translation of assets and liabilities in foreign currencies | 129,055 | 527,565 | 139,874 | |||||||||
|
|
|
|
|
| |||||||
Net change in unrealized appreciation/depreciation | 141,521,669 | 127,209,450 | 156,684,789 | |||||||||
|
|
|
|
|
| |||||||
Net realized and unrealized gain | 215,912,256 | 206,204,961 | 295,979,781 | |||||||||
|
|
|
|
|
| |||||||
NET INCREASE IN NET ASSETS RESULTING FROM OPERATIONS | $ | 293,546,202 | $ | 276,469,157 | $ | 358,203,336 | ||||||
|
|
|
|
|
| |||||||
| a | Net of foreign withholding tax of $4,512,840, $479,534 and $13,737,118, respectively. |
See notes to financial statements.
FINANCIAL STATEMENTS | 49 |
Table of Contents
Statements of Operations (Continued)
iSHARES®, INC.
Year ended August 31, 2017
| iShares MSCI Japan ETF | iShares MSCI Mexico Capped ETF | iShares MSCI South Korea Capped ETF | ||||||||||
NET INVESTMENT INCOME | ||||||||||||
Dividends — unaffiliateda | $ | 300,652,682 | $ | 31,861,308 | $ | 50,888,121 | ||||||
Dividends — affiliated (Note 2) | 43,064 | 4,023 | 41,681 | |||||||||
Interest — unaffiliated | — | — | 58 | |||||||||
Securities lending income — affiliated — net (Note 2) | 3,382,165 | 703,004 | 4,908,542 | |||||||||
|
|
|
|
|
| |||||||
| 304,077,911 | 32,568,335 | 55,838,402 | ||||||||||
Less: Other foreign taxes (Note 1) | — | — | 937 | |||||||||
|
|
|
|
|
| |||||||
Total investment income | 304,077,911 | 32,568,335 | 55,839,339 | |||||||||
|
|
|
|
|
| |||||||
EXPENSES | ||||||||||||
Investment advisory fees (Note 2) | 76,064,253 | 6,962,143 | 20,609,453 | |||||||||
Proxy fees | 344,241 | 28,311 | 69,215 | |||||||||
|
|
|
|
|
| |||||||
Total expenses | 76,408,494 | 6,990,454 | 20,678,668 | |||||||||
|
|
|
|
|
| |||||||
Net investment income | 227,669,417 | 25,577,881 | 35,160,671 | |||||||||
|
|
|
|
|
| |||||||
NET REALIZED AND UNREALIZED GAIN (LOSS) | ||||||||||||
Net realized gain (loss) from: | ||||||||||||
Investments — unaffiliated | (197,802,651 | ) | (75,908,002 | ) | 164,460,523 | |||||||
Investments — affiliated (Note 2) | 1,589 | (2,087 | ) | 4,709 | ||||||||
In-kind redemptions — unaffiliated | 644,849,506 | 68,249,782 | — | |||||||||
Futures contracts | 24,447,380 | — | — | |||||||||
Foreign currency transactions | (15,913,555 | ) | (218,589 | ) | 1,863,380 | |||||||
Realized gain distributions from affiliated funds | 122 | 61 | 57 | |||||||||
|
|
|
|
|
| |||||||
Net realized gain (loss) | 455,582,391 | (7,878,835 | ) | 166,328,669 | ||||||||
|
|
|
|
|
| |||||||
Net change in unrealized appreciation/depreciation on: | ||||||||||||
Investments — unaffiliated | 1,309,943,854 | 189,192,269 | 392,350,106 | |||||||||
Investments — affiliated (Note 2) | 6,812 | 6,472 | 19,841 | |||||||||
Futures contracts | (26,487 | ) | — | — | ||||||||
Translation of assets and liabilities in foreign currencies | 330,724 | 76,604 | 282,147 | |||||||||
|
|
|
|
|
| |||||||
Net change in unrealized appreciation/depreciation | 1,310,254,903 | 189,275,345 | 392,652,094 | |||||||||
|
|
|
|
|
| |||||||
Net realized and unrealized gain | 1,765,837,294 | 181,396,510 | 558,980,763 | |||||||||
|
|
|
|
|
| |||||||
NET INCREASE IN NET ASSETS RESULTING FROM OPERATIONS | $ | 1,993,506,711 | $ | 206,974,391 | $ | 594,141,434 | ||||||
|
|
|
|
|
| |||||||
| a | Net of foreign withholding tax of $33,367,209, $1,103,631 and $9,393,027, respectively. |
See notes to financial statements.
| 50 | 2017 iSHARES ANNUAL REPORTTO SHAREHOLDERS |
Table of Contents
Statements of Changes in Net Assets
iSHARES®, INC.
| iShares Edge MSCI Min Vol Global ETF | iShares MSCI Australia ETF | |||||||||||||||
| Year ended August 31, 2017 | Year ended August 31, 2016 | Year ended August 31, 2017 | Year ended August 31, 2016 | |||||||||||||
INCREASE (DECREASE) IN NET ASSETS | ||||||||||||||||
OPERATIONS: | ||||||||||||||||
Net investment income | $ | 77,633,946 | $ | 64,576,560 | $ | 70,264,196 | $ | 62,740,787 | ||||||||
Net realized gain (loss) | 74,390,587 | 30,872,741 | 78,995,511 | (22,265,463 | ) | |||||||||||
Net change in unrealized appreciation/depreciation | 141,521,669 | 252,873,179 | 127,209,450 | 137,229,771 | ||||||||||||
|
|
|
|
|
|
|
| |||||||||
Net increase in net assets resulting from operations | 293,546,202 | 348,322,480 | 276,469,157 | 177,705,095 | ||||||||||||
|
|
|
|
|
|
|
| |||||||||
DISTRIBUTIONS TO SHAREHOLDERS: | ||||||||||||||||
From net investment income | (82,291,396 | ) | (59,015,735 | ) | (83,656,742 | ) | (59,291,158 | ) | ||||||||
|
|
|
|
|
|
|
| |||||||||
Total distributions to shareholders | (82,291,396 | ) | (59,015,735 | ) | (83,656,742 | ) | (59,291,158 | ) | ||||||||
|
|
|
|
|
|
|
| |||||||||
CAPITAL SHARE TRANSACTIONS: | ||||||||||||||||
Proceeds from shares sold | 684,634,417 | 1,225,242,572 | 624,267,864 | 683,182,993 | ||||||||||||
Cost of shares redeemed | (488,203,636 | ) | (362,492,946 | ) | (719,870,284 | ) | (360,957,779 | ) | ||||||||
|
|
|
|
|
|
|
| |||||||||
Net increase (decrease) in net assets from capital share transactions | 196,430,781 | 862,749,626 | (95,602,420 | ) | 322,225,214 | |||||||||||
|
|
|
|
|
|
|
| |||||||||
INCREASE IN NET ASSETS | 407,685,587 | 1,152,056,371 | 97,209,995 | 440,639,151 | ||||||||||||
NET ASSETS | ||||||||||||||||
Beginning of year | 3,267,688,345 | 2,115,631,974 | 1,668,702,331 | 1,228,063,180 | ||||||||||||
|
|
|
|
|
|
|
| |||||||||
End of year | $ | 3,675,373,932 | $ | 3,267,688,345 | $ | 1,765,912,326 | $ | 1,668,702,331 | ||||||||
|
|
|
|
|
|
|
| |||||||||
Undistributed net investment income included in net assets at end of year | $ | 12,801,276 | $ | 16,401,105 | $ | 6,908,701 | $ | 11,677,105 | ||||||||
|
|
|
|
|
|
|
| |||||||||
SHARES ISSUED AND REDEEMED | ||||||||||||||||
Shares sold | 8,700,000 | 16,900,000 | 29,400,000 | 35,400,000 | ||||||||||||
Shares redeemed | (6,500,000 | ) | (5,100,000 | ) | (33,400,000 | ) | (19,000,000 | ) | ||||||||
|
|
|
|
|
|
|
| |||||||||
Net increase (decrease) in shares outstanding | 2,200,000 | 11,800,000 | (4,000,000 | ) | 16,400,000 | |||||||||||
|
|
|
|
|
|
|
| |||||||||
See notes to financial statements.
FINANCIAL STATEMENTS | 51 |
Table of Contents
Statements of Changes in Net Assets (Continued)
iSHARES®, INC.
| iShares MSCI Canada ETF | iShares MSCI Japan ETF | |||||||||||||||
| Year ended August 31, 2017 | Year ended August 31, 2016 | Year ended August 31, 2017a | Year ended August 31, 2016a | |||||||||||||
INCREASE (DECREASE) IN NET ASSETS | ||||||||||||||||
OPERATIONS: | ||||||||||||||||
Net investment income | $ | 62,223,555 | $ | 49,872,015 | $ | 227,669,417 | $ | 264,486,625 | ||||||||
Net realized gain (loss) | 139,294,992 | (61,752,843 | ) | 455,582,391 | 179,035,668 | |||||||||||
Net change in unrealized appreciation/depreciation | 156,684,789 | 237,092,373 | 1,310,254,903 | (335,550,040 | ) | |||||||||||
|
|
|
|
|
|
|
| |||||||||
Net increase in net assets resulting from operations | 358,203,336 | 225,211,545 | 1,993,506,711 | 107,972,253 | ||||||||||||
|
|
|
|
|
|
|
| |||||||||
DISTRIBUTIONS TO SHAREHOLDERS: | ||||||||||||||||
From net investment income | (60,198,481 | ) | (46,033,306 | ) | (288,645,468 | ) | (261,611,433 | ) | ||||||||
|
|
|
|
|
|
|
| |||||||||
Total distributions to shareholders | (60,198,481 | ) | (46,033,306 | ) | (288,645,468 | ) | (261,611,433 | ) | ||||||||
|
|
|
|
|
|
|
| |||||||||
CAPITAL SHARE TRANSACTIONS: | ||||||||||||||||
Proceeds from shares sold | 1,022,753,433 | 1,347,709,468 | 4,661,723,572 | 3,254,831,968 | ||||||||||||
Cost of shares redeemed | (1,290,632,177 | ) | (360,548,208 | ) | (4,364,075,580 | ) | (8,233,815,497 | ) | ||||||||
|
|
|
|
|
|
|
| |||||||||
Net increase (decrease) in net assets from capital share transactions | (267,878,744 | ) | 987,161,260 | 297,647,992 | (4,978,983,529 | ) | ||||||||||
|
|
|
|
|
|
|
| |||||||||
INCREASE (DECREASE) IN NET ASSETS | 30,126,111 | 1,166,339,499 | 2,002,509,235 | (5,132,622,709 | ) | |||||||||||
NET ASSETS | ||||||||||||||||
Beginning of year | 3,097,793,591 | 1,931,454,092 | 14,015,179,664 | 19,147,802,373 | ||||||||||||
|
|
|
|
|
|
|
| |||||||||
End of year | $ | 3,127,919,702 | $ | 3,097,793,591 | $ | 16,017,688,899 | $ | 14,015,179,664 | ||||||||
|
|
|
|
|
|
|
| |||||||||
Undistributed (distributions in excess of) net investment income included in net assets at end of year | $ | 7,575,046 | $ | 4,768,460 | $ | (26,048,656 | ) | $ | 41,500,905 | |||||||
|
|
|
|
|
|
|
| |||||||||
SHARES ISSUED AND REDEEMED | ||||||||||||||||
Shares sold | 38,600,000 | 57,300,000 | 113,100,000 | 69,900,000 | ||||||||||||
Shares redeemed | (48,500,000 | ) | (15,400,000 | ) | (105,300,000 | ) | (178,050,000 | ) | ||||||||
|
|
|
|
|
|
|
| |||||||||
Net increase (decrease) in shares outstanding | (9,900,000 | ) | 41,900,000 | 7,800,000 | (108,150,000 | ) | ||||||||||
|
|
|
|
|
|
|
| |||||||||
| a | Share transactions reflect a one-for-four reverse stock split effective after the close of trading on November 4, 2016. See Note 4. |
See notes to financial statements.
| 52 | 2017 iSHARES ANNUAL REPORTTO SHAREHOLDERS |
Table of Contents
Statements of Changes in Net Assets (Continued)
iSHARES®, INC.
| iShares MSCI Mexico Capped ETF | iShares MSCI South Korea Capped ETF | |||||||||||||||
| Year ended August 31, 2017 | Year ended August 31, 2016 | Year ended August 31, 2017 | Year ended August 31, 2016 | |||||||||||||
INCREASE (DECREASE) IN NET ASSETS | ||||||||||||||||
OPERATIONS: | ||||||||||||||||
Net investment income | $ | 25,577,881 | $ | 22,572,568 | $ | 35,160,671 | $ | 35,496,600 | ||||||||
Net realized gain (loss) | (7,878,835 | ) | (105,424,948 | ) | 166,328,669 | (72,441,943 | ) | |||||||||
Net change in unrealized appreciation/depreciation | 189,275,345 | 13,777,983 | 392,652,094 | 641,389,742 | ||||||||||||
|
|
|
|
|
|
|
| |||||||||
Net increase (decrease) in net assets resulting from operations | 206,974,391 | (69,074,397 | ) | 594,141,434 | 604,444,399 | |||||||||||
|
|
|
|
|
|
|
| |||||||||
DISTRIBUTIONS TO SHAREHOLDERS: | ||||||||||||||||
From net investment income | (21,098,710 | ) | (31,509,179 | ) | (34,948,193 | ) | (75,311,690 | ) | ||||||||
|
|
|
|
|
|
|
| |||||||||
Total distributions to shareholders | (21,098,710 | ) | (31,509,179 | ) | (34,948,193 | ) | (75,311,690 | ) | ||||||||
|
|
|
|
|
|
|
| |||||||||
CAPITAL SHARE TRANSACTIONS: | ||||||||||||||||
Proceeds from shares sold | 2,161,693,065 | 1,471,785,156 | 330,287,930 | 456,857,078 | ||||||||||||
Cost of shares redeemed | (2,344,445,161 | ) | (1,260,625,873 | ) | (557,813,596 | ) | (693,973,908 | ) | ||||||||
|
|
|
|
|
|
|
| |||||||||
Net increase (decrease) in net assets from capital share transactions | (182,752,096 | ) | 211,159,283 | (227,525,666 | ) | (237,116,830 | ) | |||||||||
|
|
|
|
|
|
|
| |||||||||
INCREASE IN NET ASSETS | 3,123,585 | 110,575,707 | 331,667,575 | 292,015,879 | ||||||||||||
NET ASSETS | ||||||||||||||||
Beginning of year | 1,317,518,010 | 1,206,942,303 | 3,452,970,188 | 3,160,954,309 | ||||||||||||
|
|
|
|
|
|
|
| |||||||||
End of year | $ | 1,320,641,595 | $ | 1,317,518,010 | $ | 3,784,637,763 | $ | 3,452,970,188 | ||||||||
|
|
|
|
|
|
|
| |||||||||
Undistributed (distributions in excess of) net investment income included in net assets at end of year | $ | 7,154,017 | $ | (3,342,828 | ) | $ | (81,351,030 | ) | $ | (111,718,391 | ) | |||||
|
|
|
|
|
|
|
| |||||||||
SHARES ISSUED AND REDEEMED | ||||||||||||||||
Shares sold | 45,200,000 | 28,200,000 | 4,750,000 | 8,900,000 | ||||||||||||
Shares redeemed | (48,000,000 | ) | (25,000,000 | ) | (9,950,000 | ) | (13,850,000 | ) | ||||||||
|
|
|
|
|
|
|
| |||||||||
Net increase (decrease) in shares outstanding | (2,800,000 | ) | 3,200,000 | (5,200,000 | ) | (4,950,000 | ) | |||||||||
|
|
|
|
|
|
|
| |||||||||
See notes to financial statements.
FINANCIAL STATEMENTS | 53 |
Table of Contents
iSHARES®, INC.
(For a share outstanding throughout each period)
| iShares Edge MSCI Min Vol Global ETF | ||||||||||||||||||||
| Year ended Aug. 31, 2017 | Year ended Aug. 31, 2016 | Year ended Aug. 31, 2015 | Year ended Aug. 31, 2014 | Year ended Aug. 31, 2013 | ||||||||||||||||
Net asset value, beginning of year | $ | 75.82 | $ | 67.59 | $ | 68.25 | $ | 59.99 | $ | 55.65 | ||||||||||
|
|
|
|
|
|
|
|
|
| |||||||||||
Income from investment operations: | ||||||||||||||||||||
Net investment incomea | 1.84 | 1.79 | 1.70 | 1.72 | 1.68 | |||||||||||||||
Net realized and unrealized gain (loss)b | 5.40 | 8.07 | (0.89 | ) | 8.18 | 4.20 | ||||||||||||||
|
|
|
|
|
|
|
|
|
| |||||||||||
Total from investment operations | 7.24 | 9.86 | 0.81 | 9.90 | 5.88 | |||||||||||||||
|
|
|
|
|
|
|
|
|
| |||||||||||
Less distributions from: | ||||||||||||||||||||
Net investment income | (1.93 | ) | (1.63 | ) | (1.47 | ) | (1.64 | ) | (1.54 | ) | ||||||||||
|
|
|
|
|
|
|
|
|
| |||||||||||
Total distributions | (1.93 | ) | (1.63 | ) | (1.47 | ) | (1.64 | ) | (1.54 | ) | ||||||||||
|
|
|
|
|
|
|
|
|
| |||||||||||
Net asset value, end of year | $ | 81.13 | $ | 75.82 | $ | 67.59 | $ | 68.25 | $ | 59.99 | ||||||||||
|
|
|
|
|
|
|
|
|
| |||||||||||
Total return | 9.75 | % | 14.76 | % | 1.15 | % | 16.70 | % | 10.69 | % | ||||||||||
|
|
|
|
|
|
|
|
|
| |||||||||||
Ratios/Supplemental data: | ||||||||||||||||||||
Net assets, end of year (000s) | $ | 3,675,374 | $ | 3,267,688 | $ | 2,115,632 | $ | 1,283,012 | $ | 1,007,760 | ||||||||||
Ratio of expenses to average net assets | 0.20 | % | 0.20 | % | 0.20 | % | 0.20 | % | 0.20 | % | ||||||||||
Ratio of expenses to average net assets prior to waived fees | 0.32 | % | 0.32 | % | 0.33 | % | 0.33 | % | 0.34 | % | ||||||||||
Ratio of net investment income to average net assets | 2.40 | % | 2.49 | % | 2.41 | % | 2.67 | % | 2.83 | % | ||||||||||
Portfolio turnover ratec | 24 | % | 24 | % | 22 | % | 24 | % | 13 | % | ||||||||||
| a | Based on average shares outstanding throughout each period. |
| b | The amounts reported for a share outstanding may not accord with the change in aggregate gains and losses in securities for the fiscal period due to the timing of capital share transactions in relation to the fluctuating market values of the Fund’s underlying securities. |
| c | Portfolio turnover rates exclude portfolio securities received or delivered in Creation Units but include portfolio transactions that are executed as a result of the Fund processing capital share transactions in Creation Units partially for cash in U.S. dollars. Excluding such cash transactions, the portfolio turnover rates for the years ended August 31, 2017, August 31, 2016, August 31, 2015, August 31, 2014 and August 31, 2013 were 24%, 23%, 22%, 23% and 13%, respectively. See Note 4. |
See notes to financial statements.
| 54 | 2017 iSHARES ANNUAL REPORTTO SHAREHOLDERS |
Table of Contents
Financial Highlights (Continued)
iSHARES®, INC.
(For a share outstanding throughout each period)
| iShares MSCI Australia ETF | ||||||||||||||||||||
| Year ended Aug. 31, 2017 | Year ended Aug. 31, 2016 | Year ended Aug. 31, 2015 | Year ended Aug. 31, 2014 | Year ended Aug. 31, 2013 | ||||||||||||||||
Net asset value, beginning of year | $ | 20.30 | $ | 18.66 | $ | 27.15 | $ | 23.61 | $ | 23.39 | ||||||||||
|
|
|
|
|
|
|
|
|
| |||||||||||
Income from investment operations: | ||||||||||||||||||||
Net investment incomea | 0.84 | 0.84 | 1.23 | 1.10 | 1.02 | |||||||||||||||
Net realized and unrealized gain (loss)b | 2.45 | 1.59 | (8.49 | ) | 3.43 | 0.64 | ||||||||||||||
|
|
|
|
|
|
|
|
|
| |||||||||||
Total from investment operations | 3.29 | 2.43 | (7.26 | ) | 4.53 | 1.66 | ||||||||||||||
|
|
|
|
|
|
|
|
|
| |||||||||||
Less distributions from: | ||||||||||||||||||||
Net investment income | (1.01 | ) | (0.79 | ) | (1.23 | ) | (0.99 | ) | (1.44 | ) | ||||||||||
|
|
|
|
|
|
|
|
|
| |||||||||||
Total distributions | (1.01 | ) | (0.79 | ) | (1.23 | ) | (0.99 | ) | (1.44 | ) | ||||||||||
|
|
|
|
|
|
|
|
|
| |||||||||||
Net asset value, end of year | $ | 22.58 | $ | 20.30 | $ | 18.66 | $ | 27.15 | $ | 23.61 | ||||||||||
|
|
|
|
|
|
|
|
|
| |||||||||||
Total return | 16.70 | % | 13.36 | % | (27.31 | )% | 19.76 | % | 7.06 | % | ||||||||||
|
|
|
|
|
|
|
|
|
| |||||||||||
Ratios/Supplemental data: | ||||||||||||||||||||
Net assets, end of year (000s) | $ | 1,765,912 | $ | 1,668,702 | $ | 1,228,063 | $ | 2,047,113 | $ | 1,916,849 | ||||||||||
Ratio of expenses to average net assets | 0.49 | % | 0.48 | % | 0.48 | % | 0.48 | % | 0.51 | % | ||||||||||
Ratio of net investment income to average net assets | 3.90 | % | 4.41 | % | 5.37 | % | 4.28 | % | 4.05 | % | ||||||||||
Portfolio turnover ratec | 4 | % | 7 | % | 9 | % | 6 | % | 6 | % | ||||||||||
| a | Based on average shares outstanding throughout each period. |
| b | The amounts reported for a share outstanding may not accord with the change in aggregate gains and losses in securities for the fiscal period due to the timing of capital share transactions in relation to the fluctuating market values of the Fund’s underlying securities. |
| c | Portfolio turnover rates exclude portfolio securities received or delivered as a result of processing capital share transactions in Creation Units. |
See notes to financial statements.
FINANCIAL HIGHLIGHTS | 55 |
Table of Contents
Financial Highlights (Continued)
iSHARES®, INC.
(For a share outstanding throughout each period)
| iShares MSCI Canada ETF | ||||||||||||||||||||
| Year ended Aug. 31, 2017 | Year ended Aug. 31, 2016 | Year ended Aug. 31, 2015 | Year ended Aug. 31, 2014 | Year ended Aug. 31, 2013 | ||||||||||||||||
Net asset value, beginning of year | $ | 25.33 | $ | 24.02 | $ | 32.93 | $ | 27.34 | $ | 27.52 | ||||||||||
|
|
|
|
|
|
|
|
|
| |||||||||||
Income from investment operations: | ||||||||||||||||||||
Net investment incomea | 0.51 | 0.51 | 0.54 | 0.59 | 0.60 | |||||||||||||||
Net realized and unrealized gain (loss)b | 2.47 | 1.29 | (8.85 | ) | 5.62 | (0.10 | ) | |||||||||||||
|
|
|
|
|
|
|
|
|
| |||||||||||
Total from investment operations | 2.98 | 1.80 | (8.31 | ) | 6.21 | 0.50 | ||||||||||||||
|
|
|
|
|
|
|
|
|
| |||||||||||
Less distributions from: | ||||||||||||||||||||
Net investment income | (0.48 | ) | (0.49 | ) | (0.60 | ) | (0.62 | ) | (0.68 | ) | ||||||||||
|
|
|
|
|
|
|
|
|
| |||||||||||
Total distributions | (0.48 | ) | (0.49 | ) | (0.60 | ) | (0.62 | ) | (0.68 | ) | ||||||||||
|
|
|
|
|
|
|
|
|
| |||||||||||
Net asset value, end of year | $ | 27.83 | $ | 25.33 | $ | 24.02 | $ | 32.93 | $ | 27.34 | ||||||||||
|
|
|
|
|
|
|
|
|
| |||||||||||
Total return | 11.88 | % | 7.73 | % | (25.48 | )% | 23.00 | % | 1.84 | % | ||||||||||
|
|
|
|
|
|
|
|
|
| |||||||||||
Ratios/Supplemental data: | ||||||||||||||||||||
Net assets, end of year (000s) | $ | 3,127,920 | $ | 3,097,794 | $ | 1,931,454 | $ | 3,786,906 | $ | 3,428,223 | ||||||||||
Ratio of expenses to average net assets | 0.49 | % | 0.48 | % | 0.48 | % | 0.48 | % | 0.51 | % | ||||||||||
Ratio of net investment income to average net assets | 1.93 | % | 2.18 | % | 1.92 | % | 1.97 | % | 2.12 | % | ||||||||||
Portfolio turnover ratec | 6 | % | 4 | % | 5 | % | 6 | % | 7 | % | ||||||||||
| a | Based on average shares outstanding throughout each period. |
| b | The amounts reported for a share outstanding may not accord with the change in aggregate gains and losses in securities for the fiscal period due to the timing of capital share transactions in relation to the fluctuating market values of the Fund’s underlying securities. |
| c | Portfolio turnover rates exclude portfolio securities received or delivered as a result of processing capital share transactions in Creation Units. |
See notes to financial statements.
| 56 | 2017 iSHARES ANNUAL REPORTTO SHAREHOLDERS |
Table of Contents
Financial Highlights (Continued)
iSHARES®, INC.
(For a share outstanding throughout each period)
| iShares MSCI Japan ETF | ||||||||||||||||||||
| Year ended Aug. 31, 2017a | Year ended Aug. 31, 2016a | Year ended Aug. 31, 2015a | Year ended Aug. 31, 2014a | Year ended Aug. 31, 2013a | ||||||||||||||||
Net asset value, beginning of year | $ | 49.05 | $ | 48.61 | $ | 47.32 | $ | 43.87 | $ | 36.09 | ||||||||||
|
|
|
|
|
|
|
|
|
| |||||||||||
Income from investment operations: | ||||||||||||||||||||
Net investment incomeb | 0.49 | 0.72 | 0.60 | 0.60 | 0.52 | |||||||||||||||
Net realized and unrealized gainc | 5.96 | 0.44 | 1.22 | 3.53 | 7.85 | |||||||||||||||
|
|
|
|
|
|
|
|
|
| |||||||||||
Total from investment operations | 6.45 | 1.16 | 1.82 | 4.13 | 8.37 | |||||||||||||||
|
|
|
|
|
|
|
|
|
| |||||||||||
Less distributions from: | ||||||||||||||||||||
Net investment income | (0.93 | ) | (0.72 | ) | (0.53 | ) | (0.68 | ) | (0.59 | ) | ||||||||||
|
|
|
|
|
|
|
|
|
| |||||||||||
Total distributions | (0.93 | ) | (0.72 | ) | (0.53 | ) | (0.68 | ) | (0.59 | ) | ||||||||||
|
|
|
|
|
|
|
|
|
| |||||||||||
Net asset value, end of year | $ | 54.57 | $ | 49.05 | $ | 48.61 | $ | 47.32 | $ | 43.87 | ||||||||||
|
|
|
|
|
|
|
|
|
| |||||||||||
Total return | 13.31 | % | 2.44 | % | 3.84 | % | 9.39 | % | 23.46 | % | ||||||||||
|
|
|
|
|
|
|
|
|
| |||||||||||
Ratios/Supplemental data: | ||||||||||||||||||||
Net assets, end of year (000s) | $ | 16,017,689 | $ | 14,015,180 | $ | 19,147,802 | $ | 14,729,189 | $ | 10,461,942 | ||||||||||
Ratio of expenses to average net assets | 0.49 | % | 0.48 | % | 0.48 | % | 0.48 | % | 0.50 | % | ||||||||||
Ratio of net investment income to average net assets | 1.45 | % | 1.53 | % | 1.20 | % | 1.31 | % | 1.18 | % | ||||||||||
Portfolio turnover rated | 4 | % | 4 | % | 2 | % | 2 | % | 4 | % | ||||||||||
| a | Per share amounts reflect a one-for-four reverse stock split effective after the close of trading on November 4, 2016. See Note 4. |
| b | Based on average shares outstanding throughout each period. |
| c | The amounts reported for a share outstanding may not accord with the change in aggregate gains and losses in securities for the fiscal period due to the timing of capital share transactions in relation to the fluctuating market values of the Fund’s underlying securities. |
| d | Portfolio turnover rates exclude portfolio securities received or delivered as a result of processing capital share transactions in Creation Units. |
See notes to financial statements.
FINANCIAL HIGHLIGHTS | 57 |
Table of Contents
Financial Highlights (Continued)
iSHARES®, INC.
(For a share outstanding throughout each period)
| iShares MSCI Mexico Capped ETF | ||||||||||||||||||||
| Year ended Aug. 31, 2017 | Year ended Aug. 31, 2016 | Year ended Aug. 31, 2015 | Year ended Aug. 31, 2014 | Year ended Aug. 31, 2013 | ||||||||||||||||
Net asset value, beginning of year | $ | 50.48 | $ | 52.70 | $ | 71.51 | $ | 61.93 | $ | 60.96 | ||||||||||
|
|
|
|
|
|
|
|
|
| |||||||||||
Income from investment operations: | ||||||||||||||||||||
Net investment incomea | 0.88 | 0.93 | 0.68 | 1.06 | 0.75 | |||||||||||||||
Net realized and unrealized gain (loss)b | 6.10 | (1.82 | ) | (18.56 | ) | 9.61 | 0.85 | |||||||||||||
|
|
|
|
|
|
|
|
|
| |||||||||||
Total from investment operations | 6.98 | (0.89 | ) | (17.88 | ) | 10.67 | 1.60 | |||||||||||||
|
|
|
|
|
|
|
|
|
| |||||||||||
Less distributions from: | ||||||||||||||||||||
Net investment income | (0.78 | ) | (1.33 | ) | (0.93 | ) | (1.09 | ) | (0.63 | ) | ||||||||||
|
|
|
|
|
|
|
|
|
| |||||||||||
Total distributions | (0.78 | ) | (1.33 | ) | (0.93 | ) | (1.09 | ) | (0.63 | ) | ||||||||||
|
|
|
|
|
|
|
|
|
| |||||||||||
Net asset value, end of year | $ | 56.68 | $ | 50.48 | $ | 52.70 | $ | 71.51 | $ | 61.93 | ||||||||||
|
|
|
|
|
|
|
|
|
| |||||||||||
Total return | 14.03 | % | (1.68 | )% | (25.10 | )% | 17.42 | % | 2.53 | % | ||||||||||
|
|
|
|
|
|
|
|
|
| |||||||||||
Ratios/Supplemental data: | ||||||||||||||||||||
Net assets, end of year (000s) | $ | 1,320,642 | $ | 1,317,518 | $ | 1,206,942 | $ | 3,275,152 | $ | 2,217,052 | ||||||||||
Ratio of expenses to average net assets | 0.49 | % | 0.48 | % | 0.48 | % | 0.48 | % | 0.50 | % | ||||||||||
Ratio of net investment income to average net assets | 1.79 | % | 1.82 | % | 1.10 | % | 1.61 | % | 1.09 | % | ||||||||||
Portfolio turnover ratec | 8 | % | 8 | % | 13 | % | 19 | % | 32 | % | ||||||||||
| a | Based on average shares outstanding throughout each period. |
| b | The amounts reported for a share outstanding may not accord with the change in aggregate gains and losses in securities for the fiscal period due to the timing of capital share transactions in relation to the fluctuating market values of the Fund’s underlying securities. |
| c | Portfolio turnover rates exclude portfolio securities received or delivered as a result of processing capital share transactions in Creation Units. |
See notes to financial statements.
| 58 | 2017 iSHARES ANNUAL REPORTTO SHAREHOLDERS |
Table of Contents
Financial Highlights (Continued)
iSHARES®, INC.
(For a share outstanding throughout each period)
| iShares MSCI South Korea Capped ETF | ||||||||||||||||||||
| Year ended Aug. 31, 2017 | Year ended Aug. 31, 2016 | Year ended Aug. 31, 2015 | Year ended Aug. 31, 2014 | Year ended Aug. 31, 2013 | ||||||||||||||||
Net asset value, beginning of year | $ | 56.89 | $ | 48.15 | $ | 66.42 | $ | 57.67 | $ | 55.97 | ||||||||||
|
|
|
|
|
|
|
|
|
| |||||||||||
Income from investment operations: | ||||||||||||||||||||
Net investment incomea | 0.64 | 0.56 | 0.46 | 0.25 | 0.23 | |||||||||||||||
Net realized and unrealized gain (loss)b | 11.31 | 9.38 | (18.07 | ) | 9.40 | 1.83 | ||||||||||||||
|
|
|
|
|
|
|
|
|
| |||||||||||
Total from investment operations | 11.95 | 9.94 | (17.61 | ) | 9.65 | 2.06 | ||||||||||||||
|
|
|
|
|
|
|
|
|
| |||||||||||
Less distributions from: | ||||||||||||||||||||
Net investment income | (0.65 | ) | (1.20 | ) | (0.66 | ) | (0.90 | ) | (0.36 | ) | ||||||||||
|
|
|
|
|
|
|
|
|
| |||||||||||
Total distributions | (0.65 | ) | (1.20 | ) | (0.66 | ) | (0.90 | ) | (0.36 | ) | ||||||||||
|
|
|
|
|
|
|
|
|
| |||||||||||
Net asset value, end of year | $ | 68.19 | $ | 56.89 | $ | 48.15 | $ | 66.42 | $ | 57.67 | ||||||||||
|
|
|
|
|
|
|
|
|
| |||||||||||
Total return | 21.28 | % | 20.92 | % | (26.58 | )% | 16.83 | % | 3.65 | % | ||||||||||
|
|
|
|
|
|
|
|
|
| |||||||||||
Ratios/Supplemental data: | ||||||||||||||||||||
Net assets, end of year (000s) | $ | 3,784,638 | $ | 3,452,970 | $ | 3,160,954 | $ | 4,891,619 | $ | 3,376,516 | ||||||||||
Ratio of expenses to average net assets | 0.62 | % | 0.64 | % | 0.62 | % | 0.62 | % | 0.61 | % | ||||||||||
Ratio of net investment income to average net assets | 1.05 | % | 1.09 | % | 0.81 | % | 0.39 | % | 0.40 | % | ||||||||||
Portfolio turnover ratec | 16 | % | 22 | % | 24 | % | 13 | % | 13 | % | ||||||||||
| a | Based on average shares outstanding throughout each period. |
| b | The amounts reported for a share outstanding may not accord with the change in aggregate gains and losses in securities for the fiscal period due to the timing of capital share transactions in relation to the fluctuating market values of the Fund’s underlying securities. |
| c | Portfolio turnover rates include portfolio transactions that are executed as a result of the Fund processing capital share transactions in Creation Units solely for cash in U.S. dollars. Excluding such cash transactions, the portfolio turnover rates for the years ended August 31, 2017, August 31, 2016, August 31, 2015, August 31, 2014 and August 31, 2013 were 6%, 10%, 10%, 10% and 11%, respectively. See Note 4. |
See notes to financial statements.
FINANCIAL HIGHLIGHTS | 59 |
Table of Contents
iSHARES®, INC.
iShares, Inc. (the “Company”) is registered under the Investment Company Act of 1940, as amended (the “1940 Act”), as an open-end management investment company. The Company was incorporated under the laws of the State of Maryland on September 1, 1994 pursuant to Articles of Incorporation as subsequently amended and restated.
These financial statements relate only to the following funds (each, a “Fund,” and collectively, the “Funds”):
| iShares ETF | Diversification Classification | |
Edge MSCI Min Vol Global | Diversified | |
MSCI Australia | Non-diversified | |
MSCI Canada | Diversified | |
MSCI Japan | Diversified | |
MSCI Mexico Capped | Non-diversified | |
MSCI South Korea Capped | Non-diversified |
The investment objective of each Fund is to seek investment results that correspond generally to the price and yield performance, before fees and expenses, of its underlying index. The investment adviser uses a “passive” or index approach to try to achieve each Fund’s investment objective.
Pursuant to the Company’s organizational documents, the Funds’ officers and directors are indemnified against certain liabilities that may arise out of the performance of their duties to the Funds. Additionally, in the normal course of business, the Funds enter into contracts with service providers that contain general indemnification clauses. The Funds’ maximum exposure under these arrangements is unknown as this would involve future claims that may be made against the Funds that have not yet occurred.
| 1. | SIGNIFICANT ACCOUNTING POLICIES |
The following significant accounting policies are consistently followed by each Fund in the preparation of its financial statements in conformity with accounting principles generally accepted in the United States of America (“U.S. GAAP”). The preparation of financial statements in conformity with U.S. GAAP requires management to make certain estimates and assumptions that affect the reported amounts of assets and liabilities and disclosures of contingent assets and liabilities at the date of the financial statements and the reported amounts of revenue and expenses during the reporting period. Actual results could differ from those estimates. Each Fund is considered an investment company under U.S. GAAP and follows the accounting and reporting guidance applicable to investment companies.
SECURITY VALUATION
Each Fund’s investments are valued at fair value each day that the Fund’s listing exchange is open and, for financial reporting purposes, as of the report date should the reporting period end on a day that the Fund’s listing exchange is not open. U.S. GAAP defines fair value as the price a fund would receive to sell an asset or pay to transfer a liability in an orderly transaction between market participants at the measurement date. The BlackRock Global Valuation Methodologies Committee (the “Global Valuation Committee”) provides oversight of the valuation of investments for the Funds. The investments of each Fund are valued pursuant to policies and procedures developed by the Global Valuation Committee and approved by the Board of Directors of the Company (the “Board”).
| • | Equity investments traded on a recognized securities exchange are valued at that day’s last reported trade price or the official closing price, as applicable, on the exchange where the stock is primarily traded. Equity investments traded on a recognized exchange for which there were no sales on that day are valued at the last traded price. |
| 60 | 2017 iSHARES ANNUAL REPORTTO SHAREHOLDERS |
Table of Contents
Notes to Financial Statements (Continued)
iSHARES®, INC.
| • | Open-end U.S. mutual funds (including money market funds) are valued at that day’s published net asset value (“NAV”). |
| • | Futures contract notional values are determined based on that day’s last reported settlement price on the exchange where the contract is traded. |
In the event that application of these methods of valuation results in a price for an investment which is deemed not to be representative of the fair value of such investment or if a price is not available, the investment will be valued by the Global Valuation Committee, in accordance with policies approved by the Board. The fair valuation approaches that may be utilized by the Global Valuation Committee to determine fair value include market approach, income approach and the cost approach. The valuation techniques used under these approaches take into consideration inputs that include but are not limited to (i) attributes specific to the investment; (ii) the principal market for the investment; (iii) the customary participants in the principal market for the investment; (iv) data assumptions by market participants for the investment, if reasonably available; (v) quoted prices for similar investments in active markets; and (vi) other inputs, such as future cash flows, interest rates, yield curves, volatilities, prepayment speeds, loss severities, credit risks and/or default rates. Valuations based on such inputs are reported to the Board on a quarterly basis.
The Global Valuation Committee employs various methods for calibrating valuation approaches for investments where an active market does not exist, including regular due diligence of the Company’s pricing vendors, a regular review of key inputs and assumptions, transactional back-testing or disposition analysis to compare unrealized gains and losses to realized gains and losses, reviews of missing or stale prices, reviews of large movements in market values, and reviews of market related activity.
Fair value pricing could result in a difference between the prices used to calculate a Fund’s NAV and the prices used by the Fund’s underlying index, which in turn could result in a difference between the Fund’s performance and the performance of the Fund’s underlying index.
Various inputs are used in determining the fair value of financial instruments. Inputs may be based on independent market data (“observable inputs”) or they may be internally developed (“unobservable inputs”). These inputs to valuation techniques are categorized into a fair value hierarchy consisting of three broad levels for financial reporting purposes as follows:
| • | Level 1 — Unadjusted quoted prices in active markets for identical assets or liabilities; |
| • | Level 2 — Inputs other than quoted prices included within Level 1 that are observable for the asset or liability either directly or indirectly, including quoted prices for similar assets or liabilities in active markets, quoted prices for identical or similar assets or liabilities in markets that are not considered to be active, inputs other than quoted prices that are observable for the asset or liability (such as exchange rates, financing terms, interest rates, yield curves, volatilities, prepayment speeds, loss severities, credit risks and default rates) or other market-corroborated inputs; and |
| • | Level 3 — Unobservable inputs for the asset or liability based on the best information available in the circumstances, to the extent observable inputs are not available, including the Global Valuation Committee’s assumptions used in determining the fair value of investments. |
The hierarchy gives the highest priority to unadjusted quoted prices in active markets for identical assets or liabilities (Level 1 measurements) and the lowest priority to unobservable inputs (Level 3 measurements). Accordingly, the degree of judgement exercised in determining fair value is greatest for instruments categorized in Level 3. The inputs used to measure fair value may fall into different levels of the fair value hierarchy. In such cases, for disclosure purposes, the fair value hierarchy classification is determined based on the lowest level input that is significant to the fair value measurement in its entirety. The fair value hierarchy for each Fund’s investments is included in its schedule of investments.
NOTESTO FINANCIAL STATEMENTS | 61 |
Table of Contents
Notes to Financial Statements (Continued)
iSHARES®, INC.
Changes in valuation techniques may result in transfers in or out of an assigned level within the fair value hierarchy. In accordance with the Company’s policy, transfers between different levels of the fair value hierarchy are deemed to have occurred as of the beginning of the reporting period. The categorization of values determined for financial instruments are based on the pricing transparency of the financial instruments and are not necessarily an indication of the risks associated with investing in those securities.
SECURITY TRANSACTIONS AND INCOME RECOGNITION
Security transactions are accounted for on trade date. Realized gains and losses on investment transactions are determined using the specific identification method. Dividend income and capital gain distributions, if any, are recognized on the ex-dividend date, net of any foreign taxes withheld at source. Any taxes withheld that are reclaimable from foreign tax authorities as of August 31, 2017 are reflected in tax reclaims receivable. Upon notification from issuers, some of the dividend income received from a real estate investment trust may be re-designated as a reduction of cost of the related investment and/or realized gain. Non-cash dividends received, if any, are recognized on the ex-dividend date and recorded as non-cash dividend income at fair value. Distributions received by the Funds may include a return of capital that is estimated by management. Such amounts are recorded as a reduction of the cost of investments or reclassified to capital gains. Interest income is accrued daily.
FOREIGN CURRENCY TRANSLATION
The accounting records of the Funds are maintained in U.S. dollars. Foreign currencies, as well as investment securities and other assets and liabilities denominated in foreign currencies, are translated into U.S. dollars using exchange rates deemed appropriate by the investment adviser. Purchases and sales of securities, income receipts and expense payments are translated into U.S. dollars on the respective dates of such transactions.
Each Fund does not isolate the effect of fluctuations in foreign exchange rates from the effect of fluctuations in the market prices of securities. Such fluctuations are reflected by the Funds as a component of realized and unrealized gains and losses from investments for financial reporting purposes. Each Fund reports realized currency gains (losses) on foreign currency related transactions as components of net realized gain (loss) for financial reporting purposes, whereas such components are generally treated as ordinary income for U.S. federal income tax purposes.
FOREIGN TAXES
The Funds may be subject to foreign taxes (a portion of which may be reclaimable) on income, stock dividends, capital gains on investments, or certain foreign currency transactions. All foreign taxes are recorded in accordance with the applicable foreign tax regulations and rates that exist in the foreign jurisdictions in which the Funds invest. These foreign taxes, if any, are paid by the Funds and are reflected in their statements of operations as follows: foreign taxes withheld at source are presented as a reduction of income, foreign taxes on securities lending income are presented as a reduction of securities lending income, foreign taxes on stock dividends are presented as “other foreign taxes”, and foreign taxes on capital gains from sales of investments and foreign taxes on foreign currency transactions are included in their respective net realized gain (loss) categories. Foreign taxes payable or deferred as of August 31, 2017, if any, are disclosed in the Funds’ statements of assets and liabilities.
DISTRIBUTIONS TO SHAREHOLDERS
Dividends and distributions paid by each Fund are recorded on the ex-dividend dates. Distributions are determined on a tax basis and may differ from net investment income and net realized capital gains for financial reporting purposes. Dividends and distributions are paid in U.S. dollars and cannot be automatically reinvested in additional shares of the Funds.
| 62 | 2017 iSHARES ANNUAL REPORTTO SHAREHOLDERS |
Table of Contents
Notes to Financial Statements (Continued)
iSHARES®, INC.
LOANS OF PORTFOLIO SECURITIES
Each Fund may lend its investment securities to approved borrowers, such as brokers, dealers and other financial institutions. The borrower pledges and maintains with the Fund collateral consisting of cash, an irrevocable letter of credit issued by an approved bank, or securities issued or guaranteed by the U.S. government. The initial collateral received by each Fund is required to have a value of at least 102% of the current value of the loaned securities for securities traded on U.S. exchanges and a value of at least 105% for all other securities. The collateral is maintained thereafter at a value equal to at least 100% of the current value of the securities on loan. The market value of the loaned securities is determined at the close of each business day of the Funds. Any additional required collateral is delivered to the Funds and any excess collateral is returned by the Funds on the next business day. During the term of the loan, each Fund is entitled to all distributions made on or in respect of the loaned securities but does not receive interest income on securities received as collateral. Loans of securities are terminable at any time and the borrower, after notice, is required to return borrowed securities within the standard time period for settlement of securities transactions.
Cash received as collateral for securities on loan may be reinvested in certain short-term instruments either directly on behalf of a fund or through one or more joint accounts or money market funds, including those managed by BlackRock Fund Advisors (“BFA”), the Funds’ investment adviser, or its affiliates. As of August 31, 2017, any securities on loan were collateralized by cash and/or U.S. government obligations. Cash collateral received was invested in money market funds managed by BFA and is disclosed in the schedules of investments. Any non-cash collateral received cannot be sold, re-invested or pledged by the Fund, except in the event of borrower default. The securities on loan for each Fund are also disclosed in its schedule of investments. The total value of any securities on loan as of August 31, 2017 and the total value of the related cash collateral are disclosed in the statements of assets and liabilities. Income earned by the Funds from securities lending is disclosed in the statements of operations.
The risks of securities lending include the risk that the borrower may not provide additional collateral when required or may not return the securities when due. To mitigate these risks, the Funds benefit from a borrower default indemnity provided by BlackRock, Inc. (“BlackRock”). BlackRock’s indemnity allows for full replacement of securities loaned if the collateral received does not cover the value of the securities loaned in the event of borrower default. Each Fund could incur a loss if the value of an investment purchased with cash collateral falls below the value of the loaned securities or if the value of an investment purchased with cash collateral falls below the value of the original cash collateral received.
Securities lending transactions are entered into by the Funds under Master Securities Lending Agreements (“MSLA”) which provide the right, in the event of default (including bankruptcy or insolvency) for the non-defaulting party to liquidate the collateral and calculate a net exposure to the defaulting party or request additional collateral. In the event that a borrower defaults, a Fund, as lender, would offset the market value of the collateral received against the market value of the securities loaned. The value of the collateral is typically greater than that of the market value of the securities loaned, leaving the lender with a net amount payable to the defaulting party. However, bankruptcy or insolvency laws of a particular jurisdiction may impose restrictions on or prohibitions against such a right of offset in the event of an MSLA counterparty’s bankruptcy or insolvency. Under the MSLA, the borrower can resell or re-pledge the loaned securities, and a Fund can reinvest cash collateral, or, upon an event of default, resell or re-pledge the collateral.
NOTESTO FINANCIAL STATEMENTS | 63 |
Table of Contents
Notes to Financial Statements (Continued)
iSHARES®, INC.
The following table is a summary of securities lending agreements which are subject to offset under an MSLA as of August 31, 2017:
iShares ETF and Counterparty | Market Value of Securities on Loan | Cash Collateral Received a | Net Amount | |||||||||
Edge MSCI Min Vol Global | ||||||||||||
Citigroup Global Markets Inc. | $ | 4,180,812 | $ | 4,180,812 | $ | — | ||||||
Credit Suisse Securities (USA) LLC | 1,969,583 | 1,969,583 | — | |||||||||
Deutsche Bank AG | 1,278,772 | 1,278,772 | — | |||||||||
Deutsche Bank Securities Inc. | 656,528 | 656,528 | — | |||||||||
Goldman Sachs & Co. | 9,802,245 | 9,802,245 | — | |||||||||
HSBC Bank PLC | 45,755 | 45,755 | — | |||||||||
Jefferies LLC | 1,894 | 1,894 | — | |||||||||
JPMorgan Securities LLC | 7,598,900 | 7,598,900 | — | |||||||||
JPMorgan Securities PLC | 1,217,446 | 1,217,446 | — | |||||||||
Merrill Lynch, Pierce, Fenner & Smith | 8,792,776 | 8,792,776 | — | |||||||||
Morgan Stanley & Co. International PLC | 827,973 | 827,973 | — | |||||||||
Morgan Stanley & Co. LLC | 10,498,309 | 10,498,309 | — | |||||||||
Morgan Stanley & Co. LLC (U.S. Equity Securities Lending) | 531,706 | 531,706 | — | |||||||||
Nomura Securities International Inc. | 777,161 | 777,161 | — | |||||||||
State Street Bank & Trust Company | 5,883,493 | 5,883,493 | — | |||||||||
UBS Securities LLC | 445,262 | 445,262 | — | |||||||||
|
|
|
|
|
| |||||||
| $ | 54,508,615 | $ | 54,508,615 | $ | — | |||||||
|
|
|
|
|
| |||||||
MSCI Australia | ||||||||||||
Barclays Capital Inc. | $ | 3,517,482 | $ | 3,517,482 | $ | — | ||||||
UBS Securities LLC | 3,172,404 | 3,172,404 | — | |||||||||
|
|
|
|
|
| |||||||
| $ | 6,689,886 | $ | 6,689,886 | $ | — | |||||||
|
|
|
|
|
| |||||||
MSCI Canada | ||||||||||||
Credit Suisse Securities (USA) LLC | $ | 7,066,093 | $ | 7,066,093 | $ | — | ||||||
Goldman Sachs & Co. | 25,194,109 | 25,194,109 | — | |||||||||
Merrill Lynch, Pierce, Fenner & Smith | 18,628 | 18,628 | — | |||||||||
Morgan Stanley & Co. LLC | 4,726,213 | 4,726,213 | — | |||||||||
State Street Bank & Trust Company | 5,080,403 | 5,080,403 | — | |||||||||
UBS AG | 152,854 | 152,854 | — | |||||||||
|
|
|
|
|
| |||||||
| $ | 42,238,300 | $ | 42,238,300 | $ | — | |||||||
|
|
|
|
|
| |||||||
MSCI Japan | ||||||||||||
Barclays Capital Inc. | $ | 1,357,213 | $ | 1,357,213 | $ | — | ||||||
Citigroup Global Markets Inc. | 954,786 | 954,786 | — | |||||||||
Credit Suisse Securities (USA) LLC | 5,578,395 | 5,578,395 | — | |||||||||
Goldman Sachs & Co. | 5,367,767 | 5,367,767 | — | |||||||||
Merrill Lynch, Pierce, Fenner & Smith | 16,001,624 | 16,001,624 | — | |||||||||
Morgan Stanley & Co. LLC | 8,519,203 | 8,519,203 | — | |||||||||
Nomura Securities International Inc. | 9,144 | 9,144 | — | |||||||||
State Street Bank & Trust Company | 928,174 | 928,174 | — | |||||||||
|
|
|
|
|
| |||||||
| $ | 38,716,306 | $ | 38,716,306 | $ | — | |||||||
|
|
|
|
|
| |||||||
| 64 | 2017 iSHARES ANNUAL REPORTTO SHAREHOLDERS |
Table of Contents
Notes to Financial Statements (Continued)
iSHARES®, INC.
iShares ETF and Counterparty | Market Value of Securities on Loan | Cash Collateral Received a | Net Amount | |||||||||
MSCI Mexico Capped | ||||||||||||
Credit Suisse Securities (USA) LLC | $ | 589,088 | $ | 589,088 | $ | — | ||||||
Deutsche Bank Securities Inc. | 38,378 | 38,378 | — | |||||||||
Goldman Sachs & Co. | 7,929,754 | 7,929,754 | — | |||||||||
Morgan Stanley & Co. LLC | 17,143,566 | 17,143,566 | — | |||||||||
UBS Securities LLC | 330,971 | 330,971 | — | |||||||||
|
|
|
|
|
| |||||||
| $ | 26,031,757 | $ | 26,031,757 | $ | — | |||||||
|
|
|
|
|
| |||||||
MSCI South Korea Capped | ||||||||||||
BNP Paribas Prime Brokerage Inc. | $ | 317,488 | $ | 317,488 | $ | — | ||||||
Citigroup Global Markets Inc. | 43,335,662 | 43,335,662 | — | |||||||||
Credit Suisse Securities (USA) LLC | 7,366,152 | 7,366,152 | — | |||||||||
Deutsche Bank Securities Inc. | 6,437,551 | 6,437,551 | — | |||||||||
Goldman Sachs & Co. | 33,614,193 | 33,614,193 | — | |||||||||
HSBC Bank PLC | 679,108 | 679,108 | — | |||||||||
JPMorgan Securities LLC | 396,861 | 396,861 | — | |||||||||
Macquarie Bank Limited | 3,658,158 | 3,658,158 | — | |||||||||
Morgan Stanley & Co. LLC | 37,941,576 | 37,941,576 | — | |||||||||
|
|
|
|
|
| |||||||
| $ | 133,746,749 | $ | 133,746,749 | $ | — | |||||||
|
|
|
|
|
| |||||||
| a | Collateral received in excess of the market value of securities on loan is not presented in this table. The total cash collateral received by each Fund is disclosed in the Fund’s statement of assets and liabilities. |
| 2. | INVESTMENT ADVISORY AGREEMENT AND OTHER TRANSACTIONS WITH AFFILIATES |
Pursuant to an Investment Advisory Agreement with the Company, BFA manages the investment of each Fund’s assets. BFA is a California corporation indirectly owned by BlackRock. Under the Investment Advisory Agreement, BFA is responsible for substantially all expenses of the Funds, except (i) interest and taxes; (ii) brokerage commissions and other expenses connected with the execution of portfolio transactions; (iii) distribution fees; (iv) the advisory fee payable to BFA; and (v) litigation expenses and any extraordinary expenses (in each case as determined by a majority of the independent directors).
For its investment advisory services to the iShares Edge MSCI Min Vol Global ETF, BFA is entitled to an annual investment advisory fee, accrued daily and paid monthly by the Fund, based on the Fund’s allocable portion of the aggregate of the average daily net assets of the Fund and certain other iShares funds, as follows:
| Investment Advisory Fee | Aggregate Average Daily Net Assets | ||||
| 0.350 | % | First $30 billion | |||
| 0.320 | Over $30 billion, up to and including $60 billion | ||||
| 0.280 | Over $60 billion, up to and including $90 billion | ||||
| 0.252 | Over $90 billion, up to and including $120 billiona | ||||
| 0.227 | Over $120 billiona | ||||
| a | Break level added or amended effective July 1, 2017. |
NOTESTO FINANCIAL STATEMENTS | 65 |
Table of Contents
Notes to Financial Statements (Continued)
iSHARES®, INC.
In addition, the iShares Edge MSCI Min Vol Global ETF may incur its pro rata share of fees and expenses attributable to its investments in other investment companies (“acquired fund fees and expenses”). The total of the investment advisory fee and acquired fund fees and expenses are a fund’s total annual operating expenses. BFA has contractually agreed to waive through December 31, 2023 any portion of its investment advisory fee for the Fund necessary to limit total annual operating expenses to 0.20% of average daily net assets.
For its investment advisory services to each of the iShares MSCI Australia, iShares MSCI Canada, iShares MSCI Japan and iShares MSCI Mexico Capped ETFs, BFA is entitled to an annual investment advisory fee, accrued daily and paid monthly by the Funds, based on each Fund’s allocable portion of the aggregate of the average daily net assets of the Fund and certain other iShares funds, as follows:
| Investment Advisory Fee | Aggregate Average Daily Net Assets | ||||
| 0.59 | % | First $7 billion | |||
| 0.54 | Over $7 billion, up to and including $11 billion | ||||
| 0.49 | Over $11 billion, up to and including $24 billion | ||||
| 0.44 | Over $24 billion, up to and including $48 billion | ||||
| 0.40 | Over $48 billion, up to and including $72 billion | ||||
| 0.36 | Over $72 billion, up to and including $96 billiona | ||||
| 0.32 | Over $96 billiona | ||||
| a | Break level added or amended effective July 1, 2017. |
For its investment advisory services to the iShares MSCI South Korea Capped ETF, BFA is entitled to an annual investment advisory fee, accrued daily and paid monthly by the Fund, based on the Fund’s allocable portion of the aggregate of the average daily net assets of the Fund and certain other iShares funds, as follows:
| Investment Advisory Fee | Aggregate Average Daily Net Assets | ||||
| 0.74 | % | First $2 billion | |||
| 0.69 | Over $2 billion, up to and including $4 billion | ||||
| 0.64 | Over $4 billion, up to and including $8 billion | ||||
| 0.57 | Over $8 billion, up to and including $16 billion | ||||
| 0.51 | Over $16 billion, up to and including $24 billion | ||||
| 0.48 | Over $24 billion, up to and including $32 billion | ||||
| 0.45 | Over $32 billion | ||||
The U.S. Securities and Exchange Commission has issued an exemptive order which permits BlackRock Institutional Trust Company, N.A. (“BTC”), an affiliate of BFA, to serve as securities lending agent for the Funds, subject to applicable conditions. As securities lending agent, BTC bears all operational costs directly related to securities lending. Each Fund is responsible for fees in connection with the investment of cash collateral received for securities on loan in a money market fund managed by BFA, however, BTC has agreed to reduce the amount of securities lending income it receives in order to effectively limit the collateral investment fees each Fund bears to an annual rate of 0.04% (the “collateral investment fees”). Securities lending income is equal to the total of income earned from the reinvestment of cash collateral, net of fees and other payments to and from borrowers of securities, and less the collateral investment fees. The Funds retain a portion of securities lending income and remit the remaining portion to BTC as compensation for its services as securities lending agent.
Pursuant to a securities lending agreement, each Fund retains 80% of securities lending income and the amount retained can never be less than 70% of the total of securities lending income plus the collateral investment fees. In addition, commencing the business day following the date that the aggregate securities lending income plus the collateral investment fees generated across
| 66 | 2017 iSHARES ANNUAL REPORTTO SHAREHOLDERS |
Table of Contents
Notes to Financial Statements (Continued)
iSHARES®, INC.
all 1940 Act iShares exchange-traded funds (the “iShares ETF Complex”) in a given calendar year exceeds the aggregate securities lending income generated across the iShares ETF Complex in the calendar year 2013, each Fund, pursuant to a securities lending agreement, will retain for the remainder of that calendar year 85% of securities lending income and the amount retained can never be less than 70% of the total of securities lending income plus the collateral investment fees.
For the year ended August 31, 2017, the total of securities lending agent services and collateral investment fees paid were as follows:
| iShares ETF | Fees Paid to BTC | |||
Edge MSCI Min Vol Global | $ | 245,849 | ||
MSCI Australia | 8,954 | |||
MSCI Canada | 26,793 | |||
MSCI Japan | 793,698 | |||
MSCI Mexico Capped | 176,754 | |||
MSCI South Korea Capped | 1,121,053 | |||
BlackRock Investments, LLC, an affiliate of BFA, is the distributor for each Fund. Pursuant to the distribution agreement, BFA is responsible for any fees or expenses for distribution services provided to the Funds.
Cross trading is the buying or selling of portfolio securities between funds to which BFA (or an affiliate) serves as investment adviser. At its regularly scheduled quarterly meetings, the Board reviews such transactions as of the most recent calendar quarter for compliance with the requirements and restrictions set forth by Rule 17a-7.
For the year ended August 31, 2017, transactions executed by the Funds pursuant to Rule 17a-7 under the 1940 Act were as follows:
| iShares ETF | Purchases | Sales | ||||||
Edge MSCI Min Vol Global | $ | 106,539,039 | $ | 44,433,771 | ||||
MSCI Australia | 3,094,430 | 5,735,234 | ||||||
MSCI Japan | 55,625,584 | 27,440,774 | ||||||
MSCI South Korea Capped | 24,001,756 | 5,085,653 | ||||||
Each Fund may invest its positive cash balances in certain money market funds managed by BFA or an affiliate. The income earned on these temporary cash investments is included in “Dividends – affiliated” in the statements of operations.
The PNC Financial Services Group, Inc. is the largest stockholder of BlackRock and is considered to be an affiliate of the Funds for 1940 Act purposes.
Certain directors and officers of the Company are also officers of BTC and/or BFA.
NOTESTO FINANCIAL STATEMENTS | 67 |
Table of Contents
Notes to Financial Statements (Continued)
iSHARES®, INC.
| 3. | INVESTMENT PORTFOLIO TRANSACTIONS |
Purchases and sales of investments (excluding in-kind transactions and short-term investments) for the year ended August 31, 2017 were as follows:
| iShares ETF | Purchases | Sales | ||||||
Edge MSCI Min Vol Global | $ | 809,307,324 | $ | 789,468,503 | ||||
MSCI Australia | 95,435,256 | 62,528,480 | ||||||
MSCI Canada | 226,062,007 | 199,117,529 | ||||||
MSCI Japan | 574,767,839 | 624,259,718 | ||||||
MSCI Mexico Capped | 146,171,156 | 118,864,540 | ||||||
MSCI South Korea Capped | 547,043,826 | 749,775,880 | ||||||
In-kind transactions (see Note 4) for the year ended August 31, 2017 were as follows:
| iShares ETF | In-kind Purchases | In-kind Sales | ||||||
Edge MSCI Min Vol Global | $ | 614,584,779 | $ | 439,908,551 | ||||
MSCI Australia | 582,421,403 | 714,108,532 | ||||||
MSCI Canada | 978,097,817 | 1,276,326,666 | ||||||
MSCI Japan | 4,483,728,662 | 4,186,916,459 | ||||||
MSCI Mexico Capped | 2,132,387,727 | 2,335,377,061 | ||||||
| 4. | CAPITAL SHARE TRANSACTIONS |
Capital shares are issued and redeemed by each Fund only in aggregations of a specified number of shares or multiples thereof (“Creation Units”) at NAV. Except when aggregated in Creation Units, shares of each Fund are not redeemable. Transactions in capital shares for each Fund are disclosed in detail in the statements of changes in net assets.
The consideration for the purchase of Creation Units of a fund in the Company generally consists of the in-kind deposit of a designated portfolio of securities and a specified amount of cash. Certain funds in the Company may be offered in Creation Units solely or partially for cash in U.S. dollars. Investors purchasing and redeeming Creation Units may pay a purchase transaction fee and a redemption transaction fee directly to State Street Bank and Trust Company, the Company’s administrator, to offset transfer and other transaction costs associated with the issuance and redemption of Creation Units, including Creation Units for cash. Investors transacting in Creation Units for cash may also pay an additional variable charge to compensate the relevant fund for certain transaction costs (i.e., stamp taxes, taxes on currency or other financial transactions, and brokerage costs) and market impact expenses relating to investing in portfolio securities. Such variable charges, if any, are included in “Proceeds from shares sold” in the statements of changes in net assets.
From time to time, settlement of securities related to in-kind contributions or in-kind redemptions may be delayed. In such cases, securities related to in-kind contributions are reflected as “Due from custodian” and securities related to in-kind redemptions are reflected as “Securities related to in-kind transactions” in the statements of assets and liabilities.
The Board authorized a one-for-four reverse stock split for the iShares MSCI Japan ETF, effective after the close of trading on November 4, 2016. The impact of the stock split was to decrease the number of shares outstanding by a factor of four, while increasing the NAV per share by a factor of four, resulting in no effect on the net assets of the Fund. The financial statements for the Fund have been adjusted to reflect the reverse stock split.
| 68 | 2017 iSHARES ANNUAL REPORTTO SHAREHOLDERS |
Table of Contents
Notes to Financial Statements (Continued)
iSHARES®, INC.
| 5. | FUTURES CONTRACTS |
Each Fund’s use of futures contracts is generally limited to cash equitization. This involves the use of available cash to invest in index futures contracts in order to gain exposure to the equity markets represented in or by the Fund’s underlying index and is intended to allow the Fund to better track its underlying index. Futures contracts are standardized, exchange-traded agreements to buy or sell a financial instrument at a set price on a future date. Upon entering into a futures contract, a fund is required to pledge to the executing broker which holds segregated from its own assets, an amount of cash, U.S. government securities or other high-quality debt and equity securities equal to the minimum initial margin requirements of the exchange on which the contract is traded.
Pursuant to the contract, the fund agrees to receive from or pay to the broker an amount of cash equal to the daily fluctuation in notional value of the contract. Such receipts or payments are known as margin variation and are recorded by the fund as unrealized appreciation or depreciation. When the contract is closed, the fund records a realized gain or loss equal to the difference between the notional value of the contract at the time it was opened and the notional value at the time it was closed. Losses may arise if the notional value of a futures contract decreases due to an unfavorable change in the market rates or values of the underlying instrument during the term of the contract or if the counterparty does not perform under the contract. The use of futures contracts also involves the risk of an imperfect correlation in the movements in the price of futures contracts and the assets underlying such contracts.
The following table shows the value of futures contracts held as of August 31, 2017 and the related locations in the statements of assets and liabilities, presented by risk exposure category:
| Assets | ||||||||
| iShares MSCI Canada ETF | iShares MSCI Japan ETF | |||||||
Equity contracts: | ||||||||
Variation margin / Net assets consist of – net unrealized appreciation (depreciation)a | $ | 47,272 | $ | 642,232 | ||||
|
|
|
| |||||
| a | Represents cumulative appreciation of futures contracts as reported in the schedules of investments. |
| Liabilities | ||||
| iShares MSCI Australia ETF | ||||
Equity contracts: | ||||
Variation margin / Net assets consist of – net unrealized appreciation (depreciation)b | $ | 80,653 | ||
|
| |||
| b | Represents cumulative depreciation of futures contracts as reported in the schedules of investments. |
NOTESTO FINANCIAL STATEMENTS | 69 |
Table of Contents
Notes to Financial Statements (Continued)
iSHARES®, INC.
The following table shows the realized and unrealized gains (losses) on futures contracts held during the year ended August 31, 2017 and the related locations in the statements of operations, presented by risk exposure category:
| Net Realized Gain (Loss) | ||||||||||||
| iShares MSCI Australia ETF | iShares MSCI Canada ETF | iShares MSCI Japan ETF | ||||||||||
Equity contracts: | ||||||||||||
Futures contracts | $ | 1,617,158 | $ | 993,580 | $ | 24,447,380 | ||||||
|
|
|
|
|
| |||||||
| Net Change in Unrealized Appreciation/Depreciation | ||||||||||||
| iShares MSCI Australia ETF | iShares MSCI Canada ETF | iShares MSCI Japan ETF | ||||||||||
Equity contracts: | ||||||||||||
Futures contracts | $ | (236,915 | ) | $ | (318,333 | ) | $ | (26,487 | ) | |||
|
|
|
|
|
| |||||||
The following table shows the average quarter-end balances of open futures contracts for the year ended August 31, 2017:
| iShares MSCI Australia ETF | iShares MSCI Canada ETF | iShares MSCI Japan ETF | ||||||||||
Average value of contracts purchased | $ | 17,449,280 | $ | 10,625,735 | $ | 85,363,645 | ||||||
| 6. | PRINCIPAL RISKS |
In the normal course of business, each Fund invests in securities or other instruments and may enter into certain transactions, and such activities subject the Fund to various risks, including, among others, fluctuations in the market (market risk) or failure of an issuer to meet all of its obligations. The value of securities or other instruments may also be affected by various factors, including, without limitation: (i) the general economy; (ii) the overall market as well as local, regional or global political and/or social instability; (iii) regulation, taxation or international tax treaties between various countries; or (iv) currency, interest rate or price fluctuations. Each Fund’s prospectus provides details of the risks to which the Fund is subject.
BFA uses a “passive” or index approach to try to achieve each Fund’s investment objective following the securities included in its underlying index during upturns as well as downturns. BFA does not take steps to reduce market exposure or to lessen the effects of a declining market. Divergence from the underlying index and the composition of the portfolio is monitored by BFA.
MARKET RISK
Market risk arises mainly from uncertainty about future values of financial instruments influenced by price, currency and interest rate movements. It represents the potential loss a fund may suffer through holding market positions in the face of market movements. A fund is exposed to market risk by its investment in equity, fixed income and/or financial derivative instruments or by its investment in underlying funds. The fair value of securities held by a fund may decline due to general market conditions, economic trends or events that are not specifically related to the issuers of the securities including local, regional or global political, social or economic instability or to factors that affect a particular industry or group of industries. The extent of a fund’s exposure to market risk is the market value of the investments held as shown in the fund’s schedule of investments.
| 70 | 2017 iSHARES ANNUAL REPORTTO SHAREHOLDERS |
Table of Contents
Notes to Financial Statements (Continued)
iSHARES®, INC.
A diversified portfolio, where this is appropriate and consistent with a fund’s objectives, minimizes the risk that a price change of a particular investment will have a material impact on the NAV of a fund. The investment concentrations within each Fund’s portfolio are disclosed in its schedule of investments.
Investing in the securities of non-U.S. issuers involves certain considerations and risks not typically associated with securities of U.S. issuers. Such risks include, but are not limited to: differences in accounting, auditing and financial reporting standards; more substantial governmental involvement in the economy; higher inflation rates, greater social, economic and political uncertainties; possible nationalization or expropriation of assets; less availability of public information about issuers; imposition of withholding or other taxes; higher transaction and custody costs and delays in settlement procedures; and lower level of regulation of the securities markets and issuers. Non-U.S. securities may be less liquid, more difficult to value, and have greater price volatility due to exchange rate fluctuations. These and other risks are heightened for investments in issuers from countries with less developed capital markets.
The economies and markets of European countries are often closely connected and interdependent, and events in one country in Europe can have an adverse impact on other European countries. The European financial markets have experienced volatility and adverse trends in recent years due to concerns about economic downturns or rising government debt levels in several European countries. These events have adversely affected the exchange rate of the euro and may continue to significantly affect European countries. The occurrence of terrorist incidents throughout Europe also could impact financial markets. In addition, the United Kingdom has voted to withdraw from the European Union. The referendum may introduce significant new uncertainties and instability in the financial markets as the United Kingdom negotiates its exit from the European Union.
When a fund concentrates its investments in issuers located in a single country, it assumes the risk that economic, political and social conditions in that country may have a significant impact on its investment performance.
CREDIT RISK
Credit risk is the risk that an issuer or guarantor of debt instruments or the counterparty to a financial transaction, including derivatives contracts, repurchase agreements or loans of portfolio securities, is unable or unwilling to make timely interest and/or principal payments or to otherwise honor its obligations. BFA and its affiliates manage counterparty credit risk by entering into transactions only with counterparties that they believe have the financial resources to honor their obligations and by monitoring the financial stability of those counterparties. Financial assets, which potentially expose a fund to issuer and counterparty credit risks, consist principally of financial instruments and receivables due from counterparties. The extent of a fund’s exposure to credit and counterparty risks with respect to those financial assets is approximated by their value recorded in its statement of assets and liabilities.
| 7. | INCOME TAX INFORMATION |
Each Fund is treated as an entity separate from the Company’s other funds for federal income tax purposes. It is the policy of each Fund to qualify as a regulated investment company by complying with the provisions applicable to regulated investment companies, as defined under Subchapter M of the Internal Revenue Code of 1986, as amended, and to annually distribute substantially all of its ordinary income and any net capital gains (taking into account any capital loss carryforwards) sufficient to relieve it from all, or substantially all, federal income and excise taxes. Accordingly, no provision for federal income taxes is required.
U.S. GAAP requires that certain components of net assets be adjusted to reflect permanent differences between financial and tax reporting. These reclassifications have no effect on net assets or NAV per share. The following permanent differences as of August 31, 2017, attributable to the characterization of corporate actions, passive foreign investment companies, the expiration of
NOTESTO FINANCIAL STATEMENTS | 71 |
Table of Contents
Notes to Financial Statements (Continued)
iSHARES®, INC.
capital loss carryforwards, foreign currency transactions and realized gains (losses) from in-kind redemptions, were reclassified to the following accounts:
| iShares ETF | Paid-in Capital | Undistributed Net Investment Income/Distributions in Excess of Net Investment Income | Undistributed Net Realized Gain/Accumulated Net Realized Loss | |||||||||
Edge MSCI Min Vol Global | $ | 96,384,727 | $ | 1,057,621 | $ | (97,442,348 | ) | |||||
MSCI Australia | 46,516,026 | 8,624,142 | (55,140,168 | ) | ||||||||
MSCI Canada | 183,617,082 | 781,512 | (184,398,594 | ) | ||||||||
MSCI Japan | 424,091,976 | (6,573,510 | ) | (417,518,466 | ) | |||||||
MSCI Mexico Capped | 503,991 | 6,017,674 | (6,521,665 | ) | ||||||||
MSCI South Korea Capped | (60,990,953 | ) | 30,154,883 | 30,836,070 | ||||||||
The tax character of distributions paid during the years ended August 31, 2017 and August 31, 2016 was as follows:
| iShares ETF | 2017 | 2016 | ||||||
Edge MSCI Min Vol Global | ||||||||
Ordinary income | $ | 82,291,396 | $ | 59,015,735 | ||||
|
|
|
| |||||
MSCI Australia | ||||||||
Ordinary income | $ | 83,656,742 | $ | 59,291,158 | ||||
|
|
|
| |||||
MSCI Canada | ||||||||
Ordinary income | $ | 60,198,481 | $ | 46,033,306 | ||||
|
|
|
| |||||
MSCI Japan | ||||||||
Ordinary income | $ | 288,645,468 | $ | 261,611,433 | ||||
|
|
|
| |||||
MSCI Mexico Capped | ||||||||
Ordinary income | $ | 21,098,710 | $ | 31,509,179 | ||||
|
|
|
| |||||
MSCI South Korea Capped | ||||||||
Ordinary income | $ | 34,948,193 | $ | 75,311,690 | ||||
|
|
|
| |||||
| 72 | 2017 iSHARES ANNUAL REPORTTO SHAREHOLDERS |
Table of Contents
Notes to Financial Statements (Continued)
iSHARES®, INC.
As of August 31, 2017, the tax components of accumulated net earnings (losses) were as follows:
| iShares ETF | Undistributed Ordinary Income | Capital Loss | Net Unrealized Gains (Losses) a | Total | ||||||||||||
Edge MSCI Min Vol Global | $ | 13,577,122 | $ | (86,612,072 | ) | $ | 459,760,758 | $ | 386,725,808 | |||||||
MSCI Australia | 18,437,394 | (196,433,666 | ) | (225,818,458 | ) | (403,814,730 | ) | |||||||||
MSCI Canada | 8,999,212 | (464,673,029 | ) | (459,569,767 | ) | (915,243,584 | ) | |||||||||
MSCI Japan | 1,927,845 | (999,223,744 | ) | (184,519,637 | ) | (1,181,815,536 | ) | |||||||||
MSCI Mexico Capped | 7,674,574 | (244,158,733 | ) | (291,351,380 | ) | (527,835,539 | ) | |||||||||
MSCI South Korea Capped | 38,622,494 | (631,844,491 | ) | 1,515,807,157 | 922,585,160 | |||||||||||
| a | The difference between book-basis and tax-basis unrealized gains (losses) was attributable primarily to the characterization of corporate actions, the tax deferral of losses on wash sales and the realization for tax purposes of unrealized gains on investments in passive foreign investment companies. |
As of August 31, 2017, the Funds had capital loss carryforwards available to offset future realized capital gains through the indicated expiration dates as follows:
| iShares ETF | Non- Expiring a | Expiring 2018 | Expiring 2019 | Total | ||||||||||||
Edge MSCI Min Vol Global | $ | 86,612,072 | $ | — | $ | — | $ | 86,612,072 | ||||||||
MSCI Australia | 160,958,058 | 23,348,244 | 12,127,364 | 196,433,666 | ||||||||||||
MSCI Canada | 380,840,433 | 68,928,677 | 14,903,919 | 464,673,029 | ||||||||||||
MSCI Japan | 686,418,449 | 173,577,101 | 139,228,194 | 999,223,744 | ||||||||||||
MSCI Mexico Capped | 218,505,597 | 2,789,471 | 22,863,665 | 244,158,733 | ||||||||||||
MSCI South Korea Capped | 326,749,122 | 226,591,665 | 78,503,704 | 631,844,491 | ||||||||||||
| a | Must be utilized prior to losses subject to expiration. |
For the year ended August 31, 2017, the iShares MSCI South Korea Capped ETF utilized $21,661,340 of its capital loss carryforwards.
The Funds may own shares in certain foreign investment entities, referred to, under U.S. tax law, as “passive foreign investment companies.” The Funds may elect to mark-to-market annually the shares of each passive foreign investment company and would be required to distribute to shareholders any such marked-to-market gains.
Management has analyzed tax laws and regulations and their application to the Funds as of August 31, 2017, inclusive of the open tax return years, and does not believe there are any uncertain tax positions that require recognition of a tax liability in the Funds’ financial statements.
| 8. | LEGAL PROCEEDINGS |
On June 16, 2016, investors (the “Plaintiffs”) in certain iShares funds (iShares Core S&P Small-Cap ETF, iShares Russell 1000 Growth ETF, iShares Core S&P 500 ETF, iShares Russell Mid-Cap Growth ETF, iShares Russell Mid-Cap ETF, iShares Russell Mid-Cap Value ETF, iShares Select Dividend ETF, iShares Morningstar Mid-Cap ETF, iShares Morningstar Large-Cap ETF, iShares U.S. Aerospace & Defense ETF and iShares U.S. Preferred Stock ETF) filed a putative class action lawsuit against iShares Trust, BlackRock, Inc. and certain of its advisory affiliates, and certain directors/trustees and officers of the Funds (collectively, “Defendants”). The lawsuit alleges the Defendants violated federal securities laws by failing to adequately disclose in the prospectuses issued by the funds noted above the risks of using stop-loss orders in the event of a ‘flash crash’, such as the
NOTESTO FINANCIAL STATEMENTS | 73 |
Table of Contents
Notes to Financial Statements (Continued)
iSHARES®, INC.
one that occurred on May 6, 2010. On September 18, 2017, the Court issued a Statement of Decision holding that the Plaintiffs lack standing to assert their claims. On October 11, 2017, the Court entered final judgment dismissing all of Plaintiffs’ claims with prejudice.
| 9. | SUBSEQUENT EVENTS |
Management has evaluated the impact of all subsequent events on the Funds through the date the financial statements were available to be issued and has determined that there were no subsequent events requiring adjustment or disclosure in the financial statements, except as noted below, except as noted below.
At a meeting held on September 14-15, 2017, the Board approved a line of credit for the iShares Edge MSCI Min Vol Global ETF. The Fund, along with certain other iShares funds, will be a party to a $275 million credit agreement with State Street Bank and Trust Company, which will expire on October 24, 2018. The line of credit may be used for temporary or emergency purposes, including redemptions, settlement of trades and rebalancing of portfolio holdings. The credit agreement is expected to be effective on or around October 25, 2017.
Effective September 1, 2017, the iShares MSCI Canada ETF will track a new underlying index, the MSCI Canada Custom Capped Index, and will cease to track the MSCI Canada Index. The change to a capped benchmark is being implemented to seek to reduce tracking error and improve the investor experience.
| 74 | 2017 iSHARES ANNUAL REPORTTO SHAREHOLDERS |
Table of Contents
Report of Independent Registered Public Accounting Firm
To the Board of Directors of iShares, Inc. and
Shareholders of the iShares Edge MSCI Min Vol Global ETF, iShares MSCI Australia ETF,
iShares MSCI Canada ETF, iShares MSCI Japan ETF, iShares MSCI Mexico Capped ETF and
iShares MSCI South Korea Capped ETF
In our opinion, the accompanying statements of assets and liabilities, including the schedules of investments, and the related statements of operations and of changes in net assets and the financial highlights present fairly, in all material respects, the financial position of iShares Edge MSCI Min Vol Global ETF, iShares MSCI Australia ETF, iShares MSCI Canada ETF, iShares MSCI Japan ETF, iShares MSCI Mexico Capped ETF and iShares MSCI South Korea Capped ETF (constituting funds of iShares, Inc., hereafter referred to as the “Funds”) as of August 31, 2017, and the results of each of their operations, the changes in each of their net assets and the financial highlights for each of the periods indicated, in conformity with accounting principles generally accepted in the United States of America. These financial statements and financial highlights (hereafter referred to as “financial statements”) are the responsibility of the Funds’ management. Our responsibility is to express an opinion on these financial statements based on our audits. We conducted our audits of these financial statements in accordance with the standards of the Public Company Accounting Oversight Board (United States). Those standards require that we plan and perform the audit to obtain reasonable assurance about whether the financial statements are free of material misstatement. An audit includes examining, on a test basis, evidence supporting the amounts and disclosures in the financial statements, assessing the accounting principles used and significant estimates made by management, and evaluating the overall financial statement presentation. We believe that our audits, which included confirmation of securities as of August 31, 2017 by correspondence with the custodian, transfer agent and brokers, or by other appropriate auditing procedures where replies were not received, provide a reasonable basis for our opinion.
PricewaterhouseCoopers LLP
San Francisco, California
October 23, 2017
REPORTOF INDEPENDENT REGISTERED PUBLIC ACCOUNTING FIRM | 75 |
Table of Contents
iSHARES®, INC.
The following maximum amounts are hereby designated as qualified dividend income for individuals for the fiscal year ended August 31, 2017:
| iShares ETF | Qualified Dividend Income | |||
Edge MSCI Min Vol Global | $ | 61,075,464 | ||
MSCI Australia | 72,694,868 | |||
MSCI Canada | 91,132,878 | |||
MSCI Japan | 314,167,652 | |||
MSCI Mexico Capped | 30,088,863 | |||
MSCI South Korea Capped | 84,686,130 | |||
For corporate shareholders, the percentage of income dividends paid by the iShares Edge MSCI Min Vol Global ETF during the fiscal year ended August 31, 2017 that qualified for the dividends-received deduction was 51.50%.
For the fiscal year ended August 31, 2017, the following Funds earned foreign source income and paid foreign taxes which they intend to pass through to their shareholders:
| iShares ETF | Foreign Source Income Earned | Foreign Taxes Paid | ||||||
MSCI Australia | $ | 79,509,924 | $ | 479,412 | ||||
MSCI Canada | 91,620,768 | 13,765,737 | ||||||
MSCI Japan | 333,859,362 | 33,360,177 | ||||||
MSCI Mexico Capped | 32,798,442 | 1,081,778 | ||||||
MSCI South Korea Capped | 86,326,759 | 9,392,107 | ||||||
| 76 | 2017 iSHARES ANNUAL REPORTTO SHAREHOLDERS |
Table of Contents
Board Review and Approval of Investment Advisory
Contract
iSHARES®, INC.
I. iShares Edge MSCI Min Vol Global ETF
Under Section 15(c) of the Investment Company Act of 1940 (the “1940 Act”), the Company’s Board of Directors (the “Board”), including a majority of Directors who are not “interested persons” of the Company (as that term is defined in the 1940 Act) (the “Independent Directors”), is required annually to consider and approve the Investment Advisory Contract between the Company and BFA (the “Advisory Contract”) on behalf of the Fund. The Independent Directors requested, and BFA provided, such information as the Independent Directors, with advice from independent counsel, deemed reasonably necessary to evaluate the Advisory Contract. A committee of all of the Independent Directors (the “15(c) Committee”), with independent counsel, met with management on May 5, 2017 and May 12, 2017. At these meetings, the 15(c) Committee reviewed and discussed information provided in response to the 15(c) Committee’s initial requests, and requested certain additional information, which management agreed to provide. At a meeting held on May 18, 2017, management presented information to the Board relating to the continuance of the Advisory Contract, including information requested by the 15(c) Committee during its meetings. The Board, including the Independent Directors, reviewed and discussed such information at length. The Independent Directors requested from management certain additional information, which management agreed to provide. At a meeting held on June 19-21, 2017, the Board, including the Independent Directors, reviewed the additional information provided by management in response to these requests. After extensive discussions, the Board, including all of the Independent Directors, approved the continuance of the Advisory Contract for the Fund, based on a review of qualitative and quantitative information provided by BFA. The Board noted its satisfaction with the extent and quality of information provided and its frequent interactions with management, as well as the detailed responses and other information provided by BFA. The Board also noted that the Board and BFA agreed to discuss potential further enhancements to the 15(c) process for the coming year. The Independent Directors were advised by their independent counsel throughout the process, including about the legal standards applicable to their review. In approving the Advisory Contract for the Fund, the Board, including the Independent Directors, considered the following factors, no one of which was controlling, and reached the following conclusions:
Expenses and Performance of the Fund — The Board reviewed statistical information prepared by Broadridge Financial Solutions Inc. (“Broadridge”), an independent provider of investment company data, regarding the expense ratio components, including gross and net total expenses, waivers/reimbursements (if any), and underlying fund fees and expenses (if any) of the Fund in comparison with the same information for other exchange traded funds (“ETFs”) (including, where applicable, funds sponsored by an “at cost” service provider) and, in the limited instances where no comparable ETFs existed and the comparison group would not otherwise be reasonable in Broadridge’s judgment, pure index institutional mutual funds, objectively selected by Broadridge as comprising the Fund’s applicable peer group pursuant to Broadridge’s proprietary ETF methodology (the “Peer Group”). The Board was provided with a detailed description of the proprietary ETF methodology used by Broadridge to determine the Fund’s Peer Group. The Board further noted that due to the limitations in providing comparable funds in the Peer Group, the statistical information provided in Broadridge’s report may or may not provide meaningful direct comparisons to the Fund in all instances.
The Board also noted that the investment advisory fee rate and overall expenses (net of waivers and reimbursements) for the Fund were lower than the median of the investment advisory fee rates and overall expenses (net of waivers and reimbursements) of the funds in its Peer Group, excluding iShares funds.
In addition, to the extent that any of the comparison funds included in the Peer Group, excluding iShares funds, track the same index as the Fund, Broadridge also provided, and the Board reviewed, a comparison of the Fund’s performance for the one-, three-, five-, ten-year, and since inception periods, as applicable, and for the quarter ended December 31, 2016, to that of relevant comparison funds for the same periods.
BOARD REVIEWAND APPROVALOF INVESTMENT ADVISORY CONTRACT | 77 |
Table of Contents
Board Review and Approval of Investment Advisory
Contract (Continued)
iSHARES®, INC.
The Board noted that the Fund seeks to track its specified underlying index and that, during the year, the Board received periodic reports on the Fund’s short- and longer-term performance in comparison with its underlying index. Such periodic comparative performance information, including any additional detailed information requested by the Boards, was also considered. The Board noted that the Fund generally performed in line with its underlying index over the relevant periods.
Based on this review, the other factors considered at the meeting, and their general knowledge of ETF pricing, the Board concluded that the investment advisory fee rate and the historical performance of the Fund supported the Board’s approval of the continuance of the Advisory Contract for the coming year.
Nature, Extent and Quality of Services Provided by BFA — Based on management’s representations, including information about recent and proposed enhancements to the iShares business, including with respect to capital markets support and analysis, technology, product design, compliance and risk management, and other services, the Board expected that there would be no diminution in the scope of services required of or provided by BFA under the Advisory Contract for the coming year as compared to the scope of services provided by BFA during prior years. In reviewing the scope of these services, the Board considered BFA’s investment philosophy and experience, noting that BFA and its affiliates have committed significant resources over time, including during the past year, to supporting the iShares funds and their shareholders. The Board also considered BFA’s compliance program and its compliance record with respect to the Fund. In that regard, the Board noted that BFA reports to the Board about portfolio management and compliance matters on a periodic basis in connection with regularly scheduled meetings of the Board, and on other occasions as necessary and appropriate, and has provided information and made appropriate officers available as needed to provide further assistance with these matters. The Board also reviewed the background and experience of the persons responsible for the day-to-day management of the Fund, as well as the resources available to them in managing the Fund. In addition to the above considerations, the Board reviewed and considered detailed presentations regarding BFA’s investment performance, investment and risk management processes and strategies provided at the June 19-21, 2017 meeting and throughout the previous year, and matters related to BFA’s portfolio compliance policies and procedures. The Board noted that the Fund had met its investment objective consistently since its inception date.
Based on review of this information, and the performance information discussed above, the Board concluded that the nature, extent and quality of services provided by BFA to the Fund under the Advisory Contract supported the Board’s approval of the continuance of the Advisory Contract for the coming year.
Costs of Services Provided to Fund and Profits Realized by BFA and Affiliates — The Board reviewed information about the profitability of the Fund to BlackRock, based on the fees payable to BFA and its affiliates (including fees under the Advisory Contract), and other sources of revenue and expense to BFA and its affiliates from the Fund’s operations for the last calendar year. The Board reviewed BlackRock’s profitability methodology for the iShares funds, including supplemental information that was responsive to requests of the 15(c) Committee. The Board noted that the 15(c) Committee had focused on the methodology and profitability presentation during its meetings. The Board discussed the sources of direct and ancillary revenue with management, including the revenues to BTC, a BFA affiliate, from securities lending by the Fund. The Board also discussed BFA’s profit margin as reflected in the Fund’s profitability analysis and reviewed information regarding potential economies of scale (as discussed below). Based on this review, the Board concluded that the profits realized by BFA and its affiliates under the Advisory Contract and from other relationships between the Fund and BFA and/or its affiliates, if any, were within a reasonable range in light of the factors considered.
Economies of Scale — The Board reviewed information regarding potential economies of scale or other efficiencies that may result from increases in the Fund’s assets, noting that the issue of economies of scale had been focused on by the 15(c) Committee during its meetings and addressed by management, including through supplemental information. The Board and the 15(c) Committee reviewed information provided by BFA regarding scale benefits shared with the iShares funds through
| 78 | 2017 iSHARES ANNUAL REPORTTO SHAREHOLDERS |
Table of Contents
Board Review and Approval of Investment Advisory
Contract (Continued)
iSHARES®, INC.
relatively low fee rates established at inception, breakpoints and waivers or other fee reductions, as well as through additional investment in the iShares business and the provision of improved or additional infrastructure and services to the iShares funds and their shareholders. The Board and the 15(c) Committee received information regarding BlackRock’s historical profitability, including BFA’s and its affiliates’ costs in providing services. The cost information distinguished, among other things, between fixed and variable costs, and explained how the level of fixed and variable costs, as well as the nature of such costs, may impact the existence or size of scale benefits. The Board noted that the Advisory Contract for the Fund already provided for breakpoints in the Fund’s investment advisory fee rate, and that BFA and the Board had agreed to revise the Advisory Contract for the Fund to provide for an additional breakpoint as the assets of the Fund, on an aggregated basis with the assets of certain other iShares funds, increase. The Board noted that it would continue to monitor the sharing of economies of scale to determine the appropriateness of adding new or revised breakpoints in the future.
Based on this review, as well as the other factors considered at the meeting, the Board, recognizing its responsibility to consider the Advisory Contract at least annually, determined to approve the continuance of the Advisory Contract for the coming year.
Fees and Services Provided for Other Comparable Funds/Accounts Managed by BFA and its Affiliates — The Board received and considered information regarding the investment advisory/management fee rates for other funds/accounts in the U.S. for which BFA (or its affiliates) provides investment advisory/management services, including open-end funds registered under the 1940 Act (including sub-advised funds), collective trust funds, and institutional separate accounts (together, the “Other Accounts”), and acknowledged BFA’s assertion that the iShares funds are fundamentally different investment vehicles from the Other Accounts. The Board noted that BFA and its affiliates do manage Other Accounts with substantially the same investment objective and strategy as the Fund and that track the same index as the Fund. The Board further noted that BFA provided the Board with detailed information regarding how the Other Accounts (particularly institutional clients) generally differ from the Fund, including in terms of the different and generally more extensive services provided to the Fund, as well as other significant differences. In that regard, the Board considered that the pricing of services to institutional clients is typically based on a number of factors beyond the nature and extent of the specific services to be provided and often depends on the overall relationship between the client and its affiliates and the adviser and its affiliates. In addition, the Board considered the relative complexity and inherent risks and challenges of managing and providing other services to the Fund, as a publicly traded ETF, as compared to the Other Accounts that are institutional clients, in light of differing regulatory requirements and client-imposed mandates. The Board also acknowledged BFA’s expressed business purpose for launching a suite of iShares “Core” ETFs that generally are subject to lower investment advisory fees than iShares non-Core ETFs that may provide a similar investment exposure. The Board also considered the “all-inclusive” nature of the Fund’s advisory fee structure, and the Fund expenses borne by BFA under this arrangement. The Board noted that the investment advisory fee rate under the Advisory Contract for the Fund was generally higher than the investment advisory/management fee rates for certain of the Other Accounts (particularly institutional clients) and concluded that the differences appeared to be consistent with the factors discussed.
Other Benefits to BFA and/or its Affiliates — The Board reviewed the “fallout” benefits or ancillary revenue received by BFA and/or its affiliates in connection with the services provided to the Fund by BFA, such as payment of revenue to BTC, the Fund’s securities lending agent, for loaning portfolio securities (which was included in the profit margins reviewed by the Board pursuant to BFA’s profitability methodology), and payment of advisory fees and/or administration fees to BFA and BTC (or their affiliates) in connection with any investments by the Fund in other funds for which BFA (or its affiliates) provides investment advisory services and/or administration services. The Board also noted the revenue received by BFA and/or its affiliates pursuant to an agreement that permits a service provider to use certain portions of BlackRock’s technology platform to service accounts managed by BFA and/or its affiliates, including the iShares funds. The Board noted that BFA generally does not use soft dollars or consider the value of research or other services that may be provided to BFA (including its affiliates) in selecting brokers for portfolio transactions for the Fund. The Board further noted that any portfolio transactions on behalf of the Fund placed through a BFA affiliate or purchased from an underwriting syndicate in which a BFA affiliate participates, are reported to the Board pursuant to
BOARD REVIEWAND APPROVALOF INVESTMENT ADVISORY CONTRACT | 79 |
Table of Contents
Board Review and Approval of Investment Advisory
Contract (Continued)
iSHARES®, INC.
Rule 17e-1 or Rule 10f-3, as applicable, under the 1940 Act. The Board concluded that any such ancillary benefits would not be disadvantageous to the Fund’s shareholders and thus would not alter the Board’s conclusion with respect to the appropriateness of approving the continuance of the Advisory Contract for the coming year.
Conclusion — Based on the considerations described above, the Board determined that the Fund’s investment advisory fee rate under the Advisory Contract does not constitute a fee that is so disproportionately large as to bear no reasonable relationship to the services rendered and that could not have been the product of arm’s-length bargaining, and concluded to approve the continuance of the Advisory Contract for the coming year.
II. iShares MSCI Australia ETF and iShares MSCI Canada ETF
Under Section 15(c) of the Investment Company Act of 1940 (the “1940 Act”), the Company’s Board of Directors (the “Board”), including a majority of Directors who are not “interested persons” of the Company (as that term is defined in the 1940 Act) (the “Independent Directors”), is required annually to consider and approve the Investment Advisory Contract between the Company and BFA (the “Advisory Contract”) on behalf of the Funds. The Independent Directors requested, and BFA provided, such information as the Independent Directors, with advice from independent counsel, deemed reasonably necessary to evaluate the Advisory Contract. A committee of all of the Independent Directors (the “15(c) Committee”), with independent counsel, met with management on May 5, 2017 and May 12, 2017. At these meetings, the 15(c) Committee reviewed and discussed information provided in response to the 15(c) Committee’s initial requests, and requested certain additional information, which management agreed to provide. At a meeting held on May 18, 2017, management presented information to the Board relating to the continuance of the Advisory Contract, including information requested by the 15(c) Committee during its meetings. The Board, including the Independent Directors, reviewed and discussed such information at length. The Independent Directors requested from management certain additional information, which management agreed to provide. At a meeting held on June 19-21, 2017, the Board, including the Independent Directors, reviewed the additional information provided by management in response to these requests. After extensive discussions, the Board, including all of the Independent Directors, approved the continuance of the Advisory Contract for the Funds, based on a review of qualitative and quantitative information provided by BFA. The Board noted its satisfaction with the extent and quality of information provided and its frequent interactions with management, as well as the detailed responses and other information provided by BFA. The Board also noted that the Board and BFA agreed to discuss potential further enhancements to the 15(c) process for the coming year. The Independent Directors were advised by their independent counsel throughout the process, including about the legal standards applicable to their review. In approving the Advisory Contract for the Funds, the Board, including the Independent Directors, considered the following factors, no one of which was controlling, and reached the following conclusions:
Expenses and Performance of the Funds — The Board reviewed statistical information prepared by Broadridge Financial Solutions Inc. (“Broadridge”), an independent provider of investment company data, regarding the expense ratio components, including gross and net total expenses, waivers/reimbursements (if any), and underlying fund fees and expenses (if any) of each Fund in comparison with the same information for other exchange traded funds (“ETFs”) (including, where applicable, funds sponsored by an “at cost” service provider) and, in the limited instances where no comparable ETFs existed and the comparison group would not otherwise be reasonable in Broadridge’s judgment, pure index institutional mutual funds, objectively selected by Broadridge as comprising such Fund’s applicable peer group pursuant to Broadridge’s proprietary ETF methodology (the “Peer Group”). The Board was provided with a detailed description of the proprietary ETF methodology used by Broadridge to determine the applicable Peer Groups. The Board further noted that due to the limitations in providing comparable funds in the various Peer Groups, the statistical information provided in Broadridge’s report may or may not provide meaningful direct comparisons to the Funds in all instances.
| 80 | 2017 iSHARES ANNUAL REPORTTO SHAREHOLDERS |
Table of Contents
Board Review and Approval of Investment Advisory
Contract (Continued)
iSHARES®, INC.
The Board also noted that the investment advisory fee rates and overall expenses (net of waivers and reimbursements) for the Funds were lower than the median of the investment advisory fee rates and overall expenses (net of waivers and reimbursements) of the funds in their respective Peer Group, excluding iShares funds.
In addition, to the extent that any of the comparison funds included in the Peer Group, excluding iShares funds, track the same index as any particular Fund, Broadridge also provided, and the Board reviewed, a comparison of such Fund’s performance for the one-, three-, five-, ten-year, and since inception periods, as applicable, and for the quarter ended December 31, 2016, to that of relevant comparison funds for the same periods.
The Board noted that each Fund seeks to track its own underlying index and that, during the year, the Board received periodic reports on each Fund’s short- and longer-term performance in comparison with its underlying index. Such periodic comparative performance information, including any additional detailed information requested by the Boards, was also considered. The Board noted that each Fund generally performed in line with its underlying index over the relevant periods.
Based on this review, the other factors considered at the meeting, and their general knowledge of ETF pricing, the Board concluded that the investment advisory fee rate and the historical performance of each Fund supported the Board’s approval of the continuance of the Advisory Contract for the coming year.
Nature, Extent and Quality of Services Provided by BFA — Based on management’s representations, including information about recent and proposed enhancements to the iShares business, including with respect to capital markets support and analysis, technology, product design, compliance and risk management, and other services, the Board expected that there would be no diminution in the scope of services required of or provided by BFA under the Advisory Contract for the coming year as compared to the scope of services provided by BFA during prior years. In reviewing the scope of these services, the Board considered BFA’s investment philosophy and experience, noting that BFA and its affiliates have committed significant resources over time, including during the past year, to supporting the iShares funds and their shareholders. The Board also considered BFA’s compliance program and its compliance record with respect to the Funds. In that regard, the Board noted that BFA reports to the Board about portfolio management and compliance matters on a periodic basis in connection with regularly scheduled meetings of the Board, and on other occasions as necessary and appropriate, and has provided information and made appropriate officers available as needed to provide further assistance with these matters. The Board also reviewed the background and experience of the persons responsible for the day-to-day management of the Funds, as well as the resources available to them in managing the Funds. In addition to the above considerations, the Board reviewed and considered detailed presentations regarding BFA’s investment performance, investment and risk management processes and strategies provided at the June 19-21, 2017 meeting and throughout the previous year, and matters related to BFA’s portfolio compliance policies and procedures. The Board noted that each Fund had met its investment objective consistently since its respective inception date.
Based on review of this information, and the performance information discussed above, the Board concluded that the nature, extent and quality of services provided by BFA to the Funds under the Advisory Contract supported the Board’s approval of the continuance of the Advisory Contract for the coming year.
Costs of Services Provided to Funds and Profits Realized by BFA and Affiliates — The Board reviewed information about the profitability of the Funds to BlackRock, on a Fund-by-Fund basis and in the aggregate, based on the fees payable to BFA and its affiliates (including fees under the Advisory Contract), and other sources of revenue and expense to BFA and its affiliates from the Funds’ operations for the last calendar year. The Board reviewed BlackRock’s profitability methodology for the iShares funds, including supplemental information that was responsive to requests of the 15(c) Committee. The Board noted that the 15(c) Committee had focused on the methodology and profitability presentation during its meetings. The Board discussed the sources of direct and ancillary revenue with management, including the revenues to BTC, a BFA affiliate, from securities lending
BOARD REVIEWAND APPROVALOF INVESTMENT ADVISORY CONTRACT | 81 |
Table of Contents
Board Review and Approval of Investment Advisory
Contract (Continued)
iSHARES®, INC.
by the Funds. The Board also discussed BFA’s profit margin as reflected in the Funds’ profitability analyses and reviewed information regarding potential economies of scale (as discussed below). Based on this review, the Board concluded that the profits realized by BFA and its affiliates under the Advisory Contract and from other relationships between the Funds and BFA and/or its affiliates, if any, were within a reasonable range in light of the factors considered.
Economies of Scale — The Board reviewed information regarding potential economies of scale or other efficiencies that may result from increases in the Funds’ assets, noting that the issue of economies of scale had been focused on by the 15(c) Committee during its meetings and addressed by management, including through supplemental information. The Board and the 15(c) Committee reviewed information provided by BFA regarding scale benefits shared with the iShares funds through relatively low fee rates established at inception, breakpoints and waivers or other fee reductions, as well as through additional investment in the iShares business and the provision of improved or additional infrastructure and services to the iShares funds and their shareholders. The Board and the 15(c) Committee received information regarding BlackRock’s historical profitability, including BFA’s and its affiliates’ costs in providing services. The cost information distinguished, among other things, between fixed and variable costs, and explained how the level of fixed and variable costs, as well as the nature of such costs, may impact the existence or size of scale benefits. The Board noted that the Advisory Contract for the Funds already provided for breakpoints in the Funds’ investment advisory fee rates and that, following negotiations, BFA and the Board had agreed to revise the Advisory Contract for the Funds to provide for an additional breakpoint as the assets of the Funds, on an aggregated basis with the assets of certain other iShares funds, increase. The Board noted that it would continue to monitor the sharing of economies of scale to determine the appropriateness of adding new or revised breakpoints in the future.
Based on this review, as well as the other factors considered at the meeting, the Board, recognizing its responsibility to consider the Advisory Contract at least annually, determined to approve the continuance of the Advisory Contract for the coming year.
Fees and Services Provided for Other Comparable Funds/Accounts Managed by BFA and its Affiliates — The Board received and considered information regarding the investment advisory/management fee rates for other funds/accounts in the U.S. for which BFA (or its affiliates) provides investment advisory/management services, including open-end funds registered under the 1940 Act (including sub-advised funds), collective trust funds, and institutional separate accounts (together, the “Other Accounts”), and acknowledged BFA’s assertion that the iShares funds are fundamentally different investment vehicles from the Other Accounts. The Board noted that BFA and its affiliates do manage Other Accounts with substantially the same investment objectives and strategies as the Funds and that track the same index as the Funds. The Board further noted that BFA provided the Board with detailed information regarding how the Other Accounts (particularly institutional clients) generally differ from the Funds, including in terms of the different and generally more extensive services provided to the Funds, as well as other significant differences. In that regard, the Board considered that the pricing of services to institutional clients is typically based on a number of factors beyond the nature and extent of the specific services to be provided and often depends on the overall relationship between the client and its affiliates and the adviser and its affiliates. In addition, the Board considered the relative complexity and inherent risks and challenges of managing and providing other services to the Funds, as publicly traded ETFs, as compared to the Other Accounts that are institutional clients in light of differing regulatory requirements and client-imposed mandates. The Board also acknowledged BFA’s expressed business purpose for launching a suite of iShares “Core” ETFs that generally are subject to lower investment advisory fees than iShares non-Core ETFs that may provide a similar investment exposure. The Board also considered the “all-inclusive” nature of the Funds’ advisory fee structure, and the Fund expenses borne by BFA under this arrangement. The Board noted that the investment advisory fee rates under the Advisory Contract for the Funds were generally higher than the investment advisory/management fee rates for certain of the Other Accounts (particularly institutional clients) and concluded that the differences appeared to be consistent with the factors discussed.
Other Benefits to BFA and/or its Affiliates — The Board reviewed the “fallout” benefits or ancillary revenue received by BFA and/or its affiliates in connection with the services provided to the Funds by BFA, such as payment of revenue to BTC, the Funds’
| 82 | 2017 iSHARES ANNUAL REPORTTO SHAREHOLDERS |
Table of Contents
Board Review and Approval of Investment Advisory
Contract (Continued)
iSHARES®, INC.
securities lending agent, for loaning portfolio securities (which was included in the profit margins reviewed by the Board pursuant to BFA’s profitability methodology), and payment of advisory fees and/or administration fees to BFA and BTC (or their affiliates) in connection with any investments by the Funds in other funds for which BFA (or its affiliates) provides investment advisory services and/or administration services. The Board also noted the revenue received by BFA and/or its affiliates pursuant to an agreement that permits a service provider to use certain portions of BlackRock’s technology platform to service accounts managed by BFA and/or its affiliates, including the iShares funds. The Board noted that BFA generally does not use soft dollars or consider the value of research or other services that may be provided to BFA (including its affiliates) in selecting brokers for portfolio transactions for the Funds. The Board further noted that any portfolio transactions on behalf of the Funds placed through a BFA affiliate or purchased from an underwriting syndicate in which a BFA affiliate participates, are reported to the Board pursuant to Rule 17e-1 or Rule 10f-3, as applicable, under the 1940 Act. The Board concluded that any such ancillary benefits would not be disadvantageous to the Funds’ shareholders and thus would not alter the Board’s conclusion with respect to the appropriateness of approving the continuance of the Advisory Contract for the coming year.
Conclusion — Based on the considerations described above, the Board determined that each Fund’s investment advisory fee rate under the Advisory Contract does not constitute a fee that is so disproportionately large as to bear no reasonable relationship to the services rendered and that could not have been the product of arm’s-length bargaining, and concluded to approve the continuance of the Advisory Contract for the coming year.
III. iShares MSCI Japan ETF
Under Section 15(c) of the Investment Company Act of 1940 (the “1940 Act”), the Company’s Board of Directors (the “Board”), including a majority of Directors who are not “interested persons” of the Company (as that term is defined in the 1940 Act) (the “Independent Directors”), is required annually to consider and approve the Investment Advisory Contract between the Company and BFA (the “Advisory Contract”) on behalf of the Fund. The Independent Directors requested, and BFA provided, such information as the Independent Directors, with advice from independent counsel, deemed reasonably necessary to evaluate the Advisory Contract. A committee of all of the Independent Directors (the “15(c) Committee”), with independent counsel, met with management on May 5, 2017 and May 12, 2017. At these meetings, the 15(c) Committee reviewed and discussed information provided in response to the 15(c) Committee’s initial requests, and requested certain additional information, which management agreed to provide. At a meeting held on May 18, 2017, management presented information to the Board relating to the continuance of the Advisory Contract, including information requested by the 15(c) Committee during its meetings. The Board, including the Independent Directors, reviewed and discussed such information at length. The Independent Directors requested from management certain additional information, which management agreed to provide. At a meeting held on June 19-21, 2017, the Board, including the Independent Directors, reviewed the additional information provided by management in response to these requests. After extensive discussions, the Board, including all of the Independent Directors, approved the continuance of the Advisory Contract for the Fund, based on a review of qualitative and quantitative information provided by BFA. The Board noted its satisfaction with the extent and quality of information provided and its frequent interactions with management, as well as the detailed responses and other information provided by BFA. The Board also noted that the Board and BFA agreed to discuss potential further enhancements to the 15(c) process for the coming year. The Independent Directors were advised by their independent counsel throughout the process, including about the legal standards applicable to their review. In approving the Advisory Contract for the Fund, the Board, including the Independent Directors, considered the following factors, no one of which was controlling, and reached the following conclusions:
Expenses and Performance of the Fund — The Board reviewed statistical information prepared by Broadridge Financial Solutions Inc. (“Broadridge”), an independent provider of investment company data, regarding the expense ratio components, including gross and net total expenses, waivers/reimbursements (if any), and underlying fund fees and expenses (if any) of the Fund in comparison with the same information for other exchange traded funds (“ETFs”) (including, where applicable, funds
BOARD REVIEWAND APPROVALOF INVESTMENT ADVISORY CONTRACT | 83 |
Table of Contents
Board Review and Approval of Investment Advisory
Contract (Continued)
iSHARES®, INC.
sponsored by an “at cost” service provider) and, in the limited instances where no comparable ETFs existed and the comparison group would not otherwise be reasonable in Broadridge’s judgment, pure index institutional mutual funds, objectively selected by Broadridge as comprising the Fund’s applicable peer group pursuant to Broadridge’s proprietary ETF methodology (the “Peer Group”). The Board was provided with a detailed description of the proprietary ETF methodology used by Broadridge to determine the Fund’s Peer Group. The Board further noted that due to the limitations in providing comparable funds in the Peer Group, the statistical information provided in Broadridge’s report may or may not provide meaningful direct comparisons to the Fund in all instances.
The Board also noted that the investment advisory fee rate and overall expenses (net of waivers and reimbursements) for the Fund were higher than the median of the investment advisory fee rates and overall expenses (net of waivers and reimbursements) of the funds in its Peer Group, excluding iShares funds.
In addition, to the extent that any of the comparison funds included in the Peer Group, excluding iShares funds, track the same index as the Fund, Broadridge also provided, and the Board reviewed, a comparison of the Fund’s performance for the one-, three-, five-, ten-year, and since inception periods, as applicable, and for the quarter ended December 31, 2016, to that of relevant comparison funds for the same periods.
The Board noted that the Fund seeks to track its specified underlying index and that, during the year, the Board received periodic reports on the Fund’s short- and longer-term performance in comparison with its underlying index. Such periodic comparative performance information, including any additional detailed information requested by the Boards, was also considered. The Board noted that the Fund generally performed in line with its underlying index over the relevant periods.
Based on this review, the other factors considered at the meeting, and their general knowledge of ETF pricing, the Board concluded that the investment advisory fee rate and the historical performance of the Fund supported the Board’s approval of the continuance of the Advisory Contract for the coming year.
Nature, Extent and Quality of Services Provided by BFA — Based on management’s representations, including information about recent and proposed enhancements to the iShares business, including with respect to capital markets support and analysis, technology, product design, compliance and risk management, and other services, the Board expected that there would be no diminution in the scope of services required of or provided by BFA under the Advisory Contract for the coming year as compared to the scope of services provided by BFA during prior years. In reviewing the scope of these services, the Board considered BFA’s investment philosophy and experience, noting that BFA and its affiliates have committed significant resources over time, including during the past year, to supporting the iShares funds and their shareholders. The Board also considered BFA’s compliance program and its compliance record with respect to the Fund. In that regard, the Board noted that BFA reports to the Board about portfolio management and compliance matters on a periodic basis in connection with regularly scheduled meetings of the Board, and on other occasions as necessary and appropriate, and has provided information and made appropriate officers available as needed to provide further assistance with these matters. The Board also reviewed the background and experience of the persons responsible for the day-to-day management of the Fund, as well as the resources available to them in managing the Fund. In addition to the above considerations, the Board reviewed and considered detailed presentations regarding BFA’s investment performance, investment and risk management processes and strategies provided at the June 19-21, 2017 meeting and throughout the previous year, and matters related to BFA’s portfolio compliance policies and procedures. The Board noted that the Fund had met its investment objective consistently since its inception date.
Based on review of this information, and the performance information discussed above, the Board concluded that the nature, extent and quality of services provided by BFA to the Fund under the Advisory Contract supported the Board’s approval of the continuance of the Advisory Contract for the coming year.
| 84 | 2017 iSHARES ANNUAL REPORTTO SHAREHOLDERS |
Table of Contents
Board Review and Approval of Investment Advisory
Contract (Continued)
iSHARES®, INC.
Costs of Services Provided to Fund and Profits Realized by BFA and Affiliates — The Board reviewed information about the profitability of the Fund to BlackRock, based on the fees payable to BFA and its affiliates (including fees under the Advisory Contract), and other sources of revenue and expense to BFA and its affiliates from the Fund’s operations for the last calendar year. The Board reviewed BlackRock’s profitability methodology for the iShares funds, including supplemental information that was responsive to requests of the 15(c) Committee. The Board noted that the 15(c) Committee had focused on the methodology and profitability presentation during its meetings. The Board discussed the sources of direct and ancillary revenue with management, including the revenues to BTC, a BFA affiliate, from securities lending by the Fund. The Board also discussed BFA’s profit margin as reflected in the Fund’s profitability analysis and reviewed information regarding potential economies of scale (as discussed below). Based on this review, the Board concluded that the profits realized by BFA and its affiliates under the Advisory Contract and from other relationships between the Fund and BFA and/or its affiliates, if any, were within a reasonable range in light of the factors considered.
Economies of Scale — The Board reviewed information regarding potential economies of scale or other efficiencies that may result from increases in the Fund’s assets, noting that the issue of economies of scale had been focused on by the 15(c) Committee during its meetings and addressed by management, including through supplemental information. The Board and the 15(c) Committee reviewed information provided by BFA regarding scale benefits shared with the iShares funds through relatively low fee rates established at inception, breakpoints and waivers or other fee reductions, as well as through additional investment in the iShares business and the provision of improved or additional infrastructure and services to the iShares funds and their shareholders. The Board and the 15(c) Committee received information regarding BlackRock’s historical profitability, including BFA’s and its affiliates’ costs in providing services. The cost information distinguished, among other things, between fixed and variable costs, and explained how the level of fixed and variable costs, as well as the nature of such costs, may impact the existence or size of scale benefits. The Board noted that the Advisory Contract for the Fund already provided for breakpoints in the Fund’s investment advisory fee rate, and that, following negotiations, BFA and the Board had agreed to revise the Advisory Contract for the Fund to provide for an additional breakpoint as the assets of the Fund, on an aggregated basis with the assets of certain other iShares funds, increase. The Board noted that it would continue to monitor the sharing of economies of scale to determine the appropriateness of adding new or revised breakpoints in the future.
Based on this review, as well as the other factors considered at the meeting, the Board, recognizing its responsibility to consider the Advisory Contract at least annually, determined to approve the continuance of the Advisory Contract for the coming year.
Fees and Services Provided for Other Comparable Funds/Accounts Managed by BFA and its Affiliates — The Board received and considered information regarding the investment advisory/management fee rates for other funds/accounts in the U.S. for which BFA (or its affiliates) provides investment advisory/management services, including open-end funds registered under the 1940 Act (including sub-advised funds), collective trust funds, and institutional separate accounts (together, the “Other Accounts”), and acknowledged BFA’s assertion that the iShares funds are fundamentally different investment vehicles from the Other Accounts. The Board noted that BFA and its affiliates do manage Other Accounts with substantially the same investment objective and strategy as the Fund and that track the same index as the Fund. The Board further noted that BFA provided the Board with detailed information regarding how the Other Accounts (particularly institutional clients) generally differ from the Fund, including in terms of the different and generally more extensive services provided to the Fund, as well as other significant differences. In that regard, the Board considered that the pricing of services to institutional clients is typically based on a number of factors beyond the nature and extent of the specific services to be provided and often depends on the overall relationship between the client and its affiliates and the adviser and its affiliates. In addition, the Board considered the relative complexity and inherent risks and challenges of managing and providing other services to the Fund, as a publicly traded ETF, as compared to the Other Accounts that are institutional clients, in light of differing regulatory requirements and client-imposed mandates. The Board also acknowledged BFA’s expressed business purpose for launching a suite of iShares “Core” ETFs that generally are subject to lower investment advisory fees than iShares non-Core ETFs that may provide a similar investment exposure. The Board also
BOARD REVIEWAND APPROVALOF INVESTMENT ADVISORY CONTRACT | 85 |
Table of Contents
Board Review and Approval of Investment Advisory
Contract (Continued)
iSHARES®, INC.
considered the “all-inclusive” nature of the Fund’s advisory fee structure, and the Fund expenses borne by BFA under this arrangement. The Board noted that the investment advisory fee rate under the Advisory Contract for the Fund was generally higher than the investment advisory/management fee rates for certain of the Other Accounts (particularly institutional clients) and concluded that the differences appeared to be consistent with the factors discussed.
Other Benefits to BFA and/or its Affiliates — The Board reviewed the “fallout” benefits or ancillary revenue received by BFA and/or its affiliates in connection with the services provided to the Fund by BFA, such as payment of revenue to BTC, the Fund’s securities lending agent, for loaning portfolio securities (which was included in the profit margins reviewed by the Board pursuant to BFA’s profitability methodology), and payment of advisory fees and/or administration fees to BFA and BTC (or their affiliates) in connection with any investments by the Fund in other funds for which BFA (or its affiliates) provides investment advisory services and/or administration services. The Board also noted the revenue received by BFA and/or its affiliates pursuant to an agreement that permits a service provider to use certain portions of BlackRock’s technology platform to service accounts managed by BFA and/or its affiliates, including the iShares funds. The Board noted that BFA generally does not use soft dollars or consider the value of research or other services that may be provided to BFA (including its affiliates) in selecting brokers for portfolio transactions for the Fund. The Board further noted that any portfolio transactions on behalf of the Fund placed through a BFA affiliate or purchased from an underwriting syndicate in which a BFA affiliate participates, are reported to the Board pursuant to Rule 17e-1 or Rule 10f-3, as applicable, under the 1940 Act. The Board concluded that any such ancillary benefits would not be disadvantageous to the Fund’s shareholders and thus would not alter the Board’s conclusion with respect to the appropriateness of approving the continuance of the Advisory Contract for the coming year.
Conclusion — Based on the considerations described above, the Board determined that the Fund’s investment advisory fee rate under the Advisory Contract does not constitute a fee that is so disproportionately large as to bear no reasonable relationship to the services rendered and that could not have been the product of arm’s-length bargaining, and concluded to approve the continuance of the Advisory Contract for the coming year.
IV. iShares MSCI Mexico Capped ETF
Under Section 15(c) of the Investment Company Act of 1940 (the “1940 Act”), the Company’s Board of Directors (the “Board”), including a majority of Directors who are not “interested persons” of the Company (as that term is defined in the 1940 Act) (the “Independent Directors”), is required annually to consider and approve the Investment Advisory Contract between the Company and BFA (the “Advisory Contract”) on behalf of the Fund. The Independent Directors requested, and BFA provided, such information as the Independent Directors, with advice from independent counsel, deemed reasonably necessary to evaluate the Advisory Contract. A committee of all of the Independent Directors (the “15(c) Committee”), with independent counsel, met with management on May 5, 2017 and May 12, 2017. At these meetings, the 15(c) Committee reviewed and discussed information provided in response to the 15(c) Committee’s initial requests, and requested certain additional information, which management agreed to provide. At a meeting held on May 18, 2017, management presented information to the Board relating to the continuance of the Advisory Contract, including information requested by the 15(c) Committee during its meetings. The Board, including the Independent Directors, reviewed and discussed such information at length. The Independent Directors requested from management certain additional information, which management agreed to provide. At a meeting held on June 19-21, 2017, the Board, including the Independent Directors, reviewed the additional information provided by management in response to these requests. After extensive discussions, the Board, including all of the Independent Directors, approved the continuance of the Advisory Contract for the Fund, based on a review of qualitative and quantitative information provided by BFA. The Board noted its satisfaction with the extent and quality of information provided and its frequent interactions with management, as well as the detailed responses and other information provided by BFA. The Board also noted that the Board and BFA agreed to discuss potential further enhancements to the 15(c) process for the coming year. The Independent Directors were advised by their independent counsel throughout the process, including about the legal standards applicable to their review. In approving the
| 86 | 2017 iSHARES ANNUAL REPORTTO SHAREHOLDERS |
Table of Contents
Board Review and Approval of Investment Advisory
Contract (Continued)
iSHARES®, INC.
Advisory Contract for the Fund, the Board, including the Independent Directors, considered the following factors, no one of which was controlling, and reached the following conclusions:
Expenses and Performance of the Fund — The Board reviewed statistical information prepared by Broadridge Financial Solutions Inc. (“Broadridge”), an independent provider of investment company data, regarding the expense ratio components, including gross and net total expenses, waivers/reimbursements (if any), and underlying fund fees and expenses (if any) of the Fund in comparison with the same information for other exchange traded funds (“ETFs”) (including, where applicable, funds sponsored by an “at cost” service provider) and, in the limited instances where no comparable ETFs existed and the comparison group would not otherwise be reasonable in Broadridge’s judgment, pure index institutional mutual funds, objectively selected by Broadridge as comprising the Fund’s applicable peer group pursuant to Broadridge’s proprietary ETF methodology (the “Peer Group”). The Board was provided with a detailed description of the proprietary ETF methodology used by Broadridge to determine the Fund’s Peer Group. The Board further noted that due to the limitations in providing comparable funds in the Peer Group, the statistical information provided in Broadridge’s report may or may not provide meaningful direct comparisons to the Fund in all instances.
The Board also noted that the investment advisory fee rate and overall expenses (net of waivers and reimbursements) for the Fund were lower than the median of the investment advisory fee rates and overall expenses (net of waivers and reimbursements) of the funds in its Peer Group, excluding iShares funds.
In addition, to the extent that any of the comparison funds included in the Peer Group, excluding iShares funds, track the same index as the Fund, Broadridge also provided, and the Board reviewed, a comparison of the Fund’s performance for the one-, three-, five-, ten-year, and since inception periods, as applicable, and for the quarter ended December 31, 2016, to that of relevant comparison funds for the same periods.
The Board noted that the Fund seeks to track its specified underlying index and that, during the year, the Board received periodic reports on the Fund’s short- and longer-term performance in comparison with its underlying index. Such periodic comparative performance information, including any additional detailed information requested by the Boards, was also considered. The Board noted that the Fund generally performed in line with its underlying index over the relevant periods.
Based on this review, the other factors considered at the meeting, and their general knowledge of ETF pricing, the Board concluded that the investment advisory fee rate and the historical performance of the Fund supported the Board’s approval of the continuance of the Advisory Contract for the coming year.
Nature, Extent and Quality of Services Provided by BFA — Based on management’s representations, including information about recent and proposed enhancements to the iShares business, including with respect to capital markets support and analysis, technology, product design, compliance and risk management, and other services, the Board expected that there would be no diminution in the scope of services required of or provided by BFA under the Advisory Contract for the coming year as compared to the scope of services provided by BFA during prior years. In reviewing the scope of these services, the Board considered BFA’s investment philosophy and experience, noting that BFA and its affiliates have committed significant resources over time, including during the past year, to supporting the iShares funds and their shareholders. The Board also considered BFA’s compliance program and its compliance record with respect to the Fund. In that regard, the Board noted that BFA reports to the Board about portfolio management and compliance matters on a periodic basis in connection with regularly scheduled meetings of the Board, and on other occasions as necessary and appropriate, and has provided information and made appropriate officers available as needed to provide further assistance with these matters. The Board also reviewed the background and experience of the persons responsible for the day-to-day management of the Fund, as well as the resources available to them in managing the Fund. In addition to the above considerations, the Board reviewed and considered detailed
BOARD REVIEWAND APPROVALOF INVESTMENT ADVISORY CONTRACT | 87 |
Table of Contents
Board Review and Approval of Investment Advisory
Contract (Continued)
iSHARES®, INC.
presentations regarding BFA’s investment performance, investment and risk management processes and strategies provided at the June 19-21, 2017 meeting and throughout the previous year, and matters related to BFA’s portfolio compliance policies and procedures. The Board noted that the Fund had met its investment objective consistently since its inception date.
Based on review of this information, and the performance information discussed above, the Board concluded that the nature, extent and quality of services provided by BFA to the Fund under the Advisory Contract supported the Board’s approval of the continuance of the Advisory Contract for the coming year.
Costs of Services Provided to Fund and Profits Realized by BFA and Affiliates — The Board reviewed information about the profitability of the Fund to BlackRock, based on the fees payable to BFA and its affiliates (including fees under the Advisory Contract), and other sources of revenue and expense to BFA and its affiliates from the Fund’s operations for the last calendar year. The Board reviewed BlackRock’s profitability methodology for the iShares funds, including supplemental information that was responsive to requests of the 15(c) Committee. The Board noted that the 15(c) Committee had focused on the methodology and profitability presentation during its meetings. The Board discussed the sources of direct and ancillary revenue with management, including the revenues to BTC, a BFA affiliate, from securities lending by the Fund. The Board also discussed BFA’s profit margin as reflected in the Fund’s profitability analysis and reviewed information regarding potential economies of scale (as discussed below). Based on this review, the Board concluded that the profits realized by BFA and its affiliates under the Advisory Contract and from other relationships between the Fund and BFA and/or its affiliates, if any, were within a reasonable range in light of the factors considered.
Economies of Scale — The Board reviewed information regarding potential economies of scale or other efficiencies that may result from increases in the Fund’s assets, noting that the issue of economies of scale had been focused on by the 15(c) Committee during its meetings and addressed by management, including through supplemental information. The Board and the 15(c) Committee reviewed information provided by BFA regarding scale benefits shared with the iShares funds through relatively low fee rates established at inception, breakpoints and waivers or other fee reductions, as well as through additional investment in the iShares business and the provision of improved or additional infrastructure and services to the iShares funds and their shareholders. The Board and the 15(c) Committee received information regarding BlackRock’s historical profitability, including BFA’s and its affiliates’ costs in providing services. The cost information distinguished, among other things, between fixed and variable costs, and explained how the level of fixed and variable costs, as well as the nature of such costs, may impact the existence or size of scale benefits. The Board noted that the Advisory Contract for the Fund already provided for breakpoints in the Fund’s investment advisory fee rate, and that, following negotiations, BFA and the Board had agreed to revise the Advisory Contract for the Fund to provide for an additional breakpoint as the assets of the Fund, on an aggregated basis with the assets of certain other iShares funds, increase. The Board noted that it would continue to monitor the sharing of economies of scale to determine the appropriateness of adding new or revised breakpoints in the future.
Based on this review, as well as the other factors considered at the meeting, the Board, recognizing its responsibility to consider the Advisory Contract at least annually, determined to approve the continuance of the Advisory Contract for the coming year.
Fees and Services Provided for Other Comparable Funds/Accounts Managed by BFA and its Affiliates — The Board received and considered information regarding the investment advisory/management fee rates for other funds/accounts in the U.S. for which BFA (or its affiliates) provides investment advisory/management services, including open-end funds registered under the 1940 Act (including sub-advised funds), collective trust funds, and institutional separate accounts (together, the “Other Accounts”), and acknowledged BFA’s assertion that the iShares funds are fundamentally different investment vehicles from the Other Accounts. The Board noted that BFA and its affiliates do not manage Other Accounts with substantially the same investment objective and strategy as the Fund and that track the same index as the Fund. The Board further noted that BFA provided the Board with detailed information regarding how the Other Accounts (particularly institutional clients) generally differ
| 88 | 2017 iSHARES ANNUAL REPORTTO SHAREHOLDERS |
Table of Contents
Board Review and Approval of Investment Advisory
Contract (Continued)
iSHARES®, INC.
from the Fund, including in terms of the different and generally more extensive services provided to the Fund, as well as other significant differences. In that regard, the Board considered that the pricing of services to institutional clients is typically based on a number of factors beyond the nature and extent of the specific services to be provided and often depends on the overall relationship between the client and its affiliates and the adviser and its affiliates. In addition, the Board considered the relative complexity and inherent risks and challenges of managing and providing other services to the Fund, as a publicly traded ETF, as compared to the Other Accounts that are institutional clients, in light of differing regulatory requirements and client-imposed mandates. The Board also acknowledged BFA’s expressed business purpose for launching a suite of iShares “Core” ETFs that generally are subject to lower investment advisory fees than iShares non-Core ETFs that may provide a similar investment exposure. The Board also considered the “all-inclusive” nature of the Fund’s advisory fee structure, and the Fund expenses borne by BFA under this arrangement. The Board noted that the investment advisory fee rate under the Advisory Contract for the Fund was generally higher than the investment advisory/management fee rates for certain of the Other Accounts (particularly institutional clients) and concluded that the differences appeared to be consistent with the factors discussed.
Other Benefits to BFA and/or its Affiliates — The Board reviewed the “fallout” benefits or ancillary revenue received by BFA and/or its affiliates in connection with the services provided to the Fund by BFA, such as payment of revenue to BTC, the Fund’s securities lending agent, for loaning portfolio securities (which was included in the profit margins reviewed by the Board pursuant to BFA’s profitability methodology), and payment of advisory fees and/or administration fees to BFA and BTC (or their affiliates) in connection with any investments by the Fund in other funds for which BFA (or its affiliates) provides investment advisory services and/or administration services. The Board also noted the revenue received by BFA and/or its affiliates pursuant to an agreement that permits a service provider to use certain portions of BlackRock’s technology platform to service accounts managed by BFA and/or its affiliates, including the iShares funds. The Board noted that BFA generally does not use soft dollars or consider the value of research or other services that may be provided to BFA (including its affiliates) in selecting brokers for portfolio transactions for the Fund. The Board further noted that any portfolio transactions on behalf of the Fund placed through a BFA affiliate or purchased from an underwriting syndicate in which a BFA affiliate participates, are reported to the Board pursuant to Rule 17e-1 or Rule 10f-3, as applicable, under the 1940 Act. The Board concluded that any such ancillary benefits would not be disadvantageous to the Fund’s shareholders and thus would not alter the Board’s conclusion with respect to the appropriateness of approving the continuance of the Advisory Contract for the coming year.
Conclusion — Based on the considerations described above, the Board determined that the Fund’s investment advisory fee rate under the Advisory Contract does not constitute a fee that is so disproportionately large as to bear no reasonable relationship to the services rendered and that could not have been the product of arm’s-length bargaining, and concluded to approve the continuance of the Advisory Contract for the coming year.
VI. iShares MSCI South Korea Capped ETF
Under Section 15(c) of the Investment Company Act of 1940 (the “1940 Act”), the Company’s Board of Directors (the “Board”), including a majority of Directors who are not “interested persons” of the Company (as that term is defined in the 1940 Act) (the “Independent Directors”), is required annually to consider and approve the Investment Advisory Contract between the Company and BFA (the “Advisory Contract”) on behalf of the Fund. The Independent Directors requested, and BFA provided, such information as the Independent Directors, with advice from independent counsel, deemed reasonably necessary to evaluate the Advisory Contract. A committee of all of the Independent Directors (the “15(c) Committee”), with independent counsel, met with management on May 5, 2017 and May 12, 2017. At these meetings, the 15(c) Committee reviewed and discussed information provided in response to the 15(c) Committee’s initial requests, and requested certain additional information, which management agreed to provide. At a meeting held on May 18, 2017, management presented information to the Board relating to the continuance of the Advisory Contract, including information requested by the 15(c) Committee during its meetings. The Board, including the Independent Directors, reviewed and discussed such information at length. The Independent Directors requested
BOARD REVIEWAND APPROVALOF INVESTMENT ADVISORY CONTRACT | 89 |
Table of Contents
Board Review and Approval of Investment Advisory
Contract (Continued)
iSHARES®, INC.
from management certain additional information, which management agreed to provide. At a meeting held on June 19-21, 2017, the Board, including the Independent Directors, reviewed the additional information provided by management in response to these requests. After extensive discussions, the Board, including all of the Independent Directors, approved the continuance of the Advisory Contract for the Fund, based on a review of qualitative and quantitative information provided by BFA. The Board noted its satisfaction with the extent and quality of information provided and its frequent interactions with management, as well as the detailed responses and other information provided by BFA. The Board also noted that the Board and BFA agreed to discuss potential further enhancements to the 15(c) process for the coming year. The Independent Directors were advised by their independent counsel throughout the process, including about the legal standards applicable to their review. In approving the Advisory Contract for the Fund, the Board, including the Independent Directors, considered the following factors, no one of which was controlling, and reached the following conclusions:
Expenses and Performance of the Fund — The Board reviewed statistical information prepared by Broadridge Financial Solutions Inc. (“Broadridge”), an independent provider of investment company data, regarding the expense ratio components, including gross and net total expenses, waivers/reimbursements (if any), and underlying fund fees and expenses (if any) of the Fund in comparison with the same information for other exchange traded funds (“ETFs”) (including, where applicable, funds sponsored by an “at cost” service provider) and, in the limited instances where no comparable ETFs existed and the comparison group would not otherwise be reasonable in Broadridge’s judgment, pure index institutional mutual funds, objectively selected by Broadridge as comprising the Fund’s applicable peer group pursuant to Broadridge’s proprietary ETF methodology (the “Peer Group”). The Board was provided with a detailed description of the proprietary ETF methodology used by Broadridge to determine the Fund’s Peer Group. The Board further noted that due to the limitations in providing comparable funds in the Peer Group, the statistical information provided in Broadridge’s report may or may not provide meaningful direct comparisons to the Fund in all instances.
The Board also noted that the investment advisory fee rate and overall expenses (net of waivers and reimbursements) for the Fund were lower than the median of the investment advisory fee rates and overall expenses (net of waivers and reimbursements) of the funds in its Peer Group, excluding iShares funds.
In addition, to the extent that any of the comparison funds included in the Peer Group, excluding iShares funds, track the same index as the Fund, Broadridge also provided, and the Board reviewed, a comparison of the Fund’s performance for the one-, three-, five-, ten-year, and since inception periods, as applicable, and for the quarter ended December 31, 2016, to that of relevant comparison funds for the same periods.
The Board noted that the Fund seeks to track its specified underlying index and that, during the year, the Board received periodic reports on the Fund’s short- and longer-term performance in comparison with its underlying index. Such periodic comparative performance information, including any additional detailed information requested by the Boards, was also considered. The Board noted that the Fund generally performed in line with its underlying index over the relevant periods.
Based on this review, the other factors considered at the meeting, and their general knowledge of ETF pricing, the Board concluded that the investment advisory fee rate and the historical performance of the Fund supported the Board’s approval of the continuance of the Advisory Contract for the coming year.
Nature, Extent and Quality of Services Provided by BFA — Based on management’s representations, including information about recent and proposed enhancements to the iShares business, including with respect to capital markets support and analysis, technology, product design, compliance and risk management, and other services, the Board expected that there would be no diminution in the scope of services required of or provided by BFA under the Advisory Contract for the coming year as compared to the scope of services provided by BFA during prior years. In reviewing the scope of these services, the Board
| 90 | 2017 iSHARES ANNUAL REPORTTO SHAREHOLDERS |
Table of Contents
Board Review and Approval of Investment Advisory
Contract (Continued)
iSHARES®, INC.
considered BFA’s investment philosophy and experience, noting that BFA and its affiliates have committed significant resources over time, including during the past year, to supporting the iShares funds and their shareholders. The Board also considered BFA’s compliance program and its compliance record with respect to the Fund. In that regard, the Board noted that BFA reports to the Board about portfolio management and compliance matters on a periodic basis in connection with regularly scheduled meetings of the Board, and on other occasions as necessary and appropriate, and has provided information and made appropriate officers available as needed to provide further assistance with these matters. The Board also reviewed the background and experience of the persons responsible for the day-to-day management of the Fund, as well as the resources available to them in managing the Fund. In addition to the above considerations, the Board reviewed and considered detailed presentations regarding BFA’s investment performance, investment and risk management processes and strategies provided at the June 19-21, 2017 meeting and throughout the previous year, and matters related to BFA’s portfolio compliance policies and procedures. The Board noted that the Fund had met its investment objective consistently since its inception date.
Based on review of this information, and the performance information discussed above, the Board concluded that the nature, extent and quality of services provided by BFA to the Fund under the Advisory Contract supported the Board’s approval of the continuance of the Advisory Contract for the coming year.
Costs of Services Provided to Fund and Profits Realized by BFA and Affiliates — The Board reviewed information about the profitability of the Fund to BlackRock, based on the fees payable to BFA and its affiliates (including fees under the Advisory Contract), and other sources of revenue and expense to BFA and its affiliates from the Fund’s operations for the last calendar year. The Board reviewed BlackRock’s profitability methodology for the iShares funds, including supplemental information that was responsive to requests of the 15(c) Committee. The Board noted that the 15(c) Committee had focused on the methodology and profitability presentation during its meetings. The Board discussed the sources of direct and ancillary revenue with management, including the revenues to BTC, a BFA affiliate, from securities lending by the Fund. The Board also discussed BFA’s profit margin as reflected in the Fund’s profitability analysis and reviewed information regarding potential economies of scale (as discussed below). Based on this review, the Board concluded that the profits realized by BFA and its affiliates under the Advisory Contract and from other relationships between the Fund and BFA and/or its affiliates, if any, were within a reasonable range in light of the factors considered.
Economies of Scale — The Board reviewed information regarding potential economies of scale or other efficiencies that may result from increases in the Fund’s assets, noting that the issue of economies of scale had been focused on by the 15(c) Committee during its meetings and addressed by management, including through supplemental information. The Board and the 15(c) Committee reviewed information provided by BFA regarding scale benefits shared with the iShares funds through relatively low fee rates established at inception, breakpoints and waivers or other fee reductions, as well as through additional investment in the iShares business and the provision of improved or additional infrastructure and services to the iShares funds and their shareholders. The Board and the 15(c) Committee received information regarding BlackRock’s historical profitability, including BFA’s and its affiliates’ costs in providing services. The cost information distinguished, among other things, between fixed and variable costs, and explained how the level of fixed and variable costs, as well as the nature of such costs, may impact the existence or size of scale benefits. The Board noted that the Advisory Contract for the Fund already provided for breakpoints in the Fund’s investment advisory fee rate as the assets of the Fund, on an aggregated basis with the assets of certain other iShares funds, increase. The Board noted that it would continue to monitor the sharing of economies of scale to determine the appropriateness of adding new or revised breakpoints in the future.
Based on this review, as well as the other factors considered at the meeting, the Board, recognizing its responsibility to consider the Advisory Contract at least annually, determined to approve the continuance of the Advisory Contract for the coming year.
BOARD REVIEWAND APPROVALOF INVESTMENT ADVISORY CONTRACT | 91 |
Table of Contents
Board Review and Approval of Investment Advisory
Contract (Continued)
iSHARES®, INC.
Fees and Services Provided for Other Comparable Funds/Accounts Managed by BFA and its Affiliates — The Board received and considered information regarding the investment advisory/management fee rates for other funds/accounts in the U.S. for which BFA (or its affiliates) provides investment advisory/management services, including open-end funds registered under the 1940 Act (including sub-advised funds), collective trust funds, and institutional separate accounts (together, the “Other Accounts”), and acknowledged BFA’s assertion that the iShares funds are fundamentally different investment vehicles from the Other Accounts. The Board noted that BFA and its affiliates do not manage Other Accounts with substantially the same investment objective and strategy as the Fund and that track the same index as the Fund. The Board further noted that BFA provided the Board with detailed information regarding how the Other Accounts (particularly institutional clients) generally differ from the Fund, including in terms of the different and generally more extensive services provided to the Fund, as well as other significant differences. In that regard, the Board considered that the pricing of services to institutional clients is typically based on a number of factors beyond the nature and extent of the specific services to be provided and often depends on the overall relationship between the client and its affiliates and the adviser and its affiliates. In addition, the Board considered the relative complexity and inherent risks and challenges of managing and providing other services to the Fund, as a publicly traded ETF, as compared to the Other Accounts that are institutional clients, in light of differing regulatory requirements and client-imposed mandates. The Board also acknowledged BFA’s expressed business purpose for launching a suite of iShares “Core” ETFs that generally are subject to lower investment advisory fees than iShares non-Core ETFs that may provide a similar investment exposure. The Board also considered the “all-inclusive” nature of the Fund’s advisory fee structure, and the Fund expenses borne by BFA under this arrangement. The Board noted that the investment advisory fee rate under the Advisory Contract for the Fund was generally higher than the investment advisory/management fee rates for certain of the Other Accounts (particularly institutional clients) and concluded that the differences appeared to be consistent with the factors discussed.
Other Benefits to BFA and/or its Affiliates — The Board reviewed the “fallout” benefits or ancillary revenue received by BFA and/or its affiliates in connection with the services provided to the Fund by BFA, such as payment of revenue to BTC, the Fund’s securities lending agent, for loaning portfolio securities (which was included in the profit margins reviewed by the Board pursuant to BFA’s profitability methodology), and payment of advisory fees and/or administration fees to BFA and BTC (or their affiliates) in connection with any investments by the Fund in other funds for which BFA (or its affiliates) provides investment advisory services and/or administration services. The Board also noted the revenue received by BFA and/or its affiliates pursuant to an agreement that permits a service provider to use certain portions of BlackRock’s technology platform to service accounts managed by BFA and/or its affiliates, including the iShares funds. The Board noted that BFA generally does not use soft dollars or consider the value of research or other services that may be provided to BFA (including its affiliates) in selecting brokers for portfolio transactions for the Fund. The Board further noted that any portfolio transactions on behalf of the Fund placed through a BFA affiliate or purchased from an underwriting syndicate in which a BFA affiliate participates, are reported to the Board pursuant to Rule 17e-1 or Rule 10f-3, as applicable, under the 1940 Act. The Board concluded that any such ancillary benefits would not be disadvantageous to the Fund’s shareholders and thus would not alter the Board’s conclusion with respect to the appropriateness of approving the continuance of the Advisory Contract for the coming year.
Conclusion — Based on the considerations described above, the Board determined that the Fund’s investment advisory fee rate under the Advisory Contract does not constitute a fee that is so disproportionately large as to bear no reasonable relationship to the services rendered and that could not have been the product of arm’s-length bargaining, and concluded to approve the continuance of the Advisory Contract for the coming year.
| 92 | 2017 iSHARES ANNUAL REPORTTO SHAREHOLDERS |
Table of Contents
Supplemental Information (Unaudited)
iSHARES®, INC.
Proxy Results
A special meeting of the shareholders of each series of iShares Trust (the “Trust”) was held on June 19, 2017, to elect five Trustees to the Board of Trustees of the Trust. The five nominees were Jane D. Carlin, Richard L. Fagnani, Drew E. Lawton, Madhav V. Rajan and Mark Wiedman, all of whom were elected as Trustees at the special meeting. The other Trustees whose terms of office as Trustees continued after the special meeting are Cecilia H. Herbert, Charles A. Hurty, John E. Kerrigan, John E. Martinez and Robert S. Kapito.
| Trustee | Votes For | Votes Withheld | ||||||
Jane D. Carlin | 8,669,874,031 | 59,322,838 | ||||||
Richard L. Fagnani | 8,672,718,914 | 56,477,955 | ||||||
Drew E. Lawton | 8,670,713,236 | 58,483,633 | ||||||
Madhav V. Rajan | 8,653,682,870 | 75,513,999 | ||||||
Mark Wiedman | 8,664,674,816 | 64,522,053 | ||||||
Section 19(a) Notices
The amounts and sources of distributions reported are estimates and are provided pursuant to regulatory requirements and are not being provided for tax reporting purposes. The actual amounts and sources for tax reporting purposes will depend upon each Fund’s investment experience during the year and may be subject to changes based on the tax regulations. Shareholders will receive a Form 1099-DIV each calendar year that will inform them how to report these distributions for federal income tax purposes.
| Total Cumulative Distributions for the Fiscal Year | % Breakdown of the Total Cumulative Distributions for the Fiscal Year | |||||||||||||||||||||||||||||||
| iShares ETF | Net Investment Income | Net Realized Capital Gains | Return of Capital | Total Per Share | Net Investment Income | Net Realized Capital Gains | Return of Capital | Total Per Share | ||||||||||||||||||||||||
Edge MSCI Min Vol Global | $ | 1.895846 | $ | — | $ | 0.032141 | $ | 1.927987 | 98 | % | — | % | 2 | % | 100 | % | ||||||||||||||||
MSCI Australia | 1.009461 | — | — | 1.009461 | 100 | — | — | 100 | ||||||||||||||||||||||||
MSCI Canada | 0.434019 | — | 0.044022 | 0.478041 | 91 | — | 9 | 100 | ||||||||||||||||||||||||
MSCI Japan | 0.930654 | — | 0.001098 | 0.931752 | 100 | — | 0 | a | 100 | |||||||||||||||||||||||
MSCI Mexico Capped | 0.782184 | — | — | 0.782184 | 100 | — | — | 100 | ||||||||||||||||||||||||
MSCI South Korea Capped | — | — | 0.645396 | 0.645396 | — | — | 100 | 100 | ||||||||||||||||||||||||
| a | Rounds to less than 1%. |
Premium/Discount Information
The Premium/Discount Information section is intended to present information about the differences between the daily market price on secondary markets for shares of a fund and that fund’s NAV. NAV is the price at which a fund issues and redeems shares. It is calculated in accordance with the standard formula for valuing mutual fund shares. The “Market Price” of a fund generally is determined using the midpoint between the highest bid and the lowest ask on the primary securities exchange on which shares of such fund are listed for trading, as of the time that the fund’s NAV is calculated. A fund’s Market Price may be at, above or below its NAV. The NAV of a fund will fluctuate with changes in the value of its portfolio holdings. The Market Price of a fund will fluctuate in accordance with changes in its NAV, as well as market supply and demand.
SUPPLEMENTAL INFORMATION | 93 |
Table of Contents
Supplemental Information (Unaudited) (Continued)
iSHARES®, INC.
Premiums or discounts are the differences (expressed as a percentage) between the NAV and Market Price of a fund on a given day, generally at the time the NAV is calculated. A premium is the amount that a fund is trading above the reported NAV, expressed as a percentage of the NAV. A discount is the amount that a fund is trading below the reported NAV, expressed as a percentage of the NAV.
Premium/discount information for the Funds covering the most recently completed calendar year and the most recently completed calendar quarters since that year (or the life of the Fund, if shorter) is publicly accessible, free of charge, at www.iShares.com.
The following information shows the frequency of distributions of premiums and discounts for the Funds for the immediately preceding five calendar years (or from the inception date of the Fund, if less than five years) through the date of the most recent calendar quarter-end. Each line in each table shows the number of trading days in which the Fund traded within the premium/discount range indicated. The number of trading days in each premium/discount range is also shown as a percentage of the total number of trading days in the period covered by each table. All data presented here represents past performance, which cannot be used to predict future results.
iShares Edge MSCI Min Vol Global ETF
Period Covered: January 1, 2012 through June 30, 2017
Premium/Discount Range | Number of Days | Percentage of Total Days | ||||||
Greater than 3.0% | 2 | 0.14 | % | |||||
Greater than 2.5% and Less than 3.0% | 1 | 0.07 | ||||||
Greater than 2.0% and Less than 2.5% | 6 | 0.43 | ||||||
Greater than 1.5% and Less than 2.0% | 3 | 0.22 | ||||||
Greater than 1.0% and Less than 1.5% | 16 | 1.16 | ||||||
Greater than 0.5% and Less than 1.0% | 103 | 7.45 | ||||||
Greater than 0.0% and Less than 0.5% | 856 | 61.90 | ||||||
At NAV | 21 | 1.52 | ||||||
Less than 0.0% and Greater than –0.5% | 356 | 25.74 | ||||||
Less than –0.5% and Greater than –1.0% | 17 | 1.23 | ||||||
Less than –1.0% and Greater than –1.5% | 1 | 0.07 | ||||||
Less than –1.5% | 1 | 0.07 | ||||||
|
|
|
| |||||
| 1,383 | 100.00 | % | ||||||
|
|
|
| |||||
| 94 | 2017 iSHARES ANNUAL REPORTTO SHAREHOLDERS |
Table of Contents
Supplemental Information (Unaudited) (Continued)
iSHARES®, INC.
iShares MSCI Australia ETF
Period Covered: January 1, 2012 through June 30, 2017
Premium/Discount Range | Number of Days | Percentage of Total Days | ||||||
Greater than 3.0% and Less than 3.5% | 2 | 0.14 | % | |||||
Greater than 2.5% and Less than 3.0% | 1 | 0.07 | ||||||
Greater than 2.0% and Less than 2.5% | 6 | 0.43 | ||||||
Greater than 1.5% and Less than 2.0% | 22 | 1.59 | ||||||
Greater than 1.0% and Less than 1.5% | 60 | 4.34 | ||||||
Greater than 0.5% and Less than 1.0% | 237 | 17.14 | ||||||
Greater than 0.0% and Less than 0.5% | 474 | 34.28 | ||||||
At NAV | 13 | 0.94 | ||||||
Less than 0.0% and Greater than –0.5% | 331 | 23.93 | ||||||
Less than –0.5% and Greater than –1.0% | 148 | 10.71 | ||||||
Less than –1.0% and Greater than –1.5% | 60 | 4.34 | ||||||
Less than –1.5% and Greater than –2.0% | 13 | 0.94 | ||||||
Less than –2.0% and Greater than –2.5% | 12 | 0.87 | ||||||
Less than –2.5% and Greater than –3.0% | 2 | 0.14 | ||||||
Less than –3.0% and Greater than –3.5% | 1 | 0.07 | ||||||
Less than –3.5% | 1 | 0.07 | ||||||
|
|
|
| |||||
| 1,383 | 100.00 | % | ||||||
|
|
|
| |||||
iShares MSCI Canada ETF
Period Covered: January 1, 2012 through June 30, 2017
Premium/Discount Range | Number of Days | Percentage of Total Days | ||||||
Greater than 2.5% | 1 | 0.07 | % | |||||
Greater than 2.0% and Less than 2.5% | 1 | 0.07 | ||||||
Greater than 1.5% and Less than 2.0% | 2 | 0.14 | ||||||
Greater than 1.0% and Less than 1.5% | 5 | 0.36 | ||||||
Greater than 0.5% and Less than 1.0% | 35 | 2.53 | ||||||
Greater than 0.0% and Less than 0.5% | 623 | 45.05 | ||||||
At NAV | 34 | 2.46 | ||||||
Less than 0.0% and Greater than –0.5% | 641 | 46.35 | ||||||
Less than –0.5% and Greater than –1.0% | 37 | 2.68 | ||||||
Less than –1.0% and Greater than –1.5% | 4 | 0.29 | ||||||
|
|
|
| |||||
| 1,383 | 100.00 | % | ||||||
|
|
|
| |||||
SUPPLEMENTAL INFORMATION | 95 |
Table of Contents
Supplemental Information (Unaudited) (Continued)
iSHARES®, INC.
iShares MSC Japan ETF
Period Covered: January 1, 2012 through June 30, 2017
Premium/Discount Range | Number of Days | Percentage of Total Days | ||||||
Greater than 4.5% | 1 | 0.07 | % | |||||
Greater than 4.0% and Less than 4.5% | 3 | 0.22 | ||||||
Greater than 3.5% and Less than 4.0% | 3 | 0.22 | ||||||
Greater than 3.0% and Less than 3.5% | 4 | 0.29 | ||||||
Greater than 2.5% and Less than 3.0% | 4 | 0.29 | ||||||
Greater than 2.0% and Less than 2.5% | 14 | 1.01 | ||||||
Greater than 1.5% and Less than 2.0% | 47 | 3.40 | ||||||
Greater than 1.0% and Less than 1.5% | 108 | 7.81 | ||||||
Greater than 0.5% and Less than 1.0% | 259 | 18.73 | ||||||
Greater than 0.0% and Less than 0.5% | 353 | 25.52 | ||||||
At NAV | 11 | 0.80 | ||||||
Less than 0.0% and Greater than –0.5% | 289 | 20.90 | ||||||
Less than –0.5% and Greater than –1.0% | 160 | 11.57 | ||||||
Less than –1.0% and Greater than –1.5% | 63 | 4.56 | ||||||
Less than –1.5% and Greater than –2.0% | 36 | 2.60 | ||||||
Less than –2.0% and Greater than –2.5% | 15 | 1.08 | ||||||
Less than –2.5% and Greater than –3.0% | 5 | 0.36 | ||||||
Less than –3.0% and Greater than –3.5% | 1 | 0.07 | ||||||
Less than –3.5% and Greater than –4.0% | 1 | 0.07 | ||||||
Less than –4.0% and Greater than –4.5% | 2 | 0.14 | ||||||
Less than –4.5% and Greater than –5.0% | 1 | 0.07 | ||||||
Less than –5.0% | 3 | 0.22 | ||||||
|
|
|
| |||||
| 1,383 | 100.00 | % | ||||||
|
|
|
| |||||
iShares MSCI Mexico Capped ETF
Period Covered: January 1, 2012 through June 30, 2017
Premium/Discount Range | Number of Days | Percentage of Total Days | ||||||
Greater than 2.0% and Less than 2.5% | 4 | 0.29 | % | |||||
Greater than 1.5% and Less than 2.0% | 5 | 0.36 | ||||||
Greater than 1.0% and Less than 1.5% | 19 | 1.37 | ||||||
Greater than 0.5% and Less than 1.0% | 101 | 7.30 | ||||||
Greater than 0.0% and Less than 0.5% | 508 | 36.73 | ||||||
At NAV | 25 | 1.81 | ||||||
Less than 0.0% and Greater than –0.5% | 562 | 40.65 | ||||||
Less than –0.5% and Greater than –1.0% | 134 | 9.69 | ||||||
Less than –1.0% and Greater than –1.5% | 20 | 1.45 | ||||||
Less than –1.5% and Greater than –2.0% | 2 | 0.14 | ||||||
Less than –2.0% and Greater than –2.5% | 1 | 0.07 | ||||||
Less than –2.5% and Greater than –3.0% | 1 | 0.07 | ||||||
Less than –3.0% and Greater than –3.5% | 1 | 0.07 | ||||||
|
|
|
| |||||
| 1,383 | 100.00 | % | ||||||
|
|
|
| |||||
| 96 | 2017 iSHARES ANNUAL REPORTTO SHAREHOLDERS |
Table of Contents
Supplemental Information (Unaudited) (Continued)
iSHARES®, INC.
iShares MSCI South Korea Capped ETF
Period Covered: January 1, 2012 through June 30, 2017
Premium/Discount Range | Number of Days | Percentage of Total Days | ||||||
Greater than 4.0% and Less than 4.5% | 1 | 0.07 | % | |||||
Greater than 3.5% and Less than 4.0% | 1 | 0.07 | ||||||
Greater than 3.0% and Less than 3.5% | 1 | 0.07 | ||||||
Greater than 2.5% and Less than 3.0% | 3 | 0.22 | ||||||
Greater than 2.0% and Less than 2.5% | 8 | 0.58 | ||||||
Greater than 1.5% and Less than 2.0% | 27 | 1.95 | ||||||
Greater than 1.0% and Less than 1.5% | 53 | 3.83 | ||||||
Greater than 0.5% and Less than 1.0% | 188 | 13.59 | ||||||
Greater than 0.0% and Less than 0.5% | 327 | 23.65 | ||||||
At NAV | 10 | 0.72 | ||||||
Less than 0.0% and Greater than –0.5% | 348 | 25.17 | ||||||
Less than –0.5% and Greater than –1.0% | 243 | 17.57 | ||||||
Less than –1.0% and Greater than –1.5% | 107 | 7.74 | ||||||
Less than –1.5% and Greater than –2.0% | 38 | 2.75 | ||||||
Less than –2.0% and Greater than –2.5% | 17 | 1.23 | ||||||
Less than –2.5% and Greater than –3.0% | 10 | 0.72 | ||||||
Less than –3.0% and Greater than –3.5% | 1 | 0.07 | ||||||
|
|
|
| |||||
| 1,383 | 100.00 | % | ||||||
|
|
|
| |||||
Regulation under the Alternative Investment Fund Managers Directive
The Alternative Investment Fund Managers Directive (“AIFMD”) imposes obligations on fund managers established in the European Union (the “EU”). These do not currently apply to managers established outside the EU, such as BFA. Rather, non-EU managers are only required to comply with certain disclosure, reporting and transparency obligations of AIFMD if such managers market a fund to EU investors.
BFA has registered the iShares MSCI Canada ETF, iShares MSCI Japan ETF, iShares MSCI Mexico Capped ETF and iShares MSCI South Korea Capped ETF (each a “Fund”, collectively the “Funds”) for marketing to investors in the United Kingdom, the Netherlands, Finland, Sweden and Luxembourg.
Report on Remuneration
BFA is required under AIFMD to make quantitative disclosures of remuneration. These disclosures are made in line with BlackRock’s interpretation of currently available regulatory guidance on quantitative remuneration disclosures. As market or regulatory practice develops BlackRock may consider it appropriate to make changes to the way in which quantitative remuneration disclosures are calculated. Where such changes are made, this may result in disclosures in relation to a fund not being comparable to the disclosures made in the prior year, or in relation to other BlackRock fund disclosures in that same year.
Disclosures are provided in relation to both (a) the staff of BFA; (b) staff who are senior management; and (c) staff who have the ability to materially affect the risk profile of the Funds.
SUPPLEMENTAL INFORMATION | 97 |
Table of Contents
Supplemental Information (Unaudited) (Continued)
iSHARES®, INC.
All individuals included in the aggregated figures disclosed are rewarded in line with BlackRock’s remuneration policy for their responsibilities across the relevant BlackRock business area. As all individuals have a number of areas of responsibilities, only the portion of remuneration for those individuals’ services attributable to each Fund is included in the aggregate figures disclosed.
BlackRock has a clear and well defined pay-for-performance philosophy, and compensation programs which support that philosophy. For senior management, a significant percentage of variable remuneration is deferred over time. All employees are subject to a claw-back policy.
Compensation decisions for employees are made based on BlackRock’s full-year financial results and other non-financial goals and objectives. Alongside financial performance, individual compensation is also based on strategic and operating results and other considerations such as management and leadership capabilities. No set formulas are established and no fixed benchmarks are used in determining annual incentive awards.
Bonus pools are reviewed by BlackRock’s independent compensation committee, taking into account both actual and projected financial information together with information provided by the Operational Risk and Regulatory Compliance departments in relation to any activities, incidents or events that warrant consideration in making compensation decisions.
Functions such as Finance, Operational Risk, Legal & Compliance, and Human Resources each have their own organizational structures which are independent of the business units. Functional bonus pools are determined with reference to the performance of each individual function and the remuneration of the senior members of control functions is directly overseen by BlackRock’s independent compensation committee. No individual is involved in setting his or her own remuneration.
Members of staff and senior management of BFA typically provide both AIFMD and non-AIFMD related services in respect of multiple funds, clients and functions of BFA and across the broader BlackRock group. Therefore, the figures disclosed are a sum of each individual’s portion of remuneration attributable to each Fund according to an objective apportionment methodology which acknowledges the multiple-service nature of BFA. Accordingly the figures are not representative of any individual’s actual remuneration or their remuneration structure.
The amount of the total remuneration awarded by BFA to its staff which has been attributed to the iShares MSCI Canada ETF in respect of BFA’s financial year ending December 31, 2016 was USD 372.86 thousand. This figure is comprised of fixed remuneration of USD 146.68 thousand and variable remuneration of USD 226.18 thousand. There were a total of 325 beneficiaries of the remuneration described above.
The amount of the aggregate remuneration awarded by BFA, which has been attributed to the iShares MSCI Canada ETF in respect of BFA’s financial year ending December 31, 2016, to its senior management was USD 51.57 thousand, and to members of its staff whose actions have a material impact on the risk profile of the Fund was USD 12.42 thousand.
The amount of the total remuneration awarded by BFA to its staff which has been attributed to the iShares MSCI Japan ETF in respect of BFA’s financial year ending December 31, 2016 was USD 1.63 million. This figure is comprised of fixed remuneration of USD 642.93 thousand and variable remuneration of USD 991.42 thousand. There were a total of 325 beneficiaries of the remuneration described above.
The amount of the aggregate remuneration awarded by BFA, which has been attributed to the iShares MSCI Japan ETF in respect of the BFA’s financial year ending December 31, 2016, to its senior management was USD 226.03 thousand, and to members of its staff whose actions have a material impact on the risk profile of the Fund was USD 54.46 thousand.
The amount of the total remuneration awarded by BFA to its staff which has been attributed to the iShares MSCI Mexico Capped ETF in respect of BFA’s financial year ending December 31, 2016 was USD 190.23 thousand. This figure is comprised of fixed
| 98 | 2017 iSHARES ANNUAL REPORTTO SHAREHOLDERS |
Table of Contents
Supplemental Information (Unaudited) (Continued)
iSHARES®, INC.
remuneration of USD 74.83 thousand and variable remuneration of USD 115.39 thousand. There were a total of 325 beneficiaries of the remuneration described above.
The amount of the aggregate remuneration awarded by BFA, which has been attributed to the iShares MSCI Mexico Capped ETF in respect of the BFA’s financial year ending December 31, 2016, to its senior management was USD 26.31 thousand, and to members of its staff whose actions have a material impact on the risk profile of the Fund was USD 6.34 thousand.
The amount of the total remuneration awarded by BFA to its staff which has been attributed to the iShares MSCI South Korea Capped ETF in respect of BFA’s financial year ending December 31, 2016 was USD 301.00 thousand. This figure is comprised of fixed remuneration of USD 118.41 thousand and variable remuneration of USD 182.59 thousand. There were a total of 325 beneficiaries of the remuneration described above.
The amount of the aggregate remuneration awarded by BFA, which has been attributed to the iShares MSCI South Korea Capped ETF in respect of the BFA’s financial year ending December 31, 2016, to its senior management was USD 41.63 thousand, and to members of its staff whose actions have a material impact on the risk profile of the Fund was USD 10.03 thousand.
SUPPLEMENTAL INFORMATION | 99 |
Table of Contents
Director and Officer Information
iSHARES®, INC.
The Board of Directors has responsibility for the overall management and operations of the Funds, including general supervision of the duties performed by BFA and other service providers. Each Director serves until he or she resigns, is removed, dies, retires or becomes incapacitated. Each officer shall hold office until his or her successor is elected and qualifies or until his or her death, resignation or removal. Directors who are not “interested persons” (as defined in the 1940 Act) of the Company are referred to as independent directors (“Independent Directors”).
The registered investment companies advised by BFA or its affiliates (the “BlackRock-advised Funds”) are organized into one complex of closed-end funds, two complexes of open-end funds and one complex of exchange-traded funds (“Exchange-Traded Fund Complex”) (each, a “BlackRock Fund Complex”). Each Fund is included in the BlackRock Fund Complex referred to as the Exchange-Traded Fund Complex. Each Director also serves as a Trustee of iShares Trust and a Trustee of iShares U.S. ETF Trust and, as a result, oversees a total of 344 funds (as of August 31, 2017) within the Exchange-Traded Fund Complex. Drew E. Lawton, from October 2016 to June 2017, and Richard L. Fagnani, from April 2017 to June 2017, served as Advisory Board Members for iShares Trust, iShares Inc. and iShares U.S. ETF Trust with respect to all funds within the Exchange-Traded Fund Complex. With the exception of Robert S. Kapito, Mark K. Wiedman, Charles Park, Martin Small and Benjamin Archibald, the address of each Director, and officer is c/o BlackRock, Inc., 400 Howard Street, San Francisco, CA 94105. The address of Mr. Kapito, Mr. Wiedman, Mr. Park, Mr. Small and Mr. Archibald is c/o BlackRock, Inc., Park Avenue Plaza, 55 East 52nd Street, New York, NY 10055. The Board has designated Cecilia H. Herbert as its Independent Board Chair. Additional information about the Funds’ Directors and officers may be found in the Funds’ combined Statement of Additional Information, which is available without charge, upon request, by calling toll-free 1-800-iShares (1-800-474-2737).
Interested Directors
| Name (Age) | Position(s) | Principal Occupation(s) During the Past 5 Years | Other Directorships Held by Director | |||
Robert S. Kapitoa (60) | Director (since 2009). | President, BlackRock, Inc. (since 2006); Vice Chairman of BlackRock, Inc. and Head of BlackRock’s Portfolio Management Group (since its formation in 1998) and BlackRock, Inc.’s predecessor entities (since 1988); Trustee, University of Pennsylvania (since 2009); President of Board of Directors, Hope & Heroes Children’s Cancer Fund (since 2002). | Director of BlackRock, Inc. (since 2006); Trustee of iShares Trust (since 2009); Trustee of iShares U.S. ETF Trust (since 2011). | |||
Mark K. Wiedmanb (46) | Director (since 2013). | Senior Managing Director, BlackRock, Inc. (since 2014); Managing Director, BlackRock, Inc. (2007-2014); Global Head of BlackRock’s ETF and Index Investments Business (since 2016); Global Head of iShares (2011-2016); Head of Corporate Strategy, BlackRock, Inc. (2009-2011). | Trustee of iShares Trust (since 2013); Trustee of iShares U.S. ETF Trust (since 2013); Director of PennyMac Financial Services, Inc. (since 2008). | |||
| a | Robert S. Kapito is deemed to be an “interested person” (as defined in the 1940 Act) of the Company due to his affiliations with BlackRock, Inc. and its affiliates. |
| b | Mark K. Wiedman is deemed to be an “interested person” (as defined in the 1940 Act) of the Company due to his affiliations with BlackRock, Inc. and its affiliates. |
| 100 | 2017 iSHARES ANNUAL REPORTTO SHAREHOLDERS |
Table of Contents
Director and Officer Information (Continued)
iSHARES®, INC.
Independent Directors
| Name (Age) | Position(s) | Principal Occupation(s) During the Past 5 Years | Other Directorships Held by Director | |||
Cecilia H. Herbert (68) | Director Independent Board Chair | Trustee and Member of the Finance, Technology and Quality Committee of Stanford Health Care (since 2016); Trustee and Member of the Investment Committee, WNET, a New York public media company (since 2011); Chair (1994-2005) and Member (since 1992) of the Investment Committee, Archdiocese of San Francisco; Director (1998-2013) and President (2007-2011) of the Board of Directors, Catholic Charities CYO; Trustee (2002-2011) and Chair of the Finance and Investment Committee (2006-2010) of the Thacher School. | Trustee of iShares Trust (since 2005); Trustee of iShares U.S. ETF Trust (since 2011); Independent Board Chair of iShares Trust and iShares U.S. ETF Trust (since 2016); Trustee of Forward Funds (14 portfolios) (since 2009); Trustee of Salient MF Trust (4 portfolios) (since 2015). | |||
Jane D. Carlin (61) | Director Risk Committee Chair | Consultant (since 2012); Managing Director and Global Head of Financial Holding Company Governance & Assurance and the Global Head of Operational Risk Management of Morgan Stanley (2006-2012). | Trustee of iShares Trust (since 2015); Trustee of iShares U.S. ETF Trust (since 2015); Director of PHH Corporation (mortgage solutions) (since 2012); Director of The Hanover Insurance Group, Inc. (since 2016). | |||
Richard L. Fagnani (62) | Director Equity Plus Committee Chair | Partner, KPMG LLP (2002-2016). | Trustee of iShares Trust (since 2017); Trustee of iShares U.S. ETF Trust (since 2017). | |||
Charles A. Hurty (73) | Director Audit Committee Chair | Retired; Partner, KPMG LLP (1968-2001). | Trustee of iShares Trust (since 2005); Trustee of iShares U.S. ETF Trust (since 2011); Director of SkyBridge Alternative Investments Multi-Adviser Hedge Fund Portfolios LLC (2 portfolios) (since 2002). | |||
John E. Kerrigan (62) | Director Securities Lending Committee Chair | Chief Investment Officer, Santa Clara University (since 2002). | Trustee of iShares Trust (since 2005); Trustee of iShares U.S. ETF Trust (since 2011). | |||
Drew E. Lawton (58) | Director 15(c) Committee Chair | Senior Managing Director of New York Life Insurance Company (2010-2015). | Trustee of iShares Trust (since 2017); Trustee of iShares U.S. ETF Trust (since 2017). | |||
DIRECTORAND OFFICER INFORMATION | 101 |
Table of Contents
Director and Officer Information (Continued)
iSHARES®, INC.
Independent Directors (Continued)
| Name (Age) | Position(s) | Principal Occupation(s) During the Past 5 Years | Other Directorships Held by Director | |||
John E. Martinez (56) | Director Fixed Income Plus Committee Chair | Director of Real Estate Equity Exchange, Inc. (since 2005). | Trustee of iShares Trust (since 2003); Trustee of iShares U.S. ETF Trust (since 2011). | |||
Madhav V. Rajan (53) | Director Nominating and Governance Committee Chair | Dean, and George Pratt Shultz Professor of Accounting, University of Chicago Booth School of Business (since 2017); Robert K. Jaedicke Professor of Accounting, Stanford University Graduate School of Business (2001-2017); Professor of Law (by courtesy), Stanford Law School (2005-2017); Senior Associate Dean for Academic Affairs and Head of MBA Program, Stanford University Graduate School of Business (2010-2016) . | Trustee of iShares Trust (since 2011); Trustee of iShares U.S. ETF Trust (since 2011); Director, Cavium, Inc. (since 2013). | |||
| 102 | 2017 iSHARES ANNUAL REPORTTO SHAREHOLDERS |
Table of Contents
Director and Officer Information (Continued)
iSHARES®, INC.
Officersc
| Name (Age) | Position(s) | Principal Occupation(s) During the Past 5 Years | ||
Martin Small (42) | President (since 2016). | Managing Director, BlackRock, Inc. (since 2010); Head of U.S. iShares (since 2015); Co-Head of the U.S. Financial Markets Advisory Group, BlackRock, Inc. (2008-2014). | ||
Jack Gee (57) | Treasurer and Chief Financial Officer (since 2008). | Managing Director, BlackRock, Inc. (since 2009); Senior Director of Fund Administration of Intermediary Investor Business, BGI (2009). | ||
Benjamin Archibald (42) | Secretary (since 2015). | Managing Director, BlackRock, Inc. (since 2014); Director, BlackRock, Inc. (2010-2013); Secretary of the BlackRock-advised Mutual Funds (since 2012). | ||
Alan Mason (56) | Executive Vice President (since 2016). | Managing Director, BlackRock, Inc. (since 2009). | ||
Steve Messinger (55) | Executive Vice President (since 2016). | Managing Director, BlackRock, Inc. (2007-2014 and since 2016); Managing Director, Beacon Consulting Group (2014-2016). | ||
Charles Park (49) | Chief Compliance Officer (since 2006). | Chief Compliance Officer of BlackRock Advisors, LLC and the BlackRock-advised Funds in the Equity-Bond Complex, the Equity-Liquidity Complex and the Closed-End Complex (since 2014); Chief Compliance Officer of BFA (since 2006). | ||
Scott Radell (48) | Executive Vice President (since 2012). | Managing Director, BlackRock, Inc. (since 2009); Head of Portfolio Solutions, BlackRock, Inc. (since 2009). | ||
| c | Manish Mehta served as President until October 15, 2016. |
DIRECTORAND OFFICER INFORMATION | 103 |
Table of Contents
Notes:
| 104 | 2017 iSHARES ANNUAL REPORTTO SHAREHOLDERS |
Table of Contents
Notes:
NOTES | 105 |
Table of Contents
Notes:
| 106 | 2017 iSHARES ANNUAL REPORTTO SHAREHOLDERS |
Table of Contents
For more information visit www.iShares.com or call 1-800-474-2737
This report is intended for the Funds’ shareholders. It may not be distributed to prospective investors unless it is preceded or accompanied by the current prospectus.
Investing involves risk, including possible loss of principal.
The iShares Funds are distributed by BlackRock Investments, LLC (together with its affiliates, “BlackRock”).
The iShares Funds are not sponsored, endorsed, issued, sold or promoted by MSCI Inc., nor does this company make any representation regarding the advisability of investing in the iShares Funds. BlackRock is not affiliated with the company listed above.
A description of the policies that the Funds use to determine how to vote proxies relating to portfolio securities and information about how the Funds voted proxies relating to portfolio securities during the most recent twelve-month period ending June 30 is available without charge, upon request, by calling toll-free 1-800-474-2737; on the Funds’ website at www.iShares.com; and on the U.S. Securities and Exchange Commission (SEC) website at www.sec.gov.
The Funds file their complete schedules of portfolio holdings with the SEC for the first and third quarters of each fiscal year on Form N-Q. The Funds’ Forms N-Q are available on the SEC’s website or may be reviewed and copied at the SEC’s Public Reference Room in Washington, D.C. Information on the operation of the Public Reference Room may be obtained by calling 1-800-SEC-0330. The Funds also disclose their complete schedules of portfolio holdings on a daily basis on the Funds’ website.
Certain financial information required by regulations or listing exchange rules in jurisdictions outside the U.S. in which iShares Funds are cross-listed may be publicly filed in those jurisdictions. This information is available upon request by calling 1-800-474-2737.
©2017 BlackRock, Inc. All rights reserved. iSHARES and BLACKROCK are registered trademarks of BlackRock, Inc. or its subsidiaries. All other marks are the property of their respective owners.
iS-AR-815-0817
 | |
Table of Contents
AUGUST 31, 2017
2017 ANNUAL REPORT | |
iShares, Inc.
| Ø | iShares Core MSCI Emerging Markets ETF | IEMG | NYSE Arca |
| Ø | iShares MSCI BRIC ETF | BKF | NYSE Arca |
| Ø | iShares MSCI Emerging Markets Asia ETF | EEMA | NASDAQ |
| Ø | iShares MSCI Emerging Markets Small-Cap ETF | EEMS | NYSE Arca |
Table of Contents
| 5 | ||||
| 14 | ||||
| 14 | ||||
| 15 | ||||
| 15 | ||||
| 46 | ||||
| 52 | ||||
| 62 | ||||
| 81 | ||||
| 87 | ||||
| 91 | ||||
| 105 | ||||
| 106 | ||||
| 107 | ||||
| 120 | ||||
| 125 |
Table of Contents
Management’s Discussion of Fund Performance
iSHARES®, INC.
GLOBAL EQUITY MARKET OVERVIEW
Global equity markets posted strong returns for the 12 months ended August 31, 2017 (the “reporting period”). The MSCI ACWI, a broad global equity index that includes both developed and emerging markets, returned 17.11% in U.S. dollar terms for the reporting period.
The primary factor behind the robust performance of global equity markets was improving global economic growth, driven largely by the continuation of accommodative monetary policies from many of the world’s central banks. Signs of stronger economic activity in Europe emerged as the European Central Bank (“ECB”) maintained policies such as quantitative easing and negative interest rates. Economic growth rates in China and Japan, the largest economies in Asia, also increased during the reporting period, reflecting efforts by the People’s Bank of China (“PBOC”) and the Bank of Japan (“BOJ”) to stimulate economic activity. Stronger economic growth led several central banks to consider reducing their economic stimulus measures. For example, late in the reporting period, the ECB discussed the possibility of tapering its quantitative easing program, while the PBOC increased short-term interest rates during the first half of 2017.
On a regional basis, European equity markets posted the best returns among developed markets, advancing by approximately 20% in U.S. dollar terms for the reporting period. European stocks benefited from improving economic conditions and stronger corporate earnings. In addition, election outcomes in France and the Netherlands eased investor concerns about nationalist presidential candidates and their opposition to the European Union (“E.U.”). Currency fluctuations also contributed meaningfully to European equity performance in U.S. dollar terms as the euro appreciated by approximately 6% against the U.S. dollar during the reporting period. The best-performing European stock markets included Austria, Italy, and Spain, while Ireland and Belgium posted the weakest returns.
Equity markets in the Asia-Pacific region gained about 16% in U.S. dollar terms for the reporting period, led by Singapore and Hong Kong. Japanese stocks also posted strong returns, benefiting from improving consumer spending and employment trends that contributed to the ongoing recovery in the Japanese economy. However, equity market returns in Japan were hindered by a decline in the Japanese yen, which depreciated by approximately 6% against the U.S. dollar.
The U.S. stock market returned approximately 15% for the reporting period. Despite mixed U.S. economic data, U.S. stocks advanced initially in anticipation of pro-business fiscal policies from the new presidential administration. Although the administration struggled to implement its fiscal agenda, stocks continued to move higher as better global economic conditions led to a notable improvement in corporate earnings growth, particularly for multinational companies with significant operations outside of the U.S. U.S. stocks advanced despite three short-term interest rate increases by the U.S. Federal Reserve Bank (the “Fed”) during the reporting period, which increased the short-term interest rate target to its highest level since October 2008. The Fed also unveiled a plan to start reducing the amount of U.S. Treasury bonds and mortgage-backed securities on its balance sheet before the end of 2017.
Emerging markets stocks outperformed those in developed markets, returning more than 23% in U.S. dollar terms for the reporting period. Emerging markets in Eastern Europe were the best performers, led by Poland, Greece, and Hungary. Equity markets in the Middle East trailed for the reporting period amid continued geopolitical conflict in the region.
MANAGEMENT’S DISCUSSIONSOF FUND PERFORMANCE | 5 |
Table of Contents
Management’s Discussion of Fund Performance
iSHARES® CORE MSCI EMERGING MARKETS ETF
Performance as of August 31, 2017
| Average Annual Total Returns | Cumulative Total Returns | |||||||||||||||||||||||||||
| NAV | MARKET | INDEX | NAV | MARKET | INDEX | |||||||||||||||||||||||
1 Year | 23.45% | 24.16% | 23.41% | 23.45% | 24.16% | 23.41% | ||||||||||||||||||||||
Since Inception | 4.00% | 4.03% | 3.99% | 21.07% | 21.25% | 21.01% | ||||||||||||||||||||||
GROWTH OF $10,000 INVESTMENT
(SINCE INCEPTION AT NET ASSET VALUE)
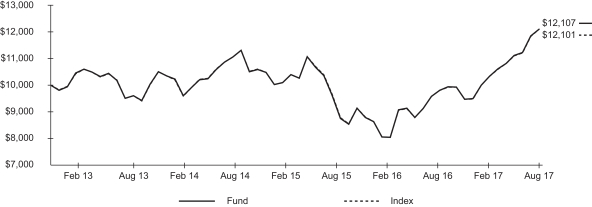
The inception date of the Fund was 10/18/12. The first day of secondary market trading was 10/22/12.
Past performance is no guarantee of future results. Performance results do not reflect the deduction of taxes that a shareholder would pay on fund distributions or on the redemption or sale of fund shares. See “About Fund Performance” on page 14 for more information.
| Shareholder Expenses | ||||||||||||||||||||||||||
| Actual | Hypothetical 5% Return | |||||||||||||||||||||||||
| Beginning Account Value (3/1/17) | Ending Account Value (8/31/17) | Expenses Paid During Period a | Beginning Account Value (3/1/17) | Ending Account Value (8/31/17) | Expenses Paid During Period a | Annualized Expense Ratio | ||||||||||||||||||||
| $ | 1,000.00 | $ | 1,170.80 | $ | 0.77 | $ | 1,000.00 | $ | 1,024.50 | $ | 0.71 | 0.14% | ||||||||||||||
| a | Expenses are calculated using the Fund’s annualized expense ratio (as disclosed in the table), multiplied by the average account value for the period, multiplied by the number of days in the period (184 days) and divided by the number of days in the year (365 days). See “Shareholder Expenses” on page 14 for more information. |
| 6 | 2017 iSHARES ANNUAL REPORTTO SHAREHOLDERS |
Table of Contents
Management’s Discussion of Fund Performance (Continued)
iSHARES® CORE MSCI EMERGING MARKETS ETF
The iShares Core MSCI Emerging Markets ETF (the “Fund”) seeks to track the investment results of an index composed of large-, mid- and small-capitalization emerging market equities, as represented by the MSCI Emerging Markets Investable Market Index (the “Index”). The Fund invests in a representative sample of securities included in the Index that collectively has an investment profile similar to the Index. Due to the use of representative sampling, the Fund may or may not hold all of the securities that are included in the Index. For the 12-month reporting period ended August 31, 2017, the total return for the Fund was 23.45%, net of fees, while the total return for the Index was 23.41%.
The robust performance of the Index for the reporting period was led by stocks in China, which represented about 27% of the Index on average. As a major global exporter, China capitalized on strengthening economic growth in many regions of the world. Chinese stocks also benefited from government stimulus efforts focused primarily on infrastructure and real estate expansion.
Taiwan and South Korea were also meaningful contributors to the Index’s return for the reporting period, as stocks in both countries gained due to strong growth in technology-related companies. Taiwan’s technology-heavy stock market rose to its highest level in 27 years, led by smartphone component suppliers. South Korea’s equity market reached an all-time high, despite tepid economic growth.
In contrast, stocks in Qatar and the Philippines detracted from the Index’s return for the reporting period. The stock market in Qatar declined amid the country’s growing diplomatic crisis with Saudi Arabia and other neighboring countries, while slowing economic growth and political controversies surrounding the Philippine president negatively affected the Philippine equity market.
From a sector perspective, the information technology sector contributed the most to the Index’s return for the reporting period, benefiting from growing demand for a range of technological devices. Sector gains were driven primarily by several large technology companies with diversified businesses and strong profit growth. The financials sector also contributed meaningfully to the Index’s return for the reporting period, led by banks and the insurance industry. Other notable contributors included the economically sensitive materials and consumer discretionary sectors.
Currency fluctuations had a positive impact on the Index’s return for the reporting period, particularly an approximately 5% gain in the Taiwanese new dollar and about a 4% gain in the Indian rupee relative to the U.S. dollar.
ALLOCATION BY SECTOR
As of 8/31/17
| Sector | Percentage of Total Investments* |
Information Technology | 25.80 | % | ||
Financials | 22.01 | |||
Consumer Discretionary | 10.99 | |||
Materials | 7.96 | |||
Industrials | 6.67 | |||
Consumer Staples | 6.53 | |||
Energy | 6.04 | |||
Telecommunication Services | 4.64 | |||
Real Estate | 3.62 | |||
Health Care | 2.98 | |||
Utilities | 2.76 | |||
|
| |||
TOTAL | 100.00 | % | ||
|
|
TEN LARGEST COUNTRIES
As of 8/31/17
| Country | Percentage of Total Investments* |
China | 28.05 | % | ||
South Korea | 14.74 | |||
Taiwan | 12.68 | |||
India | 9.36 | |||
Brazil | 6.98 | |||
South Africa | 6.57 | |||
Mexico | 3.49 | |||
Russia | 2.92 | |||
Malaysia | 2.36 | |||
Thailand | 2.34 | |||
|
| |||
TOTAL | 89.49 | % | ||
|
|
| * | Excludes money market funds. |
MANAGEMENT’S DISCUSSIONSOF FUND PERFORMANCE | 7 |
Table of Contents
Management’s Discussion of Fund Performance
iSHARES® MSCI BRIC ETF
Performance as of August 31, 2017
| Average Annual Total Returns | Cumulative Total Returns | |||||||||||||||||||||||||||
| NAV | MARKET | INDEX | NAV | MARKET | INDEX | |||||||||||||||||||||||
1 Year | 28.15% | 29.22% | 28.85% | 28.15% | 29.22% | 28.85% | ||||||||||||||||||||||
5 Years | 5.74% | 5.82% | 6.36% | 32.19% | 32.72% | 36.08% | ||||||||||||||||||||||
Since Inception | (0.97)% | (0.94)% | (0.51)% | (9.08)% | (8.82)% | (4.90)% | ||||||||||||||||||||||
GROWTH OF $10,000 INVESTMENT
(SINCE INCEPTION AT NET ASSET VALUE)
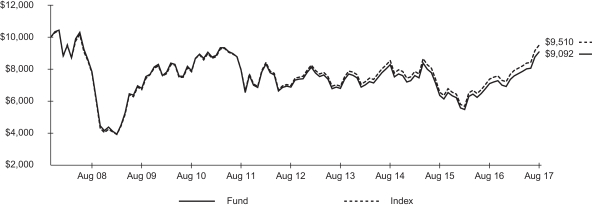
The inception date of the Fund was 11/12/07. The first day of secondary market trading was 11/16/07.
Past performance is no guarantee of future results. Performance results do not reflect the deduction of taxes that a shareholder would pay on fund distributions or on the redemption or sale of fund shares. See “About Fund Performance” on page 14 for more information.
| Shareholder Expenses | ||||||||||||||||||||||||||
| Actual | Hypothetical 5% Return | |||||||||||||||||||||||||
| Beginning Account Value (3/1/17) | Ending Account Value (8/31/17) | Expenses Paid During Period a | Beginning Account Value (3/1/17) | Ending Account Value (8/31/17) | Expenses Paid During Period a | Annualized Expense Ratio | ||||||||||||||||||||
| $ | 1,000.00 | $ | 1,197.70 | $ | 3.88 | $ | 1,000.00 | $ | 1,021.70 | $ | 3.57 | 0.70% | ||||||||||||||
| a | Expenses are calculated using the Fund’s annualized expense ratio (as disclosed in the table), multiplied by the average account value for the period, multiplied by the number of days in the period (184 days) and divided by the number of days in the year (365 days). See “Shareholder Expenses” on page 14 for more information. |
| 8 | 2017 iSHARES ANNUAL REPORTTO SHAREHOLDERS |
Table of Contents
Management’s Discussion of Fund Performance (Continued)
iSHARES® MSCI BRIC ETF
The iShares MSCI BRIC ETF (the “Fund”) seeks to track the investment of an index composed of Chinese equities that are available to international investors, and Brazilian, Russian, and Indian equities, as represented by the MSCI BRIC Index (the “Index”). The Fund invests in a representative sample of securities included in the Index that collectively has an investment profile similar to the Index. Due to the use of representative sampling, the Fund may or may not hold all of the securities that are included in the Index. For the 12-month reporting period ended August 31, 2017, the total return for the Fund was 28.15%, net of fees, while the total return for the Index was 28.85%.
The robust performance of the Index for the reporting period was led by stocks in China, which represented the largest country weight in the Index on average. As a major global exporter, China benefited from strengthening economic growth in many regions of the world. Government stimulus efforts focused primarily on infrastructure and real estate expansion, which drove property prices higher and supported a surge in industrial output, contributing to the advance in Chinese stocks. Brazilian stocks were meaningful contributors to the Index’s return as the Brazilian economy emerged from recession during the reporting period. A series of interest rate cuts by Brazil’s central bank, along with stronger consumer spending and growth in exports, helped bring about the recovery in the Brazilian economy.
Stocks in India also contributed significantly to the Index’s return despite a slowdown in the country’s economy during the reporting period. The stock market in India reached an all-time high amid government-driven economic reforms that are expected to stimulate economic activity, including a demonetization campaign and a new goods and services tax. Russia, the smallest country weight in the Index on average, was also a contributor to the Index’s performance as the country’s economy began to recover from a period of contraction.
From a sector perspective, the information technology sector contributed the most to the Index’s return for the reporting period, benefiting from growing demand for a range of technological devices. The financials sector also contributed meaningfully to the Index’s return, led by strong performance from the banking and insurance industries. Other notable contributors included the economically sensitive consumer discretionary and materials sectors.
Currency fluctuations had a positive impact on the Index’s return, particularly an approximately 11% gain in the Russian ruble, an approximately 4% gain in the Indian rupee, and an approximately 3% gain in the Brazilian real relative to the U.S. dollar.
ALLOCATION BY SECTOR
As of 8/31/17
| Sector | Percentage of Total Investments* |
Information Technology | 26.97 | % | ||
Financials | 25.87 | |||
Energy | 9.86 | |||
Consumer Discretionary | 8.61 | |||
Materials | 5.55 | |||
Consumer Staples | 5.25 | |||
Telecommunication Services | 4.68 | |||
Industrials | 4.66 | |||
Real Estate | 3.18 | |||
Utilities | 2.77 | |||
Health Care | 2.60 | |||
|
| |||
TOTAL | 100.00 | % | ||
|
|
ALLOCATION BY COUNTRY
As of 8/31/17
| Country | Percentage of Total Investments* |
China | 60.30 | % | ||
India | 18.04 | |||
Brazil | 14.92 | |||
Russia | 6.74 | |||
|
| |||
TOTAL | 100.00 | % | ||
|
|
| * | Excludes money market funds. |
MANAGEMENT’S DISCUSSIONSOF FUND PERFORMANCE | 9 |
Table of Contents
Management’s Discussion of Fund Performance
iSHARES® MSCI EMERGING MARKETS ASIA ETF
Performance as of August 31, 2017
| Average Annual Total Returns | Cumulative Total Returns | |||||||||||||||||||||||||||
| NAV | MARKET | INDEX | NAV | MARKET | INDEX | |||||||||||||||||||||||
1 Year | 24.80% | 26.23% | 25.50% | 24.80% | 26.23% | 25.50% | ||||||||||||||||||||||
5 Years | 8.60% | 8.55% | 8.94% | 51.07% | 50.73% | 53.47% | ||||||||||||||||||||||
Since Inception | 6.19% | 6.25% | 6.56% | 39.70% | 40.13% | 42.40% | ||||||||||||||||||||||
GROWTH OF $10,000 INVESTMENT
(SINCE INCEPTION AT NET ASSET VALUE)
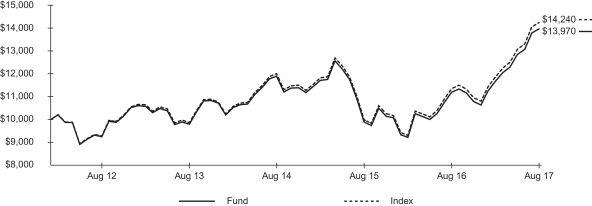
The inception date of the Fund was 2/8/12. The first day of secondary market trading was 2/9/12.
Past performance is no guarantee of future results. Performance results do not reflect the deduction of taxes that a shareholder would pay on fund distributions or on the redemption or sale of fund shares. See “About Fund Performance” on page 14 for more information.
| Shareholder Expenses | ||||||||||||||||||||||||||
| Actual | Hypothetical 5% Return | |||||||||||||||||||||||||
| Beginning Account Value (3/1/17) | Ending Account Value (8/31/17) | Expenses Paid During Period a | Beginning Account Value (3/1/17) | Ending Account Value (8/31/17) | Expenses Paid During Period a | Annualized Expense Ratio | ||||||||||||||||||||
| $ | 1,000.00 | $ | 1,197.90 | $ | 2.77 | $ | 1,000.00 | $ | 1,022.70 | $ | 2.55 | 0.50% | ||||||||||||||
| a | Expenses are calculated using the Fund’s annualized expense ratio (as disclosed in the table), multiplied by the average account value for the period, multiplied by the number of days in the period (184 days) and divided by the number of days in the year (365 days). See “Shareholder Expenses” on page 14 for more information. |
The iShares MSCI Emerging Markets Asia ETF (the “Fund”) seeks to track the investment results of an index composed of Asian emerging market equities, as represented by the MSCI Emerging Markets Asia Index (the “Index”) The Fund invests in a representative sample of securities included in the Index that collectively has an investment profile similar to the Index. Due to the use of representative sampling, the Fund may or may not hold all of the securities that are included in the Index. For the 12-month reporting period ended August 31, 2017, the total return for the Fund was 24.80%, net of fees, while the total return for the Index was 25.50%.
China, which represented about 38% of the Index on average, contributed the most to the Index’s return for the reporting period. China’s economy expanded, reflecting solid fixed-asset investment, as well as improving industrial output and retail sales. The
| 10 | 2017 iSHARES ANNUAL REPORTTO SHAREHOLDERS |
Table of Contents
Management’s Discussion of Fund Performance (Continued)
iSHARES® MSCI EMERGING MARKETS ASIA ETF
country’s unemployment rate dipped to 3.95%, its lowest level since data collection began in the third quarter of 2002. Growth in manufacturing strengthened as output and new export orders rose.
South Korea’s stock market reached an all-time high during the reporting period, driven up by foreign demand for technology stocks. Exports surged, particularly for semiconductors and flat screens, which hit record highs. However, weak domestic demand limited economic growth and led the South Korean government to initiate a fiscal stimulus package aimed at creating public sector jobs and increasing social welfare subsidies.
Taiwan’s technology-heavy stock market rose to its highest level in 27 years. Rising global demand for smartphones and other electronic devices during the reporting period was a driver of expansion for Taiwan’s export-heavy economy. Taiwan’s main trading partners include China, Hong Kong, and the U.S., and improving conditions among those countries also benefited Taiwan’s export trade.
India contributed to the Index’s return for the reporting period, despite slowing economic growth amid a decline in consumer spending. Manufacturing declined into contraction in July 2017 and consumer prices rose, reflecting the implementation of a new goods and services tax, which became effective in July 2017.
From a sector perspective, information technology made the largest contribution to the Index’s performance for the reporting period. Sector strength reflected increased global demand for technology-related goods. Industries leading the sector’s gains included software and services, technology hardware and equipment, and semiconductors and semiconductor equipment.
The financials sector contributed significantly to the Index’s return for the reporting period. Within the sector, banks led the advance. The materials, consumer discretionary, and energy sectors all contributed meaningfully to the Index’s gain.
ALLOCATION BY SECTOR
As of 8/31/17
| Sector | Percentage of Total Investments* |
Information Technology | 37.13 | % | ||
Financials | 21.11 | |||
Consumer Discretionary | 9.04 | |||
Industrials | 5.85 | |||
Materials | 5.55 | |||
Energy | 4.98 | |||
Consumer Staples | 4.78 | |||
Telecommunication Services | 4.58 | |||
Real Estate | 2.45 | |||
Health Care | 2.40 | |||
Utilities | 2.13 | |||
|
| |||
TOTAL | 100.00 | % | ||
|
|
ALLOCATION BY COUNTRY
As of 8/31/17
| Country | Percentage of Total Investments* |
China | 40.34 | % | ||
South Korea | 20.22 | |||
Taiwan | 16.47 | |||
India | 12.08 | |||
Indonesia | 3.15 | |||
Malaysia | 3.11 | |||
Thailand | 2.98 | |||
Philippines | 1.52 | |||
Pakistan | 0.13 | |||
|
| |||
TOTAL | 100.00 | % | ||
|
|
| * | Excludes money market funds. |
MANAGEMENT’S DISCUSSIONSOF FUND PERFORMANCE | 11 |
Table of Contents
Management’s Discussion of Fund Performance
iSHARES® MSCI EMERGING MARKETS SMALL-CAP ETF
Performance as of August 31, 2017
| Average Annual Total Returns | Cumulative Total Returns | |||||||||||||||||||||||||||
| NAV | MARKET | INDEX | NAV | MARKET | INDEX | |||||||||||||||||||||||
1 Year | 16.17% | 16.96% | 16.35% | 16.17% | 16.96% | 16.35% | ||||||||||||||||||||||
5 Years | 5.37% | 5.45% | 5.86% | 29.88% | 30.41% | 32.93% | ||||||||||||||||||||||
Since Inception | 2.30% | 2.36% | 2.98% | 14.75% | 15.15% | 19.41% | ||||||||||||||||||||||
GROWTH OF $10,000 INVESTMENT
(SINCE INCEPTION AT NET ASSET VALUE)
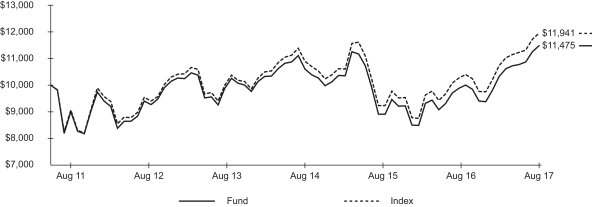
The inception date of the Fund was 8/16/11. The first day of secondary market trading was 8/18/11.
Past performance is no guarantee of future results. Performance results do not reflect the deduction of taxes that a shareholder would pay on fund distributions or on the redemption or sale of fund shares. See “About Fund Performance” on page 14 for more information.
| Shareholder Expenses | ||||||||||||||||||||||||||
| Actual | Hypothetical 5% Return | |||||||||||||||||||||||||
| Beginning Account Value (3/1/17) | Ending Account Value (8/31/17) | Expenses Paid During Period a | Beginning Account Value (3/1/17) | Ending Account Value (8/31/17) | Expenses Paid During Period a | Annualized Expense Ratio | ||||||||||||||||||||
| $ | 1,000.00 | $ | 1,111.70 | $ | 3.67 | $ | 1,000.00 | $ | 1,021.70 | $ | 3.52 | 0.69% | ||||||||||||||
| a | Expenses are calculated using the Fund’s annualized expense ratio (as disclosed in the table), multiplied by the average account value for the period, multiplied by the number of days in the period (184 days) and divided by the number of days in the year (365 days). See “Shareholder Expenses” on page 14 for more information. |
The iShares MSCI Emerging Markets Small-Cap ETF (the “Fund”) seeks to track the investment results of an index composed of small-capitalization emerging market equities, as represented by the MSCI Emerging Markets Small Cap Index (the “Index”). The Fund invests in a representative sample of securities included in the Index that collectively has an investment profile similar to the Index. Due to the use of representative sampling, the Fund may or may not hold all of the securities that are included in the Index. For the 12-month reporting period ended August 31, 2017, the total return for the Fund was 16.17%, net of fees, while the total return for the Index was 16.35%.
The robust performance of the Index for the reporting period was led by small-capitalization stocks in Taiwan, which benefited from strong growth in technology-related companies. Taiwan’s technology-heavy stock market rose to its highest level in 27 years, led by component suppliers that were helped by robust smartphone production.
| 12 | 2017 iSHARES ANNUAL REPORTTO SHAREHOLDERS |
Table of Contents
Management’s Discussion of Fund Performance (Continued)
iSHARES® MSCI EMERGING MARKETS SMALL-CAP ETF
Small-capitalization stocks in India also contributed significantly to the Index’s return despite a slowdown in the country’s economy during the reporting period. The stock market in India reached an all-time high amid government-driven economic reforms, including a demonetization campaign and a new goods and services tax, which are expected generally to stimulate economic activity.
Chinese small-capitalization stocks also contributed meaningfully to the Index’s return for the reporting period. As a major global exporter, China benefited from strengthening economic growth in many regions of the world. Government stimulus efforts focused primarily on infrastructure and real estate expansion, which drove property prices higher and supported a surge in industrial output, contributing to the advance in Chinese small-capitalization stocks.
On the downside, small-capitalization stocks in Indonesia, Pakistan, and the Philippines detracted from the Index’s return for the reporting period.
From a sector perspective, the information technology sector contributed the most to the Index’s return for the reporting period, benefiting from growing demand for a range of technological devices. Technology hardware and equipment companies led the advance in the information technology sector. The materials sector also contributed meaningfully to the Index’s return, led by a strong performance from the metals and mining and chemicals industries. Other notable contributors included the financials and industrials sectors.
Currency fluctuations had a positive impact on the Index’s return, particularly an approximately 5% gain in the Taiwanese new dollar, an approximately 4% gain in the Indian rupee, and an approximately 3% gain in the Brazilian real relative to the U.S. dollar.
ALLOCATION BY SECTOR
As of 8/31/17
| Sector | Percentage of Total Investments* |
Information Technology | 17.62 | % | ||
Consumer Discretionary | 16.60 | |||
Industrials | 14.62 | |||
Materials | 11.41 | |||
Financials | 9.23 | |||
Real Estate | 9.12 | |||
Health Care | 7.91 | |||
Consumer Staples | 6.50 | |||
Utilities | 3.85 | |||
Energy | 2.11 | |||
Telecommunication Services | 1.03 | |||
|
| |||
TOTAL | 100.00 | % | ||
|
|
TEN LARGEST COUNTRIES
As of 8/31/17
| Country | Percentage of Total Investments* |
China | 20.92 | % | ||
Taiwan | 18.03 | |||
South Korea | 15.66 | |||
India | 13.62 | |||
Brazil | 5.38 | |||
South Africa | 5.19 | |||
Thailand | 3.55 | |||
Malaysia | 3.15 | |||
Mexico | 2.97 | |||
Indonesia | 2.30 | |||
|
| |||
TOTAL | 90.77 | % | ||
|
|
| * | Excludes money market funds. |
MANAGEMENT’S DISCUSSIONSOF FUND PERFORMANCE | 13 |
Table of Contents
Past performance is no guarantee of future results. Current performance may be lower or higher than the performance data quoted. Performance data current to the most recent month-end is available at www.ishares.com. Performance results assume reinvestment of all dividends and capital gain distributions and do not reflect the deduction of taxes that a shareholder would pay on fund distributions or on the redemption or sale of fund shares. The investment return and principal value of shares will vary with changes in market conditions. Shares may be worth more or less than their original cost when they are redeemed or sold in the market. Performance for certain funds may reflect a waiver of a portion of investment advisory fees. Without such a waiver, performance would have been lower.
Net asset value or “NAV” is the value of one share of a fund as calculated in accordance with the standard formula for valuing mutual fund shares. The price used to calculate market return (“Market Price”) is determined by using the midpoint between the highest bid and the lowest offer on the primary stock exchange on which shares of a fund are listed for trading, as of the time that such fund’s NAV is calculated. Certain funds may have a NAV which is determined prior to the opening of regular trading on its listed exchange and their market returns are calculated using the midpoint of the bid/ask spread as of the opening of regular trading on the exchange. Market and NAV returns assume that dividends and capital gain distributions have been reinvested at Market Price and NAV, respectively.
An index is a statistical composite that tracks a specified financial market or sector. Unlike a fund, an index does not actually hold a portfolio of securities and therefore does not incur the expenses incurred by a fund. These expenses negatively impact fund performance. Also, market returns do not include brokerage commissions that may be payable on secondary market transactions. If brokerage commissions were included, market returns would be lower.
As a shareholder of a Fund, you incur two types of costs: (1) transaction costs, including brokerage commissions on purchases and sales of fund shares and (2) ongoing costs, including management fees and other fund expenses. The expense example, which is based on an investment of $1,000 invested on March 1, 2017 and held through August 31, 2017, is intended to help you understand your ongoing costs (in dollars and cents) of investing in a Fund and to compare these costs with the ongoing costs of investing in other funds.
Actual Expenses — The table provides information about actual account values and actual expenses. Annualized expense ratios reflect contractual and voluntary fee waivers, if any. To estimate the expenses that you paid on your account over the period, simply divide your account value by $1,000 (for example, an $8,600 account value divided by $1,000 = 8.6), then multiply the result by the number corresponding to your Fund under the heading entitled “Expenses Paid During Period.”
Hypothetical Example for Comparison Purposes — The table also provides information about hypothetical account values and hypothetical expenses based on each Fund’s actual expense ratio and an assumed rate of return of 5% per year before expenses. You may use this information to compare the ongoing costs of investing in your Fund and other funds. To do so, compare this 5% hypothetical example with the 5% hypothetical examples that appear in the shareholder reports of the other funds.
Please note that the expenses shown in the table are meant to highlight your ongoing costs only and do not reflect any transactional costs, such as brokerage commissions paid on purchases and sales of fund shares. Therefore, the hypothetical examples are useful in comparing ongoing costs only and will not help you determine the relative total costs of owning different funds. In addition, if these transactional costs were included, your costs would have been higher.
| 14 | 2017 iSHARES ANNUAL REPORTTO SHAREHOLDERS |
Table of Contents
Consolidated Schedule of Investments
iSHARES® CORE MSCI EMERGING MARKETS ETF
August 31, 2017
| Security | Shares | Value | ||||||
COMMON STOCKS — 96.21% |
| |||||||
BRAZIL — 4.54% |
| |||||||
AES Tiete Energia SA | 1,215,800 | $ | 5,467,613 | |||||
Aliansce Shopping Centers SAa | 747,900 | 4,135,918 | ||||||
Alupar Investimento SA Units | 1,163,024 | 6,912,091 | ||||||
Ambev SA | 29,645,300 | 187,117,436 | ||||||
Arezzo Industria e Comercio SA | 451,900 | 6,575,023 | ||||||
B2W Cia. Digitala | 1,365,027 | 8,021,532 | ||||||
B3 SA – Brasil Bolsa Balcao | 13,068,578 | 91,873,999 | ||||||
Banco ABC Brasil SAa | 22,913 | 120,957 | ||||||
Banco Bradesco SA | 5,980,066 | 61,293,562 | ||||||
Banco do Brasil SA | 5,471,800 | 53,388,504 | ||||||
Banco Santander Brasil SA Units | 2,718,000 | 24,221,812 | ||||||
BB Seguridade Participacoes SA | 4,463,900 | 39,326,640 | ||||||
BR Malls Participacoes SA | 5,176,565 | 22,374,830 | ||||||
BR Properties SA | 814,100 | 2,843,509 | ||||||
BRF SAa | 2,822,600 | 38,143,607 | ||||||
CCR SA | 7,594,200 | 42,141,058 | ||||||
Centrais Eletricas Brasileiras SAa | 1,511,600 | 8,464,902 | ||||||
Cia. de Saneamento Basico do Estado de Sao Paulo | 2,208,400 | 22,565,132 | ||||||
Cia. de Saneamento de Minas Gerais-COPASA | 513,500 | 7,035,543 | ||||||
Cia. Hering | 304,700 | 2,614,661 | ||||||
Cia. Siderurgica Nacional SAa | 3,946,700 | 10,900,165 | ||||||
Cielo SA | 7,680,496 | 54,751,712 | ||||||
Cosan SA Industria e Comercio | 1,144,300 | 14,034,400 | ||||||
CPFL Energia SA | 1,685,533 | 14,511,938 | ||||||
CVC Brasil Operadora e Agencia de Viagens SA | 767,600 | 9,319,176 | ||||||
Cyrela Brazil Realty SA Empreendimentos e Participacoes | 1,781,600 | 7,462,851 | ||||||
Duratex SA | 2,282,629 | 6,238,971 | ||||||
EcoRodovias Infraestrutura e Logistica SA | 1,737,100 | 5,907,283 | ||||||
EDP – Energias do Brasil SA | 2,005,700 | 9,714,716 | ||||||
Embraer SA | 4,310,900 | 24,565,602 | ||||||
Engie Brasil Energia SA | 964,400 | 11,064,800 | ||||||
Equatorial Energia SA | 1,303,376 | 25,318,165 | ||||||
Estacio Participacoes SA | 1,793,400 | 14,711,072 | ||||||
| Security | Shares | Value | ||||||
EZ TEC Empreendimentos e Participacoes SA | 541,223 | $ | 3,832,398 | |||||
Fibria Celulose SA | 1,607,200 | 21,346,244 | ||||||
Fleury SA | 966,200 | 9,734,316 | ||||||
Gafisa SAa | 1 | 4 | ||||||
Hypermarcas SA | 2,154,600 | 20,207,614 | ||||||
Iguatemi Empresa de Shopping Centers SA | 637,100 | 7,572,833 | ||||||
Iochpe Maxion SA | 671,909 | 4,313,611 | ||||||
JBS SA | 5,243,600 | 14,448,668 | ||||||
JSL SAa | 807,200 | 2,026,690 | ||||||
Klabin SA Units | 3,782,400 | 20,580,237 | ||||||
Kroton Educacional SA | 8,781,656 | 50,153,779 | ||||||
Light SAa | 613,300 | 4,015,312 | ||||||
Linx SA | 996,900 | 5,807,554 | ||||||
Localiza Rent A Car SA | 1,102,112 | 20,858,668 | ||||||
Lojas Americanas SA | 1,413,810 | 6,488,397 | ||||||
Lojas Renner SA | 4,578,960 | 44,531,512 | ||||||
M. Dias Branco SA | 731,300 | 11,411,855 | ||||||
Magnesita Refratarios SA | 376,260 | 4,723,504 | ||||||
Marfrig Global Foods SAa | 1,744,700 | 3,953,570 | ||||||
Minerva SA | 1,040,700 | 3,830,128 | ||||||
MRV Engenharia e Participacoes SA | 1,944,100 | 8,335,079 | ||||||
Multiplan Empreendimentos Imobiliarios SA | 534,711 | 12,420,991 | ||||||
Multiplus SA | 391,800 | 4,670,793 | ||||||
Natura Cosmeticos SA | 1,147,900 | 10,762,304 | ||||||
Odontoprev SA | 1,836,700 | 8,650,986 | ||||||
Petroleo Brasileiro SAa | 18,886,000 | 83,852,411 | ||||||
Porto Seguro SA | 837,200 | 9,246,198 | ||||||
Qualicorp SA | 1,482,900 | 16,424,563 | ||||||
Raia Drogasil SA | 1,505,200 | 33,175,681 | ||||||
Rumo SAa | 5,356,900 | 17,587,051 | ||||||
Sao Martinho SA | 1,233,100 | 6,838,690 | ||||||
SLC Agricola SA | 552,300 | 3,896,792 | ||||||
Smiles SA | 443,200 | 9,790,981 | ||||||
Sonae Sierra Brasil SA | 334,200 | 2,612,888 | ||||||
Sul America SA | 1,371,532 | 7,837,450 | ||||||
TIM Participacoes SA | 5,443,100 | 19,513,473 | ||||||
TOTVS SA | 776,200 | 7,662,214 | ||||||
Transmissora Alianca de Energia Eletrica SA Units | 1,226,700 | 8,772,029 | ||||||
Ultrapar Participacoes SA | 2,300,400 | 53,700,005 | ||||||
Vale SA | 19,425,664 | 216,578,139 | ||||||
WEG SA | 3,628,360 | 23,593,652 | ||||||
|
| |||||||
| 1,668,898,444 | ||||||||
CONSOLIDATED SCHEDULESOF INVESTMENTS | 15 |
Table of Contents
Consolidated Schedule of Investments (Continued)
iSHARES® CORE MSCI EMERGING MARKETS ETF
August 31, 2017
| Security | Shares | Value | ||||||
CHILE — 1.13% |
| |||||||
AES Gener SA | 19,469,425 | $ | 6,812,626 | |||||
Aguas Andinas SA Series A | 15,968,932 | 10,199,239 | ||||||
Banco de Chile | 167,284,270 | 24,367,007 | ||||||
Banco de Credito e Inversiones | 271,558 | 17,610,392 | ||||||
Banco Santander Chile | 420,984,958 | 30,781,393 | ||||||
CAP SA | 516,879 | 6,067,842 | ||||||
Cencosud SA | 8,863,342 | 26,644,748 | ||||||
Cia. Cervecerias Unidas SA | 946,690 | 12,905,287 | ||||||
Cia. Sud Americana de Vapores SAa | 100,168,632 | 5,220,105 | ||||||
Colbun SA | 52,523,287 | 12,652,760 | ||||||
Empresa Nacional de Telecomunicaciones SA | 935,457 | 9,774,040 | ||||||
Empresas CMPC SA | 7,607,011 | 19,855,165 | ||||||
Empresas COPEC SA | 2,860,125 | 36,510,694 | ||||||
Enel Americas SA | 185,275,060 | 39,968,398 | ||||||
Enel Chile SA | 127,434,864 | 15,003,669 | ||||||
Enel Generacion Chile SA | 21,280,659 | 18,039,324 | ||||||
Engie Energia Chile SA | 3,310,842 | 6,962,652 | ||||||
Inversiones Aguas Metropolitanas SA | 3,161,392 | 5,606,033 | ||||||
Inversiones La Construccion SA | 373,579 | 5,378,149 | ||||||
Itau CorpBanca | 919,092,151 | 8,782,300 | ||||||
LATAM Airlines Group SA | 1,877,563 | 23,541,839 | ||||||
Parque Arauco SA | 4,163,721 | 11,341,508 | ||||||
SACI Falabella | 4,475,487 | 44,996,292 | ||||||
SalfaCorp SA | 4,738,650 | 7,170,937 | ||||||
SONDA SA | 3,303,282 | 6,107,844 | ||||||
Vina Concha y Toro SA | 3,005,474 | 5,096,642 | ||||||
|
| |||||||
| 417,396,885 | ||||||||
CHINA — 27.94% |
| |||||||
21Vianet Group Inc. ADRa,b | 584,132 | 3,031,645 | ||||||
361 Degrees International Ltd. | 7,581,000 | 3,264,311 | ||||||
3SBio Inc.a,b,c | 6,927,500 | 9,524,101 | ||||||
51job Inc. ADRa,b | 214,921 | 12,766,307 | ||||||
58.com Inc. ADRa,b | 582,541 | 36,484,543 | ||||||
AAC Technologies Holdings Inc.b | 4,695,500 | 85,613,254 | ||||||
Agile Group Holdings Ltd. | 11,666,500 | 13,982,300 | ||||||
Agricultural Bank of China Ltd. Class H | 162,332,000 | 76,328,573 | ||||||
AGTech Holdings Ltd.a,b | 21,804,000 | 4,457,500 | ||||||
Air China Ltd. Class H | 11,162,000 | 9,926,278 | ||||||
Ajisen (China) Holdings Ltd. | 7,670,000 | 3,234,033 | ||||||
| Security | Shares | Value | ||||||
Alibaba Group Holding Ltd. ADRa,b | 7,202,913 | $ | 1,237,028,279 | |||||
Alibaba Health Information Technology Ltd.a,b | 22,316,000 | 10,407,452 | ||||||
Alibaba Pictures Group Ltd.a,b | 90,650,000 | 15,868,050 | ||||||
Aluminum Corp. of China Ltd. Class Ha,b | 26,928,000 | 19,921,308 | ||||||
Anhui Conch Cement Co. Ltd. Class H | 7,888,500 | 29,431,505 | ||||||
Anhui Expressway Co. Ltd. Class H | 3,378,000 | 2,555,151 | ||||||
ANTA Sports Products Ltd. | 6,997,000 | 27,535,805 | ||||||
APT Satellite Holdings Ltd. | 5,529,500 | 2,755,406 | ||||||
Asia Cement China Holdings Corp. | 5,205,000 | 1,729,136 | ||||||
Autohome Inc. ADRa,b | 353,934 | 22,747,338 | ||||||
AVIC International Holding HK Ltd.a | 52,016,000 | 2,492,318 | ||||||
AviChina Industry & Technology Co. Ltd. Class Hb | 14,015,000 | 8,291,045 | ||||||
Baidu Inc. ADRa | 1,728,518 | 394,188,530 | ||||||
Bank of China Ltd. Class H | 498,077,000 | 262,197,706 | ||||||
Bank of Communications Co. Ltd. Class H | 53,735,000 | 41,057,606 | ||||||
Baozun Inc. ADRa,b | 200,530 | 5,452,411 | ||||||
Beijing Capital International Airport Co. Ltd. Class H | 10,298,000 | 16,657,959 | ||||||
Beijing Capital Land Ltd. Class Hb | 7,896,000 | 3,995,191 | ||||||
Beijing Enterprises Holdings Ltd.b | 3,246,500 | 18,127,254 | ||||||
Beijing Enterprises Medical & Health Group Ltd.a | 57,024,000 | 3,643,031 | ||||||
Beijing Enterprises Water Group Ltd. | 30,872,000 | 26,231,408 | ||||||
Beijing Tong Ren Tang Chinese Medicine Co. Ltd. | 3,306,000 | 4,359,310 | ||||||
BEP International Holdings Ltd. | 39,880,000 | 963,057 | ||||||
Bitauto Holdings Ltd. ADRa | 178,517 | 6,390,909 | ||||||
Bosideng International Holdings Ltd. | 37,258,000 | 3,189,551 | ||||||
Brilliance China Automotive Holdings Ltd. | 19,620,000 | 50,764,395 | ||||||
Byd Co. Ltd. Class Hb | 3,994,500 | 23,783,925 | ||||||
BYD Electronic International Co. Ltd.b | 5,051,500 | 13,941,493 | ||||||
| 16 | 2017 iSHARES ANNUAL REPORTTO SHAREHOLDERS |
Table of Contents
Consolidated Schedule of Investments (Continued)
iSHARES® CORE MSCI EMERGING MARKETS ETF
August 31, 2017
| Security | Shares | Value | ||||||
C C Land Holdings Ltd.a,b | 18,961,500 | $ | 4,167,123 | |||||
Carnival Group International Holdings Ltd.a,b | 48,947,000 | 4,002,591 | ||||||
CGN Power Co. Ltd. Class Hc | 63,644,000 | 17,564,929 | ||||||
Chaowei Power Holdings Ltd. | 7,167,000 | 3,708,750 | ||||||
Cheetah Mobile Inc. ADRa,b | 213,017 | 1,942,715 | ||||||
China Aerospace International Holdings Ltd.b | 31,586,000 | 3,955,086 | ||||||
China Agri-Industries Holdings Ltd. | 15,835,200 | 7,405,252 | ||||||
China Aircraft Leasing Group Holdings Ltd.b | 3,086,500 | 3,324,521 | ||||||
China Animal Healthcare Ltd.a,b,d | 1,237,000 | 44,255 | ||||||
China Aoyuan Property Group Ltd.b | 16,722,000 | 7,072,149 | ||||||
China BlueChemical Ltd. Class H | 14,036,000 | 4,322,108 | ||||||
China Cinda Asset Management Co. Ltd. Class H | 54,710,000 | 20,342,058 | ||||||
China CITIC Bank Corp. Ltd. Class H | 52,387,000 | 34,605,829 | ||||||
China Coal Energy Co. Ltd. Class H | 13,333,000 | 6,712,113 | ||||||
China Communications Construction Co. Ltd. Class H | 28,007,000 | 37,288,035 | ||||||
China Communications Services Corp. Ltd. Class H | 17,088,000 | 9,257,469 | ||||||
China Conch Venture Holdings Ltd.b | 10,529,000 | 19,157,212 | ||||||
China Construction Bank Corp. Class H | 532,020,000 | 466,323,454 | ||||||
China Datang Corp. Renewable Power Co. Ltd. Class H | 24,583,000 | 2,732,683 | ||||||
China Dongxiang Group Co. Ltd.b | 28,788,000 | 5,149,614 | ||||||
China Electronics Corp. Holdings Co. Ltd.b | 9,990,000 | 1,416,849 | ||||||
China Everbright Bank Co. Ltd. Class H | 16,612,000 | 7,980,773 | ||||||
China Everbright International Ltd.b | 16,036,000 | 21,186,137 | ||||||
China Everbright Ltd. | 5,948,000 | 13,588,567 | ||||||
China Everbright Water Ltd.b | 7,760,300 | 2,685,818 | ||||||
China Evergrande Groupa,b | 23,177,000 | 70,036,357 | ||||||
| Security | Shares | Value | ||||||
China Fiber Optic Network System Group Ltd.a,d | 10,394,800 | $ | 743,771 | |||||
China First Capital Group Ltd.a | 10,698,000 | 4,278,407 | ||||||
China Foods Ltd. | 8,498,000 | 4,516,950 | ||||||
China Galaxy Securities Co. Ltd. Class H | 20,080,000 | 18,190,521 | ||||||
China Gas Holdings Ltd. | 11,762,000 | 29,696,366 | ||||||
China Huarong Asset Management Co. Ltd. Class Hc | 43,392,000 | 18,517,882 | ||||||
China Huishan Dairy Holdings Co. Ltd.b,d | 24,768,000 | 32 | ||||||
China Huiyuan Juice Group Ltd.a,b | 8,340,500 | 2,578,948 | ||||||
China Innovationpay Group Ltd.a,b | 45,128,000 | 2,306,435 | ||||||
China Jinmao Holdings Group Ltd. | 26,134,000 | 11,620,380 | ||||||
China Lesso Group Holdings Ltd. | 8,776,000 | 6,301,851 | ||||||
China Life Insurance Co. Ltd. Class H | 46,993,000 | 150,710,003 | ||||||
China Lilang Ltd. | 5,398,000 | 4,241,732 | ||||||
China Logistics Property Holdings Co. Ltd.a,b | 5,772,000 | 1,969,123 | ||||||
China Longyuan Power Group Corp. Ltd. Class H | 20,160,000 | 15,094,660 | ||||||
China Lumena New Materials Corp.a,b,d | 2,584,000 | 3 | ||||||
China Maple Leaf Educational Systems Ltd.b | 4,844,000 | 4,109,674 | ||||||
China Medical System Holdings Ltd.b | 8,804,000 | 16,198,609 | ||||||
China Mengniu Dairy Co. Ltd. | 17,382,000 | 40,598,606 | ||||||
China Merchants Bank Co. Ltd. Class H | 24,382,964 | 91,905,965 | ||||||
China Merchants Land Ltd.b | 16,818,000 | 3,373,721 | ||||||
China Merchants Port Holdings Co. Ltd. | 8,268,000 | 27,044,292 | ||||||
China Metal Recycling Holdings Ltd.a,d | 62,400 | — | ||||||
China Minsheng Banking Corp. Ltd. Class H | 33,936,100 | 33,864,771 | ||||||
China Mobile Ltd. | 38,770,500 | 411,163,618 | ||||||
China National Building Material Co. Ltd. Class H | 18,204,000 | 11,443,717 | ||||||
CONSOLIDATED SCHEDULESOF INVESTMENTS | 17 |
Table of Contents
Consolidated Schedule of Investments (Continued)
iSHARES® CORE MSCI EMERGING MARKETS ETF
August 31, 2017
| Security | Shares | Value | ||||||
China National Materials Co. Ltd. Class H | 9,424,000 | $ | 4,118,097 | |||||
China Ocean Industry Group Ltd.a,b | 128,580,000 | 1,051,450 | ||||||
China Oil and Gas Group Ltd.b | 50,068,000 | 3,518,505 | ||||||
China Oilfield Services Ltd. Class H | 11,946,000 | 9,799,247 | ||||||
China Overseas Grand Oceans Group Ltd. | 8,601,000 | 4,681,594 | ||||||
China Overseas Land & Investment Ltd. | 24,060,000 | 84,079,116 | ||||||
China Pacific Insurance Group Co. Ltd. Class H | 16,352,600 | 76,994,462 | ||||||
China Petroleum & Chemical Corp. Class H | 160,120,200 | 122,548,537 | ||||||
China Power Clean Energy Development Co. Ltd.b | 4,036,500 | 2,253,832 | ||||||
China Power International Development Ltd. | 19,934,000 | 6,800,501 | ||||||
China Railway Construction Corp. Ltd. Class H | 12,360,500 | 16,203,864 | ||||||
China Railway Group Ltd. Class H | 24,928,000 | 19,938,705 | ||||||
China Regenerative Medicine International Ltd.a,b | 101,810,000 | 2,575,674 | ||||||
China Resources Beer Holdings Co. Ltd. | 10,660,000 | 26,750,621 | ||||||
China Resources Gas Group Ltd.b | 5,860,000 | 20,665,308 | ||||||
China Resources Land Ltd. | 17,453,777 | 54,525,979 | ||||||
China Resources Phoenix Healthcare Holdings Co. Ltd.b | 4,180,000 | 5,282,114 | ||||||
China Resources Power Holdings Co. Ltd. | 12,010,000 | 22,035,993 | ||||||
China SCE Property Holdings Ltd. | 13,441,200 | 6,869,628 | ||||||
China Shenhua Energy Co. Ltd. Class H | 21,417,500 | 55,141,555 | ||||||
China Shineway Pharmaceutical Group Ltd. | 4,285,000 | 3,909,167 | ||||||
China Singyes Solar Technologies Holdings Ltd.b | 6,901,000 | 2,230,836 | ||||||
China South City Holdings Ltd.b | 20,982,000 | 4,316,263 | ||||||
China Southern Airlines Co. Ltd. Class H | 11,684,000 | 9,121,535 | ||||||
| Security | Shares | Value | ||||||
China State Construction International Holdings Ltd. | 11,728,000 | $ | 16,993,084 | |||||
China Suntien Green Energy Corp. Ltd. Class H | 16,423,000 | 3,567,275 | ||||||
China Taiping Insurance Holdings Co. Ltd. | 10,470,108 | 31,772,396 | ||||||
China Telecom Corp. Ltd. Class H | 84,264,000 | 43,281,600 | ||||||
China Traditional Chinese Medicine Holdings Co. Ltd.b | 14,032,000 | 8,498,320 | ||||||
China Travel International Investment Hong Kong Ltd.b | 17,870,000 | 5,594,043 | ||||||
China Unicom Hong Kong Ltd.a | 37,966,000 | 55,301,241 | ||||||
China Vanke Co. Ltd. Class H | 7,749,887 | 23,220,598 | ||||||
China Water Affairs Group Ltd. | 8,064,000 | 4,657,192 | ||||||
China ZhengTong Auto Services Holdings Ltd. | 6,600,000 | 6,240,377 | ||||||
Chinasoft International Ltd. | 14,954,000 | 7,948,513 | ||||||
Chong Sing Holdings FinTech Group Ltd.a,b | 103,676,000 | 14,041,687 | ||||||
Chongqing Changan Automobile Co. Ltd. Class B | 5,270,567 | 6,895,924 | ||||||
Chongqing Rural Commercial Bank Co. Ltd. Class H | 17,159,000 | 11,948,783 | ||||||
CIFI Holdings Group Co. Ltd. | 22,198,000 | 12,479,630 | ||||||
CIMC Enric Holdings Ltd.a,b | 6,108,000 | 3,652,415 | ||||||
CITIC Ltd. | 35,798,000 | 54,979,200 | ||||||
CITIC Resources Holdings Ltd.b | 24,362,000 | 2,801,500 | ||||||
CITIC Securities Co. Ltd. Class H | 13,720,000 | 30,432,597 | ||||||
CNOOC Ltd. | 112,930,000 | 135,058,015 | ||||||
Colour Life Services Group Co. Ltd.b | 4,751,000 | 3,126,277 | ||||||
Comba Telecom Systems Holdings Ltd.b | 19,103,524 | 2,880,253 | ||||||
Concord New Energy Group Ltd. | 75,950,000 | 3,202,410 | ||||||
Coolpad Group Ltd.a,b,d | 25,508,000 | 2,118,483 | ||||||
COSCO SHIPPING International Hong Kong Co. Ltd. | 7,772,000 | 3,286,972 | ||||||
COSCO SHIPPING Ports Ltd. | 11,056,000 | 13,066,972 | ||||||
Country Garden Holdings Co. Ltd.b | 36,427,733 | 48,406,164 | ||||||
CPMC Holdings Ltd. | 4,779,000 | 2,949,303 | ||||||
| 18 | 2017 iSHARES ANNUAL REPORTTO SHAREHOLDERS |
Table of Contents
Consolidated Schedule of Investments (Continued)
iSHARES® CORE MSCI EMERGING MARKETS ETF
August 31, 2017
| Security | Shares | Value | ||||||
CRRC Corp. Ltd. Class H | 24,553,750 | $ | 22,149,183 | |||||
CSPC Pharmaceutical Group Ltd. | 27,614,000 | 43,115,727 | ||||||
CT Environmental Group Ltd.b | 21,304,000 | 3,021,477 | ||||||
Ctrip.com International Ltd. ADRa,b | 2,487,743 | 127,994,377 | ||||||
Dah Chong Hong Holdings Ltd.b | 8,388,000 | 4,169,109 | ||||||
Dawnrays Pharmaceutical Holdings Ltd. | 5,416,000 | 3,224,778 | ||||||
Dazhong Transportation Group Co. Ltd. Class B | 5,846,950 | 3,999,314 | ||||||
Digital China Holdings Ltd.a,b | 6,846,000 | 4,128,707 | ||||||
Dongfeng Motor Group Co. Ltd. Class H | 16,922,000 | 21,967,497 | ||||||
Dongjiang Environmental Co. Ltd. Class H | 2,007,700 | 2,770,497 | ||||||
Eastern Communications Co. Ltd. Class B | 2,927,600 | 1,885,374 | ||||||
ENN Energy Holdings Ltd. | 4,991,000 | 32,108,664 | ||||||
Fang Holdings Ltd. ADRa,b | 1,783,283 | 6,598,147 | ||||||
Fantasia Holdings Group Co. Ltd. | 26,704,500 | 3,616,808 | ||||||
Far East Horizon Ltd.b | 14,143,000 | 12,920,603 | ||||||
FDG Electric Vehicles Ltd.a,b | 118,820,000 | 4,630,465 | ||||||
First Tractor Co. Ltd. Class H | 5,930,000 | 2,765,558 | ||||||
Fosun International Ltd.b | 16,049,000 | 27,847,290 | ||||||
Fu Shou Yuan International Group Ltd. | 8,270,000 | 5,536,968 | ||||||
Fufeng Group Ltd.b | 12,025,400 | 7,636,443 | ||||||
Fullshare Holdings Ltd.b | 41,985,000 | 16,737,244 | ||||||
Fuyao Glass Industry Group Co. Ltd. Class Hc | 3,389,600 | 10,805,732 | ||||||
GCL-Poly Energy Holdings Ltd.a,b | 86,069,000 | 9,677,532 | ||||||
Geely Automobile Holdings Ltd. | 32,286,000 | 79,369,655 | ||||||
GF Securities Co. Ltd. Class H | 8,071,600 | 17,223,099 | ||||||
Glorious Property Holdings Ltd.a,b | 22,864,000 | 2,541,597 | ||||||
Golden Eagle Retail Group Ltd.b | 4,913,000 | 6,277,431 | ||||||
GOME Electrical Appliances Holding Ltd.b | 78,884,000 | 8,264,907 | ||||||
Great Wall Motor Co. Ltd. Class Hb | 19,610,500 | 24,605,678 | ||||||
Greatview Aseptic Packaging Co. Ltd.b | 10,745,000 | 6,589,961 | ||||||
| Security | Shares | Value | ||||||
Greentown China Holdings Ltd.b | 5,120,500 | $ | 6,215,430 | |||||
Guangdong Investment Ltd. | 18,266,000 | 26,979,660 | ||||||
Guangdong Land Holdings Ltd.a | 8,154,000 | 1,802,403 | ||||||
Guangzhou Automobile Group Co. Ltd. Class H | 13,748,000 | 27,122,018 | ||||||
Guangzhou R&F Properties Co. Ltd. Class H | 6,432,000 | 15,023,026 | ||||||
Haier Electronics Group Co. Ltd. | 8,104,000 | 21,537,632 | ||||||
Haitian International Holdings Ltd. | 4,642,000 | 13,938,248 | ||||||
Haitong Securities Co. Ltd. Class H | 19,562,000 | 32,793,085 | ||||||
Hanergy Thin Film Power Group Ltd.a,d | 8,046 | — | ||||||
Hangzhou Steam Turbine Co. Ltd. Class Ba | 2,494,100 | 2,616,328 | ||||||
Harbin Electric Co. Ltd. Class H | 6,262,000 | 3,200,429 | ||||||
HC International Inc.b | 3,802,000 | 3,453,957 | ||||||
Health and Happiness H&H International Holdings Ltd.a,b | 1,420,722 | 5,082,792 | ||||||
Hengan International Group Co. Ltd. | 4,615,500 | 38,568,406 | ||||||
Hengdeli Holdings Ltd. | 8,670,800 | 498,548 | ||||||
Hi Sun Technology (China) Ltd.a | 21,105,000 | 4,880,891 | ||||||
Hisense Kelon Electrical Holdings Co. Ltd. Class H | 2,856,000 | 3,386,424 | ||||||
Hopson Development Holdings Ltd.b | 5,090,000 | 4,812,655 | ||||||
Hua Han Health Industry Holdings Ltd. Class Ha,b,d | 22,424,288 | 1,203,381 | ||||||
Hua Hong Semiconductor Ltd.c | 3,157,000 | 4,195,108 | ||||||
Huabao International Holdings Ltd. | 7,983,000 | 4,875,613 | ||||||
Huadian Fuxin Energy Corp. Ltd. Class H | 17,192,000 | 3,800,211 | ||||||
Huaneng Power International Inc. Class H | 25,420,000 | 16,629,557 | ||||||
Huaneng Renewables Corp. Ltd. Class H | 31,346,000 | 9,612,327 | ||||||
Huangshi Dongbei Electrical Appliance Co. Ltd. Class B | 1,408,400 | 2,284,425 | ||||||
Huatai Securities Co. Ltd. Class Hc | 10,084,600 | 22,446,158 | ||||||
IGG Inc.b | 6,232,000 | 9,762,321 | ||||||
CONSOLIDATED SCHEDULESOF INVESTMENTS | 19 |
Table of Contents
Consolidated Schedule of Investments (Continued)
iSHARES® CORE MSCI EMERGING MARKETS ETF
August 31, 2017
| Security | Shares | Value | ||||||
iKang Healthcare Group Inc. ADRa,b | 394,827 | $ | 5,736,836 | |||||
IMAX China Holding Inc.a,b,c | 587,300 | 1,353,729 | ||||||
Industrial & Commercial Bank of China Ltd. Class H | 464,338,000 | 347,669,848 | ||||||
Inner Mongolia Yitai Coal Co. Ltd. Class B | 7,913,316 | 10,303,137 | ||||||
JA Solar Holdings Co. Ltd. ADRa,b | 442,225 | 2,954,063 | ||||||
JD.com Inc. ADRa,b | 4,193,192 | 175,736,677 | ||||||
Jiangsu Expressway Co. Ltd. Class H | 8,606,000 | 13,195,255 | ||||||
Jiangxi Copper Co. Ltd. Class H | 8,527,000 | 14,795,554 | ||||||
JinkoSolar Holding Co. Ltd.a,b | 184,379 | 5,131,268 | ||||||
Ju Teng International Holdings Ltd.b | 8,322,000 | 3,296,284 | ||||||
Jumei International Holding Ltd. ADRa,b | 895,679 | 3,036,352 | ||||||
K Wah International Holdings Ltd. | 10,322,000 | 5,974,441 | ||||||
Kaisa Group Holdings Ltd.a,b | 14,354,000 | 6,730,916 | ||||||
Kama Co. Ltd.a | 2,457,500 | 2,533,682 | ||||||
Kingboard Chemical Holdings Ltd. | 4,610,700 | 25,155,325 | ||||||
Kingboard Laminates Holdings Ltd. | 6,684,000 | 11,341,479 | ||||||
Kingdee International Software Group Co. Ltd.a,b | 14,646,000 | 6,231,584 | ||||||
Kingsoft Corp. Ltd.b | 5,038,000 | 11,947,343 | ||||||
Konka Group Co. Ltd. Class Ba | 5,707,900 | 2,297,323 | ||||||
KuangChi Science Ltd.a,b | 12,440,000 | 4,212,127 | ||||||
Kunlun Energy Co. Ltd. | 21,284,000 | 20,613,780 | ||||||
KWG Property Holding Ltd. | 8,899,500 | 8,096,192 | ||||||
Lao Feng Xiang Co. Ltd. Class B | 1,486,417 | 5,734,597 | ||||||
Launch Tech Co. Ltd. | 1,807,500 | 2,120,099 | ||||||
Lee & Man Paper Manufacturing Ltd. | 10,918,000 | 12,736,469 | ||||||
Lenovo Group Ltd.b | 44,636,000 | 24,409,800 | ||||||
Leyou Technologies Holdings Ltd.a,b | 19,415,000 | 4,266,788 | ||||||
Li Ning Co. Ltd.a | 11,847,500 | 8,779,907 | ||||||
Lianhua Supermarket Holdings Co. Ltd. Class Ha | 4,724,000 | 1,768,531 | ||||||
Lifetech Scientific Corp.a,b | 17,600,000 | 3,890,397 | ||||||
| Security | Shares | Value | ||||||
Livzon Pharmaceutical Group Inc. Class H | 941,051 | $ | 5,122,217 | |||||
Longfor Properties Co. Ltd. | 9,972,500 | 23,955,050 | ||||||
Lonking Holdings Ltd. | 17,146,000 | 6,813,314 | ||||||
Luthai Textile Co. Ltd. Class B | 2,503,592 | 2,805,423 | ||||||
Luye Pharma Group Ltd.b | 9,466,500 | 4,789,827 | ||||||
MIE Holdings Corp.a | 15,864,000 | 1,418,881 | ||||||
Minth Group Ltd. | 4,600,000 | 21,188,406 | ||||||
MMG Ltd.a,b | 15,683,999 | 7,655,179 | ||||||
Momo Inc. ADRa | 690,694 | 26,612,440 | ||||||
NetDragon Websoft Holdings Ltd.b | 1,431,500 | 5,267,676 | ||||||
NetEase Inc. ADR | 506,103 | 139,603,451 | ||||||
New China Life Insurance Co. Ltd. Class H | 5,034,700 | 32,228,976 | ||||||
New Oriental Education & Technology Group Inc. ADR | 862,548 | 70,513,299 | ||||||
Nexteer Automotive Group Ltd. | 6,093,000 | 10,120,680 | ||||||
Nine Dragons Paper (Holdings) Ltd. | 10,956,000 | 18,282,281 | ||||||
Noah Holdings Ltd. ADRa,b | 223,943 | 6,559,290 | ||||||
North Mining Shares Co. Ltd.a,b | 118,200,000 | 2,084,163 | ||||||
NQ Mobile Inc. ADRa,b | 816,304 | 2,718,292 | ||||||
Panda Green Energy Group Ltd.a,b | 34,420,852 | 4,485,976 | ||||||
Parkson Retail Group Ltd.b | 20,881,500 | 3,175,001 | ||||||
PAX Global Technology Ltd.b | 6,833,000 | 3,780,372 | ||||||
People’s Insurance Co. Group of China Ltd. (The) Class H | 41,504,000 | 19,568,228 | ||||||
PetroChina Co. Ltd. Class H | 131,744,000 | 84,165,873 | ||||||
Phoenix Satellite Television Holdings Ltd.b | 21,670,000 | 3,156,450 | ||||||
PICC Property & Casualty Co. Ltd. Class H | 28,633,360 | 53,780,500 | ||||||
Ping An Insurance Group Co. of China Ltd. Class H | 32,882,500 | 261,120,607 | ||||||
Poly Property Group Co. Ltd.a | 14,415,000 | 7,551,508 | ||||||
Pou Sheng International Holdings Ltd.b | 18,064,000 | 3,346,703 | ||||||
Renhe Commercial Holdings Co. Ltd.a,b | 130,594,000 | 3,036,895 | ||||||
Renren Inc. ADRa | 240,864 | 1,816,115 | ||||||
Road King Infrastructure Ltd. | 3,856,000 | 5,123,958 | ||||||
Sany Heavy Equipment International Holdings Co. Ltd.a,b | 14,889,000 | 2,587,257 | ||||||
| 20 | 2017 iSHARES ANNUAL REPORTTO SHAREHOLDERS |
Table of Contents
Consolidated Schedule of Investments (Continued)
iSHARES® CORE MSCI EMERGING MARKETS ETF
August 31, 2017
| Security | Shares | Value | ||||||
Semiconductor Manufacturing International Corp.a,b | 18,346,200 | $ | 17,252,782 | |||||
Shandong Airlines Co. Ltd. Class B | 1,489,192 | 2,540,196 | ||||||
Shandong Chenming Paper Holdings Ltd. Class H | 3,226,000 | 4,707,233 | ||||||
Shandong Weigao Group Medical Polymer Co. Ltd. Class H | 12,228,000 | 9,764,964 | ||||||
Shang Gong Group Co. Ltd. Class Ba | 3,244,600 | 3,299,758 | ||||||
Shanghai Baosight Software Co. Ltd. Class B | 2,030,100 | 2,959,886 | ||||||
Shanghai Chlor-Alkali Chemical Co. Ltd. Class Ba | 3,988,000 | 3,006,952 | ||||||
Shanghai Electric Group Co. Ltd. Class Ha,b | 17,632,000 | 7,997,700 | ||||||
Shanghai Fosun Pharmaceutical Group Co. Ltd. Class H | 3,199,500 | 12,018,897 | ||||||
Shanghai Greencourt Investment Group Co. Ltd. Class Ba | 4,622,500 | 2,620,957 | ||||||
Shanghai Haixin Group Co. Class B | 3,900,000 | 2,667,600 | ||||||
Shanghai Industrial Holdings Ltd. | 3,252,000 | 9,889,235 | ||||||
Shanghai Industrial Urban Development Group Ltd.b | 17,126,000 | 3,741,857 | ||||||
Shanghai Jin Jiang International Hotels Group Co. Ltd. Class H | 10,590,000 | 3,017,422 | ||||||
Shanghai Jinjiang International Industrial Investment Co. Ltd. Class B | 1,537,900 | 2,105,385 | ||||||
Shanghai Jinjiang International Travel Co. Ltd. Class B | 794,200 | 2,349,244 | ||||||
Shanghai Lingyun Industries Development Co. Ltd. Class Ba | 2,241,699 | 2,273,083 | ||||||
Shanghai Lujiazui Finance & Trade Zone Development Co. Ltd. Class B | 6,086,560 | 9,817,621 | ||||||
Shanghai Pharmaceuticals Holding Co. Ltd. Class H | 4,624,600 | 11,380,613 | ||||||
| Security | Shares | Value | ||||||
Shanghai Shibei Hi-Tech Co. Ltd. Class B | 4,131,800 | $ | 2,367,521 | |||||
Shenzhen Expressway Co. Ltd. Class H | 5,704,000 | 5,568,113 | ||||||
Shenzhen International Holdings Ltd. | 6,444,750 | 11,841,321 | ||||||
Shenzhen Investment Ltd. | 20,846,000 | 9,508,809 | ||||||
Shenzhou International Group Holdings Ltd. | 3,659,000 | 29,313,329 | ||||||
Shimao Property Holdings Ltd. | 7,751,500 | 16,005,244 | ||||||
Shougang Concord International Enterprises Co. Ltd.a | 91,202,000 | 3,379,384 | ||||||
Shougang Fushan Resources Group Ltd. | 19,972,000 | 4,516,791 | ||||||
Shui On Land Ltd. | 25,234,166 | 5,900,315 | ||||||
Sihuan Pharmaceutical Holdings Group Ltd. | 28,658,000 | 11,021,674 | ||||||
SINA Corp./Chinaa | 365,937 | 37,263,365 | ||||||
Sino Biopharmaceutical Ltd. | 28,892,000 | 25,361,184 | ||||||
Sino Oil And Gas Holdings Ltd.a,b | 100,265,000 | 2,049,767 | ||||||
Sino-Ocean Group Holding Ltd. | 20,171,000 | 13,917,344 | ||||||
Sinofert Holdings Ltd.a,b | 23,808,000 | 3,285,352 | ||||||
Sinolink Worldwide Holdings Ltd.a | 23,582,000 | 3,344,559 | ||||||
Sinopec Engineering Group Co. Ltd. Class H | 8,819,000 | 7,955,349 | ||||||
Sinopec Kantons Holdings Ltd.b | 8,254,000 | 5,114,950 | ||||||
Sinopec Shanghai Petrochemical Co. Ltd. Class H | 22,887,000 | 14,270,654 | ||||||
Sinopharm Group Co. Ltd. Class H | 7,454,800 | 33,671,355 | ||||||
Sinosoft Technology Group Ltd.b | 7,525,600 | 2,307,744 | ||||||
Sinotrans Ltd. Class H | 14,632,000 | 8,263,445 | ||||||
Sinotrans Shipping Ltd.b | 14,787,000 | 4,610,044 | ||||||
Skyworth Digital Holdings Ltd.b | 13,364,000 | 6,198,381 | ||||||
SMI Holdings Group Ltd.b | 10,379,999 | 5,159,197 | ||||||
SOHO China Ltd. | 15,210,000 | 8,861,949 | ||||||
Sohu.com Inc.a | 197,190 | 10,518,115 | ||||||
SSY Group Ltd. | 16,482,411 | 7,623,677 | ||||||
Sun Art Retail Group Ltd. | 16,343,500 | 15,056,205 | ||||||
Sunac China Holdings Ltd.b | 13,600,000 | 40,835,883 | ||||||
CONSOLIDATED SCHEDULESOF INVESTMENTS | 21 |
Table of Contents
Consolidated Schedule of Investments (Continued)
iSHARES® CORE MSCI EMERGING MARKETS ETF
August 31, 2017
| Security | Shares | Value | ||||||
Sunny Optical Technology Group Co. Ltd. | 4,574,000 | $ | 65,572,871 | |||||
Superb Summit International Group Ltd.a,b,d | 6,035,000 | 46,266 | ||||||
TAL Education Group Class A ADR | 1,800,696 | 54,795,179 | ||||||
Tarena International Inc. ADR | 293,187 | 4,139,800 | ||||||
TCL Multimedia Technology Holdings Ltd.a,b | 5,470,000 | 2,627,909 | ||||||
Technovator International Ltd.a,b | 8,710,000 | 2,637,556 | ||||||
Tencent Holdings Ltd. | 36,022,100 | 1,514,258,815 | ||||||
Tian Ge Interactive Holdings Ltd.b,c | 3,986,000 | 2,750,212 | ||||||
Tianjin Capital Environmental Protection Group Co. Ltd. Class H | 4,140,000 | 2,623,718 | ||||||
Tianjin Development Holdings Ltd. | 6,932,000 | 3,728,858 | ||||||
Tianjin Port Development Holdings Ltd. | 25,354,000 | 4,178,990 | ||||||
Tianneng Power International Ltd.b | 5,436,000 | 4,653,604 | ||||||
Tibet Water Resources Ltd.a,b | 15,172,000 | 5,951,362 | ||||||
Tingyi Cayman Islands Holding Corp.b | 13,052,000 | 17,377,207 | ||||||
Tong Ren Tang Technologies Co. Ltd. Class Hb | 4,235,000 | 5,952,252 | ||||||
Tongda Group Holdings Ltd.b | 21,230,000 | 5,886,334 | ||||||
Towngas China Co. Ltd.b | 8,164,000 | 5,528,586 | ||||||
TravelSky Technology Ltd. Class H | 6,048,000 | 16,537,153 | ||||||
Tsingtao Brewery Co. Ltd. Class H | 2,426,000 | 10,058,673 | ||||||
Tuniu Corp. ADRa,b | 288,511 | 2,163,832 | ||||||
Vinda International Holdings Ltd. | 1,988,000 | 3,530,745 | ||||||
Vipshop Holdings Ltd. ADRa | 2,646,033 | 24,634,567 | ||||||
Viva China Holdings Ltd.a | 23,312,000 | 2,025,460 | ||||||
Want Want China Holdings Ltd.b | 32,073,000 | 21,227,778 | ||||||
Wasion Group Holdings Ltd.b | 4,284,000 | 1,828,231 | ||||||
Weibo Corp. ADRa,b | 299,134 | 30,242,447 | ||||||
Weichai Power Co. Ltd. Class H | 13,148,000 | 13,540,351 | ||||||
Weiqiao Textile Co. Class Ha | 2,907,500 | 1,545,426 | ||||||
Welling Holding Ltd. | 15,424,000 | 2,798,469 | ||||||
West China Cement Ltd.a | 20,980,000 | 3,029,138 | ||||||
| Security | Shares | Value | ||||||
Wisdom Sports Groupa,b | 9,365,000 | $ | 1,232,481 | |||||
Xiamen International Port Co. Ltd. Class H | 15,386,000 | 3,204,413 | ||||||
Xingda International Holdings Ltd. | 9,222,000 | 3,534,936 | ||||||
Xinhua Winshare Publishing and Media Co. Ltd. Class H | 3,243,000 | 2,660,218 | ||||||
Xinyi Solar Holdings Ltd.b | 21,400,800 | 7,273,557 | ||||||
XTEP International Holdings Ltd.b | 8,182,000 | 2,906,293 | ||||||
Yanchang Petroleum International Ltd.a | 16,860,000 | 320,981 | ||||||
Yanzhou Coal Mining Co. Ltd. Class H | 11,998,000 | 12,049,432 | ||||||
YuanShengTai Dairy Farm Ltd.a | 41,696,000 | 1,917,927 | ||||||
Yuexiu Property Co. Ltd. | 48,022,880 | 8,835,800 | ||||||
Yuexiu REITb | 9,874,000 | 6,497,339 | ||||||
Yuexiu Transport Infrastructure Ltd.b | 7,478,000 | 5,732,867 | ||||||
Yum China Holdings Inc.a | 2,480,656 | 87,715,996 | ||||||
Yuzhou Properties Co. Ltd. | 13,510,400 | 8,683,031 | ||||||
YY Inc. ADRa | 216,100 | 16,146,992 | ||||||
Zhaojin Mining Industry Co. Ltd. Class Hb | 7,404,500 | 6,433,389 | ||||||
Zhejiang Expressway Co. Ltd. Class H | 9,474,000 | 11,850,898 | ||||||
Zhongsheng Group Holdings Ltd.b | 4,336,500 | 9,419,405 | ||||||
Zhuzhou CRRC Times Electric Co. Ltd. Class H | 3,461,700 | 18,112,505 | ||||||
Zijin Mining Group Co. Ltd. Class H | 35,888,000 | 13,160,317 | ||||||
ZTE Corp. Class Ha | 4,686,640 | 12,784,821 | ||||||
|
| |||||||
| 10,276,808,383 | ||||||||
COLOMBIA — 0.28% |
| |||||||
Almacenes Exito SA | 1,112,926 | 5,805,003 | ||||||
Bancolombia SA | 1,158,730 | 12,984,975 | ||||||
Cementos Argos SA | 2,963,421 | 12,035,648 | ||||||
Corp. Financiera Colombiana SA | 816,139 | 7,976,270 | ||||||
Ecopetrol SA | 31,505,862 | 14,657,397 | ||||||
Grupo Argos SA/Colombia | 1,771,820 | 12,623,216 | ||||||
Grupo de Inversiones Suramericana SA | 1,678,006 | 23,647,571 | ||||||
| 22 | 2017 iSHARES ANNUAL REPORTTO SHAREHOLDERS |
Table of Contents
Consolidated Schedule of Investments (Continued)
iSHARES® CORE MSCI EMERGING MARKETS ETF
August 31, 2017
| Security | Shares | Value | ||||||
Interconexion Electrica SA ESP | 2,553,765 | $ | 11,585,968 | |||||
|
| |||||||
| 101,316,048 | ||||||||
CZECH REPUBLIC — 0.18% |
| |||||||
CEZ AS | 1,017,143 | 19,260,740 | ||||||
Komercni Banka AS | 516,097 | 22,705,487 | ||||||
Moneta Money Bank ASc | 3,681,159 | 12,885,715 | ||||||
Pegas Nonwovens SA | 110,643 | 5,066,634 | ||||||
Philip Morris CR AS | 7,565 | 5,356,788 | ||||||
|
| |||||||
| 65,275,364 | ||||||||
EGYPT — 0.14% |
| |||||||
Commercial International Bank Egypt SAE | 5,737,162 | 27,370,096 | ||||||
Egyptian Financial Group-Hermes Holding Co. | 4,853,282 | 5,685,980 | ||||||
Ezz Steela | 1,889,873 | 1,796,771 | ||||||
Global Telecom Holding SAEa | 26,829,111 | 10,695,184 | ||||||
Heliopolis Housing | 656,450 | 920,368 | ||||||
Medinet Nasr Housing | 1,742,250 | 962,874 | ||||||
Oriental Weavers | 336,397 | 348,207 | ||||||
Six of October Development & Investmenta | 1,723,988 | 1,337,409 | ||||||
Telecom Egypt Co. | 1,362,589 | 985,292 | ||||||
|
| |||||||
| 50,102,181 | ||||||||
GREECE — 0.42% |
| |||||||
Alpha Bank AEa,b | 8,825,394 | 22,349,039 | ||||||
Athens Water Supply & Sewage Co. SA | 247,025 | 1,776,812 | ||||||
Eurobank Ergasias SAa,b | 11,928,467 | 12,862,846 | ||||||
FF Groupa,b | 241,124 | 5,991,449 | ||||||
Hellenic Exchanges-Athens Stock Exchange SA | 627,642 | 3,813,099 | ||||||
Hellenic Telecommunications Organization SA | 1,616,240 | 20,560,552 | ||||||
HOLDING Co. ADMIE IPTO SAa | 846,965 | 2,094,469 | ||||||
JUMBO SA | 728,321 | 12,122,606 | ||||||
Motor Oil Hellas Corinth Refineries SA | 465,419 | 10,458,058 | ||||||
Mytilineos Holdings SAa | 880,608 | 8,993,338 | ||||||
National Bank of Greece SAa,b | 34,574,712 | 14,017,097 | ||||||
OPAP SA | 1,532,601 | 17,109,599 | ||||||
Piraeus Bank SAa | 1,755,806 | 9,832,016 | ||||||
Piraeus Port Authority SA | 44,848 | 832,322 | ||||||
Public Power Corp. SAa | 965,319 | 2,582,251 | ||||||
| Security | Shares | Value | ||||||
Titan Cement Co. SA | 308,601 | $ | 8,750,459 | |||||
|
| |||||||
| 154,146,012 | ||||||||
HUNGARY — 0.31% |
| |||||||
Magyar Telekom Telecommunications PLC | 2,478,790 | 4,706,612 | ||||||
MOL Hungarian Oil & Gas PLC | 303,735 | 28,150,453 | ||||||
OTP Bank PLC | 1,490,171 | 60,561,043 | ||||||
Richter Gedeon Nyrt | 829,578 | 21,571,358 | ||||||
|
| |||||||
| 114,989,466 | ||||||||
INDIA — 9.32% |
| |||||||
ACC Ltd. | 407,404 | 11,473,050 | ||||||
Adani Enterprises Ltd. | 2,190,107 | 4,541,150 | ||||||
Adani Ports & Special Economic Zone Ltd. | 4,805,285 | 29,537,737 | ||||||
Adani Power Ltd.a | 8,666,644 | 4,521,344 | ||||||
Adani Transmissions Ltd.a | 2,412,974 | 4,795,657 | ||||||
Aditya Birla Capital Ltd.a | 3,177,949 | 9,223,489 | ||||||
AIA Engineering Ltd. | 323,466 | 6,634,149 | ||||||
Ajanta Pharma Ltd. | 236,234 | 4,412,140 | ||||||
Amara Raja Batteries Ltd. | 326,656 | 3,976,771 | ||||||
Ambuja Cements Ltd. | 4,405,252 | 19,319,331 | ||||||
Apollo Hospitals Enterprise Ltd.a | 528,176 | 8,944,735 | ||||||
Apollo Tyres Ltd. | 1,936,503 | 7,676,187 | ||||||
Arvind Ltd. | 1,012,833 | 5,873,287 | ||||||
Ashok Leyland Ltd. | 8,430,587 | 14,124,337 | ||||||
Asian Paints Ltd. | 1,916,059 | 35,024,904 | ||||||
Aurobindo Pharma Ltd. | 1,886,865 | 21,406,681 | ||||||
Axis Bank Ltd. | 10,653,457 | 83,384,482 | ||||||
Bajaj Auto Ltd. | 556,708 | 24,510,349 | ||||||
Bajaj Finance Ltd. | 1,118,148 | 31,167,602 | ||||||
Bajaj Finserv Ltd. | 283,544 | 24,407,815 | ||||||
Balkrishna Industries Ltd. | 334,086 | 8,195,073 | ||||||
Bata India Ltd. | 566,621 | 6,034,828 | ||||||
Bayer CropScience Ltd./India | 99,116 | 6,198,176 | ||||||
Bharat Financial Inclusion Ltd.a | 261,184 | 3,592,767 | ||||||
Bharat Forge Ltd. | 694,360 | 12,250,041 | ||||||
Bharat Heavy Electricals Ltd. | 3,878,834 | 7,821,227 | ||||||
Bharat Petroleum Corp. Ltd. | 5,081,542 | 42,050,577 | ||||||
Bharti Airtel Ltd. | 7,733,025 | 51,737,976 | ||||||
Bharti Infratel Ltd. | 3,644,768 | 21,392,103 | ||||||
Biocon Ltd. | 1,222,802 | 6,446,245 | ||||||
Blue Dart Express Ltd. | 64,336 | 4,282,223 | ||||||
Bosch Ltd. | 51,267 | 17,632,776 | ||||||
Cadila Healthcare Ltd. | 1,468,926 | 11,489,224 | ||||||
Canara Bank Ltd. | �� | 990,834 | 5,266,003 | |||||
CONSOLIDATED SCHEDULESOF INVESTMENTS | 23 |
Table of Contents
Consolidated Schedule of Investments (Continued)
iSHARES® CORE MSCI EMERGING MARKETS ETF
August 31, 2017
| Security | Shares | Value | ||||||
Care Ratings Ltd. | 219,863 | $ | 5,098,968 | |||||
Ceat Ltd. | 166,988 | 4,455,626 | ||||||
Century Textiles & Industries Ltd. | 276,843 | 5,369,372 | ||||||
CESC Ltd. | 576,395 | 9,158,122 | ||||||
CG Power and Industrial Solutions Ltd.a | 3,623,515 | 4,554,458 | ||||||
Cipla Ltd. | 2,397,258 | 21,446,461 | ||||||
Coal India Ltd. | 4,755,084 | 17,658,739 | ||||||
Container Corp. of India Ltd. | 383,272 | 7,913,505 | ||||||
CRISIL Ltd. | 192,657 | 5,702,144 | ||||||
Crompton Greaves Consumer Electricals Ltd. | 2,752,232 | 9,435,117 | ||||||
Dabur India Ltd. | 3,883,669 | 19,143,061 | ||||||
DCB Bank Ltd. | 1,878,843 | 5,399,088 | ||||||
Dewan Housing Finance Corp. Ltd. | 1,173,484 | 9,273,876 | ||||||
Dish TV India Ltd.a | 3,544,872 | 4,408,476 | ||||||
Divi’s Laboratories Ltd.a | 640,271 | 6,974,986 | ||||||
Dr. Reddy’s Laboratories Ltd. | 737,831 | 23,325,045 | ||||||
Edelweiss Financial Services Ltd. | 1,191,232 | 4,607,374 | ||||||
Eicher Motors Ltd. | 87,438 | 43,018,313 | ||||||
Exide Industries Ltd. | 1,990,013 | 6,127,906 | ||||||
Federal Bank Ltd. | 9,944,267 | 16,854,756 | ||||||
Finolex Cables Ltd. | 847,225 | 7,128,214 | ||||||
GAIL (India) Ltd. | 3,355,683 | 19,858,116 | ||||||
Gateway Distriparks Ltd. | 974,243 | 3,371,112 | ||||||
GE T&D India Ltd. | 784,051 | 5,011,451 | ||||||
Glenmark Pharmaceuticals Ltd. | 1,047,665 | 9,982,327 | ||||||
GMR Infrastructure Ltd.a | 18,387,050 | 4,947,221 | ||||||
Godrej Consumer Products Ltd. | 1,655,624 | 24,067,912 | ||||||
Godrej Industries Ltd. | 695,211 | 6,659,431 | ||||||
Grasim Industries Ltd. | 2,357,030 | 44,068,317 | ||||||
GRUH Finance Ltd. | 1,063,436 | 8,674,507 | ||||||
Gujarat Pipavav Port Ltd. | 1,520,932 | 3,041,805 | ||||||
Havells India Ltd. | 1,842,724 | 14,077,070 | ||||||
HCL Technologies Ltd. | 3,587,025 | 48,553,649 | ||||||
Hero Motocorp Ltd. | 336,082 | 21,003,597 | ||||||
Hexaware Technologies Ltd. | 1,017,061 | 4,346,588 | ||||||
Hindalco Industries Ltd. | 7,906,636 | 29,436,724 | ||||||
Hindustan Petroleum Corp. Ltd. | 4,162,747 | 31,800,356 | ||||||
Hindustan Unilever Ltd. | 4,213,064 | 80,387,709 | ||||||
Housing Development & Infrastructure Ltd.a | 3,020,193 | 2,933,912 | ||||||
| Security | Shares | Value | ||||||
Housing Development Finance Corp. Ltd. | 9,564,897 | $ | 265,866,768 | |||||
ICICI Bank Ltd. | 15,022,008 | 70,038,669 | ||||||
Idea Cellular Ltd. | 9,437,410 | 13,382,628 | ||||||
IDFC Bank Ltd. | 9,698,323 | 8,321,355 | ||||||
IFCI Ltd.a | 7,329,156 | 2,740,139 | ||||||
India Cements Ltd. (The) | 1,540,125 | 4,288,414 | ||||||
Indiabulls Housing Finance Ltd. | 2,072,923 | 39,414,762 | ||||||
Indian Hotels Co. Ltd. (The) | 3,311,055 | 6,155,826 | ||||||
Indian Oil Corp. Ltd. | 4,013,033 | 28,544,238 | ||||||
Infosys Ltd. | 11,581,378 | 165,759,478 | ||||||
IRB Infrastructure Developers Ltd. | 1,482,259 | 4,964,340 | ||||||
ITC Ltd. | 21,744,361 | 96,006,662 | ||||||
Jain Irrigation Systems Ltd. | 3,068,073 | 4,729,803 | ||||||
Jaiprakash Associates Ltd.a | 11,897,427 | 4,448,071 | ||||||
Jammu & Kashmir Bank Ltd. (The) | 2,155,974 | 2,672,782 | ||||||
Jindal Steel & Power Ltd.a | 2,238,255 | 4,800,293 | ||||||
JSW Steel Ltd. | 5,898,076 | 23,471,900 | ||||||
Jubilant Foodworks Ltd. | 286,614 | 6,252,255 | ||||||
Jubilant Life Sciences Ltd. | 538,192 | 5,915,155 | ||||||
Just Dial Ltd.a | 264,055 | 1,616,311 | ||||||
Kajaria Ceramics Ltd. | 615,297 | 6,755,381 | ||||||
Karur Vysya Bank Ltd. (The) | 2,833,303 | 6,306,940 | ||||||
KPIT Technologies Ltd. | 1,975,674 | 3,602,038 | ||||||
L&T Finance Holdings Ltd. | 3,610,524 | 11,312,848 | ||||||
Larsen & Toubro Ltd. | 3,043,824 | 54,104,491 | ||||||
LIC Housing Finance Ltd. | 2,110,510 | 22,246,998 | ||||||
Lupin Ltd. | 1,452,317 | 22,251,765 | ||||||
Mahindra & Mahindra Financial Services Ltd. | 1,968,750 | 13,165,806 | ||||||
Mahindra & Mahindra Ltd. | 2,385,845 | 50,190,405 | ||||||
Manappuram Finance Ltd. | 3,462,510 | 5,378,499 | ||||||
Marico Ltd. | 3,246,990 | 16,022,573 | ||||||
Maruti Suzuki India Ltd. | 693,101 | 83,488,170 | ||||||
Max Financial Services Ltd. | 893,617 | 8,408,992 | ||||||
Max India Ltd.a | 1,196,511 | 2,615,708 | ||||||
MindTree Ltd. | 766,636 | 5,528,546 | ||||||
Motherson Sumi Systems Ltd. | 4,170,716 | 20,101,251 | ||||||
Mphasis Ltd. | 562,031 | 5,355,125 | ||||||
NCC Ltd./India | 3,567,795 | 4,710,458 | ||||||
Nestle India Ltd. | 166,125 | 18,505,976 | ||||||
NIIT Technologies Ltd. | 484,924 | 3,781,840 | ||||||
NTPC Ltd. | 10,741,774 | 28,355,712 | ||||||
| 24 | 2017 iSHARES ANNUAL REPORTTO SHAREHOLDERS |
Table of Contents
Consolidated Schedule of Investments (Continued)
iSHARES® CORE MSCI EMERGING MARKETS ETF
August 31, 2017
| Security | Shares | Value | ||||||
Oil & Natural Gas Corp. Ltd. | 8,465,962 | $ | 20,785,401 | |||||
Page Industries Ltd. | 44,489 | 12,351,833 | ||||||
Persistent Systems Ltd. | 467,551 | 4,552,179 | ||||||
PI Industries Ltd. | 514,594 | 5,809,546 | ||||||
Piramal Enterprises Ltd. | 521,366 | 22,132,237 | ||||||
Power Finance Corp. Ltd. | 4,536,238 | 8,664,276 | ||||||
PTC India Ltd. | 3,551,275 | 6,644,101 | ||||||
Rajesh Exports Ltd. | 661,158 | 7,694,829 | ||||||
Rallis India Ltd. | 1,136,557 | 4,039,432 | ||||||
Ramco Cements Ltd. (The) | 685,222 | 7,404,648 | ||||||
Raymond Ltd. | 376,555 | 4,577,771 | ||||||
Redington India Ltd. | 2,842,906 | 6,590,699 | ||||||
Reliance Capital Ltd. | 796,195 | 10,029,930 | ||||||
Reliance Industries Ltd. | 8,258,535 | 205,991,030 | ||||||
Reliance Infrastructure Ltd. | 915,110 | 7,289,959 | ||||||
Rural Electrification Corp. Ltd. | 4,785,374 | 12,617,270 | ||||||
Shree Cement Ltd. | 63,095 | 17,362,309 | ||||||
Shriram Transport Finance Co. Ltd. | 1,015,762 | 15,651,248 | ||||||
Siemens Ltd. | 567,890 | 11,415,321 | ||||||
Sintex Plastics Technology Ltd.a | 2,794,150 | 4,508,579 | ||||||
Sobha Ltd. | 572,705 | 3,524,407 | ||||||
SRF Ltd. | 156,495 | 3,753,481 | ||||||
State Bank of India | 10,910,216 | 47,403,258 | ||||||
Strides Shasun Ltd. | 373,330 | 5,286,378 | ||||||
Sun Pharma Advanced Research Co. Ltd.a | 846,611 | 5,117,311 | ||||||
Sun Pharmaceuticals Industries Ltd. | 6,250,106 | 47,042,311 | ||||||
Sundaram Finance Ltd. | 319,027 | 7,989,118 | ||||||
Suzlon Energy Ltd.a | 18,352,838 | 4,679,631 | ||||||
Tata Communications Ltd. | 598,005 | 6,098,269 | ||||||
Tata Consultancy Services Ltd. | 2,982,564 | 116,470,521 | ||||||
Tata Elxsi Ltd. | 111,025 | 2,848,037 | ||||||
Tata Global Beverages Ltd. | 2,791,435 | 8,645,965 | ||||||
Tata Motors Ltd.a | 10,162,510 | 59,861,061 | ||||||
Tata Motors Ltd. Class Aa | 2,224,150 | 7,610,846 | ||||||
Tata Power Co. Ltd. | 8,057,851 | 9,989,397 | ||||||
Tata Steel Ltd. | 1,970,227 | 19,664,900 | ||||||
Tech Mahindra Ltd. | 3,027,553 | 20,277,223 | ||||||
Thermax Ltd. | 321,782 | 4,475,413 | ||||||
Titan Co. Ltd. | 2,195,072 | 21,189,714 | ||||||
Torrent Power Ltd. | 1,107,956 | 3,642,275 | ||||||
TTK Prestige Ltd. | 41,968 | 4,110,978 | ||||||
Tube Investments of India Ltd. | 695,884 | 8,634,562 | ||||||
| Security | Shares | Value | ||||||
TV18 Broadcast Ltd.a | 5,405,982 | $ | 3,226,190 | |||||
TVS Motor Co. Ltd. | 947,472 | 8,947,636 | ||||||
Ultratech Cement Ltd. | 589,137 | 36,867,228 | ||||||
Union Bank of Indiaa | 1,279,738 | 2,728,586 | ||||||
United Spirits Ltd.a | 402,169 | 15,997,740 | ||||||
UPL Ltd. | 2,382,035 | 30,854,994 | ||||||
VA Tech Wabag Ltd. | 366,736 | 3,524,440 | ||||||
Vakrangee Ltd. | 1,280,973 | 10,259,607 | ||||||
Vedanta Ltd. | 9,809,807 | 47,402,270 | ||||||
Vijaya Bank | 3,478,925 | 3,708,785 | ||||||
Voltas Ltd. | 929,357 | 7,628,792 | ||||||
Welspun India Ltd. | 2,042,263 | 2,477,503 | ||||||
Wipro Ltd. | 7,916,840 | 37,041,542 | ||||||
Wockhardt Ltd. | 308,806 | 2,900,570 | ||||||
Yes Bank Ltd. | 2,132,184 | 58,470,897 | ||||||
Zee Entertainment Enterprises Ltd. | 3,724,654 | 30,268,595 | ||||||
|
| |||||||
| 3,426,932,247 | ||||||||
INDONESIA — 2.27% |
| |||||||
Ace Hardware Indonesia Tbk PT | 71,353,200 | 5,829,335 | ||||||
Adaro Energy Tbk PT | 101,952,400 | 13,945,670 | ||||||
Adhi Karya Persero Tbk PT | 18,782,200 | 2,843,655 | ||||||
AKR Corporindo Tbk PT | 13,966,800 | 7,092,270 | ||||||
Alam Sutera Realty Tbk PT | 92,491,400 | 2,481,781 | ||||||
Aneka Tambang Persero Tbk PTa | 64,049,543 | 3,552,441 | ||||||
Astra International Tbk PT | 126,947,600 | 74,929,722 | ||||||
Bank Bukopin Tbk | 49,496,200 | 2,207,333 | ||||||
Bank Central Asia Tbk PT | 67,129,000 | 95,345,117 | ||||||
Bank Danamon Indonesia Tbk PT | 23,850,300 | 9,742,478 | ||||||
Bank Mandiri Persero Tbk PT | 59,546,700 | 58,466,629 | ||||||
Bank Negara Indonesia Persero Tbk PT | 49,526,900 | 27,283,969 | ||||||
Bank Pembangunan Daerah Jawa Barat Dan Banten Tbk PT | 20,466,500 | 3,927,015 | ||||||
Bank Rakyat Indonesia Persero Tbk PT | 70,497,400 | 79,918,541 | ||||||
Bank Tabungan Negara Persero Tbk PT | 34,986,776 | 7,893,134 | ||||||
Bumi Serpong Damai Tbk PT | 56,159,300 | 7,723,903 | ||||||
Charoen Pokphand Indonesia Tbk PT | 50,243,700 | 10,431,348 | ||||||
CONSOLIDATED SCHEDULESOF INVESTMENTS | 25 |
Table of Contents
Consolidated Schedule of Investments (Continued)
iSHARES® CORE MSCI EMERGING MARKETS ETF
August 31, 2017
| Security | Shares | Value | ||||||
Ciputra Development Tbk PT | 95,687,127 | $ | 8,391,091 | |||||
Eagle High Plantations Tbk PTa | 94,782,900 | 1,520,277 | ||||||
Gudang Garam Tbk PT | 3,156,800 | 16,373,149 | ||||||
Hanjaya Mandala Sampoerna Tbk PT | 60,103,500 | 16,397,597 | ||||||
Hanson International Tbk PTa | 482,237,900 | 4,879,487 | ||||||
Indocement Tunggal Prakarsa Tbk PT | 10,890,700 | 16,162,184 | ||||||
Indofood CBP Sukses Makmur Tbk PT | 16,380,800 | 10,712,223 | ||||||
Indofood Sukses Makmur Tbk PT | 28,015,300 | 17,585,680 | ||||||
Jasa Marga Persero Tbk PT | 17,740,680 | 7,745,425 | ||||||
Kalbe Farma Tbk PT | 141,920,300 | 18,189,455 | ||||||
Kawasan Industri Jababeka Tbk PT | 169,031,488 | 3,927,429 | ||||||
Krakatau Steel Persero Tbk PTa | 32,864,914 | 1,367,113 | ||||||
Link Net Tbk PT | 9,640,300 | 3,598,313 | ||||||
Lippo Karawaci Tbk PT | 88,169,400 | 5,187,602 | ||||||
Matahari Department Store Tbk PT | 15,693,300 | 11,762,330 | ||||||
Media Nusantara Citra Tbk PT | 41,435,400 | 4,627,398 | ||||||
Mitra Adiperkasa Tbk PT | 8,053,400 | 4,225,289 | ||||||
Modernland Realty Tbk PT | 96,810,000 | 1,959,129 | ||||||
Pakuwon Jati Tbk PT | 157,955,300 | 7,932,098 | ||||||
Panin Financial Tbk PTa | 159,924,400 | 2,972,662 | ||||||
Pembangunan Perumahan Persero Tbk PT | 25,790,250 | 5,431,765 | ||||||
Perusahaan Gas Negara Persero Tbk PT | 69,800,200 | 11,091,023 | ||||||
Perusahaan Perkebunan London Sumatra Indonesia Tbk PT | 28,578,900 | 2,945,285 | ||||||
Ramayana Lestari Sentosa Tbk PT | 32,743,000 | 2,478,671 | ||||||
Salim Ivomas Pratama Tbk PT | 33,834,100 | 1,262,883 | ||||||
Semen Indonesia Persero Tbk PT | 19,462,200 | 15,280,059 | ||||||
Siloam International Hospitals Tbk PTa | 2,077,337 | 1,708,797 | ||||||
Sugih Energy Tbk PTa | 82,105,800 | 307,697 | ||||||
Summarecon Agung Tbk PT | 67,182,100 | 5,261,977 | ||||||
Surya Citra Media Tbk PT | 42,968,300 | 7,117,369 | ||||||
Tambang Batubara Bukit Asam Persero Tbk PT | 5,845,500 | 5,421,831 | ||||||
| Security | Shares | Value | ||||||
Telekomunikasi Indonesia Persero Tbk PT | 317,586,200 | $ | 111,638,381 | |||||
Timah Persero Tbk PT | 33,354,052 | 2,387,432 | ||||||
Tower Bersama Infrastructure Tbk PT | 16,550,800 | 7,970,236 | ||||||
Unilever Indonesia Tbk PT | 9,798,700 | 37,125,190 | ||||||
United Tractors Tbk PT | 11,518,700 | 26,159,242 | ||||||
Waskita Karya Persero Tbk PT | 39,932,800 | 6,644,492 | ||||||
Wijaya Karya Persero Tbk PT | 25,153,823 | 3,742,343 | ||||||
|
| |||||||
| 833,104,945 | ||||||||
MALAYSIA — 2.35% |
| |||||||
AEON Credit Service M Bhd | 1,903,800 | 5,563,616 | ||||||
AirAsia Bhd | 10,465,600 | 8,136,235 | ||||||
Alliance Financial Group Bhd | 8,230,300 | 7,400,621 | ||||||
AMMB Holdings Bhd | 10,382,500 | 10,405,597 | ||||||
Astro Malaysia Holdings Bhd | 12,521,000 | 7,857,694 | ||||||
Axiata Group Bhdb | 17,387,300 | 20,072,448 | ||||||
Berjaya Corp. Bhda | 31,219,306 | 2,412,451 | ||||||
Berjaya Sports Toto Bhd | 4,675,473 | 2,463,368 | ||||||
British American Tobacco Malaysia Bhd | 976,900 | 10,106,414 | ||||||
Bursa Malaysia Bhd | 3,654,200 | 8,693,753 | ||||||
Cahya Mata Sarawak Bhdb | 5,286,800 | 5,026,205 | ||||||
Capitaland Malaysia Mall Trustb | 12,263,700 | 4,192,718 | ||||||
Carlsberg Brewery Malaysia Bhd | 1,344,600 | 4,666,192 | ||||||
CIMB Group Holdings Bhd | 25,696,100 | 42,601,191 | ||||||
Dialog Group Bhdb | 25,777,596 | 12,374,212 | ||||||
DiGi.Com Bhdb | 20,027,300 | 22,698,076 | ||||||
DRB-Hicom Bhd | 4,682,600 | 1,732,469 | ||||||
Eastern & Oriental Bhdb | 7,689,029 | 2,664,738 | ||||||
Felda Global Ventures Holdings Bhdb | 10,277,400 | 3,730,235 | ||||||
Gamuda Bhd | 10,671,800 | 13,344,436 | ||||||
Genting Bhd | 14,078,300 | 32,010,372 | ||||||
Genting Malaysia Bhd | 19,441,200 | 26,722,830 | ||||||
Genting Plantations Bhdb | 1,848,900 | 4,606,556 | ||||||
HAP Seng Consolidated Bhdb | 4,609,100 | 9,799,936 | ||||||
Hartalega Holdings Bhd | 4,762,900 | 7,572,905 | ||||||
Hong Leong Bank Bhd | 4,892,300 | 17,688,119 | ||||||
Hong Leong Financial Group Bhd | 1,857,600 | 7,351,233 | ||||||
IHH Healthcare Bhd | 15,102,900 | 21,184,023 | ||||||
IJM Corp. Bhd | 16,614,400 | 12,994,285 | ||||||
Inari Amertron Bhd | 12,232,100 | 7,275,386 | ||||||
IOI Corp. Bhdb | 14,860,000 | 15,797,775 | ||||||
| 26 | 2017 iSHARES ANNUAL REPORTTO SHAREHOLDERS |
Table of Contents
Consolidated Schedule of Investments (Continued)
iSHARES® CORE MSCI EMERGING MARKETS ETF
August 31, 2017
| Security | Shares | Value | ||||||
IOI Properties Group Bhd | 14,269,541 | $ | 6,649,429 | |||||
Kossan Rubber Industriesb | 2,359,800 | 3,978,588 | ||||||
KPJ Healthcare Bhd | 4,793,350 | 4,669,321 | ||||||
Kuala Lumpur Kepong Bhd | 2,818,300 | 16,195,078 | ||||||
Lafarge Malaysia Bhdb | 3,463,900 | 4,404,397 | ||||||
Magnum Bhd | 6,594,400 | 2,933,933 | ||||||
Mah Sing Group Bhd | 11,103,723 | 3,848,147 | ||||||
Malayan Banking Bhd | 22,194,600 | 49,165,418 | ||||||
Malaysia Airports Holdings Bhd | 5,832,200 | 12,291,254 | ||||||
Malaysia Building Society Bhd | 11,527,600 | 3,482,169 | ||||||
Malaysian Resources Corp. Bhdb | 10,825,900 | 3,042,051 | ||||||
Maxis Bhdb | 12,148,300 | 16,442,378 | ||||||
MISC Bhd | 7,712,100 | 13,435,903 | ||||||
My EG Services Bhdb | 15,405,200 | 7,647,588 | ||||||
OSK Holdings Bhd | 5,781,400 | 2,166,079 | ||||||
Pavilion REIT | 9,771,300 | 3,935,520 | ||||||
Petronas Chemicals Group Bhd | 15,253,300 | 25,573,967 | ||||||
Petronas Dagangan Bhd | 1,802,400 | 10,298,223 | ||||||
Petronas Gas Bhd | 4,240,000 | 18,268,587 | ||||||
POS Malaysia Bhdb | 2,930,600 | 3,774,336 | ||||||
PPB Group Bhd | 2,977,400 | 11,629,325 | ||||||
Public Bank Bhd | 17,428,960 | 84,073,663 | ||||||
QL Resources Bhd | 5,361,950 | 6,051,891 | ||||||
RHB Bank Bhd | 5,845,766 | 6,912,801 | ||||||
RHB Bank Bhd Newa,d | 1,769,000 | 4 | ||||||
Sapura Energy Bhd | 30,366,600 | 9,812,881 | ||||||
Sime Darby Bhd | 14,753,100 | 31,091,886 | ||||||
Sunway Bhd | 6,144,752 | 6,244,754 | ||||||
Sunway Construction Group Bhdb | 6,837,270 | 3,682,407 | ||||||
Sunway REITb | 12,646,400 | 5,063,890 | ||||||
Supermax Corp. Bhdb | 4,898,700 | 2,041,842 | ||||||
Ta Ann Holdings Bhd | 3,542,060 | 3,043,990 | ||||||
Telekom Malaysia Bhd | 6,906,800 | 10,399,420 | ||||||
Tenaga Nasional Bhd | 20,927,800 | 69,979,858 | ||||||
TIME dotCom Bhd | 2,979,900 | 6,908,093 | ||||||
Top Glove Corp. Bhdb | 4,934,600 | 6,482,404 | ||||||
UEM Sunrise Bhda,b | 11,421,000 | 3,075,553 | ||||||
UOA Development Bhd | 6,917,800 | 4,211,750 | ||||||
WCT Holdings Bhda,b | 8,531,179 | 3,495,975 | ||||||
Westports Holdings Bhdb | 8,562,200 | 7,518,616 | ||||||
YTL Corp. Bhd | 24,604,700 | 8,239,017 | ||||||
YTL Power International Bhd | 12,361,435 | 4,081,401 | ||||||
|
| |||||||
| 865,389,876 | ||||||||
| Security | Shares | Value | ||||||
MEXICO — 3.48% |
| |||||||
Alfa SAB de CV | 19,528,500 | $ | 27,425,529 | |||||
Alsea SAB de CV | 3,621,800 | 13,218,953 | ||||||
America Movil SAB de CV Series L | 210,306,700 | 196,114,368 | ||||||
Arca Continental SAB de CV | 2,902,900 | 21,304,194 | ||||||
Axtel SAB de CV CPOa,b | 10,940,700 | 2,553,664 | ||||||
Banregio Grupo Financiero SAB de CV | 1,764,600 | 11,419,616 | ||||||
Bolsa Mexicana de Valores SAB de CV | 3,260,200 | 5,654,166 | ||||||
Cemex SAB de CV CPOa | 91,436,586 | 85,727,811 | ||||||
Coca-Cola Femsa SAB de CV Series L | 3,114,500 | 25,605,907 | ||||||
Concentradora Fibra Hotelera Mexicana SA de CV | 4,133,100 | 3,392,701 | ||||||
Consorcio ARA SAB de CV | 8,744,000 | 2,987,808 | ||||||
Controladora Vuela Cia. de Aviacion SAB de CV Class Aa,b | 4,271,300 | 5,389,827 | ||||||
Corp Inmobiliaria Vesta SAB de CV | 3,988,700 | 5,881,418 | ||||||
El Puerto de Liverpool SAB de CV Series C1b | 1,221,980 | 10,982,410 | ||||||
Fibra Uno Administracion SA de CV | 15,968,500 | 28,572,216 | ||||||
Fomento Economico Mexicano SAB de CV | 12,252,600 | 123,008,947 | ||||||
Genomma Lab Internacional SAB de CV Series Ba,b | 5,614,700 | 7,217,336 | ||||||
Gentera SAB de CV | 7,099,000 | 10,925,675 | ||||||
Gruma SAB de CV Series B | 1,405,680 | 20,681,287 | ||||||
Grupo Aeromexico SAB de CVa,b | 3,335,900 | 6,762,484 | ||||||
Grupo Aeroportuario del Centro Norte SAB de CV | 2,038,800 | 12,370,472 | ||||||
Grupo Aeroportuario del Pacifico SAB de CV Series B | 2,321,600 | 25,688,670 | ||||||
Grupo Aeroportuario del Sureste SAB de CV Series B | 1,368,990 | 28,013,878 | ||||||
Grupo Bimbo SAB de CV Series Ab | 10,524,400 | 25,592,431 | ||||||
Grupo Carso SAB de CV Series A1 | 3,653,400 | 14,810,181 | ||||||
Grupo Comercial Chedraui SA de CV | 2,706,800 | 5,816,748 | ||||||
CONSOLIDATED SCHEDULESOF INVESTMENTS | 27 |
Table of Contents
Consolidated Schedule of Investments (Continued)
iSHARES® CORE MSCI EMERGING MARKETS ETF
August 31, 2017
| Security | Shares | Value | ||||||
Grupo Financiero Banorte SAB de CV Series O | 15,807,200 | $ | 108,132,237 | |||||
Grupo Financiero Inbursa SAB de CV Series O | 15,278,000 | 25,630,848 | ||||||
Grupo Financiero Santander Mexico SAB de CV Series B | 11,295,300 | 23,341,286 | ||||||
Grupo Herdez SAB de CV | 2,260,900 | 5,553,700 | ||||||
Grupo Lala SAB de CVb | 4,628,400 | 8,242,578 | ||||||
Grupo Mexico SAB de CV Series B | 24,507,000 | 81,044,877 | ||||||
Grupo Televisa SAB | 15,488,900 | 80,335,185 | ||||||
Industrias Bachoco SAB de CV Series B | 1,282,700 | 6,829,216 | ||||||
Industrias CH SAB de CV Series Ba,b | 1,194,700 | 5,733,273 | ||||||
Industrias Penoles SAB de CV | 886,955 | 23,117,488 | ||||||
Infraestructura Energetica Nova SAB de CV | 3,444,500 | 18,775,620 | ||||||
Kimberly-Clark de Mexico SAB de CV Series A | 9,846,600 | 19,391,826 | ||||||
La Comer SAB de CVa,b | 3,338,600 | 3,332,465 | ||||||
Macquarie Mexico Real Estate Management SA de CV | 5,447,800 | 7,335,972 | ||||||
Mexichem SAB de CV | 6,547,983 | 17,495,333 | ||||||
PLA Administradora Industrial S. de RL de CV | 4,332,400 | 7,389,710 | ||||||
Promotora y Operadora de Infraestructura SAB de CV | 1,581,585 | 17,384,989 | ||||||
Qualitas Controladora SAB de CV | 2,416,500 | 4,223,477 | ||||||
Telesites SAB de CVa,b | 10,379,395 | 8,287,093 | ||||||
Wal-Mart de Mexico SAB de CV | 32,711,600 | 79,820,874 | ||||||
|
| |||||||
| 1,278,516,744 | ||||||||
PAKISTAN — 0.19% |
| |||||||
DG Khan Cement Co. Ltd. | 2,169,700 | 3,206,701 | ||||||
Engro Corp. Ltd./Pakistan | 2,229,100 | 6,007,340 | ||||||
Engro Fertilizers Ltd. | 5,597,347 | 3,080,137 | ||||||
Fauji Cement Co. Ltd. | 6,183,000 | 2,016,528 | ||||||
Fauji Fertilizer Co. Ltd. | 4,111,720 | 2,769,548 | ||||||
Habib Bank Ltd. | 3,730,900 | 6,300,682 | ||||||
Hub Power Co. Ltd. (The) | 5,171,495 | 5,559,357 | ||||||
Lucky Cement Ltd. | 1,008,500 | 5,723,142 | ||||||
MCB Bank Ltd. | 2,460,500 | 4,524,794 | ||||||
National Bank of Pakistan | 3,639,500 | 1,921,116 | ||||||
Nishat Mills Ltd. | 2,586,100 | 3,512,130 | ||||||
| Security | Shares | Value | ||||||
Oil & Gas Development Co. Ltd. | 4,842,700 | $ | 6,495,294 | |||||
Pakistan Oilfields Ltd. | 802,200 | 3,663,202 | ||||||
Pakistan State Oil Co. Ltd. | 1,295,900 | 5,171,897 | ||||||
Searle Co. Ltd. (The) | 714,300 | 2,665,113 | ||||||
SUI Northern Gas Pipelinea | 2,274,100 | 3,166,663 | ||||||
United Bank Ltd./Pakistan | 3,150,400 | 5,573,992 | ||||||
|
| |||||||
| 71,357,636 | ||||||||
PERU — 0.36% |
| |||||||
Cia. de Minas Buenaventura SAA ADR | 1,277,508 | 17,156,932 | ||||||
Credicorp Ltd. | 437,084 | 88,658,119 | ||||||
Southern Copper Corp. | 620,430 | 25,251,501 | ||||||
|
| |||||||
| 131,066,552 | ||||||||
PHILIPPINES — 1.08% |
| |||||||
Aboitiz Equity Ventures Inc. | 12,853,820 | 18,701,718 | ||||||
Aboitiz Power Corp. | 8,592,800 | 6,633,097 | ||||||
Alliance Global Group Inc. | 17,695,200 | 4,806,787 | ||||||
Ayala Corp. | 1,661,540 | 29,873,301 | ||||||
Ayala Land Inc. | 45,341,400 | 37,215,923 | ||||||
Bank of the Philippine Islands | 5,619,535 | 11,630,032 | ||||||
BDO Unibank Inc. | 12,937,746 | 32,135,773 | ||||||
Cebu Air Inc. | 2,002,600 | 4,238,452 | ||||||
Cosco Capital Inc. | 18,478,100 | 2,831,118 | ||||||
D&L Industries Inc. | 20,126,400 | 4,066,972 | ||||||
DMCI Holdings Inc. | 26,693,400 | 8,190,080 | ||||||
DoubleDragon Properties Corp.a | 4,618,600 | 3,935,332 | ||||||
Energy Development Corp. | 58,376,900 | 7,734,911 | ||||||
Filinvest Land Inc. | 82,314,000 | 3,072,498 | ||||||
First Gen Corp. | 8,809,600 | 2,895,788 | ||||||
First Philippine Holdings Corp. | 1,412,470 | 1,849,433 | ||||||
Globe Telecom Inc. | 222,360 | 8,691,030 | ||||||
GT Capital Holdings Inc. | 588,540 | 12,858,857 | ||||||
International Container Terminal Services Inc. | 3,403,280 | 6,943,569 | ||||||
JG Summit Holdings Inc. | 18,555,113 | 26,035,902 | ||||||
Jollibee Foods Corp. | 2,809,500 | 13,078,423 | ||||||
Lopez Holdings Corp. | 13,466,600 | 1,779,054 | ||||||
Manila Water Co. Inc. | 8,235,600 | 4,981,275 | ||||||
Megaworld Corp. | 75,385,600 | 7,277,797 | ||||||
Melco Resorts And Entertainment (Philippines) Corp.a | 13,665,300 | 2,374,136 | ||||||
Metro Pacific Investments Corp. | 91,926,200 | 11,407,687 | ||||||
Metropolitan Bank & Trust Co. | 4,761,122 | 8,150,758 | ||||||
| 28 | 2017 iSHARES ANNUAL REPORTTO SHAREHOLDERS |
Table of Contents
Consolidated Schedule of Investments (Continued)
iSHARES® CORE MSCI EMERGING MARKETS ETF
August 31, 2017
| Security | Shares | Value | ||||||
Nickel Asia Corp. | 11,832,124 | $ | 1,669,493 | |||||
PLDT Inc. | 567,930 | 19,201,073 | ||||||
Rizal Commercial Banking Corp. | 1,838,150 | 1,842,820 | ||||||
Robinsons Land Corp. | 11,931,000 | 5,409,404 | ||||||
Security Bank Corp. | 1,164,360 | 5,688,685 | ||||||
SM Investments Corp. | 1,554,322 | 24,619,464 | ||||||
SM Prime Holdings Inc. | 54,359,696 | 35,481,998 | ||||||
Universal Robina Corp. | 5,682,780 | 16,225,409 | ||||||
Vista Land & Lifescapes Inc. | 33,305,500 | 3,872,733 | ||||||
|
| |||||||
| 397,400,782 | ||||||||
POLAND — 1.34% |
| |||||||
Alior Bank SAa | 573,211 | 10,587,095 | ||||||
Asseco Poland SA | 480,463 | 6,090,831 | ||||||
Bank Handlowy w Warszawie SA | 222,137 | 4,413,647 | ||||||
Bank Millennium SAa | 3,950,041 | 8,235,240 | ||||||
Bank Pekao SA | 939,065 | 33,624,382 | ||||||
Bank Zachodni WBK SA | 220,688 | 22,825,960 | ||||||
Budimex SA | 89,564 | 5,693,307 | ||||||
CCC SA | 179,892 | 13,199,665 | ||||||
CD Projekt SA | 457,469 | 10,676,922 | ||||||
Ciech SAa | 201,065 | 3,529,638 | ||||||
Cyfrowy Polsat SA | 1,448,835 | 10,866,060 | ||||||
Enea SA | 1,405,421 | 5,997,837 | ||||||
Eurocash SA | 535,925 | 5,870,069 | ||||||
Getin Noble Bank SAa,b | 3,650,041 | 1,307,453 | ||||||
Globe Trade Centre SAb | 1,700,147 | 4,710,207 | ||||||
Grupa Azoty SA | 292,716 | 5,643,962 | ||||||
Grupa Lotos SAa | 668,192 | 11,006,263 | ||||||
Jastrzebska Spolka Weglowa SAa | 352,068 | 10,246,564 | ||||||
KGHM Polska Miedz SA | 900,598 | 31,780,771 | ||||||
KRUK SAb | 118,697 | 11,325,276 | ||||||
LPP SA | 8,198 | 20,033,642 | ||||||
Lubelski Wegiel Bogdanka SAb | 119,831 | 2,548,597 | ||||||
mBank SAa | 95,905 | 11,755,300 | ||||||
Netia SAb | 2,395,332 | 2,614,260 | ||||||
Orange Polska SAa | 3,813,737 | 6,392,871 | ||||||
PGE Polska Grupa Energetyczna SA | 5,082,911 | 20,298,075 | ||||||
Polski Koncern Naftowy ORLEN SA | 1,900,308 | 62,698,358 | ||||||
Polskie Gornictwo Naftowe i Gazownictwo SA | 11,476,724 | 21,935,978 | ||||||
| Security | Shares | Value | ||||||
Powszechna Kasa Oszczednosci Bank Polski SAa | 5,807,044 | $ | 59,607,761 | |||||
Powszechny Zaklad Ubezpieczen SA | 3,806,551 | 51,664,444 | ||||||
Synthos SA | 3,537,264 | 4,731,662 | ||||||
Tauron Polska Energia SAa | 6,414,503 | 7,036,674 | ||||||
Warsaw Stock Exchange | 369,904 | 4,877,673 | ||||||
|
| |||||||
| 493,826,444 | ||||||||
QATAR — 0.59% |
| |||||||
Al Meera Consumer Goods Co. QSC | 70,082 | 2,888,928 | ||||||
Barwa Real Estate Co. | 662,112 | 5,762,397 | ||||||
Commercial Bank PQSC (The)a | 1,418,067 | 11,609,359 | ||||||
Doha Bank QPSC | 324,447 | 2,687,352 | ||||||
Ezdan Holding Group QSC | 5,237,038 | 16,165,961 | ||||||
Gulf International Services QSC | 261,044 | 1,318,393 | ||||||
Industries Qatar QSC | 920,844 | 23,013,197 | ||||||
Masraf Al Rayan QSC | 2,512,397 | 26,322,814 | ||||||
Mazaya Qatar Real Estate Development QSCa | 1,087,817 | 2,957,607 | ||||||
Medicare Group | 102,142 | 1,936,666 | ||||||
Ooredoo QSC | 546,926 | 13,156,265 | ||||||
Qatar Electricity & Water Co. QSC | 199,042 | 10,167,336 | ||||||
Qatar Gas Transport Co. Ltd. | 992,991 | 4,633,276 | ||||||
Qatar Industrial Manufacturing Co. QSC | 213,011 | 2,486,225 | ||||||
Qatar Insurance Co. SAQ | 963,326 | 17,460,904 | ||||||
Qatar Islamic Bank SAQ | 459,760 | 11,742,583 | ||||||
Qatar National Bank QPSC | 1,273,773 | 45,686,167 | ||||||
Qatar National Cement Co. QSC | 159,506 | 2,934,954 | ||||||
Salam International Investment Ltd. QSC | 1,141,360 | 2,633,003 | ||||||
United Development Co. QSC | 1,241,886 | 5,173,886 | ||||||
Vodafone Qatar QSCa | 2,534,952 | 5,778,263 | ||||||
|
| |||||||
| 216,515,536 | ||||||||
RUSSIA — 2.83% |
| |||||||
Aeroflot PJSC | 4,239,100 | 14,197,244 | ||||||
Alrosa PJSC | 16,325,300 | 22,699,405 | ||||||
Gazprom PJSC | 51,101,130 | 103,583,728 | ||||||
Gazprom PJSC ADR | 8,407,079 | 33,544,245 | ||||||
Inter RAO UES PJSC | 217,488,000 | 14,489,213 | ||||||
LSR Group PJSC GDRe | 1,883,472 | 5,367,895 | ||||||
CONSOLIDATED SCHEDULESOF INVESTMENTS | 29 |
Table of Contents
Consolidated Schedule of Investments (Continued)
iSHARES® CORE MSCI EMERGING MARKETS ETF
August 31, 2017
| Security | Shares | Value | ||||||
Lukoil PJSC | 2,019,838 | $ | 101,904,870 | |||||
Lukoil PJSC ADR | 692,893 | 34,817,873 | ||||||
M Video OJSCa | 185,640 | 1,304,195 | ||||||
Magnit PJSC GDRe | 1,956,219 | 81,750,392 | ||||||
Mechel PJSCa | 684,220 | 3,886,370 | ||||||
MMC Norilsk Nickel PJSC | 404,857 | 68,179,104 | ||||||
Mobile TeleSystems PJSC ADR | 3,251,444 | 32,481,926 | ||||||
Moscow Exchange MICEX-RTS PJSC | 10,066,420 | 18,234,824 | ||||||
Novatek PJSC GDRe | 588,259 | 62,178,976 | ||||||
Novolipetsk Steel PJSC | 7,029,386 | 16,642,972 | ||||||
PhosAgro PJSC GDRe | 876,894 | 12,188,827 | ||||||
Rosneft Oil Co. PJSC | 1,206,660 | 6,349,639 | ||||||
Rosneft Oil Co. PJSC GDR | 5,869,622 | 30,522,034 | ||||||
Rostelecom PJSC | 8,809,930 | 10,080,411 | ||||||
RusHydro PJSC | 697,610,000 | 9,929,306 | ||||||
Sberbank of Russia PJSC | 12,641,030 | 40,026,845 | ||||||
Sberbank of Russia PJSC ADR | 12,961,062 | 176,918,496 | ||||||
Severstal PJSC | 1,289,600 | 20,229,455 | ||||||
Surgutneftegas OJSC | 40,040,950 | 18,522,602 | ||||||
Surgutneftegas OJSC ADR | 1,092,661 | 4,997,831 | ||||||
Tatneft PJSC Class S | 9,805,270 | 64,833,813 | ||||||
VTB Bank PJSC | 5,421,870,000 | 6,049,715 | ||||||
VTB Bank PJSC GDRe | 11,821,936 | 26,410,205 | ||||||
|
| |||||||
| 1,042,322,411 | ||||||||
SOUTH AFRICA — 6.55% |
| |||||||
Adcock Ingram Holdings Ltd.b | 817,288 | 3,961,465 | ||||||
Advtech Ltd. | 4,066,766 | 5,694,568 | ||||||
Aeci Ltd. | 950,655 | 7,826,127 | ||||||
African Rainbow Minerals Ltd. | 791,645 | 6,693,732 | ||||||
Anglo American Platinum Ltd.a | 339,188 | 9,198,982 | ||||||
AngloGold Ashanti Ltd. | 2,677,577 | 27,122,892 | ||||||
Aspen Pharmacare Holdings Ltd. | 2,453,195 | 54,718,658 | ||||||
Astral Foods Ltd. | 353,117 | 4,211,051 | ||||||
Attacq Ltd.a | 3,842,447 | 5,350,898 | ||||||
AVI Ltd. | 2,114,433 | 16,071,155 | ||||||
Barclays Africa Group Ltd. | 4,208,416 | 48,043,452 | ||||||
Barloworld Ltd. | 1,398,991 | 13,831,148 | ||||||
Bid Corp. Ltd. | 2,132,640 | 48,476,027 | ||||||
Bidvest Group Ltd. (The) | 2,132,585 | 28,130,925 | ||||||
Blue Label Telecoms Ltd. | 4,092,426 | 5,821,809 | ||||||
| Security | Shares | Value | ||||||
Brait SEa | 2,394,232 | $ | 10,599,277 | |||||
Capitec Bank Holdings Ltd. | 270,018 | 18,707,537 | ||||||
Cashbuild Ltd. | 183,444 | 5,243,132 | ||||||
City Lodge Hotels Ltd. | 408,699 | 4,449,387 | ||||||
Clicks Group Ltd. | 1,667,634 | 19,091,667 | ||||||
Clover Industries Ltd. | 2,822,472 | 3,463,622 | ||||||
Coronation Fund Managers Ltd. | 1,503,236 | 8,136,384 | ||||||
DataTec Ltd. | 1,382,178 | 6,015,758 | ||||||
Discovery Ltd. | 2,250,322 | 26,074,129 | ||||||
Emira Property Fund Ltd. | 4,166,244 | 4,445,917 | ||||||
EOH Holdings Ltd.b | 951,452 | 8,162,100 | ||||||
Exxaro Resources Ltd. | 1,358,629 | 13,679,844 | ||||||
Famous Brands Ltd. | 591,473 | 5,378,889 | ||||||
FirstRand Ltd. | 21,034,450 | 89,866,744 | ||||||
Fortress Income Fund Ltd. | 5,040,996 | 15,284,913 | ||||||
Fortress Income Fund Ltd. Class A | 5,937,654 | 8,012,806 | ||||||
Foschini Group Ltd. (The) | 1,392,763 | 16,423,834 | ||||||
Gold Fields Ltd. | 5,428,350 | 24,223,451 | ||||||
Grindrod Ltd.a | 3,464,689 | 3,601,304 | ||||||
Growthpoint Properties Ltd. | 12,419,249 | 24,031,092 | ||||||
Harmony Gold Mining Co. Ltd. | 2,768,399 | 5,503,784 | ||||||
Hosken Consolidated Investments Ltd. | 525,088 | 5,373,087 | ||||||
Hudaco Industries Ltd. | 433,214 | 4,332,973 | ||||||
Hyprop Investments Ltd. | 1,533,489 | 13,465,443 | ||||||
Impala Platinum Holdings Ltd.a,b | 3,836,924 | 11,867,232 | ||||||
Imperial Holdings Ltd. | 941,636 | 15,113,991 | ||||||
Investec Ltd. | 1,617,734 | 12,330,749 | ||||||
JSE Ltd. | 683,856 | 7,090,846 | ||||||
KAP Industrial Holdings Ltd. | 6,603,614 | 4,293,175 | ||||||
Lewis Group Ltd. | 947,051 | 2,331,651 | ||||||
Liberty Holdings Ltd. | 917,013 | 7,309,294 | ||||||
Life Healthcare Group Holdings Ltd. | 7,606,334 | 15,432,124 | ||||||
Massmart Holdings Ltd. | 764,774 | 7,158,485 | ||||||
Metair Investments Ltd. | 2,055,057 | 3,098,990 | ||||||
MMI Holdings Ltd./South Africa | 5,789,977 | 9,270,200 | ||||||
Mondi Ltd. | 734,050 | 20,033,254 | ||||||
Mpact Ltd. | 1,701,241 | 3,534,026 | ||||||
Mr. Price Group Ltd. | 1,548,382 | 21,592,171 | ||||||
MTN Group Ltd. | 10,658,552 | 105,974,585 | ||||||
Murray & Roberts Holdings Ltd. | 3,390,599 | 3,978,198 | ||||||
Nampak Ltd.a | 3,945,013 | 5,730,475 | ||||||
Naspers Ltd. Class N | 2,773,084 | 627,471,195 | ||||||
| 30 | 2017 iSHARES ANNUAL REPORTTO SHAREHOLDERS |
Table of Contents
Consolidated Schedule of Investments (Continued)
iSHARES® CORE MSCI EMERGING MARKETS ETF
August 31, 2017
| Security | Shares | Value | ||||||
Nedbank Group Ltd. | 1,400,335 | $ | 23,688,529 | |||||
NEPI Rockcastle PLCa | 1,987,128 | 28,818,898 | ||||||
Netcare Ltd. | 6,252,202 | 11,597,660 | ||||||
Northam Platinum Ltd.a | 2,279,970 | 8,628,715 | ||||||
Omnia Holdings Ltd. | 490,405 | 5,338,897 | ||||||
Pick n Pay Stores Ltd. | 2,406,068 | 11,843,834 | ||||||
Pioneer Foods Group Ltd. | 861,661 | 8,396,181 | ||||||
PPC Ltd.a | 10,586,000 | 4,626,157 | ||||||
PSG Group Ltd. | 628,292 | 12,210,545 | ||||||
Rand Merchant Investment Holdings Ltd. | 4,646,133 | 14,881,209 | ||||||
Redefine Properties Ltd. | 29,414,401 | 24,124,448 | ||||||
Remgro Ltd. | 3,276,887 | 54,797,568 | ||||||
Resilient REIT Ltd. | 1,765,540 | 16,987,762 | ||||||
Reunert Ltd. | 1,308,180 | 6,995,077 | ||||||
RMB Holdings Ltd. | 4,346,365 | 22,220,885 | ||||||
Royal Bafokeng Platinum Ltd.a,b | 494,201 | 1,226,234 | ||||||
SA Corporate Real Estate Ltd. | 15,629,008 | 6,505,323 | ||||||
Sanlam Ltd. | 8,802,153 | 48,624,319 | ||||||
Sappi Ltd. | 3,560,159 | 23,939,827 | ||||||
Sasol Ltd. | 3,458,370 | 104,271,286 | ||||||
Shoprite Holdings Ltd. | 2,772,378 | 48,075,882 | ||||||
Sibanye Gold Ltd. | 11,036,971 | 17,637,075 | ||||||
SPAR Group Ltd. (The) | 1,213,226 | 15,779,639 | ||||||
Standard Bank Group Ltd. | 8,096,725 | 104,299,647 | ||||||
Steinhoff International Holdings NV Class H | 18,883,009 | 91,324,174 | ||||||
Sun International Ltd./South Africa | 894,347 | 3,990,931 | ||||||
Super Group Ltd./South Africaa | 2,670,539 | 8,487,784 | ||||||
Telkom SA SOC Ltd. | 1,747,941 | 8,440,144 | ||||||
Tiger Brands Ltd. | 1,020,548 | 31,643,073 | ||||||
Tongaat Hulett Ltd. | 724,176 | 6,609,098 | ||||||
Trencor Ltd. | 1,347,761 | 4,090,723 | ||||||
Truworths International Ltd. | 2,856,336 | 18,246,707 | ||||||
Tsogo Sun Holdings Ltd. | 2,944,233 | 4,944,998 | ||||||
Vodacom Group Ltd. | 3,346,484 | 46,754,224 | ||||||
Vukile Property Fund Ltd. | 4,544,693 | 6,556,106 | ||||||
Wilson Bayly Holmes-Ovcon Ltd. | 451,676 | 4,821,700 | ||||||
Woolworths Holdings Ltd./South Africa | 6,317,946 | 28,844,541 | ||||||
Zeder Investments Ltd. | 10,841,524 | 5,296,686 | ||||||
|
| |||||||
| 2,407,897,090 | ||||||||
| Security | Shares | Value | ||||||
SOUTH KOREA — 14.02% |
| |||||||
Advanced Process Systems Corp.a | 71,026 | $ | 2,771,501 | |||||
Ahnlab Inc.b | 40,960 | 1,881,632 | ||||||
AK Holdings Inc.b | 40,085 | 2,495,537 | ||||||
ALUKO Co. Ltd.b | 395,994 | 1,422,291 | ||||||
Amicogen Inc.a | 60,167 | 1,622,097 | ||||||
AmorePacific Corp.b | 203,099 | 51,873,459 | ||||||
AmorePacific Group | 186,889 | 22,209,228 | ||||||
Aprogen pharmaceuticals Inc.a,b | 751,452 | 2,622,352 | ||||||
Asiana Airlines Inc.a | 740,879 | 2,946,827 | ||||||
ATGen Co. Ltd.a,b | 73,643 | 1,893,976 | ||||||
BGF retail Co. Ltd. | 154,418 | 12,489,288 | ||||||
Binex Co. Ltd.a,b | 249,093 | 2,114,065 | ||||||
Binggrae Co. Ltd. | 54,696 | 2,939,498 | ||||||
BNK Financial Group Inc. | 1,513,049 | 13,230,457 | ||||||
Boditech Med Inc.b | 168,565 | 2,272,249 | ||||||
Bukwang Pharmaceutical Co. Ltd. | 200,233 | 3,791,215 | ||||||
Byucksan Corp.b | 560,034 | 1,800,393 | ||||||
Caregen Co. Ltd.b | 29,396 | 1,777,942 | ||||||
Cell Biotech Co. Ltd.b | 67,066 | 2,277,960 | ||||||
Celltrion Inc.a,b | 501,974 | 51,239,098 | ||||||
Chabiotech Co. Ltd.a,b | 276,627 | 3,078,812 | ||||||
Cheil Worldwide Inc. | 436,747 | 7,359,164 | ||||||
Chong Kun Dang Pharmaceutical Corp. | 42,004 | 3,874,083 | ||||||
CJ CGV Co. Ltd.b | 105,810 | 6,136,905 | ||||||
CJ CheilJedang Corp.b | 48,433 | 15,570,204 | ||||||
CJ Corp. | 91,628 | 14,382,898 | ||||||
CJ E&M Corp. | 129,066 | 8,699,021 | ||||||
CJ Freshway Corp. | 68,807 | 2,605,586 | ||||||
CJ Logistics Corp.a,b | 55,344 | 8,294,729 | ||||||
CJ O Shopping Co. Ltd. | 21,982 | 4,171,823 | ||||||
Com2uSCorp.b | 63,153 | 6,104,715 | ||||||
Cosmax Inc.b | 52,537 | 5,497,841 | ||||||
Coway Co. Ltd. | 338,031 | 29,618,183 | ||||||
CrystalGenomics Inc.a,b | 170,206 | 2,037,762 | ||||||
Daeduck Electronics Co. | 433,665 | 4,634,324 | ||||||
Daeduck GDS Co. Ltd.b | 257,439 | 4,257,926 | ||||||
Daekyo Co. Ltd. | 269,987 | 2,023,226 | ||||||
Daelim Industrial Co. Ltd. | 171,330 | 12,732,755 | ||||||
Daesang Corp. | 149,908 | 3,203,958 | ||||||
Daewoo Engineering & Construction Co. Ltd.a,b | 826,442 | 5,152,436 | ||||||
CONSOLIDATED SCHEDULESOF INVESTMENTS | 31 |
Table of Contents
Consolidated Schedule of Investments (Continued)
iSHARES® CORE MSCI EMERGING MARKETS ETF
August 31, 2017
| Security | Shares | Value | ||||||
Daewoo Shipbuilding & Marine Engineering Co. Ltd.a,b,d | 397,780 | $ | 1,185,297 | |||||
Daewoong Pharmaceutical Co. Ltd.b | 37,347 | 3,345,200 | ||||||
Daishin Securities Co. Ltd. | 264,845 | 3,311,737 | ||||||
Daou Technology Inc.b | 180,825 | 3,159,146 | ||||||
Dawonsys Co. Ltd.b | 214,369 | 2,167,264 | ||||||
DGB Financial Group Inc. | 1,044,107 | 10,185,506 | ||||||
DIO Corp.a,b | 87,063 | 2,640,612 | ||||||
Dong-A Socio Holdings Co. Ltd. | 29,607 | 3,321,466 | ||||||
Dong-A ST Co. Ltd.b | 44,159 | 3,270,022 | ||||||
Dongbu HiTek Co. Ltd.a | 244,094 | 3,452,731 | ||||||
Dongbu Insurance Co. Ltd. | 312,453 | 20,837,589 | ||||||
DongKook Pharmaceutical Co. Ltd. | 54,621 | 2,867,651 | ||||||
Dongkuk Steel Mill Co. Ltd. | 378,978 | 4,251,571 | ||||||
Dongsuh Cos. Inc. | 249,499 | 5,863,536 | ||||||
Dongwon Industries Co. Ltd.b | 13,170 | 3,363,746 | ||||||
Doosan Bobcat Inc. | 194,759 | 6,589,266 | ||||||
Doosan Heavy Industries & Construction Co. Ltd. | 335,531 | 5,356,117 | ||||||
Doosan Infracore Co. Ltd.a,b | 851,128 | 6,317,791 | ||||||
DoubleUGames Co. Ltd. | 75,722 | 3,585,983 | ||||||
Douzone Bizon Co. Ltd.b | 150,734 | 4,418,019 | ||||||
E-MART Inc. | 134,250 | 26,669,032 | ||||||
E1 Corp. | 26,993 | 1,414,763 | ||||||
Emerson Pacific Inc.a,b | 61,848 | 1,593,370 | ||||||
EO Technics Co. Ltd.b | 59,392 | 3,802,858 | ||||||
Fila Korea Ltd.b | 80,099 | 5,029,274 | ||||||
Foosung Co. Ltd.a,b | 425,185 | 4,223,193 | ||||||
G-SMATT GLOBAL Co. Ltd.a,b | 146,378 | 1,726,523 | ||||||
G-treeBNT Co. Ltd.a,b | 149,444 | 3,618,146 | ||||||
GemVax & Kael Co. Ltd.a,b | 248,661 | 2,348,563 | ||||||
Genexine Co. Ltd.a,b | 82,816 | 3,404,152 | ||||||
Golfzon Co. Ltd. | 12,997 | 567,092 | ||||||
GOLFZONNEWDIN Co. Ltd. | 1 | 5 | ||||||
Grand Korea Leisure Co. Ltd.b | 225,337 | 4,616,251 | ||||||
Green Cross Cell Corp. | 97,425 | 2,846,891 | ||||||
Green Cross Corp./South Koreab | 37,794 | 6,083,373 | ||||||
Green Cross Holdings Corp. | 180,240 | 5,394,732 | ||||||
GS Engineering & Construction Corp.a,b | 297,457 | 7,518,202 | ||||||
GS Holdings Corp. | 316,438 | 19,812,454 | ||||||
GS Home Shopping Inc. | 25,232 | 4,934,069 | ||||||
| Security | Shares | Value | ||||||
GS Retail Co. Ltd. | 172,288 | $ | 6,165,148 | |||||
Gwangju Shinsegae Co. Ltd. | 9,388 | 2,048,109 | ||||||
Halla Holdings Corp.b | 59,056 | 3,346,646 | ||||||
Hana Financial Group Inc. | 1,859,582 | 80,808,370 | ||||||
Hana Tour Service Inc.b | 73,350 | 5,535,726 | ||||||
Hanall Biopharma Co. Ltd.a,b | 217,677 | 2,451,665 | ||||||
Hancom Inc. | 182,460 | 2,669,910 | ||||||
Handsome Co. Ltd. | 132,874 | 3,876,866 | ||||||
Hanil Cement Co. Ltd. | 24,452 | 2,786,522 | ||||||
Hanjin Heavy Industries & Construction Co. Ltd.a,b | 558,234 | 2,326,800 | ||||||
Hanjin Kal Corp.a,b | 290,843 | 5,919,517 | ||||||
Hanjin Transportation Co. Ltd. | 78,388 | 2,123,761 | ||||||
Hankook Shell Oil Co. Ltd. | 9,270 | 3,304,842 | ||||||
Hankook Tire Co. Ltd. | 467,770 | 24,475,372 | ||||||
Hankook Tire Worldwide Co. Ltd.b | 196,721 | 3,715,996 | ||||||
Hanmi Pharm Co. Ltd.a,b | 39,396 | 14,079,982 | ||||||
Hanmi Science Co. Ltd.a,b | 89,575 | 7,109,757 | ||||||
Hanon Systems | 1,192,138 | 12,211,062 | ||||||
Hansae Co. Ltd. | 141,677 | 3,153,683 | ||||||
Hansol Chemical Co. Ltd. | 62,858 | 4,303,510 | ||||||
Hansol Holdings Co. Ltd.a | 434,558 | 2,427,914 | ||||||
Hansol Technics Co. Ltd.a | 160,477 | 2,291,309 | ||||||
Hanssem Co. Ltd.b | 68,751 | 10,365,085 | ||||||
Hanwha Chemical Corp. | 653,444 | 20,485,319 | ||||||
Hanwha Corp. | 267,710 | 11,668,984 | ||||||
Hanwha General Insurance Co. Ltd. | 540,258 | 4,642,692 | ||||||
Hanwha Investment & Securities Co. Ltd.a,b | 1,026,889 | 2,836,785 | ||||||
Hanwha Life Insurance Co. Ltd. | 1,465,279 | 9,512,099 | ||||||
Hanwha Techwin Co. Ltd.a,b | 235,318 | 8,097,143 | ||||||
Hite Jinro Co. Ltd. | 183,751 | 4,253,194 | ||||||
HLB Inc.a,b | 226,347 | 2,709,901 | ||||||
HMC Investment Securities Co. Ltd. | 291,200 | 2,827,811 | ||||||
Homecast Co. Ltd.a,b | 221,665 | 2,191,881 | ||||||
Hotel Shilla Co. Ltd.b | 207,299 | 11,379,752 | ||||||
HS Industries Co. Ltd.b | 276,349 | 2,367,445 | ||||||
Huchems Fine Chemical Corp. | 159,329 | 3,384,116 | ||||||
Hugel Inc.a | 16,207 | 8,336,343 | ||||||
Humedix Co. Ltd.b | 100,161 | 2,846,896 | ||||||
Huons Co. Ltd.a | 55,107 | 3,289,022 | ||||||
Huons Global Co. Ltd.b | 70,453 | 2,858,482 | ||||||
| 32 | 2017 iSHARES ANNUAL REPORTTO SHAREHOLDERS |
Table of Contents
Consolidated Schedule of Investments (Continued)
iSHARES® CORE MSCI EMERGING MARKETS ETF
August 31, 2017
| Security | Shares | Value | ||||||
Hy-Lok Corp.b | 123,444 | �� | $ | 2,402,976 | ||||
Hyosung Corp. | 129,870 | 18,255,051 | ||||||
Hyundai Construction Equipment Co. Ltd.a,b | 13,555 | 4,033,081 | ||||||
Hyundai Corp. | 118,138 | 2,352,074 | ||||||
Hyundai Department Store Co. Ltd. | 89,022 | 7,626,397 | ||||||
Hyundai Development Co. Engineering & Construction | 381,588 | 12,741,032 | ||||||
Hyundai Electric & Energy System Co. Ltd.a,b | 12,399 | 2,985,392 | ||||||
Hyundai Elevator Co. Ltd. | 90,626 | 4,179,276 | ||||||
Hyundai Engineering & Construction Co. Ltd. | 490,590 | 17,685,778 | ||||||
Hyundai Glovis Co. Ltd. | 122,949 | 16,900,581 | ||||||
Hyundai Greenfood Co. Ltd. | 330,739 | 5,074,304 | ||||||
Hyundai Heavy Industries Co. Ltd.a | 194,633 | 25,632,317 | ||||||
Hyundai Home Shopping Network Corp. | 47,929 | 5,844,482 | ||||||
Hyundai Livart Furniture Co. Ltd.b | 97,416 | 2,034,540 | ||||||
Hyundai Marine & Fire Insurance Co. Ltd. | 402,119 | 16,475,610 | ||||||
Hyundai Mipo Dockyard Co. Ltd.a,b | 77,375 | 6,930,538 | ||||||
Hyundai Mobis Co. Ltd. | 426,114 | 89,183,136 | ||||||
Hyundai Motor Co. | 974,833 | 121,465,091 | ||||||
Hyundai Robotics Co. Ltd.a | 58,374 | 22,933,382 | ||||||
Hyundai Rotem Co. Ltd.a | 178,507 | 2,928,680 | ||||||
Hyundai Steel Co. | 480,009 | 24,562,362 | ||||||
Hyundai Wia Corp.b | 101,835 | 6,321,790 | ||||||
Il Dong Pharmaceutical Co. Ltd. | 123,055 | 2,160,774 | ||||||
IlDong Holdings Co. Ltd. | 1 | 13 | ||||||
Ilyang Pharmaceutical Co. Ltd.b | 108,588 | 3,486,064 | ||||||
iMarketKorea Inc.b | 187,869 | 1,891,019 | ||||||
InBody Co. Ltd. | 119,514 | 3,338,676 | ||||||
Industrial Bank of Korea | 1,436,464 | 19,044,995 | ||||||
Innocean Worldwide Inc. | 69,555 | 4,422,751 | ||||||
Interpark Holdings Corp.b | 619,727 | 2,665,552 | ||||||
IS Dongseo Co. Ltd.b | 98,029 | 3,103,614 | ||||||
JB Financial Group Co. Ltd. | 744,208 | 4,105,156 | ||||||
Jeil Pharma Holdings Inc.b | 11,898 | 422,592 | ||||||
Jeil Pharmaceutical Co. Ltd.a | 37,101 | 1,633,615 | ||||||
Jenax Inc.a,b | 112,909 | 2,838,746 | ||||||
| Security | Shares | Value | ||||||
Jusung Engineering Co. Ltd.a | 306,787 | $ | 4,434,754 | |||||
JW Holdings Corp.b | 262,169 | 2,171,567 | ||||||
JW Pharmaceutical Corp. | 84,418 | 3,417,596 | ||||||
JW Shinyak Corp.b | 338,611 | 2,225,175 | ||||||
Kakao Corp.b | 212,743 | 23,206,269 | ||||||
Kangwon Land Inc. | 728,246 | 22,281,383 | ||||||
KB Financial Group Inc. | 2,471,438 | 121,423,967 | ||||||
KC Tech Co. Ltd.b | 183,506 | 4,231,249 | ||||||
KCC Corp. | 31,765 | 11,155,498 | ||||||
KEPCO Engineering & Construction Co. Inc.b | 116,267 | 1,866,294 | ||||||
KEPCO Plant Service & Engineering Co. Ltd. | 156,059 | 6,331,766 | ||||||
Kia Motors Corp. | 1,624,069 | 51,058,217 | ||||||
KISWIRE Ltd. | 59,644 | 2,047,023 | ||||||
KIWOOM Securities Co. Ltd.b | 77,815 | 5,569,059 | ||||||
Koh Young Technology Inc. | 97,693 | 5,284,918 | ||||||
Kolon Corp. | 48,634 | 2,863,868 | ||||||
Kolon Industries Inc.b | 100,518 | 6,373,747 | ||||||
Kolon Life Science Inc.b | 37,429 | 4,348,350 | ||||||
Komipharm International Co. Ltd.a,b | 235,242 | 7,687,715 | ||||||
Korea Aerospace Industries Ltd. Class Ab | 431,731 | 17,708,016 | ||||||
Korea Electric Power Corp. | 1,580,618 | 60,135,254 | ||||||
Korea Gas Corp.a | 151,381 | 6,081,553 | ||||||
Korea Investment Holdings Co. Ltd. | 237,846 | 13,858,179 | ||||||
Korea Kolmar Co. Ltd.b | 98,464 | 5,929,147 | ||||||
Korea PetroChemical Ind. Co. Ltd. | 21,144 | 5,015,981 | ||||||
Korea REIT Co. Ltd.b | 1,129,879 | 3,401,862 | ||||||
Korea Zinc Co. Ltd. | 55,551 | 25,420,642 | ||||||
Korean Air Lines Co. Ltd.a | 291,256 | 8,575,469 | ||||||
Korean Reinsurance Co. | 609,481 | 6,729,371 | ||||||
KT Corp. | 51,660 | 1,429,401 | ||||||
KT Skylife Co. Ltd. | 224,940 | 3,211,719 | ||||||
KT&G Corp. | 732,061 | 74,335,744 | ||||||
Kukdo Chemical Co. Ltd. | 67,402 | 3,233,814 | ||||||
Kumho Industrial Co. Ltd. | 235,950 | 1,931,375 | ||||||
Kumho Petrochemical Co. Ltd.b | 111,850 | 7,816,407 | ||||||
Kumho Tire Co. Inc.a,b | 771,799 | 4,599,583 | ||||||
Kwang Dong Pharmaceutical Co. Ltd. | 445,945 | 3,416,961 | ||||||
CONSOLIDATED SCHEDULESOF INVESTMENTS | 33 |
Table of Contents
Consolidated Schedule of Investments (Continued)
iSHARES® CORE MSCI EMERGING MARKETS ETF
August 31, 2017
| Security | Shares | Value | ||||||
Kwangju Bank Co. Ltd. | 325,773 | $ | 3,669,135 | |||||
Leaders Cosmetics Co. Ltd.a,b | 152,305 | 1,924,748 | ||||||
LF Corp. | 147,954 | 3,818,252 | ||||||
LG Chem Ltd. | 287,678 | 96,692,056 | ||||||
LG Corp. | 589,717 | 43,930,674 | ||||||
LG Display Co. Ltd. | 1,454,757 | 40,187,727 | ||||||
LG Electronics Inc.b | 656,734 | 47,467,028 | ||||||
LG Hausys Ltd. | 44,210 | 3,889,351 | ||||||
LG Household & Health Care Ltd. | 59,294 | 50,480,880 | ||||||
LG Innotek Co. Ltd.b | 96,283 | 15,754,003 | ||||||
LG International Corp. | 192,100 | 4,914,939 | ||||||
Loen Entertainment Inc. | 53,952 | 3,842,094 | ||||||
Lotte Chemical Corp. | 97,288 | 34,468,389 | ||||||
Lotte Chilsung Beverage Co. Ltd.b | 3,966 | 5,441,116 | ||||||
Lotte Confectionery Co. Ltd.b | 36,440 | 6,382,494 | ||||||
LOTTE Fine Chemical Co. Ltd. | 123,723 | 4,778,411 | ||||||
Lotte Food Co. Ltd.b | 6,139 | 3,364,581 | ||||||
LOTTE Himart Co. Ltd. | 50,681 | 3,074,300 | ||||||
Lotte Shopping Co. Ltd. | 77,321 | 17,622,825 | ||||||
LS Corp. | 112,365 | 8,420,400 | ||||||
LS Industrial Systems Co. Ltd. | 101,975 | 5,263,342 | ||||||
Lutronic Corp.b | 210,702 | 1,971,361 | ||||||
Macrogen Inc.a,b | 144,440 | 3,266,424 | ||||||
Maeil Dairies Co. Ltd.a,b | 32,431 | 2,079,426 | ||||||
Maeil Holdings Co. Ltd. | 28,200 | 553,946 | ||||||
Mando Corp. | 42,817 | 9,094,246 | ||||||
Medipost Co. Ltd.a,b | 62,170 | 5,011,753 | ||||||
Medy-Tox Inc. | 27,960 | 14,111,419 | ||||||
Meritz Fire & Marine Insurance Co. Ltd. | 390,509 | 8,761,864 | ||||||
Meritz Securities Co. Ltd. | 2,092,772 | 8,954,971 | ||||||
Mirae Asset Daewoo Co. Ltd. | 2,224,648 | 20,024,989 | ||||||
Modetour Network Inc. | 163,747 | 3,949,910 | ||||||
Muhak Co. Ltd. | 130,072 | 2,307,059 | ||||||
Namhae Chemical Corp. | 324,131 | 2,722,171 | ||||||
Namyang Dairy Products Co. Ltd. | 4,219 | 2,533,046 | ||||||
Naturalendo Tech Co. Ltd.a,b | 90,659 | 2,588,879 | ||||||
NAVER Corp. | 176,166 | 117,954,354 | ||||||
NCsoft Corp. | 114,613 | 39,081,854 | ||||||
Netmarble Games Corp.a,b,c | 103,653 | 14,202,189 | ||||||
Nexen Corp. | 346,513 | 2,698,106 | ||||||
Nexen Tire Corp. | 258,469 | 3,025,710 | ||||||
| Security | Shares | Value | ||||||
NH Investment & Securities Co. Ltd. | 808,427 | $ | 9,893,839 | |||||
NHN Entertainment Corp.a,b | 74,418 | 4,230,395 | ||||||
NHN KCP Corp.a | 136,872 | 2,069,588 | ||||||
NICE Holdings Co. Ltd.b | 192,652 | 2,759,250 | ||||||
NICE Information Service Co. Ltd. | 341,190 | 2,447,878 | ||||||
Nong Shim Holdings Co. Ltd.b | 26,997 | 2,729,388 | ||||||
NongShim Co. Ltd.b | 20,056 | 5,913,994 | ||||||
NS Shopping Co. Ltd.b | 186,422 | 2,711,352 | ||||||
NUTRIBIOTECH Co. Ltd.a,b | 97,657 | 1,749,443 | ||||||
OCI Co. Ltd.b | 105,806 | 9,223,776 | ||||||
Orion Corp./Republic of Koreaa | 148,977 | 11,533,959 | ||||||
Orion Holdings Corp.b | 75,381 | 1,838,398 | ||||||
Osstem Implant Co. Ltd.a,b | 84,346 | 5,355,777 | ||||||
Ottogi Corp.b | 8,519 | 5,749,343 | ||||||
Pan Ocean Co. Ltd.a,b | 1,338,449 | 7,632,340 | ||||||
Paradise Co. Ltd.b | 327,267 | 4,237,405 | ||||||
Partron Co. Ltd.b | 292,439 | 2,331,524 | ||||||
Poongsan Corp. | 160,802 | 8,128,515 | ||||||
POSCO | 452,726 | 137,913,605 | ||||||
POSCO Chemtech Co. Ltd.b | 197,537 | 5,781,058 | ||||||
Posco Daewoo Corp. | 229,329 | 4,301,444 | ||||||
POSCO ICT Co. Ltd.b | 391,353 | 2,297,585 | ||||||
Pyeong Hwa Automotive Co. Ltd.b | 178,674 | 1,814,311 | ||||||
S&T Dynamics Co. Ltd.a | 299,146 | 2,395,609 | ||||||
S&T Motiv Co. Ltd. | 83,172 | 3,857,658 | ||||||
S-1 Corp. | 108,191 | 8,606,538 | ||||||
S-Oil Corp. | 284,843 | 31,702,551 | ||||||
Samchully Co. Ltd. | 19,587 | 1,867,331 | ||||||
Samjin Pharmaceutical Co. Ltd. | 125,165 | 3,735,192 | ||||||
Samkwang Glass | 53,477 | 2,499,324 | ||||||
Samsung Biologics Co. Ltd.a,b,c | 111,045 | 27,869,577 | ||||||
Samsung C&T Corp. | 472,936 | 54,104,952 | ||||||
Samsung Card Co. Ltd. | 173,611 | 5,712,104 | ||||||
Samsung Electro-Mechanics Co. Ltd. | 352,189 | 31,545,840 | ||||||
Samsung Electronics Co. Ltd. | 619,553 | 1,272,512,192 | ||||||
Samsung Engineering Co. Ltd.a,b | 806,106 | 7,649,285 | ||||||
Samsung Fire & Marine Insurance Co. Ltd. | 192,140 | 47,114,855 | ||||||
Samsung Heavy Industries Co. Ltd.a,b | 1,576,613 | 14,960,765 | ||||||
| 34 | 2017 iSHARES ANNUAL REPORTTO SHAREHOLDERS |
Table of Contents
Consolidated Schedule of Investments (Continued)
iSHARES® CORE MSCI EMERGING MARKETS ETF
August 31, 2017
| Security | Shares | Value | ||||||
Samsung Life Insurance Co. Ltd. | 438,088 | $ | 44,873,327 | |||||
Samsung SDI Co. Ltd. | 348,679 | 60,762,171 | ||||||
Samsung SDS Co. Ltd. | 219,188 | 32,559,409 | ||||||
Samsung Securities Co. Ltd.b | 369,926 | 11,990,773 | ||||||
Samyang Corp. | 25,497 | 2,227,257 | ||||||
Samyang Holdings Corp. | 27,430 | 2,602,882 | ||||||
Seah Besteel Corp. | 99,129 | 3,116,462 | ||||||
Sebang Co. Ltd. | 153,230 | 2,011,178 | ||||||
Sebang Global Battery Co. Ltd. | 90,033 | 2,930,304 | ||||||
Seegene Inc.a,b | 118,179 | 3,301,382 | ||||||
Seobu T&Db | 261,904 | 3,274,961 | ||||||
Seoul Semiconductor Co. Ltd. | 251,739 | 5,123,634 | ||||||
SFA Engineering Corp. | 133,592 | 4,484,265 | ||||||
Shinhan Financial Group Co. Ltd. | 2,630,885 | 121,324,956 | ||||||
Shinsegae Food Co. Ltd.b | 18,698 | 2,246,877 | ||||||
Shinsegae Inc.b | 47,803 | 8,181,961 | ||||||
Shinsegae International Inc. | 32,638 | 1,913,242 | ||||||
Silicon Works Co. Ltd. | 95,915 | 3,729,933 | ||||||
SillaJen Inc.a,b | 171,381 | 3,792,086 | ||||||
Sindoh Co. Ltd. | 57,686 | 3,402,021 | ||||||
SK Bioland Co. Ltd.b | 173,239 | 2,511,935 | ||||||
SK Chemicals Co. Ltd. | 99,869 | 6,058,034 | ||||||
SK Gas Ltd. | 35,612 | 3,537,198 | ||||||
SK Holdings Co. Ltd. | 226,630 | 53,763,325 | ||||||
SK Hynix Inc. | 3,702,715 | 225,262,725 | ||||||
SK Innovation Co. Ltd. | 404,295 | 67,585,675 | ||||||
SK Materials Co. Ltd.b | 40,505 | 6,559,252 | ||||||
SK Networks Co. Ltd.b | 854,330 | 5,311,150 | ||||||
SK Securities Co. Ltd.a,b | 2,719,158 | 3,038,435 | ||||||
SK Telecom Co. Ltd. | 127,338 | 28,627,335 | ||||||
SKC Co. Ltd. | 143,917 | 4,709,593 | ||||||
SL Corp. | 127,630 | 2,212,812 | ||||||
SM Entertainment Co.a,b | 179,631 | 4,699,463 | ||||||
Songwon Industrial Co. Ltd. | 139,285 | 2,575,463 | ||||||
Soulbrain Co. Ltd. | 68,905 | 3,941,444 | ||||||
SPC Samlip Co. Ltd. | 18,394 | 2,585,535 | ||||||
Ssangyong Cement Industrial Co. Ltd. | 199,269 | 2,359,206 | ||||||
Ssangyong Motor Co.a | 379,798 | 1,859,245 | ||||||
Sung Kwang Bend Co. Ltd.b | 217,056 | 1,897,989 | ||||||
Sungwoo Hitech Co. Ltd. | 319,030 | 1,833,376 | ||||||
Taekwang Industrial Co. Ltd. | 3,037 | 3,277,784 | ||||||
Taewoong Co. Ltd.a,b | 81,287 | 1,430,957 | ||||||
| Security | Shares | Value | ||||||
Taeyoung Engineering & Construction Co. Ltd.a | 540,218 | $ | 4,393,224 | |||||
Tera Resource Co. Ltd.a,d | 49,111 | — | ||||||
Tongyang Inc. | 1,228,871 | 2,310,400 | ||||||
Tongyang Life Insurance Co. Ltd. | 346,084 | 2,814,465 | ||||||
Toptec Co. Ltd.b | 140,182 | 3,487,145 | ||||||
Value Added Technologies Co. Ltd.b | 91,017 | 2,627,353 | ||||||
Vieworks Co. Ltd.b | 55,356 | 2,356,410 | ||||||
ViroMed Co. Ltd.a,b | 91,888 | 10,145,491 | ||||||
Webzen Inc.a | 129,335 | 2,133,408 | ||||||
Wonik Holdings Co. Ltd.a,b | 218,824 | 1,606,831 | ||||||
WONIK IPS Co. Ltd.a,b | 180,038 | 4,853,809 | ||||||
Woongjin Thinkbig Co. Ltd.a | 365,731 | 2,416,367 | ||||||
Woori Bank | 2,158,209 | 35,600,113 | ||||||
YG Entertainment Inc.b | 116,552 | 2,842,480 | ||||||
Youlchon Chemical Co. Ltd. | 243,224 | 2,976,668 | ||||||
Youngone Corp.b | 156,042 | 4,677,385 | ||||||
Youngone Holdings Co. Ltd. | 59,639 | 2,824,337 | ||||||
Yuanta Securities Korea Co. Ltd.a | 638,140 | 2,071,295 | ||||||
Yuhan Corp. | 51,588 | 10,339,560 | ||||||
Yungjin Pharmaceutical Co. Ltd.a,b | 608,977 | 5,643,677 | ||||||
|
| |||||||
| 5,154,522,148 | ||||||||
TAIWAN — 12.63% |
| |||||||
A-DATA Technology Co. Ltd.b | 1,745,820 | 4,344,448 | ||||||
AcBel Polytech Inc.b | 3,661,000 | 2,917,494 | ||||||
Accton Technology Corp.b | 3,134,000 | 8,203,917 | ||||||
Acer Inc.b | 17,769,872 | 8,950,000 | ||||||
Advanced Ceramic X Corp.b | 325,000 | 4,630,703 | ||||||
Advanced Semiconductor Engineering Inc.b | 40,480,444 | 48,824,950 | ||||||
Advanced Wireless Semiconductor Co.b | 1,524,000 | 2,893,575 | ||||||
Advantech Co. Ltd.b | 2,070,165 | 15,262,657 | ||||||
Airtac International Groupb | 758,880 | 10,548,731 | ||||||
Alpha Networks Inc.b | 3,351,700 | 2,387,804 | ||||||
Ambassador Hotel (The)b | 3,059,000 | 2,371,868 | ||||||
AmTRAN Technology Co. Ltd.b | 5,350,000 | 2,978,230 | ||||||
Ardentec Corp.b | 4,454,546 | 4,324,802 | ||||||
Asia Cement Corp. | 13,886,050 | 12,584,362 | ||||||
Asia Optical Co. Inc.b | 2,081,000 | 8,205,673 | ||||||
Asia Pacific Telecom Co. Ltd.a | 11,965,000 | 4,103,441 | ||||||
CONSOLIDATED SCHEDULESOF INVESTMENTS | 35 |
Table of Contents
Consolidated Schedule of Investments (Continued)
iSHARES® CORE MSCI EMERGING MARKETS ETF
August 31, 2017
| Security | Shares | Value | ||||||
Asia Polymer Corp.b | 7,042,977 | $ | 4,340,746 | |||||
Asustek Computer Inc.b | 4,174,000 | 34,577,024 | ||||||
AU Optronics Corp.b | 54,712,000 | 22,480,162 | ||||||
Bank of Kaohsiung Co. Ltd.b | 15,837,149 | 5,053,572 | ||||||
BES Engineering Corp.b | 15,107,000 | 3,228,740 | ||||||
Bioteque Corp.b | 901,000 | 2,307,807 | ||||||
Bizlink Holding Inc.b | 717,055 | 6,248,897 | ||||||
Brogent Technologies Inc.b | 353,799 | 3,241,506 | ||||||
Capital Securities Corp. | 15,684,000 | 5,124,233 | ||||||
Catcher Technology Co. Ltd. | 4,143,000 | 52,715,862 | ||||||
Cathay Financial Holding Co. Ltd. | 51,359,078 | 83,814,394 | ||||||
Cathay Real Estate Development Co. Ltd.b | 5,588,900 | 3,064,922 | ||||||
Center Laboratories Inc.a,b | 2,043,736 | 4,070,000 | ||||||
Chailease Holding Co. Ltd.b | 6,780,945 | 18,469,587 | ||||||
Chang Hwa Commercial Bank Ltd. | 29,853,470 | 16,322,020 | ||||||
Cheng Loong Corp.b | 8,276,000 | 4,963,571 | ||||||
Cheng Shin Rubber Industry Co. Ltd.b | 11,450,650 | 23,031,063 | ||||||
Cheng Uei Precision Industry Co. Ltd. | 2,788,000 | 3,806,143 | ||||||
Chicony Electronics Co. Ltd. | 3,252,326 | 8,168,803 | ||||||
Chin-Poon Industrial Co. Ltd.b | 2,428,000 | 4,384,705 | ||||||
China Airlines Ltd. | 12,082,000 | 5,124,411 | ||||||
China Bills Finance Corp.b | 10,820,000 | 5,359,985 | ||||||
China Development Financial Holding Corp. | 73,209,000 | 22,851,280 | ||||||
China Life Insurance Co. Ltd./Taiwanb | 21,974,369 | 24,246,877 | ||||||
China Man-Made Fiber Corp. | 12,986,550 | 3,743,762 | ||||||
China Metal Products | 2,642,146 | 2,766,553 | ||||||
China Motor Corp.b | 3,708,000 | 3,452,560 | ||||||
China Petrochemical Development Corp.a,b | 15,023,900 | 6,845,112 | ||||||
China Steel Chemical Corp.b | 1,199,000 | 4,588,770 | ||||||
China Steel Corp.b | 76,182,529 | 63,866,198 | ||||||
China Synthetic Rubber Corp. | 4,807,005 | 5,821,798 | ||||||
Chipbond Technology Corp.b | 4,219,000 | 7,059,860 | ||||||
Chlitina Holding Ltd.b | 478,000 | 1,773,949 | ||||||
Chong Hong Construction Co. Ltd.b | 1,640,122 | 3,662,952 | ||||||
Chroma ATE Inc.b | 2,507,000 | 8,597,849 | ||||||
Chunghwa Telecom Co. Ltd. | 22,868,000 | 79,563,272 | ||||||
| Security | Shares | Value | ||||||
Cleanaway Co. Ltd.b | 670,000 | $ | 3,774,148 | |||||
Clevo Co.b | 2,747,175 | 2,776,395 | ||||||
CMC Magnetics Corp.a,b | 26,530,566 | 3,516,427 | ||||||
Compal Electronics Inc.b | 23,824,000 | 17,130,481 | ||||||
Compeq Manufacturing Co. Ltd.b | 7,236,000 | 7,804,493 | ||||||
Continental Holdings Corp.b | 7,446,600 | 3,059,672 | ||||||
Coretronic Corp. | 3,132,200 | 3,803,808 | ||||||
CSBC Corp. Taiwana,b | 6,684,000 | 2,790,629 | ||||||
CTBC Financial Holding Co. Ltd.b | 106,502,599 | 68,992,538 | ||||||
CTCI Corp.b | 3,941,000 | 6,372,670 | ||||||
Cub Elecparts Inc.b | 370,061 | 4,537,015 | ||||||
D-Link Corp.b | 7,130,991 | 2,575,559 | ||||||
Darwin Precisions Corp.b | 5,207,000 | 3,847,579 | ||||||
Delta Electronics Inc. | 12,080,000 | 66,246,065 | ||||||
Depo Auto Parts Ind. Co. Ltd. | 974,000 | 2,678,750 | ||||||
E Ink Holdings Inc. | 5,745,000 | 8,280,841 | ||||||
E.Sun Financial Holding Co. Ltd. | 56,240,926 | 34,662,554 | ||||||
Eclat Textile Co. Ltd.b | 1,110,683 | 13,617,175 | ||||||
Egis Technology Inc.a,b | 527,000 | 4,889,493 | ||||||
Elan Microelectronics Corp.b | 3,153,000 | 4,508,166 | ||||||
Elite Advanced Laser Corp.b | 1,066,560 | 3,763,830 | ||||||
Elite Material Co. Ltd.b | 2,078,000 | 10,466,086 | ||||||
Elite Semiconductor Memory Technology Inc.b | 3,763,000 | 5,517,504 | ||||||
Ennoconn Corp. | 321,000 | 4,690,712 | ||||||
Epistar Corp.a,b | 6,292,000 | 6,369,350 | ||||||
Eternal Materials Co. Ltd.b | 5,801,145 | 6,131,963 | ||||||
EVA Airways Corp. | 11,910,963 | 6,196,432 | ||||||
Evergreen Marine Corp. Taiwan Ltd.a | 10,755,870 | 8,197,257 | ||||||
Everlight Chemical Industrial Corp.b | 6,265,781 | 4,131,649 | ||||||
Everlight Electronics Co. Ltd.b | 2,616,000 | 3,926,731 | ||||||
Far Eastern Department Stores Ltd.b | 5,525,167 | 2,764,506 | ||||||
Far Eastern International Bankb | 15,879,201 | 4,898,617 | ||||||
Far Eastern New Century Corp. | 17,698,916 | 14,163,121 | ||||||
Far EasTone Telecommunications Co. Ltd. | 9,839,000 | 23,864,767 | ||||||
Faraday Technology Corp.b | 2,361,000 | 3,571,346 | ||||||
Farglory Land Development Co. Ltd. | 1,959,782 | 2,373,506 | ||||||
| 36 | 2017 iSHARES ANNUAL REPORTTO SHAREHOLDERS |
Table of Contents
Consolidated Schedule of Investments (Continued)
iSHARES® CORE MSCI EMERGING MARKETS ETF
August 31, 2017
| Security | Shares | Value | ||||||
Feng Hsin Steel Co. Ltd. | 3,236,000 | $ | 5,640,134 | |||||
Feng TAY Enterprise Co. Ltd.b | 2,090,506 | 9,905,642 | ||||||
Firich Enterprises Co. Ltd.b | 1,985,798 | 2,664,927 | ||||||
First Financial Holding Co. Ltd.b | 57,385,052 | 37,269,194 | ||||||
FLEXium Interconnect Inc.b | 2,060,619 | 9,115,366 | ||||||
Formosa Chemicals & Fibre Corp. | 17,925,210 | 56,367,091 | ||||||
Formosa Petrochemical Corp.b | 8,514,000 | 30,045,429 | ||||||
Formosa Plastics Corp. | 25,241,800 | 78,538,223 | ||||||
Formosa Taffeta Co. Ltd. | 3,466,000 | 3,445,442 | ||||||
Formosan Rubber Group Inc. | 7,472,602 | 3,726,520 | ||||||
Foxconn Technology Co. Ltd.b | 5,529,424 | 17,552,564 | ||||||
Fubon Financial Holding Co. Ltd. | 41,487,000 | 66,672,835 | ||||||
General Interface Solution Holding Ltd. | 1,083,000 | 12,972,746 | ||||||
Getac Technology Corp.b | 3,515,000 | 5,014,107 | ||||||
Giant Manufacturing Co. Ltd.b | 1,875,000 | 9,474,718 | ||||||
Gigabyte Technology Co. Ltd. | 3,225,000 | 4,392,044 | ||||||
Gigasolar Materials Corp.b | 237,800 | 1,859,598 | ||||||
Gigastorage Corp.a,b | 4,062,000 | 2,146,821 | ||||||
Ginko International Co. Ltd.b | 316,000 | 2,455,416 | ||||||
Gintech Energy Corp.a,b | 4,386,762 | 2,362,069 | ||||||
Globalwafers Co. Ltd.b | 1,383,000 | 10,975,463 | ||||||
Gloria Material Technology Corp.b | 6,104,048 | 4,500,317 | ||||||
Goldsun Building Materials Co. Ltd.a,b | 11,822,000 | 3,592,158 | ||||||
Gourmet Master Co. Ltd.b | 489,855 | 5,810,931 | ||||||
Grand Pacific Petrochemicalb | 7,001,000 | 5,927,153 | ||||||
Grape King Bio Ltd.b | 744,000 | 4,523,808 | ||||||
Great Wall Enterprise Co. Ltd.b | 4,424,500 | 4,537,535 | ||||||
Greatek Electronics Inc.b | 2,771,000 | 4,434,849 | ||||||
HannStar Display Corp.b | 18,890,640 | 7,699,224 | ||||||
Highwealth Construction Corp.b | 5,222,230 | 8,306,009 | ||||||
Hiwin Technologies Corp. | 1,379,621 | 12,228,656 | ||||||
Ho Tung Chemical Corp.a | 17,248,812 | 5,075,365 | ||||||
Holy Stone Enterprise Co. Ltd. | 3,878,900 | 4,954,823 | ||||||
Hon Hai Precision Industry Co. Ltd. | 97,944,410 | 381,340,276 | ||||||
Hota Industrial Manufacturing Co. Ltd.b | 1,390,219 | 6,495,274 | ||||||
Hotai Motor Co. Ltd. | 1,676,000 | 19,742,801 | ||||||
HTC Corp.a,b | 4,127,000 | 9,394,775 | ||||||
Hu Lane Associate Inc. | 582,000 | 3,239,869 | ||||||
| Security | Shares | Value | ||||||
Hua Nan Financial Holdings Co. Ltd.b | 44,601,182 | $ | 24,902,413 | |||||
Huaku Development Co. Ltd.b | 2,303,000 | 4,723,672 | ||||||
Hung Sheng Construction Ltd. | 6,143,000 | 4,905,607 | ||||||
IEI Integration Corp.b | 2,689,582 | 4,099,565 | ||||||
Innolux Corp.b | 56,870,241 | 27,701,135 | ||||||
International Games System Co. Ltd.b | 389,000 | 2,107,475 | ||||||
Inventec Corp. | 15,735,000 | 12,487,268 | ||||||
ITEQ Corp. | 2,641,000 | 5,198,164 | ||||||
Kenda Rubber Industrial Co. Ltd.b | 2,934,889 | 4,196,311 | ||||||
Kerry TJ Logistics Co. Ltd. | 2,530,000 | 3,068,293 | ||||||
Kindom Construction Corp.b | 4,112,000 | 2,486,630 | ||||||
King Slide Works Co. Ltd.b | 402,000 | 5,594,619 | ||||||
King Yuan Electronics Co. Ltd.b | 7,032,000 | 6,815,534 | ||||||
King’s Town Bank Co. Ltd.b | 6,693,000 | 7,063,589 | ||||||
Kinpo Electronicsb | 10,417,000 | 3,607,066 | ||||||
Kinsus Interconnect Technology Corp.b | 1,864,000 | 5,188,243 | ||||||
Kuoyang Construction Co. Ltd.b | 7,974,023 | 3,527,393 | ||||||
Land Mark Optoelectronics Corp.b | 408,900 | 5,399,339 | ||||||
Largan Precision Co. Ltd. | 632,000 | 122,090,195 | ||||||
LCY Chemical Corp.b | 3,520,000 | 4,717,983 | ||||||
Lealea Enterprise Co. Ltd.a,b | 14,230,173 | 5,351,816 | ||||||
Lien Hwa Industrial Corp. | 5,406,405 | 4,935,434 | ||||||
Lite-On Technology Corp.b | 13,278,238 | 19,645,228 | ||||||
Long Bon International Co. Ltd. | 8,925,000 | 4,583,899 | ||||||
Makalot Industrial Co. Ltd.b | 1,326,208 | 6,262,124 | ||||||
Masterlink Securities Corp. | 15,248,344 | 4,107,791 | ||||||
MediaTek Inc.b | 9,421,572 | 84,447,305 | ||||||
Mega Financial Holding Co. Ltd.b | 66,129,958 | 53,137,993 | ||||||
Merida Industry Co. Ltd.b | 1,334,850 | 5,860,619 | ||||||
Merry Electronics Co. Ltd.b | 1,094,070 | 8,591,888 | ||||||
Micro-Star International Co. Ltd.b | 4,448,000 | 10,125,504 | ||||||
Microbio Co. Ltd.a | 5,469,141 | 4,086,588 | ||||||
Mitac Holdings Corp.b | 4,202,560 | 5,006,197 | ||||||
Motech Industries Inc.a,b | 3,755,948 | 2,688,243 | ||||||
Nan Kang Rubber Tire Co. Ltd.b | 3,920,000 | 3,539,547 | ||||||
Nan Ya Plastics Corp. | 29,002,440 | 73,229,263 | ||||||
Nan Ya Printed Circuit Board Corp.b | 1,906,000 | 1,553,650 | ||||||
CONSOLIDATED SCHEDULESOF INVESTMENTS | 37 |
Table of Contents
Consolidated Schedule of Investments (Continued)
iSHARES® CORE MSCI EMERGING MARKETS ETF
August 31, 2017
| Security | Shares | Value | ||||||
Nanya Technology Corp.b | 4,667,000 | $ | 10,005,464 | |||||
Neo Solar Power Corp.a,b | 6,675,806 | 3,030,536 | ||||||
Nien Made Enterprise Co. Ltd. | 960,000 | 10,322,410 | ||||||
Novatek Microelectronics Corp.b | 3,537,000 | 13,771,083 | ||||||
OBI Pharma Inc.a | 729,000 | 4,589,615 | ||||||
Oriental Union Chemical Corp.b | 4,868,000 | 4,322,953 | ||||||
Pan-International Industrial Corp.b | 3,003,366 | 2,776,564 | ||||||
Parade Technologies Ltd. | 439,000 | 6,996,885 | ||||||
PChome Online Inc.b | 675,073 | 4,026,414 | ||||||
Pegatron Corp.b | 11,958,000 | 37,642,400 | ||||||
PharmaEngine Inc.b | 604,796 | 3,547,132 | ||||||
PharmaEssentia Corp.a | 944,000 | 4,629,444 | ||||||
Phison Electronics Corp. | 982,000 | 13,243,447 | ||||||
Pixart Imaging Inc.b | 1,252,000 | 5,310,183 | ||||||
Pou Chen Corp.b | 12,789,000 | 16,590,654 | ||||||
Powertech Technology Inc. | 4,493,000 | 13,637,258 | ||||||
Poya International Co. Ltd.b | 396,447 | 5,156,084 | ||||||
President Chain Store Corp. | 3,612,000 | 30,220,683 | ||||||
President Securities Corp.a | 9,445,135 | 4,334,641 | ||||||
Primax Electronics Ltd. | 3,050,000 | 7,236,158 | ||||||
Prince Housing & Development Corp.b | 8,951,995 | 3,411,244 | ||||||
Qisda Corp.b | 12,585,000 | 9,007,456 | ||||||
Quanta Computer Inc.b | 16,608,000 | 37,806,740 | ||||||
Radiant Opto-Electronics Corp.b | 2,952,000 | 7,443,825 | ||||||
Radium Life Tech Co. Ltd.a,b | 10,443,196 | 4,533,148 | ||||||
Realtek Semiconductor Corp. | 3,028,110 | 11,739,583 | ||||||
Ritek Corp.a | 13,703,503 | 2,311,237 | ||||||
Ruentex Development Co. Ltd.a,b | 5,922,986 | 5,799,537 | ||||||
Ruentex Industries Ltd.b | 3,724,906 | 5,992,385 | ||||||
Sampo Corp.b | 9,194,000 | 4,569,734 | ||||||
Sanyang Motor Co. Ltd.b | 4,370,000 | 2,990,175 | ||||||
ScinoPharm Taiwan Ltd.b | 1,839,027 | 2,114,525 | ||||||
Sercomm Corp. | 1,819,000 | 4,791,759 | ||||||
Shin Kong Financial Holding Co. Ltd.b | 51,472,443 | 14,957,862 | ||||||
Shin Zu Shing Co. Ltd.b | 1,103,000 | 3,143,179 | ||||||
Shining Building Business Co. Ltd.a,b | 6,912,281 | 2,404,949 | ||||||
Shinkong Synthetic Fibers Corp. | 11,657,000 | 3,507,259 | ||||||
Sigurd Microelectronics Corp. | 5,182,000 | 4,533,112 | ||||||
Silergy Corp.b | 398,000 | 8,875,509 | ||||||
Siliconware Precision Industries Co. Ltd. | 12,284,819 | 19,457,714 | ||||||
| Security | Shares | Value | ||||||
Simplo Technology Co. Ltd.b | 1,753,000 | $ | 5,953,892 | |||||
Sinbon Electronics Co. Ltd.b | 1,818,809 | 4,489,919 | ||||||
Sino-American Silicon Products Inc.b | 3,618,000 | 6,449,796 | ||||||
SinoPac Financial Holdings Co. Ltd.b | 55,950,055 | 17,983,218 | ||||||
Sinyi Realty Inc.b | 2,599,087 | 2,712,855 | ||||||
Sitronix Technology Corp.b | 1,239,000 | 3,760,642 | ||||||
Soft-World International Corp.b | 1,334,000 | 3,182,610 | ||||||
St. Shine Optical Co. Ltd. | 298,000 | 6,793,598 | ||||||
Standard Foods Corp.b | 3,342,096 | 8,538,242 | ||||||
Sunny Friend Environmental Technology Co. Ltd. | 663,000 | 4,163,110 | ||||||
Synnex Technology International Corp. | 8,172,250 | 9,125,711 | ||||||
TA Chen Stainless Pipeb | 6,654,347 | 4,189,423 | ||||||
Taichung Commercial Bank Co. Ltd. | 16,029,200 | 5,072,364 | ||||||
Taigen Biopharmaceuticals Holdings Ltd.a | 2,113,000 | 1,606,857 | ||||||
TaiMed Biologics Inc.a,b | 1,138,000 | 8,182,710 | ||||||
Tainan Spinning Co. Ltd. | 7,881,894 | 3,538,874 | ||||||
Taishin Financial Holding Co. Ltd.b | 57,044,448 | 25,328,725 | ||||||
Taiwan Acceptance Corp. | 1,536,000 | 5,751,284 | ||||||
Taiwan Business Bank | 23,678,718 | 6,543,640 | ||||||
Taiwan Cement Corp.b | 20,073,000 | 23,179,829 | ||||||
Taiwan Cogeneration Corp.b | 3,886,000 | 3,000,225 | ||||||
Taiwan Cooperative Financial Holding Co. Ltd. | 48,313,966 | 25,454,523 | ||||||
Taiwan Fertilizer Co. Ltd. | 3,209,000 | 4,279,872 | ||||||
Taiwan Glass Industry Corp.a,b | 8,356,053 | 4,540,882 | ||||||
Taiwan High Speed Rail Corp. | 9,335,000 | 8,227,940 | ||||||
Taiwan Hon Chuan Enterprise Co. Ltd. | 2,517,674 | 4,563,331 | ||||||
Taiwan Land Development Corp.b | 11,636,973 | 4,029,503 | ||||||
Taiwan Mobile Co. Ltd. | 9,551,000 | 34,179,661 | ||||||
Taiwan Paiho Ltd.b | 1,545,000 | 6,476,109 | ||||||
Taiwan PCB Techvest Co. Ltd.b | 4,491,042 | 4,814,116 | ||||||
Taiwan Secom Co. Ltd.b | 1,993,185 | 5,891,252 | ||||||
Taiwan Semiconductor Co. Ltd.b | 2,557,000 | 3,609,404 | ||||||
Taiwan Semiconductor Manufacturing Co. Ltd. | 155,291,000 | 1,114,036,300 | ||||||
| 38 | 2017 iSHARES ANNUAL REPORTTO SHAREHOLDERS |
Table of Contents
Consolidated Schedule of Investments (Continued)
iSHARES® CORE MSCI EMERGING MARKETS ETF
August 31, 2017
| Security | Shares | Value | ||||||
Taiwan Shin Kong Security Co. Ltd. | 3,939,770 | $ | 5,274,088 | |||||
Taiwan Surface Mounting Technology Corp.b | 5,048,261 | 4,165,204 | ||||||
Taiwan TEA Corp.b | 6,493,000 | 3,463,909 | ||||||
Tatung Co. Ltd.a,b | 13,551,000 | 6,263,841 | ||||||
Teco Electric and Machinery Co. Ltd. | 11,652,000 | 10,887,915 | ||||||
Test Research Inc. | 2,113,400 | 2,752,133 | ||||||
Test Rite International Co. Ltd. | 6,146,000 | 4,602,525 | ||||||
Ton Yi Industrial Corp. | 6,120,000 | 2,899,897 | ||||||
Tong Hsing Electronic Industries Ltd.b | 1,063,000 | 4,279,615 | ||||||
Tong Yang Industry Co. Ltd. | 2,508,400 | 4,696,133 | ||||||
Topco Scientific Co. Ltd. | 1,648,338 | 4,314,878 | ||||||
TPK Holding Co. Ltd.a,b | 1,845,000 | 7,580,768 | ||||||
Transcend Information Inc.b | 1,250,000 | 3,727,758 | ||||||
Tripod Technology Corp.b | 3,154,000 | 11,809,603 | ||||||
TSRC Corp.b | 4,332,900 | 4,579,990 | ||||||
TTY Biopharm Co. Ltd.b | 1,632,124 | 5,181,003 | ||||||
Tung Ho Steel Enterprise Corp. | 6,109,000 | 4,878,455 | ||||||
Tung Thih Electronic Co. Ltd.b | 405,000 | 2,449,137 | ||||||
TWi Pharmaceuticals Inc.a,b | 682,000 | 1,645,170 | ||||||
TXC Corp. | 2,923,000 | 3,961,387 | ||||||
U-Ming Marine Transport Corp. | 3,538,000 | 4,501,779 | ||||||
Uni-President Enterprises Corp. | 29,927,369 | 63,664,704 | ||||||
Unimicron Technology Corp. | 9,636,000 | 5,507,837 | ||||||
United Integrated Services Co. Ltd.b | 2,385,000 | 4,291,246 | ||||||
United Microelectronics Corp.b | 72,194,000 | 36,002,508 | ||||||
UPC Technology Corp.b | 8,848,099 | 4,383,150 | ||||||
USI Corp. | 7,850,040 | 3,914,745 | ||||||
Vanguard International Semiconductor Corp.b | 5,508,000 | 9,946,850 | ||||||
Visual Photonics Epitaxy Co. Ltd.b | 1,849,000 | 3,737,334 | ||||||
Voltronic Power Technology Corp.b | 353,974 | 6,380,657 | ||||||
Wah Lee Industrial Corp. | 1,945,000 | 3,119,321 | ||||||
Walsin Lihwa Corp.b | 18,898,000 | 9,111,167 | ||||||
Walsin Technology Corp. | 2,500,400 | 5,708,524 | ||||||
Waterland Financial Holdings Co. Ltd.b | 19,400,939 | 5,676,473 | ||||||
Win Semiconductors Corp.b | 2,167,427 | 12,496,514 | ||||||
Winbond Electronics Corp.b | 18,294,000 | 14,033,139 | ||||||
Wistron Corp.b | 16,614,826 | 15,690,465 | ||||||
| Security | Shares | Value | ||||||
Wistron NeWeb Corp.b | 1,903,736 | $ | 5,727,798 | |||||
Wowprime Corp. | 587,260 | 3,531,850 | ||||||
WPG Holdings Ltd. | 8,733,000 | 11,372,375 | ||||||
WT Microelectronics Co. Ltd.b | 2,919,990 | 4,876,487 | ||||||
XPEC Entertainment Inc.d | 31,000 | — | ||||||
Yageo Corp. | 1,699,370 | 10,924,079 | ||||||
Yang Ming Marine Transport Corp.a | 6,760,632 | 3,752,297 | ||||||
Yeong Guan Energy Technology Group Co. Ltd.b | 674,937 | 1,858,487 | ||||||
YFY Inc.a,b | 10,080,000 | 4,008,085 | ||||||
Yieh Phui Enterprise Co. Ltd.b | 9,427,900 | 3,842,512 | ||||||
Yuanta Financial Holding Co. Ltd. | 61,438,912 | 26,669,199 | ||||||
Yulon Motor Co. Ltd.b | 3,750,000 | 3,230,723 | ||||||
YungShin Global Holding Corp.b | 2,672,650 | 3,546,825 | ||||||
Yungtay Engineering Co. Ltd. | 2,926,000 | 5,448,862 | ||||||
Zhen Ding Technology Holding Ltd. | 2,752,950 | 6,376,328 | ||||||
Zinwell Corp. | 2,776,000 | 2,621,558 | ||||||
|
| |||||||
| 4,646,395,834 | ||||||||
THAILAND — 2.33% | ||||||||
Advanced Info Service PCL NVDR | 6,444,000 | 36,387,592 | ||||||
Airports of Thailand PCL NVDR | 27,657,000 | 45,393,962 | ||||||
Amata Corp. PCL NVDR | 5,956,200 | 3,300,529 | ||||||
AP Thailand PCL NVDRb | 16,050,790 | 3,794,570 | ||||||
Bangchak Corp. PCL NVDR | 3,495,000 | 3,999,699 | ||||||
Bangkok Airways PCLb | 5,134,100 | 2,875,900 | ||||||
Bangkok Bank PCL Foreign | 1,611,600 | 9,100,286 | ||||||
Bangkok Chain Hospital PCL NVDR | 10,506,450 | 4,682,893 | ||||||
Bangkok Dusit Medical Services PCL NVDR | 23,238,400 | 14,626,790 | ||||||
Bangkok Expressway & Metro PCL | 51,546,385 | 12,108,472 | ||||||
Bangkok Land PCL NVDR | 78,080,700 | 4,256,168 | ||||||
Banpu PCL NVDR | 13,241,900 | 7,018,745 | ||||||
Beauty Community PCLb | 15,566,500 | 6,469,438 | ||||||
Berli Jucker PCL NVDR | 8,195,000 | 12,154,909 | ||||||
BTS Group Holdings PCL NVDR | 36,693,900 | 9,558,869 | ||||||
Bumrungrad Hospital PCL NVDR | 2,239,700 | 14,704,249 | ||||||
CONSOLIDATED SCHEDULESOF INVESTMENTS | 39 |
Table of Contents
Consolidated Schedule of Investments (Continued)
iSHARES® CORE MSCI EMERGING MARKETS ETF
August 31, 2017
| Security | Shares | Value | ||||||
Central Pattana PCL NVDR | 9,083,100 | $ | 19,695,323 | |||||
Charoen Pokphand Foods PCL NVDR | 18,466,100 | 15,154,381 | ||||||
Chularat Hospital PCL NVDRb | 45,061,400 | 3,338,384 | ||||||
CP ALL PCL NVDR | 31,158,600 | 58,178,985 | ||||||
Delta Electronics Thailand PCL NVDR | 3,461,900 | 9,278,997 | ||||||
Dynasty Ceramic PCL NVDR | 30,241,720 | 3,588,387 | ||||||
Eastern Polymer Group PCLb | 7,986,700 | 2,766,061 | ||||||
Electricity Generating PCL NVDR | 851,900 | 6,003,451 | ||||||
Energy Absolute PCL NVDRb | 8,775,000 | 9,976,095 | ||||||
Esso Thailand PCL NVDRa | 10,631,800 | 3,874,259 | ||||||
Global Power Synergy PCL NVDRb | 3,260,900 | 3,829,998 | ||||||
Glow Energy PCL NVDR | 3,025,100 | 7,812,147 | ||||||
Group Lease PCLb | 3,013,100 | 1,778,550 | ||||||
Gunkul Engineering PCL NVDRb | 21,912,735 | 2,718,882 | ||||||
Hana Microelectronics PCL NVDR | 4,478,900 | 5,901,276 | ||||||
Home Product Center PCL NVDR | 31,524,874 | 9,494,014 | ||||||
Indorama Ventures PCL NVDR | 9,157,200 | 10,755,332 | ||||||
Inter Far East Energy Corp.a,b,d | 7,049,000 | 2 | ||||||
IRPC PCL NVDR | 66,288,400 | 11,878,211 | ||||||
Italian-Thai Development PCL NVDRb | 17,219,600 | 2,167,683 | ||||||
Jasmine International PCL NVDRb | 15,896,100 | 3,734,064 | ||||||
Kasikornbank PCL Foreign | 7,475,200 | 47,500,894 | ||||||
Kasikornbank PCL NVDR | 3,552,100 | 21,501,946 | ||||||
KCE Electronics PCL NVDR | 1,986,400 | 5,234,453 | ||||||
Khon Kaen Sugar Industry PCL NVDRb | 13,669,086 | 1,835,992 | ||||||
Kiatnakin Bank PCL NVDR | 2,823,400 | 5,973,313 | ||||||
Krung Thai Bank PCL NVDR | 21,220,600 | 11,950,767 | ||||||
Krungthai Card PCL NVDRb | 1,055,800 | 3,783,774 | ||||||
LPN Development PCL NVDRb | 7,107,400 | 2,311,698 | ||||||
Major Cineplex Group PCL NVDRb | 2,827,900 | 2,554,947 | ||||||
Minor International PCL NVDRb | 13,585,560 | 16,263,394 | ||||||
Muangthai Leasing PCLb | 5,178,300 | 5,302,280 | ||||||
PTG Energy PCLb | 5,576,300 | 3,526,647 | ||||||
PTT Exploration & Production PCL NVDR | 8,874,501 | 23,385,600 | ||||||
| Security | Shares | Value | ||||||
PTT Global Chemical PCL NVDR | 13,523,800 | $ | 31,157,076 | |||||
PTT PCL NVDR | 6,651,200 | 79,922,566 | ||||||
Quality Houses PCL NVDRb | 39,860,117 | 2,881,020 | ||||||
Robinson PCL NVDR | 3,725,400 | 6,451,152 | ||||||
Siam Cement PCL (The) Foreign | 2,279,300 | 34,321,638 | ||||||
Siam Cement PCL (The) NVDR | 238,400 | 3,589,821 | ||||||
Siam Commercial Bank PCL (The) NVDR | 11,001,000 | 49,861,482 | ||||||
Siam Global House PCL NVDRb | 12,768,295 | 5,767,939 | ||||||
Singha Estate PCLa,b | 18,806,500 | 2,310,812 | ||||||
Sino-Thai Engineering & Construction PCL NVDR | 6,076,828 | 4,758,245 | ||||||
Sri Trang Agro-Industry PCL NVDRb | 5,250,300 | 1,881,601 | ||||||
Srisawad Corp PCL NVDRb | 4,309,630 | 6,651,665 | ||||||
Supalai PCL NVDR | 5,779,500 | 4,394,892 | ||||||
Superblock PCLa | 79,736,300 | 3,217,788 | ||||||
Thai Airways International PCL NVDRa,b | 4,842,300 | 2,639,531 | ||||||
Thai Oil PCL NVDR | 5,706,100 | 16,196,354 | ||||||
Thai Union Group PCL NVDR | 13,228,700 | 7,888,217 | ||||||
Thai Vegetable Oil PCL NVDRb | 4,027,100 | 3,456,478 | ||||||
Thaicom PCL NVDR | 4,530,100 | 2,019,138 | ||||||
Thanachart Capital PCL NVDR | 4,441,900 | 6,253,842 | ||||||
Thoresen Thai Agencies PCL NVDRb | 9,222,223 | 2,555,171 | ||||||
TICON Industrial Connection PCL NVDRb | 5,189,160 | 2,312,892 | ||||||
Tisco Financial Group PCL NVDRb | 2,643,150 | 5,950,172 | ||||||
TMB Bank PCL NVDR | 99,985,800 | 7,106,354 | ||||||
True Corp. PCL NVDRa | 63,194,311 | 10,657,676 | ||||||
TTW PCL NVDRb | 11,943,400 | 3,920,586 | ||||||
Unique Engineering & Construction PCLb | 5,376,200 | 2,946,750 | ||||||
VGI Global Media PCL NVDRb | 21,445,700 | 3,552,217 | ||||||
Vibhavadi Medical Center PCL NVDRb | 40,992,700 | 3,432,004 | ||||||
WHA Corp. PCL NVDR | 53,809,300 | 5,153,247 | ||||||
|
| |||||||
| 856,691,584 | ||||||||
TURKEY — 1.22% |
| |||||||
Akbank Turk AS | 13,982,924 | 41,877,289 | ||||||
Aksa Akrilik Kimya Sanayii AS | 828,163 | 3,007,969 | ||||||
| 40 | 2017 iSHARES ANNUAL REPORTTO SHAREHOLDERS |
Table of Contents
Consolidated Schedule of Investments (Continued)
iSHARES® CORE MSCI EMERGING MARKETS ETF
August 31, 2017
| Security | Shares | Value | ||||||
Albaraka Turk Katilim Bankasi AS | 8,688,504 | $ | 3,749,655 | |||||
Anadolu Efes Biracilik ve Malt Sanayii AS | 1,407,300 | 8,641,369 | ||||||
Arcelik AS | 1,564,440 | 10,875,023 | ||||||
Aselsan Elektronik Sanayi ve TAS | 1,496,212 | 11,700,837 | ||||||
BIM Birlesik Magazalar AS | 1,395,022 | 30,910,250 | ||||||
Cimsa Cimento Sanayi VE Ticaret AS | 703,627 | 2,920,443 | ||||||
Coca-Cola Icecek AS | 589,537 | 6,854,069 | ||||||
Emlak Konut Gayrimenkul Yatirim Ortakligi ASa | 12,346,315 | 10,513,437 | ||||||
Eregli Demir ve Celik Fabrikalari TAS | 9,214,549 | 21,938,449 | ||||||
Ford Otomotiv Sanayi AS | 518,207 | 7,135,468 | ||||||
Haci Omer Sabanci Holding AS | 5,751,594 | 17,658,512 | ||||||
Is Gayrimenkul Yatirim Ortakligi AS | 5,985,386 | 2,461,731 | ||||||
Kardemir Karabuk Demir Celik Sanayi ve Ticaret AS Class Da | 6,707,023 | 4,623,457 | ||||||
KOC Holding AS | 4,984,882 | 26,046,624 | ||||||
Otokar Otomotiv Ve Savunma Sanayi ASb | 83,111 | 2,780,357 | ||||||
Petkim Petrokimya Holding AS | 5,466,826 | 9,880,521 | ||||||
Soda Sanayii AS | 3,149,376 | 4,752,502 | ||||||
TAV Havalimanlari Holding AS | 1,261,571 | 7,753,845 | ||||||
Tekfen Holding AS | 1,353,407 | 5,021,547 | ||||||
Tofas Turk Otomobil Fabrikasi AS | 862,089 | 7,890,403 | ||||||
Trakya Cam Sanayii AS | 4,669,734 | 4,977,371 | ||||||
Tupras Turkiye Petrol Rafinerileri AS | 826,295 | 28,073,280 | ||||||
Turk Hava Yollari AOa | 3,427,923 | 9,690,382 | ||||||
Turk Telekomunikasyon ASa | 3,512,598 | 7,304,877 | ||||||
Turkcell Iletisim Hizmetleri AS | 6,010,170 | 22,995,857 | ||||||
Turkiye Garanti Bankasi AS | 14,544,911 | 45,245,498 | ||||||
Turkiye Halk Bankasi AS | 4,173,929 | 17,916,505 | ||||||
Turkiye Is Bankasi Class C | 10,222,679 | 22,177,192 | ||||||
Turkiye Sinai Kalkinma Bankasi AS | 10,852,942 | 4,778,054 | ||||||
Turkiye Sise ve Cam Fabrikalari AS | 5,773,908 | 7,425,280 | ||||||
| Security | Shares | Value | ||||||
Turkiye Vakiflar Bankasi Tao Class D | 5,311,483 | $ | 11,076,647 | |||||
Ulker Biskuvi Sanayi AS | 1,165,579 | 6,968,053 | ||||||
Yapi ve Kredi Bankasi ASa,b | 5,783,737 | 8,141,508 | ||||||
Yazicilar Holding ASb | 474,784 | 3,102,381 | ||||||
|
| |||||||
| 448,866,642 | ||||||||
UNITED ARAB EMIRATES — 0.71% |
| |||||||
Abu Dhabi Commercial Bank PJSC | 13,295,763 | 26,424,293 | ||||||
Agthia Group PJSC | 1,403,669 | 2,101,816 | ||||||
Air Arabia PJSC | 17,115,996 | 5,219,002 | ||||||
Al Waha Capital PJSC | 8,106,056 | 3,884,092 | ||||||
Aldar Properties PJSC | 21,109,840 | 13,275,906 | ||||||
Amlak Finance PJSCa | 8,399,242 | 2,583,960 | ||||||
Arabtec Holding PJSCa | 5,065,858 | 4,413,369 | ||||||
DAMAC Properties Dubai Co. PJSC | 7,733,614 | 8,506,112 | ||||||
Dana Gas PJSCa | 31,032,012 | 5,407,010 | ||||||
Deyaar Development PJSCa | 16,313,813 | 2,318,426 | ||||||
DP World Ltd. | 1,093,992 | 25,096,177 | ||||||
Dubai Islamic Bank PJSC | 8,267,864 | 13,708,119 | ||||||
DXB Entertainments PJSCa | 23,658,439 | 5,056,185 | ||||||
Emaar Malls PJSC | 11,588,001 | 7,760,878 | ||||||
Emaar Properties PJSC | 21,913,067 | 50,709,501 | ||||||
Emirates Telecommunications Group Co. PJSC | 11,117,032 | 54,478,935 | ||||||
Eshraq Properties Co. PJSCa | 9,866,948 | 2,337,057 | ||||||
First Abu Dhabi Bank PJSC | 9,328,258 | 26,411,991 | ||||||
Orascom Construction Ltd.a | 517,732 | 3,261,712 | ||||||
|
| |||||||
| 262,954,541 | ||||||||
|
| |||||||
TOTAL COMMON STOCKS |
| |||||||
(Cost: $29,766,895,970) | 35,382,693,795 | |||||||
PREFERRED STOCKS — 3.41% |
| |||||||
BRAZIL — 2.41% |
| |||||||
Alpargatas SA, Preference Shares | 1,127,700 | 4,945,974 | ||||||
Banco ABC Brasil SA, Preference Shares | 682,534 | 3,689,842 | ||||||
Banco Bradesco SA, Preference Shares | 19,102,062 | 203,863,796 | ||||||
Banco do Estado do Rio Grande do Sul SA Class B, Preference Shares | 1,231,900 | 6,624,529 | ||||||
CONSOLIDATED SCHEDULESOF INVESTMENTS | 41 |
Table of Contents
Consolidated Schedule of Investments (Continued)
iSHARES® CORE MSCI EMERGING MARKETS ETF
August 31, 2017
| Security | Shares | Value | ||||||
Bradespar SA, Preference Shares | 1,531,400 | $ | 13,082,691 | |||||
Braskem SA Class A, Preference Shares | 1,109,600 | 13,439,545 | ||||||
Centrais Eletricas Brasileiras SA Class B, Preference Shares | 1,381,600 | 9,014,683 | ||||||
Cia. Brasileira de Distribuicao, Preference Shares | 999,000 | 22,856,874 | ||||||
Cia. de Saneamento do Parana, Preference Shares | 1,993,500 | 6,614,483 | ||||||
Cia. Energetica de Minas Gerais, Preference Shares | 4,725,220 | 12,584,768 | ||||||
Cia. Energetica de Sao Paulo Class B, Preference Shares | 1,307,000 | 6,118,677 | ||||||
Cia. Energetica do Ceara Class A, Preference Shares | 93,400 | 1,543,284 | ||||||
Cia. Paranaense de Energia Class B, Preference Shares | 657,900 | 6,009,327 | ||||||
Eletropaulo Metropolitana Eletricidade de Sao Paulo SA, Preference Shares | 761,400 | 3,852,433 | ||||||
Gerdau SA, Preference Shares | 5,780,800 | 21,771,355 | ||||||
Itau Unibanco Holding SA, Preference Shares | 20,353,413 | 261,011,684 | ||||||
Itausa-Investimentos Itau SA, Preference Shares | 24,937,292 | 80,840,432 | ||||||
Lojas Americanas SA, Preference Shares | 4,590,510 | 25,925,523 | ||||||
Marcopolo SA, Preference Shares | 3,869,600 | 4,784,040 | ||||||
Metalurgica Gerdau SA, Preference Shares | 4,320,900 | 7,772,662 | ||||||
Petroleo Brasileiro SA, Preference Shares | 24,740,100 | 107,328,057 | ||||||
Suzano Papel e Celulose SA Class A, Preference Shares | 2,670,300 | 14,851,738 | ||||||
Telefonica Brasil SA, Preference Shares | 2,776,900 | 43,103,750 | ||||||
Usinas Siderurgicas de Minas Gerais SA Class A, Preference Shares | 2,697,300 | 5,906,465 | ||||||
|
| |||||||
| 887,536,612 | ||||||||
CHILE — 0.10% |
| |||||||
Embotelladora Andina SA Class B, Preference Shares | 1,735,153 | 8,176,291 | ||||||
| Security | Shares | Value | ||||||
Sociedad Quimica y Minera de Chile SA Series B, Preference Shares | 602,679 | $ | 28,164,148 | |||||
|
| |||||||
| 36,340,439 | ||||||||
COLOMBIA — 0.15% |
| |||||||
Avianca Holdings SA, Preference Shares | 2,775,944 | 2,648,878 | ||||||
Bancolombia SA, Preference Shares | 3,066,303 | 34,986,402 | ||||||
Grupo Aval Acciones y Valores SA, Preference Shares | 25,119,421 | 11,259,743 | ||||||
Grupo de Inversiones Suramericana SA, Preference Shares | 523,875 | 7,158,641 | ||||||
|
| |||||||
| 56,053,664 | ||||||||
RUSSIA — 0.08% |
| |||||||
Surgutneftegas OJSC, Preference Shares | 43,156,100 | 21,304,957 | ||||||
Transneft PJSC, Preference Shares | 2,068 | 6,336,644 | ||||||
|
| |||||||
| 27,641,601 | ||||||||
SOUTH KOREA — 0.67% |
| |||||||
AmorePacific Corp., Preference Shares | 60,685 | 9,229,760 | ||||||
Hyundai Motor Co., Preference Shares | 137,068 | 11,718,123 | ||||||
Hyundai Motor Co. Series 2, Preference Shares | 223,098 | 20,180,912 | ||||||
LG Chem Ltd., Preference Shares | 48,140 | 11,228,113 | ||||||
LG Household & Health Care Ltd., Preference Shares | 13,831 | 7,359,524 | ||||||
Samsung Electronics Co. Ltd., Preference Shares | 111,993 | 187,217,812 | ||||||
|
| |||||||
| 246,934,244 | ||||||||
|
| |||||||
TOTAL PREFERRED STOCKS |
| |||||||
(Cost: $1,034,220,576) | 1,254,506,560 | |||||||
RIGHTS — 0.00% | ||||||||
CHINA — 0.00% | ||||||||
Carnival Group International Holdings Ltd. (Expires 09/21/17)a | 12,096,750 | 370,950 | ||||||
| 42 | 2017 iSHARES ANNUAL REPORTTO SHAREHOLDERS |
Table of Contents
Consolidated Schedule of Investments (Continued)
iSHARES® CORE MSCI EMERGING MARKETS ETF
August 31, 2017
| Security | Shares | Value | ||||||
Digital China Holdings Ltd. (Expires 09/07/17)a,b | 1,704,000 | $ | 139,343 | |||||
Fosun International Ltd. (Expires 09/07/17)a | 10,241 | — | ||||||
|
| |||||||
| 510,293 | ||||||||
|
| |||||||
TOTAL RIGHTS | ||||||||
(Cost: $0) | 510,293 | |||||||
WARRANTS — 0.00% |
| |||||||
THAILAND — 0.00% |
| |||||||
Superblock PCL NVDR (Expires 08/31/20)a | 15,691,820 | 5 | ||||||
Vibhavadi Medical Center PCL NVDR (Expires 06/14/22)a,b | 2,800,631 | 68,318 | ||||||
|
| |||||||
| 68,323 | ||||||||
|
| |||||||
TOTAL WARRANTS |
| |||||||
(Cost: $0) | 68,323 | |||||||
SHORT-TERM INVESTMENTS — 7.23% |
| |||||||
MONEY MARKET FUNDS — 7.23% |
| |||||||
BlackRock Cash Funds: Institutional, |
| |||||||
1.32%f,g,h | 2,544,586,672 | 2,545,350,048 | ||||||
BlackRock Cash Funds: Treasury, |
| |||||||
0.96%f,g | 111,111,661 | 111,111,661 | ||||||
|
| |||||||
| 2,656,461,709 | ||||||||
|
| |||||||
TOTAL SHORT-TERM INVESTMENTS |
| |||||||
(Cost: $2,656,155,849) |
| 2,656,461,709 | ||||||
|
| |||||||
TOTAL INVESTMENTS |
| |||||||
(Cost: $33,457,272,395)i |
| 39,294,240,680 | ||||||
Other Assets, Less Liabilities — (6.85)% |
| (2,518,943,140 | ) | |||||
|
| |||||||
NET ASSETS — 100.00% |
| $ | 36,775,297,540 | |||||
|
| |||||||
ADR — American Depositary Receipts
CPO — Certificates of Participation (Ordinary)
GDR — Global Depositary Receipts
NVDR — Non-Voting Depositary Receipts
| a | Non-income earning security. |
| b | All or a portion of this security represents a security on loan. See Note 1. |
| c | This security may be resold to qualified institutional buyers under Rule 144A of the Securities Act of 1933. |
| d | Security is valued using significant unobservable inputs and is classified as Level 3 in the fair value hierarchy. |
| e | This security may be resold to qualified foreign investors and foreign institutional buyers under Regulation S of the Securities Act of 1933. |
| f | Affiliated issuer. See Schedule 1. |
| g | The rate quoted is the annualized seven-day yield of the fund at period end. |
| h | All or a portion of this security represents an investment of securities lending collateral. See Note 1. |
| i | The cost of investments (including short positions and derivatives, if any) for federal income tax purposes was $34,203,974,384. Net unrealized appreciation was $5,090,266,296, of which $6,807,984,137 represented gross unrealized appreciation on investments and $1,717,717,841 represented gross unrealized depreciation on investments. |
CONSOLIDATED SCHEDULESOF INVESTMENTS | 43 |
Table of Contents
Consolidated Schedule of Investments (Continued)
iSHARES® CORE MSCI EMERGING MARKETS ETF
August 31, 2017
Schedule 1 — Affiliates (Note 2)
Investments in issuers considered to be affiliates of the Fund during the year ended August 31, 2017, for purposes of Section 2(a)(3) of the 1940 Act, and/or related parties of the Fund were as follows:
| Affiliated issuer | Shares held at | Shares purchased | Shares sold | Shares held at 08/31/17 | Value at 08/31/17 | Net realized gain (loss) a | Change in unrealized appreciation (depreciation) | Income | ||||||||||||||||||||||||
BlackRock Cash Funds: Institutional, SL Agency Shares | 871,454,644 | 1,673,132,028 | b | — | 2,544,586,672 | $ | 2,545,350,048 | $ | (123,726 | ) | $ | 305,860 | $ | — | c | |||||||||||||||||
BlackRock Cash Funds: Treasury, SL Agency Shares | 8,588,279 | 102,523,382 | b | — | 111,111,661 | 111,111,661 | 3,710 | — | 368,419 | |||||||||||||||||||||||
|
|
|
|
|
|
|
| |||||||||||||||||||||||||
| $ | 2,656,461,709 | $ | (120,016 | ) | $ | 305,860 | $ | 368,419 | ||||||||||||||||||||||||
|
|
|
|
|
|
|
| |||||||||||||||||||||||||
| a | Includes realized capital gain distributions from an affiliated fund, if any. |
| b | Net of shares purchased and sold. |
| c | Does not include income earned on the investment of securities lending cash collateral which is not direct income of the Fund and is reflected as a component of securities lending income in the statement of operations. |
Schedule 2 — Futures Contracts (Note 5)
Futures contracts outstanding as of August 31, 2017 were as follows:
| Description | Number of contracts | Expiration date | Notional amount (000) | Value / unrealized appreciation (depreciation) | ||||||||||||
Long Contracts: | ||||||||||||||||
MSCI Emerging Markets E-Mini | 84,750 | Sep 2017 | $ | 92,055 | $ | 6,970,178 | ||||||||||
|
| |||||||||||||||
Schedule 3 — Fair Value Measurements
Various inputs are used in determining the fair value of financial instruments. For description of the input levels and information about the Fund’s policy regarding valuation of financial instruments, see Note 1.
| 44 | 2017 iSHARES ANNUAL REPORTTO SHAREHOLDERS |
Table of Contents
Consolidated Schedule of Investments (Continued)
iSHARES® CORE MSCI EMERGING MARKETS ETF
August 31, 2017
The following table summarizes the value of the Fund’s investments according to the fair value hierarchy as of August 31, 2017. The breakdown of the Fund’s investments into major categories is disclosed in the consolidated schedule of investments above.
| Level 1 | Level 2 | Level 3 | Total | |||||||||||||
Investments: | ||||||||||||||||
Assets: | ||||||||||||||||
Common stocks | $ | 35,356,172,784 | $ | 21,179,517 | $ | 5,341,494 | $ | 35,382,693,795 | ||||||||
Preferred stocks | 1,254,506,560 | — | — | 1,254,506,560 | ||||||||||||
Rights | 139,343 | 370,950 | — | 510,293 | ||||||||||||
Warrants | 68,318 | 5 | — | 68,323 | ||||||||||||
Money market funds | 2,656,461,709 | — | — | 2,656,461,709 | ||||||||||||
|
|
|
|
|
|
|
| |||||||||
Total | $ | 39,267,348,714 | $ | 21,550,472 | $ | 5,341,494 | $ | 39,294,240,680 | ||||||||
|
|
|
|
|
|
|
| |||||||||
Derivative financial instrumentsa: | ||||||||||||||||
Assets: | ||||||||||||||||
Futures contracts | $ | 6,970,178 | $ | — | $ | — | $ | 6,970,178 | ||||||||
|
|
|
|
|
|
|
| |||||||||
Total | $ | 6,970,178 | $ | — | $ | — | $ | 6,970,178 | ||||||||
|
|
|
|
|
|
|
| |||||||||
| a | Shown at the unrealized appreciation (depreciation) on the contracts. |
See notes to consolidated financial statements.
CONSOLIDATED SCHEDULESOF INVESTMENTS | 45 |
Table of Contents
Consolidated Schedule of Investments
August 31, 2017
| Security | Shares | Value | ||||||
COMMON STOCKS — 94.26% |
| |||||||
BRAZIL — 9.57% |
| |||||||
Ambev SA | 496,065 | $ | 3,131,100 | |||||
B3 SA — Brasil Bolsa Balcao | 223,269 | 1,569,613 | ||||||
Banco Bradesco SA | 88,018 | 902,153 | ||||||
Banco do Brasil SA | 99,289 | 968,765 | ||||||
Banco Santander Brasil SA Units | 49,600 | 442,017 | ||||||
BB Seguridade Participacoes SA | 74,400 | 655,459 | ||||||
BR Malls Participacoes SA | 77,118 | 333,330 | ||||||
BRF SAa | 49,600 | 670,277 | ||||||
CCR SA | 124,000 | 688,090 | ||||||
Centrais Eletricas Brasileiras SAa | 24,800 | 138,879 | ||||||
Cia. de Saneamento Basico do Estado de Sao Paulo | 37,200 | 380,105 | ||||||
Cia. Siderurgica Nacional SAa | 62,000 | 171,234 | ||||||
Cielo SA | 136,421 | 972,500 | ||||||
Cosan SA Industria e Comercio | 12,400 | 152,081 | ||||||
CPFL Energia SA | 24,854 | 213,986 | ||||||
Duratex SA | 37,248 | 101,808 | ||||||
EDP — Energias do Brasil SA | 37,200 | 180,180 | ||||||
Embraer SA | 78,500 | 447,331 | ||||||
Engie Brasil Energia SA | 12,400 | 142,268 | ||||||
Equatorial Energia SA | 24,800 | 481,742 | ||||||
Fibria Celulose SA | 24,841 | 329,929 | ||||||
Hypermarcas SA | 37,200 | 348,892 | ||||||
JBS SA | 86,852 | 239,319 | ||||||
Klabin SA Units | 62,000 | 337,345 | ||||||
Kroton Educacional SA | 148,864 | 850,192 | ||||||
Localiza Rent A Car SA | 13,293 | 251,584 | ||||||
Lojas Americanas SA | 24,800 | 113,815 | ||||||
Lojas Renner SA | 84,360 | 820,422 | ||||||
M. Dias Branco SA | 12,400 | 193,501 | ||||||
Multiplan Empreendimentos Imobiliarios SA | 12,910 | 299,891 | ||||||
Natura Cosmeticos SA | 12,400 | 116,258 | ||||||
Odontoprev SA | 24,800 | 116,810 | ||||||
Petroleo Brasileiro SAa | 322,400 | 1,431,432 | ||||||
Porto Seguro SA | 12,400 | 136,948 | ||||||
Qualicorp SA | 24,800 | 274,684 | ||||||
Raia Drogasil SA | 24,850 | 547,712 | ||||||
Rumo SAa | 83,500 | 274,136 | ||||||
Sul America SA | 24,889 | 142,225 | ||||||
TIM Participacoes SA | 99,269 | 355,879 | ||||||
Transmissora Alianca de Energia Eletrica SA Units | 17,400 | 124,426 | ||||||
| Security | Shares | Value | ||||||
Ultrapar Participacoes SA | 37,200 | $ | 868,388 | |||||
Vale SA | 333,329 | 3,716,313 | ||||||
WEG SA | 62,440 | 406,020 | ||||||
|
| |||||||
| 25,039,039 | ||||||||
CHINA — 60.13% | ||||||||
3SBio Inc.a,b,c | 124,000 | 170,478 | ||||||
58.com Inc. ADRa,c | 9,300 | 582,459 | ||||||
AAC Technologies Holdings Inc. | 76,000 | 1,385,711 | ||||||
Agricultural Bank of China Ltd. Class H | 2,728,000 | 1,282,707 | ||||||
Air China Ltd. Class H | 248,000 | 220,544 | ||||||
Alibaba Group Holding Ltd. ADRa,c | 121,396 | 20,848,549 | ||||||
Alibaba Health Information Technology Ltd.a,c | 326,000 | 152,036 | ||||||
Alibaba Pictures Group Ltd.a | 1,240,000 | 217,059 | ||||||
Aluminum Corp. of China Ltd. Class Ha,c | 496,000 | 366,940 | ||||||
Anhui Conch Cement Co. Ltd. Class H | 124,000 | 462,636 | ||||||
ANTA Sports Products Ltd. | 124,040 | 488,144 | ||||||
Autohome Inc. ADRa | 4,960 | 318,779 | ||||||
AviChina Industry & Technology Co. Ltd. Class Hc | 248,000 | 146,713 | ||||||
Baidu Inc. ADRa | 29,140 | 6,645,377 | ||||||
Bank of China Ltd. Class H | 8,432,000 | 4,438,774 | ||||||
Bank of Communications Co. Ltd. Class H | 992,200 | 758,116 | ||||||
Beijing Capital International Airport Co. Ltd. Class H | 248,000 | 401,163 | ||||||
Beijing Enterprises Holdings Ltd. | 62,000 | 346,185 | ||||||
Beijing Enterprises Water Group Ltd.c | 496,000 | 421,443 | ||||||
Brilliance China Automotive Holdings Ltd. | 248,000 | 641,670 | ||||||
Byd Co. Ltd. Class H | 62,000 | 369,158 | ||||||
CGN Power Co. Ltd. Class Hb | 1,116,000 | 308,002 | ||||||
China Cinda Asset Management Co. Ltd. Class H | 992,000 | 368,842 | ||||||
China CITIC Bank Corp. Ltd. Class H | 992,000 | 655,296 | ||||||
China Coal Energy Co. Ltd. Class H | 248,000 | 124,848 | ||||||
China Communications Construction Co. Ltd. Class H | 506,000 | 673,680 | ||||||
| 46 | 2017 iSHARES ANNUAL REPORTTO SHAREHOLDERS |
Table of Contents
Consolidated Schedule of Investments (Continued)
iSHARES® MSCI BRIC ETF
August 31, 2017
| Security | Shares | Value | ||||||
China Communications Services Corp. Ltd. Class H | 248,800 | $ | 134,788 | |||||
China Conch Venture Holdings Ltd. | 186,000 | 338,422 | ||||||
China Construction Bank Corp. Class H | 9,052,370 | 7,934,537 | ||||||
China Everbright Bank Co. Ltd. Class H | 381,000 | 183,041 | ||||||
China Everbright International Ltd. | 248,000 | 327,648 | ||||||
China Evergrande Groupa | 496,000 | 1,498,815 | ||||||
China Galaxy Securities Co. Ltd. Class H | 310,000 | 280,830 | ||||||
China Gas Holdings Ltd. | 248,000 | 626,143 | ||||||
China Huarong Asset Management Co. Ltd. Class Hb | 744,000 | 317,508 | ||||||
China Huishan Dairy Holdings Co. Ltd.c,d | 345,000 | — | ||||||
China Jinmao Holdings Group Ltd. | 496,000 | 220,544 | ||||||
China Life Insurance Co. Ltd. Class H | 744,000 | 2,386,063 | ||||||
China Longyuan Power Group Corp. Ltd. Class H | 372,000 | 278,532 | ||||||
China Medical System Holdings Ltd. | 124,000 | 228,149 | ||||||
China Mengniu Dairy Co. Ltd. | 248,000 | 579,246 | ||||||
China Merchants Bank Co. Ltd. Class H | 434,456 | 1,637,582 | ||||||
China Merchants Port Holdings Co. Ltd. | 248,000 | 811,198 | ||||||
China Minsheng Banking Corp. Ltd. Class H | 620,000 | 618,697 | ||||||
China Mobile Ltd. | 682,000 | 7,232,653 | ||||||
China National Building Material Co. Ltd. Class H | 248,000 | 155,902 | ||||||
China Oilfield Services Ltd. Class H | 248,000 | 203,433 | ||||||
China Overseas Land & Investment Ltd. | 496,800 | 1,736,097 | ||||||
China Pacific Insurance Group Co. Ltd. Class H | 297,600 | 1,401,218 | ||||||
China Petroleum & Chemical Corp. Class H | 2,728,600 | 2,088,343 | ||||||
China Power International Development Ltd. | 372,000 | 126,908 | ||||||
China Railway Construction Corp. Ltd. Class H | 198,000 | 259,566 | ||||||
| Security | Shares | Value | ||||||
China Railway Group Ltd. Class H | 372,000 | $ | 297,545 | |||||
China Resources Beer Holdings Co. Ltd. | 248,000 | 622,341 | ||||||
China Resources Gas Group Ltd. | 89,000 | 313,859 | ||||||
China Resources Land Ltd. | 276,444 | 863,617 | ||||||
China Resources Power Holdings Co. Ltd. | 248,200 | 455,398 | ||||||
China Shenhua Energy Co. Ltd. Class H | 372,000 | 957,752 | ||||||
China Southern Airlines Co. Ltd. Class H | 248,000 | 193,610 | ||||||
China State Construction International Holdings Ltd. | 248,000 | 359,335 | ||||||
China Taiping Insurance Holdings Co. Ltd. | 173,640 | 526,925 | ||||||
China Telecom Corp. Ltd. Class H | 1,488,000 | 764,301 | ||||||
China Unicom Hong Kong Ltd.a | 539,900 | 786,418 | ||||||
China Vanke Co. Ltd. Class H | 124,001 | 371,538 | ||||||
Chongqing Changan Automobile Co. Ltd. Class B | 99,200 | 129,792 | ||||||
Chongqing Rural Commercial Bank Co. Ltd. Class H | 248,000 | 172,696 | ||||||
CITIC Ltd. | 620,000 | 952,207 | ||||||
CITIC Securities Co. Ltd. Class H | 248,000 | 550,094 | ||||||
CNOOC Ltd. | 1,860,000 | 2,224,457 | ||||||
COSCO SHIPPING Ports Ltd. | 248,000 | 293,109 | ||||||
Country Garden Holdings Co. Ltd. | 496,046 | 659,159 | ||||||
CRRC Corp. Ltd. Class H | 447,400 | 403,586 | ||||||
CSPC Pharmaceutical Group Ltd. | 496,000 | 774,441 | ||||||
Ctrip.com International Ltd. ADRa | 41,044 | 2,111,714 | ||||||
Dongfeng Motor Group Co. Ltd. Class H | 248,000 | 321,944 | ||||||
ENN Energy Holdings Ltd. | 74,000 | 476,065 | ||||||
Far East Horizon Ltd. | 248,000 | 226,565 | ||||||
Fosun International Ltd. | 248,000 | 430,315 | ||||||
Fullshare Holdings Ltd.c | 705,000 | 281,047 | ||||||
Fuyao Glass Industry Group Co. Ltd. Class Hb | 49,600 | 158,120 | ||||||
GCL-Poly Energy Holdings Ltd.a,c | 1,488,000 | 167,310 | ||||||
Geely Automobile Holdings Ltd. | 620,000 | 1,524,165 | ||||||
GF Securities Co. Ltd. Class H | 148,800 | 317,508 | ||||||
GOME Electrical Appliances Holding Ltd.c | 1,364,400 | 142,952 | ||||||
Great Wall Motor Co. Ltd. Class H | 310,000 | 388,963 | ||||||
Guangdong Investment Ltd.c | 248,000 | 366,307 | ||||||
CONSOLIDATED SCHEDULESOF INVESTMENTS | 47 |
Table of Contents
Consolidated Schedule of Investments (Continued)
iSHARES® MSCI BRIC ETF
August 31, 2017
| Security | Shares | Value | ||||||
Guangzhou Automobile Group Co. Ltd. Class H | 248,454 | $ | 490,149 | |||||
Guangzhou R&F Properties Co. Ltd. Class H | 99,200 | 231,698 | ||||||
Haier Electronics Group Co. Ltd. | 144,000 | 382,702 | ||||||
Haitong Securities Co. Ltd. Class H | 347,200 | 582,035 | ||||||
Hanergy Thin Film Power Group Ltd.a,d | 7,709 | — | ||||||
Hengan International Group Co. Ltd. | 62,000 | 518,089 | ||||||
Huaneng Power International Inc. Class H | 496,000 | 324,479 | ||||||
Huaneng Renewables Corp. Ltd. Class H | 496,000 | 152,100 | ||||||
Huatai Securities Co. Ltd. Class Hb | 173,600 | 386,396 | ||||||
Industrial & Commercial Bank of China Ltd. Class H | 7,812,050 | 5,849,218 | ||||||
JD.com Inc. ADRa | 68,696 | 2,879,049 | ||||||
Jiangxi Copper Co. Ltd. Class H | 124,000 | 215,158 | ||||||
Kingsoft Corp. Ltd.c | 124,000 | 294,059 | ||||||
Kunlun Energy Co. Ltd. | 248,000 | 240,191 | ||||||
Lenovo Group Ltd. | 744,000 | 406,866 | ||||||
Longfor Properties Co. Ltd. | 124,000 | 297,862 | ||||||
Momo Inc. ADRa | 10,664 | 410,884 | ||||||
NetEase Inc. ADR | 8,432 | 2,325,883 | ||||||
New China Life Insurance Co. Ltd. Class H | 86,800 | 555,639 | ||||||
New Oriental Education & Technology Group Inc. ADR | 14,136 | 1,155,618 | ||||||
Nine Dragons Paper (Holdings) Ltd. | 124,000 | 206,919 | ||||||
People’s Insurance Co. Group of China Ltd. (The) Class H | 744,000 | 350,780 | ||||||
PetroChina Co. Ltd. Class H | 2,232,000 | 1,425,934 | ||||||
PICC Property & Casualty Co. Ltd. Class H | 497,548 | 934,518 | ||||||
Ping An Insurance Group Co. of China Ltd. Class H | 558,000 | 4,431,089 | ||||||
Semiconductor Manufacturing International Corp.a,c | 276,200 | 259,739 | ||||||
Shandong Weigao Group Medical Polymer Co. Ltd. Class H | 184,000 | 146,938 | ||||||
Shanghai Electric Group Co. Ltd. Class Ha | 252,000 | 114,305 | ||||||
| Security | Shares | Value | ||||||
Shanghai Fosun Pharmaceutical Group Co. Ltd. Class H | 65,500 | $ | 246,050 | |||||
Shanghai Lujiazui Finance & Trade Zone Development Co. Ltd. Class B | 86,880 | 140,137 | ||||||
Shanghai Pharmaceuticals Holding Co. Ltd. Class H | 74,400 | 183,090 | ||||||
Shenzhou International Group Holdings Ltd. | 55,000 | 440,621 | ||||||
Shimao Property Holdings Ltd. | 124,000 | 256,034 | ||||||
Sihuan Pharmaceutical Holdings Group Ltd. | 372,000 | 143,069 | ||||||
SINA Corp./Chinaa | 6,076 | 618,719 | ||||||
Sino Biopharmaceutical Ltd. | 496,000 | 435,385 | ||||||
Sino-Ocean Group Holding Ltd. | 310,000 | 213,890 | ||||||
Sinopec Engineering Group Co. Ltd. Class H | 124,000 | 111,857 | ||||||
Sinopec Shanghai Petrochemical Co. Ltd. Class H | 249,000 | 155,258 | ||||||
Sinopharm Group Co. Ltd. Class H | 148,800 | 672,090 | ||||||
SOHO China Ltd. | 248,000 | 144,495 | ||||||
Sun Art Retail Group Ltd. | 248,000 | 228,466 | ||||||
Sunac China Holdings Ltd.c | 248,000 | 744,654 | ||||||
Sunny Optical Technology Group Co. Ltd. | 124,000 | 1,777,664 | ||||||
TAL Education Group Class A ADR | 27,528 | 837,677 | ||||||
Tencent Holdings Ltd. | 607,600 | 25,541,644 | ||||||
Tingyi Cayman Islands Holding Corp.c | 248,000 | 330,183 | ||||||
TravelSky Technology Ltd. Class H | 124,000 | 339,055 | ||||||
Tsingtao Brewery Co. Ltd. Class H | 40,000 | 165,848 | ||||||
Vipshop Holdings Ltd. ADRa | 43,152 | 401,745 | ||||||
Want Want China Holdings Ltd.c | 496,000 | 328,282 | ||||||
Weibo Corp. ADRa,c | 4,588 | 463,847 | ||||||
Weichai Power Co. Ltd. Class H | 249,100 | 256,533 | ||||||
Yanzhou Coal Mining Co. Ltd. Class H | 248,000 | 249,063 | ||||||
Yum China Holdings Inc.a | 39,928 | 1,411,854 | ||||||
YY Inc. ADRa | 4,092 | 305,754 | ||||||
Zhuzhou CRRC Times Electric Co. Ltd. Class H | 49,600 | 259,520 | ||||||
Zijin Mining Group Co. Ltd. Class H | 527,000 | 193,254 | ||||||
ZTE Corp. Class Ha | 74,448 | 203,089 | ||||||
|
| |||||||
| 157,353,451 | ||||||||
| 48 | 2017 iSHARES ANNUAL REPORTTO SHAREHOLDERS |
Table of Contents
Consolidated Schedule of Investments (Continued)
iSHARES® MSCI BRIC ETF
August 31, 2017
| Security | Shares | Value | ||||||
INDIA — 17.99% | ||||||||
ACC Ltd. | 5,704 | $ | 160,632 | |||||
Adani Ports & Special Economic Zone Ltd. | 74,525 | 458,100 | ||||||
Aditya Birla Capital Ltd.a | 48,608 | 141,077 | ||||||
Ambuja Cements Ltd. | 63,860 | 280,059 | ||||||
Apollo Hospitals Enterprise Ltd.a | 7,440 | 125,997 | ||||||
Ashok Leyland Ltd. | 120,798 | 202,381 | ||||||
Asian Paints Ltd. | 31,372 | 573,469 | ||||||
Aurobindo Pharma Ltd. | 28,398 | 322,178 | ||||||
Axis Bank Ltd. | 179,552 | 1,405,351 | ||||||
Bajaj Auto Ltd. | 10,168 | 447,670 | ||||||
Bajaj Finance Ltd. | 17,360 | 483,898 | ||||||
Bajaj Finserv Ltd. | 3,844 | 330,896 | ||||||
Bharat Forge Ltd. | 10,664 | 188,136 | ||||||
Bharat Heavy Electricals Ltd. | 64,604 | 130,267 | ||||||
Bharat Petroleum Corp. Ltd. | 80,352 | 664,926 | ||||||
Bharti Airtel Ltd. | 124,992 | 836,262 | ||||||
Bharti Infratel Ltd. | 59,923 | 351,704 | ||||||
Bosch Ltd. | 868 | 298,540 | ||||||
Cadila Healthcare Ltd. | 20,212 | 158,088 | ||||||
Cipla Ltd. | 34,844 | 311,723 | ||||||
Coal India Ltd. | 81,096 | 301,163 | ||||||
Container Corp. of India Ltd. | 4,734 | 97,744 | ||||||
Dabur India Ltd. | 58,032 | 286,047 | ||||||
Dr. Reddy’s Laboratories Ltd. | 12,279 | 388,176 | ||||||
Eicher Motors Ltd. | 1,488 | 732,076 | ||||||
GAIL (India) Ltd. | 51,832 | 306,729 | ||||||
Glenmark Pharmaceuticals Ltd. | 13,888 | 132,327 | ||||||
Godrej Consumer Products Ltd. | 26,288 | 382,150 | ||||||
Grasim Industries Ltd. | 34,720 | 649,144 | ||||||
Havells India Ltd. | 25,048 | 191,348 | ||||||
HCL Technologies Ltd. | 60,760 | 822,442 | ||||||
Hero Motocorp Ltd. | 5,704 | 356,474 | ||||||
Hindalco Industries Ltd. | 126,233 | 469,971 | ||||||
Hindustan Petroleum Corp. Ltd. | 64,170 | 490,212 | ||||||
Hindustan Unilever Ltd. | 69,316 | 1,322,590 | ||||||
Housing Development Finance Corp. Ltd. | 161,324 | 4,484,177 | ||||||
ICICI Bank Ltd. | 254,076 | 1,184,605 | ||||||
Idea Cellular Ltd. | 146,692 | 208,015 | ||||||
IDFC Bank Ltd. | 151,900 | 130,333 | ||||||
Indiabulls Housing Finance Ltd. | 33,108 | 629,519 | ||||||
Indian Oil Corp. Ltd. | 63,240 | 449,819 | ||||||
Infosys Ltd. | 195,920 | 2,804,122 | ||||||
| Security | Shares | Value | ||||||
ITC Ltd. | 358,608 | $ | 1,583,342 | |||||
JSW Steel Ltd. | 88,412 | 351,843 | ||||||
Larsen & Toubro Ltd. | 52,080 | 925,731 | ||||||
LIC Housing Finance Ltd. | 31,744 | 334,615 | ||||||
Lupin Ltd. | 23,436 | 359,076 | ||||||
Mahindra & Mahindra Financial Services Ltd. | 30,345 | 202,929 | ||||||
Mahindra & Mahindra Ltd. | 41,083 | 864,252 | ||||||
Marico Ltd. | 52,080 | 256,994 | ||||||
Maruti Suzuki India Ltd. | 11,284 | 1,359,225 | ||||||
Motherson Sumi Systems Ltd. | 63,426 | 305,689 | ||||||
Nestle India Ltd. | 2,604 | 290,080 | ||||||
NTPC Ltd. | 172,236 | 454,662 | ||||||
Oil & Natural Gas Corp. Ltd. | 155,744 | 382,378 | ||||||
Piramal Enterprises Ltd. | 7,812 | 331,623 | ||||||
Power Finance Corp. Ltd. | 69,316 | 132,394 | ||||||
Reliance Industries Ltd. | 138,632 | 3,457,871 | ||||||
Rural Electrification Corp. Ltd. | 71,672 | 188,973 | ||||||
Shree Cement Ltd. | 992 | 272,976 | ||||||
Shriram Transport Finance Co. Ltd. | 16,244 | 250,294 | ||||||
Siemens Ltd. | 8,435 | 169,554 | ||||||
State Bank of India | 184,512 | 801,677 | ||||||
Sun Pharmaceuticals Industries Ltd. | 102,920 | 774,642 | ||||||
Tata Consultancy Services Ltd. | 50,220 | 1,961,115 | ||||||
Tata Motors Ltd.a | 169,884 | 1,000,682 | ||||||
Tata Motors Ltd. Class Aa | 44,144 | 151,057 | ||||||
Tata Power Co. Ltd. | 104,163 | 129,132 | ||||||
Tata Steel Ltd. | 31,372 | 313,125 | ||||||
Tech Mahindra Ltd. | 50,096 | 335,521 | ||||||
Titan Co. Ltd. | 32,612 | 314,814 | ||||||
Ultratech Cement Ltd. | 9,176 | 574,219 | ||||||
United Spirits Ltd.a | 5,828 | 231,830 | ||||||
UPL Ltd. | 38,068 | 493,103 | ||||||
Vedanta Ltd. | 160,056 | 773,412 | ||||||
Wipro Ltd. | 126,982 | 594,127 | ||||||
Yes Bank Ltd. | 35,960 | 986,131 | ||||||
Zee Entertainment Enterprises Ltd. | 58,652 | 476,639 | ||||||
|
| |||||||
| 47,076,264 | ||||||||
RUSSIA — 6.57% | ||||||||
Alrosa PJSC | 285,200 | 396,555 | ||||||
Gazprom PJSC | 855,604 | 1,734,338 | ||||||
Gazprom PJSC ADR | 166,532 | 664,463 | ||||||
Inter RAO UES PJSC | 3,100,000 | 206,524 | ||||||
Lukoil PJSC | 26,536 | 1,338,794 | ||||||
CONSOLIDATED SCHEDULESOF INVESTMENTS | 49 |
Table of Contents
Consolidated Schedule of Investments (Continued)
iSHARES® MSCI BRIC ETF
August 31, 2017
| Security | Shares | Value | ||||||
Lukoil PJSC ADR | 20,212 | $ | 1,015,653 | |||||
Magnit PJSC GDRe | 32,984 | 1,378,401 | ||||||
MMC Norilsk Nickel PJSC | 6,572 | 1,106,744 | ||||||
Mobile TeleSystems PJSC ADR | 55,552 | 554,965 | ||||||
Moscow Exchange MICEX-RTS PJSC | 178,550 | 323,435 | ||||||
Novatek PJSC GDRe | 10,168 | 1,074,758 | ||||||
Novolipetsk Steel PJSC | 121,400 | 287,430 | ||||||
PhosAgro PJSC GDRe | 17,608 | 244,751 | ||||||
Rosneft Oil Co. PJSC | 97,602 | 513,597 | ||||||
Rostelecom PJSC | 122,760 | 140,463 | ||||||
RusHydro PJSC | 11,160,200 | 158,847 | ||||||
Sberbank of Russia PJSC | 878,900 | 2,782,969 | ||||||
Sberbank of Russia PJSC ADR | 64,604 | 881,845 | ||||||
Severstal PJSC | 19,840 | 311,222 | ||||||
Sistema PJSC FC GDRe | 21,080 | 87,482 | ||||||
Surgutneftegas OJSC | 595,210 | 275,339 | ||||||
Surgutneftegas OJSC ADR | 32,984 | 150,869 | ||||||
Tatneft PJSC Class S | 164,923 | 1,090,494 | ||||||
VTB Bank PJSC | 434,186,001 | 484,464 | ||||||
|
| |||||||
| 17,204,402 | ||||||||
|
| |||||||
TOTAL COMMON STOCKS | ||||||||
(Cost: $206,812,706) | 246,673,156 | |||||||
PREFERRED STOCKS — 5.46% |
| |||||||
BRAZIL — 5.32% | ||||||||
Banco Bradesco SA, Preference Shares | 334,893 | 3,574,094 | ||||||
Braskem SA Class A, Preference Shares | 12,400 | 150,190 | ||||||
Centrais Eletricas Brasileiras SA Class B, Preference Shares | 24,882 | 162,350 | ||||||
Cia. Brasileira de Distribuicao, Preference Shares | 12,756 | 291,854 | ||||||
Cia. Energetica de Minas Gerais, Preference Shares | 74,432 | 198,236 | ||||||
Cia. Paranaense de Energia Class B, Preference Shares | 12,400 | 113,263 | ||||||
Gerdau SA, Preference Shares | 99,200 | 373,602 | ||||||
Itau Unibanco Holding SA, Preference Shares | 341,371 | 4,377,734 | ||||||
Itausa-Investimentos Itau SA, Preference Shares | 440,131 | 1,426,794 | ||||||
Lojas Americanas SA, Preference Shares | 74,504 | 420,771 | ||||||
| Security | Shares | Value | ||||||
Petroleo Brasileiro SA, | 409,214 | $ | 1,775,261 | |||||
Suzano Papel e Celulose SA Class A, Preference Shares | 49,600 | 275,867 | ||||||
Telefonica Brasil SA, Preference Shares | 49,664 | 770,897 | ||||||
|
| |||||||
| 13,910,913 | ||||||||
RUSSIA — 0.14% | ||||||||
Surgutneftegas OJSC, Preference Shares | 768,800 | 379,535 | ||||||
|
| |||||||
| 379,535 | ||||||||
|
| |||||||
TOTAL PREFERRED STOCKS | ||||||||
(Cost: $11,517,432) | 14,290,448 | |||||||
RIGHTS — 0.00% | ||||||||
CHINA — 0.00% | ||||||||
Fosun International Ltd. (Expires 09/07/17)a | 158 | — | ||||||
|
| |||||||
| — | ||||||||
|
| |||||||
TOTAL RIGHTS | ||||||||
(Cost: $0) | — | |||||||
SHORT-TERM INVESTMENTS — 9.80% |
| |||||||
MONEY MARKET FUNDS — 9.80% |
| |||||||
BlackRock Cash Funds: Institutional, | ||||||||
1.32%f,g,h | 25,497,132 | 25,504,781 | ||||||
BlackRock Cash Funds: Treasury, | ||||||||
0.96%f,g | 159,468 | 159,468 | ||||||
|
| |||||||
| 25,664,249 | ||||||||
|
| |||||||
TOTAL SHORT-TERM INVESTMENTS |
| |||||||
(Cost: $25,662,112) |
| 25,664,249 | ||||||
|
| |||||||
| 50 | 2017 iSHARES ANNUAL REPORTTO SHAREHOLDERS |
Table of Contents
Consolidated Schedule of Investments (Continued)
iSHARES® MSCI BRIC ETF
August 31, 2017
| Security | Value | |||||||
TOTAL INVESTMENTS |
| |||||||
(Cost: $243,992,250)i | $ | 286,627,853 | ||||||
Other Assets, Less Liabilities — (9.52)% |
| (24,926,147 | ) | |||||
|
| |||||||
NET ASSETS — 100.00% | $ | 261,701,706 | ||||||
|
| |||||||
ADR — American Depositary Receipts
GDR — Global Depositary Receipts
| a | Non-income earning security. |
| b | This security may be resold to qualified institutional buyers under Rule 144A of the Securities Act of 1933. |
| c | All or a portion of this security represents a security on loan. See Note 1. |
| d | Security is valued using significant unobservable inputs and is classified as Level 3 in the fair value hierarchy. |
| e | This security may be resold to qualified foreign investors and foreign institutional buyers under Regulation S of the Securities Act of 1933. |
| f | Affiliated issuer. See Schedule 1. |
| g | The rate quoted is the annualized seven-day yield of the fund at period end. |
| h | All or a portion of this security represents an investment of securities lending collateral. See Note 1. |
| i | The cost of investments (including short positions and derivatives, if any) for federal income tax purposes was $250,639,483. Net unrealized appreciation was $35,988,370, of which $61,840,477 represented gross unrealized appreciation on investments and $25,852,107 represented gross unrealized depreciation on investments. |
Schedule 1 — Affiliates (Note 2)
Investments in issuers considered to be affiliates of the Fund during the year ended August 31, 2017, for purposes of Section 2(a)(3) of the 1940 Act, and/or related parties of the Fund were as follows:
| Affiliated issuer | Shares held at 08/31/16 | Shares purchased | Shares sold | Shares held at 08/31/17 | Value at 08/31/17 | Net realized gain (loss) a | Change in unrealized appreciation (depreciation) | Income | ||||||||||||||||||||||||
BlackRock Cash Funds: Institutional, | 6,588,665 | 18,908,467 | b | — | 25,497,132 | $ | 25,504,781 | $ | 1,489 | $ | 2,137 | $ | — | c | ||||||||||||||||||
BlackRock Cash Funds: Treasury, | — | 159,468 | b | — | 159,468 | 159,468 | 6 | — | 1,236 | |||||||||||||||||||||||
|
|
|
|
|
|
|
| |||||||||||||||||||||||||
| $ | 25,664,249 | $ | 1,495 | $ | 2,137 | $ | 1,236 | |||||||||||||||||||||||||
|
|
|
|
|
|
|
| |||||||||||||||||||||||||
| a | Includes realized capital gain distributions from an affiliated fund, if any. |
| b | Net of shares purchased and sold. |
| c | Does not include income earned on the investment of securities lending cash collateral which is not direct income of the Fund and is reflected as a component of securities lending income in the statement of operations. |
Schedule 2 — Fair Value Measurements
Various inputs are used in determining the fair value of financial instruments. For description of the input levels and information about the Fund’s policy regarding valuation of financial instruments, see Note 1.
The following table summarizes the value of the Fund’s investments according to the fair value hierarchy as of August 31, 2017. The breakdown of the Fund’s investments into major categories is disclosed in the consolidated schedule of investments above.
| Level 1 | Level 2 | Level 3 | Total | |||||||||||||
Investments: | ||||||||||||||||
Assets: | ||||||||||||||||
Common stocks | $ | 246,532,079 | $ | 141,077 | $ | 0 | a | $ | 246,673,156 | |||||||
Preferred stocks | 14,290,448 | — | — | 14,290,448 | ||||||||||||
Rights | — | 0 | a | — | 0 | a | ||||||||||
Money market funds | 25,664,249 | — | — | 25,664,249 | ||||||||||||
|
|
|
|
|
|
|
| |||||||||
Total | $ | 286,486,776 | $ | 141,077 | $ | 0 | a | $ | 286,627,853 | |||||||
|
|
|
|
|
|
|
| |||||||||
| a | Rounds to less than $1. |
See notes to consolidated financial statements.
CONSOLIDATED SCHEDULESOF INVESTMENTS | 51 |
Table of Contents
Consolidated Schedule of Investments
iSHARES® MSCI EMERGING MARKETS ASIA ETF
August 31, 2017
| Security | Shares | Value | ||||||
COMMON STOCKS — 98.60% |
| |||||||
CHINA — 40.21% | ||||||||
3SBio Inc.a,b,c | 136,500 | $ | 187,664 | |||||
58.com Inc. ADRa | 12,429 | 778,428 | ||||||
AAC Technologies Holdings Inc.c | 102,000 | 1,859,770 | ||||||
Agricultural Bank of China Ltd. Class H | 3,592,000 | 1,688,960 | ||||||
Air China Ltd. Class H | 246,000 | 218,766 | ||||||
Alibaba Group Holding Ltd. ADRa | 156,390 | 26,858,419 | ||||||
Alibaba Health Information Technology Ltd.a,c | 462,000 | 215,462 | ||||||
Alibaba Pictures Group Ltd.a,c | 1,700,000 | 297,581 | ||||||
Aluminum Corp. of China Ltd. Class Ha,c | 530,000 | 392,093 | ||||||
Anhui Conch Cement Co. Ltd. Class H | 171,500 | 639,856 | ||||||
ANTA Sports Products Ltd. | 150,000 | 590,306 | ||||||
Autohome Inc. ADRa | 7,105 | 456,638 | ||||||
AviChina Industry & Technology Co. Ltd. Class Hc | 287,000 | 169,785 | ||||||
Baidu Inc. ADRa | 37,568 | 8,567,382 | ||||||
Bank of China Ltd. Class H | 10,922,000 | 5,749,560 | ||||||
Bank of Communications Co. Ltd. Class H | 1,195,000 | 913,070 | ||||||
Beijing Capital International Airport Co. Ltd. Class H | 204,000 | 329,989 | ||||||
Beijing Enterprises Holdings Ltd. | 68,500 | 382,479 | ||||||
Beijing Enterprises Water Group Ltd. | 662,000 | 562,490 | ||||||
Brilliance China Automotive Holdings Ltd. | 414,000 | 1,071,175 | ||||||
Byd Co. Ltd. Class H | 89,000 | 529,921 | ||||||
CGN Power Co. Ltd. Class Hb | 1,472,000 | 406,253 | ||||||
China Cinda Asset Management Co. Ltd. Class H | 1,193,000 | 443,577 | ||||||
China CITIC Bank Corp. Ltd. Class H | 1,225,000 | 809,211 | ||||||
China Coal Energy Co. Ltd. Class Hc | 276,000 | 138,944 | ||||||
China Communications Construction Co. Ltd. Class H | 607,000 | 808,149 | ||||||
China Communications Services Corp. Ltd. Class H | 326,000 | 176,611 | ||||||
China Conch Venture Holdings Ltd. | 230,500 | 419,388 | ||||||
| Security | Shares | Value | ||||||
China Construction Bank Corp. Class H | 11,569,000 | $ | 10,140,401 | |||||
China Everbright Bank Co. Ltd. Class H | 370,000 | 177,756 | ||||||
China Everbright International Ltd.c | 334,000 | 441,268 | ||||||
China Everbright Ltd. | 126,000 | 287,855 | ||||||
China Evergrande Groupa,c | 448,000 | 1,353,768 | ||||||
China Galaxy Securities Co. Ltd. Class H | 463,500 | 419,886 | ||||||
China Gas Holdings Ltd. | 244,000 | 616,044 | ||||||
China Huarong Asset Management Co. Ltd. Class Hb | 878,000 | 374,694 | ||||||
China Huishan Dairy Holdings Co. Ltd.c,d | 404,000 | 1 | ||||||
China Jinmao Holdings Group Ltd. | 534,000 | 237,441 | ||||||
China Life Insurance Co. Ltd. Class H | 1,023,000 | 3,280,836 | ||||||
China Longyuan Power Group Corp. Ltd. Class H | 442,000 | 330,944 | ||||||
China Medical System Holdings Ltd. | 169,000 | 310,946 | ||||||
China Mengniu Dairy Co. Ltd.c | 377,000 | 880,547 | ||||||
China Merchants Bank Co. Ltd. Class H | 536,331 | 2,021,576 | ||||||
China Merchants Port Holdings Co. Ltd. | 184,000 | 601,857 | ||||||
China Minsheng Banking Corp. Ltd. Class H | 759,300 | 757,704 | ||||||
China Mobile Ltd. | 844,500 | 8,955,976 | ||||||
China National Building Material Co. Ltd. Class H | 404,000 | 253,970 | ||||||
China Oilfield Services Ltd. Class H | 244,000 | 200,152 | ||||||
China Overseas Land & Investment Ltd. | 532,000 | 1,859,106 | ||||||
China Pacific Insurance Group Co. Ltd. Class H | 363,200 | 1,710,088 | ||||||
China Petroleum & Chemical Corp. Class H | 3,508,600 | 2,685,319 | ||||||
China Power International Development Ltd. | 454,000 | 154,882 | ||||||
China Railway Construction Corp. Ltd. Class H | 266,000 | 348,710 | ||||||
China Railway Group Ltd. Class H | 560,000 | 447,917 | ||||||
China Resources Beer Holdings Co. Ltd. | 220,000 | 552,077 | ||||||
China Resources Gas Group Ltd. | 126,000 | 444,339 | ||||||
| 52 | 2017 iSHARES ANNUAL REPORTTO SHAREHOLDERS |
Table of Contents
Consolidated Schedule of Investments (Continued)
iSHARES® MSCI EMERGING MARKETS ASIA ETF
August 31, 2017
| Security | Shares | Value | ||||||
China Resources Land Ltd. | 385,777 | $ | 1,205,176 | |||||
China Resources Power Holdings Co. Ltd. | 268,000 | 491,727 | ||||||
China Shenhua Energy Co. Ltd. Class H | 470,500 | 1,211,351 | ||||||
China Southern Airlines Co. Ltd. Class H | 246,000 | 192,049 | ||||||
China State Construction International Holdings Ltd. | 252,000 | 365,131 | ||||||
China Taiping Insurance Holdings Co. Ltd. | 223,100 | 677,015 | ||||||
China Telecom Corp. Ltd. Class H | 1,910,000 | 981,058 | ||||||
China Unicom Hong Kong Ltd.a | 824,000 | 1,200,238 | ||||||
China Vanke Co. Ltd. Class H | 165,900 | 497,078 | ||||||
Chongqing Changan Automobile Co. Ltd. Class B | 113,400 | 148,371 | ||||||
Chongqing Rural Commercial Bank Co. Ltd. Class H | 340,000 | 236,761 | ||||||
CITIC Ltd. | 804,000 | 1,234,797 | ||||||
CITIC Securities Co. Ltd. Class H | 314,500 | 697,599 | ||||||
CNOOC Ltd. | 2,457,000 | 2,938,436 | ||||||
COSCO SHIPPING Ports Ltd. | 226,000 | 267,107 | ||||||
Country Garden Holdings Co. Ltd.c | 734,828 | 976,459 | ||||||
CRRC Corp. Ltd. Class H | 571,750 | 515,758 | ||||||
CSPC Pharmaceutical Group Ltd. | 584,000 | 911,841 | ||||||
Ctrip.com International Ltd. ADRa | 53,948 | 2,775,625 | ||||||
Dongfeng Motor Group Co. Ltd. Class H | 378,000 | 490,705 | ||||||
ENN Energy Holdings Ltd. | 104,000 | 669,065 | ||||||
Far East Horizon Ltd. | 277,000 | 253,059 | ||||||
Fosun International Ltd.c | 356,000 | 617,710 | ||||||
Fullshare Holdings Ltd.c | 702,500 | 280,050 | ||||||
Fuyao Glass Industry Group Co. Ltd. Class Hb | 68,800 | 219,328 | ||||||
GCL-Poly Energy Holdings Ltd.a,c | 1,764,000 | 198,343 | ||||||
Geely Automobile Holdings Ltd. | 674,000 | 1,656,915 | ||||||
GF Securities Co. Ltd. Class H | 190,600 | 406,700 | ||||||
GOME Electrical Appliances Holding Ltd.c | 1,509,000 | 158,102 | ||||||
Great Wall Motor Co. Ltd. Class Hc | 426,500 | 535,138 | ||||||
Guangdong Investment Ltd. | 382,000 | 564,230 | ||||||
Guangzhou Automobile Group Co. Ltd. Class H | 290,000 | 572,111 | ||||||
Guangzhou R&F Properties Co. Ltd. Class H | 132,000 | 308,308 | ||||||
| Security | Shares | Value | ||||||
Haier Electronics Group Co. Ltd. | 170,000 | $ | 451,801 | |||||
Haitian International Holdings Ltd. | 90,000 | 270,237 | ||||||
Haitong Securities Co. Ltd. Class H | 447,200 | 749,671 | ||||||
Hanergy Thin Film Power Group Ltd.a,d | 2,513 | — | ||||||
Hengan International Group Co. Ltd.c | 99,000 | 827,272 | ||||||
Huaneng Power International Inc. Class H | 572,000 | 374,198 | ||||||
Huaneng Renewables Corp. Ltd. Class H | 680,000 | 208,524 | ||||||
Huatai Securities Co. Ltd. Class Hb | 227,200 | 505,698 | ||||||
Industrial & Commercial Bank of China Ltd. Class H | 10,143,000 | 7,594,501 | ||||||
JD.com Inc. ADRa | 90,170 | 3,779,025 | ||||||
Jiangsu Expressway Co. Ltd. Class H | 168,000 | 257,588 | ||||||
Jiangxi Copper Co. Ltd. Class H | 173,000 | 300,180 | ||||||
Kingsoft Corp. Ltd.c | 106,000 | 251,373 | ||||||
Kunlun Energy Co. Ltd. | 440,000 | 426,145 | ||||||
Lenovo Group Ltd.c | 1,004,000 | 549,051 | ||||||
Longfor Properties Co. Ltd. | 205,500 | 493,634 | ||||||
Minth Group Ltd. | 92,000 | 423,768 | ||||||
Momo Inc. ADRa | 12,099 | 466,174 | ||||||
NetEase Inc. ADR | 10,938 | 3,017,138 | ||||||
New China Life Insurance Co. Ltd. Class H | 107,300 | 686,867 | ||||||
New Oriental Education & Technology Group Inc. ADR | 18,352 | 1,500,276 | ||||||
Nine Dragons Paper (Holdings) Ltd. | 222,000 | 370,451 | ||||||
People’s Insurance Co. Group of China Ltd. (The) Class H | 960,000 | 452,619 | ||||||
PetroChina Co. Ltd. Class H | 2,908,000 | 1,857,803 | ||||||
PICC Property & Casualty Co. Ltd. Class H | 635,160 | 1,192,987 | ||||||
Ping An Insurance Group Co. of China Ltd. Class H | 716,500 | 5,689,741 | ||||||
Semiconductor Manufacturing International Corp.a,c | 381,300 | 358,575 | ||||||
Shandong Weigao Group Medical Polymer Co. Ltd. Class H | 252,000 | 201,241 | ||||||
Shanghai Electric Group Co. Ltd. Class Ha,c | 382,000 | 173,271 | ||||||
Shanghai Fosun Pharmaceutical Group Co. Ltd. Class H | 66,000 | 247,929 | ||||||
CONSOLIDATED SCHEDULESOF INVESTMENTS | 53 |
Table of Contents
Consolidated Schedule of Investments (Continued)
iSHARES® MSCI EMERGING MARKETS ASIA ETF
August 31, 2017
| Security | Shares | Value | ||||||
Shanghai Industrial Holdings Ltd. | 70,000 | $ | 212,868 | |||||
Shanghai Lujiazui Finance & Trade Zone Development Co. Ltd. Class B | 123,180 | 198,689 | ||||||
Shanghai Pharmaceuticals Holding Co. Ltd. Class H | 93,900 | 231,077 | ||||||
Shenzhou International Group Holdings Ltd. | 76,000 | 608,858 | ||||||
Shimao Property Holdings Ltd. | 162,500 | 335,529 | ||||||
Sihuan Pharmaceutical Holdings Group Ltd. | 516,000 | 198,450 | ||||||
SINA Corp./Chinaa | 7,799 | 794,172 | ||||||
Sino Biopharmaceutical Ltd. | 620,000 | 544,231 | ||||||
Sino-Ocean Group Holding Ltd. | 428,500 | 295,651 | ||||||
Sinopec Engineering Group Co. Ltd. Class H | 169,500 | 152,901 | ||||||
Sinopec Shanghai Petrochemical Co. Ltd. Class H | 473,000 | 294,928 | ||||||
Sinopharm Group Co. Ltd. Class H | 163,600 | 738,938 | ||||||
SOHO China Ltd. | 289,500 | 168,674 | ||||||
Sun Art Retail Group Ltd.c | 323,500 | 298,020 | ||||||
Sunac China Holdings Ltd. | 288,000 | 864,760 | ||||||
Sunny Optical Technology Group Co. Ltd. | 98,000 | 1,404,928 | ||||||
TAL Education Group Class A ADR | 37,758 | 1,148,976 | ||||||
Tencent Holdings Ltd. | 781,800 | 32,864,479 | ||||||
Tingyi Cayman Islands Holding Corp.c | 266,000 | 354,148 | ||||||
TravelSky Technology Ltd. Class H | 126,000 | 344,524 | ||||||
Tsingtao Brewery Co. Ltd. Class H | 52,000 | 215,602 | ||||||
Vipshop Holdings Ltd. ADRa | 55,758 | 519,107 | ||||||
Want Want China Holdings Ltd.c | 689,000 | 456,020 | ||||||
Weibo Corp. ADRa | 6,387 | 645,726 | ||||||
Weichai Power Co. Ltd. Class H | 264,200 | 272,084 | ||||||
Yanzhou Coal Mining Co. Ltd. Class H | 250,000 | 251,072 | ||||||
Yum China Holdings Inc.a | 52,656 | 1,861,916 | ||||||
YY Inc. ADRa | 5,911 | 441,670 | ||||||
Zhejiang Expressway Co. Ltd. Class H | 194,000 | 242,672 | ||||||
Zhuzhou CRRC Times Electric Co. Ltd. Class H | 76,800 | 401,837 | ||||||
Zijin Mining Group Co. Ltd. Class H | 810,000 | 297,031 | ||||||
ZTE Corp. Class Ha | 97,360 | 265,591 | ||||||
|
| |||||||
| 201,564,195 | ||||||||
| Security | Shares | Value | ||||||
INDIA — 12.04% | ||||||||
ACC Ltd. | 6,270 | $ | 176,572 | |||||
Adani Ports & Special Economic Zone Ltd. | 99,307 | 610,433 | ||||||
Aditya Birla Capital Ltd.a | 52,445 | 152,213 | ||||||
Ambuja Cements Ltd. | 80,870 | 354,657 | ||||||
Apollo Hospitals Enterprise Ltd.a | 11,217 | 189,961 | ||||||
Ashok Leyland Ltd. | 154,449 | 258,759 | ||||||
Asian Paints Ltd. | 39,786 | 727,274 | ||||||
Aurobindo Pharma Ltd. | 36,479 | 413,858 | ||||||
Axis Bank Ltd. | 228,347 | 1,787,269 | ||||||
Bajaj Auto Ltd. | 11,733 | 516,572 | ||||||
Bajaj Finance Ltd. | 22,879 | 637,736 | ||||||
Bajaj Finserv Ltd. | 5,195 | 447,192 | ||||||
Bharat Forge Ltd. | 14,074 | 248,296 | ||||||
Bharat Heavy Electricals Ltd. | 79,006 | 159,307 | ||||||
Bharat Petroleum Corp. Ltd. | 104,388 | 863,828 | ||||||
Bharti Airtel Ltd. | 164,477 | 1,100,437 | ||||||
Bharti Infratel Ltd. | 77,718 | 456,147 | ||||||
Bosch Ltd. | 1,032 | 354,946 | ||||||
Cadila Healthcare Ltd. | 27,786 | 217,329 | ||||||
Cipla Ltd. | 47,021 | 420,661 | ||||||
Coal India Ltd. | 92,762 | 344,486 | ||||||
Container Corp. of India Ltd. | 5,736 | 118,433 | ||||||
Dabur India Ltd. | 71,924 | 354,522 | ||||||
Dr. Reddy’s Laboratories Ltd. | 15,931 | 503,627 | ||||||
Eicher Motors Ltd. | 1,831 | 900,827 | ||||||
GAIL (India) Ltd. | 68,807 | 407,183 | ||||||
Glenmark Pharmaceuticals Ltd. | 18,853 | 179,635 | ||||||
Godrej Consumer Products Ltd. | 33,276 | 483,735 | ||||||
Grasim Industries Ltd. | 45,448 | 849,721 | ||||||
Havells India Ltd. | 33,965 | 259,468 | ||||||
HCL Technologies Ltd. | 77,256 | 1,045,730 | ||||||
Hero Motocorp Ltd. | 6,795 | 424,657 | ||||||
Hindalco Industries Ltd. | 161,458 | 601,115 | ||||||
Hindustan Petroleum Corp. Ltd. | 84,641 | 646,596 | ||||||
Hindustan Unilever Ltd. | 89,589 | 1,709,410 | ||||||
Housing Development Finance Corp. Ltd. | 207,138 | 5,757,627 | ||||||
ICICI Bank Ltd. | 326,466 | 1,522,116 | ||||||
Idea Cellular Ltd. | 194,455 | 275,745 | ||||||
IDFC Bank Ltd. | 183,943 | 157,827 | ||||||
Indiabulls Housing Finance Ltd. | 43,553 | 828,121 | ||||||
Indian Oil Corp. Ltd. | 81,430 | 579,202 | ||||||
Infosys Ltd. | 252,734 | 3,617,277 | ||||||
| 54 | 2017 iSHARES ANNUAL REPORTTO SHAREHOLDERS |
Table of Contents
Consolidated Schedule of Investments (Continued)
iSHARES® MSCI EMERGING MARKETS ASIA ETF
August 31, 2017
| Security | Shares | Value | ||||||
ITC Ltd. | 467,383 | $ | 2,063,610 | |||||
JSW Steel Ltd. | 114,457 | 455,491 | ||||||
Larsen & Toubro Ltd. | 65,580 | 1,165,696 | ||||||
LIC Housing Finance Ltd. | 41,766 | 440,258 | ||||||
Lupin Ltd. | 30,606 | 468,932 | ||||||
Mahindra & Mahindra Financial Services Ltd. | 37,504 | 250,804 | ||||||
Mahindra & Mahindra Ltd. | 51,114 | 1,075,272 | ||||||
Marico Ltd. | 60,847 | 300,255 | ||||||
Maruti Suzuki India Ltd. | 14,587 | 1,757,092 | ||||||
Motherson Sumi Systems Ltd. | 87,902 | 423,654 | ||||||
Nestle India Ltd. | 3,155 | 351,460 | ||||||
NTPC Ltd. | 229,057 | 604,656 | ||||||
Oil & Natural Gas Corp. Ltd. | 173,906 | 426,969 | ||||||
Piramal Enterprises Ltd. | 10,709 | 454,602 | ||||||
Power Finance Corp. Ltd. | 90,198 | 172,279 | ||||||
Reliance Industries Ltd. | 178,391 | 4,449,572 | ||||||
Rural Electrification Corp. Ltd. | 93,207 | 245,753 | ||||||
Shree Cement Ltd. | 1,128 | 310,400 | ||||||
Shriram Transport Finance Co. Ltd. | 20,511 | 316,041 | ||||||
Siemens Ltd. | 9,607 | 193,113 | ||||||
State Bank of India | 239,109 | 1,038,893 | ||||||
Sun Pharmaceuticals Industries Ltd. | 132,282 | 995,639 | ||||||
Tata Consultancy Services Ltd. | 63,164 | 2,466,584 | ||||||
Tata Motors Ltd.a | 218,584 | 1,287,543 | ||||||
Tata Motors Ltd. Class Aa | 50,966 | 174,401 | ||||||
Tata Power Co. Ltd. | 151,450 | 187,754 | ||||||
Tata Steel Ltd. | 42,215 | 421,349 | ||||||
Tech Mahindra Ltd. | 65,509 | 438,751 | ||||||
Titan Co. Ltd. | 43,673 | 421,589 | ||||||
Ultratech Cement Ltd. | 12,149 | 760,265 | ||||||
United Spirits Ltd.a | 7,857 | 312,541 | ||||||
UPL Ltd. | 49,153 | 636,689 | ||||||
Vedanta Ltd. | 204,015 | 985,827 | ||||||
Wipro Ltd. | 167,461 | 783,521 | ||||||
Yes Bank Ltd. | 46,062 | 1,263,159 | ||||||
Zee Entertainment Enterprises Ltd. | 73,548 | 597,692 | ||||||
|
| |||||||
| 60,358,613 | ||||||||
INDONESIA — 3.14% | ||||||||
Adaro Energy Tbk PT | 1,954,300 | 267,321 | ||||||
AKR Corporindo Tbk PT | 243,900 | 123,851 | ||||||
Astra International Tbk PT | 2,790,700 | 1,647,186 | ||||||
Bank Central Asia Tbk PT | 1,355,300 | 1,924,969 | ||||||
Bank Danamon Indonesia Tbk PT | 452,300 | 184,757 | ||||||
Bank Mandiri Persero Tbk PT | 1,279,900 | 1,256,685 | ||||||
| Security | Shares | Value | ||||||
Bank Negara Indonesia Persero Tbk PT | 1,035,700 | $ | 570,559 | |||||
Bank Rakyat Indonesia Persero Tbk PT | 1,531,400 | 1,736,053 | ||||||
Bumi Serpong Damai Tbk PT | 1,044,700 | 143,683 | ||||||
Charoen Pokphand Indonesia Tbk PT | 1,031,200 | 214,093 | ||||||
Gudang Garam Tbk PT | 65,100 | 337,649 | ||||||
Hanjaya Mandala Sampoerna Tbk PT | 1,258,500 | 343,347 | ||||||
Indocement Tunggal Prakarsa Tbk PT | 256,900 | 381,249 | ||||||
Indofood CBP Sukses Makmur Tbk PT | 316,900 | 207,237 | ||||||
Indofood Sukses Makmur Tbk PT | 606,700 | 380,836 | ||||||
Jasa Marga Persero Tbk PT | 291,198 | 127,134 | ||||||
Kalbe Farma Tbk PT | 2,849,700 | 365,237 | ||||||
Lippo Karawaci Tbk PT | 1,886,300 | 110,984 | ||||||
Matahari Department Store Tbk PT | 345,300 | 258,807 | ||||||
Media Nusantara Citra Tbk PT | 761,000 | 84,986 | ||||||
Pakuwon Jati Tbk PT | 2,898,700 | 145,565 | ||||||
Perusahaan Gas Negara Persero Tbk PT | 1,468,000 | 233,260 | ||||||
Semen Indonesia Persero Tbk PT | 410,900 | 322,604 | ||||||
Summarecon Agung Tbk PT | 1,365,800 | 106,975 | ||||||
Surya Citra Media Tbk PT | 789,200 | 130,725 | ||||||
Telekomunikasi Indonesia Persero Tbk PT | 6,947,400 | 2,442,161 | ||||||
Tower Bersama Infrastructure Tbk PT | 292,600 | 140,905 | ||||||
Unilever Indonesia Tbk PT | 208,900 | 791,478 | ||||||
United Tractors Tbk PT | 234,300 | 532,101 | ||||||
Waskita Karya Persero Tbk PT | 647,800 | 107,789 | ||||||
XL Axiata Tbk PTa | 427,800 | 115,431 | ||||||
|
| |||||||
| 15,735,617 | ||||||||
MALAYSIA — 3.10% | ||||||||
AirAsia Bhd | 203,000 | 157,818 | ||||||
Alliance Financial Group Bhd | 144,100 | 129,574 | ||||||
AMMB Holdings Bhd | 221,100 | 221,592 | ||||||
Astro Malaysia Holdings Bhd | 224,100 | 140,636 | ||||||
Axiata Group Bhdc | 373,300 | 430,949 | ||||||
British American Tobacco Malaysia Bhd | 19,300 | 199,666 | ||||||
CIMB Group Holdings Bhd | 560,000 | 928,416 | ||||||
Dialog Group Bhdc | 414,678 | 199,061 | ||||||
CONSOLIDATED SCHEDULESOF INVESTMENTS | 55 |
Table of Contents
Consolidated Schedule of Investments (Continued)
iSHARES® MSCI EMERGING MARKETS ASIA ETF
August 31, 2017
| Security | Shares | Value | ||||||
DiGi.Com Bhdc | 424,200 | $ | 480,770 | |||||
Felda Global Ventures Holdings Bhdc | 195,700 | 71,030 | ||||||
Gamuda Bhdc | 231,300 | 289,227 | ||||||
Genting Bhd | 306,900 | 697,810 | ||||||
Genting Malaysia Bhd | 410,900 | 564,801 | ||||||
Genting Plantations Bhd | 32,800 | 81,722 | ||||||
HAP Seng Consolidated Bhd | 84,000 | 178,602 | ||||||
Hartalega Holdings Bhd | 88,400 | 140,554 | ||||||
Hong Leong Bank Bhd | 89,100 | 322,141 | ||||||
Hong Leong Financial Group Bhd | 30,200 | 119,513 | ||||||
IHH Healthcare Bhd | 279,600 | 392,180 | ||||||
IJM Corp. Bhd | 389,400 | 304,554 | ||||||
IOI Corp. Bhdc | 305,100 | 324,354 | ||||||
IOI Properties Group Bhd | 226,543 | 105,566 | ||||||
Kuala Lumpur Kepong Bhd | 65,700 | 377,538 | ||||||
Malayan Banking Bhd | 490,100 | 1,085,668 | ||||||
Malaysia Airports Holdings Bhd | 112,800 | 237,724 | ||||||
Maxis Bhdc | 258,900 | 350,414 | ||||||
MISC Bhdc | 185,500 | 323,175 | ||||||
Petronas Chemicals Group Bhd | 327,100 | 548,422 | ||||||
Petronas Dagangan Bhd | 33,900 | 193,692 | ||||||
Petronas Gas Bhd | 96,400 | 415,352 | ||||||
PPB Group Bhd | 64,500 | 251,928 | ||||||
Public Bank Bhd | 404,210 | 1,949,825 | ||||||
RHB Bank Bhd | 106,562 | 126,013 | ||||||
RHB Bank Bhd Newa,d | 28,800 | — | ||||||
Sapura Energy Bhdc | 520,500 | 168,198 | ||||||
Sime Darby Bhd | 330,600 | 696,733 | ||||||
Telekom Malaysia Bhd | 156,100 | 235,036 | ||||||
Tenaga Nasional Bhd | 469,100 | 1,568,610 | ||||||
UMW Holdings Bhda,c | 64,500 | 91,830 | ||||||
Westports Holdings Bhd | 138,000 | 121,180 | ||||||
YTL Corp. Bhd | 627,753 | 210,207 | ||||||
YTL Power International Bhd | 273,115 | 90,175 | ||||||
|
| |||||||
| 15,522,256 | ||||||||
PAKISTAN — 0.13% | ||||||||
Engro Corp. Ltd./Pakistan | 35,200 | 94,863 | ||||||
Habib Bank Ltd. | 79,300 | 133,920 | ||||||
Lucky Cement Ltd. | 17,050 | 96,757 | ||||||
MCB Bank Ltd. | 60,100 | 110,522 | ||||||
Oil & Gas Development Co. Ltd. | 85,800 | 115,080 | ||||||
United Bank Ltd./Pakistan | 65,400 | 115,712 | ||||||
|
| |||||||
| 666,854 | ||||||||
| Security | Shares | Value | ||||||
PHILIPPINES — 1.52% | ||||||||
Aboitiz Equity Ventures Inc. | 273,010 | $ | 397,217 | |||||
Aboitiz Power Corp. | 195,200 | 150,682 | ||||||
Alliance Global Group Inc. | 547,900 | 148,833 | ||||||
Ayala Corp. | 34,480 | 619,926 | ||||||
Ayala Land Inc. | 1,005,200 | 825,062 | ||||||
Bank of the Philippine Islands | 107,420 | 222,313 | ||||||
BDO Unibank Inc. | 267,159 | 663,590 | ||||||
DMCI Holdings Inc. | 536,400 | 164,578 | ||||||
Energy Development Corp. | 1,263,300 | 167,387 | ||||||
Globe Telecom Inc. | 4,470 | 174,712 | ||||||
GT Capital Holdings Inc. | 11,720 | 256,067 | ||||||
International Container Terminal Services Inc. | 68,250 | 139,248 | ||||||
JG Summit Holdings Inc. | 391,116 | 548,801 | ||||||
Jollibee Foods Corp. | 60,900 | 283,494 | ||||||
Megaworld Corp. | 1,633,400 | 157,690 | ||||||
Metro Pacific Investments Corp. | 1,968,800 | 244,320 | ||||||
Metropolitan Bank & Trust Co. | 87,146 | 149,189 | ||||||
PLDT Inc. | 12,110 | 409,425 | ||||||
Robinsons Land Corp. | 219,200 | 99,383 | ||||||
Security Bank Corp. | 23,090 | 112,810 | ||||||
SM Investments Corp. | 32,769 | 519,040 | ||||||
SM Prime Holdings Inc. | 1,211,750 | 790,941 | ||||||
Universal Robina Corp. | 123,480 | 352,559 | ||||||
|
| |||||||
| 7,597,267 | ||||||||
SOUTH KOREA — 19.08% | ||||||||
AmorePacific Corp. | 4,430 | 1,131,465 | ||||||
AmorePacific Group | 4,040 | 480,099 | ||||||
BGF retail Co. Ltd. | 3,033 | 245,308 | ||||||
BNK Financial Group Inc. | 37,812 | 330,637 | ||||||
Celltrion Inc.a | 10,906 | 1,113,232 | ||||||
Cheil Worldwide Inc. | 9,421 | 158,743 | ||||||
CJ CheilJedang Corp. | 1,075 | 345,590 | ||||||
CJ Corp. | 2,065 | 324,144 | ||||||
CJ E&M Corp. | 2,579 | 173,824 | ||||||
CJ Logistics Corp.a | 1,096 | 164,264 | ||||||
Coway Co. Ltd. | 7,380 | 646,634 | ||||||
Daelim Industrial Co. Ltd. | 3,763 | 279,655 | ||||||
Daewoo Engineering & Construction Co. Ltd.a | 17,011 | 106,055 | ||||||
DGB Financial Group Inc. | 23,052 | 224,878 | ||||||
Dongbu Insurance Co. Ltd. | 6,840 | 456,162 | ||||||
Dongsuh Cos. Inc. | 4,849 | 113,958 | ||||||
Doosan Bobcat Inc. | 4,695 | 158,846 | ||||||
| 56 | 2017 iSHARES ANNUAL REPORTTO SHAREHOLDERS |
Table of Contents
Consolidated Schedule of Investments (Continued)
iSHARES® MSCI EMERGING MARKETS ASIA ETF
August 31, 2017
| Security | Shares | Value | ||||||
Doosan Heavy Industries & Construction Co. Ltd. | 7,193 | $ | 114,823 | |||||
E-MART Inc. | 2,875 | 571,125 | ||||||
GS Engineering & Construction Corp.a | 6,712 | 169,645 | ||||||
GS Holdings Corp. | 6,948 | 435,020 | ||||||
GS Retail Co. Ltd. | 3,706 | 132,615 | ||||||
Hana Financial Group Inc. | 40,747 | 1,770,666 | ||||||
Hankook Tire Co. Ltd. | 10,230 | 535,270 | ||||||
Hanmi Pharm Co. Ltd.a | 832 | 297,354 | ||||||
Hanmi Science Co. Ltd.a | 1,696 | 134,615 | ||||||
Hanon Systems | 25,174 | 257,857 | ||||||
Hanssem Co. Ltd. | 1,442 | 217,400 | ||||||
Hanwha Chemical Corp. | 14,912 | 467,488 | ||||||
Hanwha Corp. | 6,102 | 265,975 | ||||||
Hanwha Life Insurance Co. Ltd. | 29,753 | 193,147 | ||||||
Hanwha Techwin Co. Ltd.a | 5,047 | 173,664 | ||||||
Hotel Shilla Co. Ltd. | 4,265 | 234,129 | ||||||
Hyosung Corp. | 2,949 | 414,523 | ||||||
Hyundai Department Store Co. Ltd. | 1,940 | 166,197 | ||||||
Hyundai Development Co. Engineering & Construction | 8,146 | 271,991 | ||||||
Hyundai Engineering & Construction Co. Ltd. | 10,936 | 394,243 | ||||||
Hyundai Glovis Co. Ltd. | 2,546 | 349,973 | ||||||
Hyundai Heavy Industries Co. Ltd.a | 4,272 | 562,604 | ||||||
Hyundai Marine & Fire Insurance Co. Ltd. | 8,478 | 347,360 | ||||||
Hyundai Mobis Co. Ltd. | 9,372 | 1,961,504 | ||||||
Hyundai Motor Co. | 21,199 | 2,641,415 | ||||||
Hyundai Robotics Co. Ltd.a | 1,368 | 537,446 | ||||||
Hyundai Steel Co. | 11,147 | 570,399 | ||||||
Hyundai Wia Corp. | 2,199 | 136,511 | ||||||
Industrial Bank of Korea | 35,337 | 468,507 | ||||||
Kakao Corp. | 4,657 | 507,991 | ||||||
Kangwon Land Inc. | 16,480 | 504,221 | ||||||
KB Financial Group Inc. | 54,609 | 2,682,989 | ||||||
KCC Corp. | 785 | 275,683 | ||||||
KEPCO Plant Service & Engineering Co. Ltd. | 3,101 | 125,817 | ||||||
Kia Motors Corp. | 36,179 | 1,137,412 | ||||||
Korea Aerospace Industries Ltd. Class A | 9,675 | 396,833 | ||||||
Korea Electric Power Corp. | 35,137 | 1,336,801 | ||||||
Korea Gas Corp.a | 3,797 | 152,540 | ||||||
| Security | Shares | Value | ||||||
Korea Investment Holdings Co. Ltd. | 5,258 | $ | 306,359 | |||||
Korea Zinc Co. Ltd. | 1,185 | 542,267 | ||||||
Korean Air Lines Co. Ltd.a | 6,136 | 180,663 | ||||||
KT Corp. | 1,558 | 43,109 | ||||||
KT&G Corp. | 16,146 | 1,639,515 | ||||||
Kumho Petrochemical Co. Ltd. | 2,459 | 171,842 | ||||||
LG Chem Ltd. | 6,337 | 2,129,942 | ||||||
LG Corp. | 13,141 | 978,932 | ||||||
LG Display Co. Ltd. | 31,891 | 880,990 | ||||||
LG Electronics Inc. | 14,518 | 1,049,323 | ||||||
LG Household & Health Care Ltd. | 1,292 | 1,099,965 | ||||||
LG Innotek Co. Ltd. | 1,929 | 315,627 | ||||||
Lotte Chemical Corp. | 2,116 | 749,683 | ||||||
Lotte Chilsung Beverage Co. Ltd. | 86 | 117,987 | ||||||
Lotte Confectionery Co. Ltd. | 766 | 134,166 | ||||||
Lotte Shopping Co. Ltd. | 1,770 | 403,414 | ||||||
Medy-Tox Inc. | 607 | 306,353 | ||||||
Mirae Asset Daewoo Co. Ltd. | 51,093 | 459,910 | ||||||
NAVER Corp. | 3,852 | 2,579,159 | ||||||
NCsoft Corp. | 2,406 | 820,421 | ||||||
Netmarble Games Corp.a,b | 2,310 | 316,509 | ||||||
NH Investment & Securities Co. Ltd. | 18,958 | 232,015 | ||||||
OCI Co. Ltd.c | 2,256 | 196,670 | ||||||
Orion Corp./Republic of Koreaa | 3,230 | 250,070 | ||||||
Ottogi Corp. | 166 | 112,031 | ||||||
Pan Ocean Co. Ltd.a | 29,021 | 165,489 | ||||||
POSCO | 10,188 | 3,103,563 | ||||||
Posco Daewoo Corp. | 4,980 | 93,408 | ||||||
S-1 Corp. | 2,329 | 185,271 | ||||||
S-Oil Corp. | 6,256 | 696,282 | ||||||
Samsung Biologics Co. Ltd.a,b | 2,312 | 580,255 | ||||||
Samsung C&T Corp. | 10,515 | 1,202,940 | ||||||
Samsung Card Co. Ltd. | 3,924 | 129,106 | ||||||
Samsung Electro-Mechanics Co. Ltd. | 7,759 | 694,980 | ||||||
Samsung Electronics Co. Ltd. | 13,474 | 27,674,516 | ||||||
Samsung Fire & Marine Insurance Co. Ltd. | 4,222 | 1,035,281 | ||||||
Samsung Heavy Industries Co. Ltd.a | 35,830 | 339,997 | ||||||
Samsung Life Insurance Co. Ltd. | 9,604 | 983,737 | ||||||
Samsung SDI Co. Ltd. | 7,610 | 1,326,148 | ||||||
Samsung SDS Co. Ltd. | 4,770 | 708,562 | ||||||
Samsung Securities Co. Ltd. | 8,755 | 283,784 | ||||||
CONSOLIDATED SCHEDULESOF INVESTMENTS | 57 |
Table of Contents
Consolidated Schedule of Investments (Continued)
iSHARES® MSCI EMERGING MARKETS ASIA ETF
August 31, 2017
| Security | Shares | Value | ||||||
Shinhan Financial Group Co. Ltd. | 58,675 | $ | 2,705,835 | |||||
Shinsegae Inc. | 1,003 | 171,673 | ||||||
SK Holdings Co. Ltd. | 4,348 | 1,031,474 | ||||||
SK Hynix Inc. | 80,071 | 4,871,294 | ||||||
SK Innovation Co. Ltd. | 8,865 | 1,481,955 | ||||||
SK Networks Co. Ltd. | 18,940 | 117,745 | ||||||
SK Telecom Co. Ltd. | 2,765 | 621,610 | ||||||
Woori Bank | 51,072 | 842,443 | ||||||
Yuhan Corp. | 1,115 | 223,475 | ||||||
|
| |||||||
| 95,654,992 | ||||||||
TAIWAN — 16.41% |
| |||||||
Acer Inc. | 396,062 | 199,481 | ||||||
Advanced Semiconductor Engineering Inc. | 906,969 | 1,093,929 | ||||||
Advantech Co. Ltd. | 47,282 | 348,595 | ||||||
Asia Cement Corp. | 317,229 | 287,492 | ||||||
Asia Pacific Telecom Co. Ltd.a | 290,000 | 99,457 | ||||||
Asustek Computer Inc. | 98,000 | 811,823 | ||||||
AU Optronics Corp. | 1,170,000 | 480,732 | ||||||
Catcher Technology Co. Ltd. | 90,000 | 1,145,167 | ||||||
Cathay Financial Holding Co. Ltd. | 1,122,944 | 1,832,565 | ||||||
Chailease Holding Co. Ltd. | 139,496 | 379,952 | ||||||
Chang Hwa Commercial Bank Ltd. | 644,294 | 352,260 | ||||||
Cheng Shin Rubber Industry Co. Ltd. | 269,776 | 542,609 | ||||||
Chicony Electronics Co. Ltd. | 72,173 | 181,276 | ||||||
China Airlines Ltd. | 393,000 | 166,685 | ||||||
China Development Financial Holding Corp. | 1,856,200 | 579,390 | ||||||
China Life Insurance Co. Ltd./Taiwan | 470,835 | 519,527 | ||||||
China Steel Corp. | 1,725,867 | 1,446,848 | ||||||
Chunghwa Telecom Co. Ltd. | 524,000 | 1,823,122 | ||||||
Compal Electronics Inc. | 584,000 | 419,921 | ||||||
CTBC Financial Holding Co. Ltd. | 2,412,265 | 1,562,669 | ||||||
Delta Electronics Inc. | 266,000 | 1,458,730 | ||||||
E.Sun Financial Holding Co. Ltd. | 1,243,766 | 766,561 | ||||||
Eclat Textile Co. Ltd. | 24,604 | 301,649 | ||||||
EVA Airways Corp. | 282,628 | 147,031 | ||||||
Evergreen Marine Corp. Taiwan Ltd.a | 235,050 | 179,136 | ||||||
Far Eastern New Century Corp. | 432,460 | 346,065 | ||||||
Far EasTone Telecommunications Co. Ltd. | 220,000 | 533,616 | ||||||
Feng TAY Enterprise Co. Ltd. | 45,064 | 213,531 | ||||||
First Financial Holding Co. Ltd. | 1,271,817 | 825,992 | ||||||
| Security | Shares | Value | ||||||
Formosa Chemicals & Fibre Corp. | 400,950 | $ | 1,260,816 | |||||
Formosa Petrochemical Corp. | 185,000 | 652,855 | ||||||
Formosa Plastics Corp. | 569,400 | 1,771,651 | ||||||
Formosa Taffeta Co. Ltd. | 105,000 | 104,377 | ||||||
Foxconn Technology Co. Ltd. | 128,521 | 407,976 | ||||||
Fubon Financial Holding Co. Ltd. | 917,396 | 1,474,327 | ||||||
General Interface Solution Holding Ltd. | 23,000 | 275,506 | ||||||
Giant Manufacturing Co. Ltd. | 42,000 | 212,234 | ||||||
Globalwafers Co. Ltd. | 30,000 | 238,079 | ||||||
Highwealth Construction Corp. | 111,840 | 177,883 | ||||||
Hiwin Technologies Corp. | 28,540 | 252,972 | ||||||
Hon Hai Precision Industry Co. Ltd. | 2,144,314 | 8,348,749 | ||||||
Hotai Motor Co. Ltd. | 37,000 | 435,849 | ||||||
HTC Corp.a | 89,000 | 202,601 | ||||||
Hua Nan Financial Holdings Co. Ltd. | 979,011 | 546,616 | ||||||
Innolux Corp. | 1,231,620 | 599,914 | ||||||
Inventec Corp. | 339,980 | 269,808 | ||||||
Largan Precision Co. Ltd. | 14,000 | 2,704,530 | ||||||
Lite-On Technology Corp. | 292,032 | 432,063 | ||||||
MediaTek Inc. | 207,176 | 1,856,957 | ||||||
Mega Financial Holding Co. Ltd. | 1,501,542 | 1,206,547 | ||||||
Merida Industry Co. Ltd. | 28,350 | 124,470 | ||||||
Micro-Star International Co. Ltd. | 91,000 | 207,154 | ||||||
Nan Ya Plastics Corp. | 657,090 | 1,659,109 | ||||||
Nanya Technology Corp. | 94,000 | 201,524 | ||||||
Nien Made Enterprise Co. Ltd. | 20,000 | 215,050 | ||||||
Novatek Microelectronics Corp. | 78,000 | 303,688 | ||||||
Pegatron Corp. | 269,000 | 846,781 | ||||||
Phison Electronics Corp. | 20,000 | 269,724 | ||||||
Pou Chen Corp. | 305,000 | 395,664 | ||||||
Powertech Technology Inc. | 95,000 | 288,346 | ||||||
President Chain Store Corp. | 79,000 | 660,973 | ||||||
Quanta Computer Inc. | 370,000 | 842,274 | ||||||
Realtek Semiconductor Corp. | 61,140 | 237,032 | ||||||
Ruentex Development Co. Ltd.a | 127,065 | 124,417 | ||||||
Ruentex Industries Ltd. | 77,855 | 125,248 | ||||||
Shin Kong Financial Holding Co. Ltd. | 1,144,138 | 332,486 | ||||||
Siliconware Precision Industries Co. Ltd. | 274,438 | 434,678 | ||||||
SinoPac Financial Holdings Co. Ltd. | 1,410,173 | 453,252 | ||||||
Standard Foods Corp. | 80,987 | 206,902 | ||||||
Synnex Technology International Corp. | 192,050 | 214,457 | ||||||
| 58 | 2017 iSHARES ANNUAL REPORTTO SHAREHOLDERS |
Table of Contents
Consolidated Schedule of Investments (Continued)
iSHARES® MSCI EMERGING MARKETS ASIA ETF
August 31, 2017
| Security | Shares | Value | ||||||
TaiMed Biologics Inc.a | 24,000 | $ | 172,570 | |||||
Taishin Financial Holding Co. Ltd. | 1,316,305 | 584,462 | ||||||
Taiwan Business Bank | 527,768 | 145,849 | ||||||
Taiwan Cement Corp. | 456,000 | 526,578 | ||||||
Taiwan Cooperative Financial Holding Co. Ltd. | 1,081,948 | 570,031 | ||||||
Taiwan Fertilizer Co. Ltd. | 100,000 | 133,371 | ||||||
Taiwan High Speed Rail Corp. | 230,000 | 202,724 | ||||||
Taiwan Mobile Co. Ltd. | 222,000 | 794,460 | ||||||
Taiwan Semiconductor Manufacturing Co. Ltd. | 3,387,000 | 24,297,873 | ||||||
Teco Electric and Machinery Co. Ltd. | 256,000 | 239,213 | ||||||
Transcend Information Inc. | 26,000 | 77,537 | ||||||
Uni-President Enterprises Corp. | 669,650 | 1,424,551 | ||||||
United Microelectronics Corp. | 1,658,000 | 826,830 | ||||||
Vanguard International Semiconductor Corp. | 121,000 | 218,513 | ||||||
Wistron Corp. | 351,119 | 331,585 | ||||||
WPG Holdings Ltd. | 212,000 | 276,073 | ||||||
Yuanta Financial Holding Co. Ltd. | 1,396,893 | 606,359 | ||||||
Yulon Motor Co. Ltd. | 118,000 | 101,660 | ||||||
Zhen Ding Technology Holding Ltd. | 59,455 | 137,708 | ||||||
|
| |||||||
| 82,289,297 | ||||||||
THAILAND — 2.97% | ||||||||
Advanced Info Service PCL NVDR | 143,100 | 808,048 | ||||||
Airports of Thailand PCL NVDR | 592,800 | 972,974 | ||||||
Bangkok Bank PCL Foreign | 34,500 | 194,812 | ||||||
Bangkok Dusit Medical Services PCL NVDRc | 524,900 | 330,384 | ||||||
Bangkok Expressway & Metro PCL | 1,011,600 | 237,629 | ||||||
Banpu PCL NVDR | 267,400 | 141,733 | ||||||
BEC World PCL NVDR | 146,700 | 76,432 | ||||||
Berli Jucker PCL NVDR | 161,900 | 240,132 | ||||||
BTS Group Holdings PCL NVDR | 791,000 | 206,058 | ||||||
Bumrungrad Hospital PCL NVDR | 49,600 | 325,638 | ||||||
Central Pattana PCL NVDR | 181,900 | 394,422 | ||||||
Charoen Pokphand Foods PCL NVDR | 414,400 | 340,081 | ||||||
CP ALL PCL NVDR | 679,100 | 1,268,008 | ||||||
Delta Electronics Thailand PCL NVDR | 67,000 | 179,581 | ||||||
Electricity Generating PCL NVDRc | 17,900 | 126,144 | ||||||
Energy Absolute PCL NVDRc | 151,100 | 171,782 | ||||||
Glow Energy PCL NVDR | 69,000 | 178,188 | ||||||
Home Product Center PCL NVDR | 541,845 | 163,182 | ||||||
| Security | Shares | Value | ||||||
Indorama Ventures PCL NVDR | 193,700 | $ | 227,505 | |||||
IRPC PCL NVDR | 1,356,600 | 243,089 | ||||||
Kasikornbank PCL Foreign | 160,300 | 1,018,621 | ||||||
Kasikornbank PCL NVDR | 80,600 | 487,896 | ||||||
KCE Electronics PCL NVDR | 35,700 | 94,075 | ||||||
Krung Thai Bank PCL NVDR | 471,750 | 265,675 | ||||||
Minor International PCL NVDRc | 303,380 | 363,179 | ||||||
PTT Exploration & Production PCL NVDR | 192,310 | 506,765 | ||||||
PTT Global Chemical PCL NVDR | 299,300 | 689,548 | ||||||
PTT PCL NVDR | 145,100 | 1,743,560 | ||||||
Robinson PCL NVDR | 67,000 | 116,022 | ||||||
Siam Cement PCL (The) Foreign | 41,800 | 629,423 | ||||||
Siam Cement PCL (The) NVDR | 15,200 | 228,881 | ||||||
Siam Commercial Bank PCL (The) NVDR | 242,400 | 1,098,666 | ||||||
Thai Oil PCL NVDR | 110,900 | 314,782 | ||||||
Thai Union Group PCL NVDR | 261,400 | 155,872 | ||||||
TMB Bank PCL NVDR | 1,758,200 | 124,962 | ||||||
True Corp. PCL NVDRa | 1,434,405 | 241,911 | ||||||
|
| |||||||
| 14,905,660 | ||||||||
|
| |||||||
TOTAL COMMON STOCKS | ||||||||
(Cost: $417,008,188) | 494,294,751 | |||||||
PREFERRED STOCKS — 1.08% |
| |||||||
SOUTH KOREA — 1.08% | ||||||||
AmorePacific Corp., Preference Shares | 1,200 | 182,512 | ||||||
Hyundai Motor Co., Preference Shares | 3,319 | 283,746 | ||||||
Hyundai Motor Co. Series 2, Preference Shares | 5,147 | 465,585 | ||||||
LG Chem Ltd., Preference Shares | 1,082 | 252,364 | ||||||
LG Household & Health Care Ltd., Preference Shares | 304 | 161,760 | ||||||
Samsung Electronics Co. Ltd., Preference Shares | 2,435 | 4,070,570 | ||||||
|
| |||||||
| 5,416,537 | ||||||||
|
| |||||||
TOTAL PREFERRED STOCKS | ||||||||
(Cost: $4,277,160) | 5,416,537 | |||||||
CONSOLIDATED SCHEDULESOF INVESTMENTS | 59 |
Table of Contents
Consolidated Schedule of Investments (Continued)
iSHARES® MSCI EMERGING MARKETS ASIA ETF
August 31, 2017
| Security | Shares | Value | ||||||
RIGHTS — 0.00% | ||||||||
CHINA — 0.00% | ||||||||
Fosun International Ltd. (Expires 09/07/17)a | 227 | $ | — | |||||
|
| |||||||
| — | ||||||||
|
| |||||||
TOTAL RIGHTS | ||||||||
(Cost: $0) | — | |||||||
SHORT-TERM INVESTMENTS — 2.11% |
| |||||||
MONEY MARKET FUNDS — 2.11% |
| |||||||
BlackRock Cash Funds: Institutional, | ||||||||
1.32%e,f,g | 9,807,306 | 9,810,248 | ||||||
BlackRock Cash Funds: Treasury, SL Agency Shares | ||||||||
0.96%e,f | 768,227 | 768,227 | ||||||
|
| |||||||
| 10,578,475 | ||||||||
|
| |||||||
| Security | Value | |||||||
TOTAL SHORT-TERM INVESTMENTS |
| |||||||
(Cost: $10,577,204) |
| $ | 10,578,475 | |||||
|
| |||||||
TOTAL INVESTMENTS |
| |||||||
(Cost: $431,862,552)h | 510,289,763 | |||||||
|
| |||||||
Other Assets, Less Liabilities — (1.79)% |
| (8,959,458 | ) | |||||
|
| |||||||
NET ASSETS — 100.00% | $ | 501,330,305 | ||||||
|
| |||||||
ADR — American Depositary Receipts
NVDR — Non-Voting Depositary Receipts
| a | Non-income earning security. |
| b | This security may be resold to qualified institutional buyers under Rule 144A of the Securities Act of 1933. |
| c | All or a portion of this security represents a security on loan. See Note 1. |
| d | Security is valued using significant unobservable inputs and is classified as Level 3 in the fair value hierarchy. |
| e | Affiliated issuer. See Schedule 1. |
| f | The rate quoted is the annualized seven-day yield of the fund at period end. |
| g | All or a portion of this security represents an investment of securities lending collateral. See Note 1. |
| h | The cost of investments (including short positions and derivatives, if any) for federal income tax purposes was $437,054,765. Net unrealized appreciation was $73,234,998, of which $87,538,769 represented gross unrealized appreciation on investments and $14,303,771 represented gross unrealized depreciation on investments. |
Schedule 1 — Affiliates (Note 2)
Investments in issuers considered to be affiliates of the Fund during the year ended August 31, 2017, for purposes of Section 2(a)(3) of the 1940 Act, and/or related parties of the Fund were as follows:
| Affiliated issuer | Shares held at 08/31/16 | Shares purchased | Shares sold | Shares held at 08/31/17 | Value at 08/31/17 | Net realized gain (loss) a | Change in unrealized appreciation (depreciation) | Income | ||||||||||||||||||||||||
BlackRock Cash Funds: Institutional, | 4,479,688 | 5,327,618 | b | — | 9,807,306 | $ | 9,810,248 | $ | (779 | ) | $ | 1,271 | $ | — | c | |||||||||||||||||
BlackRock Cash Funds: Treasury, | — | 768,227 | b | — | 768,227 | 768,227 | 16 | — | 8,705 | |||||||||||||||||||||||
|
|
|
|
|
|
|
| |||||||||||||||||||||||||
| $ | 10,578,475 | $ | (763 | ) | $ | 1,271 | $ | 8,705 | ||||||||||||||||||||||||
|
|
|
|
|
|
|
| |||||||||||||||||||||||||
| a | Includes realized capital gain distributions from an affiliated fund, if any. |
| b | Net of shares purchased and sold. |
| c | Does not include income earned on the investment of securities lending cash collateral which is not direct income of the Fund and is reflected as a component of securities lending income in the statement of operations. |
| 60 | 2017 iSHARES ANNUAL REPORTTO SHAREHOLDERS |
Table of Contents
Consolidated Schedule of Investments (Continued)
iSHARES® MSCI EMERGING MARKETS ASIA ETF
August 31, 2017
Schedule 2 — Fair Value Measurements
Various inputs are used in determining the fair value of financial instruments. For description of the input levels and information about the Fund’s policy regarding valuation of financial instruments, see Note 1.
The following table summarizes the value of the Fund’s investments according to the fair value hierarchy as of August 31, 2017. The breakdown of the Fund’s investments into major categories is disclosed in the consolidated schedule of investments above.
| Level 1 | Level 2 | Level 3 | Total | |||||||||||||
Investments: | ||||||||||||||||
Assets: | ||||||||||||||||
Common stocks | $ | 494,142,537 | $ | 152,213 | $ | 1 | $ | 494,294,751 | ||||||||
Preferred stocks | 5,416,537 | — | — | 5,416,537 | ||||||||||||
Rights | — | 0 | a | — | 0 | a | ||||||||||
Money market funds | 10,578,475 | — | — | 10,578,475 | ||||||||||||
|
|
|
|
|
|
|
| |||||||||
Total | $ | 510,137,549 | $ | 152,213 | $ | 1 | $ | 510,289,763 | ||||||||
|
|
|
|
|
|
|
| |||||||||
| a | Rounds to less than $1. |
See notes to consolidated financial statements.
CONSOLIDATED SCHEDULESOF INVESTMENTS | 61 |
Table of Contents
Consolidated Schedule of Investments
iSHARES® MSCI EMERGING MARKETS SMALL-CAP ETF
August 31, 2017
| Security | Shares | Value | ||||||
COMMON STOCKS — 98.06% |
| |||||||
BRAZIL — 3.97% | ||||||||
AES Tiete Energia SA | 41,700 | $ | 187,530 | |||||
Aliansce Shopping Centers SAa | 41,000 | 226,732 | ||||||
Alupar Investimento SA Units | 59,108 | 351,291 | ||||||
Arezzo Industria e Comercio SA | 19,400 | 282,265 | ||||||
B2W Cia. Digitala | 68,323 | 401,498 | ||||||
Banco ABC Brasil SAa | 1,093 | 5,770 | ||||||
BR Properties SA | 28,541 | 99,689 | ||||||
Cia. de Saneamento de Minas Gerais-COPASA | 23,700 | 324,717 | ||||||
Cia. Hering | 54,200 | 465,096 | ||||||
Cosan Logistica SAa | 30,000 | 76,562 | ||||||
CVC Brasil Operadora e Agencia de Viagens SA | 29,700 | 360,578 | ||||||
Cyrela Brazil Realty SA Empreendimentos e Participacoes | 88,000 | 368,619 | ||||||
EcoRodovias Infraestrutura e Logistica SA | 84,800 | 288,376 | ||||||
Estacio Participacoes SA | 93,300 | 765,330 | ||||||
Even Construtora e Incorporadora SAa | 83,500 | 126,585 | ||||||
EZ TEC Empreendimentos e Participacoes SA | 24,944 | 176,628 | ||||||
Fleury SA | 50,200 | 505,757 | ||||||
GAEC Educacao SA | 13,400 | 79,639 | ||||||
Guararapes Confeccoes SA | 1,800 | 72,299 | ||||||
Iguatemi Empresa de Shopping Centers SA | 24,900 | 295,972 | ||||||
Iochpe Maxion SA | 30,705 | 197,124 | ||||||
Light SAa | 30,900 | 202,304 | ||||||
Linx SA | 54,400 | 316,913 | ||||||
Magazine Luiza SA | 2,000 | 361,042 | ||||||
Magnesita Refratarios SA | 10,400 | 130,560 | ||||||
Mahle-Metal Leve SA | 17,500 | 106,509 | ||||||
Marfrig Global Foods SAa | 86,100 | 195,107 | ||||||
Minerva SA | 45,400 | 167,087 | ||||||
MRV Engenharia e Participacoes SA | 102,400 | 439,027 | ||||||
Multiplus SA | 18,900 | 225,314 | ||||||
Prumo Logistica SAa | 19,300 | 69,313 | ||||||
Santos Brasil Participacoes SAa | 150,600 | 138,804 | ||||||
Sao Martinho SA | 66,600 | 369,359 | ||||||
| Security | Shares | Value | ||||||
Ser Educacional SAb | 10,800 | $ | 100,193 | |||||
SLC Agricola SA | 28,200 | 198,967 | ||||||
Smiles SA | 21,900 | 483,805 | ||||||
TOTVS SA | 38,400 | 379,063 | ||||||
Valid Solucoes e Servicos de Seguranca em Meios de Pagamento e Identificacao SA | 29,040 | 184,497 | ||||||
Via Varejo SA | 46,300 | 242,797 | ||||||
Wiz Solucoes e Corretagem de Seguros SA | 19,200 | 103,919 | ||||||
|
| |||||||
| 10,072,637 | ||||||||
CHILE — 1.24% | ||||||||
CAP SA | 26,445 | 310,448 | ||||||
Cia. Sud Americana de Vapores SAa | 4,485,245 | 233,740 | ||||||
Engie Energia Chile SA | 162,014 | 340,713 | ||||||
Forus SA | 21,458 | 88,753 | ||||||
Inversiones Aguas Metropolitanas SA | 151,158 | 268,045 | ||||||
Inversiones La Construccion SA | 12,944 | 186,346 | ||||||
Parque Arauco SA | 219,423 | 597,684 | ||||||
Ripley Corp. SA | 281,203 | 269,703 | ||||||
SalfaCorp SA | 190,257 | 287,913 | ||||||
Sociedad de Inversiones Oro Blanco SA | 7,565,600 | 75,423 | ||||||
SONDA SA | 125,999 | 232,975 | ||||||
Vina Concha y Toro SA | 145,604 | 246,913 | ||||||
|
| |||||||
| 3,138,656 | ||||||||
CHINA — 20.81% |
| |||||||
21Vianet Group Inc. ADRa | 26,380 | 136,912 | ||||||
361 Degrees International Ltd. | 306,000 | 131,761 | ||||||
500.com Ltd. ADRa,c | 9,209 | 95,221 | ||||||
51job Inc. ADRa | 8,627 | 512,444 | ||||||
Agile Group Holdings Ltd. | 546,000 | 654,381 | ||||||
AGTech Holdings Ltd.a,c | 932,000 | 190,533 | ||||||
Ajisen China Holdings Ltd. | 411,000 | 173,297 | ||||||
Anhui Expressway Co. Ltd. Class H | 152,000 | 114,974 | ||||||
Anton Oilfield Services Group/Hong Konga,c | 1,070,000 | 98,435 | ||||||
Anxin-China Holdings Ltd.a,d | 1,084,000 | 26,316 | ||||||
APT Satellite Holdings Ltd. | 222,000 | 110,625 | ||||||
Asia Cement China Holdings Corp. | 391,500 | 130,059 | ||||||
| 62 | 2017 iSHARES ANNUAL REPORTTO SHAREHOLDERS |
Table of Contents
Consolidated Schedule of Investments (Continued)
iSHARES® MSCI EMERGING MARKETS SMALL-CAP ETF
August 31, 2017
| Security | Shares | Value | ||||||
AVIC International Holding HK Ltd.a,c | 2,924,000 | $ | 140,102 | |||||
Baozun Inc. ADRa,c | 8,698 | 236,499 | ||||||
Beijing Beida Jade Bird Universal Sci-Tech Co. Ltd. Class Ha | 196,000 | 40,069 | ||||||
Beijing Capital Land Ltd. Class H | 434,000 | 219,594 | ||||||
Beijing Enterprises Medical & Health Group Ltd.a | 2,172,000 | 138,760 | ||||||
Beijing Tong Ren Tang Chinese Medicine Co. Ltd. | 142,000 | 187,242 | ||||||
BEP International Holdings Ltd.c | 4,700,000 | 113,500 | ||||||
Best Pacific International Holdings Ltd.c | 146,000 | 81,708 | ||||||
Bitauto Holdings Ltd. ADRa | 7,217 | 258,369 | ||||||
Boshiwa International Holding Ltd.a,c,d | 32,000 | 286 | ||||||
Bosideng International Holdings Ltd.c | 1,440,000 | 123,274 | ||||||
Boyaa Interactive International Ltd.a | 145,000 | 57,433 | ||||||
BYD Electronic International Co. Ltd.c | 236,500 | 652,710 | ||||||
C C Land Holdings Ltd.a | 921,000 | 202,406 | ||||||
C.banner International Holdings Ltd.a,c | 490,000 | 180,312 | ||||||
Capital Environment Holdings Ltd.a | 3,872,000 | 143,472 | ||||||
Carnival Group International Holdings Ltd.a,c | 2,492,000 | 203,781 | ||||||
CGN Meiya Power Holdings Co. Ltd.a,b,c | 842,000 | 108,660 | ||||||
Changyou.com Ltd. ADRa | 4,741 | 189,735 | ||||||
Chaowei Power Holdings Ltd. | 306,000 | 158,348 | ||||||
Cheetah Mobile Inc. ADRa,c | 8,421 | 76,800 | ||||||
Chiho Environmental Group Ltd.a,c | 134,000 | 77,046 | ||||||
China Aerospace International Holdings Ltd.c | 1,544,000 | 193,334 | ||||||
China Agri-Industries Holdings Ltd. | 779,000 | 364,295 | ||||||
China Aircraft Leasing Group Holdings Ltd. | 62,500 | 67,320 | ||||||
China All Access Holdings Ltd.c | 570,000 | 161,682 | ||||||
China Animal Healthcare Ltd.a,c,d | 126,000 | 4,508 | ||||||
China Animation Characters Co. Ltd.c | 219,000 | 85,905 | ||||||
| Security | Shares | Value | ||||||
China Beidahuang Industry Group Holdings Ltd.a | 2,228,000 | $ | 103,907 | |||||
China BlueChemical Ltd. Class H | 638,000 | 196,459 | ||||||
China Chengtong Development Group Ltd.a,c | 1,694,000 | 110,387 | ||||||
China Datang Corp. Renewable Power Co. Ltd. Class H | 1,235,000 | 137,284 | ||||||
China Dongxiang Group Co. Ltd. | 1,371,000 | 245,245 | ||||||
China Electronics Corp. Holdings Co. Ltd.c | 552,000 | 78,288 | ||||||
China Electronics Optics Valley Union Holding Co Ltd. | 1,296,000 | 119,226 | ||||||
China Fangda Group Co. Ltd. Class B | 379,300 | 248,620 | ||||||
China First Capital Group Ltd.a | 1,024,000 | 409,524 | ||||||
China Foods Ltd. | 400,000 | 212,612 | ||||||
China Greenland Broad Greenstate Group Co Ltd.c | 260,000 | 56,475 | ||||||
China Harmony New Energy Auto Holding Ltd.a,c | 278,500 | 144,117 | ||||||
China High Speed Transmission Equipment Group Co. Ltd.c | 79,000 | 81,458 | ||||||
China Huiyuan Juice Group Ltd.a | 284,500 | 87,970 | ||||||
China Innovationpay Group Ltd.a,c | 2,288,000 | 116,937 | ||||||
China Lesso Group Holdings Ltd. | 409,000 | 293,694 | ||||||
China Lilang Ltd. | 217,000 | 170,518 | ||||||
China Logistics Property Holdings Co. Ltd.a,c | 505,000 | 172,281 | ||||||
China LotSynergy Holdings Ltd.a | 4,240,000 | 78,554 | ||||||
China Lumena New Materials Corp.a,c,d | 210,000 | — | ||||||
China Maple Leaf Educational Systems Ltd.c | 224,000 | 190,043 | ||||||
China Merchants Land Ltd. | 670,000 | 134,403 | ||||||
China Metal Recycling Holdings Ltd.a,d | 12,000 | — | ||||||
China Metal Resources Utilization Ltd.a,b,c | 252,000 | 96,274 | ||||||
China Minsheng Financial Holding Corp. Ltd.a,c | 2,960,000 | 192,884 | ||||||
China Modern Dairy Holdings Ltd.a | 356,000 | 70,050 | ||||||
China National Materials Co. Ltd. Class H | 271,000 | 118,422 | ||||||
China NT Pharma Group Co. Ltd. | 598,500 | 133,825 | ||||||
CONSOLIDATED SCHEDULESOF INVESTMENTS | 63 |
Table of Contents
Consolidated Schedule of Investments (Continued)
iSHARES® MSCI EMERGING MARKETS SMALL-CAP ETF
August 31, 2017
| Security | Shares | Value | ||||||
China Ocean Industry Group Ltd.a,c | 6,365,000 | $ | 52,049 | |||||
China Oil & Gas Group Ltd.c | 2,630,000 | 184,822 | ||||||
China Overseas Grand Oceans Group Ltd. | 368,000 | 200,305 | ||||||
China Overseas Property Holdings Ltd.c | 590,000 | 125,140 | ||||||
China Power Clean Energy Development Co. Ltd. | 156,000 | 87,105 | ||||||
China Regenerative Medicine International Ltd.a,c | 4,870,000 | 123,205 | ||||||
China Resources Phoenix Healthcare Holdings Co. Ltd.c | 185,000 | 233,778 | ||||||
China SCE Property Holdings Ltd. | 587,000 | 300,008 | ||||||
China Shengmu Organic Milk Ltd.a,b,c | 1,151,000 | 191,185 | ||||||
China Shineway Pharmaceutical Group Ltd. | 224,000 | 204,353 | ||||||
China Silver Group Ltd.c | 280,000 | 57,242 | ||||||
China Singyes Solar Technologies Holdings Ltd. | 310,000 | 100,211 | ||||||
China Suntien Green Energy Corp. Ltd. Class H | 773,000 | 167,905 | ||||||
China Traditional Chinese Medicine Holdings Co. Ltd.c | 700,000 | 423,947 | ||||||
China Travel International Investment Hong Kong Ltd.c | 868,000 | 271,720 | ||||||
China Water Affairs Group Ltd. | 388,000 | 224,081 | ||||||
China Water Industry Group Ltd.a,c | 884,000 | 185,239 | ||||||
China Yurun Food Group Ltd.a | 824,000 | 105,284 | ||||||
China ZhengTong Auto Services Holdings Ltd. | 316,500 | 299,254 | ||||||
Chinasoft International Ltd.c | 670,000 | 356,126 | ||||||
Chong Sing Holdings FinTech Group Ltd.a,c | 5,168,000 | 699,944 | ||||||
Chongqing Machinery & Electric Co. Ltd. Class H | 1,714,000 | 210,241 | ||||||
CIFI Holdings Group Co. Ltd. | 1,010,000 | 567,818 | ||||||
CIMC Enric Holdings Ltd.a,c | 288,000 | 172,216 | ||||||
CITIC Resources Holdings Ltd.c | 1,044,000 | 120,054 | ||||||
Citychamp Watch & Jewellery Group Ltd.c | 752,000 | 167,187 | ||||||
COFCO Meat Holdings Ltd.a,c | 649,000 | 130,191 | ||||||
Cogobuy Groupa,b,c | 232,000 | 157,108 | ||||||
| Security | Shares | Value | ||||||
Colour Life Services Group Co. Ltd. | 206,000 | $ | 135,553 | |||||
Comba Telecom Systems Holdings Ltd. | 1,016,894 | 153,318 | ||||||
Concord New Energy Group Ltd. | 3,730,000 | 157,274 | ||||||
Coolpad Group Ltd.a,c,d | 1,144,000 | 95,011 | ||||||
COSCO SHIPPING International Hong Kong Co. Ltd. | 632,000 | 267,288 | ||||||
Cosmo Lady China Holdings Co. Ltd.b,c | 264,000 | 99,171 | ||||||
Crown International Corp Ltd.a,c | 460,000 | 75,232 | ||||||
CT Environmental Group Ltd.c | 872,000 | 123,673 | ||||||
Dah Chong Hong Holdings Ltd.c | 369,000 | 183,405 | ||||||
Dawnrays Pharmaceutical Holdings Ltd. | 264,000 | 157,190 | ||||||
Dazhong Transportation Group Co. Ltd. Class B | 354,500 | 242,478 | ||||||
Digital China Holdings Ltd.a,c | 243,000 | 146,549 | ||||||
eHi Car Services Ltd. ADRa | 16,640 | 153,920 | ||||||
Fang Holdings Ltd. ADRa,c | 87,201 | 322,644 | ||||||
Fantasia Holdings Group Co. Ltd. | 1,165,500 | 157,853 | ||||||
FDG Electric Vehicles Ltd.a,c | 4,405,000 | 171,665 | ||||||
First Tractor Co. Ltd. Class H | 306,000 | 142,708 | ||||||
Fu Shou Yuan International Group Ltd.c | 445,000 | 297,938 | ||||||
Fufeng Group Ltd. | 557,400 | 353,964 | ||||||
Future Land Development Holdings Ltd.c | 526,000 | 215,738 | ||||||
Genscript Biotech Corp.c | 114,000 | 105,312 | ||||||
Glorious Property Holdings Ltd.a | 1,081,000 | 120,166 | ||||||
Golden Eagle Retail Group Ltd. | 192,000 | 245,322 | ||||||
Golden Meditech Holdings Ltd.a | 1,024,000 | 146,539 | ||||||
Greatview Aseptic Packaging Co. Ltd.c | 483,000 | 296,226 | ||||||
Greenland Hong Kong Holdings Ltd. | 365,000 | 128,251 | ||||||
Greentown China Holdings Ltd.c | 242,500 | 294,354 | ||||||
Greentown Service Group Co. Ltd. | 196,000 | 119,957 | ||||||
Gridsum Holding Inc. ADRa | 4,179 | 38,823 | ||||||
Guorui Properties Ltd. | 492,000 | 152,759 | ||||||
Haichang Ocean Park Holdings Ltd.a,b | 747,000 | 168,939 | ||||||
Hangzhou Steam Turbine Co. Ltd. Class Ba | 123,180 | 129,217 | ||||||
| 64 | 2017 iSHARES ANNUAL REPORTTO SHAREHOLDERS |
Table of Contents
Consolidated Schedule of Investments (Continued)
iSHARES® MSCI EMERGING MARKETS SMALL-CAP ETF
August 31, 2017
| Security | Shares | Value | ||||||
Harbin Electric Co. Ltd. Class H | 268,000 | $ | 136,971 | |||||
Harmonicare Medical Holdings Ltd.b | 156,000 | 58,801 | ||||||
HC International Inc.c | 206,000 | 187,142 | ||||||
Health and Happiness H&H International Holdings Ltd.a,c | 70,000 | 250,433 | ||||||
Hengdeli Holdings Ltd. | 849,600 | 48,850 | ||||||
HengTen Networks Group Ltd.a,c | 5,988,000 | 189,744 | ||||||
Hi Sun Technology China Ltd.a | 810,000 | 187,326 | ||||||
Hilong Holding Ltd. | 398,000 | 51,362 | ||||||
Hisense Kelon Electrical Holdings Co. Ltd. Class H | 131,000 | 155,330 | ||||||
Honghua Group Ltd.a | 533,000 | 42,223 | ||||||
Hopewell Highway Infrastructure Ltd. | 527,500 | 323,518 | ||||||
Hopson Development Holdings Ltd. | 228,000 | 215,577 | ||||||
Hua Han Health Industry Holdings Ltd. Class Ha,c,d | 1,112,400 | 59,696 | ||||||
Hua Hong Semiconductor Ltd.b | 157,000 | 208,626 | ||||||
Huabao International Holdings Ltd. | 247,000 | 150,855 | ||||||
Huadian Fuxin Energy Corp. Ltd. Class H | 798,000 | 176,394 | ||||||
Huangshi Dongbei Electrical Appliance Co. Ltd. Class B | 68,000 | 110,296 | ||||||
Huanxi Media Group Ltd.a,c | 530,000 | 134,084 | ||||||
Huayi Tencent Entertainment Co. Ltd.a,c | 2,070,000 | 75,379 | ||||||
Hutchison China Meditech Ltd.a,c | 7,540 | 369,438 | ||||||
Hybrid Kinetic Group Ltd.a,c,d | 5,928,000 | 136,338 | ||||||
IGG Inc. | 285,000 | 446,448 | ||||||
iKang Healthcare Group Inc. ADRa,c | 18,527 | 269,197 | ||||||
IMAX China Holding Inc.a,b | 42,000 | 96,810 | ||||||
Inner Mongolia Yitai Coal Co. Ltd. Class B | 384,000 | 499,968 | ||||||
JA Solar Holdings Co. Ltd. ADRa,c | 17,670 | 118,036 | ||||||
JinkoSolar Holding Co. Ltd.a,c | 8,677 | 241,481 | ||||||
Ju Teng International Holdings Ltd. | 416,000 | 164,775 | ||||||
Jumei International Holding Ltd. ADRa,c | 29,080 | 98,581 | ||||||
K Wah International Holdings Ltd. | 482,000 | 278,985 | ||||||
Kaisa Group Holdings Ltd.a,c | 1,319,000 | 618,509 | ||||||
| Security | Shares | Value | ||||||
Kama Co. Ltd.a | 123,300 | $ | 127,122 | |||||
Kingboard Chemical Holdings Ltd. | 231,000 | 1,260,303 | ||||||
Kingboard Laminates Holdings Ltd. | 318,000 | 539,586 | ||||||
Kingdee International Software Group Co. Ltd.a,c | 682,000 | 290,178 | ||||||
Kong Sun Holdings Ltd.a | 1,450,000 | 66,697 | ||||||
Konka Group Co. Ltd. Class Ba | 238,500 | 95,992 | ||||||
KuangChi Science Ltd.a,c | 540,000 | 182,842 | ||||||
KWG Property Holding Ltd. | 434,500 | 395,280 | ||||||
Lao Feng Xiang Co. Ltd. Class B | 64,000 | 246,912 | ||||||
Launch Tech Co. Ltd. | 92,000 | 107,911 | ||||||
Lee & Man Paper Manufacturing Ltd. | 572,000 | 667,271 | ||||||
Lee’s Pharmaceutical Holdings Ltd. | 95,000 | 75,258 | ||||||
Leyou Technologies Holdings Ltd.a | 855,000 | 187,901 | ||||||
Li Ning Co. Ltd.a | 554,000 | 410,557 | ||||||
Lifestyle China Group Ltd.a | 266,500 | 99,429 | ||||||
Lifetech Scientific Corp.a,c | 736,000 | 162,689 | ||||||
Livzon Pharmaceutical Group Inc. Class H | 41,990 | 228,555 | ||||||
Logan Property Holdings Co. Ltd. | 470,000 | 440,187 | ||||||
Lonking Holdings Ltd. | 766,000 | 304,386 | ||||||
Luthai Textile Co. Ltd. Class B | 137,100 | 153,629 | ||||||
Luye Pharma Group Ltd.c | 433,500 | 219,341 | ||||||
MMG Ltd.a,c | 760,000 | 370,947 | ||||||
Nan Hai Corp. Ltd.c | 5,300,000 | 172,684 | ||||||
National Agricultural Holdings Ltd.a,c,d | 354,000 | 48,397 | ||||||
NetDragon Websoft Holdings Ltd.c | 58,500 | 215,270 | ||||||
Nexteer Automotive Group Ltd. | 299,000 | 496,649 | ||||||
Noah Holdings Ltd. ADRa | 10,036 | 293,954 | ||||||
North Mining Shares Co. Ltd.a,c | 5,840,000 | 102,974 | ||||||
NQ Mobile Inc. ADRa,c | 37,720 | 125,608 | ||||||
NVC Lighting Holding Ltd. | 511,000 | 63,333 | ||||||
O-Net Technologies Group Ltd.a,c | 105,000 | 62,653 | ||||||
Panda Green Energy Group Ltd.a,c | 1,384,000 | 180,373 | ||||||
PAX Global Technology Ltd.c | 326,000 | 180,360 | ||||||
Phoenix Satellite Television Holdings Ltd. | 912,000 | 132,842 | ||||||
Poly Property Group Co. Ltd.a | 674,000 | 353,085 | ||||||
CONSOLIDATED SCHEDULESOF INVESTMENTS | 65 |
Table of Contents
Consolidated Schedule of Investments (Continued)
iSHARES® MSCI EMERGING MARKETS SMALL-CAP ETF
August 31, 2017
| Security | Shares | Value | ||||||
Pou Sheng International Holdings Ltd.c | 778,000 | $ | 144,139 | |||||
Powerlong Real Estate Holdings Ltd. | 241,000 | 121,940 | ||||||
Q Technology Group Co. Ltd.c | 105,000 | 244,709 | ||||||
Qingdao Port International Co. Ltd.b | 381,000 | 221,986 | ||||||
Renhe Commercial Holdings Co. Ltd.a,c | 6,110,000 | 142,085 | ||||||
Ronshine China Holdings Ltd.a | 101,000 | 108,660 | ||||||
Seaspan Corp. | 18,506 | 132,133 | ||||||
Shandong Airlines Co. Ltd. Class B | 64,200 | 109,509 | ||||||
Shandong Chenming Paper Holdings Ltd. Class B | 252,300 | 368,145 | ||||||
Shang Gong Group Co. Ltd. Class Ba | 152,500 | 155,092 | ||||||
Shanghai Baosight Software Co. Ltd. Class B | 67,400 | 98,269 | ||||||
Shanghai Dasheng Agricultural Finance Technology Co. Ltd.c | 1,344,000 | 118,490 | ||||||
Shanghai Haixin Group Co. Class B | 151,400 | 103,558 | ||||||
Shanghai Jin Jiang International Hotels Group Co. Ltd. Class H | 414,000 | 117,962 | ||||||
Shanghai Jinjiang International Industrial Investment Co. Ltd. Class B | 78,300 | 107,193 | ||||||
Shanghai Jinjiang International Travel Co. Ltd. Class B | 61,700 | 182,509 | ||||||
Shanghai Lingyun Industries Development Co. Ltd. Class Ba | 103,900 | 105,355 | ||||||
Shanghai Shibei Hi-Tech Co. Ltd. Class B | 178,800 | 102,452 | ||||||
Shanghai Zhongyida Co. Ltd.a | 144,900 | 64,480 | ||||||
Shenzhen Expressway Co. Ltd. Class H | 272,000 | 265,520 | ||||||
Shenzhen International Holdings Ltd. | 326,000 | 598,979 | ||||||
Shenzhen Investment Ltd. | 1,004,000 | 457,970 | ||||||
Shougang Concord International Enterprises Co. Ltd.a | 4,410,000 | 163,407 | ||||||
Shougang Fushan Resources Group Ltd. | 916,000 | 207,159 | ||||||
Shui On Land Ltd. | 1,392,500 | 325,598 | ||||||
| Security | Shares | Value | ||||||
Sino Oil And Gas Holdings Ltd.a | 6,060,000 | $ | 123,888 | |||||
Sinolink Worldwide Holdings Ltd.a | 1,186,000 | 168,207 | ||||||
Sinopec Kantons Holdings Ltd. | 358,000 | 221,850 | ||||||
Sinosoft Technology Group Ltd.c | 356,800 | 109,414 | ||||||
Sinotrans Ltd. Class H | 538,000 | 303,836 | ||||||
Sinotrans Shipping Ltd. | 703,000 | 219,170 | ||||||
Sinotruk Hong Kong Ltd. | 271,000 | 299,863 | ||||||
Skyworth Digital Holdings Ltd. | 662,000 | 307,043 | ||||||
SMI Holdings Group Ltd.c | 456,800 | 227,044 | ||||||
Sohu.com Inc.a | 9,780 | 521,665 | ||||||
SSY Group Ltd. | 667,970 | 308,959 | ||||||
Superb Summit International Group Ltd.a,c,d | 238,250 | 1,827 | ||||||
Tarena International Inc. ADR | 13,389 | 189,053 | ||||||
TCC International Holdings Ltd. | 372,000 | 170,637 | ||||||
TCL Multimedia Technology Holdings Ltd.a,c | 212,000 | 101,849 | ||||||
Technovator International Ltd.a,c | 400,000 | 121,128 | ||||||
Texhong Textile Group Ltd. | 113,000 | 128,500 | ||||||
Tian Ge Interactive Holdings Ltd.b,c | 185,000 | 127,644 | ||||||
Tianjin Development Holdings Ltd. | 324,000 | 174,286 | ||||||
Tianjin Port Development Holdings Ltd.c | 1,486,000 | 244,931 | ||||||
Tianneng Power International Ltd.c | 284,000 | 243,124 | ||||||
Tibet Water Resources Ltd.a,c | 672,000 | 263,598 | ||||||
Tong Ren Tang Technologies Co. Ltd. Class H | 208,000 | 292,342 | ||||||
Tongda Group Holdings Ltd.c | 1,050,000 | 291,128 | ||||||
Towngas China Co. Ltd. | 395,000 | 267,490 | ||||||
TPV Technology Ltd. | 232,000 | 40,018 | ||||||
Tuniu Corp. ADRa,c | 13,595 | 101,962 | ||||||
Universal Medical Financial & Technical Advisory Services Co. Ltd.b,c | 126,000 | 105,289 | ||||||
Vinda International Holdings Ltd. | 87,000 | 154,514 | ||||||
Viva China Holdings Ltd.a | 1,112,000 | 96,616 | ||||||
Wasion Group Holdings Ltd. | 184,000 | 78,523 | ||||||
Weiqiao Textile Co. Class Ha | 137,000 | 72,820 | ||||||
West China Cement Ltd.a | 1,014,000 | 146,404 | ||||||
Wisdom Sports Groupa,c | 425,000 | 55,932 | ||||||
Xiamen International Port Co. Ltd. Class H | 898,000 | 187,025 | ||||||
| 66 | 2017 iSHARES ANNUAL REPORTTO SHAREHOLDERS |
Table of Contents
Consolidated Schedule of Investments (Continued)
iSHARES® MSCI EMERGING MARKETS SMALL-CAP ETF
August 31, 2017
| Security | Shares | Value | ||||||
Xingda International Holdings Ltd. | 392,000 | $ | 150,260 | |||||
Xinjiang Xinxin Mining Industry Co. Ltd. Class Ha | 570,000 | 80,113 | ||||||
Xinyi Solar Holdings Ltd.c | 1,111,400 | 377,735 | ||||||
Xinyuan Real Estate Co. Ltd. ADR | 21,878 | 109,828 | ||||||
XTEP International Holdings Ltd. | 326,000 | 115,797 | ||||||
Yanchang Petroleum International Ltd.a | 1,630,000 | 31,032 | ||||||
Yangtze Optical Fibre and Cable Joint Stock Ltd. Co.b | 68,500 | 196,053 | ||||||
Yihai International Holding Ltd. | 135,000 | 92,283 | ||||||
Yip’s Chemical Holdings Ltd.c | 444,000 | 173,596 | ||||||
Yirendai Ltd. ADRa | 3,679 | 147,160 | ||||||
Yuexiu Property Co. Ltd. | 2,478,000 | 455,931 | ||||||
Yuexiu REIT | 575,000 | 378,364 | ||||||
Yuexiu Transport Infrastructure Ltd. | 370,000 | 283,654 | ||||||
Yuxing InfoTech Investment Holdings Ltd.a,c | 642,000 | 65,624 | ||||||
Yuzhou Properties Co. Ltd. | 347,000 | 223,014 | ||||||
Zhaojin Mining Industry Co. Ltd. Class Hc | 398,500 | 346,236 | ||||||
Zhonglu Co. Ltd. Class B | 33,500 | 46,498 | ||||||
Zhongsheng Group Holdings Ltd. | 173,000 | 375,777 | ||||||
Zhou Hei Ya International Holdings Co. Ltd.b | 155,000 | 140,415 | ||||||
|
| |||||||
| 52,744,296 | ||||||||
COLOMBIA — 0.30% | ||||||||
Almacenes Exito SA | 54,371 | 283,598 | ||||||
Cemex Latam Holdings SAa | 64,827 | 246,558 | ||||||
Corp. Financiera Colombiana SA | 23,857 | 233,159 | ||||||
|
| |||||||
| 763,315 | ||||||||
CZECH REPUBLIC — 0.15% |
| |||||||
Central European Media Enterprises Ltd. AS Class Aa | 21,959 | 91,910 | ||||||
Philip Morris CR AS | 410 | 290,321 | ||||||
|
| |||||||
| 382,231 | ||||||||
EGYPT — 0.36% | ||||||||
Alexandria Mineral Oils Co. | 116,658 | 69,096 | ||||||
Ezz Steela | 67,628 | 64,296 | ||||||
Heliopolis Housing | 41,543 | 58,245 | ||||||
Juhayna Food Industriesa | 128,363 | 52,334 | ||||||
Medinet Nasr Housing | 187,232 | 103,476 | ||||||
| Security | Shares | Value | ||||||
Orascom Telecom Media And Technology Holding SAE | 1,441,060 | $ | 53,856 | |||||
Oriental Weavers | 68,236 | 70,632 | ||||||
Palm Hills Developments SAEa | 445,760 | 72,695 | ||||||
Pioneers Holding For Financial Investments SAEa | 129,488 | 57,265 | ||||||
Sidi Kerir Petrochemicals Co. | 56,459 | 59,560 | ||||||
Six of October Development & Investmenta | 80,256 | 62,260 | ||||||
Talaat Moustafa Group | 250,376 | 108,742 | ||||||
Telecom Egypt Co. | 91,293 | 66,014 | ||||||
|
| |||||||
| 898,471 | ||||||||
GREECE — 0.74% | ||||||||
Aegean Airlines SA | 13,428 | 126,918 | ||||||
Grivalia Properties REIC AE | 19,455 | 208,170 | ||||||
Hellenic Exchanges-Athens Stock Exchange SA | 27,523 | 167,210 | ||||||
Hellenic Petroleum SA | 23,381 | 211,818 | ||||||
Motor Oil Hellas Corinth Refineries SA | 23,881 | 536,611 | ||||||
Mytilineos Holdings SAa | 51,343 | 524,348 | ||||||
Public Power Corp. SAa | 40,598 | 108,601 | ||||||
|
| |||||||
| 1,883,676 | ||||||||
HUNGARY — 0.12% | ||||||||
Magyar Telekom Telecommunications PLC | 156,936 | 297,983 | ||||||
|
| |||||||
| 297,983 | ||||||||
INDIA — 13.55% | ||||||||
Adani Enterprises Ltd. | 94,247 | 195,420 | ||||||
Adani Power Ltd.a | 227,514 | 118,693 | ||||||
Adani Transmissions Ltd.a | 74,409 | 147,884 | ||||||
Aditya Birla Fashion and Retail Ltd.a | 77,794 | 208,035 | ||||||
Aegis Logistics Ltd. | 20,425 | 60,595 | ||||||
AIA Engineering Ltd. | 16,061 | 329,404 | ||||||
Ajanta Pharma Ltd. | 10,779 | 201,319 | ||||||
Alembic Pharmaceuticals Ltd. | 28,331 | 230,145 | ||||||
Allcargo Logistics Ltd. | 17,860 | 46,811 | ||||||
Amara Raja Batteries Ltd. | 15,881 | 193,338 | ||||||
Andhra Bank | 136,865 | 112,080 | ||||||
Apollo Tyres Ltd. | 100,126 | 396,894 | ||||||
Arvind Ltd. | 52,770 | 306,006 | ||||||
Avanti Feeds Ltd. | 3,434 | 99,242 | ||||||
Balkrishna Industries Ltd. | 15,195 | 372,731 | ||||||
Balrampur Chini Mills Ltd. | 32,320 | 86,834 | ||||||
CONSOLIDATED SCHEDULESOF INVESTMENTS | 67 |
Table of Contents
Consolidated Schedule of Investments (Continued)
iSHARES® MSCI EMERGING MARKETS SMALL-CAP ETF
August 31, 2017
| Security | Shares | Value | ||||||
Bayer CropScience Ltd./India | 5,103 | $ | 319,114 | |||||
Bharat Financial Inclusion Ltd.a | 10,427 | 143,431 | ||||||
Biocon Ltd. | 55,461 | 292,374 | ||||||
Birla Corp. Ltd. | 4,958 | 75,231 | ||||||
Blue Dart Express Ltd. | 3,188 | 212,194 | ||||||
Can Fin Homes Ltd. | 1,789 | 80,193 | ||||||
Canara Bank Ltd. | 45,291 | 240,709 | ||||||
Care Ratings Ltd. | 10,825 | 251,049 | ||||||
Ceat Ltd. | 8,651 | 230,829 | ||||||
Century Plyboards India Ltd. | 10,909 | 43,106 | ||||||
Century Textiles & Industries Ltd. | 5,392 | 104,578 | ||||||
Cera Sanitaryware Ltd. | 1,496 | 67,379 | ||||||
CESC Ltd. | 30,020 | 476,976 | ||||||
CG Power and Industrial Solutions Ltd.a | 161,933 | 203,536 | ||||||
Chennai Petroleum Corp. Ltd. | 8,301 | 58,219 | ||||||
Coromandel International Ltd. | 15,520 | 107,503 | ||||||
Cox & Kings Ltd. | 43,129 | 177,775 | ||||||
CRISIL Ltd. | 8,708 | 257,734 | ||||||
Crompton Greaves Consumer Electricals Ltd. | 136,055 | 466,420 | ||||||
Dalmia Bharat Ltd.a | 8,277 | 351,291 | ||||||
DCB Bank Ltd. | 79,037 | 227,123 | ||||||
Dewan Housing Finance Corp. Ltd. | 52,354 | 413,746 | ||||||
Dilip Buildcon Ltd.a,b | 8,241 | 77,871 | ||||||
Dish TV India Ltd.a | 149,999 | 186,542 | ||||||
Divi’s Laboratories Ltd.a | 23,114 | 251,799 | ||||||
Dr Lal PathLabs Ltd.b | 4,377 | 55,508 | ||||||
eClerx Services Ltd. | 14,308 | 282,920 | ||||||
Edelweiss Financial Services Ltd. | 119,550 | 462,388 | ||||||
EID Parry India Ltd. | 37,382 | 189,318 | ||||||
Endurance Technologies Ltd.b | 6,477 | 101,046 | ||||||
Engineers India Ltd. | 29,105 | 70,798 | ||||||
Escorts Ltd. | 15,154 | 153,445 | ||||||
Eveready Industries India Ltd.a | 17,816 | 84,654 | ||||||
Exide Industries Ltd. | 106,192 | 327,000 | ||||||
Federal Bank Ltd. | 510,122 | 864,617 | ||||||
Finolex Cables Ltd. | 38,961 | 327,802 | ||||||
Force Motors Ltd.a | 589 | 35,439 | ||||||
Future Retail Ltd.a | 32,937 | 275,728 | ||||||
Gateway Distriparks Ltd. | 53,141 | 183,880 | ||||||
Gayatri Projects Ltd. | 77,979 | 215,178 | ||||||
GE T&D India Ltd. | 36,648 | 234,244 | ||||||
Gillette India Ltd. | 3,921 | 331,057 | ||||||
| Security | Shares | Value | ||||||
GMR Infrastructure Ltd.a | 835,981 | $ | 224,929 | |||||
Godfrey Phillips India Ltd. | 3,007 | 48,106 | ||||||
Godrej Industries Ltd. | 13,485 | 129,173 | ||||||
Great Eastern Shipping Co. Ltd. (The) | 49,483 | 308,658 | ||||||
GRUH Finance Ltd. | 21,545 | 175,744 | ||||||
Gujarat Fluorochemicals Ltd.a | 15,916 | 178,203 | ||||||
Gujarat Gas Ltd. | 21,228 | 258,683 | ||||||
Gujarat Mineral Development Corp. Ltd. | 62,061 | 137,760 | ||||||
Gujarat Narmada Valley Fertilizers & Chemicals Ltd. | 15,734 | 74,023 | ||||||
Gujarat Pipavav Port Ltd. | 81,422 | 162,841 | ||||||
Gujarat State Petronet Ltd. | 81,137 | 242,423 | ||||||
Hexaware Technologies Ltd. | 53,112 | 226,983 | ||||||
Hindustan Construction Co. Ltd.a | 148,750 | 80,743 | ||||||
Housing Development & Infrastructure Ltd.a | 125,038 | 121,466 | ||||||
IIFL Holdings Ltd. | 42,162 | 409,443 | ||||||
India Cements Ltd. (The) | 70,815 | 197,181 | ||||||
Indiabulls Real Estate Ltd.a | 48,969 | 179,173 | ||||||
Indiabulls Ventures Ltd. | 36,051 | 123,871 | ||||||
Indian Hotels Co. Ltd. (The) | 163,015 | 303,073 | ||||||
Info Edge India Ltd. | 26,434 | 397,898 | ||||||
Inox Leisure Ltd.a | 16,177 | 62,581 | ||||||
Ipca Laboratories Ltd. | 24,089 | 157,287 | ||||||
IRB Infrastructure Developers Ltd. | 73,135 | 244,942 | ||||||
Jain Irrigation Systems Ltd. | 147,040 | 226,680 | ||||||
Jaiprakash Associates Ltd.a | 426,437 | 159,431 | ||||||
Jammu & Kashmir Bank Ltd. (The) | 95,624 | 118,546 | ||||||
Jindal Steel & Power Ltd.a | 108,682 | 233,086 | ||||||
JK Cement Ltd. | 4,016 | 63,143 | ||||||
JM Financial Ltd. | 46,256 | 97,105 | ||||||
Jubilant Foodworks Ltd. | 14,302 | 311,987 | ||||||
Jubilant Life Sciences Ltd. | 25,813 | 283,705 | ||||||
Just Dial Ltd.a | 11,462 | 70,160 | ||||||
Kajaria Ceramics Ltd. | 29,221 | 320,819 | ||||||
Kansai Nerolac Paints Ltd. | 63,172 | 502,599 | ||||||
Karnataka Bank Ltd. (The) | 36,794 | 87,199 | ||||||
Karur Vysya Bank Ltd. (The) | 72,294 | 160,927 | ||||||
Kaveri Seed Co. Ltd. | 7,042 | 61,281 | ||||||
KPIT Technologies Ltd. | 97,425 | 177,625 | ||||||
KRBL Ltd.a | 28,314 | 208,569 | ||||||
Kushal Tradelink Ltd. | 17,608 | 33,425 | ||||||
| 68 | 2017 iSHARES ANNUAL REPORTTO SHAREHOLDERS |
Table of Contents
Consolidated Schedule of Investments (Continued)
iSHARES® MSCI EMERGING MARKETS SMALL-CAP ETF
August 31, 2017
| Security | Shares | Value | ||||||
L&T Finance Holdings Ltd. | 156,387 | $ | 490,007 | |||||
Laurus Labs Ltd.b | 9,524 | 78,567 | ||||||
Mahanagar Gas Ltd. | 13,096 | 213,844 | ||||||
Manappuram Finance Ltd. | 151,708 | 235,656 | ||||||
Marksans Pharma Ltd. | 138,395 | 86,380 | ||||||
Max Financial Services Ltd. | 40,462 | 380,750 | ||||||
Max India Ltd.a | 67,371 | 147,281 | ||||||
MindTree Ltd. | 40,974 | 295,481 | ||||||
MOIL Ltd. | 10,060 | 56,842 | ||||||
Motilal Oswal Financial Services Ltd. | 9,102 | 174,241 | ||||||
Mphasis Ltd. | 33,298 | 317,269 | ||||||
Muthoot Finance Ltd. | 36,880 | 274,756 | ||||||
Natco Pharma Ltd. | 23,421 | 263,424 | ||||||
National Aluminium Co. Ltd. | 117,998 | 133,362 | ||||||
NCC Ltd./India | 176,599 | 233,159 | ||||||
NIIT Technologies Ltd. | 11,220 | 87,503 | ||||||
Oberoi Realty Ltd.a | 42,835 | 255,296 | ||||||
Page Industries Ltd. | 2,269 | 629,960 | ||||||
PC Jeweller Ltd. | 45,380 | 252,434 | ||||||
Persistent Systems Ltd. | 25,375 | 247,057 | ||||||
PI Industries Ltd. | 24,363 | 275,048 | ||||||
Prestige Estates Projects Ltd.a | 28,739 | 123,136 | ||||||
PTC India Ltd. | 167,075 | 312,582 | ||||||
PVR Ltd. | 12,296 | 254,176 | ||||||
Rajesh Exports Ltd. | 32,381 | 376,863 | ||||||
Ramco Cements Ltd. (The) | 11,543 | 124,736 | ||||||
Raymond Ltd. | 7,049 | 85,695 | ||||||
RBL Bank Ltd.b | 36,752 | 313,097 | ||||||
Redington India Ltd. | 148,253 | 343,694 | ||||||
Reliance Capital Ltd. | 35,356 | 445,391 | ||||||
Reliance Communications Ltd.a | 374,950 | 136,663 | ||||||
Reliance Infrastructure Ltd. | 44,249 | 352,497 | ||||||
Repco Home Finance Ltd. | 7,184 | 73,013 | ||||||
Sadbhav Engineering Ltd. | 43,772 | 198,297 | ||||||
Shilpa Medicare Ltd. | 6,875 | 64,614 | ||||||
Somany Ceramics Ltd. | 5,541 | 68,952 | ||||||
SpiceJet Ltd.a | 40,810 | 83,534 | ||||||
SRF Ltd. | 2,611 | 62,624 | ||||||
Sterlite Technologies Ltd. | 24,254 | 83,773 | ||||||
Strides Shasun Ltd. | 17,931 | 253,904 | ||||||
Sun Pharma Advanced Research Co. Ltd.a | 33,685 | 203,608 | ||||||
Sundaram Finance Ltd. | 13,788 | 345,281 | ||||||
Sundram Fasteners Ltd. | 26,979 | 171,261 | ||||||
| Security | Shares | Value | ||||||
Supreme Industries Ltd. | 19,057 | $ | 358,193 | |||||
Suzlon Energy Ltd.a | 867,694 | 221,246 | ||||||
Symphony Ltd. | 9,981 | 197,251 | ||||||
Syndicate Banka | 90,829 | 91,715 | ||||||
Syngene International Ltd.b | 8,139 | 56,746 | ||||||
Tata Communications Ltd. | 16,440 | 167,650 | ||||||
Tata Global Beverages Ltd. | 139,566 | 432,280 | ||||||
Thermax Ltd. | 17,616 | 245,007 | ||||||
Torrent Power Ltd. | 56,566 | 185,954 | ||||||
TTK Prestige Ltd. | 680 | 66,609 | ||||||
Tube Investments of India Ltd. | 36,903 | 457,894 | ||||||
TVS Motor Co. Ltd. | 52,272 | 493,641 | ||||||
V-Guard Industries Ltd. | 24,385 | 71,008 | ||||||
VA Tech Wabag Ltd. | 7,349 | 70,626 | ||||||
Vakrangee Ltd. | 48,465 | 388,167 | ||||||
Voltas Ltd. | 46,030 | 377,845 | ||||||
VRL Logistics Ltd. | 8,105 | 43,101 | ||||||
WABCO India Ltd. | 3,527 | 302,866 | ||||||
Welspun India Ltd. | 98,156 | 119,075 | ||||||
Whirlpool of India Ltd.a | 5,280 | 97,636 | ||||||
Wockhardt Ltd. | 12,776 | 120,003 | ||||||
|
| |||||||
| 34,348,867 | ||||||||
INDONESIA — 2.29% | ||||||||
Ace Hardware Indonesia Tbk PT | 3,223,000 | 263,309 | ||||||
Alam Sutera Realty Tbk PT | 5,573,900 | 149,562 | ||||||
Aneka Tambang Persero Tbk PTa | 3,630,600 | 201,367 | ||||||
Bank Bukopin Tbk | 2,879,800 | 128,428 | ||||||
Bank Pembangunan Daerah Jawa Barat Dan Banten Tbk PT | 848,000 | 162,710 | ||||||
Bank Tabungan Negara Persero Tbk PT | 1,606,123 | 362,347 | ||||||
Bumi Resources Tbk PTa | 8,460,500 | 144,581 | ||||||
Ciputra Development Tbk PT | 4,834,863 | 423,984 | ||||||
Eagle High Plantations Tbk PTa | 2,456,300 | 39,398 | ||||||
Global Mediacom Tbk PT | 1,881,600 | 68,822 | ||||||
Hanson International Tbk PTa | 24,796,400 | 250,900 | ||||||
Harum Energy Tbk PTa | 201,000 | 34,951 | ||||||
Indo Tambangraya Megah Tbk PT | 147,500 | 215,026 | ||||||
Indofarma Persero Tbk PTa | 156,700 | 29,715 | ||||||
Japfa Comfeed Indonesia Tbk PT | 1,819,000 | 163,604 | ||||||
Kawasan Industri Jababeka Tbk PT | 12,440,698 | 289,058 | ||||||
Krakatau Steel Persero Tbk PTa | 957,100 | 39,813 | ||||||
Kresna Graha Investama PT Tbka | 5,929,100 | 198,200 | ||||||
CONSOLIDATED SCHEDULESOF INVESTMENTS | 69 |
Table of Contents
Consolidated Schedule of Investments (Continued)
iSHARES® MSCI EMERGING MARKETS SMALL-CAP ETF
August 31, 2017
| Security | Shares | Value | ||||||
Link Net Tbk PT | 482,000 | $ | 179,910 | |||||
Medco Energi Internasional Tbk PTa | 433,800 | 107,296 | ||||||
Mitra Adiperkasa Tbk PT | 377,200 | 197,901 | ||||||
Panin Financial Tbk PTa | 5,194,600 | 96,557 | ||||||
Pelat Timah Nusantara Tbk PTa | 157,000 | 40,480 | ||||||
Pembangunan Perumahan Persero Tbk PT | 1,298,725 | 273,529 | ||||||
Perusahaan Perkebunan London Sumatra Indonesia Tbk PT | 1,387,500 | 142,993 | ||||||
PP Properti Tbk PT | 8,341,369 | 127,540 | ||||||
PT Delta Dunia Makmur Tbka | 1,372,000 | 98,720 | ||||||
PT Tunas Baru Lampung Tbk | 881,100 | 92,455 | ||||||
Ramayana Lestari Sentosa Tbk PT | 1,512,800 | 114,520 | ||||||
Sawit Sumbermas Sarana Tbk PT | 514,300 | 57,821 | ||||||
Semen Baturaja Persero TBK PT | 897,200 | 203,084 | ||||||
Siloam International Hospitals Tbk PTa | 66,500 | 54,702 | ||||||
Sri Rejeki Isman Tbk PT | 2,923,500 | 81,074 | ||||||
Sugih Energy Tbk PTa | 5,450,300 | 20,425 | ||||||
Surya Semesta Internusa Tbk PT | 2,099,550 | 104,647 | ||||||
Tambang Batubara Bukit Asam Persero Tbk PT | 279,000 | 258,779 | ||||||
Tiga Pilar Sejahtera Food Tbka | 937,800 | 72,749 | ||||||
Timah Persero Tbk PT | 1,248,196 | 89,344 | ||||||
Visi Media Asia Tbk PTa | 2,483,300 | 52,860 | ||||||
Wijaya Karya Persero Tbk PT | 1,155,048 | 171,846 | ||||||
|
| |||||||
| 5,805,007 | ||||||||
MALAYSIA — 3.14% |
| |||||||
AirAsia X Bhda,c | 496,400 | 43,008 | ||||||
Bumi Armada Bhda,c | 969,300 | 166,827 | ||||||
Bursa Malaysia Bhd | 176,200 | 419,200 | ||||||
Cahya Mata Sarawak Bhdc | 307,200 | 292,058 | ||||||
Carlsberg Brewery Malaysia Bhd | 86,500 | 300,183 | ||||||
DRB-Hicom Bhdc | 220,500 | 81,581 | ||||||
Eastern & Oriental Bhd | 444,281 | 153,972 | ||||||
Globetronics Technology BHD | 71,500 | 107,489 | ||||||
IGB REIT | 939,700 | 378,476 | ||||||
Inari Amertron Bhd | 636,900 | 378,814 | ||||||
Iskandar Waterfront City Bhda | 92,400 | 27,695 | ||||||
Karex Bhdc | 283,300 | 93,538 | ||||||
Kossan Rubber Industries | 123,300 | 207,882 | ||||||
KPJ Healthcare Bhd | 324,750 | 316,347 | ||||||
Magnum Bhd | 428,700 | 190,734 | ||||||
| Security | Shares | Value | ||||||
Mah Sing Group Bhd | 497,057 | $ | 172,262 | |||||
Malaysia Building Society Bhd | 568,000 | 171,577 | ||||||
Malaysian Pacific Industries Bhd | 65,400 | 215,626 | ||||||
Malaysian Resources Corp. Bhdc | 478,100 | 134,345 | ||||||
Media Prima Bhd | 578,100 | 94,759 | ||||||
My EG Services Bhdc | 771,500 | 382,995 | ||||||
OSK Holdings Bhd | 504,987 | 189,200 | ||||||
Padini Holdings Bhd | 87,200 | 84,739 | ||||||
POS Malaysia Bhdc | 141,800 | 182,625 | ||||||
QL Resources Bhd | 298,100 | 336,458 | ||||||
Scientex BHD | 38,200 | 77,286 | ||||||
Sunway Bhd | 411,272 | 417,965 | ||||||
Sunway Construction Group Bhd | 507,720 | 273,447 | ||||||
Sunway REITc | 675,900 | 270,645 | ||||||
Supermax Corp. Bhd | 268,700 | 111,998 | ||||||
TIME dotCom Bhd | 157,000 | 363,962 | ||||||
Top Glove Corp. Bhdc | 264,900 | 347,989 | ||||||
Tune Protect Group Bhd | 243,500 | 59,870 | ||||||
Unisem M Bhd | 297,300 | 285,430 | ||||||
VS Industry Bhdc | 463,100 | 257,007 | ||||||
WCT Holdings Bhda | 492,715 | 201,909 | ||||||
Yinson Holdings BHD | 190,700 | 162,545 | ||||||
|
| |||||||
| 7,952,443 | ||||||||
MEXICO — 2.95% |
| |||||||
Alsea SAB de CV | 183,059 | 668,134 | ||||||
Axtel SAB de CV CPOa,c | 331,400 | 77,352 | ||||||
Banregio Grupo Financiero SAB de CV | 78,300 | 506,719 | ||||||
Bolsa Mexicana de Valores SAB de CV | 145,000 | 251,474 | ||||||
Concentradora Fibra Hotelera Mexicana SA de CV | 237,700 | 195,119 | ||||||
Consorcio ARA SAB de CV | 381,400 | 130,324 | ||||||
Controladora Vuela Cia. de Aviacion SAB de CV Class Aa,c | 215,500 | 271,933 | ||||||
Corp Inmobiliaria Vesta SAB de CV | 190,500 | 280,896 | ||||||
Credito Real SAB de CV SOFOM ER | 71,500 | 133,831 | ||||||
Genomma Lab Internacional SAB de CV Series Ba,c | 287,900 | 370,077 | ||||||
Grupo Aeromexico SAB de CVa | 132,200 | 267,994 | ||||||
Grupo Aeroportuario del Centro Norte SAB de CV | 88,100 | 534,549 | ||||||
| 70 | 2017 iSHARES ANNUAL REPORTTO SHAREHOLDERS |
Table of Contents
Consolidated Schedule of Investments (Continued)
iSHARES® MSCI EMERGING MARKETS SMALL-CAP ETF
August 31, 2017
| Security | Shares | Value | ||||||
Grupo Comercial Chedraui SA de CV | 113,100 | $ | 243,045 | |||||
Grupo Financiero Interacciones SA de CV Series O | 39,400 | 236,120 | ||||||
Grupo Herdez SAB de CV | 96,000 | 235,815 | ||||||
Industrias Bachoco SAB de CV Series B | 62,400 | 332,224 | ||||||
Industrias CH SAB de CV Series Ba,c | 60,900 | 292,254 | ||||||
La Comer SAB de CVa,c | 145,600 | 145,332 | ||||||
Macquarie Mexico Real Estate Management SA de CV | 302,100 | 406,806 | ||||||
Minera Frisco SAB de CV Series A1a,c | 213,000 | 147,356 | ||||||
PLA Administradora Industrial S. de RL de CVc | 262,600 | 447,913 | ||||||
Prologis Property Mexico SA de CV | 142,200 | 290,420 | ||||||
Qualitas Controladora SAB de CV | 130,100 | 227,384 | ||||||
Rassini SAB de CV | 18,100 | 83,997 | ||||||
Telesites SAB de CVa,c | 505,500 | 403,600 | ||||||
TV Azteca SAB de CV CPOc | 505,700 | 97,039 | ||||||
Unifin Financiera SAB de CV SOFOM ENR | 59,800 | 206,416 | ||||||
Urbi Desarrollos Urbanos SAB de CVa | 1 | — | ||||||
|
| |||||||
| 7,484,123 | ||||||||
PAKISTAN — 0.89% | ||||||||
Bank Alfalah Ltd.a | 238,000 | 90,879 | ||||||
DG Khan Cement Co. Ltd. | 77,373 | 114,353 | ||||||
Engro Fertilizers Ltd. | 171,500 | 94,374 | ||||||
Fauji Cement Co. Ltd. | 256,500 | 83,655 | ||||||
Fauji Fertilizer Co. Ltd. | 168,500 | 113,497 | ||||||
Ferozsons Laboratories Ltd. | 14,800 | 42,771 | ||||||
Honda Atlas Cars Pakistan Ltd. | 7,600 | 39,748 | ||||||
Hub Power Co. Ltd. (The) | 210,600 | 226,395 | ||||||
Indus Motor Co. Ltd. | 4,940 | 81,920 | ||||||
International Steels Ltd. | 65,500 | 76,757 | ||||||
Kot Addu Power Co. Ltd. | 159,000 | 110,106 | ||||||
Maple Leaf Cement Factory Ltd. | 79,500 | 69,540 | ||||||
Millat Tractors Ltd. | 8,750 | 96,860 | ||||||
National Bank of Pakistan | 134,500 | 70,996 | ||||||
National Refinery Ltd. | 10,600 | 65,051 | ||||||
Nishat Mills Ltd. | 40,464 | 54,953 | ||||||
Packages Ltd. | 8,650 | 50,565 | ||||||
| Security | Shares | Value | ||||||
Pak Elektron Ltd. | 98,500 | $ | 68,744 | |||||
PAK Suzuki Motor Co. Ltd. | 5,800 | 24,742 | ||||||
Pakistan Oilfields Ltd. | 36,800 | 168,045 | ||||||
Pakistan State Oil Co. Ltd. | 51,091 | 203,903 | ||||||
Searle Co. Ltd. (The) | 25,000 | 93,277 | ||||||
Shell Pakistan Ltd. | 6,400 | 25,168 | ||||||
SUI Northern Gas Pipelinea | 68,500 | 95,386 | ||||||
Thal Ltd. | 17,700 | 98,252 | ||||||
|
| |||||||
| 2,259,937 | ||||||||
PERU — 0.09% |
| |||||||
Grana y Montero SAA SP ADRa | 63,807 | 232,257 | ||||||
|
| |||||||
| 232,257 | ||||||||
PHILIPPINES — 1.01% | ||||||||
Bloomberry Resorts Corp.a | 1,342,600 | 294,391 | ||||||
Cebu Air Inc. | 95,830 | 202,822 | ||||||
Cosco Capital Inc. | 1,371,200 | 210,088 | ||||||
D&L Industries Inc. | 1,072,400 | 216,702 | ||||||
DoubleDragon Properties Corp.a | 238,110 | 202,884 | ||||||
Filinvest Land Inc. | 6,143,000 | 229,297 | ||||||
First Gen Corp. | 550,500 | 180,954 | ||||||
First Philippine Holdings Corp. | 141,320 | 185,039 | ||||||
Manila Water Co. Inc. | 568,500 | 343,855 | ||||||
Melco Resorts And Entertainment (Philippines) Corp.a | 482,500 | 83,827 | ||||||
Petron Corp. | 528,100 | 101,141 | ||||||
Premium Leisure Corp. | 2,343,000 | 74,177 | ||||||
Vista Land & Lifescapes Inc. | 2,102,900 | 244,523 | ||||||
|
| |||||||
| 2,569,700 | ||||||||
POLAND — 1.29% | ||||||||
Asseco Poland SA | 24,802 | 314,415 | ||||||
Boryszew SAa | 27,647 | 80,077 | ||||||
Budimex SA | 4,682 | 297,620 | ||||||
CD Projekt SA | 23,209 | 541,678 | ||||||
Ciech SAa | 9,601 | 168,543 | ||||||
Enea SA | 81,095 | 346,085 | ||||||
Energa SAa | 49,744 | 189,877 | ||||||
Globe Trade Centre SA | 81,895 | 226,888 | ||||||
KRUK SA | 5,885 | 561,507 | ||||||
Netia SA | 130,213 | 142,114 | ||||||
PKP Cargo SAa | 11,721 | 209,367 | ||||||
Warsaw Stock Exchange | 14,628 | 192,889 | ||||||
|
| |||||||
| 3,271,060 | ||||||||
QATAR — 0.51% | ||||||||
Gulf International Services QSC | 8,804 | 44,464 | ||||||
Gulf Warehousing Co. | 8,485 | 111,386 | ||||||
CONSOLIDATED SCHEDULESOF INVESTMENTS | 71 |
Table of Contents
Consolidated Schedule of Investments (Continued)
iSHARES® MSCI EMERGING MARKETS SMALL-CAP ETF
August 31, 2017
| Security | Shares | Value | ||||||
Medicare Group | 3,317 | $ | 62,892 | |||||
Qatar First Banka | 93,324 | 175,563 | ||||||
Qatar National Cement Co. QSC | 13,962 | 256,905 | ||||||
Salam International Investment Ltd. QSC | 43,693 | 100,795 | ||||||
United Development Co. QSC | 65,314 | 272,108 | ||||||
Vodafone Qatar QSCa | 119,168 | 271,636 | ||||||
|
| |||||||
| 1,295,749 | ||||||||
RUSSIA — 0.64% |
| |||||||
Aeroflot PJSC | 186,056 | 623,123 | ||||||
Detsky Mir PJSCb | 23,980 | 40,094 | ||||||
DIXY Group OJSCa | 51,640 | 266,759 | ||||||
LSR Group PJSC GDRe | 99,265 | 282,905 | ||||||
M Video OJSCa | 8,000 | 56,203 | ||||||
Mechel PJSCa | 30,901 | 175,518 | ||||||
TMK PJSC GDRe | 38,871 | 178,807 | ||||||
|
| |||||||
| 1,623,409 | ||||||||
SOUTH AFRICA — 5.16% |
| |||||||
Adcock Ingram Holdings Ltd. | 34,911 | 169,217 | ||||||
Advtech Ltd. | 186,837 | 261,622 | ||||||
Aeci Ltd. | 41,137 | 338,654 | ||||||
African Rainbow Minerals Ltd. | 39,500 | 333,991 | ||||||
Alexander Forbes Group Holdings Ltd. | 309,937 | 160,721 | ||||||
ArcelorMittal South Africa Ltd.a | 86,086 | 32,984 | ||||||
Arrowhead Properties Ltd. Class A | 373,636 | 244,922 | ||||||
Ascendis Health Ltd. | 75,688 | 125,200 | ||||||
Assore Ltd. | 13,594 | 290,403 | ||||||
Astral Foods Ltd. | 17,055 | 203,387 | ||||||
Attacq Ltd.a | 140,636 | 195,846 | ||||||
AVI Ltd. | 108,859 | 827,404 | ||||||
Barloworld Ltd. | 72,905 | 720,777 | ||||||
Blue Label Telecoms Ltd. | 177,106 | 251,948 | ||||||
Cashbuild Ltd. | 8,050 | 230,082 | ||||||
City Lodge Hotels Ltd. | 20,692 | 225,268 | ||||||
Clicks Group Ltd. | 81,408 | 931,988 | ||||||
Clover Industries Ltd. | 161,424 | 198,093 | ||||||
Curro Holdings Ltd.a,c | 55,081 | 164,851 | ||||||
DataTec Ltd. | 66,094 | 287,666 | ||||||
Delta Property Fund Ltd. | 181,804 | 104,907 | ||||||
Dis-Chem Pharmacies Ltd.b | 60,520 | 137,360 | ||||||
Emira Property Fund Ltd. | 201,700 | 215,240 | ||||||
EOH Holdings Ltd. | 39,670 | 340,312 | ||||||
Famous Brands Ltd. | 25,467 | 231,598 | ||||||
| Security | Shares | Value | ||||||
Grindrod Ltd.a | 168,375 | $ | 175,014 | |||||
Harmony Gold Mining Co. Ltd. | 140,767 | 279,855 | ||||||
Hosken Consolidated Investments Ltd. | 22,625 | 231,516 | ||||||
Hudaco Industries Ltd. | 9,770 | 97,719 | ||||||
Invicta Holdings Ltd. | 17,271 | 65,908 | ||||||
JSE Ltd. | 28,315 | 293,596 | ||||||
KAP Industrial Holdings Ltd. | 577,705 | 375,580 | ||||||
Lewis Group Ltd. | 43,613 | 107,376 | ||||||
Metair Investments Ltd. | 57,791 | 87,148 | ||||||
Mpact Ltd. | 81,134 | 168,541 | ||||||
Murray & Roberts Holdings Ltd. | 153,001 | 179,516 | ||||||
Nampak Ltd.a | 208,219 | 302,456 | ||||||
Northam Platinum Ltd.a | 113,874 | 430,965 | ||||||
Oceana Group Ltd. | 10,233 | 73,755 | ||||||
Omnia Holdings Ltd. | 21,485 | 233,901 | ||||||
PPC Ltd.a | 553,460 | 241,866 | ||||||
Raubex Group Ltd. | 77,044 | 134,853 | ||||||
Reunert Ltd. | 59,764 | 319,569 | ||||||
SA Corporate Real Estate Ltd. | 668,753 | 278,358 | ||||||
Sun International Ltd./ South Africa | 41,181 | 183,766 | ||||||
Super Group Ltd./South Africaa | 107,075 | 340,317 | ||||||
Tongaat Hulett Ltd. | 33,205 | 303,041 | ||||||
Trencor Ltd. | 64,609 | 196,101 | ||||||
Vukile Property Fund Ltd. | 222,502 | 320,978 | ||||||
Wilson Bayly Holmes-Ovcon Ltd. | 20,513 | 218,979 | ||||||
Zeder Investments Ltd. | 446,407 | 218,095 | ||||||
|
| |||||||
| 13,083,210 | ||||||||
SOUTH KOREA — 15.58% |
| |||||||
Advanced Process Systems Corp.a | 3,951 | 154,172 | ||||||
Ahnlab Inc. | 2,089 | 95,965 | ||||||
AK Holdings Inc. | 1,652 | 102,847 | ||||||
ALUKO Co. Ltd. | 18,405 | 66,105 | ||||||
Amicogen Inc.a | 3,437 | 92,661 | ||||||
Aprogen pharmaceuticals Inc.a,c | 33,980 | 118,580 | ||||||
APS Holdings Corp.a | 1 | 9 | ||||||
Asiana Airlines Inc.a | 41,711 | 165,904 | ||||||
ATGen Co. Ltd.a,c | 3,467 | 89,165 | ||||||
Binex Co. Ltd.a | 11,119 | 94,368 | ||||||
Binggrae Co. Ltd. | 3,708 | 199,277 | ||||||
Bukwang Pharmaceutical Co. Ltd. | 10,436 | 197,595 | ||||||
Caregen Co. Ltd. | 1,470 | 88,909 | ||||||
Cell Biotech Co. Ltd. | 3,531 | 119,934 | ||||||
| 72 | 2017 iSHARES ANNUAL REPORTTO SHAREHOLDERS |
Table of Contents
Consolidated Schedule of Investments (Continued)
iSHARES® MSCI EMERGING MARKETS SMALL-CAP ETF
August 31, 2017
| Security | Shares | Value | ||||||
Celltrion Pharm Inc.a,c | 6,647 | $ | 111,707 | |||||
Chabiotech Co. Ltd.a | 18,088 | 201,316 | ||||||
Chong Kun Dang Pharmaceutical Corp.c | 2,026 | 186,861 | ||||||
CJ CGV Co. Ltd.c | 4,915 | 285,067 | ||||||
CJ Freshway Corp. | 3,732 | 141,324 | ||||||
CJ O Shopping Co. Ltd. | 1,419 | 269,303 | ||||||
CLIO Cosmetics Co. Ltd. | 1,847 | 55,528 | ||||||
CMG Pharmaceutical Co. Ltd.a,c | 32,397 | 104,293 | ||||||
Com2uSCorp. | 3,394 | 328,083 | ||||||
Cosmax Inc. | 2,636 | 275,850 | ||||||
CrystalGenomics Inc.a | 8,371 | 100,220 | ||||||
Dae Hwa Pharmaceutical Co. Ltd.c | 5,034 | 93,975 | ||||||
Daesang Corp. | 9,348 | 199,793 | ||||||
Daewoo Shipbuilding & Marine Engineering Co. Ltd.a,d | 21,862 | 65,144 | ||||||
Daewoong Pharmaceutical Co. Ltd. | 1,889 | 169,199 | ||||||
Daishin Securities Co. Ltd. | 18,528 | 231,682 | ||||||
Daou Technology Inc. | 9,331 | 163,019 | ||||||
Dawonsys Co. Ltd. | 9,863 | 99,715 | ||||||
DIO Corp.a | 4,220 | 127,992 | ||||||
Dong-A Socio Holdings Co. Ltd. | 1,102 | 123,628 | ||||||
Dong-A ST Co. Ltd. | 1,863 | 137,957 | ||||||
Dongbu HiTek Co. Ltd.a | 13,125 | 185,654 | ||||||
Dongjin Semichem Co. Ltd.c | 10,157 | 168,893 | ||||||
Dongkuk Steel Mill Co. Ltd. | 20,598 | 231,079 | ||||||
Dongwon Development Co. Ltd. | 41,929 | 197,077 | ||||||
Dongwon F&B Co. Ltd. | 558 | 101,198 | ||||||
Doosan Infracore Co. Ltd.a | 43,830 | 325,343 | ||||||
DoubleUGames Co. Ltd. | 3,943 | 186,730 | ||||||
Douzone Bizon Co. Ltd. | 8,553 | 250,689 | ||||||
Duk San Neolux Co. Ltd.a | 3,001 | 66,535 | ||||||
Easy Bio Inc. | 25,892 | 153,157 | ||||||
Emerson Pacific Inc.a,c | 3,420 | 88,108 | ||||||
EO Technics Co. Ltd. | 3,030 | 194,010 | ||||||
Fila Korea Ltd.c | 3,885 | 243,932 | ||||||
Finetex EnE Inc.a,c | 20,092 | 81,430 | ||||||
Foosung Co. Ltd.a | 20,618 | 204,790 | ||||||
G-SMATT GLOBAL Co. Ltd.a,c | 6,347 | 74,863 | ||||||
G-treeBNT Co. Ltd.a,c | 7,811 | 189,110 | ||||||
Gamevil Inc.a,c | 2,473 | 118,430 | ||||||
GemVax & Kael Co. Ltd.a,c | 10,837 | 102,354 | ||||||
Genexine Co. Ltd.a | 3,427 | 140,867 | ||||||
| Security | Shares | Value | ||||||
Grand Korea Leisure Co. Ltd. | 12,132 | $ | 248,536 | |||||
Green Cross Cell Corp. | 5,010 | 146,399 | ||||||
Green Cross Corp./South Korea | 1,986 | 319,669 | ||||||
Green Cross Holdings Corp. | 8,768 | 262,433 | ||||||
GS Home Shopping Inc. | 1,480 | 289,411 | ||||||
Halla Holdings Corp.c | 3,287 | 186,271 | ||||||
Hana Tour Service Inc. | 3,514 | 265,202 | ||||||
Hanall Biopharma Co. Ltd.a,c | 9,542 | 107,470 | ||||||
Handsome Co. Ltd. | 7,456 | 217,544 | ||||||
Hanil Cement Co. Ltd. | 993 | 113,161 | ||||||
Hanjin Heavy Industries & Construction Co. Ltd.a | 28,472 | 118,675 | ||||||
Hanjin Kal Corp.a | 15,297 | 311,339 | ||||||
Hanjin Transportation Co. Ltd.c | 3,836 | 103,929 | ||||||
Hankook Tire Worldwide Co. Ltd. | 11,188 | 211,338 | ||||||
Hansae Co. Ltd. | 6,485 | 144,354 | ||||||
Hansol Chemical Co. Ltd. | 3,451 | 236,269 | ||||||
Hansol Holdings Co. Ltd.a | 38,387 | 214,472 | ||||||
Hansol Technics Co. Ltd.a | 8,012 | 114,396 | ||||||
Hanwha Investment & Securities Co. Ltd.a | 44,091 | 121,802 | ||||||
Hite Jinro Co. Ltd. | 9,790 | 226,604 | ||||||
HLB Inc.a,c | 10,600 | 126,907 | ||||||
Homecast Co. Ltd.a,c | 10,009 | 98,972 | ||||||
HS Industries Co. Ltd.c | 13,734 | 117,657 | ||||||
Huchems Fine Chemical Corp. | 9,439 | 200,482 | ||||||
Hugel Inc.a | 819 | 421,266 | ||||||
Humedix Co. Ltd.c | 4,223 | 120,031 | ||||||
Huons Co. Ltd.a | 2,493 | 148,793 | ||||||
Huons Global Co. Ltd. | 3,282 | 133,160 | ||||||
Hyundai Construction Equipment Co. Ltd.a | 662 | 196,968 | ||||||
Hyundai Corp. | 7,283 | 145,001 | ||||||
Hyundai Electric & Energy System Co. Ltd.a | 680 | 163,728 | ||||||
Hyundai Elevator Co. Ltd. | 5,053 | 233,022 | ||||||
Hyundai Greenfood Co. Ltd. | 18,868 | 289,479 | ||||||
Hyundai Home Shopping Network Corp. | 2,605 | 317,655 | ||||||
Hyundai Livart Furniture Co. Ltd. | 5,035 | 105,156 | ||||||
Hyundai Mipo Dockyard Co. Ltd.a | 3,868 | 346,460 | ||||||
Hyundai Rotem Co. Ltd.a | 9,413 | 154,435 | ||||||
Iljin Materials Co. Ltd.c | 7,298 | 264,387 | ||||||
Ilyang Pharmaceutical Co. Ltd. | 5,635 | 180,904 | ||||||
InBody Co. Ltd. | 5,486 | 153,254 | ||||||
CONSOLIDATED SCHEDULESOF INVESTMENTS | 73 |
Table of Contents
Consolidated Schedule of Investments (Continued)
iSHARES® MSCI EMERGING MARKETS SMALL-CAP ETF
August 31, 2017
| Security | Shares | Value | ||||||
Innocean Worldwide Inc. | 3,684 | $ | 234,252 | |||||
Interflex Co. Ltd.a | 3,120 | 137,794 | ||||||
Interojo Co. Ltd. | 5,370 | 160,967 | ||||||
Interpark Holdings Corp. | 33,208 | 142,833 | ||||||
iNtRON Biotechnology Inc.a,c | 4,045 | 112,102 | ||||||
IS Dongseo Co. Ltd. | 5,260 | 166,532 | ||||||
Jayjun Cosmetic Co. Ltd.a,c | 15,670 | 93,803 | ||||||
Jeil Pharma Holdings Inc. | 743 | 26,390 | ||||||
Jeil Pharmaceutical Co. Ltd.a | 1,798 | 79,169 | ||||||
Jenax Inc.a,c | 5,457 | 137,199 | ||||||
Jusung Engineering Co. Ltd.a | 16,387 | 236,882 | ||||||
JW Holdings Corp. | 11,422 | 94,609 | ||||||
JW Pharmaceutical Corp. | 4,200 | 170,034 | ||||||
JW Shinyak Corp. | 15,608 | 102,568 | ||||||
KC Tech Co. Ltd.c | 9,719 | 224,099 | ||||||
KEPCO Engineering & Construction Co. Inc.c | 5,812 | 93,293 | ||||||
KIWOOM Securities Co. Ltd. | 3,965 | 283,767 | ||||||
Koh Young Technology Inc. | 5,551 | 300,294 | ||||||
Kolmar BNH Co. Ltd.c | 5,364 | 129,391 | ||||||
Kolon Corp. | 2,760 | 162,526 | ||||||
Kolon Industries Inc.c | 5,734 | 363,587 | ||||||
Kolon Life Science Inc. | 1,789 | 207,839 | ||||||
Komipharm International Co. Ltd.a | 12,171 | 397,749 | ||||||
Korea Asset In Trust Co. Ltd. | 13,799 | 113,564 | ||||||
Korea Electric Terminal Co. Ltd. | 2,963 | 188,669 | ||||||
Korea Kolmar Co. Ltd.c | 4,827 | 290,664 | ||||||
Korea Kolmar Holdings Co. Ltd. | 3,179 | 85,424 | ||||||
Korea Line Corp.a | 4,018 | 126,320 | ||||||
Korea PetroChemical Ind. Co. Ltd. | 1,127 | 267,358 | ||||||
Korea REIT Co. Ltd. | 61,694 | 185,749 | ||||||
Korean Reinsurance Co. | 39,943 | 441,017 | ||||||
KT Skylife Co. Ltd. | 14,008 | 200,008 | ||||||
Kumho Tire Co. Inc.a,c | 43,230 | 257,632 | ||||||
Kyung Dong Navien Co. Ltd. | 2,756 | 86,644 | ||||||
L&F Co. Ltd.c | 4,874 | 156,905 | ||||||
Leaders Cosmetics Co. Ltd.a | 5,799 | 73,285 | ||||||
LEENO Industrial Inc. | 5,933 | 265,186 | ||||||
LF Corp. | 11,908 | 307,310 | ||||||
LG Hausys Ltd. | 2,637 | 231,989 | ||||||
LG International Corp. | 10,868 | 278,061 | ||||||
Lock&Lock Co. Ltd. | 11,697 | 162,862 | ||||||
Loen Entertainment Inc. | 2,873 | 204,596 | ||||||
LOTTE Fine Chemical Co. Ltd. | 6,816 | 263,247 | ||||||
| Security | Shares | Value | ||||||
Lotte Food Co. Ltd. | 342 | $ | 187,439 | |||||
LOTTE Himart Co. Ltd. | 3,471 | 210,550 | ||||||
LS Corp. | 6,022 | 451,276 | ||||||
LS Industrial Systems Co. Ltd. | 6,377 | 329,143 | ||||||
Lutronic Corp.c | 10,965 | 102,590 | ||||||
Macrogen Inc.a | 8,327 | 188,310 | ||||||
Mando Corp. | 2,314 | 491,489 | ||||||
Medipost Co. Ltd.a | 3,495 | 281,745 | ||||||
Meritz Financial Group Inc. | 23,700 | 352,053 | ||||||
Meritz Fire & Marine Insurance Co. Ltd. | 25,444 | 570,888 | ||||||
Meritz Securities Co. Ltd. | 122,147 | 522,667 | ||||||
Modetour Network Inc. | 4,911 | 118,463 | ||||||
Muhak Co. Ltd. | 7,428 | 131,749 | ||||||
Namhae Chemical Corp. | 25,277 | 212,286 | ||||||
Namyang Dairy Products Co. Ltd. | 275 | 165,107 | ||||||
Naturalendo Tech Co. Ltd.a,c | 7,630 | 217,884 | ||||||
Nexen Tire Corp. | 15,015 | 175,770 | ||||||
NHN Entertainment Corp.a | 3,559 | 202,316 | ||||||
NHN KCP Corp.a | 8,221 | 124,307 | ||||||
NICE Holdings Co. Ltd. | 9,490 | 135,920 | ||||||
NICE Information Service Co. Ltd. | 16,821 | 120,683 | ||||||
NongShim Co. Ltd. | 1,100 | 324,361 | ||||||
NS Shopping Co. Ltd.c | 13,047 | 189,758 | ||||||
NUTRIBIOTECH Co. Ltd.a,c | 4,871 | 87,260 | ||||||
Osstem Implant Co. Ltd.a | 4,402 | 279,517 | ||||||
Paradise Co. Ltd.c | 16,456 | 213,070 | ||||||
Partron Co. Ltd.c | 17,874 | 142,504 | ||||||
Peptron Inc.a | 2,856 | 108,531 | ||||||
Poongsan Corp. | 8,488 | 429,067 | ||||||
POSCO Chemtech Co. Ltd. | 11,030 | 322,801 | ||||||
POSCO ICT Co. Ltd. | 26,728 | 156,917 | ||||||
S&T Dynamics Co. Ltd.a | 19,234 | 154,029 | ||||||
S&T Motiv Co. Ltd. | 4,383 | 203,291 | ||||||
Samsung Engineering Co. Ltd.a,c | 41,997 | 398,517 | ||||||
Samyang Corp. | 1,400 | 122,295 | ||||||
Samyang Foods Co. Ltd. | 2,343 | 109,711 | ||||||
Samyang Holdings Corp. | 1,470 | 139,491 | ||||||
Seah Besteel Corp. | 5,875 | 184,701 | ||||||
Seegene Inc.a | 6,143 | 171,607 | ||||||
Seoul Semiconductor Co. Ltd. | 15,290 | 311,197 | ||||||
SFA Engineering Corp. | 7,350 | 246,716 | ||||||
SillaJen Inc.a,c | 17,638 | 390,270 | ||||||
SK Chemicals Co. Ltd. | 5,666 | 343,698 | ||||||
SK Gas Ltd. | 1,237 | 122,866 | ||||||
| 74 | 2017 iSHARES ANNUAL REPORTTO SHAREHOLDERS |
Table of Contents
Consolidated Schedule of Investments (Continued)
iSHARES® MSCI EMERGING MARKETS SMALL-CAP ETF
August 31, 2017
| Security | Shares | Value | ||||||
SK Materials Co. Ltd. | 2,043 | $ | 330,837 | |||||
SK Securities Co. Ltd.a,c | 164,898 | 184,260 | ||||||
SKC Co. Ltd. | 9,196 | 300,933 | ||||||
SM Entertainment Co.a,c | 8,600 | 224,991 | ||||||
Songwon Industrial Co. Ltd. | 4,737 | 87,590 | ||||||
Soulbrain Co. Ltd. | 3,588 | 205,238 | ||||||
SPC Samlip Co. Ltd. | 894 | 125,664 | ||||||
Ssangyong Cement Industrial Co. Ltd. | 10,815 | 128,042 | ||||||
Sung Kwang Bend Co. Ltd. | 9,932 | 86,848 | ||||||
Sungwoo Hitech Co. Ltd. | 25,672 | 147,530 | ||||||
Taekwang Industrial Co. Ltd. | 192 | 207,222 | ||||||
Taewoong Co. Ltd.a | 3,767 | 66,313 | ||||||
TES Co. Ltd./Korea | 4,893 | 131,915 | ||||||
Tongyang Inc. | 81,958 | 154,089 | ||||||
Tongyang Life Insurance Co. Ltd. | 21,154 | 172,031 | ||||||
Toptec Co. Ltd. | 7,816 | 194,430 | ||||||
Vieworks Co. Ltd. | 3,020 | 128,556 | ||||||
ViroMed Co. Ltd.a | 4,609 | 508,887 | ||||||
Webzen Inc.a | 7,351 | 121,256 | ||||||
WeMade Entertainment Co. Ltd. | 3,046 | 88,873 | ||||||
WONIK IPS Co. Ltd.a | 8,327 | 224,495 | ||||||
Woongjin Thinkbig Co. Ltd.a | 17,352 | 114,644 | ||||||
Youngone Corp. | 8,249 | 247,265 | ||||||
Yuanta Securities Korea Co. Ltd.a | 34,808 | 112,981 | ||||||
Yungjin Pharmaceutical Co. Ltd.a | 30,060 | 278,580 | ||||||
|
| |||||||
| 39,500,836 | ||||||||
TAIWAN — 17.94% | ||||||||
A-DATA Technology Co. Ltd. | 80,000 | 199,079 | ||||||
AcBel Polytech Inc. | 144,000 | 114,755 | ||||||
Accton Technology Corp. | 158,000 | 413,599 | ||||||
Advanced Ceramic X Corp. | 14,000 | 199,476 | ||||||
Advanced Wireless Semiconductor Co. | 69,000 | 131,008 | ||||||
Airtac International Group | 40,586 | 564,161 | ||||||
Ambassador Hotel (The) | 324,000 | 251,221 | ||||||
AmTRAN Technology Co. Ltd. | 338,312 | 188,331 | ||||||
Asia Optical Co. Inc. | 93,000 | 366,712 | ||||||
Asia Polymer Corp. | 501,869 | 309,313 | ||||||
ASPEED Technology Inc. | 9,000 | 199,211 | ||||||
Basso Industry Corp. | 47,000 | 140,008 | ||||||
BES Engineering Corp. | 908,000 | 194,062 | ||||||
Bizlink Holding Inc. | 37,982 | 331,001 | ||||||
Casetek Holdings Ltd. | 35,000 | 115,975 | ||||||
| Security | Shares | Value | ||||||
Cathay Real Estate Development Co. Ltd. | 298,300 | $ | 163,586 | |||||
Charoen Pokphand Enterprise | 45,000 | 97,816 | ||||||
Chaun-Choung Technology Corp. | 26,000 | 91,322 | ||||||
Cheng Loong Corp. | 408,000 | 244,700 | ||||||
Cheng Uei Precision Industry Co. Ltd. | 177,000 | 241,638 | ||||||
Chin-Poon Industrial Co. Ltd. | 119,000 | 214,901 | ||||||
China Bills Finance Corp. | 649,000 | 321,500 | ||||||
China Man-Made Fiber Corp. | 651,700 | 187,872 | ||||||
China Petrochemical Development Corp.a | 725,000 | 330,321 | ||||||
China Steel Chemical Corp. | 71,000 | 271,729 | ||||||
China Synthetic Rubber Corp. | 289,233 | 350,292 | ||||||
Chipbond Technology Corp. | 211,000 | 353,077 | ||||||
Chlitina Holding Ltd. | 20,000 | 74,224 | ||||||
Chong Hong Construction Co. Ltd. | 81,424 | 181,848 | ||||||
Chroma ATE Inc. | 120,000 | 411,544 | ||||||
Chunghwa Precision Test Tech Co. Ltd. | 4,000 | 188,210 | ||||||
Compeq Manufacturing Co. Ltd. | 386,000 | 416,326 | ||||||
Concraft Holding Co. Ltd. | 12,528 | 86,761 | ||||||
Coretronic Corp. | 183,400 | 222,725 | ||||||
CSBC Corp. Taiwana | 383,420 | 160,081 | ||||||
CTCI Corp. | 229,000 | 370,297 | ||||||
Cub Elecparts Inc. | 13,000 | 159,382 | ||||||
D-Link Corp. | 301,246 | 108,804 | ||||||
E Ink Holdings Inc. | 290,000 | 418,006 | ||||||
Egis Technology Inc.a | 23,000 | 213,393 | ||||||
Elan Microelectronics Corp. | 188,000 | 268,803 | ||||||
Elite Advanced Laser Corp. | 57,840 | 204,114 | ||||||
Elite Material Co. Ltd. | 98,000 | 493,588 | ||||||
Ennoconn Corp. | 15,000 | 219,192 | ||||||
Epistar Corp.a | 327,000 | 331,020 | ||||||
Eternal Materials Co. Ltd. | 314,532 | 332,469 | ||||||
Everlight Electronics Co. Ltd. | 144,000 | 216,150 | ||||||
Far Eastern Department Stores Ltd. | 280,000 | 140,097 | ||||||
Far Eastern International Bank | 988,360 | 304,902 | ||||||
Faraday Technology Corp. | 119,000 | 180,004 | ||||||
Feng Hsin Steel Co. Ltd. | 188,000 | 327,672 | ||||||
Firich Enterprises Co. Ltd. | 95,267 | 127,848 | ||||||
FLEXium Interconnect Inc. | 105,418 | 466,328 | ||||||
Formosan Rubber Group Inc. | 504,300 | 251,490 | ||||||
CONSOLIDATED SCHEDULESOF INVESTMENTS | 75 |
Table of Contents
Consolidated Schedule of Investments (Continued)
iSHARES® MSCI EMERGING MARKETS SMALL-CAP ETF
August 31, 2017
| Security | Shares | Value | ||||||
Genius Electronic Optical Co. Ltd.a | 18,000 | $ | 297,028 | |||||
Getac Technology Corp. | 155,000 | 221,106 | ||||||
Gigabyte Technology Co. Ltd. | 177,000 | 241,052 | ||||||
Gigastorage Corp.a | 192,400 | 101,686 | ||||||
Ginko International Co. Ltd. | 15,000 | 116,555 | ||||||
Gintech Energy Corp.a | 189,647 | 102,116 | ||||||
Global Unichip Corp. | 39,000 | 286,242 | ||||||
Gloria Material Technology Corp. | 324,850 | 239,501 | ||||||
Goldsun Building Materials Co. Ltd.a | 613,000 | 186,262 | ||||||
Gourmet Master Co. Ltd. | 26,070 | 309,257 | ||||||
Grand Pacific Petrochemical | 344,000 | 291,236 | ||||||
Grape King Bio Ltd. | 38,000 | 231,055 | ||||||
Great Wall Enterprise Co. Ltd. | 252,128 | 258,569 | ||||||
Greatek Electronics Inc. | 190,000 | 304,086 | ||||||
HannStar Display Corp. | 910,320 | 371,017 | ||||||
Ho Tung Chemical Corp.a | 880,524 | 259,089 | ||||||
Holy Stone Enterprise Co. Ltd. | 241,500 | 308,487 | ||||||
Hota Industrial Manufacturing Co. Ltd. | 70,192 | 327,946 | ||||||
Hu Lane Associate Inc. | 23,000 | 128,036 | ||||||
Huaku Development Co. Ltd. | 130,080 | 266,806 | ||||||
Huang Hsiang Construction Corp. | 75,000 | 78,780 | ||||||
Hung Sheng Construction Ltd. | 365,000 | 291,478 | ||||||
International Games System Co. Ltd. | 19,000 | 102,936 | ||||||
Iron Force Industrial Co. Ltd. | 24,000 | 95,431 | ||||||
ITEQ Corp. | 118,600 | 233,435 | ||||||
Jih Sun Financial Holdings Co. Ltd. | 657,690 | 156,473 | ||||||
Kenda Rubber Industrial Co. Ltd. | 182,341 | 260,712 | ||||||
Kerry TJ Logistics Co. Ltd. | 191,000 | 231,638 | ||||||
Kindom Construction Corp. | 207,000 | 125,178 | ||||||
King Slide Works Co. Ltd. | 22,000 | 306,173 | ||||||
King Yuan Electronics Co. Ltd. | 392,000 | 379,933 | ||||||
King’s Town Bank Co. Ltd. | 349,000 | 368,324 | ||||||
Kinpo Electronics | 588,000 | 203,605 | ||||||
Kinsus Interconnect Technology Corp. | 101,000 | 281,123 | ||||||
Land Mark Optoelectronics Corp. | 18,400 | 242,964 | ||||||
LCY Chemical Corp. | 181,000 | 242,601 | ||||||
Lealea Enterprise Co. Ltd.a | 658,590 | 247,689 | ||||||
Li Cheng Enterprise Co. Ltd. | 32,240 | 74,994 | ||||||
Lien Hwa Industrial Corp. | 337,904 | 308,468 | ||||||
| Security | Shares | Value | ||||||
Long Chen Paper Co. Ltd. | 169,751 | $ | 248,898 | |||||
Makalot Industrial Co. Ltd. | 57,559 | 271,784 | ||||||
Masterlink Securities Corp. | 882,121 | 237,637 | ||||||
Medigen Biotechnology Corp.a | 22,397 | 34,287 | ||||||
Mercuries & Associates Holding Ltd. | 307,330 | 233,713 | ||||||
Merry Electronics Co. Ltd. | 56,000 | 439,776 | ||||||
Microbio Co. Ltd.a | 281,727 | 210,509 | ||||||
Mitac Holdings Corp. | 231,379 | 275,625 | ||||||
Motech Industries Inc.a | 150,344 | 107,606 | ||||||
Nan Kang Rubber Tire Co. Ltd. | 239,000 | 215,804 | ||||||
Neo Solar Power Corp.a | 357,364 | 162,228 | ||||||
OBI Pharma Inc.a | 36,000 | 226,648 | ||||||
Pan-International Industrial Corp. | 138,722 | 128,246 | ||||||
Parade Technologies Ltd. | 23,000 | 366,579 | ||||||
PChome Online Inc. | 33,305 | 198,645 | ||||||
PharmaEngine Inc. | 29,756 | 174,519 | ||||||
PharmaEssentia Corp.a | 48,000 | 235,395 | ||||||
Pharmally International Holding Co. Ltd. | 7,000 | 102,174 | ||||||
Pixart Imaging Inc. | 59,635 | 252,933 | ||||||
Poya International Co. Ltd. | 20,453 | 266,006 | ||||||
President Securities Corp.a | 516,741 | 237,147 | ||||||
Primax Electronics Ltd. | 166,000 | 393,837 | ||||||
Prince Housing & Development Corp. | 528,917 | 201,549 | ||||||
Qisda Corp. | 598,000 | 428,006 | ||||||
Radiant Opto-Electronics Corp. | 158,000 | 398,416 | ||||||
Radium Life Tech Co. Ltd.a | 515,707 | 223,856 | ||||||
Ritek Corp.a | 613,260 | 103,433 | ||||||
Sanyang Motor Co. Ltd. | 255,820 | 175,045 | ||||||
ScinoPharm Taiwan Ltd. | 103,708 | 119,244 | ||||||
Senao International Co. Ltd. | 113,000 | 199,573 | ||||||
Sercomm Corp. | 115,000 | 302,942 | ||||||
Shin Zu Shing Co. Ltd. | 61,000 | 173,829 | ||||||
Shining Building Business Co. Ltd.a | 479,858 | 166,954 | ||||||
Shinkong Synthetic Fibers Corp. | 759,135 | 228,402 | ||||||
Silergy Corp. | 19,000 | 423,705 | ||||||
Simplo Technology Co. Ltd. | 66,000 | 224,162 | ||||||
Sino-American Silicon Products Inc. | 182,000 | 324,451 | ||||||
Sinyi Realty Inc. | 148,588 | 155,092 | ||||||
Sitronix Technology Corp. | 57,000 | 173,008 | ||||||
Soft-World International Corp. | 65,140 | 155,409 | ||||||
| 76 | 2017 iSHARES ANNUAL REPORTTO SHAREHOLDERS |
Table of Contents
Consolidated Schedule of Investments (Continued)
iSHARES® MSCI EMERGING MARKETS SMALL-CAP ETF
August 31, 2017
| Security | Shares | Value | ||||||
St. Shine Optical Co. Ltd. | 15,000 | $ | 341,960 | |||||
Sunny Friend Environmental Technology Co. Ltd. | 30,000 | 188,376 | ||||||
TA Chen Stainless Pipe | 358,722 | 225,843 | ||||||
Taichung Commercial Bank Co. Ltd. | 875,014 | 276,894 | ||||||
Tainan Spinning Co. Ltd. | 399,190 | 179,231 | ||||||
Taiwan Glass Industry Corp.a | 294,000 | 159,767 | ||||||
Taiwan Hon Chuan Enterprise Co. Ltd. | 165,004 | 299,073 | ||||||
Taiwan Paiho Ltd. | 85,050 | 356,500 | ||||||
Taiwan Secom Co. Ltd. | 155,450 | 459,463 | ||||||
Taiwan Shin Kong Security Co. Ltd. | 266,640 | 356,945 | ||||||
Taiwan Surface Mounting Technology Corp. | 361,633 | 298,375 | ||||||
Taiwan TEA Corp. | 393,000 | 209,659 | ||||||
Taiwan Union Technology Corp. | 57,000 | 139,199 | ||||||
Tatung Co. Ltd.a | 626,000 | 289,363 | ||||||
TCI Co. Ltd. | 16,000 | 100,202 | ||||||
Ton Yi Industrial Corp. | 366,000 | 173,425 | ||||||
Tong Hsing Electronic Industries Ltd. | 53,000 | 213,377 | ||||||
Tong Yang Industry Co. Ltd. | 133,133 | 249,247 | ||||||
Toung Loong Textile Manufacturing | 61,000 | 163,925 | ||||||
TPK Holding Co. Ltd.a | 90,000 | 369,794 | ||||||
Tripod Technology Corp. | 169,000 | 632,791 | ||||||
TSRC Corp. | 235,000 | 248,401 | ||||||
TTY Biopharm Co. Ltd. | 80,450 | 255,380 | ||||||
Tung Ho Steel Enterprise Corp. | 318,000 | 253,945 | ||||||
Tung Thih Electronic Co. Ltd. | 22,000 | 133,040 | ||||||
TWi Pharmaceuticals Inc.a | 38,000 | 91,666 | ||||||
TXC Corp. | 177,000 | 239,879 | ||||||
U-Ming Marine Transport Corp. | 109,000 | 138,692 | ||||||
Unimicron Technology Corp. | 437,000 | 249,785 | ||||||
UPC Technology Corp. | 391,202 | 193,793 | ||||||
USI Corp. | 466,089 | 232,434 | ||||||
Visual Photonics Epitaxy Co. Ltd. | 94,425 | 190,859 | ||||||
Voltronic Power Technology Corp. | 19,077 | 343,878 | ||||||
Wah Lee Industrial Corp. | 190,000 | 304,715 | ||||||
Walsin Lihwa Corp. | 920,000 | 443,553 | ||||||
Walsin Technology Corp. | 122,200 | 278,988 | ||||||
Waterland Financial Holdings Co. Ltd. | 997,097 | 291,738 | ||||||
| Security | Shares | Value | ||||||
Win Semiconductors Corp. | 109,736 | $ | 632,694 | |||||
Winbond Electronics Corp. | 925,000 | 709,558 | ||||||
Wistron NeWeb Corp. | 100,923 | 303,648 | ||||||
Wowprime Corp. | 19,000 | 114,268 | ||||||
WT Microelectronics Co. Ltd. | 183,168 | 305,897 | ||||||
XinTec Inc.a | 45,000 | 91,554 | ||||||
Yageo Corp. | 90,289 | 580,406 | ||||||
Yang Ming Marine Transport Corp.a | 219,000 | 121,550 | ||||||
Yeong Guan Energy Technology Group Co. Ltd. | 28,601 | 78,755 | ||||||
YFY Inc.a | 656,000 | 260,844 | ||||||
Yieh Phui Enterprise Co. Ltd. | 507,342 | 206,776 | ||||||
YungShin Global Holding Corp. | 220,200 | 292,223 | ||||||
Yungtay Engineering Co. Ltd. | 180,000 | 335,200 | ||||||
Zinwell Corp. | 148,000 | 139,766 | ||||||
|
| |||||||
| 45,485,377 | ||||||||
THAILAND — 3.53% | ||||||||
Amata Corp. PCL NVDR | 387,200 | 214,560 | ||||||
Bangchak Corp. PCL NVDR | 214,600 | 245,590 | ||||||
Bangkok Airways PCLc | 266,800 | 149,450 | ||||||
Bangkok Chain Hospital PCL NVDR | 558,700 | 249,022 | ||||||
Bangkok Land PCL NVDR | 5,714,800 | 311,513 | ||||||
Beauty Community PCL | 763,900 | 317,477 | ||||||
CH Karnchang PCL NVDR | 195,900 | 169,617 | ||||||
Chularat Hospital PCL NVDR | 2,303,000 | 170,618 | ||||||
Eastern Polymer Group PCLc | 322,600 | 111,727 | ||||||
Esso Thailand PCL NVDRa | 561,700 | 204,685 | ||||||
GFPT PCL NVDR | 198,800 | 114,951 | ||||||
Global Power Synergy PCL NVDRc | 210,600 | 247,354 | ||||||
Group Lease PCLc | 136,100 | 80,336 | ||||||
Gunkul Engineering PCL NVDRc | 1,292,183 | 160,331 | ||||||
Hana Microelectronics PCL NVDR | 241,500 | 318,194 | ||||||
Italian-Thai Development PCL NVDR | 1,006,300 | 126,678 | ||||||
Jasmine International PCL NVDR | 830,600 | 195,112 | ||||||
Khon Kaen Sugar Industry PCL NVDRc | 713,330 | 95,812 | ||||||
Kiatnakin Bank PCL NVDR | 155,532 | 329,051 | ||||||
Krungthai Card PCL NVDRc | 53,000 | 189,941 | ||||||
LPN Development PCL NVDR | 485,200 | 157,812 | ||||||
Major Cineplex Group PCL NVDR | 165,700 | 149,706 | ||||||
Malee Group PCLc | 40,900 | 49,886 | ||||||
CONSOLIDATED SCHEDULESOF INVESTMENTS | 77 |
Table of Contents
Consolidated Schedule of Investments (Continued)
iSHARES® MSCI EMERGING MARKETS SMALL-CAP ETF
August 31, 2017
| Security | Shares | Value | ||||||
Muangthai Leasing PCLc | 183,600 | $ | 187,996 | |||||
PTG Energy PCL | 282,500 | 178,663 | ||||||
Quality Houses PCL NVDRc | 3,233,967 | 233,746 | ||||||
Samart Corp. PCL NVDR | 258,600 | 105,917 | ||||||
Siam Global House PCL NVDRc | 608,595 | 274,926 | ||||||
Sino-Thai Engineering & Construction PCL NVDR | 340,428 | 266,560 | ||||||
Sri Trang Agro-Industry PCL NVDRc | 276,400 | 99,056 | ||||||
Srisawad Corp PCL NVDRc | 212,925 | 328,637 | ||||||
Supalai PCL NVDRc | 384,500 | 292,384 | ||||||
Superblock PCLa | 4,195,400 | 169,307 | ||||||
Taokaenoi Food & Marketing PCLc | 106,700 | 62,661 | ||||||
Thai Airways International PCL NVDRa | 267,200 | 145,650 | ||||||
Thai Vegetable Oil PCL NVDR | 213,600 | 183,334 | ||||||
Thaicom PCL NVDR | 289,000 | 128,812 | ||||||
Thanachart Capital PCL NVDR | 281,700 | 396,611 | ||||||
Tisco Financial Group PCL NVDR | 142,340 | 320,431 | ||||||
TTW PCL NVDR | 905,600 | 297,276 | ||||||
U City PCL NVDRa | 229,475,900 | 138,218 | ||||||
VGI Global Media PCL NVDR | 1,085,900 | 179,866 | ||||||
Vibhavadi Medical Center PCL NVDR | 2,428,700 | 203,336 | ||||||
WHA Corp. PCL NVDR | 2,885,800 | 276,369 | ||||||
Workpoint Entertainment PCL | 53,100 | 117,538 | ||||||
|
| |||||||
| 8,946,717 | ||||||||
TURKEY — 1.21% | ||||||||
Akcansa Cimento AS | 65,023 | 209,992 | ||||||
Aksa Akrilik Kimya Sanayii AS | 51,361 | 186,548 | ||||||
Aygaz AS | 23,588 | 106,990 | ||||||
Besiktas Futbol Yatirimlari Sanayi ve Ticaret ASa,c | 50,780 | 69,569 | ||||||
Cimsa Cimento Sanayi VE Ticaret AS | 60,064 | 249,299 | ||||||
Dogan Sirketler Grubu Holding ASa,c | 464,836 | 123,865 | ||||||
Kardemir Karabuk Demir Celik Sanayi ve Ticaret AS Class Da,c | 295,428 | 203,652 | ||||||
Koza Altin Isletmeleri ASa | 17,778 | 165,496 | ||||||
Logo Yazilim Sanayi Ve Ticaret ASa,c | 5,649 | 94,571 | ||||||
NET Holding ASa,c | 237,007 | 180,541 | ||||||
| Security | Shares | Value | ||||||
Otokar Otomotiv Ve Savunma Sanayi ASc | 4,595 | $ | 153,719 | |||||
Soda Sanayii AS | 111,306 | 167,964 | ||||||
Tekfen Holding AS | 71,223 | 264,259 | ||||||
Trakya Cam Sanayii AS | 302,064 | 321,964 | ||||||
Turkiye Sinai Kalkinma Bankasi AS | 514,338 | 226,439 | ||||||
Vestel Elektronik Sanayi ve Ticaret ASa,c | 40,897 | 99,028 | ||||||
Yazicilar Holding ASc | 20,690 | 135,195 | ||||||
Zorlu Enerji Elektrik Uretim ASa,c | 227,105 | 114,455 | ||||||
|
| |||||||
| 3,073,546 | ||||||||
UNITED ARAB EMIRATES — 0.59% |
| |||||||
Agthia Group PJSC | 66,027 | 98,867 | ||||||
Air Arabia PJSC | 859,182 | 261,981 | ||||||
Al Waha Capital PJSC | 343,180 | 164,438 | ||||||
Amanat Holdings PJSC | 454,609 | 137,382 | ||||||
Amlak Finance PJSCa | 303,003 | 93,217 | ||||||
Arabtec Holding PJSCa | 218,296 | 190,179 | ||||||
Dana Gas PJSCa | 1,193,608 | 207,974 | ||||||
Deyaar Development PJSCa | 674,225 | 95,817 | ||||||
Eshraq Properties Co. PJSCa | 430,265 | 101,911 | ||||||
Orascom Construction Ltd.a | 21,424 | 134,971 | ||||||
|
| |||||||
| 1,486,737 | ||||||||
|
| |||||||
TOTAL COMMON STOCKS |
| 248,600,240 | ||||||
PREFERRED STOCKS — 1.42% |
| |||||||
BRAZIL — 1.38% | ||||||||
Alpargatas SA, Preference Shares | 55,400 | 242,979 | ||||||
Banco ABC Brasil SA, Preference Shares | 31,043 | 167,821 | ||||||
Banco do Estado do Rio Grande do Sul SA Class B, Preference Shares | 59,000 | 317,272 | ||||||
Bradespar SA, Preference Shares | 76,700 | 655,245 | ||||||
Cia. de Gas de Sao Paulo – COMGAS, Preference Shares | 6,800 | 116,703 | ||||||
Cia. de Saneamento do Parana, Preference Shares | 94,600 | 313,885 | ||||||
Cia. Energetica de Sao Paulo Class B, Preference Shares | 68,400 | 320,212 | ||||||
| 78 | 2017 iSHARES ANNUAL REPORTTO SHAREHOLDERS |
Table of Contents
Consolidated Schedule of Investments (Continued)
iSHARES® MSCI EMERGING MARKETS SMALL-CAP ETF
August 31, 2017
| Security | Shares | Value | ||||||
Eletropaulo Metropolitana Eletricidade de Sao Paulo SA, Preference Shares | 33,800 | $ | 171,017 | |||||
GOL Linhas Aereas Inteligentes SA, Preference Shares | 26,100 | 93,983 | ||||||
Marcopolo SA, Preference Shares | 207,700 | 256,783 | ||||||
Metalurgica Gerdau SA, Preference Shares | 210,300 | 378,299 | ||||||
Randon SA Implemetos e Participacoes, Preference Shares | 68,325 | 138,541 | ||||||
Usinas Siderurgicas de Minas Gerais SA Class A, Preference Shares | 147,600 | 323,210 | ||||||
|
| |||||||
| 3,495,950 | ||||||||
COLOMBIA — 0.04% | ||||||||
Avianca Holdings SA, Preference Shares | 120,421 | 114,909 | ||||||
|
| |||||||
| 114,909 | ||||||||
|
| |||||||
TOTAL PREFERRED STOCKS |
| 3,610,859 | ||||||
RIGHTS — 0.01% | ||||||||
CHINA — 0.01% | ||||||||
Carnival Group International Holdings Ltd. (Expires 09/21/17)a | 585,500 | 17,954 | ||||||
Digital China Holdings Ltd. (Expires 09/07/17)a | 60,749 | 4,968 | ||||||
|
| |||||||
| 22,922 | ||||||||
|
| |||||||
TOTAL RIGHTS | 22,922 | |||||||
WARRANTS — 0.00% | ||||||||
THAILAND — 0.00% | ||||||||
Superblock PCL NVDR (Expires 08/31/20)a | 839,080 | — | ||||||
|
| |||||||
| — | ||||||||
|
| |||||||
TOTAL WARRANTS | — | |||||||
| Security | Shares | Value | ||||||
SHORT-TERM INVESTMENTS — 10.10% |
| |||||||
MONEY MARKET FUNDS — 10.10% |
| |||||||
BlackRock Cash Funds: Institutional, |
| |||||||
1.32%f,g,h | 25,015,086 | $ | 25,022,591 | |||||
BlackRock Cash Funds: Treasury, | ||||||||
0.96%f,g | 579,280 | 579,280 | ||||||
|
| |||||||
| 25,601,871 | ||||||||
|
| |||||||
TOTAL SHORT-TERM INVESTMENTS |
| 25,601,871 | ||||||
|
| |||||||
TOTAL INVESTMENTS |
| 277,835,892 | ||||||
Other Assets, Less Liabilities — (9.59)% |
| (24,316,799 | ) | |||||
|
| |||||||
NET ASSETS — 100.00% |
| $ | 253,519,093 | |||||
|
| |||||||
ADR — American Depositary Receipts
CPO — Certificates of Participation (Ordinary)
GDR — Global Depositary Receipts
NVDR — Non-Voting Depositary Receipts
| a | Non-income earning security. |
| b | This security may be resold to qualified institutional buyers under Rule 144A of the Securities Act of 1933. |
| c | All or a portion of this security represents a security on loan. See Note 1. |
| d | Security is valued using significant unobservable inputs and is classified as Level 3 in the fair value hierarchy. |
| e | This security may be resold to qualified foreign investors and foreign institutional buyers under Regulation S of the Securities Act of 1933. |
| f | Affiliated issuer. See Schedule 1. |
| g | The rate quoted is the annualized seven-day yield of the fund at period end. |
| h | All or a portion of this security represents an investment of securities lending collateral. See Note 1. |
| i | The cost of investments (including short positions and derivatives, if any) for federal income tax purposes was $255,795,512. Net unrealized appreciation was $22,040,380, of which $44,087,291 represented gross unrealized appreciation on investments and $22,046,911 represented gross unrealized depreciation on investments. |
CONSOLIDATED SCHEDULESOF INVESTMENTS | 79 |
Table of Contents
Consolidated Schedule of Investments (Continued)
iSHARES® MSCI EMERGING MARKETS SMALL-CAP ETF
August 31, 2017
Schedule 1 — Affiliates (Note 2)
Investments in issuers considered to be affiliates of the Fund during the year ended August 31, 2017, for purposes of Section 2(a)(3) of the 1940 Act, and/or related parties of the Fund were as follows:
| Affiliated issuer | Shares held at 08/31/16 | Shares purchased | Shares sold | Shares held at 08/31/17 | Value at 08/31/17 | Net realized gain (loss) a | Change in unrealized appreciation (depreciation) | Income | ||||||||||||||||||||||||
BlackRock Cash Funds: Institutional, | 14,859,449 | 10,155,637b | — | 25,015,086 | $ | 25,022,591 | $ | (652 | ) | $ | 4,484 | $ | —c | |||||||||||||||||||
BlackRock Cash Funds: Treasury, | 149,857 | 429,423b | — | 579,280 | 579,280 | 115 | — | 2,958 | ||||||||||||||||||||||||
|
|
|
|
|
|
|
| |||||||||||||||||||||||||
| $ | 25,601,871 | $ | (537 | ) | $ | 4,484 | $ | 2,958 | ||||||||||||||||||||||||
|
|
|
|
|
|
|
| |||||||||||||||||||||||||
| a | Includes realized capital gain distributions from an affiliated fund, if any. |
| b | Net of shares purchased and sold. |
| c | Does not include income earned on the investment of securities lending cash collateral which is not direct income of the Fund and is reflected as a component of securities lending income in the statement of operations. |
Schedule 2 — Fair Value Measurements
Various inputs are used in determining the fair value of financial instruments. For description of the input levels and information about the Fund’s policy regarding valuation of financial instruments, see Note 1.
The following table summarizes the value of the Fund’s investments according to the fair value hierarchy as of August 31, 2017. The breakdown of the Fund’s investments into major categories is disclosed in the consolidated schedule of investments above.
| Level 1 | Level 2 | Level 3 | Total | |||||||||||||
Investments: | ||||||||||||||||
Assets: | ||||||||||||||||
Common stocks | $ | 247,581,195 | $ | 581,522 | $ | 437,523 | $ | 248,600,240 | ||||||||
Preferred stocks | 3,610,859 | — | — | 3,610,859 | ||||||||||||
Rights | 4,968 | 17,954 | — | 22,922 | ||||||||||||
Warrants | — | 0 | a | — | 0 | a | ||||||||||
Money market funds | 25,601,871 | — | — | 25,601,871 | ||||||||||||
|
|
|
|
|
|
|
| |||||||||
Total | $ | 276,798,893 | $ | 599,476 | $ | 437,523 | $ | 277,835,892 | ||||||||
|
|
|
|
|
|
|
| |||||||||
| a | Rounds to less than $1. |
See notes to consolidated financial statements.
| 80 | 2017 iSHARES ANNUAL REPORTTO SHAREHOLDERS |
Table of Contents
Consolidated Statements of Assets and Liabilities
iSHARES®, INC.
August 31, 2017
| iShares Core MSCI Emerging Markets ETF | iShares MSCI BRIC ETF | iShares MSCI Emerging Markets ETF | ||||||||||
ASSETS | ||||||||||||
Investments in securities, at cost: | ||||||||||||
Unaffiliated | $ | 30,801,116,546 | $ | 218,330,138 | $ | 421,285,348 | ||||||
Affiliated (Note 2) | 2,656,155,849 | 25,662,112 | 10,577,204 | |||||||||
|
|
|
|
|
| |||||||
Total cost of investments in securities | $ | 33,457,272,395 | $ | 243,992,250 | $ | 431,862,552 | ||||||
|
|
|
|
|
| |||||||
Investments in securities, at fair value (including securities on loana) (Note 1): |
| |||||||||||
Unaffiliated | $ | 36,637,778,971 | $ | 260,963,604 | $ | 499,711,288 | ||||||
Affiliated (Note 2) | 2,656,461,709 | 25,664,249 | 10,578,475 | |||||||||
Foreign currency, at valueb | 44,169,326 | 255,775 | 599,944 | |||||||||
Cash | 6,524,166 | 36,035 | — | |||||||||
Receivables: |
| |||||||||||
Investment securities sold | 32,929,266 | — | 646,872 | |||||||||
Due from custodian (Note 4) | 1,995,341 | — | — | |||||||||
Dividends and interest | 72,785,145 | 537,661 | 1,024,666 | |||||||||
Capital shares sold | 3,915,465 | — | — | |||||||||
Futures variation margin | 6,970,178 | — | — | |||||||||
Tax reclaims | 109,496 | — | — | |||||||||
|
|
|
|
|
| |||||||
Total Assets | 39,463,639,063 | 287,457,324 | 512,561,245 | |||||||||
|
|
|
|
|
| |||||||
LIABILITIES |
| |||||||||||
Payables: |
| |||||||||||
Investment securities purchased | 125,348,822 | — | 1,113,844 | |||||||||
Collateral for securities on loan (Note 1) | 2,545,167,897 | 25,501,156 | 9,809,756 | |||||||||
Due to broker | 37,602 | — | — | |||||||||
Foreign taxes (Note 1) | 1,441,301 | — | 21,049 | |||||||||
Deferred foreign capital gains taxes (Note 1) | 12,089,148 | 108,601 | 82,873 | |||||||||
Investment advisory fees (Note 2) | 4,256,753 | 145,861 | 203,418 | |||||||||
|
|
|
|
|
| |||||||
Total Liabilities | 2,688,341,523 | 25,755,618 | 11,230,940 | |||||||||
|
|
|
|
|
| |||||||
NET ASSETS | $ | 36,775,297,540 | $ | 261,701,706 | $ | 501,330,305 | ||||||
|
|
|
|
|
| |||||||
Net assets consist of: |
| |||||||||||
Paid-in capital | $ | 31,651,297,079 | $ | 449,922,901 | $ | 450,270,056 | ||||||
Undistributed net investment income | 335,190,679 | 2,438,261 | 4,251,863 | |||||||||
Accumulated net realized loss | (1,043,223,526 | ) | (233,187,843 | ) | (31,537,042 | ) | ||||||
Net unrealized appreciation | 5,832,033,308 | 42,528,387 | 78,345,428 | |||||||||
|
|
|
|
|
| |||||||
NET ASSETS | $ | 36,775,297,540 | $ | 261,701,706 | $ | 501,330,305 | ||||||
|
|
|
|
|
| |||||||
Shares outstandingc | 682,200,000 | 6,200,000 | 7,250,000 | |||||||||
|
|
|
|
|
| |||||||
Net asset value per share | $ | 53.91 | $ | 42.21 | $ | 69.15 | ||||||
|
|
|
|
|
| |||||||
| a | Securities on loan with values of $2,434,126,083, $24,886,520 and $9,196,235, respectively. See Note 1. |
| b | Cost of foreign currency: $44,143,839, $255,727 and $599,911, respectively. |
| c | $0.001 par value, number of shares authorized: 2.05 billion, 500 million and 500 million, respectively. |
See notes to consolidated financial statements.
CONSOLIDATED FINANCIAL STATEMENTS | 81 |
Table of Contents
Consolidated Statements of Assets and Liabilities (Continued)
iSHARES®, INC.
August 31, 2017
| iShares MSCI Emerging Markets Small-Cap ETF | ||||
ASSETS | ||||
Investments in securities, at cost: | ||||
Unaffiliated | $ | 225,272,367 | ||
Affiliated (Note 2) | 25,597,387 | |||
|
| |||
Total cost of investments in securities | $ | 250,869,754 | ||
|
| |||
Investments in securities, at fair value (including securities on loana) (Note 1): | ||||
Unaffiliated | $ | 252,234,021 | ||
Affiliated (Note 2) | 25,601,871 | |||
Foreign currency, at valueb | 271,614 | |||
Cash | 104,422 | |||
Receivables: | ||||
Investment securities sold | 1,352,353 | |||
Dividends and interest | 732,330 | |||
Tax reclaims | 593 | |||
|
| |||
Total Assets | 280,297,204 | |||
|
| |||
LIABILITIES | ||||
Payables: | ||||
Investment securities purchased | 1,605,127 | |||
Collateral for securities on loan (Note 1) | 25,018,758 | |||
Foreign taxes (Note 1) | 12,766 | |||
Investment advisory fees (Note 2) | 141,460 | |||
|
| |||
Total Liabilities | 26,778,111 | |||
|
| |||
NET ASSETS | $ | 253,519,093 | ||
|
| |||
Net assets consist of: | ||||
Paid-in capital | $ | 239,609,968 | ||
Undistributed net investment income | 1,578,413 | |||
Accumulated net realized loss | (14,637,130 | ) | ||
Net unrealized appreciation | 26,967,842 | |||
|
| |||
NET ASSETS | $ | 253,519,093 | ||
|
| |||
Shares outstandingc | 5,150,000 | |||
|
| |||
Net asset value per share | $ | 49.23 | ||
|
| |||
| a | Securities on loan with a value of $22,061,100. See Note 1. |
| b | Cost of foreign currency: $271,187. |
| c | $0.001 par value, number of shares authorized: 500 million. |
See notes to consolidated financial statements.
| 82 | 2017 iSHARES ANNUAL REPORTTO SHAREHOLDERS |
Table of Contents
Consolidated Statements of Operations
iSHARES®, INC.
Year ended August 31, 2017
| iShares Core MSCI Emerging Markets ETF | iShares MSCI BRIC ETF | iShares MSCI Emerging Markets ETF | ||||||||||
NET INVESTMENT INCOME |
| |||||||||||
Dividends — unaffiliateda | $ | 677,585,642 | $ | 5,424,613 | $ | 7,504,846 | ||||||
Dividends — affiliated (Note 2) | 368,419 | 1,236 | 8,705 | |||||||||
Interest — unaffiliated | 14,298 | — | — | |||||||||
Securities lending income — affiliated — net (Note 2)b | 32,105,306 | 103,065 | 104,404 | |||||||||
|
|
|
|
|
| |||||||
| 710,073,665 | 5,528,914 | 7,617,955 | ||||||||||
Less: Other foreign taxes (Note 1) | (1,990,452 | ) | — | (35,518 | ) | |||||||
|
|
|
|
|
| |||||||
Total investment income | 708,083,213 | 5,528,914 | 7,582,437 | |||||||||
|
|
|
|
|
| |||||||
EXPENSES |
| |||||||||||
Investment advisory fees (Note 2) | 34,726,501 | 1,431,569 | 1,400,953 | |||||||||
Mauritius income taxes (Note 1) | 542,487 | 10,989 | 1,794 | |||||||||
Proxy fees | 623,303 | 6,616 | 7,188 | |||||||||
Commitment fees (Note 8) | 178,211 | 3,383 | 2,677 | |||||||||
Interest expense (Note 8) | 83,846 | 1,451 | 1,477 | |||||||||
|
|
|
|
|
| |||||||
Total expenses | 36,154,348 | 1,454,008 | 1,414,089 | |||||||||
Less investment advisory fees waived (Note 2) | (1,137,131 | ) | — | — | ||||||||
|
|
|
|
|
| |||||||
Net expenses | 35,017,217 | 1,454,008 | 1,414,089 | |||||||||
|
|
|
|
|
| |||||||
Net investment income | 673,065,996 | 4,074,906 | 6,168,348 | |||||||||
|
|
|
|
|
| |||||||
NET REALIZED AND UNREALIZED GAIN (LOSS) |
| |||||||||||
Net realized gain (loss) from: |
| |||||||||||
Investments — unaffiliatedc | (275,864,953 | ) | (7,937,555 | ) | (5,164,422 | ) | ||||||
Investments — affiliated (Note 2) | (123,726 | ) | 1,489 | (779 | ) | |||||||
In-kind redemptions — unaffiliated | — | 12,318,779 | 3,329,261 | |||||||||
Futures contracts | 27,548,406 | — | — | |||||||||
Foreign currency transactions | (2,981,251 | ) | 21,155 | (95,631 | ) | |||||||
Realized gain distributions from affiliated funds | 3,710 | 6 | 16 | |||||||||
|
|
|
|
|
| |||||||
Net realized gain (loss) | (251,417,814 | ) | 4,403,874 | (1,931,555 | ) | |||||||
|
|
|
|
|
| |||||||
Net change in unrealized appreciation/depreciation on: |
| |||||||||||
Investments — unaffiliatedd | 5,494,055,695 | 45,790,926 | 71,497,555 | |||||||||
Investments — affiliated (Note 2) | 305,860 | 2,137 | 1,271 | |||||||||
Futures contracts | 1,991,138 | — | — | |||||||||
Translation of assets and liabilities in foreign currencies | 240,701 | (1,139 | ) | 4,624 | ||||||||
|
|
|
|
|
| |||||||
Net change in unrealized appreciation/depreciation | 5,496,593,394 | 45,791,924 | 71,503,450 | |||||||||
|
|
|
|
|
| |||||||
Net realized and unrealized gain | 5,245,175,580 | 50,195,798 | 69,571,895 | |||||||||
|
|
|
|
|
| |||||||
NET INCREASE IN NET ASSETS RESULTING FROM OPERATIONS | $ | 5,918,241,576 | $ | 54,270,704 | $ | 75,740,243 | ||||||
|
|
|
|
|
| |||||||
| a | Net of foreign withholding tax of $80,593,821, $452,489 and $1,007,836, respectively. |
| b | Net of securities lending income tax paid of $1,660,136, $ — and $ —, respectively. |
| c | Net of foreign capital gains taxes of $165, $ — and $ —, respectively. |
| d | Net of deferred foreign capital gains taxes of $12,089,148, $108,601 and $82,873, respectively. |
See notes to consolidated financial statements.
CONSOLIDATED FINANCIAL STATEMENTS | 83 |
Table of Contents
Consolidated Statements of Operations (Continued)
iSHARES®, INC.
Year ended August 31, 2017
| iShares MSCI Emerging Markets Small-Cap ETF | ||||
NET INVESTMENT INCOME |
| |||
Dividends — unaffiliateda | $ | 4,657,615 | ||
Dividends — affiliated (Note 2) | 2,958 | |||
Interest — unaffiliated | 5 | |||
Securities lending income — affiliated — net (Note 2) | 906,447 | |||
|
| |||
| 5,567,025 | ||||
Less: Other foreign taxes (Note 1) | (21,007 | ) | ||
|
| |||
Total investment income | 5,546,018 | |||
|
| |||
EXPENSES |
| |||
Investment advisory fees (Note 2) | 1,264,169 | |||
Proxy fees | 4,633 | |||
Commitment fees (Note 8) | 1,873 | |||
Interest expense (Note 8) | 3,287 | |||
|
| |||
Total expenses | 1,273,962 | |||
|
| |||
Net investment income | 4,272,056 | |||
|
| |||
NET REALIZED AND UNREALIZED GAIN (LOSS) |
| |||
Net realized gain (loss) from: |
| |||
Investments — unaffiliatedb | (1,041,450 | ) | ||
Investments — affiliated (Note 2) | (652 | ) | ||
Foreign currency transactions | (9,165 | ) | ||
Realized gain distributions from affiliated funds | 115 | |||
|
| |||
Net realized loss | (1,051,152 | ) | ||
|
| |||
Net change in unrealized appreciation/depreciation on: |
| |||
Investments — unaffiliated | 29,199,841 | |||
Investments — affiliated (Note 2) | 4,484 | |||
Translation of assets and liabilities in foreign currencies | 2,616 | |||
|
| |||
Net change in unrealized appreciation/depreciation | 29,206,941 | |||
|
| |||
Net realized and unrealized gain | 28,155,789 | |||
|
| |||
NET INCREASE IN NET ASSETS RESULTING FROM OPERATIONS | $ | 32,427,845 | ||
|
| |||
| a | Net of foreign withholding tax of $509,031. |
| b | Net of foreign capital gains taxes of $23. |
See notes to consolidated financial statements.
| 84 | 2017 iSHARES ANNUAL REPORTTO SHAREHOLDERS |
Table of Contents
Consolidated Statements of Changes in Net Assets
iSHARES®, INC.
| iShares Core MSCI Emerging Markets ETF | iShares MSCI BRIC ETF | |||||||||||||||
Year ended August 31, 2017 | Year ended August 31, 2016 | Year ended August 31, 2017 | Year ended August 31, 2016 | |||||||||||||
INCREASE (DECREASE) IN NET ASSETS |
| |||||||||||||||
OPERATIONS: | ||||||||||||||||
Net investment income | $ | 673,065,996 | $ | 300,560,736 | $ | 4,074,906 | $ | 3,742,371 | ||||||||
Net realized gain (loss) | (251,417,814 | ) | (543,220,439 | ) | 4,403,874 | (22,678,091 | ) | |||||||||
Net change in unrealized appreciation/depreciation | 5,496,593,394 | 1,646,957,449 | 45,791,924 | 36,181,152 | ||||||||||||
|
|
|
|
|
|
|
| |||||||||
Net increase in net assets resulting from operations | 5,918,241,576 | 1,404,297,746 | 54,270,704 | 17,245,432 | ||||||||||||
|
|
|
|
|
|
|
| |||||||||
DISTRIBUTIONS TO SHAREHOLDERS: | ||||||||||||||||
From net investment income | (472,049,457 | ) | (238,601,549 | ) | (2,786,991 | ) | (4,397,149 | ) | ||||||||
|
|
|
|
|
|
|
| |||||||||
Total distributions to shareholders | (472,049,457 | ) | (238,601,549 | ) | (2,786,991 | ) | (4,397,149 | ) | ||||||||
|
|
|
|
|
|
|
| |||||||||
CAPITAL SHARE TRANSACTIONS: | ||||||||||||||||
Proceeds from shares sold | 15,325,617,290 | 7,812,461,106 | 130,590,725 | 12,282 | ||||||||||||
Cost of shares redeemed | — | — | (102,860,630 | ) | (27,130,689 | ) | ||||||||||
|
|
|
|
|
|
|
| |||||||||
Net increase (decrease) in net assets from | 15,325,617,290 | 7,812,461,106 | 27,730,095 | (27,118,407 | ) | |||||||||||
|
|
|
|
|
|
|
| |||||||||
INCREASE (DECREASE) IN NET ASSETS | 20,771,809,409 | 8,978,157,303 | 79,213,808 | (14,270,124 | ) | |||||||||||
NET ASSETS | ||||||||||||||||
Beginning of year | 16,003,488,131 | 7,025,330,828 | 182,487,898 | 196,758,022 | ||||||||||||
|
|
|
|
|
|
|
| |||||||||
End of year | $ | 36,775,297,540 | $ | 16,003,488,131 | $ | 261,701,706 | $ | 182,487,898 | ||||||||
|
|
|
|
|
|
|
| |||||||||
Undistributed net investment income included in net assets at end of year | $ | 335,190,679 | $ | 110,497,865 | $ | 2,438,261 | $ | 1,089,171 | ||||||||
|
|
|
|
|
|
|
| |||||||||
SHARES ISSUED | ||||||||||||||||
Shares sold | 323,400,000 | 186,400,000 | 3,600,000 | — | ||||||||||||
Shares redeemed | — | — | (2,850,000 | ) | (950,000 | ) | ||||||||||
|
|
|
|
|
|
|
| |||||||||
Net increase (decrease) in shares outstanding | 323,400,000 | 186,400,000 | 750,000 | (950,000 | ) | |||||||||||
|
|
|
|
|
|
|
| |||||||||
See notes to consolidated financial statements.
CONSOLIDATED FINANCIAL STATEMENTS | 85 |
Table of Contents
Consolidated Statements of Changes in Net Assets (Continued)
iSHARES®, INC.
| iShares MSCI Emerging Markets Asia ETF | iShares MSCI Emerging Markets Small-Cap ETF | |||||||||||||||
Year ended August 31, 2017 | Year ended August 31, 2016 | Year ended August 31, 2017 | Year ended August 31, 2016 | |||||||||||||
INCREASE (DECREASE) IN NET ASSETS | ||||||||||||||||
OPERATIONS: | ||||||||||||||||
Net investment income | $ | 6,168,348 | $ | 2,513,325 | $ | 4,272,056 | $ | 2,035,989 | ||||||||
Net realized loss | (1,931,555 | ) | (9,379,096 | ) | (1,051,152 | ) | (6,143,159 | ) | ||||||||
Net change in unrealized appreciation/depreciation | 71,503,450 | 24,288,569 | 29,206,941 | 14,192,002 | ||||||||||||
|
|
|
|
|
|
|
| |||||||||
Net increase in net assets resulting from operations | 75,740,243 | 17,422,798 | 32,427,845 | 10,084,832 | ||||||||||||
|
|
|
|
|
|
|
| |||||||||
DISTRIBUTIONS TO SHAREHOLDERS: | ||||||||||||||||
From net investment income | (3,388,608 | ) | (2,586,361 | ) | (3,832,107 | ) | (2,370,926 | ) | ||||||||
|
|
|
|
|
|
|
| |||||||||
Total distributions to shareholders | (3,388,608 | ) | (2,586,361 | ) | (3,832,107 | ) | (2,370,926 | ) | ||||||||
|
|
|
|
|
|
|
| |||||||||
CAPITAL SHARE TRANSACTIONS: | ||||||||||||||||
Proceeds from shares sold | 262,708,017 | 92,508,092 | 103,772,829 | 37,316,559 | ||||||||||||
Cost of shares redeemed | (50,592,389 | ) | (15,118,523 | ) | — | — | ||||||||||
|
|
|
|
|
|
|
| |||||||||
Net increase in net assets from | 212,115,628 | 77,389,569 | 103,772,829 | 37,316,559 | ||||||||||||
|
|
|
|
|
|
|
| |||||||||
INCREASE IN NET ASSETS | 284,467,263 | 92,226,006 | 132,368,567 | 45,030,465 | ||||||||||||
NET ASSETS | ||||||||||||||||
Beginning of year | 216,863,042 | 124,637,036 | 121,150,526 | 76,120,061 | ||||||||||||
|
|
|
|
|
|
|
| |||||||||
End of year | $ | 501,330,305 | $ | 216,863,042 | $ | 253,519,093 | $ | 121,150,526 | ||||||||
|
|
|
|
|
|
|
| |||||||||
Undistributed net investment income included in net assets at end of year | $ | 4,251,863 | $ | 1,121,945 | $ | 1,578,413 | $ | 278,839 | ||||||||
|
|
|
|
|
|
|
| |||||||||
SHARES ISSUED AND REDEEMED | ||||||||||||||||
Shares sold | 4,300,000 | 1,700,000 | 2,350,000 | 900,000 | ||||||||||||
Shares redeemed | (900,000 | ) | (300,000 | ) | — | — | ||||||||||
|
|
|
|
|
|
|
| |||||||||
Net increase in shares outstanding | 3,400,000 | 1,400,000 | 2,350,000 | 900,000 | ||||||||||||
|
|
|
|
|
|
|
| |||||||||
See notes to consolidated financial statements.
| 86 | 2017 iSHARES ANNUAL REPORTTO SHAREHOLDERS |
Table of Contents
Consolidated Financial Highlights
iSHARES®, INC.
(For a share outstanding throughout each period)
| iShares Core MSCI Emerging Markets ETF | ||||||||||||||||||||
| Year ended Aug. 31, 2017 | Year ended Aug. 31, 2016 | Year ended Aug. 31, 2015 | Year ended Aug. 31, 2014 | Period from to Aug. 31, 2013 | ||||||||||||||||
Net asset value, beginning of period | $ | 44.60 | $ | 40.75 | $ | 53.89 | $ | 45.71 | $ | 49.06 | ||||||||||
|
|
|
|
|
|
|
|
|
| |||||||||||
Income from investment operations: | ||||||||||||||||||||
Net investment incomeb | 1.31 | 1.20 | 1.21 | 1.31 | 1.33 | |||||||||||||||
Net realized and unrealized gain (loss)c | 8.95 | 3.58 | (13.26 | ) | 7.78 | (4.14 | ) | |||||||||||||
|
|
|
|
|
|
|
|
|
| |||||||||||
Total from investment operations | 10.26 | 4.78 | (12.05 | ) | 9.09 | (2.81 | ) | |||||||||||||
|
|
|
|
|
|
|
|
|
| |||||||||||
Less distributions from: | ||||||||||||||||||||
Net investment income | (0.95 | ) | (0.93 | ) | (1.09 | ) | (0.91 | ) | (0.54 | ) | ||||||||||
|
|
|
|
|
|
|
|
|
| |||||||||||
Total distributions | (0.95 | ) | (0.93 | ) | (1.09 | ) | (0.91 | ) | (0.54 | ) | ||||||||||
|
|
|
|
|
|
|
|
|
| |||||||||||
Net asset value, end of period | $ | 53.91 | $ | 44.60 | $ | 40.75 | $ | 53.89 | $ | 45.71 | ||||||||||
|
|
|
|
|
|
|
|
|
| |||||||||||
Total return | 23.45 | % | 11.99 | % | (22.61 | )% | 20.05 | % | (5.75 | )%d | ||||||||||
|
|
|
|
|
|
|
|
|
| |||||||||||
Ratios/Supplemental data: | ||||||||||||||||||||
Net assets, end of period (000s) | $ | 36,775,298 | $ | 16,003,488 | $ | 7,025,331 | $ | 5,669,167 | $ | 1,864,965 | ||||||||||
Ratio of expenses to average net assetse | 0.14 | % | 0.17 | % | 0.18 | % | 0.17 | % | 0.05 | % | ||||||||||
Ratio of expenses to average net assets prior to waived feese | 0.15 | % | 0.17 | % | 0.18 | % | 0.18 | % | 0.18 | % | ||||||||||
Ratio of net investment income to average | 2.74 | % | 2.93 | % | 2.49 | % | 2.61 | % | 3.17 | % | ||||||||||
Portfolio turnover ratef | 4 | % | 10 | % | 7 | % | 8 | % | 15 | %d | ||||||||||
| a | Commencement of operations. |
| b | Based on average shares outstanding throughout each period. |
| c | The amounts reported for a share outstanding may not accord with the change in aggregate gains and losses in securities for the fiscal period due to the timing of capital share transactions in relation to the fluctuating market values of the Fund’s underlying securities. |
| d | Not annualized. |
| e | Annualized for periods of less than one year. |
| f | Portfolio turnover rates exclude portfolio securities received or delivered in Creation Units but include portfolio transactions that are executed as a result of the Fund processing capital share transactions in Creation Units partially for cash in U.S. dollars. Excluding such cash transactions, the portfolio turnover rates for the years ended August 31, 2017, August 31, 2016, August 31, 2015, August 31, 2014 and the period ended August 31, 2013 were 4%, 10%, 7%, 8% and 15%, respectively. See Note 4. |
See notes to consolidated financial statements.
CONSOLIDATED FINANCIAL HIGHLIGHTS | 87 |
Table of Contents
Consolidated Financial Highlights (Continued)
iSHARES®, INC.
(For a share outstanding throughout each period)
| iShares MSCI BRIC ETF | ||||||||||||||||||||
| Year ended Aug. 31, 2017 | Year ended Aug. 31, 2016 | Year ended Aug. 31, 2015 | Year ended Aug. 31, 2014 | Year ended Aug. 31, 2013 | ||||||||||||||||
Net asset value, beginning of year | $ | 33.48 | $ | 30.74 | $ | 41.12 | $ | 34.41 | $ | 35.68 | ||||||||||
|
|
|
|
|
|
|
|
|
| |||||||||||
Income from investment operations: | ||||||||||||||||||||
Net investment incomea | 0.70 | 0.64 | 0.77 | 0.89 | 0.84 | |||||||||||||||
Net realized and unrealized gain (loss)b | 8.57 | 2.84 | (10.20 | ) | 6.53 | (1.25 | ) | |||||||||||||
|
|
|
|
|
|
|
|
|
| |||||||||||
Total from investment operations | 9.27 | 3.48 | (9.43 | ) | 7.42 | (0.41 | ) | |||||||||||||
|
|
|
|
|
|
|
|
|
| |||||||||||
Less distributions from: | ||||||||||||||||||||
Net investment income | (0.54 | ) | (0.74 | ) | (0.95 | ) | (0.71 | ) | (0.86 | ) | ||||||||||
|
|
|
|
|
|
|
|
|
| |||||||||||
Total distributions | (0.54 | ) | (0.74 | ) | (0.95 | ) | (0.71 | ) | (0.86 | ) | ||||||||||
|
|
|
|
|
|
|
|
|
| |||||||||||
Net asset value, end of year | $ | 42.21 | $ | 33.48 | $ | 30.74 | $ | 41.12 | $ | 34.41 | ||||||||||
|
|
|
|
|
|
|
|
|
| |||||||||||
Total return | 28.15 | % | 11.61 | % | (23.19 | )% | 21.73 | % | (1.17 | )% | ||||||||||
|
|
|
|
|
|
|
|
|
| |||||||||||
Ratios/Supplemental data: | ||||||||||||||||||||
Net assets, end of year (000s) | $ | 261,702 | $ | 182,488 | $ | 196,758 | $ | 411,164 | $ | 474,861 | ||||||||||
Ratio of expenses to average net assets | 0.70 | % | 0.73 | % | 0.69 | % | 0.68 | % | 0.67 | % | ||||||||||
Ratio of net investment income to average net assets | 1.96 | % | 2.13 | % | 2.07 | % | 2.38 | % | 2.18 | % | ||||||||||
Portfolio turnover ratec | 24 | % | 20 | % | 9 | % | 10 | % | 10 | % | ||||||||||
| a | Based on average shares outstanding throughout each period. |
| b | The amounts reported for a share outstanding may not accord with the change in aggregate gains and losses in securities for the fiscal period due to the timing of capital share transactions in relation to the fluctuating market values of the Fund’s underlying securities. |
| c | Portfolio turnover rates exclude portfolio securities received or delivered in Creation Units but include portfolio transactions that are executed as a result of the Fund processing capital share transactions in Creation Units partially for cash in U.S. dollars. Excluding such cash transactions, the portfolio turnover rates for the years ended August 31, 2017, August 31, 2016, August 31, 2015, August 31, 2014 and August 31, 2013 were 7% ,20%, 9%, 6% and 9% respectively. See Note 4. |
See notes to consolidated financial statements.
| 88 | 2017 iSHARES ANNUAL REPORTTO SHAREHOLDERS |
Table of Contents
Consolidated Financial Highlights (Continued)
iSHARES®, INC.
(For a share outstanding throughout each period)
| iShares MSCI Emerging Markets Asia ETF | ||||||||||||||||||||
| Year ended Aug. 31, 2017 | Year ended Aug. 31, 2016 | Year ended Aug. 31, 2015 | Year ended Aug. 31, 2014 | Year ended Aug. 31, 2013 | ||||||||||||||||
Net asset value, beginning of year | $ | 56.33 | $ | 50.87 | $ | 62.08 | $ | 52.23 | $ | 50.18 | ||||||||||
|
|
|
|
|
|
|
|
|
| |||||||||||
Income from investment operations: | ||||||||||||||||||||
Net investment incomea | 1.31 | 1.02 | 1.25 | 1.36 | 1.15 | |||||||||||||||
Net realized and unrealized gain (loss)b | 12.43 | 5.54 | (11.61 | ) | 9.75 | 1.82 | ||||||||||||||
|
|
|
|
|
|
|
|
|
| |||||||||||
Total from investment operations | 13.74 | 6.56 | (10.36 | ) | 11.11 | 2.97 | ||||||||||||||
|
|
|
|
|
|
|
|
|
| |||||||||||
Less distributions from: | ||||||||||||||||||||
Net investment income | (0.92 | ) | (1.10 | ) | (0.85 | ) | (1.26 | ) | (0.92 | ) | ||||||||||
|
|
|
|
|
|
|
|
|
| |||||||||||
Total distributions | (0.92 | ) | (1.10 | ) | (0.85 | ) | (1.26 | ) | (0.92 | ) | ||||||||||
|
|
|
|
|
|
|
|
|
| |||||||||||
Net asset value, end of year | $ | 69.15 | $ | 56.33 | $ | 50.87 | $ | 62.08 | $ | 52.23 | ||||||||||
|
|
|
|
|
|
|
|
|
| |||||||||||
Total return | 24.80 | % | 13.14 | % | (16.86 | )% | 21.54 | %c | 5.88 | % | ||||||||||
|
|
|
|
|
|
|
|
|
| |||||||||||
Ratios/Supplemental data: | ||||||||||||||||||||
Net assets, end of year (000s) | $ | 501,330 | $ | 216,863 | $ | 124,637 | $ | 80,706 | $ | 31,341 | ||||||||||
Ratio of expenses to average net assets | 0.49 | % | 0.49 | % | 0.49 | % | 0.49 | % | 0.49 | % | ||||||||||
Ratio of expenses to average net assets prior to | n/a | 0.66 | % | 0.68 | % | 0.68 | % | 0.68 | % | |||||||||||
Ratio of net investment income to average net assets | 2.16 | % | 1.98 | % | 2.10 | % | 2.36 | % | 2.09 | % | ||||||||||
Portfolio turnover rated | 15 | % | 22 | % | 16 | % | 33 | % | 174 | % | ||||||||||
| a | Based on average shares outstanding throughout each period. |
| b | The amounts reported for a share outstanding may not accord with the change in aggregate gains and losses in securities for the fiscal period due to the timing of capital share transactions in relation to the fluctuating market values of the Fund’s underlying securities. |
| c | Includes payment from an affiliate. Not including these proceeds, the Fund’s total return would have been 21.46%. |
| d | Portfolio turnover rates exclude portfolio securities received or delivered in Creation Units but include portfolio transactions that are executed as a result of the Fund processing capital share transactions in Creation Units partially for cash in U.S. dollars. Excluding such cash transactions, the portfolio turnover rates for the years ended August 31, 2017, August 31,2016, August 31, 2015, August 31, 2014 and August 31, 2013 were 6%, 16%, 10%, 33% and 21% , respectively. See Note 4. |
See notes to consolidated financial statements.
CONSOLIDATED FINANCIAL HIGHLIGHTS | 89 |
Table of Contents
Consolidated Financial Highlights (Continued)
iSHARES®, INC.
(For a share outstanding throughout each period)
| iShares MSCI Emerging Markets Small-Cap ETF | ||||||||||||||||||||
| Year ended Aug. 31, 2017 | Year ended Aug. 31, 2016 | Year ended Aug. 31, 2015 | Year ended Aug. 31, 2014 | Year ended Aug. 31, 2013 | ||||||||||||||||
Net asset value, beginning of year | $ | 43.27 | $ | 40.06 | $ | 51.37 | $ | 43.78 | $ | 43.44 | ||||||||||
|
|
|
|
|
|
|
|
|
| |||||||||||
Income from investment operations: | ||||||||||||||||||||
Net investment incomea | 1.04 | 0.90 | 1.04 | 0.93 | 1.07 | |||||||||||||||
Net realized and unrealized gain (loss)b | 5.81 | 3.36 | (11.06 | ) | 7.67 | 1.13 | ||||||||||||||
|
|
|
|
|
|
|
|
|
| |||||||||||
Total from investment operations | 6.85 | 4.26 | (10.02 | ) | 8.60 | 2.20 | ||||||||||||||
|
|
|
|
|
|
|
|
|
| |||||||||||
Less distributions from: | ||||||||||||||||||||
Net investment income | (0.89 | ) | (1.05 | ) | (1.29 | ) | (1.01 | ) | (1.86 | ) | ||||||||||
|
|
|
|
|
|
|
|
|
| |||||||||||
Total distributions | (0.89 | ) | (1.05 | ) | (1.29 | ) | (1.01 | ) | (1.86 | ) | ||||||||||
|
|
|
|
|
|
|
|
|
| |||||||||||
Net asset value, end of year | $ | 49.23 | $ | 43.27 | $ | 40.06 | $ | 51.37 | $ | 43.78 | ||||||||||
|
|
|
|
|
|
|
|
|
| |||||||||||
Total return | 16.17 | % | 10.83 | % | (19.77 | )% | 19.92 | %c | 4.85 | % | ||||||||||
|
|
|
|
|
|
|
|
|
| |||||||||||
Ratios/Supplemental data: | ||||||||||||||||||||
Net assets, end of year (000s) | $ | 253,519 | $ | 121,151 | $ | 76,120 | $ | 43,666 | $ | 30,644 | ||||||||||
Ratio of expenses to average net assets | 0.69 | % | 0.71 | % | 0.69 | % | 0.67 | % | 0.67 | % | ||||||||||
Ratio of net investment income to average net assets | 2.32 | % | 2.20 | % | 2.20 | % | 1.93 | % | 2.26 | % | ||||||||||
Portfolio turnover rated | 19 | % | 24 | % | 23 | % | 20 | % | 21 | % | ||||||||||
| a | Based on average shares outstanding throughout each period. |
| b | The amounts reported for a share outstanding may not accord with the change in aggregate gains and losses in securities for the fiscal period due to the timing of capital share transactions in relation to the fluctuating market values of the Fund’s underlying securities. |
| c | Includes payment from an affiliate. Not including these proceeds, the Fund’s total return would have been 19.73%. |
| d | Portfolio turnover rates exclude portfolio securities received or delivered in Creation Units but include portfolio transactions that are executed as a result of the Fund processing capital share transactions in Creation Units partially for cash in U.S. dollars. Excluding such cash transactions, the portfolio turnover rates for the years ended August 31, 2017, August 31, 2016, August 31, 2015, August 31, 2014 and August 31, 2013 were 19%, 24%, 23%, 20% and 21% respectively. See Note 4. |
See notes to consolidated financial statements.
| 90 | 2017 iSHARES ANNUAL REPORTTO SHAREHOLDERS |
Table of Contents
Notes to Consolidated Financial Statements
iSHARES®, INC.
iShares, Inc. (the “Company”) is registered under the Investment Company Act of 1940, as amended (the “1940 Act”), as an open-end management investment company. The Company was incorporated under the laws of the State of Maryland on September 1, 1994 pursuant to Articles of Incorporation as subsequently amended and restated.
These consolidated financial statements relate only to the following funds (each, a “Fund,” and collectively, the “Funds”):
| iShares ETF | Diversification Classification | |
Core MSCI Emerging Markets | Diversified | |
MSCI BRIC | Diversified | |
MSCI Emerging Markets Asia | Diversified | |
MSCI Emerging Markets Small-Cap | Diversified |
The investment objective of each Fund is to seek investment results that correspond generally to the price and yield performance, before fees and expenses, of its underlying index. The investment adviser uses a “passive” or index approach to try to achieve each Fund’s investment objective.
Each Fund carries out its investment strategies associated with investment in Indian securities by investing in a wholly-owned subsidiary in the Republic of Mauritius (each, a “Subsidiary”), which in turn invests in Indian securities included in the underlying index. The investment adviser of each Fund also serves as the investment adviser to each Subsidiary. Through this investment structure, each Fund expects to obtain certain benefits under a current tax treaty between Mauritius and India. The accompanying consolidated financial statements for each Fund include the accounts of its Subsidiary. Intercompany accounts and transactions, if any, have been eliminated.
Pursuant to the Company’s organizational documents, the Funds’ officers and directors are indemnified against certain liabilities that may arise out of the performance of their duties to the Funds. Additionally, in the normal course of business, the Funds enter into contracts with service providers that contain general indemnification clauses. The Funds’ maximum exposure under these arrangements is unknown as this would involve future claims that may be made against the Funds that have not yet occurred.
| 1. | SIGNIFICANT ACCOUNTING POLICIES |
The following significant accounting policies are consistently followed by each Fund in the preparation of its financial statements in conformity with accounting principles generally accepted in the United States of America (“U.S. GAAP”). The preparation of financial statements in conformity with U.S. GAAP requires management to make certain estimates and assumptions that affect the reported amounts of assets and liabilities and disclosures of contingent assets and liabilities at the date of the financial statements and the reported amounts of revenue and expenses during the reporting period. Actual results could differ from those estimates. Each Fund is considered an investment company under U.S. GAAP and follows the accounting and reporting guidance applicable to investment companies.
SECURITY VALUATION
Each Fund’s investments are valued at fair value each day that the Fund’s listing exchange is open and, for financial reporting purposes, as of the report date should the reporting period end on a day that the Fund’s listing exchange is not open. U.S. GAAP defines fair value as the price a fund would receive to sell an asset or pay to transfer a liability in an orderly transaction between market participants at the measurement date. The BlackRock Global Valuation Methodologies Committee (the “Global Valuation Committee”) provides oversight of the valuation of investments for the Funds. The investments of each Fund are valued pursuant to policies and procedures developed by the Global Valuation Committee and approved by the Board of Directors of the Company (the “Board”).
NOTESTO CONSOLIDATED FINANCIAL STATEMENTS | 91 |
Table of Contents
Notes to Consolidated Financial Statements (Continued)
iSHARES®, INC.
| • | Equity investments traded on a recognized securities exchange are valued at that day’s last reported trade price or the official closing price, as applicable, on the exchange where the stock is primarily traded. Equity investments traded on a recognized exchange for which there were no sales on that day are valued at the last traded price. |
| • | Open-end U.S. mutual funds (including money market funds) are valued at that day’s published net asset value (“NAV”). |
| • | Futures contract notional values are determined based on that day’s last reported settlement price on the exchange where the contract is traded. |
In the event that application of these methods of valuation results in a price for an investment which is deemed not to be representative of the fair value of such investment or if a price is not available, the investment will be valued by the Global Valuation Committee, in accordance with policies approved by the Board. The fair valuation approaches that may be utilized by the Global Valuation Committee to determine fair value include market approach, income approach and the cost approach. The valuation techniques used under these approaches take into consideration inputs that include but are not limited to (i) attributes specific to the investment; (ii) the principal market for the investment; (iii) the customary participants in the principal market for the investment; (iv) data assumptions by market participants for the investment, if reasonably available; (v) quoted prices for similar investments in active markets; and (vi) other inputs, such as future cash flows, interest rates, yield curves, volatilities, prepayment speeds, loss severities, credit risks and/or default rates. Valuations based on such inputs are reported to the Board on a quarterly basis.
The Global Valuation Committee employs various methods for calibrating valuation approaches for investments where an active market does not exist, including regular due diligence of the Company’s pricing vendors, a regular review of key inputs and assumptions, transactional back-testing or disposition analysis to compare unrealized gains and losses to realized gains and losses, reviews of missing or stale prices, reviews of large movements in market values, and reviews of market related activity.
Fair value pricing could result in a difference between the prices used to calculate a Fund’s NAV and the prices used by the Fund’s underlying index, which in turn could result in a difference between the Fund’s performance and the performance of the Fund’s underlying index.
Various inputs are used in determining the fair value of financial instruments. Inputs may be based on independent market data (“observable inputs”) or they may be internally developed (“unobservable inputs”). These inputs to valuation techniques are categorized into a fair value hierarchy consisting of three broad levels for financial reporting purposes as follows:
| • | Level 1 — Unadjusted quoted prices in active markets for identical assets or liabilities; |
| • | Level 2 — Inputs other than quoted prices included within Level 1 that are observable for the asset or liability either directly or indirectly, including quoted prices for similar assets or liabilities in active markets, quoted prices for identical or similar assets or liabilities in markets that are not considered to be active, inputs other than quoted prices that are observable for the asset or liability (such as exchange rates, financing terms, interest rates, yield curves, volatilities, prepayment speeds, loss severities, credit risks and default rates) or other market-corroborated inputs; and |
| • | Level 3 — Unobservable inputs for the asset or liability based on the best information available in the circumstances, to the extent observable inputs are not available, including the Global Valuation Committee’s assumptions used in determining the fair value of investments. |
The hierarchy gives the highest priority to unadjusted quoted prices in active markets for identical assets or liabilities (Level 1 measurements) and the lowest priority to unobservable inputs (Level 3 measurements). Accordingly, the degree of judgement exercised in determining fair value is greatest for instruments categorized in Level 3. The inputs used to measure fair value may fall into different levels of the fair value hierarchy. In such cases, for disclosure purposes, the fair value hierarchy classification is
| 92 | 2017 iSHARES ANNUAL REPORTTO SHAREHOLDERS |
Table of Contents
Notes to Consolidated Financial Statements (Continued)
iSHARES®, INC.
determined based on the lowest level input that is significant to the fair value measurement in its entirety. The fair value hierarchy for each Fund’s investments is included in its consolidated schedule of investments.
Changes in valuation techniques may result in transfers in or out of an assigned level within the fair value hierarchy. In accordance with the Company’s policy, transfers between different levels of the fair value hierarchy are deemed to have occurred as of the beginning of the reporting period. The categorization of values determined for financial instruments are based on the pricing transparency of the financial instruments and are not necessarily an indication of the risks associated with investing in those securities.
SECURITY TRANSACTIONS AND INCOME RECOGNITION
Security transactions are accounted for on trade date. Realized gains and losses on investment transactions are determined using the specific identification method. Dividend income and capital gain distributions, if any, are recognized on the ex-dividend date, net of any foreign taxes withheld at source. Any taxes withheld that are reclaimable from foreign tax authorities as of August 31, 2017 are reflected in tax reclaims receivable. Upon notification from issuers, some of the dividend income received from a real estate investment trust may be re-designated as a reduction of cost of the related investment and/or realized gain. Non-cash dividends received, if any, are recognized on the ex-dividend date and recorded as non-cash dividend income at fair value. Distributions received by the Funds may include a return of capital that is estimated by management. Such amounts are recorded as a reduction of the cost of investments or reclassified to capital gains. Interest income is accrued daily.
FOREIGN CURRENCY TRANSLATION
The accounting records of the Funds are maintained in U.S. dollars. Foreign currencies, as well as investment securities and other assets and liabilities denominated in foreign currencies, are translated into U.S. dollars using exchange rates deemed appropriate by the investment adviser. Purchases and sales of securities, income receipts and expense payments are translated into U.S. dollars on the respective dates of such transactions.
Each Fund does not isolate the effect of fluctuations in foreign exchange rates from the effect of fluctuations in the market prices of securities. Such fluctuations are reflected by the Funds as a component of realized and unrealized gains and losses from investments for financial reporting purposes. Each Fund reports realized currency gains (losses) on foreign currency related transactions as components of net realized gain (loss) for financial reporting purposes, whereas such components are generally treated as ordinary income for U.S. federal income tax purposes.
FOREIGN TAXES
The Funds may be subject to foreign taxes (a portion of which may be reclaimable) on income, stock dividends, capital gains on investments, or certain foreign currency transactions. All foreign taxes are recorded in accordance with the applicable foreign tax regulations and rates that exist in the foreign jurisdictions in which the Funds invest. These foreign taxes, if any, are paid by the Funds and are reflected in their consolidated statements of operations as follows: foreign taxes withheld at source are presented as a reduction of income, foreign taxes on securities lending income are presented as a reduction of securities lending income, foreign taxes on stock dividends are presented as “other foreign taxes”, and foreign taxes on capital gains from sales of investments and foreign taxes on foreign currency transactions are included in their respective net realized gain (loss) categories. Foreign taxes payable or deferred as of August 31, 2017, if any, are disclosed in the Funds’ consolidated statements of assets and liabilities.
Each Fund conducts its investment activities in India through its Subsidiary and expects to obtain benefits under the Double Tax Avoidance Agreement (“DTAA”) between India and Mauritius. In order to be eligible to claim benefits under the DTAA, each
NOTESTO CONSOLIDATED FINANCIAL STATEMENTS | 93 |
Table of Contents
Notes to Consolidated Financial Statements (Continued)
iSHARES®, INC.
Subsidiary must, on an annual basis, satisfy certain tests and conditions, including the establishment and maintenance of valid tax residence in Mauritius and related requirements. Each Fund has obtained a current tax residence certificate issued by the Mauritian Revenue Authorities.
Based upon current interpretation and practice of the current tax laws in India and Mauritius and the DTAA, each Subsidiary is subject to tax in Mauritius on its net income at the rate of 15%. However, a system of tax credits effectively reduces the Mauritius income tax rate to a maximum of 3%. Taxes on income, if any, are paid by the Subsidiaries and are disclosed in the consolidated statements of operations. Any dividends paid by a Subsidiary to its Fund are not subject to tax in Mauritius. Each Subsidiary is currently exempt from tax in Mauritius on any gains from the sale of securities.
The DTAA provides that capital gains will be taxable in India with respect to the sale of shares acquired on or after April 1, 2017. Capital gains arising from shares acquired before April 1, 2017, regardless of when they are sold, will continue to be exempt from taxation under the amended DTAA, assuming requirements for eligibility under the DTAA are satisfied.
DISTRIBUTIONS TO SHAREHOLDERS
Dividends and distributions paid by each Fund are recorded on the ex-dividend dates. Distributions are determined on a tax basis and may differ from net investment income and net realized capital gains for financial reporting purposes. Dividends and distributions are paid in U.S. dollars and cannot be automatically reinvested in additional shares of the Funds.
LOANS OF PORTFOLIO SECURITIES
Each Fund may lend its investment securities to approved borrowers, such as brokers, dealers and other financial institutions. The borrower pledges and maintains with the Fund collateral consisting of cash, an irrevocable letter of credit issued by an approved bank, or securities issued or guaranteed by the U.S. government. The initial collateral received by each Fund is required to have a value of at least 102% of the current value of the loaned securities for securities traded on U.S. exchanges and a value of at least 105% for all other securities. The collateral is maintained thereafter at a value equal to at least 100% of the current value of the securities on loan. The market value of the loaned securities is determined at the close of each business day of the Funds. Any additional required collateral is delivered to the Funds and any excess collateral is returned by the Funds on the next business day. During the term of the loan, each Fund is entitled to all distributions made on or in respect of the loaned securities but does not receive interest income on securities received as collateral. Loans of securities are terminable at any time and the borrower, after notice, is required to return borrowed securities within the standard time period for settlement of securities transactions.
Cash received as collateral for securities on loan may be reinvested in certain short-term instruments either directly on behalf of a fund or through one or more joint accounts or money market funds, including those managed by BlackRock Fund Advisors (“BFA”), the Funds’ investment adviser, or its affiliates. As of August 31, 2017, any securities on loan were collateralized by cash and/or U.S. government obligations. Cash collateral received was invested in money market funds managed by BFA and is disclosed in the consolidated schedules of investments. Any non-cash collateral received cannot be sold, re-invested or pledged by the Fund, except in the event of borrower default. The securities on loan for each Fund are also disclosed in its consolidated schedule of investments. The total value of any securities on loan as of August 31, 2017 and the total value of the related cash collateral are disclosed in the consolidated statements of assets and liabilities. Income earned by the Funds from securities lending is disclosed in the consolidated statements of operations.
The risks of securities lending include the risk that the borrower may not provide additional collateral when required or may not return the securities when due. To mitigate these risks, the Funds benefit from a borrower default indemnity provided by BlackRock, Inc. (“BlackRock”). BlackRock’s indemnity allows for full replacement of securities loaned if the collateral received does not cover the value of the securities loaned in the event of borrower default. Each Fund could incur a loss if the value of an
| 94 | 2017 iSHARES ANNUAL REPORTTO SHAREHOLDERS |
Table of Contents
Notes to Consolidated Financial Statements (Continued)
iSHARES®, INC.
investment purchased with cash collateral falls below the value of the loaned securities or if the value of an investment purchased with cash collateral falls below the value of the original cash collateral received.
Securities lending transactions are entered into by the Funds under Master Securities Lending Agreements (“MSLA”) which provide the right, in the event of default (including bankruptcy or insolvency) for the non-defaulting party to liquidate the collateral and calculate a net exposure to the defaulting party or request additional collateral. In the event that a borrower defaults, a Fund, as lender, would offset the market value of the collateral received against the market value of the securities loaned. The value of the collateral is typically greater than that of the market value of the securities loaned, leaving the lender with a net amount payable to the defaulting party. However, bankruptcy or insolvency laws of a particular jurisdiction may impose restrictions on or prohibitions against such a right of offset in the event of an MSLA counterparty’s bankruptcy or insolvency. Under the MSLA, the borrower can resell or re-pledge the loaned securities, and a Fund can reinvest cash collateral, or, upon an event of default, resell or re-pledge the collateral.
The following table is a summary of securities lending agreements which are subject to offset under an MSLA as of August 31, 2017:
| iShares ETF and Counterparty | Market Value of Securities on Loan | Cash Collateral Received a | Net Amount | |||||||||
Core MSCI Emerging Markets | ||||||||||||
Barclays Capital Inc. | $ | 13,658,035 | $ | 13,658,035 | $ | — | ||||||
BNP Paribas New York Branch | 57,624,136 | 57,624,136 | — | |||||||||
BNP Paribas Prime Brokerage International Ltd. | 20,608,800 | 20,608,800 | — | |||||||||
Citigroup Global Markets Inc. | 345,718,280 | 345,718,280 | — | |||||||||
Citigroup Global Markets Ltd. | 45,216,637 | 45,216,637 | — | |||||||||
Credit Suisse Securities (Europe) Ltd. | 113,049,722 | 113,049,722 | — | |||||||||
Credit Suisse Securities (USA) LLC | 92,345,592 | 92,345,592 | — | |||||||||
Deutsche Bank AG | 11,659,584 | 11,659,584 | — | |||||||||
Deutsche Bank Securities Inc. | 58,147,683 | 58,147,683 | — | |||||||||
Goldman Sachs & Co. | 488,892,295 | 488,892,295 | — | |||||||||
Goldman Sachs International | 26,774,801 | 26,774,801 | — | |||||||||
HSBC Bank PLC | 187,835,488 | 187,835,488 | — | |||||||||
Jefferies LLC | 3,786,179 | 3,786,179 | — | |||||||||
JPMorgan Securities LLC | 112,207,858 | 112,207,858 | — | |||||||||
JPMorgan Securities PLC | 34,797,622 | 34,797,622 | — | |||||||||
Macquarie Bank Limited | 6,743,033 | 6,743,033 | — | |||||||||
Merrill Lynch, Pierce, Fenner & Smith | 85,304,592 | 85,304,592 | — | |||||||||
Morgan Stanley & Co. International PLC | 191,591,460 | 191,591,460 | — | |||||||||
Morgan Stanley & Co. LLC | 217,979,128 | 217,979,128 | — | |||||||||
Morgan Stanley & Co. LLC (U.S. Equity Securities Lending) | 28,944,502 | 28,944,502 | — | |||||||||
National Financial Services LLC | 29,074,395 | 29,074,395 | — | |||||||||
SG Americas Securities LLC | 323,929 | 323,929 | — | |||||||||
State Street Bank & Trust Company | 20,927,638 | 20,927,638 | — | |||||||||
UBS AG | 26,595,143 | 26,595,143 | — | |||||||||
UBS Ltd. | 19,161,278 | 19,161,278 | — | |||||||||
UBS Securities LLC | 14,954,754 | 14,954,754 | — | |||||||||
Wells Fargo Securities LLC | 180,203,519 | 180,203,519 | — | |||||||||
|
|
|
|
|
| |||||||
| $ | 2,434,126,083 | $ | 2,434,126,083 | $ | — | |||||||
|
|
|
|
|
| |||||||
NOTESTO CONSOLIDATED FINANCIAL STATEMENTS | 95 |
Table of Contents
Notes to Consolidated Financial Statements (Continued)
iSHARES®, INC.
| iShares ETF and Counterparty | Market Value of Securities on Loan | Cash Collateral Received a | Net Amount | |||||||||
MSCI BRIC | ||||||||||||
Citigroup Global Markets Inc. | $ | 17,922,187 | $ | 17,922,187 | $ | — | ||||||
Credit Suisse Securities (USA) LLC | 207,496 | 207,496 | — | |||||||||
Deutsche Bank Securities Inc. | 671,574 | 671,574 | — | |||||||||
Goldman Sachs & Co. | 466,067 | 466,067 | — | |||||||||
JPMorgan Securities LLC | 3,096,008 | 3,096,008 | — | |||||||||
Merrill Lynch, Pierce, Fenner & Smith | 890,475 | 890,475 | — | |||||||||
Morgan Stanley & Co. LLC | 1,281,679 | 1,281,679 | — | |||||||||
Scotia Capital (USA) Inc. | 188,334 | 188,334 | — | |||||||||
State Street Bank & Trust Company | 162,700 | 162,700 | — | |||||||||
|
|
|
|
|
| |||||||
| $ | 24,886,520 | $ | 24,886,520 | $ | — | |||||||
|
|
|
|
|
| |||||||
MSCI Emerging Markets Asia | ||||||||||||
Barclays Capital Inc. | $ | 108,092 | $ | 108,092 | $ | — | ||||||
Citigroup Global Markets Inc. | 223,986 | 223,986 | — | |||||||||
Credit Suisse Securities (USA) LLC | 563,589 | 563,589 | — | |||||||||
Deutsche Bank AG | 216,360 | 216,360 | — | |||||||||
Deutsche Bank Securities Inc. | 251,239 | 251,239 | — | |||||||||
HSBC Bank PLC | 684,019 | 684,019 | — | |||||||||
JPMorgan Securities LLC | 26,122 | 26,122 | — | |||||||||
JPMorgan Securities PLC | 264,877 | 264,877 | — | |||||||||
Merrill Lynch, Pierce, Fenner & Smith | 876,318 | 876,318 | — | |||||||||
Morgan Stanley & Co. International PLC | 393,158 | 393,158 | — | |||||||||
Morgan Stanley & Co. LLC | 5,479,276 | 5,479,276 | — | |||||||||
UBS AG | 109,199 | 109,199 | — | |||||||||
|
|
|
|
|
| |||||||
| $ | 9,196,235 | $ | 9,196,235 | $ | — | |||||||
|
|
|
|
|
| |||||||
MSCI Emerging Markets Small-Cap | ||||||||||||
Barclays Capital Inc. | $ | 1,201,630 | $ | 1,201,630 | $ | — | ||||||
Citigroup Global Markets Inc. | 465,919 | 465,919 | — | |||||||||
Credit Suisse Securities (USA) LLC | 3,130,574 | 3,130,574 | — | |||||||||
Deutsche Bank AG | 407,490 | 407,490 | — | |||||||||
Deutsche Bank Securities Inc. | 2,717,866 | 2,717,866 | — | |||||||||
Goldman Sachs & Co. | 3,858,902 | 3,858,902 | — | |||||||||
HSBC Bank PLC | 1,014,430 | 1,014,430 | — | |||||||||
JPMorgan Securities LLC | 1,375,716 | 1,375,716 | — | |||||||||
Macquarie Bank Limited | 4,893 | 4,893 | — | |||||||||
Merrill Lynch, Pierce, Fenner & Smith | 2,076,716 | 2,076,716 | — | |||||||||
Morgan Stanley & Co. International PLC | 198,020 | 198,020 | — | |||||||||
Morgan Stanley & Co. LLC | 2,661,953 | 2,661,953 | — | |||||||||
SG Americas Securities LLC | 199,779 | 199,779 | — | |||||||||
UBS AG | 1,849,511 | 1,849,511 | — | |||||||||
UBS Securities LLC | 897,701 | 897,701 | — | |||||||||
|
|
|
|
|
| |||||||
| $ | 22,061,100 | $ | 22,061,100 | $ | — | |||||||
|
|
|
|
|
| |||||||
| a | Collateral received in excess of the market value of securities on loan is not presented in this table. The total cash collateral received by each Fund is disclosed in the Fund’s consolidated statement of assets and liabilities. |
| 96 | 2017 iSHARES ANNUAL REPORTTO SHAREHOLDERS |
Table of Contents
Notes to Consolidated Financial Statements (Continued)
iSHARES®, INC.
| 2. | INVESTMENT ADVISORY AGREEMENT AND OTHER TRANSACTIONS WITH AFFILIATES |
Pursuant to an Investment Advisory Agreement with the Company, BFA manages the investment of each Fund’s assets. BFA is a California corporation indirectly owned by BlackRock. Under the Investment Advisory Agreement, BFA is responsible for substantially all expenses of the Funds, except (i) interest and taxes; (ii) brokerage commissions and other expenses connected with the execution of portfolio transactions; (iii) distribution fees; (iv) the advisory fee payable to BFA; and (v) litigation expenses and any extraordinary expenses (in each case as determined by a majority of the independent directors).
Each Subsidiary has entered into a separate contract with BFA under which BFA provides investment advisory services to the Subsidiary but does not receive separate compensation from the Subsidiary for providing it with such services. Each Subsidiary has also entered into separate arrangements that provide for the provision of other services to the Subsidiary (including administrative, custody, transfer agency and other services), and BFA pays the costs and expenses related to the provision of those services.
For its investment advisory services to the iShares Core MSCI Emerging Markets ETF, BFA is entitled to an annual investment advisory fee of 0.14%, accrued daily and paid monthly by the Fund, based on the average daily net assets of the Fund. Prior to October 5, 2016, for its investment advisory services to the Fund, BFA was entitled to an annual investment advisory fee of 0.16% based on the average daily net assets of the Fund. In addition, the Fund may incur its pro rata share of fees and expenses attributable to its investments in other investment companies (“acquired fund fees and expenses”). The total of the investment advisory fee and acquired fund fees and expenses are a fund’s total annual operating expenses. BFA has contractually agreed to waive a portion of its investment advisory fee through December 31, 2017 in order to limit the total annual operating expenses of the Fund to 0.14% of average daily net assets.
For its investment advisory services to each of the iShares MSCI BRIC and iShares MSCI Emerging Markets Small-Cap ETFs, BFA is entitled to an annual investment advisory fee, accrued daily and paid monthly by the Funds, based on each Fund’s allocable portion of the aggregate of the average daily net assets of the Fund and certain other iShares funds, as follows:
| Investment Advisory Fee | Aggregate Average Daily Net Assets | ||||
| 0.75 | % | First $14 billion | |||
| 0.68 | Over $14 billion, up to and including $28 billion | ||||
| 0.61 | Over $28 billion, up to and including $42 billion | ||||
| 0.54 | Over $42 billion, up to and including $56 billion | ||||
| 0.47 | Over $56 billion, up to and including $70 billion | ||||
| 0.41 | Over $70 billion, up to and including $84 billion | ||||
| 0.35 | Over $84 billion | ||||
For its investment advisory services to the iShares MSCI Emerging Markets Asia ETF, BFA is entitled to an annual investment advisory fee of 0.49%, accrued daily and paid monthly by the Fund, based on the average daily net assets of the Fund.
The U.S. Securities and Exchange Commission has issued an exemptive order which permits BlackRock Institutional Trust Company, N.A. (“BTC”), an affiliate of BFA, to serve as securities lending agent for the Funds, subject to applicable conditions. As securities lending agent, BTC bears all operational costs directly related to securities lending. Each Fund is responsible for fees in connection with the investment of cash collateral received for securities on loan in a money market fund managed by BFA, however, BTC has agreed to reduce the amount of securities lending income it receives in order to effectively limit the collateral investment fees each Fund bears to an annual rate of 0.04% (the “collateral investment fees”). Securities lending income is equal to the total of income earned from the reinvestment of cash collateral, net of fees and other payments to and from borrowers of securities, and less the collateral investment fees. The Funds retain a portion of securities lending income and remit the remaining portion to BTC as compensation for its services as securities lending agent.
NOTESTO CONSOLIDATED FINANCIAL STATEMENTS | 97 |
Table of Contents
Notes to Consolidated Financial Statements (Continued)
iSHARES®, INC.
Pursuant to a securities lending agreement, each Fund retains 80% of securities lending income and the amount retained can never be less than 70% of the total of securities lending income plus the collateral investment fees. In addition, commencing the business day following the date that the aggregate securities lending income plus the collateral investment fees generated across all 1940 Act iShares exchange-traded funds (the “iShares ETF Complex”) in a given calendar year exceeds the aggregate securities lending income generated across the iShares ETF Complex in the calendar year 2013, each Fund, pursuant to a securities lending agreement, will retain for the remainder of that calendar year 85% of securities lending income and the amount retained can never be less than 70% of the total of securities lending income plus the collateral investment fees.
For the year ended August 31, 2017, the total of securities lending agent services and collateral investment fees paid were as follows:
| iShares ETF | Fees Paid to BTC | |||
Core MSCI Emerging Markets | $ | 8,283,092 | ||
MSCI BRIC | 30,487 | |||
MSCI Emerging Markets Asia | 26,961 | |||
MSCI Emerging Markets Small-Cap | 215,380 | |||
For the year ended August 31, 2017, BTC, the Funds’ securities lending agent, has agreed to voluntarily reimburse the iShares Core MSCI Emerging Markets ETF in the amount of $311,391, related to the foreign tax on the securities lending income. Such reimbursement is included in “Securities lending income – affiliated – net” in the Fund’s statement of operations.
BlackRock Investments, LLC, an affiliate of BFA, is the distributor for each Fund. Pursuant to the distribution agreement, BFA is responsible for any fees or expenses for distribution services provided to the Funds.
Cross trading is the buying or selling of portfolio securities between funds to which BFA (or an affiliate) serves as investment adviser. At its regularly scheduled quarterly meetings, the Board reviews such transactions as of the most recent calendar quarter for compliance with the requirements and restrictions set forth by Rule 17a-7.
For the year ended August 31, 2017, transactions executed by the Funds pursuant to Rule 17a-7 under the 1940 Act were as follows:
| iShares ETF | Purchases | Sales | ||||||
Core MSCI Emerging Markets | $ | 66,035,821 | $ | 28,710,903 | ||||
MSCI BRIC | 1,306,546 | 451,472 | ||||||
MSCI Emerging Markets Asia | 1,151,300 | 766,670 | ||||||
MSCI Emerging Markets Small-Cap | 1,876,509 | 5,916,804 | ||||||
Each Fund may invest its positive cash balances in certain money market funds managed by BFA or an affiliate. The income earned on these temporary cash investments is included in “Dividends – affiliated” in the consolidated statements of operations.
The PNC Financial Services Group, Inc. is the largest stockholder of BlackRock and is considered to be an affiliate of the Funds for 1940 Act purposes.
Certain Funds, in order to improve their portfolio liquidity and their ability to track their respective underlying index, may invest in shares of other iShares funds that invest in securities in each Fund’s respective underlying index.
Certain directors and officers of the Company are also officers of BTC and/or BFA.
| 98 | 2017 iSHARES ANNUAL REPORTTO SHAREHOLDERS |
Table of Contents
Notes to Consolidated Financial Statements (Continued)
iSHARES®, INC.
| 3. | INVESTMENT PORTFOLIO TRANSACTIONS |
Purchases and sales of investments (excluding in-kind transactions and short-term investments) for the year ended August 31, 2017 were as follows:
| iShares ETF | Purchases | Sales | ||||||
Core MSCI Emerging Markets | $ | 12,047,923,988 | $ | 1,088,509,494 | ||||
MSCI BRIC | 62,012,058 | 49,861,089 | ||||||
MSCI Emerging Markets Asia | 255,781,602 | 42,303,700 | ||||||
MSCI Emerging Markets Small-Cap | 119,220,067 | 34,479,499 | ||||||
In-kind transactions (see Note 4) for the year ended August 31, 2017 were as follows:
| iShares ETF | In-kind Purchases | In-kind Sales | ||||||
Core MSCI Emerging Markets | $ | 4,553,990,138 | $ | — | ||||
MSCI BRIC | 80,923,708 | 64,535,588 | ||||||
MSCI Emerging Markets Asia | 22,117,338 | 21,338,257 | ||||||
MSCI Emerging Markets Small-Cap | 18,883,151 | — | ||||||
| 4. | CAPITAL SHARE TRANSACTIONS |
Capital shares are issued and redeemed by each Fund only in aggregations of a specified number of shares or multiples thereof (“Creation Units”) at NAV. Except when aggregated in Creation Units, shares of each Fund are not redeemable. Transactions in capital shares for each Fund are disclosed in detail in the consolidated statements of changes in net assets.
The consideration for the purchase of Creation Units of a fund in the Company generally consists of the in-kind deposit of a designated portfolio of securities and a specified amount of cash. Certain funds in the Company may be offered in Creation Units solely or partially for cash in U.S. dollars. Investors purchasing and redeeming Creation Units may pay a purchase transaction fee and a redemption transaction fee directly to State Street Bank and Trust Company, the Company’s administrator, to offset transfer and other transaction costs associated with the issuance and redemption of Creation Units, including Creation Units for cash. Investors transacting in Creation Units for cash may also pay an additional variable charge to compensate the relevant fund for certain transaction costs (i.e., stamp taxes, taxes on currency or other financial transactions, and brokerage costs) and market impact expenses relating to investing in portfolio securities. Such variable charges, if any, are included in “Proceeds from shares sold” in the consolidated statements of changes in net assets.
From time to time, settlement of securities related to in-kind contributions or in-kind redemptions may be delayed. In such cases, securities related to in-kind contributions are reflected as “Due from custodian” and securities related to in-kind redemptions are reflected as “Securities related to in-kind transactions” in the consolidated statements of assets and liabilities.
| 5. | FUTURES CONTRACTS |
Each Fund’s use of futures contracts is generally limited to cash equitization. This involves the use of available cash to invest in index futures contracts in order to gain exposure to the equity markets represented in or by the Fund’s underlying index and is intended to allow the Fund to better track its underlying index. Futures contracts are standardized, exchange-traded agreements to buy or sell a financial instrument at a set price on a future date. Upon entering into a futures contract, a fund is required to
NOTESTO CONSOLIDATED FINANCIAL STATEMENTS | 99 |
Table of Contents
Notes to Consolidated Financial Statements (Continued)
iSHARES®, INC.
pledge to the executing broker which holds segregated from its own assets, an amount of cash, U.S. government securities or other high-quality debt and equity securities equal to the minimum initial margin requirements of the exchange on which the contract is traded.
Pursuant to the contract, the fund agrees to receive from or pay to the broker an amount of cash equal to the daily fluctuation in notional value of the contract. Such receipts or payments are known as margin variation and are recorded by the fund as unrealized appreciation or depreciation. When the contract is closed, the fund records a realized gain or loss equal to the difference between the notional value of the contract at the time it was opened and the notional value at the time it was closed. Losses may arise if the notional value of a futures contract decreases due to an unfavorable change in the market rates or values of the underlying instrument during the term of the contract or if the counterparty does not perform under the contract. The use of futures contracts also involves the risk of an imperfect correlation in the movements in the price of futures contracts and the assets underlying such contracts.
The following table shows the value of futures contracts held by the iShares Core MSCI Emerging Markets ETF as of August 31, 2017 and the related locations in the consolidated statements of assets and liabilities, presented by risk exposure category:
| Assets | ||||
Equity contracts: | ||||
Variation margin/Net assets consist of – net unrealized appreciationa | $ | 6,970,178 | ||
|
| |||
| a | Represents cumulative appreciation of futures contracts as reported in the consolidated schedule of investments. |
The following table shows the realized and unrealized gains (losses) on futures contracts held by the iShares Core MSCI Emerging Markets ETF during the year ended August 31, 2017 and the related locations in the consolidated statements of operations, presented by risk exposure category:
| Net Realized Gain (Loss) | Net Change in Unrealized Appreciation/Depreciation | |||||||
Equity contracts: | ||||||||
Futures contracts | $ | 27,548,406 | $ | 1,991,138 | ||||
|
|
|
| |||||
The following table shows the average quarter-end balances of open futures contracts for the iShares Core MSCI Emerging Markets ETF for the year ended August 31, 2017:
Average value of contracts purchased | $ | 76,800,863 |
| 6. | PRINCIPAL RISKS |
In the normal course of business, each Fund invests in securities or other instruments and may enter into certain transactions, and such activities subject the Fund to various risks, including, among others, fluctuations in the market (market risk) or failure of an issuer to meet all of its obligations. The value of securities or other instruments may also be affected by various factors, including, without limitation: (i) the general economy; (ii) the overall market as well as local, regional or global political and/or social instability; (iii) regulation, taxation or international tax treaties between various countries; or (iv) currency, interest rate or price fluctuations. Each Fund’s prospectus provides details of the risks to which the Fund is subject.
| 100 | 2017 iSHARES ANNUAL REPORTTO SHAREHOLDERS |
Table of Contents
Notes to Consolidated Financial Statements (Continued)
iSHARES®, INC.
BFA uses a “passive” or index approach to try to achieve each Fund’s investment objective following the securities included in its underlying index during upturns as well as downturns. BFA does not take steps to reduce market exposure or to lessen the effects of a declining market. Divergence from the underlying index and the composition of the portfolio is monitored by BFA.
MARKET RISK
Market risk arises mainly from uncertainty about future values of financial instruments influenced by price, currency and interest rate movements. It represents the potential loss a fund may suffer through holding market positions in the face of market movements. A fund is exposed to market risk by its investment in equity, fixed income and/or financial derivative instruments or by its investment in underlying funds. The fair value of securities held by a fund may decline due to general market conditions, economic trends or events that are not specifically related to the issuers of the securities including local, regional or global political, social or economic instability or to factors that affect a particular industry or group of industries. The extent of a fund’s exposure to market risk is the market value of the investments held as shown in the fund’s schedule of investments.
A diversified portfolio, where this is appropriate and consistent with a fund’s objectives, minimizes the risk that a price change of a particular investment will have a material impact on the NAV of a fund. The investment concentrations within each Fund’s portfolio are disclosed in its consolidated schedule of investments.
Investing in the securities of non-U.S. issuers involves certain considerations and risks not typically associated with securities of U.S. issuers. Such risks include, but are not limited to: differences in accounting, auditing and financial reporting standards; more substantial governmental involvement in the economy; higher inflation rates, greater social, economic and political uncertainties; possible nationalization or expropriation of assets; less availability of public information about issuers; imposition of withholding or other taxes; higher transaction and custody costs and delays in settlement procedures; and lower level of regulation of the securities markets and issuers. Non-U.S. securities may be less liquid, more difficult to value, and have greater price volatility due to exchange rate fluctuations. These and other risks are heightened for investments in issuers from countries with less developed capital markets.
The economies and markets of European countries are often closely connected and interdependent, and events in one country in Europe can have an adverse impact on other European countries. The European financial markets have experienced volatility and adverse trends in recent years due to concerns about economic downturns or rising government debt levels in several European countries. These events have adversely affected the exchange rate of the euro and may continue to significantly affect European countries. The occurrence of terrorist incidents throughout Europe also could impact financial markets. In addition, the United Kingdom has voted to withdraw from the European Union. The referendum may introduce significant new uncertainties and instability in the financial markets as the United Kingdom negotiates its exit from the European Union.
The United States and the European Union, along with the regulatory bodies of a number of countries including Japan, Australia, Norway, Switzerland and Canada, have imposed economic sanctions, which consist of asset freezes and sectorial sanctions, on certain Russian individuals and Russian corporate entities. Broader sanctions on Russia could also be instituted. These sanctions, or even the threat of further sanctions, may result in the decline of the value and liquidity of Russian securities, a weakening of the ruble or other adverse consequences to the Russian economy. Current or future sanctions may result in Russia taking counter measures or retaliatory actions, which may further impair the value and liquidity of Russian securities. These retaliatory measures may include the immediate freeze of Russian assets held by a fund.
CREDIT RISK
Credit risk is the risk that an issuer or guarantor of debt instruments or the counterparty to a financial transaction, including derivatives contracts, repurchase agreements or loans of portfolio securities, is unable or unwilling to make timely interest and/or principal payments or to otherwise honor its obligations. BFA and its affiliates manage counterparty credit risk by entering into
NOTESTO CONSOLIDATED FINANCIAL STATEMENTS | 101 |
Table of Contents
Notes to Consolidated Financial Statements (Continued)
iSHARES®, INC.
transactions only with counterparties that they believe have the financial resources to honor their obligations and by monitoring the financial stability of those counterparties. Financial assets, which potentially expose a fund to issuer and counterparty credit risks, consist principally of financial instruments and receivables due from counterparties. The extent of a fund’s exposure to credit and counterparty risks with respect to those financial assets is approximated by their value recorded in its statement of assets and liabilities.
| 7. | INCOME TAX INFORMATION |
Each Fund is treated as an entity separate from the Company’s other funds for federal income tax purposes. It is the policy of each Fund to qualify as a regulated investment company by complying with the provisions applicable to regulated investment companies, as defined under Subchapter M of the Internal Revenue Code of 1986, as amended, and to annually distribute substantially all of its ordinary income and any net capital gains (taking into account any capital loss carryforwards) sufficient to relieve it from all, or substantially all, federal income and excise taxes. Accordingly, no provision for federal income taxes is required.
U.S. GAAP requires that certain components of net assets be adjusted to reflect permanent differences between financial and tax reporting. These reclassifications have no effect on net assets or NAV per share. The following permanent differences as of August 31, 2017, attributable to the characterization of corporate actions, passive foreign investment companies, the expiration of capital loss carryforwards, foreign currency transactions and realized gains (losses) from in-kind redemptions, were reclassified to the following accounts:
| iShares ETF | Paid-in Capital | Undistributed Net Investment Income/Distributions in Excess of Net Investment Income | Undistributed Net Realized Gain/Accumulated Net Realized Loss | |||||||||
Core MSCI Emerging Markets | $ | — | $ | 23,676,275 | $ | (23,676,275 | ) | |||||
MSCI BRIC | 10,313,587 | 61,175 | (10,374,762 | ) | ||||||||
MSCI Emerging Markets Asia | 3,266,216 | 350,178 | (3,616,394 | ) | ||||||||
MSCI Emerging Markets Small-Cap | — | 859,625 | (859,625 | ) | ||||||||
The tax character of distributions paid during the years ended August 31, 2017 and August 31, 2016 was as follows:
| iShares ETF | 2017 | 2016 | ||||||
Core MSCI Emerging Markets | ||||||||
Ordinary income | $ | 472,049,457 | $ | 238,601,549 | ||||
|
|
|
| |||||
MSCI BRIC | ||||||||
Ordinary income | $ | 2,786,991 | $ | 4,397,149 | ||||
|
|
|
| |||||
MSCI Emerging Markets Asia | ||||||||
Ordinary income | $ | 3,388,608 | $ | 2,586,361 | ||||
|
|
|
| |||||
MSCI Emerging Markets Small-Cap | ||||||||
Ordinary income | $ | 3,832,107 | $ | 2,370,926 | ||||
|
|
|
| |||||
| 102 | 2017 iSHARES ANNUAL REPORTTO SHAREHOLDERS |
Table of Contents
Notes to Consolidated Financial Statements (Continued)
iSHARES®, INC.
As of August 31, 2017, the tax components of accumulated net earnings (losses) were as follows:
| iShares ETF | Undistributed Ordinary Income | Capital Loss | Net Unrealized Gains (Losses) a | Total | ||||||||||||
Core MSCI Emerging Markets | $ | 431,491,086 | $ | (385,850,660 | ) | $ | 5,078,360,035 | $ | 5,124,000,461 | |||||||
MSCI BRIC | 2,719,048 | (226,821,397 | ) | 35,881,154 | (188,221,195 | ) | ||||||||||
MSCI Emerging Markets Asia | 5,266,973 | (27,359,939 | ) | 73,153,215 | 51,060,249 | |||||||||||
MSCI Emerging Markets Small-Cap | 3,711,256 | (11,844,208 | ) | 22,042,077 | 13,909,125 | |||||||||||
| a | The difference between book-basis and tax-basis unrealized gains (losses) was attributable primarily to the characterization of corporation actions, the tax deferral of losses on wash sales, the realization for tax purposes of unrealized gains (losses) on certain futures contracts, and the realization for tax purposes of unrealized gains on investments in passive foreign investment companies. |
As of August 31, 2017, the Funds had capital loss carryforwards available to offset future realized capital gains through the indicated expiration dates as follows:
| iShares ETF | Non- Expiring a | Expiring 2018 | Expiring 2019 | Total | ||||||||||||
Core MSCI Emerging Markets | $ | 385,850,660 | $ | — | $ | — | $ | 385,850,660 | ||||||||
MSCI BRIC | 207,792,753 | 11,268,086 | 7,760,558 | 226,821,397 | ||||||||||||
MSCI Emerging Markets Asia | 27,359,939 | — | — | 27,359,939 | ||||||||||||
MSCI Emerging Markets Small-Cap | 11,844,208 | — | — | 11,844,208 | ||||||||||||
| a | Must be utilized prior to losses subject to expiration. |
The Funds may own shares in certain foreign investment entities, referred to, under U.S. tax law, as “passive foreign investment companies.” The Funds may elect to mark-to-market annually the shares of each passive foreign investment company and would be required to distribute to shareholders any such marked-to-market gains.
Management has analyzed tax laws and regulations and their application to the Funds as of August 31, 2017, inclusive of the open tax return years, and does not believe there are any uncertain tax positions that require recognition of a tax liability in the Funds’ consolidated financial statements.
| 8. | LINE OF CREDIT |
The Funds, along with certain other iShares funds, are parties to a $250 million credit agreement with State Street Bank and Trust Company, which expires on October 25, 2017. The line of credit may be used for temporary or emergency purposes, including redemptions, settlement of trades and rebalancing of portfolio holdings. The credit agreement has the following terms: a commitment fee of 0.20% per annum on the unused portion of the credit agreement and interest at a rate equal to the higher of (a) the one-month LIBOR (not less than zero) plus 1.00% per annum or (b) the U.S. Federal Funds rate (not less than zero) plus 1.00% per annum on amounts borrowed. The commitment fee is allocated to each fund participating in the credit agreement based on each fund’s pro-rata share of the aggregate average daily value of assets invested in local securities of certain foreign markets.
NOTESTO CONSOLIDATED FINANCIAL STATEMENTS | 103 |
Table of Contents
Notes to Consolidated Financial Statements (Continued)
iSHARES®, INC.
For the year ended August 31, 2017, the maximum amounts borrowed, the average borrowings and the weighted average interest rates, if any, under the credit agreement were as follows:
| iShares ETF | Maximum Amount Borrowed | Average Borrowings | Weighted Average Interest Rates | |||||||||
Core MSCI Emerging Markets | $ | 120,000,000 | $ | 4,424,658 | 0.13 | % | ||||||
MSCI BRIC | 1,375,000 | 86,692 | 1.65 | |||||||||
MSCI Emerging Markets Asia | 1,550,000 | 86,371 | 1.69 | |||||||||
MSCI Emerging Markets Small-Cap | 4,600,000 | 174,745 | 1.86 | |||||||||
At a meeting held on September 14-15, 2017, the Board approved the amendment of certain terms of the credit agreement including (i) increasing the maximum borrowing amount to $275 million and (ii) extending the expiration date to October 24, 2018. These changes to the credit agreement are expected to be effective on or around October 25, 2017.
| 9. | LEGAL PROCEEDINGS |
On June 16, 2016, investors (the “Plaintiffs”) in certain iShares funds (iShares Core S&P Small-Cap ETF, iShares Russell 1000 Growth ETF, iShares Core S&P 500 ETF, iShares Russell Mid-Cap Growth ETF, iShares Russell Mid-Cap ETF, iShares Russell Mid-Cap Value ETF, iShares Select Dividend ETF, iShares Morningstar Mid-Cap ETF, iShares Morningstar Large-Cap ETF, iShares U.S. Aerospace & Defense ETF and iShares U.S. Preferred Stock ETF) filed a putative class action lawsuit against iShares Trust, BlackRock, Inc. and certain of its advisory affiliates, and certain directors/trustees and officers of the Funds (collectively, “Defendants”). The lawsuit alleges the Defendants violated federal securities laws by failing to adequately disclose in the prospectuses issued by the funds noted above the risks of using stop-loss orders in the event of a ‘flash crash’, such as the one that occurred on May 6, 2010. On September 18, 2017, the Court issued a Statement of Decision holding that the Plaintiffs lack standing to assert their claims. On October 11, 2017, the Court entered final judgment dismissing all of Plaintiffs’ claims with prejudice.
| 10. | SUBSEQUENT EVENTS |
Management has evaluated the impact of all subsequent events on the Funds through the date the consolidated financial statements were available to be issued and has determined that there were no subsequent events requiring adjustment or disclosure in the consolidated financial statements.
| 104 | 2017 iSHARES ANNUAL REPORTTO SHAREHOLDERS |
Table of Contents
Report of Independent Registered Public Accounting Firm
To the Board of Directors of iShares, Inc. and
Shareholders of the iShares Core MSCI Emerging Markets ETF, iShares MSCI BRIC ETF,
iShares MSCI Emerging Markets Asia ETF and iShares MSCI Emerging Markets Small-Cap ETF
In our opinion, the accompanying consolidated statements of assets and liabilities, including the consolidated schedules of investments, and the related consolidated statements of operations and of changes in net assets and the consolidated financial highlights present fairly, in all material respects, the financial position of iShares Core MSCI Emerging Markets ETF, iShares MSCI BRIC ETF, iShares MSCI Emerging Markets Asia ETF and iShares MSCI Emerging Markets Small-Cap ETF and their subsidiaries (constituting funds of iShares, Inc., hereafter referred to as the “Funds”) as of August 31, 2017, and the results of each of their operations, the changes in each of their net assets and the financial highlights for each of the periods indicated, in conformity with accounting principles generally accepted in the United States of America. These consolidated financial statements and consolidated financial highlights (hereafter referred to as “financial statements”) are the responsibility of the Funds’ management. Our responsibility is to express an opinion on these financial statements based on our audits. We conducted our audits of these financial statements in accordance with the standards of the Public Company Accounting Oversight Board (United States). Those standards require that we plan and perform the audit to obtain reasonable assurance about whether the financial statements are free of material misstatement. An audit includes examining, on a test basis, evidence supporting the amounts and disclosures in the financial statements, assessing the accounting principles used and significant estimates made by management, and evaluating the overall financial statement presentation. We believe that our audits, which included confirmation of securities as of August 31, 2017 by correspondence with the custodian, transfer agent and brokers, or by other appropriate auditing procedures where replies were not received, provide a reasonable basis for our opinion.
PricewaterhouseCoopers LLP
San Francisco, California
October 23, 2017
REPORTOF INDEPENDENT REGISTERED PUBLIC ACCOUNTING FIRM | 105 |
Table of Contents
iSHARES®, INC.
The following maximum amounts are hereby designated as qualified dividend income for individuals for the fiscal year ended August 31, 2017:
| iShares ETF | Qualified Dividend Income | |||
Core MSCI Emerging Markets | $ | 433,226,218 | ||
MSCI BRIC | 3,555,505 | |||
MSCI Emerging Markets Asia | 4,698,157 | |||
MSCI Emerging Markets Small-Cap | 1,987,697 | |||
For the fiscal year ended August 31, 2017, the Funds earned foreign source income and paid foreign taxes which they intend to pass through to their shareholders:
| iShares ETF | Foreign Source Income Earned | Foreign Taxes Paid | ||||||
Core MSCI Emerging Markets | $ | 783,370,543 | $ | 84,738,990 | ||||
MSCI BRIC | 5,877,102 | 463,410 | ||||||
MSCI Emerging Markets Asia | 8,939,408 | 1,045,148 | ||||||
MSCI Emerging Markets Small-Cap | 5,258,379 | 527,968 | ||||||
| 106 | 2017 iSHARES ANNUAL REPORTTO SHAREHOLDERS |
Table of Contents
Board Review and Approval of Investment Advisory
Contract
iSHARES®, INC.
I. iShares Core MSCI Emerging Markets ETF
Under Section 15(c) of the Investment Company Act of 1940 (the “1940 Act”), the Company’s Board of Directors (the “Board”), including a majority of Directors who are not “interested persons” of the Company (as that term is defined in the 1940 Act) (the “Independent Directors”), is required annually to consider and approve the Investment Advisory Contract between the Company and BFA (the “Advisory Contract”) on behalf of the Fund. The Independent Directors requested, and BFA provided, such information as the Independent Directors, with advice from independent counsel, deemed reasonably necessary to evaluate the Advisory Contract. A committee of all of the Independent Directors (the “15(c) Committee”), with independent counsel, met with management on May 5, 2017 and May 12, 2017. At these meetings, the 15(c) Committee reviewed and discussed information provided in response to the 15(c) Committee’s initial requests, and requested certain additional information, which management agreed to provide. At a meeting held on May 18, 2017, management presented information to the Board relating to the continuance of the Advisory Contract, including information requested by the 15(c) Committee during its meetings. The Board, including the Independent Directors, reviewed and discussed such information at length. The Independent Directors requested from management certain additional information, which management agreed to provide. At a meeting held on June 19-21, 2017, the Board, including the Independent Directors, reviewed the additional information provided by management in response to these requests. After extensive discussions, the Board, including all of the Independent Directors, approved the continuance of the Advisory Contract for the Fund, based on a review of qualitative and quantitative information provided by BFA. The Board noted its satisfaction with the extent and quality of information provided and its frequent interactions with management, as well as the detailed responses and other information provided by BFA. The Board also noted that the Board and BFA agreed to discuss potential further enhancements to the 15(c) process for the coming year. The Independent Directors were advised by their independent counsel throughout the process, including about the legal standards applicable to their review. In approving the Advisory Contract for the Fund, the Board, including the Independent Directors, considered the following factors, no one of which was controlling, and reached the following conclusions:
Expenses and Performance of the Fund — The Board reviewed statistical information prepared by Broadridge Financial Solutions Inc. (“Broadridge”), an independent provider of investment company data, regarding the expense ratio components, including gross and net total expenses, waivers/reimbursements (if any), and underlying fund fees and expenses (if any) of the Fund in comparison with the same information for other exchange traded funds (“ETFs”) (including, where applicable, funds sponsored by an “at cost” service provider) and, in the limited instances where no comparable ETFs existed and the comparison group would not otherwise be reasonable in Broadridge’s judgment, pure index institutional mutual funds, objectively selected by Broadridge as comprising the Fund’s applicable peer group pursuant to Broadridge’s proprietary ETF methodology (the “Peer Group”). The Board was provided with a detailed description of the proprietary ETF methodology used by Broadridge to determine the Fund’s Peer Group. The Board further noted that due to the limitations in providing comparable funds in the Peer Group, the statistical information provided in Broadridge’s report may or may not provide meaningful direct comparisons to the Fund in all instances.
The Board also noted that the investment advisory fee rate and overall expenses (net of waivers and reimbursements) for the Fund were lower than the median of the investment advisory fee rates and overall expenses (net of waivers and reimbursements) of the funds in its Peer Group, excluding iShares funds.
In addition, to the extent that any of the comparison funds included in the Peer Group, excluding iShares funds, track the same index as the Fund, Broadridge also provided, and the Board reviewed, a comparison of the Fund’s performance for the one-, three-, five-, ten-year, and since inception periods, as applicable, and for the quarter ended December 31, 2016, to that of relevant comparison funds for the same periods.
BOARD REVIEWAND APPROVALOF INVESTMENT ADVISORY CONTRACT | 107 |
Table of Contents
Board Review and Approval of Investment Advisory
Contract (Continued)
iSHARES®, INC.
The Board noted that the Fund seeks to track its specified underlying index and that, during the year, the Board received periodic reports on the Fund’s short- and longer-term performance in comparison with its underlying index. Such periodic comparative performance information, including any additional detailed information requested by the Boards, was also considered. The Board noted that the Fund generally performed in line with its underlying index over the relevant periods.
Based on this review, the other factors considered at the meeting, and their general knowledge of ETF pricing, the Board concluded that the investment advisory fee rate and the historical performance of the Fund supported the Board’s approval of the continuance of the Advisory Contract for the coming year.
Nature, Extent and Quality of Services Provided by BFA — Based on management’s representations, including information about recent and proposed enhancements to the iShares business, including with respect to capital markets support and analysis, technology, product design, compliance and risk management, and other services, the Board expected that there would be no diminution in the scope of services required of or provided by BFA under the Advisory Contract for the coming year as compared to the scope of services provided by BFA during prior years. In reviewing the scope of these services, the Board considered BFA’s investment philosophy and experience, noting that BFA and its affiliates have committed significant resources over time, including during the past year, to supporting the iShares funds and their shareholders. The Board also considered BFA’s compliance program and its compliance record with respect to the Fund. In that regard, the Board noted that BFA reports to the Board about portfolio management and compliance matters on a periodic basis in connection with regularly scheduled meetings of the Board, and on other occasions as necessary and appropriate, and has provided information and made appropriate officers available as needed to provide further assistance with these matters. The Board also reviewed the background and experience of the persons responsible for the day-to-day management of the Fund, as well as the resources available to them in managing the Fund. In addition to the above considerations, the Board reviewed and considered detailed presentations regarding BFA’s investment performance, investment and risk management processes and strategies provided at the June 19-21, 2017 meeting and throughout the previous year, and matters related to BFA’s portfolio compliance policies and procedures. The Board noted that the Fund had met its investment objective consistently since its inception date.
Based on review of this information, and the performance information discussed above, the Board concluded that the nature, extent and quality of services provided by BFA to the Fund under the Advisory Contract supported the Board’s approval of the continuance of the Advisory Contract for the coming year.
Costs of Services Provided to Fund and Profits Realized by BFA and Affiliates — The Board reviewed information about the profitability of the Fund to BlackRock, based on the fees payable to BFA and its affiliates (including fees under the Advisory Contract), and other sources of revenue and expense to BFA and its affiliates from the Fund’s operations for the last calendar year. The Board reviewed BlackRock’s profitability methodology for the iShares funds, including supplemental information that was responsive to requests of the 15(c) Committee. The Board noted that the 15(c) Committee had focused on the methodology and profitability presentation during its meetings. The Board discussed the sources of direct and ancillary revenue with management, including the revenues to BTC, a BFA affiliate, from securities lending by the Fund. The Board also discussed BFA’s profit margin as reflected in the Fund’s profitability analysis and reviewed information regarding potential economies of scale (as discussed below). Based on this review, the Board concluded that the profits realized by BFA and its affiliates under the Advisory Contract and from other relationships between the Fund and BFA and/or its affiliates, if any, were within a reasonable range in light of the factors considered.
Economies of Scale — The Board reviewed information regarding potential economies of scale or other efficiencies that may result from increases in the Fund’s assets, noting that the issue of economies of scale had been focused on by the 15(c) Committee during its meetings and addressed by management, including through supplemental information. The Board and the 15(c) Committee reviewed information provided by BFA regarding scale benefits shared with the iShares funds through relatively
| 108 | 2017 iSHARES ANNUAL REPORTTO SHAREHOLDERS |
Table of Contents
Board Review and Approval of Investment Advisory
Contract (Continued)
iSHARES®, INC.
low fee rates established at inception, breakpoints and waivers or other fee reductions, as well as through additional investment in the iShares business and the provision of improved or additional infrastructure and services to the iShares funds and their shareholders. The Board and the 15(c) Committee received information regarding BlackRock’s historical profitability, including BFA’s and its affiliates’ costs in providing services. The cost information distinguished, among other things, between fixed and variable costs, and explained how the level of fixed and variable costs, as well as the nature of such costs, may impact the existence or size of scale benefits. The Board noted that the Advisory Contract for the Fund did not provide for any breakpoints in the Fund’s investment advisory fee rate as the assets of the Fund increase. However, the Board noted that should material economies of scale be identified in the future that are not otherwise shared, a breakpoint structure for the Fund may be appropriate, and that it would continue to monitor the sharing of economies of scale to determine the appropriateness of adding breakpoints in the future.
Based on this review, as well as the other factors considered at the meeting, the Board, recognizing its responsibility to consider the Advisory Contract at least annually, determined to approve the continuance of the Advisory Contract for the coming year.
Fees and Services Provided for Other Comparable Funds/Accounts Managed by BFA and its Affiliates — The Board received and considered information regarding the investment advisory/management fee rates for other funds/accounts in the U.S. for which BFA (or its affiliates) provides investment advisory/management services, including open-end funds registered under the 1940 Act (including sub-advised funds), collective trust funds, and institutional separate accounts (together, the “Other Accounts”), and acknowledged BFA’s assertion that the iShares funds are fundamentally different investment vehicles from the Other Accounts. The Board noted that BFA and its affiliates do manage Other Accounts with substantially the same investment objective and strategy as the Fund and that track the same index as the Fund. The Board further noted that BFA provided the Board with detailed information regarding how the Other Accounts (particularly institutional clients) generally differ from the Fund, including in terms of the different and generally more extensive services provided to the Fund, as well as other significant differences. In that regard, the Board considered that the pricing of services to institutional clients is typically based on a number of factors beyond the nature and extent of the specific services to be provided and often depends on the overall relationship between the client and its affiliates and the adviser and its affiliates. In addition, the Board considered the relative complexity and inherent risks and challenges of managing and providing other services to the Fund, as a publicly traded ETF, as compared to the Other Accounts that are institutional clients, in light of differing regulatory requirements and client-imposed mandates. The Board also acknowledged BFA’s expressed business purpose for launching a suite of iShares “Core” ETFs that generally are subject to lower investment advisory fees than iShares non-Core ETFs that may provide a similar investment exposure. The Board also considered the “all-inclusive” nature of the Fund’s advisory fee structure, and the Fund expenses borne by BFA under this arrangement. The Board noted that the investment advisory fee rate under the Advisory Contract for the Fund was generally higher than the investment advisory/management fee rates for certain of the Other Accounts (particularly institutional clients) and concluded that the differences appeared to be consistent with the factors discussed.
Other Benefits to BFA and/or its Affiliates — The Board reviewed the “fallout” benefits or ancillary revenue received by BFA and/or its affiliates in connection with the services provided to the Fund by BFA, such as payment of revenue to BTC, the Fund’s securities lending agent, for loaning portfolio securities (which was included in the profit margins reviewed by the Board pursuant to BFA’s profitability methodology), and payment of advisory fees and/or administration fees to BFA and BTC (or their affiliates) in connection with any investments by the Fund in other funds for which BFA (or its affiliates) provides investment advisory services and/or administration services. The Board also noted the revenue received by BFA and/or its affiliates pursuant to an agreement that permits a service provider to use certain portions of BlackRock’s technology platform to service accounts managed by BFA and/or its affiliates, including the iShares funds. The Board noted that BFA generally does not use soft dollars or consider the value of research or other services that may be provided to BFA (including its affiliates) in selecting brokers for portfolio transactions for the Fund. The Board further noted that any portfolio transactions on behalf of the Fund placed through a BFA affiliate or purchased from an underwriting syndicate in which a BFA affiliate participates, are reported to the Board pursuant to
BOARD REVIEWAND APPROVALOF INVESTMENT ADVISORY CONTRACT | 109 |
Table of Contents
Board Review and Approval of Investment Advisory
Contract (Continued)
iSHARES®, INC.
Rule 17e-1 or Rule 10f-3, as applicable, under the 1940 Act. The Board concluded that any such ancillary benefits would not be disadvantageous to the Fund’s shareholders and thus would not alter the Board’s conclusion with respect to the appropriateness of approving the continuance of the Advisory Contract for the coming year.
Conclusion — Based on the considerations described above, the Board determined that the Fund’s investment advisory fee rate under the Advisory Contract does not constitute a fee that is so disproportionately large as to bear no reasonable relationship to the services rendered and that could not have been the product of arm’s-length bargaining, and concluded to approve the continuance of the Advisory Contract for the coming year.
II. iShares MSCI BRIC ETF
Under Section 15(c) of the Investment Company Act of 1940 (the “1940 Act”), the Company’s Board of Directors (the “Board”), including a majority of Directors who are not “interested persons” of the Company (as that term is defined in the 1940 Act) (the “Independent Directors”), is required annually to consider and approve the Investment Advisory Contract between the Company and BFA (the “Advisory Contract”) on behalf of the Fund. The Independent Directors requested, and BFA provided, such information as the Independent Directors, with advice from independent counsel, deemed reasonably necessary to evaluate the Advisory Contract. A committee of all of the Independent Directors (the “15(c) Committee”), with independent counsel, met with management on May 5, 2017 and May 12, 2017. At these meetings, the 15(c) Committee reviewed and discussed information provided in response to the 15(c) Committee’s initial requests, and requested certain additional information, which management agreed to provide. At a meeting held on May 18, 2017, management presented information to the Board relating to the continuance of the Advisory Contract, including information requested by the 15(c) Committee during its meetings. The Board, including the Independent Directors, reviewed and discussed such information at length. The Independent Directors requested from management certain additional information, which management agreed to provide. At a meeting held on June 19-21, 2017, the Board, including the Independent Directors, reviewed the additional information provided by management in response to these requests. After extensive discussions, the Board, including all of the Independent Directors, approved the continuance of the Advisory Contract for the Fund, based on a review of qualitative and quantitative information provided by BFA. The Board noted its satisfaction with the extent and quality of information provided and its frequent interactions with management, as well as the detailed responses and other information provided by BFA. The Board also noted that the Board and BFA agreed to discuss potential further enhancements to the 15(c) process for the coming year. The Independent Directors were advised by their independent counsel throughout the process, including about the legal standards applicable to their review. In approving the Advisory Contract for the Fund, the Board, including the Independent Directors, considered the following factors, no one of which was controlling, and reached the following conclusions:
Expenses and Performance of the Fund — The Board reviewed statistical information prepared by Broadridge Financial Solutions Inc. (“Broadridge”), an independent provider of investment company data, regarding the expense ratio components, including gross and net total expenses, waivers/reimbursements (if any), and underlying fund fees and expenses (if any) of the Fund in comparison with the same information for other exchange traded funds (“ETFs”) (including, where applicable, funds sponsored by an “at cost” service provider) and, in the limited instances where no comparable ETFs existed and the comparison group would not otherwise be reasonable in Broadridge’s judgment, pure index institutional mutual funds, objectively selected by Broadridge as comprising the Fund’s applicable peer group pursuant to Broadridge’s proprietary ETF methodology (the “Peer Group”). The Board was provided with a detailed description of the proprietary ETF methodology used by Broadridge to determine the Fund’s Peer Group. The Board further noted that due to the limitations in providing comparable funds in the Peer Group, the statistical information provided in Broadridge’s report may or may not provide meaningful direct comparisons to the Fund in all instances.
| 110 | 2017 iSHARES ANNUAL REPORTTO SHAREHOLDERS |
Table of Contents
Board Review and Approval of Investment Advisory
Contract (Continued)
iSHARES®, INC.
The Board also noted that the investment advisory fee rate and overall expenses (net of waivers and reimbursements) for the Fund were higher than the median of the investment advisory fee rates and overall expenses (net of waivers and reimbursements) of the funds in its Peer Group, excluding iShares funds.
In addition, to the extent that any of the comparison funds included in the Peer Group, excluding iShares funds, track the same index as the Fund, Broadridge also provided, and the Board reviewed, a comparison of the Fund’s performance for the one-, three-, five-, ten-year, and since inception periods, as applicable, and for the quarter ended December 31, 2016, to that of relevant comparison funds for the same periods.
The Board noted that the Fund seeks to track its specified underlying index and that, during the year, the Board received periodic reports on the Fund’s short- and longer-term performance in comparison with its underlying index. Such periodic comparative performance information, including any additional detailed information requested by the Boards, was also considered. The Board noted that the Fund generally performed in line with its underlying index over the relevant periods.
Based on this review, the other factors considered at the meeting, and their general knowledge of ETF pricing, the Board concluded that the investment advisory fee rate and the historical performance of the Fund supported the Board’s approval of the continuance of the Advisory Contract for the coming year.
Nature, Extent and Quality of Services Provided by BFA — Based on management’s representations, including information about recent and proposed enhancements to the iShares business, including with respect to capital markets support and analysis, technology, product design, compliance and risk management, and other services, the Board expected that there would be no diminution in the scope of services required of or provided by BFA under the Advisory Contract for the coming year as compared to the scope of services provided by BFA during prior years. In reviewing the scope of these services, the Board considered BFA’s investment philosophy and experience, noting that BFA and its affiliates have committed significant resources over time, including during the past year, to supporting the iShares funds and their shareholders. The Board also considered BFA’s compliance program and its compliance record with respect to the Fund. In that regard, the Board noted that BFA reports to the Board about portfolio management and compliance matters on a periodic basis in connection with regularly scheduled meetings of the Board, and on other occasions as necessary and appropriate, and has provided information and made appropriate officers available as needed to provide further assistance with these matters. The Board also reviewed the background and experience of the persons responsible for the day-to-day management of the Fund, as well as the resources available to them in managing the Fund. In addition to the above considerations, the Board reviewed and considered detailed presentations regarding BFA’s investment performance, investment and risk management processes and strategies provided at the June 19-21, 2017 meeting and throughout the previous year, and matters related to BFA’s portfolio compliance policies and procedures. The Board noted that the Fund had met its investment objective consistently since its inception date.
Based on review of this information, and the performance information discussed above, the Board concluded that the nature, extent and quality of services provided by BFA to the Fund under the Advisory Contract supported the Board’s approval of the continuance of the Advisory Contract for the coming year.
Costs of Services Provided to Fund and Profits Realized by BFA and Affiliates — The Board reviewed information about the profitability of the Fund to BlackRock, based on the fees payable to BFA and its affiliates (including fees under the Advisory Contract), and other sources of revenue and expense to BFA and its affiliates from the Fund’s operations for the last calendar year. The Board reviewed BlackRock’s profitability methodology for the iShares funds, including supplemental information that was responsive to requests of the 15(c) Committee. The Board noted that the 15(c) Committee had focused on the methodology and profitability presentation during its meetings. The Board discussed the sources of direct and ancillary revenue with management, including the revenues to BTC, a BFA affiliate, from securities lending by the Fund. The Board also discussed
BOARD REVIEWAND APPROVALOF INVESTMENT ADVISORY CONTRACT | 111 |
Table of Contents
Board Review and Approval of Investment Advisory
Contract (Continued)
iSHARES®, INC.
BFA’s profit margin as reflected in the Fund’s profitability analysis and reviewed information regarding potential economies of scale (as discussed below). Based on this review, the Board concluded that the profits realized by BFA and its affiliates under the Advisory Contract and from other relationships between the Fund and BFA and/or its affiliates, if any, were within a reasonable range in light of the factors considered.
Economies of Scale — The Board reviewed information regarding potential economies of scale or other efficiencies that may result from increases in the Fund’s assets, noting that the issue of economies of scale had been focused on by the 15(c) Committee during its meetings and addressed by management, including through supplemental information. The Board and the 15(c) Committee reviewed information provided by BFA regarding scale benefits shared with the iShares funds through relatively low fee rates established at inception, breakpoints and waivers or other fee reductions, as well as through additional investment in the iShares business and the provision of improved or additional infrastructure and services to the iShares funds and their shareholders. The Board and the 15(c) Committee received information regarding BlackRock’s historical profitability, including BFA’s and its affiliates’ costs in providing services. The cost information distinguished, among other things, between fixed and variable costs, and explained how the level of fixed and variable costs, as well as the nature of such costs, may impact the existence or size of scale benefits. The Board noted that the Advisory Contract for the Fund already provided for breakpoints in the Fund’s investment advisory fee rate as the assets of the Fund, on an aggregated basis with the assets of certain other iShares funds, increase. The Board noted that it would continue to monitor the sharing of economies of scale to determine the appropriateness of adding new or revised breakpoints in the future.
Based on this review, as well as the other factors considered at the meeting, the Board, recognizing its responsibility to consider the Advisory Contract at least annually, determined to approve the continuance of the Advisory Contract for the coming year.
Fees and Services Provided for Other Comparable Funds/Accounts Managed by BFA and its Affiliates — The Board received and considered information regarding the investment advisory/management fee rates for other funds/accounts in the U.S. for which BFA (or its affiliates) provides investment advisory/management services, including open-end funds registered under the 1940 Act (including sub-advised funds), collective trust funds, and institutional separate accounts (together, the “Other Accounts”), and acknowledged BFA’s assertion that the iShares funds are fundamentally different investment vehicles from the Other Accounts. The Board noted that BFA and its affiliates do not manage Other Accounts with substantially the same investment objective and strategy as the Fund and that track the same index as the Fund. The Board further noted that BFA provided the Board with detailed information regarding how the Other Accounts (particularly institutional clients) generally differ from the Fund, including in terms of the different and generally more extensive services provided to the Fund, as well as other significant differences. In that regard, the Board considered that the pricing of services to institutional clients is typically based on a number of factors beyond the nature and extent of the specific services to be provided and often depends on the overall relationship between the client and its affiliates and the adviser and its affiliates. In addition, the Board considered the relative complexity and inherent risks and challenges of managing and providing other services to the Fund, as a publicly traded ETF, as compared to the Other Accounts that are institutional clients, in light of differing regulatory requirements and client-imposed mandates. The Board also acknowledged BFA’s expressed business purpose for launching a suite of iShares “Core” ETFs that generally are subject to lower investment advisory fees than iShares non-Core ETFs that may provide a similar investment exposure. The Board also considered the “all-inclusive” nature of the Fund’s advisory fee structure, and the Fund expenses borne by BFA under this arrangement. The Board noted that the investment advisory fee rate under the Advisory Contract for the Fund was generally higher than the investment advisory/management fee rates for certain of the Other Accounts (particularly institutional clients) and concluded that the differences appeared to be consistent with the factors discussed.
Other Benefits to BFA and/or its Affiliates — The Board reviewed the “fallout” benefits or ancillary revenue received by BFA and/or its affiliates in connection with the services provided to the Fund by BFA, such as payment of revenue to BTC, the Fund’s securities lending agent, for loaning portfolio securities (which was included in the profit margins reviewed by the Board pursuant
| 112 | 2017 iSHARES ANNUAL REPORTTO SHAREHOLDERS |
Table of Contents
Board Review and Approval of Investment Advisory
Contract (Continued)
iSHARES®, INC.
to BFA’s profitability methodology), and payment of advisory fees and/or administration fees to BFA and BTC (or their affiliates) in connection with any investments by the Fund in other funds for which BFA (or its affiliates) provides investment advisory services and/or administration services. The Board also noted the revenue received by BFA and/or its affiliates pursuant to an agreement that permits a service provider to use certain portions of BlackRock’s technology platform to service accounts managed by BFA and/or its affiliates, including the iShares funds. The Board noted that BFA generally does not use soft dollars or consider the value of research or other services that may be provided to BFA (including its affiliates) in selecting brokers for portfolio transactions for the Fund. The Board further noted that any portfolio transactions on behalf of the Fund placed through a BFA affiliate or purchased from an underwriting syndicate in which a BFA affiliate participates, are reported to the Board pursuant to Rule 17e-1 or Rule 10f-3, as applicable, under the 1940 Act. The Board concluded that any such ancillary benefits would not be disadvantageous to the Fund’s shareholders and thus would not alter the Board’s conclusion with respect to the appropriateness of approving the continuance of the Advisory Contract for the coming year.
Conclusion — Based on the considerations described above, the Board determined that the Fund’s investment advisory fee rate under the Advisory Contract does not constitute a fee that is so disproportionately large as to bear no reasonable relationship to the services rendered and that could not have been the product of arm’s-length bargaining, and concluded to approve the continuance of the Advisory Contract for the coming year.
III. iShares MSCI Emerging Markets Asia ETF
Under Section 15(c) of the Investment Company Act of 1940 (the “1940 Act”), the Company’s Board of Directors (the “Board”), including a majority of Directors who are not “interested persons” of the Company (as that term is defined in the 1940 Act) (the “Independent Directors”), is required annually to consider and approve the Investment Advisory Contract between the Company and BFA (the “Advisory Contract”) on behalf of the Fund. The Independent Directors requested, and BFA provided, such information as the Independent Directors, with advice from independent counsel, deemed reasonably necessary to evaluate the Advisory Contract. A committee of all of the Independent Directors (the “15(c) Committee”), with independent counsel, met with management on May 5, 2017 and May 12, 2017. At these meetings, the 15(c) Committee reviewed and discussed information provided in response to the 15(c) Committee’s initial requests, and requested certain additional information, which management agreed to provide. At a meeting held on May 18, 2017, management presented information to the Board relating to the continuance of the Advisory Contract, including information requested by the 15(c) Committee during its meetings. The Board, including the Independent Directors, reviewed and discussed such information at length. The Independent Directors requested from management certain additional information, which management agreed to provide. At a meeting held on June 19-21, 2017, the Board, including the Independent Directors, reviewed the additional information provided by management in response to these requests. After extensive discussions, the Board, including all of the Independent Directors, approved the continuance of the Advisory Contract for the Fund, based on a review of qualitative and quantitative information provided by BFA. The Board noted its satisfaction with the extent and quality of information provided and its frequent interactions with management, as well as the detailed responses and other information provided by BFA. The Board also noted that the Board and BFA agreed to discuss potential further enhancements to the 15(c) process for the coming year. The Independent Directors were advised by their independent counsel throughout the process, including about the legal standards applicable to their review. In approving the Advisory Contract for the Fund, the Board, including the Independent Directors, considered the following factors, no one of which was controlling, and reached the following conclusions:
Expenses and Performance of the Fund — The Board reviewed statistical information prepared by Broadridge Financial Solutions Inc. (“Broadridge”), an independent provider of investment company data, regarding the expense ratio components, including gross and net total expenses, waivers/reimbursements (if any), and underlying fund fees and expenses (if any) of the Fund in comparison with the same information for other exchange traded funds (“ETFs”) (including, where applicable, funds sponsored by an “at cost” service provider) and, in the limited instances where no comparable ETFs existed and the comparison
BOARD REVIEWAND APPROVALOF INVESTMENT ADVISORY CONTRACT | 113 |
Table of Contents
Board Review and Approval of Investment Advisory
Contract (Continued)
iSHARES®, INC.
group would not otherwise be reasonable in Broadridge’s judgment, pure index institutional mutual funds, objectively selected by Broadridge as comprising the Fund’s applicable peer group pursuant to Broadridge’s proprietary ETF methodology (the “Peer Group”). The Board was provided with a detailed description of the proprietary ETF methodology used by Broadridge to determine the Fund’s Peer Group. The Board further noted that due to the limitations in providing comparable funds in the Peer Group, the statistical information provided in Broadridge’s report may or may not provide meaningful direct comparisons to the Fund in all instances.
The Board also noted that the investment advisory fee rate and overall expenses (net of waivers and reimbursements) for the Fund were lower than the median of the investment advisory fee rates and overall expenses (net of waivers and reimbursements) of the funds in its Peer Group, excluding iShares funds.
In addition, to the extent that any of the comparison funds included in the Peer Group, excluding iShares funds, track the same index as the Fund, Broadridge also provided, and the Board reviewed, a comparison of the Fund’s performance for the one-, three-, five-, ten-year, and since inception periods, as applicable, and for the quarter ended December 31, 2016, to that of relevant comparison funds for the same periods.
The Board noted that the Fund seeks to track its specified underlying index and that, during the year, the Board received periodic reports on the Fund’s short- and longer-term performance in comparison with its underlying index. Such periodic comparative performance information, including any additional detailed information requested by the Boards, was also considered. The Board noted that the Fund generally performed in line with its underlying index over the relevant periods.
Based on this review, the other factors considered at the meeting, and their general knowledge of ETF pricing, the Board concluded that the investment advisory fee rate and the historical performance of the Fund supported the Board’s approval of the continuance of the Advisory Contract for the coming year.
Nature, Extent and Quality of Services Provided by BFA — Based on management’s representations, including information about recent and proposed enhancements to the iShares business, including with respect to capital markets support and analysis, technology, product design, compliance and risk management, and other services, the Board expected that there would be no diminution in the scope of services required of or provided by BFA under the Advisory Contract for the coming year as compared to the scope of services provided by BFA during prior years. In reviewing the scope of these services, the Board considered BFA’s investment philosophy and experience, noting that BFA and its affiliates have committed significant resources over time, including during the past year, to supporting the iShares funds and their shareholders. The Board also considered BFA’s compliance program and its compliance record with respect to the Fund. In that regard, the Board noted that BFA reports to the Board about portfolio management and compliance matters on a periodic basis in connection with regularly scheduled meetings of the Board, and on other occasions as necessary and appropriate, and has provided information and made appropriate officers available as needed to provide further assistance with these matters. The Board also reviewed the background and experience of the persons responsible for the day-to-day management of the Fund, as well as the resources available to them in managing the Fund. In addition to the above considerations, the Board reviewed and considered detailed presentations regarding BFA’s investment performance, investment and risk management processes and strategies provided at the June 19-21, 2017 meeting and throughout the previous year, and matters related to BFA’s portfolio compliance policies and procedures. The Board noted that the Fund had met its investment objective consistently since its inception date.
Based on review of this information, and the performance information discussed above, the Board concluded that the nature, extent and quality of services provided by BFA to the Fund under the Advisory Contract supported the Board’s approval of the continuance of the Advisory Contract for the coming year.
| 114 | 2017 iSHARES ANNUAL REPORTTO SHAREHOLDERS |
Table of Contents
Board Review and Approval of Investment Advisory
Contract (Continued)
iSHARES®, INC.
Costs of Services Provided to Fund and Profits Realized by BFA and Affiliates — The Board reviewed information about the profitability of the Fund to BlackRock, based on the fees payable to BFA and its affiliates (including fees under the Advisory Contract), and other sources of revenue and expense to BFA and its affiliates from the Fund’s operations for the last calendar year. The Board reviewed BlackRock’s profitability methodology for the iShares funds, including supplemental information that was responsive to requests of the 15(c) Committee. The Board noted that the 15(c) Committee had focused on the methodology and profitability presentation during its meetings. The Board discussed the sources of direct and ancillary revenue with management, including the revenues to BTC, a BFA affiliate, from securities lending by the Fund. The Board also discussed BFA’s profit margin as reflected in the Fund’s profitability analysis and reviewed information regarding potential economies of scale (as discussed below). Based on this review, the Board concluded that the profits realized by BFA and its affiliates under the Advisory Contract and from other relationships between the Fund and BFA and/or its affiliates, if any, were within a reasonable range in light of the factors considered.
Economies of Scale — The Board reviewed information regarding potential economies of scale or other efficiencies that may result from increases in the Fund’s assets, noting that the issue of economies of scale had been focused on by the 15(c) Committee during its meetings and addressed by management, including through supplemental information. The Board and the 15(c) Committee reviewed information provided by BFA regarding scale benefits shared with the iShares funds through relatively low fee rates established at inception, breakpoints and waivers or other fee reductions, as well as through additional investment in the iShares business and the provision of improved or additional infrastructure and services to the iShares funds and their shareholders. The Board and the 15(c) Committee received information regarding BlackRock’s historical profitability, including BFA’s and its affiliates’ costs in providing services. The cost information distinguished, among other things, between fixed and variable costs, and explained how the level of fixed and variable costs, as well as the nature of such costs, may impact the existence or size of scale benefits. The Board noted that the Advisory Contract for the Fund did not provide for any breakpoints in the Fund’s investment advisory fee rate as the assets of the Fund increase. However, the Board noted that should material economies of scale be identified in the future that are not otherwise shared, a breakpoint structure for the Fund may be appropriate, and that it would continue to monitor the sharing of economies of scale to determine the appropriateness of adding breakpoints in the future.
Based on this review, as well as the other factors considered at the meeting, the Board, recognizing its responsibility to consider the Advisory Contract at least annually, determined to approve the continuance of the Advisory Contract for the coming year.
Fees and Services Provided for Other Comparable Funds/Accounts Managed by BFA and its Affiliates — The Board received and considered information regarding the investment advisory/management fee rates for other funds/accounts in the U.S. for which BFA (or its affiliates) provides investment advisory/management services, including open-end funds registered under the 1940 Act (including sub-advised funds), collective trust funds, and institutional separate accounts (together, the “Other Accounts”), and acknowledged BFA’s assertion that the iShares funds are fundamentally different investment vehicles from the Other Accounts. The Board noted that BFA and its affiliates do not manage Other Accounts with substantially the same investment objective and strategy as the Fund and that track the same index as the Fund. The Board further noted that BFA provided the Board with detailed information regarding how the Other Accounts (particularly institutional clients) generally differ from the Fund, including in terms of the different and generally more extensive services provided to the Fund, as well as other significant differences. In that regard, the Board considered that the pricing of services to institutional clients is typically based on a number of factors beyond the nature and extent of the specific services to be provided and often depends on the overall relationship between the client and its affiliates and the adviser and its affiliates. In addition, the Board considered the relative complexity and inherent risks and challenges of managing and providing other services to the Fund, as a publicly traded ETF, as compared to the Other Accounts that are institutional clients, in light of differing regulatory requirements and client-imposed mandates. The Board also acknowledged BFA’s expressed business purpose for launching a suite of iShares “Core” ETFs that generally are subject to lower investment advisory fees than iShares non-Core ETFs that may provide a similar investment
BOARD REVIEWAND APPROVALOF INVESTMENT ADVISORY CONTRACT | 115 |
Table of Contents
Board Review and Approval of Investment Advisory
Contract (Continued)
iSHARES®, INC.
exposure. The Board also considered the “all-inclusive” nature of the Fund’s advisory fee structure, and the Fund expenses borne by BFA under this arrangement. The Board noted that the investment advisory fee rate under the Advisory Contract for the Fund was generally higher than the investment advisory/management fee rates for certain of the Other Accounts (particularly institutional clients) and concluded that the differences appeared to be consistent with the factors discussed.
Other Benefits to BFA and/or its Affiliates — The Board reviewed the “fallout” benefits or ancillary revenue received by BFA and/or its affiliates in connection with the services provided to the Fund by BFA, such as payment of revenue to BTC, the Fund’s securities lending agent, for loaning portfolio securities (which was included in the profit margins reviewed by the Board pursuant to BFA’s profitability methodology), and payment of advisory fees and/or administration fees to BFA and BTC (or their affiliates) in connection with any investments by the Fund in other funds for which BFA (or its affiliates) provides investment advisory services and/or administration services. The Board also noted the revenue received by BFA and/or its affiliates pursuant to an agreement that permits a service provider to use certain portions of BlackRock’s technology platform to service accounts managed by BFA and/or its affiliates, including the iShares funds. The Board noted that BFA generally does not use soft dollars or consider the value of research or other services that may be provided to BFA (including its affiliates) in selecting brokers for portfolio transactions for the Fund. The Board further noted that any portfolio transactions on behalf of the Fund placed through a BFA affiliate or purchased from an underwriting syndicate in which a BFA affiliate participates, are reported to the Board pursuant to Rule 17e-1 or Rule 10f-3, as applicable, under the 1940 Act. The Board concluded that any such ancillary benefits would not be disadvantageous to the Fund’s shareholders and thus would not alter the Board’s conclusion with respect to the appropriateness of approving the continuance of the Advisory Contract for the coming year.
Conclusion — Based on the considerations described above, the Board determined that the Fund’s investment advisory fee rate under the Advisory Contract does not constitute a fee that is so disproportionately large as to bear no reasonable relationship to the services rendered and that could not have been the product of arm’s-length bargaining, and concluded to approve the continuance of the Advisory Contract for the coming year.
IV. iShares MSCI Emerging Markets Small-Cap ETF
Under Section 15(c) of the Investment Company Act of 1940 (the “1940 Act”), the Company’s Board of Directors (the “Board”), including a majority of Directors who are not “interested persons” of the Company (as that term is defined in the 1940 Act) (the “Independent Directors”), is required annually to consider and approve the Investment Advisory Contract between the Company and BFA (the “Advisory Contract”) on behalf of the Fund. The Independent Directors requested, and BFA provided, such information as the Independent Directors, with advice from independent counsel, deemed reasonably necessary to evaluate the Advisory Contract. A committee of all of the Independent Directors (the “15(c) Committee”), with independent counsel, met with management on May 5, 2017 and May 12, 2017. At these meetings, the 15(c) Committee reviewed and discussed information provided in response to the 15(c) Committee’s initial requests, and requested certain additional information, which management agreed to provide. At a meeting held on May 18, 2017, management presented information to the Board relating to the continuance of the Advisory Contract, including information requested by the 15(c) Committee during its meetings. The Board, including the Independent Directors, reviewed and discussed such information at length. The Independent Directors requested from management certain additional information, which management agreed to provide. At a meeting held on June 19-21, 2017, the Board, including the Independent Directors, reviewed the additional information provided by management in response to these requests. After extensive discussions, the Board, including all of the Independent Directors, approved the continuance of the Advisory Contract for the Fund, based on a review of qualitative and quantitative information provided by BFA. The Board noted its satisfaction with the extent and quality of information provided and its frequent interactions with management, as well as the detailed responses and other information provided by BFA. The Board also noted that the Board and BFA agreed to discuss potential further enhancements to the 15(c) process for the coming year. The Independent Directors were advised by their
| 116 | 2017 iSHARES ANNUAL REPORTTO SHAREHOLDERS |
Table of Contents
Board Review and Approval of Investment Advisory
Contract (Continued)
iSHARES®, INC.
independent counsel throughout the process, including about the legal standards applicable to their review. In approving the Advisory Contract for the Fund, the Board, including the Independent Directors, considered the following factors, no one of which was controlling, and reached the following conclusions:
Expenses and Performance of the Fund — The Board reviewed statistical information prepared by Broadridge Financial Solutions Inc. (“Broadridge”), an independent provider of investment company data, regarding the expense ratio components, including gross and net total expenses, waivers/reimbursements (if any), and underlying fund fees and expenses (if any) of the Fund in comparison with the same information for other exchange traded funds (“ETFs”) (including, where applicable, funds sponsored by an “at cost” service provider) and, in the limited instances where no comparable ETFs existed and the comparison group would not otherwise be reasonable in Broadridge’s judgment, pure index institutional mutual funds, objectively selected by Broadridge as comprising the Fund’s applicable peer group pursuant to Broadridge’s proprietary ETF methodology (the “Peer Group”). The Board was provided with a detailed description of the proprietary ETF methodology used by Broadridge to determine the Fund’s Peer Group. The Board further noted that due to the limitations in providing comparable funds in the Peer Group, the statistical information provided in Broadridge’s report may or may not provide meaningful direct comparisons to the Fund in all instances.
The Board also noted that the investment advisory fee rate and overall expenses (net of waivers and reimbursements) for the Fund were higher than the median of the investment advisory fee rates and overall expenses (net of waivers and reimbursements) of the funds in its Peer Group, excluding iShares funds. The Board further noted that the Fund invests primarily in securities of small-cap companies in emerging markets, as compared to most of the funds in the Peer Group, which do not invest primarily in the securities of small-cap companies in emerging markets.
In addition, to the extent that any of the comparison funds included in the Peer Group, excluding iShares funds, track the same index as the Fund, Broadridge also provided, and the Board reviewed, a comparison of the Fund’s performance for the one-, three-, five-, ten-year, and since inception periods, as applicable, and for the quarter ended December 31, 2016, to that of relevant comparison funds for the same periods.
The Board noted that the Fund seeks to track its specified underlying index and that, during the year, the Board received periodic reports on the Fund’s short- and longer-term performance in comparison with its underlying index. Such periodic comparative performance information, including any additional detailed information requested by the Boards, was also considered. The Board noted that the Fund generally performed in line with its underlying index over the relevant periods.
Based on this review, the other factors considered at the meeting, and their general knowledge of ETF pricing, the Board concluded that the investment advisory fee rate and the historical performance of the Fund supported the Board’s approval of the continuance of the Advisory Contract for the coming year.
Nature, Extent and Quality of Services Provided by BFA — Based on management’s representations, including information about recent and proposed enhancements to the iShares business, including with respect to capital markets support and analysis, technology, product design, compliance and risk management, and other services, the Board expected that there would be no diminution in the scope of services required of or provided by BFA under the Advisory Contract for the coming year as compared to the scope of services provided by BFA during prior years. In reviewing the scope of these services, the Board considered BFA’s investment philosophy and experience, noting that BFA and its affiliates have committed significant resources over time, including during the past year, to supporting the iShares funds and their shareholders. The Board also considered BFA’s compliance program and its compliance record with respect to the Fund. In that regard, the Board noted that BFA reports to the Board about portfolio management and compliance matters on a periodic basis in connection with regularly scheduled meetings of the Board, and on other occasions as necessary and appropriate, and has provided information and made
BOARD REVIEWAND APPROVALOF INVESTMENT ADVISORY CONTRACT | 117 |
Table of Contents
Board Review and Approval of Investment Advisory
Contract (Continued)
iSHARES®, INC.
appropriate officers available as needed to provide further assistance with these matters. The Board also reviewed the background and experience of the persons responsible for the day-to-day management of the Fund, as well as the resources available to them in managing the Fund. In addition to the above considerations, the Board reviewed and considered detailed presentations regarding BFA’s investment performance, investment and risk management processes and strategies provided at the June 19-21, 2017 meeting and throughout the previous year, and matters related to BFA’s portfolio compliance policies and procedures. The Board noted that the Fund had met its investment objective consistently since its inception date.
Based on review of this information, and the performance information discussed above, the Board concluded that the nature, extent and quality of services provided by BFA to the Fund under the Advisory Contract supported the Board’s approval of the continuance of the Advisory Contract for the coming year.
Costs of Services Provided to Fund and Profits Realized by BFA and Affiliates — The Board reviewed information about the profitability of the Fund to BlackRock, based on the fees payable to BFA and its affiliates (including fees under the Advisory Contract), and other sources of revenue and expense to BFA and its affiliates from the Fund’s operations for the last calendar year. The Board reviewed BlackRock’s profitability methodology for the iShares funds, including supplemental information that was responsive to requests of the 15(c) Committee. The Board noted that the 15(c) Committee had focused on the methodology and profitability presentation during its meetings. The Board discussed the sources of direct and ancillary revenue with management, including the revenues to BTC, a BFA affiliate, from securities lending by the Fund. The Board also discussed BFA’s profit margin as reflected in the Fund’s profitability analysis and reviewed information regarding potential economies of scale (as discussed below). Based on this review, the Board concluded that the profits realized by BFA and its affiliates under the Advisory Contract and from other relationships between the Fund and BFA and/or its affiliates, if any, were within a reasonable range in light of the factors considered.
Economies of Scale — The Board reviewed information regarding potential economies of scale or other efficiencies that may result from increases in the Fund’s assets, noting that the issue of economies of scale had been focused on by the 15(c) Committee during its meetings and addressed by management, including through supplemental information. The Board and the 15(c) Committee reviewed information provided by BFA regarding scale benefits shared with the iShares funds through relatively low fee rates established at inception, breakpoints and waivers or other fee reductions, as well as through additional investment in the iShares business and the provision of improved or additional infrastructure and services to the iShares funds and their shareholders. The Board and the 15(c) Committee received information regarding BlackRock’s historical profitability, including BFA’s and its affiliates’ costs in providing services. The cost information distinguished, among other things, between fixed and variable costs, and explained how the level of fixed and variable costs, as well as the nature of such costs, may impact the existence or size of scale benefits. The Board noted that the Advisory Contract for the Fund already provided for breakpoints in the Fund’s investment advisory fee rate as the assets of the Fund, on an aggregated basis with the assets of certain other iShares funds, increase. The Board noted that it would continue to monitor the sharing of economies of scale to determine the appropriateness of adding new or revised breakpoints in the future.
Based on this review, as well as the other factors considered at the meeting, the Board, recognizing its responsibility to consider the Advisory Contract at least annually, determined to approve the continuance of the Advisory Contract for the coming year.
Fees and Services Provided for Other Comparable Funds/Accounts Managed by BFA and its Affiliates — The Board received and considered information regarding the investment advisory/management fee rates for other funds/accounts in the U.S. for which BFA (or its affiliates) provides investment advisory/management services, including open-end funds registered under the 1940 Act (including sub-advised funds), collective trust funds, and institutional separate accounts (together, the “Other Accounts”), and acknowledged BFA’s assertion that the iShares funds are fundamentally different investment vehicles from the Other Accounts. The Board noted that BFA and its affiliates do manage Other Accounts with substantially the same investment
| 118 | 2017 iSHARES ANNUAL REPORTTO SHAREHOLDERS |
Table of Contents
Board Review and Approval of Investment Advisory
Contract (Continued)
iSHARES®, INC.
objective and strategy as the Fund and that track the same index as the Fund. The Board further noted that BFA provided the Board with detailed information regarding how the Other Accounts (particularly institutional clients) generally differ from the Fund, including in terms of the different and generally more extensive services provided to the Fund, as well as other significant differences. In that regard, the Board considered that the pricing of services to institutional clients is typically based on a number of factors beyond the nature and extent of the specific services to be provided and often depends on the overall relationship between the client and its affiliates and the adviser and its affiliates. In addition, the Board considered the relative complexity and inherent risks and challenges of managing and providing other services to the Fund, as a publicly traded ETF, as compared to the Other Accounts that are institutional clients, in light of differing regulatory requirements and client-imposed mandates. The Board also acknowledged BFA’s expressed business purpose for launching a suite of iShares “Core” ETFs that generally are subject to lower investment advisory fees than iShares non-Core ETFs that may provide a similar investment exposure. The Board also considered the “all-inclusive” nature of the Fund’s advisory fee structure, and the Fund expenses borne by BFA under this arrangement. The Board noted that the investment advisory fee rate under the Advisory Contract for the Fund was generally higher than the investment advisory/management fee rates for certain of the Other Accounts (particularly institutional clients) and concluded that the differences appeared to be consistent with the factors discussed.
Other Benefits to BFA and/or its Affiliates — The Board reviewed the “fallout” benefits or ancillary revenue received by BFA and/or its affiliates in connection with the services provided to the Fund by BFA, such as payment of revenue to BTC, the Fund’s securities lending agent, for loaning portfolio securities (which was included in the profit margins reviewed by the Board pursuant to BFA’s profitability methodology), and payment of advisory fees and/or administration fees to BFA and BTC (or their affiliates) in connection with any investments by the Fund in other funds for which BFA (or its affiliates) provides investment advisory services and/or administration services. The Board also noted the revenue received by BFA and/or its affiliates pursuant to an agreement that permits a service provider to use certain portions of BlackRock’s technology platform to service accounts managed by BFA and/or its affiliates, including the iShares funds. The Board noted that BFA generally does not use soft dollars or consider the value of research or other services that may be provided to BFA (including its affiliates) in selecting brokers for portfolio transactions for the Fund. The Board further noted that any portfolio transactions on behalf of the Fund placed through a BFA affiliate or purchased from an underwriting syndicate in which a BFA affiliate participates, are reported to the Board pursuant to Rule 17e-1 or Rule 10f-3, as applicable, under the 1940 Act. The Board concluded that any such ancillary benefits would not be disadvantageous to the Fund’s shareholders and thus would not alter the Board’s conclusion with respect to the appropriateness of approving the continuance of the Advisory Contract for the coming year.
Conclusion — Based on the considerations described above, the Board determined that the Fund’s investment advisory fee rate under the Advisory Contract does not constitute a fee that is so disproportionately large as to bear no reasonable relationship to the services rendered and that could not have been the product of arm’s-length bargaining, and concluded to approve the continuance of the Advisory Contract for the coming year.
BOARD REVIEWAND APPROVALOF INVESTMENT ADVISORY CONTRACT | 119 |
Table of Contents
Supplemental Information (Unaudited)
iSHARES®, INC.
Proxy Results
A special meeting of the shareholders of each series of iShares, Inc. (the “Company”) was held on June 19, 2017, to elect five Directors to the Board of Directors of the Company. The five nominees were Jane D. Carlin, Richard L. Fagnani, Drew E. Lawton, Madhav V. Rajan and Mark Wiedman, all of whom were elected as Directors at the special meeting. The other Directors whose terms of office as Directors continued after the special meeting are Cecilia H. Herbert, Charles A. Hurty, John E. Kerrigan, John E. Martinez and Robert S. Kapito.
| Director | Votes For | Votes Withheld | ||||||
Jane D. Carlin | 1,911,835,929 | 49,339,171 | ||||||
Richard L. Fagnani | 1,911,725,344 | 49,449,755 | ||||||
Drew E. Lawton | 1,911,790,083 | 49,385,017 | ||||||
Madhav V. Rajan | 1,902,999,095 | 58,176,004 | ||||||
Mark Wiedman | 1,908,143,500 | 53,031,599 | ||||||
Section 19(a) Notices
The amounts and sources of distributions reported are estimates and are provided pursuant to regulatory requirements and are not being provided for tax reporting purposes. The actual amounts and sources for tax reporting purposes will depend upon each Fund’s investment experience during the year and may be subject to changes based on the tax regulations. Shareholders will receive a Form 1099-DIV each calendar year that will inform them how to report these distributions for federal income tax purposes.
| Total Cumulative Distributions for the Fiscal Year | % Breakdown of the Total Cumulative Distributions for the Fiscal Yea | |||||||||||||||||||||||||||||||
| iShares ETF | Net Investment Income | Net Realized Capital Gains | Return of Capital | Total Per Share | Net Investment Income | Net Realized Capital Gains | Return of Capital | Total Per Share | ||||||||||||||||||||||||
Core MSCI Emerging Markets | $ | 0.946487 | $ | — | $ | — | $ | 0.946487 | 100 | — | % | — | % | 100 | % | |||||||||||||||||
MSCI BRIC | 0.535903 | — | 0.007314 | 0.543217 | 99 | — | 1 | 100 | ||||||||||||||||||||||||
MSCI Emerging Markets Asia | 0.920183 | — | — | 0.920183 | 100 | — | — | 100 | ||||||||||||||||||||||||
MSCI Emerging Markets Small-Cap | 0.885048 | — | — | 0.885048 | 100 | — | — | 100 | ||||||||||||||||||||||||
Premium/Discount Information
The Premium/Discount Information section is intended to present information about the differences between the daily market price on secondary markets for shares of a fund and that fund’s NAV. NAV is the price at which a fund issues and redeems shares. It is calculated in accordance with the standard formula for valuing mutual fund shares. The “Market Price” of a fund generally is determined using the midpoint between the highest bid and the lowest ask on the primary securities exchange on which shares of such fund are listed for trading, as of the time that the fund’s NAV is calculated. A fund’s Market Price may be at, above or below its NAV. The NAV of a fund will fluctuate with changes in the value of its portfolio holdings. The Market Price of a fund will fluctuate in accordance with changes in its NAV, as well as market supply and demand.
Premiums or discounts are the differences (expressed as a percentage) between the NAV and Market Price of a fund on a given day, generally at the time the NAV is calculated. A premium is the amount that a fund is trading above the reported NAV,
| 120 | 2017 iSHARES ANNUAL REPORTTO SHAREHOLDERS |
Table of Contents
Supplemental Information (Unaudited) (Continued)
iSHARES®, INC.
expressed as a percentage of the NAV. A discount is the amount that a fund is trading below the reported NAV, expressed as a percentage of the NAV.
Premium/discount information for the Funds covering the most recently completed calendar year and the most recently completed calendar quarters since that year (or the life of the Fund, if shorter) is publicly accessible, free of charge, at www.iShares.com.
The following information shows the frequency of distributions of premiums and discounts for the Funds for the immediately preceding five calendar years (or from the inception date of the Fund, if less than five years) through the date of the most recent calendar quarter-end. Each line in each table shows the number of trading days in which the Fund traded within the premium/discount range indicated. The number of trading days in each premium/discount range is also shown as a percentage of the total number of trading days in the period covered by each table. All data presented here represents past performance, which cannot be used to predict future results.
iShares MSCI Core Emerging Markets ETF
Period Covered: October 18, 2012 through June 30, 2017
Premium/Discount Range | Number of Days | Percentage of Total Days | ||||||
Greater than 2.5% | 2 | 0.17 | % | |||||
Greater than 2.0% and Less than 2.5% | 8 | 0.68 | ||||||
Greater than 1.5% and Less than 2.0% | 25 | 2.12 | ||||||
Greater than 1.0% and Less than 1.5% | 74 | 6.26 | ||||||
Greater than 0.5% and Less than 1.0% | 275 | 23.27 | ||||||
Greater than 0.0% and Less than 0.5% | 415 | 35.10 | ||||||
At NAV | 11 | 0.93 | ||||||
Less than 0.0% and Greater than –0.5% | 232 | 19.63 | ||||||
Less than –0.5% and Greater than –1.0% | 94 | 7.95 | ||||||
Less than –1.0% and Greater than –1.5% | 29 | 2.45 | ||||||
Less than –1.5% and Greater than –2.0% | 12 | 1.02 | ||||||
Less than –2.0% and Greater than –2.5% | 5 | 0.42 | ||||||
|
|
|
| |||||
| 1,182 | 100.00 | % | ||||||
|
|
|
| |||||
SUPPLEMENTAL INFORMATION | 121 |
Table of Contents
Supplemental Information (Unaudited) (Continued)
iSHARES®, INC.
iShares MSCI BRIC ETF
Period Covered: January 1, 2012 through June 30, 2017
Premium/Discount Range | Number of Days | Percentage of Total Days | ||||||
Greater than 2.5% | 1 | 0.07 | % | |||||
Greater than 2.0% and Less than 2.5% | 1 | 0.07 | ||||||
Greater than 1.5% and Less than 2.0% | 9 | 0.65 | ||||||
Greater than 1.0% and Less than 1.5% | 30 | 2.17 | ||||||
Greater than 0.5% and Less than 1.0% | 122 | 8.82 | ||||||
Greater than 0.0% and Less than 0.5% | 356 | 25.74 | ||||||
At NAV | 12 | 0.87 | ||||||
Less than 0.0% and Greater than –0.5% | 442 | 31.97 | ||||||
Less than –0.5% and Greater than –1.0% | 268 | 19.38 | ||||||
Less than –1.0% and Greater than –1.5% | 94 | 6.80 | ||||||
Less than –1.5% and Greater than –2.0% | 32 | 2.31 | ||||||
Less than –2.0% and Greater than –2.5% | 9 | 0.65 | ||||||
Less than –2.5% and Greater than –3.0% | 4 | 0.29 | ||||||
Less than –3.0% and Greater than –3.5% | 1 | 0.07 | ||||||
Less than –3.5% and Greater than –4.0% | 1 | 0.07 | ||||||
Less than –4.0% | 1 | 0.07 | ||||||
|
|
|
| |||||
| 1,383 | 100.00 | % | ||||||
|
|
|
| |||||
iShares MSCI Emerging Markets Asia ETF
Period Covered: February 8, 2012 through June 30, 2017
Premium/Discount Range | Number of Days | Percentage of Total Days | ||||||
Greater than 3.0% | 1 | 0.07 | % | |||||
Greater than 2.5% and Less than 3.0% | 2 | 0.15 | ||||||
Greater than 2.0% and Less than 2.5% | 6 | 0.44 | ||||||
Greater than 1.5% and Less than 2.0% | 35 | 2.58 | ||||||
Greater than 1.0% and Less than 1.5% | 103 | 7.58 | ||||||
Greater than 0.5% and Less than 1.0% | 252 | 18.56 | ||||||
Greater than 0.0% and Less than 0.5% | 388 | 28.58 | ||||||
At NAV | 15 | 1.10 | ||||||
Less than 0.0% and Greater than –0.5% | 272 | 20.03 | ||||||
Less than –0.5% and Greater than –1.0% | 181 | 13.33 | ||||||
Less than –1.0% and Greater than –1.5% | 59 | 4.34 | ||||||
Less than –1.5% and Greater than –2.0% | 24 | 1.77 | ||||||
Less than –2.0% and Greater than –2.5% | 11 | 0.81 | ||||||
Less than –2.5% and Greater than –3.0% | 6 | 0.44 | ||||||
Less than –3.0% and Greater than –3.5% | 3 | 0.22 | ||||||
|
|
|
| |||||
| 1,358 | 100.00 | % | ||||||
|
|
|
| |||||
| 122 | 2017 iSHARES ANNUAL REPORTTO SHAREHOLDERS |
Table of Contents
Supplemental Information (Unaudited) (Continued)
iSHARES®, INC.
iShares MSCI Emerging Markets Small-Cap ETF
Period Covered: January 1, 2012 through June 30, 2017
Premium/Discount Range | Number of Days | Percentage of Total Days | ||||||
Greater than 5.5% | 1 | 0.07 | % | |||||
Greater than 5.0% and Less than 5.5% | 1 | 0.07 | ||||||
Greater than 4.5% and Less than 5.0% | 1 | 0.07 | ||||||
Greater than 4.0% and Less than 4.5% | 2 | 0.14 | ||||||
Greater than 3.5% and Less than 4.0% | 2 | 0.14 | ||||||
Greater than 3.0% and Less than 3.5% | 3 | 0.22 | ||||||
Greater than 2.5% and Less than 3.0% | 6 | 0.43 | ||||||
Greater than 2.0% and Less than 2.5% | 21 | 1.52 | ||||||
Greater than 1.5% and Less than 2.0% | 51 | 3.69 | ||||||
Greater than 1.0% and Less than 1.5% | 136 | 9.83 | ||||||
Greater than 0.5% and Less than 1.0% | 320 | 23.15 | ||||||
Greater than 0.0% and Less than 0.5% | 389 | 28.14 | ||||||
At NAV | 8 | 0.58 | ||||||
Less than 0.0% and Greater than –0.5% | 235 | 16.99 | ||||||
Less than –0.5% and Greater than –1.0% | 130 | 9.40 | ||||||
Less than –1.0% and Greater than –1.5% | 45 | 3.25 | ||||||
Less than –1.5% and Greater than –2.0% | 22 | 1.59 | ||||||
Less than –2.0% and Greater than –2.5% | 7 | 0.51 | ||||||
Less than –2.5% and Greater than –3.0% | 2 | 0.14 | ||||||
Less than –3.0% | 1 | 0.07 | ||||||
|
|
|
| |||||
| 1,383 | 100.00 | % | ||||||
|
|
|
| |||||
Regulation under the Alternative Investment Fund Managers Directive
The Alternative Investment Fund Managers Directive (“AIFMD”) imposes obligations on fund managers established in the European Union (the “EU”). These do not currently apply to managers established outside the EU, such as BFA. Rather, non-EU managers are only required to comply with certain disclosure, reporting and transparency obligations of AIFMD if such managers market a fund to EU investors.
BFA has registered the iShares Core MSCI Emerging Markets ETF and iShares MSCI BRIC ETF (each a “Fund”, collectively the “Funds”) for marketing to investors in the United Kingdom, the Netherlands, Finland, Sweden and Luxembourg.
Report on Remuneration
BFA is required under AIFMD to make quantitative disclosures of remuneration. These disclosures are made in line with BlackRock’s interpretation of currently available regulatory guidance on quantitative remuneration disclosures. As market or regulatory practice develops BlackRock may consider it appropriate to make changes to the way in which quantitative remuneration disclosures are calculated. Where such changes are made, this may result in disclosures in relation to a fund not being comparable to the disclosures made in the prior year, or in relation to other BlackRock fund disclosures in that same year.
Disclosures are provided in relation to both (a) the staff of BFA; (b) staff who are senior management; and (c) staff who have the ability to materially affect the risk profile of the Funds.
SUPPLEMENTAL INFORMATION | 123 |
Table of Contents
Supplemental Information (Unaudited) (Continued)
iSHARES®, INC.
All individuals included in the aggregated figures disclosed are rewarded in line with BlackRock’s remuneration policy for their responsibilities across the relevant BlackRock business area. As all individuals have a number of areas of responsibilities, only the portion of remuneration for those individuals’ services attributable to each Fund is included in the aggregate figures disclosed.
BlackRock has a clear and well defined pay-for-performance philosophy, and compensation programs which support that philosophy. For senior management, a significant percentage of variable remuneration is deferred over time. All employees are subject to a claw-back policy.
Compensation decisions for employees are made based on BlackRock’s full-year financial results and other non-financial goals and objectives. Alongside financial performance, individual compensation is also based on strategic and operating results and other considerations such as management and leadership capabilities. No set formulas are established and no fixed benchmarks are used in determining annual incentive awards.
Bonus pools are reviewed by BlackRock’s independent compensation committee, taking into account both actual and projected financial information together with information provided by the Operational Risk and Regulatory Compliance departments in relation to any activities, incidents or events that warrant consideration in making compensation decisions.
Functions such as Finance, Operational Risk, Legal & Compliance, and Human Resources each have their own organizational structures which are independent of the business units. Functional bonus pools are determined with reference to the performance of each individual function and the remuneration of the senior members of control functions is directly overseen by BlackRock’s independent compensation committee. No individual is involved in setting his or her own remuneration.
Members of staff and senior management of BFA typically provide both AIFMD and non-AIFMD related services in respect of multiple funds, clients and functions of BFA and across the broader BlackRock group. Therefore, the figures disclosed are a sum of each individual’s portion of remuneration attributable to each Fund according to an objective apportionment methodology which acknowledges the multiple-service nature of BFA. Accordingly the figures are not representative of any individual’s actual remuneration or their remuneration structure.
The amount of the total remuneration awarded by BFA to its staff which has been attributed to the iShares Core MSCI Emerging Markets ETF in respect of BFA’s financial year ending December 31, 2016 was USD 1.91 million. This figure is comprised of fixed remuneration of USD 749.98 thousand and variable remuneration of USD 1.16 million. There were a total of 325 beneficiaries of the remuneration described above.
The amount of the aggregate remuneration awarded by BFA, which has been attributed to the iShares Core MSCI Emerging Markets ETF in respect of BFA’s financial year ending December 31, 2016, to its senior management was USD 263.67 thousand, and to members of its staff whose actions have a material impact on the risk profile of the Fund was USD 63.52 thousand.
The amount of the total remuneration awarded by BFA to its staff which has been attributed to the iShares MSCI BRIC ETF in respect of BFA’s financial year ending December 31, 2016 was USD 16.16 thousand. This figure is comprised of fixed remuneration of USD 6.36 thousand and variable remuneration of USD 9.80 thousand. There were a total of 325 beneficiaries of the remuneration described above.
The amount of the aggregate remuneration awarded by BFA, which has been attributed to the iShares MSCI BRIC ETF in respect of the BFA’s financial year ending December 31, 2016, to its senior management was USD 2.24 thousand, and to members of its staff whose actions have a material impact on the risk profile of the Fund was USD 0.54 thousand.
| 124 | 2017 iSHARES ANNUAL REPORTTO SHAREHOLDERS |
Table of Contents
Director and Officer Information
iSHARES®, INC.
The Board of Directors has responsibility for the overall management and operations of the Funds, including general supervision of the duties performed by BFA and other service providers. Each Director serves until he or she resigns, is removed, dies, retires or becomes incapacitated. Each officer shall hold office until his or her successor is elected and qualifies or until his or her death, resignation or removal. Directors who are not “interested persons” (as defined in the 1940 Act) of the Company are referred to as independent directors (“Independent Directors”).
The registered investment companies advised by BFA or its affiliates (the “BlackRock-advised Funds”) are organized into one complex of closed-end funds, two complexes of open-end funds and one complex of exchange-traded funds (“Exchange-Traded Fund Complex”) (each, a “BlackRock Fund Complex”). Each Fund is included in the BlackRock Fund Complex referred to as the Exchange-Traded Fund Complex. Each Director also serves as a Trustee of iShares Trust and a Trustee of iShares U.S. ETF Trust and, as a result, oversees a total of 344 funds (as of August 31, 2017) within the Exchange-Traded Fund Complex. Drew E. Lawton, from October 2016 to June 2017, and Richard L. Fagnani, from April 2017 to June 2017, served as Advisory Board Members for iShares Trust, iShares Inc. and iShares U.S. ETF Trust with respect to all funds within the Exchange-Traded Fund Complex. With the exception of Robert S. Kapito, Mark K. Wiedman, Charles Park, Martin Small and Benjamin Archibald, the address of each Director, and officer is c/o BlackRock, Inc., 400 Howard Street, San Francisco, CA 94105. The address of Mr. Kapito, Mr. Wiedman, Mr. Park, Mr. Small and Mr. Archibald is c/o BlackRock, Inc., Park Avenue Plaza, 55 East 52nd Street, New York, NY 10055. The Board has designated Cecilia H. Herbert as its Independent Board Chair. Additional information about the Funds’ Directors and officers may be found in the Funds’ combined Statement of Additional Information, which is available without charge, upon request, by calling toll-free 1-800-iShares (1-800-474-2737).
Interested Directors
| Name (Age) | Position(s) | Principal Occupation(s) During the Past 5 Years | Other Directorships Held by Director | |||
Robert S. Kapitoa (60) | Director (since 2009). | President, BlackRock, Inc. (since 2006); Vice Chairman of BlackRock, Inc. and Head of BlackRock’s Portfolio Management Group (since its formation in 1998) and BlackRock, Inc.’s predecessor entities (since 1988); Trustee, University of Pennsylvania (since 2009); President of Board of Directors, Hope & Heroes Children’s Cancer Fund (since 2002). | Director of BlackRock, Inc. (since 2006); Trustee of iShares Trust (since 2009); Trustee of iShares U.S. ETF Trust (since 2011). | |||
Mark K. Wiedmanb (46) | Director (since 2013). | Senior Managing Director, BlackRock, Inc. (since 2014); Managing Director, BlackRock, Inc. (2007-2014); Global Head of BlackRock’s ETF and Index Investments Business (since 2016); Global Head of iShares (2011-2016); Head of Corporate Strategy, BlackRock, Inc. (2009-2011). | Trustee of iShares Trust (since 2013); Trustee of iShares U.S. ETF Trust (since 2013); Director of PennyMac Financial Services, Inc. (since 2008). | |||
| a | Robert S. Kapito is deemed to be an “interested person” (as defined in the 1940 Act) of the Company due to his affiliations with BlackRock, Inc. and its affiliates. |
| b | Mark K. Wiedman is deemed to be an “interested person” (as defined in the 1940 Act) of the Company due to his affiliations with BlackRock, Inc. and its affiliates. |
DIRECTORAND OFFICER INFORMATION | 125 |
Table of Contents
Director and Officer Information (Continued)
iSHARES®, INC.
Independent Directors
| Name (Age) | Position(s) | Principal Occupation(s) During the Past 5 Years | Other Directorships Held by Director | |||
Cecilia H. Herbert (68) | Director (since 2005); Independent Board Chair (since 2016). | Trustee and Member of the Finance, Technology and Quality Committee of Stanford Health Care (since 2016); Trustee and Member of the Investment Committee, WNET, a New York public media company (since 2011); Chair (1994-2005) and Member (since 1992) of the Investment Committee, Archdiocese of San Francisco; Director (1998-2013) and President (2007-2011) of the Board of Directors, Catholic Charities CYO; Trustee (2002-2011) and Chair of the Finance and Investment Committee (2006-2010) of the Thacher School. | Trustee of iShares Trust (since 2005); Trustee of iShares U.S. ETF Trust (since 2011); Independent Board Chair of iShares Trust and iShares U.S. ETF Trust (since 2016); Trustee of Forward Funds (14 portfolios) (since 2009); Trustee of Salient MF Trust (4 portfolios) (since 2015). | |||
Jane D. Carlin (61) | Director (since 2015); Risk Committee Chair (since 2016). | Consultant (since 2012); Managing Director and Global Head of Financial Holding Company Governance & Assurance and the Global Head of Operational Risk Management of Morgan Stanley (2006-2012). | Trustee of iShares Trust (since 2015); Trustee of iShares U.S. ETF Trust (since 2015); Director of PHH Corporation (mortgage solutions) (since 2012); Director of The Hanover Insurance Group, Inc. (since 2016). | |||
Richard L. Fagnani (62) | Director (since 2017); Equity Plus Committee Chair (since 2017). | Partner, KPMG LLP (2002-2016). | Trustee of iShares Trust (since 2017); Trustee of iShares U.S. ETF Trust (since 2017). | |||
Charles A. Hurty (73) | Director (since 2005); Audit Committee Chair (since 2006). | Retired; Partner, KPMG LLP (1968-2001). | Trustee of iShares Trust (since 2005); Trustee of iShares U.S. ETF Trust (since 2011); Director of SkyBridge Alternative Investments Multi-Adviser Hedge Fund Portfolios LLC (2 portfolios) (since 2002). | |||
John E. Kerrigan (62) | Director (since 2005); Securities Lending Committee Chair (since 2016). | Chief Investment Officer, Santa Clara University (since 2002). | Trustee of iShares Trust (since 2005); Trustee of iShares U.S. ETF Trust (since 2011). | |||
Drew E. Lawton (58) | Director (since 2017); 15(c) Committee Chair (since 2017). | Senior Managing Director of New York Life Insurance Company (2010-2015). | Trustee of iShares Trust (since 2017); Trustee of iShares U.S. ETF Trust (since 2017). | |||
| 126 | 2017 iSHARES ANNUAL REPORTTO SHAREHOLDERS |
Table of Contents
Director and Officer Information (Continued)
iSHARES®, INC.
Independent Directors (Continued)
| Name (Age) | Position(s) | Principal Occupation(s) During the Past 5 Years | Other Directorships Held by Director | |||
John E. Martinez (56) | Director (since 2003); Fixed Income Plus Committee Chair (since 2016). | Director of Real Estate Equity Exchange, Inc. (since 2005). | Trustee of iShares Trust (since 2003); Trustee of iShares U.S. ETF Trust (since 2011). | |||
Madhav V. Rajan (53) | Director (since 2011); Nominating and Governance Committee Chair (since 2017). | Dean, and George Pratt Shultz Professor of Accounting, University of Chicago Booth School of Business (since 2017); Robert K. Jaedicke Professor of Accounting, Stanford University Graduate School of Business (2001-2017); Professor of Law (by courtesy), Stanford Law School (2005-2017); Senior Associate Dean for Academic Affairs and Head of MBA Program, Stanford University Graduate School of Business (2010-2016) . | Trustee of iShares Trust (since 2011); Trustee of iShares U.S. ETF Trust (since 2011); Director, Cavium, Inc. (since 2013). | |||
DIRECTORAND OFFICER INFORMATION | 127 |
Table of Contents
Director and Officer Information (Continued)
iSHARES®, INC.
Officersc
| Name (Age) | Position(s) | Principal Occupation(s) During the Past 5 Years | ||
Martin Small (42) | President (since 2016). | Managing Director, BlackRock, Inc. (since 2010); Head of U.S. iShares (since 2015); Co-Head of the U.S. Financial Markets Advisory Group, BlackRock, Inc. (2008-2014). | ||
Jack Gee (57) | Treasurer and Chief Financial Officer (since 2008). | Managing Director, BlackRock, Inc. (since 2009); Senior Director of Fund Administration of Intermediary Investor Business, BGI (2009). | ||
Benjamin Archibald (42) | Secretary (since 2015). | Managing Director, BlackRock, Inc. (since 2014); Director, BlackRock, Inc. (2010-2013); Secretary of the BlackRock-advised Mutual Funds (since 2012). | ||
Alan Mason (56) | Executive Vice President (since 2016). | Managing Director, BlackRock, Inc. (since 2009). | ||
Steve Messinger (55) | Executive Vice President (since 2016). | Managing Director, BlackRock, Inc. (2007-2014 and since 2016); Managing Director, Beacon Consulting Group (2014-2016). | ||
Charles Park (49) | Chief Compliance Officer (since 2006). | Chief Compliance Officer of BlackRock Advisors, LLC and the BlackRock-advised Funds in the Equity-Bond Complex, the Equity-Liquidity Complex and the Closed-End Complex (since 2014); Chief Compliance Officer of BFA (since 2006). | ||
Scott Radell (48) | Executive Vice President (since 2012). | Managing Director, BlackRock, Inc. (since 2009); Head of Portfolio Solutions, BlackRock, Inc. (since 2009). | ||
| c | Manish Mehta served as President until October 15, 2016. |
| 128 | 2017 iSHARES ANNUAL REPORTTO SHAREHOLDERS |
Table of Contents
Notes:
NOTES | 129 |
Table of Contents
Notes:
| 130 | 2017 iSHARES ANNUAL REPORTTO SHAREHOLDERS |
Table of Contents
For more information visit www.iShares.com or call 1-800-474-2737
This report is intended for the Funds’ shareholders. It may not be distributed to prospective investors unless it is preceded or accompanied by the current prospectus.
Investing involves risk, including possible loss of principal.
The iShares Funds are distributed by BlackRock Investments, LLC (together with its affiliates, “BlackRock”).
The iShares Funds are not sponsored, endorsed, issued, sold or promoted by MSCI Inc., nor does this company make any representation regarding the advisability of investing in the iShares Funds. BlackRock is not affiliated with the company listed above.
A description of the policies that the Funds use to determine how to vote proxies relating to portfolio securities and information about how the Funds voted proxies relating to portfolio securities during the most recent twelve-month period ending June 30 is available without charge, upon request, by calling toll-free 1-800-474-2737; on the Funds’ website at www.iShares.com; and on the U.S. Securities and Exchange Commission (SEC) website at www.sec.gov.
The Funds file their complete schedules of portfolio holdings with the SEC for the first and third quarters of each fiscal year on Form N-Q. The Funds’ Forms N-Q are available on the SEC’s website or may be reviewed and copied at the SEC’s Public Reference Room in Washington, D.C. Information on the operation of the Public Reference Room may be obtained by calling 1-800-SEC-0330. The Funds also disclose their complete schedules of portfolio holdings on a daily basis on the Funds’ website.
Certain financial information required by regulations or listing exchange rules in jurisdictions outside the U.S. in which iShares Funds are cross-listed may be publicly filed in those jurisdictions. This information is available upon request by calling 1-800-474-2737.
©2017 BlackRock, Inc. All rights reserved. iSHARES and BLACKROCK are registered trademarks of BlackRock, Inc. or its subsidiaries. All other marks are the property of their respective owners.
iS-AR-810-0817
| |
Table of Contents
AUGUST 31, 2017
2017 ANNUAL REPORT | |
iShares, Inc.
| Ø | iShares Currency Hedged MSCI Emerging Markets ETF | HEEM | BATS |
| Ø | iShares Edge MSCI Min Vol EM Currency Hedged ETF | HEMV | BATS |
| Ø | iShares Edge MSCI Min Vol Emerging Markets ETF | EEMV | BATS |
| Ø | iShares MSCI Emerging Markets ETF | EEM | NYSE Arca |
Table of Contents
| 5 | ||||
| 14 | ||||
| 14 | ||||
| 15 | ||||
| 15 | ||||
| 18 | ||||
iShares Edge MSCI Min Vol Emerging Markets ETF (Consolidated) | 21 | |||
| 27 | ||||
| 44 | ||||
| 50 | ||||
| 54 | ||||
| 71 | ||||
| 72 | ||||
| 73 | ||||
| 86 | ||||
| 91 |
Table of Contents
Management’s Discussion of Fund Performance
iSHARES®, INC.
GLOBAL EQUITY MARKET OVERVIEW
Global equity markets posted strong returns for the 12 months ended August 31, 2017 (the “reporting period”). The MSCI ACWI, a broad global equity index that includes both developed and emerging markets, returned 17.11% in U.S. dollar terms for the reporting period.
The primary factor behind the robust performance of global equity markets was improving global economic growth, driven largely by the continuation of accommodative monetary policies from many of the world’s central banks. Signs of stronger economic activity in Europe emerged as the European Central Bank (“ECB”) maintained policies such as quantitative easing and negative interest rates. Economic growth rates in China and Japan, the largest economies in Asia, also increased during the reporting period, reflecting efforts by the People’s Bank of China (“PBOC”) and the Bank of Japan (“BOJ”) to stimulate economic activity. Stronger economic growth led several central banks to consider reducing their economic stimulus measures. For example, late in the reporting period, the ECB discussed the possibility of tapering its quantitative easing program, while the PBOC increased short-term interest rates during the first half of 2017.
On a regional basis, European equity markets posted the best returns among developed markets, advancing by approximately 20% in U.S. dollar terms for the reporting period. European stocks benefited from improving economic conditions and stronger corporate earnings. In addition, election outcomes in France and the Netherlands eased investor concerns about nationalist presidential candidates and their opposition to the European Union (“E.U.”). Currency fluctuations also contributed meaningfully to European equity performance in U.S. dollar terms as the euro appreciated by approximately 6% against the U.S. dollar during the reporting period. The best-performing European stock markets included Austria, Italy, and Spain, while Ireland and Belgium posted the weakest returns.
Equity markets in the Asia-Pacific region gained about 16% in U.S. dollar terms for the reporting period, led by Singapore and Hong Kong. Japanese stocks also posted strong returns, benefiting from improving consumer spending and employment trends that contributed to the ongoing recovery in the Japanese economy. However, equity market returns in Japan were hindered by a decline in the Japanese yen, which depreciated by approximately 6% against the U.S. dollar.
The U.S. stock market returned approximately 15% for the reporting period. Despite mixed U.S. economic data, U.S. stocks advanced initially in anticipation of pro-business fiscal policies from the new presidential administration. Although the administration struggled to implement its fiscal agenda, stocks continued to move higher as better global economic conditions led to a notable improvement in corporate earnings growth, particularly for multinational companies with significant operations outside of the U.S. U.S. stocks advanced despite three short-term interest rate increases by the U.S. Federal Reserve Bank (the “Fed”) during the reporting period, which increased the short-term interest rate target to its highest level since October 2008. The Fed also unveiled a plan to start reducing the amount of U.S. Treasury bonds and mortgage-backed securities on its balance sheet before the end of 2017.
Emerging markets stocks outperformed those in developed markets, returning more than 23% in U.S. dollar terms for the reporting period. Emerging markets in Eastern Europe were the best performers, led by Poland, Greece, and Hungary. Equity markets in the Middle East trailed for the reporting period amid continued geopolitical conflict in the region.
MANAGEMENT’S DISCUSSIONSOF FUND PERFORMANCE | 5 |
Table of Contents
Management’s Discussion of Fund Performance
iSHARES® CURRENCY HEDGED MSCI EMERGING MARKETS ETF
Performance as of August 31, 2017
| Average Annual Total Returns | Cumulative Total Returns | |||||||||||||||||||||||||||
| NAV | MARKET | INDEX | NAV | MARKET | INDEX | |||||||||||||||||||||||
1 Year | 19.55% | 19.77% | 19.47% | 19.55% | 19.77% | 19.47% | ||||||||||||||||||||||
Since Inception | 5.18% | 5.26% | 5.56% | 16.02% | 16.27% | 17.22% | ||||||||||||||||||||||
GROWTH OF $10,000 INVESTMENT
(SINCE INCEPTION AT NET ASSET VALUE)
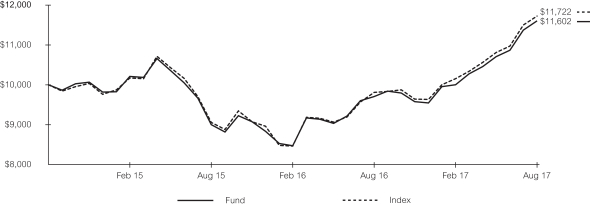
The inception date of the Fund was 9/23/14. The first day of secondary market trading was 9/25/14.
Past performance is no guarantee of future results. Performance results do not reflect the deduction of taxes that a shareholder would pay on fund distributions or on the redemption or sale of fund shares. See “About Fund Performance” on page 14 for more information.
| Shareholder Expenses | ||||||||||||||||||||||||||
| Actual | Hypothetical 5% Return | |||||||||||||||||||||||||
| Beginning Account Value (3/1/17) | Ending Account Value (8/31/17) | Expenses Paid During Period a,b | Beginning Account Value (3/1/17) | Ending Account Value (8/31/17) | Expenses Paid During Period a,b | Annualized Expense Ratio a | ||||||||||||||||||||
| $ | 1,000.00 | $ | 1,160.20 | $ | 0.00 | $ | 1,000.00 | $ | 1,025.20 | $ | 0.00 | 0.00% | ||||||||||||||
| a | Annualized expense ratio and expenses paid during the period do not include fees and expenses of the underlying fund in which the Fund invests. |
| b | Expenses are calculated using the Fund’s annualized expense ratio (as disclosed in the table), multiplied by the average account value for the period, multiplied by the number of days in the period (184 days) and divided by the number of days in the year (365 days). See “Shareholder Expenses” on page 14 for more information. |
The iShares Currency Hedged MSCI Emerging Markets ETF (the “Fund”) seeks to track the investment results of an index composed of large- and mid-capitalization emerging market equities while mitigating exposure to fluctuations between the value of the component currencies and the U.S. dollar, as represented by the MSCI Emerging Markets 100% Hedged to USD Index (the “Index”). The Fund invests in a representative sample of securities included in the Index that collectively has an investment profile similar to the Index. Due to the use of representative sampling, the Fund may or may not hold all of the securities that are included in the Index. The Fund currently seeks to achieve its investment objective by investing a substantial portion of its assets in one underlying fund, the iShares MSCI Emerging Markets ETF. For the 12-month reporting period ended August 31, 2017, the total return for the Fund was 19.55%, net of fees, while the total return for the Index was 19.47%.
| 6 | 2017 iSHARES ANNUAL REPORTTO SHAREHOLDERS |
Table of Contents
Management’s Discussion of Fund Performance (Continued)
iSHARES® CURRENCY HEDGED MSCI EMERGING MARKETS ETF
The robust performance of the Index for the reporting period was led by stocks in China, which represented about 27% of the Index on average. As a major global exporter, China capitalized on strengthening economic growth in many regions of the world. Chinese stocks also benefited from government stimulus efforts focused primarily on infrastructure and real estate expansion.
South Korea and Taiwan were also meaningful contributors to the Index’s return in U.S. dollar terms for the reporting period, as stocks in both countries gained due to strong growth in technology-related companies. Taiwan’s technology-heavy stock market rose to its highest level in 27 years, led by smartphone component suppliers. South Korea’s equity market reached an all-time high during the reporting period, despite tepid economic growth.
In contrast, stocks in Qatar and the Philippines detracted from the Index’s return in U.S. dollar terms for the reporting period. The stock market in Qatar declined amid the country’s growing diplomatic crisis with Saudi Arabia and other neighboring countries, while slowing economic growth and political controversies surrounding the Philippine president negatively affected the Philippine equity market.
From a sector perspective, the information technology sector contributed the most to the Index’s return in U.S. dollar terms for the reporting period, benefiting from growing demand for a range of technological devices. Sector gains were driven primarily by several large technology companies with diversified businesses and strong profit growth. The financials sector also contributed meaningfully to the Index’s return for the reporting period, led by banks and the insurance industry. Other notable contributors included the economically sensitive materials and consumer discretionary sectors.
In terms of currency performance, the Chinese yuan and the Taiwanese new dollar appreciated by 1% and 5%, respectively, against the U.S. dollar, while the South Korean won depreciated by approximately 1% for the reporting period.
Overall, the positive performance of emerging market currencies meant hedging activity was a meaningful detractor from the Index’s return for the reporting period. A fully hedged investor seeks to bypass the currency fluctuations — both on the upside and on the downside — related to holding foreign-currency-denominated securities. The Index’s hedging activity offset the positive impact of foreign currencies relative to the U.S. dollar, resulting in an Index return that was relatively close to the return of emerging market equities measured in local currencies.
ALLOCATION BY SECTOR 1
As of 8/31/17
| Sector | Percentage of Total Investments 2 |
Information Technology | 26.97 | % | ||
Financials | 23.93 | |||
Consumer Discretionary | 10.23 | |||
Materials | 7.44 | |||
Energy | 6.62 | |||
Consumer Staples | 6.55 | |||
Industrials | 5.45 | |||
Telecommunication Services | 5.22 | |||
Real Estate | 2.78 | |||
Utilities | 2.59 | |||
Health Care | 2.22 | |||
|
| |||
TOTAL | 100.00 | % | ||
|
|
TEN LARGEST COUNTRIES 1
As of 8/31/17
| Country | Percentage of Total Investments 2 |
China | 29.06 | % | ||
South Korea | 14.59 | |||
Taiwan | 11.87 | |||
India | 8.72 | |||
Brazil | 7.22 | |||
South Africa | 6.79 | |||
Mexico | 3.57 | |||
Russia | 3.26 | |||
Indonesia | 2.27 | |||
Malaysia | 2.24 | |||
|
| |||
TOTAL | 89.59 | % | ||
|
|
| 1 | Table shown is for the iShares MSCI Emerging Markets ETF, the underlying fund in which the Fund invests. |
| 2 | Excludes money market funds. |
MANAGEMENT’S DISCUSSIONSOF FUND PERFORMANCE | 7 |
Table of Contents
Management’s Discussion of Fund Performance
iSHARES® EDGE MSCI MIN VOL EM CURRENCY HEDGED ETF
Performance as of August 31, 2017
| Average Annual Total Returns | Cumulative Total Returns | |||||||||||||||||||||||||||
| NAV | MARKET | INDEX | NAV | MARKET | INDEX | |||||||||||||||||||||||
1 Year | 8.61% | 8.54% | 8.87% | 8.61% | 8.54% | 8.87% | ||||||||||||||||||||||
Since Inception | 6.52% | 6.72% | 6.26% | 12.36% | 12.74% | 11.82% | ||||||||||||||||||||||
GROWTH OF $10,000 INVESTMENT
(SINCE INCEPTION AT NET ASSET VALUE)
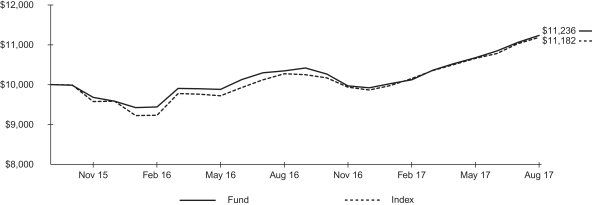
The inception date of the Fund was 10/29/15. The first day of secondary market trading was 11/2/15.
Past performance is no guarantee of future results. Performance results do not reflect the deduction of taxes that a shareholder would pay on fund distributions or on the redemption or sale of fund shares. See “About Fund Performance” on page 14 for more information.
| Shareholder Expenses | ||||||||||||||||||||||||||
| Actual | Hypothetical 5% Return | |||||||||||||||||||||||||
| Beginning Account Value (3/1/17) | Ending Account Value (8/31/17) | Expenses Paid During Period a,b | Beginning Account Value (3/1/17) | Ending Account Value (8/31/17) | Expenses Paid During Period a,b | Annualized Expense Ratio a | ||||||||||||||||||||
| $ | 1,000.00 | $ | 1,110.30 | $ | 0.16 | $ | 1,000.00 | $ | 1,025.10 | $ | 0.15 | 0.03% | ||||||||||||||
| a | Annualized expense ratio and expenses paid during the period do not include fees and expenses of the underlying fund in which the Fund invests. |
| b | Expenses are calculated using the Fund’s annualized expense ratio (as disclosed in the table), multiplied by the average account value for the period, multiplied by the number of days in the period (184 days) and divided by the number of days in the year (365 days). See “Shareholder Expenses” on page 14 for more information. |
The iShares Edge MSCI Min Vol EM Currency Hedged ETF (the “Fund”) seeks to track the investment results of an index composed of emerging market equities that, in the aggregate, have lower volatility characteristics relative to the broader emerging equity markets while mitigating exposure to fluctuations between the value of the component currencies and the U.S. dollar, as represented by the MSCI Emerging Markets Minimum Volatility (USD) 100% Hedged to USD Index (the “Index”). The Fund invests in a representative sample of securities included in the Index that collectively has an investment profile similar to the Index. Due to the use of representative sampling, the Fund may or may not hold all of the securities that are included in the Index. The Fund currently seeks to achieve its investment objective by investing a substantial portion of its assets in one underlying fund, the iShares Edge MSCI Min Vol Emerging Markets ETF. For the 12-month reporting period ended August 31, 2017, the total return for the Fund was 8.61%, net of fees, while the total return for the Index was 8.87%.
Low-volatility stocks in China and Taiwan, which represented about 22% and 17%, respectively, of the Index on average for the reporting period, contributed the most to the Index’s return in U.S. dollar terms. As a major global exporter, China capitalized on strengthening economic growth in many regions of the world. Chinese stocks also benefited from government stimulus efforts focused primarily on infrastructure and real estate expansion, which drove property prices higher and supported a surge in industrial output.
| 8 | 2017 iSHARES ANNUAL REPORTTO SHAREHOLDERS |
Table of Contents
Management’s Discussion of Fund Performance (Continued)
iSHARES® EDGE MSCI MIN VOL EM CURRENCY HEDGED ETF
The Taiwanese stock market was helped by robust growth in technology-related companies during the reporting period. Taiwan’s technology-heavy equity market rose to its highest level in 27 years, led by component suppliers that benefited from robust smartphone production. Other noteworthy contributors to the Index’s return in U.S. dollar terms for the reporting period included Chile, Thailand, and South Korea.
In contrast, low-volatility stocks in the Philippines and Qatar detracted from the Index’s return in U.S. dollar terms for the reporting period. Slowing economic growth and political controversies involving the newly elected Philippine president negatively affected the Philippine equity market, while the stock market in Qatar declined amid the country’s growing diplomatic crisis with Saudi Arabia and other neighboring countries in the Middle East.
From a sector perspective, the information technology sector contributed the most to the Index’s return in U.S. dollar terms for the reporting period, benefiting from growing demand for a range of technological devices. The financials sector also contributed meaningfully to the Index’s return for the reporting period, led by a strong performance from the banking industry. Other notable contributors included the consumer discretionary and industrials sectors.
The Index seeks lower volatility than the broader market with returns in line with the market over the long term. For the reporting period, the Index trailed the broader market in U.S. dollar terms, as represented by the MSCI Emerging Markets Index. As the broader market rose sharply, stocks with relatively low volatility characteristics underperformed.
Relative to the broader market, overweight allocations in the Index to underperforming markets in the Philippines and Qatar detracted from the Index’s performance for the reporting period in U.S. dollar terms, while underweight allocations in the Index to Russian and South African stocks benefited relative performance. On a sector basis, overweight allocations in the Index to the telecommunication services and consumer staples sectors detracted from the Index’s relative performance as these sectors underperformed for the reporting period. On the positive side, an underweight allocation in the Index to the energy sector benefited relative performance.
In terms of currency performance, the Chinese yuan and the Taiwanese new dollar appreciated by 1% and 5%, respectively, against the U.S. dollar, while the South Korean won depreciated by approximately 1% for the reporting period.
Overall, hedging activity was a meaningful detractor from the Index’s return for the reporting period. As the Index’s hedging activity offset the positive impact of foreign currencies relative to the U.S. dollar, it resulted in an Index return that was relatively close to the return of low volatility emerging market equities measured in local currencies.
ALLOCATION BY SECTOR 1
As of 8/31/17
| Sector | Percentage of Total Investments 2 |
Financials | 21.85 | % | ||
Information Technology | 20.81 | |||
Consumer Staples | 11.73 | |||
Telecommunication Services | 9.93 | |||
Consumer Discretionary | 8.38 | |||
Utilities | 7.73 | |||
Health Care | 7.56 | |||
Industrials | 6.64 | |||
Energy | 2.20 | |||
Materials | 2.03 | |||
Real Estate | 1.14 | |||
|
| |||
TOTAL | 100.00 | % | ||
|
|
TEN LARGEST COUNTRIES 1
As of 8/31/17
| Country | Percentage of Total Investments 2 |
China | 23.56 | % | ||
Taiwan | 16.35 | |||
South Korea | 10.48 | |||
Malaysia | 6.97 | |||
Thailand | 6.73 | |||
India | 6.13 | |||
Indonesia | 4.96 | |||
Chile | 3.88 | |||
Philippines | 3.40 | |||
Mexico | 2.59 | |||
|
| |||
TOTAL | 85.05 | % | ||
|
|
| 1 | Table shown is for the iShares Edge MSCI Min Vol Emerging Markets ETF, the underlying fund in which the Fund invests. |
| 2 | Excludes money market funds. |
MANAGEMENT’S DISCUSSIONSOF FUND PERFORMANCE | 9 |
Table of Contents
Management’s Discussion of Fund Performance
iSHARES® EDGE MSCI MIN VOL EMERGING MARKETS ETF
Performance as of August 31, 2017
| Average Annual Total Returns | Cumulative Total Returns | |||||||||||||||||||||||||||
| NAV | MARKET | INDEX | NAV | MARKET | INDEX | |||||||||||||||||||||||
1 Year | 11.11% | 11.64% | 11.45% | 11.11% | 11.64% | 11.45% | ||||||||||||||||||||||
5 Years | 3.35% | 3.31% | 3.53% | 17.92% | 17.68% | 18.96% | ||||||||||||||||||||||
Since Inception | 5.35% | 5.38% | 5.58% | 35.80% | 36.02% | 37.53% | ||||||||||||||||||||||
GROWTH OF $10,000 INVESTMENT
(SINCE INCEPTION AT NET ASSET VALUE)
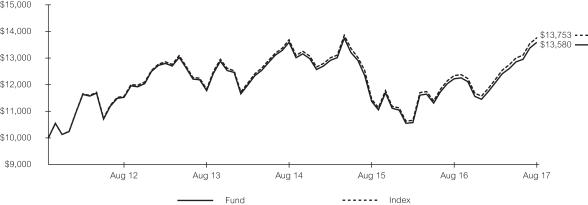
The inception date of the Fund was 10/18/11. The first day of secondary market trading was 10/20/11.
Past performance is no guarantee of future results. Performance results do not reflect the deduction of taxes that a shareholder would pay on fund distributions or on the redemption or sale of fund shares. See “About Fund Performance” on page 14 for more information.
| Shareholder Expenses | ||||||||||||||||||||||||||
| Actual | Hypothetical 5% Return | |||||||||||||||||||||||||
| Beginning Account Value (3/1/17) | Ending Account Value (8/31/17) | Expenses Paid During Period a | Beginning Account Value (3/1/17) | Ending Account Value (8/31/17) | Expenses Paid During Period a | Annualized Expense Ratio | ||||||||||||||||||||
| $ | 1,000.00 | $ | 1,123.60 | $ | 1.34 | $ | 1,000.00 | $ | 1,023.90 | $ | 1.28 | 0.25% | ||||||||||||||
| a | Expenses are calculated using the Fund’s annualized expense ratio (as disclosed in the table), multiplied by the average account value for the period, multiplied by the number of days in the period (184 days) and divided by the number of days in the year (365 days). See “Shareholder Expenses” on page 14 for more information. |
The iShares Edge MSCI Min Vol Emerging Markets ETF (the “Fund”) seeks to track the investment results of an index composed of emerging market equities that, in the aggregate, have lower volatility characteristics relative to the broader emerging equity markets, as represented by the MSCI Emerging Markets Minimum Volatility (USD) Index (the “Index”). The Fund invests in a representative sample of securities included in the Index that collectively has an investment profile similar to the Index. Due to the use of representative sampling, the Fund may or may not hold all of the securities that are included in the Index. For the 12-month reporting period ended August 31, 2017, the total return for the Fund was 11.11%, net of fees, while the total return for the Index was 11.45%.
Low-volatility stocks in China and Taiwan, which represented about 22% and 17%, respectively, of the Index on average for the reporting period, contributed the most to the Index’s return. As a major global exporter, China capitalized on strengthening
| 10 | 2017 iSHARES ANNUAL REPORTTO SHAREHOLDERS |
Table of Contents
Management’s Discussion of Fund Performance (Continued)
iSHARES® EDGE MSCI MIN VOL EMERGING MARKETS ETF
economic growth in many regions of the world. Chinese stocks also benefited from government stimulus efforts focused primarily on infrastructure and real estate expansion, which drove property prices higher and supported a surge in industrial output.
The Taiwanese stock market was helped by robust growth in technology-related companies during the reporting period. Taiwan’s technology-heavy equity market rose to its highest level in 27 years, led by component suppliers that benefited from robust smartphone production. Other noteworthy contributors to the Index’s return for the reporting period included Chile, Thailand, and South Korea.
In contrast, low-volatility stocks in the Philippines and Qatar detracted from the Index’s return for the reporting period. Slowing economic growth and political controversies involving the newly elected Philippine president negatively affected the Philippine equity market, while the stock market in Qatar declined amid the country’s growing diplomatic crisis with Saudi Arabia and other neighboring countries in the Middle East.
From a sector perspective, the information technology sector contributed the most to the Index’s return for the reporting period, benefiting from growing demand for a range of technological devices. The financials sector also contributed meaningfully to the Index’s return for the reporting period, led by a strong performance from the banking industry. Other notable contributors included the consumer discretionary and industrials sectors.
The Index seeks lower volatility than the broader market with returns in line with the market over the long term, so they have tended to outperform during periods of elevated volatility but tend to underperform during periods of low volatility and risk-on markets. For the reporting period, the Index trailed the broader market, as represented by the MSCI Emerging Markets Index. As the broader market rose sharply, stocks with relatively low volatility characteristics underperformed.
Relative to the broader market, overweight allocations in the Index to underperforming markets in the Philippines and Qatar detracted from the Index’s performance for the reporting period, while underweight allocations in the Index to Russian and South African stocks benefited relative performance. On a sector basis, overweight allocations in the Index to the telecommunication services and consumer staples sectors detracted from the Index’s relative performance as these sectors underperformed for the reporting period. On the positive side, an underweight allocation in the Index to the energy sector benefited relative performance.
ALLOCATION BY SECTOR
As of 8/31/17
| Sector | Percentage of Total Investments* |
Financials | 21.85 | % | ||
Information Technology | 20.81 | |||
Consumer Staples | 11.73 | |||
Telecommunication Services | 9.93 | |||
Consumer Discretionary | 8.38 | |||
Utilities | 7.73 | |||
Health Care | 7.56 | |||
Industrials | 6.64 | |||
Energy | 2.20 | |||
Materials | 2.03 | |||
Real Estate | 1.14 | |||
|
| |||
TOTAL | 100.00 | % | ||
|
|
TEN LARGEST COUNTRIES
As of 8/31/17
| Country | Percentage of Total Investments* |
China | 23.56 | % | ||
Taiwan | 16.35 | |||
South Korea | 10.48 | |||
Malaysia | 6.97 | |||
Thailand | 6.73 | |||
India | 6.13 | |||
Indonesia | 4.96 | |||
Chile | 3.88 | |||
Philippines | 3.40 | |||
Mexico | 2.59 | |||
|
| |||
TOTAL | 85.05 | % | ||
|
|
| * | Excludes money market funds. |
MANAGEMENT’S DISCUSSIONSOF FUND PERFORMANCE | 11 |
Table of Contents
Management’s Discussion of Fund Performance
iSHARES® MSCI EMERGING MARKETS ETF
Performance as of August 31, 2017
| Average Annual Total Returns | Cumulative Total Returns | |||||||||||||||||||||||||||
| NAV | MARKET | INDEX | NAV | MARKET | INDEX | |||||||||||||||||||||||
1 Year | 23.80% | 24.59% | 24.53% | 23.80% | 24.59% | 24.53% | ||||||||||||||||||||||
5 Years | 4.69% | 4.68% | 5.30% | 25.74% | 25.69% | 29.43% | ||||||||||||||||||||||
10 Years | 1.99% | 2.03% | 2.43% | 21.78% | 22.32% | 27.08% | ||||||||||||||||||||||
GROWTH OF $10,000 INVESTMENT
(AT NET ASSET VALUE)
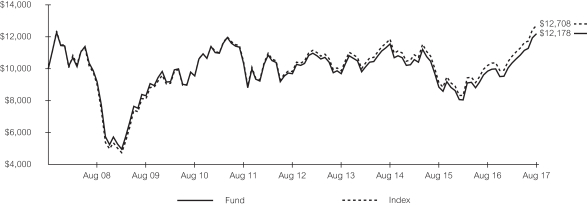
Past performance is no guarantee of future results. Performance results do not reflect the deduction of taxes that a shareholder would pay on fund distributions or on the redemption or sale of fund shares. See “About Fund Performance” on page 14 for more information.
| Shareholder Expenses | ||||||||||||||||||||||||||
| Actual | Hypothetical 5% Return | |||||||||||||||||||||||||
| Beginning Account Value (3/1/17) | Ending Account Value (8/31/17) | Expenses Paid During Period a | Beginning Account Value (3/1/17) | Ending Account Value (8/31/17) | Expenses Paid During Period a | Annualized Expense Ratio | ||||||||||||||||||||
| $ | 1,000.00 | $ | 1,176.60 | $ | 3.79 | $ | 1,000.00 | $ | 1,021.70 | $ | 3.52 | 0.69% | ||||||||||||||
| a | Expenses are calculated using the Fund’s annualized expense ratio (as disclosed in the table), multiplied by the average account value for the period, multiplied by the number of days in the period (184 days) and divided by the number of days in the year (365 days). See “Shareholder Expenses” on page 14 for more information. |
The iShares MSCI Emerging Markets ETF (the “Fund”) seeks to track the investment results of an index composed of large- and mid-capitalization emerging market equities, as represented by the MSCI Emerging Markets Index (the “Index”). The Fund invests in a representative sample of securities included in the Index that collectively has an investment profile similar to the Index. Due to the use of representative sampling, the Fund may or may not hold all of the securities that are included in the Index. For the 12-month reporting period ended August 31, 2017, the total return for the Fund was 23.80%, net of fees, while the total return for the Index was 24.53%.
The robust performance of the Index for the reporting period was led by stocks in China, which represented about 27% of the Index on average. As a major global exporter, China capitalized on strengthening economic growth in many regions of the world. Chinese stocks also benefited from government stimulus efforts focused primarily on infrastructure and real estate expansion, which drove property prices higher and supported a surge in industrial output.
| 12 | 2017 iSHARES ANNUAL REPORTTO SHAREHOLDERS |
Table of Contents
Management’s Discussion of Fund Performance (Continued)
iSHARES® MSCI EMERGING MARKETS ETF
South Korea and Taiwan were also meaningful contributors to the Index’s return for the reporting period, as stocks in both countries gained due to strong growth in technology-related companies. Taiwan’s technology-heavy equity market rose to its highest level in 27 years, led by component suppliers that benefited from robust smartphone production. South Korea’s stock market reached an all-time high during the reporting period, despite tepid economic growth.
In contrast, stocks in the Philippines and Qatar detracted from the Index’s return for the reporting period. Slowing economic growth and political controversies involving the newly elected Philippine president negatively affected the Philippine equity market, while the stock market in Qatar declined amid the country’s growing diplomatic crisis with Saudi Arabia and other neighboring countries in the Middle East.
From a sector perspective, the information technology sector contributed the most to the Index’s return for the reporting period, benefiting from growing demand for a range of technological devices. Sector gains were driven primarily by several large technology companies with diversified businesses and strong profit growth. The financials sector also contributed meaningfully to the Index’s return for the reporting period, led by strong performance from banks and the insurance industry. Other notable contributors included the economically sensitive materials and consumer discretionary sectors.
Currency fluctuations had a positive impact on the Index’s return, particularly gains by the Taiwanese new dollar, Indian rupee, and Brazilian real relative to the U.S. dollar.
ALLOCATION BY SECTOR
As of 8/31/17
| Sector | Percentage of Total Investments* | |||
Information Technology | 26.97 | % | ||
Financials | 23.93 | |||
Consumer Discretionary | 10.23 | |||
Materials | 7.44 | |||
Energy | 6.62 | |||
Consumer Staples | 6.55 | |||
Industrials | 5.45 | |||
Telecommunication Services | 5.22 | |||
Real Estate | 2.78 | |||
Utilities | 2.59 | |||
Health Care | 2.22 | |||
|
| |||
TOTAL | 100.00 | % | ||
|
| |||
TEN LARGEST COUNTRIES
As of 8/31/17
| Country | Percentage of Total Investments* | |||
China | 29.06 | % | ||
South Korea | 14.59 | |||
Taiwan | 11.87 | |||
India | 8.72 | |||
Brazil | 7.22 | |||
South Africa | 6.79 | |||
Mexico | 3.57 | |||
Russia | 3.26 | |||
Indonesia | 2.27 | |||
Malaysia | 2.24 | |||
|
| |||
TOTAL | 89.59 | % | ||
|
| |||
| * | Excludes money market funds. |
MANAGEMENT’S DISCUSSIONSOF FUND PERFORMANCE | 13 |
Table of Contents
Past performance is no guarantee of future results. Current performance may be lower or higher than the performance data quoted. Performance data current to the most recent month-end is available at www.ishares.com. Performance results assume reinvestment of all dividends and capital gain distributions and do not reflect the deduction of taxes that a shareholder would pay on fund distributions or on the redemption or sale of fund shares. The investment return and principal value of shares will vary with changes in market conditions. Shares may be worth more or less than their original cost when they are redeemed or sold in the market. Performance for certain funds may reflect a waiver of a portion of investment advisory fees. Without such a waiver, performance would have been lower.
Net asset value or “NAV” is the value of one share of a fund as calculated in accordance with the standard formula for valuing mutual fund shares. The price used to calculate market return (“Market Price”) is determined by using the midpoint between the highest bid and the lowest offer on the primary stock exchange on which shares of a fund are listed for trading, as of the time that such fund’s NAV is calculated. Certain funds may have a NAV which is determined prior to the opening of regular trading on its listed exchange and their market returns are calculated using the midpoint of the bid/ask spread as of the opening of regular trading on the exchange. Market and NAV returns assume that dividends and capital gain distributions have been reinvested at Market Price and NAV, respectively.
An index is a statistical composite that tracks a specified financial market or sector. Unlike a fund, an index does not actually hold a portfolio of securities and therefore does not incur the expenses incurred by a fund. These expenses negatively impact fund performance. Also, market returns do not include brokerage commissions that may be payable on secondary market transactions. If brokerage commissions were included, market returns would be lower.
As a shareholder of a Fund, you incur two types of costs: (1) transaction costs, including brokerage commissions on purchases and sales of fund shares and (2) ongoing costs, including management fees and other fund expenses. The expense example, which is based on an investment of $1,000 invested on March 1, 2017 and held through August 31, 2017, is intended to help you understand your ongoing costs (in dollars and cents) of investing in a Fund and to compare these costs with the ongoing costs of investing in other funds.
Actual Expenses — The table provides information about actual account values and actual expenses. Annualized expense ratios reflect contractual and voluntary fee waivers, if any. To estimate the expenses that you paid on your account over the period, simply divide your account value by $1,000 (for example, an $8,600 account value divided by $1,000 = 8.6), then multiply the result by the number corresponding to your Fund under the heading entitled “Expenses Paid During Period.”
Hypothetical Example for Comparison Purposes — The table also provides information about hypothetical account values and hypothetical expenses based on each Fund’s actual expense ratio and an assumed rate of return of 5% per year before expenses. You may use this information to compare the ongoing costs of investing in your Fund and other funds. To do so, compare this 5% hypothetical example with the 5% hypothetical examples that appear in the shareholder reports of the other funds.
Please note that the expenses shown in the table are meant to highlight your ongoing costs only and do not reflect any transactional costs, such as brokerage commissions paid on purchases and sales of fund shares. Therefore, the hypothetical examples are useful in comparing ongoing costs only and will not help you determine the relative total costs of owning different funds. In addition, if these transactional costs were included, your costs would have been higher.
| 14 | 2017 iSHARES ANNUAL REPORTTO SHAREHOLDERS |
Table of Contents
iSHARES® CURRENCY HEDGED MSCI EMERGING MARKETS ETF
August 31, 2017
| Security | Shares | Value | ||||||
INVESTMENT COMPANIES — 100.14% |
| |||||||
EXCHANGE-TRADED FUNDS — 100.14% |
| |||||||
iShares MSCI Emerging Markets ETFa | 8,795,358 | $ | 394,295,899 | |||||
|
| |||||||
| 394,295,899 | ||||||||
|
| |||||||
TOTAL INVESTMENT COMPANIES |
| |||||||
(Cost: $343,142,968) |
| 394,295,899 | ||||||
|
| |||||||
TOTAL INVESTMENTS |
| |||||||
(Cost: $343,142,968)b |
| 394,295,899 | ||||||
Other Assets, Less Liabilities — (0.14)% |
| (538,525 | ) | |||||
|
| |||||||
NET ASSETS — 100.00% |
| $ | 393,757,374 | |||||
|
| |||||||
| a | Affiliated issuer. See Schedule 1. |
| b | The cost of investments (including short positions and derivatives, if any) for federal income tax purposes was $348,640,976. Net unrealized appreciation was $45,636,711, of which $52,196,052 represented gross unrealized appreciation on investments and $6,559,341 represented gross unrealized depreciation on investments. |
Schedule 1 — Affiliates (Note 2)
Investments in issuers considered to be affiliates of the Fund during the year ended August 31, 2017, for purposes of Section 2(a)(3) of the 1940 Act, and/or related parties of the Fund were as follows:
| Affiliated issuer | Shares held at | Shares purchased | Shares sold | Shares held at 08/31/17 | Value at 08/31/17 | Net realized gain (loss) a | Change in unrealized appreciation (depreciation) | Income | ||||||||||||||||||||||||
BlackRock Cash Funds: Institutional, | — | — | — | — | $ | — | $ | 14,970 | $ | — | $ | — | c | |||||||||||||||||||
BlackRock Cash Funds: Treasury, | 119,104 | — | (119,104 | )b | — | — | 6 | — | 2,789 | |||||||||||||||||||||||
iShares MSCI Emerging Markets ETF | 4,928,896 | 5,803,170 | (1,936,708 | ) | 8,795,358 | 394,295,899 | 1,778,662 | 65,227,894 | 3,628,622 | |||||||||||||||||||||||
|
|
|
|
|
|
|
| |||||||||||||||||||||||||
| $ | 394,295,899 | $ | 1,793,638 | $ | 65,227,894 | $ | 3,631,411 | |||||||||||||||||||||||||
|
|
|
|
|
|
|
| |||||||||||||||||||||||||
| a | Includes realized capital gain distributions from an affiliated fund, if any. |
| b | Net of shares purchased and sold. |
| c | Does not include income earned on the investment of securities lending cash collateral which is not direct income of the Fund and is reflected as a component of securities lending income in the statement of operations. |
SCHEDULESOF INVESTMENTS | 15 |
Table of Contents
Schedule of Investments (Continued)
iSHARES® CURRENCY HEDGED MSCI EMERGING MARKETS ETF
August 31, 2017
Schedule 2 — Forward Currency Contracts (Note 6)
Forward currency contracts outstanding as of August 31, 2017 were as follows:
Currency purchased | Currency sold | Counterparty | Settlement date | Unrealized appreciation (depreciation) | ||||||||||||||||||||
| BRL | 84,297,000 | USD | 26,579,537 | MS | 09/06/2017 | $ | 196,170 | |||||||||||||||||
| CLP | 4,138,887,000 | USD | 6,595,836 | MS | 09/06/2017 | 23,826 | ||||||||||||||||||
| EUR | 7,170,000 | USD | 8,533,806 | MS | 09/06/2017 | 2,145 | ||||||||||||||||||
| INR | 2,252,428,000 | USD | 35,188,689 | MS | 09/06/2017 | 41,082 | ||||||||||||||||||
| MXN | 253,738,000 | USD | 14,182,888 | MS | 09/06/2017 | 6,592 | ||||||||||||||||||
| RUB | 590,037,000 | USD | 10,057,533 | MS | 09/06/2017 | 112,748 | ||||||||||||||||||
| TRY | 16,387,000 | USD | 4,728,250 | MS | 09/06/2017 | 9,882 | ||||||||||||||||||
| TWD | 412,000 | USD | 13,623 | MS | 09/06/2017 | 34 | ||||||||||||||||||
| USD | 1,193,803 | BRL | 3,756,000 | MS | 09/06/2017 | 765 | ||||||||||||||||||
| USD | 117,355 | EUR | 98,000 | MS | 09/06/2017 | 685 | ||||||||||||||||||
| USD | 80,651,213 | HKD | 629,314,000 | MS | 09/06/2017 | 233,131 | ||||||||||||||||||
| USD | 225,274 | INR | 14,384,000 | MS | 09/06/2017 | 297 | ||||||||||||||||||
| USD | 72,963,308 | KRW | 81,984,438,000 | MS | 09/06/2017 | 225,876 | ||||||||||||||||||
| USD | 13,467,324 | MXN | 240,542,000 | MS | 09/06/2017 | 15,788 | ||||||||||||||||||
| USD | 62,538 | TRY | 216,000 | MS | 09/06/2017 | 84 | ||||||||||||||||||
| USD | 828,052 | TWD | 24,923,000 | MS | 09/06/2017 | 1,884 | ||||||||||||||||||
| ZAR | 341,608,000 | USD | 26,085,609 | MS | 09/06/2017 | 169,890 | ||||||||||||||||||
| BRL | 1,091,000 | USD | 344,740 | MS | 10/05/2017 | 229 | ||||||||||||||||||
| CLP | 32,270,000 | USD | 51,508 | MS | 10/05/2017 | 64 | ||||||||||||||||||
| INR | 48,547,000 | USD | 756,726 | MS | 10/05/2017 | 283 | ||||||||||||||||||
| USD | 2,153,726 | BRL | 6,809,000 | MS | 10/05/2017 | 751 | ||||||||||||||||||
| USD | 9,548 | MXN | 171,000 | MS | 10/05/2017 | 30 | ||||||||||||||||||
| USD | 132,076 | TRY | 460,000 | MS | 10/05/2017 | 144 | ||||||||||||||||||
| USD | 508,718 | TWD | 15,294,000 | MS | 10/05/2017 | 104 | ||||||||||||||||||
| USD | 706,170 | ZAR | 9,224,000 | MS | 10/05/2017 | 572 | ||||||||||||||||||
| KRW | 893,867,000 | USD | 795,076 | MS | 10/10/2017 | 65 | ||||||||||||||||||
|
| |||||||||||||||||||||||
| 1,043,121 | ||||||||||||||||||||||||
|
| |||||||||||||||||||||||
| HKD | 629,314,000 | USD | 80,423,075 | MS | 09/06/2017 | (4,993 | ) | |||||||||||||||||
| KRW | 81,984,438,000 | USD | 72,848,366 | MS | 09/06/2017 | (110,933 | ) | |||||||||||||||||
| TWD | 1,907,738,000 | USD | 63,274,892 | MS | 09/06/2017 | (35,657 | ) | |||||||||||||||||
| USD | 25,367,428 | BRL | 80,541,000 | MS | 09/06/2017 | (215,240 | ) | |||||||||||||||||
| USD | 6,373,241 | CLP | 4,138,887,000 | MS | 09/06/2017 | (246,422 | ) | |||||||||||||||||
| USD | 8,302,613 | EUR | 7,072,000 | MS | 09/06/2017 | (116,668 | ) | |||||||||||||||||
| USD | 34,740,430 | INR | 2,238,044,000 | MS | 09/06/2017 | (264,364 | ) | |||||||||||||||||
| USD | 735,715 | MXN | 13,196,000 | MS | 09/06/2017 | (2,229 | ) | |||||||||||||||||
| USD | 9,833,896 | RUB | 590,037,000 | MS | 09/06/2017 | (336,385 | ) | |||||||||||||||||
| USD | 4,522,695 | TRY | 16,171,000 | MS | 09/06/2017 | (152,984 | ) | |||||||||||||||||
| USD | 62,325,490 | TWD | 1,883,227,000 | MS | 09/06/2017 | (101,235 | ) | |||||||||||||||||
| USD | 26,005,435 | ZAR | 341,608,000 | MS | 09/06/2017 | (250,063 | ) | |||||||||||||||||
| MXN | 1,738,000 | USD | 97,247 | MS | 10/05/2017 | (510 | ) | |||||||||||||||||
| TRY | 79,000 | USD | 22,671 | MS | 10/05/2017 | (14 | ) | |||||||||||||||||
| USD | 26,458,569 | BRL | 84,297,000 | MS | 10/05/2017 | (195,766 | ) | |||||||||||||||||
| USD | 6,641,219 | CLP | 4,171,277,000 | MS | 10/05/2017 | (25,091 | ) | |||||||||||||||||
| USD | 8,911,603 | EUR | 7,476,000 | MS | 10/05/2017 | (2,710 | ) | |||||||||||||||||
| USD | 35,333,750 | INR | 2,268,069,000 | MS | 10/05/2017 | (32,990 | ) | |||||||||||||||||
| USD | 14,116,106 | MXN | 253,738,000 | MS | 10/05/2017 | (6,930 | ) | |||||||||||||||||
| USD | 10,363,102 | RUB | 610,949,000 | MS | 10/05/2017 | (111,070 | ) | |||||||||||||||||
| USD | 4,675,142 | TRY | 16,343,000 | MS | 10/05/2017 | (12,182 | ) | |||||||||||||||||
| USD | 63,333,710 | TWD | 1,907,738,000 | MS | 10/05/2017 | (109,523 | ) | |||||||||||||||||
| USD | 25,962,221 | ZAR | 341,608,000 | MS | 10/05/2017 | (169,402 | ) | |||||||||||||||||
| ZAR | 3,747,000 | USD | 286,851 | MS | 10/05/2017 | (220 | ) | |||||||||||||||||
| USD | 84,560,689 | HKD | 661,090,000 | MS | 10/10/2017 | (1,957 | ) | |||||||||||||||||
| 16 | 2017 iSHARES ANNUAL REPORTTO SHAREHOLDERS |
Table of Contents
Schedule of Investments (Continued)
iSHARES® CURRENCY HEDGED MSCI EMERGING MARKETS ETF
August 31, 2017
Currency purchased | Currency sold | Counterparty | Settlement date | Unrealized appreciation (depreciation) | ||||||||||||||||||||
| USD | 71,944,858 | KRW | 80,970,305,000 | MS | 10/10/2017 | $ | (82,444 | ) | ||||||||||||||||
|
| |||||||||||||||||||||||
| (2,587,982 | ) | |||||||||||||||||||||||
|
| |||||||||||||||||||||||
| Net unrealized depreciation | $ | (1,544,861 | ) | |||||||||||||||||||||
|
| |||||||||||||||||||||||
Counterparties:
MS — Morgan Stanley and Co. International PLC
Currency abbreviations:
BRL — Brazilian Real
CLP — Chilean Peso
EUR — Euro
HKD — Hong Kong Dollar
INR — Indian Rupee
KRW — South Korean Won
MXN — Mexican Peso
RUB — New Russian Ruble
TRY — Turkish Lira
TWD — Taiwan New Dollar
USD — United States Dollar
ZAR — South African Rand
Schedule 3 — Fair Value Measurements
Various inputs are used in determining the fair value of financial instruments. For description of the input levels and information about the Fund’s policy regarding valuation of financial instruments, see Note 1.
The following table summarizes the value of the Fund’s investments according to the fair value hierarchy as of August 31, 2017. The breakdown of the Fund’s investments into major categories is disclosed in the schedule of investments above.
| Level 1 | Level 2 | Level 3 | Total | |||||||||||||
Investments: | ||||||||||||||||
Assets: | ||||||||||||||||
Investment companies | $ | 394,295,899 | $ | — | $ | — | $ | 394,295,899 | ||||||||
|
|
|
|
|
|
|
| |||||||||
Total | $ | 394,295,899 | $ | — | $ | — | $ | 394,295,899 | ||||||||
|
|
|
|
|
|
|
| |||||||||
Derivative financial instrumentsa: | ||||||||||||||||
Assets: | ||||||||||||||||
Forward currency contracts | $ | — | $ | 1,043,121 | $ | — | $ | 1,043,121 | ||||||||
Liabilities: | ||||||||||||||||
Forward currency contracts | — | (2,587,982 | ) | — | (2,587,982 | ) | ||||||||||
|
|
|
|
|
|
|
| |||||||||
Total | $ | — | $ | (1,544,861 | ) | $ | — | $ | (1,544,861 | ) | ||||||
|
|
|
|
|
|
|
| |||||||||
| a | Shown at the unrealized appreciation (depreciation) on the contracts. |
See notes to financial statements.
SCHEDULESOF INVESTMENTS | 17 |
Table of Contents
Schedule of Investments
iSHARES® EDGE MSCI MIN VOL EM CURRENCY HEDGED ETF
August 31, 2017
| Security | Shares | Value | ||||||
INVESTMENT COMPANIES — 99.99% |
| |||||||
EXCHANGE-TRADED FUNDS — 99.99% |
| |||||||
iShares Edge MSCI Min Vol Emerging Markets ETFa | 112,856 | $ | 6,561,448 | |||||
|
| |||||||
| 6,561,448 | ||||||||
|
| |||||||
TOTAL INVESTMENT COMPANIES |
| |||||||
(Cost: $5,755,687) |
| 6,561,448 | ||||||
SHORT-TERM INVESTMENTS — 0.04% |
| |||||||
MONEY MARKET FUNDS — 0.04% |
| |||||||
BlackRock Cash Funds: Treasury, SL Agency Shares | ||||||||
0.96%a,b | 3,008 | 3,008 | ||||||
|
| |||||||
| 3,008 | ||||||||
|
| |||||||
TOTAL SHORT-TERM INVESTMENTS |
| |||||||
(Cost: $3,008) |
| 3,008 | ||||||
|
| |||||||
| Value | ||||||
TOTAL INVESTMENTS | ||||||
(Cost: $5,758,695)c | $ | 6,564,456 | ||||
Other Assets, Less Liabilities — (0.03)% | (2,103 | ) | ||||
|
| |||||
NET ASSETS — 100.00% | $ | 6,562,353 | ||||
|
| |||||
| a | Affiliated issuer. See Schedule 1. |
| b | The rate quoted is the annualized seven-day yield of the fund at period end. |
| c | The cost of investments (including short positions and derivatives, if any) for federal income tax purposes was $5,773,467. Net unrealized appreciation was $788,763, of which $820,297 represented gross unrealized appreciation on investments and $31,534 represented gross unrealized depreciation on investments. |
Schedule 1 — Affiliates (Note 2)
Investments in issuers considered to be affiliates of the Fund during the year ended August 31, 2017, for purposes of Section 2(a)(3) of the 1940 Act, and/or related parties of the Fund were as follows:
| Affiliated issuer | Shares held at 08/31/16 | Shares purchased | Shares sold | Shares held at 08/31/17 | Value at 08/31/17 | Net realized gain (loss) a | Change in unrealized appreciation (depreciation) | Income | ||||||||||||||||||||||||
BlackRock Cash Funds: Treasury, | 3,286 | — | (278 | )b | 3,008 | $ | 3,008 | $ | — | $ | — | $ | 22 | |||||||||||||||||||
iShares Edge MSCI Min Vol | 115,665 | 80,735 | (83,544 | ) | 112,856 | 6,561,448 | 18,322 | 480,039 | 185,655 | |||||||||||||||||||||||
|
|
|
|
|
|
|
| |||||||||||||||||||||||||
| $ | 6,564,456 | $ | 18,322 | $ | 480,039 | $ | 185,677 | |||||||||||||||||||||||||
|
|
|
|
|
|
|
| |||||||||||||||||||||||||
| a | Includes realized capital gain distributions from an affiliated fund, if any. |
| b | Net of shares purchased and sold. |
Schedule 2 — Forward Currency Contracts (Note 6)
Forward currency contracts outstanding as of August 31, 2017 were as follows:
Currency purchased | Currency sold | Counterparty | Settlement date | Unrealized appreciation (depreciation) | ||||||||||||||||||||
| BRL | 378,000 | USD | 119,288 | JPM | 09/06/2017 | $ | 778 | |||||||||||||||||
| CLP | 186,794,000 | USD | 297,618 | JPM | 09/06/2017 | 1,137 | ||||||||||||||||||
| EUR | 4,000 | USD | 4,725 | JPM | 09/06/2017 | 37 | ||||||||||||||||||
| INR | 27,174,000 | USD | 424,547 | JPM | 09/06/2017 | 476 | ||||||||||||||||||
| PLN | 685,000 | USD | 191,764 | MS | 09/06/2017 | 258 | ||||||||||||||||||
| RUB | 1,072,000 | USD | 18,272 | JPM | 09/06/2017 | 206 | ||||||||||||||||||
| RUB | 10,000 | USD | 165 | MS | 09/06/2017 | 7 | ||||||||||||||||||
| 18 | 2017 iSHARES ANNUAL REPORTTO SHAREHOLDERS |
Table of Contents
Schedule of Investments (Continued)
iSHARES® EDGE MSCI MIN VOL EM CURRENCY HEDGED ETF
August 31, 2017
Currency purchased | Currency sold | Counterparty | Settlement date | Unrealized appreciation (depreciation) | ||||||||||||||||||||
| TWD | 39,000 | USD | 1,290 | MS | 09/06/2017 | $ | 3 | |||||||||||||||||
| USD | 3,814 | BRL | 12,000 | BNP | 09/06/2017 | 2 | ||||||||||||||||||
| USD | 24,350 | HKD | 190,000 | BNP | 09/06/2017 | 71 | ||||||||||||||||||
| USD | 1,130,261 | HKD | 8,819,000 | SSB | 09/06/2017 | 3,307 | ||||||||||||||||||
| USD | 1,261,690 | KRW | 1,417,243,000 | BNP | 09/06/2017 | 4,298 | ||||||||||||||||||
| USD | 170,939 | MXN | 3,051,000 | GS | 09/06/2017 | 321 | ||||||||||||||||||
| USD | 20,445 | RUB | 1,082,000 | BNP | 09/06/2017 | 1,795 | ||||||||||||||||||
| ZAR | 1,689,000 | USD | 129,237 | JPM | 09/06/2017 | 577 | ||||||||||||||||||
| BRL | 3,000 | USD | 948 | DB | 10/05/2017 | 1 | ||||||||||||||||||
| CLP | 1,431,000 | USD | 2,286 | DB | 10/05/2017 | 1 | ||||||||||||||||||
| EUR | 1,000 | USD | 1,191 | BNP | 10/05/2017 | 2 | ||||||||||||||||||
| INR | 440,000 | USD | 6,858 | BNP | 10/05/2017 | 3 | ||||||||||||||||||
| RUB | 11,000 | USD | 188 | BNP | 10/05/2017 | — | ||||||||||||||||||
| USD | 1,581 | BRL | 5,000 | JPM | 10/05/2017 | — | ||||||||||||||||||
| USD | 74,069 | EUR | 62,000 | SSB | 10/05/2017 | 140 | ||||||||||||||||||
| USD | 171,451 | MXN | 3,078,000 | BBP | 10/05/2017 | 129 | ||||||||||||||||||
| USD | 1,297 | TWD | 39,000 | DB | 10/05/2017 | — | ||||||||||||||||||
| USD | 1,966,461 | TWD | 59,102,000 | JPM | 10/05/2017 | 981 | ||||||||||||||||||
| USD | 3,445 | ZAR | 45,000 | SSB | 10/05/2017 | 3 | ||||||||||||||||||
| KRW | 13,903,000 | USD | 12,366 | BNP | 10/10/2017 | 2 | ||||||||||||||||||
|
| |||||||||||||||||||||||
| 14,535 | ||||||||||||||||||||||||
|
| |||||||||||||||||||||||
| EUR | 62,000 | USD | 73,950 | SSB | 09/06/2017 | (139 | ) | |||||||||||||||||
| HKD | 8,970,000 | USD | 1,146,268 | BNP | 09/06/2017 | (20 | ) | |||||||||||||||||
| HKD | 39,000 | USD | 4,998 | SCB | 09/06/2017 | (14 | ) | |||||||||||||||||
| KRW | 1,416,847,000 | USD | 1,260,114 | JPM | 09/06/2017 | (3,073 | ) | |||||||||||||||||
| KRW | 396,000 | USD | 354 | MS | 09/06/2017 | (3 | ) | |||||||||||||||||
| MXN | 3,078,000 | USD | 172,252 | BBP | 09/06/2017 | (125 | ) | |||||||||||||||||
| TWD | 59,407,000 | USD | 1,973,633 | JPM | 09/06/2017 | (4,362 | ) | |||||||||||||||||
| USD | 115,156 | BRL | 366,000 | BNP | 09/06/2017 | (1,099 | ) | |||||||||||||||||
| USD | 286,613 | CLP | 186,241,000 | BNP | 09/06/2017 | (11,257 | ) | |||||||||||||||||
| USD | 849 | CLP | 553,000 | MS | 09/06/2017 | (35 | ) | |||||||||||||||||
| USD | 77,461 | EUR | 66,000 | SSB | 09/06/2017 | (1,112 | ) | |||||||||||||||||
| USD | 420,741 | INR | 27,100,000 | BNP | 09/06/2017 | (3,124 | ) | |||||||||||||||||
| USD | 1,150 | INR | 74,000 | MS | 09/06/2017 | (8 | ) | |||||||||||||||||
| USD | 501 | MXN | 9,000 | BNP | 09/06/2017 | (2 | ) | |||||||||||||||||
| USD | 1,003 | MXN | 18,000 | GS | 09/06/2017 | (4 | ) | |||||||||||||||||
| USD | 2,493 | PLN | 9,000 | BNP | 09/06/2017 | (30 | ) | |||||||||||||||||
| USD | 554 | PLN | 2,000 | CITI | 09/06/2017 | (6 | ) | |||||||||||||||||
| USD | 185,543 | PLN | 674,000 | MS | 09/06/2017 | (3,394 | ) | |||||||||||||||||
| USD | 1,968,411 | TWD | 59,446,000 | BNP | 09/06/2017 | (2,153 | ) | |||||||||||||||||
| USD | 127,698 | ZAR | 1,676,000 | BNP | 09/06/2017 | (1,117 | ) | |||||||||||||||||
| USD | 977 | ZAR | 13,000 | SSB | 09/06/2017 | (22 | ) | |||||||||||||||||
| MXN | 24,000 | USD | 1,343 | JPM | 10/05/2017 | (7 | ) | |||||||||||||||||
| MXN | 35,000 | USD | 1,954 | SSB | 10/05/2017 | (6 | ) | |||||||||||||||||
| TWD | 52,000 | USD | 1,730 | BNP | 10/05/2017 | (1 | ) | |||||||||||||||||
| USD | 118,748 | BRL | 378,000 | JPM | 10/05/2017 | (774 | ) | |||||||||||||||||
| USD | 302,118 | CLP | 189,842,000 | JPM | 10/05/2017 | (1,278 | ) | |||||||||||||||||
| USD | 390 | INR | 25,000 | DB | 10/05/2017 | — | ||||||||||||||||||
| USD | 423,403 | INR | 27,174,000 | JPM | 10/05/2017 | (330 | ) | |||||||||||||||||
| USD | 280 | PLN | 1,000 | DB | 10/05/2017 | (1 | ) | |||||||||||||||||
| USD | 191,798 | PLN | 685,000 | MS | 10/05/2017 | (256 | ) | |||||||||||||||||
| USD | 7,837 | PLN | 28,000 | SSB | 10/05/2017 | (14 | ) | |||||||||||||||||
| USD | 171 | RUB | 10,000 | DB | 10/05/2017 | — | ||||||||||||||||||
| USD | 17,680 | RUB | 1,042,000 | JPM | 10/05/2017 | (184 | ) | |||||||||||||||||
| USD | 128,630 | ZAR | 1,689,000 | JPM | 10/05/2017 | (572 | ) | |||||||||||||||||
| ZAR | 14,000 | USD | 1,071 | DB | 10/05/2017 | — | ||||||||||||||||||
| KRW | 5,790,000 | USD | 5,151 | DB | 10/10/2017 | — | ||||||||||||||||||
SCHEDULESOF INVESTMENTS | 19 |
Table of Contents
Schedule of Investments (Continued)
iSHARES® EDGE MSCI MIN VOL EM CURRENCY HEDGED ETF
August 31, 2017
Currency purchased | Currency sold | Counterparty | Settlement date | Unrealized appreciation (depreciation) | ||||||||||||||||||||
| USD | 1,147,357 | HKD | 8,970,000 | BNP | 10/10/2017 | $ | (32 | ) | ||||||||||||||||
| USD | 54,741 | HKD | 428,000 | JPM | 10/10/2017 | (6 | ) | |||||||||||||||||
| USD | 8,570 | HKD | 67,000 | MS | 10/10/2017 | — | ||||||||||||||||||
| USD | 1,260,215 | KRW | 1,416,847,000 | JPM | 10/10/2017 | (144 | ) | |||||||||||||||||
|
| |||||||||||||||||||||||
| (34,704 | ) | |||||||||||||||||||||||
|
| |||||||||||||||||||||||
| Net unrealized depreciation | $ | (20,169 | ) | |||||||||||||||||||||
|
| |||||||||||||||||||||||
Counterparties:
BBP — Barclays Bank PLC Wholesale
BNP — BNP Paribas SA
CITI — Citibank N.A. London
DB — Deutsche Bank AG
GS — Goldman Sachs International
JPM — JPMorgan Chase Bank N.A.
MS — Morgan Stanley and Co. International PLC
SCB — Standard Chartered Bank
SSB — State Street Bank London
Currency abbreviations:
BRL — Brazilian Real
CLP — Chilean Peso
EUR — Euro
HKD — Hong Kong Dollar
INR — Indian Rupee
KRW — South Korean Won
MXN — Mexican Peso
PLN — Polish Zloty
RUB — New Russian Ruble
TWD — Taiwan New Dollar
USD — United States Dollar
ZAR — South African Rand
Schedule 3 — Fair Value Measurements
Various inputs are used in determining the fair value of financial instruments. For description of the input levels and information about the Fund’s policy regarding valuation of financial instruments, see Note 1.
The following table summarizes the value of the Fund’s investments according to the fair value hierarchy as of August 31, 2017. The breakdown of the Fund’s investments into major categories is disclosed in the schedule of investments above.
| Level 1 | Level 2 | Level 3 | Total | |||||||||||||
Investments: | ||||||||||||||||
Assets: | ||||||||||||||||
Investment companies | $ | 6,561,448 | $ | — | $ | — | $ | 6,561,448 | ||||||||
Money market funds | 3,008 | — | — | 3,008 | ||||||||||||
|
|
|
|
|
|
|
| |||||||||
Total | $ | 6,564,456 | $ | — | $ | — | $ | 6,564,456 | ||||||||
|
|
|
|
|
|
|
| |||||||||
Derivative financial instrumentsa: | ||||||||||||||||
Assets: | ||||||||||||||||
Forward currency contracts | $ | — | $ | 14,535 | $ | — | $ | 14,535 | ||||||||
Liabilities: | ||||||||||||||||
Forward currency contracts | — | (34,704 | ) | — | (34,704 | ) | ||||||||||
|
|
|
|
|
|
|
| |||||||||
Total | $ | — | $ | (20,169 | ) | $ | — | $ | (20,169 | ) | ||||||
|
|
|
|
|
|
|
| |||||||||
| a | Shown at the unrealized appreciation (depreciation) on the contracts. |
See notes to financial statements.
| 20 | 2017 iSHARES ANNUAL REPORTTO SHAREHOLDERS |
Table of Contents
Consolidated Schedule of Investments
iSHARES® EDGE MSCI MIN VOL EMERGING MARKETS ETF
August 31, 2017
| Security | Shares | Value | ||||||
COMMON STOCKS — 99.42% |
| |||||||
BRAZIL — 1.83% | ||||||||
Ambev SA | 3,897,600 | $ | 24,601,165 | |||||
Cielo SA | 1,600,816 | 11,411,687 | ||||||
CPFL Energia SA | 1,116,800 | 9,615,316 | ||||||
EDP — Energias do Brasil SA | 487,200 | 2,359,780 | ||||||
Equatorial Energia SA | 626,400 | 12,167,862 | ||||||
Raia Drogasil SA | 626,400 | 13,806,302 | ||||||
|
| |||||||
| 73,962,112 | ||||||||
CHILE — 3.87% | ||||||||
Aguas Andinas SA Series A | 43,170,792 | 27,572,867 | ||||||
Banco de Chile | 414,012,120 | 60,305,947 | ||||||
Banco de Credito e Inversiones | 90,438 | 5,864,856 | ||||||
Cia. Cervecerias Unidas SA | 162,864 | 2,220,164 | ||||||
Colbun SA | 18,059,112 | 4,350,406 | ||||||
Empresas COPEC SA | 307,632 | 3,927,051 | ||||||
Enel Americas SA | 18,459,312 | 3,982,129 | ||||||
Enel Generacion Chile SA | 5,916,696 | 5,015,502 | ||||||
SACI Falabella | 4,259,520 | 42,824,972 | ||||||
|
| |||||||
| 156,063,894 | ||||||||
CHINA — 23.49% | ||||||||
3SBio Inc.a,b,c | 5,568,000 | 7,655,026 | ||||||
AAC Technologies Holdings Inc. | 2,436,000 | 44,415,693 | ||||||
Agricultural Bank of China Ltd. Class H | 27,840,000 | 13,090,379 | ||||||
Alibaba Group Holding Ltd. ADRa | 195,576 | 33,588,222 | ||||||
ANTA Sports Products Ltd. | 4,176,000 | 16,434,118 | ||||||
Autohome Inc. ADRa | 48,024 | 3,086,502 | ||||||
Baidu Inc. ADRa | 70,992 | 16,189,726 | ||||||
Bank of China Ltd. Class H | 62,640,000 | 32,974,950 | ||||||
Bank of Communications Co. Ltd. Class H | 4,856,000 | 3,710,351 | ||||||
Beijing Capital International Airport Co. Ltd. Class H | 6,960,000 | 11,258,438 | ||||||
Beijing Enterprises Water Group Ltd.c | 2,784,000 | 2,365,517 | ||||||
China CITIC Bank Corp. Ltd. Class H | 7,656,000 | 5,057,404 | ||||||
China Construction Bank Corp. Class H | 38,280,000 | 33,552,990 | ||||||
China Everbright Bank Co. Ltd. Class H | 20,880,000 | 10,031,215 | ||||||
China Gas Holdings Ltd. | 1,392,000 | 3,514,482 | ||||||
| Security | Shares | Value | ||||||
China Huarong Asset Management Co. Ltd. Class Hb | 9,048,000 | $ | 3,861,306 | |||||
China Huishan Dairy Holdings Co. Ltd.c,d | 70,195,000 | 90 | ||||||
China Medical System Holdings Ltd.c | 7,656,000 | 14,086,387 | ||||||
China Mengniu Dairy Co. Ltd. | 7,656,000 | 17,881,885 | ||||||
China Merchants Port Holdings Co. Ltd. | 1,132,000 | 3,702,726 | ||||||
China Mobile Ltd. | 3,828,000 | 40,596,183 | ||||||
China Petroleum & Chemical Corp. Class H | 18,096,000 | 13,849,835 | ||||||
China Resources Beer Holdings Co. Ltd. | 6,960,000 | 17,465,696 | ||||||
China Resources Gas Group Ltd. | 5,570,000 | 19,642,622 | ||||||
China Resources Power Holdings Co. Ltd. | 2,790,000 | 5,119,103 | ||||||
China Telecom Corp. Ltd. Class H | 18,096,000 | 9,294,881 | ||||||
China Unicom Hong Kong Ltd.a | 2,784,000 | 4,055,172 | ||||||
COSCO SHIPPING Ports Ltd.c | 13,920,000 | 16,451,903 | ||||||
CSPC Pharmaceutical Group Ltd. | 25,056,000 | 39,121,737 | ||||||
Fullshare Holdings Ltd.c | 18,120,000 | 7,223,505 | ||||||
Fuyao Glass Industry Group Co. Ltd. Class Hb | 835,200 | 2,662,541 | ||||||
Guangdong Investment Ltd.c | 32,016,000 | 47,288,996 | ||||||
Hengan International Group Co. Ltd. | 2,088,000 | 17,447,911 | ||||||
Industrial & Commercial Bank of China Ltd. Class H | 34,800,000 | 26,056,258 | ||||||
Jiangsu Expressway Co. Ltd. Class H | 19,488,000 | 29,880,214 | ||||||
Lenovo Group Ltd.c | 6,960,000 | 3,806,170 | ||||||
NetEase Inc. ADR | 89,784 | 24,766,019 | ||||||
New Oriental Education & Technology Group Inc. ADR | 192,096 | 15,703,848 | ||||||
Semiconductor Manufacturing International Corp.a,c | 14,268,000 | 13,417,639 | ||||||
Shandong Weigao Group Medical Polymer Co. Ltd. Class H | 13,920,000 | 11,116,151 | ||||||
Shanghai Lujiazui Finance & Trade Zone Development Co. Ltd. Class B | 8,143,200 | 13,134,982 | ||||||
CONSOLIDATED SCHEDULESOF INVESTMENTS | 21 |
Table of Contents
Consolidated Schedule of Investments (Continued)
iSHARES® EDGE MSCI MIN VOL EMERGING MARKETS ETF
August 31, 2017
| Security | Shares | Value | ||||||
Shanghai Pharmaceuticals Holding Co. Ltd. Class H | 2,992,800 | $ | 7,364,939 | |||||
Shenzhou International Group Holdings Ltd. | 4,872,000 | 39,031,029 | ||||||
Sihuan Pharmaceutical Holdings Group Ltd. | 32,016,000 | 12,313,138 | ||||||
Sino Biopharmaceutical Ltd. | 18,096,000 | 15,884,535 | ||||||
Sinopharm Group Co. Ltd. Class H | 835,600 | 3,774,184 | ||||||
Sun Art Retail Group Ltd. | 5,220,000 | 4,808,847 | ||||||
Sunny Optical Technology Group Co. Ltd. | 200,000 | 2,867,200 | ||||||
TAL Education Group Class A ADR | 1,411,488 | 42,951,580 | ||||||
Tencent Holdings Ltd. | 1,670,400 | 70,218,503 | ||||||
TravelSky Technology Ltd. Class H | 6,264,000 | 17,127,765 | ||||||
Tsingtao Brewery Co. Ltd. Class H | 1,834,000 | 7,604,124 | ||||||
Want Want China Holdings Ltd.c | 3,480,000 | 2,303,267 | ||||||
Yum China Holdings Inc.a | 1,570,872 | 55,546,034 | ||||||
Zhejiang Expressway Co. Ltd. Class H | 9,744,000 | 12,188,637 | ||||||
|
| |||||||
| 948,542,555 | ||||||||
COLOMBIA — 0.53% |
| |||||||
Grupo Argos SA/Colombia | 199,752 | 1,423,120 | ||||||
Interconexion Electrica SA ESP | 4,388,280 | 19,908,829 | ||||||
|
| |||||||
| 21,331,949 | ||||||||
CZECH REPUBLIC — 0.56% |
| |||||||
CEZ AS | 100,224 | 1,897,854 | ||||||
Komercni Banka AS | 240,816 | 10,594,606 | ||||||
Moneta Money Bank ASb | 758,640 | 2,655,582 | ||||||
O2 Czech Republic AS | 598,560 | 7,492,694 | ||||||
|
| |||||||
| 22,640,736 | ||||||||
EGYPT — 0.40% | ||||||||
Commercial International Bank Egypt SAE | 3,421,536 | 16,323,013 | ||||||
|
| |||||||
| 16,323,013 | ||||||||
GREECE — 1.10% | ||||||||
Hellenic Telecommunications Organization SA | 679,015 | 8,637,902 | ||||||
JUMBO SA | 1,120,560 | 18,651,265 | ||||||
OPAP SA | 361,400 | 4,034,585 | ||||||
Titan Cement Co. SA | 460,752 | 13,064,739 | ||||||
|
| |||||||
| 44,388,491 | ||||||||
| Security | Shares | Value | ||||||
HUNGARY — 0.97% |
| |||||||
MOL Hungarian Oil & Gas PLC | 149,640 | $ | 13,868,780 | |||||
Richter Gedeon Nyrt | 970,224 | 25,228,549 | ||||||
|
| |||||||
| 39,097,329 | ||||||||
INDIA — 6.11% | ||||||||
Asian Paints Ltd. | 1,387,128 | 25,356,226 | ||||||
Cadila Healthcare Ltd. | 311,808 | 2,438,810 | ||||||
Cipla Ltd. | 293,712 | 2,627,620 | ||||||
Coal India Ltd. | 432,216 | 1,605,101 | ||||||
Dabur India Ltd. | 5,942,448 | 29,291,024 | ||||||
HCL Technologies Ltd. | 1,848,576 | 25,022,159 | ||||||
Hindustan Unilever Ltd. | 1,011,984 | 19,309,243 | ||||||
Infosys Ltd. | 1,788,024 | 25,591,249 | ||||||
Lupin Ltd. | 150,336 | 2,303,382 | ||||||
Marico Ltd. | 2,932,248 | 14,469,449 | ||||||
Nestle India Ltd. | 32,016 | 3,566,515 | ||||||
Sun Pharmaceuticals Industries Ltd. | 653,544 | 4,918,992 | ||||||
Tata Consultancy Services Ltd. | 817,104 | 31,908,294 | ||||||
Tech Mahindra Ltd. | 1,848,576 | 12,380,952 | ||||||
Titan Co. Ltd. | 535,920 | 5,173,403 | ||||||
Wipro Ltd. | 8,711,832 | 40,761,173 | ||||||
|
| |||||||
| 246,723,592 | ||||||||
INDONESIA — 4.95% | ||||||||
Bank Central Asia Tbk PT | 34,869,600 | 49,526,227 | ||||||
Bank Rakyat Indonesia Persero Tbk PT | 3,410,400 | 3,866,160 | ||||||
Gudang Garam Tbk PT | 1,670,300 | 8,663,226 | ||||||
Hanjaya Mandala Sampoerna Tbk PT | 88,531,200 | 24,153,318 | ||||||
Indofood CBP Sukses Makmur Tbk PT | 10,579,200 | 6,918,267 | ||||||
Indofood Sukses Makmur Tbk PT | 15,033,600 | 9,436,846 | ||||||
Jasa Marga Persero Tbk PT | 5,707,295 | 2,491,755 | ||||||
Kalbe Farma Tbk PT | 146,786,400 | 18,813,127 | ||||||
Telekomunikasi Indonesia Persero Tbk PT | 106,766,400 | 37,530,686 | ||||||
Unilever Indonesia Tbk PT | 10,161,600 | 38,500,141 | ||||||
|
| |||||||
| 199,899,753 | ||||||||
MALAYSIA — 6.95% | ||||||||
DiGi.Com Bhdc | 3,410,400 | 3,865,200 | ||||||
HAP Seng Consolidated Bhd | 2,714,400 | 5,771,397 | ||||||
Hartalega Holdings Bhd | 1,670,400 | 2,655,899 | ||||||
| 22 | 2017 iSHARES ANNUAL REPORTTO SHAREHOLDERS |
Table of Contents
Consolidated Schedule of Investments (Continued)
iSHARES® EDGE MSCI MIN VOL EMERGING MARKETS ETF
August 31, 2017
| Security | Shares | Value | ||||||
Hong Leong Bank Bhd | 10,300,800 | $ | 37,242,560 | |||||
IHH Healthcare Bhd | 31,946,400 | 44,809,492 | ||||||
Malayan Banking Bhd | 20,532,000 | 45,482,431 | ||||||
Maxis Bhdc | 18,583,200 | 25,151,831 | ||||||
Petronas Chemicals Group Bhd | 6,194,400 | 10,385,647 | ||||||
Petronas Dagangan Bhd | 1,044,000 | 5,965,016 | ||||||
Petronas Gas Bhd | 5,498,400 | 23,690,565 | ||||||
Public Bank Bhd | 10,216,580 | 49,282,648 | ||||||
Telekom Malaysia Bhdc | 7,099,200 | 10,689,113 | ||||||
Tenaga Nasional Bhd | 3,828,000 | 12,800,337 | ||||||
Westports Holdings Bhdc | 2,992,800 | 2,628,029 | ||||||
|
| |||||||
| 280,420,165 | ||||||||
MEXICO — 2.58% |
| |||||||
Arca Continental SAB de CV | 3,897,600 | 28,604,232 | ||||||
Coca-Cola Femsa SAB de CV Series L | 556,800 | 4,577,739 | ||||||
Gruma SAB de CV Series B | 661,200 | 9,728,009 | ||||||
Grupo Aeroportuario del Pacifico SAB de CV Series B | 2,088,000 | 23,103,869 | ||||||
Grupo Aeroportuario del Sureste SAB de CV Series B | 459,360 | 9,399,963 | ||||||
Infraestructura Energetica Nova SAB de CV | 1,600,800 | 8,725,798 | ||||||
Wal-Mart de Mexico SAB de CV | 8,282,400 | 20,210,213 | ||||||
|
| |||||||
| 104,349,823 | ||||||||
PAKISTAN — 0.29% | ||||||||
Habib Bank Ltd. | 1,948,700 | 3,290,932 | ||||||
Lucky Cement Ltd. | 556,800 | 3,159,787 | ||||||
MCB Bank Ltd. | 2,783,900 | 5,119,518 | ||||||
|
| |||||||
| 11,570,237 | ||||||||
PERU — 1.22% | ||||||||
Credicorp Ltd. | 243,600 | 49,411,824 | ||||||
|
| |||||||
| 49,411,824 | ||||||||
PHILIPPINES — 3.39% | ||||||||
Aboitiz Equity Ventures Inc. | 16,216,800 | 23,594,699 | ||||||
Aboitiz Power Corp. | 24,568,800 | 18,965,558 | ||||||
Bank of the Philippine Islands | 12,806,404 | 26,503,775 | ||||||
BDO Unibank Inc. | 10,739,283 | 26,675,061 | ||||||
Jollibee Foods Corp. | 4,412,640 | 20,541,154 | ||||||
Metropolitan Bank & Trust Co. | 4,322,161 | 7,399,283 | ||||||
Security Bank Corp. | 1,357,200 | 6,630,839 | ||||||
Universal Robina Corp. | 2,303,760 | 6,577,669 | ||||||
|
| |||||||
| 136,888,038 | ||||||||
| Security | Shares | Value | ||||||
POLAND — 1.50% | ||||||||
Bank Pekao SA | 396,024 | $ | 14,180,128 | |||||
Bank Zachodni WBK SA | 82,824 | 8,566,561 | ||||||
Cyfrowy Polsat SA | 533,136 | 3,998,446 | ||||||
Grupa Lotos SAa | 176,088 | 2,900,470 | ||||||
PGE Polska Grupa Energetyczna SA | 4,306,848 | 17,198,948 | ||||||
Polski Koncern Naftowy ORLEN SA | 416,904 | 13,755,242 | ||||||
|
| |||||||
| 60,599,795 | ||||||||
QATAR — 1.94% | ||||||||
Commercial Bank PQSC (The)a | 725,232 | 5,937,292 | ||||||
Doha Bank QPSC | 522,972 | 4,331,709 | ||||||
Masraf Al Rayan QSC | 226,200 | 2,369,936 | ||||||
Qatar Electricity & Water Co. QSC | 462,144 | 23,606,944 | ||||||
Qatar Gas Transport Co. Ltd. | 453,835 | 2,117,585 | ||||||
Qatar Insurance Co. SAQ | 469,800 | 8,515,427 | ||||||
Qatar Islamic Bank SAQ | 623,616 | 15,927,577 | ||||||
Qatar National Bank QPSC | 430,128 | 15,427,317 | ||||||
|
| |||||||
| 78,233,787 | ||||||||
RUSSIA — 0.21% |
| |||||||
Rosneft Oil Co. PJSC | 371,300 | 1,953,841 | ||||||
Rosneft Oil Co. PJSC GDR | 1,290,771 | 6,712,009 | ||||||
|
| |||||||
| 8,665,850 | ||||||||
SOUTH AFRICA — 2.01% | ||||||||
Bidvest Group Ltd. (The) | 343,128 | 4,526,201 | ||||||
Fortress Income Fund Ltd. Class A | 7,168,104 | 9,673,287 | ||||||
NEPI Rockcastle PLCa | 890,184 | 12,910,151 | ||||||
Pick n Pay Stores Ltd. | 1,921,656 | 9,459,323 | ||||||
Sappi Ltd. | 260,304 | 1,750,380 | ||||||
SPAR Group Ltd. (The) | 708,528 | 9,215,361 | ||||||
Tiger Brands Ltd. | 77,952 | 2,416,977 | ||||||
Vodacom Group Ltd. | 2,245,296 | 31,369,363 | ||||||
|
| |||||||
| 81,321,043 | ||||||||
SOUTH KOREA — 10.39% | ||||||||
Cheil Worldwide Inc. | 177,480 | 2,990,528 | ||||||
CJ CheilJedang Corp.c | 11,136 | 3,579,993 | ||||||
CJ Logistics Corp.a,c | 52,200 | 7,823,519 | ||||||
Coway Co. Ltd. | 70,992 | 6,220,299 | ||||||
Dongbu Insurance Co. Ltd. | 438,480 | 29,242,370 | ||||||
E-MART Inc. | 27,144 | 5,392,210 | ||||||
GS Retail Co. Ltd. | 127,368 | 4,557,732 | ||||||
CONSOLIDATED SCHEDULESOF INVESTMENTS | 23 |
Table of Contents
Consolidated Schedule of Investments (Continued)
iSHARES® EDGE MSCI MIN VOL EMERGING MARKETS ETF
August 31, 2017
| Security | Shares | Value | ||||||
Hanssem Co. Ltd.c | 43,152 | $ | 6,505,711 | |||||
Hanwha Life Insurance Co. Ltd. | 475,368 | 3,085,929 | ||||||
Hyundai Marine & Fire Insurance Co. Ltd. | 265,176 | 10,864,785 | ||||||
Kakao Corp.c | 36,192 | 3,947,868 | ||||||
Kangwon Land Inc. | 718,968 | 21,997,513 | ||||||
Kia Motors Corp. | 225,504 | 7,089,497 | ||||||
Korea Electric Power Corp. | 107,184 | 4,077,859 | ||||||
KT Corp. | 262,836 | 7,272,511 | ||||||
KT&G Corp. | 389,760 | 39,577,439 | ||||||
LG Display Co. Ltd. | 95,352 | 2,634,103 | ||||||
Lotte Confectionery Co. Ltd. | 23,664 | 4,144,768 | ||||||
NAVER Corp. | 48,719 | 32,620,473 | ||||||
NCsoft Corp.c | 48,024 | 16,375,690 | ||||||
S-1 Corp. | 281,880 | 22,423,409 | ||||||
Samsung Biologics Co. Ltd.a,b,c | 162,168 | 40,700,199 | ||||||
Samsung Electro-Mechanics Co. Ltd. | 59,160 | 5,299,007 | ||||||
Samsung Electronics Co. Ltd. | 13,224 | 27,161,036 | ||||||
Samsung Fire & Marine Insurance Co. Ltd. | 92,568 | 22,698,698 | ||||||
Samsung Life Insurance Co. Ltd. | 257,520 | 26,377,758 | ||||||
Samsung SDI Co. Ltd. | 60,552 | 10,552,029 | ||||||
SK Hynix Inc. | 239,424 | 14,565,880 | ||||||
SK Telecom Co. Ltd. | 132,240 | 29,729,372 | ||||||
|
| |||||||
| 419,508,185 | ||||||||
TAIWAN — 16.30% | ||||||||
Advanced Semiconductor Engineering Inc. | 2,784,890 | 3,358,958 | ||||||
Advantech Co. Ltd. | 2,903,333 | 21,405,335 | ||||||
Asustek Computer Inc. | 1,667,000 | 13,809,271 | ||||||
Chicony Electronics Co. Ltd. | 7,695,085 | 19,327,593 | ||||||
Chunghwa Telecom Co. Ltd. | 15,312,000 | 53,274,131 | ||||||
Delta Electronics Inc. | 2,327,000 | 12,761,142 | ||||||
EVA Airways Corp. | 6,452,582 | 3,356,822 | ||||||
Far EasTone Telecommunications Co. Ltd. | 18,792,000 | 45,580,516 | ||||||
First Financial Holding Co. Ltd. | 58,200,159 | 37,798,572 | ||||||
Formosa Petrochemical Corp. | 5,568,000 | 19,649,160 | ||||||
Formosa Plastics Corp. | 2,784,840 | 8,664,849 | ||||||
Formosa Taffeta Co. Ltd. | 7,656,000 | 7,610,590 | ||||||
Foxconn Technology Co. Ltd. | 3,213,331 | 10,200,375 | ||||||
Hon Hai Precision Industry Co. Ltd. | 12,528,125 | 48,777,451 | ||||||
Hua Nan Financial Holdings Co. Ltd. | 52,200,034 | 29,145,120 | ||||||
| Security | Shares | Value | ||||||
Lite-On Technology Corp. | 16,008,752 | $ | 23,685,039 | |||||
Novatek Microelectronics Corp. | 541,000 | 2,106,349 | ||||||
Phison Electronics Corp. | 152,000 | 2,049,902 | ||||||
Powertech Technology Inc. | 2,785,000 | 8,453,097 | ||||||
President Chain Store Corp. | 2,786,000 | 23,309,752 | ||||||
Quanta Computer Inc. | 2,784,000 | 6,337,546 | ||||||
Siliconware Precision Industries Co. Ltd. | 28,536,000 | 45,197,681 | ||||||
Standard Foods Corp. | 1,819,476 | 4,648,318 | ||||||
Synnex Technology International Corp. | 14,616,000 | 16,321,257 | ||||||
TaiMed Biologics Inc.a | 349,000 | 2,509,460 | ||||||
Taiwan Business Bank | 15,055,476 | 4,160,597 | ||||||
Taiwan Cooperative Financial Holding Co. Ltd. | 98,929,770 | 52,121,785 | ||||||
Taiwan Mobile Co. Ltd. | 13,920,000 | 49,814,772 | ||||||
Taiwan Semiconductor Manufacturing Co. Ltd. | 8,352,000 | 59,916,101 | ||||||
Transcend Information Inc. | 3,480,000 | 10,378,077 | ||||||
United Microelectronics Corp. | 8,352,000 | 4,165,068 | ||||||
WPG Holdings Ltd. | 6,264,000 | 8,157,169 | ||||||
|
| |||||||
| 658,051,855 | ||||||||
THAILAND — 6.71% | ||||||||
Advanced Info Service PCL NVDR | 1,809,600 | 10,218,340 | ||||||
Airports of Thailand PCL NVDR | 15,247,800 | 25,026,505 | ||||||
Bangkok Dusit Medical Services PCL NVDRc | 38,280,000 | 24,094,323 | ||||||
Bangkok Expressway & Metro PCL | 71,537,000 | 16,804,355 | ||||||
BTS Group Holdings PCL NVDR | 96,604,800 | 25,165,834 | ||||||
Bumrungrad Hospital PCL NVDR | 3,312,600 | 21,748,134 | ||||||
Central Pattana PCL NVDR | 1,392,000 | 3,018,341 | ||||||
CP ALL PCL NVDR | 15,451,200 | 28,850,306 | ||||||
Delta Electronics Thailand PCL NVDR | 6,659,000 | 17,848,246 | ||||||
Electricity Generating PCL NVDR | 2,205,300 | 15,541,039 | ||||||
Glow Energy PCL NVDR | 8,421,600 | 21,748,297 | ||||||
Home Product Center PCL NVDR | 25,709,400 | 7,742,629 | ||||||
Kasikornbank PCL NVDR | 1,531,200 | 9,268,821 | ||||||
KCE Electronics PCL NVDR | 4,384,800 | 11,554,585 | ||||||
Minor International PCL NVDRc | 3,310,500 | 3,963,029 | ||||||
Robinson PCL NVDR | 3,310,500 | 5,732,683 | ||||||
Siam Cement PCL (The) Foreign | 1,183,200 | 17,816,594 | ||||||
| 24 | 2017 iSHARES ANNUAL REPORTTO SHAREHOLDERS |
Table of Contents
Consolidated Schedule of Investments (Continued)
iSHARES® EDGE MSCI MIN VOL EMERGING MARKETS ETF
August 31, 2017
| Security | Shares | Value | ||||||
Thai Union Group PCL NVDR | 7,864,800 | $ | 4,689,747 | |||||
|
| |||||||
| 270,831,808 | ||||||||
UNITED ARAB EMIRATES — 2.12% |
| |||||||
DP World Ltd. | 942,384 | 21,618,289 | ||||||
Dubai Islamic Bank PJSC | 3,866,976 | 6,411,446 | ||||||
Emirates Telecommunications Group Co. PJSC | 5,135,088 | 25,164,462 | ||||||
First Abu Dhabi Bank PJSC | 11,380,296 | 32,222,122 | ||||||
|
| |||||||
| 85,416,319 | ||||||||
TOTAL COMMON STOCKS |
| |||||||
(Cost: $3,442,143,464) |
| 4,014,242,153 | ||||||
PREFERRED STOCKS — 0.27% |
| |||||||
COLOMBIA — 0.16% | ||||||||
Grupo de Inversiones Suramericana SA, Preference Shares | 459,360 | 6,277,057 | ||||||
|
| |||||||
| 6,277,057 | ||||||||
RUSSIA — 0.05% | ||||||||
Transneft PJSC, Preference Shares | 695 | 2,129,578 | ||||||
|
| |||||||
| 2,129,578 | ||||||||
SOUTH KOREA — 0.06% | ||||||||
Samsung Electronics Co. Ltd., Preference Shares | 1,392 | 2,326,996 | ||||||
|
| |||||||
| 2,326,996 | ||||||||
|
| |||||||
TOTAL PREFERRED STOCKS |
| |||||||
(Cost: $7,841,928) |
| 10,733,631 | ||||||
SHORT-TERM INVESTMENTS — 2.22% |
| |||||||
MONEY MARKET FUNDS — 2.22% |
| |||||||
BlackRock Cash Funds: Institutional, SL Agency Shares | ||||||||
1.32%e,f,g | 84,571,230 | 84,596,601 | ||||||
BlackRock Cash Funds: | ||||||||
0.96%e,f | 4,920,351 | 4,920,351 | ||||||
|
| |||||||
| 89,516,952 | ||||||||
|
| |||||||
TOTAL SHORT-TERM INVESTMENTS |
| |||||||
(Cost: $89,502,029) |
| 89,516,952 | ||||||
|
| |||||||
| Value | ||||||
TOTAL INVESTMENTS | ||||||
(Cost: $3,539,487,421)h | $ | 4,114,492,736 | ||||
Other Assets, Less Liabilities — (1.91)% | (77,064,641 | ) | ||||
|
| |||||
NET ASSETS — 100.00% | $ | 4,037,428,095 | ||||
|
| |||||
ADR — American Depositary Receipts
GDR — Global Depositary Receipts
NVDR — Non-Voting Depositary Receipts
| a | Non-income earning security. |
| b | This security may be resold to qualified institutional buyers under Rule 144A of the Securities Act of 1933. |
| c | All or a portion of this security represents a security on loan. See Note 1. |
| d | Security is valued using significant unobservable inputs and is classified as Level 3 in the fair value hierarchy. |
| e | Affiliated issuer. See Schedule 1. |
| f | The rate quoted is the annualized seven-day yield of the fund at period end. |
| g | All or a portion of this security represents an investment of securities lending collateral. See Note 1. |
| h | The cost of investments (including short positions and derivatives, if any) for federal income tax purposes was $3,593,723,443. Net unrealized appreciation was $520,769,293, of which $700,768,390 represented gross unrealized appreciation on investments and $179,999,097 represented gross unrealized depreciation on investments. |
CONSOLIDATED SCHEDULESOF INVESTMENTS | 25 |
Table of Contents
Consolidated Schedule of Investments (Continued)
iSHARES® EDGE MSCI MIN VOL EMERGING MARKETS ETF
August 31, 2017
Schedule 1 — Affiliates (Note 2)
Investments in issuers considered to be affiliates of the Fund during the year ended August 31, 2017, for purposes of Section 2(a)(3) of the 1940 Act, and/or related parties of the Fund were as follows:
| Affiliated issuer | Shares held at 08/31/16 | Shares purchased | Shares sold | Shares held at 08/31/17 | Value at 08/31/17 | Net realized gain (loss) a | Change in unrealized appreciation (depreciation) | Income | ||||||||||||||||||||||||
BlackRock Cash Funds: Institutional, | 110,089,754 | — | (25,518,524 | )b | 84,571,230 | $ | 84,596,601 | $ | 12,206 | $ | 14,923 | $ | — | c | ||||||||||||||||||
BlackRock Cash Funds: Treasury, | 10,381,725 | — | (5,461,374 | )b | 4,920,351 | 4,920,351 | 445 | — | 25,146 | |||||||||||||||||||||||
|
|
|
|
|
|
|
| |||||||||||||||||||||||||
| $ | 89,516,952 | $ | 12,651 | $ | 14,923 | $ | 25,146 | |||||||||||||||||||||||||
|
|
|
|
|
|
|
| |||||||||||||||||||||||||
| a | Includes realized capital gain distributions from an affiliated fund, if any. |
| b | Net of shares purchased and sold. |
| c | Does not include income earned on the investment of securities lending cash collateral which is not direct income of the Fund and is reflected as a component of securities lending income in the statement of operations. |
Schedule 2 — Fair Value Measurements
Various inputs are used in determining the fair value of financial instruments. For description of the input levels and information about the Fund’s policy regarding valuation of financial instruments, see Note 1.
The following table summarizes the value of the Fund’s investments according to the fair value hierarchy as of August 31, 2017. The breakdown of the Fund’s investments into major categories is disclosed in the consolidated schedule of investments above.
| Level 1 | Level 2 | Level 3 | Total | |||||||||||||
Investments: | ||||||||||||||||
Assets: | ||||||||||||||||
Common stocks | $ | 4,014,242,063 | $ | — | $ | 90 | $ | 4,014,242,153 | ||||||||
Preferred stocks | 10,733,631 | — | — | 10,733,631 | ||||||||||||
Money market funds | 89,516,952 | — | — | 89,516,952 | ||||||||||||
|
|
|
|
|
|
|
| |||||||||
Total | $ | 4,114,492,646 | $ | — | $ | 90 | $ | 4,114,492,736 | ||||||||
|
|
|
|
|
|
|
| |||||||||
See notes to financial statements.
| 26 | 2017 iSHARES ANNUAL REPORTTO SHAREHOLDERS |
Table of Contents
Consolidated Schedule of Investments
iSHARES® MSCI EMERGING MARKETS ETF
August 31, 2017
| Security | Shares | Value | ||||||
COMMON STOCKS — 95.85% |
| |||||||
BRAZIL — 4.56% | ||||||||
Ambev SA | 33,448,615 | $ | 211,123,486 | |||||
B3 SA-Brasil Bolsa Balcao | 14,711,401 | 103,423,283 | ||||||
Banco Bradesco SA | 6,508,438 | 66,709,188 | ||||||
Banco do Brasil SA | 6,094,874 | 59,467,855 | ||||||
Banco Santander Brasil SA Units | 2,971,300 | 26,479,128 | ||||||
BB Seguridade Participacoes SA | 4,954,700 | 43,650,554 | ||||||
BR Malls Participacoes SA | 5,838,488 | 25,235,881 | ||||||
BRF SAa | 3,193,485 | 43,155,614 | ||||||
CCR SA | 8,601,100 | 47,728,458 | ||||||
Centrais Eletricas Brasileiras SAa | 1,381,200 | 7,734,667 | ||||||
Cia. de Saneamento Basico do Estado de Sao Paulo | 2,437,024 | 24,901,181 | ||||||
Cia. Siderurgica Nacional SAa | 4,426,128 | 12,224,269 | ||||||
Cielo SA | 8,656,876 | 61,712,002 | ||||||
Cosan SA Industria e Comercio | 1,123,400 | 13,778,069 | ||||||
CPFL Energia SA | 1,760,467 | 15,157,098 | ||||||
Duratex SA | 2,218,055 | 6,062,475 | ||||||
EDP-Energias do Brasil SA | 2,146,600 | 10,397,173 | ||||||
Embraer SA | 4,741,500 | 27,019,369 | ||||||
Engie Brasil Energia SA | 1,140,900 | 13,089,828 | ||||||
Equatorial Energia SA | 1,410,800 | 27,404,884 | ||||||
Fibria Celulose SA | 1,767,061 | 23,469,459 | ||||||
Hypermarcas SA | 2,461,100 | 23,082,223 | ||||||
JBS SA | 5,792,065 | 15,959,956 | ||||||
Klabin SA Units | 4,153,000 | 22,596,692 | ||||||
Kroton Educacional SA | 9,794,680 | 55,939,360 | ||||||
Localiza Rent A Car SA | 1,185,663 | 22,439,975 | ||||||
Lojas Americanas SA | 1,325,450 | 6,082,886 | ||||||
Lojas Renner SA | 5,034,390 | 48,960,681 | ||||||
M. Dias Branco SA | 734,200 | 11,457,109 | ||||||
Multiplan Empreendimentos Imobiliarios SA | 600,003 | 13,937,682 | ||||||
Natura Cosmeticos SA | 1,219,600 | 11,434,537 | ||||||
Odontoprev SA | 1,907,600 | 8,984,930 | ||||||
Petroleo Brasileiro SAa | 21,082,274 | 93,603,702 | ||||||
Porto Seguro SA | 808,400 | 8,928,125 | ||||||
Qualicorp SA | 1,594,700 | 17,662,857 | ||||||
| Security | Shares | Value | ||||||
Raia Drogasil SA | 1,645,400 | $ | 36,265,788 | |||||
Rumo SAa | 5,707,000 | 18,736,452 | ||||||
Sul America SA | 1,411,736 | 8,067,191 | ||||||
TIM Participacoes SA | 5,965,376 | 21,385,829 | ||||||
Transmissora Alianca de Energia Eletrica SA Units | 1,347,200 | 9,633,714 | ||||||
Ultrapar Participacoes SA | 2,565,000 | 59,876,766 | ||||||
Vale SA | 20,148,716 | 224,639,506 | ||||||
WEG SA | 4,024,720 | 26,171,009 | ||||||
|
| |||||||
| 1,635,770,891 | ||||||||
CHILE — 1.11% | ||||||||
AES Gener SA | 19,202,170 | 6,719,110 | ||||||
Aguas Andinas SA Series A | 19,054,241 | 12,169,803 | ||||||
Banco de Chile | 179,961,937 | 26,213,665 | ||||||
Banco de Credito e Inversiones | 267,078 | 17,319,866 | ||||||
Banco Santander Chile | 472,589,283 | 34,554,576 | ||||||
Cencosud SA | 10,126,782 | 30,442,869 | ||||||
Cia. Cervecerias Unidas SA | 1,027,144 | 14,002,037 | ||||||
Colbun SA | 56,316,834 | 13,566,618 | ||||||
Empresa Nacional de Telecomunicaciones SA | 1,038,800 | 10,853,810 | ||||||
Empresas CMPC SA | 8,917,209 | 23,274,931 | ||||||
Empresas COPEC SA | 3,251,802 | 41,510,616 | ||||||
Enel Americas SA | 206,853,549 | 44,623,410 | ||||||
Enel Chile SA | 140,726,889 | 16,568,618 | ||||||
Enel Generacion Chile SA | 23,294,944 | 19,746,806 | ||||||
Itau CorpBanca | 1,114,596,765 | 10,650,426 | ||||||
LATAM Airlines Group SA | 2,171,351 | 27,225,502 | ||||||
SACI Falabella | 5,034,012 | 50,611,670 | ||||||
|
| |||||||
| 400,054,333 | ||||||||
CHINA — 28.95% | ||||||||
3SBio Inc.a,b,c | 7,219,000 | 9,924,863 | ||||||
58.com Inc. ADRa,c | 645,005 | 40,396,663 | ||||||
AAC Technologies Holdings Inc.c | 5,223,000 | 95,231,184 | ||||||
Agricultural Bank of China Ltd. Class H | 185,199,000 | 87,080,646 | ||||||
Air China Ltd. Class H | 12,828,000 | 11,407,839 | ||||||
Alibaba Group Holding Ltd. ADRa,c | 8,080,564 | 1,387,756,061 | ||||||
Alibaba Health Information Technology Ltd.a,c | 22,842,000 | 10,652,761 | ||||||
Alibaba Pictures Group Ltd.a,c | 85,020,000 | 14,882,533 | ||||||
CONSOLIDATED SCHEDULESOF INVESTMENTS | 27 |
Table of Contents
Consolidated Schedule of Investments (Continued)
iSHARES® MSCI EMERGING MARKETS ETF
August 31, 2017
| Security | Shares | Value | ||||||
Aluminum Corp. of China Ltd. Class Ha,c | 28,038,000 | $ | 20,742,485 | |||||
Anhui Conch Cement Co. Ltd. Class H | 8,779,000 | 32,753,905 | ||||||
ANTA Sports Products Ltd.c | 7,586,402 | 29,855,322 | ||||||
Autohome Inc. ADRa,c | 372,565 | 23,944,753 | ||||||
AviChina Industry & Technology Co. Ltd. Class Hc | 14,907,000 | 8,818,738 | ||||||
Baidu Inc. ADRa | 1,944,999 | 443,557,022 | ||||||
Bank of China Ltd. Class H | 563,546,000 | 296,661,899 | ||||||
Bank of Communications Co. Ltd. Class H | 62,149,600 | 47,486,997 | ||||||
Beijing Capital International Airport Co. Ltd. Class H | 10,868,000 | 17,579,986 | ||||||
Beijing Enterprises Holdings Ltd. | 3,584,500 | 20,014,521 | ||||||
Beijing Enterprises Water Group Ltd. | 33,794,000 | 28,714,181 | ||||||
Brilliance China Automotive Holdings Ltd. | 21,500,000 | 55,628,669 | ||||||
Byd Co. Ltd. Class Hc | 4,554,000 | 27,115,282 | ||||||
CGN Power Co. Ltd. Class Hb | 75,199,000 | 20,753,961 | ||||||
China Cinda Asset Management Co. Ltd. Class H | 62,652,000 | 23,295,021 | ||||||
China CITIC Bank Corp. Ltd. Class H | 63,585,800 | 42,003,538 | ||||||
China Coal Energy Co. Ltd. Class H | 14,829,000 | 7,465,231 | ||||||
China Communications Construction Co. Ltd. Class H | 31,447,000 | 41,867,991 | ||||||
China Communications Services Corp. Ltd. Class H | 17,374,000 | 9,412,410 | ||||||
China Conch Venture Holdings Ltd.c | 11,042,500 | 20,091,510 | ||||||
China Construction Bank Corp. Class H | 596,883,760 | 523,177,506 | ||||||
China Everbright Bank Co. Ltd. Class H | 21,710,000 | 10,429,965 | ||||||
China Everbright International Ltd. | 17,456,000 | 23,062,185 | ||||||
| Security | Shares | Value | ||||||
China Everbright Ltd. | 6,510,000 | $ | 14,872,490 | |||||
China Evergrande Groupa,c | 23,651,388 | 71,469,865 | ||||||
China Galaxy Securities Co. Ltd. Class H | 23,263,000 | 21,074,008 | ||||||
China Gas Holdings Ltd. | 12,304,000 | 31,064,792 | ||||||
China Huarong Asset Management Co. Ltd. Class Hb | 43,454,000 | 18,544,341 | ||||||
China Huishan Dairy Holdings Co. Ltd.a,c,d | 27,094,000 | 35 | ||||||
China Jinmao Holdings Group Ltd. | 26,560,000 | 11,809,799 | ||||||
China Life Insurance Co. Ltd. Class H | 52,768,000 | 169,230,852 | ||||||
China Longyuan Power Group Corp. Ltd. Class H | 22,511,000 | 16,854,955 | ||||||
China Medical System Holdings Ltd.c | 8,924,000 | 16,419,398 | ||||||
China Mengniu Dairy Co. Ltd. | 19,453,000 | 45,435,777 | ||||||
China Merchants Bank Co. Ltd. Class H | 27,663,467 | 104,271,065 | ||||||
China Merchants Port Holdings Co. Ltd. | 9,214,000 | 30,138,620 | ||||||
China Minsheng Banking Corp. Ltd. Class H | 40,434,040 | 40,349,054 | ||||||
China Mobile Ltd. | 43,529,500 | 461,633,116 | ||||||
China National Building Material Co. Ltd. Class H | 20,394,000 | 12,820,433 | ||||||
China Oilfield Services Ltd. Class Hc | 12,816,000 | 10,512,904 | ||||||
China Overseas Land & Investment Ltd. | 27,164,960 | 94,929,586 | ||||||
China Pacific Insurance Group Co. Ltd. Class H | 18,675,400 | 87,931,117 | ||||||
China Petroleum & Chemical Corp. Class H | 180,898,800 | 138,451,509 | ||||||
China Power International Development Ltd. | 23,397,000 | 7,981,906 | ||||||
China Railway Construction Corp. Ltd. Class H | 14,045,500 | 18,412,796 | ||||||
China Railway Group Ltd. Class H | 28,518,000 | 22,810,173 | ||||||
China Resources Beer Holdings Co. Ltd. | 11,514,000 | 28,893,682 | ||||||
| 28 | 2017 iSHARES ANNUAL REPORTTO SHAREHOLDERS |
Table of Contents
Consolidated Schedule of Investments (Continued)
iSHARES® MSCI EMERGING MARKETS ETF
August 31, 2017
| Security | Shares | Value | ||||||
China Resources Gas Group Ltd.c | 6,244,000 | $ | 22,019,485 | |||||
China Resources Land Ltd. | 19,595,333 | 61,216,246 | ||||||
China Resources Power Holdings Co. Ltd. | 13,556,999 | 24,874,433 | ||||||
China Shenhua Energy Co. Ltd. Class H | 24,099,000 | 62,045,353 | ||||||
China Southern Airlines Co. Ltd. Class H | 12,946,000 | 10,106,761 | ||||||
China State Construction International Holdings Ltd. | 12,728,000 | 18,442,017 | ||||||
China Taiping Insurance Holdings Co. Ltd. | 11,480,060 | 34,837,177 | ||||||
China Telecom Corp. Ltd. Class H | 98,038,000 | 50,356,517 | ||||||
China Unicom Hong Kong Ltd.a | 42,322,000 | 61,646,187 | ||||||
China Vanke Co. Ltd. Class H | 8,555,931 | 25,635,707 | ||||||
Chongqing Changan Automobile Co. Ltd. Class B | 6,113,975 | 7,999,426 | ||||||
Chongqing Rural Commercial Bank Co. Ltd. Class H | 18,277,000 | 12,727,309 | ||||||
CITIC Ltd. | 40,644,000 | 62,421,772 | ||||||
CITIC Securities Co. Ltd. Class H | 16,028,500 | 35,553,126 | ||||||
CNOOC Ltd. | 126,689,000 | 151,513,016 | ||||||
COSCO SHIPPING Ports Ltd. | 11,698,000 | 13,825,745 | ||||||
Country Garden Holdings Co. Ltd.c | 38,488,939 | 51,145,151 | ||||||
CRRC Corp. Ltd. Class H | 29,433,300 | 26,550,875 | ||||||
CSPC Pharmaceutical Group Ltd. | 29,932,000 | 46,734,987 | ||||||
Ctrip.com International Ltd. ADRa,c | 2,781,221 | 143,093,820 | ||||||
Dongfeng Motor Group Co. Ltd. Class H | 19,258,000 | 25,000,004 | ||||||
ENN Energy Holdings Ltd. | 5,380,000 | 34,611,222 | ||||||
Far East Horizon Ltd.c | 14,157,000 | 12,933,393 | ||||||
Fosun International Ltd.c | 18,307,000 | 31,765,240 | ||||||
Fullshare Holdings Ltd.c | 47,450,000 | 18,915,856 | ||||||
| Security | Shares | Value | ||||||
Fuyao Glass Industry Group Co. Ltd. Class Hb | 3,476,800 | $ | 11,083,717 | |||||
GCL-Poly Energy Holdings Ltd.a,c | 92,506,000 | 10,401,303 | ||||||
Geely Automobile Holdings Ltd. | 34,792,000 | 85,530,231 | ||||||
GF Securities Co. Ltd. Class H | 9,716,200 | 20,732,329 | ||||||
GOME Electrical Appliances Holding Ltd.c | 84,243,200 | 8,826,406 | ||||||
Great Wall Motor Co. Ltd. Class Hc | 22,050,000 | 27,666,567 | ||||||
Guangdong Investment Ltd. | 20,232,110 | 29,883,688 | ||||||
Guangzhou Automobile Group Co. Ltd. Class H | 14,980,742 | 29,553,968 | ||||||
Guangzhou R&F Properties Co. Ltd. Class H | 6,924,400 | 16,173,109 | ||||||
Haier Electronics Group Co. Ltd. | 8,937,000 | 23,751,458 | ||||||
Haitian International Holdings Ltd. | 4,605,000 | 13,827,150 | ||||||
Haitong Securities Co. Ltd. Class H | 22,672,800 | 38,007,926 | ||||||
Hengan International Group Co. Ltd. | 5,115,500 | 42,746,545 | ||||||
Huaneng Power International Inc. Class H | 29,982,000 | 19,613,981 | ||||||
Huaneng Renewables Corp. Ltd. Class H | 33,098,000 | 10,149,583 | ||||||
Huatai Securities Co. Ltd. Class Hb | 11,454,800 | 25,495,929 | ||||||
Industrial & Commercial Bank of China Ltd. Class H | 523,393,085 | 391,886,932 | ||||||
JD.com Inc. ADRa,c | 4,666,966 | 195,592,545 | ||||||
Jiangsu Expressway Co. Ltd. Class H | 8,688,000 | 13,320,982 | ||||||
Jiangxi Copper Co. Ltd. Class H | 8,809,000 | 15,284,864 | ||||||
Kingsoft Corp. Ltd.c | 5,574,000 | 13,218,438 | ||||||
Kunlun Energy Co. Ltd.c | 22,818,000 | 22,099,476 | ||||||
Lenovo Group Ltd.c | 51,286,000 | 28,046,443 | ||||||
Longfor Properties Co. Ltd. | 10,438,500 | 25,074,434 | ||||||
Momo Inc. ADRa | 758,231 | 29,214,640 | ||||||
NetEase Inc. ADR | 561,424 | 154,863,196 | ||||||
CONSOLIDATED SCHEDULESOF INVESTMENTS | 29 |
Table of Contents
Consolidated Schedule of Investments (Continued)
iSHARES® MSCI EMERGING MARKETS ETF
August 31, 2017
| Security | Shares | Value | ||||||
New China Life Insurance Co. Ltd. Class Hc | 5,537,100 | $ | 35,445,024 | |||||
New Oriental Education & Technology Group Inc. ADR | 953,358 | 77,937,017 | ||||||
Nine Dragons Paper Holdings Ltd. | 11,655,000 | 19,448,703 | ||||||
People’s Insurance Co. Group of China Ltd. (The) Class H | 49,397,000 | 23,289,605 | ||||||
PetroChina Co. Ltd. Class H | 149,528,000 | 95,527,346 | ||||||
PICC Property & Casualty Co. Ltd. Class H | 32,554,128 | 61,144,667 | ||||||
Ping An Insurance Group Co. of China Ltd. Class H | 36,991,500 | 293,750,260 | ||||||
Semiconductor Manufacturing International Corp.a,c | 19,623,999 | 18,454,425 | ||||||
Shandong Weigao Group Medical Polymer Co. Ltd. Class H | 13,272,000 | 10,598,675 | ||||||
Shanghai Electric Group Co. Ltd. Class Ha,c | 20,094,000 | 9,114,439 | ||||||
Shanghai Fosun Pharmaceutical Group Co. Ltd. Class H | 3,323,500 | 12,484,703 | ||||||
Shanghai Industrial Holdings Ltd. | 3,581,000 | 10,889,714 | ||||||
Shanghai Lujiazui Finance & Trade Zone Development Co. Ltd. Class B | 7,038,921 | 11,353,780 | ||||||
Shanghai Pharmaceuticals Holding Co. Ltd. Class H | 5,000,700 | 12,306,152 | ||||||
Shenzhou International Group Holdings Ltd.c | 4,001,000 | 32,053,191 | ||||||
Shimao Property Holdings Ltd. | 8,538,500 | 17,630,236 | ||||||
Sihuan Pharmaceutical Holdings Group Ltd. | 26,358,000 | 10,137,109 | ||||||
SINA Corp./Chinaa | 404,900 | 41,230,967 | ||||||
Sino Biopharmaceutical Ltd. | 31,585,000 | 27,725,080 | ||||||
Sino-Ocean Group Holding Ltd. | 21,644,000 | 14,933,667 | ||||||
| Security | Shares | Value | ||||||
Sinopec Engineering Group Co. Ltd. Class H | 8,876,500 | $ | 8,007,218 | |||||
Sinopec Shanghai Petrochemical Co. Ltd. Class H | 24,815,000 | 15,472,813 | ||||||
Sinopharm Group Co. Ltd. Class H | 8,398,800 | 37,935,153 | ||||||
SOHO China Ltd. | 15,260,500 | 8,891,372 | ||||||
Sun Art Retail Group Ltd.c | 17,123,500 | 15,774,768 | ||||||
Sunac China Holdings Ltd.c | 14,598,000 | 43,832,517 | ||||||
Sunny Optical Technology Group Co. Ltd. | 5,054,000 | 72,454,152 | ||||||
TAL Education Group Class A ADR | 1,979,178 | 60,226,387 | ||||||
Tencent Holdings Ltd. | 40,347,000 | 1,696,064,371 | ||||||
Tingyi Cayman Islands Holding Corp.c | 13,844,000 | 18,431,662 | ||||||
TravelSky Technology Ltd. Class H | 6,616,000 | 18,090,245 | ||||||
Tsingtao Brewery Co. Ltd. Class H | 2,450,000 | 10,158,182 | ||||||
Vipshop Holdings Ltd. ADRa | 2,881,619 | 26,827,873 | ||||||
Want Want China Holdings Ltd.c | 37,785,000 | 25,008,312 | ||||||
Weibo Corp. ADRa,c | 325,964 | 32,954,960 | ||||||
Weichai Power Co. Ltd. Class H | 13,920,800 | 14,336,212 | ||||||
Yanzhou Coal Mining Co. Ltd. Class H | 13,188,800 | 13,245,337 | ||||||
Yum China Holdings Inc.a | 2,732,064 | 96,605,783 | ||||||
YY Inc. ADRa | 299,799 | 22,400,981 | ||||||
Zhejiang Expressway Co. Ltd. Class H | 10,092,000 | 12,623,946 | ||||||
Zhuzhou CRRC Times Electric Co. Ltd. Class H | 3,888,600 | 20,346,156 | ||||||
Zijin Mining Group Co. Ltd. Class H | 40,632,000 | 14,899,966 | ||||||
ZTE Corp. Class Ha | 5,261,000 | 14,351,635 | ||||||
|
| |||||||
| 10,390,089,327 | ||||||||
COLOMBIA — 0.28% | ||||||||
Bancolombia SA | 1,622,814 | 18,185,599 | ||||||
Cementos Argos SA | 3,216,845 | 13,064,905 | ||||||
Ecopetrol SA | 34,983,894 | �� | 16,275,474 | |||||
Grupo Argos SA/Colombia | 2,114,497 | 15,064,596 | ||||||
| 30 | 2017 iSHARES ANNUAL REPORTTO SHAREHOLDERS |
Table of Contents
Consolidated Schedule of Investments (Continued)
iSHARES® MSCI EMERGING MARKETS ETF
August 31, 2017
| Security | Shares | Value | ||||||
Grupo de Inversiones Suramericana SA | 1,856,317 | $ | 26,160,448 | |||||
Interconexion Electrica SA ESP | 2,741,006 | 12,435,446 | ||||||
|
| |||||||
| 101,186,468 | ||||||||
CZECH REPUBLIC — 0.18% |
| |||||||
CEZ AS | 1,159,269 | 21,952,054 | ||||||
Komercni Banka AS | 552,787 | 24,319,649 | ||||||
Moneta Money Bank ASb | 3,441,368 | 12,046,339 | ||||||
O2 Czech Republic AS | 438,521 | 5,489,347 | ||||||
|
| |||||||
| 63,807,389 | ||||||||
EGYPT — 0.13% | ||||||||
Commercial International Bank Egypt SAE | 7,081,955 | 33,785,657 | ||||||
Egyptian Financial Group-Hermes Holding Co. | 2,468,463 | 2,891,988 | ||||||
Global Telecom Holding SAEa | 20,623,793 | 8,221,489 | ||||||
|
| |||||||
| 44,899,134 | ||||||||
GREECE — 0.37% | ||||||||
Alpha Bank AEa | 9,756,054 | 24,705,801 | ||||||
Eurobank Ergasias SAa,c | 13,084,444 | 14,109,372 | ||||||
FF Groupa,c | 238,362 | 5,922,819 | ||||||
Hellenic Telecommunications Organization SA | 1,717,303 | 21,846,197 | ||||||
JUMBO SA | 723,640 | 12,044,693 | ||||||
National Bank of Greece SAa | 38,676,218 | 15,679,908 | ||||||
OPAP SA | 1,574,616 | 17,578,645 | ||||||
Piraeus Bank SAa | 1,995,611 | 11,174,856 | ||||||
Titan Cement Co. SA | 322,172 | 9,135,269 | ||||||
|
| |||||||
| 132,197,560 | ||||||||
HONG KONG — 0.06% | ||||||||
Minth Group Ltd. | 4,774,000 | 21,989,880 | ||||||
|
| |||||||
| 21,989,880 | ||||||||
HUNGARY — 0.35% | ||||||||
MOL Hungarian Oil & Gas PLC | 324,630 | 30,087,022 | ||||||
OTP Bank PLC | 1,695,383 | 68,900,927 | ||||||
Richter Gedeon Nyrt | 983,931 | 25,584,969 | ||||||
|
| |||||||
| 124,572,918 | ||||||||
INDIA — 8.69% | ||||||||
ACC Ltd. | 307,014 | 8,645,931 | ||||||
| Security | Shares | Value | ||||||
Adani Ports & Special Economic Zone Ltd. | 5,317,093 | $ | 32,683,783 | |||||
Aditya Birla Capital Ltd.a | 3,044,568 | 8,836,372 | ||||||
Ambuja Cements Ltd. | 4,356,455 | 19,105,331 | ||||||
Apollo Hospitals Enterprise Ltd.a | 564,653 | 9,562,478 | ||||||
Ashok Leyland Ltd. | 8,180,377 | 13,705,143 | ||||||
Asian Paints Ltd. | 2,044,171 | 37,366,747 | ||||||
Aurobindo Pharma Ltd. | 1,890,318 | 21,445,856 | ||||||
Axis Bank Ltd. GDR | 11,856,064 | 92,797,272 | ||||||
Bajaj Auto Ltd. | 599,628 | 26,400,000 | ||||||
Bajaj Finance Ltd. | 1,176,477 | 32,793,483 | ||||||
Bajaj Finserv Ltd. | 266,749 | 22,962,081 | ||||||
Bharat Forge Ltd. | 744,467 | 13,134,039 | ||||||
Bharat Heavy Electricals Ltd. | 4,138,074 | 8,343,955 | ||||||
Bharat Petroleum Corp. Ltd. | 5,341,681 | 44,203,269 | ||||||
Bharti Airtel Ltd. | 8,411,755 | 56,279,034 | ||||||
Bharti Infratel Ltd. | 3,933,785 | 23,088,420 | ||||||
Bosch Ltd. | 53,517 | 18,406,642 | ||||||
Cadila Healthcare Ltd. | 1,470,029 | 11,497,851 | ||||||
Cipla Ltd. | 2,509,554 | 22,451,089 | ||||||
Coal India Ltd. | 4,887,826 | 18,151,697 | ||||||
Container Corp. of India Ltd. | 306,004 | 6,318,135 | ||||||
Dabur India Ltd. | 3,806,082 | 18,760,626 | ||||||
Dr. Reddy’s Laboratories Ltd. | 815,584 | 25,783,050 | ||||||
Eicher Motors Ltd. | 94,144 | 46,317,574 | ||||||
GAIL (India) Ltd. | 3,551,363 | 21,016,103 | ||||||
Glenmark Pharmaceuticals Ltd. | 995,667 | 9,486,882 | ||||||
Godrej Consumer Products Ltd. | 1,723,947 | 25,061,128 | ||||||
Grasim Industries Ltd. | 2,306,929 | 43,131,601 | ||||||
Havells India Ltd. | 1,767,746 | 13,504,292 | ||||||
HCL Technologies Ltd. | 4,010,234 | 54,282,169 | ||||||
Hero Motocorp Ltd. | 353,950 | 22,120,266 | ||||||
Hindalco Industries Ltd. | 8,302,632 | 30,911,033 | ||||||
Hindustan Petroleum Corp. Ltd. | 4,290,014 | 32,772,583 | ||||||
Hindustan Unilever Ltd. | 4,599,120 | 87,753,882 | ||||||
Housing Development Finance Corp. Ltd. | 10,689,523 | 297,126,977 | ||||||
ICICI Bank Ltd. | 16,756,549 | 78,125,800 | ||||||
CONSOLIDATED SCHEDULESOF INVESTMENTS | 31 |
Table of Contents
Consolidated Schedule of Investments (Continued)
iSHARES® MSCI EMERGING MARKETS ETF
August 31, 2017
| Security | Shares | Value | ||||||
Idea Cellular Ltd. | 10,070,308 | $ | 14,280,103 | |||||
IDFC Bank Ltd. | 9,532,997 | 8,179,502 | ||||||
Indiabulls Housing Finance Ltd. | 2,242,223 | 42,633,848 | ||||||
Indian Oil Corp. Ltd. | 4,061,351 | 28,887,918 | ||||||
Infosys Ltd. | 13,014,416 | 186,269,958 | ||||||
ITC Ltd. | 24,078,474 | 106,312,341 | ||||||
JSW Steel Ltd. | 6,127,952 | 24,386,711 | ||||||
Larsen & Toubro Ltd. | 3,350,531 | 59,556,260 | ||||||
LIC Housing Finance Ltd. | 2,147,956 | 22,641,718 | ||||||
Lupin Ltd. | 1,579,156 | 24,195,136 | ||||||
Mahindra & Mahindra Financial Services Ltd. | 2,033,062 | 13,595,886 | ||||||
Mahindra & Mahindra Ltd. | 2,637,900 | 55,492,821 | ||||||
Marico Ltd. | 3,239,600 | 15,986,106 | ||||||
Maruti Suzuki India Ltd. | 750,667 | 90,422,340 | ||||||
Motherson Sumi Systems Ltd. | 4,364,862 | 21,036,960 | ||||||
Nestle India Ltd. | 166,230 | 18,517,673 | ||||||
NTPC Ltd. | 11,773,053 | 31,078,042 | ||||||
Oil & Natural Gas Corp. Ltd. | 9,074,596 | 22,279,703 | ||||||
Piramal Enterprises Ltd. | 561,887 | 23,852,373 | ||||||
Power Finance Corp. Ltd. | 4,522,281 | 8,637,618 | ||||||
Reliance Industries Ltd. | 9,207,653 | 229,664,695 | ||||||
Rural Electrification Corp. Ltd. | 4,785,446 | 12,617,460 | ||||||
Shree Cement Ltd. | 60,177 | 16,559,342 | ||||||
Shriram Transport Finance Co. Ltd. | 1,055,505 | 16,263,623 | ||||||
Siemens Ltd. | 524,153 | 10,536,151 | ||||||
State Bank of India | 12,173,542 | 52,892,220 | ||||||
Sun Pharmaceuticals Industries Ltd. | 6,826,727 | 51,382,330 | ||||||
Tata Consultancy Services Ltd. | 3,314,582 | 129,435,979 | ||||||
Tata Motors Ltd.a | 11,219,020 | 66,084,308 | ||||||
Tata Motors Ltd. Class Aa | 2,681,412 | 9,175,556 | ||||||
Tata Power Co. Ltd. | 8,239,209 | 10,214,228 | ||||||
Tata Steel Ltd. | 2,143,490 | 21,394,244 | ||||||
Tech Mahindra Ltd. | 3,267,262 | 21,882,689 | ||||||
Titan Co. Ltd. | 2,186,398 | 21,105,981 | ||||||
Ultratech Cement Ltd. | 612,524 | 38,330,748 | ||||||
United Spirits Ltd.a | 424,633 | 16,891,328 | ||||||
UPL Ltd. | 2,532,838 | 32,808,377 | ||||||
Vedanta Ltd. | 10,508,552 | 50,778,698 | ||||||
| Security | Shares | Value | ||||||
Wipro Ltd. | 8,572,738 | $ | 40,110,376 | |||||
Yes Bank Ltd. | 2,372,712 | 65,066,898 | ||||||
Zee Entertainment Enterprises Ltd. | 3,943,409 | 32,046,319 | ||||||
|
| |||||||
| 3,117,817,141 | ||||||||
INDONESIA — 2.26% | ||||||||
Adaro Energy Tbk PT | 104,348,400 | 14,273,410 | ||||||
AKR Corporindo Tbk PT | 12,524,600 | 6,359,928 | ||||||
Astra International Tbk PT | 143,415,600 | 84,649,816 | ||||||
Bank Central Asia Tbk PT | 71,160,900 | 101,071,733 | ||||||
Bank Danamon Indonesia Tbk PT | 25,262,716 | 10,319,428 | ||||||
Bank Mandiri Persero Tbk PT | 66,000,400 | 64,803,271 | ||||||
Bank Negara Indonesia Persero Tbk PT | 52,907,376 | 29,146,246 | ||||||
Bank Rakyat Indonesia Persero Tbk PT | 78,576,222 | 89,077,002 | ||||||
Bumi Serpong Damai Tbk PT | 54,412,700 | 7,483,683 | ||||||
Charoen Pokphand Indonesia Tbk PT | 52,891,745 | 10,981,122 | ||||||
Gudang Garam Tbk PT | 3,421,700 | 17,747,087 | ||||||
Hanjaya Mandala Sampoerna Tbk PT | 65,298,200 | 17,814,829 | ||||||
Indocement Tunggal Prakarsa Tbk PT | 11,953,300 | 17,739,120 | ||||||
Indofood CBP Sukses Makmur Tbk PT | 16,280,500 | 10,646,632 | ||||||
Indofood Sukses Makmur Tbk PT | 31,200,900 | 19,585,335 | ||||||
Jasa Marga Persero Tbk PT | 15,076,695 | 6,582,353 | ||||||
Kalbe Farma Tbk PT | 152,004,715 | 19,481,941 | ||||||
Lippo Karawaci Tbk PT | 111,353,600 | 6,551,685 | ||||||
Matahari Department Store Tbk PT | 17,410,100 | 13,049,093 | ||||||
Media Nusantara Citra Tbk PT | 37,105,100 | 4,143,801 | ||||||
Pakuwon Jati Tbk PT | 141,250,200 | 7,093,212 | ||||||
Perusahaan Gas Negara Persero Tbk PT | 76,976,800 | 12,231,361 | ||||||
Semen Indonesia Persero Tbk PT | 20,911,400 | 16,417,847 | ||||||
| 32 | 2017 iSHARES ANNUAL REPORTTO SHAREHOLDERS |
Table of Contents
Consolidated Schedule of Investments (Continued)
iSHARES® MSCI EMERGING MARKETS ETF
August 31, 2017
| Security | Shares | Value | ||||||
Summarecon Agung Tbk PT | 71,039,300 | $ | 5,564,088 | |||||
Surya Citra Media Tbk PT | 40,848,200 | 6,766,191 | ||||||
Telekomunikasi Indonesia Persero Tbk PT | 356,091,500 | 125,173,822 | ||||||
Tower Bersama Infrastructure Tbk PT | 16,061,000 | 7,734,367 | ||||||
Unilever Indonesia Tbk PT | 10,765,500 | 40,788,190 | ||||||
United Tractors Tbk PT | 12,049,553 | 27,364,822 | ||||||
Waskita Karya Persero Tbk PT | 33,339,700 | 5,547,454 | ||||||
XL Axiata Tbk PTa | 25,112,700 | 6,776,025 | ||||||
|
| |||||||
| 812,964,894 | ||||||||
MALAYSIA — 2.24% | ||||||||
AirAsia Bhd | 10,587,400 | 8,230,926 | ||||||
Alliance Financial Group Bhd | 7,575,500 | 6,811,830 | ||||||
AMMB Holdings Bhd | 12,680,175 | 12,708,383 | ||||||
Astro Malaysia Holdings Bhd | 10,402,500 | 6,528,205 | ||||||
Axiata Group Bhdc | 19,035,300 | 21,974,951 | ||||||
British American Tobacco Malaysia Bhd | 999,500 | 10,340,220 | ||||||
CIMB Group Holdings Bhd | 28,271,000 | 46,870,081 | ||||||
Dialog Group Bhd | 23,197,812 | 11,135,819 | ||||||
DiGi.Com Bhdc | 24,745,000 | 28,044,913 | ||||||
Felda Global Ventures Holdings Bhdc | 9,816,900 | 3,563,094 | ||||||
Gamuda Bhdc | 12,305,500 | 15,387,278 | ||||||
Genting Bhd | 15,997,800 | 36,374,813 | ||||||
Genting Malaysia Bhd | 21,465,700 | 29,505,599 | ||||||
Genting Plantations Bhd | 2,021,100 | 5,035,594 | ||||||
HAP Seng Consolidated Bhd | 4,032,100 | 8,573,110 | ||||||
Hartalega Holdings Bhd | 4,456,400 | 7,085,577 | ||||||
Hong Leong Bank Bhdc | 4,373,700 | 15,813,120 | ||||||
Hong Leong Financial Group Bhd | 1,442,800 | 5,709,711 | ||||||
IHH Healthcare Bhdc | 17,407,700 | 24,416,842 | ||||||
IJM Corp. Bhd | 20,006,140 | 15,646,999 | ||||||
IOI Corp. Bhdc | 16,284,120 | 17,311,768 | ||||||
IOI Properties Group Bhd | 15,491,756 | 7,218,966 | ||||||
Kuala Lumpur Kepong Bhd | 3,166,900 | 18,198,273 | ||||||
Malayan Banking Bhd | 25,380,900 | 56,223,701 | ||||||
| Security | Shares | Value | ||||||
Malaysia Airports Holdings Bhd | 5,676,700 | $ | 11,963,541 | |||||
Maxis Bhdc | 13,394,400 | 18,128,939 | ||||||
MISC Bhd | 8,216,900 | 14,315,358 | ||||||
Petronas Chemicals Group Bhd | 17,026,600 | 28,547,115 | ||||||
Petronas Dagangan Bhd | 1,503,400 | 8,589,851 | ||||||
Petronas Gas Bhd | 4,932,600 | 21,252,743 | ||||||
PPB Group Bhd | 3,479,700 | 13,591,241 | ||||||
Public Bank Bhd | 20,189,730 | 97,391,040 | ||||||
RHB Bank Bhd | 5,489,525 | 6,491,535 | ||||||
RHB Bank Bhd Newa,d | 3,214,200 | 8 | ||||||
Sapura Energy Bhdc | 27,631,500 | 8,929,041 | ||||||
Sime Darby Bhd | 16,774,173 | 35,351,260 | ||||||
Telekom Malaysia Bhd | 7,902,100 | 11,898,022 | ||||||
Tenaga Nasional Bhd | 24,081,550 | 80,525,590 | ||||||
UMW Holdings Bhda,c | 3,565,100 | 5,075,707 | ||||||
Westports Holdings Bhd | 6,747,500 | 5,925,097 | ||||||
YTL Corp. Bhd | 31,266,362 | 10,469,710 | ||||||
YTL Power International Bhd | 17,232,243 | 5,689,606 | ||||||
|
| |||||||
| 802,845,177 | ||||||||
MEXICO — 3.56% | ||||||||
Alfa SAB de CV | 21,250,600 | 29,844,021 | ||||||
America Movil SAB de CV Series L | 236,571,300 | 220,606,529 | ||||||
Arca Continental SAB de CV | 3,033,036 | 22,259,253 | ||||||
Cemex SAB de CV CPOa | 103,224,673 | 96,779,918 | ||||||
Coca-Cola Femsa SAB de CV Series L | 3,529,393 | 29,016,956 | ||||||
El Puerto de Liverpool SAB de CV Series C1c | 1,313,375 | 11,803,813 | ||||||
Fibra Uno Administracion SA de CV | 18,260,300 | 32,672,902 | ||||||
Fomento Economico Mexicano SAB de CV | 13,731,800 | 137,859,251 | ||||||
Gentera SAB de CV | 7,325,500 | 11,274,268 | ||||||
Gruma SAB de CV Series B | 1,525,985 | 22,451,293 | ||||||
Grupo Aeroportuario del Pacifico SAB de CV Series B | 2,558,000 | 28,304,452 | ||||||
Grupo Aeroportuario del Sureste SAB de CV Series B | 1,494,275 | 30,577,606 | ||||||
CONSOLIDATED SCHEDULESOF INVESTMENTS | 33 |
Table of Contents
Consolidated Schedule of Investments (Continued)
iSHARES® MSCI EMERGING MARKETS ETF
August 31, 2017
| Security | Shares | Value | ||||||
Grupo Bimbo SAB de CV Series A | 11,643,000 | $ | 28,312,557 | |||||
Grupo Carso SAB de CV Series A1 | 3,848,441 | 15,600,840 | ||||||
Grupo Financiero Banorte SAB de CV Series O | 17,675,656 | 120,913,775 | ||||||
Grupo Financiero Inbursa SAB de CV Series Oc | 16,566,300 | 27,792,140 | ||||||
Grupo Financiero Santander Mexico SAB de CV Series B | 12,953,500 | 26,767,890 | ||||||
Grupo Lala SAB de CVc | 4,244,600 | 7,559,081 | ||||||
Grupo Mexico SAB de CV Series B | 26,980,188 | 89,223,733 | ||||||
Grupo Televisa SAB | 17,296,800 | 89,712,092 | ||||||
Industrias Penoles SAB de CV | 985,553 | 25,687,334 | ||||||
Infraestructura Energetica Nova SAB de CV | 3,716,000 | 20,255,539 | ||||||
Kimberly-Clark de Mexico SAB de CV Series A | 10,818,700 | 21,306,273 | ||||||
Mexichem SAB de CV | 7,537,734 | 20,139,815 | ||||||
Promotora y Operadora de Infraestructura SAB de CV | 1,780,920 | 19,576,106 | ||||||
Wal-Mart de Mexico SAB de CV | 37,041,300 | 90,385,947 | ||||||
|
| |||||||
| 1,276,683,384 | ||||||||
PAKISTAN — 0.09% |
| |||||||
Engro Corp. Ltd./Pakistan | 1,846,700 | 4,976,786 | ||||||
Habib Bank Ltd. | 3,958,500 | 6,685,049 | ||||||
Lucky Cement Ltd. | 908,550 | 5,155,935 | ||||||
MCB Bank Ltd. | 2,545,900 | 4,681,842 | ||||||
Oil & Gas Development Co. Ltd. | 4,468,600 | 5,993,531 | ||||||
United Bank Ltd./Pakistan | 3,213,900 | 5,686,342 | ||||||
|
| |||||||
| 33,179,485 | ||||||||
PERU — 0.39% | ||||||||
Cia. de Minas Buenaventura SAA ADR | 1,358,484 | 18,244,440 | ||||||
Credicorp Ltd. | 481,964 | 97,761,578 | ||||||
Southern Copper Corp. | 613,034 | 24,950,484 | ||||||
|
| |||||||
| 140,956,502 | ||||||||
| Security | Shares | Value | ||||||
PHILIPPINES — 1.09% | ||||||||
Aboitiz Equity Ventures Inc. | 14,885,870 | $ | 21,658,257 | |||||
Aboitiz Power Corp. | 8,257,964 | 6,374,625 | ||||||
Alliance Global Group Inc. | 23,439,180 | 6,367,102 | ||||||
Ayala Corp. | 1,762,126 | 31,681,765 | ||||||
Ayala Land Inc. | 53,937,100 | 44,271,218 | ||||||
Bank of the Philippine Islands | 5,857,272 | 12,122,046 | ||||||
BDO Unibank Inc. | 13,560,351 | 33,682,248 | ||||||
DMCI Holdings Inc. | 25,404,800 | 7,794,711 | ||||||
Energy Development Corp. | 62,792,800 | 8,320,015 | ||||||
Globe Telecom Inc. | 242,675 | 9,485,050 | ||||||
GT Capital Holdings Inc. | 572,425 | 12,506,765 | ||||||
International Container Terminal Services Inc. | 3,875,640 | 7,907,305 | ||||||
JG Summit Holdings Inc. | 19,926,234 | 27,959,812 | ||||||
Jollibee Foods Corp. | 3,371,259 | 15,693,451 | ||||||
Megaworld Corp. | 74,660,400 | 7,207,785 | ||||||
Metro Pacific Investments Corp. | 93,393,500 | 11,589,774 | ||||||
Metropolitan Bank & Trust Co. | 4,434,186 | 7,591,063 | ||||||
PLDT Inc. | 662,458 | 22,396,958 | ||||||
Robinsons Land Corp. | 9,653,500 | 4,376,807 | ||||||
Security Bank Corp. | 1,221,390 | 5,967,315 | ||||||
SM Investments Corp. | 1,842,072 | 29,177,240 | ||||||
SM Prime Holdings Inc. | 60,404,225 | 39,427,421 | ||||||
Universal Robina Corp. | 6,336,300 | 18,091,331 | ||||||
|
| |||||||
| 391,650,064 | ||||||||
POLAND — 1.36% | ||||||||
Alior Bank SAa | 642,431 | 11,865,575 | ||||||
Bank Handlowy w Warszawie SA | 246,272 | 4,893,186 | ||||||
Bank Millennium SAa | 4,400,275 | 9,173,910 | ||||||
Bank Pekao SA | 1,119,259 | 40,076,451 | ||||||
Bank Zachodni WBK SA | 249,537 | 25,809,838 | ||||||
CCC SA | 193,254 | 14,180,108 | ||||||
Cyfrowy Polsat SA | 1,466,894 | 11,001,500 | ||||||
Eurocash SA | 550,994 | 6,035,122 | ||||||
Grupa Azoty SA | 309,819 | 5,973,731 | ||||||
Grupa Lotos SAa | 655,019 | 10,789,281 | ||||||
Jastrzebska Spolka Weglowa SAa | 373,498 | 10,870,261 | ||||||
KGHM Polska Miedz SA | 989,591 | 34,921,203 | ||||||
LPP SAc | 9,176 | 22,423,603 | ||||||
| 34 | 2017 iSHARES ANNUAL REPORTTO SHAREHOLDERS |
Table of Contents
Consolidated Schedule of Investments (Continued)
iSHARES® MSCI EMERGING MARKETS ETF
August 31, 2017
| Security | Shares | Value | ||||||
mBank SAa | 107,105 | $ | 13,128,110 | |||||
Orange Polska SAa | 4,623,654 | 7,750,514 | ||||||
PGE Polska Grupa Energetyczna SA | 5,955,107 | 23,781,098 | ||||||
Polski Koncern Naftowy ORLEN SA | 2,163,134 | 71,369,983 | ||||||
Polskie Gornictwo Naftowe i Gazownictwo SA | 12,607,692 | 24,097,648 | ||||||
Powszechna Kasa Oszczednosci Bank Polski SAa | 6,611,027 | 67,860,433 | ||||||
Powszechny Zaklad Ubezpieczen SA | 4,251,778 | 57,707,291 | ||||||
Synthos SA | 3,901,627 | 5,219,057 | ||||||
Tauron Polska Energia SAa | 7,542,900 | 8,274,520 | ||||||
|
| |||||||
| 487,202,423 | ||||||||
QATAR — 0.60% | ||||||||
Barwa Real Estate Co. | 724,466 | 6,305,068 | ||||||
Commercial Bank PQSC (The)a | 1,430,764 | 11,713,306 | ||||||
Doha Bank QPSC | 702,894 | 5,821,980 | ||||||
Ezdan Holding Group QSC | 5,753,059 | 17,758,842 | ||||||
Industries Qatar QSC | 1,039,572 | 25,980,378 | ||||||
Masraf Al Rayan QSC | 2,668,535 | 27,958,698 | ||||||
Ooredoo QSC | 579,129 | 13,930,905 | ||||||
Qatar Electricity & Water Co. QSC | 209,275 | 10,690,052 | ||||||
Qatar Gas Transport Co. Ltd. | 1,906,436 | 8,895,392 | ||||||
Qatar Insurance Co. SAQ | 986,761 | 17,885,678 | ||||||
Qatar Islamic Bank SAQ | 434,553 | 11,098,779 | ||||||
Qatar National Bank QPSC | 1,598,344 | 57,327,491 | ||||||
|
| |||||||
| 215,366,569 | ||||||||
RUSSIA — 3.14% | ||||||||
Alrosa PJSC | 18,323,000 | 25,477,094 | ||||||
Gazprom PJSC | 57,873,929 | 117,312,422 | ||||||
Gazprom PJSC ADR | 9,083,053 | 36,241,381 | ||||||
Inter RAO UES PJSC | 220,515,000 | 14,690,874 | ||||||
Lukoil PJSC | 2,288,086 | 115,438,519 | ||||||
Lukoil PJSC ADR | 741,219 | 37,246,255 | ||||||
Magnit PJSC GDRe | 2,168,050 | 90,602,810 | ||||||
MMC Norilsk Nickel PJSC | 447,387 | 75,341,280 | ||||||
Mobile TeleSystems PJSC ADR | 3,544,686 | 35,411,413 | ||||||
| Security | Shares | Value | ||||||
Moscow Exchange MICEX-RTS PJSC | 10,426,180 | $ | 18,886,511 | |||||
Novatek PJSC GDRe | 650,846 | 68,794,422 | ||||||
Novolipetsk Steel PJSC | 7,938,199 | 18,794,703 | ||||||
PhosAgro PJSC GDRe | 758,030 | 10,536,617 | ||||||
Rosneft Oil Co. PJSC | 6,700,087 | 35,256,937 | ||||||
Rosneft Oil Co. PJSC GDR | 1,340,410 | 6,970,132 | ||||||
Rostelecom PJSC | 6,910,400 | 7,906,949 | ||||||
RusHydro PJSC | 764,906,100 | 10,887,153 | ||||||
Sberbank of Russia PJSC | 61,067,081 | 193,364,193 | ||||||
Sberbank of Russia PJSC ADR | 3,475,361 | 47,438,678 | ||||||
Severstal PJSC | 1,355,463 | 21,262,622 | ||||||
Sistema PJSC FC GDRe | 1,207,897 | 5,012,773 | ||||||
Surgutneftegas OJSC | 38,697,660 | 17,901,208 | ||||||
Surgutneftegas OJSC ADR | 1,292,397 | 5,911,424 | ||||||
Tatneft PJSC Class S | 10,679,140 | 70,611,963 | ||||||
VTB Bank PJSC | 29,830,502,000 | 33,284,830 | ||||||
VTB Bank PJSC GDRe | 2,946,203 | 6,581,818 | ||||||
|
| |||||||
| 1,127,164,981 | ||||||||
SOUTH AFRICA — 6.76% |
| |||||||
Anglo American Platinum Ltd.a | 378,333 | 10,260,618 | ||||||
AngloGold Ashanti Ltd. | 2,900,474 | 29,380,758 | ||||||
Aspen Pharmacare Holdings Ltd. | 2,740,038 | 61,116,708 | ||||||
Barclays Africa Group Ltd. | 4,804,947 | 54,853,475 | ||||||
Bid Corp. Ltd. | 2,382,184 | 54,148,293 | ||||||
Bidvest Group Ltd. (The) | 2,370,179 | 31,265,027 | ||||||
Brait SEa | 2,550,289 | 11,290,143 | ||||||
Capitec Bank Holdings Ltd. | 295,200 | 20,452,210 | ||||||
Coronation Fund Managers Ltd. | 1,618,936 | 8,762,620 | ||||||
Discovery Ltd. | 2,543,112 | 29,466,641 | ||||||
Exxaro Resources Ltd. | 1,439,369 | 14,492,804 | ||||||
FirstRand Ltd. | 24,057,955 | 102,784,246 | ||||||
Fortress Income Fund Ltd. | 5,725,015 | 17,358,941 | ||||||
Fortress Income Fund Ltd. Class A | 7,042,771 | 9,504,151 | ||||||
Foschini Group Ltd. (The) | 1,577,655 | 18,604,130 | ||||||
Gold Fields Ltd. | 5,836,452 | 26,044,564 | ||||||
Growthpoint Properties Ltd. | 15,177,104 | 29,367,507 | ||||||
Hyprop Investments Ltd. | 1,741,864 | 15,295,167 | ||||||
Impala Platinum Holdings Ltd.a | 4,435,881 | 13,719,747 | ||||||
CONSOLIDATED SCHEDULESOF INVESTMENTS | 35 |
Table of Contents
Consolidated Schedule of Investments (Continued)
iSHARES® MSCI EMERGING MARKETS ETF
August 31, 2017
| Security | Shares | Value | ||||||
Imperial Holdings Ltd. | 1,117,185 | $ | 17,931,690 | |||||
Investec Ltd. | 1,889,314 | 14,400,795 | ||||||
Liberty Holdings Ltd. | 878,098 | 6,999,112 | ||||||
Life Healthcare Group Holdings Ltd. | 9,179,123 | 18,623,079 | ||||||
Massmart Holdings Ltd. | 766,434 | 7,174,023 | ||||||
MMI Holdings Ltd./South Africa | 7,365,724 | 11,793,092 | ||||||
Mondi Ltd. | 844,122 | 23,037,273 | ||||||
Mr. Price Group Ltd. | 1,737,043 | 24,223,046 | ||||||
MTN Group Ltd. | 12,038,047 | 119,690,465 | ||||||
Naspers Ltd. Class N | 3,110,774 | 703,880,978 | ||||||
Nedbank Group Ltd. | 1,580,681 | 26,739,322 | ||||||
NEPI Rockcastle PLCa | 2,146,621 | 31,131,991 | ||||||
Netcare Ltd. | 7,029,587 | 13,039,688 | ||||||
Pick n Pay Stores Ltd. | 2,570,881 | 12,655,123 | ||||||
Pioneer Foods Group Ltd. | 901,966 | 8,788,920 | ||||||
PSG Group Ltd. | 659,265 | 12,812,490 | ||||||
Rand Merchant Investment Holdings Ltd. | 4,687,701 | 15,014,348 | ||||||
Redefine Properties Ltd. | 35,477,843 | 29,097,427 | ||||||
Remgro Ltd. | 3,773,354 | 63,099,711 | ||||||
Resilient REIT Ltd. | 2,078,692 | 20,000,863 | ||||||
RMB Holdings Ltd. | 5,051,844 | 25,827,662 | ||||||
Sanlam Ltd. | 10,049,254 | 55,513,479 | ||||||
Sappi Ltd. | 3,946,902 | 26,540,430 | ||||||
Sasol Ltd. | 3,934,326 | 118,621,556 | ||||||
Shoprite Holdings Ltd. | 3,160,798 | 54,811,484 | ||||||
Sibanye Gold Ltd. | 12,038,541 | 19,237,584 | ||||||
SPAR Group Ltd. (The) | 1,358,679 | 17,671,451 | ||||||
Standard Bank Group Ltd. | 9,208,194 | 118,617,267 | ||||||
Steinhoff International Holdings NV Class H | 21,341,233 | 103,212,918 | ||||||
Telkom SA SOC Ltd. | 1,887,652 | 9,114,756 | ||||||
Tiger Brands Ltd. | 1,170,855 | 36,303,486 | ||||||
Truworths International Ltd. | 3,167,666 | 20,235,531 | ||||||
Vodacom Group Ltd. | 3,694,989 | 51,623,239 | ||||||
Woolworths Holdings Ltd./South Africa | 7,068,634 | 32,271,802 | ||||||
|
| |||||||
| 2,427,903,831 | ||||||||
SOUTH KOREA — 13.76% |
| |||||||
AmorePacific Corp.c | 227,529 | 58,113,118 | ||||||
AmorePacific Groupc | 203,043 | 24,128,913 | ||||||
BGF retail Co. Ltd.c | 168,584 | 13,635,031 | ||||||
BNK Financial Group Inc. | 1,861,318 | 16,275,803 | ||||||
| Security | Shares | Value | ||||||
Celltrion Inc.a,c | 567,071 | $ | 57,883,888 | |||||
Cheil Worldwide Inc. | 500,382 | 8,431,410 | ||||||
CJ CheilJedang Corp. | 56,098 | 18,034,343 | ||||||
CJ Corp. | 103,292 | 16,213,803 | ||||||
CJ E&M Corp. | 135,047 | 9,102,139 | ||||||
CJ Logistics Corp.a,c | 53,573 | 8,029,299 | ||||||
Coway Co. Ltd. | 379,642 | 33,264,127 | ||||||
Daelim Industrial Co. Ltd. | 199,202 | 14,804,122 | ||||||
Daewoo Engineering & Construction Co. Ltd.a | 905,165 | 5,643,233 | ||||||
DGB Financial Group Inc. | 1,204,487 | 11,750,051 | ||||||
Dongbu Insurance Co. Ltd. | 354,242 | 23,624,511 | ||||||
Dongsuh Cos. Inc. | 255,712 | 6,009,549 | ||||||
Doosan Bobcat Inc. | 238,644 | 8,074,023 | ||||||
Doosan Heavy Industries & Construction Co. Ltd. | 371,978 | 5,937,925 | ||||||
E-MART Inc. | 147,341 | 29,269,585 | ||||||
GS Engineering & Construction Corp.a,c | 348,003 | 8,795,748 | ||||||
GS Holdings Corp. | 365,371 | 22,876,191 | ||||||
GS Retail Co. Ltd. | 194,178 | 6,948,459 | ||||||
Hana Financial Group Inc. | 2,100,066 | 91,258,632 | ||||||
Hankook Tire Co. Ltd. | 530,371 | 27,750,877 | ||||||
Hanmi Pharm Co. Ltd.a,c | 43,352 | 15,493,842 | ||||||
Hanmi Science Co. Ltd.a,c | 89,129 | 7,074,357 | ||||||
Hanon Systems | 1,323,492 | 13,556,521 | ||||||
Hanssem Co. Ltd.c | 75,430 | 11,372,029 | ||||||
Hanwha Chemical Corp. | 758,602 | 23,781,998 | ||||||
Hanwha Corp. | 321,518 | 14,014,375 | ||||||
Hanwha Life Insurance Co. Ltd. | 1,708,664 | 11,092,072 | ||||||
Hanwha Techwin Co. Ltd.a,c | 263,361 | 9,062,085 | ||||||
Hotel Shilla Co. Ltd. | 226,040 | 12,408,546 | ||||||
Hyosung Corp. | 149,498 | 21,014,041 | ||||||
Hyundai Department Store Co. Ltd. | 106,004 | 9,081,222 | ||||||
Hyundai Development Co. Engineering & Construction | 423,753 | 14,148,901 | ||||||
Hyundai Engineering & Construction Co. Ltd. | 548,779 | 19,783,493 | ||||||
Hyundai Glovis Co. Ltd. | 133,107 | 18,296,900 | ||||||
Hyundai Heavy Industries Co. Ltd.a | 221,106 | 29,118,695 | ||||||
| 36 | 2017 iSHARES ANNUAL REPORTTO SHAREHOLDERS |
Table of Contents
Consolidated Schedule of Investments (Continued)
iSHARES® MSCI EMERGING MARKETS ETF
August 31, 2017
| Security | Shares | Value | ||||||
Hyundai Marine & Fire Insurance Co. Ltd. | 440,141 | $ | 18,033,446 | |||||
Hyundai Mobis Co. Ltd. | 483,341 | 101,160,408 | ||||||
Hyundai Motor Co. | 1,094,973 | 136,434,646 | ||||||
Hyundai Robotics Co. Ltd.a | 68,910 | 27,072,659 | ||||||
Hyundai Steel Co. | 564,801 | 28,901,222 | ||||||
Hyundai Wia Corp.c | 115,245 | 7,154,266 | ||||||
Industrial Bank of Korea | 1,798,682 | 23,847,371 | ||||||
Kakao Corp.c | 239,622 | 26,138,264 | ||||||
Kangwon Land Inc. | 832,047 | 25,457,273 | ||||||
KB Financial Group Inc. | 2,800,574 | 137,594,714 | ||||||
KCC Corp. | 41,111 | 14,437,705 | ||||||
KEPCO Plant Service & Engineering Co. Ltd. | 161,085 | 6,535,685 | ||||||
Kia Motors Corp. | 1,869,888 | 58,786,387 | ||||||
Korea Aerospace Industries Ltd. Class A | 481,813 | 19,762,195 | ||||||
Korea Electric Power Corp. | 1,822,167 | 69,325,084 | ||||||
Korea Gas Corp.a | 204,380 | 8,210,725 | ||||||
Korea Investment Holdings Co. Ltd. | 279,301 | 16,273,568 | ||||||
Korea Zinc Co. Ltd. | 59,881 | 27,402,089 | ||||||
Korean Air Lines Co. Ltd.a | 329,877 | 9,712,590 | ||||||
KT Corp. | 170,925 | 4,729,390 | ||||||
KT&G Corp. | 828,849 | 84,163,897 | ||||||
Kumho Petrochemical Co. Ltd.c | 129,161 | 9,026,150 | ||||||
LG Chem Ltd. | 325,399 | 109,370,540 | ||||||
LG Corp. | 674,313 | 50,232,611 | ||||||
LG Display Co. Ltd. | 1,651,832 | 45,631,932 | ||||||
LG Electronics Inc. | 750,300 | 54,229,736 | ||||||
LG Household & Health Care Ltd.c | 66,814 | 56,883,150 | ||||||
LG Innotek Co. Ltd. | 100,982 | 16,522,862 | ||||||
Lotte Chemical Corp. | 109,346 | 38,740,446 | ||||||
Lotte Chilsung Beverage Co. Ltd.c | 4,395 | 6,029,678 | ||||||
Lotte Confectionery Co. Ltd.c | 40,386 | 7,073,639 | ||||||
Lotte Shopping Co. Ltd.c | 88,613 | 20,196,471 | ||||||
Medy-Tox Inc. | 29,776 | 15,027,955 | ||||||
Mirae Asset Daewoo Co. Ltd. | 2,678,150 | 24,107,150 | ||||||
NAVER Corp. | 198,598 | 132,974,007 | ||||||
NCsoft Corp. | 124,653 | 42,505,391 | ||||||
| Security | Shares | Value | ||||||
Netmarble Games Corp.a,b,c | 118,622 | $ | 16,253,192 | |||||
NH Investment & Securities Co. Ltd. | 996,279 | 12,192,843 | ||||||
OCI Co. Ltd.c | 118,617 | 10,340,592 | ||||||
Orion Corp./Republic of Koreaa | 165,909 | 12,844,853 | ||||||
Ottogi Corp.c | 8,588 | 5,795,910 | ||||||
Pan Ocean Co. Ltd.a | 1,505,099 | 8,582,641 | ||||||
POSCO | 522,787 | 159,256,238 | ||||||
Posco Daewoo Corp. | 288,556 | 5,412,344 | ||||||
S-1 Corp. | 131,455 | 10,457,178 | ||||||
S-Oil Corp. | 319,970 | 35,612,128 | ||||||
Samsung Biologics Co. Ltd.a,b,c | 117,360 | 29,454,487 | ||||||
Samsung C&T Corp. | 538,026 | 61,551,396 | ||||||
Samsung Card Co. Ltd. | 235,932 | 7,762,573 | ||||||
Samsung Electro-Mechanics Co. Ltd. | 398,238 | 35,670,484 | ||||||
Samsung Electronics Co. Ltd. | 695,708 | 1,428,928,457 | ||||||
Samsung Fire & Marine Insurance Co. Ltd. | 220,790 | 54,140,152 | ||||||
Samsung Heavy Industries Co. Ltd.a,c | 1,795,762 | 17,040,310 | ||||||
Samsung Life Insurance Co. Ltd. | 496,367 | 50,842,842 | ||||||
Samsung SDI Co. Ltd. | 390,748 | 68,093,280 | ||||||
Samsung SDS Co. Ltd. | 246,333 | 36,591,679 | ||||||
Samsung Securities Co. Ltd. | 457,067 | 14,815,359 | ||||||
Shinhan Financial Group Co. Ltd. | 3,025,965 | 139,544,324 | ||||||
Shinsegae Inc.c | 53,011 | 9,073,362 | ||||||
SK Holdings Co. Ltd. | 228,681 | 54,249,882 | ||||||
SK Hynix Inc. | 4,135,264 | 251,577,785 | ||||||
SK Innovation Co. Ltd. | 459,412 | 76,799,541 | ||||||
SK Networks Co. Ltd. | 945,253 | 5,876,395 | ||||||
SK Telecom Co. Ltd. | 143,096 | 32,169,950 | ||||||
Woori Bank | 2,519,494 | 41,559,585 | ||||||
Yuhan Corp. | 58,699 | 11,764,787 | ||||||
|
| |||||||
| 4,939,093,708 | ||||||||
TAIWAN — 11.83% | ||||||||
Acer Inc.c | 20,899,121 | 10,526,082 | ||||||
Advanced Semiconductor Engineering Inc.c | 46,706,220 | 56,334,087 | ||||||
Advantech Co. Ltd.c | 2,466,126 | 18,181,949 | ||||||
CONSOLIDATED SCHEDULESOF INVESTMENTS | 37 |
Table of Contents
Consolidated Schedule of Investments (Continued)
iSHARES® MSCI EMERGING MARKETS ETF
August 31, 2017
| Security | Shares | Value | ||||||
Asia Cement Corp. | 16,555,077 | $ | 15,003,193 | |||||
Asia Pacific Telecom Co. Ltd.a | 14,391,000 | 4,935,447 | ||||||
Asustek Computer Inc.c | 4,975,968 | 41,220,451 | ||||||
AU Optronics Corp.c | 61,504,000 | 25,270,870 | ||||||
Catcher Technology Co. Ltd.c | 4,639,210 | 59,029,678 | ||||||
Cathay Financial Holding Co. Ltd. | 57,895,644 | 94,481,609 | ||||||
Chailease Holding Co. Ltd.c | 7,274,932 | 19,815,084 | ||||||
Chang Hwa Commercial Bank Ltd. | 37,063,940 | 20,264,257 | ||||||
Cheng Shin Rubber Industry Co. Ltd.c | 13,761,128 | 27,678,202 | ||||||
Chicony Electronics Co. Ltd. | 3,805,267 | 9,557,614 | ||||||
China Airlines Ltd. | 18,411,347 | 7,808,915 | ||||||
China Development Financial Holding Corp. | 96,567,848 | 30,142,454 | ||||||
China Life Insurance Co. Ltd./Taiwanc | 24,742,822 | 27,301,633 | ||||||
China Steel Corp.c | 88,165,313 | 73,911,741 | ||||||
Chunghwa Telecom Co. Ltd. | 26,937,410 | 93,721,729 | ||||||
Compal Electronics Inc. | 29,900,908 | 21,500,040 | ||||||
CTBC Financial Holding Co. Ltd. | 124,902,772 | 80,912,197 | ||||||
Delta Electronics Inc.c | 13,770,000 | 75,513,933 | ||||||
E.Sun Financial Holding Co. Ltd.c | 64,414,712 | 39,700,243 | ||||||
Eclat Textile Co. Ltd.c | 1,254,427 | 15,379,502 | ||||||
EVA Airways Corp. | 14,870,364 | 7,735,999 | ||||||
Evergreen Marine Corp. Taiwan Ltd.a | 12,289,808 | 9,366,301 | ||||||
Far Eastern New Century Corp. | 22,587,038 | 18,074,720 | ||||||
Far EasTone Telecommunications Co. Ltd. | 11,302,000 | 27,413,314 | ||||||
Feng TAY Enterprise Co. Ltd.c | 2,337,529 | 11,076,134 | ||||||
First Financial Holding Co. Ltd. | 68,722,639 | 44,632,484 | ||||||
Formosa Chemicals & Fibre Corp. | 21,404,090 | 67,306,675 | ||||||
| Security | Shares | Value | ||||||
Formosa Petrochemical Corp. | 9,265,000 | $ | 32,695,666 | |||||
Formosa Plastics Corp. | 29,322,280 | 91,234,371 | ||||||
Formosa Taffeta Co. Ltd. | 5,432,000 | 5,399,781 | ||||||
Foxconn Technology Co. Ltd.c | 6,531,637 | 20,733,981 | ||||||
Fubon Financial Holding Co. Ltd. | 47,448,969 | 76,254,183 | ||||||
General Interface Solution Holding Ltd. | 1,149,000 | 13,763,329 | ||||||
Giant Manufacturing Co. Ltd.c | 2,066,203 | 10,440,901 | ||||||
Globalwafers Co. Ltd.c | 1,477,000 | 11,721,445 | ||||||
Highwealth Construction Corp.c | 5,805,170 | 9,233,181 | ||||||
Hiwin Technologies Corp.c | 1,478,971 | 13,109,273 | ||||||
Hon Hai Precision Industry Co. Ltd. | 110,648,592 | 430,803,193 | ||||||
Hotai Motor Co. Ltd.c | 1,838,000 | 21,651,115 | ||||||
HTC Corp.a,c | 4,653,708 | 10,593,782 | ||||||
Hua Nan Financial Holdings Co. Ltd. | 54,907,305 | 30,656,685 | ||||||
Innolux Corp.c | 63,564,002 | 30,961,623 | ||||||
Inventec Corp. | 17,983,281 | 14,271,499 | ||||||
Largan Precision Co. Ltd.c | 710,000 | 137,158,289 | ||||||
Lite-On Technology Corp. | 15,168,246 | 22,441,505 | ||||||
MediaTek Inc.c | 10,661,338 | 95,559,559 | ||||||
Mega Financial Holding Co. Ltd. | 77,451,162 | 62,235,020 | ||||||
Merida Industry Co. Ltd.c | 1,444,500 | 6,342,034 | ||||||
Micro-Star International Co. Ltd.c | 4,778,000 | 10,876,722 | ||||||
Nan Ya Plastics Corp. | 33,723,160 | 85,148,772 | ||||||
Nanya Technology Corp.c | 4,876,000 | 10,453,534 | ||||||
Nien Made Enterprise Co. Ltd. | 1,024,000 | 11,010,570 | ||||||
Novatek Microelectronics Corp. | 4,084,000 | 15,900,792 | ||||||
Pegatron Corp. | 13,672,414 | 43,039,177 | ||||||
Phison Electronics Corp. | 1,046,535 | 14,113,779 | ||||||
Pou Chen Corp. | 15,619,220 | 20,262,184 | ||||||
Powertech Technology Inc. | 4,932,300 | 14,970,631 | ||||||
President Chain Store Corp. | 4,061,000 | 33,977,352 | ||||||
Quanta Computer Inc.c | 19,144,000 | 43,579,734 | ||||||
| 38 | 2017 iSHARES ANNUAL REPORTTO SHAREHOLDERS |
Table of Contents
Consolidated Schedule of Investments (Continued)
iSHARES® MSCI EMERGING MARKETS ETF
August 31, 2017
| Security | Shares | Value | ||||||
Realtek Semiconductor Corp. | 3,212,637 | $ | 12,454,970 | |||||
Ruentex Development Co. Ltd.a,c | 6,968,430 | 6,823,192 | ||||||
Ruentex Industries Ltd.c | 3,961,598 | 6,373,160 | ||||||
Shin Kong Financial Holding Co. Ltd. | 58,670,865 | 17,049,720 | ||||||
Siliconware Precision Industries Co. Ltd. | 14,881,509 | 23,570,567 | ||||||
SinoPac Financial Holdings Co. Ltd. | 72,651,021 | 23,351,168 | ||||||
Standard Foods Corp.c | 3,474,615 | 8,876,796 | ||||||
Synnex Technology International Corp. | 9,953,834 | 11,115,153 | ||||||
TaiMed Biologics Inc.a,c | 1,214,000 | 8,729,183 | ||||||
Taishin Financial Holding Co. Ltd.c | 65,665,006 | 29,156,403 | ||||||
Taiwan Business Bank | 29,620,632 | 8,185,694 | ||||||
Taiwan Cement Corp.c | 23,649,296 | 27,309,651 | ||||||
Taiwan Cooperative Financial Holding Co. Ltd. | 56,904,605 | 29,980,557 | ||||||
Taiwan Fertilizer Co. Ltd. | 5,013,000 | 6,685,883 | ||||||
Taiwan High Speed Rail Corp. | 10,665,000 | 9,400,212 | ||||||
Taiwan Mobile Co. Ltd. | 11,400,600 | 40,798,728 | ||||||
Taiwan Semiconductor Manufacturing Co. Ltd. | 174,782,000 | 1,253,862,056 | ||||||
Teco Electric and Machinery Co. Ltd. | 13,508,000 | 12,622,207 | ||||||
Transcend Information Inc. | 1,307,000 | 3,897,743 | ||||||
Uni-President Enterprises Corp. | 34,283,839 | 72,932,253 | ||||||
United Microelectronics Corp.c | 85,331,000 | 42,553,814 | ||||||
Vanguard International Semiconductor Corp.c | 6,410,000 | 11,575,765 | ||||||
Wistron Corp.c | 18,461,156 | 17,434,075 | ||||||
WPG Holdings Ltd. | 10,817,532 | 14,086,915 | ||||||
Yuanta Financial Holding Co. Ltd. | 70,852,635 | 30,755,476 | ||||||
Yulon Motor Co. Ltd. | 5,889,000 | 5,073,528 | ||||||
Zhen Ding Technology Holding Ltd.c | 3,065,075 | 7,099,266 | ||||||
|
| |||||||
| 4,246,144,334 | ||||||||
| Security | Shares | Value | ||||||
THAILAND — 2.15% | ||||||||
Advanced Info Service PCL NVDR | 7,373,600 | $ | 41,636,802 | |||||
Airports of Thailand PCL NVDR | 30,541,700 | 50,128,675 | ||||||
Bangkok Bank PCL Foreign | 1,780,400 | 10,053,456 | ||||||
Bangkok Dusit Medical Services PCL NVDR | 27,604,800 | 17,375,104 | ||||||
Bangkok Expressway & Metro PCL NVDR | 51,924,700 | 12,197,340 | ||||||
Banpu PCL NVDR | 13,960,700 | 7,399,739 | ||||||
BEC World PCL NVDR | 7,337,400 | 3,822,828 | ||||||
Berli Jucker PCL NVDR | 8,333,600 | 12,360,482 | ||||||
BTS Group Holdings PCL NVDR | 39,430,000 | 10,271,631 | ||||||
Bumrungrad Hospital PCL NVDR | 2,572,200 | 16,887,204 | ||||||
Central Pattana PCL NVDR | 9,829,900 | 21,314,645 | ||||||
Charoen Pokphand Foods PCL NVDR | 20,578,300 | 16,887,778 | ||||||
CP ALL PCL NVDR | 35,133,500 | 65,600,873 | ||||||
Delta Electronics Thailand PCL NVDR | 3,554,100 | 9,526,123 | ||||||
Electricity Generating PCL NVDRc | 859,700 | 6,058,419 | ||||||
Energy Absolute PCL NVDRc | 7,760,900 | 8,823,189 | ||||||
Glow Energy PCL NVDR | 3,821,600 | 9,869,062 | ||||||
Home Product Center PCL NVDR | 28,280,414 | 8,516,914 | ||||||
Indorama Ventures PCL NVDR | 10,387,980 | 12,200,910 | ||||||
IRPC PCL NVDR | 72,662,400 | 13,020,367 | ||||||
Kasikornbank PCL Foreign | 8,381,400 | 53,259,310 | ||||||
Kasikornbank PCL NVDR | 4,024,300 | 24,360,316 | ||||||
KCE Electronics PCL NVDR | 1,922,300 | 5,065,540 | ||||||
Krung Thai Bank PCL NVDR | 25,107,600 | 14,139,802 | ||||||
Minor International PCL NVDRc | 15,391,120 | 18,424,846 | ||||||
PTT Exploration & Production PCL NVDR | 9,913,539 | 26,123,616 | ||||||
PTT Global Chemical PCL NVDR | 15,238,130 | 35,106,669 | ||||||
CONSOLIDATED SCHEDULESOF INVESTMENTS | 39 |
Table of Contents
Consolidated Schedule of Investments (Continued)
iSHARES® MSCI EMERGING MARKETS ETF
August 31, 2017
| Security | Shares | Value | ||||||
PTT PCL NVDR | 7,493,200 | $ | 90,040,259 | |||||
Robinson PCL NVDR | 3,531,200 | 6,114,862 | ||||||
Siam Cement PCL (The) Foreign | 2,224,100 | 33,490,438 | ||||||
Siam Cement PCL (The) NVDR | 690,700 | 10,400,542 | ||||||
Siam Commercial Bank PCL (The) NVDR | 12,547,400 | 56,870,462 | ||||||
Thai Oil PCL NVDR | 5,957,500 | 16,909,934 | ||||||
Thai Union Group PCL NVDR | 13,494,600 | 8,046,772 | ||||||
TMB Bank PCL NVDR | 94,718,100 | 6,731,960 | ||||||
True Corp. PCL NVDRa,c | 69,940,201 | 11,795,366 | ||||||
|
| |||||||
| 770,832,235 | ||||||||
TURKEY — 1.21% | ||||||||
Akbank Turk AS | 15,612,290 | 46,757,057 | ||||||
Anadolu Efes Biracilik ve Malt Sanayii AS | 1,465,830 | 9,000,766 | ||||||
Arcelik AS | 1,697,486 | 11,799,877 | ||||||
Aselsan Elektronik Sanayi ve TAS | 1,422,774 | 11,126,529 | ||||||
BIM Birlesik Magazalar AS | 1,517,599 | 33,626,254 | ||||||
Coca-Cola Icecek AS | 536,727 | 6,240,090 | ||||||
Emlak Konut Gayrimenkul Yatirim Ortakligi ASa | 13,648,564 | 11,622,360 | ||||||
Enka Insaat ve Sanayi AS | 1 | 1 | ||||||
Eregli Demir ve Celik Fabrikalari TAS | 9,949,037 | 23,687,153 | ||||||
Ford Otomotiv Sanayi AS | 505,323 | 6,958,061 | ||||||
Haci Omer Sabanci Holding AS | 6,609,719 | 20,293,123 | ||||||
KOC Holding AS | 5,397,519 | 28,202,703 | ||||||
Petkim Petrokimya Holding AS | 4,908,565 | 8,871,543 | ||||||
TAV Havalimanlari Holding AS | 1,178,097 | 7,240,798 | ||||||
Tofas Turk Otomobil Fabrikasi AS | 897,590 | 8,215,332 | ||||||
Tupras Turkiye Petrol Rafinerileri AS | 891,341 | 30,283,211 | ||||||
Turk Hava Yollari AOa | 3,990,695 | 11,281,280 | ||||||
Turk Telekomunikasyon ASa | 3,299,052 | 6,860,782 | ||||||
Turkcell Iletisim Hizmetleri AS | 6,618,032 | 25,321,633 | ||||||
| Security | Shares | Value | ||||||
Turkiye Garanti Bankasi AS | 16,449,765 | $ | 51,171,012 | |||||
Turkiye Halk Bankasi AS | 4,457,121 | 19,132,100 | ||||||
Turkiye Is Bankasi Class C | 11,276,304 | 24,462,938 | ||||||
Turkiye Sise ve Cam Fabrikalari AS | 5,774,638 | 7,426,219 | ||||||
Turkiye Vakiflar Bankasi Tao Class D | 5,404,389 | 11,270,395 | ||||||
Ulker Biskuvi Sanayi AS | 1,100,654 | 6,579,919 | ||||||
Yapi ve Kredi Bankasi ASa | 6,099,494 | 8,585,985 | ||||||
|
| |||||||
| 436,017,121 | ||||||||
UNITED ARAB EMIRATES — 0.73% |
| |||||||
Abu Dhabi Commercial Bank PJSC | 14,773,115 | 29,360,415 | ||||||
Aldar Properties PJSC | 23,098,197 | 14,526,377 | ||||||
DAMAC Properties Dubai Co. PJSC | 10,405,225 | 11,444,586 | ||||||
DP World Ltd. | 1,208,116 | 27,714,181 | ||||||
Dubai Islamic Bank PJSC | 9,308,268 | 15,433,109 | ||||||
DXB Entertainments PJSCa | 22,248,190 | 4,754,793 | ||||||
Emaar Malls PJSC | 14,104,870 | 9,446,511 | ||||||
Emaar Properties PJSC | 25,234,746 | 58,396,270 | ||||||
Emirates Telecommunications Group Co. PJSC | 12,512,758 | 61,318,680 | ||||||
First Abu Dhabi Bank PJSC | 10,251,786 | 29,026,864 | ||||||
|
| |||||||
| 261,421,786 | ||||||||
|
| |||||||
TOTAL COMMON STOCKS |
| 34,401,811,535 | ||||||
PREFERRED STOCKS — 3.78% |
| |||||||
BRAZIL — 2.63% | ||||||||
Banco Bradesco SA, Preference Shares | 21,659,833 | 231,161,211 | ||||||
Braskem SA Class A, Preference Shares | 1,218,600 | 14,759,760 | ||||||
Centrais Eletricas Brasileiras SA Class B, Preference Shares | 1,735,737 | 11,325,361 | ||||||
Cia. Brasileira de Distribuicao, Preference Shares | 1,121,186 | 25,652,459 | ||||||
Cia. Energetica de Minas Gerais, Preference Shares | 5,352,902 | 14,256,485 | ||||||
| 40 | 2017 iSHARES ANNUAL REPORTTO SHAREHOLDERS |
Table of Contents
Consolidated Schedule of Investments (Continued)
iSHARES® MSCI EMERGING MARKETS ETF
August 31, 2017
| Security | Shares | Value | ||||||
Cia. Paranaense de Energia Class B, Preference Shares | 736,175 | $ | 6,724,299 | |||||
Gerdau SA, Preference Shares | 6,508,185 | 24,510,795 | ||||||
Itau Unibanco Holding SA, Preference Shares | 22,917,653 | 293,895,437 | ||||||
Itausa-Investimentos Itau SA, Preference Shares | 28,082,685 | 91,037,006 | ||||||
Lojas Americanas SA, Preference Shares | 5,159,224 | 29,137,412 | ||||||
Petroleo Brasileiro SA, Preference Shares | 27,844,327 | 120,794,884 | ||||||
Suzano Papel e Celulose SA Class A, Preference Shares | 2,877,600 | 16,004,704 | ||||||
Telefonica Brasil SA, Preference Shares | 3,166,967 | 49,158,470 | ||||||
Vale SA, Preference Shares | 1,553,200 | 16,077,714 | ||||||
|
| |||||||
| 944,495,997 | ||||||||
CHILE — 0.11% | ||||||||
Embotelladora Andina SA Class B, Preference Shares | 1,859,279 | 8,761,191 | ||||||
Sociedad Quimica y Minera de Chile SA Series B, Preference Shares | 689,464 | 32,219,748 | ||||||
|
| |||||||
| 40,980,939 | ||||||||
COLOMBIA — 0.16% | ||||||||
Bancolombia SA, Preference Shares | 3,330,127 | 37,996,624 | ||||||
Grupo Aval Acciones y Valores SA, Preference Shares | 23,132,789 | 10,369,238 | ||||||
Grupo de Inversiones Suramericana SA, Preference Shares | 643,823 | 8,797,705 | ||||||
|
| |||||||
| 57,163,567 | ||||||||
RUSSIA — 0.10% | ||||||||
Surgutneftegas OJSC, Preference Shares | 49,692,100 | 24,531,597 | ||||||
Transneft PJSC, Preference Shares | 4,048 | 12,403,644 | ||||||
|
| |||||||
| 36,935,241 | ||||||||
| Security | Shares | Value | ||||||
SOUTH KOREA — 0.78% | ||||||||
AmorePacific Corp., Preference Shares | 64,550 | $ | 9,817,600 | |||||
Hyundai Motor Co., Preference Shares | 165,041 | 14,109,571 | ||||||
Hyundai Motor Co. Series 2, Preference Shares | 269,591 | 24,386,557 | ||||||
LG Chem Ltd., Preference Shares | 54,847 | 12,792,445 | ||||||
LG Household & Health Care Ltd., Preference Shares | 14,239 | 7,576,623 | ||||||
Samsung Electronics Co. Ltd., Preference Shares | 125,383 | 209,601,769 | ||||||
|
| |||||||
| 278,284,565 | ||||||||
|
| |||||||
TOTAL PREFERRED STOCKS |
| 1,357,860,309 | ||||||
RIGHTS — 0.00% | ||||||||
CHINA — 0.00% | ||||||||
Fosun International Ltd. (Expires 09/07/17)a | 11,689 | — | ||||||
|
| |||||||
| — | ||||||||
|
| |||||||
TOTAL RIGHTS | ||||||||
(Cost: $0) | — | |||||||
SHORT-TERM INVESTMENTS — 6.38% |
| |||||||
MONEY MARKET FUNDS — 6.38% |
| |||||||
BlackRock Cash Funds: Institutional, SL Agency Shares | ||||||||
1.32%f,g,h | 2,193,968,858 | 2,194,627,049 | ||||||
|
| |||||||
BlackRock Cash Funds: Treasury, SL Agency Shares | ||||||||
0.96%f,g | 94,337,685 | 94,337,685 | ||||||
|
| |||||||
| 2,288,964,734 | ||||||||
|
| |||||||
TOTAL SHORT-TERM INVESTMENTS |
| |||||||
(Cost: $2,288,576,204) | 2,288,964,734 | |||||||
|
| |||||||
CONSOLIDATED SCHEDULESOF INVESTMENTS | 41 |
Table of Contents
Consolidated Schedule of Investments (Continued)
iSHARES® MSCI EMERGING MARKETS ETF
August 31, 2017
| Value | ||||||||
TOTAL INVESTMENTS |
| |||||||
(Cost: $31,701,760,325)i | $ | 38,048,636,578 | ||||||
Other Assets, Less Liabilities — (6.01)% |
| (2,156,746,533 | ) | |||||
|
| |||||||
NET ASSETS — 100.00% | $ | 35,891,890,045 | ||||||
|
| |||||||
ADR — American Depositary Receipts
CPO — Certificates of Participation (Ordinary)
GDR — Global Depositary Receipts
NVDR — Non-Voting Depositary Receipts
| a | Non-income earning security. |
| b | This security may be resold to qualified institutional buyers under Rule 144A of the Securities Act of 1933. |
| c | All or a portion of this security represents a security on loan. See Note 1. |
| d | Security is valued using significant unobservable inputs and is classified as Level 3 in the fair value hierarchy. |
| e | This security may be resold to qualified foreign investors and foreign institutional buyers under Regulation S of the Securities Act of 1933. |
| f | Affiliated issuer. See Schedule 1. |
| g | The rate quoted is the annualized seven-day yield of the fund at period end. |
| h | All or a portion of this security represents an investment of securities lending collateral. See Note 1. |
| i | The cost of investments (including short positions and derivatives, if any) for federal income tax purposes was $33,023,233,035. Net unrealized appreciation was $5,025,403,543, of which $9,268,485,519 represented gross unrealized appreciation on investments and $4,243,081,976 represented gross unrealized depreciation on investments. |
Schedule 1 — Affiliates (Note 2)
Investments in issuers considered to be affiliates of the Fund during the year ended August 31, 2017, for purposes of Section 2(a)(3) of the 1940 Act, and/or related parties of the Fund were as follows:
| Affiliated issuer | Shares held at 08/31/16 | Shares purchased | Shares sold | Shares held at 08/31/17 | Value at 08/31/17 | Net realized gain (loss) a | Change in unrealized appreciation (depreciation) | Income | ||||||||||||||||||||||||
BlackRock Cash | 1,728,148,121 | 465,820,737 | b | — | 2,193,968,858 | $ | 2,194,627,049 | $ | 44,253 | $ | 388,530 | $ | — | c | ||||||||||||||||||
BlackRock Cash | — | 94,337,685 | b | — | 94,337,685 | 94,337,685 | 5,679 | — | 392,254 | |||||||||||||||||||||||
|
|
|
|
|
|
|
| |||||||||||||||||||||||||
| $ | 2,288,964,734 | $ | 49,932 | $ | 388,530 | $ | 392,254 | |||||||||||||||||||||||||
|
|
|
|
|
|
|
| |||||||||||||||||||||||||
| a | Includes realized capital gain distributions from an affiliated fund, if any. |
| b | Net of shares purchased and sold. |
| c | Does not include income earned on the investment of securities lending cash collateral which is not direct income of the Fund and is reflected as a component of securities lending income in the statement of operations. |
| 42 | 2017 iSHARES ANNUAL REPORTTO SHAREHOLDERS |
Table of Contents
Consolidated Schedule of Investments (Continued)
iSHARES® MSCI EMERGING MARKETS ETF
August 31, 2017
Schedule 2 — Futures Contracts (Note 5)
Futures contracts outstanding as of August 31, 2017 were as follows:
| Description | Number of contracts | Expiration date | Notional amount (000) | Value/ unrealized appreciation (depreciation) | ||||||||||||
Long Contracts: | ||||||||||||||||
MSCI Emerging Markets E-Mini | 86,900 | Sep 2017 | $ | 94,391 | $ | 7,082,911 | ||||||||||
|
| |||||||||||||||
Schedule 3 — Fair Value Measurements
Various inputs are used in determining the fair value of financial instruments. For description of the input levels and information about the Fund’s policy regarding valuation of financial instruments, see Note 1.
The following table summarizes the value of the Fund’s investments according to the fair value hierarchy as of August 31, 2017. The breakdown of the Fund’s investments into major categories is disclosed in the consolidated schedule of investments above.
| Level 1 | �� | Level 2 | Level 3 | Total | ||||||||||||
Investments: | ||||||||||||||||
Assets: | ||||||||||||||||
Common stocks | $ | 34,392,975,120 | $ | 8,836,372 | $ | 43 | $ | 34,401,811,535 | ||||||||
Preferred stocks | 1,357,860,309 | — | — | 1,357,860,309 | ||||||||||||
Rights | — | 0 | a | — | 0 | a | ||||||||||
Money market funds | 2,288,964,734 | — | — | 2,288,964,734 | ||||||||||||
|
|
|
|
|
|
|
| |||||||||
Total | $ | 38,039,800,163 | $ | 8,836,372 | $ | 43 | $ | 38,048,636,578 | ||||||||
|
|
|
|
|
|
|
| |||||||||
Derivative financial instrumentsb: | ||||||||||||||||
Assets: | ||||||||||||||||
Futures contracts | $ | 7,082,911 | $ | — | $ | — | $ | 7,082,911 | ||||||||
|
|
|
|
|
|
|
| |||||||||
Total | $ | 7,082,911 | $ | — | $ | — | $ | 7,082,911 | ||||||||
|
|
|
|
|
|
|
| |||||||||
| a | Rounds to less than $1. |
| b | Shown at the unrealized appreciation (depreciation) on the contracts. |
See notes to financial statements.
CONSOLIDATED SCHEDULESOF INVESTMENTS | 43 |
Table of Contents
Statements of Assets and Liabilities
iSHARES®, INC.
August 31, 2017
| iShares Currency Hedged MSCI Emerging Markets ETF | iShares Edge MSCI Min Vol EM Currency Hedged ETF | iShares (Consolidated) | ||||||||||
ASSETS | ||||||||||||
Investments in securities, at cost: | ||||||||||||
Unaffiliated | $ | — | $ | — | $ | 3,449,985,392 | ||||||
Affiliated (Note 2) | 343,142,968 | 5,758,695 | 89,502,029 | |||||||||
|
|
|
|
|
| |||||||
Total cost of investments in securities | $ | 343,142,968 | $ | 5,758,695 | $ | 3,539,487,421 | ||||||
|
|
|
|
|
| |||||||
Investments in securities, at fair value (including securities on loana) (Note 1): | ||||||||||||
Unaffiliated | $ | — | $ | — | $ | 4,024,975,784 | ||||||
Affiliated (Note 2) | 394,295,899 | 6,564,456 | 89,516,952 | |||||||||
Foreign currency, at valueb | 96 | — | 3,010,414 | |||||||||
Cash pledged to broker for forward currency contracts | 1,530,000 | — | — | |||||||||
Receivables: | ||||||||||||
Investment securities sold | 789,624 | 18,229 | 409,538 | |||||||||
Dividends and interest | 26,031 | 3 | 11,189,875 | |||||||||
Unrealized appreciation on forward currency contracts (Note 6) | 1,043,121 | 14,535 | — | |||||||||
Tax reclaims | — | — | 18,453 | |||||||||
|
|
|
|
|
| |||||||
Total Assets | 397,684,771 | 6,597,223 | 4,129,121,016 | |||||||||
|
|
|
|
|
| |||||||
LIABILITIES | ||||||||||||
Payables: | ||||||||||||
Investment securities purchased | — | — | 3,682,842 | |||||||||
Collateral for securities on loan (Note 1) | — | — | 84,569,472 | |||||||||
Capital shares sold | 6,355 | — | — | |||||||||
Due to custodian | 1,333,060 | — | — | |||||||||
Deferred foreign capital gains taxes (Note 1) | — | — | 2,594,304 | |||||||||
Unrealized depreciation on forward currency contracts (Note 6) | 2,587,982 | 34,704 | — | |||||||||
Investment advisory fees (Note 2) | — | 166 | 846,303 | |||||||||
|
|
|
|
|
| |||||||
Total Liabilities | 3,927,397 | 34,870 | 91,692,921 | |||||||||
|
|
|
|
|
| |||||||
NET ASSETS | $ | 393,757,374 | $ | 6,562,353 | $ | 4,037,428,095 | ||||||
|
|
|
|
|
| |||||||
Net assets consist of: | ||||||||||||
Paid-in capital | $ | 368,349,168 | $ | 6,037,866 | $ | 4,093,555,110 | ||||||
Undistributed net investment income | 56,519 | — | 43,163,304 | |||||||||
Accumulated net realized loss | (24,256,383 | ) | (261,105 | ) | (672,217,932 | ) | ||||||
Net unrealized appreciation | 49,608,070 | 785,592 | 572,927,613 | |||||||||
|
|
|
|
|
| |||||||
NET ASSETS | $ | 393,757,374 | $ | 6,562,353 | $ | 4,037,428,095 | ||||||
|
|
|
|
|
| |||||||
Shares outstandingc | 15,400,000 | 250,000 | 69,600,000 | |||||||||
|
|
|
|
|
| |||||||
Net asset value per share | $ | 25.57 | $ | 26.25 | $ | 58.01 | ||||||
|
|
|
|
|
| |||||||
| a | Securities on loan with values of $ —, $ — and $78,509,016, respectively. See Note 1. |
| b | Cost of foreign currency: $96, $ — and $2,998,426, respectively. |
| c | $0.001 par value, number of shares authorized: 250 million, 25 million and 500 million, respectively. |
See notes to financial statements.
| 44 | 2017 iSHARES ANNUAL REPORTTO SHAREHOLDERS |
Table of Contents
Statements of Assets and Liabilities (Continued)
iSHARES®, INC.
August 31, 2017
(Consolidated) | ||||
ASSETS | ||||
Investments in securities, at cost: | ||||
Unaffiliated | $ | 29,413,184,121 | ||
Affiliated (Note 2) | 2,288,576,204 | |||
|
| |||
Total cost of investments in securities | $ | 31,701,760,325 | ||
|
| |||
Investments in securities, at fair value (including securities on loana) (Note 1): | ||||
Unaffiliated | $ | 35,759,671,844 | ||
Affiliated (Note 2) | 2,288,964,734 | |||
Foreign currency, at valueb | 50,358,993 | |||
Cash pledged to broker for futures contracts | 5,733,010 | |||
Cash | 6,460,097 | |||
Receivables: | ||||
Investment securities sold | 53,901,437 | |||
Due from custodian (Note 4) | 732,939 | |||
Dividends and interest | 63,224,277 | |||
Capital shares sold | 24,264,098 | |||
Futures variation margin | 63,881 | |||
Tax reclaims | 126,510 | |||
|
| |||
Total Assets | 38,253,501,820 | |||
|
| |||
LIABILITIES | ||||
Payables: | ||||
Investment securities purchased | 136,364,279 | |||
Collateral for securities on loan (Note 1) | 2,194,194,266 | |||
Deferred foreign capital gains taxes (Note 1) | 10,991,439 | |||
Professional fees (Note 10) | 3,231 | |||
Investment advisory fees (Note 2) | 20,058,560 | |||
|
| |||
Total Liabilities | 2,361,611,775 | |||
|
| |||
NET ASSETS | $ | 35,891,890,045 | ||
|
| |||
Net assets consist of: | ||||
Paid-in capital | $ | 41,589,517,225 | ||
Undistributed net investment income | 233,610,496 | |||
Accumulated net realized loss | (12,275,599,399 | ) | ||
Net unrealized appreciation | 6,344,361,723 | |||
|
| |||
NET ASSETS | $ | 35,891,890,045 | ||
|
| |||
Shares outstandingc | 801,900,000 | |||
|
| |||
Net asset value per share | $ | 44.76 | ||
|
| |||
| a | Securities on loan with values of $2,108,619,972. See Note 1. |
| b | Cost of foreign currency: $50,300,569. |
| c | $0.001 par value, number of shares authorized: 2 billion. |
See notes to financial statements.
FINANCIAL STATEMENTS | 45 |
Table of Contents
Statements of Operations
iSHARES®, INC.
Year ended August 31, 2017
| iShares Currency Hedged MSCI Emerging Markets ETF | iShares Edge MSCI Min Vol EM Currency Hedged ETF | iShares (Consolidated) | ||||||||||
NET INVESTMENT INCOME |
| |||||||||||
Dividends — unaffiliateda | $ | — | $ | — | $ | 101,978,768 | ||||||
Dividends — affiliated (Note 2) | 3,631,411 | 185,677 | 25,146 | |||||||||
Miscellaneous income | 96 | — | — | |||||||||
Securities lending income — affiliated — net (Note 2) | 376,944 | — | 2,745,178 | |||||||||
|
|
|
|
|
| |||||||
| 4,008,451 | 185,677 | 104,749,092 | ||||||||||
Less: Other foreign taxes (Note 1) | — | — | (664,213 | ) | ||||||||
|
|
|
|
|
| |||||||
Total investment income | 4,008,451 | 185,677 | 104,084,879 | |||||||||
|
|
|
|
|
| |||||||
EXPENSES | ||||||||||||
Investment advisory fees (Note 2) | 2,010,274 | 50,233 | 27,058,256 | |||||||||
Mauritius income taxes (Note 1) | — | — | 70,734 | |||||||||
Proxy fees | 6,190 | 134 | 81,974 | |||||||||
Commitment fees (Note 9) | — | — | 20,562 | |||||||||
Interest expense (Note 9) | — | — | 20,536 | |||||||||
|
|
|
|
|
| |||||||
Total expenses | 2,016,464 | 50,367 | 27,252,062 | |||||||||
Less investment advisory fees waived (Note 2) | (2,016,464 | ) | (48,435 | ) | (17,417,862 | ) | ||||||
|
|
|
|
|
| |||||||
Net expenses | — | 1,932 | 9,834,200 | |||||||||
|
|
|
|
|
| |||||||
Net investment income | 4,008,451 | 183,745 | 94,250,679 | |||||||||
|
|
|
|
|
| |||||||
NET REALIZED AND UNREALIZED GAIN (LOSS) | ||||||||||||
Net realized gain (loss) from: | ||||||||||||
Investments — unaffiliated | — | — | (181,681,232 | ) | ||||||||
Investments — affiliated (Note 2) | (2,516,506 | ) | (8,963 | ) | 12,206 | |||||||
In-kind redemptions — unaffiliated | — | — | 53,785,519 | |||||||||
In-kind redemptions — affiliated (Note 2) | 4,310,138 | 27,285 | — | |||||||||
Foreign currency transactions | — | — | (794,630 | ) | ||||||||
Forward currency contracts | (14,276,353 | ) | (155,984 | ) | — | |||||||
Realized gain distributions from affiliated funds | 6 | — | 445 | |||||||||
|
|
|
|
|
| |||||||
Net realized loss | (12,482,715 | ) | (137,662 | ) | (128,677,692 | ) | ||||||
|
|
|
|
|
| |||||||
Net change in unrealized appreciation/depreciation on: | ||||||||||||
Investments — unaffiliatedb | — | — | 391,320,129 | |||||||||
Investments — affiliated (Note 2) | 65,227,894 | 480,039 | 14,923 | |||||||||
Forward currency contracts | (540,375 | ) | 7,271 | — | ||||||||
Translation of assets and liabilities in foreign currencies | — | — | 89,103 | |||||||||
|
|
|
|
|
| |||||||
Net change in unrealized appreciation/depreciation | 64,687,519 | 487,310 | 391,424,155 | |||||||||
|
|
|
|
|
| |||||||
Net realized and unrealized gain | 52,204,804 | 349,648 | 262,746,463 | |||||||||
|
|
|
|
|
| |||||||
NET INCREASE IN NET ASSETS RESULTING FROM OPERATIONS | $ | 56,213,255 | $ | 533,393 | $ | 356,997,142 | ||||||
|
|
|
|
|
| |||||||
| a | Net of foreign withholding tax of $ —, $ — and $13,093,629, respectively. |
| b | Net of deferred foreign capital gains taxes of $ —, $ — and $2,122,868, respectively. |
See notes to financial statements.
| 46 | 2017 iSHARES ANNUAL REPORTTO SHAREHOLDERS |
Table of Contents
Statements of Operations (Continued)
iSHARES®, INC.
Year ended August 31, 2017
(Consolidated) | ||||
NET INVESTMENT INCOME |
| |||
Dividends — unaffiliateda | $ | 772,602,990 | ||
Dividends — affiliated (Note 2) | 392,254 | |||
Interest — unaffiliated | 15,881 | |||
Miscellaneous income | 136 | |||
Securities lending income — affiliated — net (Note 2)b | 18,238,122 | |||
Foreign withholding tax claims (Note 10) | 1,122,121 | |||
|
| |||
| 792,371,504 | ||||
Less: Other foreign taxes (Note 1) | (2,624,499 | ) | ||
|
| |||
Total investment income | 789,747,005 | |||
|
| |||
EXPENSES | ||||
Investment advisory fees (Note 2) | 207,622,093 | |||
Mauritius income taxes (Note 1) | 854,408 | |||
Proxy fees | 663,245 | |||
Commitment fees (Note 9) | 238,896 | |||
Interest expense (Note 9) | 65,570 | |||
Professional fees (Note 10) | 116,605 | |||
|
| |||
Total expenses | 209,560,817 | |||
|
| |||
Net investment income | 580,186,188 | |||
|
| |||
NET REALIZED AND UNREALIZED GAIN (LOSS) | ||||
Net realized gain (loss) from: |
| |||
Investments — unaffiliated | (818,440,258 | ) | ||
Investments — affiliated (Note 2) | 44,253 | |||
In-kind redemptions — unaffiliated | 238,286,576 | |||
Futures contracts | 35,180,144 | |||
Foreign currency transactions | (996,900 | ) | ||
Realized gain distributions from affiliated funds | 5,679 | |||
|
| |||
Net realized loss | (545,920,506 | ) | ||
|
| |||
Net change in unrealized appreciation/depreciation on: |
| |||
Investments — unaffiliatedc | 6,416,650,625 | |||
Investments — affiliated (Note 2) | 388,530 | |||
Futures contracts | (2,104,720 | ) | ||
Translation of assets and liabilities in foreign currencies | 484,662 | |||
|
| |||
Net change in unrealized appreciation/depreciation | 6,415,419,097 | |||
|
| |||
Net realized and unrealized gain | 5,869,498,591 | |||
|
| |||
NET INCREASE IN NET ASSETS RESULTING FROM OPERATIONS | $ | 6,449,684,779 | ||
|
| |||
| a | Net of foreign withholding tax of $96,548,344. |
| b | Net of securities lending income tax paid of $760,133. |
| c | Net of deferred foreign capital gains taxes of $9,808,442. |
See notes to financial statements.
FINANCIAL STATEMENTS | 47 |
Table of Contents
Statements of Changes in Net Assets
iSHARES®, INC.
| iShares Currency Hedged MSCI Emerging Markets ETF | iShares Edge MSCI Min Vol EM Currency Hedged ETF | |||||||||||||||
Year ended August 31, 2017 | Year ended August 31, 2016 | Year ended August 31, 2017 | Period from to | |||||||||||||
INCREASE (DECREASE) IN NET ASSETS | ||||||||||||||||
OPERATIONS: | ||||||||||||||||
Net investment income | $ | 4,008,451 | $ | 4,831,535 | $ | 183,745 | $ | 105,245 | ||||||||
Net realized loss | (12,482,715 | ) | (8,044,500 | ) | (137,662 | ) | (106,194 | ) | ||||||||
Net change in unrealized appreciation/depreciation | 64,687,519 | 15,786,871 | 487,310 | 298,282 | ||||||||||||
|
|
|
|
|
|
|
| |||||||||
Net increase in net assets resulting from operations | 56,213,255 | 12,573,906 | 533,393 | 297,333 | ||||||||||||
|
|
|
|
|
|
|
| |||||||||
DISTRIBUTIONS TO SHAREHOLDERS: | ||||||||||||||||
From net investment income | (3,977,750 | ) | (4,805,723 | ) | (184,054 | ) | (105,245 | ) | ||||||||
From net realized gain | — | (7,816,489 | ) | — | — | |||||||||||
Return of capital | — | — | — | (355 | ) | |||||||||||
|
|
|
|
|
|
|
| |||||||||
Total distributions to shareholders | (3,977,750 | ) | (12,622,212 | ) | (184,054 | ) | (105,600 | ) | ||||||||
|
|
|
|
|
|
|
| |||||||||
CAPITAL SHARE TRANSACTIONS: | ||||||||||||||||
Proceeds from shares sold | 209,783,628 | 60,096,742 | 3,586,153 | 5,985,059 | ||||||||||||
Cost of shares redeemed | (48,515,551 | ) | (91,659,549 | ) | (3,549,931 | ) | — | |||||||||
|
|
|
|
|
|
|
| |||||||||
Net increase (decrease) in net assets from capital share transactions | 161,268,077 | (31,562,807 | ) | 36,222 | 5,985,059 | |||||||||||
|
|
|
|
|
|
|
| |||||||||
INCREASE (DECREASE) IN NET ASSETS | 213,503,582 | (31,611,113 | ) | 385,561 | 6,176,792 | |||||||||||
NET ASSETS | ||||||||||||||||
Beginning of period | 180,253,792 | 211,864,905 | 6,176,792 | — | ||||||||||||
|
|
|
|
|
|
|
| |||||||||
End of period | $ | 393,757,374 | $ | 180,253,792 | $ | 6,562,353 | $ | 6,176,792 | ||||||||
|
|
|
|
|
|
|
| |||||||||
Undistributed net investment income included in net assets at end of period | $ | 56,519 | $ | 25,812 | $ | — | $ | — | ||||||||
|
|
|
|
|
|
|
| |||||||||
SHARES ISSUED AND REDEEMED | ||||||||||||||||
Shares sold | 9,300,000 | 2,850,000 | 150,000 | 250,000 | ||||||||||||
Shares redeemed | (2,200,000 | ) | (4,450,000 | ) | (150,000 | ) | — | |||||||||
|
|
|
|
|
|
|
| |||||||||
Net increase (decrease) in shares outstanding | 7,100,000 | (1,600,000 | ) | — | 250,000 | |||||||||||
|
|
|
|
|
|
|
| |||||||||
| a | Commencement of operations. |
See notes to financial statements.
| 48 | 2017 iSHARES ANNUAL REPORTTO SHAREHOLDERS |
Table of Contents
Statements of Changes in Net Assets (Continued)
iSHARES®, INC.
| iShares Edge MSCI Min Vol Emerging Markets ETF (Consolidated) | iShares MSCI Emerging Markets ETF (Consolidated) | |||||||||||||||
Year ended August 31, 2017 | Year ended August 31, 2016 | Year ended August 31, 2017 | Year ended August 31, 2016 | |||||||||||||
INCREASE (DECREASE) IN NET ASSETS | ||||||||||||||||
OPERATIONS: | ||||||||||||||||
Net investment income | $ | 94,250,679 | $ | 97,409,176 | $ | 580,186,188 | $ | 490,598,902 | ||||||||
Net realized loss | (128,677,692 | ) | (285,334,960 | ) | (545,920,506 | ) | (2,033,422,033 | ) | ||||||||
Net change in unrealized appreciation/depreciation | 391,424,155 | 474,631,130 | 6,415,419,097 | 3,716,580,146 | ||||||||||||
|
|
|
|
|
|
|
| |||||||||
Net increase in net assets resulting from operations | 356,997,142 | 286,705,346 | 6,449,684,779 | 2,173,757,015 | ||||||||||||
|
|
|
|
|
|
|
| |||||||||
DISTRIBUTIONS TO SHAREHOLDERS: | ||||||||||||||||
From net investment income | (84,793,898 | ) | (81,549,891 | ) | (442,844,825 | ) | (501,097,523 | ) | ||||||||
|
|
|
|
|
|
|
| |||||||||
Total distributions to shareholders | (84,793,898 | ) | (81,549,891 | ) | (442,844,825 | ) | (501,097,523 | ) | ||||||||
|
|
|
|
|
|
|
| |||||||||
CAPITAL SHARE TRANSACTIONS: | ||||||||||||||||
Proceeds from shares sold | 93,359,655 | 1,711,528,424 | 2,729,984,147 | 14,107,740,227 | ||||||||||||
Cost of shares redeemed | (707,175,671 | ) | — | (3,711,402,633 | ) | (5,914,796,140 | ) | |||||||||
|
|
|
|
|
|
|
| |||||||||
Net increase (decrease) in net assets from capital share transactions | (613,816,016 | ) | 1,711,528,424 | (981,418,486 | ) | 8,192,944,087 | ||||||||||
|
|
|
|
|
|
|
| |||||||||
INCREASE (DECREASE) IN NET ASSETS | (341,612,772 | ) | 1,916,683,879 | 5,025,421,468 | 9,865,603,579 | |||||||||||
NET ASSETS | ||||||||||||||||
Beginning of year | 4,379,040,867 | 2,462,356,988 | 30,866,468,577 | 21,000,864,998 | ||||||||||||
|
|
|
|
|
|
|
| |||||||||
End of year | $ | 4,037,428,095 | $ | 4,379,040,867 | $ | 35,891,890,045 | $ | 30,866,468,577 | ||||||||
|
|
|
|
|
|
|
| |||||||||
Undistributed net investment income included in net assets at end of year | $ | 43,163,304 | $ | 33,247,567 | $ | 233,610,496 | $ | 83,860,297 | ||||||||
|
|
|
|
|
|
|
| |||||||||
SHARES ISSUED AND REDEEMED | ||||||||||||||||
Shares sold | 1,700,000 | 33,700,000 | 65,700,000 | 405,900,000 | ||||||||||||
Shares redeemed | (14,100,000 | ) | — | (103,950,000 | ) | (187,200,000 | ) | |||||||||
|
|
|
|
|
|
|
| |||||||||
Net increase (decrease) in shares outstanding | (12,400,000 | ) | 33,700,000 | (38,250,000 | ) | 218,700,000 | ||||||||||
|
|
|
|
|
|
|
| |||||||||
See notes to financial statements.
FINANCIAL STATEMENTS | 49 |
Table of Contents
iSHARES®, INC.
(For a share outstanding throughout each period)
iShares Currency Hedged MSCI Emerging Markets ETF |
| Year ended Aug. 31, 2017 | Year ended Aug. 31, 2016 | Period from to | ||||||||||
Net asset value, beginning of period | $ | 21.72 | $ | 21.40 | $ | 24.44 | ||||||
|
|
|
|
|
| |||||||
Income from investment operations: | ||||||||||||
Net investment incomeb | 0.36 | 0.50 | 0.41 | |||||||||
Net realized and unrealized gain (loss)c | 3.83 | 1.08 | (2.80 | ) | ||||||||
|
|
|
|
|
| |||||||
Total from investment operations | 4.19 | 1.58 | (2.39 | ) | ||||||||
|
|
|
|
|
| |||||||
Less distributions from: | ||||||||||||
Net investment income | (0.34 | ) | (0.48 | ) | (0.65 | ) | ||||||
Net realized gain | — | (0.78 | ) | — | ||||||||
|
|
|
|
|
| |||||||
Total distributions | (0.34 | ) | (1.26 | ) | (0.65 | ) | ||||||
|
|
|
|
|
| |||||||
Net asset value, end of period | $ | 25.57 | $ | 21.72 | $ | 21.40 | ||||||
|
|
|
|
|
| |||||||
Total return | 19.55 | % | 7.84 | % | (10.01 | )%d | ||||||
|
|
|
|
|
| |||||||
Ratios/Supplemental data: | ||||||||||||
Net assets, end of period (000s) | $ | 393,757 | $ | 180,254 | $ | 211,865 | ||||||
Ratio of expenses to average net assetse,f | 0.00 | % | 0.00 | % | 0.02 | % | ||||||
Ratio of expenses to average net assets prior to waived feese,f | 0.78 | % | 0.78 | % | 0.78 | % | ||||||
Ratio of net investment income to average net assetse | 1.56 | % | 2.42 | % | 1.82 | % | ||||||
Portfolio turnover rateg,h | 4 | % | 11 | % | 7 | %d | ||||||
| a | Commencement of operations. |
| b | Based on average shares outstanding throughout each period. |
| c | The amounts reported for a share outstanding may not accord with the change in aggregate gains and losses in securities for the fiscal period due to the timing of capital share transactions in relation to the fluctuating market values of the Fund’s underlying securities. |
| d | Not annualized. |
| e | Annualized for periods of less than one year. |
| f | The Fund indirectly bears its proportionate share of fees and expenses incurred by the underlying fund in which the Fund is invested. This ratio does not include these indirect fees and expenses. |
| g | Portfolio turnover rates exclude portfolio securities received or delivered as a result of processing capital share transactions in Creation Units. |
| h | Portfolio turnover rates exclude the portfolio activity of the underlying fund in which the Fund is invested. See page 53 for the portfolio turnover rates of the underlying fund. |
See notes to financial statements.
| 50 | 2017 iSHARES ANNUAL REPORTTO SHAREHOLDERS |
Table of Contents
Financial Highlights (Continued)
iSHARES®, INC.
(For a share outstanding throughout each period)
iShares Edge MSCI Min Vol EM Currency Hedged ETF |
Year ended Aug. 31, 2017 | Period from to | |||||||
Net asset value, beginning of period | $ | 24.71 | $ | 24.50 | ||||
|
|
|
| |||||
Income from investment operations: | ||||||||
Net investment incomeb | 0.70 | 0.58 | ||||||
Net realized and unrealized gainc | 1.37 | 0.23 | ||||||
|
|
|
| |||||
Total from investment operations | 2.07 | 0.81 | ||||||
|
|
|
| |||||
Less distributions from: | ||||||||
Net investment income | (0.53 | ) | (0.60 | ) | ||||
Return of capital | — | (0.00 | )d | |||||
|
|
|
| |||||
Total distributions | (0.53 | ) | (0.60 | ) | ||||
|
|
|
| |||||
Net asset value, end of period | $ | 26.25 | $ | 24.71 | ||||
|
|
|
| |||||
Total return | 8.61 | % | 3.45 | %e | ||||
|
|
|
| |||||
Ratios/Supplemental data: | ||||||||
Net assets, end of period (000s) | $ | 6,562 | $ | 6,177 | ||||
Ratio of expenses to average net assetsf,g | 0.03 | % | 0.03 | % | ||||
Ratio of expenses to average net assets prior to waived feesf,g | 0.78 | % | 0.78 | % | ||||
Ratio of net investment income to average net assetsf | 2.85 | % | 2.88 | % | ||||
Portfolio turnover rateh,i | 8 | % | 8 | %e | ||||
| a | Commencement of operations. |
| b | Based on average shares outstanding throughout each period. |
| c | The amounts reported for a share outstanding may not accord with the change in aggregate gains and losses in securities for the fiscal period due to the timing of capital share transactions in relation to the fluctuating market values of the Fund’s underlying securities. |
| d | Rounds to less than 0.01%. |
| e | Not annualized. |
| f | Annualized for periods of less than one year. |
| g | The Fund indirectly bears its proportionate share of fees and expenses incurred by the underlying fund in which the Fund is invested. This ratio does not include these indirect fees and expenses. |
| h | Portfolio turnover rates exclude portfolio securities received or delivered as a result of processing capital share transactions in Creation Units. |
| i | Portfolio turnover rates exclude the portfolio activity of the underlying fund in which the Fund is invested. See page 52 for the portfolio turnover rates of the underlying fund. |
See notes to financial statements.
FINANCIAL HIGHLIGHTS | 51 |
Table of Contents
Financial Highlights (Continued)
iSHARES®, INC.
(For a share outstanding throughout each period)
iShares Edge MSCI Min Vol Emerging Markets ETF (Consolidated) | ||
| Year ended Aug. 31, 2017 | Year ended Aug. 31, 2016 | Year ended Aug. 31, 2015 | Year ended Aug. 31, 2014 | Year ended Aug. 31, 2013 | ||||||||||||||||
Net asset value, beginning of year | $ | 53.40 | $ | 50.98 | $ | 62.47 | $ | 55.56 | $ | 55.32 | ||||||||||
|
|
|
|
|
|
|
|
|
| |||||||||||
Income from investment operations: | ||||||||||||||||||||
Net investment incomea | 1.28 | 1.57 | 1.58 | 1.51 | 1.85 | |||||||||||||||
Net realized and unrealized gain (loss)b | 4.48 | 2.13 | (11.65 | ) | 6.94 | (0.60 | ) | |||||||||||||
|
|
|
|
|
|
|
|
|
| |||||||||||
Total from investment operations | 5.76 | 3.70 | (10.07 | ) | 8.45 | 1.25 | ||||||||||||||
|
|
|
|
|
|
|
|
|
| |||||||||||
Less distributions from: | ||||||||||||||||||||
Net investment income | (1.15 | ) | (1.28 | ) | (1.42 | ) | (1.54 | ) | (1.01 | ) | ||||||||||
|
|
|
|
|
|
|
|
|
| |||||||||||
Total distributions | (1.15 | ) | (1.28 | ) | (1.42 | ) | (1.54 | ) | (1.01 | ) | ||||||||||
|
|
|
|
|
|
|
|
|
| |||||||||||
Net asset value, end of year | $ | 58.01 | $ | 53.40 | $ | 50.98 | $ | 62.47 | $ | 55.56 | ||||||||||
|
|
|
|
|
|
|
|
|
| |||||||||||
Total return | 11.11 | % | 7.48 | % | (16.32 | )% | 15.44 | % | 2.22 | % | ||||||||||
|
|
|
|
|
|
|
|
|
| |||||||||||
Ratios/Supplemental data: | ||||||||||||||||||||
Net assets, end of year (000s) | $ | 4,037,428 | $ | 4,379,041 | $ | 2,462,357 | $ | 2,080,363 | $ | 2,455,727 | ||||||||||
Ratio of expenses to average net assets | 0.25 | % | 0.25 | % | 0.25 | % | 0.25 | % | 0.25 | % | ||||||||||
Ratio of expenses to average net assets prior to waived fees | 0.69 | % | 0.71 | % | 0.69 | % | 0.67 | % | 0.67 | % | ||||||||||
Ratio of net investment income to average net assets | 2.40 | % | 3.12 | % | 2.71 | % | 2.58 | % | 3.13 | % | ||||||||||
Portfolio turnover ratec | 23 | % | 23 | % | 28 | % | 34 | % | 23 | % | ||||||||||
| a | Based on average shares outstanding throughout each period. |
| b | The amounts reported for a share outstanding may not accord with the change in aggregate gains and losses in securities for the fiscal period due to the timing of capital share transactions in relation to the fluctuating market values of the Fund’s underlying securities. |
| c | Portfolio turnover rates exclude portfolio securities received or delivered in Creation Units but include portfolio transactions that are executed as a result of the Fund processing capital share transactions in Creation Units partially for cash in U.S. dollars. Excluding such cash transactions, the portfolio turnover rates for the years ended August 31, 2017, August 31, 2016, August 31, 2015, August 31, 2014 and August 31, 2013 were 22%, 23%, 24%, 26% and 23%, respectively. See Note 4. |
See notes to financial statements.
| 52 | 2017 iSHARES ANNUAL REPORTTO SHAREHOLDERS |
Table of Contents
Financial Highlights (Continued)
iSHARES®, INC.
(For a share outstanding throughout each period)
| iShares MSCI Emerging Markets ETF (Consolidated) | ||||||||||||||||||||
Year ended Aug. 31, 2017 | Year ended Aug. 31, 2016 | Year ended Aug. 31, 2015 | Year ended Aug. 31, 2014 | Year ended Aug. 31, 2013 | ||||||||||||||||
Net asset value, beginning of year | $ | 36.74 | $ | 33.79 | $ | 45.11 | $ | 38.44 | $ | 39.22 | ||||||||||
|
|
|
|
|
|
|
|
|
| |||||||||||
Income from investment operations: | ||||||||||||||||||||
Net investment incomea | 0.75 | 0.72 | 0.73 | 0.83 | 0.75 | |||||||||||||||
Net realized and unrealized gain (loss)b | 7.86 | 3.00 | (11.21 | ) | 6.55 | (0.76 | ) | |||||||||||||
|
|
|
|
|
|
|
|
|
| |||||||||||
Total from investment operations | 8.61 | 3.72 | (10.48 | ) | 7.38 | (0.01 | ) | |||||||||||||
|
|
|
|
|
|
|
|
|
| |||||||||||
Less distributions from: | ||||||||||||||||||||
Net investment income | (0.59 | ) | (0.77 | ) | (0.84 | ) | (0.71 | ) | (0.77 | ) | ||||||||||
|
|
|
|
|
|
|
|
|
| |||||||||||
Total distributions | (0.59 | ) | (0.77 | ) | (0.84 | ) | (0.71 | ) | (0.77 | ) | ||||||||||
|
|
|
|
|
|
|
|
|
| |||||||||||
Net asset value, end of year | $ | 44.76 | $ | 36.74 | $ | 33.79 | $ | 45.11 | $ | 38.44 | ||||||||||
|
|
|
|
|
|
|
|
|
| |||||||||||
Total return | 23.80 | % | 11.28 | % | (23.46 | )% | 19.34 | % | (0.08 | )% | ||||||||||
|
|
|
|
|
|
|
|
|
| |||||||||||
Ratios/Supplemental data: | ||||||||||||||||||||
Net assets, end of year (000s) | $ | 35,891,890 | $ | 30,866,469 | $ | 21,000,865 | $ | 44,336,401 | $ | 34,804,192 | ||||||||||
Ratio of expenses to average net assets | 0.69 | % | 0.72 | % | 0.69 | % | 0.67 | % | 0.67 | % | ||||||||||
Ratio of expenses to average net assets prior to waived fees | 0.69 | % | 0.72 | % | 0.69 | % | 0.68 | % | 0.67 | % | ||||||||||
Ratio of expenses to average net assets excluding professional fees for foreign withholding tax claims (Note 10) | 0.69 | % | n/a | n/a | n/a | n/a | ||||||||||||||
Ratio of net investment income to average net assets | 1.92 | % | 2.15 | % | 1.79 | % | 1.98 | % | 1.78 | % | ||||||||||
Portfolio turnover ratec | 9 | % | 23 | % | 10 | % | 22 | % | 24 | % | ||||||||||
| a | Based on average shares outstanding throughout each period. |
| b | The amounts reported for a share outstanding may not accord with the change in aggregate gains and losses in securities for the fiscal period due to the timing of capital share transactions in relation to the fluctuating market values of the Fund’s underlying securities. |
| c | Portfolio turnover rates include portfolio transactions that are executed as a result of the Fund processing capital share transactions in Creation Units solely for cash in U.S. dollars. Excluding such transactions, the portfolio turnover rates for the years ended August 31, 2017, August 31, 2016, August 31, 2015, August 31, 2014 and August 31, 2013, were 4%, 10%, 7%, 7%, and 9%, respectively. See Note 4. |
See notes to financial statements.
FINANCIAL HIGHLIGHTS | 53 |
Table of Contents
iSHARES®, INC.
iShares, Inc. (the “Company”) is registered under the Investment Company Act of 1940, as amended (the “1940 Act”), as an open-end management investment company. The Company was incorporated under the laws of the State of Maryland on September 1, 1994 pursuant to Articles of Incorporation as subsequently amended and restated.
These financial statements relate only to the following funds (each, a “Fund,” and collectively, the “Funds”):
| iShares ETF | Diversification Classification | |||
Currency Hedged MSCI Emerging Markets | Non-diversified | |||
Edge MSCI Min Vol EM Currency Hedged | Non-diversified | |||
Edge MSCI Min Vol Emerging Markets | Diversified | |||
MSCI Emerging Markets | Diversified | |||
The investment objective of each Fund is to seek investment results that correspond generally to the price and yield performance, before fees and expenses, of its underlying index. The investment adviser uses a “passive” or index approach to try to achieve each Fund’s investment objective. Currently each currency hedged fund seeks to achieve its investment objective by investing a substantial portion of its assets in an iShares fund (an “underlying fund”). The financial statements and schedules of investments for the underlying funds are included in this report and should be read in conjunction with the financial statements of the currency hedged funds.
Each of the iShares Edge MSCI Min Vol Emerging Markets ETF and iShares MSCI Emerging Markets ETF carries out its investment strategies associated with investment in Indian securities by investing in a wholly-owned subsidiary in the Republic of Mauritius (each, a “Subsidiary”), which in turn invests in Indian securities included in the underlying index. The investment adviser of each Fund also serves as the investment adviser to each Subsidiary. Through this investment structure, each Fund expects to obtain certain benefits under a current tax treaty between Mauritius and India. The accompanying consolidated financial statements for each Fund include the accounts of its Subsidiary. Intercompany accounts and transactions, if any, have been eliminated.
Pursuant to the Company’s organizational documents, the Funds’ officers and directors are indemnified against certain liabilities that may arise out of the performance of their duties to the Funds. Additionally, in the normal course of business, the Funds enter into contracts with service providers that contain general indemnification clauses. The Funds’ maximum exposure under these arrangements is unknown as this would involve future claims that may be made against the Funds that have not yet occurred.
| 1. | SIGNIFICANT ACCOUNTING POLICIES |
The following significant accounting policies are consistently followed by each Fund in the preparation of its financial statements in conformity with accounting principles generally accepted in the United States of America (“U.S. GAAP”). The preparation of financial statements in conformity with U.S. GAAP requires management to make certain estimates and assumptions that affect the reported amounts of assets and liabilities and disclosures of contingent assets and liabilities at the date of the financial statements and the reported amounts of revenue and expenses during the reporting period. Actual results could differ from those estimates. Each Fund is considered an investment company under U.S. GAAP and follows the accounting and reporting guidance applicable to investment companies.
SECURITY VALUATION
Each Fund’s investments are valued at fair value each day that the Fund’s listing exchange is open and, for financial reporting purposes, as of the report date should the reporting period end on a day that the Fund’s listing exchange is not open. U.S. GAAP
| 54 | 2017 iSHARES ANNUAL REPORTTO SHAREHOLDERS |
Table of Contents
Notes to Financial Statements (Continued)
iSHARES®, INC.
defines fair value as the price a fund would receive to sell an asset or pay to transfer a liability in an orderly transaction between market participants at the measurement date. The BlackRock Global Valuation Methodologies Committee (the “Global Valuation Committee”) provides oversight of the valuation of investments for the Funds. The investments of each Fund are valued pursuant to policies and procedures developed by the Global Valuation Committee and approved by the Board of Directors of the Company (the “Board”).
| • | Equity investments traded on a recognized securities exchange are valued at that day’s last reported trade price or the official closing price, as applicable, on the exchange where the stock is primarily traded. Equity investments traded on a recognized exchange for which there were no sales on that day are valued at the last traded price. |
| • | Exchange-traded funds and closed-end funds traded on a recognized securities exchange are valued at that day’s last reported trade price or the official closing price, as applicable, on the exchange where the fund is primarily traded. Funds traded on a recognized exchange for which there were no sales on that day are valued at the last traded price. |
| • | Open-end U.S. mutual funds (including money market funds) are valued at that day’s published net asset value (“NAV”). |
| • | Futures contract notional values are determined based on that day’s last reported settlement price on the exchange where the contract is traded. |
| • | Forward currency contracts are valued based on that day’s prevailing forward exchange rate for the underlying currencies. Interpolated forward exchange rates are used for contracts with interim settlement dates for which quotations are not available. |
In the event that application of these methods of valuation results in a price for an investment which is deemed not to be representative of the fair value of such investment or if a price is not available, the investment will be valued by the Global Valuation Committee, in accordance with policies approved by the Board. The fair valuation approaches that may be utilized by the Global Valuation Committee to determine fair value include market approach, income approach and the cost approach. The valuation techniques used under these approaches take into consideration inputs that include but are not limited to (i) attributes specific to the investment; (ii) the principal market for the investment; (iii) the customary participants in the principal market for the investment; (iv) data assumptions by market participants for the investment, if reasonably available; (v) quoted prices for similar investments in active markets; and (vi) other inputs, such as future cash flows, interest rates, yield curves, volatilities, prepayment speeds, loss severities, credit risks and/or default rates. Valuations based on such inputs are reported to the Board on a quarterly basis.
The Global Valuation Committee employs various methods for calibrating valuation approaches for investments where an active market does not exist, including regular due diligence of the Company’s pricing vendors, a regular review of key inputs and assumptions, transactional back-testing or disposition analysis to compare unrealized gains and losses to realized gains and losses, reviews of missing or stale prices, reviews of large movements in market values, and reviews of market related activity.
Fair value pricing could result in a difference between the prices used to calculate a Fund’s NAV and the prices used by the Fund’s underlying index, which in turn could result in a difference between the Fund’s performance and the performance of the Fund’s underlying index.
Various inputs are used in determining the fair value of financial instruments. Inputs may be based on independent market data (“observable inputs”) or they may be internally developed (“unobservable inputs”). These inputs to valuation techniques are categorized into a fair value hierarchy consisting of three broad levels for financial reporting purposes as follows:
| • | Level 1 — Unadjusted quoted prices in active markets for identical assets or liabilities; |
NOTESTO FINANCIAL STATEMENTS | 55 |
Table of Contents
Notes to Financial Statements (Continued)
iSHARES®, INC.
| • | Level 2 — Inputs other than quoted prices included within Level 1 that are observable for the asset or liability either directly or indirectly, including quoted prices for similar assets or liabilities in active markets, quoted prices for identical or similar assets or liabilities in markets that are not considered to be active, inputs other than quoted prices that are observable for the asset or liability (such as exchange rates, financing terms, interest rates, yield curves, volatilities, prepayment speeds, loss severities, credit risks and default rates) or other market-corroborated inputs; and |
| • | Level 3 — Unobservable inputs for the asset or liability based on the best information available in the circumstances, to the extent observable inputs are not available, including the Global Valuation Committee’s assumptions used in determining the fair value of investments. |
The hierarchy gives the highest priority to unadjusted quoted prices in active markets for identical assets or liabilities (Level 1 measurements) and the lowest priority to unobservable inputs (Level 3 measurements). Accordingly, the degree of judgement exercised in determining fair value is greatest for instruments categorized in Level 3. The inputs used to measure fair value may fall into different levels of the fair value hierarchy. In such cases, for disclosure purposes, the fair value hierarchy classification is determined based on the lowest level input that is significant to the fair value measurement in its entirety. The fair value hierarchy for each Fund’s investments is included in its schedule of investments.
Changes in valuation techniques may result in transfers in or out of an assigned level within the fair value hierarchy. In accordance with the Company’s policy, transfers between different levels of the fair value hierarchy are deemed to have occurred as of the beginning of the reporting period. The categorization of values determined for financial instruments are based on the pricing transparency of the financial instruments and are not necessarily an indication of the risks associated with investing in those securities.
SECURITY TRANSACTIONS AND INCOME RECOGNITION
Security transactions are accounted for on trade date. Realized gains and losses on investment transactions are determined using the specific identification method. Dividend income and capital gain distributions, if any, are recognized on the ex-dividend date, net of any foreign taxes withheld at source. Any taxes withheld that are reclaimable from foreign tax authorities as of August 31, 2017 are reflected in tax reclaims receivable. Upon notification from issuers, some of the dividend income received from a real estate investment trust may be re-designated as a reduction of cost of the related investment and/or realized gain. Non-cash dividends received, if any, are recognized on the ex-dividend date and recorded as non-cash dividend income at fair value. Distributions received by the Funds may include a return of capital that is estimated by management. Such amounts are recorded as a reduction of the cost of investments or reclassified to capital gains. Interest income is accrued daily.
FOREIGN CURRENCY TRANSLATION
The accounting records of the Funds are maintained in U.S. dollars. Foreign currencies, as well as investment securities and other assets and liabilities denominated in foreign currencies, are translated into U.S. dollars using exchange rates deemed appropriate by the investment adviser. Purchases and sales of securities, income receipts and expense payments are translated into U.S. dollars on the respective dates of such transactions.
Each Fund does not isolate the effect of fluctuations in foreign exchange rates from the effect of fluctuations in the market prices of securities. Such fluctuations are reflected by the Funds as a component of realized and unrealized gains and losses from investments for financial reporting purposes. Each Fund reports realized currency gains (losses) on foreign currency related transactions as components of net realized gain (loss) for financial reporting purposes, whereas such components are generally treated as ordinary income for U.S. federal income tax purposes.
| 56 | 2017 iSHARES ANNUAL REPORTTO SHAREHOLDERS |
Table of Contents
Notes to Financial Statements (Continued)
iSHARES®, INC.
However, the iShares Currency Hedged MSCI Emerging Markets ETF and iShares Edge MSCI Min Vol EM Currency Hedged ETF elected to treat realized gains (losses) from certain foreign currency contracts as capital gain (loss) for U.S. federal income tax purposes.
FOREIGN TAXES
The Funds may be subject to foreign taxes (a portion of which may be reclaimable) on income, stock dividends, capital gains on investments, or certain foreign currency transactions. All foreign taxes are recorded in accordance with the applicable foreign tax regulations and rates that exist in the foreign jurisdictions in which the Funds invest. These foreign taxes, if any, are paid by the Funds and are reflected in their statements of operations as follows: foreign taxes withheld at source are presented as a reduction of income, foreign taxes on securities lending income are presented as a reduction of securities lending income, foreign taxes on stock dividends are presented as “other foreign taxes”, and foreign taxes on capital gains from sales of investments and foreign taxes on foreign currency transactions are included in their respective net realized gain (loss) categories. Foreign taxes payable or deferred as of August 31, 2017, if any, are disclosed in the Funds’ statements of assets and liabilities.
Each of the iShares Edge MSCI Min Vol Emerging Markets ETF and iShares MSCI Emerging Markets ETF conducts its investment activities in India through its Subsidiary and expects to obtain benefits under the Double Tax Avoidance Agreement (“DTAA”) between India and Mauritius. In order to be eligible to claim benefits under the DTAA, each Subsidiary must, on an annual basis, satisfy certain tests and conditions, including the establishment and maintenance of valid tax residence in Mauritius and related requirements. Each Fund has obtained a current tax residence certificate issued by the Mauritian Revenue Authorities.
Based upon current interpretation and practice of the current tax laws in India and Mauritius and the DTAA, each Subsidiary is subject to tax in Mauritius on its net income at the rate of 15%. However, a system of tax credits effectively reduces the Mauritius income tax rate to a maximum of 3%. Taxes on income, if any, are paid by the Subsidiaries and are disclosed in the consolidated statements of operations. Any dividends paid by a Subsidiary to its Fund are not subject to tax in Mauritius. Each Subsidiary is currently exempt from tax in Mauritius on any gains from the sale of securities.
The DTAA provides that capital gains will be taxable in India with respect to the sale of shares acquired on or after April 1, 2017. Capital gains arising from shares acquired before April 1, 2017, regardless of when they are sold, will continue to be exempt from taxation under the amended DTAA, assuming requirements for eligibility under the DTAA are satisfied.
DISTRIBUTIONS TO SHAREHOLDERS
Dividends and distributions paid by each Fund are recorded on the ex-dividend dates. Distributions are determined on a tax basis and may differ from net investment income and net realized capital gains for financial reporting purposes. Dividends and distributions are paid in U.S. dollars and cannot be automatically reinvested in additional shares of the Funds.
LOANS OF PORTFOLIO SECURITIES
Each Fund may lend its investment securities to approved borrowers, such as brokers, dealers and other financial institutions. The borrower pledges and maintains with the Fund collateral consisting of cash, an irrevocable letter of credit issued by an approved bank, or securities issued or guaranteed by the U.S. government. The initial collateral received by each Fund is required to have a value of at least 102% of the current value of the loaned securities for securities traded on U.S. exchanges and a value of at least 105% for all other securities. The collateral is maintained thereafter at a value equal to at least 100% of the current value of the securities on loan. The market value of the loaned securities is determined at the close of each business day of the Funds. Any additional required collateral is delivered to the Funds and any excess collateral is returned by the Funds on
NOTESTO FINANCIAL STATEMENTS | 57 |
Table of Contents
Notes to Financial Statements (Continued)
iSHARES®, INC.
the next business day. During the term of the loan, each Fund is entitled to all distributions made on or in respect of the loaned securities but does not receive interest income on securities received as collateral. Loans of securities are terminable at any time and the borrower, after notice, is required to return borrowed securities within the standard time period for settlement of securities transactions.
Cash received as collateral for securities on loan may be reinvested in certain short-term instruments either directly on behalf of a fund or through one or more joint accounts or money market funds, including those managed by BlackRock Fund Advisors (“BFA”), the Funds’ investment adviser, or its affiliates. As of August 31, 2017, any securities on loan were collateralized by cash and/or U.S. government obligations. Cash collateral received was invested in money market funds managed by BFA and is disclosed in the schedules of investments. Any non-cash collateral received cannot be sold, re-invested or pledged by the Fund, except in the event of borrower default. The securities on loan for each Fund are also disclosed in its schedule of investments. The total value of any securities on loan as of August 31, 2017 and the total value of the related cash collateral are disclosed in the statements of assets and liabilities. Income earned by the Funds from securities lending is disclosed in the statements of operations.
The risks of securities lending include the risk that the borrower may not provide additional collateral when required or may not return the securities when due. To mitigate these risks, the Funds benefit from a borrower default indemnity provided by BlackRock, Inc. (“BlackRock”). BlackRock’s indemnity allows for full replacement of securities loaned if the collateral received does not cover the value of the securities loaned in the event of borrower default. Each Fund could incur a loss if the value of an investment purchased with cash collateral falls below the value of the loaned securities or if the value of an investment purchased with cash collateral falls below the value of the original cash collateral received.
Securities lending transactions are entered into by the Funds under Master Securities Lending Agreements (“MSLA”) which provide the right, in the event of default (including bankruptcy or insolvency) for the non-defaulting party to liquidate the collateral and calculate a net exposure to the defaulting party or request additional collateral. In the event that a borrower defaults, a Fund, as lender, would offset the market value of the collateral received against the market value of the securities loaned. The value of the collateral is typically greater than that of the market value of the securities loaned, leaving the lender with a net amount payable to the defaulting party. However, bankruptcy or insolvency laws of a particular jurisdiction may impose restrictions on or prohibitions against such a right of offset in the event of an MSLA counterparty’s bankruptcy or insolvency. Under the MSLA, the borrower can resell or re-pledge the loaned securities, and a Fund can reinvest cash collateral, or, upon an event of default, resell or re-pledge the collateral.
| 58 | 2017 iSHARES ANNUAL REPORTTO SHAREHOLDERS |
Table of Contents
Notes to Financial Statements (Continued)
iSHARES®, INC.
The following table is a summary of securities lending agreements which are subject to offset under an MSLA as of August 31, 2017:
| iShares ETF and Counterparty | Market Value of Securities on Loan | Cash Collateral Received a | Net Amount | |||||||||
Edge MSCI Min Vol Emerging Markets | ||||||||||||
Citigroup Global Markets Inc. | $ | 12,559,191 | $ | 12,559,191 | $ | — | ||||||
Credit Suisse Securities (USA) LLC | 8,853,192 | 8,853,192 | — | |||||||||
Deutsche Bank AG | 104,604 | 104,604 | — | |||||||||
Deutsche Bank Securities Inc. | 2,012,427 | 2,012,427 | — | |||||||||
Goldman Sachs & Co. | 10,263,237 | 10,263,237 | — | |||||||||
HSBC Bank PLC | 2,201,386 | 2,201,386 | — | |||||||||
Jefferies LLC | 279,054 | 279,054 | — | |||||||||
Morgan Stanley & Co. International PLC | 15,350,387 | 15,350,387 | — | |||||||||
Morgan Stanley & Co. LLC | 26,441,886 | 26,441,886 | — | |||||||||
State Street Bank & Trust Company | 58,877 | 58,877 | — | |||||||||
UBS AG | 384,775 | 384,775 | — | |||||||||
|
|
|
|
|
| |||||||
| $ | 78,509,016 | $ | 78,509,016 | $ | — | |||||||
|
|
|
|
|
| |||||||
MSCI Emerging Markets | ||||||||||||
Barclays Capital Inc. | $ | 23,738 | $ | 23,738 | $ | — | ||||||
BMO Capital Markets | 8,947,654 | 8,947,654 | — | |||||||||
BNP Paribas New York Branch | 105,443,024 | 105,443,024 | — | |||||||||
Citigroup Global Markets Inc. | 69,243,091 | 69,243,091 | — | |||||||||
Citigroup Global Markets Ltd. | 10,827,605 | 10,827,605 | — | |||||||||
Credit Suisse Securities (Europe) Ltd. | 75,436,299 | 75,436,299 | — | |||||||||
Credit Suisse Securities (USA) LLC | 33,924,615 | 33,924,615 | — | |||||||||
Deutsche Bank AG | 2,016,081 | 2,016,081 | — | |||||||||
Deutsche Bank Securities Inc. | 43,454,673 | 43,454,673 | — | |||||||||
Goldman Sachs & Co. | 558,941,858 | 558,941,858 | — | |||||||||
Goldman Sachs International | 19,133,419 | 19,133,419 | — | |||||||||
HSBC Bank PLC | 2,051,771 | 2,051,771 | — | |||||||||
Jefferies LLC | 37,319 | 37,319 | — | |||||||||
JPMorgan Securities LLC | 566,936,659 | 566,936,659 | — | |||||||||
JPMorgan Securities PLC | 34,528,479 | 34,528,479 | — | |||||||||
Macquarie Bank Limited | 885,801 | 885,801 | — | |||||||||
Merrill Lynch, Pierce, Fenner & Smith | 118,867,043 | 118,867,043 | — | |||||||||
Morgan Stanley & Co. International PLC | 105,350,203 | 105,350,203 | — | |||||||||
Morgan Stanley & Co. LLC | 223,781,551 | 223,781,551 | — | |||||||||
Morgan Stanley & Co. LLC (U.S. Equity Securities Lending) | 12,565,813 | 12,565,813 | — | |||||||||
National Financial Services LLC | 46,053,667 | 46,053,667 | — | |||||||||
State Street Bank & Trust Company | 42,036,717 | 42,036,717 | — | |||||||||
UBS AG | 8,665,943 | 8,665,943 | — | |||||||||
UBS Ltd. | 14,954,353 | 14,954,353 | — | |||||||||
UBS Securities LLC | 4,512,596 | 4,512,596 | — | |||||||||
|
|
|
|
|
| |||||||
| $ | 2,108,619,972 | $ | 2,108,619,972 | $ | — | |||||||
|
|
|
|
|
| |||||||
| a | Collateral received in excess of the market value of securities on loan is not presented in this table. The total cash collateral received by each Fund is disclosed in the Fund’s consolidated statement of assets and liabilities. |
NOTESTO FINANCIAL STATEMENTS | 59 |
Table of Contents
Notes to Financial Statements (Continued)
iSHARES®, INC.
| 2. | INVESTMENT ADVISORY AGREEMENT AND OTHER TRANSACTIONS WITH AFFILIATES |
Pursuant to an Investment Advisory Agreement with the Company, BFA manages the investment of each Fund’s assets. BFA is a California corporation indirectly owned by BlackRock. Under the Investment Advisory Agreement, BFA is responsible for substantially all expenses of the Funds, except (i) interest and taxes; (ii) brokerage commissions and other expenses connected with the execution of portfolio transactions; (iii) distribution fees; (iv) the advisory fee payable to BFA; and (v) litigation expenses and any extraordinary expenses (in each case as determined by a majority of the independent directors).
Each Subsidiary has entered into a separate contract with BFA under which BFA provides investment advisory services to the Subsidiary but does not receive separate compensation from the Subsidiary for providing it with such services. Each Subsidiary has also entered into separate arrangements that provide for the provision of other services to the Subsidiary (including administrative, custody, transfer agency and other services), and BFA pays the costs and expenses related to the provision of those services.
For its investment advisory services to the iShares Currency Hedged MSCI Emerging Markets ETF, BFA is entitled to an annual investment advisory fee of 0.78%, accrued daily and paid monthly by the Fund, based on the average daily net assets of the Fund. In addition, the Fund may incur its pro rata share of fees and expenses attributable to its investments in other investment companies (“acquired fund fees and expenses”). BFA has contractually agreed to reduce the investment advisory fee for the Fund through December 31, 2020 so that the investment advisory fee is equal to the acquired fund fees and expenses attributable to the Fund’s investment in the iShares MSCI Emerging Markets ETF (“EEM”), after taking into account any fee waivers by EEM.
For its investment advisory services to the iShares Edge MSCI Min Vol EM Currency Hedged ETF, BFA is entitled to an annual investment advisory fee of 0.78%, accrued daily and paid monthly by the Fund, based on the average daily net assets of the Fund. In addition, the Fund may incur acquired fund fees and expenses. BFA has contractually agreed reduce the investment advisory fee for the Fund through December 31, 2020 so that the investment advisory fee is equal to the acquired fund fees and expenses attributable to the Fund’s investment in the iShares Edge MSCI MinVol Emerging Markets ETF (“EEMV”), after taking into account any fee waivers by EEMV, plus 0.03%.
For its investment advisory services to each of the iShares Edge MSCI Min Vol Emerging Markets ETF and iShares MSCI Emerging Markets ETF, BFA is entitled to an annual investment advisory fee, accrued daily and paid monthly by the Funds, based on each Fund’s allocable portion of the aggregate of the average daily net assets of the Fund and certain other iShares funds, as follows:
| Investment Advisory Fee | Aggregate Average Daily Net Assets | ||||
| 0.75 | % | First $14 billion | |||
| 0.68 | Over $14 billion, up to and including $28 billion | ||||
| 0.61 | Over $28 billion, up to and including $42 billion | ||||
| 0.54 | Over $42 billion, up to and including $56 billion | ||||
| 0.47 | Over $56 billion, up to and including $70 billion | ||||
| 0.41 | Over $70 billion, up to and including $84 billion | ||||
| 0.35 | Over $84 billion | ||||
The total of the investment advisory fee and any other fund expenses are a fund’s total annual operating expenses. For the iShares Edge MSCI Min Vol Emerging Markets ETF, BFA has contractually agreed to waive a portion of its investment advisory fees for the Fund through December 31, 2023 in order to limit total annual operating expenses to 0.25% of average daily net assets.
| 60 | 2017 iSHARES ANNUAL REPORTTO SHAREHOLDERS |
Table of Contents
Notes to Financial Statements (Continued)
iSHARES®, INC.
The U.S. Securities and Exchange Commission has issued an exemptive order which permits BlackRock Institutional Trust Company, N.A. (“BTC”), an affiliate of BFA, to serve as securities lending agent for the Funds, subject to applicable conditions. As securities lending agent, BTC bears all operational costs directly related to securities lending. Each Fund is responsible for fees in connection with the investment of cash collateral received for securities on loan in a money market fund managed by BFA, however, BTC has agreed to reduce the amount of securities lending income it receives in order to effectively limit the collateral investment fees each Fund bears to an annual rate of 0.04% (the “collateral investment fees”). Securities lending income is equal to the total of income earned from the reinvestment of cash collateral, net of fees and other payments to and from borrowers of securities, and less the collateral investment fees. The Funds retain a portion of securities lending income and remit the remaining portion to BTC as compensation for its services as securities lending agent.
Pursuant to a securities lending agreement, each Fund retains 80% of securities lending income and the amount retained can never be less than 70% of the total of securities lending income plus the collateral investment fees. In addition, commencing the business day following the date that the aggregate securities lending income plus the collateral investment fees generated across all 1940 Act iShares exchange-traded funds (the “iShares ETF Complex”) in a given calendar year exceeds the aggregate securities lending income generated across the iShares ETF Complex in the calendar year 2013, each Fund, pursuant to a securities lending agreement, will retain for the remainder of that calendar year 85% of securities lending income and the amount retained can never be less than 70% of the total of securities lending income plus the collateral investment fees.
For the year ended August 31, 2017, the total of securities lending agent services and collateral investment fees paid were as follows:
| iShares ETF | Fees Paid to BTC | |||
Currency Hedged MSCI Emerging Markets | $ | 121,507 | ||
Edge MSCI Min Vol Emerging Markets | 637,057 | |||
MSCI Emerging Markets | 4,820,576 | |||
For the year ended August 31, 2017, BTC, the Funds’ securities lending agent, has agreed to voluntarily reimburse the iShares MSCI Emerging Markets ETF in the amount of $137,396, related to the foreign tax on the securities lending income. Such reimbursement is included in “Securities lending income – affiliated – net” in the Fund’s consolidated statement of operations.
BlackRock Investments, LLC, an affiliate of BFA, is the distributor for each Fund. Pursuant to the distribution agreement, BFA is responsible for any fees or expenses for distribution services provided to the Funds.
Cross trading is the buying or selling of portfolio securities between funds to which BFA (or an affiliate) serves as investment adviser. At its regularly scheduled quarterly meetings, the Board reviews such transactions as of the most recent calendar quarter for compliance with the requirements and restrictions set forth by Rule 17a-7.
For the year ended August 31, 2017, transactions executed by the Funds pursuant to Rule 17a-7 under the 1940 Act were as follows:
| iShares ETF | Purchases | Sales | ||||||
Edge MSCI Min Vol Emerging Markets | $ | 47,525,034 | $ | 24,590,518 | ||||
MSCI Emerging Markets | 112,122,910 | 49,073,113 | ||||||
Each Fund may invest its positive cash balances in certain money market funds managed by BFA or an affiliate. The income earned on these temporary cash investments is included in “Dividends–affiliated” in the statements of operations.
NOTESTO FINANCIAL STATEMENTS | 61 |
Table of Contents
Notes to Financial Statements (Continued)
iSHARES®, INC.
The PNC Financial Services Group, Inc. is the largest stockholder of BlackRock and is considered to be an affiliate of the Funds for 1940 Act purposes.
Certain directors and officers of the Company are also officers of BTC and/or BFA.
| 3. | INVESTMENT PORTFOLIO TRANSACTIONS |
Purchases and sales of investments (excluding in-kind transactions and short-term investments) for the year ended August 31, 2017 were as follows:
| iShares ETF | Purchases | Sales | ||||||
Currency Hedged MSCI Emerging Markets | $ | 11,046,895 | $ | 24,835,252 | ||||
Edge MSCI Min Vol EM Currency Hedged | 492,369 | 624,218 | ||||||
Edge MSCI Min Vol Emerging Markets | 915,304,801 | 1,232,237,332 | ||||||
MSCI Emerging Markets | 2,860,426,712 | 3,055,379,044 | ||||||
In-kind transactions (see Note 4) for the year ended August 31, 2017 were as follows:
| iShares ETF | In-kind Purchases | In-kind Sales | ||||||
Currency Hedged MSCI Emerging Markets | $ | 209,617,702 | $ | 48,592,573 | ||||
Edge MSCI Min Vol EM Currency Hedged | 3,595,035 | 3,561,578 | ||||||
Edge MSCI Min Vol Emerging Markets | 42,098,039 | 322,840,040 | ||||||
MSCI Emerging Markets | 1,256,372,161 | 1,808,980,515 | ||||||
| 4. | CAPITAL SHARE TRANSACTIONS |
Capital shares are issued and redeemed by each Fund only in aggregations of a specified number of shares or multiples thereof (“Creation Units”) at NAV. Except when aggregated in Creation Units, shares of each Fund are not redeemable. Transactions in capital shares for each Fund are disclosed in detail in the statements of changes in net assets.
The consideration for the purchase of Creation Units of a fund in the Company generally consists of the in-kind deposit of a designated portfolio of securities and a specified amount of cash. Certain funds in the Company may be offered in Creation Units solely or partially for cash in U.S. dollars. Investors purchasing and redeeming Creation Units may pay a purchase transaction fee and a redemption transaction fee directly to State Street Bank and Trust Company, the Company’s administrator, to offset transfer and other transaction costs associated with the issuance and redemption of Creation Units, including Creation Units for cash. Investors transacting in Creation Units for cash may also pay an additional variable charge to compensate the relevant fund for certain transaction costs (i.e., stamp taxes, taxes on currency or other financial transactions, and brokerage costs) and market impact expenses relating to investing in portfolio securities. Such variable charges, if any, are included in “Proceeds from shares sold” in the statements of changes in net assets.
From time to time, settlement of securities related to in-kind contributions or in-kind redemptions may be delayed. In such cases, securities related to in-kind contributions are reflected as “Due from custodian” and securities related to in-kind redemptions are reflected as “Securities related to in-kind transactions” in the statements of assets and liabilities.
| 62 | 2017 iSHARES ANNUAL REPORTTO SHAREHOLDERS |
Table of Contents
Notes to Financial Statements (Continued)
iSHARES®, INC.
| 5. | FUTURES CONTRACTS |
Each Fund’s use of futures contracts is generally limited to cash equitization. This involves the use of available cash to invest in index futures contracts in order to gain exposure to the equity markets represented in or by the Fund’s underlying index and is intended to allow the Fund to better track its underlying index. Futures contracts are standardized, exchange-traded agreements to buy or sell a financial instrument at a set price on a future date. Upon entering into a futures contract, a fund is required to pledge to the executing broker which holds segregated from its own assets, an amount of cash, U.S. government securities or other high-quality debt and equity securities equal to the minimum initial margin requirements of the exchange on which the contract is traded.
Pursuant to the contract, the fund agrees to receive from or pay to the broker an amount of cash equal to the daily fluctuation in notional value of the contract. Such receipts or payments are known as margin variation and are recorded by the fund as unrealized appreciation or depreciation. When the contract is closed, the fund records a realized gain or loss equal to the difference between the notional value of the contract at the time it was opened and the notional value at the time it was closed. Losses may arise if the notional value of a futures contract decreases due to an unfavorable change in the market rates or values of the underlying instrument during the term of the contract or if the counterparty does not perform under the contract. The use of futures contracts also involves the risk of an imperfect correlation in the movements in the price of futures contracts and the assets underlying such contracts.
The following table shows the value of futures contracts held by the iShares MSCI Emerging Markets ETF as of August 31, 2017 and the related locations in the consolidated statements of assets and liabilities, presented by risk exposure category:
| Assets | ||||
Equity contracts: | ||||
Variation margin / Net assets consist of – net unrealized appreciation (depreciation) | $ | 7,082,911 | a | |
|
| |||
| a | Represents cumulative appreciation of futures contracts as reported in the consolidated schedule of investments. Only current day’s variation margin is reported separately within the consolidated statement of assets and liabilities. |
The following table shows the realized and unrealized gains (losses) on futures contracts held by the iShares MSCI Emerging Markets ETF during the year ended August 31, 2017 and the related locations in the consolidated statements of operations, presented by risk exposure category:
| Net Realized Gain (Loss) | Net Change in Unrealized | |||||||
Equity contracts: | ||||||||
Futures contracts | $ | 35,180,144 | $ | (2,104,720 | ) | |||
|
|
|
| |||||
The following table shows the average quarter-end balances of open futures contracts for the iShares MSCI Emerging Markets ETF for the year ended August 31, 2017:
Average value of contracts purchased | $ | 99,315,175 | ||
|
| |||
NOTESTO FINANCIAL STATEMENTS | 63 |
Table of Contents
Notes to Financial Statements (Continued)
iSHARES®, INC.
| 6. | FORWARD CURRENCY CONTRACTS |
Each currency-hedged fund uses forward currency contracts to hedge the currency exposure of non-U.S. dollar-denominated securities held by the Fund or its underlying fund. A forward currency contract is an obligation to purchase or sell a currency against another currency at a specified future date at an agreed upon price and quantity. Forward currency contracts are traded over-the-counter (“OTC”) and not on an organized exchange.
The contract is marked-to-market daily and the change in market value is recorded as unrealized appreciation or depreciation. When the contract is closed, a realized gain or loss equal to the difference between the value at the time it was opened and the value at the time it was closed is recorded. Non-deliverable forward currency contracts (“NDFs”) are settled with the counterparty in cash without the delivery of foreign currency. Losses may arise if there are unfavorable movements in the value of a foreign currency relative to the U.S. dollar or if the counterparties do not meet the terms of the agreement. A fund’s use of forward currency contracts also involves the risks of imperfect correlation between the value of its currency positions and its other investments or the fund failing to close out its position due to an illiquid market.
The following table shows the value of forward currency contracts held as of August 31, 2017 and the related locations in the statements of assets and liabilities, presented by risk exposure category:
| Assets | ||||||||
| iShares Currency Hedged MSCI Emerging Markets ETF | iShares Edge MSCI Min Vol EM Currency Hedged ETF | |||||||
Forward currency contracts: | ||||||||
Unrealized appreciation on forward currency contracts/Net assets consist of – net unrealized appreciation (depreciation) | $ | 1,043,121 | $ | 14,535 | ||||
|
|
|
| |||||
| Liabilities | ||||||||
| iShares Currency Hedged MSCI Emerging Markets ETF | iShares Edge MSCI Min Vol EM Currency Hedged ETF | |||||||
Forward currency contracts: | ||||||||
Unrealized depreciation on forward currency contracts/Net assets consist of – net unrealized appreciation (depreciation) | $ | 2,587,982 | $ | 34,704 | ||||
|
|
|
| |||||
| 64 | 2017 iSHARES ANNUAL REPORTTO SHAREHOLDERS |
Table of Contents
Notes to Financial Statements (Continued)
iSHARES®, INC.
The following table shows the realized and unrealized gains (losses) on forward currency contracts held during the year ended August 31, 2017 and the related locations in the statements of operations, presented by risk exposure category:
| Net Realized Gain (Loss) | ||||||||
| iShares Currency Hedged MSCI Emerging Markets ETF | iShares Edge MSCI Min Vol EM Currency Hedged ETF | |||||||
Forward currency contracts: | ||||||||
| $ | (14,276,353 | ) | $ | (155,984 | ) | |||
|
|
|
| |||||
| Net Change in Unrealized Appreciation/Depreciation | ||||||||
| iShares Currency Hedged MSCI Emerging Markets ETF | iShares Edge MSCI Min Vol EM Currency Hedged ETF | |||||||
Forward currency contracts: | ||||||||
| $ | (540,375 | ) | $ | 7,271 | ||||
|
|
|
| |||||
The following table shows the average quarter-end balances of outstanding forward currency contracts for the year ended August 31, 2017:
| iShares Currency Hedged MSCI Emerging Markets ETF | iShares Edge MSCI Min Vol EM Currency Hedged ETF | |||||||
Average amounts purchased in U.S. dollars | $ | 257,169,818 | $ | 5,983,784 | ||||
Average amounts sold in U.S. dollars | $ | 490,450,031 | $ | 11,568,404 | ||||
The Funds’ risk of loss from counterparty credit risk on OTC derivatives is generally limited to the aggregate unrealized gain netted against any collateral held by the Funds. In order to better define their contractual rights and to secure rights that will help the Funds to mitigate their counterparty risk, the Funds may enter into an International Swaps and Derivatives Association, Inc. master agreement (“ISDA Master Agreement”) or similar agreement with their derivative contract counterparties. An ISDA Master Agreement is a bilateral agreement between the Funds and a counterparty that governs OTC derivatives and foreign exchange contracts and typically contains, among other things, collateral posting terms and netting provisions in the event of a default and/or termination event. The provisions of the ISDA Master Agreement typically permit a single net payment in the event of default including the bankruptcy or insolvency of the counterparty. However, bankruptcy or insolvency laws of a particular jurisdiction may impose restrictions on or prohibitions against the right of offset in bankruptcy or insolvency.
The collateral requirements under an ISDA Master Agreement are typically calculated by netting the mark-to-market amount for each transaction under such agreement, and comparing that amount to the value of any collateral currently pledged by the parties. Except for NDFs, the forward currency contracts held by the Funds generally do not require collateral. Cash collateral pledged to the counterparty, if any, is presented as “Cash pledged to broker for forward currency contacts” on the statement of assets and liabilities. Cash received as collateral from the counterparty may be reinvested in money market funds, including those
NOTESTO FINANCIAL STATEMENTS | 65 |
Table of Contents
Notes to Financial Statements (Continued)
iSHARES®, INC.
managed by the Funds’ investment adviser, or its affiliates. Such collateral, if any, is presented in the statement of assets and liabilities as “Investments in securities – affiliated” and “Payable due to broker for collateral on forwards.” To the extent amounts due to the Funds from the counterparty are not fully collateralized, contractually or otherwise, the Funds bear the risk of loss from counterparty non-performance. The Funds attempt to mitigate counterparty risk by only entering into agreements with counterparties that they believe have the financial resources to honor their obligations and by monitoring the financial stability of those counterparties.
For financial reporting purposes, the Funds do not offset financial assets and financial liabilities that are subject to netting arrangements in the statements of assets and liabilities.
The following table presents the exposure of the open forward currency contracts that are subject to potential offset in the statements of assets and liabilities as of August 31, 2017:
| Derivative Assets Subject to Offsetting | Derivatives Available for Offset | Cash Received | Net Amount of Derivative Assets | |||||||||||||
iShares Currency Hedged MSCI Emerging Markets ETF | ||||||||||||||||
Forward currency contracts | $ | 1,043,121 | $ | (1,043,121 | ) | $ | — | $ | — | |||||||
|
|
|
|
|
|
|
| |||||||||
iShares Edge MSCI Min Vol EM Currency Hedged ETF | ||||||||||||||||
Forward currency contracts | $ | 14,535 | $ | (12,055 | ) | $ | — | $ | 2,480 | |||||||
|
|
|
|
|
|
|
| |||||||||
| Derivative Liabilities Subject to Offsetting | Derivatives Available for Offset | Cash Collateral Pledged | Net Amount of Derivative Liabilities | |||||||||||||
iShares Currency Hedged MSCI Emerging Markets ETF | ||||||||||||||||
Forward currency contracts | $ | 2,587,982 | $ | (1,043,121 | ) | $ | (1,530,000 | ) | $ | 14,861 | ||||||
|
|
|
|
|
|
|
| |||||||||
iShares Edge MSCI Min Vol EM Currency Hedged ETF | ||||||||||||||||
Forward currency contracts | $ | 34,704 | $ | (12,055 | ) | $ | — | $ | 22,649 | |||||||
|
|
|
|
|
|
|
| |||||||||
| 7. | PRINCIPAL RISKS |
In the normal course of business, each Fund invests in securities or other instruments and may enter into certain transactions, and such activities subject the Fund to various risks, including, among others, fluctuations in the market (market risk) or failure of an issuer to meet all of its obligations. The value of securities or other instruments may also be affected by various factors, including, without limitation: (i) the general economy; (ii) the overall market as well as local, regional or global political and/or social instability; (iii) regulation, taxation or international tax treaties between various countries; or (iv) currency, interest rate or price fluctuations. Each Fund’s prospectus provides details of the risks to which the Fund is subject.
BFA uses a “passive” or index approach to try to achieve each Fund’s investment objective following the securities included in its underlying index during upturns as well as downturns. BFA does not take steps to reduce market exposure or to lessen the effects of a declining market. Divergence from the underlying index and the composition of the portfolio is monitored by BFA.
| 66 | 2017 iSHARES ANNUAL REPORTTO SHAREHOLDERS |
Table of Contents
Notes to Financial Statements (Continued)
iSHARES®, INC.
MARKET RISK
Market risk arises mainly from uncertainty about future values of financial instruments influenced by price, currency and interest rate movements. It represents the potential loss a fund may suffer through holding market positions in the face of market movements. A fund is exposed to market risk by its investment in equity, fixed income and/or financial derivative instruments or by its investment in underlying funds. The fair value of securities held by a fund may decline due to general market conditions, economic trends or events that are not specifically related to the issuers of the securities including local, regional or global political, social or economic instability or to factors that affect a particular industry or group of industries. The extent of a fund’s exposure to market risk is the market value of the investments held as shown in the fund’s schedule of investments.
A diversified portfolio, where this is appropriate and consistent with a fund’s objectives, minimizes the risk that a price change of a particular investment will have a material impact on the NAV of a fund. The investment concentrations within each Fund’s portfolio are disclosed in its schedule of investments.
Investing in the securities of non-U.S. issuers involves certain considerations and risks not typically associated with securities of U.S. issuers. Such risks include, but are not limited to: differences in accounting, auditing and financial reporting standards; more substantial governmental involvement in the economy; higher inflation rates, greater social, economic and political uncertainties; possible nationalization or expropriation of assets; less availability of public information about issuers; imposition of withholding or other taxes; higher transaction and custody costs and delays in settlement procedures; and lower level of regulation of the securities markets and issuers. Non-U.S. securities may be less liquid, more difficult to value, and have greater price volatility due to exchange rate fluctuations. These and other risks are heightened for investments in issuers from countries with less developed capital markets.
The economies and markets of European countries are often closely connected and interdependent, and events in one country in Europe can have an adverse impact on other European countries. The European financial markets have experienced volatility and adverse trends in recent years due to concerns about economic downturns or rising government debt levels in several European countries. These events have adversely affected the exchange rate of the euro and may continue to significantly affect European countries. The occurrence of terrorist incidents throughout Europe also could impact financial markets. In addition, the United Kingdom has voted to withdraw from the European Union. The referendum may introduce significant new uncertainties and instability in the financial markets as the United Kingdom negotiates its exit from the European Union.
The United States and the European Union, along with the regulatory bodies of a number of countries including Japan, Australia, Norway, Switzerland and Canada, have imposed economic sanctions, which consist of asset freezes and sectorial sanctions, on certain Russian individuals and Russian corporate entities. Broader sanctions on Russia could also be instituted. These sanctions, or even the threat of further sanctions, may result in the decline of the value and liquidity of Russian securities, a weakening of the ruble or other adverse consequences to the Russian economy. Current or future sanctions may result in Russia taking counter measures or retaliatory actions, which may further impair the value and liquidity of Russian securities. These retaliatory measures may include the immediate freeze of Russian assets held by a fund.
CREDIT RISK
Credit risk is the risk that an issuer or guarantor of debt instruments or the counterparty to a financial transaction, including derivatives contracts, repurchase agreements or loans of portfolio securities, is unable or unwilling to make timely interest and/or principal payments or to otherwise honor its obligations. BFA and its affiliates manage counterparty credit risk by entering into transactions only with counterparties that they believe have the financial resources to honor their obligations and by monitoring the financial stability of those counterparties. Financial assets, which potentially expose a fund to issuer and counterparty credit risks, consist principally of financial instruments and receivables due from counterparties. The extent of a fund’s exposure to credit and counterparty risks with respect to those financial assets is approximated by their value recorded in its statement of assets and liabilities.
NOTESTO FINANCIAL STATEMENTS | 67 |
Table of Contents
Notes to Financial Statements (Continued)
iSHARES®, INC.
| 8. | INCOME TAX INFORMATION |
Each Fund is treated as an entity separate from the Company’s other funds for federal income tax purposes. It is the policy of each Fund to qualify as a regulated investment company by complying with the provisions applicable to regulated investment companies, as defined under Subchapter M of the Internal Revenue Code of 1986, as amended, and to annually distribute substantially all of its ordinary income and any net capital gains (taking into account any capital loss carryforwards) sufficient to relieve it from all, or substantially all, federal income and excise taxes. Accordingly, no provision for federal income taxes is required.
U.S. GAAP requires that certain components of net assets be adjusted to reflect permanent differences between financial and tax reporting. These reclassifications have no effect on net assets or NAV per share. The following permanent differences as of August 31, 2017, attributable to the characterization of corporate actions, passive foreign investment companies, the expiration of capital loss carryforwards, foreign currency transactions and realized gains (losses) from in-kind redemptions, were reclassified to the following accounts:
| iShares ETF | Paid-in Capital | Undistributed Net Investment Income/Distributions in Excess of Net Investment Income | Undistributed Net Realized Gain/Accumulated Net Realized Loss | |||||||||
Currency Hedged MSCI Emerging Markets | $ | 922,456 | $ | 6 | $ | (922,462 | ) | |||||
Edge MSCI Min Vol EM Currency Hedged | 16,940 | 309 | (17,249 | ) | ||||||||
Edge MSCI Min Vol Emerging Markets | 48,953,580 | 458,956 | (49,412,536 | ) | ||||||||
iShares MSCI Emerging Markets | (86,669,393 | ) | 12,408,836 | 74,260,557 | ||||||||
The tax character of distributions paid during the years ended August 31, 2017 and August 31, 2016 was as follows:
| iShares ETF | 2017 | 2016 | ||||||
Currency Hedged MSCI Emerging Markets | ||||||||
Ordinary income | $ | 3,977,750 | $ | 8,407,790 | ||||
Long-term capital gain | — | 4,214,422 | ||||||
|
|
|
| |||||
| $ | 3,977,750 | $ | 12,622,212 | |||||
|
|
|
| |||||
Edge MSCI Min Vol EM Currency Hedged | ||||||||
Ordinary income | $ | 184,054 | $ | 105,245 | ||||
Return of capital | — | 355 | ||||||
|
|
|
| |||||
| $ | 184,054 | $ | 105,600 | |||||
|
|
|
| |||||
Edge MSCI Min Vol Emerging Markets | ||||||||
Ordinary income | $ | 84,793,898 | $ | 81,549,891 | ||||
|
|
|
| |||||
MSCI Emerging Markets | ||||||||
Ordinary income | $ | 442,844,825 | $ | 501,097,523 | ||||
|
|
|
| |||||
| 68 | 2017 iSHARES ANNUAL REPORTTO SHAREHOLDERS |
Table of Contents
Notes to Financial Statements (Continued)
iSHARES®, INC.
As of August 31, 2017, the tax components of accumulated net earnings (losses) were as follows:
| iShares ETF | Undistributed Ordinary Income | Capital Loss Carryforwards | Net Unrealized | Total | ||||||||||||
Currency Hedged MSCI Emerging Markets | $ | 56,519 | $ | (20,285,024 | ) | $ | 45,636,711 | $ | 25,408,206 | |||||||
Edge MSCI Min Vol EM Currency Hedged | — | (264,276 | ) | 788,763 | 524,487 | |||||||||||
Edge MSCI Min Vol Emerging Markets | 51,873,455 | (626,690,250 | ) | 518,689,780 | (56,127,015 | ) | ||||||||||
MSCI Emerging Markets | 334,407,079 | (11,047,796,595 | ) | 5,015,762,336 | (5,697,627,180 | ) | ||||||||||
| a | The difference between book-basis and tax-basis unrealized gains (losses) was attributable primarily to the tax deferral of losses on wash sales, the realization for tax purposes of unrealized gains (losses) on certain futures contracts and foreign currency contracts, and the realization for tax purposes of unrealized gains on investments in passive foreign investment companies. |
As of August 31, 2017, the Funds had capital loss carryforwards available to offset future realized capital gains through the indicated expiration dates as follows:
| iShares ETF | Non- Expiring a | Expiring 2018 | Expiring 2019 | Total | ||||||||||||
Currency Hedged MSCI Emerging Markets | $ | 20,285,024 | $ | — | $ | — | $ | 20,285,024 | ||||||||
Edge MSCI Min Vol EM Currency Hedged | 264,276 | — | — | 264,276 | ||||||||||||
Edge MSCI Min Vol Emerging Markets | 626,690,250 | — | — | 626,690,250 | ||||||||||||
MSCI Emerging Markets | 8,973,262,771 | 1,201,366,175 | 873,167,649 | 11,047,796,595 | ||||||||||||
| a | Must be utilized prior to losses subject to expiration. |
The Funds may own shares in certain foreign investment entities, referred to, under U.S. tax law, as “passive foreign investment companies.” The Funds may elect to mark-to-market annually the shares of each passive foreign investment company and would be required to distribute to shareholders any such marked-to-market gains.
Management has analyzed tax laws and regulations and their application to the Funds as of August 31, 2017, inclusive of the open tax return years, and does not believe there are any uncertain tax positions that require recognition of a tax liability in the Funds’ financial statements.
| 9. | LINE OF CREDIT |
The iShares Edge MSCI Min Vol Emerging Markets ETF and iShares MSCI Emerging Markets ETF, along with certain other iShares funds, are parties to a $250 million credit agreement with State Street Bank and Trust Company, which expires on October 25, 2017. The line of credit may be used for temporary or emergency purposes, including redemptions, settlement of trades and rebalancing of portfolio holdings. The credit agreement has the following terms: a commitment fee of 0.20% per annum on the unused portion of the credit agreement and interest at a rate equal to the higher of (a) the one-month LIBOR (not less than zero) plus 1.00% per annum or (b) the U.S. Federal Funds rate (not less than zero) plus 1.00% per annum on amounts borrowed. The commitment fee is allocated to each fund participating in the credit agreement based on each fund’s pro-rata share of the aggregate average daily value of assets invested in local securities of certain foreign markets.
NOTESTO FINANCIAL STATEMENTS | 69 |
Table of Contents
Notes to Financial Statements (Continued)
iSHARES®, INC.
For the year ended August 31, 2017, the maximum amounts borrowed, the average borrowings and the weighted average interest rates, if any, under the credit agreement were as follows:
| iShares ETF | Maximum Amount Borrowed | Average Borrowings | Weighted Average | |||||||||
Edge MSCI Min Vol Emerging Markets | $ | 74,000,000 | $ | 1,433,973 | 1.41 | % | ||||||
MSCI Emerging Markets | 90,000,000 | 3,534,247 | 1.83 | % | ||||||||
At a meeting held on September 14-15, 2017, the Board approved the amendment of certain terms of the credit agreement including (i) increasing the maximum borrowing amount to $275 million and (ii) extending the expiration date to October 24, 2018. These changes to the credit agreement are expected to be effective on or around October 25, 2017.
| 10. | FOREIGN WITHHOLDING TAX CLAIMS |
The iShares MSCI Emerging Markets ETF has filed claims to recover taxes withheld by Poland on dividend income on the basis that Poland had purportedly violated certain provisions in the Treaty on the Functioning of the European Union. The Fund has received payments on certain of the claims resulting from a favorable court ruling that the imposition of a withholding tax by a European Union member state on dividends paid to a nonresident company, including the Fund, while exempting domestic funds from such taxes results in discriminatory tax withholding contrary to the free movement of capital. The Fund continues to evaluate developments in Poland for potential impacts on recoverable withholding taxes. Polish withholding tax claims received are disclosed in the statement of operations. Professional fees associated with the filing of tax claims in Poland that result in the recovery of foreign withholding taxes have been approved by the Board as appropriate expenses of the Fund.
The Internal Revenue Service has issued guidance to address U.S. income tax liabilities attributable to fund shareholders resulting from the recovery of foreign taxes withheld in prior years. These withheld foreign taxes were passed through to shareholders in the form of foreign tax credits in the year the taxes were withheld. Assuming there are sufficient foreign taxes paid which the Fund is able to pass through to its shareholders as a foreign tax credit in the current year, the Fund will be able to offset the prior years’ withholding taxes recovered against the foreign taxes paid in the current year. Accordingly, no federal income tax liability is recorded by the Fund.
| 11. | LEGAL PROCEEDINGS |
On June 16, 2016, investors (the “Plaintiffs”) in certain iShares funds (iShares Core S&P Small-Cap ETF, iShares Russell 1000 Growth ETF, iShares Core S&P 500 ETF, iShares Russell Mid-Cap Growth ETF, iShares Russell Mid-Cap ETF, iShares Russell Mid-Cap Value ETF, iShares Select Dividend ETF, iShares Morningstar Mid-Cap ETF, iShares Morningstar Large-Cap ETF, iShares U.S. Aerospace & Defense ETF and iShares U.S. Preferred Stock ETF) filed a putative class action lawsuit against iShares Trust, BlackRock, Inc. and certain of its advisory affiliates, and certain directors/trustees and officers of the Funds (collectively, “Defendants”). The lawsuit alleges the Defendants violated federal securities laws by failing to adequately disclose in the prospectuses issued by the funds noted above the risks of using stop-loss orders in the event of a ‘flash crash’, such as the one that occurred on May 6, 2010. On September 18, 2017, the Court issued a Statement of Decision holding that the Plaintiffs lack standing to assert their claims. On October 11, 2017, the Court entered final judgment dismissing all of Plaintiffs’ claims with prejudice.
| 12. | SUBSEQUENT EVENTS |
Management has evaluated the impact of all subsequent events on the Funds through the date the financial statements were available to be issued and has determined that there were no subsequent events requiring adjustment or disclosure in the financial statements.
| 70 | 2017 iSHARES ANNUAL REPORTTO SHAREHOLDERS |
Table of Contents
Report of Independent Registered Public Accounting Firm
To the Board of Directors of iShares, Inc. and
Shareholders of the iShares Currency Hedged MSCI Emerging Markets ETF,
iShares Edge MSCI Min Vol EM Currency Hedged ETF, iShares Edge MSCI Min Vol Emerging Markets ETF
and iShares MSCI Emerging Markets ETF
In our opinion, the accompanying statements of assets and liabilities, including the schedules of investments, and the related statements of operations and of changes in net assets and the financial highlights present fairly, in all material respects, the financial position of iShares Currency Hedged MSCI Emerging Markets ETF, iShares Edge MSCI Min Vol EM Currency Hedged ETF, iShares Edge MSCI Min Vol Emerging Markets ETF and iShares MSCI Emerging Markets ETF (constituting funds of iShares, Inc., hereafter referred to as the “Funds”) as of August 31, 2017, and the results of each of their operations, the changes in each of their net assets and the financial highlights for each of the periods indicated, in conformity with accounting principles generally accepted in the United States of America. These financial statements and financial highlights (hereafter referred to as “financial statements”) are the responsibility of the Funds’ management. Our responsibility is to express an opinion on these financial statements based on our audits. We conducted our audits of these financial statements in accordance with the standards of the Public Company Accounting Oversight Board (United States). Those standards require that we plan and perform the audit to obtain reasonable assurance about whether the financial statements are free of material misstatement. An audit includes examining, on a test basis, evidence supporting the amounts and disclosures in the financial statements, assessing the accounting principles used and significant estimates made by management, and evaluating the overall financial statement presentation. We believe that our audits, which included confirmation of securities as of August 31, 2017 by correspondence with the custodian, transfer agent and brokers, or by other appropriate auditing procedures where replies were not received, provide a reasonable basis for our opinion.
PricewaterhouseCoopers LLP
San Francisco, California
October 23, 2017
REPORTOF INDEPENDENT REGISTERED PUBLIC ACCOUNTING FIRM | 71 |
Table of Contents
iSHARES®, INC.
The following maximum amounts are hereby designated as qualified dividend income for individuals for the fiscal year ended August 31, 2017:
| iShares ETF | Qualified Dividend Income | |||
Currency Hedged MSCI Emerging Markets | $ | 2,519,548 | ||
Edge MSCI Min Vol EM Currency Hedged | 74,773 | |||
Edge MSCI Min Vol Emerging Markets | 47,150,658 | |||
MSCI Emerging Markets | 506,030,480 | |||
For the fiscal year ended August 31, 2017, the following Funds earned foreign source income and paid foreign taxes which they intend to pass through to their shareholders:
| iShares ETF | Foreign Source Income Earned | Foreign Taxes Paid | ||||||
Edge MSCI Min Vol Emerging Markets | $ | 115,072,428 | $ | 13,828,607 | ||||
MSCI Emerging Markets | 881,023,403 | 99,262,661 | a | |||||
| a | Amount has been reduced by the foreign withholding tax reclaims recovered from Poland in the current year. See Note 10. |
For the fiscal year ended August 31, 2017, the following Funds intend to pass through to their shareholders foreign source income earned and foreign taxes paid by the underlying funds:
| iShares ETF | Foreign Source Income Earned | Foreign Taxes Paid | ||||||
Currency Hedged MSCI Emerging Markets | $ | 4,462,092 | $ | 870,450 | ||||
Edge MSCI Min Vol EM Currency Hedged | 205,848 | 25,131 | ||||||
| 72 | 2017 iSHARES ANNUAL REPORTTO SHAREHOLDERS |
Table of Contents
Board Review and Approval of Investment Advisory
Contract
iSHARES®, INC.
I. iShares Currency Hedged MSCI Emerging Markets ETF
Under Section 15(c) of the Investment Company Act of 1940 (the “1940 Act”), the Company’s Board of Directors (the “Board”), including a majority of Directors who are not “interested persons” of the Company (as that term is defined in the 1940 Act) (the “Independent Directors”), is required annually to consider and approve the Investment Advisory Contract between the Company and BFA (the “Advisory Contract”) on behalf of the Fund. The Independent Directors requested, and BFA provided, such information as the Independent Directors, with advice from independent counsel, deemed reasonably necessary to evaluate the Advisory Contract. A committee of all of the Independent Directors (the “15(c) Committee”), with independent counsel, met with management on May 5, 2017 and May 12, 2017. At these meetings, the 15(c) Committee reviewed and discussed information provided in response to the 15(c) Committee’s initial requests, and requested certain additional information, which management agreed to provide. At a meeting held on May 18, 2017, management presented information to the Board relating to the continuance of the Advisory Contract, including information requested by the 15(c) Committee during its meetings. The Board, including the Independent Directors, reviewed and discussed such information at length. The Independent Directors requested from management certain additional information, which management agreed to provide. At a meeting held on June 19-21, 2017, the Board, including the Independent Directors, reviewed the additional information provided by management in response to these requests. After extensive discussions, the Board, including all of the Independent Directors, approved the continuance of the Advisory Contract for the Fund, based on a review of qualitative and quantitative information provided by BFA. The Board noted its satisfaction with the extent and quality of information provided and its frequent interactions with management, as well as the detailed responses and other information provided by BFA. The Board also noted that the Board and BFA agreed to discuss potential further enhancements to the 15(c) process for the coming year. The Independent Directors were advised by their independent counsel throughout the process, including about the legal standards applicable to their review. In approving the Advisory Contract for the Fund, the Board, including the Independent Directors, considered the following factors, no one of which was controlling, and reached the following conclusions:
Expenses and Performance of the Fund — The Board reviewed statistical information prepared by Broadridge Financial Solutions Inc. (“Broadridge”), an independent provider of investment company data, regarding the expense ratio components, including gross and net total expenses, waivers/reimbursements (if any), and underlying fund fees and expenses (if any) of the Fund in comparison with the same information for other exchange traded funds (“ETFs”) (including, where applicable, funds sponsored by an “at cost” service provider) and, in the limited instances where no comparable ETFs existed and the comparison group would not otherwise be reasonable in Broadridge’s judgment, pure index institutional mutual funds, objectively selected by Broadridge as comprising the Fund’s applicable peer group pursuant to Broadridge’s proprietary ETF methodology (the “Peer Group”). The Board was provided with a detailed description of the proprietary ETF methodology used by Broadridge to determine the Fund’s Peer Group. The Board further noted that due to the limitations in providing comparable funds in the Peer Group, the statistical information provided in Broadridge’s report may or may not provide meaningful direct comparisons to the Fund in all instances.
The Board also noted that the investment advisory fee rate and overall expenses (net of waivers and reimbursements) for the Fund were higher than the median of the investment advisory fee rates and overall expenses (net of waivers and reimbursements) of the funds in its Peer Group, excluding iShares funds. The Board further noted that the Fund’s pricing reflects the use of currency hedging strategies, as compared to certain of the funds in the Peer Group, which are not currency hedged.
In addition, to the extent that any of the comparison funds included in the Peer Group, excluding iShares funds, track the same index as the Fund, Broadridge also provided, and the Board reviewed, a comparison of the Fund’s performance for the one-, three-, five-, ten-year, and since inception periods, as applicable, and for the quarter ended December 31, 2016, to that of relevant comparison funds for the same periods.
BOARD REVIEWAND APPROVALOF INVESTMENT ADVISORY CONTRACT | 73 |
Table of Contents
Board Review and Approval of Investment Advisory
Contract (Continued)
iSHARES®, INC.
The Board noted that the Fund seeks to track its specified underlying index and that, during the year, the Board received periodic reports on the Fund’s short- and longer-term performance in comparison with its underlying index. Such periodic comparative performance information, including any additional detailed information requested by the Boards, was also considered. The Board noted that the Fund generally performed in line with its underlying index over the relevant periods.
Based on this review, the other factors considered at the meeting, and their general knowledge of ETF pricing, the Board concluded that the investment advisory fee rate and the historical performance of the Fund supported the Board’s approval of the continuance of the Advisory Contract for the coming year.
Nature, Extent and Quality of Services Provided by BFA — Based on management’s representations, including information about recent and proposed enhancements to the iShares business, including with respect to capital markets support and analysis, technology, product design, compliance and risk management, and other services, the Board expected that there would be no diminution in the scope of services required of or provided by BFA under the Advisory Contract for the coming year as compared to the scope of services provided by BFA during prior years. In reviewing the scope of these services, the Board considered BFA’s investment philosophy and experience, noting that BFA and its affiliates have committed significant resources over time, including during the past year, to supporting the iShares funds and their shareholders. The Board also considered BFA’s compliance program and its compliance record with respect to the Fund. In that regard, the Board noted that BFA reports to the Board about portfolio management and compliance matters on a periodic basis in connection with regularly scheduled meetings of the Board, and on other occasions as necessary and appropriate, and has provided information and made appropriate officers available as needed to provide further assistance with these matters. The Board also reviewed the background and experience of the persons responsible for the day-to-day management of the Fund, as well as the resources available to them in managing the Fund. In addition to the above considerations, the Board reviewed and considered detailed presentations regarding BFA’s investment performance, investment and risk management processes and strategies provided at the June 19-21, 2017 meeting and throughout the previous year, and matters related to BFA’s portfolio compliance policies and procedures. The Board noted that the Fund had met its investment objective consistently since its inception date.
Based on review of this information, and the performance information discussed above, the Board concluded that the nature, extent and quality of services provided by BFA to the Fund under the Advisory Contract supported the Board’s approval of the continuance of the Advisory Contract for the coming year.
Costs of Services Provided to Fund and Profits Realized by BFA and Affiliates — The Board reviewed information about the profitability of the Fund to BlackRock, based on the fees payable to BFA and its affiliates (including fees under the Advisory Contract), and other sources of revenue and expense to BFA and its affiliates from the Fund’s operations for the last calendar year. The Board reviewed BlackRock’s profitability methodology for the iShares funds, including supplemental information that was responsive to requests of the 15(c) Committee. The Board noted that the 15(c) Committee had focused on the methodology and profitability presentation during its meetings. The Board discussed the sources of direct and ancillary revenue with management, including the revenues to BTC, a BFA affiliate, from securities lending by the Fund. The Board also discussed BFA’s profit margin as reflected in the Fund’s profitability analysis and reviewed information regarding potential economies of scale (as discussed below). Based on this review, the Board concluded that the profits realized by BFA and its affiliates under the Advisory Contract and from other relationships between the Fund and BFA and/or its affiliates, if any, were within a reasonable range in light of the factors considered.
Economies of Scale — The Board reviewed information regarding potential economies of scale or other efficiencies that may result from increases in the Fund’s assets, noting that the issue of economies of scale had been focused on by the 15(c) Committee during its meetings and addressed by management, including through supplemental information. The Board and the 15(c) Committee reviewed information provided by BFA regarding scale benefits shared with the iShares funds through
| 74 | 2017 iSHARES ANNUAL REPORTTO SHAREHOLDERS |
Table of Contents
Board Review and Approval of Investment Advisory
Contract (Continued)
iSHARES®, INC.
relatively low fee rates established at inception, breakpoints and waivers or other fee reductions, as well as through additional investment in the iShares business and the provision of improved or additional infrastructure and services to the iShares funds and their shareholders. The Board and the 15(c) Committee received information regarding BlackRock’s historical profitability, including BFA’s and its affiliates’ costs in providing services. The cost information distinguished, among other things, between fixed and variable costs, and explained how the level of fixed and variable costs, as well as the nature of such costs, may impact the existence or size of scale benefits. The Board noted that the Advisory Contract for the Fund did not provide for any breakpoints in the Fund’s investment advisory fee rate as the assets of the Fund increase. However, the Board noted that to the extent that the Fund invests in an underlying iShares fund that has breakpoints, the shareholders of the Fund would benefit from such breakpoints in the underlying iShares fund’s investment advisory fee rate as the assets of the underlying iShares fund, on an aggregated basis with the assets of certain other iShares funds, increase. The Board further noted that should material economies of scale be identified in the future that are not otherwise shared, a breakpoint structure for the Fund may be appropriate, and that it would continue to monitor the sharing of economies of scale to determine the appropriateness of adding breakpoints in the future.
Based on this review, as well as the other factors considered at the meeting, the Board, recognizing its responsibility to consider the Advisory Contract at least annually, determined to approve the continuance of the Advisory Contract for the coming year.
Fees and Services Provided for Other Comparable Funds/Accounts Managed by BFA and its Affiliates — The Board received and considered information regarding the investment advisory/management fee rates for other funds/accounts in the U.S. for which BFA (or its affiliates) provides investment advisory/management services, including open-end funds registered under the 1940 Act (including sub-advised funds), collective trust funds, and institutional separate accounts (together, the “Other Accounts”), and acknowledged BFA’s assertion that the iShares funds are fundamentally different investment vehicles from the Other Accounts. The Board noted that BFA and its affiliates do manage Other Accounts with substantially the same investment objective and strategy as the Fund and that track the same index as the Fund. The Board further noted that BFA provided the Board with detailed information regarding how the Other Accounts (particularly institutional clients) generally differ from the Fund, including in terms of the different and generally more extensive services provided to the Fund, as well as other significant differences. In that regard, the Board considered that the pricing of services to institutional clients is typically based on a number of factors beyond the nature and extent of the specific services to be provided and often depends on the overall relationship between the client and its affiliates and the adviser and its affiliates. In addition, the Board considered the relative complexity and inherent risks and challenges of managing and providing other services to the Fund, as a publicly traded ETF, as compared to the Other Accounts that are institutional clients, in light of differing regulatory requirements and client-imposed mandates. The Board also acknowledged BFA’s expressed business purpose for launching a suite of iShares “Core” ETFs that generally are subject to lower investment advisory fees than iShares non-Core ETFs that may provide a similar investment exposure. The Board also considered the “all-inclusive” nature of the Fund’s advisory fee structure, and the Fund expenses borne by BFA under this arrangement. The Board noted that the investment advisory fee rate under the Advisory Contract for the Fund was generally higher than the investment advisory/management fee rates for certain of the Other Accounts (particularly institutional clients) and concluded that the differences appeared to be consistent with the factors discussed.
Other Benefits to BFA and/or its Affiliates — The Board reviewed the “fallout” benefits or ancillary revenue received by BFA and/or its affiliates in connection with the services provided to the Fund by BFA, such as payment of revenue to BTC, the Fund’s securities lending agent, for loaning portfolio securities (which was included in the profit margins reviewed by the Board pursuant to BFA’s profitability methodology), and payment of advisory fees and/or administration fees to BFA and BTC (or their affiliates) in connection with any investments by the Fund in other funds for which BFA (or its affiliates) provides investment advisory services and/or administration services. The Board also noted the revenue received by BFA and/or its affiliates pursuant to an agreement that permits a service provider to use certain portions of BlackRock’s technology platform to service accounts managed by BFA and/or its affiliates, including the iShares funds. The Board noted that BFA generally does not use soft dollars or consider the
BOARD REVIEWAND APPROVALOF INVESTMENT ADVISORY CONTRACT | 75 |
Table of Contents
Board Review and Approval of Investment Advisory
Contract (Continued)
iSHARES®, INC.
value of research or other services that may be provided to BFA (including its affiliates) in selecting brokers for portfolio transactions for the Fund. The Board further noted that any portfolio transactions on behalf of the Fund placed through a BFA affiliate or purchased from an underwriting syndicate in which a BFA affiliate participates, are reported to the Board pursuant to Rule 17e-1 or Rule 10f-3, as applicable, under the 1940 Act. The Board concluded that any such ancillary benefits would not be disadvantageous to the Fund’s shareholders and thus would not alter the Board’s conclusion with respect to the appropriateness of approving the continuance of the Advisory Contract for the coming year.
Conclusion — Based on the considerations described above, the Board determined that the Fund’s investment advisory fee rate under the Advisory Contract does not constitute a fee that is so disproportionately large as to bear no reasonable relationship to the services rendered and that could not have been the product of arm’s-length bargaining, and concluded to approve the continuance of the Advisory Contract for the coming year.
II. iShares Edge MSCI Min Vol EM Currency Hedged ETF
Under Section 15(c) of the Investment Company Act of 1940 (the “1940 Act”), the Company’s Board of Directors (the “Board”), including a majority of Directors who are not “interested persons” of the Company (as that term is defined in the 1940 Act) (the “Independent Directors”), is required annually to consider and approve the Investment Advisory Contract between the Company and BFA (the “Advisory Contract”) on behalf of the Fund. The Independent Directors requested, and BFA provided, such information as the Independent Directors, with advice from independent counsel, deemed reasonably necessary to evaluate the Advisory Contract. A committee of all of the Independent Directors (the “15(c) Committee”), with independent counsel, met with management on May 5, 2017 and May 12, 2017. At these meetings, the 15(c) Committee reviewed and discussed information provided in response to the 15(c) Committee’s initial requests, and requested certain additional information, which management agreed to provide. At a meeting held on May 18, 2017, management presented information to the Board relating to the continuance of the Advisory Contract, including information requested by the 15(c) Committee during its meetings. The Board, including the Independent Directors, reviewed and discussed such information at length. The Independent Directors requested from management certain additional information, which management agreed to provide. At a meeting held on June 19-21, 2017, the Board, including the Independent Directors, reviewed the additional information provided by management in response to these requests. After extensive discussions, the Board, including all of the Independent Directors, approved the continuance of the Advisory Contract for the Fund, based on a review of qualitative and quantitative information provided by BFA. The Board noted its satisfaction with the extent and quality of information provided and its frequent interactions with management, as well as the detailed responses and other information provided by BFA. The Board also noted that the Board and BFA agreed to discuss potential further enhancements to the 15(c) process for the coming year. The Independent Directors were advised by their independent counsel throughout the process, including about the legal standards applicable to their review. In approving the Advisory Contract for the Fund, the Board, including the Independent Directors, considered the following factors, no one of which was controlling, and reached the following conclusions:
Expenses and Performance of the Fund — The Board reviewed statistical information prepared by Broadridge Financial Solutions Inc. (“Broadridge”), an independent provider of investment company data, regarding the expense ratio components, including gross and net total expenses, waivers/reimbursements (if any), and underlying fund fees and expenses (if any) of the Fund in comparison with the same information for other exchange traded funds (“ETFs”) (including, where applicable, funds sponsored by an “at cost” service provider) and, in the limited instances where no comparable ETFs existed and the comparison group would not otherwise be reasonable in Broadridge’s judgment, pure index institutional mutual funds, objectively selected by Broadridge as comprising the Fund’s applicable peer group pursuant to Broadridge’s proprietary ETF methodology (the “Peer Group”). The Board was provided with a detailed description of the proprietary ETF methodology used by Broadridge to
| 76 | 2017 iSHARES ANNUAL REPORTTO SHAREHOLDERS |
Table of Contents
Board Review and Approval of Investment Advisory
Contract (Continued)
iSHARES®, INC.
determine the Fund’s Peer Group. The Board further noted that due to the limitations in providing comparable funds in the Peer Group, the statistical information provided in Broadridge’s report may or may not provide meaningful direct comparisons to the Fund in all instances.
The Board also noted that the investment advisory fee rate and overall expenses (net of waivers and reimbursements) for the Fund were lower than the median of the investment advisory fee rates and overall expenses (net of waivers and reimbursements) of the funds in its Peer Group, excluding iShares funds.
In addition, to the extent that any of the comparison funds included in the Peer Group, excluding iShares funds, track the same index as the Fund, Broadridge also provided, and the Board reviewed, a comparison of the Fund’s performance for the one-, three-, five-, ten-year, and since inception periods, as applicable, and for the quarter ended December 31, 2016, to that of relevant comparison funds for the same periods.
The Board noted that the Fund seeks to track its specified underlying index and that, during the year, the Board received periodic reports on the Fund’s short- and longer-term performance in comparison with its underlying index. Such periodic comparative performance information, including any additional detailed information requested by the Boards, was also considered. The Board noted that the Fund generally performed in line with its underlying index over the relevant periods.
Based on this review, the other factors considered at the meeting, and their general knowledge of ETF pricing, the Board concluded that the investment advisory fee rate and the historical performance of the Fund supported the Board’s approval of the continuance of the Advisory Contract for the coming year.
Nature, Extent and Quality of Services Provided by BFA — Based on management’s representations, including information about recent and proposed enhancements to the iShares business, including with respect to capital markets support and analysis, technology, product design, compliance and risk management, and other services, the Board expected that there would be no diminution in the scope of services required of or provided by BFA under the Advisory Contract for the coming year as compared to the scope of services provided by BFA during prior years. In reviewing the scope of these services, the Board considered BFA’s investment philosophy and experience, noting that BFA and its affiliates have committed significant resources over time, including during the past year, to supporting the iShares funds and their shareholders. The Board also considered BFA’s compliance program and its compliance record with respect to the Fund. In that regard, the Board noted that BFA reports to the Board about portfolio management and compliance matters on a periodic basis in connection with regularly scheduled meetings of the Board, and on other occasions as necessary and appropriate, and has provided information and made appropriate officers available as needed to provide further assistance with these matters. The Board also reviewed the background and experience of the persons responsible for the day-to-day management of the Fund, as well as the resources available to them in managing the Fund. In addition to the above considerations, the Board reviewed and considered detailed presentations regarding BFA’s investment performance, investment and risk management processes and strategies provided at the June 19-21, 2017 meeting and throughout the previous year, and matters related to BFA’s portfolio compliance policies and procedures. The Board noted that the Fund had met its investment objective consistently since its inception date.
Based on review of this information, and the performance information discussed above, the Board concluded that the nature, extent and quality of services provided by BFA to the Fund under the Advisory Contract supported the Board’s approval of the continuance of the Advisory Contract for the coming year.
Costs of Services Provided to Fund and Profits Realized by BFA and Affiliates — The Board reviewed information about the profitability of the Fund to BlackRock, based on the fees payable to BFA and its affiliates (including fees under the Advisory
BOARD REVIEWAND APPROVALOF INVESTMENT ADVISORY CONTRACT | 77 |
Table of Contents
Board Review and Approval of Investment Advisory
Contract (Continued)
iSHARES®, INC.
Contract), and other sources of revenue and expense to BFA and its affiliates from the Fund’s operations for the last calendar year. The Board reviewed BlackRock’s profitability methodology for the iShares funds, including supplemental information that was responsive to requests of the 15(c) Committee. The Board noted that the 15(c) Committee had focused on the methodology and profitability presentation during its meetings. The Board discussed the sources of direct and ancillary revenue with management, including the revenues to BTC, a BFA affiliate, from securities lending by the Fund. The Board also discussed BFA’s profit margin as reflected in the Fund’s profitability analysis and reviewed information regarding potential economies of scale (as discussed below). Based on this review, the Board concluded that the profits realized by BFA and its affiliates under the Advisory Contract and from other relationships between the Fund and BFA and/or its affiliates, if any, were within a reasonable range in light of the factors considered.
Economies of Scale — The Board reviewed information regarding potential economies of scale or other efficiencies that may result from increases in the Fund’s assets, noting that the issue of economies of scale had been focused on by the 15(c) Committee during its meetings and addressed by management, including through supplemental information. The Board and the 15(c) Committee reviewed information provided by BFA regarding scale benefits shared with the iShares funds through relatively low fee rates established at inception, breakpoints and waivers or other fee reductions, as well as through additional investment in the iShares business and the provision of improved or additional infrastructure and services to the iShares funds and their shareholders. The Board and the 15(c) Committee received information regarding BlackRock’s historical profitability, including BFA’s and its affiliates’ costs in providing services. The cost information distinguished, among other things, between fixed and variable costs, and explained how the level of fixed and variable costs, as well as the nature of such costs, may impact the existence or size of scale benefits. The Board noted that the Advisory Contract for the Fund did not provide for any breakpoints in the Fund’s investment advisory fee rate as the assets of the Fund increase. However, the Board noted that should material economies of scale be identified in the future that are not otherwise shared, a breakpoint structure for the Fund may be appropriate, and that it would continue to monitor the sharing of economies of scale to determine the appropriateness of adding breakpoints in the future.
Based on this review, as well as the other factors considered at the meeting, the Board, recognizing its responsibility to consider the Advisory Contract at least annually, determined to approve the continuance of the Advisory Contract for the coming year.
Fees and Services Provided for Other Comparable Funds/Accounts Managed by BFA and its Affiliates — The Board received and considered information regarding the investment advisory/management fee rates for other funds/accounts in the U.S. for which BFA (or its affiliates) provides investment advisory/management services, including open-end funds registered under the 1940 Act (including sub-advised funds), collective trust funds, and institutional separate accounts (together, the “Other Accounts”), and acknowledged BFA’s assertion that the iShares funds are fundamentally different investment vehicles from the Other Accounts. The Board noted that BFA and its affiliates do not manage Other Accounts with substantially the same investment objective and strategy as the Fund and that track the same index as the Fund. The Board further noted that BFA provided the Board with detailed information regarding how the Other Accounts (particularly institutional clients) generally differ from the Fund, including in terms of the different and generally more extensive services provided to the Fund, as well as other significant differences. In that regard, the Board considered that the pricing of services to institutional clients is typically based on a number of factors beyond the nature and extent of the specific services to be provided and often depends on the overall relationship between the client and its affiliates and the adviser and its affiliates. In addition, the Board considered the relative complexity and inherent risks and challenges of managing and providing other services to the Fund, as a publicly traded ETF, as compared to the Other Accounts that are institutional clients, in light of differing regulatory requirements and client-imposed mandates. The Board also acknowledged BFA’s expressed business purpose for launching a suite of iShares “Core” ETFs that generally are subject to lower investment advisory fees than iShares non-Core ETFs that may provide a similar investment exposure. The Board also considered the “all-inclusive” nature of the Fund’s advisory fee structure, and the Fund expenses borne by BFA under this arrangement. The Board noted that the investment advisory fee rate under the Advisory Contract for the Fund
| 78 | 2017 iSHARES ANNUAL REPORTTO SHAREHOLDERS |
Table of Contents
Board Review and Approval of Investment Advisory
Contract (Continued)
iSHARES®, INC.
was generally higher than the investment advisory/management fee rates for certain of the Other Accounts (particularly institutional clients) and concluded that the differences appeared to be consistent with the factors discussed.
Other Benefits to BFA and/or its Affiliates — The Board reviewed the “fallout” benefits or ancillary revenue received by BFA and/or its affiliates in connection with the services provided to the Fund by BFA, such as payment of revenue to BTC, the Fund’s securities lending agent, for loaning portfolio securities (which was included in the profit margins reviewed by the Board pursuant to BFA’s profitability methodology), and payment of advisory fees and/or administration fees to BFA and BTC (or their affiliates) in connection with any investments by the Fund in other funds for which BFA (or its affiliates) provides investment advisory services and/or administration services. The Board also noted the revenue received by BFA and/or its affiliates pursuant to an agreement that permits a service provider to use certain portions of BlackRock’s technology platform to service accounts managed by BFA and/or its affiliates, including the iShares funds. The Board noted that BFA generally does not use soft dollars or consider the value of research or other services that may be provided to BFA (including its affiliates) in selecting brokers for portfolio transactions for the Fund. The Board further noted that any portfolio transactions on behalf of the Fund placed through a BFA affiliate or purchased from an underwriting syndicate in which a BFA affiliate participates, are reported to the Board pursuant to Rule 17e-1 or Rule 10f-3, as applicable, under the 1940 Act. The Board concluded that any such ancillary benefits would not be disadvantageous to the Fund’s shareholders and thus would not alter the Board’s conclusion with respect to the appropriateness of approving the continuance of the Advisory Contract for the coming year.
Conclusion — Based on the considerations described above, the Board determined that the Fund’s investment advisory fee rate under the Advisory Contract does not constitute a fee that is so disproportionately large as to bear no reasonable relationship to the services rendered and that could not have been the product of arm’s-length bargaining, and concluded to approve the continuance of the Advisory Contract for the coming year.
III. iShares Edge MSCI Min Vol Emerging Markets ETF
Under Section 15(c) of the Investment Company Act of 1940 (the “1940 Act”), the Company’s Board of Directors (the “Board”), including a majority of Directors who are not “interested persons” of the Company (as that term is defined in the 1940 Act) (the “Independent Directors”), is required annually to consider and approve the Investment Advisory Contract between the Company and BFA (the “Advisory Contract”) on behalf of the Fund. The Independent Directors requested, and BFA provided, such information as the Independent Directors, with advice from independent counsel, deemed reasonably necessary to evaluate the Advisory Contract. A committee of all of the Independent Directors (the “15(c) Committee”), with independent counsel, met with management on May 5, 2017 and May 12, 2017. At these meetings, the 15(c) Committee reviewed and discussed information provided in response to the 15(c) Committee’s initial requests, and requested certain additional information, which management agreed to provide. At a meeting held on May 18, 2017, management presented information to the Board relating to the continuance of the Advisory Contract, including information requested by the 15(c) Committee during its meetings. The Board, including the Independent Directors, reviewed and discussed such information at length. The Independent Directors requested from management certain additional information, which management agreed to provide. At a meeting held on June 19-21, 2017, the Board, including the Independent Directors, reviewed the additional information provided by management in response to these requests. After extensive discussions, the Board, including all of the Independent Directors, approved the continuance of the Advisory Contract for the Fund, based on a review of qualitative and quantitative information provided by BFA. The Board noted its satisfaction with the extent and quality of information provided and its frequent interactions with management, as well as the detailed responses and other information provided by BFA. The Board also noted that the Board and BFA agreed to discuss potential further enhancements to the 15(c) process for the coming year. The Independent Directors were advised by their independent counsel throughout the process, including about the legal standards applicable to their review. In approving the Advisory Contract for the Fund, the Board, including the Independent Directors, considered the following factors, no one of which was controlling, and reached the following conclusions:
BOARD REVIEWAND APPROVALOF INVESTMENT ADVISORY CONTRACT | 79 |
Table of Contents
Board Review and Approval of Investment Advisory
Contract (Continued)
iSHARES®, INC.
Expenses and Performance of the Fund — The Board reviewed statistical information prepared by Broadridge Financial Solutions Inc. (“Broadridge”), an independent provider of investment company data, regarding the expense ratio components, including gross and net total expenses, waivers/reimbursements (if any), and underlying fund fees and expenses (if any) of the Fund in comparison with the same information for other exchange traded funds (“ETFs”) (including, where applicable, funds sponsored by an “at cost” service provider) and, in the limited instances where no comparable ETFs existed and the comparison group would not otherwise be reasonable in Broadridge’s judgment, pure index institutional mutual funds, objectively selected by Broadridge as comprising the Fund’s applicable peer group pursuant to Broadridge’s proprietary ETF methodology (the “Peer Group”). The Board was provided with a detailed description of the proprietary ETF methodology used by Broadridge to determine the Fund’s Peer Group. The Board further noted that due to the limitations in providing comparable funds in the Peer Group, the statistical information provided in Broadridge’s report may or may not provide meaningful direct comparisons to the Fund in all instances.
The Board also noted that the investment advisory fee rate and overall expenses (net of waivers and reimbursements) for the Fund were lower than the median of the investment advisory fee rates and overall expenses (net of waivers and reimbursements) of the funds in its Peer Group, excluding iShares funds.
In addition, to the extent that any of the comparison funds included in the Peer Group, excluding iShares funds, track the same index as the Fund, Broadridge also provided, and the Board reviewed, a comparison of the Fund’s performance for the one-, three-, five-, ten-year, and since inception periods, as applicable, and for the quarter ended December 31, 2016, to that of relevant comparison funds for the same periods.
The Board noted that the Fund seeks to track its specified underlying index and that, during the year, the Board received periodic reports on the Fund’s short- and longer-term performance in comparison with its underlying index. Such periodic comparative performance information, including any additional detailed information requested by the Boards, was also considered. The Board noted that the Fund generally performed in line with its underlying index over the relevant periods.
Based on this review, the other factors considered at the meeting, and their general knowledge of ETF pricing, the Board concluded that the investment advisory fee rate and the historical performance of the Fund supported the Board’s approval of the continuance of the Advisory Contract for the coming year.
Nature, Extent and Quality of Services Provided by BFA — Based on management’s representations, including information about recent and proposed enhancements to the iShares business, including with respect to capital markets support and analysis, technology, product design, compliance and risk management, and other services, the Board expected that there would be no diminution in the scope of services required of or provided by BFA under the Advisory Contract for the coming year as compared to the scope of services provided by BFA during prior years. In reviewing the scope of these services, the Board considered BFA’s investment philosophy and experience, noting that BFA and its affiliates have committed significant resources over time, including during the past year, to supporting the iShares funds and their shareholders. The Board also considered BFA’s compliance program and its compliance record with respect to the Fund. In that regard, the Board noted that BFA reports to the Board about portfolio management and compliance matters on a periodic basis in connection with regularly scheduled meetings of the Board, and on other occasions as necessary and appropriate, and has provided information and made appropriate officers available as needed to provide further assistance with these matters. The Board also reviewed the background and experience of the persons responsible for the day-to-day management of the Fund, as well as the resources available to them in managing the Fund. In addition to the above considerations, the Board reviewed and considered detailed presentations regarding BFA’s investment performance, investment and risk management processes and strategies provided at the June 19-21, 2017 meeting and throughout the previous year, and matters related to BFA’s portfolio compliance policies and procedures. The Board noted that the Fund had met its investment objective consistently since its inception date.
| 80 | 2017 iSHARES ANNUAL REPORTTO SHAREHOLDERS |
Table of Contents
Board Review and Approval of Investment Advisory
Contract (Continued)
iSHARES®, INC.
Based on review of this information, and the performance information discussed above, the Board concluded that the nature, extent and quality of services provided by BFA to the Fund under the Advisory Contract supported the Board’s approval of the continuance of the Advisory Contract for the coming year.
Costs of Services Provided to Fund and Profits Realized by BFA and Affiliates — The Board reviewed information about the profitability of the Fund to BlackRock, based on the fees payable to BFA and its affiliates (including fees under the Advisory Contract), and other sources of revenue and expense to BFA and its affiliates from the Fund’s operations for the last calendar year. The Board reviewed BlackRock’s profitability methodology for the iShares funds, including supplemental information that was responsive to requests of the 15(c) Committee. The Board noted that the 15(c) Committee had focused on the methodology and profitability presentation during its meetings. The Board discussed the sources of direct and ancillary revenue with management, including the revenues to BTC, a BFA affiliate, from securities lending by the Fund. The Board also discussed BFA’s profit margin as reflected in the Fund’s profitability analysis and reviewed information regarding potential economies of scale (as discussed below). Based on this review, the Board concluded that the profits realized by BFA and its affiliates under the Advisory Contract and from other relationships between the Fund and BFA and/or its affiliates, if any, were within a reasonable range in light of the factors considered.
Economies of Scale — The Board reviewed information regarding potential economies of scale or other efficiencies that may result from increases in the Fund’s assets, noting that the issue of economies of scale had been focused on by the 15(c) Committee during its meetings and addressed by management, including through supplemental information. The Board and the 15(c) Committee reviewed information provided by BFA regarding scale benefits shared with the iShares funds through relatively low fee rates established at inception, breakpoints and waivers or other fee reductions, as well as through additional investment in the iShares business and the provision of improved or additional infrastructure and services to the iShares funds and their shareholders. The Board and the 15(c) Committee received information regarding BlackRock’s historical profitability, including BFA’s and its affiliates’ costs in providing services. The cost information distinguished, among other things, between fixed and variable costs, and explained how the level of fixed and variable costs, as well as the nature of such costs, may impact the existence or size of scale benefits. The Board noted that the Advisory Contract for the Fund already provided for breakpoints in the Fund’s investment advisory fee rate as the assets of the Fund, on an aggregated basis with the assets of certain other iShares funds, increase. The Board noted that it would continue to monitor the sharing of economies of scale to determine the appropriateness of adding new or revised breakpoints in the future.
Based on this review, as well as the other factors considered at the meeting, the Board, recognizing its responsibility to consider the Advisory Contract at least annually, determined to approve the continuance of the Advisory Contract for the coming year.
Fees and Services Provided for Other Comparable Funds/Accounts Managed by BFA and its Affiliates — The Board received and considered information regarding the investment advisory/management fee rates for other funds/accounts in the U.S. for which BFA (or its affiliates) provides investment advisory/management services, including open-end funds registered under the 1940 Act (including sub-advised funds), collective trust funds, and institutional separate accounts (together, the “Other Accounts”), and acknowledged BFA’s assertion that the iShares funds are fundamentally different investment vehicles from the Other Accounts. The Board noted that BFA and its affiliates do not manage Other Accounts with substantially the same investment objective and strategy as the Fund and that track the same index as the Fund. The Board further noted that BFA provided the Board with detailed information regarding how the Other Accounts (particularly institutional clients) generally differ from the Fund, including in terms of the different and generally more extensive services provided to the Fund, as well as other significant differences. In that regard, the Board considered that the pricing of services to institutional clients is typically based on a number of factors beyond the nature and extent of the specific services to be provided and often depends on the overall relationship between the client and its affiliates and the adviser and its affiliates. In addition, the Board considered the relative complexity and inherent risks and challenges of managing and providing other services to the Fund, as a publicly traded ETF, as
BOARD REVIEWAND APPROVALOF INVESTMENT ADVISORY CONTRACT | 81 |
Table of Contents
Board Review and Approval of Investment Advisory
Contract (Continued)
iSHARES®, INC.
compared to the Other Accounts that are institutional clients, in light of differing regulatory requirements and client-imposed mandates. The Board also acknowledged BFA’s expressed business purpose for launching a suite of iShares “Core” ETFs that generally are subject to lower investment advisory fees than iShares non-Core ETFs that may provide a similar investment exposure. The Board also considered the “all-inclusive” nature of the Fund’s advisory fee structure, and the Fund expenses borne by BFA under this arrangement. The Board noted that the investment advisory fee rate under the Advisory Contract for the Fund was generally higher than the investment advisory/management fee rates for certain of the Other Accounts (particularly institutional clients) and concluded that the differences appeared to be consistent with the factors discussed.
Other Benefits to BFA and/or its Affiliates — The Board reviewed the “fallout” benefits or ancillary revenue received by BFA and/or its affiliates in connection with the services provided to the Fund by BFA, such as payment of revenue to BTC, the Fund’s securities lending agent, for loaning portfolio securities (which was included in the profit margins reviewed by the Board pursuant to BFA’s profitability methodology), and payment of advisory fees and/or administration fees to BFA and BTC (or their affiliates) in connection with any investments by the Fund in other funds for which BFA (or its affiliates) provides investment advisory services and/or administration services. The Board also noted the revenue received by BFA and/or its affiliates pursuant to an agreement that permits a service provider to use certain portions of BlackRock’s technology platform to service accounts managed by BFA and/or its affiliates, including the iShares funds. The Board noted that BFA generally does not use soft dollars or consider the value of research or other services that may be provided to BFA (including its affiliates) in selecting brokers for portfolio transactions for the Fund. The Board further noted that any portfolio transactions on behalf of the Fund placed through a BFA affiliate or purchased from an underwriting syndicate in which a BFA affiliate participates, are reported to the Board pursuant to Rule 17e-1 or Rule 10f-3, as applicable, under the 1940 Act. The Board concluded that any such ancillary benefits would not be disadvantageous to the Fund’s shareholders and thus would not alter the Board’s conclusion with respect to the appropriateness of approving the continuance of the Advisory Contract for the coming year.
Conclusion — Based on the considerations described above, the Board determined that the Fund’s investment advisory fee rate under the Advisory Contract does not constitute a fee that is so disproportionately large as to bear no reasonable relationship to the services rendered and that could not have been the product of arm’s-length bargaining, and concluded to approve the continuance of the Advisory Contract for the coming year.
IV. iShares MSCI Emerging Markets ETF
Under Section 15(c) of the Investment Company Act of 1940 (the “1940 Act”), the Company’s Board of Directors (the “Board”), including a majority of Directors who are not “interested persons” of the Company (as that term is defined in the 1940 Act) (the “Independent Directors”), is required annually to consider and approve the Investment Advisory Contract between the Company and BFA (the “Advisory Contract”) on behalf of the Fund. The Independent Directors requested, and BFA provided, such information as the Independent Directors, with advice from independent counsel, deemed reasonably necessary to evaluate the Advisory Contract. A committee of all of the Independent Directors (the “15(c) Committee”), with independent counsel, met with management on May 5, 2017 and May 12, 2017. At these meetings, the 15(c) Committee reviewed and discussed information provided in response to the 15(c) Committee’s initial requests, and requested certain additional information, which management agreed to provide. At a meeting held on May 18, 2017, management presented information to the Board relating to the continuance of the Advisory Contract, including information requested by the 15(c) Committee during its meetings. The Board, including the Independent Directors, reviewed and discussed such information at length. The Independent Directors requested from management certain additional information, which management agreed to provide. At a meeting held on June 19-21, 2017, the Board, including the Independent Directors, reviewed the additional information provided by management in response to these requests. After extensive discussions, the Board, including all of the Independent Directors, approved the continuance of the Advisory Contract for the Fund, based on a review of qualitative and quantitative information provided by BFA. The Board noted its satisfaction with the extent and quality of information provided and its frequent interactions with management, as well as
| 82 | 2017 iSHARES ANNUAL REPORTTO SHAREHOLDERS |
Table of Contents
Board Review and Approval of Investment Advisory
Contract (Continued)
iSHARES®, INC.
the detailed responses and other information provided by BFA. The Board also noted that the Board and BFA agreed to discuss potential further enhancements to the 15(c) process for the coming year. The Independent Directors were advised by their independent counsel throughout the process, including about the legal standards applicable to their review. In approving the Advisory Contract for the Fund, the Board, including the Independent Directors, considered the following factors, no one of which was controlling, and reached the following conclusions:
Expenses and Performance of the Fund — The Board reviewed statistical information prepared by Broadridge Financial Solutions Inc. (“Broadridge”), an independent provider of investment company data, regarding the expense ratio components, including gross and net total expenses, waivers/reimbursements (if any), and underlying fund fees and expenses (if any) of the Fund in comparison with the same information for other exchange traded funds (“ETFs”) (including, where applicable, funds sponsored by an “at cost” service provider) and, in the limited instances where no comparable ETFs existed and the comparison group would not otherwise be reasonable in Broadridge’s judgment, pure index institutional mutual funds, objectively selected by Broadridge as comprising the Fund’s applicable peer group pursuant to Broadridge’s proprietary ETF methodology (the “Peer Group”). The Board was provided with a detailed description of the proprietary ETF methodology used by Broadridge to determine the Fund’s Peer Group. The Board further noted that due to the limitations in providing comparable funds in the Peer Group, the statistical information provided in Broadridge’s report may or may not provide meaningful direct comparisons to the Fund in all instances.
The Board also noted that the investment advisory fee rate and overall expenses (net of waivers and reimbursements) for the Fund were higher than the median of the investment advisory fee rates and overall expenses (net of waivers and reimbursements) of the funds in its Peer Group, excluding iShares funds.
In addition, to the extent that any of the comparison funds included in the Peer Group, excluding iShares funds, track the same index as the Fund, Broadridge also provided, and the Board reviewed, a comparison of the Fund’s performance for the one-, three-, five-, ten-year, and since inception periods, as applicable, and for the quarter ended December 31, 2016, to that of relevant comparison funds for the same periods.
The Board noted that the Fund seeks to track its specified underlying index and that, during the year, the Board received periodic reports on the Fund’s short- and longer-term performance in comparison with its underlying index. Such periodic comparative performance information, including any additional detailed information requested by the Boards, was also considered. The Board noted that the Fund generally performed in line with its underlying index over the relevant periods.
Based on this review, the other factors considered at the meeting, and their general knowledge of ETF pricing, the Board concluded that the investment advisory fee rate and the historical performance of the Fund supported the Board’s approval of the continuance of the Advisory Contract for the coming year.
Nature, Extent and Quality of Services Provided by BFA — Based on management’s representations, including information about recent and proposed enhancements to the iShares business, including with respect to capital markets support and analysis, technology, product design, compliance and risk management, and other services, the Board expected that there would be no diminution in the scope of services required of or provided by BFA under the Advisory Contract for the coming year as compared to the scope of services provided by BFA during prior years. In reviewing the scope of these services, the Board considered BFA’s investment philosophy and experience, noting that BFA and its affiliates have committed significant resources over time, including during the past year, to supporting the iShares funds and their shareholders. The Board also considered BFA’s compliance program and its compliance record with respect to the Fund. In that regard, the Board noted that BFA reports to the Board about portfolio management and compliance matters on a periodic basis in connection with regularly scheduled meetings of the Board, and on other occasions as necessary and appropriate, and has provided information and made
BOARD REVIEWAND APPROVALOF INVESTMENT ADVISORY CONTRACT | 83 |
Table of Contents
Board Review and Approval of Investment Advisory
Contract (Continued)
iSHARES®, INC.
appropriate officers available as needed to provide further assistance with these matters. The Board also reviewed the background and experience of the persons responsible for the day-to-day management of the Fund, as well as the resources available to them in managing the Fund. In addition to the above considerations, the Board reviewed and considered detailed presentations regarding BFA’s investment performance, investment and risk management processes and strategies provided at the June 19-21, 2017 meeting and throughout the previous year, and matters related to BFA’s portfolio compliance policies and procedures. The Board noted that the Fund had met its investment objective consistently since its inception date.
Based on review of this information, and the performance information discussed above, the Board concluded that the nature, extent and quality of services provided by BFA to the Fund under the Advisory Contract supported the Board’s approval of the continuance of the Advisory Contract for the coming year.
Costs of Services Provided to Fund and Profits Realized by BFA and Affiliates — The Board reviewed information about the profitability of the Fund to BlackRock, based on the fees payable to BFA and its affiliates (including fees under the Advisory Contract), and other sources of revenue and expense to BFA and its affiliates from the Fund’s operations for the last calendar year. The Board reviewed BlackRock’s profitability methodology for the iShares funds, including supplemental information that was responsive to requests of the 15(c) Committee. The Board noted that the 15(c) Committee had focused on the methodology and profitability presentation during its meetings. The Board discussed the sources of direct and ancillary revenue with management, including the revenues to BTC, a BFA affiliate, from securities lending by the Fund. The Board also discussed BFA’s profit margin as reflected in the Fund’s profitability analysis and reviewed information regarding potential economies of scale (as discussed below). Based on this review, the Board concluded that the profits realized by BFA and its affiliates under the Advisory Contract and from other relationships between the Fund and BFA and/or its affiliates, if any, were within a reasonable range in light of the factors considered.
Economies of Scale — The Board reviewed information regarding potential economies of scale or other efficiencies that may result from increases in the Fund’s assets, noting that the issue of economies of scale had been focused on by the 15(c) Committee during its meetings and addressed by management, including through supplemental information. The Board and the 15(c) Committee reviewed information provided by BFA regarding scale benefits shared with the iShares funds through relatively low fee rates established at inception, breakpoints and waivers or other fee reductions, as well as through additional investment in the iShares business and the provision of improved or additional infrastructure and services to the iShares funds and their shareholders. The Board and the 15(c) Committee received information regarding BlackRock’s historical profitability, including BFA’s and its affiliates’ costs in providing services. The cost information distinguished, among other things, between fixed and variable costs, and explained how the level of fixed and variable costs, as well as the nature of such costs, may impact the existence or size of scale benefits. The Board noted that the Advisory Contract for the Fund already provided for breakpoints in the Fund’s investment advisory fee rate as the assets of the Fund, on an aggregated basis with the assets of certain other iShares funds, increase. The Board noted that it would continue to monitor the sharing of economies of scale to determine the appropriateness of adding new or revised breakpoints in the future.
Based on this review, as well as the other factors considered at the meeting, the Board, recognizing its responsibility to consider the Advisory Contract at least annually, determined to approve the continuance of the Advisory Contract for the coming year.
Fees and Services Provided for Other Comparable Funds/Accounts Managed by BFA and its Affiliates — The Board received and considered information regarding the investment advisory/management fee rates for other funds/accounts in the U.S. for which BFA (or its affiliates) provides investment advisory/management services, including open-end funds registered under the 1940 Act (including sub-advised funds), collective trust funds, and institutional separate accounts (together, the “Other Accounts”), and acknowledged BFA’s assertion that the iShares funds are fundamentally different investment vehicles from the Other Accounts. The Board noted that BFA and its affiliates do manage Other Accounts with substantially the same investment
| 84 | 2017 iSHARES ANNUAL REPORTTO SHAREHOLDERS |
Table of Contents
Board Review and Approval of Investment Advisory
Contract (Continued)
iSHARES®, INC.
objective and strategy as the Fund and that track the same index as the Fund. The Board further noted that BFA provided the Board with detailed information regarding how the Other Accounts (particularly institutional clients) generally differ from the Fund, including in terms of the different and generally more extensive services provided to the Fund, as well as other significant differences. In that regard, the Board considered that the pricing of services to institutional clients is typically based on a number of factors beyond the nature and extent of the specific services to be provided and often depends on the overall relationship between the client and its affiliates and the adviser and its affiliates. In addition, the Board considered the relative complexity and inherent risks and challenges of managing and providing other services to the Fund, as a publicly traded ETF, as compared to the Other Accounts that are institutional clients, in light of differing regulatory requirements and client-imposed mandates. The Board also acknowledged BFA’s expressed business purpose for launching a suite of iShares “Core” ETFs that generally are subject to lower investment advisory fees than iShares non-Core ETFs that may provide a similar investment exposure. The Board also considered the “all-inclusive” nature of the Fund’s advisory fee structure, and the Fund expenses borne by BFA under this arrangement. The Board noted that the investment advisory fee rate under the Advisory Contract for the Fund was generally higher than the investment advisory/management fee rates for certain of the Other Accounts (particularly institutional clients) and concluded that the differences appeared to be consistent with the factors discussed.
Other Benefits to BFA and/or its Affiliates — The Board reviewed the “fallout” benefits or ancillary revenue received by BFA and/or its affiliates in connection with the services provided to the Fund by BFA, such as payment of revenue to BTC, the Fund’s securities lending agent, for loaning portfolio securities (which was included in the profit margins reviewed by the Board pursuant to BFA’s profitability methodology), and payment of advisory fees and/or administration fees to BFA and BTC (or their affiliates) in connection with any investments by the Fund in other funds for which BFA (or its affiliates) provides investment advisory services and/or administration services. The Board also noted the revenue received by BFA and/or its affiliates pursuant to an agreement that permits a service provider to use certain portions of BlackRock’s technology platform to service accounts managed by BFA and/or its affiliates, including the iShares funds. The Board noted that BFA generally does not use soft dollars or consider the value of research or other services that may be provided to BFA (including its affiliates) in selecting brokers for portfolio transactions for the Fund. The Board further noted that any portfolio transactions on behalf of the Fund placed through a BFA affiliate or purchased from an underwriting syndicate in which a BFA affiliate participates, are reported to the Board pursuant to Rule 17e-1 or Rule 10f-3, as applicable, under the 1940 Act. The Board concluded that any such ancillary benefits would not be disadvantageous to the Fund’s shareholders and thus would not alter the Board’s conclusion with respect to the appropriateness of approving the continuance of the Advisory Contract for the coming year.
Conclusion — Based on the considerations described above, the Board determined that the Fund’s investment advisory fee rate under the Advisory Contract does not constitute a fee that is so disproportionately large as to bear no reasonable relationship to the services rendered and that could not have been the product of arm’s-length bargaining, and concluded to approve the continuance of the Advisory Contract for the coming year.
BOARD REVIEWAND APPROVALOF INVESTMENT ADVISORY CONTRACT | 85 |
Table of Contents
Supplemental Information (Unaudited)
iSHARES®, INC.
Proxy Results
A special meeting of the shareholders of each series of iShares, Inc. (the “Company”) was held on June 19, 2017, to elect five Directors to the Board of Directors of the Company. The five nominees were Jane D. Carlin, Richard L. Fagnani, Drew E. Lawton, Madhav V. Rajan and Mark Wiedman, all of whom were elected as Directors at the special meeting. The other Directors whose terms of office as Directors continued after the special meeting are Cecilia H. Herbert, Charles A. Hurty, John E. Kerrigan, John E. Martinez and Robert S. Kapito.
| Director | Votes For | Votes Withheld | ||||||
Jane D. Carlin | 1,911,835,929 | 49,339,171 | ||||||
Richard L. Fagnani | 1,911,725,344 | 49,449,755 | ||||||
Drew E. Lawton | 1,911,790,083 | 49,385,017 | ||||||
Madhav V. Rajan | 1,902,999,095 | 58,176,004 | ||||||
Mark Wiedman | 1,908,143,500 | 53,031,599 | ||||||
Section 19(a) Notices
The amounts and sources of distributions reported are estimates and are provided pursuant to regulatory requirements and are not being provided for tax reporting purposes. The actual amounts and sources for tax reporting purposes will depend upon each Fund’s investment experience during the year and may be subject to changes based on the tax regulations. Shareholders will receive a Form 1099-DIV each calendar year that will inform them how to report these distributions for federal income tax purposes.
| Total Cumulative Distributions for the Fiscal Year | % Breakdown of the Total Cumulative Distributions for the Fiscal Year | |||||||||||||||||||||||||||||||
| iShares ETF | Net Investment Income | Net Realized Capital Gains | Return of Capital | Total Per Share | Net Investment Income | Net Realized Capital Gains | Return of Capital | Total Per Share | ||||||||||||||||||||||||
Currency Hedged MSCI Emerging Market | $ | 0.329356 | $ | — | $ | 0.011010 | $ | 0.340366 | 97 | % | — | % | 3 | % | 100 | % | ||||||||||||||||
Edge MSCI Min Vol EM Currency Hedged | 0.531611 | — | — | 0.531611 | 100 | — | — | 100 | ||||||||||||||||||||||||
Edge MSCI Min Vol Emerging Markets ETF | 1.152268 | — | — | 1.152268 | 100 | — | — | 100 | ||||||||||||||||||||||||
MSCI Emerging Markets | 0.567076 | — | 0.020843 | 0.587919 | 96 | — | 4 | 100 | ||||||||||||||||||||||||
Premium/Discount Information
The Premium/Discount Information section is intended to present information about the differences between the daily market price on secondary markets for shares of a fund and that fund’s NAV. NAV is the price at which a fund issues and redeems shares. It is calculated in accordance with the standard formula for valuing mutual fund shares. The “Market Price” of a fund generally is determined using the midpoint between the highest bid and the lowest ask on the primary securities exchange on which shares of such fund are listed for trading, as of the time that the fund’s NAV is calculated. A fund’s Market Price may be at, above or below its NAV. The NAV of a fund will fluctuate with changes in the value of its portfolio holdings. The Market Price of a fund will fluctuate in accordance with changes in its NAV, as well as market supply and demand.
| 86 | 2017 iSHARES ANNUAL REPORTTO SHAREHOLDERS |
Table of Contents
Supplemental Information (Unaudited) (Continued)
iSHARES®, INC.
Premiums or discounts are the differences (expressed as a percentage) between the NAV and Market Price of a fund on a given day, generally at the time the NAV is calculated. A premium is the amount that a fund is trading above the reported NAV, expressed as a percentage of the NAV. A discount is the amount that a fund is trading below the reported NAV, expressed as a percentage of the NAV.
Premium/discount information for the Funds covering the most recently completed calendar year and the most recently completed calendar quarters since that year (or the life of the Fund, if shorter) is publicly accessible, free of charge, at www.iShares.com.
The following information shows the frequency of distributions of premiums and discounts for the Funds for the immediately preceding five calendar years (or from the inception date of the Fund, if less than five years) through the date of the most recent calendar quarter-end. Each line in each table shows the number of trading days in which the Fund traded within the premium/discount range indicated. The number of trading days in each premium/discount range is also shown as a percentage of the total number of trading days in the period covered by each table. All data presented here represents past performance, which cannot be used to predict future results.
iShares Currency Hedged MSCI Emerging Markets ETF
Period Covered: September 23, 2014 through June 30, 2017
Premium/Discount Range | Number of Days | Percentage of Total Days | ||||||
Greater than 0.5% and Less than 1.0% | 5 | 0.72 | % | |||||
Greater than 0.0% and Less than 0.5% | 432 | 61.80 | ||||||
At NAV | 16 | 2.29 | ||||||
Less than 0.0% and Greater than –0.5% | 245 | 35.05 | ||||||
Less than –0.5% and Greater than –1.0% | 1 | 0.14 | ||||||
|
|
|
| |||||
| 699 | 100.00 | % | ||||||
|
|
|
| |||||
iShares Edge MSCI Min Vol EM Currency Hedged ETF
Period Covered: October 29, 2015 through June 30, 2017
Premium/Discount Range | Number of Days | Percentage of Total Days | ||||||
Greater than 0.5% and Less than 1.0% | 14 | 3.33 | % | |||||
Greater than 0.0% and Less than 0.5% | 300 | 71.25 | ||||||
At NAV | 8 | 1.90 | ||||||
Less than 0.0% and Greater than –0.5% | 95 | 22.56 | ||||||
Less than –0.5% and Greater than –1.0% | 2 | 0.48 | ||||||
Less than –1.0% | 2 | 0.48 | ||||||
|
|
|
| |||||
| 421 | 100.00 | % | ||||||
|
|
|
| |||||
SUPPLEMENTAL INFORMATION | 87 |
Table of Contents
Supplemental Information (Unaudited) (Continued)
iSHARES®, INC.
iShares Edge MSCI Min Vol Emerging Markets ETF
Period Covered: January 1, 2012 through June 30, 2017
Premium/Discount Range | Number of Days | Percentage of Total Days | ||||||
Greater than 3.0% | 1 | 0.07 | % | |||||
Greater than 2.5% and Less than 3.0% | 2 | 0.14 | ||||||
Greater than 2.0% and Less than 2.5% | 1 | 0.07 | ||||||
Greater than 1.5% and Less than 2.0% | 26 | 1.88 | ||||||
Greater than 1.0% and Less than 1.5% | 65 | 4.70 | ||||||
Greater than 0.5% and Less than 1.0% | 275 | 19.88 | ||||||
Greater than 0.0% and Less than 0.5% | 463 | 33.49 | ||||||
At NAV | 14 | 1.01 | ||||||
Less than 0.0% and Greater than –0.5% | 350 | 25.32 | ||||||
Less than –0.5% and Greater than –1.0% | 132 | 9.54 | ||||||
Less than –1.0% and Greater than –1.5% | 39 | 2.82 | ||||||
Less than –1.5% and Greater than –2.0% | 12 | 0.87 | ||||||
Less than –2.0% and Greater than –2.5% | 2 | 0.14 | ||||||
Less than –2.5% and Greater than –3.0% | 1 | 0.07 | ||||||
|
|
|
| |||||
| 1,383 | 100.00 | % | ||||||
|
|
|
| |||||
iShares MSCI Emerging Markets ETF
Period Covered: January 1, 2012 through June 30, 2017
Premium/Discount Range | Number of Days | Percentage of Total Days | ||||||
Greater than 3.0% | 1 | 0.07 | % | |||||
Greater than 2.5% and Less than 3.0% | 1 | 0.07 | ||||||
Greater than 2.0% and Less than 2.5% | 5 | 0.36 | ||||||
Greater than 1.5% and Less than 2.0% | 22 | 1.59 | ||||||
Greater than 1.0% and Less than 1.5% | 63 | 4.56 | ||||||
Greater than 0.5% and Less than 1.0% | 226 | 16.34 | ||||||
Greater than 0.0% and Less than 0.5% | 442 | 31.97 | ||||||
At NAV | 7 | 0.51 | ||||||
Less than 0.0% and Greater than –0.5% | 328 | 23.71 | ||||||
Less than –0.5% and Greater than –1.0% | 191 | 13.81 | ||||||
Less than –1.0% and Greater than –1.5% | 63 | 4.56 | ||||||
Less than –1.5% and Greater than –2.0% | 23 | 1.66 | ||||||
Less than –2.0% and Greater than –2.5% | 10 | 0.72 | ||||||
Less than –2.5% and Greater than –3.0% | 1 | 0.07 | ||||||
|
|
|
| |||||
| 1,383 | 100.00 | % | ||||||
|
|
|
| |||||
| 88 | 2017 iSHARES ANNUAL REPORTTO SHAREHOLDERS |
Table of Contents
Supplemental Information (Unaudited) (Continued)
iSHARES®, INC.
Regulation under the Alternative Investment Fund Managers Directive
The Alternative Investment Fund Managers Directive (“AIFMD”) imposes obligations on fund managers established in the European Union (the “EU”). These do not currently apply to managers established outside the EU, such as BFA. Rather, non-EU managers are only required to comply with certain disclosure, reporting and transparency obligations of AIFMD if such managers market a fund to EU investors.
BFA has registered the iShares Edge MSCI Min Vol Emerging Markets ETF and iShares MSCI Emerging Markets ETF (each a “Fund”, collectively the “Funds”) for marketing to investors in the United Kingdom, the Netherlands, Finland, Sweden and Luxembourg.
Report on Remuneration
BFA is required under AIFMD to make quantitative disclosures of remuneration. These disclosures are made in line with BlackRock’s interpretation of currently available regulatory guidance on quantitative remuneration disclosures. As market or regulatory practice develops BlackRock may consider it appropriate to make changes to the way in which quantitative remuneration disclosures are calculated. Where such changes are made, this may result in disclosures in relation to a fund not being comparable to the disclosures made in the prior year, or in relation to other BlackRock fund disclosures in that same year.
Disclosures are provided in relation to both (a) the staff of BFA; (b) staff who are senior management; and (c) staff who have the ability to materially affect the risk profile of the Funds.
All individuals included in the aggregated figures disclosed are rewarded in line with BlackRock’s remuneration policy for their responsibilities across the relevant BlackRock business area. As all individuals have a number of areas of responsibilities, only the portion of remuneration for those individuals’ services attributable to each Fund is included in the aggregate figures disclosed.
BlackRock has a clear and well defined pay-for-performance philosophy, and compensation programs which support that philosophy. For senior management, a significant percentage of variable remuneration is deferred over time. All employees are subject to a claw-back policy.
Compensation decisions for employees are made based on BlackRock’s full-year financial results and other non-financial goals and objectives. Alongside financial performance, individual compensation is also based on strategic and operating results and other considerations such as management and leadership capabilities. No set formulas are established and no fixed benchmarks are used in determining annual incentive awards.
Bonus pools are reviewed by BlackRock’s independent compensation committee, taking into account both actual and projected financial information together with information provided by the Operational Risk and Regulatory Compliance departments in relation to any activities, incidents or events that warrant consideration in making compensation decisions.
Functions such as Finance, Operational Risk, Legal & Compliance, and Human Resources each have their own organizational structures which are independent of the business units. Functional bonus pools are determined with reference to the performance of each individual function and the remuneration of the senior members of control functions is directly overseen by BlackRock’s independent compensation committee. No individual is involved in setting his or her own remuneration.
Members of staff and senior management of BFA typically provide both AIFMD and non-AIFMD related services in respect of multiple funds, clients and functions of BFA and across the broader BlackRock group. Therefore, the figures disclosed are a sum of each individual’s portion of remuneration attributable to each Fund according to an objective apportionment methodology which acknowledges the multiple-service nature of BFA. Accordingly the figures are not representative of any individual’s actual remuneration or their remuneration structure.
SUPPLEMENTAL INFORMATION | 89 |
Table of Contents
Supplemental Information (Unaudited) (Continued)
iSHARES®, INC.
The amount of the total remuneration awarded by BFA to its staff which has been attributed to the iShares Edge MSCI Min Vol Emerging Markets ETF in respect of BFA’s financial year ending December 31, 2016 was USD 385.71 thousand. This figure is comprised of fixed remuneration of USD 151.73 thousand and variable remuneration of USD 233.98 thousand. There were a total of 325 beneficiaries of the remuneration described above.
The amount of the aggregate remuneration awarded by BFA, which has been attributed to the iShares Edge MSCI Min Vol Emerging Markets ETF in respect of BFA’s financial year ending December 31, 2016, to its senior management was USD 53.34 thousand, and to members of its staff whose actions have a material impact on the risk profile of the Fund was USD 12.85 thousand.
The amount of the total remuneration awarded by BFA to its staff which has been attributed to the iShares MSCI Emerging Markets ETF in respect of BFA’s financial year ending December 31, 2016 was USD 2.78 million. This figure is comprised of fixed remuneration of USD 1.09 million and variable remuneration of USD 1.68 million. There were a total of 325 beneficiaries of the remuneration described above.
The amount of the aggregate remuneration awarded by BFA, which has been attributed to the iShares MSCI Emerging Markets ETF in respect of the BFA’s financial year ending December 31, 2016, to its senior management was USD 383.97 thousand, and to members of its staff whose actions have a material impact on the risk profile of the Fund was USD 92.50 thousand.
| 90 | 2017 iSHARES ANNUAL REPORTTO SHAREHOLDERS |
Table of Contents
Director and Officer Information
iSHARES®, INC.
The Board of Directors has responsibility for the overall management and operations of the Funds, including general supervision of the duties performed by BFA and other service providers. Each Director serves until he or she resigns, is removed, dies, retires or becomes incapacitated. Each officer shall hold office until his or her successor is elected and qualifies or until his or her death, resignation or removal. Directors who are not “interested persons” (as defined in the 1940 Act) of the Company are referred to as independent directors (“Independent Directors”).
The registered investment companies advised by BFA or its affiliates (the “BlackRock-advised Funds”) are organized into one complex of closed-end funds, two complexes of open-end funds and one complex of exchange-traded funds (“Exchange-Traded Fund Complex”) (each, a “BlackRock Fund Complex”). Each Fund is included in the BlackRock Fund Complex referred to as the Exchange-Traded Fund Complex. Each Director also serves as a Trustee of iShares Trust and a Trustee of iShares U.S. ETF Trust and, as a result, oversees a total of 344 funds (as of August 31, 2017) within the Exchange-Traded Fund Complex. Drew E. Lawton, from October 2016 to June 2017, and Richard L. Fagnani, from April 2017 to June 2017, served as Advisory Board Members for iShares Trust, iShares Inc. and iShares U.S. ETF Trust with respect to all funds within the Exchange-Traded Fund Complex. With the exception of Robert S. Kapito, Mark K. Wiedman, Charles Park, Martin Small and Benjamin Archibald, the address of each Director, and officer is c/o BlackRock, Inc., 400 Howard Street, San Francisco, CA 94105. The address of Mr. Kapito, Mr. Wiedman, Mr. Park, Mr. Small and Mr. Archibald is c/o BlackRock, Inc., Park Avenue Plaza, 55 East 52nd Street, New York, NY 10055. The Board has designated Cecilia H. Herbert as its Independent Board Chair. Additional information about the Funds’ Directors and officers may be found in the Funds’ combined Statement of Additional Information, which is available without charge, upon request, by calling toll-free 1-800-iShares (1-800-474-2737).
Interested Directors
| Name (Age) | Position(s) | Principal Occupation(s) During the Past 5 Years | Other Directorships Held by Director | |||
Robert S. Kapitoa (60) | Director (since 2009). | President, BlackRock, Inc. (since 2006); Vice Chairman of BlackRock, Inc. and Head of BlackRock’s Portfolio Management Group (since its formation in 1998) and BlackRock, Inc.’s predecessor entities (since 1988); Trustee, University of Pennsylvania (since 2009); President of Board of Directors, Hope & Heroes Children’s Cancer Fund (since 2002). | Director of BlackRock, Inc. (since 2006); Trustee of iShares Trust (since 2009); Trustee of iShares U.S. ETF Trust (since 2011). | |||
Mark K. Wiedmanb (46) | Director (since 2013). | Senior Managing Director, BlackRock, Inc. (since 2014); Managing Director, BlackRock, Inc. (2007-2014); Global Head of BlackRock’s ETF and Index Investments Business (since 2016); Global Head of iShares (2011-2016); Head of Corporate Strategy, BlackRock, Inc. (2009-2011). | Trustee of iShares Trust (since 2013); Trustee of iShares U.S. ETF Trust (since 2013); Director of PennyMac Financial Services, Inc. (since 2008). | |||
| a | Robert S. Kapito is deemed to be an “interested person” (as defined in the 1940 Act) of the Company due to his affiliations with BlackRock, Inc. and its affiliates. |
| b | Mark K. Wiedman is deemed to be an “interested person” (as defined in the 1940 Act) of the Company due to his affiliations with BlackRock, Inc. and its affiliates. |
DIRECTORAND OFFICER INFORMATION | 91 |
Table of Contents
Director and Officer Information (Continued)
iSHARES®, INC.
Independent Directors
| Name (Age) | Position(s) | Principal Occupation(s) During the Past 5 Years | Other Directorships Held by Director | |||
Cecilia H. Herbert (68) | Director (since 2005); Independent Board Chair (since 2016). | Trustee and Member of the Finance, Technology and Quality Committee of Stanford Health Care (since 2016); Trustee and Member of the Investment Committee, WNET, a New York public media company (since 2011); Chair (1994-2005) and Member (since 1992) of the Investment Committee, Archdiocese of San Francisco; Director (1998-2013) and President (2007-2011) of the Board of Directors, Catholic Charities CYO; Trustee (2002-2011) and Chair of the Finance and Investment Committee (2006-2010) of the Thacher School. | Trustee of iShares Trust (since 2005); Trustee of iShares U.S. ETF Trust (since 2011); Independent Board Chair of iShares Trust and iShares U.S. ETF Trust (since 2016); Trustee of Forward Funds (14 portfolios) (since 2009); Trustee of Salient MF Trust (4 portfolios) (since 2015). | |||
Jane D. Carlin (61) | Director (since 2015); Risk Committee Chair (since 2016). | Consultant (since 2012); Managing Director and Global Head of Financial Holding Company Governance & Assurance and the Global Head of Operational Risk Management of Morgan Stanley (2006-2012). | Trustee of iShares Trust (since 2015); Trustee of iShares U.S. ETF Trust (since 2015); Director of PHH Corporation (mortgage solutions) (since 2012); Director of The Hanover Insurance Group, Inc. (since 2016). | |||
Richard L. Fagnani (62) | Director (since 2017); Equity Plus Committee Chair (since 2017). | Partner, KPMG LLP (2002-2016). | Trustee of iShares Trust (since 2017); Trustee of iShares U.S. ETF Trust (since 2017). | |||
Charles A. Hurty (73) | Director (since 2005); Audit Committee Chair (since 2006). | Retired; Partner, KPMG LLP (1968-2001). | Trustee of iShares Trust (since 2005); Trustee of iShares U.S. ETF Trust (since 2011); Director of SkyBridge Alternative Investments Multi-Adviser Hedge Fund Portfolios LLC (2 portfolios) (since 2002). | |||
John E. Kerrigan (62) | Director (since 2005); Securities Lending Committee Chair (since 2016). | Chief Investment Officer, Santa Clara University (since 2002). | Trustee of iShares Trust (since 2005); Trustee of iShares U.S. ETF Trust (since 2011). | |||
Drew E. Lawton (58) | Director (since 2017); 15(c) Committee Chair (since 2017). | Senior Managing Director of New York Life Insurance Company (2010-2015). | Trustee of iShares Trust (since 2017); Trustee of iShares U.S. ETF Trust (since 2017). | |||
| 92 | 2017 iSHARES ANNUAL REPORTTO SHAREHOLDERS |
Table of Contents
Director and Officer Information (Continued)
iSHARES®, INC.
Independent Directors (Continued)
| Name (Age) | Position(s) | Principal Occupation(s) During the Past 5 Years | Other Directorships Held by Director | |||
John E. Martinez (56) | Director (since 2003); Fixed Income Plus Committee Chair (since 2016). | Director of Real Estate Equity Exchange, Inc. (since 2005). | Trustee of iShares Trust (since 2003); Trustee of iShares U.S. ETF Trust (since 2011). | |||
Madhav V. Rajan (53) | Director (since 2011); Nominating and Governance Committee Chair (since 2017). | Dean, and George Pratt Shultz Professor of Accounting, University of Chicago Booth School of Business (since 2017); Robert K. Jaedicke Professor of Accounting, Stanford University Graduate School of Business (2001-2017); Professor of Law (by courtesy), Stanford Law School (2005-2017); Senior Associate Dean for Academic Affairs and Head of MBA Program, Stanford University Graduate School of Business (2010-2016) . | Trustee of iShares Trust (since 2011); Trustee of iShares U.S. ETF Trust (since 2011); Director, Cavium, Inc. (since 2013). | |||
DIRECTORAND OFFICER INFORMATION | 93 |
Table of Contents
Director and Officer Information (Continued)
iSHARES®, INC.
Officersc
| Name (Age) | Position(s) | Principal Occupation(s) During the Past 5 Years | ||
Martin Small (42) | President (since 2016). | Managing Director, BlackRock, Inc. (since 2010); Head of U.S. iShares (since 2015); Co-Head of the U.S. Financial Markets Advisory Group, BlackRock, Inc. (2008-2014). | ||
Jack Gee (57) | Treasurer and Chief Financial Officer (since 2008). | Managing Director, BlackRock, Inc. (since 2009); Senior Director of Fund Administration of Intermediary Investor Business, BGI (2009). | ||
Benjamin Archibald (42) | Secretary (since 2015). | Managing Director, BlackRock, Inc. (since 2014); Director, BlackRock, Inc. (2010-2013); Secretary of the BlackRock-advised Mutual Funds (since 2012). | ||
Alan Mason (56) | Executive Vice President (since 2016). | Managing Director, BlackRock, Inc. (since 2009). | ||
Steve Messinger (55) | Executive Vice President (since 2016). | Managing Director, BlackRock, Inc. (2007-2014 and since 2016); Managing Director, Beacon Consulting Group (2014-2016). | ||
Charles Park (49) | Chief Compliance Officer (since 2006). | Chief Compliance Officer of BlackRock Advisors, LLC and the BlackRock-advised Funds in the Equity-Bond Complex, the Equity-Liquidity Complex and the Closed-End Complex (since 2014); Chief Compliance Officer of BFA (since 2006). | ||
Scott Radell (48) | Executive Vice President (since 2012). | Managing Director, BlackRock, Inc. (since 2009); Head of Portfolio Solutions, BlackRock, Inc. (since 2009). | ||
| c | Manish Mehta served as President until October 15, 2016. |
| 94 | 2017 iSHARES ANNUAL REPORTTO SHAREHOLDERS |
Table of Contents
For more information visit www.iShares.com or call 1-800-474-2737
This report is intended for the Funds’ shareholders. It may not be distributed to prospective investors unless it is preceded or accompanied by the current prospectus.
Investing involves risk, including possible loss of principal.
The iShares Funds are distributed by BlackRock Investments, LLC (together with its affiliates, “BlackRock”).
The iShares Funds are not sponsored, endorsed, issued, sold or promoted by MSCI Inc., nor does this company make any representation regarding the advisability of investing in the iShares Funds. BlackRock is not affiliated with the company listed above.
A description of the policies that the Funds use to determine how to vote proxies relating to portfolio securities and information about how the Funds voted proxies relating to portfolio securities during the most recent twelve-month period ending June 30 is available without charge, upon request, by calling toll-free 1-800-474-2737; on the Funds’ website at www.iShares.com; and on the U.S. Securities and Exchange Commission (SEC) website at www.sec.gov.
The Funds file their complete schedules of portfolio holdings with the SEC for the first and third quarters of each fiscal year on Form N-Q. The Funds’ Forms N-Q are available on the SEC’s website or may be reviewed and copied at the SEC’s Public Reference Room in Washington, D.C. Information on the operation of the Public Reference Room may be obtained by calling 1-800-SEC-0330. The Funds also disclose their complete schedules of portfolio holdings on a daily basis on the Funds’ website.
Certain financial information required by regulations or listing exchange rules in jurisdictions outside the U.S. in which iShares Funds are cross-listed may be publicly filed in those jurisdictions. This information is available upon request by calling 1-800-474-2737.
©2017 BlackRock, Inc. All rights reserved. iSHARES and BLACKROCK are registered trademarks of BlackRock, Inc. or its subsidiaries. All other marks are the property of their respective owners.
iS-AR-805-0817
| |
Table of Contents
AUGUST 31, 2017
2017 ANNUAL REPORT | |
iShares, Inc.
| Ø | iShares MSCI Frontier 100 ETF | FM | NYSE Arca |
| Ø | iShares MSCI World ETF | URTH | NYSE Arca |
Table of Contents
| 5 | ||||
| 10 | ||||
| 10 | ||||
| 11 | ||||
| 11 | ||||
| 15 | ||||
| 31 | ||||
| 34 | ||||
| 36 | ||||
| 46 | ||||
| 47 | ||||
| 48 | ||||
| 55 | ||||
| 59 |
Table of Contents
Management’s Discussion of Fund Performance
iSHARES®, INC.
GLOBAL EQUITY MARKET OVERVIEW
Global equity markets posted strong returns for the 12 months ended August 31, 2017 (the “reporting period”). The MSCI ACWI, a broad global equity index that includes both developed and emerging markets, returned 17.11% in U.S. dollar terms for the reporting period.
The primary factor behind the robust performance of global equity markets was improving global economic growth, driven largely by the continuation of accommodative monetary policies from many of the world’s central banks. Signs of stronger economic activity in Europe emerged as the European Central Bank (“ECB”) maintained policies such as quantitative easing and negative interest rates. Economic growth rates in China and Japan, the largest economies in Asia, also increased during the reporting period, reflecting efforts by the People’s Bank of China (“PBOC”) and the Bank of Japan (“BOJ”) to stimulate economic activity. Stronger economic growth led several central banks to consider reducing their economic stimulus measures. For example, late in the reporting period, the ECB discussed the possibility of tapering its quantitative easing program, while the PBOC increased short-term interest rates during the first half of 2017.
On a regional basis, European equity markets posted the best returns among developed markets, advancing by approximately 20% in U.S. dollar terms for the reporting period. European stocks benefited from improving economic conditions and stronger corporate earnings. In addition, election outcomes in France and the Netherlands eased investor concerns about nationalist presidential candidates and their opposition to the European Union (“E.U.”). Currency fluctuations also contributed meaningfully to European equity performance in U.S. dollar terms as the euro appreciated by approximately 6% against the U.S. dollar during the reporting period. The best-performing European stock markets included Austria, Italy, and Spain, while Ireland and Belgium posted the weakest returns.
Equity markets in the Asia-Pacific region gained about 16% in U.S. dollar terms for the reporting period, led by Singapore and Hong Kong. Japanese stocks also posted strong returns, benefiting from improving consumer spending and employment trends that contributed to the ongoing recovery in the Japanese economy. However, equity market returns in Japan were hindered by a decline in the Japanese yen, which depreciated by approximately 6% against the U.S. dollar.
The U.S. stock market returned approximately 15% for the reporting period. Despite mixed U.S. economic data, U.S. stocks advanced initially in anticipation of pro-business fiscal policies from the new presidential administration. Although the administration struggled to implement its fiscal agenda, stocks continued to move higher as better global economic conditions led to a notable improvement in corporate earnings growth, particularly for multinational companies with significant operations outside of the U.S. U.S. stocks advanced despite three short-term interest rate increases by the U.S. Federal Reserve Bank (the “Fed”) during the reporting period, which increased the short-term interest rate target to its highest level since October 2008. The Fed also unveiled a plan to start reducing the amount of U.S. Treasury bonds and mortgage-backed securities on its balance sheet before the end of 2017.
Emerging markets stocks outperformed those in developed markets, returning more than 23% in U.S. dollar terms for the reporting period. Emerging markets in Eastern Europe were the best performers, led by Poland, Greece, and Hungary. Equity markets in the Middle East trailed for the reporting period amid continued geopolitical conflict in the region.
MANAGEMENT’S DISCUSSIONSOF FUND PERFORMANCE | 5 |
Table of Contents
Management’s Discussion of Fund Performance
iSHARES® MSCI FRONTIER 100 ETF
Performance as of August 31, 2017
| Average Annual Total Returns | Cumulative Total Returns | |||||||||||||||||||||||||||
| NAV | MARKET | INDEX | NAV | MARKET | INDEX | |||||||||||||||||||||||
1 Year | 27.91% | 26.68% | 30.06% | 27.91% | 26.68% | 30.06% | ||||||||||||||||||||||
Since Inception | 8.02% | 7.88% | 9.83% | 46.74% | 45.76% | 59.28% | ||||||||||||||||||||||
GROWTH OF $10,000 INVESTMENT
(SINCE INCEPTION AT NET ASSET VALUE)
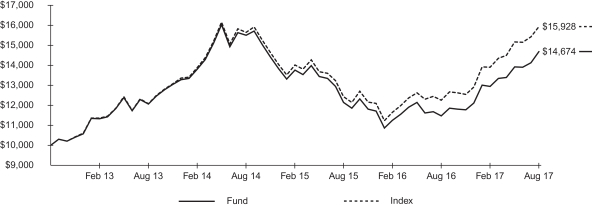
The inception date of the Fund was 9/12/12. The first day of secondary market trading was 9/13/12.
Past performance is no guarantee of future results. Performance results do not reflect the deduction of taxes that a shareholder would pay on fund distributions or on the redemption or sale of fund shares. See “About Fund Performance” on page 10 for more information.
| Shareholder Expenses | ||||||||||||||||||||||||||
| Actual | Hypothetical 5% Return | |||||||||||||||||||||||||
| Beginning Account Value (3/1/17) | Ending Account Value (8/31/17) | Expenses Paid During Period a | Beginning Account Value (3/1/17) | Ending Account Value (8/31/17) | Expenses Paid During Period a | Annualized Expense Ratio | ||||||||||||||||||||
| $ | 1,000.00 | $ | 1,133.80 | $ | 4.30 | $ | 1,000.00 | $ | 1,021.20 | $ | 4.08 | 0.80% | ||||||||||||||
| a | Expenses are calculated using the Fund’s annualized expense ratio (as disclosed in the table), multiplied by the average account value for the period, multiplied by the number of days in the period (184 days) and divided by the number of days in the year (365 days). See “Shareholder Expenses” on page 10 for more information. |
The iShares MSCI Frontier 100 ETF (the “Fund”) seeks to track the investment results of an index composed of frontier market equities, as represented by the MSCI Frontier Markets 100 Index (the “Index”). The Fund invests in a representative sample of securities included in the Index that collectively has an investment profile similar to the Index. Due to the use of representative sampling, the Fund may or may not hold all of the securities that are included in the Index. For the 12-month reporting period ended August 31, 2017, the total return for the Fund was 27.91%, net of fees, while the total return for the Index was 30.06%.
Argentina contributed to the Index’s performance as the country’s economy exited recession during the reporting period. Economic indicators largely strengthened; in June 2017 inflation edged down for a third consecutive month and industrial production rose following 15 months of decline. Private consumption, traditionally the Argentine economy’s key driver, improved, but at a slower pace than forecast. The country’s stock market gained for much of the reporting period on expectations that the
| 6 | 2017 iSHARES ANNUAL REPORTTO SHAREHOLDERS |
Table of Contents
Management’s Discussion of Fund Performance (Continued)
iSHARES® MSCI FRONTIER 100 ETF
benchmark index provider MSCI Inc. would include Argentina in its emerging market stock index; stocks then slumped following the surprise decision in June 2017 against including the country in the index.
Potential emerging-market status also positively affected Kuwait’s stock market performance for the reporting period, as the country appeared on track to be classified as a secondary emerging market by FTSE Russell by the end of September 2017. Expectations of the inclusion supported market strength and liquidity. A rebound in oil prices boosted stock market gains, as the country holds the world’s sixth-largest proven reserves of oil, and oil represents 80% of state revenues.
Stocks in Kenya contributed to the Index’s performance for the reporting period. The country’s banks performed well as the government agreed to review a law limiting interest rates, which had pressured bank revenues. An ongoing severe drought continued to dampen economic strength, however, pushing up food costs.
Moroccan stocks also contributed meaningfully to the Index’s performance for the reporting period. Abundant rainfall benefited the country’s agricultural sector, which represents approximately 15% of Morocco’s economy. Nigerian companies also contributed to the Index’s return.
From a sector standpoint, financials contributed the most to the Index’s return for the reporting period, led by gains in the banks industry. The telecommunication services sector also helped the Index’s performance, driven primarily by strength in the wireless telecommunication services industry.
Within the energy sector, the oil, gas, and consumable fuels industry performed well overall as oil prices rebounded from recent lows. The utilities sector also contributed to the Index’s return for the reporting period.
ALLOCATION BY SECTOR
As of 8/31/17
| Sector | Percentage of Total Investments* |
Financials | 44.36 | % | ||
Telecommunication Services | 12.94 | |||
Consumer Staples | 11.73 | |||
Energy | 8.44 | |||
Real Estate | 5.52 | |||
Industrials | 4.97 | |||
Utilities | 4.48 | |||
Health Care | 2.53 | |||
Materials | 2.47 | |||
Consumer Discretionary | 1.72 | |||
Information Technology | 0.84 | |||
|
| |||
TOTAL | 100.00 | % | ||
|
|
TEN LARGEST COUNTRIES
As of 8/31/17
| Country | Percentage of Total Investments* |
Kuwait | 20.42 | % | ||
Argentina | 20.25 | |||
Vietnam | 12.28 | |||
Morocco | 7.97 | |||
Kenya | 6.72 | |||
Bangladesh | 6.40 | |||
Nigeria | 5.96 | |||
Romania | 5.26 | |||
Oman | 3.90 | |||
Mauritius | 2.69 | |||
|
| |||
TOTAL | 91.85 | % | ||
|
|
| * | Excludes money market funds. |
MANAGEMENT’S DISCUSSIONSOF FUND PERFORMANCE | 7 |
Table of Contents
Management’s Discussion of Fund Performance
iSHARES® MSCI WORLD ETF
Performance as of August 31, 2017
| Average Annual Total Returns | Cumulative Total Returns | |||||||||||||||||||||||||||
| NAV | MARKET | INDEX | NAV | MARKET | INDEX | |||||||||||||||||||||||
1 Year | 16.29% | 16.01% | 16.19% | 16.29% | 16.01% | 16.19% | ||||||||||||||||||||||
5 Years | 11.27% | 11.16% | 11.10% | 70.55% | 69.69% | 69.27% | ||||||||||||||||||||||
Since Inception | 11.39% | 11.39% | 11.23% | 83.79% | 83.84% | 82.28% | ||||||||||||||||||||||
GROWTH OF $10,000 INVESTMENT
(SINCE INCEPTION AT NET ASSET VALUE)
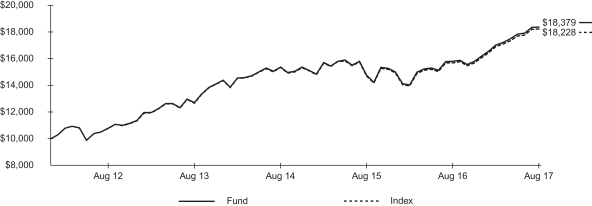
The inception date of the Fund was 1/10/12. The first day of secondary market trading was 1/12/12.
Past performance is no guarantee of future results. Performance results do not reflect the deduction of taxes that a shareholder would pay on fund distributions or on the redemption or sale of fund shares. See “About Fund Performance” on page 10 for more information.
| Shareholder Expenses | ||||||||||||||||||||||||||
| Actual | Hypothetical 5% Return | |||||||||||||||||||||||||
| Beginning Account Value (3/1/17) | Ending Account Value (8/31/17) | Expenses Paid During Period a | Beginning Account Value (3/1/17) | Ending Account Value (8/31/17) | Expenses Paid During Period a | Annualized Expense Ratio | ||||||||||||||||||||
| $ | 1,000.00 | $ | 1,079.10 | $ | 1.26 | $ | 1,000.00 | $ | 1,024.00 | $ | 1.22 | 0.24% | ||||||||||||||
| a | Expenses are calculated using the Fund’s annualized expense ratio (as disclosed in the table), multiplied by the average account value for the period, multiplied by the number of days in the period (184 days) and divided by the number of days in the year (365 days). See “Shareholder Expenses” on page 10 for more information. |
The iShares MSCI World ETF (the “Fund”) seeks to track the investment results of an index composed of developed market equities, as represented by the MSCI World Index (the “Index”). The Fund invests in a representative sample of securities included in the Index that collectively has an investment profile similar to the Index. Due to the use of representative sampling, the Fund may or may not hold all of the securities that are included in the Index. For the 12-month reporting period ended August 31, 2017, the total return for the Fund was 16.29%, net of fees, while the total return for the Index was 16.19%.
| 8 | 2017 iSHARES ANNUAL REPORTTO SHAREHOLDERS |
Table of Contents
Management’s Discussion of Fund Performance (Continued)
iSHARES® MSCI WORLD ETF
U.S. stocks represented about 60% of the Index on average and made the largest contribution to the Index’s performance for the reporting period. Improving corporate earnings helped drive the equity market, despite tepid economic expansion in the U.S. Those companies that generated most of their revenues overseas generally performed well, as stronger economic growth in some international markets drove demand for U.S. goods, from technology devices and components to heavy machinery.
Japanese stocks contributed significantly to the Index’s return, largely benefiting from increases in consumer spending and exports. The country’s economy expanded during the reporting period, posting its longest span of sustained growth in a decade. Private consumption, which represented more than half of economic growth, increased. A weaker Japanese yen and a global recovery in manufacturing supported export demand for automobiles and auto parts, as well as flat panels and semiconductor manufacturing equipment, particularly to other Asian countries.
France helped the Index’s performance for the reporting period, as French stocks benefited from the strongest pace of economic growth since 2011. An increase in exports included transportation equipment and refined petroleum products. In addition, French equities rose following the presidential election of Emmanuel Macron, which eased concerns regarding nationalist sentiment in the country.
The U.K. and Germany also contributed to the Index’s return for the reporting period. Although economic growth in the U.K. was moderate overall, moves by the Bank of England to support the economy lifted the country’s equity market. Germany’s stock market strength was largely a reflection of economic growth, supported by strong domestic demand and improving industrial production.
From a sector perspective, information technology was the largest contributor to the Index’s return for the reporting period amid increased global demand for technology products. Leading contributors included the technology hardware, storage, and peripherals industry and the software industry. Banks led an advance in the financials sector, while strength in the industrials sector reflected gains within the capital goods industry. The consumer discretionary and healthcare sectors also contributed to the Index’s performance.
ALLOCATION BY SECTOR
As of 8/31/17
| Sector | Percentage of Total Investments* |
Financials | 17.84 | % | ||
Information Technology | 16.34 | |||
Health Care | 12.52 | |||
Consumer Discretionary | 12.18 | |||
Industrials | 11.40 | |||
Consumer Staples | 9.26 | |||
Energy | 5.86 | |||
Materials | 5.10 | |||
Utilities | 3.30 | |||
Real Estate | 3.24 | |||
Telecommunication Services | 2.96 | |||
|
| |||
TOTAL | 100.00 | % | ||
|
|
TEN LARGEST COUNTRIES
As of 8/31/17
| Country | Percentage of Total Investments* |
United States | 59.12 | % | ||
Japan | 8.73 | |||
United Kingdom | 6.57 | |||
France | 3.86 | |||
Canada | 3.55 | |||
Germany | 3.50 | |||
Switzerland | 3.07 | |||
Australia | 2.66 | |||
Netherlands | 1.44 | |||
Hong Kong | 1.34 | |||
|
| |||
TOTAL | 93.84 | % | ||
|
|
| * | Excludes money market funds. |
MANAGEMENT’S DISCUSSIONSOF FUND PERFORMANCE | 9 |
Table of Contents
Past performance is no guarantee of future results. Current performance may be lower or higher than the performance data quoted. Performance data current to the most recent month-end is available at www.ishares.com. Performance results assume reinvestment of all dividends and capital gain distributions and do not reflect the deduction of taxes that a shareholder would pay on fund distributions or on the redemption or sale of fund shares. The investment return and principal value of shares will vary with changes in market conditions. Shares may be worth more or less than their original cost when they are redeemed or sold in the market. Performance for certain funds may reflect a waiver of a portion of investment advisory fees. Without such a waiver, performance would have been lower.
Net asset value or “NAV” is the value of one share of a fund as calculated in accordance with the standard formula for valuing mutual fund shares. The price used to calculate market return (“Market Price”) is determined by using the midpoint between the highest bid and the lowest offer on the primary stock exchange on which shares of a fund are listed for trading, as of the time that such fund’s NAV is calculated. Certain funds may have a NAV which is determined prior to the opening of regular trading on its listed exchange and their market returns are calculated using the midpoint of the bid/ask spread as of the opening of regular trading on the exchange. Market and NAV returns assume that dividends and capital gain distributions have been reinvested at Market Price and NAV, respectively.
An index is a statistical composite that tracks a specified financial market or sector. Unlike a fund, an index does not actually hold a portfolio of securities and therefore does not incur the expenses incurred by a fund. These expenses negatively impact fund performance. Also, market returns do not include brokerage commissions that may be payable on secondary market transactions. If brokerage commissions were included, market returns would be lower.
As a shareholder of a Fund, you incur two types of costs: (1) transaction costs, including brokerage commissions on purchases and sales of fund shares and (2) ongoing costs, including management fees and other fund expenses. The expense example, which is based on an investment of $1,000 invested on March 1, 2017 and held through August 31, 2017, is intended to help you understand your ongoing costs (in dollars and cents) of investing in a Fund and to compare these costs with the ongoing costs of investing in other funds.
Actual Expenses — The table provides information about actual account values and actual expenses. Annualized expense ratios reflect contractual and voluntary fee waivers, if any. To estimate the expenses that you paid on your account over the period, simply divide your account value by $1,000 (for example, an $8,600 account value divided by $1,000 = 8.6), then multiply the result by the number corresponding to your Fund under the heading entitled “Expenses Paid During Period.”
Hypothetical Example for Comparison Purposes — The table also provides information about hypothetical account values and hypothetical expenses based on each Fund’s actual expense ratio and an assumed rate of return of 5% per year before expenses. You may use this information to compare the ongoing costs of investing in your Fund and other funds. To do so, compare this 5% hypothetical example with the 5% hypothetical examples that appear in the shareholder reports of the other funds.
Please note that the expenses shown in the table are meant to highlight your ongoing costs only and do not reflect any transactional costs, such as brokerage commissions paid on purchases and sales of fund shares. Therefore, the hypothetical examples are useful in comparing ongoing costs only and will not help you determine the relative total costs of owning different funds. In addition, if these transactional costs were included, your costs would have been higher.
| 10 | 2017 iSHARES ANNUAL REPORTTO SHAREHOLDERS |
Table of Contents
iSHARES® MSCI FRONTIER 100 ETF
August 31, 2017
| Security | Shares | Value | ||||||
COMMON STOCKS — 100.12% |
| |||||||
ARGENTINA — 20.28% |
| |||||||
Adecoagro SAa | 459,558 | $ | 4,457,713 | |||||
Arcos Dorados Holdings Inc. Class Aa | 604,076 | 5,195,054 | ||||||
Banco Macro SA ADR | 215,660 | 22,387,665 | ||||||
BBVA Banco Frances SA ADR | 322,670 | 5,543,471 | ||||||
Cresud SACIF y A ADRa | 170,560 | 3,291,808 | ||||||
Empresa Distribuidora y Comercializadora Norte SA ADRa | 109,470 | 3,853,344 | ||||||
Globant SAa,b | 134,890 | 5,245,872 | ||||||
Grupo Financiero Galicia SA ADR | 435,830 | 19,873,848 | ||||||
Grupo Supervielle SA ADRb | 154,570 | 3,157,865 | ||||||
IRSA Inversiones y Representaciones SA ADRa | 115,620 | 2,798,004 | ||||||
Pampa Energia SA ADRa | 284,540 | 17,359,785 | ||||||
Telecom Argentina SA ADR | 356,290 | 10,670,885 | ||||||
Transportadora de Gas del Sur SA ADRa | 381,300 | 6,630,807 | ||||||
YPF SA ADR | 838,440 | 16,819,106 | ||||||
|
| |||||||
| 127,285,227 | ||||||||
BAHRAIN — 1.47% |
| |||||||
Aluminium Bahrain BSC | 930,921 | 1,234,152 | ||||||
GFH Financial Group BSC | 13,674,479 | 6,738,398 | ||||||
Ithmaar Holding BSCa | 8,806,390 | 1,240,131 | ||||||
|
| |||||||
| 9,212,681 | ||||||||
BANGLADESH — 6.41% |
| |||||||
ACI Ltd. | 191,756 | 1,329,781 | ||||||
Acme Laboratores Ltd. (The) | 965,557 | 1,423,896 | ||||||
Bangladesh Export Import Co. Ltd.a | 4,278,441 | 1,686,033 | ||||||
Beximco Pharmaceuticals Ltd. | 2,695,166 | 3,620,497 | ||||||
BRAC Bank Ltd. | 3,405,326 | 3,620,757 | ||||||
City Bank Ltd. (The) | 4,030,504 | 2,197,685 | ||||||
GrameenPhone Ltd. | 772,320 | 3,728,804 | ||||||
International Finance Investment & Commerce Bank Ltd.a | 4,876,049 | 1,244,769 | ||||||
Islami Bank Bangladesh Ltd. | 3,600,763 | 1,472,522 | ||||||
Lafarge Surma Cement Ltd. | 3,114,046 | 2,269,111 | ||||||
National Bank Ltd.a | 11,150,748 | 1,782,572 | ||||||
Olympic Industries Ltd. | 1,058,414 | 3,589,912 | ||||||
| Security | Shares | Value | ||||||
Renata Ltd. | 28,544 | $ | 403,355 | |||||
Square Pharmaceuticals Ltd. | 2,943,877 | 10,437,365 | ||||||
Summit Power Ltd.a | 2,717,907 | 1,407,875 | ||||||
|
| |||||||
| 40,214,934 | ||||||||
CROATIA — 0.26% |
| |||||||
Valamar Riviera DD | 214,600 | 1,613,650 | ||||||
|
| |||||||
| 1,613,650 | ||||||||
JORDAN — 1.82% |
| |||||||
Al-Eqbal Investment Co. PLC | 24,403 | 923,115 | ||||||
Arab Bank PLC | 642,060 | 5,152,781 | ||||||
Bank of Jordan | 271,010 | 1,058,812 | ||||||
Jordan Islamic Bank | 304,220 | 1,626,225 | ||||||
Jordan Petroleum Refinery Co. | 612,950 | 2,636,809 | ||||||
|
| |||||||
| 11,397,742 | ||||||||
KAZAKHSTAN — 2.44% |
| |||||||
Halyk Savings Bank of Kazakhstan JSC GDRa,c | 421,070 | 4,210,700 | ||||||
KazMunaiGas Exploration Production JSC GDRc | 1,101,505 | 11,125,201 | ||||||
|
| |||||||
| 15,335,901 | ||||||||
KENYA — 6.74% |
| |||||||
Co-operative Bank of Kenya Ltd. (The) | 14,545,260 | 2,412,419 | ||||||
East African Breweries Ltd. | 2,749,542 | 6,954,094 | ||||||
Equity Group Holdings Ltd./Kenya | 15,533,300 | 6,610,719 | ||||||
KCB Group Ltd. | 15,374,036 | 6,729,880 | ||||||
Safaricom Ltd. | 78,879,967 | 19,566,529 | ||||||
|
| |||||||
| 42,273,641 | ||||||||
KUWAIT — 20.46% |
| |||||||
Agility Public Warehousing Co. KSC | 3,824,326 | 11,087,758 | ||||||
Al Mazaya Holding Co. KSCP | 2,200,060 | 831,037 | ||||||
Alimtiaz Investment Co. KSCC | 3,871,220 | 2,257,570 | ||||||
Boubyan Bank KSCP | 3,594,510 | 5,383,428 | ||||||
Burgan Bank SAK | 3,232,440 | 3,855,793 | ||||||
Human Soft Holding Co. KSC | 202,509 | 2,750,445 | ||||||
Jazeera Airways Co. KSC | 498,560 | 941,614 | ||||||
Kuwait Finance House KSCP | 14,343,937 | 28,089,022 | ||||||
Kuwait International Bank KSCP | 1,587,594 | 1,278,281 | ||||||
Kuwait Projects Co. Holding KSCP | 2,111,508 | 2,462,726 | ||||||
Mabanee Co. SAK | 2,466,848 | 6,465,463 | ||||||
Mezzan Holding Co. KSCC | 632,497 | 1,781,387 | ||||||
SCHEDULESOF INVESTMENTS | 11 |
Table of Contents
Schedule of Investments (Continued)
iSHARES® MSCI FRONTIER 100 ETF
August 31, 2017
| Security | Shares | Value | ||||||
Mobile Telecommunications Co. KSC | 11,944,554 | $ | 19,749,279 | |||||
National Bank of Kuwait SAKP | 14,549,886 | 35,723,875 | ||||||
National Industries Group Holding SAKa | 4,802,330 | 2,259,546 | ||||||
National Real Estate Co. KPSCa | 2,600,430 | 1,042,585 | ||||||
Warba Bank KSCPa | 2,756,430 | 2,429,458 | ||||||
|
| |||||||
| 128,389,267 | ||||||||
MAURITIUS — 2.69% |
| |||||||
Greenbay Properties Ltd. | 31,147,954 | 5,296,171 | ||||||
MCB Group Ltd. | 1,407,328 | 11,595,317 | ||||||
|
| |||||||
| 16,891,488 | ||||||||
MOROCCO — 7.98% |
| |||||||
Attijariwafa Bank | 289,188 | 13,837,482 | ||||||
Banque Centrale Populaire | 153,129 | 4,770,780 | ||||||
Ciments du Maroc | 4,920 | 811,935 | ||||||
Cosumar | 141,047 | 4,499,346 | ||||||
Douja Promotion Groupe Addoha SA | 917,340 | 4,794,222 | ||||||
Maroc Telecom | 1,194,480 | 17,495,839 | ||||||
Societe d’Exploitation des Ports | 138,563 | 2,254,255 | ||||||
Taqa Morocco | 7,791 | 705,825 | ||||||
TOTAL Maroc SA | 5,244 | 947,929 | ||||||
|
| |||||||
| 50,117,613 | ||||||||
NIGERIA — 5.96% | ||||||||
Access Bank PLC | 90,391,806 | 2,438,183 | ||||||
Afriland Properties PLCa | 8,020 | 44 | ||||||
FBN Holdings PLC | 111,793,870 | 1,777,476 | ||||||
Guaranty Trust Bank PLC | 91,703,656 | 10,024,732 | ||||||
Lafarge Africa PLC | 9,434,792 | 1,499,566 | ||||||
Nigerian Breweries PLC | 22,718,662 | 11,408,761 | ||||||
Oando PLCa | 31,574,622 | 599,786 | ||||||
Transnational Corp. of Nigeria PLCa | 141,678,690 | 513,758 | ||||||
United Bank for Africa PLC | 112,968,507 | 2,867,541 | ||||||
Zenith Bank PLC | 98,357,393 | 6,310,237 | ||||||
|
| |||||||
| 37,440,084 | ||||||||
OMAN — 3.86% | ||||||||
Bank Muscat SAOG | 8,354,892 | 8,418,902 | ||||||
Bank Nizwa SAOGa | 4,398,070 | 1,062,253 | ||||||
Bank Sohar SAOG | 7,827,720 | 3,090,023 | ||||||
HSBC Bank Oman SAOG | 2,958,150 | 868,124 | ||||||
Oman Telecommunications Co. SAOG | 2,350,120 | 7,629,269 | ||||||
| Security | Shares | Value | ||||||
Ooredoo QSC | 2,206,210 | $ | 2,521,055 | |||||
Phoenix Power Co. SAOC | 2,082,800 | 659,918 | ||||||
|
| |||||||
| 24,249,544 | ||||||||
PAKISTAN — 0.49% | ||||||||
Fauji Cement Co. Ltd. | 299,500 | 97,679 | ||||||
Habib Bank Ltd. | 631,500 | 1,066,466 | ||||||
Lucky Cement Ltd. | 150,098 | 851,792 | ||||||
MCB Bank Ltd. | 294,466 | 541,515 | ||||||
National Bank of Pakistan | 369,626 | 195,108 | ||||||
Pakistan Oilfields Ltd. | 73,700 | 336,547 | ||||||
|
| |||||||
| 3,089,107 | ||||||||
ROMANIA — 5.27% | ||||||||
Banca Transilvania SA | 19,773,389 | 11,726,136 | ||||||
BRD-Groupe Societe Generale SA | 1,359,496 | 4,597,899 | ||||||
OMV Petrom SA | 52,215,057 | 4,056,536 | ||||||
Societatea Energetica Electrica SA | 1,089,222 | 3,666,892 | ||||||
Societatea Nationala de Gaze Naturale ROMGAZ SA | 743,319 | 5,909,516 | ||||||
Transgaz SA Medias | 30,646 | 3,095,115 | ||||||
|
| |||||||
| 33,052,094 | ||||||||
SLOVENIA — 0.57% | ||||||||
Petrol DD Ljubljana | 2,818 | 1,246,318 | ||||||
Zavarovalnica Triglav DD | 72,003 | 2,311,317 | ||||||
|
| |||||||
| 3,557,635 | ||||||||
SRI LANKA — 1.12% | ||||||||
John Keells Holdings PLC | 6,629,315 | 7,029,612 | ||||||
|
| |||||||
| 7,029,612 | ||||||||
VIETNAM — 12.30% | ||||||||
Bank for Foreign Trade of Vietnam JSC | 1,929,685 | 3,149,432 | ||||||
FLC Faros Construction JSCa | 786,410 | 3,840,112 | ||||||
Hoa Phat Group JSC | 4,005,832 | 6,176,645 | ||||||
Hoa Sen Group | 1,116,030 | 1,465,521 | ||||||
Hoang Huy Investment Financial Services JSC | 1,157,370 | 827,366 | ||||||
Kinh Bac City Development Share Holding Corp.a | 1,505,150 | 999,836 | ||||||
Masan Group Corp. | 3,614,600 | 7,553,109 | ||||||
No Va Land Investment Group Corp.a | 1,366,980 | 3,620,183 | ||||||
PetroVietnam Fertilizer & Chemicals JSC | 1,103,760 | 1,136,220 | ||||||
| 12 | 2017 iSHARES ANNUAL REPORTTO SHAREHOLDERS |
Table of Contents
Schedule of Investments (Continued)
iSHARES® MSCI FRONTIER 100 ETF
August 31, 2017
| Security | Principal or Shares | Value | ||||||
PetroVietnam Technical Services Corp. | 1,213,700 | $ | 875,643 | |||||
Saigon Beer Alcohol Beverage Corp. | 131,600 | 1,453,120 | ||||||
Saigon Securities Inc. | 2,299,520 | 2,534,060 | ||||||
Saigon Thuong Tin Commercial JSBa | 3,084,629 | 1,587,672 | ||||||
Vietnam Dairy Products JSC | 4,765,860 | 31,113,372 | ||||||
Vingroup JSCa | 5,045,530 | 10,876,140 | ||||||
|
| |||||||
| 77,208,431 | ||||||||
|
| |||||||
TOTAL COMMON STOCKS | ||||||||
(Cost: $556,027,920) | 628,358,651 | |||||||
CONVERTIBLE BONDS — 0.05% |
| |||||||
OMAN — 0.05% |
| |||||||
Bank Muscat SAOG | ||||||||
0.35%, 03/19/18 | OMR | 1,026,177 | 282,495 | |||||
|
| |||||||
| 282,495 | ||||||||
|
| |||||||
TOTAL CONVERTIBLE BONDS |
| |||||||
(Cost: $255,878) | 282,495 | |||||||
SHORT-TERM INVESTMENTS — 1.34% |
| |||||||
MONEY MARKET FUNDS — 1.34% |
| |||||||
BlackRock Cash Funds: Institutional, |
| |||||||
1.32%d,e,f | 4,575,839 | 4,577,212 | ||||||
BlackRock Cash Funds: Treasury, |
| |||||||
0.96%d,e | 3,859,935 | 3,859,935 | ||||||
|
| |||||||
| 8,437,147 | ||||||||
|
| |||||||
TOTAL SHORT-TERM INVESTMENTS | ||||||||
(Cost: $8,436,484) |
| 8,437,147 | ||||||
|
| |||||||
TOTAL INVESTMENTS | ||||||||
(Cost: $564,720,282)g | 637,078,293 | |||||||
Other Assets, Less Liabilities — (1.51)% |
| (9,452,181 | ) | |||||
|
| |||||||
NET ASSETS — 100.00% |
| $ | 627,626,112 | |||||
|
| |||||||
ADR — American Depositary Receipts
GDR — Global Depositary Receipts
Currency abbreviations:
OMR — Omani Rial
| a | Non-income earning security. |
| b | All or a portion of this security represents a security on loan. See Note 1. |
| c | This security may be resold to qualified foreign investors and foreign institutional buyers under Regulation S of the Securities Act of 1933. |
| d | Affiliated issuer. See Schedule 1. |
| e | The rate quoted is the annualized seven-day yield of the fund at period end. |
| f | All or a portion of this security represents an investment of securities lending collateral. See Note 1. |
| g | The cost of investments (including short positions and derivatives, if any) for federal income tax purposes was $592,116,408. Net unrealized appreciation was $44,961,885, of which $120,056,137 represented gross unrealized appreciation on investments and $75,094,252 represented gross unrealized depreciation on investments. |
SCHEDULESOF INVESTMENTS | 13 |
Table of Contents
Schedule of Investments (Continued)
iSHARES® MSCI FRONTIER 100 ETF
August 31, 2017
Schedule 1 — Affiliates (Note 2)
Investments in issuers considered to be affiliates of the Fund during the year ended August 31, 2017, for purposes of Section 2(a)(3) of the 1940 Act, and/or related parties of the Fund were as follows:
| Affiliated issuer | Shares held at 08/31/16 | Shares purchased | Shares sold | Shares held at 08/31/17 | Value at 08/31/17 | Net realized gain (loss) a | Change in unrealized appreciation (depreciation) | Income | ||||||||||||||||||||||||
BlackRock Cash Funds: Institutional, | 2,940,667 | 1,635,172 | b | — | 4,575,839 | $ | 4,577,212 | $ | 618 | $ | 663 | $ | — | c | ||||||||||||||||||
BlackRock Cash Funds: Treasury, | 5,413,364 | — | (1,553,429 | )b | 3,859,935 | 3,859,935 | — | — | 30,087 | |||||||||||||||||||||||
|
|
|
|
|
|
|
| |||||||||||||||||||||||||
| $ | 8,437,147 | $ | 618 | $ | 663 | $ | 30,087 | |||||||||||||||||||||||||
|
|
|
|
|
|
|
| |||||||||||||||||||||||||
| a | Includes realized capital gain distributions from an affiliated fund, if any. |
| b | Net of shares purchased and sold. |
| c | Does not include income earned on investment of securities lending cash collateral which is not direct income of the Fund and is reflected as a component of securities lending income in the statement of operations. |
Schedule 2 — Fair Value Measurements
Various inputs are used in determining the fair value of financial instruments. For description of the input levels and information about the Fund’s policy regarding valuation of financial instruments, see Note 1.
The following table summarizes the value of the Fund’s investments according to the fair value hierarchy as of August 31, 2017. The breakdown of the Fund’s investments into major categories is disclosed in the schedule of investments above.
| Level 1 | Level 2 | Level 3 | Total | |||||||||||||
Investments: | ||||||||||||||||
Assets: | ||||||||||||||||
Common stocks | $ | 628,358,607 | $ | 44 | $ | — | $ | 628,358,651 | ||||||||
Convertible bonds | — | 282,495 | — | 282,495 | ||||||||||||
Money market funds | 8,437,147 | — | — | 8,437,147 | ||||||||||||
|
|
|
|
|
|
|
| |||||||||
Total | $ | 636,795,754 | $ | 282,539 | $ | — | $ | 637,078,293 | ||||||||
|
|
|
|
|
|
|
| |||||||||
During the year ended August 31, 2017, Nigerian securities in the amount of $23,389,554 transferred from Level 2 to Level 1 as the foreign exchange rate used to translate the Nigerian naira into U.S. dollars was changed from the three-month non-deliverable forward rate, a Level 2 input, to the World Market Reuters rate, a Level 1 input.
See notes to financial statements.
| 14 | 2017 iSHARES ANNUAL REPORTTO SHAREHOLDERS |
Table of Contents
Schedule of Investments
August 31, 2017
| Security | Shares | Value | ||||||
COMMON STOCKS — 99.41% |
| |||||||
AUSTRALIA — 2.65% |
| |||||||
AGL Energy Ltd. | 12,152 | $ | 231,224 | |||||
Amcor Ltd./Australia | 19,592 | 250,340 | ||||||
AMP Ltd. | 42,160 | 170,540 | ||||||
APA Group | 19,482 | 136,906 | ||||||
ASX Ltd. | 3,723 | 161,464 | ||||||
Aurizon Holdings Ltd. | 33,046 | 130,004 | ||||||
Australia & New Zealand Banking Group Ltd. | 36,766 | 857,332 | ||||||
Bendigo & Adelaide Bank Ltd. | 10,354 | 98,137 | ||||||
BHP Billiton Ltd. | 43,276 | 939,801 | ||||||
Brambles Ltd. | 23,126 | 170,768 | ||||||
Cochlear Ltd. | 1,674 | 207,405 | ||||||
Commonwealth Bank of Australia | 21,903 | 1,316,825 | ||||||
Computershare Ltd. | 8,866 | 98,801 | ||||||
Crown Resorts Ltd. | 7,130 | 65,600 | ||||||
CSL Ltd. | 6,510 | 663,601 | ||||||
Dexus | 22,085 | 167,985 | ||||||
Fortescue Metals Group Ltd. | 23,064 | 109,942 | ||||||
Goodman Group | 31,620 | 207,908 | ||||||
GPT Group (The) | 41,168 | 163,262 | ||||||
Incitec Pivot Ltd. | 37,882 | 100,053 | ||||||
Insurance Australia Group Ltd. | 37,138 | 188,813 | ||||||
James Hardie Industries PLC | 9,184 | 128,859 | ||||||
LendLease Group | 13,082 | 172,034 | ||||||
Macquarie Group Ltd. | 4,412 | 303,746 | ||||||
Medibank Pvt Ltd. | 46,378 | 111,825 | ||||||
Mirvac Group | 93,310 | 171,700 | ||||||
National Australia Bank Ltd. | 33,914 | 812,346 | ||||||
Newcrest Mining Ltd. | 12,214 | 221,360 | ||||||
Oil Search Ltd. | 21,846 | 116,265 | ||||||
Orica Ltd. | 7,130 | 114,969 | ||||||
Origin Energy Ltd.a | 33,170 | 201,262 | ||||||
QBE Insurance Group Ltd. | 19,778 | 163,771 | ||||||
Ramsay Health Care Ltd. | 2,542 | 137,726 | ||||||
Rio Tinto Ltd. | 5,766 | 310,253 | ||||||
Santos Ltd.a | 26,673 | 79,545 | ||||||
Scentre Group | 79,567 | 243,599 | ||||||
Sonic Healthcare Ltd. | 8,432 | 146,464 | ||||||
South32 Ltd. | 83,952 | 194,433 | ||||||
Stockland | 53,326 | 187,369 | ||||||
Suncorp Group Ltd. | 16,695 | 172,538 | ||||||
Sydney Airport | 18,106 | 106,270 | ||||||
| Security | Shares | Value | ||||||
Tatts Group Ltd. | 30,628 | $ | 99,843 | |||||
Telstra Corp. Ltd. | 53,405 | 155,454 | ||||||
Transurban Group | 29,778 | 287,200 | ||||||
Vicinity Centres | 61,752 | 128,324 | ||||||
Wesfarmers Ltd. | 14,384 | 486,237 | ||||||
Westfield Corp. | 28,148 | 165,879 | ||||||
Westpac Banking Corp. | 42,846 | 1,062,658 | ||||||
Woodside Petroleum Ltd. | 10,292 | 235,342 | ||||||
Woolworths Ltd. | 17,174 | 354,160 | ||||||
|
| |||||||
| 13,508,142 | ||||||||
AUSTRIA — 0.10% |
| |||||||
Andritz AG | 1,798 | 97,711 | ||||||
Erste Group Bank AG | 5,084 | 214,545 | ||||||
OMV AG | 3,782 | 217,132 | ||||||
|
| |||||||
| 529,388 | ||||||||
BELGIUM — 0.48% |
| |||||||
Ageas | 3,844 | 178,281 | ||||||
Anheuser-Busch InBev SA/NV | 9,796 | 1,159,056 | ||||||
Colruyt SA | 1,984 | 110,096 | ||||||
Groupe Bruxelles Lambert SA | 1,054 | 107,153 | ||||||
KBC Group NV | 3,735 | 306,530 | ||||||
Proximus SADP | 3,162 | 111,332 | ||||||
Solvay SA | 1,061 | 153,704 | ||||||
UCB SA | 2,170 | 149,351 | ||||||
Umicore SA | 2,294 | 171,140 | ||||||
|
| |||||||
| 2,446,643 | ||||||||
CANADA — 3.54% |
| |||||||
Agnico Eagle Mines Ltd. | 4,154 | 212,082 | ||||||
Agrium Inc. | 1,860 | 181,705 | ||||||
Alimentation Couche-Tard Inc. Class B | 5,952 | 283,085 | ||||||
ARC Resources Ltd. | 6,262 | 81,912 | ||||||
Bank of Montreal | 8,432 | 602,665 | ||||||
Bank of Nova Scotia (The) | 15,562 | 964,316 | ||||||
Barrick Gold Corp. | 17,918 | 321,416 | ||||||
BCE Inc. | 1,426 | 67,606 | ||||||
BlackBerry Ltd.a,b | 9,238 | 85,251 | ||||||
Brookfield Asset Management Inc. Class A | 11,656 | 459,174 | ||||||
Cameco Corp. | 8,122 | 81,107 | ||||||
Canadian Imperial Bank of Commerce | 4,960 | 415,038 | ||||||
Canadian National Railway Co. | 10,788 | 870,956 | ||||||
Canadian Natural Resources Ltd. | 14,880 | 456,577 | ||||||
SCHEDULESOF INVESTMENTS | 15 |
Table of Contents
Schedule of Investments (Continued)
iSHARES® MSCI WORLD ETF
August 31, 2017
| Security | Shares | Value | ||||||
Canadian Pacific Railway Ltd. | 2,108 | $ | 326,704 | |||||
Canadian Tire Corp. Ltd. Class Ab | 1,364 | 160,797 | ||||||
Canadian Utilities Ltd. Class A | 2,976 | 92,384 | ||||||
Cenovus Energy Inc. | 15,438 | 120,303 | ||||||
CGI Group Inc. Class Aa | 3,720 | 188,500 | ||||||
CI Financial Corp. | 4,588 | 100,049 | ||||||
Constellation Software Inc./Canada | 372 | 206,023 | ||||||
Crescent Point Energy Corp. | 7,936 | 54,246 | ||||||
Enbridge Inc. | 21,870 | 870,788 | ||||||
Encana Corp. | 14,694 | 136,538 | ||||||
Fairfax Financial Holdings Ltd. | 372 | 192,588 | ||||||
Finning International Inc. | 4,402 | 100,311 | ||||||
First Quantum Minerals Ltd. | 9,582 | 115,022 | ||||||
Fortis Inc./Canada | 5,890 | 214,647 | ||||||
Franco-Nevada Corp.b | 2,728 | 222,287 | ||||||
George Weston Ltd. | 1,550 | 134,175 | ||||||
Gildan Activewear Inc. | 4,712 | 146,988 | ||||||
Goldcorp Inc. | 13,578 | 185,841 | ||||||
Great-West Lifeco Inc. | 3,720 | 102,632 | ||||||
Husky Energy Inc.a,b | 6,159 | 71,771 | ||||||
IGM Financial Inc. | 1,798 | 58,640 | ||||||
Imperial Oil Ltd. | 4,712 | 138,532 | ||||||
Intact Financial Corp. | 2,294 | 188,350 | ||||||
Inter Pipeline Ltd. | 6,836 | 124,697 | ||||||
Loblaw Companies Ltd. | 3,472 | 187,564 | ||||||
Magna International Inc. Class A | 5,394 | 258,525 | ||||||
Manulife Financial Corp. | 26,040 | 509,481 | ||||||
Metro Inc. | 5,580 | 183,456 | ||||||
National Bank of Canada | 5,208 | 238,768 | ||||||
Onex Corp. | 2,294 | 182,697 | ||||||
Open Text Corp. | 4,588 | 147,036 | ||||||
Pembina Pipeline Corp. | 7,564 | 242,832 | ||||||
Potash Corp. of Saskatchewan Inc. | 12,524 | 217,066 | ||||||
Power Corp. of Canada | 5,084 | 123,760 | ||||||
Power Financial Corp. | 3,596 | 96,687 | ||||||
PrairieSky Royalty Ltd. | 5,022 | 117,524 | ||||||
Restaurant Brands International Inc. | 3,658 | 222,412 | ||||||
RioCan REIT | 4,960 | 94,156 | ||||||
Rogers Communications Inc. Class B | 5,394 | 280,467 | ||||||
Royal Bank of Canada | 18,724 | 1,384,120 | ||||||
Saputo Inc. | 5,208 | 175,130 | ||||||
Shaw Communications Inc. Class B | 6,392 | 142,039 | ||||||
SNC-Lavalin Group Inc. | 2,914 | 126,787 | ||||||
| Security | Shares | Value | ||||||
Sun Life Financial Inc. | 7,750 | $ | 296,401 | |||||
Suncor Energy Inc. | 22,392 | 698,863 | ||||||
Teck Resources Ltd. Class B | 8,308 | 205,952 | ||||||
TELUS Corp. | 2,450 | 88,347 | ||||||
Thomson Reuters Corp. | 4,712 | 214,600 | ||||||
Toronto-Dominion Bank (The) | 23,622 | 1,263,483 | ||||||
Tourmaline Oil Corp.a | 3,658 | 71,074 | ||||||
TransCanada Corp. | 11,904 | 602,060 | ||||||
Valeant Pharmaceuticals International Inc.a,b | 5,146 | 68,914 | ||||||
Vermilion Energy Inc. | 2,728 | 88,558 | ||||||
Wheaton Precious Metals Corp. | 8,060 | 166,761 | ||||||
|
| |||||||
| 18,031,223 | ||||||||
DENMARK — 0.72% |
| |||||||
AP Moller – Maersk A/S Class A | 124 | 242,412 | ||||||
Carlsberg A/S Class B | 1,838 | 210,655 | ||||||
Coloplast A/S Class B | 2,356 | 192,632 | ||||||
Danske Bank A/S | 10,086 | 391,448 | ||||||
DSV A/S | 4,659 | 329,916 | ||||||
Genmab A/Sa | 896 | 208,820 | ||||||
Novo Nordisk A/S Class B | 25,172 | 1,199,060 | ||||||
Novozymes A/S Class B | 4,278 | 217,321 | ||||||
Pandora A/S | 1,804 | 191,475 | ||||||
Vestas Wind Systems A/S | 3,364 | 305,967 | ||||||
William Demant Holding A/Sa | 7,564 | 199,862 | ||||||
|
| |||||||
| 3,689,568 | ||||||||
FINLAND — 0.38% |
| |||||||
Elisa OYJ | 3,348 | 146,082 | ||||||
Fortum OYJ | 3,906 | 70,029 | ||||||
Kone OYJ Class B | 4,960 | 268,783 | ||||||
Metso OYJ | 3,374 | 111,676 | ||||||
Nokia OYJ | 79,878 | 494,303 | ||||||
Sampo OYJ Class A | 5,208 | 274,544 | ||||||
Stora Enso OYJ Class R | 10,044 | 131,832 | ||||||
UPM-Kymmene OYJ | 8,246 | 214,308 | ||||||
Wartsila OYJ Abp | 3,224 | 222,123 | ||||||
|
| |||||||
| 1,933,680 | ||||||||
FRANCE — 3.85% |
| |||||||
Accor SA | 3,224 | 149,104 | ||||||
Air Liquide SA | 5,105 | 622,410 | ||||||
Airbus SE | 8,060 | 676,622 | ||||||
Alstom SA | 3,844 | 136,533 | ||||||
Atos SE | 2,046 | 315,251 | ||||||
AXA SA | 24,676 | 715,096 | ||||||
| 16 | 2017 iSHARES ANNUAL REPORTTO SHAREHOLDERS |
Table of Contents
Schedule of Investments (Continued)
iSHARES® MSCI WORLD ETF
August 31, 2017
| Security | Shares | Value | ||||||
BNP Paribas SA | 14,819 | $ | 1,125,986 | |||||
Bollore SA | 29,450 | 136,621 | ||||||
Bouygues SA | 3,100 | 140,403 | ||||||
Bureau Veritas SA | 5,085 | 120,760 | ||||||
Capgemini SE | 2,356 | 260,862 | ||||||
Carrefour SA | 7,812 | 157,333 | ||||||
Casino Guichard Perrachon SA | 992 | 56,333 | ||||||
Cie. de Saint-Gobain | 6,448 | 353,212 | ||||||
Cie. Generale des Etablissements Michelin Class B | 2,666 | 362,920 | ||||||
Credit Agricole SA | 15,376 | 270,734 | ||||||
Danone SA | 7,812 | 614,380 | ||||||
Dassault Systemes SE | 2,356 | 231,787 | ||||||
Edenred | 4,278 | 115,556 | ||||||
Engie SA | 19,964 | 332,767 | ||||||
Essilor International SA | 2,914 | 367,405 | ||||||
Eutelsat Communications SA | 4,030 | 116,979 | ||||||
Groupe Eurotunnel SE Registered | 11,718 | 139,524 | ||||||
Hermes International | 505 | 266,755 | ||||||
Iliad SA | 620 | 159,918 | ||||||
Ingenico Group SA | 868 | 86,066 | ||||||
Kering | 1,240 | 464,826 | ||||||
Klepierre SA | 4,240 | 170,636 | ||||||
L’Oreal SA | 3,224 | 679,785 | ||||||
Lagardere SCA | 2,790 | 89,527 | ||||||
Legrand SA | 4,278 | 299,470 | ||||||
LVMH Moet Hennessy Louis Vuitton SE | 3,782 | 990,336 | ||||||
Orange SA | 25,916 | 439,834 | ||||||
Pernod Ricard SA | 3,100 | 423,106 | ||||||
Peugeot SA | 7,378 | 155,566 | ||||||
Publicis Groupe SA | 2,852 | 192,255 | ||||||
Renault SA | 2,680 | 236,898 | ||||||
Safran SA | 4,464 | 433,018 | ||||||
Sanofi | 15,686 | 1,522,884 | ||||||
Schneider Electric SE | 7,397 | 595,637 | ||||||
SCOR SE | 2,728 | 114,165 | ||||||
SES SA | 5,828 | 133,070 | ||||||
Societe BIC SA | 620 | 74,412 | ||||||
Societe Generale SA | 10,540 | 589,333 | ||||||
Sodexo SA | 1,550 | 180,649 | ||||||
STMicroelectronics NV | 12,269 | 212,308 | ||||||
Suez | 6,262 | 118,634 | ||||||
Thales SA | 1,984 | 219,366 | ||||||
Total SA | 29,512 | 1,524,346 | ||||||
| Security | Shares | Value | ||||||
Unibail-Rodamco SE | 1,320 | $ | 335,134 | |||||
Valeo SA | 3,906 | 260,891 | ||||||
Veolia Environnement SA | 7,006 | 164,173 | ||||||
Vinci SA | 6,634 | 610,072 | ||||||
Vivendi SA | 15,128 | 346,674 | ||||||
|
| |||||||
| 19,608,322 | ||||||||
GERMANY — 3.33% |
| |||||||
adidas AGb | 2,790 | 625,426 | ||||||
Allianz SE Registered | 5,890 | 1,258,721 | ||||||
BASF SE | 12,152 | 1,175,594 | ||||||
Bayer AG Registered | 11,222 | 1,434,247 | ||||||
Bayerische Motoren Werke AG | 4,092 | 379,468 | ||||||
Beiersdorf AG | 2,693 | 287,129 | ||||||
Brenntag AG | 3,348 | 177,189 | ||||||
Commerzbank AGa | 19,407 | 240,882 | ||||||
Continental AG | 1,506 | 339,386 | ||||||
Daimler AG Registered | 11,116 | 809,204 | ||||||
Deutsche Bank AG Registered | 29,848 | 478,000 | ||||||
Deutsche Boerse AG | 2,832 | 302,320 | ||||||
Deutsche Lufthansa AG Registered | 4,450 | 111,473 | ||||||
Deutsche Post AG Registered | 14,198 | 588,183 | ||||||
Deutsche Telekom AG Registered | 42,099 | 758,780 | ||||||
E.ON SE | 31,772 | 358,661 | ||||||
Fresenius Medical Care AG & Co. KGaA | 3,410 | 318,251 | ||||||
Fresenius SE & Co. KGaAb | 5,828 | 492,576 | ||||||
GEA Group AGb | 3,782 | 166,367 | ||||||
Hannover Rueck SE | 1,240 | 150,077 | ||||||
HeidelbergCement AG | 2,480 | 237,794 | ||||||
Henkel AG & Co. KGaA | 1,798 | 217,398 | ||||||
Infineon Technologies AGb | 18,972 | 436,906 | ||||||
Lanxess AG | 2,294 | 170,868 | ||||||
Linde AGb | 2,728 | 522,336 | ||||||
MAN SE | 1,426 | 159,890 | ||||||
Merck KGaA | 2,294 | 251,624 | ||||||
Muenchener Rueckversicherungs-Gesellschaft AG in Muenchen Registered | 2,046 | 421,794 | ||||||
Osram Licht AG | 2,171 | 178,044 | ||||||
ProSiebenSat.1 Media SE Registered | 3,669 | 122,923 | ||||||
QIAGEN NVb | 5,254 | 168,374 | ||||||
RWE AGa | 8,432 | 210,070 | ||||||
SAP SE | 13,330 | 1,396,211 | ||||||
Siemens AG Registered | 10,292 | 1,343,530 | ||||||
SCHEDULESOF INVESTMENTS | 17 |
Table of Contents
Schedule of Investments (Continued)
iSHARES® MSCI WORLD ETF
August 31, 2017
| Security | Shares | Value | ||||||
thyssenkrupp AGb | 6,882 | $ | 206,105 | |||||
Vonovia SE | 8,122 | 342,845 | ||||||
Zalando SEa,b,c | 2,418 | 114,372 | ||||||
|
| |||||||
| 16,953,018 | ||||||||
HONG KONG — 1.34% |
| |||||||
AIA Group Ltd. | 173,600 | 1,331,981 | ||||||
Bank of East Asia Ltd. (The)b | 49,600 | 227,199 | ||||||
BOC Hong Kong Holdings Ltd. | 93,000 | 473,529 | ||||||
Cheung Kong Property Holdings Ltd. | 62,000 | 544,231 | ||||||
CK Hutchison Holdings Ltd. | 31,000 | 405,599 | ||||||
CLP Holdings Ltd. | 31,000 | 327,370 | ||||||
Galaxy Entertainment Group Ltd. | 62,000 | 388,963 | ||||||
Hang Seng Bank Ltd. | 18,600 | 427,780 | ||||||
Hong Kong & China Gas Co. Ltd.b | 222,497 | 420,747 | ||||||
Hong Kong Exchanges & Clearing Ltd. | 15,500 | 423,027 | ||||||
Jardine Matheson Holdings Ltd. | 6,200 | 407,402 | ||||||
Li & Fung Ltd.b | 132,000 | 59,536 | ||||||
Link REIT | 62,000 | 511,752 | ||||||
MTR Corp. Ltd. | 62,000 | 362,425 | ||||||
New World Development Co. Ltd. | 204,333 | 279,356 | ||||||
Sands China Ltd.b | 49,600 | 222,129 | ||||||
|
| |||||||
| 6,813,026 | ||||||||
IRELAND — 0.16% |
| |||||||
Bank of Ireland Group PLCa | 12,663 | 105,385 | ||||||
CRH PLC | 10,540 | 367,597 | ||||||
Kerry Group PLC Class A | 2,728 | 253,725 | ||||||
Paddy Power Betfair PLC | 1,252 | 109,836 | ||||||
|
| |||||||
| 836,543 | ||||||||
ISRAEL — 0.15% |
| |||||||
Bank Hapoalim BM | 33,170 | 223,159 | ||||||
Check Point Software Technologies Ltd.a,b | 2,046 | 228,886 | ||||||
Nice Ltd. | 1,736 | 134,363 | ||||||
Teva Pharmaceutical Industries Ltd. ADRb | 12,710 | 201,580 | ||||||
|
| |||||||
| 787,988 | ||||||||
ITALY — 0.90% |
| |||||||
Assicurazioni Generali SpA | 16,244 | 290,460 | ||||||
Atlantia SpA | 7,688 | 246,787 | ||||||
CNH Industrial NV | 18,315 | 207,513 | ||||||
Enel SpA | 100,832 | 609,585 | ||||||
Eni SpA | 33,914 | 531,019 | ||||||
| Security | Shares | Value | ||||||
Ferrari NV | 2,410 | $ | 275,350 | |||||
Fiat Chrysler Automobiles NVa | 15,376 | 231,249 | ||||||
Intesa Sanpaolo SpA | 182,280 | 614,597 | ||||||
Leonardo SpA | 3,996 | 67,510 | ||||||
Luxottica Group SpA | 2,790 | 160,378 | ||||||
Saipem SpAa,b | 13,729 | 50,893 | ||||||
Snam SpA | 46,788 | 227,511 | ||||||
Telecom Italia SpA/Milanoa | 238,766 | 228,372 | ||||||
Tenaris SAb | 7,688 | 102,645 | ||||||
Terna Rete Elettrica Nazionale SpA | 30,566 | 180,246 | ||||||
UniCredit SpAa | 26,996 | 548,513 | ||||||
|
| |||||||
| 4,572,628 | ||||||||
JAPAN — 8.69% |
| |||||||
Aeon Co. Ltd. | 12,400 | 182,744 | ||||||
Aisin Seiki Co. Ltd. | 6,200 | 311,521 | ||||||
Ajinomoto Co. Inc. | 12,400 | 244,654 | ||||||
ANA Holdings Inc. | 62,000 | 229,726 | ||||||
Asahi Group Holdings Ltd. | 12,400 | 539,557 | ||||||
Asahi Kasei Corp. | 62,000 | 741,904 | ||||||
Astellas Pharma Inc. | 37,200 | 467,620 | ||||||
Bridgestone Corp. | 12,400 | 531,670 | ||||||
Canon Inc. | 18,600 | 651,321 | ||||||
Casio Computer Co. Ltd. | 6,500 | 91,777 | ||||||
Chubu Electric Power Co. Inc. | 18,600 | 242,851 | ||||||
Chugai Pharmaceutical Co. Ltd. | 6,200 | 251,808 | ||||||
Chugoku Electric Power Co. Inc. (The) | 18,600 | 214,290 | ||||||
Concordia Financial Group Ltd. | 24,800 | 118,502 | ||||||
Dai-ichi Life Holdings Inc. | 15,200 | 244,449 | ||||||
Daiichi Sankyo Co. Ltd. | 13,300 | 314,071 | ||||||
Daikin Industries Ltd. | 6,200 | 619,380 | ||||||
Daiwa House Industry Co. Ltd. | 12,400 | 433,425 | ||||||
Denso Corp. | 6,200 | 300,592 | ||||||
Dentsu Inc. | 6,200 | 259,131 | ||||||
East Japan Railway Co. | 6,200 | 568,117 | ||||||
Eisai Co. Ltd. | 6,200 | 320,760 | ||||||
FANUC Corp. | 2,700 | 523,514 | ||||||
Fast Retailing Co. Ltd. | 700 | 200,154 | ||||||
FUJIFILM Holdings Corp. | 6,200 | 243,471 | ||||||
Fujitsu Ltd. | 62,000 | 459,170 | ||||||
Hakuhodo DY Holdings Inc. | 12,400 | 168,661 | ||||||
Hitachi Ltd. | 62,000 | 426,440 | ||||||
Honda Motor Co. Ltd. | 24,800 | 694,247 | ||||||
Hoya Corp. | 6,200 | 354,616 | ||||||
| 18 | 2017 iSHARES ANNUAL REPORTTO SHAREHOLDERS |
Table of Contents
Schedule of Investments (Continued)
iSHARES® MSCI WORLD ETF
August 31, 2017
| Security | Shares | Value | ||||||
Hulic Co. Ltd. | 12,400 | $ | 122,693 | |||||
Iida Group Holdings Co. Ltd. | 6,200 | 105,286 | ||||||
INPEX Corp. | 24,800 | 236,824 | ||||||
ITOCHU Corp. | 24,800 | 404,696 | ||||||
Japan Airlines Co. Ltd. | 6,200 | 212,826 | ||||||
Japan Exchange Group Inc. | 12,400 | 211,023 | ||||||
Japan Retail Fund Investment Corp. | 124 | 227,923 | ||||||
Japan Tobacco Inc. | 18,600 | 636,111 | ||||||
JFE Holdings Inc. | 12,400 | 244,710 | ||||||
JTEKT Corp. | 6,200 | 82,866 | ||||||
JXTG Holdings Inc. | 55,800 | 269,925 | ||||||
Kansai Electric Power Co. Inc. (The) | 18,600 | 260,258 | ||||||
Kao Corp. | 6,200 | 386,556 | ||||||
KDDI Corp. | 24,800 | 668,559 | ||||||
Kirin Holdings Co. Ltd. | 18,600 | 421,905 | ||||||
Kobe Steel Ltd.a | 6,200 | 74,585 | ||||||
Komatsu Ltd. | 18,600 | 502,771 | ||||||
Konami Holdings Corp. | 6,200 | 322,788 | ||||||
Konica Minolta Inc. | 18,600 | 148,381 | ||||||
Kubota Corp. | 18,600 | 321,774 | ||||||
Kuraray Co. Ltd. | 18,600 | 352,869 | ||||||
Kyocera Corp. | 6,200 | 371,797 | ||||||
Kyushu Electric Power Co. Inc. | 12,400 | 145,564 | ||||||
Kyushu Financial Group Inc. | 18,600 | 113,229 | ||||||
M3 Inc.b | 6,200 | 160,943 | ||||||
Marubeni Corp. | 43,400 | 282,104 | ||||||
Marui Group Co. Ltd. | 6,200 | 86,696 | ||||||
Mazda Motor Corp. | 12,400 | 182,406 | ||||||
Mitsubishi Chemical Holdings Corp. | 43,400 | 403,400 | ||||||
Mitsubishi Corp. | 24,800 | 573,131 | ||||||
Mitsubishi Electric Corp. | 28,600 | 422,789 | ||||||
Mitsubishi Estate Co. Ltd. | 13,600 | 234,040 | ||||||
Mitsubishi Heavy Industries Ltd. | 62,000 | 237,105 | ||||||
Mitsubishi Motors Corp. | 12,400 | 91,485 | ||||||
Mitsubishi UFJ Financial Group Inc. | 180,400 | 1,104,921 | ||||||
Mitsubishi UFJ Lease & Finance Co. Ltd. | 43,400 | 219,248 | ||||||
Mitsui & Co. Ltd. | 31,100 | 464,692 | ||||||
Mitsui Fudosan Co. Ltd. | 8,800 | 190,136 | ||||||
Mizuho Financial Group Inc. | 378,200 | 649,806 | ||||||
MS&AD Insurance Group Holdings Inc. | 8,100 | 267,081 | ||||||
Murata Manufacturing Co. Ltd. | 2,400 | 367,218 | ||||||
Nagoya Railroad Co. Ltd. | 62,000 | 277,158 | ||||||
| Security | Shares | Value | ||||||
NEC Corp. | 30,000 | $ | 79,320 | |||||
Nidec Corp. | 6,200 | 701,908 | ||||||
Nikon Corp. | 12,400 | 204,263 | ||||||
Nintendo Co. Ltd. | �� | 1,600 | 532,655 | |||||
Nippon Paint Holdings Co. Ltd.b | 6,200 | 211,248 | ||||||
Nippon Steel & Sumitomo Metal Corp. | 12,447 | 296,812 | ||||||
Nippon Telegraph & Telephone Corp. | 12,400 | 616,057 | ||||||
Nissan Motor Co. Ltd. | 43,400 | 431,003 | ||||||
Nitto Denko Corp. | 6,200 | 546,317 | ||||||
Nomura Holdings Inc. | 68,200 | 379,543 | ||||||
Nomura Real Estate Master Fund Inc. | 124 | 163,703 | ||||||
NTT DOCOMO Inc. | 24,800 | 575,384 | ||||||
Olympus Corp.b | 6,200 | 213,783 | ||||||
Omron Corp. | 6,200 | 310,958 | ||||||
Ono Pharmaceutical Co. Ltd. | 6,200 | 126,242 | ||||||
Oriental Land Co. Ltd./Japan | 6,200 | 465,254 | ||||||
ORIX Corp. | 24,800 | 396,471 | ||||||
Otsuka Holdings Co. Ltd. | 6,200 | 249,499 | ||||||
Panasonic Corp. | 37,200 | 495,335 | ||||||
Rakuten Inc. | 18,600 | 220,628 | ||||||
Recruit Holdings Co. Ltd. | 18,600 | 370,276 | ||||||
Resona Holdings Inc. | 43,400 | 216,330 | ||||||
Ricoh Co. Ltd. | 18,600 | 186,068 | ||||||
Sekisui House Ltd. | 12,400 | 214,516 | ||||||
Seven & I Holdings Co. Ltd. | 12,400 | 491,786 | ||||||
Seven Bank Ltd. | 37,200 | 140,945 | ||||||
Shin-Etsu Chemical Co. Ltd. | 6,200 | 547,781 | ||||||
Shionogi & Co. Ltd. | 6,200 | 326,449 | ||||||
Shiseido Co. Ltd. | 6,200 | 256,822 | ||||||
SoftBank Group Corp. | 12,400 | 1,005,204 | ||||||
Sompo Holdings Inc. | 6,200 | 232,937 | ||||||
Sony Corp. | 18,600 | 732,948 | ||||||
Subaru Corp. | 6,200 | 217,220 | ||||||
Sumitomo Corp. | 31,000 | 438,411 | ||||||
Sumitomo Electric Industries Ltd. | 18,600 | 291,016 | ||||||
Sumitomo Mitsui Financial Group Inc. | 18,600 | 695,261 | ||||||
Sumitomo Mitsui Trust Holdings Inc. | 6,200 | 214,403 | ||||||
Sumitomo Realty & Development Co. Ltd. | 5,000 | 151,145 | ||||||
Suzuki Motor Corp. | 6,200 | 311,296 | ||||||
SCHEDULESOF INVESTMENTS | 19 |
Table of Contents
Schedule of Investments (Continued)
iSHARES® MSCI WORLD ETF
August 31, 2017
| Security | Shares | Value | ||||||
Sysmex Corp. | 6,200 | $ | 381,937 | |||||
T&D Holdings Inc. | 12,400 | 169,956 | ||||||
Takeda Pharmaceutical Co. Ltd. | 12,400 | 684,670 | ||||||
Terumo Corp. | 6,200 | 239,415 | ||||||
Tohoku Electric Power Co. Inc. | 12,400 | 169,449 | ||||||
Tokio Marine Holdings Inc. | 12,400 | 494,603 | ||||||
Tokyo Electric Power Co. Holdings Inc.a | 31,000 | 125,341 | ||||||
Tokyo Gas Co. Ltd. | 62,000 | 328,534 | ||||||
Tokyu Fudosan Holdings Corp. | 24,800 | 147,818 | ||||||
Toshiba Corp.a,b | 62,000 | 172,379 | ||||||
Toyota Motor Corp. | 37,200 | 2,089,838 | ||||||
Unicharm Corp. | 6,200 | 145,733 | ||||||
USS Co. Ltd. | 6,200 | 121,735 | ||||||
Yahoo Japan Corp. | 43,500 | 199,200 | ||||||
Yamada Denki Co. Ltd. | 24,800 | 134,072 | ||||||
Yamaha Corp. | 6,200 | 215,755 | ||||||
Yamato Holdings Co. Ltd. | 6,200 | 132,044 | ||||||
Yokogawa Electric Corp. | 6,200 | 96,498 | ||||||
|
| |||||||
| 44,316,595 | ||||||||
NETHERLANDS — 1.43% |
| |||||||
Aegon NV | 25,792 | 147,065 | ||||||
AerCap Holdings NVa,b | 2,666 | 134,100 | ||||||
Akzo Nobel NV | 3,721 | 339,755 | ||||||
Altice NV Class Aa,b | 4,244 | 97,735 | ||||||
Altice NV Class Ba | 2,418 | 55,842 | ||||||
ArcelorMittala,b | 9,072 | 242,031 | ||||||
ASML Holding NV | 5,208 | 808,028 | ||||||
Gemalto NVb | 1,612 | 87,000 | ||||||
Heineken Holding NV | 2,108 | 207,864 | ||||||
Heineken NV | 3,286 | 344,300 | ||||||
ING Groep NV | 51,336 | 909,397 | ||||||
Koninklijke Ahold Delhaize NV | 18,807 | 337,630 | ||||||
Koninklijke DSM NV | 3,039 | 230,261 | ||||||
Koninklijke KPN NV | 54,188 | 191,404 | ||||||
Koninklijke Philips NV | 13,779 | 520,615 | ||||||
NN Group NV | 3,658 | 144,974 | ||||||
NXP Semiconductors NVa | 4,712 | 532,267 | ||||||
Randstad Holding NV | 2,123 | 123,943 | ||||||
RELX NV | 14,203 | 297,784 | ||||||
Unilever NV CVA | 21,576 | 1,282,841 | ||||||
Wolters Kluwer NV | 5,766 | 251,551 | ||||||
|
| |||||||
| 7,286,387 | ||||||||
| Security | Shares | Value | ||||||
NEW ZEALAND — 0.04% |
| |||||||
Fletcher Building Ltd. | 19,716 | $ | 115,224 | |||||
Spark New Zealand Ltd. | 39,990 | 112,129 | ||||||
|
| |||||||
| 227,353 | ||||||||
NORWAY — 0.25% |
| |||||||
DNB ASA | 15,376 | 299,423 | ||||||
Norsk Hydro ASA | 23,932 | 172,265 | ||||||
Orkla ASA | 15,162 | 155,228 | ||||||
Statoil ASA | 16,306 | 308,101 | ||||||
Telenor ASA | 9,858 | 199,064 | ||||||
Yara International ASA | 3,720 | 151,720 | ||||||
|
| |||||||
| 1,285,801 | ||||||||
PORTUGAL — 0.04% |
| |||||||
EDP – Energias de Portugal SA | 30,283 | 116,111 | ||||||
Galp Energia SGPS SA | 3,923 | 64,877 | ||||||
|
| |||||||
| 180,988 | ||||||||
SINGAPORE — 0.47% |
| |||||||
Ascendas REIT | 101,765 | 199,334 | ||||||
CapitaLand Ltd.b | 86,800 | 241,608 | ||||||
CapitaLand Mall Trust | 136,400 | 217,959 | ||||||
DBS Group Holdings Ltd. | 23,400 | 355,308 | ||||||
Genting Singapore PLC | 142,600 | 124,434 | ||||||
Global Logistic Properties Ltd.b | 74,400 | 177,508 | ||||||
Hutchison Port Holdings Trustb | 173,600 | 78,988 | ||||||
Oversea-Chinese Banking Corp. Ltd. | 43,400 | 356,979 | ||||||
Singapore Press Holdings Ltd.b | 3,700 | 7,520 | ||||||
Singapore Telecommunications Ltd.b | 124,000 | 337,850 | ||||||
United Overseas Bank Ltd. | 16,800 | 297,278 | ||||||
|
| |||||||
| 2,394,766 | ||||||||
SPAIN — 1.33% |
| |||||||
Abertis Infraestructuras SA | 12,747 | 257,633 | ||||||
ACS Actividades de Construccion y Servicios SA | 4,203 | 158,703 | ||||||
Aena SAc | 1,302 | 253,941 | ||||||
Amadeus IT Group SA | 6,882 | 426,037 | ||||||
Banco Bilbao Vizcaya Argentaria SA | 87,919 | 775,798 | ||||||
Banco de Sabadell SA | 89,661 | 196,886 | ||||||
Banco Santander SA | 212,824 | 1,381,271 | ||||||
Bankia SA | 25,714 | 125,006 | ||||||
Bankinter SA | 16,430 | 156,464 | ||||||
CaixaBank SA | 59,229 | 305,470 | ||||||
Distribuidora Internacional de Alimentacion SAb | 11,842 | 74,844 | ||||||
| 20 | 2017 iSHARES ANNUAL REPORTTO SHAREHOLDERS |
Table of Contents
Schedule of Investments (Continued)
iSHARES® MSCI WORLD ETF
August 31, 2017
| Security | Shares | Value | ||||||
Enagas SA | 537 | $ | 15,805 | |||||
Endesa SA | 3,930 | 94,686 | ||||||
Ferrovial SA | 8,242 | 187,600 | ||||||
Gas Natural SDG SA | 4,092 | 99,343 | ||||||
Grifols SA | 6,262 | 176,816 | ||||||
Iberdrola SA | 72,260 | 589,428 | ||||||
Industria de Diseno Textil SA | 13,950 | 529,315 | ||||||
International Consolidated Airlines Group SA | 10,292 | 81,334 | ||||||
Red Electrica Corp. SA | 1,519 | 34,069 | ||||||
Repsol SA | 17,705 | 303,744 | ||||||
Telefonica SA | 53,233 | 573,332 | ||||||
|
| |||||||
| 6,797,525 | ||||||||
SWEDEN — 1.09% |
| |||||||
Alfa Laval AB | 5,766 | 130,430 | ||||||
Assa Abloy AB Class B | 15,004 | 323,938 | ||||||
Atlas Copco AB Class A | 8,122 | 317,843 | ||||||
Atlas Copco AB Class B | 6,944 | 247,484 | ||||||
Boliden AB | 5,584 | 195,084 | ||||||
Electrolux AB Class B | 4,216 | 153,066 | ||||||
Essity AB Class Ba | 8,680 | 240,634 | ||||||
Hennes & Mauritz AB Class B | 11,656 | 294,427 | ||||||
Hexagon AB Class B | 4,402 | 215,693 | ||||||
Investor AB Class B | 6,200 | 289,534 | ||||||
Kinnevik AB Class B | 3,968 | 119,229 | ||||||
Lundin Petroleum ABa,b | 4,650 | 99,634 | ||||||
Millicom International Cellular SA SDR | 1,366 | 85,095 | ||||||
Nordea Bank AB | 38,750 | 520,572 | ||||||
Sandvik AB | 20,961 | 345,866 | ||||||
Skandinaviska Enskilda Banken AB Class A | 19,592 | 254,584 | ||||||
Skanska AB Class B | 6,262 | 141,257 | ||||||
SKF AB Class B | 6,200 | 123,730 | ||||||
Svenska Handelsbanken AB Class A | 19,902 | 297,129 | ||||||
Swedbank AB Class A | 10,354 | 279,495 | ||||||
Swedish Match AB | 4,030 | 143,477 | ||||||
Telefonaktiebolaget LM Ericsson Class B | 43,090 | 252,182 | ||||||
Telia Co. AB | 25,510 | 121,501 | ||||||
Volvo AB Class B | 21,711 | 370,247 | ||||||
|
| |||||||
| 5,562,131 | ||||||||
| Security | Shares | Value | ||||||
SWITZERLAND — 3.06% |
| |||||||
ABB Ltd. Registered | 26,722 | $ | 617,303 | |||||
Adecco Group AG Registered | 2,604 | 188,323 | ||||||
Baloise Holding AG Registered | 1,178 | 187,181 | ||||||
Cie. Financiere Richemont SA Class A Registered | 7,378 | 658,339 | ||||||
Credit Suisse Group AG Registered | 30,700 | 450,437 | ||||||
Geberit AG Registered | 744 | 339,174 | ||||||
Givaudan SA Registered | 124 | 252,903 | ||||||
Julius Baer Group Ltd. | 3,658 | 204,026 | ||||||
Kuehne + Nagel International AG Registered | 1,522 | 275,100 | ||||||
LafargeHolcim Ltd. Registered | 6,696 | 392,632 | ||||||
Nestle SA Registered | 41,540 | 3,516,419 | ||||||
Novartis AG Registered | 29,512 | 2,484,413 | ||||||
Partners Group Holding AG | 496 | 321,032 | ||||||
Roche Holding AG | 9,362 | 2,372,161 | ||||||
Schindler Holding AG Participation Certificates | 744 | 159,019 | ||||||
Schindler Holding AG Registered | 744 | 156,000 | ||||||
SGS SA Registered | 124 | 276,516 | ||||||
Sonova Holding AG Registered | 1,364 | 230,078 | ||||||
Swatch Group AG (The) Bearer | 682 | 271,665 | ||||||
Swiss Life Holding AG Registered | 558 | 199,277 | ||||||
Swiss Prime Site AG Registered | 970 | 87,613 | ||||||
Swiss Re AG | 4,030 | 364,210 | ||||||
Swisscom AG Registered | 414 | 208,336 | ||||||
UBS Group AG | 49,052 | 806,474 | ||||||
Zurich Insurance Group AG | 1,922 | 573,800 | ||||||
|
| |||||||
| 15,592,431 | ||||||||
UNITED KINGDOM — 6.54% |
| |||||||
3i Group PLC | 16,213 | 202,541 | ||||||
Admiral Group PLC | 3,906 | 97,189 | ||||||
Anglo American PLC | 19,654 | 355,185 | ||||||
Antofagasta PLC | 9,672 | 128,991 | ||||||
Ashtead Group PLC | 7,524 | 161,229 | ||||||
Associated British Foods PLC | 5,270 | 225,586 | ||||||
AstraZeneca PLC | 17,050 | 997,648 | ||||||
Auto Trader Group PLCc | 22,878 | 104,180 | ||||||
Aviva PLC | 51,410 | 346,127 | ||||||
Babcock International Group PLC | 7,316 | 76,595 | ||||||
BAE Systems PLC | 46,190 | 361,573 | ||||||
Barclays PLC | 225,060 | 554,192 | ||||||
BHP Billiton PLC | 29,636 | 563,838 | ||||||
SCHEDULESOF INVESTMENTS | 21 |
Table of Contents
Schedule of Investments (Continued)
iSHARES® MSCI WORLD ETF
August 31, 2017
| Security | Shares | Value | ||||||
BP PLC | 255,750 | $ | 1,466,977 | |||||
British American Tobacco PLC | 31,051 | 1,932,920 | ||||||
British Land Co. PLC (The) | 13,206 | 104,056 | ||||||
BT Group PLC | 113,956 | 429,575 | ||||||
Bunzl PLC | 7,254 | 215,919 | ||||||
Burberry Group PLC | 7,378 | 170,839 | ||||||
Capita PLC | 11,408 | 95,328 | ||||||
Carnival PLC | 3,224 | 223,293 | ||||||
Centrica PLC | 73,718 | 189,884 | ||||||
Cobham PLC | 57,308 | 101,388 | ||||||
Compass Group PLC | 22,842 | 486,234 | ||||||
Croda International PLC | 2,998 | 148,419 | ||||||
Diageo PLC | 33,666 | 1,124,418 | ||||||
Experian PLC | 14,632 | 292,992 | ||||||
Ferguson PLC | 4,041 | 239,680 | ||||||
G4S PLC | 30,256 | 110,526 | ||||||
GKN PLC | 28,954 | 118,977 | ||||||
GlaxoSmithKline PLC | 65,906 | 1,302,297 | ||||||
Glencore PLC | 167,590 | 776,333 | ||||||
Hammerson PLC | 12,896 | 93,222 | ||||||
HSBC Holdings PLC | 265,422 | 2,566,782 | ||||||
IMI PLC | 7,253 | 106,075 | ||||||
Imperial Brands PLC | 12,710 | 524,161 | ||||||
Inmarsat PLC | 8,060 | 76,023 | ||||||
InterContinental Hotels Group PLC | 3,453 | 171,567 | ||||||
Intertek Group PLC | 3,720 | 244,943 | ||||||
Intu Properties PLCb | 22,755 | 72,951 | ||||||
Investec PLC | 13,702 | 104,169 | ||||||
ITV PLC | 56,730 | 115,936 | ||||||
J Sainsbury PLC | 27,914 | 84,742 | ||||||
Johnson Matthey PLC | 3,226 | 114,896 | ||||||
Kingfisher PLC | 31,992 | 123,216 | ||||||
Land Securities Group PLC | 11,470 | 149,275 | ||||||
Legal & General Group PLC | 77,686 | 260,466 | ||||||
Lloyds Banking Group PLC | 930,744 | 765,400 | ||||||
London Stock Exchange Group PLC | 5,274 | 268,435 | ||||||
Marks & Spencer Group PLC | 23,064 | 94,982 | ||||||
Meggitt PLC | 16,120 | 107,596 | ||||||
National Grid PLC | 45,694 | 573,894 | ||||||
Next PLC | 2,294 | 122,051 | ||||||
Old Mutual PLC | 73,160 | 195,611 | ||||||
Pearson PLC | 11,904 | 93,030 | ||||||
Prudential PLC | 35,092 | 820,929 | ||||||
Randgold Resources Ltd. | 1,160 | 118,232 | ||||||
| Security | Shares | Value | ||||||
Reckitt Benckiser Group PLC | 8,742 | $ | 825,914 | |||||
RELX PLC | 16,864 | 367,456 | ||||||
Rio Tinto PLC | 16,988 | 820,105 | ||||||
Rolls-Royce Holdings PLC | 25,358 | 298,650 | ||||||
Royal Bank of Scotland Group PLCa | 53,940 | 175,082 | ||||||
Royal Dutch Shell PLC Class A ADR | 56,884 | 1,559,046 | ||||||
Royal Dutch Shell PLC Class B | 52,021 | 1,448,219 | ||||||
RSA Insurance Group PLC | 19,485 | 167,341 | ||||||
Sage Group PLC (The) | 20,646 | 184,229 | ||||||
Segro PLC | 23,216 | �� | 160,943 | |||||
Severn Trent PLC | 5,332 | 155,893 | ||||||
Shire PLC | 12,356 | 610,344 | ||||||
Sky PLC | 13,578 | 167,261 | ||||||
Smith & Nephew PLC | 12,958 | 233,258 | ||||||
Smiths Group PLC | 8,494 | 169,099 | ||||||
SSE PLC | 12,728 | 233,709 | ||||||
Standard Chartered PLCa | 45,757 | 453,993 | ||||||
Standard Life Aberdeen PLC | 39,898 | 220,860 | ||||||
Tate & Lyle PLC | 14,942 | 131,598 | ||||||
Taylor Wimpey PLC | 56,482 | 145,924 | ||||||
Tesco PLCa | 118,730 | 276,758 | ||||||
TUI AG | 8,308 | 140,025 | ||||||
Unilever PLC | 17,546 | 1,021,696 | ||||||
United Utilities Group PLC | 12,834 | 150,489 | ||||||
Vodafone Group PLC | 342,367 | 976,722 | ||||||
Weir Group PLC (The) | 4,464 | 103,250 | ||||||
Whitbread PLC | 3,224 | 156,118 | ||||||
WPP PLC | 17,608 | 322,181 | ||||||
|
| |||||||
| 33,349,676 | ||||||||
UNITED STATES — 58.87% |
| |||||||
3M Co. | 7,874 | 1,608,816 | ||||||
Abbott Laboratories | 22,425 | 1,142,330 | ||||||
AbbVie Inc. | 21,080 | 1,587,324 | ||||||
Accenture PLC Class A | 8,246 | 1,078,247 | ||||||
Activision Blizzard Inc. | 9,921 | 650,421 | ||||||
Acuity Brands Inc. | 682 | 120,571 | ||||||
Adobe Systems Inc.a | 6,882 | 1,067,811 | ||||||
Advance Auto Parts Inc.b | 1,240 | 121,396 | ||||||
AES Corp./VA | 9,114 | 100,619 | ||||||
Aetna Inc. | 4,712 | 743,082 | ||||||
Affiliated Managers Group Inc. | 992 | 175,276 | ||||||
Aflac Inc. | 5,270 | 435,039 | ||||||
AGCO Corp. | 1,736 | 118,829 | ||||||
Agilent Technologies Inc. | 5,766 | 373,176 | ||||||
| 22 | 2017 iSHARES ANNUAL REPORTTO SHAREHOLDERS |
Table of Contents
Schedule of Investments (Continued)
iSHARES® MSCI WORLD ETF
August 31, 2017
| Security | Shares | Value | ||||||
AGNC Investment Corp. | 5,938 | $ | 127,905 | |||||
Air Products & Chemicals Inc. | 2,852 | 414,595 | ||||||
Akamai Technologies Inc.a | 2,666 | 125,702 | ||||||
Albemarle Corp. | 1,861 | 216,360 | ||||||
Alexion Pharmaceuticals Inc.a | 3,224 | 459,130 | ||||||
Alkermes PLCa | 2,790 | 141,676 | ||||||
Alleghany Corp.a | 151 | 84,978 | ||||||
Allergan PLC | 4,526 | 1,038,626 | ||||||
Alliance Data Systems Corp. | 806 | 181,753 | ||||||
Alliant Energy Corp. | 4,526 | 193,441 | ||||||
Allstate Corp. (The) | 5,332 | 482,546 | ||||||
Alphabet Inc. Class Aa | 4,030 | 3,849,617 | ||||||
Alphabet Inc. Class Ca | 4,216 | 3,960,215 | ||||||
Altria Group Inc. | 25,669 | 1,627,415 | ||||||
Amazon.com Inc.a | 5,456 | 5,350,154 | ||||||
Ameren Corp. | 4,092 | 245,479 | ||||||
American Airlines Group Inc. | 1,922 | 85,990 | ||||||
American Electric Power Co. Inc. | 6,572 | 483,896 | ||||||
American Express Co. | 10,106 | 870,127 | ||||||
American International Group Inc. | 13,082 | 791,199 | ||||||
American Tower Corp. | 5,952 | 881,194 | ||||||
American Water Works Co. Inc. | 3,720 | 300,948 | ||||||
Ameriprise Financial Inc. | 2,480 | 343,505 | ||||||
AmerisourceBergen Corp. | 2,604 | 208,971 | ||||||
AMETEK Inc. | 4,154 | 262,741 | ||||||
Amgen Inc. | 9,734 | 1,730,413 | ||||||
Amphenol Corp. Class A | 4,836 | 391,426 | ||||||
Anadarko Petroleum Corp. | 7,502 | 307,057 | ||||||
Analog Devices Inc. | 5,319 | 445,041 | ||||||
Andeavor | 2,294 | 229,744 | ||||||
Annaly Capital Management Inc. | 16,182 | 202,275 | ||||||
ANSYS Inc.a | 1,799 | 231,747 | ||||||
Anthem Inc. | 3,596 | 704,960 | ||||||
Aon PLC | 3,968 | 552,187 | ||||||
Apache Corp. | 5,208 | 202,279 | ||||||
Apple Inc. | 70,742 | 11,601,688 | ||||||
Applied Materials Inc. | 16,521 | 745,428 | ||||||
Arch Capital Group Ltd.a | 2,542 | 247,438 | ||||||
Archer-Daniels-Midland Co. | 8,060 | 333,039 | ||||||
Arconic Inc. | 5,874 | 149,611 | ||||||
Arrow Electronics Inc.a | 1,860 | 147,740 | ||||||
Assurant Inc. | 1,240 | 117,416 | ||||||
AT&T Inc. | 80,166 | 3,003,018 | ||||||
Autodesk Inc.a | 3,348 | 383,212 | ||||||
| Security | Shares | Value | ||||||
Autoliv Inc. | 1,364 | $ | 148,158 | |||||
Automatic Data Processing Inc. | 6,138 | 653,513 | ||||||
AutoZone Inc.a | 434 | 229,343 | ||||||
AvalonBay Communities Inc. | 1,984 | 372,456 | ||||||
Avery Dennison Corp. | 1,984 | 187,012 | ||||||
Avnet Inc. | 2,542 | 98,045 | ||||||
Axis Capital Holdings Ltd. | 2,108 | 126,986 | ||||||
Baker Hughes a GE Co. | 5,952 | 201,773 | ||||||
Ball Corp. | 5,208 | 208,268 | ||||||
Bank of America Corp. | 135,222 | 3,230,454 | ||||||
Bank of New York Mellon Corp. (The) | 14,198 | 742,271 | ||||||
Baxter International Inc. | 6,634 | 411,573 | ||||||
BB&T Corp. | 11,409 | 525,841 | ||||||
Becton Dickinson and Co. | 3,294 | 656,955 | ||||||
Bed Bath & Beyond Inc. | 2,666 | 73,555 | ||||||
Berkshire Hathaway Inc. Class Ba | 15,712 | 2,846,386 | ||||||
Best Buy Co. Inc. | 4,340 | 235,488 | ||||||
Biogen Inc.a | 2,976 | 942,083 | ||||||
BioMarin Pharmaceutical Inc.a | 2,604 | 234,855 | ||||||
BlackRock Inc.d | 1,612 | 675,444 | ||||||
Boeing Co. (The) | 7,812 | 1,872,224 | ||||||
BorgWarner Inc. | 3,286 | 152,503 | ||||||
Boston Properties Inc. | 2,356 | 284,134 | ||||||
Boston Scientific Corp.a | 20,212 | 556,841 | ||||||
Brighthouse Financial Inc.a | 1,341 | 76,531 | ||||||
Bristol-Myers Squibb Co. | 22,692 | 1,372,412 | ||||||
Broadcom Ltd. | 5,518 | 1,390,922 | ||||||
Brown-Forman Corp. Class B | 3,720 | 197,309 | ||||||
Bunge Ltd. | 2,170 | 161,947 | ||||||
CA Inc. | 4,774 | 158,401 | ||||||
Cabot Oil & Gas Corp. | 7,564 | 193,260 | ||||||
Campbell Soup Co. | 3,410 | 157,542 | ||||||
Capital One Financial Corp. | 6,882 | 547,876 | ||||||
Cardinal Health Inc. | 4,464 | 301,141 | ||||||
CarMax Inc.a | 3,162 | 212,328 | ||||||
Carnival Corp. | 5,022 | 348,929 | ||||||
Caterpillar Inc. | 7,750 | 910,548 | ||||||
CBRE Group Inc. Class Aa | 4,898 | 176,720 | ||||||
CBS Corp. Class B NVS | 5,828 | 373,342 | ||||||
CDK Global Inc. | 2,542 | 163,959 | ||||||
Celanese Corp. Series A | 2,418 | 234,594 | ||||||
Celgene Corp.a | 10,478 | 1,455,709 | ||||||
Centene Corp.a | 2,914 | 258,909 | ||||||
SCHEDULESOF INVESTMENTS | 23 |
Table of Contents
Schedule of Investments (Continued)
iSHARES® MSCI WORLD ETF
August 31, 2017
| Security | Shares | Value | ||||||
CenterPoint Energy Inc. | 6,510 | $ | 192,826 | |||||
CenturyLink Inc. | 7,502 | 147,939 | ||||||
Cerner Corp.a | 4,216 | 285,760 | ||||||
CF Industries Holdings Inc. | 3,540 | 102,625 | ||||||
CH Robinson Worldwide Inc. | 2,542 | 179,541 | ||||||
Charles Schwab Corp. (The) | 16,864 | 672,874 | ||||||
Charter Communications Inc. Class Aa | 2,945 | 1,173,700 | ||||||
Cheniere Energy Inc.a | 3,472 | 148,567 | ||||||
Chevron Corp. | 24,986 | 2,688,993 | ||||||
Chipotle Mexican Grill Inc.a,b | 434 | 137,452 | ||||||
Chubb Ltd. | 5,899 | 834,237 | ||||||
Church & Dwight Co. Inc. | 4,712 | 236,401 | ||||||
Cigna Corp. | 3,596 | 654,688 | ||||||
Cimarex Energy Co. | 1,488 | 148,339 | ||||||
Cincinnati Financial Corp. | 2,356 | 181,035 | ||||||
Cintas Corp. | 1,798 | 242,748 | ||||||
Cisco Systems Inc. | 65,472 | 2,108,853 | ||||||
CIT Group Inc. | 3,720 | 166,842 | ||||||
Citigroup Inc. | 36,828 | 2,505,409 | ||||||
Citizens Financial Group Inc. | 8,460 | 280,280 | ||||||
Citrix Systems Inc.a | 2,666 | 208,508 | ||||||
Clorox Co. (The) | 2,109 | 292,160 | ||||||
CME Group Inc. | 4,588 | 577,170 | ||||||
CMS Energy Corp. | 4,960 | 240,758 | ||||||
Coach Inc. | 4,216 | 175,807 | ||||||
Coca-Cola Co. (The) | 52,576 | 2,394,837 | ||||||
Cognizant Technology Solutions Corp. Class A | 8,308 | 587,957 | ||||||
Colgate-Palmolive Co. | 11,222 | 803,944 | ||||||
Comcast Corp. Class A | 63,364 | 2,573,212 | ||||||
Comerica Inc. | 3,782 | 258,122 | ||||||
Conagra Brands Inc. | 6,820 | 221,377 | ||||||
Concho Resources Inc.a | 2,170 | 240,805 | ||||||
ConocoPhillips | 16,368 | 714,627 | ||||||
Consolidated Edison Inc. | 4,464 | 376,181 | ||||||
Constellation Brands Inc. Class A | 2,604 | 521,060 | ||||||
Continental Resources Inc./OKa,b | 1,620 | 54,950 | ||||||
Core Laboratories NV | 992 | 87,475 | ||||||
Corning Inc. | 15,004 | 431,515 | ||||||
Costco Wholesale Corp. | 5,952 | 932,916 | ||||||
Coty Inc. Class A | 6,718 | 111,384 | ||||||
CR Bard Inc. | 1,116 | 358,024 | ||||||
Crown Castle International Corp. | 5,518 | 598,372 | ||||||
| Security | Shares | Value | ||||||
Crown Holdings Inc.a | 2,976 | $ | 175,673 | |||||
CSX Corp. | 13,392 | 672,278 | ||||||
Cummins Inc. | 2,356 | 375,499 | ||||||
CVS Health Corp. | 13,578 | 1,050,123 | ||||||
Danaher Corp. | 8,122 | 677,537 | ||||||
Darden Restaurants Inc. | 2,170 | 178,135 | ||||||
DaVita Inc.a | 2,480 | 145,229 | ||||||
Deere & Co. | 3,782 | 438,447 | ||||||
Dell Technologies Inc. Class Va | 3,411 | 255,586 | ||||||
Delphi Automotive PLC | 3,676 | 354,366 | ||||||
Delta Air Lines Inc. | 1,632 | 77,014 | ||||||
DENTSPLY SIRONA Inc. | 3,782 | 213,948 | ||||||
Devon Energy Corp. | 6,820 | 214,148 | ||||||
Dick’s Sporting Goods Inc. | 1,860 | 49,030 | ||||||
Digital Realty Trust Inc. | 2,666 | 315,494 | ||||||
Discover Financial Services | 5,642 | 332,596 | ||||||
Discovery Communications Inc. Class Aa | 2,108 | 46,819 | ||||||
Discovery Communications Inc. Class C NVSa,b | 4,030 | 84,670 | ||||||
DISH Network Corp. Class Aa | 3,348 | 191,807 | ||||||
Dollar General Corp. | 4,092 | 296,916 | ||||||
Dollar Tree Inc.a | 3,286 | 261,697 | ||||||
Dominion Energy Inc. | 7,998 | 630,002 | ||||||
Dover Corp. | 2,790 | 236,815 | ||||||
Dow Chemical Co. (The) | 14,756 | 983,487 | ||||||
DR Horton Inc. | 5,456 | 197,234 | ||||||
Dr Pepper Snapple Group Inc. | 3,224 | 293,545 | ||||||
DTE Energy Co. | 2,666 | 299,445 | ||||||
Duke Energy Corp. | 8,680 | 757,764 | ||||||
Duke Realty Corp. | 7,688 | 228,487 | ||||||
DXC Technology Co. | 4,265 | 362,525 | ||||||
Eastman Chemical Co. | 2,356 | 203,087 | ||||||
Eaton Corp. PLC | 6,076 | 436,014 | ||||||
Eaton Vance Corp. NVS | 2,480 | 117,998 | ||||||
eBay Inc.a | 15,190 | 548,815 | ||||||
Ecolab Inc. | 3,906 | 520,670 | ||||||
Edison International | 4,898 | 392,722 | ||||||
Edwards Lifesciences Corp.a | 3,100 | 352,346 | ||||||
EI du Pont de Nemours & Co. | 11,780 | 988,695 | ||||||
Electronic Arts Inc.a | 4,402 | 534,843 | ||||||
Eli Lilly & Co. | 13,826 | 1,123,916 | ||||||
Emerson Electric Co. | 8,742 | 516,128 | ||||||
Entergy Corp. | 2,790 | 220,884 | ||||||
| 24 | 2017 iSHARES ANNUAL REPORTTO SHAREHOLDERS |
Table of Contents
Schedule of Investments (Continued)
iSHARES® MSCI WORLD ETF
August 31, 2017
| Security | Shares | Value | ||||||
EOG Resources Inc. | 7,502 | $ | 637,595 | |||||
EQT Corp.b | 2,560 | 159,590 | ||||||
Equifax Inc. | 1,984 | 282,660 | ||||||
Equinix Inc. | 1,116 | 522,746 | ||||||
Equity Residential | 5,084 | 341,391 | ||||||
Essex Property Trust Inc. | 1,054 | 280,332 | ||||||
Estee Lauder Companies Inc. (The) Class A | 3,100 | 331,669 | ||||||
Everest Re Group Ltd. | 718 | 181,281 | ||||||
Eversource Energy | 4,836 | 304,668 | ||||||
Exelon Corp. | 12,276 | 464,892 | ||||||
Expedia Inc. | 1,798 | 266,751 | ||||||
Expeditors International of Washington Inc. | 3,596 | 201,736 | ||||||
Express Scripts Holding Co.a | 8,370 | 525,803 | ||||||
Exxon Mobil Corp. | 55,056 | 4,202,424 | ||||||
F5 Networks Inc.a | 1,302 | 155,433 | ||||||
Facebook Inc. Class Aa | 31,930 | 5,491,002 | ||||||
Fastenal Co. | 4,278 | 182,542 | ||||||
Federal Realty Investment Trust | 1,550 | 196,742 | ||||||
FedEx Corp. | 3,472 | 744,327 | ||||||
Fidelity National Information Services Inc. | 4,464 | 414,795 | ||||||
Fifth Third Bancorp. | 12,152 | 317,532 | ||||||
First Republic Bank/CA | 2,976 | 288,821 | ||||||
FirstEnergy Corp. | 6,448 | 210,076 | ||||||
Fiserv Inc.a | 3,596 | 444,861 | ||||||
FleetCor Technologies Inc.a | 1,303 | 187,332 | ||||||
Flex Ltd.a | 10,726 | 174,512 | ||||||
FLIR Systems Inc. | 3,100 | 117,800 | ||||||
Flowserve Corp. | 2,790 | 109,591 | ||||||
Fluor Corp. | 2,666 | 102,828 | ||||||
FMC Corp. | 2,294 | 197,789 | ||||||
FNF Group | 4,216 | 203,380 | ||||||
Foot Locker Inc. | 2,188 | 77,083 | ||||||
Ford Motor Co. | 43,958 | 484,857 | ||||||
Fortive Corp. | 4,546 | 295,354 | ||||||
Franklin Resources Inc. | 5,394 | 233,183 | ||||||
Freeport-McMoRan Inc.a | 18,042 | 266,661 | ||||||
Gap Inc. (The) | 3,658 | 86,402 | ||||||
Garmin Ltd. | 1,922 | 98,983 | ||||||
General Dynamics Corp. | 3,658 | 736,538 | ||||||
General Electric Co. | 114,328 | 2,806,752 | ||||||
General Mills Inc. | 7,998 | 425,973 | ||||||
| Security | Shares | Value | ||||||
General Motors Co. | 16,864 | $ | 616,211 | |||||
Genuine Parts Co. | 2,542 | 210,554 | ||||||
GGP Inc. | 8,432 | 174,964 | ||||||
Gilead Sciences Inc. | 17,050 | 1,427,255 | ||||||
Global Payments Inc. | 2,666 | 254,576 | ||||||
Goldman Sachs Group Inc. (The) | 4,774 | 1,068,135 | ||||||
Goodyear Tire & Rubber Co. (The) | 4,092 | 123,988 | ||||||
H&R Block Inc. | 3,472 | 92,841 | ||||||
Halliburton Co. | 11,656 | 454,234 | ||||||
Hanesbrands Inc. | 5,642 | 136,875 | ||||||
Harley-Davidson Inc. | 2,542 | 119,499 | ||||||
Harris Corp. | 2,465 | 302,949 | ||||||
Hartford Financial Services Group Inc. (The) | 5,766 | 311,768 | ||||||
Hasbro Inc. | 1,737 | 170,660 | ||||||
HCA Healthcare Inc.a | 4,340 | 341,384 | ||||||
HCP Inc. | 6,882 | 205,152 | ||||||
Helmerich & Payne Inc. | 1,612 | 68,252 | ||||||
Henry Schein Inc.a,b | 1,426 | 247,668 | ||||||
Hershey Co. (The) | 2,418 | 253,697 | ||||||
Hess Corp. | 3,968 | 154,355 | ||||||
Hewlett Packard Enterprise Co. | 23,126 | 417,656 | ||||||
Hilton Worldwide Holdings Inc. | 3,102 | 199,552 | ||||||
HollyFrontier Corp. | 3,038 | 95,120 | ||||||
Hologic Inc.a | 5,580 | 215,388 | ||||||
Home Depot Inc. (The) | 15,934 | 2,388,029 | ||||||
Honeywell International Inc. | 9,424 | 1,303,056 | ||||||
Hormel Foods Corp. | 4,898 | 150,565 | ||||||
Host Hotels & Resorts Inc. | 10,168 | 184,244 | ||||||
HP Inc. | 24,242 | 462,537 | ||||||
Humana Inc. | 2,108 | 543,063 | ||||||
Huntington Bancshares Inc./OH | 17,150 | 215,919 | ||||||
IHS Markit Ltd.a | 5,518 | 258,463 | ||||||
Illinois Tool Works Inc. | 4,712 | 647,947 | ||||||
Illumina Inc.a | 2,170 | 443,678 | ||||||
Incyte Corp.a | 2,666 | 366,335 | ||||||
Ingersoll-Rand PLC | 3,968 | 338,828 | ||||||
Intel Corp. | 60,947 | 2,137,411 | ||||||
Intercontinental Exchange Inc. | 8,308 | 537,278 | ||||||
International Business Machines Corp. | 11,656 | 1,667,158 | ||||||
International Flavors & Fragrances Inc. | 1,426 | 195,148 | ||||||
International Paper Co. | 5,456 | 293,915 | ||||||
SCHEDULESOF INVESTMENTS | 25 |
Table of Contents
Schedule of Investments (Continued)
iSHARES® MSCI WORLD ETF
August 31, 2017
| Security | Shares | Value | ||||||
Interpublic Group of Companies Inc. (The) | 6,882 | $ | 138,603 | |||||
Intuit Inc. | 3,596 | 508,654 | ||||||
Intuitive Surgical Inc.a | 620 | 622,895 | ||||||
Invesco Ltd. | 6,510 | 213,398 | ||||||
Iron Mountain Inc. | 4,235 | 166,944 | ||||||
Jacobs Engineering Group Inc. | 2,480 | 135,135 | ||||||
Jazz Pharmaceuticals PLCa,b | 992 | 148,165 | ||||||
JB Hunt Transport Services Inc. | 1,612 | 159,411 | ||||||
JM Smucker Co. (The) | 1,922 | 201,349 | ||||||
Johnson & Johnson | 36,580 | 4,842,095 | ||||||
Johnson Controls International PLC | 12,777 | 505,841 | ||||||
JPMorgan Chase & Co. | 47,616 | 4,327,818 | ||||||
Juniper Networks Inc. | 6,944 | 192,557 | ||||||
Kansas City Southern | 1,922 | 198,792 | ||||||
Kellogg Co. | 3,906 | 255,687 | ||||||
KeyCorp | 16,740 | 288,095 | ||||||
Kimberly-Clark Corp. | 4,774 | 588,586 | ||||||
Kimco Realty Corp. | 7,276 | 142,755 | ||||||
Kinder Morgan Inc./DE | 26,226 | 506,949 | ||||||
KLA-Tencor Corp. | 3,410 | 319,483 | ||||||
Kohl’s Corp. | 2,914 | 115,919 | ||||||
Kraft Heinz Co. (The) | 7,750 | 625,813 | ||||||
Kroger Co. (The) | 13,206 | 288,815 | ||||||
L Brands Inc. | 3,534 | 128,001 | ||||||
L3 Technologies Inc. | 1,364 | 247,539 | ||||||
Laboratory Corp. of America Holdingsa | 1,674 | 262,600 | ||||||
Lam Research Corp. | 2,955 | 490,471 | ||||||
Las Vegas Sands Corp. | 5,518 | 343,275 | ||||||
Leggett & Platt Inc. | 2,790 | 128,256 | ||||||
Leucadia National Corp. | 6,200 | 146,816 | ||||||
Level 3 Communications Inc.a | 4,650 | 253,100 | ||||||
Liberty Global PLC Series Aa,b | 3,844 | 130,696 | ||||||
Liberty Global PLC Series C NVSa | 7,936 | 262,126 | ||||||
Liberty Interactive Corp. QVC Group Series Aa | 7,440 | 164,573 | ||||||
Liberty Media Corp.-Liberty SiriusXM Class Ca | 4,774 | 212,968 | ||||||
Liberty Property Trust | 3,162 | 134,701 | ||||||
Lincoln National Corp. | 3,472 | 235,610 | ||||||
LKQ Corp.a | 5,332 | 184,754 | ||||||
Lockheed Martin Corp. | 3,436 | 1,049,320 | ||||||
Loews Corp. | 4,340 | 202,157 | ||||||
| Security | Shares | Value | ||||||
Lowe’s Companies Inc. | 11,594 | $ | 856,681 | |||||
lululemon athletica Inc.a,b | 1,736 | 99,907 | ||||||
LyondellBasell Industries NV Class A | 4,712 | 426,860 | ||||||
M&T Bank Corp. | 2,294 | 339,191 | ||||||
Macerich Co. (The) | 1,984 | 104,696 | ||||||
Macy’s Inc. | 4,402 | 91,430 | ||||||
Mallinckrodt PLCa | 1,737 | 71,356 | ||||||
ManpowerGroup Inc. | 1,240 | 138,272 | ||||||
Marathon Oil Corp. | 12,649 | 140,657 | ||||||
Marathon Petroleum Corp. | 7,440 | 390,228 | ||||||
Markel Corp.a | 248 | 260,894 | ||||||
Marriott International Inc./MD Class A | 4,658 | 482,476 | ||||||
Marsh & McLennan Companies Inc. | 6,821 | 532,584 | ||||||
Martin Marietta Materials Inc. | 992 | 210,294 | ||||||
Marvell Technology Group Ltd. | 7,440 | 133,250 | ||||||
Masco Corp. | 5,704 | 209,736 | ||||||
MasterCard Inc. Class A | 12,710 | 1,694,243 | ||||||
Mattel Inc. | 4,960 | 80,451 | ||||||
Maxim Integrated Products Inc. | 4,650 | 216,969 | ||||||
McCormick & Co. Inc./MD NVS | 2,542 | 241,820 | ||||||
McDonald’s Corp. | 10,974 | 1,755,511 | ||||||
McKesson Corp. | 2,976 | 444,347 | ||||||
Medtronic PLC | 17,856 | 1,439,551 | ||||||
Merck & Co. Inc. | 36,828 | 2,351,836 | ||||||
MetLife Inc. | 12,028 | 563,271 | ||||||
MGM Resorts International | 7,254 | 239,092 | ||||||
Michael Kors Holdings Ltd.a | 2,480 | 104,706 | ||||||
Microchip Technology Inc. | 4,030 | 349,804 | ||||||
Micron Technology Inc.a | 14,920 | 476,992 | ||||||
Microsoft Corp. | 98,332 | 7,352,284 | ||||||
Mohawk Industries Inc.a | 992 | 251,095 | ||||||
Molson Coors Brewing Co. Class B | 2,666 | 239,274 | ||||||
Mondelez International Inc. Class A | 20,584 | 836,945 | ||||||
Monsanto Co. | 5,890 | 690,308 | ||||||
Monster Beverage Corp.a | 5,766 | 321,858 | ||||||
Moody’s Corp. | 2,914 | 390,563 | ||||||
Morgan Stanley | 19,902 | 905,541 | ||||||
Mosaic Co. (The) | 5,022 | 100,340 | ||||||
Motorola Solutions Inc. | 2,666 | 234,928 | ||||||
Murphy Oil Corp. | 2,852 | 64,626 | ||||||
Mylan NVa | 6,882 | 216,645 | ||||||
Nasdaq Inc. | 2,170 | 163,575 | ||||||
| 26 | 2017 iSHARES ANNUAL REPORTTO SHAREHOLDERS |
Table of Contents
Schedule of Investments (Continued)
iSHARES® MSCI WORLD ETF
August 31, 2017
| Security | Shares | Value | ||||||
National Oilwell Varco Inc. | 5,456 | $ | 167,336 | |||||
Navient Corp. | 6,944 | 91,661 | ||||||
NetApp Inc. | 4,092 | 158,197 | ||||||
Netflix Inc.a | 5,890 | 1,029,042 | ||||||
New York Community Bancorp. Inc. | 9,858 | 118,789 | ||||||
Newell Brands Inc. | 6,596 | 318,455 | ||||||
Newfield Exploration Co.a,b | 3,136 | 81,944 | ||||||
Newmont Mining Corp. | 8,122 | 311,397 | ||||||
News Corp. Class A | 6,079 | 81,276 | ||||||
NextEra Energy Inc. | 6,342 | 954,534 | ||||||
Nielsen Holdings PLC | 4,960 | 192,696 | ||||||
NIKE Inc. Class B | 17,484 | 923,330 | ||||||
Noble Energy Inc. | 6,696 | 159,164 | ||||||
Nordstrom Inc. | 2,170 | 96,825 | ||||||
Norfolk Southern Corp. | 4,030 | 485,696 | ||||||
Northern Trust Corp. | 3,224 | 285,324 | ||||||
Northrop Grumman Corp. | 2,356 | 641,327 | ||||||
Nucor Corp. | 4,526 | 249,428 | ||||||
NVIDIA Corp. | 7,502 | 1,271,139 | ||||||
O’Reilly Automotive Inc.a,b | 1,426 | 279,681 | ||||||
Occidental Petroleum Corp. | 10,230 | 610,731 | ||||||
Omnicom Group Inc. | 3,534 | 255,791 | ||||||
ONEOK Inc. | 5,396 | 292,247 | ||||||
Oracle Corp. | 39,990 | 2,012,697 | ||||||
PACCAR Inc. | 5,084 | 337,222 | ||||||
Palo Alto Networks Inc.a | 1,550 | 205,670 | ||||||
Parker-Hannifin Corp. | 2,232 | 359,106 | ||||||
Patterson Companies Inc. | 1,736 | 66,836 | ||||||
Paychex Inc. | 4,712 | 268,725 | ||||||
PayPal Holdings Inc.a | 15,686 | 967,512 | ||||||
Pentair PLC | 3,162 | 196,202 | ||||||
People’s United Financial Inc. | 8,928 | 149,098 | ||||||
PepsiCo Inc. | 18,414 | 2,131,052 | ||||||
Perrigo Co. PLC | 2,108 | 166,448 | ||||||
Pfizer Inc. | 78,430 | 2,660,346 | ||||||
PG&E Corp. | 6,758 | 475,628 | ||||||
Philip Morris International Inc. | 20,708 | 2,421,386 | ||||||
Phillips 66 | 6,262 | 524,818 | ||||||
Pinnacle West Capital Corp. | 2,294 | 206,391 | ||||||
Pioneer Natural Resources Co. | 2,356 | 305,455 | ||||||
Plains GP Holdings LP Class A | 2,356 | 52,963 | ||||||
PNC Financial Services Group Inc. (The)d | 6,510 | 816,419 | ||||||
PPG Industries Inc. | 3,844 | 401,006 | ||||||
| Security | Shares | Value | ||||||
PPL Corp. | 9,566 | $ | 375,370 | |||||
Praxair Inc. | 3,720 | 489,329 | ||||||
Priceline Group Inc. (The)a | 682 | 1,263,119 | ||||||
Principal Financial Group Inc. | 4,154 | 259,708 | ||||||
Procter & Gamble Co. (The) | 33,520 | 3,092,890 | ||||||
Progressive Corp. (The) | 8,805 | 409,256 | ||||||
Prologis Inc. | 7,564 | 479,255 | ||||||
Prudential Financial Inc. | 5,890 | 601,251 | ||||||
Public Service Enterprise Group Inc. | 7,626 | 357,202 | ||||||
Public Storage | 2,170 | 445,588 | ||||||
PulteGroup Inc. | 5,580 | 144,076 | ||||||
PVH Corp. | 1,240 | 156,104 | ||||||
Qorvo Inc.a | 2,307 | 168,919 | ||||||
QUALCOMM Inc. | 19,592 | 1,024,074 | ||||||
Quest Diagnostics Inc. | 2,480 | 268,708 | ||||||
Ralph Lauren Corp. | 992 | 87,187 | ||||||
Range Resources Corp. | 3,472 | 60,274 | ||||||
Raytheon Co. | 4,154 | 756,070 | ||||||
Realty Income Corp. | 4,154 | 239,104 | ||||||
Red Hat Inc.a | 3,203 | 344,323 | ||||||
Regency Centers Corp. | 3,162 | 203,380 | ||||||
Regeneron Pharmaceuticals Inc.a | 1,116 | 554,540 | ||||||
Regions Financial Corp. | 20,026 | 282,567 | ||||||
Reinsurance Group of America Inc. | 832 | 111,862 | ||||||
RenaissanceRe Holdings Ltd. | 403 | 56,081 | ||||||
Republic Services Inc. | 4,216 | 275,052 | ||||||
Robert Half International Inc. | 2,604 | 117,961 | ||||||
Rockwell Automation Inc. | 2,108 | 345,838 | ||||||
Rockwell Collins Inc. | 2,480 | 325,004 | ||||||
Roper Technologies Inc. | 1,674 | 386,125 | ||||||
Ross Stores Inc. | 5,952 | 347,894 | ||||||
Royal Caribbean Cruises Ltd. | 2,356 | 293,228 | ||||||
S&P Global Inc. | 3,906 | 602,813 | ||||||
salesforce.com Inc.a | 8,866 | 846,614 | ||||||
SBA Communications Corp.a | 1,984 | 304,643 | ||||||
SCANA Corp. | 2,418 | 145,999 | ||||||
Schlumberger Ltd. | 17,805 | 1,130,796 | ||||||
Scripps Networks Interactive Inc. Class A | 1,364 | 116,827 | ||||||
Seagate Technology PLC | 4,402 | 138,795 | ||||||
SEI Investments Co. | 3,348 | 195,724 | ||||||
Sempra Energy | 3,162 | 372,895 | ||||||
ServiceNow Inc.a | 2,604 | 302,559 | ||||||
Sherwin-Williams Co. (The) | 1,178 | 399,660 | ||||||
SCHEDULESOF INVESTMENTS | 27 |
Table of Contents
Schedule of Investments (Continued)
iSHARES® MSCI WORLD ETF
August 31, 2017
| Security | Shares | Value | ||||||
Signet Jewelers Ltd. | 1,116 | $ | 70,386 | |||||
Simon Property Group Inc. | 4,157 | 652,025 | ||||||
Sirius XM Holdings Inc.b | 40,424 | 232,438 | ||||||
Skyworks Solutions Inc. | 2,852 | 300,487 | ||||||
SL Green Realty Corp. | 1,576 | 151,895 | ||||||
Southern Co. (The) | 11,718 | 565,511 | ||||||
Southwest Airlines Co. | 2,108 | 109,911 | ||||||
Splunk Inc.a | 2,294 | 153,904 | ||||||
Sprint Corp.a | 14,328 | 118,206 | ||||||
Stanley Black & Decker Inc. | 2,356 | 339,264 | ||||||
Staples Inc. | 11,160 | 113,999 | ||||||
Starbucks Corp. | 19,158 | 1,051,008 | ||||||
State Street Corp. | 5,263 | 486,775 | ||||||
Stericycle Inc.a | 1,426 | 102,515 | ||||||
Stryker Corp. | 4,464 | 631,076 | ||||||
SunTrust Banks Inc. | 7,254 | 399,695 | ||||||
Symantec Corp. | 10,501 | 314,820 | ||||||
Synchrony Financial | 11,722 | 360,920 | ||||||
Synopsys Inc.a | 3,472 | 279,218 | ||||||
Sysco Corp. | 7,440 | 391,865 | ||||||
T Rowe Price Group Inc. | 3,596 | 303,359 | ||||||
T-Mobile U.S. Inc.a | 4,588 | 296,889 | ||||||
Target Corp. | 7,316 | 398,941 | ||||||
TD Ameritrade Holding Corp. | 4,030 | 174,580 | ||||||
TE Connectivity Ltd. | 4,898 | 389,881 | ||||||
TechnipFMC PLCa | 7,502 | 193,777 | ||||||
Tesla Inc.a,b | 1,798 | 639,908 | ||||||
Texas Instruments Inc. | 13,082 | 1,083,451 | ||||||
Textron Inc. | 4,526 | 222,181 | ||||||
Thermo Fisher Scientific Inc. | 5,394 | 1,009,433 | ||||||
Tiffany & Co. | 2,046 | 187,004 | ||||||
Time Warner Inc. | 10,292 | 1,040,521 | ||||||
TJX Companies Inc. (The) | 8,928 | 645,494 | ||||||
Toll Brothers Inc. | 3,844 | 149,762 | ||||||
Torchmark Corp. | 2,243 | 172,644 | ||||||
Total System Services Inc. | 3,100 | 214,272 | ||||||
Tractor Supply Co. | 2,108 | 125,447 | ||||||
TransDigm Group Inc. | 806 | 210,092 | ||||||
Travelers Companies Inc. (The) | 3,844 | 465,816 | ||||||
Trimble Inc.a | 4,464 | 172,668 | ||||||
TripAdvisor Inc.a | 1,984 | 84,776 | ||||||
Twenty-First Century Fox Inc. Class A | 16,988 | 468,699 | ||||||
Twenty-First Century Fox Inc. Class B | 3,720 | 100,812 | ||||||
| Security | Shares | Value | ||||||
Twitter Inc.a,b | 10,354 | $ | 175,086 | |||||
Tyson Foods Inc. Class A | 4,464 | 282,571 | ||||||
U.S. Bancorp. | 21,886 | 1,121,658 | ||||||
UDR Inc. | 4,898 | 190,140 | ||||||
Ulta Salon Cosmetics & Fragrance Inc.a | 930 | 205,539 | ||||||
Under Armour Inc. Class Aa,b | 2,790 | 45,059 | ||||||
Under Armour Inc. Class Ca,b | 2,802 | 42,310 | ||||||
Union Pacific Corp. | 10,974 | 1,155,562 | ||||||
United Parcel Service Inc. Class B | 8,618 | 985,554 | ||||||
United Rentals Inc.a | 1,550 | 182,993 | ||||||
United Technologies Corp. | 10,168 | 1,217,313 | ||||||
UnitedHealth Group Inc. | 12,834 | 2,552,683 | ||||||
Universal Health Services Inc. Class B | 1,364 | 147,489 | ||||||
Unum Group | 3,658 | 176,242 | ||||||
Valero Energy Corp. | 6,324 | 430,664 | ||||||
Varian Medical Systems Inc.a | 2,046 | 217,388 | ||||||
Ventas Inc. | 5,094 | 348,633 | ||||||
VEREIT Inc. | 15,996 | 135,006 | ||||||
VeriSign Inc.a,b | 1,984 | 205,840 | ||||||
Verisk Analytics Inc. Class Aa | 2,542 | 206,029 | ||||||
Verizon Communications Inc. | 53,568 | 2,569,657 | ||||||
Vertex Pharmaceuticals Inc.a | 3,720 | 597,209 | ||||||
VF Corp. | 5,022 | 315,733 | ||||||
Viacom Inc. Class B NVS | 4,960 | 141,856 | ||||||
Visa Inc. Class A | 24,428 | 2,528,787 | ||||||
VMware Inc. Class Aa,b | 1,178 | 127,342 | ||||||
Vornado Realty Trust | 2,604 | 193,972 | ||||||
Vulcan Materials Co. | 2,170 | 263,134 | ||||||
Wal-Mart Stores Inc. | 20,398 | 1,592,472 | ||||||
Walgreens Boots Alliance Inc. | 11,780 | 960,070 | ||||||
Walt Disney Co. (The) | 20,274 | 2,051,729 | ||||||
Waste Connections Inc. | 4,557 | 303,906 | ||||||
Waste Management Inc. | 6,014 | 463,740 | ||||||
Waters Corp.a | 1,612 | 295,770 | ||||||
Weatherford International PLCa,b | 15,810 | 60,552 | ||||||
WEC Energy Group Inc. | 5,024 | 327,665 | ||||||
Wells Fargo & Co. | 63,116 | 3,223,334 | ||||||
Welltower Inc. | 5,022 | 367,711 | ||||||
Western Digital Corp. | 4,170 | 368,086 | ||||||
Western Union Co. (The) | 8,370 | 158,360 | ||||||
WestRock Co. | 3,791 | 215,746 | ||||||
Weyerhaeuser Co. | 10,788 | 351,797 | ||||||
| 28 | 2017 iSHARES ANNUAL REPORTTO SHAREHOLDERS |
Table of Contents
Schedule of Investments (Continued)
iSHARES® MSCI WORLD ETF
August 31, 2017
| Security | Shares | Value | ||||||
Whirlpool Corp. | 1,178 | $ | 202,168 | |||||
Williams Companies Inc. (The) | 11,780 | 350,219 | ||||||
Willis Towers Watson PLC | 1,798 | 266,949 | ||||||
Workday Inc. Class Aa | 1,923 | 210,934 | ||||||
WR Berkley Corp. | 2,914 | 194,189 | ||||||
WW Grainger Inc. | 930 | 151,190 | ||||||
Wyndham Worldwide Corp. | 1,798 | 179,225 | ||||||
Wynn Resorts Ltd. | 1,240 | 172,348 | ||||||
Xcel Energy Inc. | 7,192 | 356,004 | ||||||
Xerox Corp. | 3,208 | 103,522 | ||||||
Xilinx Inc. | 4,154 | 274,413 | ||||||
XL Group Ltd. | 4,154 | 170,148 | ||||||
Xylem Inc./NY | 4,216 | 261,687 | ||||||
Yum! Brands Inc. | 5,208 | 400,079 | ||||||
Zillow Group Inc. Class Ca,b | 2,561 | 101,467 | ||||||
Zimmer Biomet Holdings Inc. | 2,666 | 304,644 | ||||||
Zoetis Inc. | 7,440 | 466,488 | ||||||
|
| |||||||
| 300,078,906 | ||||||||
|
| |||||||
TOTAL COMMON STOCKS |
| |||||||
(Cost: $463,923,702) |
| 506,782,728 | ||||||
PREFERRED STOCKS — 0.16% |
| |||||||
GERMANY — 0.16% |
| |||||||
Henkel AG & Co. KGaA, Preference Shares | 2,418 | 323,554 | ||||||
Porsche Automobil Holding SE, Preference Shares | 2,046 | 115,811 | ||||||
Volkswagen AG, Preference Shares | 2,542 | 378,830 | ||||||
|
| |||||||
| 818,195 | ||||||||
|
| |||||||
TOTAL PREFERRED STOCKS |
| |||||||
(Cost: $906,404) |
| 818,195 | ||||||
SHORT-TERM INVESTMENTS — 1.60% |
| |||||||
MONEY MARKET FUNDS — 1.60% |
| |||||||
BlackRock Cash Funds: Institutional, |
| |||||||
1.32%d,e,f | 7,849,531 | 7,851,886 | ||||||
BlackRock Cash Funds: Treasury, |
| |||||||
0.96%d,e | 287,312 | 287,312 | ||||||
|
| |||||||
| 8,139,198 | ||||||||
|
| |||||||
TOTAL SHORT-TERM INVESTMENTS |
| |||||||
(Cost: $8,137,689) |
| 8,139,198 | ||||||
|
| |||||||
| Value | ||||||||
TOTAL INVESTMENTS |
| |||||||
(Cost: $472,967,795)g | $ | 515,740,121 | ||||||
Other Assets, Less Liabilities — (1.17)% |
| (5,971,002 | ) | |||||
|
| |||||||
NET ASSETS — 100.00% | $ | 509,769,119 | ||||||
|
| |||||||
ADR — American Depositary Receipts
NVS — Non-Voting Shares
SDR — Swedish Depositary Receipts
| a | Non-income earning security. |
| b | All or a portion of this security represents a security on loan. See Note 1. |
| c | This security may be resold to qualified institutional buyers under Rule 144A of the Securities Act of 1933. |
| d | Affiliated issuer. See Schedule 1. |
| e | The rate quoted is the annualized seven-day yield of the fund at period end. |
| f | All or a portion of this security represents an investment of securities lending collateral. See Note 1. |
| g | The cost of investments (including short positions and derivatives, if any) for federal income tax purposes was $475,199,620. Net unrealized appreciation was $40,540,501, of which $63,671,589 represented gross unrealized appreciation on investments and $23,131,088 represented gross unrealized depreciation on investments. |
SCHEDULESOF INVESTMENTS | 29 |
Table of Contents
Schedule of Investments (Continued)
iSHARES® MSCI WORLD ETF
August 31, 2017
Schedule 1 — Affiliates (Note 2)
Investments in issuers considered to be affiliates of the Fund during the year ended August 31, 2017, for purposes of Section 2(a)(3) of the 1940 Act, and/or related parties of the Fund were as follows:
| Affiliated issuer | Shares held at 08/31/16 | Shares purchased | Shares sold | Shares held at 08/31/17 | Value at 08/31/17 | Net realized gain (loss) a | Change in unrealized appreciation (depreciation) | Income | ||||||||||||||||||||||||
BlackRock Cash Funds: Institutional, | 4,756,712 | 3,092,819 | b | — | 7,849,531 | $ | 7,851,886 | $ | (411 | ) | $ | 1,509 | $ | — | c | |||||||||||||||||
BlackRock Cash Funds: Treasury, | 204,920 | 82,392 | b | — | 287,312 | 287,312 | 36 | — | 2,224 | |||||||||||||||||||||||
BlackRock Inc. | 1,080 | 682 | (150 | ) | 1,612 | 675,444 | 5,742 | 61,535 | 13,907 | |||||||||||||||||||||||
PNC Financial Services | 4,120 | 2,802 | (412 | ) | 6,510 | 816,419 | 2,821 | 162,793 | 13,153 | |||||||||||||||||||||||
|
|
|
|
|
|
|
| |||||||||||||||||||||||||
| $ | 9,631,061 | $ | 8,188 | $ | 225,837 | $ | 29,284 | |||||||||||||||||||||||||
|
|
|
|
|
|
|
| |||||||||||||||||||||||||
| a | Includes realized capital gain distributions from an affiliated fund, if any. |
| b | Net of shares purchased and sold. |
| c | Does not include income earned on investment of securities lending cash collateral which is not direct income of the Fund and is reflected as a component of securities lending income in the statement of operations. |
Schedule 2 — Fair Value Measurements
Various inputs are used in determining the fair value of financial instruments. For description of the input levels and information about the Fund’s policy regarding valuation of financial instruments, see Note 1.
The following table summarizes the value of the Fund’s investments according to the fair value hierarchy as of August 31, 2017. The breakdown of the Fund’s investments into major categories is disclosed in the schedule of investments above.
| Level 1 | Level 2 | Level 3 | Total | |||||||||||||
Investments: | ||||||||||||||||
Assets: | ||||||||||||||||
Common stocks | $ | 506,468,657 | $ | 314,071 | $ | — | $ | 506,782,728 | ||||||||
Preferred stocks | 818,195 | — | — | 818,195 | ||||||||||||
Money market funds | 8,139,198 | — | — | 8,139,198 | ||||||||||||
|
|
|
|
|
|
|
| |||||||||
Total | $ | 515,426,050 | $ | 314,071 | $ | — | $ | 515,740,121 | ||||||||
|
|
|
|
|
|
|
| |||||||||
See notes to financial statements.
| 30 | 2017 iSHARES ANNUAL REPORTTO SHAREHOLDERS |
Table of Contents
Statements of Assets and Liabilities
iSHARES®, INC.
August 31, 2017
iShares 100 ETF | iShares ETF | |||||||
ASSETS | ||||||||
Investments in securities, at cost: | ||||||||
Unaffiliated | $ | 556,283,798 | $ | 463,592,008 | ||||
Affiliated (Note 2) | 8,436,484 | 9,375,787 | ||||||
|
|
|
| |||||
Total cost of investments in securities | $ | 564,720,282 | $ | 472,967,795 | ||||
|
|
|
| |||||
Investments in securities, at fair value (including securities on loana) (Note 1): | ||||||||
Unaffiliated | $ | 628,641,146 | $ | 506,109,060 | ||||
Affiliated (Note 2) | 8,437,147 | 9,631,061 | ||||||
Foreign currency, at valueb | 6,694,488 | 568,894 | ||||||
Cash | 299,890 | — | ||||||
Receivables: | ||||||||
Investment securities sold | 24,725,674 | — | ||||||
Dividends and interest | 469,197 | 1,180,105 | ||||||
Tax reclaims | 980 | 234,387 | ||||||
|
|
|
| |||||
Total Assets | 669,268,522 | 517,723,507 | ||||||
|
|
|
| |||||
LIABILITIES | ||||||||
Payables: | ||||||||
Investment securities purchased | 25,656,188 | — | ||||||
Collateral for securities on loan (Note 1) | 4,575,931 | 7,850,788 | ||||||
Due to custodian | — | 320 | ||||||
Foreign taxes | 2,151,599 | — | ||||||
Deferred foreign capital gains taxes (Note 1) | 8,845,202 | — | ||||||
Investment advisory fees (Note 2) | 413,490 | 103,280 | ||||||
|
|
|
| |||||
Total Liabilities | 41,642,410 | 7,954,388 | ||||||
|
|
|
| |||||
NET ASSETS | $ | 627,626,112 | $ | 509,769,119 | ||||
|
|
|
| |||||
Net assets consist of: | ||||||||
Paid-in capital | $ | 673,974,723 | $ | 469,373,305 | ||||
Undistributed net investment income | 4,578,443 | 1,667,798 | ||||||
Accumulated net realized loss | (114,440,558 | ) | (4,057,176 | ) | ||||
Net unrealized appreciation | 63,513,504 | 42,785,192 | ||||||
|
|
|
| |||||
NET ASSETS | $ | 627,626,112 | $ | 509,769,119 | ||||
|
|
|
| |||||
Shares outstandingc | 20,500,000 | 6,200,000 | ||||||
|
|
|
| |||||
Net asset value per share | $ | 30.62 | $ | 82.22 | ||||
|
|
|
| |||||
| a | Securities on loan with values of $4,508,851 and $7,581,645, respectively. See Note 1. |
| b | Cost of foreign currency: $6,686,011 and $563,249, respectively. |
| c | $0.001 par value, number of shares authorized: 500 million and 500 million, respectively. |
See notes to financial statements.
FINANCIAL STATEMENTS | 31 |
Table of Contents
Statements of Operations
iSHARES®, INC.
Year ended August 31, 2017
iShares 100 ETF | iShares ETF | |||||||
NET INVESTMENT INCOME | ||||||||
Dividends — unaffiliateda | $ | 18,897,332 | $ | 9,792,364 | ||||
Dividends — affiliated (Note 2) | 30,087 | 29,284 | ||||||
Interest — unaffiliated | 11,531 | — | ||||||
Securities lending income — affiliated — net (Note 2) | 25,538 | 48,512 | ||||||
|
|
|
| |||||
| 18,964,488 | 9,870,160 | |||||||
Less: Other foreign taxes (Note 1) | — | (170 | ) | |||||
|
|
|
| |||||
Total investment income | 18,964,488 | 9,869,990 | ||||||
|
|
|
| |||||
EXPENSES | ||||||||
Investment advisory fees (Note 2) | 4,353,023 | 950,275 | ||||||
Proxy fees | 12,648 | 9,593 | ||||||
Commitment fees (Note 7) | 5,929 | — | ||||||
Interest expense (Note 7) | 11,360 | — | ||||||
|
|
|
| |||||
Total expenses | 4,382,960 | 959,868 | ||||||
|
|
|
| |||||
Net investment income | 14,581,528 | 8,910,122 | ||||||
|
|
|
| |||||
NET REALIZED AND UNREALIZED GAIN (LOSS) | ||||||||
Net realized gain (loss) from: | ||||||||
Investments — unaffiliatedb | (15,643,309 | ) | (862,930 | ) | ||||
Investments — affiliated (Note 2) | 618 | 328 | ||||||
In-kind redemptions — unaffiliated | 2,451,790 | 4,060,500 | ||||||
In-kind redemptions — affiliated (Note 2) | — | 7,824 | ||||||
Foreign currency transactions | (1,938,594 | ) | (7,850 | ) | ||||
Realized gain distributions from affiliated funds | — | 36 | ||||||
|
|
|
| |||||
Net realized gain (loss) | (15,129,495 | ) | 3,197,908 | |||||
|
|
|
| |||||
Net change in unrealized appreciation/depreciation on: | ||||||||
Investments — unaffiliatedc | 133,144,498 | 48,748,649 | ||||||
Investments — affiliated (Note 2) | 663 | 225,837 | ||||||
Translation of assets and liabilities in foreign currencies | 6,839 | 21,213 | ||||||
|
|
|
| |||||
Net change in unrealized appreciation/depreciation | 133,152,000 | 48,995,699 | ||||||
|
|
|
| |||||
Net realized and unrealized gain | 118,022,505 | 52,193,607 | ||||||
|
|
|
| |||||
NET INCREASE IN NET ASSETS RESULTING FROM OPERATIONS | $ | 132,604,033 | $ | 61,103,729 | ||||
|
|
|
| |||||
| a | Net of foreign withholding tax of $1,315,985 and $452,753, respectively. |
| b | Net of foreign capital gains taxes of $571,529 and $ —, respectively. |
| c | Net of deferred foreign capital gains taxes of $8,845,202 and $ —, respectively. |
See notes to financial statements.
| 32 | 2017 iSHARES ANNUAL REPORTTO SHAREHOLDERS |
Table of Contents
Statements of Changes in Net Assets
iSHARES®, INC.
| iShares MSCI Frontier 100 ETF | iShares MSCI World ETF | |||||||||||||||
Year ended August 31, 2017 | Year ended August 31, 2016 | Year ended August 31, 2017 | Year ended August 31, 2016 | |||||||||||||
INCREASE (DECREASE) IN NET ASSETS | ||||||||||||||||
OPERATIONS: | ||||||||||||||||
Net investment income | $ | 14,581,528 | $ | 13,480,226 | $ | 8,910,122 | $ | 5,617,187 | ||||||||
Net realized gain (loss) | (15,129,495 | ) | (60,711,158 | ) | 3,197,908 | (540,768 | ) | |||||||||
Net change in unrealized appreciation/depreciation | 133,152,000 | 16,637,146 | 48,995,699 | 9,321,554 | ||||||||||||
|
|
|
|
|
|
|
| |||||||||
Net increase (decrease) in net assets resulting from operations | 132,604,033 | (30,593,786 | ) | 61,103,729 | 14,397,973 | |||||||||||
|
|
|
|
|
|
|
| |||||||||
DISTRIBUTIONS TO SHAREHOLDERS: | ||||||||||||||||
From net investment income | (6,259,265 | ) | (9,930,758 | ) | (8,262,836 | ) | (5,779,653 | ) | ||||||||
|
|
|
|
|
|
|
| |||||||||
Total distributions to shareholders | (6,259,265 | ) | (9,930,758 | ) | (8,262,836 | ) | (5,779,653 | ) | ||||||||
|
|
|
|
|
|
|
| |||||||||
CAPITAL SHARE TRANSACTIONS: | ||||||||||||||||
Proceeds from shares sold | 117,275,876 | 31,628,173 | 196,779,133 | 131,162,561 | ||||||||||||
Cost of shares redeemed | (23,717,030 | ) | (86,373,632 | ) | (28,454,357 | ) | (58,019,921 | ) | ||||||||
|
|
|
|
|
|
|
| |||||||||
Net increase (decrease) in net assets from | 93,558,846 | (54,745,459 | ) | 168,324,776 | 73,142,640 | |||||||||||
|
|
|
|
|
|
|
| |||||||||
INCREASE (DECREASE) IN NET ASSETS | 219,903,614 | (95,270,003 | ) | 221,165,669 | 81,760,960 | |||||||||||
NET ASSETS | ||||||||||||||||
Beginning of year | 407,722,498 | 502,992,501 | 288,603,450 | 206,842,490 | ||||||||||||
|
|
|
|
|
|
|
| |||||||||
End of year | $ | 627,626,112 | $ | 407,722,498 | $ | 509,769,119 | $ | 288,603,450 | ||||||||
|
|
|
|
|
|
|
| |||||||||
Undistributed (distributions in excess of) net investment income included in net assets at end of year | $ | 4,578,443 | $ | (2,465,352 | ) | $ | 1,667,798 | $ | 966,142 | |||||||
|
|
|
|
|
|
|
| |||||||||
SHARES ISSUED AND REDEEMED | ||||||||||||||||
Shares sold | 4,500,000 | 1,200,000 | 2,600,000 | 1,900,000 | ||||||||||||
Shares redeemed | (850,000 | ) | (3,550,000 | ) | (400,000 | ) | (900,000 | ) | ||||||||
|
|
|
|
|
|
|
| |||||||||
Net increase (decrease) in shares outstanding | 3,650,000 | (2,350,000 | ) | 2,200,000 | 1,000,000 | |||||||||||
|
|
|
|
|
|
|
| |||||||||
See notes to financial statements.
FINANCIAL STATEMENTS | 33 |
Table of Contents
iSHARES®, INC.
(For a share outstanding throughout each period)
| iShares MSCI Frontier 100 ETF | ||||||||||||||||||||
| Year ended Aug. 31, 2017 | Year ended Aug. 31, 2016 | Year ended Aug. 31, 2015 | Year ended Aug. 31, 2014 | Period from to Aug. 31, 2013 | ||||||||||||||||
Net asset value, beginning of period | $ | 24.20 | $ | 26.20 | $ | 37.79 | $ | 30.12 | $ | 25.25 | ||||||||||
|
|
|
|
|
|
|
|
|
| |||||||||||
Income from investment operations: | ||||||||||||||||||||
Net investment incomeb | 0.72 | 0.76 | 0.77 | 1.09 | 0.67 | |||||||||||||||
Net realized and unrealized gain (loss)c | 6.00 | (2.17 | ) | (8.78 | ) | 7.47 | 4.51 | |||||||||||||
|
|
|
|
|
|
|
|
|
| |||||||||||
Total from investment operations | 6.72 | (1.41 | ) | (8.01 | ) | 8.56 | 5.18 | |||||||||||||
|
|
|
|
|
|
|
|
|
| |||||||||||
Less distributions from: | ||||||||||||||||||||
Net investment income | (0.30 | ) | (0.59 | ) | (0.76 | ) | (0.89 | ) | (0.28 | ) | ||||||||||
Net realized gain | — | — | (2.82 | ) | — | — | ||||||||||||||
Return of capital | — | — | — | — | (0.03 | ) | ||||||||||||||
|
|
|
|
|
|
|
|
|
| |||||||||||
Total distributions | (0.30 | ) | (0.59 | ) | (3.58 | ) | (0.89 | ) | (0.31 | ) | ||||||||||
|
|
|
|
|
|
|
|
|
| |||||||||||
Net asset value, end of period | $ | 30.62 | $ | 24.20 | $ | 26.20 | $ | 37.79 | $ | 30.12 | ||||||||||
|
|
|
|
|
|
|
|
|
| |||||||||||
Total return | 27.91 | % | (5.45 | )% | (21.70 | )% | 28.56 | % | 20.54 | %d | ||||||||||
|
|
|
|
|
|
|
|
|
| |||||||||||
Ratios/Supplemental data: | ||||||||||||||||||||
Net assets, end of period (000s) | $ | 627,626 | $ | 407,722 | $ | 502,993 | $ | 799,349 | $ | 280,084 | ||||||||||
Ratio of expenses to average net assetse | 0.80 | % | 0.79 | % | 0.79 | % | 0.79 | % | 0.79 | % | ||||||||||
Ratio of net investment income to average net assetse | 2.65 | % | 3.03 | % | 2.43 | % | 3.07 | % | 2.32 | % | ||||||||||
Portfolio turnover ratef | 32 | % | 20 | % | 47 | % | 61 | % | 18 | %d | ||||||||||
| a | Commencement of operations. |
| b | Based on average shares outstanding throughout each period. |
| c | The amounts reported for a share outstanding may not accord with the change in aggregate gains and losses in securities for the fiscal period due to the timing of capital share transactions in relation to the fluctuating market values of the Fund’s underlying securities. |
| d | Not annualized. |
| e | Annualized for periods of less than one year. |
| f | Portfolio turnover rates exclude portfolio securities received or delivered in Creation Units but include portfolio transactions that are executed as a result of the Fund processing capital share transactions in Creation Units partially for cash in U.S. dollars. Excluding such cash transactions, the portfolio turnover rates for the years ended August 31, 2017, August 31, 2016, August 31, 2015, August 31, 2014 and the period ended August 31, 2013 were 31%, 19%, 45%, 42% and 10%, respectively. See Note 4. |
See notes to financial statements.
| 34 | 2017 iSHARES ANNUAL REPORTTO SHAREHOLDERS |
Table of Contents
Financial Highlights (Continued)
iSHARES®, INC.
(For a share outstanding throughout each period)
| iShares MSCI World ETF | ||||||||||||||||||||
| Year ended Aug. 31, 2017 | Year ended Aug. 31, 2016 | Year ended Aug. 31, 2015 | Year ended Aug. 31, 2014 | Year ended Aug. 31, 2013 | ||||||||||||||||
Net asset value, beginning of year | $ | 72.15 | $ | 68.95 | $ | 73.36 | $ | 61.76 | $ | 53.45 | ||||||||||
|
|
|
|
|
|
|
|
|
| |||||||||||
Income from investment operations: | ||||||||||||||||||||
Net investment incomea | 1.74 | 1.62 | 1.64 | 1.81 | 1.40 | |||||||||||||||
Net realized and unrealized gain (loss)b | 9.90 | 3.16 | (4.49 | ) | 11.16 | 8.03 | ||||||||||||||
|
|
|
|
|
|
|
|
|
| |||||||||||
Total from investment operations | 11.64 | 4.78 | (2.85 | ) | 12.97 | 9.43 | ||||||||||||||
|
|
|
|
|
|
|
|
|
| |||||||||||
Less distributions from: | ||||||||||||||||||||
Net investment income | (1.57 | ) | (1.58 | ) | (1.56 | ) | (1.37 | ) | (1.12 | ) | ||||||||||
|
|
|
|
|
|
|
|
|
| |||||||||||
Total distributions | (1.57 | ) | (1.58 | ) | (1.56 | ) | (1.37 | ) | (1.12 | ) | ||||||||||
|
|
|
|
|
|
|
|
|
| |||||||||||
Net asset value, end of year | $ | 82.22 | $ | 72.15 | $ | 68.95 | $ | 73.36 | $ | 61.76 | ||||||||||
|
|
|
|
|
|
|
|
|
| |||||||||||
Total return | 16.29 | % | 7.05 | % | (3.97 | )% | 21.07 | % | 17.84 | % | ||||||||||
|
|
|
|
|
|
|
|
|
| |||||||||||
Ratios/Supplemental data: | ||||||||||||||||||||
Net assets, end of year (000s) | $ | 509,769 | $ | 288,603 | $ | 206,842 | $ | 168,728 | $ | 24,704 | ||||||||||
Ratio of expenses to average net assets | 0.24 | % | 0.24 | % | 0.24 | % | 0.24 | % | 0.24 | % | ||||||||||
Ratio of net investment income to average net assets | 2.25 | % | 2.34 | % | 2.25 | % | 2.57 | % | 2.34 | % | ||||||||||
Portfolio turnover ratec | 3 | % | 5 | % | 5 | % | 5 | % | 5 | % | ||||||||||
| a | Based on average shares outstanding throughout each period. |
| b | The amounts reported for a share outstanding may not accord with the change in aggregate gains and losses in securities for the fiscal period due to the timing of capital share transactions in relation to the fluctuating market values of the Fund’s underlying securities. |
| c | Portfolio turnover rates exclude portfolio securities received or delivered as a result of processing capital share transactions in Creation Units. |
See notes to financial statements.
FINANCIAL HIGHLIGHTS | 35 |
Table of Contents
iSHARES®, INC.
iShares, Inc. (the “Company”) is registered under the Investment Company Act of 1940, as amended (the “1940 Act”), as an open-end management investment company. The Company was incorporated under the laws of the State of Maryland on September 1, 1994 pursuant to Articles of Incorporation as subsequently amended and restated.
These financial statements relate only to the following funds (each, a “Fund,” and collectively, the “Funds”):
| iShares ETF | Diversification Classification | |
MSCI Frontier 100 | Diversified | |
MSCI World | Diversified |
The investment objective of each Fund is to seek investment results that correspond generally to the price and yield performance, before fees and expenses, of its underlying index. The investment adviser uses a “passive” or index approach to try to achieve each Fund’s investment objective.
Pursuant to the Company’s organizational documents, the Funds’ officers and directors are indemnified against certain liabilities that may arise out of the performance of their duties to the Funds. Additionally, in the normal course of business, the Funds enter into contracts with service providers that contain general indemnification clauses. The Funds’ maximum exposure under these arrangements is unknown as this would involve future claims that may be made against the Funds that have not yet occurred.
| 1. | SIGNIFICANT ACCOUNTING POLICIES |
The following significant accounting policies are consistently followed by each Fund in the preparation of its financial statements in conformity with accounting principles generally accepted in the United States of America (“U.S. GAAP”). The preparation of financial statements in conformity with U.S. GAAP requires management to make certain estimates and assumptions that affect the reported amounts of assets and liabilities and disclosures of contingent assets and liabilities at the date of the financial statements and the reported amounts of revenue and expenses during the reporting period. Actual results could differ from those estimates. Each Fund is considered an investment company under U.S. GAAP and follows the accounting and reporting guidance applicable to investment companies.
SECURITY VALUATION
Each Fund’s investments are valued at fair value each day that the Fund’s listing exchange is open and, for financial reporting purposes, as of the report date should the reporting period end on a day that the Fund’s listing exchange is not open. U.S. GAAP defines fair value as the price a fund would receive to sell an asset or pay to transfer a liability in an orderly transaction between market participants at the measurement date. The BlackRock Global Valuation Methodologies Committee (the “Global Valuation Committee”) provides oversight of the valuation of investments for the Funds. The investments of each Fund are valued pursuant to policies and procedures developed by the Global Valuation Committee and approved by the Board of Directors of the Company (the “Board”).
| • | Equity investments traded on a recognized securities exchange are valued at that day’s last reported trade price or the official closing price, as applicable, on the exchange where the stock is primarily traded. Equity investments traded on a recognized exchange for which there were no sales on that day are valued at the last traded price. |
| • | Fixed income investments are valued using the last available bid price or current market quotations provided by dealers or prices (including evaluated prices) supplied by approved independent third-party pricing services. The pricing services may use matrix pricing or valuation models that utilize certain inputs and assumptions to derive values, including transaction |
| 36 | 2017 iSHARES ANNUAL REPORTTO SHAREHOLDERS |
Table of Contents
Notes to Financial Statements (Continued)
iSHARES®, INC.
data, credit quality information, perceived market movements, news, and other relevant information and by other methods, which may include consideration of: yields or prices of securities of comparable quality, coupon, maturity and type; indications as to values from dealers; general market conditions; and/or other factors and assumptions. Pricing services generally value fixed income securities assuming orderly transactions of an institutional round lot size, but a fund may hold or transact in such securities in smaller odd lot sizes. |
| • | Open-end U.S. mutual funds (including money market funds) are valued at that day’s published net asset value (“NAV”). |
In the event that application of these methods of valuation results in a price for an investment which is deemed not to be representative of the fair value of such investment or if a price is not available, the investment will be valued by the Global Valuation Committee, in accordance with policies approved by the Board. The fair valuation approaches that may be utilized by the Global Valuation Committee to determine fair value include market approach, income approach and the cost approach. The valuation techniques used under these approaches take into consideration inputs that include but are not limited to (i) attributes specific to the investment; (ii) the principal market for the investment; (iii) the customary participants in the principal market for the investment; (iv) data assumptions by market participants for the investment, if reasonably available; (v) quoted prices for similar investments in active markets; and (vi) other inputs, such as future cash flows, interest rates, yield curves, volatilities, prepayment speeds, loss severities, credit risks and/or default rates. Valuations based on such inputs are reported to the Board on a quarterly basis.
The Global Valuation Committee employs various methods for calibrating valuation approaches for investments where an active market does not exist, including regular due diligence of the Company’s pricing vendors, a regular review of key inputs and assumptions, transactional back-testing or disposition analysis to compare unrealized gains and losses to realized gains and losses, reviews of missing or stale prices, reviews of large movements in market values, and reviews of market related activity.
Fair value pricing could result in a difference between the prices used to calculate a Fund’s NAV and the prices used by the Fund’s underlying index, which in turn could result in a difference between the Fund’s performance and the performance of the Fund’s underlying index.
Various inputs are used in determining the fair value of financial instruments. Inputs may be based on independent market data (“observable inputs”) or they may be internally developed (“unobservable inputs”). These inputs to valuation techniques are categorized into a fair value hierarchy consisting of three broad levels for financial reporting purposes as follows:
| • | Level 1 — Unadjusted quoted prices in active markets for identical assets or liabilities; |
| • | Level 2 — Inputs other than quoted prices included within Level 1 that are observable for the asset or liability either directly or indirectly, including quoted prices for similar assets or liabilities in active markets, quoted prices for identical or similar assets or liabilities in markets that are not considered to be active, inputs other than quoted prices that are observable for the asset or liability (such as exchange rates, financing terms, interest rates, yield curves, volatilities, prepayment speeds, loss severities, credit risks and default rates) or other market-corroborated inputs; and |
| • | Level 3 — Unobservable inputs for the asset or liability based on the best information available in the circumstances, to the extent observable inputs are not available, including the Global Valuation Committee’s assumptions used in determining the fair value of investments. |
The hierarchy gives the highest priority to unadjusted quoted prices in active markets for identical assets or liabilities (Level 1 measurements) and the lowest priority to unobservable inputs (Level 3 measurements). Accordingly, the degree of judgement exercised in determining fair value is greatest for instruments categorized in Level 3. The inputs used to measure fair value may fall into different levels of the fair value hierarchy. In such cases, for disclosure purposes, the fair value hierarchy classification is
NOTESTO FINANCIAL STATEMENTS | 37 |
Table of Contents
Notes to Financial Statements (Continued)
iSHARES®, INC.
determined based on the lowest level input that is significant to the fair value measurement in its entirety. The fair value hierarchy for each Fund’s investments is included in its schedule of investments.
Changes in valuation techniques may result in transfers in or out of an assigned level within the fair value hierarchy. In accordance with the Company’s policy, transfers between different levels of the fair value hierarchy are deemed to have occurred as of the beginning of the reporting period. The categorization of values determined for financial instruments are based on the pricing transparency of the financial instruments and are not necessarily an indication of the risks associated with investing in those securities.
SECURITY TRANSACTIONS AND INCOME RECOGNITION
Security transactions are accounted for on trade date. Realized gains and losses on investment transactions are determined using the specific identification method. Dividend income and capital gain distributions, if any, are recognized on the ex-dividend date, net of any foreign taxes withheld at source. Any taxes withheld that are reclaimable from foreign tax authorities as of August 31, 2017 are reflected in tax reclaims receivable. Upon notification from issuers, some of the dividend income received from a real estate investment trust may be re-designated as a reduction of cost of the related investment and/or realized gain. Non-cash dividends received, if any, are recognized on the ex-dividend date and recorded as non-cash dividend income at fair value. Distributions received by the Funds may include a return of capital that is estimated by management. Such amounts are recorded as a reduction of the cost of investments or reclassified to capital gains. Interest income is accrued daily.
FOREIGN CURRENCY TRANSLATION
The accounting records of the Funds are maintained in U.S. dollars. Foreign currencies, as well as investment securities and other assets and liabilities denominated in foreign currencies, are translated into U.S. dollars using exchange rates deemed appropriate by the investment adviser. Purchases and sales of securities, income receipts and expense payments are translated into U.S. dollars on the respective dates of such transactions.
Each Fund does not isolate the effect of fluctuations in foreign exchange rates from the effect of fluctuations in the market prices of securities. Such fluctuations are reflected by the Funds as a component of realized and unrealized gains and losses from investments for financial reporting purposes. Each Fund reports realized currency gains (losses) on foreign currency related transactions as components of net realized gain (loss) for financial reporting purposes, whereas such components are generally treated as ordinary income for U.S. federal income tax purposes.
FOREIGN TAXES
The Funds may be subject to foreign taxes (a portion of which may be reclaimable) on income, stock dividends, capital gains on investments, or certain foreign currency transactions. All foreign taxes are recorded in accordance with the applicable foreign tax regulations and rates that exist in the foreign jurisdictions in which the Funds invest. These foreign taxes, if any, are paid by the Funds and are reflected in their statements of operations as follows: foreign taxes withheld at source are presented as a reduction of income, foreign taxes on securities lending income are presented as a reduction of securities lending income, foreign taxes on stock dividends are presented as “other foreign taxes”, and foreign taxes on capital gains from sales of investments and foreign taxes on foreign currency transactions are included in their respective net realized gain (loss) categories. Foreign taxes payable or deferred as of August 31, 2017, if any, are disclosed in the Funds’ statements of assets and liabilities.
| 38 | 2017 iSHARES ANNUAL REPORTTO SHAREHOLDERS |
Table of Contents
Notes to Financial Statements (Continued)
iSHARES®, INC.
DISTRIBUTIONS TO SHAREHOLDERS
Dividends and distributions paid by each Fund are recorded on the ex-dividend dates. Distributions are determined on a tax basis and may differ from net investment income and net realized capital gains for financial reporting purposes. Dividends and distributions are paid in U.S. dollars and cannot be automatically reinvested in additional shares of the Funds.
LOANS OF PORTFOLIO SECURITIES
Each Fund may lend its investment securities to approved borrowers, such as brokers, dealers and other financial institutions. The borrower pledges and maintains with the Fund collateral consisting of cash, an irrevocable letter of credit issued by an approved bank, or securities issued or guaranteed by the U.S. government. The initial collateral received by each Fund is required to have a value of at least 102% of the current value of the loaned securities for securities traded on U.S. exchanges and a value of at least 105% for all other securities. The collateral is maintained thereafter at a value equal to at least 100% of the current value of the securities on loan. The market value of the loaned securities is determined at the close of each business day of the Funds. Any additional required collateral is delivered to the Funds and any excess collateral is returned by the Funds on the next business day. During the term of the loan, each Fund is entitled to all distributions made on or in respect of the loaned securities but does not receive interest income on securities received as collateral. Loans of securities are terminable at any time and the borrower, after notice, is required to return borrowed securities within the standard time period for settlement of securities transactions.
Cash received as collateral for securities on loan may be reinvested in certain short-term instruments either directly on behalf of a fund or through one or more joint accounts or money market funds, including those managed by BlackRock Fund Advisors (“BFA”), the Funds’ investment adviser, or its affiliates. As of August 31, 2017, any securities on loan were collateralized by cash and/or U.S. government obligations. Cash collateral received was invested in money market funds managed by BFA and is disclosed in the schedules of investments. Any non-cash collateral received cannot be sold, re-invested or pledged by the Fund, except in the event of borrower default. The securities on loan for each Fund are also disclosed in its schedule of investments. The total value of any securities on loan as of August 31, 2017 and the total value of the related cash collateral are disclosed in the statements of assets and liabilities. Income earned by the Funds from securities lending is disclosed in the statements of operations.
The risks of securities lending include the risk that the borrower may not provide additional collateral when required or may not return the securities when due. To mitigate these risks, the Funds benefit from a borrower default indemnity provided by BlackRock, Inc. (“BlackRock”). BlackRock’s indemnity allows for full replacement of securities loaned if the collateral received does not cover the value of the securities loaned in the event of borrower default. Each Fund could incur a loss if the value of an investment purchased with cash collateral falls below the value of the loaned securities or if the value of an investment purchased with cash collateral falls below the value of the original cash collateral received.
Securities lending transactions are entered into by the Funds under Master Securities Lending Agreements (“MSLA”) which provide the right, in the event of default (including bankruptcy or insolvency) for the non-defaulting party to liquidate the collateral and calculate a net exposure to the defaulting party or request additional collateral. In the event that a borrower defaults, a Fund, as lender, would offset the market value of the collateral received against the market value of the securities loaned. The value of the collateral is typically greater than that of the market value of the securities loaned, leaving the lender with a net amount payable to the defaulting party. However, bankruptcy or insolvency laws of a particular jurisdiction may impose restrictions on or prohibitions against such a right of offset in the event of an MSLA counterparty’s bankruptcy or insolvency. Under the MSLA, the borrower can resell or re-pledge the loaned securities, and a Fund can reinvest cash collateral, or, upon an event of default, resell or re-pledge the collateral.
NOTESTO FINANCIAL STATEMENTS | 39 |
Table of Contents
Notes to Financial Statements (Continued)
iSHARES®, INC.
The following table is a summary of securities lending agreements which are subject to offset under an MSLA as of August 31, 2017:
iShares ETF and Counterparty | Market Value of Securities on Loan | Cash Collateral Received a | Net Amount b | |||||||||
MSCI Frontier 100 | ||||||||||||
Citigroup Global Markets Inc. | $ | 694,620 | $ | 694,620 | $ | — | ||||||
Jefferies LLC | 102,150 | 102,150 | — | |||||||||
JPMorgan Securities LLC | 1,638,350 | 1,638,350 | — | |||||||||
Morgan Stanley & Co. LLC (U.S. Equity Securities Lending) | 2,073,731 | 2,073,731 | — | |||||||||
|
|
|
|
|
| |||||||
| $ | 4,508,851 | $ | 4,508,851 | $ | — | |||||||
|
|
|
|
|
| |||||||
MSCI World | ||||||||||||
Barclays Capital Inc. | $ | 44,275 | $ | 44,275 | $ | — | ||||||
BNP Paribas New York Branch | 148,165 | 147,857 | (308 | ) | ||||||||
BNP Paribas Prime Brokerage Inc. | 47,895 | 47,895 | — | |||||||||
BNP Paribas Prime Brokerage International Ltd. | 37,566 | 37,566 | — | |||||||||
Citigroup Global Markets Inc. | 474,600 | 474,600 | — | |||||||||
Credit Suisse Securities (USA) LLC | 36,874 | 36,874 | — | |||||||||
Deutsche Bank Securities Inc. | 201,581 | 201,581 | — | |||||||||
Goldman Sachs & Co. | 703,330 | 703,330 | — | |||||||||
HSBC Bank PLC | 17,102 | 17,102 | — | |||||||||
JPMorgan Securities LLC | 605,394 | 605,394 | — | |||||||||
Merrill Lynch, Pierce, Fenner & Smith | 477,738 | 477,738 | — | |||||||||
Morgan Stanley & Co. LLC | 480,671 | 480,671 | — | |||||||||
Morgan Stanley & Co. LLC (U.S. Equity Securities Lending) | 403,582 | 403,582 | — | |||||||||
State Street Bank & Trust Company | 3,766,749 | 3,766,749 | — | |||||||||
UBS AG | 45,280 | 45,280 | — | |||||||||
UBS Securities LLC | 61,366 | 61,366 | — | |||||||||
Wells Fargo Securities LLC | 29,477 | 29,477 | — | |||||||||
|
|
|
|
|
| |||||||
| $ | 7,581,645 | $ | 7,581,337 | $ | (308 | ) | ||||||
|
|
|
|
|
| |||||||
a Collateral received in excess of the market value of securities on loan is not presented in this table. The total cash collateral received by each Fund is disclosed in the Fund’s statement of assets and liabilities. b Additional collateral is delivered to the Funds on the next business day in accordance with the MSLA. The net amount would be subject to the borrower default indemnity in the event of default by a counterparty. |
| 2. | INVESTMENT ADVISORY AGREEMENT AND OTHER TRANSACTIONS WITH AFFILIATES |
Pursuant to an Investment Advisory Agreement with the Company, BFA manages the investment of each Fund’s assets. BFA is a California corporation indirectly owned by BlackRock. Under the Investment Advisory Agreement, BFA is responsible for substantially all expenses of the Funds, except (i) interest and taxes; (ii) brokerage commissions and other expenses connected with the execution of portfolio transactions; (iii) distribution fees; (iv) the advisory fee payable to BFA; and (v) litigation expenses and any extraordinary expenses (in each case as determined by a majority of the independent directors).
| 40 | 2017 iSHARES ANNUAL REPORTTO SHAREHOLDERS |
Table of Contents
Notes to Financial Statements (Continued)
iSHARES®, INC.
For its investment advisory services to each Fund, BFA is entitled to an annual investment advisory fee, accrued daily and paid monthly by the Funds, based on the average daily net assets of each Fund as follows:
| iShares ETF | Investment Advisory Fee | |||
MSCI Frontier 100 | 0.79 | % | ||
MSCI World | 0.24 | |||
The U.S. Securities and Exchange Commission has issued an exemptive order which permits BlackRock Institutional Trust Company, N.A. (“BTC”), an affiliate of BFA, to serve as securities lending agent for the Funds, subject to applicable conditions. As securities lending agent, BTC bears all operational costs directly related to securities lending. Each Fund is responsible for fees in connection with the investment of cash collateral received for securities on loan in a money market fund managed by BFA, however, BTC has agreed to reduce the amount of securities lending income it receives in order to effectively limit the collateral investment fees each Fund bears to an annual rate of 0.04% (the “collateral investment fees”). Securities lending income is equal to the total of income earned from the reinvestment of cash collateral, net of fees and other payments to and from borrowers of securities, and less the collateral investment fees. The Funds retain a portion of securities lending income and remit the remaining portion to BTC as compensation for its services as securities lending agent.
Pursuant to a securities lending agreement, each Fund retains 80% of securities lending income and the amount retained can never be less than 70% of the total of securities lending income plus the collateral investment fees. In addition, commencing the business day following the date that the aggregate securities lending income plus the collateral investment fees generated across all 1940 Act iShares exchange-traded funds (the “iShares ETF Complex”) in a given calendar year exceeds the aggregate securities lending income generated across the iShares ETF Complex in the calendar year 2013, each Fund, pursuant to a securities lending agreement, will retain for the remainder of that calendar year 85% of securities lending income and the amount retained can never be less than 70% of the total of securities lending income plus the collateral investment fees.
For the year ended August 31, 2017, the total of securities lending agent services and collateral investment fees paid were as follows:
| iShares ETF | Fees Paid to BTC | |||
MSCI Frontier 100 | $ | 7,530 | ||
MSCI World | 13,816 | |||
BlackRock Investments, LLC, an affiliate of BFA, is the distributor for each Fund. Pursuant to the distribution agreement, BFA is responsible for any fees or expenses for distribution services provided to the Funds.
Cross trading is the buying or selling of portfolio securities between funds to which BFA (or an affiliate) serves as investment adviser. At its regularly scheduled quarterly meetings, the Board reviews such transactions as of the most recent calendar quarter for compliance with the requirements and restrictions set forth by Rule 17a-7.
For the year ended August 31, 2017, transactions executed by the Funds pursuant to Rule 17a-7 under the 1940 Act were as follows:
| iShares ETF | Purchases | Sales | ||||||
MSCI Frontier 100 | $ | 601,870 | $ | 750,168 | ||||
MSCI World | 1,099,652 | 1,104,539 | ||||||
NOTESTO FINANCIAL STATEMENTS | 41 |
Table of Contents
Notes to Financial Statements (Continued)
iSHARES®, INC.
Each Fund may invest its positive cash balances in certain money market funds managed by BFA or an affiliate. The income earned on these temporary cash investments is included in “Dividends – affiliated” in the statements of operations.
The PNC Financial Services Group, Inc. is the largest stockholder of BlackRock and is considered to be an affiliate of the Funds for 1940 Act purposes.
Certain directors and officers of the Company are also officers of BTC and/or BFA.
| 3. | INVESTMENT PORTFOLIO TRANSACTIONS |
Purchases and sales of investments (excluding in-kind transactions and short-term investments) for the year ended August 31, 2017 were as follows:
| iShares ETF | Purchases | Sales | ||||||
MSCI Frontier 100 | $ | 260,906,035 | $ | 174,041,843 | ||||
MSCI World | 17,275,339 | 12,270,680 | ||||||
In-kind transactions (see Note 4) for the year ended August 31, 2017 were as follows:
| iShares ETF | In-kind Purchases | In-kind Sales | ||||||
MSCI Frontier 100 | $ | 15,022,532 | $ | 5,862,175 | ||||
MSCI World | 193,812,798 | 28,111,576 | ||||||
| 4. | CAPITAL SHARE TRANSACTIONS |
Capital shares are issued and redeemed by each Fund only in aggregations of a specified number of shares or multiples thereof (“Creation Units”) at NAV. Except when aggregated in Creation Units, shares of each Fund are not redeemable. Transactions in capital shares for each Fund are disclosed in detail in the statements of changes in net assets.
The consideration for the purchase of Creation Units of a fund in the Company generally consists of the in-kind deposit of a designated portfolio of securities and a specified amount of cash. Certain funds in the Company may be offered in Creation Units solely or partially for cash in U.S. dollars. Investors purchasing and redeeming Creation Units may pay a purchase transaction fee and a redemption transaction fee directly to State Street Bank and Trust Company, the Company’s administrator, to offset transfer and other transaction costs associated with the issuance and redemption of Creation Units, including Creation Units for cash. Investors transacting in Creation Units for cash may also pay an additional variable charge to compensate the relevant fund for certain transaction costs (i.e., stamp taxes, taxes on currency or other financial transactions, and brokerage costs) and market impact expenses relating to investing in portfolio securities. Such variable charges, if any, are included in “Proceeds from shares sold” in the statements of changes in net assets.
| 5. | PRINCIPAL RISKS |
In the normal course of business, each Fund invests in securities or other instruments and may enter into certain transactions, and such activities subject the Fund to various risks, including, among others, fluctuations in the market (market risk) or failure of an issuer to meet all of its obligations. The value of securities or other instruments may also be affected by various factors, including, without limitation: (i) the general economy; (ii) the overall market as well as local, regional or global political and/or social instability; (iii) regulation, taxation or international tax treaties between various countries; or (iv) currency, interest rate or price fluctuations. Each Fund’s prospectus provides details of the risks to which the Fund is subject.
| 42 | 2017 iSHARES ANNUAL REPORTTO SHAREHOLDERS |
Table of Contents
Notes to Financial Statements (Continued)
iSHARES®, INC.
BFA uses a “passive” or index approach to try to achieve each Fund’s investment objective following the securities included in its underlying index during upturns as well as downturns. BFA does not take steps to reduce market exposure or to lessen the effects of a declining market. Divergence from the underlying index and the composition of the portfolio is monitored by BFA.
MARKET RISK
Market risk arises mainly from uncertainty about future values of financial instruments influenced by price, currency and interest rate movements. It represents the potential loss a fund may suffer through holding market positions in the face of market movements. A fund is exposed to market risk by its investment in equity, fixed income and/or financial derivative instruments or by its investment in underlying funds. The fair value of securities held by a fund may decline due to general market conditions, economic trends or events that are not specifically related to the issuers of the securities including local, regional or global political, social or economic instability or to factors that affect a particular industry or group of industries. The extent of a fund’s exposure to market risk is the market value of the investments held as shown in the fund’s schedule of investments.
A diversified portfolio, where this is appropriate and consistent with a fund’s objectives, minimizes the risk that a price change of a particular investment will have a material impact on the NAV of a fund. The investment concentrations within each Fund’s portfolio are disclosed in its schedule of investments.
Investing in the securities of non-U.S. issuers involves certain considerations and risks not typically associated with securities of U.S. issuers. Such risks include, but are not limited to: differences in accounting, auditing and financial reporting standards; more substantial governmental involvement in the economy; higher inflation rates, greater social, economic and political uncertainties; possible nationalization or expropriation of assets; less availability of public information about issuers; imposition of withholding or other taxes; higher transaction and custody costs and delays in settlement procedures; and lower level of regulation of the securities markets and issuers. Non-U.S. securities may be less liquid, more difficult to value, and have greater price volatility due to exchange rate fluctuations. These and other risks are heightened for investments in issuers from countries with less developed capital markets.
The economies and markets of European countries are often closely connected and interdependent, and events in one country in Europe can have an adverse impact on other European countries. The European financial markets have experienced volatility and adverse trends in recent years due to concerns about economic downturns or rising government debt levels in several European countries. These events have adversely affected the exchange rate of the euro and may continue to significantly affect European countries. The occurrence of terrorist incidents throughout Europe also could impact financial markets. In addition, the United Kingdom has voted to withdraw from the European Union. The referendum may introduce significant new uncertainties and instability in the financial markets as the United Kingdom negotiates its exit from the European Union.
CREDIT RISK
Credit risk is the risk that an issuer or guarantor of debt instruments or the counterparty to a financial transaction, including derivatives contracts, repurchase agreements or loans of portfolio securities, is unable or unwilling to make timely interest and/or principal payments or to otherwise honor its obligations. BFA and its affiliates manage counterparty credit risk by entering into transactions only with counterparties that they believe have the financial resources to honor their obligations and by monitoring the financial stability of those counterparties. Financial assets, which potentially expose a fund to issuer and counterparty credit risks, consist principally of financial instruments and receivables due from counterparties. The extent of a fund’s exposure to credit and counterparty risks with respect to those financial assets is approximated by their value recorded in its statement of assets and liabilities.
NOTESTO FINANCIAL STATEMENTS | 43 |
Table of Contents
Notes to Financial Statements (Continued)
iSHARES®, INC.
| 6. | INCOME TAX INFORMATION |
Each Fund is treated as an entity separate from the Company’s other funds for federal income tax purposes. It is the policy of each Fund to qualify as a regulated investment company by complying with the provisions applicable to regulated investment companies, as defined under Subchapter M of the Internal Revenue Code of 1986, as amended, and to annually distribute substantially all of its ordinary income and any net capital gains (taking into account any capital loss carryforwards) sufficient to relieve it from all, or substantially all, federal income and excise taxes. Accordingly, no provision for federal income taxes is required.
U.S. GAAP requires that certain components of net assets be adjusted to reflect permanent differences between financial and tax reporting. These reclassifications have no effect on net assets or NAV per share. The following permanent differences as of August 31, 2017, attributable to the characterization of corporate actions, passive foreign investment companies, the characterization of expenses, foreign currency transactions and realized gains (losses) from in-kind redemptions, were reclassified to the following accounts:
| iShares ETF | Paid-in Capital | Undistributed Net Investment Income/Distributions in Excess of Net Investment Income | Undistributed Net Realized Gain/Accumulated Net Realized Loss | |||||||||
MSCI Frontier 100 | $ | 2,158,952 | $ | (1,278,468 | ) | $ | (880,484 | ) | ||||
MSCI World | 3,697,476 | 54,370 | (3,751,846 | ) | ||||||||
The tax character of distributions paid during the years ended August 31, 2017 and August 31, 2016 was as follows:
| iShares ETF | 2017 | 2016 | ||||||
MSCI Frontier 100 | ||||||||
Ordinary income | $ | 6,259,265 | $ | 9,930,758 | ||||
|
|
|
| |||||
MSCI World | ||||||||
Ordinary income | $ | 8,262,836 | $ | 5,779,653 | ||||
|
|
|
| |||||
As of August 31, 2017, the tax components of accumulated net earnings (losses) were as follows:
| iShares ETF | Undistributed Ordinary Income | Capital Loss Carryforwards | Net Unrealized Gains (Losses) a | Total | ||||||||||||
MSCI Frontier 100 | $ | 5,546,798 | $ | (88,012,787 | ) | $ | 36,117,378 | $ | (46,348,611 | ) | ||||||
MSCI World | 2,110,678 | (2,268,231 | ) | 40,553,367 | 40,395,814 | |||||||||||
| a | The difference between book-basis and tax-basis unrealized gains (losses) was attributable primarily to the tax deferral of losses on wash sales, the characterization of corporate actions, and the realization for tax purposes of unrealized gains on investments in passive foreign investment companies. |
As of August 31, 2017, the Funds had non-expiring capital loss carryforwards available to offset future realized capital gains as follows:
| iShares ETF | Non- Expiring | |||
MSCI Frontier 100 | $ | 88,012,787 | ||
MSCI World | 2,268,231 | |||
| 44 | 2017 iSHARES ANNUAL REPORTTO SHAREHOLDERS |
Table of Contents
Notes to Financial Statements (Continued)
iSHARES®, INC.
The Funds may own shares in certain foreign investment entities, referred to, under U.S. tax law, as “passive foreign investment companies.” The Funds may elect to mark-to-market annually the shares of each passive foreign investment company and would be required to distribute to shareholders any such marked-to-market gains.
Management has analyzed tax laws and regulations and their application to the Funds as of August 31, 2017, inclusive of the open tax return years, and does not believe there are any uncertain tax positions that require recognition of a tax liability in the Funds’ financial statements.
| 7. | LINE OF CREDIT |
The iShares MSCI Frontier 100 ETF, along with certain other iShares funds, is a party to a $250 million credit agreement with State Street Bank and Trust Company, which expires on October 25, 2017. The line of credit may be used for temporary or emergency purposes, including redemptions, settlement of trades and rebalancing of portfolio holdings. The credit agreement has the following terms: a commitment fee of 0.20% per annum on the unused portion of the credit agreement and interest at a rate equal to the higher of (a) the one-month LIBOR (not less than zero) plus 1.00% per annum or (b) the U.S. Federal Funds rate (not less than zero) plus 1.00% per annum on amounts borrowed. The commitment fee is allocated to each fund participating in the credit agreement based on each fund’s pro-rata share of the aggregate average daily value of assets invested in local securities of certain foreign markets.
For the year ended August 31, 2017, the Fund’s maximum amount borrowed, the average borrowings and the weighted average interest rate under the credit agreement were $35,000,000, $767,123 and 1.23%, respectively.
At a meeting held on September 14-15, 2017, the Board approved the amendment of certain terms of the credit agreement including (i) increasing the maximum borrowing amount to $275 million and (ii) extending the expiration date to October 24, 2018. These changes to the credit agreement are expected to be effective on or around October 25, 2017.
| 8. | LEGAL PROCEEDINGS |
On June 16, 2016, investors (the “Plaintiffs”) in certain iShares funds (iShares Core S&P Small-Cap ETF, iShares Russell 1000 Growth ETF, iShares Core S&P 500 ETF, iShares Russell Mid-Cap Growth ETF, iShares Russell Mid-Cap ETF, iShares Russell Mid-Cap Value ETF, iShares Select Dividend ETF, iShares Morningstar Mid-Cap ETF, iShares Morningstar Large-Cap ETF, iShares U.S. Aerospace & Defense ETF and iShares U.S. Preferred Stock ETF) filed a putative class action lawsuit against iShares Trust, BlackRock, Inc. and certain of its advisory affiliates, and certain directors/trustees and officers of the Funds (collectively, “Defendants”). The lawsuit alleges the Defendants violated federal securities laws by failing to adequately disclose in the prospectuses issued by the funds noted above the risks of using stop-loss orders in the event of a ‘flash crash’, such as the one that occurred on May 6, 2010. On September 18, 2017, the Court issued a Statement of Decision holding that the Plaintiffs lack standing to assert their claims. On October 11, 2017, the Court entered final judgment dismissing all of Plaintiffs’ claims with prejudice.
| 9. | SUBSEQUENT EVENTS |
Management has evaluated the impact of all subsequent events on the Funds through the date the financial statements were available to be issued and has determined that there were no subsequent events requiring adjustment or disclosure in the financial statements.
NOTESTO FINANCIAL STATEMENTS | 45 |
Table of Contents
Report of Independent Registered Public Accounting Firm
To the Board of Directors of iShares, Inc. and
Shareholders of the iShares MSCI Frontier 100 ETF and iShares MSCI World ETF
In our opinion, the accompanying statements of assets and liabilities, including the schedules of investments, and the related statements of operations and of changes in net assets and the financial highlights present fairly, in all material respects, the financial position of iShares MSCI Frontier 100 ETF and iShares MSCI World ETF (constituting funds of iShares, Inc., hereafter referred to as the “Funds”) as of August 31, 2017, and the results of each of their operations, the changes in each of their net assets and the financial highlights for each of the periods indicated, in conformity with accounting principles generally accepted in the United States of America. These financial statements and financial highlights (hereafter referred to as “financial statements”) are the responsibility of the Funds’ management. Our responsibility is to express an opinion on these financial statements based on our audits. We conducted our audits of these financial statements in accordance with the standards of the Public Company Accounting Oversight Board (United States). Those standards require that we plan and perform the audit to obtain reasonable assurance about whether the financial statements are free of material misstatement. An audit includes examining, on a test basis, evidence supporting the amounts and disclosures in the financial statements, assessing the accounting principles used and significant estimates made by management, and evaluating the overall financial statement presentation. We believe that our audits, which included confirmation of securities as of August 31, 2017 by correspondence with the custodian, transfer agent and brokers, or by other appropriate auditing procedures where replies were not received, provide a reasonable basis for our opinion.
PricewaterhouseCoopers LLP
San Francisco, California
October 23, 2017
| 46 | 2017 iSHARES ANNUAL REPORTTO SHAREHOLDERS |
Table of Contents
iSHARES®, INC.
The following maximum amounts are hereby designated as qualified dividend income for individuals for the fiscal year ended August 31, 2017:
| iShares ETF | Qualified Dividend Income | |||
MSCI Frontier 100 | $ | 7,876,852 | ||
MSCI World | 9,716,904 | |||
For corporate shareholders, the percentage of income dividends paid by the iShares MSCI World ETF during the fiscal year ended August 31, 2017 that qualified for the dividends-received deduction was 48.68%.
For the fiscal year ended August 31, 2017, the iShares MSCI Frontier 100 ETF earned foreign source income of $20,212,058 and paid foreign taxes of $1,887,515 which it intends to pass through to its shareholders.
TAX INFORMATION | 47 |
Table of Contents
Board Review and Approval of Investment Advisory
Contracts
iSHARES®, INC.
I. iShares MSCI Frontier 100 ETF
Under Section 15(c) of the Investment Company Act of 1940 (the “1940 Act”), the Company’s Board of Directors (the “Board”), including a majority of Directors who are not “interested persons” of the Company (as that term is defined in the 1940 Act) (the “Independent Directors”), is required annually to consider and approve the Investment Advisory Contract between the Company and BFA (the “Advisory Contract”) on behalf of the Fund. The Independent Directors requested, and BFA provided, such information as the Independent Directors, with advice from independent counsel, deemed reasonably necessary to evaluate the Advisory Contract. A committee of all of the Independent Directors (the “15(c) Committee”), with independent counsel, met with management on May 5, 2017 and May 12, 2017. At these meetings, the 15(c) Committee reviewed and discussed information provided in response to the 15(c) Committee’s initial requests, and requested certain additional information, which management agreed to provide. At a meeting held on May 18, 2017, management presented information to the Board relating to the continuance of the Advisory Contract, including information requested by the 15(c) Committee during its meetings. The Board, including the Independent Directors, reviewed and discussed such information at length. The Independent Directors requested from management certain additional information, which management agreed to provide. At a meeting held on June 19-21, 2017, the Board, including the Independent Directors, reviewed the additional information provided by management in response to these requests. After extensive discussions, the Board, including all of the Independent Directors, approved the continuance of the Advisory Contract for the Fund, based on a review of qualitative and quantitative information provided by BFA. The Board noted its satisfaction with the extent and quality of information provided and its frequent interactions with management, as well as the detailed responses and other information provided by BFA. The Board also noted that the Board and BFA agreed to discuss potential further enhancements to the 15(c) process for the coming year. The Independent Directors were advised by their independent counsel throughout the process, including about the legal standards applicable to their review. In approving the Advisory Contract for the Fund, the Board, including the Independent Directors, considered the following factors, no one of which was controlling, and reached the following conclusions:
Expenses and Performance of the Fund — The Board reviewed statistical information prepared by Broadridge Financial Solutions Inc. (“Broadridge”), an independent provider of investment company data, regarding the expense ratio components, including gross and net total expenses, waivers/reimbursements (if any), and underlying fund fees and expenses (if any) of the Fund in comparison with the same information for other exchange traded funds (“ETFs”) (including, where applicable, funds sponsored by an “at cost” service provider) and, in the limited instances where no comparable ETFs existed and the comparison group would not otherwise be reasonable in Broadridge’s judgment, pure index institutional mutual funds, objectively selected by Broadridge as comprising the Fund’s applicable peer group pursuant to Broadridge’s proprietary ETF methodology (the “Peer Group”). The Board was provided with a detailed description of the proprietary ETF methodology used by Broadridge to determine the Fund’s Peer Group. The Board further noted that due to the limitations in providing comparable funds in the Peer Group, the statistical information provided in Broadridge’s report may or may not provide meaningful direct comparisons to the Fund in all instances.
The Board also noted that the investment advisory fee rate and overall expenses (net of waivers and reimbursements) for the Fund were higher than the median of the investment advisory fee rates and overall expenses (net of waivers and reimbursements) of the funds in its Peer Group, excluding iShares funds. The Board further noted that the Fund’s pricing reflects the additional complexity associated with investing in frontier markets, as compared to the funds in the Peer Group, which have little or no frontier market exposure.
In addition, to the extent that any of the comparison funds included in the Peer Group, excluding iShares funds, track the same index as the Fund, Broadridge also provided, and the Board reviewed, a comparison of the Fund’s performance for the one-, three-, five-, ten-year, and since inception periods, as applicable, and for the quarter ended December 31, 2016, to that of relevant comparison funds for the same periods.
| 48 | 2017 iSHARES ANNUAL REPORTTO SHAREHOLDERS |
Table of Contents
Board Review and Approval of Investment Advisory
Contracts (Continued)
iSHARES®, INC.
The Board noted that the Fund seeks to track its specified underlying index and that, during the year, the Board received periodic reports on the Fund’s short- and longer-term performance in comparison with its underlying index. Such periodic comparative performance information, including any additional detailed information requested by the Boards, was also considered. The Board noted that the Fund generally performed in line with its underlying index over the relevant periods.
Based on this review, the other factors considered at the meeting, and their general knowledge of ETF pricing, the Board concluded that the investment advisory fee rate and the historical performance of the Fund supported the Board’s approval of the continuance of the Advisory Contract for the coming year.
Nature, Extent and Quality of Services Provided by BFA — Based on management’s representations, including information about recent and proposed enhancements to the iShares business, including with respect to capital markets support and analysis, technology, product design, compliance and risk management, and other services, the Board expected that there would be no diminution in the scope of services required of or provided by BFA under the Advisory Contract for the coming year as compared to the scope of services provided by BFA during prior years. In reviewing the scope of these services, the Board considered BFA’s investment philosophy and experience, noting that BFA and its affiliates have committed significant resources over time, including during the past year, to supporting the iShares funds and their shareholders. The Board also considered BFA’s compliance program and its compliance record with respect to the Fund. In that regard, the Board noted that BFA reports to the Board about portfolio management and compliance matters on a periodic basis in connection with regularly scheduled meetings of the Board, and on other occasions as necessary and appropriate, and has provided information and made appropriate officers available as needed to provide further assistance with these matters. The Board also reviewed the background and experience of the persons responsible for the day-to-day management of the Fund, as well as the resources available to them in managing the Fund. In addition to the above considerations, the Board reviewed and considered detailed presentations regarding BFA’s investment performance, investment and risk management processes and strategies provided at the June 19-21, 2017 meeting and throughout the previous year, and matters related to BFA’s portfolio compliance policies and procedures. The Board noted that the Fund had met its investment objective consistently since its inception date.
Based on review of this information, and the performance information discussed above, the Board concluded that the nature, extent and quality of services provided by BFA to the Fund under the Advisory Contract supported the Board’s approval of the continuance of the Advisory Contract for the coming year.
Costs of Services Provided to Fund and Profits Realized by BFA and Affiliates — The Board reviewed information about the profitability of the Fund to BlackRock, based on the fees payable to BFA and its affiliates (including fees under the Advisory Contract), and other sources of revenue and expense to BFA and its affiliates from the Fund’s operations for the last calendar year. The Board reviewed BlackRock’s profitability methodology for the iShares funds, including supplemental information that was responsive to requests of the 15(c) Committee. The Board noted that the 15(c) Committee had focused on the methodology and profitability presentation during its meetings. The Board discussed the sources of direct and ancillary revenue with management, including the revenues to BTC, a BFA affiliate, from securities lending by the Fund. The Board also discussed BFA’s profit margin as reflected in the Fund’s profitability analysis and reviewed information regarding potential economies of scale (as discussed below). Based on this review, the Board concluded that the profits realized by BFA and its affiliates under the Advisory Contract and from other relationships between the Fund and BFA and/or its affiliates, if any, were within a reasonable range in light of the factors considered.
Economies of Scale — The Board reviewed information regarding potential economies of scale or other efficiencies that may result from increases in the Fund’s assets, noting that the issue of economies of scale had been focused on by the 15(c) Committee during its meetings and addressed by management, including through supplemental information. The Board and the 15(c) Committee reviewed information provided by BFA regarding scale benefits shared with the iShares funds through relatively
BOARD REVIEWAND APPROVALOF INVESTMENT ADVISORY CONTRACTS | 49 |
Table of Contents
Board Review and Approval of Investment Advisory
Contracts (Continued)
iSHARES®, INC.
low fee rates established at inception, breakpoints and waivers or other fee reductions, as well as through additional investment in the iShares business and the provision of improved or additional infrastructure and services to the iShares funds and their shareholders. The Board and the 15(c) Committee received information regarding BlackRock’s historical profitability, including BFA’s and its affiliates’ costs in providing services. The cost information distinguished, among other things, between fixed and variable costs, and explained how the level of fixed and variable costs, as well as the nature of such costs, may impact the existence or size of scale benefits. The Board noted that the Advisory Contract for the Fund did not provide for any breakpoints in the Fund’s investment advisory fee rate as the assets of the Fund increase. However, the Board noted that should material economies of scale be identified in the future that are not otherwise shared, a breakpoint structure for the Fund may be appropriate, and that it would continue to monitor the sharing of economies of scale to determine the appropriateness of adding breakpoints in the future.
Based on this review, as well as the other factors considered at the meeting, the Board, recognizing its responsibility to consider the Advisory Contract at least annually, determined to approve the continuance of the Advisory Contract for the coming year.
Fees and Services Provided for Other Comparable Funds/Accounts Managed by BFA and its Affiliates — The Board received and considered information regarding the investment advisory/management fee rates for other funds/accounts in the U.S. for which BFA (or its affiliates) provides investment advisory/management services, including open-end funds registered under the 1940 Act (including sub-advised funds), collective trust funds, and institutional separate accounts (together, the “Other Accounts”), and acknowledged BFA’s assertion that the iShares funds are fundamentally different investment vehicles from the Other Accounts. The Board noted that BFA and its affiliates do not manage Other Accounts with substantially the same investment objective and strategy as the Fund and that track the same index as the Fund. The Board further noted that BFA provided the Board with detailed information regarding how the Other Accounts (particularly institutional clients) generally differ from the Fund, including in terms of the different and generally more extensive services provided to the Fund, as well as other significant differences. In that regard, the Board considered that the pricing of services to institutional clients is typically based on a number of factors beyond the nature and extent of the specific services to be provided and often depends on the overall relationship between the client and its affiliates and the adviser and its affiliates. In addition, the Board considered the relative complexity and inherent risks and challenges of managing and providing other services to the Fund, as a publicly traded ETF, as compared to the Other Accounts that are institutional clients, in light of differing regulatory requirements and client-imposed mandates. The Board also acknowledged BFA’s expressed business purpose for launching a suite of iShares “Core” ETFs that generally are subject to lower investment advisory fees than iShares non-Core ETFs that may provide a similar investment exposure. The Board also considered the “all-inclusive” nature of the Fund’s advisory fee structure, and the Fund expenses borne by BFA under this arrangement. The Board noted that the investment advisory fee rate under the Advisory Contract for the Fund was generally higher than the investment advisory/management fee rates for certain of the Other Accounts (particularly institutional clients) and concluded that the differences appeared to be consistent with the factors discussed.
Other Benefits to BFA and/or its Affiliates — The Board reviewed the “fallout” benefits or ancillary revenue received by BFA and/or its affiliates in connection with the services provided to the Fund by BFA, such as payment of revenue to BTC, the Fund’s securities lending agent, for loaning portfolio securities (which was included in the profit margins reviewed by the Board pursuant to BFA’s profitability methodology), and payment of advisory fees and/or administration fees to BFA and BTC (or their affiliates) in connection with any investments by the Fund in other funds for which BFA (or its affiliates) provides investment advisory services and/or administration services. The Board also noted the revenue received by BFA and/or its affiliates pursuant to an agreement that permits a service provider to use certain portions of BlackRock’s technology platform to service accounts managed by BFA and/or its affiliates, including the iShares funds. The Board noted that BFA generally does not use soft dollars or consider the value of research or other services that may be provided to BFA (including its affiliates) in selecting brokers for portfolio transactions for the Fund. The Board further noted that any portfolio transactions on behalf of the Fund placed through a BFA affiliate or purchased from an underwriting syndicate in which a BFA affiliate participates, are reported to the Board pursuant to
| 50 | 2017 iSHARES ANNUAL REPORTTO SHAREHOLDERS |
Table of Contents
Board Review and Approval of Investment Advisory
Contracts (Continued)
iSHARES®, INC.
Rule 17e-1 or Rule 10f-3, as applicable, under the 1940 Act. The Board concluded that any such ancillary benefits would not be disadvantageous to the Fund’s shareholders and thus would not alter the Board’s conclusion with respect to the appropriateness of approving the continuance of the Advisory Contract for the coming year.
Conclusion — Based on the considerations described above, the Board determined that the Fund’s investment advisory fee rate under the Advisory Contract does not constitute a fee that is so disproportionately large as to bear no reasonable relationship to the services rendered and that could not have been the product of arm’s-length bargaining, and concluded to approve the continuance of the Advisory Contract for the coming year.
II. iShares MSCI World ETF
Under Section 15(c) of the Investment Company Act of 1940 (the “1940 Act”), the Company’s Board of Directors (the “Board”), including a majority of Directors who are not “interested persons” of the Company (as that term is defined in the 1940 Act) (the “Independent Directors”), is required annually to consider and approve the Investment Advisory Contract between the Company and BFA (the “Advisory Contract”) on behalf of the Fund. The Independent Directors requested, and BFA provided, such information as the Independent Directors, with advice from independent counsel, deemed reasonably necessary to evaluate the Advisory Contract. A committee of all of the Independent Directors (the “15(c) Committee”), with independent counsel, met with management on May 5, 2017 and May 12, 2017. At these meetings, the 15(c) Committee reviewed and discussed information provided in response to the 15(c) Committee’s initial requests, and requested certain additional information, which management agreed to provide. At a meeting held on May 18, 2017, management presented information to the Board relating to the continuance of the Advisory Contract, including information requested by the 15(c) Committee during its meetings. The Board, including the Independent Directors, reviewed and discussed such information at length. The Independent Directors requested from management certain additional information, which management agreed to provide. At a meeting held on June 19-21, 2017, the Board, including the Independent Directors, reviewed the additional information provided by management in response to these requests. After extensive discussions, the Board, including all of the Independent Directors, approved the continuance of the Advisory Contract for the Fund, based on a review of qualitative and quantitative information provided by BFA. The Board noted its satisfaction with the extent and quality of information provided and its frequent interactions with management, as well as the detailed responses and other information provided by BFA. The Board also noted that the Board and BFA agreed to discuss potential further enhancements to the 15(c) process for the coming year. The Independent Directors were advised by their independent counsel throughout the process, including about the legal standards applicable to their review. In approving the Advisory Contract for the Fund, the Board, including the Independent Directors, considered the following factors, no one of which was controlling, and reached the following conclusions:
Expenses and Performance of the Fund — The Board reviewed statistical information prepared by Broadridge Financial Solutions Inc. (“Broadridge”), an independent provider of investment company data, regarding the expense ratio components, including gross and net total expenses, waivers/reimbursements (if any), and underlying fund fees and expenses (if any) of the Fund in comparison with the same information for other exchange traded funds (“ETFs”) (including, where applicable, funds sponsored by an “at cost” service provider) and, in the limited instances where no comparable ETFs existed and the comparison group would not otherwise be reasonable in Broadridge’s judgment, pure index institutional mutual funds, objectively selected by Broadridge as comprising the Fund’s applicable peer group pursuant to Broadridge’s proprietary ETF methodology (the “Peer Group”). The Board was provided with a detailed description of the proprietary ETF methodology used by Broadridge to determine the Fund’s Peer Group. The Board further noted that due to the limitations in providing comparable funds in the Peer Group, the statistical information provided in Broadridge’s report may or may not provide meaningful direct comparisons to the Fund in all instances.
BOARD REVIEWAND APPROVALOF INVESTMENT ADVISORY CONTRACTS | 51 |
Table of Contents
Board Review and Approval of Investment Advisory
Contracts (Continued)
iSHARES®, INC.
The Board also noted that the investment advisory fee rate and overall expenses (net of waivers and reimbursements) for the Fund were lower than the median of the investment advisory fee rates and overall expenses (net of waivers and reimbursements) of the funds in its Peer Group, excluding iShares funds.
In addition, to the extent that any of the comparison funds included in the Peer Group, excluding iShares funds, track the same index as the Fund, Broadridge also provided, and the Board reviewed, a comparison of the Fund’s performance for the one-, three-, five-, ten-year, and since inception periods, as applicable, and for the quarter ended December 31, 2016, to that of relevant comparison funds for the same periods.
The Board noted that the Fund seeks to track its specified underlying index and that, during the year, the Board received periodic reports on the Fund’s short- and longer-term performance in comparison with its underlying index. Such periodic comparative performance information, including any additional detailed information requested by the Boards, was also considered. The Board noted that the Fund generally performed in line with its underlying index over the relevant periods.
Based on this review, the other factors considered at the meeting, and their general knowledge of ETF pricing, the Board concluded that the investment advisory fee rate and the historical performance of the Fund supported the Board’s approval of the continuance of the Advisory Contract for the coming year.
Nature, Extent and Quality of Services Provided by BFA — Based on management’s representations, including information about recent and proposed enhancements to the iShares business, including with respect to capital markets support and analysis, technology, product design, compliance and risk management, and other services, the Board expected that there would be no diminution in the scope of services required of or provided by BFA under the Advisory Contract for the coming year as compared to the scope of services provided by BFA during prior years. In reviewing the scope of these services, the Board considered BFA’s investment philosophy and experience, noting that BFA and its affiliates have committed significant resources over time, including during the past year, to supporting the iShares funds and their shareholders. The Board also considered BFA’s compliance program and its compliance record with respect to the Fund. In that regard, the Board noted that BFA reports to the Board about portfolio management and compliance matters on a periodic basis in connection with regularly scheduled meetings of the Board, and on other occasions as necessary and appropriate, and has provided information and made appropriate officers available as needed to provide further assistance with these matters. The Board also reviewed the background and experience of the persons responsible for the day-to-day management of the Fund, as well as the resources available to them in managing the Fund. In addition to the above considerations, the Board reviewed and considered detailed presentations regarding BFA’s investment performance, investment and risk management processes and strategies provided at the June 19-21, 2017 meeting and throughout the previous year, and matters related to BFA’s portfolio compliance policies and procedures. The Board noted that the Fund had met its investment objective consistently since its inception date.
Based on review of this information, and the performance information discussed above, the Board concluded that the nature, extent and quality of services provided by BFA to the Fund under the Advisory Contract supported the Board’s approval of the continuance of the Advisory Contract for the coming year.
Costs of Services Provided to Fund and Profits Realized by BFA and Affiliates — The Board reviewed information about the profitability of the Fund to BlackRock, based on the fees payable to BFA and its affiliates (including fees under the Advisory Contract), and other sources of revenue and expense to BFA and its affiliates from the Fund’s operations for the last calendar year. The Board reviewed BlackRock’s profitability methodology for the iShares funds, including supplemental information that was responsive to requests of the 15(c) Committee. The Board noted that the 15(c) Committee had focused on the methodology and profitability presentation during its meetings. The Board discussed the sources of direct and ancillary revenue with management, including the revenues to BTC, a BFA affiliate, from securities lending by the Fund. The Board also discussed
| 52 | 2017 iSHARES ANNUAL REPORTTO SHAREHOLDERS |
Table of Contents
Board Review and Approval of Investment Advisory
Contracts (Continued)
iSHARES®, INC.
BFA’s profit margin as reflected in the Fund’s profitability analysis and reviewed information regarding potential economies of scale (as discussed below). Based on this review, the Board concluded that the profits realized by BFA and its affiliates under the Advisory Contract and from other relationships between the Fund and BFA and/or its affiliates, if any, were within a reasonable range in light of the factors considered.
Economies of Scale — The Board reviewed information regarding potential economies of scale or other efficiencies that may result from increases in the Fund’s assets, noting that the issue of economies of scale had been focused on by the 15(c) Committee during its meetings and addressed by management, including through supplemental information. The Board and the 15(c) Committee reviewed information provided by BFA regarding scale benefits shared with the iShares funds through relatively low fee rates established at inception, breakpoints and waivers or other fee reductions, as well as through additional investment in the iShares business and the provision of improved or additional infrastructure and services to the iShares funds and their shareholders. The Board and the 15(c) Committee received information regarding BlackRock’s historical profitability, including BFA’s and its affiliates’ costs in providing services. The cost information distinguished, among other things, between fixed and variable costs, and explained how the level of fixed and variable costs, as well as the nature of such costs, may impact the existence or size of scale benefits. The Board noted that the Advisory Contract for the Fund did not provide for any breakpoints in the Fund’s investment advisory fee rate as the assets of the Fund increase. However, the Board noted that should material economies of scale be identified in the future that are not otherwise shared, a breakpoint structure for the Fund may be appropriate, and that it would continue to monitor the sharing of economies of scale to determine the appropriateness of adding breakpoints in the future.
Based on this review, as well as the other factors considered at the meeting, the Board, recognizing its responsibility to consider the Advisory Contract at least annually, determined to approve the continuance of the Advisory Contract for the coming year.
Fees and Services Provided for Other Comparable Funds/Accounts Managed by BFA and its Affiliates — The Board received and considered information regarding the investment advisory/management fee rates for other funds/accounts in the U.S. for which BFA (or its affiliates) provides investment advisory/management services, including open-end funds registered under the 1940 Act (including sub-advised funds), collective trust funds, and institutional separate accounts (together, the “Other Accounts”), and acknowledged BFA’s assertion that the iShares funds are fundamentally different investment vehicles from the Other Accounts. The Board noted that BFA and its affiliates do manage Other Accounts with substantially the same investment objective and strategy as the Fund and that track the same index as the Fund. The Board further noted that BFA provided the Board with detailed information regarding how the Other Accounts (particularly institutional clients) generally differ from the Fund, including in terms of the different and generally more extensive services provided to the Fund, as well as other significant differences. In that regard, the Board considered that the pricing of services to institutional clients is typically based on a number of factors beyond the nature and extent of the specific services to be provided and often depends on the overall relationship between the client and its affiliates and the adviser and its affiliates. In addition, the Board considered the relative complexity and inherent risks and challenges of managing and providing other services to the Fund, as a publicly traded ETF, as compared to the Other Accounts that are institutional clients, in light of differing regulatory requirements and client-imposed mandates. Further, with respect to comparisons with one or more open-end index mutual funds registered under the 1940 Act managed by BFA (or an affiliate) that track the same index as the Fund and have investment advisory fee rates and overall expenses (net of waivers and reimbursements) that are lower than the investment advisory fee rate and overall expenses (net of waivers and reimbursements) of the Fund, the Board gave weight to management’s explanations of the relevant circumstances applicable to such mutual funds. The Board also acknowledged BFA’s expressed business purpose for launching a suite of iShares “Core” ETFs that generally are subject to lower investment advisory fees than iShares non-Core ETFs that may provide a similar investment exposure. The Board also considered the “all-inclusive” nature of the Fund’s advisory fee structure, and the Fund expenses borne by BFA under this arrangement. The Board noted that the investment advisory fee rate under the Advisory Contract for the Fund was generally higher than the investment advisory/management fee rates for certain of the Other Accounts (particularly institutional clients) and concluded that the differences appeared to be consistent with the factors discussed.
BOARD REVIEWAND APPROVALOF INVESTMENT ADVISORY CONTRACTS | 53 |
Table of Contents
Board Review and Approval of Investment Advisory
Contracts (Continued)
iSHARES®, INC.
Other Benefits to BFA and/or its Affiliates — The Board reviewed the “fallout” benefits or ancillary revenue received by BFA and/or its affiliates in connection with the services provided to the Fund by BFA, such as payment of revenue to BTC, the Fund’s securities lending agent, for loaning portfolio securities (which was included in the profit margins reviewed by the Board pursuant to BFA’s profitability methodology), and payment of advisory fees and/or administration fees to BFA and BTC (or their affiliates) in connection with any investments by the Fund in other funds for which BFA (or its affiliates) provides investment advisory services and/or administration services. The Board also noted the revenue received by BFA and/or its affiliates pursuant to an agreement that permits a service provider to use certain portions of BlackRock’s technology platform to service accounts managed by BFA and/or its affiliates, including the iShares funds. The Board noted that BFA generally does not use soft dollars or consider the value of research or other services that may be provided to BFA (including its affiliates) in selecting brokers for portfolio transactions for the Fund. The Board further noted that any portfolio transactions on behalf of the Fund placed through a BFA affiliate or purchased from an underwriting syndicate in which a BFA affiliate participates, are reported to the Board pursuant to Rule 17e-1 or Rule 10f-3, as applicable, under the 1940 Act. The Board concluded that any such ancillary benefits would not be disadvantageous to the Fund’s shareholders and thus would not alter the Board’s conclusion with respect to the appropriateness of approving the continuance of the Advisory Contract for the coming year.
Conclusion — Based on the considerations described above, the Board determined that the Fund’s investment advisory fee rate under the Advisory Contract does not constitute a fee that is so disproportionately large as to bear no reasonable relationship to the services rendered and that could not have been the product of arm’s-length bargaining, and concluded to approve the continuance of the Advisory Contract for the coming year.
| 54 | 2017 iSHARES ANNUAL REPORTTO SHAREHOLDERS |
Table of Contents
Supplemental Information (Unaudited)
iSHARES®, INC.
Proxy Results
A special meeting of the shareholders of each series of iShares, Inc. (the “Company”) was held on June 19, 2017, to elect five Directors to the Board of Directors of the Company. The five nominees were Jane D. Carlin, Richard L. Fagnani, Drew E. Lawton, Madhav V. Rajan and Mark Wiedman, all of whom were elected as Directors at the special meeting. The other Directors whose terms of office as Directors continued after the special meeting are Cecilia H. Herbert, Charles A. Hurty, John E. Kerrigan, John E. Martinez and Robert S. Kapito.
| Director | Votes For | Votes Withheld | ||||||
Jane D. Carlin | 1,911,835,929 | 49,339,171 | ||||||
Richard L. Fagnani | 1,911,725,344 | 49,449,755 | ||||||
Drew E. Lawton | 1,911,790,083 | 49,385,017 | ||||||
Madhav V. Rajan | 1,902,999,095 | 58,176,004 | ||||||
Mark Wiedman | 1,908,143,500 | 53,031,599 | ||||||
Section 19(a) Notices
The amounts and sources of distributions reported are estimates and are provided pursuant to regulatory requirements and are not being provided for tax reporting purposes. The actual amounts and sources for tax reporting purposes will depend upon each Fund’s investment experience during the year and may be subject to changes based on the tax regulations. Shareholders will receive a Form 1099-DIV each calendar year that will inform them how to report these distributions for federal income tax purposes.
| Total Cumulative Distributions for the Fiscal Year | % Breakdown of the Total Cumulative Distributions for the Fiscal Year | |||||||||||||||||||||||||||||||
| iShares ETF | Net Investment Income | Net Realized Capital Gains | Return of Capital | Total Per Share | Net Investment Income | Net Realized Capital Gains | Return of Capital | Total Per Share | ||||||||||||||||||||||||
MSCI Frontier 100 | $ | 0.218114 | $ | — | $ | 0.082626 | $ | 0.300740 | 73 | % | — | % | 27 | % | 100 | % | ||||||||||||||||
MSCI World | 1.562360 | — | 0.008481 | 1.570841 | 99 | — | 1 | 100 | ||||||||||||||||||||||||
Premium/Discount Information
The Premium/Discount Information section is intended to present information about the differences between the daily market price on secondary markets for shares of a fund and that fund’s NAV. NAV is the price at which a fund issues and redeems shares. It is calculated in accordance with the standard formula for valuing mutual fund shares. The “Market Price” of a fund generally is determined using the midpoint between the highest bid and the lowest ask on the primary securities exchange on which shares of such fund are listed for trading, as of the time that the fund’s NAV is calculated. A fund’s Market Price may be at, above or below its NAV. The NAV of a fund will fluctuate with changes in the value of its portfolio holdings. The Market Price of a fund will fluctuate in accordance with changes in its NAV, as well as market supply and demand.
Premiums or discounts are the differences (expressed as a percentage) between the NAV and Market Price of a fund on a given day, generally at the time the NAV is calculated. A premium is the amount that a fund is trading above the reported NAV, expressed as a percentage of the NAV. A discount is the amount that a fund is trading below the reported NAV, expressed as a percentage of the NAV.
SUPPLEMENTAL INFORMATION | 55 |
Table of Contents
Supplemental Information (Unaudited) (Continued)
iSHARES®, INC.
Premium/discount information for the Funds covering the most recently completed calendar year and the most recently completed calendar quarters since that year (or the life of the Fund, if shorter) is publicly accessible, free of charge, at www.iShares.com.
The following information shows the frequency of distributions of premiums and discounts for the Funds for the immediately preceding five calendar years (or from the inception date of the Fund, if less than five years) through the date of the most recent calendar quarter-end. Each line in each table shows the number of trading days in which the Fund traded within the premium/discount range indicated. The number of trading days in each premium/discount range is also shown as a percentage of the total number of trading days in the period covered by each table. All data presented here represents past performance, which cannot be used to predict future results.
iShares MSCI Frontier 100 ETF
Period Covered: September 12, 2012 through June 30, 2017
Premium/Discount Range | Number of Days | Percentage of Total Days | ||||||
Greater than 3.5% and Less than 4.0% | 1 | 0.08 | % | |||||
Greater than 3.0% and Less than 3.5% | 23 | 1.90 | ||||||
Greater than 2.5% and Less than 3.0% | 52 | 4.30 | ||||||
Greater than 2.0% and Less than 2.5% | 92 | 7.62 | ||||||
Greater than 1.5% and Less than 2.0% | 220 | 18.22 | ||||||
Greater than 1.0% and Less than 1.5% | 208 | 17.23 | ||||||
Greater than 0.5% and Less than 1.0% | 120 | 9.93 | ||||||
Greater than 0.0% and Less than 0.5% | 76 | 6.29 | ||||||
At NAV | 4 | 0.33 | ||||||
Less than 0.0% and Greater than –0.5% | 73 | 6.04 | ||||||
Less than –0.5% and Greater than –1.0% | 113 | 9.35 | ||||||
Less than –1.0% and Greater than –1.5% | 101 | 8.36 | ||||||
Less than –1.5% and Greater than –2.0% | 62 | 5.13 | ||||||
Less than –2.0% and Greater than –2.5% | 40 | 3.31 | ||||||
Less than –2.5% and Greater than –3.0% | 17 | 1.41 | ||||||
Less than –3.0% and Greater than –3.5% | 3 | 0.25 | ||||||
Less than –3.5% and Greater than –4.0% | 2 | 0.17 | ||||||
Less than –4.0% | 1 | 0.08 | ||||||
|
|
|
| |||||
| 1,208 | 100.00 | % | ||||||
|
|
|
| |||||
| 56 | 2017 iSHARES ANNUAL REPORTTO SHAREHOLDERS |
Table of Contents
Supplemental Information (Unaudited) (Continued)
iSHARES®, INC.
iShares MSCI World ETF
Period Covered: January 10, 2012 through June 30, 2017
Premium/Discount Range | Number of Days | Percentage of Total Days | ||||||
Greater than 2.5% and Less than 3.0% | 2 | 0.15 | % | |||||
Greater than 2.0% and Less than 2.5% | 37 | 2.69 | ||||||
Greater than 1.5% and Less than 2.0% | 49 | 3.56 | ||||||
Greater than 1.0% and Less than 1.5% | 78 | 5.67 | ||||||
Greater than 0.5% and Less than 1.0% | 261 | 18.97 | ||||||
Greater than 0.0% and Less than 0.5% | 774 | 56.25 | ||||||
At NAV | 9 | 0.65 | ||||||
Less than 0.0% and Greater than –0.5% | 153 | 11.12 | ||||||
Less than –0.5% and Greater than –1.0% | 11 | 0.80 | ||||||
Less than –1.0% and Greater than –1.5% | 1 | 0.07 | ||||||
Less than –1.5% | 1 | 0.07 | ||||||
|
|
|
| |||||
| 1,376 | 100.00 | % | ||||||
|
|
|
| |||||
Regulation under the Alternative Investment Fund Managers Directive
The Alternative Investment Fund Managers Directive (“AIFMD”) imposes obligations on fund managers established in the European Union (the “EU”). These do not currently apply to managers established outside the EU, such as BFA. Rather, non-EU managers are only required to comply with certain disclosure, reporting and transparency obligations of AIFMD if such managers market a fund to EU investors.
BFA has registered the iShares MSCI Frontier 100 ETF (the “Fund”) for marketing to investors in the United Kingdom, the Netherlands, Finland, Sweden and Luxembourg.
Report on Remuneration
BFA is required under AIFMD to make quantitative disclosures of remuneration. These disclosures are made in line with BlackRock’s interpretation of currently available regulatory guidance on quantitative remuneration disclosures. As market or regulatory practice develops BlackRock may consider it appropriate to make changes to the way in which quantitative remuneration disclosures are calculated. Where such changes are made, this may result in disclosures in relation to a fund not being comparable to the disclosures made in the prior year, or in relation to other BlackRock fund disclosures in that same year.
Disclosures are provided in relation to both (a) the staff of BFA; (b) staff who are senior management; and (c) staff who have the ability to materially affect the risk profile of the Fund.
All individuals included in the aggregated figures disclosed are rewarded in line with BlackRock’s remuneration policy for their responsibilities across the relevant BlackRock business area. As all individuals have a number of areas of responsibilities, only the portion of remuneration for those individuals’ services attributable to the Fund is included in the aggregate figures disclosed.
BlackRock has a clear and well defined pay-for-performance philosophy, and compensation programs which support that philosophy. For senior management, a significant percentage of variable remuneration is deferred over time. All employees are subject to a claw-back policy.
SUPPLEMENTAL INFORMATION | 57 |
Table of Contents
Supplemental Information (Unaudited) (Continued)
iSHARES®, INC.
Compensation decisions for employees are made based on BlackRock’s full-year financial results and other non-financial goals and objectives. Alongside financial performance, individual compensation is also based on strategic and operating results and other considerations such as management and leadership capabilities. No set formulas are established and no fixed benchmarks are used in determining annual incentive awards.
Bonus pools are reviewed by BlackRock’s independent compensation committee, taking into account both actual and projected financial information together with information provided by the Operational Risk and Regulatory Compliance departments in relation to any activities, incidents or events that warrant consideration in making compensation decisions.
Functions such as Finance, Operational Risk, Legal & Compliance, and Human Resources each have their own organizational structures which are independent of the business units. Functional bonus pools are determined with reference to the performance of each individual function and the remuneration of the senior members of control functions is directly overseen by BlackRock’s independent compensation committee. No individual is involved in setting his or her own remuneration.
Members of staff and senior management of BFA typically provide both AIFMD and non-AIFMD related services in respect of multiple funds, clients and functions of BFA and across the broader BlackRock group. Therefore, the figures disclosed are a sum of each individual’s portion of remuneration attributable to the Fund according to an objective apportionment methodology which acknowledges the multiple-service nature of BFA. Accordingly the figures are not representative of any individual’s actual remuneration or their remuneration structure.
The amount of the total remuneration awarded by BFA to its staff which has been attributed to the Fund in respect of BFA’s financial year ending December 31, 2016 was USD 54.54 thousand. This figure is comprised of fixed remuneration of USD 21.45 thousand and variable remuneration of USD 33.08 thousand. There were a total of 325 beneficiaries of the remuneration described above.
The amount of the aggregate remuneration awarded by BFA, which has been attributed to the Fund in respect of BFA’s financial year ending December 31, 2016, to its senior management was USD 7.54 thousand, and to members of its staff whose actions have a material impact on the risk profile of the Fund was USD 1.82 thousand.
| 58 | 2017 iSHARES ANNUAL REPORTTO SHAREHOLDERS |
Table of Contents
Director and Officer Information
iSHARES®, INC.
The Board of Directors has responsibility for the overall management and operations of the Funds, including general supervision of the duties performed by BFA and other service providers. Each Director serves until he or she resigns, is removed, dies, retires or becomes incapacitated. Each officer shall hold office until his or her successor is elected and qualifies or until his or her death, resignation or removal. Directors who are not “interested persons” (as defined in the 1940 Act) of the Company are referred to as independent directors (“Independent Directors”).
The registered investment companies advised by BFA or its affiliates (the “BlackRock-advised Funds”) are organized into one complex of closed-end funds, two complexes of open-end funds and one complex of exchange-traded funds (“Exchange-Traded Fund Complex”) (each, a “BlackRock Fund Complex”). Each Fund is included in the BlackRock Fund Complex referred to as the Exchange-Traded Fund Complex. Each Director also serves as a Trustee of iShares Trust and a Trustee of iShares U.S. ETF Trust and, as a result, oversees a total of 344 funds (as of August 31, 2017) within the Exchange-Traded Fund Complex. Drew E. Lawton, from October 2016 to June 2017, and Richard L. Fagnani, from April 2017 to June 2017, served as Advisory Board Members for iShares Trust, iShares Inc. and iShares U.S. ETF Trust with respect to all funds within the Exchange-Traded Fund Complex. With the exception of Robert S. Kapito, Mark K. Wiedman, Charles Park, Martin Small and Benjamin Archibald, the address of each Director, and officer is c/o BlackRock, Inc., 400 Howard Street, San Francisco, CA 94105. The address of Mr. Kapito, Mr. Wiedman, Mr. Park, Mr. Small and Mr. Archibald is c/o BlackRock, Inc., Park Avenue Plaza, 55 East 52nd Street, New York, NY 10055. The Board has designated Cecilia H. Herbert as its Independent Board Chair. Additional information about the Funds’ Directors and officers may be found in the Funds’ combined Statement of Additional Information, which is available without charge, upon request, by calling toll-free 1-800-iShares (1-800-474-2737).
Interested Directors
| Name (Age) | Position(s) | Principal Occupation(s) During the Past 5 Years | Other Directorships Held by Director | |||
Robert S. Kapitoa (60) | Director (since 2009). | President, BlackRock, Inc. (since 2006); Vice Chairman of BlackRock, Inc. and Head of BlackRock’s Portfolio Management Group (since its formation in 1998) and BlackRock, Inc.’s predecessor entities (since 1988); Trustee, University of Pennsylvania (since 2009); President of Board of Directors, Hope & Heroes Children’s Cancer Fund (since 2002). | Director of BlackRock, Inc. (since 2006); Trustee of iShares Trust (since 2009); Trustee of iShares U.S. ETF Trust (since 2011). | |||
Mark K. Wiedmanb (46) | Director (since 2013). | Senior Managing Director, BlackRock, Inc. (since 2014); Managing Director, BlackRock, Inc. (2007-2014); Global Head of BlackRock’s ETF and Index Investments Business (since 2016); Global Head of iShares (2011-2016); Head of Corporate Strategy, BlackRock, Inc. (2009-2011). | Trustee of iShares Trust (since 2013); Trustee of iShares U.S. ETF Trust (since 2013); Director of PennyMac Financial Services, Inc. (since 2008). | |||
| a | Robert S. Kapito is deemed to be an “interested person” (as defined in the 1940 Act) of the Company due to his affiliations with BlackRock, Inc. and its affiliates. |
| b | Mark K. Wiedman is deemed to be an “interested person” (as defined in the 1940 Act) of the Company due to his affiliations with BlackRock, Inc. and its affiliates. |
DIRECTORAND OFFICER INFORMATION | 59 |
Table of Contents
Director and Officer Information (Continued)
iSHARES®, INC.
Independent Directors
| Name (Age) | Position(s) | Principal Occupation(s) During the Past 5 Years | Other Directorships Held by Director | |||
Cecilia H. Herbert (68) | Director Independent Board Chair | Trustee and Member of the Finance, Technology and Quality Committee of Stanford Health Care (since 2016); Trustee and Member of the Investment Committee, WNET, a New York public media company (since 2011); Chair (1994-2005) and Member (since 1992) of the Investment Committee, Archdiocese of San Francisco; Director (1998-2013) and President (2007-2011) of the Board of Directors, Catholic Charities CYO; Trustee (2002-2011) and Chair of the Finance and Investment Committee (2006-2010) of the Thacher School. | Trustee of iShares Trust (since 2005); Trustee of iShares U.S. ETF Trust (since 2011); Independent Board Chair of iShares Trust and iShares U.S. ETF Trust (since 2016); Trustee of Forward Funds (14 portfolios) (since 2009); Trustee of Salient MF Trust (4 portfolios) (since 2015). | |||
Jane D. Carlin (61) | Director Risk Committee Chair | Consultant (since 2012); Managing Director and Global Head of Financial Holding Company Governance & Assurance and the Global Head of Operational Risk Management of Morgan Stanley (2006-2012). | Trustee of iShares Trust (since 2015); Trustee of iShares U.S. ETF Trust (since 2015); Director of PHH Corporation (mortgage solutions) (since 2012); Director of The Hanover Insurance Group, Inc. (since 2016). | |||
Richard L. Fagnani (62) | Director Equity Plus Committee Chair (since 2017). | Partner, KPMG LLP (2002-2016). | Trustee of iShares Trust (since 2017); Trustee of iShares U.S. ETF Trust (since 2017). | |||
Charles A. Hurty (73) | Director Audit Committee Chair | Retired; Partner, KPMG LLP (1968-2001). | Trustee of iShares Trust (since 2005); Trustee of iShares U.S. ETF Trust (since 2011); Director of SkyBridge Alternative Investments Multi-Adviser Hedge Fund Portfolios LLC (2 portfolios) (since 2002). | |||
John E. Kerrigan (62) | Director (since 2005); Securities Lending Committee Chair (since 2016). | Chief Investment Officer, Santa Clara University (since 2002). | Trustee of iShares Trust (since 2005); Trustee of iShares U.S. ETF Trust (since 2011). | |||
Drew E. Lawton (58) | Director (since 2017); 15(c) Committee Chair (since 2017). | Senior Managing Director of New York Life Insurance Company (2010-2015). | Trustee of iShares Trust (since 2017); Trustee of iShares U.S. ETF Trust (since 2017). | |||
| 60 | 2017 iSHARES ANNUAL REPORTTO SHAREHOLDERS |
Table of Contents
Director and Officer Information (Continued)
iSHARES®, INC.
Independent Directors (Continued)
| Name (Age) | Position(s) | Principal Occupation(s) During the Past 5 Years | Other Directorships Held by Director | |||
John E. Martinez (56) | Director (since 2003); Fixed Income Plus Committee Chair (since 2016). | Director of Real Estate Equity Exchange, Inc. (since 2005). | Trustee of iShares Trust (since 2003); Trustee of iShares U.S. ETF Trust (since 2011). | |||
Madhav V. Rajan (53) | Director (since 2011); Nominating and Governance Committee Chair (since 2017). | Dean, and George Pratt Shultz Professor of Accounting, University of Chicago Booth School of Business (since 2017); Robert K. Jaedicke Professor of Accounting, Stanford University Graduate School of Business (2001-2017); Professor of Law (by courtesy), Stanford Law School (2005-2017); Senior Associate Dean for Academic Affairs and Head of MBA Program, Stanford University Graduate School of Business (2010-2016) . | Trustee of iShares Trust (since 2011); Trustee of iShares U.S. ETF Trust (since 2011); Director, Cavium, Inc. (since 2013). | |||
DIRECTORAND OFFICER INFORMATION | 61 |
Table of Contents
Director and Officer Information (Continued)
iSHARES®, INC.
Officersc
| Name (Age) | Position(s) | Principal Occupation(s) During the Past 5 Years | ||
Martin Small (42) | President (since 2016). | Managing Director, BlackRock, Inc. (since 2010); Head of U.S. iShares (since 2015); Co-Head of the U.S. Financial Markets Advisory Group, BlackRock, Inc. (2008-2014). | ||
Jack Gee (57) | Treasurer and Chief Financial Officer (since 2008). | Managing Director, BlackRock, Inc. (since 2009); Senior Director of Fund Administration of Intermediary Investor Business, BGI (2009). | ||
Benjamin Archibald (42) | Secretary (since 2015). | Managing Director, BlackRock, Inc. (since 2014); Director, BlackRock, Inc. (2010-2013); Secretary of the BlackRock-advised Mutual Funds (since 2012). | ||
Alan Mason (56) | Executive Vice President (since 2016). | Managing Director, BlackRock, Inc. (since 2009). | ||
Steve Messinger (55) | Executive Vice President (since 2016). | Managing Director, BlackRock, Inc. (2007-2014 and since 2016); Managing Director, Beacon Consulting Group (2014-2016). | ||
Charles Park (49) | Chief Compliance Officer (since 2006). | Chief Compliance Officer of BlackRock Advisors, LLC and the BlackRock-advised Funds in the Equity-Bond Complex, the Equity-Liquidity Complex and the Closed-End Complex (since 2014); Chief Compliance Officer of BFA (since 2006). | ||
Scott Radell (48) | Executive Vice President (since 2012). | Managing Director, BlackRock, Inc. (since 2009); Head of Portfolio Solutions, BlackRock, Inc. (since 2009). | ||
| c | Manish Mehta served as President until October 15, 2016. |
| 62 | 2017 iSHARES ANNUAL REPORTTO SHAREHOLDERS |
Table of Contents
For more information visit www.iShares.com or call 1-800-474-2737
This report is intended for the Funds’ shareholders. It may not be distributed to prospective investors unless it is preceded or accompanied by the current prospectus.
Investing involves risk, including possible loss of principal.
The iShares Funds are distributed by BlackRock Investments, LLC (together with its affiliates, “BlackRock”).
The iShares Funds are not sponsored, endorsed, issued, sold or promoted by MSCI Inc., nor does this company make any representation regarding the advisability of investing in the iShares Funds. BlackRock is not affiliated with the company listed above.
A description of the policies that the Funds use to determine how to vote proxies relating to portfolio securities and information about how the Funds voted proxies relating to portfolio securities during the most recent twelve-month period ending June 30 is available without charge, upon request, by calling toll-free 1-800-474-2737; on the Funds’ website at www.iShares.com; and on the U.S. Securities and Exchange Commission (SEC) website at www.sec.gov.
The Funds file their complete schedules of portfolio holdings with the SEC for the first and third quarters of each fiscal year on Form N-Q. The Funds’ Forms N-Q are available on the SEC’s website or may be reviewed and copied at the SEC’s Public Reference Room in Washington, D.C. Information on the operation of the Public Reference Room may be obtained by calling 1-800-SEC-0330. The Funds also disclose their complete schedules of portfolio holdings on a daily basis on the Funds’ website.
©2017 BlackRock, Inc. All rights reserved. iSHARES and BLACKROCK are registered trademarks of BlackRock, Inc. or its subsidiaries. All other marks are the property of their respective owners.
iS-AR-811-0817
| |
Table of Contents
AUGUST 31, 2017
2017 ANNUAL REPORT | |
iShares, Inc.
| Ø | iShares MSCI Global Agriculture Producers ETF | VEGI | NYSE Arca |
| Ø | iShares MSCI Global Energy Producers ETF | FILL | NYSE Arca |
| Ø | iShares MSCI Global Gold Miners ETF | RING | NASDAQ |
| Ø | iShares MSCI Global Metals & Mining Producers ETF | PICK | BATS |
| Ø | iShares MSCI Global Silver Miners ETF | SLVP | BATS |
Table of Contents
| 5 | ||||
| 16 | ||||
| 16 | ||||
| 17 | ||||
| 17 | ||||
| 21 | ||||
| 26 | ||||
| 28 | ||||
| 33 | ||||
| 35 | ||||
| 42 | ||||
| 47 | ||||
| 60 | ||||
| 61 | ||||
| 62 | ||||
| 66 | ||||
| 70 |
Table of Contents
Management’s Discussion of Fund Performance
iSHARES®, INC.
GLOBAL EQUITY MARKET OVERVIEW
Global equity markets posted strong returns for the 12 months ended August 31, 2017 (the “reporting period”). The MSCI ACWI, a broad global equity index that includes both developed and emerging markets, returned 17.11% in U.S. dollar terms for the reporting period.
The primary factor behind the robust performance of global equity markets was improving global economic growth, driven largely by the continuation of accommodative monetary policies from many of the world’s central banks. Signs of stronger economic activity in Europe emerged as the European Central Bank (“ECB”) maintained policies such as quantitative easing and negative interest rates. Economic growth rates in China and Japan, the largest economies in Asia, also increased during the reporting period, reflecting efforts by the People’s Bank of China (“PBOC”) and the Bank of Japan (“BOJ”) to stimulate economic activity. Stronger economic growth led several central banks to consider reducing their economic stimulus measures. For example, late in the reporting period, the ECB discussed the possibility of tapering its quantitative easing program, while the PBOC increased short-term interest rates during the first half of 2017.
On a regional basis, European equity markets posted the best returns among developed markets, advancing by approximately 20% in U.S. dollar terms for the reporting period. European stocks benefited from improving economic conditions and stronger corporate earnings. In addition, election outcomes in France and the Netherlands eased investor concerns about nationalist presidential candidates and their opposition to the European Union (“E.U.”). Currency fluctuations also contributed meaningfully to European equity performance in U.S. dollar terms as the euro appreciated by approximately 6% against the U.S. dollar during the reporting period. The best-performing European stock markets included Austria, Italy, and Spain, while Ireland and Belgium posted the weakest returns.
Equity markets in the Asia-Pacific region gained about 16% in U.S. dollar terms for the reporting period, led by Singapore and Hong Kong. Japanese stocks also posted strong returns, benefiting from improving consumer spending and employment trends that contributed to the ongoing recovery in the Japanese economy. However, equity market returns in Japan were hindered by a decline in the Japanese yen, which depreciated by approximately 6% against the U.S. dollar.
The U.S. stock market returned approximately 15% for the reporting period. Despite mixed U.S. economic data, U.S. stocks advanced initially in anticipation of pro-business fiscal policies from the new presidential administration. Although the administration struggled to implement its fiscal agenda, stocks continued to move higher as better global economic conditions led to a notable improvement in corporate earnings growth, particularly for multinational companies with significant operations outside of the U.S. U.S. stocks advanced despite three short-term interest rate increases by the U.S. Federal Reserve Bank (the “Fed”) during the reporting period, which increased the short-term interest rate target to its highest level since October 2008. The Fed also unveiled a plan to start reducing the amount of U.S. Treasury bonds and mortgage-backed securities on its balance sheet before the end of 2017.
Emerging markets stocks outperformed those in developed markets, returning more than 23% in U.S. dollar terms for the reporting period. Emerging markets in Eastern Europe were the best performers, led by Poland, Greece, and Hungary. Equity markets in the Middle East trailed for the reporting period amid continued geopolitical conflict in the region.
MANAGEMENT’S DISCUSSIONSOF FUND PERFORMANCE | 5 |
Table of Contents
Management’s Discussion of Fund Performance
iSHARES® MSCI GLOBAL AGRICULTURE PRODUCERS ETF
Performance as of August 31, 2017
| Average Annual Total Returns | Cumulative Total Returns | |||||||||||||||||||||||||||
| NAV | MARKET | INDEX | NAV | MARKET | INDEX | |||||||||||||||||||||||
1 Year | 13.53% | 13.88% | 13.74% | 13.53% | 13.88% | 13.74% | ||||||||||||||||||||||
5 Years | 3.64% | 3.56% | 3.72% | 19.58% | 19.14% | 20.02% | ||||||||||||||||||||||
Since Inception | 3.43% | 3.44% | 3.53% | 20.73% | 20.83% | 21.40% | ||||||||||||||||||||||
GROWTH OF $10,000 INVESTMENT
(SINCE INCEPTION AT NET ASSET VALUE)
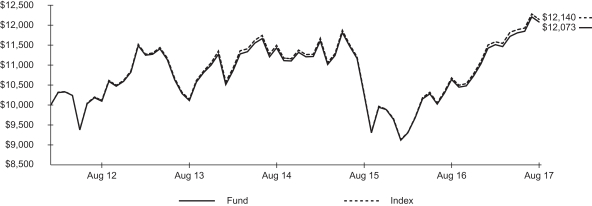
The inception date of the Fund was 1/31/12. The first day of secondary market trading was 2/2/12.
Past performance is no guarantee of future results. Performance results do not reflect the deduction of taxes that a shareholder would pay on fund distributions or on the redemption or sale of fund shares. See “About Fund Performance” on page 16 for more information.
| Shareholder Expenses | ||||||||||||||||||||||||||
| Actual | Hypothetical 5% Return | |||||||||||||||||||||||||
| Beginning Account Value (3/1/17) | Ending Account Value (8/31/17) | Expenses Paid During Period a | Beginning Account Value (3/1/17) | Ending Account Value (8/31/17) | Expenses Paid During Period a | Annualized Expense Ratio | ||||||||||||||||||||
| $ | 1,000.00 | $ | 1,049.30 | $ | 1.91 | $ | 1,000.00 | $ | 1,023.30 | $ | 1.89 | 0.37% | ||||||||||||||
| a | Expenses are calculated using the Fund’s annualized expense ratio (as disclosed in the table), multiplied by the average account value for the period, multiplied by the number of days in the period (184 days) and divided by the number of days in the year (365 days). See “Shareholder Expenses” on page 16 for more information. |
| 6 | 2017 iSHARES ANNUAL REPORTTO SHAREHOLDERS |
Table of Contents
Management’s Discussion of Fund Performance (Continued)
iSHARES® MSCI GLOBAL AGRICULTURE PRODUCERS ETF
The iShares MSCI Global Agriculture Producers ETF (the “Fund”) seeks to track the investment results of an index composed of global equities of companies primarily engaged in the business of agriculture, as represented by the MSCI ACWI Select Agriculture Producers Investable Market Index (the “Index”). The Fund invests in a representative sample of securities included in the Index that collectively has an investment profile similar to the Index. Due to the use of representative sampling, the Fund may or may not hold all of the securities that are included in the Index. For the 12-month reporting period ended August 31, 2017, the total return for the Fund was 13.53%, net of fees, while the total return for the Index was 13.74%.
The Index posted a solid gain for the reporting period despite generally lower prices for most agricultural commodities. After near-record crop yields in 2016, crop production surveys indicated a slowdown in 2017, but not enough to meaningfully reduce agricultural inventories. Consequently, the prices for many agricultural crops declined for the reporting period. Other food-related commodity prices also eased, resulting in a 5% decline in a broad global food price index for the reporting period.
Within the Index, the agricultural and farm machinery industry contributed the most to the Index’s return for the reporting period. Agricultural machinery companies benefited from signs of stabilization after several years of declining demand, as well as an increase in merger and acquisition activity.
Fertilizer and agricultural chemicals stocks were also meaningful contributors to the Index’s return for the reporting period, amid a significant increase in mergers and acquisitions, particularly among some of the largest companies in the industry. The food products industry was another contributor to the Index’s performance, led by packaged food and meats producers.
On a country basis, agricultural producers in the U.S., the largest country weight at about 48% of the Index on average, contributed the most to the Index’s return for the reporting period. Agricultural stocks in Japan, Norway, and Italy were also significant contributors to the Index’s performance. On the downside, small Index weights in China and Indonesia detracted modestly from the Index’s performance.
With regard to currency effects, an approximate 6% gain in the euro and 5% gain in the Canadian dollar relative to the U.S. dollar contributed to the Index’s return for the reporting period, while an approximate 6% decline in the Japanese yen against the U.S. dollar detracted from the Index’s performance.
ALLOCATION BY SECTOR
As of 8/31/17
| Sector/Investment Type | Percentage of Total Investments* |
Materials | 40.44 | % | ||
Food, Beverage & Tobacco | 34.72 | |||
Capital Goods | 22.01 | |||
Investment Companies | 2.83 | |||
|
| |||
TOTAL | 100.00 | % | ||
|
|
TEN LARGEST COUNTRIES
As of 8/31/17
| Country | Percentage of Total Investments* |
United States | 50.92 | % | ||
Canada | 8.53 | |||
Japan | 8.15 | |||
Norway | 6.47 | |||
Italy | 3.31 | |||
India | 2.83 | |||
Hong Kong | 2.41 | |||
Singapore | 2.11 | |||
Germany | 2.00 | |||
Malaysia | 1.95 | |||
|
| |||
TOTAL | 88.68 | % | ||
|
|
| * | Excludes money market funds. |
MANAGEMENT’S DISCUSSIONSOF FUND PERFORMANCE | 7 |
Table of Contents
Management’s Discussion of Fund Performance
iSHARES® MSCI GLOBAL ENERGY PRODUCERS ETF
Performance as of August 31, 2017
| Average Annual Total Returns | Cumulative Total Returns | |||||||||||||||||||||||||||
| NAV | MARKET | INDEX | NAV | MARKET | INDEX | |||||||||||||||||||||||
1 Year | 2.26% | 2.43% | 1.87% | 2.26% | 2.43% | 1.87% | ||||||||||||||||||||||
5 Years | (2.02)% | (1.94)% | (2.15)% | (9.68)% | (9.35)% | (10.30)% | ||||||||||||||||||||||
Since Inception | (2.48)% | (2.47)% | (2.60)% | (13.09)% | (13.06)% | (13.68)% | ||||||||||||||||||||||
GROWTH OF $10,000 INVESTMENT
(SINCE INCEPTION AT NET ASSET VALUE)
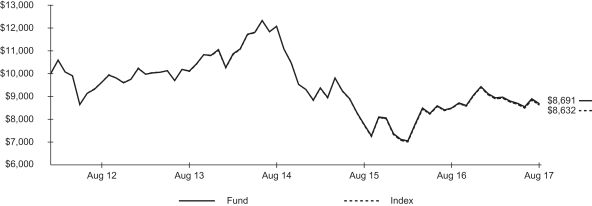
The inception date of the Fund was 1/31/12. The first day of secondary market trading was 2/2/12.
Past performance is no guarantee of future results. Performance results do not reflect the deduction of taxes that a shareholder would pay on fund distributions or on the redemption or sale of fund shares. See “About Fund Performance” on page 16 for more information.
| Shareholder Expenses | ||||||||||||||||||||||||||
| Actual | Hypothetical 5% Return | |||||||||||||||||||||||||
| Beginning Account Value (3/1/17) | Ending Account Value (8/31/17) | Expenses Paid During Period a | Beginning Account Value (3/1/17) | Ending Account Value (8/31/17) | Expenses Paid During Period a | Annualized Expense Ratio | ||||||||||||||||||||
| $ | 1,000.00 | $ | 972.40 | $ | 1.94 | $ | 1,000.00 | $ | 1,023.20 | $ | 1.99 | 0.39% | ||||||||||||||
| a | Expenses are calculated using the Fund’s annualized expense ratio (as disclosed in the table), multiplied by the average account value for the period, multiplied by the number of days in the period (184 days) and divided by the number of days in the year (365 days). See “Shareholder Expenses” on page 16 for more information. |
| 8 | 2017 iSHARES ANNUAL REPORTTO SHAREHOLDERS |
Table of Contents
Management’s Discussion of Fund Performance (Continued)
iSHARES® MSCI GLOBAL ENERGY PRODUCERS ETF
The iShares MSCI Global Energy Producers ETF (the “Fund”) seeks to track the investment results of an index composed of global equities of companies primarily engaged in the business of energy exploration and production, as represented by the MSCI ACWI Select Energy Producers Investable Market Index (the “Index”). The Fund invests in a representative sample of securities included in the Index that collectively has an investment profile similar to the Index. Due to the use of representative sampling, the Fund may or may not hold all of the securities that are included in the Index. For the 12-month reporting period ended August 31, 2017, the total return for the Fund was 2.26%, net of fees, while the total return for the Index was 1.87%.
The relatively flat return for the Index during the reporting period masked some meaningful volatility. The Index rose sharply in late 2016 along with the price of oil after OPEC members responded to record global crude oil inventories by agreeing to reduce their daily output levels. However, the Index declined steadily over the remainder of the reporting period as rising oil and gas production in the U.S., led by a resurgence in U.S. shale oil production, kept inventories high. In addition, many OPEC countries failed to fully comply with the reduced output agreement. The end result was an ongoing excess of supply that kept the price of oil below $50 per barrel, down from a peak of more than $110 per barrel in 2013.
Oil prices below $50 per barrel continued to pressure the profitability of oil and gas exploration and production companies, which detracted from the Index’s return for the reporting period. In contrast, oil and gas refining and marketing companies contributed the most to the Index’s return as relatively lower input costs led to higher refining profit margins.
Integrated oil and gas companies, which have both production and refining businesses, contributed meaningfully to the Index’s return as strength in refining more than offset weakness on the production side.
On a country basis, energy producers in the U.K. contributed the most to the Index’s performance for the reporting period, followed by energy producers in India, France, and Russia. On the downside, North American energy producers detracted from performance as rising energy output in the U.S. and Canada led to excess supply and record-high U.S. oil inventories.
Currency fluctuations had a mixed effect on the Index’s performance for the reporting period due to the approximately 6% gain in the euro, 5% gain in the Canadian dollar, and 2% decline in the British pound relative to the U.S. dollar.
ALLOCATION BY SECTOR
As of 8/31/17
| Sector | Percentage of Total Investments* | |||
Integrated Oil & Gas | 62.24 | % | ||
Oil & Gas Exploration & Production | 26.26 | |||
Oil & Gas Refining & Marketing | 9.66 | |||
Coal & Consumable Fuels | 1.84 | |||
|
| |||
TOTAL | 100.00 | % | ||
|
| |||
TEN LARGEST COUNTRIES
As of 8/31/17
| Country | Percentage of Total Investments* | |||
United States | 48.48 | % | ||
United Kingdom | 16.83 | |||
Canada | 8.25 | |||
France | 5.87 | |||
Russia | 2.62 | |||
China | 2.38 | |||
India | 2.08 | |||
Italy | 2.01 | |||
Australia | 1.60 | |||
Japan | 1.54 | |||
|
| |||
TOTAL | 91.66 | % | ||
|
| |||
| * | Excludes money market funds. |
MANAGEMENT’S DISCUSSIONSOF FUND PERFORMANCE | 9 |
Table of Contents
Management’s Discussion of Fund Performance
iSHARES® MSCI GLOBAL GOLD MINERS ETF
Performance as of August 31, 2017
| Average Annual Total Returns | Cumulative Total Returns | |||||||||||||||||||||||||||
| NAV | MARKET | INDEX | NAV | MARKET | INDEX | |||||||||||||||||||||||
1 Year | (4.30)% | (3.81)% | (3.61)% | (4.30)% | (3.81)% | (3.61)% | ||||||||||||||||||||||
5 Years | (12.10)% | (12.13)% | (11.97)% | (47.53)% | (47.61)% | (47.13)% | ||||||||||||||||||||||
Since Inception | (14.29)% | (14.20)% | (14.16)% | (57.74)% | (57.49)% | (57.36)% | ||||||||||||||||||||||
GROWTH OF $10,000 INVESTMENT
(SINCE INCEPTION AT NET ASSET VALUE)

The inception date of the Fund was 1/31/12. The first day of secondary market trading was 2/2/12.
Past performance is no guarantee of future results. Performance results do not reflect the deduction of taxes that a shareholder would pay on fund distributions or on the redemption or sale of fund shares. See “About Fund Performance” on page 16 for more information.
| Shareholder Expenses | ||||||||||||||||||||||||||
| Actual | Hypothetical 5% Return | |||||||||||||||||||||||||
| Beginning Account Value (3/1/17) | Ending Account Value (8/31/17) | Expenses Paid During Period a | Beginning Account Value (3/1/17) | Ending Account Value (8/31/17) | Expenses Paid During Period a | Annualized Expense Ratio | ||||||||||||||||||||
| $ | 1,000.00 | $ | 1,054.60 | $ | 2.02 | $ | 1,000.00 | $ | 1,023.20 | $ | 1.99 | 0.39% | ||||||||||||||
| a | Expenses are calculated using the Fund’s annualized expense ratio (as disclosed in the table), multiplied by the average account value for the period, multiplied by the number of days in the period (184 days) and divided by the number of days in the year (365 days). See “Shareholder Expenses” on page 16 for more information. |
| 10 | 2017 iSHARES ANNUAL REPORTTO SHAREHOLDERS |
Table of Contents
Management’s Discussion of Fund Performance (Continued)
iSHARES® MSCI GLOBAL GOLD MINERS ETF
The iShares MSCI Global Gold Miners ETF (the “Fund”) seeks to track the investment results of an index composed of global equities of companies primarily engaged in the business of gold mining, as represented by the MSCI ACWI Select Gold Miners Investable Market Index (the “Index”). The Fund invests in a representative sample of securities included in the Index that collectively has an investment profile similar to the Index. Due to the use of representative sampling, the Fund may or may not hold all of the securities that are included in the Index. For the 12-month reporting period ended August 31, 2017, the total return for the Fund was -4.30%, net of fees, while the total return for the Index was -3.61%.
The decline in the Index for the reporting period mirrored a similar decline in the price of gold, which declined by approximately 4%. Gold has traditionally served as a hedge against rising inflation and economic and political uncertainty. During the reporting period, global inflation generally remained low, falling to its lowest level in eight years, even as global economic conditions improved. Low inflation and increased confidence in the global economy weighed on demand for gold.
Gold also faced competition from cryptocurrencies such as bitcoin, which some investors view as an alternative to gold. In times of political upheaval during the reporting period — such as the U.S. presidential election in November 2016, or escalating tensions between the U.S. and North Korea in August 2017 — the prices of both gold and bitcoin rose simultaneously.
Gold production declined in the first half of 2017, for the first time since 2008. Changes to mining policies in several countries contributed to the slowdown in gold supply, which helped limit the gold price decline.
From a country perspective, gold mining stocks in South Africa detracted the most from the Index’s return for the reporting period. A conflict between gold mining companies and the South African government over a proposed new mining charter weighed on South African gold mining stocks. Canada, the largest country weight in the Index, also detracted from the Index’s performance for the reporting period. On the positive side, Australian gold mining stocks contributed the most to the Index’s return for the reporting period.
Currency fluctuations had a mixed effect on the Index’s performance for the reporting period due to the approximately 12% gain of the South African rand, the 2% decline of the British pound, and the 5% gain of both the Australian dollar and the Canadian dollar relative to the U.S. dollar.
ALLOCATION BY COUNTRY
As of 8/31/17
| Country | Percentage of Total Investments* |
Canada | 53.76 | % | ||
United States | 14.70 | |||
Australia | 11.58 | |||
South Africa | 9.88 | |||
United Kingdom | 6.62 | |||
Peru | 2.36 | |||
Turkey | 1.10 | |||
|
| |||
TOTAL | 100.00 | % | ||
|
|
TEN LARGEST FUND HOLDINGS
As of 8/31/17
| Security | Percentage of Total Investments* |
Barrick Gold Corp. (Canada) | 14.18 | % | ||
Newmont Mining Corp. | 13.85 | |||
Newcrest Mining Ltd. (Australia) | 9.07 | |||
Goldcorp Inc. (Canada) | 7.56 | |||
Agnico Eagle Mines Ltd. (Canada) | 4.61 | |||
Randgold Resources Ltd. (United Kingdom) | 4.50 | |||
Kinross Gold Corp. (Canada) | 4.48 | |||
AngloGold Ashanti Ltd. (South Africa) | 3.20 | |||
Gold Fields Ltd. (South Africa) | 3.19 | |||
IAMGOLD Corp. (Canada) | 2.87 | |||
|
| |||
TOTAL | 67.51 | % | ||
|
|
| * | Excludes money market funds. |
MANAGEMENT’S DISCUSSIONSOF FUND PERFORMANCE | 11 |
Table of Contents
Management’s Discussion of Fund Performance
iSHARES® MSCI GLOBAL METALS & MINING PRODUCERS ETF
Performance as of August 31, 2017
| Average Annual Total Returns | Cumulative Total Returns | |||||||||||||||||||||||||||
| NAV | MARKET | INDEX | NAV | MARKET | INDEX | |||||||||||||||||||||||
1 Year | 50.55% | 52.07% | 50.24% | 50.55% | 52.07% | 50.24% | ||||||||||||||||||||||
5 Years | 0.50% | 0.36% | 0.57% | 2.53% | 1.80% | 2.86% | ||||||||||||||||||||||
Since Inception | (4.09)% | (4.02)% | (4.07)% | (20.81)% | (20.46)% | (20.71)% | ||||||||||||||||||||||
GROWTH OF $10,000 INVESTMENT
(SINCE INCEPTION AT NET ASSET VALUE)
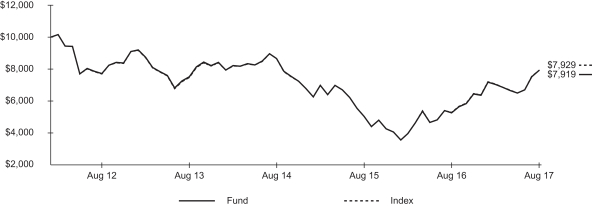
The inception date of the Fund was 1/31/12. The first day of secondary market trading was 2/2/12.
Certain sectors and markets performed exceptionally well based on market conditions during the one-year period. Achieving such exceptional returns involves the risk of volatility and investors should not expect that such exceptional returns will be repeated.
Past performance is no guarantee of future results. Performance results do not reflect the deduction of taxes that a shareholder would pay on fund distributions or on the redemption or sale of fund shares. See “About Fund Performance” on page 16 for more information.
| Shareholder Expenses | ||||||||||||||||||||||||||
| Actual | Hypothetical 5% Return | |||||||||||||||||||||||||
| Beginning Account Value (3/1/17) | Ending Account Value (8/31/17) | Expenses Paid During Period a | Beginning Account Value (3/1/17) | Ending Account Value (8/31/17) | Expenses Paid During Period a | Annualized Expense Ratio | ||||||||||||||||||||
| $ | 1,000.00 | $ | 1,123.00 | $ | 2.09 | $ | 1,000.00 | $ | 1,023.20 | $ | 1.99 | 0.39% | ||||||||||||||
| a | Expenses are calculated using the Fund’s annualized expense ratio (as disclosed in the table), multiplied by the average account value for the period, multiplied by the number of days in the period (184 days) and divided by the number of days in the year (365 days). See “Shareholder Expenses” on page 16 for more information. |
| 12 | 2017 iSHARES ANNUAL REPORTTO SHAREHOLDERS |
Table of Contents
Management’s Discussion of Fund Performance (Continued)
iSHARES® MSCI GLOBAL METALS & MINING PRODUCERS ETF
The iShares MSCI Global Metals & Mining Producers ETF (the “Fund”) seeks to track the investment results of an index composed of global equities of companies primarily engaged in mining, extraction or production of diversified metals, excluding gold and silver, as represented by the MSCI ACWI Select Metals & Mining Producers ex Gold & Silver Investable Market Index (the “Index”). The Fund invests in a representative sample of securities included in the Index that collectively has an investment profile similar to the Index. Due to the use of representative sampling, the Fund may or may not hold all of the securities that are included in the Index. For the 12-month reporting period ended August 31, 2017, the total return for the Fund was 50.55%, net of fees, while the total return for the Index was 50.24%.
The Index’s strong return for the reporting period reflected improving global economic growth, which helped drive increased demand for raw materials worldwide. In particular, a recovery in the Chinese economy, one of the world’s largest consumers of raw materials, provided support for metals and minerals prices. Collectively, metals and minerals prices increased by approximately 28% in U.S. dollar terms for the reporting period, led by copper, zinc, lead, iron ore, and aluminum. The primary exception was the price of platinum, which declined modestly for the reporting period amid growing supply and weaker demand.
Within the Index, metals and mining stocks in the U.K., the largest country weight in the Index on average, contributed the most to the Index’s return for the reporting period. Australian metals and mining companies also contributed meaningfully to the Index’s performance. The mining industry represents a major component of Australia’s economy, and a significant portion of its metals exports go to China. Other leading contributors to the Index’s return included Brazil, the U.S., and Canada.
From an industry perspective, diversified metals and mining companies, the largest industry weight in the Index on average, contributed the most to the Index’s performance for the reporting period. Steel producers were also key contributors to the Index’s return as they benefited from an increase of nearly 50% in steel prices. Copper and aluminum producers were other notable contributors to the Index’s performance.
Currency fluctuations had a mixed effect on the Index’s performance for the reporting period. On the positive side, the Canadian and Australian dollars gained about 5% relative to the U.S. dollar, and the Brazilian real gained approximately 3%. However, the British pound declined by approximately 2% and the Japanese yen declined by about 6% relative to the U.S. dollar for the reporting period.
ALLOCATION BY SECTOR
As of 8/31/17
| Sector | Percentage of Total Investments* |
Diversified Metals & Mining | 51.06 | % | ||
Steel | 35.77 | |||
Copper | 7.61 | |||
Aluminum | 4.00 | |||
Precious Metals & Minerals | 1.56 | |||
|
| |||
TOTAL | 100.00 | % | ||
|
|
TEN LARGEST COUNTRIES
As of 8/31/17
| Country | Percentage of Total Investments* |
United Kingdom | 26.49 | % | ||
Australia | 17.44 | |||
United States | 10.95 | |||
Japan | 8.78 | |||
Brazil | 5.60 | |||
Canada | 5.19 | |||
South Korea | 4.33 | |||
Russia | 2.58 | |||
Netherlands | 2.40 | |||
Germany | 2.03 | |||
|
| |||
TOTAL | 85.79 | % | ||
|
|
| * | Excludes money market funds. |
MANAGEMENT’S DISCUSSIONSOF FUND PERFORMANCE | 13 |
Table of Contents
Management’s Discussion of Fund Performance
iSHARES® MSCI GLOBAL SILVER MINERS ETF
Performance as of August 31, 2017
| Average Annual Total Returns | Cumulative Total Returns | |||||||||||||||||||||||||||
| NAV | MARKET | INDEX | NAV | MARKET | INDEX | |||||||||||||||||||||||
1 Year | (13.26)% | (12.47)% | (13.44)% | (13.26)% | (12.47)% | (13.44)% | ||||||||||||||||||||||
5 Years | (9.85)% | (9.42)% | (9.86)% | (40.45)% | (39.03)% | (40.48)% | ||||||||||||||||||||||
Since Inception | (11.51)% | (11.41)% | (11.49)% | (49.49)% | (49.19)% | (49.41)% | ||||||||||||||||||||||
GROWTH OF $10,000 INVESTMENT
(SINCE INCEPTION AT NET ASSET VALUE)
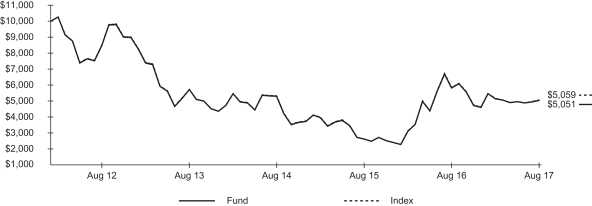
The inception date of the Fund was 1/31/12. The first day of secondary market trading was 2/2/12.
Past performance is no guarantee of future results. Performance results do not reflect the deduction of taxes that a shareholder would pay on fund distributions or on the redemption or sale of fund shares. See “About Fund Performance” on page 16 for more information.
| Shareholder Expenses | ||||||||||||||||||||||||||
| Actual | Hypothetical 5% Return | |||||||||||||||||||||||||
| Beginning Account Value (3/1/17) | Ending Account Value (8/31/17) | Expenses Paid During Period a | Beginning Account Value (3/1/17) | Ending Account Value (8/31/17) | Expenses Paid During Period a | Annualized Expense Ratio | ||||||||||||||||||||
| $ | 1,000.00 | $ | 981.10 | $ | 1.95 | $ | 1,000.00 | $ | 1,023.20 | $ | 1.99 | 0.39% | ||||||||||||||
| a | Expenses are calculated using the Fund’s annualized expense ratio (as disclosed in the table), multiplied by the average account value for the period, multiplied by the number of days in the period (184 days) and divided by the number of days in the year (365 days). See “Shareholder Expenses” on page 16 for more information. |
| 14 | 2017 iSHARES ANNUAL REPORTTO SHAREHOLDERS |
Table of Contents
Management’s Discussion of Fund Performance (Continued)
iSHARES® MSCI GLOBAL SILVER MINERS ETF
The iShares MSCI Global Silver Miners ETF (the “Fund”) seeks to track the investment results of an index composed of global equities of companies primarily engaged in the business of silver mining, as represented by the MSCI ACWI Select Silver Miners Investable Market Index (the “Index”). The Fund invests in a representative sample of securities included in the Index that collectively has an investment profile similar to the Index. Due to the use of representative sampling, the Fund may or may not hold all of the securities that are included in the Index. For the 12-month reporting period ended August 31, 2017, the total return for the Fund was -13.26%, net of fees, while the total return for the Index was -13.44%.
The decline in the Index for the reporting period mirrored a similar decline in the price of silver, which declined by approximately 13%. Along with gold, silver has traditionally been considered a store of value, serving as a hedge against rising inflation and a hedge against economic and political uncertainty. During the reporting period, global inflation generally remained low, falling to its lowest level in eight years, even as global economic conditions improved. Low inflation and increased confidence in the global economy weighed on investor demand for silver.
However, silver also has industrial uses, ranging from consumer electronics to brazing alloys to solar panels. Currently, more than half of the demand for silver comes from the industrials sector. Industrial demand for silver was steady in 2016 as strong growth in solar panel usage offset declines in other uses.
On the supply side, global silver mine output declined modestly in 2016, for the first time in 14 years, and production is expected to decline further in 2017. The majority of mined silver is a by-product of other mining operations.
From a country perspective, silver stocks in Canada, the largest country weight in the Index on average, detracted the most from the Index’s return for the reporting period. Silver mining stocks in the U.S. were also meaningful detractors from the Index’s return. On the positive side, silver mining stocks in Mexico, Peru, and the U.K. were modest contributors to the Index’s return for the reporting period.
Currency fluctuations had a mixed effect on the Index’s performance for the reporting period due to the approximately 5% gain of the Canadian dollar, the 6% gain of the Mexican peso, and the 2% decline of the British pound relative to the U.S. dollar.
ALLOCATION BY COUNTRY
As of 8/31/17
| Country | Percentage of Total Investments* |
Canada | 57.57 | % | ||
United Kingdom | 15.38 | |||
United States | 11.91 | |||
Mexico | 9.75 | |||
Peru | 4.48 | |||
China | 0.91 | |||
|
| |||
TOTAL | 100.00 | % | ||
|
|
TEN LARGEST FUND HOLDINGS
As of 8/31/17
| Security | Percentage of Total Investments* |
Wheaton Precious Metals Corp. (Canada) | 22.96 | % | ||
Fresnillo PLC (United Kingdom) | 12.39 | |||
Industrias Penoles SAB de CV (Mexico) | 9.75 | |||
Hecla Mining Co. | 4.52 | |||
Cia. de Minas Buenaventura SAA ADR (Peru) | 4.48 | |||
Pan American Silver Corp. (Canada) | 4.45 | |||
Coeur Mining Inc. | 4.21 | |||
SSR Mining Inc. (Canada) | 3.83 | |||
Tahoe Resources Inc. (Canada) | 3.64 | |||
First Majestic Silver Corp. (Canada) | 3.41 | |||
|
| |||
TOTAL | 73.64 | % | ||
|
|
| * | Excludes money market funds. |
MANAGEMENT’S DISCUSSIONSOF FUND PERFORMANCE | 15 |
Table of Contents
Past performance is no guarantee of future results. Current performance may be lower or higher than the performance data quoted. Performance data current to the most recent month-end is available at www.ishares.com. Performance results assume reinvestment of all dividends and capital gain distributions and do not reflect the deduction of taxes that a shareholder would pay on fund distributions or on the redemption or sale of fund shares. The investment return and principal value of shares will vary with changes in market conditions. Shares may be worth more or less than their original cost when they are redeemed or sold in the market. Performance for certain funds may reflect a waiver of a portion of investment advisory fees. Without such a waiver, performance would have been lower.
Net asset value or “NAV” is the value of one share of a fund as calculated in accordance with the standard formula for valuing mutual fund shares. The price used to calculate market return (“Market Price”) is determined by using the midpoint between the highest bid and the lowest offer on the primary stock exchange on which shares of a fund are listed for trading, as of the time that such fund’s NAV is calculated. Certain funds may have a NAV which is determined prior to the opening of regular trading on its listed exchange and their market returns are calculated using the midpoint of the bid/ask spread as of the opening of regular trading on the exchange. Market and NAV returns assume that dividends and capital gain distributions have been reinvested at Market Price and NAV, respectively.
An index is a statistical composite that tracks a specified financial market or sector. Unlike a fund, an index does not actually hold a portfolio of securities and therefore does not incur the expenses incurred by a fund. These expenses negatively impact fund performance. Also, market returns do not include brokerage commissions that may be payable on secondary market transactions. If brokerage commissions were included, market returns would be lower.
As a shareholder of a Fund, you incur two types of costs: (1) transaction costs, including brokerage commissions on purchases and sales of fund shares and (2) ongoing costs, including management fees and other fund expenses. The expense example, which is based on an investment of $1,000 invested on March 1, 2017 and held through August 31, 2017, is intended to help you understand your ongoing costs (in dollars and cents) of investing in a Fund and to compare these costs with the ongoing costs of investing in other funds.
Actual Expenses — The table provides information about actual account values and actual expenses. Annualized expense ratios reflect contractual and voluntary fee waivers, if any. To estimate the expenses that you paid on your account over the period, simply divide your account value by $1,000 (for example, an $8,600 account value divided by $1,000 = 8.6), then multiply the result by the number corresponding to your Fund under the heading entitled “Expenses Paid During Period.”
Hypothetical Example for Comparison Purposes — The table also provides information about hypothetical account values and hypothetical expenses based on each Fund’s actual expense ratio and an assumed rate of return of 5% per year before expenses. You may use this information to compare the ongoing costs of investing in your Fund and other funds. To do so, compare this 5% hypothetical example with the 5% hypothetical examples that appear in the shareholder reports of the other funds.
Please note that the expenses shown in the table are meant to highlight your ongoing costs only and do not reflect any transactional costs, such as brokerage commissions paid on purchases and sales of fund shares. Therefore, the hypothetical examples are useful in comparing ongoing costs only and will not help you determine the relative total costs of owning different funds. In addition, if these transactional costs were included, your costs would have been higher.
| 16 | 2017 iSHARES ANNUAL REPORTTO SHAREHOLDERS |
Table of Contents
iSHARES® MSCI GLOBAL AGRICULTURE PRODUCERS ETF
August 31, 2017
| Security | Shares | Value | ||||||
COMMON STOCKS — 95.24% |
| |||||||
AUSTRALIA — 1.61% | ||||||||
Australian Agricultural Co. Ltd.a,b | 24,801 | $ | 31,375 | |||||
Costa Group Holdings Ltd. | 22,008 | 92,515 | ||||||
GrainCorp Ltd. Class A | 17,808 | 121,893 | ||||||
Inghams Group Ltd. | 13,881 | 40,626 | ||||||
Nufarm Ltd./Australia | 15,771 | 111,453 | ||||||
Select Harvests Ltd.b | 5,229 | 17,046 | ||||||
Tassal Group Ltd. | 13,944 | 43,022 | ||||||
|
| |||||||
| 457,930 | ||||||||
BRAZIL — 0.35% | ||||||||
Sao Martinho SA | 12,600 | 69,879 | ||||||
SLC Agricola SA | 4,200 | 29,633 | ||||||
|
| |||||||
| 99,512 | ||||||||
CANADA — 8.47% | ||||||||
Ag Growth International Inc. | 1,407 | 65,258 | ||||||
Agrium Inc. | 11,256 | 1,099,609 | ||||||
Clearwater Seafoods Inc. | 2,772 | 24,476 | ||||||
Potash Corp. of Saskatchewan Inc. | 68,292 | 1,183,637 | ||||||
Rogers Sugar Inc. | 7,014 | 36,140 | ||||||
|
| |||||||
| 2,409,120 | ||||||||
CHINA — 1.08% | ||||||||
China Agri-Industries Holdings Ltd. | 168,200 | 78,658 | ||||||
China BlueChemical Ltd. Class H | 168,000 | 51,732 | ||||||
China Huishan Dairy Holdings Co. Ltd.b,c | 315,000 | — | ||||||
China Modern Dairy Holdings Ltd.a | 105,000 | 20,661 | ||||||
China Shengmu Organic Milk Ltd.a,d | 273,000 | 45,346 | ||||||
COFCO Meat Holdings Ltd.a,b | 168,000 | 33,701 | ||||||
First Tractor Co. Ltd. Class H | 42,000 | 19,588 | ||||||
Hubei Sanonda Co. Ltd. Class Ba | 12,900 | 12,692 | ||||||
Sinofert Holdings Ltd.a,b | 252,000 | 34,774 | ||||||
YuanShengTai Dairy Farm Ltd.a | 189,000 | 8,694 | ||||||
|
| |||||||
| 305,846 | ||||||||
FINLAND — 0.09% | ||||||||
Ponsse OYJ | 903 | 25,261 | ||||||
|
| |||||||
| 25,261 | ||||||||
FRANCE — 0.16% | ||||||||
Naturexa,b | 462 | 46,139 | ||||||
|
| |||||||
| 46,139 | ||||||||
GERMANY — 1.99% | ||||||||
K+S AG Registeredb | 15,918 | 378,877 | ||||||
KWS Saat SE | 147 | 61,169 | ||||||
| Security | Shares | Value | ||||||
Suedzucker AG | 5,880 | $ | 124,854 | |||||
|
| |||||||
| 564,900 | ||||||||
HONG KONG — 2.39% |
| |||||||
WH Group Ltd.d | 651,000 | 680,408 | ||||||
|
| |||||||
| 680,408 | ||||||||
INDONESIA — 0.89% |
| |||||||
Charoen Pokphand Indonesia Tbk PT | 588,000 | 122,078 | ||||||
Eagle High Plantations Tbk PTa | 1,010,100 | 16,202 | ||||||
Japfa Comfeed Indonesia Tbk PT | 352,800 | 31,731 | ||||||
Perusahaan Perkebunan London Sumatra Indonesia Tbk PT | 268,800 | 27,702 | ||||||
PT Tunas Baru Lampung Tbk | 266,700 | 27,985 | ||||||
Salim Ivomas Pratama Tbk PT | 176,400 | 6,584 | ||||||
Sawit Sumbermas Sarana Tbk PT | 186,900 | 21,013 | ||||||
|
| |||||||
| 253,295 | ||||||||
IRELAND — 0.26% |
| |||||||
Origin Enterprises PLC | 9,870 | 75,335 | ||||||
|
| |||||||
| 75,335 | ||||||||
ISRAEL — 0.82% |
| |||||||
Israel Chemicals Ltd. | 40,887 | 176,240 | ||||||
Israel Corp. Ltd. (The)a | 294 | 56,101 | ||||||
|
| |||||||
| 232,341 | ||||||||
ITALY — 3.29% |
| |||||||
CNH Industrial NV | 82,593 | 935,796 | ||||||
|
| |||||||
| 935,796 | ||||||||
JAPAN — 8.10% |
| |||||||
Hokuto Corp. | 2,100 | 37,569 | ||||||
Iseki & Co. Ltd. | 2,100 | 43,332 | ||||||
Kubota Corp. | 86,100 | 1,489,500 | ||||||
Kumiai Chemical Industry Co. Ltd.b | 4,200 | 25,072 | ||||||
Maruha Nichiro Corp. | 4,200 | 121,734 | ||||||
Mitsui Sugar Co. Ltd. | 2,100 | 71,266 | ||||||
NH Foods Ltd. | 14,000 | 410,867 | ||||||
Nippon Beet Sugar Manufacturing Co. Ltd. | 700 | 15,264 | ||||||
Sakata Seed Corp.b | 2,100 | 65,064 | ||||||
YAMABIKO Corp. | 2,100 | 24,080 | ||||||
|
| |||||||
| 2,303,748 | ||||||||
MALAYSIA — 1.93% |
| |||||||
Felda Global Ventures Holdings Bhdb | 126,000 | 45,732 | ||||||
Genting Plantations Bhd | 18,900 | 47,090 | ||||||
IOI Corp. Bhdb | 174,300 | 185,300 | ||||||
SCHEDULESOF INVESTMENTS | 17 |
Table of Contents
Schedule of Investments (Continued)
iSHARES® MSCI GLOBAL AGRICULTURE PRODUCERS ETF
August 31, 2017
| Security | Shares | Value | ||||||
Kuala Lumpur Kepong Bhd | 35,700 | $ | 205,146 | |||||
QL Resources Bhd | 58,850 | 66,422 | ||||||
|
| |||||||
| 549,690 | ||||||||
MEXICO — 0.24% |
| |||||||
Industrias Bachoco SAB de CV Series B | 12,600 | 67,084 | ||||||
|
| |||||||
| 67,084 | ||||||||
NETHERLANDS — 0.50% |
| |||||||
ForFarmers NV | 1,365 | 16,967 | ||||||
OCI NVa,b | 6,615 | 125,322 | ||||||
|
| |||||||
| 142,289 | ||||||||
NORWAY — 6.43% |
| |||||||
Austevoll Seafood ASA | 7,203 | 74,300 | ||||||
Bakkafrost P/F | 3,360 | 156,429 | ||||||
Grieg Seafood ASA | 5,250 | 51,961 | ||||||
Leroy Seafood Group ASA | 24,507 | 162,543 | ||||||
Marine Harvest ASA | 32,718 | 648,064 | ||||||
Norway Royal Salmon ASA | 1,360 | 29,718 | ||||||
Salmar ASA | 4,095 | 118,431 | ||||||
Yara International ASA | 14,406 | 587,546 | ||||||
|
| |||||||
| 1,828,992 | ||||||||
PAKISTAN — 0.48% | ||||||||
Engro Corp. Ltd./Pakistan | 23,100 | 62,254 | ||||||
Engro Fertilizers Ltd. | 31,967 | 17,591 | ||||||
Fauji Fertilizer Bin Qasim Ltd. | 31,500 | 10,040 | ||||||
Fauji Fertilizer Co. Ltd. | 33,600 | 22,632 | ||||||
Millat Tractors Ltd. | 2,100 | 23,246 | ||||||
|
| |||||||
| 135,763 | ||||||||
POLAND — 0.25% |
| |||||||
Grupa Azoty SA | 3,738 | 72,074 | ||||||
|
| |||||||
| 72,074 | ||||||||
RUSSIA — 0.47% |
| |||||||
PhosAgro PJSC GDRe | 9,618 | 133,690 | ||||||
|
| |||||||
| 133,690 | ||||||||
SINGAPORE — 2.10% |
| |||||||
Bumitama Agri Ltd. | 39,900 | 21,742 | ||||||
China XLX Fertiliser Ltd. | 42,000 | 11,270 | ||||||
First Resources Ltd.b | 46,200 | 63,449 | ||||||
Golden Agri-Resources Ltd. | 571,200 | 166,144 | ||||||
Indofood Agri Resources Ltd. | 12,600 | 4,407 | ||||||
Japfa Ltd.b | 27,300 | 11,057 | ||||||
Wilmar International Ltd. | 130,200 | 318,309 | ||||||
|
| |||||||
| 596,378 | ||||||||
| Security | Shares | Value | ||||||
SOUTH AFRICA — 0.46% | ||||||||
Astral Foods Ltd. | 3,276 | $ | 39,067 | |||||
Oceana Group Ltd. | 3,045 | 21,947 | ||||||
Tongaat Hulett Ltd. | 7,770 | 70,912 | ||||||
|
| |||||||
| 131,926 | ||||||||
SOUTH KOREA — 0.40% |
| |||||||
Dongwon Industries Co. Ltd. | 126 | 32,181 | ||||||
Easy Bio Inc. | 2,835 | 16,769 | ||||||
Farmsco | 1,302 | 14,318 | ||||||
Harim Co. Ltd. | 3,066 | 13,011 | ||||||
Namhae Chemical Corp. | 2,856 | 23,986 | ||||||
Sajo Industries Co. Ltd. | 189 | 12,638 | ||||||
|
| |||||||
| 112,903 | ||||||||
SWEDEN — 0.08% |
| |||||||
Scandi Standard AB | 3,024 | 22,327 | ||||||
|
| |||||||
| 22,327 | ||||||||
TAIWAN — 0.36% |
| |||||||
Charoen Pokphand Enterprise | 21,000 | 45,647 | ||||||
Taiwan Fertilizer Co. Ltd. | 42,000 | 56,016 | ||||||
|
| |||||||
| 101,663 | ||||||||
THAILAND — 0.90% |
| |||||||
Charoen Pokphand Foods PCL NVDR | 221,600 | 181,858 | ||||||
GFPT PCL NVDR | 51,500 | 29,779 | ||||||
Khon Kaen Sugar Industry PCL NVDR | 153,454 | 20,611 | ||||||
Thaifoods Group PCL NVDRa | 121,800 | 22,559 | ||||||
|
| |||||||
| 254,807 | ||||||||
TURKEY — 0.12% |
| |||||||
Gubre Fabrikalari TASa | 12,726 | 18,541 | ||||||
Turk Traktor ve Ziraat Makineleri AS | 651 | 15,650 | ||||||
|
| |||||||
| 34,191 | ||||||||
UNITED KINGDOM — 0.41% |
| |||||||
Sirius Minerals PLCa | 332,556 | 116,942 | ||||||
|
| |||||||
| 116,942 | ||||||||
UNITED STATES — 50.61% |
| |||||||
AGCO Corp. | 5,208 | 356,488 | ||||||
AgroFresh Solutions Inc.a | 2,394 | 17,045 | ||||||
American Vanguard Corp. | 2,247 | 45,502 | ||||||
Archer-Daniels-Midland Co. | 45,885 | 1,895,968 | ||||||
Bunge Ltd. | 11,256 | 840,035 | ||||||
Cal-Maine Foods Inc.a,b | 2,415 | 88,027 | ||||||
CF Industries Holdings Inc. | 19,215 | 557,043 | ||||||
Darling Ingredients Inc.a | 12,873 | 223,990 | ||||||
| 18 | 2017 iSHARES ANNUAL REPORTTO SHAREHOLDERS |
Table of Contents
Schedule of Investments (Continued)
iSHARES® MSCI GLOBAL AGRICULTURE PRODUCERS ETF
August 31, 2017
| Security | Shares | Value | ||||||
Deere & Co. | 21,987 | $ | 2,548,953 | |||||
FMC Corp. | 11,046 | 952,386 | ||||||
Fresh Del Monte Produce Inc. | 2,667 | 125,322 | ||||||
Ingredion Inc. | 5,670 | 702,059 | ||||||
Lindsay Corp.b | 924 | 79,991 | ||||||
Monsanto Co. | 35,616 | 4,174,195 | ||||||
Mosaic Co. (The) | 27,321 | 545,873 | ||||||
Omega Protein Corp. | 1,806 | 28,535 | ||||||
Sanderson Farms Inc. | 1,680 | 247,834 | ||||||
Scotts Miracle-Gro Co. (The) Class A | 3,864 | 369,360 | ||||||
Titan International Inc. | 4,578 | 39,279 | ||||||
Toro Co. (The) | 8,946 | 551,789 | ||||||
|
| |||||||
| 14,389,674 | ||||||||
|
| |||||||
TOTAL COMMON STOCKS | ||||||||
(Cost: $28,277,036) | 27,080,024 | |||||||
INVESTMENT COMPANIES — 2.82% |
| |||||||
INDIA — 2.82% |
| |||||||
iShares India 50 ETFb,f | 22,680 | 800,604 | ||||||
|
| |||||||
| 800,604 | ||||||||
|
| |||||||
TOTAL INVESTMENT COMPANIES |
| |||||||
(Cost: $667,409) | 800,604 | |||||||
PREFERRED STOCKS — 1.33% |
| |||||||
CHILE — 1.33% | ||||||||
Sociedad Quimica y Minera de Chile SA Series B, Preference Shares | 8,106 | 378,806 | ||||||
|
| |||||||
| 378,806 | ||||||||
|
| |||||||
TOTAL PREFERRED STOCKS | ||||||||
(Cost: $225,393) | 378,806 | |||||||
SHORT-TERM INVESTMENTS — 6.76% |
| |||||||
MONEY MARKET FUNDS — 6.76% |
| |||||||
BlackRock Cash Funds: Institutional, |
| |||||||
1.32%f,g,h | 1,885,655 | 1,886,221 | ||||||
BlackRock Cash Funds: Treasury, |
| |||||||
0.96%f,g | 37,102 | 37,102 | ||||||
|
| |||||||
| 1,923,323 | ||||||||
|
| |||||||
TOTAL SHORT-TERM INVESTMENTS |
| |||||||
(Cost: $1,923,196) |
| 1,923,323 | ||||||
|
| |||||||
| Value | ||||||
TOTAL INVESTMENTS | ||||||
(Cost: $31,093,034)i | $ | 30,182,757 | ||||
Other Assets, Less Liabilities — (6.15)% | (1,748,430 | ) | ||||
|
| |||||
NET ASSETS — 100.00% | $ | 28,434,327 | ||||
|
| |||||
| GDR | — Global Depositary Receipts | |
| NVDR | — Non-Voting Depositary Receipts |
| a | Non-income earning security. |
| b | All or a portion of this security represents a security on loan. See Note 1. |
| c | Security is valued using significant unobservable inputs and is classified as Level 3 in the fair value hierarchy. |
| d | This security may be resold to qualified institutional buyers under Rule 144A of the Securities Act of 1933. |
| e | This security may be resold to qualified foreign investors and foreign institutional buyers under Regulation S of the Securities Act of 1933. |
| f | Affiliated issuer. See Schedule 1. |
| g | The rate quoted is the annualized seven-day yield of the fund at period end. |
| h | All or a portion of this security represents an investment of securities lending collateral. See Note 1. |
| i | The cost of investments (including short positions and derivatives, if any) for federal income tax purposes was $31,325,816. Net unrealized depreciation was $1,143,059, of which $3,677,488 represented gross unrealized appreciation on investments and $4,820,547 represented gross unrealized depreciation on investments. |
SCHEDULESOF INVESTMENTS | 19 |
Table of Contents
Schedule of Investments (Continued)
iSHARES® MSCI GLOBAL AGRICULTURE PRODUCERS ETF
August 31, 2017
Schedule 1 — Affiliates (Note 2)
Investments in issuers considered to be affiliates of the Fund during the year ended August 31, 2017, for purposes of Section 2(a)(3) of the 1940 Act, and/or related parties of the Fund were as follows:
| Affiliated issuer | Shares held at 08/31/16 | Shares purchased | Shares sold | Shares held at 08/31/17 | Value at 08/31/17 | Net realized gain (loss) a | Change in unrealized appreciation (depreciation) | Income | ||||||||||||||||||||||||
BlackRock Cash Funds: Institutional, | 202,370 | 1,683,285 | b | — | 1,885,655 | $ | 1,886,221 | $ | (46 | ) | $ | 128 | $ | — | c | |||||||||||||||||
BlackRock Cash Funds: Treasury, | 11,859 | 25,243 | b | — | 37,102 | 37,102 | 3 | — | 1,148 | |||||||||||||||||||||||
iShares India 50 ETF | 18,711 | 9,155 | (5,186 | ) | 22,680 | 800,604 | 34,049 | 88,891 | 1,556 | |||||||||||||||||||||||
|
|
|
|
|
|
|
| |||||||||||||||||||||||||
| $ | 2,723,927 | $ | 34,006 | $ | 89,019 | $ | 2,704 | |||||||||||||||||||||||||
|
|
|
|
|
|
|
| |||||||||||||||||||||||||
| a | Includes realized capital gain distributions from an affiliated fund, if any. |
| b | Net of shares purchased and sold. |
| c | Does not include income earned on investment of securities lending cash collateral which is not direct income of the Fund and is reflected as a component of securities lending income in the statement of operations. |
Schedule 2 — Fair Value Measurements
Various inputs are used in determining the fair value of financial instruments. For description of the input levels and information about the Fund’s policy regarding valuation of financial instruments, see Note 1.
The following table summarizes the value of the Fund’s investments according to the fair value hierarchy as of August 31, 2017. The breakdown of the Fund’s investments into major categories is disclosed in the schedule of investments above.
| Level 1 | Level 2 | Level 3 | Total | |||||||||||||
Investments: | ||||||||||||||||
Assets: | ||||||||||||||||
Common stocks | $ | 27,080,024 | $ | — | $ | 0 | a | $ | 27,080,024 | |||||||
Investment companies | 800,604 | — | — | 800,604 | ||||||||||||
Preferred stocks | 378,806 | — | — | 378,806 | ||||||||||||
Money market funds | 1,923,323 | — | — | 1,923,323 | ||||||||||||
|
|
|
|
|
|
|
| |||||||||
Total | $ | 30,182,757 | $ | — | $ | 0 | a | $ | 30,182,757 | |||||||
|
|
|
|
|
|
|
| |||||||||
| a | Rounds to less than $1. |
See notes to financial statements.
| 20 | 2017 iSHARES ANNUAL REPORTTO SHAREHOLDERS |
Table of Contents
Schedule of Investments
iSHARES® MSCI GLOBAL ENERGY PRODUCERS ETF
August 31, 2017
| Security | Shares | Value | ||||||
COMMON STOCKS — 98.36% |
| |||||||
AUSTRALIA — 1.59% |
| |||||||
Beach Energy Ltd. | 18,786 | $ | 9,983 | |||||
Karoon Gas Australia Ltd.a,b | 4,454 | 4,010 | ||||||
Oil Search Ltd. | 21,335 | 113,546 | ||||||
Santos Ltd.a | 27,914 | 83,246 | ||||||
Whitehaven Coal Ltd.a | 8,619 | 23,926 | ||||||
Woodside Petroleum Ltd. | 11,679 | 267,058 | ||||||
|
| |||||||
| 501,769 | ||||||||
AUSTRIA — 0.42% |
| |||||||
OMV AG | 2,329 | 133,712 | ||||||
|
| |||||||
| 133,712 | ||||||||
BRAZIL — 0.66% |
| |||||||
Petroleo Brasileiro SAa | 45,900 | 203,792 | ||||||
QGEP Participacoes SA | 1,700 | 4,074 | ||||||
|
| |||||||
| 207,866 | ||||||||
CANADA — 8.19% |
| |||||||
Advantage Oil & Gas Ltd.a,b | 2,941 | 18,672 | ||||||
ARC Resources Ltd. | 5,394 | 70,558 | ||||||
Athabasca Oil Corp.a | 4,862 | 3,606 | ||||||
Baytex Energy Corp.a,b | 3,266 | 8,232 | ||||||
Birchcliff Energy Ltd.b | 3,060 | 14,424 | ||||||
Bonavista Energy Corp. | 3,434 | 7,532 | ||||||
Bonterra Energy Corp. | 476 | 6,181 | ||||||
Cameco Corp. | 6,392 | 63,831 | ||||||
Canacol Energy Ltd.a | 1,258 | 4,214 | ||||||
Canadian Natural Resources Ltd. | 17,085 | 524,235 | ||||||
Cardinal Energy Ltd. | 2,720 | 9,090 | ||||||
Cenovus Energy Inc. | 15,640 | 121,877 | ||||||
Crescent Point Energy Corp. | 8,177 | 55,894 | ||||||
Crew Energy Inc.a | 3,009 | 10,008 | ||||||
Denison Mines Corp.a,b | 8,466 | 4,119 | ||||||
Encana Corp. | 15,334 | 142,485 | ||||||
Enerplus Corp. | 3,570 | 31,578 | ||||||
Freehold Royalties Ltd. | 1,241 | 13,828 | ||||||
Husky Energy Inc.a | 5,457 | 63,591 | ||||||
Imperial Oil Ltd. | 4,386 | 128,948 | ||||||
Kelt Exploration Ltd.a | 2,149 | 10,319 | ||||||
MEG Energy Corp.a,b | 3,264 | 13,043 | ||||||
NexGen Energy Ltd.a | 5,033 | 11,722 | ||||||
NuVista Energy Ltd.a | 2,482 | 13,145 | ||||||
Obsidian Energy Ltd.a | 6,460 | 6,441 | ||||||
Painted Pony Energy Ltd.a | 1,649 | 4,393 | ||||||
Paramount Resources Ltd. Class Aa,b | 663 | 11,322 | ||||||
| Security | Shares | Value | ||||||
Parex Resources Inc.a | 2,176 | $ | 22,337 | |||||
Pengrowth Energy Corp.a,b | 9,555 | 5,944 | ||||||
Peyto Exploration & Development Corp. | 2,771 | 47,364 | ||||||
PrairieSky Royalty Ltd. | 3,128 | 73,201 | ||||||
Raging River Exploration Inc.a | 3,281 | 17,115 | ||||||
Seven Generations Energy Ltd. Class Aa | 3,952 | 59,922 | ||||||
Spartan Energy Corp.a | 1,615 | 7,278 | ||||||
Suncor Energy Inc. | 25,364 | 791,620 | ||||||
Surge Energy Inc. | 4,624 | 7,339 | ||||||
TORC Oil & Gas Ltd. | 1,326 | 5,394 | ||||||
Tourmaline Oil Corp.a | 3,638 | 70,685 | ||||||
Trilogy Energy Corp.a | 510 | 2,327 | ||||||
Vermilion Energy Inc. | 2,006 | 65,120 | ||||||
Whitecap Resources Inc. | 5,202 | 37,259 | ||||||
|
| |||||||
| 2,586,193 | ||||||||
CHINA — 2.37% |
| |||||||
China Coal Energy Co. Ltd. Class Hb | 34,000 | 17,116 | ||||||
China Shenhua Energy Co. Ltd. Class H | 51,000 | 131,305 | ||||||
CNOOC Ltd. | 272,000 | 325,297 | ||||||
Inner Mongolia Yitai Coal Co. Ltd. Class B | 15,300 | 19,921 | ||||||
MIE Holdings Corp.a | 32,000 | 2,862 | ||||||
PetroChina Co. Ltd. Class H | 340,000 | 217,212 | ||||||
Yanzhou Coal Mining Co. Ltd. Class H | 34,000 | 34,146 | ||||||
|
| |||||||
| 747,859 | ||||||||
COLOMBIA — 0.12% |
| |||||||
Ecopetrol SA | 83,470 | 38,833 | ||||||
|
| |||||||
| 38,833 | ||||||||
FINLAND — 0.28% |
| |||||||
Neste OYJ | 1,989 | 87,589 | ||||||
|
| |||||||
| 87,589 | ||||||||
FRANCE — 5.83% |
| |||||||
Esso SA Francaisea | 119 | 7,937 | ||||||
Etablissements Maurel et Proma,b | 1,088 | 4,579 | ||||||
Total SA | 35,394 | 1,828,162 | ||||||
|
| |||||||
| 1,840,678 | ||||||||
GREECE — 0.10% |
| |||||||
Hellenic Petroleum SA | 739 | 6,695 | ||||||
Motor Oil Hellas Corinth Refineries SA | 1,065 | 23,931 | ||||||
|
| |||||||
| 30,626 | ||||||||
HUNGARY — 0.20% |
| |||||||
MOL Hungarian Oil & Gas PLC | 680 | 63,023 | ||||||
|
| |||||||
| 63,023 | ||||||||
SCHEDULESOF INVESTMENTS | 21 |
Table of Contents
Schedule of Investments (Continued)
iSHARES® MSCI GLOBAL ENERGY PRODUCERS ETF
August 31, 2017
| Security | Shares | Value | ||||||
INDIA — 2.06% |
| |||||||
Reliance Industries Ltd. GDRc | 13,175 | $ | 651,504 | |||||
|
| |||||||
| 651,504 | ||||||||
INDONESIA — 0.43% |
| |||||||
Adaro Energy Tbk PT | 227,800 | 31,160 | ||||||
Bumi Resources Tbk PTa | 411,400 | 7,030 | ||||||
Harum Energy Tbk PTa | 13,600 | 2,365 | ||||||
Indo Tambangraya Megah Tbk PT | 6,800 | 9,913 | ||||||
Medco Energi Internasional Tbk PTa | 23,800 | 5,887 | ||||||
PT Delta Dunia Makmur Tbka | 76,500 | 5,504 | ||||||
Sugih Energy Tbk PTa | 618,000 | 2,316 | ||||||
Tambang Batubara Bukit Asam Persero Tbk PT | 11,900 | 11,038 | ||||||
United Tractors Tbk PT | 27,200 | 61,772 | ||||||
|
| |||||||
| 136,985 | ||||||||
ISRAEL — 0.15% |
| |||||||
Jerusalem Oil Explorationa | 68 | 3,509 | ||||||
Naphtha Israel Petroleum Corp. Ltd.a | 1,038 | 7,000 | ||||||
Oil Refineries Ltd. | 31,263 | 14,522 | ||||||
Paz Oil Co. Ltd. | 136 | 21,621 | ||||||
|
| |||||||
| 46,652 | ||||||||
ITALY — 2.00% |
| |||||||
Eni SpA | 39,202 | 613,817 | ||||||
Saras SpA | 6,562 | 16,149 | ||||||
|
| |||||||
| 629,966 | ||||||||
JAPAN — 1.53% |
| |||||||
Cosmo Energy Holdings Co. Ltd. | 1,700 | 35,140 | ||||||
Idemitsu Kosan Co. Ltd. | 1,700 | 41,488 | ||||||
INPEX Corp. | 15,300 | 146,105 | ||||||
Japan Petroleum Exploration Co. Ltd. | 100 | 1,917 | ||||||
JXTG Holdings Inc. | 45,900 | 222,035 | ||||||
Showa Shell Sekiyu KK | 3,400 | 37,225 | ||||||
|
| |||||||
| 483,910 | ||||||||
NEW ZEALAND — 0.02% |
| |||||||
New Zealand Refining Co. Ltd. (The) | 2,550 | 4,621 | ||||||
|
| |||||||
| 4,621 | ||||||||
NORWAY — 1.20% |
| |||||||
Aker BP ASA | 1,904 | 34,752 | ||||||
DNO ASAa | 9,690 | 15,158 | ||||||
Statoil ASA | 17,323 | 327,318 | ||||||
|
| |||||||
| 377,228 | ||||||||
| Security | Shares | Value | ||||||
PAKISTAN — 0.07% |
| |||||||
Oil & Gas Development Co. Ltd. | 10,200 | $ | 13,681 | |||||
Pakistan Oilfields Ltd. | 1,776 | 8,110 | ||||||
|
| |||||||
| 21,791 | ||||||||
PHILIPPINES — 0.02% |
| |||||||
Petron Corp. | 34,000 | 6,512 | ||||||
|
| |||||||
| 6,512 | ||||||||
POLAND — 0.58% |
| |||||||
Grupa Lotos SAa | 1,649 | 27,162 | ||||||
Lubelski Wegiel Bogdanka SA | 127 | 2,701 | ||||||
Polski Koncern Naftowy ORLEN SA | 4,641 | 153,124 | ||||||
|
| |||||||
| 182,987 | ||||||||
PORTUGAL — 0.33% |
| |||||||
Galp Energia SGPS SA | 6,324 | 104,584 | ||||||
|
| |||||||
| 104,584 | ||||||||
RUSSIA — 2.43% |
| |||||||
Lukoil PJSC | 4,029 | 203,271 | ||||||
Lukoil PJSC ADR | 2,380 | 119,595 | ||||||
Novatek PJSC GDRd | 1,418 | 149,882 | ||||||
Rosneft Oil Co. PJSC | 9,280 | 48,833 | ||||||
Rosneft Oil Co. PJSC GDR | 9,003 | 46,815 | ||||||
Surgutneftegas OJSC | 49,300 | 22,806 | ||||||
Surgutneftegas OJSC ADR | 4,496 | 20,565 | ||||||
Tatneft PJSC Class S | 23,290 | 153,997 | ||||||
|
| |||||||
| 765,764 | ||||||||
SOUTH AFRICA — 0.11% |
| |||||||
Exxaro Resources Ltd. | 3,553 | 35,775 | ||||||
|
| |||||||
| 35,775 | ||||||||
SOUTH KOREA — 0.80% |
| |||||||
S-Oil Corp. | 748 | 83,251 | ||||||
SK Innovation Co. Ltd. | 1,020 | 170,513 | ||||||
|
| |||||||
| 253,764 | ||||||||
SPAIN — 1.01% |
| |||||||
Repsol SA | 18,655 | 320,042 | ||||||
|
| |||||||
| 320,042 | ||||||||
SWEDEN — 0.21% |
| |||||||
Lundin Petroleum ABa,b | 3,026 | 64,837 | ||||||
|
| |||||||
| 64,837 | ||||||||
THAILAND — 0.53% |
| |||||||
Bangchak Corp. PCL NVDR | 8,500 | 9,727 | ||||||
Banpu PCL NVDR | 28,900 | 15,318 | ||||||
Esso Thailand PCL NVDRa | 23,800 | 8,673 | ||||||
| 22 | 2017 iSHARES ANNUAL REPORTTO SHAREHOLDERS |
Table of Contents
Schedule of Investments (Continued)
iSHARES® MSCI GLOBAL ENERGY PRODUCERS ETF
August 31, 2017
| Security | Shares | Value | ||||||
IRPC PCL NVDR | 195,500 | $ | 35,032 | |||||
PTT Exploration & Production PCL NVDR | 22,131 | 58,318 | ||||||
Thai Oil PCL NVDR | 13,600 | 38,603 | ||||||
|
| |||||||
| 165,671 | ||||||||
TURKEY — 0.21% |
| |||||||
Tupras Turkiye Petrol Rafinerileri AS | 1,940 | 65,911 | ||||||
|
| |||||||
| 65,911 | ||||||||
UNITED ARAB EMIRATES — 0.03% |
| |||||||
Dana Gas PJSCa | 47,413 | 8,261 | ||||||
|
| |||||||
| 8,261 | ||||||||
UNITED KINGDOM — 16.72% |
| |||||||
Amerisur Resources PLCa,b | 21,046 | 4,068 | ||||||
BP PLC | 295,920 | 1,697,392 | ||||||
Cairn Energy PLCa | 9,945 | 21,977 | ||||||
EnQuest PLC ADRa,b | 21,505 | 6,997 | ||||||
Faroe Petroleum PLCa | 6,018 | 6,669 | ||||||
Hurricane Energy PLCa,b | 20,179 | 7,215 | ||||||
Nostrum Oil & Gas PLCa | 1,139 | 5,560 | ||||||
Ophir Energy PLCa,b | 12,954 | 12,936 | ||||||
Pantheon Resources PLCa,b | 2,193 | 1,243 | ||||||
Premier Oil PLCa,b | 10,506 | 7,513 | ||||||
Royal Dutch Shell PLC Class A ADR | 67,014 | 1,836,684 | ||||||
Royal Dutch Shell PLC Class B | 57,341 | 1,596,323 | ||||||
SOCO International PLC | 3,706 | 5,683 | ||||||
Sound Energy PLCa,b | 8,772 | 5,482 | ||||||
Stobart Group Ltd. | 5,423 | 20,474 | ||||||
Tullow Oil PLCa,b | 21,539 | 43,324 | ||||||
|
| |||||||
| 5,279,540 | ||||||||
UNITED STATES — 48.16% |
| |||||||
Anadarko Petroleum Corp. | 8,568 | 350,688 | ||||||
Andeavor | 2,329 | 233,249 | ||||||
Antero Resources Corp.a,b | 3,298 | 64,938 | ||||||
Apache Corp. | 5,814 | 225,816 | ||||||
Arch Coal Inc. Class A | 340 | 27,156 | ||||||
Bill Barrett Corp.a,b | 799 | 2,389 | ||||||
Cabot Oil & Gas Corp. | 6,970 | 178,084 | ||||||
California Resources Corp.a,b | 649 | 5,062 | ||||||
Callon Petroleum Co.a,b | 3,077 | 31,878 | ||||||
Carrizo Oil & Gas Inc.a,b | 1,190 | 15,994 | ||||||
Centennial Resource Development Inc./DE Class Aa,b | 1,377 | 23,808 | ||||||
Chesapeake Energy Corp.a,b | 13,430 | 48,885 | ||||||
Chevron Corp. | 28,696 | 3,088,264 | ||||||
| Security | Shares | Value | ||||||
Cimarex Energy Co. | 1,513 | $ | 150,831 | |||||
Concho Resources Inc.a | 2,312 | 256,563 | ||||||
ConocoPhillips | 18,802 | 820,895 | ||||||
CONSOL Energy Inc.a | 2,924 | 42,544 | ||||||
Continental Resources Inc./OKa,b | 1,496 | 50,744 | ||||||
CVR Energy Inc. | 340 | 7,283 | ||||||
Delek U.S. Holdings Inc. | 1,303 | 32,210 | ||||||
Denbury Resources Inc.a | 6,188 | 6,559 | ||||||
Devon Energy Corp. | 7,582 | 238,075 | ||||||
Diamondback Energy Inc.a,b | 1,394 | 126,561 | ||||||
Eclipse Resources Corp.a,b | 1,071 | 2,495 | ||||||
Energen Corp.a | 1,547 | 79,330 | ||||||
Energy XXI Gulf Coast Inc.a | 340 | 3,553 | ||||||
EOG Resources Inc. | 8,806 | 748,422 | ||||||
EQT Corp. | 2,669 | 166,385 | ||||||
Extraction Oil & Gas Inc.a | 1,513 | 19,881 | ||||||
Exxon Mobil Corp. | 63,699 | 4,862,145 | ||||||
Gran Tierra Energy Inc.a,b | 5,491 | 11,147 | ||||||
Gulfport Energy Corp.a | 2,329 | 29,182 | ||||||
Halcon Resources Corp.a | 1,479 | 9,155 | ||||||
Hess Corp. | 4,420 | 171,938 | ||||||
HollyFrontier Corp. | 2,686 | 84,099 | ||||||
Jagged Peak Energy Inc.a | 204 | 2,613 | ||||||
Kosmos Energy Ltd.a,b | 3,400 | 23,936 | ||||||
Laredo Petroleum Inc.a | 2,414 | 29,982 | ||||||
Marathon Oil Corp. | 13,158 | 146,317 | ||||||
Marathon Petroleum Corp. | 7,565 | 396,784 | ||||||
Matador Resources Co.a,b | 1,394 | 32,871 | ||||||
Murphy Oil Corp. | 2,737 | 62,020 | ||||||
Newfield Exploration Co.a,b | 3,196 | 83,512 | ||||||
Noble Energy Inc. | 7,225 | 171,738 | ||||||
Oasis Petroleum Inc.a | 3,383 | 24,696 | ||||||
Occidental Petroleum Corp. | 11,543 | 689,117 | ||||||
Par Pacific Holdings Inc.a | 425 | 7,569 | ||||||
Parsley Energy Inc. Class Aa | 3,349 | 83,892 | ||||||
PBF Energy Inc. Class A | 1,683 | 39,853 | ||||||
PDC Energy Inc.a | 935 | 36,774 | ||||||
Pioneer Natural Resources Co. | 2,601 | 337,220 | ||||||
QEP Resources Inc.a | 3,519 | 26,568 | ||||||
Range Resources Corp. | 3,723 | 64,631 | ||||||
Resolute Energy Corp.a | 255 | 7,535 | ||||||
Ring Energy Inc.a | 816 | 9,727 | ||||||
RSP Permian Inc.a | 1,802 | 56,547 | ||||||
Sanchez Energy Corp.a,b | 705 | 3,088 | ||||||
SandRidge Energy Inc.a | 323 | 5,562 | ||||||
SCHEDULESOF INVESTMENTS | 23 |
Table of Contents
Schedule of Investments (Continued)
iSHARES® MSCI GLOBAL ENERGY PRODUCERS ETF
August 31, 2017
| Security | Shares | Value | ||||||
SM Energy Co. | 1,581 | $ | 21,122 | |||||
Southwestern Energy Co.a | 7,531 | 41,044 | ||||||
SRC Energy Inc.a | 2,822 | 22,266 | ||||||
Tellurian Inc.a,b | 850 | 7,854 | ||||||
Valero Energy Corp. | 6,885 | 468,869 | ||||||
Whiting Petroleum Corp.a | 5,355 | 23,937 | ||||||
WPX Energy Inc.a | 6,069 | 60,629 | ||||||
|
| |||||||
| 15,204,481 | ||||||||
|
| |||||||
TOTAL COMMON STOCKS | ||||||||
(Cost: $35,050,585) | 31,048,934 | |||||||
PREFERRED STOCKS — 0.99% |
| |||||||
BRAZIL — 0.82% |
| |||||||
Petroleo Brasileiro SA, Preference Shares | 59,500 | 258,124 | ||||||
|
| |||||||
| 258,124 | ||||||||
RUSSIA — 0.17% |
| |||||||
Surgutneftegas OJSC, Preference Shares | 112,200 | 55,390 | ||||||
|
| |||||||
| 55,390 | ||||||||
|
| |||||||
TOTAL PREFERRED STOCKS |
| |||||||
(Cost: $240,375) |
| 313,514 | ||||||
SHORT-TERM INVESTMENTS — 2.16% |
| |||||||
MONEY MARKET FUNDS — 2.16% |
| |||||||
BlackRock Cash Funds: Institutional, |
| |||||||
1.32%e,f,g | 656,714 | 656,911 | ||||||
BlackRock Cash Funds: Treasury, |
| |||||||
0.96%e,f | 25,717 | 25,717 | ||||||
|
| |||||||
| 682,628 | ||||||||
|
| |||||||
TOTAL SHORT-TERM INVESTMENTS |
| |||||||
(Cost: $682,534) |
| 682,628 | ||||||
|
| |||||||
TOTAL INVESTMENTS |
| |||||||
(Cost: $35,973,494)h |
| 32,045,076 | ||||||
Other Assets, Less Liabilities — (1.51)% |
| (476,989 | ) | |||||
|
| |||||||
NET ASSETS — 100.00% |
| $ | 31,568,087 | |||||
|
| |||||||
ADR | — American Depositary Receipts | |
GDR | — Global Depositary Receipts | |
NVDR | — Non-Voting Depositary Receipts |
| a | Non-income earning security. |
| b | All or a portion of this security represents a security on loan. See Note 1. |
| c | This security may be resold to qualified institutional buyers under Rule 144A of the Securities Act of 1933. |
| d | This security may be resold to qualified foreign investors and foreign institutional buyers under Regulation S of the Securities Act of 1933. |
| e | Affiliated issuer. See Schedule 1. |
| f | The rate quoted is the annualized seven-day yield of the fund at period end. |
| g | All or a portion of this security represents an investment of securities lending collateral. See Note 1. |
| h | The cost of investments (including short positions and derivatives, if any) for federal income tax purposes was $36,433,997. Net unrealized depreciation was $4,388,921, of which $1,577,346 represented gross unrealized appreciation on investments and $5,966,267 represented gross unrealized depreciation on investments. |
| 24 | 2017 iSHARES ANNUAL REPORTTO SHAREHOLDERS |
Table of Contents
Schedule of Investments (Continued)
iSHARES® MSCI GLOBAL ENERGY PRODUCERS ETF
August 31, 2017
Schedule 1 — Affiliates (Note 2)
Investments in issuers considered to be affiliates of the Fund during the year ended August 31, 2017, for purposes of Section 2(a)(3) of the 1940 Act, and/or related parties of the Fund were as follows:
| Affiliated issuer | Shares held at 08/31/16 | Shares purchased | Shares sold | Shares held at 08/31/17 | Value at 08/31/17 | Net realized gain (loss)a | Change in unrealized appreciation (depreciation) | Income | ||||||||||||||||||||||||
BlackRock Cash Funds: Institutional, | 379,615 | 277,099 | b | — | 656,714 | $ | 656,911 | $ | (17 | ) | $ | 94 | $ | — | c | |||||||||||||||||
BlackRock Cash Funds: Treasury, | 25,744 | — | (27 | )b | 25,717 | 25,717 | 8 | — | 227 | |||||||||||||||||||||||
|
|
|
|
|
|
|
| |||||||||||||||||||||||||
| $ | 682,628 | $ | (9 | ) | $ | 94 | $ | 227 | ||||||||||||||||||||||||
|
|
|
|
|
|
|
| |||||||||||||||||||||||||
| a | Includes realized capital gain distributions from an affiliated fund, if any. |
| b | Net of shares purchased and sold. |
| c | Does not include income earned on investment of securities lending cash collateral which is not direct income of the Fund and is reflected as a component of securities lending income in the statement of operations. |
Schedule 2 — Fair Value Measurements
Various inputs are used in determining the fair value of financial instruments. For description of the input levels and information about the Fund’s policy regarding valuation of financial instruments, see Note 1.
The following table summarizes the value of the Fund’s investments according to the fair value hierarchy as of August 31, 2017. The breakdown of the Fund’s investments into major categories is disclosed in the schedule of investments above.
| Level 1 | Level 2 | Level 3 | Total | |||||||||||||
Investments: | ||||||||||||||||
Assets: | ||||||||||||||||
Common stocks | $ | 31,048,934 | $ | — | $ | — | $ | 31,048,934 | ||||||||
Preferred stocks | 313,514 | — | — | 313,514 | ||||||||||||
Money market funds | 682,628 | — | — | 682,628 | ||||||||||||
|
|
|
|
|
|
|
| |||||||||
Total | $ | 32,045,076 | $ | — | $ | — | $ | 32,045,076 | ||||||||
|
|
|
|
|
|
|
| |||||||||
See notes to financial statements.
SCHEDULESOF INVESTMENTS | 25 |
Table of Contents
Schedule of Investments
iSHARES® MSCI GLOBAL GOLD MINERS ETF
August 31, 2017
| Security | Shares | Value | ||||||
COMMON STOCKS — 99.94% |
| |||||||
AUSTRALIA — 11.58% |
| |||||||
Newcrest Mining Ltd. | 1,956,539 | $ | 35,459,278 | |||||
Resolute Mining Ltd. | 2,729,302 | 2,619,342 | ||||||
St. Barbara Ltd.a,b | 2,248,270 | 5,028,666 | ||||||
Westgold Resources Ltd.a | 1,535,806 | 2,192,623 | ||||||
|
| |||||||
| 45,299,909 | ||||||||
CANADA — 53.73% |
| |||||||
Agnico Eagle Mines Ltd. | 352,715 | 18,007,806 | ||||||
Alacer Gold Corp.a | 1,910,430 | 3,337,062 | ||||||
Alamos Gold Inc. Class Ab | 921,679 | 7,645,433 | ||||||
Asanko Gold Inc.a,b | 1,108,879 | 1,362,053 | ||||||
Barrick Gold Corp. | 3,091,096 | 55,448,653 | ||||||
Centerra Gold Inc. | 918,346 | 5,493,595 | ||||||
China Gold International Resources Corp. Ltd.a,b | 1,654,153 | 2,981,763 | ||||||
Eldorado Gold Corp. | 2,831,527 | 5,804,207 | ||||||
Endeavour Mining Corp.a,b | 230,812 | 4,565,613 | ||||||
Goldcorp Inc. | 2,160,051 | 29,564,487 | ||||||
Guyana Goldfields Inc.a,b | 643,591 | 2,566,664 | ||||||
IAMGOLD Corp.a | 1,695,018 | 11,207,736 | ||||||
Kinross Gold Corp.a | 3,860,917 | 17,522,327 | ||||||
Kirkland Lake Gold Ltd.b | 730,921 | 9,485,212 | ||||||
New Gold Inc.a,b | 2,244,218 | 8,359,321 | ||||||
Richmont Mines Inc.a,b | 414,291 | 3,790,164 | ||||||
SEMAFO Inc.a | 1,571,197 | 4,411,257 | ||||||
SSR Mining Inc.a,b | 398,224 | 4,141,847 | ||||||
Tahoe Resources Inc. | 985,833 | 4,686,393 | ||||||
Yamana Gold Inc. | 3,336,405 | 9,819,609 | ||||||
|
| |||||||
| 210,201,202 | ||||||||
PERU — 2.35% |
| |||||||
Cia. de Minas Buenaventura SAA ADR | 686,310 | 9,217,143 | ||||||
|
| |||||||
| 9,217,143 | ||||||||
SOUTH AFRICA — 9.87% |
| |||||||
AngloGold Ashanti Ltd. | 1,235,593 | 12,516,113 | ||||||
Gold Fields Ltd. | 2,798,492 | 12,487,981 | ||||||
Harmony Gold Mining Co. Ltd. | 1,901,992 | 3,781,302 | ||||||
Sibanye Gold Ltd. | 6,153,315 | 9,832,995 | ||||||
|
| |||||||
| 38,618,391 | ||||||||
TURKEY — 1.10% |
| |||||||
Koza Altin Isletmeleri ASa | 464,013 | 4,319,526 | ||||||
|
| |||||||
| 4,319,526 | ||||||||
| Security | Shares | Value | ||||||
UNITED KINGDOM — 6.62% |
| |||||||
Acacia Mining PLC | 236,978 | $ | 618,045 | |||||
Centamin PLC | 3,930,215 | 7,672,383 | ||||||
Randgold Resources Ltd. | 172,775 | 17,609,974 | ||||||
|
| |||||||
| 25,900,402 | ||||||||
UNITED STATES — 14.69% |
| |||||||
McEwen Mining Inc. | 1,285,871 | 3,304,689 | ||||||
Newmont Mining Corp. | 1,412,869 | 54,169,397 | ||||||
|
| |||||||
| 57,474,086 | ||||||||
|
| |||||||
TOTAL COMMON STOCKS |
| 391,030,659 | ||||||
SHORT-TERM INVESTMENTS — 1.32% |
| |||||||
MONEY MARKET FUNDS — 1.32% |
| |||||||
BlackRock Cash Funds: Institutional, |
| |||||||
1.32%c,d,e | 5,122,703 | 5,124,240 | ||||||
BlackRock Cash Funds: Treasury, | ||||||||
0.96%c,d | 27,472 | 27,472 | ||||||
|
| |||||||
| 5,151,712 | ||||||||
|
| |||||||
TOTAL SHORT-TERM INVESTMENTS |
| 5,151,712 | ||||||
|
| |||||||
TOTAL INVESTMENTS |
| |||||||
(Cost: $385,069,880)f |
| 396,182,371 | ||||||
Other Assets, Less Liabilities — (1.26)% |
| (4,935,702 | ) | |||||
|
| |||||||
NET ASSETS — 100.00% | $ | 391,246,669 | ||||||
|
| |||||||
ADR | — American Depositary Receipts | |||
| a | Non-income earning security. |
| b | All or a portion of this security represents a security on loan. See Note 1. |
| c | Affiliated issuer. See Schedule 1. |
| d | The rate quoted is the annualized seven-day yield of the fund at period end. |
| e | All or a portion of this security represents an investment of securities lending collateral. See Note 1. |
| f | The cost of investments (including short positions and derivatives, if any) for federal income tax purposes was $399,621,049. Net unrealized depreciation was $3,438,678, of which $32,778,377 represented gross unrealized appreciation on investments and $36,217,055 represented gross unrealized depreciation on investments. |
| 26 | 2017 iSHARES ANNUAL REPORTTO SHAREHOLDERS |
Table of Contents
Schedule of Investments (Continued)
iSHARES® MSCI GLOBAL GOLD MINERS ETF
August 31, 2017
Schedule 1 — Affiliates (Note 2)
Investments in issuers considered to be affiliates of the Fund during the year ended August 31, 2017, for purposes of Section 2(a)(3) of the 1940 Act, and/or related parties of the Fund were as follows:
| Affiliated issuer | Shares held at 08/31/16 | Shares purchased | Shares sold | Shares held at 08/31/17 | Value at 08/31/17 | Net realized gain (loss)a | Change in unrealized appreciation (depreciation) | Income | ||||||||||||||||||||||||
BlackRock Cash Funds: Institutional, | 2,229,494 | 2,893,209 | b | — | 5,122,703 | $ | 5,124,240 | $ | (3,210 | ) | $ | 837 | $ | — | c | |||||||||||||||||
BlackRock Cash Funds: Treasury, | 352,827 | — | (325,355 | )b | 27,472 | 27,472 | 6 | — | 1,845 | |||||||||||||||||||||||
|
|
|
|
|
|
|
| |||||||||||||||||||||||||
| $ | 5,151,712 | $ | (3,204 | ) | $ | 837 | $ | 1,845 | ||||||||||||||||||||||||
|
|
|
|
|
|
|
| |||||||||||||||||||||||||
| a | Includes realized capital gain distributions from an affiliated fund, if any. |
| b | Net of shares purchased and sold. |
| c | Does not include income earned on investment of securities lending cash collateral which is not direct income of the Fund and is reflected as a component of securities lending income in the statement of operations. |
Schedule 2 — Fair Value Measurements
Various inputs are used in determining the fair value of financial instruments. For description of the input levels and information about the Fund’s policy regarding valuation of financial instruments, see Note 1.
The following table summarizes the value of the Fund’s investments according to the fair value hierarchy as of August 31, 2017. The breakdown of the Fund’s investments into major categories is disclosed in the schedule of investments above.
| Level 1 | Level 2 | Level 3 | Total | |||||||||||||
Investments: | ||||||||||||||||
Assets: | ||||||||||||||||
Common stocks | $ | 391,030,659 | $ | — | $ | — | $ | 391,030,659 | ||||||||
Money market funds | 5,151,712 | — | — | 5,151,712 | ||||||||||||
|
|
|
|
|
|
|
| |||||||||
Total | $ | 396,182,371 | $ | — | $ | — | $ | 396,182,371 | ||||||||
|
|
|
|
|
|
|
| |||||||||
See notes to financial statements.
SCHEDULESOF INVESTMENTS | 27 |
Table of Contents
Schedule of Investments
iSHARES® MSCI GLOBAL METALS & MINING PRODUCERS ETF
August 31, 2017
| Security | Shares | Value | ||||||
COMMON STOCKS — 98.56% |
| |||||||
AUSTRALIA — 17.36% |
| |||||||
A.C.N. 004 410 833 Ltd.a,b,c | 727,228 | $ | 6 | |||||
Alumina Ltd. | 1,096,976 | 1,844,540 | ||||||
BHP Billiton Ltd. | 1,430,734 | 31,070,448 | ||||||
BlueScope Steel Ltd. | 252,008 | 2,172,696 | ||||||
Fortescue Metals Group Ltd. | 684,738 | 3,264,030 | ||||||
Galaxy Resources Ltd.a,b | 175,810 | 264,943 | ||||||
Iluka Resources Ltd. | 191,404 | 1,437,660 | ||||||
Independence Group NL | 230,208 | 615,326 | ||||||
Jacana Minerals Ltd.a,b,c | 6,808 | — | ||||||
Mineral Resources Ltd. | 68,452 | 805,160 | ||||||
Orocobre Ltd.a,b | 90,252 | 276,312 | ||||||
OZ Minerals Ltd. | 134,724 | 866,605 | ||||||
Pilbara Minerals Ltd.a,b | 629,148 | 177,148 | ||||||
Rio Tinto Ltd. | 189,878 | 10,216,818 | ||||||
Sandfire Resources NL | 76,082 | 357,239 | ||||||
Sims Metal Management Ltd. | 72,594 | 857,911 | ||||||
South32 Ltd. | 2,383,830 | 5,520,944 | ||||||
Syrah Resources Ltd.a,b | 117,066 | 278,553 | ||||||
Western Areas Ltd.a,b | 128,620 | 275,440 | ||||||
|
| |||||||
| 60,301,779 | ||||||||
AUSTRIA — 0.74% |
| |||||||
Voestalpine AG | 49,486 | 2,564,569 | ||||||
|
| |||||||
| 2,564,569 | ||||||||
BELGIUM — 0.30% |
| |||||||
Bekaert SA | 15,914 | 757,563 | ||||||
Nyrstar NVa,b | 39,240 | 281,967 | ||||||
|
| |||||||
| 1,039,530 | ||||||||
BRAZIL — 4.59% |
| |||||||
Cia. Siderurgica Nacional SAb | 261,600 | 722,498 | ||||||
Vale SA | 1,365,463 | 15,223,644 | ||||||
|
| |||||||
| 15,946,142 | ||||||||
CANADA — 5.16% |
| |||||||
Altius Minerals Corp.a | 20,056 | 195,641 | ||||||
Dominion Diamond Corp. | 38,150 | 537,980 | ||||||
First Quantum Minerals Ltd. | 308,252 | 3,700,253 | ||||||
HudBay Minerals Inc. | 106,166 | 922,152 | ||||||
Imperial Metals Corp.b | 29,212 | 90,170 | ||||||
Ivanhoe Mines Ltd. Class Aa,b | 282,964 | 1,022,394 | ||||||
Labrador Iron Ore Royalty Corp. | 26,160 | 417,517 | ||||||
Lucara Diamond Corp. | 145,188 | 324,248 | ||||||
Lundin Mining Corp. | 293,428 | 2,209,340 | ||||||
Major Drilling Group International Inc.b | 40,984 | 253,995 | ||||||
| Security | Shares | Value | ||||||
Nevsun Resources Ltd.a | 134,288 | $ | 284,910 | |||||
Stornoway Diamond Corp.b | 242,852 | 147,212 | ||||||
Teck Resources Ltd. Class B | 254,188 | 6,301,227 | ||||||
Turquoise Hill Resources Ltd.b | 454,966 | 1,527,742 | ||||||
|
| |||||||
| 17,934,781 | ||||||||
CHILE — 0.11% |
| |||||||
CAP SA | 33,182 | 389,536 | ||||||
|
| |||||||
| 389,536 | ||||||||
CHINA — 1.02% |
| |||||||
Aluminum Corp. of China Ltd. Class Hb | 1,744,000 | 1,290,210 | ||||||
Chiho Environmental Group Ltd.a,b | 436,000 | 250,688 | ||||||
China Daye Non-Ferrous Metals Mining Ltd.b | 3,924,000 | 70,193 | ||||||
China Metal Recycling Holdings Ltd.b,c | 132,000 | — | ||||||
Inner Mongolia Eerduosi Resourses Co. Ltd. Class B | 91,074 | 101,365 | ||||||
Jiangxi Copper Co. Ltd. Class H | 436,000 | 756,522 | ||||||
MMG Ltd.a,b | 878,000 | 428,542 | ||||||
North Mining Shares Co. Ltd.a,b | 6,540,000 | 115,317 | ||||||
Shougang Concord International Enterprises Co. Ltd.b | 4,360,000 | 161,555 | ||||||
Shougang Fushan Resources Group Ltd. | 1,308,000 | 295,812 | ||||||
Xinjiang Xinxin Mining Industry Co. Ltd. Class Hb | 436,000 | 61,279 | ||||||
|
| |||||||
| 3,531,483 | ||||||||
EGYPT — 0.02% |
| |||||||
Ezz Steelb | 73,188 | 69,582 | ||||||
|
| |||||||
| 69,582 | ||||||||
FINLAND — 0.41% |
| |||||||
Outokumpu OYJ | 137,340 | 1,417,300 | ||||||
|
| |||||||
| 1,417,300 | ||||||||
FRANCE — 0.38% |
| |||||||
APERAM SA | 19,693 | 1,038,015 | ||||||
Erameta,b | 4,360 | 288,260 | ||||||
|
| |||||||
| 1,326,275 | ||||||||
GERMANY — 2.02% |
| |||||||
Aurubis AG | 15,914 | 1,420,335 | ||||||
Salzgitter AGa | 16,786 | 753,372 | ||||||
thyssenkrupp AGa | 161,538 | 4,837,801 | ||||||
|
| |||||||
| 7,011,508 | ||||||||
| 28 | 2017 iSHARES ANNUAL REPORTTO SHAREHOLDERS |
Table of Contents
Schedule of Investments (Continued)
iSHARES® MSCI GLOBAL METALS & MINING PRODUCERS ETF
August 31, 2017
| Security | Shares | Value | ||||||
INDIA — 1.11% |
| |||||||
Tata Steel Ltd. GDRa,d | 390,520 | $ | 3,854,432 | |||||
|
| |||||||
| 3,854,432 | ||||||||
INDONESIA — 0.14% |
| |||||||
Aneka Tambang Persero Tbk PTb | 4,076,638 | 226,106 | ||||||
Krakatau Steel Persero Tbk PTb | 1,678,753 | 69,833 | ||||||
Pelat Timah Nusantara Tbk PTb | 244,400 | 63,014 | ||||||
Timah Persero Tbk PT | 1,684,667 | 120,586 | ||||||
|
| |||||||
| 479,539 | ||||||||
JAPAN — 8.74% |
| |||||||
Asahi Holdings Inc. | 4,900 | 102,488 | ||||||
Daido Steel Co. Ltd. | 98,000 | 582,337 | ||||||
Dowa Holdings Co. Ltd. | 71,000 | 535,435 | ||||||
Hitachi Metals Ltd. | 109,000 | 1,454,852 | ||||||
JFE Holdings Inc. | 243,100 | 4,797,503 | ||||||
Kobe Steel Ltd.b | 152,600 | 1,835,748 | ||||||
Kyoei Steel Ltd. | 21,800 | 333,358 | ||||||
Maruichi Steel Tube Ltd. | 32,300 | 955,265 | ||||||
Mitsubishi Materials Corp. | 45,100 | 1,616,568 | ||||||
Mitsui Mining & Smelting Co. Ltd. | 218,000 | 1,156,751 | ||||||
Nakayama Steel Works Ltd. | 43,600 | 281,661 | ||||||
Neturen Co. Ltd. | 43,600 | 425,066 | ||||||
Nippon Denko Co. Ltd. | 65,400 | 270,371 | ||||||
Nippon Light Metal Holdings Co. Ltd. | 370,600 | 1,090,990 | ||||||
Nippon Steel & Sumitomo Metal Corp. | 348,840 | 8,318,468 | ||||||
Nisshin Steel Co. Ltd. | 43,600 | 566,491 | ||||||
OSAKA Titanium Technologies Co. Ltd.a | 1,800 | 26,135 | ||||||
Sumitomo Metal Mining Co. Ltd. | 218,000 | 3,753,498 | ||||||
Toho Titanium Co. Ltd.a | 21,800 | 161,826 | ||||||
Tokyo Steel Manufacturing Co. Ltd. | 43,600 | 368,813 | ||||||
Topy Industries Ltd. | 4,400 | 148,919 | ||||||
Toyo Kohan Co. Ltd. | 43,600 | 213,128 | ||||||
UACJ Corp. | 43,386 | 117,078 | ||||||
Yamato Kogyo Co. Ltd. | 21,800 | 616,010 | ||||||
Yodogawa Steel Works Ltd. | 21,800 | 609,077 | ||||||
|
| |||||||
| 30,337,836 | ||||||||
MEXICO — 1.77% |
| |||||||
Grupo Mexico SAB de CV Series B | 1,700,400 | 5,623,239 | ||||||
Industrias CH SAB de CV Series Ba,b | 65,400 | 313,849 | ||||||
Minera Frisco SAB de CV Series A1a,b | 327,000 | 226,223 | ||||||
|
| |||||||
| 6,163,311 | ||||||||
| Security | Shares | Value | ||||||
NETHERLANDS — 2.39% |
| |||||||
AMG Advanced Metallurgical Group NV | 12,208 | $ | 438,543 | |||||
ArcelorMittala,b | 294,736 | 7,863,234 | ||||||
|
| |||||||
| 8,301,777 | ||||||||
NORWAY — 1.26% |
| |||||||
Norsk Hydro ASA | 607,130 | 4,370,172 | ||||||
|
| |||||||
| 4,370,172 | ||||||||
PAKISTAN — 0.04% |
| |||||||
International Steels Ltd. | 109,000 | 127,733 | ||||||
|
| |||||||
| 127,733 | ||||||||
PERU — 0.48% |
| |||||||
Southern Copper Corp. | 41,420 | 1,685,794 | ||||||
|
| |||||||
| 1,685,794 | ||||||||
PHILIPPINES — 0.02% |
| |||||||
Nickel Asia Corp. | 619,400 | 87,396 | ||||||
|
| |||||||
| 87,396 | ||||||||
POLAND — 0.88% |
| |||||||
Boryszew SAb | 55,808 | 161,642 | ||||||
Jastrzebska Spolka Weglowa SAb | 23,436 | 682,080 | ||||||
KGHM Polska Miedz SA | 62,348 | 2,200,169 | ||||||
|
| |||||||
| 3,043,891 | ||||||||
RUSSIA — 2.57% |
| |||||||
Alrosa PJSC | 1,177,200 | 1,636,830 | ||||||
Mechel PJSCb | 35,970 | 204,310 | ||||||
MMC Norilsk Nickel PJSC | 27,958 | 4,708,209 | ||||||
Novolipetsk Steel PJSC | 490,500 | 1,161,321 | ||||||
Raspadskaya OAOb | 50,140 | 74,319 | ||||||
Severstal PJSC | 71,940 | 1,128,495 | ||||||
|
| |||||||
| 8,913,484 | ||||||||
SINGAPORE — 0.04% |
| |||||||
Midas Holdings Ltd.a,b | 959,200 | 151,862 | ||||||
|
| |||||||
| 151,862 | ||||||||
SOUTH AFRICA — 0.86% |
| |||||||
African Rainbow Minerals Ltd. | 48,832 | 412,898 | ||||||
Anglo American Platinum Ltd.b | 24,198 | 656,264 | ||||||
ArcelorMittal South Africa Ltd.b | 90,034 | 34,497 | ||||||
Assore Ltd. | 16,132 | 344,621 | ||||||
Impala Platinum Holdings Ltd.b | 284,272 | 879,226 | ||||||
Northam Platinum Ltd.b | 154,562 | 584,951 | ||||||
Royal Bafokeng Platinum Ltd.b | 36,188 | 89,791 | ||||||
|
| |||||||
| 3,002,248 | ||||||||
SCHEDULESOF INVESTMENTS | 29 |
Table of Contents
Schedule of Investments (Continued)
iSHARES® MSCI GLOBAL METALS & MINING PRODUCERS ETF
August 31, 2017
| Security | Shares | Value | ||||||
SOUTH KOREA — 4.31% |
| |||||||
Dongkuk Steel Mill Co. Ltd. | 26,230 | $ | 294,262 | |||||
Hyundai Steel Co. | 35,316 | 1,807,142 | ||||||
Jenax Inc.a,b | 6,758 | 169,909 | ||||||
KISCO Corp. | 2,186 | 81,035 | ||||||
KISWIRE Ltd. | 2,707 | 92,906 | ||||||
Korea Zinc Co. Ltd. | 3,924 | 1,795,658 | ||||||
Poongsan Corp. | 11,336 | 573,033 | ||||||
Poongsan Holdings Corp. | 3,052 | 162,668 | ||||||
POSCO | 31,826 | 9,695,132 | ||||||
Seah Besteel Corp. | 5,668 | 178,193 | ||||||
SeAH Steel Corp. | 1,335 | 109,869 | ||||||
|
| |||||||
| 14,959,807 | ||||||||
SPAIN — 0.34% |
| |||||||
Acerinox SA | 70,964 | 1,010,741 | ||||||
Tubacex SAa,b | 44,472 | 159,676 | ||||||
|
| |||||||
| 1,170,417 | ||||||||
SWEDEN — 1.79% |
| |||||||
Boliden AB | 124,478 | 4,348,795 | ||||||
Granges AB | 37,278 | 413,427 | ||||||
SSAB AB Class Aa,b | 96,605 | 489,863 | ||||||
SSAB AB Class Bb | 233,478 | 958,870 | ||||||
|
| |||||||
| 6,210,955 | ||||||||
SWITZERLAND — 0.06% |
| |||||||
Schmolz + Bickenbach AG Registeredb | 206,228 | 195,283 | ||||||
|
| |||||||
| 195,283 | ||||||||
TAIWAN — 1.85% |
| |||||||
China Metal Products | 218,011 | 228,276 | ||||||
China Steel Corp. | 5,668,612 | 4,752,175 | ||||||
Feng Hsin Steel Co. Ltd. | 218,000 | 379,959 | ||||||
Gloria Material Technology Corp. | 436,000 | 321,449 | ||||||
TA Chen Stainless Pipe | 257,934 | 162,389 | ||||||
Ton Yi Industrial Corp. | 70,000 | 33,169 | ||||||
Tung Ho Steel Enterprise Corp. | 436,000 | 348,176 | ||||||
Yieh Phui Enterprise Co. Ltd. | 460,706 | 187,769 | ||||||
|
| |||||||
| 6,413,362 | ||||||||
THAILAND — 0.02% |
| |||||||
STP & I PCL NVDRa | 268,760 | 55,444 | ||||||
|
| |||||||
| 55,444 | ||||||||
TURKEY — 0.51% |
| |||||||
Borusan Mannesmann Boru Sanayi ve Ticaret ASa | 25,070 | 86,918 | ||||||
| Security | Shares | Value | ||||||
Eregli Demir ve Celik Fabrikalari TAS | 612,580 | $ | 1,458,460 | |||||
Kardemir Karabuk Demir Celik Sanayi ve Ticaret AS Class Db | 320,701 | 221,074 | ||||||
|
| |||||||
| 1,766,452 | ||||||||
UNITED KINGDOM — 26.37% |
| |||||||
Anglo American PLC | 595,140 | 10,755,320 | ||||||
Antofagasta PLC | 178,542 | 2,381,124 | ||||||
BHP Billiton PLC | 941,760 | 17,917,402 | ||||||
Evraz PLC | 155,434 | 671,354 | ||||||
Ferrexpo PLC | 129,710 | 500,244 | ||||||
Glencore PLC | 5,453,924 | 25,264,419 | ||||||
Hill & Smith Holdings PLC | 33,572 | 555,881 | ||||||
KAZ Minerals PLCb | 111,180 | 1,204,109 | ||||||
Lonmin PLCa,b | 115,976 | 127,025 | ||||||
Petra Diamonds Ltd.a,b | 246,558 | 299,117 | ||||||
Rio Tinto PLC | 551,976 | 26,646,936 | ||||||
Vedanta Ltd. ADR | 247,430 | 4,849,628 | ||||||
Vedanta Resources PLC | 37,496 | 411,889 | ||||||
|
| |||||||
| 91,584,448 | ||||||||
UNITED STATES — 10.90% |
| |||||||
AK Steel Holding Corp.b | 138,430 | 775,208 | ||||||
Alcoa Corp. | 74,624 | 3,274,501 | ||||||
Allegheny Technologies Inc. | 47,524 | 989,925 | ||||||
Carpenter Technology Corp. | 20,056 | 812,870 | ||||||
Century Aluminum Co.b | 23,980 | 468,090 | ||||||
Cleveland-Cliffs Inc.b | 169,168 | 1,414,244 | ||||||
Commercial Metals Co. | 50,358 | 951,263 | ||||||
Compass Minerals International Inc. | 16,132 | 1,077,618 | ||||||
Freeport-McMoRan Inc.b | 613,670 | 9,070,042 | ||||||
Haynes International Inc. | 5,014 | 153,178 | ||||||
Kaiser Aluminum Corp. | 8,502 | 818,913 | ||||||
Materion Corp. | 11,118 | 424,708 | ||||||
Nucor Corp. | 140,392 | 7,737,003 | ||||||
Reliance Steel & Aluminum Co. | 31,610 | 2,289,196 | ||||||
Ryerson Holding Corp.b | 6,976 | 59,994 | ||||||
Schnitzer Steel Industries Inc. Class A | 11,336 | 304,938 | ||||||
Steel Dynamics Inc. | 107,038 | 3,687,459 | ||||||
SunCoke Energy Inc.b | 26,160 | 243,811 | ||||||
TimkenSteel Corp.b | 16,132 | 239,237 | ||||||
U.S. Steel Corp. | 76,300 | 2,030,343 | ||||||
Worthington Industries Inc. | 20,928 | 1,045,563 | ||||||
|
| |||||||
| 37,868,104 | ||||||||
TOTAL COMMON STOCKS |
| 342,276,232 | ||||||
| 30 | 2017 iSHARES ANNUAL REPORTTO SHAREHOLDERS |
Table of Contents
Schedule of Investments (Continued)
iSHARES® MSCI GLOBAL METALS & MINING PRODUCERS ETF
August 31, 2017
| Security | Shares | Value | ||||||
PREFERRED STOCKS — 0.99% |
| |||||||
BRAZIL — 0.99% |
| |||||||
Bradespar SA, Preference Shares | 109,000 | $ | 931,182 | |||||
Gerdau SA, Preference Shares | 414,200 | 1,559,939 | ||||||
Metalurgica Gerdau SA, Preference Shares | 283,400 | 509,795 | ||||||
Usinas Siderurgicas de Minas Gerais SA Class A, Preference Shares | 196,200 | 429,633 | ||||||
|
| |||||||
| 3,430,549 | ||||||||
|
| |||||||
TOTAL PREFERRED STOCKS |
| 3,430,549 | ||||||
SHORT-TERM INVESTMENTS — 3.64% |
| |||||||
MONEY MARKET FUNDS — 3.64% |
| |||||||
BlackRock Cash Funds: Institutional, |
| |||||||
1.32%e,f,g | 10,837,677 | 10,840,928 | ||||||
BlackRock Cash Funds: Treasury, |
| |||||||
0.96%e,f | 1,803,747 | 1,803,747 | ||||||
|
| |||||||
| 12,644,675 | ||||||||
|
| |||||||
TOTAL SHORT-TERM INVESTMENTS |
| 12,644,675 | ||||||
|
| |||||||
| Value | ||||||
TOTAL INVESTMENTS | ||||||
(Cost: $315,217,446)h | $ | 358,351,456 | ||||
Other Assets, Less Liabilities — (3.19)% | (11,092,299 | ) | ||||
|
| |||||
NET ASSETS — 100.00% | $ | 347,259,157 | ||||
|
| |||||
ADR | — American Depositary Receipts | |||
GDR | — Global Depositary Receipts | |||
NVDR | — Non-Voting Depositary Receipts | |||
| a | All or a portion of this security represents a security on loan. See Note 1. |
| b | Non-income earning security. |
| c | Security is valued using significant unobservable inputs and is classified as Level 3 in the fair value hierarchy. |
| d | This security may be resold to qualified foreign investors and foreign institutional buyers under Regulation S of the Securities Act of 1933. |
| e | Affiliated issuer. See Schedule 1. |
| f | The rate quoted is the annualized seven-day yield of the fund at period end. |
| g | All or a portion of this security represents an investment of securities lending collateral. See Note 1. |
| h | The cost of investments (including short positions and derivatives, if any) for federal income tax purposes was $323,658,091. Net unrealized appreciation was $34,693,365, of which $48,906,330 represented gross unrealized appreciation on investments and $14,212,965 represented gross unrealized depreciation on investments. |
Schedule 1 — Affiliates (Note 2)
Investments in issuers considered to be affiliates of the Fund during the year ended August 31, 2017, for purposes of Section 2(a)(3) of the 1940 Act, and/or related parties of the Fund were as follows:
| Affiliated issuer | Shares held at 08/31/16 | Shares purchased | Shares sold | Shares held at 08/31/17 | Value at 08/31/17 | Net realized gain (loss)a | Change in unrealized appreciation (depreciation) | Income | ||||||||||||||||||||||||
BlackRock Cash Funds: Institutional, | 3,818,084 | 7,019,593 | b | — | 10,837,677 | $ | 10,840,928 | $ | 1,599 | $ | 1,260 | $ | — | c | ||||||||||||||||||
BlackRock Cash Funds: Treasury, | 377,671 | 1,426,076 | b | — | 1,803,747 | 1,803,747 | 4 | — | 1,941 | |||||||||||||||||||||||
|
|
|
|
|
|
|
| |||||||||||||||||||||||||
| $ | 12,644,675 | $ | 1,603 | $ | 1,260 | $ | 1,941 | |||||||||||||||||||||||||
|
|
|
|
|
|
|
| |||||||||||||||||||||||||
| a | Includes realized capital gain distributions from an affiliated fund, if any. |
| b | Net of shares purchased and sold. |
| c | Does not include income earned on investment of securities lending cash collateral which is not direct income of the Fund and is reflected as a component of securities lending income in the statement of operations. |
SCHEDULESOF INVESTMENTS | 31 |
Table of Contents
Schedule of Investments (Continued)
iSHARES® MSCI GLOBAL METALS & MINING PRODUCERS ETF
August 31, 2017
Schedule 2 — Fair Value Measurements
Various inputs are used in determining the fair value of financial instruments. For description of the input levels and information about the Fund’s policy regarding valuation of financial instruments, see Note 1.
The following table summarizes the value of the Fund’s investments according to the fair value hierarchy as of August 31, 2017. The breakdown of the Fund’s investments into major categories is disclosed in the schedule of investments above.
| Level 1 | Level 2 | Level 3 | Total | |||||||||||||
Investments: | ||||||||||||||||
Assets: | ||||||||||||||||
Common stocks | $ | 342,276,226 | $ | — | $ | 6 | $ | 342,276,232 | ||||||||
Preferred stocks | 3,430,549 | — | — | 3,430,549 | ||||||||||||
Money market funds | 12,644,675 | — | — | 12,644,675 | ||||||||||||
|
|
|
|
|
|
|
| |||||||||
Total | $ | 358,351,450 | $ | — | $ | 6 | $ | 358,351,456 | ||||||||
|
|
|
|
|
|
|
| |||||||||
See notes to financial statements.
| 32 | 2017 iSHARES ANNUAL REPORTTO SHAREHOLDERS |
Table of Contents
Schedule of Investments
iSHARES® MSCI GLOBAL SILVER MINERS ETF
August 31, 2017
| Security | Shares | Value | ||||||
COMMON STOCKS — 99.99% |
| |||||||
CANADA — 57.56% |
| |||||||
Alexco Resource Corp.a,b | 364,871 | $ | 637,342 | |||||
Americas Silver Corp.a | 157,088 | 667,820 | ||||||
Dalradian Resources Inc.a,b | 665,186 | 859,502 | ||||||
Dundee Precious Metals Inc.a | 387,417 | 893,029 | ||||||
Endeavour Silver Corp.a,b | 302,972 | 746,707 | ||||||
Excellon Resources Inc.a,b | 332,056 | 540,294 | ||||||
First Majestic Silver Corp.a,b | 311,167 | 2,189,027 | ||||||
Fortuna Silver Mines Inc.a | 338,672 | 1,628,867 | ||||||
GoGold Resources Inc.a,b | 803,051 | 352,286 | ||||||
Great Panther Silver Ltd.a,b | 489,231 | 675,070 | ||||||
Klondex Mines Ltd.a,b | 379,356 | 1,270,824 | ||||||
Levon Resources Ltd.a | 1,158,278 | 323,348 | ||||||
MAG Silver Corp.a,b | 148,853 | 1,861,627 | ||||||
Mandalay Resources Corp.b | 1,238,845 | 350,780 | ||||||
Minco Silver Corp.a,b | 435,567 | 361,308 | ||||||
Pan American Silver Corp. | 153,841 | 2,856,565 | ||||||
Silvercorp Metals Inc. | 392,081 | 1,219,634 | ||||||
SSR Mining Inc.a,b | 236,665 | 2,461,505 | ||||||
Tahoe Resources Inc. | 491,851 | 2,338,131 | ||||||
Wheaton Precious Metals Corp. | 713,123 | 14,754,465 | ||||||
|
| |||||||
| 36,988,131 | ||||||||
CHINA — 0.91% |
| |||||||
China Silver Group Ltd. | 2,874,000 | 587,546 | ||||||
|
| |||||||
| 587,546 | ||||||||
MEXICO — 9.75% |
| |||||||
Industrias Penoles SAB de CV | 240,292 | 6,262,942 | ||||||
|
| |||||||
| 6,262,942 | ||||||||
PERU — 4.48% |
| |||||||
Cia. de Minas Buenaventura SAA ADR | 214,427 | 2,879,755 | ||||||
|
| |||||||
| 2,879,755 | ||||||||
UNITED KINGDOM — 15.38% |
| |||||||
Fresnillo PLC | 382,297 | 7,960,559 | ||||||
Hochschild Mining PLC | 525,711 | 1,923,153 | ||||||
|
| |||||||
| 9,883,712 | ||||||||
UNITED STATES — 11.91% |
| |||||||
Coeur Mining Inc.a | 309,010 | 2,703,837 | ||||||
Golden Minerals Co.a | 620,190 | 336,763 | ||||||
Hecla Mining Co. | 550,521 | 2,906,751 | ||||||
McEwen Mining Inc. | 507,173 | 1,303,435 | ||||||
Solitario Exploration & Royalty Corp.a | 571,613 | 400,129 | ||||||
|
| |||||||
| 7,650,915 | ||||||||
|
| |||||||
TOTAL COMMON STOCKS |
| 64,253,001 | ||||||
| Security | Shares | Value | ||||||
SHORT-TERM INVESTMENTS — 11.82% |
| |||||||
MONEY MARKET FUNDS — 11.82% |
| |||||||
BlackRock Cash Funds: Institutional, |
| |||||||
1.32%c,d,e | 7,553,574 | $ | 7,555,840 | |||||
BlackRock Cash Funds: Treasury, |
| |||||||
0.96%c,d | 37,449 | 37,449 | ||||||
|
| |||||||
| 7,593,289 | ||||||||
|
| |||||||
TOTAL SHORT-TERM INVESTMENTS |
| 7,593,289 | ||||||
|
| |||||||
TOTAL INVESTMENTS |
| |||||||
(Cost: $70,740,765)f | 71,846,290 | |||||||
Other Assets, Less Liabilities — (11.81)% |
| (7,588,240 | ) | |||||
|
| |||||||
NET ASSETS — 100.00% | $ | 64,258,050 | ||||||
|
| |||||||
ADR | — American Depositary Receipts | |||
| a | Non-income earning security. |
| b | All or a portion of this security represents a security on loan. See Note 1. |
| c | Affiliated issuer. See Schedule 1. |
| d | The rate quoted is the annualized seven-day yield of the fund at period end. |
| e | All or a portion of this security represents an investment of securities lending collateral. See Note 1. |
| f | The cost of investments (including short positions and derivatives, if any) for federal income tax purposes was $74,207,535. Net unrealized depreciation was $2,361,245, of which $7,676,011 represented gross unrealized appreciation on investments and $10,037,256 represented gross unrealized depreciation on investments. |
SCHEDULESOF INVESTMENTS | 33 |
Table of Contents
Schedule of Investments (Continued)
iSHARES® MSCI GLOBAL SILVER MINERS ETF
August 31, 2017
Schedule 1 — Affiliates (Note 2)
Investments in issuers considered to be affiliates of the Fund during the year ended August 31, 2017, for purposes of Section 2(a)(3) of the 1940 Act, and/or related parties of the Fund were as follows:
| Affiliated issuer | Shares held at 08/31/16 | Shares purchased | Shares sold | Shares held at 08/31/17 | Value at 08/31/17 | Net realized gain (loss)a | Change in unrealized appreciation (depreciation) | Income | ||||||||||||||||||||||||
BlackRock Cash Funds: Institutional, |
| |||||||||||||||||||||||||||||||
SL Agency Shares | 7,889,139 | — | (335,565 | )b | 7,553,574 | $ | 7,555,840 | $ | 229 | $ | 1,717 | $ | — | c | ||||||||||||||||||
BlackRock Cash Funds: Treasury, |
| |||||||||||||||||||||||||||||||
SL Agency Shares | 34,480 | 2,969 | b | — | 37,449 | 37,449 | 2 | — | 235 | |||||||||||||||||||||||
|
|
|
|
|
|
|
| |||||||||||||||||||||||||
| $ | 7,593,289 | $ | 231 | $ | 1,717 | $ | 235 | |||||||||||||||||||||||||
|
|
|
|
|
|
|
| |||||||||||||||||||||||||
| a | Includes realized capital gain distributions from an affiliated fund, if any. |
| b | Net of shares purchased and sold. |
| c | Does not include income earned on investment of securities lending cash collateral which is not direct income of the Fund and is reflected as a component of securities lending income in the statement of operations. |
Schedule 2 — Fair Value Measurements
Various inputs are used in determining the fair value of financial instruments. For description of the input levels and information about the Fund’s policy regarding valuation of financial instruments, see Note 1.
The following table summarizes the value of the Fund’s investments according to the fair value hierarchy as of August 31, 2017. The breakdown of the Fund’s investments into major categories is disclosed in the schedule of investments above.
| Level 1 | Level 2 | Level 3 | Total | |||||||||||||
Investments: |
| |||||||||||||||
Assets: |
| |||||||||||||||
Common stocks | $ | 64,253,001 | $ | — | $ | — | $ | 64,253,001 | ||||||||
Money market funds | 7,593,289 | — | — | 7,593,289 | ||||||||||||
|
|
|
|
|
|
|
| |||||||||
Total | $ | 71,846,290 | $ | — | $ | — | $ | 71,846,290 | ||||||||
|
|
|
|
|
|
|
| |||||||||
See notes to financial statements.
| 34 | 2017 iSHARES ANNUAL REPORTTO SHAREHOLDERS |
Table of Contents
Statements of Assets and Liabilities
iSHARES®, INC.
August 31, 2017
iShares MSCI Global Producers ETF | iShares MSCI Global Producers ETF | iShares MSCI Global Gold Miners ETF | ||||||||||
ASSETS | ||||||||||||
Investments in securities, at cost: | ||||||||||||
Unaffiliated | $ | 28,502,429 | $ | 35,290,960 | $ | 379,919,005 | ||||||
Affiliated (Note 2) | 2,590,605 | 682,534 | 5,150,875 | |||||||||
|
|
|
|
|
| |||||||
Total cost of investments in securities | $ | 31,093,034 | $ | 35,973,494 | $ | 385,069,880 | ||||||
|
|
|
|
|
| |||||||
Investments in securities, at fair value (including securities on loana) (Note 1): | ||||||||||||
Unaffiliated | $ | 27,458,830 | $ | 31,362,448 | $ | 391,030,659 | ||||||
Affiliated (Note 2) | 2,723,927 | 682,628 | 5,151,712 | |||||||||
Foreign currency, at valueb | 54,799 | 76,449 | 272,195 | |||||||||
Cash | 57 | — | — | |||||||||
Receivables: | ||||||||||||
Investment securities sold | 112,671 | 118,333 | 5,365,245 | |||||||||
Dividends and interest | 45,989 | 209,208 | 211,808 | |||||||||
Tax reclaims | 46,301 | 1,302 | 2,753 | |||||||||
|
|
|
|
|
| |||||||
Total Assets | 30,442,574 | 32,450,368 | 402,034,372 | |||||||||
|
|
|
|
|
| |||||||
LIABILITIES | ||||||||||||
Payables: | ||||||||||||
Investment securities purchased | 113,232 | 142,829 | 5,053,367 | |||||||||
Collateral for securities on loan (Note 1) | 1,886,139 | 656,834 | 5,126,612 | |||||||||
Capital shares redeemed | — | 71,514 | 484,019 | |||||||||
Investment advisory fees (Note 2) | 8,876 | 11,104 | 123,705 | |||||||||
|
|
|
|
|
| |||||||
Total Liabilities | 2,008,247 | 882,281 | 10,787,703 | |||||||||
|
|
|
|
|
| |||||||
NET ASSETS | $ | 28,434,327 | $ | 31,568,087 | $ | 391,246,669 | ||||||
|
|
|
|
|
| |||||||
Net assets consist of: | ||||||||||||
Paid-in capital | $ | 31,348,472 | $ | 37,209,904 | $ | 422,942,941 | ||||||
Undistributed net investment income | 61,073 | 251,539 | 562,406 | |||||||||
Accumulated net realized loss | (2,065,933 | ) | (1,966,850 | ) | (43,374,099 | ) | ||||||
Net unrealized appreciation (depreciation) | (909,285 | ) | (3,926,506 | ) | 11,115,421 | |||||||
|
|
|
|
|
| |||||||
NET ASSETS | $ | 28,434,327 | $ | 31,568,087 | $ | 391,246,669 | ||||||
|
|
|
|
|
| |||||||
Shares outstandingc | 1,050,000 | 1,700,000 | 19,600,000 | d | ||||||||
|
|
|
|
|
| |||||||
Net asset value per share | $ | 27.08 | $ | 18.57 | $ | 19.96 | d | |||||
|
|
|
|
|
| |||||||
| a | Securities on loan with values of $1,820,358, $630,263 and $5,032,489, respectively. See Note 1. |
| b | Cost of foreign currency: $54,125, $74,696 and $269,962, respectively. |
| c | $0.001 par value, number of shares authorized: 500 million, 500 million and 500 million, respectively. |
| d | Shares outstanding and net asset value per share reflect a one-for-two reverse stock split effective after the close of trading on November 4, 2016. See Note 4. |
See notes to financial statements.
FINANCIAL STATEMENTS | 35 |
Table of Contents
Statements of Assets and Liabilities (Continued)
iSHARES®, INC.
August 31, 2017
iShares Producers ETF | iShares Silver | |||||||
ASSETS | ||||||||
Investments in securities, at cost: | ||||||||
Unaffiliated | $ | 302,574,031 | $ | 63,149,193 | ||||
Affiliated (Note 2) | 12,643,415 | 7,591,572 | ||||||
|
|
|
| |||||
Total cost of investments in securities | $ | 315,217,446 | $ | 70,740,765 | ||||
|
|
|
| |||||
Investments in securities, at fair value (including securities on loana) (Note 1): | ||||||||
Unaffiliated | $ | 345,706,781 | $ | 64,253,001 | ||||
Affiliated (Note 2) | 12,644,675 | 7,593,289 | ||||||
Foreign currency, at valueb | 539,536 | 37,103 | ||||||
Cash | 10,294 | 2,003 | ||||||
Receivables: |
| |||||||
Investment securities sold | 3,531 | 1,507,523 | ||||||
Due from custodian (Note 4) | 511,262 | — | ||||||
Dividends and interest | 1,207,941 | 127,668 | ||||||
Capital shares sold | 1,418,676 | — | ||||||
Tax reclaims | 26,653 | — | ||||||
|
|
|
| |||||
Total Assets | 362,069,349 | 73,520,587 | ||||||
|
|
|
| |||||
LIABILITIES | ||||||||
Payables: | ||||||||
Investment securities purchased | 3,577,028 | 1,688,455 | ||||||
Due to custodian | 292,196 | — | ||||||
Collateral for securities on loan (Note 1) | 10,838,068 | 7,553,893 | ||||||
Foreign taxes (Note 1) | 1,604 | — | ||||||
Investment advisory fees (Note 2) | 101,296 | 20,189 | ||||||
|
|
|
| |||||
Total Liabilities | 14,810,192 | 9,262,537 | ||||||
|
|
|
| |||||
NET ASSETS | $ | 347,259,157 | $ | 64,258,050 | ||||
|
|
|
| |||||
Net assets consist of: | ||||||||
Paid-in capital | $ | 330,475,733 | $ | 74,577,703 | ||||
Undistributed (distributions in excess of) net investment income | 1,573,871 | (670,207 | ) | |||||
Accumulated net realized loss | (27,924,498 | ) | (10,754,583 | ) | ||||
Net unrealized appreciation | 43,134,051 | 1,105,137 | ||||||
|
|
|
| |||||
NET ASSETS | $ | 347,259,157 | $ | 64,258,050 | ||||
|
|
|
| |||||
Shares outstandingc | 10,900,000 | d | 5,600,000 | |||||
|
|
|
| |||||
Net asset value per share | $ | 31.86 | d | $ | 11.47 | |||
|
|
|
| |||||
| a | Securities on loan with values of $10,228,975 and $7,492,653, respectively. See Note 1. |
| b | Cost of foreign currency: $537,465 and $37,119, respectively. |
| c | $0.001 par value, number of shares authorized: 500 million and 500 million, respectively. |
| d | Shares outstanding and net asset value per share reflect a one-for-two reverse stock split effective after the close of trading on November 4, 2016. See Note 4. |
See notes to financial statements.
| 36 | 2017 iSHARES ANNUAL REPORTTO SHAREHOLDERS |
Table of Contents
Statements of Operations
iSHARES®, INC.
Year ended August 31, 2017
iShares Producers ETF | iShares Energy Producers ETF | iShares MSCI Global Gold | ||||||||||
NET INVESTMENT INCOME | ||||||||||||
Dividends — unaffiliateda | $ | 585,543 | $ | 1,150,439 | $ | 1,838,673 | ||||||
Dividends — affiliated (Note 2) | 2,704 | 227 | 1,845 | |||||||||
Securities lending income — affiliated — net (Note 2) | 23,675 | 9,435 | 105,754 | |||||||||
Non-cash dividends — unaffiliated | — | 91,962 | — | |||||||||
|
|
|
|
|
| |||||||
Total investment income | 611,922 | 1,252,063 | 1,946,272 | |||||||||
|
|
|
|
|
| |||||||
EXPENSES | ||||||||||||
Investment advisory fees (Note 2) | 111,939 | 139,680 | 977,649 | |||||||||
Proxy fees | 594 | 741 | 4,649 | |||||||||
|
|
|
|
|
| |||||||
Total expenses | 112,533 | 140,421 | 982,298 | |||||||||
Less investment advisory fees waived (Note 2) | (5,765 | ) | — | — | ||||||||
|
|
|
|
|
| |||||||
Net expenses | 106,768 | 140,421 | 982,298 | |||||||||
|
|
|
|
|
| |||||||
Net investment income | 505,154 | 1,111,642 | 963,974 | |||||||||
|
|
|
|
|
| |||||||
NET REALIZED AND UNREALIZED GAIN (LOSS) | ||||||||||||
Net realized gain (loss) from: |
| |||||||||||
Investments — unaffiliated | (46,979 | ) | (462,330 | ) | (23,467,454 | ) | ||||||
Investments — affiliated (Note 2) | (46 | ) | (17 | ) | (3,210 | ) | ||||||
In-kind redemptions — unaffiliated | 950,331 | 952,416 | 11,088,384 | |||||||||
In-kind redemptions — affiliated (Note 2) | 34,049 | — | — | |||||||||
Foreign currency transactions | (1,739 | ) | (159 | ) | 87,482 | |||||||
Realized gain distributions from affiliated funds | 3 | 8 | 6 | |||||||||
|
|
|
|
|
| |||||||
Net realized gain (loss) | 935,619 | 489,918 | (12,294,792 | ) | ||||||||
|
|
|
|
|
| |||||||
Net change in unrealized appreciation/depreciation on: |
| |||||||||||
Investments — unaffiliated | 2,185,008 | (736,615 | ) | (1,701,366 | ) | |||||||
Investments — affiliated (Note 2) | 89,019 | 94 | 837 | |||||||||
Translation of assets and liabilities in foreign currencies | 4,898 | 2,244 | 12,132 | |||||||||
|
|
|
|
|
| |||||||
Net change in unrealized appreciation/depreciation | 2,278,925 | (734,277 | ) | (1,688,397 | ) | |||||||
|
|
|
|
|
| |||||||
Net realized and unrealized gain (loss) | 3,214,544 | (244,359 | ) | (13,983,189 | ) | |||||||
|
|
|
|
|
| |||||||
NET INCREASE (DECREASE) IN NET ASSETS RESULTING FROM OPERATIONS | $ | 3,719,698 | $ | 867,283 | $ | (13,019,215 | ) | |||||
|
|
|
|
|
| |||||||
| a | Net of foreign withholding tax of $36,269, $51,937 and $174,911, respectively. |
See notes to financial statements.
FINANCIAL STATEMENTS | 37 |
Table of Contents
Statements of Operations (Continued)
iSHARES®, INC.
Year ended August 31, 2017
iShares MSCI Global Producers ETF | iShares Silver | |||||||
NET INVESTMENT INCOME | ||||||||
Dividends — unaffiliateda | $ | 7,158,602 | $ | 561,652 | ||||
Dividends — affiliated (Note 2) | 1,941 | 235 | ||||||
Securities lending income — affiliated — net (Note 2) | 127,386 | 243,355 | ||||||
|
|
|
| |||||
| 7,287,929 | 805,242 | |||||||
Less: Other foreign taxes (Note 1) | (2,023 | ) | — | |||||
|
|
|
| |||||
Total investment income | 7,285,906 | 805,242 | ||||||
|
|
|
| |||||
EXPENSES | ||||||||
Investment advisory fees (Note 2) | 1,053,471 | 266,110 | ||||||
Proxy fees | 6,090 | 1,343 | ||||||
|
|
|
| |||||
Total expenses | 1,059,561 | 267,453 | ||||||
|
|
|
| |||||
Net investment income | 6,226,345 | 537,789 | ||||||
|
|
|
| |||||
NET REALIZED AND UNREALIZED GAIN (LOSS) | ||||||||
Net realized gain (loss) from: |
| |||||||
Investments — unaffiliated | (5,853,686 | ) | (4,364,024 | ) | ||||
Investments — affiliated (Note 2) | 1,599 | 229 | ||||||
In-kind redemptions — unaffiliated | 33,348,293 | 4,947,538 | ||||||
Foreign currency transactions | (28,153 | ) | (99 | ) | ||||
Realized gain distributions from affiliated funds | 4 | 2 | ||||||
|
|
|
| |||||
Net realized gain | 27,468,057 | 583,646 | ||||||
|
|
|
| |||||
Net change in unrealized appreciation/depreciation on: |
| |||||||
Investments — unaffiliated | 62,026,687 | (13,354,877 | ) | |||||
Investments — affiliated (Note 2) | 1,260 | 1,717 | ||||||
Translation of assets and liabilities in foreign currencies | 1,775 | (49 | ) | |||||
|
|
|
| |||||
Net change in unrealized appreciation/depreciation | 62,029,722 | (13,353,209 | ) | |||||
|
|
|
| |||||
Net realized and unrealized gain (loss) | 89,497,779 | (12,769,563 | ) | |||||
|
|
|
| |||||
NET INCREASE (DECREASE) IN NET ASSETS RESULTING FROM OPERATIONS | $ | 95,724,124 | $ | (12,231,774 | ) | |||
|
|
|
| |||||
| a | Net of foreign withholding tax of $355,780 and $54,502, respectively. |
See notes to financial statements.
| 38 | 2017 iSHARES ANNUAL REPORTTO SHAREHOLDERS |
Table of Contents
Statements of Changes in Net Assets
iSHARES®, INC.
| iShares MSCI Global Agriculture Producers ETF | iShares MSCI Global Energy Producers ETF | |||||||||||||||
Year ended August 31, 2017 | Year ended August 31, 2016 | Year ended August 31, 2017 | Year ended August 31, 2016 | |||||||||||||
INCREASE (DECREASE) IN NET ASSETS | ||||||||||||||||
OPERATIONS: | ||||||||||||||||
Net investment income | $ | 505,154 | $ | 611,355 | $ | 1,111,642 | $ | 1,064,512 | ||||||||
Net realized gain (loss) | 935,619 | (965,789 | ) | 489,918 | (1,072,422 | ) | ||||||||||
Net change in unrealized appreciation/depreciation | 2,278,925 | 1,179,886 | (734,277 | ) | 3,444,630 | |||||||||||
|
|
|
|
|
|
|
| |||||||||
Net increase in net assets resulting from operations | 3,719,698 | 825,452 | 867,283 | 3,436,720 | ||||||||||||
|
|
|
|
|
|
|
| |||||||||
DISTRIBUTIONS TO SHAREHOLDERS: | ||||||||||||||||
From net investment income | (561,907 | ) | (596,259 | ) | (1,091,944 | ) | (1,004,806 | ) | ||||||||
|
|
|
|
|
|
|
| |||||||||
Total distributions to shareholders | (561,907 | ) | (596,259 | ) | (1,091,944 | ) | (1,004,806 | ) | ||||||||
|
|
|
|
|
|
|
| |||||||||
CAPITAL SHARE TRANSACTIONS: | ||||||||||||||||
Proceeds from shares sold | 4,945,056 | 1,137,540 | 513 | 10,268,692 | ||||||||||||
Cost of shares redeemed | (7,619,400 | ) | (1,055,827 | ) | (5,647,790 | ) | — | |||||||||
|
|
|
|
|
|
|
| |||||||||
Net increase (decrease) in net assets from capital share transactions | (2,674,344 | ) | 81,713 | (5,647,277 | ) | 10,268,692 | ||||||||||
|
|
|
|
|
|
|
| |||||||||
INCREASE (DECREASE) IN NET ASSETS | 483,447 | 310,906 | (5,871,938 | ) | 12,700,606 | |||||||||||
NET ASSETS | ||||||||||||||||
Beginning of year | 27,950,880 | 27,639,974 | 37,440,025 | 24,739,419 | ||||||||||||
|
|
|
|
|
|
|
| |||||||||
End of year | $ | 28,434,327 | $ | 27,950,880 | $ | 31,568,087 | $ | 37,440,025 | ||||||||
|
|
|
|
|
|
|
| |||||||||
Undistributed net investment income included in net assets at end of year | $ | 61,073 | $ | 115,569 | $ | 251,539 | $ | 226,240 | ||||||||
|
|
|
|
|
|
|
| |||||||||
SHARES ISSUED AND REDEEMED | ||||||||||||||||
Shares sold | 200,000 | 50,000 | — | 600,000 | ||||||||||||
Shares redeemed | (300,000 | ) | (50,000 | ) | (300,000 | ) | — | |||||||||
|
|
|
|
|
|
|
| |||||||||
Net increase (decrease) in shares outstanding | (100,000 | ) | — | (300,000 | ) | 600,000 | ||||||||||
|
|
|
|
|
|
|
| |||||||||
See notes to financial statements.
FINANCIAL STATEMENTS | 39 |
Table of Contents
Statements of Changes in Net Assets (Continued)
iSHARES®, INC.
| iShares MSCI Global Gold Miners ETF | iShares MSCI Global Metals & Mining Producers ETF | |||||||||||||||
Year ended August 31, 2017a | Year ended August 31, 2016a | Year ended August 31, 2017a | Year ended August 31, 2016a | |||||||||||||
INCREASE (DECREASE) IN NET ASSETS | ||||||||||||||||
OPERATIONS: | ||||||||||||||||
Net investment income | $ | 963,974 | $ | 64,262 | $ | 6,226,345 | $ | 2,544,584 | ||||||||
Net realized gain (loss) | (12,294,792 | ) | (7,802,775 | ) | 27,468,057 | (5,727,606 | ) | |||||||||
Net change in unrealized appreciation/depreciation | (1,688,397 | ) | 43,607,604 | 62,029,722 | 18,667,008 | |||||||||||
|
|
|
|
|
|
|
| |||||||||
Net increase (decrease) in net assets resulting from operations | (13,019,215 | ) | 35,869,091 | 95,724,124 | 15,483,986 | |||||||||||
|
|
|
|
|
|
|
| |||||||||
DISTRIBUTIONS TO SHAREHOLDERS: | ||||||||||||||||
From net investment income | (2,501,502 | ) | (300,013 | ) | (5,470,440 | ) | (2,206,034 | ) | ||||||||
|
|
|
|
|
|
|
| |||||||||
Total distributions to shareholders | (2,501,502 | ) | (300,013 | ) | (5,470,440 | ) | (2,206,034 | ) | ||||||||
|
|
|
|
|
|
|
| |||||||||
CAPITAL SHARE TRANSACTIONS: | ||||||||||||||||
Proceeds from shares sold | 302,448,527 | 191,934,458 | 181,847,994 | 159,613,046 | ||||||||||||
Cost of shares redeemed | (161,789,520 | ) | (7,321,308 | ) | (148,024,373 | ) | (18,927,748 | ) | ||||||||
|
|
|
|
|
|
|
| |||||||||
Net increase in net assets from capital share transactions | 140,659,007 | 184,613,150 | 33,823,621 | 140,685,298 | ||||||||||||
|
|
|
|
|
|
|
| |||||||||
INCREASE IN NET ASSETS | 125,138,290 | 220,182,228 | 124,077,305 | 153,963,250 | ||||||||||||
NET ASSETS | ||||||||||||||||
Beginning of year | 266,108,379 | 45,926,151 | 223,181,852 | 69,218,602 | ||||||||||||
|
|
|
|
|
|
|
| |||||||||
End of year | $ | 391,246,669 | $ | 266,108,379 | $ | 347,259,157 | $ | 223,181,852 | ||||||||
|
|
|
|
|
|
|
| |||||||||
Undistributed (distributions in excess of) net investment income included in net assets at end of year | $ | 562,406 | $ | (6,914 | ) | $ | 1,573,871 | $ | 640,757 | |||||||
|
|
|
|
|
|
|
| |||||||||
SHARES ISSUED AND REDEEMED | ||||||||||||||||
Shares sold | 16,300,000 | 8,775,000 | 7,300,000 | 8,050,000 | ||||||||||||
Shares redeemed | (9,250,000 | ) | (350,000 | ) | (6,700,000 | ) | (1,000,000 | ) | ||||||||
|
|
|
|
|
|
|
| |||||||||
Net increase in shares outstanding | 7,050,000 | 8,425,000 | 600,000 | 7,050,000 | ||||||||||||
|
|
|
|
|
|
|
| |||||||||
| a | Share transactions reflect a one-for-two reverse stock split effective after the close of trading on November 4, 2016. See Note 4. |
See notes to financial statements.
| 40 | 2017 iSHARES ANNUAL REPORTTO SHAREHOLDERS |
Table of Contents
Statements of Changes in Net Assets (Continued)
iSHARES®, INC.
| iShares MSCI Global Silver Miners ETF | ||||||||
Year ended August 31, 2017 | Year ended August 31, 2016 | |||||||
INCREASE (DECREASE) IN NET ASSETS | ||||||||
OPERATIONS: | ||||||||
Net investment income | $ | 537,789 | $ | 155,283 | ||||
Net realized gain (loss) | 583,646 | (1,145,451 | ) | |||||
Net change in unrealized appreciation/depreciation | (13,353,209 | ) | 20,735,242 | |||||
|
|
|
| |||||
Net increase (decrease) in net assets resulting from operations | (12,231,774 | ) | 19,745,074 | |||||
|
|
|
| |||||
DISTRIBUTIONS TO SHAREHOLDERS: | ||||||||
From net investment income | (1,593,868 | ) | (80,025 | ) | ||||
|
|
|
| |||||
Total distributions to shareholders | (1,593,868 | ) | (80,025 | ) | ||||
|
|
|
| |||||
CAPITAL SHARE TRANSACTIONS: | ||||||||
Proceeds from shares sold | 3,458,260 | 58,622,345 | ||||||
Cost of shares redeemed | (12,452,605 | ) | (3,488,063 | ) | ||||
|
|
|
| |||||
Net increase (decrease) in net assets from capital share transactions | (8,994,345 | ) | 55,134,282 | |||||
|
|
|
| |||||
INCREASE (DECREASE) IN NET ASSETS | (22,819,987 | ) | 74,799,331 | |||||
NET ASSETS | ||||||||
Beginning of year | 87,078,037 | 12,278,706 | ||||||
|
|
|
| |||||
End of year | $ | 64,258,050 | $ | 87,078,037 | ||||
|
|
|
| |||||
Undistributed (distributions in excess of) net investment income included in net assets at end of year | $ | (670,207 | ) | $ | 38,940 | |||
|
|
|
| |||||
SHARES ISSUED AND REDEEMED | ||||||||
Shares sold | 300,000 | 4,700,000 | ||||||
Shares redeemed | (1,100,000 | ) | (300,000 | ) | ||||
|
|
|
| |||||
Net increase (decrease) in shares outstanding | (800,000 | ) | 4,400,000 | |||||
|
|
|
| |||||
See notes to financial statements.
FINANCIAL STATEMENTS | 41 |
Table of Contents
iSHARES®, INC.
(For a share outstanding throughout each period)
| iShares MSCI Global Agriculture Producers ETF | ||||||||||||||||||||
| Year ended Aug. 31, 2017 | Year ended Aug. 31, 2016 | Year ended Aug. 31, 2015 | Year ended Aug. 31, 2014 | Year ended Aug. 31, 2013 | ||||||||||||||||
Net asset value, beginning of year | $ | 24.31 | $ | 24.03 | $ | 27.29 | $ | 24.63 | $ | 24.91 | ||||||||||
|
|
|
|
|
|
|
|
|
| |||||||||||
Income from investment operations: | ||||||||||||||||||||
Net investment incomea | 0.45 | 0.54 | 0.50 | 0.58 | 0.50 | |||||||||||||||
Net realized and unrealized gain (loss)b | 2.81 | 0.27 | (3.21 | ) | 2.63 | (0.46 | ) | |||||||||||||
|
|
|
|
|
|
|
|
|
| |||||||||||
Total from investment operations | 3.26 | 0.81 | (2.71 | ) | 3.21 | 0.04 | ||||||||||||||
|
|
|
|
|
|
|
|
|
| |||||||||||
Less distributions from: | ||||||||||||||||||||
Net investment income | (0.49 | ) | (0.53 | ) | (0.55 | ) | (0.55 | ) | (0.32 | ) | ||||||||||
|
|
|
|
|
|
|
|
|
| |||||||||||
Total distributions | (0.49 | ) | (0.53 | ) | (0.55 | ) | (0.55 | ) | (0.32 | ) | ||||||||||
|
|
|
|
|
|
|
|
|
| |||||||||||
Net asset value, end of year | $ | 27.08 | $ | 24.31 | $ | 24.03 | $ | 27.29 | $ | 24.63 | ||||||||||
|
|
|
|
|
|
|
|
|
| |||||||||||
Total return | 13.53 | % | 3.55 | % | (10.11 | )% | 13.05 | % | 0.10 | % | ||||||||||
|
|
|
|
|
|
|
|
|
| |||||||||||
Ratios/Supplemental data: | ||||||||||||||||||||
Net assets, end of year (000s) | $ | 28,434 | $ | 27,951 | $ | 27,640 | $ | 46,395 | $ | 35,716 | ||||||||||
Ratio of expenses to average net assets | 0.37 | % | 0.38 | % | 0.38 | % | 0.38 | % | 0.38 | % | ||||||||||
Ratio of expenses to average net assets prior to waived fees | 0.39 | % | 0.39 | % | 0.39 | % | 0.39 | % | 0.39 | % | ||||||||||
Ratio of net investment income to average net assets | 1.76 | % | 2.38 | % | 1.87 | % | 2.17 | % | 1.87 | % | ||||||||||
Portfolio turnover ratec | 16 | % | 7 | % | 10 | % | 14 | % | 6 | % | ||||||||||
| a | Based on average shares outstanding throughout each period. |
| b | The amounts reported for a share outstanding may not accord with the change in aggregate gains and losses in securities for the fiscal period due to the timing of capital share transactions in relation to the fluctuating market values of the Fund’s underlying securities. |
| c | Portfolio turnover rates exclude portfolio securities received or delivered in Creation Units but include portfolio transactions that are executed as a result of the Fund processing capital share transactions in Creation Units partially for cash in U.S. dollars. Excluding such cash transactions, the portfolio turnover rates for the years ended August 31, 2017, August 31, 2016, August 31, 2015, August 31, 2014 and August 31, 2013 were 15%, 7%, 10%, 13% and 6%, respectively. See Note 4. |
See notes to financial statements.
| 42 | 2017 iSHARES ANNUAL REPORTTO SHAREHOLDERS |
Table of Contents
Financial Highlights (Continued)
iSHARES®, INC.
(For a share outstanding throughout each period)
| iShares MSCI Global Energy Producers ETF | ||||||||||||||||||||
| Year ended Aug. 31, 2017 | Year ended Aug. 31, 2016 | Year ended Aug. 31, 2015 | Year ended Aug. 31, 2014 | Year ended Aug. 31, 2013 | ||||||||||||||||
Net asset value, beginning of year | $ | 18.72 | $ | 17.67 | $ | 28.06 | $ | 24.06 | $ | 23.51 | ||||||||||
|
|
|
|
|
|
|
|
|
| |||||||||||
Income from investment operations: | ||||||||||||||||||||
Net investment incomea | 0.60 | 0.59 | 0.68 | 0.68 | 0.63 | |||||||||||||||
Net realized and unrealized gain (loss)b | (0.16 | ) | 1.00 | (10.61 | ) | 3.96 | 0.55 | |||||||||||||
|
|
|
|
|
|
|
|
|
| |||||||||||
Total from investment operations | 0.44 | 1.59 | (9.93 | ) | 4.64 | 1.18 | ||||||||||||||
|
|
|
|
|
|
|
|
|
| |||||||||||
Less distributions from: | ||||||||||||||||||||
Net investment income | (0.59 | ) | (0.54 | ) | (0.46 | ) | (0.64 | ) | (0.63 | ) | ||||||||||
|
|
|
|
|
|
|
|
|
| |||||||||||
Total distributions | (0.59 | ) | (0.54 | ) | (0.46 | ) | (0.64 | ) | (0.63 | ) | ||||||||||
|
|
|
|
|
|
|
|
|
| |||||||||||
Net asset value, end of year | $ | 18.57 | $ | 18.72 | $ | 17.67 | $ | 28.06 | $ | 24.06 | ||||||||||
|
|
|
|
|
|
|
|
|
| |||||||||||
Total return | 2.26 | % | 9.31 | % | (35.63 | )% | 19.44 | % | 5.10 | % | ||||||||||
|
|
|
|
|
|
|
|
|
| |||||||||||
Ratios/Supplemental data: | ||||||||||||||||||||
Net assets, end of year (000s) | $ | 31,568 | $ | 37,440 | $ | 24,739 | $ | 8,419 | $ | 4,811 | ||||||||||
Ratio of expenses to average net assets | 0.39 | % | 0.39 | % | 0.39 | % | 0.39 | % | 0.39 | % | ||||||||||
Ratio of net investment income to average net assets | 3.10 | % | 3.36 | % | 3.23 | % | 2.57 | % | 2.61 | % | ||||||||||
Portfolio turnover ratec | 4 | % | 6 | % | 4 | % | 8 | % | 6 | % | ||||||||||
| a | Based on average shares outstanding throughout each period. |
| b | The amounts reported for a share outstanding may not accord with the change in aggregate gains and losses in securities for the fiscal period due to the timing of capital share transactions in relation to the fluctuating market values of the Fund’s underlying securities. |
| c | Portfolio turnover rates exclude portfolio securities received or delivered in Creation Units but includes portfolio transactions that are executed as a result of the Fund processing capital share transactions in Creation Units partially for cash in U.S. dollars. Excluding such cash transactions, the portfolio turnover rates for the years ended August 31, 2017, August 31, 2016, August 31, 2015, August 31, 2014 and August 31, 2013 were 4%, 6%, 4%, 8% and 6%, respectively. See Note 4. |
See notes to financial statements.
FINANCIAL HIGHLIGHTS | 43 |
Table of Contents
Financial Highlights (Continued)
iSHARES®, INC.
(For a share outstanding throughout each period)
| iShares MSCI Global Gold Miners ETF | ||||||||||||||||||||
| Year ended Aug. 31, 2017a | Year ended Aug. 31, 2016a | Year ended Aug. 31, 2015a | Year ended Aug. 31, 2014a | Year ended Aug. 31, 2013a | ||||||||||||||||
Net asset value, beginning of year | $ | 21.20 | $ | 11.13 | $ | 22.53 | $ | 23.20 | $ | 40.11 | ||||||||||
|
|
|
|
|
|
|
|
|
| |||||||||||
Income from investment operations: | ||||||||||||||||||||
Net investment incomeb | 0.06 | 0.02 | 0.14 | 0.16 | 0.42 | |||||||||||||||
Net realized and unrealized gain (loss)c | (1.04 | ) | 10.11 | (11.42 | ) | (0.67 | ) | (16.95 | ) | |||||||||||
|
|
|
|
|
|
|
|
|
| |||||||||||
Total from investment operations | (0.98 | ) | 10.13 | (11.28 | ) | (0.51 | ) | (16.53 | ) | |||||||||||
|
|
|
|
|
|
|
|
|
| |||||||||||
Less distributions from: | ||||||||||||||||||||
Net investment income | (0.26 | ) | (0.06 | ) | (0.12 | ) | (0.16 | ) | (0.38 | ) | ||||||||||
|
|
|
|
|
|
|
|
|
| |||||||||||
Total distributions | (0.26 | ) | (0.06 | ) | (0.12 | ) | (0.16 | ) | (0.38 | ) | ||||||||||
|
|
|
|
|
|
|
|
|
| |||||||||||
Net asset value, end of year | $ | 19.96 | $ | 21.20 | $ | 11.13 | $ | 22.53 | $ | 23.20 | ||||||||||
|
|
|
|
|
|
|
|
|
| |||||||||||
Total return | (4.30 | )% | 91.17 | % | (50.16 | )% | (2.01 | )% | (41.28 | )% | ||||||||||
|
|
|
|
|
|
|
|
|
| |||||||||||
Ratios/Supplemental data: | ||||||||||||||||||||
Net assets, end of year (000s) | $ | 391,247 | $ | 266,108 | $ | 45,926 | $ | 70,976 | $ | 38,285 | ||||||||||
Ratio of expenses to average net assets | 0.39 | % | 0.39 | % | 0.39 | % | 0.39 | % | 0.39 | % | ||||||||||
Ratio of net investment income to average net assets | 0.38 | % | 0.06 | % | 0.88 | % | 0.81 | % | 1.37 | % | ||||||||||
Portfolio turnover rated | 26 | % | 30 | % | 20 | % | 22 | % | 19 | % | ||||||||||
| a | Per share amounts reflect a one-for-two reverse stock split effective after the close of trading on November 4, 2016. See Note 4. |
| b | Based on average shares outstanding throughout each period. |
| c | The amounts reported for a share outstanding may not accord with the change in aggregate gains and losses in securities for the fiscal period due to the timing of capital share transactions in relation to the fluctuating market values of the Fund’s underlying securities. |
| d | Portfolio turnover rates exclude portfolio securities received or delivered as a result of processing capital share transactions in Creation Units. |
See notes to financial statements.
| 44 | 2017 iSHARES ANNUAL REPORTTO SHAREHOLDERS |
Table of Contents
Financial Highlights (Continued)
iSHARES®, INC.
(For a share outstanding throughout each period)
| iShares MSCI Global Metals & Mining Producers ETF | ||||||||||||||||||||
| Year ended Aug. 31, 2017a | Year ended Aug. 31, 2016a | Year ended Aug. 31, 2015a | Year ended Aug. 31, 2014a | Year ended Aug. 31, 2013a | ||||||||||||||||
Net asset value, beginning of year | $ | 21.67 | $ | 21.30 | $ | 40.37 | $ | 36.23 | $ | 38.01 | ||||||||||
|
|
|
|
|
|
|
|
|
| |||||||||||
Income from investment operations: | ||||||||||||||||||||
Net investment incomeb | 0.53 | 0.42 | 1.62 | 1.00 | 1.00 | |||||||||||||||
Net realized and unrealized gain (loss)c | 10.26 | 0.41 | (17.91 | ) | 4.44 | (2.01 | ) | |||||||||||||
|
|
|
|
|
|
|
|
|
| |||||||||||
Total from investment operations | 10.79 | 0.83 | (16.29 | ) | 5.44 | (1.01 | ) | |||||||||||||
|
|
|
|
|
|
|
|
|
| |||||||||||
Less distributions from: | ||||||||||||||||||||
Net investment income | (0.60 | ) | (0.46 | ) | (2.78 | ) | (1.30 | ) | (0.77 | ) | ||||||||||
|
|
|
|
|
|
|
|
|
| |||||||||||
Total distributions | (0.60 | ) | (0.46 | ) | (2.78 | ) | (1.30 | ) | (0.77 | ) | ||||||||||
|
|
|
|
|
|
|
|
|
| |||||||||||
Net asset value, end of year | $ | 31.86 | $ | 21.67 | $ | 21.30 | $ | 40.37 | $ | 36.23 | ||||||||||
|
|
|
|
|
|
|
|
|
| |||||||||||
Total return | 50.55 | % | 4.52 | % | (41.94 | )% | 15.32 | % | (2.68 | )% | ||||||||||
|
|
|
|
|
|
|
|
|
| |||||||||||
Ratios/Supplemental data: | ||||||||||||||||||||
Net assets, end of year (000s) | $ | 347,259 | $ | 223,182 | $ | 69,219 | $ | 183,699 | $ | 222,808 | ||||||||||
Ratio of expenses to average net assets | 0.39 | % | 0.39 | % | 0.39 | % | 0.39 | % | 0.39 | % | ||||||||||
Ratio of expenses to average net assets prior to waived fees | 0.39 | % | 0.39 | % | 0.39 | % | 0.39 | % | 0.39 | % | ||||||||||
Ratio of net investment income to average net assets | 2.31 | % | 2.16 | % | 5.18 | % | 2.53 | % | 2.51 | % | ||||||||||
Portfolio turnover rated | 12 | % | 8 | % | 17 | % | 18 | % | 11 | % | ||||||||||
| a | Per share amounts reflect a one-for-two reverse stock split effective after the close of trading on November 4, 2016. See Note 4. |
| b | Based on average shares outstanding throughout each period. |
| c | The amounts reported for a share outstanding may not accord with the change in aggregate gains and losses in securities for the fiscal period due to the timing of capital share transactions in relation to the fluctuating market values of the Fund’s underlying securities. |
| d | Portfolio turnover rates exclude portfolio securities received or delivered in Creation Units but include portfolio transactions that are executed as a result of the Fund processing capital share transactions in Creation Units partially for cash in U.S. dollars. Excluding such cash transactions, the portfolio turnover rates for the years ended August 31, 2017, August 31, 2016, August 31, 2015, August 31, 2014 and August 31, 2013 were 6%, 6%, 10%, 15%, and 7% respectively. See Note 4. |
See notes to financial statements.
FINANCIAL HIGHLIGHTS | 45 |
Table of Contents
Financial Highlights (Continued)
iSHARES®, INC.
(For a share outstanding throughout each period)
| iShares MSCI Global Silver Miners ETF | ||||||||||||||||||||
| Year ended Aug. 31, 2017 | Year ended Aug. 31, 2016 | Year ended Aug. 31, 2015 | Year ended Aug. 31, 2014 | Year ended Aug. 31, 2013 | ||||||||||||||||
Net asset value, beginning of year | $ | 13.61 | $ | 6.14 | $ | 12.70 | $ | 13.92 | $ | 20.94 | ||||||||||
|
|
|
|
|
|
|
|
|
| |||||||||||
Income from investment operations: | ||||||||||||||||||||
Net investment incomea | 0.09 | 0.05 | 0.05 | 0.08 | 0.16 | |||||||||||||||
Net realized and unrealized gain (loss)b | (1.94 | ) | 7.44 | (6.42 | ) | (1.15 | ) | (6.90 | ) | |||||||||||
|
|
|
|
|
|
|
|
|
| |||||||||||
Total from investment operations | (1.85 | ) | 7.49 | (6.37 | ) | (1.07 | ) | (6.74 | ) | |||||||||||
|
|
|
|
|
|
|
|
|
| |||||||||||
Less distributions from: | ||||||||||||||||||||
Net investment income | (0.29 | ) | (0.02 | ) | (0.19 | ) | (0.15 | ) | (0.28 | ) | ||||||||||
|
|
|
|
|
|
|
|
|
| |||||||||||
Total distributions | (0.29 | ) | (0.02 | ) | (0.19 | ) | (0.15 | ) | (0.28 | ) | ||||||||||
|
|
|
|
|
|
|
|
|
| |||||||||||
Net asset value, end of year | $ | 11.47 | $ | 13.61 | $ | 6.14 | $ | 12.70 | $ | 13.92 | ||||||||||
|
|
|
|
|
|
|
|
|
| |||||||||||
Total return | (13.26 | )% | 122.11 | % | (50.51 | )% | (7.48 | )% | (32.49 | )% | ||||||||||
|
|
|
|
|
|
|
|
|
| |||||||||||
Ratios/Supplemental data: | ||||||||||||||||||||
Net assets, end of year (000s) | $ | 64,258 | $ | 87,078 | $ | 12,279 | $ | 13,975 | $ | 6,959 | ||||||||||
Ratio of expenses to average net assets | 0.39 | % | 0.39 | % | 0.39 | % | 0.39 | % | 0.39 | % | ||||||||||
Ratio of net investment income to average net assets | 0.79 | % | 0.47 | % | 0.57 | % | 0.63 | % | 1.03 | % | ||||||||||
Portfolio turnover ratec | 14 | % | 27 | % | 31 | % | 22 | % | 13 | % | ||||||||||
| a | Based on average shares outstanding throughout each period. |
| b | The amounts reported for a share outstanding may not accord with the change in aggregate gains and losses in securities for the fiscal period due to the timing of capital share transactions in relation to the fluctuating market values of the Fund’s underlying securities. |
| c | Portfolio turnover rates exclude portfolio securities received or delivered as a result of processing capital share transactions in Creation Units. |
See notes to financial statements.
| 46 | 2017 iSHARES ANNUAL REPORTTO SHAREHOLDERS |
Table of Contents
iSHARES®, INC.
iShares, Inc. (the “Company”) is registered under the Investment Company Act of 1940, as amended (the “1940 Act”), as an open-end management investment company. The Company was incorporated under the laws of the State of Maryland on September 1, 1994 pursuant to Articles of Incorporation as subsequently amended and restated.
These financial statements relate only to the following funds (each, a “Fund,” and collectively, the “Funds”):
| iShares ETF | Diversification Classification | |
MSCI Global Agriculture Producers | Non-diversified | |
MSCI Global Energy Producers | Non-diversified | |
MSCI Global Gold Miners | Non-diversified | |
MSCI Global Metals & Mining Producers | Non-diversified | |
MSCI Global Silver Miners | Non-diversified |
The investment objective of each Fund is to seek investment results that correspond generally to the price and yield performance, before fees and expenses, of its underlying index. The investment adviser uses a “passive” or index approach to try to achieve each Fund’s investment objective.
Pursuant to the Company’s organizational documents, the Funds’ officers and directors are indemnified against certain liabilities that may arise out of the performance of their duties to the Funds. Additionally, in the normal course of business, the Funds enter into contracts with service providers that contain general indemnification clauses. The Funds’ maximum exposure under these arrangements is unknown as this would involve future claims that may be made against the Funds that have not yet occurred.
| 1. | SIGNIFICANT ACCOUNTING POLICIES |
The following significant accounting policies are consistently followed by each Fund in the preparation of its financial statements in conformity with accounting principles generally accepted in the United States of America (“U.S. GAAP”). The preparation of financial statements in conformity with U.S. GAAP requires management to make certain estimates and assumptions that affect the reported amounts of assets and liabilities and disclosures of contingent assets and liabilities at the date of the financial statements and the reported amounts of revenue and expenses during the reporting period. Actual results could differ from those estimates. Each Fund is considered an investment company under U.S. GAAP and follows the accounting and reporting guidance applicable to investment companies.
SECURITY VALUATION
Each Fund’s investments are valued at fair value each day that the Fund’s listing exchange is open and, for financial reporting purposes, as of the report date should the reporting period end on a day that the Fund’s listing exchange is not open. U.S. GAAP defines fair value as the price a fund would receive to sell an asset or pay to transfer a liability in an orderly transaction between market participants at the measurement date. The BlackRock Global Valuation Methodologies Committee (the “Global Valuation Committee”) provides oversight of the valuation of investments for the Funds. The investments of each Fund are valued pursuant to policies and procedures developed by the Global Valuation Committee and approved by the Board of Directors of the Company (the “Board”).
| • | Equity investments traded on a recognized securities exchange are valued at that day’s last reported trade price or the official closing price, as applicable, on the exchange where the stock is primarily traded. Equity investments traded on a recognized exchange for which there were no sales on that day are valued at the last traded price. |
NOTESTO FINANCIAL STATEMENTS | 47 |
Table of Contents
Notes to Financial Statements (Continued)
iSHARES®, INC.
| • | Exchange-traded funds and closed-end funds traded on a recognized securities exchange are valued at that day’s last reported trade price or the official closing price, as applicable, on the exchange where the fund is primarily traded. Funds traded on a recognized exchange for which there were no sales on that day are valued at the last traded price. |
| • | Open-end U.S. mutual funds (including money market funds) are valued at that day’s published net asset value (“NAV”). |
In the event that application of these methods of valuation results in a price for an investment which is deemed not to be representative of the fair value of such investment or if a price is not available, the investment will be valued by the Global Valuation Committee, in accordance with policies approved by the Board. The fair valuation approaches that may be utilized by the Global Valuation Committee to determine fair value include market approach, income approach and the cost approach. The valuation techniques used under these approaches take into consideration inputs that include but are not limited to (i) attributes specific to the investment; (ii) the principal market for the investment; (iii) the customary participants in the principal market for the investment; (iv) data assumptions by market participants for the investment, if reasonably available; (v) quoted prices for similar investments in active markets; and (vi) other inputs, such as future cash flows, interest rates, yield curves, volatilities, prepayment speeds, loss severities, credit risks and/or default rates. Valuations based on such inputs are reported to the Board on a quarterly basis.
The Global Valuation Committee employs various methods for calibrating valuation approaches for investments where an active market does not exist, including regular due diligence of the Company’s pricing vendors, a regular review of key inputs and assumptions, transactional back-testing or disposition analysis to compare unrealized gains and losses to realized gains and losses, reviews of missing or stale prices, reviews of large movements in market values, and reviews of market related activity.
Fair value pricing could result in a difference between the prices used to calculate a Fund’s NAV and the prices used by the Fund’s underlying index, which in turn could result in a difference between the Fund’s performance and the performance of the Fund’s underlying index.
Various inputs are used in determining the fair value of financial instruments. Inputs may be based on independent market data (“observable inputs”) or they may be internally developed (“unobservable inputs”). These inputs to valuation techniques are categorized into a fair value hierarchy consisting of three broad levels for financial reporting purposes as follows:
| • | Level 1 — Unadjusted quoted prices in active markets for identical assets or liabilities; |
| • | Level 2 — Inputs other than quoted prices included within Level 1 that are observable for the asset or liability either directly or indirectly, including quoted prices for similar assets or liabilities in active markets, quoted prices for identical or similar assets or liabilities in markets that are not considered to be active, inputs other than quoted prices that are observable for the asset or liability (such as exchange rates, financing terms, interest rates, yield curves, volatilities, prepayment speeds, loss severities, credit risks and default rates) or other market-corroborated inputs; and |
| • | Level 3 — Unobservable inputs for the asset or liability based on the best information available in the circumstances, to the extent observable inputs are not available, including the Global Valuation Committee’s assumptions used in determining the fair value of investments. |
The hierarchy gives the highest priority to unadjusted quoted prices in active markets for identical assets or liabilities (Level 1 measurements) and the lowest priority to unobservable inputs (Level 3 measurements). Accordingly, the degree of judgement exercised in determining fair value is greatest for instruments categorized in Level 3. The inputs used to measure fair value may fall into different levels of the fair value hierarchy. In such cases, for disclosure purposes, the fair value hierarchy classification is determined based on the lowest level input that is significant to the fair value measurement in its entirety. The fair value hierarchy for each Fund’s investments is included in its schedule of investments.
| 48 | 2017 iSHARES ANNUAL REPORTTO SHAREHOLDERS |
Table of Contents
Notes to Financial Statements (Continued)
iSHARES®, INC.
Changes in valuation techniques may result in transfers in or out of an assigned level within the fair value hierarchy. In accordance with the Company’s policy, transfers between different levels of the fair value hierarchy are deemed to have occurred as of the beginning of the reporting period. The categorization of values determined for financial instruments are based on the pricing transparency of the financial instruments and are not necessarily an indication of the risks associated with investing in those securities.
SECURITY TRANSACTIONS AND INCOME RECOGNITION
Security transactions are accounted for on trade date. Realized gains and losses on investment transactions are determined using the specific identification method. Dividend income and capital gain distributions, if any, are recognized on the ex-dividend date, net of any foreign taxes withheld at source. Any taxes withheld that are reclaimable from foreign tax authorities as of August 31, 2017 are reflected in tax reclaims receivable. Upon notification from issuers, some of the dividend income received from a real estate investment trust may be re-designated as a reduction of cost of the related investment and/or realized gain. Non-cash dividends received, if any, are recognized on the ex-dividend date and recorded as non-cash dividend income at fair value. Distributions received by the Funds may include a return of capital that is estimated by management. Such amounts are recorded as a reduction of the cost of investments or reclassified to capital gains. Interest income is accrued daily.
FOREIGN CURRENCY TRANSLATION
The accounting records of the Funds are maintained in U.S. dollars. Foreign currencies, as well as investment securities and other assets and liabilities denominated in foreign currencies, are translated into U.S. dollars using exchange rates deemed appropriate by the investment adviser. Purchases and sales of securities, income receipts and expense payments are translated into U.S. dollars on the respective dates of such transactions.
Each Fund does not isolate the effect of fluctuations in foreign exchange rates from the effect of fluctuations in the market prices of securities. Such fluctuations are reflected by the Funds as a component of realized and unrealized gains and losses from investments for financial reporting purposes. Each Fund reports realized currency gains (losses) on foreign currency related transactions as components of net realized gain (loss) for financial reporting purposes, whereas such components are generally treated as ordinary income for U.S. federal income tax purposes.
FOREIGN TAXES
The Funds may be subject to foreign taxes (a portion of which may be reclaimable) on income, stock dividends, capital gains on investments, or certain foreign currency transactions. All foreign taxes are recorded in accordance with the applicable foreign tax regulations and rates that exist in the foreign jurisdictions in which the Funds invest. These foreign taxes, if any, are paid by the Funds and are reflected in their statements of operations as follows: foreign taxes withheld at source are presented as a reduction of income, foreign taxes on securities lending income are presented as a reduction of securities lending income, foreign taxes on stock dividends are presented as “other foreign taxes”, and foreign taxes on capital gains from sales of investments and foreign taxes on foreign currency transactions are included in their respective net realized gain (loss) categories. Foreign taxes payable or deferred as of August 31, 2017, if any, are disclosed in the Funds’ statements of assets and liabilities.
DISTRIBUTIONS TO SHAREHOLDERS
Dividends and distributions paid by each Fund are recorded on the ex-dividend dates. Distributions are determined on a tax basis and may differ from net investment income and net realized capital gains for financial reporting purposes. Dividends and distributions are paid in U.S. dollars and cannot be automatically reinvested in additional shares of the Funds.
NOTESTO FINANCIAL STATEMENTS | 49 |
Table of Contents
Notes to Financial Statements (Continued)
iSHARES®, INC.
LOANS OF PORTFOLIO SECURITIES
Each Fund may lend its investment securities to approved borrowers, such as brokers, dealers and other financial institutions. The borrower pledges and maintains with the Fund collateral consisting of cash, an irrevocable letter of credit issued by an approved bank, or securities issued or guaranteed by the U.S. government. The initial collateral received by each Fund is required to have a value of at least 102% of the current value of the loaned securities for securities traded on U.S. exchanges and a value of at least 105% for all other securities. The collateral is maintained thereafter at a value equal to at least 100% of the current value of the securities on loan. The market value of the loaned securities is determined at the close of each business day of the Funds. Any additional required collateral is delivered to the Funds and any excess collateral is returned by the Funds on the next business day. During the term of the loan, each Fund is entitled to all distributions made on or in respect of the loaned securities but does not receive interest income on securities received as collateral. Loans of securities are terminable at any time and the borrower, after notice, is required to return borrowed securities within the standard time period for settlement of securities transactions.
Cash received as collateral for securities on loan may be reinvested in certain short-term instruments either directly on behalf of a fund or through one or more joint accounts or money market funds, including those managed by BlackRock Fund Advisors (“BFA”), the Funds’ investment adviser, or its affiliates. As of August 31, 2017, any securities on loan were collateralized by cash and/or U.S. government obligations. Cash collateral received was invested in money market funds managed by BFA and is disclosed in the schedules of investments. Any non-cash collateral received cannot be sold, re-invested or pledged by the Fund, except in the event of borrower default. The securities on loan for each Fund are also disclosed in its schedule of investments. The total value of any securities on loan as of August 31, 2017 and the total value of the related cash collateral are disclosed in the statements of assets and liabilities. Income earned by the Funds from securities lending is disclosed in the statements of operations.
The risks of securities lending include the risk that the borrower may not provide additional collateral when required or may not return the securities when due. To mitigate these risks, the Funds benefit from a borrower default indemnity provided by BlackRock, Inc. (“BlackRock”). BlackRock’s indemnity allows for full replacement of securities loaned if the collateral received does not cover the value of the securities loaned in the event of borrower default. Each Fund could incur a loss if the value of an investment purchased with cash collateral falls below the value of the loaned securities or if the value of an investment purchased with cash collateral falls below the value of the original cash collateral received.
Securities lending transactions are entered into by the Funds under Master Securities Lending Agreements (“MSLA”) which provide the right, in the event of default (including bankruptcy or insolvency) for the non-defaulting party to liquidate the collateral and calculate a net exposure to the defaulting party or request additional collateral. In the event that a borrower defaults, a Fund, as lender, would offset the market value of the collateral received against the market value of the securities loaned. The value of the collateral is typically greater than that of the market value of the securities loaned, leaving the lender with a net amount payable to the defaulting party. However, bankruptcy or insolvency laws of a particular jurisdiction may impose restrictions on or prohibitions against such a right of offset in the event of an MSLA counterparty’s bankruptcy or insolvency. Under the MSLA, the borrower can resell or re-pledge the loaned securities, and a Fund can reinvest cash collateral, or, upon an event of default, resell or re-pledge the collateral.
| 50 | 2017 iSHARES ANNUAL REPORTTO SHAREHOLDERS |
Table of Contents
Notes to Financial Statements (Continued)
iSHARES®, INC.
The following table is a summary of securities lending agreements which are subject to offset under an MSLA as of August 31, 2017:
| iShares ETF and Counterparty | Market Value of Securities on Loan | Cash Collateral Received a | Net Amount b | |||||||||
MSCI Global Agriculture Producers | ||||||||||||
Barclays Capital Inc. | $ | 1,021 | $ | 1,021 | $ | — | ||||||
Credit Suisse Securities (USA) LLC | 11,012 | 11,012 | — | |||||||||
Deutsche Bank AG | 85,952 | 85,952 | — | |||||||||
Deutsche Bank Securities Inc. | 53,982 | 53,982 | — | |||||||||
Goldman Sachs & Co. | 32,719 | 32,719 | — | |||||||||
JPMorgan Securities LLC | 843,902 | 843,902 | — | |||||||||
Macquarie Bank Limited | 17,046 | 17,046 | — | |||||||||
Merrill Lynch, Pierce, Fenner & Smith | 63,283 | 63,283 | — | |||||||||
Morgan Stanley & Co. International PLC | 12,758 | 12,758 | — | |||||||||
Morgan Stanley & Co. LLC | 542,661 | �� | 542,661 | — | ||||||||
Morgan Stanley & Co. LLC (U.S. Equity Securities Lending) | 109 | 109 | — | |||||||||
Scotia Capital (USA) Inc. | 34,989 | 34,989 | — | |||||||||
SG Americas Securities LLC | 24,658 | 24,658 | — | |||||||||
State Street Bank & Trust Company | 65,065 | 65,065 | — | |||||||||
UBS Securities LLC | 31,201 | 31,201 | — | |||||||||
|
|
|
|
|
| |||||||
| $ | 1,820,358 | $ | 1,820,358 | $ | — | |||||||
|
|
|
|
|
| |||||||
MSCI Global Energy Producers | ||||||||||||
Barclays Capital Inc. | $ | 412 | $ | 400 | $ | (12 | ) | |||||
BNP Paribas New York Branch | 5,387 | 5,387 | — | |||||||||
BNP Paribas Prime Brokerage Inc. | 50,744 | 50,744 | — | |||||||||
Citigroup Global Markets Inc. | 20,156 | 20,156 | — | |||||||||
Credit Suisse Securities (USA) LLC | 55,183 | 55,183 | — | |||||||||
Deutsche Bank Securities Inc. | 72,453 | 72,453 | — | |||||||||
Goldman Sachs & Co. | 134,972 | 134,972 | — | |||||||||
JPMorgan Securities LLC | 106,848 | 106,848 | — | |||||||||
Merrill Lynch, Pierce, Fenner & Smith | 37,095 | 37,095 | — | |||||||||
Morgan Stanley & Co. LLC | 15,699 | 15,682 | (17 | ) | ||||||||
Morgan Stanley & Co. LLC (U.S. Equity Securities Lending) | 7,451 | 7,439 | (12 | ) | ||||||||
Scotia Capital (USA) Inc. | 23,936 | 23,936 | — | |||||||||
State Street Bank & Trust Company | 99,927 | 99,927 | — | |||||||||
|
|
|
|
|
| |||||||
| $ | 630,263 | $ | 630,222 | $ | (41 | ) | ||||||
|
|
|
|
|
| |||||||
NOTESTO FINANCIAL STATEMENTS | 51 |
Table of Contents
Notes to Financial Statements (Continued)
iSHARES®, INC.
| iShares ETF and Counterparty | Market Value of Securities on Loan | Cash Collateral Received a | Net Amount b | |||||||||
MSCI Global Gold Miners | ||||||||||||
Credit Suisse Securities (USA) LLC | $ | 1,175,855 | $ | 1,175,855 | $ | — | ||||||
Goldman Sachs & Co. | 5,489 | 5,489 | — | |||||||||
JPMorgan Securities LLC | 89,013 | 89,013 | — | |||||||||
Merrill Lynch, Pierce, Fenner & Smith | 1,290,125 | 1,290,125 | — | |||||||||
Morgan Stanley & Co. LLC | 6,053 | 6,053 | — | |||||||||
Scotia Capital (USA) Inc. | 95,656 | 95,656 | — | |||||||||
State Street Bank & Trust Company | 2,350,517 | 2,350,517 | — | |||||||||
UBS AG | 19,781 | 19,781 | — | |||||||||
|
|
|
|
|
| |||||||
| $ | 5,032,489 | $ | 5,032,489 | $ | — | |||||||
|
|
|
|
|
| |||||||
MSCI Global Metals & Mining Producers | ||||||||||||
BMO Capital Markets | $ | 9,870 | $ | 9,870 | $ | — | ||||||
Credit Suisse Securities (USA) LLC | 516,766 | 516,766 | — | |||||||||
Deutsche Bank Securities Inc. | 67,557 | 67,557 | — | |||||||||
HSBC Bank PLC | 467,400 | 467,400 | — | |||||||||
JPMorgan Securities LLC | 737,531 | 737,531 | — | |||||||||
Merrill Lynch, Pierce, Fenner & Smith | 542,020 | 542,020 | — | |||||||||
Morgan Stanley & Co. LLC | 1,876,099 | 1,876,099 | — | |||||||||
SG Americas Securities LLC | 84,017 | 84,017 | — | |||||||||
State Street Bank & Trust Company | 5,768,976 | 5,768,976 | — | |||||||||
UBS AG | 138,100 | 138,100 | — | |||||||||
UBS Securities LLC | 20,639 | 20,639 | — | |||||||||
|
|
|
|
|
| |||||||
| $ | 10,228,975 | $ | 10,228,975 | $ | — | |||||||
|
|
|
|
|
| |||||||
MSCI Global Silver Miners | ||||||||||||
Barclays Capital Inc. | $ | 977,699 | $ | 977,699 | $ | — | ||||||
BMO Capital Markets | 342,365 | 342,365 | — | |||||||||
Credit Suisse Securities (USA) LLC | 1,644,592 | 1,644,592 | — | |||||||||
JPMorgan Securities LLC | 926,135 | 926,135 | — | |||||||||
Merrill Lynch, Pierce, Fenner & Smith | 809,795 | 809,795 | — | |||||||||
Morgan Stanley & Co. LLC | 1,913,753 | 1,895,960 | (17,793 | ) | ||||||||
Scotia Capital (USA) Inc. | 57,816 | 57,816 | — | |||||||||
State Street Bank & Trust Company | 253,648 | 253,648 | — | |||||||||
UBS AG | 566,850 | 564,058 | (2,792 | ) | ||||||||
|
|
|
|
|
| |||||||
| $ | 7,492,653 | $ | 7,472,068 | $ | (20,585 | ) | ||||||
|
|
|
|
|
| |||||||
| a | Collateral received in excess of the market value of securities on loan is not presented in this table. The total cash collateral received by each Fund is disclosed in the Fund’s statement of assets and liabilities. |
| b | Additional collateral is delivered to the Funds on the next business day in accordance with the MSLA. The net amount would be subject to the borrower default indemnity in the event of default by a counterparty. |
| 52 | 2017 iSHARES ANNUAL REPORTTO SHAREHOLDERS |
Table of Contents
Notes to Financial Statements (Continued)
iSHARES®, INC.
| 2. | INVESTMENT ADVISORY AGREEMENT AND OTHER TRANSACTIONS WITH AFFILIATES |
Pursuant to an Investment Advisory Agreement with the Company, BFA manages the investment of each Fund’s assets. BFA is a California corporation indirectly owned by BlackRock. Under the Investment Advisory Agreement, BFA is responsible for substantially all expenses of the Funds, except (i) interest and taxes; (ii) brokerage commissions and other expenses connected with the execution of portfolio transactions; (iii) distribution fees; (iv) the advisory fee payable to BFA; and (v) litigation expenses and any extraordinary expenses (in each case as determined by a majority of the independent directors).
For its investment advisory services to each Fund, BFA is entitled to an annual investment advisory fee of 0.39%, accrued daily and paid monthly by the Funds, based on the average daily net assets of each Fund.
In addition, each of the iShares MSCI Global Agriculture Producers and iShares MSCI Global Metals & Mining Producers ETFs may incur its pro rata share of fees and expenses attributable to its investments in other investment companies (“acquired fund fees and expenses”). BFA has contractually agreed to waive a portion of its investment advisory fees for each Fund through December 31, 2023 in an amount equal to the acquired fund fees and expenses, if any, attributable to each Fund’s investments in other iShares funds.
The U.S. Securities and Exchange Commission has issued an exemptive order which permits BlackRock Institutional Trust Company, N.A. (“BTC”), an affiliate of BFA, to serve as securities lending agent for the Funds, subject to applicable conditions. As securities lending agent, BTC bears all operational costs directly related to securities lending. Each Fund is responsible for fees in connection with the investment of cash collateral received for securities on loan in a money market fund managed by BFA, however, BTC has agreed to reduce the amount of securities lending income it receives in order to effectively limit the collateral investment fees each Fund bears to an annual rate of 0.04% (the “collateral investment fees”). Securities lending income is equal to the total of income earned from the reinvestment of cash collateral, net of fees and other payments to and from borrowers of securities, and less the collateral investment fees. The Funds retain a portion of securities lending income and remit the remaining portion to BTC as compensation for its services as securities lending agent.
Pursuant to a securities lending agreement, each Fund retains 80% of securities lending income and the amount retained can never be less than 70% of the total of securities lending income plus the collateral investment fees. In addition, commencing the business day following the date that the aggregate securities lending income plus the collateral investment fees generated across all 1940 Act iShares exchange-traded funds (the “iShares ETF Complex”) in a given calendar year exceeds the aggregate securities lending income generated across the iShares ETF Complex in the calendar year 2013, each Fund, pursuant to a securities lending agreement, will retain for the remainder of that calendar year 85% of securities lending income and the amount retained can never be less than 70% of the total of securities lending income plus the collateral investment fees.
For the year ended August 31, 2017, the total of securities lending agent services and collateral investment fees paid were as follows:
| iShares ETF | Fees Paid to BTC | |||
MSCI Global Agriculture Producers | $ | 5,690 | ||
MSCI Global Energy Producers | 2,321 | |||
MSCI Global Gold Miners | 26,359 | |||
MSCI Global Metals & Mining Producers | 31,232 | |||
MSCI Global Silver Miners | 58,141 | |||
NOTESTO FINANCIAL STATEMENTS | 53 |
Table of Contents
Notes to Financial Statements (Continued)
iSHARES®, INC.
BlackRock Investments, LLC, an affiliate of BFA, is the distributor for each Fund. Pursuant to the distribution agreement, BFA is responsible for any fees or expenses for distribution services provided to the Funds.
Cross trading is the buying or selling of portfolio securities between funds to which BFA (or an affiliate) serves as investment adviser. At its regularly scheduled quarterly meetings, the Board reviews such transactions as of the most recent calendar quarter for compliance with the requirements and restrictions set forth by Rule 17a-7.
For the year ended August 31, 2017, transactions executed by the Funds pursuant to Rule 17a-7 under the 1940 Act were as follows:
| iShares ETF | Purchases | Sales | ||||||
MSCI Global Agriculture Producers | $ | 543,047 | $ | 74,717 | ||||
MSCI Global Energy Producers | 81,152 | 166,818 | ||||||
MSCI Global Gold Miners | 2,339,945 | 2,794,744 | ||||||
MSCI Global Metals & Mining Producers | 429,659 | 1,186,175 | ||||||
MSCI Global Silver Miners | 230,000 | 45,234 | ||||||
Each Fund may invest its positive cash balances in certain money market funds managed by BFA or an affiliate. The income earned on these temporary cash investments is included in “Dividends – affiliated” in the statements of operations.
The PNC Financial Services Group, Inc. is the largest stockholder of BlackRock and is considered to be an affiliate of the Funds for 1940 Act purposes.
The iShares MSCI Global Agriculture Producers and iShares MSCI Global Metals & Mining Producers ETFs, in order to improve their portfolio liquidity and their ability to track their respective underlying index, may invest in shares of other iShares funds that invest in securities in each Fund’s respective underlying index.
Certain directors and officers of the Company are also officers of BTC and/or BFA.
| 3. | INVESTMENT PORTFOLIO TRANSACTIONS |
Purchases and sales of investments (excluding in-kind transactions and short-term investments) for the year ended August 31, 2017 were as follows:
| iShares ETF | Purchases | Sales | ||||||
MSCI Global Agriculture Producers | $ | 4,369,332 | $ | 4,625,102 | ||||
MSCI Global Energy Producers | 1,505,665 | 1,651,358 | ||||||
MSCI Global Gold Miners | 72,165,256 | 66,473,867 | ||||||
MSCI Global Metals & Mining Producers | 38,047,181 | 33,031,956 | ||||||
MSCI Global Silver Miners | 9,657,955 | 11,009,218 | ||||||
| 54 | 2017 iSHARES ANNUAL REPORTTO SHAREHOLDERS |
Table of Contents
Notes to Financial Statements (Continued)
iSHARES®, INC.
In-kind transactions (see Note 4) for the year ended August 31, 2017 were as follows:
| iShares ETF | In-kind Purchases | In-kind Sales | ||||||
MSCI Global Agriculture Producers | $ | 4,674,827 | $ | 7,148,290 | ||||
MSCI Global Energy Producers | — | 5,440,208 | ||||||
MSCI Global Gold Miners | 280,803,060 | 149,125,016 | ||||||
MSCI Global Metals & Mining Producers | 157,179,920 | 128,592,472 | ||||||
MSCI Global Silver Miners | 3,453,163 | 12,115,140 | ||||||
| 4. | CAPITAL SHARE TRANSACTIONS |
Capital shares are issued and redeemed by each Fund only in aggregations of a specified number of shares or multiples thereof (“Creation Units”) at NAV. Except when aggregated in Creation Units, shares of each Fund are not redeemable. Transactions in capital shares for each Fund are disclosed in detail in the statements of changes in net assets.
The consideration for the purchase of Creation Units of a fund in the Company generally consists of the in-kind deposit of a designated portfolio of securities and a specified amount of cash. Certain funds in the Company may be offered in Creation Units solely or partially for cash in U.S. dollars. Investors purchasing and redeeming Creation Units may pay a purchase transaction fee and a redemption transaction fee directly to State Street Bank and Trust Company, the Company’s administrator, to offset transfer and other transaction costs associated with the issuance and redemption of Creation Units, including Creation Units for cash. Investors transacting in Creation Units for cash may also pay an additional variable charge to compensate the relevant fund for certain transaction costs (i.e., stamp taxes, taxes on currency or other financial transactions, and brokerage costs) and market impact expenses relating to investing in portfolio securities. Such variable charges, if any, are included in “Proceeds from shares sold” in the statements of changes in net assets.
From time to time, settlement of securities related to in-kind contributions or in-kind redemptions may be delayed. In such cases, securities related to in-kind contributions are reflected as “Due from custodian” and securities related to in-kind redemptions are reflected as “Securities related to in-kind transactions” in the statements of assets and liabilities.
The Board authorized a one-for-two reverse stock split for each of the iShares MSCI Global Gold Miners ETF and iShares Global Metals & Mining Producers ETF, effective after the close of trading on November 4, 2016. The impact of the stock split was to decrease the number of shares outstanding by a factor of two, while increasing the NAV per share by a factor of two, resulting in no effect on the net assets of the Funds. The financial statements for the Fund have been adjusted to reflect the reverse stock split.
| 5. | PRINCIPAL RISKS |
In the normal course of business, each Fund invests in securities or other instruments and may enter into certain transactions, and such activities subject the Fund to various risks, including, among others, fluctuations in the market (market risk) or failure of an issuer to meet all of its obligations. The value of securities or other instruments may also be affected by various factors, including, without limitation: (i) the general economy; (ii) the overall market as well as local, regional or global political and/or social instability; (iii) regulation, taxation or international tax treaties between various countries; or (iv) currency, interest rate or price fluctuations. Each Fund’s prospectus provides details of the risks to which the Fund is subject.
NOTESTO FINANCIAL STATEMENTS | 55 |
Table of Contents
Notes to Financial Statements (Continued)
iSHARES®, INC.
BFA uses a “passive” or index approach to try to achieve each Fund’s investment objective following the securities included in its underlying index during upturns as well as downturns. BFA does not take steps to reduce market exposure or to lessen the effects of a declining market. Divergence from the underlying index and the composition of the portfolio is monitored by BFA.
MARKET RISK
Market risk arises mainly from uncertainty about future values of financial instruments influenced by price, currency and interest rate movements. It represents the potential loss a fund may suffer through holding market positions in the face of market movements. A fund is exposed to market risk by its investment in equity, fixed income and/or financial derivative instruments or by its investment in underlying funds. The fair value of securities held by a fund may decline due to general market conditions, economic trends or events that are not specifically related to the issuers of the securities including local, regional or global political, social or economic instability or to factors that affect a particular industry or group of industries. The extent of a fund’s exposure to market risk is the market value of the investments held as shown in the fund’s schedule of investments.
A diversified portfolio, where this is appropriate and consistent with a fund’s objectives, minimizes the risk that a price change of a particular investment will have a material impact on the NAV of a fund. The investment concentrations within each Fund’s portfolio are disclosed in its schedule of investments.
Investing in the securities of non-U.S. issuers involves certain considerations and risks not typically associated with securities of U.S. issuers. Such risks include, but are not limited to: differences in accounting, auditing and financial reporting standards; more substantial governmental involvement in the economy; higher inflation rates, greater social, economic and political uncertainties; possible nationalization or expropriation of assets; less availability of public information about issuers; imposition of withholding or other taxes; higher transaction and custody costs and delays in settlement procedures; and lower level of regulation of the securities markets and issuers. Non-U.S. securities may be less liquid, more difficult to value, and have greater price volatility due to exchange rate fluctuations. These and other risks are heightened for investments in issuers from countries with less developed capital markets.
The economies and markets of European countries are often closely connected and interdependent, and events in one country in Europe can have an adverse impact on other European countries. The European financial markets have experienced volatility and adverse trends in recent years due to concerns about economic downturns or rising government debt levels in several European countries. These events have adversely affected the exchange rate of the euro and may continue to significantly affect European countries. The occurrence of terrorist incidents throughout Europe also could impact financial markets. In addition, the United Kingdom has voted to withdraw from the European Union. The referendum may introduce significant new uncertainties and instability in the financial markets as the United Kingdom negotiates its exit from the European Union.
When a fund concentrates its investments in securities within a single or limited number of market sectors, it assumes the risk that economic, political and social conditions affecting those market sectors may have a significant impact on its investment performance.
The United States and the European Union, along with the regulatory bodies of a number of countries including Japan, Australia, Norway, Switzerland and Canada, have imposed economic sanctions, which consist of asset freezes and sectorial sanctions, on certain Russian individuals and Russian corporate entities. Broader sanctions on Russia could also be instituted. These sanctions, or even the threat of further sanctions, may result in the decline of the value and liquidity of Russian securities, a weakening of the ruble or other adverse consequences to the Russian economy. Current or future sanctions may result in Russia taking counter measures or retaliatory actions, which may further impair the value and liquidity of Russian securities. These retaliatory measures may include the immediate freeze of Russian assets held by a fund.
| 56 | 2017 iSHARES ANNUAL REPORTTO SHAREHOLDERS |
Table of Contents
Notes to Financial Statements (Continued)
iSHARES®, INC.
CREDIT RISK
Credit risk is the risk that an issuer or guarantor of debt instruments or the counterparty to a financial transaction, including derivatives contracts, repurchase agreements or loans of portfolio securities, is unable or unwilling to make timely interest and/or principal payments or to otherwise honor its obligations. BFA and its affiliates manage counterparty credit risk by entering into transactions only with counterparties that they believe have the financial resources to honor their obligations and by monitoring the financial stability of those counterparties. Financial assets, which potentially expose a fund to issuer and counterparty credit risks, consist principally of financial instruments and receivables due from counterparties. The extent of a fund’s exposure to credit and counterparty risks with respect to those financial assets is approximated by their value recorded in its statement of assets and liabilities.
| 6. | INCOME TAX INFORMATION |
Each Fund is treated as an entity separate from the Company’s other funds for federal income tax purposes. It is the policy of each Fund to qualify as a regulated investment company by complying with the provisions applicable to regulated investment companies, as defined under Subchapter M of the Internal Revenue Code of 1986, as amended, and to annually distribute substantially all of its ordinary income and any net capital gains (taking into account any capital loss carryforwards) sufficient to relieve it from all, or substantially all, federal income and excise taxes. Accordingly, no provision for federal income taxes is required.
U.S. GAAP requires that certain components of net assets be adjusted to reflect permanent differences between financial and tax reporting. These reclassifications have no effect on net assets or NAV per share. The following permanent differences as of August 31, 2017, attributable to the characterization of corporate actions, passive foreign investment companies, foreign currency transactions and realized gains (losses) from in-kind redemptions, were reclassified to the following accounts:
| iShares ETF | Paid-in Capital | Undistributed Net Investment Income/Distributions in Excess of Net Investment Income | Undistributed Net Realized | |||||||||
MSCI Global Agriculture Producers | $ | 804,010 | $ | 2,257 | $ | (806,267 | ) | |||||
MSCI Global Energy Producers | 781,179 | 5,601 | (786,780 | ) | ||||||||
MSCI Global Gold Miners | (5,604,073 | ) | 2,106,848 | 3,497,225 | ||||||||
MSCI Global Metals & Mining Producers | 29,842,872 | 177,209 | (30,020,081 | ) | ||||||||
MSCI Global Silver Miners | 3,755,922 | 346,932 | (4,102,854 | ) | ||||||||
NOTESTO FINANCIAL STATEMENTS | 57 |
Table of Contents
Notes to Financial Statements (Continued)
iSHARES®, INC.
The tax character of distributions paid during the years ended August 31, 2017 and August 31, 2016 was as follows:
| iShares ETF | 2017 | 2016 | ||||||
MSCI Global Agriculture Producers | ||||||||
Ordinary income | $ | 561,907 | $ | 596,259 | ||||
|
|
|
| |||||
MSCI Global Energy Producers | ||||||||
Ordinary income | $ | 1,091,944 | $ | 1,004,806 | ||||
|
|
|
| |||||
MSCI Global Gold Miners | ||||||||
Ordinary income | $ | 2,501,502 | $ | 300,013 | ||||
|
|
|
| |||||
MSCI Global Metals & Mining Producers | ||||||||
Ordinary income | $ | 5,470,440 | $ | 2,206,034 | ||||
|
|
|
| |||||
MSCI Global Silver Miners | ||||||||
Ordinary income | $ | 1,593,868 | $ | 80,025 | ||||
|
|
|
| |||||
As of August 31, 2017, the tax components of accumulated net earnings (losses) were as follows:
| iShares ETF | Undistributed Ordinary Income | Capital Loss | Net Unrealized | Total | ||||||||||||
MSCI Global Agriculture Producers | $ | 92,566 | $ | (1,864,644 | ) | $ | (1,142,067 | ) | $ | (2,914,145 | ) | |||||
MSCI Global Energy Producers | 261,028 | (1,515,836 | ) | (4,387,009 | ) | (5,641,817 | ) | |||||||||
MSCI Global Gold Miners | 562,288 | (28,822,930 | ) | (3,435,630 | ) | (31,696,272 | ) | |||||||||
MSCI Global Metals & Mining Producers | 2,769,798 | (20,679,780 | ) | 34,693,406 | 16,783,424 | |||||||||||
MSCI Global Silver Miners | 153,975 | (8,112,033 | ) | (2,361,595 | ) | (10,319,653 | ) | |||||||||
| a | The difference between book-basis and tax-basis unrealized gains (losses) was attributable primarily to the tax deferral of losses on wash sales and the realization for tax purposes of unrealized gains on investments in passive foreign investment companies. |
As of August 31, 2017, the Funds had non-expiring capital loss carryforwards available to offset future realized capital gains as follows:
| iShares ETF | Non- Expiring | |||
MSCI Global Agriculture Producers | $ | 1,864,644 | ||
MSCI Global Energy Producers | 1,515,836 | |||
MSCI Global Gold Miners | 28,822,930 | |||
MSCI Global Metals & Mining Producers | 20,679,780 | |||
MSCI Global Silver Miners | 8,112,033 | |||
The Funds may own shares in certain foreign investment entities, referred to, under U.S. tax law, as “passive foreign investment companies.” The Funds may elect to mark-to-market annually the shares of each passive foreign investment company and would be required to distribute to shareholders any such marked-to-market gains.
| 58 | 2017 iSHARES ANNUAL REPORTTO SHAREHOLDERS |
Table of Contents
Notes to Financial Statements (Continued)
iSHARES®, INC.
Management has analyzed tax laws and regulations and their application to the Funds as of August 31, 2017, inclusive of the open tax return years, and does not believe there are any uncertain tax positions that require recognition of a tax liability in the Funds’ financial statements.
| 7. | LEGAL PROCEEDINGS |
On June 16, 2016, investors (the “Plaintiffs”) in certain iShares funds (iShares Core S&P Small-Cap ETF, iShares Russell 1000 Growth ETF, iShares Core S&P 500 ETF, iShares Russell Mid-Cap Growth ETF, iShares Russell Mid-Cap ETF, iShares Russell Mid-Cap Value ETF, iShares Select Dividend ETF, iShares Morningstar Mid-Cap ETF, iShares Morningstar Large-Cap ETF, iShares U.S. Aerospace & Defense ETF and iShares U.S. Preferred Stock ETF) filed a putative class action lawsuit against iShares Trust, BlackRock, Inc. and certain of its advisory affiliates, and certain directors/trustees and officers of the Funds (collectively, “Defendants”). The lawsuit alleges the Defendants violated federal securities laws by failing to adequately disclose in the prospectuses issued by the funds noted above the risks of using stop-loss orders in the event of a ‘flash crash’, such as the one that occurred on May 6, 2010. On September 18, 2017, the Court issued a Statement of Decision holding that the Plaintiffs
lack standing to assert their claims. On October 11, 2017, the Court entered final judgment dismissing all of Plaintiffs’ claims with prejudice.
| 8. | SUBSEQUENT EVENTS |
Management has evaluated the impact of all subsequent events on the Funds through the date the financial statements were available to be issued and has determined that there were no subsequent events requiring adjustment or disclosure in the financial statements, except as noted below.
At a meeting held on September 14-15, 2017, the Board approved a line of credit for the iShares MSCI Global Agriculture Producers, iShares MSCI Global Energy Producers and iShares MSCI Global Metals & Mining Producers ETFs. The Funds, along with certain other iShares funds, will be parties to a $275 million credit agreement with State Street Bank and Trust Company, which will expire on October 24, 2018. The line of credit may be used for temporary or emergency purposes, including redemptions, settlement of trades and rebalancing of portfolio holdings. The credit agreement is expected to be effective on or around October 25, 2017.
NOTESTO FINANCIAL STATEMENTS | 59 |
Table of Contents
Report of Independent Registered Public Accounting Firm
To the Board of Directors of iShares, Inc. and
Shareholders of the iShares MSCI Global Agriculture Producers ETF,
iShares MSCI Global Energy Producers ETF, iShares MSCI Global Gold Miners ETF,
iShares MSCI Global Metals & Mining Producers ETF and iShares MSCI Global Silver Miners ETF
In our opinion, the accompanying statements of assets and liabilities, including the schedules of investments, and the related statements of operations and of changes in net assets and the financial highlights present fairly, in all material respects, the financial position of iShares MSCI Global Agriculture Producers ETF, iShares MSCI Global Energy Producers ETF, iShares MSCI Global Gold Miners ETF, iShares MSCI Global Metals & Mining Producers ETF and iShares MSCI Global Silver Miners ETF (constituting funds of iShares, Inc., hereafter referred to as the “Funds”) as of August 31, 2017, and the results of each of their operations, the changes in each of their net assets and the financial highlights for each of the periods indicated, in conformity with accounting principles generally accepted in the United States of America. These financial statements and financial highlights (hereafter referred to as “financial statements”) are the responsibility of the Funds’ management. Our responsibility is to express an opinion on these financial statements based on our audits. We conducted our audits of these financial statements in accordance with the standards of the Public Company Accounting Oversight Board (United States). Those standards require that we plan and perform the audit to obtain reasonable assurance about whether the financial statements are free of material misstatement. An audit includes examining, on a test basis, evidence supporting the amounts and disclosures in the financial statements, assessing the accounting principles used and significant estimates made by management, and evaluating the overall financial statement presentation. We believe that our audits, which included confirmation of securities as of August 31, 2017 by correspondence with the custodian, transfer agent and brokers, or by other appropriate auditing procedures where replies were not received, provide a reasonable basis for our opinion.
PricewaterhouseCoopers LLP
San Francisco, California
October 23, 2017
| 60 | 2017 iSHARES ANNUAL REPORTTO SHAREHOLDERS |
Table of Contents
iSHARES®, INC.
The following maximum amounts are hereby designated as qualified dividend income for individuals for the fiscal year ended August 31, 2017:
| iShares ETF | Qualified Dividend Income | |||
MSCI Global Agriculture Producers | $ | 558,716 | ||
MSCI Global Energy Producers | 1,282,190 | |||
MSCI Global Gold Miners | 2,776,393 | |||
MSCI Global Metals & Mining Producers | 6,713,020 | |||
MSCI Global Silver Miners | 595,737 | |||
For corporate shareholders, the percentage of income dividends paid during the fiscal year ended August 31, 2017 that qualified for the dividends-received deduction were as follows:
| iShares ETF | Dividends- Received Deduction | |||
MSCI Global Agriculture Producers | 55.59 | % | ||
MSCI Global Energy Producers | 43.77 | |||
MSCI Global Gold Miners | 5.02 | |||
MSCI Global Metals & Mining Producers | 6.06 | |||
For the fiscal year ended August 31, 2017, the following Funds earned foreign source income and paid foreign taxes which they intend to pass through to their shareholders:
| iShares ETF | Foreign Source Income Earned | Foreign Taxes Paid | ||||||
MSCI Global Gold Miners | $ | 3,362,527 | $ | 173,956 | ||||
MSCI Global Metals & Mining Producers | 7,051,338 | 343,295 | ||||||
MSCI Global Silver Miners | 614,235 | 54,502 | ||||||
TAX INFORMATION | 61 |
Table of Contents
Board Review and Approval of Investment Advisory
Contract
iSHARES®, INC.
Under Section 15(c) of the Investment Company Act of 1940 (the “1940 Act”), the Company’s Board of Directors (the “Board”), including a majority of Directors who are not “interested persons” of the Company (as that term is defined in the 1940 Act) (the “Independent Directors”), is required annually to consider and approve the Investment Advisory Contract between the Company and BFA (the “Advisory Contract”) on behalf of the Funds. The Independent Directors requested, and BFA provided, such information as the Independent Directors, with advice from independent counsel, deemed reasonably necessary to evaluate the Advisory Contract. A committee of all of the Independent Directors (the “15(c) Committee”), with independent counsel, met with management on May 5, 2017 and May 12, 2017. At these meetings, the 15(c) Committee reviewed and discussed information provided in response to the 15(c) Committee’s initial requests, and requested certain additional information, which management agreed to provide. At a meeting held on May 18, 2017, management presented information to the Board relating to the continuance of the Advisory Contract, including information requested by the 15(c) Committee during its meetings. The Board, including the Independent Directors, reviewed and discussed such information at length. The Independent Directors requested from management certain additional information, which management agreed to provide. At a meeting held on June 19-21, 2017, the Board, including the Independent Directors, reviewed the additional information provided by management in response to these requests. After extensive discussions, the Board, including all of the Independent Directors, approved the continuance of the Advisory Contract for the Funds, based on a review of qualitative and quantitative information provided by BFA. The Board noted its satisfaction with the extent and quality of information provided and its frequent interactions with management, as well as the detailed responses and other information provided by BFA. The Board also noted that the Board and BFA agreed to discuss potential further enhancements to the 15(c) process for the coming year. The Independent Directors were advised by their independent counsel throughout the process, including about the legal standards applicable to their review. In approving the Advisory Contract for the Funds, the Board, including the Independent Directors, considered the following factors, no one of which was controlling, and reached the following conclusions:
Expenses and Performance of the Funds — The Board reviewed statistical information prepared by Broadridge Financial Solutions Inc. (“Broadridge”), an independent provider of investment company data, regarding the expense ratio components, including gross and net total expenses, waivers/reimbursements (if any), and underlying fund fees and expenses (if any) of each Fund in comparison with the same information for other exchange traded funds (“ETFs”) (including, where applicable, funds sponsored by an “at cost” service provider) and, in the limited instances where no comparable ETFs existed and the comparison group would not otherwise be reasonable in Broadridge’s judgment, pure index institutional mutual funds, objectively selected by Broadridge as comprising such Fund’s applicable peer group pursuant to Broadridge’s proprietary ETF methodology (the “Peer Group”). The Board was provided with a detailed description of the proprietary ETF methodology used by Broadridge to determine the applicable Peer Groups. The Board further noted that due to the limitations in providing comparable funds in the various Peer Groups, the statistical information provided in Broadridge’s report may or may not provide meaningful direct comparisons to the Funds in all instances.
The Board also noted that the investment advisory fee rates and overall expenses (net of waivers and reimbursements) for the Funds were lower than the median of the investment advisory fee rates and overall expenses (net of waivers and reimbursements) of the funds in their respective Peer Group, excluding iShares funds.
In addition, to the extent that any of the comparison funds included in the Peer Group, excluding iShares funds, track the same index as any particular Fund, Broadridge also provided, and the Board reviewed, a comparison of such Fund’s performance for the one-, three-, five-, ten-year, and since inception periods, as applicable, and for the quarter ended December 31, 2016, to that of relevant comparison funds for the same periods.
The Board noted that each Fund seeks to track its own underlying index and that, during the year, the Board received periodic reports on each Fund’s short- and longer-term performance in comparison with its underlying index. Such periodic comparative performance information, including any additional detailed information requested by the Boards, was also considered. The Board noted that each Fund generally performed in line with its underlying index over the relevant periods.
| 62 | 2017 iSHARES ANNUAL REPORTTO SHAREHOLDERS |
Table of Contents
Board Review and Approval of Investment Advisory
Contract (Continued)
iSHARES®, INC.
Based on this review, the other factors considered at the meeting, and their general knowledge of ETF pricing, the Board concluded that the investment advisory fee rate and the historical performance of each Fund supported the Board’s approval of the continuance of the Advisory Contract for the coming year.
Nature, Extent and Quality of Services Provided by BFA — Based on management’s representations, including information about recent and proposed enhancements to the iShares business, including with respect to capital markets support and analysis, technology, product design, compliance and risk management, and other services, the Board expected that there would be no diminution in the scope of services required of or provided by BFA under the Advisory Contract for the coming year as compared to the scope of services provided by BFA during prior years. In reviewing the scope of these services, the Board considered BFA’s investment philosophy and experience, noting that BFA and its affiliates have committed significant resources over time, including during the past year, to supporting the iShares funds and their shareholders. The Board also considered BFA’s compliance program and its compliance record with respect to the Funds. In that regard, the Board noted that BFA reports to the Board about portfolio management and compliance matters on a periodic basis in connection with regularly scheduled meetings of the Board, and on other occasions as necessary and appropriate, and has provided information and made appropriate officers available as needed to provide further assistance with these matters. The Board also reviewed the background and experience of the persons responsible for the day-to-day management of the Funds, as well as the resources available to them in managing the Funds. In addition to the above considerations, the Board reviewed and considered detailed presentations regarding BFA’s investment performance, investment and risk management processes and strategies provided at the June 19-21, 2017 meeting and throughout the previous year, and matters related to BFA’s portfolio compliance policies and procedures. The Board noted that each Fund had met its investment objective consistently since its respective inception date.
Based on review of this information, and the performance information discussed above, the Board concluded that the nature, extent and quality of services provided by BFA to the Funds under the Advisory Contract supported the Board’s approval of the continuance of the Advisory Contract for the coming year.
Costs of Services Provided to Funds and Profits Realized by BFA and Affiliates — The Board reviewed information about the profitability of the Funds to BlackRock, on a Fund-by-Fund basis and in the aggregate, based on the fees payable to BFA and its affiliates (including fees under the Advisory Contract), and other sources of revenue and expense to BFA and its affiliates from the Funds’ operations for the last calendar year. The Board reviewed BlackRock’s profitability methodology for the iShares funds, including supplemental information that was responsive to requests of the 15(c) Committee. The Board noted that the 15(c) Committee had focused on the methodology and profitability presentation during its meetings. The Board discussed the sources of direct and ancillary revenue with management, including the revenues to BTC, a BFA affiliate, from securities lending by the Funds. The Board also discussed BFA’s profit margin as reflected in the Funds’ profitability analyses and reviewed information regarding potential economies of scale (as discussed below). Based on this review, the Board concluded that the profits realized by BFA and its affiliates under the Advisory Contract and from other relationships between the Funds and BFA and/or its affiliates, if any, were within a reasonable range in light of the factors considered.
Economies of Scale — The Board reviewed information regarding potential economies of scale or other efficiencies that may result from increases in the Funds’ assets, noting that the issue of economies of scale had been focused on by the 15(c) Committee during its meetings and addressed by management, including through supplemental information. The Board and the 15(c) Committee reviewed information provided by BFA regarding scale benefits shared with the iShares funds through relatively low fee rates established at inception, breakpoints and waivers or other fee reductions, as well as through additional investment in the iShares business and the provision of improved or additional infrastructure and services to the iShares funds and their shareholders. The Board and the 15(c) Committee received information regarding BlackRock’s historical profitability, including BFA’s and its affiliates’ costs in providing services. The cost information distinguished, among other things, between fixed and variable costs, and explained how the level of fixed and variable costs, as well as the nature of such costs, may impact the
BOARD REVIEWAND APPROVALOF INVESTMENT ADVISORY CONTRACT | 63 |
Table of Contents
Board Review and Approval of Investment Advisory
Contract (Continued)
iSHARES®, INC.
existence or size of scale benefits. The Board noted that the Advisory Contract for the Funds did not provide for any breakpoints in the Funds’ investment advisory fee rates as the assets of the Funds increase. However, the Board noted that should material economies of scale be identified in the future that are not otherwise shared, a breakpoint structure for the Funds may be appropriate, and that it would continue to monitor the sharing of economies of scale to determine the appropriateness of adding breakpoints in the future.
Based on this review, as well as the other factors considered at the meeting, the Board, recognizing its responsibility to consider the Advisory Contract at least annually, determined to approve the continuance of the Advisory Contract for the coming year.
Fees and Services Provided for Other Comparable Funds/Accounts Managed by BFA and its Affiliates — The Board received and considered information regarding the investment advisory/management fee rates for other funds/accounts in the U.S. for which BFA (or its affiliates) provides investment advisory/management services, including open-end funds registered under the 1940 Act (including sub-advised funds), collective trust funds, and institutional separate accounts (together, the “Other Accounts”), and acknowledged BFA’s assertion that the iShares funds are fundamentally different investment vehicles from the Other Accounts. The Board noted that BFA and its affiliates do not manage Other Accounts with substantially the same investment objectives and strategies as the Funds and that track the same index as the Funds. The Board further noted that BFA provided the Board with detailed information regarding how the Other Accounts (particularly institutional clients) generally differ from the Funds, including in terms of the different and generally more extensive services provided to the Funds, as well as other significant differences. In that regard, the Board considered that the pricing of services to institutional clients is typically based on a number of factors beyond the nature and extent of the specific services to be provided and often depends on the overall relationship between the client and its affiliates and the adviser and its affiliates. In addition, the Board considered the relative complexity and inherent risks and challenges of managing and providing other services to the Funds, as publicly traded ETFs, as compared to the Other Accounts that are institutional clients in light of differing regulatory requirements and client-imposed mandates. The Board also acknowledged BFA’s expressed business purpose for launching a suite of iShares “Core” ETFs that generally are subject to lower investment advisory fees than iShares non-Core ETFs that may provide a similar investment exposure. The Board also considered the “all-inclusive” nature of the Funds’ advisory fee structure, and the Fund expenses borne by BFA under this arrangement. The Board noted that the investment advisory fee rates under the Advisory Contract for the Funds were generally higher than the investment advisory/management fee rates for certain of the Other Accounts (particularly institutional clients) and concluded that the differences appeared to be consistent with the factors discussed.
Other Benefits to BFA and/or its Affiliates — The Board reviewed the “fallout” benefits or ancillary revenue received by BFA and/or its affiliates in connection with the services provided to the Funds by BFA, such as payment of revenue to BTC, the Funds’ securities lending agent, for loaning portfolio securities (which was included in the profit margins reviewed by the Board pursuant to BFA’s profitability methodology), and payment of advisory fees and/or administration fees to BFA and BTC (or their affiliates) in connection with any investments by the Funds in other funds for which BFA (or its affiliates) provides investment advisory services and/or administration services. The Board also noted the revenue received by BFA and/or its affiliates pursuant to an agreement that permits a service provider to use certain portions of BlackRock’s technology platform to service accounts managed by BFA and/or its affiliates, including the iShares funds. The Board noted that BFA generally does not use soft dollars or consider the value of research or other services that may be provided to BFA (including its affiliates) in selecting brokers for portfolio transactions for the Funds. The Board further noted that any portfolio transactions on behalf of the Funds placed through a BFA affiliate or purchased from an underwriting syndicate in which a BFA affiliate participates, are reported to the Board pursuant to Rule 17e-1 or Rule 10f-3, as applicable, under the 1940 Act. The Board concluded that any such ancillary benefits would not be disadvantageous to the Funds’ shareholders and thus would not alter the Board’s conclusion with respect to the appropriateness of approving the continuance of the Advisory Contract for the coming year.
| 64 | 2017 iSHARES ANNUAL REPORTTO SHAREHOLDERS |
Table of Contents
Board Review and Approval of Investment Advisory
Contract (Continued)
iSHARES®, INC.
Conclusion — Based on the considerations described above, the Board determined that each Fund’s investment advisory fee rate under the Advisory Contract does not constitute a fee that is so disproportionately large as to bear no reasonable relationship to the services rendered and that could not have been the product of arm’s-length bargaining, and concluded to approve the continuance of the Advisory Contract for the coming year.
BOARD REVIEWAND APPROVALOF INVESTMENT ADVISORY CONTRACT | 65 |
Table of Contents
Supplemental Information (Unaudited)
iSHARES®, INC.
A special meeting of the shareholders of each series of iShares, Inc. (the “Company”) was held on June 19, 2017, to elect five Directors to the Board of Directors of the Company. The five nominees were Jane D. Carlin, Richard L. Fagnani, Drew E. Lawton, Madhav V. Rajan and Mark Wiedman, all of whom were elected as Directors at the special meeting. The other Directors whose terms of office as Directors continued after the special meeting are Cecilia H. Herbert, Charles A. Hurty, John E. Kerrigan, John E. Martinez and Robert S. Kapito.
| Director | Votes For | Votes Withheld | ||||||
Jane D. Carlin | 1,911,835,929 | 49,339,171 | ||||||
Richard L. Fagnani | 1,911,725,344 | 49,449,755 | ||||||
Drew E. Lawton | 1,911,790,083 | 49,385,017 | ||||||
Madhav V. Rajan | 1,902,999,095 | 58,176,004 | ||||||
Mark Wiedman | 1,908,143,500 | 53,031,599 | ||||||
Section 19(a) Notices
The amounts and sources of distributions reported are estimates and are provided pursuant to regulatory requirements and are not being provided for tax reporting purposes. The actual amounts and sources for tax reporting purposes will depend upon each Fund’s investment experience during the year and may be subject to changes based on the tax regulations. Shareholders will receive a Form 1099-DIV each calendar year that will inform them how to report these distributions for federal income tax purposes.
| Total Cumulative Distributions for the Fiscal Year | % Breakdown of the Total Cumulative Distributions for the Fiscal Year | |||||||||||||||||||||||||||||||
| iShares ETF | Net Investment Income | Net Realized Capital Gains | Return of Capital | Total Per Share | Net Investment Income | Net Realized Capital Gains | Return of Capital | Total Per Share | ||||||||||||||||||||||||
MSCI Global Agriculture Producers | $ | 0.491458 | $ | — | $ | — | $ | 0.491458 | 100 | % | — | % | — | % | 100 | % | ||||||||||||||||
MSCI Global Energy Producers | 0.590445 | — | — | 0.590445 | 100 | — | — | 100 | ||||||||||||||||||||||||
MSCI Global Metals & Mining Producers | 0.596772 | — | — | 0.596772 | 100 | — | — | 100 | ||||||||||||||||||||||||
MSCI Global Silver Miners | 0.288645 | — | — | 0.288645 | 100 | — | — | 100 | ||||||||||||||||||||||||
Premium/Discount Information
The Premium/Discount Information section is intended to present information about the differences between the daily market price on secondary markets for shares of a fund and that fund’s NAV. NAV is the price at which a fund issues and redeems shares. It is calculated in accordance with the standard formula for valuing mutual fund shares. The “Market Price” of a fund generally is determined using the midpoint between the highest bid and the lowest ask on the primary securities exchange on which shares of such fund are listed for trading, as of the time that the fund’s NAV is calculated. A fund’s Market Price may be at, above or below its NAV. The NAV of a fund will fluctuate with changes in the value of its portfolio holdings. The Market Price of a fund will fluctuate in accordance with changes in its NAV, as well as market supply and demand.
Premiums or discounts are the differences (expressed as a percentage) between the NAV and Market Price of a fund on a given day, generally at the time the NAV is calculated. A premium is the amount that a fund is trading above the reported NAV, expressed as a percentage of the NAV. A discount is the amount that a fund is trading below the reported NAV, expressed as a percentage of the NAV.
| 66 | 2017 iSHARES ANNUAL REPORTTO SHAREHOLDERS |
Table of Contents
Supplemental Information (Unaudited) (Continued)
iSHARES®, INC.
Premium/discount information for the Funds covering the most recently completed calendar year and the most recently completed calendar quarters since that year (or the life of the Fund, if shorter) is publicly accessible, free of charge, at www.iShares.com.
The following information shows the frequency of distributions of premiums and discounts for the Funds for the immediately preceding five calendar years (or from the inception date of the Fund, if less than five years) through the date of the most recent calendar quarter-end. Each line in each table shows the number of trading days in which the Fund traded within the premium/discount range indicated. The number of trading days in each premium/discount range is also shown as a percentage of the total number of trading days in the period covered by each table. All data presented here represents past performance, which cannot be used to predict future results.
iShares MSCI Global Agriculture Producers ETF
Period Covered: January 31, 2012 through June 30, 2017
Premium/Discount Range | Number of Days | Percentage of Total Days | ||||||
Greater than 1.5% and Less than 2.0% | 1 | 0.07 | % | |||||
Greater than 1.0% and Less than 1.5% | 21 | 1.54 | ||||||
Greater than 0.5% and Less than 1.0% | 361 | 26.47 | ||||||
Greater than 0.0% and Less than 0.5% | 496 | 36.36 | ||||||
At NAV | 14 | 1.03 | ||||||
Less than 0.0% and Greater than -0.5% | 393 | 28.81 | ||||||
Less than -0.5% and Greater than -1.0% | 72 | 5.28 | ||||||
Less than -1.0% and Greater than -1.5% | 6 | 0.44 | ||||||
|
|
|
| |||||
| 1,364 | 100.00 | % | ||||||
|
|
|
| |||||
iShares MSCI Global Energy Producers ETF
Period Covered: January 31, 2012 through June 30, 2017
Premium/Discount Range | Number of Days | Percentage of Total Days | ||||||
Greater than 3.0% | 1 | 0.07 | % | |||||
Greater than 2.5% and Less than 3.0% | 3 | 0.22 | ||||||
Greater than 2.0% and Less than 2.5% | 9 | 0.66 | ||||||
Greater than 1.5% and Less than 2.0% | 20 | 1.47 | ||||||
Greater than 1.0% and Less than 1.5% | 68 | 4.99 | ||||||
Greater than 0.5% and Less than 1.0% | 215 | 15.76 | ||||||
Greater than 0.0% and Less than 0.5% | 416 | 30.50 | ||||||
At NAV | 21 | 1.54 | ||||||
Less than 0.0% and Greater than -0.5% | 517 | 37.90 | ||||||
Less than -0.5% and Greater than -1.0% | 84 | 6.16 | ||||||
Less than -1.0% and Greater than -1.5% | 9 | 0.66 | ||||||
Less than -1.5% and Greater than -2.0% | 1 | 0.07 | ||||||
|
|
|
| |||||
| 1,364 | 100.00 | % | ||||||
|
|
|
| |||||
SUPPLEMENTAL INFORMATION | 67 |
Table of Contents
Supplemental Information (Unaudited) (Continued)
iSHARES®, INC.
iShares MSCI Global Gold Miners ETF
Period Covered: January 31, 2012 through June 30, 2017
Premium/Discount Range | Number of Days | Percentage of Total Days | ||||||
Greater than 4.0% | 1 | 0.07 | % | |||||
Greater than 3.5% and Less than 4.0% | 2 | 0.15 | ||||||
Greater than 3.0% and Less than 3.5% | 2 | 0.15 | ||||||
Greater than 2.5% and Less than 3.0% | 4 | 0.29 | ||||||
Greater than 2.0% and Less than 2.5% | 3 | 0.22 | ||||||
Greater than 1.5% and Less than 2.0% | 12 | 0.88 | ||||||
Greater than 1.0% and Less than 1.5% | 43 | 3.15 | ||||||
Greater than 0.5% and Less than 1.0% | 261 | 19.13 | ||||||
Greater than 0.0% and Less than 0.5% | 602 | 44.13 | ||||||
At NAV | 12 | 0.88 | ||||||
Less than 0.0% and Greater than -0.5% | 322 | 23.61 | ||||||
Less than -0.5% and Greater than -1.0% | 68 | 4.99 | ||||||
Less than -1.0% and Greater than -1.5% | 21 | 1.54 | ||||||
Less than -1.5% and Greater than -2.0% | 3 | 0.22 | ||||||
Less than -2.0% and Greater than -2.5% | 5 | 0.37 | ||||||
Less than -2.5% and Greater than -3.0% | 1 | 0.07 | ||||||
Less than -3.0% | 2 | 0.15 | ||||||
|
|
|
| |||||
| 1,364 | 100.00 | % | ||||||
|
|
|
| |||||
iShares MSCI Global Metals & Mining Producers ETF
Period Covered: January 31, 2012 through June 30, 2017
Premium/Discount Range | Number of Days | Percentage of Total Days | ||||||
Greater than 4.5% | 3 | 0.22 | % | |||||
Greater than 4.0% and Less than 4.5% | 1 | 0.07 | ||||||
Greater than 3.5% and Less than 4.0% | 1 | 0.07 | ||||||
Greater than 3.0% and Less than 3.5% | 1 | 0.07 | ||||||
Greater than 2.5% and Less than 3.0% | 7 | 0.51 | ||||||
Greater than 2.0% and Less than 2.5% | 13 | 0.95 | ||||||
Greater than 1.5% and Less than 2.0% | 58 | 4.25 | ||||||
Greater than 1.0% and Less than 1.5% | 207 | 15.18 | ||||||
Greater than 0.5% and Less than 1.0% | 339 | 24.85 | ||||||
Greater than 0.0% and Less than 0.5% | 369 | 27.06 | ||||||
At NAV | 11 | 0.81 | ||||||
Less than 0.0% and Greater than -0.5% | 238 | 17.45 | ||||||
Less than -0.5% and Greater than -1.0% | 81 | 5.94 | ||||||
Less than -1.0% and Greater than -1.5% | 26 | 1.91 | ||||||
Less than -1.5% and Greater than -2.0% | 5 | 0.37 | ||||||
Less than -2.0% | 4 | 0.29 | ||||||
|
|
|
| |||||
| 1,364 | 100.00 | % | ||||||
|
|
|
| |||||
| 68 | 2017 iSHARES ANNUAL REPORTTO SHAREHOLDERS |
Table of Contents
Supplemental Information (Unaudited) (Continued)
iSHARES®, INC.
iShares MSCI Global Silver Miners ETF
Period Covered: January 31, 2012 through June 30, 2017
Premium/Discount Range | Number of Days | Percentage of Total Days | ||||||
Greater than 3.5% and Less than 4.0% | 1 | 0.07 | % | |||||
Greater than 3.0% and Less than 3.5% | 2 | 0.15 | ||||||
Greater than 2.5% and Less than 3.0% | 6 | 0.44 | ||||||
Greater than 2.0% and Less than 2.5% | 14 | 1.03 | ||||||
Greater than 1.5% and Less than 2.0% | 33 | 2.42 | ||||||
Greater than 1.0% and Less than 1.5% | 101 | 7.40 | ||||||
Greater than 0.5% and Less than 1.0% | 291 | 21.33 | ||||||
Greater than 0.0% and Less than 0.5% | 451 | 33.06 | ||||||
At NAV | 10 | 0.73 | ||||||
Less than 0.0% and Greater than –0.5% | 280 | 20.53 | ||||||
Less than –0.5% and Greater than –1.0% | 95 | 6.96 | ||||||
Less than –1.0% and Greater than –1.5% | 41 | 3.01 | ||||||
Less than –1.5% and Greater than –2.0% | 29 | 2.13 | ||||||
Less than –2.0% and Greater than –2.5% | 8 | 0.59 | ||||||
Less than –2.5% and Greater than –3.0% | 2 | 0.15 | ||||||
|
|
|
| |||||
| 1,364 | 100.00 | % | ||||||
|
|
|
| |||||
SUPPLEMENTAL INFORMATION | 69 |
Table of Contents
Director and Officer Information
iSHARES®, INC.
The Board of Directors has responsibility for the overall management and operations of the Funds, including general supervision of the duties performed by BFA and other service providers. Each Director serves until he or she resigns, is removed, dies, retires or becomes incapacitated. Each officer shall hold office until his or her successor is elected and qualifies or until his or her death, resignation or removal. Directors who are not “interested persons” (as defined in the 1940 Act) of the Company are referred to as independent directors (“Independent Directors”).
The registered investment companies advised by BFA or its affiliates (the “BlackRock-advised Funds”) are organized into one complex of closed-end funds, two complexes of open-end funds and one complex of exchange-traded funds (“Exchange-Traded Fund Complex”) (each, a “BlackRock Fund Complex”). Each Fund is included in the BlackRock Fund Complex referred to as the Exchange-Traded Fund Complex. Each Director also serves as a Trustee of iShares Trust and a Trustee of iShares U.S. ETF Trust and, as a result, oversees a total of 344 funds (as of August 31, 2017) within the Exchange-Traded Fund Complex. Drew E. Lawton, from October 2016 to June 2017, and Richard L. Fagnani, from April 2017 to June 2017, served as Advisory Board Members for iShares Trust, iShares Inc. and iShares U.S. ETF Trust with respect to all funds within the Exchange-Traded Fund Complex. With the exception of Robert S. Kapito, Mark K. Wiedman, Charles Park, Martin Small and Benjamin Archibald, the address of each Director, and officer is c/o BlackRock, Inc., 400 Howard Street, San Francisco, CA 94105. The address of Mr. Kapito, Mr. Wiedman, Mr. Park, Mr. Small and Mr. Archibald is c/o BlackRock, Inc., Park Avenue Plaza, 55 East 52nd Street, New York, NY 10055. The Board has designated Cecilia H. Herbert as its Independent Board Chair. Additional information about the Funds’ Directors and officers may be found in the Funds’ combined Statement of Additional Information, which is available without charge, upon request, by calling toll-free 1-800-iShares (1-800-474-2737).
Interested Directors
| Name (Age) | Position(s) | Principal Occupation(s) During the Past 5 Years | Other Directorships Held by Director | |||
Robert S. Kapitoa (60) | Director (since 2009). | President, BlackRock, Inc. (since 2006); Vice Chairman of BlackRock, Inc. and Head of BlackRock’s Portfolio Management Group (since its formation in 1998) and BlackRock, Inc.’s predecessor entities (since 1988); Trustee, University of Pennsylvania (since 2009); President of Board of Directors, Hope & Heroes Children’s Cancer Fund (since 2002). | Director of BlackRock, Inc. (since 2006); Trustee of iShares Trust (since 2009); Trustee of iShares U.S. ETF Trust (since 2011). | |||
Mark K. Wiedmanb (46) | Director (since 2013). | Senior Managing Director, BlackRock, Inc. (since 2014); Managing Director, BlackRock, Inc. (2007-2014); Global Head of BlackRock’s ETF and Index Investments Business (since 2016); Global Head of iShares (2011-2016); Head of Corporate Strategy, BlackRock, Inc. (2009-2011). | Trustee of iShares Trust (since 2013); Trustee of iShares U.S. ETF Trust (since 2013); Director of PennyMac Financial Services, Inc. (since 2008). | |||
| a | Robert S. Kapito is deemed to be an “interested person” (as defined in the 1940 Act) of the Company due to his affiliations with BlackRock, Inc. and its affiliates. |
| b | Mark K. Wiedman is deemed to be an “interested person” (as defined in the 1940 Act) of the Company due to his affiliations with BlackRock, Inc. and its affiliates. |
| 70 | 2017 iSHARES ANNUAL REPORTTO SHAREHOLDERS |
Table of Contents
Director and Officer Information (Continued)
iSHARES®, INC.
Independent Directors
| Name (Age) | Position(s) | Principal Occupation(s) During the Past 5 Years | Other Directorships Held by Director | |||
Cecilia H. Herbert (68) | Director (since 2005); Independent Board Chair (since 2016). | Trustee and Member of the Finance, Technology and Quality Committee of Stanford Health Care (since 2016); Trustee and Member of the Investment Committee, WNET, a New York public media company (since 2011); Chair (1994-2005) and Member (since 1992) of the Investment Committee, Archdiocese of San Francisco; Director (1998-2013) and President (2007-2011) of the Board of Directors, Catholic Charities CYO; Trustee (2002-2011) and Chair of the Finance and Investment Committee (2006-2010) of the Thacher School. | Trustee of iShares Trust (since 2005); Trustee of iShares U.S. ETF Trust (since 2011); Independent Board Chair of iShares Trust and iShares U.S. ETF Trust (since 2016); Trustee of Forward Funds (14 portfolios) (since 2009); Trustee of Salient MF Trust (4 portfolios) (since 2015). | |||
Jane D. Carlin (61) | Director (since 2015); Risk Committee Chair (since 2016). | Consultant (since 2012); Managing Director and Global Head of Financial Holding Company Governance & Assurance and the Global Head of Operational Risk Management of Morgan Stanley (2006-2012). | Trustee of iShares Trust (since 2015); Trustee of iShares U.S. ETF Trust (since 2015); Director of PHH Corporation (mortgage solutions) (since 2012); Director of The Hanover Insurance Group, Inc. (since 2016). | |||
Richard L. Fagnani (62) | Director (since 2017); Equity Plus Committee Chair (since 2017). | Partner, KPMG LLP (2002-2016). | Trustee of iShares Trust (since 2017); Trustee of iShares U.S. ETF Trust (since 2017). | |||
Charles A. Hurty (73) | Director (since 2005); Audit Committee Chair (since 2006). | Retired; Partner, KPMG LLP (1968-2001). | Trustee of iShares Trust (since 2005); Trustee of iShares U.S. ETF Trust (since 2011); Director of SkyBridge Alternative Investments Multi-Adviser Hedge Fund Portfolios LLC (2 portfolios) (since 2002). | |||
John E. Kerrigan (62) | Director (since 2005); Securities Lending Committee Chair (since 2016). | Chief Investment Officer, Santa Clara University (since 2002). | Trustee of iShares Trust (since 2005); Trustee of iShares U.S. ETF Trust (since 2011). | |||
Drew E. Lawton (58) | Director (since 2017); 15(c) Committee Chair (since 2017). | Senior Managing Director of New York Life Insurance Company (2010-2015). | Trustee of iShares Trust (since 2017); Trustee of iShares U.S. ETF Trust (since 2017). | |||
DIRECTORAND OFFICER INFORMATION | 71 |
Table of Contents
Director and Officer Information (Continued)
iSHARES®, INC.
Independent Directors (Continued)
| Name (Age) | Position(s) | Principal Occupation(s) During the Past 5 Years | Other Directorships Held by Director | |||
John E. Martinez (56) | Director (since 2003); Fixed Income Plus Committee Chair (since 2016). | Director of Real Estate Equity Exchange, Inc. (since 2005). | Trustee of iShares Trust (since 2003); Trustee of iShares U.S. ETF Trust (since 2011). | |||
Madhav V. Rajan (53) | Director (since 2011); Nominating and Governance Committee Chair (since 2017). | Dean, and George Pratt Shultz Professor of Accounting, University of Chicago Booth School of Business (since 2017); Robert K. Jaedicke Professor of Accounting, Stanford University Graduate School of Business (2001-2017); Professor of Law (by courtesy), Stanford Law School (2005-2017); Senior Associate Dean for Academic Affairs and Head of MBA Program, Stanford University Graduate School of Business (2010-2016) . | Trustee of iShares Trust (since 2011); Trustee of iShares U.S. ETF Trust (since 2011); Director, Cavium, Inc. (since 2013). | |||
| 72 | 2017 iSHARES ANNUAL REPORTTO SHAREHOLDERS |
Table of Contents
Director and Officer Information (Continued)
iSHARES®, INC.
Officersc
| Name (Age) | Position(s) | Principal Occupation(s) During the Past 5 Years | ||
Martin Small (42) | President (since 2016). | Managing Director, BlackRock, Inc. (since 2010); Head of U.S. iShares (since 2015); Co-Head of the U.S. Financial Markets Advisory Group, BlackRock, Inc. (2008-2014). | ||
Jack Gee (57) | Treasurer and Chief Financial Officer (since 2008). | Managing Director, BlackRock, Inc. (since 2009); Senior Director of Fund Administration of Intermediary Investor Business, BGI (2009). | ||
Benjamin Archibald (42) | Secretary (since 2015). | Managing Director, BlackRock, Inc. (since 2014); Director, BlackRock, Inc. (2010-2013); Secretary of the BlackRock-advised Mutual Funds (since 2012). | ||
Alan Mason (56) | Executive Vice President (since 2016). | Managing Director, BlackRock, Inc. (since 2009). | ||
Steve Messinger (55) | Executive Vice President (since 2016). | Managing Director, BlackRock, Inc. (2007-2014 and since 2016); Managing Director, Beacon Consulting Group (2014-2016). | ||
Charles Park (49) | Chief Compliance Officer (since 2006). | Chief Compliance Officer of BlackRock Advisors, LLC and the BlackRock-advised Funds in the Equity-Bond Complex, the Equity-Liquidity Complex and the Closed-End Complex (since 2014); Chief Compliance Officer of BFA (since 2006). | ||
Scott Radell (48) | Executive Vice President (since 2012). | Managing Director, BlackRock, Inc. (since 2009); Head of Portfolio Solutions, BlackRock, Inc. (since 2009). | ||
| c | Manish Mehta served as President until October 15, 2016. |
DIRECTORAND OFFICER INFORMATION | 73 |
Table of Contents
Notes:
| 74 | 2017 iSHARES ANNUAL REPORTTO SHAREHOLDERS |
Table of Contents
For more information visit www.iShares.com or call 1-800-474-2737
This report is intended for the Funds’ shareholders. It may not be distributed to prospective investors unless it is preceded or accompanied by the current prospectus.
Investing involves risk, including possible loss of principal.
The iShares Funds are distributed by BlackRock Investments, LLC (together with its affiliates, “BlackRock”).
The iShares Funds are not sponsored, endorsed, issued, sold or promoted by MSCI Inc., nor does this company make any representation regarding the advisability of investing in the iShares Funds. BlackRock is not affiliated with the company listed above.
A description of the policies that the Funds use to determine how to vote proxies relating to portfolio securities and information about how the Funds voted proxies relating to portfolio securities during the most recent twelve-month period ending June 30 is available without charge, upon request, by calling toll-free 1-800-474-2737; on the Funds’ website at www.iShares.com; and on the U.S. Securities and Exchange Commission (SEC) website at www.sec.gov.
The Funds file their complete schedules of portfolio holdings with the SEC for the first and third quarters of each fiscal year on Form N-Q. The Funds’ Forms N-Q are available on the SEC’s website or may be reviewed and copied at the SEC’s Public Reference Room in Washington, D.C. Information on the operation of the Public Reference Room may be obtained by calling 1-800-SEC-0330. The Funds also disclose their complete schedules of portfolio holdings on a daily basis on the Funds’ website.
©2017 BlackRock, Inc. All rights reserved. iSHARES and BLACKROCK are registered trademarks of BlackRock, Inc. or its subsidiaries. All other marks are the property of their respective owners.
iS-AR-812-0817
 | |
Table of Contents
AUGUST 31, 2017
2017 ANNUAL REPORT | |
iShares, Inc.
| Ø | iShares Edge MSCI Multifactor Emerging Markets ETF | EMGF | BATS |
| Ø | iShares MSCI EM ESG Optimized ETF | ESGE | NASDAQ |
| Ø | iShares MSCI Emerging Markets ex China ETF | EMXC | NASDAQ |
Table of Contents
| 5 | ||||
| 12 | ||||
| 12 | ||||
| 13 | ||||
| 13 | ||||
| 17 | ||||
| 23 | ||||
| 31 | ||||
| 35 | ||||
| 38 | ||||
| 49 | ||||
| 50 | ||||
| 51 | ||||
| 60 | ||||
| 62 |
Table of Contents
Management’s Discussion of Fund Performance
iSHARES®, INC.
GLOBAL EQUITY MARKET OVERVIEW
Global equity markets posted strong returns for the 12 months ended August 31, 2017 (the “reporting period”). The MSCI ACWI, a broad global equity index that includes both developed and emerging markets, returned 17.11% in U.S. dollar terms for the reporting period.
The primary factor behind the robust performance of global equity markets was improving global economic growth, driven largely by the continuation of accommodative monetary policies from many of the world’s central banks. Signs of stronger economic activity in Europe emerged as the European Central Bank (“ECB”) maintained policies such as quantitative easing and negative interest rates. Economic growth rates in China and Japan, the largest economies in Asia, also increased during the reporting period, reflecting efforts by the People’s Bank of China (“PBOC”) and the Bank of Japan (“BOJ”) to stimulate economic activity. Stronger economic growth led several central banks to consider reducing their economic stimulus measures. For example, late in the reporting period, the ECB discussed the possibility of tapering its quantitative easing program, while the PBOC increased short-term interest rates during the first half of 2017.
On a regional basis, European equity markets posted the best returns among developed markets, advancing by approximately 20% in U.S. dollar terms for the reporting period. European stocks benefited from improving economic conditions and stronger corporate earnings. In addition, election outcomes in France and the Netherlands eased investor concerns about nationalist presidential candidates and their opposition to the European Union (“E.U.”). Currency fluctuations also contributed meaningfully to European equity performance in U.S. dollar terms as the euro appreciated by approximately 6% against the U.S. dollar during the reporting period. The best-performing European stock markets included Austria, Italy, and Spain, while Ireland and Belgium posted the weakest returns.
Equity markets in the Asia-Pacific region gained about 16% in U.S. dollar terms for the reporting period, led by Singapore and Hong Kong. Japanese stocks also posted strong returns, benefiting from improving consumer spending and employment trends that contributed to the ongoing recovery in the Japanese economy. However, equity market returns in Japan were hindered by a decline in the Japanese yen, which depreciated by approximately 6% against the U.S. dollar.
The U.S. stock market returned approximately 15% for the reporting period. Despite mixed U.S. economic data, U.S. stocks advanced initially in anticipation of pro-business fiscal policies from the new presidential administration. Although the administration struggled to implement its fiscal agenda, stocks continued to move higher as better global economic conditions led to a notable improvement in corporate earnings growth, particularly for multinational companies with significant operations outside of the U.S. U.S. stocks advanced despite three short-term interest rate increases by the U.S. Federal Reserve Bank (the “Fed”) during the reporting period, which increased the short-term interest rate target to its highest level since October 2008. The Fed also unveiled a plan to start reducing the amount of U.S. Treasury bonds and mortgage-backed securities on its balance sheet before the end of 2017.
Emerging markets stocks outperformed those in developed markets, returning more than 23% in U.S. dollar terms for the reporting period. Emerging markets in Eastern Europe were the best performers, led by Poland, Greece, and Hungary. Equity markets in the Middle East trailed for the reporting period amid continued geopolitical conflict in the region.
MANAGEMENT’S DISCUSSIONSOF FUND PERFORMANCE | 5 |
Table of Contents
Management’s Discussion of Fund Performance
iSHARES® EDGE MSCI MULTIFACTOR EMERGING MARKETS ETF
Performance as of August 31, 2017
| Average Annual Total Returns | Cumulative Total Returns | |||||||||||||||||||||||||||
| NAV | MARKET | INDEX | NAV | MARKET | INDEX | |||||||||||||||||||||||
1 Year | 25.80% | 26.88% | 27.74% | 25.80% | 26.88% | 27.74% | ||||||||||||||||||||||
Since Inception | 21.33% | 21.82% | 22.51% | 39.84% | 40.82% | 42.03% | ||||||||||||||||||||||
GROWTH OF $10,000 INVESTMENT
(SINCE INCEPTION AT NET ASSET VALUE)
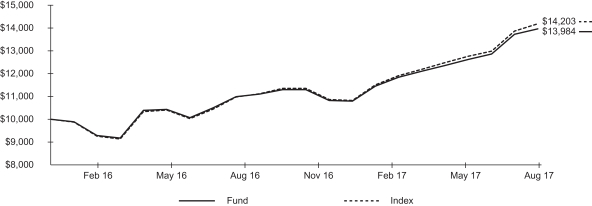
The inception date of the Fund was 12/8/15. The first day of secondary market trading was 12/10/15.
Past performance is no guarantee of future results. Performance results do not reflect the deduction of taxes that a shareholder would pay on fund distributions or on the redemption or sale of fund shares. See “About Fund Performance” on page 12 for more information.
| Shareholder Expenses | ||||||||||||||||||||||||||
| Actual | Hypothetical 5% Return | |||||||||||||||||||||||||
| Beginning Account Value (3/1/17) | Ending Account Value (8/31/17) | Expenses Paid During Period a | Beginning Account Value (3/1/17) | Ending Account Value (8/31/17) | Expenses Paid During Period a | Annualized Expense Ratio | ||||||||||||||||||||
| $ | 1,000.00 | $ | 1,180.40 | $ | 2.20 | $ | 1,000.00 | $ | 1,023.20 | $ | 2.04 | 0.40% | ||||||||||||||
| a | Expenses are calculated using the Fund’s annualized expense ratio (as disclosed in the table), multiplied by the average account value for the period, multiplied by the number of days in the period (184 days) and divided by the number of days in the year (365 days). See “Shareholder Expenses” on page 12 for more information. |
The iShares Edge MSCI Multifactor Emerging Markets ETF (the “Fund”) seeks to track the investment results of an index composed of stocks of large- and mid-capitalization companies in emerging markets that have favorable exposure to target style factors subject to constraints, as represented by the MSCI Emerging Markets Diversified Multiple-Factor Index (the “Index”). The Fund invests in a representative sample of securities included in the Index that collectively has an investment profile similar to the Index. Due to the use of representative sampling, the Fund may or may not hold all of the securities that are included in the Index. For the 12-month reporting period ended August 31, 2017, the total return for the Fund was 25.80%, net of fees, while the total return for the Index was 27.74%.
Stocks in China, which represented about 47% of the Index on average, contributed the most to the Index’s return for the reporting period. As a major global exporter, China capitalized on strengthening economic growth in many regions of the world.
| 6 | 2017 iSHARES ANNUAL REPORTTO SHAREHOLDERS |
Table of Contents
Management’s Discussion of Fund Performance (Continued)
iSHARES® EDGE MSCI MULTIFACTOR EMERGING MARKETS ETF
Chinese stocks also benefited from government stimulus efforts focused primarily on infrastructure and real estate expansion, which drove property prices higher and supported a surge in industrial output.
Stocks in South Korea and India were also meaningful contributors to the Index’s return for the reporting period. South Korea’s equity market reached an all-time high during the reporting period, benefiting from strong growth in technology-related companies. The stock market in India also reached all-time highs, amid government-driven economic reforms that are expected to stimulate economic activity. In contrast, stocks in Mexico, Qatar, and Pakistan detracted from the Index’s return for the reporting period.
From a sector perspective, the information technology sector contributed the most to the Index’s return for the reporting period. The consumer discretionary and financials sectors also contributed meaningfully to the Index’s return, as did the materials and energy sectors. The utilities sector detracted fractionally from the Index’s performance for the reporting period.
Currency fluctuations had a positive impact on the Index’s return for the reporting period, particularly an approximately 5% gain in the Taiwanese new dollar and about a 4% gain in the Indian rupee relative to the U.S. dollar.
For the reporting period, the Index outperformed the broader market, as represented by the MSCI Emerging Markets Index. The Index’s research-based selection process focuses on four investment factors: value, quality, momentum, and size. Of the four target style factors, momentum was the most significant contributor to the Index’s performance relative to the performance of the broader market for the reporting period. Value and quality were also contributors, while size detracted modestly from the Index’s relative return.
In addition to the net contribution from the target style factors, country allocation generated mixed performance, while industry allocation detracted from the Index’s performance relative to that of the broader market for the reporting period. From a country standpoint, an underweight allocation in the Index to Indian stocks and an overweight allocation to Chinese stocks benefited the Index’s relative performance for the reporting period, while overweight allocations in the Index to Russian and Brazilian stock detracted. On a sector basis, underweight allocations in the Index to banks and the software and services industry detracted from the Index’s relative performance for the reporting period, while an underweight allocation in the Index to the telecommunication services sector benefited relative performance.
ALLOCATION BY SECTOR
As of 8/31/17
| Sector | Percentage of Total Investments* |
Information Technology | 22.31 | % | ||
Financials | 16.24 | |||
Consumer Discretionary | 12.45 | |||
Materials | 7.78 | |||
Real Estate | 7.64 | |||
Investment Companies | 7.51 | |||
Industrials | 5.80 | |||
Energy | 5.15 | |||
Health Care | 5.02 | |||
Consumer Staples | 4.68 | |||
Utilities | 3.13 | |||
Telecommunication Services | 2.29 | |||
|
| |||
TOTAL | 100.00 | % | ||
|
|
TEN LARGEST COUNTRIES
As of 8/31/17
| Country | Percentage of Total Investments* |
China | 36.38 | % | ||
South Korea | 17.80 | |||
Taiwan | 10.21 | |||
India | 7.50 | |||
Russia | 6.28 | |||
Brazil | 6.05 | |||
South Africa | 4.16 | |||
Indonesia | 2.61 | |||
United Arab Emirates | 1.93 | |||
Turkey | 1.03 | |||
|
| |||
TOTAL | 93.95 | % | ||
|
|
| * | Excludes money market funds. |
MANAGEMENT’S DISCUSSIONSOF FUND PERFORMANCE | 7 |
Table of Contents
Management’s Discussion of Fund Performance
iSHARES® MSCI EM ESG OPTIMIZED ETF
Performance as of August 31, 2017
| Average Annual Total Returns | Cumulative Total Returns | |||||||||||||||||||||||||||
| NAV | MARKET | INDEX | NAV | MARKET | INDEX | |||||||||||||||||||||||
1 Year | 23.75% | 24.43% | 25.48% | 23.75% | 24.43% | 25.48% | ||||||||||||||||||||||
Since Inception | 32.01% | 32.63% | 34.33% | 38.71% | 39.47% | 41.33% | ||||||||||||||||||||||
GROWTH OF $10,000 INVESTMENT
(SINCE INCEPTION AT NET ASSET VALUE)
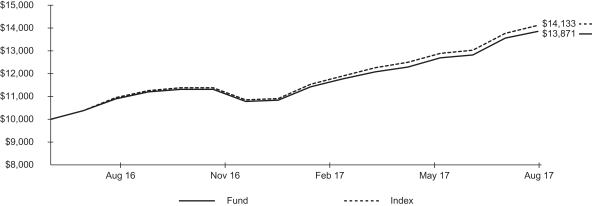
The inception date of the Fund was 6/28/16. The first day of secondary market trading was 6/30/16.
Past performance is no guarantee of future results. Performance results do not reflect the deduction of taxes that a shareholder would pay on fund distributions or on the redemption or sale of fund shares. See “About Fund Performance” on page 12 for more information.
| Shareholder Expenses | ||||||||||||||||||||||||||
| Actual | Hypothetical 5% Return | |||||||||||||||||||||||||
| Beginning Account Value (3/1/17) | Ending Account Value (8/31/17) | Expenses Paid During Period a | Beginning Account Value (3/1/17) | Ending Account Value (8/31/17) | Expenses Paid During Period a | Annualized Expense Ratio | ||||||||||||||||||||
| $ | 1,000.00 | $ | 1,177.80 | $ | 2.25 | $ | 1,000.00 | $ | 1,023.10 | $ | 2.09 | 0.41% | ||||||||||||||
| a | Expenses are calculated using the Fund’s annualized expense ratio (as disclosed in the table), multiplied by the average account value for the period, multiplied by the number of days in the period (184 days) and divided by the number of days in the year (365 days). See “Shareholder Expenses” on page 12 for more information. |
| 8 | 2017 iSHARES ANNUAL REPORTTO SHAREHOLDERS |
Table of Contents
Management’s Discussion of Fund Performance (Continued)
iSHARES® MSCI EM ESG OPTIMIZED ETF
The iShares MSCI EM ESG Optimized ETF (the “Fund”) seeks to track the investment results of an index composed of large- and mid-capitalization emerging market equities that have positive environmental, social and governance characteristics, as represented by the MSCI Emerging Markets ESG Focus Index (the “Index”). The Fund invests in a representative sample of securities included in the Index that collectively has an investment profile similar to the Index. Due to the use of representative sampling, the Fund may or may not hold all of the securities that are included in the Index. For the 12-month reporting period ended August 31, 2017, the total return for the Fund was 23.75%, net of fees, while the total return for the Index was 25.48%.
The robust performance of emerging markets stocks with positive environmental, social, and governance (“ESG”) characteristics were led by stocks in several Asian countries, including China, South Korea, and Taiwan. Many emerging economies in Asia have begun to focus on greater transparency regarding ESG disclosure as ESG investing expands in the region. China is increasingly addressing environmental protection issues in the country and has become a leader in “green bonds,” which are debt instruments issued to help finance sustainable development projects. In Taiwan, many of the largest public companies have led the way in greater ESG data reporting, while South Korea has set ambitious goals to increase renewable energy generation.
An improving global economic environment was also beneficial for ESG stocks in these three countries. As a major global exporter, China benefited from strengthening economic growth in many regions of the world. South Korea and Taiwan were beneficiaries of strong growth in technology-related companies. South Korea’s equity market reached an all-time high during the reporting period, benefiting from a surge in semiconductor exports. Taiwan’s technology-heavy stock market rose to its highest level in 27 years, led by component suppliers that benefited from robust smartphone production.
In contrast, ESG stocks in Qatar detracted from the Index’s return for the reporting period amid the country’s growing diplomatic crisis with Saudi Arabia and other neighboring countries in the Middle East.
From a sector perspective, the information technology sector contributed the most to the Index’s return for the reporting period, benefiting from growing demand for a range of technological devices. The financials and consumer discretionary sectors also contributed meaningfully to the Index’s return for the reporting period, as did the energy and materials sectors.
Currency fluctuations had a positive impact on the Index’s return for the reporting period, particularly an approximately 5% gain in the Taiwanese new dollar and about a 4% gain in the Indian rupee relative to the U.S. dollar.
ALLOCATION BY SECTOR
As of 8/31/17
| Sector | Percentage of Total Investments* |
Information Technology | 28.14 | % | ||
Financials | 27.10 | |||
Consumer Discretionary | 10.24 | |||
Energy | 7.13 | |||
Materials | 5.79 | |||
Consumer Staples | 5.45 | |||
Telecommunication Services | 5.18 | |||
Industrials | 5.15 | |||
Utilities | 2.87 | |||
Health Care | 1.75 | |||
Real Estate | 1.20 | |||
|
| |||
TOTAL | 100.00 | % | ||
|
|
TEN LARGEST COUNTRIES
As of 8/31/17
| Country | Percentage of Total Investments* |
China | 27.87 | % | ||
South Korea | 14.53 | |||
Taiwan | 11.50 | �� | ||
India | 8.30 | |||
South Africa | 7.68 | |||
Brazil | 7.60 | |||
Mexico | 3.26 | |||
Russia | 3.17 | |||
Thailand | 3.03 | |||
Malaysia | 2.92 | |||
|
| |||
TOTAL | 89.86 | % | ||
|
|
| * | Excludes money market funds. |
MANAGEMENT’S DISCUSSIONSOF FUND PERFORMANCE | 9 |
Table of Contents
Management’s Discussion of Fund Performance
iSHARES® MSCI EMERGING MARKETS ex CHINA ETF
Performance as of August 31, 2017
| Cumulative Total Returns | ||||||||||||
| NAV | MARKET | INDEX | ||||||||||
Since Inception | 1.83% | 2.63% | 1.93% | |||||||||
The inception date of the Fund was 7/18/17. The first day of secondary market trading was 7/20/17.
For the fiscal period ended 8/31/17, the Fund did not have six months of performance and therefore line graphs are not presented.
Past performance is no guarantee of future results. Performance results do not reflect the deduction of taxes that a shareholder would pay on fund distributions or on the redemption or sale of fund shares. See “About Fund Performance” on page 12 for more information.
| Shareholder Expenses | ||||||||||||||||||||||||||
| Actual | Hypothetical 5% Return | |||||||||||||||||||||||||
Beginning (7/18/17) | Ending Account Value (8/31/17) | Expenses Paid During Period b | Beginning Account Value (3/1/17) | Ending Account Value (8/31/17) | Expenses Paid During Period b | Annualized Expense Ratio | ||||||||||||||||||||
| $ | 1,000.00 | $ | 1,018.30 | $ | 0.50 | $ | 1,000.00 | $ | 1,023.10 | $ | 2.09 | 0.41% | ||||||||||||||
| a | The beginning of the period (commencement of operations) is July 18, 2017. |
| b | Expenses are calculated using the Fund’s annualized expense ratio (as disclosed in the table), multiplied by the average account value for the period, multiplied by the number of days in the period (44 days for actual and 184 days for hypothetical expenses) and divided by the number of days in the year (365 days). See “Shareholder Expenses” on page 12 for more information. |
| 10 | 2017 iSHARES ANNUAL REPORTTO SHAREHOLDERS |
Table of Contents
Management’s Discussion of Fund Performance (Continued)
iSHARES® MSCI EMERGING MARKETS ex CHINA ETF
The iShares MSCI Emerging Markets ex China ETF (the “Fund”) seeks to track the investment results of an index composed of large- and mid-capitalization emerging market equities, excluding China, as represented by the MSCI Emerging Markets ex China Index (the “Index”). The Fund invests in a representative sample of securities included in the Index that collectively has an investment profile similar to the Index. Due to the use of representative sampling, the Fund may or may not hold all of the securities that are included in the Index. For the period from July 18, 2017 (inception date of the Fund) through August 31, 2017, the total return for the Fund was 1.83%, net of fees, while the total return for the Index was 1.93%.
The modest advance in the Index for the reporting period reflected improving global economic growth and increased geopolitical tensions. On the economic front, strengthening growth in Europe and a recovery in the Chinese economy contributed to a better economic environment for many emerging markets. Exports are a key component of many emerging economies, so stronger economic growth in developed countries and large emerging markets such as China typically lead to increased demand for exports.
Many of the leading contributors to the Index’s return for the reporting period benefited from stronger export growth, including stocks in Brazil, South Africa, and Russia. Brazil and Russia both emerged from recession in 2017, driven in large part by increased exports, while South Africa’s economy continued to rebound as the end of a drought in the country led to a recovery in agricultural production.
However, positive performance in the Index for the reporting period was impacted by geopolitical conflicts around the globe. Stocks in South Korea, which detracted the most from the Index’s return for the reporting period, declined amid rising tensions between the U.S. and neighboring North Korea. Stocks in Qatar, another notable detractor from the Index for the reporting period, declined amid the country’s growing diplomatic crisis with Saudi Arabia and other countries in the Middle East.
From a sector perspective, the financials sector contributed the most to the Index’s return for the reporting period, led by strong performance from the banking industry. The materials and energy sectors also contributed meaningfully to the Index’s performance, benefiting from stronger commodities prices during the reporting period. In contrast, the information technology sector detracted the most from the Index’s return for the reporting period.
ALLOCATION BY SECTOR
As of 8/31/17
| Sector | Percentage of Total Investments* |
Financials | 20.59 | % | ||
Information Technology | 19.96 | |||
Investment Companies | 13.05 | |||
Consumer Discretionary | 9.02 | |||
Materials | 8.73 | |||
Consumer Staples | 7.42 | |||
Energy | 5.87 | |||
Industrials | 4.89 | |||
Telecommunication Services | 4.65 | |||
Utilities | 2.34 | |||
Real Estate | 1.89 | |||
Health Care | 1.59 | |||
|
| |||
TOTAL | 100.00 | % | ||
|
|
TEN LARGEST COUNTRIES
As of 8/31/17
| Country | Percentage of Total Investments* |
South Korea | 20.66 | % | ||
Taiwan | 16.78 | |||
India | 12.18 | |||
Brazil | 10.17 | |||
South Africa | 9.56 | |||
Mexico | 5.08 | |||
Russia | 4.60 | |||
Indonesia | 3.24 | |||
Malaysia | 3.17 | |||
Thailand | 3.04 | |||
|
| |||
TOTAL | 88.48 | % | ||
|
|
| * | Excludes money market funds. |
MANAGEMENT’S DISCUSSIONSOF FUND PERFORMANCE | 11 |
Table of Contents
Past performance is no guarantee of future results. Current performance may be lower or higher than the performance data quoted. Performance data current to the most recent month-end is available at www.ishares.com. Performance results assume reinvestment of all dividends and capital gain distributions and do not reflect the deduction of taxes that a shareholder would pay on fund distributions or on the redemption or sale of fund shares. The investment return and principal value of shares will vary with changes in market conditions. Shares may be worth more or less than their original cost when they are redeemed or sold in the market. Performance for certain funds may reflect a waiver of a portion of investment advisory fees. Without such a waiver, performance would have been lower.
Net asset value or “NAV” is the value of one share of a fund as calculated in accordance with the standard formula for valuing mutual fund shares. The price used to calculate market return (“Market Price”) is determined by using the midpoint between the highest bid and the lowest offer on the primary stock exchange on which shares of a fund are listed for trading, as of the time that such fund’s NAV is calculated. Certain funds may have a NAV which is determined prior to the opening of regular trading on its listed exchange and their market returns are calculated using the midpoint of the bid/ask spread as of the opening of regular trading on the exchange. Market and NAV returns assume that dividends and capital gain distributions have been reinvested at Market Price and NAV, respectively.
An index is a statistical composite that tracks a specified financial market or sector. Unlike a fund, an index does not actually hold a portfolio of securities and therefore does not incur the expenses incurred by a fund. These expenses negatively impact fund performance. Also, market returns do not include brokerage commissions that may be payable on secondary market transactions. If brokerage commissions were included, market returns would be lower.
As a shareholder of a Fund, you incur two types of costs: (1) transaction costs, including brokerage commissions on purchases and sales of fund shares and (2) ongoing costs, including management fees and other fund expenses. The expense example, which is based on an investment of $1,000 invested on March 1, 2017 (or commencement of operations, as applicable) and held through August 31, 2017, is intended to help you understand your ongoing costs (in dollars and cents) of investing in a Fund and to compare these costs with the ongoing costs of investing in other funds.
Actual Expenses — The table provides information about actual account values and actual expenses. Annualized expense ratios reflect contractual and voluntary fee waivers, if any. To estimate the expenses that you paid on your account over the period, simply divide your account value by $1,000 (for example, an $8,600 account value divided by $1,000 = 8.6), then multiply the result by the number corresponding to your Fund under the heading entitled “Expenses Paid During Period.”
Hypothetical Example for Comparison Purposes — The table also provides information about hypothetical account values and hypothetical expenses based on each Fund’s actual expense ratio and an assumed rate of return of 5% per year before expenses. You may use this information to compare the ongoing costs of investing in your Fund and other funds. To do so, compare this 5% hypothetical example with the 5% hypothetical examples that appear in the shareholder reports of the other funds.
Please note that the expenses shown in the table are meant to highlight your ongoing costs only and do not reflect any transactional costs, such as brokerage commissions paid on purchases and sales of fund shares. Therefore, the hypothetical examples are useful in comparing ongoing costs only and will not help you determine the relative total costs of owning different funds. In addition, if these transactional costs were included, your costs would have been higher.
| 12 | 2017 iSHARES ANNUAL REPORTTO SHAREHOLDERS |
Table of Contents
iSHARES® EDGE MSCI MULTIFACTOR EMERGING MARKETS ETF
August 31, 2017
| Security | Shares | Value | ||||||
COMMON STOCKS — 86.87% |
| |||||||
BRAZIL — 3.13% |
| |||||||
BB Seguridade Participacoes SA | 21,600 | $ | 190,295 | |||||
Centrais Eletricas Brasileiras SAa | 38,600 | 216,159 | ||||||
Cia. de Saneamento Basico do Estado de Sao Paulo | 46,800 | 478,196 | ||||||
EDP – Energias do Brasil SA | 43,200 | 209,242 | ||||||
M. Dias Branco SA | 14,800 | 230,952 | ||||||
Odontoprev SA | 34,600 | 162,968 | ||||||
Porto Seguro SA | 19,900 | 219,779 | ||||||
Qualicorp SA | 34,200 | 378,798 | ||||||
Sul America SA | 36,178 | 206,735 | ||||||
Transmissora Alianca de Energia Eletrica SA Units | 41,500 | 296,763 | ||||||
|
| |||||||
| 2,589,887 | ||||||||
CHINA — 36.30% |
| |||||||
AAC Technologies Holdings Inc.b | 114,000 | 2,078,567 | ||||||
Alibaba Group Holding Ltd. ADRa | 5,579 | 958,137 | ||||||
ANTA Sports Products Ltd. | 149,000 | 586,371 | ||||||
China Communications Services Corp. Ltd. Class H | 576,000 | 312,049 | ||||||
China Conch Venture Holdings Ltd. | 171,000 | 311,130 | ||||||
China Construction Bank Corp. Class H | 1,404,000 | 1,230,627 | ||||||
China Everbright Ltd. | 144,000 | 328,977 | ||||||
China Medical System Holdings Ltd. | 148,000 | 272,307 | ||||||
China Resources Land Ltd. | 434,000 | 1,355,825 | ||||||
China State Construction International Holdings Ltd. | 92,000 | 133,302 | ||||||
Chongqing Changan Automobile Co. Ltd. Class B | 195,600 | 255,920 | ||||||
Chongqing Rural Commercial Bank Co. Ltd. Class H | 576,000 | 401,101 | ||||||
COSCO SHIPPING Ports Ltd. | 262,000 | 309,655 | ||||||
Country Garden Holdings Co. Ltd.b | 954,000 | 1,267,701 | ||||||
CSPC Pharmaceutical Group Ltd. | 720,000 | 1,124,188 | ||||||
Dongfeng Motor Group Co. Ltd. Class H | 360,000 | 467,338 | ||||||
Fuyao Glass Industry Group Co. Ltd. Class Hc | 52,400 | 167,046 | ||||||
Geely Automobile Holdings Ltd. | 810,000 | 1,991,248 | ||||||
Guangzhou Automobile Group Co. Ltd. Class H | 396,000 | 781,228 | ||||||
Haitian International Holdings Ltd. | 144,000 | 432,380 | ||||||
| Security | Shares | Value | ||||||
Jiangsu Expressway Co. Ltd. Class H | 126,000 | $ | 193,191 | |||||
Longfor Properties Co. Ltd. | 288,000 | 691,808 | ||||||
NetEase Inc. ADR | 6,300 | 1,737,792 | ||||||
New Oriental Education & Technology Group Inc. ADR | 23,076 | 1,886,463 | ||||||
Nine Dragons Paper (Holdings) Ltd. | 342,000 | 570,696 | ||||||
Shandong Weigao Group Medical Polymer Co. Ltd. Class H | 184,000 | 146,938 | ||||||
Shanghai Industrial Holdings Ltd. | 46,000 | 139,885 | ||||||
Shanghai Pharmaceuticals Holding Co. Ltd. Class H | 72,800 | 179,152 | ||||||
Sihuan Pharmaceutical Holdings Group Ltd. | 864,000 | 332,289 | ||||||
Sino Biopharmaceutical Ltd. | 745,000 | 653,955 | ||||||
Sino-Ocean Group Holding Ltd. | 654,000 | 451,239 | ||||||
Sinopec Engineering Group Co. Ltd. Class H | 279,000 | 251,677 | ||||||
Sunac China Holdings Ltd. | 360,000 | 1,080,950 | ||||||
Sunny Optical Technology Group Co. Ltd. | 114,000 | 1,634,304 | ||||||
TAL Education Group Class A ADR | 49,896 | 1,518,335 | ||||||
Tencent Holdings Ltd. | 46,800 | 1,967,329 | ||||||
TravelSky Technology Ltd. Class H | 114,000 | 311,712 | ||||||
Yum China Holdings Inc.a | 44,424 | 1,570,833 | ||||||
|
| |||||||
| 30,083,645 | ||||||||
CZECH REPUBLIC — 0.67% |
| |||||||
Moneta Money Bank ASc | 112,518 | 393,863 | ||||||
O2 Czech Republic AS | 13,140 | 164,485 | ||||||
|
| |||||||
| 558,348 | ||||||||
EGYPT — 0.37% |
| |||||||
Commercial International Bank Egypt SAE | 63,909 | 304,889 | ||||||
|
| |||||||
| 304,889 | ||||||||
HUNGARY — 0.91% |
| |||||||
MOL Hungarian Oil & Gas PLC | 2,990 | 277,116 | ||||||
Richter Gedeon Nyrt | 18,198 | 473,199 | ||||||
|
| |||||||
| 750,315 | ||||||||
INDONESIA — 2.60% |
| |||||||
Adaro Energy Tbk PT | 3,283,200 | 449,096 | ||||||
Bank Danamon Indonesia Tbk PT | 838,800 | 342,637 | ||||||
Bank Negara Indonesia Persero Tbk PT | 986,400 | 543,400 | ||||||
United Tractors Tbk PT | 325,800 | 739,900 | ||||||
SCHEDULESOF INVESTMENTS | 13 |
Table of Contents
Schedule of Investments (Continued)
iSHARES® EDGE MSCI MULTIFACTOR EMERGING MARKETS ETF
August 31, 2017
| Security | Shares | Value | ||||||
Waskita Karya Persero Tbk PT | 489,600 | $ | 81,465 | |||||
|
| |||||||
| 2,156,498 | ||||||||
MALAYSIA — 0.91% |
| |||||||
AirAsia Bhd | 394,200 | 306,461 | ||||||
Alliance Financial Group Bhd | 282,600 | 254,112 | ||||||
PPB Group Bhd | 48,600 | 189,825 | ||||||
|
| |||||||
| 750,398 | ||||||||
MEXICO — 1.02% |
| |||||||
Gentera SAB de CV | 189,300 | 291,341 | ||||||
Grupo Aeroportuario del Pacifico SAB de CV Series B | 50,400 | 557,680 | ||||||
|
| |||||||
| 849,021 | ||||||||
PAKISTAN — 0.13% |
| |||||||
Lucky Cement Ltd. | 18,200 | 103,283 | ||||||
|
| |||||||
| 103,283 | ||||||||
POLAND — 0.79% |
| |||||||
Jastrzebska Spolka Weglowa SAa | 14,580 | 424,335 | ||||||
Tauron Polska Energia SAa | 213,125 | 233,797 | ||||||
|
| |||||||
| 658,132 | ||||||||
QATAR — 0.72% |
| |||||||
Qatar Electricity & Water Co. QSC | 3,854 | 196,868 | ||||||
Qatar Insurance Co. SAQ | 22,014 | 399,018 | ||||||
|
| |||||||
| 595,886 | ||||||||
RUSSIA — 5.74% |
| |||||||
Alrosa PJSC | 451,900 | 628,341 | ||||||
Inter RAO UES PJSC | 5,886,000 | 392,130 | ||||||
Lukoil PJSC | 597 | 30,120 | ||||||
Mobile TeleSystems PJSC ADR | 78,357 | 782,786 | ||||||
Novolipetsk Steel PJSC | 252,360 | 597,495 | ||||||
PhosAgro PJSC GDRd | 15,501 | 215,464 | ||||||
RusHydro PJSC | 19,804,000 | 281,877 | ||||||
Surgutneftegas OJSC | 1,118,100 | 517,223 | ||||||
Tatneft PJSC Class S | 198,900 | 1,315,155 | ||||||
|
| |||||||
| 4,760,591 | ||||||||
SOUTH AFRICA — 4.15% |
| |||||||
Bidvest Group Ltd. (The) | 59,400 | 783,545 | ||||||
Capitec Bank Holdings Ltd. | 4,788 | 331,725 | ||||||
Coronation Fund Managers Ltd. | 52,932 | 286,499 | ||||||
Exxaro Resources Ltd. | 49,284 | 496,234 | ||||||
Liberty Holdings Ltd. | 32,436 | 258,540 | ||||||
Mondi Ltd. | 20,448 | 558,054 | ||||||
Netcare Ltd. | 91,602 | 169,919 | ||||||
Pick n Pay Stores Ltd. | 33,858 | 166,665 | ||||||
SPAR Group Ltd. (The) | 26,892 | 349,767 | ||||||
| Security | Shares | Value | ||||||
Tiger Brands Ltd. | 1,325 | $ | 41,083 | |||||
|
| |||||||
| 3,442,031 | ||||||||
SOUTH KOREA — 15.77% |
| |||||||
BGF retail Co. Ltd. | 4,464 | 361,047 | ||||||
BNK Financial Group Inc. | 42,048 | 367,678 | ||||||
DGB Financial Group Inc. | 27,270 | 266,025 | ||||||
Dongbu Insurance Co. Ltd. | 8,028 | 535,390 | ||||||
E-MART Inc. | 3,402 | 675,814 | ||||||
GS Retail Co. Ltd. | 5,688 | 203,539 | ||||||
Hana Financial Group Inc. | 45,486 | 1,976,600 | ||||||
Hanwha Chemical Corp. | 15,912 | 498,837 | ||||||
Hanwha Life Insurance Co. Ltd. | 25,500 | 165,537 | ||||||
Hyosung Corp. | 4,086 | 574,345 | ||||||
Hyundai Department Store Co. Ltd. | 2,456 | 210,402 | ||||||
Hyundai Engineering & Construction Co. Ltd. | 15,372 | 554,161 | ||||||
Hyundai Marine & Fire Insurance Co. Ltd. | 10,080 | 412,997 | ||||||
Hyundai Steel Co. | 14,004 | 716,593 | ||||||
KT&G Corp. | 13,194 | 1,339,760 | ||||||
Kumho Petrochemical Co. Ltd. | 2,496 | 174,428 | ||||||
LG Display Co. Ltd. | 16,399 | 453,023 | ||||||
Lotte Chemical Corp. | 2,862 | 1,013,985 | ||||||
Samsung Electronics Co. Ltd. | 813 | 1,669,837 | ||||||
SK Telecom Co. Ltd. | 2,837 | 637,797 | ||||||
Yuhan Corp. | 1,296 | 259,752 | ||||||
|
| |||||||
| 13,067,547 | ||||||||
TAIWAN — 10.19% |
| |||||||
Chicony Electronics Co. Ltd. | 114,621 | 287,891 | ||||||
China Life Insurance Co. Ltd./Taiwan | 614,000 | 677,498 | ||||||
Feng TAY Enterprise Co. Ltd. | 29,880 | 141,583 | ||||||
Foxconn Technology Co. Ltd. | 114,720 | 364,166 | ||||||
Highwealth Construction Corp. | 165,000 | 262,434 | ||||||
Innolux Corp. | 1,350,000 | 657,576 | ||||||
Inventec Corp. | 461,000 | 365,849 | ||||||
Lite-On Technology Corp. | 288,718 | 427,160 | ||||||
Micro-Star International Co. Ltd. | 144,000 | 327,804 | ||||||
Nien Made Enterprise Co. Ltd. | 30,000 | 322,575 | ||||||
Novatek Microelectronics Corp. | 114,000 | 443,852 | ||||||
Phison Electronics Corp. | 12,000 | 161,834 | ||||||
Powertech Technology Inc. | 131,000 | 397,614 | ||||||
Realtek Semiconductor Corp. | 108,000 | 418,702 | ||||||
Ruentex Development Co. Ltd.a | 34,800 | 34,075 | ||||||
Ruentex Industries Ltd. | 162,000 | 260,615 | ||||||
| 14 | 2017 iSHARES ANNUAL REPORTTO SHAREHOLDERS |
Table of Contents
Schedule of Investments (Continued)
iSHARES® EDGE MSCI MULTIFACTOR EMERGING MARKETS ETF
August 31, 2017
| Security | Shares | Value | ||||||
Shin Kong Financial Holding Co. Ltd. | 918,000 | $ | 266,770 | |||||
Taiwan Business Bank | 999,504 | 276,214 | ||||||
Taiwan Semiconductor Manufacturing Co. Ltd. | 165,000 | 1,183,687 | ||||||
Teco Electric and Machinery Co. Ltd. | 216,000 | 201,836 | ||||||
Transcend Information Inc. | 46,000 | 137,182 | ||||||
Vanguard International Semiconductor Corp. | 29,000 | 52,371 | ||||||
Wistron Corp. | 389,906 | 368,214 | ||||||
WPG Holdings Ltd. | 313,000 | 407,598 | ||||||
|
| |||||||
| 8,445,100 | ||||||||
THAILAND — 0.52% |
| |||||||
KCE Electronics PCL NVDR | 61,400 | 161,798 | ||||||
Robinson PCL NVDR | 77,900 | 134,897 | ||||||
Thai Union Group PCL NVDR | 222,300 | 132,556 | ||||||
|
| |||||||
| 429,251 | ||||||||
TURKEY — 1.03% |
| |||||||
Aselsan Elektronik Sanayi ve TAS | 33,840 | 264,639 | ||||||
Turkiye Halk Bankasi AS | 72,126 | 309,599 | ||||||
Turkiye Sise ve Cam Fabrikalari AS | 215,219 | 276,773 | ||||||
|
| |||||||
| 851,011 | ||||||||
UNITED ARAB EMIRATES — 1.92% |
| |||||||
Aldar Properties PJSC | 370,530 | 233,025 | ||||||
DAMAC Properties Dubai Co. PJSC | 433,260 | 476,538 | ||||||
Dubai Islamic Bank PJSC | 250,259 | 414,929 | ||||||
Emaar Properties PJSC | 202,338 | 468,235 | ||||||
|
| |||||||
| 1,592,727 | ||||||||
TOTAL COMMON STOCKS |
| |||||||
(Cost: $61,406,242) |
| 71,988,560 | ||||||
PREFERRED STOCKS — 5.43% |
| |||||||
BRAZIL — 2.92% |
| |||||||
Braskem SA Class A, Preference Shares | 29,900 | 362,151 | ||||||
Cia. Paranaense de Energia Class B, Preference Shares | 30,600 | 279,504 | ||||||
Itausa-Investimentos Itau SA, Preference Shares | 547,280 | 1,774,144 | ||||||
|
| |||||||
| 2,415,799 | ||||||||
RUSSIA — 0.52% |
| |||||||
Surgutneftegas OJSC, Preference Shares | 880,200 | 434,530 | ||||||
|
| |||||||
| 434,530 | ||||||||
| Security | Shares | Value | ||||||
SOUTH KOREA — 1.99% |
| |||||||
LG Household & Health Care Ltd., Preference Shares | 330 | $ | 175,594 | |||||
Samsung Electronics Co. Ltd., Preference Shares | 883 | 1,476,104 | ||||||
|
| |||||||
| 1,651,698 | ||||||||
TOTAL PREFERRED STOCKS |
| |||||||
(Cost: $3,789,711) |
| 4,502,027 | ||||||
INVESTMENT COMPANIES — 7.49% |
| |||||||
INDIA — 7.49% |
| |||||||
iShares MSCI India ETFe | 181,962 | 6,206,724 | ||||||
|
| |||||||
| 6,206,724 | ||||||||
|
| |||||||
TOTAL INVESTMENT COMPANIES |
| |||||||
(Cost: $5,506,383) |
| 6,206,724 | ||||||
SHORT-TERM INVESTMENTS — 3.07% |
| |||||||
MONEY MARKET FUNDS — 3.07% |
| |||||||
BlackRock Cash Funds: Institutional, |
| |||||||
1.32%e,f,g | 2,360,187 | 2,360,895 | ||||||
BlackRock Cash Funds: Treasury, | ||||||||
0.96%e,f | 184,901 | 184,901 | ||||||
|
| |||||||
| 2,545,796 | ||||||||
|
| |||||||
TOTAL SHORT-TERM INVESTMENTS |
| |||||||
(Cost: $2,545,796) |
| 2,545,796 | ||||||
|
| |||||||
TOTAL INVESTMENTS IN SECURITIES — 102.86% |
| |||||||
(Cost: $73,248,132)h |
| 85,243,107 | ||||||
Other Assets, Less Liabilities — (2.86)% |
| (2,370,192 | ) | |||||
|
| |||||||
NET ASSETS — 100.00% |
| $ | 82,872,915 | |||||
|
| |||||||
ADR — American Depositary Receipts
GDR — Global Depositary Receipts
NVDR — Non-Voting Depositary Receipts
| a | Non-income earning security. |
| b | All or a portion of this security represents a security on loan. See Note 1. |
| c | This security may be resold to qualified institutional buyers under Rule 144A of the Securities Act of 1933. |
| d | This security may be resold to qualified foreign investors and foreign institutional buyers under Regulation S of the Securities Act of 1933. |
| e | Affiliated issuer. See Schedule 1. |
| f | The rate quoted is the annualized seven-day yield of the fund at period end. |
| g | All or a portion of this security represents an investment of securities lending collateral. See Note 1. |
| h | The cost of investments (including short positions and derivatives, if any) for federal income tax purposes was $73,503,920. Net unrealized appreciation was $11,739,187, of which $12,639,388 represented gross unrealized appreciation on investments and $900,201 represented gross unrealized depreciation on investments. |
SCHEDULESOF INVESTMENTS | 15 |
Table of Contents
Schedule of Investments (Continued)
iSHARES® EDGE MSCI MULTIFACTOR EMERGING MARKETS ETF
August 31, 2017
Schedule 1 — Affiliates (Note 2)
Investments in issuers considered to be affiliates of the Fund during the year ended August 31, 2017, for purposes of Section 2(a)3 of the 1940 Act, and/or related parties of the Fund were as follows:
| Affiliated issuer | Shares held at 08/31/16 | Shares purchased | Shares sold | Shares held at 08/31/17 | Value at 08/31/17 | Net realized gain (loss) a | Change in unrealized appreciation (depreciation) | Income | ||||||||||||||||||||||||
BlackRock Cash Funds: Institutional, | 160,740 | 2,199,447 | b | — | 2,360,187 | $ | 2,360,895 | $ | 64 | $ | — | $ | — | c | ||||||||||||||||||
BlackRock Cash Funds: Treasury, | — | 184,901 | b | — | 184,901 | 184,901 | 2 | — | 447 | |||||||||||||||||||||||
iShares MSCI India ETF | 46,118 | 135,844 | — | 181,962 | 6,206,724 | — | 616,602 | 21,588 | ||||||||||||||||||||||||
|
|
|
|
|
|
|
| |||||||||||||||||||||||||
| $ | 8,752,520 | $ | 66 | $ | 616,602 | $ | 22,035 | |||||||||||||||||||||||||
|
|
|
|
|
|
|
| |||||||||||||||||||||||||
| a | Includes realized capital gain distributions from an affiliated fund, if any. |
| b | Net of shares purchased and sold. |
| c | Does not include income earned on the investment of securities lending cash collateral which is not direct income of the Fund and is reflected as a component of securities lending income in the statement of operations. |
Schedule 2 — Fair Value Measurements
Various inputs are used in determining the fair value of financial instruments. For description of the input levels and information about the Fund’s policy regarding valuation of financial instruments, see Note 1.
The following table summarizes the value of the Fund’s investments according to the fair value hierarchy as of August 31, 2017. The breakdown of the Fund’s investments into major categories is disclosed in the schedule of investments above.
| Level 1 | Level 2 | Level 3 | Total | |||||||||||||
Investments: | ||||||||||||||||
Assets: | ||||||||||||||||
Common stocks | $ | 71,988,560 | $ | — | $ | — | $ | 71,988,560 | ||||||||
Preferred stocks | 4,502,027 | — | — | 4,502,027 | ||||||||||||
Investment companies | 6,206,724 | — | — | 6,206,724 | ||||||||||||
Money market funds | 2,545,796 | — | — | 2,545,796 | ||||||||||||
|
|
|
|
|
|
|
| |||||||||
Total | $ | 85,243,107 | $ | — | $ | — | $ | 85,243,107 | ||||||||
|
|
|
|
|
|
|
| |||||||||
See notes to financial statements.
| 16 | 2017 iSHARES ANNUAL REPORTTO SHAREHOLDERS |
Table of Contents
Schedule of Investments
iSHARES® MSCI EM ESG OPTIMIZED ETF
August 31, 2017
| Security | Shares | Value | ||||||
COMMON STOCKS — 95.20% | ||||||||
BRAZIL — 4.21% | ||||||||
Ambev SA | 64,800 | $ | 409,010 | |||||
B3 SA – Brasil Bolsa Balcao | 64,400 | 452,741 | ||||||
Banco Bradesco SA | 12,520 | 128,326 | ||||||
Banco do Brasil SA | 22,400 | 218,557 | ||||||
Banco Santander Brasil SA Units | 25,200 | 224,573 | ||||||
Cielo SA | 12,600 | 89,821 | ||||||
Cosan SA Industria e Comercio | 18,000 | 220,763 | ||||||
CPFL Energia SA | 36,400 | 313,393 | ||||||
Duratex SA | 33,600 | 91,837 | ||||||
EDP – Energias do Brasil SA | 73,600 | 356,486 | ||||||
Engie Brasil Energia SA | 11,200 | 128,500 | ||||||
Localiza Rent A Car SA | 25,910 | 490,375 | ||||||
Lojas Renner SA | 8,610 | 83,734 | ||||||
Natura Cosmeticos SA | 31,200 | 292,520 | ||||||
Ultrapar Participacoes SA | 4,400 | 102,713 | ||||||
WEG SA | 73,100 | 475,338 | ||||||
|
| |||||||
| 4,078,687 | ||||||||
CHILE — 1.36% |
| |||||||
Aguas Andinas SA Series A | 123,760 | 79,045 | ||||||
Banco de Credito e Inversiones | 4,939 | 320,292 | ||||||
Banco Santander Chile | 4,877,069 | 356,599 | ||||||
Cia. Cervecerias Unidas SA | 9,017 | 122,920 | ||||||
Empresas COPEC SA | 34,559 | 441,160 | ||||||
|
| |||||||
| 1,320,016 | ||||||||
CHINA — 27.78% |
| |||||||
58.com Inc. ADRa | 1,877 | 117,556 | ||||||
AAC Technologies Holdings Inc. | 22,000 | 401,127 | ||||||
Agricultural Bank of China Ltd. | 409,000 | 192,312 | ||||||
Air China Ltd. Class H | 144,000 | 128,058 | ||||||
Alibaba Group Holding Ltd. ADRa,b | 19,657 | 3,375,893 | ||||||
Alibaba Health Information Technology Ltd.a,b | 196,000 | 91,408 | ||||||
Alibaba Pictures Group Ltd.a | 1,120,000 | 196,053 | ||||||
Aluminum Corp. of China Ltd. Class Ha | 224,000 | 165,715 | ||||||
ANTA Sports Products Ltd. | 17,000 | 66,901 | ||||||
Baidu Inc. ADRa | 5,074 | 1,157,126 | ||||||
Bank of China Ltd. Class H | 993,000 | 522,735 | ||||||
Bank of Communications Co. Ltd. Class H | 290,000 | 221,582 | ||||||
Beijing Enterprises Holdings Ltd. | 22,000 | 122,840 | ||||||
| Security | Shares | Value | ||||||
Beijing Enterprises Water Group Ltd. | 196,000 | $ | 166,538 | |||||
Brilliance China Automotive Holdings Ltd. | 142,000 | 367,408 | ||||||
Byd Co. Ltd. Class H | 77,000 | 458,471 | ||||||
China CITIC Bank Corp. Ltd. Class H | 420,000 | 277,444 | ||||||
China Conch Venture Holdings Ltd. | 63,000 | 114,627 | ||||||
China Construction Bank Corp. Class H | 1,400,000 | 1,227,121 | ||||||
China Everbright Bank Co. Ltd. Class H | 728,000 | 349,747 | ||||||
China Everbright International Ltd. | 252,000 | 332,933 | ||||||
China Everbright Ltd. | 88,000 | 201,041 | ||||||
China Galaxy Securities Co. Ltd. Class H | 224,000 | 202,922 | ||||||
China Life Insurance Co. Ltd. | 98,000 | 314,293 | ||||||
China Longyuan Power Group | 364,000 | 272,542 | ||||||
China Medical System Holdings Ltd. | 126,000 | 231,829 | ||||||
China Merchants Bank Co. Ltd. Class H | 157,000 | 591,775 | ||||||
China Minsheng Banking Corp. Ltd. Class H | 336,000 | 335,294 | ||||||
China Mobile Ltd. | 62,000 | 657,514 | ||||||
China Oilfield Services Ltd. Class H | 34,000 | 27,890 | ||||||
China Overseas Land & Investment Ltd. | 34,000 | 118,815 | ||||||
China Pacific Insurance Group Co. Ltd. Class H | 98,600 | 464,248 | ||||||
China Shenhua Energy Co. Ltd. Class H | 129,500 | 333,411 | ||||||
China Southern Airlines Co. Ltd. Class H | 142,000 | 110,857 | ||||||
China Vanke Co. Ltd. Class H | 78,400 | 234,906 | ||||||
Chongqing Changan Automobile Co. Ltd. Class B | 72,326 | 94,630 | ||||||
CRRC Corp. Ltd. Class H | 211,000 | 190,337 | ||||||
CSPC Pharmaceutical Group Ltd. | 144,000 | 224,838 | ||||||
Ctrip.com International Ltd. ADRa,b | 4,095 | 210,688 | ||||||
Dongfeng Motor Group Co. Ltd. Class H | 88,000 | 114,238 | ||||||
Fosun International Ltd. | 49,000 | 85,022 | ||||||
GCL-Poly Energy Holdings Ltd.a,b | 840,000 | 94,449 | ||||||
Geely Automobile Holdings Ltd. | 289,000 | 710,457 | ||||||
SCHEDULESOF INVESTMENTS | 17 |
Table of Contents
Schedule of Investments (Continued)
iSHARES® MSCI EM ESG OPTIMIZED ETF
August 31, 2017
| Security | Shares | Value | ||||||
Guangzhou Automobile Group Co. Ltd. Class H | 224,000 | $ | 441,907 | |||||
Haier Electronics Group Co. Ltd. | 44,000 | 116,937 | ||||||
Huaneng Renewables Corp. Ltd. Class H | 728,000 | 223,243 | ||||||
Industrial & Commercial Bank of China Ltd. Class H | 735,000 | 550,326 | ||||||
JD.com Inc. ADRa | 12,936 | 542,148 | ||||||
Lenovo Group Ltd. | 560,000 | 306,244 | ||||||
Momo Inc. ADRa | 1,792 | 69,046 | ||||||
NetEase Inc. ADR | 952 | 262,600 | ||||||
New Oriental Education & Technology Group Inc. ADR | 2,128 | 173,964 | ||||||
People’s Insurance Co. Group of China Ltd. (The) Class H | 655,000 | 308,818 | ||||||
Ping An Insurance Group Co. of China Ltd. Class H | 157,000 | 1,246,740 | ||||||
Shandong Weigao Group Medical Polymer Co. Ltd. Class H | 68,000 | 54,303 | ||||||
Shanghai Fosun Pharmaceutical Group Co. Ltd. Class H | 90,000 | 338,084 | ||||||
Shanghai Pharmaceuticals Holding Co. Ltd. Class H | 110,400 | 271,682 | ||||||
Shenzhou International Group Holdings Ltd. | 17,000 | 136,192 | ||||||
Sino-Ocean Group Holding Ltd. | 260,000 | 179,392 | ||||||
Sinopharm Group Co. Ltd. Class H | 67,200 | 303,525 | ||||||
Sun Art Retail Group Ltd. | 157,000 | 144,634 | ||||||
Tencent Holdings Ltd. | 120,400 | 5,061,247 | ||||||
Weibo Corp. ADRa,b | 1,484 | 150,032 | ||||||
Zhejiang Expressway Co. Ltd. Class H | 112,000 | 140,099 | ||||||
|
| |||||||
| 26,896,754 | ||||||||
COLOMBIA — 0.65% |
| |||||||
Cementos Argos SA | 155,696 | 632,344 | ||||||
|
| |||||||
| 632,344 | ||||||||
CZECH REPUBLIC — 0.46% |
| |||||||
Komercni Banka AS | 9,996 | 439,770 | ||||||
|
| |||||||
| 439,770 | ||||||||
EGYPT — 0.11% |
| |||||||
Global Telecom Holding SAEa | 254,828 | 101,585 | ||||||
|
| |||||||
| 101,585 | ||||||||
GREECE — 0.20% |
| |||||||
Hellenic Telecommunications Organization SA | 8,481 | 107,889 | ||||||
OPAP SA | 7,616 | 85,023 | ||||||
|
| |||||||
| 192,912 | ||||||||
| Security | Shares | Value | ||||||
HUNGARY — 0.86% |
| |||||||
MOL Hungarian Oil & Gas PLC | 9,026 | $ | 836,538 | |||||
|
| |||||||
| 836,538 | ||||||||
INDIA — 8.27% |
| |||||||
Axis Bank Ltd. GDRc | 26,916 | 1,037,612 | ||||||
ICICI Bank Ltd. ADR | 129,866 | 1,216,844 | ||||||
Infosys Ltd. ADR | 116,816 | 1,752,240 | ||||||
Mahindra & Mahindra Ltd. GDR | 50,456 | 1,052,008 | ||||||
Reliance Industries Ltd. GDRd | 31,640 | 1,564,598 | ||||||
Wipro Ltd. ADR | 232,960 | 1,383,782 | ||||||
|
| |||||||
| 8,007,084 | ||||||||
INDONESIA — 2.24% |
| |||||||
Astra International Tbk PT | 412,200 | 243,298 | ||||||
Bank Central Asia Tbk PT | 174,200 | 247,421 | ||||||
Bank Mandiri Persero Tbk PT | 414,900 | 407,374 | ||||||
Bank Negara Indonesia Persero | 212,800 | 117,230 | ||||||
Bank Rakyat Indonesia Persero | 264,000 | 299,281 | ||||||
Perusahaan Gas Negara Persero Tbk PT | 529,200 | 84,088 | ||||||
Telekomunikasi Indonesia Persero Tbk PT | 375,400 | 131,961 | ||||||
Unilever Indonesia Tbk PT | 60,100 | 227,706 | ||||||
United Tractors Tbk PT | 132,000 | 299,775 | ||||||
XL Axiata Tbk PTa | 409,500 | 110,493 | ||||||
|
| |||||||
| 2,168,627 | ||||||||
MALAYSIA — 2.91% |
| |||||||
Astro Malaysia Holdings Bhd | 540,400 | 339,134 | ||||||
Axiata Group Bhd | 190,400 | 219,804 | ||||||
CIMB Group Holdings Bhd | 123,900 | 205,412 | ||||||
DiGi.Com Bhdb | 219,100 | 248,318 | ||||||
Maxis Bhd | 110,400 | 149,423 | ||||||
Petronas Dagangan Bhd | 25,200 | 143,983 | ||||||
Public Bank Bhd | 159,600 | 769,877 | ||||||
Sime Darby Bhd | 255,900 | 539,305 | ||||||
Telekom Malaysia Bhd | 132,000 | 198,750 | ||||||
|
| |||||||
| 2,814,006 | ||||||||
MEXICO — 3.25% |
| |||||||
Arca Continental SAB de CV | 42,200 | 309,703 | ||||||
Cemex SAB de CV CPOa | 232,640 | 218,115 | ||||||
Coca-Cola Femsa SAB de CV Series L | 84,700 | 696,362 | ||||||
Fomento Economico Mexicano SAB de CV | 31,000 | 311,222 | ||||||
| 18 | 2017 iSHARES ANNUAL REPORTTO SHAREHOLDERS |
Table of Contents
Schedule of Investments (Continued)
iSHARES® MSCI EM ESG OPTIMIZED ETF
August 31, 2017
| Security | Shares | Value | ||||||
Gentera SAB de CV | 216,400 | $ | 333,049 | |||||
Grupo Financiero Banorte SAB de CV Series O | 76,300 | 521,945 | ||||||
Grupo Financiero Santander Mexico SAB de CV Series B | 129,300 | 267,193 | ||||||
Industrias Penoles SAB de CV | 6,300 | 164,203 | ||||||
Infraestructura Energetica Nova SAB de CV | 14,000 | 76,313 | ||||||
Kimberly-Clark de Mexico SAB de CV Series A | 126,600 | 249,325 | ||||||
|
| |||||||
| 3,147,430 | ||||||||
PHILIPPINES — 0.73% |
| |||||||
Aboitiz Equity Ventures Inc. | 50,200 | 73,039 | ||||||
Energy Development Corp. | 1,492,400 | 197,742 | ||||||
SM Prime Holdings Inc. | 663,700 | 433,214 | ||||||
|
| |||||||
| 703,995 | ||||||||
POLAND — 1.08% |
| |||||||
Bank Millennium SAa | 29,853 | 62,239 | ||||||
Bank Zachodni WBK SA | 1,347 | 139,322 | ||||||
KGHM Polska Miedz SA | 13,137 | 463,585 | ||||||
mBank SAa | 655 | 80,285 | ||||||
Polski Koncern Naftowy ORLEN SA | 9,115 | 300,738 | ||||||
|
| |||||||
| 1,046,169 | ||||||||
QATAR — 0.48% |
| |||||||
Commercial Bank PQSC (The)a | 23,979 | 196,310 | ||||||
Ooredoo QSC | 11,212 | 269,704 | ||||||
|
| |||||||
| 466,014 | ||||||||
RUSSIA — 3.16% |
| |||||||
Alrosa PJSC | 106,400 | 147,943 | ||||||
Gazprom PJSC | 101,210 | 205,156 | ||||||
Gazprom PJSC ADR | 46,606 | 185,958 | ||||||
Inter RAO UES PJSC | 4,060,000 | 270,480 | ||||||
Lukoil PJSC | 1,521 | 76,737 | ||||||
Lukoil PJSC ADR | 4,598 | 231,049 | ||||||
Magnit PJSC GDRc | 2,940 | 122,863 | ||||||
Novatek PJSC GDRc | 2,999 | 316,994 | ||||||
Novolipetsk Steel PJSC | 56,896 | 134,709 | ||||||
Rosneft Oil Co. PJSC | 2,040 | 10,735 | ||||||
RusHydro PJSC | 11,060,000 | 157,421 | ||||||
Sberbank of Russia PJSC | 73,710 | 233,397 | ||||||
Sberbank of Russia PJSC ADR | 55,371 | 755,814 | ||||||
Tatneft PJSC Class S | 32,270 | 213,374 | ||||||
|
| |||||||
| 3,062,630 | ||||||||
| Security | Shares | Value | ||||||
SOUTH AFRICA — 7.66% |
| |||||||
Barclays Africa Group Ltd. | 23,942 | $ | 273,323 | |||||
Coronation Fund Managers Ltd. | 38,808 | 210,051 | ||||||
Exxaro Resources Ltd. | 12,555 | 126,415 | ||||||
FirstRand Ltd. | 75,516 | 322,632 | ||||||
Foschini Group Ltd. (The) | 4,508 | 53,160 | ||||||
Gold Fields Ltd. | 47,103 | 210,192 | ||||||
Imperial Holdings Ltd. | 14,560 | 233,699 | ||||||
Investec Ltd. | 90,754 | 691,748 | ||||||
Massmart Holdings Ltd. | 8,344 | 78,102 | ||||||
Mondi Ltd. | 10,732 | 292,891 | ||||||
Mr. Price Group Ltd. | 11,900 | 165,945 | ||||||
MTN Group Ltd. | 20,593 | 204,750 | ||||||
Naspers Ltd. Class N | 7,984 | 1,806,556 | ||||||
Nedbank Group Ltd. | 5,280 | 89,318 | ||||||
NEPI Rockcastle PLCa | 13,243 | 192,060 | ||||||
Netcare Ltd. | 92,484 | 171,555 | ||||||
RMB Holdings Ltd. | 16,049 | 82,051 | ||||||
Sanlam Ltd. | 58,889 | 325,311 | ||||||
Sasol Ltd. | 9,753 | 294,057 | ||||||
SPAR Group Ltd. (The) | 287 | 3,733 | ||||||
Standard Bank Group Ltd. | 39,822 | 512,975 | ||||||
Vodacom Group Ltd. | 62,952 | 879,512 | ||||||
Woolworths Holdings Ltd./South Africa | 42,644 | 194,691 | ||||||
|
| |||||||
| 7,414,727 | ||||||||
SOUTH KOREA — 13.67% |
| |||||||
AmorePacific Corp. | 925 | 236,254 | ||||||
AmorePacific Group | 1,607 | 190,970 | ||||||
BNK Financial Group Inc. | 17,612 | 154,003 | ||||||
CJ CheilJedang Corp. | 449 | 144,344 | ||||||
DGB Financial Group Inc. | 25,093 | 244,788 | ||||||
Doosan Heavy Industries & Construction Co. Ltd. | 5,124 | 81,795 | ||||||
GS Engineering & Construction Corp.a | 2,072 | 52,370 | ||||||
GS Holdings Corp. | 5,837 | 365,460 | ||||||
Hana Financial Group Inc. | 5,862 | 254,734 | ||||||
Hankook Tire Co. Ltd. | 4,773 | 249,740 | ||||||
Hanwha Chemical Corp. | 4,037 | 126,559 | ||||||
Hyosung Corp. | 996 | 140,002 | ||||||
Hyundai Heavy Industries Co. Ltd.a | 784 | 103,249 | ||||||
Hyundai Marine & Fire Insurance Co. Ltd. | 3,640 | 149,138 | ||||||
Hyundai Motor Co. | 206 | 25,668 | ||||||
Kangwon Land Inc. | 8,232 | 251,866 | ||||||
KB Financial Group Inc. | 6,020 | 295,768 | ||||||
SCHEDULESOF INVESTMENTS | 19 |
Table of Contents
Schedule of Investments (Continued)
iSHARES® MSCI EM ESG OPTIMIZED ETF
August 31, 2017
| Security | Shares | Value | ||||||
LG Chem Ltd. | 1,820 | $ | 611,724 | |||||
LG Corp. | 5,656 | 421,341 | ||||||
LG Display Co. Ltd. | 13,496 | 372,828 | ||||||
LG Electronics Inc. | 4,984 | 360,231 | ||||||
LG Household & Health Care Ltd. | 343 | 292,018 | ||||||
LG Innotek Co. Ltd. | 1,906 | 311,863 | ||||||
NAVER Corp. | 420 | 281,217 | ||||||
NCsoft Corp. | 308 | 105,025 | ||||||
POSCO | 2,016 | 614,133 | ||||||
S-Oil Corp. | 3,057 | 340,239 | ||||||
Samsung C&T Corp. | 969 | 110,856 | ||||||
Samsung Card Co. Ltd. | 4,490 | 147,729 | ||||||
Samsung Electro-Mechanics Co. Ltd. | 2,272 | 203,505 | ||||||
Samsung Electronics Co. Ltd. | 1,889 | 3,879,854 | ||||||
Samsung Fire & Marine Insurance Co. Ltd. | 1,104 | 270,713 | ||||||
Samsung SDI Co. Ltd. | 1,517 | 264,358 | ||||||
Samsung SDS Co. Ltd. | 601 | 89,276 | ||||||
Shinhan Financial Group Co. Ltd. | 18,032 | 831,557 | ||||||
SK Hynix Inc. | 7,349 | 447,092 | ||||||
SK Telecom Co. Ltd. | 925 | 207,953 | ||||||
|
| |||||||
| 13,230,220 | ||||||||
TAIWAN — 11.46% |
| |||||||
Acer Inc. | 577,000 | 290,613 | ||||||
Advanced Semiconductor Engineering Inc. | 260,372 | 314,044 | ||||||
AU Optronics Corp. | 206,000 | 84,642 | ||||||
Cathay Financial Holding Co. Ltd. | 140,000 | 228,470 | ||||||
Chailease Holding Co. Ltd. | 98,000 | 266,927 | ||||||
China Steel Corp. | 532,000 | 445,992 | ||||||
Chunghwa Telecom Co. Ltd. | 287,000 | 998,542 | ||||||
Delta Electronics Inc. | 44,000 | 241,294 | ||||||
EVA Airways Corp. | 231,441 | 120,402 | ||||||
Far Eastern New Century Corp. | 420,000 | 336,095 | ||||||
Fubon Financial Holding Co. Ltd. | 448,000 | 719,971 | ||||||
Hiwin Technologies Corp. | 17,380 | 154,053 | ||||||
Hotai Motor Co. Ltd. | 17,000 | 200,255 | ||||||
Innolux Corp. | 206,000 | 100,341 | ||||||
Inventec Corp. | 206,000 | 163,481 | ||||||
Lite-On Technology Corp. | 180,039 | 266,369 | ||||||
MediaTek Inc. | 17,000 | 152,374 | ||||||
Micro-Star International Co. Ltd. | 38,000 | 86,504 | ||||||
President Chain Store Corp. | 72,000 | 602,406 | ||||||
Siliconware Precision Industries Co. Ltd. | 125,000 | 197,985 | ||||||
| Security | Shares | Value | ||||||
Taiwan Business Bank | 759,400 | $ | 209,861 | |||||
Taiwan Mobile Co. Ltd. | 125,000 | 447,331 | ||||||
Taiwan Semiconductor Manufacturing Co. Ltd. | 588,000 | 4,218,231 | ||||||
Wistron Corp. | 266,529 | 251,701 | ||||||
|
| |||||||
| 11,097,884 | ||||||||
THAILAND — 3.02% |
| |||||||
BTS Group Holdings PCL NVDR | 2,161,600 | 563,103 | ||||||
Kasikornbank PCL NVDR | 78,400 | 474,579 | ||||||
Minor International PCL NVDR | 392,300 | 469,626 | ||||||
PTT Exploration & Production PCL NVDR | 60,100 | 158,372 | ||||||
PTT PCL NVDR | 31,400 | 377,311 | ||||||
Siam Cement PCL (The) Foreign | 4,400 | 66,255 | ||||||
Siam Cement PCL (The) NVDR | 39,200 | 590,272 | ||||||
Siam Commercial Bank PCL (The) NVDR | 49,300 | 223,450 | ||||||
|
| |||||||
| 2,922,968 | ||||||||
TURKEY — 1.04% |
| |||||||
Anadolu Efes Biracilik ve Malt Sanayii AS | 17,052 | 104,706 | ||||||
Arcelik AS | 63,318 | 440,148 | ||||||
Coca-Cola Icecek AS | 11,487 | 133,550 | ||||||
KOC Holding AS | 42,840 | 223,844 | ||||||
Ulker Biskuvi Sanayi AS | 17,276 | 103,279 | ||||||
|
| |||||||
| 1,005,527 | ||||||||
UNITED ARAB EMIRATES — 0.60% |
| |||||||
Abu Dhabi Commercial Bank PJSC | 146,496 | 291,150 | ||||||
First Abu Dhabi Bank PJSC | 101,040 | 286,084 | ||||||
|
| |||||||
| 577,234 | ||||||||
|
| |||||||
TOTAL COMMON STOCKS | ||||||||
(Cost: $80,611,028) |
| 92,163,121 | ||||||
PREFERRED STOCKS — 4.49% |
| |||||||
BRAZIL — 3.37% |
| |||||||
Banco Bradesco SA, Preference Shares | 75,650 | 807,363 | ||||||
Cia. Brasileira de Distribuicao, Preference Shares | 15,100 | 345,484 | ||||||
Cia. Energetica de Minas Gerais, Preference Shares | 81,200 | 216,262 | ||||||
Cia. Paranaense de Energia Class B, Preference Shares | 25,200 | 230,179 | ||||||
Itau Unibanco Holding SA, Preference Shares | 96,840 | 1,241,874 | ||||||
| 20 | 2017 iSHARES ANNUAL REPORTTO SHAREHOLDERS |
Table of Contents
Schedule of Investments (Continued)
iSHARES® MSCI EM ESG OPTIMIZED ETF
August 31, 2017
| Security | Shares | Value | ||||||
Itausa-Investimentos Itau SA, Preference Shares | 107,772 | $ | 349,370 | |||||
Telefonica Brasil SA, Preference Shares | 4,400 | 68,298 | ||||||
|
| |||||||
| 3,258,830 | ||||||||
CHILE — 0.14% | ||||||||
Embotelladora Andina SA Class B, Preference Shares | 29,937 | 141,067 | ||||||
|
| |||||||
| 141,067 | ||||||||
COLOMBIA — 0.16% | ||||||||
Bancolombia SA, Preference Shares | 13,755 | 156,944 | ||||||
|
| |||||||
| 156,944 | ||||||||
SOUTH KOREA — 0.82% | ||||||||
LG Chem Ltd., Preference Shares | 763 | 177,961 | ||||||
Samsung Electronics Co. Ltd., Preference Shares | 368 | 615,183 | ||||||
|
| |||||||
| 793,144 | ||||||||
|
| |||||||
TOTAL PREFERRED STOCKS |
| |||||||
(Cost: $3,646,820) |
| 4,349,985 | ||||||
RIGHTS — 0.00% |
| |||||||
CHINA — 0.00% |
| |||||||
Fosun International Ltd. | 31 | — | ||||||
|
| |||||||
| — | ||||||||
|
| |||||||
TOTAL RIGHTS |
| |||||||
(Cost: $0) |
| — | ||||||
SHORT-TERM INVESTMENTS — 4.24% |
| |||||||
MONEY MARKET FUNDS — 4.24% |
| |||||||
BlackRock Cash Funds: Institutional, |
| |||||||
1.32%e,f,g | 3,986,796 | 3,987,993 | ||||||
BlackRock Cash Funds: Treasury, |
| |||||||
0.96%e,f | 113,313 | 113,313 | ||||||
|
| |||||||
| 4,101,306 | ||||||||
|
| |||||||
TOTAL SHORT-TERM INVESTMENTS |
| |||||||
(Cost: $4,101,247) |
| 4,101,306 | ||||||
|
| |||||||
| Value | ||||||
TOTAL INVESTMENTS | ||||||
(Cost: $88,359,095)h | $ | 100,614,412 | ||||
Other Assets, Less Liabilities — (3.93)% | (3,801,954 | ) | ||||
|
| |||||
NET ASSETS — 100.00% | $ | 96,812,458 | ||||
|
| |||||
ADR — American Depositary Receipts
CPO — Certificates of Participation (Ordinary)
GDR — Global Depositary Receipts
NVDR — Non-Voting Depositary Receipts
| a | Non-income earning security. |
| b | All or a portion of this security represents a security on loan. See Note 1. |
| c | This security may be resold to qualified foreign investors and foreign institutional buyers under Regulation S of the Securities Act of 1933. |
| d | This security may be resold to qualified institutional buyers under Rule 144A of the Securities Act of 1933. |
| e | Affiliated issuer. See Schedule 1. |
| f | The rate quoted is the annualized seven-day yield of the fund at period end. |
| g | All or a portion of this security represents an investment of securities lending collateral. See Note 1. |
| h | The cost of investments (including short positions and derivatives, if any) for federal income tax purposes was $88,662,119. Net unrealized appreciation was $11,952,293, of which $12,534,573 represented gross unrealized appreciation on investments and $582,280 represented gross unrealized depreciation on investments. |
SCHEDULESOF INVESTMENTS | 21 |
Table of Contents
Schedule of Investments (Continued)
iSHARES® MSCI EM ESG OPTIMIZED ETF
August 31, 2017
Schedule 1 — Affiliates (Note 2)
Investments in issuers considered to be affiliates of the Fund during the year ended August 31, 2017, for purposes of Section 2(a)3 of the 1940 Act, and/or related parties of the Fund were as follows:
| Affiliated issuer | Shares held at 08/31/16 | Shares purchased | Shares sold | Shares held at 08/31/17 | Value at 08/31/17 | Net realized gain (loss) a | Change in unrealized appreciation (depreciation) | Income | ||||||||||||||||||||||||
BlackRock Cash Funds: Institutional, | 6,846 | 3,979,950 | b | — | 3,986,796 | $ | 3,987,993 | $ | (272 | ) | $ | 59 | $ | — | c | |||||||||||||||||
BlackRock Cash Funds: Treasury, | 8,895 | 104,418 | b | — | 113,313 | 113,313 | — | — | 415 | |||||||||||||||||||||||
|
|
|
|
|
|
|
| |||||||||||||||||||||||||
| $ | 4,101,306 | $ | (272 | ) | $ | 59 | $ | 415 | ||||||||||||||||||||||||
|
|
|
|
|
|
|
| |||||||||||||||||||||||||
| a | Includes realized capital gain distributions from an affiliated fund, if any. |
| b | Net of shares purchased and sold. |
| c | Does not include income earned on the investment of securities lending cash collateral which is not direct income of the Fund and is reflected as a component of securities lending income in the statement of operations. |
Schedule 2 — Fair Value Measurements
Various inputs are used in determining the fair value of financial instruments. For description of the input levels and information about the Fund’s policy regarding valuation of financial instruments, see Note 1.
The following table summarizes the value of the Fund’s investments according to the fair value hierarchy as of August 31, 2017. The breakdown of the Fund’s investments into major categories is disclosed in the schedule of investments above.
| Level 1 | Level 2 | Level 3 | Total | |||||||||||||
Investments: | ||||||||||||||||
Assets: | ||||||||||||||||
Common stocks | $ | 92,163,121 | $ | — | $ | — | $ | 92,163,121 | ||||||||
Preferred stocks | 4,349,985 | — | — | 4,349,985 | ||||||||||||
Rights | — | 0 | a | — | 0 | a | ||||||||||
Money market funds | 4,101,306 | — | — | 4,101,306 | ||||||||||||
|
|
|
|
|
|
|
| |||||||||
Total | $ | 100,614,412 | $ | 0 | a | $ | — | $ | 100,614,412 | |||||||
|
|
|
|
|
|
|
| |||||||||
| a | Rounds to less than $1. |
See notes to financial statements.
| 22 | 2017 iSHARES ANNUAL REPORTTO SHAREHOLDERS |
Table of Contents
Schedule of Investments
iSHARES® MSCI EMERGING MARKETS ex CHINA ETF
August 31, 2017
| Security | Shares | Value | ||||||
COMMON STOCKS — 81.55% |
| |||||||
BRAZIL — 6.39% |
| |||||||
Ambev SA | 14,000 | $ | 88,366 | |||||
B3 SA – Brasil Bolsa Balcao | 6,400 | 44,993 | ||||||
Banco Bradesco SA | 2,200 | 22,549 | ||||||
Banco do Brasil SA | 2,600 | 25,368 | ||||||
Banco Santander Brasil SA Units | 1,200 | 10,694 | ||||||
BB Seguridade Participacoes SA | 2,200 | 19,382 | ||||||
BR Malls Participacoes SA | 3,000 | 12,967 | ||||||
BRF SAa | 1,400 | 18,919 | ||||||
CCR SA | 4,000 | 22,196 | ||||||
Cia. de Saneamento Basico do Estado de Sao Paulo | 600 | 6,131 | ||||||
Cielo SA | 3,000 | 21,386 | ||||||
Cosan SA Industria e Comercio | 600 | 7,359 | ||||||
CPFL Energia SA | 1,000 | 8,610 | ||||||
Embraer SA | 2,400 | 13,676 | ||||||
Engie Brasil Energia SA | 800 | 9,179 | ||||||
Equatorial Energia SA | 800 | 15,540 | ||||||
Fibria Celulose SA | 800 | 10,625 | ||||||
Hypermarcas SA | 1,000 | 9,379 | ||||||
JBS SA | 3,200 | 8,817 | ||||||
Klabin SA Units | 1,800 | 9,794 | ||||||
Kroton Educacional SA | 3,200 | 18,276 | ||||||
Localiza Rent A Car SA | 600 | 11,356 | ||||||
Lojas Renner SA | 2,400 | 23,341 | ||||||
Multiplan Empreendimentos Imobiliarios SA | 400 | 9,292 | ||||||
Petroleo Brasileiro SAa | 7,800 | 34,631 | ||||||
Qualicorp SA | 600 | 6,646 | ||||||
Raia Drogasil SA | 800 | 17,632 | ||||||
Rumo SAa | 3,000 | 9,849 | ||||||
TIM Participacoes SA | 2,600 | 9,321 | ||||||
Ultrapar Participacoes SA | 1,000 | 23,344 | ||||||
Vale SA | 8,271 | 92,214 | ||||||
WEG SA | 1,800 | 11,705 | ||||||
|
| |||||||
| 653,537 | ||||||||
CHILE — 1.57% |
| |||||||
AES Gener SA | 760 | 266 | ||||||
Banco de Chile | 36,924 | 5,378 | ||||||
Banco de Credito e Inversiones | 100 | 6,485 | ||||||
Banco Santander Chile | 119,992 | 8,774 | ||||||
Cencosud SA | 3,790 | 11,393 | ||||||
Cia. Cervecerias Unidas SA | 388 | 5,289 | ||||||
| Security | Shares | Value | ||||||
Colbun SA | 44,700 | $ | 10,768 | |||||
Empresas CMPC SA | 2,794 | 7,293 | ||||||
Empresas COPEC SA | 1,722 | 21,982 | ||||||
Enel Americas SA | 108,040 | 23,307 | ||||||
Enel Chile SA | 57,028 | 6,714 | ||||||
Enel Generacion Chile SA | 8,716 | 7,388 | ||||||
Itau CorpBanca | 956,646 | 9,141 | ||||||
LATAM Airlines Group SA | 1,260 | 15,799 | ||||||
SACI Falabella | 2,030 | 20,410 | ||||||
|
| |||||||
| 160,387 | ||||||||
COLOMBIA — 0.51% |
| |||||||
Bancolombia SA | 704 | 7,889 | ||||||
Cementos Argos SA | 1,302 | 5,288 | ||||||
Ecopetrol SA | 24,920 | 11,593 | ||||||
Grupo Argos SA/Colombia | 1,030 | 7,338 | ||||||
Grupo de Inversiones Suramericana SA | 988 | 13,924 | ||||||
Interconexion Electrica SA ESP | 1,354 | 6,143 | ||||||
|
| |||||||
| 52,175 | ||||||||
CZECH REPUBLIC — 0.25% |
| |||||||
CEZ AS | 746 | 14,126 | ||||||
Komercni Banka AS | 260 | 11,439 | ||||||
|
| |||||||
| 25,565 | ||||||||
EGYPT — 0.16% |
| |||||||
Commercial International Bank Egypt SAE | 3,370 | 16,077 | ||||||
|
| |||||||
| 16,077 | ||||||||
GREECE — 0.55% |
| |||||||
Alpha Bank AEa | 4,416 | 11,183 | ||||||
Eurobank Ergasias SAa | 5,956 | 6,422 | ||||||
Hellenic Telecommunications Organization SA | 904 | 11,500 | ||||||
JUMBO SA | 434 | 7,224 | ||||||
National Bank of Greece SAa | 15,724 | 6,375 | ||||||
OPAP SA | 896 | 10,002 | ||||||
Piraeus Bank SAa | 620 | 3,472 | ||||||
|
| |||||||
| 56,178 | ||||||||
HUNGARY — 0.50% |
| |||||||
MOL Hungarian Oil & Gas PLC | 138 | 12,790 | ||||||
OTP Bank PLC | 680 | 27,636 | ||||||
Richter Gedeon Nyrt | 416 | 10,817 | ||||||
|
| |||||||
| 51,243 | ||||||||
INDONESIA — 3.23% |
| |||||||
Adaro Energy Tbk PT | 54,200 | 7,414 | ||||||
Astra International Tbk PT | 63,600 | 37,539 | ||||||
SCHEDULESOF INVESTMENTS | 23 |
Table of Contents
Schedule of Investments (Continued)
iSHARES® MSCI EMERGING MARKETS ex CHINA ETF
August 31, 2017
| Security | Shares | Value | ||||||
Bank Central Asia Tbk PT | 31,200 | $ | 44,314 | |||||
Bank Mandiri Persero Tbk PT | 29,600 | 29,063 | ||||||
Bank Negara Indonesia Persero Tbk PT | 26,000 | 14,323 | ||||||
Bank Rakyat Indonesia Persero Tbk PT | 35,400 | 40,131 | ||||||
Charoen Pokphand Indonesia Tbk PT | 26,000 | 5,398 | ||||||
Gudang Garam Tbk PT | 2,000 | 10,373 | ||||||
Hanjaya Mandala Sampoerna Tbk PT | 38,800 | 10,586 | ||||||
Indocement Tunggal Prakarsa Tbk PT | 6,600 | 9,795 | ||||||
Indofood Sukses Makmur Tbk PT | 17,800 | 11,173 | ||||||
Kalbe Farma Tbk PT | 67,400 | 8,639 | ||||||
Matahari Department Store Tbk PT | 10,400 | 7,795 | ||||||
Perusahaan Gas Negara Persero Tbk PT | 42,400 | 6,737 | ||||||
Semen Indonesia Persero Tbk PT | 11,400 | 8,950 | ||||||
Telekomunikasi Indonesia Persero Tbk PT | 136,800 | 48,088 | ||||||
Unilever Indonesia Tbk PT | 5,000 | 18,944 | ||||||
United Tractors Tbk PT | 5,000 | 11,355 | ||||||
|
| |||||||
| 330,617 | ||||||||
MALAYSIA — 3.16% |
| |||||||
AMMB Holdings Bhd | 4,800 | 4,811 | ||||||
Astro Malaysia Holdings Bhd | 12,800 | 8,033 | ||||||
Axiata Group Bhd | 8,600 | 9,928 | ||||||
CIMB Group Holdings Bhd | 8,800 | 14,589 | ||||||
DiGi.Com Bhd | 9,200 | 10,427 | ||||||
Gamuda Bhd | 5,600 | 7,002 | ||||||
Genting Bhd | 6,800 | 15,461 | ||||||
Genting Malaysia Bhd | 10,000 | 13,746 | ||||||
Hong Leong Bank Bhd | 2,000 | 7,231 | ||||||
IHH Healthcare Bhd | 6,000 | 8,416 | ||||||
IJM Corp. Bhd | 8,000 | 6,257 | ||||||
IOI Corp. Bhd | 8,200 | 8,718 | ||||||
IOI Properties Group Bhd | 14,600 | 6,803 | ||||||
Kuala Lumpur Kepong Bhd | 2,200 | 12,642 | ||||||
Malayan Banking Bhd | 12,400 | 27,468 | ||||||
Maxis Bhd | 6,800 | 9,204 | ||||||
MISC Bhd | 4,000 | 6,969 | ||||||
Petronas Chemicals Group Bhd | 5,200 | 8,718 | ||||||
Petronas Gas Bhd | 1,800 | 7,756 | ||||||
PPB Group Bhd | 2,600 | 10,155 | ||||||
Public Bank Bhd | 8,400 | 40,520 | ||||||
Sapura Energy Bhd | 14,800 | 4,783 | ||||||
Sime Darby Bhd | 5,000 | 10,537 | ||||||
Telekom Malaysia Bhd | 6,200 | 9,335 | ||||||
| Security | Shares | Value | ||||||
Tenaga Nasional Bhd | 11,200 | $ | 37,451 | |||||
UMW Holdings Bhda | 5,000 | 7,119 | ||||||
YTL Corp. Bhd | 27,000 | 9,041 | ||||||
|
| |||||||
| 323,120 | ||||||||
MEXICO — 5.06% |
| |||||||
Alfa SAB de CV | 9,800 | 13,763 | ||||||
America Movil SAB de CV Series L | 98,400 | 91,760 | ||||||
Arca Continental SAB de CV | 1,200 | 8,807 | ||||||
Cemex SAB de CV CPOa | 38,800 | 36,378 | ||||||
Coca-Cola Femsa SAB de CV Series L | 1,400 | 11,510 | ||||||
Fibra Uno Administracion SA de CV | 6,400 | 11,451 | ||||||
Fomento Economico Mexicano SAB de CV | 5,800 | 58,229 | ||||||
Gruma SAB de CV Series B | 840 | 12,359 | ||||||
Grupo Aeroportuario del Pacifico SAB de CV Series B | 1,200 | 13,278 | ||||||
Grupo Aeroportuario del Sureste SAB de CV Series B | 770 | 15,757 | ||||||
Grupo Bimbo SAB de CV Series A | 6,000 | 14,590 | ||||||
Grupo Carso SAB de CV Series A1 | 1,400 | 5,675 | ||||||
Grupo Financiero Banorte SAB de CV Series O | 7,000 | 47,885 | ||||||
Grupo Financiero Inbursa SAB de CV Series O | 7,000 | 11,743 | ||||||
Grupo Financiero Santander Mexico SAB de CV Series B | 4,200 | 8,679 | ||||||
Grupo Mexico SAB de CV Series B | 11,200 | 37,038 | ||||||
Grupo Televisa SAB | 7,600 | 39,418 | ||||||
Industrias Penoles SAB de CV | 400 | 10,426 | ||||||
Infraestructura Energetica Nova SAB de CV | 600 | 3,270 | ||||||
Kimberly-Clark de Mexico SAB de CV Series A | 4,400 | 8,665 | ||||||
Mexichem SAB de CV | 3,600 | 9,619 | ||||||
Promotora y Operadora de Infraestructura SAB de CV | 670 | 7,365 | ||||||
Wal-Mart de Mexico SAB de CV | 16,200 | 39,530 | ||||||
|
| |||||||
| 517,195 | ||||||||
PERU — 0.52% |
| |||||||
Cia. de Minas Buenaventura SAA ADR | 538 | 7,225 | ||||||
Credicorp Ltd. | 176 | 35,700 | ||||||
Southern Copper Corp. | 258 | 10,501 | ||||||
|
| |||||||
| 53,426 | ||||||||
PHILIPPINES — 1.56% |
| |||||||
Aboitiz Equity Ventures Inc. | 6,160 | 8,962 | ||||||
| 24 | 2017 iSHARES ANNUAL REPORTTO SHAREHOLDERS |
Table of Contents
Schedule of Investments (Continued)
iSHARES® MSCI EMERGING MARKETS ex CHINA ETF
August 31, 2017
| Security | Shares | Value | ||||||
Ayala Corp. | 700 | $ | 12,585 | |||||
Ayala Land Inc. | 27,200 | 22,326 | ||||||
BDO Unibank Inc. | 7,400 | 18,381 | ||||||
DMCI Holdings Inc. | 28,000 | 8,591 | ||||||
GT Capital Holdings Inc. | 360 | 7,866 | ||||||
JG Summit Holdings Inc. | 9,680 | 13,583 | ||||||
Jollibee Foods Corp. | 1,820 | 8,472 | ||||||
Metro Pacific Investments Corp. | 53,600 | 6,652 | ||||||
PLDT Inc. | 300 | 10,143 | ||||||
SM Investments Corp. | 720 | 11,404 | ||||||
SM Prime Holdings Inc. | 32,400 | 21,148 | ||||||
Universal Robina Corp. | 3,340 | 9,536 | ||||||
|
| |||||||
| 159,649 | ||||||||
POLAND — 1.97% |
| |||||||
Alior Bank SAa | 432 | 7,979 | ||||||
Bank Pekao SA | 562 | 20,123 | ||||||
Bank Zachodni WBK SA | 122 | 12,619 | ||||||
CCC SA | 158 | 11,593 | ||||||
KGHM Polska Miedz SA | 454 | 16,021 | ||||||
LPP SA | 6 | 14,662 | ||||||
mBank SAa | 56 | 6,864 | ||||||
PGE Polska Grupa Energetyczna SA | 3,406 | 13,601 | ||||||
Polski Koncern Naftowy ORLEN SA | 982 | 32,400 | ||||||
Polskie Gornictwo Naftowe i Gazownictwo SA | 6,568 | 12,554 | ||||||
Powszechna Kasa Oszczednosci Bank Polski SAa | 3,014 | 30,938 | ||||||
Powszechny Zaklad Ubezpieczen SA | 1,644 | 22,313 | ||||||
|
| |||||||
| 201,667 | ||||||||
QATAR — 0.00% |
| |||||||
Masraf Al Rayan QSC | 1 | 10 | ||||||
|
| |||||||
| 10 | ||||||||
RUSSIA — 4.48% |
| |||||||
Alrosa PJSC | 8,600 | 11,958 | ||||||
Gazprom PJSC | 30,600 | 62,027 | ||||||
Inter RAO UES PJSC | 134,000 | 8,927 | ||||||
Lukoil PJSC | 1,262 | 63,670 | ||||||
Magnit PJSC GDRb | 772 | 32,262 | ||||||
MMC Norilsk Nickel PJSC | 168 | 28,292 | ||||||
Mobile TeleSystems PJSC ADR | 1,268 | 12,667 | ||||||
Moscow Exchange MICEX-RTS PJSC | 5,600 | 10,144 | ||||||
Novatek PJSC GDRb | 228 | 24,100 | ||||||
Novolipetsk Steel PJSC | 4,620 | 10,939 | ||||||
Rosneft Oil Co. PJSC GDRb | 3,482 | 18,106 | ||||||
RusHydro PJSC | 500,000 | 7,117 | ||||||
| Security | Shares | Value | ||||||
Sberbank of Russia PJSC ADR | 7,606 | $ | 103,822 | |||||
Severstal PJSC | 400 | 6,275 | ||||||
Surgutneftegas OJSC | 20,000 | 9,252 | ||||||
Tatneft PJSC Class S | 4,720 | 31,209 | ||||||
VTB Bank PJSC GDRb | 7,912 | 17,675 | ||||||
|
| |||||||
| 458,442 | ||||||||
SOUTH AFRICA — 9.52% |
| |||||||
AngloGold Ashanti Ltd. | 1,376 | 13,938 | ||||||
Aspen Pharmacare Holdings Ltd. | 1,204 | 26,855 | ||||||
Barclays Africa Group Ltd. | 1,816 | 20,732 | ||||||
Bid Corp. Ltd. | 1,168 | 26,549 | ||||||
Bidvest Group Ltd. (The) | 778 | 10,263 | ||||||
Brait SEa | 1,370 | 6,065 | ||||||
Capitec Bank Holdings Ltd. | 116 | 8,037 | ||||||
Discovery Ltd. | 1,012 | 11,726 | ||||||
Exxaro Resources Ltd. | 12 | 121 | ||||||
FirstRand Ltd. | 8,600 | 36,742 | ||||||
Fortress Income Fund Ltd. | 3,046 | 9,236 | ||||||
Foschini Group Ltd. (The) | 688 | 8,113 | ||||||
Gold Fields Ltd. | 2,766 | 12,343 | ||||||
Growthpoint Properties Ltd. | 6,664 | 12,895 | ||||||
Hyprop Investments Ltd. | 880 | 7,727 | ||||||
Impala Platinum Holdings Ltd.a | 2,018 | 6,242 | ||||||
Imperial Holdings Ltd. | 504 | 8,090 | ||||||
Investec Ltd. | 800 | 6,098 | ||||||
Life Healthcare Group Holdings Ltd. | 4,634 | 9,402 | ||||||
Mondi Ltd. | 360 | 9,825 | ||||||
Mr. Price Group Ltd. | 766 | 10,682 | ||||||
MTN Group Ltd. | 5,190 | 51,603 | ||||||
Naspers Ltd. Class N | 1,256 | 284,198 | ||||||
Nedbank Group Ltd. | 510 | 8,627 | ||||||
NEPI Rockcastle PLCa | 610 | 8,847 | ||||||
Netcare Ltd. | 4,040 | 7,494 | ||||||
Pick n Pay Stores Ltd. | 22 | 108 | ||||||
PSG Group Ltd. | 276 | 5,364 | ||||||
Rand Merchant Investment Holdings Ltd. | 2,062 | 6,604 | ||||||
Redefine Properties Ltd. | 14,472 | 11,869 | ||||||
Remgro Ltd. | 1,364 | 22,809 | ||||||
Resilient REIT Ltd. | 844 | 8,121 | ||||||
RMB Holdings Ltd. | 1,398 | 7,147 | ||||||
Sanlam Ltd. | 4,954 | 27,367 | ||||||
Sappi Ltd. | 1,684 | 11,324 | ||||||
Sasol Ltd. | 1,758 | 53,004 | ||||||
Shoprite Holdings Ltd. | 1,232 | 21,364 | ||||||
SCHEDULESOF INVESTMENTS | 25 |
Table of Contents
Schedule of Investments (Continued)
iSHARES® MSCI EMERGING MARKETS ex CHINA ETF
August 31, 2017
| Security | Shares | Value | ||||||
Sibanye Gold Ltd. | 6,002 | $ | 9,591 | |||||
SPAR Group Ltd. (The) | 838 | 10,899 | ||||||
Standard Bank Group Ltd. | 4,136 | 53,279 | ||||||
Steinhoff International Holdings NV Class H | 9,486 | 45,877 | ||||||
Tiger Brands Ltd. | 526 | 16,309 | ||||||
Truworths International Ltd. | 1,526 | 9,748 | ||||||
Vodacom Group Ltd. | 1,166 | 16,290 | ||||||
Woolworths Holdings Ltd./South Africa | 3,244 | 14,811 | ||||||
|
| |||||||
| 974,335 | ||||||||
SOUTH KOREA — 19.64% |
| |||||||
AmorePacific Corp. | 94 | 24,008 | ||||||
AmorePacific Group | 96 | 11,408 | ||||||
BGF retail Co. Ltd. | 86 | 6,956 | ||||||
BNK Financial Group Inc. | 788 | 6,890 | ||||||
Celltrion Inc.a | 220 | 22,457 | ||||||
CJ CheilJedang Corp. | 32 | 10,287 | ||||||
CJ Corp. | 58 | 9,104 | ||||||
Coway Co. Ltd. | 160 | 14,019 | ||||||
Daelim Industrial Co. Ltd. | 116 | 8,621 | ||||||
DGB Financial Group Inc. | 506 | 4,936 | ||||||
Dongbu Insurance Co. Ltd. | 170 | 11,337 | ||||||
E-MART Inc. | 72 | 14,303 | ||||||
GS Holdings Corp. | 154 | 9,642 | ||||||
Hana Financial Group Inc. | 912 | 39,631 | ||||||
Hankook Tire Co. Ltd. | 246 | 12,872 | ||||||
Hanmi Pharm Co. Ltd.a | 20 | 7,148 | ||||||
Hanon Systems | 716 | 7,334 | ||||||
Hanssem Co. Ltd. | 26 | 3,920 | ||||||
Hanwha Chemical Corp. | 362 | 11,349 | ||||||
Hanwha Corp. | 186 | 8,107 | ||||||
Hotel Shilla Co. Ltd. | 102 | 5,599 | ||||||
Hyosung Corp. | 72 | 10,121 | ||||||
Hyundai Development Co. Engineering & Construction | 224 | 7,479 | ||||||
Hyundai Engineering & Construction Co. Ltd. | 272 | 9,806 | ||||||
Hyundai Glovis Co. Ltd. | 86 | 11,822 | ||||||
Hyundai Heavy Industries Co. Ltd.a | 102 | 13,433 | ||||||
Hyundai Marine & Fire Insurance Co. Ltd. | 228 | 9,342 | ||||||
Hyundai Mobis Co. Ltd. | 214 | 44,789 | ||||||
Hyundai Motor Co. | 406 | 50,588 | ||||||
Hyundai Robotics Co. Ltd.a | 14 | 5,500 | ||||||
Hyundai Steel Co. | 242 | 12,383 | ||||||
| Security | Shares | Value | ||||||
Industrial Bank of Korea | 744 | $ | 9,864 | |||||
Kakao Corp. | 122 | 13,308 | ||||||
Kangwon Land Inc. | 408 | 12,483 | ||||||
KB Financial Group Inc. | 1,040 | 51,096 | ||||||
KCC Corp. | 26 | 9,131 | ||||||
Kia Motors Corp. | 902 | 28,357 | ||||||
Korea Aerospace Industries Ltd. Class A | 240 | 9,844 | ||||||
Korea Electric Power Corp. | 766 | 29,143 | ||||||
Korea Investment Holdings Co. Ltd. | 126 | 7,341 | ||||||
Korea Zinc Co. Ltd. | 26 | 11,898 | ||||||
KT&G Corp. | 340 | 34,525 | ||||||
LG Chem Ltd. | 120 | 40,333 | ||||||
LG Corp. | 346 | 25,775 | ||||||
LG Display Co. Ltd. | 784 | 21,658 | ||||||
LG Electronics Inc. | 300 | 21,683 | ||||||
LG Household & Health Care Ltd. | 30 | 25,541 | ||||||
LG Innotek Co. Ltd. | 58 | 9,490 | ||||||
Lotte Chemical Corp. | 54 | 19,132 | ||||||
Lotte Shopping Co. Ltd. | 46 | 10,484 | ||||||
Medy-Tox Inc. | 18 | 9,085 | ||||||
Mirae Asset Daewoo Co. Ltd. | 1,168 | 10,514 | ||||||
NAVER Corp. | 80 | 53,565 | ||||||
NCsoft Corp. | 58 | 19,777 | ||||||
Netmarble Games Corp.a,c | 38 | 5,207 | ||||||
NH Investment & Securities Co. Ltd. | 514 | 6,291 | ||||||
POSCO | 226 | 68,846 | ||||||
S-Oil Corp. | 134 | 14,914 | ||||||
Samsung Biologics Co. Ltd.a,c | 58 | 14,557 | ||||||
Samsung C&T Corp. | 244 | 27,914 | ||||||
Samsung Electro-Mechanics Co. Ltd. | 184 | 16,481 | ||||||
Samsung Electronics Co. Ltd. | 280 | 575,098 | ||||||
Samsung Fire & Marine Insurance Co. Ltd. | 102 | 25,012 | ||||||
Samsung Heavy Industries Co. Ltd.a | 936 | 8,882 | ||||||
Samsung Life Insurance Co. Ltd. | 230 | 23,559 | ||||||
Samsung SDI Co. Ltd. | 176 | 30,670 | ||||||
Samsung SDS Co. Ltd. | 116 | 17,231 | ||||||
Samsung Securities Co. Ltd. | 254 | 8,233 | ||||||
Shinhan Financial Group Co. Ltd. | 1,262 | 58,198 | ||||||
SK Holdings Co. Ltd. | 104 | 24,672 | ||||||
SK Hynix Inc. | 1,692 | 102,936 | ||||||
SK Innovation Co. Ltd. | 202 | 33,768 | ||||||
SK Telecom Co. Ltd. | 76 | 17,086 | ||||||
Woori Bank | 800 | 13,196 | ||||||
Yuhan Corp. | 32 | 6,414 | ||||||
|
| |||||||
| 2,008,383 | ||||||||
| 26 | 2017 iSHARES ANNUAL REPORTTO SHAREHOLDERS |
Table of Contents
Schedule of Investments (Continued)
iSHARES® MSCI EMERGING MARKETS ex CHINA ETF
August 31, 2017
| Security | Shares | Value | ||||||
TAIWAN — 16.73% |
| |||||||
Advanced Semiconductor Engineering Inc. | 20,000 | $ | 24,123 | |||||
Asia Cement Corp. | 8,000 | 7,250 | ||||||
Asustek Computer Inc. | 2,000 | 16,568 | ||||||
AU Optronics Corp. | 30,000 | 12,326 | ||||||
Catcher Technology Co. Ltd. | 2,000 | 25,448 | ||||||
Cathay Financial Holding Co. Ltd. | 26,000 | 42,430 | ||||||
Chailease Holding Co. Ltd. | 4,000 | 10,895 | ||||||
Chang Hwa Commercial Bank Ltd. | 16,800 | 9,185 | ||||||
Cheng Shin Rubber Industry Co. Ltd. | 6,000 | 12,068 | ||||||
China Development Financial Holding Corp. | 48,000 | 14,983 | ||||||
China Life Insurance Co. Ltd./Taiwan | 10,000 | 11,034 | ||||||
China Steel Corp. | 40,000 | 33,533 | ||||||
Chunghwa Telecom Co. Ltd. | 12,000 | 41,751 | ||||||
Compal Electronics Inc. | 18,000 | 12,943 | ||||||
CTBC Financial Holding Co. Ltd. | 44,000 | 28,503 | ||||||
Delta Electronics Inc. | 6,000 | 32,904 | ||||||
E.Sun Financial Holding Co. Ltd. | 30,074 | 18,535 | ||||||
Far Eastern New Century Corp. | 12,000 | 9,603 | ||||||
Far EasTone Telecommunications Co. Ltd. | 6,000 | 14,553 | ||||||
Feng TAY Enterprise Co. Ltd. | 2,000 | 9,477 | ||||||
First Financial Holding Co. Ltd. | 26,520 | 17,224 | ||||||
Formosa Chemicals & Fibre Corp. | 10,000 | 31,446 | ||||||
Formosa Petrochemical Corp. | 4,000 | 14,116 | ||||||
Formosa Plastics Corp. | 12,000 | 37,337 | ||||||
Foxconn Technology Co. Ltd. | 4,000 | 12,698 | ||||||
Fubon Financial Holding Co. Ltd. | 20,000 | 32,142 | ||||||
Highwealth Construction Corp. | 4,000 | 6,362 | ||||||
Hon Hai Precision Industry Co. Ltd. | 44,000 | 171,311 | ||||||
Hotai Motor Co. Ltd. | 600 | 7,068 | ||||||
Hua Nan Financial Holdings Co. Ltd. | 23,100 | 12,898 | ||||||
Innolux Corp. | 32,000 | 15,587 | ||||||
Inventec Corp. | 10,000 | 7,936 | ||||||
Largan Precision Co. Ltd. | 288 | 55,636 | ||||||
Lite-On Technology Corp. | 8,000 | 11,836 | ||||||
MediaTek Inc. | 4,000 | 35,853 | ||||||
Mega Financial Holding Co. Ltd. | 32,000 | 25,713 | ||||||
Micro-Star International Co. Ltd. | 2,000 | 4,553 | ||||||
Nan Ya Plastics Corp. | 14,000 | 35,349 | ||||||
Novatek Microelectronics Corp. | 2,000 | 7,787 | ||||||
Pegatron Corp. | 6,000 | 18,887 | ||||||
Pou Chen Corp. | 8,000 | 10,378 | ||||||
| Security | Shares | Value | ||||||
Powertech Technology Inc. | 2,000 | $ | 6,070 | |||||
President Chain Store Corp. | 2,000 | 16,733 | ||||||
Quanta Computer Inc. | 8,000 | 18,211 | ||||||
Realtek Semiconductor Corp. | 2,000 | 7,754 | ||||||
Shin Kong Financial Holding Co. Ltd. | 20,000 | 5,812 | ||||||
Siliconware Precision Industries Co. Ltd. | 6,000 | 9,503 | ||||||
SinoPac Financial Holdings Co. Ltd. | 42,000 | 13,499 | ||||||
Taishin Financial Holding Co. Ltd. | 35,460 | 15,745 | ||||||
Taiwan Cement Corp. | 10,000 | 11,548 | ||||||
Taiwan Cooperative Financial Holding Co. Ltd. | 24,720 | 13,024 | ||||||
Taiwan High Speed Rail Corp. | 6,000 | 5,288 | ||||||
Taiwan Mobile Co. Ltd. | 6,000 | 21,472 | ||||||
Taiwan Semiconductor Manufacturing Co. Ltd. | 70,000 | 502,170 | ||||||
Teco Electric and Machinery Co. Ltd. | 10,000 | 9,344 | ||||||
Uni-President Enterprises Corp. | 16,000 | 34,037 | ||||||
United Microelectronics Corp. | 42,000 | 20,945 | ||||||
Vanguard International Semiconductor Corp. | 2,000 | 3,612 | ||||||
Wistron Corp. | 10,296 | 9,723 | ||||||
WPG Holdings Ltd. | 8,000 | 10,418 | ||||||
Yuanta Financial Holding Co. Ltd. | 36,000 | 15,627 | ||||||
|
| |||||||
| 1,710,764 | ||||||||
THAILAND — 3.03% |
| |||||||
Advanced Info Service PCL NVDR | 3,800 | 21,458 | ||||||
Airports of Thailand PCL NVDR | 12,400 | 20,352 | ||||||
Bangkok Dusit Medical Services PCL NVDR | 9,000 | 5,665 | ||||||
Bangkok Expressway & Metro PCL NVDR | 44,000 | 10,336 | ||||||
Banpu PCL NVDR | 11,000 | 5,830 | ||||||
BEC World PCL NVDR | 11,200 | 5,835 | ||||||
Berli Jucker PCL NVDR | 7,000 | 10,382 | ||||||
Bumrungrad Hospital PCL NVDR | 1,400 | 9,191 | ||||||
Central Pattana PCL NVDR | 2,800 | 6,071 | ||||||
Charoen Pokphand Foods PCL NVDR | 8,000 | 6,565 | ||||||
CP ALL PCL NVDR | 12,200 | 22,780 | ||||||
Energy Absolute PCL NVDR | 5,200 | 5,912 | ||||||
Indorama Ventures PCL NVDR | 4,800 | 5,638 | ||||||
Kasikornbank PCL Foreign | 3,800 | 24,147 | ||||||
Kasikornbank PCL NVDR | 2,400 | 14,528 | ||||||
Krung Thai Bank PCL NVDR | 10,400 | 5,857 | ||||||
Minor International PCL NVDR | 5,200 | 6,225 | ||||||
SCHEDULESOF INVESTMENTS | 27 |
Table of Contents
Schedule of Investments (Continued)
iSHARES® MSCI EMERGING MARKETS ex CHINA ETF
August 31, 2017
| Security | Shares | Value | ||||||
PTT Exploration & Production PCL NVDR | 5,800 | $ | 15,284 | |||||
PTT Global Chemical PCL NVDR | 5,200 | 11,980 | ||||||
PTT PCL NVDR | 3,000 | 36,049 | ||||||
Siam Cement PCL (The) Foreign | 1,000 | 15,058 | ||||||
Siam Cement PCL (The) NVDR | 600 | 9,035 | ||||||
Siam Commercial Bank PCL (The) NVDR | 5,400 | 24,475 | ||||||
Thai Oil PCL NVDR | 2,200 | 6,245 | ||||||
True Corp. PCL NVDRa | 28,400 | 4,790 | ||||||
|
| |||||||
| 309,688 | ||||||||
TURKEY — 1.69% |
| |||||||
Akbank Turk AS | 7,804 | 23,372 | ||||||
Arcelik AS | 678 | 4,713 | ||||||
BIM Birlesik Magazalar AS | 768 | 17,017 | ||||||
Eregli Demir ve Celik Fabrikalari TAS | 5,232 | 12,457 | ||||||
Haci Omer Sabanci Holding AS | 3,188 | 9,788 | ||||||
KOC Holding AS | 2,438 | 12,739 | ||||||
Petkim Petrokimya Holding AS | 2,800 | 5,061 | ||||||
Tupras Turkiye Petrol Rafinerileri AS | 408 | 13,862 | ||||||
Turk Hava Yollari AOa | 3,586 | 10,137 | ||||||
Turkcell Iletisim Hizmetleri AS | 3,628 | 13,881 | ||||||
Turkiye Garanti Bankasi AS | 6,400 | 19,909 | ||||||
Turkiye Halk Bankasi AS | 2,200 | 9,443 | ||||||
Turkiye Is Bankasi Class C | 5,900 | 12,799 | ||||||
Turkiye Vakiflar Bankasi Tao Class D | 3,800 | 7,925 | ||||||
|
| |||||||
| 173,103 | ||||||||
UNITED ARAB EMIRATES — 1.03% |
| |||||||
Abu Dhabi Commercial Bank PJSC | 6,136 | 12,195 | ||||||
Aldar Properties PJSC | 12,000 | 7,547 | ||||||
DAMAC Properties Dubai Co. PJSC | 5,400 | 5,939 | ||||||
DP World Ltd. | 500 | 11,470 | ||||||
Dubai Islamic Bank PJSC | 3,200 | 5,306 | ||||||
Emaar Properties PJSC | 10,400 | 24,067 | ||||||
Emirates Telecommunications Group Co. PJSC | 5,602 | 27,452 | ||||||
First Abu Dhabi Bank PJSC | 4,000 | 11,326 | ||||||
|
| |||||||
| 105,302 | ||||||||
|
| |||||||
TOTAL COMMON STOCKS |
| |||||||
(Cost: $8,227,206) |
| 8,340,863 | ||||||
INVESTMENT COMPANIES — 13.01% |
| |||||||
INDIA — 12.14% | ||||||||
iShares MSCI India ETFd | 36,404 | 1,241,741 | ||||||
|
| |||||||
| 1,241,741 | ||||||||
| Security | Shares | Value | ||||||
QATAR — 0.87% | ||||||||
iShares MSCI Qatar Capped ETFd | 5,430 | $ | 88,943 | |||||
|
| |||||||
| 88,943 | ||||||||
|
| |||||||
TOTAL INVESTMENT COMPANIES |
| |||||||
(Cost: $1,318,912) |
| 1,330,684 | ||||||
PREFERRED STOCKS — 5.10% |
| |||||||
BRAZIL — 3.75% |
| |||||||
Banco Bradesco SA, Preference Shares | 8,800 | 93,917 | ||||||
Braskem SA Class A, Preference Shares | 600 | 7,267 | ||||||
Cia. Brasileira de Distribuicao, Preference Shares | 600 | 13,728 | ||||||
Cia. Energetica de Minas Gerais, Preference Shares | 2,800 | 7,457 | ||||||
Gerdau SA, Preference Shares | 3,000 | 11,299 | ||||||
Itau Unibanco Holding SA, Preference Shares | 9,400 | 120,545 | ||||||
Itausa-Investimentos Itau SA, Preference Shares | 11,800 | 38,253 | ||||||
Lojas Americanas SA, Preference Shares | 2,800 | 15,813 | ||||||
Petroleo Brasileiro SA, Preference Shares | 10,200 | 44,250 | ||||||
Suzano Papel e Celulose SA Class A, Preference Shares | 1,600 | 8,899 | ||||||
Telefonica Brasil SA, Preference Shares | 1,400 | 21,731 | ||||||
|
| |||||||
| 383,159 | ||||||||
CHILE — 0.20% |
| |||||||
Embotelladora Andina SA Class B, Preference Shares | 1,936 | 9,123 | ||||||
Sociedad Quimica y Minera de Chile SA Series B, Preference Shares | 244 | 11,402 | ||||||
|
| |||||||
| 20,525 | ||||||||
COLOMBIA — 0.10% |
| |||||||
Bancolombia SA, Preference Shares | 922 | 10,520 | ||||||
|
| |||||||
| 10,520 | ||||||||
RUSSIA — 0.10% |
| |||||||
Surgutneftegas OJSC, Preference Shares | 20,000 | 9,873 | ||||||
|
| |||||||
| 9,873 | ||||||||
| 28 | 2017 iSHARES ANNUAL REPORTTO SHAREHOLDERS |
Table of Contents
Schedule of Investments (Continued)
iSHARES® MSCI EMERGING MARKETS ex CHINA ETF
August 31, 2017
| Security | Shares | Value | ||||||
SOUTH KOREA — 0.95% |
| |||||||
Hyundai Motor Co., Preference Shares | 56 | $ | 4,788 | |||||
Hyundai Motor Co. Series 2, Preference Shares | 66 | 5,970 | ||||||
Samsung Electronics Co. Ltd., Preference Shares | 52 | 86,928 | ||||||
|
| |||||||
| 97,686 | ||||||||
|
| |||||||
TOTAL PREFERRED STOCKS |
| |||||||
(Cost: $490,036) |
| 521,763 | ||||||
SHORT-TERM INVESTMENTS — 0.16% |
| |||||||
MONEY MARKET FUNDS — 0.16% |
| |||||||
BlackRock Cash Funds: Treasury, | ||||||||
0.96%d,e | 15,969 | 15,969 | ||||||
|
| |||||||
| 15,969 | ||||||||
|
| |||||||
TOTAL SHORT-TERM INVESTMENTS |
| |||||||
(Cost: $15,969) |
| 15,969 | ||||||
|
| |||||||
| Value | ||||||
TOTAL INVESTMENTS | ||||||
(Cost: $10,052,123)f | $ | 10,209,279 | ||||
Other Assets, Less Liabilities — 0.18% | 17,909 | |||||
|
| |||||
NET ASSETS — 100.00% | $ | 10,227,188 | ||||
|
| |||||
ADR — American Depositary Receipts
CPO — Certificates of Participation (Ordinary)
GDR — Global Depositary Receipts
NVDR — Non-Voting Depositary Receipts
| a | Non-income earning security. |
| b | This security may be resold to qualified foreign investors and foreign institutional buyers under Regulation S of the Securities Act of 1933. |
| c | This security may be resold to qualified institutional buyers under Rule 144A of the Securities Act of 1933. |
| d | Affiliated issuer. See Schedule 1. |
| e | The rate quoted is the annualized seven-day yield of the fund at period end. |
| f | The cost of investments (including short positions and derivatives, if any) for federal income tax purposes was $10,055,492. Net unrealized appreciation was $153,787, of which $363,343 represented gross unrealized appreciation on investments and $209,556 represented gross unrealized depreciation on investments. |
Schedule 1 — Affiliates (Note 2)
Investments in issuers considered to be affiliates of the Fund during the period ended August 31, 2017, for purposes of Section 2(a)(3) of the 1940 Act, and/or related parties of the Fund were as follows:
| Affiliated issuer | Shares held at 7/18/17 a | Shares purchased | Shares sold | Shares held at 08/31/17 | Value at 08/31/17 | Net realized gain (loss) b | Change in unrealized appreciation (depreciation) | Income | ||||||||||||||||||||||||
BlackRock Cash Funds: Treasury, | — | 15,969 | c | — | 15,969 | $ | 15,969 | $ | — | $ | — | $ | 11 | |||||||||||||||||||
iShares MSCI India ETF | — | 36,404 | — | 36,404 | 1,241,741 | — | 17,474 | — | ||||||||||||||||||||||||
iShares MSCI Qatar Capped ETF | — | 5,430 | — | 5,430 | 88,943 | — | (5,702 | ) | — | |||||||||||||||||||||||
|
|
|
|
|
|
|
| |||||||||||||||||||||||||
| $ | 1,346,653 | $ | — | $ | 11,772 | $ | 11 | |||||||||||||||||||||||||
|
|
|
|
|
|
|
| |||||||||||||||||||||||||
| a | The Fund commenced operations on July 18, 2017. |
| b | Includes realized capital gain distributions from an affiliated fund, if any. |
| c | Net of shares purchased and sold. |
SCHEDULESOF INVESTMENTS | 29 |
Table of Contents
Schedule of Investments (Continued)
iSHARES® MSCI EMERGING MARKETS ex CHINA ETF
August 31, 2017
Schedule 2 — Fair Value Measurements
Various inputs are used in determining the fair value of financial instruments. For description of the input levels and information about the Fund’s policy regarding valuation of financial instruments, see Note 1.
The following table summarizes the value of the Fund’s investments according to the fair value hierarchy as of August 31, 2017. The breakdown of the Fund’s investments into major categories is disclosed in the schedule of investments above.
| Level 1 | Level 2 | Level 3 | Total | |||||||||||||
Investments: | ||||||||||||||||
Assets: | ||||||||||||||||
Common stocks | $ | 8,340,863 | $ | — | $ | — | $ | 8,340,863 | ||||||||
Investment companies | 1,330,684 | — | — | 1,330,684 | ||||||||||||
Preferred stocks | 521,763 | — | — | 521,763 | ||||||||||||
Money market funds | 15,969 | — | — | 15,969 | ||||||||||||
|
|
|
|
|
|
|
| |||||||||
Total | $ | 10,209,279 | $ | — | $ | — | $ | 10,209,279 | ||||||||
|
|
|
|
|
|
|
| |||||||||
See notes to financial statements.
| 30 | 2017 iSHARES ANNUAL REPORTTO SHAREHOLDERS |
Table of Contents
Statements of Assets and Liabilities
iSHARES®, INC.
August 31, 2017
| iShares Edge MSCI Multifactor Emerging Markets ETF | iShares MSCI EM ESG Optimized ETF | iShares MSCI Emerging Markets ex China ETF | ||||||||||
ASSETS | ||||||||||||
Investments in securities, at cost: | ||||||||||||
Unaffiliated | $ | 65,195,953 | $ | 84,257,848 | $ | 8,717,242 | ||||||
Affiliated (Note 2) | 8,052,179 | 4,101,247 | 1,334,881 | |||||||||
|
|
|
|
|
| |||||||
Total cost of investments in securities | $ | 73,248,132 | $ | 88,359,095 | $ | 10,052,123 | ||||||
|
|
|
|
|
| |||||||
Investments in securities, at fair value (including securities on loana) (Note 1): | ||||||||||||
Unaffiliated | $ | 76,490,587 | $ | 96,513,106 | $ | 8,862,626 | ||||||
Affiliated (Note 2) | 8,752,520 | 4,101,306 | 1,346,653 | |||||||||
Foreign currency, at valueb | 254,397 | 189,752 | 8,277 | |||||||||
Cash | — | 13,997 | — | |||||||||
Receivables: | ||||||||||||
Investment securities sold | — | 4,539,096 | 17,706 | |||||||||
Due from custodian (Note 4) | 38,549 | — | — | |||||||||
Dividends and interest | 110,283 | 117,228 | 16,550 | |||||||||
Capital shares sold | 33,545 | — | — | |||||||||
Tax reclaims | 2,996 | — | 18 | |||||||||
|
|
|
|
|
| |||||||
Total Assets | 85,682,877 | 105,474,485 | 10,251,830 | |||||||||
|
|
|
|
|
| |||||||
LIABILITIES | ||||||||||||
Payables: | ||||||||||||
Investment securities purchased | 423,963 | 4,652,589 | 20,732 | |||||||||
Collateral for securities on loan (Note 1) | 2,360,940 | 3,988,206 | — | |||||||||
Foreign taxes (Note 1) | 1,887 | 1,621 | 441 | |||||||||
Investment advisory fees (Note 2) | 23,172 | 19,611 | 3,469 | |||||||||
|
|
|
|
|
| |||||||
Total Liabilities | 2,809,962 | 8,662,027 | 24,642 | |||||||||
|
|
|
|
|
| |||||||
NET ASSETS | $ | 82,872,915 | $ | 96,812,458 | $ | 10,227,188 | ||||||
|
|
|
|
|
| |||||||
Net assets consist of: | ||||||||||||
Paid-in capital | $ | 70,874,221 | $ | 84,220,401 | $ | 10,046,048 | ||||||
Undistributed net investment income | 431,727 | 629,407 | 23,397 | |||||||||
Undistributed net realized gain (accumulated net realized loss) | (429,937 | ) | (293,931 | ) | 411 | |||||||
Net unrealized appreciation | 11,996,904 | 12,256,581 | 157,332 | |||||||||
|
|
|
|
|
| |||||||
NET ASSETS | $ | 82,872,915 | $ | 96,812,458 | $ | 10,227,188 | ||||||
|
|
|
|
|
| |||||||
Shares outstandingc | 1,800,000 | 1,400,000 | 200,000 | |||||||||
|
|
|
|
|
| |||||||
Net asset value per share | $ | 46.04 | $ | 69.15 | $ | 51.14 | ||||||
|
|
|
|
|
| |||||||
| a | Securities on loan with values of $1,216,212, $3,877,685 and $ —, respectively. See Note 1. |
| b | Cost of foreign currency: $253,884, $189,167 and $8,210, respectively. |
| c | $0.001 par value, number of shares authorized: 25 million, 25 million and 25 million, respectively. |
See notes to financial statements.
FINANCIAL STATEMENTS | 31 |
Table of Contents
Statements of Operations
iSHARES®, INC.
Year ended August 31, 2017
| iShares Edge MSCI Multifactor Emerging Markets ETF | iShares MSCI EM ESG Optimized ETF | iShares MSCI Emerging Markets ex China ETFa | ||||||||||
NET INVESTMENT INCOME | ||||||||||||
Dividends — unaffiliatedb | $ | 1,032,819 | $ | 1,249,863 | $ | 30,537 | ||||||
Dividends — affiliated (Note 2) | 22,035 | 415 | 11 | |||||||||
Interest — unaffiliated | — | 3 | — | |||||||||
Securities lending income — affiliated — net (Note 2) | 10,558 | 7,967 | — | |||||||||
|
|
|
|
|
| |||||||
| 1,065,412 | 1,258,248 | 30,548 | ||||||||||
Less: Other foreign taxes (Note 1) | (3,964 | ) | (2,234 | ) | (460 | ) | ||||||
|
|
|
|
|
| |||||||
Total investment income | 1,061,448 | 1,256,014 | 30,088 | |||||||||
|
|
|
|
|
| |||||||
EXPENSES | ||||||||||||
Investment advisory fees (Note 2) | 197,073 | 166,101 | 5,952 | |||||||||
Proxy fees | 894 | 1,146 | — | |||||||||
|
|
|
|
|
| |||||||
Total expenses | 197,967 | 167,247 | 5,952 | |||||||||
Less investment advisory fees waived (Note 2) | (31,551 | ) | — | (1,002 | ) | |||||||
|
|
|
|
|
| |||||||
Net expenses | 166,416 | 167,247 | 4,950 | |||||||||
|
|
|
|
|
| |||||||
Net investment income | 895,032 | 1,088,767 | 25,138 | |||||||||
|
|
|
|
|
| |||||||
NET REALIZED AND UNREALIZED GAIN (LOSS) | ||||||||||||
Net realized gain (loss) from: | ||||||||||||
Investments — unaffiliated | (309,379 | ) | (295,218 | ) | 411 | |||||||
Investments — affiliated (Note 2) | 64 | (272 | ) | — | ||||||||
In-kind redemptions — unaffiliated | 369,036 | 570,973 | — | |||||||||
Foreign currency transactions | (449 | ) | 6,521 | (1,741 | ) | |||||||
Realized gain distributions from affiliated funds | 2 | — | — | |||||||||
|
|
|
|
|
| |||||||
Net realized gain (loss) | 59,274 | 282,004 | (1,330 | ) | ||||||||
|
|
|
|
|
| |||||||
Net change in unrealized appreciation/depreciation on: | ||||||||||||
Investments — unaffiliated | 9,128,902 | 11,677,459 | 145,384 | |||||||||
Investments — affiliated (Note 2) | 616,602 | 59 | 11,772 | |||||||||
Translation of assets and liabilities in foreign currencies | 2,799 | 1,403 | 176 | |||||||||
|
|
|
|
|
| |||||||
Net change in unrealized appreciation/depreciation | 9,748,303 | 11,678,921 | 157,332 | |||||||||
|
|
|
|
|
| |||||||
Net realized and unrealized gain | 9,807,577 | 11,960,925 | 156,002 | |||||||||
|
|
|
|
|
| |||||||
NET INCREASE IN NET ASSETS RESULTING FROM OPERATIONS | $ | 10,702,609 | $ | 13,049,692 | $ | 181,140 | ||||||
|
|
|
|
|
| |||||||
| a | For the period from July 18, 2017 (commencement of operations) to August 31, 2017. |
| b | Net of foreign withholding tax of $130,920, $160,597 and $5,662, respectively. |
See notes to financial statements.
| 32 | 2017 iSHARES ANNUAL REPORTTO SHAREHOLDERS |
Table of Contents
Statements of Changes in Net Assets
iSHARES®, INC.
| iShares Edge MSCI Multifactor Emerging Markets ETF | iShares MSCI EM ESG Optimized ETF | |||||||||||||||
| Year ended August 31, 2017 | Period from to August 31, 2016 | Year ended August 31, 2017 | Period from to | |||||||||||||
INCREASE (DECREASE) IN NET ASSETS | ||||||||||||||||
OPERATIONS: | ||||||||||||||||
Net investment income | $ | 895,032 | $ | 422,570 | $ | 1,088,767 | $ | 31,368 | ||||||||
Net realized gain (loss) | 59,274 | (107,720 | ) | 282,004 | (2,734 | ) | ||||||||||
Net change in unrealized appreciation/depreciation | 9,748,303 | 2,248,601 | 11,678,921 | 577,660 | ||||||||||||
|
|
|
|
|
|
|
| |||||||||
Net increase in net assets resulting from operations | 10,702,609 | 2,563,451 | 13,049,692 | 606,294 | ||||||||||||
|
|
|
|
|
|
|
| |||||||||
DISTRIBUTIONS TO SHAREHOLDERS: | ||||||||||||||||
From net investment income | (797,610 | ) | (100,720 | ) | (499,570 | ) | — | |||||||||
|
|
|
|
|
|
|
| |||||||||
Total distributions to shareholders | (797,610 | ) | (100,720 | ) | (499,570 | ) | — | |||||||||
|
|
|
|
|
|
|
| |||||||||
CAPITAL SHARE TRANSACTIONS: | ||||||||||||||||
Proceeds from shares sold | 47,184,280 | 27,506,253 | 81,808,084 | 5,039,084 | ||||||||||||
Cost of shares redeemed | (4,185,348 | ) | — | (3,191,126 | ) | — | ||||||||||
|
|
|
|
|
|
|
| |||||||||
Net increase in net assets from capital share transactions | 42,998,932 | 27,506,253 | 78,616,958 | 5,039,084 | ||||||||||||
|
|
|
|
|
|
|
| |||||||||
INCREASE IN NET ASSETS | 52,903,931 | 29,968,984 | 91,167,080 | 5,645,378 | ||||||||||||
NET ASSETS | ||||||||||||||||
Beginning of period | 29,968,984 | — | 5,645,378 | — | ||||||||||||
|
|
|
|
|
|
|
| |||||||||
End of period | $ | 82,872,915 | $ | 29,968,984 | $ | 96,812,458 | $ | 5,645,378 | ||||||||
|
|
|
|
|
|
|
| |||||||||
Undistributed net investment income included in net assets at end of period | $ | 431,727 | $ | 314,129 | $ | 629,407 | $ | 29,307 | ||||||||
|
|
|
|
|
|
|
| |||||||||
SHARES ISSUED AND REDEEMED | ||||||||||||||||
Shares sold | 1,100,000 | 800,000 | 1,350,000 | 100,000 | ||||||||||||
Shares redeemed | (100,000 | ) | — | (50,000 | ) | — | ||||||||||
|
|
|
|
|
|
|
| |||||||||
Net increase in shares outstanding | 1,000,000 | 800,000 | 1,300,000 | 100,000 | ||||||||||||
|
|
|
|
|
|
|
| |||||||||
| a | Commencement of operations. |
See notes to financial statements.
FINANCIAL STATEMENTS | 33 |
Table of Contents
Statements of Changes in Net Assets (Continued)
iSHARES®, INC.
| iShares MSCI Emerging Markets ex China ETF |
Period from to | ||||
INCREASE (DECREASE) IN NET ASSETS | ||||
OPERATIONS: | ||||
Net investment income | $ | 25,138 | ||
Net realized loss | (1,330 | ) | ||
Net change in unrealized appreciation/depreciation | 157,332 | |||
|
| |||
Net increase in net assets resulting from operations | 181,140 | |||
|
| |||
CAPITAL SHARE TRANSACTIONS: | ||||
Proceeds from shares sold | 10,046,048 | |||
|
| |||
Net increase in net assets from capital share transactions | 10,046,048 | |||
|
| |||
INCREASE IN NET ASSETS | 10,227,188 | |||
NET ASSETS | ||||
Beginning of period | — | |||
|
| |||
End of period | $ | 10,227,188 | ||
|
| |||
Undistributed net investment income included in net assets at end of period | $ | 23,397 | ||
|
| |||
SHARES ISSUED | ||||
Shares sold | 200,000 | |||
|
| |||
Net increase in shares outstanding | 200,000 | |||
|
| |||
| a | Commencement of operations. |
See notes to financial statements.
| 34 | 2017 iSHARES ANNUAL REPORTTO SHAREHOLDERS |
Table of Contents
iSHARES®, INC.
(For a share outstanding throughout each period)
| iShares Edge MSCI Multifactor Emerging Markets ETF | ||||
| Year ended Aug. 31, 2017 | Period from to | |||||||
Net asset value, beginning of period | $ | 37.46 | $ | 33.82 | ||||
|
|
|
| |||||
Income from investment operations: | ||||||||
Net investment incomeb | 0.91 | 1.27 | ||||||
Net realized and unrealized gainc | 8.53 | 2.50 | ||||||
|
|
|
| |||||
Total from investment operations | 9.44 | 3.77 | ||||||
|
|
|
| |||||
Less distributions from: | ||||||||
Net investment income | (0.86 | ) | (0.13 | ) | ||||
|
|
|
| |||||
Total distributions | (0.86 | ) | (0.13 | ) | ||||
|
|
|
| |||||
Net asset value, end of period | $ | 46.04 | $ | 37.46 | ||||
|
|
|
| |||||
Total return | 25.80 | % | 11.16 | %d | ||||
|
|
|
| |||||
Ratios/Supplemental data: | ||||||||
Net assets, end of period (000s) | $ | 82,873 | $ | 29,969 | ||||
Ratio of expenses to average net assetse | 0.42 | % | 0.49 | % | ||||
Ratio of expenses to average net assets prior to waived feese | 0.50 | % | 0.65 | % | ||||
Ratio of net investment income to average net assetse | 2.24 | % | 4.91 | % | ||||
Portfolio turnover ratef | 36 | % | 11 | %d | ||||
| a | Commencement of operations. |
| b | Based on average shares outstanding throughout each period. |
| c | The amounts reported for a share outstanding may not accord with the change in aggregate gains and losses in securities for the fiscal period due to the timing of capital share transactions in relation to the fluctuating market values of the Fund’s underlying securities. |
| d | Not annualized. |
| e | Annualized for periods of less than one year. |
| f | Portfolio turnover rates exclude portfolio securities received or delivered in Creation Units but includes portfolio transactions that are executed as a result of the Fund processing capital share transactions in Creation Units partially for cash in U.S. dollars. Excluding such cash transactions, the portfolio turnover rates for the year ended August 31, 2017 and the period ended August 31, 2016 were 36% and 11%, respectively. See Note 4. |
See notes to financial statements.
FINANCIAL HIGHLIGHTS | 35 |
Table of Contents
Financial Highlights (Continued)
iSHARES®, INC.
(For a share outstanding throughout each period)
| iShares MSCI EM ESG Optimized ETF | ||||
| Year ended Aug. 31, 2017 | Period from to | |||||||
Net asset value, beginning of period | $ | 56.45 | $ | 50.37 | ||||
|
|
|
| |||||
Income from investment operations: | ||||||||
Net investment incomeb | 1.70 | 0.31 | ||||||
Net realized and unrealized gainc | 11.62 | 5.77 | ||||||
|
|
|
| |||||
Total from investment operations | 13.32 | 6.08 | ||||||
|
|
|
| |||||
Less distributions from: | ||||||||
Net investment income | (0.62 | ) | — | |||||
|
|
|
| |||||
Total distributions | (0.62 | ) | — | |||||
|
|
|
| |||||
Net asset value, end of period | $ | 69.15 | $ | 56.45 | ||||
|
|
|
| |||||
Total return | 23.75 | % | 12.09 | %d | ||||
|
|
|
| |||||
Ratios/Supplemental data: | ||||||||
Net assets, end of period (000s) | $ | 96,812 | $ | 5,645 | ||||
Ratio of expenses to average net assetse | 0.42 | % | 0.45 | % | ||||
Ratio of net investment income to average net assetse | 2.73 | % | 3.26 | % | ||||
Portfolio turnover ratef | 29 | % | 9 | %d | ||||
| a | Commencement of operations. |
| b | Based on average shares outstanding throughout each period. |
| c | The amounts reported for a share outstanding may not accord with the change in aggregate gains and losses in securities for the fiscal period due to the timing of capital share transactions in relation to the fluctuating market values of the Fund’s underlying securities. |
| d | Not annualized. |
| e | Annualized for periods of less than one year. |
| f | Portfolio turnover rates exclude portfolio securities received or delivered in Creation Units but includes portfolio transactions that are executed as a result of the Fund processing capital share transactions in Creation Units partially for cash in U.S. dollars. Excluding such cash transactions, the portfolio turnover rates for the year ended August 31, 2017 and the period ended August 31, 2016 were 29% and 9%, respectively. See Note 4. |
See notes to financial statements.
| 36 | 2017 iSHARES ANNUAL REPORTTO SHAREHOLDERS |
Table of Contents
Financial Highlights (Continued)
iSHARES®, INC.
(For a share outstanding throughout the period)
| iShares MSCI Emerging Markets ex China ETF |
Period from to | ||||
Net asset value, beginning of period | $ | 50.22 | ||
|
| |||
Income from investment operations: | ||||
Net investment incomeb | 0.13 | |||
Net realized and unrealized gainc | 0.79 | |||
|
| |||
Total from investment operations | 0.92 | |||
|
| |||
Net asset value, end of period | $ | 51.14 | ||
|
| |||
Total return | 1.83 | %d | ||
|
| |||
Ratios/Supplemental data: | ||||
Net assets, end of period (000s) | $ | 10,227 | ||
Ratio of expenses to average net assetse | 0.41 | % | ||
Ratio of expenses to average net assets prior to waived feese | 0.49 | % | ||
Ratio of net investment income to average net assetse | 2.07 | % | ||
Portfolio turnover ratef | 0 | %d,g | ||
| a | Commencement of operations. |
| b | Based on average shares outstanding throughout the period. |
| c | The amount reported for a share outstanding may not accord with the change in aggregate gains and losses in securities for the fiscal period due to the timing of capital share transactions in relation to the fluctuating market values of the Fund’s underlying securities. |
| d | Not annualized. |
| e | Annualized for periods of less than one year. |
| f | Portfolio turnover rate excludes portfolio securities received or delivered in Creation Units but includes portfolio transactions that are executed as a result of the Fund processing capital share transactions in Creation Units partially for cash in U.S. dollars. Excluding such cash transactions, the portfolio turnover rate for the period ended August 31, 2017 was 0%. See Note 4. |
| g | Rounds to less than 1%. |
See notes to financial statements.
FINANCIAL HIGHLIGHTS | 37 |
Table of Contents
iSHARES®, INC.
iShares, Inc. (the “Company”) is registered under the Investment Company Act of 1940, as amended (the “1940 Act”), as an open-end management investment company. The Company was incorporated under the laws of the State of Maryland on September 1, 1994 pursuant to Articles of Incorporation as subsequently amended and restated.
These financial statements relate only to the following funds (each, a “Fund,” and collectively, the “Funds”):
| iShares ETF | Diversification Classification | |||
Edge MSCI Multifactor Emerging Markets | Non-diversified | |||
MSCI EM ESG Optimized | Non-diversified | |||
MSCI Emerging Markets ex Chinaa | Non-diversified | |||
| a | The Fund commenced operations on July 18, 2017. |
The investment objective of each Fund is to seek investment results that correspond generally to the price and yield performance, before fees and expenses, of its underlying index. The investment adviser uses a “passive” or index approach to try to achieve each Fund’s investment objective.
Pursuant to the Company’s organizational documents, the Funds’ officers and directors are indemnified against certain liabilities that may arise out of the performance of their duties to the Funds. Additionally, in the normal course of business, the Funds enter into contracts with service providers that contain general indemnification clauses. The Funds’ maximum exposure under these arrangements is unknown as this would involve future claims that may be made against the Funds that have not yet occurred.
| 1. | SIGNIFICANT ACCOUNTING POLICIES |
The following significant accounting policies are consistently followed by each Fund in the preparation of its financial statements in conformity with accounting principles generally accepted in the United States of America (“U.S. GAAP”). The preparation of financial statements in conformity with U.S. GAAP requires management to make certain estimates and assumptions that affect the reported amounts of assets and liabilities and disclosures of contingent assets and liabilities at the date of the financial statements and the reported amounts of revenue and expenses during the reporting period. Actual results could differ from those estimates. Each Fund is considered an investment company under U.S. GAAP and follows the accounting and reporting guidance applicable to investment companies.
SECURITY VALUATION
Each Fund’s investments are valued at fair value each day that the Fund’s listing exchange is open and, for financial reporting purposes, as of the report date should the reporting period end on a day that the Fund’s listing exchange is not open. U.S. GAAP defines fair value as the price a fund would receive to sell an asset or pay to transfer a liability in an orderly transaction between market participants at the measurement date. The BlackRock Global Valuation Methodologies Committee (the “Global Valuation Committee”) provides oversight of the valuation of investments for the Funds. The investments of each Fund are valued pursuant to policies and procedures developed by the Global Valuation Committee and approved by the Board of Directors of the Company (the “Board”).
| • | Equity investments traded on a recognized securities exchange are valued at that day’s last reported trade price or the official closing price, as applicable, on the exchange where the stock is primarily traded. Equity investments traded on a recognized exchange for which there were no sales on that day are valued at the last traded price. |
| 38 | 2017 iSHARES ANNUAL REPORTTO SHAREHOLDERS |
Table of Contents
Notes to Financial Statements (Continued)
iSHARES®, INC.
| • | Exchange-traded funds and closed-end funds traded on a recognized securities exchange are valued at that day’s last reported trade price or the official closing price, as applicable, on the exchange where the fund is primarily traded. Funds traded on a recognized exchange for which there were no sales on that day are valued at the last traded price. |
| • | Open-end U.S. mutual funds (including money market funds) are valued at that day’s published net asset value (“NAV”). |
In the event that application of these methods of valuation results in a price for an investment which is deemed not to be representative of the fair value of such investment or if a price is not available, the investment will be valued by the Global Valuation Committee, in accordance with policies approved by the Board. The fair valuation approaches that may be utilized by the Global Valuation Committee to determine fair value include market approach, income approach and the cost approach. The valuation techniques used under these approaches take into consideration inputs that include but are not limited to (i) attributes specific to the investment; (ii) the principal market for the investment; (iii) the customary participants in the principal market for the investment; (iv) data assumptions by market participants for the investment, if reasonably available; (v) quoted prices for similar investments in active markets; and (vi) other inputs, such as future cash flows, interest rates, yield curves, volatilities, prepayment speeds, loss severities, credit risks and/or default rates. Valuations based on such inputs are reported to the Board on a quarterly basis.
The Global Valuation Committee employs various methods for calibrating valuation approaches for investments where an active market does not exist, including regular due diligence of the Company’s pricing vendors, a regular review of key inputs and assumptions, transactional back-testing or disposition analysis to compare unrealized gains and losses to realized gains and losses, reviews of missing or stale prices, reviews of large movements in market values, and reviews of market related activity.
Fair value pricing could result in a difference between the prices used to calculate a Fund’s NAV and the prices used by the Fund’s underlying index, which in turn could result in a difference between the Fund’s performance and the performance of the Fund’s underlying index.
Various inputs are used in determining the fair value of financial instruments. Inputs may be based on independent market data (“observable inputs”) or they may be internally developed (“unobservable inputs”). These inputs to valuation techniques are categorized into a fair value hierarchy consisting of three broad levels for financial reporting purposes as follows:
| • | Level 1 — Unadjusted quoted prices in active markets for identical assets or liabilities; |
| • | Level 2 — Inputs other than quoted prices included within Level 1 that are observable for the asset or liability either directly or indirectly, including quoted prices for similar assets or liabilities in active markets, quoted prices for identical or similar assets or liabilities in markets that are not considered to be active, inputs other than quoted prices that are observable for the asset or liability (such as exchange rates, financing terms, interest rates, yield curves, volatilities, prepayment speeds, loss severities, credit risks and default rates) or other market-corroborated inputs; and |
| • | Level 3 — Unobservable inputs for the asset or liability based on the best information available in the circumstances, to the extent observable inputs are not available, including the Global Valuation Committee’s assumptions used in determining the fair value of investments. |
The hierarchy gives the highest priority to unadjusted quoted prices in active markets for identical assets or liabilities (Level 1 measurements) and the lowest priority to unobservable inputs (Level 3 measurements). Accordingly, the degree of judgement exercised in determining fair value is greatest for instruments categorized in Level 3. The inputs used to measure fair value may fall into different levels of the fair value hierarchy. In such cases, for disclosure purposes, the fair value hierarchy classification is determined based on the lowest level input that is significant to the fair value measurement in its entirety. The fair value hierarchy for each Fund’s investments is included in its schedule of investments.
NOTESTO FINANCIAL STATEMENTS | 39 |
Table of Contents
Notes to Financial Statements (Continued)
iSHARES®, INC.
Changes in valuation techniques may result in transfers in or out of an assigned level within the fair value hierarchy. In accordance with the Company’s policy, transfers between different levels of the fair value hierarchy are deemed to have occurred as of the beginning of the reporting period. The categorization of values determined for financial instruments are based on the pricing transparency of the financial instruments and are not necessarily an indication of the risks associated with investing in those securities.
SECURITY TRANSACTIONS AND INCOME RECOGNITION
Security transactions are accounted for on trade date. Realized gains and losses on investment transactions are determined using the specific identification method. Dividend income and capital gain distributions, if any, are recognized on the ex-dividend date, net of any foreign taxes withheld at source. Any taxes withheld that are reclaimable from foreign tax authorities as of August 31, 2017 are reflected in tax reclaims receivable. Upon notification from issuers, some of the dividend income received from a real estate investment trust may be re-designated as a reduction of cost of the related investment and/or realized gain. Non-cash dividends received, if any, are recognized on the ex-dividend date and recorded as non-cash dividend income at fair value. Distributions received by the Funds may include a return of capital that is estimated by management. Such amounts are recorded as a reduction of the cost of investments or reclassified to capital gains. Interest income is accrued daily.
FOREIGN CURRENCY TRANSLATION
The accounting records of the Funds are maintained in U.S. dollars. Foreign currencies, as well as investment securities and other assets and liabilities denominated in foreign currencies, are translated into U.S. dollars using exchange rates deemed appropriate by the investment adviser. Purchases and sales of securities, income receipts and expense payments are translated into U.S. dollars on the respective dates of such transactions.
Each Fund does not isolate the effect of fluctuations in foreign exchange rates from the effect of fluctuations in the market prices of securities. Such fluctuations are reflected by the Funds as a component of realized and unrealized gains and losses from investments for financial reporting purposes. Each Fund reports realized currency gains (losses) on foreign currency related transactions as components of net realized gain (loss) for financial reporting purposes, whereas such components are generally treated as ordinary income for U.S. federal income tax purposes.
FOREIGN TAXES
The Funds may be subject to foreign taxes (a portion of which may be reclaimable) on income, stock dividends, capital gains on investments, or certain foreign currency transactions. All foreign taxes are recorded in accordance with the applicable foreign tax regulations and rates that exist in the foreign jurisdictions in which the Funds invest. These foreign taxes, if any, are paid by the Funds and are reflected in their statements of operations as follows: foreign taxes withheld at source are presented as a reduction of income, foreign taxes on securities lending income are presented as a reduction of securities lending income, foreign taxes on stock dividends are presented as “other foreign taxes”, and foreign taxes on capital gains from sales of investments and foreign taxes on foreign currency transactions are included in their respective net realized gain (loss) categories. Foreign taxes payable or deferred as of August 31, 2017, if any, are disclosed in the Funds’ statements of assets and liabilities.
DISTRIBUTIONS TO SHAREHOLDERS
Dividends and distributions paid by each Fund are recorded on the ex-dividend dates. Distributions are determined on a tax basis and may differ from net investment income and net realized capital gains for financial reporting purposes. Dividends and distributions are paid in U.S. dollars and cannot be automatically reinvested in additional shares of the Funds.
| 40 | 2017 iSHARES ANNUAL REPORTTO SHAREHOLDERS |
Table of Contents
Notes to Financial Statements (Continued)
iSHARES®, INC.
LOANS OF PORTFOLIO SECURITIES
Each Fund may lend its investment securities to approved borrowers, such as brokers, dealers and other financial institutions. The borrower pledges and maintains with the Fund collateral consisting of cash, an irrevocable letter of credit issued by an approved bank, or securities issued or guaranteed by the U.S. government. The initial collateral received by each Fund is required to have a value of at least 102% of the current value of the loaned securities for securities traded on U.S. exchanges and a value of at least 105% for all other securities. The collateral is maintained thereafter at a value equal to at least 100% of the current value of the securities on loan. The market value of the loaned securities is determined at the close of each business day of the Funds. Any additional required collateral is delivered to the Funds and any excess collateral is returned by the Funds on the next business day. During the term of the loan, each Fund is entitled to all distributions made on or in respect of the loaned securities but does not receive interest income on securities received as collateral. Loans of securities are terminable at any time and the borrower, after notice, is required to return borrowed securities within the standard time period for settlement of securities transactions.
Cash received as collateral for securities on loan may be reinvested in certain short-term instruments either directly on behalf of a fund or through one or more joint accounts or money market funds, including those managed by BlackRock Fund Advisors (“BFA”), the Funds’ investment adviser, or its affiliates. As of August 31, 2017, any securities on loan were collateralized by cash and/or U.S. government obligations. Cash collateral received was invested in money market funds managed by BFA and is disclosed in the schedules of investments. Any non-cash collateral received cannot be sold, re-invested or pledged by the Fund, except in the event of borrower default. The securities on loan for each Fund are also disclosed in its schedule of investments. The total value of any securities on loan as of August 31, 2017 and the total value of the related cash collateral are disclosed in the statements of assets and liabilities. Income earned by the Funds from securities lending is disclosed in the statements of operations.
The risks of securities lending include the risk that the borrower may not provide additional collateral when required or may not return the securities when due. To mitigate these risks, the Funds benefit from a borrower default indemnity provided by BlackRock, Inc. (“BlackRock”). BlackRock’s indemnity allows for full replacement of securities loaned if the collateral received does not cover the value of the securities loaned in the event of borrower default. Each Fund could incur a loss if the value of an investment purchased with cash collateral falls below the value of the loaned securities or if the value of an investment purchased with cash collateral falls below the value of the original cash collateral received.
Securities lending transactions are entered into by the Funds under Master Securities Lending Agreements (“MSLA”) which provide the right, in the event of default (including bankruptcy or insolvency) for the non-defaulting party to liquidate the collateral and calculate a net exposure to the defaulting party or request additional collateral. In the event that a borrower defaults, a Fund, as lender, would offset the market value of the collateral received against the market value of the securities loaned. The value of the collateral is typically greater than that of the market value of the securities loaned, leaving the lender with a net amount payable to the defaulting party. However, bankruptcy or insolvency laws of a particular jurisdiction may impose restrictions on or prohibitions against such a right of offset in the event of an MSLA counterparty’s bankruptcy or insolvency. Under the MSLA, the borrower can resell or re-pledge the loaned securities, and a Fund can reinvest cash collateral, or, upon an event of default, resell or re-pledge the collateral.
NOTESTO FINANCIAL STATEMENTS | 41 |
Table of Contents
Notes to Financial Statements (Continued)
iSHARES®, INC.
The following table is a summary of securities lending agreements which are subject to offset under an MSLA as of August 31, 2017:
| iShares ETF and Counterparty | Market Value of Securities on Loan | Cash Collateral Received a | Net Amount | |||||||||
Edge MSCI Multifactor Emerging Markets | ||||||||||||
Morgan Stanley & Co. LLC | $ | 1,216,212 | $ | 1,216,212 | $ | — | ||||||
|
|
|
|
|
| |||||||
MSCI EM ESG Optimized | ||||||||||||
Citigroup Global Markets Inc. | $ | 1,350,735 | $ | 1,350,735 | $ | — | ||||||
Credit Suisse Securities (USA) LLC | 89,726 | 89,726 | — | |||||||||
Jefferies LLC | 210,688 | 210,688 | — | |||||||||
JPMorgan Securities LLC | 2,146,578 | 2,146,578 | — | |||||||||
UBS AG | 79,958 | 79,958 | — | |||||||||
|
|
|
|
|
| |||||||
| $ | 3,877,685 | $ | 3,877,685 | $ | — | |||||||
|
|
|
|
|
| |||||||
| a | Collateral received in excess of the market value of securities on loan is not presented in this table. The total cash collateral received by each Fund is disclosed in the Fund’s statement of assets and liabilities. |
| 2. | INVESTMENT ADVISORY AGREEMENT AND OTHER TRANSACTIONS WITH AFFILIATES |
Pursuant to an Investment Advisory Agreement with the Company, BFA manages the investment of each Fund’s assets. BFA is a California corporation indirectly owned by BlackRock. Under the Investment Advisory Agreement, BFA is responsible for substantially all expenses of the Funds, except (i) interest and taxes; (ii) brokerage commissions and other expenses connected with the execution of portfolio transactions; (iii) distribution fees; (iv) the advisory fee payable to BFA; and (v) litigation expenses and any extraordinary expenses (in each case as determined by a majority of the independent directors).
For its investment advisory services to the iShares Edge MSCI Multifactor Emerging Markets ETF, BFA is entitled to an annual investment advisory fee of 0.45%, accrued daily and paid monthly by the Fund, based on the average daily net assets of the Fund. Prior to December 16, 2016, BFA was entitled to an annual investment advisory fee of 0.65% based on average daily net assets. In addition, the Fund may incur its pro rata share of fees and expenses attributable to its investments in other investment companies (“acquired fund fees and expenses”). BFA has contractually agreed to waive a portion of its investment advisory fees for the Fund through December 31, 2021 in an amount equal to the acquired fund fees and expenses, if any, attributable to the Fund’s investments in other iShares funds. For the year ended August 31, 2017, BFA voluntarily waived a portion of its investment advisory fees for the Fund in the amount of $13,031. The voluntary waiver was discontinued effective December 16, 2016, and in conjunction with the annual investment advisory fee reduction from 0.65% to 0.45%.
For its investment advisory services to the iShares MSCI EM ESG Optimized ETF, BFA is entitled to an annual investment advisory fee of 0.25%, accrued daily and paid monthly by the Fund, based on the average daily net assets of the Fund. Prior to August 4, 2017, BFA was entitled to an annual investment advisory fee of 0.45%.
For its investment advisory services to the iShares MSCI Emerging Market ex China ETF, BFA is entitled to an annual investment advisory fee of 0.49%, accrued daily and paid monthly by the Fund, based on the average daily net assets of the Fund. BFA has contractually agreed to waive a portion of its investment advisory fees for the Fund through December 31, 2022 in an amount equal to the aggregate acquired fund fees and expenses, if any, attributable to the Fund’s investments in other iShares funds.
The U.S. Securities and Exchange Commission has issued an exemptive order which permits BlackRock Institutional Trust Company, N.A. (“BTC”), an affiliate of BFA, to serve as securities lending agent for the Funds, subject to applicable conditions. As
| 42 | 2017 iSHARES ANNUAL REPORTTO SHAREHOLDERS |
Table of Contents
Notes to Financial Statements (Continued)
iSHARES®, INC.
securities lending agent, BTC bears all operational costs directly related to securities lending. Each Fund is responsible for fees in connection with the investment of cash collateral received for securities on loan in a money market fund managed by BFA, however, BTC has agreed to reduce the amount of securities lending income it receives in order to effectively limit the collateral investment fees each Fund bears to an annual rate of 0.04% (the “collateral investment fees”). Securities lending income is equal to the total of income earned from the reinvestment of cash collateral, net of fees and other payments to and from borrowers of securities, and less the collateral investment fees. The Funds retain a portion of securities lending income and remit the remaining portion to BTC as compensation for its services as securities lending agent.
Pursuant to a securities lending agreement, each Fund retains 80% of securities lending income and the amount retained can never be less than 70% of the total of securities lending income plus the collateral investment fees. In addition, commencing the business day following the date that the aggregate securities lending income plus the collateral investment fees generated across all 1940 Act iShares exchange-traded funds (the “iShares ETF Complex”) in a given calendar year exceeds the aggregate securities lending income generated across the iShares ETF Complex in the calendar year 2013, each Fund, pursuant to a securities lending agreement, will retain for the remainder of that calendar year 85% of securities lending income and the amount retained can never be less than 70% of the total of securities lending income plus the collateral investment fees.
For the year ended August 31, 2017, the total of securities lending agent services and collateral investment fees paid were as follows:
| iShares ETF | Fees Paid to BTC | |||
Edge MSCI Multifactor Emerging Markets | $ | 2,614 | ||
MSCI EM ESG Optimized | 2,489 | |||
BlackRock Investments, LLC, an affiliate of BFA, is the distributor for each Fund. Pursuant to the distribution agreement, BFA is responsible for any fees or expenses for distribution services provided to the Funds.
Cross trading is the buying or selling of portfolio securities between funds to which BFA (or an affiliate) serves as investment adviser. At its regularly scheduled quarterly meetings, the Board reviews such transactions as of the most recent calendar quarter for compliance with the requirements and restrictions set forth by Rule 17a-7.
For the year ended August 31, 2017, transactions executed by the Funds pursuant to Rule 17a-7 under the 1940 Act were as follows:
| iShares ETF | Purchases | Sales | ||||||
Edge MSCI Multifactor Emerging Markets | $ | 2,169,260 | $ | 271,124 | ||||
MSCI EM ESG Optimized | 39,493 | 25,067 | ||||||
Each Fund may invest its positive cash balances in certain money market funds managed by BFA or an affiliate. The income earned on these temporary cash investments is included in “Dividends – affiliated” in the statements of operations.
It is possible that, from time to time, BlackRock and/or funds or other accounts managed by BFA or an affiliate (collectively, “Affiliates”) may purchase and hold shares of a Fund. Affiliates reserve the right, subject to compliance with applicable law, to sell into the market or redeem in Creation Units through an authorized participant at any time some or all of the shares of a Fund acquired for their own accounts. A large sale or redemption of shares of a Fund by Affiliates could significantly reduce the asset
NOTESTO FINANCIAL STATEMENTS | 43 |
Table of Contents
Notes to Financial Statements (Continued)
iSHARES®, INC.
size of the Fund, which might have an adverse effect on the Fund. As of August 31, 2017, the number of affiliated accounts that individually represent more than 10% ownership of a Fund’s total shares outstanding and the aggregate percentage of net assets represented by such holdings were as follows:
| iShares ETF | Number of Affiliated | Aggregate Affiliated Ownership Percentage | ||||||
MSCI Emerging Markets ex China | 1 | 50 | % | |||||
The PNC Financial Services Group, Inc. is the largest stockholder of BlackRock and is considered to be an affiliate of the Funds for 1940 Act purposes.
Certain Funds, in order to improve their portfolio liquidity and their ability to track their respective underlying index, may invest in shares of other iShares funds that invest in securities in each Fund’s respective underlying index.
Certain directors and officers of the Company are also officers of BTC and/or BFA.
| 3. | INVESTMENT PORTFOLIO TRANSACTIONS |
Purchases and sales of investments (excluding in-kind transactions and short-term investments) for the year ended August 31, 2017 were as follows:
| iShares ETF | Purchases | Sales | ||||||
Edge MSCI Multifactor Emerging Markets | $ | 38,537,277 | $ | 15,012,988 | ||||
MSCI EM ESG Optimized | 54,048,593 | 11,867,010 | ||||||
MSCI Emerging Markets ex China | 5,596,743 | 17,705 | ||||||
In-kind transactions (see Note 4) for the year ended August 31, 2017 were as follows:
| iShares ETF | In-kind Purchases | In-kind Sales | ||||||
Edge MSCI Multifactor Emerging Markets | $ | 23,408,804 | $ | 3,925,435 | ||||
MSCI EM ESG Optimized | 39,551,246 | 2,800,123 | ||||||
MSCI Emerging Markets ex China | 4,456,705 | — | ||||||
| 4. | CAPITAL SHARE TRANSACTIONS |
Capital shares are issued and redeemed by each Fund only in aggregations of a specified number of shares or multiples thereof (“Creation Units”) at NAV. Except when aggregated in Creation Units, shares of each Fund are not redeemable. Transactions in capital shares for each Fund are disclosed in detail in the statements of changes in net assets.
The consideration for the purchase of Creation Units of a fund in the Company generally consists of the in-kind deposit of a designated portfolio of securities and a specified amount of cash. Certain funds in the Company may be offered in Creation Units solely or partially for cash in U.S. dollars. Investors purchasing and redeeming Creation Units may pay a purchase transaction fee and a redemption transaction fee directly to State Street Bank and Trust Company, the Company’s administrator, to offset
| 44 | 2017 iSHARES ANNUAL REPORTTO SHAREHOLDERS |
Table of Contents
Notes to Financial Statements (Continued)
iSHARES®, INC.
transfer and other transaction costs associated with the issuance and redemption of Creation Units, including Creation Units for cash. Investors transacting in Creation Units for cash may also pay an additional variable charge to compensate the relevant fund for certain transaction costs (i.e., stamp taxes, taxes on currency or other financial transactions, and brokerage costs) and market impact expenses relating to investing in portfolio securities. Such variable charges, if any, are included in “Proceeds from shares sold” in the statements of changes in net assets.
From time to time, settlement of securities related to in-kind contributions or in-kind redemptions may be delayed. In such cases, securities related to in-kind contributions are reflected as “Due from custodian” and securities related to in-kind redemptions are reflected as “Securities related to in-kind transactions” in the statements of assets and liabilities.
| 5. | PRINCIPAL RISKS |
In the normal course of business, each Fund invests in securities or other instruments and may enter into certain transactions, and such activities subject the Fund to various risks, including, among others, fluctuations in the market (market risk) or failure of an issuer to meet all of its obligations. The value of securities or other instruments may also be affected by various factors, including, without limitation: (i) the general economy; (ii) the overall market as well as local, regional or global political and/or social instability; (iii) regulation, taxation or international tax treaties between various countries; or (iv) currency, interest rate or price fluctuations. Each Fund’s prospectus provides details of the risks to which the Fund is subject.
BFA uses a “passive” or index approach to try to achieve each Fund’s investment objective following the securities included in its underlying index during upturns as well as downturns. BFA does not take steps to reduce market exposure or to lessen the effects of a declining market. Divergence from the underlying index and the composition of the portfolio is monitored by BFA.
MARKET RISK
Market risk arises mainly from uncertainty about future values of financial instruments influenced by price, currency and interest rate movements. It represents the potential loss a fund may suffer through holding market positions in the face of market movements. A fund is exposed to market risk by its investment in equity, fixed income and/or financial derivative instruments or by its investment in underlying funds. The fair value of securities held by a fund may decline due to general market conditions, economic trends or events that are not specifically related to the issuers of the securities including local, regional or global political, social or economic instability or to factors that affect a particular industry or group of industries. The extent of a fund’s exposure to market risk is the market value of the investments held as shown in the fund’s schedule of investments.
A diversified portfolio, where this is appropriate and consistent with a fund’s objectives, minimizes the risk that a price change of a particular investment will have a material impact on the NAV of a fund. The investment concentrations within each Fund’s portfolio are disclosed in its schedule of investments.
Investing in the securities of non-U.S. issuers involves certain considerations and risks not typically associated with securities of U.S. issuers. Such risks include, but are not limited to: differences in accounting, auditing and financial reporting standards; more substantial governmental involvement in the economy; higher inflation rates, greater social, economic and political uncertainties; possible nationalization or expropriation of assets; less availability of public information about issuers; imposition of withholding or other taxes; higher transaction and custody costs and delays in settlement procedures; and lower level of regulation of the securities markets and issuers. Non-U.S. securities may be less liquid, more difficult to value, and have greater price volatility due to exchange rate fluctuations. These and other risks are heightened for investments in issuers from countries with less developed capital markets.
The economies and markets of European countries are often closely connected and interdependent, and events in one country in Europe can have an adverse impact on other European countries. The European financial markets have experienced volatility
NOTESTO FINANCIAL STATEMENTS | 45 |
Table of Contents
Notes to Financial Statements (Continued)
iSHARES®, INC.
and adverse trends in recent years due to concerns about economic downturns or rising government debt levels in several European countries. These events have adversely affected the exchange rate of the euro and may continue to significantly affect European countries. The occurrence of terrorist incidents throughout Europe also could impact financial markets. In addition, the United Kingdom has voted to withdraw from the European Union. The referendum may introduce significant new uncertainties and instability in the financial markets as the United Kingdom negotiates its exit from the European Union.
The United States and the European Union, along with the regulatory bodies of a number of countries including Japan, Australia, Norway, Switzerland and Canada, have imposed economic sanctions, which consist of asset freezes and sectorial sanctions, on certain Russian individuals and Russian corporate entities. Broader sanctions on Russia could also be instituted. These sanctions, or even the threat of further sanctions, may result in the decline of the value and liquidity of Russian securities, a weakening of the ruble or other adverse consequences to the Russian economy. Current or future sanctions may result in Russia taking counter measures or retaliatory actions, which may further impair the value and liquidity of Russian securities. These retaliatory measures may include the immediate freeze of Russian assets held by a fund.
CREDIT RISK
Credit risk is the risk that an issuer or guarantor of debt instruments or the counterparty to a financial transaction, including derivatives contracts, repurchase agreements or loans of portfolio securities, is unable or unwilling to make timely interest and/or principal payments or to otherwise honor its obligations. BFA and its affiliates manage counterparty credit risk by entering into transactions only with counterparties that they believe have the financial resources to honor their obligations and by monitoring the financial stability of those counterparties. Financial assets, which potentially expose a fund to issuer and counterparty credit risks, consist principally of financial instruments and receivables due from counterparties. The extent of a fund’s exposure to credit and counterparty risks with respect to those financial assets is approximated by their value recorded in its statement of assets and liabilities.
| 6. | INCOME TAX INFORMATION |
Each Fund is treated as an entity separate from the Company’s other funds for federal income tax purposes. It is the policy of each Fund to qualify as a regulated investment company by complying with the provisions applicable to regulated investment companies, as defined under Subchapter M of the Internal Revenue Code of 1986, as amended, and to annually distribute substantially all of its ordinary income and any net capital gains (taking into account any capital loss carryforwards) sufficient to relieve it from all, or substantially all, federal income and excise taxes. Accordingly, no provision for federal income taxes is required.
U.S. GAAP requires that certain components of net assets be adjusted to reflect permanent differences between financial and tax reporting. These reclassifications have no effect on net assets or NAV per share. The following permanent differences as of August 31, 2017, attributable to passive foreign investment companies, foreign currency transactions and realized gains (losses) from in-kind redemptions, were reclassified to the following accounts:
| iShares ETF | Paid-in Capital | Undistributed Net Investment Income/Distributions | Undistributed Net Realized Gain/Accumulated Net Realized Loss | |||||||||
Edge MSCI Multifactor Emerging Markets | $ | 369,036 | $ | 20,176 | $ | (389,212 | ) | |||||
MSCI EM ESG Optimized | 564,359 | 10,903 | (575,262 | ) | ||||||||
MSCI Emerging Markets ex China | — | (1,741 | ) | 1,741 | ||||||||
| 46 | 2017 iSHARES ANNUAL REPORTTO SHAREHOLDERS |
Table of Contents
Notes to Financial Statements (Continued)
iSHARES®, INC.
The tax character of distributions paid during the years ended August 31, 2017 and August 31, 2016 was as follows:
| iShares ETF | 2017 | 2016 | ||||||
Edge MSCI Multifactor Emerging Markets | ||||||||
Ordinary income | $ | 797,610 | $ | 100,720 | ||||
|
|
|
| |||||
MSCI EM ESG Optimized | ||||||||
Ordinary income | $ | 499,570 | $ | N/A | ||||
|
|
|
| |||||
As of August 31, 2017, the tax components of accumulated net earnings (losses) were as follows:
| iShares ETF | Undistributed Ordinary Income | Capital Loss Carryforwards | Net Unrealized Gains (Losses) a | Total | ||||||||||||
Edge MSCI Multifactor Emerging Markets | $ | 563,078 | $ | (305,500 | ) | $ | 11,741,116 | $ | 11,998,694 | |||||||
MSCI EM ESG Optimized | 745,017 | (106,499 | ) | 11,953,539 | 12,592,057 | |||||||||||
MSCI Emerging Markets ex China | 27,177 | — | 153,963 | 181,140 | ||||||||||||
| a | The difference between book-basis and tax-basis unrealized gains (losses) was attributable primarily to the tax deferral of losses on wash sales and the realization for tax purposes of unrealized gains on investments in passive foreign investment companies. |
As of August 31, 2017, the following Funds had non-expiring capital loss carryforwards available to offset future realized capital gains as follows:
| iShares ETF | Non- Expiring | |||
Edge MSCI Multifactor Emerging Markets | $ | 305,500 | ||
MSCI EM ESG Optimized | 106,499 | |||
The Funds may own shares in certain foreign investment entities, referred to, under U.S. tax law, as “passive foreign investment companies.” The Funds may elect to mark-to-market annually the shares of each passive foreign investment company and would be required to distribute to shareholders any such marked-to-market gains.
Management has analyzed tax laws and regulations and their application to the Funds as of August 31, 2017, inclusive of the open tax return years, and does not believe there are any uncertain tax positions that require recognition of a tax liability in the Funds’ financial statements.
| 7. | LINE OF CREDIT |
The iShares Edge MSCI Multifactor Emerging Markets and iShares MSCI EM ESG Optimized ETFs, along with certain other iShares funds, are parties to a $250 million credit agreement with State Street Bank and Trust Company, which expires on October 25, 2017. The line of credit may be used for temporary or emergency purposes, including redemptions, settlement of trades and rebalancing of portfolio holdings. The credit agreement has the following terms: a commitment fee of 0.20% per annum on the unused portion of the credit agreement and interest at a rate equal to the higher of (a) the one-month LIBOR (not less than zero) plus 1.00% per annum or (b) the U.S. Federal Funds rate (not less than zero) plus 1.00% per annum on amounts borrowed. The commitment fee is allocated to each fund participating in the credit agreement based on each fund’s pro-rata share of the aggregate average daily value of assets invested in local securities of certain foreign markets.
The Funds did not borrow under the credit agreement during the year ended August 31, 2017.
NOTESTO FINANCIAL STATEMENTS | 47 |
Table of Contents
Notes to Financial Statements (Continued)
iSHARES®, INC.
At a meeting held on September 14-15, 2017, the Board approved the amendment of certain terms of the credit agreement including (i) increasing the maximum borrowing amount to $275 million and (ii) extending the expiration date to October 24, 2018. The Board also approved the addition of the iShares MSCI Emerging Market ex China ETF as a party to the line of credit. These changes to the credit agreement are expected to be effective on or around October 25, 2017.
| 8. | LEGAL PROCEEDINGS |
On June 16, 2016, investors (the “Plaintiffs”) in certain iShares funds (iShares Core S&P Small-Cap ETF, iShares Russell 1000 Growth ETF, iShares Core S&P 500 ETF, iShares Russell Mid-Cap Growth ETF, iShares Russell Mid-Cap ETF, iShares Russell Mid-Cap Value ETF, iShares Select Dividend ETF, iShares Morningstar Mid-Cap ETF, iShares Morningstar Large-Cap ETF, iShares U.S. Aerospace & Defense ETF and iShares U.S. Preferred Stock ETF) filed a putative class action lawsuit against iShares Trust, BlackRock, Inc. and certain of its advisory affiliates, and certain directors/trustees and officers of the Funds (collectively, “Defendants”). The lawsuit alleges the Defendants violated federal securities laws by failing to adequately disclose in the prospectuses issued by the funds noted above the risks of using stop-loss orders in the event of a ‘flash crash’, such as the one that occurred on May 6, 2010. On September 18, 2017, the Court issued a Statement of Decision holding that the Plaintiffs lack standing to assert their claims. On October 11, 2017, the Court entered final judgment dismissing all of Plaintiffs’ claims with prejudice.
| 9. | SUBSEQUENT EVENTS |
Management has evaluated the impact of all subsequent events on the Funds through the date the financial statements were available to be issued and has determined that there were no subsequent events requiring adjustment or disclosure in the financial statements.
| 48 | 2017 iSHARES ANNUAL REPORTTO SHAREHOLDERS |
Table of Contents
Report of Independent Registered Public Accounting Firm
To the Board of Directors of iShares, Inc. and
Shareholders of the iShares Edge MSCI Multifactor Emerging Markets ETF,
iShares MSCI EM ESG Optimized ETF and iShares MSCI Emerging Markets ex China ETF
In our opinion, the accompanying statements of assets and liabilities, including the schedules of investments, and the related statements of operations and of changes in net assets and the financial highlights present fairly, in all material respects, the financial position of iShares Edge MSCI Multifactor Emerging Markets ETF, iShares MSCI EM ESG Optimized ETF and iShares MSCI Emerging Markets ex China ETF (constituting funds of iShares, Inc., hereafter referred to as the “Funds”) as of August 31, 2017, and the results of each of their operations, the changes in each of their net assets and the financial highlights for each of the periods indicated, in conformity with accounting principles generally accepted in the United States of America. These financial statements and financial highlights (hereafter referred to as “financial statements”) are the responsibility of the Funds’ management. Our responsibility is to express an opinion on these financial statements based on our audits. We conducted our audits of these financial statements in accordance with the standards of the Public Company Accounting Oversight Board (United States). Those standards require that we plan and perform the audit to obtain reasonable assurance about whether the financial statements are free of material misstatement. An audit includes examining, on a test basis, evidence supporting the amounts and disclosures in the financial statements, assessing the accounting principles used and significant estimates made by management, and evaluating the overall financial statement presentation. We believe that our audits, which included confirmation of securities as of August 31, 2017 by correspondence with the custodian, transfer agent and brokers, or by other appropriate auditing procedures where replies were not received, provide a reasonable basis for our opinion.
PricewaterhouseCoopers LLP
San Francisco, California
October 23, 2017
REPORTOF INDEPENDENT REGISTERED PUBLIC ACCOUNTING FIRM | 49 |
Table of Contents
iSHARES®, INC.
The following maximum amounts are hereby designated as qualified dividend income for individuals for the fiscal year ended August 31, 2017:
| iShares ETF | Qualified Dividend Income | |||
Edge MSCI Multifactor Emerging Markets | $589,992 | |||
MSCI EM ESG Optimized | 813,995 | |||
MSCI Emerging Markets ex China | 10,748 | |||
For the fiscal year ended August 31, 2017, the Funds earned foreign source income and paid foreign taxes which they intend to pass through to their shareholders:
| iShares ETF | Foreign Source Income Earned | Foreign Taxes Paid | ||||||
Edge MSCI Multifactor Emerging Markets | $ | 1,163,739 | $ | 134,884 | ||||
MSCI EM ESG Optimized | 1,410,463 | 162,831 | ||||||
MSCI Emerging Markets ex China | 36,163 | 6,122 | ||||||
| 50 | 2017 iSHARES ANNUAL REPORTTO SHAREHOLDERS |
Table of Contents
Board Review and Approval of Investment Advisory Contract
iSHARES®, INC.
I. iShares Edge MSCI Multifactor Emerging Markets ETF
Under Section 15(c) of the Investment Company Act of 1940 (the “1940 Act”), the Company’s Board of Directors (the “Board”), including a majority of Directors who are not “interested persons” of the Company (as that term is defined in the 1940 Act) (the “Independent Directors”), is required annually to consider and approve the Investment Advisory Contract between the Company and BFA (the “Advisory Contract”) on behalf of the Fund. The Independent Directors requested, and BFA provided, such information as the Independent Directors, with advice from independent counsel, deemed reasonably necessary to evaluate the Advisory Contract. A committee of all of the Independent Directors (the “15(c) Committee”), with independent counsel, met with management on May 5, 2017 and May 12, 2017. At these meetings, the 15(c) Committee reviewed and discussed information provided in response to the 15(c) Committee’s initial requests, and requested certain additional information, which management agreed to provide. At a meeting held on May 18, 2017, management presented information to the Board relating to the continuance of the Advisory Contract, including information requested by the 15(c) Committee during its meetings. The Board, including the Independent Directors, reviewed and discussed such information at length. The Independent Directors requested from management certain additional information, which management agreed to provide. At a meeting held on June 19-21, 2017, the Board, including the Independent Directors, reviewed the additional information provided by management in response to these requests. After extensive discussions, the Board, including all of the Independent Directors, approved the continuance of the Advisory Contract for the Fund, based on a review of qualitative and quantitative information provided by BFA. The Board noted its satisfaction with the extent and quality of information provided and its frequent interactions with management, as well as the detailed responses and other information provided by BFA. The Board also noted that the Board and BFA agreed to discuss potential further enhancements to the 15(c) process for the coming year. The Independent Directors were advised by their independent counsel throughout the process, including about the legal standards applicable to their review. In approving the Advisory Contract for the Fund, the Board, including the Independent Directors, considered the following factors, no one of which was controlling, and reached the following conclusions:
Expenses and Performance of the Fund — The Board reviewed statistical information prepared by Broadridge Financial Solutions Inc. (“Broadridge”), an independent provider of investment company data, regarding the expense ratio components, including gross and net total expenses, waivers/reimbursements (if any), and underlying fund fees and expenses (if any) of the Fund in comparison with the same information for other exchange traded funds (“ETFs”) (including, where applicable, funds sponsored by an “at cost” service provider) and, in the limited instances where no comparable ETFs existed and the comparison group would not otherwise be reasonable in Broadridge’s judgment, pure index institutional mutual funds, objectively selected by Broadridge as comprising the Fund’s applicable peer group pursuant to Broadridge’s proprietary ETF methodology (the “Peer Group”). The Board was provided with a detailed description of the proprietary ETF methodology used by Broadridge to determine the Fund’s Peer Group. The Board further noted that due to the limitations in providing comparable funds in the Peer Group, the statistical information provided in Broadridge’s report may or may not provide meaningful direct comparisons to the Fund in all instances.
The Board also noted that the investment advisory fee rate and overall expenses (net of waivers and reimbursements) for the Fund were lower than the median of the investment advisory fee rates and overall expenses (net of waivers and reimbursements) of the funds in its Peer Group, excluding iShares funds.
In addition, to the extent that any of the comparison funds included in the Peer Group, excluding iShares funds, track the same index as the Fund, Broadridge also provided, and the Board reviewed, a comparison of the Fund’s performance for the one-, three-, five-, ten-year, and since inception periods, as applicable, and for the quarter ended December 31, 2016, to that of relevant comparison funds for the same periods.
BOARD REVIEWAND APPROVALOF INVESTMENT ADVISORY CONTRACT | 51 |
Table of Contents
Board Review and Approval of Investment Advisory Contract (Continued)
iSHARES®, INC.
The Board noted that the Fund seeks to track its specified underlying index and that, during the year, the Board received periodic reports on the Fund’s short- and longer-term performance in comparison with its underlying index. Such periodic comparative performance information, including any additional detailed information requested by the Boards, was also considered. The Board noted that the Fund generally performed in line with its underlying index over the relevant periods.
Based on this review, the other factors considered at the meeting, and their general knowledge of ETF pricing, the Board concluded that the investment advisory fee rate and the historical performance of the Fund supported the Board’s approval of the continuance of the Advisory Contract for the coming year.
Nature, Extent and Quality of Services Provided by BFA — Based on management’s representations, including information about recent and proposed enhancements to the iShares business, including with respect to capital markets support and analysis, technology, product design, compliance and risk management, and other services, the Board expected that there would be no diminution in the scope of services required of or provided by BFA under the Advisory Contract for the coming year as compared to the scope of services provided by BFA during prior years. In reviewing the scope of these services, the Board considered BFA’s investment philosophy and experience, noting that BFA and its affiliates have committed significant resources over time, including during the past year, to supporting the iShares funds and their shareholders. The Board also considered BFA’s compliance program and its compliance record with respect to the Fund. In that regard, the Board noted that BFA reports to the Board about portfolio management and compliance matters on a periodic basis in connection with regularly scheduled meetings of the Board, and on other occasions as necessary and appropriate, and has provided information and made appropriate officers available as needed to provide further assistance with these matters. The Board also reviewed the background and experience of the persons responsible for the day-to-day management of the Fund, as well as the resources available to them in managing the Fund. In addition to the above considerations, the Board reviewed and considered detailed presentations regarding BFA’s investment performance, investment and risk management processes and strategies provided at the June 19-21, 2017 meeting and throughout the previous year, and matters related to BFA’s portfolio compliance policies and procedures. The Board noted that the Fund had met its investment objective consistently since its inception date.
Based on review of this information, and the performance information discussed above, the Board concluded that the nature, extent and quality of services provided by BFA to the Fund under the Advisory Contract supported the Board’s approval of the continuance of the Advisory Contract for the coming year.
Costs of Services Provided to Fund and Profits Realized by BFA and Affiliates — The Board reviewed information about the profitability of the Fund to BlackRock, based on the fees payable to BFA and its affiliates (including fees under the Advisory Contract), and other sources of revenue and expense to BFA and its affiliates from the Fund’s operations for the last calendar year. The Board reviewed BlackRock’s profitability methodology for the iShares funds, including supplemental information that was responsive to requests of the 15(c) Committee. The Board noted that the 15(c) Committee had focused on the methodology and profitability presentation during its meetings. The Board discussed the sources of direct and ancillary revenue with management, including the revenues to BTC, a BFA affiliate, from securities lending by the Fund. The Board also discussed BFA’s profit margin as reflected in the Fund’s profitability analysis and reviewed information regarding potential economies of scale (as discussed below). Based on this review, the Board concluded that the profits realized by BFA and its affiliates under the Advisory Contract and from other relationships between the Fund and BFA and/or its affiliates, if any, were within a reasonable range in light of the factors considered.
Economies of Scale — The Board reviewed information regarding potential economies of scale or other efficiencies that may result from increases in the Fund’s assets, noting that the issue of economies of scale had been focused on by the 15(c) Committee during its meetings and addressed by management, including through supplemental information. The Board and the 15(c) Committee reviewed information provided by BFA regarding scale benefits shared with the iShares funds through relatively
| 52 | 2017 iSHARES ANNUAL REPORTTO SHAREHOLDERS |
Table of Contents
Board Review and Approval of Investment Advisory Contract (Continued)
iSHARES®, INC.
low fee rates established at inception, breakpoints and waivers or other fee reductions, as well as through additional investment in the iShares business and the provision of improved or additional infrastructure and services to the iShares funds and their shareholders. The Board and the 15(c) Committee received information regarding BlackRock’s historical profitability, including BFA’s and its affiliates’ costs in providing services. The cost information distinguished, among other things, between fixed and variable costs, and explained how the level of fixed and variable costs, as well as the nature of such costs, may impact the existence or size of scale benefits. The Board noted that the Advisory Contract for the Fund did not provide for any breakpoints in the Fund’s investment advisory fee rate as the assets of the Fund increase. However, the Board noted that should material economies of scale be identified in the future that are not otherwise shared, a breakpoint structure for the Fund may be appropriate, and that it would continue to monitor the sharing of economies of scale to determine the appropriateness of adding breakpoints in the future.
Based on this review, as well as the other factors considered at the meeting, the Board, recognizing its responsibility to consider the Advisory Contract at least annually, determined to approve the continuance of the Advisory Contract for the coming year.
Fees and Services Provided for Other Comparable Funds/Accounts Managed by BFA and its Affiliates — The Board received and considered information regarding the investment advisory/management fee rates for other funds/accounts in the U.S. for which BFA (or its affiliates) provides investment advisory/management services, including open-end funds registered under the 1940 Act (including sub-advised funds), collective trust funds, and institutional separate accounts (together, the “Other Accounts”), and acknowledged BFA’s assertion that the iShares funds are fundamentally different investment vehicles from the Other Accounts. The Board noted that BFA and its affiliates do not manage Other Accounts with substantially the same investment objective and strategy as the Fund and that track the same index as the Fund. The Board further noted that BFA provided the Board with detailed information regarding how the Other Accounts (particularly institutional clients) generally differ from the Fund, including in terms of the different and generally more extensive services provided to the Fund, as well as other significant differences. In that regard, the Board considered that the pricing of services to institutional clients is typically based on a number of factors beyond the nature and extent of the specific services to be provided and often depends on the overall relationship between the client and its affiliates and the adviser and its affiliates. In addition, the Board considered the relative complexity and inherent risks and challenges of managing and providing other services to the Fund, as a publicly traded ETF, as compared to the Other Accounts that are institutional clients, in light of differing regulatory requirements and client-imposed mandates. The Board also acknowledged BFA’s expressed business purpose for launching a suite of iShares “Core” ETFs that generally are subject to lower investment advisory fees than iShares non-Core ETFs that may provide a similar investment exposure. The Board also considered the “all-inclusive” nature of the Fund’s advisory fee structure, and the Fund expenses borne by BFA under this arrangement. The Board noted that the investment advisory fee rate under the Advisory Contract for the Fund was generally higher than the investment advisory/management fee rates for certain of the Other Accounts (particularly institutional clients) and concluded that the differences appeared to be consistent with the factors discussed.
Other Benefits to BFA and/or its Affiliates — The Board reviewed the “fallout” benefits or ancillary revenue received by BFA and/or its affiliates in connection with the services provided to the Fund by BFA, such as payment of revenue to BTC, the Fund’s securities lending agent, for loaning portfolio securities (which was included in the profit margins reviewed by the Board pursuant to BFA’s profitability methodology), and payment of advisory fees and/or administration fees to BFA and BTC (or their affiliates) in connection with any investments by the Fund in other funds for which BFA (or its affiliates) provides investment advisory services and/or administration services. The Board also noted the revenue received by BFA and/or its affiliates pursuant to an agreement that permits a service provider to use certain portions of BlackRock’s technology platform to service accounts managed by BFA and/or its affiliates, including the iShares funds. The Board noted that BFA generally does not use soft dollars or consider the value of research or other services that may be provided to BFA (including its affiliates) in selecting brokers for portfolio transactions for the Fund. The Board further noted that any portfolio transactions on behalf of the Fund placed through a BFA affiliate or purchased from an underwriting syndicate in which a BFA affiliate participates, are reported to the Board pursuant to
BOARD REVIEWAND APPROVALOF INVESTMENT ADVISORY CONTRACT | 53 |
Table of Contents
Board Review and Approval of Investment Advisory Contract (Continued)
iSHARES®, INC.
Rule 17e-1 or Rule 10f-3, as applicable, under the 1940 Act. The Board concluded that any such ancillary benefits would not be disadvantageous to the Fund’s shareholders and thus would not alter the Board’s conclusion with respect to the appropriateness of approving the continuance of the Advisory Contract for the coming year.
Conclusion — Based on the considerations described above, the Board determined that the Fund’s investment advisory fee rate under the Advisory Contract does not constitute a fee that is so disproportionately large as to bear no reasonable relationship to the services rendered and that could not have been the product of arm’s-length bargaining, and concluded to approve the continuance of the Advisory Contract for the coming year.
II. iShares MSCI EM ESG Optimized ETF
Under Section 15(c) of the Investment Company Act of 1940 (the “1940 Act”), the Company’s Board of Directors (the “Board”), including a majority of Directors who are not “interested persons” of the Company (as that term is defined in the 1940 Act) (the “Independent Directors”), is required annually to consider and approve the Investment Advisory Contract between the Company and BFA (the “Advisory Contract”) on behalf of the Fund. The Independent Directors requested, and BFA provided, such information as the Independent Directors, with advice from independent counsel, deemed reasonably necessary to evaluate the Advisory Contract. A committee of all of the Independent Directors (the “15(c) Committee”), with independent counsel, met with management on May 5, 2017 and May 12, 2017. At these meetings, the 15(c) Committee reviewed and discussed information provided in response to the 15(c) Committee’s initial requests, and requested certain additional information, which management agreed to provide. At a meeting held on May 18, 2017, management presented information to the Board relating to the continuance of the Advisory Contract, including information requested by the 15(c) Committee during its meetings. The Board, including the Independent Directors, reviewed and discussed such information at length. The Independent Directors requested from management certain additional information, which management agreed to provide. At a meeting held on June 19-21, 2017, the Board, including the Independent Directors, reviewed the additional information provided by management in response to these requests. After extensive discussions, the Board, including all of the Independent Directors, approved the continuance of the Advisory Contract for the Fund, based on a review of qualitative and quantitative information provided by BFA. The Board noted its satisfaction with the extent and quality of information provided and its frequent interactions with management, as well as the detailed responses and other information provided by BFA. The Board also noted that the Board and BFA agreed to discuss potential further enhancements to the 15(c) process for the coming year. The Independent Directors were advised by their independent counsel throughout the process, including about the legal standards applicable to their review. In approving the Advisory Contract for the Fund, the Board, including the Independent Directors, considered the following factors, no one of which was controlling, and reached the following conclusions:
Expenses and Performance of the Fund — The Board reviewed statistical information prepared by Broadridge Financial Solutions Inc. (“Broadridge”), an independent provider of investment company data, regarding the expense ratio components, including gross and net total expenses, waivers/reimbursements (if any), and underlying fund fees and expenses (if any) of the Fund in comparison with the same information for other exchange traded funds (“ETFs”) (including, where applicable, funds sponsored by an “at cost” service provider) and, in the limited instances where no comparable ETFs existed and the comparison group would not otherwise be reasonable in Broadridge’s judgment, pure index institutional mutual funds, objectively selected by Broadridge as comprising the Fund’s applicable peer group pursuant to Broadridge’s proprietary ETF methodology (the “Peer Group”). The Board was provided with a detailed description of the proprietary ETF methodology used by Broadridge to determine the Fund’s Peer Group. The Board further noted that due to the limitations in providing comparable funds in the Peer Group, the statistical information provided in Broadridge’s report may or may not provide meaningful direct comparisons to the Fund in all instances.
| 54 | 2017 iSHARES ANNUAL REPORTTO SHAREHOLDERS |
Table of Contents
Board Review and Approval of Investment Advisory Contract (Continued)
iSHARES®, INC.
The Board also noted that the investment advisory fee rate and overall expenses (net of waivers and reimbursements) for the Fund were lower than the median of the investment advisory fee rates and overall expenses (net of waivers and reimbursements) of the funds in its Peer Group, excluding iShares funds.
In addition, to the extent that any of the comparison funds included in the Peer Group, excluding iShares funds, track the same index as the Fund, Broadridge also provided, and the Board reviewed, a comparison of the Fund’s performance for the one-, three-, five-, ten-year, and since inception periods, as applicable, and for the quarter ended December 31, 2016, to that of relevant comparison funds for the same periods.
The Board noted that the Fund seeks to track its specified underlying index and that, during the year, the Board received periodic reports on the Fund’s short- and longer-term performance in comparison with its underlying index. Such periodic comparative performance information, including any additional detailed information requested by the Boards, was also considered. The Board noted that the Fund generally performed in line with its underlying index over the relevant periods.
Based on this review, the other factors considered at the meeting, and their general knowledge of ETF pricing, the Board concluded that the investment advisory fee rate and the historical performance of the Fund supported the Board’s approval of the continuance of the Advisory Contract for the coming year.
Nature, Extent and Quality of Services Provided by BFA — Based on management’s representations, including information about recent and proposed enhancements to the iShares business, including with respect to capital markets support and analysis, technology, product design, compliance and risk management, and other services, the Board expected that there would be no diminution in the scope of services required of or provided by BFA under the Advisory Contract for the coming year as compared to the scope of services provided by BFA during prior years. In reviewing the scope of these services, the Board considered BFA’s investment philosophy and experience, noting that BFA and its affiliates have committed significant resources over time, including during the past year, to supporting the iShares funds and their shareholders. The Board also considered BFA’s compliance program and its compliance record with respect to the Fund. In that regard, the Board noted that BFA reports to the Board about portfolio management and compliance matters on a periodic basis in connection with regularly scheduled meetings of the Board, and on other occasions as necessary and appropriate, and has provided information and made appropriate officers available as needed to provide further assistance with these matters. The Board also reviewed the background and experience of the persons responsible for the day-to-day management of the Fund, as well as the resources available to them in managing the Fund. In addition to the above considerations, the Board reviewed and considered detailed presentations regarding BFA’s investment performance, investment and risk management processes and strategies provided at the June 19-21, 2017 meeting and throughout the previous year, and matters related to BFA’s portfolio compliance policies and procedures. The Board noted that the Fund had met its investment objective consistently since its inception date.
Based on review of this information, and the performance information discussed above, the Board concluded that the nature, extent and quality of services provided by BFA to the Fund under the Advisory Contract supported the Board’s approval of the continuance of the Advisory Contract for the coming year.
Costs of Services Provided to Fund and Profits Realized by BFA and Affiliates — The Board reviewed information about the profitability of the Fund to BlackRock, based on the fees payable to BFA and its affiliates (including fees under the Advisory Contract), and other sources of revenue and expense to BFA and its affiliates from the Fund’s operations for the last calendar year. The Board reviewed BlackRock’s profitability methodology for the iShares funds, including supplemental information that was responsive to requests of the 15(c) Committee. The Board noted that the 15(c) Committee had focused on the methodology and profitability presentation during its meetings. The Board discussed the sources of direct and ancillary revenue with management, including the revenues to BTC, a BFA affiliate, from securities lending by the Fund. The Board also discussed
BOARD REVIEWAND APPROVALOF INVESTMENT ADVISORY CONTRACT | 55 |
Table of Contents
Board Review and Approval of Investment Advisory Contract (Continued)
iSHARES®, INC.
BFA’s profit margin as reflected in the Fund’s profitability analysis and reviewed information regarding potential economies of scale (as discussed below). Based on this review, the Board concluded that the profits realized by BFA and its affiliates under the Advisory Contract and from other relationships between the Fund and BFA and/or its affiliates, if any, were within a reasonable range in light of the factors considered.
Economies of Scale — The Board reviewed information regarding potential economies of scale or other efficiencies that may result from increases in the Fund’s assets, noting that the issue of economies of scale had been focused on by the 15(c) Committee during its meetings and addressed by management, including through supplemental information. The Board and the 15(c) Committee reviewed information provided by BFA regarding scale benefits shared with the iShares funds through relatively low fee rates established at inception, breakpoints and waivers or other fee reductions, as well as through additional investment in the iShares business and the provision of improved or additional infrastructure and services to the iShares funds and their shareholders. The Board and the 15(c) Committee received information regarding BlackRock’s historical profitability, including BFA’s and its affiliates’ costs in providing services. The cost information distinguished, among other things, between fixed and variable costs, and explained how the level of fixed and variable costs, as well as the nature of such costs, may impact the existence or size of scale benefits. The Board noted that the Advisory Contract for the Fund did not provide for any breakpoints in the Fund’s investment advisory fee rate as the assets of the Fund increase. During the June 19-21, 2017 meeting, the Board approved a permanent reduction to the advisory fee rate charged to the Fund. In addition, the Board noted that should additional material economies of scale be identified in the future that are not otherwise shared, a breakpoint structure for the Fund may be appropriate, and that it would continue to monitor the sharing of economies of scale to determine the appropriateness of adding breakpoints in the future.
Based on this review, as well as the other factors considered at the meeting, the Board, recognizing its responsibility to consider the Advisory Contract at least annually, determined to approve the continuance of the Advisory Contract for the coming year.
Fees and Services Provided for Other Comparable Funds/Accounts Managed by BFA and its Affiliates — The Board received and considered information regarding the investment advisory/management fee rates for other funds/accounts in the U.S. for which BFA (or its affiliates) provides investment advisory/management services, including open-end funds registered under the 1940 Act (including sub-advised funds), collective trust funds, and institutional separate accounts (together, the “Other Accounts”), and acknowledged BFA’s assertion that the iShares funds are fundamentally different investment vehicles from the Other Accounts. The Board noted that BFA and its affiliates do not manage Other Accounts with substantially the same investment objective and strategy as the Fund and that track the same index as the Fund. The Board further noted that BFA provided the Board with detailed information regarding how the Other Accounts (particularly institutional clients) generally differ from the Fund, including in terms of the different and generally more extensive services provided to the Fund, as well as other significant differences. In that regard, the Board considered that the pricing of services to institutional clients is typically based on a number of factors beyond the nature and extent of the specific services to be provided and often depends on the overall relationship between the client and its affiliates and the adviser and its affiliates. In addition, the Board considered the relative complexity and inherent risks and challenges of managing and providing other services to the Fund, as a publicly traded ETF, as compared to the Other Accounts that are institutional clients, in light of differing regulatory requirements and client-imposed mandates. The Board also acknowledged BFA’s expressed business purpose for launching a suite of iShares “Core” ETFs that generally are subject to lower investment advisory fees than iShares non-Core ETFs that may provide a similar investment exposure. The Board also considered the “all-inclusive” nature of the Fund’s advisory fee structure, and the Fund expenses borne by BFA under this arrangement. The Board noted that the investment advisory fee rate under the Advisory Contract for the Fund was generally higher than the investment advisory/management fee rates for certain of the Other Accounts (particularly institutional clients) and concluded that the differences appeared to be consistent with the factors discussed.
| 56 | 2017 iSHARES ANNUAL REPORTTO SHAREHOLDERS |
Table of Contents
Board Review and Approval of Investment Advisory
Contract (Continued)
iSHARES®, INC.
Other Benefits to BFA and/or its Affiliates — The Board reviewed the “fallout” benefits or ancillary revenue received by BFA and/or its affiliates in connection with the services provided to the Fund by BFA, such as payment of revenue to BTC, the Fund’s securities lending agent, for loaning portfolio securities (which was included in the profit margins reviewed by the Board pursuant to BFA’s profitability methodology), and payment of advisory fees and/or administration fees to BFA and BTC (or their affiliates) in connection with any investments by the Fund in other funds for which BFA (or its affiliates) provides investment advisory services and/or administration services. The Board also noted the revenue received by BFA and/or its affiliates pursuant to an agreement that permits a service provider to use certain portions of BlackRock’s technology platform to service accounts managed by BFA and/or its affiliates, including the iShares funds. The Board noted that BFA generally does not use soft dollars or consider the value of research or other services that may be provided to BFA (including its affiliates) in selecting brokers for portfolio transactions for the Fund. The Board further noted that any portfolio transactions on behalf of the Fund placed through a BFA affiliate or purchased from an underwriting syndicate in which a BFA affiliate participates, are reported to the Board pursuant to Rule 17e-1 or Rule 10f-3, as applicable, under the 1940 Act. The Board concluded that any such ancillary benefits would not be disadvantageous to the Fund’s shareholders and thus would not alter the Board’s conclusion with respect to the appropriateness of approving the continuance of the Advisory Contract for the coming year.
Conclusion — Based on the considerations described above, the Board determined that the Fund’s investment advisory fee rate under the Advisory Contract does not constitute a fee that is so disproportionately large as to bear no reasonable relationship to the services rendered and that could not have been the product of arm’s-length bargaining, and concluded to approve the continuance of the Advisory Contract for the coming year.
III. iShares MSCI Emerging Markets ex China ETF
Under Section 15(c) of the Investment Company Act of 1940 (the “1940 Act”), the Company’s Board of Directors (the “Board”), including a majority of Directors who are not “interested persons” of the Company (as that term is defined in the 1940 Act) (the “Independent Directors”), is required to consider and approve the proposed Investment Advisory Contract between the Company and BFA (the “Advisory Contract”) on behalf of the Fund. The Independent Directors requested, and BFA provided, such information as the Independent Directors, with advice from independent counsel, deemed reasonably necessary to evaluate the terms of the proposed Advisory Contract.
At a meeting held on June 19-21, 2017, the Board, including all of the Independent Directors, approved the selection of BFA as investment adviser and approved the proposed Advisory Contract for the Fund, based on its review of qualitative and quantitative information provided by BFA. The Board also considered information previously provided by BFA, BlackRock Institutional Trust Company, N.A. (“BTC”), and BlackRock, Inc. (“BlackRock”), as applicable, at prior Board meetings. The Independent Directors were advised by their independent counsel throughout the process, including about the legal standards applicable to their review.
In selecting BFA and approving the Advisory Contract for the Fund, the Board, including the Independent Directors, considered the following factors, no one of which was controlling, and made the following conclusions:
Expenses of the Fund — The Board reviewed statistical information prepared by Broadridge Financial Solutions Inc. (“Broadridge”), an independent provider of investment company data, regarding the expense ratio components, including gross and net total expenses, waivers/reimbursements (if any), and underlying fund fees and expenses (if any) of the Fund in comparison with the same information for other exchange traded funds (“ETFs”) (including, where applicable, funds sponsored by an “at cost” service provider) and, in the limited instances where no comparable ETFs existed and the comparison group would not otherwise be reasonable in Broadridge’s judgment, pure index institutional mutual funds, objectively selected by Broadridge as comprising the Fund’s applicable peer group pursuant to Broadridge’s proprietary ETF methodology (the “Peer Group”). The Board was provided with a detailed description of the proprietary ETF methodology used by Broadridge to determine the Fund’s
BOARD REVIEWAND APPROVALOF INVESTMENT ADVISORY CONTRACT | 57 |
Table of Contents
Board Review and Approval of Investment Advisory
Contract (Continued)
iSHARES®, INC.
Peer Group. The Board further noted that due to the limitations in providing comparable funds in the Peer Group, the statistical information provided in Broadridge’s report may or may not provide meaningful direct comparisons to the Fund in all instances.
The Board also noted that the investment advisory fee rate and overall expenses (net of waivers and reimbursements) for the Fund were lower than the median of the investment advisory fee rates and overall expenses (net of waivers and reimbursements) of the funds in its Peer Group.
Based on this review, the other factors considered at the meeting, and their general knowledge of ETF pricing, the Board concluded that the proposed investment advisory fee rate of the Fund supported the Board’s approval of the Advisory Contract.
Nature, Extent and Quality of Services to be Provided by BFA — The Board reviewed the scope of services to be provided by BFA under the Advisory Contract. In reviewing the scope of these services, the Board considered BFA’s investment philosophy and experience, noting that BFA and its affiliates have committed significant resources over time, including during the past year, to supporting iShares funds and their shareholders. The Board considered representations by BFA, BTC, and BlackRock that the scope and quality of services to be provided to the Fund would be similar to the scope and quality of services provided to other iShares funds. The Board also considered BFA’s compliance program and its compliance record with respect to other iShares funds. In that regard, the Board noted that BFA reports to the Board about portfolio management and compliance matters on a periodic basis in connection with regularly scheduled meetings of the Board, and on other occasions as necessary and appropriate, and has provided information and made appropriate officers available as needed to provide further assistance with these matters. The Board also reviewed the background and experience of the persons who will be responsible for the day-to-day management of the Fund, as well as the resources that will be available to them in managing the Fund. In addition to the above considerations, the Board reviewed and considered detailed presentations regarding BFA’s investment performance, investment and risk management processes and strategies provided throughout the previous year, and matters related to BFA’s portfolio compliance policies and procedures.
Based on the review of this information, the Board concluded that the nature, extent and quality of services to be provided by BFA to the Fund under the Advisory Contract supported the Board’s approval of the Advisory Contract.
Costs of Services to be Provided to the Fund and Profits to be Realized by BFA and Affiliates — The Board did not consider the profitability of the Fund to BFA based on the fees payable under the Advisory Contract or revenue to be received by BFA or its affiliates in connection with services to be provided to the Fund since the proposed relationship had not yet commenced. The Board noted that it expects to receive profitability information from BFA periodically following the Fund’s launch and will thus be in a position to evaluate whether any new or additional breakpoints or other adjustments in Fund fees would be appropriate.
Economies of Scale — The Board reviewed information regarding potential economies of scale or other efficiencies that may result from increases in the Fund’s assets. The Board noted that it had previously received and considered information regarding scale benefits shared with the iShares funds through relatively low fee rates established at inception, breakpoints, waivers, or other fee reductions, as well as through additional investment in the iShares business and the provision of improved or additional infrastructure and services to the iShares funds and their shareholders. The Board noted that the Advisory Contract for the Fund did not provide for any breakpoints in the Fund’s investment advisory fee rate as the assets of the Fund increase. However, the Board noted that should material economies of scale be identified in the future that are not otherwise shared, a breakpoint structure for the Fund may be appropriate, and that it would continue to monitor the sharing of economies of scale to determine the appropriateness of adding breakpoints in the future.
| 58 | 2017 iSHARES ANNUAL REPORTTO SHAREHOLDERS |
Table of Contents
Board Review and Approval of Investment Advisory
Contract (Continued)
iSHARES®, INC.
Based on this review, as well as the other factors considered at the meeting, the Board, recognizing its responsibility to consider this issue periodically, determined to approve the Advisory Contract.
Fees and Services Provided for Other Comparable Funds/Accounts Managed by BFA and its Affiliates — The Board received and considered information regarding the investment advisory/management fee rates for other funds/accounts in the U.S. for which BFA (or its affiliates) provides investment advisory/management services, including open-end funds registered under the 1940 Act (including sub-advised funds), collective trust funds, and institutional separate accounts (together, the “Other Accounts”), and acknowledged BFA’s assertion that the iShares funds are fundamentally different investment vehicles from the Other Accounts. The Board noted that BFA and its affiliates do not manage Other Accounts with substantially the same investment objective and strategy as the Fund and that track the same index as the Fund. The Board further noted that BFA previously provided the Board with detailed information regarding how the Other Accounts (particularly institutional clients) generally differ from the iShares funds, including in terms of the different and generally more extensive services provided to the iShares funds, as well as other significant differences. In that regard, the Board considered that the pricing of services to institutional clients is typically based on a number of factors beyond the nature and extent of the specific services to be provided and often depends on the overall relationship between the client and its affiliates and the adviser and its affiliates. In addition, the Board considered the relative complexity and inherent risks and challenges of managing and providing other services to the Fund, as a publicly traded ETF, as compared to the Other Accounts that are institutional clients in light of differing regulatory requirements and client-imposed mandates. The Board also acknowledged BFA’s expressed business purpose for launching a suite of iShares “Core” ETFs that generally are subject to lower investment advisory fees than iShares non-Core ETFs that may provide a similar investment exposure. The Board also considered the “all-inclusive” nature of the Fund’s advisory fee structure, and the Fund expenses borne by BFA under this arrangement. The Board noted that the investment advisory fee rate under the Advisory Contract for the Fund was generally higher than the investment advisory/management fee rates for certain of the Other Accounts (particularly institutional clients) and concluded that the differences appeared to be consistent with the factors discussed.
Other Benefits to BFA and/or its Affiliates — Except as noted below, the Board did not consider the “fallout” benefits or ancillary revenue to be received by BFA and/or its affiliates in connection with the services to be provided to the Fund by BFA since the proposed relationship had not yet commenced. However, the Board noted that BFA generally does not use soft dollars or consider the value of research or other services that may be provided to BFA (including its affiliates) in selecting brokers for portfolio transactions for the Fund. The Board considered the potential payment of advisory fees and/or administration fees to BFA and BTC (or their affiliates) in connection with any investments by the Fund in other funds for which BFA (or its affiliates) provides investment advisory services and/or administration services. The Board also noted the potential revenue to be received by BFA and/or its affiliates pursuant to an agreement that would permit a service provider to use certain portions of BlackRock’s technology platform to service accounts managed by BFA and/or its affiliates, including the iShares funds. The Board also considered the potential for revenue to BTC, the Fund’s securities lending agent, and its affiliates in the event of any loaning of portfolio securities of the Fund. The Board further noted that any portfolio transactions on behalf of the Fund placed through a BFA affiliate or purchased from an underwriting syndicate in which a BFA affiliate participates, will be reported to the Board pursuant to Rule 17e-1 or Rule 10f-3, as applicable, under the 1940 Act. The Board concluded that any such ancillary benefits would not be disadvantageous to the Fund’s shareholders and thus would not alter the Board’s conclusion with respect to the appropriateness of approving the Advisory Contract.
Conclusion — Based on the considerations described above, the Board determined that the Fund’s investment advisory fee rate under the Advisory Contract does not constitute a fee that is so disproportionately large as to bear no reasonable relationship to the services to be rendered and that could not have been the product of arm’s-length bargaining, and concluded to approve the Advisory Contract.
BOARD REVIEWAND APPROVALOF INVESTMENT ADVISORY CONTRACT | 59 |
Table of Contents
Supplemental Information (Unaudited)
iSHARES®, INC.
Proxy Results
A special meeting of the shareholders of each series of iShares, Inc. (the “Company”) was held on June 19, 2017, to elect five Directors to the Board of Directors of the Company. The five nominees were Jane D. Carlin, Richard L. Fagnani, Drew E. Lawton, Madhav V. Rajan and Mark Wiedman, all of whom were elected as Directors at the special meeting. The other Directors whose terms of office as Directors continued after the special meeting are Cecilia H. Herbert, Charles A. Hurty, John E. Kerrigan, John E. Martinez and Robert S. Kapito.
| Director | Votes For | Votes Withheld | ||||||
Jane D. Carlin | 1,911,835,929 | 49,339,171 | ||||||
Richard L. Fagnani | 1,911,725,344 | 49,449,755 | ||||||
Drew E. Lawton | 1,911,790,083 | 49,385,017 | ||||||
Madhav V. Rajan | 1,902,999,095 | 58,176,004 | ||||||
Mark Wiedman | 1,908,143,500 | 53,031,599 | ||||||
Section 19(a) Notices
The amounts and sources of distributions reported are estimates and are provided pursuant to regulatory requirements and are not being provided for tax reporting purposes. The actual amounts and sources for tax reporting purposes will depend upon each Fund’s investment experience during the year and may be subject to changes based on the tax regulations. Shareholders will receive a Form 1099-DIV each calendar year that will inform them how to report these distributions for federal income tax purposes.
| Total Cumulative Distributions for the Fiscal Year | % Breakdown of the Total Cumulative Distributions for the Fiscal Year | |||||||||||||||||||||||||||||||
| iShares ETF | Net Investment Income | Net Realized Capital Gains | Return of Capital | Total Per Share | Net Investment Income | Net Realized Capital Gains | Return of Capital | Total Per Share | ||||||||||||||||||||||||
Edge MSCI Multifactor Emerging Markets | $ | 0.864252 | $ | — | $ | — | $ | 0.864252 | 100 | % | — | % | — | % | 100 | % | ||||||||||||||||
MSCI EM ESG Optimized | 0.621828 | — | — | 0.621828 | 100 | — | — | 100 | ||||||||||||||||||||||||
Premium/Discount Information
The Premium/Discount Information section is intended to present information about the differences between the daily market price on secondary markets for shares of a fund and that fund’s NAV. NAV is the price at which a fund issues and redeems shares. It is calculated in accordance with the standard formula for valuing mutual fund shares. The “Market Price” of a fund generally is determined using the midpoint between the highest bid and the lowest ask on the primary securities exchange on which shares of such fund are listed for trading, as of the time that the fund’s NAV is calculated. A fund’s Market Price may be at, above or below its NAV. The NAV of a fund will fluctuate with changes in the value of its portfolio holdings. The Market Price of a fund will fluctuate in accordance with changes in its NAV, as well as market supply and demand.
Premiums or discounts are the differences (expressed as a percentage) between the NAV and Market Price of a fund on a given day, generally at the time the NAV is calculated. A premium is the amount that a fund is trading above the reported NAV, expressed as a percentage of the NAV. A discount is the amount that a fund is trading below the reported NAV, expressed as a percentage of the NAV.
| 60 | 2017 iSHARES ANNUAL REPORTTO SHAREHOLDERS |
Table of Contents
Supplemental Information (Unaudited) (Continued)
iSHARES®, INC.
Premium/discount information for the Funds covering the most recently completed calendar year and the most recently completed calendar quarters since that year (or the life of the Fund, if shorter) is publicly accessible, free of charge, at www.iShares.com.
The following information shows the frequency of distributions of premiums and discounts for the Funds for the immediately preceding five calendar years (or from the inception date of the Fund, if less than five years) through the date of the most recent calendar quarter-end. Each line in each table shows the number of trading days in which the Fund traded within the premium/discount range indicated. The number of trading days in each premium/discount range is also shown as a percentage of the total number of trading days in the period covered by each table. All data presented here represents past performance, which cannot be used to predict future results.
iShares Edge MSCI Multifactor Emerging Markets ETF
Period Covered: December 8, 2015 through June 30, 2017
Premium/Discount | Number of Days | Percentage of Total Days | ||||||
Greater than 2.0% and Less than 2.5% | 4 | 1.02 | % | |||||
Greater than 1.5% and Less than 2.0% | 3 | 0.76 | ||||||
Greater than 1.0% and Less than 1.5% | 26 | 6.60 | ||||||
Greater than 0.5% and Less than 1.0% | 98 | 24.87 | ||||||
Greater than 0.0% and Less than 0.5% | 130 | 32.99 | ||||||
At NAV | 2 | 0.51 | ||||||
Less than 0.0% and Greater than –0.5% | 89 | 22.59 | ||||||
Less than –0.5% and Greater than –1.0% | 31 | 7.87 | ||||||
Less than –1.0% and Greater than –1.5% | 5 | 1.27 | ||||||
Less than –1.5% and Greater than –2.0% | 3 | 0.76 | ||||||
Less than –2.0% and Greater than –2.5% | 1 | 0.25 | ||||||
Less than –2.5% | 2 | 0.51 | ||||||
|
|
|
| |||||
| 394 | 100.00 | % | ||||||
|
|
|
| |||||
iShares MSCI EM ESG Optimized ETF
Period Covered: June 28, 2016 through June 30, 2017
Premium/Discount | Number of Days | Percentage of Total Days | ||||||
Greater than 2.0% and Less than 2.5% | 1 | 0.39 | % | |||||
Greater than 1.5% and Less than 2.0% | 3 | 1.18 | ||||||
Greater than 1.0% and Less than 1.5% | 16 | 6.30 | ||||||
Greater than 0.5% and Less than 1.0% | 100 | 39.37 | ||||||
Greater than 0.0% and Less than 0.5% | 99 | 38.98 | ||||||
At NAV | 3 | 1.18 | ||||||
Less than 0.0% and Greater than –0.5% | 24 | 9.45 | ||||||
Less than –0.5% and Greater than –1.0% | 5 | 1.97 | ||||||
Less than –1.0% and Greater than –1.5% | 3 | 1.18 | ||||||
|
|
|
| |||||
| 254 | 100.00 | % | ||||||
|
|
|
| |||||
SUPPLEMENTAL INFORMATION | 61 |
Table of Contents
Director and Officer Information
iSHARES®, INC.
The Board of Directors has responsibility for the overall management and operations of the Funds, including general supervision of the duties performed by BFA and other service providers. Each Director serves until he or she resigns, is removed, dies, retires or becomes incapacitated. Each officer shall hold office until his or her successor is elected and qualifies or until his or her death, resignation or removal. Directors who are not “interested persons” (as defined in the 1940 Act) of the Company are referred to as independent directors (“Independent Directors”).
The registered investment companies advised by BFA or its affiliates (the “BlackRock-advised Funds”) are organized into one complex of closed-end funds, two complexes of open-end funds and one complex of exchange-traded funds (“Exchange-Traded Fund Complex”) (each, a “BlackRock Fund Complex”). Each Fund is included in the BlackRock Fund Complex referred to as the Exchange-Traded Fund Complex. Each Director also serves as a Trustee of iShares Trust and a Trustee of iShares U.S. ETF Trust and, as a result, oversees a total of 344 funds (as of August 31, 2017) within the Exchange-Traded Fund Complex. Drew E. Lawton, from October 2016 to June 2017, and Richard L. Fagnani, from April 2017 to June 2017, served as Advisory Board Members for iShares Trust, iShares Inc. and iShares U.S. ETF Trust with respect to all funds within the Exchange-Traded Fund Complex. With the exception of Robert S. Kapito, Mark K. Wiedman, Charles Park, Martin Small and Benjamin Archibald, the address of each Director, and officer is c/o BlackRock, Inc., 400 Howard Street, San Francisco, CA 94105. The address of Mr. Kapito, Mr. Wiedman, Mr. Park, Mr. Small and Mr. Archibald is c/o BlackRock, Inc., Park Avenue Plaza, 55 East 52nd Street, New York, NY 10055. The Board has designated Cecilia H. Herbert as its Independent Board Chair. Additional information about the Funds’ Directors and officers may be found in the Funds’ combined Statement of Additional Information, which is available without charge, upon request, by calling toll-free 1-800-iShares (1-800-474-2737).
Interested Directors
| Name (Age) | Position(s) | Principal Occupation(s) During the Past 5 Years | Other Directorships Held by Director | |||
Robert S. Kapitoa (60) | Director (since 2009). | President, BlackRock, Inc. (since 2006); Vice Chairman of BlackRock, Inc. and Head of BlackRock’s Portfolio Management Group (since its formation in 1998) and BlackRock, Inc.’s predecessor entities (since 1988); Trustee, University of Pennsylvania (since 2009); President of Board of Directors, Hope & Heroes Children’s Cancer Fund (since 2002). | Director of BlackRock, Inc. (since 2006); Trustee of iShares Trust (since 2009); Trustee of iShares U.S. ETF Trust (since 2011). | |||
Mark K. Wiedmanb (46) | Director (since 2013). | Senior Managing Director, BlackRock, Inc. (since 2014); Managing Director, BlackRock, Inc. (2007-2014); Global Head of BlackRock’s ETF and Index Investments Business (since 2016); Global Head of iShares (2011-2016); Head of Corporate Strategy, BlackRock, Inc. (2009-2011). | Trustee of iShares U.S. ETF Trust (since 2013); Director of PennyMac Financial Services, Inc. (since 2008). | |||
| a | Robert S. Kapito is deemed to be an “interested person” (as defined in the 1940 Act) of the Company due to his affiliations with BlackRock, Inc. and its affiliates. |
| b | Mark K. Wiedman is deemed to be an “interested person” (as defined in the 1940 Act) of the Company due to his affiliations with BlackRock, Inc. and its affiliates. |
| 62 | 2017 iSHARES ANNUAL REPORTTO SHAREHOLDERS |
Table of Contents
Director and Officer Information (Continued)
iSHARES®, INC.
Independent Directors
| Name (Age) | Position(s) | Principal Occupation(s) During the Past 5 Years | Other Directorships Held by Director | |||
Cecilia H. Herbert (68) | Director (since 2005); Independent Board Chair (since 2016). | Trustee and Member of the Finance, Technology and Quality Committee of Stanford Health Care (since 2016); Trustee and Member of the Investment Committee, WNET, a New York public media company (since 2011); Chair (1994-2005) and Member (since 1992) of the Investment Committee, Archdiocese of San Francisco; Director (1998-2013) and President (2007-2011) of the Board of Directors, Catholic Charities CYO; Trustee (2002-2011) and Chair of the Finance and Investment Committee (2006-2010) of the Thacher School. | Trustee of iShares Trust (since 2005); Trustee of iShares U.S. ETF Trust (since 2011); Independent Board Chair of iShares Trust and iShares U.S. ETF Trust (since 2016); Trustee of Forward Funds (14 portfolios) (since 2009); Trustee of Salient MF Trust (4 portfolios) (since 2015). | |||
Jane D. Carlin (61) | Director (since 2015); Risk Committee Chair (since 2016). | Consultant (since 2012); Managing Director and Global Head of Financial Holding Company Governance & Assurance and the Global Head of Operational Risk Management of Morgan Stanley (2006-2012). | Trustee of iShares Trust (since 2015); Trustee of iShares U.S. ETF Trust (since 2015); Director of PHH Corporation (mortgage solutions) (since 2012); Director of The Hanover Insurance Group, Inc. (since 2016). | |||
Richard L. Fagnani (62) | Director (since 2017); Equity Plus Committee Chair (since 2017). | Partner, KPMG LLP (2002-2016). | Trustee of iShares Trust (since 2017); Trustee of iShares U.S. ETF Trust (since 2017). | |||
Charles A. Hurty (73) | Director (since 2005); Audit Committee Chair (since 2006). | Retired; Partner, KPMG LLP (1968-2001). | Trustee of iShares Trust (since 2005); Trustee of iShares U.S. ETF Trust (since 2011); Director of SkyBridge Alternative Investments Multi-Adviser Hedge Fund Portfolios LLC (2 portfolios) (since 2002). | |||
John E. Kerrigan (62) | Director (since 2005); Securities Lending Committee Chair (since 2016). | Chief Investment Officer, Santa Clara University (since 2002). | Trustee of iShares Trust (since 2005); Trustee of iShares U.S. ETF Trust (since 2011). | |||
Drew E. Lawton (58) | Director (since 2017); 15c Committee Chair (since 2017). | Senior Managing Director of New York Life Insurance Company (2010-2015). | Trustee of iShares Trust (since 2017); Trustee of iShares U.S. ETF Trust (since 2017). | |||
DIRECTORAND OFFICER INFORMATION | 63 |
Table of Contents
Director and Officer Information (Continued)
iSHARES®, INC.
Independent Directors (Continued)
| Name (Age) | Position(s) | Principal Occupation(s) During the Past 5 Years | Other Directorships Held by Director | |||
John E. Martinez (56) | Director (since 2003); Fixed Income Plus Committee Chair (since 2016). | Director of Real Estate Equity Exchange, Inc. (since 2005). | Trustee of iShares Trust (since 2003); Trustee of iShares U.S. ETF Trust (since 2011). | |||
Madhav V. Rajan (53) | Director (since 2011); Nominating and Governance Committee Chair (since 2017). | Dean, and George Pratt Shultz Professor of Accounting, University of Chicago Booth School of Business (since 2017); Robert K. Jaedicke Professor of Accounting, Stanford University Graduate School of Business (2001-2017); Professor of Law (by courtesy), Stanford Law School (2005-2017); Senior Associate Dean for Academic Affairs and Head of MBA Program, Stanford University Graduate School of Business (2010-2016) . | Trustee of iShares Trust (since 2011); Trustee of iShares U.S. ETF Trust (since 2011); Director, Cavium, Inc. (since 2013). | |||
| 64 | 2017 iSHARES ANNUAL REPORTTO SHAREHOLDERS |
Table of Contents
Director and Officer Information (Continued)
iSHARES®, INC.
Officersc
| Name (Age) | Position(s) | Principal Occupation(s) During the Past 5 Years | ||
Martin Small (42) | President (since 2016). | Managing Director, BlackRock, Inc. (since 2010); Head of U.S. iShares (since 2015); Co-Head of the U.S. Financial Markets Advisory Group, BlackRock, Inc. (2008-2014). | ||
Jack Gee (57) | Treasurer and Chief Financial Officer (since 2008). | Managing Director, BlackRock, Inc. (since 2009); Senior Director of Fund Administration of Intermediary Investor Business, BGI (2009). | ||
Benjamin Archibald (42) | Secretary (since 2015). | Managing Director, BlackRock, Inc. (since 2014); Director, BlackRock, Inc. (2010-2013); Secretary of the BlackRock-advised Mutual Funds (since 2012). | ||
Alan Mason (56) | Executive Vice President (since 2016). | Managing Director, BlackRock, Inc. (since 2009). | ||
Steve Messinger (55) | Executive Vice President (since 2016). | Managing Director, BlackRock, Inc. (2007-2014 and since 2016); Managing Director, Beacon Consulting Group (2014-2016). | ||
Charles Park (49) | Chief Compliance Officer (since 2006). | Chief Compliance Officer of BlackRock Advisors, LLC and the BlackRock-advised Funds in the Equity-Bond Complex, the Equity-Liquidity Complex and the Closed-End Complex (since 2014); Chief Compliance Officer of BFA (since 2006). | ||
Scott Radell (48) | Executive Vice President (since 2012). | Managing Director, BlackRock, Inc. (since 2009); Head of Portfolio Solutions, BlackRock, Inc. (since 2009). | ||
| c | Manish Mehta served as President until October 15, 2016. |
DIRECTORAND OFFICER INFORMATION | 65 |
Table of Contents
Notes:
| 66 | 2017 iSHARES ANNUAL REPORTTO SHAREHOLDERS |
Table of Contents
For more information visit www.iShares.com or call 1-800-474-2737
This report is intended for the Funds’ shareholders. It may not be distributed to prospective investors unless it is preceded or accompanied by the current prospectus.
Investing involves risk, including possible loss of principal.
The iShares Funds are distributed by BlackRock Investments, LLC (together with its affiliates, “BlackRock”).
The iShares Funds are not sponsored, endorsed, issued, sold or promoted by MSCI Inc., nor does this company make any representation regarding the advisability of investing in the iShares Funds. BlackRock is not affiliated with the company listed above.
A description of the policies that the Funds use to determine how to vote proxies relating to portfolio securities and information about how the Funds voted proxies relating to portfolio securities during the most recent twelve-month period ending June 30 is available without charge, upon request, by calling toll-free 1-800-474-2737; on the Funds’ website at www.iShares.com; and on the U.S. Securities and Exchange Commission (SEC) website at www.sec.gov.
The Funds file their complete schedules of portfolio holdings with the SEC for the first and third quarters of each fiscal year on Form N-Q. The Funds’ Forms N-Q are available on the SEC’s website or may be reviewed and copied at the SEC’s Public Reference Room in Washington, D.C. Information on the operation of the Public Reference Room may be obtained by calling 1-800-SEC-0330. The Funds also disclose their complete schedules of portfolio holdings on a daily basis on the Funds’ website.
©2017 BlackRock, Inc. All rights reserved. iSHARES and BLACKROCK are registered trademarks of BlackRock, Inc. or its subsidiaries. All other marks are the property of their respective owners.
iS-AR-816-0817
| |
Table of Contents
| Item 2. | Code of Ethics. |
The registrant has adopted a code of ethics, as of the end of the period covered by this report, applicable to the registrant’s principal executive officer, principal financial officer, principal accounting officer or controller, or persons performing similar functions. During the period covered by this report, the code of ethics was amended to clarify an inconsistency in to whom persons covered by the code should report suspected violations of the code. The amendment clarifies that such reporting should be made to BlackRock’s General Counsel, and retains the alternative option of anonymous reporting following “whistleblower” policies. Other non-material changes were also made in connection with this amendment. During the period covered by this report, there have been no waivers granted under the code of ethics. The registrant undertakes to provide a copy of the code of ethics to any person upon request, without charge, by calling 1-800-474-2737.
| Item 3. | Audit Committee Financial Expert. |
The registrant’s Board of Directors has determined that the registrant has more than one audit committee financial expert, as that term is defined under Item 3(b) and 3(c), serving on its audit committee. The audit committee financial experts serving on the registrant’s audit committee are Charles A. Hurty, Richard L. Fagnani (began serving on the audit committee effective as of June 20, 2017 and was designated as an audit committee financial expert serving on the audit committee effective as of September 15, 2017), John E. Kerrigan, and Madhav V. Rajan, all of whom are independent, as that term is defined under Item 3(a)(2).
Table of Contents
| Item 4. | Principal Accountant Fees and Services. |
The principal accountant fees disclosed in items 4(a), 4(b), 4(c), 4(d) and 4(g) are for the forty-nine series of the registrant for which the fiscal year-end is August 31, 2017 (the “Funds”), and whose annual financial statements are reported in Item 1.
| (a) | Audit Fees – The aggregate fees billed for each of the last two fiscal years for professional services rendered by the principal accountant for the audit of the Funds’ annual financial statements or services that are normally provided by the accountant in connection with statutory and regulatory filings or engagements for those fiscal years were $760,740 for the fiscal year ended August 31, 2016 and $762,300 for the fiscal year ended August 31, 2017. |
| (b) | Audit-Related Fees – There were no fees billed for the fiscal years ended August 31, 2016 and August 31, 2017 for assurance and related services by the principal accountant that were reasonably related to the performance of the audit of the Fund’s financial statements and are not reported under (a) of this Item. |
| (c) | Tax Fees – The aggregate fees billed in each of the last two fiscal years for professional services rendered by the principal accountant for tax compliance, tax advice and tax planning for the Funds were $181,488 for the fiscal year ended August 31, 2016 and $185,269 for the fiscal year ended August 31, 2017. These services related to the review of the Funds’ tax returns and excise tax calculations. |
| (d) | All Other Fees – There were no other fees billed in each of the fiscal years ended August 31, 2016 and August 31, 2017 for products and services provided by the principal accountant, other than the services reported in (a) through (c) of this Item. |
| (e) | (1) The registrant’s audit committee charter, as amended, provides that the audit committee is responsible for the approval, prior to appointment, of the engagement of the principal accountant to annually audit and provide their opinion on the registrant’s financial statements. The audit committee must also approve, prior to appointment, the engagement of the principal accountant to provide non-audit services to the registrant or to any entity controlling, controlled by or under common control with the registrant’s investment adviser (“Adviser Affiliate”) that provides ongoing services to the registrant, if the engagement relates directly to the operations and financial reporting of the registrant. |
(2) There were no services described in (b) through (d) above that were approved by the audit committee pursuant to paragraph (c)(7)(i)(C) of Rule 2-01 of Regulation S-X.
| (f) | None of the hours expended on the principal accountant’s engagement to audit the Funds’ financial statements for the fiscal year ended August 31, 2017 were attributable to work performed by persons other than the principal accountant’s full-time, permanent employees. |
| (g) | The aggregate non-audit fees billed by the registrant’s principal accountant for services rendered to the Funds, and rendered to the registrant’s investment adviser, and any Adviser Affiliate that provides ongoing services to the registrant for the last two fiscal years were $181,488 for the fiscal year ended August 31, 2016 and $185,269 for the fiscal year ended August 31, 2017. The aggregate non-audit fees for the fiscal year ended August 31, 2016 included in this report are different from those included in the previously filed report covering the 12-month period ended August 31, 2016 as this report excludes non-audit fees for services that were rendered to the registrant’s investment adviser or any Adviser Affiliate that provides ongoing services to the registrant but that were not related to the registrant. |
| (h) | The registrant’s audit committee has considered whether the provision of non-audit services rendered to the registrant’s investment adviser and any Adviser Affiliate that provides ongoing services to the registrant that were not pre-approved pursuant to paragraph (c)(7)(ii) of Rule 2-01 of Regulation S-X, if any, is compatible with maintaining the principal accountant’s independence, and has determined that the provision of these services, if any, does not compromise the principal accountant’s independence. |
Table of Contents
| Item 5. | Audit Committee of Listed Registrants |
(a) The registrant is a listed issuer as defined in Rule 10A-3 under the Exchange Act of 1934 and has a separately-designated standing audit committee established in accordance with Section 3(a)(58)(A) of the Exchange Act of 1934. The registrant’s audit committee members are Charles A. Hurty, Richard L. Fagnani (began serving on the audit committee effective as of June 20, 2017), John E. Kerrigan, and Madhav V. Rajan.
(b) Not applicable.
| Item 6. | Investments. |
(a) Schedules of investments are included as part of the reports to shareholders filed under Item 1 of this Form.
(b) Not applicable.
| Item 7. | Disclosure of Proxy Voting Policies and Procedures for Closed-End Management Investment Companies. |
Not applicable to the registrant.
| Item 8. | Portfolio Managers of Closed-End Management Investment Companies. |
Not applicable to the registrant.
| Item 9. | Purchases of Equity Securities by Closed-End Management Investment Company and Affiliated Purchasers. |
Not applicable to the registrant.
| Item 10. | Submission of Matters to a Vote of Security Holders. |
There were no material changes to the procedures by which shareholders may recommend nominees to the registrant’s Board of Directors.
| Item 11. | Controls and Procedures. |
(a) The President (the registrant’s Principal Executive Officer) and Treasurer and Chief Financial Officer (the registrant’s Principal Financial Officer) have concluded that the registrant’s disclosure controls and procedures (as defined in Rule 30a-3(c) under the Investment Company Act of 1940) are effective as of a date within 90 days of the filing date of this report, based on their evaluation of these controls and procedures required by Rule 30a-3(b) under the Investment Company Act of 1940 and Rules 13a-15(b) or 15d-15(b) under the Exchange Act of 1934.
(b) There were no changes in the registrant’s internal control over financial reporting (as defined in Rule 30a-3(d) under the Investment Company Act of 1940) that occurred during the period covered by this report that have materially affected, or are reasonably likely to materially affect, the registrant’s internal control over financial reporting.
| Item 12. | Disclosure of Securities Lending Activities for Closed-End Management Investment Companies. |
Not applicable to the registrant.
Table of Contents
| Item 13. | Exhibits. |
(a) (1) Code of Ethics is not filed as an exhibit; please refer to Item 2.
(a) (2) Section 302 Certifications are attached.
(a) (3) Not applicable.
(a) (4) Not applicable.
(b) Section 906 Certifications are attached.
Table of Contents
SIGNATURES
Pursuant to the requirements of the Securities Exchange Act of 1934 and the Investment Company Act of 1940, the registrant has duly caused this report to be signed on its behalf by the undersigned, thereunto duly authorized.
iShares, Inc.
By: /s/ Martin Small |
| Martin Small, President (Principal Executive Officer) |
Date: May 4, 2018
Pursuant to the requirements of the Securities Exchange Act of 1934 and the Investment Company Act of 1940, this report has been signed below by the following persons on behalf of the registrant and in the capacities and on the dates indicated.
By: /s/ Martin Small |
| Martin Small, President (Principal Executive Officer) |
Date: May 4, 2018
By: /s/ Jack Gee |
| Jack Gee, Treasurer and Chief Financial Officer (Principal Financial Officer) |
Date: May 4, 2018