UNITED STATES
SECURITIES AND EXCHANGE COMMISSION
Washington, D.C. 20549
FORM N-CSR
CERTIFIED SHAREHOLDER REPORT
OF REGISTERED MANAGEMENT INVESTMENT COMPANIES
Investment Company Act file number 811-09102
iShares, Inc.
(Exact name of registrant as specified in charter)
c/o: State Street Bank and Trust Company
100 Summer Street, 4th Floor, Boston, MA 02110
(Address of principal executive offices) (Zip code)
The Corporation Trust Incorporated
2405 York Road, Suite 201, Lutherville-Timonium, Maryland 21093
(Name and address of agent for service)
Registrant’s telephone number, including area code: (415) 670-2000
Date of fiscal year end: October 31, 2022
Date of reporting period: October 31, 2022
| Item 1. | Reports to Stockholders. |
(a) The Report to Shareholders is attached herewith.
| | |

| | OCTOBER 31, 2022 |
iShares, Inc.
| · | | iShares International High Yield Bond ETF | HYXU | Cboe BZX |
| · | | iShares J.P. Morgan EM Corporate Bond ETF | CEMB | Cboe BZX |
| · | | iShares J.P. Morgan EM High Yield Bond ETF | EMHY | Cboe BZX |
| · | | iShares J.P. Morgan EM Local Currency Bond ETF | LEMB | NYSE Arca |
| · | | iShares US & Intl High Yield Corp Bond ETF | GHYG | Cboe BZX |
The Markets in Review
Dear Shareholder,
Significant economic headwinds emerged during the 12-month reporting period ended October 31, 2022, disrupting the economic recovery and strong financial markets of 2021. The U.S. economy shrank in the first half of 2022 before returning to moderate growth in the third quarter, marking a shift to a more challenging post-reopening economic environment. Changes in consumer spending patterns and a tight labor market led to elevated inflation, which reached a 40-year high. Moreover, while the foremost effect of Russia’s invasion of Ukraine has been a severe humanitarian crisis, the ongoing war continued to present challenges for both investors and policymakers.
Equity prices fell as interest rates rose, particularly weighing on relatively high-valuation growth stocks as inflation decreased the value of future cash flows and investors shifted focus to balance sheet resilience. Both large- and small-capitalization U.S. stocks fell, although declines for small-capitalization U.S. stocks were slightly steeper. Emerging market stocks and international equities from developed markets also declined significantly, pressured by rising interest rates and a strengthening U.S. dollar.
The 10-year U.S. Treasury yield rose notably during the reporting period, driving its price down, as investors reacted to higher inflation and attempted to anticipate its impact on future interest rate changes. The corporate bond market also faced inflationary headwinds, and increasing uncertainty led to higher corporate bond spreads (the difference in yield between U.S. Treasuries and similarly-dated corporate bonds).
The U.S. Federal Reserve (the “Fed”), acknowledging that inflation has been more persistent than expected, raised interest rates five times while indicating that additional rate hikes were likely. Furthermore, the Fed wound down its bond-buying programs and is accelerating the reduction of its balance sheet. As investors attempted to assess the Fed’s future trajectory, the Fed’s statements late in the reporting period led markets to believe that additional tightening is likely in the near term.
The pandemic’s restructuring of the economy brought an ongoing mismatch between supply and demand, contributing to the current inflationary regime. While growth has slowed in 2022, we believe that taming inflation requires a more dramatic economic decline to bring demand back to a lower level that is more in line with the economy’s capacity. The Fed has been raising interest rates at the fastest pace in decades, and seems set to overtighten in its effort to get inflation back to target. With this in mind, we believe the possibility of a U.S. recession in the near-term is high, and the outlook for Europe and the U.K. is also troubling. Investors should expect a period of higher volatility as markets adjust to the new economic reality and policymakers attempt to adapt to rapidly changing conditions.
In this environment, while we favor an overweight to equities in the long-term, the market’s concerns over excessive rate hikes from central banks moderate our outlook. Rising input costs and a deteriorating economic backdrop in China and Europe are likely to challenge corporate earnings, so we are underweight equities overall in the near term. However, we see better opportunities in credit, where higher spreads provide income opportunities and partially compensate for inflation risk. We believe that investment-grade corporates, local-currency emerging market debt, and inflation-protected bonds (particularly in Europe) offer strong opportunities for a six- to twelve-month horizon.
Overall, our view is that investors need to think globally, position themselves to be prepared for a decarbonizing economy, and be nimble as market conditions change. We encourage you to talk with your financial advisor and visit iShares.com for further insight about investing in today’s markets.

Rob Kapito
President, BlackRock, Inc.

Rob Kapito
President, BlackRock, Inc.
| | | | | | | | |
Total Returns as of October 31, 2022 | |
| | | |
| | | 6-Month | | | 12-Month | |
| | |
U.S. large cap equities
(S&P 500® Index) | | | (5.50 | )% | | | (14.61 | )% |
| | |
U.S. small cap equities
(Russell 2000® Index) | | | (0.20 | ) | | | (18.54 | ) |
| | |
International equities
(MSCI Europe, Australasia, Far East Index) | | | (12.70 | ) | | | (23.00 | ) |
| | |
Emerging market equities
(MSCI Emerging Markets Index) | | | (19.66 | ) | | | (31.03 | ) |
| | |
3-month Treasury bills
(ICE BofA 3-Month U.S. Treasury Bill Index) | | | 0.72 | | | | 0.79 | |
| | |
U.S. Treasury securities
(ICE BofA 10-Year U.S. Treasury Index) | | | (8.24 | ) | | | (17.68 | ) |
| | |
U.S. investment grade bonds
(Bloomberg U.S. Aggregate Bond Index) | | | (6.86 | ) | | | (15.68 | ) |
| | |
Tax-exempt municipal bonds
(Bloomberg Municipal Bond Index) | | | (4.43 | ) | | | (11.98 | ) |
| | |
U.S. high yield bonds
(Bloomberg U.S. Corporate High Yield 2% Issuer Capped Index) | | | (4.71 | ) | | | (11.76 | ) |
| | | | |
|
Past performance is not an indication of future results. Index performance is shown for illustrative purposes only. You cannot invest directly in an index. |
| | |
| 2 | | T H I S P A G E I S N O T P A R T O F Y O U R F U N D R E P O R T |
Table of Contents
Market Overview
iShares, Inc.
Global Bond Market Overview
Global investment-grade bonds experienced a sizable decline the 12 months ended October 31, 2022 (the “reporting period”). The Bloomberg Global Aggregate Index, a broad measure of global bond market performance, returned -20.79% in U.S. dollar terms for the reporting period.
The poor returns for fixed income reflected the backdrop of sharply rising inflation worldwide. Annualized consumer price inflation in the United States came in above 7.5% in each month of 2022, with a peak of 9.1% in June. Inflation was even more pronounced overseas, particularly in Europe. Inflation rose more than 10% year-over-year in September across the region as a whole, with many Eastern European nations posting increases north of 20%. The trend of rising inflation, which had already begun in 2021, was exacerbated by Russia’s invasion of Ukraine in February 2022. The conflict, together with the sanctions that followed, further snarled global supply chains and contributed to a spike in food and energy prices across the globe.
Developed-market central banks responded by tightening monetary policy in dramatic fashion. In the United States, for example, the U.S. Federal Reserve wound down its stimulative quantitative easing program and raised interest rates from a range of 0%-0.25% to 3.0% - 3.25%. Other central banks followed suit, but the Bank of Japan—which continued to provide stimulus to the nation’s economy—was a notable outlier.
These events fueled a spike in bond yields across the globe. In the United States, the yield on the two-year note rose from 0.50% at the beginning of the period to 4.48% by the end of October 2022, while the 10-year issue climbed from 1.55% to 4.05%. The overseas markets experienced a similar trend directionally, with the weakest performance occurring in the United Kingdom and Continental Europe. Japan held up better in relative terms due to the more accommodative policy of its central bank. Emerging-market bonds, which are highly sensitive to global growth trends, were particularly weak in the annual period.
Corporate bonds generally underperformed government debt. In addition to being hurt by rising prevailing yields, the category was pressured by rising yield spreads over government issues – a trend caused by concerns about economic growth as well as the broader “risk-off” environment.
Unfavorable currency translation weighed on the returns of foreign debt for U.S-based investors. The U.S. dollar surged against most major currencies due in part to expectations that the nation’s stronger relative growth would cause the Fed to raise interest rates more aggressively than its global peers. As a result, the value of non-U.S. investments suffered larger losses in U.S. dollar terms than they did in their local markets. The effect was especially pronounced with respect to emerging-market bonds.
One notable outcome of the downturn in bond prices is that negative-yielding debt—which had risen to be a fairly sizable portion of the overall fixed-income market by late 2021—largely disappeared as yields climbed into positive territory in most countries. However, the real (after-inflation) yields on a large swath of the market remained negative at the close of the period.
| | |
| 4 | | 2 0 2 2 I S H A R E S A N N U A L R E P O R T T O S H A R E H O L D E R S |
| | |
| Fund Summary as of October 31, 2022 | | iShares® International High Yield Bond ETF |
Investment Objective
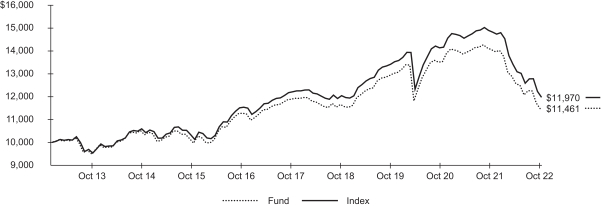
The iShares International High Yield Bond ETF (the “Fund”) seeks to track the investment results of an index composed of euro, British pound sterling and Canadian dollar-denominated, high yield corporate bonds, as represented by the Markit iBoxx® Global Developed Markets ex-US High Yield Index (the “Index”). The Fund invests in a representative sample of securities included in the Index that collectively has an investment profile similar to the Index. Due to the use of representative sampling, the Fund may or may not hold all of the securities that are included in the Index.
Performance
| | | | | | | | | | | | | | | | | | | | | | | | | | | | |
| | | Average Annual Total Returns | | | | | | Cumulative Total Returns | |
| | | | | | | |
| | | 1 Year | | | 5 Years | | | 10 Years | | | | | | 1 Year | | | 5 Years | | | 10 Years | |
| | | | | | | |
Fund NAV | | | (25.15 | )% | | | (3.77 | )% | | | (0.05 | )% | | | | | | | (25.15 | )% | | | (17.46 | )% | | | (0.52 | )% |
| | | | | | | |
Fund Market | | | (24.35 | ) | | | (3.63 | ) | | | 0.02 | | | | | | | | (24.35 | ) | | | (16.88 | ) | | | 0.18 | |
| | | | | | | |
Index | | | (24.97 | ) | | | (3.41 | ) | | | 0.19 | | | | | | | | (24.97 | ) | | | (15.94 | ) | | | 1.94 | |
GROWTH OF $10,000 INVESTMENT
(AT NET ASSET VALUE)

Past performance is not an indication of future results. Performance results do not reflect the deduction of taxes that a shareholder would pay on fund distributions or on the redemption or sale of fund shares. See “About Fund Performance” for more information.
Expense Example
| | | | | | | | | | | | | | | | | | | | | | | | | | | | | | |
| Actual | | | | | | Hypothetical 5% Return | | | | |
| | | | | | | |
Beginning Account Value (05/01/22) | | | Ending
Account Value
(10/31/22) | | | Expenses Paid During the Period(a) | | | | | | Beginning
Account Value
(05/01/22) | | | Ending
Account Value
(10/31/22) | | | Expenses Paid During the Period(a) | | | Annualized
Expense
Ratio | |
| | | | | | | |
| $ | 1,000.00 | | | $ | 877.50 | | | $ | 1.89 | | | | | | | $ | 1,000.00 | | | $ | 1,023.20 | | | $ | 2.04 | | | | 0.40 | % |
| | (a) | Expenses are equal to the annualized expense ratio, multiplied by the average account value over the period, multiplied by 184/365 (to reflect the one-half year period shown). Other fees, such as brokerage commissions and other fees to financial intermediaries, may be paid which are not reflected in the tables and examples above. See “Disclosure of Expenses” for more information. | |
Portfolio Management Commentary
International high yield bonds fell sharply in the annual period. The shift toward tighter monetary policy by the world’s central banks led to a sharp increase in prevailing yields across the global bond markets. High yield issues faced additional pressure from a widening of spreads over government debt. This trend reflected the combination of the broader “risk-off” market tone and concerns that rising interest rates would lead to a slowdown in global economic growth (and thus a deterioration of credit conditions). Bonds in Europe were further hurt by the negative sentiment associated with Russia’s invasion of Ukraine. In addition to fueling uncertainty, the conflict and resulting sanctions contributed to supply-chain disruptions, slower economic growth, and rising energy prices across the region. The significant decline in the value of non-U.S. currencies relative to the U.S. Dollar was a further headwind for non-U.S. securities.
In this environment, most countries in the Index posed losses in a range from 20% to 26%. Norway and Canada, while losing ground in absolute terms, nonetheless outpaced the Index thanks in part to the tailwind rising oil prices provided for energy-exporting nations. Consistent with the backdrop of heightened investor risk aversion, lower-quality bonds (those rated Caa and below or unrated) lagged the broader market.
| | |
| Fund Summary as of October 31, 2022 (continued) | | iShares® International High Yield Bond ETF |
Portfolio Information
CREDIT QUALITY ALLOCATION
| | | | |
| | |
| Moody’s Credit Rating* | | Percent of Total Investments(a) | |
| |
Baa | | | 4.9% | |
| |
Ba | | | 45.3 | |
| |
B | | | 29.6 | |
| |
Caa | | | 4.1 | |
| |
Not Rated | | | 16.1 | |
GEOGRAPHIC ALLOCATION
| | | | |
| | |
| Country/Geographic Region | | Percent of Total Investments(a) | |
| |
Italy | | | 14.8% | |
| |
United States | | | 14.4 | |
| |
France | | | 13.4 | |
| |
United Kingdom | | | 12.3 | |
| |
Germany | | | 11.1 | |
| |
Spain | | | 9.1 | |
| |
Netherlands | | | 4.6 | |
| |
Luxembourg | | | 3.7 | |
| |
Sweden | | | 3.2 | |
| |
Portugal | | | 2.1 | |
| | * | Credit quality ratings shown reflect the ratings assigned by Moody’s Investors Service (“Moody’s”), a widely used independent, nationally recognized statistical rating organization. Moody’s credit ratings are opinions of the credit quality of individual obligations or of an issuer’s general creditworthiness. Investment grade ratings are credit ratings of Baa or higher. Below investment grade ratings are credit ratings of Ba or lower. Unrated investments do not necessarily indicate low credit quality. Credit quality ratings are subject to change. |
| | (a) | Excludes money market funds. |
| | |
| 6 | | 2 0 2 2 I S H A R E S A N N U A L R E P O R T T O S H A R E H O L D E R S |
| | |
| Fund Summary as of October 31, 2022 | | iShares® J.P. Morgan EM Corporate Bond ETF |
Investment Objective
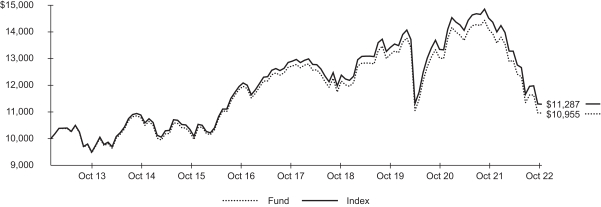
The iShares J.P. Morgan EM Corporate Bond ETF (the “Fund”) seeks to track the investment results of an index composed of U.S. dollar-denominated, emerging market corporate bonds, as represented by the J.P. Morgan CEMBI Broad Diversified Core Index (the “Index”). The Fund invests in a representative sample of securities included in the Index that collectively has an investment profile similar to the Index. Due to the use of representative sampling, the Fund may or may not hold all of the securities that are included in the Index.
Performance
| | | | | | | | | | | | | | | | | | | | | | | | | | | | |
| | | Average Annual Total Returns | | | | | | Cumulative Total Returns | |
| | | | | | | |
| | | 1 Year | | | 5 Years | | | 10 Years | | | | | | 1 Year | | | 5 Years | | | 10 Years | |
| | | | | | | |
Fund NAV | | | (18.42 | )% | | | (0.79 | )% | | | 1.37 | % | | | | | | | (18.42 | )% | | | (3.91 | )% | | | 14.61 | % |
| | | | | | | |
Fund Market | | | (19.10 | ) | | | (0.93 | ) | | | 1.23 | | | | | | | | (19.10 | ) | | | (4.55 | ) | | | 12.96 | |
| | | | | | | |
Index | | | (19.22 | ) | | | (0.46 | ) | | | 1.81 | | | | | | | | (19.22 | ) | | | (2.30 | ) | | | 19.70 | |
GROWTH OF $10,000 INVESTMENT
(AT NET ASSET VALUE)
Index Performance through May 31, 2017 reflects the performance of the Morningstar® Emerging Markets Corporate Bond IndexSM. Index performance beginning on June 1, 2017 reflects the performance of the J.P. Morgan CEMBI Broad Diversified Core Index.
Past performance is not an indication of future results. Performance results do not reflect the deduction of taxes that a shareholder would pay on fund distributions or on the redemption or sale of fund shares. See “About Fund Performance” for more information.
Expense Example
| | | | | | | | | | | | | | | | | | | | | | | | | | | | | | |
| Actual | | | | | | Hypothetical 5% Return | | | | |
| | | | | | | |
| Beginning
Account Value
(05/01/22) |
| |
| Ending
Account Value
(10/31/22) |
| |
| Expenses
Paid During
the Period |
(a) | | | | | |
| Beginning
Account Value
(05/01/22) |
| |
| Ending
Account Value
(10/31/22) |
| |
| Expenses
Paid During
the Period |
(a) | |
| Annualized
Expense
Ratio |
|
| | | | | | | |
| $ | 1,000.00 | | | $ | 912.20 | | | $ | 2.41 | | | | | | | $ | 1,000.00 | | | $ | 1,022.70 | | | $ | 2.55 | | | | 0.50 | % |
| | (a) | Expenses are equal to the annualized expense ratio, multiplied by the average account value over the period, multiplied by 184/365 (to reflect the one-half year period shown). Other fees, such as brokerage commissions and other fees to financial intermediaries, may be paid which are not reflected in the tables and examples above. See “Disclosure of Expenses” for more information. | |
| | |
| Fund Summary as of October 31, 2022 (continued) | | iShares® J.P. Morgan EM Corporate Bond ETF |
Portfolio Management Commentary
Emerging market corporate bonds suffered losses in the 12-month period, with the adverse effect of falling prices more than offsetting the contribution from the category’s above-average income. However, the asset class finished ahead of emerging market government issues.
As was the case across the rest of the bond market, the Index was hurt by the environment of sharply rising inflation and the aggressive interest rate hikes by the world’s major central banks. In addition, credit spreads widened amid the pronounced deterioration in investor sentiment and concerns about the trajectory of global growth.
Emerging markets were hurt by events specific occurring within the region. First, Russia’s invasion of Ukraine together with the sanctions that followed caused significant losses in Russian bonds contributing to underperformance across Eastern Europe. Second, China was a persistent source of concern. The government’s increased regulation of technology companies and continued lockdowns associated with its zero-COVID policy weighed on the nation’s financial assets, as did instability in the property market.
These factors caused emerging market bond funds to experience record outflows, which exacerbated the effect of falling prices. On the positive side, supply also fell considerably as higher yields dissuaded corporations from issuing new debt.
All countries represented in the Index finished with a negative total return. However, Latin America outperformed in relative terms due in part to its higher sensitivity to the rally in commodities. Similarly, markets in the Middle East generally posted narrower losses than the Index thanks to the strength in crude oil prices.
Portfolio Information
CREDIT QUALITY ALLOCATION
| | | | |
| | |
Moody’s Credit Rating* | |
| Percent of
Total Investments |
(a) |
| |
Aaa | | | 0.4 | % |
| |
Aa | | | 8.3 | |
| |
A | | | 17.3 | |
| |
Baa | | | 33.9 | |
| |
Ba | | | 12.6 | |
| |
B | | | 7.9 | |
| |
Caa | | | 1.8 | |
| |
C | | | 1.0 | |
| |
Not Rated | | | 16.8 | |
GEOGRAPHIC ALLOCATION
| | | | |
| | |
Country/Geographic Region | |
| Percent of
Total Investments |
(a) |
| |
China | | | 7.5 | % |
| |
Brazil | | | 5.4 | |
| |
Hong Kong | | | 5.0 | |
| |
United Arab Emirates | | | 5.0 | |
| |
South Korea | | | 4.7 | |
| |
India | | | 4.7 | |
| |
Saudi Arabia | | | 4.6 | |
| |
Mexico | | | 4.5 | |
| |
Qatar | | | 4.2 | |
| |
Singapore | | | 4.1 | |
| | * | Credit quality ratings shown reflect the ratings assigned by Moody’s Investors Service (“Moody’s”), a widely used independent, nationally recognized statistical rating organization. Moody’s credit ratings are opinions of the credit quality of individual obligations or of an issuer’s general creditworthiness. Investment grade ratings are credit ratings of Baa or higher. Below investment grade ratings are credit ratings of Ba or lower. Unrated investments do not necessarily indicate low credit quality. Credit quality ratings are subject to change. | |
| | (a) | Excludes money market funds. | |
| | |
| 8 | | 2 0 2 2 I S H A R E S A N N U A L R E P O R T T O S H A R E H O L D E R S |
| | |
| Fund Summary as of October 31, 2022 | | iShares® J.P. Morgan EM High Yield Bond ETF |
Investment Objective
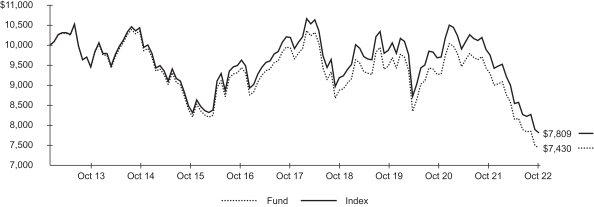
The iShares J.P. Morgan EM High Yield Bond ETF (the “Fund”) seeks to track the investment results of an index composed of U.S. dollar-denominated, emerging market high yield sovereign and corporate bonds, as represented by the J.P. Morgan USD Emerging Markets High Yield Bond Index (the “Index”). The Fund invests in a representative sample of securities included in the Index that collectively has an investment profile similar to the Index. Due to the use of representative sampling, the Fund may or may not hold all of the securities that are included in the Index.
Performance
| | | | | | | | | | | | | | | | | | | | | | | | | | | | |
| | | Average Annual Total Returns | | | | | | Cumulative Total Returns | |
| | | | | | | |
| | | 1 Year | | | 5 Years | | | 10 Years | | | | | | 1 Year | | | 5 Years | | | 10 Years | |
| | | | | | | |
Fund NAV | | | (21.35 | )% | | | (3.03 | )% | | | 0.92 | % | | | | | | | (21.35 | )% | | | (14.24 | )% | | | 9.55 | % |
| | | | | | | |
Fund Market | | | (21.85 | ) | | | (3.19 | ) | | | 0.72 | | | | | | | | (21.85 | ) | | | (14.95 | ) | | | 7.43 | |
| | | | | | | |
Index | | | (21.38 | ) | | | (2.73 | ) | | | 1.22 | | | | | | | | (21.38 | ) | | | (12.93 | ) | | | 12.87 | |
GROWTH OF $10,000 INVESTMENT
(AT NET ASSET VALUE)
Index performance through March 01, 2020 reflects the performance of the Morningstar Emerging Markets High Yield Bond IndexSM which terminated on April 01, 2020. Index performance beginning on March 02, 2020 reflects the performance of the J.P. Morgan USD Emerging Markets High Yield Bond Index.
Past performance is not an indication of future results. Performance results do not reflect the deduction of taxes that a shareholder would pay on fund distributions or on the redemption or sale of fund shares. See “About Fund Performance” for more information.
Expense Example
| | | | | | | | | | | | | | | | | | | | | | | | | | | | | | |
| Actual | | | | | | Hypothetical 5% Return | | | | |
| | | | | | | |
| Beginning
Account Value
(05/01/22) |
| |
| Ending
Account Value
(10/31/22) |
| |
| Expenses
Paid During the Period |
(a) | | | | | |
| Beginning
Account Value
(05/01/22) |
| |
| Ending
Account Value
(10/31/22) |
| |
| Expenses
Paid During the Period |
(a) | |
| Annualized
Expense
Ratio |
|
| $ | 1,000.00 | | | $ | 882.80 | | | $ | 2.37 | | | | | | | $ | 1,000.00 | | | $ | 1,022.70 | | | $ | 2.55 | | | | 0.50 | % |
| | (a) | Expenses are equal to the annualized expense ratio, multiplied by the average account value over the period, multiplied by 184/365 (to reflect the one-half year period shown). Other fees, such as brokerage commissions and other fees to financial intermediaries, may be paid which are not reflected in the tables and examples above. See “Disclosure of Expenses” for more information. | |
| | |
| Fund Summary as of October 31, 2022 (continued) | | iShares® J.P. Morgan EM High Yield Bond ETF |
Portfolio Management Commentary
Emerging market high yield bonds suffered losses in the 12-month period, but the category finished ahead of emerging market sovereign bonds. A higher contribution from yield, together with relative strength for corporate bonds (particularly energy-related issues) versus government securities helped fuel the outperformance.
As was the case across the rest of the global fixed-income market, the Index was hurt by the environment of sharply rising inflation and the aggressive interest rate hikes by the world’s major central banks. In addition, credit spreads widened amid a pronounced deterioration in investor sentiment and concerns about the trajectory of global growth.
Emerging markets were hurt by events specific occurring within the region. First, Russia’s invasion of Ukraine together with the sanctions that followed caused significant losses in Russian bonds contributing to underperformance across Eastern Europe. Second, China was a persistent source of concern. The government’s increased regulation of technology companies and continued lockdowns associated with its zero-COVID policy weighed on the nation’s financial assets, as did instability in the property market.
All countries represented in the Index finished with a negative total return. However, Latin America outperformed in relative terms due in part to its higher sensitivity to the rally in commodities. Similarly, markets in the Middle East generally posted narrower losses than the Index thanks to the strength in crude oil prices.
Portfolio Information
CREDIT QUALITY ALLOCATION
| | | | |
| | |
Moody’s Credit Rating* | |
| Percent of
Total Investments |
(a) |
| |
Aa | | | 0.4 | % |
| |
A | | | 0.3 | |
| |
Baa | | | 11.6 | |
| |
Ba | | | 34.8 | |
| |
B | | | 32.3 | |
| |
Caa | | | 4.7 | |
| |
Ca | | | 2.8 | |
| |
C | | | 0.7 | |
| |
Not Rated | | | 12.4 | |
GEOGRAPHIC ALLOCATION
| | | | |
| | |
Country/Geographic Region | |
| Percent of
Total Investments |
(a) |
| |
Brazil | | | 15.0 | % |
| |
Turkey | | | 13.0 | |
| |
Mexico | | | 8.5 | |
| |
Colombia | | | 6.7 | |
| |
South Africa | | | 4.3 | |
| |
Oman | | | 4.1 | |
| |
Dominican Republic | | | 3.4 | |
| |
Argentina | | | 3.1 | |
| |
Hong Kong | | | 3.1 | |
| |
Bahrain | | | 2.9 | |
| | * | Credit quality ratings shown reflect the ratings assigned by Moody’s Investors Service (“Moody’s”), a widely used independent, nationally recognized statistical rating organization. Moody’s credit ratings are opinions of the credit quality of individual obligations or of an issuer’s general creditworthiness. Investment grade ratings are credit ratings of Baa or higher. Below investment grade ratings are credit ratings of Ba or lower. Unrated investments do not necessarily indicate low credit quality. Credit quality ratings are subject to change. | |
| | (a) | Excludes money market funds. | |
| | |
| 10 | | 2 0 2 2 I S H A R E S A N N U A L R E P O R T T O S H A R E H O L D E R S |
| | |
| Fund Summary as of October 31, 2022 | | iShares® J.P. Morgan EM Local Currency Bond ETF |
Investment Objective
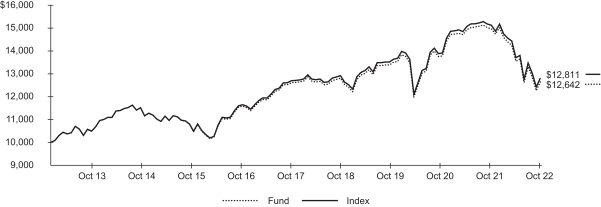
The iShares J.P. Morgan EM Local Currency Bond ETF (the “Fund”) seeks to track the investment results of an index composed of local currency denominated, emerging market sovereign bonds, as represented by the J.P. Morgan GBI-EM Global Diversified 15% Cap 4.5% Floor Index (the “Index”). The Fund invests in a representative sample of securities included in the Index that collectively has an investment profile similar to the Index. Due to the use of representative sampling, the Fund may or may not hold all of the securities that are included in the Index.
Performance
| | | | | | | | | | | | | | | | | | | | | | | | | | | | |
| | | Average Annual Total Returns | | | | | | Cumulative Total Returns | |
| | | | | | | |
| | | 1 Year | | | 5 Years | | | 10 Years | | | | | | 1 Year | | | 5 Years | | | 10 Years | |
| | | | | | | |
Fund NAV | | | (20.04 | )% | | | (5.10 | )% | | | (2.93 | )% | | | | | | | (20.04 | )% | | | (23.02 | )% | | | (25.70 | )% |
| | | | | | | |
Fund Market | | | (19.97 | ) | | | (5.02 | ) | | | (3.03 | ) | | | | | | | (19.97 | ) | | | (22.71 | ) | | | (26.45 | ) |
| | | | | | | |
Index | | | (19.90 | ) | | | (4.66 | ) | | | (2.44 | ) | | | | | | | (19.90 | ) | | | (21.22 | ) | | | (21.91 | ) |
GROWTH OF $10,000 INVESTMENT
(AT NET ASSET VALUE)
Index performance through May 31, 2017 reflects the performance of the Bloomberg Emerging Markets Broad Local Currency Bond Index. Index performance beginning on June 1, 2017 reflects the performance of the J.P. Morgan GBI-EM Global Diversified 15% Cap 4.5% Floor Index.
Past performance is not an indication of future results. Performance results do not reflect the deduction of taxes that a shareholder would pay on fund distributions or on the redemption or sale of fund shares. See “About Fund Performance” for more information.
Expense Example
| | | | | | | | | | | | | | | | | | | | | | | | | | | | | | |
| Actual | | | | | | Hypothetical 5% Return | | | | |
| | | | | | | |
| Beginning
Account Value
(05/01/22) |
| |
| Ending
Account Value
(10/31/22) |
| |
| Expenses
Paid During the Period |
(a) | | | | | |
| Beginning
Account Value
(05/01/22) |
| |
| Ending
Account Value
(10/31/22) |
| |
| Expenses
Paid During the Period |
(a) | |
| Annualized
Expense
Ratio |
|
| $ | 1,000.00 | | | $ | 912.00 | | | $ | 1.45 | | | | | | | $ | 1,000.00 | | | $ | 1,023.70 | | | $ | 1.53 | | | | 0.30 | % |
| | (a) | Expenses are equal to the annualized expense ratio, multiplied by the average account value over the period, multiplied by 184/365 (to reflect the one-half year period shown). Other fees, such as brokerage commissions and other fees to financial intermediaries, may be paid which are not reflected in the tables and examples above. See “Disclosure of Expenses” for more information. | |
| | |
| Fund Summary as of October 31, 2022 (continued) | | iShares® J.P. Morgan EM Local Currency Bond ETF |
Portfolio Management Commentary
Emerging market bonds suffered losses in the 12-month period, with the adverse effect of falling prices more than offsetting the contribution from the category’s above-average income. As was the case across the rest of the bond market, the Index was hurt by the environment of sharply rising inflation and the aggressive interest rate hikes by the world’s major central banks. In addition, credit spreads widened amid the pronounced deterioration in investor sentiment. These trends also led to losses for emerging market currencies relative to the U.S. Dollar, causing local-currency bonds to lag U.S. Dollar-denominated issues.
Russia was a key detractor from Index performance, as the sanctions that followed the country’s invasion of Ukraine caused challenging financial markets and resulted in a meaningful decline in asset prices. Other Eastern European nations, including Poland, Hungary, Romania, Serbia, and the Czech Republic, also lagged the Index. The region had above-average vulnerability to the economic impact of the war in Ukraine, particularly the reduction in energy supplies.
Asian local currency bonds outperformed. The region was less affected by the conflict, and it continued to source energy supplies from Russia. China was a source of relative strength, which was notable given the country’s challenges. Indonesia, while losing ground in absolute terms, outpaced the broader market on optimism about the country’s fiscal picture. Latin American bonds strongly outperformed the larger category. Brazil was the top performer in the region and the Index as a whole, and both Mexico and Uruguay posted positive returns despite the weakness in the global fixed-income markets more broadly.
Portfolio Information
CREDIT QUALITY ALLOCATION
| | | | |
| | |
| Moody’s Credit Rating* | |
| Percent of
Total Investments |
(a) |
| |
Aa | | | 0.4 | % |
| |
A | | | 5.4 | |
| |
Baa | | | 22.4 | |
| |
Ba | | | 10.0 | |
| |
C | | | 3.1 | |
| |
Not Rated | | | 58.7 | |
GEOGRAPHIC ALLOCATION
| | | | |
| | |
| Country/Geographic Region | |
| Percent of
Total Investments |
(a) |
| |
China | | | 14.6 | % |
| |
Brazil | | | 4.8 | |
| |
Chile | | | 4.7 | |
| |
Uruguay | | | 4.6 | |
| |
Peru | | | 4.6 | |
| |
Mexico | | | 4.6 | |
| |
Czech Republic | | | 4.6 | |
| |
Thailand | | | 4.5 | |
| |
Hungary | | | 4.5 | |
| |
Romania | | | 4.5 | |
| | * | Credit quality ratings shown reflect the ratings assigned by Moody’s Investors Service (“Moody’s”), a widely used independent, nationally recognized statistical rating organization. Moody’s credit ratings are opinions of the credit quality of individual obligations or of an issuer’s general creditworthiness. Investment grade ratings are credit ratings of Baa or higher. Below investment grade ratings are credit ratings of Ba or lower. Unrated investments do not necessarily indicate low credit quality. Credit quality ratings are subject to change. | |
| | (a) | Excludes money market funds. | |
| | |
| 12 | | 2 0 2 2 I S H A R E S A N N U A L R E P O R T T O S H A R E H O L D E R S |
| | |
| Fund Summary as of October 31, 2022 | | iShares® US & Intl High Yield Corp Bond ETF |
Investment Objective
The iShares US & Intl HighYield Corp Bond ETF (the “Fund”) seeks to track the investment results of an index composed of U.S. dollar, euro, British pound sterling and Canadian dollar-denominated, high yield corporate bonds, as represented by the Markit iBoxx® Global Developed Markets High Yield Index (the “Index”). The Fund invests in a representative sample of securities included in the Index that collectively has an investment profile similar to the Index. Due to the use of representative sampling, the Fund may or may not hold all of the securities that are included in the Index.
Performance
| | | | | | | | | | | | | | | | | | | | | | | | | | | | |
| | | Average Annual Total Returns | | | | | | Cumulative Total Returns | |
| | | | | | | |
| | | 1 Year | | | 5 Years | | | 10 Years | | | | | | 1 Year | | | 5 Years | | | 10 Years | |
| | | | | | | |
Fund NAV | | | (15.46 | )% | | | 0.04 | % | | | 2.37 | % | | | | | | | (15.46 | )% | | | 0.18 | % | | | 26.42 | % |
| | | | | | | |
Fund Market | | | (15.56 | ) | | | (0.03 | ) | | | 2.32 | | | | | | | | (15.56 | ) | | | (0.15 | ) | | | 25.75 | |
| | | | | | | |
Index | | | (15.23 | ) | | | 0.16 | | | | 2.51 | | | | | | | | (15.23 | ) | | | 0.82 | | | | 28.11 | |
GROWTH OF $10,000 INVESTMENT
(AT NET ASSET VALUE)
Past performance is not an indication of future results. Performance results do not reflect the deduction of taxes that a shareholder would pay on fund distributions or on the redemption or sale of fund shares. See “About Fund Performance” for more information.
Expense Example
| | | | | | | | | | | | | | | | | | | | | | | | | | | | | | |
| Actual | | | | | | Hypothetical 5% Return | | | | |
| | | | | | | |
| Beginning
Account Value
(05/01/22) |
| |
| Ending
Account Value
(10/31/22) |
| |
| Expenses
Paid During
the Period |
(a) | | | | | |
| Beginning
Account Value
(05/01/22) |
| |
| Ending
Account Value
(10/31/22) |
| |
| Expenses
Paid During
the Period |
(a) | |
| Annualized
Expense
Ratio |
|
| | | | | | | |
| $ | 1,000.00 | | | $ | 933.60 | | | $ | 1.95 | | | | | | | $ | 1,000.00 | | | $ | 1,023.20 | | | $ | 2.04 | | | | 0.40 | % |
| | (a) | Expenses are equal to the annualized expense ratio, multiplied by the average account value over the period, multiplied by 184/365 (to reflect the one-half year period shown). Other fees, such as brokerage commissions and other fees to financial intermediaries, may be paid which are not reflected in the tables and examples above. See “Disclosure of Expenses” for more information. | |
| | |
| Fund Summary as of October 31, 2022 (continued) | | iShares® US & Intl High Yield Corp Bond ETF |
Portfolio Management Commentary
Global high yield bonds fell sharply in the annual period. The shift toward tighter monetary policy by the U.S. Federal Reserve and other central banks led to a sharp increase in prevailing yields across the global bond markets. High yield issues faced additional pressure from a widening of spreads over government debt. This trend reflected the combination of the broader “risk-off” market tone and concerns that rising interest rates would lead to a slowdown in global economic growth (and thus a deterioration of credit conditions). Bonds in Europe were further hurt by the negative sentiment associated with Russia’s invasion of Ukraine. In addition to fueling uncertainty, the conflict and resulting sanctions contributed to supply-chain disruptions, slower economic growth, and rising energy prices across the region. The significant decline in the value of non-U.S. currencies relative to the U.S. Dollar was a further headwind for non-U.S. securities.
In this environment, all countries represented in the Index lost ground. The United States, which makes up more than 60% or the Index, outperformed the international markets. The relative strength reflected the country’s more robust economic outlook and larger weighting in the energy sector, which benefited from the rally in the prices of crude oil and other related commodities. The European markets were among the worst performers in the Index, with the United Kingdom, Italy, France and Germany all posting losses in a range of 20% to 25%. Bonds rated B and Ba by Moody’s, which comprise the majority of the Index, outperformed. In contrast, the lowest rated credit tiers (those rated Caa and below or unrated) lagged.
Portfolio Information
CREDIT QUALITY ALLOCATION
| | | | |
| | |
| Moody’s Credit Rating* | |
| Percent of
Total Investments |
(a) |
| |
Aaa | | | 0.2 | % |
| |
A | | | 0.2 | |
| |
Baa | | | 3.0 | |
| |
Ba | | | 44.7 | |
| |
B | | | 38.9 | |
| |
Caa | | | 8.5 | |
| |
Ca | | | 0.1 | |
| |
Not Rated | | | 4.4 | |
GEOGRAPHIC ALLOCATION
| | | | |
| | |
| Country/Geographic Region | |
| Percent of
Total Investments |
(a) |
| |
United States | | | 66.8 | % |
| |
United Kingdom | | | 5.2 | |
| |
France | | | 4.8 | |
| |
Italy | | | 4.4 | |
| |
Canada | | | 3.5 | |
| |
Germany | | | 3.2 | |
| |
Spain | | | 2.2 | |
| |
Netherlands | | | 1.6 | |
| |
Israel | | | 1.5 | |
| |
Luxembourg | | | 1.4 | |
| | * | Credit quality ratings shown reflect the ratings assigned by Moody’s Investors Service (“Moody’s”), a widely used independent, nationally recognized statistical rating organization. Moody’s credit ratings are opinions of the credit quality of individual obligations or of an issuer’s general creditworthiness. Investment grade ratings are credit ratings of Baa or higher. Below investment grade ratings are credit ratings of Ba or lower. Unrated investments do not necessarily indicate low credit quality. Credit quality ratings are subject to change. | |
| | (a) | Excludes money market funds. | |
| | |
| 14 | | 2 0 2 2 I S H A R E S A N N U A L R E P O R T T O S H A R E H O L D E R S |
Past performance is not an indication of future results. Financial markets have experienced extreme volatility and trading in many instruments has been disrupted. These circumstances may continue for an extended period of time and may continue to affect adversely the value and liquidity of each Fund’s investments. As a result, current performance may be lower or higher than the performance data quoted. Performance data current to the most recent month-end is available at iShares.com. Performance results assume reinvestment of all dividends and capital gain distributions and do not reflect the deduction of taxes that a shareholder would pay on fund distributions or on the redemption or sale of fund shares. The investment return and principal value of shares will vary with changes in market conditions. Shares may be worth more or less than their original cost when they are redeemed or sold in the market. Performance for certain funds may reflect a waiver of a portion of investment advisory fees. Without such a waiver, performance would have been lower.
Net asset value or “NAV” is the value of one share of a fund as calculated in accordance with the standard formula for valuing mutual fund shares. Beginning August 10, 2020, the price used to calculate market return (“Market Price”) is the closing price. Prior to August 10, 2020, Market Price was determined using the midpoint between the highest bid and the lowest ask on the primary stock exchange on which shares of a fund are listed for trading, as of the time that such fund’s NAV is calculated. Market and NAV returns assume that dividends and capital gain distributions have been reinvested at Market Price and NAV, respectively.
An index is a statistical composite that tracks a specified financial market or sector. Unlike a fund, an index does not actually hold a portfolio of securities and therefore does not incur the expenses incurred by a fund. These expenses negatively impact fund performance. Also, market returns do not include brokerage commissions that may be payable on secondary market transactions. If brokerage commissions were included, market returns would be lower.
Disclosure of Expenses
Shareholders of each Fund may incur the following charges: (1) transactional expenses, including brokerage commissions on purchases and sales of fund shares and (2) ongoing expenses, including management fees and other fund expenses. The expense examples shown (which are based on a hypothetical investment of $1,000 invested at the beginning of the period and held through the end of the period) are intended to assist shareholders both in calculating expenses based on an investment in each Fund and in comparing these expenses with similar costs of investing in other funds.
The expense examples provide information about actual account values and actual expenses. Annualized expense ratios reflect contractual and voluntary fee waivers, if any. In order to estimate the expenses a shareholder paid during the period covered by this report, shareholders can divide their account value by $1,000 and then multiply the result by the number under the heading entitled “Expenses Paid During the Period.”
The expense examples also provide information about hypothetical account values and hypothetical expenses based on a fund’s actual expense ratio and an assumed rate of return of 5% per year before expenses. In order to assist shareholders in comparing the ongoing expenses of investing in the Funds and other funds, compare the 5% hypothetical examples with the 5% hypothetical examples that appear in the shareholder reports of the other funds.
The expenses shown in the expense examples are intended to highlight shareholders’ ongoing costs only and do not reflect any transactional expenses, such as brokerage commissions and other fees paid on purchases and sales of fund shares. Therefore, the hypothetical examples are useful in comparing ongoing expenses only and will not help shareholders determine the relative total expenses of owning different funds. If these transactional expenses were included, shareholder expenses would have been higher.
| | |
A B O U T F U N D P E R F O R M A N C E / D I S C L O S U R E O F E X P E N S E S | | 15 |
| | |
Schedule of Investments October 31, 2022 | | iShares® International High Yield Bond ETF (Percentages shown are based on Net Assets) |
| | | | | | | | | | | | |
| Security | | | | | Par
(000) | | | Value | |
|
Corporate Bonds & Notes | |
|
Austria — 0.3% | |
ams-OSRAM AG, 6.00%, 07/31/25(a) | | | EUR | | | | 100 | | | $ | 86,505 | |
| | | | | | | | | | | | |
|
Belgium — 0.3% | |
Telenet Finance Luxembourg Notes Sarl, 3.50%, 03/01/28 (Call 12/01/22)(a) | | | EUR | | | | 100 | | | | 84,824 | |
| | | | | | | | | | | | |
|
Canada — 1.5% | |
Air Canada, 4.63%, 08/15/29 (Call 02/15/26)(b) | | | CAD | | | | 225 | | | | 136,932 | |
Mattamy Group Corp., 4.63%, 03/01/28
(Call 03/01/23)(a) | | | CAD | | | | 50 | | | | 29,838 | |
Parkland Corp. | | | | | | | | | | | | |
3.88%, 06/16/26 (Call 06/16/23)(b) | | | CAD | | | | 100 | | | | 65,787 | |
4.38%, 03/26/29 (Call 03/26/24) | | | CAD | | | | 75 | | | | 45,325 | |
Southern Pacific Resource Corp.,
8.75%, 01/25/18(b)(c)(d)(e) | | | CAD | | | | 50 | | | | — | |
Tamarack Valley Energy Ltd., 7.25%, 05/10/27
(Call 05/10/24)(b) | | | CAD | | | | 25 | | | | 17,153 | |
Videotron Ltd. | | | | | | | | | | | | |
3.63%, 06/15/28 (Call 06/15/24)(b) | | | CAD | | | | 150 | | | | 92,900 | |
4.50%, 01/15/30 (Call 10/15/24) | | | CAD | | | | 150 | | | | 92,785 | |
| | | | | | | | | | | | |
| | | |
| | | | | | | | | | | 480,720 | |
|
Finland — 1.8% | |
Nokia OYJ | | | | | | | | | | | | |
2.00%, 03/15/24 (Call 12/15/23)(a) | | | EUR | | | | 100 | | | | 96,784 | |
2.00%, 03/11/26 (Call 12/11/25)(a) | | | EUR | | | | 150 | | | | 136,867 | |
2.38%, 05/15/25(a) | | | EUR | | | | 100 | | | | 94,929 | |
Teollisuuden Voima OYJ | | | | | | | | | | | | |
1.13%, 03/09/26 (Call 12/09/25)(a) | | | EUR | | | | 200 | | | | 175,308 | |
1.38%, 06/23/28 (Call 03/23/28)(a) | | | EUR | | | | 100 | | | | 81,393 | |
| | | | | | | | | | | | |
| | | |
| | | | | | | | | | | 585,281 | |
|
France — 13.0% | |
Accor SA | | | | | | | | | | | | |
2.38%, 11/29/28 (Call 08/29/28)(a) | | | EUR | | | | 100 | | | | 80,385 | |
3.00%, 02/04/26 (Call 11/04/25)(a) | | | EUR | | | | 100 | | | | 92,800 | |
Adevinta ASA, 2.63%, 11/15/25 (Call 11/15/22)(a) | | | EUR | | | | 100 | | | | 90,953 | |
Altice France SA/France | | | | | | | | | | | | |
2.13%, 02/15/25 (Call 11/30/22)(a) | | | EUR | | | | 150 | | | | 130,076 | |
4.00%, 07/15/29 (Call 04/15/24)(a) | | | EUR | | | | 100 | | | | 75,088 | |
4.25%, 10/15/29 (Call 10/15/24)(a) | | | EUR | | | | 100 | | | | 75,096 | |
5.88%, 02/01/27(a) | | | EUR | | | | 150 | | | | 127,926 | |
Atos SE | | | | | | | | | | | | |
1.00%, 11/12/29 (Call 08/12/29)(a) | | | EUR | | | | 100 | | | | 54,887 | |
1.75%, 05/07/25 (Call 02/07/25)(a) | | | EUR | | | | 100 | | | | 72,837 | |
Banijay Entertainment SASU, 3.50%, 03/01/25(a) | | | EUR | | | | 200 | | | | 185,405 | |
CAB SELAS, 3.38%, 02/01/28
(Call 02/01/24)(a) | | | EUR | | | | 200 | | | | 153,633 | |
Casino Guichard Perrachon SA | | | | | | | | | | | | |
3.58%, 02/07/25 (Call 11/07/24)(a) | | | EUR | | | | 200 | | | | 107,756 | |
5.25%, 04/15/27 (Call 04/15/23)(a) | | | EUR | | | | 100 | | | | 43,334 | |
CGG SA, 7.75%, 04/01/27 (Call 04/01/24)(a) | | | EUR | | | | 100 | | | | 86,075 | |
Chrome Bidco SASU, 3.50%, 05/31/28
(Call 05/31/24)(a) | | | EUR | | | | 100 | | | | 79,508 | |
Elis SA | | | | | | | | | | | | |
1.63%, 04/03/28 (Call 01/03/28)(a) | | | EUR | | | | 100 | | | | 81,844 | |
1.75%, 04/11/24 (Call 01/11/24)(a) | | | EUR | | | | 100 | | | | 96,402 | |
4.13%, 05/24/27 (Call 02/24/27)(a) | | | EUR | | | | 100 | | | | 95,079 | |
Faurecia SE | | | | | | | | | | | | |
2.38%, 06/15/27 (Call 06/15/23)(a) | | | EUR | | | | 100 | | | | 80,665 | |
2.63%, 06/15/25(a) | | | EUR | | | | 100 | | | | 92,758 | |
2.75%, 02/15/27 (Call 02/15/24)(a) | | | EUR | | | | 125 | | | | 105,311 | |
3.13%, 06/15/26(a) | | | EUR | | | | 100 | | | | 91,535 | |
3.75%, 06/15/28 (Call 06/15/23)(a) | | | EUR | | | | 100 | | | | 83,201 | |
| | | | | | | | | | | | |
| Security | | | | | Par
(000) | | | Value | |
|
France (continued) | |
Iliad Holding SASU | | | | | | | | | | | | |
5.13%, 10/15/26 (Call 10/15/23)(a) | | | EUR | | | | 150 | | | $ | 137,342 | |
5.63%, 10/15/28 (Call 10/15/24)(a) | | | EUR | | | | 100 | | | | 88,501 | |
iliad SA, 1.88%, 04/25/25 (Call 01/25/25)(a) | | | EUR | | | | 300 | | | | 275,366 | |
Loxam SAS | | | | | | | | | | | | |
2.88%, 04/15/26(a) | | | EUR | | | | 100 | | | | 84,845 | |
4.50%, 02/15/27 (Call 02/15/24)(a) | | | EUR | | | | 175 | | | | 152,912 | |
Picard Groupe SAS, 3.88%, 07/01/26
(Call 07/01/23)(a) | | | EUR | | | | 100 | | | | 84,707 | |
Quatrim SASU, 5.88%, 01/15/24(a) | | | EUR | | | | 100 | | | | 95,613 | |
RCI Banque SA, 2.63%, 02/18/30
(Call 02/18/25)(a)(f) | | | EUR | | | | 200 | | | | 171,493 | |
Renault SA | | | | | | | | | | | | |
1.00%, 11/28/25 (Call 08/28/25)(a) | | | EUR | | | | 70 | | | | 63,336 | |
1.25%, 06/24/25 (Call 03/24/25)(a) | | | EUR | | | | 100 | | | | 89,642 | |
2.00%, 09/28/26 (Call 06/28/26)(a) | | | EUR | | | | 100 | | | | 83,475 | |
2.50%, 06/02/27 (Call 03/02/27)(a) | | | EUR | | | | 100 | | | | 83,402 | |
2.50%, 04/01/28 (Call 01/01/28)(a) | | | EUR | | | | 100 | | | | 82,647 | |
SPIE SA, 3.13%, 03/22/24 (Call 09/22/23)(a) | | | EUR | | | | 100 | | | | 97,728 | |
Tereos Finance Groupe I SA, 7.50%, 10/30/25(a) | | | EUR | | | | 100 | | | | 97,431 | |
Valeo | | | | | | | | | | | | |
1.00%, 08/03/28 (Call 05/03/28)(a) | | | EUR | | | | 100 | | | | 74,849 | |
1.50%, 06/18/25 (Call 03/18/25)(a) | | | EUR | | | | 100 | | | | 90,834 | |
3.25%, 01/22/24(a) | | | EUR | | | | 100 | | | | 97,555 | |
| | | | | | | | | | | | |
| | | |
| | | | | | | | | | | 4,134,232 | |
|
Germany — 10.8% | |
ADLER Group SA | | | | | | | | | | | | |
1.50%, 07/26/24 (Call 04/26/24)(a) | | | EUR | | | | 100 | | | | 47,109 | |
1.88%, 01/14/26 (Call 10/14/25)(a) | | | EUR | | | | 100 | | | | 42,510 | |
2.25%, 01/14/29 (Call 10/14/28)(a) | | | EUR | | | | 200 | | | | 81,901 | |
ADLER Real Estate AG, 1.88%, 04/27/23
(Call 03/27/23)(a) | | | EUR | | | | 100 | | | | 78,167 | |
Bayer AG | | | | | | | | | | | | |
2.38%, 11/12/79 (Call 02/12/25)(a)(f) | | | EUR | | | | 100 | | | | 88,606 | |
3.75%, 07/01/74 (Call 07/01/24)(a)(f) | | | EUR | | | | 200 | | | | 189,246 | |
5.38%, 03/25/82 (Call 06/25/30)(a)(f) | | | EUR | | | | 100 | | | | 85,269 | |
Series N5.5, 4.50%, Series N5.5, 03/25/82
(Call 06/25/27)(a)(f) | | | EUR | | | | 100 | | | | 89,195 | |
Bertelsmann SE & Co. KGaA, 3.50%, 04/23/75 (Call 04/23/27)(a)(f) | | | EUR | | | | 100 | | | | 85,116 | |
Cheplapharm Arzneimittel GmbH, 4.38%, 01/15/28 (Call 01/15/24)(a) | | | EUR | | | | 150 | | | | 124,756 | |
Commerzbank AG | | | | | | | | | | | | |
4.00%, 03/23/26(a) | | | EUR | | | | 100 | | | | 93,780 | |
4.00%, 03/30/27(a) | | | EUR | | | | 75 | | | | 69,197 | |
4.00%, 12/05/30 (Call 09/05/25)(a)(f) | | | EUR | | | | 100 | | | | 90,609 | |
6.50%, 12/06/32 (Call 09/06/27)(a)(f) | | | EUR | | | | 100 | | | | 93,972 | |
Deutsche Lufthansa AG | | | | | | | | | | | | |
2.00%, 07/14/24 (Call 06/14/24)(a) | | | EUR | | | | 100 | | | | 93,387 | |
2.88%, 02/11/25 (Call 01/11/25)(a) | | | EUR | | | | 200 | | | | 183,496 | |
3.00%, 05/29/26(a) | | | EUR | | | | 300 | | | | 259,659 | |
3.50%, 07/14/29 (Call 04/14/29)(a) | | | EUR | | | | 100 | | | | 78,055 | |
Douglas GmbH, 6.00%, 04/08/26
(Call 04/15/23)(a) | | | EUR | | | | 100 | | | | 75,516 | |
Nidda BondCo GmbH, 5.00%, 09/30/25
(Call 11/30/22)(a) | | | EUR | | | | 100 | | | | 79,598 | |
Nidda Healthcare Holding GmbH,
3.50%, 09/30/24 (Call 11/10/22)(a) | | | EUR | | | | 100 | | | | 92,467 | |
Schaeffler AG | | | | | | | | | | | | |
1.88%, 03/26/24 (Call 12/26/23)(a) | | | EUR | | | | 100 | | | | 95,465 | |
2.75%, 10/12/25 (Call 07/12/25)(a) | | | EUR | | | | 100 | | | | 91,456 | |
2.88%, 03/26/27 (Call 12/26/26)(a) | | | EUR | | | | 75 | | | | 65,121 | |
3.38%, 10/12/28 (Call 07/12/28)(a) | | | EUR | | | | 100 | | | | 83,386 | |
Techem Verwaltungsgesellschaft 675 mbH,
2.00%, 07/15/25(a) | | | EUR | | | | 150 | | | | 136,233 | |
thyssenkrupp AG, 2.88%, 02/22/24
(Call 11/22/23)(a) | | | EUR | | | | 200 | | | | 192,387 | |
| | |
| 16 | | 2 0 2 2 I S H A R E S A N N U A L R E P O R T T O S H A R E H O L D E R S |
| | |
Schedule of Investments (continued) October 31, 2022 | | iShares® International High Yield Bond ETF (Percentages shown are based on Net Assets) |
| | | | | | | | | | | | |
| Security | | Par (000) | | | Value | |
| | | |
| Germany (continued) | | | | | | | | | |
TK Elevator Holdco GmbH, 6.63%, 07/15/28 (Call 07/15/23)(a) . | | | EUR | | | | 90 | | | $ | 69,573 | |
TK Elevator Midco GmbH, 4.38%, 07/15/27 (Call 07/15/23)(a) | | | EUR | | | | 100 | | | | 83,424 | |
ZF Europe Finance BV | | | | | | | | | | | | |
2.00%, 02/23/26 (Call 12/23/25)(a) | | | EUR | | | | 100 | | | | 85,948 | |
2.50%, 10/23/27 (Call 07/23/27)(a) | | | EUR | | | | 100 | | | | 79,242 | |
3.00%, 10/23/29 (Call 07/23/29)(a) | | | EUR | | | | 100 | | | | 76,790 | |
ZF Finance GmbH | | | | | | | | | | | | |
2.00%, 05/06/27 (Call 02/06/27)(a) | | | EUR | | | | 100 | | | | 79,891 | |
3.00%, 09/21/25 (Call 06/21/25)(a) | | | EUR | | | | 100 | | | | 90,550 | |
3.75%, 09/21/28 (Call 06/21/28)(a) | | | EUR | | | | 100 | | | | 81,089 | |
| | | | | | | | | | | | |
| | | |
| | | | | | | | | | | 3,432,166 | |
| | | |
| Greece — 1.6% | | | | | | | | | |
Alpha Bank SA, 2.50%, 03/23/28
(Call 03/23/27)(a)(f) | | | EUR | | | | 100 | | | | 77,445 | |
Alpha Services and Holdings SA, 4.25%, 02/13/30 (Call 02/13/25)(a)(f) | | | EUR | | | | 100 | | | | 80,193 | |
Eurobank SA, 2.25%, 03/14/28
(Call 03/14/27)(a)(f) | | | EUR | | | | 100 | | | | 77,960 | |
National Bank of Greece SA, 2.75%, 10/08/26 (Call 10/08/25)(a)(f) | | | EUR | | | | 100 | | | | 85,200 | |
Piraeus Financial Holdings SA,
9.75%, 06/26/29 (Call 06/26/24)(a)(f) | | | EUR | | | | 100 | | | | 94,333 | |
Public Power Corp. SA, 3.88%, 03/30/26 (Call 03/30/23)(a) | | | EUR | | | | 100 | | | | 89,392 | |
| | | | | | | | | | | | |
| | | |
| | | | | | | | | | | 504,523 | |
| | | |
| Ireland — 1.4% | | | | | | | | | |
AIB Group PLC, 2.88%, 05/30/31
(Call 05/30/26)(a)(f) | | | EUR | | | | 100 | | | | 85,001 | |
Bank of Ireland Group PLC | | | | | | | | | | | | |
1.38%, 08/11/31 (Call 05/11/26)(a)(f) | | | EUR | | | | 100 | | | | 80,362 | |
7.59%, 12/06/32 (Call 09/06/27)(a)(f) | | | GBP | | | | 100 | | | | 109,957 | |
eircom Finance DAC | | | | | | | | | | | | |
1.75%, 11/01/24 (Call 11/30/22)(a) | | | EUR | | | | 100 | | | | 96,869 | |
3.50%, 05/15/26(a) | | | EUR | | | | 100 | | | | 87,267 | |
| | | | | | | | | | | | |
| | | |
| | | | | | | | | | | 459,456 | |
| | | |
| Israel — 1.8% | | | | | | | | | |
Teva Pharmaceutical Finance Netherlands II BV | | | | | | | | | | | | |
1.13%, 10/15/24(a) | | | EUR | | | | 100 | | | | 90,272 | |
1.63%, 10/15/28(a) | | | EUR | | | | 150 | | | | 107,971 | |
3.75%, 05/09/27 (Call 02/09/27) | | | EUR | | | | 150 | | | | 129,292 | |
4.38%, 05/09/30 (Call 02/09/30) | | | EUR | | | | 200 | | | | 158,930 | |
4.50%, 03/01/25 (Call 12/01/24) | | | EUR | | | | 100 | | | | 94,795 | |
| | | | | | | | | | | | |
| | | |
| | | | | | | | | | | 581,260 | |
| | | |
| Italy — 14.3% | | | | | | | | | |
Atlantia SpA | | | | | | | | | | | | |
1.63%, 02/03/25(a) | | | EUR | | | | 100 | | | | 91,229 | |
1.88%, 07/13/27 (Call 04/13/27)(a) | | | EUR | | | | 175 | | | | 141,839 | |
1.88%, 02/12/28 (Call 11/12/27)(a) | | | EUR | | | | 100 | | | | 77,807 | |
Banca Monte dei Paschi di Siena SpA | | | | | | | | | | | | |
3.63%, 09/24/24(a) | | | EUR | | | | 200 | | | | 184,490 | |
10.50%, 07/23/29(a) | | | EUR | | | | 100 | | | | 81,672 | |
Banca Popolare di Sondrio SCPA | | | | | | | | | | | | |
2.38%, 04/03/24(a) | | | EUR | | | | 100 | | | | 95,621 | |
3.88%, 02/25/32 (Call 11/25/26)(a)(f) | | | EUR | | | | 100 | | | | 77,275 | |
Banco BPM SpA | | | | | | | | | | | | |
0.88%, 07/15/26(a) | | | EUR | | | | 100 | | | | 84,255 | |
1.75%, 01/28/25(a) | | | EUR | | | | 100 | | | | 92,091 | |
3.25%, 01/14/31 (Call 01/14/26)(a)(f) | | | EUR | | | | 100 | | | | 82,923 | |
4.25%, 10/01/29 (Call 10/01/24)(a)(f) | | | EUR | | | | 100 | | | | 91,272 | |
6.00%, 09/13/26(a) | | | EUR | | | | 150 | | | | 149,811 | |
BPER Banca | | | | | | | | | | | | |
1.88%, 07/07/25(a) | | | EUR | | | | 100 | | | | 89,654 | |
3.88%, 07/25/32 (Call 01/25/27)(a)(f) | | | EUR | | | | 200 | | | | 154,426 | |
Brunello Bidco SpA, 3.50%, 02/15/28 (Call 02/15/24)(a) | | | EUR | | | | 100 | | | | 80,762 | |
| | | | | | | | | | | | |
| Security | | Par (000) | | | Value | |
| | | |
| Italy (continued) | | | | | | | | | |
Iccrea Banca SpA | | | | | | | | | | | | |
2.13%, 01/17/27 (Call 01/17/26)(a)(f) | | | EUR | | | | 100 | | | $ | 86,450 | |
4.13%, 11/28/29 (Call 11/28/24)(a)(f) | | | EUR | | | | 100 | | | | 87,501 | |
6.38%, 09/20/27 (Call 09/20/26)(a)(f) | | | EUR | | | | 100 | | | | 95,848 | |
IMA Industria Macchine Automatiche SpA, 3.75%, 01/15/28 (Call 01/15/23)(a) | | | EUR | | | | 100 | | | | 80,681 | |
Infrastrutture Wireless Italiane SpA | | | | | | | | | | | | |
1.75%, 04/19/31 (Call 01/19/31)(a) | | | EUR | | | | 100 | | | | 73,047 | |
1.88%, 07/08/26 (Call 04/08/26)(a) | | | EUR | | | | 150 | | | | 131,762 | |
Intesa Sanpaolo SpA | | | | | | | | | | | | |
2.93%, 10/14/30(a) | | | EUR | | | | 100 | | | | 75,491 | |
4.38%, 07/12/29 (Call 07/12/24)(a)(f) | | | EUR | | | | 150 | | | | 144,048 | |
5.15%, 06/10/30(a) | | | GBP | | | | 100 | | | | 88,270 | |
5.88%, 03/04/29 (Call 03/04/24)(a)(f) | | | EUR | | | | 150 | | | | 148,012 | |
Leonardo SpA, 2.38%, 01/08/26
(Call 10/08/25)(a) | | | EUR | | | | 100 | | | | 91,879 | |
Lottomatica SpA/Roma, 5.13%, 07/15/25 (Call 11/10/22)(a) | | | EUR | | | | 100 | | | | 91,538 | |
Mediobanca Banca di Credito Finanziario SpA, 3.75%, 06/16/26 | | | EUR | | | | 50 | | | | 47,572 | |
Nexi SpA | | | | | | | | | | | | |
1.63%, 04/30/26 (Call 01/30/26)(a) | | | EUR | | | | 100 | | | | 87,899 | |
2.13%, 04/30/29 (Call 01/30/29)(a) | | | EUR | | | | 150 | | | | 117,981 | |
Rossini Sarl, 6.75%, 10/30/25(a) | | | EUR | | | | 100 | | | | 96,781 | |
Saipem Finance International BV,
2.63%, 01/07/25(a) | | | EUR | | | | 100 | | | | 92,250 | |
Telecom Italia SpA/Milano | | | | | | | | | | | | |
1.63%, 01/18/29 (Call 10/18/28)(a) | | | EUR | | | | 100 | | | | 71,083 | |
2.38%, 10/12/27 (Call 07/12/27)(a) | | | EUR | | | | 100 | | | | 79,657 | |
2.75%, 04/15/25 (Call 01/15/25)(a) | | | EUR | | | | 100 | | | | 90,125 | |
2.88%, 01/28/26 (Call 10/28/25)(a) | | | EUR | | | | 300 | | | | 260,299 | |
3.63%, 01/19/24(a) | | | EUR | | | | 100 | | | | 95,822 | |
3.63%, 05/25/26(a) | | | EUR | | | | 100 | | | | 87,885 | |
4.00%, 04/11/24 (Call 01/11/24)(a) | | | EUR | | | | 100 | | | | 95,982 | |
UniCredit SpA | | | | | | | | | | | | |
2.73%, 01/15/32 (Call 01/15/27)(a)(f) | | | EUR | | | | 200 | | | | 161,018 | |
4.88%, 02/20/29 (Call 02/20/24)(a)(f) | | | EUR | | | | 200 | | | | 192,593 | |
Webuild SpA | | | | | | | | | | | | |
1.75%, 10/26/24(a) | | | EUR | | | | 150 | | | | 124,838 | |
5.88%, 12/15/25 (Call 06/15/25)(a) | | | EUR | | | | 100 | | | | 81,567 | |
| | | | | | | | | | | | |
| | | |
| | | | | | | | | | | 4,553,006 | |
| | | |
| Japan — 1.5% | | | | | | | | | |
SoftBank Group Corp. | | | | | | | | | | | | |
2.13%, 07/06/24 (Call 04/06/24)(a) | | | EUR | | | | 175 | | | | 161,441 | |
2.88%, 01/06/27 (Call 10/06/26)(a) | | | EUR | | | | 100 | | | | 79,661 | |
3.38%, 07/06/29 (Call 04/06/29)(a) | | | EUR | | | | 125 | | | | 89,951 | |
3.88%, 07/06/32 (Call 04/06/32)(a) | | | EUR | | | | 100 | | | | 67,220 | |
5.00%, 04/15/28 (Call 01/16/28)(a) | | | EUR | | | | 100 | | | | 81,777 | |
| | | | | | | | | | | | |
| | | |
| | | | | | | | | | | 480,050 | |
| | | |
| Luxembourg — 3.6% | | | | | | | | | |
Altice Financing SA | | | | | | | | | | | | |
2.25%, 01/15/25 (Call 11/30/22)(a) | | | EUR | | | | 100 | | | | 88,161 | |
4.25%, 08/15/29 (Call 08/15/24)(a) | | | EUR | | | | 100 | | | | 75,096 | |
Altice Finco SA, 4.75%, 01/15/28(a) | | | EUR | | | | 100 | | | | 68,455 | |
Altice France Holding SA | | | | | | | | | | | | |
4.00%, 02/15/28 (Call 02/15/23)(a) | | | EUR | | | | 100 | | | | 60,994 | |
8.00%, 05/15/27(a) | | | EUR | | | | 100 | | | | 71,454 | |
Cidron Aida Finco Sarl, 5.00%, 04/01/28 (Call 04/01/24)(a) | | | EUR | | | | 100 | | | | 77,218 | |
Garfunkelux Holdco 3 SA, 6.75%, 11/01/25(a) | | | EUR | | | | 100 | | | | 70,480 | |
INEOS Finance PLC | | | | | | | | | | | | |
2.13%, 11/15/25(a) | | | EUR | | | | 100 | | | | 87,376 | |
2.88%, 05/01/26(a) | | | EUR | | | | 175 | | | | 153,462 | |
Matterhorn Telecom SA, 3.13%, 09/15/26(a) | | | EUR | | | | 200 | | | | 173,461 | |
| | |
S C H E D U L E O F I N V E S T M E N T S | | 17 |
| | |
Schedule of Investments (continued) October 31, 2022 | | iShares® International High Yield Bond ETF (Percentages shown are based on Net Assets) |
| | | | | | | | | | | | |
| Security | | Par (000) | | | Value | |
| | | |
| Luxembourg (continued) | | | | | | | | | |
Summer BC Holdco B Sarl, 5.75%, 10/31/26(a) | | | EUR | | | | 150 | | | $ | 128,005 | |
Vivion Investments Sarl, 3.00%, 08/08/24(a) | | | EUR | | | | 100 | | | | 84,346 | |
| | | | | | | | | | | | |
| | | |
| | | | | | | | | | | 1,138,508 | |
| | | |
| Netherlands — 4.5% | | | | | | | | | |
Lincoln Financing Sarl, 3.63%, 04/01/24 (Call 11/30/22)(a) | | | EUR | | | | 200 | | | | 190,585 | |
PPF Telecom Group BV | | | | | | | | | | | | |
3.25%, 09/29/27 (Call 06/29/27)(a) | | | EUR | | | | 100 | | | | 84,951 | |
3.50%, 05/20/24 (Call 02/20/24)(a) | | | EUR | | | | 200 | | | | 193,173 | |
Q-Park Holding I BV, 2.00%, 03/01/27 (Call 03/01/23)(a) | | | EUR | | | | 100 | | | | 78,040 | |
Sigma Holdco BV, 5.75%, 05/15/26(a) | | | EUR | | | | 100 | | | | 59,708 | |
SNS Bank NV, 6.25%, 10/26/20(d) | | | EUR | | | | 50 | | | | — | |
Trivium Packaging Finance BV,
3.75%, 08/15/26(a) | | | EUR | | | | 100 | | | | 88,519 | |
United Group BV | | | | | | | | | | | | |
3.63%, 02/15/28 (Call 02/15/23)(a) | | | EUR | | | | 100 | | | | 70,883 | |
4.88%, 07/01/24 (Call 11/30/22)(a) | | | EUR | | | | 100 | | | | 94,128 | |
5.25%, 02/01/30 (Call 02/01/25)(a) | | | EUR | | | | 100 | | | | 69,939 | |
UPC Holding BV, 3.88%, 06/15/29(a) | | | EUR | | | | 100 | | | | 79,325 | |
VZ Vendor Financing II BV, 2.88%, 01/15/29 (Call 12/18/23)(a) | | | EUR | | | | 200 | | | | 144,341 | |
WP/AP Telecom Holdings III BV,
5.50%, 01/15/30 (Call 01/15/25)(a) | | | EUR | | | | 100 | | | | 76,372 | |
WP/AP Telecom Holdings IV BV,
3.75%, 01/15/29 (Call 01/15/25)(a) | | | EUR | | | | 100 | | | | 82,898 | |
Ziggo Bond Co. BV, 3.38%, 02/28/30 (Call 02/15/25)(a) | | | EUR | | | | 150 | | | | 108,840 | |
| | | | | | | | | | | | |
| | | |
| | | | | | | | | | | 1,421,702 | |
| | | |
| Portugal — 2.1% | | | | | | | | | |
Banco Comercial Portugues SA | | | | | | | | | | | | |
1.75%, 04/07/28 (Call 04/07/27)(a)(f) | | | EUR | | | | 100 | | | | 71,231 | |
4.00%, 05/17/32 (Call 11/17/26)(a)(f) | | | EUR | | | | 100 | | | | 63,296 | |
8.50%, 10/25/25 | | | EUR | | | | 100 | | | | 100,113 | |
Caixa Geral de Depositos SA,
1.25%, 11/25/24(a) | | | EUR | | | | 100 | | | | 92,494 | |
EDP - Energias de Portugal SA | | | | | | | | | | | | |
1.70%, 07/20/80 (Call 04/20/25)(a)(f) | | | EUR | | | | 100 | | | | 86,311 | |
1.88%, 08/02/81 (Call 05/02/26)(a)(f) | | | EUR | | | | 100 | | | | 81,434 | |
4.50%, 04/30/79 (Call 01/30/24)(a)(f) | | | EUR | | | | 100 | | | | 96,150 | |
Energias De Portugal SA, 1.88%, 03/14/82 (Call 06/14/29)(a)(f) | | | EUR | | | | 100 | | | | 67,194 | |
| | | | | | | | | | | | |
| | | |
| | | | | | | | | | | 658,223 | |
| | | |
| Spain — 8.8% | | | | | | | | | |
Banco de Credito Social Cooperativo SA | | | | | | | | | | | | |
1.75%, 03/09/28 (Call 03/09/27)(a)(f) | | | EUR | | | | 100 | | | | 73,702 | |
8.00%, 09/22/26 (Call 09/22/25)(a)(f) | | | EUR | | | | 100 | | | | 97,979 | |
Banco de Sabadell SA | | | | | | | | | | | | |
0.88%, 06/16/28 (Call 06/16/27)(a)(f) | | | EUR | | | | 100 | | | | 77,870 | |
1.13%, 03/27/25(a) | | | EUR | | | | 100 | | | | 89,460 | |
1.75%, 05/10/24(a) | | | EUR | | | | 100 | | | | 94,144 | |
2.63%, 03/24/26 (Call 03/24/25)(a)(f) | | | EUR | | | | 100 | | | | 91,686 | |
5.38%, 09/08/26 (Call 09/08/25)(a)(f) | | | EUR | | | | 100 | | | | 97,161 | |
5.38%, 12/12/28 (Call 12/12/23)(a)(f) | | | EUR | | | | 100 | | | | 96,848 | |
Cellnex Finance Co. SA | | | | | | | | | | | | |
0.75%, 11/15/26 (Call 08/15/26)(a) | | | EUR | | | | 200 | | | | 165,857 | |
1.00%, 09/15/27 (Call 06/15/27)(a) | | | EUR | | | | 100 | | | | 79,899 | |
1.50%, 06/08/28 (Call 03/08/28)(a) | | | EUR | | | | 100 | | | | 79,559 | |
2.00%, 09/15/32 (Call 06/15/32)(a) | | | EUR | | | | 200 | | | | 138,926 | |
2.00%, 02/15/33 (Call 11/15/32)(a) | | | EUR | | | | 100 | | | | 68,228 | |
2.25%, 04/12/26 (Call 01/12/26)(a) | | | EUR | | | | 100 | | | | 89,817 | |
Cellnex Telecom SA | | | | | | | | | | | | |
1.00%, 04/20/27 (Call 01/20/27)(a) | | | EUR | | | | 100 | | | | 82,089 | |
1.88%, 06/26/29 (Call 03/26/29) | | | EUR | | | | 100 | | | | 77,440 | |
2.38%, 01/16/24 (Call 10/16/23)(a) | | | EUR | | | | 100 | | | | 97,313 | |
Cirsa Finance International Sarl | | | | | | | | | | | | |
4.50%, 03/15/27 (Call 09/15/23)(a) | | | EUR | | | | 100 | | | | 81,709 | |
| | | | | | | | | | | | |
| Security | | Par (000) | | | Value | |
| | | |
| Spain (continued) | | | | | | | | | |
6.25%, 12/20/23 (Call 11/10/22)(a) | | | EUR | | | | 85 | | | $ | 83,618 | |
ContourGlobal Power Holdings SA, 4.13%, 08/01/25(a) | | | EUR | | | | 200 | | | | 188,145 | |
Grifols Escrow Issuer SA, 3.88%, 10/15/28 (Call 10/15/24)(a) | | | EUR | | | | 150 | | | | 112,415 | |
Grifols SA | | | | | | | | | | | | |
1.63%, 02/15/25(a) | | | EUR | | | | 150 | | | | 134,811 | |
3.20%, 05/01/25 (Call 11/30/22)(a) | | | EUR | | | | 100 | | | | 87,643 | |
Ibercaja Banco SA, 2.75%, 07/23/30 (Call 07/23/25)(a)(f) | | | EUR | | | | 100 | | | | 80,307 | |
Kaixo Bondco Telecom SA, 5.13%, 09/30/29 (Call 09/30/24)(a) | | | EUR | | | | 100 | | | | 79,273 | |
Lorca Telecom Bondco SA, 4.00%, 09/18/27 (Call 09/30/23)(a) | | | EUR | | | | 200 | | | | 173,227 | |
Repsol International Finance BV,
4.50%, 03/25/75 (Call 03/25/25)(a)(f) | | | EUR | | | | 100 | | | | 94,165 | |
Unicaja Banco SA, 2.88%, 11/13/29
(Call 11/13/24)(a)(f) | | | EUR | | | | 100 | | | | 84,988 | |
| | | | | | | | | | | | |
| | | |
| | | | | | | | | | | 2,798,279 | |
| | | |
| Sweden — 3.1% | | | | | | | | | |
Fastighets AB Balder, 2.87%, 06/02/81 (Call 03/02/26)(a)(f) | | | EUR | | | | 100 | | | | 56,855 | |
Intrum AB | | | | | | | | | | | | |
3.00%, 09/15/27(a) | | | EUR | | | | 100 | | | | 74,834 | |
3.13%, 07/15/24(a) | | | EUR | | | | 100 | | | | 93,124 | |
3.50%, 07/15/26(a) | | | EUR | | | | 175 | | | | 140,474 | |
Verisure Holding AB | | | | | | | | | | | | |
3.25%, 02/15/27 (Call 02/15/23)(a) | | | EUR | | | | 150 | | | | 125,507 | |
9.25%, 10/15/27 (Call 10/15/24)(a) | | | EUR | | | | 100 | | | | 101,606 | |
Verisure Midholding AB, 5.25%, 02/15/29 (Call 02/15/24)(a) | | | EUR | | | | 150 | | | | 113,441 | |
Volvo Car AB | | | | | | | | | | | | |
2.00%, 01/24/25 (Call 10/24/24)(a) | | | EUR | | | | 100 | | | | 93,186 | |
2.13%, 04/02/24 (Call 01/02/24)(a) | | | EUR | | | | 100 | | | | 95,700 | |
2.50%, 10/07/27 (Call 07/07/27)(a) | | | EUR | | | | 100 | | | | 85,090 | |
| | | | | | | | | | | | |
| | | |
| | | | | | | | | | | 979,817 | |
| | | |
| Switzerland — 0.6% | | | | | | | | | |
Dufry One BV | | | | | | | | | | | | |
2.50%, 10/15/24 (Call 11/30/22)(a) | | | EUR | | | | 100 | | | | 94,275 | |
3.38%, 04/15/28 (Call 04/15/24)(a) | | | EUR | | | | 100 | | | | 81,133 | |
| | | | | | | | | | | | |
| | | |
| | | | | | | | | | | 175,408 | |
| | | |
| United Kingdom — 11.9% | | | | | | | | | |
BCP V Modular Services Finance II PLC | | | | | | | | | | | | |
4.75%, 11/30/28 (Call 11/30/24)(a) | | | EUR | | | | 100 | | | | 81,292 | |
6.13%, 11/30/28 (Call 11/30/24)(a) | | | GBP | | | | 100 | | | | 91,424 | |
Bellis Acquisition Co. PLC | | | | | | | | | | | | |
3.25%, 02/16/26 (Call 02/24/23)(a) | | | GBP | | | | 100 | | | | 93,135 | |
4.50%, 02/16/26 (Call 02/24/23)(a) | | | GBP | | | | 100 | | | | 96,339 | |
Bellis Finco PLC, 4.00%, 02/16/27
(Call 02/24/23)(a) | | | GBP | | | | 100 | | | | 79,491 | |
British Telecommunications PLC, 1.87%,
08/18/80 (Call 05/18/25)(a)(f) | | | EUR | | | | 100 | | | | 83,408 | |
eG Global Finance PLC, 4.38%, 02/07/25(a) | | | EUR | | | | 100 | | | | 84,423 | |
Heathrow Finance PLC, 3.88%, 03/01/27(a)(g) | | | GBP | | | | 100 | | | | 92,005 | |
Iceland Bondco PLC, 4.63%, 03/15/25 (Call 11/10/22)(a) | | | GBP | | | | 100 | | | | 90,030 | |
INEOS Quattro Finance 2 PLC, 2.50%, 01/15/26 (Call 01/15/23)(a) | | | EUR | | | | 100 | | | | 82,276 | |
INEOS Styrolution Group GmbH, 2.25%, 01/16/27 (Call 01/15/23)(a) | | | EUR | | | | 100 | | | | 77,897 | |
International Consolidated Airlines Group SA | | | | | | | | | | | | |
2.75%, 03/25/25 (Call 12/25/24)(a) | | | EUR | | | | 100 | | | | 87,084 | |
3.75%, 03/25/29 (Call 12/25/28)(a) | | | EUR | | | | 100 | | | | 72,722 | |
Jaguar Land Rover Automotive PLC | | | | | | | | | | | | |
2.20%, 01/15/24(a) | | | EUR | | | | 100 | | | | 92,361 | |
4.50%, 01/15/26 (Call 10/15/25)(a) | | | EUR | | | | 150 | | | | 125,652 | |
4.50%, 07/15/28 (Call 07/15/24)(a) | | | EUR | | | | 100 | | | | 70,554 | |
Jerrold Finco PLC, 5.25%, 01/15/27
(Call 01/15/23)(a) | | | GBP | | | | 100 | | | | 89,554 | |
Market Bidco Finco PLC, 5.50%, 11/04/27 (Call 11/04/24)(a) | | | GBP | | | | 100 | | | | 86,450 | |
Marks & Spencer PLC, 6.00%, 06/12/25(a) | | | GBP | | | | 100 | | | | 106,548 | |
| | |
| 18 | | 2 0 2 2 I S H A R E S A N N U A L R E P O R T T O S H A R E H O L D E R S |
| | |
Schedule of Investments (continued) October 31, 2022 | | iShares® International High Yield Bond ETF (Percentages shown are based on Net Assets) |
| | | | | | | | | | | | |
| Security | | Par (000) | | | Value | |
| | | |
| United Kingdom (continued) | | | | | | | | | |
Motion Finco Sarl, 7.00%, 05/15/25 (Call 11/30/22)(a) | | | EUR | | | | 100 | | | $ | 96,693 | |
NGG Finance PLC | | | | | | | | | | | | |
1.63%, 12/05/79 (Call 09/05/24)(a)(f) | | | EUR | | | | 100 | | | | 89,517 | |
2.13%, 09/05/82 (Call 06/05/27)(a) | | | EUR | | | | 100 | | | | 78,989 | |
5.63%, 06/18/73 (Call 06/18/25)(a)(f) | | | GBP | | | | 100 | | | | 104,107 | |
Pinewood Finance Co. Ltd., 3.63%, 11/15/27 (Call 11/15/23)(a) . | | | GBP | | | | 175 | | | | 165,064 | |
Pinnacle Bidco PLC, 5.50%, 02/15/25 (Call 11/30/22)(a) | | | EUR | | | | 100 | | | | 89,059 | |
Rolls-Royce PLC | | | | | | | | | | | | |
0.88%, 05/09/24 (Call 02/09/24)(a) | | | EUR | | | | 100 | | | | 92,447 | |
4.63%, 02/16/26 (Call 11/16/25)(a) | | | EUR | | | | 100 | | | | 94,042 | |
5.75%, 10/15/27 (Call 07/15/27)(a) | | | GBP | | | | 100 | | | | 98,310 | |
Sherwood Financing PLC, 4.50%, 11/15/26 (Call 11/15/23)(a) | | | EUR | | | | 100 | | | | 69,566 | |
Stonegate Pub Co. Financing 2019 PLC,
8.25%, 07/31/25 (Call 11/30/22)(a) | | | GBP | | | | 200 | | | | 206,695 | |
Thames Water Utilities Finance PLC,
2.88%, 05/03/27(a) | | | GBP | | | | 100 | | | | 96,343 | |
Virgin Media Secured Finance PLC | | | | | | | | | | | | |
4.13%, 08/15/30 (Call 08/15/25)(a) | | | GBP | | | | 100 | | | | 88,865 | |
4.25%, 01/15/30 (Call 10/15/24)(a) | | | GBP | | | | 100 | | | | 90,846 | |
5.00%, 04/15/27(a) | | | GBP | | | | 100 | | | | 104,655 | |
Vmed O2 UK Financing I PLC | | | | | | | | | | | | |
3.25%, 01/31/31 (Call 01/31/26)(a) | | | EUR | | | | 100 | | | | 80,347 | |
4.00%, 01/31/29 (Call 01/31/24)(a) | | | GBP | | | | 100 | | | | 93,028 | |
4.50%, 07/15/31 (Call 07/15/26)(a) | | | GBP | | | | 100 | | | | 88,210 | |
Vodafone Group PLC | | | | | | | | | | | | |
2.63%, 08/27/80 (Call 05/27/26)(a)(f) | | | EUR | | | | 200 | | | | 172,273 | |
3.00%, 08/27/80 (Call 05/27/30)(a)(f) | | | EUR | | | | 150 | | | | 114,355 | |
| | | | | | | | | | | | |
| | | |
| | | | | | | | | | | 3,796,056 | |
| | | |
| United States — 14.0% | | | | | | | | | |
Adient Global Holdings Ltd., 3.50%, 08/15/24 (Call 05/15/24)(a) | | | EUR | | | | 111 | | | | 103,350 | |
Allied Universal Holdco LLC/Allied Universal Finance Corp/Atlas Luxco 4 Sarl, 3.63%, 06/01/28 (Call 06/01/24)(a) | | | EUR | | | | 100 | | | | 78,464 | |
Ardagh Metal Packaging Finance USA LLC/Ardagh Metal Packaging Finance PLC, 2.00%, 09/01/28 (Call 05/15/24)(a) | | | EUR | | | | 100 | | | | 75,775 | |
Ardagh Packaging Finance PLC/Ardagh Holdings USA Inc. | | | | | | | | | | | | |
2.13%, 08/15/26(a) | | | EUR | | | | 100 | | | | 80,518 | |
4.75%, 07/15/27(a) | | | GBP | | | | 100 | | | | 74,235 | |
Ashland Services BV, 2.00%, 01/30/28
(Call 11/01/27)(a) | | | EUR | | | | 100 | | | | 80,667 | |
Avantor Funding Inc., 2.63%, 11/01/25(a) | | | EUR | | | | 100 | | | | 91,759 | |
Avis Budget Finance PLC, 4.13%, 11/15/24(a) | | | EUR | | | | 100 | | | | 94,713 | |
Axalta Coating Systems Dutch Holding B BV, 3.75%, 01/15/25(a) | | | EUR | | | | 100 | | | | 91,900 | |
Ball Corp. | | | | | | | | | | | | |
0.88%, 03/15/24 (Call 12/15/23) | | | EUR | | | | 100 | | | | 94,474 | |
4.38%, 12/15/23 | | | EUR | | | | 100 | | | | 98,997 | |
Belden Inc., 3.88%, 03/15/28(a) | | | EUR | | | | 150 | | | | 131,123 | |
Boxer Parent Co. Inc., 6.50%, 10/02/25 (Call 11/30/22)(a) | | | EUR | | | | 100 | | | | 92,558 | |
Brookfield Property Finance ULC | | | | | | | | | | | | |
3.93%, 08/24/25 (Call 07/24/25) | | | CAD | | | | 100 | | | | 67,763 | |
4.00%, 09/30/26 (Call 08/30/26) | | | CAD | | | | 75 | | | | 49,200 | |
Carnival PLC, 1.00%, 10/28/29 (Call 07/28/29) | | | EUR | | | | 100 | | | | 41,104 | |
Catalent Pharma Solutions Inc., 2.38%, 03/01/28 (Call 03/01/23)(a) | | | EUR | | | | 150 | | | | 123,895 | |
Clarios Global LP/Clarios US Finance Co., 4.38%, 05/15/26(a) | | | EUR | | | | 100 | | | | 91,763 | |
Constellium SE, 3.13%, 07/15/29
(Call 07/15/24)(a) | | | EUR | | | | 100 | | | | 72,908 | |
Coty Inc., 3.88%, 04/15/26 (Call 04/15/23)(a) | | | EUR | | | | 100 | | | | 89,784 | |
Crown European Holdings SA | | | | | | | | | | | | |
2.63%, 09/30/24(a) | | | EUR | | | | 100 | | | | 95,092 | |
2.88%, 02/01/26 (Call 08/01/25)(a) | | | EUR | | | | 100 | | | | 90,617 | |
Darling Global Finance BV, 3.63%, 05/15/26(a) | | | EUR | | | | 100 | | | | 94,005 | |
Encore Capital Group Inc., 5.38%, 02/15/26(a) | | | GBP | | | | 100 | | | | 99,629 | |
| | | | | | | | | | | | |
| Security | | Par (000) | | | Value | |
| | | |
| United States (continued) | | | | | | | | | |
Energizer Gamma Acquisition BV,
3.50%, 06/30/29 (Call 06/30/24)(a) | | | EUR | | | | 100 | | | $ | 71,724 | |
Ford Credit Canada Co, 2.96%, 09/16/26
(Call 08/16/26) | | | CAD | | | | 100 | | | | 62,152 | |
Ford Credit Canada Co. | | | | | | | | | | | | |
3.50%, 11/30/23 | | | CAD | | | | 50 | | | | 35,444 | |
4.46%, 11/13/24 | | | CAD | | | | 50 | | | | 35,002 | |
Ford Motor Credit Co. LLC | | | | | | | | | | | | |
1.36%, 02/07/25 | | | EUR | | | | 100 | | | | 90,258 | |
1.74%, 07/19/24 | | | EUR | | | | 100 | | | | 93,413 | |
2.39%, 02/17/26 | | | EUR | | | | 125 | | | | 111,580 | |
2.75%, 06/14/24 | | | GBP | | | | 100 | | | | 105,957 | |
3.02%, 03/06/24 | | | EUR | | | | 100 | | | | 96,377 | |
3.25%, 09/15/25 | | | EUR | | | | 100 | | | | 92,525 | |
Hanesbrands Finance Luxembourg SCA, 3.50%, 06/15/24 (Call 03/15/24)(a) | | | EUR | | | | 100 | | | | 92,229 | |
International Game Technology PLC,
3.50%, 06/15/26(a) | | | EUR | | | | 150 | | | | 139,491 | |
IQVIA Inc. | | | | | | | | | | | | |
1.75%, 03/15/26 (Call 03/15/23)(a) | | | EUR | | | | 100 | | | | 89,977 | |
2.25%, 01/15/28(a) | | | EUR | | | | 150 | | | | 127,711 | |
2.25%, 03/15/29 (Call 03/15/24)(a) | | | EUR | | | | 100 | | | | 79,753 | |
Iron Mountain UK PLC, 3.88%, 11/15/25(a) | | | GBP | | | | 100 | | | | 102,361 | |
Levi Strauss & Co., 3.38%, 03/15/27 | | | EUR | | | | 100 | | | | 89,691 | |
MPT Operating Partnership LP/MPT Finance Corp. | | | | | | | | | | | | |
2.50%, 03/24/26 (Call 02/24/26) | | | GBP | | | | 100 | | | | 88,063 | |
3.33%, 03/24/25 (Call 12/24/24) | | | EUR | | | | 100 | | | | 86,672 | |
3.38%, 04/24/30 (Call 01/24/30) | | | GBP | | | | 100 | | | | 71,417 | |
Novelis Sheet Ingot GmbH, 3.38%, 04/15/29 (Call 04/15/24)(a) | | | EUR | | | | 100 | | | | 80,608 | |
OI European Group BV, 3.13%, 11/15/24 (Call 08/15/24)(a) | | | EUR | | | | 100 | | | | 94,526 | |
Olympus Water U.S. Holding Corp.,
3.88%, 10/01/28 (Call 10/01/24)(a) | | | EUR | | | | 100 | | | | 73,889 | |
Organon & Co./Organon Foreign Debt Co.-Issuer BV, 2.88%, 04/30/28
(Call 04/30/24)(a) | | | EUR | | | | 100 | | | | 83,067 | |
Silgan Holdings Inc., 3.25%, 03/15/25
(Call 11/30/22) | | | EUR | | | | 100 | | | | 94,732 | |
Standard Industries Inc./NJ, 2.25%, 11/21/26 (Call 08/21/26)(a) | | | EUR | | | | 100 | | | | 81,048 | |
WMG Acquisition Corp., 2.25%, 08/15/31
(Call 08/15/26)(a) | | | EUR | | | | 100 | | | | 72,793 | |
| | | | | | | | | | | | |
| | | |
| | | | | | | | | | | 4,446,753 | |
| | | | | | | | | | | | |
| | | |
Total Corporate Bonds & Notes — 96.9%
(Cost: $41,306,108) | | | | | | | | | | | 30,796,769 | |
| | | | | | | | | | | | |
| | | |
| Common Stocks | | | | | | | | | |
| | | |
| Jersey — 0.0% | | | | | | | | | |
Sentry Holdings Ltd.Class A | | | | | | | 0 | (h) | | | — | |
| | | | | | | | | | | | |
| | | |
Total Common Stocks — 0.0%
(Cost: $159,437) | | | | | | | | | | | — | |
| | | | | | | | | | | | |
| | | |
Total Long-Term Investments — 96.9%
(Cost: $41,465,545) | | | | | | | | | | | 30,796,769 | |
| | | | | | | | | | | | |
| | |
S C H E D U L E O F I N V E S T M E N T S | | 19 |
| | |
Schedule of Investments (continued) October 31, 2022 | | iShares® International High Yield Bond ETF (Percentages shown are based on Net Assets) |
| | | | | | | | | | |
| Security | | | | Shares
(000) | | | Value | |
| | | |
Short-Term Securities | | | | | | | | | | |
| | | |
| Money Market Funds — 0.0% | | | | | | | | |
BlackRock Cash Funds: Treasury, SL Agency Shares, 2.97%(i)(j) | | | | | 10 | | | $ | 10,000 | |
| | | | | | | |
| |
Total Short-Term Securities — 0.0%
(Cost: $10,000) | | | | 10,000 | |
| | | | | | | |
| |
Total Investments — 96.9%
(Cost: $41,475,545) | | | | 30,806,769 | |
| | |
Other Assets Less Liabilities — 3.1% | | | | | | | 988,986 | |
| | | | | | | |
| | | |
Net Assets — 100.0% | | | | | | | | $ | 31,795,755 | |
| | | | | | | | | | |
| (a) | This security may be resold to qualified foreign investors and foreign institutional buyers under Regulation S of the Securities Act of 1933. |
| (b) | Security exempt from registration pursuant to Rule 144A under the Securities Act of 1933, as amended. These securities may be resold in transactions exempt from registration to qualified institutional investors. |
| (c) | Issuer filed for bankruptcy and/or is in default. |
| (d) | Security is valued using significant unobservable inputs and is classified as Level 3 in the fair value hierarchy. |
| (e) | Non-income producing security. |
| (f) | Variable rate security. Interest rate resets periodically. The rate shown is the effective interest rate as of period end. Security description also includes the reference rate and spread if published and available. |
| (g) | Step coupon security. Coupon rate will either increase (step-up bond) or decrease (step-down bond) at regular intervals until maturity. Interest rate shown reflects the rate currently in effect. |
| (h) | Rounds to less than 1,000. |
| (i) | Affiliate of the Fund. |
| (j) | Annualized 7-day yield as of period end. |
Affiliates
Investments in issuers considered to be affiliate(s) of the Fund during the year ended October 31, 2022 for purposes of Section 2(a)(3) of the Investment Company Act of 1940, as amended, were as follows:
| | | | | | | | | | | | | | | | | | | | | | | | | | | | | | | | | | | | |
| |
| | | | | | | | | |
| Affiliated Issuer | | Value at
10/31/21 | | | Purchases
at Cost | | | Proceeds
from Sale | | | Net Realized
Gain (Loss) | | | Change in
Unrealized
Appreciation
(Depreciation) | | | Value at
10/31/22 | | | Shares
Held at
10/31/22
(000) | | | Income | | | Capital Gain
Distributions from
Underlying Funds | |
| |
BlackRock Cash Funds: Treasury, SL Agency Shares | | $ | 20,000 | | | $ | — | | | $ | (10,000 | )(a) | | $ | — | | | $ | — | | | $ | 10,000 | | | | 10 | | | $ | 31 | | | $ | — | |
| | | | | | | | | | | | | | | | | | | | | | | | | | | | | | | | | | | | |
| (a) | Represents net amount purchased (sold). | |
Fair Value Hierarchy as of Period End
Various inputs are used in determining the fair value of financial instruments. For a description of the input levels and information about the Fund’s policy regarding valuation of financial instruments, refer to the Notes to Financial Statements.
The following table summarizes the Fund’s financial instruments categorized in the fair value hierarchy. The breakdown of the Fund’s financial instruments into major categories is disclosed in the Schedule of Investments above.
| | | | | | | | | | | | | | | | |
| |
| | | | |
| | | Level 1 | | | Level 2 | | | Level 3 | | | Total | |
| |
Investments | | | | | | | | | | | | | | | | |
Assets | | | | | | | | | | | | | | | | |
Corporate Bonds & Notes | | $ | — | | | $ | 30,796,769 | | | $ | — | | | $ | 30,796,769 | |
Common Stocks | | | — | | | | — | | | | — | | | | — | |
Money Market Funds | | | 10,000 | | | | — | | | | — | | | | 10,000 | |
| | | | | | | | | | | | | | | | |
| | | | |
| | $ | 10,000 | | | $ | 30,796,769 | | | $ | — | | | $ | 30,806,769 | |
| | | | | | | | | | | | | | | | |
See notes to financial statements.
| | |
| 20 | | 2 0 2 2 I SHARES ANNUAL REPORT TO SHAREHOLDERS |
| | |
Schedule of Investments October 31, 2022 | | iShares® J.P. Morgan EM Corporate Bond ETF (Percentages shown are based on Net Assets) |
| | | | | | | | |
| Security | | Par
(000) | | | Value | |
| | |
Corporate Bonds & Notes | | | | | | | | |
| | |
Argentina — 1.1% | | | | | | |
MSU Energy SA/UGEN SA/UENSA SA, 6.88%, 02/01/25 (Call 11/30/22)(a) | | $ | 350 | | | $ | 220,784 | |
Pampa Energia SA, 7.50%, 01/24/27
(Call 11/30/22)(a) | | | 450 | | | | 372,459 | |
Transportadora de Gas del Sur SA,
6.75%, 05/02/25 (Call 11/30/22)(a) | | | 300 | | | | 257,685 | |
YPF SA
2.50%, 06/30/29(a)(b) | | | 480 | | | | 298,800 | |
6.95%, 07/21/27(a) | | | 600 | | | | 355,500 | |
7.00%, 12/15/47 (Call 06/15/47)(a) | | | 350 | | | | 180,250 | |
8.50%, 07/28/25(a) | | | 775 | | | | 558,000 | |
8.75%, 04/04/24(a) | | | 455 | | | | 392,239 | |
YPF Sociedad Anonima | | | | | | | | |
1.50%, 09/30/33(a)(b) | | | 375 | | | | 203,625 | |
4.00%, 02/12/26(a)(b) | | | 480 | | | | 412,800 | |
| | | | | | | | |
| | |
| | | | | | | 3,252,142 | |
| | |
Azerbaijan — 0.2% | | | | | | |
International Bank of Azerbaijan OJSC,
3.50%, 09/01/24(a) | | | 700 | | | | 658,000 | |
| | | | | | | | |
| | |
Bahrain — 0.3% | | | | | | |
AUB Sukuk Ltd., 2.62%, 09/09/26(a) | | | 400 | | | | 351,950 | |
BBK BSC, 5.50%, 07/09/24(a) | | | 200 | | | | 192,975 | |
GFH Sukuk Ltd., 7.50%, 01/28/25(a) | | | 400 | | | | 381,000 | |
| | | | | | | | |
| | |
| | | | | | | 925,925 | |
| | |
Brazil — 5.3% | | | | | | |
Adecoagro SA, 6.00%, 09/21/27(a) | | | 150 | | | | 135,094 | |
Aegea Finance Sarl, 6.75%, 05/20/29
(Call 05/20/25)(a) | | | 200 | | | | 182,700 | |
Amaggi Luxembourg International Sarl,
5.25%, 01/28/28(a) | | | 200 | | | | 175,475 | |
Azul Investments LLP, 7.25%, 06/15/26(a) | | | 200 | | | | 125,725 | |
B3 SA - Brasil Bolsa Balcao, 4.13%, 09/20/31(a) | | | 200 | | | | 158,538 | |
Banco Bradesco SA/Cayman Islands,
4.38%, 03/18/27(a)(c) | | | 200 | | | | 185,880 | |
Banco BTG Pactual SA/Cayman Islands
2.75%, 01/11/26 (Call 12/11/25)(a) | | | 200 | | | | 174,725 | |
4.50%, 01/10/25 (Call 12/10/24)(a)(c) | | | 200 | | | | 190,210 | |
Banco do Brasil SA/Cayman
3.25%, 09/30/26(a) | | | 200 | | | | 177,663 | |
4.63%, 01/15/25(a) | | | 200 | | | | 193,595 | |
4.75%, 03/20/24(a) | | | 200 | | | | 196,287 | |
4.88%, 01/11/29(a) | | | 200 | | | | 179,100 | |
6.25%, (Call 04/15/24)(a)(d)(e) | | | 200 | | | | 174,725 | |
9.00%, (Call 06/18/24)(a)(d)(e) | | | 200 | | | | 199,662 | |
9.25%, 10/29/49(a) | | | 200 | | | | 200,100 | |
Banco Votorantim SA, 4.38%, 07/29/25(a) | | | 200 | | | | 188,500 | |
Braskem Netherlands Finance BV
4.50%, 01/10/28 (Call 10/10/27)(a) | | | 200 | | | | 172,600 | |
4.50%, 01/31/30(a) | | | 400 | | | | 322,000 | |
5.88%, 01/31/50(a) | | | 200 | | | | 144,735 | |
8.50%, 01/23/81 (Call 10/24/25)(a)(e) | | | 200 | | | | 190,000 | |
BRF SA, 5.75%, 09/21/50 (Call 03/21/50)(a) | | | 200 | | | | 133,500 | |
Cemig Geracao e Transmissao SA,
9.25%, 12/05/24 (Call 12/05/23)(a) | | | 200 | | | | 204,975 | |
Centrais Eletricas Brasileiras SA,
4.63%, 02/04/30(a) | | | 200 | | | | 170,660 | |
Cosan Luxembourg SA, 7.00%, 01/20/27
(Call 11/30/22)(a) | | | 200 | | | | 196,037 | |
Cosan SA, 5.50%, 09/20/29 (Call 09/20/24)(a) | | | 200 | | | | 176,850 | |
CSN Inova Ventures, 6.75%, 01/28/28
(Call 01/28/24)(a) | | | 200 | | | | 170,050 | |
CSN Resources SA | | | | | | | | |
4.63%, 06/10/31 (Call 06/10/26)(a) | | | 200 | | | | 133,065 | |
5.88%, 04/08/32 (Call 04/08/27)(a) | | | 200 | | | | 144,060 | |
Embraer Netherlands Finance BV
5.05%, 06/15/25 | | | 200 | | | | 187,950 | |
| | | | | | | | |
| Security | | Par
(000) | | | Value | |
| | |
Brazil (continued) | | | | | | |
5.40%, 02/01/27(c) | | $ | 250 | | | $ | 228,016 | |
Fibria Overseas Finance Ltd., 5.50%, 01/17/27 | | | 200 | | | | 191,000 | |
FS Luxembourg Sarl, 10.00%, 12/15/25(a) | | | 200 | | | | 203,081 | |
Gol Finance SA, 8.00%, 06/30/26
(Call 12/24/22)(a) | | | 200 | | | | 116,000 | |
GTL Trade Finance Inc., 7.25%, 04/16/44
(Call 10/16/43)(a) | | | 200 | | | | 205,537 | |
Guara Norte Sarl, 5.20%, 06/15/34(a) | | | 187 | | | | 146,039 | |
InterCement Financial Operations BV,
5.75%, 07/17/24 (Call 11/30/22)(a) | | | 200 | | | | 137,913 | |
Itau Unibanco Holding SA/Cayman Island
3.25%, 01/24/25(a)(c) | | | 200 | | | | 190,287 | |
4.50%, 11/21/29 (Call 11/21/24)(a)(e) | | | 200 | | | | 184,413 | |
6.13%, (Call 12/12/22)(a)(c)(d)(e) | | | 200 | | | | 186,925 | |
6.50%, (Call 03/19/23)(a)(c)(d)(e) | | | 200 | | | | 184,850 | |
JBS USA LUX SA/JBS USA Food Co/JBS USA Finance Inc., 2.50%, 01/15/27 | | | 200 | | | | 170,110 | |
JSM Global Sarl, 4.75%, 10/20/30(a) | | | 200 | | | | 138,163 | |
Klabin Austria GmbH, 7.00%, 04/03/49
(Call 10/03/48)(a) | | | 200 | | | | 176,150 | |
Light Servicos de Eletricidade SA/Light Energia SA, 4.38%, 06/18/26 (Call 06/18/24)(a) | | | 200 | | | | 161,200 | |
MARB BondCo PLC, 3.95%, 01/29/31
(Call 01/29/26)(a) | | | 200 | | | | 147,000 | |
MC Brazil Downstream Trading SARL,
7.25%, 06/30/31(a) | | | 400 | | | | 303,640 | |
MercadoLibre Inc., 3.13%, 01/14/31 (Call 10/14/30) | | | 200 | | | | 143,500 | |
Minerva Luxembourg SA, 4.38%, 03/18/31(a) | | | 200 | | | | 151,500 | |
Movida Europe SA, 5.25%, 02/08/31
(Call 02/08/26)(a) | | | 200 | | | | 146,176 | |
Natura Cosmeticos SA, 4.13%, 05/03/28
(Call 03/03/28)(a) | | | 200 | | | | 155,100 | |
NBM U.S. Holdings Inc., 6.63%, 08/06/29
(Call 08/06/24)(a) | | | 200 | | | | 184,975 | |
Nexa Resources SA
5.38%, 05/04/27 (Call 02/04/27)(a) | | | 600 | | | | 541,680 | |
6.50%, 01/18/28 (Call 10/18/27)(a) | | | 200 | | | | 183,600 | |
Odebrecht Drilling Norbe VIII/IX Ltd., 7.35%,
(7.35% PIK), 12/01/26 (Call 11/30/22)(a)(f) | | | 172 | | | | 94,737 | |
Odebrecht Offshore Drilling Finance Ltd., 7.72%,
(7.72% PIK), 12/01/26 (Call 11/30/22)(a)(c)(f) | | | 303 | | | | 64,573 | |
Oi SA, 10.00%, (12.00% PIK), 07/27/25(f) | | | 300 | | | | 77,119 | |
Petrobras Global Finance BV
5.09%, 01/15/30(c) | | | 150 | | | | 133,406 | |
5.30%, 01/27/25 | | | 50 | | | | 49,244 | |
5.50%, 06/10/51 (Call 12/10/50) | | | 100 | | | | 70,763 | |
5.60%, 01/03/31 (Call 10/03/30)(c) | | | 250 | | | | 226,300 | |
5.75%, 02/01/29 | | | 150 | | | | 139,616 | |
6.00%, 01/27/28 | | | 225 | | | | 215,775 | |
6.25%, 03/17/24 | | | 50 | | | | 50,009 | |
6.75%, 01/27/41 | | | 150 | | | | 130,148 | |
6.75%, 06/03/50 (Call 12/03/49)(c) | | | 75 | | | | 60,169 | |
6.85%, 06/05/2115 | | | 350 | | | | 272,562 | |
6.88%, 01/20/40(c) | | | 148 | | | | 130,869 | |
6.90%, 03/19/49 | | | 150 | | | | 123,150 | |
7.25%, 03/17/44(c) | | | 150 | | | | 134,250 | |
7.38%, 01/17/27(c) | | | 150 | | | | 152,250 | |
Petrorio Luxembourg Trading Sarl, 6.13%, 06/09/26 (Call 06/09/24)(a) | | | 200 | | | | 180,975 | |
Raizen Fuels Finance SA, 5.30%, 01/20/27(a) | | | 200 | | | | 189,850 | |
Rede D’or Finance Sarl, 4.95%, 01/17/28
(Call 10/17/27)(a) | | | 200 | | | | 177,288 | |
Rumo Luxembourg Sarl, 5.25%, 01/10/28
(Call 01/10/24)(a) | | | 200 | | | | 178,100 | |
Simpar Europe SA, 5.20%, 01/26/31(a) | | | 200 | | | | 143,500 | |
Suzano Austria GmbH
2.50%, 09/15/28 (Call 07/15/28) | | | 100 | | | | 78,900 | |
3.13%, 01/15/32 (Call 10/15/31) | | | 300 | | | | 221,250 | |
3.75%, 01/15/31 (Call 10/15/30)(c) | | | 250 | | | | 198,906 | |
5.00%, 01/15/30 (Call 10/15/29)(c) | | | 200 | | | | 176,225 | |
6.00%, 01/15/29 (Call 10/15/28) | | | 200 | | | | 189,825 | |
| | |
S C H E D U L E O F I N V E S T M E N T S | | 21 |
| | |
Schedule of Investments (continued) October 31, 2022 | | iShares® J.P. Morgan EM Corporate Bond ETF (Percentages shown are based on Net Assets) |
| | | | | | | | |
| Security | | Par
(000) | | | Value | |
| | |
| Brazil (continued) | | | | | | |
7.00%, 03/16/47 (Call 09/16/46)(a)(c) | | $ | 200 | | | $ | 182,375 | |
Usiminas International Sarl, 5.88%, 07/18/26 (Call 07/18/23)(a) | | | 200 | | | | 185,475 | |
Vale Overseas Ltd.
3.75%, 07/08/30 (Call 04/08/30)(c) | | | 200 | | | | 164,500 | |
6.25%, 08/10/26 | | | 150 | | | | 152,250 | |
6.88%, 11/21/36 | | | 350 | | | | 337,479 | |
6.88%, 11/10/39 | | | 250 | | | | 237,381 | |
XP Inc., 3.25%, 07/01/26 (Call 06/01/26)(a) | | | 200 | | | | 173,850 | |
| | | | | | | | |
| | |
| | | | | | | 15,054,385 | |
| | |
| Burkina Faso — 0.1% | | | | | | |
Endeavour Mining PLC, 5.00%, 10/14/26 (Call 10/14/23)(a) | | | 400 | | | | 310,700 | |
| | | | | | | | |
| | |
| Cayman Islands — 0.0% | | | | | | |
Odebrecht Holdco Finance Ltd., 0.00%, 09/10/58 (Call 11/30/22)(a)(g) | | | 400 | | | | 1,000 | |
| | | | | | | | |
| | |
| Chile — 4.0% | | | | | | |
AES Andes SA., 7.13%, 03/26/79
(Call 04/07/24)(a)(e) | | | 400 | | | | 326,200 | |
Agrosuper SA, 4.60%, 01/20/32 (Call 10/20/31)(a) | | | 250 | | | | 202,391 | |
Alfa Desarrollo SpA, 4.55%, 09/27/51
(Call 03/27/51)(a) | | | 598 | | | | 382,600 | |
Antofagasta PLC
2.38%, 10/14/30 (Call 07/14/30)(a) | | | 200 | | | | 146,500 | |
5.63%, 05/13/32 (Call 02/13/32)(a) | | | 400 | | | | 368,000 | |
Banco de Chile,
2.99%, 12/09/31 (Call 09/09/31)(a) | | | 400 | | | | 305,450 | |
Banco de Credito e Inversiones SA | | | | | | | | |
2.88%, 10/14/31 (Call 07/14/31)(a) | | | 200 | | | | 151,788 | |
3.50%, 10/12/27(a)(c) | | | 400 | | | | 357,500 | |
Banco Santander Chile
2.70%, 01/10/25 (Call 12/10/24)(a)(c) | | | 300 | | | | 279,431 | |
3.18%, 10/26/31 (Call 07/28/31)(a)(c) | | | 400 | | | | 312,200 | |
Celulosa Arauco y Constitucion SA
4.20%, 01/29/30 (Call 10/29/29)(a)(c) | | | 400 | | | | 335,825 | |
4.25%, 04/30/29 (Call 01/30/29)(a) | | | 200 | | | | 170,975 | |
4.50%, 08/01/24 (Call 05/01/24) | | | 200 | | | | 194,662 | |
5.15%, 01/29/50 (Call 07/29/49)(a) | | | 400 | | | | 292,250 | |
5.50%, 04/30/49 (Call 10/30/48)(a)(c) | | | 200 | | | | 149,600 | |
Cencosud SA
4.38%, 07/17/27 (Call 04/17/27)(a)(c) | | | 600 | | | | 537,600 | |
5.15%, 02/12/25 (Call 11/12/24)(a) | | | 200 | | | | 194,475 | |
Cia. Cervecerias Unidas SA,
3.35%, 01/19/32 (Call 10/19/31)(a) | | | 400 | | | | 317,325 | |
Colbun SA 3.15%, 03/06/30 (Call 12/06/29)(a) | | | 200 | | | | 161,000 | |
3.15%, 01/19/32 (Call 10/19/31)(a) | | | 400 | | | | 303,000 | |
3.95%, 10/11/27 (Call 07/11/27)(a) | | | 400 | | | | 356,700 | |
Empresa Nacional de Telecomunicaciones SA
3.05%, 09/14/32 (Call 06/14/32)(a) | | | 600 | | | | 437,250 | |
4.75%, 08/01/26 (Call 05/03/26)(a) | | | 200 | | | | 186,225 | |
Enel Americas SA, 4.00%, 10/25/26 (Call 07/25/26)(c) | | | 300 | | | | 276,337 | |
Enel Chile SA, 4.88%, 06/12/28 (Call 03/12/28) | | | 600 | | | | 541,830 | |
Engie Energia Chile SA, 3.40%, 01/28/30 (Call 10/28/29)(a) | | | 400 | | | | 292,000 | |
Falabella SA, 3.38%, 01/15/32 (Call 10/15/31)(a) | | | 400 | | | | 284,000 | |
GNL Quintero SA, 4.63%, 07/31/29(a) | | | 494 | | | | 455,863 | |
Guacolda Energia SA, 4.56%, 04/30/25
(Call 01/30/25)(a) | | | 200 | | | | 61,788 | |
Interchile SA, 4.50%, 06/30/56 (Call 12/30/55)(a) | | | 700 | | | | 502,819 | |
Inversiones CMPC SA
3.00%, 04/06/31 (Call 01/06/31)(a) | | | 200 | | | | 150,225 | |
3.85%, 01/13/30 (Call 10/13/29)(a) | | | 200 | | | | 166,537 | |
4.38%, 04/04/27(a)(c) | | | 400 | | | | 366,300 | |
4.75%, 09/15/24 (Call 06/15/24)(a) | | | 400 | | | | 389,825 | |
| | | | | | | | |
| Security | | Par
(000) | | | Value | |
| | |
| Chile (continued) | | | | | | |
Kenbourne Invest SA, 6.88%, 11/26/24 (Call 11/30/22)(a) | | $ | 400 | | | $ | 356,000 | |
Latam Airlines Group SA, 13.38%, 10/15/29 | | | 400 | | | | 391,000 | |
Sociedad Quimica y Minera de Chile SA, 3.50%, 09/10/51 (Call 03/10/51)(a) | | | 400 | | | | 254,450 | |
Telefonica Moviles Chile SA, 3.54%, 11/18/31 (Call 08/18/31)(a)(c) | | | 250 | | | | 187,391 | |
VTR Finance NV, 6.38%, 07/15/28 (Call 07/15/23)(a) | | | 400 | | | | 201,575 | |
| | | | | | | | |
| | |
| | | | | | | 11,346,887 | |
| | |
| China — 7.4% | | | | | | |
Agile Group Holdings Ltd., 6.88%, (Call 03/07/23)(a)(d)(e) | | | 200 | | | | 31,000 | |
Agricultural Bank of China Ltd./Hong Kong, 0.70%, 06/17/24(a) | | | 200 | | | | 187,096 | |
Agricultural Bank of China Ltd./New York, 0.85%, 01/19/24(a) | | | 200 | | | | 190,618 | |
Alibaba Group Holding Ltd.
2.13%, 02/09/31 (Call 11/09/30)(c) | | | 200 | | | | 143,046 | |
2.70%, 02/09/41 (Call 08/09/40) | | | 200 | | | | 104,326 | |
3.25%, 02/09/61 (Call 08/09/60) | | | 200 | | | | 92,650 | |
3.40%, 12/06/27 (Call 09/06/27)(c) | | | 300 | | | | 257,038 | |
3.60%, 11/28/24 (Call 08/28/24) | | | 200 | | | | 189,972 | |
4.00%, 12/06/37 (Call 06/06/37) | | | 200 | | | | 138,078 | |
4.20%, 12/06/47 (Call 06/06/47) | | | 200 | | | | 121,038 | |
4.50%, 11/28/34 (Call 05/28/34) | | | 200 | | | | 154,188 | |
Amipeace Ltd.
1.75%, 11/09/26(a) | | | 200 | | | | 177,838 | |
2.50%, 12/05/24(a) | | | 200 | | | | 190,138 | |
Baidu Inc.
2.38%, 08/23/31 (Call 05/23/31)(c) | | | 200 | | | | 142,584 | |
3.08%, 04/07/25 (Call 03/07/25) | | | 200 | | | | 186,384 | |
4.13%, 06/30/25 | | | 200 | | | | 190,030 | |
Bank of China Ltd.
3.83%, 04/28/25 | | | 200 | | | | 199,738 | |
5.00%, 11/13/24(a)(c) | | | 400 | | | | 394,776 | |
Bank of China Ltd./Hong Kong, 3.88%, 06/30/25(a) | | | 200 | | | | 194,412 | |
Bank of China Ltd./Luxembourg, 1.40%, 04/28/26(a) | | | 200 | | | | 178,484 | |
Bank of Communications Co. Ltd., 3.80%, (Call 11/18/25)(a)(d)(e) | | | 400 | | | | 369,000 | |
Beijing Gas Singapore Capital Corp., 1.88%, 01/18/25(a) | | | 200 | | | | 184,974 | |
Bluestar Finance Holdings Ltd., 3.88%, (Call 06/24/23)(a)(d)(e) . | | | 200 | | | | 194,000 | |
BOCOM International Blossom Ltd., 1.75%, 06/28/26(a) | | | 200 | | | | 176,164 | |
CCBL Cayman 1 Corp. Ltd., 1.80%, 07/22/26(a) | | | 200 | | | | 175,287 | |
CCCI Treasure Ltd., 3.43%,
(Call 11/21/24)(a)(d)(e) | | | 200 | | | | 185,875 | |
CDBL Funding 2, 2.00%, 03/04/26(a) | | | 200 | | | | 178,282 | |
Central Plaza Development Ltd., 4.65%, 01/19/26 (Call 10/19/25)(a) | | | 200 | | | | 116,038 | |
Chalco Hong Kong Investment Co. Ltd., 2.10%, 07/28/26 (Call 06/28/26)(a) | | | 200 | | | | 177,054 | |
China Cinda 2020 I Management Ltd., 2.50%, 03/18/25 (Call 02/18/25)(a) | | | 200 | | | | 179,975 | |
China Cinda Finance 2015 I Ltd., 4.25%, 04/23/25(a) | | | 400 | | | | 369,950 | |
China Cinda Finance 2017 I Ltd.
4.75%, 02/08/28(a) | | | 200 | | | | 168,912 | |
4.75%, 02/21/29(a) | | | 200 | | | | 162,600 | |
China Construction Bank Corp.
2.85%, 01/21/32 (Call 01/21/27)(a)(e) | | | 200 | | | | 181,428 | |
3.38%, 12/21/24(a)(e) | | | 200 | | | | 198,548 | |
4.25%, 02/27/29 (Call 02/27/24)(a)(e) | | | 200 | | | | 196,394 | |
China Construction Bank Corp./Hong Kong, 1.25%, 08/04/25(a) | | | 200 | | | | 181,242 | |
China Construction Bank Corp./London, 3.13%, 05/17/25(a) | | | 200 | | | | 191,596 | |
China Everbright Bank Co. Ltd./Luxembourg, 0.83%, 09/14/24(a) | | | 200 | | | | 185,232 | |
| | |
| 22 | | 2 0 2 2 I SHARES ANNUAL REPORT TO SHAREHOLDERS |
| | |
Schedule of Investments (continued) October 31, 2022 | | iShares® J.P. Morgan EM Corporate Bond ETF (Percentages shown are based on Net Assets) |
| | | | | | | | |
| Security | | Par
(000) | | | Value | |
|
| China (continued) | |
China Great Wall International Holdings III Ltd., 3.88%, 08/31/27(a) | | $ | 200 | | | $ | 149,663 | |
China Mengniu Dairy Co. Ltd., 1.88%, 06/17/25 (Call 05/17/25)(a) | | | 200 | | | | 181,220 | |
China Overseas Finance Cayman VI Ltd. | | | | | | | | |
5.95%, 05/08/24(a) | | | 200 | | | | 198,725 | |
6.45%, 06/11/34(a) | | | 200 | | | | 187,225 | |
China Railway Xunjie Co. Ltd., 4.00%, 07/06/27(a) | | | 200 | | | | 191,202 | |
China Resources Land Ltd., 3.75%,
(Call 12/09/24)(a)(d)(e) | | | 200 | | | | 173,287 | |
China SCE Group Holdings Ltd., 7.38%, 04/09/24 (Call 11/30/22)(a) | | | 200 | | | | 26,788 | |
China State Construction Finance Cayman I Ltd., 3.40%, (Call 06/08/26)(a)(d)(e) | | | 200 | | | | 179,000 | |
CICC Hong Kong Finance 2016 MTN Ltd., 1.63%, 01/26/24(a) | | | 200 | | | | 190,814 | |
CIFI Holdings Group Co. Ltd., 6.00%, 07/16/25 (Call 01/16/23)(a)(h)(i) | | | 200 | | | | 13,500 | |
CITIC Ltd. | | | | | | | | |
2.85%, 02/25/30(a) | | | 200 | | | | 163,638 | |
3.88%, 02/28/27(a) | | | 200 | | | | 187,332 | |
CMB International Leasing Management Ltd., 1.88%, 08/12/25(a) | | | 200 | | | | 178,287 | |
CMHI Finance BVI Co. Ltd., 3.50%,
(Call 10/09/23)(a)(d)(e) | | | 200 | | | | 195,162 | |
CMS International Gemstone Ltd., 1.30%, 09/16/24(a) | | | 200 | | | | 183,968 | |
CNOOC Finance 2013 Ltd., 3.30%, 09/30/49 (Call 03/30/49) | | | 200 | | | | 122,022 | |
CNOOC Finance 2014 ULC, 4.25%, 04/30/24 | | | 400 | | | | 393,950 | |
CNOOC Finance 2015 USA LLC, 4.38%, 05/02/28(c) | | | 200 | | | | 192,037 | |
CNOOC Petroleum North America ULC | | | | | | | | |
5.88%, 03/10/35 | | | 100 | | | | 94,947 | |
6.40%, 05/15/37 | | | 275 | | | | 272,638 | |
7.50%, 07/30/39 | | | 150 | | | | 165,351 | |
Contemporary Ruiding Development Ltd., 1.88%, 09/17/25 (Call 08/17/25)(a) | | | 200 | | | | 177,384 | |
COSL Singapore Capital Ltd., 4.50%, 07/30/25(a) | | | 200 | | | | 194,786 | |
Country Garden Holdings Co. Ltd. | | | | | | | | |
3.13%, 10/22/25 (Call 09/22/25)(a) | | | 200 | | | | 18,000 | |
3.30%, 01/12/31 (Call 10/12/30)(a) | | | 200 | | | | 14,000 | |
4.20%, 02/06/26 (Call 02/06/24)(a) | | | 200 | | | | 17,000 | |
5.40%, 05/27/25 (Call 05/27/23)(a) | | | 200 | | | | 18,000 | |
7.25%, 04/08/26 (Call 04/08/23)(a) | | | 200 | | | | 17,000 | |
CSCIF Asia Ltd., 1.13%, 06/10/24(a) | | | 200 | | | | 186,787 | |
Easy Tactic Ltd. | | | | | | | | |
7.50%, (7.50% PIK), 07/11/25 (Call 11/30/22)(f) | | | 150 | | | | 25,434 | |
7.50%, (7.50% PIK), 07/11/27 (Call 11/30/22)(f) | | | 200 | | | | 20,000 | |
7.50%, (7.50% PIK), 07/11/28 (Call 11/30/22)(f) | | | 150 | | | | 12,000 | |
ENN Clean Energy International Investment Ltd., 3.38%, 05/12/26 (Call 05/12/24)(a)(c) | | | 200 | | | | 155,913 | |
ENN Energy Holdings Ltd., 2.63%, 09/17/30 (Call 06/17/30)(a) | | | 200 | | | | 153,350 | |
Fortune Star BVI Ltd., 5.95%, 10/19/25
(Call 10/19/23)(a) | | | 200 | | | | 74,840 | |
Franshion Brilliant Ltd., 6.00%,
(Call 02/08/26)(a)(d)(e) | | | 200 | | | | 149,788 | |
GLP China Holdings Ltd., 2.95%, 03/29/26(a) | | | 200 | | | | 112,538 | |
Huarong Finance 2017 Co. Ltd. | | | | | | | | |
4.25%, 11/07/27(a) | | | 200 | | | | 134,975 | |
4.75%, 04/27/27(a) | | | 200 | | | | 142,913 | |
Huarong Finance 2019 Co. Ltd. 3.38%, 02/24/30 (Call 11/28/29)(a) | | | 200 | | | | 121,038 | |
3.75%, 05/29/24(a) | | | 400 | | | | 350,200 | |
4.50%, 05/29/29(a) | | | 200 | | | | 132,975 | |
ICBCIL Finance Co. Ltd. | | | | | | | | |
1.63%, 11/02/24(a) | | | 400 | | | | 369,388 | |
2.70%, 01/27/27(a) | | | 200 | | | | 178,254 | |
| | | | | | | | |
| Security | | Par
(000) | | | Value | |
|
| China (continued) | |
3.75%, 03/05/24(a) | | $ | 200 | | | $ | 195,162 | |
Industrial & Commercial Bank of China Ltd., 3.20%, (Call 09/24/26)(a)(d)(e) | | | 800 | | | | 714,080 | |
Industrial & Commercial Bank of China Ltd./Hong Kong | | | | | | | | |
1.63%, 10/28/26(a) | | | 200 | | | | 177,788 | |
2.95%, 06/01/25(a) | | | 200 | | | | 190,600 | |
Industrial & Commercial Bank of China Ltd./Singapore | | | | | | | | |
1.00%, 10/28/24(a) | | | 200 | | | | 185,462 | |
1.20%, 09/09/25(a) | | | 200 | | | | 180,362 | |
5.19%, 04/25/24, (3 mo. LIBOR US +
0.830%)(a)(e) | | | 200 | | | | 200,440 | |
Industrial Bank Co. Ltd./Hong Kong, 0.88%, 06/10/24(a) | | | 200 | | | | 187,194 | |
JD.com Inc., 3.88%, 04/29/26 | | | 200 | | | | 184,912 | |
Legend Fortune Ltd., 1.38%, 06/02/24(a) | | | 200 | | | | 187,714 | |
Lenovo Group Ltd. | | | | | | | | |
3.42%, 11/02/30 (Call 08/02/30)(a) | | | 200 | | | | 138,288 | |
5.83%, 01/27/28 | | | 200 | | | | 178,238 | |
Longfor Group Holdings Ltd., 3.95%, 09/16/29(a) | | | 200 | | | | 38,038 | |
MCC Holding Hong Kong Corp. Ltd., 2.95%, (Call 04/20/24)(a)(d)(e) | | | 200 | | | | 189,600 | |
Meituan | | | | | | | | |
2.13%, 10/28/25 (Call 09/28/25)(a) | | | 200 | | | | 163,880 | |
3.05%, 10/28/30 (Call 07/28/30)(a) | | | 200 | | | | 117,000 | |
Pioneer Reward Ltd., 1.30%, 04/09/24(a) | | | 200 | | | | 189,125 | |
Poly Real Estate Finance Ltd., 3.88%, 03/25/24(a) | | | 200 | | | | 191,537 | |
Prosus NV, 4.85%, 07/06/27 (Call 04/06/27)(a) | | | 400 | | | | 348,325 | |
SF Holding Investment 2021 Ltd., 3.13%, 11/17/31(a) | | | 200 | | | | 152,550 | |
Shanghai Port Group BVI Development 2 Co. Ltd., 2.38%, 07/13/30 (Call 04/13/30)(a) | | | 200 | | | | 162,284 | |
Shanghai Pudong Development Bank Co. Ltd./Hong Kong, 0.88%, 07/13/24(a) | | | 200 | | | | 186,952 | |
Shui On Development Holding Ltd., 6.15%, 08/24/24 (Call 11/30/22)(a) | | | 200 | | | | 112,000 | |
Sino-Ocean Land Treasure Finance II Ltd., 5.95%, 02/04/27(a) | | | 200 | | | | 20,475 | |
State Elite Global Ltd., 5.09%, 10/24/24, (3 mo. LIBOR US + 0.770%)(a)(e) | | | 200 | | | | 199,466 | |
Tencent Holdings Ltd. | | | | | | | | |
1.81%, 01/26/26 (Call 12/26/25)(a) | | | 200 | | | | 175,350 | |
2.39%, 06/03/30 (Call 03/03/30)(a) | | | 200 | | | | 145,475 | |
2.88%, 04/22/31 (Call 01/22/31)(a) | | | 200 | | | | 148,516 | |
3.24%, 06/03/50 (Call 12/03/49)(a) | | | 400 | | | | 207,825 | |
3.28%, 04/11/24 (Call 03/11/24)(a) | | | 200 | | | | 193,438 | |
3.58%, 04/11/26 (Call 02/11/26)(a)(c) | | | 200 | | | | 184,475 | |
3.60%, 01/19/28 (Call 10/19/27)(a)(c) | | | 300 | | | | 255,258 | |
3.84%, 04/22/51 (Call 10/22/50)(a) | | | 200 | | | | 116,600 | |
3.94%, 04/22/61 (Call 10/22/60)(a) | | | 200 | | | | 113,130 | |
3.98%, 04/11/29 (Call 01/11/29)(a) | | | 200 | | | | 168,287 | |
4.53%, 04/11/49 (Call 10/11/48)(a)(c) | | | 200 | | | | 133,350 | |
Times China Holdings Ltd., 5.55%, 06/04/24 (Call 06/04/23)(a) | | | 200 | | | | 15,000 | |
Vanke Real Estate Hong Kong Co. Ltd. | | | | | | | | |
4.20%, 06/07/24(a) | | | 200 | | | | 119,663 | |
5.35%, 03/11/24(a) | | | 200 | | | | 149,788 | |
Vigorous Champion International Ltd., 2.75%, 06/02/25(a) | | | 200 | | | | 179,870 | |
Weibo Corp., 3.38%, 07/08/30 (Call 04/08/30) | | | 200 | | | | 137,538 | |
Westwood Group Holdings Ltd., 2.80%, 01/20/26(a) | | | 200 | | | | 125,900 | |
Xiaomi Best Time International Ltd., 3.38%, 04/29/30(a) | | | 200 | | | | 139,225 | |
| | | | | | | | |
| | |
| | | | | | | 21,153,464 | |
|
| Colombia — 4.0% | |
AI Candelaria Spain SLU, 5.75%, 06/15/33 (Call 06/15/28)(a) | | | 400 | | | | 258,000 | |
Avianca Midco 2 Ltd., 9.00%, 12/01/28
(Call 12/01/24)(a) | | | 950 | | | | 708,344 | |
| | |
S C H E D U L E O F I N V E S T M E N T S | | 23 |
| | |
Schedule of Investments (continued) October 31, 2022 | | iShares® J.P. Morgan EM Corporate Bond ETF (Percentages shown are based on Net Assets) |
| | | | | | | | |
| Security | | Par
(000) | | | Value | |
|
| Colombia (continued) | |
Banco Davivienda SA, 6.65%,
(Call 04/22/31)(a)(d)(e) | | $ | 200 | | | $ | 134,788 | |
Banco de Bogota SA, 6.25%, 05/12/26(a) | | | 600 | | | | 546,600 | |
Bancolombia SA | | | | | | | | |
3.00%, 01/29/25 (Call 12/29/24) | | | 600 | | | | 533,362 | |
4.63%, 12/18/29 (Call 12/18/24)(c)(e) | | | 400 | | | | 323,075 | |
7.14%, 10/18/27(c)(e) | | | 400 | | | | 343,700 | |
Canacol Energy Ltd., 5.75%, 11/24/28
(Call 11/24/24)(a) | | | 400 | | | | 299,450 | |
Colombia Telecomunicaciones SA ESP, 4.95%, 07/17/30 (Call 04/17/30)(a) | | | 400 | | | | 278,575 | |
Ecopetrol SA | | | | | | | | |
4.13%, 01/16/25(c) | | | 783 | | | | 720,262 | |
4.63%, 11/02/31 (Call 08/02/31) | | | 750 | | | | 516,562 | |
5.38%, 06/26/26 (Call 03/26/26) | | | 835 | | | | 757,449 | |
5.88%, 05/28/45 | | | 1,200 | | | | 730,584 | |
5.88%, 11/02/51 (Call 05/02/51) | | | 400 | | | | 235,400 | |
6.88%, 04/29/30 (Call 01/29/30)(c) | | | 1,400 | | | | 1,143,100 | |
7.38%, 09/18/43(c) | | | 475 | | | | 345,355 | |
EnfraGen Energia Sur SA, 5.38%, 12/30/30(a) | | | 400 | | | | 204,000 | |
Geopark Ltd., 5.50%, 01/17/27 (Call 01/17/24)(a) | | | 200 | | | | 161,350 | |
Grupo Aval Ltd., 4.38%, 02/04/30 (Call 11/04/29)(a) | | | 600 | | | | 414,113 | |
Grupo de Inversiones Suramericana SA, 5.50%, 04/29/26(a) | | | 400 | | | | 364,200 | |
Millicom International Cellular SA | | | | | | | | |
4.50%, 04/27/31 (Call 04/27/26)(a) | | | 600 | | | | 448,800 | |
6.25%, 03/25/29 (Call 03/25/24)(a)(c) | | | 360 | | | | 313,875 | |
Oleoducto Central SA, 4.00%, 07/14/27 (Call 05/14/27)(a) | | | 200 | | | | 162,725 | |
Promigas SA ESP/Gases del Pacifico SAC, 3.75%, 10/16/29
(Call 07/16/29)(a) | | | 200 | | | | 148,850 | |
Sierracol Energy Andina Co., 6.00%, 06/15/28 (Call 06/15/24)(a) | | | 400 | | | | 262,300 | |
SURA Asset Management SA,
4.88%, 04/17/24(a)(c) | | | 300 | | | | 289,650 | |
Termocandelaria Power Ltd., 7.88%, 01/30/29 (Call 01/30/23)(a) | | | 340 | | | | 288,639 | |
Transportadora de Gas Internacional SA ESP, 5.55%, 11/01/28 (Call 08/01/28)(a)(c) | | | 400 | | | | 351,200 | |
| | | | | | | | |
| | | | | | | 11,284,308 | |
|
| Ghana — 0.6% | |
Kosmos Energy Ltd., 7.13%, 04/04/26
(Call 11/30/22)(a) | | | 400 | | | | 333,000 | |
Tullow Oil PLC | | | | | | | | |
7.00%, 03/01/25 (Call 11/30/22)(a) | | | 600 | | | | 394,500 | |
10.25%, 05/15/26 (Call 05/15/23)(a) | | | 1,178 | | | | 1,004,245 | |
| | | | | | | | |
| | | | | | | 1,731,745 | |
|
| Guatemala — 0.5% | |
Central American Bottling Corp./CBC Bottling Holdco SL/Beliv Holdco SL, 5.25%, 04/27/29 (Call 04/27/26)(a) | | | 800 | | | | 704,900 | |
CT Trust, 5.13%, 02/03/32 (Call 02/03/27)(a) | | | 600 | | | | 477,675 | |
Investment Energy Resources Ltd.,
6.25%, 04/26/29 (Call 04/26/25)(a) | | | 400 | | | | 336,200 | |
| | | | | | | | |
| | | | | | | 1,518,775 | |
|
| Hong Kong — 4.9% | |
AIA Group Ltd. | | | | | | | | |
2.70%, (Call 04/07/26)(a)(d)(e) | | | 200 | | | | 158,000 | |
3.20%, 03/11/25 (Call 12/11/24)(a) | | | 200 | | | | 189,787 | |
3.20%, 09/16/40 (Call 03/16/40)(a) | | | 600 | | | | 389,737 | |
3.38%, 04/07/30 (Call 01/07/30)(a) | | | 200 | | | | 169,100 | |
3.60%, 04/09/29 (Call 01/09/29)(a) | | | 200 | | | | 175,975 | |
3.90%, 04/06/28 (Call 01/06/28)(a)(c) | | | 200 | | | | 180,537 | |
4.50%, 03/16/46 (Call 09/16/45)(a) | | | 200 | | | | 158,475 | |
5.63%, 10/25/27 | | | 200 | | | | 196,972 | |
Bank of China Hong Kong Ltd., 5.90%, (Call 09/14/23)(a)(d)(e) | | | 600 | | | | 594,000 | |
| | | | | | | | |
| Security | | Par
(000) | | | Value | |
|
| Hong Kong (continued) | |
Bank of Communications Hong Kong Ltd. | | | | | | | | |
2.30%, 07/08/31 (Call 07/08/26)(a)(e) | | $ | 250 | | | $ | 218,855 | |
3.73%, (Call 03/03/25)(a)(d)(e) | | | 250 | | | | 232,187 | |
Bank of East Asia Ltd. (The) | | | | | | | | |
5.83%, (Call 10/21/25)(a)(d)(e) | | | 250 | | | | 182,500 | |
5.88%, (Call 09/19/24)(a)(d)(e) | | | 250 | | | | 200,203 | |
Bocom Leasing Management Hong Kong Co. Ltd., 4.32%, 12/10/24, (3 mo. LIBOR US +
1.075%)(a)(e) | | | 200 | | | | 198,287 | |
CAS Capital No. 1 Ltd., 4.00%,
(Call 07/12/26)(a)(d)(e) | | | 200 | | | | 126,475 | |
Castle Peak Power Finance Co. Ltd., 3.25%, 07/25/27(a) | | | 200 | | | | 183,537 | |
Cathay Pacific MTN Financing HK Ltd., 4.88%, 08/17/26(a) | | | 200 | | | | 171,663 | |
Celestial Miles Ltd., 5.75%, (a)(d)(e) | | | 200 | | | | 168,000 | |
China CITIC Bank International Ltd. | | | | | | | | |
4.63%, 02/28/29 (Call 02/28/24)(a)(e) | | | 250 | | | | 244,578 | |
7.10%, (Call 11/06/23)(a)(d)(e) | | | 200 | | | | 200,000 | |
CLP Power HK Finance Ltd., 3.55%,
(Call 02/06/25)(a)(d)(e) | | | 200 | | | | 185,725 | |
CNCBINV 1 BVI Ltd., 1.75%, 11/17/24(a) | | | 200 | | | | 184,100 | |
Elect Global Investments Ltd., 4.10%,
(Call 06/03/25)(a)(d)(e) | | | 200 | | | | 147,538 | |
FWD Group Ltd. | | | | | | | | |
5.75%, 07/09/24(a) | | | 200 | | | | 182,160 | |
6.38%, (Call 09/13/24)(a)(d)(e) | | | 200 | | | | 168,163 | |
8.05%, (Call 12/15/22)(a)(d)(e) | | | 200 | | | | 185,100 | |
Henderson Land MTN Ltd., 2.38%, 05/27/25(a) | | | 200 | | | | 182,725 | |
HKT Capital No. 4 Ltd., 3.00%, 07/14/26(a) | | | 400 | | | | 364,450 | |
HKT Capital No. 6 Ltd., 3.00%, 01/18/32 (Call 10/18/31)(a) | | | 200 | | | | 155,208 | |
Hongkong Electric Finance Ltd. | | | | | | | | |
1.88%, 08/27/30 (Call 02/27/30)(a) | | | 200 | | | | 151,663 | |
2.88%, 05/03/26(a) | | | 200 | | | | 184,975 | |
Hongkong Land Finance Cayman Islands Co. Ltd. (The) | | | | | | | | |
2.25%, 07/15/31 (Call 04/15/31)(a) | | | 200 | | | | 151,300 | |
2.88%, 05/27/30 (Call 02/27/30)(a) | | | 200 | | | | 165,038 | |
HPHT Finance 19 Ltd., 2.88%, 11/05/24(a) | | | 200 | | | | 189,350 | |
HPHT Finance 21 Ltd., 2.00%, 03/19/26 (Call 02/19/26)(a) | | | 200 | | | | 176,182 | |
Hysan MTN Ltd., 2.82%, 09/04/29(a) | | | 200 | | | | 168,663 | |
IFC Development Corporate Treasury Ltd., 3.63%, 04/17/29(a) | | | 200 | | | | 178,912 | |
Inventive Global Investments Ltd., 1.65%, 09/03/25(a) | | | 200 | | | | 179,634 | |
JMH Co. Ltd., 2.50%, 04/09/31 (Call 01/09/31)(a) | | | 200 | | | | 155,296 | |
Joy Treasure Assets Holdings Inc., 3.50%, 09/24/29 (Call 06/24/29)(a) | | | 200 | | | | 141,494 | |
Lai Sun MTN Ltd., 5.00%, 07/28/26(a) | | | 200 | | | | 121,663 | |
Li & Fung Ltd. | | | | | | | | |
4.38%, 10/04/24 (Call 09/04/24)(a) | | | 200 | | | | 186,000 | |
5.25%, (a)(d) | | | 200 | | | | 82,000 | |
Link Finance Cayman 2009 Ltd. (The) | | | | | | | | |
2.75%, 01/19/32(a) | | | 200 | | | | 158,330 | |
3.60%, 09/03/24(a) | | | 200 | | | | 194,287 | |
Melco Resorts Finance Ltd. | | | | | | | | |
4.88%, 06/06/25 (Call 11/30/22)(a)(c) | | | 400 | | | | 278,950 | |
5.25%, 04/26/26 (Call 11/30/22)(a) | | | 400 | | | | 256,000 | |
5.38%, 12/04/29 (Call 12/04/24)(a) | | | 800 | | | | 436,000 | |
5.63%, 07/17/27 (Call 11/30/22)(a)(c) | | | 600 | | | | 354,174 | |
5.75%, 07/21/28 (Call 07/21/23)(a) | | | 400 | | | | 230,000 | |
MTR Corp. Ltd., 1.63%, 08/19/30(a) | | | 400 | | | | 308,825 | |
Nan Fung Treasury III Ltd., 5.00%,
(Call 09/10/23)(a)(d) | | | 200 | | | | 114,000 | |
Nan Fung Treasury Ltd., 5.00%, 09/05/28(a) | | | 200 | | | | 177,913 | |
Nanyang Commercial Bank Ltd., 3.80%, 11/20/29 (Call 11/20/24)(a)(e) | | | 250 | | | | 232,625 | |
New World China Land Ltd., 4.75%, 01/23/27(a) | | | 200 | | | | 181,225 | |
NWD Finance BVI Ltd. 4.13%,
(Call 03/10/28)(a)(d)(e) | | | 200 | | | | 121,000 | |
| | |
| 24 | | 2 0 2 2 I SHARES ANNUAL REPORT TO SHAREHOLDERS |
| | |
Schedule of Investments (continued) October 31, 2022 | | iShares® J.P. Morgan EM Corporate Bond ETF (Percentages shown are based on Net Assets |
| | | | | | | | |
| Security | | Par
(000) | | | Value | |
| | |
| Hong Kong (continued) | | | | | | |
4.80%, (Call 09/09/23)(a)(d) | | $ | 200 | | | $ | 90,000 | |
6.15%, (Call 03/16/25)(a)(d)(e) | | | 200 | | | | 143,100 | |
6.25%, (Call 03/07/24)(a)(d) | | | 400 | | | | 217,075 | |
NWD MTN Ltd. | | | | | | | | |
4.13%, 07/18/29(a) | | | 200 | | | | 150,038 | |
4.50%, 05/19/30(a) | | | 200 | | | | 149,850 | |
PCPD Capital Ltd., 5.13%, 06/18/26 (Call 06/18/24)(a) | | | 200 | | | | 157,975 | |
Phoenix Lead Ltd., 4.85%, (Call 02/23/23)(a)(d) | | | 200 | | | | 139,538 | |
Prudential PLC | | | | | | | | |
2.95%, 11/03/33 (Call 08/03/28)(a)(e) | | | 200 | | | | 150,500 | |
3.13%, 04/14/30 | | | 400 | | | | 327,644 | |
Seaspan Corp., 5.50%, 08/01/29 (Call 08/01/24)(a) | | | 200 | | | | 154,314 | |
Sun Hung Kai Properties Capital Market Ltd. | | | | | | | | |
2.88%, 01/21/30(a) | | | 200 | | | | 165,850 | |
3.75%, 02/25/29(a) | | | 200 | | | | 179,882 | |
Swire Pacific MTN Financing HK Ltd., 2.88%, 01/30/30 (Call 10/30/29)(a) | | | 200 | | | | 167,600 | |
Swire Properties MTN Financing Ltd., 3.63%, 01/13/26(a) | | | 200 | | | | 190,475 | |
Wharf REIC Finance BVI Ltd., 3.50%, 01/17/28(a) | | | 200 | | | | 180,912 | |
Wheelock MTN BVI Ltd., 2.38%, 01/25/26(a) | | | 200 | | | | 180,537 | |
| | | | | | | | |
| | |
| | | | | | | 14,114,826 | |
|
| India — 4.6% | |
ABJA Investment Co. Pte Ltd. | | | | | | | | |
5.45%, 01/24/28(a) | | | 200 | | | | 177,750 | |
5.95%, 07/31/24(a) | | | 400 | | | | 391,000 | |
Adani Electricity Mumbai Ltd., 3.95%, 02/12/30(a) | | | 400 | | | | 263,075 | |
Adani Green Energy Ltd., 4.38%, 09/08/24(a) | | | 200 | | | | 149,000 | |
Adani Green Energy UP Ltd./Prayatna Developers Pvt Ltd./Parampujya Solar Energy, 6.25%, 12/10/24(a) | | | 200 | | | | 181,100 | |
Adani Ports & Special Economic Zone Ltd. | | | | | | | | |
3.10%, 02/02/31(a) | | | 200 | | | | 127,000 | |
3.38%, 07/24/24(a) | | | 200 | | | | 184,725 | |
4.20%, 08/04/27 (Call 02/04/27)(a) | | | 400 | | | | 320,380 | |
4.38%, 07/03/29(a) | | | 200 | | | | 149,288 | |
Adani Transmission Ltd., 4.00%, 08/03/26(a) | | | 200 | | | | 170,663 | |
Axis Bank Ltd., 4.10%, (Call 09/08/26)(a)(d)(e) | | | 200 | | | | 160,000 | |
Bharat Petroleum Corp. Ltd., 4.00%, 05/08/25(a) | | | 200 | | | | 190,038 | |
Bharti Airtel International Netherlands BV, 5.35%, 05/20/24(a) | | | 200 | | | | 197,856 | |
Bharti Airtel Ltd. | | | | | | | | |
3.25%, 06/03/31(a) | | | 200 | | | | 155,832 | |
4.38%, 06/10/25(a) | | | 200 | | | | 190,287 | |
BPRL International Singapore Pte Ltd., 4.38%, 01/18/27(a) | | | 200 | | | | 182,788 | |
CA Magnum Holdings, 5.38%, 10/31/26
(Call 10/31/23)(a) | | | 200 | | | | 167,500 | |
Continuum Energy Levanter Pte Ltd., 4.50%, 02/09/27 (Call 02/09/24)(a) | | | 194 | | | | 152,865 | |
Delhi International Airport Ltd., 6.13%, 10/31/26(a) | | | 400 | | | | 358,450 | |
Greenko Dutch BV, 3.85%, 03/29/26 (Call 03/29/23)(a) | | | 191 | | | | 148,980 | |
Greenko Power II Ltd., 4.30%, 12/13/28 (Call 12/14/24)(a) | | | 195 | | | | 149,069 | |
Greenko Solar Mauritius Ltd. | | | | | | | | |
5.55%, 01/29/25(a) | | | 200 | | | | 174,000 | |
5.95%, 07/29/26 (Call 11/30/22)(a) | | | 200 | | | | 160,500 | |
Greenko Wind Projects Mauritius Ltd., 5.50%, 04/06/25 (Call 04/06/24)(a) | | | 200 | | | | 169,500 | |
HCL America Inc., 1.38%, 03/10/26
(Call 02/10/26)(a) | | | 200 | | | | 173,350 | |
HDFC Bank Ltd., 3.70%, (Call 08/25/26)(a)(c)(d)(e) | | | 400 | | | | 319,000 | |
Hindustan Petroleum Corp. Ltd., 4.00%, 07/12/27(a) | | | 200 | | | | 179,975 | |
ICICI Bank Ltd./Dubai, 4.00%, 03/18/26(a) | | | 450 | | | | 422,100 | |
Indian Oil Corp. Ltd., 4.75%, 01/16/24(a) | | | 200 | | | | 197,287 | |
Indian Railway Finance Corp. Ltd. | | | | | | | | |
2.80%, 02/10/31(a) | | | 200 | | | | 148,940 | |
3.25%, 02/13/30(a)(c) | | | 200 | | | | 159,163 | |
| | | | | | | | |
| Security | | Par
(000) | | | Value | |
|
| India (continued) | |
3.57%, 01/21/32(a) | | $ | 200 | | | $ | 155,725 | |
3.73%, 03/29/24(a) | | | 200 | | | | 194,037 | |
JSW Hydro Energy Ltd., 4.13%, 05/18/31 (Call 05/18/26)(a) | | | 184 | | | | 141,600 | |
JSW Steel Ltd. | | | | | | | | |
3.95%, 04/05/27 (Call 10/05/26)(a) | | | 200 | | | | 146,000 | |
5.05%, 04/05/32 (Call 10/05/31)(a) | | | 200 | | | | 128,538 | |
Network i2i Ltd. | | | | | | | | |
3.98%, (a) | | | 200 | | | | 157,000 | |
5.65%, (Call 01/15/25)(a)(d)(e) | | | 400 | | | | 355,575 | |
NTPC Ltd., 4.25%, 02/26/26(a) | | | 200 | | | | 189,350 | |
Oil India Ltd. | | | | | | | | |
5.13%, 02/04/29(a) | | | 200 | | | | 182,913 | |
5.38%, 04/17/24(a) | | | 200 | | | | 197,787 | |
ONGC Videsh Ltd., 4.63%, 07/15/24(a) | | | 200 | | | | 194,662 | |
ONGC Videsh Vankorneft Pte Ltd., 3.75%, 07/27/26(a) | | | 200 | | | | 183,350 | |
Periama Holdings LLC/DE, 5.95%, 04/19/26(a) | | | 200 | | | | 161,913 | |
Power Finance Corp. Ltd. | | | | | | | | |
3.95%, 04/23/30(a) | | | 200 | | | | 162,538 | |
4.50%, 06/18/29(a) | | | 400 | | | | 343,575 | |
REC Ltd. | | | | | | | | |
2.25%, 09/01/26(a) | | | 200 | | | | 170,100 | |
3.38%, 07/25/24(a) | | | 200 | | | | 190,537 | |
Reliance Industries Ltd. | | | | | | | | |
2.88%, 01/12/32(a) | | | 350 | | | | 263,077 | |
3.63%, 01/12/52(a) | | | 400 | | | | 234,700 | |
3.67%, 11/30/27(a) | | | 250 | | | | 223,562 | |
3.75%, 01/12/62(a) | | | 400 | | | | 228,200 | |
4.13%, 01/28/25(a) | | | 250 | | | | 240,203 | |
6.25%, 10/19/40(a) | | | 250 | | | | 236,531 | |
ReNew Wind Energy AP2/ReNew Power Pvt Ltd. other 9 Subsidiaries, 4.50%, 07/14/28 (Call 10/14/23)(a) | | | 200 | | | | 148,000 | |
Shriram Transport Finance Co. Ltd., 4.40%, 03/13/24(a) | | | 200 | | | | 185,122 | |
State Bank of India/London | | | | | | | | |
1.80%, 07/13/26(a) | | | 400 | | | | 346,408 | |
4.38%, 01/24/24(a) | | | 200 | | | | 196,287 | |
4.88%, 04/17/24(a) | | | 200 | | | | 197,350 | |
Summit Digitel Infrastructure Pvt. Ltd., 2.88%, 08/12/31 (Call 08/12/30)(a) | | | 200 | | | | 137,704 | |
Vedanta Resources Finance II PLC | | | | | | | | |
8.95%, 03/11/25 (Call 09/11/24)(a) | | | 400 | | | | 248,000 | |
9.25%, 04/23/26 (Call 04/23/23)(a)(c) | | | 200 | | | | 115,800 | |
13.88%, 01/21/24 (Call 12/21/22)(a) | | | 400 | | | | 333,700 | |
Vedanta Resources Ltd., 6.13%, 08/09/24 (Call 11/30/22)(a) | | | 200 | | | | 116,000 | |
Wipro IT Services LLC, 1.50%, 06/23/26 (Call 05/23/26)(a) | | | 200 | | | | 171,875 | |
| | | | | | | | |
| | |
| | | | | | | 13,149,180 | |
|
| Indonesia — 3.2% | |
Adaro Indonesia PT, 4.25%, 10/31/24
(Call 11/30/22)(a) | | | 500 | | | | 467,281 | |
Bank Mandiri Persero Tbk PT | | | | | | | | |
3.75%, 04/11/24(a) | | | 200 | | | | 193,413 | |
4.75%, 05/13/25(a) | | | 600 | | | | 576,112 | |
Bank Negara Indonesia Persero Tbk PT | | | | | | | | |
3.75%, 03/30/26(a) | | | 400 | | | | 326,044 | |
4.30%, (Call 03/24/27)(a)(d)(e) | | | 400 | | | | 282,044 | |
Bank Rakyat Indonesia Persero Tbk PT, 3.95%, 03/28/24(a) | | | 300 | | | | 290,283 | |
Cikarang Listrindo Tbk PT, 4.95%, 09/14/26 (Call 11/30/22)(a) | | | 400 | | | | 347,700 | |
Freeport Indonesia PT | | | | | | | | |
4.76%, 04/14/27 (Call 03/14/27)(a) | | | 500 | | | | 448,125 | |
5.32%, 04/14/32 (Call 01/01/32)(a) | | | 1,000 | | | | 833,750 | |
6.20%, 04/14/52 (Call 10/14/51)(a) | | | 500 | | | | 372,555 | |
| | |
S C H E D U L E O F I N V E S T M E N T S | | 25 |
| | |
Schedule of Investments (continued) October 31, 2022 | | iShares® J.P. Morgan EM Corporate Bond ETF (Percentages shown are based on Net Assets) |
| | | | | | | | |
| Security | | Par (000) | | | Value | |
| | |
| Indonesia (continued) | | | | | | |
Indika Energy Capital IV Pte Ltd.,
8.25%, 10/22/25 (Call 11/30/22)(a) | | $ | 500 | | | $ | 470,000 | |
Indofood CBP Sukses Makmur Tbk PT | | | | | | | | |
3.40%, 06/09/31 (Call 12/09/30)(a) | | | 800 | | | | 582,088 | |
3.54%, 04/27/32 (Call 10/27/31)(a) | | | 400 | | | | 290,044 | |
4.75%, 06/09/51 (Call 12/09/50)(a) | | | 400 | | | | 244,044 | |
LLPL Capital Pte Ltd., 6.88%, 02/04/39(a) | | | 341 | | | | 262,786 | |
Medco Bell Pte Ltd., 6.38%, 01/30/27 (Call 01/30/24)(a) | | | 400 | | | | 320,000 | |
Medco Oak Tree Pte Ltd., 7.38%, 05/14/26 (Call 05/14/23)(a) | | | 400 | | | | 356,000 | |
Medco Platinum Road Pte Ltd., 6.75%, 01/30/25 (Call 11/30/22)(a) | | | 200 | | | | 190,663 | |
Minejesa Capital BV | | | | | | | | |
4.63%, 08/10/30(a) | | | 800 | | | | 606,800 | |
5.63%, 08/10/37(a) | | | 600 | | | | 387,112 | |
Perusahaan Gas Negara Tbk PT, 5.13%, 05/16/24(a) | | | 1,000 | | | | 972,500 | |
Star Energy Geothermal Darajat II/Star Energy Geothermal Salak, 4.85%, 10/14/38 (Call 10/14/29)(a) | | | 600 | | | | 444,487 | |
| | | | | | | | |
| | | | | | | 9,263,831 | |
| | |
| Israel — 3.7% | | | | | | |
Bank Hapoalim BM, 3.26%, 01/21/32 (Call 01/21/27)(e)(j) | | | 400 | | | | 327,000 | |
Bank Leumi Le-Israel BM | | | | | | | | |
3.28%, 01/29/31 (Call 01/29/26)(e)(j) | | | 400 | | | | 341,250 | |
5.13%, 07/27/27 (Call 06/27/27)(j) | | | 200 | | | | 194,620 | |
Energean Israel Finance Ltd. | | | | | | | | |
4.50%, 03/30/24 (Call 12/30/23)(j) | | | 350 | | | | 333,340 | |
4.88%, 03/30/26 (Call 12/30/25)(j) | | | 350 | | | | 315,000 | |
5.38%, 03/30/28 (Call 09/30/27)(j) | | | 350 | | | | 307,125 | |
5.88%, 03/30/31 (Call 09/30/30)(j) | | | 350 | | | | 295,750 | |
ICL Group Ltd., 6.38%, 05/31/38
(Call 11/30/37)(j) | | | 400 | | | | 373,936 | |
Israel Electric Corp. Ltd. | | | | | | | | |
3.75%, 02/22/32(j) | | | 200 | | | | 166,338 | |
4.25%, 08/14/28(j) | | | 600 | | | | 544,350 | |
Series 6, 5.00%, 11/12/24(j) | | | 700 | | | | 682,675 | |
Leviathan Bond Ltd. | | | | | | | | |
6.13%, 06/30/25 (Call 03/30/25)(j) | | | 350 | | | | 332,938 | |
6.50%, 06/30/27 (Call 12/30/26)(j) | | | 300 | | | | 281,625 | |
6.75%, 06/30/30 (Call 12/30/29)(j) | | | 325 | | | | 288,498 | |
Mizrahi Tefahot Bank Ltd., 3.08%, 04/07/31 (Call 04/07/26)(e)(j) | | | 400 | | | | 333,000 | |
Teva Pharmaceutical Finance Co. LLC, 6.15%, 02/01/36(c) | | | 480 | | | | 394,800 | |
Teva Pharmaceutical Finance Netherlands III BV | | | | | | | | |
3.15%, 10/01/26 | | | 2,100 | | | | 1,753,500 | |
4.10%, 10/01/46 | | | 1,050 | | | | 625,931 | |
4.75%, 05/09/27 (Call 02/09/27) | | | 400 | | | | 351,500 | |
5.13%, 05/09/29 (Call 02/09/29)(c) | | | 550 | | | | 472,010 | |
6.00%, 04/15/24 (Call 01/15/24) | | | 600 | | | | 591,000 | |
6.75%, 03/01/28 (Call 12/01/27) | | | 700 | | | | 655,944 | |
7.13%, 01/31/25 (Call 10/31/24) | | | 600 | | | | 591,375 | |
| | | | | | | | |
| | | | | | | 10,553,505 | |
| | |
| Jamaica — 0.2% | | | | | | |
Digicel International Finance Ltd./Digicel international Holdings Ltd., 8.75%, 05/25/24 (Call 11/15/22)(a) | | | 800 | | | | 677,859 | |
| | | | | | | | |
| | |
| Jordan — 0.1% | | | | | | |
Hikma Finance USA LLC, 3.25%, 07/09/25(a) | | | 400 | | | | 367,700 | |
| | | | | | | | |
| | |
| Kampuchea, Democratic — 0.1% | | | | | | |
NagaCorp Ltd., 7.95%, 07/06/24(a) | | | 400 | | | | 342,950 | |
| | | | | | | | |
| | | | | | | | |
| Security | | Par (000) | | | Value | |
| | |
| Kazakhstan — 0.4% | | | | | | |
Tengizchevroil Finance Co. International Ltd. | | | | | | | | |
2.63%, 08/15/25 (Call 05/15/25)(a) | | $ | 400 | | | $ | 309,500 | |
3.25%, 08/15/30 (Call 02/15/30)(a) | | | 600 | | | | 383,700 | |
4.00%, 08/15/26(a) | | | 500 | | | | 387,250 | |
| | | | | | | | |
| | | | | | | 1,080,450 | |
| | |
| Kuwait — 2.2% | | | | | | |
Boubyan Sukuk Ltd. | | | | | | | | |
2.59%, 02/18/25(a) | | | 400 | | | | 379,075 | |
3.39%, 03/29/27(a) | | | 400 | | | | 373,825 | |
Burgan Bank SAK | | | | | | | | |
2.75%, 12/15/31 (Call 09/15/26)(a)(e) | | | 400 | | | | 296,450 | |
5.75%, (Call 07/09/24)(a)(d)(e) | | | 400 | | | | 336,075 | |
Equate Petrochemical BV | | | | | | | | |
2.63%, 04/28/28 (Call 01/28/28)(a) | | | 600 | | | | 495,690 | |
4.25%, 11/03/26(a) | | | 800 | | | | 743,200 | |
Equate Sukuk Spc Ltd., 3.94%, 02/21/24(a) | | | 200 | | | | 196,100 | |
Kuwait Projects Co. SPC Ltd. | | | | | | | | |
4.23%, 10/29/26(a) | | | 400 | | | | 329,075 | |
4.50%, 02/23/27(a) | | | 200 | | | | 156,037 | |
MEGlobal Canada ULC | | | | | | | | |
5.00%, 05/18/25(a) | | | 600 | | | | 578,550 | |
5.88%, 05/18/30(a) | | | 400 | | | | 384,825 | |
NBK SPC Ltd., 1.63%, 09/15/27 (Call 09/15/26), (SOFR + 1.050%)(a)(e) | | | 800 | | | | 678,000 | |
NBK Tier 1 Financing 2 Ltd., 4.50%,
(Call 08/27/25)(a)(d)(e) | | | 600 | | | | 525,000 | |
NBK Tier 1 Financing Ltd., 3.63%,
(Call 08/24/26)(a)(d)(e) | | | 400 | | | | 331,075 | |
Warba Sukuk Ltd., 2.98%, 09/24/24(a) | | | 400 | | | | 385,700 | |
| | | | | | | | |
| | | | | | | 6,188,677 | |
| | |
| Luxembourg — 0.5% | | | | | | |
Altice Financing SA | | | | | | | | |
5.00%, 01/15/28 (Call 01/15/23)(a) | | | 600 | | | | 479,748 | |
5.75%, 08/15/29(a) | | | 1,200 | | | | 942,000 | |
| | | | | | | | |
| | | | | | | 1,421,748 | |
| | |
| Macau — 2.8% | | | | | | |
Champion Path Holdings Ltd. | | | | | | | | |
4.50%, 01/27/26 (Call 01/27/24)(a) | | | 400 | | | | 260,000 | |
4.85%, 01/27/28 (Call 01/27/25)(a) | | | 300 | | | | 182,306 | |
Industrial & Commercial Bank of China Macau Ltd., 2.88%, 09/12/29
(Call 09/12/24)(a)(e) | | | 200 | | | | 189,288 | |
MGM China Holdings Ltd. | | | | | | | | |
4.75%, 02/01/27 (Call 02/01/24)(a) | | | 600 | | | | 444,000 | |
5.25%, 06/18/25 (Call 11/10/22)(a) | | | 200 | | | | 172,500 | |
5.38%, 05/15/24 (Call 11/10/22)(a) | | | 500 | | | | 408,750 | |
5.88%, 05/15/26 (Call 11/10/22)(a) | | | 500 | | | | 379,810 | |
Sands China Ltd. | | | | | | | | |
2.80%, 03/08/27 (Call 02/08/27) | | | 400 | | | | 289,960 | |
3.35%, 03/08/29 (Call 01/08/29) | | | 600 | | | | 399,000 | |
3.75%, 08/08/31 (Call 05/08/31) | | | 500 | | | | 324,650 | |
4.30%, 01/08/26 (Call 12/08/25) | | | 600 | | | | 481,812 | |
4.88%, 06/18/30 (Call 03/18/30) | | | 400 | | | | 280,000 | |
5.63%, 08/08/25 (Call 06/08/25)(c) | | | 1,200 | | | | 1,053,000 | |
5.90%, 08/08/28 (Call 05/08/28)(c) | | | 1,000 | | | | 784,890 | |
Studio City Finance Ltd. | | | | | | | | |
5.00%, 01/15/29 (Call 01/15/24)(a) | | | 700 | | | | 290,150 | |
6.00%, 07/15/25 (Call 11/30/22)(a) | | | 200 | | | | 95,225 | |
6.50%, 01/15/28 (Call 07/15/23)(a) | | | 400 | | | | 166,825 | |
Wynn Macau Ltd. | | | | | | | | |
4.88%, 10/01/24 (Call 11/30/22)(a) | | | 400 | | | | 305,000 | |
5.13%, 12/15/29 (Call 12/15/24)(a) | | | 600 | | | | 351,000 | |
5.50%, 01/15/26 (Call 11/30/22)(a) | | | 600 | | | | 411,000 | |
| | |
| 26 | | 2 0 2 2 I S H A R E S A N N U A L R E P O R T T O S H A R E H O L D E R S |
| | |
Schedule of Investments (continued) October 31, 2022 | | iShares® J.P. Morgan EM Corporate Bond ETF (Percentages shown are based on Net Assets) |
| | | | | | | | |
| Security | | Par (000) | | | Value | |
| | |
| Macau (continued) | | | | | | |
5.50%, 10/01/27 (Call 11/30/22)(a) | | $ | 600 | | | $ | 360,168 | |
5.63%, 08/26/28 (Call 08/26/23)(a) | | | 800 | | | | 472,000 | |
| | | | | | | | |
| | |
| | | | | | | 8,101,334 | |
| | |
| Malaysia — 1.8% | | | | | | |
Axiata SPV2 Bhd | | | | | | | | |
2.16%, 08/19/30 (Call 05/19/30)(a) | | | 400 | | | | 310,575 | |
4.36%, 03/24/26(a) | | | 200 | | | | 192,663 | |
Axiata SPV5 Labuan Ltd., 3.06%, 08/19/50 (Call 02/19/50)(a) . | | | 800 | | | | 454,840 | |
CIMB Bank Bhd | | | | | | | | |
2.13%, 07/20/27(a) | | | 200 | | | | 171,475 | |
4.69%, 10/09/24, (3 mo. LIBOR
US + 0.780%)(a)(e) | | | 600 | | | | 598,050 | |
Genm Capital Labuan Ltd., 3.88%, 04/19/31 (Call 01/19/31)(a) | | | 600 | | | | 357,488 | |
Gohl Capital Ltd., 4.25%, 01/24/27(a) | | | 1,100 | | | | 814,000 | |
Malayan Banking Bhd, 3.72%, 08/16/24, (3 mo. LIBOR US + 0.800%)(a)(e) | | | 600 | | | | 598,800 | |
Misc Capital Two Labuan Ltd., 3.75%, 04/06/27 (Call 03/06/27)(a) | | | 400 | | | | 356,200 | |
RBH Bank, 1.66%, 06/29/26(a) | | | 400 | | | | 349,832 | |
TNB Global Ventures Capital Bhd | | | | | | | | |
3.24%, 10/19/26(a) | | | 400 | | | | 365,200 | |
4.85%, 11/01/28(a) | | | 500 | | | | 472,437 | |
| | | | | | | | |
| | |
| | | | | | | 5,041,560 | |
| | |
| Mexico — 4.4% | | | | | | |
Alfa SAB de CV | | | | | | | | |
5.25%, 03/25/24 (Call 12/25/23)(a) | | | 200 | | | | 197,975 | |
6.88%, 03/25/44 (Call 09/25/43)(a) | | | 200 | | | | 175,500 | |
Alpek SAB de CV, 4.25%, 09/18/29 (Call 06/18/29)(a) | | | 200 | | | | 169,850 | |
Alsea SAB de CV, 7.75%, 12/14/26 (Call 12/14/23)(a) | | | 200 | | | | 188,100 | |
America Movil SAB de CV | | | | | | | | |
2.88%, 05/07/30 (Call 02/07/30) | | | 200 | | | | 163,850 | |
3.63%, 04/22/29 (Call 01/22/29) | | | 200 | | | | 176,100 | |
4.38%, 07/16/42 | | | 200 | | | | 155,244 | |
4.38%, 04/22/49 (Call 10/22/48)(c) | | | 400 | | | | 311,700 | |
4.70%, 07/21/32 (Call 04/21/32) | | | 200 | | | | 183,500 | |
5.38%, 04/04/32 (Call 01/04/32)(a) | | | 200 | | | | 168,912 | |
6.13%, 03/30/40 | | | 500 | | | | 476,885 | |
6.38%, 03/01/35 | | | 250 | | | | 250,906 | |
Banco Inbursa SA Institucion De Banca Multiple Grupo Financiero Inbursa | | | | | | | | |
4.13%, 06/06/24(a) | | | 300 | | | | 288,712 | |
4.38%, 04/11/27 (Call 01/11/27)(a) | | | 150 | | | | 135,825 | |
Banco Mercantil del Norte SA/Grand Cayman | | | | | | | | |
5.88%, (Call 01/24/27)(a)(d)(e) | | | 200 | | | | 153,500 | |
6.63%, (Call 01/24/32)(a)(d)(e) | | | 200 | | | | 148,500 | |
6.75%, (a)(c)(d)(e) | | | 200 | | | | 181,250 | |
8.38%, (Call 10/14/30)(a)(d)(e) | | | 200 | | | | 167,787 | |
Banco Santander Mexico SA Institucion de Banca Multiple Grupo Financiero Santand | | | | | | | | |
5.38%, 04/17/25(a) | | | 500 | | | | 481,125 | |
5.95%, 10/01/28(a) | | | 200 | | | | 192,150 | |
BBVA Bancomer SA/Texas | | | | | | | | |
4.38%, 04/10/24(a)(c) | | | 200 | | | | 195,225 | |
5.13%, 01/18/33(a)(e) | | | 200 | | | | 161,810 | |
5.88%, 09/13/34 (Call 09/13/29)(a)(e) | | | 200 | | | | 166,445 | |
6.75%, 09/30/22(a) | | | 200 | | | | 177,975 | |
Becle SAB de CV, 2.50%, 10/14/31 (Call 07/14/31)(a) | | | 200 | | | | 149,975 | |
Braskem Idesa SAPI
6.99%, 02/20/32 (Call 02/20/27)(a) | | | 400 | | | | 265,052 | |
7.45%, 11/15/29 (Call 11/15/24)(a)(c) | | | 200 | | | | 151,750 | |
| | | | | | | | |
| Security | | Par (000) | | | Value | |
| | |
| Mexico (continued) | | | | | | |
Cemex SAB de CV | | | | | | | | |
3.88%, 07/11/31 (Call 07/11/26)(a) | | $ | 400 | | | $ | 306,000 | |
5.20%, 09/17/30 (Call 09/17/25)(a) | | | 200 | | | | 169,975 | |
5.45%, 11/19/29 (Call 11/19/24)(a) | | | 200 | | | | 174,110 | |
7.38%, 06/05/27 (Call 06/05/23)(a) | | | 200 | | | | 196,500 | |
Cemex SAB De CV, 5.13%, (Call 06/08/26)(a)(d)(e) | | | 200 | | | | 164,110 | |
Cibanco SA Ibm/PLA Administradora Industrial S de RL de CV, 4.96%, 07/18/29
(Call 04/18/29)(a) | | | 200 | | | | 165,037 | |
CIBANCO SA Institucion de Banca Multiple Trust CIB/3332, 4.38%, 07/22/31 (Call 04/22/31)(a) | | | 200 | | | | 124,000 | |
Coca-Cola Femsa SAB de CV | | | | | | | | |
1.85%, 09/01/32 (Call 06/01/32)(c) | | | 150 | | | | 106,950 | |
2.75%, 01/22/30 (Call 10/22/29) | | | 350 | | | | 292,972 | |
Cometa Energia SA de CV, 6.38%, 04/24/35 (Call 01/24/35)(a)(c) | | | 172 | | | | 147,704 | |
FEL Energy VI Sarl, 5.75%, 12/01/40(a) | | | 188 | | | | 126,131 | |
Fomento Economico Mexicano SAB de CV
3.50%, 01/16/50 (Call 07/16/49) | | | 600 | | | | 382,500 | |
4.38%, 05/10/43 | | | 150 | | | | 113,640 | |
Fresnillo PLC, 4.25%, 10/02/50 (Call 04/02/50)(a) | | | 200 | | | | 135,538 | |
Grupo Aeromexico SAB de CV, 8.50%, 03/17/27 (Call 03/17/24)(a) | | | 200 | | | | 165,000 | |
Grupo Bimbo SAB de CV | | | | | | | | |
3.88%, 06/27/24(a) | | | 200 | | | | 195,100 | |
4.00%, 09/06/49(a) | | | 200 | | | | 140,350 | |
4.70%, 11/10/47 (Call 05/10/47)(a) | | | 200 | | | | 159,288 | |
4.88%, 06/27/44(a) | | | 200 | | | | 159,913 | |
5.95%, (Call 04/17/23)(a)(d)(e) | | | 200 | | | | 195,162 | |
Grupo Televisa SAB | | | | | | | | |
5.00%, 05/13/45 (Call 11/13/44)(c) | | | 200 | | | | 159,225 | |
5.25%, 05/24/49 (Call 11/24/48)(c) | | | 200 | | | | 165,225 | |
6.13%, 01/31/46 (Call 07/31/45) | | | 200 | | | | 185,526 | |
6.63%, 01/15/40 | | | 200 | | | | 188,350 | |
Industrias Penoles SAB de CV | | | | | | | | |
4.15%, 09/12/29 (Call 06/12/29)(a) | | | 200 | | | | 173,537 | |
4.75%, 08/06/50 (Call 02/06/50)(a) | | | 200 | | | | 142,038 | |
Infraestructura Energetica Nova SAB de CV | | | | | | | | |
4.75%, 01/15/51 (Call 07/15/50)(a) | | | 200 | | | | 134,000 | |
4.88%, 01/14/48(a) | | | 200 | | | | 135,913 | |
Mexico Remittances Funding Fiduciary Estate Management Sarl, 4.88%, 01/15/28(a) | | | 200 | | | | 163,788 | |
Minera Mexico SA de CV, 4.50%, 01/26/50 (Call 07/26/49)(a) | | | 200 | | | | 132,975 | |
Orbia Advance Corp. SAB de CV | | | | | | | | |
1.88%, 05/11/26 (Call 04/11/26)(a) | | | 200 | | | | 167,287 | |
2.88%, 05/11/31 (Call 02/11/31)(a) | | | 200 | | | | 146,750 | |
4.00%, 10/04/27 (Call 07/04/27)(a) | | | 200 | | | | 173,875 | |
5.50%, 01/15/48 (Call 07/15/47)(a) | | | 200 | | | | 143,875 | |
Sigma Alimentos SA de CV, 4.13%, 05/02/26 (Call 02/02/26)(a) | | | 400 | | | | 363,852 | |
Total Play Telecomunicaciones SA de CV, 6.38%, 09/20/28 (Call 09/30/25)(a) | | | 200 | | | | 137,913 | |
Trust Fibra Uno | | | | | | | | |
4.87%, 01/15/30 (Call 10/30/29)(a) | | | 200 | | | | 150,260 | |
5.25%, 01/30/26 (Call 10/30/25)(a)(c) | | | 200 | | | | 179,250 | |
6.39%, 01/15/50 (Call 07/15/49)(a) | | | 200 | | | | 131,725 | |
6.95%, 01/30/44 (Call 07/30/43)(a) | | | 200 | | | | 143,475 | |
| | | | | | | | |
| | |
| | | | | | | 12,574,422 | |
| | |
| Moldova — 0.1% | | | | | | |
Aragvi Finance International SR, 8.45%, 04/29/26 (Call 04/29/24)(a) | | | 400 | | | | 278,325 | |
| | | | | | | | |
| | |
S C H E D U L E O F I N V E S T M E N T S | | 27 |
| | |
Schedule of Investments (continued) October 31, 2022 | | iShares® J.P. Morgan EM Corporate Bond ETF (Percentages shown are based on Net Assets) |
| | | | | | | | |
| Security | | Par (000) | | | Value | |
| | |
| Morocco — 0.6% | | | | | | |
OCP SA | | | | | | | | |
3.75%, 06/23/31 (Call 03/23/31)(a) | | $ | 300 | | | $ | 222,337 | |
4.50%, 10/22/25(a) | | | 400 | | | | 380,120 | |
5.13%, 06/23/51 (Call 12/23/50)(a) | | | 600 | | | | 358,425 | |
5.63%, 04/25/24(a) | | | 525 | | | | 518,536 | |
6.88%, 04/25/44(a) | | | 400 | | | | 312,950 | |
| | | | | | | | |
| | | | | | | 1,792,368 | |
| | |
| Nigeria — 0.6% | | | | | | |
Access Bank PLC | | | | | | | | |
6.13%, 09/21/26(a) | | | 200 | | | | 145,400 | |
9.13%, (Call 10/07/26)(a)(d)(e) | | | 400 | | | | 274,500 | |
IHS Holding Ltd. | | | | | | | | |
5.63%, 11/29/26 (Call 11/29/23)(a) | | | 200 | | | | 148,350 | |
6.25%, 11/29/28 (Call 11/29/24)(a) | | | 600 | | | | 429,113 | |
IHS Netherlands Holdco BV, 8.00%, 09/18/27 (Call 11/30/22)(a) | | | 600 | | | | 461,250 | |
SEPLAT Energy PLC, 7.75%, 04/01/26 (Call 04/01/23)(a) | | | 400 | | | | 309,200 | |
| | | | | | | | |
| | | | | | | 1,767,813 | |
| | |
| Oman — 0.3% | | | | | | |
Bank Muscat SAOG, 4.75%, 03/17/26(a) | | | 400 | | | | 376,950 | |
Oztel Holdings SPC Ltd., 6.63%, 04/24/28(a) | | | 350 | | | | 342,081 | |
| | | | | | | | |
| | | | | | | 719,031 | |
| | |
| Panama — 0.8% | | | | | | |
AES Panama Generation Holdings SRL, 4.38%, 05/31/30 (Call 02/28/30)(a) | | | 1,000 | | | | 786,125 | |
Banco General SA, 4.13%, 08/07/27 (Call 05/07/27)(a)(c) | | | 400 | | | | 364,150 | |
C&W Senior Financing DAC,
6.88%, 09/15/27(a)(c) | | | 800 | | | | 692,000 | |
Cable Onda SA, 4.50%, 01/30/30
(Call 01/30/25)(a) | | | 400 | | | | 325,200 | |
| | | | | | | | |
| | | | | | | 2,167,475 | |
| | |
| Paraguay — 0.2% | | | | | | |
Bioceanico Sovereign Certificate Ltd., 0.00%, 06/05/34(a)(g) | | | 421 | | | | 260,256 | |
Telefonica Celular del Paraguay SA, 5.88%, 04/15/27(a) | | | 400 | | | | 361,325 | |
| | | | | | | | |
| | | | | | | 621,581 | |
| | |
| Peru — 2.4% | | | | | | |
Banco de Credito del Peru, 2.70%, 01/11/25 (Call 12/11/24)(a)(c) | | | 500 | | | | 462,650 | |
Banco de Credito del Peru S.A. | | | | | | | | |
3.13%, 07/01/30 (Call 07/01/25)(a)(e) | | | 550 | | | | 482,240 | |
3.25%, 09/30/31 (Call 09/30/26)(a)(e) | | | 250 | | | | 208,375 | |
Cia. De Minas Buenaventur Co., 5.50%, 07/23/26 (Call 07/23/23)(a) | | | 400 | | | | 330,950 | |
Consorcio Transmantaro SA | | | | | | | | |
4.70%, 04/16/34(a) | | | 400 | | | | 347,100 | |
5.20%, 04/11/38 (Call 01/11/38)(a) | | | 400 | | | | 343,000 | |
Credicorp Ltd., 2.75%, 06/17/25
(Call 05/17/25)(a) | | | 400 | | | | 364,950 | |
Hunt Oil Co. of Peru LLC Sucursal Del Peru,
6.38%, 06/01/28(a) | | | 366 | | | | 330,676 | |
InRetail Consumer, 3.25%, 03/22/28 (Call 01/22/28)(a) | | | 400 | | | | 316,250 | |
Kallpa Generacion SA, 4.13%, 08/16/27 (Call 05/16/27)(a)(c) | | | 400 | | | | 350,200 | |
Lima Metro Line 2 Finance Ltd. | | | | | | | | |
4.35%, 04/05/36(a) | | | 371 | | | | 303,302 | |
5.88%, 07/05/34(a) | | | 379 | | | | 351,044 | |
Minsur SA, 4.50%, 10/28/31(a) | | | 400 | | | | 319,852 | |
Peru LNG Srl, 5.38%, 03/22/30(a)(c) | | | 600 | | | | 471,225 | |
Southern Copper Corp. | | | | | | | | |
3.88%, 04/23/25 | | | 150 | | | | 143,156 | |
5.25%, 11/08/42 | | | 300 | | | | 257,625 | |
5.88%, 04/23/45(c) | | | 370 | | | | 341,094 | |
6.75%, 04/16/40 | | | 300 | | | | 304,181 | |
7.50%, 07/27/35(c) | | | 200 | | | | 211,875 | |
| | | | | | | | |
| Security | | Par (000) | | | Value | |
| | |
| Peru (continued) | | | | | | |
Transportadora de Gas del Peru SA, 4.25%, 04/30/28(a) | | $ | 600 | | | $ | 550,800 | |
| | | | | | | | |
| | | | | | | 6,790,545 | |
| | |
| Philippines — 1.5% | | | | | | |
BDO Unibank Inc., 2.13%, 01/13/26(a) | | | 400 | | | | 352,000 | |
Globe Telecom Inc., 4.20%, (Call 08/02/26)(a)(d)(e) | | | 400 | | | | 335,950 | |
JGSH Philippines Ltd., 4.13%, 07/09/30(a) | | | 400 | | | | 350,700 | |
Manila Water Co. Inc., 4.38%, 07/30/30 (Call 07/30/25)(a) | | | 400 | | | | 338,075 | |
Metropolitan Bank & Trust Co., 2.13%, 01/15/26(a) | | | 400 | | | | 352,000 | |
Petron Corp. | | | | | | | | |
4.60%, (Call 07/19/23)(a)(d)(e) | | | 200 | | | | 176,912 | |
5.95%, (Call 04/19/26)(a)(d)(e) | | | 400 | | | | 318,700 | |
Philippine National Bank, 3.28%, 09/27/24(a) | | | 400 | | | | 373,950 | |
San Miguel Crop., 5.50%, (Call 07/29/25)(a)(d)(e) | | | 400 | | | | 292,000 | |
SMC Global Power Holdings Corp. | | | | | | | | |
5.45%, (Call 12/09/26)(a)(d)(e) | | | 400 | | | | 249,075 | |
5.70%, (Call 01/21/26)(a)(d)(e) | | | 400 | | | | 255,075 | |
5.95%, (Call 05/05/25)(a)(d)(e) | | | 400 | | | | 259,575 | |
6.50%, (Call 04/25/24)(a)(d)(e) | | | 700 | | | | 473,944 | |
7.00%, (Call 10/21/25)(a)(d)(e) | | | 400 | | | | 267,325 | |
| | | | | | | | |
| | | | | | | 4,395,281 | |
| | |
| Poland — 0.1% | | | | | | |
Canpack SA/Canpack U.S. LLC, 3.88%, 11/15/29
(Call 11/15/24)(a) | | | 500 | | | | 396,875 | |
| | |
| Qatar — 4.1% | | | | | | |
ABQ Finance Co., 2.00%, 07/06/26(a) | | | 400 | | | | 345,575 | |
ABQ Finance Ltd. | | | | | | | | |
1.88%, 09/08/25(a) | | | 400 | | | | 355,075 | |
3.13%, 09/24/24(a) | | | 400 | | | | 379,575 | |
CBQ Finance Ltd. | | | | | | | | |
2.00%, 09/15/25(a) | | | 400 | | | | 357,825 | |
2.00%, 05/12/26(a) | | | 400 | | | | 349,825 | |
Commercial Bank PSQC (The), 4.50%,
(Call 03/03/26)(a)(d)(e) . | | | 400 | | | | 355,450 | |
Doha Finance Ltd., 2.38%, 03/31/26(a) | | | 700 | | | | 611,319 | |
MAR Sukuk Ltd. | | | | | | | | |
2.21%, 09/02/25(a) | | | 400 | | | | 364,500 | |
3.03%, 11/13/24(a) | | | 400 | | | | 379,825 | |
Nakilat Inc., 6.07%, 12/31/33(a) | | | 598 | | | | 589,380 | |
Ooredoo International Finance Ltd. | | | | | | | | |
2.63%, 04/08/31(a) | | | 800 | | | | 659,040 | |
3.75%, 06/22/26(a) | | | 400 | | | | 376,075 | |
3.88%, 01/31/28(a) | | | 200 | | | | 185,350 | |
4.50%, 01/31/43(a) | | | 200 | | | | 176,663 | |
5.00%, 10/19/25(a) | | | 600 | | | | 592,987 | |
QIB Sukuk Ltd. | | | | | | | | |
1.95%, 10/27/25(a) | | | 500 | | | | 450,150 | |
3.98%, 03/26/24(a) | | | 600 | | | | 586,988 | |
4.21%, 02/07/25, (3 mo. LIBOR US + 1.350%)(a)(e) | | | 600 | | | | 596,175 | |
QIIB Senior Sukuk Ltd., 4.26%, 03/05/24(a) | | | 400 | | | | 393,825 | |
QNB Finance Ltd. | | | | | | | | |
1.38%, 01/26/26(a) | | | 650 | | | | 566,028 | |
1.63%, 09/22/25(a) | | | 400 | | | | 356,200 | |
2.63%, 05/12/25(a) | | | 600 | | | | 555,675 | |
2.75%, 02/12/27(a) | | | 700 | | | | 623,131 | |
3.50%, 03/28/24(a) | | | 600 | | | | 581,175 | |
Ras Laffan Liquefied Natural Gas Co. Ltd. III | | | | | | | | |
5.84%, 09/30/27(a) | | | 489 | | | | 489,282 | |
6.33%, 09/30/27(a) | | | 422 | | | | 425,577 | |
| | | | | | | | |
| | | | | | | 11,702,670 | |
| | |
| 28 | | 2 0 2 2 I S H A R E S A N N U A L R E P O R T T O S H A R E H O L D E R S |
| | |
Schedule of Investments (continued) October 31, 2022 | | iShares® J.P. Morgan EM Corporate Bond ETF (Percentages shown are based on Net Assets) |
| | | | | | | | |
| Security | | Par (000) | | | Value | |
|
| Saudi Arabia — 4.5% | |
Acwa Power Management And Investments One Ltd., 5.95%, 12/15/39(a) | | $ | 200 | | | $ | 163,647 | |
Almarai Sukuk Ltd., 4.31%, 03/05/24(a) | | | 200 | | | | 195,287 | |
Arab National Bank, 3.33%, 10/28/30 (Call 10/28/25)(a)(e) | | | 200 | | | | 186,300 | |
Arabian Centres Sukuk II Ltd., 5.63%, 10/07/26(a) | | | 200 | | | | 170,538 | |
Arabian Centres Sukuk Ltd., 5.38%, 11/26/24(a) | | | 300 | | | | 275,550 | |
Dar Al-Arkan Sukuk Co. Ltd., 6.75%, 02/15/25(a) | | | 200 | | | | 190,163 | |
EIG Pearl Holdings Sarl | | | | | | | | |
3.55%, 08/31/36(a) | | | 400 | | | | 307,000 | |
4.39%, 11/30/46(a) | | | 500 | | | | 338,750 | |
Riyad Sukuk Ltd., 3.17%, 02/25/30
(Call 02/25/25)(a)(e) | | | 600 | | | | 559,612 | |
Riyad Tier 1 Sukuk Ltd., 4.00%,
(Call 02/16/27)(a)(d)(e) | | | 200 | | | | 182,913 | |
SA Global Sukuk Ltd. | | | | | | | | |
0.95%, 06/17/24 (Call 05/17/24)(a) | | | 200 | | | | 186,600 | |
1.60%, 06/17/26 (Call 05/17/26)(a) | | | 700 | | | | 613,550 | |
2.69%, 06/17/31 (Call 03/17/31)(a) | | | 1,200 | | | | 972,756 | |
SABIC Capital I BV | | | | | | | | |
2.15%, 09/14/30 (Call 06/14/30)(a) | | | 200 | | | | 155,725 | |
3.00%, 09/14/50 (Call 03/14/50)(a) | | | 200 | | | | 127,350 | |
SABIC Capital II BV, 4.50%, 10/10/28(a) | | | 400 | | | | 378,750 | |
Samba Funding Ltd., 2.75%, 10/02/24(a) | | | 400 | | | | 377,575 | |
Saudi Arabian Oil Co. | | | | | | | | |
1.63%, 11/24/25 (Call 10/24/25)(a) | | | 400 | | | | 357,400 | |
2.25%, 11/24/30 (Call 08/24/30)(a) | | | 800 | | | | 630,400 | |
3.25%, 11/24/50 (Call 05/24/50)(a) | | | 900 | | | | 559,856 | |
3.50%, 04/16/29(a) | | | 1,100 | | | | 975,150 | |
3.50%, 11/24/70 (Call 05/24/70)(a) | | | 800 | | | | 488,000 | |
4.25%, 04/16/39(a) | | | 1,000 | | | | 820,010 | |
4.38%, 04/16/49(a) | | | 1,000 | | | | 783,750 | |
Saudi Electricity Global Sukuk Co. 2, 5.06%, 04/08/43(a) | | | 400 | | | | 351,200 | |
Saudi Electricity Global Sukuk Co. 3 | | | | | | | | |
4.00%, 04/08/24(a) | | | 600 | | | | 587,250 | |
5.50%, 04/08/44(a) | | | 400 | | | | 369,200 | |
Saudi Electricity Global Sukuk Co. 4 | | | | | | | | |
4.22%, 01/27/24(a) | | | 400 | | | | 392,000 | |
4.72%, 09/27/28(a) | | | 400 | | | | 389,325 | |
Saudi Electricity Global Sukuk Co. 5, 1.74%, 09/17/25(a) | | | 200 | | | | 179,350 | |
Saudi Telecom Co., 3.89%, 05/13/29(a) | | | 400 | | | | 362,144 | |
SNB Sukuk Ltd., 2.34%, 01/19/27(a) | | | 400 | | | | 351,992 | |
| | | | | | | | |
| | | | | | | 12,979,093 | |
|
| Singapore — 4.1% | |
BOC Aviation Ltd. | | | | | | | | |
1.75%, 01/21/26 (Call 12/21/25)(a) | | | 300 | | | | 261,456 | |
2.63%, 09/17/30 (Call 06/17/30)(a)(c) | | | 400 | | | | 301,450 | |
3.00%, 09/11/29 (Call 06/11/29)(a) | | | 300 | | | | 239,587 | |
3.25%, 04/29/25 (Call 03/29/25)(a) | | | 400 | | | | 372,075 | |
3.50%, 10/10/24 (Call 09/10/24)(a) | | | 400 | | | | 380,700 | |
3.50%, 09/18/27 (Call 06/18/27)(a) | | | 400 | | | | 357,375 | |
3.88%, 04/27/26 (Call 01/27/26)(a)(c) | | | 300 | | | | 279,150 | |
4.00%, 01/25/24 (Call 12/25/23)(a) | | | 200 | | | | 194,975 | |
BOC Aviation USA Corp., 1.63%, 04/29/24 (Call 03/29/24)(a) | | | 600 | | | | 561,648 | |
DBS Group Holdings Ltd. | | | | | | | | |
1.17%, 11/22/24(a) | | | 400 | | | | 368,950 | |
1.19%, 03/15/27(a) | | | 400 | | | | 340,452 | |
1.82%, 03/10/31 (Call 03/10/26)(a)(e) | | | 200 | | | | 172,570 | |
3.30%, (Call 02/27/25)(a)(d)(e) | | | 400 | | | | 349,000 | |
4.52%, 12/11/28 (Call 12/11/23)(a)(e) | | | 400 | | | | 394,428 | |
GLP Pte Ltd. | | | | | | | | |
3.88%, 06/04/25(a) | | | 600 | | | | 401,550 | |
4.50%, (a)(d)(e) | | | 400 | | | | 160,000 | |
| | | | | | | | |
| Security | | Par (000) | | | Value | |
|
| Singapore (continued) | |
Oversea-Chinese Banking Corp. Ltd. | | | | | | | | |
1.83%, 09/10/30 (Call 09/10/25)(a)(e) | | $ | 400 | | | $ | 351,268 | |
4.25%, 06/19/24(a)(c) | | | 600 | | | | 587,737 | |
4.60%, 06/15/32 (Call 06/15/27)(a)(e) | | | 400 | | | | 369,548 | |
Singapore Airlines Ltd. | | | | | | | | |
3.00%, 07/20/26 (Call 06/20/26)(a) | | | 200 | | | | 183,480 | |
3.38%, 01/19/29 (Call 11/19/28)(a) | | | 400 | | | | 339,552 | |
Singapore Telecommunications Ltd., 7.38%, 12/01/31(a) | | | 300 | | | | 345,806 | |
SingTel Group Treasury Pte Ltd. | | | | | | | | |
1.88%, 06/10/30 (Call 03/10/30)(a) | | | 300 | | | | 237,056 | |
2.38%, 10/03/26(a) | | | 200 | | | | 181,288 | |
2.38%, 08/28/29 (Call 05/28/29)(a) | | | 400 | | | | 335,950 | |
3.25%, 06/30/25(a) | | | 300 | | | | 285,337 | |
3.88%, 08/28/28 (Call 05/28/28)(a) | | | 200 | | | | 186,788 | |
ST Engineering RHQ Ltd., 1.50%, 04/29/25 (Call 01/29/25)(a) . | | | 400 | | | | 365,200 | |
Ste Transcore Holdings Inc., 3.38%, 05/05/27 (Call 02/05/27)(a) | | | 400 | | | | 371,152 | |
United Overseas Bank Ltd, 3.06%, 04/07/25(a) | | | 400 | | | | 380,824 | |
United Overseas Bank Ltd. | | | | | | | | |
1.25%, 04/14/26(a) | | | 400 | | | | 351,980 | |
1.75%, 03/16/31 (Call 03/16/26)(a)(e) | | | 200 | | | | 170,892 | |
2.00%, 10/14/31 (Call 10/14/26)(a)(c)(e) | | | 400 | | | | 335,880 | |
3.75%, 04/15/29 (Call 04/15/24)(a)(e) | | | 200 | | | | 193,413 | |
3.86%, 10/07/32 (Call 10/07/27)(a)(e) | | | 400 | | | | 353,160 | |
3.88%, (Call 10/19/23)(a)(d)(e) | | | 400 | | | | 380,825 | |
Vena Energy Capital Pte Ltd., 3.13%, 02/26/25(a) | | | 200 | | | | 182,163 | |
| | | | | | | | |
| | | | | | | 11,624,665 | |
|
| South Africa — 2.1% | |
Absa Group Ltd., 6.38%, (a)(d)(e) | | | 400 | | | | 341,200 | |
AngloGold Ashanti Holdings PLC | | | | | | | | |
3.38%, 11/01/28 (Call 09/01/28)(c) | | | 400 | | | | 317,950 | |
3.75%, 10/01/30 (Call 07/01/30) | | | 500 | | | | 382,438 | |
Bidvest Group UK PLC (The), 3.63%, 09/23/26
(Call 09/23/23)(a) | | | 400 | | | | 337,075 | |
FirstRand Bank Ltd., 6.25%, 04/23/28 (Call 04/23/23)(a)(e) | | | 400 | | | | 387,950 | |
Gold Fields Orogen Holdings BVI Ltd. | | | | | | | | |
5.13%, 05/15/24 (Call 04/15/24)(a) | | | 400 | | | | 390,950 | |
6.13%, 05/15/29 (Call 02/15/29)(a) | | | 200 | | | | 186,663 | |
Liquid Telecommunications Financing Plc, 5.50%, 09/04/26 (Call 03/04/23)(a) | | | 400 | | | | 270,000 | |
MTN Mauritius Investments Ltd., 6.50%, 10/13/26(a) | | | 400 | | | | 379,825 | |
Sasol Financing USA LLC | | | | | | | | |
4.38%, 09/18/26 (Call 08/18/26)(c) | | | 600 | | | | 524,362 | |
5.50%, 03/18/31 (Call 03/18/30) | | | 500 | | | | 373,531 | |
5.88%, 03/27/24 (Call 02/27/24) | | | 900 | | | | 874,125 | |
6.50%, 09/27/28 (Call 06/27/28) | | | 600 | | | | 529,237 | |
Stillwater Mining Co. | | | | | | | | |
4.00%, 11/16/26 (Call 11/16/23)(a) | | | 400 | | | | 327,450 | |
4.50%, 11/16/29 (Call 11/16/25)(a) | | | 400 | | | | 292,800 | |
| | | | | | | | |
| | | | | | | 5,915,556 | |
|
| South Korea — 4.0% | |
Hana Bank | | | | | | | | |
1.25%, 12/16/26(a) | | | 400 | | | | 336,324 | |
3.25%, 03/30/27(a) | | | 200 | | | | 179,663 | |
Hanwha Life Insurance Co. Ltd. | | | | | | | | |
3.38%, 02/04/32 (Call 02/04/27)(a)(e) | | | 400 | | | | 329,450 | |
4.70%, (Call 04/23/23)(a)(d)(e) | | | 400 | | | | 389,825 | |
Heungkuk Life Insurance Co. Ltd., 4.48%, (Call 11/09/22)(a)(d)(e) | | | 200 | | | | 198,287 | |
Hyundai Capital Services Inc., 1.25%, 02/08/26(a) | | | 200 | | | | 171,744 | |
| | |
S C H E D U L E O F I N V E S T M E N T S | | 29 |
| | |
Schedule of Investments (continued) October 31, 2022 | | iShares® J.P. Morgan EM Corporate Bond ETF (Percentages shown are based on Net Assets) |
| | | | | | | | |
| Security | | Par (000) | | | Value | |
|
| South Korea (continued) | |
Kookmin Bank | | | | | | | | |
1.38%, 05/06/26(a) | | $ | 200 | | | $ | 173,784 | |
1.75%, 05/04/25(a)(c) | | | 400 | | | | 363,760 | |
2.50%, 11/04/30(a) | | | 200 | | | | 149,106 | |
4.35%, (Call 07/02/24)(a)(d)(e) | | | 200 | | | | 181,288 | |
Korea East-West Power Co. Ltd. | | | | | | | | |
1.75%, 05/06/25(a) | | | 200 | | | | 182,163 | |
3.60%, 05/06/25 | | | 200 | | | | 190,912 | |
Korea Electric Power Corp. | | | | | | | | |
1.13%, 06/15/25(a) | | | 200 | | | | 178,725 | |
2.50%, 06/24/24(a) | | | 400 | | | | 382,575 | |
Korea Gas Corp. | | | | | | | | |
3.50%, 07/21/25(a) | | | 200 | | | | 189,850 | |
3.50%, 07/02/26(a) | | | 200 | | | | 187,162 | |
3.88%, 02/12/24(a) | | | 200 | | | | 196,412 | |
6.25%, 01/20/42(a)(c) | | | 600 | | | | 646,656 | |
KT Corp., 4.00%, 08/08/25(a) | | | 200 | | | | 192,466 | |
Kyobo Life Insurance Co. Ltd., 5.90%, 06/15/52 (Call 06/15/27)(a)(e) | | | 200 | | | | 173,000 | |
LG Chem Ltd. | | | | | | | | |
1.38%, 07/07/26(a) | | | 400 | | | | 342,228 | |
2.38%, 07/07/31(a) | | | 200 | | | | 150,858 | |
3.25%, 10/15/24(a) | | | 200 | | | | 191,126 | |
3.63%, 04/15/29(a) | | | 200 | | | | 177,100 | |
NAVER Corp., 1.50%, 03/29/26(a) | | | 400 | | | | 349,716 | |
NongHyup Bank, 1.25%, 07/20/25(a) | | | 200 | | | | 177,746 | |
POSCO | | | | | | | | |
2.75%, 07/15/24(a) | | | 200 | | | | 190,412 | |
4.38%, 08/04/25(a) | | | 400 | | | | 380,928 | |
Shinhan Bank Co. Ltd. | | | | | | | | |
1.38%, 10/21/26(a)(c) | | | 400 | | | | 340,788 | |
3.88%, 03/24/26(a) | | | 200 | | | | 184,852 | |
4.38%, 04/13/32(a)(c) | | | 200 | | | | 167,806 | |
6.02%, 04/24/25, (3 mo. LIBOR
US + 1.700%)(a)(e) | | | 200 | | | | 203,725 | |
Shinhan Financial Group Co. Ltd. | | | | | | | | |
1.35%, 01/10/26(a) | | | 200 | | | | 175,286 | |
2.88%, (Call 05/12/26)(a)(d)(e) | | | 200 | | | | 147,500 | |
3.34%, 02/05/30 (Call 02/05/25)(a)(c)(e) | | | 200 | | | | 183,725 | |
5.88%, (Call 08/13/23)(a)(d)(e) | | | 400 | | | | 384,075 | |
SK Battery America Inc., 2.13%, 01/26/26(a) | | | 400 | | | | 329,364 | |
SK Hynix Inc. | | | | | | | | |
1.00%, 01/19/24(a) | | | 200 | | | | 188,206 | |
1.50%, 01/19/26(a) | | | 600 | | | | 514,425 | |
2.38%, 01/19/31(a) | | | 400 | | | | 281,575 | |
3.00%, 09/17/24(a) | | | 200 | | | | 188,850 | |
Woori Bank | | | | | | | | |
0.75%, 02/01/26(a) | | | 400 | | | | 342,228 | |
2.00%, 01/20/27(a) | | | 200 | | | | 171,850 | |
4.25%, (Call 10/04/24)(a)(d)(e) | | | 200 | | | | 172,288 | |
4.75%, 04/30/24(a) | | | 400 | | | | 391,200 | |
| | | | | | | | |
| | | | | | | 11,321,009 | |
|
| Spain — 0.1% | |
Banco Bilbao Vizcaya Argentaria SA | | | | | | | | |
5.86%, 09/14/26 (Call 09/14/25)(e) | | | 200 | | | | 192,814 | |
6.14%, 09/14/28 (Call 09/14/27)(e) | | | 200 | | | | 189,405 | |
| | | | | | | | |
| | | | | | | 382,219 | |
|
| Supranational — 0.5% | |
Africa Finance Corp., 2.88%, 04/28/28(a) | | | 400 | | | | 303,000 | |
African Export-Import Bank (The), 2.63%, 05/17/26 (Call 04/17/26)(a) | | | 400 | | | | 330,500 | |
| | | | | | | | |
| Security | | Par (000) | | | Value | |
|
| Supranational (continued) | |
Eastern & Southern African Trade & Development Bank (The) | | | | | |
4.13%, 06/30/28(a) | | $ | 400 | | | $ | 320,441 | |
4.88%, 05/23/24(a) | | | 400 | | | | 372,197 | |
| | | | | | | | |
| | | | | | | 1,326,138 | |
|
| Switzerland — 0.1% | |
Oriflame Investment Holding PLC, 5.13%, 05/04/26 (Call 05/15/23)(a) | | | 400 | | | | 232,556 | |
| | | | | | | | |
|
| Taiwan — 3.6% | |
Competition Team Technologies Ltd., 3.75%, 03/12/24(a) | | | 400 | | | | 389,700 | |
Formosa Group Cayman Ltd., 3.38%, 04/22/25(a) | | | 800 | | | | 753,900 | |
Foxconn Far East Ltd. | | | | | | | | |
1.63%, 10/28/25(a) | | | 600 | | | | 529,998 | |
2.50%, 10/28/30(a) | | | 400 | | | | 307,200 | |
TSMC Arizona Corp. | | | | | | | | |
1.75%, 10/25/26 (Call 09/25/26) | | | 1,000 | | | | 864,130 | |
2.50%, 10/25/31 (Call 07/25/31) | | | 800 | | | | 616,936 | |
3.13%, 10/25/41 (Call 04/25/41) | | | 600 | | | | 414,756 | |
3.25%, 10/25/51 (Call 04/25/51)(c) | | | 800 | | | | 518,852 | |
3.88%, 04/22/27 (Call 03/22/27) | | | 600 | | | | 561,126 | |
4.13%, 04/22/29 (Call 02/22/29) | | | 200 | | | | 184,658 | |
4.25%, 04/22/32 (Call 01/22/32) | | | 600 | | | | 534,876 | |
4.50%, 04/22/52 (Call 10/22/51)(c) | | | 700 | | | | 574,644 | |
TSMC Global Ltd. | | | | | | | | |
0.75%, 09/28/25 (Call 08/28/25)(a) | | | 600 | | | | 522,862 | |
1.00%, 09/28/27 (Call 07/28/27)(a) | | | 600 | | | | 483,366 | |
1.25%, 04/23/26 (Call 03/23/26)(a) | | | 800 | | | | 692,912 | |
1.38%, 09/28/30 (Call 06/28/30)(a) | | | 1,000 | | | | 722,500 | |
1.75%, 04/23/28(a) | | | 600 | | | | 490,230 | |
2.25%, 04/23/31 (Call 01/23/31)(a) | | | 900 | | | | 686,727 | |
4.63%, 07/22/32 | | | 400 | | | | 370,160 | |
| | | | | | | | |
| | | | | | | 10,219,533 | |
|
| Tanzania — 0.2% | |
HTA Group Ltd./Mauritius, 7.00%, 12/18/25 (Call 11/30/22)(a) | | | 600 | | | | 526,800 | |
| | | | | | | | |
|
| Thailand — 2.5% | |
Bangkok Bank PCL/Hong Kong | | | | | | | | |
3.47%, 09/23/36(a) | | | 600 | | | | 409,704 | |
3.73%, 09/25/34 (Call 09/25/29)(a)(e) | | | 800 | | | | 594,150 | |
4.05%, 03/19/24(a) | | | 400 | | | | 392,200 | |
4.30%, 06/15/27 (Call 05/15/27)(a) | | | 600 | | | | 560,724 | |
4.45%, 09/19/28(a) | | | 400 | | | | 372,842 | |
5.00%, (a) | | | 600 | | | | 528,450 | |
GC Treasury Center Co. Ltd. | | | | | | | | |
2.98%, 03/18/31 (Call 12/18/30)(a) | | | 400 | | | | 295,450 | |
4.30%, 03/18/51 (Call 09/18/50)(a) | | | 400 | | | | 243,950 | |
4.40%, 03/30/32 (Call 09/30/31)(a) | | | 800 | | | | 640,400 | |
Kasikornbank PCL/Hong Kong | | | | | | | | |
3.34%, 10/02/31 (Call 10/02/26)(a)(e) | | | 600 | | | | 491,820 | |
5.28%, (Call 10/14/25)(a)(d)(e) | | | 400 | | | | 349,950 | |
Krung Thai Bank PCL/Cayman Islands, 4.40%, (Call 03/25/26)(a)(d)(e) | | | 400 | | | | 318,575 | |
PTT Treasury Center Co. Ltd., 3.70%, 07/16/70 (Call 01/16/70)(a)(c) | | | 400 | | | | 230,700 | |
PTTEP Treasury Center Co. Ltd. | | | | | | | | |
2.59%, 06/10/27 (Call 04/10/27)(a) | | | 400 | | | | 341,936 | |
3.90%, 12/06/59(a)(c) | | | 400 | | | | 237,232 | |
Siam Commercial Bank PCL/Cayman Islands | | | | | | | | |
3.90%, 02/11/24(a) | | | 400 | | | | 392,450 | |
4.40%, 02/11/29(a) | | | 200 | | | | 187,475 | |
| | |
| 30 | | 2 0 2 2 I S H A R E S A N N U A L R E P O R T T O S H A R E H O L D E R S |
| | |
Schedule of Investments (continued) October 31, 2022 | | iShares® J.P. Morgan EM Corporate Bond ETF (Percentages shown are based on Net Assets) |
| | | | | | | | |
| Security | | Par
(000) | | | Value | |
|
| Thailand (continued) | |
Thaioil Treasury Center Co. Ltd. | | | | | | | | |
3.50%, 10/17/49(a) | | $ | 400 | | | $ | 195,075 | |
3.75%, 06/18/50(a) | | | 400 | | | | 194,252 | |
5.38%, 11/20/48(a)(c) | | | 400 | | | | 267,192 | |
| | | | | | | | |
| | |
| | | | | | | 7,244,527 | |
|
| Togo — 0.1% | |
Ecobank Transnational Inc., 9.50%, 04/18/24(a) | | | 400 | | | | 375,825 | |
| | | | | | | | |
|
| Turkey — 3.5% | |
Akbank TAS | | | | | | | | |
5.13%, 03/31/25(a) | | | 400 | | | | 356,075 | |
6.80%, 02/06/26(a) | | | 300 | | | | 270,525 | |
6.80%, 06/22/31 (Call 06/22/26)(a)(e) | | | 400 | | | | 327,950 | |
Anadolu Efes Biracilik Ve Malt Sanayii AS, 3.38%, 06/29/28 (Call 03/29/28)(a) | | | 400 | | | | 280,575 | |
Aydem Yenilenebilir Enerji AS, 7.75%, 02/02/27
(Call 02/02/24)(a) | | | 400 | | | | 294,575 | |
Coca-Cola Icecek AS, 4.50%, 01/20/29
(Call 10/20/28)(a) | | | 400 | | | | 319,075 | |
KOC Holding AS, 6.50%, 03/11/25
(Call 12/11/24)(a) | | | 500 | | | | 468,375 | |
Mersin Uluslararasi Liman Isletmeciligi AS, 5.38%, 11/15/24 (Call 11/30/22)(a) | | | 400 | | | | 366,825 | |
QNB Finansbank AS, 6.88%, 09/07/24(a) | | | 400 | | | | 398,700 | |
Turk Telekomunikasyon AS | | | | | | | | |
4.88%, 06/19/24(a) | | | 200 | | | | 175,000 | |
6.88%, 02/28/25(a) | | | 400 | | | | 347,575 | |
Turkcell Iletisim Hizmetleri AS | | | | | | | | |
5.75%, 10/15/25(a) | | | 400 | | | | 352,575 | |
5.80%, 04/11/28 (Call 01/11/28)(a) | | | 365 | | | | 289,217 | |
Turkiye Garanti Bankasi AS, 7.18%, 05/24/27(a)(e) | | | 600 | | | | 510,675 | |
Turkiye Is Bankasi AS | | | | | | | | |
6.13%, 04/25/24(a) | | | 800 | | | | 757,400 | |
7.00%, 06/29/28 (Call 06/29/23)(a)(e) | | | 400 | | | | 358,825 | |
7.75%, 01/22/30 (Call 01/22/25)(a)(e) | | | 500 | | | | 437,125 | |
Turkiye Petrol Rafinerileri AS, 4.50%, 10/18/24
(Call 07/20/24)(a) | | | 400 | | | | 365,200 | |
Turkiye Sise ve Cam Fabrikalari AS, 6.95%, 03/14/26 (Call 12/14/25)(a) | | | 400 | | | | 368,900 | |
Turkiye Vakiflar Bankasi TAO | | | | | | | | |
5.25%, 02/05/25(a) | | | 400 | | | | 361,412 | |
6.50%, 01/08/26(a) | | | 500 | | | | 436,656 | |
8.13%, 03/28/24(a) | | | 400 | | | | 389,825 | |
Ulker Biskuvi Sanayi AS, 6.95%, 10/30/25(a) | | | 400 | | | | 277,500 | |
Yapi ve Kredi Bankasi AS | | | | | | | | |
5.85%, 06/21/24(a) | | | 400 | | | | 379,200 | |
7.88%, 01/22/31 (Call 01/22/26)(a)(e) | | | 400 | | | | 348,950 | |
8.25%, 10/15/24(a) | | | 400 | | | | 387,450 | |
13.88%, (Call 01/15/24)(a)(d)(e) | | | 300 | | | | 309,150 | |
| | | | | | | | |
| | |
| | | | | | | 9,935,310 | |
|
| Ukraine — 0.1% | |
DTEK Finance PLC, 7.00%, (5.00% PIK), 12/31/27
(Call 11/30/22)(a)(f) | | | 6 | | | | 1,298 | |
Metinvest BV, 7.75%, 10/17/29(a) | | | 400 | | | | 159,450 | |
| | | | | | | | |
| | |
| | | | | | | 160,748 | |
|
| United Arab Emirates — 4.9% | |
Abu Dhabi Commercial Bank PJSC,
3.50%, 03/31/27(a) | | | 400 | | | | 366,000 | |
Abu Dhabi National Energy Co. PJSC | | | | | | | | |
2.00%, 04/29/28 (Call 01/29/28)(a) | | | 400 | | | | 335,575 | |
3.40%, 04/29/51 (Call 10/29/50)(a) | | | 200 | | | | 147,163 | |
3.88%, 05/06/24(a) | | | 400 | | | | 389,950 | |
4.00%, 10/03/49(a) | | | 200 | | | | 160,725 | |
4.38%, 04/23/25(a) | | | 200 | | | | 194,912 | |
| | | | | | | | |
| Security | | Par
(000) | | | Value | |
|
| United Arab Emirates (continued) | |
4.38%, 06/22/26(a) | | $ | 200 | | | $ | 194,725 | |
4.88%, 04/23/30(a) | | | 400 | | | | 388,200 | |
6.50%, 10/27/36(a) | | | 300 | | | | 320,681 | |
Abu Dhabi Ports Co. PJSC, 2.50%, 05/06/31
(Call 02/06/31)(a) | | | 300 | | | | 235,297 | |
ADIB Capital Invest 2 Ltd., 7.13%,
(Call 09/20/23)(a)(d)(e) | | | 200 | | | | 199,412 | |
Aldar Sukuk No. 2 Ltd., 3.88%, 10/22/29(a) | | | 400 | | | | 351,575 | |
BOS Funding Ltd., 4.00%, 09/18/24(a) | | | 200 | | | | 189,163 | |
Commercial Bank of Dubai PSC, 6.00%,
(Call 04/21/26)(a)(d)(e) | | | 200 | | | | 187,288 | |
DIB Sukuk Ltd. | | | | | | | | |
1.96%, 06/22/26(a) | | | 400 | | | | 350,750 | |
2.95%, 02/20/25(a) | | | 200 | | | | 188,225 | |
2.95%, 01/16/26(a) | | | 600 | | | | 552,862 | |
DIB Tier 1 Sukuk 3 Ltd., 6.25%,
(Call 01/22/25)(a)(d)(e) | | | 200 | | | | 198,008 | |
DIB Tier 1 Sukuk 4 Ltd., 4.63%,
(Call 05/19/26)(a)(d)(e) | | | 400 | | | | 373,950 | |
EI Sukuk Co. Ltd., 1.83%, 09/23/25(a) | | | 400 | | | | 361,340 | |
Emaar Sukuk Ltd. | | | | | | | | |
3.64%, 09/15/26(a) | | | 200 | | | | 183,288 | |
3.70%, 07/06/31(a) | | | 200 | | | | 170,100 | |
3.88%, 09/17/29(a) | | | 200 | | | | 178,600 | |
EMG Sukuk Ltd., 4.56%, 06/18/24(a) | | | 200 | | | | 194,287 | |
Emirates NBD Bank PJSC | | | | | | | | |
1.64%, 01/13/26(a) | | | 400 | | | | 352,075 | |
4.25%, (Call 02/27/27)(a)(d)(e) | | | 200 | | | | 169,913 | |
6.13%, (Call 03/20/25)(a)(d)(e) | | | 400 | | | | 377,950 | |
6.13%, (Call 04/09/26)(a)(d)(e) | | | 200 | | | | 188,250 | |
Emirates Telecommunications Group Co. PJSC, 3.50%, 06/18/24(a) | | | 200 | | | | 193,975 | |
Esic Sukuk Ltd., 3.94%, 07/30/24(a) | | | 200 | | | | 188,225 | |
Fab Sukuk Co. Ltd. | | | | | | | | |
1.41%, 01/14/26(a) | | | 200 | | | | 175,725 | |
2.50%, 01/21/25(a) | | | 200 | | | | 187,288 | |
3.88%, 01/22/24(a) | | | 400 | | | | 391,325 | |
First Abu Dhabi Bank PJSC | | | | | | | | |
4.50%, (Call 04/05/26)(a)(d)(e) | | | 400 | | | | 364,450 | |
4.81%, 07/08/24, (3 mo. LIBOR
US + 0.900%)(a)(e) | | | 200 | | | | 198,287 | |
Galaxy Pipeline Assets Bidco Ltd. | | | | | | | | |
1.75%, 09/30/27(a) | | | 325 | | | | 294,509 | |
2.16%, 03/31/34(a) | | | 555 | | | | 451,485 | |
2.63%, 03/31/36(a) | | | 600 | | | | 454,237 | |
2.94%, 09/30/40(a) | | | 580 | | | | 433,054 | |
3.25%, 09/30/40(a) | | | 400 | | | | 281,950 | |
GEMS MENASA Cayman Ltd./GEMS Education Delaware LLC, 7.13%, 07/31/26 (Call 11/30/22)(a) | | | 400 | | | | 375,250 | |
MAF Global Securities Ltd. | | | | | | | | |
4.75%, 05/07/24(a) | | | 200 | | | | 195,537 | |
7.88%, (Call 06/30/27)(a)(d)(e) | | | 200 | | | | 191,288 | |
MAF Sukuk Ltd. | | | | | | | | |
3.93%, 02/28/30(a) | | | 200 | | | | 174,913 | |
4.64%, 05/14/29(a) | | | 200 | | | | 181,250 | |
Mashreqbank PSC, 4.25%, 02/26/24(a) | | | 200 | | | | 195,750 | |
National Central Cooling Co. PJSC, 2.50%, 10/21/27(a) | | | 200 | | | | 166,850 | |
Petrofac Ltd., 9.75%, 11/15/26 (Call 11/15/23)(a) | | | 200 | | | | 151,710 | |
Rakfunding Cayman Ltd., 4.13%, 04/09/24(a) | | | 200 | | | | 195,725 | |
Ruwais Power Co. PJSC, 6.00%, 08/31/36(a) | | | 200 | | | | 205,000 | |
Shelf Drilling Holdings Ltd., 8.25%, 02/15/25(a) | | | 340 | | | | 285,600 | |
SIB Sukuk Co. III Ltd., 2.85%, 06/23/25(a) | | | 200 | | | | 188,350 | |
Sweihan PV Power Co. PJSC, 3.63%, 01/31/49(a) | | | 198 | | | | 150,074 | |
Tabreed Sukuk Spc Ltd., 5.50%, 10/31/25(a) | | | 200 | | | | 199,162 | |
| | | | | | | | |
| | |
| | | | | | | 13,971,233 | |
| | |
S C H E D U L E O F I N V E S T M E N T S | | 31 |
| | |
Schedule of Investments (continued) October 31, 2022 | | iShares® J.P. Morgan EM Corporate Bond ETF (Percentages shown are based on Net Assets) |
| | | | | | | | |
| Security | |
Par
(000) | | | Value | |
|
| United Kingdom — 0.8% | |
CK Hutchison International 16 Ltd., 2.75%, 10/03/26(a) | | $ | 200 | | | $ | 181,748 | |
CK Hutchison International 17 II Ltd., 3.25%, 09/29/27(a) | | | 200 | | | | 181,163 | |
CK Hutchison International 17 Ltd., 3.50%, 04/05/27(a) | | | 200 | | | | 184,900 | |
CK Hutchison International 19 II Ltd., 2.75%, 09/06/29 (Call 06/06/29)(a) | | | 200 | | | | 166,422 | |
CK Hutchison International 19 Ltd. | | | | | | | | |
3.25%, 04/11/24 (Call 03/11/24)(a)(c) | | | 200 | | | | 194,480 | |
3.38%, 09/06/49(a) | | | 200 | | | | 132,958 | |
3.63%, 04/11/29 (Call 01/11/29)(a) | | | 200 | | | | 177,284 | |
CK Hutchison International 20 Ltd. | | | | | | | | |
2.50%, 05/08/30 (Call 02/08/30)(a) | | | 200 | | | | 160,764 | |
3.38%, 05/08/50(a) | | | 200 | | | | 131,878 | |
CK Hutchison International 21 Co. | | | | | | | | |
1.50%, 04/15/26 (Call 03/15/26)(a) | | | 200 | | | | 175,912 | |
2.50%, 04/15/31 (Call 01/15/31)(a) | | | 200 | | | | 156,600 | |
3.13%, 04/15/41 (Call 10/15/40)(a) | | | 200 | | | | 138,268 | |
Hutchison Whampoa International 14 Ltd., 3.63%, 10/31/24(a). | | | 200 | | | | 193,162 | |
Hutchison Whampoa International Ltd., 7.45%, 11/24/33(a) | | | 100 | | | | 113,802 | |
| | | | | | | | |
| | |
| | | | | | | 2,289,341 | |
|
| United States — 1.1% | |
Flex Ltd. | | | | | | | | |
3.75%, 02/01/26 (Call 01/01/26) | | | 300 | | | | 277,678 | |
4.75%, 06/15/25 (Call 03/15/25) | | | 284 | | | | 273,640 | |
4.88%, 06/15/29 (Call 03/15/29) | | | 399 | | | | 356,856 | |
4.88%, 05/12/30 (Call 02/12/30) | | | 315 | | | | 274,700 | |
GCC SAB de CV, 3.61%, 04/20/32
(Call 01/20/32)(a) | | | 200 | | | | 157,500 | |
JBS USA LUX SA/JBS USA Food Co/JBS USA Finance Inc. | | | | | | | | |
3.00%, 02/02/29 (Call 12/02/28)(a) | | | 200 | | | | 162,218 | |
3.00%, 05/15/32 (Call 02/15/32)(a) | | | 100 | | | | 73,806 | |
3.63%, 01/15/32 (Call 01/15/27)(a) | | | 200 | | | | 155,859 | |
3.75%, 12/01/31 (Call 12/01/26)(a) | | | 100 | | | | 77,660 | |
4.38%, 02/02/52 (Call 08/02/51)(a) | | | 200 | | | | 129,687 | |
5.13%, 02/01/28 | | | 100 | | | | 92,945 | |
5.75%, 04/01/33 (Call 01/01/33)(a) | | | 350 | | | | 314,999 | |
6.50%, 12/01/52 | | | 250 | | | | 217,088 | |
Playtika Holding Corp., 4.25%, 03/15/29
(Call 03/15/24)(a) | | | 350 | | | | 291,539 | |
Sagicor Financial Co. Ltd., 5.30%, 05/13/28
(Call 05/13/24)(a) . | | | 400 | | | | 365,800 | |
| | | | | | | | |
| | |
| | | | | | | 3,221,975 | |
|
| Vietnam — 0.1% | |
Mong Duong Finance Holdings BV, 5.13%, 05/07/29(a) | | | 500 | | | | 346,500 | |
| | | | | | | | |
|
| Zambia — 1.0% | |
First Quantum Minerals Ltd. | | | | | | | | |
6.50%, 03/01/24 (Call 11/10/22)(a) | | | 600 | | | | 585,300 | |
6.88%, 03/01/26 (Call 11/10/22)(a) | | | 650 | | | | 608,345 | |
6.88%, 10/15/27 (Call 10/15/23)(a) | | | 1,000 | | | | 926,062 | |
7.50%, 04/01/25 (Call 11/10/22)(a) | | | 800 | | | | 770,400 | |
| | | | | | | | |
| | |
| | | | | | | 2,890,107 | |
| | | | | | | | |
| |
Total Corporate Bonds & Notes — 96.4%
(Cost: $337,593,141) | | | | 275,710,472 | |
| | | | | | | | |
|
Foreign Government Obligations(k) | |
|
| South Korea — 0.7% | |
Industrial Bank of Korea | | | | | | | | |
0.63%, 09/17/24(a) | | | 200 | | | | 183,924 | |
1.04%, 06/22/25(a) | | | 200 | | | | 178,678 | |
Korea Electric Power Corp. | | | | | | | | |
3.63%, 06/14/25(a) | | | 200 | | | | 190,348 | |
5.38%, 04/06/26(j) | | | 200 | | | | 197,622 | |
| | | | | | | | |
| Security | | Par/ Shares (000) | | | Value | |
|
| South Korea (continued) | |
Korea Expressway Corp. | | | | | | | | |
1.13%, 05/17/26(a)(c) | | $ | 200 | | | $ | 172,126 | |
3.63%, 05/18/25(a) | | | 200 | | | | 191,475 | |
Korea Gas Corp., 3.88%, 07/13/27(a) | | | 200 | | | | 186,037 | |
Korea Hydro & Nuclear Power Co. Ltd. | | | | | | | | |
1.25%, 04/27/26(a) | | | 200 | | | | 172,884 | |
4.25%, 07/27/27(a) | | | 400 | | | | 375,560 | |
| | | | | | | | |
| | |
| | | | | | | 1,848,654 | |
|
| Supranational — 1.0% | |
Africa Finance Corp. | | | | | | | | |
3.13%, 06/16/25(a) | | | 600 | | | | 534,000 | |
3.75%, 10/30/29(a) | | | 200 | | | | 151,000 | |
3.88%, 04/13/24(a) | | | 400 | | | | 379,000 | |
4.38%, 04/17/26(a) | | | 600 | | | | 535,500 | |
African Export-Import Bank (The) | | | | | | | | |
3.80%, 05/17/31 (Call 02/17/31)(a) | | | 400 | | | | 313,000 | |
3.99%, 09/21/29 (Call 06/23/29)(a) | | | 600 | | | | 486,750 | |
4.13%, 06/20/24(a) | | | 600 | | | | 567,000 | |
| | | | | | | | |
| | |
| | | | | | | 2,966,250 | |
|
| Turkey — 0.1% | |
Turkiye Vakiflar Bankasi TAO, 5.50%, 10/01/26(a) | | | 400 | | | | 332,200 | |
| | | | | | | | |
| |
Total Foreign Government Obligations — 1.8%
(Cost: $5,832,166) | | | | 5,147,104 | |
| | | | | | | | |
| |
Total Long-Term Investments — 98.2%
(Cost: $343,425,307) | | | | 280,857,576 | |
| | | | | | | | |
|
Short-Term Securities | |
|
| Money Market Funds — 7.7% | |
BlackRock Cash Funds: Institutional, SL Agency Shares, 3.29%(l)(m)(n) | | | 17,960 | | | | 17,956,028 | |
BlackRock Cash Funds: Treasury, SL Agency Shares, 2.97%(l)(m) | | | 3,897 | | | | 3,897,000 | |
| | | | | | | | |
| |
Total Short-Term Securities — 7.7%
(Cost: $21,851,658) | | | | 21,853,028 | |
| | | | | | | | |
| |
Total Investments — 105.9%
(Cost: $365,276,965) | | | | 302,710,604 | |
| |
Liabilities in Excess of Other Assets — (5.9)% | | | | (16,812,331 | ) |
| | | | | | | | |
| |
Net Assets — 100.0% | | | $ | 285,898,273 | |
| | | | | | | | |
| (a) | This security may be resold to qualified foreign investors and foreign institutional buyers under Regulation S of the Securities Act of 1933. |
| (b) | Step coupon security. Coupon rate will either increase (step-up bond) or decrease (step-down bond) at regular intervals until maturity. Interest rate shown reflects the rate currently in effect. |
| (c) | All or a portion of this security is on loan. |
| (d) | Perpetual security with no stated maturity date. |
| (e) | Variable rate security. Interest rate resets periodically. The rate shown is the effective interest rate as of period end. Security description also includes the reference rate and spread if published and available. |
| (f) | Payment-in-kind security which may pay interest/dividends in additional par/shares and/or in cash. Rates shown are the current rate and possible payment rates. |
| (h) | Issuer filed for bankruptcy and/or is in default. |
| (i) | Non-income producing security. |
| (j) | Security exempt from registration pursuant to Rule 144A under the Securities Act of 1933, as amended. These securities may be resold in transactions exempt from registration to qualified institutional investors. |
| (k) | U.S. dollar denominated security issued by foreign domiciled entity. |
| (l) | Affiliate of the Fund. |
| | |
| 32 | | 2 0 2 2 I S H A R E S A N N U A L R E P O R T T O S H A R E H O L D E R S |
| | |
Schedule of Investments (continued) October 31, 2022 | | iShares® J.P. Morgan EM Corporate Bond ETF |
| (m) | Annualized 7-day yield as of period end. |
| (n) | All or a portion of this security was purchased with the cash collateral from loaned securities. |
Affiliates
Investments in issuers considered to be affiliate(s) of the Fund during the year ended October 31, 2022 for purposes of Section 2(a)(3) of the Investment Company Act of 1940, as amended, were as follows:
| | | | | | | | | | | | | | | | | | | | | | | | | | | | | | | | | | | | |
| Affiliated Issuer | | Value at
10/31/21 | | | Purchases
at Cost | | | Proceeds
from Sale | | | Net Realized
Gain (Loss) | | | Change in
Unrealized
Appreciation
(Depreciation) | | | Value at
10/31/22 | | | Shares
Held at
10/31/22
(000) | | | Income | | | Capital Gain
Distributions from
Underlying Funds | |
BlackRock Cash Funds: Institutional, SL
Agency Shares | | $ | 41,898,642 | | | $ | — | | | $ | (23,916,552 | )(a) | | $ | (20,875 | ) | | $ | (5,187 | ) | | $ | 17,956,028 | | | | 17,960 | | | $ | 151,956 | (b) | | $ | — | |
BlackRock Cash Funds: Treasury, SL
Agency Shares | | | 6,007,000 | | | | — | | | | (2,110,000 | )(a) | | | — | | | | — | | | | 3,897,000 | | | | 3,897 | | | | 23,341 | | | | — | |
| | | | | | | | | | | | | | | | | | | | | | | | | | | | | | | | | | | | |
| | | | | | | | | | | | | | $ | (20,875 | ) | | $ | (5,187 | ) | | $ | 21,853,028 | | | | | | | $ | 175,297 | | | $ | — | |
| | | | | | | | | | | | | | | | | | | | | | | | | | | | | | | | | | | | |
| (a) | Represents net amount purchased (sold). |
| (b) | All or a portion represents securities lending income earned from the reinvestment of cash collateral from loaned securities, net of fees and collateral investment expenses, and other payments to and from borrowers of securities. |
Fair Value Hierarchy as of Period End
Various inputs are used in determining the fair value of financial instruments. For a description of the input levels and information about the Fund’s policy regarding valuation of financial instruments, refer to the Notes to Financial Statements.
The following table summarizes the Fund’s financial instruments categorized in the fair value hierarchy. The breakdown of the Fund’s financial instruments into major categories is disclosed in the Schedule of Investments above.
| | | | | | | | | | | | | | | | |
| | | Level 1 | | | Level 2 | | | Level 3 | | | Total | |
Investments | | | | | | | | | | | | | | | | |
Assets | | | | | | | | | | | | | | | | |
Corporate Bonds & Notes | | $ | — | | | $ | 275,710,472 | | | $ | — | | | $ | 275,710,472 | |
Foreign Government Obligations | | | — | | | | 5,147,104 | | | | — | | | | 5,147,104 | |
Money Market Funds | | | 21,853,028 | | | | — | | | | — | | | | 21,853,028 | |
| | | | | | | | | | | | | | | | |
| | $ | 21,853,028 | | | $ | 280,857,576 | | | $ | — | | | $ | 302,710,604 | |
| | | | | | | | | | | | | | | | |
See notes to financial statements.
| | |
S C H E D U L E O F I N V E S T M E N T S | | 33 |
| | |
Schedule of Investments October 31, 2022 | | iShares® J.P. Morgan EM High Yield Bond ETF (Percentages shown are based on Net Assets) |
| | | | | | | | |
| Security | | Par
(000) | | | Value | |
|
Corporate Bonds & Notes | |
|
| Argentina — 0.8% | |
MSU Energy SA/UGEN SA/UENSA SA, 6.88%, 02/01/25 (Call 11/30/22)(a) | | $ | 300 | | | $ | 189,244 | |
Pampa Energia SA, 7.50%, 01/24/27
(Call 11/30/22)(a) | | | 250 | | | | 206,922 | |
Transportadora de Gas del Sur SA, 6.75%, 05/02/25 (Call 11/30/22)(a) | | | 150 | | | | 128,842 | |
YPF SA | | | | | | | | |
2.50%, 06/30/29(a) | | | 300 | | | | 186,750 | |
6.95%, 07/21/27(a) | | | 400 | | | | 237,000 | |
7.00%, 12/15/47 (Call 06/15/47)(a) | | | 250 | | | | 128,750 | |
8.50%, 07/28/25(a) | | | 500 | | | | 360,000 | |
8.75%, 04/04/24(a) | | | 308 | | | | 265,515 | |
YPF Sociedad Anonima | | | | | | | | |
1.50%, 09/30/33(a) | | | 300 | | | | 162,900 | |
4.00%, 02/12/26(a) | | | 400 | | | | 344,000 | |
| | | | | | | | |
| | |
| | | | | | | 2,209,923 | |
|
| Azerbaijan — 0.5% | |
International Bank of Azerbaijan OJSC,
3.50%, 09/01/24(a) | | | 550 | | | | 517,000 | |
Southern Gas Corridor CJSC, 6.88%, 03/24/26(a) | | | 1,000 | | | | 982,400 | |
| | | | | | | | |
| | |
| | | | | | | 1,499,400 | |
|
| Bahrain — 0.4% | |
AUB Sukuk Ltd., 2.62%, 09/09/26(a) | | | 400 | | | | 351,950 | |
BBK BSC, 5.50%, 07/09/24(a) | | | 200 | | | | 192,975 | |
GFH Sukuk Ltd., 7.50%, 01/28/25(a) | | | 200 | | | | 190,500 | |
Oil and Gas Holding Co. BSCC (The),
7.50%, 10/25/27(a)(b) | | | 400 | | | | 386,200 | |
| | | | | | | | |
| | |
| | | | | | | 1,121,625 | |
|
| Brazil — 9.8% | |
Acu Petroleo Luxembourg Sarl, 7.50%, 01/13/32 (Call 01/13/27)(a) | | | 250 | | | | 195,175 | |
Adecoagro SA, 6.00%, 09/21/27(a) | | | 200 | | | | 180,125 | |
Aegea Finance Sarl, 6.75%, 05/20/29
(Call 05/20/25)(a) | | | 200 | | | | 182,700 | |
Amaggi Luxembourg International Sarl, 5.25%, 01/28/28(a) | | | 400 | | | | 350,950 | |
Atento Luxco 1 SA, 8.00%, 02/10/26(a) | | | 300 | | | | 116,250 | |
Azul Investments LLP, 7.25%, 06/15/26 | | | 200 | | | | 125,725 | |
B2W Digital Lux Sarl, 4.38%, 12/20/30
(Call 09/20/30)(a) | | | 200 | | | | 136,913 | |
B3 SA - Brasil Bolsa Balcao, 4.13%, 09/20/31(a) | | | 400 | | | | 317,075 | |
Banco Bradesco SA/Cayman Islands | | | | | | | | |
3.20%, 01/27/25(a) | | | 400 | | | | 377,400 | |
4.38%, 03/18/27(a)(b) | | | 200 | | | | 185,880 | |
Banco BTG Pactual SA/Cayman Islands | | | | | | | | |
2.75%, 01/11/26 (Call 12/11/25)(a) | | | 200 | | | | 174,725 | |
4.50%, 01/10/25 (Call 12/10/24)(a)(b) | | | 600 | | | | 570,630 | |
7.75%, 02/15/29 (Call 02/15/24)(a)(c) | | | 200 | | | | 199,000 | |
Banco do Brasil SA/Cayman | | | | | | | | |
3.25%, 09/30/26(a) | | | 400 | | | | 355,325 | |
4.63%, 01/15/25(a) | | | 400 | | | | 387,190 | |
4.75%, 03/20/24(a) | | | 400 | | | | 392,575 | |
4.88%, 01/11/29(a) | | | 200 | | | | 179,100 | |
6.25%, (Call 04/15/24)(a)(c)(d) | | | 1,000 | | | | 873,625 | |
9.00%, (Call 06/18/24)(a)(b)(c)(d) | | | 1,000 | | | | 998,312 | |
9.25%, 10/29/49(a) | | | 600 | | | | 600,300 | |
Banco Votorantim SA, 4.38%, 07/29/25(a) | | | 400 | | | | 377,000 | |
Braskem Netherlands Finance BV, 8.50%, 01/23/81 (Call 10/24/25)(a)(c) | | | 200 | | | | 190,000 | |
BRF SA | | | | | | | | |
4.88%, 01/24/30 (Call 10/24/29)(a) | | | 400 | | | | 312,075 | |
5.75%, 09/21/50 (Call 03/21/50)(a) | | | 400 | | | | 267,000 | |
Cemig Geracao e Transmissao SA, 9.25%, 12/05/24 (Call 12/05/23)(a) | | | 400 | | | | 409,950 | |
| | | | | | | | |
| Security | | Par
(000) | | | Value | |
|
| Brazil (continued) | |
Centrais Eletricas Brasileiras SA | | | | | | | | |
3.63%, 02/04/25(a) | | $ | 200 | | | $ | 187,425 | |
4.63%, 02/04/30(a) | | | 400 | | | | 341,320 | |
Cosan Luxembourg SA, 7.00%, 01/20/27
(Call 11/30/22)(a) | | | 400 | | | | 392,075 | |
Cosan Overseas Ltd., 8.25%, (a)(d) | | | 200 | | | | 191,350 | |
Cosan SA, 5.50%, 09/20/29 (Call 09/20/24)(a) | | | 400 | | | | 353,700 | |
CSN Inova Ventures, 6.75%, 01/28/28
(Call 01/28/24)(a) | | | 600 | | | | 510,150 | |
CSN Resources SA | | | | | | | | |
4.63%, 06/10/31 (Call 06/10/26)(a) | | | 400 | | | | 266,130 | |
5.88%, 04/08/32 (Call 04/08/27)(a) | | | 200 | | | | 144,060 | |
Embraer Netherlands Finance BV | | | | | | | | |
5.05%, 06/15/25(b) | | | 550 | | | | 516,862 | |
5.40%, 02/01/27(b) | | | 300 | | | | 273,619 | |
6.95%, 01/17/28 (Call 10/17/27)(a) | | | 400 | | | | 376,530 | |
FS Luxembourg Sarl, 10.00%, 12/15/25(a) | | | 400 | | | | 406,162 | |
Globo Comunicacao e Participacoes SA,
4.88%, 01/22/30(a) | | | 200 | | | | 154,776 | |
Gol Finance SA | | | | | | | | |
7.00%, 01/31/25(a) | | | 300 | | | | 127,500 | |
8.00%, 06/30/26 (Call 12/24/22)(a) | | | 200 | | | | 116,000 | |
Guara Norte Sarl, 5.20%, 06/15/34(a) | | | 374 | | | | 292,079 | |
InterCement Financial Operations BV, 5.75%, 07/17/24 (Call 11/30/22)(a) | | | 400 | | | | 275,825 | |
Itau Unibanco Holding SA/Cayman Island | | | | | | | | |
3.25%, 01/24/25(a)(b) | | | 200 | | | | 190,288 | |
3.88%, 04/15/31(a)(c) | | | 400 | | | | 342,570 | |
4.50%, 11/21/29 (Call 11/21/24)(a)(c) | | | 400 | | | | 368,825 | |
4.63%, (Call 02/27/25)(a)(c)(d) | | | 200 | | | | 152,500 | |
6.13%, (Call 12/12/22)(a)(b)(c)(d) | | | 600 | | | | 560,775 | |
6.50%, (Call 03/19/23)(a)(b)(c)(d) | | | 400 | | | | 369,700 | |
JSM Global Sarl, 4.75%, 10/20/30(a) | | | 200 | | | | 138,163 | |
Klabin Austria GmbH | | | | | | | | |
3.20%, 01/12/31 (Call 10/12/30)(a) | | | 200 | | | | 149,500 | |
5.75%, 04/03/29 (Call 01/03/29)(a) | | | 400 | | | | 370,852 | |
7.00%, 04/03/49 (Call 10/03/48)(a) | | | 400 | | | | 352,300 | |
Light Servicos de Eletricidade SA/Light Energia SA, 4.38%, 06/18/26 (Call 06/18/24)(a) | | | 200 | | | | 161,200 | |
MARB BondCo PLC, 3.95%, 01/29/31
(Call 01/29/26)(a) | | | 600 | | | | 441,000 | |
MC Brazil Downstream Trading SARL, 7.25%, 06/30/31(a) | | | 800 | | | | 607,280 | |
MercadoLibre Inc., 3.13%, 01/14/31
(Call 10/14/30)(b) | | | 400 | | | | 287,000 | |
Minerva Luxembourg SA, 4.38%, 03/18/31(a) | | | 600 | | | | 454,500 | |
Movida Europe SA, 5.25%, 02/08/31
(Call 02/08/26)(a) | | | 400 | | | | 292,352 | |
Natura &Co. Luxembourg Holdings Sarl, 6.00%, 04/19/29 (Call 02/19/29)(a) | | | 400 | | | | 332,370 | |
Natura Cosmeticos SA, 4.13%, 05/03/28
(Call 03/03/28)(a) | | | 400 | | | | 310,200 | |
NBM U.S. Holdings Inc. | | | | | | | | |
6.63%, 08/06/29 (Call 08/06/24)(a) | | | 200 | | | | 184,975 | |
7.00%, 05/14/26 (Call 11/30/22)(a) | | | 400 | | | | 385,700 | |
Nexa Resources SA | | | | | | | | |
5.38%, 05/04/27 (Call 02/04/27)(a) | | | 400 | | | | 361,120 | |
6.50%, 01/18/28 (Call 10/18/27)(a) | | | 200 | | | | 183,600 | |
Odebrecht Drilling Norbe VIII/IX Ltd., 7.35%, (7.35% PIK), 12/01/26 (Call 11/30/22)(a)(e) | | | 396 | | | | 217,831 | |
Odebrecht Offshore Drilling Finance Ltd., 7.72%,
(7.72% PIK), 12/01/26 (Call 11/30/22)(a)(e) | | | 932 | | | | 198,888 | |
Oi SA, 10.00%, (12.00% PIK), 07/27/25(e) | | | 784 | | | | 201,537 | |
Petrobras Global Finance BV | | | | | | | | |
5.09%, 01/15/30(b) | | | 250 | | | | 222,344 | |
5.30%, 01/27/25(b) | | | 250 | | | | 246,219 | |
5.50%, 06/10/51 (Call 12/10/50) | | | 300 | | | | 212,287 | |
5.60%, 01/03/31 (Call 10/03/30)(b) | | | 525 | | | | 475,230 | |
5.75%, 02/01/29 | | | 300 | | | | 279,232 | |
| | |
| 34 | | 2 0 2 2 I S H A R E S A N N U A L R E P O R T T O S H A R E H O L D E R S |
| | |
Schedule of Investments (continued) October 31, 2022 | | iShares® J.P. Morgan EM High Yield Bond ETF (Percentages shown are based on Net Assets) |
| | | | | | | | |
| Security | | Par
(000) | | | Value | |
| | |
Brazil (continued) | | | | | | |
6.00%, 01/27/28(b) | | $ | 626 | | | $ | 600,334 | |
6.25%, 03/17/24(b) | | | 200 | | | | 200,038 | |
6.75%, 01/27/41(b) | | | 300 | | | | 260,295 | |
6.75%, 06/03/50 (Call 12/03/49)(b) | | | 300 | | | | 240,675 | |
6.85%, 06/05/2115 | | | 900 | | | | 700,875 | |
6.88%, 01/20/40(b) | | | 350 | | | | 309,487 | |
6.90%, 03/19/49(b) | | | 400 | | | | 328,400 | |
7.25%, 03/17/44 | | | 460 | | | | 411,700 | |
7.38%, 01/17/27(b) | | | 400 | | | | 406,000 | |
Petrorio Luxembourg Trading Sarl,
6.13%, 06/09/26 (Call 06/09/24)(a) | | | 200 | | | | 180,975 | |
Rede D’or Finance Sarl
4.50%, 01/22/30 (Call 10/22/29)(a) | | | 300 | | | | 246,562 | |
4.95%, 01/17/28 (Call 10/17/27)(a) | | | 400 | | | | 354,575 | |
Rumo Luxembourg Sarl
4.20%, 01/18/32(a) | | | 200 | | | | 151,038 | |
5.25%, 01/10/28 (Call 01/10/24)(a) | | | 200 | | | | 178,100 | |
Simpar Europe SA, 5.20%, 01/26/31(a) | | | 400 | | | | 287,000 | |
StoneCo Ltd., 3.95%, 06/16/28
(Call 05/16/28)(a)(b) | | | 300 | | | | 223,462 | |
Unigel Luxembourg SA, 8.75%, 10/01/26
(Call 11/30/22)(a) | | | 200 | | | | 192,038 | |
Usiminas International Sarl, 5.88%, 07/18/26 (Call 07/18/23)(a) | | | 400 | | | | 370,950 | |
XP Inc., 3.25%, 07/01/26
(Call 06/01/26)(a) | | | 400 | | | | 347,700 | |
| | | | | | | | |
| | | | | | | 28,421,105 | |
| | |
Burkina Faso — 0.1% | | | | | | |
Endeavour Mining PLC, 5.00%, 10/14/26
(Call 10/14/23)(a) | | | 200 | | | | 155,350 | |
| | | | | | | | |
| | |
Canada — 0.0% | | | | | | |
Sino-Ocean Land Treasure IV Ltd., 2.70%, 01/13/25 (Call 12/13/24)(a) | | | 200 | | | | 27,000 | |
| | | | | | | | |
| | |
Cayman Islands — 0.0% | | | | | | |
Odebrecht Holdco Finance Ltd., 0.00%, 09/10/58 (Call 11/30/22)(a)(f) | | | 900 | | | | 2,250 | |
| | | | | | | | |
| | |
Chile — 0.4% | | | | | | |
AES Andes SA., 7.13%, 03/26/79
(Call 04/07/24)(a)(c) | | | 400 | | | | 326,200 | |
Agrosuper SA, 4.60%, 01/20/32 (Call 10/20/31)(a) | | | 200 | | | | 161,912 | |
Guacolda Energia SA, 4.56%, 04/30/25
(Call 01/30/25)(a) | | | 200 | | | | 61,788 | |
Kenbourne Invest SA, 6.88%, 11/26/24
(Call 11/30/22)(a) | | | 200 | | | | 178,000 | |
Latam Airlines Group SA, 13.38%, 10/15/29 | | | 400 | | | | 391,000 | |
VTR Finance NV, 6.38%, 07/15/28
(Call 07/15/23)(a) | | | 200 | | | | 100,787 | |
| | | | | | | | |
| | | | | | | 1,219,687 | |
| | |
China — 2.7% | | | | | | |
Agile Group Holdings Ltd., 7.88%,
(Call 07/31/24)(a)(c)(d) | | | 600 | | | | 87,000 | |
Bank of Communications Co. Ltd.,
3.80%, (Call 11/18/25)(a)(c)(d) | | | 1,500 | | | | 1,383,750 | |
Central Plaza Development Ltd.,
5.75%, (Call 11/14/24)(a)(c)(d) | | | 200 | | | | 114,663 | |
China Hongqiao Group Ltd., 6.25%, 06/08/24(a) | | | 200 | | | | 169,162 | |
China SCE Group Holdings Ltd., 7.00%, 05/02/25 (Call 05/02/23)(a) | | | 400 | | | | 30,000 | |
China Shenhua Overseas Capital Co. Ltd., 3.88%, 01/20/25(a) | | | 200 | | | | 191,356 | |
CIFI Holdings Group Co. Ltd. | | | | | | | | |
4.45%, 08/17/26 (Call 05/17/24)(a)(g)(h) | | | 200 | | | | 13,500 | |
5.95%, 10/20/25 (Call 07/20/23)(a)(g)(h) | | | 400 | | | | 27,000 | |
6.00%, 07/16/25 (Call 01/16/23)(a)(g)(h) | | | 200 | | | | 13,500 | |
6.45%, 11/07/24 (Call 11/30/22)(a)(g)(h) | | | 200 | | | | 14,500 | |
Country Garden Holdings Co. Ltd. | | | | | | | | |
2.70%, 07/12/26 (Call 06/12/26)(a) | | | 400 | | | | 34,000 | |
3.13%, 10/22/25 (Call 09/22/25)(a) | | | 400 | | | | 36,000 | |
| | | | | | | | |
| Security | | Par
(000) | | | Value | |
| | |
China (continued) | | | | | | |
3.30%, 01/12/31 (Call 10/12/30)(a) | | $ | 400 | | | $ | 28,000 | |
3.88%, 10/22/30 (Call 07/22/30)(a) | | | 400 | | | | 30,000 | |
5.13%, 01/17/25 (Call 11/30/22)(a) | | | 800 | | | | 72,000 | |
5.13%, 01/14/27 (Call 01/14/24)(a) | | | 200 | | | | 16,000 | |
6.15%, 09/17/25 (Call 09/17/23)(a) | | | 400 | | | | 36,000 | |
6.50%, 04/08/24 (Call 11/30/22)(a) | | | 400 | | | | 57,575 | |
7.25%, 04/08/26 (Call 04/08/23)(a) | | | 1,000 | | | | 85,000 | |
Ease Trade Global Ltd., 4.00%, 11/10/25(a) | | | 200 | | | | 188,412 | |
Easy Tactic Ltd. | | | | | | | | |
7.50%, (7.50% PIK), 07/11/25
(Call 11/30/22)(e) | | | 600 | | | | 101,738 | |
7.50%, (7.50% PIK), 07/11/27
(Call 11/30/22)(e) | | | 1,171 | | | | 117,076 | |
7.50%, (7.50% PIK), 07/11/28
(Call 11/30/22)(e) | | | 700 | | | | 56,000 | |
ENN Clean Energy International Investment Ltd., 3.38%, 05/12/26 (Call 05/12/24)(a)(b) | | | 400 | | | | 311,825 | |
Fortune Star BVI Ltd.
5.00%, 05/18/26 (Call 05/18/24)(a) | | | 200 | | | | 69,000 | |
5.05%, 01/27/27 (Call 01/27/25)(a) | | | 200 | | | | 65,000 | |
5.95%, 10/19/25 (Call 10/19/23)(a) | | | 400 | | | | 149,680 | |
Franshion Brilliant Ltd., 6.00%,
(Call 02/08/26)(a)(c)(d) | | | 200 | | | | 149,787 | |
Greenland Global Investment Ltd., 5.88%, 07/03/24(a) | | | 200 | | | | 23,350 | |
Industrial & Commercial Bank of China Ltd., 3.20%, (Call 09/24/26)(a)(c)(d) | | | 2,900 | | | | 2,584,424 | |
KWG Group Holdings Ltd., 5.88%, 11/10/24
(Call 11/15/22)(a) | | | 400 | | | | 46,000 | |
Lenovo Group Ltd., 5.88%, 04/24/25(a) | | | 600 | | | | 575,280 | |
Overseas Chinese Town Asia Holdings Ltd., 4.50%, (Call 07/15/23)(a)(c)(d) | | | 200 | | | | 190,537 | |
Powerlong Real Estate Holdings Ltd.,
6.25%, 08/10/24 (Call 12/13/22)(a) | | | 400 | | | | 36,075 | |
RKPF Overseas 2020 A Ltd.
5.13%, 07/26/26 (Call 07/26/24)(a) | | | 200 | | | | 61,000 | |
5.20%, 01/12/26 (Call 01/12/24)(a) | | | 200 | | | | 62,000 | |
Shui On Development Holding Ltd.,
6.15%, 08/24/24 (Call 11/30/22)(a) | | | 200 | | | | 112,000 | |
Sino-Ocean Land Treasure Finance I Ltd.,
6.00%, 07/30/24(a) | | | 200 | | | | 33,663 | |
Sino-Ocean Land Treasure Finance II Ltd.,
5.95%, 02/04/27(a) | | | 200 | | | | 20,475 | |
Sino-Ocean Land Treasure III Ltd., 6.88%, (Call 09/21/27)(a)(c)(d) | | | 400 | | | | 40,200 | |
Sino-Ocean Land Treasure IV Ltd., 4.75%, 08/05/29 (Call 05/05/29)(a) | | | 400 | | | | 37,825 | |
Times China Holdings Ltd. | | | | | | | | |
5.55%, 06/04/24 (Call 06/04/23)(a) | | | 400 | | | | 30,000 | |
6.75%, 07/08/25 (Call 07/08/23)(a) | | | 200 | | | | 13,000 | |
Wanda Properties International Co. Ltd.,
7.25%, 01/29/24(a) | | | 400 | | | | 172,000 | |
West China Cement Ltd., 4.95%, 07/08/26
(Call 07/08/24)(a) | | | 400 | | | | 226,075 | |
Yancoal International Resources Development Co. Ltd., 3.50%, 11/04/23(a) | | | 0 | | | | — | |
Yanlord Land HK Co. Ltd., 5.13%, 05/20/26 (Call 05/20/24)(a) | | | 200 | | | | 84,000 | |
| | | | | | | | |
| | | | | | | 7,995,428 | |
| | |
Colombia — 2.8% | | | | | | |
AI Candelaria Spain SLU, 5.75%, 06/15/33 (Call 06/15/28)(a) | | | 400 | | | | 258,000 | |
Avianca Midco 2 Ltd., 9.00%, 12/01/28
(Call 12/01/24)(a) | | | 850 | | | | 633,781 | |
Banco Davivienda SA, 6.65%,
(Call 04/22/31)(a)(c)(d) | | | 200 | | | | 134,788 | |
Banco de Bogota SA, 6.25%, 05/12/26(a) | | | 600 | | | | 546,600 | |
Bancolombia SA | | | | | | | | |
3.00%, 01/29/25 (Call 12/29/24) | | | 400 | | | | 355,575 | |
4.63%, 12/18/29 (Call 12/18/24)(b)(c) | | | 200 | | | | 161,537 | |
7.14%, 10/18/27(b)(c) | | | 400 | | | | 343,700 | |
Canacol Energy Ltd., 5.75%, 11/24/28
(Call 11/24/24)(a) | | | 200 | | | | 149,725 | |
Colombia Telecomunicaciones SA ESP,
4.95%, 07/17/30 (Call 04/17/30)(a) | | | 200 | | | | 139,288 | |
| | |
S C H E D U L E O F I N V E S T M E N T S | | 35 |
| | |
Schedule of Investments (continued) October 31, 2022 | | iShares® J.P. Morgan EM High Yield Bond ETF (Percentages shown are based on Net Assets) |
| | | | | | | | |
| Security | | Par
(000) | | | Value | |
| | |
Colombia (continued) | | | | | | |
Ecopetrol SA | | | | | | | | |
4.13%, 01/16/25(b) | | $ | 560 | | | $ | 515,130 | |
4.63%, 11/02/31 (Call 08/02/31)(b) | | | 600 | | | | 413,250 | |
5.38%, 06/26/26 (Call 03/26/26) | | | 750 | | | | 680,344 | |
5.88%, 05/28/45 | | | 940 | | | | 572,291 | |
5.88%, 11/02/51 (Call 05/02/51)(b) | | | 355 | | | | 208,917 | |
6.88%, 04/29/30 (Call 01/29/30)(b) | | | 950 | | | | 775,675 | |
7.38%, 09/18/43(b) | | | 400 | | | | 290,825 | |
EnfraGen Energia Sur SA, 5.38%, 12/30/30(a) | | | 400 | | | | 204,000 | |
Geopark Ltd., 5.50%, 01/17/27
(Call 01/17/24)(a) | | | 200 | | | | 161,350 | |
Grupo Aval Ltd., 4.38%, 02/04/30
(Call 11/04/29)(a) | | | 400 | | | | 276,075 | |
Grupo de Inversiones Suramericana SA,
5.50%, 04/29/26(a) | | | 200 | | | | 182,100 | |
Millicom International Cellular SA | | | | | | | | |
4.50%, 04/27/31 (Call 04/27/26)(a) | | | 400 | | | | 299,200 | |
6.25%, 03/25/29 (Call 03/25/24)(a) | | | 360 | | | | 313,875 | |
Oleoducto Central SA, 4.00%, 07/14/27
(Call 05/14/27)(a) | | | 200 | | | | 162,725 | |
Sierracol Energy Andina Co., 6.00%, 06/15/28 (Call 06/15/24)(a) | | | 200 | | | | 131,150 | |
Termocandelaria Power Ltd., 7.88%, 01/30/29 (Call 01/30/23)(a) | | | 340 | | | | 288,639 | |
| | | | | | | | |
| | | | | | | 8,198,540 | |
| | |
Ghana — 0.4% | | | | | | |
Kosmos Energy Ltd., 7.13%, 04/04/26
(Call 11/30/22)(a) | | | 200 | | | | 166,500 | |
Tullow Oil PLC | | | | | | | | |
7.00%, 03/01/25 (Call 11/30/22)(a) | | | 400 | | | | 263,000 | |
10.25%, 05/15/26 (Call 05/15/23)(a) | | | 906 | | | | 772,365 | |
| | | | | | | | |
| | | | | | | 1,201,865 | |
| | |
Guatemala — 0.4% | | | | | | |
Central American Bottling Corp./CBC Bottling Holdco SL/Beliv Holdco SL, 5.25%, 04/27/29 (Call 04/27/26)(a) | | | 600 | | | | 528,675 | |
CT Trust, 5.13%, 02/03/32 (Call 02/03/27)(a) | | | 400 | | | | 318,450 | |
Investment Energy Resources Ltd.,
6.25%, 04/26/29 (Call 04/26/25)(a) | | | 200 | | | | 168,100 | |
| | | | | | | | |
| | | | | | | 1,015,225 | |
| | |
Hong Kong — 3.0% | | | | | | |
Bank of Communications Hong Kong Ltd.,
3.73%, (Call 03/03/25)(a)(c)(d) | | | 250 | | | | 232,187 | |
Bank of East Asia Ltd. (The) | | | | | | | | |
5.83%, (Call 10/21/25)(a)(c)(d) | | | 250 | | | | 182,500 | |
5.88%, (Call 09/19/24)(a)(c)(d) | | | 250 | | | | 200,203 | |
CAS Capital No. 1 Ltd.,
4.00%, (Call 07/12/26)(a)(c)(d) | | | 400 | | | | 252,950 | |
Cathay Pacific MTN Financing HK Ltd.,
4.88%, 08/17/26(a) | | | 200 | | | | 171,663 | |
Celestial Miles Ltd.,
5.75%, (Call 01/31/24)(a)(c)(d) | | | 600 | | | | 504,000 | |
China Citic Bank, 3.25%, (Call 07/29/26)(a)(c)(d) | | | 250 | | | | 216,250 | |
China CITIC Bank International Ltd. | | | | | | | | |
4.80%, (Call 04/22/27)(a)(c)(d) | | | 250 | | | | 223,125 | |
7.10%, (Call 11/06/23)(a)(c)(d) | | | 400 | | | | 400,000 | |
FWD Group Ltd. | | | | | | | | |
5.75%, 07/09/24(a) | | | 400 | | | | 364,320 | |
6.38%, (Call 09/13/24)(a)(c)(d) | | | 400 | | | | 336,325 | |
8.05%, (Call 12/15/22)(a)(c)(d) | | | 400 | | | | 370,200 | |
Henderson Land MTN Ltd., 2.38%, 05/27/25(a) | | | 200 | | | | 182,725 | |
Lai Sun MTN Ltd., 5.00%, 07/28/26(a) | | | 200 | | | | 121,663 | |
Li & Fung Ltd. | | | | | | | | |
4.38%, 10/04/24 (Call 09/04/24)(a) | | | 200 | | | | 186,000 | |
4.50%, 08/18/25 (Call 07/18/25)(a) | | | 400 | | | | 339,950 | |
5.25%, (Call 05/03/23)(a)(d) | | | 200 | | | | 82,000 | |
Melco Resorts Finance Ltd. | | | | | | | | |
4.88%, 06/06/25 (Call 11/30/22)(a) | | | 200 | | | | 139,475 | |
5.25%, 04/26/26 (Call 11/30/22)(a) | | | 300 | | | | 192,000 | |
| | | | | | | | |
| Security | | Par
(000) | | | Value | |
| | |
Hong Kong (continued) | | | | | | |
5.38%, 12/04/29 (Call 12/04/24)(a) | | $ | 600 | | | $ | 327,000 | |
5.63%, 07/17/27 (Call 11/30/22)(a) | | | 400 | | | | 236,116 | |
5.75%, 07/21/28 (Call 07/21/23)(a) | | | 400 | | | | 230,000 | |
Nanyang Commercial Bank Ltd.,
6.50%, (Call 04/28/27)(a)(c)(d) | | | 250 | | | | 216,766 | |
New World China Land Ltd., 4.75%, 01/23/27(a) | | | 400 | | | | 362,450 | |
NWD Finance BVI Ltd. | | | | | | | | |
4.13%, (Call 03/10/28)(a)(c)(d) | | | 600 | | | | 363,000 | |
4.80%, (Call 09/09/23)(a)(d) | | | 400 | | | | 180,000 | |
5.25%, (Call 03/22/26)(a)(c)(d) | | | 600 | | | | 378,000 | |
6.25%, (Call 03/07/24)(a)(d) | | | 600 | | | | 325,612 | |
NWD MTN Ltd. | | | | | | | | |
4.13%, 07/18/29(a) | | | 600 | | | | 450,112 | |
4.50%, 05/19/30(a) | | | 200 | | | | 149,850 | |
PCPD Capital Ltd., 5.13%, 06/18/26
(Call 06/18/24)(a) | | | 400 | | | | 315,950 | |
Seaspan Corp., 5.50%, 08/01/29
(Call 08/01/24)(a) | | | 400 | | | | 308,628 | |
Wheelock MTN BVI Ltd., 2.38%, 01/25/26(a) | | | 200 | | | | 180,538 | |
| | | | | | | | |
| | | | | | | 8,721,558 | |
| | |
India — 2.5% | | | | | | |
ABJA Investment Co. Pte Ltd.,
5.95%, 07/31/24(a) | | | 625 | | | | 610,937 | |
Adani Green Energy Ltd., 4.38%, 09/08/24(a) | | | 400 | | | | 298,000 | |
Adani Green Energy UP Ltd./Prayatna Developers Pvt Ltd./Parampujya Solar Energy, 6.25%, 12/10/24(a) | | | 200 | | | | 181,100 | |
Axis Bank Ltd., 4.10%, (Call 09/08/26)(a)(c)(d) | | | 200 | | | | 160,000 | |
CA Magnum Holdings, 5.38%, 10/31/26
(Call 10/31/23)(a) | | | 400 | | | | 335,000 | |
Continuum Energy Levanter Pte Ltd.,
4.50%, 02/09/27 (Call 02/09/24)(a) | | | 194 | | | | 152,865 | |
Delhi International Airport Ltd. | | | | | | | | |
6.13%, 10/31/26(a) | | | 200 | | | | 179,225 | |
6.45%, 06/04/29(a) | | | 200 | | | | 162,500 | |
Greenko Dutch BV,
3.85%, 03/29/26 (Call 03/29/23)(a) | | | 382 | | | | 297,960 | |
Greenko Power II Ltd.,
4.30%, 12/13/28 (Call 12/14/24)(a) | | | 586 | | | | 447,206 | |
Greenko Solar Mauritius Ltd. | | | | | | | | |
5.55%, 01/29/25(a) | | | 200 | | | | 174,000 | |
5.95%, 07/29/26 (Call 11/30/22)(a) | | | 200 | | | | 160,500 | |
Greenko Wind Projects Mauritius Ltd.,
5.50%, 04/06/25 (Call 04/06/24)(a) | | | 400 | | | | 339,000 | |
HDFC Bank Ltd.,
3.70%, (Call 08/25/26)(a)(b)(c)(d) | | | 400 | | | | 319,000 | |
JSW Hydro Energy Ltd., 4.13%, 05/18/31
(Call 05/18/26)(a) | | | 368 | | | | 283,199 | |
JSW Steel Ltd. | | | | | | | | |
3.95%, 04/05/27 (Call 10/05/26)(a) | | | 400 | | | | 292,000 | |
5.05%, 04/05/32 (Call 10/05/31)(a) | | | 200 | | | | 128,538 | |
5.95%, 04/18/24(a) | | | 200 | | | | 188,000 | |
Network i2i Ltd. | | | | | | | | |
3.98%, (a) | | | 200 | | | | 157,000 | |
5.65%, (Call 01/15/25)(a)(c)(d) | | | 600 | | | | 533,363 | |
Periama Holdings LLC/DE, 5.95%, 04/19/26(a) | | | 400 | | | | 323,825 | |
ReNew Wind Energy AP2/ReNew Power Pvt Ltd. other 9 Subsidiaries, 4.50%, 07/14/28 (Call 10/14/23)(a) | | | 200 | | | | 148,000 | |
Shriram Transport Finance Co. Ltd.,
4.40%, 03/13/24(a) | | | 400 | | | | 370,244 | |
Vedanta Resources Finance II PLC | | | | | | | | |
8.95%, 03/11/25 (Call 09/11/24)(a) | | | 600 | | | | 372,000 | |
9.25%, 04/23/26 (Call 04/23/23)(a)(b) | | | 400 | | | | 231,600 | |
13.88%, 01/21/24 (Call 12/21/22)(a) | | | 400 | | | | 333,700 | |
Vedanta Resources Ltd., 6.13%, 08/09/24
(Call 11/30/22)(a) | | | 400 | | | | 232,000 | |
| | | | | | | | |
| | | | | | | 7,410,762 | |
| | |
Indonesia — 0.6% | | | | | | |
Adaro Indonesia PT, 4.25%, 10/31/24
(Call 11/30/22)(a) | | | 250 | | | | 233,641 | |
Bank Negara Indonesia Persero Tbk PT
3.75%, 03/30/26(a) | | | 600 | | | | 489,066 | |
| | |
| 36 | | 2 0 2 2 I S H A R E S A N N U A L R E P O R T T O S H A R E H O L D E R S |
| | |
Schedule of Investments (continued) October 31, 2022 | | iShares® J.P. Morgan EM High Yield Bond ETF (Percentages shown are based on Net Assets) |
| | | | | | | | |
| Security | | Par
(000) | | | Value | |
| | |
Indonesia (continued) | | | | | | |
| | |
Indonesia (continued) | | | | | | | | |
4.30%, (Call 03/24/27)(a)(c)(d) | | $ | 200 | | | $ | 141,022 | |
Indika Energy Capital IV Pte Ltd., 8.25%, 10/22/25 (Call 11/30/22)(a) | | | 350 | | | | 329,000 | |
Medco Bell Pte Ltd., 6.38%, 01/30/27
(Call 01/30/24)(a) | | | 400 | | | | 320,000 | |
Medco Oak Tree Pte Ltd., 7.38%, 05/14/26
(Call 05/14/23)(a) | | | 400 | | | | 356,000 | |
| | | | | | | | |
| | | | | | | 1,868,729 | |
| | |
| Israel — 2.3% | | | | | | |
Energean Israel Finance Ltd. | | | | | | | | |
4.50%, 03/30/24 (Call 12/30/23)(a)(i) | | | 300 | | | | 285,720 | |
4.88%, 03/30/26 (Call 12/30/25)(a)(i) | | | 300 | | | | 270,000 | |
5.38%, 03/30/28 (Call 09/30/27)(a)(i) | | | 300 | | | | 263,250 | |
5.88%, 03/30/31 (Call 09/30/30)(a)(i) | | | 300 | | | | 253,500 | |
Leviathan Bond Ltd. | | | | | | | | |
6.13%, 06/30/25 (Call 03/30/25)(a)(i) | | | 275 | | | | 261,594 | |
6.50%, 06/30/27 (Call 12/30/26)(a)(i) | | | 300 | | | | 281,625 | |
6.75%, 06/30/30 (Call 12/30/29)(a)(i) | | | 250 | | | | 221,922 | |
Teva Pharmaceutical Finance Co. LLC,
6.15%, 02/01/36(b) | | | 450 | | | | 370,125 | |
Teva Pharmaceutical Finance Netherlands III BV | | | | | | | | |
3.15%, 10/01/26 | | | 1,800 | | | | 1,503,000 | |
4.10%, 10/01/46 | | | 900 | | | | 536,513 | |
4.75%, 05/09/27 (Call 02/09/27) | | | 500 | | | | 439,375 | |
5.13%, 05/09/29 (Call 02/09/29)(b) | | | 400 | | | | 343,280 | |
6.00%, 04/15/24 (Call 01/15/24)(b) | | | 600 | | | | 591,000 | |
6.75%, 03/01/28 (Call 12/01/27) | | | 600 | | | | 562,237 | |
7.13%, 01/31/25 (Call 10/31/24) | | | 400 | | | | 394,250 | |
| | | | | | | | |
| | | | | | | 6,577,391 | |
| | |
| Jamaica — 0.2% | | | | | | |
Digicel International Finance Ltd./Digicel international Holdings Ltd., 8.75%, 05/25/24 (Call 11/15/22)(a) | | | 700 | | | | 593,279 | |
| | | | | | | | |
| | |
| Kampuchea, Democratic — 0.1% | | | | | | |
NagaCorp Ltd., 7.95%, 07/06/24
(Call 11/10/22)(a) | | | 200 | | | | 171,475 | |
| | | | | | | | |
| | |
| Kazakhstan — 0.2% | | | | | | |
Tengizchevroil Finance Co. International Ltd. | | | | | | | | |
2.63%, 08/15/25 (Call 05/15/25)(a) | | | 200 | | | | 154,750 | |
3.25%, 08/15/30 (Call 02/15/30)(a) | | | 400 | | | | 255,800 | |
4.00%, 08/15/26(a) | | | 400 | | | | 309,800 | |
| | | | | | | | |
| | | | | | | 720,350 | |
| | |
| Kuwait — 0.2% | | | | | | |
Burgan Bank SAK, 5.75%, (Call 07/09/24)(a)(c)(d) | | | 200 | | | | 168,037 | |
Kuwait Projects Co. SPC Ltd. | | | | | | | | |
4.23%, 10/29/26(a) | | | 400 | | | | 329,075 | |
4.50%, 02/23/27(a) | | | 200 | | | | 156,038 | |
| | | | | | | | |
| | | | | | | 653,150 | |
| | |
| Luxembourg — 0.4% | | | | | | |
Altice Financing SA | | | | | | | | |
5.00%, 01/15/28 (Call 01/15/23)(a) | | | 500 | | | | 399,790 | |
5.75%, 08/15/29 | | | 1,000 | | | | 785,000 | |
| | | | | | | | |
| | | | | | | 1,184,790 | |
| | |
| Macau — 2.0% | | | | | | |
Champion Path Holdings Ltd. | | | | | | | | |
4.50%, 01/27/26 (Call 01/27/24)(a) | | | 200 | | | | 130,000 | |
4.85%, 01/27/28 (Call 01/27/25)(a) | | | 200 | | | | 121,537 | |
MGM China Holdings Ltd. | | | | | | | | |
4.75%, 02/01/27 (Call 02/01/24)(a) | | | 200 | | | | 148,000 | |
5.25%, 06/18/25 (Call 11/10/22)(a) | | | 200 | | | | 172,500 | |
5.38%, 05/15/24 (Call 11/10/22)(a) | | | 600 | | | | 490,500 | |
5.88%, 05/15/26 (Call 11/10/22)(a) | | | 400 | | | | 303,848 | |
| | | | | | | | |
| Security | | Par
(000) | | | Value | |
| | |
| Macau (continued) | | | | | | |
| | |
Macau (continued) | | | | | | | | |
Sands China Ltd. | | | | | | | | |
2.80%, 03/08/27 (Call 02/08/27) | | $ | 300 | | | $ | 217,470 | |
3.35%, 03/08/29 (Call 01/08/29) | | | 400 | | | | 266,000 | |
3.75%, 08/08/31 (Call 05/08/31) | | | 400 | | | | 259,720 | |
4.30%, 01/08/26 (Call 12/08/25)(b) | | | 400 | | | | 321,208 | |
4.88%, 06/18/30 (Call 03/18/30) | | | 400 | | | | 280,000 | |
5.63%, 08/08/25 (Call 06/08/25)(b) | | | 800 | | | | 702,000 | |
5.90%, 08/08/28 (Call 05/08/28)(b) | | | 800 | | | | 627,912 | |
Studio City Finance Ltd. | | | | | | | | |
5.00%, 01/15/29 (Call 01/15/24)(a) | | | 800 | | | | 331,600 | |
6.50%, 01/15/28 (Call 07/15/23)(a) | | | 200 | | | | 83,413 | |
Wynn Macau Ltd. | | | | | | | | |
4.88%, 10/01/24 (Call 11/30/22)(a) | | | 200 | | | | 152,500 | |
5.13%, 12/15/29 (Call 12/15/24)(a) | | | 400 | | | | 234,000 | |
5.50%, 01/15/26 (Call 11/30/22)(a) | | | 600 | | | | 411,000 | |
5.50%, 10/01/27 (Call 11/30/22)(a) | | | 400 | | | | 240,112 | |
5.63%, 08/26/28 (Call 08/26/23)(a) | | | 600 | | | | 354,000 | |
| | | | | | | | |
| | | | | | | 5,847,320 | |
| | |
| Mexico — 8.3% | | | | | | |
Alsea SAB de CV, 7.75%, 12/14/26
(Call 12/14/23)(a) | | | 200 | | | | 188,100 | |
Banco Mercantil del Norte SA/Grand Cayman | | | | | | | | |
5.88%, (Call 01/24/27)(a)(c)(d) | | | 400 | | | | 307,000 | |
6.63%, (Call 01/24/32)(a)(c)(d) | | | 200 | | | | 148,500 | |
6.75%, (Call 09/27/24)(a)(b)(c)(d) | | | 300 | | | | 271,875 | |
7.50%, (Call 06/27/29)(a)(c)(d) | | | 200 | | | | 154,163 | |
7.63%, (a) | | | 200 | | | | 163,288 | |
8.38%, (Call 10/14/30)(a)(c)(d) | | | 200 | | | | 167,787 | |
BBVA Bancomer SA/Texas | | | | | | | | |
5.13%, 01/18/33 (Call 01/17/28)(a)(c) | | | 400 | | | | 323,620 | |
5.88%, 09/13/34 (Call 09/13/29)(a)(c) | | | 350 | | | | 291,279 | |
Braskem Idesa SAPI | | | | | | | | |
6.99%, 02/20/32 (Call 02/20/27)(a) | | | 700 | | | | 463,841 | |
7.45%, 11/15/29 (Call 11/15/24)(a)(b) | | | 400 | | | | 303,500 | |
Cemex SAB de CV | | | | | | | | |
3.88%, 07/11/31 (Call 07/11/26)(a) | | | 500 | | | | 382,500 | |
5.20%, 09/17/30 (Call 09/17/25)(a) | | | 400 | | | | 339,950 | |
5.45%, 11/19/29 (Call 11/19/24)(a) | | | 400 | | | | 348,220 | |
7.38%, 06/05/27 (Call 06/05/23)(a) | | | 400 | | | | 393,000 | |
Cemex SAB De CV, 5.13%, (Call 06/08/26)(a)(c)(d) | | | 500 | | | | 410,275 | |
CIBANCO SA Institucion de Banca Multiple Trust CIB/3332, 4.38%, 07/22/31 (Call 04/22/31)(a) | | | 400 | | | | 248,000 | |
Grupo Aeromexico SAB de CV, 8.50%, 03/17/27
(Call 03/17/24)(a) | | | 300 | | | | 247,500 | |
Grupo Bimbo SAB de CV, 5.95%,
(Call 04/17/23)(a)(c)(d) | | | 200 | | | | 195,162 | |
Mexico Remittances Funding Fiduciary Estate Management Sarl, 4.88%, 01/15/28(a) | | | 200 | | | | 163,788 | |
Nemak SAB de CV, 3.63%, 06/28/31
(Call 03/28/31)(a) | | | 200 | | | | 144,500 | |
Petroleos Mexicanos | | | | | | | | |
4.50%, 01/23/26 | | | 600 | | | | 530,700 | |
5.35%, 02/12/28(b) | | | 953 | | | | 758,085 | |
5.95%, 01/28/31 (Call 10/28/30) | | | 1,800 | | | | 1,293,300 | |
6.35%, 02/12/48 | | | 800 | | | | 459,056 | |
6.38%, 01/23/45 | | | 600 | | | | 350,400 | |
6.49%, 01/23/27 (Call 11/23/26) | | | 748 | | | | 653,303 | |
6.50%, 03/13/27(b) | | | 1,900 | | | | 1,655,850 | |
6.50%, 01/23/29(b) | | | 575 | | | | 463,450 | |
6.50%, 06/02/41 | | | 700 | | | | 435,820 | |
6.63%, 06/15/35 | | | 1,250 | | | | 862,000 | |
6.70%, 02/16/32 (Call 11/16/31) | | | 3,300 | | | | 2,479,341 | |
6.75%, 09/21/47 | | | 2,600 | | | | 1,563,900 | |
| | |
S C H E D U L E O F I N V E S T M E N T S | | 37 |
| | |
Schedule of Investments (continued) October 31, 2022 | | iShares® J.P. Morgan EM High Yield Bond ETF (Percentages shown are based on Net Assets) |
| | | | | | | | |
| Security | | Par
(000) | | | Value | |
| | |
| Mexico (continued) | | | | | | |
6.84%, 01/23/30 (Call 10/23/29) | | $ | 1,100 | | | $ | 872,443 | |
6.88%, 08/04/26 | | | 1,300 | | | | 1,198,138 | |
6.95%, 01/28/60 (Call 07/28/59) | | | 1,800 | | | | 1,073,250 | |
7.69%, 01/23/50 (Call 07/23/49)(b) | | | 3,800 | | | | 2,449,831 | |
8.75%, 06/02/29 | | | 950 | | | | 852,031 | |
Total Play Telecomunicaciones SA de CV | | | | | | | | |
6.38%, 09/20/28 (Call 09/30/25)(a) | | | 200 | | | | 137,913 | |
7.50%, 11/12/25(a) | | | 400 | | | | 335,524 | |
| | | | | | | | |
| | |
| | | | | | | 24,080,183 | |
|
| Moldova — 0.0% | |
Aragvi Finance International SR,
8.45%, 04/29/26 (Call 04/29/24)(a) | | | 200 | | | | 139,163 | |
| | | | | | | | |
|
| Morocco — 0.4% | |
OCP SA | | | | | | | | |
3.75%, 06/23/31 (Call 03/23/31)(a) | | | 200 | | | | 148,225 | |
4.50%, 10/22/25(a) | | | 200 | | | | 190,060 | |
5.13%, 06/23/51 (Call 12/23/50)(a) | | | 400 | | | | 238,950 | |
5.63%, 04/25/24(a) | | | 300 | | | | 296,306 | |
6.88%, 04/25/44(a) | | | 400 | | | | 312,950 | |
| | | | | | | | |
| | |
| | | | | | | 1,186,491 | |
|
| Nigeria — 0.5% | |
Access Bank PLC, 9.13%, (Call 10/07/26)(a)(c)(d) | | | 400 | | | | 274,500 | |
IHS Holding Ltd. | | | | | | | | |
5.63%, 11/29/26 (Call 11/29/23)(a) | | | 200 | | | | 148,350 | |
6.25%, 11/29/28 (Call 11/29/24)(a) | | | 200 | | | | 143,037 | |
IHS Netherlands Holdco BV, 8.00%, 09/18/27
(Call 11/30/22)(a) | | | 600 | | | | 461,250 | |
SEPLAT Energy PLC, 7.75%, 04/01/26
(Call 04/01/23)(a) | | | 400 | | | | 309,200 | |
| | | | | | | | |
| | |
| | | | | | | 1,336,337 | |
|
| Oman — 0.2% | |
Bank Muscat SAOG, 4.75%, 03/17/26(a) | | | 200 | | | | 188,475 | |
Oztel Holdings SPC Ltd., 6.63%, 04/24/28(a) | | | 250 | | | | 244,344 | |
| | | | | | | | |
| | |
| | | | | | | 432,819 | |
|
| Panama — 0.2% | |
C&W Senior Financing DAC, 6.88%, 09/15/27
(Call 11/10/22)(a)(b) | | | 600 | | | | 519,000 | |
Cable Onda SA, 4.50%, 01/30/30
(Call 01/30/25)(a) | | | 200 | | | | 162,600 | |
| | | | | | | | |
| | |
| | | | | | | 681,600 | |
|
| Paraguay — 0.2% | |
Bioceanico Sovereign Certificate Ltd.,
0.00%, 06/05/34(a)(f) | | | 468 | | | | 289,173 | |
Telefonica Celular del Paraguay SA,
5.88%, 04/15/27(a) | | | 400 | | | | 361,325 | |
| | | | | | | | |
| | |
| | | | | | | 650,498 | |
|
| Peru — 0.7% | |
Cia. De Minas Buenaventur Co.,
5.50%, 07/23/26 (Call 07/23/23)(a) | | | 200 | | | | 165,475 | |
Hunt Oil Co. of Peru LLC Sucursal Del Peru,
6.38%, 06/01/28(a) | | | 183 | | | | 165,338 | |
InRetail Consumer, 3.25%, 03/22/28
(Call 01/22/28)(a) | | | 400 | | | | 316,250 | |
Minsur SA, 4.50%, 10/28/31(a) | | | 200 | | | | 159,926 | |
Peru LNG Srl, 5.38%, 03/22/30(a) | | | 400 | | | | 314,150 | |
Petroleos del Peru SA | | | | | | | | |
4.75%, 06/19/32(a) | | | 400 | | | | 293,850 | |
5.63%, 06/19/47(a) | | | 1,100 | | | | 701,250 | |
| | | | | | | | |
| | |
| | | | | | | 2,116,239 | |
|
| Philippines — 0.8% | |
Globe Telecom Inc., 4.20%, (Call 08/02/26)(a)(c)(d) | | | 400 | | | | 335,950 | |
JGSH Philippines Ltd., 4.13%, 07/09/30(a) | | | 400 | | | | 350,700 | |
Manila Water Co. Inc., 4.38%, 07/30/30
(Call 07/30/25)(a) | | | 200 | | | | 169,037 | |
| | | | | | | | |
| Security | | Par
(000) | | | Value | |
|
| Philippines (continued) | |
Petron Corp. | | | | | | | | |
4.60%, (Call 07/19/23)(a)(c)(d) | | $ | 200 | | | $ | 176,912 | |
5.95%, (Call 04/19/26)(a)(c)(d) | | | 200 | | | | 159,350 | |
San Miguel Crop., 5.50%, (Call 07/29/25)(a)(c)(d) | | | 200 | | | | 146,000 | |
SMC Global Power Holdings Corp. | | | | | | | | |
5.45%, (Call 12/09/26)(a)(c)(d) | | | 400 | | | | 249,075 | |
5.70%, (Call 01/21/26)(a)(c)(d) | | | 200 | | | | 127,538 | |
5.95%, (Call 05/05/25)(a)(c)(d) | | | 200 | | | | 129,788 | |
6.50%, (Call 04/25/24)(a)(c)(d) | | | 400 | | | | 270,825 | |
7.00%, (Call 10/21/25)(a)(c)(d) | | | 400 | | | | 267,325 | |
| | | | | | | | |
| | |
| | | | | | | 2,382,500 | |
|
| Poland — 0.1% | |
Canpack SA/Canpack U.S. LLC, 3.88%, 11/15/29
(Call 11/15/24)(a) | | | 400 | | | | 317,500 | |
| | | | | | | | |
|
| Qatar — 0.1% | |
Commercial Bank PSQC (The), 4.50%,
(Call 03/03/26)(a)(c)(d) | | | 400 | | | | 355,450 | |
| | | | | | | | |
|
| Saudi Arabia — 0.5% | |
Acwa Power Management And Investments One Ltd., 5.95%, 12/15/39(a) | | | 399 | | | | 327,294 | |
Arabian Centres Sukuk II Ltd., 5.63%, 10/07/26(a) | | | 400 | | | | 341,075 | |
Arabian Centres Sukuk Ltd., 5.38%, 11/26/24(a) | | | 200 | | | | 183,700 | |
Dar Al-Arkan Sukuk Co. Ltd., 6.75%, 02/15/25(a) | | | 200 | | | | 190,163 | |
Riyad Tier 1 Sukuk Ltd., 4.00%,
(Call 02/16/27)(a)(c)(d) | | | 400 | | | | 365,825 | |
| | | | | | | | |
| | |
| | | | | | | 1,408,057 | |
|
| Singapore — 0.2% | |
GLP Pte Ltd., 4.50%, (Call 05/17/26)(a)(c)(d) | | | 400 | | | | 160,000 | |
Singapore Airlines Ltd. | | | | | | | | |
3.00%, 07/20/26 (Call 06/20/26)(a) | | | 200 | | | | 183,480 | |
3.38%, 01/19/29 (Call 11/19/28)(a) | | | 400 | | | | 339,552 | |
| | | | | | | | |
| | |
| | | | | | | 683,032 | |
|
| South Africa — 1.4% | |
Absa Group Ltd., 6.38%, (Call 05/27/26)(a)(c)(d) | | | 200 | | | | 170,600 | |
Bidvest Group UK PLC (The), 3.63%, 09/23/26
(Call 09/23/23)(a) | | | 400 | | | | 337,075 | |
Eskom Holdings SOC Ltd. | | | | | | | | |
6.35%, 08/10/28(a) | | | 600 | | | | 537,187 | |
7.13%, 02/11/25(a) | | | 460 | | | | 428,174 | |
FirstRand Bank Ltd., 6.25%, 04/23/28
(Call 04/23/23)(a)(c) | | | 200 | | | | 193,975 | |
Liquid Telecommunications Financing Plc,
5.50%, 09/04/26 (Call 03/04/23)(a) | | | 400 | | | | 270,000 | |
MTN Mauritius Investments Ltd.,
6.50%, 10/13/26(a) | | | 200 | | | | 189,912 | |
Sasol Financing USA LLC | | | | | | | | |
4.38%, 09/18/26 (Call 08/18/26)(b) | | | 200 | | | | 174,788 | |
5.50%, 03/18/31 (Call 03/18/30) | | | 400 | | | | 298,825 | |
5.88%, 03/27/24 (Call 02/27/24)(b) | | | 800 | | | | 777,000 | |
6.50%, 09/27/28 (Call 06/27/28) | | | 400 | | | | 352,825 | |
Stillwater Mining Co. | | | | | | | | |
4.00%, 11/16/26 (Call 11/16/23)(a) | | | 200 | | | | 163,725 | |
4.50%, 11/16/29 (Call 11/16/25)(a) | | | 400 | | | | 292,800 | |
| | | | | | | | |
| | |
| | | | | | | 4,186,886 | |
| | |
| South Korea — 0.1% | | | | | | |
Woori Bank, 4.25%, (Call 10/04/24)(a)(c)(d) | | | 200 | | | | 172,288 | |
| | | | | | | | |
|
| Supranational — 0.2% | |
Eastern & Southern African Trade & Development Bank (The) | | | | | | | | |
4.13%, 06/30/28(a) | | | 400 | | | | 320,441 | |
4.88%, 05/23/24(a) | | | 200 | | | | 186,099 | |
| | | | | | | | |
| | |
| | | | | | | 506,540 | |
| | |
| 38 | | 2 0 2 2 I S H A R E S A N N U A L R E P O R T T O S H A R E H O L D E R S |
| | |
Schedule of Investments (continued) October 31, 2022 | | iShares® J.P. Morgan EM High Yield Bond ETF (Percentages shown are based on Net Assets) |
| | | | | | | | |
| Security | | Par
(000) | | | Value | |
|
| Switzerland — 0.0% | |
Oriflame Investment Holding PLC,
5.13%, 05/04/26 (Call 05/15/23)(a) | | $ | 200 | | | $ | 116,278 | |
| | | | | | | | |
|
| Tanzania — 0.1% | |
HTA Group Ltd./Mauritius, 7.00%, 12/18/25
(Call 11/30/22)(a) | | | 400 | | | | 351,200 | |
| | | | | | | | |
|
| Thailand — 0.6% | |
Bangkok Bank PCL/Hong Kong | | | | | | | | |
3.73%, 09/25/34 (Call 09/25/29)(a)(c) | | | 600 | | | | 445,612 | |
5.00%, (a) | | | 400 | | | | 352,300 | |
Kasikornbank PCL/Hong Kong, 3.34%, 10/02/31
(Call 10/02/26)(a)(c) | | | 600 | | | | 491,820 | |
Krung Thai Bank PCL/Cayman Islands, 4.40%,
(Call 03/25/26)(a)(c)(d) | | | 400 | | | | 318,575 | |
| | | | | | | | |
| | |
| | | | | | | 1,608,307 | |
|
| Togo — 0.1% | |
Ecobank Transnational Inc., 9.50%, 04/18/24(a) | | | 200 | | | | 187,912 | |
| | | | | | | | |
|
Turkey — 2.4% | |
|
Akbank TAS | | | | | | | | |
5.13%, 03/31/25(a) | | | 200 | | | | 178,037 | |
6.80%, 02/06/26(a) | | | 200 | | | | 180,350 | |
6.80%, 06/22/31 (Call 06/22/26)(a)(c) | | | 400 | | | | 327,950 | |
Anadolu Efes Biracilik Ve Malt Sanayii AS,
3.38%, 06/29/28 (Call 03/29/28)(a) | | | 200 | | | | 140,288 | |
Aydem Yenilenebilir Enerji AS, 7.75%, 02/02/27
(Call 02/02/24)(a) | | | 400 | | | | 294,575 | |
Coca-Cola Icecek AS, 4.50%, 01/20/29
(Call 10/20/28)(a) | | | 200 | | | | 159,538 | |
KOC Holding AS, 6.50%, 03/11/25
(Call 12/11/24)(a) | | | 400 | | | | 374,700 | |
Mersin Uluslararasi Liman Isletmeciligi AS,
5.38%, 11/15/24 (Call 11/30/22)(a) | | | 200 | | | | 183,412 | |
QNB Finansbank AS, 6.88%, 09/07/24(a) | | | 400 | | | | 398,700 | |
Turk Telekomunikasyon AS | | | | | | | | |
4.88%, 06/19/24(a) | | | 200 | | | | 175,000 | |
6.88%, 02/28/25(a) | | | 200 | | | | 173,788 | |
Turkcell Iletisim Hizmetleri AS | | | | | | | | |
5.75%, 10/15/25(a) | | | 200 | | | | 176,288 | |
5.80%, 04/11/28 (Call 01/11/28)(a) | | | 200 | | | | 158,475 | |
Turkiye Garanti Bankasi AS, 7.18%, 05/24/27(a)(c) | | | 400 | | | | 340,450 | |
Turkiye Is Bankasi AS | | | | | | | | |
6.13%, 04/25/24(a) | | | 600 | | | | 568,050 | |
7.00%, 06/29/28 (Call 06/29/23)(a)(c) | | | 200 | | | | 179,412 | |
7.75%, 01/22/30 (Call 01/22/25)(a)(c) | | | 400 | | | | 349,700 | |
Turkiye Petrol Rafinerileri AS, 4.50%, 10/18/24
(Call 07/20/24)(a) | | | 400 | | | | 365,200 | |
Turkiye Sise ve Cam Fabrikalari AS,
6.95%, 03/14/26 (Call 12/14/25)(a) | | | 300 | | | | 276,675 | |
Turkiye Vakiflar Bankasi TAO | | | | | | | | |
5.25%, 02/05/25(a) | | | 400 | | | | 361,412 | |
6.50%, 01/08/26(a) | | | 400 | | | | 349,325 | |
8.13%, 03/28/24(a) | | | 200 | | | | 194,912 | |
Ulker Biskuvi Sanayi AS, 6.95%, 10/30/25(a) | | | 200 | | | | 138,750 | |
Yapi ve Kredi Bankasi AS | | | | | | | | |
5.85%, 06/21/24(a) | | | 300 | | | | 284,400 | �� |
7.88%, 01/22/31 (Call 01/22/26)(a)(c) | | | 200 | | | | 174,475 | |
8.25%, 10/15/24(a) | | | 200 | | | | 193,725 | |
13.88%, (Call 01/15/24)(a)(c)(d) | | | 400 | | | | 412,200 | |
| | | | | | | | |
| | |
| | | | | | | 7,109,787 | |
|
| Ukraine — 0.0% | |
DTEK Finance PLC, 7.00%, (5.00% PIK), 12/31/27 (Call 11/30/22)(a)(e) | | | 5 | | | | 1,084 | |
| | | | | | | | |
| Security | | Par
(000) | | | Value | |
|
| Ukraine (continued) | |
Metinvest BV, 7.75%, 10/17/29(a) | | $ | 200 | | | $ | 79,725 | |
| | | | | | | | |
| | |
| | | | | | | 80,809 | |
|
| United Arab Emirates — 1.4% | |
ADIB Capital Invest 2 Ltd., 7.13%,
(Call 09/20/23)(a)(c)(d) | | | 400 | | | | 398,825 | |
Commercial Bank of Dubai PSC, 6.00%,
(Call 04/21/26)(a)(c)(d) | | | 200 | | | | 187,288 | |
DIB Tier 1 Sukuk 3 Ltd., 6.25%,
(Call 01/22/25)(a)(c)(d) | | | 400 | | | | 396,016 | |
DIB Tier 1 Sukuk 4 Ltd., 4.63%,
(Call 05/19/26)(a)(c)(d) | | | 400 | | | | 373,950 | |
DP World Salaam, 6.00%, (Call 10/01/25)(a)(c)(d) | | | 600 | | | | 579,937 | |
Emirates NBD Bank PJSC | | | | | | | | |
4.25%, (Call 02/27/27)(a)(c)(d) | | | 400 | | | | 339,825 | |
6.13%, (Call 03/20/25)(a)(c)(d) | | | 400 | | | | 377,950 | |
6.13%, (Call 04/09/26)(a)(c)(d) | | | 400 | | | | 376,500 | |
GEMS MENASA Cayman Ltd./GEMS Education Delaware LLC, 7.13%, 07/31/26
(Call 11/30/22)(a) | | | 400 | | | | 375,250 | |
MAF Global Securities Ltd., 7.88%,
(Call 06/30/27)(a)(c)(d) | | | 200 | | | | 191,287 | |
Petrofac Ltd., 9.75%, 11/15/26 (Call 11/15/23)(a) | | | 200 | | | | 151,710 | |
Shelf Drilling Holdings Ltd., 8.25%, 02/15/25(a) | | | 470 | | | | 394,800 | |
| | | | | | | | |
| | |
| | | | | | | 4,143,338 | |
|
| United States — 0.2% | |
Playtika Holding Corp., 4.25%, 03/15/29
(Call 03/15/24)(a) | | | 300 | | | | 249,891 | |
Sagicor Financial Co. Ltd., 5.30%, 05/13/28
(Call 05/13/24)(a) . | | | 200 | | | | 182,900 | |
| | | | | | | | |
| | |
| | | | | | | 432,791 | |
|
| Vietnam — 0.1% | |
Mong Duong Finance Holdings BV,
5.13%, 05/07/29(a) | | | 250 | | | | 173,250 | |
| | | | | | | | |
|
| Zambia — 0.8% | |
First Quantum Minerals Ltd. | | | | | | | | |
6.50%, 03/01/24 (Call 11/10/22)(a) | | | 400 | | | | 390,200 | |
6.88%, 03/01/26 (Call 11/10/22)(a) | | | 600 | | | | 561,549 | |
6.88%, 10/15/27 (Call 10/15/23)(a) | | | 800 | | | | 740,850 | |
7.50%, 04/01/25 (Call 11/10/22)(a) | | | 600 | | | | 577,800 | |
| | | | | | | | |
| | |
| | | | | | | 2,270,399 | |
| | | | | | | | |
| | |
Total Corporate Bonds & Notes — 49.4%
(Cost: $183,415,495) | | | | | | | 143,925,856 | |
| | | | | | | | |
|
Foreign Government Obligations(j) | |
|
| Angola — 1.1% | |
Angolan Government International Bond | | | | | | | | |
8.00%, 11/26/29(a) | | | 800 | | | | 650,000 | |
8.25%, 05/09/28(a) | | | 800 | | | | 670,000 | |
8.75%, 04/14/32(a) | | | 900 | | | | 720,000 | |
9.13%, 11/26/49(a) | | | 600 | | | | 450,300 | |
| | |
9.38%, 05/08/48(a) | | | 800 | | | | 608,000 | |
| | | | | | | | |
| | |
| | | | | | | 3,098,300 | |
|
| Argentina — 2.3% | |
Argentine Republic Government International Bond | | | | | | | | |
0.50%, 07/09/30 (Call 12/01/22)(k) | | | 7,669 | | | | 1,606,757 | |
1.00%, 07/09/29 (Call 12/01/22)(b) | | | 1,231 | | | | 251,712 | |
1.50%, 07/09/35 (Call 12/01/22)(k) | | | 9,814 | | | | 1,943,218 | |
1.50%, 07/09/46 (Call 12/01/22)(k) | | | 1,026 | | | | 207,085 | |
3.50%, 07/09/41 (Call 12/01/22)(b)(k) | | | 5,054 | | | | 1,200,232 | |
3.88%, 01/09/38 (Call 12/01/22)(k) | | | 5,399 | | | | 1,387,756 | |
| | | | | | | | |
| | |
| | | | | | | 6,596,760 | |
| | |
S C H E D U L E O F I N V E S T M E N T S | | 39 |
| | |
Schedule of Investments (continued) October 31, 2022 | | iShares® J.P. Morgan EM High Yield Bond ETF (Percentages shown are based on Net Assets) |
| | | | | | | | |
| Security | | Par
(000) | | | Value | |
|
| Azerbaijan — 0.3% | |
Republic of Azerbaijan International Bond | | | | | | | | |
3.50%, 09/01/32(a) | | $ | 450 | | | $ | 359,803 | |
4.75%, 03/18/24(a) | | | 600 | | | | 583,988 | |
| | | | | | | | |
| | |
| | | | | | | 943,791 | |
|
| Bahrain — 2.4% | |
Bahrain Government International Bond | | | | | | | | |
5.25%, 01/25/33(a) | | | 600 | | | | 469,968 | |
5.45%, 09/16/32(a) | | | 400 | | | | 322,296 | |
5.63%, 09/30/31(a) | | | 400 | | | | 333,556 | |
5.63%, 05/18/34(a) | | | 600 | | | | 472,752 | |
6.00%, 09/19/44(a) | | | 600 | | | | 419,175 | |
6.75%, 09/20/29(a) | | | 600 | | | | 562,238 | |
7.00%, 01/26/26(a) | | | 600 | | | | 597,862 | |
7.00%, 10/12/28(a) | | | 700 | | | | 669,506 | |
7.38%, 05/14/30(a) | | | 400 | | | | 380,075 | |
CBB International Sukuk Co. 5 SPC,
5.62%, 02/12/24(a) | | | 600 | | | | 597,862 | |
CBB International Sukuk Co. 7 SPC,
6.88%, 10/05/25(a) | | | 400 | | | | 409,700 | |
CBB International Sukuk Programme Co. WLL | | | | | | | | |
3.88%, 05/18/29(b)(i) | | | 75 | | | | 64,256 | |
3.88%, 05/18/29(a) | | | 350 | | | | 299,863 | |
3.95%, 09/16/27(a) | | | 500 | | | | 460,250 | |
4.50%, 03/30/27(a) | | | 400 | | | | 376,950 | |
6.25%, 11/14/24(a) | | | 600 | | | | 602,436 | |
| | | | | | | | |
| | |
| | | | | | | 7,038,745 | |
|
| Bolivia — 0.1% | |
Bolivian Government International Bond,
4.50%, 03/20/28(a)(b) | | | 400 | | | | 312,825 | |
| | | | | | | | |
|
| Brazil — 4.9% | |
Brazilian Government International Bond | | | | | | | | |
2.88%, 06/06/25 | | | 800 | | | | 750,800 | |
3.75%, 09/12/31(b) | | | 500 | | | | 411,000 | |
3.88%, 06/12/30(b) | | | 1,700 | | | | 1,427,787 | |
4.25%, 01/07/25(b) | | | 1,948 | | | | 1,893,578 | |
4.50%, 05/30/29 (Call 02/28/29)(b) | | | 1,000 | | | | 894,875 | |
4.63%, 01/13/28 (Call 10/13/27)(b) | | | 1,600 | | | | 1,499,300 | |
4.75%, 01/14/50 (Call 07/14/49) | | | 1,850 | | | | 1,236,378 | |
5.00%, 01/27/45(b) | | | 1,700 | | | | 1,221,131 | |
5.63%, 01/07/41 | | | 1,100 | | | | 882,956 | |
5.63%, 02/21/47(b) | | | 1,300 | | | | 984,588 | |
6.00%, 04/07/26(b) | | | 1,000 | | | | 1,022,375 | |
7.13%, 01/20/37(b) | | | 800 | | | | 796,900 | |
8.25%, 01/20/34(b) | | | 650 | | | | 701,513 | |
8.88%, 04/15/24 | | | 450 | | | | 474,131 | |
| | | | | | | | |
| | |
| | | | | | | 14,197,312 | |
|
| Colombia — 3.7% | |
Colombia Government International Bond | | | | | | | | |
3.00%, 01/30/30 (Call 10/30/29) | | | 700 | | | | 494,550 | |
3.13%, 04/15/31 (Call 01/15/31) | | | 1,200 | | | | 822,975 | |
3.25%, 04/22/32 (Call 01/22/32) | | | 1,000 | | | | 663,500 | |
3.88%, 04/25/27 (Call 01/25/27)(b) | | | 800 | | | | 666,150 | |
3.88%, 02/15/61 (Call 08/15/60) | | | 600 | | | | 303,112 | |
4.00%, 02/26/24 (Call 11/26/23) | | | 800 | | | | 766,150 | |
4.13%, 02/22/42 (Call 08/22/41) | | | 400 | | | | 222,600 | |
4.13%, 05/15/51 (Call 11/15/50)(b) | | | 800 | | | | 423,150 | |
4.50%, 01/28/26 (Call 10/28/25)(b) | | | 800 | | | | 718,150 | |
4.50%, 03/15/29 (Call 12/15/28)(b) | | | 1,000 | | | | 806,750 | |
5.00%, 06/15/45 (Call 12/15/44) | | | 2,200 | | | | 1,334,850 | |
5.20%, 05/15/49 (Call 11/15/48)(b) | | | 1,250 | | | | 759,219 | |
5.63%, 02/26/44 (Call 08/26/43)(b) | | | 1,200 | | | | 775,800 | |
| | | | | | | | |
| Security | | Par
(000) | | | Value | |
|
| Colombia (continued) | |
6.13%, 01/18/41 | | $ | 1,250 | | | $ | 893,203 | |
7.38%, 09/18/37(b) | | | 900 | | | | 757,294 | |
8.13%, 05/21/24(b) | | | 375 | | | | 375,656 | |
| | | | | | | | |
| | |
| | | | | | | 10,783,109 | |
|
| Costa Rica — 0.5% | |
Costa Rica Government International Bond | | | | | | | | |
6.13%, 02/19/31(a)(b) | | | 600 | | | | 556,050 | |
7.00%, 04/04/44(a) | | | 450 | | | | 380,616 | |
7.16%, 03/12/45(a) | | | 600 | | | | 517,237 | |
| | | | | | | | |
| | |
| | | | | | | 1,453,903 | |
|
| Dominican Republic — 3.3% | |
Dominican Republic International Bond | | | | | | | | |
4.50%, 01/30/30(a) | | | 1,000 | | | | 798,312 | |
4.88%, 09/23/32(a) | | | 1,500 | | | | 1,150,594 | |
5.30%, 01/21/41(a) | | | 700 | | | | 480,069 | |
5.50%, 01/27/25(a) | | | 525 | | | | 512,466 | |
5.50%, 02/22/29 (Call 12/22/28)(a) | | | 850 | | | | 738,862 | |
5.88%, 01/30/60(a) | | | 1,500 | | | | 1,005,000 | |
5.95%, 01/25/27(a) | | | 850 | | | | 791,456 | |
6.00%, 07/19/28(a) | | | 600 | | | | 545,925 | |
6.00%, 02/22/33 (Call 11/22/32)(a) | | | 1,000 | | | | 833,312 | |
6.40%, 06/05/49(a) | | | 600 | | | | 429,675 | |
6.50%, 02/15/48(a) | | | 450 | | | | 327,038 | |
6.85%, 01/27/45(a)(b) | | | 1,000 | | | | 768,312 | |
6.88%, 01/29/26(a) | | | 700 | | | | 685,694 | |
7.45%, 04/30/44(a) | | | 750 | | | | 625,688 | |
| | | | | | | | |
| | |
| | | | | | | 9,692,403 | |
|
| Ecuador — 1.1% | |
Ecuador Government International Bond | | | | | | | | |
0.00%, 07/31/30(a)(f) | | | 467 | | | | 143,574 | |
1.50%, 07/31/40(a)(k) | | | 1,613 | | | | 523,046 | |
2.50%, 07/31/35(a)(k) | | | 4,110 | | | | 1,493,410 | |
5.50%, 07/31/30(a)(k) | | | 1,756 | | | | 930,239 | |
| | | | | | | | |
| | |
| | | | | | | 3,090,269 | |
|
| Egypt — 2.6% | |
Egypt Government International Bond | | | | | | | | |
5.75%, 05/29/24(a) | | | 600 | | | | 564,750 | |
5.80%, 09/30/27(a) | | | 400 | | | | 290,500 | |
5.88%, 06/11/25(a) | | | 800 | | | | 687,000 | |
5.88%, 02/16/31(a) | | | 800 | | | | 486,400 | |
6.59%, 02/21/28(a) | | | 600 | | | | 429,000 | |
7.05%, 01/15/32(a) | | | 400 | | | | 251,450 | |
7.30%, 09/30/33(a) | | | 600 | | | | 372,750 | |
7.50%, 01/31/27(a) | | | 1,000 | | | | 803,750 | |
7.50%, 02/16/61(a) | | | 600 | | | | 339,000 | |
7.60%, 03/01/29(a) | | | 800 | | | | 572,000 | |
7.63%, 05/29/32(a) | | | 800 | | | | 507,150 | |
7.90%, 02/21/48(a) | | | 850 | | | | 474,937 | |
8.50%, 01/31/47(a) | | | 1,300 | | | | 765,375 | |
8.70%, 03/01/49(a) | | | 600 | | | | 354,750 | |
8.88%, 05/29/50(a) | | | 1,000 | | | | 592,500 | |
| | | | | | | | |
| | |
| | | | | | | 7,491,312 | |
|
| El Salvador — 0.2% | |
El Salvador Government International Bond | | | | | | | | |
7.12%, 01/20/50 (Call 07/20/49)(a) | | | 550 | | | | 184,525 | |
7.65%, 06/15/35(a) | | | 450 | | | | 160,256 | |
9.50%, 07/15/52 (Call 01/15/52)(a) | | | 550 | | | | 206,250 | |
| | | | | | | | |
| | |
| | | | | | | 551,031 | |
| | |
| 40 | | 2 0 2 2 I S H A R E S A N N U A L R E P O R T T O S H A R E H O L D E R S |
| | |
Schedule of Investments (continued) October 31, 2022 | | iShares® J.P. Morgan EM High Yield Bond ETF (Percentages shown are based on Net Assets) |
| | | | | | | | |
| Security | | Par
(000) | | | Value | |
| | |
| Ethiopia — 0.1% | | | | | | |
Ethiopia International Bond, 6.63%, 12/11/24(a) | | $ | 400 | | | $ | 201,075 | |
| | | | | | | | |
| | |
| Gabon — 0.1% | | | | | | |
Gabon Government International Bond, 6.63%, 02/06/31(a) | | | 400 | | | | 279,075 | |
| | | | | | | | |
| | |
| Ghana — 0.5% | | | | | | |
Ghana Government International Bond | | | | | | | | |
6.38%, 02/11/27(a) | | | 600 | | | | 180,000 | |
7.63%, 05/16/29(a) | | | 500 | | | | 137,500 | |
7.75%, 04/07/29(a) | | | 600 | | | | 169,987 | |
7.88%, 02/11/35(a) | | | 400 | | | | 110,950 | |
8.13%, 01/18/26(a) | | | 470 | | | | 170,904 | |
8.13%, 03/26/32(a) | | | 500 | | | | 140,000 | |
8.63%, 04/07/34(a) | | | 400 | | | | 112,500 | |
8.63%, 06/16/49(a) | | | 600 | | | | 160,988 | |
8.95%, 03/26/51(a) | | | 500 | | | | 139,781 | |
10.75%, 10/14/30(a) | | | 400 | | | | 258,000 | |
| | | | | | | | |
| | | | | | | 1,580,610 | |
| | |
| Guatemala — 0.2% | | | | | | |
Guatemala Government Bond, 6.13%, 06/01/50 (Call 12/01/49)(a) | | | 700 | | | | 601,038 | |
| | | | | | | | |
| | |
| Iraq — 0.2% | | | | | | |
Iraq International Bond, 5.80%, 01/15/28(Call 12/15/22)(a) | | | 859 | | | | 729,019 | |
| | | | | | | | |
| | |
| Ivory Coast — 0.2% | | | | | | |
Ivory Coast Government International Bond, 6.13%, 06/15/33(a) | | | 600 | | | | 466,050 | |
| | | | | | | | |
| | |
| Jamaica — 0.8% | | | | | | |
Jamaica Government International Bond | | | | | | | | |
6.75%, 04/28/28(b) | | | 600 | | | | 626,738 | |
7.88%, 07/28/45(b) | | | 900 | | | | 953,887 | |
8.00%, 03/15/39(b) | | | 600 | | | | 660,487 | |
| | | | | | | | |
| | | | | | | 2,241,112 | |
| | |
| Jordan — 0.6% | | | | | | |
Jordan Government International Bond | | | | | | | | |
5.75%, 01/31/27(a) | | | 600 | | | | 548,550 | |
5.85%, 07/07/30(a) | | | 700 | | | | 579,250 | |
6.13%, 01/29/26(a) | | | 400 | | | | 381,450 | |
7.38%, 10/10/47(a) | | | 400 | | | | 298,500 | |
| | | | | | | | |
| | | | | | | 1,807,750 | |
| | |
| Kenya — 0.8% | | | | | | |
Republic of Kenya Government International Bond | | | | | | | | |
6.30%, 01/23/34(a) | | | 400 | | | | 252,000 | |
6.88%, 06/24/24(a) | | | 1,000 | | | | 872,500 | |
7.25%, 02/28/28(a) | | | 400 | | | | 302,000 | |
8.00%, 05/22/32(a) | | | 600 | | | | 417,000 | |
8.25%, 02/28/48(a) | | | 600 | | | | 378,000 | |
| | | | | | | | |
| | | | | | | 2,221,500 | |
| | |
| Lebanon — 0.1% | | | | | | |
Lebanon Government International Bond | | | | | | | | |
6.00%, 01/27/23(a)(g)(h) | | | 500 | | | | 28,531 | |
6.10%, 10/04/24 | | | 730 | | | | 44,393 | |
6.60%, 12/31/99(a)(f)(g)(h) | | | 760 | | | | 43,130 | |
6.65%, 12/31/99(a)(g)(h) | | | 760 | | | | 42,893 | |
6.75%, 12/31/99(a)(g)(h) | | | 470 | | | | 26,673 | |
6.85%, 12/31/99(a)(g)(h) | | | 590 | | | | 33,298 | |
7.00%, 12/31/99(a)(g)(h) | | | 475 | | | | 26,956 | |
| | | | | | | | |
| | | | | | | 245,874 | |
| | | | | | | | |
| Security | | Par
(000) | | | Value | |
| | |
| Morocco — 0.2% | | | | | | |
Morocco Government International Bond | | | | | | | | |
3.00%, 12/15/32(a) | | $ | 400 | | | $ | 287,450 | |
4.00%, 12/15/50(a) | | | 600 | | | | 353,362 | |
| | | | | | | | |
| | | | | | | 640,812 | |
| | |
| Nigeria — 1.5% | | | | | | |
Nigeria Government International Bond | | | | | | | | |
6.13%, 09/28/28(a) | | | 800 | | | | 526,000 | |
6.50%, 11/28/27(a) | | | 600 | | | | 424,500 | |
7.14%, 02/23/30(a) | | | 714 | | | | 464,100 | |
7.38%, 09/28/33(a) | | | 600 | | | | 361,500 | |
7.63%, 11/21/25(a) | | | 500 | | | | 430,000 | |
7.63%, 11/28/47(a) | | | 600 | | | | 339,000 | |
7.70%, 02/23/38(a) | | | 600 | | | | 351,000 | |
7.88%, 02/16/32(a) | | | 800 | | | | 512,000 | |
8.25%, 09/28/51(a) | | | 600 | | | | 345,000 | |
8.38%, 03/24/29(a) | | | 600 | | | | 433,500 | |
8.75%, 01/21/31(a) | | | 400 | | | | 280,000 | |
| | | | | | | | |
| | | | | | | 4,466,600 | |
| | |
| Oman — 3.9% | | | | | | |
Oman Government International Bond | | | | | | | | |
4.75%, 06/15/26(a) | | | 1,000 | | | | 945,000 | |
4.88%, 02/01/25(a) | | | 200 | | | | 194,000 | |
5.38%, 03/08/27(a) | | | 1,000 | | | | 952,500 | |
5.63%, 01/17/28(a) | | | 1,200 | | | | 1,140,000 | |
6.00%, 08/01/29(a) | | | 1,200 | | | | 1,138,500 | |
6.25%, 01/25/31(a) | | | 800 | | | | 762,000 | |
6.50%, 03/08/47(a) | | | 1,000 | | | | 823,750 | |
6.75%, 10/28/27(a) | | | 800 | | | | 801,150 | |
6.75%, 01/17/48(a) | | | 1,200 | | | | 1,006,500 | |
7.00%, 01/25/51(a) | | | 400 | | | | 341,000 | |
7.38%, 10/28/32(a) | | | 600 | | | | 612,000 | |
Oman Sovereign Sukuk Co. | | | | | | | | |
4.40%, 06/01/24(a) | | | 1,000 | | | | 975,000 | |
4.88%, 06/15/30(a) | | | 800 | | | | 759,650 | |
5.93%, 10/31/25(a) | | | 800 | | | | 806,000 | |
| | | | | | | | |
| | | | | | | 11,257,050 | |
| | |
| Pakistan — 0.4% | | | | | | |
Pakistan Global Sukuk Programme Co. Ltd. (The), 7.95%, 01/31/29(a) | | | 400 | | | | 206,023 | |
Pakistan Government International Bond | | | | | | | | |
6.00%, 04/08/26(a) | | | 800 | | | | 250,088 | |
6.88%, 12/05/27(a) | | | 750 | | | | 232,583 | |
7.38%, 04/08/31(a) | | | 600 | | | | 181,566 | |
8.25%, 04/15/24(a) | | | 470 | | | | 195,102 | |
| | | | | | | | |
| | | | | | | 1,065,362 | |
| | |
| Paraguay — 0.4% | | | | | | |
Paraguay Government International Bond | | | | | | | | |
4.95%, 04/28/31 (Call 01/28/31)(a) | | | 400 | | | | 364,950 | |
5.40%, 03/30/50 (Call 09/30/49)(a) | | | 600 | | | | 456,862 | |
6.10%, 08/11/44(a) | | | 400 | | | | 343,700 | |
| | | | | | | | |
| | | | | | | 1,165,512 | |
| | |
| Senegal — 0.2% | | | | | | |
Senegal Government International Bond | | | | | | | | |
6.25%, 05/23/33(a) | | | 300 | | | | 223,650 | |
6.75%, 03/13/48(a) | | | 600 | | | | 379,988 | |
| | | | | | | | |
| | | | | | | 603,638 | |
| | |
| Serbia — 0.1% | | | | | | |
Serbia International Bond, 2.13%, 12/01/30(a) | | | 535 | | | | 368,247 | |
| | | | | | | | |
| | |
S C H E D U L E O F I N V E S T M E N T S | | 41 |
| | |
Schedule of Investments (continued) October 31, 2022 | | iShares® J.P. Morgan EM High Yield Bond ETF (Percentages shown are based on Net Assets) |
| | | | | | | | |
| Security | | Par
(000) | | | Value | |
| | |
| South Africa — 2.8% | | | | | | |
Republic of South Africa Government International Bond | | | | | |
4.30%, 10/12/28(b) | | $ | 1,000 | | | $ | 851,750 | |
4.67%, 01/17/24(b) | | | 800 | | | | 785,400 | |
4.85%, 09/27/27(b) | | | 400 | | | | 361,950 | |
4.85%, 09/30/29 | | | 900 | | | | 762,356 | |
4.88%, 04/14/26(b) | | | 604 | | | | 565,797 | |
5.00%, 10/12/46 | | | 600 | | | | 375,863 | |
5.38%, 07/24/44 | | | 500 | | | | 332,594 | |
5.65%, 09/27/47 | | | 800 | | | | 531,000 | |
5.75%, 09/30/49 | | | 1,350 | | | | 894,375 | |
5.88%, 09/16/25 | | | 986 | | | | 974,168 | |
5.88%, 06/22/30(b) | | | 600 | | | | 531,487 | |
5.88%, 04/20/32 | | | 700 | | | | 597,625 | |
7.30%, 04/20/52 | | | 700 | | | | 544,250 | |
| | | | | | | | |
| | | | | | | 8,108,615 | |
| | |
| Sri Lanka — 0.3% | | | | | | |
Sri Lanka Government International Bond | | | | | | | | |
6.20%, 05/11/27(a)(g)(h) | | | 700 | | | | 148,827 | |
6.75%, 04/18/28(a)(g)(h) | | | 700 | | | | 153,912 | |
6.83%, 07/18/26(a)(g)(h) | | | 600 | | | | 135,300 | |
6.85%, 03/14/24(a)(g)(h) | | | 600 | | | | 134,738 | |
6.85%, 11/03/25(a)(g)(h) | | | 700 | | | | 156,100 | |
7.55%, 03/28/30(a)(g)(h) | | | 400 | | | | 87,325 | |
7.85%, 03/14/29(a)(g)(h) | | | 700 | | | | 151,725 | |
| | | | | | | | |
| | | | | | | 967,927 | |
| | |
| Trinidad And Tobago — 0.1% | | | | | | |
Trinidad & Tobago Government International Bond, 4.50%, 08/04/26(a)(b) | | | 400 | | | | 384,575 | |
| | | | | | | | |
| | |
| Tunisia — 0.1% | | | | | | |
Tunisian Republic, 5.75%, 01/30/25(a) | | | 400 | | | | 249,950 | |
| | | | | | | | |
| | |
| Turkey — 10.2% | | | | | | |
Hazine Mustesarligi Varlik Kiralama AS | | | | | | | | |
4.49%, 11/25/24(a) | | | 400 | | | | 369,450 | |
5.13%, 06/22/26(a) | | | 1,200 | | | | 1,057,350 | |
7.25%, 02/24/27(a) | | | 1,500 | | | | 1,383,562 | |
9.76%, 11/13/25 | | | 1,200 | | | | 1,215,000 | |
Turkey Government International Bond | | | | | | | | |
4.25%, 03/13/25 | | | 1,000 | | | | 903,750 | |
4.25%, 04/14/26(b) | | | 700 | | | | 594,125 | |
4.75%, 01/26/26(b) | | | 800 | | | | 700,000 | |
4.88%, 10/09/26 | | | 1,500 | | | | 1,273,125 | |
4.88%, 04/16/43 | | | 1,370 | | | | 801,450 | |
5.13%, 02/17/28 | | | 1,000 | | | | 807,500 | |
5.25%, 03/13/30 | | | 900 | | | | 669,375 | |
5.60%, 11/14/24 | | | 1,100 | | | | 1,050,500 | |
5.75%, 03/22/24 | | | 1,250 | | | | 1,226,563 | |
5.75%, 05/11/47 | | | 1,600 | | | | 984,000 | |
5.88%, 06/26/31 | | | 900 | | | | 676,125 | |
5.95%, 01/15/31 | | | 1,200 | | | | 916,500 | |
6.00%, 03/25/27(b) | | | 1,500 | | | | 1,303,125 | |
6.00%, 01/14/41 | | | 1,500 | | | | 963,750 | |
6.13%, 10/24/28 | | | 1,300 | | | | 1,080,625 | |
6.35%, 08/10/24(b) | | | 1,050 | | | | 1,024,603 | |
6.38%, 10/14/25 | | | 1,200 | | | | 1,111,500 | |
6.50%, 09/20/33 | | | 700 | | | | 525,000 | |
6.63%, 02/17/45(b) | | | 1,400 | | | | 950,250 | |
6.75%, 05/30/40 | | | 950 | | | | 680,438 | |
6.88%, 03/17/36 | | | 1,300 | | | | 975,000 | |
7.25%, 12/23/23 | | | 800 | | | | 807,000 | |
| | | | | | | | |
| Security | | Par/
Shares
(000) | | | Value | |
| | |
| Turkey (continued) | | | | | | |
7.25%, 03/05/38 | | $ | 500 | | | $ | 393,750 | |
7.38%, 02/05/25 | | | 1,570 | | | | 1,536,637 | |
7.63%, 04/26/29(b) | | | 1,400 | | | | 1,233,750 | |
8.00%, 02/14/34 | | | 750 | | | | 656,250 | |
8.60%, 09/24/27 | | | 1,000 | | | | 958,750 | |
11.88%, 01/15/30 | | | 700 | | | | 768,250 | |
Turkiye Vakiflar Bankasi TAO, 5.50%, 10/01/26(a) | | | 200 | | | | 166,100 | |
| | | | | | | | |
| | | | | | | 29,763,153 | |
| | |
| Ukraine — 0.4% | | | | | | |
Ukraine Government International Bond | | | | | | | | |
6.88%, 05/21/31(a)(g)(h) | | | 800 | | | | 115,900 | |
7.25%, 03/15/35(a)(g)(h) | | | 1,200 | | | | 179,100 | |
7.38%, 09/25/34(a)(g)(h) | | | 1,400 | | | | 209,825 | |
7.75%, 09/01/25(a)(g)(h) | | | 625 | | | | 130,977 | |
7.75%, 09/01/26(a)(g)(h) | | | 700 | | | | 115,412 | |
7.75%, 09/01/27(a)(g)(h) | | | 675 | | | | 112,134 | |
7.75%, 09/01/28(a)(g)(h) | | | 600 | | | | 106,500 | |
7.75%, 09/01/29(a)(g)(h) | | | 650 | | | | 113,669 | |
9.75%, 11/01/30(a)(g)(h) | | | 800 | | | | 146,650 | |
| | | | | | | | |
| | | | | | | 1,230,167 | |
| | |
| United Arab Emirates — 1.0% | | | | | | |
Emirate of Dubai Government International Bonds | | | | | | | | |
3.90%, 09/09/50(a) | | | 600 | | | | 388,425 | |
5.25%, 01/30/43(a) | | | 600 | | | | 499,613 | |
Finance Department Government of Sharjah,
4.00%, 07/28/50(a) | | | 500 | | | | 287,281 | |
Sharjah Sukuk Program Ltd. | | | | | | | | |
2.94%, 06/10/27(a) | | | 400 | | | | 340,575 | |
3.23%, 10/23/29(a) | | | 500 | | | | 407,125 | |
3.85%, 04/03/26(a) | | | 400 | | | | 361,450 | |
4.23%, 03/14/28(a) | | | 800 | | | | 702,400 | |
| | | | | | | | |
| | | | | | | 2,986,869 | |
| | |
| Vietnam — 0.2% | | | | | | |
Vietnam Government International Bond, 4.80%, 11/19/24(a) | | | 600 | | | | 575,175 | |
| | | | | | | | |
| | |
| Zambia — 0.1% | | | | | | |
Zambia Government International Bond | | | | | | | | |
8.50%, 04/14/24(a)(g)(h) | | | 400 | | | | 154,000 | |
8.97%, 07/30/27(a)(g)(h) | �� | | 600 | | | | 222,000 | |
| | | | | | | | |
| | | | | | | 376,000 | |
| | | | | | | | |
| |
Total Foreign Government Obligations — 48.0%
(Cost: $202,796,059) | | | | 139,832,515 | |
| | | | | | | | |
| |
Total Long-Term Investments — 97.4%
(Cost: $386,211,554) | | | | 283,758,371 | |
| | | | | | | | |
| | |
Short-Term Securities | | | | | | | | |
| | |
Money Market Funds — 12.8% | | | | | | | | |
BlackRock Cash Funds: Institutional, SL Agency Shares, 3.29%(l)(m)(n) | | | 34,738 | | | | 34,730,604 | |
| | |
| 42 | | 2 0 2 2 I S H A R E S A N N U A L R E P O R T T O S H A R E H O L D E R S |
| | |
Schedule of Investments (continued) October 31, 2022 | | iShares® J.P. Morgan EM High Yield Bond ETF (Percentages shown are based on Net Assets) |
| | | | | | | | |
| Security | | Shares
(000) | | | Value | |
| | |
| Money Market Funds (continued) | | | | | | |
BlackRock Cash Funds: Treasury, SL Agency Shares, 2.97%(l)(m) | | | 2,469 | | | $ | 2,469,000 | |
| | | | | | | | |
| | |
Total Short-Term Securities — 12.8%
(Cost: $37,198,260) | | | | | | | 37,199,604 | |
| | | | | | | | |
| | |
Total Investments — 110.2%
(Cost: $423,409,814) | | | | | | | 320,957,975 | |
| |
Liabilities in Excess of Other Assets — (10.2)% | | | | (29,661,427 | ) |
| | | | | | | | |
| | |
Net Assets — 100.0% | | | | | | $ | 291,296,548 | |
| | | | | | | | |
| (a) | This security may be resold to qualified foreign investors and foreign institutional buyers under Regulation S of the Securities Act of 1933. |
| (b) | All or a portion of this security is on loan. |
| (c) | Variable rate security. Interest rate resets periodically. The rate shown is the effective interest rate as of period end. Security description also includes the reference rate and spread if published and available. |
| (d) | Perpetual security with no stated maturity date. |
| (e) | Payment-in-kind security which may pay interest/dividends in additional par/shares and/or in cash. Rates shown are the current rate and possible payment rates. |
| (g) | Issuer filed for bankruptcy and/or is in default. |
| (h) | Non-income producing security. |
| (i) | Security exempt from registration pursuant to Rule 144A under the Securities Act of 1933, as amended. These securities may be resold in transactions exempt from registration to qualified institutional investors. |
| (j) | U.S. dollar denominated security issued by foreign domiciled entity. |
| (k) | Step coupon security. Coupon rate will either increase (step-up bond) or decrease (step-down bond) at regular intervals until maturity. Interest rate shown reflects the rate currently in effect. |
| (l) | Affiliate of the Fund. |
| (m) | Annualized 7-day yield as of period end. |
| (n) | All or a portion of this security was purchased with the cash collateral from loaned securities. |
Affiliates
Investments in issuers considered to be affiliate(s) of the Fund during the year ended October 31, 2022 for purposes of Section 2(a)(3) of the Investment Company Act of 1940, as amended, were as follows:
| | | | | | | | | | | | | | | | | | | | | | | | | | | | | | | | | | | | |
| |
| | | | | | | | | |
| Affiliated Issuer | | Value at
10/31/21 | | | Purchases
at Cost | | | Proceeds
from Sale | | | Net Realized
Gain (Loss) | | | Change in
Unrealized
Appreciation
(Depreciation) | | | Value at
10/31/22 | | | Shares
Held at
10/31/22
(000) | | | Income | | | Capital Gain
Distributions from
Underlying Funds | |
| |
| | | | | | | | | |
BlackRock Cash Funds: Institutional, SL Agency Shares | | $ | 33,402,228 | | | $ | 1,347,558 | (a) | | $ | — | | | $ | (20,525 | ) | | $ | 1,343 | | | $ | 34,730,604 | | | | 34,738 | | | $ | 202,013 | (b) | | $ | — | |
BlackRock Cash Funds: Treasury, SL Agency Shares | | | 2,999,000 | | | | — | | | | (530,000 | )(a) | | | — | | | | — | | | | 2,469,000 | | | | 2,469 | | | | 20,761 | | | | — | |
| | | | | | | | | | | | | | | | | | | | | | | | | | | | | | | | | | | | |
| | | | | | | | | | | | | | $ | (20,525 | ) | | $ | 1,343 | | | $ | 37,199,604 | | | | | | | $ | 222,774 | | | $ | — | |
| | | | | | | | | | | | | | | | | | | | | | | | | | | | | | | | | | | | |
| (a) | Represents net amount purchased (sold). |
| (b) | All or a portion represents securities lending income earned from the reinvestment of cash collateral from loaned securities, net of fees and collateral investment expenses, and other payments to and from borrowers of securities. |
Fair Value Hierarchy as of Period End
Various inputs are used in determining the fair value of financial instruments. For a description of the input levels and information about the Fund’s policy regarding valuation of financial instruments, refer to the Notes to Financial Statements.
The following table summarizes the Fund’s financial instruments categorized in the fair value hierarchy. The breakdown of the Fund’s financial instruments into major categories is disclosed in the Schedule of Investments above.
| | | | | | | | | | | | | | | | |
| |
| | | | |
| | | Level 1 | | | Level 2 | | | Level 3 | | | Total | |
| |
| | | | |
Investments | | | | | | | | | | | | | | | | |
Assets | | | | | | | | | | | | | | | | |
Corporate Bonds & Notes | | $ | — | | | $ | 143,925,856 | | | $ | — | | | $ | 143,925,856 | |
Foreign Government Obligations | | | — | | | | 139,832,515 | | | | — | | | | 139,832,515 | |
Money Market Funds | | | 37,199,604 | | | | — | | | | — | | | | 37,199,604 | |
| | | | | | | | | | | | | | | | |
| | $ | 37,199,604 | | | $ | 283,758,371 | | | $ | — | | | $ | 320,957,975 | |
| | | | | | | | | | | | | | | | |
See notes to financial statements.
| | |
S C H E D U L E O F I N V E S T M E N T S | | 43 |
| | |
Schedule of Investments October 31, 2022 | | iShares® J.P. Morgan EM Local Currency Bond ETF (Percentages shown are based on Net Assets) |
| | | | | | | | | | | | |
| Security | | Par (000) | | | Value | |
| |
Foreign Government Obligations | | | | | |
| | | |
| Brazil — 4.7% | | | | | | | | | |
Brazil Letras do Tesouro Nacional | | | | | | | | | | | | |
0.00%, 07/01/23(a) | | | BRL | | | | 15,783 | | | $ | 2,809,456 | |
0.00%, 01/01/24(a) | | | BRL | | | | 23,859 | | | | 4,013,197 | |
0.00%, 07/01/24(a) | | | BRL | | | | 9,263 | | | | 1,482,346 | |
0.00%, 07/01/25(a) | | | BRL | | | | 10,786 | | | | 1,558,471 | |
0.00%, 01/01/26(a) | | | BRL | | | | 1,000 | | | | 136,331 | |
Brazil Notas do Tesouro Nacional | | | | | | | | | | | | |
Series F, 10.00%, 01/01/25 | | | BRL | | | | 8,929 | | | | 1,671,506 | |
Series F, 10.00%, 01/01/29 | | | BRL | | | | 7,080 | | | | 1,271,581 | |
Series F, 10.00%, 01/01/31 | | | BRL | | | | 4,000 | | | | 704,840 | |
Brazil Notas do Tesouro Nacional Serie F | | | | | | | | | | | | |
10.00%, 01/01/33 | | | BRL | | | | 1,000 | | | | 173,412 | |
Series F, 10.00%, 01/01/27 | | | BRL | | | | 10,960 | | | | 2,014,873 | |
Brazilian Government International Bond | | | | | | | | | | | | |
8.50%, 01/05/24 | | | BRL | | | | 500 | | | | 90,601 | |
10.25%, 01/10/28 | | | BRL | | | | 1,420 | | | | 253,972 | |
| | | | | | | | | | | | |
| | | | | | | | | | | 16,180,586 | |
| | | |
| Chile — 4.6% | | | | | | | | | |
Bonos de la Tesoreria de la Republica en pesos | | | | | | | | | | | | |
2.30%, 10/01/28(b)(c) | | | CLP | | | | 675,000 | | | | 563,669 | |
2.50%, 03/01/25 | | | CLP | | | | 4,085,000 | | | | 3,890,384 | |
4.50%, 03/01/26 | | | CLP | | | | 2,550,000 | | | | 2,509,595 | |
4.70%, 09/01/30(b)(c) | | | CLP | | | | 2,830,000 | | | | 2,663,977 | |
5.00%, 10/01/28(b)(c) | | | CLP | | | | 925,000 | | | | 898,586 | |
5.00%, 03/01/35 | | | CLP | | | | 2,850,000 | | | | 2,670,378 | |
6.00%, 01/01/43 | | | CLP | | | | 2,555,000 | | | | 2,590,612 | |
| | | | | | | | | | | | |
| | | | | | | | | | | 15,787,201 | |
| | | |
| China — 14.3% | | | | | | | | | |
China Government Bond | | | | | | | | | | | | |
1.99%, 04/09/25 | | | CNY | | | | 11,550 | | | | 1,575,084 | |
2.24%, 05/25/25 | | | CNY | | | | 6,920 | | | | 949,034 | |
2.26%, 02/24/25 | | | CNY | | | | 3,010 | | | | 413,370 | |
2.36%, 07/02/23 | | | CNY | | | | 9,300 | | | | 1,278,745 | |
2.37%, 01/20/27 | | | CNY | | | | 9,050 | | | | 1,237,491 | |
2.47%, 09/02/24 | | | CNY | | | | 12,170 | | | | 1,680,354 | |
2.48%, 04/15/27 | | | CNY | | | | 3,690 | | | | 506,388 | |
2.50%, 07/25/27 | | | CNY | | | | 4,890 | | | | 671,947 | |
2.68%, 05/21/30 | | | CNY | | | | 13,520 | | | | 1,849,199 | |
2.69%, 08/12/26 | | | CNY | | | | 11,170 | | | | 1,548,192 | |
2.69%, 08/15/32 | | | CNY | | | | 1,760 | | | | 241,155 | |
2.75%, 06/15/29 | | | CNY | | | | 3,700 | | | | 509,402 | |
2.75%, 02/17/32 | | | CNY | | | | 9,340 | | | | 1,280,400 | |
2.76%, 05/15/32 | | | CNY | | | | 8,120 | | | | 1,116,581 | |
2.80%, 03/24/29 | | | CNY | | | | 6,960 | | | | 963,244 | |
2.84%, 04/08/24 | | | CNY | | | | 10,060 | | | | 1,396,202 | |
2.85%, 06/04/27 | | | CNY | | | | 11,910 | | | | 1,660,002 | |
2.88%, 11/05/23 | | | CNY | | | | 11,630 | | | | 1,610,704 | |
2.89%, 11/18/31 | | | CNY | | | | 6,850 | | | | 950,199 | |
2.91%, 10/14/28 | | | CNY | | | | 11,790 | | | | 1,645,090 | |
2.94%, 10/17/24 | | | CNY | | | | 7,570 | | | | 1,055,193 | |
3.01%, 05/13/28 | | | CNY | | | | 10,340 | | | | 1,452,613 | |
3.02%, 10/22/25 | | | CNY | | | | 13,930 | | | | 1,953,793 | |
3.02%, 05/27/31 | | | CNY | | | | 13,270 | | | | 1,861,874 | |
3.03%, 03/11/26 | | | CNY | | | | 9,850 | | | | 1,382,980 | |
3.12%, 12/05/26 | | | CNY | | | | 10,590 | | | | 1,493,120 | |
3.13%, 11/21/29 | | | CNY | | | | 12,860 | | | | 1,819,276 | |
3.19%, 04/11/24 | | | CNY | | | | 9,960 | | | | 1,391,538 | |
3.22%, 12/06/25 | | | CNY | | | | 7,160 | | | | 1,010,070 | |
| | | | | | | | | | | | |
| Security | | Par (000) | | | Value | |
| | | |
| China (continued) | | | | | | | | | |
3.25%, 06/06/26 | | | CNY | | | | 11,450 | | | $ | 1,621,216 | |
3.25%, 11/22/28 | | | CNY | | | | 9,460 | | | | 1,349,056 | |
3.27%, 11/19/30 | | | CNY | | | | 12,350 | | | | 1,767,440 | |
3.28%, 12/03/27 | | | CNY | | | | 11,010 | | | | 1,569,600 | |
3.29%, 10/18/23 | | | CNY | | | | 7,240 | | | | 1,007,383 | |
3.29%, 05/23/29 | | | CNY | | | | 11,120 | | | | 1,591,560 | |
3.32%, 04/15/52 | | | CNY | | | | 1,310 | | | | 186,107 | |
3.53%, 10/18/51 | | | CNY | | | | 6,110 | | | | 897,463 | |
3.72%, 04/12/51 | | | CNY | | | | 7,820 | | | | 1,181,690 | |
3.81%, 09/14/50 | | | CNY | | | | 11,170 | | | | 1,709,228 | |
| | | | | | | | | | | | |
| | | | | | | | | | | 49,383,983 | |
| | | |
| Colombia — 4.2% | | | | | | | | | |
Colombia Government International Bond, 9.85%, 06/28/27 | | | COP | | | | 745,000 | | | | 130,436 | |
Colombian TES | | | | | | | | | | | | |
9.25%, 05/28/42 | | | COP | | | | 5,545,200 | | | | 768,216 | |
Series B, 5.75%, 11/03/27 | | | COP | | | | 8,119,000 | | | | 1,191,839 | |
Series B, 6.00%, 04/28/28 | | | COP | | | | 10,355,200 | | | | 1,489,786 | |
Series B, 6.25%, 11/26/25 | | | COP | | | | 6,741,500 | | | | 1,134,756 | |
Series B, 6.25%, 07/09/36 | | | COP | | | | 4,133,800 | | | | 453,552 | |
Series B, 7.00%, 03/26/31 | | | COP | | | | 11,526,400 | | | | 1,557,671 | |
Series B, 7.00%, 06/30/32 | | | COP | | | | 9,697,900 | | | | 1,258,974 | |
Series B, 7.25%, 10/18/34 | | | COP | | | | 11,141,000 | | | | 1,409,220 | |
Series B, 7.25%, 10/26/50 | | | COP | | | | 8,237,000 | | | | 891,080 | |
Series B, 7.50%, 08/26/26 | | | COP | | | | 10,213,700 | | | | 1,714,857 | |
Series B, 7.75%, 09/18/30 | | | COP | | | | 7,500,200 | | | | 1,087,402 | |
Series B, 10.00%, 07/24/24 | | | COP | | | | 7,441,300 | | | | 1,448,242 | |
| | | | | | | | | | | | |
| | | | | | | | | | | 14,536,031 | |
| | | |
| Czech Republic — 4.5% | | | | | | | | | |
Czech Republic Government Bond | | | | | | | | | | | | |
0.00%, 12/12/24(a) | | | CZK | | | | 8,150 | | | | 290,398 | |
0.05%, 11/29/29 | | | CZK | | | | 19,930 | | | | 532,122 | |
0.25%, 02/10/27 | | | CZK | | | | 35,970 | | | | 1,141,170 | |
0.45%, 10/25/23(c) | | | CZK | | | | 29,310 | | | | 1,110,651 | |
0.95%, 05/15/30(c) | | | CZK | | | | 36,560 | | | | 1,030,671 | |
1.00%, 06/26/26(c) | | | CZK | | | | 33,420 | | | | 1,129,801 | |
1.20%, 03/13/31 | | | CZK | | | | 30,850 | | | | 868,653 | |
1.25%, 02/14/25 | | | CZK | | | | 26,440 | | | | 955,002 | |
1.50%, 04/24/40 | | | CZK | | | | 13,730 | | | | 298,670 | |
1.75%, 06/23/32 | | | CZK | | | | 32,480 | | | | 920,732 | |
2.00%, 10/13/33 | | | CZK | | | | 36,590 | | | | 1,026,907 | |
2.40%, 09/17/25(c) | | | CZK | | | | 37,980 | | | | 1,386,497 | |
2.50%, 08/25/28(c) | | | CZK | | | | 37,990 | | | | 1,280,330 | |
2.75%, 07/23/29 | | | CZK | | | | 37,500 | | | | 1,245,549 | |
3.50%, 05/30/35 | | | CZK | | | | 8,930 | | | | 288,283 | |
4.20%, 12/04/36(c) | | | CZK | | | | 19,050 | | | | 657,924 | |
5.70%, 05/25/24(c) | | | CZK | | | | 17,050 | | | | 682,606 | |
6.00%, 02/26/26 | | | CZK | | | | 14,910 | | | | 598,374 | |
| | | | | | | | | | | | |
| | | | | | | | | | | 15,444,340 | |
| | | |
| Dominican Republic — 4.3% | | | | | | | | | |
Dominican Republic International Bond, 9.75%, 06/05/26(c) | | | DOP | | | | 846,350 | | | | 14,808,657 | |
| | | | | | | | | | | | |
| | | |
| Egypt — 3.9% | | | | | | | | | |
Egypt Government Bond | | | | | | | | | | | | |
13.54%, 01/14/25 | | | EGP | | | | 16,251 | | | | 613,502 | |
14.06%, 01/12/26 | | | EGP | | | | 56,362 | | | | 2,084,924 | |
14.29%, 01/05/28 | | | EGP | | | | 34,072 | | | | 1,207,048 | |
14.35%, 09/10/24 | | | EGP | | | | 16,886 | | | | 654,046 | |
14.37%, 10/20/25 | | | EGP | | | | 48,005 | | | | 1,803,675 | |
| | |
| 44 | | 2 0 2 2 I S H A R E S A N N U A L R E P O R T T O S H A R E H O L D E R S |
| | |
Schedule of Investments (continued) October 31, 2022 | | iShares® J.P. Morgan EM Local Currency Bond ETF (Percentages shown are based on Net Assets) |
| | | | | | | | | | | | |
| Security | | Par (000) | | | Value | |
| | | |
| Egypt (continued) | | | | | | | | | |
14.40%, 09/10/29 | | | EGP | | | | 18,168 | | | $ | 628,617 | |
14.48%, 04/06/26 | | | EGP | | | | 41,336 | | | | 1,543,692 | |
14.53%, 09/14/24 | | | EGP | | | | 40,661 | | | | 1,581,239 | |
14.56%, 07/06/26 | | | EGP | | | | 23,927 | | | | 886,750 | |
14.56%, 10/13/27 | | | EGP | | | | 35,303 | | | | 1,273,447 | |
14.66%, 10/06/30 | | | EGP | | | | 17,509 | | | | 603,832 | |
16.10%, 05/07/29 | | | EGP | | | | 15,329 | | | | 573,071 | |
| | | | | | | | | | | | |
| | | | | | | | | | | 13,453,843 | |
| | | |
| Hungary — 4.4% | | | | | | | | | |
Hungary Government Bond | | | | | | | | | | | | |
1.00%, 11/26/25 | | | HUF | | | | 667,520 | | | | 1,172,588 | |
1.50%, 08/23/23 | | | HUF | | | | 111,060 | | | | 247,191 | |
1.50%, 04/22/26 | | | HUF | | | | 646,240 | | | | 1,108,074 | |
1.50%, 08/26/26 | | | HUF | | | | 392,850 | | | | 652,545 | |
2.00%, 05/23/29 | | | HUF | | | | 518,050 | | | | 757,386 | |
2.25%, 04/20/33 | | | HUF | | | | 650,770 | | | | 804,324 | |
2.25%, 06/22/34 | | | HUF | | | | 219,350 | | | | 262,069 | |
2.50%, 10/24/24 | | | HUF | | | | 476,870 | | | | 943,117 | |
2.75%, 12/22/26 | | | HUF | | | | 510,020 | | | | 869,677 | |
3.00%, 06/26/24 | | | HUF | | | | 392,100 | | | | 806,876 | |
3.00%, 10/27/27 | | | HUF | | | | 656,860 | | | | 1,089,889 | |
3.00%, 08/21/30 | | | HUF | | | | 608,270 | | | | 911,113 | |
3.00%, 10/27/38 | | | HUF | | | | 431,710 | | | | 498,190 | |
3.00%, 04/25/41 | | | HUF | | | | 248,670 | | | | 270,526 | |
3.25%, 10/22/31 | | | HUF | | | | 705,170 | | | | 1,032,487 | |
4.50%, 03/23/28 | | | HUF | | | | 298,470 | | | | 523,011 | |
4.75%, 11/24/32 | | | HUF | | | | 337,290 | | | | 544,459 | |
5.50%, 06/24/25 | | | HUF | | | | 609,450 | | | | 1,229,640 | |
6.00%, 11/24/23 | | | HUF | | | | 447,860 | | | | 1,006,288 | |
6.75%, 10/22/28 | | | HUF | | | | 320,050 | | | | 630,317 | |
| | | | | | | | | | | | |
| | | | | | | | | | | 15,359,767 | |
| | | |
| Indonesia — 4.3% | | | | | | | | | |
Indonesia Treasury Bond | | | | | | | | | | | | |
5.13%, 04/15/27 | | | IDR | | | | 9,368,000 | | | | 554,662 | |
5.50%, 04/15/26 | | | IDR | | | | 8,304,000 | | | | 506,306 | |
6.13%, 05/15/28 | | | IDR | | | | 9,215,000 | | | | 555,352 | |
6.25%, 06/15/36 | | | IDR | | | | 5,099,000 | | | | 287,519 | |
6.38%, 04/15/32 | | | IDR | | | | 12,842,000 | | | | 757,470 | |
6.50%, 06/15/25 | | | IDR | | | | 9,239,000 | | | | 585,230 | |
6.50%, 02/15/31 | | | IDR | | | | 12,077,000 | | | | 723,188 | |
6.63%, 05/15/33 | | | IDR | | | | 6,120,000 | | | | 360,981 | |
7.00%, 05/15/27 | | | IDR | | | | 10,003,000 | | | | 633,625 | |
7.00%, 09/15/30 | | | IDR | | | | 13,496,000 | | | | 837,146 | |
7.13%, 06/15/42 | | | IDR | | | | 7,950,000 | | | | 483,702 | |
7.50%, 08/15/32 | | | IDR | | | | 4,501,000 | | | | 284,243 | |
7.50%, 06/15/35 | | | IDR | | | | 8,675,000 | | | | 547,836 | |
7.50%, 05/15/38 | | | IDR | | | | 5,228,000 | | | | 330,154 | |
7.50%, 04/15/40 | | | IDR | | | | 9,857,000 | | | | 619,321 | |
8.13%, 05/15/24 | | | IDR | | | | 7,112,000 | | | | 464,178 | |
8.25%, 05/15/29 | | | IDR | | | | 9,054,000 | | | | 602,246 | |
8.25%, 06/15/32 | | | IDR | | | | 3,270,000 | | | | 216,987 | |
8.25%, 05/15/36 | | | IDR | | | | 8,623,000 | | | | 572,747 | |
8.38%, 03/15/24 | | | IDR | | | | 9,666,000 | | | | 631,489 | |
8.38%, 09/15/26 | | | IDR | | | | 9,339,000 | | | | 620,305 | |
8.38%, 03/15/34 | | | IDR | | | | 11,986,000 | | | | 803,805 | |
8.38%, 04/15/39 | | | IDR | | | | 4,025,000 | | | | 270,957 | |
8.75%, 05/15/31 | | | IDR | | | | 4,957,000 | | | | 339,259 | |
9.00%, 03/15/29 | | | IDR | | | | 6,220,000 | | | | 428,292 | |
9.50%, 07/15/31 | | | IDR | | | | 2,585,000 | | | | 184,791 | |
10.50%, 08/15/30 | | | IDR | | | | 203,000 | | | | 15,195 | |
| | | | | | | | | | | | |
| Security | | Par (000) | | | Value | |
| | | |
| Indonesia (continued) | | | | | | | | | |
11.00%, 09/15/25 | | | IDR | | | | 2,856,000 | | | $ | 201,417 | |
Perusahaan Penerbit SBSN Indonesia | | | | | | | | | | | | |
6.38%, 03/15/34 | | | IDR | | | | 7,282,000 | | | | 420,994 | |
6.63%, 10/15/24 | | | IDR | | | | 6,528,000 | | | | 420,575 | |
8.25%, 09/15/23 | | | IDR | | | | 5,370,000 | | | | 350,172 | |
8.88%, 11/15/31 | | | IDR | | | | 5,023,000 | | | | 359,074 | |
| | | | | | | | | | | | |
| | | | | | | | | | | 14,969,218 | |
| | | |
| Malaysia — 4.4% | | | | | | | | | |
Malaysia Government Bond | | | | | | | | | | | | |
2.63%, 04/15/31 | | | MYR | | | | 2,404 | | | | 440,357 | |
3.48%, 06/14/24 | | | MYR | | | | 2,213 | | | | 467,632 | |
3.50%, 05/31/27 | | | MYR | | | | 2,045 | | | | 419,476 | |
3.58%, 07/15/32 | | | MYR | | | | 1,029 | | | | 203,752 | |
3.73%, 06/15/28 | | | MYR | | | | 3,010 | | | | 616,191 | |
3.76%, 05/22/40 | | | MYR | | | | 3,045 | | | | 555,268 | |
3.80%, 08/17/23 | | | MYR | | | | 1,303 | | | | 277,166 | |
3.83%, 07/05/34 | | | MYR | | | | 2,773 | | | | 540,049 | |
3.88%, 03/14/25 | | | MYR | | | | 1,087 | | | | 230,137 | |
3.89%, 08/15/29 | | | MYR | | | | 2,527 | | | | 515,903 | |
3.90%, 11/30/26 | | | MYR | | | | 2,450 | | | | 513,790 | |
3.90%, 11/16/27 | | | MYR | | | | 2,143 | | | | 446,658 | |
3.91%, 07/15/26 | | | MYR | | | | 1,647 | | | | 345,988 | |
3.96%, 09/15/25 | | | MYR | | | | 2,754 | | | | 582,825 | |
4.06%, 09/30/24 | | | MYR | | | | 1,221 | | | | 260,503 | |
4.07%, 06/15/50 | | | MYR | | | | 3,527 | | | | 641,514 | |
4.18%, 07/15/24 | | | MYR | | | | 1,373 | | | | 293,284 | |
4.25%, 05/31/35 | | | MYR | | | | 1,704 | | | | 342,526 | |
4.50%, 04/30/29 | | | MYR | | | | 1,016 | | | | 217,112 | |
4.70%, 10/15/42 | | | MYR | | | | 1,233 | | | | 255,589 | |
4.76%, 04/07/37 | | | MYR | | | | 3,493 | | | | 745,624 | |
Malaysia Government Investment Issue | | | | | | | | | | | | |
3.42%, 09/30/27 | | | MYR | | | | 3,094 | | | | 631,476 | |
3.45%, 07/15/36 | | | MYR | | | | 2,694 | | | | 490,675 | |
3.47%, 10/15/30 | | | MYR | | | | 3,930 | | | | 773,698 | |
3.66%, 10/15/24 | | | MYR | | | | 2,274 | | | | 481,118 | |
3.73%, 03/31/26 | | | MYR | | | | 3,105 | | | | 650,710 | |
3.99%, 10/15/25 | | | MYR | | | | 1,519 | | | | 322,425 | |
4.09%, 11/30/23 | | | MYR | | | | 1,591 | | | | 339,747 | |
4.13%, 08/15/25 | | | MYR | | | | 1,522 | | | | 323,522 | |
4.13%, 07/09/29 | | | MYR | | | | 2,100 | | | | 438,317 | |
4.19%, 10/07/32 | | | MYR | | | | 2,347 | | | | 484,391 | |
4.26%, 07/26/27 | | | MYR | | | | 1,715 | | | | 362,758 | |
4.37%, 10/31/28 | | | MYR | | | | 2,575 | | | | 544,437 | |
Malaysia Investment Issue Bond, 4.42%, 09/30/41 | | | MYR | | | | 2,188 | | | | 435,073 | |
| | | | | | | | | | | | |
| | | | | | | | | | | 15,189,691 | |
| | | |
| Mexico — 4.5% | | | | | | | | | |
Mexican Bonos | | | | | | | | | | | | |
5.00%, 03/06/25 | | | MXN | | | | 7,000 | | | | 314,997 | |
5.50%, 03/04/27 | | | MXN | | | | 12,400 | | | | 529,212 | |
Series M, 5.75%, 03/05/26 | | | MXN | | | | 41,870 | | | | 1,863,329 | |
Series M, 7.75%, 05/29/31 | | | MXN | | | | 43,167 | | | | 1,915,228 | |
Series M, 7.75%, 11/23/34 | | | MXN | | | | 9,900 | | | | 424,409 | |
Series M, 7.75%, 11/13/42 | | | MXN | | | | 26,102 | | | | 1,060,960 | |
Series M, 8.00%, 12/07/23 | | | MXN | | | | 22,315 | | | | 1,095,065 | |
Series M, 8.00%, 09/05/24 | | | MXN | | | | 30,283 | | | | 1,469,707 | |
Series M, 8.00%, 11/07/47 | | | MXN | | | | 27,269 | | | | 1,126,218 | |
Series M 20, 7.50%, 06/03/27 | | | MXN | | | | 34,718 | | | | 1,602,502 | |
Series M 20, 8.50%, 05/31/29 | | | MXN | | | | 26,416 | | | | 1,247,221 | |
Series M 20, 10.00%, 12/05/24 | | | MXN | | | | 25,797 | | | | 1,295,499 | |
Series M 30, 8.50%, 11/18/38 | | | MXN | | | | 20,698 | | | | 918,324 | |
| | |
S C H E D U L E O F I N V E S T M E N T S | | 45 |
| | |
Schedule of Investments (continued) October 31, 2022 | | iShares® J.P. Morgan EM Local Currency Bond ETF (Percentages shown are based on Net Assets) |
| | | | | | | | | | | | |
| Security | | Par (000) | | | Value | |
| | | |
| Mexico (continued) | | | | | | | | | |
Series M 30, 10.00%, 11/20/36 | | | MXN | | | | 8,523 | | | $ | 431,579 | |
Mexico Bonos, 8.00%, 07/31/53 | | | MXN | | | | 3,895 | | | | 159,771 | |
| | | | | | | | | | | | |
| | | | | | | | | | | 15,454,021 | |
| | | |
| Peru — 4.5% | | | | | | | | | |
Peru Government Bond | | | | | | | | | | | | |
5.35%, 08/12/40 | | | PEN | | | | 5,271 | | | | 940,870 | |
5.40%, 08/12/34 | | | PEN | | | | 7,081 | | | | 1,375,969 | |
5.70%, 08/12/24 | | | PEN | | | | 4,213 | | | | 1,033,148 | |
5.94%, 02/12/29 | | | PEN | | | | 10,262 | | | | 2,310,828 | |
6.15%, 08/12/32 | | | PEN | | | | 8,965 | | | | 1,918,483 | |
6.35%, 08/12/28 | | | PEN | | | | 9,407 | | | | 2,196,533 | |
6.90%, 08/12/37 | | | PEN | | | | 9,152 | | | | 1,976,378 | |
6.95%, 08/12/31 | | | PEN | | | | 9,291 | | | | 2,146,386 | |
8.20%, 08/12/26 | | | PEN | | | | 6,970 | | | | 1,805,641 | |
| | | | | | | | | | | | |
| | | | | | | | | | | 15,704,236 | |
| | | |
| Philippines — 4.4% | | | | | | | | | |
Philippine Government International Bond, 6.25%, 01/14/36 | | | PHP | | | | 986,000 | | | | 15,142,694 | |
| | | | | | | | | | | | |
| | | |
| Poland — 4.4% | | | | | | | | | |
Republic of Poland Government Bond | | | | | | | | | | | | |
0.25%, 10/25/26 | | | PLN | | | | 7,769 | | | | 1,182,282 | |
0.75%, 04/25/25 | | | PLN | | | | 6,415 | | | | 1,116,084 | |
1.25%, 10/25/30 | | | PLN | | | | 7,364 | | | | 923,365 | |
1.75%, 04/25/32 | | | PLN | | | | 4,855 | | | | 588,842 | |
2.25%, 10/25/24 | | | PLN | | | | 7,369 | | | | 1,372,189 | |
2.50%, 04/25/24 | | | PLN | | | | 6,450 | | | | 1,244,348 | |
2.50%, 07/25/26 | | | PLN | | | | 10,145 | | | | 1,717,495 | |
2.50%, 07/25/27 | | | PLN | | | | 6,652 | | | | 1,075,612 | |
2.75%, 04/25/28 | | | PLN | | | | 7,964 | | | | 1,266,657 | |
2.75%, 10/25/29 | | | PLN | | | | 9,497 | | | | 1,415,946 | |
3.25%, 07/25/25 | | | PLN | | | | 7,437 | | | | 1,358,276 | |
3.75%, 05/25/27 | | | PLN | | | | 5,194 | | | | 894,505 | |
4.00%, 10/25/23 | | | PLN | | | | 5,603 | | | | 1,136,655 | |
| | | | | | | | | | | | |
| | | | | | | | | | | 15,292,256 | |
| | | |
| Romania — 4.4% | | | | | | | | | |
Romania Government Bond | | | | | | | | | | | | |
2.50%, 10/25/27 | | | RON | | | | 4,125 | | | | 615,168 | |
3.25%, 04/29/24 | | | RON | | | | 4,520 | | | | 843,071 | |
3.25%, 06/24/26 | | | RON | | | | 4,980 | | | | 823,941 | |
3.65%, 07/28/25 | | | RON | | | | 5,230 | | | | 917,542 | |
3.65%, 09/24/31 | | | RON | | | | 5,570 | | | | 754,695 | |
3.70%, 11/25/24 | | | RON | | | | 5,070 | | | | 923,245 | |
4.00%, 10/25/23 | | | RON | | | | 4,705 | | | | 907,688 | |
4.15%, 01/26/28 | | | RON | | | | 5,485 | | | | 879,146 | |
4.15%, 10/24/30 | | | RON | | | | 5,270 | | | | 763,672 | |
4.25%, 06/28/23 | | | RON | | | | 4,515 | | | | 884,414 | |
4.40%, 09/25/23 | | | RON | | | | 4,650 | | | | 903,568 | |
4.50%, 06/17/24 | | | RON | | | | 5,675 | | | | 1,068,204 | |
4.75%, 02/24/25 | | | RON | | | | 4,355 | | | | 798,991 | |
4.75%, 10/11/34 | | | RON | | | | 4,000 | | | | 541,834 | |
4.85%, 04/22/26 | | | RON | | | | 5,195 | | | | 916,023 | |
4.85%, 07/25/29 | | | RON | | | | 2,720 | | | | 430,200 | |
5.00%, 02/12/29 | | | RON | | | | 5,180 | | | | 838,752 | |
5.80%, 07/26/27 | | | RON | | | | 5,030 | | | | 883,775 | |
6.70%, 02/25/32 | | | RON | | | | 3,765 | | | | 642,514 | |
| | | | | | | | | | | | |
| | | | | | | | | | | 15,336,443 | |
| | | |
| Serbia — 4.4% | | | | | | | | | |
Serbia Treasury Bonds | | | | | | | | | | | | |
4.50%, 01/11/26 | | | RSD | | | | 742,930 | | | | 5,784,757 | |
| | | | | | | | | | | | |
| Security | | Par (000) | | | Value | |
| | | |
| Serbia (continued) | | | | | | | | | |
4.50%, 08/20/32 | | | RSD | | | | 727,070 | | | $ | 4,692,170 | |
5.88%, 02/08/28 | | | RSD | | | | 607,130 | | | | 4,747,037 | |
| | | | | | | | | | | | |
| | | | | | | | | | | 15,223,964 | |
| | | |
| South Africa — 4.3% | | | | | | | | | |
Republic of South Africa Government Bond | | | | | | | | | | | | |
6.25%, 03/31/36 | | | ZAR | | | | 13,084 | | | | 451,385 | |
6.50%, 02/28/41 | | | ZAR | | | | 11,961 | | | | 394,313 | |
7.00%, 02/28/31 | | | ZAR | | | | 19,292 | | | | 814,250 | |
8.00%, 01/31/30 | | | ZAR | | | | 44,391 | | | | 2,075,413 | |
8.25%, 03/31/32 | | | ZAR | | | | 36,360 | | | | 1,629,689 | |
8.50%, 01/31/37 | | | ZAR | | | | 33,196 | | | | 1,391,317 | |
8.75%, 01/31/44 | | | ZAR | | | | 28,956 | | | | 1,194,883 | |
8.75%, 02/28/48 | | | ZAR | | | | 49,439 | | | | 2,031,491 | |
8.88%, 02/28/35 | | | ZAR | | | | 30,362 | | | | 1,348,431 | |
9.00%, 01/31/40 | | | ZAR | | | | 23,026 | | | | 986,623 | |
10.50%, 12/21/26 | | | ZAR | | | | 47,856 | | | | 2,729,814 | |
| | | | | | | | | | | | |
| | | | | | | | | | | 15,047,609 | |
| | | |
| Thailand — 4.4% | | | | | | | | | |
Thailand Government Bond | | | | | | | | | | | | |
0.75%, 06/17/24 | | | THB | | | | 28,861 | | | | 745,014 | |
0.75%, 09/17/24 | | | THB | | | | 32,379 | | | | 834,146 | |
0.95%, 06/17/25 | | | THB | | | | 30,641 | | | | 780,142 | |
1.00%, 06/17/27 | | | THB | | | | 42,114 | | | | 1,024,334 | |
1.45%, 12/17/24 | | | THB | | | | 32,672 | | | | 847,763 | |
1.59%, 12/17/35 | | | THB | | | | 27,727 | | | | 569,442 | |
1.60%, 12/17/29 | | | THB | | | | 23,857 | | | | 570,140 | |
1.60%, 06/17/35 | | | THB | | | | 13,217 | | | | 274,235 | |
2.00%, 12/17/31 | | | THB | | | | 43,831 | | | | 1,047,273 | |
2.00%, 06/17/42 | | | THB | | | | 20,662 | | | | 388,994 | |
2.13%, 12/17/26 | | | THB | | | | 28,426 | | | | 731,908 | |
2.40%, 12/17/23 | | | THB | | | | 24,807 | | | | 658,051 | |
2.65%, 06/17/28 | | | THB | | | | 6,739 | | | | 175,126 | |
2.88%, 12/17/28 | | | THB | | | | 27,520 | | | | 718,004 | |
2.88%, 06/17/46 | | | THB | | | | 24,137 | | | | 504,938 | |
3.30%, 06/17/38 | | | THB | | | | 34,238 | | | | 834,810 | |
3.40%, 06/17/36 | | | THB | | | | 25,786 | | | | 645,370 | |
3.63%, 06/16/23 | | | THB | | | | 21,341 | | | | 567,913 | |
3.65%, 06/20/31 | | | THB | | | | 25,891 | | | | 703,144 | |
3.78%, 06/25/32 | | | THB | | | | 36,169 | | | | 992,866 | |
3.85%, 12/12/25 | | | THB | | | | 30,573 | | | | 839,647 | |
4.88%, 06/22/29 | | | THB | | | | 32,614 | | | | 948,515 | |
| | | | | | | | | | | | |
| | | | | | | | | | | 15,401,775 | |
| | | |
| Turkey — 4.4% | | | | | | | | | |
Turkey Government Bond | | | | | | | | | | | | |
8.00%, 03/12/25 | | | TRY | | | | 20,741 | | | | 998,374 | |
9.00%, 07/24/24 | | | TRY | | | | 26,740 | | | | 1,341,743 | |
10.40%, 03/20/24 | | | TRY | | | | 11,540 | | | | 589,577 | |
10.50%, 08/11/27 | | | TRY | | | | 23,948 | | | | 1,314,845 | |
10.60%, 02/11/26 | | | TRY | | | | 31,857 | | | | 1,593,342 | |
11.00%, 02/24/27 | | | TRY | | | | 20,507 | | | | 1,119,831 | |
11.70%, 11/13/30 | | | TRY | | | | 50,705 | | | | 3,061,748 | |
12.40%, 03/08/28 | | | TRY | | | | 13,076 | | | | 778,340 | |
12.60%, 10/01/25 | | | TRY | | | | 54,054 | | | | 2,912,616 | |
16.20%, 06/14/23 | | | TRY | | | | 29,102 | | | | 1,584,141 | |
| | | | | | | | | | | | |
| | | | | | | | | | | 15,294,557 | |
| | |
| 46 | | 2 0 2 2 I S H A R E S A N N U A L R E P O R T T O S H A R E H O L D E R S |
| | |
Schedule of Investments (continued) October 31, 2022 | | iShares® J.P. Morgan EM Local Currency Bond ETF (Percentages shown are based on Net Assets) |
| | | | | | | | | | | | |
| Security | | | | | Par/
Shares
(000) | | | Value | |
|
| Uruguay — 4.5% | |
Uruguay Government International Bond | | | | | | | | | | | | |
8.25%, 05/21/31 | | | UYU | | | | 463,636 | | | $ | 9,507,038 | |
8.50%, 03/15/28(c) | | | UYU | | | | 285,913 | | | | 6,257,740 | |
| | | | | | | | | | | | |
| | | |
| | | | | | | | | | | 15,764,778 | |
| | | | | | | | | | | | |
| |
Total Long-Term Investments — 97.8%
(Cost: $438,486,617) | | | | 338,775,650 | |
| | | | | | | | | | | | |
|
Short-Term Securities | |
|
| Money Market Funds — 0.1% | |
BlackRock Cash Funds: Treasury, SL Agency Shares, 2.97%(d)(e) | | | | | | | 440 | | | | 440,000 | |
| | | | | | | | | | | | |
| |
Total Short-Term Securities — 0.1%
(Cost: $440,000) | | | | 440,000 | |
| | | | | | | | | | | | |
| |
Total Investments — 97.9%
(Cost: $438,926,617) | | | | 339,215,650 | |
| |
Other Assets Less Liabilities — 2.1% | | | | 7,309,832 | |
| | | | | | | | | | | | |
| |
Net Assets — 100.0% | | | $ | 346,525,482 | |
| | | | | | | | | | | | |
| (b) | Security exempt from registration pursuant to Rule 144A under the Securities Act of 1933, as amended. These securities may be resold in transactions exempt from registration to qualified institutional investors. |
| (c) | This security may be resold to qualified foreign investors and foreign institutional buyers under Regulation S of the Securities Act of 1933. |
| (d) | Affiliate of the Fund. |
| (e) | Annualized 7-day yield as of period end. |
Affiliates
Investments in issuers considered to be affiliate(s) of the Fund during the year ended October 31, 2022 for purposes of Section 2(a)(3) of the Investment Company Act of 1940, as amended, were as follows:
| | | | | | | | | | | | | | | | | | | | | | | | | | | | | | | | | | | | |
| Affiliated Issuer | | Value at
10/31/21 | | | Purchases
at Cost | | | Proceeds
from Sale | | | Net Realized
Gain (Loss) | | | Change in
Unrealized
Appreciation
(Depreciation) | | | Value at
10/31/22 | | | Shares
Held at
10/31/22
(000) | | | Income | | | Capital Gain
Distributions from
Underlying Funds | |
BlackRock Cash Funds: Treasury, SL Agency Shares | | $ | 1,000,000 | | | $ | — | | | $ | (560,000 | )(a) | | $ | — | | | $ | — | | | $ | 440,000 | | | | 440 | | | $ | 10,026 | | | $ | — | |
| | | | | | | | | | | | | | | | | | | | | | | | | | | | | | | | | | | | |
| (a) | Represents net amount purchased (sold). |
Fair Value Hierarchy as of Period End
Various inputs are used in determining the fair value of financial instruments. For a description of the input levels and information about the Fund’s policy regarding valuation of financial instruments, refer to the Notes to Financial Statements.
The following table summarizes the Fund’s financial instruments categorized in the fair value hierarchy. The breakdown of the Fund’s financial instruments into major categories is disclosed in the Schedule of Investments above.
| | | | | | | | | | | | | | | | |
| | | | | |
| | | Level 1 | | | Level 2 | | | Level 3 | | | Total | |
Investments | | | | | | | | | | | | | | | | |
Assets | | | | | | | | | | | | | | | | |
Foreign Government Obligations | | $ | — | | | $ | 338,775,650 | | | $ | — | | | $ | 338,775,650 | |
Money Market Funds | | | 440,000 | | | | — | | | | — | | | | 440,000 | |
| | | | | | | | | | | | | | | | |
| | $ | 440,000 | | | $ | 338,775,650 | | | $ | — | | | $ | 339,215,650 | |
| | | | | | | | | | | | | | | | |
See notes to financial statements.
| | |
S C H E D U L E O F I N V E S T M E N T S | | 47 |
| | |
Schedule of Investments October 31, 2022 | | iShares® US & Intl High Yield Corp Bond ETF (Percentages shown are based on Net Assets) |
| | | | | | | | | | | | |
| Security | | | | | Par
(000) | | | Value | |
| | | |
Corporate Bonds & Notes | | | | | | | | | | | | |
| | | |
| Australia — 0.5% | | | | | | | | | |
FMG Resources August 2006 Pty Ltd. | | | | | | | | | | | | |
4.38%, 04/01/31 (Call 01/01/31)(a) | | | USD | | | | 125 | | | $ | 99,350 | |
4.50%, 09/15/27 (Call 06/15/27)(a) | | | USD | | | | 50 | | | | 44,645 | |
5.13%, 05/15/24 (Call 02/15/24)(a)(b) | | | USD | | | | 50 | | | | 48,975 | |
FMG Resources August Pty. Ltd. | | | | | | | | | | | | |
5.88%, 04/15/30 (Call 01/15/30)(a) | | | USD | | | | 45 | | | | 39,937 | |
6.13%, 04/15/32 (Call 01/15/32)(a) | | | USD | | | | 65 | | | | 57,128 | |
Mineral Resources Ltd. | | | | | | | | | | | | |
8.00%, 11/01/27 (Call 11/01/24)(a) | | | USD | | | | 50 | | | | 49,250 | |
8.13%, 05/01/27 (Call 12/01/22)(a) | | | USD | | | | 50 | | | | 49,750 | |
8.50%, 05/01/30 (Call 05/01/25)(a) | | | USD | | | | 65 | | | | 63,960 | |
| | | | | | | | | | | | |
| | | |
| | | | | | | | | | | 452,995 | |
| | | |
| Austria — 0.1% | | | | | | | | | |
ams-OSRAM AG, 6.00%, 07/31/25
(Call 11/30/22)(c) | | | EUR | | | | 100 | | | | 86,505 | |
Wienerberger AG, 2.00%, 05/02/24(c) | | | EUR | | | | 50 | | | | 47,510 | |
| | | | | | | | | | | | |
| | | |
| | | | | | | | | | | 134,015 | |
| | | |
| Belgium — 0.2% | | | | | | | | | |
Ontex Group NV, 3.50%, 07/15/26
(Call 07/15/23)(c) | | | EUR | | | | 100 | | | | 76,419 | |
Telenet Finance Luxembourg Notes Sarl, 5.50%, 03/01/28 (Call 12/01/22)(a) | | | USD | | | | 200 | | | | 174,767 | |
| | | | | | | | | | | | |
| | | |
| | | | | | | | | | | 251,186 | |
| | | |
| Canada — 3.4% | | | | | | | | | |
1011778 BC ULC/New Red Finance Inc. | | | | | | | | | | | | |
3.50%, 02/15/29 (Call 02/15/24)(a) | | | USD | | | | 70 | | | | 58,625 | |
3.88%, 01/15/28 (Call 12/01/22)(a) | | | USD | | | | 145 | | | | 127,538 | |
4.00%, 10/15/30 (Call 10/15/25)(a) | | | USD | | | | 200 | | | | 163,250 | |
4.38%, 01/15/28 (Call 12/01/22)(a) | | | USD | | | | 45 | | | | 39,585 | |
5.75%, 04/15/25 (Call 12/01/22)(a) | | | USD | | | | 40 | | | | 40,012 | |
1375209 BC Ltd., 9.00%, 01/30/28(b) | | | USD | | | | 155 | | | | 151,125 | |
Air Canada | | | | | | | | | | | | |
3.88%, 08/15/26 (Call 02/15/26)(a) | | | USD | | | | 100 | | | | 88,163 | |
4.63%, 08/15/29 (Call 02/15/26)(a) | | | CAD | | | | 238 | | | | 144,843 | |
AutoCanada Inc., 5.75%, 02/07/29(a) | | | CAD | | | | 75 | | | | 47,161 | |
Bombardier Inc. | | | | | | | | | | | | |
6.00%, 02/15/28 (Call 02/15/24)(a) | | | USD | | | | 65 | | | | 57,931 | |
7.13%, 06/15/26 (Call 06/15/23)(a) | | | USD | | | | 75 | | | | 70,883 | |
7.50%, 12/01/24 (Call 12/01/22)(a)(b) | | | USD | | | | 70 | | | | 69,921 | |
7.50%, 03/15/25 (Call 12/01/22)(a)(b) | | | USD | | | | 102 | | | | 100,447 | |
7.88%, 04/15/27 (Call 12/01/22)(a) | | | USD | | | | 155 | | | | 147,196 | |
Brookfield Residential Properties Inc./Brookfield Residential U.S. LLC | | | | | | | | | | | | |
4.88%, 02/15/30 (Call 02/15/25)(a) | | | USD | | | | 50 | | | | 38,256 | |
6.25%, 09/15/27 (Call 12/01/22)(a) | | | USD | | | | 57 | | | | 49,733 | |
CES Energy Solutions Corp.,
6.38%, 10/21/24 | | | CAD | | | | 40 | | | | 29,074 | |
Crew Energy Inc., 6.50%, 03/14/24(a) | | | CAD | | | | 23 | | | | 16,724 | |
Emera Inc., Series 16-A, 6.75%, 06/15/76 (Call 06/15/26)(d) | | | USD | | | | 75 | | | | 69,725 | |
Garda World Security Corp. | | | | | | | | | | | | |
4.63%, 02/15/27 (Call 02/15/23)(a) | | | USD | | | | 50 | | | | 44,610 | |
6.00%, 06/01/29 (Call 06/01/24)(a) | | | USD | | | | 50 | | | | 38,990 | |
9.50%, 11/01/27 (Call 12/01/22)(a) | | | USD | | | | 50 | | | | 45,150 | |
GFL Environmental Inc. | | | | | | | | | | | | |
3.50%, 09/01/28 (Call 03/01/28)(a) | | | USD | | | | 50 | | | | 42,402 | |
3.75%, 08/01/25 (Call 12/01/22)(a) | | | USD | | | | 80 | | | | 75,600 | |
4.00%, 08/01/28 (Call 08/01/23)(a) | | | USD | | | | 60 | | | | 51,494 | |
4.25%, 06/01/25 (Call 12/01/22)(a) | | | USD | | | | 40 | | | | 38,100 | |
4.38%, 08/15/29 (Call 08/15/24)(a)(b) | | | USD | | | | 40 | | | | 33,900 | |
4.75%, 06/15/29 (Call 06/15/24)(a)(b) | | | USD | | | | 60 | | | | 52,468 | |
| | | | | | | | | | | | |
| Security | | | | | Par
(000) | | | Value | |
| | | |
| Canada (continued) | | | | | | | | | |
5.13%, 12/15/26 (Call 12/15/22)(a) | | | USD | | | | 34 | | | $ | 32,385 | |
Kronos Acquisition Holdings Inc./KIK Custom Products Inc. | | | | | | | | | | | | |
5.00%, 12/31/26 (Call 06/30/23)(a) | | | USD | | | | 35 | | | | 31,726 | |
7.00%, 12/31/27 (Call 12/31/23)(a) | | | USD | | | | 45 | | | | 38,093 | |
Mattamy Group Corp. | | | | | | | | | | | | |
4.63%, 03/01/30 (Call 03/01/25)(a) | | | USD | | | | 20 | | | | 15,744 | |
5.25%, 12/15/27 (Call 12/15/22)(a)(b) | | | USD | | | | 50 | | | | 42,751 | |
MEG Energy Corp. | | | | | | | | | | | | |
5.88%, 02/01/29 (Call 02/01/24)(a) | | | USD | | | | 25 | | | | 23,875 | |
7.13%, 02/01/27 (Call 02/01/23)(a) | | | USD | | | | 110 | | | | 111,930 | |
Methanex Corp. | | | | | | | | | | | | |
5.13%, 10/15/27 (Call 04/15/27)(b) | | | USD | | | | 50 | | | | 45,600 | |
5.25%, 12/15/29 (Call 09/15/29)(b) | | | USD | | | | 65 | | | | 55,840 | |
NOVA Chemicals Corp. | | | | | | | | | | | | |
4.25%, 05/15/29 (Call 05/15/24)(a)(b) | | | USD | | | | 32 | | | | 26,003 | |
4.88%, 06/01/24 (Call 03/03/24)(a) | | | USD | | | | 80 | | | | 77,527 | |
5.00%, 05/01/25 (Call 01/31/25)(a) | | | USD | | | | 40 | | | | 38,000 | |
5.25%, 06/01/27 (Call 03/03/27)(a) | | | USD | | | | 100 | | | | 89,500 | |
NuVista Energy Ltd., 7.88%, 07/23/26(a) | | | CAD | | | | 25 | | | | 18,561 | |
Open Text Corp. | | | | | | | | | | | | |
3.88%, 02/15/28 (Call 02/15/23)(a)(b) | | | USD | | | | 65 | | | | 55,737 | |
3.88%, 12/01/29 (Call 12/01/24)(a) | | | USD | | | | 60 | | | | 47,550 | |
Open Text Holdings Inc. | | | | | | | | | | | | |
4.13%, 02/15/30 (Call 02/15/25)(a) | | | USD | | | | 65 | | | | 51,756 | |
4.13%, 12/01/31 (Call 12/01/26)(a) | | | USD | | | | 68 | | | | 51,460 | |
Parkland Corp. | | | | | | | | | | | | |
3.88%, 06/16/26 (Call 06/16/23)(a) | | | CAD | | | | 125 | | | | 82,234 | |
4.50%, 10/01/29 (Call 10/01/24)(a) | | | USD | | | | 70 | | | | 58,502 | |
4.63%, 05/01/30 (Call 05/01/25)(a) | | | USD | | | | 55 | | | | 45,789 | |
5.88%, 07/15/27 (Call 12/01/22)(a) | | | USD | | | | 40 | | | | 37,834 | |
Superior Plus LP, 4.25%, 05/18/28
(Call 05/18/24)(a) | | | CAD | | | | 50 | | | | 30,875 | |
Tamarack Valley Energy Ltd.,
7.25%, 05/10/27 (Call 05/10/24)(a) | | | CAD | | | | 25 | | | | 17,153 | |
Telesat Canada/Telesat LLC | | | | | | | | | | | | |
4.88%, 06/01/27 (Call 12/01/22)(a) | | | USD | | | | 35 | | | | 15,794 | |
5.63%, 12/06/26 (Call 12/06/23)(a) | | | USD | | | | 60 | | | | 27,994 | |
Titan Acquisition Ltd./Titan Co-Borrower LLC, 7.75%, 04/15/26 (Call 12/01/22)(a) | | | USD | | | | 55 | | | | 45,020 | |
Videotron Ltd. | | | | | | | | | | | | |
3.13%, 01/15/31 (Call 01/15/26) | | | CAD | | | | 25 | | | | 13,693 | |
3.63%, 06/15/28 (Call 06/15/24)(a) | | | CAD | | | | 50 | | | | 30,967 | |
3.63%, 06/15/29 (Call 06/15/24)(a)(b) | | | USD | | | | 25 | | | | 21,095 | |
4.50%, 01/15/30 (Call 10/15/24) | | | CAD | | | | 110 | | | | 68,043 | |
5.13%, 04/15/27 (Call 12/01/22)(a) | | | USD | | | | 60 | | | | 56,497 | |
5.38%, 06/15/24 (Call 03/15/24)(a) | | | USD | | | | 50 | | | | 49,558 | |
5.63%, 06/15/25 (Call 03/15/25) | | | CAD | | | | 50 | | | | 35,949 | |
| | | | | | | | | | | | |
| | | |
| | | | | | | | | | | 3,423,941 | |
| | | |
| Finland — 0.4% | | | | | | | | | |
Huhtamaki Oyj, 4.25%, 06/09/27
(Call 03/09/27)(c) | | | EUR | | | | 100 | | | | 94,943 | |
Nokia OYJ | | | | | | | | | | | | |
2.00%, 03/11/26 (Call 12/11/25)(c) | | | EUR | | | | 100 | | | | 91,244 | |
4.38%, 06/12/27 | | | USD | | | | 60 | | | | 54,960 | |
Teollisuuden Voima OYJ, 2.63%, 03/31/27
(Call 12/31/26)(c) | | | EUR | | | | 150 | | | | 135,354 | |
| | | | | | | | | | | | |
| | | |
| | | | | | | | | | | 376,501 | |
| | | |
| France — 4.7% | | | | | | | | | |
Accor SA, 3.00%, 02/04/26
(Call 11/04/25)(c) | | | EUR | | | | 100 | | | | 92,800 | |
Adevinta ASA, 2.63%, 11/15/25
(Call 11/15/22)(c) | | | EUR | | | | 100 | | | | 90,953 | |
Altice France SA, 5.50%, 10/15/29
(Call 10/15/24)(a) | | | USD | | | | 150 | | | | 114,000 | |
| | |
| 48 | | 2 0 2 2 I S H A R E S A N N U A L R E P O R T T O S H A R E H O L D E R S |
| | |
Schedule of Investments (continued) October 31, 2022 | | iShares® US & Intl High Yield Corp Bond ETF (Percentages shown are based on Net Assets) |
| | | | | | | | | | | | |
| Security | | | | | Par
(000) | | | Value | |
| | | |
| France (continued) | | | | | | | | | |
Altice France SA/France | | | | | | | | | | | | |
2.13%, 02/15/25 (Call 11/30/22)(c) | | | EUR | | | | 100 | | | $ | 86,718 | |
4.13%, 01/15/29 (Call 09/15/23)(c) | | | EUR | | | | 100 | | | | 75,973 | |
5.13%, 01/15/29 (Call 09/15/23)(a) | | | USD | | | | 25 | | | | 18,725 | |
5.13%, 07/15/29 (Call 04/15/24)(a) | | | USD | | | | 200 | | | | 149,705 | |
5.50%, 01/15/28 (Call 12/01/22)(a) | | | USD | | | | 100 | | | | 79,863 | |
5.88%, 02/01/27 (Call 11/30/22)(c) | | | EUR | | | | 100 | | | | 85,284 | |
8.13%, 02/01/27 (Call 11/14/22)(a) | | | USD | | | | 150 | | | | 137,550 | |
Atos SE | | | | | | | | | | | | |
1.00%, 11/12/29 (Call 08/12/29)(c) | | | EUR | | | | 100 | | | | 54,887 | |
2.50%, 11/07/28 (Call 08/07/28)(c) | | | EUR | | | | 100 | | | | 60,874 | |
Banijay Entertainment SASU,
3.50%, 03/01/25 (Call 11/30/22)(c) | | | EUR | | | | 100 | | | | 92,702 | |
CAB SELAS, 3.38%, 02/01/28
(Call 02/01/24)(c) | | | EUR | | | | 100 | | | | 76,816 | |
Casino Guichard Perrachon SA,
5.25%, 04/15/27 (Call 04/15/23)(c) | | | EUR | | | | 100 | | | | 43,334 | |
Chrome Bidco SASU, 3.50%, 05/31/28
(Call 05/31/24)(c) | | | EUR | | | | 100 | | | | 79,508 | |
CMA CGM SA, 7.50%, 01/15/26
(Call 01/15/23)(c) | | | EUR | | | | 100 | | | | 100,569 | |
Electricite de France SA, 5.63%,
(Call 01/22/24)(a)(b)(d)(e) | | | USD | | | | 120 | | | | 105,731 | |
Elis SA, 1.63%, 04/03/28 (Call 01/03/28)(c) | | | EUR | | | | 100 | | | | 81,844 | |
Emeria SASU, 3.38%, 03/31/28
(Call 03/31/24)(c) | | | EUR | | | | 100 | | | | 74,706 | |
Faurecia SE | | | | | | | | | | | | |
2.38%, 06/15/27 (Call 06/15/23)(c) | | | EUR | | | | 100 | | | | 80,665 | |
2.63%, 06/15/25 (Call 11/30/22)(c) | | | EUR | | | | 100 | | | | 92,758 | |
2.75%, 02/15/27 (Call 02/15/24)(c) | | | EUR | | | | 100 | | | | 84,249 | |
3.13%, 06/15/26 (Call 11/30/22)(c) | | | EUR | | | | 100 | | | | 91,535 | |
Fnac Darty SA, 2.63%, 05/30/26(c) | | | EUR | | | | 100 | | | | 89,160 | |
Getlink SE, 3.50%, 10/30/25
(Call 11/30/22)(c) | | | EUR | | | | 100 | | | | 94,114 | |
Iliad Holding SASU | | | | | | | | | | | | |
5.63%, 10/15/28 (Call 10/15/24)(c) | | | EUR | | | | 100 | | | | 88,501 | |
7.00%, 10/15/28 (Call 10/15/24)(a) | | | USD | | | | 150 | | | | 135,750 | |
iliad SA | | | | | | | | | | | | |
1.50%, 10/14/24 (Call 07/14/24)(c) | | | EUR | | | | 100 | | | | 94,133 | |
1.88%, 04/25/25 (Call 01/25/25)(c) | | | EUR | | | | 200 | | | | 183,578 | |
IPD 3 BV, 5.50%, 12/01/25
(Call 12/01/22)(c) | | | EUR | | | | 100 | | | | 89,945 | |
La Financiere Atalian SASU,
4.00%, 05/15/24 (Call 11/10/22)(c) | | | EUR | | | | 200 | | | | 185,791 | |
Loxam SAS | | | | | | | | | | | | |
3.25%, 01/14/25(c) | | | EUR | | | | 125 | | | | 113,602 | |
3.75%, 07/15/26(c) | | | EUR | | | | 100 | | | | 85,834 | |
Lune Holdings Sarl, 5.63%, 11/15/28
(Call 11/15/24)(c) | | | EUR | | | | 100 | | | | 75,167 | |
Paprec Holding SA, 4.00%, 03/31/25(c) | | | EUR | | | | 100 | | | | 90,832 | |
Parts Europe SA, 6.50%, 07/16/25(c) | | | EUR | | | | 100 | | | | 98,489 | |
Picard Groupe SAS, 3.88%, 07/01/26
(Call 07/01/23)(c) | | | EUR | | | | 100 | | | | 84,707 | |
Quatrim SASU, 5.88%, 01/15/24
(Call 11/10/22)(c) | | | EUR | | | | 100 | | | | 95,614 | |
RCI Banque SA, 2.63%, 02/18/30
(Call 02/18/25)(c)(d) | | | EUR | | | | 100 | | | | 85,747 | |
Renault SA | | | | | | | | | | | | |
1.00%, 03/08/23 (Call 12/08/22)(c) | | | EUR | | | | 100 | | | | 97,957 | |
1.13%, 10/04/27 (Call 07/04/27)(c) | | | EUR | | | | 100 | | | | 78,057 | |
2.38%, 05/25/26 (Call 02/25/26)(c) | | | EUR | | | | 100 | | | | 87,373 | |
2.50%, 06/02/27 (Call 03/02/27)(c) | | | EUR | | | | 100 | | | | 83,402 | |
Rexel SA, 2.13%, 12/15/28
(Call 12/15/24)(c) | | | EUR | | | | 100 | | | | 80,239 | |
SPCM SA, 2.63%, 02/01/29
(Call 09/15/23)(c) | | | EUR | | | | 100 | | | | 75,819 | |
SPIE SA, 2.63%, 06/18/26
(Call 12/18/25)(c) | | | EUR | | | | 100 | | | | 91,351 | |
Tereos Finance Groupe, 4.75%, 04/30/27
(Call 04/30/24)(c) | | | EUR | | | | 100 | | | | 86,309 | |
Valeo | | | | | | | | | | | | |
1.50%, 06/18/25 (Call 03/18/25)(c) | | | EUR | | | | 100 | | | | 90,834 | |
1.63%, 03/18/26 (Call 12/18/25)(c) | | | EUR | | | | 100 | | | | 89,001 | |
Verallia SA, 1.63%, 05/14/28
(Call 02/14/28)(c) | | | EUR | | | | 100 | | | | 81,968 | |
| | | | | | | | | | | | |
| | | |
| | | | | | | | | | | 4,685,023 | |
| | | | | | | | | | | | |
| Security | | | | | Par
(000) | | | Value | |
| | | |
| Germany — 3.1% | | | | | | | | | |
ADLER Group SA | | | | | | | | | | | | |
1.88%, 01/14/26 (Call 10/14/25)(c) | | | EUR | | | | 100 | | | $ | 42,510 | |
2.25%, 04/27/27 (Call 01/27/27)(c) | | | EUR | | | | 100 | | | | 41,507 | |
3.25%, 08/05/25 (Call 05/05/25)(c) | | | EUR | | | | 100 | | | | 44,623 | |
Adler Pelzer Holding GmbH,
4.13%, 04/01/24 (Call 11/10/22)(c) | | | EUR | | | | 100 | | | | 76,241 | |
Bayer AG | | | | | | | | | | | | |
3.13%, 11/12/79 (Call 08/12/27)(c) | | | EUR | | | | 100 | | | | 82,221 | |
3.75%, 07/01/74 (Call 07/01/24)(c)(d) | | | EUR | | | | 100 | | | | 94,623 | |
5.38%, 03/25/82 (Call 06/25/30)(c)(d) | | | EUR | | | | 100 | | | | 85,269 | |
Bertelsmann SE & Co. KGaA,
3.50%, 04/23/75 (Call 04/23/27)(c)(d) | | | EUR | | | | 100 | | | | 85,116 | |
Cheplapharm Arzneimittel GmbH,
4.38%, 01/15/28 (Call 01/15/24)(c) | | | EUR | | | | 100 | | | | 83,171 | |
Commerzbank AG | | | | | | | | | | | | |
4.00%, 03/30/27(c) | | | EUR | | | | 80 | | | | 73,811 | |
4.00%, 12/05/30 (Call 09/05/25)(c)(d) | | | EUR | | | | 100 | | | | 90,609 | |
CT Investment GmbH, 5.50%, 04/15/26
(Call 04/15/23)(c) . | | | EUR | | | | 100 | | | | 81,107 | |
Deutsche Bank AG/New York NY,
3.73%, 01/14/32 (Call 10/14/30),
(SOFR + 2.757%)(d) | | | USD | | | | 100 | | | | 70,312 | |
Deutsche Lufthansa AG | | | | | | | | | | | | |
1.63%, 11/16/23 (Call 10/16/23)(c) | | | EUR | | | | 100 | | | | 95,520 | |
2.88%, 05/16/27 (Call 02/16/27)(c) | | | EUR | | | | 100 | | | | 82,373 | |
3.00%, 05/29/26 (Call 03/02/26)(c) | | | EUR | | | | 100 | | | | 86,553 | |
3.50%, 07/14/29 (Call 04/14/29)(c) | | | EUR | | | | 100 | | | | 78,055 | |
Douglas GmbH, 6.00%, 04/08/26
(Call 04/15/23)(c) | | | EUR | | | | 100 | | | | 75,516 | |
Evonik Industries AG, 1.38%, 09/02/81
(Call 09/02/26)(c)(d) | | | EUR | | | | 100 | | | | 73,617 | |
Gruenenthal GMBH, 4.13%, 05/15/28
(Call 05/15/24)(c) | | | EUR | | | | 100 | | | | 81,352 | |
Mahle GmbH, 2.38%, 05/14/28
(Call 02/14/28)(c) | | | EUR | | | | 100 | | | | 69,900 | |
Mercer International Inc., 5.13%, 02/01/29
(Call 02/01/24) | | | USD | | | | 60 | | | | 50,025 | |
Nidda BondCo GmbH, 5.00%, 09/30/25
(Call 11/30/22)(c) | | | EUR | | | | 100 | | | | 79,598 | |
Nidda Healthcare Holding GmbH,
3.50%, 09/30/24 (Call 11/10/22)(c) | | | EUR | | | | 100 | | | | 92,467 | |
ProGroup AG, 3.00%, 03/31/26(c) | | | EUR | | | | 100 | | | | 86,194 | |
RWE AG, 3.50%, 04/21/75
(Call 04/21/25)(c)(d) | | | EUR | | | | 50 | | | | 46,857 | |
Schaeffler AG | | | | | | | | | | | | |
2.88%, 03/26/27 (Call 12/26/26)(c) | | | EUR | | | | 100 | | | | 86,828 | |
3.38%, 10/12/28 (Call 07/12/28)(c) | | | EUR | | | | 100 | | | | 83,386 | |
Techem Verwaltungsgesellschaft 674 mbH, 6.00%, 07/30/26(c) | | | EUR | | | | 88 | | | | 80,761 | |
thyssenkrupp AG | | | | | | | | | | | | |
1.88%, 03/06/23 (Call 02/06/23)(c) | | | EUR | | | | 175 | | | | 171,147 | |
2.88%, 02/22/24 (Call 11/22/23)(c) | | | EUR | | | | 25 | | | | 24,048 | |
TK Elevator Holdco GmbH | | | | | | | | | | | | |
6.63%, 07/15/28 (Call 07/15/23)(c) | | | EUR | | | | 90 | | | | 69,573 | |
7.63%, 07/15/28 (Call 07/15/23)(a)(b) | | | USD | | | | 25 | | | | 20,411 | |
TK Elevator Midco GmbH, 4.38%, 07/15/27
(Call 07/15/23)(c) | | | EUR | | | | 100 | | | | 83,424 | |
TK Elevator U.S. Newco Inc.,
5.25%, 07/15/27 (Call 07/15/23)(a) | | | USD | | | | 100 | | | | 89,546 | |
ZF Europe Finance BV | | | | | | | | | | | | |
2.00%, 02/23/26 (Call 12/23/25)(c) | | | EUR | | | | 100 | | | | 85,948 | |
3.00%, 10/23/29 (Call 07/23/29)(c) | | | EUR | | | | 100 | | | | 76,789 | |
ZF Finance GmbH | | | | | | | | | | | | |
2.25%, 05/03/28 (Call 02/03/28)(c) | | | EUR | | | | 100 | | | | 76,687 | |
2.75%, 05/25/27 (Call 02/25/27)(c) | | | EUR | | | | 100 | | | | 82,317 | |
3.00%, 09/21/25 (Call 06/21/25)(c) | | | EUR | | | | 100 | | | | 90,550 | |
ZF North America Capital Inc.,
4.75%, 04/29/25(a) | | | USD | | | | 75 | | | | 70,595 | |
| | | | | | | | | | | | |
| | | |
| | | | | | | | | | | 3,141,157 | |
| | |
S C H E D U L E O F I N V E S T M E N T S | | 49 |
| | |
Schedule of Investments (continued) October 31, 2022 | | iShares® US & Intl High Yield Corp Bond ETF (Percentages shown are based on Net Assets) |
| | | | | | | | | | | | |
| Security | | | | | Par
(000) | | | Value | |
|
| Gibraltar — 0.1% | |
888 Acquisitions Ltd., 7.56%, 07/15/27
(Call 07/15/24)(c) | | | EUR | | | | 100 | | | $ | 84,600 | |
| | | | | | | | | | | | |
|
| Greece — 0.5% | |
Alpha Bank SA, 2.50%, 03/23/28
(Call 03/23/27)(c)(d) | | | EUR | | | | 100 | | | | 77,445 | |
Eurobank SA, 2.00%, 05/05/27
(Call 05/05/26)(c)(d) | | | EUR | | | | 100 | | | | 80,646 | |
National Bank of Greece SA,
2.75%, 10/08/26 (Call 10/08/25)(c)(d) | | | EUR | | | | 150 | | | | 127,800 | |
Piraeus Bank SA, 3.88%, 11/03/27
(Call 11/03/26)(c)(d) | | | EUR | | | | 100 | | | | 78,500 | |
Public Power Corp. SA, 3.88%, 03/30/26
(Call 03/30/23)(c) | | | EUR | | | | 100 | | | | 89,393 | |
Titan Global Finance PLC,
2.38%, 11/16/24(c) | | | EUR | | | | 100 | | | | 92,901 | |
| | | | | | | | | | | | |
| | | |
| | | | | | | | | | | 546,685 | |
|
| Hong Kong — 0.2% | |
Melco Resorts Finance Ltd. | | | | | | | | | | | | |
4.88%, 06/06/25 (Call 12/01/22)(a) | | | USD | | | | 170 | | | | 122,081 | |
5.38%, 12/04/29 (Call 12/04/24)(a)(b) | | | USD | | | | 125 | | | | 69,688 | |
5.75%, 07/21/28 (Call 07/21/23)(a) | | | USD | | | | 25 | | | | 14,425 | |
| | | | | | | | | | | | |
| | | |
| | | | | | | | | | | 206,194 | |
|
| Ireland — 0.5% | |
AerCap Global Aviation Trust,
6.50%, 06/15/45 (Call 06/15/25)(a)(d) | | | USD | | | | 25 | | | | 22,842 | |
AerCap Holdings NV, 5.88%, 10/10/79
(Call 10/10/24)(b)(d) | | | USD | | | | 75 | | | | 67,350 | |
AIB Group PLC, 1.88%, 11/19/29
(Call 11/19/24)(c)(d) | | | EUR | | | | 100 | | | | 88,592 | |
Bank of Ireland Group PLC,
1.38%, 08/11/31 (Call 05/11/26)(c)(d) | | | EUR | | | | 100 | | | | 80,362 | |
eircom Finance DAC, 3.50%, 05/15/26
(Call 11/30/22)(c) | | | EUR | | | | 125 | | | | 109,084 | |
Permanent TSB Group Holdings PLC, 5.25%, 06/30/25 (Call 06/30/24)(c)(d) | | | EUR | | | | 100 | | | | 94,921 | |
| | | | | | | | | | | | |
| | | |
| | | | | | | | | | | 463,151 | |
|
| Israel — 1.4% | |
Energean Israel Finance Ltd. | | | | | | | | | | | | |
4.50%, 03/30/24 (Call 12/30/23)(a) | | | USD | | | | 50 | | | | 47,801 | |
4.88%, 03/30/26 (Call 12/30/25)(a) | | | USD | | | | 60 | | | | 54,061 | |
5.38%, 03/30/28 (Call 09/30/27)(a) | | | USD | | | | 45 | | | | 39,622 | |
5.88%, 03/30/31 (Call 09/30/30)(a) | | | USD | | | | 60 | | | | 50,858 | |
Leviathan Bond Ltd. | | | | | | | | | | | | |
6.13%, 06/30/25 (Call 03/30/25)(a) | | | USD | | | | 45 | | | | 42,806 | |
6.50%, 06/30/27 (Call 12/30/26)(a) | | | USD | | | | 55 | | | | 51,168 | |
6.75%, 06/30/30 (Call 12/30/29)(a) | | | USD | | | | 40 | | | | 35,814 | |
Teva Pharmaceutical Finance Netherlands II BV | | | | | | | | | | | | |
1.25%, 03/31/23 (Call 12/31/22)(c) | | | EUR | | | | 100 | | | | 97,546 | |
1.63%, 10/15/28(c) | | | EUR | | | | 100 | | | | 71,981 | |
3.75%, 05/09/27 (Call 02/09/27) | | | EUR | | | | 100 | | | | 86,195 | |
4.38%, 05/09/30 (Call 02/09/30) | | | EUR | | | | 150 | | | | 119,198 | |
6.00%, 01/31/25 (Call 10/31/24) | | | EUR | | | | 100 | | | | 97,578 | |
Teva Pharmaceutical Finance Netherlands III BV | | | | | | | | | | | | |
3.15%, 10/01/26 | | | USD | | | | 275 | | | | 232,375 | |
4.75%, 05/09/27 (Call 02/09/27) | | | USD | | | | 75 | | | | 66,000 | |
5.13%, 05/09/29 (Call 02/09/29)(b) | | | USD | | | | 100 | | | | 85,891 | |
6.00%, 04/15/24 (Call 01/15/24)(b) | | | USD | | | | 150 | | | | 148,500 | |
6.75%, 03/01/28 (Call 12/01/27)(b) | | | USD | | | | 100 | | | | 94,377 | |
| | | | | | | | | | | | |
| | | |
| | | | | | | | | | | 1,421,771 | |
|
| Italy — 4.2% | |
Atlantia SpA | | | | | | | | | | | | |
1.88%, 07/13/27 (Call 04/13/27)(c) | | | EUR | | | | 100 | | | | 81,051 | |
1.88%, 02/12/28 (Call 11/12/27)(c) | | | EUR | | | | 100 | | | | 77,807 | |
Azzurra Aeroporti SpA, 2.63%, 05/30/27
(Call 02/28/27)(c) | | | EUR | | | | 100 | | | | 86,357 | |
Banca Monte dei Paschi di Siena SpA | | | | | | | | | | | | |
3.63%, 09/24/24(c) | | | EUR | | | | 100 | | | | 92,245 | |
10.50%, 07/23/29(c) | | | EUR | | | | 100 | | | | 81,672 | |
| | | | | | | | | | | | |
| Security | | | | | Par
(000) | | | Value | |
|
| Italy (continued) | |
Banca Popolare di Sondrio SCPA,
2.38%, 04/03/24(c) | | | EUR | | | | 100 | | | $ | 95,621 | |
Banco BPM SpA | | | | | | | | | | | | |
0.88%, 07/15/26(c) | | | EUR | | | | 100 | | | | 84,255 | |
1.75%, 01/28/25(c) | | | EUR | | | | 100 | | | | 92,091 | |
3.25%, 01/14/31 (Call 01/14/26)(c)(d) | | | EUR | | | | 100 | | | | 82,923 | |
6.00%, 09/13/26(c) | | | EUR | | | | 150 | | | | 149,811 | |
BPER Banca | | | | | | | | | | | | |
1.38%, 03/31/27 (Call 03/31/26)(c)(d) | | | EUR | | | | 100 | | | | 83,603 | |
3.38%, 06/30/25 (Call 05/31/24)(c)(d) | | | EUR | | | | 100 | | | | 95,668 | |
Centurion Bidco SpA, 5.88%, 09/30/26
(Call 11/03/22)(c) | | | EUR | | | | 100 | | | | 87,060 | |
doValue SpA, 3.38%, 07/31/26
(Call 07/31/23)(c) | | | EUR | | | | 100 | | | | 81,147 | |
Esselunga SpA, 1.88%, 10/25/27
(Call 07/25/27)(c) | | | EUR | | | | 100 | | | | 87,719 | |
Guala Closures SpA, 3.25%, 06/15/28
(Call 06/15/24)(c) | | | EUR | | | | 100 | | | | 79,880 | |
Iccrea Banca SpA, 4.75%, 01/18/32
(Call 10/18/26)(c)(d) | | | EUR | | | | 100 | | | | 79,439 | |
IMA Industria Macchine Automatiche SpA, 3.75%, 01/15/28 (Call 01/15/23)(c) | | | EUR | | | | 100 | | | | 80,681 | |
Infrastrutture Wireless Italiane SpA,
1.88%, 07/08/26 (Call 04/08/26)(c) | | | EUR | | | | 100 | | | | 87,841 | |
Intesa Sanpaolo SpA | | | | | | | | | | | | |
3.93%, 09/15/26(c) | | | EUR | | | | 100 | | | | 94,904 | |
4.20%, 06/01/32 (Call 06/01/31)(a)(d) | | | USD | | | | 60 | | | | 40,908 | |
5.15%, 06/10/30(c) | | | GBP | | | | 100 | | | | 88,270 | |
5.71%, 01/15/26(a) | | | USD | | | | 225 | | | | 207,506 | |
5.88%, 03/04/29 (Call 03/04/24)(c)(d) | | | EUR | | | | 100 | | | | 98,675 | |
6.63%, 09/13/23(c) | | | EUR | | | | 100 | | | | 100,692 | |
Leonardo SpA, 1.50%, 06/07/24
(Call 03/07/24)(c) | | | EUR | | | | 100 | | | | 95,005 | �� |
Lottomatica SpA/Roma, 5.13%, 07/15/25
(Call 11/10/22)(c) | | | EUR | | | | 100 | | | | 91,538 | |
Nexi SpA, 1.63%, 04/30/26
(Call 01/30/26)(c) | | | EUR | | | | 100 | | | | 87,899 | |
Saipem Finance International BV | | | | | | | | | | | | |
2.63%, 01/07/25(c) | | | EUR | | | | 100 | | | | 92,250 | |
3.13%, 03/31/28 (Call 12/31/27)(c) | | | EUR | | | | 100 | | | | 75,933 | |
Telecom Italia SpA/Milano | | | | | | | | | | | | |
1.63%, 01/18/29 (Call 10/18/28)(c) | | | EUR | | | | 100 | | | | 71,083 | |
2.50%, 07/19/23(c) | | | EUR | | | | 100 | | | | 96,839 | |
2.75%, 04/15/25 (Call 01/15/25)(c) | | | EUR | | | | 100 | | | | 90,125 | |
3.00%, 09/30/25(c) | | | EUR | | | | 100 | | | | 89,056 | |
3.63%, 05/25/26(c) | | | EUR | | | | 200 | | | | 175,769 | |
4.00%, 04/11/24 (Call 01/11/24)(c) | | | EUR | | | | 100 | | | | 95,982 | |
5.30%, 05/30/24(a) | | | USD | | | | 120 | | | | 113,100 | |
UniCredit SpA | | | | | | | | | | | | |
2.00%, 09/23/29 (Call 09/23/24)(c)(d) | | | EUR | | | | 200 | | | | 176,050 | |
2.73%, 01/15/32 (Call 01/15/27)(c)(d) | | | EUR | | | | 200 | | | | 161,018 | |
5.46%, 06/30/35 (Call 06/30/30)(a)(d) | | | USD | | | | 110 | | | | 81,420 | |
5.86%, 06/19/32 (Call 06/19/27)(a)(b)(d) | | | USD | | | | 75 | | | | 62,202 | |
7.30%, 04/02/34 (Call 04/02/29)(a)(d) | | | USD | | | | 100 | | | | 86,607 | |
Verde Bidco SpA, 4.63%, 10/01/26
(Call 10/01/23)(c) | | | EUR | | | | 100 | | | | 78,868 | |
Webuild SpA, 1.75%, 10/26/24(c) | | | EUR | | | | 100 | | | | 83,225 | |
| | | | | | | | | | | | |
| | | |
| | | | | | | | | | | 4,221,795 | |
|
| Japan — 0.4% | |
Rakuten Group Inc. | | | | | | | | | | | | |
5.13%, (Call 04/22/26)(a)(b)(d)(e) | | | USD | | | | 60 | | | | 44,744 | |
6.25%, (Call 04/22/31)(a)(b)(d)(e) | | | USD | | | | 85 | | | | 58,070 | |
SoftBank Group Corp. | | | | | | | | | | | | |
2.13%, 07/06/24 (Call 04/06/24)(c) | | | EUR | | | | 100 | | | | 92,252 | |
3.13%, 09/19/25 (Call 06/21/25)(c) | | | EUR | | | | 150 | | | | 130,379 | |
5.00%, 04/15/28 (Call 01/16/28)(c) | | | EUR | | | | 100 | | | | 81,778 | |
| | | | | | | | | | | | |
| | | | | | | | | | | 407,223 | |
| | |
| 50 | | 2 0 2 2 I S H A R E S A N N U A L R E P O R T T O S H A R E H O L D E R S |
| | |
Schedule of Investments (continued) October 31, 2022 | | iShares® US & Intl High Yield Corp Bond ETF (Percentages shown are based on Net Assets) |
| | | | | | | | | | | | |
| Security | | | | | Par
(000) | | | Value | |
|
Jersey — 0.1% | |
Aston Martin Capital Holdings Ltd., 10.50%, 11/30/25
(Call 11/01/24)(a)(b) | | | USD | | | | 75 | | | $ | 72,000 | |
| | | | | | | | | | | | |
|
Luxembourg — 1.4% | |
Albion Financing 1 SARL/Aggreko Holdings Inc., 6.13%, 10/15/26 (Call 10/15/23)(a) | | | USD | | | | 90 | | | | 76,140 | |
Altice Financing SA | | | | | | | | | | | | |
4.25%, 08/15/29
(Call 08/15/24)(c) | | | EUR | | | | 100 | | | | 75,096 | |
5.00%, 01/15/28
(Call 01/15/23)(a) | | | USD | | | | 50 | | | | 39,774 | |
5.75%, 08/15/29
(Call 08/15/24)(a) | | | USD | | | | 200 | | | | 157,500 | |
Altice Finco SA, 4.75%, 01/15/28 (Call 11/30/22)(c) | | | EUR | | | | 100 | | | | 68,454 | |
Altice France Holding SA | | | | | | | | | | | | |
4.00%, 02/15/28
(Call 02/15/23)(c) | | | EUR | | | | 100 | | | | 60,994 | |
6.00%, 02/15/28
(Call 02/15/23)(a)(b) | | | USD | | | | 50 | | | | 32,357 | |
8.00%, 05/15/27 (Call 11/10/22)(c) | | | EUR | | | | 100 | | | | 71,454 | |
10.50%, 05/15/27
(Call 11/14/22)(a) | | | USD | | | | 150 | | | | 116,796 | |
Cidron Aida Finco Sarl,
5.00%, 04/01/28
(Call 04/01/24)(c) | | | EUR | | | | 100 | | | | 77,218 | |
Garfunkelux Holdco 3 SA,
6.75%, 11/01/25 (Call 11/30/22)(c) | | | EUR | | | | 100 | | | | 70,480 | |
INEOS Finance PLC,
2.88%, 05/01/26 (Call 11/10/22)(c) | | | EUR | | | | 100 | | | | 87,692 | |
Loarre Investments Sarl,
6.50%, 05/15/29
(Call 05/15/25)(c) | | | EUR | | | | 100 | | | | 92,311 | |
Matterhorn Telecom SA, 4.00%, 11/15/27(c) | | | EUR | | | | 100 | | | | 87,173 | |
Mytilineos Financial Partners SA, 2.50%, 12/01/24
(Call 06/01/24)(c) | | | EUR | | | | 100 | | | | 94,511 | |
Summer BC Holdco B Sarl,
5.75%, 10/31/26 (Call 11/30/22)(c) | | | EUR | | | | 100 | | | | 85,337 | |
Swissport Investments SA, 6.75%, 12/15/21(c)(f)(g) | | | EUR | | | | 100 | | | | 1 | |
Vivion Investments Sarl, 3.00%, 08/08/24(c) | | | EUR | | | | 100 | | | | 84,345 | |
| | | | | | | | | | | | |
| | | |
| | | | | | | | | | | 1,377,633 | |
|
Macau — 0.4% | |
MGM China Holdings Ltd. | | | | | | | | | | | | |
4.75%, 02/01/27
(Call 02/01/24)(a) | | | USD | | | | 75 | | | | 56,250 | |
5.25%, 06/18/25 (Call 11/11/22)(a) | | | USD | | | | 25 | | | | 20,009 | |
5.88%, 05/15/26 (Call 11/11/22)(a) | | | USD | | | | 50 | | | | 38,356 | |
Studio City Finance Ltd. | | | | | | | | | | | | |
5.00%, 01/15/29
(Call 01/15/24)(a)(b) | | | USD | | | | 100 | | | | 42,450 | |
6.50%, 01/15/28
(Call 07/15/23)(a)(b) | | | USD | | | | 60 | | | | 27,097 | |
Wynn Macau Ltd. | | | | | | | | | | | | |
5.13%, 12/15/29
(Call 12/15/24)(a) | | | USD | | | | 125 | | | | 75,625 | |
5.50%, 01/15/26
(Call 12/01/22)(a) | | | USD | | | | 50 | | | | 34,750 | |
5.50%, 10/01/27
(Call 12/01/22)(a) | | | USD | | | | 50 | | | | 32,238 | |
5.63%, 08/26/28
(Call 08/26/23)(a) | | | USD | | | | 125 | | | | 76,250 | |
| | | | | | | | | | | | |
| | | |
| | | | | | | | | | | 403,025 | |
|
Netherlands — 1.6% | |
Intertrust Group BV,
3.38%, 11/15/25 (Call 11/15/22)(c) | | | EUR | | | | 100 | | | | 98,180 | |
Lincoln Financing Sarl,
3.63%, 04/01/24
(Call 11/30/22)(c) | | | EUR | | | | 125 | | | | 119,116 | |
Nobian Finance BV,
3.63%, 07/15/26
(Call 07/15/23)(c) | | | EUR | | | | 100 | | | | 74,749 | |
PPF Telecom Group BV,
3.25%, 09/29/27
(Call 06/29/27)(c) | | | EUR | | | | 175 | | | | 148,664 | |
Q-Park Holding I BV,
2.00%, 03/01/27
(Call 03/01/23)(c) | | | EUR | | | | 150 | | | | 117,060 | |
Sigma Holdco BV, 5.75%, 05/15/26 (Call 11/10/22)(c) | | | EUR | | | | 100 | | | | 59,708 | |
Trivium Packaging Finance BV | | | | | | | | | | | | |
3.75%, 08/15/26 (Call 11/30/22)(c) | | | EUR | | | | 100 | | | | 88,519 | |
8.50%, 08/15/27
(Call 11/11/22)(a)(b) | | | USD | | | | 125 | | | | 118,572 | |
United Group BV | | | | | | | | | | | | |
3.63%, 02/15/28
(Call 02/15/23)(c) | | | EUR | | | | 100 | | | | 70,883 | |
4.00%, 11/15/27 (Call 11/15/23)(c) | | | EUR | | | | 100 | | | | 71,992 | |
4.63%, 08/15/28
(Call 08/15/24)(c) | | | EUR | | | | 100 | | | | 70,951 | |
UPC Holding BV, 3.88%, 06/15/29 (Call 11/30/22)(c) | | | EUR | | | | 100 | | | | 79,325 | |
| | | | | | | | | | | | |
| Security | | | | | Par
(000) | | | Value | |
|
Netherlands (continued) | |
VZ Secured Financing BV, 5.00%, 01/15/32 (Call 01/15/27)(a) | | | USD | | | | 100 | | | $ | 79,650 | |
WP/AP Telecom Holdings IV BV,
3.75%, 01/15/29 (Call 01/15/25)(c) | | | EUR | | | | 100 | | | | 82,898 | |
Ziggo Bond Co. BV | | | | | | | | | | | | |
3.38%, 02/28/30 (Call 02/15/25)(c) | | | EUR | | | | 100 | | | | 72,560 | |
5.13%, 02/28/30 (Call 02/15/25)(a) | | | USD | | | | 25 | | | | 19,715 | |
Ziggo BV | | | | | | | | | | | | |
2.88%, 01/15/30 (Call 10/15/24)(c) | | | EUR | | | | 100 | | | | 76,649 | |
4.88%, 01/15/30 (Call 10/15/24)(a) | | | USD | | | | 150 | | | | 126,341 | |
| | | | | | | | | | | | |
| | | |
| | | | | | | | | | | 1,575,532 | |
|
Panama — 0.1% | |
C&W Senior Financing DAC,
6.88%, 09/15/27
(Call 11/11/22)(a)(b) | | | USD | | | | 100 | | | | 86,965 | |
| | | | | | | | | | | | |
|
Portugal — 0.3% | |
Banco Comercial Portugues SA | | | | | | | | | | | | |
3.87%, 03/27/30
(Call 03/27/25)(c)(d) | | | EUR | | | | 100 | | | | 71,951 | |
8.50%, 10/25/25 | | | EUR | | | | 100 | | | | 100,113 | |
EDP - Energias de Portugal SA | | | | | | | | | | | | |
1.50%, 03/14/82
(Call 12/14/26)(c)(d) | | | EUR | | | | 100 | | | | 77,492 | |
1.88%, 08/02/81
(Call 05/02/26)(c)(d) | | | EUR | | | | 100 | | | | 81,434 | |
| | | | | | | | | | | | |
| | | |
| | | | | | | | | | | 330,990 | |
|
Singapore — 0.2% | |
Puma International Financing SA,
5.13%, 10/06/24 (Call 11/11/22)(a) | | | USD | | | | 200 | | | | 187,856 | |
| | | | | | | | | | | | |
|
Spain — 2.1% | |
Abanca Corp. Bancaria SA,
4.63%, 04/07/30
(Call 04/07/25)(c)(d) | | | EUR | | | | 100 | | | | 88,561 | |
Banco de Credito Social Cooperativo SA, 1.75%, 03/09/28
(Call 03/09/27)(c)(d) | | | EUR | | | | 100 | | | | 73,702 | |
Banco de Sabadell SA | | | | | | | | | | | | |
1.75%, 05/10/24(c) | | | EUR | | | | 100 | | | | 94,144 | |
2.63%, 03/24/26
(Call 03/24/25)(c)(d) | | | EUR | | | | 100 | | | | 91,686 | |
5.38%, 09/08/26
(Call 09/08/25)(c)(d) | | | EUR | | | | 100 | | | | 97,161 | |
5.38%, 12/12/28
(Call 12/12/23)(c)(d) | | | EUR | | | | 100 | | | | 96,849 | |
Cellnex Finance Co. SA | | | | | | | | | | | | |
0.75%, 11/15/26 (Call 08/15/26)(c) | | | EUR | | | | 100 | | | | 82,928 | |
1.00%, 09/15/27 (Call 06/15/27)(c) | | | EUR | | | | 100 | | | | 79,899 | |
2.00%, 09/15/32 (Call 06/15/32)(c) | | | EUR | | | | 100 | | | | 69,463 | |
2.00%, 02/15/33 (Call 11/15/32)(c) | | | EUR | | | | 100 | | | | 68,228 | |
2.25%, 04/12/26 (Call 01/12/26)(c) | | | EUR | | | | 100 | | | | 89,817 | |
Cellnex Telecom SA | | | | | | | | | | | | |
1.75%, 10/23/30 (Call 07/23/30)(c) | | | EUR | | | | 200 | | | | 146,257 | |
2.88%, 04/18/25 (Call 01/18/25)(c) | | | EUR | | | | 100 | | | | 94,983 | |
Cirsa Finance International Sarl,
4.50%, 03/15/27 (Call 09/15/23)(c) | | | EUR | | | | 100 | | | | 81,709 | |
ContourGlobal Power Holdings SA,
2.75%, 01/01/26 (Call 01/01/23)(c) | | | EUR | | | | 100 | | | | 80,840 | |
eDreams ODIGEO SA, 5.50%, 07/15/27(c) | | | EUR | | | | 100 | | | | 77,711 | |
Grifols Escrow Issuer SA,
3.88%, 10/15/28 (Call 10/15/24)(c) | | | EUR | | | | 125 | | | | 93,679 | |
Grifols SA | | | | | | | | | | | | |
1.63%, 02/15/25 (Call 11/30/22)(c) | | | EUR | | | | 100 | | | | 89,874 | |
3.20%, 05/01/25 (Call 11/30/22)(c) | | | EUR | | | | 100 | | | | 87,643 | |
Ibercaja Banco SA, 2.75%, 07/23/30
(Call 07/23/25)(c)(d) | | | EUR | | | | 100 | | | | 80,307 | |
Kaixo Bondco Telecom SA,
5.13%, 09/30/29 (Call 09/30/24)(c) | | | EUR | | | | 100 | | | | 79,273 | |
Lorca Telecom Bondco SA,
4.00%, 09/18/27 (Call 09/30/23)(c) | | | EUR | | | | 150 | | | | 129,920 | |
| | |
S C H E D U L E O F I N V E S T M E N T S | | 51 |
| | |
Schedule of Investments (continued) October 31, 2022 | | iShares® US & Intl High Yield Corp Bond ETF (Percentages shown are based on Net Assets) |
| | | | | | | | | | | | |
| Security | | | | | Par
(000) | | | Value | |
| | | |
Spain (continued) | | | | | | | | | |
Repsol International Finance BV,
4.50%, 03/25/75
(Call 03/25/25)(c)(d) | | | EUR | | | | 100 | | | $ | 94,165 | |
Unicaja Banco SA, 3.13%, 07/19/32 (Call 01/19/27)(c)(d) | | | EUR | | | | 100 | | | | 71,790 | |
| | | | | | | | | | | | |
| | | | | | | | | | | 2,140,589 | |
| | | |
Sweden — 0.7% | | | | | | | | | |
Dometic Group AB, 2.00%, 09/29/28 (Call 06/29/28)(c) | | | EUR | | | | 100 | | | | 70,400 | |
Heimstaden AB, 4.25%, 03/09/26
(Call 12/09/25)(c) | | | EUR | | | | 100 | | | | 72,734 | |
Intrum AB | | | | | | | | | | | | |
3.50%, 07/15/26 (Call 11/10/22)(c) | | | EUR | | | | 200 | | | | 160,542 | |
4.88%, 08/15/25(c) | | | EUR | | | | 100 | | | | 88,948 | |
Verisure Holding AB | | | | | | | | | | | | |
3.88%, 07/15/26 (Call 11/30/22)(c) | | | EUR | | | | 100 | | | | 88,119 | |
9.25%, 10/15/27 (Call 10/15/24)(c) | | | EUR | | | | 100 | | | | 101,606 | |
Verisure Midholding AB,
5.25%, 02/15/29 (Call 02/15/24)(c) | | | EUR | | | | 100 | | | | 75,627 | |
Volvo Car AB, 2.00%, 01/24/25
(Call 10/24/24)(c) | | | EUR | | | | 100 | | | | 93,186 | |
| | | | | | | | | | | | |
| | | | | | | | | | | 751,162 | |
| | | |
Switzerland — 0.4% | | | | | | | | | |
Dufry One BV | | | | | | | | | | | | |
2.50%, 10/15/24 (Call 11/30/22)(c) | | | EUR | | | | 100 | | | | 94,275 | |
3.38%, 04/15/28 (Call 04/15/24)(c) | | | EUR | | | | 100 | | | | 81,133 | |
SIG Combibloc Purchase Co. Sarl,
2.13%, 06/18/25 (Call 03/18/25)(c) | | | EUR | | | | 100 | | | | 91,560 | |
Transocean Inc., 7.50%, 01/15/26
(Call 11/11/22)(a) | | | USD | | | | 25 | | | | 21,326 | |
VistaJet Malta Finance PLC/XO Management Holding Inc. | | | | | | | | | | | | |
6.38%, 02/01/30
(Call 02/01/25)(a)(b) | | | USD | | | | 95 | | | | 79,325 | |
7.88%, 05/01/27
(Call 05/01/24)(a)(b) | | | USD | | | | 25 | | | | 22,650 | |
| | | | | | | | | | | | |
| | | | | | | | | | | 390,269 | |
| | | |
United Kingdom — 5.1% | | | | | | | | | |
B&M European Value Retail SA, 3.63%, 07/15/25(c) | | | GBP | | | | 100 | | | | 97,719 | |
BCP V Modular Services Finance II PLC, 4.75%, 11/30/28
(Call 11/30/24)(c) | | | EUR | | | | 150 | | | | 121,938 | |
Bellis Acquisition Co. PLC,
3.25%, 02/16/26 (Call 02/24/23)(c) | | | GBP | | | | 175 | | | | 162,987 | |
Bellis Finco PLC, 4.00%, 02/16/27
(Call 02/24/23)(c) | | | GBP | | | | 100 | | | | 79,491 | |
British Telecommunications PLC | | | | | | | | | | | | |
4.25%, 11/23/81
(Call 11/23/26)(a)(b)(d) | | | USD | | | | 50 | | | | 42,044 | |
4.88%, 11/23/81
(Call 08/23/31)(a)(d) | | | USD | | | | 45 | | | | 35,946 | |
Connect Finco Sarl/Connect U.S. Finco LLC, 6.75%, 10/01/26 (Call 12/01/22)(a) | | | USD | | | | 175 | | | | 164,500 | |
Constellation Automotive Financing PLC, 4.88%, 07/15/27
(Call 07/15/23)(c) | | | GBP | | | | 100 | | | | 73,730 | |
Deuce Finco PLC, 5.50%, 06/15/27
(Call 06/15/23)(c) | | | GBP | | | | 100 | | | | 87,442 | |
eG Global Finance PLC | | | | | | | | | | | | |
4.38%, 02/07/25 (Call 11/30/22)(c) | | | EUR | | | | 100 | | | | 84,423 | |
6.75%, 02/07/25 (Call 11/11/22)(a) | | | USD | | | | 100 | | | | 90,611 | |
Heathrow Finance PLC,
3.88%, 03/01/27(c)(h) | | | GBP | | | | 100 | | | | 92,005 | |
Iceland Bondco PLC,
4.63%, 03/15/25 (Call 11/10/22)(c) | | | GBP | | | | 100 | | | | 90,030 | |
INEOS Quattro Finance 1 PLC,
3.75%, 07/15/26 (Call 01/15/23)(c) | | | EUR | | | | 100 | | | | 77,403 | |
INEOS Quattro Finance 2 PLC,
2.50%, 01/15/26 (Call 01/15/23)(c) | | | EUR | | | | 100 | | | | 82,276 | |
International Consolidated Airlines Group SA, 3.75%, 03/25/29 (Call 12/25/28)(c) | | | EUR | | | | 100 | | | | 72,722 | |
Jaguar Land Rover Automotive PLC | | | | | | | | | | | | |
4.50%, 01/15/26 (Call 10/15/25)(c) | | | EUR | | | | 100 | | | | 83,768 | |
5.88%, 01/15/28 (Call 01/15/24)(a) | | | USD | | | | 180 | | | | 133,290 | |
6.88%, 11/15/26 (Call 08/15/26)(c) | | | EUR | | | | 100 | | | | 84,703 | |
Jerrold Finco PLC, 4.88%, 01/15/26
(Call 11/30/22)(c) | | | GBP | | | | 100 | | | | 94,278 | |
Kane Bidco Ltd., 6.50%, 02/15/27
(Call 02/15/24)(c) | | | GBP | | | | 100 | | | | 91,656 | |
| | | | | | | | | | | | |
| Security | | | | | Par
(000) | | | Value | |
| | | |
United Kingdom (continued) | | | | | | | | | |
Market Bidco Finco PLC, 5.50%, 11/04/27
(Call 11/04/24)(c) | | | GBP | | | | 100 | | | $ | 86,450 | |
Motion Finco Sarl, 7.00%, 05/15/25
(Call 11/30/22)(c) | | | EUR | | | | 100 | | | | 96,693 | |
NGG Finance PLC | | | | | | | | | | | | |
1.63%, 12/05/79 (Call 09/05/24)(c)(d) | | | EUR | | | | 100 | | | | 89,517 | |
5.63%, 06/18/73 (Call 06/18/25)(c)(d) | | | GBP | | | | 100 | | | | 104,108 | |
Nomad Foods Bondco PLC,
2.50%, 06/24/28 (Call 06/24/24)(c) | | | EUR | | | | 100 | | | | 78,532 | |
Ocado Group PLC, 3.88%, 10/08/26 (Call 10/08/23)(c) | | | GBP | | | | 100 | | | | 83,161 | |
Odeon Finco PLC, 12.75%, 11/01/27 | | | USD | | | | 50 | | | | 44,688 | |
PeopleCert Wisdom Issuer PLC,
5.75%, 09/15/26 (Call 09/15/23)(c) | | | EUR | | | | 100 | | | | 88,529 | |
Pinewood Finance Co. Ltd.,
3.25%, 09/30/25(c) | | | GBP | | | | 100 | | | | 99,615 | |
Pinnacle Bidco PLC, 5.50%, 02/15/25 (Call 11/30/22)(c) | | | EUR | | | | 100 | | | | 89,059 | |
Playtech PLC, 4.25%, 03/07/26
(Call 11/30/22)(c) | | | EUR | | | | 100 | | | | 91,415 | |
Punch Finance PLC, 6.13%, 06/30/26 (Call 06/30/23)(c) | | | GBP | | | | 100 | | | | 99,280 | |
Rolls-Royce PLC | | | | | | | | | | | | |
1.63%, 05/09/28 (Call 02/09/28)(c) | | | EUR | | | | 100 | | | | 73,784 | |
3.38%, 06/18/26 | | | GBP | | | | 100 | | | | 93,480 | |
4.63%, 02/16/26 (Call 11/16/25)(c) | | | EUR | | | | 100 | | | | 94,042 | |
5.75%, 10/15/27 (Call 07/15/27)(a) | | | USD | | | | 125 | | | | 113,307 | |
Sherwood Financing PLC, 4.50%, 11/15/26 (Call 11/15/23)(c) | | | EUR | | | | 100 | | | | 69,566 | |
Stonegate Pub Co. Financing 2019 PLC,
8.25%, 07/31/25 (Call 11/30/22)(c) | | | GBP | | | | 100 | | | | 103,348 | |
Thames Water Utilities Finance PLC, 2.88%, 05/03/27(c) | | | GBP | | | | 100 | | | | 96,343 | |
Very Group Funding PLC (The),
6.50%, 08/01/26 (Call 08/01/23)(c) | | | GBP | | | | 100 | | | | 77,979 | |
Victoria PLC, 3.63%, 08/24/26
(Call 02/28/23)(c) | | | EUR | | | | 100 | | | | 75,957 | |
Virgin Media Finance PLC, 5.00%, 07/15/30 (Call 07/15/25)(a)(b) | | | USD | | | | 75 | | | | 60,825 | |
Virgin Media Secured Finance PLC | | | | | | | | | | | | |
4.25%, 01/15/30 (Call 10/15/24)(c) | | | GBP | | | | 150 | | | | 136,269 | |
4.50%, 08/15/30 (Call 08/15/25)(a) | | | USD | | | | 75 | | | | 62,292 | |
5.50%, 05/15/29 (Call 05/15/24)(a)(b) | | | USD | | | | 100 | | | | 91,000 | |
Virgin Media Vendor Financing Notes III DAC, 4.88%, 07/15/28 (Call 07/15/23)(c) | | | GBP | | | | 100 | | | | 90,907 | |
Virgin Media Vendor Financing Notes IV DAC, 5.00%, 07/15/28 (Call 07/15/23)(a) | | | USD | | | | 25 | | | | 21,133 | |
Vmed O2 UK Financing I PLC | | | | | | | | | | | | |
3.25%, 01/31/31 (Call 01/31/26)(c) | | | EUR | | | | 150 | | | | 120,521 | |
4.25%, 01/31/31 (Call 01/31/26)(a) | | | USD | | | | 100 | | | | 79,831 | |
4.75%, 07/15/31 (Call 07/15/26)(a) | | | USD | | | | 150 | | | | 121,222 | |
Vodafone Group PLC | | | | | | | | | | | | |
2.63%, 08/27/80 (Call 05/27/26)(c)(d) | | | EUR | | | | 100 | | | | 86,136 | |
3.00%, 08/27/80 (Call 05/27/30)(c)(d) | | | EUR | | | | 100 | | | | 76,237 | |
3.25%, 06/04/81 (Call 06/04/26)(d) | | | USD | | | | 40 | | | | 32,066 | |
4.13%, 06/04/81 (Call 03/04/31)(d) | | | USD | | | | 85 | | | | 60,630 | |
7.00%, 04/04/79 (Call 01/04/29)(d) | | | USD | | | | 145 | | | | 138,533 | |
Zenith Finco PLC, 6.50%, 06/30/27
(Call 01/28/24)(c) | | | GBP | | | | 100 | | | | 85,702 | |
| | | | | | | | | | | | |
| | | | | | | | | | | 5,055,119 | |
| | | |
United States — 64.7% | | | | | | | | | |
Acrisure LLC/Acrisure Finance Inc. | | | | | | | | | | | | |
4.25%, 02/15/29 (Call 02/15/24)(a) | | | USD | | | | 45 | | | | 36,790 | |
6.00%, 08/01/29 (Call 08/01/24)(a) | | | USD | | | | 35 | | | | 28,783 | |
7.00%, 11/15/25 (Call 12/01/22)(a)(b) | | | USD | | | | 65 | | | | 61,507 | |
10.13%, 08/01/26 (Call 12/01/22)(a) | | | USD | | | | 50 | | | | 49,438 | |
AdaptHealth LLC | | | | | | | | | | | | |
4.63%, 08/01/29 (Call 02/01/24)(a)(b) | | | USD | | | | 25 | | | | 21,292 | |
5.13%, 03/01/30 (Call 03/01/25)(a) | | | USD | | | | 60 | | | | 52,050 | |
| | |
| 52 | | 2 0 2 2 I S H A R E S A N N U A L R E P O R T T O S H A R E H O L D E R S |
| | |
Schedule of Investments (continued) October 31, 2022 | | iShares® US & Intl High Yield Corp Bond ETF (Percentages shown are based on Net Assets) |
| | | | | | | | | | | | |
| Security | | | | | Par
(000) | | | Value | |
| | | |
| United States (continued) | | | | | | | | | |
ADT Security Corp. (The),
4.13%, 08/01/29 (Call 08/01/28)(a) | | | USD | | | | 75 | | | $ | 64,285 | |
AG Issuer LLC, 6.25%, 03/01/28
(Call 03/01/23)(a) | | | USD | | | | 50 | | | | 46,834 | |
AG TTMT Escrow Issuer LLC,
8.63%, 09/30/27 (Call 09/30/24)(a) | | | USD | | | | 40 | | | | 40,150 | |
Albertsons Companies Inc./Safeway Inc./New | | | | | | | | | | | | |
Albertsons LP/Albertsons LLC | | | | | | | | | | | | |
3.25%, 03/15/26 (Call 12/01/22)(a) | | | USD | | | | 70 | | | | 63,000 | |
3.50%, 03/15/29 (Call 09/15/23)(a) | | | USD | | | | 100 | | | | 82,750 | |
4.63%, 01/15/27 (Call 01/15/23)(a) | | | USD | | | | 95 | | | | 87,875 | |
4.88%, 02/15/30 (Call 02/15/25)(a) | | | USD | | | | 75 | | | | 66,562 | |
5.88%, 02/15/28 (Call 12/01/22)(a) | | | USD | | | | 75 | | | | 70,553 | |
7.50%, 03/15/26 (Call 12/01/22)(a)(b) | | | USD | | | | 50 | | | | 51,213 | |
Alliant Holdings Intermediate LLC/Alliant Holdings Co-Issuer | | | | | | | | | | | | |
4.25%, 10/15/27 (Call 10/15/23)(a) | | | USD | | | | 65 | | | | 58,782 | |
5.88%, 11/01/29 (Call 11/01/24)(a) | | | USD | | | | 30 | | | | 25,436 | |
6.75%, 10/15/27 (Call 12/01/22)(a) | | | USD | | | | 105 | | | | 95,812 | |
Allied Universal Holdco LLC/Allied Universal Finance Corp. | | | | | | | | | | | | |
6.00%, 06/01/29 (Call 06/01/24)(a)(b) | | | USD | | | | 75 | | | | 52,575 | |
6.63%, 07/15/26 (Call 12/01/22)(a) | | | USD | | | | 170 | | | | 162,562 | |
9.75%, 07/15/27 (Call 12/01/22)(a)(b) | | | USD | | | | 65 | | | | 56,512 | |
Allied Universal Holdco LLC/Allied Universal Finance Corp./Atlas Luxco 4 Sarl, 4.63%, 06/01/28 (Call 06/01/24)(a) | | | USD | | | | 175 | | | | 145,398 | |
Allied Universal Holdco LLC/Allied Universal Finance Corp/Atlas Luxco 4 Sarl, 3.63%, 06/01/28 (Call 06/01/24)(c) | | | EUR | | | | 100 | | | | 78,464 | |
Allison Transmission Inc. | | | | | | | | | | | | |
3.75%, 01/30/31 (Call 01/30/26)(a) | | | USD | | | | 85 | | | | 67,678 | |
4.75%, 10/01/27 (Call 11/14/22)(a) | | | USD | | | | 25 | | | | 22,969 | |
5.88%, 06/01/29 (Call 06/01/24)(a) | | | USD | | | | 45 | | | | 41,963 | |
Ally Financial Inc., 5.75%, 11/20/25
(Call 10/21/25)(b) | | | USD | | | | 80 | | | | 77,440 | |
AMC Entertainment Holdings Inc.,
7.50%, 02/15/29 (Call 02/15/25)(a)(b) | | | USD | | | | 80 | | | | 55,000 | |
AMC Networks Inc. | | | | | | | | | | | | |
4.25%, 02/15/29 (Call 02/15/24)(b) | | | USD | | | | 85 | | | | 65,625 | |
4.75%, 08/01/25 (Call 12/01/22) | | | USD | | | | 60 | | | | 54,975 | |
5.00%, 04/01/24 (Call 12/01/22) | | | USD | | | | 41 | | | | 40,016 | |
American Airlines Group Inc.,
3.75%, 03/01/25(a)(b) | | | USD | | | | 40 | | | | 35,078 | |
American Airlines Inc.,
11.75%, 07/15/25(a)(b) | | | USD | | | | 190 | | | | 208,051 | |
American Airlines Inc./AAdvantage Loyalty IP Ltd. | | | | | | | | | | | | |
5.50%, 04/20/26(a) | | | USD | | | | 280 | | | | 266,000 | |
5.75%, 04/20/29(a) | | | USD | | | | 255 | | | | 232,050 | |
American Axle & Manufacturing Inc. | | | | | | | | | | | | |
5.00%, 10/01/29 (Call 10/01/24)(b) | | | USD | | | | 60 | | | | 48,845 | |
6.50%, 04/01/27 (Call 12/01/22)(b) | | | USD | | | | 35 | | | | 32,270 | |
6.88%, 07/01/28 (Call 07/01/23) | | | USD | | | | 25 | | | | 22,685 | |
American Builders & Contractors Supply Co. Inc. | | | | | | | | | | | | |
3.88%, 11/15/29 (Call 11/15/24)(a)(b) | | | USD | | | | 25 | | | | 20,535 | |
4.00%, 01/15/28 (Call 01/15/23)(a) | | | USD | | | | 65 | | | | 57,362 | |
AmeriGas Partners LP/AmeriGas Finance Corp. | | | | | | | | | | | | |
5.50%, 05/20/25 (Call 02/20/25) | | | USD | | | | 75 | | | | 71,989 | |
5.63%, 05/20/24 (Call 03/20/24) | | | USD | | | | 35 | | | | 34,203 | |
5.75%, 05/20/27 (Call 02/20/27) | | | USD | | | | 25 | | | | 23,029 | |
5.88%, 08/20/26 (Call 05/20/26) | | | USD | | | | 60 | | | | 56,147 | |
Antero Midstream Partners LP/Antero Midstream Finance Corp. | | | | | | | | | | | | |
5.38%, 06/15/29 (Call 06/15/24)(a) | | | USD | | | | 70 | | | | 63,861 | |
5.75%, 03/01/27 (Call 11/16/22)(a) | | | USD | | | | 60 | | | | 57,138 | |
5.75%, 01/15/28 (Call 01/15/23)(a) | | | USD | | | | 55 | | | | 51,948 | |
| | | | | | | | | | | | |
| Security | | | | | Par
(000) | | | Value | |
| | | |
| United States (continued) | | | | | | | | | |
7.88%, 05/15/26 (Call 05/15/23)(a) | | | USD | | | | 25 | | | $ | 25,481 | |
Antero Resources Corp. | | | | | | | | | | | | |
5.38%, 03/01/30 (Call 03/01/25)(a) | | | USD | | | | 60 | | | | 55,524 | |
7.63%, 02/01/29 (Call 02/01/24)(a) | | | USD | | | | 21 | | | | 21,429 | |
Apache Corp., 4.25%, 01/15/30
(Call 10/15/29) | | | USD | | | | 45 | | | | 40,211 | |
APX Group Inc. | | | | | | | | | | | | |
5.75%, 07/15/29 (Call 07/15/24)(a)(b) | | | USD | | | | 65 | | | | 51,362 | |
6.75%, 02/15/27 (Call 02/15/23)(a) | | | USD | | | | 55 | | | | 52,869 | |
Aramark Services Inc. | | | | | | | | | | | | |
5.00%, 04/01/25 (Call 12/01/22)(a) | | | USD | | | | 70 | | | | 67,643 | |
5.00%, 02/01/28 (Call 02/01/23)(a)(b) | | | USD | | | | 70 | | | | 63,889 | |
6.38%, 05/01/25 (Call 12/01/22)(a)(b) | | | USD | | | | 120 | | | | 118,995 | |
Arches Buyer Inc. | | | | | | | | | | | | |
4.25%, 06/01/28 (Call 12/01/23)(a) | | | USD | | | | 55 | | | | 45,095 | |
6.13%, 12/01/28 (Call 12/01/23)(a)(b) | | | USD | | | | 50 | | | | 38,406 | |
Archrock Partners LP/Archrock Partners Finance Corp. | | | | | | | | | | | | |
6.25%, 04/01/28 (Call 04/01/23)(a) | | | USD | | | | 50 | | | | 46,495 | |
6.88%, 04/01/27 (Call 12/01/22)(a) | | | USD | | | | 40 | | | | 38,231 | |
Arconic Corp. | | | | | | | | | | | | |
6.00%, 05/15/25 (Call 12/01/22)(a) | | | USD | | | | 45 | | | | 44,429 | |
6.13%, 02/15/28 (Call 02/15/23)(a)(b) | | | USD | | | | 90 | | | | 84,364 | |
Ardagh Metal Packaging Finance USA LLC/Ardagh Metal Packaging Finance PLC | | | | | | | | | | | | |
2.00%, 09/01/28 (Call 05/15/24)(c) | | | EUR | | | | 100 | | | | 75,775 | |
3.25%, 09/01/28 (Call 05/15/24)(a) | | | USD | | | | 75 | | | | 61,358 | |
4.00%, 09/01/29 (Call 05/15/24)(a)(b) | | | USD | | | | 50 | | | | 38,063 | |
Ardagh Packaging Finance PLC/Ardagh Holdings USA Inc. | | | | | | | | | | | | |
2.13%, 08/15/26 (Call 11/30/22)(c) | | | EUR | | | | 100 | | | | 80,518 | |
4.75%, 07/15/27 (Call 11/10/22)(c) | | | GBP | | | | 100 | | | | 74,235 | |
5.25%, 04/30/25 (Call 12/01/22)(a) | | | USD | | | | 50 | | | | 47,232 | |
5.25%, 08/15/27 (Call 12/01/22)(a) | | | USD | | | | 225 | | | | 158,062 | |
Asbury Automotive Group Inc. | | | | | | | | | | | | |
4.50%, 03/01/28 (Call 03/01/23)(b) | | | USD | | | | 25 | | | | 21,586 | |
4.63%, 11/15/29 (Call 11/15/24)(a) | | | USD | | | | 60 | | | | 49,428 | |
4.75%, 03/01/30 (Call 03/01/25) | | | USD | | | | 25 | | | | 20,564 | |
5.00%, 02/15/32 (Call 11/15/26)(a)(b) | | | USD | | | | 60 | | | | 48,375 | |
Ascent Resources Utica Holdings LLC/ARU Finance Corp. | | | | | | | | | | | | |
5.88%, 06/30/29 (Call 09/01/24)(a)(b) | | | USD | | | | 40 | | | | 35,415 | |
7.00%, 11/01/26 (Call 12/01/22)(a) | | | USD | | | | 50 | | | | 49,250 | |
Ashton Woods USA LLC/Ashton Woods Finance Co., 4.63%, 04/01/30
(Call 04/01/25)(a) | | | USD | | | | 30 | | | | 22,238 | |
ASP Unifrax Holdings Inc | | | | | | | | | | | | |
5.25%, 09/30/28 (Call 09/30/24)(a) | | | USD | | | | 35 | | | | 27,987 | |
7.50%, 09/30/29 (Call 09/30/24)(a) | | | USD | | | | 50 | | | | 33,742 | |
AssuredPartners Inc., 5.63%, 01/15/29
(Call 12/15/23)(a) | | | USD | | | | 50 | | | | 41,125 | |
Audacy Capital Corp. | | | | | | | | | | | | |
6.50%, 05/01/27 (Call 11/16/22)(a) | | | USD | | | | 25 | | | | 7,325 | |
6.75%, 03/31/29 (Call 03/31/24)(a) | | | USD | | | | 25 | | | | 7,100 | |
Avantor Funding Inc. | | | | | | | | | | | | |
2.63%, 11/01/25 (Call 11/10/22)(c) | | | EUR | | | | 100 | | | | 91,759 | |
3.88%, 11/01/29 (Call 11/01/24)(a)(b) | | | USD | | | | 60 | | | | 50,772 | |
4.63%, 07/15/28 (Call 07/15/23)(a)(b) | | | USD | | | | 130 | | | | 116,810 | |
Avaya Inc., 6.13%, 09/15/28
(Call 09/15/23)(a) | | | USD | | | | 85 | | | | 36,593 | |
Avient Corp. | | | | | | | | | | | | |
5.75%, 05/15/25 (Call 12/01/22)(a) | | | USD | | | | 50 | | | | 48,733 | |
7.13%, 08/01/30 (Call 08/01/25)(a) | | | USD | | | | 50 | | | | 47,821 | |
Avis Budget Car Rental LLC/Avis Budget Finance Inc. | | | | | | | | | | | | |
4.75%, 04/01/28 (Call 04/01/24)(a)(b) | | | USD | | | | 50 | | | | 43,466 | |
5.38%, 03/01/29 (Call 03/01/24)(a)(b) | | | USD | | | | 40 | | | | 34,960 | |
5.75%, 07/15/27 (Call 12/01/22)(a)(b) | | | USD | | | | 40 | | | | 36,480 | |
| | |
S C H E D U L E O F I N V E S T M E N T S | | 53 |
| | |
Schedule of Investments (continued) October 31, 2022 | | iShares® US & Intl High Yield Corp Bond ETF (Percentages shown are based on Net Assets) |
| | | | | | | | | | | | |
| Security | | | | | Par
(000) | | | Value | |
| | | |
| United States (continued) | | | | | | | | | |
Avis Budget Finance PLC,
4.75%, 01/30/26(c) | | | EUR | | | | 100 | | | $ | 92,213 | |
Axalta Coating Systems LLC,
3.38%, 02/15/29 (Call 02/15/24)(a)(b) | | | USD | | | | 75 | | | | 61,943 | |
B&G Foods Inc. | | | | | | | | | | | | |
5.25%, 04/01/25 (Call 12/01/22) | | | USD | | | | 75 | | | | 68,222 | |
5.25%, 09/15/27 (Call 12/01/22)(b) | | | USD | | | | 55 | | | | 46,159 | |
Ball Corp. | | | | | | | | | | | | |
2.88%, 08/15/30 (Call 05/15/30)(b) | | | USD | | | | 100 | | | | 77,750 | |
3.13%, 09/15/31 (Call 06/15/31) | | | USD | | | | 90 | | | | 68,935 | |
4.00%, 11/15/23 | | | USD | | | | 75 | | | | 73,533 | |
4.38%, 12/15/23 | | | EUR | | | | 100 | | | | 98,996 | |
4.88%, 03/15/26 (Call 12/15/25) | | | USD | | | | 45 | | | | 43,179 | |
5.25%, 07/01/25 | | | USD | | | | 85 | | | | 83,896 | |
Bath & Body Works Inc. | | | | | | | | | | | | |
5.25%, 02/01/28(b) | | | USD | | | | 40 | | | | 35,328 | |
6.63%, 10/01/30 (Call 10/01/25)(a) | | | USD | | | | 80 | | | | 71,120 | |
7.50%, 06/15/29 (Call 06/15/24)(b) | | | USD | | | | 40 | | | | 37,791 | |
Bausch Health Cos. Inc. | | | | | | | | | | | | |
4.88%, 06/01/28 (Call 06/01/24)(a) | | | USD | | | | 125 | | | | 76,562 | |
5.25%, 01/30/30 (Call 01/30/25)(a) | | | USD | | | | 12 | | | | 4,650 | |
5.50%, 11/01/25 (Call 12/01/22)(a) | | | USD | | | | 120 | | | | 96,207 | |
5.75%, 08/15/27 (Call 11/16/22)(a)(b) | | | USD | | | | 50 | | | | 31,828 | |
6.13%, 02/01/27 (Call 02/01/24)(a) | | | USD | | | | 80 | | | | 52,416 | |
11.00%, 09/30/28(b) | | | USD | | | | 279 | | | | 216,922 | |
14.00%, 10/15/30 | | | USD | | | | 44 | | | | 25,190 | |
Belden Inc., 3.88%, 03/15/28
(Call 03/15/23)(c) | | | EUR | | | | 150 | | | | 131,123 | |
Berry Global Inc., 5.63%, 07/15/27
(Call 12/01/22)(a)(b) | | | USD | | | | 30 | | | | 28,425 | |
Black Knight InfoServ LLC,
3.63%, 09/01/28 (Call 09/01/23)(a) | | | USD | | | | 100 | | | | 86,911 | |
Block Inc. | | | | | | | | | | | | |
2.75%, 06/01/26 (Call 05/01/26) | | | USD | | | | 75 | | | | 67,126 | |
3.50%, 06/01/31 (Call 03/01/31)(b) | | | USD | | | | 80 | | | | 64,387 | |
Booz Allen Hamilton Inc. | | | | | | | | | | | | |
3.88%, 09/01/28 (Call 09/01/23)(a) | | | USD | | | | 50 | | | | 44,054 | |
4.00%, 07/01/29 (Call 07/01/24)(a) | | | USD | | | | 50 | | | | 43,929 | |
Boxer Parent Co. Inc., 6.50%, 10/02/25
(Call 11/30/22)(c) | | | EUR | | | | 100 | | | | 92,558 | |
Boyd Gaming Corp. | | | | | | | | | | | | |
4.75%, 12/01/27 (Call 12/01/22)(b) | | | USD | | | | 75 | | | | 68,670 | |
4.75%, 06/15/31 (Call 06/15/26)(a) | | | USD | | | | 65 | | | | 55,006 | |
Brand Industrial Services Inc.,
8.50%, 07/15/25 (Call 12/01/22)(a)(b) | | | USD | | | | 80 | | | | 57,600 | |
Brink’s Co. (The), 5.50%, 07/15/25
(Call 12/01/22)(a) | | | USD | | | | 65 | | | | 63,187 | |
Brookfield Property Finance ULC,
4.00%, 09/30/26 (Call 08/30/26) | | | CAD | | | | 125 | | | | 82,000 | |
Brookfield Property REIT Inc./BPR Cumulus LLC/BPR Nimbus LLC/GGSI Sellco LL, 4.50%, 04/01/27 (Call 10/01/23)(a) | | | USD | | | | 70 | | | | 59,325 | |
Buckeye Partners LP | | | | | | | | | | | | |
3.95%, 12/01/26 (Call 09/01/26) | | | USD | | | | 50 | | | | 43,860 | |
4.13%, 03/01/25 (Call 02/01/25)(a) | | | USD | | | | 25 | | | | 23,563 | |
4.13%, 12/01/27 (Call 09/01/27) | | | USD | | | | 35 | | | | 30,282 | |
4.50%, 03/01/28 (Call 12/01/27)(a) | | | USD | | | | 50 | | | | 43,608 | |
Builders FirstSource Inc. | | | | | | | | | | | | |
4.25%, 02/01/32 (Call 08/01/26)(a) | | | USD | | | | 90 | | | | 71,201 | |
5.00%, 03/01/30 (Call 03/01/25)(a) | | | USD | | | | 50 | | | | 43,016 | |
6.38%, 06/15/32 (Call 06/15/27)(a) | | | USD | | | | 55 | | | | 50,579 | |
Caesars Entertainment Inc. | | | | | | | | | | | | |
4.63%, 10/15/29 (Call 10/15/24)(a)(b) | | | USD | | | | 90 | | | | 72,000 | |
6.25%, 07/01/25 (Call 11/14/22)(a) | | | USD | | | | 280 | | | | 273,350 | |
8.13%, 07/01/27 (Call 07/01/23)(a)(b) | | | USD | | | | 160 | | | | 155,507 | |
| | | | | | | | | | | | |
| Security | | | | | Par
(000) | | | Value | |
| | | |
| United States (continued) | | | | | | | | | |
Caesars Resort Collection LLC/CRC Finco Inc., 5.75%, 07/01/25 (Call 11/14/22)(a) | | | USD | | | | 85 | | | $ | 82,879 | |
Callon Petroleum Co. | | | | | | | | | | | | |
7.50%, 06/15/30 (Call 06/15/25)(a) | | | USD | | | | 50 | | | | 47,490 | |
8.00%, 08/01/28 (Call 08/01/24)(a)(b) | | | USD | | | | 50 | | | | 49,751 | |
Calpine Corp. | | | | | | | | | | | | |
3.75%, 03/01/31 (Call 03/01/26)(a) | | | USD | | | | 75 | | | | 61,568 | |
4.50%, 02/15/28 (Call 02/15/23)(a) | | | USD | | | | 105 | | | | 94,369 | |
4.63%, 02/01/29 (Call 02/01/24)(a) | | | USD | | | | 40 | | | | 33,460 | |
5.00%, 02/01/31 (Call 02/01/26)(a)(b) | | | USD | | | | 65 | | | | 54,776 | |
5.13%, 03/15/28 (Call 03/15/23)(a)(b) | | | USD | | | | 100 | | | | 88,492 | |
5.25%, 06/01/26 (Call 12/01/22)(a) | | | USD | | | | 47 | | | | 44,765 | |
Calumet Specialty Products Partners LP/Calumet Finance Corp.,
11.00%, 04/15/25 (Call 12/01/22)(a) | | | USD | | | | 45 | | | | 46,855 | |
Camelot Return Merger Sub Inc.,
8.75%, 08/01/28 (Call 08/01/24)(a) | | | USD | | | | 60 | | | | 49,950 | |
Carnival PLC, 1.00%, 10/28/29
(Call 07/28/29) | | | EUR | | | | 100 | | | | 41,104 | |
Carvana Co. | | | | | | | | | | | | |
4.88%, 09/01/29 (Call 09/01/24)(a) | | | USD | | | | 50 | | | | 22,125 | |
5.50%, 04/15/27 (Call 04/15/24)(a)(b) | | | USD | | | | 70 | | | | 33,673 | |
5.63%, 10/01/25 (Call 11/14/22)(a)(b) | | | USD | | | | 55 | | | | 36,025 | |
5.88%, 10/01/28 (Call 10/01/23)(a) | | | USD | | | | 50 | | | | 23,000 | |
10.25%, 05/01/30 (Call 05/01/27)(a) | | | USD | | | | 230 | | | | 138,000 | |
Catalent Pharma Solutions Inc. | | | | | | | | | | | | |
2.38%, 03/01/28 (Call 03/01/23)(c) | | | EUR | | | | 100 | | | | 82,597 | |
3.13%, 02/15/29 (Call 02/15/24)(a)(b) | | | USD | | | | 50 | | | | 40,926 | |
3.50%, 04/01/30 (Call 04/01/25)(a) | | | USD | | | | 60 | | | | 48,450 | |
5.00%, 07/15/27 (Call 12/01/22)(a) | | | USD | | | | 25 | | | | 23,469 | |
CCO Holdings LLC/CCO Holdings Capital Corp. | | | | | | | | | | | | |
4.25%, 02/01/31 (Call 07/01/25)(a) | | | USD | | | | 225 | | | | 177,750 | |
4.25%, 01/15/34 (Call 01/15/28)(a) | | | USD | | | | 160 | | | | 117,200 | |
4.50%, 08/15/30 (Call 02/15/25)(a) | | | USD | | | | 210 | | | | 170,887 | |
4.50%, 05/01/32 (Call 05/01/26) | | | USD | | | | 235 | | | | 184,181 | |
4.50%, 06/01/33 (Call 06/01/27)(a) | | | USD | | | | 130 | | | | 98,670 | |
4.75%, 03/01/30 (Call 09/01/24)(a) | | | USD | | | | 235 | | | | 195,461 | |
4.75%, 02/01/32 (Call 02/01/27)(a) | | | USD | | | | 95 | | | | 76,122 | |
5.00%, 02/01/28 (Call 11/16/22)(a) | | | USD | | | | 215 | | | | 194,185 | |
5.13%, 05/01/27 (Call 12/01/22)(a) | | | USD | | | | 255 | | | | 236,034 | |
5.38%, 06/01/29 (Call 06/01/24)(a) | | | USD | | | | 125 | | | | 111,126 | |
5.50%, 05/01/26 (Call 12/01/22)(a) | | | USD | | | | 70 | | | | 67,180 | |
6.38%, 09/01/29 (Call 09/01/25)(a) | | | USD | | | | 125 | | | | 115,424 | |
CDI Escrow Issuer Inc., 5.75%, 04/01/30
(Call 04/01/25)(a) | | | USD | | | | 95 | | | | 85,355 | |
Cedar Fair LP, 5.25%, 07/15/29
(Call 07/15/24) | | | USD | | | | 45 | | | | 39,600 | |
Cedar Fair LP/Canada’s Wonderland Co./Magnum Management Corp./Millennium Op | | | | | | | | | | | | |
5.38%, 04/15/27 (Call 12/01/22)(b) | | | USD | | | | 60 | | | | 56,663 | |
5.50%, 05/01/25 (Call 12/01/22)(a) | | | USD | | | | 50 | | | | 49,688 | |
Centene Corp. | | | | | | | | | | | | |
2.45%, 07/15/28 (Call 05/15/28) | | | USD | | | | 107 | | | | 88,007 | |
2.50%, 03/01/31 (Call 12/01/30) | | | USD | | | | 75 | | | | 57,470 | |
2.63%, 08/01/31 (Call 05/01/31) | | | USD | | | | 76 | | | | 58,116 | |
3.00%, 10/15/30 (Call 07/15/30) | | | USD | | | | 109 | | | | 87,613 | |
3.38%, 02/15/30 (Call 02/15/25) | | | USD | | | | 46 | | | | 38,238 | |
4.25%, 12/15/27 (Call 12/15/22) | | | USD | | | | 190 | | | | 175,275 | |
4.63%, 12/15/29 (Call 12/15/24) | | | USD | | | | 50 | | | | 45,278 | |
Central Garden & Pet Co. | | | | | | | | | | | | |
4.13%, 10/15/30 (Call 10/15/25)(b) | | | USD | | | | 50 | | | | 41,446 | |
4.13%, 04/30/31 (Call 04/30/26)(a) | | | USD | | | | 30 | | | | 25,123 | |
Central Parent Inc./CDK Global Inc.,
7.25%, 06/15/29 (Call 06/15/25)(a)(b) | | | USD | | | | 45 | | | | 43,011 | |
| | |
| 54 | | 2 0 2 2 I S H A R E S A N N U A L R E P O R T T O S H A R E H O L D E R S |
| | |
Schedule of Investments (continued) October 31, 2022 | | iShares® US & Intl High Yield Corp Bond ETF (Percentages shown are based on Net Assets) |
| | | | | | | | | | | | |
| Security | | | | | Par
(000) | | | Value | |
| | | |
| United States (continued) | | | | | | | | | |
Century Communities Inc. | | | | | | | | | | | | |
3.88%, 08/15/29 (Call 02/15/29)(a) | | | USD | | | | 50 | | | $ | 39,377 | |
6.75%, 06/01/27 (Call 12/01/22) | | | USD | | | | 25 | | | | 23,836 | |
Charles River Laboratories International Inc. | | | | | | | | | | | | |
3.75%, 03/15/29 (Call 03/15/24)(a) | | | USD | | | | 50 | | | | 43,250 | |
4.00%, 03/15/31 (Call 03/15/26)(a) | | | USD | | | | 40 | | | | 33,702 | |
4.25%, 05/01/28 (Call 05/01/23)(a)(b) | | | USD | | | | 40 | | | | 36,388 | |
Chemours Co. (The) | | | | | | | | | | | | |
4.63%, 11/15/29 (Call 11/15/24)(a)(b) | | | USD | | | | 55 | | | | 42,900 | |
5.38%, 05/15/27 (Call 02/15/27)(b) | | | USD | | | | 40 | | | | 35,790 | |
5.75%, 11/15/28 (Call 11/15/23)(a)(b) | | | USD | | | | 60 | | | | 50,970 | |
Cheniere Energy Inc., 4.63%, 10/15/28 (Call 10/15/23) | | | USD | | | | 160 | | | | 147,600 | |
Cheniere Energy Partners LP | | | | | | | | | | | | |
3.25%, 01/31/32 (Call 01/31/27) | | | USD | | | | 90 | | | | 70,030 | |
4.00%, 03/01/31 (Call 03/01/26) | | | USD | | | | 125 | | | | 105,625 | |
4.50%, 10/01/29 (Call 10/01/24)(b) | | | USD | | | | 115 | | | | 101,620 | |
Chesapeake Energy Corp. | | | | | | | | | | | | |
5.50%, 02/01/26 (Call 02/05/23)(a)(b) | | | USD | | | | 30 | | | | 28,983 | |
5.88%, 02/01/29 (Call 02/05/24)(a) | | | USD | | | | 47 | | | | 44,406 | |
6.75%, 04/15/29 (Call 04/15/24)(a)(b) | | | USD | | | | 75 | | | | 73,678 | |
CHS/Community Health Systems Inc. | | | | | | | | | | | | |
4.75%, 02/15/31 (Call 02/15/26)(a) | | | USD | | | | 95 | | | | 63,776 | |
5.25%, 05/15/30 (Call 05/15/25)(a) | | | USD | | | | 140 | | | | 96,880 | |
5.63%, 03/15/27 (Call 12/15/23)(a) | | | USD | | | | 155 | | | | 123,442 | |
6.00%, 01/15/29 (Call 01/15/24)(a)(b) | | | USD | | | | 70 | | | | 52,150 | |
6.13%, 04/01/30 (Call 04/01/25)(a)(b) | | | USD | | | | 115 | | | | 47,150 | |
6.88%, 04/01/28 (Call 04/01/23)(a)(b) | | | USD | | | | 60 | | | | 21,610 | |
6.88%, 04/15/29 (Call 04/15/24)(a)(b) | | | USD | | | | 145 | | | | 60,417 | |
8.00%, 03/15/26 (Call 12/01/22)(a)(b) | | | USD | | | | 135 | | | | 116,437 | |
8.00%, 12/15/27 (Call 12/15/22)(a)(b) | | | USD | | | | 49 | | | | 39,727 | |
Churchill Downs Inc. | | | | | | | | | | | | |
4.75%, 01/15/28 (Call 01/15/23)(a) | | | USD | | | | 65 | | | | 57,177 | |
5.50%, 04/01/27 (Call 12/01/22)(a)(b) | | | USD | | | | 55 | | | | 52,568 | |
Cinemark USA Inc. | | | | | | | | | | | | |
5.25%, 07/15/28 (Call 07/15/24)(a)(b) | | | USD | | | | 50 | | | | 38,376 | |
5.88%, 03/15/26 (Call 03/15/23)(a) | | | USD | | | | 35 | | | | 29,397 | |
Citgo Holding Inc., 9.25%, 08/01/24
(Call 12/01/22)(a) | | | USD | | | | 75 | | | | 75,165 | |
CITGO Petroleum Corp. | | | | | | | | | | | | |
6.38%, 06/15/26 (Call 06/15/23)(a)(b) | | | USD | | | | 55 | | | | 54,045 | |
7.00%, 06/15/25 (Call 12/01/22)(a) | | | USD | | | | 110 | | | | 108,322 | |
Clarios Global LP, 6.75%, 05/15/25
(Call 12/01/22)(a) | | | USD | | | | 57 | | | | 56,836 | |
Clarios Global LP/Clarios US Finance Co. | | | | | | | | | | | | |
4.38%, 05/15/26 (Call 11/30/22)(c) | | | EUR | | | | 100 | | | | 91,763 | |
6.25%, 05/15/26 (Call 12/01/22)(a)(b) | | | USD | | | | 50 | | | | 48,525 | |
8.50%, 05/15/27 (Call 12/01/22)(a)(b) | | | USD | | | | 145 | | | | 142,372 | |
Clarivate Science Holdings Corp. | | | | | | | | | | | | |
3.88%, 07/01/28 (Call 06/30/24)(a)(b) | | | USD | | | | 60 | | | | 51,927 | |
4.88%, 07/01/29 (Call 06/30/24)(a) | | | USD | | | | 85 | | | | 70,869 | |
Clear Channel Outdoor Holdings Inc. | | | | | | | | | | | | |
5.13%, 08/15/27 (Call 12/01/22)(a) | | | USD | | | | 105 | | | | 94,500 | |
7.50%, 06/01/29 (Call 06/01/24)(a)(b) | | | USD | | | | 75 | | | | 58,954 | |
7.75%, 04/15/28 (Call 04/15/24)(a)(b) | | | USD | | | | 90 | | | | 73,444 | |
Clearway Energy Operating LLC | | | | | | | | | | | | |
3.75%, 02/15/31 (Call 02/15/26)(a) | | | USD | | | | 70 | | | | 58,188 | |
4.75%, 03/15/28 (Call 03/15/23)(a)(b) | | | USD | | | | 60 | | | | 55,609 | |
Cleveland-Cliffs Inc. | | | | | | | | | | | | |
5.88%, 06/01/27 (Call 12/01/22)(b) | | | USD | | | | 50 | | | | 46,500 | |
6.75%, 03/15/26 (Call 12/01/22)(a) | | | USD | | | | 55 | | | | 54,588 | |
| | | | | | | | | | | | |
| Security | | | | | Par
(000) | | | Value | |
| | | |
| United States (continued) | | | | | | | | | |
Clydesdale Acquisition Holdings Inc. | | | | | | | | | | | | |
6.63%, 04/15/29 (Call 04/15/25)(a) | | | USD | | | | 55 | | | $ | 51,968 | |
8.75%, 04/15/30 (Call 04/15/25)(a)(b) | | | USD | | | | 70 | | | | 61,515 | |
CNX Resources Corp. | | | | | | | | | | | | |
6.00%, 01/15/29 (Call 01/15/24)(a)(b) | | | USD | | | | 80 | | | | 74,500 | |
7.38%, 01/15/31 (Call 01/15/26)(a)(b) | | | USD | | | | 45 | | | | 44,663 | |
Coinbase Global Inc. | | | | | | | | | | | | |
3.38%, 10/01/28 (Call 10/01/24)(a)(b) | | | USD | | | | 80 | | | | 52,701 | |
3.63%, 10/01/31 (Call 10/01/26)(a) | | | USD | | | | 80 | | | | 47,492 | |
Colgate Energy Partners III LLC,
5.88%, 07/01/29 (Call 07/01/24)(a) | | | USD | | | | 60 | | | | 55,966 | |
CommScope Inc. | | | | | | | | | | | | |
4.75%, 09/01/29 (Call 09/01/24)(a)(b) | | | USD | | | | 115 | | | | 97,153 | |
6.00%, 03/01/26 (Call 12/01/22)(a) | | | USD | | | | 115 | | | | 111,320 | |
7.13%, 07/01/28 (Call 07/01/23)(a)(b) | | | USD | | | | 50 | | | | 42,300 | |
8.25%, 03/01/27 (Call 12/01/22)(a)(b) | | | USD | | | | 75 | | | | 66,572 | |
CommScope Technologies LLC | | | | | | | | | | | | |
5.00%, 03/15/27 (Call 11/14/22)(a)(b) | | | USD | | | | 65 | | | | 52,731 | |
6.00%, 06/15/25 (Call 11/14/22)(a) | | | USD | | | | 81 | | | | 75,861 | |
Compass Group Diversified Holdings LLC, | | | | | | | | | | | | |
5.25%, 04/15/29 (Call 04/15/24)(a) | | | USD | | | | 75 | | | | 64,503 | |
Comstock Resources Inc. | | | | | | | | | | | | |
5.88%, 01/15/30 (Call 01/15/25)(a)(b) | | | USD | | | | 75 | | | | 67,969 | |
6.75%, 03/01/29 (Call 03/01/24)(a) | | | USD | | | | 105 | | | | 100,537 | |
Condor Merger Sub Inc., 7.38%, 02/15/30
(Call 02/15/25)(a)(b) | | | USD | | | | 175 | | | | 144,357 | |
Consolidated Communications Inc. | | | | | | | | | | | | |
5.00%, 10/01/28 (Call 10/01/23)(a) | | | USD | | | | 35 | | | | 26,996 | |
6.50%, 10/01/28 (Call 10/01/23)(a) | | | USD | | | | 60 | | | | 49,390 | |
Constellium SE | | | | | | | | | | | | |
3.13%, 07/15/29 (Call 07/15/24)(c) | | | EUR | | | | 100 | | | | 72,908 | |
3.75%, 04/15/29 (Call 04/15/24)(a)(b) | | | USD | | | | 25 | | | | 19,547 | |
Cornerstone Building Brands Inc.,
6.13%, 01/15/29 (Call 09/15/23)(a) | | | USD | | | | 50 | | | | 31,250 | |
Coty Inc. | | | | | | | | | | | | |
3.88%, 04/15/26 (Call 04/15/23)(c) | | | EUR | | | | 100 | | | | 89,784 | |
5.00%, 04/15/26 (Call 04/15/23)(a) | | | USD | | | | 70 | | | | 65,935 | |
6.50%, 04/15/26 (Call 12/01/22)(a)(b) | | | USD | | | | 50 | | | | 47,615 | |
Coty Inc./HFC Prestige Products Inc./HFC Prestige International U.S. LLC,
4.75%, 01/15/29 (Call 01/15/25)(a) | | | USD | | | | 50 | | | | 43,328 | |
Covanta Holding Corp. | | | | | | | | | | | | |
4.88%, 12/01/29 (Call 12/01/24)(a)(b) | | | USD | | | | 40 | | | | 34,200 | |
5.00%, 09/01/30 (Call 09/01/25) | | | USD | | | | 45 | | | | 37,519 | |
CQP Holdco LP/BIP-V Chinook Holdco LLC, | | | | | | | | | | | | |
5.50%, 06/15/31 (Call 06/15/26)(a) | | | USD | | | | 100 | | | | 88,750 | |
Crestwood Midstream Partners LP/Crestwood Midstream Finance Corp. | | | | | | | | | | | | |
5.63%, 05/01/27 (Call 11/16/22)(a)(b) | | | USD | | | | 50 | | | | 47,160 | |
5.75%, 04/01/25 (Call 12/01/22) | | | USD | | | | 80 | | | | 78,000 | |
6.00%, 02/01/29 (Call 02/01/24)(a) | | | USD | | | | 45 | | | | 42,236 | |
8.00%, 04/01/29 (Call 04/01/24)(a) | | | USD | | | | 35 | | | | 35,225 | |
Crown Americas LLC, 5.25%, 04/01/30
(Call 01/01/30)(a)(b) | | | USD | | | | 45 | | | | 41,161 | |
Crown Americas LLC/Crown Americas Capital Corp. V, 4.25%, 09/30/26 (Call 03/31/26) | | | | | | | | | | | | |
| | | USD | | | | 25 | | | | 23,188 | |
Crown Americas LLC/Crown Americas Capital Corp. VI, 4.75%, 02/01/26 (Call 12/01/22) | | | | | | | | | | | | |
| | | USD | | | | 50 | | | | 47,800 | |
Crown European Holdings SA, 2.88%, 02/01/26 (Call 08/01/25)(c) | | | EUR | | | | 100 | | | | 90,617 | |
| | |
S C H E D U L E O F I N V E S T M E N T S | | 55 |
| | |
Schedule of Investments (continued) October 31, 2022 | | iShares® US & Intl High Yield Corp Bond ETF (Percentages shown are based on Net Assets) |
| | | | | | | | | | | | |
| Security | | | | | Par
(000) | | | Value | |
| | | |
| United States (continued) | | | | | | | | | |
CrownRock LP/CrownRock Finance Inc. | | | | | | | | | | | | |
5.00%, 05/01/29 (Call 05/01/24)(a)(b) | | | USD | | | | 35 | | | $ | 31,983 | |
5.63%, 10/15/25 (Call 12/01/22)(a)(b) | | | USD | | | | 75 | | | | 72,394 | |
CSC Holdings LLC | | | | | | | | | | | | |
4.13%, 12/01/30 (Call 12/01/25)(a) | | | USD | | | | 100 | | | | 78,087 | |
4.50%, 11/15/31 (Call 11/15/26)(a) | | | USD | | | | 150 | | | | 117,118 | |
4.63%, 12/01/30 (Call 12/01/25)(a)(b) | | | USD | | | | 100 | | | | 72,104 | |
5.00%, 11/15/31 (Call 11/15/26)(a)(b) | | | USD | | | | 60 | | | | 42,525 | |
5.25%, 06/01/24(b) | | | USD | | | | 75 | | | | 72,750 | |
5.38%, 02/01/28 (Call 02/01/23)(a) | | | USD | | | | 100 | | | | 92,250 | |
5.50%, 04/15/27 (Call 12/01/22)(a) | | | USD | | | | 100 | | | | 93,900 | |
5.75%, 01/15/30 (Call 01/15/25)(a) | | | USD | | | | 250 | | | | 193,279 | |
6.50%, 02/01/29 (Call 02/01/24)(a) | | | USD | | | | 100 | | | | 94,062 | |
7.50%, 04/01/28 (Call 04/01/23)(a)(b) | | | USD | | | | 125 | | | | 107,929 | |
Curo Group Holdings Corp.,
7.50%, 08/01/28 (Call 08/01/24)(a) | | | USD | | | | 75 | | | | 44,250 | |
CVR Energy Inc. | | | | | | | | | | | | |
5.25%, 02/15/25 (Call 11/16/22)(a) | | | USD | | | | 20 | | | | 19,281 | |
5.75%, 02/15/28 (Call 02/15/23)(a) | | | USD | | | | 45 | | | | 41,164 | |
Dana Financing Luxembourg Sarl,
5.75%, 04/15/25 (Call 12/01/22)(a) | | | USD | | | | 40 | | | | 38,996 | |
Dana Inc. | | | | | | | | | | | | |
4.25%, 09/01/30 (Call 05/01/26)(b) | | | USD | | | | 15 | | | | 11,983 | |
5.38%, 11/15/27 (Call 11/15/22) | | | USD | | | | 40 | | | | 36,520 | |
5.63%, 06/15/28 (Call 06/15/23)(b) | | | USD | | | | 45 | | | | 40,725 | |
Darling Ingredients Inc. | | | | | | | | | | | | |
5.25%, 04/15/27 (Call 11/14/22)(a) | | | USD | | | | 50 | | | | 48,231 | |
6.00%, 06/15/30 (Call 06/15/25)(a) | | | USD | | | | 75 | | | | 72,187 | |
DaVita Inc. | | | | | | | | | | | | |
3.75%, 02/15/31 (Call 02/15/26)(a) | | | USD | | | | 130 | | | | 94,346 | |
4.63%, 06/01/30 (Call 06/01/25)(a) | | | USD | | | | 215 | | | | 166,898 | |
Delta Air Lines Inc. | | | | | | | | | | | | |
2.90%, 10/28/24 (Call 09/28/24) | | | USD | | | | 70 | | | | 66,070 | |
3.75%, 10/28/29 (Call 07/28/29) | | | USD | | | | 60 | | | | 49,505 | |
4.38%, 04/19/28 (Call 01/19/28)(b) | | | USD | | | | 40 | | | | 35,496 | |
7.38%, 01/15/26 (Call 12/15/25)(b) | | | USD | | | | 80 | | | | 81,720 | |
Diamond Sports Group LLC/Diamond Sports Finance Co. | | | | | | | | | | | | |
5.38%, 08/15/26 (Call 11/16/22)(a) | | | USD | | | | 205 | | | | 41,000 | |
6.63%, 08/15/27 (Call 11/16/22)(a) | | | USD | | | | 125 | | | | 6,406 | |
Diebold Nixdorf Inc. | | | | | | | | | | | | |
8.50%, 04/15/24 (Call 12/01/22)(b) | | | USD | | | | 25 | | | | 12,785 | |
9.38%, 07/15/25 (Call 11/16/22)(a)(b) | | | USD | | | | 55 | | | | 41,102 | |
Directv Financing LLC/Directv Financing Co-Obligor Inc.,
5.88%, 08/15/27 (Call 08/15/23)(a) | | | USD | | | | 300 | | | | 269,375 | |
DISH DBS Corp. | | | | | | | | | | | | |
5.25%, 12/01/26 (Call 06/01/26)(a) | | | USD | | | | 235 | | | | 204,156 | |
5.75%, 12/01/28 (Call 12/01/27)(a) | | | USD | | | | 200 | | | | 160,250 | |
5.88%, 11/15/24(b) | | | USD | | | | 150 | | | | 138,562 | |
7.38%, 07/01/28 (Call 07/01/23) | | | USD | | | | 80 | | | | 60,800 | |
7.75%, 07/01/26 | | | USD | | | | 150 | | | | 126,956 | |
5.13%, 06/01/29 | | | USD | | | | 115 | | | | 77,901 | |
Diversified Healthcare Trust | | | | | | | | | | | | |
4.38%, 03/01/31 (Call 09/01/30) | | | USD | | | | 40 | | | | 26,556 | |
4.75%, 02/15/28 (Call 08/15/27) | | | USD | | | | 50 | | | | 34,308 | |
9.75%, 06/15/25 (Call 12/01/22) | | | USD | | | | 30 | | | | 28,346 | |
DPL Inc. | | | | | | | | | | | | |
4.13%, 07/01/25 (Call 04/01/25) | | | USD | | | | 45 | | | | 42,413 | |
4.35%, 04/15/29 (Call 01/15/29) | | | USD | | | | 40 | | | | 34,200 | |
DT Midstream Inc. | | | | | | | | | | | | |
4.13%, 06/15/29 (Call 06/15/24)(a) | | | USD | | | | 75 | | | | 64,425 | |
4.38%, 06/15/31 (Call 06/15/26)(a) | | | USD | | | | 90 | | | | 76,504 | |
| | | | | | | | | | | | |
| Security | | | | | Par
(000) | | | Value | |
| | | |
| United States (continued) | | | | | | | | | |
Edgewell Personal Care Co. | | | | | | | | | | | | |
4.13%, 04/01/29 (Call 04/01/24)(a) | | | USD | | | | 30 | | | $ | 25,590 | |
5.50%, 06/01/28 (Call 06/01/23)(a) | | | USD | | | | 55 | | | | 51,729 | |
Encompass Health Corp. | | | | | | | | | | | | |
4.50%, 02/01/28 (Call 02/01/23) | | | USD | | | | 55 | | | | 49,115 | |
4.63%, 04/01/31 (Call 04/01/26) | | | USD | | | | 40 | | | | 33,000 | |
4.75%, 02/01/30 (Call 02/01/25)(b) | | | USD | | | | 55 | | | | 46,888 | |
Encore Capital Group Inc., 5.38%, 02/15/26
(Call 11/30/22)(c) | | | GBP | | | | 100 | | | | 99,629 | |
Endeavor Energy Resources LP/EER Finance Inc., 5.75%, 01/30/28 (Call 01/30/23)(a) | | | USD | | | | 75 | | | | 72,581 | |
Energizer Holdings Inc. | | | | | | | | | | | | |
4.38%, 03/31/29 (Call 09/30/23)(a) | | | USD | | | | 65 | | | | 52,569 | |
4.75%, 06/15/28 (Call 06/15/23)(a) | | | USD | | | | 50 | | | | 41,364 | |
EnLink Midstream LLC | | | | | | | | | | | | |
5.38%, 06/01/29 (Call 03/01/29) | | | USD | | | | 50 | | | | 46,183 | |
5.63%, 01/15/28 (Call 07/15/27)(a) | | | USD | | | | 50 | | | | 47,923 | |
6.50%, 09/01/30 (Call 03/01/30)(a)(b) | | | USD | | | | 45 | | | | 44,130 | |
EnLink Midstream Partners LP | | | | | | | | | | | | |
4.15%, 06/01/25 (Call 03/01/25) | | | USD | | | | 53 | | | | 50,013 | |
4.85%, 07/15/26 (Call 04/15/26) | | | USD | | | | 40 | | | | 37,670 | |
Enstar Finance LLC, 5.50%, 01/15/42 (Call 01/15/27)(d) | | | USD | | | | 50 | | | | 39,102 | |
Entegris Escrow Corp., 5.95%, 06/15/30 (Call 06/15/25)(a) | | | USD | | | | 75 | | | | 68,409 | |
Entegris Inc. | | | | | | | | | | | | |
3.63%, 05/01/29 (Call 05/01/24)(a) | | | USD | | | | 35 | | | | 28,559 | |
4.38%, 04/15/28 (Call 04/15/23)(a) | | | USD | | | | 25 | | | | 21,969 | |
EQM Midstream Partners LP | | | | | | | | | | | | |
4.13%, 12/01/26 (Call 09/01/26) | | | USD | | | | 35 | | | | 31,068 | |
4.50%, 01/15/29 (Call 07/15/28)(a) | | | USD | | | | 80 | | | | 67,934 | |
4.75%, 01/15/31 (Call 07/15/30)(a)(b) | | | USD | | | | 75 | | | | 62,437 | |
5.50%, 07/15/28 (Call 04/15/28) | | | USD | | | | 75 | | | | 67,161 | |
6.00%, 07/01/25 (Call 04/01/25)(a)(b) | | | USD | | | | 60 | | | | 58,188 | |
6.50%, 07/01/27 (Call 01/01/27)(a) | | | USD | | | | 50 | | | | 48,675 | |
7.50%, CALL, 06/01/27 (Call 06/01/24)(a) | | | USD | | | | 35 | | | | 34,563 | |
7.50%, CALL, 06/01/30 (Call 12/01/29)(a) | | | USD | | | | 40 | | | | 38,910 | |
Exela Intermediate LLC/Exela Finance Inc.,
11.50%, 07/15/26 (Call 12/01/22)(a)(b) | | | USD | | | | 75 | | | | 20,566 | |
Fair Isaac Corp. | | | | | | | | | | | | |
4.00%, 06/15/28 (Call 12/15/22)(a) | | | USD | | | | 75 | | | | 67,863 | |
5.25%, 05/15/26 (Call 02/15/26)(a) | | | USD | | | | 25 | | | | 24,350 | |
Ferrellgas LP/Ferrellgas Finance Corp. | | | | | | | | | | | | |
5.38%, 04/01/26 (Call 04/01/23)(a) | | | USD | | | | 65 | | | | 58,988 | |
5.88%, 04/01/29 (Call 04/01/24)(a)(b) | | | USD | | | | 60 | | | | 50,396 | |
Fertitta Entertainment LLC/Fertitta Entertainment Finance Co. Inc. | | | | | | | | | | | | |
4.63%, 01/15/29 (Call 01/15/25)(a)(b) | | | USD | | | | 75 | | | | 65,161 | |
6.75%, 01/15/30 (Call 01/15/25)(a)(b) | | | USD | | | | 90 | | | | 70,650 | |
FirstCash Inc. | | | | | | | | | | | | |
4.63%, 09/01/28 (Call 09/01/23)(a) | | | USD | | | | 50 | | | | 43,293 | |
5.63%, 01/01/30 (Call 01/01/25)(a) | | | USD | | | | 35 | | | | 31,102 | |
FirstEnergy Corp. | | | | | | | | | | | | |
2.65%, 03/01/30 (Call 12/01/29) | | | USD | | | | 45 | | | | 36,231 | |
Series B, 2.25%, 09/01/30 (Call 06/01/30) | | | USD | | | | 60 | | | | 45,936 | |
Series B, 4.15%, 07/15/27 (Call 04/15/27) | | | USD | | | | 120 | | | | 112,693 | |
Ford Credit Canada Co, 2.96%, 09/16/26 (Call 08/16/26) | | | CAD | | | | 100 | | | | 62,152 | |
Ford Credit Canada Co. | | | | | | | | | | | | |
3.50%, 11/30/23 | | | CAD | | | | 25 | | | | 17,722 | |
4.46%, 11/13/24 | | | CAD | | | | 50 | | | | 35,002 | |
Ford Motor Co. | | | | | | | | | | | | |
3.25%, 02/12/32 (Call 11/12/31) | | | USD | | | | 310 | | | | 232,396 | |
4.35%, 12/08/26 (Call 09/08/26)(b) | | | USD | | | | 25 | | | | 23,307 | |
| | |
| 56 | | 2 0 2 2 I S H A R E S A N N U A L R E P O R T T O S H A R E H O L D E R S |
| | |
Schedule of Investments (continued) October 31, 2022 | | iShares® US & Intl High Yield Corp Bond ETF (Percentages shown are based on Net Assets) |
| | | | | | | | | | | | |
| Security | | | | | Par
(000) | | | Value | |
| | | |
| United States (continued) | | | | | | | | | |
6.10%, 08/19/32 (Call 05/19/32)(b) | | | USD | | | | 150 | | | $ | 137,625 | |
Ford Motor Credit Co. LLC | | | | | | | | | | | | |
1.51%, 02/17/23 | | | EUR | | | | 100 | | | | 98,197 | |
1.74%, 07/19/24 | | | EUR | | | | 100 | | | | 93,413 | |
2.30%, 02/10/25 (Call 01/10/25) | | | USD | | | | 25 | | | | 22,613 | |
2.33%, 11/25/25 | | | EUR | | | | 100 | | | | 89,801 | |
2.70%, 08/10/26 (Call 07/10/26)(b) | | | USD | | | | 175 | | | | 150,978 | |
2.90%, 02/10/29 (Call 12/10/28) | | | USD | | | | 50 | | | | 39,188 | |
3.25%, 09/15/25 | | | EUR | | | | 100 | | | | 92,525 | |
3.37%, 11/17/23 | | | USD | | | | 150 | | | | 145,125 | |
3.38%, 11/13/25 (Call 10/13/25) | | | USD | | | | 200 | | | | 181,656 | |
3.63%, 06/17/31 (Call 03/17/31) | | | USD | | | | 25 | | | | 19,399 | |
3.81%, 01/09/24 (Call 11/09/23) | | | USD | | | | 175 | | | | 169,590 | |
3.82%, 11/02/27 (Call 08/02/27) | | | USD | | | | 110 | | | | 94,728 | |
4.00%, 11/13/30 (Call 08/13/30) | | | USD | | | | 125 | | | | 101,275 | |
4.06%, 11/01/24 (Call 10/01/24) | | | USD | | | | 225 | | | | 215,696 | |
4.13%, 08/04/25 | | | USD | | | | 25 | | | | 23,250 | |
4.13%, 08/17/27 (Call 06/17/27) | | | USD | | | | 25 | | | | 22,209 | |
4.54%, 03/06/25 | | | GBP | | | | 100 | | | | 105,725 | |
4.69%, 06/09/25 (Call 04/09/25) | | | USD | | | | 25 | | | | 23,688 | |
4.95%, 05/28/27 (Call 04/28/27) | | | USD | | | | 125 | | | | 114,520 | |
5.11%, 05/03/29 (Call 02/03/29) | | | USD | | | | 225 | | | | 201,150 | |
5.13%, 06/16/25 (Call 05/16/25) | | | USD | | | | 365 | | | | 352,152 | |
5.58%, 03/18/24 (Call 02/18/24) | | | USD | | | | 50 | | | | 49,388 | |
Fortress Transportation and Infrastructure Investors LLC | | | | | | | | | | | | |
5.50%, 05/01/28 (Call 05/01/24)(a) | | | USD | | | | 60 | | | | 50,253 | |
6.50%, 10/01/25 (Call 12/01/22)(a) | | | USD | | | | 46 | | | | 44,218 | |
9.75%, 08/01/27 (Call 08/01/23)(a) | | | USD | | | | 50 | | | | 50,866 | |
Freedom Mortgage Corp. | | | | | | | | | | | | |
6.63%, 01/15/27 (Call 01/15/24)(a) | | | USD | | | | 60 | | | | 44,425 | |
7.63%, 05/01/26 (Call 05/01/23)(a) | | | USD | | | | 45 | | | | 35,479 | |
8.13%, 11/15/24 (Call 12/01/22)(a) | | | USD | | | | 45 | | | | 39,651 | |
8.25%, 04/15/25 (Call 12/01/22)(a) | | | USD | | | | 45 | | | | 38,592 | |
Frontier Communications Holdings LLC | | | | | | | | | | | | |
5.00%, 05/01/28 (Call 05/01/24)(a) | | | USD | | | | 115 | | | | 100,548 | |
5.88%, 10/15/27 (Call 10/15/23)(a) | | | USD | | | | 85 | | | | 78,434 | |
5.88%, 11/01/29 (Call 11/01/24) | | | USD | | | | 75 | | | | 58,688 | |
6.00%, 01/15/30 (Call 10/15/24)(a)(b) | | | USD | | | | 80 | | | | 62,422 | |
6.75%, 05/01/29 (Call 05/01/24)(a) | | | USD | | | | 85 | | | | 70,019 | |
8.75%, 05/15/30 (Call 05/15/25)(a) | | | USD | | | | 100 | | | | 101,283 | |
FXI Holdings Inc. | | | | | | | | | | | | |
7.88%, 11/01/24 (Call 12/01/22)(a) | | | USD | | | | 54 | | | | 46,899 | |
12.25%, 11/15/26 (Call 12/01/22)(a) | | | USD | | | | 59 | | | | 51,276 | |
Gap Inc. (The) | | | | | | | | | | | | |
3.63%, 10/01/29 (Call 10/01/24)(a)(b) | | | USD | | | | 50 | | | | 35,180 | |
3.88%, 10/01/31 (Call 10/01/26)(a) | | | USD | | | | 50 | | | | 34,426 | |
Gartner Inc. | | | | | | | | | | | | |
3.63%, 06/15/29 (Call 06/15/24)(a) | | | USD | | | | 65 | | | | 56,002 | |
3.75%, 10/01/30 (Call 10/01/25)(a)(b) | | | USD | | | | 55 | | | | 46,470 | |
4.50%, 07/01/28 (Call 07/01/23)(a) | | | USD | | | | 50 | | | | 46,004 | |
Genesis Energy LP/Genesis Energy Finance Corp. | | | | | | | | | | | | |
6.50%, 10/01/25 (Call 12/01/22) | | | USD | | | | 45 | | | | 42,986 | |
7.75%, 02/01/28 (Call 02/01/23)(b) | | | USD | | | | 55 | | | | 52,456 | |
8.00%, 01/15/27 (Call 01/15/24) | | | USD | | | | 80 | | | | 77,700 | |
Global Atlantic Fin Co., 4.70%, 10/15/51
(Call 07/15/26)(a)(d) | | | USD | | | | 60 | | | | 44,940 | |
Go Daddy Operating Co. LLC/GD Finance Co. Inc. | | | | | | | | | | | | |
3.50%, 03/01/29 (Call 03/01/24)(a) | | | USD | | | | 50 | | | | 41,388 | |
5.25%, 12/01/27 (Call 12/01/22)(a) | | | USD | | | | 70 | | | | 65,908 | |
| | | | | | | | | | | | |
| Security | | | | | Par
(000) | | | Value | |
| | | |
| United States (continued) | | | | | | | | | |
Goodyear Tire & Rubber Co. (The) | | | | | | | | | | | | |
4.88%, 03/15/27 (Call 12/15/26)(b) | | | USD | | | | 65 | | | $ | 59,143 | |
5.00%, 05/31/26 (Call 12/01/22)(b) | | | USD | | | | 90 | | | | 86,386 | |
5.00%, 07/15/29 (Call 04/15/29) | | | USD | | | | 70 | | | | 60,643 | |
5.25%, 04/30/31 (Call 01/30/31)(b) | | | USD | | | | 60 | | | | 50,533 | |
5.25%, 07/15/31 (Call 04/15/31) | | | USD | | | | 20 | | | | 16,768 | |
5.63%, 04/30/33 (Call 01/30/33) | | | USD | | | | 35 | | | | 29,270 | |
9.50%, 05/31/25 (Call 11/16/22) | | | USD | | | | 70 | | | | 72,939 | |
Grand Canyon University | | | | | | | | | | | | |
4.13%, 10/01/24 | | | USD | | | | 25 | | | | 23,438 | |
5.13%, 10/01/28 (Call 08/01/28) | | | USD | | | | 40 | | | | 36,180 | |
Graphic Packaging International LLC | | | | | | | | | | | | |
3.50%, 03/15/28(a) | | | USD | | | | 35 | | | | 30,453 | |
3.75%, 02/01/30 (Call 08/01/29)(a) | | | USD | | | | 45 | | | | 38,700 | |
Gray Escrow II Inc., 5.38%, 11/15/31
(Call 11/15/26)(a)(b) | | | USD | | | | 95 | | | | 76,202 | |
Gray Television Inc. | | | | | | | | | | | | |
4.75%, 10/15/30 (Call 10/15/25)(a)(b) | | | USD | | | | 75 | | | | 59,177 | |
5.88%, 07/15/26 (Call 12/01/22)(a)(b) | | | USD | | | | 50 | | | | 47,102 | |
7.00%, 05/15/27 (Call 11/14/22)(a)(b) | | | USD | | | | 65 | | | | 61,912 | |
Griffon Corp., 5.75%, 03/01/28
(Call 03/01/23) | | | USD | | | | 90 | | | | 82,442 | |
GTCR AP Finance Inc., 8.00%, 05/15/27
(Call 12/01/22)(a) | | | USD | | | | 25 | | | | 23,659 | |
H&E Equipment Services Inc.,
3.88%, 12/15/28 (Call 12/15/23)(a) | | | USD | | | | 100 | | | | 84,500 | |
Hanesbrands Finance Luxembourg SCA,
3.50%, 06/15/24 (Call 03/15/24)(c) | | | EUR | | | | 100 | | | | 92,229 | |
Hanesbrands Inc. | | | | | | | | | | | | |
4.63%, 05/15/24 (Call 02/15/24)(a)(b) | | | USD | | | | 65 | | | | 63,067 | |
4.88%, 05/15/26 (Call 02/15/26)(a)(b) | | | USD | | | | 65 | | | | 59,638 | |
HAT Holdings I LLC/HAT Holdings II LLC,
3.38%, 06/15/26 (Call 03/15/26)(a) | | | USD | | | | 95 | | | | 76,950 | |
Hawaiian Brand Intellectual Property Ltd./HawaiianMiles
Loyalty Ltd., 5.75%, 01/20/26
(Call 01/20/24)(a) | | | USD | | | | 100 | | | | 92,381 | |
Herbalife Nutrition Ltd./HLF Financing Inc.,
7.88%, 09/01/25 (Call 12/01/22)(a) | | | USD | | | | 30 | | | | 28,298 | |
Herc Holdings Inc., 5.50%, 07/15/27
(Call 12/01/22)(a) | | | USD | | | | 100 | | | | 94,625 | |
Hertz Corp. (The) | | | | | | | | | | | | |
4.63%, 12/01/26 (Call 12/01/23)(a) | | | USD | | | | 50 | | | | 42,542 | |
5.00%, 12/01/29 (Call 12/01/24)(a) | | | USD | | | | 80 | | | | 63,718 | |
Hess Midstream Operations LP | | | | | | | | | | | | |
4.25%, 02/15/30 (Call 02/15/25)(a)(b) | | | USD | | | | 70 | | | | 59,802 | |
5.13%, 06/15/28 (Call 06/15/23)(a)(b) | | | USD | | | | 45 | | | | 41,303 | |
5.50%, 10/15/30 (Call 10/15/25)(a) | | | USD | | | | 35 | | | | 31,585 | |
5.63%, 02/15/26 (Call 12/01/22)(a) | | | USD | | | | 50 | | | | 49,039 | |
Hilcorp Energy I LP/Hilcorp Finance Co. | | | | | | | | | | | | |
5.75%, 02/01/29 (Call 02/01/24)(a) | | | USD | | | | 45 | | | | 40,993 | |
6.00%, 04/15/30 (Call 04/15/25)(a) | | | USD | | | | 45 | | | | 40,984 | |
6.00%, 02/01/31 (Call 02/01/26)(a) | | | USD | | | | 45 | | | | 40,731 | |
6.25%, 11/01/28 (Call 11/01/23)(a)(b) | | | USD | | | | 25 | | | | 23,540 | |
6.25%, 04/15/32 (Call 05/15/27)(a) | | | USD | | | | 50 | | | | 45,815 | |
Hilton Domestic Operating Co. Inc. | | | | | | | | | | | | |
3.63%, 02/15/32 (Call 08/15/26)(a) | | | USD | | | | 115 | | | | 91,353 | |
3.75%, 05/01/29 (Call 05/01/24)(a) | | | USD | | | | 75 | | | | 63,865 | |
4.00%, 05/01/31 (Call 05/01/26)(a) | | | USD | | | | 75 | | | | 62,398 | |
4.88%, 01/15/30 (Call 01/15/25) | | | USD | | | | 80 | | | | 71,700 | |
5.38%, 05/01/25 (Call 11/14/22)(a) | | | USD | | | | 10 | | | | 9,850 | |
5.75%, 05/01/28 (Call 05/01/23)(a) | | | USD | | | | 50 | | | | 48,230 | |
Hilton Grand Vacations Borrower Escrow LLC/Hilton Grand Vacations Borrower Esc | | | | | | | | | | | | |
4.88%, 07/01/31 (Call 07/01/26)(a)(b) | | | USD | | | | 30 | | | | 24,525 | |
5.00%, 06/01/29 (Call 06/01/24)(a)(b) | | | USD | | | | 70 | | | | 60,287 | |
| | |
S C H E D U L E O F I N V E S T M E N T S | | 57 |
| | |
Schedule of Investments (continued) October 31, 2022 | | iShares® US & Intl High Yield Corp Bond ETF (Percentages shown are based on Net Assets) |
| | | | | | | | | | | | |
| Security | | | | | Par
(000) | | | Value | |
| | | |
| United States (continued) | | | | | | | | | |
Hilton Worldwide Finance LLC/Hilton Worldwide Finance Corp.,
4.88%, 04/01/27 (Call 11/16/22) | | | USD | | | | 60 | | | $ | 56,860 | |
HLF Financing Sarl LLC/Herbalife International Inc., | | | | | | | | | | | | |
4.88%, 06/01/29 (Call 06/01/24)(a) | | | USD | | | | 70 | | | | 52,503 | |
Hologic Inc. | | | | | | | | | | | | |
3.25%, 02/15/29 (Call 09/28/23)(a)(b) | | | USD | | | | 75 | | | | 63,735 | |
4.63%, 02/01/28 (Call 02/01/23)(a) | | | USD | | | | 25 | | | | 23,333 | |
Howard Hughes Corp. (The) | | | | | | | | | | | | |
4.13%, 02/01/29 (Call 02/01/24)(a) | | | USD | | | | 40 | | | | 31,691 | |
4.38%, 02/01/31 (Call 02/01/26)(a) | | | USD | | | | 40 | | | | 30,031 | |
5.38%, 08/01/28 (Call 08/01/23)(a) | | | USD | | | | 75 | | | | 63,774 | |
Howmet Aerospace Inc. | | | | | | | | | | | | |
3.00%, 01/15/29 (Call 11/15/28) | | | USD | | | | 50 | | | | 41,619 | |
5.13%, 10/01/24 (Call 07/01/24) | | | USD | | | | 80 | | | | 79,000 | |
6.88%, 05/01/25 (Call 04/01/25) | | | USD | | | | 55 | | | | 56,222 | |
Hub International Ltd. | | | | | | | | | | | | |
5.63%, 12/01/29 (Call 12/01/24)(a)(b) | | | USD | | | | 40 | | | | 34,288 | |
7.00%, 05/01/26 (Call 11/14/22)(a) | | | USD | | | | 125 | | | | 123,437 | |
Hughes Satellite Systems Corp. | | | | | | | | | | | | |
5.25%, 08/01/26 | | | USD | | | | 45 | | | | 42,928 | |
6.63%, 08/01/26 | | | USD | | | | 65 | | | | 61,262 | |
Icahn Enterprises LP/Icahn Enterprises Finance Corp. | | | | | | | | | | | | |
4.38%, 02/01/29 (Call 08/01/28) | | | USD | | | | 60 | | | | 50,100 | |
4.75%, 09/15/24 (Call 06/15/24) | | | USD | | | | 75 | | | | 72,588 | |
5.25%, 05/15/27 (Call 11/15/26) | | | USD | | | | 117 | | | | 108,085 | |
6.25%, 05/15/26 (Call 12/01/22) | | | USD | | | | 105 | | | | 100,852 | |
6.38%, 12/15/25 (Call 12/01/22) | | | USD | | | | 45 | | | | 43,684 | |
iHeartCommunications Inc. | | | | | | | | | | | | |
4.75%, 01/15/28 (Call 01/15/23)(a)(b) | | | USD | | | | 50 | | | | 43,625 | |
5.25%, 08/15/27 (Call 11/16/22)(a) | | | USD | | | | 45 | | | | 40,682 | |
6.38%, 05/01/26 (Call 11/16/22) | | | USD | | | | 50 | | | | 47,856 | |
8.38%, 05/01/27 (Call 11/16/22)(b) | | | USD | | | | 120 | | | | 108,002 | |
Imola Merger Corp., 4.75%, 05/15/29
(Call 05/15/24)(a) | | | USD | | | | 175 | | | | 150,937 | |
Intelsat Jackson Holdings SA,
6.50%, 03/15/30 (Call 03/15/25)(a) | | | USD | | | | 250 | | | | 229,597 | |
International Game Technology PLC | | | | | | | | | | | | |
3.50%, 06/15/26 (Call 11/30/22)(c) | | | EUR | | | | 150 | | | | 139,491 | |
4.13%, 04/15/26 (Call 04/15/23)(a) | | | USD | | | | 65 | | | | 60,309 | |
6.25%, 01/15/27 (Call 07/15/26)(a) | | | USD | | | | 85 | | | | 84,215 | |
6.50%, 02/15/25 (Call 08/15/24)(a) | | | USD | | | | 90 | | | | 90,076 | |
IQVIA Inc. | | | | | | | | | | | | |
2.25%, 03/15/29 (Call 03/15/24)(c) | | | EUR | | | | 100 | | | | 79,753 | |
2.88%, 09/15/25 (Call 11/10/22)(c) | | | EUR | | | | 100 | | | | 94,719 | |
2.88%, 06/15/28 (Call 06/15/23)(c) | | | EUR | | | | 100 | | | | 86,585 | |
5.00%, 05/15/27 (Call 12/01/22)(a)(b) | | | USD | | | | 150 | | | | 142,538 | |
Iron Mountain Inc. | | | | | | | | | | | | |
4.50%, 02/15/31 (Call 02/15/26)(a) | | | USD | | | | 85 | | | | 69,128 | |
4.88%, 09/15/27 (Call 11/14/22)(a) | | | USD | | | | 75 | | | | 69,055 | |
4.88%, 09/15/29 (Call 09/15/24)(a) | | | USD | | | | 85 | | | | 72,994 | |
5.00%, 07/15/28 (Call 07/15/23)(a) | | | USD | | | | 55 | | | | 49,232 | |
5.25%, 03/15/28 (Call 12/27/22)(a)(b) | | | USD | | | | 55 | | | | 50,634 | |
5.25%, 07/15/30 (Call 07/15/25)(a) | | | USD | | | | 100 | | | | 86,653 | |
5.63%, 07/15/32 (Call 07/15/26)(a) | | | USD | | | | 60 | | | | 51,705 | |
Iron Mountain Information Management Services Inc., 5.00%, 07/15/32
(Call 07/15/27)(a) | | | USD | | | | 55 | | | | 45,221 | |
Iron Mountain UK PLC, 3.88%, 11/15/25 (Call 11/10/22)(c) | | | GBP | | | | 100 | | | | 102,361 | |
iStar Inc. | | | | | | | | | | | | |
4.25%, 08/01/25 (Call 05/01/25)(b) | | | USD | | | | 20 | | | | 19,375 | |
4.75%, 10/01/24 (Call 07/01/24) | | | USD | | | | 90 | | | | 89,079 | |
ITT Holdings LLC, 6.50%, 08/01/29
(Call 08/01/24)(a) | | | USD | | | | 90 | | | | 71,640 | |
Jazz Securities DAC, 4.38%, 01/15/29 (Call 07/15/24)(a) | | | USD | | | | 130 | | | | 115,038 | |
| | | | | | | | | | | | |
| Security | | | | | Par
(000) | | | Value | |
| | | |
| United States (continued) | | | | | | | | | |
Jefferies Finance LLC/JFIN Co-Issuer Corp., 5.00%, 08/15/28 (Call 08/15/24)(a) | | | USD | | | | 75 | | | $ | 58,877 | |
Jeld-Wen Inc. | | | | | | | | | | | | |
4.63%, 12/15/25 (Call 12/01/22)(a)(b) | | | USD | | | | 25 | | | | 20,804 | |
4.88%, 12/15/27 (Call 12/15/22)(a)(b) | | | USD | | | | 25 | | | | 18,647 | |
Kaiser Aluminum Corp. | | | | | | | | | | | | |
4.50%, 06/01/31 (Call 06/01/26)(a)(b) | | | USD | | | | 35 | | | | 28,152 | |
4.63%, 03/01/28 (Call 03/01/23)(a)(b) | | | USD | | | | 50 | | | | 43,643 | |
Kennedy-Wilson Inc. | | | | | | | | | | | | |
4.75%, 03/01/29 (Call 03/01/24) | | | USD | | | | 30 | | | | 24,008 | |
4.75%, 02/01/30 (Call 09/01/24) | | | USD | | | | 50 | | | | 39,250 | |
5.00%, 03/01/31 (Call 03/01/26)(b) | | | USD | | | | 61 | | | | 47,709 | |
KFC Holding Co./Pizza Hut Holdings LLC/Taco Bell of America LLC,
4.75%, 06/01/27 (Call 12/01/22)(a) | | | USD | | | | 50 | | | | 47,602 | |
Kinetik Holdings LP, 5.88%, 06/15/30
(Call 06/15/25)(a) | | | USD | | | | 80 | | | | 75,574 | |
LABL Inc. | | | | | | | | | | | | |
5.88%, 11/01/28 (Call 11/01/24)(a)(b) | | | USD | | | | 45 | | | | 39,276 | |
6.75%, 07/15/26 (Call 11/14/22)(a) | | | USD | | | | 65 | | | | 61,873 | |
8.25%, 11/01/29 (Call 11/01/24)(a) | | | USD | | | | 45 | | | | 36,142 | |
10.50%, 07/15/27 (Call 11/14/22)(a)(b) | | | USD | | | | 35 | | | | 31,916 | |
Ladder Capital Finance Holdings LLLP/Ladder Capital Finance Corp. | | | | | | | | | | | | |
4.25%, 02/01/27 (Call 02/01/23)(a) | | | USD | | | | 60 | | | | 50,490 | |
4.75%, 06/15/29 (Call 06/15/24)(a) | | | USD | | | | 45 | | | | 35,911 | |
5.25%, 10/01/25 (Call 11/16/22)(a) | | | USD | | | | 4 | | | | 3,689 | |
Lamar Media Corp. | | | | | | | | | | | | |
3.63%, 01/15/31 (Call 01/15/26)(b) | | | USD | | | | 55 | | | | 44,825 | |
3.75%, 02/15/28 (Call 02/15/23)(b) | | | USD | | | | 25 | | | | 21,875 | |
4.00%, 02/15/30 (Call 02/15/25)(b) | | | USD | | | | 35 | | | | 29,776 | |
4.88%, 01/15/29 (Call 01/15/24)(b) | | | USD | | | | 50 | | | | 45,235 | |
Lamb Weston Holdings Inc. | | | | | | | | | | | | |
4.13%, 01/31/30 (Call 01/31/25)(a) | | | USD | | | | 75 | | | | 65,492 | |
4.38%, 01/31/32 (Call 01/31/27)(a) | | | USD | | | | 50 | | | | 43,094 | |
4.88%, 05/15/28 (Call 11/15/27)(a) | | | USD | | | | 35 | | | | 32,650 | |
Laredo Petroleum Inc. | | | | | | | | | | | | |
7.75%, 07/31/29 (Call 07/31/24)(a)(b) | | | USD | | | | 25 | | | | 23,867 | |
9.50%, 01/15/25 (Call 12/01/22) | | | USD | | | | 50 | | | | 50,094 | |
Las Vegas Sands Corp. | | | | | | | | | | | | |
2.90%, 06/25/25 (Call 05/25/25) | | | USD | | | | 50 | | | | 45,245 | |
3.20%, 08/08/24 (Call 07/08/24) | | | USD | | | | 125 | | | | 118,702 | |
3.50%, 08/18/26 (Call 06/18/26) | | | USD | | | | 75 | | | | 65,225 | |
3.90%, 08/08/29 (Call 05/08/29) | | | USD | | | | 75 | | | | 60,539 | |
LBM Acquisition LLC, 6.25%, 01/15/29 (Call 01/15/24)(a) | | | USD | | | | 75 | | | | 52,461 | |
LCM Investments Holdings II LLC,
4.88%, 05/01/29 (Call 05/01/24)(a) | | | USD | | | | 90 | | | | 75,937 | |
LCPR Senior Secured Financing DAC | | | | | | | | | | | | |
5.13%, 07/15/29 (Call 07/15/24)(a) | | | USD | | | | 75 | | | | 63,400 | |
6.75%, 10/15/27 (Call 12/01/22)(a) | | | USD | | | | 90 | | | | 83,925 | |
LD Holdings Group LLC | | | | | | | | | | | | |
6.13%, 04/01/28 (Call 04/01/24)(a) | | | USD | | | | 40 | | | | 22,400 | |
6.50%, 11/01/25 (Call 12/01/22)(a) | | | USD | | | | 25 | | | | 17,000 | |
Legacy LifePoint Health LLC | | | | | | | | | | | | |
4.38%, 02/15/27 (Call 12/01/22)(a) | | | USD | | | | 60 | | | | 47,189 | |
6.75%, 04/15/25 (Call 12/01/22)(a)(b) | | | USD | | | | 35 | | | | 30,975 | |
Level 3 Financing Inc. | | | | | | | | | | | | |
3.40%, 03/01/27 (Call 01/01/27)(a) | | | USD | | | | 50 | | | | 43,069 | |
3.63%, 01/15/29 (Call 01/15/24)(a) | | | USD | | | | 65 | | | | 49,611 | |
3.75%, 07/15/29 (Call 01/15/24)(a) | | | USD | | | | 65 | | | | 49,407 | |
3.88%, 11/15/29 (Call 08/15/29)(a) | | | USD | | | | 68 | | | | 55,978 | |
4.25%, 07/01/28 (Call 07/01/23)(a)(b) | | | USD | | | | 100 | | | | 82,225 | |
4.63%, 09/15/27 (Call 12/01/22)(a) | | | USD | | | | 75 | | | | 65,151 | |
| | |
| 58 | | 2 0 2 2 I S H A R E S A N N U A L R E P O R T T O S H A R E H O L D E R S |
| | |
Schedule of Investments (continued) October 31, 2022 | | iShares® US & Intl High Yield Corp Bond ETF (Percentages shown are based on Net Assets) |
| | | | | | | | | | | | |
| Security | | | | | Par
(000) | | | Value | |
| | | |
| United States (continued) | | | | | | | | | |
Liberty Mutual Group Inc. | | | | | | | | | | | | |
3.63%, 05/23/59 (Call 05/23/24)(c)(d) | | | EUR | | | | 100 | | | $ | 83,525 | |
4.13%, 12/15/51 (Call 09/15/26)(a)(d) | | | USD | | | | 100 | | | | 75,000 | |
Life Time Inc. | | | | | | | | | | | | |
5.75%, 01/15/26 (Call 01/15/23)(a) | | | USD | | | | 68 | | | | 63,240 | |
8.00%, 04/15/26 (Call 02/01/23)(a)(b) | | | USD | | | | 45 | | | | 39,474 | |
Lifepoint Health Inc., 5.38%, 01/15/29 (Call 01/15/24)(a)(b) | | | USD | | | | 45 | | | | 28,154 | |
Lithia Motors Inc. | | | | | | | | | | | | |
3.88%, 06/01/29 (Call 06/01/24)(a) | | | USD | | | | 85 | | | | 69,349 | |
4.38%, 01/15/31 (Call 10/15/25)(a)(b) | | | USD | | | | 40 | | | | 32,550 | |
Live Nation Entertainment Inc. | | | | | | | | | | | | |
3.75%, 01/15/28 (Call 01/15/24)(a) | | | USD | | | | 50 | | | | 43,673 | |
4.75%, 10/15/27 (Call 12/01/22)(a)(b) | | | USD | | | | 75 | | | | 66,750 | |
6.50%, 05/15/27 (Call 05/15/23)(a) | | | USD | | | | 85 | | | | 84,575 | |
LPL Holdings Inc. | | | | | | | | | | | | |
4.00%, 03/15/29 (Call 03/15/24)(a) | | | USD | | | | 60 | | | | 52,372 | |
4.38%, 05/15/31 (Call 05/15/26)(a) | | | USD | | | | 35 | | | | 30,544 | |
4.63%, 11/15/27 (Call 12/01/22)(a) | | | USD | | | | 50 | | | | 46,273 | |
Lumen Technologies Inc. | | | | | | | | | | | | |
4.00%, 02/15/27 (Call 02/15/23)(a) | | | USD | | | | 115 | | | | 97,729 | |
4.50%, 01/15/29 (Call 01/15/24)(a) | | | USD | | | | 85 | | | | 59,949 | |
5.13%, 12/15/26 (Call 12/15/22)(a) | | | USD | | | | 40 | | | | 34,250 | |
5.38%, 06/15/29 (Call 06/15/24)(a)(b) | | | USD | | | | 30 | | | | 21,840 | |
Macy’s Retail Holdings LLC | | | | | | | | | | | | |
5.88%, 04/01/29 (Call 04/01/24)(a)(b) | | | USD | | | | 35 | | | | 30,310 | |
5.88%, 03/15/30 (Call 03/15/25)(a) | | | USD | | | | 35 | | | | 29,544 | |
6.13%, 03/15/32 (Call 03/15/27)(a)(b) | | | USD | | | | 25 | | | | 20,722 | |
Madison IAQ LLC | | | | | | | | | | | | |
4.13%, 06/30/28 (Call 06/30/24)(a) | | | USD | | | | 50 | | | | 41,792 | |
5.88%, 06/30/29 (Call 06/30/24)(a) | | | USD | | | | 80 | | | | 55,097 | |
Mallinckrodt International Finance SA/Mallinckrodt CB LLC | | | | | | | | | | | | |
10.00%, 04/15/25 (Call 11/16/22)(a) | | | USD | | | | 50 | | | | 45,125 | |
11.50%, 12/15/28 (Call 06/15/27)(a) | | | USD | | | | 50 | | | | 45,250 | |
Marriott Ownership Resorts Inc.,
4.50%, 06/15/29 (Call 06/15/24)(a) | | | USD | | | | 35 | | | | 29,183 | |
Match Group Holdings II LLC | | | | | | | | | | | | |
3.63%, 10/01/31 (Call 10/01/26)(a)(b) | | | USD | | | | 35 | | | | 26,517 | |
4.13%, 08/01/30 (Call 05/01/25)(a) | | | USD | | | | 50 | | | | 40,545 | |
4.63%, 06/01/28 (Call 06/01/23)(a)(b) | | | USD | | | | 35 | | | | 31,102 | |
5.00%, 12/15/27 (Call 12/15/22)(a) | | | USD | | | | 25 | | | | 22,444 | |
Mattel Inc. | | | | | | | | | | | | |
3.38%, 04/01/26 (Call 04/01/23)(a) | | | USD | | | | 40 | | | | 36,579 | |
3.75%, 04/01/29 (Call 04/01/24)(a) | | | USD | | | | 65 | | | | 56,179 | |
5.88%, 12/15/27 (Call 12/15/22)(a) | | | USD | | | | 35 | | | | 34,044 | |
Mauser Packaging Solutions Holding Co. | | | | | | | | | | | | |
5.50%, 04/15/24 (Call 12/01/22)(a)(b) | | | USD | | | | 110 | | | | 107,736 | |
7.25%, 04/15/25 (Call 12/01/22)(a)(b) | | | USD | | | | 110 | | | | 99,174 | |
McGraw-Hill Education Inc. | | | | | | | | | | | | |
5.75%, 08/01/28 (Call 08/01/24)(a) | | | USD | | | | 75 | | | | 66,037 | |
8.00%, 08/01/29 (Call 08/01/24)(a) | | | USD | | | | 60 | | | | 51,075 | |
Meritage Homes Corp. | | | | | | | | | | | | |
3.88%, 04/15/29 (Call 10/15/28)(a) | | | USD | | | | 40 | | | | 32,243 | |
6.00%, 06/01/25 (Call 03/01/25) | | | USD | | | | 25 | | | | 24,250 | |
MGM Resorts International | | | | | | | | | | | | |
4.63%, 09/01/26 (Call 06/01/26) | | | USD | | | | 47 | | | | 42,722 | |
4.75%, 10/15/28 (Call 07/15/28)(b) | | | USD | | | | 65 | | | | 56,425 | |
5.50%, 04/15/27 (Call 01/15/27) | | | USD | | | | 76 | | | | 70,000 | |
5.75%, 06/15/25 (Call 03/15/25)(b) | | | USD | | | | 80 | | | | 77,544 | |
6.75%, 05/01/25 (Call 12/01/22) | | | USD | | | | 60 | | | | 59,244 | |
| | | | | | | | | | | | |
| Security | | | | | Par
(000) | | | Value | |
| | | |
| United States (continued) | | | | | | | | | |
Michaels Companies Inc. (The) | | | | | | | | | | | | |
5.25%, 05/01/28 (Call 11/01/23)(a) | | | USD | | | | 65 | | | $ | 45,825 | |
7.88%, 05/01/29 (Call 05/01/24)(a)(b) | | | USD | | | | 115 | | | | 64,112 | |
Midcap Financial Issuer Trust,
6.50%, 05/01/28 (Call 05/01/24)(a) | | | USD | | | | 120 | | | | 102,045 | |
Minerva Merger Sub Inc., 6.50%, 02/15/30
(Call 02/15/25)(a)(b) | | | USD | | | | 180 | | | | 140,400 | |
ModivCare Escrow Issuer Inc.,
5.00%, 10/01/29 (Call 10/01/24)(a) | | | USD | | | | 35 | | | | 29,942 | |
ModivCare Inc., 5.88%, 11/15/25
(Call 12/01/22)(a) | | | USD | | | | 50 | | | | 47,651 | |
Mohegan Gaming & Entertainment,
8.00%, 02/01/26 (Call 02/01/23)(a) | | | USD | | | | 100 | | | | 84,318 | |
Molina Healthcare Inc. | | | | | | | | | | | | |
3.88%, 11/15/30 (Call 08/17/30)(a) | | | USD | | | | 65 | | | | 55,588 | |
3.88%, 05/15/32 (Call 02/15/32)(a)(b) | | | USD | | | | 60 | | | | 50,019 | |
4.38%, 06/15/28 (Call 06/15/23)(a) | | | USD | | | | 55 | | | | 49,431 | |
Moss Creek Resources Holdings Inc. | | | | | | | | | | | | |
7.50%, 01/15/26 (Call 12/01/22)(a) | | | USD | | | | 60 | | | | 55,200 | |
10.50%, 05/15/27 (Call 12/01/22)(a) | | | USD | | | | 40 | | | | 38,509 | |
Mozart Debt Merger Sub Inc. | | | | | | | | | | | | |
3.88%, 04/01/29 (Call 10/01/24)(a) | | | USD | | | | 355 | | | | 290,035 | |
5.25%, 10/01/29 (Call 10/01/24)(a)(b) | | | USD | | | | 190 | | | | 147,078 | |
MPH Acquisition Holdings LLC | | | | | | | | | | | | |
5.50%, 09/01/28 (Call 09/01/24)(a) | | | USD | | | | 75 | | | | 64,511 | |
5.75%, 11/01/28 (Call 11/01/23)(a)(b) | | | USD | | | | 115 | | | | 88,837 | |
MPT Operating Partnership LP/MPT Finance Corp. | | | | | | | | | | | | |
3.33%, 03/24/25 (Call 12/24/24) | | | EUR | | | | 100 | | | | 86,672 | |
3.38%, 04/24/30 (Call 01/24/30) | | | GBP | | | | 125 | | | | 89,271 | |
3.50%, 03/15/31 (Call 03/15/26) | | | USD | | | | 85 | | | | 58,545 | |
4.63%, 08/01/29 (Call 08/01/24) | | | USD | | | | 65 | | | | 51,514 | |
5.00%, 10/15/27 (Call 12/01/22)(b) | | | USD | | | | 125 | | | | 106,855 | |
5.25%, 08/01/26 (Call 12/01/22)(b) | | | USD | | | | 40 | | | | 36,094 | |
MSCI Inc. | | | | | | | | | | | | |
3.25%, 08/15/33 (Call 08/15/27)(a)(b) | | | USD | | | | 55 | | | | 42,888 | |
3.63%, 09/01/30 (Call 03/01/25)(a) | | | USD | | | | 85 | | | | 70,972 | |
3.63%, 11/01/31 (Call 11/01/26)(a) | | | USD | | | | 50 | | | | 41,265 | |
3.88%, 02/15/31 (Call 06/01/25)(a) | | | USD | | | | 75 | | | | 63,374 | |
4.00%, 11/15/29 (Call 11/15/24)(a)(b) | | | USD | | | | 75 | | | | 64,977 | |
Murphy Oil Corp. | | | | | | | | | | | | |
5.75%, 08/15/25 (Call 12/01/22) | | | USD | | | | 25 | | | | 24,793 | |
5.88%, 12/01/27 (Call 12/01/22) | | | USD | | | | 30 | | | | 29,178 | |
6.38%, 07/15/28 (Call 07/15/24)(b) | | | USD | | | | 50 | | | | 48,871 | |
Murphy Oil USA Inc. | | | | | | | | | | | | |
3.75%, 02/15/31 (Call 02/15/26)(a) | | | USD | | | | 35 | | | | 29,234 | |
4.75%, 09/15/29 (Call 09/15/24) | | | USD | | | | 50 | | | | 45,334 | |
Nabors Industries Inc. | | | | | | | | | | | | |
5.75%, 02/01/25 (Call 11/01/24)(b) | | | USD | | | | 60 | | | | 57,593 | |
7.38%, 05/15/27 (Call 05/15/24)(a) | | | USD | | | | 40 | | | | 39,450 | |
Nabors Industries Ltd., 7.25%, 01/15/26 (Call 12/01/22)(a) | | | USD | | | | 50 | | | | 48,135 | |
Nationstar Mortgage Holdings Inc. | | | | | | | | | | | | |
5.13%, 12/15/30 (Call 12/15/25)(a) | | | USD | | | | 55 | | | | 41,382 | |
5.50%, 08/15/28 (Call 08/15/23)(a) | | | USD | | | | 50 | | | | 40,549 | |
5.75%, 11/15/31 (Call 11/15/26)(a) | | | USD | | | | 50 | | | | 38,339 | |
6.00%, 01/15/27 (Call 01/15/23)(a) | | | USD | | | | 65 | | | | 57,889 | |
Navient Corp. | | | | | | | | | | | | |
4.88%, 03/15/28 (Call 06/15/27) | | | USD | | | | 45 | | | | 35,886 | |
5.00%, 03/15/27 (Call 09/15/26)(b) | | | USD | | | | 60 | | | | 50,795 | |
5.50%, 03/15/29 (Call 06/15/28) | | | USD | | | | 40 | | | | 31,957 | |
5.88%, 10/25/24 | | | USD | | | | 50 | | | | 48,625 | |
6.13%, 03/25/24 | | | USD | | | | 85 | | | | 83,825 | |
6.75%, 06/25/25 | | | USD | | | | 25 | | | | 23,872 | |
| | |
S C H E D U L E O F I N V E S T M E N T S | | 59 |
| | |
Schedule of Investments (continued) October 31, 2022 | | iShares® US & Intl High Yield Corp Bond ETF (Percentages shown are based on Net Assets) |
| | | | | | | | | | | | |
| Security | | | | | Par
(000) | | | Value | |
| | | |
| United States (continued) | | | | | | | | | |
6.75%, 06/15/26 | | | USD | | | | 40 | | | $ | 37,718 | |
NCL Corp. Ltd. | | | | | | | | | | | | |
3.63%, 12/15/24 (Call 11/14/22)(a) | | | USD | | | | 50 | | | | 43,106 | |
5.88%, 03/15/26 (Call 12/15/25)(a) | | | USD | | | | 105 | | | | 85,470 | |
5.88%, 02/15/27 (Call 02/15/24)(a) | | | USD | | | | 85 | | | | 75,820 | |
7.75%, 02/15/29 (Call 11/15/28)(a) | | | USD | | | | 45 | | | | 35,719 | |
NCL Finance Ltd., 6.13%, 03/15/28
(Call 12/15/27)(a) | | | USD | | | | 40 | | | | 30,880 | |
NCR Corp. | | | | | | | | | | | | |
5.00%, 10/01/28 (Call 10/01/23)(a)(b) | | | USD | | | | 45 | | | | 38,138 | |
5.13%, 04/15/29 (Call 04/15/24)(a) | | | USD | | | | 85 | | | | 71,288 | |
5.25%, 10/01/30 (Call 10/01/25)(a) | | | USD | | | | 30 | | | | 24,239 | |
5.75%, 09/01/27 (Call 11/14/22)(a)(b) | | | USD | | | | 40 | | | | 38,600 | |
6.13%, 09/01/29 (Call 09/01/24)(a) | | | USD | | | | 60 | | | | 57,452 | |
New Fortress Energy Inc. | | | | | | | | | | | | |
6.50%, 09/30/26 (Call 03/31/23)(a) | | | USD | | | | 125 | | | | 121,250 | |
6.75%, 09/15/25 (Call 11/21/22)(a) | | | USD | | | | 100 | | | | 97,775 | |
Newell Brands Inc. | | | | | | | | | | | | |
4.45%, 04/01/26 (Call 01/01/26) | | | USD | | | | 160 | | | | 148,691 | |
4.88%, 06/01/25 (Call 05/01/25) | | | USD | | | | 50 | | | | 48,156 | |
6.38%, 09/15/27 (Call 06/15/27) | | | USD | | | | 50 | | | | 48,894 | |
6.63%, 09/15/29 (Call 06/15/29)(b) | | | USD | | | | 50 | | | | 48,875 | |
News Corp. | | | | | | | | | | | | |
3.88%, 05/15/29 (Call 05/15/24)(a)(b) | | | USD | | | | 85 | | | | 73,057 | |
5.13%, 02/15/32 (Call 02/15/27)(a) | | | USD | | | | 35 | | | | 31,395 | |
Nexstar Media Inc. | | | | | | | | | | | | |
4.75%, 11/01/28 (Call 11/01/23)(a)(b) | | | USD | | | | 95 | | | | 83,372 | |
5.63%, 07/15/27 (Call 11/14/22)(a) | | | USD | | | | 125 | | | | 117,750 | |
NextEra Energy Operating Partners LP | | | | | | | | | | | | |
3.88%, 10/15/26 (Call 07/15/26)(a) | | | USD | | | | 40 | | | | 37,064 | |
4.25%, 07/15/24 (Call 04/15/24)(a) | | | USD | | | | 65 | | | | 63,121 | |
4.50%, 09/15/27 (Call 06/15/27)(a) | | | USD | | | | 50 | | | | 46,517 | |
NFP Corp. | | | | | | | | | | | | |
4.88%, 08/15/28 (Call 08/15/23)(a) | | | USD | | | | 35 | | | | 30,476 | |
6.88%, 08/15/28 (Call 08/15/23)(a) | | | USD | | | | 170 | | | | 145,800 | |
NGL Energy Operating LLC/NGL Energy Finance Corp., 7.50%, 02/01/26 (Call 02/01/23)(a) | | | USD | | | | 170 | | | | 153,850 | |
NGL Energy Partners LP/NGL Energy Finance Corp., 7.50%, 11/01/23 (Call 12/01/22)(b) | | | USD | | | | 40 | | | | 39,000 | |
NMG Holding Co. Inc./Neiman Marcus Group LLC, 7.13%, 04/01/26 (Call 04/01/23)(a) | | | USD | | | | 85 | | | | 80,770 | |
Nordstrom Inc. | | | | | | | | | | | | |
4.25%, 08/01/31 (Call 05/01/31) | | | USD | | | | 40 | | | | 28,958 | |
4.38%, 04/01/30 (Call 01/01/30) | | | USD | | | | 55 | | | | 42,397 | |
NortonLifeLock Inc. | | | | | | | | | | | | |
5.00%, 04/15/25 (Call 11/14/22)(a) | | | USD | | | | 65 | | | | 63,256 | |
6.75%, 09/30/27 (Call 09/30/24)(a) | | | USD | | | | 75 | | | | 74,875 | |
7.13%, 09/30/30 (Call 09/30/25)(a) | | | USD | | | | 45 | | | | 44,415 | |
Novelis Corp. | | | | | | | | | | | | |
3.25%, 11/15/26 (Call 11/15/23)(a) | | | USD | | | | 70 | | | | 61,611 | |
3.88%, 08/15/31 (Call 08/15/26)(a)(b) | | | USD | | | | 60 | | | | 46,325 | |
4.75%, 01/30/30 (Call 01/30/25)(a)(b) | | | USD | | | | 120 | | | | 102,175 | |
Novelis Sheet Ingot GmbH, 3.38%, 04/15/29 (Call 04/15/24)(c) | | | EUR | | | | 100 | | | | 80,608 | |
NRG Energy Inc. | | | | | | | | | | | | |
3.38%, 02/15/29 (Call 02/15/24)(a)(b) | | | USD | | | | 35 | | | | 29,328 | |
3.63%, 02/15/31 (Call 02/15/26)(a) | | | USD | | | | 70 | | | | 55,704 | |
3.88%, 02/15/32 (Call 02/15/27)(a) | | | USD | | | | 85 | | | | 67,197 | |
5.25%, 06/15/29 (Call 06/15/24)(a) | | | USD | | | | 65 | | | | 58,825 | |
5.75%, 01/15/28 (Call 01/15/23) | | | USD | | | | 80 | | | | 76,150 | |
NuStar Logistics LP | | | | | | | | | | | | |
5.63%, 04/28/27 (Call 01/28/27) | | | USD | | | | 50 | | | | 46,233 | |
| | | | | | | | | | | | |
| Security | | | | | Par
(000) | | | Value | |
| | | |
| United States (continued) | | | | | | | | | |
5.75%, 10/01/25 (Call 07/01/25)(b) | | | USD | | | | 55 | | | $ | 53,334 | |
6.00%, 06/01/26 (Call 03/01/26) | | | USD | | | | 40 | | | | 38,763 | |
6.38%, 10/01/30 (Call 04/01/30)(b) | | | USD | | | | 40 | | | | 37,092 | |
Occidental Petroleum Corp. | | | | | | | | | | | | |
5.50%, 12/01/25 (Call 09/01/25) | | | USD | | | | 60 | | | | 60,143 | |
5.55%, 03/15/26 (Call 12/15/25)(b) | | | USD | | | | 95 | | | | 96,306 | |
5.88%, 09/01/25 (Call 06/01/25) | | | USD | | | | 80 | | | | 80,600 | |
6.13%, 01/01/31 (Call 07/01/30) | | | USD | | | | 110 | | | | 110,012 | |
6.38%, 09/01/28 (Call 03/01/28)(b) | | | USD | | | | 40 | | | | 40,491 | |
6.63%, 09/01/30 (Call 03/01/30)(b) | | | USD | | | | 110 | | | | 114,468 | |
6.95%, 07/01/24 | | | USD | | | | 45 | | | | 45,952 | |
7.50%, 05/01/31 | | | USD | | | | 95 | | | | 102,125 | |
8.00%, 07/15/25 (Call 04/15/25) | | | USD | | | | 45 | | | | 47,502 | |
8.50%, 07/15/27 (Call 01/15/27) | | | USD | | | | 40 | | | | 43,490 | |
8.88%, 07/15/30 (Call 01/15/30) | | | USD | | | | 95 | | | | 108,689 | |
OI European Group BV | | | | | | | | | | | | |
3.13%, 11/15/24 (Call 08/15/24)(c) | | | EUR | | | | 100 | | | | 94,526 | |
4.75%, 02/15/30 (Call 11/15/24)(a) | | | USD | | | | 30 | | | | 25,336 | |
Olin Corp. | | | | | | | | | | | | |
5.00%, 02/01/30 (Call 02/01/24) | | | USD | | | | 40 | | | | 36,200 | |
5.13%, 09/15/27 (Call 12/01/22) | | | USD | | | | 40 | | | | 37,500 | |
5.63%, 08/01/29 (Call 08/01/24)(b) | | | USD | | | | 60 | | | | 56,388 | |
Olympus Water U.S. Holding Corp. | | | | | | | | | | | | |
3.88%, 10/01/28 (Call 10/01/24)(c) | | | EUR | | | | 100 | | | | 73,889 | |
4.25%, 10/01/28 (Call 10/01/24)(a) | | | USD | | | | 125 | | | | 101,031 | |
OneMain Finance Corp. | | | | | | | | | | | | |
3.50%, 01/15/27 (Call 01/15/24)(b) | | | USD | | | | 65 | | | | 53,349 | |
3.88%, 09/15/28 (Call 09/15/24)(b) | | | USD | | | | 50 | | | | 39,055 | |
4.00%, 09/15/30 (Call 09/15/25)(b) | | | USD | | | | 65 | | | | 49,075 | |
5.38%, 11/15/29 (Call 05/15/29) | | | USD | | | | 60 | | | | 49,200 | |
6.13%, 03/15/24 (Call 09/15/23) | | | USD | | | | 105 | | | | 102,507 | |
6.63%, 01/15/28 (Call 07/15/27) | | | USD | | | | 60 | | | | 54,594 | |
6.88%, 03/15/25 | | | USD | | | | 95 | | | | 92,150 | |
7.13%, 03/15/26 | | | USD | | | | 125 | | | | 120,375 | |
Organon & Co./Organon Foreign Debt Co.-Issuer BV | | | | | | | | | | | | |
4.13%, 04/30/28 (Call 04/30/24)(a) | | | USD | | | | 150 | | | | 132,123 | |
5.13%, 04/30/31 (Call 04/30/26)(a) | | | USD | | | | 150 | | | | 126,849 | |
2.88%, 04/30/28 (Call 04/30/24)(c) | | | EUR | | | | 150 | | | | 124,600 | |
Outfront Media Capital LLC/Outfront Media Capital Corp. | | | | | | | | | | | | |
4.25%, 01/15/29 (Call 01/15/24)(a) | | | USD | | | | 60 | | | | 49,350 | |
4.63%, 03/15/30 (Call 03/15/25)(a) | | | USD | | | | 50 | | | | 41,311 | |
5.00%, 08/15/27 (Call 11/14/22)(a)(b) | | | USD | | | | 30 | | | | 27,075 | |
6.25%, 06/15/25 (Call 12/01/22)(a)(b) | | | USD | | | | 30 | | | | 29,735 | |
Owens & Minor Inc. | | | | | | | | | | | | |
4.50%, 03/31/29 (Call 03/31/24)(a)(b) | | | USD | | | | 25 | | | | 19,375 | |
6.63%, 04/01/30 (Call 04/01/25)(a) | | | USD | | | | 65 | | | | 54,275 | |
Owens-Brockway Glass Container Inc.,
6.63%, 05/13/27 (Call 05/15/23)(a) | | | USD | | | | 60 | | | | 57,617 | |
Pactiv Evergreen Group Issuer Inc./Pactiv Evergreen Group Issuer LLC/Reynolds Gro, 4.00%, 10/15/27 (Call 10/15/23)(a)(b) | | | USD | | | | 65 | | | | 57,525 | |
Pactiv Evergreen Group Issuer LLC/Pactiv Evergreen Group Issuer Inc.,
4.38%, 10/15/28 (Call 10/15/24)(a)(b) | | | USD | | | | 40 | | | | 35,000 | |
Paramount Global | | | | | | | | | | | | |
6.25%, 02/28/57 (Call 02/28/27)(d) | | | USD | | | | 30 | | | | 25,334 | |
6.38%, 03/30/62 (Call 03/30/27)(d) | | | USD | | | | 85 | | | | 72,503 | |
Park Intermediate Holdings LLC/PK Domestic Property LLC/PK Finance Co-Issuer | | | | | | | | | | | | |
4.88%, 05/15/29 (Call 05/15/24)(a) | | | USD | | | | 60 | | | | 51,294 | |
5.88%, 10/01/28 (Call 10/01/23)(a) | | | USD | | | | 80 | | | | 72,600 | |
| | |
| 60 | | 2 0 2 2 I S H A R E S A N N U A L R E P O R T T O S H A R E H O L D E R S |
| | |
Schedule of Investments (continued) October 31, 2022 | | iShares® US & Intl High Yield Corp Bond ETF (Percentages shown are based on Net Assets) |
| | | | | | | | | | | | |
| Security | | | | | Par
(000) | | | Value | |
| | | |
| United States (continued) | | | | | | | | | |
PBF Holding Co. LLC/PBF Finance Corp. | | | | | | | | | | | | |
6.00%, 02/15/28 (Call 02/15/23) | | | USD | | | | 60 | | | $ | 54,199 | |
7.25%, 06/15/25 (Call 12/01/22) | | | USD | | | | 50 | | | | 49,500 | |
PennyMac Financial Services Inc. | | | | | | | | | | | | |
4.25%, 02/15/29 (Call 02/15/24)(a) | | | USD | | | | 40 | | | | 30,200 | |
5.38%, 10/15/25 (Call 12/01/22)(a) | | | USD | | | | 50 | | | | 45,188 | |
5.75%, 09/15/31 (Call 09/15/26)(a) | | | USD | | | | 45 | | | | 34,306 | |
Penske Automotive Group Inc. | | | | | | | | | | | | |
3.50%, 09/01/25 (Call 12/01/22)(b) | | | USD | | | | 55 | | | | 51,300 | |
3.75%, 06/15/29 (Call 06/15/24)(b) | | | USD | | | | 25 | | | | 20,119 | |
Performance Food Group Inc. | | | | | | | | | | | | |
4.25%, 08/01/29 (Call 08/01/24)(a) | | | USD | | | | 85 | | | | 72,307 | |
5.50%, 10/15/27 (Call 12/01/22)(a)(b) | | | USD | | | | 85 | | | | 80,325 | |
Perrigo Finance Unlimited Co. | | | | | | | | | | | | |
3.90%, 12/15/24 (Call 09/15/24) | | | USD | | | | 65 | | | | 61,920 | |
4.38%, 03/15/26 (Call 12/15/25) | | | USD | | | | 115 | | | | 107,800 | |
4.40%, 06/15/30 (Call 03/15/30) | | | USD | | | | 50 | | | | 41,788 | |
PetSmart Inc./PetSmart Finance Corp. | | | | | | | | | | | | |
4.75%, 02/15/28 (Call 02/15/24)(a) | | | USD | | | | 75 | | | | 68,142 | |
7.75%, 02/15/29 (Call 02/15/24)(a)(b) | | | USD | | | | 75 | | | | 70,357 | |
PG&E Corp. | | | | | | | | | | | | |
5.00%, 07/01/28 (Call 07/01/23)(b) | | | USD | | | | 85 | | | | 76,619 | |
5.25%, 07/01/30 (Call 07/01/25)(b) | | | USD | | | | 80 | | | | 70,967 | |
Photo Holdings Merger Sub Inc., 8.50%, 10/01/26
(Call 12/01/22)(a)(b) | | | USD | | | | 50 | | | | 32,802 | |
Picard Midco Inc., 6.50%, 03/31/29
(Call 09/30/25)(a)(b) | | | USD | | | | 330 | | | | 286,275 | |
Picasso Finance Sub Inc., 6.13%, 06/15/25
(Call 11/16/22)(a)(b) | | | USD | | | | 45 | | | | 44,911 | |
Pilgrim’s Pride Corp. | | | | | | | | | | | | |
3.50%, 03/01/32 (Call 09/01/26)(a) | | | USD | | | | 75 | | | | 57,730 | |
4.25%, 04/15/31 (Call 04/15/26)(a) | | | USD | | | | 90 | | | | 75,070 | |
5.88%, 09/30/27 (Call 12/01/22)(a) | | | USD | | | | 55 | | | | 53,790 | |
Post Holdings Inc. | | | | | | | | | | | | |
4.50%, 09/15/31 (Call 09/15/26)(a) | | | USD | | | | 130 | | | | 107,423 | |
4.63%, 04/15/30 (Call 04/15/25)(a) | | | USD | | | | 105 | | | | 88,856 | |
5.50%, 12/15/29 (Call 12/15/24)(a) | | | USD | | | | 95 | | | | 85,376 | |
5.63%, 01/15/28 (Call 12/01/22)(a) | | | USD | | | | 80 | | | | 74,600 | |
5.75%, 03/01/27 (Call 11/16/22)(a)(b) | | | USD | | | | 40 | | | | 38,700 | |
Premier Entertainment Sub LLC/Premier Entertainment Finance Corp. | | | | | | | | | | | | |
5.63%, 09/01/29 (Call 09/01/24)(a)(b) | | | USD | | | | 65 | | | | 48,095 | |
5.88%, 09/01/31 (Call 09/01/26)(a) | | | USD | | | | 60 | | | | 43,062 | |
Presidio Holdings Inc. | | | | | | | | | | | | |
4.88%, 02/01/27 (Call 02/01/23)(a) | | | USD | | | | 25 | | | | 23,085 | |
8.25%, 02/01/28 (Call 02/01/23)(a)(b) | | | USD | | | | 55 | | | | 48,950 | |
Prestige Brands Inc. | | | | | | | | | | | | |
3.75%, 04/01/31 (Call 04/01/26)(a) | | | USD | | | | 60 | | | | 48,201 | |
5.13%, 01/15/28 (Call 01/15/23)(a) | | | USD | | | | 25 | | | | 23,232 | |
Prime Security Services Borrower LLC/Prime Finance Inc. | | | | | | | | | | | | |
3.38%, 08/31/27 (Call 08/31/26)(a)(b) | | | USD | | | | 70 | | | | 60,794 | |
5.25%, 04/15/24(a) | | | USD | | | | 65 | | | | 64,347 | |
5.75%, 04/15/26(a) | | | USD | | | | 85 | | | | 82,898 | |
6.25%, 01/15/28 (Call 01/15/23)(a)(b) | | | USD | | | | 120 | | | | 111,061 | |
PTC Inc. | | | | | | | | | | | | |
3.63%, 02/15/25 (Call 12/01/22)(a) | | | USD | | | | 40 | | | | 37,940 | |
4.00%, 02/15/28 (Call 02/15/23)(a) | | | USD | | | | 40 | | | | 36,474 | |
QVC Inc. | | | | | | | | | | | | |
4.38%, 09/01/28 (Call 06/01/28) | | | USD | | | | 40 | | | | 29,000 | |
4.45%, 02/15/25 (Call 11/15/24) | | | USD | | | | 50 | | | | 43,731 | |
4.75%, 02/15/27 (Call 11/15/26)(b) | | | USD | | | | 45 | | | | 35,651 | |
4.85%, 04/01/24 | | | USD | | | | 50 | | | | 47,781 | |
| | | | | | | | | | | | |
| Security | | | | | Par
(000) | | | Value | |
| | | |
| United States (continued) | | | | | | | | | |
Rackspace Technology Global Inc. | | | | | | | | | | | | |
3.50%, 02/15/28 (Call 02/15/24)(a) | | | USD | | | | 45 | | | $ | 29,461 | |
5.38%, 12/01/28 (Call 12/01/23)(a) | | | USD | | | | 45 | | | | 18,675 | |
Radiate Holdco LLC/Radiate Finance Inc. | | | | | | | | | | | | |
4.50%, 09/15/26 (Call 09/15/23)(a) | | | USD | | | | 65 | | | | 55,190 | |
6.50%, 09/15/28 (Call 09/15/23)(a)(b) | | | USD | | | | 80 | | | | 50,400 | |
Radiology Partners Inc., 9.25%, 02/01/28
(Call 02/01/23)(a)(b) | | | USD | | | | 50 | | | | 26,625 | |
Range Resources Corp. | | | | | | | | | | | | |
4.75%, 02/15/30 (Call 02/15/25)(a) | | | USD | | | | 35 | | | | 30,899 | |
4.88%, 05/15/25 (Call 02/15/25)(b) | | | USD | | | | 70 | | | | 67,709 | |
8.25%, 01/15/29 (Call 01/15/24) | | | USD | | | | 55 | | | | 56,767 | |
Realogy Group LLC/Realogy Co-Issuer Corp. | | | | | | | | | | | | |
5.25%, 04/15/30 (Call 04/15/25)(a)(b) | | | USD | | | | 80 | | | | 55,524 | |
5.75%, 01/15/29 (Call 01/15/24)(a)(b) | | | USD | | | | 80 | | | | 56,895 | |
RegionalCare Hospital Partners Holdings Inc./LifePoint Health Inc.,
9.75%, 12/01/26 (Call 12/01/22)(a)(b) | | | USD | | | | 105 | | | | 83,709 | |
Resorts World Las Vegas LLC/RWLV Capital Inc., 4.63%, 04/16/29 (Call 01/16/29)(a) | | | USD | | | | 75 | | | | 55,415 | |
RHP Hotel Properties LP/RHP Finance Corp. | | | | | | | | | | | | |
4.50%, 02/15/29 (Call 02/15/24)(a)(b) | | | USD | | | | 50 | | | | 43,798 | |
4.75%, 10/15/27 (Call 12/01/22) | | | USD | | | | 65 | | | | 59,998 | |
Rite Aid Corp. | | | | | | | | | | | | |
7.50%, 07/01/25 (Call 12/01/22)(a) | | | USD | | | | 59 | | | | 41,479 | |
8.00%, 11/15/26 (Call 01/15/23)(a)(b) | | | USD | | | | 79 | | | | 51,343 | |
RLJ Lodging Trust LP, 4.00%, 09/15/29 (Call 09/15/24)(a) | | | USD | | | | 80 | | | | 66,686 | |
ROBLOX Corp., 3.88%, 05/01/30 (Call 11/01/24)(a)(b) | | | USD | | | | 65 | | | | 53,381 | |
Rocket Mortgage LLC/Rocket Mortgage Co-Issuer Inc. | | | | | | | | | | | | |
2.88%, 10/15/26 (Call 10/15/23)(a)(b) | | | USD | | | | 85 | | | | 71,081 | |
3.63%, 03/01/29 (Call 03/01/24)(a)(b) | | | USD | | | | 70 | | | | 54,250 | |
3.88%, 03/01/31 (Call 03/01/26)(a) | | | USD | | | | 105 | | | | 78,276 | |
4.00%, 10/15/33 (Call 10/15/27)(a) | | | USD | | | | 80 | | | | 55,747 | |
Rockies Express Pipeline LLC, 4.95%, 07/15/29
(Call 04/15/29)(a) | | | USD | | | | 65 | | | | 57,070 | |
RP Escrow Issuer LLC, 5.25%, 12/15/25 (Call 12/15/22)(a) | | | USD | | | | 70 | | | | 52,988 | |
Sabre GLBL Inc. | | | | | | | | | | | | |
7.38%, 09/01/25 (Call 12/01/22)(a)(b) | | | USD | | | | 75 | | | | 68,925 | |
9.25%, 04/15/25 (Call 03/16/25)(a) | | | USD | | | | 65 | | | | 63,300 | |
SBA Communications Corp. | | | | | | | | | | | | |
3.13%, 02/01/29 (Call 02/01/24) | | | USD | | | | 115 | | | | 93,150 | |
3.88%, 02/15/27 (Call 02/15/23) | | | USD | | | | 120 | | | | 108,600 | |
Scientific Games International Inc. | | | | | | | | | | | | |
7.00%, 05/15/28 (Call 05/15/23)(a) | | | USD | | | | 45 | | | | 43,380 | |
7.25%, 11/15/29 (Call 11/15/24)(a) | | | USD | | | | 50 | | | | 48,348 | |
8.63%, 07/01/25 (Call 12/01/22)(a) | | | USD | | | | 60 | | | | 61,908 | |
SCIH Salt Holdings Inc. | | | | | | | | | | | | |
4.88%, 05/01/28 (Call 05/01/24)(a) | | | USD | | | | 100 | | | | 86,780 | |
6.63%, 05/01/29 (Call 05/01/24)(a)(b) | | | USD | | | | 50 | | | | 40,583 | |
Scotts Miracle-Gro Co. (The) | | | | | | | | | | | | |
4.00%, 04/01/31 (Call 04/01/26) | | | USD | | | | 20 | | | | 15,240 | |
4.38%, 02/01/32 (Call 08/01/26) | | | USD | | | | 40 | | | | 30,463 | |
4.50%, 10/15/29 (Call 10/15/24) | | | USD | | | | 35 | | | | 28,350 | |
Scripps Escrow II Inc. | | | | | | | | | | | | |
3.88%, 01/15/29 (Call 01/15/24)(a) | | | USD | | | | 20 | | | | 16,517 | |
5.38%, 01/15/31 (Call 01/15/26)(a)(b) | | | USD | | | | 65 | | | | 52,813 | |
Scripps Escrow Inc., 5.88%, 07/15/27 (Call 12/01/22)(a)(b) | | | USD | | | | 25 | | | | 22,649 | |
Seagate HDD Cayman | | | | | | | | | | | | |
3.13%, 07/15/29 (Call 01/15/24) | | | USD | | | | 60 | | | | 44,463 | |
3.38%, 07/15/31 (Call 01/15/26) | | | USD | | | | 30 | | | | 21,413 | |
4.09%, 06/01/29 (Call 03/01/29) | | | USD | | | | 35 | | | | 28,050 | |
4.13%, 01/15/31 (Call 10/15/30) | | | USD | | | | 45 | | | | 33,840 | |
| | |
S C H E D U L E O F I N V E S T M E N T S | | 61 |
| | |
Schedule of Investments (continued) October 31, 2022 | | iShares® US & Intl High Yield Corp Bond ETF (Percentages shown are based on Net Assets) |
| | | | | | | | | | | | |
| Security | | | | | Par
(000) | | | Value | |
| | | |
| United States (continued) | | | | | | | | | |
4.88%, 03/01/24 (Call 01/01/24) | | | USD | | | | 60 | | | $ | 58,801 | |
4.88%, 06/01/27 (Call 03/01/27) | | | USD | | | | 60 | | | | 55,350 | |
Sealed Air Corp. | | | | | | | | | | | | |
4.00%, 12/01/27 (Call 09/01/27)(a) | | | USD | | | | 55 | | | | 48,675 | |
5.00%, 04/15/29 (Call 04/15/25)(a)(b) | | | USD | | | | 30 | | | | 27,338 | |
5.13%, 12/01/24 (Call 09/01/24)(a) | | | USD | | | | 30 | | | | 29,761 | |
5.50%, 09/15/25 (Call 06/15/25)(a)(b) | | | USD | | | | 25 | | | | 24,543 | |
Select Medical Corp., 6.25%, 08/15/26
(Call 12/01/22)(a)(b) | | | USD | | | | 105 | | | | 99,991 | |
Sensata Technologies BV | | | | | | | | | | | | |
4.00%, 04/15/29 (Call 04/15/24)(a) | | | USD | | | | 85 | | | | 71,654 | |
5.00%, 10/01/25(a) | | | USD | | | | 50 | | | | 48,555 | |
5.63%, 11/01/24(a) | | | USD | | | | 50 | | | | 49,825 | |
5.88%, 09/01/30 (Call 09/01/25)(a) | | | USD | | | | 25 | | | | 23,601 | |
Sensata Technologies Inc. | | | | | | | | | | | | |
3.75%, 02/15/31 (Call 02/15/26)(a)(b) | | | USD | | | | 55 | | | | 43,794 | |
4.38%, 02/15/30 (Call 11/15/29)(a) | | | USD | | | | 45 | | | | 38,590 | |
Service Corp. International/U.S. | | | | | | | | | | | | |
3.38%, 08/15/30 (Call 08/15/25)(b) | | | USD | | | | 75 | | | | 59,644 | |
4.00%, 05/15/31 (Call 05/15/26) | | | USD | | | | 70 | | | | 58,291 | |
4.63%, 12/15/27 (Call 12/15/22)(b) | | | USD | | | | 35 | | | | 32,523 | |
5.13%, 06/01/29 (Call 06/01/24)(b) | | | USD | | | | 65 | | | | 60,103 | |
Service Properties Trust | | | | | | | | | | | | |
3.95%, 01/15/28 (Call 07/15/27) | | | USD | | | | 45 | | | | 33,028 | |
4.35%, 10/01/24 (Call 09/01/24) | | | USD | | | | 60 | | | | 55,163 | |
4.38%, 02/15/30 (Call 08/15/29)(b) | | | USD | | | | 35 | | | | 24,938 | |
4.75%, 10/01/26 (Call 08/01/26) | | | USD | | | | 45 | | | | 36,675 | |
4.95%, 02/15/27 (Call 08/15/26) | | | USD | | | | 25 | | | | 20,219 | |
4.95%, 10/01/29 (Call 07/01/29) | | | USD | | | | 35 | | | | 25,567 | |
5.50%, 12/15/27 (Call 09/15/27) | | | USD | | | | 40 | | | | 34,396 | |
7.50%, 09/15/25 (Call 06/15/25) | | | USD | | | | 40 | | | | 39,050 | |
Silgan Holdings Inc. | | | | | | | | | | | | |
3.25%, 03/15/25 (Call 11/30/22) | | | EUR | | | | 100 | | | | 94,732 | |
4.13%, 02/01/28 (Call 11/16/22) | | | USD | | | | 60 | | | | 54,900 | |
Sinclair Television Group Inc. | | | | | | | | | | | | |
4.13%, 12/01/30 (Call 12/01/25)(a) | | | USD | | | | 55 | | | | 42,350 | |
5.50%, 03/01/30 (Call 12/01/24)(a)(b) | | | USD | | | | 40 | | | | 30,120 | |
Sirius XM Radio Inc. | | | | | | | | | | | | |
3.13%, 09/01/26 (Call 09/01/23)(a) | | | USD | | | | 55 | | | | 49,148 | |
3.88%, 09/01/31 (Call 09/01/26)(a) | | | USD | | | | 105 | | | | 83,737 | |
4.00%, 07/15/28 (Call 07/15/24)(a) | | | USD | | | | 175 | | | | 150,842 | |
4.13%, 07/01/30 (Call 07/01/25)(a) | | | USD | | | | 120 | | | | 97,846 | |
5.00%, 08/01/27 (Call 12/01/22)(a)(b) | | | USD | | | | 140 | | | | 129,573 | |
5.50%, 07/01/29 (Call 07/01/24)(a) | | | USD | | | | 105 | | | | 96,841 | |
Six Flags Entertainment Corp. | | | | | | | | | | | | |
4.88%, 07/31/24 (Call 12/01/22)(a)(b) | | | USD | | | | 85 | | | | 82,283 | |
5.50%, 04/15/27 (Call 12/01/22)(a)(b) | | | USD | | | | 40 | | | | 36,000 | |
SLM Corp. | | | | | | | | | | | | |
3.13%, 11/02/26 (Call 10/02/26) | | | USD | | | | 65 | | | | 57,010 | |
4.20%, 10/29/25 (Call 09/29/25) | | | USD | | | | 25 | | | | 23,194 | |
SM Energy Co. | | | | | | | | | | | | |
6.50%, 07/15/28 (Call 07/15/24)(b) | | | USD | | | | 55 | | | | 52,814 | |
6.63%, 01/15/27 (Call 12/01/22)(b) | | | USD | | | | 25 | | | | 24,455 | |
SoftBank Group Corp., 4.00%, 09/19/29 (Call 06/21/29)(c) | | | EUR | | | | 125 | | | | 93,179 | |
Sonic Automotive Inc. | | | | | | | | | | | | |
4.63%, 11/15/29 (Call 11/15/24)(a)(b) | | | USD | | | | 40 | | | | 31,450 | |
4.88%, 11/15/31 (Call 11/15/26)(a) | | | USD | | | | 42 | | | | 31,952 | |
Sotheby’s, 7.38%, 10/15/27 (Call 11/14/22)(a) | | | USD | | | | 50 | | | | 48,375 | |
Southwestern Energy Co. | | | | | | | | | | | | |
4.75%, 02/01/32 (Call 02/01/27)(b) | | | USD | | | | 90 | | | | 77,633 | |
| | | | | | | | | | | | |
| Security | | | | | Par
(000) | | | Value | |
| | | |
| United States (continued) | | | | | | | | | |
5.38%, 02/01/29 (Call 02/01/24) | | | USD | | | | 50 | | | $ | 46,445 | |
5.38%, 03/15/30 (Call 03/15/25) | | | USD | | | | 90 | | | | 83,391 | |
7.75%, 10/01/27 (Call 12/01/22) | | | USD | | | | 40 | | | | 41,050 | |
Spectrum Brands Inc. | | | | | | | | | | | | |
3.88%, 03/15/31 (Call 03/15/26)(a) | | | USD | | | | 30 | | | | 22,125 | |
5.75%, 07/15/25 (Call 12/01/22)(b) | | | USD | | | | 41 | | | | 40,436 | |
Spirit AeroSystems Inc. | | | | | | | | | | | | |
4.60%, 06/15/28 (Call 03/15/28)(b) | | | USD | | | | 65 | | | | 46,553 | |
5.50%, 01/15/25 (Call 12/01/22)(a) | | | USD | | | | 15 | | | | 14,441 | |
7.50%, 04/15/25 (Call 12/01/22)(a) | | | USD | | | | 100 | | | | 97,500 | |
Sprint Corp. | | | | | | | | | | | | |
7.13%, 06/15/24 | | | USD | | | | 215 | | | | 217,042 | |
7.63%, 02/15/25 (Call 11/15/24) | | | USD | | | | 125 | | | | 128,998 | |
7.63%, 03/01/26 (Call 11/01/25) | | | USD | | | | 115 | | | | 120,001 | |
SRM Escrow Issuer LLC, 6.00%, 11/01/28
(Call 11/01/23)(a)(b) | | | USD | | | | 85 | | | | 71,758 | |
SRS Distribution Inc. | | | | | | | | | | | | |
4.63%, 07/01/28 (Call 07/01/24)(a) | | | USD | | | | 55 | | | | 48,400 | |
6.00%, 12/01/29 (Call 12/01/24)(a) | | | USD | | | | 60 | | | | 48,794 | |
6.13%, 07/01/29 (Call 07/01/24)(a) | | | USD | | | | 50 | | | | 40,859 | |
SS&C Technologies Inc., 5.50%, 09/30/27
(Call 12/01/22)(a) | | | USD | | | | 175 | | | | 162,607 | |
Stagwell Global LLC, 5.63%, 08/15/29 (Call 08/15/24)(a)(b) | | | USD | | | | 75 | | | | 65,404 | |
Standard Industries Inc./NJ | | | | | | | | | | | | |
2.25%, 11/21/26 (Call 08/21/26)(c) | | | EUR | | | | 100 | | | | 81,048 | |
3.38%, 01/15/31 (Call 07/15/25)(a) | | | USD | | | | 95 | | | | 71,050 | |
4.38%, 07/15/30 (Call 07/15/25)(a) | | | USD | | | | 125 | | | | 101,065 | |
4.75%, 01/15/28 (Call 01/15/23)(a) | | | USD | | | | 75 | | | | 65,752 | |
5.00%, 02/15/27 (Call 12/01/22)(a) | | | USD | | | | 60 | | | | 54,592 | |
Staples Inc. | | | | | | | | | | | | |
7.50%, 04/15/26 (Call 12/01/22)(a) | | | USD | | | | 150 | | | | 130,500 | |
10.75%, 04/15/27 (Call 12/01/22)(a)(b) | | | USD | | | | 75 | | | | 54,495 | |
Starwood Property Trust Inc. | | | | | | | | | | | | |
3.63%, 07/15/26 (Call 01/15/26)(a) | | | USD | | | | 40 | | | | 34,810 | |
3.75%, 12/31/24 (Call 09/30/24)(a) | | | USD | | | | 30 | | | | 28,050 | |
4.38%, 01/15/27 (Call 07/15/26)(a) | | | USD | | | | 50 | | | | 43,825 | |
Station Casinos LLC | | | | | | | | | | | | |
4.50%, 02/15/28 (Call 02/15/23)(a) | | | USD | | | | 60 | | | | 51,634 | |
4.63%, 12/01/31 (Call 06/01/31)(a) | | | USD | | | | 55 | | | | 44,396 | |
Stericycle Inc., 3.88%, 01/15/29 (Call 11/15/23)(a) | | | USD | | | | 60 | | | | 52,057 | |
Suburban Propane Partners LP/Suburban Energy Finance Corp.,
5.00%, 06/01/31 (Call 06/01/26)(a) | | | USD | | | | 50 | | | | 42,041 | |
Summit Materials LLC/Summit Materials Finance Corp.,
5.25%, 01/15/29 (Call 07/15/23)(a) | | | USD | | | | 65 | | | | 59,599 | |
Sunoco LP/Sunoco Finance Corp. | | | | | | | | | | | | |
4.50%, 05/15/29 (Call 05/15/24) | | | USD | | | | 75 | | | | 64,509 | |
4.50%, 04/30/30 (Call 04/30/25) | | | USD | | | | 83 | | | | 70,550 | |
5.88%, 03/15/28 (Call 03/15/23) | | | USD | | | | 25 | | | | 23,878 | |
6.00%, 04/15/27 (Call 12/01/22)(b) | | | USD | | | | 25 | | | | 24,495 | |
Switch Ltd. | | | | | | | | | | | | |
3.75%, 09/15/28 (Call 09/15/23)(a) | | | USD | | | | 25 | | | | 25,250 | |
4.13%, 06/15/29 (Call 06/15/24)(a) | | | USD | | | | 55 | | | | 55,136 | |
Tallgrass Energy Partners LP/Tallgrass Energy
Finance Corp. | | | | | | | | | | | | |
5.50%, 01/15/28 (Call 01/15/23)(a) | | | USD | | | | 45 | | | | 40,330 | |
6.00%, 03/01/27 (Call 03/01/23)(a) | | | USD | | | | 30 | | | | 28,437 | |
6.00%, 12/31/30 (Call 12/31/25)(a) | | | USD | | | | 65 | | | | 58,906 | |
6.00%, 09/01/31 (Call 09/01/26)(a) | | | USD | | | | 45 | | | | 40,151 | |
7.50%, 10/01/25 (Call 12/01/22)(a) | | | USD | | | | 50 | | | | 50,609 | |
Taylor Morrison Communities Inc. | | | | | | | | | | | | |
5.13%, 08/01/30 (Call 02/01/30)(a) | | | USD | | | | 35 | | | | 29,313 | |
| | |
| 62 | | 2 0 2 2 I S H A R E S A N N U A L R E P O R T T O S H A R E H O L D E R S |
| | |
Schedule of Investments (continued) October 31, 2022 | | iShares® US & Intl High Yield Corp Bond ETF (Percentages shown are based on Net Assets) |
| | | | | | | | | | | | |
| Security | | | | | Par
(000) | | | Value | |
| | | |
| United States (continued) | | | | | | | | | |
5.75%, 01/15/28 (Call 10/15/27)(a) | | | USD | | | | 30 | | | $ | 27,537 | |
5.88%, 06/15/27 (Call 03/15/27)(a) | | | USD | | | | 40 | | | | 37,510 | |
TEGNA Inc. | | | | | | | | | | | | |
4.63%, 03/15/28 (Call 03/15/23)(b) | | | USD | | | | 100 | | | | 95,187 | |
4.75%, 03/15/26 (Call 03/15/23)(a) | | | USD | | | | 55 | | | | 54,253 | |
5.00%, 09/15/29 (Call 09/15/24)(b) | | | USD | | | | 70 | | | | 66,788 | |
Teleflex Inc., 4.25%, 06/01/28 (Call 06/01/23)(a) | | | USD | | | | 80 | | | | 72,384 | |
Tempur Sealy International Inc., 3.88%, 10/15/31
(Call 10/15/26)(a) | | | USD | | | | 115 | | | | 86,537 | |
Tenet Healthcare Corp. | | | | | | | | | | | | |
4.25%, 06/01/29 (Call 06/01/24)(a) | | | USD | | | | 100 | | | | 84,025 | |
4.38%, 01/15/30 (Call 12/01/24)(a)(b) | | | USD | | | | 125 | | | | 104,531 | |
4.63%, 07/15/24 (Call 12/01/22) | | | USD | | | | 72 | | | | 69,733 | |
4.63%, 09/01/24 (Call 11/16/22)(a) | | | USD | | | | 50 | | | | 48,375 | |
4.63%, 06/15/28 (Call 06/15/23)(a) | | | USD | | | | 65 | | | | 57,168 | |
4.88%, 01/01/26 (Call 12/01/22)(a) | | | USD | | | | 165 | | | | 155,925 | |
5.13%, 11/01/27 (Call 12/01/22)(a) | | | USD | | | | 110 | | | | 100,789 | |
6.13%, 10/01/28 (Call 10/01/23)(a)(b) | | | USD | | | | 200 | | | | 172,749 | |
6.13%, 06/15/30 (Call 06/15/25)(a) | | | USD | | | | 160 | | | | 148,800 | |
6.25%, 02/01/27 (Call 12/01/22)(a)(b) | | | USD | | | | 110 | | | | 105,616 | |
Tenneco Inc. | | | | | | | | | | | | |
5.00%, 07/15/26 (Call 11/07/22)(b) | | | USD | | | | 35 | | | | 34,869 | |
5.13%, 04/15/29 (Call 04/15/24)(a) | | | USD | | | | 55 | | | | 54,677 | |
7.88%, 01/15/29 (Call 01/15/24)(a) | | | USD | | | | 35 | | | | 34,961 | |
TerraForm Power Operating LLC | | | | | | | | | | | | |
4.75%, 01/15/30 (Call 01/15/25)(a) | | | USD | | | | 60 | | | | 53,681 | |
5.00%, 01/31/28 (Call 07/31/27)(a) | | | USD | | | | 75 | | | | 69,831 | |
Terrier Media Buyer Inc., 8.88%, 12/15/27
(Call 12/15/22)(a) | | | USD | | | | 80 | | | | 67,800 | |
TI Automotive Finance PLC, 3.75%, 04/15/29
(Call 04/15/24)(c) | | | EUR | | | | 100 | | | | 70,709 | |
TKC Holdings Inc. | | | | | | | | | | | | |
6.88%, 05/15/28 (Call 05/15/24)(a) | | | USD | | | | 50 | | | | 41,650 | |
10.50%, 05/15/29 (Call 05/15/24)(a)(b) | | | USD | | | | 40 | | | | 27,935 | |
TransDigm Inc. | | | | | | | | | | | | |
4.63%, 01/15/29 (Call 01/15/24) | | | USD | | | | 90 | | | | 76,817 | |
4.88%, 05/01/29 (Call 05/01/24)(b) | | | USD | | | | 60 | | | | 51,150 | |
5.50%, 11/15/27 (Call 12/01/22) | | | USD | | | | 210 | | | | 190,312 | |
6.25%, 03/15/26 (Call 12/01/22)(a) | | | USD | | | | 305 | | | | 300,905 | |
6.38%, 06/15/26 (Call 12/01/22)(b) | | | USD | | | | 90 | | | | 86,778 | |
7.50%, 03/15/27 (Call 12/01/22) | | | USD | | | | 50 | | | | 49,375 | |
8.00%, 12/15/25 (Call 12/01/22)(a) | | | USD | | | | 80 | | | | 81,400 | |
TransDigm UK Holdings PLC, 6.88%, 05/15/26
(Call 12/01/22) | | | USD | | | | 50 | | | | 48,838 | |
Transocean Inc., 11.50%, 01/30/27
(Call 07/30/23)(a) | | | USD | | | | 100 | | | | 100,610 | |
Transocean Pontus Ltd., 6.13%, 08/01/25
(Call 12/01/22)(a) | | | USD | | | | 56 | | | | 53,900 | |
Transocean Poseidon Ltd., 6.88%, 02/01/27
(Call 12/01/22)(a) | | | USD | | | | 83 | | | | 79,592 | |
Travel + Leisure Co. | | | | | | | | | | | | |
4.50%, 12/01/29 (Call 09/01/29)(a) | | | USD | | | | 45 | | | | 36,671 | |
6.00%, 04/01/27 (Call 01/01/27) | | | USD | | | | 50 | | | | 46,688 | |
6.63%, 07/31/26 (Call 04/30/26)(a) | | | USD | | | | 35 | | | | 34,169 | |
TRI Pointe Group Inc./TRI Pointe Homes Inc.,
5.88%, 06/15/24 | | | USD | | | | 25 | | | | 24,691 | |
Triumph Group Inc. | | | | | | | | | | | | |
6.25%, 09/15/24 (Call 12/01/22)(a) | | | USD | | | | 25 | | | | 23,156 | |
7.75%, 08/15/25 (Call 12/01/22)(b) | | | USD | | | | 52 | | | | 39,398 | |
8.88%, 06/01/24 (Call 02/01/23)(a) | | | USD | | | | 31 | | | | 31,334 | |
Tronox Inc., 4.63%, 03/15/29 (Call 03/15/24)(a) | | | USD | | | | 80 | | | | 61,648 | |
| | | | | | | | | | | | |
| Security | | | | | Par
(000) | | | Value | |
| | | |
| United States (continued) | | | | | | | | | |
Twilio Inc. | | | | | | | | | | | | |
3.63%, 03/15/29 (Call 03/15/24) | | | USD | | | | 50 | | | $ | 40,901 | |
3.88%, 03/15/31 (Call 03/15/26) | | | USD | | | | 20 | | | | 16,326 | |
Twitter Inc. | | | | | | | | | | | | |
3.88%, 12/15/27 (Call 09/15/27)(a) | | | USD | | | | 60 | | | | 60,525 | |
5.00%, 03/01/30 (Call 12/01/29)(a) | | | USD | | | | 90 | | | | 90,767 | |
U.S. Foods Inc. | | | | | | | | | | | | |
4.63%, 06/01/30 (Call 06/01/25)(a)(b) | | | USD | | | | 45 | | | | 39,094 | |
4.75%, 02/15/29 (Call 02/15/24)(a) | | | USD | | | | 80 | | | | 71,009 | |
6.25%, 04/15/25 (Call 12/01/22)(a) | | | USD | | | | 60 | | | | 59,793 | |
Uber Technologies Inc. | | | | | | | | | | | | |
4.50%, 08/15/29 (Call 08/15/24)(a)(b) | | | USD | | | | 135 | | | | 115,722 | |
6.25%, 01/15/28 (Call 09/15/23)(a)(b) | | | USD | | | | 50 | | | | 47,932 | |
7.50%, 05/15/25 (Call 12/01/22)(a) | | | USD | | | | 95 | | | | 94,976 | |
7.50%, 09/15/27 (Call 12/01/22)(a) | | | USD | | | | 75 | | | | 75,073 | |
8.00%, 11/01/26 (Call 12/01/22)(a) | | | USD | | | | 115 | | | | 115,425 | |
United Airlines Inc. | | | | | | | | | | | | |
4.38%, 04/15/26 (Call 10/15/25)(a) | | | USD | | | | 140 | | | | 127,926 | |
4.63%, 04/15/29 (Call 10/15/28)(a) | | | USD | | | | 165 | | | | 141,487 | |
United Rentals North America Inc. | | | | | | | | | | | | |
3.75%, 01/15/32 (Call 07/15/26) | | | USD | | | | 60 | | | | 48,342 | |
3.88%, 02/15/31 (Call 08/15/25)(b) | | | USD | | | | 95 | | | | 78,676 | |
4.00%, 07/15/30 (Call 07/15/25)(b) | | | USD | | | | 45 | | | | 38,363 | |
4.88%, 01/15/28 (Call 01/15/23) | | | USD | | | | 150 | | | | 139,500 | |
5.25%, 01/15/30 (Call 01/15/25) | | | USD | | | | 60 | | | | 55,650 | |
5.50%, 05/15/27 (Call 12/01/22)(b) | | | USD | | | | 37 | | | | 35,964 | |
United Wholesale Mortgage LLC | | | | | | | | | | | | |
5.50%, 11/15/25 (Call 12/01/22)(a) | | | USD | | | | 50 | | | | 45,203 | |
5.50%, 04/15/29 (Call 04/15/24)(a) | | | USD | | | | 65 | | | | 49,312 | |
5.75%, 06/15/27 (Call 06/15/24)(a) | | | USD | | | | 50 | | | | 40,975 | |
Uniti Group LP/Uniti Fiber Holdings Inc./CSL Capital LLC | | | | | | | | | | | | |
6.00%, 01/15/30 (Call 01/15/25)(a)(b) | | | USD | | | | 50 | | | | 34,550 | |
7.88%, 02/15/25 (Call 12/01/22)(a) | | | USD | | | | 185 | | | | 183,426 | |
Uniti Group LP/Uniti Group Finance Inc./CSL Capital LLC | | | | | | | | | | | | |
4.75%, 04/15/28 (Call 04/15/24)(a)(b) | | | USD | | | | 40 | | | | 32,893 | |
6.50%, 02/15/29 (Call 02/15/24)(a) | | | USD | | | | 95 | | | | 67,678 | |
Univision Communications Inc. | | | | | | | | | | | | |
4.50%, 05/01/29 (Call 05/01/24)(a)(b) | | | USD | | | | 80 | | | | 66,936 | |
5.13%, 02/15/25 (Call 11/14/22)(a) | | | USD | | | | 135 | | | | 130,284 | |
6.63%, 06/01/27 (Call 06/01/23)(a) | | | USD | | | | 115 | | | | 113,390 | |
7.38%, 06/30/30 (Call 06/30/25)(a) | | | USD | | | | 70 | | | | 68,067 | |
USA Compression Partners LP/USA Compression
Finance Corp. | | | | | | | | | | | | |
6.88%, 04/01/26 (Call 12/01/22) | | | USD | | | | 65 | | | | 62,392 | |
6.88%, 09/01/27 (Call 12/01/22) | | | USD | | | | 55 | | | | 52,525 | |
Valvoline Inc. | | | | | | | | | | | | |
3.63%, 06/15/31 (Call 06/15/26)(a) | | | USD | | | | 40 | | | | 31,560 | |
4.25%, 02/15/30 (Call 02/15/25)(a)(b) | | | USD | | | | 35 | | | | 33,819 | |
Vector Group Ltd. | | | | | | | | | | | | |
5.75%, 02/01/29 (Call 02/01/24)(a) | | | USD | | | | 60 | | | | 52,500 | |
10.50%, 11/01/26 (Call 12/01/22)(a) | | | USD | | | | 45 | | | | 44,404 | |
Venture Global Calcasieu Pass LLC | | | | | | | | | | | | |
3.88%, 11/01/33 (Call 05/01/33)(a)(b) | | | USD | | | | 110 | | | | 88,032 | |
3.88%, 08/15/29 (Call 02/15/29)(a) | | | USD | | | | 90 | | | | 77,479 | |
4.13%, 08/15/31 (Call 02/15/31)(a) | | | USD | | | | 90 | | | | 76,477 | |
Vericast Corp., 11.00%, 09/15/26 (Call 09/15/23)(a) | | | USD | | | | 101 | | | | 98,854 | |
Veritas U.S. Inc./Veritas Bermuda Ltd.,
7.50%, 09/01/25 (Call 12/01/22)(a) | | | USD | | | | 140 | | | | 117,250 | |
Verscend Escrow Corp., 9.75%, 08/15/26
(Call 12/01/22)(a) | | | USD | | | | 65 | | | | 65,175 | |
| | |
S C H E D U L E O F I N V E S T M E N T S | | 63 |
| | |
Schedule of Investments (continued) October 31, 2022 | | iShares® US & Intl High Yield Corp Bond ETF (Percentages shown are based on Net Assets) |
| | | | | | | | | | | | |
| Security | | | | |
Par
(000) | | | Value | |
| | | |
| United States (continued) | | | | | | | | | |
ViaSat Inc. | | | | | | | | | | | | |
5.63%, 09/15/25 (Call 11/14/22)(a) | | | USD | | | | 40 | | | $ | 36,892 | |
5.63%, 04/15/27 (Call 11/14/22)(a) | | | USD | | | | 50 | | | | 46,220 | |
6.50%, 07/15/28 (Call 07/15/23)(a) | | | USD | | | | 50 | | | | 41,781 | |
Viking Cruises Ltd. | | | | | | | | | | | | |
5.88%, 09/15/27 (Call 12/01/22)(a)(b) | | | USD | | | | 55 | | | | 43,977 | |
7.00%, 02/15/29 (Call 02/15/24)(a)(b) | | | USD | | | | 50 | | | | 40,003 | |
13.00%, 05/15/25 (Call 11/16/22)(a) | | | USD | | | | 60 | | | | 64,500 | |
Vistra Operations Co. LLC | | | | | | | | | | | | |
4.38%, 05/01/29 (Call 05/01/24)(a) | | | USD | | | | 110 | | | | 94,348 | |
5.00%, 07/31/27 (Call 11/14/22)(a) | | | USD | | | | 105 | | | | 96,880 | |
5.50%, 09/01/26 (Call 11/14/22)(a) | | | USD | | | | 75 | | | | 71,879 | |
5.63%, 02/15/27 (Call 11/14/22)(a) | | | USD | | | | 95 | | | | 90,562 | |
VOC Escrow Ltd., 5.00%, 02/15/28
(Call 02/15/23)(a) | | | USD | | | | 60 | | | | 50,027 | |
Weatherford International Ltd. | | | | | | | | | | | | |
6.50%, 09/15/28 (Call 09/15/24)(a)(b) | | | USD | | | | 45 | | | | 43,298 | |
8.63%, 04/30/30 (Call 10/30/24)(a) | | | USD | | | | 115 | | | | 108,272 | |
Wesco Aircraft Holdings Inc. | | | | | | | | | | | | |
8.50%, 11/15/24 (Call 12/01/22)(a) | | | USD | | | | 74 | | | | 38,890 | |
9.00%, 11/15/26 (Call 12/01/22)(a)(b) | | | USD | | | | 89 | | | | 56,212 | |
WESCO Distribution Inc. | | | | | | | | | | | | |
7.13%, 06/15/25 (Call 12/01/22)(a) | | | USD | | | | 80 | | | | 80,776 | |
7.25%, 06/15/28 (Call 06/15/23)(a) | | | USD | | | | 115 | | | | 116,851 | |
Western Midstream Operating LP | | | | | | | | | | | | |
3.35%, 02/01/25 (Call 01/01/25) | | | USD | | | | 60 | | | | 57,028 | |
4.30%, 02/01/30 (Call 11/01/29) | | | USD | | | | 95 | | | | 83,581 | |
4.50%, 03/01/28 (Call 12/01/27) | | | USD | | | | 35 | | | | 32,160 | |
4.65%, 07/01/26 (Call 04/01/26) | | | USD | | | | 35 | | | | 33,114 | |
4.75%, 08/15/28 (Call 05/15/28) | | | USD | | | | 35 | | | | 32,176 | |
WeWork Companies Inc., 7.88%, 05/01/25(a) | | | USD | | | | 50 | | | | 26,931 | |
WeWork Companies LLC/WW Co-Obligor Inc., 5.00%, 07/10/25 (Call 04/10/25)(a) | | | USD | | | | 55 | | | | 27,500 | |
Williams Scotsman International Inc.,
4.63%, 08/15/28 (Call 08/15/23)(a) | | | USD | | | | 30 | | | | 27,106 | |
Windstream Escrow LLC/Windstream Escrow Finance Corp., 7.75%, 08/15/28
(Call 08/15/23)(a) | | | USD | | | | 105 | | | | 90,813 | |
WMG Acquisition Corp. | | | | | | | | | | | | |
3.00%, 02/15/31 (Call 02/15/26)(a) | | | USD | | | | 40 | | | | 31,398 | |
3.75%, 12/01/29 (Call 12/01/24)(a) | | | USD | | | | 50 | | | | 41,888 | |
3.88%, 07/15/30 (Call 07/15/25)(a) | | | USD | | | | 50 | | | | 42,438 | |
WR Grace Holdings LLC | | | | | | | | | | | | |
4.88%, 06/15/27 (Call 06/15/23)(a) | | | USD | | | | 70 | | | | 61,250 | |
5.63%, 08/15/29 (Call 08/15/24)(a) | | | USD | | | | 70 | | | | 54,109 | |
Wynn Las Vegas LLC/Wynn Las Vegas Capital Corp. | | | | | | | | | | | | |
5.25%, 05/15/27 (Call 02/15/27)(a)(b) | | | USD | | | | 75 | | | | 65,344 | |
5.50%, 03/01/25 (Call 12/01/24)(a) | | | USD | | | | 135 | | | | 127,177 | |
Wynn Resorts Finance LLC/Wynn Resorts Capital Corp. | | | | | | | | | | | | |
5.13%, 10/01/29 (Call 07/01/29)(a)(b) | | | USD | | | | 75 | | | | 59,647 | |
7.75%, 04/15/25 (Call 12/01/22)(a) | | | USD | | | | 25 | | | | 24,245 | |
| | | | | | | | | | | | |
| Security | | | | | Par/
Shares
(000) | | | Value | |
| | | | | | | | | | |
| | | |
| United States (continued) | | | | | | | | | |
Xerox Holdings Corp. | | | | | | | | | | | | |
5.00%, 08/15/25 (Call 07/15/25)(a) | | | USD | | | | 65 | | | $ | 58,825 | |
5.50%, 08/15/28 (Call 07/15/28)(a)(b) | | | USD | | | | 40 | | | | 31,600 | |
XHR LP, 4.88%, 06/01/29 (Call 06/01/24)(a) | | | USD | | | | 85 | | | | 73,651 | |
Yum! Brands Inc. | | | | | | | | | | | | |
3.63%, 03/15/31 (Call 12/15/30) | | | USD | | | | 85 | | | | 68,064 | |
4.63%, 01/31/32 (Call 10/01/26) | | | USD | | | | 105 | | | | 89,355 | |
4.75%, 01/15/30 (Call 10/15/29)(a) | | | USD | | | | 50 | | | | 44,688 | |
5.38%, 04/01/32 (Call 04/01/27) | | | USD | | | | 95 | | | | 84,840 | |
Zayo Group Holdings Inc. | | | | | | | | | | | | |
4.00%, 03/01/27 (Call 12/01/22)(a)(b) | | | USD | | | | 105 | | | | 81,112 | |
6.13%, 03/01/28 (Call 03/01/23)(a)(b) | | | USD | | | | 90 | | | | 59,760 | |
| | | | | | | | | | | | |
| | | |
| | | | | | | | | | | 64,714,687 | |
| | | | | | | | | | | | |
| | | |
Total Long-Term Investments — 96.8%
(Cost: $115,706,843) | | | | | | | | | | | 96,902,064 | |
| | | | | | | | | | | | |
| | | |
Short-Term Securities | | | | | | | | | | | | |
| | | |
| Money Market Funds — 17.1% | | | | | | | | | |
BlackRock Cash Funds: Institutional, SL Agency Shares, 3.29%(i)(j)(k) | | | | | | | 15,576 | | | | 15,572,440 | |
BlackRock Cash Funds: Treasury, SL Agency Shares, 2.97%(i)(j) | | | | | | | 1,490 | | | | 1,490,000 | |
| | | | | | | | | | | | |
| | | |
Total Short-Term Securities — 17.1%
(Cost: $17,062,596) | | | | | | | | | | | 17,062,440 | |
| | | | | | | | | | | | |
| | | |
Total Investments — 113.9%
(Cost: $132,769,439) | | | | | | | | | | | 113,964,504 | |
| |
Liabilities in Excess of Other Assets — (13.9)% | | | | (13,887,433 | ) |
| | | | | | | | | | | | |
| | | |
Net Assets — 100.0% | | | | | | | | | | $ | 100,077,071 | |
| | | | | | | | | | | | |
| (a) | Security exempt from registration pursuant to Rule 144A under the Securities Act of 1933, as amended. These securities may be resold in transactions exempt from registration to qualified institutional investors. |
| (b) | All or a portion of this security is on loan. |
| (c) | This security may be resold to qualified foreign investors and foreign institutional buyers under Regulation S of the Securities Act of 1933. |
| (d) | Variable rate security. Interest rate resets periodically. The rate shown is the effective interest rate as of period end. Security description also includes the reference rate and spread if published and available. |
| (e) | Perpetual security with no stated maturity date. |
| (f) | Issuer filed for bankruptcy and/or is in default. |
| (g) | Non-income producing security. |
| (h) | Step coupon security. Coupon rate will either increase (step-up bond) or decrease (step-down bond) at regular intervals until maturity. Interest rate shown reflects the rate currently in effect. |
| (i) | Affiliate of the Fund. |
| (j) | Annualized 7-day yield as of period end. |
| (k) | All or a portion of this security was purchased with the cash collateral from loaned securities. |
| | |
| 64 | | 2 0 2 2 I S H A R E S A N N U A L R E P O R T T O S H A R E H O L D E R S |
| | |
Schedule of Investments (continued) October 31, 2022 | | iShares® US & Intl High Yield Corp Bond ETF |
Affiliates
Investments in issuers considered to be affiliate(s) of the Fund during the year ended October 31, 2022 for purposes of Section 2(a)(3) of the Investment Company Act of 1940, as amended, were as follows:
| | | | | | | | | | | | | | | | | | | | | | | | | | | | | | | | | | | | |
| | | | | | | | | | |
| Affiliated Issuer | | Value at 10/31/21 | | | Purchases at Cost | | | Proceeds from Sale | | | Net Realized Gain (Loss) | | | Change in Unrealized Appreciation (Depreciation) | | | Value at 10/31/22 | | | Shares Held at 10/31/22 (000) | | | Income | | | Capital Gain Distributions from Underlying Funds | |
BlackRock Cash Funds: Institutional, SL Agency Shares | | $ | 20,934,089 | | | $ | — | | | $ | (5,348,488 | )(a) | | $ | (9,307 | ) | | $ | (3,854 | ) | | $ | 15,572,440 | | | | 15,576 | | | $ | 73,850 | (b) | | $ | — | |
BlackRock Cash Funds: Treasury, SL Agency Shares | | | 1,290,000 | | | | 200,000 | (a) | | | — | | | | — | | | | — | | | | 1,490,000 | | | | 1,490 | | | | 8,577 | | | | — | |
| | | | | | | | | | | | | | | | | | | | | | | | | | | | | | | | | | | | |
| | | | | | | | | |
| | | | | | | | | | | | | | $ | (9,307 | ) | | $ | (3,854 | ) | | $ | 17,062,440 | | | | | | | $ | 82,427 | | | $ | — | |
| | | | | | | | | | | | | | | | | | | | | | | | | | | | | | | | | | | | |
| (a) | Represents net amount purchased (sold). |
| (b) | All or a portion represents securities lending income earned from the reinvestment of cash collateral from loaned securities, net of fees and collateral investment expenses, and other payments to and from borrowers of securities. |
Fair Value Hierarchy as of Period End
Various inputs are used in determining the fair value of financial instruments. For a description of the input levels and information about the Fund’s policy regarding valuation of financial instruments, refer to the Notes to Financial Statements.
The following table summarizes the Fund’s financial instruments categorized in the fair value hierarchy. The breakdown of the Fund’s financial instruments into major categories is disclosed in the Schedule of Investments above.
| | | | | | | | | | | | | | | | |
| | | | | |
| | | Level 1 | | | Level 2 | | | Level 3 | | | Total | |
Investments | | | | | | | | | | | | | | | | |
Assets | | | | | | | | | | | | | | | | |
Corporate Bonds & Notes | | $ | — | | | $ | 96,902,064 | | | $ | — | | | $ | 96,902,064 | |
Money Market Funds | | | 17,062,440 | | | | — | | | | — | | | | 17,062,440 | |
| | | | | | | | | | | | | | | | |
| | | | |
| | $ | 17,062,440 | | | $ | 96,902,064 | | | $ | — | | | $ | 113,964,504 | |
| | | | | | | | | | | | | | | | |
See notes to financial statements.
| | |
S C H E D U L E O F I N V E S T M E N T S | | 65 |
Statements of Assets and Liabilities
October 31, 2022
| | | | | | | | | | | | | | | | |
| | | iShares
International
High Yield
Bond ETF | | | iShares J.P. Morgan
EM Corporate
Bond ETF | | | iShares J.P. Morgan EM High Yield Bond ETF | | | iShares J.P. Morgan EM Local Currency Bond ETF | |
| | | | |
ASSETS | | | | | | | | | | | | | | | | |
Investments, at value — unaffiliated(a)(b) | | $ | 30,796,769 | | | $ | 280,857,576 | | | $ | 283,758,371 | | | $ | 338,775,650 | |
Investments, at value — affiliated(c) | | | 10,000 | | | | 21,853,028 | | | | 37,199,604 | | | | 440,000 | |
Cash | | | 4,822 | | | | — | | | | — | | | | 1,417 | |
Foreign currency, at value(d) | | | 234,721 | | | | 743 | | | | 605 | | | | 2,573,732 | |
Receivables: | | | | | | | | | | | | | | | | |
Investments sold | | | 1,711,241 | | | | 992,151 | | | | 2,562,070 | | | | 1,869,508 | |
Securities lending income — affiliated | | | — | | | | 13,606 | | | | 27,421 | | | | — | |
Capital shares sold | | | — | | | | 154,284 | | | | — | | | | 546,293 | |
Dividends — unaffiliated | | | — | | | | — | | | | — | | | | 19,395 | |
Dividends — affiliated | | | 8 | | | | 6,123 | | | | 3,584 | | | | 2,155 | |
Interest — unaffiliated | | | 416,942 | | | | 3,538,212 | | | | 5,291,304 | | | | 6,960,857 | |
| | | | | | | | | | | | | | | | |
| | | | |
Total assets | | | 33,174,503 | | | | 307,415,723 | | | | 328,842,959 | | | | 351,189,007 | |
| | | | | | | | | | | | | | | | |
| | | | |
LIABILITIES | | | | | | | | | | | | | | | | |
Bank overdraft | | | — | | | | 180,179 | | | | 1,722 | | | | — | |
Collateral on securities loaned, at value | | | — | | | | 17,986,166 | | | | 34,763,381 | | | | — | |
Deferred foreign capital gain tax | | | — | | | | — | | | | — | | | | 7,264 | |
Payables: | | | | | | | | | | | | | | | | |
Investments purchased | | | 1,368,202 | | | | 3,228,501 | | | | 2,657,602 | | | | 4,567,461 | |
Investment advisory fees | | | 10,546 | | | | 122,604 | | | | 123,706 | | | | 88,800 | |
| | | | | | | | | | | | | | | | |
| | | | |
Total liabilities | | | 1,378,748 | | | | 21,517,450 | | | | 37,546,411 | | | | 4,663,525 | |
| | | | | | | | | | | | | | | | |
| | | | |
NET ASSETS | | $ | 31,795,755 | | | $ | 285,898,273 | | | $ | 291,296,548 | | | $ | 346,525,482 | |
| | | | | | | | | | | | | | | | |
| | | | |
NET ASSETS CONSIST OF | | | | | | | | | | | | | | | | |
Paid-in capital | | $ | 48,143,081 | | | $ | 372,229,379 | | | $ | 475,087,352 | | | $ | 520,713,810 | |
Accumulated loss | | | (16,347,326 | ) | | | (86,331,106 | ) | | | (183,790,804 | ) | | | (174,188,328 | ) |
| | | | | | | | | | | | | | | | |
| | | | |
NET ASSETS | | $ | 31,795,755 | | | $ | 285,898,273 | | | $ | 291,296,548 | | | $ | 346,525,482 | |
| | | | | | | | | | | | | | | | |
| | | | |
NET ASSET VALUE | | | | | | | | | | | | | | | | |
Shares outstanding | | | 800,000 | | | | 7,100,000 | | | | 9,050,000 | | | | 10,800,000 | |
| | | | | | | | | | | | | | | | |
| | | | |
Net asset value | | $ | 39.74 | | | $ | 40.27 | | | $ | 32.19 | | | $ | 32.09 | |
| | | | | | | | | | | | | | | | |
| | | | |
Shares authorized | | | 500 million | | | | 500 million | | | | 500 million | | | | 500 million | |
| | | | | | | | | | | | | | | | |
| | | | |
Par value | | $ | 0.001 | | | $ | 0.001 | | | $ | 0.001 | | | $ | 0.001 | |
| | | | | | | | | | | | | | | | |
| | | | |
(a) Investments, at cost — unaffiliated | | $ | 41,465,545 | | | $ | 343,425,307 | | | $ | 386,211,554 | | | $ | 438,486,617 | |
(b) Securities loaned, at value | | $ | — | | | $ | 16,646,266 | | | $ | 31,055,297 | | | $ | — | |
(c) Investments, at cost — affiliated | | $ | 10,000 | | | $ | 21,851,658 | | | $ | 37,198,260 | | | $ | 440,000 | |
(d) Foreign currency, at cost | | $ | 234,120 | | | $ | 734 | | | $ | 647 | | | $ | 2,620,386 | |
See notes to financial statements.
| | |
| 66 | | 2 0 2 2 I S H A R E S A N N U A L R E P O R T T O S H A R E H O L D E R S |
Statements of Assets and Liabilities (continued)
October 31, 2022
| | | | |
| | | iShares US & Intl High Yield
Corp Bond
ETF | |
| |
ASSETS | | | | |
Investments, at value — unaffiliated(a)(b) | | $ | 96,902,064 | |
Investments, at value — affiliated(c) | | | 17,062,440 | |
Cash | | | 10,557 | |
Foreign currency, at value(d) | | | 297,238 | |
Receivables: | | | | |
Investments sold | | | 1,937,074 | |
Securities lending income — affiliated | | | 8,411 | |
Dividends — affiliated | | | 3,016 | |
Interest — unaffiliated | | | 1,529,479 | |
| | | | |
| |
Total assets | | | 117,750,279 | |
| | | | |
| |
LIABILITIES | | | | |
Collateral on securities loaned, at value | | | 15,581,229 | |
Payables: | | | | |
Investments purchased | | | 2,058,574 | |
Investment advisory fees | | | 33,405 | |
| | | | |
| |
Total liabilities | | | 17,673,208 | |
| | | | |
| |
NET ASSETS | | $ | 100,077,071 | |
| | | | |
| |
NET ASSETS CONSIST OF | | | | |
Paid-in capital | | $ | 127,743,815 | |
Accumulated loss | | | (27,666,744 | ) |
| | | | |
| |
NET ASSETS | | $ | 100,077,071 | |
| | | | |
| |
NET ASSET VALUE | | | | |
Shares outstanding | | | 2,500,000 | |
| | | | |
| |
Net asset value | | $ | 40.03 | |
| | | | |
| |
Shares authorized | | | 500 million | |
| | | | |
| |
Par value | | $ | 0.001 | |
| | | | |
| |
(a) Investments, at cost — unaffiliated | | $ | 115,706,843 | |
(b) Securities loaned, at value | | $ | 14,907,801 | |
(c) Investments, at cost — affiliated | | $ | 17,062,596 | |
(d) Foreign currency, at cost | | $ | 295,653 | |
See notes to financial statements.
| | |
F I N A N C I A L S T A T E M E N T S | | 67 |
Statements of Operations
Year Ended October 31, 2022
| | | | | | | | | | | | | | | | |
| | | iShares
International High Yield Bond ETF | | | iShares J.P. Morgan EM Corporate Bond ETF | | | iShares J.P. Morgan EM High Yield Bond ETF | | | iShares J.P. Morgan EM Local Currency Bond ETF | |
| | | | |
INVESTMENT INCOME | | | | | | | | | | | | | | | | |
Dividends — unaffiliated | | $ | — | | | $ | — | | | $ | — | | | $ | 55 | |
Dividends — affiliated | | | 31 | | | | 26,882 | | | | 23,398 | | | | 10,026 | |
Interest — unaffiliated | | | 1,601,811 | | | | 15,995,886 | | | | 26,792,649 | | | | 26,837,749 | |
Securities lending income — affiliated — net | | | — | | | | 148,415 | | | | 199,376 | | | | — | |
Other income — unaffiliated | | | 280 | | | | 22,360 | | | | 23,256 | | | | — | |
Foreign taxes withheld | | | (659 | ) | | | (54 | ) | | | (83 | ) | | | (637,498 | ) |
| | | | | | | | | | | | | | | | |
| | | | |
Total investment income | | | 1,601,463 | | | | 16,193,489 | | | | 27,038,596 | | | | 26,210,332 | |
| | | | | | | | | | | | | | | | |
| | | | |
EXPENSES | | | | | | | | | | | | | | | | |
Investment advisory | | | 193,150 | | | | 1,963,792 | | | | 2,039,659 | | | | 1,387,468 | |
Commitment costs | | | — | | | | — | | | | — | | | | 5,605 | |
Professional | | | 217 | | | | 217 | | | | 217 | | | | 217 | |
| | | | | | | | | | | | | | | | |
| | | | |
Total expenses | | | 193,367 | | | | 1,964,009 | | | | 2,039,876 | | | | 1,393,290 | |
| | | | | | | | | | | | | | | | |
| | | | |
Net investment income | | | 1,408,096 | | | | 14,229,480 | | | | 24,998,720 | | | | 24,817,042 | |
| | | | | | | | | | | | | | | | |
| | | | |
REALIZED AND UNREALIZED GAIN (LOSS) | | | | | | | | | | | | | | | | |
Net realized gain (loss) from: | | | | | | | | | | | | | | | | |
Investments — unaffiliated(a) | | | (1,559,859 | ) | | | (21,096,605 | ) | | | (22,063,602 | ) | | | (66,276,099 | ) |
Investments — affiliated | | | — | | | | (20,875 | ) | | | (20,525 | ) | | | — | |
Foreign currency transactions | | | (147,410 | ) | | | (2 | ) | | | (11 | ) | | | (2,488,779 | ) |
In-kind redemptions — unaffiliated(b) | | | (3,392,400 | ) | | | (12,889,540 | ) | | | (21,735,753 | ) | | | (7,540,873 | ) |
| | | | | | | | | | | | | | | | |
| | | | |
| | | (5,099,669 | ) | | | (34,007,022 | ) | | | (43,819,891 | ) | | | (76,305,751 | ) |
| | | | | | | | | | | | | | | | |
Net change in unrealized appreciation (depreciation) on: | | | | | | | | | | | | | | | | |
Investments — unaffiliated(c) | | | (10,444,380 | ) | | | (61,429,253 | ) | | | (82,736,179 | ) | | | (58,163,224 | ) |
Investments — affiliated | | | — | | | | (5,187 | ) | | | 1,343 | | | | — | |
Foreign currency translations | | | (2,663 | ) | | | 9 | | | | (42 | ) | | | (205,869 | ) |
| | | | | | | | | | | | | | | | |
| | | | |
| | | (10,447,043 | ) | | | (61,434,431 | ) | | | (82,734,878 | ) | | | (58,369,093 | ) |
| | | | | | | | | | | | | | | | |
| | | | |
Net realized and unrealized loss | | | (15,546,712 | ) | | | (95,441,453 | ) | | | (126,554,769 | ) | | | (134,674,844 | ) |
| | | | | | | | | | | | | | | | |
| | | | |
NET DECREASE IN NET ASSETS RESULTING FROM OPERATIONS | | $ | (14,138,616 | ) | | $ | (81,211,973 | ) | | $ | (101,556,049 | ) | | $ | (109,857,802 | ) |
| | | | | | | | | | | | | | | | |
| | | | |
(a) Net of foreign capital gain tax and capital gain tax refund, if applicable | | $ | — | | | $ | — | | | $ | — | | | $ | (28,761 | ) |
(b) See Note 2 of the Notes to Financial Statements. | | | | | | | | | | | | | | | | |
(c) Net of reduction in deferred foreign capital gain tax of | | $ | — | | | $ | — | | | $ | — | | | $ | 102,310 | |
See notes to financial statements.
| | |
| 68 | | 2 0 2 2 I S H A R E S A N N U A L R E P O R T T O S H A R E H O L D E R S |
Statements of Operations (continued)
Year Ended October 31, 2022
| | | | |
| | | iShares US & Intl High Yield Corp Bond ETF | |
| |
INVESTMENT INCOME | | | | |
Dividends — affiliated | | $ | 10,159 | |
Interest — unaffiliated | | | 6,240,456 | |
Securities lending income — affiliated — net | | | 72,268 | |
Other income — unaffiliated | | | 2,693 | |
Foreign taxes withheld | | | (340 | ) |
| | | | |
Total investment income | | | 6,325,236 | |
| | | | |
| |
EXPENSES | | | | |
Investment advisory | | | 518,180 | |
Professional | | | 217 | |
| | | | |
| |
Total expenses | | | 518,397 | |
| | | | |
| |
Net investment income | | | 5,806,839 | |
| | | | |
| |
REALIZED AND UNREALIZED GAIN (LOSS) | | | | |
Net realized gain (loss) from: | | | | |
Investments — unaffiliated | | | (891,312 | ) |
Investments — affiliated | | | (9,307 | ) |
Foreign currency transactions | | | (143,573 | ) |
In-kind redemptions — unaffiliated(a) | | | (4,701,003 | ) |
| | | | |
| |
| | | (5,745,195 | ) |
| | | | |
Net change in unrealized appreciation (depreciation) on: | | | | |
Investments — unaffiliated | | | (21,718,620 | ) |
Investments — affiliated | | | (3,854 | ) |
Foreign currency translations | | | (2,836 | ) |
| | | | |
| |
| | | (21,725,310 | ) |
| | | | |
| |
Net realized and unrealized loss | | | (27,470,505 | ) |
| | | | |
| |
NET DECREASE IN NET ASSETS RESULTING FROM OPERATIONS | | $ | (21,663,666 | ) |
| | | | |
| (a) | See Note 2 of the Notes to Financial Statements. |
See notes to financial statements.
| | |
F I N A N C I A L S T A T E M E N T S | | 69 |
Statements of Changes in Net Assets
| | | | | | | | | | | | | | | | |
| | | iShares International High Yield Bond ETF | | | iShares J.P. Morgan EM Corporate Bond ETF | |
| | | | |
| | | Year Ended 10/31/22 | | | Year Ended 10/31/21 | | | Year Ended 10/31/22 | | | Year Ended 10/31/21 | |
INCREASE (DECREASE) IN NET ASSETS | | | | | | | | | | | | | | | | |
| | | | |
OPERATIONS | | | | | | | | | | | | | | | | |
Net investment income | | $ | 1,408,096 | | | $ | 1,640,605 | | | $ | 14,229,480 | | | $ | 12,338,101 | |
Net realized gain (loss) | | | (5,099,669 | ) | | | 246,665 | | | | (34,007,022 | ) | | | (337,078 | ) |
Net change in unrealized appreciation (depreciation) | | | (10,447,043 | ) | | | 680,844 | | | | (61,434,431 | ) | | | (3,235,881 | ) |
| | | | | | | | | | | | | | | | |
| | | | |
Net increase (decrease) in net assets resulting from operations | | | (14,138,616 | ) | | | 2,568,114 | | | | (81,211,973 | ) | | | 8,765,142 | |
| | | | | | | | | | | | | | | | |
| | | | |
DISTRIBUTIONS TO SHAREHOLDERS(a) | | | | | | | | | | | | | | | | |
From net investment income | | | (2,017,426 | ) | | | (736,269 | ) | | | (15,559,902 | ) | | | (11,947,480 | ) |
Return of capital | | | (85,561 | ) | | | — | | | | — | | | | — | |
| | | | | | | | | | | | | | | | |
| | | | |
Decrease in net assets resulting from distributions to shareholders | | | (2,102,987 | ) | | | (736,269 | ) | | | (15,559,902 | ) | | | (11,947,480 | ) |
| | | | | | | | | | | | | | | | |
| | | | |
CAPITAL SHARE TRANSACTIONS | | | | | | | | | | | | | | | | |
Net increase (decrease) in net assets derived from capital share transactions | | | (23,123,187 | ) | | | 22,578,514 | | | | (135,692,796 | ) | | | 306,813,811 | |
| | | | | | | | | | | | | | | | |
| | | | |
NET ASSETS | | | | | | | | | | | | | | | | |
Total increase (decrease) in net assets | | | (39,364,790 | ) | | | 24,410,359 | | | | (232,464,671 | ) | | | 303,631,473 | |
Beginning of year | | | 71,160,545 | | | | 46,750,186 | | | | 518,362,944 | | | | 214,731,471 | |
| | | | | | | | | | | | | | | | |
| | | | |
End of year | | $ | 31,795,755 | | | $ | 71,160,545 | | | $ | 285,898,273 | | | $ | 518,362,944 | |
| | | | | | | | | | | | | | | | |
| (a) | Distributions for annual periods determined in accordance with U.S. federal income tax regulations. |
See notes to financial statements.
| | |
| 70 | | 2 0 2 2 I S H A R E S A N N U A L R E P O R T T O S H A R E H O L D E R S |
Statements of Changes in Net Assets (continued)
| | | | | | | | | | | | | | | | |
| | | iShares J.P. Morgan EM High Yield Bond ETF | | | iShares J.P. Morgan EM Local Currency Bond ETF | |
| | | | |
| | | Year Ended
10/31/22 | | | Year Ended
10/31/21 | | | Year Ended
10/31/22 | | | Year Ended
10/31/21 | |
INCREASE (DECREASE) IN NET ASSETS | | | | | | | | | | | | | | | | |
| | | | |
OPERATIONS | | | | | | | | | | | | | | | | |
Net investment income | | $ | 24,998,720 | | | $ | 21,702,643 | | | $ | 24,817,042 | | | $ | 24,130,068 | |
Net realized loss | | | (43,819,891 | ) | | | (5,754,719 | ) | | | (76,305,751 | ) | | | (3,824,330 | ) |
Net change in unrealized appreciation (depreciation) | | | (82,734,878 | ) | | | 3,814,196 | | | | (58,369,093 | ) | | | (20,231,809 | ) |
| | | | | | | | | | | | | | | | |
| | | | |
Net increase (decrease) in net assets resulting from operations | | | (101,556,049 | ) | | | 19,762,120 | | | | (109,857,802 | ) | | | 73,929 | |
| | | | | | | | | | | | | | | | |
| | | | |
DISTRIBUTIONS TO SHAREHOLDERS(a) | | | | | | | | | | | | | | | | |
Decrease in net assets resulting from distributions to shareholders | | | (25,663,616 | ) | | | (22,290,589 | ) | | | (19,531,059 | ) | | | — | |
| | | | | | | | | | | | | | | | |
| | | | |
CAPITAL SHARE TRANSACTIONS | | | | | | | | | | | | | | | | |
Net increase (decrease) in net assets derived from capital share transactions | | | (56,838,898 | ) | | | 174,299,553 | | | | (41,512,997 | ) | | | 17,252,960 | |
| | | | | | | | | | | | | | | | |
| | | | |
NET ASSETS | | | | | | | | | | | | | | | | |
Total increase (decrease) in net assets | | | (184,058,563 | ) | | | 171,771,084 | | | | (170,901,858 | ) | | | 17,326,889 | |
Beginning of year | | | 475,355,111 | | | | 303,584,027 | | | | 517,427,340 | | | | 500,100,451 | |
| | | | | | | | | | | | | | | | |
| | | | |
End of year | | $ | 291,296,548 | | | $ | 475,355,111 | | | $ | 346,525,482 | | | $ | 517,427,340 | |
| | | | | | | | | | | | | | | | |
| (a) | Distributions for annual periods determined in accordance with U.S. federal income tax regulations. |
See notes to financial statements.
| | |
F I N A N C I A L S T A T E M E N T S | | 71 |
Statements of Changes in Net Assets (continued)
| | | | | | | | |
| | | iShares US & Intl High Yield Corp Bond ETF | |
| | |
| | | Year Ended
10/31/22 | | | Year Ended
10/31/21 | |
INCREASE (DECREASE) IN NET ASSETS | | | | | | | | |
| | |
OPERATIONS | | | | | | | | |
Net investment income | | $ | 5,806,839 | | | $ | 7,955,550 | |
Net realized gain (loss) | | | (5,745,195 | ) | | | 2,777,006 | |
Net change in unrealized appreciation (depreciation) | | | (21,725,310 | ) | | | 4,307,320 | |
| | | | | | | | |
| | |
Net increase (decrease) in net assets resulting from operations | | | (21,663,666 | ) | | | 15,039,876 | |
| | | | | | | | |
| | |
DISTRIBUTIONS TO SHAREHOLDERS(a) | | | | | | | | |
Decrease in net assets resulting from distributions to shareholders | | | (6,204,063 | ) | | | (8,596,496 | ) |
| | | | | | | | |
| | |
CAPITAL SHARE TRANSACTIONS | | | | | | | | |
Net increase (decrease) in net assets derived from capital share transactions | | | (65,519,501 | ) | | | 10,169,888 | |
| | | | | | | | |
| | |
NET ASSETS | | | | | | | | |
Total increase (decrease) in net assets | | | (93,387,230 | ) | | | 16,613,268 | |
Beginning of year | | | 193,464,301 | | | | 176,851,033 | |
| | | | | | | | |
| | |
End of year | | $ | 100,077,071 | | | $ | 193,464,301 | �� |
| | | | | | | | |
| (a) | Distributions for annual periods determined in accordance with U.S. federal income tax regulations. |
See notes to financial statements.
| | |
| 72 | | 2 0 2 2 I S H A R E S A N N U A L R E P O R T T O S H A R E H O L D E R S |
Financial Highlights
(For a share outstanding throughout each period)
| | | | | | | | | | | | | | | | | | | | |
| | | iShares International High Yield Bond ETF | |
| | | | | |
| | | Year Ended
10/31/22 | | | Year Ended
10/31/21 | | | Year Ended
10/31/20 | | | Year Ended
10/31/19 | | | Year Ended
10/31/18 | |
| | | | | |
Net asset value, beginning of year | | $ | 54.74 | | | $ | 51.94 | | | $ | 51.05 | | | $ | 50.66 | | | $ | 53.04 | |
| | | | | | | | | | | | | | | | | | | | |
Net investment income(a) | | | 1.38 | | | | 1.44 | | | | 1.42 | | | | 1.51 | | | | 1.54 | |
Net realized and unrealized gain (loss)(b) | | | (14.76 | ) | | | 2.18 | | | | 0.09 | | | | 0.82 | | | | (3.92 | ) |
| | | | | | | | | | | | | | | | | | | | |
| | | | | |
Net increase (decrease) from investment operations | | | (13.38 | ) | | | 3.62 | | | | 1.51 | | | | 2.33 | | | | (2.38 | ) |
| | | | | | | | | | | | | | | | | | | | |
| | | | | |
Distributions(c) | | | | | | | | | | | | | | | | | | | | |
From net investment income | | | (1.56 | ) | | | (0.82 | ) | | | (0.62 | ) | | | (1.94 | ) | | | — | |
Return of capital | | | (0.06 | ) | | | — | | | | — | | | | — | | | | — | |
| | | | | | | | | | | | | | | | | | | | |
| | | | | |
Total distributions | | | (1.62 | ) | | | (0.82 | ) | | | (0.62 | ) | | | (1.94 | ) | | | — | |
| | | | | | | | | | | | | | | | | | | | |
| | | | | |
Net asset value, end of year | | $ | 39.74 | | | $ | 54.74 | | | $ | 51.94 | | | $ | 51.05 | | | $ | 50.66 | |
| | | | | | | | | | | | | | | | | | | | |
| | | | | |
Total Return(d) | | | | | | | | | | | | | | | | | | | | |
Based on net asset value | | | (25.15 | )% | | | 6.90 | % | | | 3.00 | % | | | 4.85 | % | | | (4.49 | )% |
| | | | | | | | | | | | | | | | | | | | |
| | | | | |
Ratios to Average Net Assets(e) | | | | | | | | | | | | | | | | | | | | |
Total expenses | | | 0.40 | % | | | 0.40 | % | | | 0.40 | % | | | 0.40 | % | | | 0.40 | % |
| | | | | | | | | | | | | | | | | | | | |
| | | | | |
Net investment income | | | 2.92 | % | | | 2.56 | % | | | 2.85 | % | | | 3.03 | % | | | 2.87 | % |
| | | | | | | | | | | | | | | | | | | | |
| | | | | |
Supplemental Data | | | | | | | | | | | | | | | | | | | | |
Net assets, end of year (000) | | $ | 31,796 | | | $ | 71,161 | | | $ | 46,750 | | | $ | 40,838 | | | $ | 65,858 | |
| | | | | | | | | | | | | | | | | | | | |
| | | | | |
Portfolio turnover rate(f) | | | 23 | % | | | 33 | % | | | 46 | % | | | 34 | % | | | 31 | % |
| | | | | | | | | | | | | | | | | | | | |
| (a) | Based on average shares outstanding. |
| (b) | The amounts reported for a share outstanding may not accord with the change in aggregate gains and losses in securities for the fiscal period due to the timing of capital share transactions in relation to the fluctuating market values of the Fund’s underlying securities. |
| (c) | Distributions for annual periods determined in accordance with U.S. federal income tax regulations. |
| (d) | Where applicable, assumes the reinvestment of distributions. |
| (e) | Excludes fees and expenses incurred indirectly as a result of investments in underlying funds. |
| (f) | Portfolio turnover rate excludes in-kind transactions. |
See notes to financial statements.
| | |
F I N A N C I A L H I G H L I G H T S | | 73 |
Financial Highlights (continued)
(For a share outstanding throughout each period)
| | | | | | | | | | | | | | | | | | | | |
| | | iShares J.P. Morgan EM Corporate Bond ETF | |
| | | | | |
| | | Year Ended
10/31/22 | | | Year Ended
10/31/21 | | | Year Ended
10/31/20 | | | Year Ended
10/31/19 | | | Year Ended
10/31/18 | |
| | | | | |
Net asset value, beginning of year | | $ | 51.32 | | | $ | 51.13 | | | $ | 51.29 | | | $ | 47.68 | | | $ | 51.33 | |
| | | | | | | | | | | | | | | | | | | | |
Net investment income(a) | | | 1.68 | | | | 1.75 | | | | 2.06 | | | | 2.25 | | | | 2.16 | |
Net realized and unrealized gain (loss)(b) | | | (10.93 | ) | | | 0.23 | | | | (0.13 | ) | | | 3.61 | | | | (3.70 | ) |
| | | | | | | | | | | | | | | | | | | | |
| | | | | |
Net increase (decrease) from investment operations | | | (9.25 | ) | | | 1.98 | | | | 1.93 | | | | 5.86 | | | | (1.54 | ) |
| | | | | | | | | | | | | | | | | | | | |
| | | | | |
Distributions from net investment income(c) | | | (1.80 | ) | | | (1.79 | ) | | | (2.09 | ) | | | (2.25 | ) | | | (2.11 | ) |
| | | | | | | | | | | | | | | | | | | | |
| | | | | |
Net asset value, end of year | | $ | 40.27 | | | $ | 51.32 | | | $ | 51.13 | | | $ | 51.29 | | | $ | 47.68 | |
| | | | | | | | | | | | | | | | | | | | |
| | | | | |
Total Return(d) | | | | | | | | | | | | | | | | | | | | |
Based on net asset value | | | (18.42 | )% | | | 3.88 | % | | | 3.94 | % | | | 12.57 | % | | | (3.09 | )% |
| | | | | | | | | | | | | | | | | | | | |
| | | | | |
Ratios to Average Net Assets(e) | | | | | | | | | | | | | | | | | | | | |
Total expenses | | | 0.50 | % | | | 0.50 | % | | | 0.50 | % | | | 0.50 | % | | | 0.50 | % |
| | | | | | | | | | | | | | | | | | | | |
| | | | | |
Net investment income | | | 3.62 | % | | | 3.36 | % | | | 4.08 | % | | | 4.51 | % | | | 4.37 | % |
| | | | | | | | | | | | | | | | | | | | |
| | | | | |
Supplemental Data | | | | | | | | | | | | | | | | | | | | |
Net assets, end of year (000) | | $ | 285,898 | | | $ | 518,363 | | | $ | 214,731 | | | $ | 166,685 | | | $ | 71,515 | |
| | | | | | | | | | | | | | | | | | | | |
| | | | | |
Portfolio turnover rate(f) | | | 18 | % | | | 16 | % | | | 25 | % | | | 21 | % | | | 16 | % |
| | | | | | | | | | | | | | | | | | | | |
| (a) | Based on average shares outstanding. |
| (b) | The amounts reported for a share outstanding may not accord with the change in aggregate gains and losses in securities for the fiscal period due to the timing of capital share transactions in relation to the fluctuating market values of the Fund’s underlying securities. |
| (c) | Distributions for annual periods determined in accordance with U.S. federal income tax regulations. |
| (d) | Where applicable, assumes the reinvestment of distributions. |
| (e) | Excludes fees and expenses incurred indirectly as a result of investments in underlying funds. |
| (f) | Portfolio turnover rate excludes in-kind transactions. |
See notes to financial statements.
| | |
| 74 | | 2 0 2 2 I S H A R E S A N N U A L R E P O R T T O S H A R E H O L D E R S |
Financial Highlights (continued)
(For a share outstanding throughout each period)
| | | | | | | | | | | | | | | | | | | | |
| | | iShares J.P. Morgan EM High Yield Bond ETF | |
| | | | | |
| | | Year Ended
10/31/22 | | | Year Ended
10/31/21 | | | Year Ended
10/31/20 | | | Year Ended
10/31/19 | | | Year Ended
10/31/18 | |
| | | | | |
Net asset value, beginning of year | | $ | 43.61 | | | $ | 43.06 | | | $ | 46.63 | | | $ | 45.29 | | | $ | 50.60 | |
| | | | | | | | | | | | | | | | | | | | |
Net investment income(a) | | | 2.34 | | | | 2.43 | | | | 2.52 | | | | 2.66 | | | | 2.44 | |
Net realized and unrealized gain (loss)(b) | | | (11.36 | ) | | | 0.68 | | | | (3.54 | ) | | | 1.93 | | | | (5.40 | ) |
| | | | | | | | | | | | | | | | | | | | |
| | | | | |
Net increase (decrease) from investment operations | | | (9.02 | ) | | | 3.11 | | | | (1.02 | ) | | | 4.59 | | | | (2.96 | ) |
| | | | | | | | | | | | | | | | | | | | |
| | | | | |
Distributions from net investment income(c) | | | (2.40 | ) | | | (2.56 | ) | | | (2.55 | ) | | | (3.25 | ) | | | (2.35 | ) |
| | | | | | | | | | | | | | | | | | | | |
| | | | | |
Net asset value, end of year | | $ | 32.19 | | | $ | 43.61 | | | $ | 43.06 | | | $ | 46.63 | | | $ | 45.29 | |
| | | | | | | | | | | | | | | | | | | | |
| | | | | |
Total Return(d) | | | | | | | | | | | | | | | | | | | | |
Based on net asset value | | | (21.35 | )% | | | 7.16 | % | | | (2.08 | )% | | | 10.51 | % | | | (5.96 | )%(e) |
| | | | | | | | | | | | | | | | | | | | |
| | | | | |
Ratios to Average Net Assets(f) | | | | | | | | | | | | | | | | | | | | |
Total expenses | | | 0.50 | % | | | 0.50 | % | | | 0.50 | % | | | 0.50 | % | | | 0.50 | % |
| | | | | | | | | | | | | | | | | | | | |
| | | | | |
Total expenses after fees waived | | | 0.50 | % | | | 0.49 | % | | | 0.48 | % | | | 0.50 | % | | | 0.50 | % |
| | | | | | | | | | | | | | | | | | | | |
| | | | | |
Net investment income | | | 6.13 | % | | | 5.40 | % | | | 5.75 | % | | | 5.75 | % | | | 5.11 | % |
| | | | | | | | | | | | | | | | | | | | |
| | | | | |
Supplemental Data | | | | | | | | | | | | | | | | | | | | |
Net assets, end of year (000) | | $ | 291,297 | | | $ | 475,355 | | | $ | 303,584 | | | $ | 333,378 | | | $ | 398,541 | |
| | | | | | | | | | | | | | | | | | | | |
| | | | | |
Portfolio turnover rate(g) | | | 16 | % | | | 23 | % | | | 65 | % | | | 32 | % | | | 19 | % |
| | | | | | | | | | | | | | | | | | | | |
| (a) | Based on average shares outstanding. |
| (b) | The amounts reported for a share outstanding may not accord with the change in aggregate gains and losses in securities for the fiscal period due to the timing of capital share transactions in relation to the fluctuating market values of the Fund’s underlying securities. |
| (c) | Distributions for annual periods determined in accordance with U.S. federal income tax regulations. |
| (d) | Where applicable, assumes the reinvestment of distributions. |
| (e) | Includes payment received from an affiliate, which had no impact on the Fund’s total return. |
| (f) | Excludes fees and expenses incurred indirectly as a result of investments in underlying funds. |
| (g) | Portfolio turnover rate excludes in-kind transactions. |
See notes to financial statements.
| | |
F I N A N C I A L H I G H L I G H T S | | 75 |
Financial Highlights (continued)
(For a share outstanding throughout each period)
| | | | | | | | | | | | | | | | | | | | |
| | | iShares J.P. Morgan EM Local Currency Bond ETF | |
| | | | | |
| | | Year Ended
10/31/22 | | | Year Ended
10/31/21 | | | Year Ended
10/31/20 | | | Year Ended
10/31/19 | | | Year Ended
10/31/18 | |
| | | | | |
Net asset value, beginning of year | | $ | 41.73 | | | $ | 41.68 | | | $ | 45.43 | | | $ | 43.24 | | | $ | 46.85 | |
| | | | | | | | | | | | | | | | | | | | |
Net investment income(a) | | | 1.95 | | | | 2.06 | | | | 2.29 | | | | 3.09 | | | | 2.87 | |
Net realized and unrealized gain (loss)(b) | | | (10.06 | ) | | | (2.01 | ) | | | (4.11 | ) | | | 0.59 | | | | (6.48 | ) |
| | | | | | | | | | | | | | | | | | | | |
| | | | | |
Net increase (decrease) from investment operations | | | (8.11 | ) | | | 0.05 | | | | (1.82 | ) | | | 3.68 | | | | (3.61 | ) |
| | | | | | | | | | | | | | | | | | | | |
| | | | | |
Distributions from net investment income(c) | | | (1.53 | ) | | | — | | | | (1.93 | ) | | | (1.49 | ) | | | — | |
| | | | | | | | | | | | | | | | | | | | |
| | | | | |
Net asset value, end of year | | $ | 32.09 | | | $ | 41.73 | | | $ | 41.68 | | | $ | 45.43 | | | $ | 43.24 | |
| | | | | | | | | | | | | | | | | | | | |
| | | | | |
Total Return(d) | | | | | | | | | | | | | | | | | | | | |
Based on net asset value | | | (20.04 | )% | | | 0.12 | % | | | (4.20 | )% | | | 8.75 | % | | | (7.71 | )% |
| | | | | | | | | | | | | | | | | | | | |
| | | | | |
Ratios to Average Net Assets(e) | | | | | | | | | | | | | | | | | | | | |
Total expenses | | | 0.30 | % | | | 0.30 | % | | | 0.30 | % | | | 0.30 | % | | | 0.42 | % |
| | | | | | | | | | | | | | | | | | | | |
| | | | | |
Total expenses after fees waived | | | 0.30 | % | | | 0.30 | % | | | 0.30 | % | | | 0.30 | % | | | 0.41 | % |
| | | | | | | | | | | | | | | | | | | | |
| | | | | |
Net investment income | | | 5.37 | % | | | 4.72 | % | | | 5.46 | % | | | 6.95 | % | | | 6.19 | % |
| | | | | | | | | | | | | | | | | | | | |
| | | | | |
Supplemental Data | | | | | | | | | | | | | | | | | | | | |
Net assets, end of year (000) | | $ | 346,525 | | | $ | 517,427 | | | $ | 500,100 | | | $ | 536,078 | | | $ | 423,732 | |
| | | | | | | | | | | | | | | | | | | | |
| | | | | |
Portfolio turnover rate(f) | | | 47 | % | | | 29 | % | | | 43 | % | | | 44 | % | | | 51 | % |
| | | | | | | | | | | | | | | | | | | | |
| (a) | Based on average shares outstanding. |
| (b) | The amounts reported for a share outstanding may not accord with the change in aggregate gains and losses in securities for the fiscal period due to the timing of capital share transactions in relation to the fluctuating market values of the Fund’s underlying securities. |
| (c) | Distributions for annual periods determined in accordance with U.S. federal income tax regulations. |
| (d) | Where applicable, assumes the reinvestment of distributions. |
| (e) | Excludes fees and expenses incurred indirectly as a result of investments in underlying funds. |
| (f) | Portfolio turnover rate excludes in-kind transactions. |
See notes to financial statements.
| | |
| 76 | | 2 0 2 2 I S H A R E S A N N U A L R E P O R T T O S H A R E H O L D E R S |
Financial Highlights (continued)
(For a share outstanding throughout each period)
| | | | | | | | | | | | | | | | | | | | |
| | | iShares US & Intl High Yield Corp Bond ETF | |
| | | | | |
| | | Year Ended
10/31/22 | | | Year Ended
10/31/21 | | | Year Ended
10/31/20 | | | Year Ended
10/31/19 | | | Year Ended
10/31/18 | |
| | | | | |
Net asset value, beginning of year | | $ | 49.61 | | | $ | 47.80 | | | $ | 48.97 | | | $ | 48.03 | | | $ | 50.98 | |
| | | | | | | | | | | | | | | | | | | | |
Net investment income(a) | | | 2.02 | | | | 2.09 | | | | 2.21 | | | | 2.42 | | | | 2.46 | |
Net realized and unrealized gain (loss)(b) | | | (9.53 | ) | | | 1.99 | | | | (1.27 | ) | | | 1.17 | | | | (2.80 | ) |
| | | | | | | | | | | | | | | | | | | | |
| | | | | |
Net increase (decrease) from investment operations | | | (7.51 | ) | | | 4.08 | | | | 0.94 | | | | 3.59 | | | | (0.34 | ) |
| | | | | | | | | | | | | | | | | | | | |
| | | | | |
Distributions from net investment income(c) | | | (2.07 | ) | | | (2.27 | ) | | | (2.11 | ) | | | (2.65 | ) | | | (2.61 | ) |
| | | | | | | | | | | | | | | | | | | | |
| | | | | |
Net asset value, end of year | | $ | 40.03 | | | $ | 49.61 | | | $ | 47.80 | | | $ | 48.97 | | | $ | 48.03 | |
| | | | | | | | | | | | | | | | | | | | |
| | | | | |
Total Return(d) | | | | | | | | | | | | | | | | | | | | |
Based on net asset value | | | (15.46 | )% | | | 8.56 | % | | | 2.04 | % | | | 7.74 | % | | | (0.71 | )% |
| | | | | | | | | | | | | | | | | | | | |
| | | | | |
Ratios to Average Net Assets(e) | | | | | | | | | | | | | | | | | | | | |
Total expenses | | | 0.40 | % | | | 0.40 | % | | | 0.40 | % | | | 0.40 | % | | | 0.40 | % |
| | | | | | | | | | | | | | | | | | | | |
| | | | | |
Net investment income | | | 4.48 | % | | | 4.16 | % | | | 4.65 | % | | | 5.02 | % | | | 4.95 | % |
| | | | | | | | | | | | | | | | | | | | |
| | | | | |
Supplemental Data | | | | | | | | | | | | | | | | | | | | |
Net assets, end of year (000) | | $ | 100,077 | | | $ | 193,464 | | | $ | 176,851 | | | $ | 176,300 | | | $ | 211,353 | |
| | | | | | | | | | | | | | | | | | | | |
| | | | | |
Portfolio turnover rate(f) | | | 16 | % | | | 31 | % | | | 33 | % | | | 24 | % | | | 20 | % |
| | | | | | | | | | | | | | | | | | | | |
| (a) | Based on average shares outstanding. |
| (b) | The amounts reported for a share outstanding may not accord with the change in aggregate gains and losses in securities for the fiscal period due to the timing of capital share transactions in relation to the fluctuating market values of the Fund’s underlying securities. |
| (c) | Distributions for annual periods determined in accordance with U.S. federal income tax regulations. |
| (d) | Where applicable, assumes the reinvestment of distributions. |
| (e) | Excludes fees and expenses incurred indirectly as a result of investments in underlying funds. |
| (f) | Portfolio turnover rate excludes in-kind transactions. |
See notes to financial statements.
| | |
F I N A N C I A L H I G H L I G H T S | | 77 |
Notes to Financial Statements
1. ORGANIZATION
iShares, Inc. (the “Company”) is registered under the Investment Company Act of 1940, as amended (the “1940 Act”), as an open-end management investment company. The Company is organized as a Maryland corporation and is authorized to have multiple series or portfolios.
These financial statements relate only to the following funds (each, a “Fund” and collectively, the “Funds”):
| | |
| | |
iShares ETF | | Diversification
Classification |
| |
International High Yield Bond | | Diversified |
J.P. Morgan EM Corporate Bond | | Diversified |
J.P. Morgan EM High Yield Bond | | Non-diversified |
J.P. Morgan EM Local Currency Bond | | Non-diversified |
US & Intl High Yield Corp Bond | | Diversified |
2. SIGNIFICANT ACCOUNTING POLICIES
The financial statements are prepared in conformity with accounting principles generally accepted in the United States of America (“U.S. GAAP”), which may require management to make estimates and assumptions that affect the reported amounts of assets and liabilities in the financial statements, disclosure of contingent assets and liabilities at the date of the financial statements and the reported amounts of increases and decreases in net assets from operations during the reporting period. Actual results could differ from those estimates. Each Fund is considered an investment company under U.S. GAAP and follows the accounting and reporting guidance applicable to investment companies. Below is a summary of significant accounting policies:
Investment Transactions and Income Recognition: For financial reporting purposes, investment transactions are recorded on the dates the transactions are executed. Realized gains and losses on investment transactions are determined using the specific identification method. Dividend income and capital gain distributions, if any, are recorded on the ex-dividend date. Non-cash dividends, if any, are recorded on the ex-dividend date at fair value. Dividends from foreign securities where the ex-dividend date may have passed are subsequently recorded when the Funds are informed of the ex-dividend date. Under the applicable foreign tax laws, a withholding tax at various rates may be imposed on capital gains, dividends and interest. Interest income, including amortization and accretion of premiums and discounts on debt securities, and payment-in-kind interest are recognized daily on an accrual basis.
Foreign Currency Translation: Each Fund’s books and records are maintained in U.S. dollars. Securities and other assets and liabilities denominated in foreign currencies are translated into U.S. dollars using prevailing market rates as quoted by one or more data service providers. Purchases and sales of investments are recorded at the rates of exchange prevailing on the respective dates of such transactions. Generally, when the U.S. dollar rises in value against a foreign currency, the investments denominated in that currency will lose value; the opposite effect occurs if the U.S. dollar falls in relative value.
Each Fund does not isolate the effect of fluctuations in foreign exchange rates from the effect of fluctuations in the market prices of investments for financial reporting purposes. Accordingly, the effects of changes in exchange rates on investments are not segregated in the Statements of Operations from the effects of changes in market prices of those investments, but are included as a component of net realized and unrealized gain (loss) from investments. Each Fund reports realized currency gains (losses) on foreign currency related transactions as components of net realized gain (loss) for financial reporting purposes, whereas such components are generally treated as ordinary income for U.S. federal income tax purposes.
Foreign Taxes: The Funds may be subject to foreign taxes (a portion of which may be reclaimable) on income, stock dividends, capital gains on investments, or certain foreign currency transactions. All foreign taxes are recorded in accordance with the applicable foreign tax regulations and rates that exist in the foreign jurisdictions in which each Fund invests. These foreign taxes, if any, are paid by each Fund and are reflected in its Statements of Operations as follows: foreign taxes withheld at source are presented as a reduction of income, foreign taxes on securities lending income are presented as a reduction of securities lending income, foreign taxes on stock dividends are presented as “Other foreign taxes”, and foreign taxes on capital gains from sales of investments and foreign taxes on foreign currency transactions are included in their respective net realized gain (loss) categories. Foreign taxes payable or deferred as of October 31, 2022, if any, are disclosed in the Statements of Assets and Liabilities.
The Funds file withholding tax reclaims in certain jurisdictions to recover a portion of amounts previously withheld. The Funds may record a reclaim receivable based on collectability, which includes factors such as the jurisdiction’s applicable laws, payment history and market convention. The Statements of Operations includes tax reclaims recorded as well as professional and other fees, if any, associated with recovery of foreign withholding taxes.
In-kind Redemptions: For financial reporting purposes, in-kind redemptions are treated as sales of securities resulting in realized capital gains or losses to the Funds. Because such gains or losses are not taxable to the Funds and are not distributed to existing Fund shareholders, the gains or losses are reclassified from accumulated net realized gain (loss) to paid-in capital at the end of the Funds’ tax year. These reclassifications have no effect on net assets or net asset value (“NAV”) per share.
Distributions: Dividends and distributions paid by each Fund are recorded on the ex-dividend dates. Distributions are determined on a tax basis and may differ from net investment income, net realized capital gains and/or return of capital for financial reporting purposes. Dividends and distributions are paid in U.S. dollars and cannot be automatically reinvested in additional shares of the Funds.
The character and timing of distributions are determined in accordance with U.S. federal income tax regulations, which may differ from U.S. GAAP. The portion of distributions that exceeds each Fund’s current and accumulated earning and profits will constitute a non-taxable return of capital. Distributions in excess of each Fund’s
| | |
| 78 | | 2 0 2 2 I S H A R E S A N N U A L R E P O R T T O S H A R E H O L D E R S |
Notes to Financial Statements (continued)
minimum distribution requirements, but not in excess of the Fund’s earnings and profits, will be taxable to the Fund’s shareholders and will not constitute non-taxable returns of capital. Return of capital distributions will reduce a shareholder’s cost basis and will result in higher capital gains or lower capital losses when each Fund’s shares on which distributions were received are sold. Once a shareholder’s cost basis is reduced to zero, further distributions will be treated as capital gains.
Indemnifications: In the normal course of business, each Fund enters into contracts that contain a variety of representations that provide general indemnification. The Funds’ maximum exposure under these arrangements is unknown because it involves future potential claims against the Funds, which cannot be predicted with any certainty.
3. INVESTMENT VALUATION AND FAIR VALUE MEASUREMENTS
Investment Valuation Policies: Each Fund’s investments are valued at fair value (also referred to as “market value” within the financial statements) each day that the Fund’s listing exchange is open and, for financial reporting purposes, as of the report date. U.S. GAAP defines fair value as the price a fund would receive to sell an asset or pay to transfer a liability in an orderly transaction between market participants at the measurement date. The Board of Directors of the Company (the “Board”) of each Fund has approved the designation of BlackRock Fund Advisors (“BFA”), the Funds’ investment adviser, as the valuation designee for each Fund. Each Fund determines the fair values of its financial instruments using various independent dealers or pricing services under BFA’s policies. If a security’s market price is not readily available or does not otherwise accurately represent the fair value of the security, the security will be valued in accordance with BFA’s policies and procedures as reflecting fair value. BFA has formed a committee (the “Valuation Committee”) to develop pricing policies and procedures and to oversee the pricing function for all financial instruments, with assistance from other BlackRock pricing committees.
Fair Value Inputs and Methodologies: The following methods and inputs are used to establish the fair value of each Fund’s assets and liabilities:
| | • | | Equity investments traded on a recognized securities exchange are valued at that day’s official closing price, as applicable, on the exchange where the stock is primarily traded. Equity investments traded on a recognized exchange for which there were no sales on that day are valued at the last traded price. |
| | • | | Fixed-income investments for which market quotations are readily available are generally valued using the last available bid price or current market quotations provided by independent dealers or third-party pricing services. Pricing services generally value fixed income securities assuming orderly transactions of an institutional round lot size, but a fund may hold or transact in such securities in smaller, odd lot sizes. Odd lots may trade at lower prices than institutional round lots. The pricing services may use matrix pricing or valuation models that utilize certain inputs and assumptions to derive values, including transaction data (e.g., recent representative bids and offers), market data, credit quality information, perceived market movements, news, and other relevant information. Certain fixed-income securities, including asset-backed and mortgage related securities may be valued based on valuation models that consider the estimated cash flows of each tranche of the entity, establish a benchmark yield and develop an estimated tranche specific spread to the benchmark yield based on the unique attributes of the tranche. The amortized cost method of valuation may be used with respect to debt obligations with sixty days or less remaining to maturity unless BFA determines such method does not represent fair value. |
| | • | | Investments in open-end U.S. mutual funds (including money market funds) are valued at that day’s published NAV. |
If events (e.g., market volatility, company announcement or a natural disaster) occur that are expected to materially affect the value of such investment, or in the event that application of these methods of valuation results in a price for an investment that is deemed not to be representative of the market value of such investment, or if a price is not available, the investment will be valued by the Valuation Committee, in accordance with BFA’s policies and procedures as reflecting fair value (“Fair Valued Investments”). The fair valuation approaches that may be used by the Valuation Committee include market approach, income approach and cost approach. Valuation techniques such as discounted cash flow, use of market comparables and matrix pricing are types of valuation approaches and are typically used in determining fair value. When determining the price for Fair Valued Investments, the Valuation Committee seeks to determine the price that each Fund might reasonably expect to receive or pay from the current sale or purchase of that asset or liability in an arm’s-length transaction. Fair value determinations shall be based upon all available factors that the Valuation Committee deems relevant and consistent with the principles of fair value measurement.
Fair value pricing could result in a difference between the prices used to calculate a fund’s NAV and the prices used by the fund’s underlying index, which in turn could result in a difference between the fund’s performance and the performance of the fund’s underlying index.
Fair Value Hierarchy: Various inputs are used in determining the fair value of financial instruments. These inputs to valuation techniques are categorized into a fair value hierarchy consisting of three broad levels for financial reporting purposes as follows:
| | • | | Level 1 – Unadjusted price quotations in active markets/exchanges for identical assets or liabilities that each Fund has the ability to access; |
| | • | | Level 2 – Other observable inputs (including, but not limited to, quoted prices for similar assets or liabilities in markets that are active, quoted prices for identical or similar assets or liabilities in markets that are not active, inputs other than quoted prices that are observable for the assets or liabilities (such as interest rates, yield curves, volatilities, prepayment speeds, loss severities, credit risks and default rates) or other market-corroborated inputs); and |
| | • | | Level 3 – Unobservable inputs based on the best information available in the circumstances, to the extent observable inputs are not available, (including the Valuation Committee’s assumptions used in determining the fair value of financial instruments). |
The hierarchy gives the highest priority to unadjusted quoted prices in active markets for identical assets or liabilities (Level 1 measurements) and the lowest priority to unobservable inputs (Level 3 measurements). Accordingly, the degree of judgment exercised in determining fair value is greatest for instruments categorized in Level 3. The inputs used to measure fair value may fall into different levels of the fair value hierarchy. In such cases, for disclosure purposes, the fair value hierarchy classification is
| | |
N O T E S T O F I N A N C I A L S T A T E M E N T S | | 79 |
Notes to Financial Statements (continued)
determined based on the lowest level input that is significant to the fair value measurement in its entirety. Investments classified within Level 3 have significant unobservable inputs used by the Valuation Committee in determining the price for Fair Valued Investments. Level 3 investments include equity or debt issued by privately held companies or funds that may not have a secondary market and/or may have a limited number of investors. The categorization of a value determined for financial instruments is based on the pricing transparency of the financial instruments and is not necessarily an indication of the risks associated with investing in those securities.
4. SECURITIES AND OTHER INVESTMENTS
Zero-Coupon Bonds: Zero-coupon bonds are normally issued at a significant discount from face value and do not provide for periodic interest payments. These bonds may experience greater volatility in market value than other debt obligations of similar maturity which provide for regular interest payments.
Securities Lending: Each Fund may lend its securities to approved borrowers, such as brokers, dealers and other financial institutions. The borrower pledges and maintains with the Fund collateral consisting of cash, an irrevocable letter of credit issued by an approved bank, or securities issued or guaranteed by the U.S. government. The initial collateral received by each Fund is required to have a value of at least 102% of the current market value of the loaned securities for securities traded on U.S. exchanges and a value of at least 105% for all other securities. The collateral is maintained thereafter at a value equal to at least 100% of the current value of the securities on loan. The market value of the loaned securities is determined at the close of each business day of the Fund and any additional required collateral is delivered to the Fund or excess collateral is returned by the Fund, on the next business day. During the term of the loan, each Fund is entitled to all distributions made on or in respect of the loaned securities but does not receive interest income on securities received as collateral. Loans of securities are terminable at any time and the borrower, after notice, is required to return borrowed securities within the standard time period for settlement of securities transactions.
As of period end, any securities on loan were collateralized by cash and/or U.S. Government obligations. Cash collateral invested in money market funds managed by BFA, or its affiliates is disclosed in the Schedule of Investments. Any non-cash collateral received cannot be sold, re-invested or pledged by the Fund, except in the event of borrower default. The securities on loan, if any, are also disclosed in each Fund’s Schedule of Investments. The market value of any securities on loan and the value of any related cash collateral are disclosed in the Statements of Assets and Liabilities.
Securities lending transactions are entered into by the Funds under Master Securities Lending Agreements (each, an “MSLA”) which provide the right, in the event of default (including bankruptcy or insolvency) for the non-defaulting party to liquidate the collateral and calculate a net exposure to the defaulting party or request additional collateral. In the event that a borrower defaults, the Funds, as lender, would offset the market value of the collateral received against the market value of the securities loaned. When the value of the collateral is greater than that of the market value of the securities loaned, the lender is left with a net amount payable to the defaulting party. However, bankruptcy or insolvency laws of a particular jurisdiction may impose restrictions on or prohibitions against such a right of offset in the event of an MSLA counterparty’s bankruptcy or insolvency. Under the MSLA, absent an event of default, the borrower can resell or re-pledge the loaned securities, and the Funds can reinvest cash collateral received in connection with loaned securities. Upon an event of default, the parties’ obligations to return the securities or collateral to the other party are extinguished, and the parties can resell or re-pledge the loaned securities or the collateral received in connection with the loaned securities in order to satisfy the defaulting party’s net payment obligation for all transactions under the MSLA. The defaulting party remains liable for any deficiency.
As of period end, the following table is a summary of the securities on loan by counterparty which are subject to offset under an MSLA:
| | | | | | | | | | | | | | | | |
| | | | | |
iShares ETF and Counterparty | |
| Securities Loaned
at Value |
| |
| Cash Collateral
Received |
(a) | |
| Non-Cash Collateral
Received, at Fair Value |
(a) | | | Net Amount | |
J.P. Morgan EM Corporate Bond | | | | | | | | | | | | | | | | |
Barclays Bank PLC | | $ | 1,009,454 | | | $ | (1,009,454 | ) | | $ | — | | | $ | — | |
Barclays Capital, Inc. | | | 2,015,022 | | | | (2,015,022 | ) | | | — | | | | — | |
BNP Paribas SA | | | 736,434 | | | | (736,434 | ) | | | — | | | | — | |
BofA Securities, Inc. | | | 1,103,342 | | | | (1,103,342 | ) | | | — | | | | — | |
Citadel Clearing LLC | | | 304,130 | | | | (304,130 | ) | | | — | | | | — | |
Citigroup Global Markets, Inc. | | | 2,351,503 | | | | (2,351,503 | ) | | | — | | | | — | |
Credit Suisse Securities (USA) LLC | | | 429,423 | | | | (429,423 | ) | | | — | | | | — | |
HSBC Securities (USA), Inc. | | | 315,180 | | | | (315,180 | ) | | | — | | | | — | |
J.P. Morgan Securities LLC | | | 2,378,386 | | | | (2,378,386 | ) | | | — | | | | — | |
Jefferies LLC | | | 1,466,605 | | | | (1,466,605 | ) | | | — | | | | — | |
Morgan Stanley | | | 1,462,034 | | | | (1,462,034 | ) | | | — | | | | — | |
Nomura Securities International, Inc. | | | 427,305 | | | | (427,305 | ) | | | — | | | | — | |
Pershing LLC | | | 414,040 | | | | (414,040 | ) | | | — | | | | — | |
Scotia Capital (USA), Inc. | | | 54,976 | | | | (54,976 | ) | | | — | | | | — | |
Wells Fargo Securities LLC | | | 2,178,432 | | | | (2,178,432 | ) | | | — | | | | — | |
| | | | | | | | | | | | | | | | |
| | | | |
| | $ | 16,646,266 | | | $ | (16,646,266 | ) | | $ | — | | | $ | — | |
| | | | | | | | | | | | | | | | |
| | |
| 80 | | 2 0 2 2 I S H A R E S A N N U A L R E P O R T T O S H A R E H O L D E R S |
Notes to Financial Statements (continued)
| | | | | | | | | | | | | | | | |
| | | | | |
iShares ETF and Counterparty | |
| Securities Loaned
at Value |
| |
| Cash Collateral
Received |
(a) | |
| Non-Cash Collateral
Received, at Fair Value |
(a) | | | Net Amount | |
J.P. Morgan EM High Yield Bond | | | | | | | | | | | | | | | | |
Barclays Bank PLC | | $ | 358,331 | | | $ | (358,331 | ) | | $ | — | | | $ | — | |
Barclays Capital, Inc. | | | 1,971,799 | | | | (1,971,799 | ) | | | — | | | | — | |
BMO Capital Markets Corp. | | | 15,448 | | | | (15,448 | ) | | | — | | | | — | |
BNP Paribas SA | | | 2,003,115 | | | | (2,003,115 | ) | | | — | | | | — | |
BofA Securities, Inc. | | | 5,362,426 | | | | (5,362,426 | ) | | | — | | | | — | |
Citadel Clearing LLC | | | 173,040 | | | | (173,040 | ) | | | — | | | | — | |
Citigroup Global Markets, Inc. | | | 1,719,372 | | | | (1,719,372 | ) | | | — | | | | — | |
Credit Suisse Securities (USA) LLC | | | 394,602 | | | | (394,602 | ) | | | — | | | | — | |
Goldman Sachs & Co. LLC | | | 2,075,018 | | | | (2,075,018 | ) | | | — | | | | — | |
J.P. Morgan Securities LLC | | | 9,619,361 | | | | (9,619,361 | ) | | | — | | | | — | |
Jefferies LLC | | | 3,146,649 | | | | (3,146,649 | ) | | | — | | | | — | |
Morgan Stanley | | | 487,151 | | | | (487,151 | ) | | | — | | | | — | |
Nomura Securities International, Inc. | | | 1,234,463 | | | | (1,234,463 | ) | | | — | | | | — | |
Pershing LLC | | | 394,000 | | | | (394,000 | ) | | | — | | | | — | |
RBC Capital Markets LLC | | | 570,655 | | | | (570,655 | ) | | | — | | | | — | |
Scotia Capital (USA), Inc. | | | 1,167,811 | | | | (1,167,811 | ) | | | — | | | | — | |
UBS AG | | | 1,651 | | | | (1,651 | ) | | | — | | | | — | |
Wells Fargo Securities LLC | | | 360,405 | | | | (360,405 | ) | | | — | | | | — | |
| | | | | | | | | | | | | | | | |
| | | | |
| | $ | 31,055,297 | | | $ | (31,055,297 | ) | | $ | — | | | $ | — | |
| | | | | | | | | | | | | | | | |
US & Intl High Yield Corp Bond | | | | | | | | | | | | | | | | |
Barclays Bank PLC | | $ | 1,205,087 | | | $ | (1,205,087 | ) | | $ | — | | | $ | — | |
Barclays Capital, Inc. | | | 810,319 | | | | (810,319 | ) | | | — | | | | — | |
BMO Capital Markets Corp. | | | 162,211 | | | | (162,211 | ) | | | — | | | | — | |
BNP Paribas SA | | | 1,675,163 | | | | (1,675,163 | ) | | | — | | | | — | |
BofA Securities, Inc. | | | 426,901 | | | | (426,901 | ) | | | — | | | | — | |
Citadel Clearing LLC | | | 294,155 | | | | (294,155 | ) | | | — | | | | — | |
Citigroup Global Markets, Inc. | | | 185,839 | | | | (185,839 | ) | | | — | | | | — | |
Credit Suisse Securities (USA) LLC | | | 115,156 | | | | (115,156 | ) | | | — | | | | — | |
Deutsche Bank Securities, Inc. | | | 375,799 | | | | (375,799 | ) | | | — | | | | — | |
Goldman Sachs & Co. LLC | | | 5,066,967 | | | | (5,066,967 | ) | | | — | | | | — | |
J.P. Morgan Securities LLC | | | 2,073,758 | | | | (2,073,758 | ) | | | — | | | | — | |
Jefferies LLC | | | 266,755 | | | | (266,755 | ) | | | — | | | | — | |
Morgan Stanley | | | 472,860 | | | | (472,860 | ) | | | — | | | | — | |
Nomura Securities International, Inc. | | | 119,430 | | | | (119,430 | ) | | | — | | | | — | |
Pershing LLC | | | 32,502 | | | | (32,502 | ) | | | — | | | | — | |
RBC Capital Markets LLC | | | 1,142,300 | | | | (1,142,300 | ) | | | — | | | | — | |
Scotia Capital (USA), Inc. | | | 119,877 | | | | (119,877 | ) | | | — | | | | — | |
State Street Bank & Trust Co. | | | 268,217 | | | | (268,217 | ) | | | — | | | | — | |
Wells Fargo Securities LLC | | | 94,505 | | | | (94,505 | ) | | | — | | | | — | |
| | | | | | | | | | | | | | | | |
| | | | |
| | $ | 14,907,801 | | | $ | (14,907,801 | ) | | $ | — | | | $ | — | |
| | | | | | | | | | | | | | | | |
| | (a) | Collateral received, if any, in excess of the market value of securities on loan is not presented in this table. The total cash collateral received by each Fund is disclosed in the Funds’ Statements of Assets and Liabilities. | |
The risks of securities lending include the risk that the borrower may not provide additional collateral when required or may not return the securities when due. To mitigate these risks, each Fund benefits from a borrower default indemnity provided by BlackRock, Inc. (“BlackRock”). BlackRock’s indemnity allows for full replacement of the securities loaned to the extent the collateral received does not cover the value of the securities loaned in the event of borrower default. Each Fund could incur a loss if the value of an investment purchased with cash collateral falls below the market value of the loaned securities or if the value of an investment purchased with cash collateral falls below the value of the original cash collateral received. Such losses are borne entirely by each Fund.
5. INVESTMENT ADVISORY AGREEMENT AND OTHER TRANSACTIONS WITH AFFILIATES
Investment Advisory Fees: Pursuant to an Investment Advisory Agreement with the Company, BFA manages the investment of each Fund’s assets. BFA is a California corporation indirectly owned by BlackRock. Under the Investment Advisory Agreement, BFA is responsible for substantially all expenses of the Funds, except (i) interest and taxes; (ii) brokerage commissions and other expenses connected with the execution of portfolio transactions; (iii) distribution fees; (iv) the advisory fee payable to BFA; and (v) litigation expenses and any extraordinary expenses (in each case as determined by a majority of the independent directors).
| | |
N O T E S T O F I N A N C I A L S T A T E M E N T S | | 81 |
Notes to Financial Statements (continued)
For its investment advisory services to each of the following Funds, BFA is entitled to an annual investment advisory fee, accrued daily and paid monthly by the Funds, based on the average daily net assets of each Fund as follows:
| | | | |
| | |
iShares ETF | | Investment Advisory Fees | |
| |
International High Yield Bond | | | 0.40 | % |
J.P. Morgan EM Corporate Bond | | | 0.50 | |
J.P. Morgan EM High Yield Bond | | | 0.50 | |
J.P. Morgan EM Local Currency Bond | | | 0.30 | |
US & Intl High Yield Corp Bond | | | 0.40 | |
Sub-Adviser: BFA has entered into a sub-advisory agreement with BlackRock International Limited (“BIL”), an affiliate of BFA, under which BFA pays BIL for services it provides to the iShares International High Yield Bond ETF, iShares J.P. Morgan EM Corporate Bond ETF, iShares J.P. Morgan EM High Yield Bond ETF, iShares J.P. Morgan EM Local Currency Bond ETF and iShares US & Intl High Yield Corp Bond ETF. BFA has entered into a separate sub-advisory agreement with BlackRock (Singapore) Limited (“BRS”, together with BlackRock International Limited, the “Sub-Advisers”), both affiliates of BFA, under which BFA pays BRS for services it provides to the iShares J.P. Morgan EM Local Currency Bond ETF.
Distributor: BlackRock Investments, LLC, an affiliate of BFA, is the distributor for each Fund. Pursuant to the distribution agreement, BFA is responsible for any fees or expenses for distribution services provided to the Funds.
Securities Lending: The U.S. Securities and Exchange Commission (the “SEC”) has issued an exemptive order which permits BlackRock Institutional Trust Company, N.A. (“BTC”), an affiliate of BFA, to serve as securities lending agent for the Funds, subject to applicable conditions. As securities lending agent, BTC bears all operational costs directly related to securities lending, including any custodial costs. Each Fund is responsible for fees in connection with the investment of cash collateral received for securities on loan (the “collateral investment fees”). The cash collateral is invested in a money market fund, BlackRock Cash Funds: Institutional or BlackRock Cash Funds: Treasury, managed by BFA, or its affiliates. However, BTC has agreed to reduce the amount of securities lending income it receives in order to effectively limit the collateral investment fees each Fund bears to an annual rate of 0.04%. The SL Agency Shares of such money market fund will not be subject to a sales load, distribution fee or service fee. The money market fund in which the cash collateral has been invested may, under certain circumstances, impose a liquidity fee of up to 2% of the value redeemed or temporarily restrict redemptions for up to 10 business days during a 90 day period, in the event that the money market fund’s weekly liquid assets fall below certain thresholds.
Securities lending income is equal to the total of income earned from the reinvestment of cash collateral, net of fees and other payments to and from borrowers of securities, and less the collateral investment fees. Each Fund retains a portion of securities lending income and remits the remaining portion to BTC as compensation for its services as securities lending agent.
Pursuant to the current securities lending agreement, each Fund retains 82% of securities lending income (which excludes collateral investment fees), and the amount retained can never be less than 70% of the total of securities lending income plus the collateral investment fees.
In addition, commencing the business day following the date that the aggregate securities lending income plus the collateral investment fees generated across all 1940 Act iShares exchange-traded funds (the “iShares ETF Complex”) in that calendar year exceeds a specified threshold, each Fund, pursuant to the securities lending agreement, will retain for the remainder of that calendar year 85% of securities lending income (which excludes collateral investment fees) and the amount retained can never be less than 70% of the total of securities lending income plus the collateral investment fees.
The share of securities lending income earned by each Fund is shown as securities lending income – affiliated – net in its Statements of Operations. For the year ended October 31, 2022, the Funds paid BTC the following amounts for securities lending agent services:
| | | | |
| | |
iShares ETF | | Amounts | |
| |
J.P. Morgan EM Corporate Bond | | $ | 44,953 | |
J.P. Morgan EM High Yield Bond | | | 57,898 | |
US & Intl High Yield Corp Bond | | | 23,563 | |
Officers and Directors: Certain officers and/or directors of the Company are officers and/or directors of BlackRock or its affiliates.
Other Transactions: Cross trading is the buying or selling of portfolio securities between funds to which BFA (or an affiliate) serves as investment adviser. At its regularly scheduled quarterly meetings, the Board reviews such transactions as of the most recent calendar quarter for compliance with the requirements and restrictions set forth by Rule 17a-7.
For the year ended October 31, 2022, transactions executed by the Funds pursuant to Rule 17a-7 under the 1940 Act were as follows:
| | | | | | | | | | | | |
| | | | |
iShares ETF | | Purchases | | | Sales | | | Net Realized
Gain (Loss) | |
| | | |
J.P. Morgan EM Corporate Bond | | $ | 1,242,333 | | | $ | 301,219 | | | $ | (50,676 | ) |
J.P. Morgan EM High Yield Bond | | | 5,510,539 | | | | 1,396,320 | | | | (303,398 | ) |
J.P. Morgan EM Local Currency Bond | | | 1,003,083 | | | | — | | | | — | |
US & Intl High Yield Corp Bond | | | 43,923 | | | | 1,684,644 | | | | (69,110 | ) |
| | |
| 82 | | 2 0 2 2 I S H A R E S A N N U A L R E P O R T T O S H A R E H O L D E R S |
Notes to Financial Statements (continued)
Each Fund may invest its positive cash balances in certain money market funds managed by BFA or an affiliate. The income earned on these temporary cash investments is shown as dividends – affiliated in the Statements of Operations.
A fund, in order to improve its portfolio liquidity and its ability to track its underlying index, may invest in shares of other iShares funds that invest in securities in the fund’s underlying index.
6. PURCHASES AND SALES
For the year ended October 31, 2022, purchases and sales of investments, excluding short-term securities and in-kind transactions, were as follows:
| | | | | | | | |
| | | |
iShares ETF | | Purchases | | | Sales | |
| | |
International High Yield Bond | | $ | 10,806,661 | | | $ | 12,120,036 | |
J.P. Morgan EM Corporate Bond | | | 79,355,520 | | | | 75,219,881 | |
J.P. Morgan EM High Yield Bond | | | 93,854,847 | | | | 69,379,390 | |
J.P. Morgan EM Local Currency Bond | | | 214,387,968 | | | | 212,244,698 | |
US & Intl High Yield Corp Bond | | | 23,218,494 | | | | 24,204,737 | |
For the year ended October 31, 2022, in-kind transactions were as follows:
| | | | | | | | |
| | | |
iShares ETF | | In-kind
Purchases | | | In-kind Sales | |
| | |
International High Yield Bond | | $ | — | | | $ | 22,100,600 | |
J.P. Morgan EM Corporate Bond | | | 45,207,866 | | | | 182,042,703 | |
J.P. Morgan EM High Yield Bond | | | 69,979,986 | | | | 149,246,540 | |
J.P. Morgan EM Local Currency Bond | | | 59,450,634 | | | | 95,411,748 | |
US & Intl High Yield Corp Bond | | | 20,762,882 | | | | 84,592,488 | |
7. INCOME TAX INFORMATION
Each Fund is treated as an entity separate from the Company’s other funds for federal income tax purposes. It is each Fund’s policy to comply with the requirements of the Internal Revenue Code of 1986, as amended, applicable to regulated investment companies, and to distribute substantially all of its taxable income to its shareholders. Therefore, no U.S. federal income tax provision is required.
Management has analyzed tax laws and regulations and their application to the Funds as of October 31, 2022, inclusive of the open tax return years, and does not believe that there are any uncertain tax positions that require recognition of a tax liability in the Funds’ financial statements.
U.S. GAAP requires that certain components of net assets be adjusted to reflect permanent differences between financial and tax reporting. These reclassifications have no effect on net assets or NAV per share. As of October 31, 2022, permanent differences attributable to distributions paid in excess of taxable income, net operating loss and realized gains (losses) from in-kind redemptions were reclassified to the following accounts:
| | | | | | | | |
| | | |
iShares ETF | | Paid-in Capital | | | Accumulated
Earnings (Loss) | |
| | |
International High Yield Bond | | $ | (3,410,483 | ) | | $ | 3,410,483 | |
J.P. Morgan EM Corporate Bond | | | (12,995,290 | ) | | | 12,995,290 | |
J.P. Morgan EM High Yield Bond | | | (22,062,932 | ) | | | 22,062,932 | |
J.P. Morgan EM Local Currency Bond | | | (18,491,226 | ) | | | 18,491,226 | |
US & Intl High Yield Corp Bond | | | (4,701,776 | ) | | | 4,701,776 | |
The tax character of distributions paid was as follows:
| | | | | | | | |
| | | |
iShares ETF | | Year Ended
10/31/22 | | | Year Ended
10/31/21 | |
| | |
International High Yield Bond | | | | | | | | |
Ordinary income | | $ | 2,017,426 | | | $ | 736,269 | |
Return of capital | | | 85,561 | | | | — | |
| | | | | | | | |
| | $ | 2,102,987 | | | $ | 736,269 | |
| | | | | | | | |
J.P. Morgan EM Corporate Bond | | | | | | | | |
Ordinary income | | $ | 15,559,902 | | | $ | 11,947,480 | |
| | | | | | | | |
J.P. Morgan EM High Yield Bond | | | | | | | | |
Ordinary income | | $ | 25,663,616 | | | $ | 22,290,589 | |
| | | | | | | | |
| | |
N O T E S T O F I N A N C I A L S T A T E M E N T S | | 83 |
Notes to Financial Statements (continued)
| | | | | | | | |
| | | |
iShares ETF | | Year Ended
10/31/22 | | | Year Ended
10/31/21 | |
| | |
J.P. Morgan EM Local Currency Bond | | | | | | | | |
Ordinary income | | $ | 19,531,059 | | | $ | — | |
| | | | | | | | |
US & Intl High Yield Corp Bond | | | | | | | | |
Ordinary income | | $ | 6,204,063 | | | $ | 8,596,496 | |
| | | | | | | | |
As of October 31, 2022, the tax components of accumulated net earnings (losses) were as follows:
| | | | | | | | | | | | | | | | |
| | | | | |
iShares ETF | |
| Undistributed
Ordinary Income |
| |
| Non-expiring
Capital Loss
Carryforwards |
(a) | |
| Net Unrealized
Gains (Losses) |
(b) | | | Total | |
| | | | |
International High Yield Bond | | $ | — | | | $ | (5,617,695 | ) | | $ | (10,729,631 | ) | | $ | (16,347,326 | ) |
J.P. Morgan EM Corporate Bond | | | 1,591,129 | | | | (23,164,025 | ) | | | (64,758,210 | ) | | | (86,331,106 | ) |
J.P. Morgan EM High Yield Bond | | | 2,286,240 | | | | (81,211,562 | ) | | | (104,865,482 | ) | | | (183,790,804 | ) |
J.P. Morgan EM Local Currency Bond | | | — | | | | (61,839,894 | ) | | | (112,348,434 | ) | | | (174,188,328 | ) |
US & Intl High Yield Corp Bond | | | 152,229 | | | | (8,797,963 | ) | | | (19,021,010 | ) | | | (27,666,744 | ) |
| | (a) | Amounts available to offset future realized capital gains. | |
| | (b) | The difference between book-basis and tax-basis unrealized gains (losses) was attributable primarily to the tax deferral of losses on wash sales, the realization for tax purposes of unrealized gains (losses) on certain foreign currency contracts, amortization methods for premiums and discounts on fixed income securities and the accrual of income on securities in default. | |
As of October 31, 2022, gross unrealized appreciation and depreciation based on cost of investments (including short positions and derivatives, if any) for U.S. federal income tax purposes were as follows:
| | | | | | | | | | | | | | | | |
| | | | | |
iShares ETF | | Tax Cost | | | Gross Unrealized
Appreciation | | | Gross Unrealized
Depreciation | | | Net Unrealized
Appreciation
(Depreciation) | |
| | | | |
International High Yield Bond | | $ | 41,523,537 | | | $ | 87,095 | | | $ | (10,803,446 | ) | | $ | (10,716,351 | ) |
J.P. Morgan EM Corporate Bond | | | 367,468,823 | | | | 607,293 | | | | (65,365,512 | ) | | | (64,758,219 | ) |
J.P. Morgan EM High Yield Bond | | | 425,823,415 | | | | 698,392 | | | | (105,563,832 | ) | | | (104,865,440 | ) |
J.P. Morgan EM Local Currency Bond | | | 451,155,984 | | | | 489,189 | | | | (112,429,523 | ) | | | (111,940,334 | ) |
US & Intl High Yield Corp Bond | | | 132,976,408 | | | | 302,743 | | | | (19,314,647 | ) | | | (19,011,904 | ) |
8. LINE OF CREDIT
The iShares J.P. Morgan EM Local Currency Bond ETF, along with certain other iShares funds (“Participating Funds”), is a party to a $800 million credit agreement (“Syndicated Credit Agreement”) with a group of lenders, which expires on August 11, 2023. The line of credit may be used for temporary or emergency purposes, including redemptions, settlement of trades and rebalancing of portfolio holdings in certain target markets. The Funds may borrow up to the aggregate commitment amount subject to asset coverage and other limitations as specified in the Syndicated Credit Agreement. The Syndicated Credit Agreement has the following terms: a commitment fee of 0.15% per annum on the unused portion of the credit agreement and interest at a rate equal to the higher of (a) Daily Simple Secured Overnight Financing Rate (“SOFR”) plus 0.10% and 1.00% per annum or (b) the U.S. Federal Funds rate plus 1.00% per annum on amounts borrowed. The commitment fee is generally allocated to each Participating Fund based on the lesser of a Participating Fund’s relative exposure to certain target markets or a Participating Fund’s maximum borrowing amount as set forth by the terms of the Syndicated Credit Agreement.
During the year ended October 31, 2022, the Fund did not borrow under the Syndicated Credit Agreement.
9. PRINCIPAL RISKS
In the normal course of business, each Fund invests in securities or other instruments and may enter into certain transactions, and such activities subject the Fund to various risks, including, among others, fluctuations in the market (market risk) or failure of an issuer to meet all of its obligations. The value of securities or other instruments may also be affected by various factors, including, without limitation: (i) the general economy; (ii) the overall market as well as local, regional or global political and/or social instability; (iii) regulation, taxation or international tax treaties between various countries; or (iv) currency, interest rate or price fluctuations. Local, regional or global events such as war, acts of terrorism, the spread of infectious illness or other public health issues, recessions, or other events could have a significant impact on the Funds and their investments. Each Fund’s prospectus provides details of the risks to which the Fund is subject.
BFA uses a “passive” or index approach to try to achieve each Fund’s investment objective following the securities included in its underlying index during upturns as well as downturns. BFA does not take steps to reduce market exposure or to lessen the effects of a declining market. Divergence from the underlying index and the composition of the portfolio is monitored by BFA.
| | |
| 84 | | 2 0 2 2 I S H A R E S A N N U A L R E P O R T T O S H A R E H O L D E R S |
Notes to Financial Statements (continued)
The Funds may be exposed to additional risks when reinvesting cash collateral in money market funds that do not seek to maintain a stable NAV per share of $1.00, which may be subject to redemption gates or liquidity fees under certain circumstances.
Market Risk: Investments in the securities of issuers domiciled in countries with emerging capital markets involve certain additional risks that do not generally apply to investments in securities of issuers in more developed capital markets, such as (i) low or nonexistent trading volume, resulting in a lack of liquidity and increased volatility in prices for such securities; (ii) uncertain national policies and social, political and economic instability, increasing the potential for expropriation of assets, confiscatory taxation, high rates of inflation or unfavorable diplomatic developments; (iii) lack of publicly available or reliable information about issuers as a result of not being subject to the same degree of regulatory requirements and accounting, auditing and financial reporting standards; and (iv) possible fluctuations in exchange rates, differing legal systems and the existence or possible imposition of exchange controls, custodial restrictions or other foreign or U.S. governmental laws or restrictions applicable to such investments.
Each Fund may be exposed to prepayment risk, which is the risk that borrowers may exercise their option to prepay principal earlier than scheduled during periods of declining interest rates, which would force each Fund to reinvest in lower yielding securities. Each Fund may also be exposed to reinvestment risk, which is the risk that income from each Fund’s portfolio will decline if each Fund invests the proceeds from matured, traded or called fixed-income securities at market interest rates that are below each Fund portfolio’s current earnings rate.
An outbreak of respiratory disease caused by a novel coronavirus has developed into a global pandemic and has resulted in closing borders, quarantines, disruptions to supply chains and customer activity, as well as general concern and uncertainty. The impact of this pandemic, and other global health crises that may arise in the future, could affect the economies of many nations, individual companies and the market in general in ways that cannot necessarily be foreseen at the present time. This pandemic may result in substantial market volatility and may adversely impact the prices and liquidity of a fund’s investments. Although vaccines have been developed and approved for use by various governments, the duration of this pandemic and its effects cannot be determined with certainty.
Valuation Risk: The market values of equities, such as common stocks and preferred securities or equity related investments, such as futures and options, may decline due to general market conditions which are not specifically related to a particular company. They may also decline due to factors which affect a particular industry or industries. A fund may invest in illiquid investments. An illiquid investment is any investment that a fund reasonably expects cannot be sold or disposed of in current market conditions in seven calendar days or less without the sale or disposition significantly changing the market value of the investment. A fund may experience difficulty in selling illiquid investments in a timely manner at the price that it believes the investments are worth. Prices may fluctuate widely over short or extended periods in response to company, market or economic news. Markets also tend to move in cycles, with periods of rising and falling prices. This volatility may cause a fund’s NAV to experience significant increases or decreases over short periods of time. If there is a general decline in the securities and other markets, the NAV of a fund may lose value, regardless of the individual results of the securities and other instruments in which a fund invests.
The price each Fund could receive upon the sale of any particular portfolio investment may differ from each Fund’s valuation of the investment, particularly for securities that trade in thin or volatile markets or that are valued using a fair valuation technique or a price provided by an independent pricing service. Changes to significant unobservable inputs and assumptions (i.e., publicly traded company multiples, growth rate, time to exit) due to the lack of observable inputs.
Counterparty Credit Risk: The Funds may be exposed to counterparty credit risk, or the risk that an entity may fail to or be unable to perform on its commitments related to unsettled or open transactions, including making timely interest and/or principal payments or otherwise honoring its obligations. The Funds manage counterparty credit risk by entering into transactions only with counterparties that BFA believes have the financial resources to honor their obligations and by monitoring the financial stability of those counterparties. Financial assets, which potentially expose the Funds to market, issuer and counterparty credit risks, consist principally of financial instruments and receivables due from counterparties. The extent of the Funds’ exposure to market, issuer and counterparty credit risks with respect to these financial assets is approximately their value recorded in the Statements of Assets and Liabilities, less any collateral held by the Funds.
Concentration Risk: A diversified portfolio, where this is appropriate and consistent with a fund’s objectives, minimizes the risk that a price change of a particular investment will have a material impact on the NAV of a fund. The investment concentrations within each Fund’s portfolio are disclosed in its Schedule of Investments.
Certain Funds invest a significant portion of their assets in issuers located in a single country or a limited number of countries. When a fund concentrates its investments in this manner, it assumes the risk that economic, regulatory, political and social conditions in that country or those countries may have a significant impact on the fund and could affect the income from, or the value or liquidity of, the Fund’s portfolio. Unanticipated or sudden political or social developments may cause uncertainty in the markets and as a result adversely affect the Fund’s investments. Foreign issuers may not be subject to the same uniform accounting, auditing and financial reporting standards and practices as used in the United States. Foreign securities markets may also be more volatile and less liquid than U.S. securities and may be less subject to governmental supervision not typically associated with investing in U.S. securities. Investment percentages in specific countries are presented in the Schedule of Investments.
Certain Funds invest a significant portion of their assets in securities of issuers located in Europe or with significant exposure to European issuers or countries. The European financial markets have recently experienced volatility and adverse trends due to concerns about economic downturns in, or rising government debt levels of, several European countries as well as acts of war in the region. These events may spread to other countries in Europe and may affect the value and liquidity of certain of the Funds’ investments.
Responses to the financial problems by European governments, central banks and others, including austerity measures and reforms, may not work, may result in social unrest and may limit future growth and economic recovery or have other unintended consequences. Further defaults or restructurings by governments and others of their debt could have additional adverse effects on economies, financial markets and asset valuations around the world. The United Kingdom has withdrawn from the European Union, and one or more other countries may withdraw from the European Union and/or abandon the Euro, the common currency of the European Union. The impact of these actions, especially if they occur in a disorderly fashion, is not clear but could be significant and far reaching. In addition, Russia launched a large-scale invasion of Ukraine
| | |
N O T E S T O F I N A N C I A L S T A T E M E N T S | | 85 |
Notes to Financial Statements (continued)
on February 24, 2022. The extent and duration of the military action, resulting sanctions and resulting future market disruptions in the region are impossible to predict, but could be significant and have a severe adverse effect on the region, including significant negative impacts on the economy and the markets for certain securities and commodities, such as oil and natural gas, as well as other sectors.
Certain Funds invest a significant portion of their assets in securities of issuers located in Asia or with significant exposure to Asian issuers or countries. The Asian financial markets have recently experienced volatility and adverse trends due to concerns in several Asian countries regarding monetary policy, government intervention in the markets, rising government debt levels or economic downturns. These events may spread to other countries in Asia and may affect the value and liquidity of certain of the Funds’ investments.
Certain Funds invest a significant portion of their assets in high yield securities. High yield securities that are rated below investment-grade (commonly referred to as “junk bonds”) or are unrated may be deemed speculative, involve greater levels of risk than higher-rated securities of similar maturity and are more likely to default. High yield securities may be issued by less creditworthy issuers, and issuers of high yield securities may be unable to meet their interest or principal payment obligations. High yield securities are subject to extreme price fluctuations, may be less liquid than higher rated fixed-income securities, even under normal economic conditions, and frequently have redemption features.
The Funds invest a significant portion of their assets in fixed-income securities and/or use derivatives tied to the fixed-income markets. Changes in market interest rates or economic conditions may affect the value and/or liquidity of such investments. Interest rate risk is the risk that prices of bonds and other fixed-income securities will decrease as interest rates rise and increase as interest rates fall. The Funds may be subject to a greater risk of rising interest rates due to the current period of historically low interest rates. The Federal Reserve has recently begun to raise the federal funds rate as part of its efforts to address inflation. There is a risk that interest rates will continue to rise, which will likely drive down the prices of bonds and other fixed-income securities, and could negatively impact the Funds’ performance.
Significant Shareholder Redemption Risk: Certain shareholders may own or manage a substantial amount of fund shares and/or hold their fund investments for a limited period of time. Large redemptions of fund shares by these shareholders may force a fund to sell portfolio securities, which may negatively impact the fund’s NAV, increase the fund’s brokerage costs, and/or accelerate the realization of taxable income/gains and cause the fund to make additional taxable distributions to shareholders.
LIBOR Transition Risk: The United Kingdom’s Financial Conduct Authority announced a phase out of the London Interbank Offered Rate (“LIBOR”). Although many LIBOR rates ceased to be published or no longer are representative of the underlying market they seek to measure after December 31, 2021, a selection of widely used USD LIBOR rates will continue to be published through June 2023 in order to assist with the transition. The Funds may be exposed to financial instruments tied to LIBOR to determine payment obligations, financing terms, hedging strategies or investment value. The transition process away from LIBOR might lead to increased volatility and illiquidity in markets for, and reduce the effectiveness of new hedges placed against instruments whose terms currently include LIBOR. The ultimate effect of the LIBOR transition process on the Funds is uncertain.
10. CAPITAL SHARE TRANSACTIONS
Capital shares are issued and redeemed by each Fund only in aggregations of a specified number of shares or multiples thereof (“Creation Units”) at NAV. Except when aggregated in Creation Units, shares of each Fund are not redeemable.
Transactions in capital shares were as follows:
| | | | | | | | | | | | | | | | |
| | | |
| | | Year Ended
10/31/22 | | | Year Ended
10/31/21 | |
| | | | |
iShares ETF | | Shares | | | Amount | | | Shares | | | Amount | |
| | | | |
International High Yield Bond | | | | | | | | | | | | | | | | |
Shares sold | | | — | | | $ | — | | | | 400,000 | | | $ | 22,578,514 | |
Shares redeemed | | | (500,000 | ) | | | (23,123,187 | ) | | | — | | | | — | |
| | | | | | | | | | | | | | | | |
| | | (500,000 | ) | | $ | (23,123,187 | ) | | | 400,000 | | | $ | 22,578,514 | |
| | | | | | | | | | | | | | | | |
J.P. Morgan EM Corporate Bond | | | | | | | | | | | | | | | | |
Shares sold | | | 1,100,000 | | | $ | 53,884,330 | | | | 5,900,000 | | | $ | 306,813,811 | |
Shares redeemed | | | (4,100,000 | ) | | | (189,577,126 | ) | | | — | | | | — | |
| | | | | | | | | | | | | | | | |
| | | (3,000,000 | ) | | $ | (135,692,796 | ) | | | 5,900,000 | | | $ | 306,813,811 | |
| | | | | | | | | | | | | | | | |
J.P. Morgan EM High Yield Bond | | | | | | | | | | | | | | | | |
Shares sold | | | 2,400,000 | | | $ | 98,689,988 | | | | 4,250,000 | | | $ | 192,187,348 | |
Shares redeemed | | | (4,250,000 | ) | | | (155,528,886 | ) | | | (400,000 | ) | | | (17,887,795 | ) |
| | | | | | | | | | | | | | | | |
| | | (1,850,000 | ) | | $ | (56,838,898 | ) | | | 3,850,000 | | | $ | 174,299,553 | |
| | | | | | | | | | | | | | | | |
J.P. Morgan EM Local Currency Bond | | | | | | | | | | | | | | | | |
Shares sold | | | 4,200,000 | | | $ | 161,169,803 | | | | 2,800,000 | | | $ | 123,271,919 | |
Shares redeemed | | | (5,800,000 | ) | | | (202,682,800 | ) | | | (2,400,000 | ) | | | (106,018,959 | ) |
| | | | | | | | | | | | | | | | |
| | | (1,600,000 | ) | | $ | (41,512,997 | ) | | | 400,000 | | | $ | 17,252,960 | |
| | | | | | | | | | | | | | | | |
| | |
| 86 | | 2 0 2 2 I S H A R E S A N N U A L R E P O R T T O S H A R E H O L D E R S |
Notes to Financial Statements (continued)
| | | | | | | | | | | | | | | | |
| | | |
| | | Year Ended
10/31/22 | | | Year Ended
10/31/21 | |
| | | | |
iShares ETF | | Shares | | | Amount | | | Shares | | | Amount | |
| | | | |
US & Intl High Yield Corp Bond | | | | | | | | | | | | | | | | |
Shares sold | | | 500,000 | | | $ | 21,399,097 | | | | 600,000 | | | $ | 30,073,163 | |
Shares redeemed | | | (1,900,000 | ) | | | (86,918,598 | ) | | | (400,000 | ) | | | (19,903,275 | ) |
| | | | | | | | | | | | | | | | |
| | | (1,400,000 | ) | | $ | (65,519,501 | ) | | | 200,000 | | | $ | 10,169,888 | |
| | | | | | | | | | | | | | | | |
The consideration for the purchase of Creation Units of a fund in the Company generally consists of the in-kind deposit of a designated portfolio of securities and a specified amount of cash. Certain funds in the Company may be offered in Creation Units solely or partially for cash in U.S. dollars. Investors purchasing and redeeming Creation Units may pay a purchase transaction fee and a redemption transaction fee directly to State Street Bank and Trust Company, the Company’s administrator, to offset transfer and other transaction costs associated with the issuance and redemption of Creation Units, including Creation Units for cash. Investors transacting in Creation Units for cash may also pay an additional variable charge to compensate the relevant fund for certain transaction costs (i.e., stamp taxes, taxes on currency or other financial transactions, and brokerage costs) and market impact expenses relating to investing in portfolio securities. Such variable charges, if any, are included in shares sold in the table above.
From time to time, settlement of securities related to in-kind contributions or in-kind redemptions may be delayed. In such cases, securities related to in-kind transactions are reflected as a receivable or a payable in the Statements of Assets and Liabilities.
11. SUBSEQUENT EVENTS
Management has evaluated the impact of all subsequent events on the Funds through the date the financial statements were available to be issued and has determined that there were no subsequent events requiring adjustment or additional disclosure in the financial statements.
| | |
N O T E S T O �� F I N A N C I A L S T A T E M E N T S | | 87 |
Report of Independent Registered Public Accounting Firm
To the Board of Trustees of
iShares, Inc. and Shareholders of each of the five funds listed in the table below
Opinions on the Financial Statements
We have audited the accompanying statements of assets and liabilities, including the schedules of investments, of each of the funds listed in the table below (five of the funds constituting iShares, Inc., hereafter collectively referred to as the “Funds”) as of October 31, 2022, the related statements of operations for the year ended October 31, 2022, the statements of changes in net assets for each of the two years in the period ended October 31, 2022, including the related notes, and the financial highlights for each of the five years in the period ended October 31, 2022 (collectively referred to as the “financial statements”). In our opinion, the financial statements present fairly, in all material respects, the financial position of each of the Funds as of October 31, 2022, the results of each of their operations for the year then ended, the changes in each of their net assets for each of the two years in the period ended October 31, 2022 and each of the financial highlights for each of the five years in the period ended October 31, 2022 in conformity with accounting principles generally accepted in the United States of America.
iShares International High Yield Bond ETF
iShares J.P. Morgan EM Corporate Bond ETF
iShares J.P. Morgan EM High Yield Bond ETF
iShares J.P. Morgan EM Local Currency Bond ETF
iShares US & Intl High Yield Corp Bond ETF
Basis for Opinions
These financial statements are the responsibility of the Funds’ management. Our responsibility is to express an opinion on the Funds’ financial statements based on our audits. We are a public accounting firm registered with the Public Company Accounting Oversight Board (United States) (PCAOB) and are required to be independent with respect to the Funds in accordance with the U.S. federal securities laws and the applicable rules and regulations of the Securities and Exchange Commission and the PCAOB.
We conducted our audits of these financial statements in accordance with the standards of the PCAOB. Those standards require that we plan and perform the audit to obtain reasonable assurance about whether the financial statements are free of material misstatement, whether due to error or fraud.
Our audits included performing procedures to assess the risks of material misstatement of the financial statements, whether due to error or fraud, and performing procedures that respond to those risks. Such procedures included examining, on a test basis, evidence regarding the amounts and disclosures in the financial statements. Our audits also included evaluating the accounting principles used and significant estimates made by management, as well as evaluating the overall presentation of the financial statements. Our procedures included confirmation of securities owned as of October 31, 2022 by correspondence with the custodian, transfer agent and brokers; when replies were not received from brokers, we performed other auditing procedures. We believe that our audits provide a reasonable basis for our opinions.
/s/PricewaterhouseCoopers LLP
Philadelphia, Pennsylvania
December 22, 2022
We have served as the auditor of one or more BlackRock investment companies since 2000.
| | |
| 88 | | 2 0 2 2 I S H A R E S A N N U A L R E P O R T T O S H A R E H O L D E R S |
Important Tax Information (unaudited)
The Funds intend to pass through to their shareholders the following amounts, or maximum amounts allowable by law, of foreign source income earned and foreign taxes paid for the fiscal year ended October 31, 2022:
| | | | | | | | |
| | | |
iShares ETF | | Foreign Source
Income Earned | | | Foreign
Taxes Paid | |
| | |
International High Yield Bond | | $ | 1,479,328 | | | $ | 660 | |
J.P. Morgan EM Corporate Bond | | | 15,648,550 | | | | — | |
J.P. Morgan EM High Yield Bond | | | 26,695,849 | | | | — | |
J.P. Morgan EM Local Currency Bond | | | 26,840,471 | | | | 591,889 | |
The Funds hereby designate the following amounts, or maximum amounts allowable by law, as interest income eligible to be treated as a Section 163(j) interest dividend for the fiscal year ended October 31, 2022:
| | | | |
| | |
iShares ETF | | Interest Dividends | |
| |
International High Yield Bond | | $ | 1,400,640 | |
J.P. Morgan EM Corporate Bond | | | 12,984,822 | |
J.P. Morgan EM High Yield Bond | | | 23,106,857 | |
J.P. Morgan EM Local Currency Bond | | | 23,707,118 | |
US & Intl High Yield Corp Bond | | | 5,677,437 | |
The Funds hereby designate the following amounts, or maximum amounts allowable by law, as interest-related dividends eligible for exemption from U.S. withholding tax for nonresident aliens and foreign corporations for the fiscal year ended October 31, 2022:
| | | | |
| | |
iShares ETF | | Interest-Related
Dividends | |
| |
International High Yield Bond | | $ | 114,407 | |
J.P. Morgan EM Corporate Bond | | | 506,793 | |
J.P. Morgan EM High Yield Bond | | | 359,535 | |
J.P. Morgan EM Local Currency Bond | | | 10,889 | |
US & Intl High Yield Corp Bond | | | 3,687,521 | |
| | |
I M P O R T A N T T A X I N F O R M A T I O N | | 89 |
Board Review and Approval of Investment Advisory Contract
iShares International HighYield Bond ETF, iShares J.P. Morgan EM Corporate Bond ETF, iShares J.P. Morgan EM HighYield Bond ETF, iShares US & Intl HighYield Corp Bond ETF (the “Fund”)
Under Section 15(c) of the Investment Company Act of 1940 (the “1940 Act”), the Company’s Board of Directors (the “Board”), including a majority of Board Members who are not “interested persons” of the Company (as that term is defined in the 1940 Act) (the “Independent Board Members”), is required annually to consider and approve the Investment Advisory Agreement between the Company and BFA (the “Advisory Agreement”), and the Sub-Advisory Agreement between BFA and BlackRock International Limited, (together the Advisory Agreements”) on behalf of the Fund. The Board’s consideration entails a year-long process whereby the Board and its committees (composed solely of Independent Board Members) assess BlackRock’s services to the Fund, including investment management; fund accounting; administrative and shareholder services; oversight of the Fund’s service providers; risk management and oversight; legal and compliance services; and ability to meet applicable legal and regulatory requirements. The Independent Board Members requested, and BFA provided, such information as the Independent Board Members, with advice from independent counsel, deemed reasonably necessary to evaluate the Advisory Agreements. At meetings on May 3, 2022 and May 18, 2022, a committee composed of all of the Independent Board Members (the “15(c) Committee”), with independent counsel, met with management and reviewed and discussed information provided in response to initial requests of the 15(c) Committee and/or its independent counsel, and requested certain additional information, which management agreed to provide. At a meeting held on June 13-15, 2022, the Board, including the Independent Board Members, reviewed the additional information provided by management in response to these requests.
After extensive discussions and deliberations, the Board, including all of the Independent Board Members, approved the continuance of the Advisory Agreements for the Fund, based on a review of qualitative and quantitative information provided by BFA and their cumulative experience as Board Members. The Board noted its satisfaction with the extent and quality of information provided and its frequent interactions with management, as well as the detailed responses and other information provided by BFA. The Independent Board Members were advised by their independent counsel throughout the process, including about the legal standards applicable to their review. In approving the continuance of the Advisory Agreements for the Fund, the Board, including the Independent Board Members, considered various factors, including: (i) the expenses and performance of the Fund; (ii) the nature, extent and quality of the services provided by BFA and BlackRock International Limited; (iii) the costs of services provided to the Fund and profits realized by BFA and its affiliates; (iv) potential economies of scale and the sharing of related benefits; (v) the fees and services provided for other comparable funds/accounts managed by BFA and its affiliates; and (vi) other benefits to BFA and/or its affiliates. The material factors, none of which was controlling, and conclusions that formed the basis for the Board, including the Independent Board Members, to approve the continuance of the Advisory Agreements are discussed below.
Expenses and Performance of the Fund: The Board reviewed statistical information prepared by Broadridge Financial Solutions Inc. (“Broadridge”), an independent provider of investment company data, regarding the expense ratio components, including gross and net total expenses, fees and expenses of another fund in which the Fund invests (if applicable), and waivers/reimbursements (if applicable) of the Fund in comparison with the same information for other ETFs, objectively selected by Broadridge as comprising the Fund’s applicable expense peer group pursuant to Broadridge’s proprietary ETF methodology (the “Peer Group”). The Board was provided with a detailed description of the proprietary ETF methodology used by Broadridge to determine the Fund’s Peer Group. The Board noted that, due to the limitations in providing comparable funds in the Peer Group, the statistical information provided in Broadridge’s report may or may not provide meaningful direct comparisons to the Fund in all instances. The Board also noted that the investment advisory fee rate and overall expenses (net of waivers and reimbursements) for the Fund were higher than the median of the investment advisory fee rates and overall expenses (net of waivers and reimbursements) of the funds in its Peer Group, excluding iShares funds. The Board further noted that BFA pays BlackRock International Limited for sub-advisory services, and that there are no additional fees imposed on the Fund in respect of the services provided under the Sub-Advisory Agreement(s).
In addition, to the extent that any of the comparison funds included in the Peer Group, excluding iShares funds, track the same index as the Fund, Broadridge also provided, and the Board reviewed, a comparison of the Fund’s performance for the one-year, three-year, five-year, ten-year, and since inception periods, as applicable, and for the quarter ended December 31, 2021, to that of such relevant comparison fund(s) for the same periods. The Board noted that the Fund seeks to track its specified underlying index and that, during the year, the Board received periodic reports on the Fund’s short- and longer-term performance in comparison with its underlying index. Such periodic comparative performance information, including additional detailed information as requested by the Board, was also considered. The Board noted that the Fund generally performed in line with its underlying index over the relevant periods.
Based on this review, the other factors considered at the meeting, and their general knowledge of ETF pricing, the Board concluded that the investment advisory fee rate and expense level and the historical performance of the Fund supported the Board’s approval of the continuance of the Advisory Agreements for the coming year.
Nature, Extent and Quality of Services Provided: Based on management’s representations, including information about recent enhancements and initiatives with respect to the iShares business, including with respect to capital markets support and analysis, technology, portfolio management, product design and quality, compliance and risk management, global public policy and other services, the Board expected that there would be no diminution in the scope of services required of or provided by BFA and BlackRock International Limited under the Advisory Agreements for the coming year as compared with the scope of services provided by BFA during prior years. In reviewing the scope of these services, the Board considered BFA’s investment philosophy and experience, noting that BFA and its affiliates have committed significant resources over time, including during the past year, to support the iShares funds and their shareholders and have made significant investments into the iShares business. The Board also considered BFA’s compliance program and its compliance record with respect to the Fund. In that regard, the Board noted that BFA reports to the Board about portfolio management and compliance matters on a periodic basis in connection with regularly scheduled meetings of the Board, and on other occasions as necessary and appropriate, and has provided information and made relevant officers and other employees of BFA (and its affiliates) available as needed to provide further assistance with these matters. The Board also reviewed the background and experience of the persons responsible for the day-to-day management of the Fund, including those of the Sub-Advisor(s), as well as the resources available to them in managing the Fund. In addition to the above considerations, the Board reviewed and considered detailed
| | |
| 90 | | 2 0 2 2 I S H A R E S A N N U A L R E P O R T T O S H A R E H O L D E R S |
Board Review and Approval of Investment Advisory Contract (continued)
presentations regarding investment performance, investment and risk management processes and strategies for BFA and BlackRock International Limited, which were provided at the May 3, 2022 meeting and throughout the year and matters related to BFA’s portfolio compliance program.
Based on review of this information, and the performance information discussed above, the Board concluded that the nature, extent and quality of services provided to the Fund under the Advisory Agreements supported the Board’s approval of the continuance of the Advisory Agreements for the coming year.
Costs of Services Provided to the Fund and Profits Realized by BFA and its Affiliates: The Board reviewed information about the estimated profitability to BlackRock in managing the Fund, based on the fees payable to BFA and its affiliates (including fees under the Advisory Agreement), and other sources of revenue and expense to BFA and its affiliates from the Fund’s operations for the last calendar year. The Board reviewed BlackRock’s methodology for calculating estimated profitability of the iShares funds, noting that the 15(c) Committee and the Board had focused on the methodology and profitability presentation. The Board recognized that profitability may be affected by numerous factors, including, among other things, fee waivers by BFA, the types of funds managed, expense allocations and business mix. The Board thus recognized that calculating and comparing profitability at individual fund levels is challenging. The Board discussed with management the sources of direct and ancillary revenue, including the revenues to BTC, a BlackRock affiliate, from securities lending by the Fund. The Board also discussed BFA’s estimated profit margin as reflected in the Fund’s profitability analysis and reviewed information regarding potential economies of scale (as discussed below).
Based on this review, the Board concluded that the information considered with respect to the profits realized by BFA and its affiliates under the Advisory Agreements and from other relationships between the Fund and BFA and/or its affiliates, if any, as well as the other factors considered at the meeting, supported the Board’s approval of the continuance of the Advisory Agreements for the coming year.
Economies of Scale: The Board reviewed information and considered the extent to which economies of scale might be realized as the assets of the Fund increase, noting that the issue of potential economies of scale had been focused on by the 15(c) Committee and the Board during their meetings and addressed by management. The 15(c) Committee and the Board received information regarding BlackRock’s historical estimated profitability, including BFA’s and its affiliates’ estimated costs in providing services. The estimated cost information distinguished, among other things, between fixed and variable costs, and showed how the level and nature of fixed and variable costs may impact the existence or size of scale benefits, with the Board recognizing that potential economies of scale are difficult to measure. The 15(c) Committee and the Board reviewed information provided by BFA regarding the sharing of scale benefits with the iShares funds through various means, including, as applicable, through relatively low fee rates established at inception, breakpoints, waivers, or other fee reductions, as well as through additional investment in the iShares business and the provision of improved or additional infrastructure and services to the iShares funds and their shareholders. The Board noted that the Advisory Agreement for the Fund did not provide for breakpoints in the Fund’s investment advisory fee rate as the assets of the Fund increase. However, the Board noted that it would continue to assess the appropriateness of adding breakpoints in the future.
The Board concluded that this review of potential economies of scale and the sharing of related benefits, as well as the other factors considered at the meeting, supported the Board’s approval of the continuance of the Advisory Agreements for the coming year.
Fees and Services Provided for Other Comparable Funds/Accounts Managed by BFA and its Affiliates: The Board received and considered information regarding the investment advisory/management fee rates for other funds/accounts in the U.S. for which BFA (or its affiliates) provides investment advisory/management services, including open-end funds registered under the 1940 Act (including sub-advised funds), collective trust funds, and institutional separate accounts (collectively, the “Other Accounts”). The Board acknowledged BFA’s representation that the iShares funds are fundamentally different investment vehicles from the Other Accounts.
The Board received detailed information regarding how the Other Accounts generally differ from the Fund, including in terms of the types of services and generally more extensive services provided to the Fund, as well as other significant differences. In that regard, the Board considered that the pricing of services to institutional clients is typically based on a number of factors beyond the nature and extent of the specific services to be provided and often depends on the overall relationship between the client and its affiliates and the adviser and its affiliates. In addition, the Board considered the relative complexity and inherent risks and challenges of managing and providing other services to the Fund, as a publicly traded investment vehicle, as compared to the Other Accounts, particularly those that are institutional clients, in light of differing regulatory requirements and client-imposed mandates. The Board noted that BFA and its affiliates do not manage Other Accounts with substantially the same investment objective and strategy as the Fund and that track the same index as the Fund. The Board also acknowledged management’s assertion that, for certain iShares funds, and for client segmentation purposes, BlackRock has launched an iShares fund that may provide a similar investment exposure at a lower investment advisory fee rate.
The Board considered the “all-inclusive” nature of the Fund’s advisory fee structure, and the Fund’s expenses borne by BFA under this arrangement and noted that the investment advisory fee rate under the Advisory Agreement for the Fund was generally higher than the investment advisory/management fee rates for certain of the Other Accounts (particularly institutional clients) and concluded that the differences appeared to be consistent with the factors discussed.
Other Benefits to BFA and/or its Affiliates: The Board reviewed other benefits or ancillary revenue received by BFA and/or its affiliates in connection with the services provided to the Fund by BFA, both direct and indirect, including, but not limited to, payment of revenue to BTC, the Fund’s securities lending agent, for loaning portfolio securities (which was included in the profit margins reviewed by the Board pursuant to BFA’s estimated profitability methodology), payment of advisory fees or other fees to BFA (or its affiliates) in connection with any investments by the Fund in other funds for which BFA (or its affiliates) provides investment advisory services or other services, and BlackRock’s profile in the investment community. The Board also noted the revenue received by BFA and/or its affiliates pursuant to an agreement that permits a service provider to use certain portions of BlackRock’s technology platform to service accounts managed by BFA and/or its affiliates, including the iShares funds. The Board noted that BFA generally does not use soft dollars or consider the value of research or other services that may be provided to BFA (including its affiliates) in selecting brokers for portfolio transactions for the Fund. The Board concluded that any such ancillary benefits would not be disadvantageous to the Fund and thus would not alter the Board’s conclusion with respect to the appropriateness of approving the continuance of the Advisory Agreements for the coming year.
| | |
B O A R D R E V I E W A N D A P P R O V A L O F I N V E S T M E N T A D V I S O R Y C O N T R A C T | | 91 |
Board Review and Approval of Investment Advisory Contract (continued)
Conclusion: Based on a review of the factors described above, as well as such other factors as deemed appropriate by the Board, the Board, including all of the Independent Board Members, determined that the Fund’s investment advisory fee rate under the Advisory Agreement does not constitute a fee that is so disproportionately large as to bear no reasonable relationship to the services rendered and that could not have been the product of arm’s-length bargaining, and concluded to approve the continuance of the Advisory Agreements for the coming year.
iShares J.P. Morgan EM Local Currency Bond ETF (the “Fund”)
Under Section 15(c) of the Investment Company Act of 1940 (the “1940 Act”), the Company’s Board of Directors (the “Board”), including a majority of Board Members who are not “interested persons” of the Company (as that term is defined in the 1940 Act) (the “Independent Board Members”), is required annually to consider and approve the Investment Advisory Agreement between the Company and BFA (the “Advisory Agreement”), and the Sub-Advisory Agreement between BFA and BlackRock International Limited and BlackRock (Singapore) Limited, (together the Advisory Agreements”) on behalf of the Fund. The Board’s consideration entails a year-long process whereby the Board and its committees (composed solely of Independent Board Members) assess BlackRock’s services to the Fund, including investment management; fund accounting; administrative and shareholder services; oversight of the Fund’s service providers; risk management and oversight; legal and compliance services; and ability to meet applicable legal and regulatory requirements. The Independent Board Members requested, and BFA provided, such information as the Independent Board Members, with advice from independent counsel, deemed reasonably necessary to evaluate the Advisory Agreements. At meetings on May 3, 2022 and May 18, 2022, a committee composed of all of the Independent Board Members (the “15(c) Committee”), with independent counsel, met with management and reviewed and discussed information provided in response to initial requests of the 15(c) Committee and/or its independent counsel, and requested certain additional information, which management agreed to provide. At a meeting held on June 13-15, 2022, the Board, including the Independent Board Members, reviewed the additional information provided by management in response to these requests.
After extensive discussions and deliberations, the Board, including all of the Independent Board Members, approved the continuance of the Advisory Agreements for the Fund, based on a review of qualitative and quantitative information provided by BFA and their cumulative experience as Board Members. The Board noted its satisfaction with the extent and quality of information provided and its frequent interactions with management, as well as the detailed responses and other information provided by BFA. The Independent Board Members were advised by their independent counsel throughout the process, including about the legal standards applicable to their review. In approving the continuance of the Advisory Agreements for the Fund, the Board, including the Independent Board Members, considered various factors, including: (i) the expenses and performance of the Fund; (ii) the nature, extent and quality of the services provided by BFA and BlackRock International Limited and BlackRock (Singapore) Limited; (iii) the costs of services provided to the Fund and profits realized by BFA and its affiliates; (iv) potential economies of scale and the sharing of related benefits; (v) the fees and services provided for other comparable funds/accounts managed by BFA and its affiliates; and (vi) other benefits to BFA and/or its affiliates. The material factors, none of which was controlling, and conclusions that formed the basis for the Board, including the Independent Board Members, to approve the continuance of the Advisory Agreements are discussed below.
Expenses and Performance of the Fund: The Board reviewed statistical information prepared by Broadridge Financial Solutions Inc. (“Broadridge”), an independent provider of investment company data, regarding the expense ratio components, including gross and net total expenses, fees and expenses of another fund in which the Fund invests (if applicable), and waivers/reimbursements (if applicable) of the Fund in comparison with the same information for other ETFs, objectively selected by Broadridge as comprising the Fund’s applicable expense peer group pursuant to Broadridge’s proprietary ETF methodology (the “Peer Group”). The Board was provided with a detailed description of the proprietary ETF methodology used by Broadridge to determine the Fund’s Peer Group. The Board noted that, due to the limitations in providing comparable funds in the Peer Group, the statistical information provided in Broadridge’s report may or may not provide meaningful direct comparisons to the Fund in all instances. The Board also noted that the investment advisory fee rate and overall expenses (net of waivers and reimbursements) for the Fund were higher than the median of the investment advisory fee rates and overall expenses (net of waivers and reimbursements) of the funds in its Peer Group, excluding iShares funds. The Board further noted that BFA pays BlackRock International Limited and BlackRock (Singapore) Limited for sub-advisory services, and that there are no additional fees imposed on the Fund in respect of the services provided under the Sub-Advisory Agreement(s).
In addition, to the extent that any of the comparison funds included in the Peer Group, excluding iShares funds, track the same index as the Fund, Broadridge also provided, and the Board reviewed, a comparison of the Fund’s performance for the one-year, three-year, five-year, ten-year, and since inception periods, as applicable, and for the quarter ended December 31, 2021, to that of such relevant comparison fund(s) for the same periods. The Board noted that the Fund seeks to track its specified underlying index and that, during the year, the Board received periodic reports on the Fund’s short- and longer-term performance in comparison with its underlying index. Such periodic comparative performance information, including additional detailed information as requested by the Board, was also considered. The Board noted that the Fund generally performed in line with its underlying index over the relevant periods.
Based on this review, the other factors considered at the meeting, and their general knowledge of ETF pricing, the Board concluded that the investment advisory fee rate and expense level and the historical performance of the Fund supported the Board’s approval of the continuance of the Advisory Agreements for the coming year.
Nature, Extent and Quality of Services Provided: Based on management’s representations, including information about recent enhancements and initiatives with respect to the iShares business, including with respect to capital markets support and analysis, technology, portfolio management, product design and quality, compliance and risk management, global public policy and other services, the Board expected that there would be no diminution in the scope of services required of or provided by BFA and BlackRock International Limited and BlackRock (Singapore) Limited under the Advisory Agreements for the coming year as compared with the scope of services provided by BFA during prior years. In reviewing the scope of these services, the Board considered BFA’s investment philosophy and experience, noting that BFA and its affiliates have committed significant resources over time, including during the past year, to support the iShares funds and their shareholders and have made significant investments into the iShares business. The Board also considered BFA’s compliance program and its compliance record with respect to the Fund. In that regard, the Board noted that BFA reports to the Board about portfolio management and compliance matters on a periodic basis in connection with regularly scheduled meetings of the Board, and on other occasions as necessary and appropriate, and has provided information and made relevant officers and other employees of BFA (and its affiliates) available as needed to provide further assistance with these matters. The Board also reviewed the background and experience of the persons responsible for the day-to-day
| | |
| 92 | | 2 0 2 2 I S H A R E S A N N U A L R E P O R T T O S H A R E H O L D E R S |
Board Review and Approval of Investment Advisory Contract (continued)
management of the Fund, including those of the Sub-Advisor(s), as well as the resources available to them in managing the Fund. In addition to the above considerations, the Board reviewed and considered detailed presentations regarding investment performance, investment and risk management processes and strategies for BFA and BlackRock International Limited and BlackRock (Singapore) Limited, which were provided at the May 3, 2022 meeting and throughout the year and matters related to BFA’s portfolio compliance program.
Based on review of this information, and the performance information discussed above, the Board concluded that the nature, extent and quality of services provided to the Fund under the Advisory Agreements supported the Board’s approval of the continuance of the Advisory Agreements for the coming year.
Nature, Extent and Quality of Services Provided: Based on management’s representations, including information about recent enhancements and initiatives with respect to the iShares business, including with respect to capital markets support and analysis, technology, portfolio management, product design and quality, compliance and risk management, global public policy and other services, the Board expected that there would be no diminution in the scope of services required of or provided by BFA and BlackRock International Limited and BlackRock (Singapore) Limited under the Advisory Agreements for the coming year as compared with the scope of services provided by BFA during prior years. In reviewing the scope of these services, the Board considered BFA’s investment philosophy and experience, noting that BFA and its affiliates have committed significant resources over time, including during the past year, to support the iShares funds and their shareholders and have made significant investments into the iShares business. The Board also considered BFA’s compliance program and its compliance record with respect to the Fund. In that regard, the Board noted that BFA reports to the Board about portfolio management and compliance matters on a periodic basis in connection with regularly scheduled meetings of the Board, and on other occasions as necessary and appropriate, and has provided information and made relevant officers and other employees of BFA (and its affiliates) available as needed to provide further assistance with these matters. The Board also reviewed the background and experience of the persons responsible for the day-to-day management of the Fund, including those of the Sub-Advisor(s), as well as the resources available to them in managing the Fund. In addition to the above considerations, the Board reviewed and considered detailed presentations regarding investment performance, investment and risk management processes and strategies for BFA and BlackRock International Limited and BlackRock (Singapore) Limited, which were provided at the May 3, 2022 meeting and throughout the year and matters related to BFA’s portfolio compliance program.
Based on review of this information, and the performance information discussed above, the Board concluded that the nature, extent and quality of services provided to the Fund under the Advisory Agreements supported the Board’s approval of the continuance of the Advisory Agreements for the coming year.
Costs of Services Provided to the Fund and Profits Realized by BFA and its Affiliates: The Board reviewed information about the estimated profitability to BlackRock in managing the Fund, based on the fees payable to BFA and its affiliates (including fees under the Advisory Agreement), and other sources of revenue and expense to BFA and its affiliates from the Fund’s operations for the last calendar year. The Board reviewed BlackRock’s methodology for calculating estimated profitability of the iShares funds, noting that the 15(c) Committee and the Board had focused on the methodology and profitability presentation. The Board recognized that profitability may be affected by numerous factors, including, among other things, fee waivers by BFA, the types of funds managed, expense allocations and business mix. The Board thus recognized that calculating and comparing profitability at individual fund levels is challenging. The Board discussed with management the sources of direct and ancillary revenue, including the revenues to BTC, a BlackRock affiliate, from securities lending by the Fund. The Board also discussed BFA’s estimated profit margin as reflected in the Fund’s profitability analysis and reviewed information regarding potential economies of scale (as discussed below).
Based on this review, the Board concluded that the information considered with respect to the profits realized by BFA and its affiliates under the Advisory Agreements and from other relationships between the Fund and BFA and/or its affiliates, if any, as well as the other factors considered at the meeting, supported the Board’s approval of the continuance of the Advisory Agreements for the coming year.
Economies of Scale: The Board reviewed information and considered the extent to which economies of scale might be realized as the assets of the Fund increase, noting that the issue of potential economies of scale had been focused on by the 15(c) Committee and the Board during their meetings and addressed by management. The 15(c) Committee and the Board received information regarding BlackRock’s historical estimated profitability, including BFA’s and its affiliates’ estimated costs in providing services. The estimated cost information distinguished, among other things, between fixed and variable costs, and showed how the level and nature of fixed and variable costs may impact the existence or size of scale benefits, with the Board recognizing that potential economies of scale are difficult to measure. The 15(c) Committee and the Board reviewed information provided by BFA regarding the sharing of scale benefits with the iShares funds through various means, including, as applicable, through relatively low fee rates established at inception, breakpoints, waivers, or other fee reductions, as well as through additional investment in the iShares business and the provision of improved or additional infrastructure and services to the iShares funds and their shareholders. The Board noted that the Advisory Agreement for the Fund did not provide for breakpoints in the Fund’s investment advisory fee rate as the assets of the Fund increase. However, the Board noted that it would continue to assess the appropriateness of adding breakpoints in the future.
The Board concluded that this review of potential economies of scale and the sharing of related benefits, as well as the other factors considered at the meeting, supported the Board’s approval of the continuance of the Advisory Agreements for the coming year.
Fees and Services Provided for Other Comparable Funds/Accounts Managed by BFA and its Affiliates: The Board received and considered information regarding the investment advisory/management fee rates for other funds/accounts in the U.S. for which BFA (or its affiliates) provides investment advisory/management services, including open-end funds registered under the 1940 Act (including sub-advised funds), collective trust funds, and institutional separate accounts (collectively, the “Other Accounts”). The Board acknowledged BFA’s representation that the iShares funds are fundamentally different investment vehicles from the Other Accounts.
The Board received detailed information regarding how the Other Accounts generally differ from the Fund, including in terms of the types of services and generally more extensive services provided to the Fund, as well as other significant differences. In that regard, the Board considered that the pricing of services to institutional clients is typically based on a number of factors beyond the nature and extent of the specific services to be provided and often depends on the overall relationship between the client and its affiliates and the adviser and its affiliates. In addition, the Board considered the relative complexity and inherent risks and challenges of managing and providing other
| | |
B O A R D R E V I E W A N D A P P R O V A L O F I N V E S T M E N T A D V I S O R Y C O N T R A C T | | 93 |
Board Review and Approval of Investment Advisory Contract (continued)
services to the Fund, as a publicly traded investment vehicle, as compared to the Other Accounts, particularly those that are institutional clients, in light of differing regulatory requirements and client-imposed mandates. The Board noted that BFA and its affiliates do not manage Other Accounts with substantially the same investment objective and strategy as the Fund and that track the same index as the Fund. The Board also acknowledged management’s assertion that, for certain iShares funds, and for client segmentation purposes, BlackRock has launched an iShares fund that may provide a similar investment exposure at a lower investment advisory fee rate.
The Board considered the “all-inclusive” nature of the Fund’s advisory fee structure, and the Fund’s expenses borne by BFA under this arrangement and noted that the investment advisory fee rate under the Advisory Agreement for the Fund was generally higher than the investment advisory/management fee rates for certain of the Other Accounts (particularly institutional clients) and concluded that the differences appeared to be consistent with the factors discussed.
Other Benefits to BFA and/or its Affiliates: The Board reviewed other benefits or ancillary revenue received by BFA and/or its affiliates in connection with the services provided to the Fund by BFA, both direct and indirect, including, but not limited to, payment of revenue to BTC, the Fund’s securities lending agent, for loaning portfolio securities (which was included in the profit margins reviewed by the Board pursuant to BFA’s estimated profitability methodology), payment of advisory fees or other fees to BFA (or its affiliates) in connection with any investments by the Fund in other funds for which BFA (or its affiliates) provides investment advisory services or other services, and BlackRock’s profile in the investment community. The Board also noted the revenue received by BFA and/or its affiliates pursuant to an agreement that permits a service provider to use certain portions of BlackRock’s technology platform to service accounts managed by BFA and/or its affiliates, including the iShares funds. The Board noted that BFA generally does not use soft dollars or consider the value of research or other services that may be provided to BFA (including its affiliates) in selecting brokers for portfolio transactions for the Fund. The Board concluded that any such ancillary benefits would not be disadvantageous to the Fund and thus would not alter the Board’s conclusion with respect to the appropriateness of approving the continuance of the Advisory Agreements for the coming year.
Conclusion: Based on a review of the factors described above, as well as such other factors as deemed appropriate by the Board, the Board, including all of the Independent Board Members, determined that the Fund’s investment advisory fee rate under the Advisory Agreement does not constitute a fee that is so disproportionately large as to bear no reasonable relationship to the services rendered and that could not have been the product of arm’s-length bargaining, and concluded to approve the continuance of the Advisory Agreements for the coming year.
| | |
| 94 | | 2 0 2 2 I S H A R E S A N N U A L R E P O R T T O S H A R E H O L D E R S |
Supplemental Information (unaudited)
Section 19(a) Notices
The amounts and sources of distributions reported are estimates and are being provided pursuant to regulatory requirements and are not being provided for tax reporting purposes. The actual amounts and sources for tax reporting purposes will depend upon each Fund’s investment experience during the year and may be subject to changes based on tax regulations. Shareholders will receive a Form 1099-DIV each calendar year that will inform them how to report these distributions for federal income tax purposes.
October 31, 2022
| | | | | | | | | | | | | | | | | | | | | | | | | | | | | | | | | | | | |
| | | | |
| | | Total Cumulative Distributions
for the Fiscal Year | | | | | | % Breakdown of the Total Cumulative Distributions for the Fiscal Year | |
| | | | | | | | | |
iShares ETF | | Net
Investment
Income | | | Net Realized
Capital Gains | | | Return of
Capital | | | Total Per
Share | | | | | | Net
Investment
Income | | | Net Realized
Capital Gains | | | Return of
Capital | | | Total Per
Share | |
| | | | | | | | | |
International High Yield Bond(a) | | $ | 1.558045 | | | $ | — | | | $ | 0.059637 | | | $ | 1.617682 | | | | | | | | 96 | % | | | — | % | | | 4 | % | | | 100 | % |
J.P. Morgan EM Corporate Bond | | | 1.796449 | | | | — | | | | — | | | | 1.796449 | | | | | | | | 100 | | | | — | | | | — | | | | 100 | |
J.P. Morgan EM High Yield Bond | | | 2.401588 | | | | — | | | | — | | | | 2.401588 | | | | | | | | 100 | | | | — | | | | — | | | | 100 | |
J.P. Morgan EM Local Currency Bond(a) | | | 1.440662 | | | | — | | | | 0.085202 | | | | 1.525864 | | | | | | | | 94 | | | | — | | | | 6 | | | | 100 | |
US & Intl High Yield Corp Bond | | | 2.073310 | | | | — | | | | — | | | | 2.073310 | | | | | | | | 100 | | | | — | | | | — | | | | 100 | |
| | (a) | The Fund estimates that it has distributed more than its net investment income and net realized capital gains; therefore, a portion of the distribution may be a return of capital. A return of capital may occur, for example, when some or all of the shareholder’s investment in the Fund is returned to the shareholder. A return of capital does not necessarily reflect the Fund’s investment performance and should not be confused with “yield” or “income”. When distributions exceed total return performance, the difference will incrementally reduce the Fund’s net asset value per share. | |
Premium/Discount Information
Information on the Fund’s net asset value, market price, premiums and discounts, and bid-ask spreads can be found at iShares.com.
Regulation under the Alternative Investment Fund Managers Directive
The Alternative Investment Fund Managers Directive and the Alternative Investment Fund Managers Regulations 2013 (as amended) and the “Guidelines on sound remuneration policies under the AIFMD” issued by the European Securities and Markets Authority (together the “Regulations”) impose detailed and prescriptive obligations on fund managers established in the European Union (the “EU”) and the UK. These do not currently apply to managers established outside of the EU or UK, such as BFA (the “Company”). Rather, non-EU and non-UK managers are only required to comply with certain disclosure, reporting and transparency obligations of the Regulations if such managers market a fund to EU investors.
The Company has registered the iShares J.P. Morgan EM High Yield Bond ETF (the “Fund”) to be marketed to United Kingdom and EU investors in the Netherlands, Finland and Sweden.
The Company has registered the iShares J.P. Morgan EM Local Currency Bond ETF (the “Fund”) to be marketed to United Kingdom.
Report on Remuneration
The Company is required under the Regulations to make quantitative disclosures of remuneration. These disclosures are made in line with BlackRock’s interpretation of currently available regulatory guidance on quantitative remuneration disclosures. As market or regulatory practice develops BlackRock may consider it appropriate to make changes to the way in which quantitative remuneration disclosures are calculated. Where such changes are made, this may result in disclosures in relation to a fund not being comparable to the disclosures made in the prior year, or in relation to other BlackRock fund disclosures in that same year.
Disclosures are provided in relation to (a) the staff of the Company; (b) staff who are senior management; and (c) staff who have the ability to materially affect the risk profile of the Funds.
All individuals included in the aggregated figures disclosed are rewarded in line with BlackRock’s remuneration policy for their responsibilities across the relevant BlackRock business area. As all individuals have a number of areas of responsibilities, only the portion of remuneration for those individuals’ services attributable to the Funds is included in the aggregate figures disclosed.
BlackRock has a clear and well defined pay-for-performance philosophy, and compensation programmes which support that philosophy.
BlackRock operates a total compensation model for remuneration which includes a base salary, which is contractual, and a discretionary bonus scheme. Although all employees are eligible to receive a discretionary bonus, there is no contractual obligation to make a discretionary bonus award to any employees. For senior management, a significant percentage of variable remuneration is deferred over time. All employees are subject to a claw-back policy.
| | |
S U P P L E M E N T A L I N F O R M A T I O N | | 95 |
Supplemental Information (unaudited) (continued)
Remuneration decisions for employees are made once annually in January following the end of the performance year, based on BlackRock’s full-year financial results and other non-financial goals and objectives. Alongside financial performance, individual total compensation is also based on strategic and operating results and other considerations such as management and leadership capabilities. No set formulas are established and no fixed benchmarks are used in determining annual incentive awards.
Annual incentive awards are paid from a bonus pool which is reviewed throughout the year by BlackRock’s independent compensation committee, taking into account both actual and projected financial information together with information provided by the Enterprise Risk and Regulatory Compliance departments in relation to any activities, incidents or events that warrant consideration in making compensation decisions. Individuals are not involved in setting their own remuneration.
Each of the control functions (Enterprise Risk, Legal & Compliance, and Internal Audit) each have their own organisational structures which are independent of the business units. Functional bonus pools for those control functions are determined with reference to the performance of each individual function and the remuneration of the senior members of control functions is directly overseen by BlackRock’s independent remuneration committee.
Members of staff and senior management of the Company typically provide both AIFMD and non-AIFMD related services in respect of multiple funds, clients and functions of the Company and across the broader BlackRock group. Therefore, the figures disclosed are a sum of each individual’s portion of remuneration attributable to the Funds according to an objective apportionment methodology which acknowledges the multiple-service nature of the Company. Accordingly the figures are not representative of any individual’s actual remuneration or their remuneration structure.
The amount of total & aggregate remuneration awarded by the Company to its staff which has been attributed to the Funds in respect of the Company’s financial year ending December 31, 2021 were as follows:
| | | | | | | | | | | | | | | | | | | | | | | | |
| | | | | | | |
| iShares ETF | | Total
Remuneration | | | Fixed
Remuneration | | | Variable
Remuneration | | | No. of
Beneficiaries | | | Senior Management
Remuneration | | | Risk Taker
Remuneration | |
| | | | | | |
J.P. Morgan EM High Yield Bond | | | $46,822 | | | | $21,892 | | | | $24,930 | | | | 661 | | | | $5,731 | | | | $592 | |
J.P. Morgan EM Local Currency Bond | | | 45,818 | | | | 21,423 | | | | 24,395 | | | | 661 | | | | 5,608 | | | | 580 | |
Disclosures Under the EU Sustainable Finance Disclosure Regulation
The iShares J.P. Morgan EM High Yield Bond ETF and iShares J.P. Morgan EM Local Currency Bond ETF (the “Funds”) are registered under the Alternative Investment Fund Managers Directive to be marketed to European Union (“EU”) investors, as noted above. As a result, certain disclosures are required under the EU Sustainable Finance Disclosure Regulation (“SFDR”).
Each Fund has not been categorized under the SFDR as an “Article 8” or “Article 9” product. In addition, each Fund’s investments do not take into account the criteria for environmentally sustainable economic activities under the EU sustainable investment taxonomy regulation.
| | |
| 96 | | 2 0 2 2 I S H A R E S A N N U A L R E P O R T T O S H A R E H O L D E R S |
Director and Officer Information (unaudited)
The Board of Directors has responsibility for the overall management and operations of the Funds, including general supervision of the duties performed by BFA and other service providers. Each Director serves until he or she resigns, is removed, dies, retires or becomes incapacitated. Each officer shall hold office until his or her successor is elected and qualifies or until his or her death, resignation or removal. Directors who are not “interested persons” (as defined in the 1940 Act) of the Company are referred to as independent directors (“Independent Directors”).
The registered investment companies advised by BFAor its affiliates (the “BlackRock-advised Funds”) are organized into one complex of open-end equity, multi-asset, index and money market funds and ETFs (the “BlackRock Multi-Asset Complex”), one complex of closed-end funds and open-end non-index fixed-income funds (including ETFs) (the “BlackRock Fixed-Income Complex”) and one complex of ETFs (“Exchange-Traded Fund Complex”) (each, a “BlackRock Fund Complex”). Each Fund is included in the Exchange-Traded Fund Complex. Each Director also serves as a Trustee of iShares Trust and a Trustee of iShares U.S. ETF Trust and, as a result, oversees all of the funds within the Exchange-Traded Fund Complex, which consists of 379 funds as of October 31, 2022. With the exception of Robert S. Kapito, Salim Ramji and Charles Park, the address of each Director and officer is c/o BlackRock, Inc., 400 Howard Street, San Francisco, CA 94105. The address of Mr. Kapito, Mr. Ramji and Mr. Park is c/o BlackRock, Inc., Park Avenue Plaza, 55 East 52nd Street, New York, NY 10055. The Board has designated John E. Kerrigan as its Independent Board Chair. Additional information about the Funds’ Directors and officers may be found in the Funds’ combined Statement of Additional Information, which is available without charge, upon request, by calling toll-free 1-800-iShares (1-800-474-2737).
| | | | | | |
| Interested Directors |
| | | | |
| Name (Age) | | Position(s) | | Principal Occupation(s) During Past 5 Years | | Other Directorships Held by Director |
| | | |
Robert S. Kapito(a) (65) | | Director (since 2009). | | President, BlackRock, Inc. (since 2006); Vice Chairman of BlackRock, Inc. and Head of BlackRock’s Portfolio Management Group (since its formation in 1998) and BlackRock, Inc.’s predecessor entities (since 1988); Trustee, University of Pennsylvania (since 2009); President of Board of Directors, Hope & Heroes Children’s Cancer Fund (since 2002). | | Director of BlackRock, Inc. (since 2006); Trustee of iShares U.S. ETF Trust (since 2011); Trustee of iShares Trust (since 2009). |
| | | |
Salim Ramji(b) (52) | | Director (since 2019). | | Senior Managing Director, BlackRock, Inc. (since 2014); Global Head of BlackRock’s ETF and Index Investments Business (since 2019); Head of BlackRock’s U.S. Wealth Advisory Business (2015-2019); Global Head of Corporate Strategy, BlackRock, Inc. (2014-2015); Senior Partner, McKinsey & Company (2010-2014). | | Trustee of iShares U.S. ETF Trust (since 2019); Trustee of iShares Trust (since 2019). |
| (a) | Robert S. Kapito is deemed to be an “interested person” (as defined in the 1940 Act) of the Company due to his affiliations with BlackRock, Inc. and its affiliates. |
| (b) | Salim Ramji is deemed to be an “interested person” (as defined in the 1940 Act) of the Company due to his affiliations with BlackRock, Inc. and its affiliates. |
| | | | | | |
| Independent Directors |
| | | | |
| Name (Age) | | Position(s) | | Principal Occupation(s) During Past 5 Years | | Other Directorships Held by Director |
| | | |
John E. Kerrigan (67) | | Director (since 2005); Independent Board Chair (since 2022). | | Chief Investment Officer, Santa Clara University (since 2002). | | Trustee of iShares U.S. ETF Trust (since 2011); Trustee of iShares Trust (since 2005); Independent Board Chair of iShares Trust and iShares U.S. ETF Trust (since 2022). |
| | | |
Jane D. Carlin (66) | | Director (since 2015); Risk Committee Chair (since 2016). | | Consultant (since 2012); Member of the Audit Committee (2012-2018), Chair of the Nominating and Governance Committee (2017-2018) and Director of PHH Corporation (mortgage solutions) (2012-2018); Managing Director and Global Head of Financial Holding Company Governance & Assurance and the Global Head of Operational Risk Management of Morgan Stanley (2006-2012). | | Trustee of iShares U.S. ETF Trust (since 2015); Trustee of iShares Trust (since 2015); Member of the Audit Committee (since 2016), Chair of the Audit Committee (since 2020) and Director of The Hanover Insurance Group, Inc. (since 2016). |
| | | |
Richard L. Fagnani (67) | | Director (since 2017); Audit Committee Chair (since 2019). | | Partner, KPMG LLP (2002-2016). | | Trustee of iShares U.S. ETF Trust (since 2017); Trustee of iShares Trust (since 2017). |
| | |
D I R E C T O R A N D O F F I C E R I N F O R M A T I O N | | 97 |
Director and Officer Information (unaudited) (continued)
| | | | | | |
| Independent Directors (continued) |
| | | | |
| Name (Age) | | Position(s) | | Principal Occupation(s) During Past 5 Years | | Other Directorships Held by Director |
| | | |
Cecilia H. Herbert (73) | | Director (since 2005); Nominating and Governance and Equity Plus Committee Chairs (since 2022). | | Chair of the Finance Committee (since 2019) and Trustee and Member of the Finance, Audit and Quality Committees of Stanford Health Care (since 2016); Trustee of WNET, New York’s public media company (since 2011) and Member of the Audit Committee (since 2018) and Investment Committee (since 2011); Chair (1994-2005) and Member (since 1992) of the Investment Committee, Archdiocese of San Francisco; Trustee of Forward Funds (14 portfolios) (2009-2018); Trustee of Salient MF Trust (4 portfolios) (2015-2018); Director (1998-2013) and President (2007-2011) of the Board of Directors, Catholic Charities CYO; Trustee (2002-2011) and Chair of the Finance and Investment Committee (2006-2010) of the Thacher School; Director of the Senior Center of Jackson Hole (since 2020). | | Trustee of iShares U.S. ETF Trust (since 2011); Trustee of iShares Trust (since 2005); Trustee of Thrivent Church Loan and Income Fund (since 2019). |
| | | |
Drew E. Lawton (63) | | Director (since 2017); 15(c) Committee Chair (since 2017). | | Senior Managing Director of New York Life Insurance Company (2010-2015). | | Trustee of iShares U.S. ETF Trust (since 2017); Trustee of iShares Trust (since 2017). |
| | | |
John E. Martinez (61) | | Director (since 2003); Securities Lending Committee Chair (since 2019). | | Director of Real Estate Equity Exchange, Inc. (since 2005); Director of Cloudera Foundation (2017-2020); and Director of Reading Partners (2012-2016). | | Trustee of iShares U.S. ETF Trust (since 2011); Trustee of iShares Trust (since 2003). |
| | | |
Madhav V. Rajan (58) | | Director (since 2011); Fixed-Income Plus Committee Chair (since 2019). | | Dean, and George Pratt Shultz Professor of Accounting, University of Chicago Booth School of Business (since 2017); Advisory Board Member (since 2016) and Director (since 2020) of C.M. Capital Corporation; Chair of the Board for the Center for Research in Security Prices, LLC (since 2020); Robert K. Jaedicke Professor of Accounting, Stanford University Graduate School of Business (2001-2017); Professor of Law (by courtesy), Stanford Law School (2005-2017); Senior Associate Dean for Academic Affairs and Head of MBA Program, Stanford University Graduate School of Business (2010-2016). | | Trustee of iShares U.S. ETF Trust (since 2011); Trustee of iShares Trust (since 2011). |
| | | | |
| Officers |
| | | |
| Name (Age) | | Position(s) | | Principal Occupation(s) During Past 5 Years |
| | |
Armando Senra (51) | | President (since 2019). | | Managing Director, BlackRock, Inc. (since 2007); Head of U.S., Canada and Latam iShares, BlackRock, Inc. (since 2019); Head of Latin America Region, BlackRock, Inc. (2006-2019); Managing Director, Bank of America Merrill Lynch (1994-2006). |
| | |
Trent Walker (48) | | Treasurer and Chief Financial Officer (since 2020). | | Managing Director, BlackRock, Inc. (since September 2019); Chief Financial Officer of iShares Delaware Trust Sponsor LLC, BlackRock Funds, BlackRock Funds II, BlackRock Funds IV, BlackRock Funds V and BlackRock Funds VI (since 2021); Executive Vice President of PIMCO (2016-2019); Senior Vice President of PIMCO (2008-2015); Treasurer (2013-2019) and Assistant Treasurer (2007-2017) of PIMCO Funds, PIMCO Variable Insurance Trust, PIMCO ETF Trust, PIMCO Equity Series, PIMCO Equity Series VIT, PIMCO Managed Accounts Trust, 2 PIMCO-sponsored interval funds and 21 PIMCO-sponsored closed-end funds. |
| | |
Charles Park (55) | | Chief Compliance Officer (since 2006). | | Chief Compliance Officer of BlackRock Advisors, LLC and the BlackRock-advised Funds in the BlackRock Multi-Asset Complex and the BlackRock Fixed-Income Complex (since 2014); Chief Compliance Officer of BFA (since 2006). |
| | |
Marisa Rolland (42) | | Secretary (since 2022). | | Director, BlackRock, Inc. (since 2018); Vice President, BlackRock, Inc. (2010-2017). |
| | |
Rachel Aguirre (40) | | Executive Vice President (since 2022). | | Managing Director, BlackRock, Inc. (since 2018); Director, BlackRock, Inc. (2009-2018); Head of U.S. iShares Product (since 2022); Head of EII U.S. Product Engineering (since 2021); Co-Head of EII’s Americas Portfolio Engineering (2020-2021); Head of Developed Markets Portfolio Engineering (2016-2019). |
| | |
Jennifer Hsui (46) | | Executive Vice President (since 2022). | | Managing Director, BlackRock, Inc. (since 2009); Co-Head of Index Equity (since 2022). |
| | |
James Mauro (52) | | Executive Vice President (since 2022). | | Managing Director, BlackRock, Inc. (since 2010); Head of Fixed Income Index Investments in the Americas and Head of San Francisco Core Portfolio Management (since 2020). |
| | |
| 98 | | 2 0 2 2 I S H A R E S A N N U A L R E P O R T T O S H A R E H O L D E R S |
Director and Officer Information (unaudited) (continued)
Effective March 18, 2022, Rachel Aguirre, Jennifer Hsui, and James Mauro have replaced Scott Radell, Alan Mason, and Marybeth Leithead as Executive Vice Presidents.
Effective June 15, 2022, Marisa Rolland replaced Deepa Damre Smith as Secretary.
| | |
D I R E C T O R A N D O F F I C E R I N F O R M A T I O N | | 99 |
General Information
Electronic Delivery
Shareholders can sign up for e-mail notifications announcing that the shareholder report or prospectus has been posted on the iShares website at iShares.com. Once you have enrolled, you will no longer receive prospectuses and shareholder reports in the mail.
To enroll in electronic delivery:
| | • | | If your brokerage firm is not listed, electronic delivery may not be available. Please contact your broker-dealer or financial advisor. |
Householding
Householding is an option available to certain fund investors. Householding is a method of delivery, based on the preference of the individual investor, in which a single copy of certain shareholder documents and Rule 30e-3 notices can be delivered to investors who share the same address, even if their accounts are registered under different names. Please contact your broker-dealer if you are interested in enrolling in householding and receiving a single copy of prospectuses and other shareholder documents, or if you are currently enrolled in householding and wish to change your householding status.
Availability of Quarterly Schedule of Investments
The Funds file their complete schedule of portfolio holdings with the SEC for the first and third quarters of each fiscal year as an exhibit to their reports on Form N-PORT. The Funds’ Forms N-PORT are available on the SEC’s website at sec.gov. Additionally, each Fund makes its portfolio holdings for the first and third quarters of each fiscal year available at iShares.com/fundreports.
Availability of Proxy Voting Policies and Proxy Voting Records
A description of the policies and procedures that the iShares Funds use to determine how to vote proxies relating to portfolio securities and information about how the iShares Funds voted proxies relating to portfolio securities during the most recent twelve-month period ending June 30 is available without charge, upon request (1) by calling toll-free 1-800-474-2737; (2) on the iShares website at iShares.com; and (3) on the SEC website at sec.gov.
A description of the Company’s policies and procedures with respect to the disclosure of the Fund’s portfolio securities is available in the Fund Prospectus. The Fund discloses its portfolio holdings daily and provides information regarding its top holdings in Fund fact sheets at iShares.com.
| | |
| 100 | | 2 0 2 2 I S H A R E S A N N U A L R E P O R T T O S H A R E H O L D E R S |
Glossary of Terms Used in this Report
| | |
| Portfolio Abbreviation |
| |
| CAB | | Capital Appreciation Bonds |
| |
| LIBOR | | London Interbank Offered Rate |
| |
| OJSC | | Open Joint Stock Company |
| |
| PIK | | Payment-in-kind |
| | |
| Currency Abbreviations |
| |
| BRL | | Brazilian Real |
| |
| CAD | | Canadian Dollar |
| |
| CLP | | Chilean Peso |
| |
| CNY | | Chinese Yuan |
| |
| COP | | Colombian Peso |
| |
| CZK | | Czech Koruna |
| |
| DOP | | Dominican Peso |
| |
| EGP | | Egyptian Pound |
| |
| EUR | | Euro |
| |
| GBP | | British Pound |
| |
| HUF | | Hungarian Forint |
| |
| IDR | | Indonesian Rupiah |
| |
| MXN | | Mexican Peso |
| |
| MYR | | Malaysian Ringgit |
| |
| PEN | | Peru Nuevo Sol |
| |
| PHP | | Philippine Peso |
| |
| PLN | | Polish Zloty |
| |
| RON | | Romanian Leu |
| |
| RSD | | Serbian Dinar |
| |
| THB | | Thai Baht |
| |
| TRY | | Turkish Lira |
| |
| UYU | | Uruguayan Peso |
| |
| ZAR | | South African Rand |
| | |
| Portfolio Abbreviation (continued) |
| |
| PJSC | | Public Joint Stock Company |
| |
| REIT | | Real Estate Investment Trust |
| |
| SOFR | | Secured Overnight Financing Rate |
| | |
G L O S S A R Y O F T E R M S U S E D I N T H I S R E P O R T | | 101 |
Want to know more?
iShares.com | 1-800-474-2737
This report is intended for the Funds’ shareholders. It may not be distributed to prospective investors unless it is preceded or accompanied by the current prospectus.
Investing involves risk, including possible loss of principal.
The iShares Funds are distributed by BlackRock Investments, LLC (together with its affiliates, “BlackRock”).
The iShares Funds are not sponsored, endorsed, issued, sold or promoted by JPMorgan Chase & Co., Markit Indices Limited or Morningstar, Inc., nor do these companies make any representation regarding the advisability of investing in the iShares Funds. BlackRock is not affiliated with the companies listed above.
©2022 BlackRock, Inc. All rights reserved. iSHARES and BLACKROCK are registered trademarks of BlackRock, Inc. or its subsidiaries. All other marks are the property of their respective owners.
iS-AR-1002-1022
(b) Not Applicable
The registrant has adopted a code of ethics, as of the end of the period covered by this report, applicable to the registrant’s principal executive officer, principal financial officer, principal accounting officer or controller, or persons performing similar functions. During the period covered by this report, the code of ethics was amended to clarify an inconsistency in to whom persons covered by the code should report suspected violations of the code. The amendment clarifies that such reporting should be made to BlackRock’s General Counsel, and retains the alternative option of anonymous reporting following “whistleblower” policies. Other non-material changes were also made in connection with this amendment. During the period covered by this report, there have been no waivers granted under the code of ethics. The registrant undertakes to provide a copy of the code of ethics to any person upon request, without charge, by calling 1-800-474-2737.
| Item 3. | Audit Committee Financial Expert. |
The registrant’s Board of Directors has determined that the registrant has more than one audit committee financial expert, as that term is defined under Item 3(b) and 3(c), serving on its audit committee. The audit committee financial experts serving on the registrant’s audit committee are Richard L. Fagnani and Madhav V. Rajan, all of whom are independent, as that term is defined under Item 3(a)(2).
| Item 4. | Principal Accountant Fees and Services. |
The principal accountant fees disclosed in items 4(a), 4(b), 4(c), 4(d) and 4(g) are for the five series of the registrant for which the fiscal year-end is October 31, 2022 (the “Funds”), and whose annual financial statements are reported in Item 1.
| | (a) | Audit Fees – The aggregate fees billed for each of the last two fiscal years for professional services rendered by the principal accountant for the audit of the Funds’ annual financial statements or services that are normally provided by the accountant in connection with statutory and regulatory filings or engagements for those fiscal years were $78,000 for the fiscal year ended October 31, 2021 and $78,000 for the fiscal year ended October 31, 2022. |
| | (b) | Audit-Related Fees – There were no fees billed for the fiscal years ended October 31, 2021 and October 31, 2022 for assurance and related services by the principal accountant that were reasonably related to the performance of the audit of the Fund’s financial statements and are not reported under (a) of this Item. |
| | (c) | Tax Fees – The aggregate fees billed in each of the last two fiscal years for professional services rendered by the principal accountant for tax compliance, tax advice and tax planning for the Funds were $48,500 for the fiscal year ended October 31, 2021 and $48,500 for the fiscal year ended October 31, 2022. These services related to the review of the Funds’ tax returns and excise tax calculations. |
| | (d) | All Other Fees – There were no other fees billed in each of the fiscal years ended October 31, 2021 and October 31, 2022 for products and services provided by the principal accountant, other than the services reported in (a) through (c) of this Item. |
| | (e) | (1) The registrant’s audit committee charter, as amended, provides that the audit committee is responsible for the approval, prior to appointment, of the engagement of the principal accountant to annually audit and provide their opinion on the registrant’s financial statements. The audit committee must also approve, prior to appointment, the engagement of the principal accountant to provide non-audit services to the registrant or to any entity controlling, controlled by or under common control with the registrant’s investment adviser (“Adviser Affiliate”) that provides ongoing services to the registrant, if the engagement relates directly to the operations and financial reporting of the registrant. |
(2) There were no services described in (b) through (d) above that were approved by the audit committee pursuant to paragraph (c)(7)(i)(C) of Rule 2-01 of Regulation S-X.
| | (f) | None of the hours expended on the principal accountant’s engagement to audit the Funds’ financial statements for the fiscal year ended October 31, 2022 were attributable to work performed by persons other than the principal accountant’s full-time, permanent employees. |
| | (g) | The aggregate non-audit fees billed by the registrant’s principal accountant for services rendered to the Funds, and rendered to the registrant’s investment adviser, and any Adviser Affiliate that provides ongoing services to the registrant for the last two fiscal years were $48,500 for the fiscal year ended October 31, 2021 and $48,500 for the fiscal year ended October 31, 2022. |
| | (h) | The registrant’s audit committee has considered whether the provision of non-audit services rendered to the registrant’s investment adviser and any Adviser Affiliate that provides ongoing services to the registrant that were not pre-approved pursuant to paragraph (c)(7)(ii) of Rule 2-01 of Regulation S-X, if any, is compatible with maintaining the principal accountant’s independence, and has determined that the provision of these services, if any, does not compromise the principal accountant’s independence. |
| Item 5. | Audit Committee of Listed Registrants |
(a) The registrant is a listed issuer as defined in Rule 10A-3 under the Exchange Act of 1934 and has a separately-designated standing audit committee established in accordance with Section 3(a)(58)(A) of the Exchange Act of 1934. The registrant’s audit committee members are Richard L. Fagnani, Cecilia H. Herbert and Madhav V. Rajan.
(b) Not applicable.
(a) Schedules of investments are included as part of the reports to shareholders filed under Item 1 of this Form.
(b) Not applicable.
| Item 7. | Disclosure of Proxy Voting Policies and Procedures for Closed-End Management Investment Companies. |
Not applicable to the registrant.
| Item 8. | Portfolio Managers of Closed-End Management Investment Companies. |
Not applicable to the registrant.
| Item 9. | Purchases of Equity Securities by Closed-End Management Investment Company and Affiliated Purchasers. |
Not applicable to the registrant.
| Item 10. | Submission of Matters to a Vote of Security Holders. |
There were no material changes to the procedures by which shareholders may recommend nominees to the registrant’s Board of Directors.
| Item 11. | Controls and Procedures. |
(a) The President (the registrant’s Principal Executive Officer) and Treasurer and Chief Financial Officer (the registrant’s Principal Financial Officer) have concluded that the registrant’s disclosure controls and procedures (as defined in Rule 30a-3(c) under the Investment Company Act of 1940) are effective as of a date within 90 days of the filing date of this report, based on their evaluation of these controls and procedures required by Rule 30a-3(b) under the Investment Company Act of 1940 and Rules 13a-15(b) or 15d-15(b) under the Exchange Act of 1934.
(b) There were no changes in the registrant’s internal control over financial reporting (as defined in Rule 30a-3(d) under the Investment Company Act of 1940) that occurred during the period covered by this report that have materially affected, or are reasonably likely to materially affect, the registrant’s internal control over financial reporting.
| Item 12. | Disclosure of Securities Lending Activities for Closed-End Management Investment Companies. |
Not applicable to the registrant.
(a) (1) Code of Ethics is not filed as an exhibit; please refer to Item 2.
(a) (2) Section 302 Certifications are attached.
(a) (3) Any written solicitation to purchase securities under Rule 23c-1 – Not Applicable.
(a) (4) Change in Registrant’s independent public accountant – Not Applicable.
(b) Section 906 Certifications are attached.
SIGNATURES
Pursuant to the requirements of the Securities Exchange Act of 1934 and the Investment Company Act of 1940, the registrant has duly caused this report to be signed on its behalf by the undersigned, thereunto duly authorized.
iShares, Inc.
| | | | | | |
| | By: | | /s/ Armando Senra |
| | | | Armando Senra, President (Principal Executive Officer) |
Date: December 22, 2022
Pursuant to the requirements of the Securities Exchange Act of 1934 and the Investment Company Act of 1940, this report has been signed below by the following persons on behalf of the registrant and in the capacities and on the dates indicated.
| | | | | | |
| | By: | | /s/ Armando Senra |
| | | | Armando Senra, President (Principal Executive Officer) |
Date: December 22, 2022
| | | | | | |
| | By: | | /s/ Trent Walker |
| | | | Trent Walker, Treasurer and Chief Financial Officer (Principal Financial Officer) |
Date: December 22, 2022