UNITED STATES
SECURITIES AND EXCHANGE COMMISSION
Washington, D.C. 20549
FORM N-CSR
CERTIFIED SHAREHOLDER REPORT
OF REGISTERED MANAGEMENT INVESTMENT COMPANIES
Investment Company Act file number 811-09102
iShares, Inc.
(Exact name of registrant as specified in charter)
c/o BlackRock Fund Advisors
400 Howard Street, San Francisco, CA 94105
(Address of principal executive offices) (Zip code)
The Corporation Trust Incorporated
2405 York Road, Suite 201, Lutherville-Timonium, Maryland 21093
(Name and address of agent for service)
Registrant’s telephone number, including area code: (415) 670-2000
Date of fiscal year end: April 30, 2024
Date of reporting period: April 30, 2024
| Item 1. | Reports to Stockholders. |
(a) The Report to Shareholders is attached herewith.

2024 Annual Report |
iShares, Inc. |
• iShares Asia/Pacific Dividend ETF | DVYA | NYSE Arca |
• iShares Emerging Markets Dividend ETF | DVYE | NYSE Arca |


President, BlackRock Inc.
Total Returns as of April 30, 2024 | ||
6-Month | 12-Month | |
U.S. large cap equities (S&P 500® Index) | 20.98% | 22.66% |
U.S. small cap equities (Russell 2000® Index) | 19.66 | 13.32 |
International equities (MSCI Europe, Australasia, Far East Index) | 18.63 | 9.28 |
Emerging market equities (MSCI Emerging Markets Index) | 15.40 | 9.88 |
3-month Treasury bills (ICE BofA 3-Month U.S. Treasury Bill Index) | 2.66 | 5.36 |
U.S. Treasury securities (ICE BofA 10-Year U.S. Treasury Index) | 3.66 | (6.40) |
U.S. investment grade bonds (Bloomberg U.S. Aggregate Bond Index) | 4.97 | (1.47) |
Tax-exempt municipal bonds (Bloomberg Municipal Bond Index) | 7.06 | 2.08 |
U.S. high yield bonds (Bloomberg U.S. Corporate High Yield 2% Issuer Capped Index) | 8.99 | 9.01 |
Past performance is not an indication of future results. Index performance is shown for illustrative purposes only. You cannot invest directly in an index. | ||
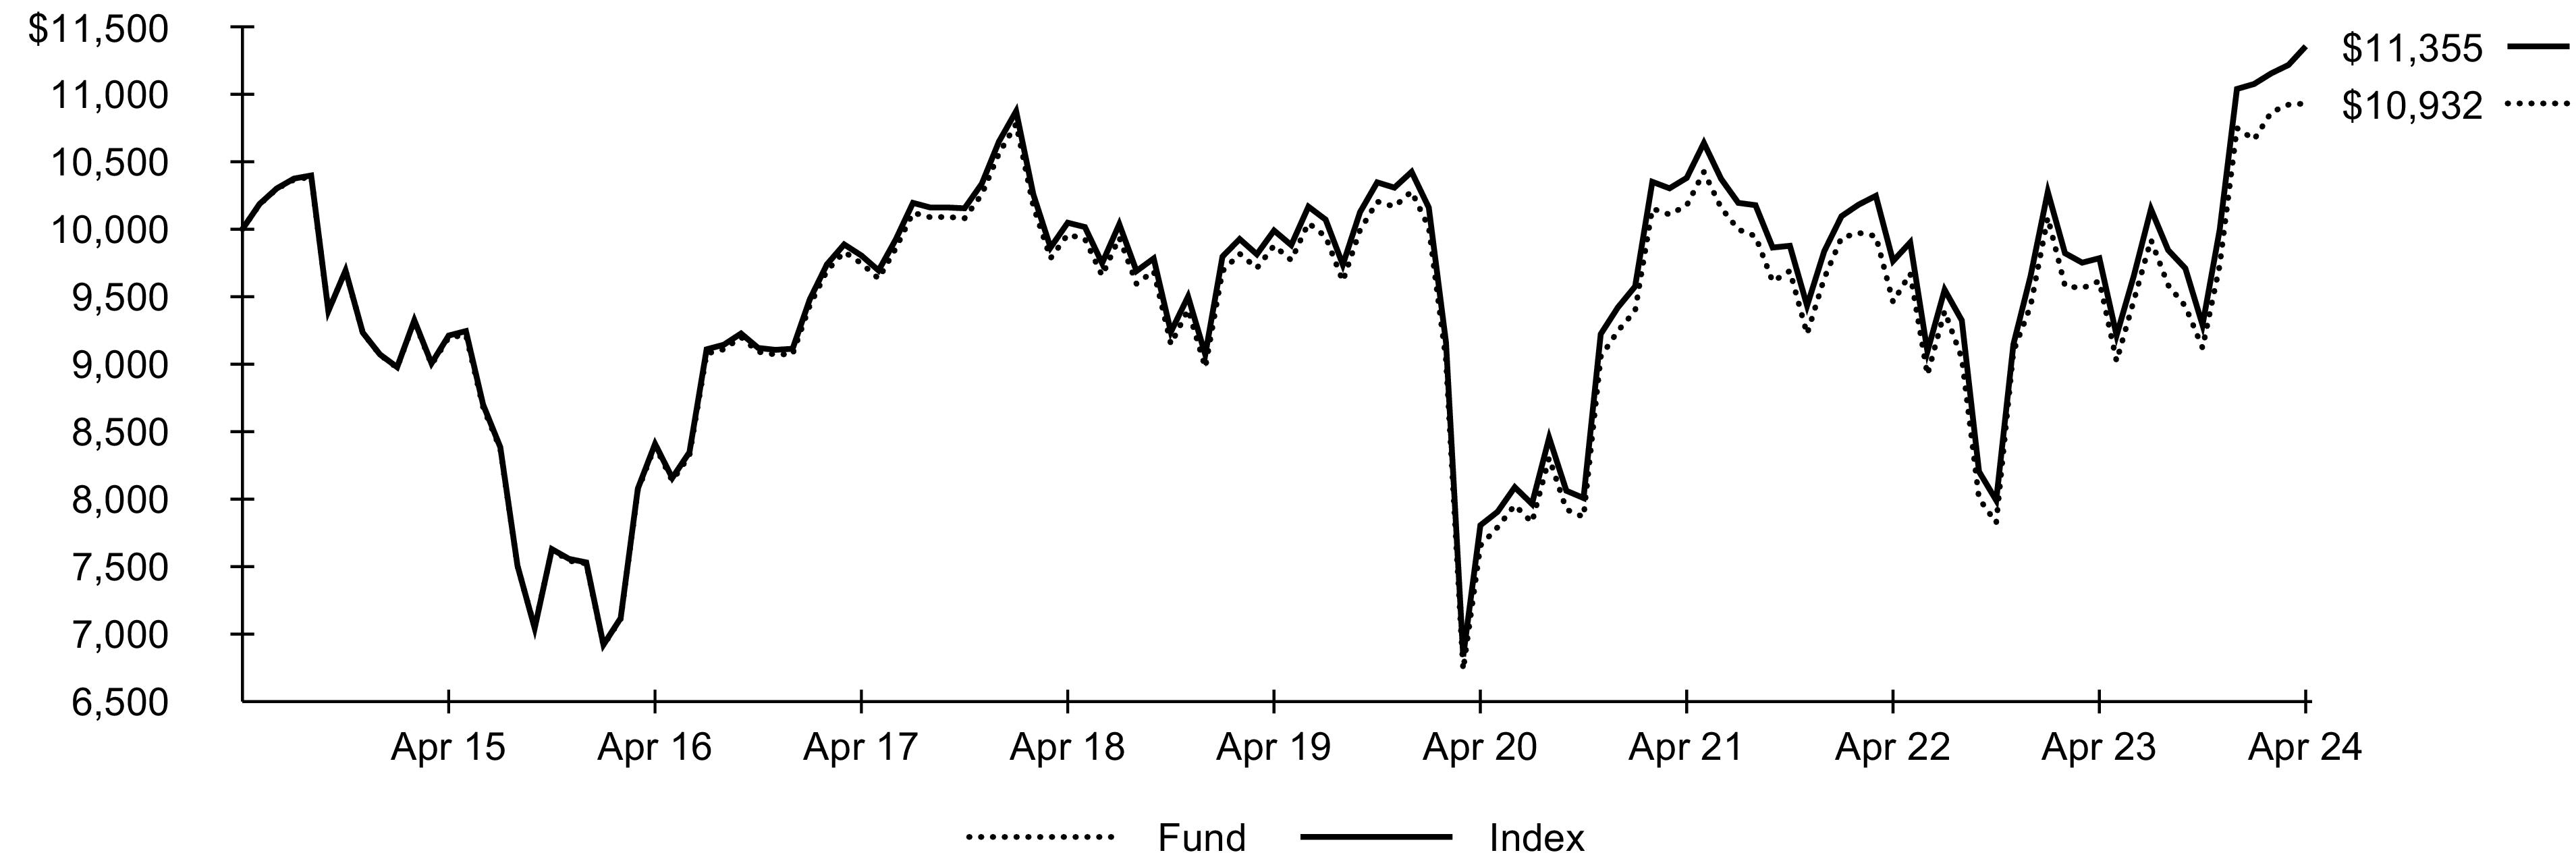
Average Annual Total Returns | Cumulative Total Returns | ||||||
1 Year | 5 Years | 10 Years | 1 Year | 5 Years | 10 Years | ||
Fund NAV | 13.69 % | 2.05 % | 0.89 % | 13.69 % | 10.66 % | 9.32 % | |
Fund Market | 13.01 | 1.98 | 0.85 | 13.01 | 10.31 | 8.83 | |
Index | 16.04 | 2.59 | 1.28 | 16.04 | 13.66 | 13.55 | |
(AT NET ASSET VALUE)
Actual | Hypothetical 5% Return | |||||
Beginning Account Value (11/01/23) | Ending Account Value (04/30/24) | Expenses Paid During the Period(a) | Beginning Account Value (11/01/23) | Ending Account Value (04/30/24) | Expenses Paid During the Period(a) | Annualized Expense Ratio |
$1,000.00 | $1,198.70 | $2.68 | $1,000.00 | $1,022.40 | $2.46 | 0.49% |
(a) | Expenses are equal to the annualized expense ratio, multiplied by the average account value over the period, multiplied by 182/366 (to reflect the one-half year period shown). Other fees, such as brokerage commissions and other fees to financial intermediaries, may be paid which are not reflected in the tables and examples above. See “Disclosure of Expenses” for more information. |
Sector | Percent of Total Investments(a) |
Financials | 31.6 % |
Materials | 22.0 |
Real Estate | 16.6 |
Industrials | 9.3 |
Energy | 5.6 |
Consumer Discretionary | 4.2 |
Communication Services | 3.6 |
Utilities | 3.5 |
Consumer Staples | 2.4 |
Information Technology | 1.2 |
Country/Geographic Region | Percent of Total Investments(a) |
Australia | 44.8 % |
Hong Kong | 32.5 |
Singapore | 18.5 |
Japan | 2.5 |
New Zealand | 1.7 |
(a) | Excludes money market funds. |
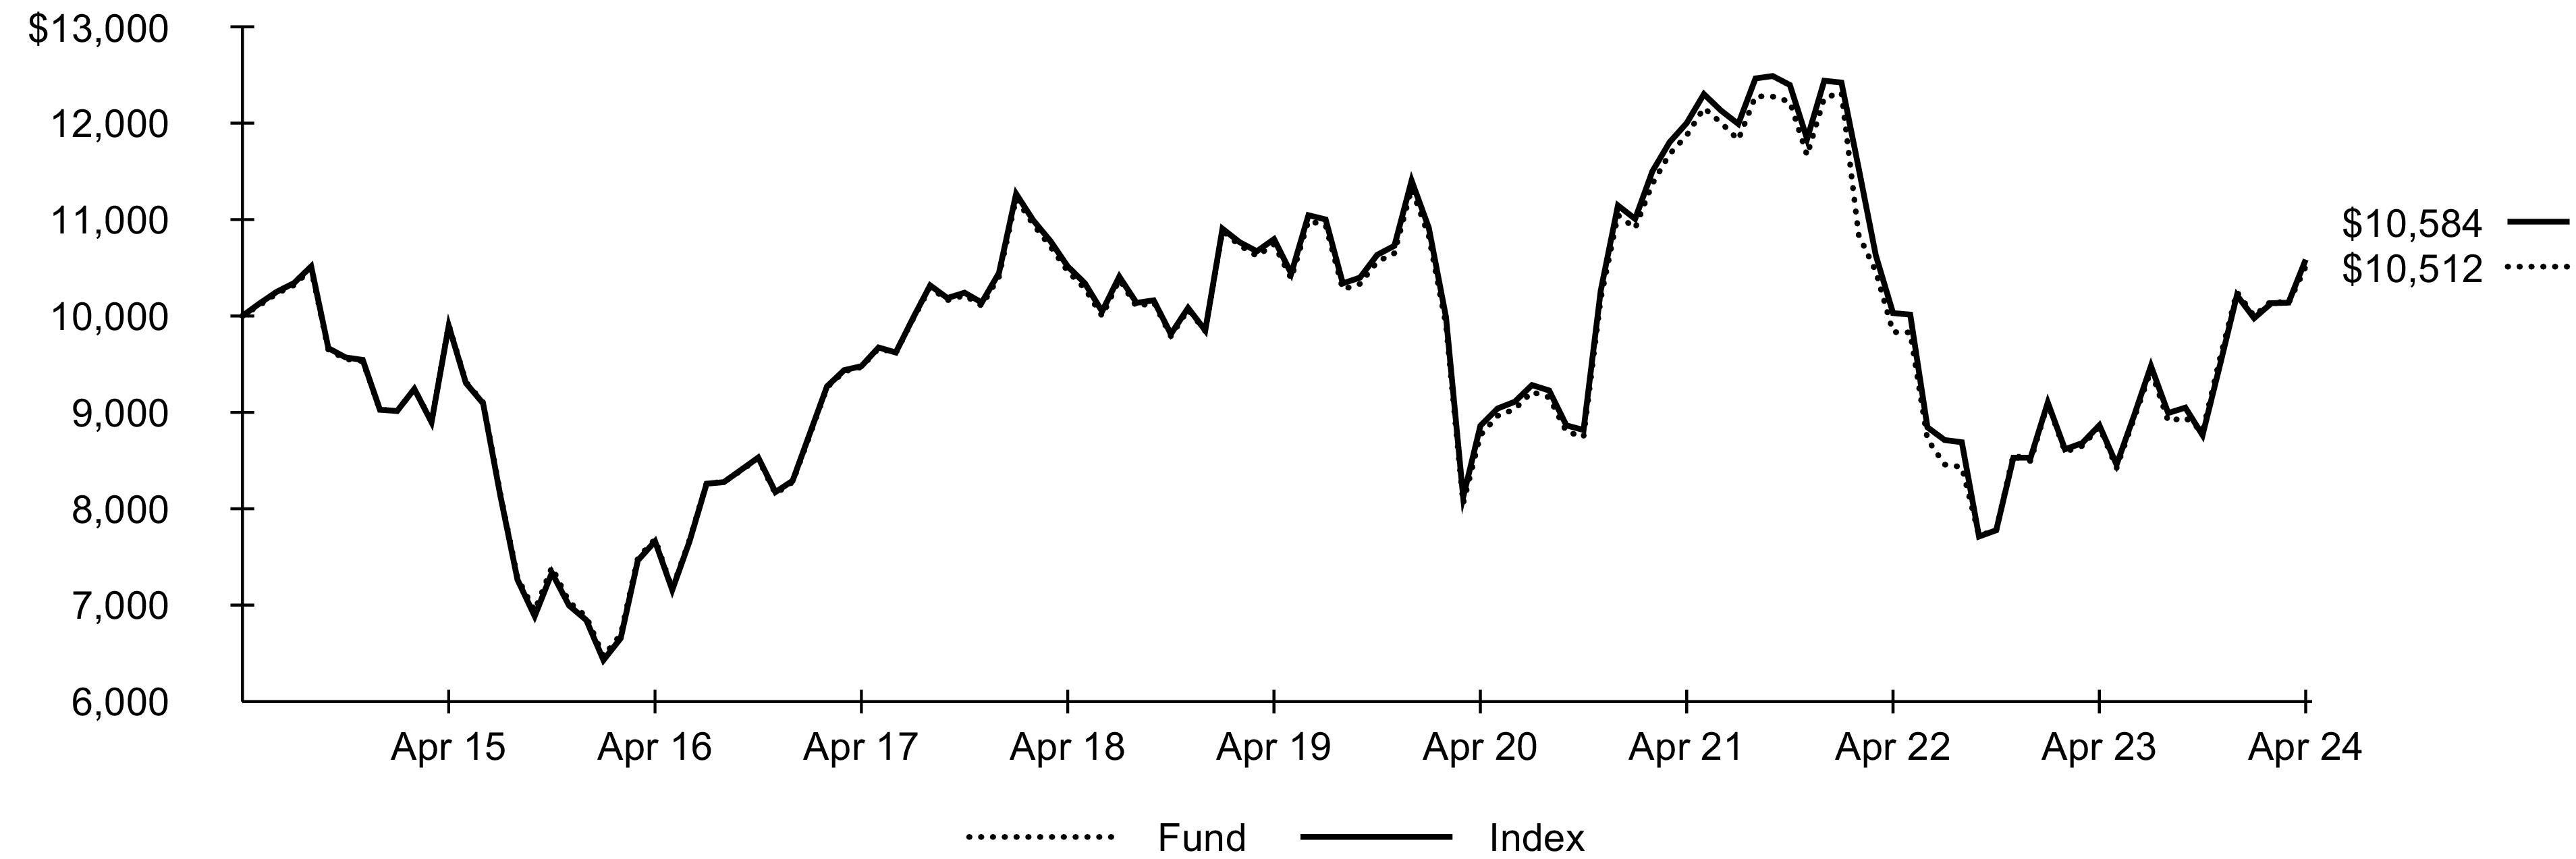
Average Annual Total Returns | Cumulative Total Returns | ||||||
1 Year | 5 Years | 10 Years | 1 Year | 5 Years | 10 Years | ||
Fund NAV | 18.79 % | (0.44 )% | 0.50 % | 18.79 % | (2.16 )% | 5.12 % | |
Fund Market | 18.72 | (0.53 ) | 0.40 | 18.72 | (2.64 ) | 4.10 | |
Index | 19.38 | (0.40 ) | 0.57 | 19.38 | (1.98 ) | 5.84 | |
(AT NET ASSET VALUE)
Actual | Hypothetical 5% Return | |||||
Beginning Account Value (11/01/23) | Ending Account Value (04/30/24) | Expenses Paid During the Period(a) | Beginning Account Value (11/01/23) | Ending Account Value (04/30/24) | Expenses Paid During the Period(a) | Annualized Expense Ratio |
$1,000.00 | $1,194.50 | $2.73 | $1,000.00 | $1,022.40 | $2.51 | 0.50% |
(a) | Expenses are equal to the annualized expense ratio, multiplied by the average account value over the period, multiplied by 182/366 (to reflect the one-half year period shown). Other fees, such as brokerage commissions and other fees to financial intermediaries, may be paid which are not reflected in the tables and examples above. See “Disclosure of Expenses” for more information. |
Sector | Percent of Total Investments(a) |
Financials | 21.7 % |
Energy | 21.1 |
Materials | 18.9 |
Industrials | 13.9 |
Utilities | 9.6 |
Information Technology | 6.4 |
Consumer Discretionary | 3.8 |
Real Estate | 2.9 |
Consumer Staples | 1.1 |
Communication Services | 0.6 |
Country/Geographic Region | Percent of Total Investments(a) |
Brazil | 23.1 % |
China | 23.1 |
Taiwan | 11.3 |
Indonesia | 7.8 |
India | 7.0 |
Chile | 5.1 |
Czech Republic | 4.2 |
South Africa | 4.2 |
Thailand | 2.8 |
Greece | 2.5 |
(a) | Excludes money market funds. |
Security | Shares | Value |
Common Stocks | ||
Australia — 44.5% | ||
Ampol Ltd. | 29,448 | $695,379 |
ANZ Group Holdings Ltd. | 110,533 | 1,994,449 |
Bank of Queensland Ltd. | 129,738 | 512,485 |
Bendigo & Adelaide Bank Ltd. | 86,027 | 539,228 |
BHP Group Ltd. | 121,474 | 3,331,559 |
CSR Ltd. | 71,852 | 409,828 |
Deterra Royalties Ltd. | 125,353 | 396,792 |
Elders Ltd. | 47,287 | 256,919 |
Fortescue Ltd. | 133,261 | 2,208,727 |
Harvey Norman Holdings Ltd. | 116,470 | 342,050 |
IGO Ltd. | 138,598 | 690,312 |
JB Hi-Fi Ltd. | 12,630 | 492,849 |
Magellan Financial Group Ltd. | 62,590 | 355,394 |
Nick Scali Ltd. | 22,271 | 223,279 |
Nickel Industries Ltd. | 751,659 | 451,457 |
Perpetual Ltd. | 18,048 | 274,406 |
Rio Tinto Ltd. | 19,438 | 1,617,714 |
Santos Ltd. | 257,010 | 1,261,242 |
Super Retail Group Ltd. | 31,878 | 296,414 |
Viva Energy Group Ltd.(a) | 161,091 | 352,708 |
Westpac Banking Corp. | 109,487 | 1,818,179 |
18,521,370 | ||
Hong Kong — 32.3% | ||
BOC Hong Kong Holdings Ltd. | 369,500 | 1,132,552 |
CK Asset Holdings Ltd. | 218,500 | 932,028 |
CK Hutchison Holdings Ltd. | 271,500 | 1,318,614 |
CK Infrastructure Holdings Ltd. | 95,500 | 539,493 |
Hang Seng Bank Ltd. | 84,900 | 1,119,540 |
Henderson Land Development Co. Ltd. | 296,000 | 892,387 |
Hongkong Land Holdings Ltd. | 208,700 | 666,834 |
Hysan Development Co. Ltd. | 267,000 | 416,141 |
Jardine Matheson Holdings Ltd. | 20,500 | 786,585 |
Kerry Properties Ltd. | 338,500 | 656,221 |
New World Development Co. Ltd.(b) | 289,250 | 307,169 |
PCCW Ltd. | 1,538,000 | 768,991 |
Power Assets Holdings Ltd. | 157,000 | 900,576 |
Sino Land Co. Ltd. | 692,000 | 739,886 |
Sun Hung Kai Properties Ltd. | 132,000 | 1,217,694 |
Swire Pacific Ltd., Class A | 60,000 | 508,122 |
Swire Properties Ltd. | 253,800 | 524,901 |
13,427,734 | ||
Japan — 2.5% | ||
Haseko Corp. | 30,700 | 370,895 |
Iino Kaiun Kaisha Ltd. | 23,900 | 192,112 |
Mitsuboshi Belting Ltd. | 8,100 | 248,432 |
Nishimatsu Construction Co. Ltd. | 7,300 | 211,078 |
1,022,517 | ||
New Zealand — 1.7% | ||
Spark New Zealand Ltd. | 258,467 | 726,479 |
Security | Shares | Value |
Singapore — 18.3% | ||
DBS Group Holdings Ltd.(b) | 76,000 | $1,934,763 |
Jardine Cycle & Carriage Ltd.(b) | 21,800 | 420,702 |
Keppel Ltd. | 132,300 | 661,753 |
Oversea-Chinese Banking Corp. Ltd. | 172,100 | 1,786,667 |
United Overseas Bank Ltd. | 71,600 | 1,588,860 |
Venture Corp. Ltd. | 47,600 | 504,333 |
Wilmar International Ltd. | 313,000 | 735,729 |
7,632,807 | ||
Total Common Stocks — 99.3% (Cost: $42,425,452) | 41,330,907 | |
Warrants | ||
Australia — 0.0% | ||
Magellan Financial Group Ltd. (Issued/Exercisable 04/14/22, 1 Share for 1 Warrant, Expires 04/16/27, Strike Price AUD 35.00)(c) | 1 | — |
Total Warrants — 0.0% (Cost: $—) | — | |
Total Long-Term Investments — 99.3% (Cost: $42,425,452) | 41,330,907 | |
Short-Term Securities | ||
Money Market Funds — 0.8% | ||
BlackRock Cash Funds: Institutional, SL Agency Shares, 5.49%(d)(e)(f) | 332,361 | 332,461 |
BlackRock Cash Funds: Treasury, SL Agency Shares, 5.28%(d)(e) | 10,000 | 10,000 |
Total Short-Term Securities — 0.8% (Cost: $342,475) | 342,461 | |
Total Investments — 100.1% (Cost: $42,767,927) | 41,673,368 | |
Liabilities in Excess of Other Assets — (0.1)% | (51,888 ) | |
Net Assets — 100.0% | $41,621,480 | |
(a) | Security exempt from registration pursuant to Rule 144A under the Securities Act of 1933, as amended. These securities may be resold in transactions exempt from registration to qualified institutional investors. |
(b) | All or a portion of this security is on loan. |
(c) | Non-income producing security. |
(d) | Affiliate of the Fund. |
(e) | Annualized 7-day yield as of period end. |
(f) | All or a portion of this security was purchased with the cash collateral from loaned securities. |
Affiliated Issuer | Value at 04/30/23 | Purchases at Cost | Proceeds from Sales | Net Realized Gain (Loss) | Change in Unrealized Appreciation (Depreciation) | Value at 04/30/24 | Shares Held at 04/30/24 | Income | Capital Gain Distributions from Underlying Funds |
BlackRock Cash Funds: Institutional, SL Agency Shares | $— | $332,354 (a) | $— | $121 | $(14 ) | $332,461 | 332,361 | $5,397 (b) | $— |
BlackRock Cash Funds: Treasury, SL Agency Shares | 10,000 | 0 (a) | — | — | — | 10,000 | 10,000 | 1,952 | — |
$121 | $(14 ) | $342,461 | $7,349 | $— |
(a) | Represents net amount purchased (sold). |
(b) | All or a portion represents securities lending income earned from the reinvestment of cash collateral from loaned securities, net of fees and collateral investment expenses, and other payments to and from borrowers of securities. |
Description | Number of Contracts | Expiration Date | Notional Amount (000) | Value/ Unrealized Appreciation (Depreciation) |
Long Contracts | ||||
MSCI Singapore Index | 9 | 05/30/24 | $199 | $(232 ) |
Mini TOPIX Index | 5 | 06/13/24 | 86 | (139 ) |
$(371 ) |
Commodity Contracts | Credit Contracts | Equity Contracts | Foreign Currency Exchange Contracts | Interest Rate Contracts | Other Contracts | Total | |
Liabilities—Derivative Financial Instruments | |||||||
Futures contracts | |||||||
Unrealized depreciation on futures contracts(a) | $— | $— | $371 | $— | $— | $— | $371 |
(a) | Net cumulative unrealized appreciation (depreciation) on futures contracts are reported in the Schedule of Investments. In the Statements of Assets and Liabilities, only current day's variation margin is reported in receivables or payables and the net cumulative unrealized appreciation (depreciation) is included in accumulated earnings (loss). |
Commodity Contracts | Credit Contracts | Equity Contracts | Foreign Currency Exchange Contracts | Interest Rate Contracts | Other Contracts | Total | |
Net Realized Gain (Loss) from | |||||||
Futures contracts | $— | $— | $45,095 | $— | $— | $— | $45,095 |
Net Change in Unrealized Appreciation (Depreciation) on | |||||||
Futures contracts | $— | $— | $(8,718 ) | $— | $— | $— | $(8,718 ) |
Futures contracts: | |
Average notional value of contracts — long | $197,916 |
Level 1 | Level 2 | Level 3 | Total | |
Assets | ||||
Investments | ||||
Long-Term Investments | ||||
Common Stocks | $1,513,064 | $39,817,843 | $— | $41,330,907 |
Warrants | — | — | — | — |
Short-Term Securities | ||||
Money Market Funds | 342,461 | — | — | 342,461 |
$1,855,525 | $39,817,843 | $— | $41,673,368 | |
Derivative Financial Instruments(a) | ||||
Liabilities | ||||
Equity Contracts | $— | $(371 ) | $— | $(371 ) |
(a) | Derivative financial instruments are futures contracts. Futures contracts are valued at the unrealized appreciation (depreciation) on the instrument. |
Security | Shares | Value |
Common Stocks | ||
Brazil — 11.6% | ||
Banco Santander Brasil SA | 659,702 | $3,671,646 |
BB Seguridade Participacoes SA | 1,279,603 | 7,934,988 |
Cia de Saneamento de Minas Gerais Copasa MG | 893,774 | 3,370,199 |
Cia. Siderurgica Nacional SA | 2,123,535 | 5,692,641 |
CPFL Energia SA | 612,845 | 3,764,926 |
CSN Mineracao SA | 3,644,055 | 3,466,786 |
Engie Brasil Energia SA | 709,582 | 5,589,089 |
Grendene SA | 3,221,271 | 3,821,405 |
JBS SA | 1,601,419 | 7,228,991 |
Telefonica Brasil SA | 471,487 | 4,298,462 |
Transmissora Alianca de Energia Eletrica SA | 521,340 | 3,536,108 |
Vale SA | 2,204,636 | 26,871,204 |
79,246,445 | ||
Chile — 3.3% | ||
CAP SA | 215,085 | 1,537,889 |
Cia. Sud Americana de Vapores SA | 116,116,185 | 9,059,010 |
Empresas CMPC SA | 2,777,737 | 5,485,745 |
Enel Chile SA | 104,416,823 | 6,199,426 |
22,282,070 | ||
China — 22.9% | ||
Agricultural Bank of China Ltd., Class H | 19,552,000 | 8,718,449 |
Anhui Conch Cement Co. Ltd., Class H | 2,131,500 | 4,945,215 |
BAIC Motor Corp. Ltd., Class H(a) | 6,373,000 | 1,807,381 |
Bank of China Ltd., Class H | 35,652,000 | 15,989,567 |
Beijing Enterprises Water Group Ltd.(b) | 11,086,000 | 2,796,008 |
China Cinda Asset Management Co. Ltd., Class H | 20,187,000 | 1,819,186 |
China CITIC Bank Corp. Ltd., Class H | 10,762,000 | 6,296,128 |
China Construction Bank Corp., Class H | 32,842,000 | 21,248,468 |
China Hongqiao Group Ltd.(b) | 1,848,000 | 2,550,016 |
China Jinmao Holdings Group Ltd. | 12,650,000 | 1,071,928 |
China Merchants Port Holdings Co. Ltd. | 2,580,000 | 3,407,186 |
China Minsheng Banking Corp. Ltd., Class H | 11,022,500 | 4,032,926 |
China National Building Material Co. Ltd., Class H | 15,012,000 | 5,808,712 |
China Petroleum & Chemical Corp., Class H | 17,272,000 | 10,309,684 |
China Shenhua Energy Co. Ltd., Class H | 2,591,500 | 10,755,937 |
Chongqing Rural Commercial Bank Co. Ltd., Class H | 6,650,000 | 2,846,417 |
Guangdong Investment Ltd. | 8,754,000 | 4,572,785 |
Huadian Power International Corp. Ltd., Class H(b) | 3,346,000 | 1,830,683 |
Industrial & Commercial Bank of China Ltd., Class H | 28,584,000 | 15,327,542 |
Kingboard Laminates Holdings Ltd. | 1,767,000 | 1,513,659 |
Longfor Group Holdings Ltd.(a)(b) | 4,375,000 | 6,480,007 |
Orient Overseas International Ltd. | 398,500 | 5,812,132 |
PICC Property & Casualty Co. Ltd., Class H | 3,368,000 | 4,184,344 |
Yankuang Energy Group Co. Ltd., Class H | 3,753,000 | 8,141,650 |
Yuexiu Property Co. Ltd.(b) | 4,353,000 | 2,597,955 |
Zhejiang Expressway Co. Ltd., Class H | 3,170,000 | 2,072,644 |
156,936,609 | ||
Czech Republic — 4.2% | ||
CEZ AS | 539,786 | 19,924,894 |
Komercni Banka AS | 236,406 | 8,710,334 |
28,635,228 | ||
Greece — 2.5% | ||
Hellenic Energy Holdings SA | 418,674 | 3,753,233 |
OPAP SA | 532,553 | 8,871,801 |
Star Bulk Carriers Corp. | 173,752 | 4,225,648 |
16,850,682 | ||
Security | Shares | Value |
Hong Kong — 1.3% | ||
SITC International Holdings Co. Ltd.(b) | 4,124,000 | $8,943,280 |
India — 7.0% | ||
Coal India Ltd. | 1,828,374 | 9,940,764 |
Hindustan Zinc Ltd. | 1,686,388 | 8,603,978 |
Indian Oil Corp. Ltd. | 3,205,666 | 6,473,465 |
Vedanta Ltd. | 4,780,282 | 22,814,658 |
47,832,865 | ||
Indonesia — 7.8% | ||
Adaro Energy Indonesia Tbk PT | 76,365,100 | 12,691,701 |
Astra International Tbk PT | 50,245,600 | 15,855,267 |
Bukit Asam Tbk PT | 37,973,800 | 7,076,298 |
Indo Tambangraya Megah Tbk PT | 3,806,200 | 5,904,760 |
United Tractors Tbk PT | 7,583,200 | 11,557,515 |
53,085,541 | ||
Kuwait — 0.4% | ||
National Investments Co. KSCP | 3,251,986 | 2,677,018 |
Malaysia — 1.8% | ||
Malayan Banking Bhd | 6,165,300 | 12,562,815 |
Poland — 1.8% | ||
Grupa Kety SA | 34,822 | 7,215,626 |
XTB SA(a)(b) | 325,808 | 5,091,731 |
12,307,357 | ||
Qatar — 0.5% | ||
Barwa Real Estate Co. | 4,858,860 | 3,738,046 |
Russia — 0.0% | ||
Federal Grid Co. Rosseti PJSC(c)(d) | 4,402,974,828 | 471 |
GMK Norilskiy Nickel PAO(c)(d) | 2,371,200 | 3 |
LUKOIL PJSC(c)(d) | 124,880 | 13 |
Magnitogorsk Iron & Steel Works PJSC(c)(d) | 14,721,471 | 1,575 |
Mobile TeleSystems PJSC(c)(d) | 2,744,644 | 294 |
Moscow Exchange MICEX-RTS PJSC(c)(d) | 2,788,700 | 298 |
Novolipetsk Steel PJSC(c)(d) | 3,457,900 | 370 |
PhosAgro PJSC(c)(d) | 180,278 | 19 |
PhosAgro PJSC, New(c)(d) | 3,484 | 35 |
Rostelecom PJSC(c)(d) | 4,681,247 | 501 |
Sberbank of Russia PJSC(c)(d) | 2,500,255 | 268 |
Severstal PAO(c)(d) | 695,941 | 74 |
Tatneft PJSC(c)(d) | 1,165,907 | 125 |
Unipro PJSC(c)(d) | 299,242,000 | 32,022 |
36,068 | ||
South Africa — 4.1% | ||
African Rainbow Minerals Ltd. | 891,090 | 9,205,075 |
Exxaro Resources Ltd. | 1,057,570 | 10,132,666 |
Kumba Iron Ore Ltd.(b) | 163,589 | 4,028,785 |
Truworths International Ltd. | 1,225,937 | 4,900,865 |
28,267,391 | ||
Taiwan — 11.2% | ||
Evergreen Marine Corp. Taiwan Ltd. | 3,361,000 | 19,559,901 |
Himax Technologies Inc., ADR | 696,281 | 3,516,219 |
Merry Electronics Co. Ltd. | 493,146 | 1,823,276 |
Novatek Microelectronics Corp. | 591,000 | 11,167,072 |
Radiant Opto-Electronics Corp. | 1,149,000 | 7,005,356 |
Simplo Technology Co. Ltd. | 363,600 | 4,855,572 |
Sitronix Technology Corp. | 438,000 | 3,740,686 |
Supreme Electronics Co. Ltd. | 1,784,685 | 4,808,977 |
Systex Corp. | 562,000 | 2,148,730 |
T3EX Global Holdings Corp. | 884,000 | 2,769,117 |
United Integrated Services Co. Ltd. | 365,000 | 4,403,904 |
Security | Shares | Value |
Taiwan (continued) | ||
Wisdom Marine Lines Co. Ltd. | 2,993,000 | $6,253,874 |
WPG Holdings Ltd. | 1,674,280 | 4,521,936 |
76,574,620 | ||
Thailand — 2.8% | ||
Banpu PCL, NVDR | 20,075,100 | 2,995,013 |
Kiatnakin Phatra Bank PCL, NVDR | 1,467,700 | 2,055,160 |
Land & Houses PCL, NVDR | 14,233,800 | 2,856,922 |
Sansiri PCL, NVDR | 67,931,700 | 3,103,493 |
Sri Trang Agro-Industry PCL, NVDR | 3,329,500 | 1,567,430 |
Thanachart Capital PCL, NVDR | 1,962,100 | 2,594,250 |
Tisco Financial Group PCL, NVDR | 1,511,600 | 3,961,908 |
19,134,176 | ||
Turkey — 0.4% | ||
Dogus Otomotiv Servis ve Ticaret AS | 317,144 | 2,778,636 |
United Arab Emirates — 1.0% | ||
Dubai Islamic Bank PJSC | 4,658,412 | 7,051,858 |
Total Common Stocks — 84.6% (Cost: $661,232,075) | 578,940,705 | |
Preferred Stocks | ||
Brazil — 11.4% | ||
Bradespar SA, Preference Shares, NVS | 936,584 | 3,594,754 |
Cia. Energetica de Minas Gerais, Preference Shares, NVS | 5,232,188 | 9,844,486 |
CTEEP-Cia. de Transmissao de Energia Eletrica Paulista, Preference Shares, NVS | 750,024 | 3,606,690 |
Gerdau SA, Preference Shares, NVS | 2,172,901 | 7,641,099 |
Metalurgica Gerdau SA, Preference Shares, NVS | 4,007,972 | 8,166,303 |
Petroleo Brasileiro SA, Preference Shares, NVS | 5,428,073 | 43,925,517 |
Unipar Carbocloro SA, Class B, Preference Shares, NVS | 118,883 | 1,208,608 |
77,987,457 | ||
Chile — 1.9% | ||
Sociedad Quimica y Minera de Chile SA, Class B, Preference Shares | 274,837 | 12,553,099 |
Security | Shares | Value |
Colombia — 1.6% | ||
Bancolombia SA, Preference Shares, NVS | 1,356,924 | $11,103,049 |
Russia — 0.0% | ||
Transneft PJSC, Preference Shares, NVS(c)(d) | 576,700 | — |
Total Preferred Stocks — 14.9% (Cost: $108,404,197) | 101,643,605 | |
Total Long-Term Investments — 99.5% (Cost: $769,636,272) | 680,584,310 | |
Short-Term Securities | ||
Money Market Funds — 3.6% | ||
BlackRock Cash Funds: Institutional, SL Agency Shares, 5.49%(e)(f)(g) | 24,895,378 | 24,902,847 |
Total Short-Term Securities — 3.6% (Cost: $24,901,114) | 24,902,847 | |
Total Investments — 103.1% (Cost: $794,537,386) | 705,487,157 | |
Liabilities in Excess of Other Assets — (3.1)% | (21,405,619 ) | |
Net Assets — 100.0% | $684,081,538 | |
(a) | Security exempt from registration pursuant to Rule 144A under the Securities Act of 1933, as amended. These securities may be resold in transactions exempt from registration to qualified institutional investors. |
(b) | All or a portion of this security is on loan. |
(c) | Security is valued using significant unobservable inputs and is classified as Level 3 in the fair value hierarchy. |
(d) | Non-income producing security. |
(e) | Affiliate of the Fund. |
(f) | Annualized 7-day yield as of period end. |
(g) | All or a portion of this security was purchased with the cash collateral from loaned securities. |
Affiliated Issuer | Value at 04/30/23 | Purchases at Cost | Proceeds from Sales | Net Realized Gain (Loss) | Change in Unrealized Appreciation (Depreciation) | Value at 04/30/24 | Shares Held at 04/30/24 | Income | Capital Gain Distributions from Underlying Funds |
BlackRock Cash Funds: Institutional, SL Agency Shares | $11,594,244 | $13,308,450 (a) | $— | $4,508 | $(4,355 ) | $24,902,847 | 24,895,378 | $227,618 (b) | $— |
BlackRock Cash Funds: Treasury, SL Agency Shares | 1,270,000 | — | (1,270,000 )(a) | — | — | — | — | 80,824 | — |
$4,508 | $(4,355 ) | $24,902,847 | $308,442 | $— |
(a) | Represents net amount purchased (sold). |
(b) | All or a portion represents securities lending income earned from the reinvestment of cash collateral from loaned securities, net of fees and collateral investment expenses, and other payments to and from borrowers of securities. |
Description | Number of Contracts | Expiration Date | Notional Amount (000) | Value/ Unrealized Appreciation (Depreciation) |
Long Contracts | ||||
MSCI Emerging Markets Index | 44 | 06/21/24 | $2,292 | $2,864 |
Commodity Contracts | Credit Contracts | Equity Contracts | Foreign Currency Exchange Contracts | Interest Rate Contracts | Other Contracts | Total | |
Assets—Derivative Financial Instruments | |||||||
Futures contracts | |||||||
Unrealized appreciation on futures contracts(a) | $— | $— | $2,864 | $— | $— | $— | $2,864 |
(a) | Net cumulative unrealized appreciation (depreciation) on futures contracts are reported in the Schedule of Investments. In the Statements of Assets and Liabilities, only current day's variation margin is reported in receivables or payables and the net cumulative unrealized appreciation (depreciation) is included in accumulated earnings (loss). |
Commodity Contracts | Credit Contracts | Equity Contracts | Foreign Currency Exchange Contracts | Interest Rate Contracts | Other Contracts | Total | |
Net Realized Gain (Loss) from | |||||||
Futures contracts | $— | $— | $(142,975 ) | $— | $— | $— | $(142,975 ) |
Net Change in Unrealized Appreciation (Depreciation) on | |||||||
Futures contracts | $— | $— | $19,037 | $— | $— | $— | $19,037 |
Futures contracts: | |
Average notional value of contracts — long | $3,963,449 |
Level 1 | Level 2 | Level 3 | Total | |
Assets | ||||
Investments | ||||
Long-Term Investments | ||||
Common Stocks | $191,661,365 | $387,243,272 | $36,068 | $578,940,705 |
Preferred Stocks | 101,643,605 | — | — | 101,643,605 |
Short-Term Securities | ||||
Money Market Funds | 24,902,847 | — | — | 24,902,847 |
$318,207,817 | $387,243,272 | $36,068 | $705,487,157 |
Level 1 | Level 2 | Level 3 | Total | |
Derivative Financial Instruments(a) | ||||
Assets | ||||
Equity Contracts | $2,864 | $— | $— | $2,864 |
(a) | Derivative financial instruments are futures contracts. Futures contracts are valued at the unrealized appreciation (depreciation) on the instrument. |
iShares Asia/Pacific Dividend ETF | iShares Emerging Markets Dividend ETF | |
ASSETS | ||
Investments, at value—unaffiliated(a)(b) | $41,330,907 | $680,584,310 |
Investments, at value—affiliated(c) | 342,461 | 24,902,847 |
Cash | 7,001 | — |
Cash pledged for futures contracts | — | 73,000 |
Foreign currency collateral pledged for futures contracts(d) | 11,469 | — |
Foreign currency, at value(e) | 44,783 | 1,871,526 |
Receivables: | ||
Investments sold | — | 9,042,299 |
Securities lending income—affiliated | 272 | 20,228 |
Dividends—unaffiliated | 232,757 | 4,465,105 |
Dividends— affiliated | 29 | 993 |
Tax reclaims | — | 38,842 |
Variation margin on futures contracts | 970 | — |
Total assets | 41,970,649 | 720,999,150 |
LIABILITIES | ||
Bank overdraft | — | 15,574 |
Collateral on securities loaned, at value | 332,495 | 24,889,979 |
Payables: | ||
Investments purchased | — | 9,477,314 |
Deferred foreign capital gain tax | — | 2,218,713 |
Investment advisory fees | 16,674 | 274,767 |
Professional fees | — | 7,618 |
Variation margin on futures contracts | — | 33,647 |
Total liabilities | 349,169 | 36,917,612 |
Commitments and contingent liabilities | ||
NET ASSETS | $41,621,480 | $684,081,538 |
NET ASSETS CONSIST OF | ||
Paid-in capital | $61,652,234 | $1,076,905,015 |
Accumulated loss | (20,030,754) | (392,823,477) |
NET ASSETS | $41,621,480 | $684,081,538 |
NET ASSET VALUE | ||
Shares outstanding | 1,150,000 | 25,200,000 |
Net asset value | $36.19 | $27.15 |
Shares authorized | 500 million | 500 million |
Par value | $0.001 | $0.001 |
(a) Investments, at cost—unaffiliated | $42,425,452 | $769,636,272 |
(b) Securities loaned, at value | $309,749 | $20,870,667 |
(c) Investments, at cost—affiliated | $342,475 | $24,901,114 |
(d) Foreign currency collateral pledged, at cost | $11,703 | $— |
(e) Foreign currency, at cost | $44,775 | $1,884,065 |
iShares Asia/Pacific Dividend ETF | iShares Emerging Markets Dividend ETF | |
INVESTMENT INCOME | ||
Dividends—unaffiliated | $2,440,805 | $57,022,942 |
Dividends—affiliated | 1,952 | 80,824 |
Interest—unaffiliated | 265 | 17,156 |
Securities lending income—affiliated—net | 5,397 | 227,618 |
Other income—unaffiliated | — | 77,299 |
Foreign taxes withheld | (43,528 ) | (5,604,759 ) |
Total investment income | 2,404,891 | 51,821,080 |
EXPENSES | ||
Investment advisory | 196,715 | 3,164,539 |
Commitment costs | — | 10,932 |
Professional | — | 7,730 |
Interest expense | — | 7,685 |
Total expenses | 196,715 | 3,190,886 |
Less: | ||
Investment advisory fees waived | (33 ) | — |
Total expenses after fees waived | 196,682 | 3,190,886 |
Net investment income | 2,208,209 | 48,630,194 |
REALIZED AND UNREALIZED GAIN (LOSS) | ||
Net realized gain (loss) from: | ||
Investments—unaffiliated(a) | (437,521 ) | (22,765,376 ) |
Investments—affiliated | 121 | 4,508 |
Foreign currency transactions | (31,819 ) | (155,633 ) |
Futures contracts | 45,095 | (142,975 ) |
In-kind redemptions—unaffiliated(b) | 341,091 | 2,109,833 |
(83,033 ) | (20,949,643 ) | |
Net change in unrealized appreciation (depreciation) on: | ||
Investments—unaffiliated(c) | 3,162,962 | 83,807,746 |
Investments—affiliated | (14 ) | (4,355 ) |
Foreign currency translations | 9,170 | (197,074 ) |
Futures contracts | (8,718 ) | 19,037 |
3,163,400 | 83,625,354 | |
Net realized and unrealized gain | 3,080,367 | 62,675,711 |
NET INCREASE IN NET ASSETS RESULTING FROM OPERATIONS | $5,288,576 | $111,305,905 |
(a) Net of foreign capital gain tax and capital gain tax refund, if applicable of | $— | $(3,508,479 ) |
(b) See Note 2 of the Notes to Financial Statements. | ||
(c) Net of increase in deferred foreign capital gain tax of | $— | $(1,317,971 ) |
iShares Asia/Pacific Dividend ETF | iShares Emerging Markets Dividend ETF | |||
Year Ended 04/30/24 | Year Ended 04/30/23 | Year Ended 04/30/24 | Year Ended 04/30/23 | |
INCREASE (DECREASE) IN NET ASSETS | ||||
OPERATIONS | ||||
Net investment income | $2,208,209 | $2,610,502 | $48,630,194 | $52,596,376 |
Net realized loss | (83,033 ) | (1,800,447 ) | (20,949,643 ) | (124,265,317 ) |
Net change in unrealized appreciation (depreciation) | 3,163,400 | (510,521 ) | 83,625,354 | 6,950,867 |
Net increase (decrease) in net assets resulting from operations | 5,288,576 | 299,534 | 111,305,905 | (64,718,074 ) |
DISTRIBUTIONS TO SHAREHOLDERS(a) | ||||
Decrease in net assets resulting from distributions to shareholders | (2,650,251 ) | (2,768,458 ) | (61,029,802 ) | (50,903,755 ) |
CAPITAL SHARE TRANSACTIONS | ||||
Net increase (decrease) in net assets derived from capital share transactions | (171,102 ) | 1,777,022 | (11,913,452 ) | 82,351,730 |
NET ASSETS | ||||
Total increase (decrease) in net assets | 2,467,223 | (691,902 ) | 38,362,651 | (33,270,099 ) |
Beginning of year | 39,154,257 | 39,846,159 | 645,718,887 | 678,988,986 |
End of year | $41,621,480 | $39,154,257 | $684,081,538 | $645,718,887 |
(a) | Distributions for annual periods determined in accordance with U.S. federal income tax regulations. |
iShares Asia/Pacific Dividend ETF | |||||
Year Ended 04/30/24 | Year Ended 04/30/23 | Year Ended 04/30/22 | Year Ended 04/30/21 | Year Ended 04/30/20 | |
Net asset value, beginning of year | $34.05 | $36.22 | $40.93 | $32.05 | $43.76 |
Net investment income(a) | 1.87 | 2.43 | 2.09 | 1.80 | 2.05 |
Net realized and unrealized gain (loss)(b) | 2.52 | (2.01 ) | (4.91 ) | 8.51 | (11.57 ) |
Net increase (decrease) from investment operations | 4.39 | 0.42 | (2.82 ) | 10.31 | (9.52 ) |
Distributions from net investment income(c) | (2.25 ) | (2.59 ) | (1.89 ) | (1.43 ) | (2.19 ) |
Net asset value, end of year | $36.19 | $34.05 | $36.22 | $40.93 | $32.05 |
Total Return(d) | |||||
Based on net asset value | 13.69 % | 1.63 % | (7.02 )% | 32.93 % | (22.50 )% |
Ratios to Average Net Assets(e) | |||||
Total expenses | 0.49 % | 0.49 % | 0.49 % | 0.49 % | 0.49 % |
Total expenses after fees waived | 0.49 % | 0.49 % | 0.49 % | 0.49 % | 0.49 % |
Net investment income | 5.50 % | 7.22 % | 5.38 % | 4.89 % | 4.99 % |
Supplemental Data | |||||
Net assets, end of year (000) | $41,621 | $39,154 | $39,846 | $45,027 | $24,038 |
Portfolio turnover rate(f) | 62 % | 45 % | 57 % | 130 % | 5 % |
(a) Based on average shares outstanding. | |||||
(b) The amounts reported for a share outstanding may not accord with the change in aggregate gains and losses in securities for the fiscal period due to the timing of capital share transactions in relation to the fluctuating market values of the Fund’s underlying securities. | |||||
(c) Distributions for annual periods determined in accordance with U.S. federal income tax regulations. | |||||
(d) Where applicable, assumes the reinvestment of distributions. | |||||
(e) Excludes fees and expenses incurred indirectly as a result of investments in underlying funds. | |||||
(f) Portfolio turnover rate excludes in-kind transactions, if any. | |||||
iShares Emerging Markets Dividend ETF | |||||
Year Ended 04/30/24 | Year Ended 04/30/23 | Year Ended 04/30/22 | Year Ended 04/30/21 | Year Ended 04/30/20 | |
Net asset value, beginning of year | $25.17 | $30.59 | $39.62 | $30.97 | $40.67 |
Net investment income(a) | 1.91 | 2.23 | 2.66 | 1.94 | 2.25 |
Net realized and unrealized gain (loss)(b) | 2.48 | (5.42 ) | (8.93 ) | 8.62 | (9.42 ) |
Net increase (decrease) from investment operations | 4.39 | (3.19 ) | (6.27 ) | 10.56 | (7.17 ) |
Distributions from net investment income(c) | (2.41 ) | (2.23 ) | (2.76 ) | (1.91 ) | (2.53 ) |
Net asset value, end of year | $27.15 | $25.17 | $30.59 | $39.62 | $30.97 |
Total Return(d) | |||||
Based on net asset value | 18.79 % | (10.01 )% | (17.19 )%(e) | 35.51 % | (18.44 )% |
Ratios to Average Net Assets(f) | |||||
Total expenses | 0.49 % | 0.49 % | 0.49 % | 0.49 % | 0.49 % |
Net investment income | 7.53 % | 8.78 % | 7.03 %(g) | 5.62 %(g) | 6.00 % |
Supplemental Data | |||||
Net assets, end of year (000) | $684,082 | $645,719 | $678,989 | $841,985 | $585,284 |
Portfolio turnover rate(h) | 67 % | 55 % | 66 % | 107 % | 15 % |
(a) Based on average shares outstanding. | |||||
(b) The amounts reported for a share outstanding may not accord with the change in aggregate gains and losses in securities for the fiscal period due to the timing of capital share transactions in relation to the fluctuating market values of the Fund’s underlying securities. | |||||
(c) Distributions for annual periods determined in accordance with U.S. federal income tax regulations. | |||||
(d) Where applicable, assumes the reinvestment of distributions. | |||||
(e) Includes payment received from an affiliate, which impacted the Fund’s total return. Excluding the payment from an affiliate, the Fund’s total return would have been (17.17)%. | |||||
(f) Excludes fees and expenses incurred indirectly as a result of investments in underlying funds. | |||||
(g) Reflects positive effect of foreign withholding tax claims, net of the associated professional fees, which resulted in the following increases for the years ended April 30, 2022 and April 30, 2021, respectively : • Ratio of net investment income to average net assets by 0.01% and 0.02%, respectively. | |||||
(h) Portfolio turnover rate excludes in-kind transactions, if any. | |||||
iShares ETF | Diversification Classification |
Asia/Pacific Dividend | Diversified |
Emerging Markets Dividend(a) | Diversified |
(a) | The Fund intends to be diversified in approximately the same proportion as its underlying index is diversified. The Fund may become non-diversified, as defined in the 1940 Act, solely as a result of a change in relative market capitalization or index weighting of one or more constituents of its underlying index. Shareholder approval will not be sought if the Fund crosses from diversified to non-diversified status due solely to a change in its relative market capitalization or index weighting of one or more constituents of its underlying index. |
iShares ETF and Counterparty | Securities Loaned at Value | Cash Collateral Received(a) | Non-Cash Collateral Received, at Fair Value(a) | Net Amount |
Asia/Pacific Dividend | ||||
BofA Securities, Inc. | $129,217 | $(129,217) | $— | $— |
Morgan Stanley | 180,532 | (180,532) | — | — |
$309,749 | $(309,749) | $— | $— | |
Emerging Markets Dividend | ||||
Barclays Capital, Inc. | $10,832,118 | $(10,832,118) | $— | $— |
BofA Securities, Inc. | 1,832,043 | (1,832,043) | — | — |
Citigroup Global Markets, Inc. | — | — | — | — |
Goldman Sachs & Co. LLC | 4,426,444 | (4,426,444) | — | — |
Jefferies LLC | — | — | — | — |
Morgan Stanley | 3,780,062 | (3,780,062) | — | — |
$20,870,667 | $(20,870,667) | $— | $— |
(a) | Collateral received, if any, in excess of the market value of securities on loan is not presented in this table. The total cash collateral received by each Fund is disclosed in the Fund’s Statements of Assets and Liabilities. |
iShares ETF | Investment Advisory Fees |
Asia/Pacific Dividend | 0.49% |
Emerging Markets Dividend | 0.49 |
iShares ETF | Amounts Waived |
Asia/Pacific Dividend | $33 |
iShares ETF | Amounts |
Asia/Pacific Dividend | $1,280 |
Emerging Markets Dividend | 51,160 |
iShares ETF | Purchases | Sales | Net Realized Gain (Loss) |
Asia/Pacific Dividend | $3,497,707 | $2,765,687 | $(540,207) |
Emerging Markets Dividend | 22,317,616 | 994,099 | 9,137 |
iShares ETF | Purchases | Sales |
Asia/Pacific Dividend | $24,932,772 | $24,671,385 |
Emerging Markets Dividend | 429,182,139 | 439,411,472 |
iShares ETF | In-kind Purchases | In-kind Sales |
Asia/Pacific Dividend | $1,138,250 | $1,757,250 |
Emerging Markets Dividend | 1,148,819 | 15,080,927 |
iShares ETF | Paid-in Capital | Accumulated Earnings (Loss) |
Asia/Pacific Dividend | $324,168 | $ (324,168) |
Emerging Markets Dividend | 2,004,721 | (2,004,721) |
iShares ETF | Year Ended 04/30/24 | Year Ended 04/30/23 |
Asia/Pacific Dividend | ||
Ordinary income | $2,650,251 | $2,768,458 |
Emerging Markets Dividend | ||
Ordinary income | $61,029,802 | $50,903,755 |
iShares ETF | Undistributed Ordinary Income | Non-expiring Capital Loss Carryforwards(a) | Net Unrealized Gains (Losses)(b) | Total |
Asia/Pacific Dividend | $639,104 | $(19,371,684) | $(1,298,174) | $(20,030,754) |
Emerging Markets Dividend | 17,574,335 | (303,163,272) | (107,234,540) | (392,823,477) |
(a) | Amounts available to offset future realized capital gains. |
(b) | The difference between book-basis and tax-basis net unrealized gains (losses) was attributable primarily to the tax deferral of losses on wash sales, the realization for tax purposes of unrealized gains (losses) on certain foreign currency contracts and futures contracts and the realization for tax purposes of unrealized gains on investments in passive foreign investment companies. |
iShares ETF | Tax Cost | Gross Unrealized Appreciation | Gross Unrealized Depreciation | Net Unrealized Appreciation (Depreciation) |
Asia/Pacific Dividend | $42,969,751 | $2,126,266 | $(3,423,020) | $(1,296,754) |
Emerging Markets Dividend | 810,393,165 | 70,621,184 | (175,521,731) | (104,900,547) |
iShares ETF | Maximum Amount Borrowed | Average Borrowing | Weighted Average Interest Rates |
Emerging Markets Dividend | $6,250,000 | $102,459 | 6.41% |
Year Ended 04/30/24 | Year Ended 04/30/23 | |||
iShares ETF | Shares | Amount | Shares | Amount |
Asia/Pacific Dividend | ||||
Shares sold | 50,000 | $1,614,898 | 250,000 | $8,388,921 |
Shares redeemed | (50,000 ) | (1,786,000 ) | (200,000 ) | (6,611,899 ) |
— | $(171,102 ) | 50,000 | $1,777,022 | |
Emerging Markets Dividend | ||||
Shares sold | 850,000 | $21,667,094 | 4,900,000 | $122,487,270 |
Shares redeemed | (1,300,000 ) | (33,580,546 ) | (1,450,000 ) | (40,135,540 ) |
(450,000 ) | $(11,913,452 ) | 3,450,000 | $82,351,730 | |
iShares, Inc. and Shareholders of each of the two funds listed in the table below
iShares Asia/Pacific Dividend ETF |
iShares Emerging Markets Dividend ETF |
Philadelphia, Pennsylvania
June 24, 2024
iShares ETF | Qualified Dividend Income |
Asia/Pacific Dividend | $1,178,599 |
Emerging Markets Dividend | 21,840,663 |
iShares ETF | Foreign Source Income Earned | Foreign Taxes Paid |
Asia/Pacific Dividend | $2,440,805 | $83,693 |
Emerging Markets Dividend | 57,022,943 | 9,638,567 |
Interested Directors | |||
Name (Year of Birth) | Position(s) | Principal Occupation(s) During Past 5 Years | Other Directorships Held by Director |
Robert S. Kapito(a) (1957) | Director (since 2009). | President of BlackRock, Inc. (since 2006); Vice Chairman of BlackRock, Inc. and Head of BlackRock’s Portfolio Management Group (since its formation in 1998) and BlackRock, Inc.’s predecessor entities (since 1988); Trustee, University of Pennsylvania (since 2009); President of Board of Directors, Hope & Heroes Children’s Cancer Fund (since 2002). | Director of BlackRock, Inc. (since 2006); Trustee of iShares U.S. ETF Trust (since 2011); Trustee of iShares Trust (since 2009). |
Stephen Cohen(b) (1975) | Director (since 2024). | Senior Managing Director, Head of Global Product Solutions of BlackRock, Inc. (since 2024); Senior Managing Director, Head of Europe, Middle East and Africa Regions of BlackRock, Inc. (2021-2024); Head of iShares Index and Wealth in EMEA of BlackRock, Inc. (2017-2021); Global Head of Fixed Income Indexing of BlackRock, Inc. (2016-2017); Chief Investment Strategist for International Fixed Income and iShares of BlackRock, Inc. (2011-2015). | Trustee of iShares U.S. ETF Trust (since 2024); Trustee of iShares Trust (since 2024). |
(a) Robert S. Kapito is deemed to be an “interested person” (as defined in the 1940 Act) of the Trust due to his affiliations with BlackRock, Inc. and its affiliates. | |||
(b) Stephen Cohen is deemed to be an "interested person" (as defined in the 1940 Act) of the Trust due to his affiliations with BlackRock, Inc. and its affiliates. | |||
Independent Directors | |||
Name (Year of Birth) | Position(s) | Principal Occupation(s) During Past 5 Years | Other Directorships Held by Director |
John E. Kerrigan (1955) | Director (since 2005); Independent Board Chair (since 2022). | Chief Investment Officer, Santa Clara University (since 2002). | Trustee of iShares U.S. ETF Trust (since 2011); Trustee of iShares Trust (since 2005); Independent Board Chair of iShares Trust and iShares U.S. ETF Trust (since 2022). |
Jane D. Carlin (1956) | Director (since 2015); Risk Committee Chair (since 2016). | Consultant (since 2012); Member of the Audit Committee (2012-2018), Chair of the Nominating and Governance Committee (2017-2018) and Director of PHH Corporation (mortgage solutions) (2012-2018); Managing Director and Global Head of Financial Holding Company Governance & Assurance and the Global Head of Operational Risk Management of Morgan Stanley (2006-2012). | Trustee of iShares U.S. ETF Trust (since 2015); Trustee of iShares Trust (since 2015); Member of the Audit Committee (since 2016), Chair of the Audit Committee (since 2020) and Director of The Hanover Insurance Group, Inc. (since 2016). |
Richard L. Fagnani (1954) | Director (since 2017); Audit Committee Chair (since 2019). | Partner, KPMG LLP (2002-2016); Director of One Generation Away (since 2021). | Trustee of iShares U.S. ETF Trust (since 2017); Trustee of iShares Trust (since 2017). |
Laura F. Fergerson (1962) | Director (since 2024). | President, Franklin Templeton Services, LLC (2017-2024); Director of the Board of Crocker Art Museum Association (since 2019); President, Crocker Art Museum Foundation (2022-2023). | Trustee of iShares U.S. ETF Trust (since 2024); Trustee of iShares Trust (since 2024). |
Independent Directors (continued) | |||
Name (Year of Birth) | Position(s) | Principal Occupation(s) During Past 5 Years | Other Directorships Held by Director |
Cecilia H. Herbert (1949) | Director (since 2005); Nominating and Governance and Equity Plus Committee Chairs (since 2022). | Chair of the Finance Committee (since 2019) and Trustee and Member of the Finance, Audit and Quality Committees of Stanford Health Care (since 2016); Trustee of WNET, New York’s public media company (since 2011) and Member of the Audit Committee (since 2018), Investment Committee (since 2011) and Personnel Committee (since 2022); Member of the Wyoming State Investment Funds Committee (since 2022); Trustee of Forward Funds (14 portfolios) (2009-2018); Trustee of Salient MF Trust (4 portfolios) (2015-2018); Director of the Jackson Hole Center for the Arts (since 2021). | Trustee of iShares U.S. ETF Trust (since 2011); Trustee of iShares Trust (since 2005). |
James Lam (1961) | Director (since 2024). | President, James Lam & Associates, Inc. (since 2002); Director of the FAIR Institute (since 2020); adjunct professor at Carnegie Mellon University (since 2018); Member, Zicklin School of Business Dean's Council of Baruch College (since 2017); Director and Audit Committee Chair of RiskLens, Inc. (2018-2023); Director, Risk Oversight Committee Chair and Audit Committee Member of E*TRADE Financial and E*TRADE Bank (2012-2020). | Trustee of iShares U.S. ETF Trust (since 2024); Trustee of iShares Trust (since 2024). |
Drew E. Lawton (1959) | Director (since 2017); 15(c) Committee Chair (since 2017). | Senior Managing Director of New York Life Insurance Company (2010-2015). | Trustee of iShares U.S. ETF Trust (since 2017); Trustee of iShares Trust (since 2017); Director of Jackson Financial Inc. (since 2021). |
John E. Martinez (1961) | Director (since 2003); Securities Lending Committee Chair (since 2019). | Director of Real Estate Equity Exchange, Inc. (since 2005); Director of Cloudera Foundation (2017-2020); and Director of Reading Partners (2012-2016). | Trustee of iShares U.S. ETF Trust (since 2011); Trustee of iShares Trust (since 2003). |
Madhav V. Rajan (1964) | Director (since 2011); Fixed-Income Plus Committee Chair (since 2019). | Dean, and George Pratt Shultz Professor of Accounting, University of Chicago Booth School of Business (since 2017); Advisory Board Member (since 2016) and Director (since 2020) of C.M. Capital Corporation; Chair of the Board for the Center for Research in Security Prices, LLC (since 2020); Director of WellBe Senior Medical (since 2023); Robert K. Jaedicke Professor of Accounting, Stanford University Graduate School of Business (2001-2017); Professor of Law (by courtesy), Stanford Law School (2005-2017); Senior Associate Dean for Academic Affairs and Head of MBA Program, Stanford University Graduate School of Business (2010-2016). | Trustee of iShares U.S. ETF Trust (since 2011); Trustee of iShares Trust (since 2011). |
Officers | ||
Name (Year of Birth) | Position(s) | Principal Occupation(s) During Past 5 Years |
Jessica Tan (1980) | President (since 2024). | Managing Director of BlackRock, Inc. (since 2015); Head of Global Product Solutions, Americas of BlackRock, Inc. (since 2024) and Head of Sustainable and Transition Solutions of BlackRock, Inc. (2022-2024); Global Head of Corporate Strategy of BlackRock, Inc. (2019-2022); Chief of Staff to the CEO of BlackRock, Inc. (2017-2019). |
Trent Walker (1974) | Treasurer and Chief Financial Officer (since 2020). | Managing Director of BlackRock, Inc. (since 2019); Chief Financial Officer of iShares Delaware Trust Sponsor LLC, BlackRock Funds, BlackRock Funds II, BlackRock Funds IV, BlackRock Funds V and BlackRock Funds VI (since 2021). |
Aaron Wasserman (1974) | Chief Compliance Officer (iShares, Inc. and iShares Trust, since 2023; iShares U.S. ETF Trust, since 2023). | Managing Director of BlackRock, Inc. (since 2018); Chief Compliance Officer of the BlackRock Multi-Asset Complex, the BlackRock Fixed-Income Complex and the iShares Complex (since 2023); Deputy Chief Compliance Officer for the BlackRock Multi-Asset Complex, the BlackRock Fixed-Income Complex and the iShares Complex (2014-2023). |
Marisa Rolland (1980) | Secretary (since 2022). | Managing Director of BlackRock, Inc. (since 2023); Director of BlackRock, Inc. (2018-2022). |
Officers (continued) | ||
Name (Year of Birth) | Position(s) | Principal Occupation(s) During Past 5 Years |
Rachel Aguirre (1982) | Executive Vice President (since 2022). | Managing Director of BlackRock, Inc. (since 2018); Head of U.S. iShares Product (since 2022); Head of EII U.S. Product Engineering of BlackRock, Inc. (since 2021); Co-Head of EII’s Americas Portfolio Engineering of BlackRock, Inc. (2020-2021); Head of Developed Markets Portfolio Engineering of BlackRock, Inc. (2016-2019). |
Jennifer Hsui (1976) | Executive Vice President (since 2022). | Managing Director of BlackRock, Inc. (since 2009); Co-Head of Index Equity of BlackRock, Inc. (since 2022). |
James Mauro (1970) | Executive Vice President (since 2022). | Managing Director of BlackRock, Inc. (since 2010); Head of Fixed Income Index Investments in the Americas and Head of San Francisco Core Portfolio Management of BlackRock, Inc. (since 2020). |
Effective July 1, 2023, Aaron Wasserman replaced Charles Park as Chief Compliance Officer. |
Effective February 1, 2024, Salim Ramji resigned as Trustee of the Trust. |
Effective March 5, 2024, Stephen Cohen replaced Salim Ramji as Trustee of the Trust. |
Effective March 5, 2024, Dominik Rohé resigned as President of the Trust. |
Effective March 5, 2024, Jessica Tan replaced Dominik Rohé as President of the Trust. |
Effective April 8, 2024, Laura Fergerson was appointed as Trustee of the Trust. |
Effective April 8, 2024, James Lam was appointed as Trustee of the Trust. |
• If your brokerage firm is not listed, electronic delivery may not be available. Please contact your broker-dealer or financial advisor.
Portfolio Abbreviation | |
ADR | American Depositary Receipt |
NVDR | Non-Voting Depositary Receipt |
NVS | Non-Voting Shares |
PJSC | Public Joint Stock Company |


(b) Not Applicable
| Item 2. | Code of Ethics. |
The registrant has adopted a code of ethics, as of the end of the period covered by this report, applicable to the registrant’s principal executive officer, principal financial officer, principal accounting officer or controller, or persons performing similar functions. During the period covered by this report, the registrant has not amended the code of ethics and there have been no waivers granted under the code of ethics. The registrant undertakes to provide a copy of the code of ethics to any person upon request, without charge, by calling 1-800-474-2737.
| Item 3. | Audit Committee Financial Expert. |
The registrant’s Board of Directors has determined that the registrant has more than one audit committee financial expert, as that term is defined under Item 3(b) and 3(c), serving on its audit committee. The audit committee financial experts serving on the registrant’s audit committee are Richard L. Fagnani and Madhav V. Rajan, all of whom are independent, as that term is defined under Item 3(a)(2).
| Item 4. | Principal Accountant Fees and Services. |
The principal accountant fees disclosed in items 4(a), 4(b), 4(c), 4(d) and 4(g) are for the two series of the registrant for which the fiscal year-end is April 30, 2024 (the “Funds”), and whose annual financial statements are reported in Item 1.
(a) Audit Fees – The aggregate fees billed for each of the last two fiscal years for professional services rendered by the principal accountant for the audit of the Funds’ annual financial statements or services that are normally provided by the accountant in connection with statutory and regulatory filings or engagements for those fiscal years were $32,800 for the fiscal year ended April 30, 2023 and $32,800 for the fiscal year ended April 30, 2024.
(b) Audit-Related Fees – There were no fees billed for the fiscal years ended April 30, 2023 and April 30, 2024 for assurance and related services by the principal accountant that were reasonably related to the performance of the audit of the Fund’s financial statements and are not reported under (a) of this Item.
(c) Tax Fees – The aggregate fees billed in each of the last two fiscal years for professional services rendered by the principal accountant for tax compliance, tax advice and tax planning for the Funds were $19,400 for the fiscal year ended April 30, 2023 and $19,400 for the fiscal year ended April 30, 2024. These services related to the review of the Funds’ tax returns and excise tax calculations.
(d) All Other Fees – There were no other fees billed in each of the fiscal years ended April 30, 2023 and April 30, 2024 for products and services provided by the principal accountant, other than the services reported in (a) through (c) of this Item.
(e) (1) The registrant’s audit committee charter, as amended, provides that the audit committee is responsible for the approval, prior to appointment, of the engagement of the principal accountant to annually audit and provide their opinion on the registrant’s financial statements. The audit committee must also approve, prior to appointment, the engagement of the principal accountant to provide non-audit services to the registrant or to any entity controlling, controlled by or under common control with the registrant’s investment adviser (“Adviser Affiliate”) that provides ongoing services to the registrant, if the engagement relates directly to the operations and financial reporting of the registrant.
(2) There were no services described in (b) through (d) above that were approved by the audit committee pursuant to paragraph (c)(7)(i)(C) of Rule 2-01 of Regulation S-X.
(f) Not Applicable
(g) The aggregate non-audit fees billed by the registrant’s principal accountant for services rendered to the Funds, and rendered to the registrant’s investment adviser, and any Adviser Affiliate that provides ongoing services to the registrant for the last two fiscal years were $19,400 for the fiscal year ended April 30, 2023 and $19,400 for the fiscal year ended April 30, 2024.
(h) The registrant’s audit committee has considered whether the provision of non-audit services rendered to the registrant’s investment adviser and any Adviser Affiliate that provides ongoing services to the registrant that were not pre-approved pursuant to paragraph (c)(7)(ii) of Rule 2-01 of Regulation S-X, if any, is compatible with maintaining the principal accountant’s independence, and has determined that the provision of these services, if any, does not compromise the principal accountant’s independence.
(i) Not Applicable
(j) Not Applicable
| Item 5. | Audit Committee of Listed Registrants. |
(a) The registrant is a listed issuer as defined in Rule 10A-3 under the Exchange Act of 1934 and has a separately-designated standing audit committee established in accordance with Section 3(a)(58)(A) of the Exchange Act of 1934. The registrant’s audit committee members are Richard L. Fagnani, Cecilia H. Herbert and Madhav V. Rajan.
(b) Not applicable.
| Item 6. | Investments. |
(a) Schedules of investments are included as part of the reports to shareholders filed under Item 1 of this Form.
(b) Not applicable.
| Item 7. | Disclosure of Proxy Voting Policies and Procedures for Closed-End Management Investment Companies. |
Not applicable to the registrant.
| Item 8. | Portfolio Managers of Closed-End Management Investment Companies. |
Not applicable to the registrant.
| Item 9. | Purchases of Equity Securities by Closed-End Management Investment Company and Affiliated Purchasers. |
Not applicable to the registrant.
| Item 10. | Submission of Matters to a Vote of Security Holders. |
There were no material changes to the procedures by which shareholders may recommend nominees to the registrant’s Board of Directors.
| Item 11. | Controls and Procedures. |
(a) The President (the registrant’s Principal Executive Officer) and Treasurer and Chief Financial Officer (the registrant’s Principal Financial Officer) have concluded that the registrant’s disclosure controls and procedures (as defined in Rule 30a-3(c) under the Investment Company Act of 1940) are effective as of a date within 90 days of the filing date of this report, based on their evaluation of these controls and procedures required by Rule 30a-3(b) under the Investment Company Act of 1940 and Rules 13a-15(b) or 15d-15(b) under the Exchange Act of 1934.
(b) There were no changes in the registrant’s internal control over financial reporting (as defined in Rule 30a-3(d) under the Investment Company Act of 1940) that occurred during the period covered by this report that have materially affected, or are reasonably likely to materially affect, the registrant’s internal control over financial reporting.
| Item 12. | Disclosure of Securities Lending Activities for Closed-End Management Investment Companies. |
Not applicable to the registrant.
| Item 13. | Recovery of Erroneously Awarded Compensation. |
Not applicable
| Item 14. | Exhibits. |
(a)(1) Code of Ethics – See Item 2
(a)(2) Any policy required by the listing standards adopted pursuant to Rule 10D-1 under the Exchange Act (17 CFR 240.10D-1) by the registered national securities exchange or registered national securities association upon which the Registrant’s securities are listed – Not Applicable
(a)(3) Section 302 Certifications are attached
(a)(4) Any written solicitation to purchase securities under Rule 23c-1 – Not Applicable
(a)(5) Change in Registrant’s independent public accountant – Not Applicable
(b) Section 906 Certifications are attached
SIGNATURES
Pursuant to the requirements of the Securities Exchange Act of 1934 and the Investment Company Act of 1940, the registrant has duly caused this report to be signed on its behalf by the undersigned, thereunto duly authorized.
iShares, Inc.
By: | /s/ Jessica Tan | |||
Jessica Tan, President (Principal Executive Officer) |
Date: June 24, 2024
Pursuant to the requirements of the Securities Exchange Act of 1934 and the Investment Company Act of 1940, this report has been signed below by the following persons on behalf of the registrant and in the capacities and on the dates indicated.
By: | /s/ Jessica Tan | |||
Jessica Tan, President (Principal Executive Officer) |
Date: June 24, 2024
By: | /s/ Trent Walker | |||
| Trent Walker, Treasurer and Chief Financial Officer (Principal Financial Officer) |
Date: June 24, 2024