UNITED STATES
SECURITIES AND EXCHANGE COMMISSION
Washington, D.C. 20549
FORM N-CSR
CERTIFIED SHAREHOLDER REPORT OF REGISTERED
MANAGEMENT INVESTMENT COMPANIES
Investment Company Act file number 811-08786
Pioneer Variable Contracts Trust
(Exact name of registrant as specified in charter)
60 State Street, Boston, MA 02109
(Address of principal executive offices) (ZIP code)
Terrence J. Cullen, Amundi Pioneer Asset Management, Inc.,
60 State Street, Boston, MA 02109
(Name and address of agent for service)
Registrant’s telephone number, including area code: (617) 742-7825
Date of fiscal year end: December 31, 2020
Date of reporting period: January 1, 2020 through June 30, 2020
Form N-CSR is to be used by management investment companies to file reports with the Commission not later than 10 days after the transmission to stockholders of any report that is required to be transmitted to stockholders under Rule 30e-1 under the Investment Company Act of 1940 (17 CFR 270.30e-1). The Commission may use the information provided on Form N-CSR in its regulatory, disclosure review, inspection, and policymaking roles.
A registrant is required to disclose the information specified by Form N-CSR, and the Commission will make this information public. A registrant is not required to respond to the collection of information contained in Form N-CSR unless the Form displays a currently valid Office of Management and Budget (“OMB”) control number. Please direct comments concerning the accuracy of the information collection burden estimate and any suggestions for reducing the burden to Secretary, Securities and Exchange Commission, 450 Fifth Street, NW, Washington, DC 20549-0609. The OMB has reviewed this collection of information under the clearance requirements of 44 U.S.C. ss. 3507.

PIONEER VARIABLE CONTRACTS TRUST
Pioneer Bond VCT Portfolio — Class I and II Shares
Beginning in February 2021, as permitted by regulations adopted by the Securities and Exchange Commission, you may not be receiving paper copies of the Portfolio’s shareholder reports like this one by mail, unless you specifically request paper copies of the reports from the insurance company that offers your variable annuity or variable life insurance contract or from your financial intermediary. Instead, the insurance company may choose to make the reports available on a website, and will notify you by mail each time a shareholder report is posted and provide you with a website link to access the report. Instructions for requesting paper copies will be provided by your insurance company.
If you already elected to receive shareholder reports electronically, you will not be affected by this change and you need not take any action. You may elect to receive shareholder reports and other communications from the insurance company or your financial intermediary electronically by following the instructions provided by the insurance company or by contacting your financial intermediary.
You may elect to receive all future Portfolio shareholder reports in paper free of charge from the insurance company. You can inform the insurance company or your financial intermediary that you wish to continue receiving paper copies of your shareholder reports by following the instructions provided by the insurance company or by contacting your financial intermediary. Your election to receive reports in paper will apply to all funds available under your contract with the insurance company.
SEMIANNUAL REPORT
June 30, 2020
Please refer to your contract prospectus to determine the applicable share class offered under your contract.
PIONEER VARIABLE CONTRACTS TRUST
Pioneer Bond VCT Portfolio | |
This report is authorized for distribution only when preceded or accompanied by a prospectus for the Portfolio being offered.
Pioneer Variable Contracts Trust files a complete schedule of portfolio holdings with the Securities and Exchange Commission for the first and third quarters of each fiscal year as an exhibit to its reports on Form N-PORT. Shareholders may view the filed Form N-PORT by visiting the Commission’s web site at https://www.sec.gov.
| Pioneer Bond VCT Portfolio | PIONEER VARIABLE CONTRACTS TRUST |
Portfolio Diversification
(As a percentage of total investments)*
(As a percentage of total investments)*

5 Largest Holdings
(As a percentage of total investments)*
(As a percentage of total investments)*
| 1. | United States Treasury | |
| Bill, 9/17/20 | 2.20% | |
| 2. | U.S. Treasury Bill, 8/27/20 | 1.65 |
| 3. | U.S. Treasury Inflation Indexed | |
| Bonds, 1.0%, 2/15/48 | 1.61 | |
| 4. | Pioneer ILS Interval Fund (k) | 1.51 |
| 5. | U.S. Treasury Inflation Indexed | |
| Bonds, 1.0%, 2/15/49 | 1.27 |
* | Excludes temporary cash investments and all derivative contracts except for options purchased. The Portfolio is actively managed, and current holdings may be different. The holdings listed should not be considered recommendations to buy or sell any securities. |
(k) | Pioneer ILS Interval Fund is an affiliated closed-end fund managed by Amundi Pioneer Asset Management, Inc. |
PERFORMANCE UPDATE 6/30/20
Prices and Distributions
| Net Asset Value per Share | 6/30/20 | 12/31/19 |
| Class I | $11.29 | $11.17 |
| Class II | $11.32 | $11.19 |
| Net | |||
| Distributions per Share | Investment | Short-Term | Long-Term |
| (1/1/20 – 6/30/20) | Income | Capital Gains | Capital Gains |
| Class I | $0.1709 | $ – | $ – |
| Class II | $0.1575 | $ – | $ – |
Performance of a $10,000 Investment
The following chart shows the change in value of an investment made in Class I and Class II shares of Pioneer Bond VCT Portfolio at net asset value during the periods shown, compared to that of the Bloomberg Barclays U.S. Aggregate Bond Index. Portfolio returns are based on net asset value and do not reflect any applicable insurance fees or surrender charges.
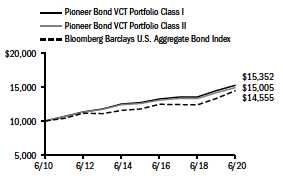
The Bloomberg Barclays U.S. Aggregate Bond Index is an unmanaged, market value-weighted measure of Treasury and agency issues, corporate bond issues and mortgage-backed securities. Index returns are calculated monthly, assume reinvestment of dividends and, unlike Portfolio returns, do not reflect any fees, expenses or sales charges. It is not possible to invest directly in an index.
Average Annual Total Returns
(As of June 30, 2020)
(As of June 30, 2020)
| Bloomberg Barclays | |||
| U.S. Aggregate | |||
| Class I | Class II | Bond Index | |
10 Years | 4.38% | 4.14% | 3.82% |
5 Years | 3.77% | 3.53% | 4.30% |
1 Year | 5.48% | 5.31% | 8.74% |
All total returns shown assume reinvestment of distributions at net asset value.
The performance table does not reflect the deduction of taxes that a shareowner would pay on distributions or the redemption of shares.
Call 800-688-9915 or visit www.amundipioneer.com/us for the most recent month-end performance results. Current performance may be lower or higher than the performance data quoted.
The performance data quoted represents past performance, which is no guarantee of future results. Investment return and principal value will fluctuate, and shares, when redeemed, may be worth more or less than their original cost.
The returns for the Portfolio do not reflect the deduction of expenses associated with variable products, such as mortality and expense risk charges, separate account charges, and sales charges. These expenses would reduce the overall returns shown.
Performance results reflect any applicable expense waivers in effect during the periods shown. Without such waivers, performance would be lower. Waivers may not be in effect for all portfolios. Certain fee waivers are contractual through a specified period. Otherwise, fee waivers can be rescinded at any time. See the prospectus and financial statements for more information.
2
| Pioneer Bond VCT Portfolio | PIONEER VARIABLE CONTRACTS TRUST |
As a shareowner in the Portfolio, you incur two types of costs:
(1) ongoing costs, including management fees, distribution and/or service (12b-1) fees, and other Portfolio expenses; and
(2) transaction costs, including sales charges (loads) on purchase payments.
This example is intended to help you understand your ongoing expenses (in dollars) of investing in the Portfolio and to compare these costs with the ongoing costs of investing in other mutual funds offered through your variable annuity contract. The example is based on an investment of $1,000 at the beginning of the Portfolio’s latest six-month period and held throughout the six months.
Using the Tables
Actual Expenses
The first table below provides information about actual account values and actual expenses. You may use the information in this table, together with the amount you invested, to estimate the expenses that you paid over the period as follows:
1. Divide your account value by $1,000
Example: an $8,600 account value ÷ $1,000 = 8.6
2. Multiply the result in (1) above by the corresponding share class’s number in the third row under the heading entitled “Expenses Paid During Period” to estimate the expenses you paid on your account during this period.
Expenses Paid on a $1,000 Investment in Pioneer Bond VCT Portfolio
Based on actual returns from January 1, 2020 through June 30, 2020.
| Share Class | I | II | ||||||
Beginning Account Value on 1/1/20 | $ | 1,000.00 | $ | 1,000.00 | ||||
Ending Account Value on 6/30/20 | $ | 1,026.50 | $ | 1,026.10 | ||||
Expenses Paid During Period* | $ | 3.02 | $ | 4.28 | ||||
* | Expenses are equal to the Portfolio’s annualized expense ratio of 0.60% and 0.85% for Class I and Class II shares multiplied by the average account value over the period, multiplied by 182/366 (to reflect the one-half year period). |
Hypothetical Example for Comparison Purposes
The table below provides information about hypothetical account values and hypothetical expenses based on the Portfolio’s actual expense ratio and an assumed rate of return of 5% per year before expenses, which is not the Portfolio’s actual return. The hypothetical account values and expenses may not be used to estimate the actual ending account balance or expenses you paid for the period.
You may use this information to compare the ongoing costs of investing in the Portfolio and other variable annuities. To do so, compare this 5% hypothetical example with the 5% hypothetical examples that appear in the shareholder reports of the other variable annuities.
Please note that the expenses shown in the tables are meant to highlight your ongoing costs only and do not reflect any transaction costs, such as sales charges (loads) that are charged at the time of the transaction. Therefore, the table below is useful in comparing ongoing costs only and will not help you determine the relative total costs of owning different variable annuities. In addition, if these transaction costs were included, your costs would have been higher.
Expenses Paid on a $1,000 Investment in Pioneer Bond VCT Portfolio
Based on a hypothetical 5% per year return before expenses, reflecting the period from January 1, 2020 through June 30, 2020.
| Share Class | I | II | ||||||
Beginning Account Value on 1/1/20 | $ | 1,000.00 | $ | 1,000.00 | ||||
Ending Account Value on 6/30/20 | $ | 1,021.88 | $ | 1,020.64 | ||||
Expenses Paid During Period* | $ | 3.02 | $ | 4.27 | ||||
* | Expenses are equal to the Portfolio’s annualized expense ratio of 0.60% and 0.85% for Class I and Class II shares multiplied by the average account value over the period, multiplied by 182/366 (to reflect the one-half year period). |
3
| Pioneer Bond VCT Portfolio | PIONEER VARIABLE CONTRACTS TRUST |
Call 1-800-688-9915 or visit www.amundipioneer.com/us for the most recent month-end performance results. Current performance may be lower or higher than the performance data quoted.
The performance data quoted represents past performance, which is no guarantee of future results. Investment return and principal value will fluctuate, and shares, when redeemed, may be worth more or less than their original cost.
The returns for the Portfolio do not reflect the deduction of expenses associated with variable products, such as mortality and expense risk charges, separate account charges, and sales charges. These expenses would reduce the overall returns shown.
Performance results reflect any applicable expense waivers in effect during the periods shown. Without such waivers, performance would be lower. Waivers may not be in effect for all portfolios. Certain fee waivers are contractual through a specified period. Otherwise, fee waivers can be rescinded at any time. See the prospectus and financial statements for more information.
In the following interview, Brad Komenda discusses the factors that affected the performance of Pioneer Bond VCT Portfolio during the six-month period ended June 30, 2020. Mr. Komenda, Senior Vice President, Deputy Director of Investment Grade Corporates, and a portfolio manager at Amundi Pioneer Asset Management, Inc. (Amundi Pioneer), is responsible for the daily management of the Portfolio, along with Kenneth J. Taubes, Executive Vice President and Chief Investment Officer, U.S., and a portfolio manager at Amundi Pioneer, and Timothy Rowe, Managing Director, Director of Multisector Fixed Income, and a portfolio manager at Amundi Pioneer.
Q: How did the Portfolio perform during the six-month period ended June 30, 2020?
A: Pioneer Bond VCT Portfolio’s Class I shares returned 2.65% at net asset value during the six-month period ended June 30, 2020, and Class II shares returned 2.61%, while the Portfolio’s benchmark, the Bloomberg Barclays U.S. Aggregate Bond Index (the Bloomberg Barclays Index), returned 6.14%.
Q: How would you describe the investment environment in the fixed-income markets during the six-month period ended June 30, 2020?
A. After a benign opening to the 2020 calendar year, credit-sensitive fixed-income markets experienced a historic disruption in March, as the emergence of the COVID-19 virus and the related lockdown policies implemented to help curb its spread all but shuttered the global economy. Investors fled riskier assets on a broad scale and moved into so-called “safe havens” such as U.S. Treasuries, which had the effect of driving Treasury yields to all-time lows. Significant selling in U.S. dollar (USD) fixed-income markets eventually stressed market functionality and led to price dislocations in all segments, even Treasury bonds. As the “liquidity grab” by investors gathered pace in mid-March, historical asset-class return relationships broke down and performance became almost entirely correlated. (Correlation is defined as the degree to which assets or asset-class prices have moved in relation to one another. Correlation ranges from -1, always moving in opposite directions; through 0, absolutely independent; to 1, always moving together.)
The liquidity stress was greatest in the securitized credit sectors of nonagency mortgage-backed securities (MBS), asset-backed securities (ABS), and commercial-mortgage backed securities (CMBS), which have traditionally had a narrower buyer base than corporate bonds. Those markets faced forced selling by real estate investment trusts (REITs) and other leveraged investors, and by certain mutual funds, as concerns escalated over the impact of the pandemic on the U.S. employment situation and on the ability of homeowners and businesses to service their mortgages.
The policy response to the market and economic turmoil from both central banks and government authorities was swift, as they sought to keep businesses and consumers from going under. The U.S. Federal Reserve (Fed) slashed the target range of the benchmark federal funds rate to zero in mid-March, resurrected its 2008 financial crisis-era lending facilities, and launched a wide-ranging bond-purchase program. On the fiscal side, the U.S. Congress and the White House agreed upon a $2.2 trillion stimulus package in late March, and later approved additional aid packages in the second quarter.
4
| Pioneer Bond VCT Portfolio | PIONEER VARIABLE CONTRACTS TRUST |
The extraordinary support from policy makers in the wake of the pandemic had a positive effect on the markets as the second quarter got underway. Investor optimism also rose on the prospects that steps taken towards re-opening the economy could support something resembling a “V-shaped” recovery (that is, a swift, sharp rise). The result was a revival of sentiment towards the riskier assets that the market had been so quick to shun at the height of the pandemic crisis. The shift in investors’ appetites allowed credit-sensitive areas of the bond market to recover much of their earlier losses over April and May. June saw the return of some market volatility as well as a widening in credit spreads as COVID-19 cases surged in a few states that had re-opened earlier than others, reigniting shutdown concerns. (Credit spreads are commonly defined as the differences in yield between Treasuries and other types of fixed-income securities with similar maturities.)
For the six-month period ended June 30, 2020, the investment-grade corporate bond market posted a positive return of 5.02%, while high-yield corporates returned -3.80% (as measured by the Bloomberg Barclays U.S. Corporate Bond Index and Bloomberg Barclays U.S. Corporate High Yield Index, respectively). Treasuries led performance within the investment-grade sectors, given the steep decline in yields seen over the first quarter of 2020. After their earlier struggles, securitized assets ended the six-month period in positive territory, though the asset class lagged the performance of both investment-grade corporates and Treasuries.
Q: What factors influenced the Portfolio’s performance relative to the Bloomberg Barclays Index during the six-month period ended June 30, 2020?
A: The Portfolio’s benchmark-relative underperformance for the six-month period derived mainly from asset allocation, while a tilt toward lower-quality holdings within spread sectors also weighed on relative returns. Positioning with respect to overall Portfolio duration was another detractor from benchmark-relative results, while security selection was a modest, positive contributor to relative performance. (Spread sectors represent non-governmental fixed-income market sectors that offer higher yields, at greater risk, than governmental investments. Duration is a measure of the sensitivity of the price, or the value of principal, of a fixed-income investment to a change in interest rates, expressed as a number of years.)
With respect to sector allocations, detractors from the Portfolio’s relative returns during the six-month period primarily reflected overweights to securitized sectors and corporate credit, and a corresponding underweight to U.S. Treasuries. The Portfolio’s significant exposure to non-agency MBS within securitized assets had the largest negative effect on benchmark-relative results. Non-agency MBS sold off in March due to the illiquidity issues discussed earlier, and because of fundamental concerns over the potential for increased delinquencies and defaults in the wake of the economic damage wrought by COVID-19. While valuations of securitized assets have not recovered to the same degree as we have seen with corporate bonds, we view the anticipated impairment reflected in current price levels within the securitized sectors as overstated. The Portfolio did realize losses on some securitized positions that we sold during the six-month period in order to fund purchases of new corporate issues that came into the market at historically wide spreads.
5
| Pioneer Bond VCT Portfolio | PIONEER VARIABLE CONTRACTS TRUST |
PORTFOLIO MANAGEMENT DISCUSSION 6/30/20 | (continued) |
The Portfolio’s lack of exposure to nominal U.S. Treasuries detracted significantly from benchmark-relative returns during the six-month period, as credit-sensitive securities underperformed in the flight-to-quality market environment that characterized the first quarter of 2020. We had based the Portfolio’s positioning within Treasuries on our view heading into the six-month period that the U.S. economy was poised for strong performance in 2020, a forecast that was derailed by the emergence of COVID-19. The Treasury exposure we did maintain in the Portfolio was a roughly 5% allocation to Treasury inflation-protected securities (TIPS), which underperformed as liquidity became a significant issue and inflation expectations fell dramatically.
Within investment-grade corporates, the Portfolio’s overweight to financials detracted from benchmark-relative performance. An overweight to industrials proved a headwind as well, but security selection within the sector largely offset that negative. The Portfolio’s positioning in the utilities sector had a modest, positive effect on relative returns.
The Portfolio’s duration positioning versus the benchmark detracted from relative performance in the declining-rate environment that prevailed during the six-month period. We had maintained the Portfolio’s duration in a range modestly below that of the Bloomberg Barclays Index, which acted as a drag on performance as Treasury yields declined. In addition, the Portfolio’s allocation to securitized assets felt the negative effects of declining rates due to the market’s expectations for an uptick in prepayment activity as rates moved sharply lower.
Q: Did the Portfolio have any exposure to derivative securities during the six-month period ended June 30, 2020. If so, did the derivatives have any material impact on performance?
A: Yes, we invested the Portfolio in Treasury futures and credit-default swaps during the six-month period. We invest in Treasury futures as part of our duration-management strategy for the Portfolio. We believe the use of Treasury futures allows us to express our views on duration and yield-curve positioning in the most efficient manner. We invest in credit-default swaps to either gain or reduce Portfolio exposure to corporate bonds very quickly, as cash-bond transactions take a little more time to settle.
The use of derivatives has allowed the Portfolio to benefit from the performance of the targeted asset classes, while retaining a better liquidity profile, which in turn may help to reduce risk. Treasury futures generally have not had an impact on the Portfolio’s performance, as we have used them primarily for hedging purposes. The credit-based derivatives had a modest effect on the Portfolio’s performance during the six-month period.
Q: What factors affected the Portfolio’s yield, or distributions* to shareholders, during the six-month period ended June 30, 2020?
A: The sharp, downward trajectory of Treasury yields weighed on the Portfolio’s distributions during the six-month period, although the widening of credit spreads helped to offset some of the decline.
* Distributions are not guaranteed.
6
| Pioneer Bond VCT Portfolio | PIONEER VARIABLE CONTRACTS TRUST |
Q: What is your investment outlook and how is the Portfolio positioned going into the second half of the fiscal year?
A: We expect that U.S. economic activity may continue to recover, but at a slower and more uneven pace relative to the re-opening “bounce” we witnessed for much of the second quarter. We believe there is a strong case to be made for additional federal government support for the economy in the near term. Enhanced unemployment benefits are scheduled to expire shortly, state and local governments need help bridging tax-revenue shortfalls, and delayed or suspended re-openings in some states could very well increase financial stress on small businesses. While passage of a fourth fiscal stimulus package seems likely, the legislative and political process may create near-term market volatility.
On the monetary side, we believe the Fed could keep its benchmark overnight lending rate at effectively zero for quite some time, possibly until the end of 2022. Should that scenario unfold, short-dated Treasury yields would likely remain low. In addition, we believe the yield curve could steepen further, with longer-maturity yields rising as economic activity picks up and issuance of Treasury notes increases substantially.
On balance, we do not look for the U.S. economic activity to return to pre-COVID levels until well into 2021, as many segments such as travel, hospitality, and consumer services could continue to struggle due to lingering concerns about the virus as well as structural changes.
The combination of attractive spreads, positive economic momentum, and supportive supply/demand dynamics have led us to enter the second half of 2020 with a constructive stance on the credit markets. As of the end of the six-month period, corporate bond and securitized credit spreads were offering attractive long-term value across a number of sectors, in our opinion. That said, we expect that selectivity with regard to choosing investments will become even more important, given the partial recovery in spreads during the second quarter of 2020 and the eventual dialing back of policy support from the Fed and the U.S. government.
As the world waits for a medical solution and learns how to live with the virus, we believe the key question still awaiting an answer is what type of activities are acceptable, without leading to an unacceptable rise in infections? Government restrictions and other recommendations seem to have had a material impact on virus spread over the past few months. Therefore, at this point, we believe individuals’ choices about what activities they are and are not comfortable with will be as important a driver of economic re-engagement and recovery as any other factor currently in play.
Within the Portfolio’s allocation to corporates, we have been focused on investments of what we believe are higher-quality issuers that have lower sensitivity to the economic cycle, and issuers that have so far been less-affected by the COVID-19 shutdowns. As we noted earlier, valuations of securitized assets have not recovered to the same degree as corporates, but we have continued to hold the Portfolio’s securitized positions, as we believe there remains a liquidity premium in the sector and we do not anticipate any meaningful impairment. As noted earlier, the Portfolio did realize some
7
| Pioneer Bond VCT Portfolio | PIONEER VARIABLE CONTRACTS TRUST |
PORTFOLIO MANAGEMENT DISCUSSION 6/30/20 | (continued) |
A Word About Risk:
All investments are subject to risk, including the possible loss of principal. In the past several years, financial markets have experienced increased volatility and heightened uncertainty. The market prices of securities may go up or down, sometimes rapidly or unpredictably, due to general market conditions, such as real or perceived adverse economic, political, or regulatory conditions, recessions, inflation, changes in interest or currency rates, lack of liquidity in the bond markets, the spread of infectious illness or other public health issues or adverse investor sentiment. These conditions may continue, recur, worsen or spread.
When interest rates rise, the prices of fixed-income securities in the Portfolio will generally fall. Conversely, when interest rates fall, the prices of fixed-income securities in the Portfolio will generally rise.
Investments in the Portfolio are subject to possible loss due to the financial failure of the issuers of the underlying securities and their inability to meet their debt obligations.
Prepayment risk is the chance that an issuer may exercise its right to prepay its security, if falling interest rates prompt the issuer to do so. Forced to reinvest the unanticipated proceeds at lower interest rates, the Portfolio would experience a decline in income and lose the opportunity for additional price appreciation.
Investments in high-yield or lower-rated securities are subject to greater-than-average price volatility, illiquidity and possibility of default.
The securities issued by U.S. Government-sponsored entities (i.e., FNMA, Freddie Mac) are neither guaranteed nor issued by the U.S. Government.
The Portfolio may invest in mortgage-backed securities, which during times of fluctuating interest rates may increase or decrease more than other fixed-income securities. Mortgage-backed securities are also subject to prepayments.
At times, the Portfolio’s investments may represent industries or industry sectors that are interrelated or have common risks, making the Portfolio more susceptible to any economic, political, or regulatory developments or other risks affecting those industries and sectors.
These risks may increase share price volatility.
modest losses on some securitized positions we sold during the six-month period in order to fund purchases of new corporate issues that came to the market at historically wide spreads, which in our view offered better risk/return profiles.
Please refer to the Schedule of Investments on pages 9 to 37 for a full listing of Portfolio securities.
Past performance is no guarantee of future results.
Any information in this shareholder report regarding market or economic trends or the factors influencing the Portfolio’s historical or future performance are statements of opinion as of the date of this report.
8
| Pioneer Bond VCT Portfolio | PIONEER VARIABLE CONTRACTS TRUST |
| Shares | Value | ||
| UNAFFILIATED ISSUERS – 99.1% | |||
| CONVERTIBLE PREFERRED STOCKS – 1.2% of Net Assets | |||
| Banks – 1.2% | |||
| 529(a) | Bank of America Corp., 7.25% | $ 710,024 | |
| 1,048(a) | Wells Fargo & Co., 7.5% | 1,359,256 | |
| Total Banks | $ 2,069,280 | ||
| TOTAL CONVERTIBLE PREFERRED STOCKS | |||
(Cost $2,136,481) | $ 2,069,280 |
| Principal | |||
| Amount | |||
| USD ($) | |||
| ASSET BACKED SECURITIES – 12.2% of Net Assets | |||
| 250,000(b) | 522 Funding CLO I, Ltd., Series 2019-1A, Class D, 5.749% (3 Month USD LIBOR + 420 bps), | ||
1/15/33 (144A) | $ 244,615 | ||
| 500,000 | American Credit Acceptance Receivables Trust, Series 2019-2, Class E, 4.29%, 6/12/25 (144A) | 493,871 | |
| 100,000 | Amur Equipment Finance Receivables VI LLC, Series 2018-2A, Class C, 4.27%, 1/20/23 (144A) | 103,923 | |
| 200,000 | Amur Equipment Finance Receivables VI LLC, Series 2018-2A, Class D, 4.45%, 6/20/23 (144A) | 207,761 | |
| 100,000 | Avid Automobile Receivables Trust, Series 2018-1, Class B, 3.85%, 7/15/24 (144A) | 101,213 | |
| 250,000(b) | Battalion CLO XV, Ltd., Series 2020-15A, Class D, 4.912% (3 Month USD LIBOR + 325 bps), | ||
1/17/33 (144A) | 233,419 | ||
| 100,000 | BCC Funding XIV LLC, Series 2018-1A, Class B, 3.39%, 8/21/23 (144A) | 101,555 | |
| 250,000(b) | Benefit Street Partners CLO XIX, Ltd., Series 2019-19A, Class E, 8.898% (3 Month USD | ||
LIBOR + 702 bps), 1/15/33 (144A) | 228,712 | ||
| 250,000(b) | Carlyle US CLO, Ltd., Series 2019-4A, Class C, 5.559% (3 Month USD LIBOR + 400 bps), | ||
1/15/33 (144A) | 239,878 | ||
| 400,000 | CIG Auto Receivables Trust, Series 2019-1A, Class B, 3.59%, 8/15/24 (144A) | 411,912 | |
| 160,000 | Conn’s Receivables Funding LLC, Series 2019-B, Class B, 3.62%, 6/17/24 (144A) | 153,929 | |
| 300,000 | Continental Credit Card ABS LLC, Series 2019-1A, Class A, 3.83%, 8/15/26 (144A) | 295,058 | |
| 100,000 | CoreVest American Finance Trust, Series 2017-1, Class C, 3.756%, 10/15/49 (144A) | 100,456 | |
| 298,500 | Domino’s Pizza Master Issuer LLC, Series 2019-1A, Class A2, 3.668%, 10/25/49 (144A) | 312,706 | |
| 250,000 | Drive Auto Receivables Trust, Series 2019-1, Class C, 3.78%, 4/15/25 | 253,063 | |
| 70,000 | Drive Auto Receivables Trust, Series 2020-2, Class C, 2.28%, 8/17/26 | 70,697 | |
| 50,000 | Drive Auto Receivables Trust, Series 2020-2, Class D, 3.05%, 5/15/28 | 50,707 | |
| 150,000 | Elm Trust, Series 2018-2A, Class A2, 4.605%, 10/20/27 (144A) | 149,804 | |
| 25,780(c) | Equifirst Mortgage Loan Trust, Series 2003-1, Class IF1, 4.01%, 12/25/32 | 26,339 | |
| 111,190 | FCI Funding LLC, Series 2019-1A, Class A, 3.63%, 2/18/31 (144A) | 112,045 | |
| 100,000+(d) | Finance of America Structured Securities Trust, Series 2019-HB1, Class M2, 3.676%, | ||
4/25/29 (144A) | 101,300 | ||
| 100,000+(d) | Finance of America Structured Securities Trust, Series 2019-HB1, Class M3, 3.813%, | ||
4/25/29 (144A) | 90,720 | ||
| 393,592 | Finance of America Structured Securities Trust, Series 2019-JR3, Class JR2, 2.0%, 9/25/69 | 407,362 | |
| 24,437 | First Investors Auto Owner Trust, Series 2015-2A, Class D, 4.22%, 12/15/21 (144A) | 24,471 | |
| 250,000 | Foundation Finance Trust, Series 2019-1A, Class B, 4.22%, 11/15/34 (144A) | 233,068 | |
| 250,000 | Foursight Capital Automobile Receivables Trust, Series 2019-1, Class D, 3.27%, | ||
6/16/25 (144A) | 255,093 | ||
| 220,000 | Genesis Sales Finance Master Trust, Series 2019-AA, Class A, 4.68%, 8/20/23 (144A) | 218,892 | |
| 250,000(b) | Goldentree Loan Management US CLO 6, Ltd., Series 2019-6A, Class D, 4.985% (3 Month | ||
USD LIBOR + 385 bps), 1/20/33 (144A) | 244,939 | ||
| 119,712(b) | Home Partners of America Trust, Series 2018-1, Class A, 1.094% (1 Month USD LIBOR + | ||
90 bps), 7/17/37 (144A) | 117,953 | ||
| 96,103 | Home Partners of America Trust, Series 2019-1, Class D, 3.406%, 9/17/39 (144A) | 94,914 | |
| 19,470 | Icon Brand Holdings LLC, Series 2013-1A, Class A2, 4.352%, 1/25/43 (144A) | 13,046 |
The accompanying notes are an integral part of these financial statements.
9
| Pioneer Bond VCT Portfolio | PIONEER VARIABLE CONTRACTS TRUST |
| SCHEDULE OF INVESTMENTS 6/30/20 (UNAUDITED) | (continued) |
| Principal | |||
| Amount | |||
| USD ($) | Value | ||
| ASSET BACKED SECURITIES – (continued) | |||
| 100,000(b) | Invitation Homes Trust, Series 2018-SFR1, Class C, 1.444% (1 Month USD LIBOR + | ||
125 bps), 3/17/37 (144A) | $ 98,311 | ||
| 160,000(b) | Invitation Homes Trust, Series 2018-SFR2, Class D, 1.635% (1 Month USD LIBOR + | ||
145 bps), 6/17/37 (144A) | 154,989 | ||
| 240,000(b) | Invitation Homes Trust, Series 2018-SFR3, Class D, 1.844% (1 Month USD LIBOR + | ||
165 bps), 7/17/37 (144A) | 234,796 | ||
| 540,000(b) | Invitation Homes Trust, Series 2018-SFR3, Class E, 2.194% (1 Month USD LIBOR + | ||
200 bps), 7/17/37 (144A) | 513,331 | ||
| 19,403 | JG Wentworth XXII LLC, Series 2010-3A, Class A, 3.82%, 12/15/48 (144A) | 20,143 | |
| 241,412 | JG Wentworth XLIII LLC, Series 2019-1A, Class A, 3.82%, 8/17/71 (144A) | 266,003 | |
| 500,000 | Kabbage Funding LLC, Series 2019-1, Class B, 4.071%, 3/15/24 (144A) | 425,097 | |
| 250,000(b) | Madison Park Funding XXXVI, Ltd., Series 2019-36A, Class E, 9.192% (3 Month USD | ||
LIBOR + 725 bps), 1/15/33 (144A) | 237,998 | ||
| 4,910 | Marlette Funding Trust, Series 2018-3A, Class A, 3.2%, 9/15/28 (144A) | 4,907 | |
| 150,000 | Marlette Funding Trust, Series 2019-2A, Class C, 4.11%, 7/16/29 (144A) | 130,895 | |
| 479,277(d) | Mill City Mortgage Loan Trust, Series 2018-2, Class M1, 3.75%, 5/25/58 (144A) | 502,895 | |
| 153,189 | Mosaic Solar Loan Trust, Series 2019-2A, Class A, 2.88%, 9/20/40 (144A) | 152,318 | |
| 116,512(b) | Newtek Small Business Loan Trust, Series 2017-1, Class A, 2.185% (1 Month USD LIBOR + | ||
200 bps), 2/15/43 (144A) | 113,734 | ||
| 142,608 | NFAS LLC, Series 2019-1, Class A, 4.172%, 8/15/24 (144A) | 138,332 | |
| 300,000 | NMEF Funding LLC, Series 2019-A, Class B, 3.06%, 8/17/26 (144A) | 303,927 | |
| 43,102(b) | NovaStar Mortgage Funding Trust, Series 2005-3, Class M1, 0.86% (1 Month USD LIBOR + | ||
68 bps), 1/25/36 | 43,012 | ||
| 130,000 | Progress Residential Trust, Series 2017-SFR1, Class E, 4.261%, 8/17/34 (144A) | 132,392 | |
| 100,000 | Progress Residential Trust, Series 2017-SFR2, Class B, 3.196%, 12/17/34 (144A) | 100,770 | |
| 130,000 | Progress Residential Trust, Series 2017-SFR2, Class E, 4.142%, 12/17/34 (144A) | 131,414 | |
| 350,000 | Progress Residential Trust, Series 2018-SFR2, Class A, 3.712%, 8/17/35 (144A) | 358,748 | |
| 100,000 | Progress Residential Trust, Series 2018-SFR2, Class D, 4.338%, 8/17/35 (144A) | 102,844 | |
| 110,000 | Progress Residential Trust, Series 2018-SFR2, Class E, 4.656%, 8/17/35 (144A) | 112,683 | |
| 190,000 | Progress Residential Trust, Series 2018-SFR3, Class E, 4.873%, 10/17/35 (144A) | 195,816 | |
| 300,000 | Progress Residential Trust, Series 2019-SFR2, Class E, 4.142%, 5/17/36 (144A) | 309,286 | |
| 300,000 | Republic Finance Issuance Trust, Series 2019-A, Class A, 3.43%, 11/22/27 (144A) | 298,484 | |
| 100,000(d) | RMF Buyout Issuance Trust, Series 2019-1, Class M3, 3.011%, 7/25/29 (144A) | 97,161 | |
| 36,928 | SCF Equipment Leasing LLC, Series 2017-2A, Class A, 3.41%, 12/20/23 (144A) | 37,020 | |
| 200,000 | SCF Equipment Leasing LLC, Series 2019-1A, Class C, 3.92%, 11/20/26 (144A) | 189,263 | |
| 200,000 | SCF Equipment Leasing LLC, Series 2019-2A, Class C, 3.11%, 6/21/27 (144A) | 177,972 | |
| 200,000 | Small Business Lending Trust, Series 2019-A, Class B, 3.42%, 7/15/26 (144A) | 167,689 | |
| 250,000(b) | Sound Point CLO XXV, Ltd., Series 2019-4A, Class D, 5.941% (3 Month USD LIBOR + | ||
411 bps), 1/15/33 (144A) | 218,873 | ||
| 362,656 | SpringCastle Funding Asset-Backed Notes, Series 2019-AA, Class A, 3.2%, 5/27/36 | ||
(144A) | 366,548 | ||
| 97,417 | STORE Master Funding I LLC, Series 2015-1A, Class A1, 3.75%, 4/20/45 (144A) | 96,114 | |
| 250,000(b) | Symphony CLO XXII, Ltd., Series 2020-22A, Class C, 3.464% (3 Month USD LIBOR + | ||
215 bps), 4/18/33 (144A) | 239,850 | ||
| 250,000(d) | Towd Point Mortgage Trust, Series 2015-2, Class 1B3, 3.745%, 11/25/60 (144A) | 241,762 | |
| 104,755(d) | Towd Point Mortgage Trust, Series 2015-3, Class A1B, 3.0%, 3/25/54 (144A) | 105,545 | |
| 300,000(d) | Towd Point Mortgage Trust, Series 2015-6, Class B1, 4.022%, 4/25/55 (144A) | 316,414 | |
| 300,000(d) | Towd Point Mortgage Trust, Series 2016-1, Class B1, 4.22%, 2/25/55 (144A) | 317,906 | |
| 300,000(d) | Towd Point Mortgage Trust, Series 2016-2, Class B2, 3.525%, 8/25/55 (144A) | 302,955 |
The accompanying notes are an integral part of these financial statements.
10
| Pioneer Bond VCT Portfolio | PIONEER VARIABLE CONTRACTS TRUST |
| Principal | |||
| Amount | |||
| USD ($) | Value | ||
| ASSET BACKED SECURITIES – (continued) | |||
| 460,000(d) | Towd Point Mortgage Trust, Series 2016-3, Class B1, 4.128%, 4/25/56 (144A) | $ 475,999 | |
| 300,000(d) | Towd Point Mortgage Trust, Series 2016-4, Class B1, 3.979%, 7/25/56 (144A) | 305,069 | |
| 550,000(d) | Towd Point Mortgage Trust, Series 2016-4, Class M1, 3.25%, 7/25/56 (144A) | 557,955 | |
| 125,000(d) | Towd Point Mortgage Trust, Series 2016-5, Class M2, 3.375%, 10/25/56 (144A) | 124,785 | |
| 325,000(d) | Towd Point Mortgage Trust, Series 2017-2, Class M2, 3.75%, 4/25/57 (144A) | 329,735 | |
| 640,000(d) | Towd Point Mortgage Trust, Series 2017-4, Class M2, 3.25%, 6/25/57 (144A) | 652,271 | |
| 500,000(d) | Towd Point Mortgage Trust, Series 2017-6, Class M1, 3.25%, 10/25/57 (144A) | 527,719 | |
| 780,000(d) | Towd Point Mortgage Trust, Series 2018-2, Class A2, 3.5%, 3/25/58 (144A) | 819,723 | |
| 325,000(d) | Towd Point Mortgage Trust, Series 2018-3, Class M1, 3.875%, 5/25/58 (144A) | 330,453 | |
| 350,000(d) | Towd Point Mortgage Trust, Series 2018-3, Class M2, 3.875%, 5/25/58 (144A) | 339,322 | |
| 600,000(d) | Towd Point Mortgage Trust, Series 2018-5, Class A1B, 3.25%, 7/25/58 (144A) | 635,169 | |
| 100,000(d) | Towd Point Mortgage Trust, Series 2018-5, Class M1, 2.852%, 7/25/58 (144A) | 100,241 | |
| 189,768(d) | Towd Point Mortgage Trust, Series 2018-SJ1, Class A1, 4.0%, 10/25/58 (144A) | 191,479 | |
| 850,000(d) | Towd Point Mortgage Trust, Series 2019-2, Class A2, 3.75%, 12/25/58 (144A) | 917,888 | |
| 500,000(b) | Towd Point Mortgage Trust, Series 2019-HY2, Class A2, 1.585% (1 Month USD LIBOR + 140 | ||
| bps), 5/25/58 (144A) | 480,360 | ||
| 400,000(b) | Towd Point Mortgage Trust, Series 2019-HY2, Class M2, 2.085% (1 Month USD LIBOR + 190 | ||
| bps), 5/25/58 (144A) | 306,935 | ||
| 233,196(d) | Towd Point Mortgage Trust, Series 2019-HY2, Class XA, 5.0%, 5/25/58 (144A) | 233,297 | |
| 118,330(d) | Towd Point Mortgage Trust, Series 2019-MH1, Class A1, 3.0%, 11/25/58 (144A) | 120,563 | |
| 310,000 | Tricon American Homes Trust, Series 2019-SFR1, Class A, 2.75%, 3/17/38 (144A) | 322,761 | |
| 100,000 | US Auto Funding LLC, Series 2019-1A, Class B, 3.99%, 12/15/22 (144A) | 101,177 | |
| 9,415 | Welk Resorts LLC, Series 2015-AA, Class A, 2.79%, 6/16/31 (144A) | 9,380 | |
| 164,705 | Welk Resorts LLC, Series 2019-AA, Class D, 4.03%, 6/15/38 (144A) | 138,027 | |
| 122,183 | Westgate Resorts LLC, Series 2018-1A, Class C, 4.1%, 12/20/31 (144A) | 116,347 | |
| 140,000 | Westlake Automobile Receivables Trust, Series 2018-3A, Class E, 4.9%, 12/15/23 (144A) | 144,016 | |
| 49,126 | WRG Debt Funding II LLC, Series 2017-1, Class A, 4.458%, 3/15/26 (144A) | 49,556 | |
| TOTAL ASSET BACKED SECURITIES | |||
| (Cost $21,989,250) | $ 21,981,845 | ||
| COLLATERALIZED MORTGAGE OBLIGATIONS – 11.6% of Net Assets | |||
| 100,000 | American Homes 4 Rent Trust, Series 2015-SFR1, Class C, 4.11%, 4/17/52 (144A) | $ 108,966 | |
| 100,000(d) | Angel Oak Mortgage Trust I LLC, Series 2019-1, Class M1, 4.5%, 11/25/48 (144A) | 98,437 | |
| 230,000(d) | Angel Oak Mortgage Trust I LLC, Series 2019-2, Class M1, 4.065%, 3/25/49 (144A) | 229,753 | |
| 326,658(d) | Bayview Opportunity Master Fund IVa Trust, Series 2017-SPL5, Class A, 3.5%, 6/28/57 (144A) | 336,560 | |
| 182,653(b) | Bear Stearns ALT-A Trust, Series 2005-7, Class 11A1, 0.725% (1 Month USD LIBOR + | ||
| 54 bps), 8/25/35 | 181,718 | ||
| 67,206(b) | Bellemeade Re, Ltd., Series 2018-1A, Class M1B, 1.785% (1 Month USD LIBOR + 160 bps), | ||
| 4/25/28 (144A) | 66,526 | ||
| 93,772(b) | Bellemeade Re, Ltd., Series 2018-2A, Class M1B, 1.535% (1 Month USD LIBOR + 135 bps), | ||
| 8/25/28 (144A) | 93,205 | ||
| 275,589(b) | Bellemeade Re, Ltd., Series 2018-3A, Class M1B, 2.035% (1 Month USD LIBOR + 185 bps), | ||
| 10/25/28 (144A) | 272,946 | ||
| 180,000(b) | Bellemeade Re, Ltd., Series 2018-3A, Class M2, 2.935% (1 Month USD LIBOR + 275 bps), | ||
| 10/25/28 (144A) | 165,313 | ||
| 150,000(b) | Bellemeade Re, Ltd., Series 2019-1A, Class M1B, 1.935% (1 Month USD LIBOR + 175 bps), | ||
| 3/25/29 (144A) | 139,642 | ||
| 150,000(b) | Bellemeade Re, Ltd., Series 2019-1A, Class M2, 2.885% (1 Month USD LIBOR + 270 bps), | ||
| 3/25/29 (144A) | 116,646 | ||
| 450,000(d) | BRAVO Residential Funding Trust, Series 2020-RPL1, Class A2, 3.0%, 5/26/59 (144A) | 467,060 |
The accompanying notes are an integral part of these financial statements.
11
| Pioneer Bond VCT Portfolio | PIONEER VARIABLE CONTRACTS TRUST |
| SCHEDULE OF INVESTMENTS 6/30/20 (UNAUDITED) | (continued) |
| Principal | |||
| Amount | |||
| USD ($) | Value | ||
| COLLATERALIZED MORTGAGE OBLIGATIONS – (continued) | |||
| 100,000 | Bunker Hill Loan Depositary Trust, Series 2020-1, Class A2, 2.6%, 2/25/55 (144A) | $ 99,996 | |
| 100,000 | Bunker Hill Loan Depositary Trust, Series 2020-2, Class A3, 3.253%, 2/25/55 (144A) | 100,000 | |
| 161,586(b) | Chase Mortgage Reference Notes, Series 2019-CL1, Class M1, 1.535% (1 Month USD | ||
LIBOR + 135 bps), 4/25/47 (144A) | 149,976 | ||
| 300,000(d) | CIM Trust, Series 2020-R2, Class M2, 3.0%, 10/25/59 (144A) | 288,109 | |
| 312,935(d) | Citigroup Mortgage Loan Trust, Inc., Series 2018-RP2, Class A1, 3.5%, 2/25/58 (144A) | 325,999 | |
| 762 | Colony American Finance, Ltd., Series 2015-1, Class A, 2.896%, 10/15/47 (144A) | 761 | |
| 333,006(b) | Connecticut Avenue Securities Trust, Series 2019-R01, Class 2M2, 2.635% (1 Month USD | ||
LIBOR + 245 bps), 7/25/31 (144A) | 324,868 | ||
| 127,173(b) | Connecticut Avenue Securities Trust, Series 2019-R02, Class 1M2, 2.485% (1 Month USD | ||
LIBOR + 230 bps), 8/25/31 (144A) | 125,259 | ||
| 110,581(b) | Connecticut Avenue Securities Trust, Series 2019-R03, Class 1M2, 2.335% (1 Month USD | ||
LIBOR + 215 bps), 9/25/31 (144A) | 109,195 | ||
| 350,000(b) | Connecticut Avenue Securities Trust, Series 2019-R06, Class 2M2, 2.285% (1 Month USD | ||
LIBOR + 210 bps), 9/25/39 (144A) | 339,474 | ||
| 410,000(b) | Connecticut Avenue Securities Trust, Series 2019-R07, Class 1M2, 2.285% (1 Month USD | ||
LIBOR + 210 bps), 10/25/39 (144A) | 397,422 | ||
| 120,000(b) | Connecticut Avenue Securities Trust, Series 2020-R02, Class 2M2, 2.185% (1 Month USD | ||
LIBOR + 200 bps), 1/25/40 (144A) | 113,604 | ||
| 160,000(b) | Connecticut Avenue Securities Trust, Series 2020-SBT1, Class 1M2, 3.835% (1 Month USD | ||
LIBOR + 365 bps), 2/25/40 (144A) | 149,590 | ||
| 200,000(b) | Connecticut Avenue Securities Trust, Series 2020-SBT1, Class 2M2, 3.835% (1 Month USD | ||
LIBOR + 365 bps), 2/25/40 (144A) | 192,011 | ||
| 206,094(d) | CSMC Trust, Series 2013-IVR3, Class B4, 3.435%, 5/25/43 (144A) | 202,018 | |
| 66,891(d) | Deephaven Residential Mortgage Trust, Series 2017-3A, Class A1, 2.577%, 10/25/47 (144A) | 67,549 | |
| 60,702(d) | Deephaven Residential Mortgage Trust, Series 2018-1A, Class A1, 2.976%, 12/25/57 (144A) | 61,286 | |
| 65,384(b) | Eagle Re, Ltd., Series 2018-1, Class M1, 1.885% (1 Month USD LIBOR + 170 bps), | ||
11/25/28 (144A) | 63,268 | ||
| 228,595(b) | Eagle Re, Ltd., Series 2019-1, Class M1B, 1.985% (1 Month USD LIBOR + 180 bps), | ||
4/25/29 (144A) | 226,705 | ||
| 138,882(d) | EverBank Mortgage Loan Trust, Series 2013-2, Class A, 3.0%, 6/25/43 (144A) | 145,466 | |
| 217,584(b) | Fannie Mae Connecticut Avenue Securities, Series 2016-C05, Class 2M2, 4.635% (1 Month | ||
USD LIBOR + 445 bps), 1/25/29 | 222,330 | ||
| 28,210 | Federal Home Loan Mortgage Corp. REMICS, Series 2944, Class OH, 5.5%, 3/15/35 | 33,085 | |
| 369,241(b)(e) | Federal Home Loan Mortgage Corp. REMICS, Series 4091, Class SH, 6.365% (1 Month USD | ||
LIBOR + 655 bps), 8/15/42 | 83,857 | ||
| 3,747 | Federal National Mortgage Association REMICS, Series 2009-36, Class HX, 4.5%, 6/25/29 | 3,957 | |
| 550,000 | Federal National Mortgage Association REMICS, Series 2013-61, Class BY, 3.0%, 6/25/43 | 605,912 | |
| 565,376(d) | Flagstar Mortgage Trust, Series 2020-1INV, Class A3, 3.0%, 3/25/50 (144A) | 580,991 | |
| 260,000(b) | Freddie Mac Stacr Remic Trust, Series 2020-DNA2, Class M2, 2.035% (1 Month USD | ||
LIBOR + 185 bps), 2/25/50 (144A) | 246,507 | ||
| 240,000(b) | Freddie Mac Stacr Remic Trust, Series 2020-HQA2, Class M2, 3.285% (1 Month USD | ||
LIBOR + 310 bps), 3/25/50 (144A) | 229,784 | ||
| 290,000(b) | Freddie Mac Stacr Trust, Series 2018-HQA2, Class B1, 4.435% (1 Month USD LIBOR + 425 bps), | ||
10/25/48 (144A) | 271,642 | ||
| 310,000(b) | Freddie Mac Stacr Trust, Series 2018-HQA2, Class M2, 2.485% (1 Month USD LIBOR + 230 bps), | ||
10/25/48 (144A) | 298,523 | ||
| 188,783(b) | Freddie Mac Stacr Trust, Series 2019-DNA2, Class M2, 2.635% (1 Month USD LIBOR + 245 bps), | ||
3/25/49 (144A) | 186,073 | ||
| 166,502(b) | Freddie Mac Stacr Trust, Series 2019-HQA1, Class M2, 2.535% (1 Month USD LIBOR + 235 bps), | ||
2/25/49 (144A) | 162,951 |
The accompanying notes are an integral part of these financial statements.
12
| Pioneer Bond VCT Portfolio | PIONEER VARIABLE CONTRACTS TRUST |
| Principal | |||
| Amount | |||
| USD ($) | Value | ||
| COLLATERALIZED MORTGAGE OBLIGATIONS – (continued) | |||
| 110,000(b) | Freddie Mac Stacr Trust, Series 2019-HQA2, Class B2, 11.435% (1 Month USD LIBOR + | ||
1,125 bps), 4/25/49 (144A) | $ 106,205 | ||
| 91,411(b) | Freddie Mac Stacr Trust, Series 2019-HQA2, Class M2, 2.235% (1 Month USD LIBOR + | ||
205 bps), 4/25/49 (144A) | 89,533 | ||
| 320,000(b) | Freddie Mac Structured Agency Credit Risk Debt Notes, Series 2017-DNA2, Class M2, | ||
3.635% (1 Month USD LIBOR + 345 bps), 10/25/29 | 324,307 | ||
| 410,000(b) | Freddie Mac Structured Agency Credit Risk Debt Notes, Series 2017-DNA3, Class M2, | ||
2.685% (1 Month USD LIBOR + 250 bps), 3/25/30 | 412,018 | ||
| 240,635(d) | FWDSecuritization Trust, Series 2019-INV1, Class A1, 2.81%, 6/25/49 (144A) | 246,165 | |
| 24,270 | Government National Mortgage Association, Series 2005-61, Class UZ, 5.25%, 8/16/35 | 25,618 | |
| 8,141 | Government National Mortgage Association, Series 2012-130, Class PA, 3.0%, 4/20/41 | 8,328 | |
| 1,222,795(e) | Government National Mortgage Association, Series 2019-159, Class CI, 3.5%, 12/20/49 | 138,126 | |
| 816,495(b)(e) | Government National Mortgage Association, Series 2020-9, Class SA, 3.16% (1 Month USD | ||
LIBOR + 335 bps), 1/20/50 | 78,615 | ||
| 148,932(d) | GS Mortgage-Backed Securities Corp. Trust, Series 2020-PJ2, Class B2, 3.6%, 7/25/50 (144A) | 142,017 | |
| 200,000(d) | GS Mortgage-Backed Securities Trust, Series 2019-SL1, Class A2, 2.875%, 1/25/59 (144A) | 196,139 | |
| 68,968(b) | Home Re, Ltd., Series 2019-1, Class M1, 1.835% (1 Month USD LIBOR + 165 bps), | ||
5/25/29 (144A) | 67,937 | ||
| 313,820(d) | JP Morgan Mortgage Trust, Series 2013-2, Class B2, 3.632%, 5/25/43 (144A) | 315,843 | |
| 301,512(d) | JP Morgan Mortgage Trust, Series 2018-LTV1, Class A3, 4.5%, 4/25/49 (144A) | 308,178 | |
| 395,839(d) | JP Morgan Mortgage Trust, Series 2019-9, Class B1A, 3.325%, 5/25/50 (144A) | 399,637 | |
| 345,840(d) | JP Morgan Mortgage Trust, Series 2019-HYB1, Class B1, 3.948%, 10/25/49 (144A) | 319,368 | |
| 287,941(d) | JP Morgan Mortgage Trust, Series 2019-LTV1, Class A3, 4.0%, 6/25/49 (144A) | 296,118 | |
| 347,699(d) | JP Morgan Mortgage Trust, Series 2020-2, Class B2A, 3.471%, 7/25/50 (144A) | 343,463 | |
| 248,738(d) | JP Morgan Mortgage Trust, Series 2020-3, Class B1A, 3.051%, 8/25/50 (144A) | 254,032 | |
| 86,990(b) | La Hipotecaria Panamanian Mortgage Trust, Series 2007-1GA, Class A, 4.5% (Panamanian | ||
Mortgage Reference Rate + -125 bps), 12/23/36 (144A) | 89,327 | ||
| 25,227(b) | La Hipotecaria Panamanian Mortgage Trust, Series 2010-1GA, Class A, 2.75% (Panamanian | ||
Mortgage Reference Rate + -300 bps), 9/8/39 (144A) | 25,905 | ||
| 905,635(d) | Mill City Mortgage Loan Trust, Series 2018-4, Class A1B, 3.5%, 4/25/66 (144A) | 956,644 | |
| 668,768(d) | Mill City Mortgage Loan Trust, Series 2019-1, Class M2, 3.5%, 10/25/69 (144A) | 649,715 | |
| 250,000(d) | Mill City Mortgage Loan Trust, Series 2019-GS1, Class M1, 3.0%, 7/25/59 (144A) | 252,292 | |
| 370,000(b) | Mortgage Insurance-Linked Notes, Series 2020-1, Class M1C, 1.935% (1 Month USD | ||
LIBOR + 175 bps), 2/25/30 (144A) | 320,276 | ||
| 359,069(d) | New Residential Mortgage Loan Trust, Series 2019-NQM4, Class A1, 2.492%, 9/25/59 (144A) | 361,529 | |
| 177,626(d) | New Residential Mortgage Loan Trust, Series 2019-RPL2, Class A1, 3.25%, 2/25/59 (144A) | 185,767 | |
| 219,135(d) | PMT Loan Trust, Series 2013-J1, Class A11, 3.5%, 9/25/43 (144A) | 228,479 | |
| 7,458(b) | Radnor Re, Ltd., Series 2018-1, Class M1, 1.585% (1 Month USD LIBOR + 140 bps), | ||
3/25/28 (144A) | 7,439 | ||
| 197,944(b) | Radnor Re, Ltd., Series 2019-1, Class M1B, 2.135% (1 Month USD LIBOR + 195 bps), | ||
2/25/29 (144A) | 196,097 | ||
| 230,833(d) | RMF Proprietary Issuance Trust, Series 2019-1, Class A, 2.75%, 10/25/63 (144A) | 229,582 | |
| 584,597(d) | Sequoia Mortgage Trust, Series 2013-5, Class A2, 3.0%, 5/25/43 (144A) | 607,871 | |
| 315,878(d) | Sequoia Mortgage Trust, Series 2013-6, Class A1, 2.5%, 5/25/43 | 323,388 | |
| 278,887(d) | Sequoia Mortgage Trust, Series 2013-7, Class A2, 3.0%, 6/25/43 | 289,276 | |
| 163,733(d) | Sequoia Mortgage Trust, Series 2018-CH3, Class A1, 4.5%, 8/25/48 (144A) | 171,780 | |
| 272,424(d) | Sequoia Mortgage Trust, Series 2019-CH3, Class A1, 4.0%, 9/25/49 (144A) | 280,595 | |
| 380,000(b) | STACR Trust, Series 2018-HRP2, Class B1, 4.385% (1 Month USD LIBOR + 420 bps), | ||
2/25/47 (144A) | 350,767 |
The accompanying notes are an integral part of these financial statements.
13
| Pioneer Bond VCT Portfolio | PIONEER VARIABLE CONTRACTS TRUST |
| SCHEDULE OF INVESTMENTS 6/30/20 (UNAUDITED) | (continued) |
| Principal | |||
| Amount | |||
| USD ($) | Value | ||
| COLLATERALIZED MORTGAGE OBLIGATIONS – (continued) | |||
| 220,000(b) | STACR Trust, Series 2018-HRP2, Class M3, 2.585% (1 Month USD LIBOR + 240 bps), | ||
2/25/47 (144A) | $ 204,124 | ||
| 200,000(b) | Starwood Waypoint Homes Trust, Series 2017-1, Class B, 1.355% (1 Month USD LIBOR + | ||
117 bps), 1/17/35 (144A) | 198,331 | ||
| 320,000(d) | Towd Point Mortgage Trust, Series 2015-5, Class M1, 3.5%, 5/25/55 (144A) | 336,415 | |
| 265,000(d) | Towd Point Mortgage Trust, Series 2015-6, Class M1, 3.75%, 4/25/55 (144A) | 282,305 | |
| 52,894(d) | Towd Point Mortgage Trust, Series 2017-5, Class XA, 3.5%, 2/25/57 (144A) | 52,848 | |
| 550,000(d) | Towd Point Mortgage Trust, Series 2019-4, Class M1, 3.5%, 10/25/59 (144A) | 544,297 | |
| 430,368(d) | Visio Trust, Series 2019-2, Class A1, 2.722%, 11/25/54 (144A) | 434,770 | |
| 610,000(d) | Vista Point Securitization Trust, Series 2020-1, Class A3, 3.201%, 3/25/65 (144A) | 609,990 | |
| TOTAL COLLATERALIZED MORTGAGE OBLIGATIONS | |||
(Cost $21,042,205) | $ 20,946,396 | ||
COMMERCIAL MORTGAGE-BACKED SECURITIES – 5.8% of Net Assets | |||
| 226,978 | A10 Term Asset Financing LLC, Series 2017-1A, Class B, 3.15%, 3/15/36 (144A) | $ 224,378 | |
| 410,000 | BANK, Series 2017-BNK7, Class AS, 3.748%, 9/15/60 | 437,242 | |
| 221,617(c)(e) | Bayview Commercial Asset Trust, Series 2007-2A, Class IO, 0.0%, 7/25/37 (144A) | — | |
| 125,000 | Benchmark Mortgage Trust, Series 2018-B5, Class A3, 3.944%, 7/15/51 | 144,975 | |
| 250,000 | Benchmark Mortgage Trust, Series 2018-B8, Class A4, 3.963%, 1/15/52 | 290,720 | |
| 265,000 | Benchmark Mortgage Trust, Series 2019-B14, Class AS, 3.352%, 12/15/62 | 287,836 | |
| 200,000(d) | Benchmark Mortgage Trust, Series 2020-IG3, Class B, 3.387%, 9/15/48 (144A) | 204,811 | |
| 200,000(b) | BX Commercial Mortgage Trust, Series 2020-BXLP, Class D, 1.435% (1 Month USD LIBOR + | ||
125 bps), 12/15/36 (144A) | 192,991 | ||
| 400,000 | BX Trust, Series 2019-OC11, Class A, 3.202%, 12/9/41 (144A) | 416,704 | |
| 100,000 | CCRESG Commercial Mortgage Trust, Series 2016-HEAT, Class A, 3.357%, 4/10/29 (144A) | 99,014 | |
| 120,000 | CD Mortgage Trust, Series 2018-CD7, Class A3, 4.013%, 8/15/51 | 138,753 | |
| 140,000 | CFCRE Commercial Mortgage Trust, Series 2016-C3, Class A2, 3.597%, 1/10/48 | 154,063 | |
| 250,000(d) | Citigroup Commercial Mortgage Trust, Series 2014-GC19, Class B, 4.805%, 3/10/47 | 263,207 | |
| 250,000(d) | Citigroup Commercial Mortgage Trust, Series 2014-GC25, Class B, 4.345%, 10/10/47 | 257,931 | |
| 125,000(d) | Citigroup Commercial Mortgage Trust, Series 2015-GC33, Class B, 4.724%, 9/10/58 | 130,658 | |
| 250,000 | Citigroup Commercial Mortgage Trust, Series 2016-P5, Class D, 3.0%, 10/10/49 (144A) | 156,142 | |
| 300,000 | Citigroup Commercial Mortgage Trust, Series 2019-SMRT, Class A, 4.149%, 1/10/36 (144A) | 322,755 | |
| 241,251 | COMM Mortgage Trust, Series 2012-CR3, Class A3, 2.822%, 10/15/45 | 245,269 | |
| 250,000 | COMM Mortgage Trust, Series 2012-CR4, Class AM, 3.251%, 10/15/45 | 254,060 | |
| 200,000(d) | COMM Mortgage Trust, Series 2013-CR11, Class C, 5.286%, 8/10/50 (144A) | 192,683 | |
| 233,783(d) | COMM Mortgage Trust, Series 2014-CR20, Class C, 4.662%, 11/10/47 | 217,134 | |
| 238,711 | COMM Mortgage Trust, Series 2014-UBS3, Class A3, 3.546%, 6/10/47 | 254,825 | |
| 150,000 | COMM Mortgage Trust, Series 2014-UBS4, Class A4, 3.42%, 8/10/47 | 159,730 | |
| 175,000(d) | COMM Mortgage Trust, Series 2015-DC1, Class B, 4.035%, 2/10/48 | 176,265 | |
| 188,302 | COMM Mortgage Trust, Series 2016-CR28, Class AHR, 3.651%, 2/10/49 | 200,781 | |
| 250,000(b) | Credit Suisse Mortgage Capital Certificates, Series 2019-ICE4, Class E, 2.335% (1 Month | ||
USD LIBOR + 215 bps), 5/15/36 (144A) | 238,737 | ||
| 300,000(d) | CSAIL Commercial Mortgage Trust, Series 2016-C5, Class C, 4.724%, 11/15/48 | 271,818 | |
| 53,849(b) | FREMF Mortgage Trust, Series 2014-KF05, Class B, 4.183% (1 Month USD LIBOR + 400 bps), | ||
9/25/22 (144A) | 53,670 | ||
| 50,100(b) | FREMF Mortgage Trust, Series 2014-KS02, Class B, 5.183% (1 Month USD LIBOR + 500 bps), | ||
8/25/23 (144A) | 44,106 | ||
| 125,000(d) | FREMF Mortgage Trust, Series 2015-K51, Class B, 4.089%, 10/25/48 (144A) | 132,850 | |
| 90,000(d) | FREMF Mortgage Trust, Series 2017-K66, Class B, 4.173%, 7/25/27 (144A) | 97,178 |
The accompanying notes are an integral part of these financial statements.
14
| Pioneer Bond VCT Portfolio | PIONEER VARIABLE CONTRACTS TRUST |
| Principal | |||
| Amount | |||
| USD ($) | Value | ||
| COMMERCIAL MORTGAGE-BACKED SECURITIES – (continued) | |||
| 100,000(d) | FREMF Mortgage Trust, Series 2019-K88, Class C, 4.525%, 2/25/52 (144A) | $ 103,401 | |
| 149,983(b) | FREMF Mortgage Trust, Series 2019-KF64, Class B, 2.483% (1 Month USD LIBOR + 230 | ||
bps), 6/25/26 (144A) | 142,080 | ||
| 178,455(d) | FRESB Mortgage Trust, Series 2018-SB52, Class A7F, 3.39%, 6/25/25 | 188,752 | |
| 1,387,256(d)(e) | Government National Mortgage Association, Series 2017-21, Class IO, 0.767%, 10/16/58 | 83,923 | |
| 200,000 | GS Mortgage Securities Trust, Series 2015-GC28, Class A5, 3.396%, 2/10/48 | 215,040 | |
| 323,000 | ILPT Trust, Series 2019-SURF, Class A, 4.145%, 2/11/41 (144A) | 363,250 | |
| 450,000 | JP Morgan Chase Commercial Mortgage Securities Trust, Series 2016-JP2, Class A4, | ||
2.822%, 8/15/49 | 479,070 | ||
| 200,000(d) | JP Morgan Chase Commercial Mortgage Securities Trust, Series 2018-BCON, Class C, | ||
3.881%, 1/5/31 (144A) | 199,280 | ||
| 250,000 | JP Morgan Chase Commercial Mortgage Securities Trust, Series 2018-WPT, Class AFX, | ||
4.248%, 7/5/33 (144A) | 264,912 | ||
| 150,000(d) | JPMDB Commercial Mortgage Securities Trust, Series 2016-C2, Class B, 3.99%, 6/15/49 | 147,164 | |
| 200,000 | JPMDB Commercial Mortgage Securities Trust, Series 2016-C4, Class A3, 3.141%, 12/15/49 | 217,661 | |
| 100,000(d) | JPMDB Commercial Mortgage Securities Trust, Series 2016-C4, Class D, 3.217%, | ||
12/15/49 (144A) | 60,543 | ||
| 250,000 | JPMDB Commercial Mortgage Securities Trust, Series 2018-C8, Class A4, 4.211%, 6/15/51 | 292,923 | |
| 1,600,000(d)(e) | JPMDB Commercial Mortgage Securities Trust, Series 2018-C8, Class XB, 0.193%, 6/15/51 | 15,967 | |
| 122,754 | Morgan Stanley Bank of America Merrill Lynch Trust, Series 2012-C6, Class A4, 2.858%, 11/15/45 | 126,090 | |
| 80,000(d) | Morgan Stanley Bank of America Merrill Lynch Trust, Series 2015-C21, Class C, 4.282%, 3/15/48 | 72,609 | |
| 250,000(d) | Morgan Stanley Capital I Trust, Series 2018-MP, Class A, 4.418%, 7/11/40 (144A) | 270,244 | |
| 142,173(b) | Multifamily Connecticut Avenue Securities Trust, Series 2019-01, Class M7, 1.885% | ||
(1 Month USD LIBOR + 170 bps), 10/15/49 (144A) | 131,492 | ||
| 260,000 | Wells Fargo Commercial Mortgage Trust, Series 2015-NXS3, Class A4, 3.617%, 9/15/57 | 284,139 | |
| 250,000 | Wells Fargo Commercial Mortgage Trust, Series 2016-C32, Class A3, 3.294%, 1/15/59 | 269,597 | |
| 200,000 | Wells Fargo Commercial Mortgage Trust, Series 2016-LC24, Class A3, 2.684%, 10/15/49 | 210,896 | |
| 104,974 | WFRBS Commercial Mortgage Trust, Series 2013-C16, Class A4, 4.136%, 9/15/46 | 111,731 | |
| TOTAL COMMERCIAL MORTGAGE-BACKED SECURITIES | |||
(Cost $10,452,915) | $ 10,512,050 | ||
| CORPORATE BONDS – 43.0% of Net Assets | |||
| Advertising – 0.7% | |||
| 407,000 | Interpublic Group of Cos., Inc., 4.75%, 3/30/30 | $ 479,897 | |
| 40,000 | Lamar Media Corp., 3.75%, 2/15/28 (144A) | 37,712 | |
| 25,000 | Lamar Media Corp., 4.0%, 2/15/30 (144A) | 23,930 | |
| 75,000 | Lamar Media Corp., 4.875%, 1/15/29 (144A) | 75,375 | |
| 445,000 | Omnicom Group, Inc., 2.45%, 4/30/30 | 454,044 | |
| 125,000 | Outfront Media Capital LLC/Outfront Media Capital Corp., 6.25%, 6/15/25 (144A) | 125,819 | |
| Total Advertising | $ 1,196,777 | ||
| Aerospace & Defense – 1.4% | |||
| 774,000 | Boeing Co., 3.75%, 2/1/50 | $ 694,979 | |
| 480,000 | Boeing Co., 3.9%, 5/1/49 | 441,029 | |
| 430,000 | Boeing Co., 5.805%, 5/1/50 | 507,824 | |
| 470,000 | Raytheon Technologies Corp., 3.2%, 3/15/24 (144A) | 506,425 | |
| 270,000 | United Technologies Corp., 4.125%, 11/16/28 | 318,029 | |
| Total Aerospace & Defense | $ 2,468,286 |
The accompanying notes are an integral part of these financial statements.
15
| Pioneer Bond VCT Portfolio | PIONEER VARIABLE CONTRACTS TRUST |
| SCHEDULE OF INVESTMENTS 6/30/20 (UNAUDITED) | (continued) |
| Principal | |||
| Amount | |||
| USD ($) | Value | ||
| Agriculture – 0.8% | |||
| 80,000 | Altria Group, Inc., 4.45%, 5/6/50 | $ 87,507 | |
| 570,000 | BAT Capital Corp., 4.54%, 8/15/47 | 618,896 | |
| 170,000 | Cargill, Inc., 2.125%, 4/23/30 (144A) | 178,206 | |
| 435,000 | Philip Morris International, Inc., 3.25%, 11/10/24 | 481,556 | |
| Total Agriculture | $ 1,366,165 | ||
| Airlines – 0.2% | |||
| 244,648 | Air Canada 2017-1 Class AA Pass Through Trust, 3.3%, 1/15/30 (144A) | $ 221,815 | |
| 210,000 | Southwest Airlines Co., 2.625%, 2/10/30 | 188,150 | |
| Total Airlines | $ 409,965 | ||
| Apparel – 0.2% | |||
| 110,000 | NIKE, Inc., 3.25%, 3/27/40 | $ 123,115 | |
| 65,000 | NIKE, Inc., 3.375%, 3/27/50 | 75,136 | |
| 180,000 | Ralph Lauren Corp., 2.95%, 6/15/30 | 184,829 | |
| Total Apparel | $ 383,080 | ||
| Auto Manufacturers – 1.1% | |||
| 165,000 | BMW US Capital LLC, 4.15%, 4/9/30 (144A) | $ 189,758 | |
| 225,000 | Ford Motor Credit Co. LLC, 5.584%, 3/18/24 | 227,182 | |
| 189,000 | General Motors Co., 6.6%, 4/1/36 | 204,311 | |
| 353,000 | General Motors Financial Co., Inc., 4.0%, 1/15/25 | 369,011 | |
| 400,000 | Hyundai Capital Services, Inc., 3.0%, 8/29/22 (144A) | 408,647 | |
| 255,000 | Nissan Motor Acceptance Corp., 3.15%, 3/15/21 (144A) | 254,244 | |
| 400,000 | Volkswagen Group of America Finance LLC, 4.0%, 11/12/21 (144A) | 416,401 | |
| Total Auto Manufacturers | $ 2,069,554 | ||
| Auto Parts & Equipment – 0.2% | |||
| 297,000 | BorgWarner, Inc., 2.65%, 7/1/27 | $ 304,721 | |
| 110,000 | Lear Corp., 3.5%, 5/30/30 | 109,864 | |
| Total Auto Parts & Equipment | $ 414,585 | ||
| Banks – 7.5% | |||
| 535,000(d) | AIB Group Plc, 4.263% (3 Month USD LIBOR + 187 bps), 4/10/25 (144A) | $ 569,960 | |
| 318,000 | Banco Santander Chile, 2.7%, 1/10/25 (144A) | 326,548 | |
| 663,000(d) | Bank of America Corp., 2.884% (3 Month USD LIBOR + 119 bps), 10/22/30 | 717,273 | |
| 318,000(d) | Bank of America Corp., 4.083% (3 Month USD LIBOR + 315 bps), 3/20/51 | 398,474 | |
| 310,000(a)(d) | Bank of America Corp., 4.3% (3 Month USD LIBOR + 266 bps) | 278,194 | |
| 250,000(a)(d) | Barclays Plc, 7.75% (5 Year USD Swap Rate + 484 bps) | 254,062 | |
| 200,000(a)(d) | Barclays Plc, 8.0% (5 Year CMT Index + 567 bps) | 207,250 | |
| 200,000(a)(d) | BNP Paribas SA, 4.5% (5 Year CMT Index + 294 bps) (144A) | 175,250 | |
| 805,000(a)(d) | BNP Paribas SA, 6.625% (5 Year USD Swap Rate + 415 bps) (144A) | 821,100 | |
| 200,000 | BPCE SA, 4.875%, 4/1/26 (144A) | 226,693 | |
| 395,000(a)(d) | Citigroup, Inc., 4.7% (SOFRRATE + 323 bps) | 351,056 | |
| 90,000 | Cooperatieve Rabobank UA, 3.875%, 2/8/22 | 95,011 | |
| 250,000 | Cooperatieve Rabobank UA, 3.95%, 11/9/22 | 264,505 | |
| 574,000(a)(d) | Credit Suisse Group AG, 5.1% (5 Year CMT Index + 329 bps) (144A) | 543,865 | |
| 400,000(a)(d) | Credit Suisse Group AG, 7.125% (5 Year USD Swap Rate + 511 bps) | 412,180 | |
| 250,000 | Credit Suisse Group Funding Guernsey, Ltd., 3.8%, 9/15/22 | 265,617 | |
| 410,000 | Danske Bank AS, 5.375%, 1/12/24 (144A) | 456,257 | |
| 200,000(a)(d) | Danske Bank AS, 6.125% (USD Swap Rate + 390 bps) | 198,000 |
The accompanying notes are an integral part of these financial statements.
16
| Pioneer Bond VCT Portfolio | PIONEER VARIABLE CONTRACTS TRUST |
| Principal | |||
| Amount | |||
| USD ($) | Value | ||
| Banks – (continued) | |||
| 286,000(d) | Goldman Sachs Group, Inc., 3.272% (3 Month USD LIBOR + 120 bps), 9/29/25 | $ 308,216 | |
| 215,000(d) | Goldman Sachs Group, Inc., 4.223% (3 Month USD LIBOR + 130 bps), 5/1/29 | 250,150 | |
| 150,000 | HSBC Bank Plc, 7.65%, 5/1/25 | 176,754 | |
| 424,000 | Intesa Sanpaolo S.p.A., 4.7%, 9/23/49 (144A) | 463,798 | |
| 200,000(a)(d) | Intesa Sanpaolo S.p.A., 7.7% (5 Year USD Swap Rate + 546 bps) (144A) | 199,750 | |
| 626,000(a)(d) | JPMorgan Chase & Co., 4.6% (SOFRRATE + 313 bps) | 558,705 | |
| 591,000(a)(d) | JPMorgan Chase & Co., 5.0% (SOFRRATE + 338 bps) | 565,291 | |
| 400,000 | Lloyds Banking Group Plc, 4.65%, 3/24/26 | 444,853 | |
| 325,000 | Morgan Stanley, 4.1%, 5/22/23 | 351,233 | |
| 600,000 | Nordea Bank Abp, 4.25%, 9/21/22 (144A) | 636,853 | |
| 300,000 | Nordea Bank Abp, 4.875%, 5/13/21 (144A) | 310,107 | |
| 435,000(a)(d) | Royal Bank of Scotland Group Plc, 8.625% (5 Year USD Swap Rate + 760 bps) | 452,291 | |
| 400,000(a)(d) | Societe Generale SA, 7.375% (5 Year USD Swap Rate + 624 bps) (144A) | 403,480 | |
| 400,000 | Sumitomo Mitsui Financial Group, Inc., 3.202%, 9/17/29 | 433,401 | |
| 250,000 | Truist Bank, 2.25%, 3/11/30 | 252,340 | |
| 354,000(a)(d) | Truist Financial Corp., 5.1% (5 Year CMT Index + 435 bps) | 365,540 | |
| 250,000 | UBS AG, 7.625%, 8/17/22 | 278,776 | |
| 400,000(a)(d) | UBS Group AG, 7.0% (5 Year USD Swap Rate + 434 bps) (144A) | 415,500 | |
| 200,000(a)(d) | UBS Group Funding Switzerland AG, 7.125% (5 Year USD Swap Rate + 588 bps) | 203,477 | |
| Total Banks | $ 13,631,810 | ||
| Beverages – 1.1% | |||
| 1,034,000 | Anheuser-Busch InBev Worldwide, Inc., 5.55%, 1/23/49 | $ 1,378,518 | |
| 372,000 | Bacardi, Ltd., 5.3%, 5/15/48 (144A) | 459,451 | |
| 185,000 | Coca-Cola Co., 4.2%, 3/25/50 | 241,588 | |
| Total Beverages | $ 2,079,557 | ||
| Biotechnology – 0.1% | |||
| 200,000 | Biogen, Inc., 3.625%, 9/15/22 | $ 212,491 | |
| Total Biotechnology | $ 212,491 | ||
| Building Materials – 0.7% | |||
| 169,000 | Carrier Global Corp., 2.7%, 2/15/31 (144A) | $ 168,505 | |
| 174,000 | Carrier Global Corp., 2.722%, 2/15/30 (144A) | 174,756 | |
| 400,000 | CRH America, Inc., 3.875%, 5/18/25 (144A) | 441,182 | |
| 110,000 | Fortune Brands Home & Security, Inc., 4.0%, 9/21/23 | 119,997 | |
| 180,000 | Martin Marietta Materials, Inc., 2.5%, 3/15/30 | 181,189 | |
| 125,000 | Standard Industries, Inc., 4.375%, 7/15/30 (144A) | 124,688 | |
| Total Building Materials | $ 1,210,317 | ||
| Chemicals – 0.5% | |||
| 375,000 | Albemarle Wodgina Pty, Ltd., 3.45%, 11/15/29 (144A) | $ 363,107 | |
| 54,000 | CF Industries, Inc., 4.95%, 6/1/43 | 58,201 | |
| 270,000 | CF Industries, Inc., 5.375%, 3/15/44 | 291,951 | |
| 103,000 | NOVA Chemicals Corp., 5.25%, 6/1/27 (144A) | 90,421 | |
| 96,000 | Sherwin-Williams Co., 3.3%, 5/15/50 | 97,363 | |
| Total Chemicals | $ 901,043 |
The accompanying notes are an integral part of these financial statements.
17
| Pioneer Bond VCT Portfolio | PIONEER VARIABLE CONTRACTS TRUST |
| SCHEDULE OF INVESTMENTS 6/30/20 (UNAUDITED) | (continued) |
| Principal | |||
| Amount | |||
| USD ($) | Value | ||
| Commercial Services – 1.1% | |||
| 123,000 | Allied Universal Holdco LLC/Allied Universal Finance Corp., 6.625%, 7/15/26 (144A) | $ 129,150 | |
| 460,000 | CoStar Group, Inc., 2.8%, 7/15/30 (144A) | 470,749 | |
| 200,000 | ERAC USA Finance LLC, 3.3%, 12/1/26 (144A) | 203,097 | |
| 165,000 | Garda World Security Corp., 4.625%, 2/15/27 (144A) | 162,525 | |
| 45,000 | Jaguar Holding Co. II/PPD Development LP, 4.625%, 6/15/25 (144A) | 45,796 | |
| 70,000 | Jaguar Holding Co. II/PPD Development LP, 5.0%, 6/15/28 (144A) | 71,662 | |
| 50,000 | President & Fellows of Harvard College, 2.3%, 10/1/23 | 52,582 | |
| 328,000 | Prime Security Services Borrower LLC/Prime Finance, Inc., 6.25%, 1/15/28 (144A) | 309,140 | |
| 200,000 | Sotheby’s, 7.375%, 10/15/27 (144A) | 189,000 | |
| 125,000 | United Rentals North America, Inc., 3.875%, 11/15/27 | 124,688 | |
| 205,000 | Verisk Analytics, Inc., 3.625%, 5/15/50 | 232,080 | |
| 29,000 | Verisk Analytics, Inc., 5.5%, 6/15/45 | 39,772 | |
| Total Commercial Services | $ 2,030,241 | ||
| Cosmetics/Personal Care – 0.2% | |||
| 120,000 | Edgewell Personal Care Co., 5.5%, 6/1/28 (144A) | $ 123,300 | |
| 150,000 | Estee Lauder Cos, Inc., 2.6%, 4/15/30 | 163,195 | |
| Total Cosmetics/Personal Care | $ 286,495 | ||
| Diversified Financial Services – 1.1% | |||
| 30,000 | Avolon Holdings Funding, Ltd., 3.95%, 7/1/24 (144A) | $ 26,065 | |
| 170,000 | Capital One Financial Corp., 3.3%, 10/30/24 | 182,917 | |
| 400,000 | Capital One Financial Corp., 3.75%, 4/24/24 | 433,416 | |
| 180,000 | Capital One Financial Corp., 4.25%, 4/30/25 | 202,260 | |
| 207,000(a)(d) | Charles Schwab Corp., 5.375% (5 Year CMT Index + 497 bps) | 221,142 | |
| 450,000 | GE Capital Funding LLC, 4.55%, 5/15/32 (144A) | 464,612 | |
| 70,000 | Mastercard, Inc., 3.85%, 3/26/50 | 87,080 | |
| 15,000 | Nationstar Mortgage Holdings, Inc., 6.0%, 1/15/27 (144A) | 14,250 | |
| 91,000 | Nationstar Mortgage Holdings, Inc., 9.125%, 7/15/26 (144A) | 96,175 | |
| 195,000 | Visa, Inc., 2.05%, 4/15/30 | 204,331 | |
| 70,000 | Visa, Inc., 2.7%, 4/15/40 | 74,902 | |
| Total Diversified Financial Services | $ 2,007,150 | ||
| Electric – 3.0% | |||
| 282,025 | Adani Renewable Energy RJ, Ltd./Kodangal Solar Parks Pvt, Ltd./Wardha Solar Maharash, | ||
4.625%, 10/15/39 (144A) | $ 269,334 | ||
| 55,000 | AEP Transmission Co. LLC, 3.65%, 4/1/50 | 63,589 | |
| 100,000 | AES Corp., 3.95%, 7/15/30 (144A) | 105,750 | |
| 185,000 | Berkshire Hathaway Energy Co., 4.25%, 10/15/50 (144A) | 232,968 | |
| 170,000 | Consolidated Edison Co. of New York, Inc., 3.95%, 4/1/50 | 204,633 | |
| 300,000 | Consolidated Edison Co. of New York, Inc., 4.625%, 12/1/54 | 384,153 | |
| 133,000(c) | Dominion Energy, Inc., 3.071%, 8/15/24 | 143,066 | |
| 376,000(a)(d) | Dominion Energy, Inc., 4.65% (5 Year CMT Index + 299 bps) | 368,219 | |
| 135,000 | Iberdrola International BV, 6.75%, 7/15/36 | 187,838 | |
| 200,000 | Indiana Michigan Power Co., 4.55%, 3/15/46 | 253,463 | |
| 12,539 | Kiowa Power Partners LLC, 5.737%, 3/30/21 (144A) | 12,592 | |
| 213,000 | New York State Electric & Gas Corp., 3.3%, 9/15/49 (144A) | 219,433 | |
| 430,000 | NextEra Energy Capital Holdings, Inc., 3.55%, 5/1/27 | 487,429 | |
| 83,000 | NRG Energy, Inc., 5.75%, 1/15/28 | 87,565 | |
| 240,000 | Puget Energy, Inc., 4.1%, 6/15/30 (144A) | 264,967 |
The accompanying notes are an integral part of these financial statements.
18
| Pioneer Bond VCT Portfolio | PIONEER VARIABLE CONTRACTS TRUST |
| Principal | |||
| Amount | |||
| USD ($) | Value | ||
| Electric – (continued) | |||
| 28,571 | San Diego Gas & Electric Co., 1.914%, 2/1/22 | $ 28,699 | |
| 335,000 | Sempra Energy, 3.4%, 2/1/28 | 366,498 | |
| 78,571 | Southern California Edison Co., 1.845%, 2/1/22 | 78,637 | |
| 239,000 | Southern California Edison Co., 3.65%, 2/1/50 | 262,291 | |
| 295,000 | Southern California Edison Co., 4.875%, 3/1/49 | 385,827 | |
| 335,000 | Southwestern Electric Power Co., 3.9%, 4/1/45 | 363,113 | |
| 470,000 | Vistra Operations Co. LLC, 3.7%, 1/30/27 (144A) | 484,020 | |
| 150,000 | Xcel Energy, Inc., 3.4%, 6/1/30 | 172,343 | |
| Total Electric | $ 5,426,427 | ||
| Electronics – 0.6% | |||
| 300,000 | Amphenol Corp., 3.125%, 9/15/21 | $ 307,337 | |
| 102,000 | Amphenol Corp., 3.2%, 4/1/24 | 109,212 | |
| 607,000 | Flex, Ltd., 4.875%, 6/15/29 | 669,873 | |
| Total Electronics | $ 1,086,422 | ||
| Energy-Alternate Sources – 0.1% | |||
| 48,620 | Alta Wind Holdings LLC, 7.0%, 6/30/35 (144A) | $ 58,833 | |
| 87,000 | TerraForm Power Operating LLC, 4.75%, 1/15/30 (144A) | 88,305 | |
| Total Energy-Alternate Sources | $ 147,138 | ||
| Environmental Control – 0.0%† | |||
| 72,000 | Covanta Holding Corp., 6.0%, 1/1/27 | $ 72,907 | |
| Total Environmental Control | $ 72,907 | ||
| Food – 0.6% | |||
| 75,000 | Albertsons Cos., Inc./Safeway, Inc./New Albertsons LP/Albertsons LLC, 4.875%, | ||
2/15/30 (144A) | $ 76,735 | ||
| 500,000 | Hershey Co., 2.65%, 6/1/50 | 507,507 | |
| 204,000 | JBS USA LUX SA/JBS USA Food Co./JBS USA Finance, Inc., 5.5%, 1/15/30 (144A) | 209,100 | |
| 150,000 | Kellogg Co., 2.1%, 6/1/30 | 151,941 | |
| 50,000 | Mondelez International, Inc., 2.75%, 4/13/30 | 53,822 | |
| 100,000 | Smithfield Foods, Inc., 2.65%, 10/3/21 (144A) | 98,896 | |
| Total Food | $ 1,098,001 | ||
| Forest Products & Paper – 0.3% | |||
| 120,000 | International Paper Co., 6.0%, 11/15/41 | $ 158,176 | |
| 234,000 | International Paper Co., 7.3%, 11/15/39 | 328,619 | |
| Total Forest Products & Paper | $ 486,795 | ||
| Gas – 0.2% | |||
| 110,000 | Boston Gas Co., 3.15%, 8/1/27 (144A) | $ 120,022 | |
| 188,223 | Nakilat, Inc., 6.267%, 12/31/33 (144A) | 222,103 | |
| Total Gas | $ 342,125 | ||
| Hand/Machine Tools – 0.1% | |||
| 96,000(d) | Stanley Black & Decker, Inc., 4.0% (5 Year CMT Index + 266 bps), 3/15/60 | $ 96,049 | |
| Total Hand/Machine Tools | $ 96,049 | ||
| Healthcare-Products – 0.8% | |||
| 141,000 | Abbott Laboratories, 3.75%, 11/30/26 | $ 164,050 | |
| 390,000 | Boston Scientific Corp., 2.65%, 6/1/30 | 406,411 |
The accompanying notes are an integral part of these financial statements.
19
| Pioneer Bond VCT Portfolio | PIONEER VARIABLE CONTRACTS TRUST |
| SCHEDULE OF INVESTMENTS 6/30/20 (UNAUDITED) | (continued) |
| Principal | |||
| Amount | |||
| USD ($) | Value | ||
| Healthcare-Products – (continued) | |||
| 425,000 | Edwards Lifesciences Corp., 4.3%, 6/15/28 | $ 506,688 | |
| 380,000 | Thermo Fisher Scientific, Inc., 3.0%, 4/15/23 | 402,669 | |
| Total Healthcare-Products | $ 1,479,818 | ||
| Healthcare-Services – 1.1% | |||
| 235,000 | Anthem, Inc., 3.125%, 5/15/50 | $ 243,103 | |
| 164,000 | Anthem, Inc., 3.65%, 12/1/27 | 186,855 | |
| 41,000 | Anthem, Inc., 4.101%, 3/1/28 | 48,048 | |
| 397,000 | Centene Corp., 3.375%, 2/15/30 | 400,855 | |
| 60,000 | Centene Corp., 4.25%, 12/15/27 | 61,915 | |
| 120,000 | Centene Corp., 4.625%, 12/15/29 | 126,600 | |
| 378,000 | HCA, Inc., 3.5%, 9/1/30 | 364,079 | |
| 176,000 | Health Care Service Corp. A Mutual Legal Reserve Co., 3.2%, 6/1/50 (144A) | 179,080 | |
| 130,000 | Humana, Inc., 3.95%, 3/15/27 | 147,395 | |
| 65,000 | LifePoint Health, Inc., 6.75%, 4/15/25 (144A) | 67,112 | |
| 35,000 | Molina Healthcare, Inc., 4.375%, 6/15/28 (144A) | 34,956 | |
| 130,000 | Tenet Healthcare Corp., 5.125%, 11/1/27 (144A) | 128,271 | |
| Total Healthcare-Services | $ 1,988,269 | ||
| Home Builders – 0.2% | |||
| 280,000 | DR Horton, Inc., 2.5%, 10/15/24 | $ 292,447 | |
| 135,000 | Meritage Homes Corp., 6.0%, 6/1/25 | 143,635 | |
| Total Home Builders | $ 436,082 | ||
| Insurance – 2.5% | |||
| 90,000 | AXA SA, 8.6%, 12/15/30 | $ 130,717 | |
| 592,000 | CNO Financial Group, Inc., 5.25%, 5/30/29 | 634,464 | |
| 100,000(d) | Farmers Exchange Capital III, 5.454% (3 Month USD LIBOR + 345 bps), 10/15/54 (144A) | 115,833 | |
| 340,000(d) | Farmers Insurance Exchange, 4.747% (3 Month USD LIBOR + 323 bps), 11/1/57 (144A) | 343,311 | |
| 175,000 | Great-West Lifeco Finance 2018 LP, 4.581%, 5/17/48 (144A) | 214,611 | |
| 645,000 | Liberty Mutual Insurance Co., 7.697%, 10/15/97 (144A) | 983,742 | |
| 500,000 | MassMutual Global Funding II, 2.75%, 6/22/24 (144A) | 534,827 | |
| 200,000 | Nationwide Financial Services, Inc., 3.9%, 11/30/49 (144A) | 199,206 | |
| 475,000 | Nationwide Mutual Insurance Co., 4.35%, 4/30/50 (144A) | 506,598 | |
| 125,000 | New York Life Insurance Co., 3.75%, 5/15/50 (144A) | 141,166 | |
| 245,000 | New York Life Insurance Co., 4.45%, 5/15/69 (144A) | 299,351 | |
| 451,000 | Prudential Financial, Inc., 3.0%, 3/10/40 | 459,399 | |
| 26,000 | Teachers Insurance & Annuity Association of America, 6.85%, 12/16/39 (144A) | 39,089 | |
| Total Insurance | $ 4,602,314 | ||
| Internet – 0.8% | |||
| 520,000 | Booking Holdings, Inc., 4.625%, 4/13/30 | $ 613,766 | |
| 562,000 | Expedia Group, Inc., 3.25%, 2/15/30 | 523,978 | |
| 225,000 | TD Ameritrade Holding Corp., 3.3%, 4/1/27 | 251,970 | |
| Total Internet | $ 1,389,714 | ||
| Iron & Steel – 0.1% | |||
| 175,000 | Commercial Metals Co., 5.75%, 4/15/26 | $ 179,375 | |
| 60,000 | Steel Dynamics, Inc., 3.25%, 1/15/31 | 61,197 | |
| Total Iron & Steel | $ 240,572 |
The accompanying notes are an integral part of these financial statements.
20
| Pioneer Bond VCT Portfolio | PIONEER VARIABLE CONTRACTS TRUST |
| Principal | |||
| Amount | |||
| USD ($) | Value | ||
| Leisure Time – 0.0%† | |||
| 69,000 | Royal Caribbean Cruises, Ltd., 11.5%, 6/1/25 (144A) | $ 71,998 | |
| Total Leisure Time | $ 71,998 | ||
| Lodging – 0.2% | |||
| 70,000 | Marriott International, Inc., 4.625%, 6/15/30 | $ 72,633 | |
| 40,000 | Marriott International, Inc., 5.75%, 5/1/25 | 43,454 | |
| 220,000 | Sands China, Ltd., 4.375%, 6/18/30 (144A) | 229,119 | |
| Total Lodging | $ 345,206 | ||
| Machinery-Diversified – 0.1% | |||
| 90,000 | Deere & Co., 3.75%, 4/15/50 | $ 110,718 | |
| Total Machinery-Diversified | $ 110,718 | ||
| Media – 0.8% | |||
| 275,000 | CCO Holdings LLC/CCO Holdings Capital Corp., 4.75%, 3/1/30 (144A) | $ 281,377 | |
| 75,000 | Comcast Corp., 3.75%, 4/1/40 | 87,817 | |
| 270,000 | Comcast Corp., 4.15%, 10/15/28 | 323,670 | |
| 190,000 | Diamond Sports Group LLC/Diamond Sports Finance Co., 6.625%, 8/15/27 (144A) | 101,175 | |
| 171,000 | Gray Television, Inc., 7.0%, 5/15/27 (144A) | 175,275 | |
| 85,000 | Walt Disney Co., 3.6%, 1/13/51 | 94,685 | |
| 325,000 | Walt Disney Co., 4.7%, 3/23/50 | 418,979 | |
| Total Media | $ 1,482,978 | ||
| Mining – 0.7% | |||
| 200,000 | Anglo American Capital Plc, 4.5%, 3/15/28 (144A) | $ 219,359 | |
| 200,000 | Anglo American Capital Plc, 4.75%, 4/10/27 (144A) | 222,603 | |
| 200,000 | Anglo American Capital Plc, 4.875%, 5/14/25 (144A) | 222,705 | |
| 462,000 | Freeport-McMoRan, Inc., 5.45%, 3/15/43 | 452,760 | |
| 65,000 | Novelis Corp., 4.75%, 1/30/30 (144A) | 62,075 | |
| Total Mining | $ 1,179,502 | ||
| Miscellaneous Manufacturers – 0.3% | |||
| 125,000 | 3M Co., 3.7%, 4/15/50 | $ 148,894 | |
| 155,000 | General Electric Co., 4.25%, 5/1/40 | 154,237 | |
| 175,000 | General Electric Co., 4.35%, 5/1/50 | 173,076 | |
| Total Miscellaneous Manufacturers | $ 476,207 | ||
| Multi-National – 0.5% | |||
| 370,000 | Africa Finance Corp., 4.375%, 4/17/26 (144A) | $ 389,832 | |
| 200,000 | African Export-Import Bank, 3.994%, 9/21/29 (144A) | 196,800 | |
| 230,000 | Banque Ouest Africaine de Developpement, 4.7%, 10/22/31 (144A) | 231,472 | |
| Total Multi-National | $ 818,104 | ||
| Oil & Gas – 1.3% | |||
| 50,000 | Apache Corp., 4.25%, 1/15/30 | $ 43,223 | |
| 435,000 | Apache Corp., 4.375%, 10/15/28 | 384,131 | |
| 535,000 | Cenovus Energy, Inc., 6.75%, 11/15/39 | 520,910 | |
| 200,000 | CNOOC Nexen Finance 2014 ULC, 4.25%, 4/30/24 | 220,192 | |
| 150,000 | MEG Energy Corp., 7.125%, 2/1/27 (144A) | 124,687 | |
| 145,000 | Newfield Exploration Co., 5.625%, 7/1/24 | 138,555 | |
| 55,000 | PBF Holding Co. LLC/PBF Finance Corp., 9.25%, 5/15/25 (144A) | 58,712 | |
| 185,000 | Petroleos Mexicanos, 5.35%, 2/12/28 | 155,400 |
The accompanying notes are an integral part of these financial statements.
21
| Pioneer Bond VCT Portfolio | PIONEER VARIABLE CONTRACTS TRUST |
| SCHEDULE OF INVESTMENTS 6/30/20 (UNAUDITED) | (continued) |
| Principal | |||
| Amount | |||
| USD ($) | Value | ||
| Oil & Gas – (continued) | |||
| 120,000 | Phillips 66, 2.15%, 12/15/30 | $ 116,485 | |
| 90,000 | Phillips 66, 3.85%, 4/9/25 | 99,757 | |
| 312,000 | Valero Energy Corp., 6.625%, 6/15/37 | 414,905 | |
| Total Oil & Gas | $ 2,276,957 | ||
| Pharmaceuticals – 1.3% | |||
| 211,000 | AbbVie, Inc., 4.05%, 11/21/39 (144A) | $ 246,756 | |
| 200,000 | Bayer US Finance II LLC, 4.25%, 12/15/25 (144A) | 229,622 | |
| 230,000 | Cardinal Health, Inc., 4.9%, 9/15/45 | 265,154 | |
| 25,533 | CVS Pass-Through Trust, 5.298%, 1/11/27 (144A) | 27,442 | |
| 78,822 | CVS Pass-Through Trust, 5.773%, 1/10/33 (144A) | 88,709 | |
| 45,506 | CVS Pass-Through Trust, 5.926%, 1/10/34 (144A) | 50,875 | |
| 124,505 | CVS Pass-Through Trust, 6.036%, 12/10/28 | 140,717 | |
| 106,346 | CVS Pass-Through Trust, 8.353%, 7/10/31 (144A) | 138,714 | |
| 200,000 | Perrigo Finance Unlimited Co., 3.9%, 12/15/24 | 212,686 | |
| 165,000 | Pfizer, Inc., 2.625%, 4/1/30 | 181,767 | |
| 350,000 | Takeda Pharmaceutical Co., Ltd., 2.05%, 3/31/30 | 349,810 | |
| 213,000 | Teva Pharmaceutical Finance Netherlands III BV, 3.15%, 10/1/26 | 190,183 | |
| 200,000 | Teva Pharmaceutical Finance Netherlands III BV, 7.125%, 1/31/25 (144A) | 212,898 | |
| Total Pharmaceuticals | $ 2,335,333 | ||
| Pipelines – 3.9% | |||
| 93,000 | Cameron LNG LLC, 3.302%, 1/15/35 (144A) | $ 102,536 | |
| 210,000 | Cameron LNG LLC, 3.402%, 1/15/38 (144A) | 225,574 | |
| 45,000 | DCP Midstream Operating LP, 3.875%, 3/15/23 | 43,650 | |
| 170,000 | DCP Midstream Operating LP, 5.375%, 7/15/25 | 168,725 | |
| 100,000 | DCP Midstream Operating LP, 5.6%, 4/1/44 | 80,000 | |
| 136,000 | Enable Midstream Partners LP, 4.4%, 3/15/27 | 126,684 | |
| 479,000 | Enable Midstream Partners LP, 4.95%, 5/15/28 | 443,694 | |
| 360,000 | Enbridge, Inc., 3.7%, 7/15/27 | 397,221 | |
| 140,000 | Energy Transfer Operating LP, 6.0%, 6/15/48 | 145,205 | |
| 40,000 | Energy Transfer Operating LP, 6.125%, 12/15/45 | 41,225 | |
| 125,000 | Energy Transfer Operating LP, 6.5%, 2/1/42 | 135,404 | |
| 340,000(a)(d) | Energy Transfer Operating LP, 7.125% (5 Year CMT Index + 531 bps) | 290,700 | |
| 20,000 | EnLink Midstream LLC, 5.375%, 6/1/29 | 15,000 | |
| 280,000 | EnLink Midstream Partners LP, 5.45%, 6/1/47 | 173,544 | |
| 134,000 | EnLink Midstream Partners LP, 5.6%, 4/1/44 | 81,740 | |
| 48,000 | Enterprise Products Operating LLC, 3.95%, 1/31/60 | 49,464 | |
| 145,000 | Hess Midstream Operations LP, 5.125%, 6/15/28 (144A) | 139,551 | |
| 513,000 | Kinder Morgan, Inc., 5.05%, 2/15/46 | 590,280 | |
| 163,000 | Midwest Connector Capital Co. LLC, 4.625%, 4/1/29 (144A) | 175,704 | |
| 340,000 | MPLX LP, 4.25%, 12/1/27 | 368,617 | |
| 110,000 | MPLX LP, 4.875%, 12/1/24 | 122,173 | |
| 175,000 | MPLX LP, 4.875%, 6/1/25 | 195,349 | |
| 205,000 | MPLX LP, 5.5%, 2/15/49 | 227,186 | |
| 450,000 | Phillips 66 Partners LP, 3.75%, 3/1/28 | 480,327 | |
| 375,000 | Sabine Pass Liquefaction LLC, 5.0%, 3/15/27 | 419,585 | |
| 224,000 | Sunoco Logistics Partners Operations LP, 5.35%, 5/15/45 | 219,396 |
The accompanying notes are an integral part of these financial statements.
22
| Pioneer Bond VCT Portfolio | PIONEER VARIABLE CONTRACTS TRUST |
| Principal | |||
| Amount | |||
| USD ($) | Value | ||
| Pipelines – (continued) | |||
| 422,000 | Sunoco Logistics Partners Operations LP, 5.4%, 10/1/47 | $ 422,217 | |
| 25,000 | Sunoco Logistics Partners Operations LP, 6.1%, 2/15/42 | 26,191 | |
| 300,000 | Texas Eastern Transmission LP, 3.5%, 1/15/28 (144A) | 319,239 | |
| 586,000 | Williams Cos., Inc., 5.75%, 6/24/44 | 677,740 | |
| 89,000 | Williams Cos., Inc., 7.75%, 6/15/31 | 114,992 | |
| Total Pipelines | $ 7,018,913 | ||
| Real Estate – 0.1% | |||
| 250,000(a)(d) | AT Securities BV, 5.25% (5 Year USD Swap Rate + 355 bps) | $ 248,960 | |
| Total Real Estate | $ 248,960 | ||
| REITs – 2.2% | |||
| 90,000 | Alexandria Real Estate Equities, Inc., 3.45%, 4/30/25 | $ 100,183 | |
| 25,000 | Alexandria Real Estate Equities, Inc., 3.95%, 1/15/27 | 28,025 | |
| 47,000 | Alexandria Real Estate Equities, Inc., 4.3%, 1/15/26 | 53,494 | |
| 35,000 | Crown Castle International Corp., 4.15%, 7/1/50 | 41,017 | |
| 160,000 | Duke Realty LP, 3.625%, 4/15/23 | 169,959 | |
| 260,000 | Duke Realty LP, 3.75%, 12/1/24 | 285,857 | |
| 100,000 | Essex Portfolio LP, 3.375%, 4/15/26 | 108,483 | |
| 360,000 | Essex Portfolio LP, 3.5%, 4/1/25 | 392,477 | |
| 131,000 | Healthcare Realty Trust, Inc., 2.4%, 3/15/30 | 124,636 | |
| 205,000 | Healthcare Trust of America Holdings LP, 3.5%, 8/1/26 | 221,479 | |
| 200,000 | Healthcare Trust of America Holdings LP, 3.75%, 7/1/27 | 211,038 | |
| 50,000 | Highwoods Realty LP, 3.2%, 6/15/21 | 50,798 | |
| 290,000 | Highwoods Realty LP, 3.625%, 1/15/23 | 300,840 | |
| 105,000 | Highwoods Realty LP, 4.125%, 3/15/28 | 112,302 | |
| 255,000 | iStar, Inc., 4.25%, 8/1/25 | 230,775 | |
| 110,000 | iStar, Inc., 4.75%, 10/1/24 | 102,712 | |
| 318,000 | MPT Operating Partnership LP/MPT Finance Corp., 4.625%, 8/1/29 | 319,590 | |
| 235,000 | SBA Tower Trust, 3.869%, 10/8/24 (144A) | 248,168 | |
| 180,000 | Simon Property Group LP, 3.25%, 9/13/49 | 167,822 | |
| 75,000 | UDR, Inc., 2.95%, 9/1/26 | 79,431 | |
| 201,000 | UDR, Inc., 4.0%, 10/1/25 | 224,188 | |
| 180,000 | UDR, Inc., 4.4%, 1/26/29 | 209,923 | |
| 219,000 | Uniti Group LP/Uniti Fiber Holdings, Inc./CSL Capital LLC, 7.875%, 2/15/25 (144A) | 221,906 | |
| Total REITs | $ 4,005,103 | ||
| Retail – 0.6% | |||
| 125,000 | AutoNation, Inc., 4.75%, 6/1/30 | $ 135,446 | |
| 201,000 | Beacon Roofing Supply, Inc., 4.875%, 11/1/25 (144A) | 179,392 | |
| 75,000 | Dollar General Corp., 4.125%, 4/3/50 | 89,746 | |
| 165,000 | Lowe’s Cos, Inc., 5.125%, 4/15/50 | 225,185 | |
| 80,000 | McDonald’s Corp., 4.2%, 4/1/50 | 96,994 | |
| 35,000 | QVC, Inc., 4.75%, 2/15/27 | 33,845 | |
| 140,000 | Starbucks Corp., 3.35%, 3/12/50 | 142,586 | |
| 100,000 | TJX Cos., Inc., 4.5%, 4/15/50 | 128,502 | |
| Total Retail | $ 1,031,696 |
The accompanying notes are an integral part of these financial statements.
23
| Pioneer Bond VCT Portfolio | PIONEER VARIABLE CONTRACTS TRUST |
| SCHEDULE OF INVESTMENTS 6/30/20 (UNAUDITED) | (continued) |
| Principal | |||
| Amount | |||
| USD ($) | Value | ||
| Semiconductors – 0.8% | |||
| 158,000 | Broadcom, Inc., 4.11%, 9/15/28 (144A) | $ 172,145 | |
| 116,000 | Broadcom, Inc., 4.25%, 4/15/26 (144A) | 129,097 | |
| 100,000 | Broadcom, Inc., 4.3%, 11/15/32 (144A) | 109,718 | |
| 475,000 | Broadcom, Inc., 5.0%, 4/15/30 (144A) | 545,952 | |
| 210,000 | Intel Corp., 4.95%, 3/25/60 | 308,471 | |
| 85,000 | NVIDIA Corp., 3.5%, 4/1/40 | 99,143 | |
| 70,000 | NVIDIA Corp., 3.5%, 4/1/50 | 79,979 | |
| 70,000 | NVIDIA Corp., 3.7%, 4/1/60 | 83,114 | |
| Total Semiconductors | $ 1,527,619 | ||
| Software – 0.7% | |||
| 470,000 | Citrix Systems, Inc., 3.3%, 3/1/30 | $ 502,426 | |
| 194,000 | Fiserv, Inc., 3.8%, 10/1/23 | 211,965 | |
| 295,000 | Infor, Inc., 1.75%, 7/15/25 (144A) | 296,232 | |
| 220,000 | Oracle Corp., 3.85%, 4/1/60 | 257,504 | |
| Total Software | $ 1,268,127 | ||
| Telecommunications – 1.0% | |||
| 255,000 | Altice France SA, 5.5%, 1/15/28 (144A) | $ 257,550 | |
| 440,000 | AT&T, Inc., 3.65%, 6/1/51 | 460,689 | |
| 350,000 | AT&T, Inc., 3.85%, 6/1/60 | 373,231 | |
| 40,000 | CenturyLink, Inc., 4.0%, 2/15/27 (144A) | 38,850 | |
| 182,000 | CommScope Technologies LLC, 5.0%, 3/15/27 (144A) | 163,927 | |
| 95,000 | Level 3 Financing, Inc., 4.625%, 9/15/27 (144A) | 95,712 | |
| 195,000 | T-Mobile USA, Inc., 3.875%, 4/15/30 (144A) | 217,027 | |
| 95,000 | T-Mobile USA, Inc., 4.5%, 4/15/50 (144A) | 113,072 | |
| Total Telecommunications | $ 1,720,058 | ||
| Transportation – 0.7% | |||
| 109,000 | Canadian Pacific Railway Co., 2.05%, 3/5/30 | $ 111,558 | |
| 575,000 | Union Pacific Corp., 3.375%, 2/1/35 | 647,115 | |
| 359,000 | Union Pacific Corp., 3.75%, 2/5/70 | 399,893 | |
| 90,000 | United Parcel Service, Inc., 5.3%, 4/1/50 | 129,520 | |
| Total Transportation | $ 1,288,086 | ||
| Trucking & Leasing – 0.4% | |||
| 221,000 | Penske Truck Leasing Co. LP/PTL Finance Corp., 2.7%, 3/14/23 (144A) | $ 226,183 | |
| 95,000 | Penske Truck Leasing Co. LP/PTL Finance Corp., 3.35%, 11/1/29 (144A) | 96,836 | |
| 170,000 | Penske Truck Leasing Co. LP/PTL Finance Corp., 3.375%, 2/1/22 (144A) | 174,391 | |
| 156,000 | Penske Truck Leasing Co. LP/PTL Finance Corp., 4.2%, 4/1/27 (144A) | 168,337 | |
| Total Trucking & Leasing | $ 665,747 | ||
| Water – 0.1% | |||
| 110,000 | Essential Utilities, Inc., 3.351%, 4/15/50 | $ 114,672 | |
| 110,000 | Essential Utilities, Inc., 3.566%, 5/1/29 | 122,128 | |
| Total Water | $ 236,800 | ||
| TOTAL CORPORATE BONDS | |||
(Cost $73,843,832) | $ 77,668,261 |
The accompanying notes are an integral part of these financial statements.
24
| Pioneer Bond VCT Portfolio | PIONEER VARIABLE CONTRACTS TRUST |
| Principal | |||
| Amount | |||
| USD ($) | Value | ||
| FOREIGN GOVERNMENT BOND – 0.3% of Net Assets | |||
Mexico – 0.3% | |||
| 475,000 | Mexico Government International Bond, 4.6%, 2/10/48 | $ 492,812 | |
| Total Mexico | $ 492,812 | ||
| TOTAL FOREIGN GOVERNMENT BOND | |||
(Cost $437,965) | $ 492,812 |
| Face | |||
| Amount | |||
| USD ($) | |||
| INSURANCE-LINKED SECURITIES – 0.0%† of Net Assets(f) | |||
| Reinsurance Sidecars – 0.0%† | |||
| Multiperil – Worldwide – 0.0%† | |||
| 50,000+(g)(h) | Lorenz Re 2018, 7/1/21 | $ 2,185 | |
| 25,723+(g)(h) | Lorenz Re 2019, 6/30/22 | 20,329 | |
| Total Reinsurance Sidecars | $ 22,514 | ||
| TOTAL INSURANCE-LINKED SECURITIES | |||
(Cost $39,391) | $ 22,514 |
| Principal | |||
| Amount | |||
| USD ($) | |||
| MUNICIPAL BONDS – 0.0%† of Net Assets(i) | |||
| Municipal General – 0.0%† | |||
| 50,000 | Virginia Commonwealth Transportation Board, Transportation Capital Projects, 4.0%, 5/15/32 | $ 54,447 | |
| Total Municipal General | $ 54,447 | ||
| Municipal Higher Education – 0.0%† | |||
| 10,000 | Trustees of Amherst College, 3.794%, 11/1/42 | $ 11,313 | |
| Total Municipal Higher Education | $ 11,313 | ||
| TOTAL MUNICIPAL BONDS | |||
(Cost $62,530) | $ 65,760 | ||
| SENIOR SECURED FLOATING RATE LOAN INTERESTS – 1.5% | |||
| of Net Assets*(b) | |||
| Automobile – 0.1% | |||
| 70,049 | American Axle & Manufacturing, Inc., Tranche B Term Loan, 3.0% (LIBOR + 225 bps), 4/6/24 | $ 66,722 | |
| 25,073 | CWGS Group LLC (aka Camping World, Inc.), Term Loan, 1.373% (LIBOR + 275 bps), 11/8/23 | 22,997 | |
| 68,333 | Goodyear Tire & Rubber Co., Second Lien Term Loan, 0.2% (LIBOR + 200 bps), 3/3/25 | 65,848 | |
| Total Automobile | $ 155,567 | ||
| Automotive – 0.0%† | |||
| 75,096 | TI Group Automotive Systems LLC, Initial US Term Loan, 0.75% (LIBOR + 250 bps), 6/30/22 | $ 72,655 | |
| Total Automotive | $ 72,655 | ||
| Beverage, Food & Tobacco – 0.1% | |||
| 175,494 | JBS USA Lux SA (fka JBS USA LLC), New Term Loan, 1.072% (LIBOR + 200 bps), 5/1/26 | $ 168,523 | |
| Total Beverage, Food & Tobacco | $ 168,523 | ||
| Broadcasting & Entertainment – 0.1% | |||
| 117,266 | Sinclair Television Group, Inc., Tranche B Term Loan, 0.18% (LIBOR + 225 bps), 1/3/24 | $ 112,380 | |
| Total Broadcasting & Entertainment | $ 112,380 |
The accompanying notes are an integral part of these financial statements.
25
| Pioneer Bond VCT Portfolio | PIONEER VARIABLE CONTRACTS TRUST |
| SCHEDULE OF INVESTMENTS 6/30/20 (UNAUDITED) | (continued) |
| Principal | |||
| Amount | |||
| USD ($) | Value | ||
| Computers & Electronics – 0.0%† | |||
| 51,125 | Energy Acquisition LP (aka Electrical Components International), First Lien Initial | ||
| Term Loan, 0.178% (LIBOR + 425 bps), 6/26/25 | $ 40,900 | ||
| Total Computers & Electronics | $ 40,900 | ||
Diversified & Conglomerate Service – 0.2% | |||
| 96,002 | Bright Horizons Family Solutions LLC (fka Bright Horizons Family Solutions, Inc.), | ||
Term B Loan, 2.5% (LIBOR + 175/PRIME + 75 + 175 bps), 11/7/23 | $ 93,762 | ||
| 96,750 | Team Health Holdings, Inc., Initial Term Loan, 1.0% (LIBOR + 275 bps), 2/6/24 | 75,126 | |
| 183,750 | West Corp., Incremental Term B-1 Loan, 1.0% (LIBOR + 350 bps), 10/10/24 | 158,178 | |
| Total Diversified & Conglomerate Service | $ 327,066 | ||
| Electric & Electrical – 0.0%† | |||
| 40,832 | Rackspace Hosting, Inc., First Lien Term B Loan, 1.0% (LIBOR + 300 bps), 11/3/23 | $ 38,872 | |
| Total Electric & Electrical | $ 38,872 | ||
| Electronics – 0.1% | |||
| 172,598 | Scientific Games International, Inc., Initial Term B-5 Loan, 3.476% (LIBOR + | ||
275 bps), 8/14/24 | $ 153,008 | ||
| 68,785 | Verint Systems, Inc., Refinancing Term Loan, 0.173% (LIBOR + 200 bps), 6/28/24 | 66,893 | |
| Total Electronics | $ 219,901 | ||
| Environmental Services – 0.1% | |||
| 196,391 | GFL Environmental, Inc., Effective Date Incremental Term Loan, 4.0% (LIBOR + | ||
300 bps), 5/30/25 | $ 191,399 | ||
| Total Environmental Services | $ 191,399 | ||
| Healthcare & Pharmaceuticals – 0.1% | |||
| 121,563 | Alphabet Holding Co., Inc. (aka Nature’s Bounty), First Lien Initial Term Loan, | ||
0.178% (LIBOR + 350 bps), 9/26/24 | $ 114,603 | ||
| 171,033 | Endo Luxembourg Finance Co. I S.a.r.l., Initial Term Loan, 0.75% (LIBOR + 425 bps), 4/29/24 | 161,156 | |
| Total Healthcare & Pharmaceuticals | $ 275,759 | ||
| Healthcare, Education & Childcare – 0.1% | |||
| 216,278 | KUEHG Corp. (fka KC MergerSub, Inc.) (aka KinderCare), Term B-3 Loan, 4.75% (LIBOR + | ||
375 bps), 2/21/25 | $ 185,675 | ||
| Total Healthcare, Education & Childcare | $ 185,675 | ||
| Hotel, Gaming & Leisure – 0.1% | |||
| 153,269 | 1011778 B.C. Unlimited Liability Co. (New Red Finance, Inc.) (aka Burger King/Tim | ||
Hortons), Term B-4 Loan, 0.178% (LIBOR + 175 bps), 11/19/26 | $ 145,720 | ||
| Total Hotel, Gaming & Leisure | $ 145,720 | ||
| Insurance – 0.1% | |||
| 132,082 | Asurion LLC (fka Asurion Corp.), New Term B7 Loan, 3.989% (LIBOR + 300 bps), 11/3/24 | $ 127,914 | |
| 90,962 | Confie Seguros Holding II Co., Term B Loan, 6.363% (LIBOR + 475 bps), 4/19/22 | 81,790 | |
| Total Insurance | $ 209,704 | ||
| Leasing – 0.2% | |||
| 52,217 | Avolon TLB Borrower 1 (US) LLC, Term B-3 Loan, 0.75% (LIBOR + 175 bps), 1/15/25 | $ 48,787 | |
| 63,029 | Avolon TLB Borrower 1 (US) LLC, Term B-4 Loan, 0.75% (LIBOR + 150 bps), 2/12/27 | 57,593 | |
| 185,725 | IBC Capital I, Ltd. (aka Goodpack, Ltd.), First Lien Tranche B-1 Term Loan, 0.308% | ||
(LIBOR + 375 bps), 9/11/23 | 178,064 | ||
| Total Leasing | $ 284,444 |
The accompanying notes are an integral part of these financial statements.
26
| Pioneer Bond VCT Portfolio | PIONEER VARIABLE CONTRACTS TRUST |
| Principal | |||
| Amount | |||
| USD ($) | Value | ||
| Securities & Trusts – 0.1% | |||
| 120,628 | Stonepeak Lonestar Holdings LLC, Initial Term Loan, 1.135% (LIBOR + 450 bps), 10/19/26 | $ 117,964 | |
| Total Securities & Trusts | $ 117,964 | ||
| Telecommunications – 0.1% | |||
| 99,500 | CenturyLink, Inc., Term B Loan, 0.178% (LIBOR + 225 bps), 3/15/27 | $ 94,106 | |
| 72,869 | Go Daddy Operating Co. LLC (GD Finance Co., Inc.), Tranche B-2 Term Loan, 1.928% | ||
(LIBOR + 175 bps), 2/15/24 | 70,409 | ||
| 67,466 | Level 3 Financing, Inc., Tranche B 2027 Term Loan, 0.233% (LIBOR + 175 bps), 3/1/27 | 63,924 | |
| Total Telecommunications | $ 228,439 | ||
| Utilities – 0.0%† | |||
| 27,089 | Eastern Power LLC (Eastern Covert Midco LLC) (aka TPF II LC LLC), Term Loan, 4.75% | ||
(LIBOR + 375 bps), 10/2/25 | $ 26,351 | ||
| Total Utilities | $ 26,351 | ||
| TOTAL SENIOR SECURED FLOATING RATE LOAN INTERESTS | |||
(Cost $3,009,001) | $ 2,801,319 | ||
U.S. GOVERNMENT AND AGENCY OBLIGATIONS – 23.5% of Net Assets | |||
| 1,000,000 | Fannie Mae, 2.0%, 7/1/35 (TBA) | $ 1,034,531 | |
| 1,000,000 | Fannie Mae, 2.0%, 7/1/50 (TBA) | 1,023,360 | |
| 1,600,000 | Fannie Mae, 2.5%, 7/1/50 (TBA) | 1,668,000 | |
| 18,136 | Fannie Mae, 2.5%, 7/1/30 | 19,281 | |
| 18,579 | Fannie Mae, 2.5%, 7/1/30 | 19,718 | |
| 32,688 | Fannie Mae, 2.5%, 7/1/30 | 34,749 | |
| 13,464 | Fannie Mae, 2.5%, 2/1/43 | 14,260 | |
| 57,523 | Fannie Mae, 2.5%, 2/1/43 | 60,924 | |
| 12,583 | Fannie Mae, 2.5%, 3/1/43 | 13,327 | |
| 11,844 | Fannie Mae, 2.5%, 8/1/43 | 12,544 | |
| 12,188 | Fannie Mae, 2.5%, 4/1/45 | 12,909 | |
| 12,685 | Fannie Mae, 2.5%, 4/1/45 | 13,428 | |
| 18,527 | Fannie Mae, 2.5%, 4/1/45 | 19,615 | |
| 28,916 | Fannie Mae, 2.5%, 4/1/45 | 30,626 | |
| 32,515 | Fannie Mae, 2.5%, 4/1/45 | 34,438 | |
| 43,410 | Fannie Mae, 2.5%, 4/1/45 | 45,971 | |
| 59,999 | Fannie Mae, 2.5%, 4/1/45 | 63,548 | |
| 57,295 | Fannie Mae, 2.5%, 8/1/45 | 60,684 | |
| 15,611 | Fannie Mae, 3.0%, 3/1/29 | 16,497 | |
| 61,082 | Fannie Mae, 3.0%, 10/1/30 | 64,918 | |
| 32,802 | Fannie Mae, 3.0%, 8/1/42 | 35,673 | |
| 286,231 | Fannie Mae, 3.0%, 8/1/42 | 308,482 | |
| 73,201 | Fannie Mae, 3.0%, 9/1/42 | 79,149 | |
| 139,250 | Fannie Mae, 3.0%, 11/1/42 | 150,565 | |
| 22,080 | Fannie Mae, 3.0%, 12/1/42 | 23,969 | |
| 62,258 | Fannie Mae, 3.0%, 12/1/42 | 66,716 | |
| 48,737 | Fannie Mae, 3.0%, 2/1/43 | 52,909 | |
| 56,980 | Fannie Mae, 3.0%, 2/1/43 | 61,857 | |
| 58,554 | Fannie Mae, 3.0%, 3/1/43 | 63,566 | |
| 70,934 | Fannie Mae, 3.0%, 4/1/43 | 76,017 | |
| 12,134 | Fannie Mae, 3.0%, 5/1/43 | 13,173 | |
| 15,804 | Fannie Mae, 3.0%, 5/1/43 | 16,931 |
The accompanying notes are an integral part of these financial statements.
27
| Pioneer Bond VCT Portfolio | PIONEER VARIABLE CONTRACTS TRUST |
| SCHEDULE OF INVESTMENTS 6/30/20 (UNAUDITED) | (continued) |
| Principal | |||
| Amount | |||
| USD ($) | Value | ||
| U.S. GOVERNMENT AND AGENCY OBLIGATIONS – (continued) | |||
| 57,250 | Fannie Mae, 3.0%, 5/1/43 | $ 62,265 | |
| 190,363 | Fannie Mae, 3.0%, 5/1/43 | 203,929 | |
| 32,467 | Fannie Mae, 3.0%, 8/1/43 | 34,785 | |
| 28,448 | Fannie Mae, 3.0%, 9/1/43 | 30,487 | |
| 25,698 | Fannie Mae, 3.0%, 3/1/45 | 27,777 | |
| 29,864 | Fannie Mae, 3.0%, 4/1/45 | 32,279 | |
| 152,271 | Fannie Mae, 3.0%, 6/1/45 | 165,537 | |
| 15,642 | Fannie Mae, 3.0%, 5/1/46 | 16,975 | |
| 77,149 | Fannie Mae, 3.0%, 5/1/46 | 84,114 | |
| 214,850 | Fannie Mae, 3.0%, 1/1/47 | 234,247 | |
| 277,000 | Fannie Mae, 3.0%, 7/1/50 (TBA) | 291,737 | |
| 20,758 | Fannie Mae, 3.5%, 11/1/40 | 22,452 | |
| 8,917 | Fannie Mae, 3.5%, 10/1/41 | 9,842 | |
| 109,624 | Fannie Mae, 3.5%, 6/1/42 | 119,877 | |
| 59,424 | Fannie Mae, 3.5%, 7/1/42 | 64,327 | |
| 40,814 | Fannie Mae, 3.5%, 8/1/42 | 44,631 | |
| 60,363 | Fannie Mae, 3.5%, 8/1/42 | 65,344 | |
| 125,187 | Fannie Mae, 3.5%, 5/1/44 | 135,827 | |
| 55,586 | Fannie Mae, 3.5%, 12/1/44 | 60,423 | |
| 145,439 | Fannie Mae, 3.5%, 2/1/45 | 159,375 | |
| 235,857 | Fannie Mae, 3.5%, 2/1/45 | 260,179 | |
| 155,138 | Fannie Mae, 3.5%, 6/1/45 | 166,793 | |
| 174,229 | Fannie Mae, 3.5%, 8/1/45 | 193,417 | |
| 43,731 | Fannie Mae, 3.5%, 9/1/45 | 48,241 | |
| 94,750 | Fannie Mae, 3.5%, 9/1/45 | 100,744 | |
| 168,651 | Fannie Mae, 3.5%, 9/1/45 | 182,092 | |
| 239,942 | Fannie Mae, 3.5%, 11/1/45 | 266,367 | |
| 48,850 | Fannie Mae, 3.5%, 5/1/46 | 53,403 | |
| 14,367 | Fannie Mae, 3.5%, 10/1/46 | 15,431 | |
| 57,662 | Fannie Mae, 3.5%, 1/1/47 | 61,168 | |
| 174,131 | Fannie Mae, 3.5%, 1/1/47 | 190,254 | |
| 280,433 | Fannie Mae, 3.5%, 1/1/47 | 301,390 | |
| 269,702 | Fannie Mae, 3.5%, 2/1/47 | 286,134 | |
| 218,390 | Fannie Mae, 3.5%, 12/1/47 | 231,526 | |
| 199,210 | Fannie Mae, 3.5%, 9/1/49 | 220,967 | |
| 166,479 | Fannie Mae, 4.0%, 10/1/40 | 187,745 | |
| 21,523 | Fannie Mae, 4.0%, 12/1/40 | 24,259 | |
| 4,372 | Fannie Mae, 4.0%, 11/1/41 | 4,785 | |
| 5,962 | Fannie Mae, 4.0%, 12/1/41 | 6,548 | |
| 3,402 | Fannie Mae, 4.0%, 1/1/42 | 3,735 | |
| 44,613 | Fannie Mae, 4.0%, 1/1/42 | 49,008 | |
| 164,936 | Fannie Mae, 4.0%, 1/1/42 | 181,146 | |
| 44,982 | Fannie Mae, 4.0%, 2/1/42 | 49,409 | |
| 42,020 | Fannie Mae, 4.0%, 4/1/42 | 45,916 | |
| 110,129 | Fannie Mae, 4.0%, 5/1/42 | 120,197 | |
| 114,982 | Fannie Mae, 4.0%, 7/1/42 | 125,866 | |
| 323,228 | Fannie Mae, 4.0%, 8/1/42 | 354,854 | |
| 92,587 | Fannie Mae, 4.0%, 8/1/43 | 100,895 |
The accompanying notes are an integral part of these financial statements.
28
| Pioneer Bond VCT Portfolio | PIONEER VARIABLE CONTRACTS TRUST |
| Principal | |||
| Amount | |||
| USD ($) | Value | ||
| U.S. GOVERNMENT AND AGENCY OBLIGATIONS – (continued) | |||
| 151,457 | Fannie Mae, 4.0%, 8/1/43 | $ 165,703 | |
| 96,912 | Fannie Mae, 4.0%, 9/1/43 | 106,290 | |
| 100,053 | Fannie Mae, 4.0%, 9/1/43 | 109,785 | |
| 85,259 | Fannie Mae, 4.0%, 11/1/43 | 94,992 | |
| 172,244 | Fannie Mae, 4.0%, 12/1/43 | 188,871 | |
| 21,377 | Fannie Mae, 4.0%, 4/1/46 | 22,876 | |
| 94,936 | Fannie Mae, 4.0%, 6/1/46 | 102,045 | |
| 96,755 | Fannie Mae, 4.0%, 7/1/46 | 103,661 | |
| 165,309 | Fannie Mae, 4.0%, 7/1/46 | 177,614 | |
| 94,670 | Fannie Mae, 4.0%, 8/1/46 | 101,670 | |
| 34,987 | Fannie Mae, 4.0%, 11/1/46 | 37,391 | |
| 39,771 | Fannie Mae, 4.0%, 11/1/46 | 42,545 | |
| 417,563 | Fannie Mae, 4.0%, 1/1/47 | 446,025 | |
| 69,543 | Fannie Mae, 4.0%, 4/1/47 | 74,151 | |
| 88,380 | Fannie Mae, 4.0%, 4/1/47 | 95,955 | |
| 119,211 | Fannie Mae, 4.0%, 4/1/47 | 129,292 | |
| 19,429 | Fannie Mae, 4.0%, 6/1/47 | 21,095 | |
| 42,301 | Fannie Mae, 4.0%, 6/1/47 | 45,662 | |
| 83,404 | Fannie Mae, 4.0%, 6/1/47 | 89,464 | |
| 91,857 | Fannie Mae, 4.0%, 6/1/47 | 97,956 | |
| 207,040 | Fannie Mae, 4.0%, 6/1/47 | 221,110 | |
| 65,343 | Fannie Mae, 4.0%, 7/1/47 | 69,524 | |
| 76,329 | Fannie Mae, 4.0%, 7/1/47 | 82,893 | |
| 63,732 | Fannie Mae, 4.0%, 8/1/47 | 68,209 | |
| 111,057 | Fannie Mae, 4.0%, 8/1/47 | 118,382 | |
| 170,908 | Fannie Mae, 4.0%, 12/1/47 | 182,036 | |
| 167,222 | Fannie Mae, 4.5%, 8/1/40 | 185,976 | |
| 29,260 | Fannie Mae, 4.5%, 11/1/40 | 32,558 | |
| 3,511 | Fannie Mae, 4.5%, 4/1/41 | 3,906 | |
| 82,445 | Fannie Mae, 4.5%, 5/1/41 | 93,048 | |
| 201,258 | Fannie Mae, 4.5%, 5/1/41 | 223,888 | |
| 230,845 | Fannie Mae, 4.5%, 5/1/41 | 256,948 | |
| 17,081 | Fannie Mae, 4.5%, 12/1/41 | 18,439 | |
| 48,727 | Fannie Mae, 4.5%, 11/1/43 | 54,214 | |
| 61,208 | Fannie Mae, 4.5%, 2/1/44 | 67,993 | |
| 69,320 | Fannie Mae, 4.5%, 2/1/44 | 76,946 | |
| 496,541 | Fannie Mae, 4.5%, 6/1/44 | 552,601 | |
| 151,377 | Fannie Mae, 4.5%, 8/1/44 | 166,326 | |
| 110,439 | Fannie Mae, 4.5%, 5/1/46 | 120,003 | |
| 58,112 | Fannie Mae, 4.5%, 2/1/47 | 62,759 | |
| 600,000 | Fannie Mae, 4.5%, 7/1/50 (TBA) | 644,672 | |
| 345 | Fannie Mae, 5.0%, 10/1/20 | 363 | |
| 60,596 | Fannie Mae, 5.0%, 5/1/31 | 67,944 | |
| 4,891 | Fannie Mae, 5.0%, 6/1/40 | 5,613 | |
| 2,859 | Fannie Mae, 5.0%, 7/1/40 | 3,281 | |
| 5,232 | Fannie Mae, 5.5%, 9/1/33 | 5,897 | |
| 5,866 | Fannie Mae, 5.5%, 12/1/34 | 6,688 | |
| 18,898 | Fannie Mae, 5.5%, 10/1/35 | 21,711 |
The accompanying notes are an integral part of these financial statements.
29
| Pioneer Bond VCT Portfolio | PIONEER VARIABLE CONTRACTS TRUST |
| SCHEDULE OF INVESTMENTS 6/30/20 (UNAUDITED) | (continued) |
| Principal | |||
| Amount | |||
| USD ($) | Value | ||
| U.S. GOVERNMENT AND AGENCY OBLIGATIONS – (continued) | |||
| 3,755 | Fannie Mae, 6.0%, 9/1/29 | $ 4,246 | |
| 901 | Fannie Mae, 6.0%, 10/1/32 | 1,005 | |
| 2,489 | Fannie Mae, 6.0%, 11/1/32 | 2,770 | |
| 12,892 | Fannie Mae, 6.0%, 11/1/32 | 14,357 | |
| 7,970 | Fannie Mae, 6.0%, 4/1/33 | 8,991 | |
| 4,140 | Fannie Mae, 6.0%, 5/1/33 | 4,615 | |
| 9,095 | Fannie Mae, 6.0%, 6/1/33 | 10,115 | |
| 14,190 | Fannie Mae, 6.0%, 7/1/34 | 16,153 | |
| 1,679 | Fannie Mae, 6.0%, 9/1/34 | 1,880 | |
| 1,716 | Fannie Mae, 6.0%, 7/1/38 | 1,929 | |
| 196 | Fannie Mae, 6.5%, 7/1/21 | 218 | |
| 818 | Fannie Mae, 6.5%, 4/1/29 | 910 | |
| 1,953 | Fannie Mae, 6.5%, 1/1/32 | 2,208 | |
| 1,205 | Fannie Mae, 6.5%, 2/1/32 | 1,375 | |
| 2,208 | Fannie Mae, 6.5%, 3/1/32 | 2,513 | |
| 2,750 | Fannie Mae, 6.5%, 4/1/32 | 3,059 | |
| 1,163 | Fannie Mae, 6.5%, 8/1/32 | 1,338 | |
| 2,277 | Fannie Mae, 6.5%, 8/1/32 | 2,599 | |
| 18,942 | Fannie Mae, 6.5%, 7/1/34 | 22,021 | |
| 657 | Fannie Mae, 7.0%, 11/1/29 | 659 | |
| 1,041 | Fannie Mae, 7.0%, 9/1/30 | 1,045 | |
| 367 | Fannie Mae, 7.0%, 7/1/31 | 377 | |
| 1,693 | Fannie Mae, 7.0%, 1/1/32 | 2,015 | |
| 533 | Fannie Mae, 7.5%, 2/1/31 | 638 | |
| 3,092 | Fannie Mae, 8.0%, 10/1/30 | 3,735 | |
| 39,184 | Federal Home Loan Mortgage Corp., 3.0%, 10/1/29 | 41,259 | |
| 18,032 | Federal Home Loan Mortgage Corp., 3.0%, 9/1/42 | 19,616 | |
| 22,713 | Federal Home Loan Mortgage Corp., 3.0%, 9/1/42 | 24,565 | |
| 138,517 | Federal Home Loan Mortgage Corp., 3.0%, 11/1/42 | 149,817 | |
| 31,603 | Federal Home Loan Mortgage Corp., 3.0%, 1/1/43 | 34,382 | |
| 51,022 | Federal Home Loan Mortgage Corp., 3.0%, 2/1/43 | 55,508 | |
| 73,441 | Federal Home Loan Mortgage Corp., 3.0%, 2/1/43 | 79,898 | |
| 47,049 | Federal Home Loan Mortgage Corp., 3.0%, 4/1/43 | 50,890 | |
| 136,862 | Federal Home Loan Mortgage Corp., 3.0%, 4/1/43 | 148,896 | |
| 49,339 | Federal Home Loan Mortgage Corp., 3.0%, 5/1/43 | 53,368 | |
| 27,328 | Federal Home Loan Mortgage Corp., 3.0%, 5/1/45 | 29,218 | |
| 107,149 | Federal Home Loan Mortgage Corp., 3.0%, 6/1/46 | 115,859 | |
| 33,664 | Federal Home Loan Mortgage Corp., 3.0%, 12/1/46 | 36,400 | |
| 55,613 | Federal Home Loan Mortgage Corp., 3.0%, 12/1/46 | 58,880 | |
| 26,667 | Federal Home Loan Mortgage Corp., 3.5%, 11/1/28 | 28,554 | |
| 45,513 | Federal Home Loan Mortgage Corp., 3.5%, 7/1/29 | 48,160 | |
| 14,804 | Federal Home Loan Mortgage Corp., 3.5%, 10/1/40 | 15,825 | |
| 44,097 | Federal Home Loan Mortgage Corp., 3.5%, 5/1/42 | 47,724 | |
| 33,019 | Federal Home Loan Mortgage Corp., 3.5%, 10/1/42 | 35,917 | |
| 40,053 | Federal Home Loan Mortgage Corp., 3.5%, 10/1/42 | 43,813 | |
| 182,589 | Federal Home Loan Mortgage Corp., 3.5%, 6/1/45 | 199,647 | |
| 156,198 | Federal Home Loan Mortgage Corp., 3.5%, 10/1/45 | 170,792 | |
| 293,340 | Federal Home Loan Mortgage Corp., 3.5%, 11/1/45 | 314,279 |
The accompanying notes are an integral part of these financial statements.
30
| Pioneer Bond VCT Portfolio | PIONEER VARIABLE CONTRACTS TRUST |
| Principal | |||
| Amount | |||
| USD ($) | Value | ||
| U.S. GOVERNMENT AND AGENCY OBLIGATIONS – (continued) | |||
| 165,739 | Federal Home Loan Mortgage Corp., 3.5%, 7/1/46 | $ 182,910 | |
| 236,069 | Federal Home Loan Mortgage Corp., 3.5%, 8/1/46 | 257,865 | |
| 296,360 | Federal Home Loan Mortgage Corp., 3.5%, 8/1/46 | 321,914 | |
| 290,033 | Federal Home Loan Mortgage Corp., 3.5%, 12/1/46 | 317,167 | |
| 18,117 | Federal Home Loan Mortgage Corp., 3.5%, 6/1/47 | 19,687 | |
| 180,129 | Federal Home Loan Mortgage Corp., 3.5%, 1/1/48 | 191,075 | |
| 152,835 | Federal Home Loan Mortgage Corp., 4.0%, 11/1/41 | 172,461 | |
| 119,275 | Federal Home Loan Mortgage Corp., 4.0%, 10/1/42 | 130,574 | |
| 25,233 | Federal Home Loan Mortgage Corp., 4.0%, 10/1/43 | 27,596 | |
| 17,985 | Federal Home Loan Mortgage Corp., 4.0%, 5/1/46 | 19,405 | |
| 79,813 | Federal Home Loan Mortgage Corp., 4.0%, 6/1/46 | 85,983 | |
| 122,873 | Federal Home Loan Mortgage Corp., 4.0%, 7/1/46 | 132,441 | |
| 100,329 | Federal Home Loan Mortgage Corp., 4.0%, 8/1/46 | 108,029 | |
| 35,145 | Federal Home Loan Mortgage Corp., 4.0%, 3/1/47 | 37,777 | |
| 56,558 | Federal Home Loan Mortgage Corp., 4.0%, 4/1/47 | 61,411 | |
| 74,604 | Federal Home Loan Mortgage Corp., 4.0%, 4/1/47 | 80,226 | |
| 180,889 | Federal Home Loan Mortgage Corp., 4.0%, 4/1/47 | 196,379 | |
| 458,730 | Federal Home Loan Mortgage Corp., 4.5%, 7/1/49 | 492,701 | |
| 517,963 | Federal Home Loan Mortgage Corp., 4.5%, 8/1/49 | 556,388 | |
| 463 | Federal Home Loan Mortgage Corp., 5.0%, 12/1/21 | 487 | |
| 3,302 | Federal Home Loan Mortgage Corp., 5.0%, 9/1/38 | 3,785 | |
| 3,659 | Federal Home Loan Mortgage Corp., 5.0%, 10/1/38 | 4,194 | |
| 6,240 | Federal Home Loan Mortgage Corp., 5.0%, 5/1/39 | 7,009 | |
| 16,437 | Federal Home Loan Mortgage Corp., 5.0%, 12/1/39 | 18,890 | |
| 8,776 | Federal Home Loan Mortgage Corp., 5.5%, 9/1/33 | 10,056 | |
| 11,958 | Federal Home Loan Mortgage Corp., 5.5%, 6/1/41 | 13,728 | |
| 689 | Federal Home Loan Mortgage Corp., 6.0%, 10/1/32 | 767 | |
| 3,091 | Federal Home Loan Mortgage Corp., 6.0%, 11/1/32 | 3,440 | |
| 4,112 | Federal Home Loan Mortgage Corp., 6.0%, 12/1/32 | 4,787 | |
| 7,250 | Federal Home Loan Mortgage Corp., 6.0%, 2/1/33 | 8,445 | |
| 2,896 | Federal Home Loan Mortgage Corp., 6.0%, 1/1/34 | 3,240 | |
| 756 | Federal Home Loan Mortgage Corp., 6.0%, 12/1/36 | 851 | |
| 2,168 | Federal Home Loan Mortgage Corp., 6.5%, 1/1/29 | 2,437 | |
| 1,069 | Federal Home Loan Mortgage Corp., 6.5%, 4/1/31 | 1,219 | |
| 4,007 | Federal Home Loan Mortgage Corp., 6.5%, 10/1/31 | 4,459 | |
| 1,477 | Federal Home Loan Mortgage Corp., 6.5%, 2/1/32 | 1,661 | |
| 1,858 | Federal Home Loan Mortgage Corp., 6.5%, 3/1/32 | 2,068 | |
| 8,129 | Federal Home Loan Mortgage Corp., 6.5%, 4/1/32 | 9,409 | |
| 3,352 | Federal Home Loan Mortgage Corp., 6.5%, 7/1/32 | 3,847 | |
| 206 | Federal Home Loan Mortgage Corp., 7.0%, 8/1/22 | 208 | |
| 932 | Federal Home Loan Mortgage Corp., 7.0%, 9/1/22 | 959 | |
| 1,019 | Federal Home Loan Mortgage Corp., 7.0%, 2/1/31 | 1,197 | |
| 704 | Federal Home Loan Mortgage Corp., 7.0%, 3/1/32 | 710 | |
| 1,804 | Federal Home Loan Mortgage Corp., 7.0%, 4/1/32 | 2,093 | |
| 28,571 | Federal Home Loan Mortgage Corp., 7.0%, 10/1/46 | 29,588 | |
| 1,281 | Federal Home Loan Mortgage Corp., 7.5%, 8/1/31 | 1,506 | |
| 148,583 | Freddie Mac Pool, 4.0%, 4/1/47 | 158,940 | |
| 357,149 | Freddie Mac Pool, 4.0%, 4/1/47 | 381,160 |
The accompanying notes are an integral part of these financial statements.
31
| Pioneer Bond VCT Portfolio | PIONEER VARIABLE CONTRACTS TRUST |
| SCHEDULE OF INVESTMENTS 6/30/20 (UNAUDITED) | (continued) |
| Principal | |||
| Amount | |||
| USD ($) | Value | ||
| U.S. GOVERNMENT AND AGENCY OBLIGATIONS – (continued) | |||
| 255,729 | Freddie Mac Pool, 4.0%, 5/1/47 | $ 272,949 | |
| 22,655 | Freddie Mac Pool, 4.0%, 6/1/47 | 24,128 | |
| 69,826 | Freddie Mac Pool, 4.0%, 7/1/47 | 74,402 | |
| 159,923 | Freddie Mac Pool, 4.0%, 10/1/47 | 169,997 | |
| 484,945 | Freddie Mac Pool, 4.0%, 10/1/47 | 515,906 | |
| 127,336 | Freddie Mac Pool, 4.5%, 5/1/47 | 137,513 | |
| 193,639 | Government National Mortgage Association I, 3.5%, 11/15/41 | 206,806 | |
| 74,279 | Government National Mortgage Association I, 3.5%, 8/15/42 | 79,334 | |
| 36,988 | Government National Mortgage Association I, 3.5%, 10/15/42 | 39,484 | |
| 115,350 | Government National Mortgage Association I, 3.5%, 1/15/45 | 122,228 | |
| 68,096 | Government National Mortgage Association I, 3.5%, 8/15/46 | 71,830 | |
| 61,608 | Government National Mortgage Association I, 4.0%, 1/15/25 | 66,462 | |
| 57,080 | Government National Mortgage Association I, 4.0%, 8/15/43 | 64,383 | |
| 213,980 | Government National Mortgage Association I, 4.0%, 3/15/44 | 227,722 | |
| 27,298 | Government National Mortgage Association I, 4.0%, 9/15/44 | 29,537 | |
| 79,521 | Government National Mortgage Association I, 4.0%, 4/15/45 | 86,424 | |
| 101,928 | Government National Mortgage Association I, 4.0%, 6/15/45 | 110,862 | |
| 13,066 | Government National Mortgage Association I, 4.0%, 7/15/45 | 14,161 | |
| 11,970 | Government National Mortgage Association I, 4.0%, 8/15/45 | 12,980 | |
| 57,473 | Government National Mortgage Association I, 4.5%, 5/15/39 | 64,783 | |
| 4,126 | Government National Mortgage Association I, 4.5%, 8/15/41 | 4,546 | |
| 5,108 | Government National Mortgage Association I, 5.0%, 9/15/33 | 5,596 | |
| 9,128 | Government National Mortgage Association I, 5.5%, 3/15/33 | 10,210 | |
| 9,580 | Government National Mortgage Association I, 5.5%, 7/15/33 | 11,176 | |
| 24,745 | Government National Mortgage Association I, 5.5%, 8/15/33 | 28,867 | |
| 10,313 | Government National Mortgage Association I, 5.5%, 10/15/34 | 11,538 | |
| 7,733 | Government National Mortgage Association I, 6.0%, 4/15/28 | 8,800 | |
| 7,647 | Government National Mortgage Association I, 6.0%, 2/15/29 | 8,611 | |
| 8,862 | Government National Mortgage Association I, 6.0%, 9/15/32 | 10,209 | |
| 1,391 | Government National Mortgage Association I, 6.0%, 10/15/32 | 1,546 | |
| 3,029 | Government National Mortgage Association I, 6.0%, 10/15/32 | 3,368 | |
| 10,229 | Government National Mortgage Association I, 6.0%, 11/15/32 | 11,785 | |
| 17,120 | Government National Mortgage Association I, 6.0%, 11/15/32 | 19,128 | |
| 5,176 | Government National Mortgage Association I, 6.0%, 1/15/33 | 6,169 | |
| 11,849 | Government National Mortgage Association I, 6.0%, 12/15/33 | 13,452 | |
| 8,140 | Government National Mortgage Association I, 6.0%, 8/15/34 | 9,054 | |
| 8,751 | Government National Mortgage Association I, 6.0%, 8/15/34 | 10,426 | |
| 968 | Government National Mortgage Association I, 6.5%, 3/15/26 | 1,065 | |
| 3,245 | Government National Mortgage Association I, 6.5%, 6/15/28 | 3,572 | |
| 3,281 | Government National Mortgage Association I, 6.5%, 6/15/28 | 3,780 | |
| 397 | Government National Mortgage Association I, 6.5%, 2/15/29 | 437 | |
| 3,263 | Government National Mortgage Association I, 6.5%, 5/15/29 | 3,812 | |
| 9,044 | Government National Mortgage Association I, 6.5%, 5/15/29 | 10,531 | |
| 2,132 | Government National Mortgage Association I, 6.5%, 5/15/31 | 2,347 | |
| 17,436 | Government National Mortgage Association I, 6.5%, 7/15/31 | 19,193 | |
| 3,108 | Government National Mortgage Association I, 6.5%, 9/15/31 | 3,514 | |
| 5,715 | Government National Mortgage Association I, 6.5%, 10/15/31 | 6,291 | |
| 1,828 | Government National Mortgage Association I, 6.5%, 12/15/31 | 2,104 |
The accompanying notes are an integral part of these financial statements.
32
| Pioneer Bond VCT Portfolio | PIONEER VARIABLE CONTRACTS TRUST |
| Principal | |||
| Amount | |||
| USD ($) | Value | ||
| U.S. GOVERNMENT AND AGENCY OBLIGATIONS – (continued) | |||
| 2,278 | Government National Mortgage Association I, 6.5%, 12/15/31 | $ 2,508 | |
| 358 | Government National Mortgage Association I, 6.5%, 4/15/32 | 406 | |
| 1,073 | Government National Mortgage Association I, 6.5%, 4/15/32 | 1,223 | |
| 852 | Government National Mortgage Association I, 6.5%, 6/15/32 | 938 | |
| 1,482 | Government National Mortgage Association I, 6.5%, 6/15/32 | 1,672 | |
| 3,141 | Government National Mortgage Association I, 6.5%, 6/15/32 | 3,458 | |
| 4,598 | Government National Mortgage Association I, 6.5%, 7/15/32 | 5,235 | |
| 14,760 | Government National Mortgage Association I, 6.5%, 12/15/32 | 17,587 | |
| 14,039 | Government National Mortgage Association I, 7.0%, 7/15/26 | 14,632 | |
| 1,217 | Government National Mortgage Association I, 7.0%, 9/15/27 | 1,244 | |
| 13,470 | Government National Mortgage Association I, 7.0%, 2/15/28 | 14,075 | |
| 3,922 | Government National Mortgage Association I, 7.0%, 11/15/28 | 4,337 | |
| 3,130 | Government National Mortgage Association I, 7.0%, 1/15/29 | 3,543 | |
| 3,712 | Government National Mortgage Association I, 7.0%, 6/15/29 | 4,059 | |
| 619 | Government National Mortgage Association I, 7.0%, 7/15/29 | 645 | |
| 2,180 | Government National Mortgage Association I, 7.0%, 7/15/29 | 2,456 | |
| 608 | Government National Mortgage Association I, 7.0%, 12/15/30 | 621 | |
| 1,605 | Government National Mortgage Association I, 7.0%, 2/15/31 | 1,643 | |
| 2,097 | Government National Mortgage Association I, 7.0%, 8/15/31 | 2,528 | |
| 2,572 | Government National Mortgage Association I, 7.0%, 5/15/32 | 2,574 | |
| 184 | Government National Mortgage Association I, 7.5%, 10/15/22 | 193 | |
| 97 | Government National Mortgage Association I, 7.5%, 6/15/23 | 97 | |
| 32 | Government National Mortgage Association I, 7.5%, 8/15/23 | 32 | |
| 1,768 | Government National Mortgage Association I, 7.5%, 10/15/29 | 1,841 | |
| 7,662 | Government National Mortgage Association II, 3.5%, 3/20/45 | 8,201 | |
| 9,630 | Government National Mortgage Association II, 3.5%, 4/20/45 | 10,331 | |
| 17,908 | Government National Mortgage Association II, 3.5%, 4/20/45 | 19,173 | |
| 24,216 | Government National Mortgage Association II, 3.5%, 4/20/45 | 26,056 | |
| 99,683 | Government National Mortgage Association II, 3.5%, 1/20/46 | 106,720 | |
| 33,731 | Government National Mortgage Association II, 3.5%, 3/20/46 | 36,620 | |
| 191,951 | Government National Mortgage Association II, 3.5%, 11/20/46 | 205,294 | |
| 19,406 | Government National Mortgage Association II, 4.0%, 8/20/39 | 21,405 | |
| 22,744 | Government National Mortgage Association II, 4.0%, 7/20/42 | 25,060 | |
| 312,594 | Government National Mortgage Association II, 4.0%, 7/20/44 | 340,763 | |
| 30,297 | Government National Mortgage Association II, 4.0%, 9/20/44 | 33,013 | |
| 37,444 | Government National Mortgage Association II, 4.0%, 3/20/46 | 40,518 | |
| 112,980 | Government National Mortgage Association II, 4.0%, 10/20/46 | 121,648 | |
| 55,810 | Government National Mortgage Association II, 4.0%, 2/20/48 | 61,377 | |
| 63,562 | Government National Mortgage Association II, 4.0%, 4/20/48 | 69,947 | |
| 107,659 | Government National Mortgage Association II, 4.0%, 12/20/49 | 114,152 | |
| 1,140,441 | Government National Mortgage Association II, 4.0%, 1/20/50 | 1,210,085 | |
| 7,977 | Government National Mortgage Association II, 4.5%, 9/20/41 | 8,762 | |
| 51,536 | Government National Mortgage Association II, 4.5%, 5/20/43 | 56,608 | |
| 146,710 | Government National Mortgage Association II, 4.5%, 1/20/44 | 160,838 | |
| 121,324 | Government National Mortgage Association II, 4.5%, 9/20/44 | 128,164 | |
| 38,963 | Government National Mortgage Association II, 4.5%, 10/20/44 | 42,718 | |
| 79,278 | Government National Mortgage Association II, 4.5%, 11/20/44 | 86,909 | |
| 346,248 | Government National Mortgage Association II, 4.5%, 2/20/48 | 375,913 |
The accompanying notes are an integral part of these financial statements.
33
| Pioneer Bond VCT Portfolio | PIONEER VARIABLE CONTRACTS TRUST |
| SCHEDULE OF INVESTMENTS 6/30/20 (UNAUDITED) | (continued) |
| Principal | |||
| Amount | |||
| USD ($) | Value | ||
| U.S. GOVERNMENT AND AGENCY OBLIGATIONS – (continued) | |||
| 668,700 | Government National Mortgage Association II, 4.5%, 1/20/50 | $ 714,879 | |
| 9,009 | Government National Mortgage Association II, 6.0%, 11/20/33 | 10,351 | |
| 1,702 | Government National Mortgage Association II, 6.5%, 8/20/28 | 1,953 | |
| 2,636 | Government National Mortgage Association II, 6.5%, 12/20/28 | 3,052 | |
| 1,651 | Government National Mortgage Association II, 6.5%, 9/20/31 | 1,943 | |
| 1,837 | Government National Mortgage Association II, 7.0%, 5/20/26 | 2,027 | |
| 5,303 | Government National Mortgage Association II, 7.0%, 2/20/29 | 6,101 | |
| 812 | Government National Mortgage Association II, 7.0%, 1/20/31 | 960 | |
| 445 | Government National Mortgage Association II, 7.5%, 8/20/27 | 515 | |
| 148 | Government National Mortgage Association II, 8.0%, 8/20/25 | 163 | |
| 3,000,000(j) | U.S. Treasury Bill, 8/27/20 | 2,999,335 | |
| 4,000,000(j) | U.S. Treasury Bill, 9/17/20 | 3,998,743 | |
| 765,364 | U.S. Treasury Inflation Indexed Bonds, 0.875%, 2/15/47 | 974,961 | |
| 2,219,781 | U.S. Treasury Inflation Indexed Bonds, 1.0%, 2/15/48 | 2,931,560 | |
| 1,736,189 | U.S. Treasury Inflation Indexed Bonds, 1.0%, 2/15/49 | 2,313,725 | |
| TOTAL U.S. GOVERNMENT AND AGENCY OBLIGATIONS | |||
(Cost $40,055,223) | $ 42,546,280 | ||
| TOTAL INVESTMENTS IN UNAFFILIATED ISSUERS – 99.1% | |||
(Cost $173,068,793) | $ 179,106,517 |
| Change | ||||||
| in Net | ||||||
| Net | Unrealized | |||||
| Dividend | Realized | Appreciation | ||||
| Shares | Income | Gain (Loss) | (Depreciation) | |||
| AFFILIATED ISSUER – 1.5% | ||||||
| CLOSED-END FUND – 1.5% of Net Assets | ||||||
| 321,413(k) | Pioneer ILS Interval Fund | $ — | $ — | $67,497 | $ 2,741,650 | |
| TOTAL CLOSED-END FUND | ||||||
(Cost $3,263,545) | $ 2,741,650 | |||||
| TOTAL INVESTMENTS IN AFFILIATED ISSUER – 1.5% | ||||||
(Cost $3,263,545) | $ 2,741,650 | |||||
| OTHER ASSETS AND LIABILITIES – (0.6)% | $ (1,075,200) | |||||
| NET ASSETS – 100.0% | $180,772,967 | |||||
bps | Basis Points. |
CMT | Constant Maturity Treasury Index. |
FREMF | Freddie Mac Multifamily Fixed-Rate Mortgage Loans. |
LIBOR | London Interbank Offered Rate. |
PRIME | U.S. Federal Funds Rate. |
REIT | Real Estate Investment Trust. |
REMICS | Real Estate Mortgage Investment Conduits. |
SOFRRATE | Secured Overnight Financing Rate. |
(144A) | Security is exempt from registration under Rule 144A of the Securities Act of 1933. Such securities may be resold normally to qualified institutional buyers in a transaction exempt from registration. At June 30, 2020, the value of these securities amounted to $69,622,386, or 38.5% of net assets. |
(TBA) | “To Be Announced” Securities. |
† | Amount rounds to less than 0.1%. |
* | Senior secured floating rate loan interests in which the Portfolio invests generally pay interest at rates that are periodically redetermined by reference to a base lending rate plus a premium. These base lending rates are generally (i) the lending rate offered by one or more major European banks, such as LIBOR, (ii) the prime rate offered by one or more major United States banks, (iii) the rate of a certificate of deposit or (iv) other base lending rates used by commercial lenders. The interest rate shown is the rate accruing at June 30, 2020. |
The accompanying notes are an integral part of these financial statements.
34
| Pioneer Bond VCT Portfolio | PIONEER VARIABLE CONTRACTS TRUST |
+ | Security that used significant unobservable inputs to determine its value. |
(a) | Security is perpetual in nature and has no stated maturity date. |
(b) | Floating rate note. Coupon rate, reference index and spread shown at June 30, 2020. |
(c) | Debt obligation initially issued at one coupon which converts to a higher coupon at a specific date. The rate shown is the rate at June 30, 2020. |
(d) | The interest rate is subject to change periodically. The interest rate and/or reference index and spread shown at June 30, 2020. |
(e) | Security represents the interest-only portion payments on a pool of underlying mortgages or mortgage-backed securities. |
(f) | Securities are restricted as to resale. |
(g) | Issued as preference shares. |
(h) | Non-income producing security. |
(i) | Consists of Revenue Bonds unless otherwise indicated. |
(j) | Security issued with a zero coupon. Income is recognized through accretion of discount. |
(k) | Pioneer ILS Interval Fund is an affiliated closed-end fund managed by Amundi Pioneer Asset Management, Inc., (the “Adviser”). |
FUTURES CONTRACTS
FIXED INCOME INDEX FUTURES CONTRACTS
FIXED INCOME INDEX FUTURES CONTRACTS
| Unrealized | ||||||||||||||
| Number of | Expiration | Notional | Market | Appreciation | ||||||||||
| Contracts Long | Description | Date | Amount | Value | (Depreciation) | |||||||||
| 32 | U.S. 2 Year Note (CBT) | 9/30/20 | $ | 7,064,750 | $ | 7,066,500 | $ | 1,750 | ||||||
| 113 | U.S. 5 Year Note (CBT) | 9/30/20 | 14,169,140 | 14,208,867 | 39,727 | |||||||||
11 | U.S. Ultra Bond (CBT) | 9/21/20 | 2,405,312 | 2,399,719 | (5,593 | ) | ||||||||
$ | 23,639,202 | $ | 23,675,086 | $ | 35,884 | |||||||||
| Number of | Expiration | Notional | Market | Unrealized | ||||||||||
| Contracts Short | Description | Date | Amount | Value | (Depreciation) | |||||||||
| 65 | U.S. 10 Year Note (CBT) | 9/21/20 | $ | 9,010,789 | $ | 9,046,172 | $ | (35,383 | ) | |||||
| 118 | U.S. 10 Year Ultra | 9/21/20 | 18,494,266 | 18,583,156 | (88,890 | ) | ||||||||
| 11 | U.S. Long Bond (CBT) | 9/21/20 | 1,952,156 | 1,964,188 | (12,032 | ) | ||||||||
| $ | 29,457,211 | $ | 29,593,516 | $ | (136,305 | ) | ||||||||
TOTAL FUTURES CONTRACTS | $ | (5,818,009 | ) | $ | (5,918,430 | ) | $ | (100,421 | ) | |||||
SWAP CONTRACT
CENTRALLY CLEARED CREDIT DEFAULT SWAP CONTRACT – SELL PROTECTION
CENTRALLY CLEARED CREDIT DEFAULT SWAP CONTRACT – SELL PROTECTION
| Notional | Pay/ | Annual | Expiration | Premiums | Unrealized | Market | ||||||||||
Amount ($)(1) | Reference Obligation/Index | Receive(2) | Fixed Rate | Date | (Received) | (Depreciation) | Value | |||||||||
| 5,215,500 | Markit CDX North America High Yield Index | Receive | 5.00% | 6/20/25 | $ | (4,346 | ) | $ | (28,986 | ) | $ | (33,332 | ) | |||
TOTAL SWAP CONTRACTS | $ | (4,346 | ) | $ | (28,986 | ) | $ | (33,332 | ) | |||||||
(1) | The notional amount is the maximum amount that a seller of credit protection would be obligated to pay upon occurrence of a credit event. |
(2) | Receives quarterly |
Purchases and sales of securities (excluding temporary cash investments) for the six months ended June 30, 2020 were as follows:
| Purchases | Sales | |
| Long-Term U.S. Government Securities | $ 4,239,746 | $25,159,945 |
| Other Long-Term Securities | $48,389,949 | $46,499,548 |
The accompanying notes are an integral part of these financial statements.
35
| Pioneer Bond VCT Portfolio | PIONEER VARIABLE CONTRACTS TRUST |
| SCHEDULE OF INVESTMENTS 6/30/20 (UNAUDITED) | (continued) |
The Portfolio is permitted to engage in purchase and sale transactions (“cross trades”) with certain funds and accounts for which the Adviser serves as the Portfolio’s investment adviser, as set forth in Rule 17a-7 under the Investment Company Act of 1940, pursuant to procedures adopted by the Board of Trustees. Under these procedures, cross trades are effected at current market prices. During the six months ended June 30, 2020, the Portfolio engaged in sales of $18,921 which resulted in a net realized gain/(loss) of $1,540.
| At June 30, 2020, the net unrealized appreciation on investments based on cost for federal tax purposes of $176,450,616 was as follows: | ||||
| Aggregate gross unrealized appreciation for all investments in which there is an excess of value over tax cost | $ | 9,064,272 | ||
| Aggregate gross unrealized depreciation for all investments in which there is an excess of tax cost over value | (3,800,474 | ) | ||
| Net unrealized appreciation | $ | 5,263,798 | ||
Various inputs are used in determining the value of the Portfolio’s investments. These inputs are summarized in the three broad levels below.
Level 1 – quoted prices in active markets for identical securities.
Level 2 – other significant observable inputs (including quoted prices for similar securities, interest rates, prepayment speeds, credit risks, etc.). See Notes to Financial Statements — Note 1A.
Level 3 – significant unobservable inputs (including the Portfolio’s own assumptions in determining fair value of investments). See Notes to Financial Statements — Note 1A.
The following is a summary of the inputs used as of June 30, 2020, in valuing the Portfolio’s investments:
| Level 1 | Level 2 | Level 3 | Total | |||||||||||||
| Convertible Preferred Stocks | $ | 2,069,280 | $ | — | $ | — | $ | 2,069,280 | ||||||||
| Asset Backed Securities | — | 21,789,825 | 192,020 | 21,981,845 | ||||||||||||
| Collateralized Mortgage Obligations | — | 20,946,396 | — | 20,946,396 | ||||||||||||
| Commercial Mortgage-Backed Securities | — | 10,512,050 | — | 10,512,050 | ||||||||||||
| Corporate Bonds | — | 77,668,261 | — | 77,668,261 | ||||||||||||
| Foreign Government Bond | — | 492,812 | — | 492,812 | ||||||||||||
| Insurance-Linked Securities | ||||||||||||||||
| Reinsurance Sidecars | ||||||||||||||||
| Multiperil - Worldwide | — | — | 22,514 | 22,514 | ||||||||||||
| Municipal Bonds | — | 65,760 | — | 65,760 | ||||||||||||
| Senior Secured Floating Rate Loan Interests | — | 2,801,319 | — | 2,801,319 | ||||||||||||
| U.S. Government and Agency Obligations | — | 42,546,280 | — | 42,546,280 | ||||||||||||
| Affiliated Closed-End Fund | — | 2,741,650 | — | 2,741,650 | ||||||||||||
| Total Investments in Securities | $ | 2,069,280 | $ | 179,564,353 | $ | 214,534 | $ | 181,848,167 | ||||||||
| Other Financial Instruments | ||||||||||||||||
| Net unrealized depreciation on futures contracts | $ | (100,421 | ) | $ | — | $ | — | $ | (100,421 | ) | ||||||
| Swap contracts, at value | — | (33,332 | ) | — | (33,332 | |||||||||||
| Total Other Financial Instruments | $ | (100,421 | ) | $ | (33,332 | ) | $ | — | $ | (133,753 | ) | |||||
The accompanying notes are an integral part of these financial statements.
36
| Pioneer Bond VCT Portfolio | PIONEER VARIABLE CONTRACTS TRUST |
The following is a reconciliation of assets valued using significant unobservable inputs (Level 3):
| Insurance- | Asset | |||||||||||
| Linked | Backed | |||||||||||
| Securities | Securities | Total | ||||||||||
| Balance as of 12/31/19 | $ | 27,503 | $ | — | $ | 27,503 | ||||||
Realized gain (loss)(1) | — | — | — | |||||||||
Change in unrealized appreciation (depreciation)(2) | (91 | ) | — | (91 | ) | |||||||
| Accrued discounts/premiums | — | — | — | |||||||||
| Purchases | — | — | — | |||||||||
| Sales | (4,898 | ) | — | (4,898 | ) | |||||||
| Transfers in to Level 3* | — | 192,020 | 192,020 | |||||||||
| Transfers out of Level 3* | — | — | — | |||||||||
| Balance as of 6/30/20 | $ | 22,514 | $ | 192,020 | $ | 214,534 | ||||||
(1) | Realized gain (loss) on these securities is included in net realized gain (loss) on investments in the Statement of Operations. |
(2) | Unrealized appreciation (depreciation) on these securities is included in change in net unrealized appreciation (depreciation) on investments in the Statement of Operations. |
* | Transfers are calculated on the beginning of period value. During the six months ended June 30, 2020, securities with an aggregate market value of $192,020 transferred from Level 2 to Level 3 due to the use of unobservable inputs. There were no other transfers between Levels 1, 2 and 3. |
Net change in unrealized appreciation (depreciation) of Level 3 investments still held and considered Level 3 at June 30, 2020: | $ | (91 | ) | |
The accompanying notes are an integral part of these financial statements.
37
| Pioneer Bond VCT Portfolio | PIONEER VARIABLE CONTRACTS TRUST |
| ASSETS: | ||||
| Investments in unaffiliated issuers, at value (cost $173,068,793) | $ | 179,106,517 | ||
| Investments in affiliated issuers, at value (cost $3,263,545) | 2,741,650 | |||
| Cash | 1,312,090 | |||
| Foreign currencies, at value (cost $115,518) | 114,337 | |||
| Futures collateral | 199,159 | |||
| Swaps collateral | 728,494 | |||
| Due from broker for futures | 474,624 | |||
| Due from broker for swaps | 29,457 | |||
| Variation margin for futures contracts | 30,438 | |||
| Variation margin for centrally cleared swap contracts | 42,619 | |||
| Receivables — | ||||
| Investment securities sold | 2,194,125 | |||
| Portfolio shares sold | 126,646 | |||
| Dividends | 9,280 | |||
| Interest | 1,087,919 | |||
| Other assets | 35,938 | |||
| Total assets | $ | 188,233,293 | ||
| LIABILITIES: | ||||
| Payables — | ||||
| Investment securities purchased | $ | 7,228,589 | ||
| Portfolio shares repurchased | 2,853 | |||
| Net unrealized depreciation on futures contracts | 100,421 | |||
| Swap contracts, at value (net premiums received $4,346) | 33,332 | |||
| Due to affiliates | 10,085 | |||
| Accrued expenses | 85,046 | |||
| Total liabilities | $ | 7,460,326 | ||
| NET ASSETS: | ||||
| Paid-in capital | $ | 175,168,703 | ||
| Distributable earnings | 5,604,264 | |||
| Net assets | $ | 180,772,967 | ||
| NET ASSET VALUE PER SHARE: | ||||
No par value (unlimited number of shares authorized) | ||||
| Class I (based on $48,706,118/4,313,348 shares) | $ | 11.29 | ||
| Class II (based on $132,066,849/11,670,110 shares) | $ | 11.32 | ||
The accompanying notes are an integral part of these financial statements.
38
| Pioneer Bond VCT Portfolio | PIONEER VARIABLE CONTRACTS TRUST |
| STATEMENT OF OPERATIONS (UNAUDITED) | |
| FOR THE SIX MONTHS ENDED 6/30/20 |
| INVESTMENT INCOME: | ||||||||
| Interest from unaffiliated issuers | $ | 3,003,746 | ||||||
| Dividends from unaffiliated issuers | 47,080 | |||||||
| Total investment income | $ | 3,050,826 | ||||||
| EXPENSES: | ||||||||
| Management fees | $ | 362,488 | ||||||
| Administrative expense | 49,803 | |||||||
| Distribution fees | ||||||||
| Class II | 167,030 | |||||||
| Custodian fees | 53,220 | |||||||
| Professional fees | 29,787 | |||||||
| Printing expense | 12,677 | |||||||
| Pricing fees | 52,950 | |||||||
| Trustees’ fees | 4,186 | |||||||
| Insurance expense | 386 | |||||||
| Miscellaneous | 2,335 | |||||||
| Total expenses | $ | 734,862 | ||||||
| Less fees waived and expenses reimbursed by the Adviser | (23,571 | ) | ||||||
| Net expenses | $ | 711,291 | ||||||
| Net investment income | $ | 2,339,535 | ||||||
| REALIZED AND UNREALIZED GAIN (LOSS) ON INVESTMENTS: | ||||||||
| Net realized gain (loss) on: | ||||||||
| Investments in unaffiliated issuers | $ | 1,657,693 | ||||||
| Short sales | (1,292 | ) | ||||||
| Futures contracts | (156,842 | ) | ||||||
| Swap contracts | (95,478 | ) | ||||||
| Other assets and liabilities denominated in foreign currencies | 602 | $ | 1,404,683 | |||||
| Change in net unrealized appreciation (depreciation) on: | ||||||||
| Investments in unaffiliated issuers | $ | 493,882 | ||||||
| Investments in affiliated issuers | 67,497 | |||||||
| Futures contracts | (117,319 | ) | ||||||
| Swap contracts | 25,632 | |||||||
| Other assets and liabilities denominated in foreign currencies | (1,190 | ) | $ | 468,502 | ||||
| Net realized and unrealized gain (loss) on investments | $ | 1,873,185 | ||||||
| Net increase in net assets resulting from operations | $ | 4,212,720 | ||||||
The accompanying notes are an integral part of these financial statements.
39
| Pioneer Bond VCT Portfolio | PIONEER VARIABLE CONTRACTS TRUST |
| STATEMENTS OF CHANGES IN NET ASSETS |
| Six Months | ||||||||
| Ended | ||||||||
| 6/30/20 | Year Ended | |||||||
| (unaudited) | 12/31/19 | |||||||
| FROM OPERATIONS: | ||||||||
Net investment income (loss) | $ | 2,339,535 | $ | 5,209,935 | ||||
Net realized gain (loss) on investments | 1,404,683 | 485,111 | ||||||
Change in net unrealized appreciation (depreciation) on investments | 468,502 | 9,865,428 | ||||||
| Net increase in net assets resulting from operations | $ | 4,212,720 | $ | 15,560,474 | ||||
| DISTRIBUTIONS TO SHAREOWNERS: | ||||||||
| Class I ($0.17 and $0.36 per share, respectively) | $ | (739,761 | ) | $ | (1,582,496 | ) | ||
| Class II ($0.16 and $0.33 per share, respectively) | (1,911,588 | ) | (4,054,843 | ) | ||||
| Total distributions to shareowners | $ | (2,651,349 | ) | $ | (5,637,339 | ) | ||
| FROM PORTFOLIO SHARE TRANSACTIONS: | ||||||||
Net proceeds from sales of shares | $ | 17,413,310 | $ | 31,325,218 | ||||
Reinvestment of distributions | 2,651,349 | 5,637,339 | ||||||
Cost of shares repurchased | (30,952,910 | ) | (28,775,440 | ) | ||||
| Net increase (decrease) in net assets resulting from Portfolio share transactions | $ | (10,888,251 | ) | $ | 8,187,117 | |||
| Net increase (decrease) in net assets | $ | (9,326,880 | ) | $ | 18,110,252 | |||
| NET ASSETS: | ||||||||
Beginning of period | $ | 190,099,847 | $ | 171,989,595 | ||||
End of period | $ | 180,772,967 | $ | 190,099,847 | ||||
| Six Months | Six Months | |||||||||||||||
| Ended | Ended | |||||||||||||||
| 6/30/20 | 6/30/20 | Year Ended | Year Ended | |||||||||||||
| Shares | Amount | 12/31/19 | 12/31/19 | |||||||||||||
| (unaudited) | (unaudited) | Shares | Amount | |||||||||||||
| CLASS I | ||||||||||||||||
Shares sold | 912,444 | $ | 10,131,184 | 996,128 | $ | 10,900,057 | ||||||||||
Reinvestment of distributions | 67,087 | 739,761 | 143,788 | 1,582,496 | ||||||||||||
Less shares repurchased | (1,063,812 | ) | (11,807,338 | ) | (1,109,052 | ) | (12,124,372 | ) | ||||||||
| Net increase (decrease) | (84,281 | ) | $ | (946,668 | ) | 30,864 | $ | 358,181 | ||||||||
| CLASS II | ||||||||||||||||
Shares sold | 644,057 | $ | 7,282,126 | 1,849,187 | $ | 20,425,161 | ||||||||||
Reinvestment of distributions | 172,955 | 1,911,588 | 367,521 | 4,054,843 | ||||||||||||
Less shares repurchased | (1,742,459 | ) | (19,145,572 | ) | (1,510,116 | ) | (16,651,068 | ) | ||||||||
| Net increase (decrease) | (925,447 | ) | $ | (9,979,659 | ) | 706,592 | $ | 7,828,936 | ||||||||
The accompanying notes are an integral part of these financial statements.
40
| Pioneer Bond VCT Portfolio | PIONEER VARIABLE CONTRACTS TRUST |
| FINANCIAL HIGHLIGHTS |
| Six Months | ||||||||||||||||||||||||
| Ended | ||||||||||||||||||||||||
| 6/30/20 | Year Ended | Year Ended | Year Ended | Year Ended | Year Ended | |||||||||||||||||||
| (unaudited) | 12/31/19 | 12/31/18 | 12/31/17 | 12/31/16* | 12/31/15* | |||||||||||||||||||
| Class I | ||||||||||||||||||||||||
Net asset value, beginning of period | $ | 11.17 | $ | 10.56 | $ | 11.04 | $ | 10.96 | $ | 10.83 | $ | 11.23 | ||||||||||||
Increase (decrease) from investment operations: | ||||||||||||||||||||||||
| Net investment income (loss) (a) | $ | 0.15 | $ | 0.33 | $ | 0.33 | $ | 0.29 | $ | 0.27 | $ | 0.28 | ||||||||||||
| Net realized and unrealized gain (loss) on investments | 0.14 | 0.64 | (0.42 | ) | 0.14 | 0.18 | (0.25 | ) | ||||||||||||||||
Net increase (decrease) from investment operations | $ | 0.29 | $ | 0.97 | $ | (0.09 | ) | $ | 0.43 | $ | 0.45 | $ | 0.03 | |||||||||||
Distributions to shareowners: | ||||||||||||||||||||||||
| Net investment income | $ | (0.17 | ) | $ | (0.36 | ) | $ | (0.36 | ) | $ | (0.31 | ) | $ | (0.31 | ) | $ | (0.33 | ) | ||||||
| Net realized gain | — | — | (0.03 | ) | (0.04 | ) | (0.01 | ) | (0.10 | ) | ||||||||||||||
Total distributions | $ | (0.17 | ) | $ | (0.36 | ) | $ | (0.39 | ) | $ | (0.35 | ) | $ | (0.32 | ) | $ | (0.43 | ) | ||||||
Net increase (decrease) in net asset value | $ | 0.12 | $ | 0.61 | $ | (0.48 | ) | $ | 0.08 | $ | 0.13 | $ | (0.40 | ) | ||||||||||
Net asset value, end of period | $ | 11.29 | $ | 11.17 | $ | 10.56 | $ | 11.04 | $ | 10.96 | $ | 10.83 | ||||||||||||
Total return (b) | 2.65 | %(c) | 9.27 | % | (0.84 | )% | 4.01 | % | 4.10 | % | 0.30 | % | ||||||||||||
Ratio of net expenses to average net assets | 0.60 | %(d) | 0.59 | % | 0.61 | % | 0.61 | % | 0.62 | % | 0.62 | % | ||||||||||||
Ratio of net investment income (loss) to average net assets | 2.76 | %(d) | 3.03 | % | 3.07 | % | 2.59 | % | 2.46 | % | 2.56 | % | ||||||||||||
Portfolio turnover rate | 30 | %(c) | 48 | % | 44 | % | 42 | % | 50 | % | 41 | % | ||||||||||||
Net assets, end of period (in thousands) | $ | 48,706 | $ | 49,115 | $ | 46,125 | $ | 49,672 | $ | 48,442 | $ | 24,785 | ||||||||||||
Ratios with no waiver of fees and assumption of expenses by | ||||||||||||||||||||||||
| the Adviser and no reduction for fees paid indirectly: | ||||||||||||||||||||||||
| Total expenses to average net assets | 0.63 | %(d) | 0.62 | % | 0.64 | % | 0.61 | % | 0.68 | % | 0.81 | % | ||||||||||||
| Net investment income (loss) to average net assets | 2.74 | %(d) | 3.00 | % | 3.04 | % | 2.59 | % | 2.40 | % | 2.37 | % | ||||||||||||
* | The Portfolio was audited by an independent registered public accounting firm other than Ernst & Young LLP. |
(a) | The per-share data presented above is based on the average shares outstanding for the period presented. |
(b) | Assumes initial investment at net asset value at the beginning of each period, reinvestment of all distributions and the complete redemption of the investment at net asset value at the end of each period. |
(c) | Not annualized. |
(d) | Annualized. |
NOTE: | The above financial highlights do not reflect the deduction of non-portfolio expenses associated with variable insurance products, such as mortality and expense risk charges, separate account charges, and sales charges. |
The accompanying notes are an integral part of these financial statements.
41
| Pioneer Bond VCT Portfolio | PIONEER VARIABLE CONTRACTS TRUST |
FINANCIAL HIGHLIGHTS | (continued) |
| Six Months | ||||||||||||||||||||||||
| Ended | ||||||||||||||||||||||||
| 6/30/20 | Year Ended | Year Ended | Year Ended | Year Ended | Year Ended | |||||||||||||||||||
| (unaudited) | 12/31/19 | 12/31/18 | 12/31/17 | 12/31/16 | 12/31/15 | |||||||||||||||||||
| Class II | ||||||||||||||||||||||||
Net asset value, beginning of period | $ | 11.19 | $ | 10.59 | $ | 11.07 | $ | 10.99 | $ | 10.85 | $ | 11.25 | ||||||||||||
Increase (decrease) from investment operations: | ||||||||||||||||||||||||
| Net investment income (loss) (a) | $ | 0.14 | $ | 0.31 | $ | 0.30 | $ | 0.26 | $ | 0.25 | $ | 0.24 | ||||||||||||
| Net realized and unrealized gain (loss) on investments | 0.15 | 0.62 | (0.42 | ) | 0.15 | 0.18 | (0.23 | ) | ||||||||||||||||
Net increase (decrease) from investment operations | $ | 0.29 | $ | 0.93 | $ | (0.12 | ) | $ | 0.41 | $ | 0.43 | $ | 0.01 | |||||||||||
Distributions to shareowners: | ||||||||||||||||||||||||
| Net investment income | $ | (0.16 | ) | $ | (0.33 | ) | $ | (0.33 | ) | $ | (0.29 | ) | $ | (0.28 | ) | $ | (0.31 | ) | ||||||
| Net realized gain | — | — | (0.03 | ) | (0.04 | ) | (0.01 | ) | (0.10 | ) | ||||||||||||||
Total distributions | $ | (0.16 | ) | $ | (0.33 | ) | $ | (0.36 | ) | $ | (0.33 | ) | $ | (0.29 | ) | $ | (0.41 | ) | ||||||
Net increase (decrease) in net asset value | $ | 0.13 | $ | 0.60 | $ | (0.48 | ) | $ | 0.08 | $ | 0.14 | $ | (0.40 | ) | ||||||||||
Net asset value, end of period | $ | 11.32 | $ | 11.19 | $ | 10.59 | $ | 11.07 | $ | 10.99 | $ | 10.85 | ||||||||||||
Total return (b) | 2.61 | %(c) | 8.90 | % | (1.08 | )% | 3.74 | % | 3.92 | % | 0.08 | % | ||||||||||||
Ratio of net expenses to average net assets | 0.85 | %(d) | 0.84 | % | 0.86 | % | 0.86 | % | 0.88 | % | 0.84 | % | ||||||||||||
Ratio of net investment income (loss) to average net assets | 2.52 | %(d) | 2.79 | % | 2.83 | % | 2.35 | % | 2.21 | % | 2.18 | % | ||||||||||||
Portfolio turnover rate | 30 | %(c) | 48 | % | 44 | % | 42 | % | 50 | % | 41 | % | ||||||||||||
Net assets, end of period (in thousands) | $ | 132,067 | $ | 140,985 | $ | 125,865 | $ | 122,239 | $ | 95,484 | $ | 65,727 | ||||||||||||
Ratios with no waiver of fees and assumption of expenses by | ||||||||||||||||||||||||
| the Adviser and no reduction for fees paid indirectly: | ||||||||||||||||||||||||
| Total expenses to average net assets | 0.88 | %(d) | 0.87 | % | 0.89 | % | 0.86 | % | 0.94 | % | 1.03 | % | ||||||||||||
| Net investment income (loss) to average net assets | 2.49 | %(d) | 2.76 | % | 2.80 | % | 2.35 | % | 2.16 | % | 1.99 | % | ||||||||||||
* | The Portfolio was audited by an independent registered public accounting firm other than Ernst & Young LLP. |
(a) | The per-share data presented above is based on the average shares outstanding for the period presented. |
(b) | Assumes initial investment at net asset value at the beginning of each period, reinvestment of all distributions, the complete redemption of the investment at net asset value at the end of each period and no sales charges. Total return would be reduced if sales charges were taken into account. |
(c) | Not annualized. |
(d) | Annualized. |
NOTE: | The above financial highlights do not reflect the deduction of non-portfolio expenses associated with variable insurance products, such as mortality and expense risk charges, separate account charges, and sales charges. |
The accompanying notes are an integral part of these financial statements.
42
| Pioneer Bond VCT Portfolio | PIONEER VARIABLE CONTRACTS TRUST |
1. Organization and Significant Accounting Policies
Pioneer Bond VCT Portfolio (the “Portfolio”) is one of 8 portfolios comprising Pioneer Variable Contracts Trust (the “Trust”), a Delaware statutory trust. The Portfolio is registered under the Investment Company Act of 1940 as a diversified, open-end management investment company. The Portfolio seeks current income and total return.
The Portfolio offers two classes of shares designated as Class I and Class II shares. Each class of shares represents an interest in the same portfolio of investments of the Portfolio and has identical rights (based on relative net asset values) to assets and liquidation proceeds. Share classes can bear different rates of class-specific fees and expenses, such as transfer agent and distribution fees. Differences in class-specific fees and expenses will result in differences in net investment income and, therefore, the payment of different dividends from net investment income earned by each class. The Amended and Restated Declaration of Trust of the Portfolio gives the Board of Trustees the flexibility to specify either per-share voting or dollar-weighted voting when submitting matters for shareowner approval. Under per-share voting, each share of a class of the Portfolio is entitled to one vote. Under dollar-weighted voting, a shareowner’s voting power is determined not by the number of shares owned, but by the dollar value of the shares on the record date. Each share class has exclusive voting rights with respect to matters affecting only that class, including with respect to the distribution plan for that class. There is no distribution plan for Class I shares.
Portfolio shares may be purchased only by insurance companies for the purpose of funding variable annuity and variable life insurance contracts or by qualified pension and retirement plans.
Amundi Pioneer Asset Management, Inc., an indirect, wholly owned subsidiary of Amundi and Amundi’s wholly owned subsidiary, Amundi USA, Inc., serves as the Portfolio’s investment adviser (the “Adviser”). Amundi Pioneer Distributor, Inc., an affiliate of Amundi Pioneer Asset Management, Inc., serves as the Portfolio’s distributor (the “Distributor”).
In August 2018, the Securities and Exchange Commission (“SEC”) released a Disclosure Update and Simplification Final Rule. The Final Rule amends Regulation S-X disclosures requirements to conform them to U.S. Generally Accepted Accounting Principles (“U.S. GAAP”) for investment companies. The Portfolio’s financial statements were prepared in compliance with the new amendments to Regulation S-X.
During March 2017, the Financial Accounting Standards Board (FASB) issued an Accounting Standard Update, ASU 2017-08, Receivables-Nonrefundable Fees and Other Costs (Subtopic 310-20), Premium Amortization on Purchased Callable Debt Securities (“ASU 2017-08”), which shortens the amortization period for purchased non-contingently callable debt securities held at a premium. ASU 2017-08 specifies that the premium amortization period ends at the earliest call date, for certain purchased non-contingently callable debt securities. ASU 2017-08 is effective for fiscal years, and interim periods within those fiscal years, beginning after December 15, 2018. The Portfolio has adopted ASU 2017-08 as of June 30, 2020. The implementation of ASU 2017-08 did not have a material impact on the Portfolio’s Financial Statements.
The Portfolio is an investment company and follows investment company accounting and reporting guidance under U.S. GAAP. U.S. GAAP requires the management of the Portfolio to make estimates and assumptions that affect the reported amounts of assets and liabilities, the disclosure of contingent assets and liabilities at the date of the financial statements, and the reported amounts of income, expenses and gain or loss on investments during the reporting period. Actual results could differ from those estimates.
The following is a summary of significant accounting policies followed by the Portfolio in the preparation of its financial statements:
A. Security Valuation
The net asset value of the Portfolio is computed once daily, on each day the New York Stock Exchange (“NYSE”) is open, as of the close of regular trading on the NYSE.
Fixed-income securities are valued by using prices supplied by independent pricing services, which consider such factors as market prices, market events, quotations from one or more brokers, Treasury spreads, yields, maturities and ratings, or may use a pricing matrix or other fair value methods or techniques to provide an estimated value of the security or instrument. A pricing matrix is a means of valuing a debt security on the basis of current market prices for other debt securities, historical trading patterns in the market for fixed-income securities and/or other factors. Non-U.S. debt securities that are listed on an exchange will be valued at the bid price obtained from an independent third party pricing service. When independent third party pricing services are unable to supply prices, or when prices or market quotations are considered to be unreliable, the value of that security may be determined using quotations from one or more broker-dealers.
43
| Pioneer Bond VCT Portfolio | PIONEER VARIABLE CONTRACTS TRUST |
NOTES TO FINANCIAL STATEMENTS 6/30/20 (UNAUDITED) | (continued) |
Loan interests are valued in accordance with guidelines established by the Board of Trustees at the mean between the last available bid and asked prices from one or more brokers or dealers as obtained from Loan Pricing Corporation, an independent third party pricing service. If price information is not available from Loan Pricing Corporation, or if the price information is deemed to be unreliable, price information will be obtained from an alternative loan interest pricing service. If no reliable price quotes are available from either the primary or alternative pricing service, broker quotes will be solicited.
Event-linked bonds are valued at the bid price obtained from an independent third party pricing service. Other insurance-linked securities (including reinsurance sidecars, collateralized reinsurance and industry loss warranties) may be valued at the bid price obtained from an independent pricing service, or through a third party using a pricing matrix, insurance industry valuation models, or other fair value methods or techniques to provide an estimated value of the instrument.
Equity securities that have traded on an exchange are valued by using the last sale price on the principal exchange where they are traded. Equity securities that have not traded on the date of valuation, or securities for which sale prices are not available, generally are valued using the mean between the last bid and asked prices or, if both last bid and asked prices are not available, at the last quoted bid price. Last sale and bid and asked prices are provided by independent third party pricing services. In the case of equity securities not traded on an exchange, prices are typically determined by independent third party pricing services using a variety of techniques and methods.
The value of foreign securities is translated into U.S. dollars based on foreign currency exchange rate quotations supplied by a third party pricing source. Trading in non-U.S. equity securities is substantially completed each day at various times prior to the close of the NYSE. The values of such securities used in computing the net asset value of the Portfolio’s shares are determined as of such times. The Portfolio may use a fair value model developed by an independent pricing service to value non-U.S. equity securities.
Futures contracts are generally valued at the closing settlement price established by the exchange on which they are traded.
Swap contracts, including interest rate swaps, caps and floors (other than centrally cleared swap contracts), are valued at the dealer quotations obtained from reputable International Swap Dealers Association members. Centrally cleared swaps are valued at the daily settlement price provided by the central clearing counterparty.
Shares of open-end registered investment companies (including money market mutual funds) are valued at such funds’ net asset value. Shares of exchange-listed closed-end funds are valued by using the last sale price on the principal exchange where they are traded. Shares of closed-end interval funds that offer their shares at net asset value are values at such funds’ net asset value.
Securities or loan interests for which independent pricing services or broker-dealers are unable to supply prices or for which market prices and/or quotations are not readily available or are considered to be unreliable are valued by a fair valuation team comprised of certain personnel of the Adviser pursuant to procedures adopted by the Portfolio’s Board of Trustees. The Adviser’s fair valuation team uses fair value methods approved by the Valuation Committee of the Board of Trustees. The Adviser’s fair valuation team is responsible for monitoring developments that may impact fair valued securities and for discussing and assessing fair values on an ongoing basis, and at least quarterly, with the Valuation Committee of the Board of Trustees.
Inputs used when applying fair value methods to value a security may include credit ratings, the financial condition of the company, current market conditions and comparable securities. The Portfolio may use fair value methods if it is determined that a significant event has occurred after the close of the exchange or market on which the security trades and prior to the determination of the Portfolio’s net asset value. Examples of a significant event might include political or economic news, corporate restructurings, natural disasters, terrorist activity or trading halts. Thus, the valuation of the Portfolio’s securities may differ significantly from exchange prices, and such differences could be material.
At June 30, 2020, no securities were valued using fair value methods (other than securities valued using prices supplied by independent pricing services, broker-dealers or using a third party insurance industry pricing model).
44
| Pioneer Bond VCT Portfolio | PIONEER VARIABLE CONTRACTS TRUST |
B. Investment Income and Transactions
Dividend income is recorded on the ex-dividend date, except that certain dividends from foreign securities where the ex-dividend date may have passed are recorded as soon as the Portfolio becomes aware of the ex-dividend data in the exercise of reasonable diligence.
Interest income, including interest on income-bearing cash accounts, is recorded on the accrual basis. Dividend and interest income are reported net of unrecoverable foreign taxes withheld at the applicable country rates and net of income accrued on defaulted securities.
Interest and dividend income payable by delivery of additional shares is reclassified as PIK (payment-in-kind) income upon receipt and is included in interest and dividend income, respectively.
Principal amounts of mortgage-backed securities are adjusted for monthly paydowns. Premiums and discounts related to certain mortgage-backed securities are amortized or accreted in proportion to the monthly paydowns. All discounts/premiums on purchase prices of debt securities are accreted/amortized for financial reporting purposes over the life of the respective securities, and such accretion/amortization is included in interest income.
Security transactions are recorded as of trade date. Gains and losses on sales of investments are calculated on the identified cost method for both financial reporting and federal income tax purposes.
C. Foreign Currency Translation
The books and records of the Portfolio are maintained in U.S. dollars. Amounts denominated in foreign currencies are translated into U.S. dollars using current exchange rates.
Net realized gains and losses on foreign currency transactions, if any, represent, among other things, the net realized gains and losses on foreign currency exchange contracts, disposition of foreign currencies and the difference between the amount of income accrued and the U.S. dollars actually received. Further, the effects of changes in foreign currency exchange rates on investments are not segregated on the Statement of Operations from the effects of changes in the market prices of those securities, but are included with the net realized and unrealized gain or loss on investments.
D. Federal Income Taxes
It is the Portfolio’s policy to comply with the requirements of the Internal Revenue Code applicable to regulated investment companies and to distribute all of its net taxable income and net realized capital gains, if any, to its shareowners. Therefore, no provision for federal income taxes is required. As of December 31, 2019, the Portfolio did not accrue any interest or penalties with respect to uncertain tax positions, which, if applicable, would be recorded as an income tax expense on the Statement of Operations. Tax returns filed within the prior three years remain subject to examination by federal and state tax authorities.
The amount and character of income and capital gain distributions to shareowners are determined in accordance with federal income tax rules, which may differ from U.S. GAAP. Distributions in excess of net investment income or net realized gains are temporary over distributions for financial statement purposes resulting from differences in the recognition or classification of income or distributions for financial statement and tax purposes. Capital accounts within the financial statements are adjusted for permanent book/tax differences to reflect tax character, but are not adjusted for temporary differences.
The tax character of current year distributions payable will be determined at the end of the current taxable year. The tax character of distributions paid during the year ended December 31, 2019 was as follows:
| 2019 | ||||
| Distributions paid from: | ||||
| Ordinary income | $ | 5,637,339 | ||
| Total | $ | 5,637,339 | ||
The following shows the components of distributable earnings on a federal income tax basis at December 31, 2019:
| 2019 | ||||
| Distributable earnings: | ||||
| Undistributed ordinary income | $ | 131,093 | ||
| Capital loss carryforward | (793,329 | ) | ||
| Net unrealized appreciation | 7,705,129 | |||
| Total | $ | 4,042,893 | ||
The difference between book basis and tax basis unrealized appreciation is attributable to the tax adjustments relating to wash sales, premium and amortization, and credit default swaps, the mark to market of futures contracts and credit default swaps.
45
| Pioneer Bond VCT Portfolio | PIONEER VARIABLE CONTRACTS TRUST |
NOTES TO FINANCIAL STATEMENTS 6/30/20 (UNAUDITED) | (continued) |
E. Portfolio Shares and Class Allocations
The Portfolio records sales and repurchases of its shares as of trade date. Distribution fees for Class II shares are calculated based on the average daily net asset value attributable to Class II shares of the Portfolio (see Note 4). Class I shares do not pay distribution fees.
Income, common expenses (excluding transfer agent and distribution fees) and realized and unrealized gains and losses are calculated at the Portfolio level and allocated daily to each class of shares based on its respective percentage of adjusted net assets at the beginning of the day.
All expenses and fees paid to the Portfolio’s transfer agent for its services are allocated between the classes of shares based on the number of accounts in each class and the ratable allocation of related out-of-pocket expenses (see Note 3).
The Portfolio declares as daily dividends substantially all of its net investment income. All dividends are paid on a monthly basis. Short-term capital gain distributions, if any, may be declared with the daily dividends. Distributions paid by the Portfolio with respect to each class of shares are calculated in the same manner and at the same time, except that net investment income dividends to Class I and Class II shares can reflect different transfer agent and distribution expense rates. Dividends and distributions to shareowners are recorded on the ex-dividend date.
F. Risks
The value of securities held by the Portfolio may go up or down, sometimes rapidly or unpredictably, due to general market conditions, such as real or perceived adverse economic, political or regulatory conditions, recessions, the spread of infectious illness or other public health issues, inflation, changes in interest rates, lack of liquidity in the bond markets or adverse investor sentiment. In the past several years, financial markets have experienced increased volatility, depressed valuations, decreased liquidity and heightened uncertainty. These conditions may continue, recur, worsen or spread. A general rise in interest rates could adversely affect the price and liquidity of fixed-income securities and could also result in increased redemptions from the Portfolio.
At times, the Portfolio’s investments may represent industries or industry sectors that are interrelated or have common risks, making the Portfolio more susceptible to any economic, political, or regulatory developments or other risks affecting those industries and sectors. The Portfolio’s investments in foreign markets and countries with limited developing markets may subject the Portfolio to a greater degree of risk than investments in a developed market. These risks include disruptive political or economic conditions and the imposition of adverse governmental laws or currency exchange restrictions.
The Portfolio invests in below-investment-grade (high-yield) debt securities and preferred stocks. Some of these high-yield securities may be convertible into equity securities of the issuer. Debt securities rated below-investment-grade are commonly referred to as “junk bonds” and are considered speculative. These securities involve greater risk of loss, are subject to greater price volatility, and are less liquid, especially during periods of economic uncertainty or change, than higher rated debt securities.
With the increased use of technologies such as the Internet to conduct business, the Portfolio is susceptible to operational, information security and related risks. While the Portfolio’s Adviser has established business continuity plans in the event of, and risk management systems to prevent, limit or mitigate, such cyber-attacks, there are inherent limitations in such plans and systems, including the possibility that certain risks have not been identified. Furthermore, the Portfolio cannot control the cybersecurity plans and systems put in place by service providers to the Portfolio such as Brown Brothers Harriman & Co., the Portfolio’s custodian and accounting agent, and DST Asset Manager Solutions, Inc., the Portfolio’s transfer agent. In addition, many beneficial owners of Portfolio shares hold them through accounts at broker-dealers, retirement platforms and other financial market participants over which neither the Portfolio nor Amundi Pioneer exercises control. Each of these may in turn rely on service providers to them, which are also subject to the risk of cyber-attacks. Cybersecurity failures or breaches at Amundi Pioneer or the Portfolio’s service providers or intermediaries have the ability to cause disruptions and impact business operations, potentially resulting in financial losses, interference with the Portfolio’s ability to calculate its net asset value, impediments to trading, the inability of Portfolio shareowners to effect share purchases, redemptions or exchanges or receive distributions, loss of or unauthorized access to private shareowner information and violations of applicable privacy and other laws, regulatory fines, penalties, reputational damage, or additional compliance costs. Such costs and losses may not be covered under any insurance. In addition, maintaining vigilance against cyber-attacks may
46
| Pioneer Bond VCT Portfolio | PIONEER VARIABLE CONTRACTS TRUST |
involve substantial costs over time, and system enhancements may themselves be subject to cyber-attacks.
COVID-19
The respiratory illness COVID-19 caused by a novel coronavirus has resulted in a global pandemic and major disruption to economies and markets around the world, including the United States. Global financial markets have experienced extreme volatility and severe losses, and trading in many instruments has been disrupted. Liquidity for many instruments has been greatly reduced for periods of time. Some interest rates are very low and in some cases yields are negative. Some sectors of the economy and individual issuers have experienced particularly large losses. These circumstances may continue for an extended period of time, and may continue to affect adversely the value and liquidity of the Portfolio’s investments. The ultimate economic fallout from the pandemic, and the long-term impact on economies, markets, industries and individual issuers, are not known. Governments and central banks, including the Federal Reserve in the U.S., have taken extraordinary and unprecedented actions to support local and global economies and the financial markets. These actions have resulted in significant expansion of public debt, including in the U.S. The impact of these measures, and whether they will be effective to mitigate the economic and market disruption, will not be known for some time. The consequences of high public debt, including its future impact on the economy and securities markets, likewise may not be known for some time.
The Portfolio’s prospectus contains unaudited information regarding the Portfolio’s principal risks. Please refer to that document when considering the Portfolio’s principal risks.
G. Insurance-Linked Securities (“ILS”)
The Portfolio invests in ILS. The Portfolio could lose a portion or all of the principal it has invested in an ILS, and the right to additional interest or dividend payments with respect to the security, upon the occurrence of one or more trigger events, as defined within the terms of an insurance-linked security. Trigger events, generally, are hurricanes, earthquakes, or other natural events of a specific size or magnitude that occur in a designated geographic region during a specified time period, and/or that involve losses or other metrics that exceed a specific amount. There is no way to accurately predict whether a trigger event will occur, and accordingly, ILS carry significant risk. The Portfolio is entitled to receive principal, and interest and/or dividend payments so long as no trigger event occurs of the description and magnitude specified by the instrument. In addition to the specified trigger events, ILS may expose the Portfolio to other risks, including but not limited to issuer (credit) default, adverse regulatory or jurisdictional interpretations and adverse tax consequences.
The Portfolio’s investments in ILS may include event-linked bonds. ILS also may include special purpose vehicles (“SPVs”) or similar instruments structured to comprise a portion of a reinsurer’s catastrophe-oriented business, known as quota share instruments (sometimes referred to as reinsurance sidecars), or to provide reinsurance relating to specific risks to insurance or reinsurance companies through a collateralized instrument, known as collateralized reinsurance. Structured reinsurance investments also may include industry loss warranties (“ILWs”). A traditional ILW takes the form of a bilateral reinsurance contract, but there are also products that take the form of derivatives, collateralized structures, or exchange-traded instruments.
Where the ILS are based on the performance of underlying reinsurance contracts, the Portfolio has limited transparency into the individual underlying contracts, and therefore must rely upon the risk assessment and sound underwriting practices of the issuer. Accordingly, it may be more difficult for the Adviser to fully evaluate the underlying risk profile of the Portfolio’s structured reinsurance investments, and therefore the Portfolio’s assets are placed at greater risk of loss than if the Adviser had more complete information. Structured reinsurance instruments generally will be considered illiquid securities by the Portfolio. These securities may be difficult to purchase, sell or unwind. Illiquid securities also may be difficult to value. If the Portfolio is forced to sell an illiquid asset, the Portfolio may be forced to sell at a loss.
Additionally, the Portfolio may gain exposure to ILS by investing in a closed-end interval fund, Pioneer ILS Interval Fund, an affiliate of the Adviser. The Portfolio’s investment in Pioneer ILS Interval Fund at June 30, 2020, is listed in the Schedule of Investments.
H. Futures Contracts
The Portfolio may enter into futures transactions in order to attempt to hedge against changes in interest rates, securities prices and currency exchange rates or to seek to increase total return. Futures contracts are types of derivatives. All futures contracts entered into by the Portfolio are traded on a futures exchange. Upon entering into a futures contract, the Portfolio is required
47
| Pioneer Bond VCT Portfolio | PIONEER VARIABLE CONTRACTS TRUST |
NOTES TO FINANCIAL STATEMENTS 6/30/20 (UNAUDITED) | (continued) |
to deposit with a broker an amount of cash or securities equal to the minimum “initial margin” requirements of the associated futures exchange. The amount of cash deposited with the broker as collateral at June 30, 2020, is recorded as “Futures collateral” on the Statement of Assets and Liabilities.
Subsequent payments for futures contracts (“variation margin”) are paid or received by the Portfolio, depending on the daily fluctuation in the value of the contracts, and are recorded by the Portfolio as unrealized appreciation or depreciation. Cash received from or paid to the broker related to previous margin movement is held in a segregated account at the broker and is recorded as either “Due from broker for futures” or “Due to broker for futures” on the Statement of Assets and Liabilities. When the contract is closed, the Portfolio realizes a gain or loss equal to the difference between the opening and closing value of the contract as well as any fluctuation in foreign currency exchange rates where applicable. Futures contracts are subject to market risk, interest rate risk and currency exchange rate risk. Changes in value of the contracts may not directly correlate to the changes in value of the underlying securities. With futures, there is reduced counterparty credit risk to the Portfolio since futures are exchange-traded and the exchange’s clearinghouse, as counterparty to all exchange-traded futures, guarantees the futures against default.
The average market value of futures contracts open during the six months ended June 30, 2020, was $2,106,355. Open futures contracts outstanding at June 30, 2020, are listed in the Schedule of Investments.
I. Credit Default Swap Contracts
A credit default swap is a contract between a buyer of protection and a seller of protection against a predefined credit event or an underlying reference obligation, which may be a single security or a basket or index of securities. The Portfolio may buy or sell credit default swap contracts to seek to increase the Portfolio’s income, or to attempt to hedge the risk of default on portfolio securities. A credit default swap index is used to hedge risk or take a position on a basket of credit entities or indices.
As a seller of protection, the Portfolio would be required to pay the notional (or other agreed-upon) value of the referenced debt obligation to the counterparty in the event of a default by a U.S. or foreign corporate issuer of a debt obligation, which would likely result in a loss to the Portfolio. In return, the Portfolio would receive from the counterparty a periodic stream of payments during the term of the contract, provided that no event of default occurred. The maximum exposure of loss to the seller would be the notional value of the credit default swaps outstanding. If no default occurs, the Portfolio would keep the stream of payments and would have no payment obligation. The Portfolio may also buy credit default swap contracts in order to hedge against the risk of default of debt securities, in which case the Portfolio would function as the counterparty referenced above.
As a buyer of protection, the Portfolio makes an upfront or periodic payment to the protection seller in exchange for the right to receive a contingent payment. An upfront payment made by the Portfolio, as the protection buyer, is recorded within the “Swap contracts, at value” line item on the Statement of Assets and Liabilities. Periodic payments received or paid by the Portfolio are recorded as realized gains or losses on the Statement of Operations.
Credit default swap contracts are marked-to-market daily using valuations supplied by independent sources, and the change in value, if any, is recorded within the “Swap contracts, at value” line item on the Statement of Assets and Liabilities. Payments received or made as a result of a credit event or upon termination of the contract are recognized, net of the appropriate amount of the upfront payment, as realized gains or losses on the Statement of Operations.
Credit default swap contracts involving the sale of protection may involve greater risks than if the Portfolio had invested in the referenced debt instrument directly. Credit default swap contracts are subject to general market risk, liquidity risk, counterparty risk and credit risk. If the Portfolio is a protection buyer and no credit event occurs, it will lose its investment. If the Portfolio is a protection seller and a credit event occurs, the value of the referenced debt instrument received by the Portfolio, together with the periodic payments received, may be less than the amount the Portfolio pays to the protection buyer, resulting in a loss to the Portfolio. In addition, obligations under sell protection credit default swaps may be partially offset by net amounts received from settlement of buy protection credit default swaps entered into by the Portfolio for the same reference obligation with the same counterparty.
Certain swap contracts that are cleared through a central clearinghouse are referred to as centrally cleared swaps. All payments made or received by the Portfolio are pursuant to a centrally cleared swap contract with the central clearing party rather than the original counterparty. Upon entering into a centrally cleared swap contract, the Portfolio is required to make
48
| Pioneer Bond VCT Portfolio | PIONEER VARIABLE CONTRACTS TRUST |
an initial margin deposit, either in cash or in securities. The daily change in value on open centrally cleared contracts is recorded as “Variation margin for centrally cleared swap contracts” on the Statement of Assets and Liabilities. Cash received from or paid to the broker related to previous margin movement is held in a segregated account at the broker and is recorded as either “Due from broker for swaps” or “Due to broker for swaps” on the Statement of Assets and Liabilities. The amount of cash deposited with a broker as collateral at June 30, 2020, is recorded as “Swaps collateral” on the Statement of Assets and Liabilities.
The average market value of credit default swap contracts open during the six months ended June 30, 2020, was $131,576. Open credit default swap contracts at June 30, 2020, are listed in the Schedule of Investments.
2. Management Agreement
The Adviser manages the Portfolio. Management fees are paid monthly and calculated daily at the annual rate of 0.40% of the Portfolio’s average daily net assets. For the six months ended June 30, 2020, the effective management fee (excluding waivers and/or assumption of expenses and acquired fund fees and expenses) was equivalent to 0.40% (annualized) of the Portfolio’s average daily net assets.
The Adviser has agreed to waive its management fee with respect to any portion of the Portfolio’s assets invested in Pioneer ILS Interval Fund, an affiliated fund managed by the Adviser. For the six months ended June 30, 2020, the Adviser waived $23,571 in management fees with respect to the Portfolio, which is reflected on the Statement of Operations as an expense waiver.
The Adviser has contractually agreed to limit ordinary operating expenses (ordinary operating expenses means all Portfolio expenses other than extraordinary expenses, such as litigation, taxes, brokerage commissions and acquired fund fees and expenses) of the Portfolio to the extent required to reduce Portfolio expenses to 0.62% of the average daily net assets attributable to Class I shares. Class II shares expenses will be reduced only to the extent Portfolio-wide expenses are reduced for Class I shares. Fees waived and expenses reimbursed during the six months ended June 30, 2020, if any, are reflected on the Statement of Operations. This expense limitation is in effect through May 1, 2021. There can be no assurance that the Adviser will extend the expense limitation agreement for a class of shares beyond the date referred to above.
In addition, under the management and administration agreements, certain other services and costs, including accounting, regulatory reporting and insurance premiums, are paid by the Portfolio as administrative reimbursements. Included in “Due to affiliates” reflected on the Statement of Assets and Liabilities is $5,584 in management fees, administrative costs and certain other reimbursements payable to the Adviser at June 30, 2020.
3. Transfer Agent
DST Asset Manager Solutions, Inc. serves as the transfer agent to the Portfolio at negotiated rates. Transfer agent fees and payables shown on the Statement of Operations and the Statement of Assets and Liabilities, respectively, include sub-transfer agent expenses incurred through the Portfolio’s omnibus relationship contracts.
4. Distribution Plan
The Portfolio has adopted a distribution plan (the “Plan”) pursuant to Rule 12b-1 of the Investment Company Act of 1940 with respect to its Class II shares. Pursuant to the Plan, the Portfolio pays the Distributor 0.25% of the average daily net assets attributable to Class II shares to compensate the Distributor for (1) distribution services and (2) personal and account maintenance services performed and expenses incurred by the Distributor in connection with the Portfolio’s Class II shares. Included in “Due to affiliates” reflected on the Statement of Assets and Liabilities is $4,501 in distribution fees payable to the Distributor at June 30, 2020.
5. Additional Disclosures about Derivative Instruments and Hedging Activities
The Portfolio’s use of derivatives may enhance or mitigate the Portfolio’s exposure to the following risks:
Interest rate risk relates to the fluctuations in the value of interest-bearing securities due to changes in the prevailing levels of market interest rates.
Credit risk relates to the ability of the issuer of a financial instrument to make further principal or interest payments on an obligation or commitment that it has to the Portfolio.
Foreign exchange rate risk relates to fluctuations in the value of an asset or liability due to changes in currency exchange rates.
Equity risk relates to the fluctuations in the value of financial instruments as a result of changes in market prices (other than those arising from interest rate risk or foreign exchange rate risk), whether caused by factors specific to an individual investment, its issuer, or all factors affecting all instruments traded in a market or market segment.
Commodity risk relates to the risk that the value of a commodity or commodity index will fluctuate based on increases or decreases in the commodities market and factors specific to a particular industry or commodity.
49
| Pioneer Bond VCT Portfolio | PIONEER VARIABLE CONTRACTS TRUST |
NOTES TO FINANCIAL STATEMENTS 6/30/20 (UNAUDITED) | (continued) |
The fair value of open derivative instruments (not considered to be hedging instruments for accounting disclosure purposes) by risk exposure at June 30, 2020, was as follows:
| Statement of Assets | Interest | Credit | Foreign | Equity | Commodity | |||||||||||||||
| and Liabilities | Rate Risk | Risk | Exchange Rate Risk | Risk | Risk | |||||||||||||||
| Liabilities | ||||||||||||||||||||
| Net unrealized | �� | |||||||||||||||||||
| depreciation on | ||||||||||||||||||||
| futures contracts | $ | 100,421 | $ | – | $ | – | $ | – | $ | – | ||||||||||
| Swap contracts, | ||||||||||||||||||||
| at value | – | 33,332 | – | – | – | |||||||||||||||
| Total Value | $ | 100,421 | $ | 33,332 | $ | – | $ | – | $ | – | ||||||||||
The effect of derivative instruments (not considered to be hedging instruments for accounting disclosure purposes) on the Statement of Operations by risk exposure at June 30, 2020 was as follows:
| Statement of | Interest | Credit | Foreign | Equity | Commodity | |||||||||||||||
| Operations | Rate Risk | Risk | Exchange Rate Risk | Risk | Risk | |||||||||||||||
| Net realized | ||||||||||||||||||||
| gain (loss) on: | ||||||||||||||||||||
| Futures contracts | $ | (156,842 | ) | $ | -- | $ | – | $ | – | $ | – | |||||||||
| Swap contracts | – | (95,478 | ) | – | – | – | ||||||||||||||
| Total Value | $ | (156,842 | ) | $ | (95,479 | ) | $ | – | $ | – | $ | – | ||||||||
| Change in net | ||||||||||||||||||||
| unrealized appreciation | ||||||||||||||||||||
| (depreciation) on: | ||||||||||||||||||||
| Futures contracts | $ | (117,319 | ) | $ | – | $ | – | $ | – | $ | – | |||||||||
| Swap contracts | – | 25,632 | – | – | – | |||||||||||||||
| Total Value | $ | (117,319 | ) | $ | 25,632 | $ | – | $ | – | $ | – | |||||||||
50
| Pioneer Bond VCT Portfolio | PIONEER VARIABLE CONTRACTS TRUST |
As required by law, the Portfolio has adopted and implemented a liquidity risk management program (the “Program”) that is designed to assess and manage liquidity risk. Liquidity risk is the risk that the Portfolio could not meet requests to redeem its shares without significant dilution of remaining investors’ interests in the Portfolio. The Portfolio’s Board of Trustees designated a liquidity risk management committee (the “Committee”) consisting of employees of Amundi Pioneer Asset Management, Inc. (the “Adviser”) to administer the Program.
The Committee provided the Board of Trustees with a report that addressed the operation of the Program and assessed its adequacy and effectiveness of implementation (the “Report”). The Report covered the period from December 1, 2018 through March 31, 2020 (the “Reporting Period”).
The Report confirmed that, throughout the Reporting Period, the Committee had monitored the Portfolio’s portfolio liquidity and liquidity risk on an ongoing basis, as described in the Program and in Board reporting throughout the Reporting Period.
The Report discussed the Committee’s annual review of the Program, which addressed, among other things, the following elements of the Program:
The Committee reviewed the Portfolio’s investment strategy and liquidity of portfolio investments during both normal and reasonably foreseeable stressed conditions. The Committee noted that the Portfolio’s investment strategy continues to be appropriate for an open-end fund, taking into account, among other things, whether and to what extent the Portfolio held less liquid and illiquid assets and the extent to which any such investments affected the Portfolio’s ability to meet redemption requests. In managing and reviewing the Portfolio’s liquidity risk, the Committee also considered the extent to which the Portfolio’s investment strategy involves a relatively concentrated portfolio or large positions in particular issuers, the extent to which the Portfolio uses borrowing for investment purposes, and the extent to which the Portfolio uses derivatives (including for hedging purposes). The Committee also reviewed the Portfolio’s short-term and long-term cash flow projections during both normal and reasonably foreseeable stressed conditions. In assessing the Portfolio’s cash flow projections, the Committee considered, among other factors, historical net redemption activity, redemption policies, ownership concentration, distribution channels, and the degree of certainty associated with the Portfolio’s short-term and long-term cash flow projections. The Committee also considered the Portfolio’s holdings of cash and cash equivalents, as well as borrowing arrangements and other funding sources, including, if applicable, the Portfolio’s participation in a credit facility, as components of the Portfolio’s ability to meet redemption requests. The Portfolio has adopted an in-kind redemption policy which may be utilized to meet larger redemption requests.
The Committee reviewed the Program’s liquidity classification methodology for categorizing the Portfolio’s investments into one of four liquidity buckets. In reviewing the Portfolio’s investments, the Committee considered, among other factors, whether trading varying portions of a position in a particular portfolio investment or asset class in sizes the Portfolio would reasonably anticipate trading, would be reasonably expected to significantly affect liquidity.
The Committee performed an analysis to determine whether the Portfolio is required to maintain a Highly Liquid Investment Minimum, and determined that no such minimum is required because the Portfolio primarily holds highly liquid investments.
The Report stated that the Committee concluded the Program operates adequately and effectively, in all material respects, to assess and manage the Portfolio’s liquidity risk throughout the Reporting Period.
51
This page was intentionally left blank.
52
Officers Lisa M. Jones, President and Chief Executive Officer Mark E. Bradley, Treasurer and Chief Financial and Accounting Officer Christopher J. Kelley, Secretary and Chief Legal Officer Investment Adviser and Administrator Amundi Pioneer Asset Management, Inc. Custodian and Sub-Administrator Brown Brothers Harriman & Co. Principal Underwriter Amundi Pioneer Distributor, Inc. Legal Counsel Morgan, Lewis & Bockius LLP Transfer Agent DST Asset Manager Solutions, Inc. | Trustees Thomas J. Perna, Chairman John E. Baumgardner, Jr. Diane Durnin Benjamin M. Friedman Lisa M. Jones Lorraine H. Monchak Marguerite A. Piret Fred J. Ricciardi Kenneth J. Taubes |
53
Proxy Voting Policies and Procedures of the Portfolio are available without charge, upon request, by calling our toll free number (1-800-225-6292). Information regarding how the Portfolio voted proxies relating to Portfolio securities during the most recent 12-month period ended June 30 is publicly available to shareowners at www.amundipioneer.com/us. This information is also available on the Securities and Exchange Commission’s web site at www.sec.gov.
19617-14-0820
PIONEER VARIABLE CONTRACTS TRUST
Pioneer Equity Income VCT Portfolio – Class I and II Shares
Pioneer Equity Income VCT Portfolio – Class I and II Shares
Beginning in February 2021, as permitted by regulations adopted by the Securities and Exchange Commission, you may not be receiving paper copies of the Portfolio’s shareholder reports like this one by mail, unless you specifically request paper copies of the reports from the insurance company that offers your variable annuity or variable life insurance contract or from your financial intermediary. Instead, the insurance company may choose to make the reports available on a website, and will notify you by mail each time a shareholder report is posted and provide you with a website link to access the report. Instructions for requesting paper copies will be provided by your insurance company.
If you already elected to receive shareholder reports electronically, you will not be affected by this change and you need not take any action. You may elect to receive shareholder reports and other communications from the insurance company or your financial intermediary electronically by following the instructions provided by the insurance company or by contacting your financial intermediary.
You may elect to receive all future Portfolio shareholder reports in paper free of charge from the insurance company. You can inform the insurance company or your financial intermediary that you wish to continue receiving paper copies of your shareholder reports by following the instructions provided by the insurance company or by contacting your financial intermediary. Your election to receive reports in paper will apply to all funds available under your contract with the insurance company.
SEMIANNUAL REPORT
June 30, 2020
June 30, 2020
Please refer to your contract prospectus to determine the applicable share class offered under your contract.
PIONEER VARIABLE CONTRACTS TRUST
Pioneer Equity Income VCT Portfolio | |
This report is authorized for distribution only when preceded or accompanied by a prospectus for the Portfolio being offered.
Pioneer Variable Contracts Trust files a complete schedule of portfolio holdings with the Securities and Exchange Commission for the first and third quarters of each fiscal year as an exhibit to its reports on Form N-PORT. Shareholders may view the filed Form N-PORT by visiting the Commission’s web site at https://www.sec.gov.
| Pioneer Equity Income VCT Portfolio | PIONEER VARIABLE CONTRACTS TRUST |
Sector Distribution
(As a percentage of total investments)*
(As a percentage of total investments)*

5 Largest Holdings
(As a percentage of total investments)*
(As a percentage of total investments)*
| 1. | AstraZeneca Plc (A.D.R.) | 2.70% |
| 2. | Eli Lilly & Co. | 2.63 |
| 3. | Verizon Communications, Inc. | 2.33 |
| 4. | Abbott Laboratories | 2.15 |
| 5. | Mondelez International, Inc. | 2.06 |
* Excludes temporary cash investments and all derivative contracts except for options purchased. The Portfolio is actively managed, and current holdings may be different. The holdings listed should not be considered recommendations to buy or sell any securities.
PERFORMANCE UPDATE 6/30/20
Prices and Distributions
Prices and Distributions
| Net Asset Value per Share | 6/30/20 | 12/31/19 |
| Class I | $13.38 | $16.65 |
| Class II | $13.62 | $16.92 |
| Net | |||
| Distributions per Share | Investment | Short-Term | Long-Term |
| (1/1/20 – 6/30/20) | Income | Capital Gains | Capital Gains |
| Class I | $0.2100 | $ – | $0.5737 |
| Class II | $0.1900 | $ – | $0.5737 |
Performance of a $10,000 Investment
The following chart shows the change in value of an investment made in Class I and Class II shares of Pioneer Equity Income VCT Portfolio at net asset value during the periods shown, compared to that of the Russell 1000 Value Index. Portfolio returns are based on net asset value and do not reflect any applicable insurance fees or surrender charges.

The Russell 1000 Value Index is an unmanaged index that measures the performance of large-cap U.S. value stocks. Index returns are calculated monthly, assume reinvestment of dividends and, unlike Portfolio returns, do not reflect any fees, expenses or sales charges. It is not possible to invest directly in an index.
Average Annual Total Returns
(As of June 30, 2020)
| Russell 1000 | |||
| Class I | Class II | Value Index | |
10 Years | 10.96% | 10.69% | 10.41% |
5 Years | 6.41% | 6.17% | 4.64% |
1 Year | -6.47% | -6.63% | -8.84% |
All total returns shown assume reinvestment of distributions at net asset value.
The performance table does not reflect the deduction of taxes that a shareowner would pay on distributions or the redemption of shares.
Call 1-800-688-9915 or visit www.amundipioneer.com/us for the most recent month-end performance results. Current performance may be lower or higher than the performance data quoted.
The performance data quoted represents past performance, which is no guarantee of future results. Investment return and principal value will fluctuate, and shares, when redeemed, may be worth more or less than their original cost.
The returns for the Portfolio do not reflect the deduction of expenses associated with variable products, such as mortality and expense risk charges, separate account charges, and sales charges. These expenses would reduce the overall returns shown.
Performance results reflect any applicable expense waivers in effect during the periods shown. Without such waivers performance would be lower. Waivers may not be in effect for all portfolios. Certain fee waivers are contractual through a specified period. Otherwise, fee waivers can be rescinded at any time. See the prospectus and financial statements for more information.
2
| Pioneer Equity Income VCT Portfolio | PIONEER VARIABLE CONTRACTS TRUST |
As a shareowner in the Portfolio, you incur two types of costs:
(1) ongoing costs, including management fees, distribution and/or service (12b-1) fees, and other Portfolio expenses; and
(2) transaction costs, including sales charges (loads) on purchase payments.
This example is intended to help you understand your ongoing expenses (in dollars) of investing in the Portfolio and to compare these costs with the ongoing costs of investing in other mutual funds offered through your variable annuity contract. The example is based on an investment of $1,000 at the beginning of the Portfolio’s latest six-month period and held throughout the six months.
Using the Tables
Actual Expenses
The first table below provides information about actual account values and actual expenses. You may use the information in this table, together with the amount you invested, to estimate the expenses that you paid over the period as follows:
1. Divide your account value by $1,000
Example: an $8,600 account value ÷ $1,000 = 8.6
2. Multiply the result in (1) above by the corresponding share class’s number in the third row under the heading entitled “Expenses Paid During Period” to estimate the expenses you paid on your account during this period.
Expenses Paid on a $1,000 Investment in Pioneer Equity Income VCT Portfolio
Based on actual returns from January 1, 2020 through June 30, 2020.
| Share Class | I | II |
Beginning Account Value on 1/1/20 | $1,000.00 | $1,000.00 |
Ending Account Value on 6/30/20 | $851.80 | $851.10 |
Expenses Paid During Period* | $3.64 | $4.79 |
* Expenses are equal to the Portfolio’s annualized expense ratio of 0.79%, 1.04% for Class I and II respectively, multiplied by the average account value over the period, multiplied by 182/366 (to reflect the one-half year period).
Hypothetical Example for Comparison Purposes
The table below provides information about hypothetical account values and hypothetical expenses based on the Portfolio’s actual expense ratio and an assumed rate of return of 5% per year before expenses, which is not the Portfolio’s actual return. The hypothetical account values and expenses may not be used to estimate the actual ending account balance or expenses you paid for the period.
You may use this information to compare the ongoing costs of investing in the Portfolio and other variable annuities. To do so, compare this 5% hypothetical example with the 5% hypothetical examples that appear in the shareholder reports of the other variable annuities.
Please note that the expenses shown in the tables are meant to highlight your ongoing costs only and do not reflect any transaction costs, such as sales charges (loads) that are charged at the time of the transaction. Therefore, the table below is useful in comparing ongoing costs only and will not help you determine the relative total costs of owning different variable annuities. In addition, if these transaction costs were included, your costs would have been higher.
Expenses Paid on a $1,000 Investment in Pioneer Equity Income VCT Portfolio
Based on a hypothetical 5% per year return before expenses, reflecting the period from January 1, 2020 through June 30, 2020.
| Share Class | I | II |
Beginning Account Value on 1/1/20 | $1,000.00 | $1,000.00 |
Ending Account Value on 6/30/20 | $1,020.93 | $1,019.69 |
Expenses Paid During Period* | $3.97 | $5.22 |
* Expenses are equal to the Portfolio’s annualized expense ratio of 0.79%, 1.04% for Class I and II respectively, multiplied by the average account value over the period, multiplied by 182/366 (to reflect the one-half year period).
3
| Pioneer Equity Income VCT Portfolio | PIONEER VARIABLE CONTRACTS TRUST |
A Word About Risk:
All investments are subject to risk, including the possible loss of principal. In the past several years, financial markets have experienced increased volatility and heightened uncertainty. The market prices of securities may go up or down, sometimes rapidly or unpredictably, due to general market conditions, such as real or perceived adverse economic, political, or regulatory conditions, recessions, inflation, changes in interest or currency rates, lack of liquidity in the bond markets, the spread of infectious illness or other public health issues or adverse investor sentiment. These conditions may continue, recur, worsen or spread.
Investing in foreign and/or emerging markets securities involves risks relating to interest rates, currency exchange rates, economic, and political conditions.
The Portfolio invests in REIT securities, the value of which can fall for a variety of reasons, such as declines in rental income, fluctuating interest rates, poor property management, environmental liabilities, uninsured damage, increased competition, or changes in real estate tax laws.
At times, the Portfolio’s investments may represent industries or industry sectors that are interrelated or have common risks, making the Portfolio more susceptible to any economic, political, or regulatory developments or other risks affecting those industries and sectors.
These risks may increase share price volatility.
Call 1-800-688-9915 or visit www.amundipioneer.com/us for the most recent month-end performance results. Current performance may be lower or higher than the performance data quoted.
The performance data quoted represents past performance, which is no guarantee of future results. Investment return and principal value will fluctuate, and shares, when redeemed, may be worth more or less than their original cost.
The returns for the Portfolio do not reflect the deduction of expenses associated with variable products, such as mortality and expense risk charges, separate account charges, and sales charges. These expenses would reduce the overall returns shown.
Performance results reflect any applicable expense waivers in effect during the periods shown. Without such waivers performance would be lower. Waivers may not be in effect for all portfolios. Certain fee waivers are contractual through a specified period. Otherwise, fee waivers can be rescinded at any time. See the prospectus and financial statements for more information.
In the following interview, John A. Carey and Sammi Truong discuss the market environment for equities and the factors that affected the performance of Pioneer Equity Income VCT Portfolio during the six-month period ended June 30, 2020. Mr. Carey, Managing Director, Director of Equity Income, U.S., and a portfolio manager at Amundi Pioneer Asset Management, Inc. (Amundi Pioneer), Ms. Truong, a vice president and a portfolio manager at Amundi Pioneer, and Walter Hunnewell, Jr., a vice president and a portfolio manager at Amundi Pioneer, are responsible for the day-to-day management of the Portfolio.
Q: How did the Portfolio perform over the six-month period ended June 30, 2020?
A: Pioneer Equity Income VCT Portfolio’s Class I shares returned -14.82% at net asset value during the six-month period ended June 30, 2020, and Class II shares returned -14.89%, while the Portfolio’s benchmark, the Russell 1000 Value Index, returned -16.26%.
Q: How would you describe the market for equities during the six-month period ended June 30, 2020, particularly for the types of equities deemed appropriate for the Portfolio?
A: The six-month period was quite volatile and unprecedented. At the outset of the period, which coincided with the beginning of the 2020 calendar year, the stock market seemed poised to continue an upward trend that saw equities achieve new highs towards the end of 2019, as trade tensions between the United States and China appeared to be easing. Discussions between the two countries had led to the signing of the Phase One trade deal in January 2020, in which China agreed to buy at least $200 billion more in U.S. products and services by 2021, and committed to stronger protection for intellectual property rights. In exchange, the United States agreed to roll back certain tariffs on Chinese goods.
However, optimism for economic growth quickly faded with the emergence of the coronavirus (COVID-19), which began to spread from China to other countries at an alarming pace. As governments around the world, including inside the U.S., shut down large swaths of their economies by putting restrictions in place to curtail the spread of the virus, business conditions deteriorated and unemployment surged. The stock market plunged by more than 30% during the initial stages of the COVID-19 crisis as virus concerns increased and containment measures expanded, before bouncing off its lows towards the end of the first quarter and then rallying in the second quarter, with positive momentum driven by hopes that government and central-bank stimulus measures around the globe could help to stabilize economic conditions.
Growth stocks widened their performance lead over value stocks during the six-month period, as investors continued to emphasize shares of growth names perceived to be less tied to the economic cycle in the uncertain environment. The Russell 1000 Growth Index advanced by 9.81% for the six-month period, while the Portfolio’s benchmark, the Russell 1000 Value Index (the Russell Index), declined by more than 16% during the same timeframe. Despite those performance numbers, we have continued to believe that many value stocks present potentially attractive long-term return prospects.
4
| Pioneer Equity Income VCT Portfolio | PIONEER VARIABLE CONTRACTS TRUST |
Q: Could you please discuss the main factors that affected the Portfolio’s benchmark-relative performance during the six-month period ended June 30, 2020, and discuss any investments or strategies that significantly helped or hurt benchmark-relative returns?
A: The Portfolio’s performance during the six-month period, while negative, did outpace the performance of the benchmark Russell Index. Benchmark-relative performance attributable to sector allocations was neutral during the period.
With regard to individual Portfolio holdings, Eli Lilly (health care), AstraZeneca (health care), and Clorox (consumer staples) were top positive contributors to the Portfolio’s benchmark-relative returns during the six-month period, while Cedar Fair (consumer discretionary), Occidental Petroleum (energy), and Nordstrom (consumer discretionary) were detractors from relative performance.
Cedar Fair, an amusement-park operator, had seen a strong start to the calendar year before the COVID-19 pandemic led the company to close its parks to help stem the spread of the virus. We have remained patient, however, as we believe the company could be able to maintain its liquidity through 2021 and weather the tumultuous conditions. Nordstrom has continued to face trouble as a “brick-and-mortar” retailer, a sub-sector already beset by problems due to the emergence of e-commerce. COVID-19 has served to exacerbate those headwinds as stores have closed and consumers have refrained from making discretionary purchases. Occidental Petroleum saw its share price decline during the six-month period, with demand for gasoline plunging as many people sheltered in place. We exited the Portfolio’s positions in both Nordstrom and Occidental Petroleum during the six-month period, judging that the longer-term as well as shorter-term prospects for both companies had become impaired.
On the positive side, the Portfolio’s pharmaceutical holdings, particularly Eli Lilly and AstraZeneca, performed well, as the companies have continued to show prospects for growth in pharmaceutical products. Clorox, too, saw its share price rise on higher demand for its disinfecting and other stay-at-home products, such as water filters and trash bags.
Q: Could you highlight some of the more notable changes you made to the Portfolio during the six-month period ended June 30, 2020?
A: During the six-month period, we added five positions to the Portfolio, and exited a dozen positions. In consumer discretionary, we sold out of Nordstrom and Intercontinental Group, and initiated a position in TJX. With its robust balance sheet, we see opportunities for off-price operator TJX to potentially gain an additional share of the consumer’s wallet from weaker, mall-based retailers over the long-term. We liquidated the Portfolio’s position in Occidental Petroleum and scaled back investments in the energy sector in general due to oil supply-demand concerns. Another notable change was our reduction of the Portfolio’s exposure to the financials sector. We exited positions in Comerica, Discover Financial, and Huntington Bancshares during the six-month period, while initiating a position in Canadian Imperial Bank of Commerce, where we saw better appreciation prospects relative to the company’s current valuation.
5
| Pioneer Equity Income VCT Portfolio | PIONEER VARIABLE CONTRACTS TRUST |
PORTFOLIO MANAGEMENT DISCUSSION 6/30/20 | (continued) |
Other additions to the Portfolio during the six-month period included Caterpillar, in industrials, Digital Realty Trust, in real estate, and American Water Works, in utilities.
Q: Did the Portfolio have any exposure to derivatives during the six-month period ended June 30, 2020?
A: No. The Portfolio had no exposure to derivatives during the period.
Q: The Portfolio typically places emphasis on dividend-paying* stocks. How would you describe the environment for dividends during the six-month period ended June 30, 2020?
A: The dividend yield on the Russell Index increased from about 2.6% at the beginning of the six-month period to 3.1%, while the current yield on the 10-Year U.S. Treasury bond fell by more than a full percentage point. As the yield difference between the two widened, dividend-paying stocks began to appear more attractive to investors seeking current income.
One should note, however, that the dividend yield on the Russell Index increased on the back of share-price declines rather than as a result of companies raising their dividends. Indeed, in an effort to preserve cash through economic uncertainty, a number of companies announced dividend suspensions or cuts. We think it is even more prudent during this uncertain time to take a cautious approach, and we have continued to focus on investments in areas of the market where we believe future dividend growth is possible, rather than on stocks that may be offering high current yield potential.
Q: What is your outlook for equities as the U.S. economy continues to deal with the effects of the COVID-19 situation?
A: With the sharp drop in revenues at many companies due to the virus-related shutdowns, current expectations are that corporate earnings reports for the second quarter could be very weak. Many companies have actually withdrawn earnings guidance for the year, as the economic effects of COVID-19 have remained uncertain and dependent on the duration of the crisis. Absent a cure or a vaccine for COVID-19, which would take time to develop, we suspect that consumers will need to adjust to this new way of life — where social distancing is the norm and avoidance of large crowds could continue.
We are cautious on the stock market, and so we are paying even more attention than usual to financial strength and business resilience when picking investments for the Portfolio.
Thank you for your support.
* Dividends are not guaranteed.
Please refer to the Schedule of Investments on pages 7 to 9 for a full listing of Portfolio securities.
Past performance is no guarantee of future results.
Any information in this shareholder report regarding market or economic trends or the factors influencing the Portfolio’s historical or future performance are statements of opinion as of the date of this report.
6
| Pioneer Equity Income VCT Portfolio | PIONEER VARIABLE CONTRACTS TRUST |
| Shares | Value | ||
| UNAFFILIATED ISSUERS – 98.7% | |||
| COMMON STOCKS – 97.7% | |||
| of Net Assets | |||
| Aerospace & Defense – 0.2% | |||
| 3,971 | Raytheon Technologies Corp. | $ 244,693 | |
| Total Aerospace & Defense | $ 244,693 | ||
| Air Freight & Logistics – 0.5% | |||
| 6,878 | CH Robinson Worldwide, Inc. | $ 543,775 | |
| Total Air Freight & | |||
| Logistics | $ 543,775 | ||
| Auto Components – 1.3% | |||
| 35,797 | BorgWarner, Inc. | $ 1,263,634 | |
| Total Auto Components | $ 1,263,634 | ||
| Banks – 6.3% | |||
| 75,970 | Bank of America Corp. | $ 1,804,288 | |
| 6,804 | Canadian Imperial Bank of Commerce | 455,664 | |
| 9,071 | JPMorgan Chase & Co. | 853,218 | |
| 9,164 | M&T Bank Corp. | 952,781 | |
| 12,376 | PNC Financial Services Group, Inc. | 1,302,079 | |
| 27,617 | Truist Financial Corp. | 1,037,018 | |
| Total Banks | $ 6,405,048 | ||
| Capital Markets – 6.4% | |||
| 33,871 | Bank of New York Mellon Corp. | $ 1,309,114 | |
| 21,911 | Morgan Stanley | 1,058,301 | |
| 11,528 | Northern Trust Corp. | 914,632 | |
| 19,086 | State Street Corp. | 1,212,915 | |
| 15,805 | T Rowe Price Group, Inc. | 1,951,918 | |
| Total Capital Markets | $ 6,446,880 | ||
| Chemicals – 2.7% | |||
| 12,288 | Celanese Corp. | $ 1,060,946 | |
| 6,299 | Corteva, Inc. | 168,750 | |
| 9,433 | Dow, Inc. | 384,489 | |
| 8,664 | DuPont de Nemours, Inc. | 460,318 | |
| 4,251 | FMC Corp. | 423,485 | |
| 4,489 | Johnson Matthey Plc (A.D.R.) | 232,934 | |
| Total Chemicals | $ 2,730,922 | ||
| Commercial Services & | |||
| Supplies – 1.0% | |||
| 9,109 | MSA Safety, Inc. | $ 1,042,434 | |
| Total Commercial Services & | |||
| Supplies | $ 1,042,434 | ||
| Communications | |||
| Equipment – 0.9% | |||
| 19,247 | Cisco Systems, Inc. | $ 897,680 | |
| Total Communications | |||
| Equipment | $ 897,680 | ||
| Distributors – 0.9% | |||
| 10,604 | Genuine Parts Co. | $ 922,124 | |
| Total Distributors | $ 922,124 |
| Shares | Value | ||
| Diversified | |||
| Telecommunication | |||
| Services – 2.8% | |||
| 11,125 | BCE, Inc. | $ 464,691 | |
| 41,937 | Verizon Communications, Inc. | 2,311,987 | |
| Total Diversified | |||
| Telecommunication Services | $ 2,776,678 | ||
| Electric Utilities – 1.7% | |||
| 35,466 | Alliant Energy Corp. | $ 1,696,694 | |
| Total Electric Utilities | $ 1,696,694 | ||
| Electrical Equipment – 0.5% | |||
| 8,517 | Emerson Electric Co. | $ 528,310 | |
| Total Electrical Equipment | $ 528,310 | ||
| Electronic Equipment, | |||
| Instruments & | |||
| Components – 0.8% | |||
| 9,417 | TE Connectivity, Ltd. | $ 767,957 | |
| Total Electronic Equipment, | |||
| Instruments & Components | $ 767,957 | ||
| Equity Real Estate | |||
| Investment Trusts (REITs) – 3.4% | |||
| 11,749 | Alexandria Real Estate Equities, Inc. | $ 1,906,275 | |
| 7,625 | Camden Property Trust | 695,553 | |
| 3,508 | Digital Realty Trust, Inc. | 498,522 | |
| 3,318 | Prologis, Inc. | 309,669 | |
| Total Equity Real Estate | |||
| Investment Trusts (REITs) | $ 3,410,019 | ||
| Food & Staples | |||
| Retailing – 0.8% | |||
| 6,832 | Walmart, Inc. | $ 818,337 | |
| Total Food & Staples | |||
| Retailing | $ 818,337 | ||
| Food Products – 8.5% | |||
| 1,764 | Calavo Growers, Inc. | $ 110,973 | |
| 19,100 | General Mills, Inc. | 1,177,515 | |
| 5,125 | Hershey Co. | 664,303 | |
| 4,654 | JM Smucker Co. | 492,440 | |
| 5,388 | John B Sanfilippo & Son, Inc. | 459,758 | |
| 17,637 | Kellogg Co. | 1,165,100 | |
| 13,953 | Lamb Weston Holdings, Inc. | 892,015 | |
| 4,866 | McCormick & Co., Inc. | 873,009 | |
| 40,010 | Mondelez International, Inc. | 2,045,711 | |
| 6,516 | Nestle S.A. (A.D.R.) | 719,627 | |
| Total Food Products | $ 8,600,451 | ||
| Gas Utilities – 0.4% | |||
| 9,399 | National Fuel Gas Co. | $ 394,100 | |
| Total Gas Utilities | $ 394,100 |
The accompanying notes are an integral part of these financial statements.
7
| Pioneer Equity Income VCT Portfolio | PIONEER VARIABLE CONTRACTS TRUST |
SCHEDULE OF INVESTMENTS 6/30/20 (UNAUDITED) | (continued) |
| Shares | Value | ||
| Health Care Equipment & | |||
| Supplies – 3.6% | |||
| 23,324 | Abbott Laboratories | $ 2,132,513 | |
| 2,759 | Becton Dickinson and Co. | 660,146 | |
| 23,096 | Smith & Nephew Plc (A.D.R.) | 880,420 | |
| Total Health Care Equipment | |||
| & Supplies | $ 3,673,079 | ||
| Health Care Providers & | |||
| Services – 3.9% | |||
| 8,602 | AmerisourceBergen Corp. | $ 866,824 | |
| 2,106 | Anthem, Inc. | 553,836 | |
| 10,825 | CVS Health Corp. | 703,300 | |
| 2,247 | Humana, Inc. | 871,274 | |
| 8,243 | Quest Diagnostics, Inc. | 939,372 | |
| Total Health Care Providers | |||
| & Services | $ 3,934,606 | ||
| Hotels, Restaurants & | |||
| Leisure – 1.2% | |||
| 27,015 | Cedar Fair LP | $ 742,912 | |
| 3,831 | Cracker Barrel Old Country Store, Inc. | 424,896 | |
| Total Hotels, Restaurants & | |||
| Leisure | $ 1,167,808 | ||
| Household Products – 1.4% | |||
| 6,498 | Clorox Co. | $ 1,425,466 | |
| Total Household Products | $ 1,425,466 | ||
| Industrial | |||
| Conglomerates – 1.0% | |||
| 6,686 | Honeywell International, Inc. | $ 966,729 | |
| Total Industrial Conglomerates | $ 966,729 | ||
| Insurance – 6.4% | |||
| 13,095 | Chubb, Ltd. | $ 1,658,089 | |
| 9,934 | Fidelity National Financial, Inc. | 304,576 | |
| 9,606 | First American Financial Corp. | 461,280 | |
| 23,693 | Lincoln National Corp. | 871,665 | |
| 18,330 | Progressive Corp. | 1,468,416 | |
| 45,076 | Sun Life Financial, Inc. | 1,656,543 | |
| Total Insurance | $ 6,420,569 | ||
| IT Services – 2.1% | |||
| 2,185 | Accenture Plc | $ 469,163 | |
| 1,759 | Automatic Data Processing, Inc. | 261,898 | |
| 2,275 | Fidelity National Information | ||
Services, Inc. | 305,055 | ||
| 9,029 | Leidos Holdings, Inc. | 845,746 | |
| 3,555 | Paychex, Inc. | 269,291 | |
| Total IT Services | $ 2,151,153 | ||
| Leisure Products – 0.3% | |||
| 3,981 | Hasbro, Inc. | $ 298,376 | |
| Total Leisure Products | $ 298,376 |
| Shares | Value | ||
| Machinery – 5.1% | |||
| 5,271 | Caterpillar, Inc. | $ 666,782 | |
| 65,047 | Gorman-Rupp Co. | 2,021,661 | |
| 21,184 | Komatsu, Ltd. (A.D.R.) | 433,001 | |
| 20,171 | PACCAR, Inc. | 1,509,799 | |
| 11,477 | Timken Co. | 522,088 | |
| Total Machinery | $ 5,153,331 | ||
| Media – 0.7% | |||
| 17,197 | Comcast Corp. | $ 670,339 | |
| Total Media | $ 670,339 | ||
| Metals & Mining – 4.3% | |||
| 12,842 | Kaiser Aluminum Corp. | $ 945,428 | |
| 14,427 | Materion Corp. | 887,116 | |
| 24,073 | Nucor Corp. | 996,863 | |
| 15,824 | Reliance Steel & Aluminum Co. | 1,502,173 | |
| Total Metals & Mining | $ 4,331,580 | ||
| Multiline Retail – 1.5% | |||
| 12,463 | Target Corp. | $ 1,494,687 | |
| Total Multiline Retail | $ 1,494,687 | ||
| Multi-Utilities – 3.5% | |||
| 13,617 | Ameren Corp. | $ 958,092 | |
| 12,023 | CMS Energy Corp. | 702,384 | |
| 21,089 | WEC Energy Group, Inc. | 1,848,451 | |
| Total Multi-Utilities | $ 3,508,927 | ||
| Oil, Gas & Consumable | |||
| Fuels – 5.4% | |||
| 14,361 | Chevron Corp. | $ 1,281,432 | |
| 16,822 | ConocoPhillips | 706,860 | |
| 27,137 | Exxon Mobil Corp. | 1,213,567 | |
| 17,584 | Phillips 66 | 1,264,290 | |
| 16,078 | Valero Energy Corp. | 945,708 | |
| Total Oil, Gas & | |||
| Consumable Fuels | $ 5,411,857 | ||
| Pharmaceuticals – 8.5% | |||
| 50,799 | AstraZeneca Plc (A.D.R.) | $ 2,686,759 | |
| 15,920 | Eli Lilly & Co. | 2,613,746 | |
| 22,952 | Merck & Co., Inc. | 1,774,878 | |
| 22,162 | Novo Nordisk AS (A.D.R.) | 1,451,168 | |
| Total Pharmaceuticals | $ 8,526,551 | ||
| Semiconductors & | |||
| Semiconductor Equipment – 4.9% | |||
| 8,488 | Analog Devices, Inc. | $ 1,040,968 | |
| 4,110 | Cabot Microelectronics Corp. | 573,509 | |
| 10,118 | KLA-Tencor Corp. | 1,967,749 | |
| 10,733 | Texas Instruments, Inc. | 1,362,769 | |
| Total Semiconductors & | |||
| Semiconductor Equipment | $ 4,944,995 |
The accompanying notes are an integral part of these financial statements.
8
| Pioneer Equity Income VCT Portfolio | PIONEER VARIABLE CONTRACTS TRUST |
| Shares | Value | ||
| Specialty Retail – 1.0% | |||
| 2,046 | Home Depot, Inc. | $ 512,543 | |
| 9,607 | TJX Cos., Inc. | 485,730 | |
| Total Specialty Retail | $ 998,273 | ||
| Textiles, Apparel & | |||
| Luxury Goods – 2.0% | |||
| 12,640 | Carter’s, Inc. | $ 1,020,048 | |
| 15,545 | VF Corp. | 947,312 | |
| Total Textiles, Apparel & | |||
| Luxury Goods | $ 1,967,360 | ||
| Trading Companies & | |||
| Distributors – 1.6% | |||
| 22,926 | Fastenal Co. | $ 982,150 | |
| 80,520 | Ferguson Plc (A.D.R.) | 656,246 | |
| Total Trading Companies & | |||
| Distributors | $ 1,638,396 | ||
| Water Utilities – 0.2% | |||
| 1,822 | American Water Works Co., Inc. | $ 234,419 | |
| Total Water Utilities | $ 234,419 | ||
| TOTAL COMMON STOCKS | |||
(Cost $80,647,813) | $ 98,408,237 |
| Principal | |||
| Amount | |||
| USD ($) | |||
| U.S. GOVERNMENT AND AGENCY | |||
| OBLIGATION – 1.0% of Net Assets | |||
| 1,000,000(a) | U.S. Treasury Bill, 7/7/20 | $ 999,980 | |
| TOTAL U.S. GOVERNMENT AND | |||
| AGENCY OBLIGATION | |||
(Cost $999,978) | $ 999,980 | ||
| TOTAL INVESTMENTS IN | |||
| UNAFFILIATED ISSUERS – 98.7% | |||
(Cost $81,647,791) | $ 99,408,217 | ||
| OTHER ASSETS AND | |||
| LIABILITIES – 1.3% | $ 1,330,518 | ||
| NET ASSETS – 100.0% | $100,738,735 |
REIT | Real Estate Investment Trust. |
(A.D.R.) | American Depositary Receipts. |
(a) | Security issued with a zero coupon. Income is recognized through accretion of discount. |
Purchases and sales of securities (excluding temporary cash investments) for the six months ended June 30, 2020, aggregated $5,933,999 and $15,863,256, respectively.
The Portfolio is permitted to engage in purchase and sale transactions (“cross trades”) with certain funds and accounts for which Amundi Pioneer Asset Management, Inc. (the “Adviser”) serves as the Portfolio’s investment adviser, as set forth in Rule 17a-7 under the Investment Company Act of 1940, pursuant to procedures adopted by the Board of Trustees. Under these procedures, cross trades are effected at current market prices. During the six months ended June 30, 2020, the Portfolio did not engage in any cross trade activity.
At June 30, 2020, the net unrealized appreciation on investments based on cost for federal tax purposes of $81,411,037 was as follows:
| Aggregate gross unrealized appreciation for all investments | ||||
| in which there is an excess of value over tax cost | $ | 23,922,860 | ||
| Aggregate gross unrealized depreciation for all investments | ||||
| in which there is an excess of tax cost over value | (5,925,680 | ) | ||
| Net unrealized appreciation | $ | 17,997,180 | ||
Various inputs are used in determining the value of the Portfolio’s investments. These inputs are summarized in the three broad levels below.
Level 1 – quoted prices in active markets for identical securities.
Level 2 – other significant observable inputs (including quoted prices for similar securities, interest rates, prepayment speeds, credit risks, etc.). See Notes to Financial Statements — Note 1A.
Level 3 – significant unobservable inputs (including the Portfolio’s own assumptions in determining fair value of investments). See Notes to Financial Statements —Note 1A.
The following is a summary of the inputs used as of June 30, 2020, in valuing the Portfolio’s investments:
| Level 1 | Level 2 | Level 3 | Total | |||||||||||||
Common Stocks | $ | 98,408,237 | $ | – | $ | – | $ | 98,408,237 | ||||||||
U.S. Government and | ||||||||||||||||
| Agency Obligation | – | 999,980 | – | 999,980 | ||||||||||||
| Total Investments | ||||||||||||||||
| in Securities | $ | 98,408,237 | $ | 999,980 | $ | – | $ | 99,408,217 | ||||||||
During the six months ended June 30, 2020, there were no transfers between Levels 1, 2 and 3.
The accompanying notes are an integral part of these financial statements.
9
| Pioneer Equity Income VCT Portfolio | PIONEER VARIABLE CONTRACTS TRUST |
| ASSETS: | ||||
| Investments in unaffiliated issuers, at value (cost $81,647,791) | $ | 99,408,217 | ||
| Cash | 1,055,549 | |||
| Foreign currencies, at value (cost $6,499) | 6,102 | |||
| Receivables — | ||||
| Portfolio shares sold | 89,415 | |||
| Dividends | 208,650 | |||
| Interest | 26,325 | |||
| Other assets | 3,377 | |||
| Total assets | $ | 100,797,635 | ||
| LIABILITIES: | ||||
| Payables — | ||||
| Portfolio shares repurchased | $ | 14,243 | ||
| Trustees’ fees | 65 | |||
| Administrative fees | 6,193 | |||
| Professional fees | 23,529 | |||
| Printing expense | 3,345 | |||
| Due to affiliates | ||||
| Management fees | 8,738 | |||
| Distributions | 1,047 | |||
| Other due to affiliates | 103 | |||
| Accrued expenses | 1,637 | |||
| Total liabilities | $ | 58,900 | ||
| NET ASSETS: | ||||
| Paid-in capital | $ | 86,323,765 | ||
| Distributable earnings | 14,414,970 | |||
| Net assets | $ | 100,738,735 | ||
| NET ASSET VALUE PER SHARE: | ||||
No par value (unlimited number of shares authorized) | ||||
| Class I (based on $69,373,694/5,184,569 shares) | $ | 13.38 | ||
| Class II (based on $31,365,041/2,303,648 shares) | $ | 13.62 | ||
The accompanying notes are an integral part of these financial statements.
10
| Pioneer Equity Income VCT Portfolio | PIONEER VARIABLE CONTRACTS TRUST |
STATEMENT OF OPERATIONS (UNAUDITED) | |
| FOR THE SIX MONTHS ENDED 6/30/20 |
| INVESTMENT INCOME: | ||||||||
| Dividends from unaffiliated issuers (net of foreign taxes withheld $12,718) | $ | 1,550,214 | ||||||
| Interest from unaffiliated issuers | 6,904 | |||||||
| Total investment income | $ | 1,557,118 | ||||||
| EXPENSES: | ||||||||
| Management fees | $ | 342,977 | ||||||
| Administrative expense | 39,849 | |||||||
| Distribution fees | ||||||||
| Class II | 40,451 | |||||||
| Custodian fees | 1,734 | |||||||
| Professional fees | 22,347 | |||||||
| Printing expense | 4,498 | |||||||
| Trustees' fees | 3,821 | |||||||
| Insurance expense | 256 | |||||||
| Miscellaneous | 702 | |||||||
| Total expenses | $ | 456,635 | ||||||
| Net investment income | $ | 1,100,483 | ||||||
| REALIZED AND UNREALIZED GAIN (LOSS) ON INVESTMENTS: | ||||||||
| Net realized gain (loss) on: | ||||||||
| Investments in unaffiliated issuers | $ | (4,064,439 | ) | |||||
| Other assets and liabilities denominated in foreign currencies | (5 | ) | $ | (4,064,444 | ) | |||
| Change in net unrealized appreciation (depreciation) on: | ||||||||
| Investments in unaffiliated issuers | $ | (15,697,258 | ) | |||||
| Other assets and liabilities denominated in foreign currencies | 317 | $ | (15,696,941 | ) | ||||
| Net realized and unrealized gain (loss) on investments | $ | (19,761,385 | ) | |||||
| Net decrease in net assets resulting from operations | $ | (18,660,902 | ) | |||||
The accompanying notes are an integral part of these financial statements.
11
| Pioneer Equity Income VCT Portfolio | PIONEER VARIABLE CONTRACTS TRUST |
STATEMENTS OF CHANGES IN NET ASSETS |
| Six Months | ||||||||
| Ended | Year | |||||||
| 6/30/20 | Ended | |||||||
| (unaudited) | 12/31/19 | |||||||
| FROM OPERATIONS: | ||||||||
Net investment income (loss) | $ | 1,100,483 | $ | 2,612,778 | ||||
Net realized gain (loss) on investments | (4,064,444 | ) | 5,251,088 | |||||
Change in net unrealized appreciation (depreciation) on investments | (15,696,941 | ) | 20,166,158 | |||||
| Net increase (decrease) in net assets resulting from operations | $ | (18,660,902 | ) | $ | 28,030,024 | |||
| DISTRIBUTIONS TO SHAREOWNERS: | ||||||||
| Class I ($0.78 and $11.63 per share, respectively) | $ | (3,892,692 | ) | $ | (39,584,740 | ) | ||
| Class II ($0.76 and $11.57 per share, respectively) | (1,694,954 | ) | (15,785,052 | ) | ||||
| Total distributions to shareowners | $ | (5,587,646 | ) | $ | (55,369,792 | ) | ||
| FROM PORTFOLIO SHARE TRANSACTIONS: | ||||||||
Net proceeds from sales of shares | $ | 4,860,539 | $ | 8,799,744 | ||||
Reinvestment of distributions | 5,587,646 | 55,369,792 | ||||||
Cost of shares repurchased | (13,991,464 | ) | (24,080,089 | ) | ||||
| Net increase (decrease) in net assets resulting from Portfolio share transactions | $ | (3,543,279 | ) | $ | 40,089,447 | |||
| Net increase (decrease) in net assets | $ | (27,791,827 | ) | $ | 12,749,679 | |||
| NET ASSETS: | ||||||||
Beginning of period | $ | 128,530,562 | $ | 115,780,883 | ||||
End of period | $ | 100,738,735 | $ | 128,530,562 | ||||
| Six Months | Six Months | |||||||||||||||
| Ended | Ended | |||||||||||||||
| 6/30/20 | 6/30/20 | Year Ended | Year Ended | |||||||||||||
| Shares | Amount | 12/31/19 | 12/31/19 | |||||||||||||
| (unaudited) | (unaudited) | Shares | Amount | |||||||||||||
| CLASS I | ||||||||||||||||
Shares sold | 99,981 | $ | 1,416,401 | 117,423 | $ | 2,220,426 | ||||||||||
Reinvestment of distributions | 295,494 | 3,892,692 | 2,551,494 | 39,584,740 | ||||||||||||
Less shares repurchased | (592,887 | ) | (8,717,858 | ) | (798,898 | ) | (14,700,720 | ) | ||||||||
| Net increase/(decrease) | (197,412 | ) | $ | (3,408,765 | ) | 1,870,019 | $ | 27,104,446 | ||||||||
| CLASS II | ||||||||||||||||
Shares sold | 245,118 | $ | 3,444,138 | 360,486 | $ | 6,579,318 | ||||||||||
Reinvestment of distributions | 126,131 | 1,694,954 | 1,001,956 | 15,785,052 | ||||||||||||
Less shares repurchased | (366,767 | ) | (5,273,606 | ) | (484,686 | ) | (9,379,369 | ) | ||||||||
| Net increase/(decrease) | 4,482 | $ | (134,514 | ) | 877,756 | $ | 12,985,001 | |||||||||
The accompanying notes are an integral part of these financial statements.
12
| Pioneer Equity Income VCT Portfolio | PIONEER VARIABLE CONTRACTS TRUST |
FINANCIAL HIGHLIGHTS |
| Six Months | ||||||||||||||||||||||||
| Ended | ||||||||||||||||||||||||
| 6/30/20 | Year Ended | Year Ended | Year Ended | Year Ended | Year Ended | |||||||||||||||||||
| (unaudited) | 12/31/19 | 12/31/18 | 12/31/17 | 12/31/16* | 12/31/15* | |||||||||||||||||||
| Class I | ||||||||||||||||||||||||
Net asset value, beginning of period | $ | 16.65 | $ | 23.41 | $ | 32.49 | $ | 31.25 | $ | 28.18 | $ | 29.70 | ||||||||||||
Increase (decrease) from investment operations: | ||||||||||||||||||||||||
| Net investment income (loss) (a) | $ | 0.15 | $ | 0.42 | $ | 0.81 | $ | 0.60 | $ | 0.67 | $ | 0.63 | ||||||||||||
| Net realized and unrealized gain (loss) on investments | (2.64 | ) | 4.45 | (2.99 | ) | 3.91 | 4.69 | (0.47 | ) | |||||||||||||||
Net increase (decrease) from investment operations | $ | (2.49 | ) | $ | 4.87 | $ | (2.18 | ) | $ | 4.51 | $ | 5.36 | $ | 0.16 | ||||||||||
Distributions to shareowners: | ||||||||||||||||||||||||
| Net investment income | $ | (0.21 | ) | $ | (0.56 | ) | $ | (0.70 | ) | $ | (0.55 | ) | $ | (0.61 | ) | $ | (0.58 | ) | ||||||
| Net realized gain | (0.57 | ) | (11.07 | ) | (6.20 | ) | (2.72 | ) | (1.68 | ) | (1.10 | ) | ||||||||||||
Total distributions | $ | (0.78 | ) | $ | (11.63 | ) | $ | (6.90 | ) | $ | (3.27 | ) | $ | (2.29 | ) | $ | (1.68 | ) | ||||||
Net increase (decrease) in net asset value | $ | (3.27 | ) | $ | (6.76 | ) | $ | (9.08 | ) | $ | 1.24 | $ | 3.07 | $ | (1.52 | ) | ||||||||
Net asset value, end of period | $ | 13.38 | $ | 16.65 | $ | 23.41 | $ | 32.49 | $ | 31.25 | $ | 28.18 | ||||||||||||
Total return (b) | (14.82 | )%(c) | 25.56 | % | (8.59 | )%(d) | 15.46 | % | 19.80 | %(e) | 0.50 | %(f) | ||||||||||||
Ratio of net expenses to average net assets | 0.79 | %(g) | 0.79 | % | 0.79 | % | 0.71 | % | 0.72 | % | 0.72 | % | ||||||||||||
Ratio of net investment income (loss) to average | ||||||||||||||||||||||||
| net assets | 2.16 | %(g) | 2.18 | % | 2.82 | % | 1.90 | % | 2.31 | % | 2.18 | % | ||||||||||||
Portfolio turnover rate | 6 | %(c) | 21 | % | 28 | % | 33 | % | 37 | % | 51 | % | ||||||||||||
Net assets, end of period (in thousands) | $ | 69,374 | $ | 89,623 | $ | 82,212 | $ | 105,198 | $ | 131,825 | $ | 84,694 | ||||||||||||
* | The Portfolio was audited by an independent registered public accounting firm other than Ernst & Young LLP. |
(a) | The per-share data presented above is based on the average shares outstanding for the period presented. |
(b) | Assumes initial investment at net asset value at the beginning of each period, reinvestment of all distributions, the complete redemption of the investment at net asset value at the end of each period. |
(c) | Not annualized. |
(d) | If the Portfolio had not recognized gains in settlement of class action lawsuits during the year ended December 31, 2018, the total return would have been (8.63)%. |
| (e) | If the Portfolio had not recognized gains in settlement of class action lawsuits during the year ended December 31, 2016, the total return would have been 19.76%. |
(f) | If the Portfolio had not recognized gains in settlement of class action lawsuits during the year ended December 31, 2015, the total return would have been 0.42%. |
(g) | Annualized. |
NOTE: | The above financial highlights do not reflect the deduction of non-portfolio expenses associated with variable insurance products, such as mortality and expense risk charges, separate account charges, and sales charges. |
The accompanying notes are an integral part of these financial statements.
13
| Pioneer Equity Income VCT Portfolio | PIONEER VARIABLE CONTRACTS TRUST |
FINANCIAL HIGHLIGHTS | (continued) |
| Six Months | ||||||||||||||||||||||||
| Ended | ||||||||||||||||||||||||
| 6/30/20 | Year Ended | Year Ended | Year Ended | Year Ended | Year Ended | |||||||||||||||||||
| (unaudited) | 12/31/19 | 12/31/18 | 12/31/17 | 12/31/16* | 12/31/15* | |||||||||||||||||||
| Class II | ||||||||||||||||||||||||
Net asset value, beginning of period | $ | 16.92 | $ | 23.62 | $ | 32.70 | $ | 31.43 | $ | 28.33 | $ | 29.87 | ||||||||||||
Increase (decrease) from investment operations: | ||||||||||||||||||||||||
| Net investment income (loss) (a) | $ | 0.14 | $ | 0.38 | $ | 0.50 | $ | 0.52 | $ | 0.60 | $ | 0.57 | ||||||||||||
| Net realized and unrealized gain (loss) on investments | (2.68 | ) | 4.49 | (2.75 | ) | 3.94 | 4.72 | (0.49 | ) | |||||||||||||||
Net increase (decrease) from investment operations | $ | (2.54 | ) | $ | 4.87 | $ | (2.25 | ) | $ | 4.46 | $ | 5.32 | $ | 0.08 | ||||||||||
Distributions to shareowners: | ||||||||||||||||||||||||
| Net investment income | $ | (0.19 | ) | $ | (0.50 | ) | $ | (0.63 | ) | $ | (0.47 | ) | $ | (0.54 | ) | $ | (0.52 | ) | ||||||
| Net realized gain | (0.57 | ) | (11.07 | ) | (6.20 | ) | (2.72 | ) | (1.68 | ) | (1.10 | ) | ||||||||||||
Total distributions | $ | (0.76 | ) | $ | (11.57 | ) | $ | (6.83 | ) | $ | (3.19 | ) | $ | (2.22 | ) | $ | (1.62 | ) | ||||||
Net increase (decrease) in net asset value | $ | (3.30 | ) | $ | (6.70 | ) | $ | (9.08 | ) | $ | 1.27 | $ | 3.10 | $ | (1.54 | ) | ||||||||
Net asset value, end of period | $ | 13.62 | $ | 16.92 | $ | 23.62 | $ | 32.70 | $ | 31.43 | $ | 28.33 | ||||||||||||
Total return (b) | (14.89 | )%(c) | 25.23 | % | (8.77 | )%(d) | 15.18 | % | 19.53 | %(e) | 0.22 | %(f) | ||||||||||||
Ratio of net expenses to average net assets | 1.04 | %(g) | 1.04 | % | 0.98 | % | 0.97 | % | 0.96 | % | 0.97 | % | ||||||||||||
Ratio of net investment income (loss) to average | ||||||||||||||||||||||||
| net assets | 1.91 | %(g) | 1.93 | % | 1.61 | % | 1.65 | % | 2.07 | % | 1.95 | % | ||||||||||||
Portfolio turnover rate | 6 | %(c) | 21 | % | 28 | % | 33 | % | 37 | % | 51 | % | ||||||||||||
Net assets, end of period (in thousands) | $ | 31,365 | $ | 38,908 | $ | 33,569 | $ | 247,973 | $ | 230,107 | $ | 185,158 | ||||||||||||
* | The Portfolio was audited by an independent registered public accounting firm other than Ernst & Young LLP. |
(a) | The per-share data presented above is based on the average shares outstanding for the period presented. |
(b) | Assumes initial investment at net asset value at the beginning of each period, reinvestment of all distributions, the complete redemption of the investment at net asset value at the end of each period and no sales charges. Total return would be reduced if sales charges were taken into account. |
(c) | Not annualized. |
(d) | If the Portfolio had not recognized gains in settlement of class action lawsuits during the year ended December 31, 2018, the total return would have been (8.81)%. |
| (e) | If the Portfolio had not recognized gains in settlement of class action lawsuits during the year ended December 31, 2016, the total return would have been 19.49%. |
(f) | If the Portfolio had not recognized gains in settlement of class action lawsuits during the year ended December 31, 2015, the total return would have been 0.18%. |
(g) | Annualized. |
NOTE: | The above financial highlights do not reflect the deduction of non-portfolio expenses associated with variable insurance products, such as mortality and expense risk charges, separate account charges, and sales charges. |
The accompanying notes are an integral part of these financial statements.
14
| Pioneer Equity Income VCT Portfolio | PIONEER VARIABLE CONTRACTS TRUST |
1. Organization and Significant Accounting Policies
Pioneer Equity Income VCT Portfolio (the “Portfolio”) is one of 8 portfolios comprising Pioneer Variable Contracts Trust (the “Trust”), a Delaware statutory trust. The Portfolio is registered under the Investment Company Act of 1940 as a diversified, open-end management investment company. The investment objectives of the Portfolio are current income and long-term growth of capital from a portfolio consisting primarily of income producing equity securities of U.S. corporations.
The Portfolio offers two classes of shares designated as Class I and Class II shares. Each class of shares represents an interest in the same schedule of investments of the Portfolio and has identical rights (based on relative net asset values) to assets and liquidation proceeds. Share classes can bear different rates of class-specific fees and expenses such as transfer agent and distribution fees. Differences in class-specific fees and expenses will result in differences in net investment income and, therefore, the payment of different dividends from net investment income earned by each class. The Amended and Restated Declaration of Trust of the Portfolio gives the Board of Trustees the flexibility to specify either per-share voting or dollar-weighted voting when submitting matters for shareholder approval. Under per-share voting, each share of a class of the Portfolio is entitled to one vote. Under dollar-weighted voting, a shareholder’s voting power is determined not by the number of shares owned, but by the dollar value of the shares on the record date. Each share class has exclusive voting rights with respect to matters affecting only that class, including with respect to the distribution plan for that class. There is no distribution plan for Class I shares.
Portfolio shares may be purchased only by insurance companies for the purpose of funding variable annuity and variable life insurance contracts or by qualified pension and retirement plans.
Amundi Pioneer Asset Management, Inc., an indirect, wholly owned subsidiary of Amundi and Amundi’s wholly owned subsidiary, Amundi USA, Inc., serves as the Portfolio’s investment adviser (the “Adviser”). Amundi Pioneer Distributor, Inc., an affiliate of Amundi Pioneer Asset Management, Inc., serves as the Portfolio’s distributor (the “Distributor”).
In August 2018, the Securities and Exchange Commission (“SEC”) released a Disclosure Update and Simplification Final Rule. The Final Rule amends Regulation S-X disclosures requirements to conform them to U.S. Generally Accepted Accounting Principles (“U.S. GAAP”) for investment companies. The Portfolio’s financial statements were prepared in compliance with the new amendments to Regulation S-X.
The Portfolio is an investment company and follows investment company accounting and reporting guidance under U.S. GAAP. U.S. GAAP requires the management of the Portfolio to make estimates and assumptions that affect the reported amounts of assets and liabilities, the disclosure of contingent assets and liabilities at the date of the financial statements, and the reported amounts of income, expenses and gain or loss on investments during the reporting period. Actual results could differ from those estimates.
The following is a summary of significant accounting policies followed by the Portfolio in the preparation of its financial statements:
A. Security Valuation
The net asset value of the Portfolio is computed once daily, on each day the New York Stock Exchange (“NYSE”) is open, as of the close of regular trading on the NYSE.
Equity securities that have traded on an exchange are valued by using the last sale price on the principal exchange where they are traded. Equity securities that have not traded on the date of valuation, or securities for which sale prices are not available, generally are valued using the mean between the last bid and asked prices or, if both last bid and asked prices are not available, at the last quoted bid price. Last sale and bid and asked prices are provided by independent third party pricing services. In the case of equity securities not traded on an exchange, prices are typically determined by independent third party pricing services using a variety of techniques and methods.
The value of foreign securities is translated into U.S. dollars based on foreign currency exchange rate quotations supplied by a third party pricing source. Trading in non-U.S. equity securities is substantially completed each day at various times prior to the close of the NYSE. The values of such securities used in computing the net asset value of the Portfolio’s shares are determined as of such times. The Portfolio may use a fair value model developed by an independent pricing service to value non-U.S. equity securities.
Fixed-income securities are valued by using prices supplied by independent pricing services, which consider such factors as market prices, market events, quotations from one or more brokers, Treasury spreads,
15
| Pioneer Equity Income VCT Portfolio | PIONEER VARIABLE CONTRACTS TRUST |
NOTES TO FINANCIAL STATEMENTS 6/30/20 (UNAUDITED) | (continued) |
yields, maturities and ratings, or may use a pricing matrix or other fair value methods or techniques to provide an estimated value of the security or instrument. A pricing matrix is a means of valuing a debt security on the basis of current market prices for other debt securities, historical trading patterns in the market for fixed-income securities and/or other factors. Non-U.S. debt securities that are listed on an exchange will be valued at the bid price obtained from an independent third party pricing service. When independent third party pricing services are unable to supply prices, or when prices or market quotations are considered to be unreliable, the value of that security may be determined using quotations from one or more broker-dealers.
Securities for which independent pricing services or broker-dealers are unable to supply prices or for which market prices and/or quotations are not readily available or are considered to be unreliable are valued by a fair valuation team comprised of certain personnel of the Adviser pursuant to procedures adopted by the Portfolio’s Board of Trustees. The Adviser’s fair valuation team uses fair value methods approved by the Valuation Committee of the Board of Trustees. The Adviser’s fair valuation team is responsible for monitoring developments that may impact fair valued securities and for discussing and assessing fair values on an ongoing basis, and at least quarterly, with the Valuation Committee of the Board of Trustees.
Inputs used when applying fair value methods to value a security may include credit ratings, the financial condition of the company, current market conditions and comparable securities. The Portfolio may use fair value methods if it is determined that a significant event has occurred after the close of the exchange or market on which the security trades and prior to the determination of the Portfolio’s net asset value. Examples of a significant event might include political or economic news, corporate restructurings, natural disasters, terrorist activity or trading halts. Thus, the valuation of the Portfolio’s securities may differ significantly from exchange prices, and such differences could be material.
At June 30, 2020, no securities were valued using fair value methods (other than securities valued using prices supplied by independent pricing services, broker-dealers or using a third party insurance industry pricing model).
B. Investment Income and Transactions
Dividend income is recorded on the ex-dividend date, except that certain dividends from foreign securities where the ex-dividend date may have passed are recorded as soon as the Portfolio becomes aware of the ex-dividend data in the exercise of reasonable diligence.
Interest income, including interest on income-bearing cash accounts, is recorded on the accrual basis. Dividend and interest income are reported net of unrecoverable foreign taxes withheld at the applicable country rates and net of income accrued on defaulted securities.
Interest and dividend income payable by delivery of additional shares is reclassified as PIK (payment-in-kind) income upon receipt and is included in interest and dividend income, respectively.
Security transactions are recorded as of trade date. Gains and losses on sales of investments are calculated on the identified cost method for both financial reporting and federal income tax purposes.
C. Foreign Currency Translation
The books and records of the Portfolio are maintained in U.S. dollars. Amounts denominated in foreign currencies are translated into U.S. dollars using current exchange rates.
Net realized gains and losses on foreign currency transactions, if any, represent, among other things, the net realized gains and losses on foreign currency exchange contracts, disposition of foreign currencies and the difference between the amount of income accrued and the U.S. dollars actually received. Further, the effects of changes in foreign currency exchange rates on investments are not segregated on the Statement of Operations from the effects of changes in the market prices of those securities, but are included with the net realized and unrealized gain or loss on investments.
D. Federal Income Taxes
It is the Portfolio’s policy to comply with the requirements of the Internal Revenue Code applicable to regulated investment companies and to distribute all of its net taxable income and net realized capital gains, if any, to its shareowners. Therefore, no provision for federal income taxes is required. As of December 31, 2019, the Portfolio did not accrue any interest or penalties with respect to uncertain tax positions, which, if applicable, would be recorded as an income tax
16
| Pioneer Equity Income VCT Portfolio | PIONEER VARIABLE CONTRACTS TRUST |
expense on the Statement of Operations. Tax returns filed within the prior three years remain subject to examination by federal and state tax authorities.
The amount and character of income and capital gain distributions to shareowners are determined in accordance with federal income tax rules, which may differ from U.S. GAAP. Distributions in excess of net investment income or net realized gains are temporary over distributions for financial statement purposes resulting from differences in the recognition or classification of income or distributions for financial statement and tax purposes. Capital accounts within the financial statements are adjusted for permanent book/tax differences to reflect tax character, but are not adjusted for temporary differences.
The tax character of current year distributions payable will be determined at the end of the current taxable year. The tax character of distributions paid during the year ended December 31, 2019 was as follows:
2019 | ||||
| Distributions paid from: | ||||
| Ordinary income | $ | 3,252,078 | ||
| Long-term capital gain | 52,117,714 | |||
| Total | $ | 55,369,792 | ||
The following shows the components of distributable earnings on a federal income tax basis at December 31, 2019:
2019 | ||||
| Distributable earnings: | ||||
| Undistributed long-term capital gain | $ | 4,112,902 | ||
| Undistributed ordinary income | 872,023 | |||
| Net unrealized appreciation | 33,678,593 | |||
| Total | $ | 38,663,518 | ||
The difference between book-basis and tax-basis net unrealized appreciation is attributable to the tax deferral of losses on wash sales, the tax basis adjustment on partnerships, REITs and common stocks.
E. Portfolio Shares and Class Allocations
The Portfolio records sales and repurchases of its shares as of trade date. Distribution fees for Class II shares are calculated based on the average daily net asset value attributable to Class II shares of the Portfolio (see Note 4). Class I shares do not pay distribution fees.
Income, common expenses (excluding transfer agent and distribution fees) and realized and unrealized gains and losses are calculated at the Portfolio level and allocated daily to each class of shares based on its respective percentage of adjusted net assets at the beginning of the day.
All expenses and fees paid to the Portfolio’s transfer agent for its services are allocated among the classes of shares based on the number of accounts in each class and the ratable allocation of related out-of-pocket expenses (see Note 3).
Dividends and distributions to shareowners are recorded as of the ex-dividend date. Distributions paid by the Portfolio with respect to each class of shares are calculated in the same manner and at the same time, except that net investment income dividends to Class I and Class II shares can reflect different transfer agent and distribution expense rates.
F. Risks
The value of securities held by the Portfolio may go up or down, sometimes rapidly or unpredictably, due to general market conditions, such as real or perceived adverse economic, political or regulatory conditions, recessions, the spread of infectious illness or other public health issues, inflation, changes in interest rates, lack of liquidity in the bond markets or adverse investor sentiment. In the past several years, financial markets have experienced increased volatility, depressed valuations, decreased liquidity and heightened uncertainty. These conditions may continue, recur, worsen or spread. A general rise in interest rates could adversely affect the price and liquidity of fixed-income securities and could also result in increased redemptions from the Portfolio.
At times, the Portfolio’s investments may represent industries or industry sectors that are interrelated or have common risks, making the Portfolio more susceptible to any economic, political, or regulatory developments or other risks affecting those industries and sectors. The Portfolio’s investments in foreign markets and countries with limited developing markets may subject the Portfolio to a greater degree of risk than investments in a developed market. These risks include disruptive political or economic conditions and the imposition of adverse governmental laws or currency exchange restrictions.
With the increased use of technologies such as the Internet to conduct business, the Portfolio is susceptible to operational, information security and related risks. While the Portfolio’s Adviser has established business continuity plans in the event of, and risk management systems to prevent, limit or mitigate, such cyber-attacks, there are inherent
17
| Pioneer Equity Income VCT Portfolio | PIONEER VARIABLE CONTRACTS TRUST |
NOTES TO FINANCIAL STATEMENTS 6/30/20 (UNAUDITED) | (continued) |
limitations in such plans and systems, including the possibility that certain risks have not been identified. Furthermore, the Portfolio cannot control the cybersecurity plans and systems put in place by service providers to the Portfolio such as Brown Brothers Harriman & Co., the Portfolio’s custodian and accounting agent, and DST Asset Manager Solutions, Inc., the Portfolio’s transfer agent. In addition, many beneficial owners of Portfolio shares hold them through accounts at broker-dealers, retirement platforms and other financial market participants over which neither the Portfolio nor Amundi Pioneer exercises control. Each of these may in turn rely on service providers to them, which are also subject to the risk of cyber-attacks. Cybersecurity failures or breaches at Amundi Pioneer or the Portfolio’s service providers or intermediaries have the ability to cause disruptions and impact business operations, potentially resulting in financial losses, interference with the Portfolio’s ability to calculate its net asset value, impediments to trading, the inability of Portfolio shareowners to effect share purchases, redemptions or exchanges or receive distributions, loss of or unauthorized access to private shareowner information and violations of applicable privacy and other laws, regulatory fines, penalties, reputational damage, or additional compliance costs. Such costs and losses may not be covered under any insurance. In addition, maintaining vigilance against cyber-attacks may involve substantial costs over time, and system enhancements may themselves be subject to cyber-attacks.
COVID-19
The respiratory illness COVID-19 caused by a novel coronavirus has resulted in a global pandemic and major disruption to economies and markets around the world, including the United States. Global financial markets have experienced extreme volatility and severe losses, and trading in many instruments has been disrupted. Liquidity for many instruments has been greatly reduced for periods of time. Some interest rates are very low and in some cases yields are negative. Some sectors of the economy and individual issuers have experienced particularly large losses. These circumstances may continue for an extended period of time, and may continue to affect adversely the value and liquidity of the Portfolio’s investments. The ultimate economic fallout from the pandemic, and the long-term impact on economies, markets, industries and individual issuers, are not known. Governments and central banks, including the Federal Reserve in the U.S., have taken extraordinary and unprecedented actions to support local and global economies and the financial markets. These actions have resulted in significant expansion of public debt, including in the U.S. The impact of these measures, and whether they will be effective to mitigate the economic and market disruption, will not be known for some time. The consequences of high public debt, including its future impact on the economy and securities markets, likewise may not be known for some time.
The Portfolio’s prospectus contains unaudited information regarding the Portfolio’s principal risks. Please refer to that document when considering the Portfolio’s principal risks.
2. Management Agreement
The Adviser manages the Portfolio. Management fees are calculated daily and paid monthly at the annual rate of 0.65% of the Portfolio’s average daily net assets up to $1 billion and 0.60% of the Portfolio’s average daily net assets over $1 billion. For the six months ended June 30, 2020, the effective management fee was equivalent to 0.65% (annualized) of the Portfolio’s average daily net assets.
In addition, under the management and administration agreements, certain other services and costs, including accounting, regulatory reporting and insurance premiums, are paid by the Portfolio as administrative reimbursements. Included in “Due to affiliates” reflected on the Statement of Assets and Liabilities is $8,841 in management fees, administrative costs and certain other reimbursements payable to the Adviser at June 30, 2020.
3. Transfer Agent
DST Asset Manager Solutions, Inc. serves as the transfer agent to the Portfolio at negotiated rates. Transfer agent fees and payables shown on the Statement of Operations and the Statement of Assets and Liabilities, respectively, include sub-transfer agent expenses incurred through the Portfolio’s omnibus relationship contracts.
4. Distribution Plan
The Portfolio has adopted a distribution plan (the “Plan“) pursuant to Rule 12b-1 of the Investment Company Act of 1940 with respect to Class II shares. Pursuant to the Plan, the Portfolio pays the Distributor a distribution fee of 0.25% of the average daily net assets attributable to Class II shares to compensate the Distributor for (1) distribution services and (2) personal and account maintenance services performed and expenses incurred by the Distributor in connection with the Portfolio’s Class II shares. Included in “Due to affiliates” reflected on the Statement of Assets and Liabilities is $1,047 in distribution fees payable to the Distributor at June 30, 2020.
18
| Pioneer Equity Income VCT Portfolio | PIONEER VARIABLE CONTRACTS TRUST |
As required by law, the Portfolio has adopted and implemented a liquidity risk management program (the “Program”) that is designed to assess and manage liquidity risk. Liquidity risk is the risk that the Portfolio could not meet requests to redeem its shares without significant dilution of remaining investors’ interests in the Portfolio. The Portfolio’s Board of Trustees designated a liquidity risk management committee (the “Committee”) consisting of employees of Amundi Pioneer Asset Management, Inc. (the “Adviser”) to administer the Program.
The Committee provided the Board of Trustees with a report that addressed the operation of the Program and assessed its adequacy and effectiveness of implementation (the “Report”). The Report covered the period from December 1, 2018 through March 31, 2020 (the “Reporting Period”).
The Report confirmed that, throughout the Reporting Period, the Committee had monitored the Portfolio’s portfolio liquidity and liquidity risk on an ongoing basis, as described in the Program and in Board reporting throughout the Reporting Period.
The Report discussed the Committee’s annual review of the Program, which addressed, among other things, the following elements of the Program:
The Committee reviewed the Portfolio’s investment strategy and liquidity of portfolio investments during both normal and reasonably foreseeable stressed conditions. The Committee noted that the Portfolio’s investment strategy continues to be appropriate for an open-end fund, taking into account, among other things, whether and to what extent the Portfolio held less liquid and illiquid assets and the extent to which any such investments affected the Portfolio’s ability to meet redemption requests. In managing and reviewing the Portfolio’s liquidity risk, the Committee also considered the extent to which the Portfolio’s investment strategy involves a relatively concentrated portfolio or large positions in particular issuers, the extent to which the Portfolio uses borrowing for investment purposes, and the extent to which the Portfolio uses derivatives (including for hedging purposes). The Committee also reviewed the Portfolio’s short-term and long-term cash flow projections during both normal and reasonably foreseeable stressed conditions. In assessing the Portfolio’s cash flow projections, the Committee considered, among other factors, historical net redemption activity, redemption policies, ownership concentration, distribution channels, and the degree of certainty associated with the Portfolio’s short-term and long-term cash flow projections. The Committee also considered the Portfolio’s holdings of cash and cash equivalents, as well as borrowing arrangements and other funding sources, including, if applicable, the Portfolio’s participation in a credit facility, as components of the Portfolio’s ability to meet redemption requests. The Portfolio has adopted an in-kind redemption policy which may be utilized to meet larger redemption requests.
The Committee reviewed the Program’s liquidity classification methodology for categorizing the Portfolio’s investments into one of four liquidity buckets. In reviewing the Portfolio’s investments, the Committee considered, among other factors, whether trading varying portions of a position in a particular portfolio investment or asset class in sizes the Portfolio would reasonably anticipate trading, would be reasonably expected to significantly affect liquidity.
The Committee performed an analysis to determine whether the Portfolio is required to maintain a Highly Liquid Investment Minimum, and determined that no such minimum is required because the Portfolio primarily holds highly liquid investments.
The Report stated that the Committee concluded the Program operates adequately and effectively, in all material respects, to assess and manage the Portfolio’s liquidity risk throughout the Reporting Period.
19
This page was intentionally left blank.
20
Officers Lisa M. Jones, President and Chief Executive Officer Mark E. Bradley, Treasurer and Chief Financial and Accounting Officer Christopher J. Kelley, Secretary and Chief Legal Officer Investment Adviser and Administrator Amundi Pioneer Asset Management, Inc. Custodian and Sub-Administrator Brown Brothers Harriman & Co. Principal Underwriter Amundi Pioneer Distributor, Inc. Legal Counsel Morgan, Lewis & Bockius LLP Transfer Agent DST Asset Manager Solutions, Inc. | Trustees Thomas J. Perna, Chairman John E. Baumgardner, Jr. Diane Durnin Benjamin M. Friedman Lisa M. Jones Lorraine H. Monchak Marguerite A. Piret Fred J. Ricciardi Kenneth J. Taubes |
21
Proxy Voting Policies and Procedures of the Portfolio are available without charge, upon request, by calling our toll free number (1-800-225-6292). Information regarding how the Portfolio voted proxies relating to Portfolio securities during the most recent 12-month period ended June 30 is publicly available to shareowners at www.amundipioneer.com/us. This information is also available on the Securities and Exchange Commission’s web site at www.sec.gov.
19610-14-0820
PIONEER VARIABLE CONTRACTS TRUST
Pioneer Select Mid Cap Growth VCT Portfolio — Class I Shares
Pioneer Select Mid Cap Growth VCT Portfolio — Class I Shares
Beginning in February 2021, as permitted by regulations adopted by the Securities and Exchange Commission, you may not be receiving paper copies of the Portfolio’s shareholder reports like this one by mail, unless you specifically request paper copies of the reports from the insurance company that offers your variable annuity or variable life insurance contract or from your financial intermediary. Instead, the insurance company may choose to make the reports available on a website, and will notify you by mail each time a shareholder report is posted and provide you with a website link to access the report. Instructions for requesting paper copies will be provided by your insurance company.
If you already elected to receive shareholder reports electronically, you will not be affected by this change and you need not take any action. You may elect to receive shareholder reports and other communications from the insurance company or your financial intermediary electronically by following the instructions provided by the insurance company or by contacting your financial intermediary.
You may elect to receive all future Portfolio shareholder reports in paper free of charge from the insurance company. You can inform the insurance company or your financial intermediary that you wish to continue receiving paper copies of your shareholder reports by following the instructions provided by the insurance company or by contacting your financial intermediary. Your election to receive reports in paper will apply to all funds available under your contract with the insurance company.
SEMIANNUAL REPORT
June 30, 2020
June 30, 2020
Please refer to your contract prospectus to determine the applicable share class offered under your contract.
PIONEER VARIABLE CONTRACTS TRUST
| Pioneer Select Mid Cap Growth VCT Portfolio | |
| 2 | |
| 3 | |
| 4 | |
| 8 | |
| 13 | |
| 17 | |
| 21 | |
| 29 |
This report is authorized for distribution only when preceded or accompanied by a prospectus for the Portfolio being offered.
Pioneer Variable Contracts Trust files a complete schedule of portfolio holdings with the Securities and Exchange Commission for the first and third quarters of each fiscal year as an exhibit to its reports on Form N-PORT. Shareholders may view the filed Form N-PORT by visiting the Commission’s web site at https://www.sec.gov.
| Pioneer Select Mid Cap Growth VCT Portfolio | PIONEER VARIABLE CONTRACTS TRUST |
| PORTFOLIO UPDATE 6/30/20 |
Sector Distribution
(As a percentage of total investments)*
(As a percentage of total investments)*
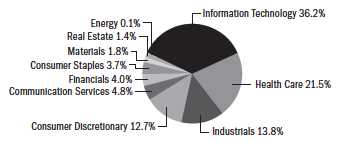
5 Largest Holdings
(As a percentage of total investments)*
(As a percentage of total investments)*
| 1. | IAC/InterActiveCorp | 2.79% |
| 2. | Veeva Systems, Inc. | 2.06 |
| 3. | Micron Technology, Inc. | 2.05 |
| 4. | Synopsys, Inc. | 2.01 |
| 5. | Clarivate Analytics Plc | 2.00 |
* Excludes temporary cash investments and all derivative contracts except for options purchased. The Portfolio is actively managed, and current holdings may be different. The holdings listed should not be considered recommendations to buy or sell any securities.
PERFORMANCE UPDATE 6/30/20
Prices and Distributions
| Net Asset Value per Share | 6/30/20 | 12/31/19 |
| Class I | $27.67 | $29.12 |
| Net | |||
| Distributions per Share | Investment | Short-Term | Long-Term |
| (1/1/20 – 6/30/20) | Income | Capital Gains | Capital Gains |
| Class I | $ – | $ – | $2.2141 |
Performance of a $10,000 Investment
The following chart shows the change in value of an investment made in Class I shares of Pioneer Select Midcap Growth VCT Portfolio at net asset value during the periods shown, compared to that of the Russell Midcap Growth Index. Portfolio returns are based on net asset value and do not reflect any applicable insurance fees or surrender charges.
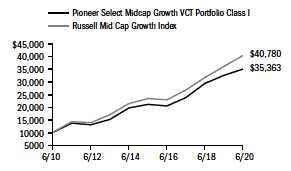
The Russell Midcap Growth Index is an unmanaged index that measures the performance of U.S. mid-cap growth stocks. Index returns are calculated monthly, assume reinvestment of dividends and, unlike Portfolio returns, do not reflect any fees, expenses or sales charges. It is not possible to invest directly in an index.
Average Annual Total Returns
(As of June 30, 2020)
| Class I | Russell Midcap Growth Index | |
10 Years | 13.46% | 15.09% |
5 Years | 10.77% | 11.60% |
1 Year | 7.70% | 11.91% |
All total returns shown assume reinvestment of distributions at net asset value.
The performance table does not reflect the deduction of taxes that a shareowner would pay on distributions or the redemption of shares.
Call 1-800-688-9915 or visit www.amundipioneer.com/us for the most recent month-end performance results. Current performance may be lower or higher than the performance data quoted.
The performance data quoted represents past performance, which is no guarantee of future results. Investment return and principal value will fluctuate, and shares, when redeemed, may be worth more or less than their original cost.
The returns for the Portfolio do not reflect the deduction of expenses associated with variable products, such as mortality and expense risk charges, separate account charges, and sales charges. These expenses would reduce the overall returns shown.
Performance results reflect any applicable expense waivers in effect during the periods shown. Without such waivers performance would be lower. Waivers may not be in effect for all portfolios. Certain fee waivers are contractual through a specified period. Otherwise, fee waivers can be rescinded at any time. See the prospectus and financial statements for more information.
2
| Pioneer Select Mid Cap Growth VCT Portfolio | PIONEER VARIABLE CONTRACTS TRUST |
As a shareowner in the Portfolio, you incur two types of costs:
(1) ongoing costs, including management fees, distribution and/or service (12b-1) fees, and other Portfolio expenses; and
(2) transaction costs, including sales charges (loads) on purchase payments.
This example is intended to help you understand your ongoing expenses (in dollars) of investing in the Portfolio and to compare these costs with the ongoing costs of investing in other mutual funds offered through your variable annuity contract. The example is based on an investment of $1,000 at the beginning of the Portfolio’s latest six-month period and held throughout the six months.
Using the Tables
Actual Expenses
The first table below provides information about actual account values and actual expenses. You may use the information in this table, together with the amount you invested, to estimate the expenses that you paid over the period as follows:
1. Divide your account value by $1,000
Example: an $8,600 account value ÷ $1,000 = 8.6
2. Multiply the result in (1) above by the corresponding share class’s number in the third row under the heading entitled “Expenses Paid During Period” to estimate the expenses you paid on your account during this period.
Expenses Paid on a $1,000 Investment in Pioneer Select Mid Cap Growth VCT Portfolio
Based on actual returns from January 1, 2020 through June 30, 2020.
| Share Class | I |
Beginning Account Value on 1/1/20 | $1,000.00 |
Ending Account Value on 6/30/20 | $1,026.30 |
Expenses Paid During Period* | $ 4.53 |
* Expenses are equal to the Portfolio’s annualized expense ratio of 0.90% for Class I shares multiplied by the average account value over the period, multiplied by 182/366 (to reflect the one-half year period).
Hypothetical Example for Comparison Purposes
The table below provides information about hypothetical account values and hypothetical expenses based on the Portfolio’s actual expense ratio and an assumed rate of return of 5% per year before expenses, which is not the Portfolio’s actual return. The hypothetical account values and expenses may not be used to estimate the actual ending account balance or expenses you paid for the period.
You may use this information to compare the ongoing costs of investing in the Portfolio and other variable annuities. To do so, compare this 5% hypothetical example with the 5% hypothetical examples that appear in the shareholder reports of the other variable annuities.
Please note that the expenses shown in the tables are meant to highlight your ongoing costs only and do not reflect any transaction costs, such as sales charges (loads) that are charged at the time of the transaction. Therefore, the table below is useful in comparing ongoing costs only and will not help you determine the relative total costs of owning different variable annuities. In addition, if these transaction costs were included, your costs would have been higher.
Expenses Paid on a $1,000 Investment in Pioneer Select Mid Cap Growth VCT Portfolio
Based on a hypothetical 5% per year return before expenses, reflecting the period from January 1, 2020 through June 30, 2020.
| Share Class | I |
Beginning Account Value on 1/1/20 | $1,000.00 |
Ending Account Value on 6/30/20 | $1,020.39 |
Expenses Paid During Period* | $ 4.52 |
* Expenses are equal to the Portfolio’s annualized expense ratio of 0.90% for Class I shares multiplied by the average account value over the period, multiplied by 182/366 (to reflect the one-half year period).
3
| Pioneer Select Mid Cap Growth VCT Portfolio | PIONEER VARIABLE CONTRACTS TRUST |
Call 1-800-688-9915 or visit www.amundipioneer.com/us for the most recent month-end performance results. Current performance may be lower or higher than the performance data quoted.
The performance data quoted represents past performance, which is no guarantee of future results. Investment return and principal value will fluctuate, and shares, when redeemed, may be worth more or less than their original cost.
The returns for the Portfolio do not reflect the deduction of expenses associated with variable products, such as mortality and expense risk charges, separate account charges, and sales charges. These expenses would reduce the overall returns shown.
Performance results reflect any applicable expense waivers in effect during the periods shown. Without such waivers performance would be lower. Waivers may not be in effect for all portfolios. Certain fee waivers are contractual through a specified period. Otherwise, fee waivers can be rescinded at any time. See the prospectus and financial statements for more information.
In the following interview, Ken Winston discusses the market environment and the factors that affected the performance of Pioneer Select Mid Cap Growth VCT Portfolio during the six-month period ended June 30, 2020. Mr. Winston, a senior vice president at Amundi Pioneer Asset Management, Inc. (Amundi Pioneer) and lead portfolio manager of the Portfolio, is responsible for the day-to-day management of the Portfolio, along with Shaji John, a vice president and a portfolio manager at Amundi Pioneer, and David Sobell, a vice president and portfolio manager at Amundi Pioneer.
Q: How did the Portfolio perform during the six-month period ended June 30, 2020?
A: Pioneer Select Mid Cap Growth VCT Portfolio’s Class I shares returned 2.63% at net asset value (NAV) during the six-month period ended June 30, 2020, while the Portfolio’s benchmark, the Russell Midcap Growth Index (the Russell Index), returned 4.16%.
Q: How would you describe the investment environment in the equity market during the six-month period ended June 30, 2020?
A: The six-month period beginning January 1, 2020, and ending on June 30, 2020, was one of the most volatile six-month periods in history for domestic equity investors. After a relatively sluggish month of January, the equity market surged for the first few weeks of February, with the Standard & Poor’s 500 Index (the S&P 500 Index) achieving a record-high closing mark on February 19, 2020.
Then, as investors began to react to the COVID-19 pandemic and the potential economic consequences of the lockdowns imposed by state governments aimed at containing the rate of infections (“flattening the curve”), equity prices sharply reversed, as the S&P 500 Index and the Portfolio’s benchmark, the Russell Index, returned -33.79% and -35.70%, respectively, between February 19 and March 23.
After the market bottomed on March 23, the final three-plus months of the six-month period saw domestic equities stage a stunning positive reversal, particularly in April and May, before a slight leveling off in June, although both the S&P 500 Index and the Russell Index finished the month in positive territory.
When all was said and done, the Russell Index returned 4.16% for the full six-month period, besting the performance of just about every other domestic equity index, including the S&P 500 Index, the S&P MidCap 400 Index, and the Russell Midcap Value Index, which returned -3.08%, -12.78%, and -18.094%, respectively.
The recovery in equity prices from the market bottom on March 23 was fueled in part by positive investor response to unprecedented actions taken by the U.S. Federal Reserve (Fed), which implemented a broad array of programs aimed at limiting the damage caused by the virtual shutting down of the domestic economy as a result of the pandemic-control measures. The Fed’s initiatives included reducing the target range of the federal funds rate to zero, reintroducing quantitative easing (asset purchases), and creating lending facilities (totaling roughly $3 trillion) in support of households, employers, financial markets, and state and local governments.
4
| Pioneer Select Mid Cap Growth VCT Portfolio | PIONEER VARIABLE CONTRACTS TRUST |
Additionally, the Trump administration and Congress moved quickly to enact three separate relief packages, at a total cost of more than $2 trillion, to provide aid to consumers and businesses, and to attempt to replace some of their income lost during the COVID-19 crisis.
Within the Russell Index, the best-performing sectors over the six-month period were health care and information technology, which returned 15.5% and 11.5%, respectively. Meanwhile, energy, down by nearly 34%, was by far the worst-performing sector in the benchmark, with materials (-7.5%) a distant second.
Q: Which of your investment decisions had the greatest effects on the Portfolio’s benchmark-relative performance during the six-month period ended June 30, 2020?
A: The Portfolio managed to generate a positive return over the six-month period, but lagged the performance of the Russell Index, as both sector allocations and stock selections detracted from benchmark-relative results.
With regard to sector allocation, the main detractor from the Portfolio’s benchmark-relative returns was a slight underweight to the outperforming consumer staples sector, which turned in the third-best performance within the Russell Index over the six-month period. Conversely, an underweight to the extremely weak energy sector benefited the Portfolio’s relative returns.
As for stock selection, the biggest detractors from the Portfolio’s benchmark-relative performance over the six-month period were results in the information technology, consumer staples, and consumer discretionary sectors, which more than offset positive selection results versus the Russell Index within health care and industrials.
Q: Which individual portfolio holdings had the most significant effects on the Portfolio’s benchmark-relative performance, either positive or negative, during the six-month period ended June 30, 2020?
A: The top individual detractors from the Portfolio’s benchmark-relative performance during the six-month period included underweight exposures to shares of Twilio and Spotify.
Twilio is a large Russell Index component that offers a cloud-computing platform that allows web developers to integrate communications protocols into applications. The company’s shares rose in the second quarter of 2020 in response to a report of strong financial results, and investors’ perception that Twilio’s solutions may continue to experience increased demand from heightened digital-communications activity brought about by the COVID-19 pandemic. We added shares of Twilio to the Portfolio during the second quarter, but the underweight exposure to the stock for the majority of the six-month period detracted from benchmark-relative results.
The Portfolio also had an underweight position in Spotify compared to the Russell Index during the six-month period, which detracted from relative returns given that Spotify is a large component of the benchmark and the share price rose significantly in the second quarter. Spotify is a provider of music streaming services. The shares performed well in the second half of the six-month period as investors cheered the company’s decision to make a
5
| Pioneer Select Mid Cap Growth VCT Portfolio | PIONEER VARIABLE CONTRACTS TRUST |
| PORTFOLIO MANAGEMENT DISCUSSION 6/30/20 | (continued) |
heavy investment in new podcast content. As was the case with Twilio, we did acquire shares of Spotify toward the end of the second quarter, but on average, the Portfolio was underweight in the stock versus the Russell Index for the majority of the semiannual reporting period, thus causing the benchmark-relative underperformance.
The top individual positive contributors to the Portfolio’s benchmark-relative performance during the six-month period were positions in Teladoc Health and Dexcom.
Teladoc Health is a leading provider of virtual access to medical professionals. The company’s share price rose during the six-month period as demand for Teladoc’s services has been accelerating because of the stay-at-home restrictions brought about by COVID-19, which have had the effect of introducing new providers and subscribers to the Teladoc ecosystem, while cementing the company’s position as one of the leading virtual-care intermediaries.
Dexcom provides continuous glucose monitoring (CGM) systems for diabetics, and has a well-established track record of introducing precise sensors for use in CGM. Dexcom’s shares rallied over the six-month period as investors came to appreciate the apparent lack of economic sensitivity of the company’s growth opportunity, given that the use of CGM is still in the early stages.
Q: Did the Portfolio have any derivatives exposure during the six-month period ended June 30, 2020?
A: No, the Portfolio had no exposure to derivative securities during the six-month period.
Q: What is your outlook heading into the second half of the calendar year?
A: The global spread of the COVID-19 virus and the related, dramatic decline in economic activity resulting from the mitigation efforts and lockdowns aimed at slowing the spread have presented a very uncertain near-term outlook. We believe the mitigation efforts in the U.S. and in other countries can ultimately be successful, and that positive economic growth in the U.S. may return. Some states and countries have begun the reopening process, though concerns over a second wave of infections that could lead to renewed lockdowns have continued to persist, and, in some areas, have even come to fruition. Given the numerous variables still in play, the extent of the economic damage suffered due to COVID-19 and the related shutdowns, and their lasting effects on the economy, have remained difficult to forecast.
In the end, however, we believe investors may come to favor owning stocks of secular growth companies that are not dependent on positive macroeconomic conditions in order to flourish; companies that they believe have resilient business models; and companies that can exhibit sustainable growth characteristics and innovation. Those characteristics typify the types of equities that we seek to hold in the Portfolio.
6
| Pioneer Select Mid Cap Growth VCT Portfolio | PIONEER VARIABLE CONTRACTS TRUST |
A Word About Risk:
All investments are subject to risk, including the possible loss of principal. In the past several years, financial markets have experienced increased volatility and heightened uncertainty. The market prices of securities may go up or down, sometimes rapidly or unpredictably, due to general market conditions, such as real or perceived adverse economic, political, or regulatory conditions, recessions, inflation, changes in interest or currency rates, lack of liquidity in the bond markets, the spread of infectious illness or other public health issues or adverse investor sentiment. These conditions may continue, recur, worsen or spread.
Investments in mid-sized companies may offer the potential for higher returns, but are also subject to greater short-term price fluctuations than investments in larger, more established companies.
When interest rates rise, the prices of fixed-income securities in the Portfolio will generally fall. Conversely, when interest rates fall, the prices of fixed-income securities in the Portfolio will generally rise.
The Portfolio invests in REIT securities, the value of which can fall for a variety of reasons, such as declines in rental income, fluctuating interest rates, poor property management, environmental liabilities, uninsured damage, increased competition, or changes in real estate tax laws.
Investing in foreign and/or emerging markets securities involves risks relating to interest rates, currency exchange rates, economic, and political conditions.
At times, the Portfolio’s investments may represent industries or industry sectors that are interrelated or have common risks, making the Portfolio more susceptible to any economic, political, or regulatory developments or other risks affecting those industries and sectors.
These risks may increase share price volatility.
With regard to positioning, at the end of the six-month period, the Portfolio was overweight versus the Russell Index in the industrials, consumer discretionary, and financials sectors, and was underweight to the health care, information technology, communication services, consumer staples, materials, and energy sectors.
More specifically, with regard to the Portfolio’s overweight positions, we have started to identify some attractive opportunities in the consumer discretionary sector. The sector has been benefiting from an increase in consumer spending as lockdown restrictions in some areas have continued to ease. In the industrials sector, we have continued to favor companies in the commercial and professional services spaces, as we believe those companies have strong and resilient business models that may continue to hold up well in the current, volatile economic environment.
Please refer to the Schedule of Investments on pages 8 to 12 for a full listing of Portfolio securities.
Past performance is no guarantee of future results.
Any information in this shareholder report regarding market or economic trends or the factors influencing the Portfolio’s historical or future performance are statements of opinion as of the date of this report.
7
| Pioneer Select Mid Cap Growth VCT Portfolio | PIONEER VARIABLE CONTRACTS TRUST |
| Shares | Value | ||
| UNAFFILIATED ISSUERS – 99.6% | |||
| COMMON STOCKS – 99.6% of Net Assets | |||
| Aerospace & Defense – 1.1% | |||
| 7,597 | HEICO Corp. | $ 757,041 | |
| 1,969(a) | Teledyne Technologies, Inc. | 612,261 | |
| Total Aerospace & Defense | $ 1,369,302 | ||
| Air Freight & Logistics – 0.3% | |||
| 4,014(a) | XPO Logistics, Inc. | $ 310,081 | |
| Total Air Freight & Logistics | $ 310,081 | ||
| Banks – 0.3% | |||
| 1,642(a) | SVB Financial Group | $ 353,900 | |
| Total Banks | $ 353,900 | ||
| Biotechnology – 7.0% | |||
| 10,328(a) | Alnylam Pharmaceuticals, Inc. | $ 1,529,680 | |
| 7,166(a) | BioMarin Pharmaceutical, Inc. | 883,854 | |
| 19,289(a) | Esperion Therapeutics, Inc. | 989,719 | |
| 11,281(a) | Exact Sciences Corp. | 980,770 | |
| 19,919(a) | FibroGen, Inc. | 807,317 | |
| 29,583(a) | Immunomedics, Inc. | 1,048,422 | |
| 6,683(a) | Mirati Therapeutics, Inc. | 762,998 | |
| 9,719(a) | Moderna, Inc. | 624,057 | |
| 11,758(a) | Natera, Inc. | 586,254 | |
| 9,856(a) | Sage Therapeutics, Inc. | 409,812 | |
| Total Biotechnology | $ 8,622,883 | ||
| Building Products – 1.1% | |||
| 6,847 | Owens Corning | $ 381,789 | |
| 7,630(a) | Trex Co., Inc. | 992,434 | |
| Total Building Products | $ 1,374,223 | ||
| Capital Markets – 3.5% | |||
| 7,137 | MSCI, Inc. | $ 2,382,473 | |
| 18,459 | Tradeweb Markets, Inc. | 1,073,206 | |
| 18,773(a) | XP, Inc. | 788,654 | |
| Total Capital Markets | $ 4,244,333 | ||
| Chemicals – 0.5% | |||
| 8,089 | Albemarle Corp. | $ 624,552 | |
| Total Chemicals | $ 624,552 | ||
| Commercial Services & Supplies – 0.8% | |||
| 11,034(a) | Copart, Inc. | $ 918,801 | |
| Total Commercial Services & Supplies | $ 918,801 | ||
| Communications Equipment – 0.7% | |||
| 6,335 | Motorola Solutions, Inc. | $ 887,724 | |
| Total Communications Equipment | $ 887,724 | ||
| Containers & Packaging – 1.3% | |||
| 4,723 | Avery Dennison Corp. | $ 538,847 | |
| 16,028(a) | Crown Holdings, Inc. | 1,043,904 | |
| Total Containers & Packaging | $ 1,582,751 | ||
| Distributors – 0.5% | |||
| 2,463 | Pool Corp. | $ 669,616 | |
| Total Distributors | $ 669,616 |
The accompanying notes are an integral part of these financial statements.
8
| Pioneer Select Mid Cap Growth VCT Portfolio | PIONEER VARIABLE CONTRACTS TRUST |
| Shares | Value | ||
| Diversified Consumer Services – 0.5% | |||
| 2,719(a) | Bright Horizons Family Solutions, Inc. | $ 318,667 | |
| 7,076(a) | ServiceMaster Global Holdings, Inc. | 252,543 | |
| Total Diversified Consumer Services | $ 571,210 | ||
| Electrical Equipment – 2.5% | |||
| 13,816(a) | Generac Holdings, Inc. | $ 1,684,585 | |
| 6,233 | Rockwell Automation, Inc. | 1,327,629 | |
| Total Electrical Equipment | $ 3,012,214 | ||
| Electronic Equipment, Instruments & Components – 1.3% | |||
| 8,445 | CDW Corp. | $ 981,140 | |
| 12,654(a) | II-VI, Inc. | 597,522 | |
| Total Electronic Equipment, Instruments & Components | $ 1,578,662 | ||
| Energy Equipment & Services – 0.1% | |||
| 8,551 | Cactus, Inc. | $ 176,407 | |
| Total Energy Equipment & Services | $ 176,407 | ||
| Entertainment – 1.3% | |||
| 5,276(a) | Live Nation Entertainment, Inc. | $ 233,885 | |
| 3,901(a) | Roku, Inc. | 454,584 | |
| 3,391(a) | Spotify Technology S.A. | 875,522 | |
| Total Entertainment | $ 1,563,991 | ||
| Equity Real Estate Investment Trusts (REITs) – 0.9% | |||
| 3,571 | SBA Communications Corp. | $ 1,063,872 | |
| Total Equity Real Estate Investment Trusts (REITs) | $ 1,063,872 | ||
| Food & Staples Retailing – 0.8% | |||
| 3,651 | Casey’s General Stores, Inc. | $ 545,898 | |
| 9,121(a) | Grocery Outlet Holding Corp. | 372,137 | |
| Total Food & Staples Retailing | $ 918,035 | ||
| Food Products – 1.8% | |||
| 14,641 | Conagra Brands, Inc. | $ 514,924 | |
| 55,970(a) | Nomad Foods, Ltd. | 1,200,556 | |
| 11,613(a) | TreeHouse Foods, Inc. | 508,649 | |
| Total Food Products | $ 2,224,129 | ||
| Food Retail – 0.5% | |||
| 16,756 | Kroger Co. | $ 567,191 | |
| Total Food Retail | $ 567,191 | ||
| Health Care Equipment & Supplies – 5.8% | |||
| 1,355(a) | Align Technology, Inc. | $ 371,866 | |
| 3,069(a) | DexCom, Inc. | 1,244,172 | |
| 2,216(a) | IDEXX Laboratories, Inc. | 731,635 | |
| 4,873(a) | Penumbra, Inc. | 871,390 | |
| 11,678 | ResMed, Inc. | 2,242,176 | |
| 4,379 | Teleflex, Inc. | 1,593,868 | |
| Total Health Care Equipment & Supplies | $ 7,055,107 | ||
| Health Care Providers & Services – 2.9% | |||
| 5,155(a) | Amedisys, Inc. | $ 1,023,474 | |
| 6,343 | McKesson Corp. | 973,143 | |
| 5,334(a) | Molina Healthcare, Inc. | 949,345 | |
| 5,370 | Quest Diagnostics, Inc. | 611,965 | |
| Total Health Care Providers & Services | $ 3,557,927 |
The accompanying notes are an integral part of these financial statements.
9
| Pioneer Select Mid Cap Growth VCT Portfolio | PIONEER VARIABLE CONTRACTS TRUST |
SCHEDULE OF INVESTMENTS 6/30/20 (UNAUDITED) | (continued) |
| Shares | Value | ||
| Health Care Technology – 3.2% | |||
| 7,051(a) | Teladoc Health, Inc. | $ 1,345,613 | |
| 10,704(a) | Veeva Systems, Inc. | 2,509,232 | |
| Total Health Care Technology | $ 3,854,845 | ||
| Hotels, Restaurants & Leisure – 3.1% | |||
| 35,324 | Brinker International, Inc. | $ 847,776 | |
| 1,145(a) | Chipotle Mexican Grill, Inc. | 1,204,952 | |
| 9,584(a) | Penn National Gaming, Inc. | 292,695 | |
| 19,758 | Wendy’s Co. | 430,329 | |
| 4,781 | Wingstop, Inc. | 664,416 | |
| 4,986 | Wynn Resorts Ltd. | 371,407 | |
| Total Hotels, Restaurants & Leisure | $ 3,811,575 | ||
| Household Durables – 0.9% | |||
| 7,777 | Dr Horton, Inc. | $ 431,235 | |
| 5,495(a) | TopBuild Corp. | 625,166 | |
| Total Household Durables | $ 1,056,401 | ||
| Household Products – 0.7% | |||
| 3,780 | Clorox Co. | $ 829,219 | |
| Total Household Products | $ 829,219 | ||
| Information Technology – 3.0% | |||
| 15,796 | Amphenol Corp. | $ 1,513,415 | |
| 6,587 | Lam Research Corp. | 2,130,631 | |
| Total Information Technology | $ 3,644,046 | ||
| Insurance – 0.2% | |||
| 10,902(a) | Selectquote, Inc. | $ 276,148 | |
| Total Insurance | $ 276,148 | ||
| Interactive Media & Services – 3.3% | |||
| 10,525(a) | IAC/InterActiveCorp | $ 3,403,785 | |
| 19,369(a) | Twitter, Inc. | 577,002 | |
| Total Interactive Media & Services | $ 3,980,787 | ||
| IT Services – 9.3% | |||
| 11,583(a) | Akamai Technologies, Inc. | $ 1,240,423 | |
| 11,752 | Booz Allen Hamilton Holding Corp. | 914,188 | |
| 6,025(a) | EPAM Systems, Inc. | 1,518,360 | |
| 28,328 | Genpact, Ltd. | 1,034,539 | |
| 7,549 | Global Payments, Inc. | 1,280,461 | |
| 7,117(a) | Okta, Inc. | 1,425,037 | |
| 900(a) | Shopify, Inc. | 854,372 | |
| 9,365(a) | Square, Inc. | 982,763 | |
| 5,663(a) | Twilio, Inc. | 1,242,575 | |
| 5,392(a) | WEX, Inc. | 889,734 | |
| Total IT Services | $ 11,382,452 | ||
| Leisure Products – 1.1% | |||
| 23,793(a) | Peloton Interactive, Inc. | $ 1,374,522 | |
| Total Leisure Products | $ 1,374,522 | ||
| Life Sciences Tools & Services – 1.1% | |||
| 9,136(a) | 10X Genomics, Inc. | $ 815,936 | |
| 5,969 | Agilent Technologies, Inc. | 527,481 | |
| Total Life Sciences Tools & Services | $ 1,343,417 |
The accompanying notes are an integral part of these financial statements.
10
| Pioneer Select Mid Cap Growth VCT Portfolio | PIONEER VARIABLE CONTRACTS TRUST |
| Shares | Value | ||
| Machinery – 1.7% | |||
| 6,144(a) | Middleby Corp. | $ 485,007 | |
| 8,681 | Nordson Corp. | 1,646,872 | |
| Total Machinery | $ 2,131,879 | ||
| Media – 0.3% | |||
| 4,137 | Nexstar Media Group, Inc. | $ 346,226 | |
| Total Media | $ 346,226 | ||
| Multiline Retail – 1.8% | |||
| 11,586 | Dollar General Corp. | $ 2,207,249 | |
| Total Multiline Retail | $ 2,207,249 | ||
| Pharmaceuticals – 1.4% | |||
| 6,894(a) | MyoKardia, Inc. | $ 666,098 | |
| 6,961(a) | Reata Pharmaceuticals, Inc. | 1,086,055 | |
| Total Pharmaceuticals | $ 1,752,153 | ||
| Professional Services – 6.2% | |||
| 108,968(a) | Clarivate Analytics Plc | $ 2,433,255 | |
| 1,828(a) | CoStar Group, Inc. | 1,299,105 | |
| 13,957 | Thomson Reuters Corp. | 948,657 | |
| 17,464 | TransUnion | 1,520,067 | |
| 8,439 | Verisk Analytics, Inc. | 1,436,318 | |
| Total Professional Services | $ 7,637,402 | ||
| Real Estate Management & Development – 0.5% | |||
| 13,962(a) | CBRE Group, Inc. | $ 631,362 | |
| Total Real Estate Management & Development | $ 631,362 | ||
| Semiconductors & Semiconductor Equipment – 4.6% | |||
| 48,473(a) | Micron Technology, Inc. | $ 2,497,329 | |
| 9,820 | MKS Instruments, Inc. | 1,112,017 | |
| 8,000 | NXP Semiconductors NV | 912,320 | |
| 5,601(a) | Qorvo, Inc. | 619,079 | |
| 3,073(a) | SolarEdge Technologies, Inc. | 426,471 | |
| Total Semiconductors & Semiconductor Equipment | $ 5,567,216 | ||
| Software – 17.1% | |||
| 11,553(a) | Anaplan, Inc. | $ 523,466 | |
| 5,972(a) | ANSYS, Inc. | 1,742,212 | |
| 5,737(a) | Atlassian Corp. Plc | 1,034,209 | |
| 5,994(a) | Avalara, Inc. | 797,741 | |
| 6,364 | Citrix Systems, Inc. | 941,299 | |
| 5,538(a) | Crowdstrike Holding, Inc. | 555,406 | |
| 10,871(a) | DocuSign, Inc. | 1,872,095 | |
| 6,726(a) | Guidewire Software, Inc. | 745,577 | |
| 2,431(a) | Paycom Software, Inc. | 752,954 | |
| 18,655(a) | RealPage, Inc. | 1,212,762 | |
| 4,041(a) | RingCentral, Inc. | 1,151,725 | |
| 2,766(a) | ServiceNow, Inc. | 1,120,396 | |
| 17,607(a) | Slack Technologies, Inc. | 547,402 | |
| 8,986(a) | Splunk, Inc. | 1,785,518 | |
| 13,036 | SS&C Technologies Holdings, Inc. | 736,273 | |
| 12,525(a) | Synopsys, Inc. | 2,442,375 | |
| 3,283(a) | Trade Desk, Inc. | 1,334,539 | |
| 12,477(a) | Zendesk, Inc. | 1,104,589 | |
| 5,758(a) | Zscaler, Inc. | 630,501 | |
| Total Software | $ 21,031,039 |
The accompanying notes are an integral part of these financial statements.
11
| Pioneer Select Mid Cap Growth VCT Portfolio | PIONEER VARIABLE CONTRACTS TRUST |
SCHEDULE OF INVESTMENTS 6/30/20 (UNAUDITED) | (continued) |
| Shares | Value | ||
| Specialty Retail – 3.4% | |||
| 841(a) | AutoZone, Inc. | $ 948,749 | |
| 4,920(a) | Burlington Stores, Inc. | 968,895 | |
| 11,627(a) | Floor & Decor Holdings, Inc. | 670,297 | |
| 2,881(a) | O’Reilly Automotive, Inc. | 1,214,831 | |
| 4,486 | Ross Stores, Inc. | 382,387 | |
| Total Specialty Retail | $ 4,185,159 | ||
| Textiles, Apparel & Luxury Goods – 1.2% | |||
| 4,854(a) | Lululemon Athletica, Inc. | $ 1,514,497 | |
Total Textiles, Apparel & Luxury Goods | $ 1,514,497 | ||
| TOTAL COMMON STOCKS | |||
(Cost $91,177,982) | $ 121,804,505 | ||
| TOTAL INVESTMENTS IN UNAFFILIATED ISSUERS – 99.6% | |||
(Cost $91,177,982) | $ 121,804,505 | ||
| OTHER ASSETS AND LIABILITIES – 0.4% | $ 457,835 | ||
| NET ASSETS – 100.0% | $122,262,340 |
REIT | Real Estate Investment Trust. |
(a) | Non-income producing security. |
Purchases and sales of securities (excluding temporary cash investments) for the six months ended June 30, 2020, aggregated $62,562,280 and $68,559,199, respectively.
The Portfolio is permitted to engage in purchase and sale transactions (“cross trades”) with certain funds and accounts for which Amundi Pioneer Asset Management, Inc. (the “Adviser”) serves as the Portfolio’s investment adviser, as set forth in Rule 17a-7 under the Investment Company Act of 1940, pursuant to procedures adopted by the Board of Trustees. Under these procedures, cross trades are effected at current market prices. During the six months ended June 30, 2020, the Portfolio did not engage in any cross trade activity.
At June 30, 2020, the net unrealized appreciation on investments based on cost for federal tax purposes of $91,975,282 was as follows: |
| Aggregate gross unrealized appreciation for all investments in which there is an excess of value over tax cost | $32,403,794 |
| Aggregate gross unrealized depreciation for all investments in which there is an excess of tax cost over value | (2,574,571) |
| Net unrealized appreciation | $29,829,223 |
Various inputs are used in determining the value of the Portfolio’s investments. These inputs are summarized in the three broad levels below.
Level 1 – quoted prices in active markets for identical securities.
Level 2 – other significant observable inputs (including quoted prices for similar securities, interest rates, prepayment speeds, credit risks, etc.). See Notes to Financial Statements — Note 1A.
Level 3 – significant unobservable inputs (including the Portfolio’s own assumptions in determining fair value of investments). See Notes to Financial Statements — Note 1A.
The following is a summary of the inputs used as of June 30, 2020, in valuing the Portfolio’s investments:
| Level 1 | Level 2 | Level 3 | Total | |||||||||||||
Common Stocks | $ | 121,804,505 | $ | — | $ | — | $ | 121,804,505 | ||||||||
| Total Investments in Securities | $ | 121,804,505 | $ | — | $ | — | $ | 121,804,505 | ||||||||
During the six months ended June 30, 2020, there were no transfers between Levels 1, 2 and 3.
The accompanying notes are an integral part of these financial statements.
12
Pioneer Select Mid Cap Growth VCT Portfolio PIONEER VARIABLE CONTRACTS TRUST |
| ASSETS: | ||||
| Investments in unaffiliated issuers, at value (cost $91,177,982) | $ | 121,804,505 | ||
| Cash | 1,505,784 | |||
| Receivables — | ||||
| Investment securities sold | 3,795,792 | |||
| Portfolio shares sold | 6,328 | |||
| Dividends | 23,636 | |||
| Due from the Adviser | 20,906 | |||
| Other assets | 363 | |||
| Total assets | $ | 127,157,314 | ||
| LIABILITIES: | ||||
| Payables — | ||||
| Investment securities purchased | $ | 4,740,885 | ||
| Portfolio shares repurchased | 102,441 | |||
| Trustees’ fees | 342 | |||
| Due to affiliates | 12,307 | |||
| Accrued expenses | 38,999 | |||
| Total liabilities | $ | 4,894,974 | ||
| NET ASSETS: | ||||
| Paid-in capital | $ | 83,780,251 | ||
| Distributable earnings | 38,482,089 | |||
| Net assets | $ | 122,262,340 | ||
| NET ASSET VALUE PER SHARE: | ||||
No par value (unlimited number of shares authorized) | ||||
| Class I (based on $122,262,340/4,418,019 shares) | $ | 27.67 | ||
The accompanying notes are an integral part of these financial statements.
13
| Pioneer Select Mid Cap Growth VCT Portfolio | PIONEER VARIABLE CONTRACTS TRUST |
| STATEMENT OF OPERATIONS (UNAUDITED) |
| FOR THE SIX MONTHS ENDED 6/30/20 |
| INVESTMENT INCOME: | ||||||||
| Interest from unaffiliated issuers | $ | 2,175 | ||||||
| Dividends from unaffiliated issuers (net of foreign taxes withheld $3,587) | 288,996 | |||||||
| Total investment income | $ | 291,171 | ||||||
| EXPENSES: | ||||||||
| Management fees | $ | 425,710 | ||||||
| Administrative expense | 36,927 | |||||||
| Custodian fees | 11,789 | |||||||
| Professional fees | 27,429 | |||||||
| Printing expense | 12,158 | |||||||
| Pricing fees | 4 | |||||||
| Trustees’ fees | 4,186 | |||||||
| Miscellaneous | 1,780 | |||||||
| Total expenses | $ | 519,983 | ||||||
| Net investment income | $ | (228,812 | ) | |||||
| REALIZED AND UNREALIZED GAIN (LOSS) ON INVESTMENTS: | ||||||||
| Net realized gain (loss) on: | ||||||||
| Investments in unaffiliated issuers | $ | 8,881,442 | ||||||
| Other assets and liabilities denominated in foreign currencies | 427 | $ | 8,881,869 | |||||
| Change in net unrealized appreciation (depreciation) on: | ||||||||
| Investments in unaffiliated issuers | $ | (5,741,318 | ) | |||||
| Other assets and liabilities denominated in foreign currencies | 27 | $ | (5,741,291 | ) | ||||
| Net realized and unrealized gain (loss) on investments | $ | 3,140,578 | ||||||
| Net increase in net assets resulting from operations | $ | 2,911,766 | ||||||
The accompanying notes are an integral part of these financial statements.
14
| Pioneer Select Mid Cap Growth VCT Portfolio | PIONEER VARIABLE CONTRACTS TRUST |
STATEMENTS OF CHANGES IN NET ASSETS |
| Six Months | ||||||||
| Ended | ||||||||
| 6/30/20 | Year Ended | |||||||
| (unaudited) | 12/31/19 | |||||||
| FROM OPERATIONS: | ||||||||
Net investment income (loss) | $ | (228,812 | ) | $ | (378,501 | ) | ||
Net realized gain (loss) on investments | 8,881,869 | 8,985,771 | ||||||
Change in net unrealized appreciation (depreciation) on investments | (5,741,291 | ) | 25,611,439 | |||||
| Net increase in net assets resulting from operations | $ | 2,911,766 | $ | 34,218,709 | ||||
| DISTRIBUTIONS TO SHAREOWNERS: | ||||||||
| Class I ($2.21 and $3.74 per share, respectively) | $ | (9,090,931 | ) | $ | (15,315,280 | ) | ||
| Total distributions to shareowners | $ | (9,090,931 | ) | $ | (15,315,280 | ) | ||
| FROM PORTFOLIO SHARE TRANSACTIONS: | ||||||||
Net proceeds from sales of shares | $ | 2,437,479 | $ | 7,635,206 | ||||
Reinvestment of distributions | 9,090,931 | 15,315,280 | ||||||
Cost of shares repurchased | (8,679,097 | ) | (21,711,414 | ) | ||||
| Net increase in net assets resulting from Portfolio share transactions | $ | 2,849,313 | $ | 1,239,072 | ||||
| Net increase (decrease) in net assets | $ | (3,329,852 | ) | $ | 20,142,501 | |||
| NET ASSETS: | ||||||||
Beginning of period | $ | 125,592,192 | $ | 105,449,691 | ||||
End of period | $ | 122,262,340 | $ | 125,592,192 | ||||
| Six Months | Six Months | |||||||||||||||
| Ended | Ended | |||||||||||||||
| 6/30/20 | 6/30/20 | Year Ended | Year Ended | |||||||||||||
| Shares | Amount | 12/31/19 | 12/31/19 | |||||||||||||
| (unaudited) | (unaudited) | Shares | Amount | |||||||||||||
| CLASS I | ||||||||||||||||
Shares sold | 89,596 | $ | 2,437,479 | 274,819 | $ | 7,635,206 | ||||||||||
Reinvestment of distributions | 329,024 | 9,090,931 | 550,118 | 15,315,280 | ||||||||||||
Less shares repurchased | (312,993 | ) | (8,679,097 | ) | (760,302 | ) | (21,711,414 | ) | ||||||||
| Net increase | 105,627 | $ | 2,849,314 | 64,635 | $ | 1,239,072 | ||||||||||
The accompanying notes are an integral part of these financial statements.
15
| Pioneer Select Mid Cap Growth VCT Portfolio | PIONEER VARIABLE CONTRACTS TRUST |
FINANCIAL HIGHLIGHTS |
| Six Months | ||||||||||||||||||||||||
| Ended | Year | Year | Year | Year | Year | |||||||||||||||||||
| 6/30/20 | Ended | Ended | Ended | Ended | Ended | |||||||||||||||||||
| (unaudited) | 12/31/19 | 12/31/18 | 12/31/17 | 12/31/16* | 12/31/15* | |||||||||||||||||||
| Class I | ||||||||||||||||||||||||
Net asset value, beginning of period | $ | 29.12 | $ | 24.82 | $ | 30.23 | $ | 23.56 | $ | 26.11 | $ | 28.73 | ||||||||||||
Increase (decrease) from investment operations: | ||||||||||||||||||||||||
| Net investment income (loss) (a) | $ | (0.05 | ) | $ | (0.09 | ) | $ | (0.10 | ) | $ | (0.05 | ) | $ | 0.01 | $ | (0.04 | ) | |||||||
| Net realized and unrealized gain (loss) on investments | 0.81 | 8.13 | (1.22 | ) | 7.07 | 0.88 | 0.68 | |||||||||||||||||
Net increase (decrease) from investment operations | $ | 0.76 | $ | 8.04 | $ | (1.32 | ) | $ | 7.02 | $ | 0.89 | $ | 0.64 | |||||||||||
Distributions to shareowners: | ||||||||||||||||||||||||
| Net investment income | $ | — | $ | — | $ | — | $ | (0.02 | ) | $ | — | $ | — | |||||||||||
| Net realized gain | (2.21 | ) | (3.74 | ) | (4.09 | ) | (0.33 | ) | (3.44 | ) | (3.26 | ) | ||||||||||||
Total distributions | $ | (2.21 | ) | $ | (3.74 | ) | $ | (4.09 | ) | $ | (0.35 | ) | $ | (3.44 | ) | $ | (3.26 | ) | ||||||
Net increase (decrease) in net asset value | $ | (1.45 | ) | $ | 4.30 | $ | (5.41 | ) | $ | 6.67 | $ | (2.55 | ) | $ | (2.62 | ) | ||||||||
Net asset value, end of period | $ | 27.67 | $ | 29.12 | $ | 24.82 | $ | 30.23 | $ | 23.56 | $ | 26.11 | ||||||||||||
Total return (b) | 2.63 | %(c) | 33.08 | % | (6.48 | )% | 30.03 | % | 3.74 | %(d) | 1.63 | %(e) | ||||||||||||
Ratio of net expenses to average net assets | 0.90 | %(f) | 0.88 | % | 0.90 | % | 0.88 | % | 0.86 | % | 0.86 | % | ||||||||||||
Ratio of net investment income (loss) to average net assets | (0.40 | )%(f) | (0.30 | )% | (0.33 | )% | (0.20 | )% | 0.06 | % | (0.13 | )% | ||||||||||||
Portfolio turnover rate | 54 | %(c) | 58 | % | 83 | % | 85 | % | 97 | % | 93 | % | ||||||||||||
Net assets, end of period (in thousands) | $ | 122,262 | $ | 125,592 | $ | 105,450 | $ | 123,007 | $ | 109,926 | $ | 119,727 | ||||||||||||
* | The Portfolio was audited by an independent registered public accounting firm other than Ernst & Young LLP. |
(a) | The per-share data presented above is based on the average shares outstanding for the period presented. |
(b) | Assumes initial investment at net asset value at the beginning of each period, reinvestment of all distributions and the complete redemption of the investment at net asset value at the end of each period. |
(c) | Not Annualized. |
(d) | If the Portfolio had not recognized gains in settlement of class action lawsuits during the year ended December 31, 2016, the total return would have been 3.65%. |
(e) | If the Portfolio had not recognized gains in settlement of class action lawsuits during the year ended December 31, 2015, the total return would have been 1.59%. |
(f) | Annualized. |
NOTE: The above financial highlights do not reflect the deduction of non-portfolio expenses associated with variable insurance products, such as mortality and expense risk charges, separate account charges, and sales charges.
The accompanying notes are an integral part of these financial statements.
16
| Pioneer Select Mid Cap Growth VCT Portfolio | PIONEER VARIABLE CONTRACTS TRUST |
1. Organization and Significant Accounting Policies
Pioneer VCT Select Mid Cap Growth Fund (the “Portfolio”) is one of 8 portfolios comprising Pioneer Variable Contracts Trust (the “Trust”), a Delaware statutory trust. The Portfolio is registered under the Investment Company Act of 1940 as a diversified, open-end management investment company. The investment objective of the Portfolio is to seek growth of capital.
The Portfolio offers one class of shares designated as Class I shares. There is no distribution plan for Class I shares.
Portfolio shares may be purchased only by insurance companies for the purpose of funding variable annuity and variable life insurance contracts or by qualified pension and retirement plans.
Amundi Pioneer Asset Management, Inc., an indirect, wholly owned subsidiary of Amundi and Amundi’s wholly owned subsidiary, Amundi USA, Inc., serves as the Portfolio’s investment adviser (the “Adviser”). Amundi Pioneer Distributor, Inc., an affiliate of Amundi Pioneer Asset Management, Inc., serves as the Portfolio’s distributor (the “Distributor”).
In August 2018, the Securities and Exchange Commission (“SEC”) released a Disclosure Update and Simplification Final Rule. The Final Rule amends Regulation S-X disclosures requirements to conform them to U.S. Generally Accepted Accounting Principles (“U.S. GAAP”) for investment companies. The Portfolio’s financial statements were prepared in compliance with the new amendments to Regulation S-X.
The Portfolio is an investment company and follows investment company accounting and reporting guidance under U.S. GAAP. U.S. GAAP requires the management of the Portfolio to make estimates and assumptions that affect the reported amounts of assets and liabilities, the disclosure of contingent assets and liabilities at the date of the financial statements, and the reported amounts of income, expenses and gain or loss on investments during the reporting period. Actual results could differ from those estimates.
The following is a summary of significant accounting policies followed by the Portfolio in the preparation of its financial statements:
A. Security Valuation
The net asset value of the Portfolio is computed once daily, on each day the New York Stock Exchange (“NYSE”) is open, as of the close of regular trading on the NYSE.
Equity securities that have traded on an exchange are valued by using the last sale price on the principal exchange where they are traded. Equity securities that have not traded on the date of valuation, or securities for which sale prices are not available, generally are valued using the mean between the last bid and asked prices or, if both last bid and asked prices are not available, at the last quoted bid price. Last sale and bid and asked prices are provided by independent third party pricing services. In the case of equity securities not traded on an exchange, prices are typically determined by independent third party pricing services using a variety of techniques and methods.
The value of foreign securities is translated into U.S. dollars based on foreign currency exchange rate quotations supplied by a third party pricing source. Trading in non-U.S. equity securities is substantially completed each day at various times prior to the close of the NYSE. The values of such securities used in computing the net asset value of the Portfolio’s shares are determined as of such times. The Portfolio may use a fair value model developed by an independent pricing service to value non-U.S. equity securities.
Securities for which independent pricing services or broker-dealers are unable to supply prices or for which market prices and/or quotations are not readily available or are considered to be unreliable are valued by a fair valuation team comprised of certain personnel of the Adviser pursuant to procedures adopted by the Portfolio’s Board of Trustees. The Adviser’s fair valuation team uses fair value methods approved by the Valuation Committee of the Board of Trustees. The Adviser’s fair valuation team is responsible for monitoring developments that may impact fair valued securities and for discussing and assessing fair values on an ongoing basis, and at least quarterly, with the Valuation Committee of the Board of Trustees.
Inputs used when applying fair value methods to value a security may include credit ratings, the financial condition of the company, current market conditions and comparable securities. The Portfolio may use fair value methods if it is determined that a significant event has occurred after the close of the exchange or market on which the security trades and prior to the determination of the Portfolio’s net asset value. Examples of a significant event might include political or economic news, corporate restructurings, natural disasters, terrorist activity or trading halts. Thus, the valuation of the Portfolio’s securities may differ significantly from exchange prices, and such differences could be material.
17
| Pioneer Select Mid Cap Growth VCT Portfolio | PIONEER VARIABLE CONTRACTS TRUST |
NOTES TO FINANCIAL STATEMENTS 6/30/20 (UNAUDITED) | (continued) |
At June 30, 2020, no securities were valued using fair value methods (other than securities valued using prices supplied by independent pricing services, broker-dealers or using a third party insurance industry pricing model).
B. Investment Income and Transactions
Dividend income is recorded on the ex-dividend date, except that certain dividends from foreign securities where the ex-dividend date may have passed are recorded as soon as the Portfolio becomes aware of the ex-dividend data in the exercise of reasonable diligence.
Interest income, including interest on income-bearing cash accounts, is recorded on the accrual basis. Dividend and interest income are reported net of unrecoverable foreign taxes withheld at the applicable country rates and net of income accrued on defaulted securities.
Interest and dividend income payable by delivery of additional shares is reclassified as PIK (payment-in-kind) income upon receipt and is included in interest and dividend income, respectively.
Security transactions are recorded as of trade date. Gains and losses on sales of investments are calculated on the identified cost method for both financial reporting and federal income tax purposes.
C. Foreign Currency Translation
The books and records of the Portfolio are maintained in U.S. dollars. Amounts denominated in foreign currencies are translated into U.S. dollars using current exchange rates.
Net realized gains and losses on foreign currency transactions, if any, represent, among other things, the net realized gains and losses on foreign currency exchange contracts, disposition of foreign currencies and the difference between the amount of income accrued and the U.S. dollars actually received. Further, the effects of changes in foreign currency exchange rates on investments are not segregated on the Statement of Operations from the effects of changes in the market prices of those securities, but are included with the net realized and unrealized gain or loss on investments.
D. Federal Income Taxes
It is the Portfolio’s policy to comply with the requirements of the Internal Revenue Code applicable to regulated investment companies and to distribute all of its net taxable income and net realized capital gains, if any, to its shareowners. Therefore, no provision for federal income taxes is required. As of December 31, 2019, the Portfolio did not accrue any interest or penalties with respect to uncertain tax positions, which, if applicable, would be recorded as an income tax expense on the Statement of Operations. Tax returns filed within the prior three years remain subject to examination by federal and state tax authorities.
The amount and character of income and capital gain distributions to shareowners are determined in accordance with federal income tax rules, which may differ from U.S. GAAP. Distributions in excess of net investment income or net realized gains are temporary over distributions for financial statement purposes resulting from differences in the recognition or classification of income or distributions for financial statement and tax purposes. Capital accounts within the financial statements are adjusted for permanent book/tax differences to reflect tax character, but are not adjusted for temporary differences.
The tax character of current year distributions payable will be determined at the end of the current taxable year. The tax character of distributions paid during the year ended December 31, 2019 was as follows:
| 2019 | ||||
| Distributions paid from: | ||||
| Long-term capital gain | $ | 15,315,280 | ||
| Total | $ | 15,315,280 | ||
The following shows the components of distributable earnings (losses) on a federal income tax basis at December 31, 2019:
| 2019 | ||||
| Distributable earnings: | ||||
| Undistributed long-term capital gain | $ | 9,090,713 | ||
| Net unrealized appreciation | 35,570,541 | |||
| Total | $ | 44,661,254 | ||
The difference between book-basis and tax-basis net unrealized appreciation is attributable to the tax deferral of losses on wash sales.
E. Portfolio Shares
The Portfolio records sales and repurchases of its shares as of trade date. Dividends and distributions to shareowners are recorded on the ex-dividend date.
18
| Pioneer Select Mid Cap Growth VCT Portfolio | PIONEER VARIABLE CONTRACTS TRUST |
F. Risks
The value of securities held by the Portfolio may go up or down, sometimes rapidly or unpredictably, due to general market conditions, such as real or perceived adverse economic, political or regulatory conditions, recessions, the spread of infectious illness or other public health issues, inflation, changes in interest rates, lack of liquidity in the bond markets or adverse investor sentiment. In the past several years, financial markets have experienced increased volatility, depressed valuations, decreased liquidity and heightened uncertainty. These conditions may continue, recur, worsen or spread. A general rise in interest rates could adversely affect the price and liquidity of fixed-income securities and could also result in increased redemptions from the Portfolio.
At times, the Portfolio’s investments may represent industries or industry sectors that are interrelated or have common risks, making the Portfolio more susceptible to any economic, political, or regulatory developments or other risks affecting those industries and sectors. The Portfolio’s investments in foreign markets and countries with limited developing markets may subject the Portfolio to a greater degree of risk than investments in a developed market. These risks include disruptive political or economic conditions and the imposition of adverse governmental laws or currency exchange restrictions.
Investments in mid-sized companies may offer the potential for higher returns, but are also subject to greater short-term price fluctuations than investments in larger, more established companies. Investing in foreign and/or emerging markets securities involves risks relating to interest rates, currency exchange rates and economic and political conditions.
With the increased use of technologies such as the Internet to conduct business, the Portfolio is susceptible to operational, information security and related risks. While the Portfolio’s Adviser has established business continuity plans in the event of, and risk management systems to prevent, limit or mitigate, such cyber-attacks, there are inherent limitations in such plans and systems, including the possibility that certain risks have not been identified. Furthermore, the Portfolio cannot control the cybersecurity plans and systems put in place by service providers to the Portfolio such as Brown Brothers Harriman & Co., the Portfolio’s custodian and accounting agent, and DST Asset Manager Solutions, Inc., the Portfolio’s transfer agent. In addition, many beneficial owners of Portfolio shares hold them through accounts at broker-dealers, retirement platforms and other financial market participants over which neither the Portfolio nor Amundi Pioneer exercises control. Each of these may in turn rely on service providers to them, which are also subject to the risk of cyber-attacks. Cybersecurity failures or breaches at Amundi Pioneer or the Portfolio’s service providers or intermediaries have the ability to cause disruptions and impact business operations, potentially resulting in financial losses, interference with the Portfolio’s ability to calculate its net asset value, impediments to trading, the inability of Portfolio shareowners to effect share purchases, redemptions or exchanges or receive distributions, loss of or unauthorized access to private shareowner information and violations of applicable privacy and other laws, regulatory fines, penalties, reputational damage, or additional compliance costs. Such costs and losses may not be covered under any insurance. In addition, maintaining vigilance against cyber-attacks may involve substantial costs over time, and system enhancements may themselves be subject to cyber-attacks.
COVID-19
The respiratory illness COVID-19 caused by a novel coronavirus has resulted in a global pandemic and major disruption to economies and markets around the world, including the United States. Global financial markets have experienced extreme volatility and severe losses, and trading in many instruments has been disrupted. Liquidity for many instruments has been greatly reduced for periods of time. Some interest rates are very low and in some cases yields are negative. Some sectors of the economy and individual issuers have experienced particularly large losses. These circumstances may continue for an extended period of time, and may continue to affect adversely the value and liquidity of the Portfolio’s investments. The ultimate economic fallout from the pandemic, and the long-term impact on economies, markets, industries and individual issuers, are not known. Governments and central banks, including the Federal Reserve in the U.S., have taken extraordinary and unprecedented actions to support local and global economies and the financial markets. These actions have resulted in significant expansion of public debt, including in the U.S. The
19
| Pioneer Select Mid Cap Growth VCT Portfolio | PIONEER VARIABLE CONTRACTS TRUST |
NOTES TO FINANCIAL STATEMENTS 6/30/20 (UNAUDITED) | (continued) |
impact of these measures, and whether they will be effective to mitigate the economic and market disruption, will not be known for some time. The consequences of high public debt, including its future impact on the economy and securities markets, likewise may not be known for some time.
The Portfolio’s prospectus contains unaudited information regarding the Portfolio’s principal risks. Please refer to that document when considering the Portfolio’s principal risks.
2. Management Agreement
The Adviser manages the Portfolio. Management fees are calculated daily and paid monthly at the annual rate of 0.74% of the Portfolio’s average daily net assets. For the six months ended June 30, 2020, the effective management fee was equivalent to 0.74% (annualized) of the Portfolio’s average daily net assets.
In addition, under the management and administration agreements, certain other services and costs, including accounting, regulatory reporting and insurance premiums, are paid by the Portfolio as administrative reimbursements. Included in “Due to affiliates” reflected on the Statement of Assets and Liabilities is $12,307 in management fees, administrative costs and certain other reimbursements payable to the Adviser at June 30, 2020.
3. Transfer Agent
DST Asset Manager Solutions, Inc. serves as the transfer agent to the Portfolio at negotiated rates. Transfer agent fees and payables shown on the Statement of Operations and the Statement of Assets and Liabilities, respectively, include sub-transfer agent expenses incurred through the Portfolio’s omnibus relationship contracts.
20
| Pioneer Select Mid Cap Growth VCT Portfolio | PIONEER VARIABLE CONTRACTS TRUST |
As required by law, the Portfolio has adopted and implemented a liquidity risk management program (the “Program”) that is designed to assess and manage liquidity risk. Liquidity risk is the risk that the Portfolio could not meet requests to redeem its shares without significant dilution of remaining investors’ interests in the Portfolio. The Portfolio’s Board of Trustees designated a liquidity risk management committee (the “Committee”) consisting of employees of Amundi Pioneer Asset Management, Inc. (the “Adviser”) to administer the Program.
The Committee provided the Board of Trustees with a report that addressed the operation of the Program and assessed its adequacy and effectiveness of implementation (the “Report”). The Report covered the period from December 1, 2018 through March 31, 2020 (the “Reporting Period”).
The Report confirmed that, throughout the Reporting Period, the Committee had monitored the Portfolio’s portfolio liquidity and liquidity risk on an ongoing basis, as described in the Program and in Board reporting throughout the Reporting Period.
The Report discussed the Committee’s annual review of the Program, which addressed, among other things, the following elements of the Program:
The Committee reviewed the Portfolio’s investment strategy and liquidity of portfolio investments during both normal and reasonably foreseeable stressed conditions. The Committee noted that the Portfolio’s investment strategy continues to be appropriate for an open-end fund, taking into account, among other things, whether and to what extent the Portfolio held less liquid and illiquid assets and the extent to which any such investments affected the Portfolio’s ability to meet redemption requests. In managing and reviewing the Portfolio’s liquidity risk, the Committee also considered the extent to which the Portfolio’s investment strategy involves a relatively concentrated portfolio or large positions in particular issuers, the extent to which the Portfolio uses borrowing for investment purposes, and the extent to which the Portfolio uses derivatives (including for hedging purposes). The Committee also reviewed the Portfolio’s short-term and long-term cash flow projections during both normal and reasonably foreseeable stressed conditions. In assessing the Portfolio’s cash flow projections, the Committee considered, among other factors, historical net redemption activity, redemption policies, ownership concentration, distribution channels, and the degree of certainty associated with the Portfolio’s short-term and long-term cash flow projections. The Committee also considered the Portfolio’s holdings of cash and cash equivalents, as well as borrowing arrangements and other funding sources, including, if applicable, the Portfolio’s participation in a credit facility, as components of the Portfolio’s ability to meet redemption requests. The Portfolio has adopted an in-kind redemption policy which may be utilized to meet larger redemption requests.
The Committee reviewed the Program’s liquidity classification methodology for categorizing the Portfolio’s investments into one of four liquidity buckets. In reviewing the Portfolio’s investments, the Committee considered, among other factors, whether trading varying portions of a position in a particular portfolio investment or asset class in sizes the Portfolio would reasonably anticipate trading, would be reasonably expected to significantly affect liquidity.
The Committee performed an analysis to determine whether the Portfolio is required to maintain a Highly Liquid Investment Minimum, and determined that no such minimum is required because the Portfolio primarily holds highly liquid investments.
The Report stated that the Committee concluded the Program operates adequately and effectively, in all material respects, to assess and manage the Portfolio’s liquidity risk throughout the Reporting Period.
21
This page was intentionally left blank.
22
This page was intentionally left blank.
23
This page was intentionally left blank.
24
This page was intentionally left blank.
25
This page was intentionally left blank.
26
This page was intentionally left blank.
27
This page was intentionally left blank.
28
| Officers | Trustees |
Lisa M. Jones, President and Chief Executive Officer | Thomas J. Perna, Chairman |
Mark E. Bradley, Treasurer and Chief Financial and Accounting Officer | John E. Baumgardner, Jr. |
Christopher J. Kelley, Secretary and Chief Legal Officer | Diane Durnin |
| Benjamin M. Friedman | |
Investment Adviser and Administrator | Lisa M. Jones |
Amundi Pioneer Asset Management, Inc. | Lorraine H. Monchak |
| Marguerite A. Piret | |
Custodian and Sub-Administrator | Fred J. Ricciardi |
Brown Brothers Harriman & Co. | Kenneth J. Taubes |
Principal Underwriter | |
Amundi Pioneer Distributor, Inc. | |
| Legal Counsel | |
| Morgan, Lewis & Bockius LLP | |
| Transfer Agent | |
| DST Asset Manager Solutions, Inc. | |
29
Proxy Voting Policies and Procedures of the Portfolio are available without charge, upon request, by calling our toll free number (1-800-225-6292). Information regarding how the Portfolio voted proxies relating to Portfolio securities during the most recent 12-month period ended June 30 is publicly available to shareowners at www.amundipioneer.com/us. This information is also available on the Securities and Exchange Commission’s web site at www.sec.gov.
19616-14-0820
PIONEER VARIABLE CONTRACTS TRUST
Pioneer High Yield VCT Portfolio — Class I and II Shares
Pioneer High Yield VCT Portfolio — Class I and II Shares
Beginning in February 2021, as permitted by regulations adopted by the Securities and Exchange Commission, you may not be receiving paper copies of the Portfolio’s shareholder reports like this one by mail, unless you specifically request paper copies of the reports from the insurance company that offers your variable annuity or variable life insurance contract or from your financial intermediary. Instead, the insurance company may choose to make the reports available on a website, and will notify you by mail each time a shareholder report is posted and provide you with a website link to access the report. Instructions for requesting paper copies will be provided by your insurance company.
If you already elected to receive shareholder reports electronically, you will not be affected by this change and you need not take any action. You may elect to receive shareholder reports and other communications from the insurance company or your financial intermediary electronically by following the instructions provided by the insurance company or by contacting your financial intermediary.
You may elect to receive all future Portfolio shareholder reports in paper free of charge from the insurance company. You can inform the insurance company or your financial intermediary that you wish to continue receiving paper copies of your shareholder reports by following the instructions provided by the insurance company or by contacting your financial intermediary. Your election to receive reports in paper will apply to all funds available under your contract with the insurance company.
SEMIANNUAL REPORT
June 30, 2020
June 30, 2020
Please refer to your contract prospectus to determine the applicable share class offered under your contract.
PIONEER VARIABLE CONTRACTS TRUST
Table of Contents | |
Pioneer High Yield VCT Portfolio | |
This report is authorized for distribution only when preceded or accompanied by a prospectus for the Portfolio being offered.
Pioneer Variable Contracts Trust files a complete schedule of portfolio holdings with the Securities and Exchange Commission for the first and third quarters of each fiscal year as an exhibit to its reports on Form N-PORT. Shareholders may view the filed Form N-PORT by visiting the Commission’s web site at https://www.sec.gov.
| Pioneer High Yield VCT Portfolio | PIONEER VARIABLE CONTRACTS TRUST |
Portfolio Diversification
(As a percentage of total investments)*
(As a percentage of total investments)*

5 Largest Holdings
(As a percentage of total investments)*
(As a percentage of total investments)*
1. CCO Holdings LLC/CCO Holdings | |
| Capital Corp., 5.5%, 5/1/26 (144A) | 1.32% |
2. Pioneer ILS Interval Fund (k) | 1.27 |
3. U.S. Treasury Note, 0.265% | |
| (3 Month U.S. Treasury Bill Money | |
| Market Yield + 12 bps), 1/31/21 | 1.24 |
4. United States Treasury Bill, 7/21/20 | 1.24 |
5. Teva Pharmaceutical Finance | |
| Netherlands III BV, 2.8%, 7/21/23 | 1.07 |
| * Excludes temporary cash investments and all derivative contracts except for options purchased. The Portfolio is actively managed, and current holdings may be different. The holdings listed should not be considered recommendations to buy or sell any securities. |
(k) Pioneer ILS Interval Fund is an affiliated closed-end fund managed by Amundi Pioneer Asset Management, Inc. |
PERFORMANCE UPDATE 6/30/20
Prices and Distributions
| Net Asset Value per Share | 6/30/20 | 12/31/19 |
| Class I | $8.56 | $9.58 |
| Class II | $8.45 | $9.47 |
| Net | |||
| Distributions per Share | Investment | Short-Term | Long-Term |
| (1/1/20 – 6/30/20) | Income | Capital Gains | Capital Gains |
| Class I | $0.2370 | $ – | $ – |
| Class II | $0.2234 | $ – | $ – |
Performance of a $10,000 Investment
The following chart shows the change in value of an investment made in Class I and Class II shares of Pioneer High Yield VCT Portfolio at net asset value during the periods shown, compared to that of the ICE Bank of America (BofA) U.S. High Yield Index and the ICE BofA U.S. All-Convertibles Speculative Quality Index. Portfolio returns are based on net asset value and do not reflect any applicable insurance fees or surrender charges.
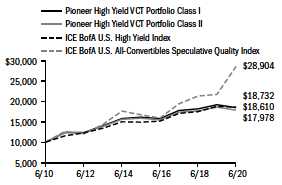
The ICE BofA U.S. High Yield Index is an unmanaged, commonly accepted measure of the performance of high-yield securities. The ICE BofA U.S. All-Convertibles Speculative Quality Index is an unmanaged index of high-yield U.S. convertible securities. Index returns are calculated monthly, assume reinvestment of dividends and, unlike Portfolio returns, do not reflect any fees, expenses or sales charges. It is not possible to invest directly in an index.
Average Annual Total Returns
(As of June 30, 2020)
| ICE | ICE BofA U.S. | |||
| BofA | All-Convertibles | |||
| U.S. High | Speculative | |||
| Class I | Class II | Yield Index | Quality Index | |
10 Years | 6.41% | 6.04% | 6.48% | 11.20% |
5 Years | 2.79% | 2.42% | 4.58% | 11.44% |
1 Year | -3.78% | -4.13% | -1.10% | 31.82% |
All total returns shown assume reinvestment of distributions at net asset value.
The performance table does not reflect the deduction of taxes that a shareowner would pay on distributions or the redemption of shares.
Call 1-800-688-9915 or visit www.amundipioneer.com/us for the most recent month-end performance results. Current performance may be lower or higher than the performance data quoted.
The performance data quoted represents past performance, which is no guarantee of future results. Investment return and principal value will fluctuate, and shares, when redeemed, may be worth more or less than their original cost.
The returns for the Portfolio do not reflect the deduction of expenses associated with variable products, such as mortality and expense risk charges, separate account charges, and sales charges. These expenses would reduce the overall returns shown.
Performance results reflect any applicable expense waivers in effect during the periods shown. Without such waivers performance would be lower. Waivers may not be in effect for all portfolios. Certain fee waivers are contractual through a specified period. Otherwise, fee waivers can be rescinded at any time. See the prospectus and financial statements for more information.
2
| Pioneer High Yield VCT Portfolio | PIONEER VARIABLE CONTRACTS TRUST |
As a shareowner in the Portfolio, you incur two types of costs:
(1) ongoing costs, including management fees, distribution and/or service (12b–1) fees, and other Portfolio expenses; and
(2) transaction costs, including sales charges (loads) on purchase payments.
This example is intended to help you understand your ongoing expenses (in dollars) of investing in the Portfolio and to compare these costs with the ongoing costs of investing in other mutual funds offered through your variable annuity contract. The example is based on an investment of $1,000 at the beginning of the Portfolio’s latest six-month period and held throughout the six months.
Using the Tables
Actual Expenses
The first table below provides information about actual account values and actual expenses. You may use the information in this table, together with the amount you invested, to estimate the expenses that you paid over the period as follows:
1. Divide your account value by $1,000
Example: an $8,600 account value ÷ $1,000 = 8.6
2. Multiply the result in (1) above by the corresponding share class’s number in the third row under the heading entitled “Expenses Paid During Period” to estimate the expenses you paid on your account during this period.
Expenses Paid on a $1,000 Investment in Pioneer High Yield VCT Portfolio
Based on actual returns from January 1, 2020 through June 30, 2020.
| Share Class | I | II |
Beginning Account Value on 1/1/20 | $1,000.00 | $1,000.00 |
Ending Account Value on 6/30/20 | $918.50 | $916.00 |
Expenses Paid During Period* | $5.20 | $6.34 |
* Expenses are equal to the Portfolio’s annualized expense ratio of 1.09%, 1.33% for Class I and Class II respectively, multiplied by the average account value over the period, multiplied by 182/366 (to reflect the one-half year period).
Hypothetical Example for Comparison Purposes
The table below provides information about hypothetical account values and hypothetical expenses based on the Portfolio’s actual expense ratio and an assumed rate of return of 5% per year before expenses, which is not the Portfolio’s actual return. The hypothetical account values and expenses may not be used to estimate the actual ending account balance or expenses you paid for the period.
You may use this information to compare the ongoing costs of investing in the Portfolio and other variable annuities. To do so, compare this 5% hypothetical example with the 5% hypothetical examples that appear in the shareholder reports of the other variable annuities.
Please note that the expenses shown in the tables are meant to highlight your ongoing costs only and do not reflect any transaction costs, such as sales charges (loads) that are charged at the time of the transaction. Therefore, the table below is useful in comparing ongoing costs only and will not help you determine the relative total costs of owning different variable annuities. In addition, if these transaction costs were included, your costs would have been higher.
Expenses Paid on a $1,000 Investment in Pioneer High Yield VCT Portfolio
Based on a hypothetical 5% per year return before expenses, reflecting the period from January 1, 2020 through June 30, 2020.
| Share Class | I | II |
Beginning Account Value on 1/1/20 | $1,000.00 | $1,000.00 |
Ending Account Value on 6/30/20 | $1,019.44 | $1,018.25 |
Expenses Paid During Period* | $5.47 | $6.67 |
* Expenses are equal to the Portfolio’s annualized expense ratio of 1.09%, 1.33% for Class I and Class II respectively, multiplied by the average account value over the period, multiplied by 182/366 (to reflect the one-half year period).
3
| Pioneer High Yield VCT Portfolio | PIONEER VARIABLE CONTRACTS TRUST |
Call 1-800-688-9915 or visit www.amundipioneer.com/us for the most recent month-end performance results. Current performance may be lower or higher than the performance data quoted.
The performance data quoted represents past performance, which is no guarantee of future results. Investment return and principal value will fluctuate, and shares, when redeemed, may be worth more or less than their original cost.
The returns for the Portfolio do not reflect the deduction of expenses associated with variable products, such as mortality and expense risk charges, separate account charges, and sales charges. These expenses would reduce the overall returns shown.
Performance results reflect any applicable expense waivers in effect during the periods shown. Without such waivers, performance would be lower. Waivers may not be in effect for all portfolios. Certain fee waivers are contractual through a specified period. Otherwise, fee waivers can be rescinded at any time. See the prospectus and financial statements for more information.
In the following interview, Matthew Shulkin and Andrew Feltus discuss the factors that influenced the performance of Pioneer High Yield VCT Portfolio during the six-month period ended June 30, 2020. Mr. Shulkin, a vice president and a portfolio manager at Amundi Pioneer Asset Management, Inc. (Amundi Pioneer), Mr. Feltus, Co-Director of High Yield and a portfolio manager at Amundi Pioneer, are responsible for the day-to-day management of the Portfolio, along with Kenneth Monaghan, Co-Director of High Yield and a portfolio manager at Amundi Pioneer.
Q: How did the Portfolio perform during the six-month period ended June 30, 2020?
A: Pioneer High Yield VCT Portfolio’s Class I shares returned -8.15% at net asset value during the six-month period ended June 30, 2020, and Class II shares returned -8.40%. During the same period, the Portfolio’s benchmarks, the ICE Bank of America (ICE BofA) U.S. High Yield Index and the ICE BofA All-Convertibles Speculative Quality Index, returned -4.78% and 15.00%, respectively.
Q: Could you please describe the market environment for high-yield investors during the six-month period ended June 30, 2020?
A: After a benign opening to the 2020 calendar year, credit-sensitive fixed-income markets experienced a historic disruption in March, as the emergence of the COVID-19 virus and the related lockdown policies implemented to help curb its spread all but shuttered the global economy. Investors fled riskier assets on a broad scale and moved into so-called “safe havens” such as U.S. Treasuries, which had the effect of driving Treasury yields to all-time lows.
The policy response to the market and economic turmoil from both central banks and government authorities was swift, as they sought to keep businesses and consumers from going under. The U.S. Federal Reserve (Fed) slashed the target range of the benchmark federal funds rate to zero in mid-March, resurrected its 2008 financial crisis-era lending facilities, and launched a wide-ranging bond-purchase program. On the fiscal side, the U.S. Congress and the White House agreed upon a $2.2 trillion stimulus package in late March, and later approved additional aid packages in the second quarter.
The extraordinary support from policy makers in the wake of the pandemic had a positive effect on the markets as the second quarter got underway. As the second quarter progressed, investor optimism also rose on the prospects that steps taken towards re-opening the economy could support something resembling a “V-shaped” recovery (that is, a swift, sharp rise). The result was a resurgence in sentiment towards the riskier assets that the market was so quick to shun at the height of the pandemic crisis. The shift in investors’ appetites allowed credit-sensitive areas of the market to recover much of their earlier losses throughout most of the second quarter, although June saw the return of some market volatility as COVID-19 cases surged in a few areas that had re-opened earlier than others, reigniting shutdown concerns.
At the sector level, issuers in market segments viewed by investors as best-positioned to weather the pandemic crisis, such as food & drug retailers, led high-yield corporate returns over the six-month period. In contrast, sectors that
4
| Pioneer High Yield VCT Portfolio | PIONEER VARIABLE CONTRACTS TRUST |
are highly dependent on out-of-the-home consumer spending, such as air transportation, finished the period sharply lower. While energy issuers rebounded in the second quarter as oil prices climbed back up to the $40-per-barrel range, the sector has remained well underwater on a year-to-date basis.
With regard to credit quality, higher-rated segments within high yield outperformed the lower-rated tiers over the six-month period.
Q: Can you review your principal strategies in managing the Portfolio during the six-month period ended June 30, 2020, and the degree to which they contributed to or detracted from benchmark-relative returns?
A: The Portfolio underperformed its benchmarks over the first half of 2020, primarily due to negative sector allocation results within its core high-yield corporate holdings. Specifically, an overweight to energy weighed most heavily on relative returns, while allocations to the media, capital goods, and leisure sectors also detracted from relative performance, albeit to a lesser extent. Security selection results were another modest detractor from benchmark-relative returns during the six-month period.
While the Portfolio’s overweight to energy was a key driver of relative underperformance, positive security selection within the sector partially offset that negative. We have long anticipated a shakeout among U.S. shale exploration-and-production (E&P) companies, and have forecasted an increase in defaults possibly as soon as 2021. Given those views, a significant portion of the Portfolio’s energy exposure has been in areas of the sector viewed as less risky, including pipeline companies and those involved in refining and marketing. The positioning within energy helped to limit the Portfolio’s losses during the six-month period as default risks rose within the E&P group with the collapse of oil prices seen in the first quarter of 2020.
Security selection results lagged the benchmark within the Portfolio’s allocations to bonds in the B and CCC-ratings categories. Entering 2020, we had viewed strong employment numbers and moderate wage growth as potentially supportive of U.S. consumers, and so we had positioned the Portfolio towards the debt of consumer-facing companies in sectors such as leisure. As unemployment spiked in the wake of pandemic-driven shutdowns, market sentiment with respect to many of those holdings suffered notably.
The Portfolio’s out-of-benchmark allocation to insurance-linked securities (ILS), which are issued by property-and-casualty insurers seeking to mitigate the impact of having to pay damage claims resulting from natural disasters, contributed positively to relative performance. We generally have sought to maintain a strategic allocation to ILS for the incremental diversification* they could potentially provide, given their historically low correlation to the performance of more traditional fixed-income assets.
Finally, the Portfolio’s holdings of convertible bonds contributed positively to benchmark-relative results as equities staged a strong rally for most of the second half of the six-month period after a big sell-off in the first quarter.
* Diversification does not assure a profit nor protected against loss.
5
| Pioneer High Yield VCT Portfolio | PIONEER VARIABLE CONTRACTS TRUST |
PORTFOLIO MANAGEMENT DISCUSSION 6/30/20 | (continued) |
A Word About Risk:
All investments are subject to risk, including the possible loss of principal. In the past several years, financial markets have experienced increased volatility and heightened uncertainty. The market prices of securities may go up or down, sometimes rapidly or unpredictably, due to general market conditions, such as real or perceived adverse economic, political, or regulatory conditions, recessions, inflation, changes in interest or currency rates, lack of liquidity in the bond markets, the spread of infectious illness or other public health issues or adverse investor sentiment. These conditions may continue, recur, worsen or spread.
Investments in high-yield or lower-rated securities are subject to greater-than-average price volatility, illiquidity and possibility of default.
When interest rates rise, the prices of fixed-income securities in the Portfolio will generally fall. Conversely, when interest rates fall the prices of fixed-income securities in the Portfolio will generally rise. Investments in the Portfolio are subject to possible loss due to the financial failure of the issuers of underlying securities and their inability to meet their debt obligations.
Prepayment risk is the chance that an issuer may exercise its right to prepay its security, if falling interest rates prompt the issuer to do so. Forced to reinvest the unanticipated proceeds at lower interest rates, the Portfolio would experience a decline in income and lose the opportunity for additional price appreciation.
The Portfolio may invest in mortgage-backed securities, which during times of fluctuating interest rates may increase or decrease more than other fixed-income securities. Mortgage-backed securities are also subject to prepayments.
The Portfolio may use derivatives, such as options, futures, inverse floating rate obligations, swaps, and other instruments, which can be illiquid, may disproportionately increase losses, and have a potentially large impact on Portfolio performance. Derivatives may have a leveraging effect on the Portfolio.
At times, the Portfolio’s investments may represent industries or industry sectors that are interrelated or have common risks, making the Portfolio more susceptible to any economic, political, or regulatory developments or other risks affecting those industries and sectors.
These risks may increase share price volatility.
Q: Can you discuss the factors that affected the Portfolio’s monthly distributions** to shareholders, either positively or negatively, during the six-month period ended June 30, 2020?
A: Spreads and yields increased over the six-month period, as the market reset for the recessionary conditions brought on by the COVID-19 crisis. We expect the 12-month trailing default rate to increase over the next year as some issuers succumb to the weak economic environment. In response to the continuing economic fallout from the virus, we have sold some holdings from the Portfolio issued by companies that we expect to have significant difficulty avoiding default. On the margin, those sales have weakened the Portfolio’s income generation/distributions. (Credit spreads, or spreads, are commonly defined as the differences in yield between Treasuries and other types of fixed-income securities with similar maturities.)
Q: Did the Portfolio have any exposure to derivatives during the six-month period ended June 30, 2020? If so, did the derivatives have a material effect on the Portfolio’s performance?
A: We utilized index-based credit-default-swap investments during the six-month period in an effort to maintain the desired level of Portfolio exposure to the high-yield market and to potentially generate income, while also seeking to maintain sufficient liquidity to make opportunistic purchases and help meet any unanticipated shareholder redemption requests. The derivatives had no material effect on the Portfolio’s performance.
Q: What is your assessment of the current climate for high-yield bond investors?
A: The strong recovery we saw in the second quarter was due in large part to investors’ positive reaction to the scale and depth of government and central-bank policy actions in the wake of the economic damage wrought by the COVID-19 situation. Although the number of virus cases grew throughout the second quarter, the rate of increase in reported virus-related deaths in key economies began to fall as the quarter progressed, spurring optimism that the continued economic fallout from the crisis would prove to be transitory. While we believe there are good reasons to be hopeful that therapeutic treatments aimed at reducing the effects of the virus and vaccines preventing the onset of the disease could be developed within a reasonable timeframe, we also believe the recent market performance is more attributable to the multi-trillion-dollar support packages and programs provided by central banks and governments, which we mentioned above.
We are optimistic regarding the global outlook and believe the high-yield market may generate attractive returns as the economy recovers and business activity gradually moves back toward pre-crisis levels. However, we do not believe the recovery will unfold in a straight-line fashion. Instead, we believe the re-opening of the global economy will be uneven, with localized virus flare-ups slowing activity, which we have already seen occur in some areas, including the southern U.S. We believe selectivity with regard to individual securities may be a key to performance going forward, particularly as we eventually begin to see the stimulus measures being reduced as economic activity picks up.
** Distributions are not guaranteed.
6
| Pioneer High Yield VCT Portfolio | PIONEER VARIABLE CONTRACTS TRUST |
We believe we have been uncovering attractive investment opportunities as the high-yield universe has expanded with issuers experiencing credit downgrades from investment grade to high yield and companies coming to market with offerings to enhance their liquidity. We have been examining corporations through the lens of how deeply the COVID-19 crisis has affected their profitability and debt-servicing abilities, with a focus on issuers relatively unaffected by the crisis, and issuers we have identified as likely to overcome the challenges generated by COVID-19.
Against the backdrop of an economy challenged by a pandemic, we believe that prudent investment management will require active re-positioning in the Portfolio to avoid deteriorating situations, and to potentially take advantage of improving situations.
Please refer to the Schedule of Investments on pages 8 to 20 for a full listing of Portfolio securities.
Past performance is no guarantee of future results.
Any information in this shareholder report regarding market or economic trends or the factors influencing the Portfolio’s historical or future performance are statements of opinion as of the date of this report.
7
| Pioneer High Yield VCT Portfolio | PIONEER VARIABLE CONTRACTS TRUST |
| Shares | Value | ||
| UNAFFILIATED ISSUERS – 95.7% | |||
| COMMON STOCK – 0.0%† of Net Assets | |||
| Transportation Infrastructure – 0.0%† | |||
| 640(a) | Syncreon Group | $ 9,440 | |
| Total Transportation Infrastructure | $ 9,440 | ||
| TOTAL COMMON STOCK | |||
(Cost $8,960) | $ 9,440 | ||
| CONVERTIBLE PREFERRED STOCK – 0.3% of Net Assets | |||
| Banks – 0.3% | |||
| 95(b) | Wells Fargo & Co., 7.5% | $ 123,215 | |
| Total Banks | $ 123,215 | ||
| TOTAL CONVERTIBLE PREFERRED STOCK | |||
(Cost $125,547) | $ 123,215 |
| Principal | |||
| Amount | |||
| USD ($) | |||
| COMMERCIAL MORTGAGE-BACKED SECURITY – 0.2% of Net Assets | |||
| 108,962(c) | Banc of America Commercial Mortgage Trust, Series 2007-4, Class H, 6.06%, | ||
2/10/51 (144A) | $ 99,192 | ||
| TOTAL COMMERCIAL MORTGAGE-BACKED SECURITY | |||
(Cost $107,247) | $ 99,192 | ||
| CONVERTIBLE CORPORATE BONDS – 5.9% of Net Assets | |||
| Airlines – 0.6% | |||
| 140,000 | Air Canada, 4.0%, 7/1/25 (144A) | $ 148,050 | |
| 101,000 | Southwest Airlines Co., 1.25%, 5/1/25 | 121,304 | |
| Total Airlines | $ 269,354 | ||
| Biotechnology – 0.8% | |||
| 174,000 | Exact Sciences Corp., 0.375%, 3/1/28 | $ 166,301 | |
| 162,000 | Insmed, Inc., 1.75%, 1/15/25 | 157,444 | |
| Total Biotechnology | $ 323,745 | ||
| Commercial Services – 0.5% | |||
| 158,000 | Cardtronics, Inc., 1.0%, 12/1/20 | $ 155,828 | |
| 64,935 | Macquarie Infrastructure Corp., 2.0%, 10/1/23 | 56,164 | |
| Total Commercial Services | $ 211,992 | ||
| Computers – 0.3% | |||
| 125,000 | Pure Storage, Inc., 0.125%, 4/15/23 | $ 122,575 | |
| Total Computers | $ 122,575 | ||
| Engineering & Construction – 0.3% | |||
| 115,000 | Dycom Industries, Inc., 0.75%, 9/15/21 | $ 108,675 | |
| Total Engineering & Construction | $ 108,675 | ||
| Healthcare-Products – 0.3% | |||
| 120,000 | Integra LifeSciences Holdings Corp., 0.5%, 8/15/25 (144A) | $ 109,088 | |
| Total Healthcare-Products | $ 109,088 | ||
| Internet – 0.9% | |||
| 115,000 | Palo Alto Networks, Inc., 0.375%, 6/1/25 (144A) | $ 114,482 | |
| 128,000 | Palo Alto Networks, Inc., 0.75%, 7/1/23 | 136,829 | |
| 108,000 | Zendesk, Inc., 0.625%, 6/15/25 (144A) | 115,206 | |
| Total Internet | $ 366,517 |
The accompanying notes are an integral part of these financial statements.
8
| Pioneer High Yield VCT Portfolio | PIONEER VARIABLE CONTRACTS TRUST |
| Principal | |||
| Amount | |||
| USD ($) | Value | ||
| Leisure Time – 0.1% | |||
| 60,000 | Royal Caribbean Cruises, Ltd., 4.25%, 6/15/23 (144A) | $ 55,800 | |
| Total Leisure Time | $ 55,800 | ||
| Media – 0.4% | |||
| 178,000 | DISH Network Corp., 3.375%, 8/15/26 | $ 163,513 | |
| Total Media | $ 163,513 | ||
| Pharmaceuticals – 0.9% | |||
| 130,000 | Revance Therapeutics, Inc., 1.75%, 2/15/27 (144A) | $ 126,729 | |
| 117,000 | Teva Pharmaceutical Finance Co. LLC, 0.25%, 2/1/26 | 113,304 | |
| 136,000 | Tricida, Inc., 3.5%, 5/15/27 (144A) | 143,636 | |
| Total Pharmaceuticals | $ 383,669 | ||
| Software – 0.6% | |||
| 103,000 | Akamai Technologies, Inc., 0.125%, 5/1/25 | $ 128,266 | |
| 135,000 | Workiva, Inc., 1.125%, 8/15/26 (144A) | 123,471 | |
| Total Software | $ 251,737 | ||
| Transportation – 0.2% | |||
| 85,000 | SEACOR Holdings, Inc., 3.0%, 11/15/28 | $ 83,778 | |
| Total Transportation | $ 83,778 | ||
| TOTAL CONVERTIBLE CORPORATE BONDS | |||
(Cost $2,381,238) | $ 2,450,443 | ||
| CORPORATE BONDS – 83.2% of Net Assets | |||
| Advertising – 1.9% | |||
| 50,000 | Lamar Media Corp., 3.75%, 2/15/28 (144A) | $ 47,140 | |
| 30,000 | Lamar Media Corp., 4.0%, 2/15/30 (144A) | 28,716 | |
| 40,000 | Lamar Media Corp., 4.875%, 1/15/29 (144A) | 40,200 | |
| 412,000 | MDC Partners, Inc., 6.5%, 5/1/24 (144A) | 383,160 | |
| 243,000 | Outfront Media Capital LLC/Outfront Media Capital Corp., 5.625%, 2/15/24 | 243,607 | |
| 60,000 | Outfront Media Capital LLC/Outfront Media Capital Corp., 6.25%, 6/15/25 (144A) | 60,393 | |
| Total Advertising | $ 803,216 | ||
| Aerospace & Defense – 1.0% | |||
| 225,000 | Bombardier, Inc., 6.0%, 10/15/22 (144A) | $ 157,500 | |
| 99,000 | Bombardier, Inc., 7.5%, 3/15/25 (144A) | 64,607 | |
| 50,000 | Bombardier, Inc., 7.875%, 4/15/27 (144A) | 32,750 | |
| 140,000 | Howmet Aerospace, Inc., 6.875%, 5/1/25 | 151,881 | |
| Total Aerospace & Defense | $ 406,738 | ||
| Airlines – 1.0% | |||
| 269,000 | Delta Air Lines, Inc., 3.75%, 10/28/29 | $ 215,246 | |
| 20,000 | Delta Air Lines, Inc., 7.375%, 1/15/26 | 19,348 | |
| 165,000 | Mileage Plus Holdings LLC/Mileage Plus Intellectual Property Assets, Ltd., 6.5%, | ||
6/20/27 (144A) | 165,413 | ||
| Total Airlines | $ 400,007 | ||
| Apparel – 0.2% | |||
| 75,000 | Wolverine World Wide, Inc., 6.375%, 5/15/25 (144A) | $ 78,563 | |
| Total Apparel | $ 78,563 |
The accompanying notes are an integral part of these financial statements.
9
| Pioneer High Yield VCT Portfolio | PIONEER VARIABLE CONTRACTS TRUST |
SCHEDULE OF INVESTMENTS 6/30/20 (UNAUDITED) | (continued) |
| Principal | |||
| Amount | |||
| USD ($) | Value | ||
| Auto Manufacturers – 2.7% | |||
| 305,000 | Ford Motor Credit Co. LLC, 3.815%, 11/2/27 | $ 277,513 | |
| 300,000 | Ford Motor Credit Co. LLC, 4.134%, 8/4/25 | 284,535 | |
| 70,000 | General Motors Co., 5.4%, 10/2/23 | 75,688 | |
| 92,000 | General Motors Co., 6.125%, 10/1/25 | 103,379 | |
| 229,000 | JB Poindexter & Co., Inc., 7.125%, 4/15/26 (144A) | 231,290 | |
| 130,000 | Navistar International Corp., 9.5%, 5/1/25 (144A) | 139,302 | |
| Total Auto Manufacturers | $ 1,111,707 | ||
| Auto Parts & Equipment – 1.9% | |||
| 55,000 | Adient US LLC, 9.0%, 4/15/25 (144A) | $ 59,246 | |
| 408,000 | American Axle & Manufacturing, Inc., 6.25%, 3/15/26 | 392,700 | |
| 192,000 | Dealer Tire LLC/DT Issuer LLC, 8.0%, 2/1/28 (144A) | 177,840 | |
| 135,000 | Goodyear Tire & Rubber Co., 9.5%, 5/31/25 | 144,450 | |
| Total Auto Parts & Equipment | $ 774,236 | ||
| Banks – 3.3% | |||
| 400,000(b)(c) | Barclays Plc, 7.75% (5 Year USD Swap Rate + 484 bps) | $ 406,500 | |
| 100,000(b)(c) | Citigroup, Inc., 4.7% (SOFRRATE + 323 bps) | 88,875 | |
| 182,000 | Freedom Mortgage Corp., 8.125%, 11/15/24 (144A) | 176,540 | |
| 152,000 | Freedom Mortgage Corp., 8.25%, 4/15/25 (144A) | 150,480 | |
| 200,000(b)(c) | Intesa Sanpaolo S.p.A., 7.7% (5 Year USD Swap Rate + 546 bps) (144A) | 199,750 | |
| 140,000(b)(c) | JPMorgan Chase & Co., 4.6% (SOFRRATE + 313 bps) | 124,950 | |
| 237,000 | Provident Funding Associates LP/PFG Finance Corp., 6.375%, 6/15/25 (144A) | 221,595 | |
| Total Banks | $ 1,368,690 | ||
| Building Materials – 2.5% | |||
| 20,000 | Builders FirstSource, Inc., 5.0%, 3/1/30 (144A) | $ 18,800 | |
| 158,000 | Builders FirstSource, Inc., 6.75%, 6/1/27 (144A) | 161,752 | |
| 100,000 | JELD-WEN, Inc., 6.25%, 5/15/25 (144A) | 103,750 | |
| 280,000 | Patrick Industries, Inc., 7.5%, 10/15/27 (144A) | 288,400 | |
| 45,000 | Standard Industries, Inc., 4.375%, 7/15/30 (144A) | 44,888 | |
| 25,000 | Standard Industries, Inc., 5.0%, 2/15/27 (144A) | 25,313 | |
| 190,000 | Standard Industries, Inc., 5.375%, 11/15/24 (144A) | 195,225 | |
| 203,000 | Summit Materials LLC/Summit Materials Finance Corp., 5.125%, 6/1/25 (144A) | 200,463 | |
| Total Building Materials | $ 1,038,591 | ||
| Chemicals – 1.8% | |||
| 157,000 | CF Industries, Inc., 5.375%, 3/15/44 | $ 169,764 | |
| 45,000 | NOVA Chemicals Corp., 5.25%, 6/1/27 (144A) | 39,504 | |
| 134,000 | Olin Corp., 5.0%, 2/1/30 | 118,590 | |
| 59,000 | Olin Corp., 5.625%, 8/1/29 | 54,281 | |
| 40,000 | Olin Corp., 9.5%, 6/1/25 (144A) | 44,600 | |
| 155,000 | Tronox, Inc., 6.5%, 5/1/25 (144A) | 156,550 | |
| 175,000 | Tronox, Inc., 6.5%, 4/15/26 (144A) | 163,625 | |
| Total Chemicals | $ 746,914 | ||
| Coal – 0.8% | |||
| 400,000 | SunCoke Energy Partners LP/SunCoke Energy Partners Finance Corp., 7.5%, | ||
6/15/25 (144A) | $ 338,080 | ||
| Total Coal | $ 338,080 |
The accompanying notes are an integral part of these financial statements.
10
| Pioneer High Yield VCT Portfolio | PIONEER VARIABLE CONTRACTS TRUST |
| Principal | |||
| Amount | |||
| USD ($) | Value | ||
| Commercial Services – 5.6% | |||
| 70,000 | Allied Universal Holdco LLC/Allied Universal Finance Corp., 6.625%, 7/15/26 (144A) | $ 73,500 | |
| 215,000 | Allied Universal Holdco LLC/Allied Universal Finance Corp., 9.75%, 7/15/27 (144A) | 226,556 | |
| 105,000 | APX Group, Inc., 6.75%, 2/15/27 (144A) | 99,094 | |
| 200,000 | Ashtead Capital, Inc., 4.125%, 8/15/25 (144A) | 204,000 | |
| 20,000 | Ashtead Capital, Inc., 4.25%, 11/1/29 (144A) | 20,000 | |
| 140,000 | Brink’s Co., 5.5%, 7/15/25 (144A) | 142,594 | |
| 85,000 | Cardtronics, Inc./Cardtronics USA, Inc., 5.5%, 5/1/25 (144A) | 82,450 | |
| 380,000 | Garda World Security Corp., 9.5%, 11/1/27 (144A) | 401,850 | |
| 100,000 | Gartner, Inc., 4.5%, 7/1/28 (144A) | 101,170 | |
| 36,000 | Herc Holdings, Inc., 5.5%, 7/15/27 (144A) | 36,077 | |
| 35,000 | Jaguar Holding Co. II/PPD Development LP, 4.625%, 6/15/25 (144A) | 35,619 | |
| 55,000 | Jaguar Holding Co. II/PPD Development LP, 5.0%, 6/15/28 (144A) | 56,306 | |
| 120,000 | Prime Security Services Borrower LLC/Prime Finance, Inc., 5.75%, 4/15/26 (144A) | 124,440 | |
| 260,000 | Prime Security Services Borrower LLC/Prime Finance, Inc., 6.25%, 1/15/28 (144A) | 245,050 | |
| 280,000 | Sotheby’s, 7.375%, 10/15/27 (144A) | 264,600 | |
| 75,000 | United Rentals North America, Inc., 3.875%, 11/15/27 | 74,813 | |
| 124,000 | United Rentals North America, Inc., 5.25%, 1/15/30 | 128,030 | |
| Total Commercial Services | $ 2,316,149 | ||
| Computers – 0.6% | |||
| 45,000 | Dell International LLC/EMC Corp., 6.2%, 7/15/30 (144A) | $ 52,764 | |
| 20,000 | NCR Corp., 8.125%, 4/15/25 (144A) | 21,200 | |
| 185,000 | Western Digital Corp., 4.75%, 2/15/26 | 191,188 | |
| Total Computers | $ 265,152 | ||
| Cosmetics/Personal Care – 0.5% | |||
| 185,000 | Edgewell Personal Care Co., 5.5%, 6/1/28 (144A) | $ 190,087 | |
| Total Cosmetics/Personal Care | $ 190,087 | ||
| Diversified Financial Services – 2.2% | |||
| 145,000 | Alliance Data Systems Corp., 4.75%, 12/15/24 (144A) | $ 130,500 | |
| 360,000 | Avation Capital SA, 6.5%, 5/15/21 (144A) | 266,400 | |
| 195,000(d) | Global Aircraft Leasing Co., Ltd., 6.5% (7.25% PIK or 6.50% cash), 9/15/24 (144A) | 130,650 | |
| 30,000 | Nationstar Mortgage Holdings, Inc., 6.0%, 1/15/27 (144A) | 28,500 | |
| 22,000 | Nationstar Mortgage Holdings, Inc., 8.125%, 7/15/23 (144A) | 22,576 | |
| 254,000 | Nationstar Mortgage Holdings, Inc., 9.125%, 7/15/26 (144A) | 268,445 | |
| 65,000 | Springleaf Finance Corp., 8.875%, 6/1/25 | 69,488 | |
| Total Diversified Financial Services | $ 916,559 | ||
| Electric – 1.8% | |||
| 155,000 | Calpine Corp., 5.125%, 3/15/28 (144A) | $ 151,900 | |
| 65,000 | Clearway Energy Operating LLC, 4.75%, 3/15/28 (144A) | 66,296 | |
| 137,000 | Clearway Energy Operating LLC, 5.75%, 10/15/25 | 141,452 | |
| 35,000 | PG&E Corp., 5.0%, 7/1/28 | 34,990 | |
| 175,000 | Talen Energy Supply LLC, 7.625%, 6/1/28 (144A) | 175,000 | |
| 183,000 | Vistra Operations Co. LLC, 5.625%, 2/15/27 (144A) | 187,822 | |
| Total Electric | $ 757,460 |
The accompanying notes are an integral part of these financial statements.
11
| Pioneer High Yield VCT Portfolio | PIONEER VARIABLE CONTRACTS TRUST |
SCHEDULE OF INVESTMENTS 6/30/20 (UNAUDITED) | (continued) |
| Principal | ||||
| Amount | ||||
| USD ($) | Value | |||
| Electrical Components & Equipment – 1.0% | ||||
EUR | 100,000 | Belden, Inc., 3.875%, 3/15/28 (144A) | $ 108,984 | |
| 112,000 | Energizer Holdings, Inc., 4.75%, 6/15/28 (144A) | 109,869 | ||
| 50,000 | Energizer Holdings, Inc., 6.375%, 7/15/26 (144A) | 51,698 | ||
| 90,000 | WESCO Distribution, Inc., 7.125%, 6/15/25 (144A) | 94,782 | ||
| 60,000 | WESCO Distribution, Inc., 7.25%, 6/15/28 (144A) | 63,450 | ||
| Total Electrical Components & Equipment | $ 428,783 | |||
| Engineering & Construction – 0.7% | ||||
| 300,000 | PowerTeam Services LLC, 9.033%, 12/4/25 (144A) | $ 306,000 | ||
| Total Engineering & Construction | $ 306,000 | |||
| Entertainment – 2.0% | ||||
| 130,000 | Colt Merger Sub, Inc., 8.125%, 7/1/27 (144A) | $ 125,612 | ||
| 89,000 | Eldorado Resorts, Inc., 6.0%, 4/1/25 | 93,094 | ||
| 5,000 | Eldorado Resorts, Inc., 6.0%, 9/15/26 | 5,402 | ||
| 200,000 | Enterprise Development Authority, 12.0%, 7/15/24 (144A) | 201,000 | ||
| 35,000 | Penn National Gaming, Inc., 5.625%, 1/15/27 (144A) | 32,651 | ||
| 100,000 | Scientific Games International, Inc., 7.0%, 5/15/28 (144A) | 80,000 | ||
| 100,000 | Scientific Games International, Inc., 7.25%, 11/15/29 (144A) | 80,000 | ||
| 242,000 | Scientific Games International, Inc., 8.25%, 3/15/26 (144A) | 217,044 | ||
| Total Entertainment | $ 834,803 | |||
| Environmental Control – 1.5% | ||||
| 330,000 | Covanta Holding Corp., 6.0%, 1/1/27 | $ 334,158 | ||
| 120,000 | GFL Environmental, Inc., 8.5%, 5/1/27 (144A) | 130,500 | ||
| 189,000 | Tervita Corp., 7.625%, 12/1/21 (144A) | 148,365 | ||
| Total Environmental Control | $ 613,023 | |||
| Food – 2.9% | ||||
| 182,000 | Albertsons Cos., Inc./Safeway, Inc./New Albertsons LP/Albertsons LLC, 5.75%, 3/15/25 | $ 185,982 | ||
| 253,000 | FAGE International SA/FAGE USA Dairy Industry, Inc., 5.625%, 8/15/26 (144A) | 237,820 | ||
| 112,000 | Ingles Markets, Inc., 5.75%, 6/15/23 | 112,560 | ||
| 211,000 | JBS USA LUX SA/JBS USA Finance, Inc., 6.75%, 2/15/28 (144A) | 222,871 | ||
| 138,000 | JBS USA LUX SA/JBS USA Food Co./JBS USA Finance, Inc., 5.5%, 1/15/30 (144A) | 141,450 | ||
| 65,000 | JBS USA LUX SA/JBS USA Food Co./JBS USA Finance, Inc., 6.5%, 4/15/29 (144A) | 68,981 | ||
| 250,000 | Simmons Foods, Inc., 5.75%, 11/1/24 (144A) | 237,500 | ||
| Total Food | $ 1,207,164 | |||
| Forest Products & Paper – 1.1% | ||||
| 262,000 | Mercer International, Inc., 7.375%, 1/15/25 | $ 260,690 | ||
| 185,000 | Schweitzer-Mauduit International, Inc., 6.875%, 10/1/26 (144A) | 189,163 | ||
| Total Forest Products & Paper | $ 449,853 | |||
| Healthcare-Services – 3.0% | ||||
| 145,000 | Centene Corp., 4.75%, 1/15/25 | $ 148,447 | ||
| 226,000 | Centene Corp., 5.25%, 4/1/25 (144A) | 232,705 | ||
| 38,000 | Centene Corp., 5.375%, 6/1/26 (144A) | 39,393 | ||
| 65,000 | LifePoint Health, Inc., 6.75%, 4/15/25 (144A) | 67,112 | ||
| 45,000 | Molina Healthcare, Inc., 4.375%, 6/15/28 (144A) | 44,944 | ||
| 22,000 | RegionalCare Hospital Partners Holdings, Inc./LifePoint Health, Inc., 9.75%, | |||
12/1/26 (144A) | 22,660 |
The accompanying notes are an integral part of these financial statements.
12
| Pioneer High Yield VCT Portfolio | PIONEER VARIABLE CONTRACTS TRUST |
| Principal | |||
| Amount | |||
| USD ($) | Value | ||
| Healthcare-Services – (continued) | |||
| 30,000 | Select Medical Corp., 6.25%, 8/15/26 (144A) | $ 30,329 | |
| 57,000 | Surgery Center Holdings, Inc., 6.75%, 7/1/25 (144A) | 51,443 | |
| 293,000 | Surgery Center Holdings, Inc., 10.0%, 4/15/27 (144A) | 293,000 | |
| 146,000 | US Renal Care, Inc., 10.625%, 7/15/27 (144A) | 150,380 | |
| 169,000 | West Street Merger Sub, Inc., 6.375%, 9/1/25 (144A) | 163,508 | |
| Total Healthcare-Services | $ 1,243,921 | ||
| Holding Companies-Diversified – 0.4% | |||
| 170,000 | VistaJet Malta Finance Plc/XO Management Holding, Inc., 10.5%, 6/1/24 (144A) | $ 153,000 | |
| Total Holding Companies-Diversified | $ 153,000 | ||
| Home Builders – 3.4% | |||
| 125,000 | Beazer Homes USA, Inc., 5.875%, 10/15/27 | $ 119,375 | |
| 182,000 | Beazer Homes USA, Inc., 6.75%, 3/15/25 | 180,180 | |
| 85,000 | Beazer Homes USA, Inc., 7.25%, 10/15/29 | 82,450 | |
| 55,000 | Brookfield Residential Properties, Inc./Brookfield Residential US Corp., 4.875%, | ||
2/15/30 (144A) | 45,958 | ||
| 108,000 | Brookfield Residential Properties, Inc./Brookfield Residential US Corp., 6.25%, | ||
9/15/27 (144A) | 103,281 | ||
| 307,000 | KB Home, 6.875%, 6/15/27 | 334,630 | |
| 195,000 | M/I Homes, Inc., 4.95%, 2/1/28 | 193,781 | |
| 70,000 | Shea Homes LP/Shea Homes Funding Corp., 4.75%, 2/15/28 (144A) | 66,500 | |
| 147,000 | Taylor Morrison Communities, Inc., 5.875%, 6/15/27 (144A) | 152,254 | |
| 115,000 | TRI Pointe Group, Inc., 5.7%, 6/15/28 | 116,725 | |
| Total Home Builders | $ 1,395,134 | ||
| Household Products/Wares – 0.7% | |||
| 105,000 | Spectrum Brands, Inc., 5.5%, 7/15/30 (144A) | $ 105,131 | |
| 190,000 | Spectrum Brands, Inc., 5.75%, 7/15/25 | 194,991 | |
| Total Household Products/Wares | $ 300,122 | ||
| Housewares – 0.1% | |||
| 30,000 | CD&R Smokey Buyer, Inc., 6.75%, 7/15/25 (144A) | $ 31,191 | |
| Total Housewares | $ 31,191 | ||
| Internet – 1.6% | |||
| 55,000 | Expedia Group, Inc., 6.25%, 5/1/25 (144A) | $ 58,590 | |
| 25,000 | Expedia Group, Inc., 7.0%, 5/1/25 (144A) | 25,986 | |
| 110,000 | Netflix, Inc., 3.625%, 6/15/25 (144A) | 110,825 | |
| 97,000 | Netflix, Inc., 4.875%, 4/15/28 | 103,719 | |
| 340,000 | Netflix, Inc., 5.375%, 11/15/29 (144A) | 372,368 | |
| Total Internet | $ 671,488 | ||
| Iron & Steel – 1.6% | |||
| 110,000 | Big River Steel LLC/BRS Finance Corp., 7.25%, 9/1/25 (144A) | $ 105,050 | |
| 320,000 | Cleveland-Cliffs, Inc., 6.75%, 3/15/26 (144A) | 308,800 | |
| 15,000 | Cleveland-Cliffs, Inc., 9.875%, 10/17/25 (144A) | 15,734 | |
| 55,000 | Commercial Metals Co., 5.375%, 7/15/27 | 55,687 | |
| 185,000 | Commercial Metals Co., 5.75%, 4/15/26 | 189,625 | |
| Total Iron & Steel | $ 674,896 |
The accompanying notes are an integral part of these financial statements.
13
| Pioneer High Yield VCT Portfolio | PIONEER VARIABLE CONTRACTS TRUST |
SCHEDULE OF INVESTMENTS 6/30/20 (UNAUDITED) | (continued) |
| Principal | |||
| Amount | |||
| USD ($) | Value | ||
| Leisure Time – 0.8% | |||
| 30,000 | Royal Caribbean Cruises, Ltd., 9.125%, 6/15/23 (144A) | $ 29,737 | |
| 73,000 | Royal Caribbean Cruises, Ltd., 11.5%, 6/1/25 (144A) | 76,172 | |
| 109,000 | Viking Cruises, Ltd., 5.875%, 9/15/27 (144A) | 64,895 | |
| 235,000 | Viking Cruises, Ltd., 6.25%, 5/15/25 (144A) | 133,950 | |
| 30,000 | Winnebago Industries, 6.25%, 7/15/28 (144A) | 30,000 | |
| Total Leisure Time | $ 334,754 | ||
| Lodging – 1.3% | |||
| 100,000 | Boyd Gaming Corp., 8.625%, 6/1/25 (144A) | $ 104,500 | |
| 25,000 | Hilton Domestic Operating Co., Inc., 5.375%, 5/1/25 (144A) | 25,000 | |
| 36,000 | Hyatt Hotels Corp., 4.375%, 9/15/28 | 36,933 | |
| 95,000 | Hyatt Hotels Corp., 5.375%, 4/23/25 | 100,668 | |
| 45,000 | Hyatt Hotels Corp., 5.75%, 4/23/30 | 49,478 | |
| 55,000 | Marriott International, Inc., 4.625%, 6/15/30 | 57,069 | |
| 35,000 | Marriott International, Inc., 5.75%, 5/1/25 | 38,023 | |
| 137,000 | Station Casinos LLC, 4.5%, 2/15/28 (144A) | 115,936 | |
| Total Lodging | $ 527,607 | ||
| Machinery-Diversified – 0.8% | |||
| 133,000 | Maxim Crane Works Holdings Capital LLC, 10.125%, 8/1/24 (144A) | $ 130,799 | |
| 200,000 | Vertical US Newco, Inc., 5.25%, 7/15/27 (144A) | 200,000 | |
| Total Machinery-Diversified | $ 330,799 | ||
| Media – 4.8% | |||
| 175,000 | CCO Holdings LLC/CCO Holdings Capital Corp., 5.125%, 5/1/27 (144A) | $ 181,055 | |
| 515,000 | CCO Holdings LLC/CCO Holdings Capital Corp., 5.5%, 5/1/26 (144A) | 533,185 | |
| 146,000 | Clear Channel Worldwide Holdings, Inc., 9.25%, 2/15/24 | 135,430 | |
| 200,000 | CSC Holdings LLC, 5.375%, 2/1/28 (144A) | 209,000 | |
| 208,000 | CSC Holdings LLC, 5.5%, 5/15/26 (144A) | 213,485 | |
| 200,000 | CSC Holdings LLC, 7.5%, 4/1/28 (144A) | 218,250 | |
| 352,000 | Diamond Sports Group LLC/Diamond Sports Finance Co., 6.625%, 8/15/27 (144A) | 187,440 | |
| 106,000 | Gray Television, Inc., 5.875%, 7/15/26 (144A) | 105,509 | |
| 230,000 | Sinclair Television Group, Inc., 5.5%, 3/1/30 (144A) | 212,750 | |
| Total Media | $ 1,996,104 | ||
| Mining – 1.8% | |||
| 39,000 | Coeur Mining, Inc., 5.875%, 6/1/24 | $ 37,440 | |
| 200,000 | First Quantum Minerals, Ltd., 7.25%, 4/1/23 (144A) | 191,000 | |
| 101,000 | Freeport-McMoRan, Inc., 4.25%, 3/1/30 | 97,970 | |
| 130,000 | Hecla Mining Co., 7.25%, 2/15/28 | 131,950 | |
| 65,000 | Joseph T Ryerson & Son, Inc., 11.0%, 5/15/22 (144A) | 66,383 | |
| 130,000 | Novelis Corp., 4.75%, 1/30/30 (144A) | 124,150 | |
| 92,000 | Novelis Corp., 5.875%, 9/30/26 (144A) | 91,885 | |
| Total Mining | $ 740,778 | ||
| Miscellaneous Manufacturers – 0.2% | |||
| 60,000 | Hillenbrand, Inc., 5.75%, 6/15/25 | $ 62,100 | |
| 18,000 | Koppers, Inc., 6.0%, 2/15/25 (144A) | 17,505 | |
| Total Miscellaneous Manufacturers | $ 79,605 |
The accompanying notes are an integral part of these financial statements.
14
| Pioneer High Yield VCT Portfolio | PIONEER VARIABLE CONTRACTS TRUST |
| Principal | |||
| Amount | |||
| USD ($) | Value | ||
| Oil & Gas – 5.0% | |||
| 271,000 | Baytex Energy Corp., 8.75%, 4/1/27 (144A) | $ 143,630 | |
| 167,000 | Cenovus Energy, Inc., 6.75%, 11/15/39 | 162,602 | |
| 60,000 | Endeavor Energy Resources LP/EER Finance, Inc., 6.625%, 7/15/25 (144A) | 60,469 | |
| 296,000 | Indigo Natural Resources LLC, 6.875%, 2/15/26 (144A) | 275,280 | |
| 42,000 | MEG Energy Corp., 6.5%, 1/15/25 (144A) | 39,191 | |
| 163,000 | MEG Energy Corp., 7.0%, 3/31/24 (144A) | 139,772 | |
| 25,000 | MEG Energy Corp., 7.125%, 2/1/27 (144A) | 20,781 | |
| 219,000 | Neptune Energy Bondco Plc, 6.625%, 5/15/25 (144A) | 190,530 | |
| 104,000 | Parkland Corp., 5.875%, 7/15/27 (144A) | 107,900 | |
| 30,000 | Parsley Energy LLC/Parsley Finance Corp., 5.25%, 8/15/25 (144A) | 28,811 | |
| 20,000 | Parsley Energy LLC/Parsley Finance Corp., 5.625%, 10/15/27 (144A) | 19,700 | |
| 300,000 | PBF Holding Co. LLC/PBF Finance Corp., 6.0%, 2/15/28 (144A) | 249,000 | |
| 75,000 | PBF Holding Co. LLC/PBF Finance Corp., 9.25%, 5/15/25 (144A) | 80,063 | |
| 350,000 | Shelf Drilling Holdings, Ltd., 8.25%, 2/15/25 (144A) | 157,500 | |
| 271,000 | Transocean Sentry, Ltd., 5.375%, 5/15/23 (144A) | 228,995 | |
| 185,000 | Transocean, Inc., 7.25%, 11/1/25 (144A) | 100,825 | |
| 37,000 | Transocean, Inc., 8.0%, 2/1/27 (144A) | 20,419 | |
| 232,000 | Whiting Petroleum Corp., 6.625%, 1/15/26 | 41,180 | |
| Total Oil & Gas | $ 2,066,648 | ||
| Oil & Gas Services – 1.2% | |||
| 80,000 | Archrock Partners LP/Archrock Partners Finance Corp., 6.25%, 4/1/28 (144A) | $ 72,800 | |
| 152,000 | Archrock Partners LP/Archrock Partners Finance Corp., 6.875%, 4/1/27 (144A) | 143,184 | |
| 89,000 | Exterran Energy Solutions LP/EES Finance Corp., 8.125%, 5/1/25 | 73,648 | |
| 296,000 | FTS International, Inc., 6.25%, 5/1/22 | 94,720 | |
| 120,000 | SESI LLC, 7.75%, 9/15/24 | 43,800 | |
| 74,000 | USA Compression Partners LP/USA Compression Finance Corp., 6.875%, 9/1/27 | 71,040 | |
| Total Oil & Gas Services | $ 499,192 | ||
| Packaging & Containers – 1.6% | |||
| 254,000 | Crown Cork & Seal Co., Inc., 7.375%, 12/15/26 | $ 297,180 | |
| 365,000 | Greif, Inc., 6.5%, 3/1/27 (144A) | 371,523 | |
| Total Packaging & Containers | $ 668,703 | ||
| Pharmaceuticals – 3.1% | |||
| 197,000 | Bausch Health Americas, Inc., 8.5%, 1/31/27 (144A) | $ 209,066 | |
| 75,000 | Bausch Health Cos., Inc., 5.0%, 1/30/28 (144A) | 70,612 | |
| 50,000 | Bausch Health Cos., Inc., 5.25%, 1/30/30 (144A) | 47,437 | |
| 80,000 | Bausch Health Cos., Inc., 5.5%, 11/1/25 (144A) | 82,000 | |
| 96,000 | Bausch Health Cos., Inc., 7.0%, 1/15/28 (144A) | 98,880 | |
| 96,000 | Bausch Health Cos., Inc., 7.25%, 5/30/29 (144A) | 100,800 | |
| 105,000 | Endo Dac/Endo Finance LLC/Endo Finco, Inc., 6.0%, 6/30/28 (144A) | 67,725 | |
| 68,000 | Endo Dac/Endo Finance LLC/Endo Finco, Inc., 9.5%, 7/31/27 (144A) | 71,924 | |
| 139,000 | Par Pharmaceutical, Inc., 7.5%, 4/1/27 (144A) | 142,642 | |
| 456,000 | Teva Pharmaceutical Finance Netherlands III BV, 2.8%, 7/21/23 | 430,778 | |
| Total Pharmaceuticals | $ 1,321,864 | ||
| Pipelines – 4.1% | |||
| 285,000 | American Midstream Partners LP/American Midstream Finance Corp., 9.5%, | ||
12/15/21 (144A) | $ 259,350 | ||
| 30,000 | DCP Midstream Operating LP, 3.875%, 3/15/23 | 29,100 |
The accompanying notes are an integral part of these financial statements.
15
| Pioneer High Yield VCT Portfolio | PIONEER VARIABLE CONTRACTS TRUST |
SCHEDULE OF INVESTMENTS 6/30/20 (UNAUDITED) | (continued) |
| Principal | |||
| Amount | |||
| USD ($) | Value | ||
| Pipelines – (continued) | |||
| 49,000 | DCP Midstream Operating LP, 4.95%, 4/1/22 | $ 49,268 | |
| 200,000 | DCP Midstream Operating LP, 5.375%, 7/15/25 | 198,500 | |
| 165,000 | Delek Logistics Partners LP/Delek Logistics Finance Corp., 6.75%, 5/15/25 | 152,625 | |
| 220,000(b)(c) | Energy Transfer Operating LP, 7.125% (5 Year CMT Index + 531 bps) | 188,100 | |
| 5,000 | EnLink Midstream LLC, 5.375%, 6/1/29 | 3,750 | |
| 90,000 | EnLink Midstream Partners LP, 4.15%, 6/1/25 | 69,300 | |
| 40,000 | EnLink Midstream Partners LP, 5.05%, 4/1/45 | 24,912 | |
| 116,000 | EnLink Midstream Partners LP, 5.6%, 4/1/44 | 70,760 | |
| 167,000 | Global Partners LP/GLP Finance Corp., 7.0%, 6/15/23 | 160,529 | |
| 111,000 | Global Partners LP/GLP Finance Corp., 7.0%, 8/1/27 | 102,675 | |
| 167,000 | Hess Midstream Operations LP, 5.625%, 2/15/26 (144A) | 165,245 | |
| 135,000 | PBF Logistics LP/PBF Logistics Finance Corp., 6.875%, 5/15/23 | 128,587 | |
| 100,000 | Tallgrass Energy Partners LP/Tallgrass Energy Finance Corp., 6.0%, 3/1/27 (144A) | 88,750 | |
| Total Pipelines | $ 1,691,451 | ||
| REITs – 2.1% | |||
| 155,000 | Iron Mountain US Holdings, Inc., 5.375%, 6/1/26 (144A) | $ 155,775 | |
| 200,000 | Iron Mountain, Inc., 5.75%, 8/15/24 | 201,920 | |
| 105,000 | iStar, Inc., 4.25%, 8/1/25 | 95,025 | |
| 195,000 | iStar, Inc., 4.75%, 10/1/24 | 182,081 | |
| 146,000 | MPT Operating Partnership LP/MPT Finance Corp., 4.625%, 8/1/29 | 146,730 | |
| 93,000 | Uniti Group LP/Uniti Fiber Holdings, Inc./CSL Capital LLC, 7.875%, 2/15/25 (144A) | 94,234 | |
| Total REITs | $ 875,765 | ||
| Retail – 2.6% | |||
| 150,000 | AAG FH LP/AAG FH Finco, Inc., 9.75%, 7/15/24 (144A) | $ 140,250 | |
| 50,000 | Abercrombie & Fitch Management Co., 8.75%, 7/15/25 (144A) | 49,250 | |
| 63,000 | Asbury Automotive Group, Inc., 4.5%, 3/1/28 (144A) | 61,110 | |
| 67,000 | Asbury Automotive Group, Inc., 4.75%, 3/1/30 (144A) | 65,325 | |
| 220,000 | Beacon Roofing Supply, Inc., 4.875%, 11/1/25 (144A) | 196,350 | |
| 113,000 | Golden Nugget, Inc., 8.75%, 10/1/25 (144A) | 63,845 | |
| 55,000 | IRB Holding Corp., 7.0%, 6/15/25 (144A) | 56,688 | |
| 304,000 | Michaels Stores, Inc., 8.0%, 7/15/27 (144A) | 264,480 | |
| 140,000 | QVC, Inc., 4.75%, 2/15/27 | 135,380 | |
| 91,000 | Staples, Inc., 7.5%, 4/15/26 (144A) | 71,503 | |
| Total Retail | $ 1,104,181 | ||
| Software – 0.1% | |||
| 21,000 | Rackspace Hosting, Inc., 8.625%, 11/15/24 (144A) | $ 21,105 | |
| Total Software | $ 21,105 | ||
| Telecommunications – 5.2% | |||
| 400,000 | Altice France Holding SA, 6.0%, 2/15/28 (144A) | $ 377,752 | |
| 80,000 | CenturyLink, Inc., 4.0%, 2/15/27 (144A) | 77,700 | |
| 150,000 | CenturyLink, Inc., 6.45%, 6/15/21 | 153,405 | |
| 90,000 | CommScope Technologies LLC, 6.0%, 6/15/25 (144A) | 86,913 | |
| 63,000 | CommScope, Inc., 8.25%, 3/1/27 (144A) | 64,745 | |
| 451,000(e) | Frontier Communications Corp., 8.75%, 4/15/22 | 147,703 | |
| 300,000 | Level 3 Financing, Inc., 5.25%, 3/15/26 | 308,250 | |
| 308,000 | Sprint Corp., 7.125%, 6/15/24 | 347,775 |
The accompanying notes are an integral part of these financial statements.
16
| Pioneer High Yield VCT Portfolio | PIONEER VARIABLE CONTRACTS TRUST |
| Principal | |||
| Amount | |||
| USD ($) | Value | ||
| Telecommunications – (continued) | |||
| 75,000 | T-Mobile USA, Inc., 6.0%, 3/1/23 | $ 75,303 | |
| 155,000 | T-Mobile USA, Inc., 6.0%, 4/15/24 | 158,363 | |
| 215,000 | T-Mobile USA, Inc., 6.5%, 1/15/26 | 224,699 | |
| 339,000 | Windstream Services LLC/Windstream Finance Corp., 8.625%, 10/31/25 (144A) | 203,400 | |
| Total Telecommunications | $ 2,226,008 | ||
| Transportation – 0.7% | |||
| 145,000 | Watco Cos LLC/Watco Finance Corp., 6.5%, 6/15/27 (144A) | $ 148,564 | |
| 153,000 | XPO Logistics, Inc., 6.25%, 5/1/25 (144A) | 160,268 | |
| Total Transportation | $ 308,832 | ||
| TOTAL CORPORATE BONDS | |||
(Cost $36,728,212) | $ 34,614,923 |
| Face | |||
| Amount | |||
| USD ($) | |||
| INSURANCE-LINKED SECURITIES – 0.1% of Net Assets(f) | |||
| Reinsurance Sidecars – 0.1% | |||
| Multiperil – Worldwide – 0.1% | |||
| 50,000+(a)(g) | Lorenz Re 2018, 7/1/21 | $ 2,185 | |
| 25,723+(a)(g) | Lorenz Re 2019, 6/30/22 | 20,329 | |
| Total Reinsurance Sidecars | $ 22,514 | ||
| TOTAL INSURANCE-LINKED SECURITIES | |||
(Cost $39,391) | $ 22,514 |
| Principal | |||
| Amount | |||
| USD ($) | |||
| SENIOR SECURED FLOATING RATE LOAN INTERESTS – 2.6% of Net Assets*(h) | |||
| Buildings & Real Estate – 0.0%† | |||
| 14,700 | Builders FirstSource, Inc., Refinancing Term Loan, 4.0% (LIBOR + 300 bps), 2/29/24 | $ 14,248 | |
| Total Buildings & Real Estate | $ 14,248 | ||
| Diversified & Conglomerate Service – 0.6% | |||
| 115,500 | DynCorp International, Inc., Term Loan, 7.0% (LIBOR + 600 bps), 8/18/25 | $ 110,303 | |
| 154,203 | Team Health Holdings, Inc., Initial Term Loan, 3.75% (LIBOR + 275 bps), 2/6/24 | 119,739 | |
| Total Diversified & Conglomerate Service | $ 230,042 | ||
| Healthcare, Education & Childcare – 0.6% | |||
| 177,648 | LifePoint Health, Inc. (fka Regionalcare Hospital Partners Holdings, Inc.), First | ||
Lien Term B Loan, 3.928% (LIBOR + 375 bps), 11/16/25 | $ 167,071 | ||
| 64,838 | Surgery Center Holdings, Inc., 2020 Incremental Term Loan, 9.0% (LIBOR + | ||
800 bps), 9/3/24 | 65,486 | ||
| Total Healthcare, Education & Childcare | $ 232,557 | ||
| Machinery – 0.4% | |||
| 232,789 | Shape Technologies Group, Inc., Initial Term Loan, 4.043% (LIBOR + 300 bps), 4/21/25 | $ 183,321 | |
| Total Machinery | $ 183,321 | ||
| Media – 0.2% | |||
| 124,063 | Diamond Sports Group LLC, Term Loan, 3.43% (LIBOR + 325 bps), 8/24/26 | $ 101,576 | |
| Total Media | $ 101,576 |
The accompanying notes are an integral part of these financial statements.
17
| Pioneer High Yield VCT Portfolio | PIONEER VARIABLE CONTRACTS TRUST |
SCHEDULE OF INVESTMENTS 6/30/20 (UNAUDITED) | (continued) |
| Principal | |||
| Amount | |||
| USD ($) | Value | ||
| Securities & Trusts – 0.5% | |||
| 215,400 | Spectacle Gary Holdings LLC, Closing Date Term Loan, 11.0% (LIBOR + | ||
900 bps), 12/23/25 | $ 200,322 | ||
| Total Securities & Trusts | $ 200,322 | ||
| Telecommunications – 0.2% | |||
| 97,361 | Commscope, Inc., Initial Term Loan, 3.428% (LIBOR + 325 bps), 4/6/26 | $ 92,736 | |
Total Telecommunications | $ 92,736 | ||
Utilities – 0.1% | |||
| 60,000 | PG&E Corp., Term Loan, 5.5% (LIBOR + 450 bps), 6/23/25 | $ 59,325 | |
| Total Utilities | $ 59,325 | ||
| TOTAL SENIOR SECURED FLOATING RATE LOAN INTERESTS | |||
(Cost $1,201,086) | $ 1,114,127 | ||
| U.S. GOVERNMENT AND AGENCY OBLIGATIONS – 3.4% of Net Assets | |||
| 500,000(h) | U.S. Treasury Note, 0.265% (3 Month U.S. Treasury Bill Money Market Yield + | ||
12 bps), 1/31/21 | $ 500,274 | ||
| 500,000(i) | United States Treasury Bill, 7/21/20 | 499,967 | |
| 400,000(i) | United States Treasury Bill, 8/13/20 | 399,936 | |
| TOTAL U.S. GOVERNMENT AND AGENCY OBLIGATIONS | |||
(Cost $1,399,686) | $ 1,400,177 |
| Shares | |||
| RIGHTS/WARRANTS – 0.0%† of Net Assets | |||
| Health Care Providers & Services – 0.0%† | |||
| 80+^(a)(j) | Option Care Health, Inc., 6/30/25 | $ 77 | |
| 80+^(a)(j) | Option Care Health, Inc., 6/30/25 | 61 | |
| Total Health Care Providers & Services | $ 138 | ||
| TOTAL RIGHTS/WARRANTS | |||
(Cost $ —) | $ 138 | ||
| TOTAL INVESTMENTS IN UNAFFILIATED ISSUERS – 95.7% | |||
(Cost $41,991,367) | $ 39,834,169 |
| Change | ||||||
| in Net | ||||||
| Net | Unrealized | |||||
| Dividend | Realized | Appreciation | ||||
| Shares | Income | Gain (Loss) | (Depreciation) | Value | ||
| AFFILIATED ISSUER – 1.2% | ||||||
| CLOSED-END FUND – 1.2% of Net Assets | ||||||
| 60,000(k) | Pioneer ILS Interval Fund | $ — | $(132,800) | $155,423 | $ 511,800 | |
| TOTAL CLOSED-END FUND | ||||||
(Cost $636,000) | $ 511,800 | |||||
| TOTAL INVESTMENTS IN AFFILIATED ISSUER – 1.2% | ||||||
(Cost $636,000) | $ 511,800 | |||||
| OTHER ASSETS AND LIABILITIES – 3.1% | $ 1,279,831 | |||||
| NET ASSETS – 100.0% | $41,625,800 | |||||
bps | Basis Points. |
CMT | Constant Maturity Treasury. |
LIBOR | London Interbank Offered Rate. |
REIT | Real Estate Investment Trust. |
The accompanying notes are an integral part of these financial statements.
18
| Pioneer High Yield VCT Portfolio | PIONEER VARIABLE CONTRACTS TRUST |
SOFRRATE | Secured Overnight Financing Rate. |
(144A) | Security is exempt from registration under Rule 144A of the Securities Act of 1933. Such securities may be resold normally to qualified institutional buyers in a transaction exempt from registration. At June 30, 2020, the value of these securities amounted to $24,111,064, or 57.9% of net assets. |
† | Amount rounds to less than 0.1%. |
* | Senior secured floating rate loan interests in which the Portfolio invests generally pay interest at rates that are periodically redetermined by reference to a base lending rate plus a premium. These base lending rates are generally (i) the lending rate offered by one or more major European banks, such as LIBOR, (ii) the prime rate offered by one or more major United States banks, (iii) the rate of a certificate of deposit or (iv) other base lending rates used by commercial lenders. The interest rate shown is the rate accruing at June 30, 2020. |
+ | Security that used significant unobservable inputs to determine its value. |
^ | Security is valued using fair value methods (other than supplied by independent pricing services). |
(a) | Non-income producing security. |
(b) | Security is perpetual in nature and has no stated maturity date. |
(c) | The interest rate is subject to change periodically. The interest rate and/or reference index and spread shown at June 30, 2020. |
(d) | Payment-in-kind (PIK) security which may pay interest in the form of additional principal amount. |
(e) | Security is in default. |
(f) | Securities are restricted as to resale. |
(g) | Issued as preference shares. |
(h) | Floating rate note. Coupon rate, reference index and spread shown at June 30, 2020. |
(i) | Security issued with a zero coupon. Income is recognized through accretion of discount. |
(j) | Option Care Health, Inc. warrants are exercisable into 160 shares. |
(k) | Pioneer ILS Interval Fund is an affiliated closed-end fund managed by Amundi Pioneer Asset Management, Inc., (the “Adviser”). |
SWAP CONTRACTS
CENTRALLY CLEARED CREDIT DEFAULT SWAP CONTRACTS – SELL PROTECTION
CENTRALLY CLEARED CREDIT DEFAULT SWAP CONTRACTS – SELL PROTECTION
| Premiums | Unrealized | ||||||
| Notional | Pay/ | Annual | Expiration | Paid/ | Appreciation | Market | |
Amount ($)(1) | Reference Obligation/Index | Receive(2) | Fixed Rate | Date | (Received) | (Depreciation) | Value |
430,001 | Markit CDX North America High Yield Index Series 27 | Receive | 5.00% | 12/20/21 | $ (2,031) | $ 3,433 | $1,402 |
178,000 | Markit CDX North America High Yield Index Series 31 | Receive | 5.00% | 12/20/23 | 10,084 | (9,806) | 278 |
236,600 | Markit CDX North America High Yield Index Series 32 | Receive | 5.00% | 6/20/24 | 11,970 | (11,509) | 461 |
| TOTAL CENTRALLY CLEARED CREDIT DEFAULT SWAP CONTRACTS – SELL PROTECTION | $20,023 | $(17,882) | $2,141 | ||||
OVER THE COUNTER (OTC) CREDIT DEFAULT SWAP CONTRACTS – SELL PROTECTION
| Notional | Obligation | Pay/ | Annual | Expiration | Premiums | Unrealized | Market | |
Amount ($)(1) | Counterparty | Reference/Index | Receive(2) | Fixed Rate | Date | (Received) | (Depreciation) | Value |
40,000 | Goldman Sachs International | Chesapeake Energy Corp. | Receive | 5.00% | 6/20/22 | $ (4,500) | $ (33,770) | $ (38,270) |
25,000 | Goldman Sachs International | Chesapeake Energy Corp. | Receive | 5.00% | 6/20/22 | (3,062) | (20,856) | (23,918) |
40,000 | Goldman Sachs International | Chesapeake Energy Corp. | Receive | 5.00% | 6/20/22 | (4,900) | (33,370) | (38,270) |
| TOTAL OVER THE COUNTER (OTC) CREDIT DEFAULT SWAP CONTRACTS – SELL PROTECTION | $(12,462) | $ (87,996) | $(100,458) | |||||
| TOTAL SWAP CONTRACTS | $ 7,561 | $(105,878) | $ (98,317) | |||||
(1) | The notional amount is the maximum amount that a seller of credit protection would be obligated to pay upon occurrence of a credit event. |
(2) | Receives Quarterly. |
Principal amounts are denominated in U.S. dollars (“USD”) unless otherwise noted.
EUR – Euro
Purchases and sales of securities (excluding temporary cash investments) for the six months ended June 30, 2020 were as follows:
| Purchases | Sales | |
| Long-Term U.S. Government Securities | $ 1,803,668 | $ 1,804,419 |
| Other Long-Term Securities | $21,948,164 | $21,217,089 |
The accompanying notes are an integral part of these financial statements.
19
| Pioneer High Yield VCT Portfolio | PIONEER VARIABLE CONTRACTS TRUST |
SCHEDULE OF INVESTMENTS 6/30/20 (UNAUDITED) | (continued) |
The Portfolio is permitted to engage in purchase and sale transactions (“cross trades”) with certain funds and accounts for which the Adviser serves as the Portfolio’s investment adviser, as set forth in Rule 17a-7 under the Investment Company Act of 1940, pursuant to procedures adopted by the Board of Trustees. Under these procedures, cross trades are effected at current market prices. During the six months ended June 30, 2020, the Portfolio engaged in purchases of $308,893 and sales of $1,621,941 pursuant to these procedures, which resulted in a net realized gain/(loss) of $(10).
At June 30, 2020, the net unrealized depreciation on investments based on cost for federal tax purposes of $42,702,582 was as follows:
| Aggregate gross unrealized appreciation for all investments in which there is an excess of value over tax cost | $ 876,325 |
| Aggregate gross unrealized depreciation for all investments in which there is an excess of tax cost over value | (3,331,255) |
| Net unrealized depreciation | $(2,454,930) |
Various inputs are used in determining the value of the Portfolio’s investments. These inputs are summarized in the three broad levels below.
Level 1 – quoted prices in active markets for identical securities.
Level 2 – other significant observable inputs (including quoted prices for similar securities, interest rates, prepayment speeds, credit risks, etc.). See Notes to Financial Statements — Note 1A.
Level 3 – significant unobservable inputs (including the Portfolio’s own assumptions in determining fair value of investments). See Notes to Financial Statements — Note 1A.
The following is a summary of the inputs used as of June 30, 2020, in valuing the Portfolio’s investments:
| Level 1 | Level 2 | Level 3 | Total | |||||||||||||
Common Stock | ||||||||||||||||
| Transportation Infrastructure | $ | — | $ | 9,440 | $ | — | $ | 9,440 | ||||||||
Convertible Preferred Stock | 123,215 | — | — | 123,215 | ||||||||||||
Commercial Mortgage-Backed Security | — | 99,192 | — | 99,192 | ||||||||||||
Convertible Corporate Bonds | — | 2,450,443 | — | 2,450,443 | ||||||||||||
Corporate Bonds | — | 34,614,923 | — | 34,614,923 | ||||||||||||
Insurance-Linked Securities | ||||||||||||||||
| Reinsurance Sidecars | ||||||||||||||||
| Multiperil - Worldwide | — | — | 22,514 | 22,514 | ||||||||||||
Senior Secured Floating Rate Loan | ||||||||||||||||
| Interests | — | 1,114,127 | — | 1,114,127 | ||||||||||||
U.S. Government and Agency Obligations | — | 1,400,177 | — | 1,400,177 | ||||||||||||
Rights/Warrants | ||||||||||||||||
| Health Care Providers & Services | — | — | 138 | 138 | ||||||||||||
Affiliated Closed-End Fund | — | 511,800 | — | 511,800 | ||||||||||||
| Total Investments in Securities | $ | 123,215 | $ | 40,200,102 | $ | 22,652 | $ | 40,345,969 | ||||||||
| Other Financial Instruments | ||||||||||||||||
Swap contracts, at value | $ | — | (98,317 | ) | — | (98,317 | ) | |||||||||
| Total Other Financial Instruments | $ | — | $ | (98,317 | ) | $ | — | $ | (98,317 | ) | ||||||
The following is a reconciliation of assets valued using significant unobservable inputs (Level 3):
| Insurance- | ||||||||||||
| Linked | Rights/ | |||||||||||
| Securities | Warrants | Total | ||||||||||
Balance as of 12/31/19 | $ | 27,503 | $ | 185 | $ | 27,688 | ||||||
Realized gain (loss)(1) | — | — | — | |||||||||
Change in unrealized appreciation (depreciation)(2) | (91 | ) | (47 | ) | (138 | ) | ||||||
Accrued discounts/premiums | — | — | — | |||||||||
Purchases | — | — | — | |||||||||
Sales | (4,898 | ) | — | (4,898 | ) | |||||||
Transfers in to Level 3* | — | — | — | |||||||||
Transfer out of Level 3* | — | — | — | |||||||||
Balance as of 6/30/20 | $ | 22,514 | $ | 138 | $ | 22,652 | ||||||
(1) | Realized gain (loss) on these securities is included in the realized gain (loss) from investments on the Statement of Operations. |
(2) | Unrealized appreciation (depreciation) on these securities is included in the change in unrealized appreciation (depreciation) from investments on the Statement of Operations. |
* | Transfers are calculated on the beginning of period value. For the six months ended June 30, 2020, there were no transfers between Levels 1, 2 and 3. |
Net change in unrealized appreciation (depreciation) of Level 3 investments still held and considered Level 3 at June 30, 2020: | $(138) |
The accompanying notes are an integral part of these financial statements.
20
| Pioneer High Yield VCT Portfolio | PIONEER VARIABLE CONTRACTS TRUST |
| ASSETS: | ||||
| Investments in unaffiliated issuers, at value (cost $41,991,367) | $ | 39,834,169 | ||
| Investments in affiliated issuers, at value (cost $636,000) | 511,800 | |||
| Cash | 495,789 | |||
| Foreign currencies, at value (cost $2,144) | 2,177 | |||
| Swaps collateral | 85,041 | |||
| Variation margin for centrally cleared swap contracts | 2,857 | |||
| Receivables — | ||||
| Investment securities sold | 569,811 | |||
| Portfolio shares sold | 414,930 | |||
| Interest | 569,001 | |||
| Other assets | 28,083 | |||
| Total assets | $ | 42,513,658 | ||
| LIABILITIES: | ||||
| Payables — | ||||
| Investment securities purchased | $ | 725,495 | ||
| Portfolio shares repurchased | 511 | |||
| Professional fees | 26,591 | |||
| Due to broker for swaps | 3,468 | |||
| Unrealized depreciation on unfunded loan commitments | 673 | |||
| Swap contracts, at value (net premiums received $7,561) | 98,317 | |||
| Due to affiliates | 2,971 | |||
| Accrued expenses | 29,832 | |||
| Total liabilities | $ | 887,858 | ||
| NET ASSETS: | ||||
| Paid-in capital | $ | 45,588,911 | ||
| Distributable earnings (loss) | (3,963,111 | ) | ||
| Net assets | $ | 41,625,800 | ||
| NET ASSET VALUE PER SHARE: | ||||
No par value (unlimited number of shares authorized) | ||||
| Class I (based on $32,563,122/3,804,084 shares) | $ | 8.56 | ||
| Class II (based on $9,062,678/1,072,518 shares) | $ | 8.45 | ||
The accompanying notes are an integral part of these financial statements.
21
| Pioneer High Yield VCT Portfolio | PIONEER VARIABLE CONTRACTS TRUST |
| STATEMENT OF OPERATIONS (UNAUDITED) | |
| FOR THE SIX MONTHS ENDED 6/30/20 |
| INVESTMENT INCOME: | ||||||||
| Interest from unaffiliated issuers | $ | 1,299,177 | ||||||
| Dividends from unaffiliated issuers | 3,563 | |||||||
| Total investment income | $ | 1,302,740 | ||||||
| EXPENSES: | ||||||||
| Management fees | $ | 134,412 | ||||||
| Administrative expense | 33,893 | |||||||
| Distribution fees | ||||||||
| Class II | 11,201 | |||||||
| Custodian fees | 6,908 | |||||||
| Professional fees | 26,036 | |||||||
| Printing expense | 19,665 | |||||||
| Pricing fees | 8,687 | |||||||
| Trustees’ fees | 3,458 | |||||||
| Insurance expense | 70 | |||||||
| Miscellaneous | 833 | |||||||
| Total expenses | $ | 245,163 | ||||||
| Less fees waived and expenses reimbursed by the Adviser | (8,281 | ) | ||||||
| Net expenses | $ | 236,882 | ||||||
| Net investment income | $ | 1,065,858 | ||||||
| REALIZED AND UNREALIZED GAIN (LOSS) ON INVESTMENTS: | ||||||||
| Net realized gain (loss) on: | ||||||||
| Investments in unaffiliated issuers | $ | (1,643,667 | ) | |||||
| Investments in affiliated issuers | (132,800 | ) | ||||||
| Swap contracts | (34,329 | ) | ||||||
| Other assets and liabilities denominated in foreign currencies | 51 | $ | (1,810,745 | ) | ||||
| Change in net unrealized appreciation (depreciation) on: | ||||||||
| Investments in unaffiliated issuers | $ | (3,134,908 | ) | |||||
| Investments in affiliated issuers | 155,423 | |||||||
| Swap contracts | (148,419 | ) | ||||||
| Unfunded loan commitments | (1,268 | ) | ||||||
| Other assets and liabilities denominated in foreign currencies | 42 | $ | (3,129,130 | ) | ||||
| Net realized and unrealized gain (loss) on investments | $ | (4,939,875 | ) | |||||
| Net decrease in net assets resulting from operations | $ | (3,874,017 | ) | |||||
The accompanying notes are an integral part of these financial statements.
22
| Pioneer High Yield VCT Portfolio | PIONEER VARIABLE CONTRACTS TRUST |
| STATEMENTS OF CHANGES IN NET ASSETS |
| Six Months | ||||||||
| Ended | ||||||||
| 6/30/20 | Year Ended | |||||||
| (unaudited) | 12/31/19 | |||||||
| FROM OPERATIONS: | ||||||||
Net investment income (loss) | $ | 1,065,858 | $ | 2,215,343 | ||||
Net realized gain (loss) on investments | (1,810,745 | ) | 28,367 | |||||
Change in net unrealized appreciation (depreciation) on investments | (3,129,130 | ) | 3,690,363 | |||||
| Net increase (decrease) in net assets resulting from operations | $ | (3,874,017 | ) | $ | 5,934,073 | |||
| DISTRIBUTIONS TO SHAREOWNERS: | ||||||||
| Class I ($0.24 and $0.46 per share, respectively) | $ | (883,957 | ) | $ | (1,691,026 | ) | ||
| Class II ($0.22 and $0.43 per share, respectively) | (229,048 | ) | (470,273 | ) | ||||
| Total distributions to shareowners | $ | (1,113,005 | ) | $ | (2,161,299 | ) | ||
| FROM PORTFOLIO SHARE TRANSACTIONS: | ||||||||
Net proceeds from sales of shares | $ | 8,179,070 | $ | 8,990,878 | ||||
Reinvestment of distributions | 1,113,005 | 2,161,299 | ||||||
Cost of shares repurchased | (9,973,015 | ) | (9,191,664 | ) | ||||
| Net increase (decrease) in net assets resulting from Portfolio share transactions | $ | (680,940 | ) | $ | 1,960,513 | |||
| Net increase (decrease) in net assets | $ | (5,667,962 | ) | $ | 5,733,287 | |||
| NET ASSETS: | ||||||||
Beginning of period | $ | 47,293,762 | $ | 41,560,475 | ||||
End of period | $ | 41,625,800 | $ | 47,293,762 | ||||
| Six Months | Six Months | |||||||||||||||
| Ended | Ended | |||||||||||||||
| 6/30/20 | 6/30/20 | Year Ended | Year Ended | |||||||||||||
| Shares | Amount | 12/31/19 | 12/31/19 | |||||||||||||
| (unaudited) | (unaudited) | Shares | Amount | |||||||||||||
| CLASS I | ||||||||||||||||
Shares sold | 397,713 | $ | 3,441,718 | 321,322 | $ | 3,003,575 | ||||||||||
Reinvestment of distributions | 102,931 | 883,957 | 181,308 | 1,691,026 | ||||||||||||
Less shares repurchased | (418,050 | ) | (3,669,463 | ) | (591,036 | ) | (5,476,479 | ) | ||||||||
Net increase/ (decrease) | 82,594 | $ | 656,212 | (88,406 | ) | $ | (781,878 | ) | ||||||||
| CLASS II | ||||||||||||||||
Shares sold | 550,966 | $ | 4,737,352 | 651,310 | $ | 5,987,303 | ||||||||||
Reinvestment of distributions | 26,886 | 229,048 | 51,030 | 470,273 | ||||||||||||
Less shares repurchased | (735,138 | ) | (6,303,552 | ) | (403,548 | ) | (3,715,185 | ) | ||||||||
Net increase/ (decrease) | (157,286 | ) | $ | (1,337,152 | ) | 298,792 | $ | 2,742,391 | ||||||||
The accompanying notes are an integral part of these financial statements.
23
| Pioneer High Yield VCT Portfolio | PIONEER VARIABLE CONTRACTS TRUST |
| FINANCIAL HIGHLIGHTS |
| Six Months | ||||||||||||||||||||||||
| Ended | ||||||||||||||||||||||||
| 6/30/20 | Year Ended | Year Ended | Year Ended | Year Ended | Year Ended | |||||||||||||||||||
| (unaudited) | 12/31/19 | 12/31/18 | 12/31/17 | 12/31/16* | 12/31/15* | |||||||||||||||||||
| Class I | ||||||||||||||||||||||||
Net asset value, beginning of period | $ | 9.58 | $ | 8.79 | $ | 9.53 | $ | 9.31 | $ | 8.55 | $ | 9.65 | ||||||||||||
Increase (decrease) from investment operations: | ||||||||||||||||||||||||
| Net investment income (loss) (a) | $ | 0.23 | $ | 0.47 | $ | 0.44 | $ | 0.43 | $ | 0.46 | $ | 0.42 | ||||||||||||
| Net realized and unrealized gain (loss) on investments | (1.01 | ) | 0.78 | (0.74 | ) | 0.22 | 0.74 | (0.75 | ) | |||||||||||||||
Net increase (decrease) from investment operations | $ | (0.78 | ) | $ | 1.25 | $ | (0.30 | ) | $ | 0.65 | $ | 1.20 | $ | (0.33 | ) | |||||||||
Distributions to shareowners: | ||||||||||||||||||||||||
| Net investment income | $ | (0.24 | ) | $ | (0.46 | ) | $ | (0.44 | ) | $ | (0.43 | ) | $ | (0.44 | ) | $ | (0.45 | ) | ||||||
| Net realized gain | — | — | — | — | — | (0.32 | ) | |||||||||||||||||
Total distributions | $ | (0.24 | ) | $ | (0.46 | ) | $ | (0.44 | ) | $ | (0.43 | ) | $ | (0.44 | ) | $ | (0.77 | ) | ||||||
Net increase (decrease) in net asset value | $ | (1.02 | ) | $ | 0.79 | $ | (0.74 | ) | $ | 0.22 | $ | 0.76 | $ | (1.10 | ) | |||||||||
Net asset value, end of period | $ | 8.56 | $ | 9.58 | $ | 8.79 | $ | 9.53 | $ | 9.31 | $ | 8.55 | ||||||||||||
Total return (b) | (8.15 | )%(c) | 14.44 | % | (3.30 | )% | 7.14 | % | 14.35 | % | (3.93 | )%(d) | ||||||||||||
Ratio of net expenses to average net assets | 1.09 | %(e) | 1.03 | % | 1.03 | % | 0.91 | % | 0.92 | % | 0.92 | % | ||||||||||||
Ratio of net investment income (loss) to average net assets | 5.23 | %(e) | 5.03 | % | 4.76 | % | 4.57 | % | 5.24 | % | 4.45 | % | ||||||||||||
Portfolio turnover rate | 59 | %(c) | 66 | % | 45 | % | 44 | % | 57 | % | 32 | % | ||||||||||||
Net assets, end of period (in thousands) | $ | 32,563 | $ | 35,652 | $ | 33,476 | $ | 42,728 | $ | 48,953 | $ | 45,949 | ||||||||||||
Ratios with no waiver of fees and assumption of expenses by | ||||||||||||||||||||||||
| the Adviser and no reduction for fees paid indirectly: | ||||||||||||||||||||||||
| Total expenses to average net assets | 1.13 | %(e) | 1.07 | % | 1.07 | % | 0.91 | % | 0.92 | % | 0.92 | % | ||||||||||||
| Net investment income (loss) to average net assets | 5.19 | %(e) | 4.99 | % | 4.72 | % | 4.57 | % | 5.24 | % | 4.45 | % | ||||||||||||
* | The Portfolio was audited by an independent registered public accounting firm other than Ernst & Young LLP. |
(a) | The per-share data presented above is based on the average shares outstanding for the period presented. |
(b) | Assumes initial investment at net asset value at the beginning of each period, reinvestment of all distributions and the complete redemption of the investment at net asset value at the end of each period. |
(c) | Not annualized. |
(d) | If the Portfolio had not recognized gains in settlement of class action lawsuits during the year ended December 31, 2015, the total return would have been (4.04)%. |
(e) | Annualized. |
NOTE: | The above financial highlights do not reflect the deduction of non-portfolio expenses associated with variable insurance products, such as mortality and expense risk charges, separate account charges, and sales charges. |
The accompanying notes are an integral part of these financial statements.
24
| Pioneer High Yield VCT Portfolio | PIONEER VARIABLE CONTRACTS TRUST |
| Six Months | ||||||||||||||||||||||||
| Ended | ||||||||||||||||||||||||
| 6/30/20 | Year Ended | Year Ended | Year Ended | Year Ended | Year Ended | |||||||||||||||||||
| (unaudited) | 12/31/19 | 12/31/18 | 12/31/17 | 12/31/16* | 12/31/15* | |||||||||||||||||||
| Class II | ||||||||||||||||||||||||
Net asset value, beginning of period | $ | 9.47 | $ | 8.68 | $ | 9.45 | $ | 9.23 | $ | 8.49 | $ | 9.59 | ||||||||||||
Increase (decrease) from investment operations: | ||||||||||||||||||||||||
| Net investment income (loss) (a) | $ | 0.21 | $ | 0.44 | $ | 0.41 | $ | 0.41 | $ | 0.43 | $ | 0.39 | ||||||||||||
| Net realized and unrealized gain (loss) on investments | (1.01 | ) | 0.78 | (0.77 | ) | 0.22 | 0.72 | (0.75 | ) | |||||||||||||||
Net increase (decrease) from investment operations | $ | (0.80 | ) | $ | 1.22 | $ | (0.36 | ) | $ | 0.63 | $ | 1.15 | $ | (0.36 | ) | |||||||||
Distributions to shareowners: | ||||||||||||||||||||||||
| Net investment income | $ | (0.22 | ) | $ | (0.43 | ) | $ | (0.41 | ) | $ | (0.41 | ) | $ | (0.41 | ) | $ | (0.42 | ) | ||||||
| Net realized gain | — | — | — | — | — | (0.32 | ) | |||||||||||||||||
Total distributions | $ | (0.22 | ) | $ | (0.43 | ) | $ | (0.41 | ) | $ | (0.41 | ) | $ | (0.41 | ) | $ | (0.74 | ) | ||||||
Net increase (decrease) in net asset value | $ | (1.02 | ) | $ | 0.79 | $ | (0.77 | ) | $ | 0.22 | $ | 0.74 | $ | (1.10 | ) | |||||||||
Net asset value, end of period | $ | 8.45 | $ | 9.47 | $ | 8.68 | $ | 9.45 | $ | 9.23 | $ | 8.49 | ||||||||||||
Total return (b) | (8.40 | )%(c) | 14.28 | % | (3.94 | )% | 6.89 | %(d) | 13.89 | % | (4.23 | )%(e) | ||||||||||||
Ratio of net expenses to average net assets | 1.33 | %(f) | 1.28 | % | 1.28 | % | 1.16 | % | 1.16 | % | 1.18 | % | ||||||||||||
Ratio of net investment income (loss) to average net assets | 4.89 | %(f) | 4.79 | % | 4.50 | % | 4.31 | % | 4.91 | % | 4.17 | % | ||||||||||||
Portfolio turnover rate | 59 | %(c) | 66 | % | 45 | % | 44 | % | 57 | % | 32 | % | ||||||||||||
Net assets, end of period (in thousands) | $ | 9,063 | $ | 11,642 | $ | 8,085 | $ | 11,594 | $ | 11,529 | $ | 10,629 | ||||||||||||
Ratios with no waiver of fees and assumption of expenses by | ||||||||||||||||||||||||
| the Adviser and no reduction for fees paid indirectly: | ||||||||||||||||||||||||
| Total expenses to average net assets | 1.37 | %(f) | 1.32 | % | 1.32 | % | 1.16 | % | 1.16 | % | 1.18 | % | ||||||||||||
| Net investment income (loss) to average net assets | 4.85 | %(f) | 4.74 | % | 4.45 | % | 4.31 | % | 4.91 | % | 4.17 | % | ||||||||||||
* | The Portfolio was audited by an independent registered public accounting firm other than Ernst & Young LLP. |
(a) | The per-share data presented above is based on the average shares outstanding for the period presented. |
(b) | Assumes initial investment at net asset value at the beginning of each period, reinvestment of all distributions and the complete redemption of the investment at net asset value at the end of each period. |
(c) | Not annualized. |
(d) | If the Portfolio had not recognized gains in settlement of class action lawsuits during the year ended December 31, 2017, the total return would have been 6.83%. |
(e) | If the Portfolio had not recognized gains in settlement of class action lawsuits during the year ended December 31, 2015, the total return would have been (4.34)%. |
(f) | Annualized. |
NOTE: The above financial highlights do not reflect the deduction of non-portfolio expenses associated with variable insurance products, such as mortality and expense risk charges, separate account charges, and sales charges.
The accompanying notes are an integral part of these financial statements.
25
| Pioneer High Yield VCT Portfolio | PIONEER VARIABLE CONTRACTS TRUST |
1. Organization and Significant Accounting Policies
Pioneer High Yield VCT Portfolio (the “Portfolio”) is one of 8 portfolios comprising Pioneer Variable Contracts Trust (the “Trust”), a Delaware statutory trust. The Portfolio is registered under the Investment Company Act of 1940 as a diversified, open-end management investment company. The investment objective of the Portfolio is to maximize total return through a combination of income and capital appreciation.
The Portfolio offers two classes of shares designated as Class I and Class II shares. Each class of shares represents an interest in the same portfolio of investments of the Portfolio and has identical rights (based on relative net asset values) to assets and liquidation proceeds. Share classes can bear different rates of class-specific fees and expenses, such as transfer agent and distribution fees. Differences in class-specific fees and expenses will result in differences in net investment income and, therefore, the payment of different dividends from net investment income earned by each class. The Amended and Restated Declaration of Trust of the Portfolio gives the Board of Trustees the flexibility to specify either per-share voting or dollar-weighted voting when submitting matters for shareowner approval. Under per-share voting, each share of a class of the Portfolio is entitled to one vote. Under dollar-weighted voting, a shareowner’s voting power is determined not by the number of shares owned, but by the dollar value of the shares on the record date. Each share class has exclusive voting rights with respect to matters affecting only that class, including with respect to the distribution plan for that class. There is no distribution plan for Class I shares.
Portfolio shares may be purchased only by insurance companies for the purpose of funding variable annuity and variable life insurance contracts or by qualified pension and retirement plans.
Amundi Pioneer Asset Management, Inc., an indirect, wholly owned subsidiary of Amundi and Amundi’s wholly owned subsidiary, Amundi USA, Inc., serves as the Portfolio’s investment adviser (the “Adviser”). Amundi Pioneer Distributor, Inc., an affiliate of Amundi Pioneer Asset Management, Inc., serves as the Portfolio’s distributor (the “Distributor”).
In August 2018, the Securities and Exchange Commission (“SEC”) released a Disclosure Update and Simplification Final Rule. The Final Rule amends Regulation S-X disclosures requirements to conform them to U.S. Generally Accepted Accounting Principles (“U.S. GAAP”) for investment companies. The Portfolio’s financial statements were prepared in compliance with the new amendments to Regulation S-X.
During March 2017, the Financial Accounting Standards Board (FASB) issued an Accounting Standard Update, ASU 2017-08, Receivables-Nonrefundable Fees and Other Costs (Subtopic 310-20), Premium Amortization on Purchased Callable Debt Securities (“ASU 2017-08”), which shortens the amortization period for purchased non-contingently callable debt securities held at a premium. ASU 2017-08 specifies that the premium amortization period ends at the earliest call date, for certain purchased non-contingently callable debt securities. ASU 2017-08 is effective for fiscal years, and interim periods within those fiscal years, beginning after December 15, 2018. The Portfolio has adopted ASU 2017-08 as of June 30, 2020. The implementation of ASU 2017-08 did not have a material impact on the Portfolio’s Financial Statements.
The Portfolio is an investment company and follows investment company accounting and reporting guidance under U.S. GAAP. U.S. GAAP requires the management of the Portfolio to make estimates and assumptions that affect the reported amounts of assets and liabilities, the disclosure of contingent assets and liabilities at the date of the financial statements, and the reported amounts of income, expenses and gain or loss on investments during the reporting period. Actual results could differ from those estimates.
The following is a summary of significant accounting policies followed by the Portfolio in the preparation of its financial statements:
A. Security Valuation
The net asset value of the Portfolio is computed once daily, on each day the New York Stock Exchange (“NYSE”) is open, as of the close of regular trading on the NYSE.
Fixed-income securities are valued by using prices supplied by independent pricing services, which consider such factors as market prices, market events, quotations from one or more brokers, Treasury spreads, yields, maturities and ratings, or may use a pricing matrix or other fair value methods or techniques to provide an estimated value of the security or instrument. A pricing matrix is a means of valuing a debt security on the basis of current market prices for other debt securities, historical trading patterns in the market for fixed-income securities and/or other factors. Non-U.S. debt securities that are listed on an exchange will be valued at the bid price obtained from an independent third party pricing service. When independent third party pricing services are unable to supply prices, or when prices or market quotations are considered to be unreliable, the value of that security may be determined using quotations from one or more broker-dealers.
26
| Pioneer High Yield VCT Portfolio | PIONEER VARIABLE CONTRACTS TRUST |
Loan interests are valued in accordance with guidelines established by the Board of Trustees at the mean between the last available bid and asked prices from one or more brokers or dealers as obtained from Loan Pricing Corporation, an independent third party pricing service. If price information is not available from Loan Pricing Corporation, or if the price information is deemed to be unreliable, price information will be obtained from an alternative loan interest pricing service. If no reliable price quotes are available from either the primary or alternative pricing service, broker quotes will be solicited.
Event-linked bonds are valued at the bid price obtained from an independent third party pricing service. Other insurance-linked securities (including reinsurance sidecars, collateralized reinsurance and industry loss warranties) may be valued at the bid price obtained from an independent pricing service, or through a third party using a pricing matrix, insurance industry valuation models, or other fair value methods or techniques to provide an estimated value of the instrument.
Equity securities that have traded on an exchange are valued by using the last sale price on the principal exchange where they are traded. Equity securities that have not traded on the date of valuation, or securities for which sale prices are not available, generally are valued using the mean between the last bid and asked prices or, if both last bid and asked prices are not available, at the last quoted bid price. Last sale and bid and asked prices are provided by independent third party pricing services. In the case of equity securities not traded on an exchange, prices are typically determined by independent third party pricing services using a variety of techniques and methods.
The value of foreign securities is translated into U.S. dollars based on foreign currency exchange rate quotations supplied by a third party pricing source. Trading in non-U.S. equity securities is substantially completed each day at various times prior to the close of the NYSE. The values of such securities used in computing the net asset value of the Portfolio’s shares are determined as of such times. The Portfolio may use a fair value model developed by an independent pricing service to value non-U.S. equity securities.
Swap contracts, including interest rate swaps, caps and floors (other than centrally cleared swap contracts), are valued at the dealer quotations obtained from reputable International Swap Dealers Association members. Centrally cleared swaps are valued at the daily settlement price provided by the central clearing counterparty.
Shares of open-end registered investment companies (including money market mutual funds) are valued at such funds’ net asset value. Shares of exchange-listed closed-end funds are valued by using the last sale price on the principal exchange where they are traded. Shares of closed-end interval funds that offer their shares at net asset value are values at such funds’ net asset value.
Securities or loan interests for which independent pricing services or broker-dealers are unable to supply prices or for which market prices and/or quotations are not readily available or are considered to be unreliable are valued by a fair valuation team comprised of certain personnel of the Adviser pursuant to procedures adopted by the Portfolio’s Board of Trustees. The Adviser’s fair valuation team uses fair value methods approved by the Valuation Committee of the Board of Trustees. The Adviser’s fair valuation team is responsible for monitoring developments that may impact fair valued securities and for discussing and assessing fair values on an ongoing basis, and at least quarterly, with the Valuation Committee of the Board of Trustees.
Inputs used when applying fair value methods to value a security may include credit ratings, the financial condition of the company, current market conditions and comparable securities. The Portfolio may use fair value methods if it is determined that a significant event has occurred after the close of the exchange or market on which the security trades and prior to the determination of the Portfolio’s net asset value. Examples of a significant event might include political or economic news, corporate restructurings, natural disasters, terrorist activity or trading halts. Thus, the valuation of the Portfolio’s securities may differ significantly from exchange prices, and such differences could be material.
At June 30, 2020, two securities were valued using fair value methods (in addition to securities valued using prices supplied by independent pricing services, broker-dealers or using a third party insurance pricing model) representing 0.0% of net assets. The value of these fair valued securities was $138.
B. Investment Income and Transactions
Dividend income is recorded on the ex-dividend date, except that certain dividends from foreign securities where the ex-dividend date may have passed are recorded as soon as the Portfolio becomes aware of the ex-dividend data in the exercise of reasonable diligence.
27
| Pioneer High Yield VCT Portfolio | PIONEER VARIABLE CONTRACTS TRUST | |
NOTES TO FINANCIAL STATEMENTS 6/30/20 (UNAUDITED) | (continued) | |
Interest income, including interest on income-bearing cash accounts, is recorded on the accrual basis. Dividend and interest income are reported net of unrecoverable foreign taxes withheld at the applicable country rates and net of income accrued on defaulted securities.
Interest and dividend income payable by delivery of additional shares is reclassified as PIK (payment-in-kind) income upon receipt and is included in interest and dividend income, respectively.
Principal amounts of mortgage-backed securities are adjusted for monthly paydowns. Premiums and discounts related to certain mortgage-backed securities are amortized or accreted in proportion to the monthly paydowns. All discounts/premiums on purchase prices of debt securities are accreted/amortized for financial reporting purposes over the life of the respective securities, and such accretion/amortization is included in interest income.
Security transactions are recorded as of trade date. Gains and losses on sales of investments are calculated on the identified cost method for both financial reporting and federal income tax purposes.
C. Foreign Currency Translation
The books and records of the Portfolio are maintained in U.S. dollars. Amounts denominated in foreign currencies are translated into U.S. dollars using current exchange rates.
Net realized gains and losses on foreign currency transactions, if any, represent, among other things, the net realized gains and losses on foreign currency exchange contracts, disposition of foreign currencies and the difference between the amount of income accrued and the U.S. dollars actually received. Further, the effects of changes in foreign currency exchange rates on investments are not segregated on the Statement of Operations from the effects of changes in the market prices of those securities, but are included with the net realized and unrealized gain or loss on investments.
D. Federal Income Taxes
It is the Portfolio’s policy to comply with the requirements of the Internal Revenue Code applicable to regulated investment companies and to distribute all of its net taxable income and net realized capital gains, if any, to its shareowners. Therefore, no provision for federal income taxes is required. As of December 31, 2019, the Portfolio did not accrue any interest or penalties with respect to uncertain tax positions, which, if applicable, would be recorded as an income tax expense on the Statement of Operations. Tax returns filed within the prior three years remain subject to examination by federal and state tax authorities.
The amount and character of income and capital gain distributions to shareowners are determined in accordance with federal income tax rules, which may differ from U.S. GAAP. Distributions in excess of net investment income or net realized gains are temporary over distributions for financial statement purposes resulting from differences in the recognition or classification of income or distributions for financial statement and tax purposes. Capital accounts within the financial statements are adjusted for permanent book/tax differences to reflect tax character, but are not adjusted for temporary differences.
The tax character of current year distributions payable will be determined at the end of the current taxable year. The tax character of distributions paid during the year ended December 31, 2019 was as follows:
| 2019 | ||||
| Distributions paid from: | ||||
| Ordinary income | $ | 2,161,299 | ||
| Total | $ | 2,161,299 | ||
The following shows the components of distributable earnings (losses) on a federal income tax basis at December 31, 2019:
| 2019 | ||||
| Distributable earnings: | ||||
| Undistributed ordinary income | $ | 474,139 | ||
| Capital loss carryforward | (144,914 | ) | ||
| Net unrealized appreciation | 694,686 | |||
| Total | $ | 1,023,911 | ||
The difference between book basis and tax basis unrealized appreciation is attributable to the tax deferral of losses on wash sales, the mark to market of swaps, and adjustments relating to credit default swaps.
E. Portfolio Shares and Class Allocations
The Portfolio records sales and repurchases of its shares as of trade date. Distribution fees for Class II shares are calculated based on the average daily net asset value attributable to Class II shares of the Portfolio (see Note 4). Class I shares do not pay distribution fees.
28
| Pioneer High Yield VCT Portfolio | PIONEER VARIABLE CONTRACTS TRUST |
Income, common expenses (excluding transfer agent and distribution fees) and realized and unrealized gains and losses are calculated at the Portfolio level and allocated daily to each class of shares based on its respective percentage of the adjusted net assets at the beginning of the day.
All expenses and fees paid to the Portfolio’s transfer agent for its services are allocated among the classes of shares based on the number of accounts in each class and the ratable allocation of related out-of-pocket expenses (see Note 3).
The Portfolio declares as daily dividends substantially all of its net investment income. All dividends are paid on a monthly basis. Short-term capital gain distributions, if any, may be declared with the daily dividends. Distributions paid by the Portfolio with respect to each class of shares are calculated in the same manner and at the same time, except that net investment income dividends to Class I and Class II shares can reflect different transfer agent and distribution expense rates. Dividends and distributions to shareowners are recorded on the ex-dividend date.
F. Risks
The value of securities held by the Portfolio may go up or down, sometimes rapidly or unpredictably, due to general market conditions, such as real or perceived adverse economic, political or regulatory conditions, recessions, the spread of infectious illness or other public health issues, inflation, changes in interest rates, lack of liquidity in the bond markets or adverse investor sentiment. In the past several years, financial markets have experienced increased volatility, depressed valuations, decreased liquidity and heightened uncertainty. These conditions may continue, recur, worsen or spread.
At times, the Portfolio’s investments may represent industries or industry sectors that are interrelated or have common risks, making the Portfolio more susceptible to any economic, political, or regulatory developments or other risks affecting those industries and sectors. The Portfolio’s investments in foreign markets and countries with limited developing markets may subject the Portfolio to a greater degree of risk than investments in a developed market. These risks include disruptive political or economic conditions and the imposition of adverse governmental laws or currency exchange restrictions.
The Portfolio invests in below-investment-grade (high-yield) debt securities and preferred stocks. Some of these high-yield securities may be convertible into equity securities of the issuer. Debt securities rated below-investment-grade are commonly referred to as “junk bonds” and are considered speculative. These securities involve greater risk of loss, are subject to greater price volatility, and are less liquid, especially during periods of economic uncertainty or change, than higher rated debt securities.
With the increased use of technologies such as the Internet to conduct business, the Portfolio is susceptible to operational, information security and related risks. While the Portfolio’s Adviser has established business continuity plans in the event of, and risk management systems to prevent, limit or mitigate, such cyber-attacks, there are inherent limitations in such plans and systems, including the possibility that certain risks have not been identified. Furthermore, the Portfolio cannot control the cybersecurity plans and systems put in place by service providers to the Portfolio such as Brown Brothers Harriman & Co., the Portfolio’s custodian and accounting agent, and DST Asset Manager Solutions, Inc., the Portfolio’s transfer agent. In addition, many beneficial owners of Portfolio shares hold them through accounts at broker-dealers, retirement platforms and other financial market participants over which neither the Portfolio nor Amundi Pioneer exercises control. Each of these may in turn rely on service providers to them, which are also subject to the risk of cyber-attacks. Cybersecurity failures or breaches at Amundi Pioneer or the Portfolio’s service providers or intermediaries have the ability to cause disruptions and impact business operations, potentially resulting in financial losses, interference with the Portfolio’s ability to calculate its net asset value, impediments to trading, the inability of Portfolio shareowners to effect share purchases, redemptions or exchanges or receive distributions, loss of or unauthorized access to private shareowner information and violations of applicable privacy and other laws, regulatory fines, penalties, reputational damage, or additional compliance costs. Such costs and losses may not be covered under any insurance. In addition, maintaining vigilance against cyber-attacks may involve substantial costs over time, and system enhancements may themselves be subject to cyber-attacks.
29
| Pioneer High Yield VCT Portfolio | PIONEER VARIABLE CONTRACTS TRUST | |
NOTES TO FINANCIAL STATEMENTS 6/30/20 (UNAUDITED) | (continued) | |
COVID-19
The respiratory illness COVID-19 caused by a novel coronavirus has resulted in a global pandemic and major disruption to economies and markets around the world, including the United States. Global financial markets have experienced extreme volatility and severe losses, and trading in many instruments has been disrupted. Liquidity for many instruments has been greatly reduced for periods of time. Some interest rates are very low and in some cases yields are negative. Some sectors of the economy and individual issuers have experienced particularly large losses. These circumstances may continue for an extended period of time, and may continue to affect adversely the value and liquidity of the Portfolio’s investments. The ultimate economic fallout from the pandemic, and the long-term impact on economies, markets, industries and individual issuers, are not known. Governments and central banks, including the Federal Reserve in the U.S., have taken extraordinary and unprecedented actions to support local and global economies and the financial markets. These actions have resulted in significant expansion of public debt, including in the U.S. The impact of these measures, and whether they will be effective to mitigate the economic and market disruption, will not be known for some time. The consequences of high public debt, including its future impact on the economy and securities markets, likewise may not be known for some time.
The Portfolio’s prospectus contains unaudited information regarding the Portfolio’s principal risks. Please refer to that document when considering the Portfolio’s principal risks.
G. Insurance-Linked Securities (“ILS”)
The Portfolio invests in ILS. The Portfolio could lose a portion or all of the principal it has invested in an ILS, and the right to additional interest or dividend payments with respect to the security, upon the occurrence of one or more trigger events, as defined within the terms of an insurance-linked security. Trigger events, generally, are hurricanes, earthquakes, or other natural events of a specific size or magnitude that occur in a designated geographic region during a specified time period, and/or that involve losses or other metrics that exceed a specific amount. There is no way to accurately predict whether a trigger event will occur, and accordingly, ILS carry significant risk. The Portfolio is entitled to receive principal, and interest and/or dividend payments so long as no trigger event occurs of the description and magnitude specified by the instrument. In addition to the specified trigger events, ILS may expose the Portfolio to other risks, including but not limited to issuer (credit) default, adverse regulatory or jurisdictional interpretations and adverse tax consequences.
The Portfolio’s investments in ILS may include event-linked bonds. ILS also may include special purpose vehicles (“SPVs”) or similar instruments structured to comprise a portion of a reinsurer’s catastrophe-oriented business, known as quota share instruments (sometimes referred to as reinsurance sidecars), or to provide reinsurance relating to specific risks to insurance or reinsurance companies through a collateralized instrument, known as collateralized reinsurance. Structured reinsurance investments also may include industry loss warranties (“ILWs”). A traditional ILW takes the form of a bilateral reinsurance contract, but there are also products that take the form of derivatives, collateralized structures, or exchange-traded instruments.
Where the ILS are based on the performance of underlying reinsurance contracts, the Portfolio has limited transparency into the individual underlying contracts, and therefore must rely upon the risk assessment and sound underwriting practices of the issuer. Accordingly, it may be more difficult for the Adviser to fully evaluate the underlying risk profile of the Portfolio’s structured reinsurance investments, and therefore the Portfolio’s assets are placed at greater risk of loss than if the Adviser had more complete information. Structured reinsurance instruments generally will be considered illiquid securities by the Portfolio. These securities may be difficult to purchase, sell or unwind. Illiquid securities also may be difficult to value. If the Portfolio is forced to sell an illiquid asset, the Portfolio may be forced to sell at a loss.
Additionally, the Portfolio may gain exposure to ILS by investing in a closed-end interval fund, Pioneer ILS Interval Fund, an affiliate of the Adviser. The Portfolio’s investment in Pioneer ILS Interval Fund at June 30, 2020, is listed in the Schedule of Investments.
H. Credit Default Swap Contracts
A credit default swap is a contract between a buyer of protection and a seller of protection against a pre-defined credit event or an underlying reference obligation, which may be a single security or a basket or index of securities. The Portfolio may buy or sell credit default swap contracts to seek to increase the Portfolio’s income, or to attempt to hedge the risk of default on portfolio securities. A credit default swap index is used to hedge risk or take a position on a basket of credit entities or indices.
30
| Pioneer High Yield VCT Portfolio | PIONEER VARIABLE CONTRACTS TRUST |
As a seller of protection, the Portfolio would be required to pay the notional (or other agreed-upon) value of the referenced debt obligation to the counterparty in the event of a default by a U.S. or foreign corporate issuer of a debt obligation, which would likely result in a loss to the Portfolio. In return, the Portfolio would receive from the counterparty a periodic stream of payments during the term of the contract, provided that no event of default occurred. The maximum exposure of loss to the seller would be the notional value of the credit default swaps outstanding. If no default occurs, the Portfolio would keep the stream of payments and would have no payment obligation. The Portfolio may also buy credit default swap contracts in order to hedge against the risk of default of debt securities, in which case the Portfolio would function as the counterparty referenced above.
As a buyer of protection, the Portfolio makes an upfront or periodic payment to the protection seller in exchange for the right to receive a contingent payment. An upfront payment made by the Portfolio, as the protection buyer, is recorded within the “Swap contracts, at value” line item on the Statement of Assets and Liabilities. Periodic payments received or paid by the Portfolio are recorded as realized gains or losses on the Statement of Operations.
Credit default swap contracts are marked-to-market daily using valuations supplied by independent sources, and the change in value, if any, is recorded within the “Swap contracts, at value” line item on the Statement of Assets and Liabilities. Payments received or made as a result of a credit event or upon termination of the contract are recognized, net of the appropriate amount of the upfront payment, as realized gains or losses on the Statement of Operations.
Credit default swap contracts involving the sale of protection may involve greater risks than if the Portfolio had invested in the referenced debt instrument directly. Credit default swap contracts are subject to general market risk, liquidity risk, counterparty risk and credit risk. If the Portfolio is a protection buyer and no credit event occurs, it will lose its investment. If the Portfolio is a protection seller and a credit event occurs, the value of the referenced debt instrument received by the Portfolio, together with the periodic payments received, may be less than the amount the Portfolio pays to the protection buyer, resulting in a loss to the Portfolio. In addition, obligations under sell protection credit default swaps may be partially offset by net amounts received from settlement of buy protection credit default swaps entered into by the Portfolio for the same reference obligation with the same counterparty.
Certain swap contracts that are cleared through a central clearinghouse are referred to as centrally cleared swaps. All payments made or received by the Portfolio are pursuant to a centrally cleared swap contract with the central clearing party rather than the original counterparty. Upon entering into a centrally cleared swap contract, the Portfolio is required to make an initial margin deposit, either in cash or in securities. The daily change in value on open centrally cleared contracts is recorded as “Variation margin for centrally cleared swap contracts” on the Statement of Assets and Liabilities. Cash received from or paid to the broker related to previous margin movement is held in a segregated account at the broker and is recorded as either “Due from broker for swaps” or “Due to broker for swaps” on the Statement of Assets and Liabilities. The amount of cash deposited with a broker as collateral at June 30, 2020, is recorded as “Swaps collateral” on the Statement of Assets and Liabilities.
The average market value of credit default swap contracts open during the six months ended June 30, 2020, was $(56,922). Open credit default swap contracts at June 30, 2020, are listed in the Schedule of Investments.
2. Management Agreement
The Adviser manages the Portfolio. Management fees are paid monthly and calculated daily at the annual rate of 0.65% of the Portfolio’s average daily net assets up to $1 billion and 0.60% of the Portfolio’s average daily net assets over $1 billion. For the six months ended June 30, 2020, the effective management fee (excluding waivers and/or assumption of expenses and acquired fund fees and expenses) was equivalent to 0.65% (annualized) of the Portfolio’s average daily net assets.
The Adviser has agreed to waive its management fee with respect to any portion of the Portfolio’s assets invested in Pioneer ILS Interval Fund, an affiliated fund managed by the Adviser. For the six months ended June 30, 2020, the Adviser waived $8,281 in management fees with respect to the Portfolio, which is reflected on the Statement of Operations as an expense waiver.
In addition, under the management and administration agreements, certain other services and costs, including accounting, regulatory reporting and insurance premiums, are paid by the Portfolio as administrative reimbursements. Included in “Due to affiliates” reflected on the Statement of Assets and Liabilities is $2,658 in management fees, administrative costs and certain other reimbursements payable to the Adviser at June 30, 2020.
31
| Pioneer High Yield VCT Portfolio | PIONEER VARIABLE CONTRACTS TRUST | |
NOTES TO FINANCIAL STATEMENTS 6/30/20 (UNAUDITED) | (continued) | |
3. Transfer Agent
DST Asset Manager Solutions, Inc. serves as the transfer agent to the Portfolio at negotiated rates. Transfer agent fees and payables shown on the Statement of Operations and the Statement of Assets and Liabilities, respectively, include sub-transfer agent expenses incurred through the Portfolio’s omnibus relationship contracts.
4. Distribution Plan
The Portfolio has adopted a distribution plan (the “Plan”) pursuant to Rule 12b-1 of the Investment Company Act of 1940 with respect to its Class II shares. Pursuant to the Plan, the Portfolio pays the Distributor 0.25% of the average daily net assets attributable to Class II shares to compensate the Distributor for (1) distribution services and (2) personal and account maintenance services performed and expenses incurred by the Distributor in connection with the Portfolio’s Class II shares. Included in “Due to affiliates” reflected on the Statement of Assets and Liabilities is $313 in distribution fees payable to the Distributor at June 30, 2020.
5. Master Netting Agreements
The Portfolio has entered into an International Swaps and Derivatives Association, Inc. Master Agreement (“ISDA Master Agreement”) or similar agreement with substantially all its derivative counterparties. An ISDA Master Agreement is a bilateral agreement between the Portfolio and a counterparty that governs the trading of certain Over the Counter (“OTC”) derivatives and typically contains, among other things, close-out and set-off provisions which apply upon the occurrence of an event of default and/or a termination event as defined under the relevant ISDA Master Agreement. The ISDA Master Agreement may also give a party the right to terminate all transactions traded under such agreement if, among other things, there is deterioration in the credit quality of the other party.
Upon an event of default or a termination of the ISDA Master Agreement, the non-defaulting party has the right to close-out all transactions under such agreement and to net amounts owed under each transaction to determine one net amount payable by one party to the other. The right to close out and net payments across all transactions under the ISDA Master Agreement could result in a reduction of the Portfolio’s credit risk to its counterparty equal to any amounts payable by the Portfolio under the applicable transactions, if any. However, the Portfolio’s right to set-off may be restricted or prohibited by the bankruptcy or insolvency laws of the particular jurisdiction to which each specific ISDA Master Agreement of each counterparty is subject.
The collateral requirements for derivatives transactions under an ISDA Master Agreement are governed by a credit support annex to the ISDA Master Agreement. Collateral requirements are generally determined at the close of business each day and are typically based on changes in market values for each transaction under an ISDA Master Agreement and netted into one amount for such agreement. Generally, the amount of collateral due from or to a counterparty is subject to threshold (a “minimum transfer amount”) before a transfer is required, which may vary by counterparty. Collateral pledged for the benefit of the Portfolio and/or counterparty is held in segregated accounts by the Portfolio’s custodian and cannot be sold, re-pledged, assigned or otherwise used while pledged. Cash that has been segregated to cover the Portfolio’s collateral obligations, if any, will be reported separately on the Statement of Assets and Liabilities as “Swaps collateral”. Securities pledged by the Portfolio as collateral, if any, are identified as such in the Schedule of Investments.
32
| Pioneer High Yield VCT Portfolio | PIONEER VARIABLE CONTRACTS TRUST |
Financial instruments subject to an enforceable master netting agreement, such as an ISDA Master Agreement, have been offset on the Statement of Assets and Liabilities. The following charts show gross assets and liabilities of the Portfolio as of June 30, 2020.
| Derivative | |||||
| Assets | |||||
| Subject to | Derivatives | Non-Cash | Net Amount of | ||
| Master Netting | Available | Collateral | Cash Collateral | Derivative | |
| Counterparty | Agreement | for Offset | Received (a) | Received (a) | Assets (b) |
Goldman Sachs | |||||
International | $ – | $ – | $ – | $ – | $ – |
| Total | $ – | $ – | $ – | $ – | $ – |
| Derivative | |||||
| Liabilities | |||||
| Subject to | Derivatives | Non-Cash | Net Amount of | ||
| Master Netting | Available | Collateral | Cash Collateral | Derivative | |
| Counterparty | Agreement | for Offset | Pledged (a) | Pledged (a) | Liabilities (c) |
Goldman Sachs | |||||
International | $87,996 | $ – | $ – | $ – | $87,996 |
| Total | $87,996 | $ – | $ – | $ – | $87,996 |
(a) | The amount presented here may be less than the total amount of collateral received/pledged as the net amount of derivative assets and liabilities |
cannot be less than $0. | |
(b) | Represents the net amount due from the counterparty in the event of default. |
(c) | Represents the net amount payable to the counterparty in the event of default. |
6. Additional Disclosures about Derivative Instruments and Hedging Activities
The Portfolio’s use of derivatives may enhance or mitigate the Portfolio’s exposure to the following risks:
Interest rate risk relates to the fluctuations in the value of interest-bearing securities due to changes in the prevailing levels of market interest rates.
Credit risk relates to the ability of the issuer of a financial instrument to make further principal or interest payments on an obligation or commitment that it has to the Portfolio.
Foreign exchange rate risk relates to fluctuations in the value of an asset or liability due to changes in currency exchange rates.
Equity risk relates to the fluctuations in the value of financial instruments as a result of changes in market prices (other than those arising from interest rate risk or foreign exchange rate risk), whether caused by factors specific to an individual investment, its issuer, or all factors affecting all instruments traded in a market or market segment.
Commodity risk relates to the risk that the value of a commodity or commodity index will fluctuate based on increases or decreases in the commodities market and factors specific to a particular industry or commodity.
33
| Pioneer High Yield VCT Portfolio | PIONEER VARIABLE CONTRACTS TRUST | |
NOTES TO FINANCIAL STATEMENTS 6/30/20 (UNAUDITED) | (continued) | |
The fair value of open derivative instruments (not considered to be hedging instruments for accounting disclosure purposes) by risk exposure at June 30, 2020, was as follows:
| Statement of Assets | Interest | Credit | Foreign | Commodity | |
| and Liabilities | Rate Risk | Risk | Exchange Rate Risk | Equity Risk | Risk |
| Liabilities | |||||
| Swap contracts, | |||||
| at value | $ – | $98,317 | $ – | $ – | $ – |
| Total Value | $ – | $98,317 | $ – | $ – | $ – |
The effect of derivative instruments (not considered to be hedging instruments for accounting disclosure purposes) on the Statement of Operations by risk exposure at June 30, 2020, was as follows:
| Statement of | Interest | Credit | Foreign | Commodity | |
| Operations | Rate Risk | Risk | Exchange Rate Risk | Equity Risk | Risk |
| Net realized gain (loss) on: | |||||
| Swap contracts | $ – | $(34,329) | $ – | $ – | $ – |
| Total Value | $ – | $(34,329) | $ – | $ – | $ – |
| Change in net unrealized | |||||
| appreciation (depreciation) on: | |||||
| Swap contracts | $ – | $(148,419) | $ – | $ – | $ – |
| Total Value | $ – | $(148,419) | $ – | $ – | $ – |
7. Unfunded Loan Commitments
The Portfolio may enter into unfunded loan commitments. Unfunded loan commitments may be partially or wholly unfunded. During the contractual period, the Portfolio is obliged to provide funding to the borrower upon demand. A fee is earned by the Portfolio on the unfunded loan commitment and is recorded as interest income on the Statement of Operations.
As of June 30, 2020, the Portfolio had the following unfunded loan commitments outstanding:
| Unrealized | ||||
| Loan | Principal | Cost | Value | Depreciation |
Spectacle Gary Holdings LLC | $15,600 | $15,181 | $14,508 | $(673) |
34
| Pioneer High Yield VCT Portfolio | PIONEER VARIABLE CONTRACTS TRUST |
As required by law, the Portfolio has adopted and implemented a liquidity risk management program (the “Program”) that is designed to assess and manage liquidity risk. Liquidity risk is the risk that the Portfolio could not meet requests to redeem its shares without significant dilution of remaining investors’ interests in the Portfolio. The Portfolio’s Board of Trustees designated a liquidity risk management committee (the “Committee”) consisting of employees of Amundi Pioneer Asset Management, Inc. (the “Adviser”) to administer the Program.
The Committee provided the Board of Trustees with a report that addressed the operation of the Program and assessed its adequacy and effectiveness of implementation (the “Report”). The Report covered the period from December 1, 2018 through March 31, 2020 (the “Reporting Period”).
The Report confirmed that, throughout the Reporting Period, the Committee had monitored the Portfolio’s portfolio liquidity and liquidity risk on an ongoing basis, as described in the Program and in Board reporting throughout the Reporting Period.
The Report discussed the Committee’s annual review of the Program, which addressed, among other things, the following elements of the Program:
The Committee reviewed the Portfolio’s investment strategy and liquidity of portfolio investments during both normal and reasonably foreseeable stressed conditions. The Committee noted that the Portfolio’s investment strategy continues to be appropriate for an open-end fund, taking into account, among other things, whether and to what extent the Portfolio held less liquid and illiquid assets and the extent to which any such investments affected the Portfolio’s ability to meet redemption requests. In managing and reviewing the Portfolio’s liquidity risk, the Committee also considered the extent to which the Portfolio’s investment strategy involves a relatively concentrated portfolio or large positions in particular issuers, the extent to which the Portfolio uses borrowing for investment purposes, and the extent to which the Portfolio uses derivatives (including for hedging purposes). The Committee also reviewed the Portfolio’s short-term and long-term cash flow projections during both normal and reasonably foreseeable stressed conditions. In assessing the Portfolio’s cash flow projections, the Committee considered, among other factors, historical net redemption activity, redemption policies, ownership concentration, distribution channels, and the degree of certainty associated with the Portfolio’s short-term and long-term cash flow projections. The Committee also considered the Portfolio’s holdings of cash and cash equivalents, as well as borrowing arrangements and other funding sources, including, if applicable, the Portfolio’s participation in a credit facility, as components of the Portfolio’s ability to meet redemption requests. The Portfolio has adopted an in-kind redemption policy which may be utilized to meet larger redemption requests.
The Committee reviewed the Program’s liquidity classification methodology for categorizing the Portfolio’s investments into one of four liquidity buckets. In reviewing the Portfolio’s investments, the Committee considered, among other factors, whether trading varying portions of a position in a particular portfolio investment or asset class in sizes the Portfolio would reasonably anticipate trading, would be reasonably expected to significantly affect liquidity.
The Committee performed an analysis to determine whether the Portfolio is required to maintain a Highly Liquid Investment Minimum, and determined that no such minimum is required because the Portfolio primarily holds highly liquid investments.
The Report stated that the Committee concluded the Program operates adequately and effectively, in all material respects, to assess and manage the Portfolio’s liquidity risk throughout the Reporting Period.
35
This page was intentionally left blank.
36
| Officers | Trustees |
Lisa M. Jones, President and Chief Executive Officer | Thomas J. Perna, Chairman |
Mark E. Bradley, Treasurer and Chief Financial and | John E. Baumgardner, Jr. |
| Accounting Officer | Diane Durnin |
Christopher J. Kelley, Secretary and Chief Legal Officer | Benjamin M. Friedman |
| Lisa M. Jones | |
Investment Adviser and Administrator | Lorraine H. Monchak |
Amundi Pioneer Asset Management, Inc. | Marguerite A. Piret |
| Fred J. Ricciardi | |
Custodian and Sub-Administrator | Kenneth J. Taubes |
Brown Brothers Harriman & Co. | |
| Principal Underwriter | |
| Amundi Pioneer Distributor, Inc. | |
| Legal Counsel | |
| Morgan, Lewis & Bockius LLP | |
| Transfer Agent | |
| DST Asset Manager Solutions, Inc. | |
37
Proxy Voting Policies and Procedures of the Portfolio are available without charge, upon request, by calling our toll free number (1-800-225-6292). Information regarding how the Portfolio voted proxies relating to Portfolio securities during the most recent 12-month period ended June 30 is publicly available to shareowners at www.amundipioneer.com/us. This information is also available on the Securities and Exchange Commission’s web site at www.sec.gov.
19622-14-0820
PIONEER VARIABLE CONTRACTS TRUST
Pioneer Mid Cap Value VCT Portfolio — Class I and II Shares
Pioneer Mid Cap Value VCT Portfolio — Class I and II Shares
Beginning in February 2021, as permitted by regulations adopted by the Securities and Exchange Commission, you may not be receiving paper copies of the Portfolio’s shareholder reports like this one by mail, unless you specifically request paper copies of the reports from the insurance company that offers your variable annuity or variable life insurance contract or from your financial intermediary. Instead, the insurance company may choose to make the reports available on a website, and will notify you by mail each time a shareholder report is posted and provide you with a website link to access the report. Instructions for requesting paper copies will be provided by your insurance company.
If you already elected to receive shareholder reports electronically, you will not be affected by this change and you need not take any action. You may elect to receive shareholder reports and other communications from the insurance company or your financial intermediary electronically by following the instructions provided by the insurance company or by contacting your financial intermediary.
You may elect to receive all future Portfolio shareholder reports in paper free of charge from the insurance company. You can inform the insurance company or your financial intermediary that you wish to continue receiving paper copies of your shareholder reports by following the instructions provided by the insurance company or by contacting your financial intermediary. Your election to receive reports in paper will apply to all funds available under your contract with the insurance company.
SEMIANNUAL REPORT
June 30, 2020
June 30, 2020
Please refer to your contract prospectus to determine the applicable share class offered under your contract.
PIONEER VARIABLE CONTRACTS TRUST
Pioneer Mid Cap Value VCT Portfolio | |
This report is authorized for distribution only when preceded or accompanied by a prospectus for the Portfolio being offered.
Pioneer Variable Contracts Trust files a complete schedule of portfolio holdings with the Securities and Exchange Commission for the first and third quarters of each fiscal year as an exhibit to its reports on Form N-PORT. Shareholders may view the filed Form N-PORT by visiting the Commission’s web site at https://www.sec.gov.
| Pioneer Mid Cap Value VCT Portfolio | PIONEER VARIABLE CONTRACTS TRUST |
Sector Distribution
(As a percentage of total investments)*
(As a percentage of total investments)*
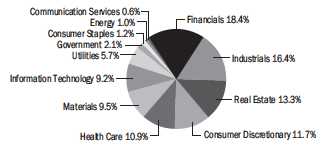
5 Largest Holdings
(As a percentage of total investments)*
(As a percentage of total investments)*
| 1. | McKesson Corp. | 2.39% |
| 2. | JB Hunt Transport | |
| Services, Inc. | 2.32 | |
| 3. | Zimmer Biomet Holdings, Inc. | 2.25 |
| 4. | PACCAR, Inc. | 2.19 |
| 5. | Lam Research Corp. | 2.19 |
* Excludes temporary cash investments and all derivative contracts except for options purchased. The Portfolio is actively managed, and current holdings may be different. The holdings listed should not be considered recommendations to buy or sell any securities.
PERFORMANCE UPDATE 6/30/20
Prices and Distributions
Prices and Distributions
| Net Asset Value per Share | 6/30/20 | 12/31/19 |
| Class I | $14.42 | $18.46 |
| Class II | $14.25 | $18.23 |
| Net | |||
| Distributions per Share | Investment | Short-Term | Long-Term |
| (1/1/20 – 6/30/20) | Income | Capital Gains | Capital Gains |
| Class I | $0.1976 | $ – | $0.5265 |
| Class II | $0.1548 | $ – | $0.5265 |
Performance of a $10,000 Investment
The following chart shows the change in value of an investment made in Class I and Class II shares of Pioneer Mid Cap Value VCT Portfolio at net asset value during the periods shown, compared to that of the Russell Midcap Value Index. Portfolio returns are based on net asset value and do not reflect any applicable insurance fees or surrender charges.
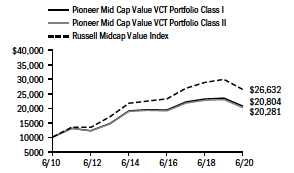
The Russell Midcap Value Index is an unmanaged index that measures the performance of U.S. mid-cap value stocks. Index returns are calculated monthly, assume reinvestment of dividends and, unlike Portfolio returns, do not reflect any fees, expenses or sales charges. It is not possible to invest directly in an index.
Average Annual Total Returns
(As of June 30, 2020)
(As of June 30, 2020)
| Russell Midcap | |||
| Class I | Class II | Value Index | |
10 Years | 7.60% | 7.33% | 10.29% |
5 Years | 1.21% | 0.95% | 3.32% |
1 Year | -11.93% | -12.20% | -11.81% |
All total returns shown assume reinvestment of distributions at net asset value.
The performance table does not reflect the deduction of taxes that a shareowner would pay on distributions or the redemption of shares.
Call 1-800-688-9915 or visit www.amundipioneer.com/us for the most recent month-end performance results. Current performance may be lower or higher than the performance data quoted.
The performance data quoted represents past performance, which is no guarantee of future results. Investment return and principal value will fluctuate, and shares, when redeemed, may be worth more or less than their original cost.
The returns for the Portfolio do not reflect the deduction of expenses associated with variable products, such as mortality and expense risk charges, separate account charges, and sales charges. These expenses would reduce the overall returns shown.
Performance results reflect any applicable expense waivers in effect during the periods shown. Without such waivers performance would be lower. Waivers may not be in effect for all portfolios. Certain fee waivers are contractual through a specified period. Otherwise, fee waivers can be rescinded at any time. See the prospectus and financial statements for more information.
2
| Pioneer Mid Cap Value VCT Portfolio | PIONEER VARIABLE CONTRACTS TRUST |
As a shareowner in the Portfolio, you incur two types of costs:
(1) ongoing costs, including management fees, distribution and/or service (12b-1) fees, and other Portfolio expenses; and
(2) transaction costs, including sales charges (loads) on purchase payments.
This example is intended to help you understand your ongoing expenses (in dollars) of investing in the Portfolio and to compare these costs with the ongoing costs of investing in other mutual funds offered through your variable annuity contract. The example is based on an investment of $1,000 at the beginning of the Portfolio’s latest six-month period and held throughout the six months.
Using the Tables
Actual Expenses
The first table below provides information about actual account values and actual expenses. You may use the information in this table, together with the amount you invested, to estimate the expenses that you paid over the period as follows:
1. Divide your account value by $1,000
Example: an $8,600 account value ÷ $1,000 = 8.6
2. Multiply the result in (1) above by the corresponding share class’s number in the third row under the heading entitled “Expenses Paid During Period” to estimate the expenses you paid on your account during this period.
Expenses Paid on a $1,000 Investment in Pioneer Mid Cap Value VCT Portfolio
Based on actual returns from January 1, 2020 through June 30, 2020.
| Share Class | I | II |
Beginning Account Value on 1/1/20 | $1,000.00 | $1,000.00 |
Ending Account Value on 6/30/20 | $819.60 | $818.30 |
Expenses Paid During Period* | $3.30 | $4.43 |
* Expenses are equal to the Portfolio’s annualized expense ratio of 0.73% and 0.98% for Class I and Class II shares respectively, multiplied by the average account value over the period, multiplied by 182/366 (to reflect the one-half year period).
Hypothetical Example for Comparison Purposes
The table below provides information about hypothetical account values and hypothetical expenses based on the Portfolio’s actual expense ratio and an assumed rate of return of 5% per year before expenses, which is not the Portfolio’s actual return. The hypothetical account values and expenses may not be used to estimate the actual ending account balance or expenses you paid for the period.
You may use this information to compare the ongoing costs of investing in the Portfolio and other variable annuities. To do so, compare this 5% hypothetical example with the 5% hypothetical examples that appear in the shareholder reports of the other variable annuities.
Please note that the expenses shown in the tables are meant to highlight your ongoing costs only and do not reflect any transaction costs, such as sales charges (loads) that are charged at the time of the transaction. Therefore, the table below is useful in comparing ongoing costs only and will not help you determine the relative total costs of owning different variable annuities. In addition, if these transaction costs were included, your costs would have been higher.
Expenses Paid on a $1,000 Investment in Pioneer Mid Cap Value VCT Portfolio
Based on a hypothetical 5% per year return before expenses, reflecting the period from January 1, 2020 through June 30, 2020.
| Share Class | I | II |
Beginning Account Value on 1/1/20 | $1,000.00 | $1,000.00 |
Ending Account Value on 6/30/20 | $1,021.23 | $1,019.99 |
Expenses Paid During Period* | $3.67 | $4.92 |
* Expenses are equal to the Portfolio’s annualized expense ratio of 0.73% and 0.98% for Class I and Class II shares respectively, multiplied by the average account value over the period, multiplied by 182/366 (to reflect the one-half year period).
3
| Pioneer Mid Cap Value VCT Portfolio | PIONEER VARIABLE CONTRACTS TRUST |
A Word About Risk:
All investments are subject to risk, including the possible loss of principal. In the past several years, financial markets have experienced increased volatility and heightened uncertainty. The market prices of securities may go up or down, sometimes rapidly or unpredictably, due to general market conditions, such as real or perceived adverse economic, political, or regulatory conditions, recessions, inflation, changes in interest or currency rates, lack of liquidity in the bond markets, the spread of infectious illness or other public health issues or adverse investor sentiment. These conditions may continue, recur, worsen or spread.
Investments in mid-sized companies may offer the potential for higher returns, but are also subject to greater short-term price fluctuations than larger, more established companies.
Investing in foreign and/or emerging markets securities involves risks relating to interest rates, currency exchange rates, economic, and political conditions.
The Portfolio invests in REIT securities, the value of which can fall for a variety of reasons, such as declines in rental income, fluctuating interest rates, poor property management, environmental liabilities, uninsured damage, increased competition, or changes in real estate tax laws.
When interest rates rise, the prices of fixed-income securities in the Portfolio will generally fall. Conversely, when interest rates fall, the prices of fixed-income securities in the Portfolio will generally rise.
At times, the Portfolio’s investments may represent industries or industry sectors that are interrelated or have common risks, making the Portfolio more susceptible to any economic, political, or regulatory developments or other risks affecting those industries and sectors. These risks may increase share price volatility.
Call 1-800-688-9915 or visit www.amundipioneer.com/us for the most recent month-end performance results. Current performance may be lower or higher than the performance data quoted.
The performance data quoted represents past performance, which is no guarantee of future results. Investment return and principal value will fluctuate, and shares, when redeemed, may be worth more or less than their original cost.
The returns for the Portfolio do not reflect the deduction of expenses associated with variable products, such as mortality and expense risk charges, separate account charges, and sales charges. These expenses would reduce the overall returns shown.
Performance results reflect any applicable expense waivers in effect during the periods shown. Without such waivers performance would be lower. Waivers may not be in effect for all portfolios. Certain fee waivers are contractual through a specified period. Otherwise, fee waivers can be rescinded at any time. See the prospectus and financial statements for more information.
Domestic mid-cap stocks fell sharply during the six-month period ended June 30, 2020, as measures aimed at containing the spread of the COVID-19 global pandemic severely hampered U.S. economic activity. In the following interview, Timothy Stanish and Raymond Haddad discuss the factors that affected the performance of Pioneer Mid Cap Value VCT Portfolio during the six-month period ended June 30, 2020. Mr. Stanish, a vice president, a portfolio EVA (economic value added) analyst, and a portfolio manager at Amundi Pioneer Asset Management, Inc. (Amundi Pioneer), and Mr. Haddad, a vice president and a portfolio manager at Amundi Pioneer, are responsible for the day-to-day management of the Portfolio.
Q: How did the Portfolio perform during the six-month period ended June 30, 2020?
A: Pioneer Mid Cap Value VCT Portfolio’s Class I shares returned -18.04% at net asset value during the six-month period ended June 30, 2020, and Class II shares returned -18.17%, while the Portfolio’s benchmark, the Russell Midcap Value Index, returned -18.09%.
Q: How would you describe the investment environment for equities during the six-month period ended June 30, 2020?
A: The six-month period was extremely volatile for U.S. equities. Heading into the new calendar year and the beginning of the period, investor sentiment received a boost from the signing of a “Phase One” trade deal between the U.S. and China in January, which seemed to indicate that the trade war between the two countries was cooling off. In addition, the interest-rate environment had become more favorable in the wake of three successive reductions in the target range of the federal funds rate by the U.S. Federal Reserve (“Fed”) over the second half of 2019. Combined with solid economic and employment data, those factors helped drive domestic equities to record highs by mid-February of 2020.
The upward move proved short-lived, however, as the arrival of the COVID-19 virus led to containment measures, including lockdowns and the shuttering of businesses deemed non-essential, which brought the global economy to a near standstill. In response, stock prices nosedived beginning in mid-February 2020 as investors fled riskier assets and moved into so-called “safe havens” such as U.S. Treasuries. The U.S. stock market declined by more than 30% between February 19 and March 23, and unemployment figures soared as the domestic economy descended to recessionary levels.
The Fed responded to the crisis, which included a “liquidity freeze” in fixed-income markets, by dropping the range of the federal funds rate to zero and reviving its 2008/2009 financial crisis-era asset-purchase programs, while creating new lending facilities to help support the financial system. Meanwhile Congress and the White House agreed on a $2.2 trillion stimulus package during March, and added more stimulus in the second quarter.
The aggressive fiscal and monetary policy measures allowed markets, particularly equities, to rebound sharply from their March lows in April and May, on optimism that the most severe economic effects of the pandemic would be short-term in nature. June saw some softening in market sentiment as well as increased volatility, however, as the number of new COVID-19 cases
4
| Pioneer Mid Cap Value VCT Portfolio | PIONEER VARIABLE CONTRACTS TRUST |
rose in some of the states, mainly in the southern and southwestern U.S., that had reopened for business earlier than those that had been most affected by the virus during the winter and spring months.
In the U.S. equity market, stocks of small- and mid-cap companies underperformed large-cap stocks during the six-month period, reflecting investors’ preference for the perceived stability of larger companies under volatile market conditions. Growth stocks dramatically outperformed value stocks during the six-month period, especially within the growth-focused information technology sector. Mid-cap equities saw similar trends, as the Russell Midcap Growth Index, which returned a positive 4.16% for the six-month period, easily outpaced the return of the Portfolio’s benchmark, Russell Midcap Value Index (the Russell Index), which declined by more than 18%.
Q: How did you position the Portfolio during the six-month period ended June 30, 2020, and how did the positioning affect performance relative to the benchmark?
A: We continued to emphasize holding stocks of what we believe are higher-quality companies in the mid-cap value universe during the six-month period, in anticipation of slower domestic economic growth rates. In that vein, we maintained a tilt in the Portfolio toward shares of companies with lower-than-average debt levels, higher-than-average profits, and lower-than-average earnings volatility. We believe the performance of such stocks is less dependent on cyclical factors and that their valuations have tended to hold up relatively well in times of uncertainty. The strategy helped benchmark-relative performance during the market pullback in the first quarter, as the Portfolio outperformed the Russell Index over the three-month period ended March 31, 2020. However, the positioning weighed on relative returns during the ensuing rebound in the second quarter, when the Russell Index outperformed the Portfolio by more than four percentage points.
Over the full six-month period, the Portfolio’s return was essentially in line with that of the Russell Index. From a sector perspective, stock selection results in financials and real estate were the most significant positive contributors to benchmark-relative performance. An overweight allocation to health care also contributed positively to relative returns, especially in combination with good stock selection results within the sector.
In contrast, the biggest detractors from the Portfolio’s benchmark-relative performance during the six-month period were stock selection results in consumer staples and energy. Those two sectors weighed on relative returns despite the Portfolio’s significant underweights versus the Russell Index.
Among the Portfolio’s individual stock holdings, the most important positive contributors to benchmark-relative performance during the six-month period included health care supplier West Pharmaceutical Services, semiconductor manufacturer Lam Research, and discount retailer Dollar General.
West Pharmaceuticals saw continued demand for its medical packaging and drug-delivery products during the six-month period, and the company captured new opportunities resulting from COVID-19-related initiatives among its customer base. Lam Research specializes in technology-testing products and has been steadily growing its parts and services operations, which we think
5
| Pioneer Mid Cap Value VCT Portfolio | PIONEER VARIABLE CONTRACTS TRUST |
PORTFOLIO MANAGEMENT DISCUSSION 6/30/20 | (continued) |
have the potential to generate more predictable earnings growth for the company. Discount retailer Dollar General has continued to fare well as shoppers facing financial difficulties due to COVID-19’s devastating effects on domestic employment have moved from higher-priced stores towards more affordable alternatives. Other noteworthy positive contributors to the Portfolio’s relative returns during the six-month period included positions in trucking company J.B. Hunt Transport Services and medical-technology specialist Hologic.
Conversely, the largest individual detractors from the Portfolio’s benchmark-relative performance during the six-month period included positions in energy companies Marathon Oil and Diamondback Energy, which struggled as ongoing disruptions to the oil market due to COVID-19 shutdowns as well as a price war between Russia and Saudi Arabia had a negative impact on mid-sized exploration-and-production companies. Other notable detractors from the Portfolio’s relative returns were shares of JetBlue Airways and Howmet Aerospace, as COVID-19 drove a significant decline in air travel and related activity during much of the first half of 2020. Finally, the Portfolio’s lack of exposure to gold-mining company Newmont also weighed on relative performance, as gold prices rose dramatically in response to economic uncertainty, and Newmont represented a significant weighting in the benchmark Russell Index.
Q: Did the Portfolio have any exposure to derivatives during the six-month period ended June 30, 2020?
A: No, the Portfolio did not have exposure to derivatives during the six-month period.
Q: What is your investment outlook and how have you positioned the Portfolio heading into the second half of 2020?
A: As we look ahead, we believe that the extent of the intermediate-term economic damage caused by the COVID-19 pandemic will depend largely on how much support the U.S. government provides to the financial system, and in what form. To date, the responses from the Fed and government authorities in terms of monetary and fiscal stimulus have been appropriate and well designed, in our view, with liquidity injections from the central bank and government aid for the unemployed and for state-government budgets. However, we have concerns that further fiscal support measures from the U.S. government could prove insufficient, leading to levels of volatility similar to what markets experienced after the global financial crisis hit during 2008 and 2009. We are therefore monitoring actions from both lawmakers and the Fed very closely.
6
| Pioneer Mid Cap Value VCT Portfolio | PIONEER VARIABLE CONTRACTS TRUST |
Despite the recovery in stock prices in the second quarter, there has remained considerable instability and uncertainty with regard to the overall economic situation. Although we have allocated a small portion of the Portfolio’s assets to value stocks of companies that are levered to the cyclical economy, we have not made a full shift in that strategic direction. Thus, the Portfolio’s positioning has remained relatively conservative.
Our preference for owning intrinsically inexpensive stocks in high-quality value companies has persisted. At period-end, the Portfolio had no exposure to the energy or communication services sectors, as we believe companies in those sectors have been facing long-term structural headwinds, thus making them classic “value trap” stocks. That said, we have begun to have a little more interest in those sectors of late. Within energy, we believe a potential wave of defaults could lead to consolidation in the sector, which would make it possible for some true value opportunities to emerge. In communication services, we believe some good values could soon appear in areas outside television networks and telecom companies.
However, until we are more certain that valuations appropriately discount the risks inherent with investments in those sectors, in a manner that could benefit the Portfolio’s performance, we expect to remain on the sidelines.
Please refer to the Schedule of Investments on pages 8 to 10 for a full listing of Portfolio securities.
Past performance is no guarantee of future results.
Any information in this shareholder report regarding market or economic trends or the factors influencing the Portfolio’s historical or future performance are statements of opinion as of the date of this report.
7
| Pioneer Mid Cap Value VCT Portfolio | PIONEER VARIABLE CONTRACTS TRUST |
| Shares | Value | ||
| UNAFFILIATED ISSUERS – 97.6% | |||
| COMMON STOCKS – 95.5% | |||
| of Net Assets | |||
| Banks – 5.8% | |||
| 167,051 | Citizens Financial Group, Inc. | $ 4,216,367 | |
| 106,740 | East West Bancorp, Inc. | 3,868,258 | |
| 36,679 | First Republic Bank | 3,887,607 | |
| 19,652 | Signature Bank | 2,101,192 | |
| Total Banks | $ 14,073,424 | ||
| Building Products – 1.8% | |||
| 50,227 | Trane Technologies Plc | $ 4,469,198 | |
| Total Building Products | $ 4,469,198 | ||
| Capital Markets – 2.6% | |||
| 62,183 | Apollo Global Management, Inc. | $ 3,104,175 | |
| 27,654 | Nasdaq, Inc. | 3,303,823 | |
| Total Capital Markets | $ 6,407,998 | ||
| Chemicals – 5.5% | |||
| 41,800 | Albemarle Corp. | $ 3,227,378 | |
| 51,230 | Celanese Corp. | 4,423,198 | |
| 153,251 | Huntsman Corp. | 2,753,920 | |
| 27,840 | PPG Industries, Inc. | 2,952,710 | |
| Total Chemicals | $ 13,357,206 | ||
| Communications | |||
| Equipment – 0.9% | |||
| 15,840 | Motorola Solutions, Inc. | $ 2,219,659 | |
| Total Communications | |||
| Equipment | $ 2,219,659 | ||
| Containers & | |||
| Packaging – 2.5% | |||
| 35,884 | Avery Dennison Corp. | $ 4,094,006 | |
| 29,479 | Ball Corp. | 2,048,496 | |
| Total Containers & Packaging | $ 6,142,502 | ||
| Electric Utilities – 3.6% | |||
| 49,650 | Entergy Corp. | $ 4,657,667 | |
| 107,228 | FirstEnergy Corp. | 4,158,302 | |
| Total Electric Utilities | $ 8,815,969 | ||
| Electrical Equipment – 2.1% | |||
| 37,439 | Eaton Corp. Plc | $ 3,275,164 | |
| 8,651 | Rockwell Automation, Inc. | 1,842,663 | |
| Total Electrical Equipment | $ 5,117,827 | ||
| Electronic Equipment, | |||
| Instruments & | |||
| Components – 4.1% | |||
| 23,155 | CDW Corp. | $ 2,690,148 | |
| 82,312 | Corning, Inc. | 2,131,881 | |
| 35,037 | Dolby Laboratories, Inc. | 2,307,887 | |
| 27,547(a) | Keysight Technologies, Inc. | 2,776,187 | |
| Total Electronic Equipment, | |||
| Instruments & Components | $ 9,906,103 |
| Shares | Value | ||
| Energy Equipment & | |||
| Services – 0.5% | |||
| 56,627 | Helmerich & Payne, Inc. | $ 1,104,793 | |
| Total Energy Equipment & | |||
| Services | $ 1,104,793 | ||
| Equity Real Estate | |||
| Investment Trusts | |||
| (REITs) – 12.8% | |||
| 98,296 | American Homes 4 Rent, Class A | $ 2,644,162 | |
| 104,446 | Brandywine Realty Trust | 1,137,417 | |
| 36,574 | Camden Property Trust | 3,336,280 | |
| 13,944 | CoreSite Realty Corp. | 1,688,061 | |
| 92,079 | Duke Realty Corp. | 3,258,676 | |
| 40,142 | EPR Properties | 1,329,904 | |
| 24,811 | Federal Realty Investment Trust, | ||
Class REIT | 2,114,145 | ||
| 87,042 | Healthpeak Properties, Inc. | 2,398,878 | |
| 123,650 | Host Hotels & Resorts, Inc., | ||
Class REIT | 1,334,183 | ||
| 17,828 | Kilroy Realty Corp. | 1,046,504 | |
| 151,478 | Kimco Realty Corp. | 1,944,978 | |
| 20,573 | Mid-America Apartment | ||
Communities, Inc. | 2,359,106 | ||
| 21,359 | SL Green Realty Corp. | 1,052,785 | |
| 27,406 | Sun Communities, Inc. | 3,718,446 | |
| 102,138 | VICI Properties, Inc. | 2,062,166 | |
| Total Equity Real Estate | |||
| Investment Trusts (REITs) | $ 31,425,691 | ||
| Food & Staples | |||
| Retailing – 0.7% | |||
| 31,525 | Sysco Corp. | $ 1,723,157 | |
| Total Food & Staples | |||
| Retailing | $ 1,723,157 | ||
| Food Products – 0.5% | |||
| 19,234 | Tyson Foods, Inc. | $ 1,148,462 | |
| Total Food Products | $ 1,148,462 | ||
| Health Care Equipment & | |||
| Supplies – 7.5% | |||
| 10,924 | Cooper Cos., Inc. | $ 3,098,483 | |
| 81,274(a) | Hologic, Inc. | 4,632,618 | |
| 14,912 | STERIS Plc | 2,288,097 | |
| 12,783 | West Pharmaceutical Services, Inc. | 2,903,914 | |
| 45,031 | Zimmer Biomet Holdings, Inc. | 5,374,900 | |
| Total Health Care Equipment | |||
| & Supplies | $ 18,298,012 | ||
| Health Care Providers & | |||
| Services – 2.3% | |||
| 37,215 | McKesson Corp. | $ 5,709,525 | |
| Total Health Care | |||
| Providers & Services | $ 5,709,525 |
The accompanying notes are an integral part of these financial statements.
8
| Pioneer Mid Cap Value VCT Portfolio | PIONEER VARIABLE CONTRACTS TRUST |
| Shares | Value | ||
| Hotels, Restaurants & | |||
| Leisure – 2.9% | |||
| 32,249 | Dunkin’ Brands Group, Inc. | $ 2,103,602 | |
| 20,702 | Hilton Worldwide Holdings, Inc. | 1,520,562 | |
| 176,395 | International Game Technology Plc | 1,569,916 | |
| 56,911 | MGM Resorts International | 956,105 | |
| 60,411(a) | Norwegian Cruise Line Holdings, Ltd. | 992,553 | |
| Total Hotels, Restaurants & | |||
| Leisure | $ 7,142,738 | ||
| Household Durables – 1.2% | |||
| 22,147 | Whirlpool Corp. | $ 2,868,701 | |
| Total Household Durables | $ 2,868,701 | ||
| Insurance – 9.2% | |||
| 28,715 | Allstate Corp. | $ 2,785,068 | |
| 28,155 | American Financial Group, Inc. | 1,786,716 | |
| 24,446 | Assurant, Inc. | 2,525,027 | |
| 56,928 | Assured Guaranty, Ltd. | 1,389,613 | |
| 89,355 | Brown & Brown, Inc. | 3,642,110 | |
| 75,754 | First American Financial Corp. | 3,637,707 | |
| 93,248 | Hartford Financial Services | ||
| Group, Inc. | 3,594,710 | ||
| 193,710 | Old Republic International Corp. | 3,159,410 | |
| Total Insurance | $ 22,520,361 | ||
| IT Services – 1.9% | |||
| 37,111 | Booz Allen Hamilton Holding Corp. | $ 2,886,864 | |
| 18,989(a) | Euronet Worldwide, Inc. | 1,819,526 | |
| Total IT Services | $ 4,706,390 | ||
| Machinery – 6.1% | |||
| 111,504(a) | Ingersoll Rand, Inc. | $ 3,135,493 | |
| 42,441 | Otis Worldwide Corp. | 2,413,195 | |
| 69,862 | PACCAR, Inc. | 5,229,171 | |
| 30,094 | Stanley Black & Decker, Inc. | 4,194,502 | |
| Total Machinery | $ 14,972,361 | ||
| Media – 0.6% | |||
| 44,810(a) | Liberty Media Corp.-Liberty | ||
| SiriusXM | $ 1,543,705 | ||
| Total Media | $ 1,543,705 | ||
| Metals & Mining – 1.3% | |||
| 33,245 | Reliance Steel & Aluminum Co. | $ 3,155,948 | |
| Total Metals & Mining | $ 3,155,948 | ||
| Multiline Retail – 1.8% | |||
| 22,974 | Dollar General Corp. | $ 4,376,777 | |
| Total Multiline Retail | $ 4,376,777 | ||
| Multi-Utilities – 2.0% | |||
| 98,670 | Public Service Enterprise | ||
| Group, Inc. | $ 4,850,617 | ||
| Total Multi-Utilities | $ 4,850,617 |
| Shares | Value | ||
| Oil, Gas & Consumable | |||
| Fuels – 0.5% | |||
| 32,035 | Marathon Petroleum Corp. | $ 1,197,468 | |
| Total Oil, Gas & | |||
| Consumable Fuels | $ 1,197,468 | ||
| Pharmaceuticals – 0.8% | |||
| 35,524 | Perrigo Co. Plc | $ 1,963,411 | |
| Total Pharmaceuticals | $ 1,963,411 | ||
| Real Estate Management & | |||
| Development – 0.5% | |||
| 26,769(a) | CBRE Group, Inc. | $ 1,210,494 | |
| Total Real Estate | |||
| Management & | |||
| Development | $ 1,210,494 | ||
| Road & Rail – 3.9% | |||
| 46,046 | JB Hunt Transport Services, Inc. | $ 5,541,176 | |
| 27,525 | Kansas City Southern | 4,109,207 | |
| Total Road & Rail | $ 9,650,383 | ||
| Semiconductors & | |||
| Semiconductor | |||
| Equipment – 2.1% | |||
| 16,144 | Lam Research Corp. | $ 5,221,938 | |
| Total Semiconductors & | |||
| Semiconductor Equipment | $ 5,221,938 | ||
| Specialty Retail – 4.1% | |||
| 63,079(a) | AutoNation, Inc. | $ 2,370,509 | |
| 53,882 | Best Buy Co., Inc. | 4,702,282 | |
| 54,535 | Foot Locker, Inc. | 1,590,241 | |
| 3,264(a) | O’Reilly Automotive, Inc. | 1,376,331 | |
| Total Specialty Retail | $ 10,039,363 | ||
| Textiles, Apparel & | |||
| Luxury Goods – 1.4% | |||
| 29,473 | Columbia Sportswear Co. | $ 2,374,934 | |
| 15,020 | Ralph Lauren Corp. | 1,089,250 | |
| Total Textiles, Apparel & | |||
| Luxury Goods | $ 3,464,184 | ||
| Thrifts & Mortgage | |||
| Finance – 0.4% | |||
| 60,684 | Radian Group, Inc. | $ 941,209 | |
| Total Thrifts & Mortgage | |||
| Finance | $ 941,209 | ||
| Trading Companies & | |||
| Distributors – 1.6% | |||
| 62,820 | Applied Industrial | ||
Technologies, Inc. | $ 3,919,340 | ||
| Total Trading Companies & | |||
| Distributors | $ 3,919,340 | ||
| TOTAL COMMON STOCKS | |||
(Cost $220,129,606) | $ 233,664,914 |
The accompanying notes are an integral part of these financial statements.
9
| Pioneer Mid Cap Value VCT Portfolio | PIONEER VARIABLE CONTRACTS TRUST |
SCHEDULE OF INVESTMENTS 6/30/20 (UNAUDITED) | (continued) |
| Principal | |||
| Amount | |||
| USD ($) | |||
| Value | |||
| U.S. GOVERNMENT AND | |||
| AGENCY OBLIGATIONS – 2.1% | |||
| of Net Assets | |||
| 2,000,000(b) | U.S. Treasury Floating Rate Note, | ||
0.304% (3 Month U.S. Treasury Bill | |||
Money Market Yield + 15 bps), | |||
1/31/22 | $ 2,002,615 | ||
| 3,000,000(c) | United States Treasury Bill, 7/7/20 | 2,999,941 | |
| TOTAL U.S. GOVERNMENT | |||
| AND AGENCY OBLIGATIONS | |||
(Cost $5,001,832) | $ 5,002,556 | ||
| TOTAL INVESTMENTS IN | |||
| UNAFFILIATED | |||
| ISSUERS – 97.6% | |||
(Cost $225,131,438) | $ 238,667,470 | ||
| OTHER ASSETS AND | |||
| LIABILITIES – 2.4% | $ 5,894,324 | ||
| NET ASSETS – 100.0% | $244,561,794 |
bps | Basis Points. |
REIT | Real Estate Investment Trust. |
(a) | Non-income producing security. |
(b) | Floating rate note. Coupon rate, reference index and spread shown at June 30, 2020. |
(c) | Security issued with a zero coupon. Income is recognized through accretion of discount. |
Purchases and sales of securities (excluding temporary cash investments) for the six months ended June 30, 2020 were as follows:
| Purchases | Sales | |||||||
Long-Term U.S. Government Securities | $ | 4,004,265 | $ | 1,996,092 | ||||
Other Long-Term Securities | $ | 113,027,472 | $ | 108,236,326 | ||||
The Portfolio is permitted to engage in purchase and sale transactions (“cross trades”) with certain funds and accounts for which Amundi Pioneer Asset Management, Inc. (the “Adviser”) serves as the Portfolio’s investment adviser, as set forth in Rule 17a-7 under the Investment Company Act of 1940, pursuant to procedures adopted by the Board of Trustees. Under these procedures, cross trades are effected at current market prices. During the six months ended June 30, 2020, the Portfolio did not engage in any cross trade activity.
At June 30, 2020, the net unrealized appreciation on investments based on cost for federal tax purposes of $225,511,309 was as follows:
| Aggregate gross unrealized appreciation for all investments | ||||
| in which there is an excess of value over tax cost | $ | 28,158,391 | ||
| Aggregate gross unrealized depreciation for all investments | ||||
| in which there is an excess of tax cost over value | (15,002,230 | ) | ||
| Net unrealized appreciation | $ | 13,156,161 | ||
Various inputs are used in determining the value of the Portfolio’s investments. These inputs are summarized in the three broad levels below.
Level 1 – quoted prices in active markets for identical securities.
Level 2 – other significant observable inputs (including quoted prices for similar securities, interest rates, prepayment speeds, credit risks, etc.). See Notes to Financial Statements — Note 1A.
Level 3 – significant unobservable inputs (including the Portfolio’s own assumptions in determining fair value of investments). See Notes to Financial Statements —Note 1A.
The following is a summary of the inputs used as of June 30, 2020, in valuing the Portfolio’s investments:
| Level 1 | Level 2 | Level 3 | Total | |||||||||||||
Common Stocks | $ | 233,664,914 | $ | — | $ | — | $ | 233,664,914 | ||||||||
U.S. Government and | ||||||||||||||||
| Agency Obligations | — | 5,002,556 | — | 5,002,556 | ||||||||||||
| Total | ||||||||||||||||
| Investments | ||||||||||||||||
| in Securities | $ | 233,664,914 | $ | 5,002,556 | $ | — | $ | 238,667,470 | ||||||||
During the six months ended June 30, 2020, there were no transfers between Levels 1, 2 and 3.
The accompanying notes are an integral part of these financial statements.
10
| Pioneer Mid Cap Value VCT Portfolio | PIONEER VARIABLE CONTRACTS TRUST |
| ASSETS: | ||||
| Investments in unaffiliated issuers, at value (cost $225,131,438) | $ | 238,667,470 | ||
| Cash | 9,895,253 | |||
| Receivables — | ||||
| Portfolio shares sold | 22,389 | |||
| Dividends | 302,897 | |||
| Interest | 1,018 | |||
| Other assets | 544 | |||
| Total assets | $ | 248,889,571 | ||
| LIABILITIES: | ||||
| Payables — | ||||
| Investment securities purchased | $ | 4,203,399 | ||
| Portfolio shares repurchased | 49,975 | |||
| Trustees’ fees | 429 | |||
| Due to affiliates | 28,782 | |||
| Accrued expenses | 45,192 | |||
| Total liabilities | $ | 4,327,777 | ||
| NET ASSETS: | ||||
| Paid-in capital | $ | 247,598,099 | ||
| Distributable earnings (loss) | (3,036,305 | ) | ||
| Net assets | $ | 244,561,794 | ||
| NET ASSET VALUE PER SHARE: | ||||
No par value (unlimited number of shares authorized) | ||||
| Class I (based on $28,607,609/1,983,978 shares) | $ | 14.42 | ||
| Class II (based on $215,954,185/15,149,703 shares) | $ | 14.25 | ||
The accompanying notes are an integral part of these financial statements.
11
| Pioneer Mid Cap Value VCT Portfolio | PIONEER VARIABLE CONTRACTS TRUST |
STATEMENT OF OPERATIONS (UNAUDITED) | |
| FOR THE SIX MONTHS ENDED 6/30/20 |
| INVESTMENT INCOME: | ||||||||
| Dividends from unaffiliated issuers | $ | 2,523,257 | ||||||
| Interest from unaffiliated issuers | 16,360 | |||||||
| Total investment income | $ | 2,539,617 | ||||||
| EXPENSES: | ||||||||
| Management fees | $ | 789,781 | ||||||
| Administrative expense | 55,472 | |||||||
| Distribution fees | ||||||||
| Class II | 265,795 | |||||||
| Custodian fees | 5,894 | |||||||
| Professional fees | 14,529 | |||||||
| Printing expense | 14,292 | |||||||
| Pricing fees | 11 | |||||||
| Trustees’ fees | 4,717 | |||||||
| Miscellaneous | 6,286 | |||||||
| Total expenses | $ | 1,156,777 | ||||||
| Net investment income | $ | 1,382,840 | ||||||
| REALIZED AND UNREALIZED GAIN (LOSS) ON INVESTMENTS: | ||||||||
| Net realized gain (loss) on: | ||||||||
| Investments in unaffiliated issuers | $ | (17,572,908 | ) | |||||
| Change in net unrealized appreciation (depreciation) on: | ||||||||
| Investments in unaffiliated issuers | $ | (33,769,232 | ) | |||||
| Net realized and unrealized gain (loss) on investments | $ | (51,342,140 | ) | |||||
| Net decrease in net assets resulting from operations | $ | (49,959,300 | ) | |||||
The accompanying notes are an integral part of these financial statements.
12
| Pioneer Mid Cap Value VCT Portfolio | PIONEER VARIABLE CONTRACTS TRUST |
STATEMENTS OF CHANGES IN NET ASSETS |
| Six Months | ||||||||
| Ended | Year | |||||||
| 6/30/20 | Ended | |||||||
| (unaudited) | 12/31/19 | |||||||
| FROM OPERATIONS: | ||||||||
Net investment income (loss) | $ | 1,382,840 | $ | 2,622,399 | ||||
Net realized gain (loss) on investments | (17,572,908 | ) | 8,844,533 | |||||
Change in net unrealized appreciation (depreciation) on investments | (33,769,232 | ) | 58,123,072 | |||||
| Net increase (decrease) in net assets resulting from operations | $ | (49,959,300 | ) | $ | 69,590,004 | |||
| DISTRIBUTIONS TO SHAREOWNERS: | ||||||||
| Class I ($0.73 and $1.38 per share, respectively) | $ | (1,370,948 | ) | $ | (2,769,330 | ) | ||
| Class II ($0.68 and $1.33 per share, respectively) | (9,892,768 | ) | (18,372,047 | ) | ||||
| Total distributions to shareowners | $ | (11,263,716 | ) | $ | (21,141,377 | ) | ||
| FROM PORTFOLIO SHARE TRANSACTIONS: | ||||||||
Net proceeds from sales of shares | $ | 25,937,982 | $ | 9,343,094 | ||||
Reinvestment of distributions | 11,263,716 | 21,141,377 | ||||||
Cost of shares repurchased | (15,859,221 | ) | (51,860,053 | ) | ||||
| Net increase (decrease) in net assets resulting from Portfolio share transactions | $ | 21,342,477 | $ | (21,375,582 | ) | |||
| Net increase (decrease) in net assets | $ | (39,880,539 | ) | $ | 27,073,045 | |||
| NET ASSETS: | ||||||||
Beginning of period | $ | 284,442,333 | $ | 257,369,288 | ||||
End of period | $ | 244,561,794 | $ | 284,442,333 | ||||
| Six Months | Six Months | |||||||||||||||
| Ended | Ended | Year Ended | Year Ended | |||||||||||||
| 6/30/20 | 6/30/20 | 12/31/19 | 12/31/19 | |||||||||||||
| Shares | Amount | Shares | Amount | |||||||||||||
| CLASS I | ||||||||||||||||
Shares sold | 100,235 | $ | 1,464,707 | 71,437 | $ | 1,266,186 | ||||||||||
Reinvestment of distributions | 93,198 | 1,370,948 | 160,914 | 2,769,330 | ||||||||||||
Less shares repurchased | (234,496 | ) | (3,685,228 | ) | (364,444 | ) | (6,430,449 | ) | ||||||||
| Net decrease | (41,063 | ) | $ | (849,573 | ) | (132,093 | ) | $ | (2,394,933 | ) | ||||||
| CLASS II | ||||||||||||||||
Shares sold | 1,670,854 | $ | 24,473,275 | 470,625 | $ | 8,076,908 | ||||||||||
Reinvestment of distributions | 680,383 | 9,892,768 | 1,079,439 | 18,372,047 | ||||||||||||
Less shares repurchased | (752,864 | ) | (12,173,993 | ) | (2,583,598 | ) | (45,429,604 | ) | ||||||||
| Net increase (decrease) | 1,598,373 | $ | 22,192,050 | (1,033,534 | ) | $ | (18,980,649 | ) | ||||||||
The accompanying notes are an integral part of these financial statements.
13
| Pioneer Mid Cap Value VCT Portfolio | PIONEER VARIABLE CONTRACTS TRUST |
FINANCIAL HIGHLIGHTS |
| Six Months | ||||||||||||||||||||||||
| Ended | Year | Year | Year | Year | Year | |||||||||||||||||||
| 6/30/20 | Ended | Ended | Ended | Ended | Ended | |||||||||||||||||||
| (unaudited) | 12/31/19 | 12/31/18 | 12/31/17 | 12/31/16* | 12/31/15* | |||||||||||||||||||
| Class I | ||||||||||||||||||||||||
Net asset value, beginning of period | $ | 18.46 | $ | 15.53 | $ | 21.11 | $ | 20.49 | $ | 18.88 | $ | 22.79 | ||||||||||||
Increase (decrease) from investment operations: | ||||||||||||||||||||||||
| Net investment income (loss) (a) | $ | 0.10 | $ | 0.20 | $ | 0.23 | $ | 0.13 | $ | 0.17 | $ | 0.18 | ||||||||||||
| Net realized and unrealized gain (loss) on investments | (3.41 | ) | 4.11 | (4.01 | ) | 2.36 | 2.81 | (1.38 | ) | |||||||||||||||
Net increase (decrease) from investment operations | $ | (3.31 | ) | $ | 4.31 | $ | (3.78 | ) | $ | 2.49 | $ | 2.98 | $ | (1.20 | ) | |||||||||
Distributions to shareowners: | ||||||||||||||||||||||||
| Net investment income | $ | (0.20 | ) | $ | (0.24 | ) | $ | (0.14 | ) | $ | (0.18 | ) | $ | (0.14 | ) | $ | (0.18 | ) | ||||||
| Net realized gain | (0.53 | ) | (1.14 | ) | (1.66 | ) | (1.69 | ) | (1.23 | ) | (2.53 | ) | ||||||||||||
Total distributions | $ | (0.73 | ) | $ | (1.38 | ) | $ | (1.80 | ) | $ | (1.87 | ) | $ | (1.37 | ) | $ | (2.71 | ) | ||||||
Net increase (decrease) in net asset value | $ | (4.04 | ) | $ | 2.93 | $ | (5.58 | ) | $ | 0.62 | $ | 1.61 | $ | (3.91 | ) | |||||||||
Net asset value, end of period | $ | 14.42 | $ | 18.46 | $ | 15.53 | $ | 21.11 | $ | 20.49 | $ | 18.88 | ||||||||||||
Total return (b) | (18.04 | )%(c) | 28.44 | % | (19.34 | )% | 13.17 | % | 16.56 | % | (6.14 | )%(d) | ||||||||||||
Ratio of net expenses to average net assets | 0.73 | %(e) | 0.73 | % | 0.73 | % | 0.71 | % | 0.71 | % | 0.71 | % | ||||||||||||
Ratio of net investment income (loss) to average net assets | 1.34 | %(e) | 1.14 | % | 1.19 | % | 0.64 | % | 0.91 | % | 0.84 | % | ||||||||||||
Portfolio turnover rate | 46 | %(c) | 93 | % | 81 | % | 61 | % | 75 | % | 87 | % | ||||||||||||
Net assets, end of period (in thousands) | $ | 28,608 | $ | 37,384 | $ | 33,506 | $ | 48,082 | $ | 68,552 | $ | 70,412 | ||||||||||||
* | The Portfolio was audited by an independent registered public accounting firm other than Ernst & Young LLP. |
(a) | The per-share data presented above is based on the average shares outstanding for the period presented. |
(b) | Assumes initial investment at net asset value at the beginning of each period, reinvestment of all distributions and the complete redemption of the investment at net asset value at the end of each period. |
(c) | Not annualized. |
(d) | If the Portfolio had not recognized gains in settlement of class action lawsuits during the year ended December 31, 2015, the total return would have been (6.19)%. |
(e) | Annualized. |
NOTE: | The above financial highlights do not reflect the deduction of non-portfolio expenses associated with variable insurance products, such as mortality and expense risk charges, separate account charges, and sales charges. |
The accompanying notes are an integral part of these financial statements.
14
| Pioneer Mid Cap Value VCT Portfolio | PIONEER VARIABLE CONTRACTS TRUST |
| Six Months | ||||||||||||||||||||||||
| Ended | Year | Year | Year | Year | Year | |||||||||||||||||||
| 6/30/20 | Ended | Ended | Ended | Ended | Ended | |||||||||||||||||||
| (unaudited) | 12/31/19 | 12/31/18 | 12/31/17 | 12/31/16* | 12/31/15* | |||||||||||||||||||
| Class II | ||||||||||||||||||||||||
Net asset value, beginning of period | $ | 18.23 | $ | 15.35 | $ | 20.87 | $ | 20.28 | $ | 18.70 | $ | 22.59 | ||||||||||||
Increase (decrease) from investment operations: | ||||||||||||||||||||||||
| Net investment income (loss) (a) | $ | 0.09 | $ | 0.15 | $ | 0.18 | $ | 0.08 | $ | 0.12 | $ | 0.12 | ||||||||||||
| Net realized and unrealized gain (loss) on investments | (3.39 | ) | 4.06 | (3.95 | ) | 2.33 | 2.78 | (1.36 | ) | |||||||||||||||
Net increase (decrease) from investment operations | $ | (3.30 | ) | $ | 4.21 | $ | (3.77 | ) | $ | 2.41 | $ | 2.90 | $ | (1.24 | ) | |||||||||
Distributions to shareowners: | ||||||||||||||||||||||||
| Net investment income | $ | (0.15 | ) | $ | (0.19 | ) | $ | (0.09 | ) | $ | (0.13 | ) | $ | (0.09 | ) | $ | (0.12 | ) | ||||||
| Net realized gain | (0.53 | ) | (1.14 | ) | (1.66 | ) | (1.69 | ) | (1.23 | ) | (2.53 | ) | ||||||||||||
Total distributions | $ | (0.68 | ) | $ | (1.33 | ) | $ | (1.75 | ) | $ | (1.82 | ) | $ | (1.32 | ) | $ | (2.65 | ) | ||||||
Net increase (decrease) in net asset value | $ | (3.98 | ) | $ | 2.88 | $ | (5.52 | ) | $ | 0.59 | $ | 1.58 | $ | (3.89 | ) | |||||||||
Net asset value, end of period | $ | 14.25 | $ | 18.23 | $ | 15.35 | $ | 20.87 | $ | 20.28 | $ | 18.70 | ||||||||||||
Total return (b) | (18.17 | )%(c) | 28.08 | % | (19.49 | )% | 12.87 | % | 16.23 | % | (6.35 | )%(d) | ||||||||||||
Ratio of net expenses to average net assets | 0.98 | %(e) | 0.98 | % | 0.98 | % | 0.96 | % | 0.96 | % | 0.96 | % | ||||||||||||
Ratio of net investment income (loss) to average net assets | 1.11 | %(e) | 0.89 | % | 0.95 | % | 0.39 | % | 0.67 | % | 0.60 | % | ||||||||||||
Portfolio turnover rate | 46 | %(c) | 93 | % | 81 | % | 61 | % | 75 | % | 87 | % | ||||||||||||
Net assets, end of period (in thousands) | $ | 215,954 | $ | 247,058 | $ | 223,863 | $ | 298,671 | $ | 294,399 | $ | 274,774 | ||||||||||||
* | The Portfolio was audited by an independent registered public accounting firm other than Ernst & Young LLP. |
(a) | The per-share data presented above is based on the average shares outstanding for the period presented. |
(b) | Assumes initial investment at net asset value at the beginning of each period, reinvestment of all distributions and the complete redemption of the investment at net asset value at the end of each period. |
(c) | Not annualized. |
(d) | If the Portfolio had not recognized gains in settlement of class action lawsuits during the year ended December 31, 2015, the total return would have been (6.40)%. |
(e) | Annualized. |
NOTE: | The above financial highlights do not reflect the deduction of non-portfolio expenses associated with variable insurance products, such as mortality and expense risk charges, separate account charges, and sales charges. |
The accompanying notes are an integral part of these financial statements.
15
| Pioneer Mid Cap Value VCT Portfolio | PIONEER VARIABLE CONTRACTS TRUST |
1. Organization and Significant Accounting Policies
Pioneer Mid Cap Value VTC Portfolio (the “Portfolio”) is one of 8 portfolios comprising Pioneer Variable Contracts Trust (the “Trust”), a Delaware statutory trust. The Portfolio is registered under the Investment Company Act of 1940 as a diversified, open-end management investment company. The investment objective of the Portfolio is capital appreciation by investing in a diversified portfolio of securities consisting primarily of common stocks.
The Portfolio offers two classes of shares designated as Class I and Class II shares. Each class of shares represents an interest in the same schedule of investments of the Portfolio and has identical rights (based on relative net asset values) to assets and liquidation proceeds. Share classes can bear different rates of class-specific fees and expenses, such as transfer agent and distribution fees. Differences in class-specific fees and expenses will result in differences in net investment income and, therefore, the payment of different dividends from net investment income earned by each class. The Amended and Restated Declaration of Trust of the Portfolio gives the Board of Trustees the flexibility to specify either per-share voting or dollar-weighted voting when submitting matters for shareowner approval. Under per-share voting, each share of a class of the Portfolio is entitled to one vote. Under dollar-weighted voting, a shareowner’s voting power is determined not by the number of shares owned, but by the dollar value of the shares on the record date. Each share class has exclusive voting rights with respect to matters affecting only that class, including with respect to the distribution plan for that class. There is no distribution plan for Class I shares.
Portfolio shares may be purchased only by insurance companies for the purpose of funding variable annuity and variable life insurance contracts or by qualified pension and retirement plans.
Amundi Pioneer Asset Management, Inc., an indirect, wholly owned subsidiary of Amundi and Amundi’s wholly owned subsidiary, Amundi USA, Inc., serves as the Portfolio’s investment adviser (the “Adviser”). Amundi Pioneer Distributor, Inc., an affiliate of Amundi Pioneer Asset Management, Inc., serves as the Portfolio’s distributor (the “Distributor”).
In August 2018, the Securities and Exchange Commission (“SEC”) released a Disclosure Update and Simplification Final Rule. The Final Rule amends Regulation S-X disclosures requirements to conform them to U.S. Generally Accepted Accounting Principles (“U.S. GAAP”) for investment companies. The Portfolio’s financial statements were prepared in compliance with the new amendments to Regulation S-X.
The Portfolio is an investment company and follows investment company accounting and reporting guidance under U.S. GAAP. U.S. GAAP requires the management of the Portfolio to make estimates and assumptions that affect the reported amounts of assets and liabilities, the disclosure of contingent assets and liabilities at the date of the financial statements, and the reported amounts of income, expenses and gain or loss on investments during the reporting period. Actual results could differ from those estimates.
The following is a summary of significant accounting policies followed by the Portfolio in the preparation of its financial statements:
A. Security Valuation
The net asset value of the Portfolio is computed once daily, on each day the New York Stock Exchange (“NYSE”) is open, as of the close of regular trading on the NYSE.
Equity securities that have traded on an exchange are valued by using the last sale price on the principal exchange where they are traded. Equity securities that have not traded on the date of valuation, or securities for which sale prices are not available, generally are valued using the mean between the last bid and asked prices or, if both last bid and asked prices are not available, at the last quoted bid price. Last sale and bid and asked prices are provided by independent third party pricing services. In the case of equity securities not traded on an exchange, prices are typically determined by independent third party pricing services using a variety of techniques and methods.
Fixed-income securities are valued by using prices supplied by independent pricing services, which consider such factors as market prices, market events, quotations from one or more brokers, Treasury spreads, yields, maturities and ratings, or may use a pricing matrix or other fair value methods or techniques to provide an estimated value of the security or instrument. A pricing matrix is a means of valuing a debt security on the basis of current market prices for other debt securities, historical trading patterns in the market for fixed-income securities and/or other factors. Non-U.S. debt securities that are listed on an exchange will be valued at the bid price obtained from an independent third party pricing service. When independent third party pricing services are unable to supply prices, or when prices or market quotations are considered to be unreliable, the value of that security may be determined using quotations from one or more broker-dealers.
Securities for which independent pricing services or broker-dealers are unable to supply prices or for which market prices and/or quotations are not readily available
16
| Pioneer Mid Cap Value VCT Portfolio | PIONEER VARIABLE CONTRACTS TRUST |
or are considered to be unreliable are valued by a fair valuation team comprised of certain personnel of the Adviser pursuant to procedures adopted by the Portfolio’s Board of Trustees. The Adviser’s fair valuation team uses fair value methods approved by the Valuation Committee of the Board of Trustees. The Adviser’s fair valuation team is responsible for monitoring developments that may impact fair valued securities and for discussing and assessing fair values on an ongoing basis, and at least quarterly, with the Valuation Committee of the Board of Trustees.
Inputs used when applying fair value methods to value a security may include credit ratings, the financial condition of the company, current market conditions and comparable securities. The Portfolio may use fair value methods if it is determined that a significant event has occurred after the close of the exchange or market on which the security trades and prior to the determination of the Portfolio’s net asset value. Examples of a significant event might include political or economic news, corporate restructurings, natural disasters, terrorist activity or trading halts. Thus, the valuation of the Portfolio’s securities may differ significantly from exchange prices, and such differences could be material.
At June 30, 2020, no securities were valued using fair value methods (other than securities valued using prices supplied by independent pricing services, broker-dealers or using a third party insurance industry pricing model).
B. Investment Income and Transactions
Dividend income is recorded on the ex-dividend date, except that certain dividends from foreign securities where the ex-dividend date may have passed are recorded as soon as the Portfolio becomes aware of the ex-dividend data in the exercise of reasonable diligence.
Interest income, including interest on income-bearing cash accounts, is recorded on the accrual basis. Dividend and interest income are reported net of unrecoverable foreign taxes withheld at the applicable country rates and net of income accrued on defaulted securities.
Interest and dividend income payable by delivery of additional shares is reclassified as PIK (payment-in-kind) income upon receipt and is included in interest and dividend income, respectively.
Security transactions are recorded as of trade date. Gains and losses on sales of investments are calculated on the identified cost method for both financial reporting and federal income tax purposes.
C. Federal Income Taxes
It is the Portfolio’s policy to comply with the requirements of the Internal Revenue Code applicable to regulated investment companies and to distribute all of its net taxable income and net realized capital gains, if any, to its shareowners. Therefore, no provision for federal income taxes is required. As of December 31, 2019, the Portfolio did not accrue any interest or penalties with respect to uncertain tax positions, which, if applicable, would be recorded as an income tax expense on the Statement of Operations. Tax returns filed within the prior three years remain subject to examination by federal and state tax authorities.
A portion of the dividend income recorded by the Portfolio is from distributions by publicly traded Real Estate Investment Trusts ("REITs"), and such distributions for tax purposes may also consist of capital gains and return of capital. The actual return of capital and capital gains portions of such distributions will be determined by formal notifications from the REITs subsequent to the calendar year-end. Distributions received from the REITs that are determined to be a return of capital are recorded by the Portfolio as a reduction of the cost basis of the securities held and those determined to be capital gain are reflected as such on the Statement of Operations.
The amount and character of income and capital gain distributions to shareowners are determined in accordance with federal income tax rules, which may differ from U.S. GAAP. Distributions in excess of net investment income or net realized gains are temporary over distributions for financial statement purposes resulting from differences in the recognition or classification of income or distributions for financial statement and tax purposes. Capital accounts within the financial statements are adjusted for permanent book/tax differences to reflect tax character, but are not adjusted for temporary differences.
The tax character of current year distributions payable will be determined at the end of the current taxable year. The tax character of distributions paid during the year ended December 31, 2019 was as follows:
2019 | ||||
| Distributions paid from: | ||||
| Ordinary income | $ | 3,122,155 | ||
| Long-term capital gain | 18,019,222 | |||
| Total distributions | $ | 21,141,377 | ||
17
| Pioneer Mid Cap Value VCT Portfolio | PIONEER VARIABLE CONTRACTS TRUST |
NOTES TO FINANCIAL STATEMENTS 6/30/20 (UNAUDITED) | (continued) |
The following shows the components of distributable earnings on a federal income tax basis at December 31, 2019:
2019 | ||||
| Distributable Earnings: | ||||
| Undistributed ordinary income | $ | 2,621,041 | ||
| Undistributed long-term capital gain | 8,640,277 | |||
| Unrealized depreciation | 46,925,393 | |||
| Total | $ | 58,186,711 | ||
The difference between book basis and tax basis unrealized appreciation is attributable to the tax deferral of losses on wash sales.
D. Portfolio Shares and Class Allocations
The Portfolio records sales and repurchases of its shares as of trade date. Distribution fees for Class II shares are calculated based on the average daily net asset value attributable to Class II shares of the Portfolio (see Note 4). Class I shares do not pay distribution fees.
Income, common expenses (excluding transfer agent and distribution fees) and realized and unrealized gains and losses are calculated at the Portfolio level and allocated daily to each class of shares based on its respective percentage of adjusted net assets at the beginning of the day.
All expenses and fees paid to the Portfolio’s transfer agent for its services are allocated between the classes of shares based on the number of accounts in each class and the ratable allocation of related out-of-pocket expenses (see Note 3).
Dividends and distributions to shareowners are recorded on the ex-dividend date. Distributions paid by the Portfolio with respect to each class of shares are calculated in the same manner and at the same time, except that net investment income dividends to Class I and Class II shares can reflect different transfer agent and distribution expense rates. Dividends and distributions to shareowners are recorded on the ex-dividend date.
E. Risks
The value of securities held by the Portfolio may go up or down, sometimes rapidly or unpredictably, due to general market conditions, such as real or perceived adverse economic, political or regulatory conditions, recessions, the spread of infectious illness or other public health issues, inflation, changes in interest rates, lack of liquidity in the bond markets or adverse investor sentiment. In the past several years, financial markets have experienced increased volatility, depressed valuations, decreased liquidity and heightened uncertainty. These conditions may continue, recur, worsen or spread.
Investments in mid-sized companies may offer the potential for higher returns, but are also subject to greater short-term price fluctuations than investments in larger, more established companies. Investing in foreign and/or emerging markets securities involves risks relating to interest rates, currency exchange rates and economic and political conditions.
At times, the Portfolio’s investments may represent industries or industry sectors that are interrelated or have common risks, making the Portfolio more susceptible to any economic, political, or regulatory developments or other risks affecting those industries and sectors. The Portfolio’s investments in foreign markets and countries with limited developing markets may subject the Portfolio to a greater degree of risk than investments in a developed market. These risks include disruptive political or economic conditions and the imposition of adverse governmental laws or currency exchange restrictions.
With the increased use of technologies such as the Internet to conduct business, the Portfolio is susceptible to operational, information security and related risks. While the Portfolio’s Adviser has established business continuity plans in the event of, and risk management systems to prevent, limit or mitigate, such cyber-attacks, there are inherent limitations in such plans and systems, including the possibility that certain risks have not been identified. Furthermore, the Portfolio cannot control the cybersecurity plans and systems put in place by service providers to the Portfolio such as Brown Brothers Harriman & Co., the Portfolio’s custodian and accounting agent, and DST Asset Manager Solutions, Inc., the Portfolio’s transfer agent. In addition, many beneficial owners of Portfolio shares hold them through accounts at broker-dealers, retirement platforms and other financial market participants over which neither the Portfolio nor Amundi Pioneer exercises control. Each of these may in turn rely on service providers to them, which are also subject to the risk of cyber-attacks. Cybersecurity failures or breaches at Amundi Pioneer or the Portfolio’s service providers or intermediaries have the ability to cause disruptions and impact business operations, potentially resulting in financial losses, interference with the Portfolio’s ability to calculate its net asset value, impediments to trading, the inability of Portfolio shareowners to effect share purchases, redemptions or
18
| Pioneer Mid Cap Value VCT Portfolio | PIONEER VARIABLE CONTRACTS TRUST |
exchanges or receive distributions, loss of or unauthorized access to private shareowner information and violations of applicable privacy and other laws, regulatory fines, penalties, reputational damage, or additional compliance costs. Such costs and losses may not be covered under any insurance. In addition, maintaining vigilance against cyber-attacks may involve substantial costs over time, and system enhancements may themselves be subject to cyber-attacks.
COVID-19
The respiratory illness COVID-19 caused by a novel coronavirus has resulted in a global pandemic and major disruption to economies and markets around the world, including the United States. Global financial markets have experienced extreme volatility and severe losses, and trading in many instruments has been disrupted. Liquidity for many instruments has been greatly reduced for periods of time. Some interest rates are very low and in some cases yields are negative. Some sectors of the economy and individual issuers have experienced particularly large losses. These circumstances may continue for an extended period of time, and may continue to affect adversely the value and liquidity of the Portfolio's investments. The ultimate economic fallout from the pandemic, and the long-term impact on economies, markets, industries and individual issuers, are not known. Governments and central banks, including the Federal Reserve in the U.S., have taken extraordinary and unprecedented actions to support local and global economies and the financial markets. These actions have resulted in significant expansion of public debt, including in the U.S. The impact of these measures, and whether they will be effective to mitigate the economic and market disruption, will not be known for some time. The consequences of high public debt, including its future impact on the economy and securities markets, likewise may not be known for some time.
The Portfolio’s prospectus contains unaudited information regarding the Portfolio’s principal risks. Please refer to that document when considering the Portfolio’s principal risks.
2. Management Agreement
The Adviser manages the Portfolio. Management fees are calculated daily and paid monthly at the annual rate of 0.65% of the Portfolio’s average daily net assets. For the six months ended June 30, 2020, the effective management fee was equivalent to 0.65% (annualized) of the Portfolio’s average daily net assets.
In addition, under the management and administration agreements, certain other services and costs, including accounting, regulatory reporting and insurance premiums, are paid by the Portfolio as administrative reimbursements. Included in “Due to affiliates” reflected on the Statement of Assets and Liabilities is $21,594 in management fees, administrative costs and certain other reimbursements payable to the Adviser at June 30, 2020.
3. Transfer Agent
DST Asset Manager Solutions, Inc. serves as the transfer agent to the Portfolio at negotiated rates. Transfer agent fees and payables shown on the Statement of Operations and the Statement of Assets and Liabilities, respectively, include sub-transfer agent expenses incurred through the Portfolio’s omnibus relationship contracts.
4. Distribution Plan
The Portfolio has adopted a distribution plan (the “Plan”) pursuant to Rule 12b-1 of the Investment Company Act of 1940 with respect to Class II shares. Pursuant to the Plan, the Portfolio pays the Distributor 0.25% of the average daily net assets attributable to Class II shares to compensate the Distributor for (1) distribution services and (2) personal and account maintenance services performed and expenses incurred by the Distributor in connection with the Portfolio’s Class II shares. Included in “Due to affiliates” reflected on the Statement of Assets and Liabilities is $7,188 in distribution fees payable to the Distributor at June 30, 2020.
19
| Pioneer Mid Cap Value VCT Portfolio | PIONEER VARIABLE CONTRACTS TRUST |
As required by law, the Portfolio has adopted and implemented a liquidity risk management program (the “Program”) that is designed to assess and manage liquidity risk. Liquidity risk is the risk that the Portfolio could not meet requests to redeem its shares without significant dilution of remaining investors’ interests in the Portfolio. The Portfolio’s Board of Trustees designated a liquidity risk management committee (the “Committee”) consisting of employees of Amundi Pioneer Asset Management, Inc. (the “Adviser”) to administer the Program.
The Committee provided the Board of Trustees with a report that addressed the operation of the Program and assessed its adequacy and effectiveness of implementation (the “Report”). The Report covered the period from December 1, 2018 through March 31, 2020 (the “Reporting Period”).
The Report confirmed that, throughout the Reporting Period, the Committee had monitored the Portfolio’s portfolio liquidity and liquidity risk on an ongoing basis, as described in the Program and in Board reporting throughout the Reporting Period.
The Report discussed the Committee’s annual review of the Program, which addressed, among other things, the following elements of the Program:
The Committee reviewed the Portfolio’s investment strategy and liquidity of portfolio investments during both normal and reasonably foreseeable stressed conditions. The Committee noted that the Portfolio’s investment strategy continues to be appropriate for an open-end fund, taking into account, among other things, whether and to what extent the Portfolio held less liquid and illiquid assets and the extent to which any such investments affected the Portfolio’s ability to meet redemption requests. In managing and reviewing the Portfolio’s liquidity risk, the Committee also considered the extent to which the Portfolio’s investment strategy involves a relatively concentrated portfolio or large positions in particular issuers, the extent to which the Portfolio uses borrowing for investment purposes, and the extent to which the Portfolio uses derivatives (including for hedging purposes). The Committee also reviewed the Portfolio’s short-term and long-term cash flow projections during both normal and reasonably foreseeable stressed conditions. In assessing the Portfolio’s cash flow projections, the Committee considered, among other factors, historical net redemption activity, redemption policies, ownership concentration, distribution channels, and the degree of certainty associated with the Portfolio’s short-term and long-term cash flow projections. The Committee also considered the Portfolio’s holdings of cash and cash equivalents, as well as borrowing arrangements and other funding sources, including, if applicable, the Portfolio’s participation in a credit facility, as components of the Portfolio’s ability to meet redemption requests. The Portfolio has adopted an in-kind redemption policy which may be utilized to meet larger redemption requests.
The Committee reviewed the Program’s liquidity classification methodology for categorizing the Portfolio’s investments into one of four liquidity buckets. In reviewing the Portfolio’s investments, the Committee considered, among other factors, whether trading varying portions of a position in a particular portfolio investment or asset class in sizes the Portfolio would reasonably anticipate trading, would be reasonably expected to significantly affect liquidity.
The Committee performed an analysis to determine whether the Portfolio is required to maintain a Highly Liquid Investment Minimum, and determined that no such minimum is required because the Portfolio primarily holds highly liquid investments.
The Report stated that the Committee concluded the Program operates adequately and effectively, in all material respects, to assess and manage the Portfolio’s liquidity risk throughout the Reporting Period.
20
| Officers Lisa M. Jones, President and Chief Executive Officer Mark E. Bradley, Treasurer and Chief Financial and Accounting Officer Christopher J. Kelley, Secretary and Chief Legal Officer Investment Adviser and Administrator Amundi Pioneer Asset Management, Inc. Custodian and Sub-Administrator Brown Brothers Harriman & Co. Principal Underwriter Amundi Pioneer Distributor, Inc. Legal Counsel Morgan, Lewis & Bockius LLP Transfer Agent DST Asset Manager Solutions, Inc. | Trustees Thomas J. Perna, Chairman John E. Baumgardner, Jr. Diane Durnin Benjamin M. Friedman Lisa M. Jones Lorraine H. Monchak Marguerite A. Piret Fred J. Ricciardi Kenneth J. Taubes |
21
Proxy Voting Policies and Procedures of the Portfolio are available without charge, upon request, by calling our toll free number (1-800-225-6292). Information regarding how the Portfolio voted proxies relating to Portfolio securities during the most recent 12-month period ended June 30 is publicly available to shareowners at www.amundipioneer.com/us. This information is also available on the Securities and Exchange Commission’s web site at www.sec.gov.
19609-14-0820
PIONEER VARIABLE CONTRACTS TRUST
Pioneer Fund VCT Portfolio — Class I and II Shares
Pioneer Fund VCT Portfolio — Class I and II Shares
Beginning in February 2021, as permitted by regulations adopted by the Securities and Exchange Commission, you may not be receiving paper copies of the Portfolio’s shareholder reports like this one by mail, unless you specifically request paper copies of the reports from the insurance company that offers your variable annuity or variable life insurance contract or from your financial intermediary. Instead, the insurance company may choose to make the reports available on a website, and will notify you by mail each time a shareholder report is posted and provide you with a website link to access the report. Instructions for requesting paper copies will be provided by your insurance company.
If you already elected to receive shareholder reports electronically, you will not be affected by this change and you need not take any action. You may elect to receive shareholder reports and other communications from the insurance company or your financial intermediary electronically by following the instructions provided by the insurance company or by contacting your financial intermediary.
You may elect to receive all future Portfolio shareholder reports in paper free of charge from the insurance company. You can inform the insurance company or your financial intermediary that you wish to continue receiving paper copies of your shareholder reports by following the instructions provided by the insurance company or by contacting your financial intermediary. Your election to receive reports in paper will apply to all funds available under your contract with the insurance company.
SEMIANNUAL REPORT
June 30, 2020
June 30, 2020
Please refer to your contract prospectus to determine the applicable share class offered under your contract.
PIONEER VARIABLE CONTRACTS TRUST
Pioneer Fund VCT Portfolio | |
This report is authorized for distribution only when preceded or accompanied by a prospectus for the Portfolio being offered.
Pioneer Variable Contracts Trust files a complete schedule of portfolio holdings with the Securities and Exchange Commission for the first and third quarters of each fiscal year as an exhibit to its reports on Form N-PORT. Shareholders may view the filed Form N-PORT by visiting the Commission’s web site at https://www.sec.gov.
| Pioneer Fund VCT Portfolio | PIONEER VARIABLE CONTRACTS TRUST |
Sector Distribution
(As a percentage of total investments)*
(As a percentage of total investments)*
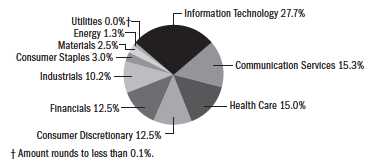
5 Largest Holdings
(As a percentage of total investments)*
(As a percentage of total investments)*
| 1. | Amazon.com, Inc. | 6.05% |
| 2. | Microsoft Corp. | 5.67 |
| 3. | Apple, Inc. | 5.47 |
| 4. | Alphabet, Inc. | 5.11 |
| 5. | Visa, Inc. | 5.02 |
* Excludes temporary cash investments and all derivative contracts except for options purchased. The Portfolio is actively managed, and current holdings may be different. The holdings listed should not be considered recommendations to buy or sell any securities.
PERFORMANCE UPDATE 6/30/20
Prices and Distributions
Prices and Distributions
| Net Asset Value per Share | 6/30/20 | 12/31/19 |
| Class I | $13.62 | $14.95 |
| Class II | $13.73 | $15.06 |
| Net | |||
| Distributions per Share | Investment | Short-Term | Long-Term |
| (1/1/20 – 6/30/20) | Income | Capital Gains | Capital Gains |
| Class I | $0.0600 | $0.2050 | $1.1021 |
| Class II | $0.0400 | $0.2050 | $1.1021 |
Performance of a $10,000 Investment
The following chart shows the change in value of an investment made in Class I and Class II shares of Pioneer Fund VCT Portfolio at net asset value during the periods shown, compared to that of the Standard & Poor’s 500 Index (the S&P 500). Portfolio returns are based on net asset value and do not reflect any applicable insurance fees or surrender charges.
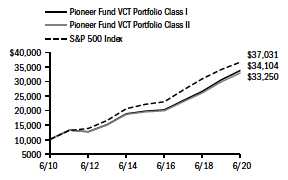
The Standard & Poor’s 500 Index (the S&P 500) is an unmanaged, commonly used measure of the broad U.S. stock market. Index returns are calculated monthly, assume reinvestment of dividends and, unlike Portfolio returns, do not reflect any fees, expenses or sales charges. It is not possible to invest directly in an index.
Average Annual Total Returns
(As of June 30, 2020)
| Class I | Class II | S&P 500 Index | |
10 Years | 13.05% | 12.77% | 13.99% |
5 Years | 11.43% | 11.16% | 10.73% |
1 Year | 10.61% | 10.29% | 7.51% |
All total returns shown assume reinvestment of distributions at net asset value.
The performance table does not reflect the deduction of taxes that a shareowner would pay on distributions or the redemption of shares.
Call 1-800-688-9915 or visit www.amundipioneer.com/us for the most recent month-end performance results. Current performance may be lower or higher than the performance data quoted.
The performance data quoted represents past performance, which is no guarantee of future results. Investment return and principal value will fluctuate, and shares, when redeemed, may be worth more or less than their original cost.
The returns for the Portfolio do not reflect the deduction of expenses associated with variable products, such as mortality and expense risk charges, separate account charges, and sales charges. These expenses would reduce the overall returns shown.
Performance results reflect any applicable expense waivers in effect during the periods shown. Without such waivers performance would be lower. Waivers may not be in effect for all portfolios. Certain fee waivers are contractual through a specified period. Otherwise, fee waivers can be rescinded at any time. See the prospectus and financial statements for more information.
2
| Pioneer Fund VCT Portfolio | PIONEER VARIABLE CONTRACTS TRUST |
As a shareowner in the Portfolio, you incur two types of costs:
(1) ongoing costs, including management fees, distribution and/or service (12b-1) fees, and other Portfolio expenses; and
(2) transaction costs, including sales charges (loads) on purchase payments.
This example is intended to help you understand your ongoing expenses (in dollars) of investing in the Portfolio and to compare these costs with the ongoing costs of investing in other mutual funds offered through your variable annuity contract. The example is based on an investment of $1,000 at the beginning of the Portfolio’s latest six-month period and held throughout the six months.
Using the Tables
Actual Expenses
The first table below provides information about actual account values and actual expenses. You may use the information in this table, together with the amount you invested, to estimate the expenses that you paid over the period as follows:
1. Divide your account value by $1,000
Example: an $8,600 account value ÷ $1,000 = 8.6
2. Multiply the result in (1) above by the corresponding share class’s number in the third row under the heading entitled “Expenses Paid During Period” to estimate the expenses you paid on your account during this period.
Expenses Paid on a $1,000 Investment in Pioneer Fund VCT Portfolio
Based on actual returns from January 1, 2020 through June 30, 2020.
| Share Class | I | II |
Beginning Account Value on 1/1/20 | $1,000.00 | $1,000.00 |
Ending Account Value on 6/30/20 | $1,002.30 | $1,000.80 |
Expenses Paid During Period* | $4.08 | $5.32 |
* Expenses are equal to the Portfolio’s annualized expense ratio of 0.82% and 1.07% for Class I and Class II shares respectively, multiplied by the average account value average account value over the period, multiplied by 182/366 (to reflect the one-half year period).
Hypothetical Example for Comparison Purposes
The table below provides information about hypothetical account values and hypothetical expenses based on the Portfolio’s actual expense ratio and an assumed rate of return of 5% per year before expenses, which is not the Portfolio’s actual return. The hypothetical account values and expenses may not be used to estimate the actual ending account balance or expenses you paid for the period.
You may use this information to compare the ongoing costs of investing in the Portfolio and other variable annuities. To do so, compare this 5% hypothetical example with the 5% hypothetical examples that appear in the shareholder reports of the other variable annuities.
Please note that the expenses shown in the tables are meant to highlight your ongoing costs only and do not reflect any transaction costs, such as sales charges (loads) that are charged at the time of the transaction. Therefore, the table below is useful in comparing ongoing costs only and will not help you determine the relative total costs of owning different variable annuities. In addition, if these transaction costs were included, your costs would have been higher.
Expenses Paid on a $1,000 Investment in Pioneer Fund VCT Portfolio
Based on a hypothetical 5% per year return before expenses, reflecting the period from January 1, 2020 through June 30, 2020.
| Share Class | I | II |
Beginning Account Value on 1/1/20 | $1,000.00 | $1,000.00 |
Ending Account Value on 6/30/20 | $1,020.79 | $1,019.54 |
Expenses Paid During Period* | $4.12 | $5.37 |
* Expenses are equal to the Portfolio’s annualized expense ratio of 0.82% and 1.07% for Class I and Class II shares respectively, multiplied by the average account value average account value over the period, multiplied by 182/366 (to reflect the one-half year period).
3
| Pioneer Fund VCT Portfolio | PIONEER VARIABLE CONTRACTS TRUST |
A Word About Risk:
All investments are subject to risk, including the possible loss of principal. In the past several years, financial markets have experienced increased volatility and heightened uncertainty. The market prices of securities may go up or down, sometimes rapidly or unpredictably, due to general market conditions, such as real or perceived adverse economic, political, or regulatory conditions, recessions, inflation, changes in interest or currency rates, lack of liquidity in the bond markets, the spread of infectious illness or other public health issues or adverse investor sentiment. These conditions may continue, recur, worsen or spread.
The Portfolio generally excludes corporate issuers that do not meet or exceed minimum ESG standards. Excluding specific issuers limits the universe of investments available to the Portfolio, which may mean forgoing some investment opportunities available to portfolios without similar ESG standards.
At times, the Portfolio’s investments may represent industries or industry sectors that are interrelated or have common risks, making the Portfolio more susceptible to any economic, political, or regulatory developments or other risks affecting those industries and sectors.
These risks may increase share price volatility.
Call 1-800-688-9915 or visit www.amundipioneer.com/us for the most recent month-end performance results. Current performance may be lower or higher than the performance data quoted.
The performance data quoted represents past performance, which is no guarantee of future results. Investment return and principal value will fluctuate, and shares, when redeemed, may be worth more or less than their original cost.
The returns for the Portfolio do not reflect the deduction of expenses associated with variable products, such as mortality and expense risk charges, separate account charges, and sales charges. These expenses would reduce the overall returns shown.
Performance results reflect any applicable expense waivers in effect during the periods shown. Without such waivers performance would be lower. Waivers may not be in effect for all portfolios. Certain fee waivers are contractual through a specified period. Otherwise, fee waivers can be rescinded at any time. See the prospectus and financial statements for more information.
In the following discussion, Jeff Kripke discusses the market environment during the six-month period ended June 30, 2020, and Pioneer Fund VCT Portfolio’s performance during the period. Mr. Kripke, a senior vice president and a portfolio manager at Amundi Pioneer Asset Management, Inc. (Amundi Pioneer), is responsible for the day-to-day management of the Portfolio, along with James Yu, a vice president and associate portfolio manager at Amundi Pioneer, Craig Sterling, Managing Director, Director of Core Equity and Director of Equity Research, U.S., and a portfolio manager at Amundi Pioneer, and John Carey, Managing Director, Director of Equity Income, U.S., and a portfolio manager at Amundi Pioneer.
Q: How did the Portfolio perform over the six-month period ended June 30, 2020?
A: Pioneer Fund VCT Portfolio’s Class I shares returned 0.23% at net asset value during the six-month period ended June 30, 2020, and Class II shares returned 0.08%, while the Portfolio’s benchmark, the Standard & Poor’s 500 Index (the S&P 500), returned -3.08%.
Q: How would you describe the market environment for equities during the six-month period ended June 30, 2020?
A: U.S. equities, while posting a negative return in the first half of 2020 as measured by the Portfolio’s benchmark, the S&P 500, nonetheless closed the six-month period on a high note, returning more than 20% during the second calendar quarter of the year (April through June).
The six-month period started off well, with healthy gains in the equity market from January through mid-February, as investor sentiment received a boost from solid economic and employment data and the news that China and the U.S. had agreed on a Phase One trade agreement, which was indicative of at least a slight thaw in the trade war between the two countries that had dominated financial headlines during 2019.
Then, stocks suffered a large, protracted slump beginning in the latter part of February as the COVID-19 virus spread from China into most other countries, including the U.S. Efforts to contain or at least slow the rate of COVID-19 infections resulted in the implementation of social-distancing guidelines and lockdowns” imposed by state and local governments, which resulted in, among other things, the cancellation of all professional and amateur/collegiate sporting events and other large public gatherings, such as concerts, as well as the shuttering of businesses deemed non-essential. The containment measures slowed commerce (with the exception of e-commerce) to a crawl, and while a number of U.S. workers were able to keep their jobs by working remotely, much of the domestic economy ground to a halt during March and April, and the unemployment rate soared. The economic damage wrought by COVID-19 was deep and immediate, with the travel and restaurant industries hit hardest as people stayed at home.
U.S. stocks hit their low on March 23, and a liquidity freeze” rattled the market for riskier fixed-income assets. At that point, the markets began to regain ground thanks to the combination of monetary and fiscal stimulus provided by the U.S. Federal Reserve (Fed) and the U.S. government. The Fed
4
| Pioneer Fund VCT Portfolio | PIONEER VARIABLE CONTRACTS TRUST |
reduced the target range of the federal funds rate to zero, dusted off its 2008/2009 financial crisis playbook by expanding its balance sheet, and implemented new lending facilities, all of which helped bolster investors’ confidence. In addition, the U.S. Congress and the White House approved $2 trillion in fiscal stimulus designed to provide financial assistance to individuals and businesses in need. Other stimulus spending packages from the government came to fruition during the second quarter, and the unprecedented level of support generated a sense of optimism that the economic pain, while severe, would be short-lived.
Moreover, as April turned to May, some U.S. states that had been less affected by the initial onslaught of the virus began re-opening for business, thus providing further impetus for market participants to come back off the sidelines and once again delve into riskier assets, such as equities. Some “new jobs” reports released during the second quarter also surprised to the upside. All of those factors helped the S&P 500 Index close the six-month period with only a narrow loss, despite analysts’ expectations for a sharp decline in domestic economic growth.
Though stimulus was a major driver of the S&P 500’s positive performance in the second half of the six-month period, the composition of the Portfolio’s benchmark also played a role. As growth stocks have outperformed value in recent years, the S&P 500 has tended to become more growth-oriented and concentrated. The top five stocks in the S&P 500 are all “big tech” and tech-related growth stocks and accounted for more than 21% of the benchmark’s value at period-end, a record level of concentration for the S&P 500.
Most sectors within the S&P 500 were in negative territory for the full six-month period, with information technology (up by 15%) and consumer discretionary (up by 7%) the only two sectors to finish with positive returns. Energy, which was down by more than 35%, was by far the worst performer in the S&P 500 for the six-month period as oil prices cratered in the first quarter and into April, for a number of reasons, including a price war between Saudi Arabia and Russia, depressed demand caused by the COVID-19 lockdowns, and oversupply. Oil prices, and the energy sector as a whole, did rebound in the second quarter, but not by nearly enough to make up for the first-quarter carnage. Financials, which returned -24%, was the S&P 500’s second-worst performer during the six-month period, as the low-interest-rate environment took its toll on several companies in the sector.
Q: Which of your investment decisions either contributed positively to, or detracted from, the Portfolio’s benchmark-relative performance during the six-month period ended June 30, 2020?
A: Sector allocation results were a positive factor for the Portfolio’s benchmark-relative returns over the six-month period. In particular, an underweight to the weak energy sector and an overweight to consumer discretionary, one of only two S&P 500 sectors to finish the period in positive territory, aided relative performance. We had underweighted the Portfolio to energy primarily due to oil-price concerns, which turned out to be even worse than anticipated.
5
| Pioneer Fund VCT Portfolio | PIONEER VARIABLE CONTRACTS TRUST |
| PORTFOLIO MANAGEMENT DISCUSSION 6/30/20 | (continued) |
Meanwhile, we had increased the Portfolio’s consumer discretionary holdings opportunistically as share prices declined in the big COVID-19-related sell-off in March, which helped boost benchmark-relative results as the market rallied in the second quarter.
Security selection also contributed positively to the Portfolio’s benchmark-relative results over the six-month period, with results in the consumer discretionary, consumer staples, information technology, and industrials sectors adding the most to relative performance.
On the negative side, an underweight to the top-performing information technology sector, driven by valuation concerns, detracted from the Portfolio’s benchmark-relative returns during the six-month period. The Portfolio’s security selection results also lagged the S&P 500 in the energy, health care, and real estate sectors over the six-month period.
With regard to individual positions, the top positive contributors to the Portfolio’s benchmark-relative performance over the six-month period were NVIDIA, Amazon.com, and Home Depot.
NVIDIA, which manufactures graphic-processing units used in computer games, driverless cars, and data centers, performed well over the six-month period as the company reported better-than-expected financial results driven by strong data-center demand. Home improvement retail giant Home Depot was another positive contributor to benchmark-relative performance for the six-month period. Home Depot reported strong first-quarter comparable store sales growth, driven by a surge in online sales, which have become a more significant factor in the company’s overall sales numbers. Home Depot has continued to display a clear competitive edge in servicing the needs of professional contractors, and we believe the contractor portion of the business may expand rapidly given the impending reconfiguration of offices, schools, and other public-gathering places to allow for greater social distancing in the wake of COVID-19. Amazon.com, one of the largest providers of e-commerce, cloud-computing, and digital-streaming services, is another company that has been benefiting from the COVID-19 quarantine measures, as many shoppers have moved into the online-purchasing world. Moreover, Amazon’s instant-video service has experienced an increase in sales. We believe those trends could continue and help generate positive returns for shareholders, especially since the company’s two highest-margin businesses, AWS (cloud) and advertising, have also been enjoying significant momentum.
Individual positions that detracted from the Portfolio’s benchmark-relative performance during the six-month period included Schlumberger, Wells Fargo, and Elanco Animal Health.
Oilfield services firm Schlumberger was a victim of the very rough environment for energy stocks over the six-month period, as most of the company’s clients reduced spending on oilfield services given the dramatic decline in oil prices and the supply/demand imbalance. Shares of Wells Fargo struggled during
6
| Pioneer Fund VCT Portfolio | PIONEER VARIABLE CONTRACTS TRUST |
the six-month period as the company’s turnaround, which includes cost savings initiatives, has been taking longer than the market expected. In addition, while it was anticipated that Wells Fargo would announce some kind of dividend* cut, the cents-per-share reduction was far greater than projected estimates. That said, Wells Fargo is one of the few nationwide, “footprint” banks in the U.S., and we believe the company’s current issues are correctible. Finally, the Portfolio’s position in Elanco Animal Health detracted from benchmark-relative performance during the six-month period after the company reported a drop in revenue, largely related to a decline in disease prevention and therapeutic medicines for companion animals, as pet owners refrained from going to veterinarians due to the COVID-19 situation. We believe Elanco’s revenues could increase once the economy fully reopens. The company is also on track to close its acquisition of Bayer’s animal health business (not a Portfolio holding), which we believe could increase the scale and scope of the overall business.
Q: Did the Portfolio have any exposure to derivatives during the six-month period ended June 30, 2020?
A: No, the Portfolio had no exposure to derivatives during the six-month period.
Q: Could you discuss the Portfolio’s commitment to environmental, social, and governance (ESG) investing?
A: ESG refers to the three central factors in measuring the sustainability and ethical impact of an investment in a company or business. We have historically followed an ESG-friendly approach when building the Portfolio. We use specific screening criteria to exclude investments from the Portfolio in companies that fail to meet certain ESG standards across all industries. Per the prospectus, the Portfolio generally will not invest in companies significantly involved in certain business activities, including but not limited to, the production of alcohol, tobacco products, and certain controversial military weapons, and the operation of coal mines, gambling casinos and other gaming businesses. In addition, we view the “governance” aspect of ESG as critically important, as we believe companies that take steps to better manage risk exposure than their competitors can help reduce volatility and lead to solid performance during more difficult periods for both the economy and the markets.
Q: What is your outlook for equities as the Portfolio enters the second half of its fiscal year, and how would you characterize the Portfolio’s current positioning?
A: We believe the economy has begun to recover - led by the regions least affected by COVID-19 - as the population withdraws in phases from the lockdowns. The nature of particular industries is likely to influence the breadth of the recovery, with some businesses such as travel, restaurants, and live entertainment lagging the overall economy. However, we believe the exceptionally prompt actions taken by U.S. fiscal and monetary authorities at
* Dividends are not guaranteed.
7
| Pioneer Fund VCT Portfolio | PIONEER VARIABLE CONTRACTS TRUST |
| PORTFOLIO MANAGEMENT DISCUSSION 6/30/20 | (continued) |
the outset of the crisis could create a bridge for many consumers as well as small, mid, and large businesses to reengage with their activities, and help steepen the trajectory of the recovery from the economic devastation that has just occurred. However, if the trend of new virus diagnoses seen in some U.S. states as the summer progressed continues, that could stall the economic recovery, as it had already led to some states dialing back their re-openings as of the end of the six-month period.
In terms of current positioning, the Portfolio is overweight versus the S&P 500 in consumer discretionary, due to the sector’s exposure to online retail as well as to equities of leading global consumer brands. As mentioned earlier, we had added some of those leading brand names to the Portfolio opportunistically in the first quarter as the stock prices fell on concerns that consumer spending would decline during the pandemic. We believe the new Portfolio additions have the potential to survive over the long term, and could possibly gain market share during the current period of economic decline.
The Portfolio is underweight to energy versus the benchmark due to oil supply-and-demand concerns, and underweight to “bond proxy” sectors such as utilities, which offer limited upside potential, in our view, due to high valuations. With respect to information technology, the Portfolio is underweight versus the S&P 500 in the sector for stock-specific/valuation reasons, but is overweight to the technology-related communications services sector by a similar amount.
Please refer to the Schedule of Investments on pages 9 to 10 for a full listing of Portfolio securities.
Past performance is no guarantee of future results.
Any information in this shareholder report regarding market or economic trends or the factors influencing the Portfolio’s historical or future performance are statements of opinion as of the date of this report.
8
| Pioneer Fund VCT Portfolio | PIONEER VARIABLE CONTRACTS TRUST |
| Shares | Value | ||
| UNAFFILIATED ISSUERS – 98.6% | |||
| COMMON STOCKS – 98.6% | |||
| of Net Assets | |||
| Air Freight & Logistics – 3.6% | |||
| 35,272 | United Parcel Service, Inc., Class B | $ 3,921,541 | |
| Total Air Freight & | |||
| Logistics | $ 3,921,541 | ||
| Banks – 6.1% | |||
| 153,305 | Bank of America Corp. | $ 3,640,994 | |
| 120,571 | Wells Fargo & Co. | 3,086,618 | |
| Total Banks | $ 6,727,612 | ||
| Beverages – 1.9% | |||
| 34,149 | Coca-Cola Co. | $ 1,525,777 | |
| 4,179 | PepsiCo., Inc. | 552,714 | |
| Total Beverages | $ 2,078,491 | ||
| Biotechnology – 1.6% | |||
| 4,166(a) | Biogen, Inc. | $ 1,114,613 | |
945(a) Regeneron Pharmaceuticals, Inc. | 589,349 | ||
| Total Biotechnology | $ 1,703,962 | ||
| Building Products – 1.1% | |||
| 55,749 | Carrier Global Corp. | $ 1,238,743 | |
| Total Building Products | $ 1,238,743 | ||
| Capital Markets – 5.4% | |||
| 2,676 | BlackRock, Inc. | $ 1,455,985 | |
| 12,893 | Charles Schwab Corp. | 435,010 | |
| 13,739 | CME Group, Inc. | 2,233,137 | |
| 5,546 | S&P Global, Inc. | 1,827,296 | |
| Total Capital Markets | $ 5,951,428 | ||
| Chemicals – 2.4% | |||
| 21,813 | International Flavors & | ||
Fragrances, Inc. | $ 2,671,220 | ||
| Total Chemicals | $ 2,671,220 | ||
| Diversified Telecommunication | |||
| Services – 4.5% | |||
| 89,967 | Verizon Communications, Inc. | $ 4,959,881 | |
| Total Diversified | |||
| Telecommunication Services | $ 4,959,881 | ||
| Electric Utilities – 0.0%† | |||
| 262 | Eversource Energy | $ 21,817 | |
| Total Electric Utilities | $ 21,817 | ||
| Energy Equipment & | |||
| Services – 1.3% | |||
| 74,954 | Schlumberger, Ltd. | $ 1,378,404 | |
| Total Energy Equipment & | |||
| Services | $ 1,378,404 | ||
| Entertainment – 2.0% | |||
| 19,482 | Walt Disney Co. | $ 2,172,438 | |
| Total Entertainment | $ 2,172,438 |
| Shares | Value | ||
| Food & Staples | |||
| Retailing – 1.0% | |||
| 9,176 | Walmart, Inc. | $ 1,099,101 | |
| Total Food & Staples | |||
| Retailing | $ 1,099,101 | ||
| Food Products – 0.0%† | |||
| 121 | McCormick & Co., Inc. | $ 21,709 | |
| Total Food Products | $ 21,709 | ||
| Health Care – 1.6% | |||
| 12,879 | Zoetis, Inc. | $ 1,764,938 | |
| Total Health Care | $ 1,764,938 | ||
| Health Care Equipment & | |||
| Supplies – 3.9% | |||
| 16,718 | Danaher Corp. | $ 2,956,244 | |
| 14,356 | Medtronic PLC | 1,316,445 | |
| Total Health Care Equipment | |||
| & Supplies | $ 4,272,689 | ||
| Hotels, Restaurants & | |||
| Leisure – 2.2% | |||
| 32,764 | Starbucks Corp. | $ 2,411,103 | |
| Total Hotels, Restaurants & | |||
| Leisure | $ 2,411,103 | ||
| Industrial | |||
| Conglomerates – 0.4% | |||
| 3,076 | Honeywell International, Inc. | $ 444,759 | |
| Total Industrial | |||
| Conglomerates | $ 444,759 | ||
| Insurance – 0.8% | |||
| 21,573 | Hartford Financial Services | ||
Group, Inc. | $ 831,639 | ||
| Total Insurance | $ 831,639 | ||
| Interactive Media & | |||
| Services – 8.6% | |||
| 3,892(a) | Alphabet, Inc. | $ 5,519,051 | |
| 17,215(a) | Facebook, Inc. | 3,909,010 | |
| Total Interactive Media & | |||
| Services | $ 9,428,061 | ||
| Internet & Direct | |||
| Marketing Retail – 6.0% | |||
| 2,368(a) | Amazon.com, Inc. | $ 6,532,886 | |
| Total Internet & Direct | |||
| Marketing Retail | $ 6,532,886 | ||
| IT Services – 5.0% | |||
| 28,075 | Visa, Inc. | $ 5,423,248 | |
| Total IT Services | $ 5,423,248 | ||
| Life Sciences Tools & | |||
| Services – 2.0% | |||
| 25,107 | Agilent Technologies, Inc. | $ 2,218,706 | |
| Total Life Sciences Tools & | |||
| Services | $ 2,218,706 |
The accompanying notes are an integral part of these financial statements.
9
| Pioneer Fund VCT Portfolio | PIONEER VARIABLE CONTRACTS TRUST |
SCHEDULE OF INVESTMENTS 6/30/20 (UNAUDITED) | (continued) |
| Shares | Value | ||
| Machinery – 0.9% | |||
| 17,876 | Otis Worldwide Corp. | $ 1,016,429 | |
| Total Machinery | $ 1,016,429 | ||
| Oil, Gas & Consumable | |||
| Fuels – 0.0%† | |||
| 222 | EOG Resources, Inc. | $ 11,247 | |
| Total Oil, Gas & Consumable | |||
| Fuels | $ 11,247 | ||
| Pharmaceuticals – 5.7% | |||
| 120,541(a) | Elanco Animal Health, Inc. | $ 2,585,604 | |
| 15,546 | Johnson & Johnson | 2,186,234 | |
| 19,532 | Merck & Co., Inc. | 1,510,410 | |
| Total Pharmaceuticals | $ 6,282,248 | ||
| Road & Rail – 4.0% | |||
| 25,758 | Union Pacific Corp. | $ 4,354,905 | |
| Total Road & Rail | $ 4,354,905 | ||
| Semiconductors & | |||
| Semiconductor | |||
| Equipment – 8.2% | |||
| 15,823 | Analog Devices, Inc. | $ 1,940,533 | |
| 7,799 | Lam Research Corp. | 2,522,664 | |
| 14,404(a) | Micron Technology, Inc. | 742,094 | |
| 9,983 | NVIDIA Corp. | 3,792,641 | |
| Total Semiconductors & | |||
| Semiconductor Equipment | $ 8,997,932 | ||
| Software – 5.6% | |||
| 30,078 | Microsoft Corp. | $ 6,121,174 | |
| Total Software | $ 6,121,174 | ||
| Software & Services – 3.1% | |||
| 11,611 | Mastercard, Inc. | $ 3,433,372 | |
| Total Software & Services | $ 3,433,372 | ||
| Specialty Retail – 1.5% | |||
| 6,418 | Home Depot, Inc. | $ 1,607,773 | |
| Total Specialty Retail | $ 1,607,773 | ||
| Technology Hardware, | |||
| Storage & Peripherals – 5.4% | |||
| 16,189 | Apple, Inc. | $ 5,905,747 | |
| Total Technology Hardware, | |||
| Storage & Peripherals | $ 5,905,747 |
| Shares | Value | ||
| Textiles, Apparel & | |||
| Luxury Goods – 2.8% | |||
| 29,953 | NIKE, Inc., Class B | $ 2,936,892 | |
| Total Textiles, Apparel & | |||
| Luxury Goods | $ 2,936,892 | ||
| TOTAL COMMON STOCKS | |||
(Cost $83,705,808) | $107,942,095 | ||
| TOTAL INVESTMENTS IN | |||
| UNAFFILIATED | |||
| ISSUERS – 98.6% | |||
(Cost $83,705,808) | $107,942,095 | ||
| OTHER ASSETS AND | |||
| LIABILITIES – 1.4% | $ 1,483,928 | ||
| NET ASSETS – 100.0% | $109,426,023 |
† | Amount rounds to less than 0.1%. |
(a) | Non-income producing security. |
Purchases and sales of securities (excluding temporary cash investments) for the six months ended June 30, 2020, aggregated $52,445,208 and $56,673,274, respectively.
The Portfolio is permitted to engage in purchase and sale transactions (“cross trades”) with certain funds and accounts for which Amundi Pioneer Asset Management, Inc. (the “Adviser”) serves as the Portfolio’s investment adviser, as set forth in Rule 17a-7 under the Investment Company Act of 1940, pursuant to procedures adopted by the Board of Trustees. Under these procedures, cross trades are effected at current market prices. During the six months ended June 30, 2020, the Portfolio did not engage in any cross trade activity.
At June 30, 2020, the net unrealized appreciation on investments based on cost for federal tax purposes of $83,941,882 was as follows:
| Aggregate gross unrealized appreciation for all investments | ||||
| in which there is an excess of value over tax cost | $ | 28,421,224 | ||
| Aggregate gross unrealized depreciation for all investments | ||||
| in which there is an excess of tax cost over value | (4,421,011 | ) | ||
| Net unrealized appreciation | $ | 24,000,213 | ||
Various inputs are used in determining the value of the Portfolio’s investments. These inputs are summarized in the three broad levels below.
Level 1 – quoted prices in active markets for identical securities.
Level 2 – other significant observable inputs (including quoted prices for similar securities, interest rates, prepayment speeds, credit risks, etc.). See Notes to Financial Statements — Note 1A.
Level 3 – significant unobservable inputs (including the Portfolio’s own assumptions in determining fair value of investments). See Notes to Financial Statements — Note 1A.
The following is a summary of the inputs used as of June 30, 2020, in valuing the Portfolio’s investments:
| Level 1 | Level 2 | Level 3 | Total | |||||||||||||
Common Stocks | $ | 107,942,095 | $ | — | $ | — | $ | 107,942,095 | ||||||||
| Total Investments in | ||||||||||||||||
| Securities | $ | 107,942,095 | $ | — | $ | — | $ | 107,942,095 | ||||||||
During the six months ended June 30, 2020, there were no transfers between Levels 1, 2 and 3.
The accompanying notes are an integral part of these financial statements.
10
| Pioneer Fund VCT Portfolio | PIONEER VARIABLE CONTRACTS TRUST |
| ASSETS: | ||||
| Investments in unaffiliated issuers, at value (cost $83,705,808) | $ | 107,942,095 | ||
| Cash | 1,026,381 | |||
| Receivables — | ||||
| Investment securities sold | 1,345,284 | |||
| Portfolio shares sold | 13,050 | |||
| Dividends | 95,563 | |||
| Interest | 10,717 | |||
| Other assets | 170 | |||
| Total assets | $ | 110,433,260 | ||
LIABILITIES: | ||||
| Payables — | ||||
| Investment securities purchased | $ | 895,409 | ||
| Portfolio shares repurchased | 55,672 | |||
| Trustees’ fees | 208 | |||
| Due to affiliates | 10,120 | |||
| Accrued expenses | 45,828 | |||
| Total liabilities | $ | 1,007,237 | ||
| NET ASSETS: | ||||
| Paid-in capital | $ | 79,987,009 | ||
| Distributable earnings | 29,439,014 | |||
| Net assets | $ | 109,426,023 | ||
| NET ASSET VALUE PER SHARE: | ||||
No par value (unlimited number of shares authorized) | ||||
| Class I (based on $95,331,230/6,999,315 shares) | $ | 13.62 | ||
| Class II (based on $14,094,793/1,026,527 shares) | $ | 13.73 | ||
The accompanying notes are an integral part of these financial statements.
11
| Pioneer Fund VCT Portfolio | PIONEER VARIABLE CONTRACTS TRUST |
STATEMENT OF OPERATIONS (UNAUDITED) | |
| FOR THE SIX MONTHS ENDED 6/30/20 |
| INVESTMENT INCOME: | ||||||||
| Dividends from unaffiliated issuers (net of foreign taxes withheld $(10,717)) | $ | 930,916 | ||||||
| Interest from unaffiliated issuers | 5,907 | |||||||
| Total investment income | $ | 936,823 | ||||||
| EXPENSES: | ||||||||
| Management fees | $ | 341,905 | ||||||
| Administrative expense | 39,805 | |||||||
| Transfer agent fees | ||||||||
| Distribution fees | ||||||||
| Class II | 15,983 | |||||||
| Custodian fees | 10,004 | |||||||
| Professional fees | 19,550 | |||||||
| Printing expense | 14,290 | |||||||
| Trustees’ fees | 3,856 | |||||||
| Insurance expense | 190 | |||||||
| Miscellaneous | 607 | |||||||
| Total expenses | $ | 446,190 | ||||||
| Net investment income | $ | 490,633 | ||||||
| REALIZED AND UNREALIZED GAIN (LOSS) ON INVESTMENTS: | ||||||||
| Net realized gain (loss) on: | ||||||||
| Investments in unaffiliated issuers | $ | 5,253,115 | ||||||
| Other assets and liabilities denominated in foreign currencies | (748 | ) | $ | 5,252,367 | ||||
| Change in net unrealized appreciation (depreciation) on: | ||||||||
| Investments in unaffiliated issuers | $ | (6,112,197 | ) | |||||
| Other assets and liabilities denominated in foreign currencies | 124 | $ | (6,112,073 | ) | ||||
| Net realized and unrealized gain (loss) on investments | $ | (859,706 | ) | |||||
| Net decrease in net assets resulting from operations | $ | (369,073 | ) | |||||
The accompanying notes are an integral part of these financial statements.
12
| Pioneer Fund VCT Portfolio | PIONEER VARIABLE CONTRACTS TRUST |
STATEMENTS OF CHANGES IN NET ASSETS |
| Six Months | ||||||||
| Ended | ||||||||
| 6/30/20 | Year Ended | |||||||
| (unaudited) | 12/31/19 | |||||||
| FROM OPERATIONS: | ||||||||
Net investment income (loss) | $ | 490,633 | $ | 1,114,293 | ||||
Net realized gain (loss) on investments | 5,252,367 | 9,594,131 | ||||||
Change in net unrealized appreciation (depreciation) on investments | (6,112,073 | ) | 17,794,075 | |||||
| Net increase (decrease) in net assets resulting from operations | $ | (369,073 | ) | $ | 28,502,499 | |||
| DISTRIBUTIONS TO SHAREOWNERS: | ||||||||
| Class I ($1.37 and $2.56 per share, respectively) | $ | (8,745,524 | ) | $ | (15,278,833 | ) | ||
| Class II ($1.35 and $2.52 per share, respectively) | (1,269,532 | ) | (2,001,964 | ) | ||||
| Total distributions to shareowners | $ | (10,015,056 | ) | $ | (17,280,797 | ) | ||
| FROM PORTFOLIO SHARE TRANSACTIONS: | ||||||||
Net proceeds from sales of shares | $ | 4,483,508 | $ | 8,389,230 | ||||
Reinvestment of distributions | 10,015,056 | 17,280,797 | ||||||
Cost of shares repurchased | (8,179,421 | ) | (19,012,750 | ) | ||||
| Net increase in net assets resulting from Portfolio share transactions | $ | 6,319,143 | $ | 6,657,277 | ||||
| Net increase (decrease) in net assets | $ | (4,064,986 | ) | $ | 17,878,979 | |||
| NET ASSETS: | ||||||||
Beginning of period | $ | 113,491,009 | $ | 95,612,030 | ||||
End of period | $ | 109,426,023 | $ | 113,491,009 | ||||
| Six Months | Six Months | |||||||||||||||
| Ended | Ended | |||||||||||||||
| 6/30/2020 | 6/30/2020 | Year Ended | Year Ended | |||||||||||||
| Shares | Amount | 12/31/19 | 12/31/19 | |||||||||||||
| (unaudited) | (unaudited) | Shares | Amount | |||||||||||||
| CLASS I | ||||||||||||||||
Shares sold | 191,427 | $ | 2,799,358 | 326,293 | $ | 4,706,777 | ||||||||||
Reinvestment of distributions | 639,108 | 8,745,524 | 1,114,770 | 15,278,833 | ||||||||||||
Less shares repurchased | (510,285 | ) | (7,021,606 | ) | (1,003,955 | ) | (14,429,994 | ) | ||||||||
| Net increase | 320,250 | $ | 4,523,276 | 437,108 | $ | 5,555,616 | ||||||||||
| CLASS II | ||||||||||||||||
Shares sold | 115,223 | $ | 1,684,150 | 254,279 | $ | 3,682,453 | ||||||||||
Reinvestment of distributions | 91,892 | 1,269,532 | 145,124 | 2,001,964 | ||||||||||||
Less shares repurchased | (86,342 | ) | (1,157,815 | ) | (320,051 | ) | (4,582,756 | ) | ||||||||
| Net increase | 120,773 | $ | 1,795,867 | 79,352 | $ | 1,101,661 | ||||||||||
The accompanying notes are an integral part of these financial statements.
13
| Pioneer Fund VCT Portfolio | PIONEER VARIABLE CONTRACTS TRUST |
FINANCIAL HIGHLIGHTS |
| Six Months | ||||||||||||||||||||||||
| Ended | ||||||||||||||||||||||||
| 6/30/20 | Year Ended | Year Ended | Year Ended | Year Ended | Year Ended | |||||||||||||||||||
| (unaudited) | 12/31/19 | 12/31/18 | 12/31/17 | 12/31/16* | 12/31/15* | |||||||||||||||||||
| Class I | ||||||||||||||||||||||||
Net asset value, beginning of period | $ | 14.95 | $ | 13.52 | $ | 18.29 | $ | 17.72 | $ | 19.75 | $ | 26.84 | ||||||||||||
Increase (decrease) from investment operations: | ||||||||||||||||||||||||
| Net investment income (loss) (a) | $ | 0.07 | $ | 0.16 | $ | 0.18 | $ | 0.21 | $ | 0.24 | $ | 0.25 | ||||||||||||
| Net realized and unrealized gain (loss) on investments | (0.03 | ) | 3.83 | (0.24 | ) | 3.31 | 1.46 | (0.07 | ) | |||||||||||||||
Net increase (decrease) from investment operations | $ | 0.04 | $ | 3.99 | $ | (0.06 | ) | $ | 3.52 | $ | 1.70 | $ | 0.18 | |||||||||||
Distributions to shareowners: | ||||||||||||||||||||||||
| Net investment income | $ | (0.06 | ) | $ | (0.15 | ) | $ | (0.19 | ) | $ | (0.21 | ) | $ | (0.24 | ) | $ | (0.26 | ) | ||||||
| Net realized gain | (1.31 | ) | (2.41 | ) | (4.52 | ) | (2.74 | ) | (3.49 | ) | (7.01 | ) | ||||||||||||
Total distributions | $ | (1.37 | ) | $ | (2.56 | ) | $ | (4.71 | ) | $ | (2.95 | ) | $ | (3.73 | ) | $ | (7.27 | ) | ||||||
Net increase (decrease) in net asset value | $ | (1.33 | ) | $ | 1.43 | $ | (4.77 | ) | $ | 0.57 | $ | (2.03 | ) | $ | (7.09 | ) | ||||||||
Net asset value, end of period | $ | 13.62 | $ | 14.95 | $ | 13.52 | $ | 18.29 | $ | 17.72 | $ | 19.75 | ||||||||||||
Total return (b) | 0.23 | %(c) | 31.33 | % | (1.51 | )%(d) | 21.72 | % | 9.81 | % | (0.06 | )%(e) | ||||||||||||
Ratio of net expenses to average net assets | 0.82 | %(f) | 0.82 | % | 0.82 | % | 0.77 | % | 0.75 | % | 0.75 | % | ||||||||||||
Ratio of net investment income (loss) to average net assets | 0.96 | %(f) | 1.08 | % | 1.12 | % | 1.16 | % | 1.32 | % | 1.09 | % | ||||||||||||
Portfolio turnover rate | 50 | %(c) | 70 | % | 58 | % | 59 | % | 60 | % | 49 | % | ||||||||||||
Net assets, end of period (in thousands) | $ | 95,331 | $ | 99,853 | $ | 84,375 | $ | 101,056 | $ | 121,626 | $ | 127,818 | ||||||||||||
* | The Portfolio was audited by an independent registered public accounting firm other than Ernst & Young LLP. |
(a) | The per-share data presented above is based on the average shares outstanding for the period presented. |
(b) | Assumes initial investment at net asset value at the beginning of each period, reinvestment of all distributions and the complete redemption of the investment at net asset value at the end of each period. |
(c) | Not annualized. |
(d) | If the Portfolio had not recognized gains in settlement of class action lawsuits during the year ended December 31, 2018, the total return would have been (1.55)%. |
(e) | If the Portfolio had not recognized gains in settlement of class action lawsuits during the year ended December 31, 2015, the total return would have been (0.21)%. |
(f) | Annualized. |
NOTE: | The above financial highlights do not reflect the deduction of non-portfolio expenses associated with variable insurance products, such as mortality and expense risk charges, separate account charges, and sales charges. |
The accompanying notes are an integral part of these financial statements.
14
| Pioneer Fund VCT Portfolio | PIONEER VARIABLE CONTRACTS TRUST |
| Six Months | ||||||||||||||||||||||||
| Ended | ||||||||||||||||||||||||
| 6/30/20 | Year Ended | Year Ended | Year Ended | Year Ended | Year Ended | |||||||||||||||||||
| (unaudited) | 12/31/19 | 12/31/18 | 12/31/17 | 12/31/16* | 12/31/15* | |||||||||||||||||||
| Class II | ||||||||||||||||||||||||
Net asset value, beginning of period | $ | 15.06 | $ | 13.60 | $ | 18.35 | $ | 17.78 | $ | 19.79 | $ | 26.89 | ||||||||||||
Increase (decrease) from investment operations: | ||||||||||||||||||||||||
| Net investment income (loss) (a) | $ | 0.05 | $ | 0.12 | $ | 0.14 | $ | 0.16 | $ | 0.19 | $ | 0.19 | ||||||||||||
| Net realized and unrealized gain (loss) on investments | (0.03 | ) | 3.86 | (0.24 | ) | 3.32 | 1.48 | (0.09 | ) | |||||||||||||||
Net increase (decrease) from investment operations | $ | 0.02 | $ | 3.98 | $ | (0.10 | ) | $ | 3.48 | $ | 1.67 | $ | 0.10 | |||||||||||
Distributions to shareowners: | ||||||||||||||||||||||||
| Net investment income | $ | (0.04 | ) | $ | (0.11 | ) | $ | (0.13 | ) | $ | (0.17 | ) | $ | (0.19 | ) | $ | (0.19 | ) | ||||||
| Net realized gain | (1.31 | ) | (2.41 | ) | (4.52 | ) | (2.74 | ) | (3.49 | ) | (7.01 | ) | ||||||||||||
Total distributions | $ | (1.35 | ) | $ | (2.52 | ) | $ | (4.65 | ) | $ | (2.91 | ) | $ | (3.68 | ) | $ | (7.20 | ) | ||||||
Net increase (decrease) in net asset value | $ | (1.33 | ) | $ | 1.46 | $ | (4.75 | ) | $ | 0.57 | $ | (2.01 | ) | $ | (7.10 | ) | ||||||||
Net asset value, end of period | $ | 13.73 | $ | 15.06 | $ | 13.60 | $ | 18.35 | $ | 17.78 | $ | 19.79 | ||||||||||||
Total return (b) | 0.08 | %(c) | 31.03 | % | (1.74 | )%(d) | 21.36 | % | 9.62 | % | (0.37 | )%(e) | ||||||||||||
Ratio of net expenses to average net assets | 1.07 | %(f) | 1.07 | % | 1.07 | % | 1.02 | % | 1.00 | % | 1.01 | % | ||||||||||||
Ratio of net investment income (loss) to average net assets | 0.71 | %(f) | 0.83 | % | 0.88 | % | 0.91 | % | 1.07 | % | 0.84 | % | ||||||||||||
Portfolio turnover rate | 50 | %(c) | 70 | % | 58 | % | 59 | % | 60 | % | 49 | % | ||||||||||||
Net assets, end of period (in thousands) | $ | 14,095 | $ | 13,638 | $ | 11,237 | $ | 13,060 | $ | 15,328 | $ | 15,420 | ||||||||||||
* | The Portfolio was audited by an independent registered public accounting firm other than Ernst & Young LLP. |
(a) | The per-share data presented above is based on the average shares outstanding for the period presented. |
(b) | Assumes initial investment at net asset value at the beginning of each period, reinvestment of all distributions and the complete redemption of the investment at net asset value at the end of each period. |
(c) | Not annualized. |
(d) | If the Portfolio had not recognized gains in settlement of class action lawsuits during the year ended December 31, 2018, the total return would have been (1.78)%. |
(e) | If the Portfolio had not recognized gains in settlement of class action lawsuits during the year ended December 31, 2015, the total return would have been (0.52)%. |
(f) | Annualized. |
NOTE: | The above financial highlights do not reflect the deduction of non-portfolio expenses associated with variable insurance products, such as mortality and expense risk charges, separate account charges, and sales charges. |
The accompanying notes are an integral part of these financial statements.
15
| Pioneer Fund VCT Portfolio | PIONEER VARIABLE CONTRACTS TRUST |
1. Organization and Significant Accounting Policies
Pioneer Fund VCT Portfolio (the “Portfolio”) is one of 8 portfolios comprising Pioneer Variable Contracts Trust (the “Trust”), a Delaware statutory trust. The Portfolio is registered under the Investment Company Act of 1940 as a diversified, open-end management investment company. The investment objectives of the Portfolio are reasonable income and capital growth.
The Portfolio offers two classes of shares designated as Class I and Class II shares. Each class of shares represents an interest in the same portfolio of investments of the Portfolio and has identical rights (based on relative net asset values) to assets and liquidation proceeds. Share classes can bear different rates of class-specific fees and expenses, such as transfer agent and distribution fees. Differences in class-specific fees and expenses will result in differences in net investment income and, therefore, the payment of different dividends from net investment income earned by each class. The Amended and Restated Declaration of Trust of the Portfolio gives the Board of Trustees the flexibility to specify either per-share voting or dollar-weighted voting when submitting matters for shareowner approval. Under per-share voting, each share of a class of the Portfolio is entitled to one vote. Under dollar-weighted voting, a shareowner’s voting power is determined not by the number of shares owned, but by the dollar value of the shares on the record date. Each share class has exclusive voting rights with respect to matters affecting only that class, including with respect to the distribution plan for that class. There is no distribution plan for Class I shares.
Portfolio shares may be purchased only by insurance companies for the purpose of funding variable annuity and variable life insurance contracts or by qualified pension and retirement plans.
Amundi Pioneer Asset Management, Inc., an indirect, wholly owned subsidiary of Amundi and Amundi’s wholly owned subsidiary, Amundi USA, Inc., serves as the Portfolio’s investment adviser (the “Adviser”). Amundi Pioneer Distributor, Inc., an affiliate of Amundi Pioneer Asset Management, Inc., serves as the Portfolio’s distributor (the “Distributor”).
In August 2018, the Securities and Exchange Commission (“SEC”) released a Disclosure Update and Simplification Final Rule. The Final Rule amends Regulation S-X disclosures requirements to conform them to U.S. Generally Accepted Accounting Principles (“U.S. GAAP”) for investment companies. The Portfolio’s financial statements were prepared in compliance with the new amendments to Regulation S-X.
The Portfolio is an investment company and follows investment company accounting and reporting guidance under U.S. GAAP. U.S. GAAP requires the management of the Portfolio to make estimates and assumptions that affect the reported amounts of assets and liabilities, the disclosure of contingent assets and liabilities at the date of the financial statements, and the reported amounts of income, expenses and gain or loss on investments during the reporting period. Actual results could differ from those estimates.
The following is a summary of significant accounting policies followed by the Portfolio in the preparation of its financial statements:
A. Security Valuation
The net asset value of the Portfolio is computed once daily, on each day the New York Stock Exchange (“NYSE”) is open, as of the close of regular trading on the NYSE.
Equity securities that have traded on an exchange are valued by using the last sale price on the principal exchange where they are traded. Equity securities that have not traded on the date of valuation, or securities for which sale prices are not available, generally are valued using the mean between the last bid and asked prices or, if both last bid and asked prices are not available, at the last quoted bid price. Last sale and bid and asked prices are provided by independent third party pricing services. In the case of equity securities not traded on an exchange, prices are typically determined by independent third party pricing services using a variety of techniques and methods.
The value of foreign securities is translated into U.S. dollars based on foreign currency exchange rate quotations supplied by a third party pricing source. Trading in non-U.S. equity securities is substantially completed each day at various times prior to the close of the NYSE. The values of such securities used in computing the net asset value of the Portfolio’s shares are determined as of such times. The Portfolio may use a fair value model developed by an independent pricing service to value non-U.S. equity securities.
16
| Pioneer Fund VCT Portfolio | PIONEER VARIABLE CONTRACTS TRUST |
Securities for which independent pricing services or broker-dealers are unable to supply prices or for which market prices and/or quotations are not readily available or are considered to be unreliable are valued by a fair valuation team comprised of certain personnel of the Adviser pursuant to procedures adopted by the Portfolio’s Board of Trustees. The Adviser’s fair valuation team uses fair value methods approved by the Valuation Committee of the Board of Trustees. The Adviser’s fair valuation team is responsible for monitoring developments that may impact fair valued securities and for discussing and assessing fair values on an ongoing basis, and at least quarterly, with the Valuation Committee of the Board of Trustees.
Inputs used when applying fair value methods to value a security may include credit ratings, the financial condition of the company, current market conditions and comparable securities. The Portfolio may use fair value methods if it is determined that a significant event has occurred after the close of the exchange or market on which the security trades and prior to the determination of the Portfolio’s net asset value. Examples of a significant event might include political or economic news, corporate restructurings, natural disasters, terrorist activity or trading halts. Thus, the valuation of the Portfolio’s securities may differ significantly from exchange prices, and such differences could be material.
At June 30, 2020, no securities were valued using fair value methods (other than securities valued using prices supplied by independent pricing services, broker-dealers or using a third party insurance industry pricing model).
B. Investment Income and Transactions
Dividend income is recorded on the ex-dividend date, except that certain dividends from foreign securities where the ex-dividend date may have passed are recorded as soon as the Portfolio becomes aware of the ex-dividend data in the exercise of reasonable diligence.
Interest income, including interest on income-bearing cash accounts, is recorded on the accrual basis. Dividend and interest income are reported net of unrecoverable foreign taxes withheld at the applicable country rates and net of income accrued on defaulted securities.
Interest and dividend income payable by delivery of additional shares is reclassified as PIK (payment-in-kind) income upon receipt and is included in interest and dividend income, respectively.
Security transactions are recorded as of trade date. Gains and losses on sales of investments are calculated on the identified cost method for both financial reporting and federal income tax purposes.
C. Foreign Currency Translation
The books and records of the Portfolio are maintained in U.S. dollars. Amounts denominated in foreign currencies are translated into U.S. dollars using current exchange rates.
Net realized gains and losses on foreign currency transactions, if any, represent, among other things, the net realized gains and losses on foreign currency exchange contracts, disposition of foreign currencies and the difference between the amount of income accrued and the U.S. dollars actually received. Further, the effects of changes in foreign currency exchange rates on investments are not segregated on the Statement of Operations from the effects of changes in the market prices of those securities, but are included with the net realized and unrealized gain or loss on investments.
D. Federal Income Taxes
It is the Portfolio’s policy to comply with the requirements of the Internal Revenue Code applicable to regulated investment companies and to distribute all of its net taxable income and net realized capital gains, if any, to its shareowners. Therefore, no provision for federal income taxes is required. As of December 31, 2019, the Portfolio did not accrue any interest or penalties with respect to uncertain tax positions, which, if applicable, would be recorded as an income tax expense on the Statement of Operations. Tax returns filed within the prior three years remain subject to examination by federal and state tax authorities.
The amount and character of income and capital gain distributions to shareowners are determined in accordance with federal income tax rules, which may differ from U.S. GAAP. Distributions in excess of net investment income or net realized gains are temporary over distributions for financial statement purposes resulting from differences in the recognition or classification of income or distributions for financial statement and tax purposes. Capital accounts within the financial statements are adjusted for permanent book/tax differences to reflect tax character, but are not adjusted for temporary differences.
17
| Pioneer Fund VCT Portfolio | PIONEER VARIABLE CONTRACTS TRUST |
NOTES TO FINANCIAL STATEMENTS 6/30/20 (UNAUDITED) | (continued) |
The tax character of current year distributions payable will be determined at the end of the current taxable year. The tax character of distributions paid during the year ended December 31, 2019 was as follows:
2019 | ||||
| Distributions paid from: | ||||
| Ordinary income | $ | 1,973,369 | ||
| Long-term capital gain | 15,307,428 | |||
| Total | $ | 17,280,797 | ||
The following shows the components of distributable earnings on a federal income tax basis at December 31, 2019.
2019 | ||||
| Distributable Earnings: | ||||
| Undistributed long-term capital gain | $ | 8,087,155 | ||
| Undistributed ordinary income | 1,623,680 | |||
| Net unrealized appreciation | 30,112,308 | |||
| Total | $ | 39,823,143 | ||
The difference between book-basis and tax-basis net unrealized appreciation is attributable to the tax deferral of losses on wash sales and the tax basis adjustments on REITs and common stocks.
E. Portfolio Shares and Class Allocations
The Portfolio records sales and repurchases of its shares as of trade date. Distribution fees for Class II shares are calculated based on the average daily net asset value attributable to Class II shares of the Portfolio (see Note 4). Class I shares do not pay distribution fees.
Income, common expenses (excluding transfer agent and distribution fees) and realized and unrealized gains and losses are calculated at the Portfolio level and allocated daily to each class of shares based on its respective percentage of the adjusted net assets at the beginning of the day.
All expenses and fees paid to the Portfolio’s transfer agent for its services are allocated among the classes of shares based on the number of accounts in each class and the ratable allocation of related out-of-pocket expenses (see Note 3).
Dividends and distributions to shareowners are recorded on the ex-dividend date. Distributions paid by the Portfolio with respect to each class of shares are calculated in the same manner and at the same time, except that net investment income dividends to Class I and Class II shares can reflect different transfer agent and distribution expense rates.
F. Risks
The value of securities held by the Portfolio may go up or down, sometimes rapidly or unpredictably, due to general market conditions, such as real or perceived adverse economic, political or regulatory conditions, recessions, the spread of infectious illness or other public health issues, inflation, changes in interest rates, lack of liquidity in the bond markets or adverse investor sentiment. In the past several years, financial markets have experienced increased volatility, depressed valuations, decreased liquidity and heightened uncertainty. These conditions may continue, recur, worsen or spread. A general rise in interest rates could adversely affect the price and liquidity of fixed-income securities and could also result in increased redemptions from the Portfolio.
At times, the Portfolio’s investments may represent industries or industry sectors that are interrelated or have common risks, making the Portfolio more susceptible to any economic, political, or regulatory developments or other risks affecting those industries and sectors. The Portfolio’s investments in foreign markets and countries with limited developing markets may subject the Portfolio to a greater degree of risk than investments in a developed market. These risks include disruptive political or economic conditions and the imposition of adverse governmental laws or currency exchange restrictions.
With the increased use of technologies such as the Internet to conduct business, the Portfolio is susceptible to operational, information security and related risks. While the Portfolio’s Adviser has established business continuity plans in the event of, and risk management systems to prevent, limit or mitigate, such cyber-attacks, there are inherent limitations in such plans and systems, including the possibility that certain risks have not been identified. Furthermore, the Portfolio cannot control the cybersecurity plans and systems put in place by service providers to the Portfolio such as Brown Brothers Harriman & Co., the Portfolio’s custodian and accounting agent, and DST Asset Manager Solutions, Inc., the Portfolio’s transfer agent. In addition, many beneficial owners of Portfolio shares hold them through accounts at broker-dealers, retirement platforms and other financial market participants over which neither the Portfolio nor Amundi Pioneer exercises control. Each of these may in turn rely on service providers to them, which are also subject to the risk of cyber-attacks. Cybersecurity failures or breaches at Amundi
18
| Pioneer Fund VCT Portfolio | PIONEER VARIABLE CONTRACTS TRUST |
Pioneer or the Portfolio’s service providers or intermediaries have the ability to cause disruptions and impact business operations, potentially resulting in financial losses, interference with the Portfolio’s ability to calculate its net asset value, impediments to trading, the inability of Portfolio shareowners to effect share purchases, redemptions or exchanges or receive distributions, loss of or unauthorized access to private shareowner information and violations of applicable privacy and other laws, regulatory fines, penalties, reputational damage, or additional compliance costs. Such costs and losses may not be covered under any insurance. In addition, maintaining vigilance against cyber-attacks may involve substantial costs over time, and system enhancements may themselves be subject to cyber-attacks.
COVID-19
The respiratory illness COVID-19 caused by a novel coronavirus has resulted in a global pandemic and major disruption to economies and markets around the world, including the United States. Global financial markets have experienced extreme volatility and severe losses, and trading in many instruments has been disrupted. Liquidity for many instruments has been greatly reduced for periods of time. Some interest rates are very low and in some cases yields are negative. Some sectors of the economy and individual issuers have experienced particularly large losses. These circumstances may continue for an extended period of time, and may continue to affect adversely the value and liquidity of the Portfolio’s investments. The ultimate economic fallout from the pandemic, and the long-term impact on economies, markets, industries and individual issuers, are not known. Governments and central banks, including the Federal Reserve in the U.S., have taken extraordinary and unprecedented actions to support local and global economies and the financial markets. These actions have resulted in significant expansion of public debt, including in the U.S. The impact of these measures, and whether they will be effective to mitigate the economic and market disruption, will not be known for some time. The consequences of high public debt, including its future impact on the economy and securities markets, likewise may not be known for some time.
The Portfolio’s prospectus contains unaudited information regarding the Portfolio’s principal risks. Please refer to that document when considering the Portfolio’s principal risks.
2. Management Agreement
The Adviser manages the Portfolio. Management fees are calculated daily and paid monthly at the annual rate of 0.65% of the Portfolio’s average daily net assets. For the six months ended June 30, 2020, the effective management fee was equivalent to 0.65% (annualized) of the Portfolio’s average daily net assets.
In addition, under the management and administration agreements, certain other services and costs, including accounting, regulatory reporting and insurance premiums, are paid by the Portfolio as administrative reimbursements. Included in “Due to affiliates” reflected on the Statement of Assets and Liabilities is $9,647 in management fees, administrative costs and certain other reimbursements payable to the Adviser at June 30, 2020.
3. Transfer Agent
DST Asset Manager Solutions, Inc. serves as the transfer agent to the Portfolio at negotiated rates. Transfer agent fees and payables shown on the Statement of Operations and the Statement of Assets and Liabilities, respectively, include sub-transfer agent expenses incurred through the Portfolio’s omnibus relationship contracts.
4. Distribution Plan
The Portfolio has adopted a distribution plan (the “Plan”) pursuant to Rule 12b-1 of the Investment Company Act of 1940 with respect to its Class II shares. Pursuant to the Plan, the Portfolio pays the Distributor a distribution fee of 0.25% of the average daily net assets attributable to Class II shares to compensate the Distributor for (1) distribution services and (2) personal and account maintenance services performed and expenses incurred by the Distributor in connection with the Portfolio’s Class II shares. Included in “Due to affiliates” reflected on the Statement of Assets and Liabilities is $473 in distribution fees payable to the Distributor at June 30, 2020.
19
| Pioneer Fund VCT Portfolio | PIONEER VARIABLE CONTRACTS TRUST |
As required by law, the Portfolio has adopted and implemented a liquidity risk management program (the “Program”) that is designed to assess and manage liquidity risk. Liquidity risk is the risk that the Portfolio could not meet requests to redeem its shares without significant dilution of remaining investors’ interests in the Portfolio. The Portfolio’s Board of Trustees designated a liquidity risk management committee (the “Committee”) consisting of employees of Amundi Pioneer Asset Management, Inc. (the “Adviser”) to administer the Program.
The Committee provided the Board of Trustees with a report that addressed the operation of the Program and assessed its adequacy and effectiveness of implementation (the “Report”). The Report covered the period from December 1, 2018 through March 31, 2020 (the “Reporting Period”).
The Report confirmed that, throughout the Reporting Period, the Committee had monitored the Portfolio’s portfolio liquidity and liquidity risk on an ongoing basis, as described in the Program and in Board reporting throughout the Reporting Period.
The Report discussed the Committee’s annual review of the Program, which addressed, among other things, the following elements of the Program:
The Committee reviewed the Portfolio’s investment strategy and liquidity of portfolio investments during both normal and reasonably foreseeable stressed conditions. The Committee noted that the Portfolio’s investment strategy continues to be appropriate for an open-end fund, taking into account, among other things, whether and to what extent the Portfolio held less liquid and illiquid assets and the extent to which any such investments affected the Portfolio’s ability to meet redemption requests. In managing and reviewing the Portfolio’s liquidity risk, the Committee also considered the extent to which the Portfolio’s investment strategy involves a relatively concentrated portfolio or large positions in particular issuers, the extent to which the Portfolio uses borrowing for investment purposes, and the extent to which the Portfolio uses derivatives (including for hedging purposes). The Committee also reviewed the Portfolio’s short-term and long-term cash flow projections during both normal and reasonably foreseeable stressed conditions. In assessing the Portfolio’s cash flow projections, the Committee considered, among other factors, historical net redemption activity, redemption policies, ownership concentration, distribution channels, and the degree of certainty associated with the Portfolio’s short-term and long-term cash flow projections. The Committee also considered the Portfolio’s holdings of cash and cash equivalents, as well as borrowing arrangements and other funding sources, including, if applicable, the Portfolio’s participation in a credit facility, as components of the Portfolio’s ability to meet redemption requests. The Portfolio has adopted an in-kind redemption policy which may be utilized to meet larger redemption requests.
The Committee reviewed the Program’s liquidity classification methodology for categorizing the Portfolio’s investments into one of four liquidity buckets. In reviewing the Portfolio’s investments, the Committee considered, among other factors, whether trading varying portions of a position in a particular portfolio investment or asset class in sizes the Portfolio would reasonably anticipate trading, would be reasonably expected to significantly affect liquidity.
The Committee performed an analysis to determine whether the Portfolio is required to maintain a Highly Liquid Investment Minimum, and determined that no such minimum is required because the Portfolio primarily holds highly liquid investments.
The Report stated that the Committee concluded the Program operates adequately and effectively, in all material respects, to assess and manage the Portfolio’s liquidity risk throughout the Reporting Period.
20
| Officers Lisa M. Jones, President and Chief Executive Officer Mark E. Bradley, Treasurer and Chief Financial and Accounting Officer Christopher J. Kelley, Secretary and Chief Legal Officer Investment Adviser and Administrator Amundi Pioneer Asset Management, Inc. Custodian and Sub-Administrator Brown Brothers Harriman & Co. Principal Underwriter Amundi Pioneer Distributor, Inc. Legal Counsel Morgan, Lewis & Bockius LLP Transfer Agent DST Asset Manager Solutions, Inc. | Trustees Thomas J. Perna, Chairman John E. Baumgardner, Jr. Diane Durnin Benjamin M. Friedman Lisa M. Jones Lorraine H. Monchak Marguerite A. Piret Fred J. Ricciardi Kenneth J. Taubes |
21
Proxy Voting Policies and Procedures of the Portfolio are available without charge, upon request, by calling our toll free number (1-800-225-6292). Information regarding how the Portfolio voted proxies relating to Portfolio securities during the most recent 12-month period ended June 30 is publicly available to shareowners at www.amundipioneer.com/us. This information is also available on the Securities and Exchange Commission’s web site at www.sec.gov.
19611-14-0820
PIONEER VARIABLE CONTRACTS TRUST
Pioneer Real Estate Shares VCT Portfolio — Class I and II Shares
Pioneer Real Estate Shares VCT Portfolio — Class I and II Shares
Beginning in February 2021, as permitted by regulations adopted by the Securities and Exchange Commission, you may not be receiving paper copies of the Portfolio’s shareholder reports like this one by mail, unless you specifically request paper copies of the reports from the insurance company that offers your variable annuity or variable life insurance contract or from your financial intermediary. Instead, the insurance company may choose to make the reports available on a website, and will notify you by mail each time a shareholder report is posted and provide you with a website link to access the report. Instructions for requesting paper copies will be provided by your insurance company.
If you already elected to receive shareholder reports electronically, you will not be affected by this change and you need not take any action. You may elect to receive shareholder reports and other communications from the insurance company or your financial intermediary electronically by following the instructions provided by the insurance company or by contacting your financial intermediary.
You may elect to receive all future Portfolio shareholder reports in paper free of charge from the insurance company. You can inform the insurance company or your financial intermediary that you wish to continue receiving paper copies of your shareholder reports by following the instructions provided by the insurance company or by contacting your financial intermediary. Your election to receive reports in paper will apply to all funds available under your contract with the insurance company.
SEMIANNUAL REPORT
June 30, 2020
June 30, 2020
Please refer to your contract prospectus to determine the applicable share class offered under your contract.
PIONEER VARIABLE CONTRACTS TRUST
Pioneer Real Estate VCT Portfolio | |
This report is authorized for distribution only when preceded or accompanied by a prospectus for the Portfolio being offered.
Pioneer Variable Contracts Trust files a complete schedule of portfolio holdings with the Securities and Exchange Commission for the first and third quarters of each fiscal year as an exhibit to its reports on Form N-PORT. Shareholders may view the filed Form N-PORT by visiting the Commission’s web site at https://www.sec.gov.
| Pioneer Real Estate Shares VCT Portfolio | PIONEER VARIABLE CONTRACTS TRUST |
Sector Distribution
(As a percentage of total investments)*
(As a percentage of total investments)*

5 Largest Holdings
(As a percentage of total investments)*
(As a percentage of total investments)*
| 1. | Prologis, Inc. | 8.66% |
| 2. | Equinix, Inc. | 8.66 |
| 3. | Equity LifeStyle Properties, Inc. | 4.77 |
| 4. | Sun Communities, Inc. | 4.49 |
| 5. | Hannon Armstrong Sustainable | |
| Infrastructure Capital, Inc. | 4.08 |
* Excludes temporary cash investments and all derivative contracts except for options purchased. The Portfolio is actively managed, and current holdings may be different. The holdings listed should not be considered recommendations to buy or sell any securities.
PERFORMANCE UPDATE 6/30/20
Prices and Distributions
| Net Asset Value per Share | 6/30/20 | 12/31/19 |
| Class I | $6.75 | $11.35 |
| Class II | $6.79 | $11.40 |
| Net | |||
| Distributions per Share: | Investment | Short-Term | Long-Term |
| (1/1/20 – 6/30/20) | Income | Capital Gains | Capital Gains |
| Class I | $0.0900 | $0.0100 | $2.4666 |
| Class II | $0.0800 | $0.0100 | $2.4666 |
Performance of a $10,000 Investment
The following chart shows the change in value of an investment made in Class I and Class II shares of Pioneer Real Estate Shares VCT Portfolio at net asset value during the periods shown, compared to that of the Morgan Stanley Capital International (MSCI) U.S. REIT Index. Portfolio returns are based on net asset value and do not reflect applicable insurance fees and surrender charges.
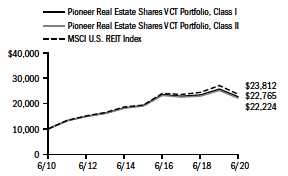
The MSCI U.S. REIT Index is an unmanaged, widely used index comprising a broad representation of the most actively traded real estate trusts, and is designed to be a measure of real estate equity performance. Index returns are calculated monthly, assume reinvestment of dividends and, unlike Portfolio returns, do not reflect any fees, expenses or sales charges. It is not possible to invest directly in an index.
Average Annual Total Returns
(As of June 30, 2020)
| MSCI U.S. | |||
| Class I | Class II | REIT Index | |
10 Years | 8.57% | 8.31% | 9.06% |
5 Years | 3.30% | 3.04% | 4.08% |
1 Year | -12.13% | -12.35% | -12.87% |
All total returns shown assume reinvestment of distributions at net asset value.
The performance table does not reflect the deduction of taxes that a shareowner would pay on distributions or the redemption of Amundi Pioneer shares.
Effective January 1, 2018, Amundi Pioneer became directly responsible for portfolio management of the Portfolio. The performance shown for periods prior to January 1, 2018 reflects the investment strategies employed during those periods.
Call 1-800-688-9915 or visit www.amundipioneer.com/us for the most recent month-end performance results. Current performance may be lower or higher than the performance data quoted.
The performance data quoted represents past performance, which is no guarantee of future results. Investment return and principal value will fluctuate, and shares, when redeemed, may be worth more or less than their original cost.
The returns for the Portfolio do not reflect the deduction of expenses associated with variable products, such as mortality and expense risk charges, separate account charges, and sales charges. These expenses would reduce the overall returns shown.
Performance results reflect any applicable expense waivers in effect during the periods shown. Without such waivers performance would be lower. Waivers may not be in effect for all portfolios. Certain fee waivers are contractual through a specified period. Otherwise, fee waivers can be rescinded at any time. See the prospectus and financial statements for more information.
2
| Pioneer Real Estate Shares VCT Portfolio | PIONEER VARIABLE CONTRACTS TRUST |
As a shareowner in the Portfolio, you incur two types of costs:
(1) ongoing costs, including management fees, distribution and/or service (12b-1) fees, and other Portfolio expenses; and
(2) transaction costs, including sales charges (loads) on purchase payments.
This example is intended to help you understand your ongoing expenses (in dollars) of investing in the Portfolio and to compare these costs with the ongoing costs of investing in other mutual funds offered through your variable annuity contract. The example is based on an investment of $1,000 at the beginning of the Portfolio’s latest six-month period and held throughout the six months.
Using the Tables
Actual Expenses
The first table below provides information about actual account values and actual expenses. You may use the information in this table, together with the amount you invested, to estimate the expenses that you paid over the period as follows:
1. Divide your account value by $1,000
Example: an $8,600 account value ÷ $1,000 = 8.6
2. Multiply the result in (1) above by the corresponding share class’s number in the third row under the heading entitled “Expenses Paid During Period” to estimate the expenses you paid on your account during this period.
Expenses Paid on a $1,000 Investment in Pioneer Real Estate Shares VCT Portfolio
Based on actual returns from January 1, 2020 through June 30, 2020.
| Share Class | I | II |
Beginning Account Value on 1/1/20 | $1,000.00 | $1,000.00 |
Ending Account Value on 6/30/20 | $813.20 | $811.90 |
Expenses Paid During Period* | $6.63 | $7.75 |
* Expenses are equal to the Portfolio’s annualized expense ratio of 1.47% and 1.72%, for Class I and Class II shares, respectively, multiplied by the average account value over the period, multiplied by 182/366 (to reflect the one-half year period).
Hypothetical Example for Comparison Purposes
The table below provides information about hypothetical account values and hypothetical expenses based on the Portfolio’s actual expense ratio and an assumed rate of return of 5% per year before expenses, which is not the Portfolio’s actual return. The hypothetical account values and expenses may not be used to estimate the actual ending account balance or expenses you paid for the period.
You may use this information to compare the ongoing costs of investing in the Portfolio and other variable annuities. To do so, compare this 5% hypothetical example with the 5% hypothetical examples that appear in the shareholder reports of the other variable annuities.
Please note that the expenses shown in the tables are meant to highlight your ongoing costs only and do not reflect any transaction costs, such as sales charges (loads) that are charged at the time of the transaction. Therefore, the table below is useful in comparing ongoing costs only and will not help you determine the relative total costs of owning different variable annuities. In addition, if these transaction costs were included, your costs would have been higher.
Expenses Paid on a $1,000 Investment in Pioneer Real Estate Shares VCT Portfolio
Based on a hypothetical 5% per year return before expenses, reflecting the period from January 1, 2020 through June 30, 2020.
| Share Class | I | II |
Beginning Account Value on 1/1/20 | $1,000.00 | $1,000.00 |
Ending Account Value on 6/30/20 | $1,017.55 | $1,016.31 |
Expenses Paid During Period* | $7.37 | $8.62 |
* Expenses are equal to the Portfolio’s annualized expense ratio of 1.47% and 1.72%, for Class I and Class II shares, respectively, multiplied by the average account value over the period, multiplied by 182/366 (to reflect the one-half year period).
3
| Pioneer Real Estate Shares VCT Portfolio | PIONEER VARIABLE CONTRACTS TRUST |
Call 1-800-688-9915 or visit www.amundipioneer.com/us for the most recent month-end performance results. Current performance may be lower or higher than the performance data quoted.
The performance data quoted represents past performance, which is no guarantee of future results. Investment return and principal value will fluctuate, and shares, when redeemed, may be worth more or less than their original cost.
The returns for the Portfolio do not reflect the deduction of expenses associated with variable products, such as mortality and expense risk charges, separate account charges, and sales charges. These expenses would reduce the overall returns shown.
Performance results reflect any applicable expense waivers in effect during the periods shown. Without such waivers performance would be lower. Waivers may not be in effect for all portfolios. Certain fee waivers are contractual through a specified period. Otherwise, fee waivers can be rescinded at any time. See the prospectus and financial statements for more information.
In the following interview, Raymond Haddad discusses the market environment for real estate investment trusts (REITs) and other real estate-related investments and the factors that influenced the performance of Pioneer Real Estate Shares VCT Portfolio during the six-month reporting period ended June 30, 2020. Mr. Haddad, a vice president and portfolio manager at Amundi Pioneer Asset Management, Inc. (Amundi Pioneer), is responsible for the day-to-day management of the Portfolio.
Q: How did the Portfolio perform during the six-month period ended June 30, 2020?
A: Pioneer Real Estate Shares VCT Portfolio’s Class I shares returned -18.68% at net asset value during the six-month period ended June 30, 2020, and Class II shares returned -18.81%, while the Portfolio’s benchmark, the Morgan Stanley Capital International (MSCI) U.S. REIT Index1, returned -18.45%.
Q: How would you describe the market environment for REIT investors during the six-month period ended June 30, 2020?
A: The six-month reporting period represented a tale of two quarters. When 2020 began, investors were in an upbeat mood due to a thawing of U.S.-China trade relations and a favorable outlook for the gradual reacceleration of the U.S. economy. However, the COVID-19 virus, which first emerged in China in late 2019, spread to Europe and the United States during the winter, and reached pandemic levels by March, completely disrupted global economic activity in the first quarter of 2020. In an effort to stem the spread of the virus, governments at every level and in almost every country issued shelter-in-place and lockdown orders. The virus-containment measures had the effect of bringing the domestic economy almost to a standstill, and the U.S. effectively entered a recession in March, bringing the longest-ever U.S. expansion to an abrupt halt.
Amid the uncertainty, investors sold higher-risk assets and moved into so-called “safe havens” such as U.S. Treasuries. After peaking on February 19, 2020, U.S. equities plummeted by more than 33% from February 19 through March 23, as measured by the Standard & Poor’s 500 Index (the S&P 500). In addition, a “liquidity freeze” rattled the market for riskier fixed-income assets as investors fled into Treasuries.
With economic conditions deteriorating rapidly and unemployment soaring, the Federal Reserve (Fed) lowered the target range for the federal funds rate to zero and announced the implementation of several programs aimed at injecting liquidity into the financial markets through various channels. Those
1 The MSCI information may only be used for your internal use, may not be reproduced or re-disseminated in any form and may not be used as a basis for or a component of any financial instruments or products or indices. None of the MSCI information is intended to constitute investment advice or a recommendation to make (or refrain from making) any kind of investment decision and may not be relied on as such. Historical data and analysis should not be taken as an indication or guarantee of any future performance analysis, forecast or prediction. The MSCI information is provided on an “as is” basis and the user of this information assumes the entire risk of any use made of this information. MSCI, each of its affiliates and each other person involved in or related to compiling, computing or creating any MSCI information (collectively, the “MSCI Parties”) expressly disclaims all warranties (including, without limitation, any warranties of originality, accuracy, completeness, timeliness, non-infringement, merchantability and fitness for a particular purpose) with respect to this information. Without limiting any of the foregoing, in no event shall any MSCI Party have any liability for any direct, indirect, special, incidental, punitive, consequential (including, without limitation, lost profits) or any other damages.
4
| Pioneer Real Estate Shares VCT Portfolio | PIONEER VARIABLE CONTRACTS TRUST |
moves helped to reassure the fixed-income and currency markets. Policy makers in the U.S. government followed the Fed’s lead and introduced multiple, large-scale fiscal stimulus programs to help soften the economic toll from what essentially amounted to the shuttering of the U.S. economy.
As the markets developed a better understanding of the pandemic and its repercussions, and as the massive monetary and fiscal stimulus measures assuaged some economic concerns, equity markets rebounded in the second quarter, recouping much of their earlier losses in the process. The rally was especially strong in April, led by many of the stocks that struggled the most during the first-quarter sell-off. However, the social-distancing and lockdown mandates designed to help curb the spread of COVID-19 continued to present new challenges for many sectors of the economy, especially those businesses dependent on face-to-face contact between employees and customers.
With the COVID-19 situation raising concerns about the resilience of the commercial real estate market practically overnight, REITs that had been flourishing prior to the pandemic declined sharply during the first quarter. The asset class rallied in the second quarter, but not as much as other equity sectors. As a result, REITs underperformed the broader equity market, as measured by the S&P 500, by a wide margin over the six-month period. The MSCI U.S. REIT Index (the MSCI Index), the Portfolio’s benchmark, returned -18.45% for the six-month period, while the S&P 500 was down by just 3.08%.
Within the MSCI Index, most subsectors finished the six-month period in negative territory, with industrials, data centers, and apartments holding up best, while retail, lodging, and diversified (triple-net) REITs struggled the most.
Q: Which of your investment decisions aided the Portfolio’s benchmark-relative performance during the six-month period ended June 30, 2020?
A: The Portfolio’s returns were essentially in line with the MSCI Index for the six-month period, with positive benchmark-relative performance results driven by allocations to apartment, warehouse, and data-center REITs.
Within the apartment subsector, the Portfolio’s investment in Mid-American Apartment Communities was the top positive performance contributor for the six-month period. Mid-American focuses on the housing rental markets in the southeastern and southwestern U.S., areas that were not as exposed to the more severe pandemic outbreaks that afflicted the coastal regions, particularly the northeast Atlantic coast, during most of the six-month period.
5
| Pioneer Real Estate Shares VCT Portfolio | PIONEER VARIABLE CONTRACTS TRUST |
PORTFOLIO MANAGEMENT DISCUSSION 6/30/20 | (continued) |
Within industrials, we focused on owning warehouse REITs, which have continued to benefit from the closure of many brick-and-mortar stores and from the social-distancing measures that have been affecting how consumers shop and receive their goods. In past recessions, declining demand had a negative effect on the subsector, which in turn had led to overcapacity and falling rents. However, the COVID-19 pandemic has produced the opposite effect. The Portfolio’s investments in Prologis and Duke Realty benefited from the trend and were standout performers over the six-month period.
Prologis’s warehouses are strategically located in urban areas to facilitate same-day or two-day shipping. During the second quarter, the company benefited from its exposure to industries that have held up well in the COVID-19 environment, such as consumer products, food and beverages, and construction. Duke Realty owns and operates industrial assets in 20 major logistics markets across the southern and mid-western U.S. The company’s “last-mile” properties reside in high-income urban areas, which have been seeing elevated demand for same-day deliveries.
With the continued migration to cloud computing, the Portfolio’s allocation to data-center REITs also aided benchmark-relative returns over the six-month period. A position in QTS Realty Trust was the leading performance contributor within the subsector. QTS owns mega-scale data-center space throughout North America, and those facilities house the network and computer equipment of multiple customers and provide access to a range of information technology/infrastructure solutions.
Finally, our decision to limit the Portfolio’s exposures to malls, office, and apartments located in the non-coastal areas of the U.S. aided returns relative to the MSCI Index over the six-month period.
Q: Which of your investment decisions detracted from the Portfolio’s benchmark-relative performance during the six-month period ended June 30, 2020?
A: With regard to individual positions, the Portfolio’s investments in Hilton Worldwide Holdings and Monarch Casinos were the largest detractors from benchmark-relative returns during the six-month period. Hotels and casinos have struggled as COVID-19 has shut down economies. Meanwhile, social-distancing requirements as well as many consumers’ reluctance to gather in large groups have effectively reduced capacity at the properties that did reopen. As the magnitude of the pandemic became more apparent, we exited both positions in March 2020, but not before the two holdings had a negative effect on the Portfolio’s performance.
6
| Pioneer Real Estate Shares VCT Portfolio | PIONEER VARIABLE CONTRACTS TRUST |
The stock of Redfin also faced challenges during the six-month period. Redfin is a tech-enabled residential real estate brokerage firm that utilizes rebates/refunds on the “buy” side of the transaction, and a lower commission rate on the “sell” side of the transaction. We sold the Portfolio’s position in February 2020 after the company experienced profit-margin pressures.
Finally, our decision to avoid the stock of Digital Realty Trust, a solid performer during the six-month period, weighed on the Portfolio’s benchmark-relative results. As with the Portfolio’s existing data-center holdings, Digital Realty offers information technology services and provides its clients with co-location and interconnection capabilities to enhance access to the cloud, which enables them to store data. The lack of exposure to Digital Realty stemmed purely from our decision to invest in other competitors in the data-center subsector.
Q: Did the Portfolio have exposure to any derivative securities during the six-month period ended June 30, 2020?
A: No, the Portfolio had no exposure to derivative investments during the six-month period.
Q: What is your view on the REIT market as we head into the second half of 2020, and how have you positioned the Portfolio?
A: With so much uncertainty about the path of the pandemic and any potential economic recovery still prevalent, we believe investing in resilient businesses with an eye for relative-value opportunities will be key to reducing risk and weathering market volatility. A focus on companies with strong balance sheets, ample liquidity, and the flexibility to meet the challenges posed by what is essentially a health care crisis is paramount, in our opinion.
We believe the pandemic has upended some well-entrenched demographic consumption trends, while accelerating other longer-term secular trends. REIT subsectors with higher fixed costs and that promote close contact between individuals, such as retail, office, lodging, and senior housing, or businesses that are non-essential, have appeared to be the most vulnerable in the current environment. In our opinion, those REIT subsectors may not bounce back quickly from COVID-19, as companies in those subsectors may not be able to recoup lost demand. On the other hand, we believe REITs that are more flexible in adapting their models to comply with social-distancing guidelines and stay-at-home orders could fare better. The latter category would include industrial REITs, residential REITs, and select REITs within health care.
7
| Pioneer Real Estate Shares VCT Portfolio | PIONEER VARIABLE CONTRACTS TRUST |
PORTFOLIO MANAGEMENT DISCUSSION 6/30/20 | (continued) |
A Word About Risk:
All investments are subject to risk, including the possible loss of principal. In the past several years, financial markets have experienced increased volatility and heightened uncertainty. The market prices of securities may go up or down, sometimes rapidly or unpredictably, due to general market conditions, such as real or perceived adverse economic, political, or regulatory conditions, recessions, inflation, changes in interest or currency rates, lack of liquidity in the bond markets, the spread of infectious illness or other public health issues or adverse investor sentiment. These conditions may continue, recur, worsen or spread.
The Portfolio invests in REIT securities, the value of which can fall for a variety of reasons, such as declines in rental income, fluctuating interest rates, poor property management, environmental liabilities, uninsured damage, increased competition, or changes in real estate tax laws.
The Portfolio invests in a limited number of securities and, as a result, the Portfolio’s performance may be more volatile than the performance of other portfolios holding more securities.
Investing in foreign and/or emerging markets securities involves risks relating to interest rates, currency exchange rates, economic, and political conditions.
When interest rates rise, the prices of fixed-income securities in the Portfolio will generally fall. Conversely, when interest rates fall, the prices of fixed-income securities in the Portfolio will generally rise.
At times, the Portfolio’s investments may represent industries or industry sectors that are interrelated or have common risks, making the Portfolio more susceptible to any economic, political, or regulatory developments or other risks affecting those industries and sectors.
These risks may increase share price volatility.
Ultimately, we believe our over-arching, secular investment themes focused on e-commerce, remote working, urbanization, and cloud computing could help the Portfolio to weather the challenges posed by the pandemic. In our view, investors have been underestimating those secular shifts, and their potential significance.
With regard to positioning, the Portfolio began the six-month period with underweight exposures to retail, lodging, and office REITs. However, given the heightened market volatility and economic uncertainty, we thought it would be prudent to bring those weightings more in line with those of the MSCI Index. Accordingly, in March and April 2020, we increased the Portfolio’s allocations to office, lodging, and strip malls within retail. Meanwhile, the Portfolio has remained overweight to specialized, industrial, and residential REITs, for the reasons mentioned above.
Please refer to the Schedule of Investments on pages 9 – 10 for a full listing of Portfolio securities.
Past performance is no guarantee of future results.
Any information in this shareholder report regarding market or economic trends or the factors influencing the Portfolio’s historical or future performance are statements of opinion as of the date of this report.
8
| Pioneer Real Estate Shares VCT Portfolio | PIONEER VARIABLE CONTRACTS TRUST |
| Shares | Value | ||
| UNAFFILIATED ISSUERS – 99.6% | |||
| COMMON STOCKS – 99.6% | |||
| of Net Assets | |||
| Equity Real Estate Investment | |||
| Trusts (REITs) – 99.2% | |||
| 8,271 | Agree Realty Corp. | $ 543,488 | |
| 4,301 | Alexander & Baldwin, Inc. | 52,429 | |
| 4,962 | Alexandria Real Estate Equities, Inc. | 805,084 | |
| 15,084 | American Homes 4 Rent | 405,760 | |
| 423 | American Tower Corp. | 109,362 | |
| 6,090 | Americold Realty Trust | 221,067 | |
| 7,817 | Apple Hospitality REIT, Inc. | 75,512 | |
| 20,510 | Brandywine Realty Trust | 223,354 | |
| 21,312 | Brixmor Property Group, Inc. | 273,220 | |
| 4,432 | Camden Property Trust | 404,287 | |
| 6,165 | CareTrust Real Estate Investment | ||
| Trust, Inc. | 105,791 | ||
| 5,040 | Community Healthcare Trust, Inc. | 206,136 | |
| 2,215 | CoreSite Realty Corp. | 268,148 | |
| 5,699 | Corporate Office Properties Trust | 144,413 | |
| 12,656 | Duke Realty Corp. | 447,896 | |
| 2,913 | EastGroup Properties, Inc. | 345,511 | |
| 4,115 | EPR Properties | 136,330 | |
| 2,530 | Equinix, Inc. | 1,776,819 | |
| 15,659 | Equity LifeStyle Properties, Inc. | 978,374 | |
| 2,795 | Federal Realty Investment Trust | 238,162 | |
| 9,981 | Global Medical REIT, Inc. | 113,085 | |
| 6,228 | Global Net Lease, Inc. | 104,194 | |
| 29,433 | Hannon Armstrong Sustainable | ||
| Infrastructure Capital, Inc. | 837,663 | ||
| 18,830 | Healthpeak Properties, Inc. | 518,955 | |
| 18,693 | Host Hotels & Resorts, Inc. | 201,697 | |
| 11,820 | Independence Realty Trust, Inc. | 135,812 | |
| 8,012 | Industrial Logistics Properties Trust | 164,647 | |
| 2,720 | Innovative Industrial Properties, Inc. | 239,414 | |
| 1,203 | Kilroy Realty Corp. | 70,616 | |
| 18,474 | Kimco Realty Corp. | 237,206 | |
| 2,792 | Lamar Advertising Co. | 186,394 | |
| 9,793 | Lexington Realty Trust, Class B | 103,316 | |
| 2,022 | Life Storage, Inc. | 191,989 | |
| 3,145 | LTC Properties, Inc. | 118,472 | |
| 24,124 | Medical Properties Trust, Inc. | 453,531 | |
| 8,913 | MGM Growth Properties LLC | 242,523 | |
| 3,712 | Mid-America Apartment Communities, Inc. | 425,655 | |
| 14,994 | National Storage Affiliates Trust | 429,728 | |
| 3,511 | Office Properties Income Trust | 91,181 | |
| 17,648 | Park Hotels & Resorts, Inc. | 174,539 | |
| 12,080 | Physicians Realty Trust | 211,642 |
| Shares | Value | ||
| Equity Real Estate Investment | |||
| Trusts (REITs) (continued) | |||
| 19,050 | Prologis, Inc. | $ 1,777,936 | |
| 7,128 | QTS Realty Trust, Inc. | 456,833 | |
| 3,078 | Realty Income Corp. | 183,141 | |
| 5,473 | Regency Centers Corp. | 251,156 | |
| 23,522 | Retail Opportunity Investments | ||
Corp. | 266,504 | ||
| 7,095 | Rexford Industrial Realty, Inc. | 293,946 | |
| 15,365 | Sabra Health Care Real Estate | ||
Investment Trust, Inc. | 221,717 | ||
| 5,219 | Safehold, Inc. | 300,040 | |
| 8,977 | Simon Property Group, Inc. | 613,847 | |
| 2,442 | SL Green Realty Corp. | 120,366 | |
| 16,347 | Summit Hotel Properties, Inc. | 96,938 | |
| 6,791 | Sun Communities, Inc. | 921,403 | |
| 4,408 | Terreno Realty Corp. | 232,037 | |
| 4,734 | UDR, Inc. | 176,957 | |
| 9,282 | Ventas, Inc. | 339,907 | |
| 16,858 | VICI Properties, Inc. | 340,363 | |
| 5,479 | Vornado Realty Trust | 209,353 | |
| 4,965 | Welltower, Inc. | 256,939 | |
| 5,500 | WP Carey, Inc. | 372,075 | |
| Total Equity Real Estate | |||
| Investment Trusts (REITs) | $ 20,444,860 | ||
| Real Estate Management | |||
| & Development – 0.4% | |||
| 1,866(a) | CBRE Group, Inc. | $ 84,381 | |
| Total Real Estate Management | |||
| & Development | $ 84,381 | ||
| TOTAL COMMON STOCKS | |||
(Cost $17,380,392) | $ 20,529,241 | ||
| TOTAL INVESTMENTS IN | |||
| UNAFFILIATED ISSUERS – 99.6% | |||
(Cost $17,380,392) | $ 20,529,241 | ||
| OTHER ASSETS AND | |||
| LIABILITIES – 0.4% | $ 82,145 | ||
| NET ASSETS – 100.0% | $20,611,386 |
The accompanying notes are an integral part of these financial statements.
9
| Pioneer Real Estate Shares VCT Portfolio | PIONEER VARIABLE CONTRACTS TRUST |
SCHEDULE OF INVESTMENTS 6/30/20 (UNAUDITED) | (continued) |
REIT | Real Estate Investment Trust. |
(a) | Non-income producing security. |
Purchases and sales of securities (excluding temporary cash investments) for the six months ended June 30, 2020, aggregated $20,725,029 and $22,105,510, respectively.
The Portfolio is permitted to engage in purchase and sale transactions (“cross trades”) with certain funds and accounts for which Amundi Pioneer Asset Management, Inc. (the “Adviser”) serves as the Portfolio’s investment adviser, as set forth in Rule 17a-7 under the Investment Company Act of 1940, pursuant to procedures adopted by the Board of Trustees. Under these procedures, cross trades are effected at current market prices. During the six months ended June 30, 2020, the Portfolio did not engage in any cross trade activity.
At June 30, 2020, the net unrealized appreciation on investments based on cost for federal tax purposes of $17,405,656 was as follows:
| Aggregate gross unrealized appreciation for all investments | ||||
| in which there is an excess of value over tax cost | $ | 3,644,258 | ||
| Aggregate gross unrealized depreciation for all investments | ||||
| in which there is an excess of tax cost over value | (520,673 | ) | ||
| Net unrealized appreciation | $ | 3,123,585 | ||
Various inputs are used in determining the value of the Portfolio’s investments. These inputs are summarized in the three broad levels below.
Level 1 – quoted prices in active markets for identical securities.
Level 2 – other significant observable inputs (including quoted prices for similar securities, interest rates, prepayment speeds, credit risks, etc.). See Notes to Financial Statements — Note 1A.
Level 3 – significant unobservable inputs (including the Portfolio’s own assumptions in determining fair value of investments). See Notes to Financial Statements —Note 1A.
The following is a summary of the inputs used as of June 30, 2020, in valuing the Portfolio’s investments:
| Level 1 | Level 2 | Level 3 | Total | |||||||||||||
Common Stocks | $ | 20,529,241 | $ | — | $ | — | $ | 20,529,241 | ||||||||
| Total Investments | ||||||||||||||||
| in Securities | $ | 20,529,241 | $ | — | $ | — | $ | 20,529,241 | ||||||||
During the six months ended June 30, 2020, there were no transfers between Levels 1, 2 and 3.
The accompanying notes are an integral part of these financial statements.
10
| Pioneer Real Estate Shares VCT Portfolio | PIONEER VARIABLE CONTRACTS TRUST |
| ASSETS: | ||||
| Investments in unaffiliated issuers, at value (cost $17,380,392) | $ | 20,529,241 | ||
| Cash | 54,440 | |||
| Receivables — | ||||
| Investment securities sold | 416,297 | |||
| Portfolio shares sold | 17,981 | |||
| Dividends | 77,014 | |||
| Other assets | 510 | |||
| Total assets | $ | 21,095,483 | ||
| LIABILITIES: | ||||
| Payables — | ||||
| Investment securities purchased | $ | 415,868 | ||
| Portfolio shares repurchased | 19,368 | |||
| Distributions | 103 | |||
| Trustees’ fees | 433 | |||
| Professional fees | 23,824 | |||
| Due to affiliates | 2,640 | |||
| Accrued expenses | 21,861 | |||
| Total liabilities | $ | 484,097 | ||
| NET ASSETS: | ||||
| Paid-in capital | $ | 20,610,634 | ||
| Distributable earnings | 752 | |||
| Net assets | $ | 20,611,386 | ||
| NET ASSET VALUE PER SHARE: | ||||
No par value (unlimited number of shares authorized) | ||||
| Class I (based on $5,380,466/796,790 shares) | $ | 6.75 | ||
| Class II (based on $15,230,920/2,241,956 shares) | $ | 6.79 | ||
The accompanying notes are an integral part of these financial statements.
11
| Pioneer Real Estate Shares VCT Portfolio | PIONEER VARIABLE CONTRACTS TRUST |
STATEMENT OF OPERATIONS (UNAUDITED) | |
| FOR THE SIX MONTHS ENDED 6/30/20 |
| INVESTMENT INCOME: | ||||||||
| Dividends from unaffiliated issuers | $ | 373,825 | ||||||
| Interest from unaffiliated issuers | 263 | |||||||
| Total investment income | $ | 374,088 | ||||||
| EXPENSES: | ||||||||
| Management fees | $ | 91,430 | ||||||
| Administrative expense | 30,465 | |||||||
| Distribution fees | ||||||||
| Class II | 21,190 | |||||||
| Custodian fees | 5,507 | |||||||
| Professional fees | 24,850 | |||||||
| Printing expense | 10,586 | |||||||
| Trustees’ fees | 4,191 | |||||||
| Miscellaneous | 1,049 | |||||||
| Total expenses | $ | 189,268 | ||||||
| Net investment income | $ | 184,820 | ||||||
| REALIZED AND UNREALIZED GAIN (LOSS) ON INVESTMENTS: | ||||||||
| Net realized gain (loss) on: | ||||||||
| Investments in unaffiliated issuers | $ | (3,120,549 | ) | |||||
| Other assets and liabilities denominated in foreign currencies | (4 | ) | $ | (3,120,553 | ) | |||
| Change in net unrealized appreciation (depreciation) on: | ||||||||
| Investments in unaffiliated issuers | $ | (1,969,357 | ) | |||||
| Other assets and liabilities denominated in foreign currencies | (5 | ) | $ | (1,969,362 | ) | |||
| Net realized and unrealized gain (loss) on investments | $ | (5,089,915 | ) | |||||
| Net decrease in net assets resulting from operations | $ | (4,905,095 | ) | |||||
The accompanying notes are an integral part of these financial statements.
12
| Pioneer Real Estate Shares VCT Portfolio | PIONEER VARIABLE CONTRACTS TRUST |
STATEMENTS OF CHANGES IN NET ASSETS |
| Six Months | ||||||||
| Ended | ||||||||
| 6/30/20 | Year Ended | |||||||
| (unaudited) | 12/31/19 | |||||||
| FROM OPERATIONS: | ||||||||
Net investment income (loss) | $ | 184,820 | $ | 301,514 | ||||
Net realized gain (loss) on investments | (3,120,553 | ) | 5,889,488 | |||||
Change in net unrealized appreciation (depreciation) on investments | (1,969,362 | ) | 413,370 | |||||
| Net increase (decrease) in net assets resulting from operations | $ | (4,905,095 | ) | $ | 6,604,372 | |||
| DISTRIBUTIONS TO SHAREOWNERS: | ||||||||
| Class I ($2.57 and $4.52 per share, respectively) | $ | (1,509,171 | ) | $ | (2,104,467 | ) | ||
| Class II ($2.56 and $4.48 per share, respectively) | (4,235,427 | ) | (6,245,831 | ) | ||||
| Total distributions to shareowners | $ | (5,744,598 | ) | $ | (8,350,298 | ) | ||
| FROM PORTFOLIO SHARE TRANSACTIONS: | ||||||||
Net proceeds from sales of shares | $ | 789,649 | $ | 1,074,630 | ||||
Reinvestment of distributions | 5,744,598 | 8,350,298 | ||||||
Cost of shares repurchased | (2,350,347 | ) | (5,205,290 | ) | ||||
| Net increase in net assets resulting from Portfolio share transactions | $ | 4,183,900 | $ | 4,219,638 | ||||
| Net increase (decrease) in net assets | $ | (6,465,793 | ) | $ | 2,473,712 | |||
| NET ASSETS: | ||||||||
Beginning of period | $ | 27,077,179 | $ | 24,603,467 | ||||
End of period | $ | 20,611,386 | $ | 27,077,179 | ||||
| Six Months | Six Months | |||||||||||||||
| Ended | Ended | |||||||||||||||
| 6/30/20 | 6/30/20 | Year Ended | Year Ended | |||||||||||||
| Shares | Amount | 12/31/19 | 12/31/19 | |||||||||||||
| (unaudited) | (unaudited) | Shares | Amount | |||||||||||||
| CLASS I | ||||||||||||||||
Shares sold | 8,572 | $ | 86,238 | 7,479 | $ | 92,554 | ||||||||||
Reinvestment of distributions | 214,964 | 1,509,171 | 191,133 | 2,104,467 | ||||||||||||
Less shares repurchased | (35,463 | ) | (354,288 | ) | (84,895 | ) | (1,071,717 | ) | ||||||||
| Net increase | 188,073 | $ | 1,241,121 | 113,717 | $ | 1,125,304 | ||||||||||
| Class II | ||||||||||||||||
Shares sold | 74,089 | $ | 703,411 | 78,397 | $ | 982,076 | ||||||||||
Reinvestment of distributions | 599,246 | 4,235,427 | 565,627 | 6,245,831 | ||||||||||||
Less shares repurchased | (200,720 | ) | (1,996,059 | ) | (336,900 | ) | (4,133,573 | ) | ||||||||
| Net increase | 472,615 | $ | 2,942,779 | 307,124 | $ | 3,094,334 | ||||||||||
The accompanying notes are an integral part of these financial statements.
13
| Pioneer Real Estate Shares VCT Portfolio | PIONEER VARIABLE CONTRACTS TRUST |
FINANCIAL HIGHLIGHTS |
| Six Months | ||||||||||||||||||||||||
| Ended | ||||||||||||||||||||||||
| 6/30/20 | Year Ended | Year Ended | Year Ended | Year Ended | Year Ended | |||||||||||||||||||
| (unaudited) | 12/31/19 | 12/31/18 | 12/31/17 | 12/31/16* | 12/31/15* | |||||||||||||||||||
| Class I | ||||||||||||||||||||||||
Net asset value, beginning of period | $ | 11.35 | $ | 12.55 | $ | 15.40 | $ | 16.37 | $ | 19.53 | $ | 21.57 | ||||||||||||
Increase (decrease) from investment operations: | ||||||||||||||||||||||||
| Net investment income (loss) (a) | $ | 0.09 | $ | 0.16 | $ | 0.25 | $ | 0.26 | $ | 0.26 | $ | 0.29 | ||||||||||||
| Net realized and unrealized gain (loss) on investments | (2.12 | ) | 3.16 | (1.26 | ) | 0.28 | 0.95 | 0.56 | ||||||||||||||||
Net increase (decrease) from investment operations | $ | (2.03 | ) | $ | 3.32 | $ | (1.01 | ) | $ | 0.54 | $ | 1.21 | $ | 0.85 | ||||||||||
Distributions to shareowners: | ||||||||||||||||||||||||
| Net investment income | $ | (0.09 | ) | $ | (0.19 | ) | $ | (0.25 | ) | $ | (0.26 | ) | $ | (0.27 | ) | $ | (0.29 | ) | ||||||
| Net realized gain | (2.48 | ) | (4.33 | ) | (1.59 | ) | (1.25 | ) | (4.10 | ) | (2.60 | ) | ||||||||||||
Total distributions | $ | (2.57 | ) | $ | (4.52 | ) | $ | (1.84 | ) | $ | (1.51 | ) | $ | (4.37 | ) | $ | (2.89 | ) | ||||||
Net increase (decrease) in net asset value | $ | (4.60 | ) | $ | (1.20 | ) | $ | (2.85 | ) | $ | (0.97 | ) | $ | (3.16 | ) | $ | (2.04 | ) | ||||||
Net asset value, end of period | $ | 6.75 | $ | 11.35 | $ | 12.55 | $ | 15.40 | $ | 16.37 | $ | 19.53 | ||||||||||||
Total return (b) | (18.68 | )%(c) | 28.16 | % | (7.24 | )% | 3.50 | % | 6.05 | % | 4.79 | % | ||||||||||||
Ratio of net expenses to average net assets | 1.47 | %(d) | 1.33 | % | 1.37 | % | 1.12 | % | 1.06 | % | 1.03 | % | ||||||||||||
Ratio of net investment income (loss) to average net assets | 1.81 | %(d) | 1.29 | % | 1.76 | % | 1.63 | % | 1.42 | % | 1.45 | % | ||||||||||||
Portfolio turnover rate | 91 | %(c) | 125 | % | 154 | % | 8 | % | 9 | % | 17 | % | ||||||||||||
Net assets, end of period (in thousands) | $ | 5,380 | $ | 6,910 | $ | 6,210 | $ | 7,824 | $ | 8,993 | $ | 10,215 | ||||||||||||
* | The Portfolio was audited by an independent registered public accounting firm other than Ernst & Young LLP. |
(a) | The per-share data presented above is based on the average shares outstanding for the period presented. |
(b) | Assumes initial investment at net asset value at the beginning of each period, reinvestment of all distributions and the complete redemption of the investment at net asset value at the end of each period. |
(c) | Not annualized. |
(d) | Annualized. |
NOTE: | The above financial highlights do not reflect the deduction of non-portfolio expenses associated with variable insurance products, such as mortality and expense risk charges, separate account charges, and sales charges. |
The accompanying notes are an integral part of these financial statements.
14
| Pioneer Real Estate Shares VCT Portfolio | PIONEER VARIABLE CONTRACTS TRUST |
| Six Months | ||||||||||||||||||||||||
| Ended | ||||||||||||||||||||||||
| 6/30/20 | Year Ended | Year Ended | Year Ended | Year Ended | Year Ended | |||||||||||||||||||
| (unaudited) | 12/31/19 | 12/31/18 | 12/31/17 | 12/31/16* | 12/31/15* | |||||||||||||||||||
| Class II | ||||||||||||||||||||||||
Net asset value, beginning of period | $ | 11.40 | $ | 12.58 | $ | 15.44 | $ | 16.40 | $ | 19.55 | $ | 21.60 | ||||||||||||
Increase (decrease) from investment operations: | ||||||||||||||||||||||||
| Net investment income (loss) (a) | $ | 0.08 | $ | 0.13 | $ | 0.21 | $ | 0.22 | $ | 0.21 | $ | 0.24 | ||||||||||||
| Net realized and unrealized gain (loss) on investments | (2.13 | ) | 3.17 | (1.27 | ) | 0.29 | 0.96 | 0.56 | ||||||||||||||||
Net increase (decrease) from investment operations | $ | (2.05 | ) | $ | 3.30 | $ | (1.06 | ) | $ | 0.51 | $ | 1.17 | $ | 0.80 | ||||||||||
Distributions to shareowners: | ||||||||||||||||||||||||
| Net investment income | $ | (0.08 | ) | $ | (0.15 | ) | $ | (0.21 | ) | $ | (0.22 | ) | $ | (0.22 | ) | $ | (0.25 | ) | ||||||
| Net realized gain | (2.48 | ) | (4.33 | ) | (1.59 | ) | (1.25 | ) | (4.10 | ) | (2.60 | ) | ||||||||||||
Total distributions | $ | (2.56 | ) | $ | (4.48 | ) | $ | (1.80 | ) | $ | (1.47 | ) | $ | (4.32 | ) | $ | (2.85 | ) | ||||||
Net increase (decrease) in net asset value | $ | (4.61 | ) | $ | (1.18 | ) | $ | (2.86 | ) | $ | (0.96 | ) | $ | (3.15 | ) | $ | (2.05 | ) | ||||||
Net asset value, end of period | $ | 6.79 | $ | 11.40 | $ | 12.58 | $ | 15.44 | $ | 16.40 | $ | 19.55 | ||||||||||||
Total return (b) | (18.81 | )%(c) | 27.91 | % | (7.54 | )% | 3.30 | % | 5.82 | % | 4.52 | % | ||||||||||||
Ratio of net expenses to average net assets | 1.72 | %(d) | 1.58 | % | 1.62 | % | 1.37 | % | 1.31 | % | 1.27 | % | ||||||||||||
Ratio of net investment income (loss) to average net assets | 1.55 | %(d) | 1.04 | % | 1.51 | % | 1.37 | % | 1.18 | % | 1.18 | % | ||||||||||||
Portfolio turnover rate | 91 | %(c) | 125 | % | 154 | % | 8 | % | 9 | % | 17 | % | ||||||||||||
Net assets, end of period (in thousands) | $ | 15,231 | $ | 20,167 | $ | 18,393 | $ | 23,592 | $ | 28,116 | $ | 31,792 | ||||||||||||
* | The Portfolio was audited by an independent registered public accounting firm other than Ernst & Young LLP. |
(a) | The per-share data presented above is based on the average shares outstanding for the period presented. |
(b) | Assumes initial investment at net asset value at the beginning of each period, reinvestment of all distributions, the complete redemption of the investment at net asset value at the end of each period and no sales charges. Total return would be reduced if sales charges were taken into account. |
(c) | Not annualized. |
(d) | Annualized. |
NOTE: | The above financial highlights do not reflect the deduction of non-portfolio expenses associated with variable insurance products, such as mortality and expense risk charges, separate account charges, and sales charges. |
The accompanying notes are an integral part of these financial statements.
15
| Pioneer Real Estate Shares VCT Portfolio | PIONEER VARIABLE CONTRACTS TRUST |
1. Organization and Significant Accounting Policies
Pioneer Real Estate Shares VCT Portfolio (the “Portfolio”) is one of 8 portfolios comprising Pioneer Variable Contracts Trust (the “Trust”), a Delaware statutory trust. The Portfolio is registered under the Investment Company Act of 1940 as a diversified, open-end management investment company. The investment objective of the Portfolio is to pursue long-term capital growth, with current income as a secondary objective.
The Portfolio offers two classes of shares designated as Class I and Class II shares. Each class of shares represents an interest in the same schedule of investments of the Portfolio and has identical rights (based on relative net asset values) to assets and liquidation proceeds. Share classes can bear different rates of class-specific fees and expenses, such as transfer agent and distribution fees. Differences in class-specific fees and expenses will result in differences in net investment income and, therefore, the payment of different dividends from net investment income earned by each class. The Amended and Restated Declaration of Trust of the Portfolio gives the Board of Trustees the flexibility to specify either per-share voting or dollar-weighted voting when submitting matters for shareowner approval. Under per-share voting, each share of a class of the Portfolio is entitled to one vote. Under dollar-weighted voting, a shareowner’s voting power is determined not by the number of shares owned, but by the dollar value of the shares on the record date. Each share class has exclusive voting rights with respect to matters affecting only that class, including with respect to the distribution plan for that class. There is no distribution plan for Class I shares.
Portfolio shares may be purchased only by insurance companies for the purpose of funding variable annuity and variable life insurance contracts or by qualified pension and retirement plans.
Amundi Pioneer Asset Management, Inc., an indirect, wholly owned subsidiary of Amundi and Amundi’s wholly owned subsidiary, Amundi USA, Inc., serves as the Portfolio’s investment adviser (the “Adviser”). Amundi Pioneer Distributor, Inc., an affiliate of Amundi Pioneer Asset Management, Inc., serves as the Portfolio’s distributor (the “Distributor”).
In August 2018, the Securities and Exchange Commission (“SEC”) released a Disclosure Update and Simplification Final Rule. The Final Rule amends Regulation S-X disclosures requirements to conform them to U.S. Generally Accepted Accounting Principles (“U.S. GAAP”) for investment companies. The Portfolio’s financial statements were prepared in compliance with the new amendments to Regulation S-X.
The Portfolio is an investment company and follows investment company accounting and reporting guidance under U.S. GAAP. U.S. GAAP requires the management of the Portfolio to make estimates and assumptions that affect the reported amounts of assets and liabilities, the disclosure of contingent assets and liabilities at the date of the financial statements, and the reported amounts of income, expenses and gain or loss on investments during the reporting period. Actual results could differ from those estimates.
The following is a summary of significant accounting policies followed by the Portfolio in the preparation of its financial statements:
A. Security Valuation
The net asset value of the Portfolio is computed once daily, on each day the New York Stock Exchange (“NYSE”) is open, as of the close of regular trading on the NYSE.
Equity securities that have traded on an exchange are valued by using the last sale price on the principal exchange where they are traded. Equity securities that have not traded on the date of valuation, or securities for which sale prices are not available, generally are valued using the mean between the last bid and asked prices or, if both last bid and asked prices are not available, at the last quoted bid price. Last sale and bid and asked prices are provided by independent third party pricing services. In the case of equity securities not traded on an exchange, prices are typically determined by independent third party pricing services using a variety of techniques and methods.
The value of foreign securities is translated into U.S. dollars based on foreign currency exchange rate quotations supplied by a third party pricing source. Trading in non-U.S. equity securities is substantially completed each day at various times prior to the close of the NYSE. The values of such securities used in computing the net asset value of the Portfolio’s shares are determined as of such times. The Portfolio may use a fair value model developed by an independent pricing service to value non-U.S. equity securities.
Securities for which independent pricing services or broker-dealers are unable to supply prices or for which market prices and/or quotations are not readily available or are considered to be unreliable are valued
16
| Pioneer Real Estate Shares VCT Portfolio | PIONEER VARIABLE CONTRACTS TRUST |
by a fair valuation team comprised of certain personnel of the Adviser pursuant to procedures adopted by the Portfolio’s Board of Trustees. The Adviser’s fair valuation team uses fair value methods approved by the Valuation Committee of the Board of Trustees. The Adviser’s fair valuation team is responsible for monitoring developments that may impact fair valued securities and for discussing and assessing fair values on an ongoing basis, and at least quarterly, with the Valuation Committee of the Board of Trustees.
Inputs used when applying fair value methods to value a security may include credit ratings, the financial condition of the company, current market conditions and comparable securities. The Portfolio may use fair value methods if it is determined that a significant event has occurred after the close of the exchange or market on which the security trades and prior to the determination of the Portfolio’s net asset value. Examples of a significant event might include political or economic news, corporate restructurings, natural disasters, terrorist activity or trading halts. Thus, the valuation of the Portfolio’s securities may differ significantly from exchange prices, and such differences could be material.
At June 30, 2020, no securities were valued using fair value methods (other than securities valued using prices supplied by independent pricing services, broker-dealers or using a third party insurance industry pricing model).
B. Investment Income and Transactions
Dividend income is recorded on the ex-dividend date, except that certain dividends from foreign securities where the ex-dividend date may have passed are recorded as soon as the Portfolio becomes aware of the ex-dividend data in the exercise of reasonable diligence.
Interest income, including interest on income-bearing cash accounts, is recorded on the accrual basis. Dividend and interest income are reported net of unrecoverable foreign taxes withheld at the applicable country rates and net of income accrued on defaulted securities.
Interest and dividend income payable by delivery of additional shares is reclassified as PIK (payment-in-kind) income upon receipt and is included in interest and dividend income, respectively.
Security transactions are recorded as of trade date. Gains and losses on sales of investments are calculated on the identified cost method for both financial reporting and federal income tax purposes.
C. Foreign Currency Translation
The books and records of the Portfolio are maintained in U.S. dollars. Amounts denominated in foreign currencies are translated into U.S. dollars using current exchange rates.
Net realized gains and losses on foreign currency transactions, if any, represent, among other things, the net realized gains and losses on foreign currency exchange contracts, disposition of foreign currencies and the difference between the amount of income accrued and the U.S. dollars actually received. Further, the effects of changes in foreign currency exchange rates on investments are not segregated on the Statement of Operations from the effects of changes in the market prices of those securities, but are included with the net realized and unrealized gain or loss on investments.
D. Federal Income Taxes
It is the Portfolio’s policy to comply with the requirements of the Internal Revenue Code applicable to regulated investment companies and to distribute all of its net taxable income and net realized capital gains, if any, to its shareowners. Therefore, no provision for federal income taxes is required. As of December 31, 2019, the Portfolio did not accrue any interest or penalties with respect to uncertain tax positions, which, if applicable, would be recorded as an income tax expense on the Statement of Operations. Tax returns filed within the prior three years remain subject to examination by federal and state tax authorities.
A portion of the dividend income recorded by the Portfolio is from distributions by publicly traded Real Estate Investment Trusts (“REITs”), and such distributions for tax purposes may also consist of capital gains and return of capital. The actual return of capital and capital gains portions of such distributions will be determined by formal notifications from the REITs subsequent to the calendar year-end. Distributions received from the REITs that are determined to be a return of capital are recorded by the Portfolio as a reduction of the cost basis of the securities held and those determined to be capital gain are reflected as such on the Statement of Operations.
17
| Pioneer Real Estate Shares VCT Portfolio | PIONEER VARIABLE CONTRACTS TRUST |
NOTES TO FINANCIAL STATEMENTS 6/30/20 (UNAUDITED) | (continued) |
The amount and character of income and capital gain distributions to shareowners are determined in accordance with federal income tax rules, which may differ from U.S. GAAP. Distributions in excess of net investment income or net realized gains are temporary over distributions for financial statement purposes resulting from differences in the recognition or classification of income or distributions for financial statement and tax purposes. Capital accounts within the financial statements are adjusted for permanent book/tax differences to reflect tax character, but are not adjusted for temporary differences.
The tax character of current year distributions payable will be determined at the end of the current taxable year. The tax character of distributions paid during the year ended December 31, 2019 was as follows:
2019 | ||||
| Distributions paid from: | ||||
| Ordinary income | $ | 544,443 | ||
| Long-term capital gain | 7,805,855 | |||
| Total | $ | 8,350,298 | ||
The following shows the components of distributable earnings on a federal income tax basis at December 31, 2019:
| 2019 | ||||
| Distributable Earnings: | ||||
| Undistributed ordinary income | $ | 22,307 | ||
| Undistributed long-term capital gain | 5,535,303 | |||
| Current Year Dividend Payable | (103 | ) | ||
| Net unrealized appreciation | 5,092,938 | |||
| Total | $ | 10,650,445 | ||
The difference between book basis and tax basis unrealized appreciation is attributable to the tax deferral of losses on wash sales.
E. Portfolio Shares and Class Allocations
The Portfolio records sales and repurchases of its shares as of trade date. Distribution fees for Class II shares are calculated based on the average daily net asset value attributable to Class II shares of the Portfolio (see Note 4). Class I shares do not pay distribution fees.
Income, common expenses (excluding transfer agent and distribution fees) and realized and unrealized gains and losses are calculated at the Portfolio level and allocated daily to each class of shares based on its respective percentage of adjusted net assets at the beginning of the day.
All expenses and fees paid to the Portfolio’s transfer agent for its services are allocated between the classes of shares based on the number of accounts in each class and the ratable allocation of related out-of-pocket expenses (see Note 3).
Dividends and distributions to shareowners are recorded on the ex-dividend date. Distributions paid by the Portfolio with respect to each class of shares are calculated in the same manner and at the same time, except that net investment income dividends to Class I and Class II shares can reflect different transfer agent and distribution expense rates.
F. Risks
The value of securities held by the Portfolio may go up or down, sometimes rapidly or unpredictably, due to general market conditions, such as real or perceived adverse economic, political or regulatory conditions, recessions, the spread of infectious illness or other public health issues, inflation, changes in interest rates, lack of liquidity in the bond markets or adverse investor sentiment. In the past several years, financial markets have experienced increased volatility, depressed valuations, decreased liquidity and heightened uncertainty. These conditions may continue, recur, worsen or spread.
Because the Portfolio may invest a substantial portion of its assets in REITs, the Portfolio may be subject to certain risks associated with direct investments in REITs. REITs may be affected by changes in the value of their underlying properties and by defaults by borrowers or tenants. REITs depend generally on their ability to generate cash flow to make distributions to shareowners, and certain REITs have self-liquidation provisions by which mortgages held may be paid in full and distributions of capital return may be made at any time. In addition, the performance of a REIT may be affected by its failure to qualify for tax-free pass-through of income under the Internal Revenue Code or its failure to maintain exemption from registration under the Investment Company Act of 1940.
With the increased use of technologies such as the Internet to conduct business, the Portfolio is susceptible to operational, information security and related risks. While the Portfolio’s Adviser has established business continuity plans in the event of, and risk management systems to prevent, limit or mitigate, such cyber-attacks, there are inherent limitations in such plans and systems, including the possibility that certain risks have not been identified. Furthermore, the Portfolio cannot control the cybersecurity plans and systems put in place by service
18
| Pioneer Real Estate Shares VCT Portfolio | PIONEER VARIABLE CONTRACTS TRUST |
providers to the Portfolio such as Brown Brothers Harriman & Co., the Portfolio’s custodian and accounting agent, and DST Asset Manager Solutions, Inc., the Portfolio’s transfer agent. In addition, many beneficial owners of Portfolio shares hold them through accounts at broker-dealers, retirement platforms and other financial market participants over which neither the Portfolio nor Amundi Pioneer exercises control. Each of these may in turn rely on service providers to them, which are also subject to the risk of cyber-attacks. Cybersecurity failures or breaches at Amundi Pioneer or the Portfolio’s service providers or intermediaries have the ability to cause disruptions and impact business operations, potentially resulting in financial losses, interference with the Portfolio’s ability to calculate its net asset value, impediments to trading, the inability of Portfolio shareowners to effect share purchases, redemptions or exchanges or receive distributions, loss of or unauthorized access to private shareowner information and violations of applicable privacy and other laws, regulatory fines, penalties, reputational damage, or additional compliance costs. Such costs and losses may not be covered under any insurance. In addition, maintaining vigilance against cyber-attacks may involve substantial costs over time, and system enhancements may themselves be subject to cyber-attacks.
COVID-19
The respiratory illness COVID-19 caused by a novel coronavirus has resulted in a global pandemic and major disruption to economies and markets around the world, including the United States. Global financial markets have experienced extreme volatility and severe losses, and trading in many instruments has been disrupted. Liquidity for many instruments has been greatly reduced for periods of time. Some interest rates are very low and in some cases yields are negative. Some sectors of the economy and individual issuers have experienced particularly large losses. These circumstances may continue for an extended period of time, and may continue to affect adversely the value and liquidity of the Portfolio’s investments. The ultimate economic fallout from the pandemic, and the long-term impact on economies, markets, industries and individual issuers, are not known. Governments and central banks, including the Federal Reserve in the U.S., have taken extraordinary and unprecedented actions to support local and global economies and the financial markets. These actions have resulted in significant expansion of public debt, including in the U.S. The impact of these measures, and whether they will be effective to mitigate the economic and market disruption, will not be known for some time. The consequences of high public debt, including its future impact on the economy and securities markets, likewise may not be known for some time.
The Portfolio’s prospectus contains unaudited information regarding the Portfolio’s principal risks. Please refer to that document when considering the Portfolio’s principal risks.
2. Management Agreement
The Adviser manages the Portfolio. Management fees are calculated daily and paid monthly at the annual rate of 0.80% of the Portfolio’s average daily net assets up to $500 million and 0.75% of the Portfolio’s average daily net assets over $500 million. For the six months ended June 30, 2020, the effective management fee was equivalent to 0.80% (annualized) of the Portfolio’s average daily net assets.
In addition, under the management and administration agreements, certain other services and costs, including accounting, regulatory reporting and insurance premiums, are paid by the Portfolio as administrative reimbursements. Included in “Due to affiliates” reflected on the Statement of Assets and Liabilities is $2,130 in management fees, administrative costs and certain other reimbursements payable to the Adviser at June 30, 2020.
3. Transfer Agent
DST Asset Manager Solutions, Inc. serves as the transfer agent to the Portfolio at negotiated rates. Transfer agent fees and payables shown on the Statement of Operations and the Statement of Assets and Liabilities, respectively, include sub-transfer agent expenses incurred through the Portfolio’s omnibus relationship contracts.
4. Distribution Plan
The Portfolio has adopted a distribution plan (the “Plan”) pursuant to Rule 12b-1 of the Investment Company Act of 1940 with respect to Class II shares. Pursuant to the Plan, the Portfolio pays the Distributor a distribution fee of 0.25% of the average daily net assets attributable to Class II shares to compensate the Distributor for (1) distribution services and (2) personal and account maintenance services performed and expenses incurred by the Distributor in connection with the Portfolio’s Class II shares. Included in “Due to affiliates” reflected on the Statement of Assets and Liabilities is $510 in distribution fees payable to the Distributor at June 30, 2020.
19
| Pioneer Real Estate Shares VCT Portfolio | PIONEER VARIABLE CONTRACTS TRUST |
As required by law, the Portfolio has adopted and implemented a liquidity risk management program (the “Program”) that is designed to assess and manage liquidity risk. Liquidity risk is the risk that the Portfolio could not meet requests to redeem its shares without significant dilution of remaining investors’ interests in the Portfolio. The Portfolio’s Board of Trustees designated a liquidity risk management committee (the “Committee”) consisting of employees of Amundi Pioneer Asset Management, Inc. (the “Adviser”) to administer the Program.
The Committee provided the Board of Trustees with a report that addressed the operation of the Program and assessed its adequacy and effectiveness of implementation (the “Report”). The Report covered the period from December 1, 2018 through March 31, 2020 (the “Reporting Period”).
The Report confirmed that, throughout the Reporting Period, the Committee had monitored the Portfolio’s portfolio liquidity and liquidity risk on an ongoing basis, as described in the Program and in Board reporting throughout the Reporting Period.
The Report discussed the Committee’s annual review of the Program, which addressed, among other things, the following elements of the Program:
The Committee reviewed the Portfolio’s investment strategy and liquidity of portfolio investments during both normal and reasonably foreseeable stressed conditions. The Committee noted that the Portfolio’s investment strategy continues to be appropriate for an open-end fund, taking into account, among other things, whether and to what extent the Portfolio held less liquid and illiquid assets and the extent to which any such investments affected the Portfolio’s ability to meet redemption requests. In managing and reviewing the Portfolio’s liquidity risk, the Committee also considered the extent to which the Portfolio’s investment strategy involves a relatively concentrated portfolio or large positions in particular issuers, the extent to which the Portfolio uses borrowing for investment purposes, and the extent to which the Portfolio uses derivatives (including for hedging purposes). The Committee also reviewed the Portfolio’s short-term and long-term cash flow projections during both normal and reasonably foreseeable stressed conditions. In assessing the Portfolio’s cash flow projections, the Committee considered, among other factors, historical net redemption activity, redemption policies, ownership concentration, distribution channels, and the degree of certainty associated with the Portfolio’s short-term and long-term cash flow projections. The Committee also considered the Portfolio’s holdings of cash and cash equivalents, as well as borrowing arrangements and other funding sources, including, if applicable, the Portfolio’s participation in a credit facility, as components of the Portfolio’s ability to meet redemption requests. The Portfolio has adopted an in-kind redemption policy which may be utilized to meet larger redemption requests.
The Committee reviewed the Program’s liquidity classification methodology for categorizing the Portfolio’s investments into one of four liquidity buckets. In reviewing the Portfolio’s investments, the Committee considered, among other factors, whether trading varying portions of a position in a particular portfolio investment or asset class in sizes the Portfolio would reasonably anticipate trading, would be reasonably expected to significantly affect liquidity.
The Committee performed an analysis to determine whether the Portfolio is required to maintain a Highly Liquid Investment Minimum, and determined that no such minimum is required because the Portfolio primarily holds highly liquid investments.
The Report stated that the Committee concluded the Program operates adequately and effectively, in all material respects, to assess and manage the Portfolio’s liquidity risk throughout the Reporting Period.
20
| Officers Lisa M. Jones, President and Chief Executive Officer Mark E. Bradley, Treasurer and Chief Financial and Accounting Officer Christopher J. Kelley, Secretary and Chief Legal Officer Investment Adviser and Administrator Amundi Pioneer Asset Management, Inc. Custodian and Sub-Administrator Brown Brothers Harriman & Co. Principal Underwriter Amundi Pioneer Distributor, Inc. Legal Counsel Morgan, Lewis & Bockius LLP Transfer Agent DST Asset Manager Solutions, Inc. | Trustees Thomas J. Perna, Chairman John E. Baumgardner, Jr. Diane Durnin Benjamin M. Friedman Lisa M. Jones Lorraine H. Monchak Marguerite A. Piret Fred J. Ricciardi Kenneth J. Taubes |
21
Proxy Voting Policies and Procedures of the Portfolio are available without charge, upon request, by calling our toll free number (1-800-225-6292). Information regarding how the Portfolio voted proxies relating to Portfolio securities during the most recent 12-month period ended June 30 is publicly available to shareowners at www.amundipioneer.com/us. This information is also available on the Securities and Exchange Commission’s web site at www.sec.gov.
19614-14-0820
PIONEER VARIABLE CONTRACTS TRUST
Pioneer Strategic Income VCT Por tfolio — Class I and II Shares
Pioneer Strategic Income VCT Por tfolio — Class I and II Shares
Beginning in February 2021, as permitted by regulations adopted by the Securities and Exchange Commission, you may not be receiving paper copies of the Portfolio’s shareholder reports like this one by mail, unless you specifically request paper copies of the reports from the insurance company that offers your variable annuity or variable life insurance contract or from your financial intermediary. Instead, the insurance company may choose to make the reports available on a website, and will notify you by mail each time a shareholder report is posted and provide you with a website link to access the report. Instructions for requesting paper copies will be provided by your insurance company.
If you already elected to receive shareholder reports electronically, you will not be affected by this change and you need not take any action. You may elect to receive shareholder reports and other communications from the insurance company or your financial intermediary electronically by following the instructions provided by the insurance company or by contacting your financial intermediary.
You may elect to receive all future Portfolio shareholder reports in paper free of charge from the insurance company. You can inform the insurance company or your financial intermediary that you wish to continue receiving paper copies of your shareholder reports by following the instructions provided by the insurance company or by contacting your financial intermediary. Your election to receive reports in paper will apply to all funds available under your contract with the insurance company.
SEMIANNUAL REPORT
June 30, 2020
June 30, 2020
Please refer to your contract prospectus to determine the applicable share class offered under your contract.
PIONEER VARIABLE CONTRACTS TRUST
Pioneer Strategic Income VCT Portfolio | |
This report is authorized for distribution only when preceded or accompanied by a prospectus for the Portfolio being offered.
Pioneer Variable Contracts Trust files a complete schedule of portfolio holdings with the Securities and Exchange Commission for the first and third quarters of each fiscal year as an exhibit to its reports on Form N-PORT. Shareholders may view the filed Form N-PORT by visiting the Commission’s web site at https://www.sec.gov.
| Pioneer Strategic Income VCT Portfolio | PIONEER VARIABLE CONTRACTS TRUST |
Portfolio Diversification
(As a percentage of total investments)*
(As a percentage of total investments)*
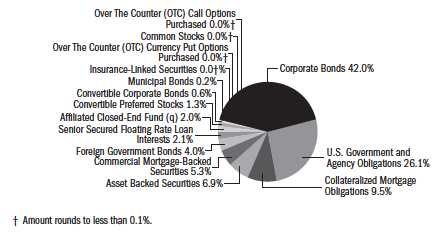
5 Largest Holdings
(As a percentage of total investments)*
(As a percentage of total investments)*
| 1. | U.S. Treasury Bill, 7/21/20 | 5.77% |
| 2. | U.S. Treasury Bill, 7/7/20 | 2.88 |
| 3. | U.S. Treasury Bill, 8/27/20 | 2.88 |
| 4. | Pioneer ILS Interval Fund (q) | 1.99 |
| 5. | U.S. Treasury Inflation Indexed | |
| Bonds, 1.0%, 2/15/48 | 1.57 | |
* | Excludes temporary cash investments and all derivative contracts except for options purchased. The Portfolio is actively managed, and current holdings may be different. The holdings listed should not be considered recommendations to buy or sell any securities. |
(q) | Pioneer ILS Interval Fund is an affiliated closed-end fund managed by Amundi Pioneer Asset Management, Inc. |
PERFORMANCE UPDATE 6/30/20
Prices and Distributions
| Net Asset Value per Share | 6/30/20 | 12/31/19 |
| Class I | $10.00 | $10.32 |
| Class II | $ 9.99 | $10.30 |
| Net | |||
| Distributions per Share | Investment | Short-Term | Long-Term |
| (1/1/20 – 6/30/20) | Income | Capital Gains | Capital Gains |
| Class I | $0.1740 | $0.0174 | $0.0145 |
| Class II | $0.1615 | $0.0174 | $0.0145 |
Performance of a $10,000 Investment
The following chart shows the change in value of an investment made in Class I and Class II shares of Pioneer Strategic Income VCT Portfolio at net asset value during the periods shown, compared to that of the Bloomberg Barclays U.S. Universal Index. Portfolio returns are based on net asset value and do not reflect any applicable insurance fees or surrender charges.
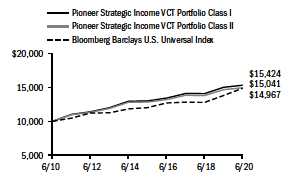
The Bloomberg Barclays U.S. Universal Index is an unmanaged index that represents the union of the U.S. Aggregate Index, the US High Yield Corporate Index, the 144A Index, the Eurodollar Index, the Emerging Markets Index, the non-ERISA portion of the CMBS Index, and the CMBS High Yield Index. Municipal debt, private placements and non-dollar-denominated issues are excluded from the Index. Index returns are calculated monthly, assume reinvestment of dividends and, unlike Portfolio returns, do not reflect any fees, expenses or sales charges. It is not possible to invest directly in an index.
Average Annual Total Returns
(As of June 30, 2020)
| Bloomberg | |||
| Barclays U.S. | |||
| Class I | Class II | Universal Index | |
10 Years | 4.43% | 4.17% | 4.12% |
5 Years | 3.38% | 3.14% | 4.42% |
1 Year | 2.11% | 1.95% | 7.88% |
All total returns shown assume reinvestment of distributions at net asset value.
Call 1-800-688-9915 or visit www.amundipioneer.com/us for the most recent month-end performance results. Current performance may be lower or higher than the performance data quoted.
The performance data quoted represents past performance, which is no guarantee of future results. Investment return and principal value will fluctuate, and shares, when redeemed, may be worth more or less than their original cost.
The returns for the Portfolio do not reflect the deduction of expenses associated with variable products, such as mortality and expense risk charges, separate account charges, and sales charges. These expenses would reduce the overall returns shown.
Performance results reflect any applicable expense waivers in effect during the periods shown. Without such waivers performance would be lower. Waivers may not be in effect for all portfolios. Certain fee waivers are contractual through a specified period. Otherwise, fee waivers can be rescinded at any time. See the prospectus and financial statements for more information.
2
| Pioneer Strategic Income VCT Portfolio | PIONEER VARIABLE CONTRACTS TRUST |
As a shareowner in the Portfolio, you incur two types of costs:
(1) ongoing costs, including management fees, distribution and/or service (12b-1) fees, and other Portfolio expenses; and
(2) transaction costs, including sales charges (loads) on purchase payments.
This example is intended to help you understand your ongoing expenses (in dollars) of investing in the Portfolio and to compare these costs with the ongoing costs of investing in other mutual funds offered through your variable annuity contract. The example is based on an investment of $1,000 at the beginning of the Portfolio’s latest six-month period and held throughout the six months.
Using the Tables
Actual Expenses
The first table below provides information about actual account values and actual expenses. You may use the information in this table, together with the amount you invested, to estimate the expenses that you paid over the period as follows:
1. Divide your account value by $1,000
Example: an $8,600 account value ÷ $1,000 = 8.6
2. Multiply the result in (1) above by the corresponding share class’s number in the third row under the heading entitled “Expenses Paid During Period” to estimate the expenses you paid on your account during this period.
Expenses Paid on a $1,000 Investment in Pioneer Strategic Income VCT Portfolio
Based on actual returns from January 1, 2020 through June 30, 2020.
| Share Class | I | II |
Beginning Account Value on 1/1/20 | $1,000.00 | $1,000.00 |
Ending Account Value on 6/30/20 | $988.30 | $989.00 |
Expenses Paid During Period* | $3.71 | $4.95 |
* Expenses are equal to the Portfolio’s annualized expense ratio of 0.75% and 1.00%, for Class I and Class II shares, respectively, multiplied by the average account value over the period, multiplied by 182/366 (to reflect the one-half year period).
Hypothetical Example for Comparison Purposes
The table below provides information about hypothetical account values and hypothetical expenses based on the Portfolio’s actual expense ratio and an assumed rate of return of 5% per year before expenses, which is not the Portfolio’s actual return. The hypothetical account values and expenses may not be used to estimate the actual ending account balance or expenses you paid for the period.
You may use this information to compare the ongoing costs of investing in the Portfolio and other variable annuities. To do so, compare this 5% hypothetical example with the 5% hypothetical examples that appear in the shareholder reports of the other variable annuities.
Please note that the expenses shown in the tables are meant to highlight your ongoing costs only and do not reflect any transaction costs, such as sales charges (loads) that are charged at the time of the transaction. Therefore, the table below is useful in comparing ongoing costs only and will not help you determine the relative total costs of owning different variable annuities. In addition, if these transaction costs were included, your costs would have been higher.
Expenses Paid on a $1,000 Investment in Pioneer Strategic Income VCT Portfolio
Based on a hypothetical 5% per year return before expenses, reflecting the period from January 1, 2020 through June 30, 2020.
| Share Class | I | II |
Beginning Account Value on 1/1/20 | $1,000.00 | $1,000.00 |
Ending Account Value on 6/30/20 | $1,021.13 | $1,019.89 |
Expenses Paid During Period* | $3.77 | $5.02 |
* Expenses are equal to the Portfolio’s annualized expense ratio of 0.75% and 1.00%, for Class I and Class II shares, respectively, multiplied by the average account value over the period, multiplied by 182/366 (to reflect the one-half year period).
3
| Pioneer Strategic Income VCT Portfolio | PIONEER VARIABLE CONTRACTS TRUST |
Call 1-800-688-9915 or visit www.amundipioneer.com/us for the most recent month-end performance results. Current performance may be lower or higher than the performance data quoted.
The performance data quoted represents past performance, which is no guarantee of future results. Investment return and principal value will fluctuate, and shares, when redeemed, may be worth more or less than their original cost.
The returns for the Portfolio do not reflect the deduction of expenses associated with variable products, such as mortality and expense risk charges, separate account charges, and sales charges. These expenses would reduce the overall returns shown.
Performance results reflect any applicable expense waivers in effect during the periods shown. Without such waivers performance would be lower. Waivers may not be in effect for all portfolios. Certain fee waivers are contractual through a specified period. Otherwise, fee waivers can be rescinded at any time. See the prospectus and financial statements for more information.
In the following interview, Jonathan Scott and Andrew Feltus discuss the factors that affected the performance of Pioneer Strategic Income VCT Portfolio during the six-month period ended June 30, 2020. Mr. Scott, a Vice President and portfolio manager at Amundi Pioneer Asset Management, Inc. (Amundi Pioneer), Mr. Feltus, Managing Director, Co-Director of High Yield, and a portfolio manager at Amundi Pioneer, and Kenneth J. Taubes, Executive Vice President and Chief Investment Officer, U.S., and a portfolio manager at Amundi Pioneer, are responsible for the day-to-day management of the Portfolio.
Q: How did the Portfolio perform during the six months ended June 30, 2020?
A: Pioneer Strategic Income VCT Portfolio’s Class I shares returned -1.17% at net asset value during the six-month period ended June 30, 2020, and Class II shares returned -1.10%, while the Portfolio’s benchmark, the Bloomberg Barclays U.S. Universal Index (the Bloomberg Barclays Index), returned 5.17%.
Q: How would you describe the investment environment in the fixed-income markets during the six-month period ended June 30, 2020?
A: After a benign opening to the 2020 calendar year, credit-sensitive fixed-income markets experienced a historic disruption in March, as the emergence of the COVID-19 virus and the related lockdown policies implemented to help curb its spread all but shuttered the global economy. Investors fled riskier assets on a broad scale and moved into so-called “safe havens” such as U.S. Treasuries, which had the effect of driving Treasury yields to all-time lows. Significant selling in U.S. dollar (USD) fixed-income markets eventually stressed market functionality and led to price dislocations in all segments, even Treasury bonds. As the “liquidity grab” by investors gathered pace in mid-March, historical asset-class return relationships broke down and performance became almost entirely correlated. (Correlation is defined as the degree to which assets or asset-class prices have moved in relation to one another. Correlation ranges from -1, always moving in opposite directions; through 0, absolutely independent; to 1, always moving together.)
The liquidity stress was greatest in the securitized credit sectors of nonagency mortgage-backed securities (MBS), asset-backed securities (ABS), and commercial-mortgage backed securities (CMBS), which have traditionally had a narrower buyer base than corporate bonds. Those markets faced forced selling by real estate investment trusts (REITs) and other leveraged investors, and by certain mutual funds, as concerns escalated over the impact of the pandemic on the U.S. employment situation and on the ability of homeowners and businesses to service their mortgages.
The policy response to the market and economic turmoil from both central banks and government authorities was swift, as they sought to keep businesses and consumers from going under. The U.S. Federal Reserve (Fed) slashed the target range of the benchmark federal funds rate to zero in mid-March, resurrected its 2008 financial crisis-era lending facilities, and
4
| Pioneer Strategic Income VCT Portfolio | PIONEER VARIABLE CONTRACTS TRUST |
launched a wide-ranging bond-purchase program. On the fiscal side, the U.S. Congress and the White House agreed upon a $2.2 trillion stimulus package in late March, and later approved additional aid packages in the second quarter.
The extraordinary support from policy makers in the wake of the pandemic had a positive effect on the markets as the second quarter got underway. Investor optimism also rose on the prospects that steps taken towards reopening the economy would support something resembling a “V-shaped” recovery (that is, a swift, sharp rise). The result was a resurgence in sentiment towards the riskier assets that the market was so quick to shun at the height of the pandemic crisis. The shift in investors’ appetites allowed credit-sensitive areas of the bond market to recover much of their earlier losses over April and May. June saw the return of some market volatility as well as a widening in credit spreads as COVID-19 cases surged in a few states that had reopened earlier than others, reigniting shutdown concerns. (Credit spreads are commonly defined as the differences in yield between Treasuries and other types of fixed-income securities with similar maturities.)
For the six-month period ended June 30, 2020, the investment-grade corporate bond market posted a positive return of 5.02%, while high-yield corporates returned -3.80% (as measured by the Bloomberg Barclays U.S. Corporate Bond Index and Bloomberg Barclays U.S. Corporate High Yield Index, respectively). Treasuries led performance within the investment-grade sectors, given the steep decline in yields seen over the first quarter of 2020. After their earlier struggles, securitized assets ended the six-month period in positive territory, though the asset class lagged the performance of both investment-grade corporates and Treasuries.
Q: What factors influenced the Portfolio’s performance relative to the Bloomberg Barclays Index during the six-month period ended June 30, 2020?
A: The Portfolio’s benchmark-relative underperformance for the six-month period derived mainly from asset allocation, while a tilt toward lower-quality holdings within spread sectors also weighed on relative returns. (Spread sectors are non-governmental fixed-income market sectors that offer higher yields, at greater risk, than governmental investments.)
Security selection and the Portfolio’s duration positioning also detracted from benchmark-relative returns over the six-month period. (Duration is a measure of the sensitivity of the price (the value of principal) of a fixed income investment to a change in interest rates, expressed as a number of years.)
With respect to sector allocation, negative benchmark-relative performance primarily reflected the Portfolio’s overweights to securitized assets and corporate credit, and a corresponding underweight to U.S. Treasuries. The Portfolio’s significant exposure to non-agency MBS within securitized assets
5
| Pioneer Strategic Income VCT Portfolio | PIONEER VARIABLE CONTRACTS TRUST |
PORTFOLIO MANAGEMENT DISCUSSION 6/30/20 | (continued) |
had the largest negative effect on benchmark-relative results. Non-agency MBS sold off in March due to the illiquidity issues discussed earlier, and because of fundamental concerns over the potential for increased delinquencies and defaults in the wake of the economic damage wrought by COVID-19. While valuations of securitized assets have not recovered to the same degree as we have seen with corporate bonds, we view the anticipated impairment reflected in current price levels within the securitized sectors as overstated. The Portfolio did realize losses on some securitized positions that we sold during the six-month period in order to fund purchases of new corporate issues that came into the market at historically wide spreads.
The Portfolio’s lack of exposure to nominal U.S. Treasuries detracted significantly from benchmark-relative returns during the six-month period, as credit-sensitive securities underperformed in the flight-to-quality market environment that characterized the first quarter of 2020. We had based the Portfolio’s positioning within Treasuries on our view heading into the six-month period that the U.S. economy was poised for strong performance in 2020, a forecast that was derailed by the emergence of COVID-19. The Treasury exposure the Portfolio did maintain was a roughly 5% allocation to Treasury inflation-protected securities, which underperformed as liquidity suffered and inflation expectations fell dramatically.
Within investment-grade corporates, the Portfolio’s overweight to financials detracted from benchmark-relative performance. An overweight to industrials proved a headwind as well, but security selection within the sector largely offset that negative. The Portfolio’s positioning in the utilities sector had a modest, positive effect on relative returns.
The Portfolio’s duration positioning versus the benchmark detracted from relative performance in the declining-rate environment that prevailed during the six-month period. We had maintained the Portfolio’s duration in a range modestly below that of the Bloomberg Barclays Index, which acted as a drag on performance as Treasury yields declined. That negative-duration impact on relative returns more than offset the benefit of the Portfolio’s short-duration position in the German bund, which outperformed as German yields rose.
Finally, the Portfolio’s non-USD exposures underperformed and detracted from benchmark-relative results as the USD rose against major currencies over the six-month period. In particular, exposure to the euro, the Russian ruble, and the Indonesian rupiah detracted from benchmark-relative returns.
Q: Did the Portfolio have any exposure to derivatives during the six-month period ended June 30, 2020? If so, did the derivatives have any material impact on performance?
A: Yes, the Portfolio invested in three types of derivatives: credit-default swaps, forward foreign currency transactions (currency forwards and options), and Treasury futures. Exposure to credit-default swaps aided the Portfolio’s performance as investors’ sentiment towards riskier assets strengthened over
6
| Pioneer Strategic Income VCT Portfolio | PIONEER VARIABLE CONTRACTS TRUST |
the six-month period. The utilization of Treasury futures constrained the Portfolio’s performance as we used them to reduce duration in a period featuring declining interest rates. The use of forwards and options to hedge the Portfolio’s currency exposures generated mixed results, with a hedge against the euro that proved beneficial for performance, while a hedge into the Swedish krona detracted from the Portfolio’s return.
Q: What factors affected the Portfolio’s yield, or distributions* to shareholders, during the six-month period ended June 30, 2020?
A: The sharp, downward trajectory of Treasury yields weighed on the Portfolio’s distributions during the six-month period, although the widening of credit spreads helped to offset some of the decline.
Q: What is your investment outlook and how is the Portfolio positioned heading into the second half of the fiscal year?
A: We expect that U.S. economic activity will continue to recover, but at a slower and more uneven pace relative to the re-opening “bounce” we witnessed for much of the second quarter. We believe there is a strong case to be made for additional federal government support for the economy in the near term. Enhanced unemployment benefits are scheduled to expire shortly, state and local governments need help bridging tax-revenue shortfalls, and delayed or suspended re-openings in some states could very well increase financial stress on small businesses. While passage of a fourth fiscal stimulus package seems likely, the legislative and political process may create near-term market volatility.
On the monetary side, we believe the Fed could keep its benchmark overnight lending rate at effectively zero for quite some time, possibly until the end of 2022. Should that scenario unfold, short-dated Treasury yields would likely remain low. In addition, we believe the yield curve could steepen further, with longer-maturity yields rising as economic activity picks up and issuance of Treasury notes increases substantially.
On balance, we do not expect U.S. economic activity to return to pre-COVID levels until well into 2021, as many segments such as travel, hospitality, and consumer services could continue to struggle due to lingering concerns about the virus as well as structural changes.
The combination of attractive spreads, positive economic momentum, and supportive supply/demand dynamics has led us to enter the second half of 2020 with a constructive stance on the credit markets. As of the end of the six-month period, corporate bond and securitized credit spreads were offering attractive long-term value across a number of sectors, in our opinion. That said, we expect that selectivity with regard to choosing investments will become even more important, given the partial recovery in spreads during the second quarter of 2020 and the eventual dialing back of policy support from the Fed and the U.S. government.
* Distributions are not guaranteed.
7
| Pioneer Strategic Income VCT Portfolio | PIONEER VARIABLE CONTRACTS TRUST |
PORTFOLIO MANAGEMENT DISCUSSION 6/30/20 | (continued) |
A Word About Risk:
All investments are subject to risk, including the possible loss of principal. In the past several years, financial markets have experienced increased volatility and heightened uncertainty. The market prices of securities may go up or down, sometimes rapidly or unpredictably, due to general market conditions, such as real or perceived adverse economic, political, or regulatory conditions, recessions, inflation, changes in interest or currency rates, lack of liquidity in the bond markets, the spread of infectious illness or other public health issues or adverse investor sentiment. These conditions may continue, recur, worsen or spread.
Investments in high-yield or lower-rated securities are subject to greater-than-average price volatility, illiquidity and possibility of default.
When interest rates rise, the prices of fixed-income securities in the Portfolio will generally fall. Conversely, when interest rates fall the prices of fixed-income securities in the Portfolio will generally rise.
Investments in the Portfolio are subject to possible loss due to the financial failure of the issuers of the underlying securities and their inability to meet their debt obligations.
Prepayment risk is the chance that an issuer may exercise its right to prepay its security, if falling interest rates prompt the issuer to do so. Forced to reinvest the unanticipated proceeds at lower interest rates, the Portfolio would experience a decline in income and lose the opportunity for additional price appreciation.
The securities issued by U.S. government sponsored entities (i.e., FNMA, Freddie Mac) are neither guaranteed nor issued by the U.S. government.
The Portfolio may invest in mortgage-backed securities, which during times of fluctuating interest rates may increase or decrease more than other fixed-income securities. Mortgage-backed securities are also subject to prepayments.
Investing in foreign and/or emerging markets securities involves risks relating to interest rates, currency exchange rates, economic, and political conditions.
At times, the Portfolio’s investments may represent industries or industry sectors that are interrelated or have common risks, making the Portfolio more susceptible to any economic, political, or regulatory developments or other risks affecting those industries and sectors.
These risks may increase share price volatility.
As the world waits for a medical solution and learns how to live with the virus, we believe the key question still awaiting an answer is what type of activities are acceptable, without leading to an unacceptable rise in infections? Government restrictions and other recommendations seem to have had a material impact on virus spread over the past few months. Therefore, at this point, we believe individuals’ choices about what activities they are and are not comfortable with will be as important a driver of economic re-engagement and recovery as any other factor currently in play.
Within the Portfolio’s allocation to corporates, we have been focused on investments of what we believe are higher-quality issuers that have lower sensitivity to the economic cycle, and issuers that have so far felt fewer effects from the COVID-19 shutdowns. With respect to securitized assets, we view the anticipated impairment reflected in current price levels as overstated and have maintained the Portfolio’s exposures to the securitized sectors, for the most part. As noted earlier, the Portfolio did realize some modest losses on some securitized positions we sold during the six-month period in order to fund purchases of new corporate issues that came to the market at historically wide spreads.
While we believe the emerging markets, particularly countries with trade exposure to China, may benefit from the swifter post-COVID recovery in China, we see less-than-compelling valuations in those areas.
We feel that the USD has reached an inflection point and could depreciate going forward. As a result, we have modestly increased the Portfolio’s non-USD allocations in recent months.
As always, we will utilize our intensive research process when picking the Portfolio’s investments, with a focus on the fundamentals and risk/reward profile of each individual issuer and security.
Please refer to the Schedule of Investments on pages 9 to 30 for a full listing of Portfolio securities.
Past performance is no guarantee of future results.
Any information in this shareholder report regarding market or economic trends or the factors influencing the Portfolio’s historical or future performance are statements of opinion as of the date of this report.
8
| Pioneer Strategic Income VCT Portfolio | PIONEER VARIABLE CONTRACTS TRUST |
| Shares | Value | ||
| UNAFFILIATED ISSUERS – 98.9% | |||
| COMMON STOCKS – 0.0%† of Net Assets | |||
| Household Durables – 0.0%† | |||
| 15,463(a) | Desarrolladora Homex SAB de CV | $ 33 | |
| Total Household Durables | $ 33 | ||
| Paper & Forest Products – 0.0%† | |||
| 1,032(a) | Emerald Plantation Holdings, Ltd. | $ 21 | |
| Total Paper & Forest Products | $ 21 | ||
| TOTAL COMMON STOCKS | |||
(Cost $5,517) | $ 54 | ||
| CONVERTIBLE PREFERRED STOCKS – 1.3% of Net Assets | |||
| Banks – 1.3% | |||
| 106(b) | Bank of America Corp., 7.25% | $ 142,273 | |
| 295(b) | Wells Fargo & Co., 7.5% | 382,615 | |
| Total Banks | $ 524,888 | ||
| TOTAL CONVERTIBLE PREFERRED STOCKS | |||
(Cost $516,126) | $ 524,888 | ||
| Principal | |||
| Amount | |||
| USD ($) | |||
| ASSET BACKED SECURITIES – 6.9% of Net Assets | |||
| 100,000 | Conn’s Receivables Funding LLC, Series 2019-B, Class C, 4.6%, 6/17/24 (144A) | $ 79,474 | |
| 25,780(c) | Equifirst Mortgage Loan Trust, Series 2003-1, Class IF1, 4.01%, 12/25/32 | 26,339 | |
| 147,597 | Finance of America Structured Securities Trust, Series 2019-JR3, Class JR2, | ||
2.0%, 9/25/69 | 152,761 | ||
| 29,475 | Hardee’s Funding LLC, Series 2018-1A, Class A2II, 4.959%, 6/20/48 (144A) | 29,179 | |
| 38,939 | Icon Brand Holdings LLC, Series 2013-1A, Class A2, 4.352%, 1/25/43 (144A) | 26,091 | |
| 79,830(d) | Mill City Mortgage Loan Trust, Series 2018-3, Class M2, 3.25%, 8/25/58 (144A) | 81,098 | |
| 9,281 | Oxford Finance Funding LLC, Series 2016-1A, Class A, 3.968%, 6/17/24 (144A) | 9,322 | |
| 100,000 | Progress Residential Trust, Series 2018-SFR2, Class A, 3.712%, 8/17/35 (144A) | 102,499 | |
| 100,000 | Progress Residential Trust, Series 2018-SFR3, Class F, 5.368%, 10/17/35 (144A) | 101,654 | |
| 100,000 | Republic Finance Issuance Trust, Series 2019-A, Class B, 3.93%, 11/22/27 (144A) | 89,188 | |
| 100,000 | Small Business Lending Trust, Series 2019-A, Class C, 4.31%, 7/15/26 (144A) | 52,513 | |
| 72,531 | SpringCastle Funding Asset-Backed Notes, Series 2019-AA, Class A, 3.2%, | ||
5/27/36 (144A) | 73,310 | ||
| 97,417 | STORE Master Funding I LLC, Series 2015-1A, Class A1, 3.75%, 4/20/45 (144A) | 96,114 | |
| 100,000(d) | Towd Point Mortgage Trust, Series 2015-2, Class 1B3, 3.745%, 11/25/60 (144A) | 96,705 | |
| 150,000(d) | Towd Point Mortgage Trust, Series 2015-6, Class B1, 4.022%, 4/25/55 (144A) | 158,207 | |
| 150,000(d) | Towd Point Mortgage Trust, Series 2016-1, Class B1, 4.22%, 2/25/55 (144A) | 158,953 | |
| 100,000(d) | Towd Point Mortgage Trust, Series 2016-2, Class B2, 3.525%, 8/25/55 (144A) | 100,985 | |
| 150,000(d) | Towd Point Mortgage Trust, Series 2016-3, Class B1, 4.128%, 4/25/56 (144A) | 155,217 | |
| 125,000(d) | Towd Point Mortgage Trust, Series 2016-4, Class B1, 3.979%, 7/25/56 (144A) | 127,112 | |
| 100,000(d) | Towd Point Mortgage Trust, Series 2016-5, Class M2, 3.375%, 10/25/56 (144A) | 99,828 | |
| 150,000(d) | Towd Point Mortgage Trust, Series 2017-1, Class B2, 3.944%, 10/25/56 (144A) | 145,919 | |
| 70,000(d) | Towd Point Mortgage Trust, Series 2017-2, Class M2, 3.75%, 4/25/57 (144A) | 71,020 | |
| 150,000(d) | Towd Point Mortgage Trust, Series 2017-3, Class M2, 3.75%, 7/25/57 (144A) | 157,713 | |
| 175,000(d) | Towd Point Mortgage Trust, Series 2017-4, Class B1, 3.593%, 6/25/57 (144A) | 178,331 | |
| 165,000(d) | Towd Point Mortgage Trust, Series 2017-6, Class A2, 3.0%, 10/25/57 (144A) | 171,564 |
The accompanying notes are an integral part of these financial statements.
9
| Pioneer Strategic Income VCT Portfolio | PIONEER VARIABLE CONTRACTS TRUST |
SCHEDULE OF INVESTMENTS 6/30/20 (UNAUDITED) | (continued) |
| Principal | |||
| Amount | |||
| USD ($) | Value | ||
| ASSET BACKED SECURITIES – (continued) | |||
| 155,000(d) | Towd Point Mortgage Trust, Series 2017-6, Class M1, 3.25%, 10/25/57 (144A) | $ 163,593 | |
| 50,000(d) | Towd Point Mortgage Trust, Series 2018-2, Class A2, 3.5%, 3/25/58 (144A) | 52,546 | |
| 100,000(d) | Towd Point Mortgage Trust, Series 2018-3, Class M1, 3.875%, 5/25/58 (144A) | 101,678 | |
| TOTAL ASSET BACKED SECURITIES | |||
(Cost $2,902,956) | $ 2,858,913 | ||
| COLLATERALIZED MORTGAGE OBLIGATIONS – 9.6% of Net Assets | |||
| 85,000(d) | Bayview Opportunity Master Fund IVa Trust, Series 2017-RT5, Class B1, 4.0%, | ||
5/28/69 (144A) | $ 89,007 | ||
| 40,000(d) | Bayview Opportunity Master Fund IVa Trust, Series 2017-SPL5, Class B1, 4.0%, | ||
6/28/57 (144A) | 41,745 | ||
| 123,423(d) | Chase Home Lending Mortgage Trust, Series 2019-1, Class B1, 3.951%, 3/25/50 (144A) | 128,163 | |
| 135,000(d) | Citigroup Mortgage Loan Trust, Inc., Series 2018-RP1, Class M1, 3.0%, 9/25/64 (144A) | 135,075 | |
| 81,790(d) | Citigroup Mortgage Loan Trust, Inc., Series 2018-RP2, Class A1, 3.5%, 2/25/58 (144A) | 85,204 | |
| 55,501(e) | Connecticut Avenue Securities Trust, Series 2019-R01, Class 2M2, 2.635% (1 Month USD | ||
LIBOR + 245 bps), 7/25/31 (144A) | 54,145 | ||
| 100,000(e) | Connecticut Avenue Securities Trust, Series 2019-R02, Class 1B1, 4.335% (1 Month USD | ||
LIBOR + 415 bps), 8/25/31 (144A) | 94,249 | ||
| 89,364(e) | Connecticut Avenue Securities Trust, Series 2019-R02, Class 1M2, 2.485% (1 Month USD | ||
LIBOR + 230 bps), 8/25/31 (144A) | 88,020 | ||
| 30,000(e) | Connecticut Avenue Securities Trust, Series 2019-R04, Class 2B1, 5.435% (1 Month USD | ||
LIBOR + 525 bps), 6/25/39 (144A) | 27,391 | ||
| 100,000(e) | Connecticut Avenue Securities Trust, Series 2019-R06, Class 2B1, 3.935% (1 Month USD | ||
LIBOR + 375 bps), 9/25/39 (144A) | 78,983 | ||
| 100,000(e) | Connecticut Avenue Securities Trust, Series 2019-R06, Class 2M2, 2.285% (1 Month USD | ||
LIBOR + 210 bps), 9/25/39 (144A) | 96,992 | ||
| 100,000(e) | Connecticut Avenue Securities Trust, Series 2019-R07, Class 1M2, 2.285% (1 Month USD | ||
LIBOR + 210 bps), 10/25/39 (144A) | 96,932 | ||
| 30,000(e) | Connecticut Avenue Securities Trust, Series 2020-SBT1, Class 1M2, 3.835% (1 Month USD | ||
LIBOR + 365 bps), 2/25/40 (144A) | 28,048 | ||
| 50,000(e) | Connecticut Avenue Securities Trust, Series 2020-SBT1, Class 2M2, 3.835% (1 Month USD | ||
LIBOR + 365 bps), 2/25/40 (144A) | 48,003 | ||
| 18,374(d) | CSMC Trust, Series 2013-IVR4, Class B4, 3.479%, 7/25/43 (144A) | 18,058 | |
| 41,240(d) | CSMC Trust, Series 2015-1, Class B4, 3.944%, 1/25/45 (144A) | 39,632 | |
| 150,000(e) | Eagle Re, Ltd., Series 2019-1, Class B1, 4.685% (1 Month USD LIBOR + 450 bps), | ||
4/25/29 (144A) | 93,893 | ||
| 90,473(e) | Fannie Mae Connecticut Avenue Securities, Series 2018-C06, Class 1M2, 2.185% (1 Month | ||
USD LIBOR + 200 bps), 3/25/31 | 86,844 | ||
| 160,861(e)(f) | Federal Home Loan Mortgage Corp. REMICS, Series 4087, Class SB, 5.845% (1 Month USD | ||
LIBOR + 603 bps), 7/15/42 | 33,033 | ||
| 91,851(e)(f) | Federal Home Loan Mortgage Corp. REMICS, Series 4091, Class SH, 6.365% (1 Month USD | ||
LIBOR + 655 bps), 8/15/42 | 20,860 | ||
| 3,747 | Federal National Mortgage Association REMICS, Series 2009-36, Class HX, 4.5%, 6/25/29 | 3,957 | |
| 76,020(e)(f) | Federal National Mortgage Association REMICS, Series 2012-14, Class SP, 6.366% (1 | ||
Month USD LIBOR + 655 bps), 8/25/41 | 10,543 | ||
| 74,693(e)(f) | Federal National Mortgage Association REMICS, Series 2018-43, Class SM, 6.016% (1 | ||
Month USD LIBOR + 620 bps), 6/25/48 | 9,239 | ||
| 95,577(e)(f) | Federal National Mortgage Association REMICS, Series 2019-33, Class S, 5.866% (1 | ||
Month USD LIBOR + 605 bps), 7/25/49 | 14,140 | ||
| 80,171(e)(f) | Federal National Mortgage Association REMICS, Series 2019-41, Class PS, 5.866% (1 | ||
Month USD LIBOR + 605 bps), 8/25/49 | 11,700 |
The accompanying notes are an integral part of these financial statements.
10
| Pioneer Strategic Income VCT Portfolio | PIONEER VARIABLE CONTRACTS TRUST |
| Principal | |||
| Amount | |||
| USD ($) | Value | ||
| COLLATERALIZED MORTGAGE OBLIGATIONS – (continued) | |||
| 78,802(e)(f) | Federal National Mortgage Association REMICS, Series 2019-41, Class SM, 5.866% (1 | ||
Month USD LIBOR + 605 bps), 8/25/49 | $ 8,970 | ||
| 82,886 | Finance of America Structured Securities Trust, Series 2018-A, Class JR2, 1.646%, | ||
12/26/68 (144A) | 88,378 | ||
| 30,000(e) | Freddie Mac Stacr Remic Trust, Series 2020-DNA2, Class B1, 2.685% (1 Month USD LIBOR | ||
+ 250 bps), 2/25/50 (144A) | 24,299 | ||
| 50,000(e) | Freddie Mac Stacr Remic Trust, Series 2020-HQA2, Class M2, 3.285% (1 Month USD LIBOR | ||
+ 310 bps), 3/25/50 (144A) | 47,872 | ||
| 150,000(e) | Freddie Mac Stacr Trust, Series 2018-HQA2, Class B1, 4.435% (1 Month USD LIBOR + 425 | ||
bps), 10/25/48 (144A) | 140,504 | ||
| 100,000(e) | Freddie Mac Stacr Trust, Series 2018-HQA2, Class M2, 2.485% (1 Month USD LIBOR + 230 | ||
bps), 10/25/48 (144A) | 96,298 | ||
| 72,392(e) | Freddie Mac Stacr Trust, Series 2019-HQA1, Class M2, 2.535% (1 Month USD LIBOR + 235 | ||
bps), 2/25/49 (144A) | 70,848 | ||
| 60,000(e) | Freddie Mac Stacr Trust, Series 2019-HRP1, Class B1, 4.235% (1 Month USD LIBOR + 405 | ||
bps), 2/25/49 (144A) | 56,123 | ||
| 27,448 | Government National Mortgage Association, Series 2009-83, Class EB, 4.5%, 9/20/39 | 31,034 | |
| 8,141 | Government National Mortgage Association, Series 2012-130, Class PA, 3.0%, 4/20/41 | 8,328 | |
| 178,155(e)(f) | Government National Mortgage Association, Series 2019-90, Class SA, 3.11% (1 Month | ||
USD LIBOR + 330 bps), 7/20/49 | 16,998 | ||
| 478,847(f) | Government National Mortgage Association, Series 2019-110, Class PI, 3.5%, 9/20/49 | 33,965 | |
| 370,719(e)(f) | Government National Mortgage Association, Series 2019-117, Class SB, 3.23% (1 Month | ||
USD LIBOR + 342 bps), 9/20/49 | 32,594 | ||
| 371,056(e)(f) | Government National Mortgage Association, Series 2019-121, Class SA, 3.16% (1 Month | ||
USD LIBOR + 335 bps), 10/20/49 | 36,293 | ||
| 557,116(f) | Government National Mortgage Association, Series 2019-128, Class IB, 3.5%, 10/20/49 | 65,242 | |
| 1,200,535(f) | Government National Mortgage Association, Series 2019-128, Class ID, 3.5%, 10/20/49 | 93,359 | |
| 305,699(f) | Government National Mortgage Association, Series 2019-159, Class CI, 3.5%, 12/20/49 | 34,531 | |
| 262,268(e)(f) | Government National Mortgage Association, Series 2020-9, Class SA, 3.16% (1 Month USD | ||
LIBOR + 335 bps), 1/20/50 | 25,252 | ||
| 100,000(e) | Home Partners of America Trust, Series 2017-1, Class D, 2.094% (1 Month USD LIBOR + | ||
190 bps), 7/17/34 (144A) | 99,494 | ||
| 59,856(e) | Home Partners of America Trust, Series 2018-1, Class A, 1.094% (1 Month USD LIBOR + | ||
90 bps), 7/17/37 (144A) | 58,976 | ||
| 22,895(d) | JP Morgan Mortgage Trust, Series 2014-1, Class B4, 3.718%, 1/25/44 (144A) | 22,936 | |
| 77,532(d) | JP Morgan Mortgage Trust, Series 2018-LTV1, Class A3, 4.5%, 4/25/49 (144A) | 79,246 | |
| 62,387(d) | JP Morgan Mortgage Trust, Series 2019-LTV1, Class A3, 4.0%, 6/25/49 (144A) | 64,159 | |
| 100,000(d) | JP Morgan Mortgage Trust, Series 2020-4, Class A15, 3.0%, 11/25/50 (144A) | 102,461 | |
| 159,706(d) | Mill City Mortgage Loan Trust, Series 2019-1, Class M3, 3.5%, 10/25/69 (144A) | 146,491 | |
| 100,000(d) | Mill City Mortgage Loan Trust, Series 2019-GS1, Class M1, 3.0%, 7/25/59 (144A) | 100,917 | |
| 87,875(d) | New Residential Mortgage Loan Trust, Series 2018-RPL1, Class A1, 3.5%, | ||
12/25/57 (144A) | 93,746 | ||
| 88,813(d) | New Residential Mortgage Loan Trust, Series 2019-RPL2, Class A1, 3.25%, | ||
2/25/59 (144A) | 92,883 | ||
| 100,000 | Progress Residential Trust, Series 2017-SFR1, Class E, 4.261%, 8/17/34 (144A) | 101,840 | |
| 145,636(d) | Sequoia Mortgage Trust, Series 2013-5, Class A2, 3.0%, 5/25/43 (144A) | 151,435 | |
| 50,948(d) | Sequoia Mortgage Trust, Series 2013-6, Class A1, 2.5%, 5/25/43 | 52,159 | |
| 57,701(d) | Sequoia Mortgage Trust, Series 2013-7, Class A2, 3.0%, 6/25/43 | 59,850 |
The accompanying notes are an integral part of these financial statements.
11
| Pioneer Strategic Income VCT Portfolio | PIONEER VARIABLE CONTRACTS TRUST |
SCHEDULE OF INVESTMENTS 6/30/20 (UNAUDITED) | (continued) |
| Principal | |||
| Amount | |||
| USD ($) | Value | ||
| COLLATERALIZED MORTGAGE OBLIGATIONS – (continued) | |||
| 102,159(d) | Sequoia Mortgage Trust, Series 2019-CH3, Class A1, 4.0%, 9/25/49 (144A) | $ 105,223 | |
| 60,000(d) | Towd Point Mortgage Trust, Series 2015-5, Class M1, 3.5%, 5/25/55 (144A) | 63,078 | |
| 70,000(d) | Towd Point Mortgage Trust, Series 2015-6, Class M1, 3.75%, 4/25/55 (144A) | 74,571 | |
| 150,000(d) | Towd Point Mortgage Trust, Series 2019-4, Class M1, 3.5%, 10/25/59 (144A) | 148,444 | |
| TOTAL COLLATERALIZED MORTGAGE OBLIGATIONS | |||
(Cost $4,191,166) | $ 3,962,653 | ||
| COMMERCIAL MORTGAGE-BACKED SECURITIES – 5.3% of Net Assets | |||
| 40,000 | Benchmark Mortgage Trust, Series 2018-B5, Class A3, 3.944%, 7/15/51 | $ 46,392 | |
| 100,000(d) | Benchmark Mortgage Trust, Series 2020-IG3, Class B, 3.387%, 9/15/48 (144A) | 102,406 | |
| 30,000 | CD Mortgage Trust, Series 2018-CD7, Class A3, 4.013%, 8/15/51 | 34,688 | |
| 40,000 | CFCRE Commercial Mortgage Trust, Series 2016-C3, Class A2, 3.597%, 1/10/48 | 44,018 | |
| 99,570(e) | CHC Commercial Mortgage Trust, Series 2019-CHC, Class E, 2.535% (1 Month USD LIBOR + | ||
235 bps), 6/15/34 (144A) | 82,624 | ||
| 150,000 | Citigroup Commercial Mortgage Trust, Series 2018-B2, Class A3, 3.744%, 3/10/51 | 170,845 | |
| 65,000(e) | CLNY Trust, Series 2019-IKPR, Class E, 2.906% (1 Month USD LIBOR + 272 bps), 11/15/38 | ||
(144A) | 53,798 | ||
| 25,000 | COMM Mortgage Trust, Series 2012-CR4, Class AM, 3.251%, 10/15/45 | 25,406 | |
| 100,000(d) | COMM Mortgage Trust, Series 2013-CR11, Class C, 5.286%, 8/10/50 (144A) | 96,342 | |
| 100,000(d) | COMM Mortgage Trust, Series 2015-CR24, Class D, 3.463%, 8/10/48 | 74,976 | |
| 75,000(d) | COMM Mortgage Trust, Series 2015-DC1, Class B, 4.035%, 2/10/48 | 75,542 | |
| 100,000(d) | CSAIL Commercial Mortgage Trust, Series 2015-C1, Class C, 4.412%, 4/15/50 | 91,252 | |
| 50,000(d) | CSAIL Commercial Mortgage Trust, Series 2015-C4, Class D, 3.732%, 11/15/48 | 33,463 | |
| 100,000(d) | FREMF Mortgage Trust, Series 2016-K52, Class B, 4.059%, 1/25/49 (144A) | 106,278 | |
| 30,000(d) | FREMF Mortgage Trust, Series 2017-K66, Class B, 4.173%, 7/25/27 (144A) | 32,392 | |
| 76,000(d) | FREMF Mortgage Trust, Series 2018-KW06, Class B, 4.367%, 6/25/28 (144A) | 58,171 | |
| 25,000(d) | FREMF Mortgage Trust, Series 2018-KW07, Class B, 4.221%, 10/25/31 (144A) | 19,153 | |
| 75,000(d) | FREMF Mortgage Trust, Series 2019-K88, Class C, 4.525%, 2/25/52 (144A) | 77,551 | |
| 97,269(d) | FREMF Mortgage Trust, Series 2019-KJ24, Class B, 7.6%, 10/25/27 (144A) | 81,062 | |
| 50,000(d) | FREMF Mortgage Trust, Series 2020-K106, Class B, 3.707%, 3/25/53 (144A) | 53,851 | |
| 50,000(d) | FREMF Trust, Series 2018-KW04, Class B, 4.044%, 9/25/28 (144A) | 50,137 | |
| 100,000(e) | GS Mortgage Securities Corp. Trust, Series 2020-DUNE, Class E, 2.685% (1 Month USD | ||
LIBOR + 250 bps), 12/15/36 (144A) | 84,554 | ||
| 100,000(e) | GS Mortgage Securities Corp. Trust, Series 2020-DUNE, Class G, 4.185% (1 Month USD | ||
LIBOR + 400 bps), 12/15/36 (144A) | 80,041 | ||
| 50,000(d) | JP Morgan Chase Commercial Mortgage Securities Trust, Series 2015-JP1, Class C, | ||
4.893%, 1/15/49 | 45,945 | ||
| 50,000 | JP Morgan Chase Commercial Mortgage Securities Trust, Series 2018-WPT, Class BFX, | ||
4.549%, 7/5/33 (144A) | 51,603 | ||
| 100,000(d) | JP Morgan Chase Commercial Mortgage Securities Trust, Series 2020-LOOP, Class F, | ||
3.861%, 12/5/38 (144A) | 72,626 | ||
| 100,000 | Morgan Stanley Capital I Trust, Series 2014-150E, Class AS, 4.012%, 9/9/32 (144A) | 106,266 | |
| 15,000 | Morgan Stanley Capital I Trust, Series 2016-UBS9, Class D, 3.0%, 3/15/49 (144A) | 10,380 | |
| 100,000(d) | Morgan Stanley Capital I Trust, Series 2018-MP, Class A, 4.418%, 7/11/40 (144A) | 108,097 | |
| 100,000(e) | Multifamily Connecticut Avenue Securities Trust, Series 2019-01, Class M10, 3.435% | ||
(1 Month USD LIBOR + 325 bps), 10/15/49 (144A) | 89,989 | ||
| 100,000(d) | Ready Capital Mortgage Trust, Series 2019-5, Class E, 5.514%, 2/25/52 (144A) | 71,974 |
The accompanying notes are an integral part of these financial statements.
12
| Pioneer Strategic Income VCT Portfolio | PIONEER VARIABLE CONTRACTS TRUST |
| Principal | |||
| Amount | |||
| USD ($) | Value | ||
| COLLATERALIZED MORTGAGE OBLIGATIONS – (continued) | |||
| 48,029(d) | Sutherland Commercial Mortgage Loans, Series 2018-SBC7, Class A, 4.72%, 5/25/39 (144A) | $ 48,118 | |
| 1,000,000(d)(f) | UBS Commercial Mortgage Trust, Series 2018-C9, Class XB, 0.443%, 3/15/51 | 25,375 | |
| TOTAL COMMERCIAL MORTGAGE-BACKED SECURITIES | |||
(Cost $2,377,048) | $ 2,205,315 | ||
| CONVERTIBLE CORPORATE BONDS – 0.6% of Net Assets | |||
| Airlines – 0.1% | |||
| 17,000 | Air Canada, 4.0%, 7/1/25 (144A) | $ 17,977 | |
| 27,000 | Southwest Airlines Co., 1.25%, 5/1/25 | 32,428 | |
| Total Airlines | $ 50,405 | ||
| Biotechnology – 0.3% | |||
| 50,000 | Exact Sciences Corp., 0.375%, 3/1/28 | $ 47,788 | |
| 54,000 | Insmed, Inc., 1.75%, 1/15/25 | 52,481 | |
| Total Biotechnology | $ 100,269 | ||
| Pharmaceuticals – 0.2% | |||
| 19,000 | Jazz Investments I, Ltd., 1.5%, 8/15/24 | $ 17,444 | |
| 31,000 | Teva Pharmaceutical Finance Co. LLC, 0.25%, 2/1/26 | 30,020 | |
| 40,000 | Tricida, Inc., 3.5%, 5/15/27 (144A) | 42,246 | |
| Total Pharmaceuticals | $ 89,710 | ||
| TOTAL CONVERTIBLE CORPORATE BONDS | |||
(Cost $221,236) | $ 240,384 | ||
| CORPORATE BONDS – 42.4% of Net Assets | |||
| Advertising – 0.6% | |||
| 115,000 | Interpublic Group of Cos., Inc., 4.75%, 3/30/30 | $ 135,598 | |
| 15,000 | Lamar Media Corp., 3.75%, 2/15/28 (144A) | 14,142 | |
| 10,000 | Lamar Media Corp., 4.0%, 2/15/30 (144A) | 9,572 | |
| 15,000 | Lamar Media Corp., 4.875%, 1/15/29 (144A) | 15,075 | |
| 55,000 | Outfront Media Capital LLC/Outfront Media Capital Corp., 6.25%, 6/15/25 (144A) | 55,360 | |
| Total Advertising | $ 229,747 | ||
| Aerospace & Defense – 0.9% | |||
| 237,000 | Boeing Co., 3.75%, 2/1/50 | $ 212,804 | |
| 85,000 | Boeing Co., 5.805%, 5/1/50 | 100,384 | |
| 45,000 | Howmet Aerospace, Inc., 6.875%, 5/1/25 | 48,819 | |
| Total Aerospace & Defense | $ 362,007 | ||
| Agriculture – 0.5% | |||
| 25,000 | Altria Group, Inc., 4.45%, 5/6/50 | $ 27,346 | |
| 125,000 | BAT Capital Corp., 4.54%, 8/15/47 | 135,723 | |
| 35,000 | Cargill, Inc., 2.125%, 4/23/30 (144A) | 36,689 | |
| Total Agriculture | $ 199,758 | ||
| Airlines – 0.2% | |||
| 25,032 | Air Canada 2013-1 Class B Pass Through Trust, 5.375%, 5/15/21 (144A) | $ 22,562 | |
| 55,000 | Mileage Plus Holdings LLC/Mileage Plus Intellectual Property Assets, Ltd., 6.5%, | ||
6/20/27 (144A) | 55,137 | ||
| Total Airlines | $ 77,699 |
The accompanying notes are an integral part of these financial statements.
13
| Pioneer Strategic Income VCT Portfolio | PIONEER VARIABLE CONTRACTS TRUST |
SCHEDULE OF INVESTMENTS 6/30/20 (UNAUDITED) | (continued) |
| Principal | ||||
| Amount | ||||
| USD ($) | Value | |||
| Apparel – 0.1% | ||||
| 55,000 | Ralph Lauren Corp., 2.95%, 6/15/30 | $ 56,476 | ||
| Total Apparel | $ 56,476 | |||
| Auto Manufacturers – 0.7% | ||||
| 135,000 | Ford Motor Co., 4.346%, 12/8/26 | $ 125,928 | ||
| 152,000 | General Motors Co., 6.6%, 4/1/36 | 164,314 | ||
| Total Auto Manufacturers | $ 290,242 | |||
| Auto Parts & Equipment – 0.4% | ||||
| 69,000 | BorgWarner, Inc., 2.65%, 7/1/27 | $ 70,794 | ||
| 55,000 | Goodyear Tire & Rubber Co., 9.5%, 5/31/25 | 58,850 | ||
| 45,000 | Lear Corp., 3.5%, 5/30/30 | 44,944 | ||
| Total Auto Parts & Equipment | $ 174,588 | |||
| Banks – 8.4% | ||||
| 200,000(d) | AIB Group Plc, 4.263% (3 Month USD LIBOR + 187 bps), 4/10/25 (144A) | $ 213,069 | ||
| 100,000(d) | Banco Continental SA via Continental Trustees Cayman, Ltd., 7.375% (3 Month USD LIBOR | |||
+ 680 bps), 10/7/40 (144A) | 101,600 | |||
| 65,000(d) | Banco de Credito del Peru, 6.875% (3 Month USD LIBOR + 771 bps), 9/16/26 (144A) | 68,737 | ||
ARS | 1,000,000(e) | Banco de la Ciudad de Buenos Aires, 33.478% (BADLARPP + 399 bps), 12/5/22 | 9,602 | |
| 70,000(d) | Bank of America Corp., 4.083% (3 Month USD LIBOR + 315 bps), 3/20/51 | 87,714 | ||
| 120,000(b)(d) | Bank of America Corp., 4.3% (3 Month USD LIBOR + 266 bps) | 107,688 | ||
| 200,000 | Barclays Plc, 4.375%, 1/12/26 | 225,204 | ||
| 210,000(b)(d) | BNP Paribas SA, 6.625% (5 Year USD Swap Rate + 415 bps) (144A) | 214,200 | ||
| 155,000(b)(d) | Citigroup, Inc., 4.7% (SOFRRATE + 323 bps) | 137,756 | ||
| 400,000(b)(d) | Credit Suisse Group AG, 5.1% (5 Year CMT Index + 329 bps) (144A) | 379,000 | ||
| 210,000(b)(d) | Danske Bank AS, 6.125% (USD Swap Rate + 390 bps) | 207,900 | ||
| 32,000 | Freedom Mortgage Corp., 8.25%, 4/15/25 (144A) | 31,680 | ||
| 60,000(d) | Goldman Sachs Group, Inc., 4.223% (3 Month USD LIBOR + 130 bps), 5/1/29 | 69,809 | ||
| 200,000 | Intesa Sanpaolo S.p.A., 4.7%, 9/23/49 (144A) | 218,773 | ||
| 160,000(b)(d) | JPMorgan Chase & Co., 4.6% (SOFRRATE + 313 bps) | 142,800 | ||
| 195,000(b)(d) | JPMorgan Chase & Co., 5.0% (SOFRRATE + 338 bps) | 186,517 | ||
| 200,000 | Lloyds Banking Group Plc, 4.65%, 3/24/26 | 222,427 | ||
| 200,000 | QNB Finansbank AS, 4.875%, 5/19/22 (144A) | 197,900 | ||
| 200,000(b)(d) | Royal Bank of Scotland Group Plc, 8.625% (5 Year USD Swap Rate + 760 bps) | 207,950 | ||
EUR | 107,600(b) | Stichting AK Rabobank Certificaten, 6.5% | 128,148 | |
| 115,000(b)(d) | Truist Financial Corp., 5.1% (5 Year CMT Index + 435 bps) | 118,749 | ||
| 200,000(b)(d) | UBS Group AG, 7.0% (5 Year USD Swap Rate + 434 bps) (144A) | 207,750 | ||
| Total Banks | $ 3,484,973 | |||
| Beverages – 1.4% | ||||
| 241,000 | Anheuser-Busch InBev Worldwide, Inc., 5.55%, 1/23/49 | $ 321,299 | ||
| 200,000 | Bacardi, Ltd., 5.3%, 5/15/48 (144A) | 247,016 | ||
| Total Beverages | $ 568,315 |
The accompanying notes are an integral part of these financial statements.
14
| Pioneer Strategic Income VCT Portfolio | PIONEER VARIABLE CONTRACTS TRUST |
| Principal | ||||
| Amount | ||||
| USD ($) | Value | |||
| Building Materials – 0.3% | ||||
| 10,000 | Builders FirstSource, Inc., 5.0%, 3/1/30 (144A) | $ 9,400 | ||
| 55,000 | Carrier Global Corp., 2.7%, 2/15/31 (144A) | 54,839 | ||
| 55,000 | Standard Industries, Inc., 4.375%, 7/15/30 (144A) | 54,863 | ||
| 5,000 | Standard Industries, Inc., 5.0%, 2/15/27 (144A) | 5,063 | ||
| Total Building Materials | $ 124,165 | |||
| Chemicals – 1.3% | ||||
| 26,000 | CF Industries, Inc., 4.95%, 6/1/43 | $ 28,023 | ||
EUR | 100,000 | INEOS Finance Plc, 2.875%, 5/1/26 (144A) | 107,018 | |
| 19,000 | NOVA Chemicals Corp., 5.0%, 5/1/25 (144A) | 17,432 | ||
| 28,000 | NOVA Chemicals Corp., 5.25%, 6/1/27 (144A) | 24,580 | ||
| 200,000 | OCI NV, 6.625%, 4/15/23 (144A) | 201,000 | ||
| 25,000 | PolyOne Corp., 5.75%, 5/15/25 (144A) | 25,719 | ||
| 22,000 | Sherwin-Williams Co., 3.3%, 5/15/50 | 22,312 | ||
| 50,000 | Tronox, Inc., 6.5%, 5/1/25 (144A) | 50,500 | ||
| 47,000 | Tronox, Inc., 6.5%, 4/15/26 (144A) | 43,945 | ||
| Total Chemicals | $ 520,529 | |||
| Commercial Services – 1.6% | ||||
| 45,000 | Allied Universal Holdco LLC/Allied Universal Finance Corp., 6.625%, 7/15/26 (144A) | $ 47,250 | ||
| 45,000 | Brink’s Co., 5.5%, 7/15/25 (144A) | 45,834 | ||
| 150,000 | CoStar Group, Inc., 2.8%, 7/15/30 (144A) | 153,505 | ||
| 35,000 | Garda World Security Corp., 4.625%, 2/15/27 (144A) | 34,475 | ||
| 38,000 | Garda World Security Corp., 9.5%, 11/1/27 (144A) | 40,185 | ||
| 10,000 | Jaguar Holding Co. II/PPD Development LP, 4.625%, 6/15/25 (144A) | 10,177 | ||
| 20,000 | Jaguar Holding Co. II/PPD Development LP, 5.0%, 6/15/28 (144A) | 20,475 | ||
| 35,000 | Prime Security Services Borrower LLC/Prime Finance, Inc., 5.75%, 4/15/26 (144A) | 36,295 | ||
| 131,000 | Prime Security Services Borrower LLC/Prime Finance, Inc., 6.25%, 1/15/28 (144A) | 123,468 | ||
| 50,000 | United Rentals North America, Inc., 3.875%, 11/15/27 | 49,875 | ||
| 35,000 | United Rentals North America, Inc., 4.875%, 1/15/28 | 35,875 | ||
| 59,000 | Verisk Analytics, Inc., 3.625%, 5/15/50 | 66,794 | ||
| 8,000 | Verisk Analytics, Inc., 5.5%, 6/15/45 | 10,972 | ||
| Total Commercial Services | $ 675,180 | |||
| Computers – 0.0%† | ||||
| 5,000 | NCR Corp., 8.125%, 4/15/25 (144A) | $ 5,300 | ||
| Total Computers | $ 5,300 | |||
| Cosmetics/Personal Care – 0.1% | ||||
| 55,000 | Edgewell Personal Care Co., 5.5%, 6/1/28 (144A) | $ 56,512 | ||
| Total Cosmetics/Personal Care | $ 56,512 | |||
| Diversified Financial Services – 0.6% | ||||
| 10,000 | Avolon Holdings Funding, Ltd., 3.95%, 7/1/24 (144A) | $ 8,688 | ||
| 60,000(b)(d) | Charles Schwab Corp., 5.375% (5 Year CMT Index + 497 bps) | 64,099 | ||
| 145,000(g) | Global Aircraft Leasing Co., Ltd., 6.5% (7.25% PIK or 6.50% cash), 9/15/24 (144A) | 97,150 | ||
| 10,000 | Nationstar Mortgage Holdings, Inc., 6.0%, 1/15/27 (144A) | 9,500 | ||
| 39,000 | Nationstar Mortgage Holdings, Inc., 8.125%, 7/15/23 (144A) | 40,022 | ||
| 14,000 | Nationstar Mortgage Holdings, Inc., 9.125%, 7/15/26 (144A) | 14,796 | ||
| Total Diversified Financial Services | $ 234,255 |
The accompanying notes are an integral part of these financial statements.
15
| Pioneer Strategic Income VCT Portfolio | PIONEER VARIABLE CONTRACTS TRUST |
SCHEDULE OF INVESTMENTS 6/30/20 (UNAUDITED) | (continued) |
| Principal | ||||
| Amount | ||||
| USD ($) | Value | |||
| Electric – 3.1% | ||||
| 20,000 | AES Corp., 3.95%, 7/15/30 (144A) | $ 21,150 | ||
| 151,000(b)(d) | Dominion Energy, Inc., 4.65% (5 Year CMT Index + 299 bps) | 147,875 | ||
| 200,000(b)(d) | Duke Energy Corp., 4.875% (5 Year CMT Index + 339 bps) | 199,780 | ||
| 65,000 | Iberdrola International BV, 6.75%, 7/15/36 | 90,440 | ||
| 47,000 | New York State Electric & Gas Corp., 3.3%, 9/15/49 (144A) | 48,420 | ||
| 17,000 | NextEra Energy Operating Partners LP, 4.5%, 9/15/27 (144A) | 17,771 | ||
| 200,000 | NRG Energy, Inc., 4.45%, 6/15/29 (144A) | 209,911 | ||
| 60,000 | Puget Energy, Inc., 4.1%, 6/15/30 (144A) | 66,242 | ||
| 95,000 | Sempra Energy, 3.4%, 2/1/28 | 103,932 | ||
| 88,000 | Southern California Edison Co., 3.65%, 2/1/50 | 96,576 | ||
| 65,000 | Southern California Edison Co., 4.875%, 3/1/49 | 85,013 | ||
| 150,000 | Vistra Operations Co. LLC, 3.7%, 1/30/27 (144A) | 154,474 | ||
| 19,000 | Vistra Operations Co. LLC, 4.3%, 7/15/29 (144A) | 19,976 | ||
| Total Electric | $ 1,261,560 | |||
| Electrical Components & Equipment – 0.4% | ||||
EUR | 100,000 | Belden, Inc., 2.875%, 9/15/25 (144A) | $ 105,881 | |
| 25,000 | Energizer Holdings, Inc., 4.75%, 6/15/28 (144A) | 24,524 | ||
| 20,000 | WESCO Distribution, Inc., 7.125%, 6/15/25 (144A) | 21,063 | ||
| 15,000 | WESCO Distribution, Inc., 7.25%, 6/15/28 (144A) | 15,863 | ||
| Total Electrical Components & Equipment | $ 167,331 | |||
| Electronics – 0.5% | ||||
| 197,000 | Flex, Ltd., 4.875%, 6/15/29 | $ 217,405 | ||
| Total Electronics | $ 217,405 | |||
| Energy-Alternate Sources – 0.2% | ||||
| 48,620 | Alta Wind Holdings LLC, 7.0%, 6/30/35 (144A) | $ 58,833 | ||
| 19,000 | TerraForm Power Operating LLC, 4.75%, 1/15/30 (144A) | 19,285 | ||
| Total Energy-Alternate Sources | $ 78,118 | |||
| Engineering & Construction – 0.2% | ||||
| 75,000 | PowerTeam Services LLC, 9.033%, 12/4/25 (144A) | $ 76,500 | ||
| Total Engineering & Construction | $ 76,500 | |||
| Entertainment – 0.3% | ||||
| 40,000 | Colt Merger Sub, Inc., 6.25%, 7/1/25 (144A) | $ 39,750 | ||
| 20,000 | Eldorado Resorts, Inc., 6.0%, 9/15/26 | 21,606 | ||
| 15,000 | Scientific Games International, Inc., 7.0%, 5/15/28 (144A) | 12,000 | ||
| 15,000 | Scientific Games International, Inc., 7.25%, 11/15/29 (144A) | 12,000 | ||
| 31,000 | Scientific Games International, Inc., 8.25%, 3/15/26 (144A) | 27,803 | ||
| Total Entertainment | $ 113,159 | |||
| Environmental Control – 0.2% | ||||
| 56,000 | Covanta Holding Corp., 6.0%, 1/1/27 | $ 56,706 | ||
| 21,000 | Tervita Corp., 7.625%, 12/1/21 (144A) | 16,485 | ||
| Total Environmental Control | $ 73,191 |
The accompanying notes are an integral part of these financial statements.
16
| Pioneer Strategic Income VCT Portfolio | PIONEER VARIABLE CONTRACTS TRUST |
| Principal | |||
| Amount | |||
| USD ($) | Value | ||
| Food – 0.8% | |||
| 30,000 | Albertsons Cos., Inc./Safeway, Inc./New Albertsons LP/Albertsons LLC, 4.875%, | ||
2/15/30 (144A) | $ 30,694 | ||
| 50,000 | JBS USA LUX SA/JBS USA Finance, Inc., 6.75%, 2/15/28 (144A) | 52,813 | |
| 39,000 | JBS USA LUX SA/JBS USA Food Co./JBS USA Finance, Inc., 5.5%, 1/15/30 (144A) | 39,975 | |
| 200,000 | Minerva Luxembourg SA, 5.875%, 1/19/28 (144A) | 195,440 | |
| 25,000 | Smithfield Foods, Inc., 2.65%, 10/3/21 (144A) | 24,724 | |
| Total Food | $ 343,646 | ||
| Forest Products & Paper – 0.4% | |||
| 70,000 | International Paper Co., 4.8%, 6/15/44 | $ 83,488 | |
| 16,000 | International Paper Co., 6.0%, 11/15/41 | 21,090 | |
| 53,000 | International Paper Co., 7.3%, 11/15/39 | 74,431 | |
| Total Forest Products & Paper | $ 179,009 | ||
| Hand/Machine Tools – 0.1% | |||
| 35,000(d) | Stanley Black & Decker, Inc., 4.0% (5 Year CMT Index + 266 bps), 3/15/60 | $ 35,018 | |
| Total Hand/Machine Tools | $ 35,018 | ||
| Healthcare-Services – 1.2% | |||
| 61,000 | Centene Corp., 3.375%, 2/15/30 | $ 61,592 | |
| 20,000 | Centene Corp., 4.25%, 12/15/27 | 20,638 | |
| 35,000 | Centene Corp., 4.625%, 12/15/29 | 36,925 | |
| 76,000 | HCA, Inc., 3.5%, 9/1/30 | 73,201 | |
| 53,000 | Health Care Service Corp. A Mutual Legal Reserve Co., 3.2%, 6/1/50 (144A) | 53,927 | |
| 20,000 | LifePoint Health, Inc., 6.75%, 4/15/25 (144A) | 20,650 | |
| 50,000 | MEDNAX, Inc., 5.25%, 12/1/23 (144A) | 49,750 | |
| 15,000 | Molina Healthcare, Inc., 4.375%, 6/15/28 (144A) | 14,981 | |
| 50,000 | NYU Langone Hospitals, 4.428%, 7/1/42 | 56,737 | |
| 13,000 | RegionalCare Hospital Partners Holdings, Inc./LifePoint Health, Inc., 9.75%, | ||
12/1/26 (144A) | 13,390 | ||
| 9,000 | Select Medical Corp., 6.25%, 8/15/26 (144A) | 9,099 | |
| 30,000 | Tenet Healthcare Corp., 5.125%, 11/1/27 (144A) | 29,601 | |
| 31,000 | US Renal Care, Inc., 10.625%, 7/15/27 (144A) | 31,930 | |
| 16,000 | West Street Merger Sub, Inc., 6.375%, 9/1/25 (144A) | 15,480 | |
| Total Healthcare-Services | $ 487,901 | ||
| Home Builders – 0.1% | |||
| 9,000 | KB Home, 6.875%, 6/15/27 | $ 9,810 | |
| 19,000 | Meritage Homes Corp., 6.0%, 6/1/25 | 20,215 | |
| Total Home Builders | $ 30,025 | ||
| Housewares – 0.0%† | |||
| 5,000 | CD&R Smokey Buyer, Inc., 6.75%, 7/15/25 (144A) | $ 5,198 | |
| Total Housewares | $ 5,198 | ||
| Insurance – 1.7% | |||
| 85,000 | AXA SA, 8.6%, 12/15/30 | $ 123,455 | |
| 132,000 | CNO Financial Group, Inc., 5.25%, 5/30/29 | 141,468 |
The accompanying notes are an integral part of these financial statements.
17
| Pioneer Strategic Income VCT Portfolio | PIONEER VARIABLE CONTRACTS TRUST |
SCHEDULE OF INVESTMENTS 6/30/20 (UNAUDITED) | (continued) |
| Principal | |||
| Amount | |||
| USD ($) | Value | ||
| Insurance – (continued) | |||
| 60,000(d) | Farmers Exchange Capital III, 5.454% (3 Month USD LIBOR + 345 bps), 10/15/54 (144A) | $ 69,500 | |
| 120,000(d) | Farmers Insurance Exchange, 4.747% (3 Month USD LIBOR + 323 bps), 11/1/57 (144A) | 121,169 | |
| 105,000 | Nationwide Mutual Insurance Co., 4.35%, 4/30/50 (144A) | 111,985 | |
| 35,000 | New York Life Insurance Co., 3.75%, 5/15/50 (144A) | 39,527 | |
| 110,000 | Prudential Financial, Inc., 3.0%, 3/10/40 | 112,049 | |
| Total Insurance | $ 719,153 | ||
| Internet – 0.9% | |||
| 145,000 | Booking Holdings, Inc., 4.625%, 4/13/30 | $ 171,146 | |
| 121,000 | Expedia Group, Inc., 3.25%, 2/15/30 | 112,814 | |
| 100,000 | Expedia Group, Inc., 3.8%, 2/15/28 | 95,783 | |
| Total Internet | $ 379,743 | ||
| Iron & Steel – 0.1% | |||
| 20,000 | Cleveland-Cliffs, Inc., 6.75%, 3/15/26 (144A) | $ 19,300 | |
| 10,000 | Cleveland-Cliffs, Inc., 9.875%, 10/17/25 (144A) | 10,489 | |
| 20,000 | Steel Dynamics, Inc., 3.25%, 1/15/31 | 20,399 | |
| Total Iron & Steel | $ 50,188 | ||
| Leisure Time – 0.2% | |||
| 29,000 | Royal Caribbean Cruises, Ltd., 11.5%, 6/1/25 (144A) | $ 30,260 | |
| 94,000 | VOC Escrow, Ltd., 5.0%, 2/15/28 (144A) | 69,795 | |
| Total Leisure Time | $ 100,055 | ||
| Lodging – 0.1% | |||
| 5,000 | Hilton Domestic Operating Co., Inc., 5.375%, 5/1/25 (144A) | $ 5,000 | |
| 5,000 | Hilton Domestic Operating Co., Inc., 5.75%, 5/1/28 (144A) | 5,050 | |
| 15,000 | Marriott International, Inc., 4.625%, 6/15/30 | 15,564 | |
| 10,000 | Marriott International, Inc., 5.75%, 5/1/25 | 10,864 | |
| Total Lodging | $ 36,478 | ||
| Media – 0.9% | |||
| 50,000 | CCO Holdings LLC/CCO Holdings Capital Corp., 4.75%, 3/1/30 (144A) | $ 51,159 | |
| 200,000 | CSC Holdings LLC, 5.5%, 4/15/27 (144A) | 208,100 | |
| 97,000 | Diamond Sports Group LLC/Diamond Sports Finance Co., 6.625%, 8/15/27 (144A) | 51,652 | |
| 69,000 | Gray Television, Inc., 7.0%, 5/15/27 (144A) | 70,725 | |
| Total Media | $ 381,636 | ||
| Mining – 1.0% | |||
| 200,000 | Anglo American Capital Plc, 4.5%, 3/15/28 (144A) | $ 219,359 | |
| 170,000 | Freeport-McMoRan, Inc., 5.45%, 3/15/43 | 166,600 | |
| 30,000 | Novelis Corp., 4.75%, 1/30/30 (144A) | 28,650 | |
| Total Mining | $ 414,609 | ||
| Miscellaneous Manufacturers – 0.3% | |||
| 14,000 | Amsted Industries, Inc., 5.625%, 7/1/27 (144A) | $ 14,437 | |
| 50,000 | General Electric Co., 4.25%, 5/1/40 | 49,754 | |
| 55,000 | General Electric Co., 4.35%, 5/1/50 | 54,395 | |
| Total Miscellaneous Manufacturers | $ 118,586 |
The accompanying notes are an integral part of these financial statements.
18
| Pioneer Strategic Income VCT Portfolio | PIONEER VARIABLE CONTRACTS TRUST |
| Principal | ||||
| Amount | ||||
| USD ($) | Value | |||
| Multi-National – 1.0% | ||||
| 200,000 | African Export-Import Bank, 3.994%, 9/21/29 (144A) | $ 196,800 | ||
IDR | 1,997,800,000 | European Bank for Reconstruction & Development, 6.45%, 12/13/22 | 137,807 | |
IDR | 980,000,000 | Inter-American Development Bank, 7.875%, 3/14/23 | 69,545 | |
| Total Multi-National | $ 404,152 | |||
| Oil & Gas – 2.3% | ||||
| 50,000 | Apache Corp., 4.25%, 1/15/30 | $ 43,223 | ||
| 95,000 | Apache Corp., 4.375%, 10/15/28 | 83,891 | ||
| 175,000 | Cenovus Energy, Inc., 6.75%, 11/15/39 | 170,391 | ||
| 200,000 | Gazprom PJSC Via Gaz Capital SA, 4.95%, 7/19/22 (144A) | 210,703 | ||
| 65,000 | Marathon Petroleum Corp., 5.375%, 10/1/22 | 65,398 | ||
| 21,000 | MEG Energy Corp., 6.5%, 1/15/25 (144A) | 19,595 | ||
| 27,000 | MEG Energy Corp., 7.0%, 3/31/24 (144A) | 23,152 | ||
| 20,000 | MEG Energy Corp., 7.125%, 2/1/27 (144A) | 16,625 | ||
| 75,000 | Newfield Exploration Co., 5.625%, 7/1/24 | 71,666 | ||
| 30,000 | PBF Holding Co. LLC/PBF Finance Corp., 9.25%, 5/15/25 (144A) | 32,025 | ||
| 42,000 | Petroleos Mexicanos, 5.35%, 2/12/28 | 35,280 | ||
| 25,000 | Precision Drilling Corp., 7.125%, 1/15/26 (144A) | 15,250 | ||
| 35,000 | Transocean, Inc., 6.8%, 3/15/38 | 10,060 | ||
| 10,000 | Transocean, Inc., 8.0%, 2/1/27 (144A) | 5,519 | ||
| 79,000 | Valero Energy Corp., 6.625%, 6/15/37 | 105,056 | ||
| 30,000 | YPF SA, 6.95%, 7/21/27 (144A) | 21,000 | ||
ARS | 175,000 | YPF SA, 16.5%, 5/9/22 (144A) | 1,615 | |
| Total Oil & Gas | $ 930,449 | |||
| Oil & Gas Services – 0.0%† | ||||
| 18,000 | USA Compression Partners LP/USA Compression Finance Corp., 6.875%, 9/1/27 | $ 17,280 | ||
| Total Oil & Gas Services | $ 17,280 | |||
| Packaging & Containers – 0.2% | ||||
| 65,000 | Greif, Inc., 6.5%, 3/1/27 (144A) | $ 66,162 | ||
| Total Packaging & Containers | $ 66,162 | |||
| Pharmaceuticals – 1.3% | ||||
| 53,000 | AbbVie, Inc., 4.05%, 11/21/39 (144A) | $ 61,981 | ||
| 7,000 | Bausch Health Americas, Inc., 8.5%, 1/31/27 (144A) | 7,429 | ||
EUR | 105,000 | Bausch Health Cos., Inc., 4.5%, 5/15/23 (144A) | 116,622 | |
| 15,000 | Bausch Health Cos., Inc., 5.0%, 1/30/28 (144A) | 14,122 | ||
| 10,000 | Bausch Health Cos., Inc., 5.25%, 1/30/30 (144A) | 9,487 | ||
| 45,000 | Cardinal Health, Inc., 4.9%, 9/15/45 | 51,878 | ||
| 32,245 | CVS Pass-Through Trust, 5.773%, 1/10/33 (144A) | 36,290 | ||
| 54,133 | CVS Pass-Through Trust, 6.036%, 12/10/28 | 61,181 | ||
| 17,724 | CVS Pass-Through Trust, 8.353%, 7/10/31 (144A) | 23,119 | ||
| 31,000 | Par Pharmaceutical, Inc., 7.5%, 4/1/27 (144A) | 31,812 | ||
| 142,000 | Teva Pharmaceutical Finance Netherlands III BV, 3.15%, 10/1/26 | 126,789 | ||
| Total Pharmaceuticals | $ 540,710 |
The accompanying notes are an integral part of these financial statements.
19
| Pioneer Strategic Income VCT Portfolio | PIONEER VARIABLE CONTRACTS TRUST |
SCHEDULE OF INVESTMENTS 6/30/20 (UNAUDITED) | (continued) |
| Principal | |||
| Amount | |||
| USD ($) | Value | ||
| Pipelines – 2.9% | |||
| 28,000 | Cameron LNG LLC, 3.302%, 1/15/35 (144A) | $ 30,871 | |
| 64,000 | Cameron LNG LLC, 3.402%, 1/15/38 (144A) | 68,746 | |
| 16,000 | DCP Midstream Operating LP, 5.6%, 4/1/44 | 12,800 | |
| 70,000 | Enable Midstream Partners LP, 4.4%, 3/15/27 | 65,205 | |
| 122,000 | Enable Midstream Partners LP, 4.95%, 5/15/28 | 113,008 | |
| 30,000 | Energy Transfer Operating LP, 5.875%, 1/15/24 | 33,399 | |
| 35,000 | Energy Transfer Operating LP, 6.0%, 6/15/48 | 36,301 | |
| 10,000 | Energy Transfer Operating LP, 6.125%, 12/15/45 | 10,306 | |
| 21,000 | Energy Transfer Operating LP, 6.5%, 2/1/42 | 22,748 | |
| 15,000(b)(d) | Energy Transfer Operating LP, 6.625% (3 Month USD LIBOR + 416 bps) | 11,478 | |
| 115,000(b)(d) | Energy Transfer Operating LP, 7.125% (5 Year CMT Index + 531 bps) | 98,325 | |
| 4,000 | EnLink Midstream LLC, 5.375%, 6/1/29 | 3,000 | |
| 9,000 | EnLink Midstream Partners LP, 5.05%, 4/1/45 | 5,605 | |
| 135,000 | EnLink Midstream Partners LP, 5.45%, 6/1/47 | 83,673 | |
| 34,000 | EnLink Midstream Partners LP, 5.6%, 4/1/44 | 20,740 | |
| 15,000 | Enterprise Products Operating LLC, 3.95%, 1/31/60 | 15,458 | |
| 30,000 | Hess Midstream Operations LP, 5.125%, 6/15/28 (144A) | 28,873 | |
| 95,000 | Kinder Morgan, Inc., 5.05%, 2/15/46 | 109,311 | |
| 38,000 | Midwest Connector Capital Co. LLC, 4.625%, 4/1/29 (144A) | 40,962 | |
| 125,000 | Phillips 66 Partners LP, 3.75%, 3/1/28 | 133,424 | |
| 38,000 | Sunoco Logistics Partners Operations LP, 5.4%, 10/1/47 | 38,019 | |
| 19,000 | Sunoco Logistics Partners Operations LP, 6.1%, 2/15/42 | 19,905 | |
| 65,000 | Williams Cos., Inc., 5.75%, 6/24/44 | 75,176 | |
| 95,000 | Williams Cos., Inc., 7.5%, 1/15/31 | 121,654 | |
| Total Pipelines | $ 1,198,987 | ||
| REITs – 2.1% | |||
| 205,000 | Duke Realty LP, 1.75%, 7/1/30 | $ 203,645 | |
| 40,000 | GLP Capital LP/GLP Financing II, Inc., 4.0%, 1/15/30 | 39,650 | |
| 55,000 | Healthcare Trust of America Holdings LP, 3.75%, 7/1/27 | 58,035 | |
| 45,000 | Highwoods Realty LP, 4.125%, 3/15/28 | 48,130 | |
| 120,000 | iStar, Inc., 4.25%, 8/1/25 | 108,600 | |
| 30,000 | iStar, Inc., 4.75%, 10/1/24 | 28,012 | |
| 86,000 | MPT Operating Partnership LP/MPT Finance Corp., 4.625%, 8/1/29 | 86,430 | |
| 150,000 | SBA Tower Trust, 3.869%, 10/8/24 (144A) | 158,405 | |
| 40,000 | Simon Property Group LP, 3.25%, 9/13/49 | 37,294 | |
| 73,000 | Uniti Group LP/Uniti Fiber Holdings, Inc./CSL Capital LLC, 7.875%, 2/15/25 (144A) | 73,969 | |
| 8,000 | VICI Properties LP/VICI Note Co., Inc., 4.125%, 8/15/30 (144A) | 7,630 | |
| Total REITs | $ 849,800 | ||
| Retail – 0.4% | |||
| 30,000 | AutoNation, Inc., 4.75%, 6/1/30 | $ 32,507 | |
| 81,000 | Beacon Roofing Supply, Inc., 4.875%, 11/1/25 (144A) | 72,292 | |
| 10,000 | QVC, Inc., 4.75%, 2/15/27 | 9,670 | |
| 44,000 | Starbucks Corp., 3.35%, 3/12/50 | 44,813 | |
| Total Retail | $ 159,282 |
The accompanying notes are an integral part of these financial statements.
20
| Pioneer Strategic Income VCT Portfolio | PIONEER VARIABLE CONTRACTS TRUST |
| Principal | ||||
| Amount | ||||
| USD ($) | Value | |||
| Semiconductors – 0.5% | ||||
| 20,000 | Broadcom, Inc., 4.3%, 11/15/32 (144A) | $ 21,944 | ||
| 160,000 | Broadcom, Inc., 5.0%, 4/15/30 (144A) | 183,900 | ||
| Total Semiconductors | $ 205,844 | |||
| Software – 0.6% | ||||
| 215,000 | Citrix Systems, Inc., 3.3%, 3/1/30 | $ 229,833 | ||
| Total Software | $ 229,833 | |||
| Telecommunications – 0.9% | ||||
| 90,000 | AT&T, Inc., 3.65%, 6/1/51 | $ 94,232 | ||
| 70,000 | AT&T, Inc., 3.85%, 6/1/60 | 74,646 | ||
| 25,000 | CenturyLink, Inc., 4.0%, 2/15/27 (144A) | 24,281 | ||
| 50,000 | CommScope Technologies LLC, 5.0%, 3/15/27 (144A) | 45,035 | ||
| 55,000 | Level 3 Financing, Inc., 4.625%, 9/15/27 (144A) | 55,412 | ||
| 13,000 | Millicom International Cellular SA, 6.25%, 3/25/29 (144A) | 13,877 | ||
| 30,000 | Sprint Corp., 7.25%, 9/15/21 | 31,450 | ||
| 40,000 | Windstream Services LLC/Windstream Finance Corp., 8.625%, 10/31/25 (144A) | 24,000 | ||
| Total Telecommunications | $ 362,933 | |||
| Transportation – 0.4% | ||||
| 103,000 | Union Pacific Corp., 3.75%, 2/5/70 | $ 114,733 | ||
| 50,000 | XPO Logistics, Inc., 6.25%, 5/1/25 (144A) | 52,375 | ||
| Total Transportation | $ 167,108 | |||
| TOTAL CORPORATE BONDS | ||||
(Cost $17,275,307) | $ 17,460,795 | |||
| FOREIGN GOVERNMENT BONDS – 4.2% of Net Assets | ||||
| Argentina – 0.6% | ||||
| 150,000(h) | Argentine Republic Government International Bond, 6.625%, 7/6/28 | $ 59,250 | ||
| 250,000 | Ciudad Autonoma De Buenos Aires, 7.5%, 6/1/27 (144A) | 191,000 | ||
| Total Argentina | $ 250,250 | |||
| Egypt – 0.3% | ||||
EGP | 1,754,000 | Egypt Government Bond, 15.7%, 11/7/27 | $ 116,264 | |
| Total Egypt | $ 116,264 | |||
| Indonesia – 0.3% | ||||
IDR | 1,784,000,000 | Indonesia Treasury Bond, 6.125%, 5/15/28 | $ 117,152 | |
| Total Indonesia | $ 117,152 | |||
| Ivory Coast – 0.3% | ||||
EUR | 100,000 | Ivory Coast Government International Bond, 5.875%, 10/17/31 (144A) | $ 105,328 | |
| Total Ivory Coast | $ 105,328 | |||
| Mexico – 1.3% | ||||
MXN | 5,300,000 | Mexican Bonos, 8.5%, 5/31/29 | $ 272,859 | |
MXN | 1,439,206 | Mexican Udibonos, 2.0%, 6/9/22 | 63,070 | |
| 200,000 | Mexico Government International Bond, 5.0%, 4/27/51 | 215,500 | ||
| Total Mexico | $ 551,429 |
The accompanying notes are an integral part of these financial statements.
21
| Pioneer Strategic Income VCT Portfolio | PIONEER VARIABLE CONTRACTS TRUST |
SCHEDULE OF INVESTMENTS 6/30/20 (UNAUDITED) | (continued) |
| Principal | ||||
| Amount | ||||
| USD ($) | Value | |||
| Peru – 0.1%† | ||||
| 20,000 | Peruvian Government International Bond, 2.783%, 1/23/31 | $ 21,330 | ||
| Total Peru | $ 21,330 | |||
| Qatar – 0.5% | ||||
| 200,000 | Qatar Government International Bond, 3.4%, 4/16/25 (144A) | $ 217,501 | ||
| Total Qatar | $ 217,501 | |||
| Russia – 0.5% | ||||
RUB | 12,276,000 | Russian Federal Bond - OFZ, 8.15%, 2/3/27 | $ 198,670 | |
| Total Russia | $ 198,670 | |||
| Uruguay – 0.3% | ||||
UYU | 4,429,000 | Uruguay Government International Bond, 9.875%, 6/20/22 (144A) | $ 104,323 | |
| Total Uruguay | $ 104,323 | |||
| TOTAL FOREIGN GOVERNMENT BONDS | ||||
(Cost $1,921,376) | $ 1,682,247 |
| Face | ||||
| Amount | ||||
| USD ($) | ||||
| INSURANCE-LINKED SECURITIES – 0.0%† of Net Assets(i) | ||||
| Reinsurance Sidecars – 0.0%† | ||||
| Multiperil – Worldwide – 0.0%† | ||||
| 40,000+(a)(j) | Lorenz Re 2018, 7/1/21 | $ 1,748 | ||
| 20,578+(a)(j) | Lorenz Re 2019, 6/30/22 | 16,263 | ||
| Total Reinsurance Sidecars | $ 18,011 | |||
| TOTAL INSURANCE-LINKED SECURITIES | ||||
(Cost $31,513) | $ 18,011 |
| Principal | ||||
| Amount | ||||
| USD ($) | ||||
| MUNICIPAL BONDS – 0.1% of Net Assets(k) | ||||
| Municipal General Obligation – 0.1% | ||||
| 100,000(h)(l) | Commonwealth of Puerto Rico, 8.0%, 7/1/35 | $ 60,000 | ||
| Total Municipal General Obligation | $ 60,000 | |||
| Municipal Higher Education – 0.0%† | ||||
| 10,000 | Trustees of Amherst College, 3.794%, 11/1/42 | $ 11,313 | ||
| Total Municipal Higher Education | $ 11,313 | |||
| TOTAL MUNICIPAL BONDS | ||||
(Cost $77,674) | $ 71,313 | |||
| SENIOR SECURED FLOATING RATE LOAN INTERESTS – 2.2% of Net Assets*(e) | ||||
| Automobile – 0.1% | ||||
| 33,614 | Navistar, Inc., Tranche B Term Loan, 3.7% (LIBOR + 350 bps), 11/6/24 | $ 31,933 | ||
| Total Automobile | $ 31,933 | |||
| Broadcasting & Entertainment – 0.2% | ||||
| 71,828 | Sinclair Television Group, Inc., Tranche B Term Loan, 2.43% (LIBOR + 225 bps), 1/3/24 | $ 68,835 | ||
| Total Broadcasting & Entertainment | $ 68,835 |
The accompanying notes are an integral part of these financial statements.
22
| Pioneer Strategic Income VCT Portfolio | PIONEER VARIABLE CONTRACTS TRUST |
| Principal | |||
| Amount | |||
| USD ($) | Value | ||
| Buildings & Real Estate – 0.0%† | |||
| 8,319 | Builders FirstSource, Inc., Refinancing Term Loan, 4.0% (LIBOR + 300 bps), 2/29/24 | $ 8,063 | |
| Total Buildings & Real Estate | $ 8,063 | ||
| Computers & Electronics – 0.0%† | |||
| 12,626 | Energy Acquisition LP (aka Electrical Components International), First Lien Initial | ||
Term Loan, 4.428% (LIBOR + 425 bps), 6/26/25 | $ 10,101 | ||
| Total Computers & Electronics | $ 10,101 | ||
| Diversified & Conglomerate Service – 0.0%† | |||
| 19,250 | DynCorp International, Inc., Term Loan, 7.0% (LIBOR + 600 bps), 8/18/25 | $ 18,384 | |
| Total Diversified & Conglomerate Service | $ 18,384 | ||
| Healthcare & Pharmaceuticals – 0.1% | |||
| 32,524 | Alphabet Holding Co., Inc. (aka Nature’s Bounty), First Lien Initial Term Loan, | ||
3.678% (LIBOR + 350 bps), 9/26/24 | $ 30,662 | ||
| Total Healthcare & Pharmaceuticals | $ 30,662 | ||
| Healthcare, Education & Childcare – 0.4% | |||
| 36,562 | Alliance HealthCare Services, Inc., First Lien Initial Term Loan, 5.5% (LIBOR + 450 | ||
bps), 10/24/23 | $ 24,896 | ||
| 71,851 | KUEHG Corp. (fka KC MergerSub, Inc.) (aka KinderCare), Term B-3 Loan, 4.75% (LIBOR + | ||
375 bps), 2/21/25 | 61,684 | ||
| 72,674 | LifePoint Health, Inc. (fka Regionalcare Hospital Partners Holdings, Inc.), First | ||
Lien Term B Loan, 3.928% (LIBOR + 375 bps), 11/16/25 | 68,347 | ||
| Total Healthcare, Education & Childcare | $ 154,927 | ||
| Hotel, Gaming & Leisure – 0.2% | |||
| 70,850 | 1011778 B.C. Unlimited Liability Co. (New Red Finance, Inc.) (aka Burger King/Tim | ||
Hortons), Term B-4 Loan, 1.928% (LIBOR + 175 bps), 11/19/26 | $ 67,361 | ||
| Total Hotel, Gaming & Leisure | $ 67,361 | ||
| Insurance – 0.7% | |||
| 146,170 | Confie Seguros Holding II Co., Term B Loan, 5.75% (LIBOR + 475 bps), 7/31/20 | $ 131,431 | |
| 65,783 | Integro Parent, Inc., First Lien Initial Term Loan, 6.75% (LIBOR + 575 bps), 10/31/22 | 61,837 | |
| 97,250 | USI, Inc. (fka Compass Investors, Inc.), 2017 New Term Loan, 3.308% (LIBOR + 300 | ||
bps), 5/16/24 | 92,582 | ||
| Total Insurance | $ 285,850 | ||
| Leisure & Entertainment – 0.1% | |||
| 53,885 | 24 Hour Fitness Worldwide, Inc., Term Loan, 3.808% (LIBOR + 350 bps), 5/30/25 | $ 12,932 | |
| 15,560 | Fitness International LLC, Term B Loan, 4.322% (LIBOR + 325 bps), 4/18/25 | 9,998 | |
| Total Leisure & Entertainment | $ 22,930 | ||
| Machinery – 0.1% | |||
| 26,464 | Shape Technologies Group, Inc., Initial Term Loan, 4.043% (LIBOR + 300 bps), 4/21/25 | $ 20,841 | |
| Total Machinery | $ 20,841 | ||
| Retail – 0.2% | |||
| 84,376 | Bass Pro Group LLC, Initial Term Loan, 6.072% (LIBOR + 500 bps), 9/25/24 | $ 81,550 | |
| 14,850 | Staples, Inc., 2019 Refinancing New Term B-2 Loan, 5.187% (LIBOR + 450 bps), 9/12/24 | 12,771 | |
| Total Retail | $ 94,321 |
The accompanying notes are an integral part of these financial statements.
23
| Pioneer Strategic Income VCT Portfolio | PIONEER VARIABLE CONTRACTS TRUST |
SCHEDULE OF INVESTMENTS 6/30/20 (UNAUDITED) | (continued) |
| Principal | |||
| Amount | |||
| USD ($) | Value | ||
| Securities & Trusts – 0.1% | |||
| 54,478 | Stonepeak Lonestar Holdings LLC, Initial Term Loan, 5.635% (LIBOR + | ||
450 bps), 10/19/26 | $ 53,274 | ||
| Total Securities & Trusts | $ 53,274 | ||
| Telecommunications – 0.0%† | |||
| 32,119 | Windstream Services LLC (fka Windstream Corp.), Tranche B-6 Term Loan, 8.25% (PRIME + | ||
500 bps), 3/29/21 | $ 19,887 | ||
| Total Telecommunications | $ 19,887 | ||
| TOTAL SENIOR SECURED FLOATING RATE LOAN INTERESTS | |||
(Cost $990,541) | $ 887,369 | ||
| U.S. GOVERNMENT AND AGENCY OBLIGATIONS – 26.3% of Net Assets | |||
| 200,000 | Fannie Mae, 2.0%, 7/1/50 (TBA) | $ 204,672 | |
| 300,000 | Fannie Mae, 2.5%, 7/1/50 (TBA) | 312,750 | |
| 24,988 | Fannie Mae, 3.0%, 10/1/30 | 26,557 | |
| 77,400 | Fannie Mae, 3.0%, 5/1/43 | 82,916 | |
| 1,677 | Fannie Mae, 3.0%, 5/1/46 | 1,793 | |
| 15,642 | Fannie Mae, 3.0%, 5/1/46 | 16,975 | |
| 1,630 | Fannie Mae, 3.0%, 10/1/46 | 1,742 | |
| 830 | Fannie Mae, 3.0%, 1/1/47 | 887 | |
| 64,455 | Fannie Mae, 3.0%, 1/1/47 | 70,274 | |
| 3,490 | Fannie Mae, 3.0%, 4/1/48 | 3,803 | |
| 5,033 | Fannie Mae, 3.0%, 7/1/49 | 5,471 | |
| 6,779 | Fannie Mae, 3.0%, 7/1/49 | 7,390 | |
| 63,000 | Fannie Mae, 3.0%, 7/1/50 (TBA) | 66,352 | |
| 50,045 | Fannie Mae, 3.5%, 6/1/45 | 53,804 | |
| 50,595 | Fannie Mae, 3.5%, 9/1/45 | 54,628 | |
| 14,367 | Fannie Mae, 3.5%, 10/1/46 | 15,431 | |
| 51,507 | Fannie Mae, 3.5%, 1/1/47 | 54,655 | |
| 87,847 | Fannie Mae, 3.5%, 1/1/47 | 94,411 | |
| 258,690 | Fannie Mae, 3.5%, 9/1/49 | 286,943 | |
| 297,000 | Fannie Mae, 3.5%, 7/1/50 (TBA) | 312,372 | |
| 48,556 | Fannie Mae, 4.0%, 10/1/40 | 54,759 | |
| 7,174 | Fannie Mae, 4.0%, 12/1/40 | 8,086 | |
| 26,390 | Fannie Mae, 4.0%, 11/1/43 | 29,402 | |
| 30,466 | Fannie Mae, 4.0%, 11/1/43 | 33,461 | |
| 24,746 | Fannie Mae, 4.0%, 4/1/47 | 26,867 | |
| 35,763 | Fannie Mae, 4.0%, 4/1/47 | 38,788 | |
| 14,100 | Fannie Mae, 4.0%, 6/1/47 | 15,221 | |
| 21,808 | Fannie Mae, 4.0%, 7/1/47 | 23,684 | |
| 420,000 | Fannie Mae, 4.0%, 7/1/50 (TBA) | 445,077 | |
| 167,222 | Fannie Mae, 4.5%, 8/1/40 | 185,976 | |
| 51,276 | Fannie Mae, 4.5%, 11/1/40 | 57,055 | |
| 26,287 | Fannie Mae, 4.5%, 5/1/41 | 29,667 | |
| 20,187 | Fannie Mae, 4.5%, 12/1/41 | 21,792 | |
| 21,329 | Fannie Mae, 4.5%, 2/1/44 | 23,676 | |
| 22,257 | Fannie Mae, 4.5%, 2/1/44 | 24,725 | |
| 67,757 | Fannie Mae, 4.5%, 6/1/44 | 75,407 |
The accompanying notes are an integral part of these financial statements.
24
| Pioneer Strategic Income VCT Portfolio | PIONEER VARIABLE CONTRACTS TRUST |
| Principal | |||
| Amount | |||
| USD ($) | Value | ||
| U.S. GOVERNMENT AND AGENCY OBLIGATIONS – (continued) | |||
| 390,000 | Fannie Mae, 4.5%, 7/1/50 (TBA) | $ 419,036 | |
| 23,897 | Fannie Mae, 5.0%, 4/1/30 | 26,792 | |
| 20,255 | Fannie Mae, 5.0%, 1/1/39 | 23,165 | |
| 4,891 | Fannie Mae, 5.0%, 6/1/40 | 5,613 | |
| 119 | Fannie Mae, 6.0%, 3/1/32 | 138 | |
| 23,511 | Federal Home Loan Mortgage Corp., 3.0%, 10/1/29 | 24,755 | |
| 2,621 | Federal Home Loan Mortgage Corp., 3.0%, 10/1/46 | 2,859 | |
| 18,538 | Federal Home Loan Mortgage Corp., 3.0%, 12/1/46 | 19,627 | |
| 40,878 | Federal Home Loan Mortgage Corp., 3.0%, 2/1/47 | 44,431 | |
| 54,171 | Federal Home Loan Mortgage Corp., 3.0%, 2/1/47 | 57,329 | |
| 1,668 | Federal Home Loan Mortgage Corp., 3.0%, 11/1/47 | 1,814 | |
| 48,553 | Federal Home Loan Mortgage Corp., 3.5%, 11/1/45 | 52,019 | |
| 49,108 | Federal Home Loan Mortgage Corp., 3.5%, 7/1/46 | 54,195 | |
| 16,635 | Federal Home Loan Mortgage Corp., 4.0%, 4/1/47 | 18,062 | |
| 22,105 | Federal Home Loan Mortgage Corp., 4.0%, 4/1/47 | 23,771 | |
| 52,622 | Federal Home Loan Mortgage Corp., 4.0%, 4/1/47 | 57,129 | |
| 199 | Federal Home Loan Mortgage Corp., 5.0%, 5/1/34 | 228 | |
| 615 | Federal Home Loan Mortgage Corp., 5.0%, 6/1/35 | 672 | |
| 4,435 | Federal Home Loan Mortgage Corp., 5.0%, 10/1/38 | 5,084 | |
| 17,288 | Federal Home Loan Mortgage Corp., 5.0%, 11/1/39 | 19,853 | |
| 8,969 | Federal Home Loan Mortgage Corp., 5.5%, 6/1/41 | 10,296 | |
| 11,381 | Government National Mortgage Association I, 3.5%, 10/15/42 | 12,149 | |
| 3,751 | Government National Mortgage Association I, 4.0%, 12/15/41 | 4,023 | |
| 142,886 | Government National Mortgage Association I, 4.0%, 4/15/42 | 153,821 | |
| 57,080 | Government National Mortgage Association I, 4.0%, 8/15/43 | 64,383 | |
| 7,080 | Government National Mortgage Association I, 4.0%, 3/15/44 | 7,698 | |
| 18,199 | Government National Mortgage Association I, 4.0%, 9/15/44 | 19,691 | |
| 22,506 | Government National Mortgage Association I, 4.0%, 4/15/45 | 24,460 | |
| 33,976 | Government National Mortgage Association I, 4.0%, 6/15/45 | 36,954 | |
| 4,838 | Government National Mortgage Association I, 4.5%, 9/15/33 | 5,372 | |
| 10,351 | Government National Mortgage Association I, 4.5%, 4/15/35 | 11,500 | |
| 19,838 | Government National Mortgage Association I, 4.5%, 1/15/40 | 22,361 | |
| 62,090 | Government National Mortgage Association I, 4.5%, 3/15/40 | 69,448 | |
| 15,608 | Government National Mortgage Association I, 4.5%, 9/15/40 | 17,448 | |
| 14,469 | Government National Mortgage Association I, 4.5%, 7/15/41 | 16,122 | |
| 3,556 | Government National Mortgage Association I, 5.0%, 4/15/35 | 4,072 | |
| 3,449 | Government National Mortgage Association I, 5.5%, 1/15/34 | 4,017 | |
| 5,767 | Government National Mortgage Association I, 5.5%, 4/15/34 | 6,729 | |
| 1,498 | Government National Mortgage Association I, 5.5%, 7/15/34 | 1,741 | |
| 4,088 | Government National Mortgage Association I, 5.5%, 6/15/35 | 4,492 | |
| 519 | Government National Mortgage Association I, 6.0%, 2/15/33 | 618 | |
| 641 | Government National Mortgage Association I, 6.0%, 3/15/33 | 715 | |
| 840 | Government National Mortgage Association I, 6.0%, 3/15/33 | 1,000 | |
| 1,422 | Government National Mortgage Association I, 6.0%, 6/15/33 | 1,695 | |
| 1,154 | Government National Mortgage Association I, 6.0%, 7/15/33 | 1,362 | |
| 1,253 | Government National Mortgage Association I, 6.0%, 7/15/33 | 1,416 | |
| 664 | Government National Mortgage Association I, 6.0%, 9/15/33 | 738 |
The accompanying notes are an integral part of these financial statements.
25
| Pioneer Strategic Income VCT Portfolio | PIONEER VARIABLE CONTRACTS TRUST |
SCHEDULE OF INVESTMENTS 6/30/20 (UNAUDITED) | (continued) |
| Principal | |||
| Amount | |||
| USD ($) | Value | ||
| U.S. GOVERNMENT AND AGENCY OBLIGATIONS – (continued) | |||
| 759 | Government National Mortgage Association I, 6.0%, 9/15/33 | $ 861 | |
| 1,114 | Government National Mortgage Association I, 6.0%, 10/15/33 | 1,278 | |
| 4,101 | Government National Mortgage Association I, 6.0%, 8/15/34 | 4,566 | |
| 325 | Government National Mortgage Association I, 6.5%, 3/15/29 | 357 | |
| 1,007 | Government National Mortgage Association I, 6.5%, 1/15/30 | 1,108 | |
| 275 | Government National Mortgage Association I, 6.5%, 2/15/32 | 318 | |
| 275 | Government National Mortgage Association I, 6.5%, 3/15/32 | 319 | |
| 441 | Government National Mortgage Association I, 6.5%, 11/15/32 | 530 | |
| 44 | Government National Mortgage Association I, 7.0%, 3/15/31 | 45 | |
| 9,630 | Government National Mortgage Association II, 3.5%, 4/20/45 | 10,331 | |
| 12,108 | Government National Mortgage Association II, 3.5%, 4/20/45 | 13,028 | |
| 16,865 | Government National Mortgage Association II, 3.5%, 3/20/46 | 18,310 | |
| 30,297 | Government National Mortgage Association II, 4.0%, 9/20/44 | 33,013 | |
| 46,303 | Government National Mortgage Association II, 4.0%, 10/20/46 | 49,856 | |
| 46,035 | Government National Mortgage Association II, 4.0%, 1/20/47 | 49,663 | |
| 18,603 | Government National Mortgage Association II, 4.0%, 2/20/48 | 20,459 | |
| 21,187 | Government National Mortgage Association II, 4.0%, 4/20/48 | 23,316 | |
| 9,307 | Government National Mortgage Association II, 4.5%, 9/20/41 | 10,223 | |
| 31,036 | Government National Mortgage Association II, 4.5%, 9/20/44 | 32,786 | |
| 11,404 | Government National Mortgage Association II, 4.5%, 10/20/44 | 12,503 | |
| 24,393 | Government National Mortgage Association II, 4.5%, 11/20/44 | 26,741 | |
| 2,545 | Government National Mortgage Association II, 5.5%, 3/20/34 | 2,933 | |
| 4,144 | Government National Mortgage Association II, 6.0%, 11/20/33 | 4,761 | |
| 1,200,000(m) | U.S. Treasury Bill, 7/7/20 | 1,199,976 | |
| 2,400,000(m) | U.S. Treasury Bill, 7/21/20 | 2,399,844 | |
| 1,200,000(m) | U.S. Treasury Bill, 8/27/20 | 1,199,734 | |
| 185,871 | U.S. Treasury Inflation Indexed Bonds, 0.875%, 2/15/47 | 236,772 | |
| 172,589 | U.S. Treasury Inflation Indexed Bonds, 1.0%, 2/15/46 | 223,275 | |
| 493,862 | U.S. Treasury Inflation Indexed Bonds, 1.0%, 2/15/48 | 652,221 | |
| 378,008 | U.S. Treasury Inflation Indexed Bonds, 1.0%, 2/15/49 | 503,751 | |
| TOTAL U.S. GOVERNMENT AND AGENCY OBLIGATIONS | |||
(Cost $10,314,160) | $ 10,861,240 |
| Number of | Strike | Expiration | |||||
| Contracts | Description | Counterparty | Notional | Price | Date | ||
| OVER THE COUNTER (OTC) CALL OPTIONS PURCHASED – 0.0% | |||||||
| 3,182^(n) | Desarrolladora Homex | Brown Brothers | MXN — | MXN —(p) | 10/23/22 | $ — | |
SAB de CV | Harriman & Co. | ||||||
| 3,182^(o) | Desarrolladora Homex | Brown Brothers | MXN — | MXN —(p) | 10/23/22 | — | |
SAB de CV | Harriman & Co. | ||||||
| $ — | |||||||
| TOTAL OVER THE COUNTER (OTC) CALL OPTIONS PURCHASED | |||||||
(Premiums paid $ —) | $ — | ||||||
The accompanying notes are an integral part of these financial statements.
26
| Pioneer Strategic Income VCT Portfolio | PIONEER VARIABLE CONTRACTS TRUST |
| Number of | Strike | Expiration | |||||
| Contracts | Description | Counterparty | Notional | Price | Date | Value | |
| OVER THE COUNTER (OTC) CURRENCY PUT OPTIONS PURCHASED – 0.0%† | |||||||
| 175,000 | Put EUR Call USD | Bank of America NA | EUR 2,896 | EUR 1.11 | 6/4/21 | $ 3,890 | |
| 330,000 | Put EUR Call USD | Bank of America NA | USD 5,140 | USD 1.11 | 3/8/21 | 5,572 | |
| $ 9,462 | |||||||
| TOTAL OVER THE COUNTER (OTC) CURRENCY PUT OPTIONS PURCHASED | |||||||
(Premiums paid $8,036) | $ 9,462 | ||||||
| TOTAL OPTIONS PURCHASED | |||||||
(Premiums paid $8,036) | $ 9,462 | ||||||
| TOTAL INVESTMENTS IN UNAFFILIATED ISSUERS – 98.9% | |||||||
(Cost $40,832,656) | $ 40,782,644 | ||||||
| Change | ||||||
| in Net | ||||||
| Net | Unrealized | |||||
| Dividend | Realized | Appreciation | ||||
| Shares | Income | Gain (Loss) | (Depreciation) | |||
| AFFILIATED ISSUER – 2.0% | ||||||
| CLOSED-END FUND – 2.0% of Net Assets | ||||||
| 97,089(q) | Pioneer ILS Interval Fund | $ — | $ — | $20,389 | $ 828,171 | |
| TOTAL CLOSED-END FUND | ||||||
(Cost $998,388) | $ 828,171 | |||||
| TOTAL INVESTMENTS IN AFFILIATED ISSUER – 2.0% | ||||||
(Cost $998,388) | $ 828,171 | |||||
| Number of | Strike | Expiration | |||||
| Contracts | Description | Counterparty | Notional | Price | Date | ||
| OVER THE COUNTER (OTC) CURRENCY CALL OPTIONS WRITTEN – (0.0)%† | |||||||
| (330,000) | Call EUR Put USD | Bank of America NA | USD 5,140 | USD 1.20 | 3/8/21 | $ (2,074) | |
| (175,000) | Call EUR Put USD | Bank of America NA | EUR 2,896 | EUR 1.17 | 6/4/21 | (2,935) | |
| $ (5,009) | |||||||
| TOTAL OVER THE COUNTER (OTC) CURRENCY CALL OPTIONS WRITTEN | |||||||
(Premiums received $(8,036)) | $ (5,009) | ||||||
| OTHER ASSETS AND LIABILITIES – (0.9)% | $ (379,837) | ||||||
| NET ASSETS – 100.0% | $41,225,969 | ||||||
bps | Basis Points. |
BADLARPP | Argentine Deposit Rate Badlar Private Banks 30-35 Days. |
CMT | Constant Maturity Treasury Index. |
FREMF | Freddie Mac Multifamily Fixed-Rate Mortgage Loans. |
LIBOR | London Interbank Offered Rate. |
PRIME | U.S. Federal Funds Rate. |
REIT | Real Estate Investment Trust. |
REMICS | Real Estate Mortgage Investment Conduits. |
SOFRRATE | Secured Overnight Financing Rate. |
(144A) | Security is exempt from registration under Rule 144A of the Securities Act of 1933. Such securities may be resold normally to qualified institutional buyers in a transaction exempt from registration. At June 30, 2020, the value of these securities amounted to $16,089,237, or 39.0% of net assets. |
(TBA) | “To Be Announced” Securities. |
† | Amount rounds to less than 0.1%. |
The accompanying notes are an integral part of these financial statements.
27
| Pioneer Strategic Income VCT Portfolio | PIONEER VARIABLE CONTRACTS TRUST |
SCHEDULE OF INVESTMENTS 6/30/20 (UNAUDITED) | (continued) |
* | Senior secured floating rate loan interests in which the Portfolio invests generally pay interest at rates that are periodically redetermined by reference to a base lending rate plus a premium. These base lending rates are generally (i) the lending rate offered by one or more major European banks, such as LIBOR, (ii) the prime rate offered by one or more major United States banks, (iii) the rate of a certificate of deposit or (iv) other base lending rates used by commercial lenders. The interest rate shown is the rate accruing at June 30, 2020. |
+ | Security that used significant unobservable inputs to determine its value. |
^ | Security is valued using fair value methods (other than supplied by independent pricing services). |
(a) | Non-income producing security. |
(b) | Security is perpetual in nature and has no stated maturity date. |
(c) | Debt obligation initially issued at one coupon which converts to a higher coupon at a specific date. The rate shown is the rate at June 30, 2020. |
(d) | The interest rate is subject to change periodically. The interest rate and/or reference index and spread shown at June 30, 2020. |
(e) | Floating rate note. Coupon rate, reference index and spread shown at June 30, 2020. |
(f) | Security represents the interest-only portion payments on a pool of underlying mortgages or mortgage-backed securities. |
(g) | Payment-in-kind (PIK) security which may pay interest in the form of additional principal amount. |
(h) | Security is in default. |
(i) | Securities are restricted as to resale. |
(j) | Issued as preference shares. |
(k) | Consists of Revenue Bonds unless otherwise indicated. |
(l) | Represents a General Obligation Bond. |
(m) | Security issued with a zero coupon. Income is recognized through accretion of discount. |
(n) | Option does not become effective until underlying company’s outstanding common shares reach a market capitalization of MXN 12.5 billion. |
(o) | Option does not become effective until underlying company’s outstanding common shares reach a market capitalization of MXN 14.5 billion. |
(p) | Strike price is 1 Mexican Peso (MXN). |
(q) | Pioneer ILS Interval Fund is an affiliated closed-end fund managed by Amundi Pioneer Asset Management, Inc., (the “Adviser”). |
FORWARD FOREIGN CURRENCY EXCHANGE CONTRACTS
| Unrealized | |||||||||||||||
| Currency | In Exchange | Currency | Settlement | Appreciation | |||||||||||
| Purchased | for | Sold | Deliver | Counterparty | Date | (Depreciation) | |||||||||
SEK | 2,136,507 | EUR | (198,295 | ) | Bank of America NA | 7/2/20 | $ | 6,553 | |||||||
EUR | 344,906 | USD | (383,105 | ) | Bank of New York Mellon Corp. | 7/24/20 | 4,608 | ||||||||
EUR | 80,951 | USD | (91,640 | ) | Citibank NA | 8/28/20 | (570 | ) | |||||||
GHS | 579,382 | USD | (98,727 | ) | Citibank NA | 8/27/20 | (1,024 | ) | |||||||
RUB | 6,405,000 | USD | (88,669 | ) | Citibank NA | 7/27/20 | 992 | ||||||||
EGP | 795,790 | USD | (48,553 | ) | Goldman Sachs International | 8/27/20 | 165 | ||||||||
EUR | 47,365 | USD | (51,270 | ) | Goldman Sachs International | 7/24/20 | 1,974 | ||||||||
NOK | 2,930,100 | USD | (296,180 | ) | HSBC Bank USA NA | 7/28/20 | 8,033 | ||||||||
SEK | 5,004,326 | USD | (519,106 | ) | HSBC Bank USA NA | 7/29/20 | 18,280 | ||||||||
AUD | 587,765 | USD | (402,321 | ) | JPMorgan Chase Bank NA | 8/28/20 | 3,159 | ||||||||
EUR | 171,590 | USD | (187,550 | ) | JPMorgan Chase Bank NA | 7/24/20 | 5,337 | ||||||||
EUR | 569,000 | USD | (642,658 | ) | JPMorgan Chase Bank NA | 9/25/20 | (2,126 | ) | |||||||
NOK | 1,861,465 | EUR | (171,773 | ) | JPMorgan Chase Bank NA | 8/4/20 | 127 | ||||||||
SEK | 2,136,507 | EUR | (204,067 | ) | JPMorgan Chase Bank NA | 9/3/20 | (77 | ) | |||||||
EUR | 216,103 | USD | (239,093 | ) | State Street Bank & Trust Co. | 7/24/20 | 3,831 | ||||||||
USD | 521,486 | EUR | (480,000 | ) | State Street Bank & Trust Co. | 7/24/20 | (18,089 | ) | |||||||
USD | 158,852 | MXN | (3,595,300 | ) | State Street Bank & Trust Co. | 7/29/20 | 3,082 | ||||||||
TOTAL FORWARD FOREIGN CURRENCY EXCHANGE CONTRACTS | $ | 34,255 | |||||||||||||
The accompanying notes are an integral part of these financial statements.
28
| Pioneer Strategic Income VCT Portfolio | PIONEER VARIABLE CONTRACTS TRUST |
FUTURES CONTRACTS
FIXED INCOME INDEX FUTURES CONTRACTS
FIXED INCOME INDEX FUTURES CONTRACTS
| Number of | ||||||||||||||||
| Contracts | Notional | Unrealized | ||||||||||||||
| Long | Description | Expiration Date | Amount | Market Value | Appreciation | |||||||||||
1 | U.S. 2 Year Note (CBT) | 9/30/20 | $ | 220,773 | $ | 220,828 | $ | 55 | ||||||||
5 | U.S. Ultra Bond (CBT) | 9/21/20 | 1,088,187 | 1,090,781 | 2,594 | |||||||||||
$ | 1,308,960 | $ | 1,311,609 | $ | 2,649 | |||||||||||
| Number of | ||||||||||||||||
| Contracts | Notional | Unrealized | ||||||||||||||
| Short | Description | Expiration Date | Amount | Market Value | (Depreciation) | |||||||||||
15 | Euro-Bobl | 9/8/20 | $ | 2,263,111 | $ | 2,274,852 | $ | (11,741 | ) | |||||||
5 | Euro-Bund | 9/8/20 | 983,331 | 991,645 | (8,314 | ) | ||||||||||
3 | U.S. 10 Year Note (CBT) | 9/21/20 | 416,430 | 417,516 | (1,086 | ) | ||||||||||
36 | U.S. 10 Year Ultra | 9/21/20 | 5,638,554 | 5,669,437 | (30,883 | ) | ||||||||||
6 | U.S. Long Bond (CBT) | 9/21/20 | 1,065,437 | 1,071,375 | (5,938 | ) | ||||||||||
| $ | 10,366,863 | $ | 10,424,825 | $ | (57,962 | ) | ||||||||||
TOTAL FUTURES CONTRACTS | $ | (9,057,903 | ) | $ | (9,113,216 | ) | $ | (55,313 | ) | |||||||
SWAP CONTRACTS
CENTRALLY CLEARED CREDIT DEFAULT SWAP CONTRACTS – SELL PROTECTION
CENTRALLY CLEARED CREDIT DEFAULT SWAP CONTRACTS – SELL PROTECTION
| Notional | Obligation | Pay/ | Annual | Expiration | Premiums | Unrealized | Market |
Amount ($)(1) | Reference/Index | Receive(2) | Fixed Rate | Date | (Received) | (Depreciation) | Value |
| 85,500 | Markit CDX North America | Receive | 5.00% | 6/20/25 | $ (169) | $ (377) | $ (546) |
| High Yield Index Series 33 | |||||||
| 2,973,500 | Markit CDX North America | Receive | 5.00% | 6/20/25 | (2,478) | (16,526) | (19,004) |
| High Yield Index Series 34 | |||||||
| TOTAL SWAP CONTRACTS | $(2,647) | $(16,903) | $(19,550) | ||||
(1) | The notional amount is the maximum amount that a seller of credit protection would be obligated to pay upon occurrence of a credit event. |
(2) | Receive quarterly. |
Principal amounts are denominated in U.S. dollars (“USD”) unless otherwise noted.
ARS — Argentine Peso
ARS — Argentine Peso
AUD — Australian Dollar
EGP — Egyptian Pound
EUR — Euro
GHS — Cedi
IDR — Indonesian Rupiah
MXN — Mexican Peso
NOK — Norwegian Krone
RUB — Russian Ruble
SEK — Swedish Krona
UYU — Uruguayan Peso
Purchases and sales of securities (excluding temporary cash investments) for the six months ended June 30, 2020 were as follows:
Purchases and sales of securities (excluding temporary cash investments) for the six months ended June 30, 2020 were as follows:
| Purchases | Sales | |||||||
| Long-Term U.S. Government Securities | $ | 45,504 | $ | 5,807,428 | ||||
| Other Long-Term Securities | $ | 12,095,421 | $ | 11,422,032 | ||||
The Portfolio is permitted to engage in purchase and sale transactions (“cross trades”) with certain funds and accounts for which the Adviser serves as the Portfolio’s investment adviser, as set forth in Rule 17a-7 under the Investment Company Act of 1940, pursuant to procedures adopted by the Board of Trustees. Under these procedures, cross trades are effected at current market prices. During the six months ended June 30, 2020, the Portfolio engaged in purchases of $7,088 and sales of $64,577 pursuant to these procedures, which resulted in a net realized gain of $1,270.
The accompanying notes are an integral part of these financial statements.
29
| Pioneer Strategic Income VCT Portfolio | PIONEER VARIABLE CONTRACTS TRUST |
SCHEDULE OF INVESTMENTS 6/30/20 (UNAUDITED) | (continued) |
| At June 30, 2020, the net unrealized depreciation on investments based on cost for federal tax purposes of $41,872,782 was as follows: | ||||
| Aggregate gross unrealized appreciation for all investments in which there is an excess of value over tax cost | $ | 1,716,423 | ||
| Aggregate gross unrealized depreciation for all investments in which there is an excess of tax cost over value | (2,024,007 | ) | ||
| Net unrealized depreciation | $ | (307,584 | ) | |
Various inputs are used in determining the value of the Portfolio’s investments. These inputs are summarized in the three broad levels below.
Level 1 – quoted prices in active markets for identical securities.
Level 2 – other significant observable inputs (including quoted prices for similar securities, interest rates, prepayment speeds, credit risks, etc.). See Notes to Financial Statements — Note 1A.
Level 3 – significant unobservable inputs (including the Portfolio’s own assumptions in determining fair value of investments). See Notes to Financial Statements — Note 1A.
The following is a summary of the inputs used as of June 30, 2020, in valuing the Portfolio’s investments:
| Level 1 | Level 2 | Level 3 | Total | |||||||||||||
| Common Stocks | ||||||||||||||||
| Paper & Forest Products | $ | — | $ | 21 | $ | — | $ | 21 | ||||||||
| All Other Common Stocks | 33 | — | — | 33 | ||||||||||||
| Convertible Preferred Stocks | 524,888 | — | — | 524,888 | ||||||||||||
| Asset Backed Securities | — | 2,858,913 | — | 2,858,913 | ||||||||||||
| Collateralized Mortgage Obligations | — | 3,962,653 | — | 3,962,653 | ||||||||||||
| Commercial Mortgage-Backed Securities | — | 2,205,315 | — | 2,205,315 | ||||||||||||
| Convertible Corporate Bonds | — | 240,384 | — | 240,384 | ||||||||||||
| Corporate Bonds | — | 17,460,795 | — | 17,460,795 | ||||||||||||
| Foreign Government Bonds | — | 1,682,247 | — | 1,682,247 | ||||||||||||
| Insurance-Linked Securities | ||||||||||||||||
| Reinsurance Sidecars | ||||||||||||||||
| Multiperil – Worldwide | — | — | 18,011 | 18,011 | ||||||||||||
| Municipal Bonds | — | 71,313 | — | 71,313 | ||||||||||||
| Senior Secured Floating Rate Loan Interests | — | 887,369 | — | 887,369 | ||||||||||||
| U.S. Government and Agency Obligations | — | 10,861,240 | — | 10,861,240 | ||||||||||||
| Over The Counter (OTC) Call Option Purchased | — | — | — | * | — | * | ||||||||||
| Over The Counter (OTC) Currency Put Option Purchased | — | 9,462 | — | 9,462 | ||||||||||||
| Investment Company | — | 828,171 | — | 828,171 | ||||||||||||
| Total Investments in Securities | $ | 524,921 | $ | 41,067,883 | $ | 18,011 | $ | 41,610,815 | ||||||||
| Other Financial Instruments | ||||||||||||||||
| Over The Counter (OTC) Currency Call Option Written | $ | — | $ | (5,009 | ) | $ | — | $ | (5,009 | ) | ||||||
| Net unrealized appreciation on forward foreign currency exchange contracts | — | 34,255 | — | 34,255 | ||||||||||||
| Net unrealized depreciation on futures contracts | (55,313 | ) | — | — | (55,313 | ) | ||||||||||
| Swap contracts, at value | — | (19,550 | ) | — | (19,550 | ) | ||||||||||
| Total Other Financial Instruments | $ | (55,313 | ) | $ | 9,696 | $ | — | $ | (45,617 | ) | ||||||
| * Securities valued at $0. | ||||||||||||||||
The following is a reconciliation of assets valued using significant unobservable inputs (Level 3):
| Insurance-Linked | ||||
| Securities | ||||
| Balance as of 12/31/19 | $ | 22,002 | ||
Realized gain (loss)(1) | — | |||
Change in unrealized appreciation (depreciation)(2) | (73 | ) | ||
| Accrued discounts/premiums | — | |||
| Purchases | — | |||
| Sales | (3,918 | ) | ||
| Transfers in to Level 3** | — | |||
| Transfers out of Level 3** | — | |||
| Balance as of 6/30/20 | $ | 18,011 | ||
(1) | Realized gain (loss) on these securities is included in the realized gain (loss) from investments on the Statement of Operations. |
(2) | Unrealized appreciation (depreciation) on these securities is included in change in net unrealized appreciation (depreciation) on investments in the Statement of Operations. |
** | Transfers are calculated on the beginning of period value. For the six months ended June 30, 2020, there were no transfers between Levels 1, 2 and 3. |
Net change in unrealized appreciation (depreciation) of Level 3 investments still held and considered Level 3 at June 30, 2020: | $ | (73 | ). | |
The accompanying notes are an integral part of these financial statements.
30
| Pioneer Strategic Income VCT Portfolio | PIONEER VARIABLE CONTRACTS TRUST |
| ASSETS: | ||||
| Investments in unaffiliated issuers, at value (cost $40,832,656) | $ | 40,782,644 | ||
| Investments in affiliated issuers, at value (cost $998,388) | 828,171 | |||
| Cash | 437,497 | |||
| Foreign currencies, at value (cost $19,888) | 18,119 | |||
| Futures collateral | 65,171 | |||
| Swaps collateral | 411,864 | |||
| Due from broker for futures | 282,070 | |||
| Due from broker for swaps | 16,794 | |||
| Variation margin for futures contracts | 8,264 | |||
| Variation margin for centrally cleared swap contracts | 24,074 | |||
| Net unrealized appreciation on forward foreign currency exchange contracts | 34,255 | |||
| Receivables — | ||||
| Investment securities sold | 387,268 | |||
| Portfolio shares sold | 82,982 | |||
| Dividends | 1,849 | |||
| Interest | 303,822 | |||
| Due from the Adviser | 26,862 | |||
| Other assets | 16,544 | |||
| Total assets | $ | 43,728,250 | ||
| LIABILITIES: | ||||
| Payables — | ||||
| Investment securities purchased | $ | 2,324,970 | ||
| Portfolio shares repurchased | 4,444 | |||
| Trustees’ fees | 143 | |||
| Written options outstanding (net premiums received $8,036) | 5,009 | |||
| Net unrealized depreciation on futures contracts | 55,313 | |||
| Swap contracts, at value (net premiums received $2,647) | 19,550 | |||
| Reserve for repatriation taxes | 1,437 | |||
| Due to affiliates | 23,510 | |||
| Accrued expenses | 67,905 | |||
| Total liabilities | $ | 2,502,281 | ||
| NET ASSETS: | ||||
| Paid-in capital | $ | 41,830,978 | ||
| Distributable earnings (loss) | (605,009 | ) | ||
| Net assets | $ | 41,225,969 | ||
| NET ASSET VALUE PER SHARE: | ||||
No par value (unlimited number of shares authorized) | ||||
| Class I (based on $5,643,153/564,053 shares) | $ | 10.00 | ||
| Class II (based on $35,582,816/3,563,421 shares) | $ | 9.99 | ||
The accompanying notes are an integral part of these financial statements.
31
| Pioneer Strategic Income VCT Portfolio | PIONEER VARIABLE CONTRACTS TRUST |
STATEMENT OF OPERATIONS (UNAUDITED) | |
| FOR THE SIX MONTHS ENDED 6/30/20 |
| INVESTMENT INCOME: | ||||||||
| Interest from unaffiliated issuers (net of foreign taxes withheld $6,070) | $ | 811,226 | ||||||
| Dividends from unaffiliated issuers (net of foreign taxes withheld $3,554) | 9,302 | |||||||
| Total investment income | $ | 820,528 | ||||||
| EXPENSES: | ||||||||
| Management fees | $ | 127,722 | ||||||
| Administrative expense | 33,662 | |||||||
| Distribution fees | ||||||||
| Class II | 42,137 | |||||||
| Custodian fees | 36,348 | |||||||
| Professional fees | 40,663 | |||||||
| Printing expense | 7,098 | |||||||
| Pricing fees | 20,655 | |||||||
| Trustees’ fees | 3,884 | |||||||
| Insurance expense | 22 | |||||||
| Miscellaneous | 2,414 | |||||||
| Total expenses | $ | 314,605 | ||||||
| Less fees waived and expenses reimbursed by the Adviser | (125,761 | ) | ||||||
| Net expenses | $ | 188,844 | ||||||
| Net investment income | $ | 631,684 | ||||||
| REALIZED AND UNREALIZED GAIN (LOSS) ON INVESTMENTS: | ||||||||
| Net realized gain (loss) on: | ||||||||
| Investments in unaffiliated issuers | $ | 185,056 | ||||||
| Written options | 7,642 | |||||||
| Forward foreign currency exchange contracts | (38,822 | ) | ||||||
| Futures contracts | (331,079 | ) | ||||||
| Swap contracts | (76,586 | ) | ||||||
| Other assets and liabilities denominated in foreign currencies | 2,593 | $ | (251,196 | ) | ||||
| Change in net unrealized appreciation (depreciation) on: | ||||||||
| Investments in unaffiliated issuers (net of foreign capital gains tax of 1,020) | $ | (1,151,807 | ) | |||||
| Investments in affiliated issuers | 20,389 | |||||||
| Written options | (4,303 | ) | ||||||
| Forward foreign currency exchange contracts | (16,544 | ) | ||||||
| Futures contracts | (87,724 | ) | ||||||
| Swap contracts | (10,220 | ) | ||||||
| Other assets and liabilities denominated in foreign currencies | (959 | ) | $ | (1,251,168 | ) | |||
| Net realized and unrealized gain (loss) on investments | $ | (1,502,364 | ) | |||||
| Net decrease in net assets resulting from operations | $ | (870,680 | ) | |||||
The accompanying notes are an integral part of these financial statements.
32
| Pioneer Strategic Income VCT Portfolio | PIONEER VARIABLE CONTRACTS TRUST |
STATEMENTS OF CHANGES IN NET ASSETS |
| Six Months | ||||||||
| Ended | ||||||||
| 6/30/2020 | Year Ended | |||||||
| (unaudited) | 12/31/19 | |||||||
| FROM OPERATIONS: | ||||||||
Net investment income (loss) | $ | 631,684 | $ | 1,314,179 | ||||
Net realized gain (loss) on investments | (251,196 | ) | 195,032 | |||||
Change in net unrealized appreciation (depreciation) on investments | (1,251,168 | ) | 2,267,572 | |||||
| Net increase (decrease) in net assets resulting from operations | $ | (870,680 | ) | $ | 3,776,783 | |||
| DISTRIBUTIONS TO SHAREOWNERS: | ||||||||
Class I ($0.20 and $0.34 per share, respectively) | $ | (116,468 | ) | $ | (219,924 | ) | ||
Class II ($0.19 and $0.31 per share, respectively) | (662,573 | ) | (1,071,742 | ) | ||||
| Total distributions to shareowners | $ | (779,041 | ) | $ | (1,291,666 | ) | ||
| FROM PORTFOLIO SHARE TRANSACTIONS: | ||||||||
Net proceeds from sales of shares | $ | 10,261,076 | $ | 15,868,473 | ||||
Reinvestment of distributions | 779,041 | 1,291,666 | ||||||
Cost of shares repurchased | (10,773,521 | ) | (19,996,552 | ) | ||||
| Net increase (decrease) in net assets resulting from Portfolio share transactions | $ | 266,596 | $ | (2,836,413 | ) | |||
| Net decrease in net assets | $ | (1,383,125 | ) | $ | (351,296 | ) | ||
| NET ASSETS: | ||||||||
Beginning of period | $ | 42,609,094 | $ | 42,960,390 | ||||
End of period | $ | 41,225,969 | $ | 42,609,094 | ||||
| Six Months | Six Months | |||||||||||||||
| Ended | Ended | |||||||||||||||
| 6/30/20 | 6/30/20 | Year Ended | Year Ended | |||||||||||||
| Shares | Amount | 12/31/19 | 12/31/19 | |||||||||||||
| (unaudited) | (unaudited) | Shares | Amount | |||||||||||||
| CLASS I | ||||||||||||||||
Shares sold | 16,256 | $ | 160,437 | 32,007 | $ | 324,180 | ||||||||||
Reinvestment of distributions | 11,742 | 116,468 | 21,851 | 219,924 | ||||||||||||
Less shares repurchased | (41,404 | ) | (405,716 | ) | (536,402 | ) | (5,308,250 | ) | ||||||||
| Net decrease | (13,406 | ) | $ | (128,811 | ) | (482,544 | ) | $ | (4,764,146 | ) | ||||||
| CLASS II | ||||||||||||||||
Shares sold | 998,980 | $ | 10,100,639 | 1,537,078 | $ | 15,544,293 | ||||||||||
Reinvestment of distributions | 66,963 | 662,573 | 106,260 | 1,071,742 | ||||||||||||
Less shares repurchased | (1,059,492 | ) | (10,367,805 | ) | (1,455,291 | ) | (14,688,302 | ) | ||||||||
| Net increase | 6,451 | $ | 395,407 | 188,047 | $ | 1,927,733 | ||||||||||
The accompanying notes are an integral part of these financial statements.
33
| Pioneer Strategic Income VCT Portfolio | PIONEER VARIABLE CONTRACTS TRUST |
| FINANCIAL HIGHLIGHTS |
| Six Months | ||||||||||||||||||||||||
| Ended | ||||||||||||||||||||||||
| 6/30/20 | Year Ended | Year Ended | Year Ended | Year Ended | Year Ended | |||||||||||||||||||
| (unaudited) | 12/31/19 | 12/31/18 | 12/31/17 | 12/31/16* | 12/31/15* | |||||||||||||||||||
| Class I | ||||||||||||||||||||||||
Net asset value, beginning of period | $ | 10.32 | $ | 9.71 | $ | 10.28 | $ | 10.16 | $ | 9.78 | $ | 10.28 | ||||||||||||
Increase (decrease) from investment operations: | ||||||||||||||||||||||||
| Net investment income (loss) (a) | $ | 0.17 | $ | 0.34 | $ | 0.34 | $ | 0.35 | $ | 0.38 | $ | 0.27 | ||||||||||||
| Net realized and unrealized gain (loss) on investments | (0.29 | ) | 0.61 | (0.52 | ) | 0.15 | 0.35 | (0.40 | ) | |||||||||||||||
Net increase (decrease) from investment operations | $ | (0.12 | ) | $ | 0.95 | $ | (0.18 | ) | $ | 0.50 | $ | 0.73 | $ | (0.13 | ) | |||||||||
Distributions to shareowners: | ||||||||||||||||||||||||
| Net investment income | $ | (0.17 | ) | $ | (0.34 | ) | $ | (0.28 | ) | $ | (0.37 | ) | $ | (0.35 | ) | $ | (0.32 | ) | ||||||
| Net realized gain | (0.03 | ) | — | (0.07 | ) | (0.01 | ) | — | (0.05 | ) | ||||||||||||||
| Tax return of capital | — | — | (0.40 | ) | — | — | — | |||||||||||||||||
Total distributions | $ | (0.20 | ) | $ | (0.34 | ) | $ | (0.39 | ) | $ | (0.38 | ) | $ | (0.35 | ) | $ | (0.37 | ) | ||||||
Net increase (decrease) in net asset value | $ | (0.32 | ) | $ | 0.61 | $ | (0.57 | ) | $ | 0.12 | $ | 0.38 | $ | (0.50 | ) | |||||||||
Net asset value, end of period | $ | 10.00 | $ | 10.32 | $ | 9.71 | $ | 10.28 | $ | 10.16 | $ | 9.78 | ||||||||||||
Total return (b) | (1.17 | )%(c) | 9.89 | % | (1.78 | )% | 4.99 | %(d) | 7.58 | % | (1.27 | )% | ||||||||||||
Ratio of net expenses to average net assets | 0.75 | %(e) | 0.75 | % | 0.75 | % | 0.75 | % | 0.75 | % | 1.20 | % | ||||||||||||
Ratio of net investment income (loss) to average net assets | 3.45 | %(e) | 3.38 | % | 3.41 | % | 3.43 | % | 3.76 | % | 2.66 | % | ||||||||||||
Portfolio turnover rate | 33 | %(c) | 62 | % | 37 | % | 48 | % | 61 | % | 56 | % | ||||||||||||
Net assets, end of period (in thousands) | $ | 5,643 | $ | 5,962 | $ | 10,296 | $ | 10,886 | $ | 10,890 | $ | 11,561 | ||||||||||||
Ratios with no waiver of fees and assumption of expenses by | ||||||||||||||||||||||||
| the Adviser and no reduction for fees paid indirectly: | ||||||||||||||||||||||||
| Total expenses to average net assets | 1.39 | %(e) | 1.33 | % | 1.32 | % | 1.18 | % | 1.17 | % | 1.20 | % | ||||||||||||
| Net investment income (loss) to average net assets | 2.81 | %(e) | 2.80 | % | 2.84 | % | 3.00 | % | 3.34 | % | 2.66 | % | ||||||||||||
* | The Portfolio was audited by an independent registered public accounting firm other than Ernst & Young LLP. |
(a) | The per-share data presented above is based on the average shares outstanding for the periods presented. |
(b) | Assumes initial investment at net asset value at the beginning of each period, reinvestment of all distributions and the complete redemption of the |
investment at net asset value at the end of each period. | |
(c) | Not annualized. |
(d) | If the Portfolio had not recognized gains in settlement of class action lawsuits during the year ended December 31, 2017, the total return would have |
been 4.94%. | |
(e) | Annualized. |
NOTE: The above financial highlights do not reflect the deduction of non-portfolio expenses associated with variable insurance products, such as mortality and expense risk charges, separate account charges, and sales charges.
The accompanying notes are an integral part of these financial statements.
34
| Pioneer Strategic Income VCT Portfolio | PIONEER VARIABLE CONTRACTS TRUST |
| Six Months | ||||||||||||||||||||||||
| Ended | ||||||||||||||||||||||||
| 6/30/20 | Year Ended | Year Ended | Year Ended | Year Ended | Year Ended | |||||||||||||||||||
| (unaudited) | 12/31/19 | 12/31/18 | 12/31/17 | 12/31/16* | 12/31/15* | |||||||||||||||||||
| Class II | ||||||||||||||||||||||||
Net asset value, beginning of period | $ | 10.30 | $ | 9.70 | $ | 10.26 | $ | 10.14 | $ | 9.76 | $ | 10.26 | ||||||||||||
Increase (decrease) from investment operations: | ||||||||||||||||||||||||
| Net investment income (loss) (a) | $ | 0.16 | $ | 0.32 | $ | 0.31 | $ | 0.33 | $ | 0.35 | $ | 0.24 | ||||||||||||
| Net realized and unrealized gain (loss) on investments | (0.28 | ) | 0.59 | (0.50 | ) | 0.14 | 0.36 | (0.39 | ) | |||||||||||||||
Net increase (decrease) from investment operations | $ | (0.12 | ) | $ | 0.91 | $ | (0.19 | ) | $ | 0.47 | $ | 0.71 | $ | (0.15 | ) | |||||||||
Distributions to shareowners: | ||||||||||||||||||||||||
Net investment income | $ | (0.16 | ) | $ | (0.31 | ) | $ | (0.26 | ) | $ | (0.34 | ) | $ | (0.33 | ) | $ | (0.30 | ) | ||||||
Net realized gain | (0.03 | ) | — | (0.07 | ) | (0.01 | ) | — | (0.05 | ) | ||||||||||||||
Tax return of capital | — | — | (0.04 | ) | — | — | — | |||||||||||||||||
Total distributions | $ | (0.19 | ) | $ | (0.31 | ) | $ | (0.37 | ) | $ | (0.35 | ) | $ | (0.33 | ) | $ | (0.35 | ) | ||||||
Net increase (decrease) in net asset value | $ | (0.31 | ) | $ | 0.60 | $ | (0.56 | ) | $ | 0.12 | $ | 0.38 | $ | (0.50 | ) | |||||||||
Net asset value, end of period | $ | 9.99 | $ | 10.30 | $ | 9.70 | $ | 10.26 | $ | 10.14 | $ | 9.76 | ||||||||||||
Total return (b) | (1.10 | )%(c) | 9.52 | % | (1.93 | )% | 4.74 | % | 7.32 | % | (1.52 | )% | ||||||||||||
Ratio of net expenses to average net assets | 1.00 | %(d) | 1.00 | % | 1.00 | % | 1.00 | % | 1.00 | % | 1.45 | % | ||||||||||||
Ratio of net investment income (loss) to average net assets | 3.18 | %(d) | 3.16 | % | 3.16 | % | 3.18 | % | 3.51 | % | 2.41 | % | ||||||||||||
Portfolio turnover rate | 33 | %(c) | 62 | % | 37 | % | 48 | % | 61 | % | 56 | % | ||||||||||||
Net assets, end of period (in thousands) | $ | 35,583 | $ | 36,647 | $ | 32,664 | $ | 35,585 | $ | 34,020 | $ | 34,943 | ||||||||||||
Ratios with no waiver of fees and assumption of expenses by | ||||||||||||||||||||||||
| the Adviser and no reduction for fees paid indirectly: | ||||||||||||||||||||||||
| Total expenses to average net assets | 1.64 | %(d) | 1.59 | % | 1.57 | % | 1.43 | % | 1.42 | % | 1.45 | % | ||||||||||||
| Net investment income (loss) to average net assets | 2.54 | %(d) | 2.57 | % | 2.59 | % | 2.75 | % | 3.09 | % | 2.41 | % | ||||||||||||
* | The Portfolio was audited by an independent registered public accounting firm other than Ernst & Young LLP. |
(a) | The per-share data presented above is based on the average shares outstanding for the periods presented. |
(b) | Assumes initial investment at net asset value at the beginning of each period, reinvestment of all distributions and the complete redemption of the |
investment at net asset value at the end of each period. | |
(c) | Not annualized. |
(d) | Annualized. |
NOTE: The above financial highlights do not reflect the deduction of non-portfolio expenses associated with variable insurance products, such as mortality and expense risk charges, separate account charges, and sales charges.
The accompanying notes are an integral part of these financial statements.
35
| Pioneer Strategic Income VCT Portfolio | PIONEER VARIABLE CONTRACTS TRUST |
1. Organization and Significant Accounting Policies
Pioneer Strategic Income VCT Portfolio (the “Portfolio”) is one of 8 portfolios comprising Pioneer Variable Contracts Trust (the “Trust”), a Delaware statutory trust. The Portfolio is registered under the Investment Company Act of 1940 as a diversified, open-end management investment company. The investment objective of the Portfolio is to produce a high level of current income.
The Portfolio offers two classes of shares designated as Class I and Class II shares. Each class of shares represents an interest in the same schedule of investments of the Portfolio and has identical rights (based on relative net asset values) to assets and liquidation proceeds. Share classes can bear different rates of class-specific fees and expenses, such as transfer agent and distribution fees. Differences in class-specific fees and expenses will result in differences in net investment income and, therefore, the payment of different dividends from net investment income earned by each class. The Amended and Restated Declaration of Trust of the Portfolio gives the Board of Trustees the flexibility to specify either per-share voting or dollar-weighted voting when submitting matters for shareowner approval. Under per-share voting, each share of a class of the Portfolio is entitled to one vote. Under dollar-weighted voting, a shareowner’s voting power is determined not by the number of shares owned, but by the dollar value of the shares on the record date. Each share class has exclusive voting rights with respect to matters affecting only that class, including with respect to the distribution plan for that class. There is no distribution plan for Class I shares.
Portfolio shares may be purchased only by insurance companies for the purpose of funding variable annuity and variable life insurance contracts, or by qualified pension and retirement plans.
Amundi Pioneer Asset Management, Inc., an indirect, wholly owned subsidiary of Amundi and Amundi’s wholly owned subsidiary, Amundi USA, Inc., serves as the Portfolio’s investment adviser (the “Adviser”). Amundi Pioneer Distributor, Inc., an affiliate of Amundi Pioneer Asset Management, Inc., serves as the Portfolio’s distributor (the “Distributor”).
In August 2018, the Securities and Exchange Commission (“SEC”) released a Disclosure Update and Simplification Final Rule. The Final Rule amends Regulation S-X disclosures requirements to conform them to U.S. Generally Accepted Accounting Principles (“U.S. GAAP”) for investment companies. The Portfolio’s financial statements were prepared in compliance with the new amendments to Regulation S-X.
During March 2017, the Financial Accounting Standards Board (FASB) issued an Accounting Standard Update, ASU 2017-08, Receivables-Nonrefundable Fees and Other Costs (Subtopic 310-20), Premium Amortization on Purchased Callable Debt Securities (“ASU 2017-08”), which shortens the amortization period for purchased non-contingently callable debt securities held at a premium. ASU 2017-08 specifies that the premium amortization period ends at the earliest call date, for certain purchased non-contingently callable debt securities. ASU 2017-08 is effective for fiscal years, and interim periods within those fiscal years, beginning after December 15, 2018. The Portfolio has adopted ASU 2017-08 as of June 30, 2020. The implementation of ASU 2017-08 did not have a material impact on the Portfolio’s Financial Statements.
The Portfolio is an investment company and follows investment company accounting and reporting guidance under U.S. GAAP. U.S. GAAP requires the management of the Portfolio to make estimates and assumptions that affect the reported amounts of assets and liabilities, the disclosure of contingent assets and liabilities at the date of the financial statements, and the reported amounts of income, expenses and gain or loss on investments during the reporting period. Actual results could differ from those estimates.
The following is a summary of significant accounting policies followed by the Portfolio in the preparation of its financial statements:
A. Security Valuation
The net asset value of the Portfolio is computed once daily, on each day the New York Stock Exchange (“NYSE”) is open, as of the close of regular trading on the NYSE.
Fixed-income securities are valued by using prices supplied by independent pricing services, which consider such factors as market prices, market events, quotations from one or more brokers, Treasury spreads, yields, maturities and ratings, or may use a pricing matrix or other fair value methods or techniques to provide an estimated value of the security or instrument. A pricing matrix is a means of valuing a debt security on the basis of current market prices for other debt securities, historical trading patterns in the market for fixed-income securities and/or other factors. Non-U.S. debt securities that are listed on an exchange will be valued at the bid price obtained from an independent third party pricing service. When independent third party pricing services are unable to supply prices, or when prices or market quotations are considered to be unreliable, the value of that security may be determined using quotations from one or more broker-dealers.
36
| Pioneer Strategic Income VCT Portfolio | PIONEER VARIABLE CONTRACTS TRUST |
Loan interests are valued in accordance with guidelines established by the Board of Trustees at the mean between the last available bid and asked prices from one or more brokers or dealers as obtained from Loan Pricing Corporation, an independent third party pricing service. If price information is not available from Loan Pricing Corporation, or if the price information is deemed to be unreliable, price information will be obtained from an alternative loan interest pricing service. If no reliable price quotes are available from either the primary or alternative pricing service, broker quotes will be solicited.
Event-linked bonds are valued at the bid price obtained from an independent third party pricing service. Other insurance-linked securities (including reinsurance sidecars, collateralized reinsurance and industry loss warranties) may be valued at the bid price obtained from an independent pricing service, or through a third party using a pricing matrix, insurance industry valuation models, or other fair value methods or techniques to provide an estimated value of the instrument.
Equity securities that have traded on an exchange are valued by using the last sale price on the principal exchange where they are traded. Equity securities that have not traded on the date of valuation, or securities for which sale prices are not available, generally are valued using the mean between the last bid and asked prices or, if both last bid and asked prices are not available, at the last quoted bid price. Last sale and bid and asked prices are provided by independent third party pricing services. In the case of equity securities not traded on an exchange, prices are typically determined by independent third party pricing services using a variety of techniques and methods.
The value of foreign securities is translated into U.S. dollars based on foreign currency exchange rate quotations supplied by a third party pricing source. Trading in non-U.S. equity securities is substantially completed each day at various times prior to the close of the NYSE. The values of such securities used in computing the net asset value of the Portfolio’s shares are determined as of such times. The Portfolio may use a fair value model developed by an independent pricing service to value non-U.S. equity securities.
Options contracts are generally valued at the mean between the last bid and ask prices on the principal exchange where they are traded. Over-the-counter (“OTC”) options and options on swaps (“swaptions”) are valued using prices supplied by independent pricing services, which consider such factors as market prices, market events, quotations from one or more brokers, Treasury spreads, yields, maturities and ratings, or may use a pricing matrix or other fair value methods or techniques to provide an estimated value of the security or instrument.
Forward foreign currency exchange contracts are valued daily using the foreign exchange rate or, for longer term forward contract positions, the spot currency rate and the forward points on a daily basis, in each case provided by a third party pricing service. Contracts whose forward settlement date falls between two quoted days are valued by interpolation.
Futures contracts are generally valued at the closing settlement price established by the exchange on which they are traded.
Swap contracts, including interest rate swaps, caps and floors (other than centrally cleared swap contracts), are valued at the dealer quotations obtained from reputable International Swap Dealers Association members. Centrally cleared swaps are valued at the daily settlement price provided by the central clearing counterparty.
Shares of open-end registered investment companies (including money market mutual funds) are valued at such funds’ net asset value. Shares of exchange-listed closed-end funds are valued by using the last sale price on the principal exchange where they are traded. Shares of closed-end interval funds that offer their shares at net asset value are values at such funds’ net asset value.
Securities or loan interests for which independent pricing services or broker-dealers are unable to supply prices or for which market prices and/or quotations are not readily available or are considered to be unreliable are valued by a fair valuation team comprised of certain personnel of the Adviser pursuant to procedures adopted by the Portfolio’s Board of Trustees. The Adviser’s fair valuation team uses fair value methods approved by the Valuation Committee of the Board of Trustees. The Adviser’s fair valuation team is responsible for monitoring developments that may impact fair valued securities and for discussing and assessing fair values on an ongoing basis, and at least quarterly, with the Valuation Committee of the Board of Trustees.
Inputs used when applying fair value methods to value a security may include credit ratings, the financial condition of the company, current market conditions and comparable securities. The Portfolio may use fair value methods if it is determined that a significant event has
37
| Pioneer Strategic Income VCT Portfolio | PIONEER VARIABLE CONTRACTS TRUST | |
NOTES TO FINANCIAL STATEMENTS 6/30/20 (UNAUDITED) | (continued) | |
occurred after the close of the exchange or market on which the security trades and prior to the determination of the Portfolio’s net asset value. Examples of a significant event might include political or economic news, corporate restructurings, natural disasters, terrorist activity or trading halts. Thus, the valuation of the Portfolio’s securities may differ significantly from exchange prices, and such differences could be material.
At June 30, 2020, two securities were valued using fair value methods (in addition to securities valued using prices supplied by independent pricing services, broker-dealers or using a third party insurance pricing model) representing 0% of net assets. The value of this fair valued securities was $--.
B. Investment Income and Transactions
Dividend income is recorded on the ex-dividend date, except that certain dividends from foreign securities where the ex-dividend date may have passed are recorded as soon as the Portfolio becomes aware of the ex-dividend data in the exercise of reasonable diligence.
Interest income, including interest on income-bearing cash accounts, is recorded on the accrual basis. Dividend and interest income are reported net of unrecoverable foreign taxes withheld at the applicable country rates and net of income accrued on defaulted securities.
Interest and dividend income payable by delivery of additional shares is reclassified as PIK (payment-in-kind) income upon receipt and is included in interest and dividend income, respectively.
Principal amounts of mortgage-backed securities are adjusted for monthly paydowns. Premiums and discounts related to certain mortgage-backed securities are amortized or accreted in proportion to the monthly paydowns. All discounts/premiums on purchase prices of debt securities are accreted/amortized for financial reporting purposes over the life of the respective securities, and such accretion/amortization is included in interest income.
Security transactions are recorded as of trade date. Gains and losses on sales of investments are calculated on the identified cost method for both financial reporting and federal income tax purposes.
C. Foreign Currency Translation
The books and records of the Portfolio are maintained in U.S. dollars. Amounts denominated in foreign currencies are translated into U.S. dollars using current exchange rates.
Net realized gains and losses on foreign currency transactions, if any, represent, among other things, the net realized gains and losses on foreign currency exchange contracts, disposition of foreign currencies and the difference between the amount of income accrued and the U.S. dollars actually received. Further, the effects of changes in foreign currency exchange rates on investments are not segregated on the Statement of Operations from the effects of changes in the market prices of those securities, but are included with the net realized and unrealized gain or loss on investments.
D. Federal Income Taxes
It is the Portfolio’s policy to comply with the requirements of the Internal Revenue Code applicable to regulated investment companies and to distribute all of its net taxable income and net realized capital gains, if any, to its shareowners. Therefore, no provision for federal income taxes is required. As of December 31, 2019, the Portfolio did not accrue any interest or penalties with respect to uncertain tax positions, which, if applicable, would be recorded as an income tax expense on the Statement of Operations. Tax returns filed within the prior three years remain subject to examination by federal and state tax authorities.
In addition to meeting the requirements of the Internal Revenue Code, the Portfolio may be required to pay local taxes on the recognition of capital gains and/or the repatriation of foreign currencies in certain countries. During the year ended December 31, 2019, the Portfolio paid no such taxes.
The Portfolio does not consider the effect of foreign currency gain/loss when calculating its monthly distribution due to its unpredictable nature over the course of a year and differing treatment for book and tax purposes. As a result, the Portfolio may report a distribution in excess of its earnings and profits or a tax return of capital at its fiscal year end.
The amount and character of income and capital gain distributions to shareowners are determined in accordance with federal income tax rules, which may differ from U.S. GAAP. Distributions in excess of net investment income or net realized gains are temporary
38
| Pioneer Strategic Income VCT Portfolio | PIONEER VARIABLE CONTRACTS TRUST |
over distributions for financial statement purposes resulting from differences in the recognition or classification of income or distributions for financial statement and tax purposes. Capital accounts within the financial statements are adjusted for permanent book/tax differences to reflect tax character, but are not adjusted for temporary differences.
The tax character of current year distributions payable will be determined at the end of the current taxable year. The tax character of distributions paid during the year ended December 31, 2019 was as follows:
| 2019 | ||||
| Distributions paid from: | ||||
| Ordinary income | $ | 1,291,666 | ||
| Total | $ | 1,291,666 | ||
The following shows the components of distributable earnings (losses) on a federal income tax basis at December 31, 2019:
| 2019 | ||||
| Distributable earnings: | ||||
| Undistributed ordinary income | $ | 71,020 | ||
| Undistributed long term capital gain | 59,124 | |||
| Net unrealized appreciation | 914,568 | |||
| Total | $ | 1,044,712 | ||
The difference between book basis and tax basis unrealized appreciation is attributable to the tax deferral of losses on wash sales, the mark to market of swaps, forward currency exchange contracts, futures contracts, adjustments relating to insurance linked securities and credit default swaps.
E. Portfolio Shares and Class Allocations
The Portfolio records sales and repurchases of its shares as of trade date. Distribution fees for Class II shares are calculated based on the average daily net asset value attributable to Class II shares of the Portfolio (see Note 4). Class I shares do not pay distribution fees.
Income, common expenses and realized and unrealized gains and losses are calculated at the Portfolio level and allocated daily to each class of shares based on its respective percentage of adjusted net assets at the beginning of the day.
All expenses and fees paid to the Portfolio’s transfer agent for its services are allocated between the classes of shares based on the number of accounts in each class and the ratable allocation of related out-of-pocket expenses (see Note 3).
The Portfolio declares as daily dividends substantially all of its net investment income. All dividends are paid on a monthly basis. Short-term capital gain distributions, if any, may be declared with the daily dividends. Distributions paid by the Portfolio with respect to each class of shares are calculated in the same manner and at the same time, except that net investment income dividends to Class I and Class II shares can reflect different transfer agent and distribution expense rates. Dividends and distributions to shareowners are recorded on the ex-dividend date.
F. Risks
The value of securities held by the Portfolio may go up or down, sometimes rapidly or unpredictably, due to general market conditions, such as real or perceived adverse economic, political or regulatory conditions, recessions, the spread of infectious illness or other public health issues, inflation, changes in interest rates, lack of liquidity in the bond markets or adverse investor sentiment. In the past several years, financial markets have experienced increased volatility, depressed valuations, decreased liquidity and heightened uncertainty. These conditions may continue, recur, worsen or spread. A general rise in interest rates could adversely affect the price and liquidity of fixed-income securities and could also result in increased redemptions from the Portfolio.
At times, the Portfolio’s investments may represent industries or industry sectors that are interrelated or have common risks, making the Portfolio more susceptible to any economic, political, or regulatory developments or other risks affecting those industries and sectors. The Portfolio’s investments in foreign markets and countries with limited developing markets may subject the Portfolio to a greater degree of risk than investments in a developed market. These risks include disruptive political or economic conditions and the imposition of adverse governmental laws or currency exchange restrictions.
The Portfolio invests in below-investment-grade (high-yield) debt securities and preferred stocks. Some of these high-yield securities may be convertible into equity securities of the issuer. Debt securities rated below-investment-grade are commonly referred to as “junk bonds” and are considered speculative. These securities involve greater risk of loss, are subject to greater price volatility, and are less liquid, especially during periods of economic uncertainty or change, than higher rated debt securities.
39
| Pioneer Strategic Income VCT Portfolio | PIONEER VARIABLE CONTRACTS TRUST | |
NOTES TO FINANCIAL STATEMENTS 6/30/20 (UNAUDITED) | (continued) | |
With the increased use of technologies such as the Internet to conduct business, the Portfolio is susceptible to operational, information security and related risks. While the Portfolio’s Adviser has established business continuity plans in the event of, and risk management systems to prevent, limit or mitigate, such cyber-attacks, there are inherent limitations in such plans and systems, including the possibility that certain risks have not been identified. Furthermore, the Portfolio cannot control the cybersecurity plans and systems put in place by service providers to the Portfolio such as Brown Brothers Harriman & Co., the Portfolio’s custodian and accounting agent, and DST Asset Manager Solutions, Inc., the Portfolio’s transfer agent. In addition, many beneficial owners of Portfolio shares hold them through accounts at broker-dealers, retirement platforms and other financial market participants over which neither the Portfolio nor Amundi Pioneer exercises control. Each of these may in turn rely on service providers to them, which are also subject to the risk of cyber-attacks. Cybersecurity failures or breaches at Amundi Pioneer or the Portfolio’s service providers or intermediaries have the ability to cause disruptions and impact business operations, potentially resulting in financial losses, interference with the Portfolio’s ability to calculate its net asset value, impediments to trading, the inability of Portfolio shareowners to effect share purchases, redemptions or exchanges or receive distributions, loss of or unauthorized access to private shareowner information and violations of applicable privacy and other laws, regulatory fines, penalties, reputational damage, or additional compliance costs. Such costs and losses may not be covered under any insurance. In addition, maintaining vigilance against cyber-attacks may involve substantial costs over time, and system enhancements may themselves be subject to cyber-attacks.
COVID-19
The respiratory illness COVID-19 caused by a novel coronavirus has resulted in a global pandemic and major disruption to economies and markets around the world, including the United States. Global financial markets have experienced extreme volatility and severe losses, and trading in many instruments has been disrupted. Liquidity for many instruments has been greatly reduced for periods of time. Some interest rates are very low and in some cases yields are negative. Some sectors of the economy and individual issuers have experienced particularly large losses. These circumstances may continue for an extended period of time, and may continue to affect adversely the value and liquidity of the Portfolio’s investments. The ultimate economic fallout from the pandemic, and the long-term impact on economies, markets, industries and individual issuers, are not known. Governments and central banks, including the Federal Reserve in the U.S., have taken extraordinary and unprecedented actions to support local and global economies and the financial markets. These actions have resulted in significant expansion of public debt, including in the U.S. The impact of these measures, and whether they will be effective to mitigate the economic and market disruption, will not be known for some time. The consequences of high public debt, including its future impact on the economy and securities markets, likewise may not be known for some time.
The Portfolio’s prospectus contains unaudited information regarding the Portfolio’s principal risks. Please refer to that document when considering the Portfolio’s principal risks.
G. Insurance-Linked Securities (“ILS”)
The Portfolio invests in ILS. The Portfolio could lose a portion or all of the principal it has invested in an ILS, and the right to additional interest or dividend payments with respect to the security, upon the occurrence of one or more trigger events, as defined within the terms of an insurance-linked security. Trigger events, generally, are hurricanes, earthquakes, or other natural events of a specific size or magnitude that occur in a designated geographic region during a specified time period, and/or that involve losses or other metrics that exceed a specific amount. There is no way to accurately predict whether a trigger event will occur, and accordingly, ILS carry significant risk. The Portfolio is entitled to receive principal, and interest and/or dividend payments so long as no trigger event occurs of the description and magnitude specified by the instrument. In addition to the specified trigger events, ILS may expose the Portfolio to other risks, including but not limited to issuer (credit) default, adverse regulatory or jurisdictional interpretations and adverse tax consequences.
The Portfolio’s investments in ILS may include event-linked bonds. ILS also may include special purpose vehicles (“SPVs”) or similar instruments structured to comprise a portion of a reinsurer’s catastrophe-oriented business, known as quota share instruments (sometimes referred to as reinsurance sidecars), or to provide reinsurance relating to specific risks to insurance or reinsurance companies through a collateralized instrument, known as collateralized reinsurance. Structured reinsurance investments also
40
| Pioneer Strategic Income VCT Portfolio | PIONEER VARIABLE CONTRACTS TRUST |
may include industry loss warranties (“ILWs”). A traditional ILW takes the form of a bilateral reinsurance contract, but there are also products that take the form of derivatives, collateralized structures, or exchange-traded instruments.
Where the ILS are based on the performance of underlying reinsurance contracts, the Portfolio has limited transparency into the individual underlying contracts, and therefore must rely upon the risk assessment and sound underwriting practices of the issuer. Accordingly, it may be more difficult for the Adviser to fully evaluate the underlying risk profile of the Portfolio’s structured reinsurance investments, and therefore the Portfolio’s assets are placed at greater risk of loss than if the Adviser had more complete information. Structured reinsurance instruments generally will be considered illiquid securities by the Portfolio. These securities may be difficult to purchase, sell or unwind. Illiquid securities also may be difficult to value. If the Portfolio is forced to sell an illiquid asset, the Portfolio may be forced to sell at a loss.
Additionally, the Portfolio may gain exposure to ILS by investing in a closed-end interval fund, Pioneer ILS Interval Fund, an affiliate of the Adviser. The Portfolio’s investment in Pioneer ILS Interval Fund at June 30, 2020, is listed in the Schedule of Investments.
H. Purchased Options
The Portfolio may purchase put and call options to seek to increase total return. Purchased call and put options entitle the Portfolio to buy and sell a specified number of shares or units of a particular security, currency or index at a specified price at a specific date or within a specific period of time. Upon the purchase of a call or put option, the premium paid by the Portfolio is included on the Statement of Assets and Liabilities as an investment. All premiums are marked-to-market daily, and any unrealized appreciation or depreciation is recorded on the Portfolio’s Statement of Operations. As the purchaser of an index option, the Portfolio has the right to receive a cash payment equal to any depreciation in the value of the index below the strike price of the option (in the case of a put) or equal to any appreciation in the value of the index over the strike price of the option (in the case of a call) as of the valuation date of the option. Premiums paid for purchased call and put options which have expired are treated as realized losses on investments on the Statement of Operations. Upon the exercise or closing of a purchased put option, the premium is offset against the proceeds on the sale of the underlying security or financial instrument in order to determine the realized gain or loss on investments. Upon the exercise or closing of a purchased call option, the premium is added to the cost of the security or financial instrument. The risk associated with purchasing options is limited to the premium originally paid.
The average market value of purchased options contracts open during the six months ended June 30, 2020, was $5,567. Open purchased options at June 30, 2020, are listed in the Schedule of Investments.
I. Option Writing
The Portfolio may write put and covered call options to seek to increase total return. When an option is written, the Portfolio receives a premium and becomes obligated to purchase or sell the underlying security at a fixed price, upon the exercise of the option. When the Portfolio writes an option, an amount equal to the premium received by the Portfolio is recorded as “Written options outstanding” on the Statement of Assets and Liabilities and is subsequently adjusted to the current value of the option written. Premiums received from writing options that expire unexercised are treated by the Portfolio on the expiration date as realized gains from investments on the Statement of Operations. The difference between the premium and the amount paid on effecting a closing purchase transaction, including brokerage commissions, is also treated as a realized gain on the Statement of Operations, or, if the premium is less than the amount paid for the closing purchase transaction, as a realized loss on the Statement of Operations. If a call option is exercised, the premium is added to the proceeds from the sale of the underlying security in determining whether the Portfolio has realized a gain or loss. The Portfolio as writer of an option bears the market risk of an unfavorable change in the price of the security underlying the written option.
The average market value of written options for the six months ended June 30, 2020, was $(1,145). Open written options contracts at June 30, 2020, are listed in the Schedule of Investments.
J. Forward Foreign Currency Exchange Contracts
The Portfolio may enter into forward foreign currency exchange contracts (“contracts”) for the purchase or sale of a specific foreign currency at a fixed price on a future date. All contracts are marked-to-market daily at the applicable exchange rates, and any resulting unrealized appreciation or depreciation is recorded in the Portfolio’s financial statements. The Portfolio records realized gains and losses at the time a contract is offset by entry into a closing transaction or extinguished by delivery of the currency. Risks may arise
41
| Pioneer Strategic Income VCT Portfolio | PIONEER VARIABLE CONTRACTS TRUST | |
NOTES TO FINANCIAL STATEMENTS 6/30/20 (UNAUDITED) | (continued) | |
upon entering into these contracts from the potential inability of counterparties to meet the terms of the contract and from unanticipated movements in the value of foreign currencies relative to the U.S. dollar (see Note 6).
During the six months ended June 30, 2020, the Portfolio had entered into various forward foreign currency exchange contracts that obligated the Portfolio to deliver or take delivery of currencies at specified future maturity dates. Alternatively, prior to the settlement date of a forward foreign currency exchange contract, the Portfolio may close out such contract by entering into an offsetting contract.
The average market value of forward foreign currency exchange contracts open during the six months ended June 30, 2020, was $1,786,598. Open forward foreign currency exchange contracts outstanding at June 30, 2020, are listed in the Schedule of Investments.
K. Futures Contracts
The Portfolio may enter into futures transactions in order to attempt to hedge against changes in interest rates, securities prices and currency exchange rates or to seek to increase total return. Futures contracts are types of derivatives. All futures contracts entered into by the Portfolio are traded on a futures exchange. Upon entering into a futures contract, the Portfolio is required to deposit with a broker an amount of cash or securities equal to the minimum “initial margin” requirements of the associated futures exchange. The amount of cash deposited with the broker as collateral at June 30, 2020, is recorded as “Futures collateral” on the Statement of Assets and Liabilities.
Subsequent payments for futures contracts (“variation margin”) are paid or received by the Portfolio, depending on the daily fluctuation in the value of the contracts, and are recorded by the Portfolio as unrealized appreciation or depreciation. Cash received from or paid to the broker related to previous margin movement is held in a segregated account at the broker and is recorded as either “Due from broker for futures” or “Due to broker for futures” on the Statement of Assets and Liabilities. When the contract is closed, the Portfolio realizes a gain or loss equal to the difference between the opening and closing value of the contract as well as any fluctuation in foreign currency exchange rates where applicable. Futures contracts are subject to market risk, interest rate risk and currency exchange rate risk. Changes in value of the contracts may not directly correlate to the changes in value of the underlying securities. With futures, there is reduced counterparty credit risk to the Portfolio since futures are exchange-traded and the exchange’s clearinghouse, as counterparty to all exchange-traded futures, guarantees the futures against default.
The average market value of futures contracts open during the six months ended June 30, 2020, was $(8,721,978). Open futures contracts outstanding at June 30, 2020, are listed in the Schedule of Investments.
L. Credit Default Swap Contracts
A credit default swap is a contract between a buyer of protection and a seller of protection against a predefined credit event or an underlying reference obligation, which may be a single security or a basket or index of securities. The Portfolio may buy or sell credit default swap contracts to seek to increase the Portfolio’s income, or to attempt to hedge the risk of default on portfolio securities. A credit default swap index is used to hedge risk or take a position on a basket of credit entities or indices.
As a seller of protection, the Portfolio would be required to pay the notional (or other agreed-upon) value of the referenced debt obligation to the counterparty in the event of a default by a U.S. or foreign corporate issuer of a debt obligation, which would likely result in a loss to the Portfolio. In return, the Portfolio would receive from the counterparty a periodic stream of payments during the term of the contract, provided that no event of default occurred. The maximum exposure of loss to the seller would be the notional value of the credit default swaps outstanding. If no default occurs, the Portfolio would keep the stream of payments and would have no payment obligation. The Portfolio may also buy credit default swap contracts in order to hedge against the risk of default of debt securities, in which case the Portfolio would function as the counterparty referenced above.
As a buyer of protection, the Portfolio makes an upfront or periodic payment to the protection seller in exchange for the right to receive a contingent payment. An upfront payment made by the Portfolio, as the protection buyer, is recorded within the “Swap contracts, at value” line item on the Statement of Assets and Liabilities. Periodic payments received or paid by the Portfolio are recorded as realized gains or losses on the Statement of Operations.
Credit default swap contracts are marked-to-market daily using valuations supplied by independent sources, and the change in value, if any, is recorded within the “Swap contracts, at value” line item on the Statement
42
| Pioneer Strategic Income VCT Portfolio | PIONEER VARIABLE CONTRACTS TRUST |
of Assets and Liabilities. Payments received or made as a result of a credit event or upon termination of the contract are recognized, net of the appropriate amount of the upfront payment, as realized gains or losses on the Statement of Operations.
Credit default swap contracts involving the sale of protection may involve greater risks than if the Portfolio had invested in the referenced debt instrument directly. Credit default swap contracts are subject to general market risk, liquidity risk, counterparty risk and credit risk. If the Portfolio is a protection buyer and no credit event occurs, it will lose its investment. If the Portfolio is a protection seller and a credit event occurs, the value of the referenced debt instrument received by the Portfolio, together with the periodic payments received, may be less than the amount the Portfolio pays to the protection buyer, resulting in a loss to the Portfolio. In addition, obligations under sell protection credit default swaps may be partially offset by net amounts received from settlement of buy protection credit default swaps entered into by the Portfolio for the same reference obligation with the same counterparty.
Certain swap contracts that are cleared through a central clearinghouse are referred to as centrally cleared swaps. All payments made or received by the Portfolio are pursuant to a centrally cleared swap contract with the central clearing party rather than the original counterparty. Upon entering into a centrally cleared swap contract, the Portfolio is required to make an initial margin deposit, either in cash or in securities. The daily change in value on open centrally cleared contracts is recorded as “Variation margin for centrally cleared swap contracts” on the Statement of Assets and Liabilities. Cash received from or paid to the broker related to previous margin movement is held in a segregated account at the broker and is recorded as either “Due from broker for swaps” or “Due to broker for swaps” on the Statement of Assets and Liabilities. The amount of cash deposited with a broker as collateral at June 30, 2020, is recorded as “Swaps collateral” on the Statement of Assets and Liabilities.
The average market value of credit default swap contracts open during the six months ended June 30, 2020, was $(55,682). Open credit default swap contracts at June 30, 2020, are listed in the Schedule of Investments.
2. Management Agreement
The Adviser manages the Portfolio. Management fees are paid monthly and calculated daily at the annual rate of 0.65% of the Portfolio’s average daily net assets. For the six months ended June 30, 2020, the effective management fee (excluding waivers and/or assumption of acquired fund fees and expenses) was equivalent to 0.65% (annualized) of the Portfolio’s average daily net assets.
The Adviser has agreed to waive its management fee with respect to any portion of the Portfolio’s assets invested in Pioneer ILS Interval Fund, an affiliated fund managed by the Adviser. For the six months ended June 30, 2020, the Adviser waived $7,120 in management fees with respect to the Portfolio, which is reflected on the Statement of Operations as an expense waiver.
The Adviser has contractually agreed to limit ordinary operating expenses (ordinary operating expenses means all portfolio expenses other than extraordinary expenses, such as litigation, taxes, brokerage commissions and acquired fund expenses) of the Portfolio to the extent required to reduce Portfolio expenses to 0.75% and 1.00%, of the average daily net assets attributable to Class I and Class II shares, respectively. Fees waived and expenses reimbursed during the six months ended June 30, 2020, are reflected on the Statement of Operations. These expense limitations are in effect through May 1, 2021. There can be no assurance that the Adviser will extend the expense limitation agreement for a class of shares beyond the date referred to above.
In addition, under the management and administration agreements, certain other services and costs, including accounting, regulatory reporting and insurance premiums, are paid by the Portfolio as administrative reimbursements. Included in “Due to affiliates” reflected on the Statement of Assets and Liabilities is $22,294 in management fees, administrative costs and certain other reimbursements payable to the Adviser at June 30, 2020.
3. Transfer Agent
DST Asset Manager Solutions, Inc. serves as the transfer agent to the Portfolio at negotiated rates. Transfer agent fees and payables shown on the Statement of Operations and the Statement of Assets and Liabilities, respectively, include sub-transfer agent expenses incurred through the Portfolio’s omnibus relationship contracts.
4. Distribution Plan
The Portfolio has adopted a distribution plan (the “Plan”) pursuant to Rule 12b-1 of the Investment Company Act of 1940 with respect to Class II shares. Pursuant to the Plan, the Portfolio pays the Distributor 0.25% of the average daily net assets attributable to Class II shares to compensate the Distributor for (1) distribution services and (2) personal and account maintenance services performed and expenses incurred by the Distributor in connection with the Portfolio’s Class II shares. Included in “Due to affiliates” reflected on the Statement of Assets and Liabilities is $1,216 in distribution fees payable to the Distributor at June 30, 2020.
43
| Pioneer Strategic Income VCT Portfolio | PIONEER VARIABLE CONTRACTS TRUST | |
NOTES TO FINANCIAL STATEMENTS 6/30/20 (UNAUDITED) | (continued) | |
5. Master Netting Agreements
The Portfolio has entered into an International Swaps and Derivatives Association, Inc. Master Agreement (“ISDA Master Agreement”) or similar agreement with substantially all its derivative counterparties. An ISDA Master Agreement is a bilateral agreement between the Portfolio and a counterparty that governs the trading of certain Over the Counter (“OTC”) derivatives and typically contains, among other things, close-out and set-off provisions which apply upon the occurrence of an event of default and/or a termination event as defined under the relevant ISDA Master Agreement. The ISDA Master Agreement may also give a party the right to terminate all transactions traded under such agreement if, among other things, there is deterioration in the credit quality of the other party.
Upon an event of default or a termination of the ISDA Master Agreement, the non-defaulting party has the right to close-out all of transactions under such agreement and to net amounts owed under each transaction to determine one net amount payable by one party to the other. The right to close out and net payments across all transactions under the ISDA Master Agreement could result in a reduction of the Portfolio’s credit risk to its counterparty equal to any amounts payable by the Portfolio under the applicable transactions, if any. However, the Portfolio’s right to set-off may be restricted or prohibited by the bankruptcy or insolvency laws of the particular jurisdiction to which each specific ISDA Master Agreement of each counterparty is subject.
The collateral requirements for derivatives transactions under an ISDA Master Agreement are governed by a credit support annex to the ISDA Master Agreement. Collateral requirements are generally determined at the close of business each day and are typically based on changes in market values for each transaction under an ISDA Master Agreement and netted into one amount for such agreement. Generally, the amount of collateral due from or to a counterparty is subject to threshold (a “minimum transfer amount”) before a transfer is required, which may vary by counterparty. Collateral pledged for the benefit of the Portfolio and/or counterparty is held in segregated accounts by the Portfolio’s custodian and cannot be sold, re-pledged, assigned or otherwise used while pledged. Cash that has been segregated to cover the Portfolio’s collateral obligations, if any, will be reported separately on the Statement of Assets and Liabilities as “Swaps collateral”. Securities pledged by the Portfolio as collateral, if any, are identified as such in the Schedule of Investments.
Financial instruments subject to an enforceable master netting agreement, such as an ISDA Master Agreement, have been offset on the Statement of Assets and Liabilities. The following charts show gross assets and liabilities of the Portfolio as of June 30, 2020:
| Derivative Assets | Derivatives | Non-Cash | Cash | Net Amount | ||||||||||||||||
| Subject to Master | Available | Collateral | Collateral | of Derivative | ||||||||||||||||
| Counterparty | Netting Agreement | for Offset | Received (a) | Received (a) | Assets (b) | |||||||||||||||
Bank of America NA | $ | 16,015 | $ | (5,009 | ) | $ | – | $ | – | $ | 11,006 | |||||||||
Bank of New York Mellon Corp. | 4,608 | – | – | – | 4,608 | |||||||||||||||
Brown Brothers Harriman & Co. | – | * | – | – | – | – | * | |||||||||||||
Citibank NA | 992 | (992 | ) | – | – | – | ||||||||||||||
Goldman Sachs International | 2,139 | – | – | – | 2,139 | |||||||||||||||
JPMorgan Chase Bank NA | 8,623 | (2,203 | ) | – | – | 6,420 | ||||||||||||||
HSBC Bank NA | 26,313 | – | – | – | 26,313 | |||||||||||||||
State Street Bank & Trust Co. | 6,913 | (6,913 | ) | – | – | – | ||||||||||||||
| Total | $ | 65,603 | $ | (15,117 | ) | $ | – | $ | – | $ | 50,486 | |||||||||
44
| Pioneer Strategic Income VCT Portfolio | PIONEER VARIABLE CONTRACTS TRUST |
| Derivative Liabilities | Derivatives | Non-Cash | Cash | Net Amount | ||||||||||||||||
| Subject to Master | Available | Collateral | Collateral | of Derivative | ||||||||||||||||
Counterparty | Netting Agreement | for Offset | Pledged (a) | Pledged (a) | Liabilities (c) | |||||||||||||||
Bank of America NA | $ | 5,009 | $ | (5,009 | ) | $ | – | $ | – | $ | – | |||||||||
Bank of New York Mellon Corp. | – | – | – | – | – | |||||||||||||||
Brown Brothers Harriman & Co. | – | – | – | – | – | |||||||||||||||
Citibank NA | 1,594 | (992 | ) | – | – | 602 | ||||||||||||||
Goldman Sachs International | – | – | – | – | – | |||||||||||||||
JPMorgan Chase Bank NA | 2,203 | (2,203 | ) | – | – | – | ||||||||||||||
HSBC Bank NA | – | – | – | – | – | |||||||||||||||
State Street Bank & Trust Co. | 18,089 | (6,913 | ) | – | – | 11,176 | ||||||||||||||
| Total | $ | 26,895 | $ | (15,117 | ) | $ | – | $ | – | $ | 11,778 | |||||||||
* Includes securities that are valued at $0.
(a) The amount presented here may be less than the total amount of collateral received/pledged, as the net amount of derivative assets and liabilities cannot be less than $0.
(b) Represents the net amount due from the counterparty in the event of default.
(c) Represents the net amount payable to the counterparty in the event of default.
6. Additional Disclosures about Derivative Instruments and Hedging Activities
The Portfolio’s use of derivatives may enhance or mitigate the Portfolio’s exposure to the following risks:
Interest rate risk relates to the fluctuations in the value of interest-bearing securities due to changes in the prevailing levels of market interest rates.
Credit risk relates to the ability of the issuer of a financial instrument to make further principal or interest payments on an obligation or commitment that it has to the Portfolio.
Foreign exchange rate risk relates to fluctuations in the value of an asset or liability due to changes in currency exchange rates.
Equity risk relates to the fluctuations in the value of financial instruments as a result of changes in market prices (other than those arising from interest rate risk or foreign exchange rate risk), whether caused by factors specific to an individual investment, its issuer, or all factors affecting all instruments traded in a market or market segment.
Commodity risk relates to the risk that the value of a commodity or commodity index will fluctuate based on increases or decreases in the commodities market and factors specific to a particular industry or commodity.
The fair value of open derivative instruments (not considered to be hedging instruments for accounting disclosure purposes) by risk exposure at June 30, 2020, was as follows:
| Foreign | ||||||||||||||||||||
| Statement of Assets | Interest Rate | Credit | Exchange Rate | Equity | Commodity | |||||||||||||||
| and Liabilities | Risk | Risk | Risk | Risk | Risk | |||||||||||||||
| Assets | ||||||||||||||||||||
| Call options purchased* | $ | – | $ | – | $ | – | $ | – | ** | $ | – | |||||||||
| Currency put options purchased* | – | – | 9,462 | – | – | |||||||||||||||
| Net unrealized appreciation on forward | ||||||||||||||||||||
| foreign currency contracts | – | – | 34,225 | – | – | |||||||||||||||
| Total Value | $ | – | $ | – | $ | 43,687 | $ | – | ** | $ | – | |||||||||
45
| Pioneer Strategic Income VCT Portfolio | PIONEER VARIABLE CONTRACTS TRUST | |
NOTES TO FINANCIAL STATEMENTS 6/30/20 (UNAUDITED) | (continued) | |
| Foreign | ||||||||||||||||||||
| Statement of Assets | Interest Rate | Credit | Exchange Rate | Equity | Commodity | |||||||||||||||
| and Liabilities | Risk | Risk | Risk | Risk | Risk | |||||||||||||||
| Liabilities | ||||||||||||||||||||
| Written options outstanding | $ | – | $ | – | $ | 5,009 | $ | – | $ | – | ||||||||||
| Net unrealized depreciation on | ||||||||||||||||||||
| futures contracts | 55,313 | – | – | – | – | |||||||||||||||
| Swap contracts, at value | – | 19,550 | – | – | – | |||||||||||||||
| Total Value | $ | 55,313 | $ | 19,550 | $ | 5,009 | $ | – | $ | – | ||||||||||
* Reflects the market value of purchased option contracts (see Note 1H). These amounts are included in investments in unaffiliated issuers, at value, on the Statement of Assets and Liabilities.
** Includes securities that are valued at $0.
The effect of derivative instruments (not considered to be hedging instruments for accounting disclosure purposes) on the Statement of Operations by risk exposure at June 30, 2020 was as follows:
| Foreign | ||||||||||||||||||||
| Interest Rate | Credit | Exchange Rate | Equity | Commodity | ||||||||||||||||
| Statement of Operations | Risk | Risk | Risk | Risk | Risk | |||||||||||||||
Net realized gain (loss) on: | ||||||||||||||||||||
| Currency put options purchased* | $ | – | $ | – | $ | (7,642 | ) | $ | – | $ | – | |||||||||
| Written options | – | – | 7,642 | – | – | |||||||||||||||
| Forward foreign currency | ||||||||||||||||||||
| contracts | – | – | (38,822 | ) | – | – | ||||||||||||||
| Futures contracts | (331,079 | ) | – | – | – | – | ||||||||||||||
| Swap contracts | – | (76,586 | ) | – | – | – | ||||||||||||||
| Total Value | $ | (331,079 | ) | $ | (76,586 | ) | $ | (38,822 | ) | $ | – | $ | – | |||||||
Change in net unrealized appreciation | ||||||||||||||||||||
| (depreciation) on: | ||||||||||||||||||||
| Currency put options purchased** | $ | – | $ | – | $ | 6,071 | $ | – | $ | – | ||||||||||
| Written options | – | – | (4,303 | ) | – | – | ||||||||||||||
| Forward foreign currency | ||||||||||||||||||||
| contracts | – | – | (16,544 | ) | – | – | ||||||||||||||
| Futures contracts | (87,724 | ) | – | – | – | – | ||||||||||||||
| Swap contracts | – | (10,220 | ) | – | – | – | ||||||||||||||
| Total Value | $ | (87,724 | ) | $ | (10,220 | ) | $ | (14,776 | ) | $ | – | $ | – | |||||||
* Reflects the net realized gain (loss) on purchased option contracts (see Note 1H). These amounts are included in net realized gain (loss) on investments in unaffiliated issuers, on the Statements of Operations.
** Reflects the change in net unrealized appreciation (depreciation) on purchased option contracts (see Note 1H). These amounts are included in change in net unrealized appreciation (depreciation) on Investments in unaffiliated issuers, on the Statements of Operations.
46
| Pioneer Strategic Income VCT Portfolio | PIONEER VARIABLE CONTRACTS TRUST |
As required by law, the Portfolio has adopted and implemented a liquidity risk management program (the “Program”) that is designed to assess and manage liquidity risk. Liquidity risk is the risk that the Portfolio could not meet requests to redeem its shares without significant dilution of remaining investors’ interests in the Portfolio. The Portfolio’s Board of Trustees designated a liquidity risk management committee (the “Committee”) consisting of employees of Amundi Pioneer Asset Management, Inc. (the “Adviser”) to administer the Program.
The Committee provided the Board of Trustees with a report that addressed the operation of the Program and assessed its adequacy and effectiveness of implementation (the “Report”). The Report covered the period from December 1, 2018 through March 31, 2020 (the “Reporting Period”).
The Report confirmed that, throughout the Reporting Period, the Committee had monitored the Portfolio’s portfolio liquidity and liquidity risk on an ongoing basis, as described in the Program and in Board reporting throughout the Reporting Period.
The Report discussed the Committee’s annual review of the Program, which addressed, among other things, the following elements of the Program:
The Committee reviewed the Portfolio’s investment strategy and liquidity of portfolio investments during both normal and reasonably foreseeable stressed conditions. The Committee noted that the Portfolio’s investment strategy continues to be appropriate for an open-end fund, taking into account, among other things, whether and to what extent the Portfolio held less liquid and illiquid assets and the extent to which any such investments affected the Portfolio’s ability to meet redemption requests. In managing and reviewing the Portfolio’s liquidity risk, the Committee also considered the extent to which the Portfolio’s investment strategy involves a relatively concentrated portfolio or large positions in particular issuers, the extent to which the Portfolio uses borrowing for investment purposes, and the extent to which the Portfolio uses derivatives (including for hedging purposes). The Committee also reviewed the Portfolio’s short-term and long-term cash flow projections during both normal and reasonably foreseeable stressed conditions. In assessing the Portfolio’s cash flow projections, the Committee considered, among other factors, historical net redemption activity, redemption policies, ownership concentration, distribution channels, and the degree of certainty associated with the Portfolio’s short-term and long-term cash flow projections. The Committee also considered the Portfolio’s holdings of cash and cash equivalents, as well as borrowing arrangements and other funding sources, including, if applicable, the Portfolio’s participation in a credit facility, as components of the Portfolio’s ability to meet redemption requests. The Portfolio has adopted an in-kind redemption policy which may be utilized to meet larger redemption requests.
The Committee reviewed the Program’s liquidity classification methodology for categorizing the Portfolio’s investments into one of four liquidity buckets. In reviewing the Portfolio’s investments, the Committee considered, among other factors, whether trading varying portions of a position in a particular portfolio investment or asset class in sizes the Portfolio would reasonably anticipate trading, would be reasonably expected to significantly affect liquidity.
The Committee performed an analysis to determine whether the Portfolio is required to maintain a Highly Liquid Investment Minimum, and determined that no such minimum is required because the Portfolio primarily holds highly liquid investments.
The Report stated that the Committee concluded the Program operates adequately and effectively, in all material respects, to assess and manage the Portfolio’s liquidity risk throughout the Reporting Period.
47
This page was intentionally left blank.
48
This page was intentionally left blank.
49
This page was intentionally left blank.
50
This page was intentionally left blank.
51
This page was intentionally left blank.
52
| Officers | Trustees |
Lisa M. Jones, President and Chief Executive Officer | Thomas J. Perna, Chairman |
Mark E. Bradley, Treasurer and Chief Financial and | John E. Baumgardner, Jr. |
| Accounting Officer | Diane Durnin |
Christopher J. Kelley, Secretary and Chief Legal Officer | Benjamin M. Friedman |
| Lisa M. Jones | |
Investment Adviser and Administrator | Lorraine H. Monchak |
Amundi Pioneer Asset Management, Inc. | Marguerite A. Piret |
| Fred J. Ricciardi | |
Custodian and Sub-Administrator | Kenneth J. Taubes |
| Brown Brothers Harriman & Co | |
| Principal Underwriter | |
| Amundi Pioneer Distributor, Inc. | |
| Legal Counsel | |
| Morgan, Lewis & Bockius LLP | |
| Transfer Agent | |
| DST Asset Manager Solutions, Inc. | |
53
Proxy Voting Policies and Procedures of the Portfolio are available without charge, upon request, by calling our toll free number (1-800-225-6292). Information regarding how the Portfolio voted proxies relating to Portfolio securities during the most recent 12-month period ended June 30 is publicly available to shareowners at www.amundipioneer.com/us. This information is also available on the Securities and Exchange Commission’s web site at www.sec.gov.
19636-14-0820
ITEM 2. CODE OF ETHICS.
(a) Disclose whether, as of the end of the period covered by the report, the registrant has adopted a code of ethics that applies to the registrant’s principal executive officer, principal financial officer, principal accounting officer or controller, or persons performing similar functions, regardless of whether these individuals are employed by the registrant or a third party. If the registrant has not adopted such a code of ethics, explain why it has not done so.
The registrant has adopted, as of the end of the period covered by this report, a code of ethics that applies to the registrant’s principal executive officer, principal financial officer, principal accounting officer and controller.
(b) For purposes of this Item, the term “code of ethics” means written standards that are reasonably designed to deter wrongdoing and to promote:
(1) Honest and ethical conduct, including the ethical handling of actual or apparent conflicts of interest between personal and professional relationships;
(2) Full, fair, accurate, timely, and understandable disclosure in reports and documents that a registrant files with, or submits to, the Commission and in other public communications made by the registrant;
(3) Compliance with applicable governmental laws, rules, and regulations;
(4) The prompt internal reporting of violations of the code to an appropriate person or persons identified in the code; and
(5) Accountability for adherence to the code.
(c) The registrant must briefly describe the nature of any amendment, during the period covered by the report, to a provision of its code of ethics that applies to the registrant’s principal executive officer, principal financial officer, principal accounting officer or controller, or persons performing similar functions, regardless of whether these individuals are employed by the registrant or a third party, and that relates to any element of the code of ethics definition enumerated in paragraph (b) of this Item. The registrant must file a copy of any such amendment as an exhibit pursuant to Item 10(a), unless the registrant has elected to satisfy paragraph (f) of this Item by posting its code of ethics on its website pursuant to paragraph (f)(2) of this Item, or by undertaking to provide its code of ethics to any person without charge, upon request, pursuant to paragraph (f)(3) of this Item.
The registrant has made no amendments to the code of ethics during the period covered by this report.
(d) If the registrant has, during the period covered by the report, granted a waiver, including an implicit waiver, from a provision of the code of ethics to the registrant’s principal executive officer, principal financial officer, principal accounting officer or controller, or persons performing similar functions, regardless of whether these individuals are employed by the registrant or a third party, that relates to one or more of the items set forth in paragraph (b) of this Item, the registrant must briefly describe the nature of the waiver, the name of the person to whom the waiver was granted, and the date of the waiver.
Not applicable.
(e) If the registrant intends to satisfy the disclosure requirement under paragraph (c) or (d) of this Item regarding an amendment to, or a waiver from, a provision of its code of ethics that applies to the registrant’s principal executive officer, principal financial officer, principal accounting officer or controller, or persons performing similar functions and that relates to any element of the code of ethics definition enumerated in paragraph (b) of this Item by posting such information on its Internet website, disclose the registrant’s Internet address and such intention.
Not applicable.
(f) The registrant must:
(1) File with the Commission, pursuant to Item 12(a)(1), a copy of its code of ethics that applies to the registrant’s principal executive officer, principal financial officer, principal accounting officer or controller, or persons performing similar functions, as an exhibit to its annual report on this Form N-CSR (see attachment);
(2) Post the text of such code of ethics on its Internet website and disclose, in its most recent report on this Form N-CSR, its Internet address and the fact that it has posted such code of ethics on its Internet website; or
(3) Undertake in its most recent report on this Form N-CSR to provide to any person without charge, upon request, a copy of such code of ethics and explain the manner in which such request may be made. See Item 10(2)
ITEM 3. AUDIT COMMITTEE FINANCIAL EXPERT.
(a) (1) Disclose that the registrant’s board of trustees has determined that the registrant either:
(i) Has at least one audit committee financial expert serving on its audit committee; or
(ii) Does not have an audit committee financial expert serving on its audit committee.
The registrant’s Board of Trustees has determined that the registrant has at least one audit committee financial expert.
(2) If the registrant provides the disclosure required by paragraph (a)(1)(i) of this Item, it must disclose the name of the audit committee financial expert and whether that person is “independent.” In order to be considered “independent” for purposes of this Item, a member of an audit committee may not, other than in his or her capacity as a member of the audit committee, the board of trustees, or any other board committee:
(i) Accept directly or indirectly any consulting, advisory, or other compensatory fee from the issuer; or
(ii) Be an “interested person” of the investment company as defined in Section 2(a)(19) of the Act (15 U.S.C. 80a-2(a)(19)).
Mr. Fred J. Ricciardi, an independent trustee, is such an audit committee financial expert.
(3) If the registrant provides the disclosure required by paragraph (a)(1) (ii) of this Item, it must explain why it does not have an audit committee financial expert.
Not applicable.
ITEM 4. PRINCIPAL ACCOUNTANT FEES AND SERVICES.
(a) Disclose, under the caption AUDIT FEES, the aggregate fees billed for each of the last two fiscal years for professional services rendered by the principal accountant for the audit of the registrant’s annual financial statements or services that are normally provided by the accountant in connection with statutory and regulatory filings or engagements for those fiscal years.
N/A
(b) Disclose, under the caption AUDIT-RELATED FEES, the aggregate fees billed in each of the last two fiscal years for assurance and related services by the principal accountant that are reasonably related to the performance of the audit of the registrant’s financial statements and are not reported under paragraph (a) of this Item. Registrants shall describe the nature of the services comprising the fees disclosed under this category.
N/A
(c) Disclose, under the caption TAX FEES, the aggregate fees billed in each of the last two fiscal years for professional services rendered by the principal accountant for tax compliance, tax advice, and tax planning. Registrants shall describe the nature of the services comprising the fees disclosed under this category.
N/A
(d) Disclose, under the caption ALL OTHER FEES, the aggregate fees billed in each of the last two fiscal years for products and services provided by the principal accountant, other than the services reported in paragraphs (a) through (c) of this Item. Registrants shall describe the nature of the services comprising the fees disclosed under this category.
N/A
(e) (1) Disclose the audit committee’s pre-approval policies and procedures described in paragraph (c)(7) of Rule 2-01 of Regulation S-X.
PIONEER FUNDS
APPROVAL OF AUDIT, AUDIT-RELATED, TAX AND OTHER SERVICES
PROVIDED BY THE INDEPENDENT AUDITOR
SECTION I - POLICY PURPOSE AND APPLICABILITY
The Pioneer Funds recognize the importance of maintaining the independence of their outside auditors. Maintaining independence is a shared responsibility involving Amundi Pioneer Asset Management, Inc, the audit committee and the independent auditors.
The Funds recognize that a Fund’s independent auditors: 1) possess knowledge of the Funds, 2) are able to incorporate certain services into the scope of the audit, thereby avoiding redundant work, cost and disruption of Fund personnel and processes, and 3) have expertise that has value to the Funds. As a result, there are situations where it is desirable to use the Fund’s independent auditors for services in addition to the annual audit and where the potential for conflicts of interests are minimal. Consequently, this policy, which is intended to comply with Rule 210.2-01(C)(7), sets forth guidelines and procedures to be followed by the Funds when retaining the independent audit firm to perform audit, audit-related tax and other services under those circumstances, while also maintaining independence.
Approval of a service in accordance with this policy for a Fund shall also constitute approval for any other Fund whose pre-approval is required pursuant to Rule 210.2-01(c)(7)(ii).
In addition to the procedures set forth in this policy, any non-audit services that may be provided consistently with Rule 210.2-01 may be approved by the Audit Committee itself and any pre-approval that may be waived in accordance with Rule 210.2-01(c)(7)(i)(C) is hereby waived.
Selection of a Fund’s independent auditors and their compensation shall be determined by the Audit Committee and shall not be subject to this policy.
| SECTION II - POLICY | |||
SERVICE CATEGORY | SERVICE CATEGORY DESCRIPTION | SPECIFIC PRE-APPROVED SERVICE SUBCATEGORIES | |
I. AUDIT SERVICES | Services that are directly | o Accounting research assistance | |
related to performing the | o SEC consultation, registration | ||
independent audit of the Funds | statements, and reporting | ||
o Tax accrual related matters | |||
o Implementation of new accounting standards | |||
o Compliance letters (e.g. rating agency letters) | |||
o Regulatory reviews and assistance | |||
regarding financial matters | |||
o Semi-annual reviews (if requested) | |||
o Comfort letters for closed end offerings | |||
II. AUDIT-RELATED | Services which are not | o AICPA attest and agreed-upon procedures | |
SERVICES | prohibited under Rule | o Technology control assessments | |
210.2-01(C)(4) (the “Rule”) | o Financial reporting control assessments | ||
and are related extensions of | o Enterprise security architecture | ||
the audit services support the | assessment | ||
audit, or use the knowledge/expertise | |||
gained from the audit procedures as a | |||
foundation to complete the project. | |||
In most cases, if the Audit-Related | |||
Services are not performed by the | |||
Audit firm, the scope of the Audit | |||
Services would likely increase. | |||
The Services are typically well-defined | |||
and governed by accounting | |||
professional standards (AICPA, | |||
SEC, etc.) | |||
AUDIT COMMITTEE APPROVAL POLICY | AUDIT COMMITTEE REPORTING POLICY | ||
| o “One-time” pre-approval | o A summary of all such | ||
| for the audit period for all | services and related fees | ||
| pre-approved specific service | reported at each regularly | ||
| subcategories. Approval of the | scheduled Audit Committee | ||
| independent auditors as | meeting. | ||
| auditors for a Fund shall | |||
| constitute pre approval for | |||
| these services. | |||
| o “One-time” pre-approval | o A summary of all such | ||
| for the fund fiscal year within | services and related fees | ||
| a specified dollar limit | (including comparison to | ||
| for all pre-approved | specified dollar limits) | ||
| specific service subcategories | reported quarterly. | ||
| o Specific approval is | |||
| needed to exceed the | |||
| pre-approved dollar limit for | |||
| these services (see general | |||
Audit Committee approval policy | |||
| below for details on obtaining | |||
| specific approvals) | |||
| o Specific approval is | |||
| needed to use the Fund’s | |||
| auditors for Audit-Related | |||
| Services not denoted as | |||
| “pre-approved”, or | |||
| to add a specific service | |||
| subcategory as “pre-approved” | |||
SECTION III - POLICY DETAIL, CONTINUED
SERVICE CATEGORY | SERVICE CATEGORY DESCRIPTION | SPECIFIC PRE-APPROVED SERVICE |
SUBCATEGORIES | ||
III. TAX SERVICES | Services which are not | o Tax planning and support |
| prohibited by the Rule, | o Tax controversy assistance | |
| if an officer of the Fund | o Tax compliance, tax returns, excise | |
| determines that using the | tax returns and support | |
| Fund’s auditor to provide | o Tax opinions | |
| these services creates | ||
| significant synergy in | ||
| the form of efficiency, | ||
| minimized disruption, or | ||
| the ability to maintain a | ||
| desired level of | ||
| confidentiality. | ||
| AUDIT COMMITTEE APPROVAL POLICY | AUDIT COMMITTEE REPORTING POLICY |
o “One-time” pre-approval | o A summary of |
for the fund fiscal year | all such services and |
within a specified dollar limit | related fees |
(including comparison | |
to specified dollar | |
limits) reported | |
quarterly. | |
o Specific approval is | |
| needed to exceed the | |
| pre-approved dollar limits for | |
| these services (see general | |
| Audit Committee approval policy | |
| below for details on obtaining | |
| specific approvals) | |
o Specific approval is | |
| needed to use the Fund’s | |
| auditors for tax services not | |
| denoted as pre-approved, or to | |
add a specific service subcategory as | |
| “pre-approved” | |
SECTION III - POLICY DETAIL, CONTINUED
SERVICE CATEGORY | SERVICE CATEGORY DESCRIPTION | SPECIFIC PRE-APPROVED SERVICE |
SUBCATEGORIES | ||
IV. OTHER SERVICES | Services which are not | o Business Risk Management support |
| prohibited by the Rule, | o Other control and regulatory | |
A. SYNERGISTIC, | if an officer of the Fund | compliance projects |
UNIQUE QUALIFICATIONS | determines that using the | |
| Fund’s auditor to provide | ||
| these services creates | ||
| significant synergy in | ||
| the form of efficiency, | ||
| minimized disruption, | ||
| the ability to maintain a | ||
| desired level of | ||
| confidentiality, or where | ||
| the Fund’s auditors | ||
| posses unique or superior | ||
| qualifications to provide | ||
| these services, resulting | ||
| in superior value and | ||
| results for the Fund. | ||
AUDIT COMMITTEE APPROVAL POLICY | AUDIT COMMITTEE REPORTING POLICY |
o “One-time” pre-approval | o A summary of |
| for the fund fiscal year within | all such services and |
| a specified dollar limit | related fees |
(including comparison | |
to specified dollar | |
limits) reported | |
quarterly. | |
o Specific approval is | |
| needed to exceed the | |
| pre-approved dollar limits for | |
| these services (see general | |
| Audit Committee approval policy | |
| below for details on obtaining | |
| specific approvals) | |
o Specific approval is | |
| needed to use the Fund’s | |
| auditors for “Synergistic” or | |
| “Unique Qualifications” Other | |
| Services not denoted as | |
| pre-approved to the left, or to | |
| add a specific service | |
| subcategory as “pre-approved” | |
SECTION III - POLICY DETAIL, CONTINUED
SERVICE CATEGORY | SERVICE CATEGORY DESCRIPTION | SPECIFIC PROHIBITED SERVICE |
SUBCATEGORIES | ||
PROHIBITED SERVICES | Services which result | 1. Bookkeeping or other services |
| in the auditors losing | related to the accounting records or | |
| independence status | financial statements of the audit | |
under the Rule. | client* | |
2. Financial information systems design | ||
| and implementation* | ||
3. Appraisal or valuation services, | ||
| fairness* opinions, or | ||
| contribution-in-kind reports | ||
4. Actuarial services (i.e., setting | ||
| actuarial reserves versus actuarial | ||
| audit work)* | ||
5. Internal audit outsourcing services* | ||
6. Management functions or human | ||
| resources | ||
7. Broker or dealer, investment | ||
| advisor, or investment banking services | ||
8. Legal services and expert services | ||
| unrelated to the audit | ||
9. Any other service that the Public | ||
| Company Accounting Oversight Board | ||
| determines, by regulation, is | ||
| impermissible | ||
AUDIT COMMITTEE APPROVAL POLICY | AUDIT COMMITTEE REPORTING POLICY |
o These services are not to be | o A summary of all |
| performed with the exception of the(*) | services and related |
| services that may be permitted | fees reported at each |
| if they would not be subject to audit | regularly scheduled |
| procedures at the audit client (as | Audit Committee meeting |
| defined in rule 2-01(f)(4)) level | will serve as continual |
| the firm providing the service. | confirmation that has |
not provided any | |
restricted services. |
GENERAL AUDIT COMMITTEE APPROVAL POLICY:
o For all projects, the officers of the Funds and the Fund’s auditors will each make an assessment to determine that any proposed projects will not impair independence.
o Potential services will be classified into the four non-restricted service categories and the “Approval of Audit, Audit-Related, Tax and Other Services” Policy above will be applied. Any services outside the specific pre-approved service subcategories set forth above must be specifically approved by the Audit Committee.
o At least quarterly, the Audit Committee shall review a report summarizing the services by service category, including fees, provided by the Audit firm as set forth in the above policy.
(2) Disclose the percentage of services described in each of paragraphs (b) through (d) of this Item that were approved by the audit committee pursuant to paragraph (c)(7)(i)(C) of Rule 2-01 of Regulation S-X.
N/A
(f) If greater than 50 percent, disclose the percentage of hours expended on the principal accountants engagement to audit the registrant’s financial statements for the most recent fiscal year that were attributed to work performed by persons other than the principal accountant’s full-time, permanent employees.
N/A
(g) Disclose the aggregate non-audit fees billed by the registrants accountant for services rendered to the registrant, and rendered to the registrants investment adviser (not including any sub-adviser whose role is primarily portfolio management and is subcontracted with or overseen by another investment adviser), and any entity controlling, controlled by, or under common control with the adviser that provides ongoing services to the registrant for each of the last two fiscal years of the registrant.
N/A
(h) Disclose whether the registrants audit committee of the board of trustees has considered whether the provision of non-audit services that were rendered to the registrants investment adviser (not including any subadviser whose role is primarily portfolio management and is subcontracted with or overseen by another investment adviser), and any entity controlling, controlled by, or under common control with the investment adviser that provides ongoing services to the registrant that were not pre-approved pursuant to paragraph (c)(7)(ii) of Rule 2-01 of Regulation S-X is compatible with maintaining the principal accountant’s independence.
The Fund’s audit committee of the Board of Trustees has considered whether the provision of non-audit services that were rendered to the Affiliates (as defined) that were not pre- approved pursuant to paragraph (c)(7)(ii) of Rule 2-01 of Regulation S-X is compatible with maintaining the principal accountant’s independence.
ITEM 5. AUDIT COMMITTEE OF LISTED REGISTRANTS
(a) If the registrant is a listed issuer as defined in Rule 10A-3 under the Exchange Act (17 CFR 240.10A-3), state whether or not the registrant has a separately-designated standing audit committee established in accordance with Section 3(a)(58)(A) of the Exchange Act (15 U.S.C. 78c(a)(58)(A)). If the registrant has such a committee, however designated, identify each committee member. If the entire board of directors is acting as the registrant’s audit committee as specified in Section 3(a)(58)(B) of the Exchange Act (15 U.S.C. 78c(a)(58)(B)), so state.
N/A
(b) If applicable, provide the disclosure required by Rule 10A-3(d) under the Exchange Act (17 CFR 240.10A-3(d)) regarding an exemption from the listing standards for audit committees.
N/A
ITEM 6. SCHEDULE OF INVESTMENTS.
File Schedule of Investments in securities of unaffiliated issuers as of the close of the reporting period as set forth in 210.1212 of Regulation S-X [17 CFR 210.12-12], unless the schedule is included as part of the report to shareholders filed under Item 1 of this Form.
Included in Item 1
ITEM 7. DISCLOSURE OF PROXY VOTING POLICIES AND PROCEDURES FOR CLOSED-END MANAGEMENT INVESTMENT COMPANIES.
A closed-end management investment company that is filing an annual report on this Form N-CSR must, unless it invests exclusively in non-voting securities, describe the policies and procedures that it uses to determine how to vote proxies relating to portfolio securities, including the procedures that the company uses when a vote presents a conflict between the interests of its shareholders, on the one hand, and those of the company’s investment adviser; principal underwriter; or any affiliated person (as defined in Section 2(a)(3) of the Investment Company Act of 1940 (15 U.S.C. 80a-2(a)(3)) and the rules thereunder) of the company, its investment adviser, or its principal underwriter, on the other. Include any policies and procedures of the company’s investment adviser, or any other third party, that the company uses, or that are used on the company’s behalf, to determine how to vote proxies relating to portfolio securities.
Not applicable to open-end management investment companies.
ITEM 8. PORTFOLIO MANAGERS OF CLOSED-END MANAGEMENT INVESTMENT COMPANIES.
(a) If the registrant is a closed-end management investment company that is filing an annual report on this Form N-CSR, provide the following information:
(1) State the name, title, and length of service of the person or persons employed by or associated with the registrant or an investment adviser of the registrant who are primarily responsible for the day-to-day management of the registrant’s portfolio (“Portfolio Manager”). Also state each Portfolio Manager’s business experience during the past 5 years.
Not applicable to open-end management investment companies.
ITEM 9. PURCHASES OF EQUITY SECURITIES BY CLOSED-END MANAGEMENT INVESTMENT COMPANY AND AFFILIATED PURCHASERS.
(a) If the registrant is a closed-end management investment company, in the following tabular format, provide the information specified in paragraph (b) of this Item with respect to any purchase made by or on behalf of the registrant or any affiliated purchaser, as defined in Rule 10b-18(a)(3) under the Exchange Act (17 CFR 240.10b-18(a)(3)), of shares or other units of any class of the registrant’s equity securities that is registered by the registrant pursuant to Section 12 of the Exchange Act (15 U.S.C. 781).
Not applicable to open-end management investment companies.
ITEM 10. SUBMISSION OF MATTERS TO A VOTE OF SECURITY HOLDERS.
Describe any material changes to the procedures by which shareholders may recommend nominees to the registrant’s board of directors, where those changes were implemented after the registrant last provided disclosure in response to the requirements of Item 407(c)(2)(iv) of Regulation S-R(17 CFR 229.407)(as required by Item 22(b)(15)) of Schedule 14A (17 CFR 240.14a-101), or this Item.
There have been no material changes to the procedures by which the shareholders may recommend nominees to the registrant’s board of directors since the registrant last provided disclosure in response to the requirements of Item 407(c)(2)(iv) of Regulation S-R of Schedule 14(A) in its definitive proxy statement, or this item.
ITEM 11. CONTROLS AND PROCEDURES.
(a) Disclose the conclusions of the registrant’s principal executive and principal financials officers, or persons performing similar functions, regarding the effectiveness of the registrant’s disclosure controls and procedures (as defined in Rule 30a-3(c) under the Act (17 CFR 270.30a-3(c))) as of a date within 90 days of the filing date of the report that includes the disclosure required by this paragraph, based on the evaluation of these controls and procedures required by Rule 30a-3(b) under the Act (17 CFR 270.30(a)-3(b) and Rules 13a-15(b) or 15d-15(b) under the Exchange Act (17 CFR 240.13a-15(b) or 240.15d-15(b)).
The registrant’s principal executive officer and principal financial officer have concluded that the registrant’s disclosure controls and procedures are effective based on the evaluation of these controls and procedures as of a date within 90 days of the filing date of this report.
(b) Disclose any change in the registrant’s internal control over financial reporting (as defined in Rule 30a-3(d) under the Act (17CFR 270.30a-3(d)) that occured during the second fiscal quarter of the period covered by this report that has materially affected, or is reasonably likely to materially affect, the registrant’s internal control over financial reporting.
There were no significant changes in the registrant’s internal control over financial reporting that occurred during the second fiscal quarter of the period covered by this report that have materially affected, or are reasonably likely to materially affect, the registrant’s internal control over financial reporting.
Item 12. Disclosure of Securities Lending Activities for Closed-End Management Investment Companies.
(a) If the registrant is a closed-end management investment company, provide the following dollar amounts of income and compensation related to the securities lending activities of the registrant during its most recent fiscal year:
N/A
(1) Gross income from securities lending activities;
N/A
(2) All fees and/or compensation for each of the following securities lending activities and related services: any share of revenue generated by the securities lending program paid to the securities lending agent(s) (revenue split); fees paid for cash collateral management services (including fees deducted from a pooled cash collateral reinvestment vehicle) that are not included in the revenue split; administrative fees that are not included in the revenue split; fees for indemnification that are not included in the revenue split; rebates paid to borrowers; and any other fees relating to the securities lending program that are not included in the revenue split, including a description of those other fees;
N/A
(3) The aggregate fees/compensation disclosed pursuant to paragraph (2); and
N/A
(4) Net income from securities lending activities (i.e., the dollar amount in paragraph (1) minus the dollar amount in paragraph (3)).
If a fee for a service is included in the revenue split, state that the fee is included in the revenue split.
N/A
(b) If the registrant is a closed-end management investment company, describe the services provided to the registrant by the securities lending agent in the registrants most recent fiscal year.
N/A
ITEM 13. EXHIBITS.
(a) File the exhibits listed below as part of this Form. Letter or number the exhibits in the sequence indicated.
SIGNATURES
[See General Instruction F]
Pursuant to the requirements of the Securities Exchange Act of 1934 and the Investment Company Act of 1940, the registrant has duly caused this report to be signed on its behalf by the undersigned, thereunto duly authorized.
(Registrant) Pioneer Variable Contracts Trust
By (Signature and Title)* /s/ Lisa M. Jones
Lisa M. Jones, President & Chief Executive Officer
Date September 4, 2020
Pursuant to the requirements of the Securities Exchange Act of 1934 and the Investment Company Act of 1940, this report has been signed below by the following persons on behalf of the registrant and in the capacities and on the dates indicated.
By (Signature and Title)* /s/ Lisa M. Jones
Lisa M. Jones, President & Chief Executive Officer
Date September 4, 2020
By (Signature and Title)* /s/ Mark E. Bradley
Mark E. Bradley, Treasurer & Chief Accounting & Financial Officer
Date September 4, 2020
* Print the name and title of each signing officer under his or her signature.