
| Polaris Industries Inc. Investor Presentation May 2009 |

| Strong Business Foundation Percentage of Sales by Product line 2008 $1.95 Billion Off-Road Vehicles (ORV) 67% Victory 5% Snowmobile 10% PG&A 18% Snowmobiles ORVs PG&A Victory 10 67 18 5 ATVs Side-by-Sides |
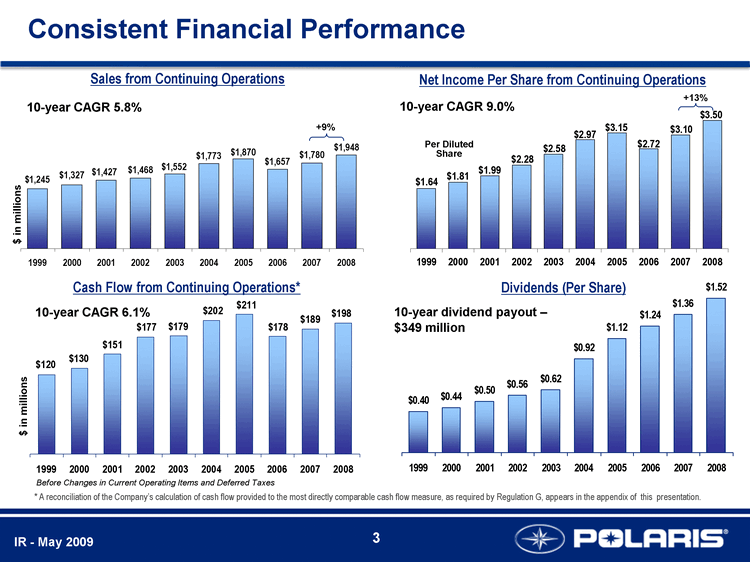
| Consistent Financial Performance Net Income Per Share from Continuing Operations Sales from Continuing Operations +9% * A reconciliation of the Company's calculation of cash flow provided to the most directly comparable cash flow measure, as required by Regulation G, appears in the appendix of this presentation. Per Diluted Share 1993 1999 2000 2001 2002 2003 2004 2005 2006 2007 2008 59 120 130 151 177 179 202 211 178 189 198 Before Changes in Current Operating Items and Deferred Taxes Cash Flow from Continuing Operations* 1999 2000 2001 2002 2003 2004 2005 2006 2007 2008 0.4 0.44 0.5 0.56 0.62 0.92 1.12 1.24 1.36 1.52 West North Dividends (Per Share) 10-year CAGR 5.8% 10-year CAGR 9.0% 10-year CAGR 6.1% 10-year dividend payout - $349 million +13% $ in millions $ in millions |

| Industry-Leading Returns 2004 2005 2006 2007 2008 0.18 0.18 0.15 0.14 0.15 Peers 0.1251118 0.1197862 0.1078636 0.098095 0.0437014 S&P 0.065443378 0.070686342 0.07608951 0.074584368 0.070991254 2004 2005 2006 2007 2008 0.38 0.37 0.41 0.66 0.76 Peers 0.2412936 0.2473326 0.2295802 0.2180638 0.0026454 S&P 0.188241356 0.25676207 0.183588901 0.304856911 0.215243527 Return on Shareholders' Equity* 2004-2008 *From continuing operations Return on Assets* 2004-2008 PII Peer Average (BC, WGO, HOG, ACAT, TTC) S&P 500 Average |

| Ready for 2009 Aligned Strategy & Structure Off-Road Vehicle Division International Team Adjacencies Attacked Costs Workforce reductions announced 460 Operating Expense reductions > $10M Manufacturing/Production costs reduced with volume Accelerated Operational Excellence Speed / Factory Adjustments Q4 2008 production cuts Productivity +8% Value Engineering > $10M Focused on Dealers / Customers Product Innovation Rush, RZR 170, Much more Process Innovation MVP / Victory Go-to Market Prepared for a Tough Year Sales -15% to -23% Contingency Plans in place |
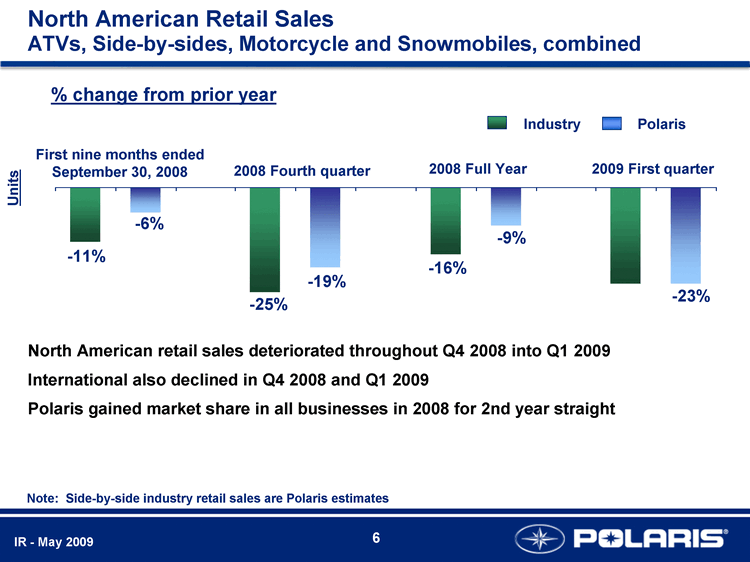
| North American Retail Sales ATVs, Side-by-sides, Motorcycle and Snowmobiles, combined North American retail sales deteriorated throughout Q4 2008 into Q1 2009 International also declined in Q4 2008 and Q1 2009 Polaris gained market share in all businesses in 2008 for 2nd year straight % change from prior year Note: Side-by-side industry retail sales are Polaris estimates Industry Polaris Industry Polaris Industry Polaris Industry Polaris Sales -0.13 -0.06 0 -0.25 -0.19 0 -0.16 -0.09 0 -0.23 -0.23 0 First nine months ended September 30, 2008 2008 Fourth quarter 2008 Full Year Industry Polaris - -16% - -9% - -25% - -19% - -11% - -6% Units - -23% 2009 First quarter |
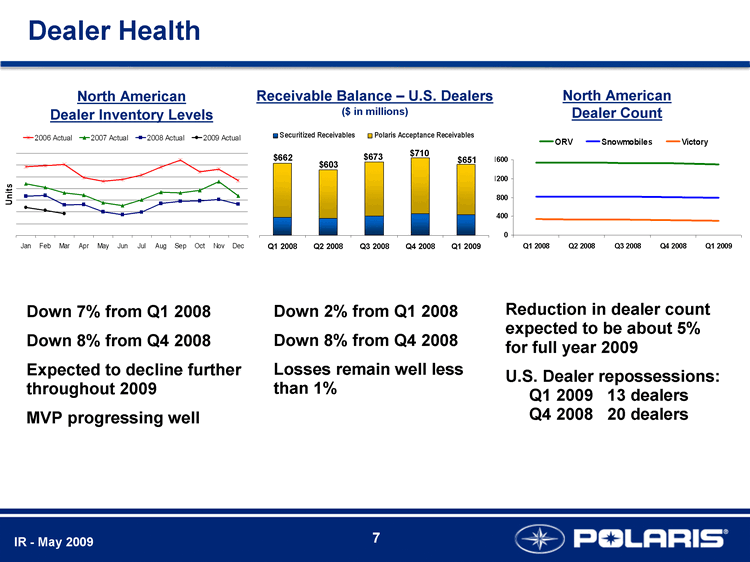
| Dealer Health North American Dealer Inventory Levels Receivable Balance - U.S. Dealers ($ in millions) North American Dealer Count Down 7% from Q1 2008 Down 8% from Q4 2008 Expected to decline further throughout 2009 MVP progressing well Down 2% from Q1 2008 Down 8% from Q4 2008 Losses remain well less than 1% Reduction in dealer count expected to be about 5% for full year 2009 U.S. Dealer repossessions: Q1 2009 13 dealers Q4 2008 20 dealers |

| 2009 Full Year Guidance Total Company Sales Down 15% to 23% Off Road Vehicles (ORV) Down 17% to 25% Snowmobiles Down 10% to 20% Victory Motorcycles Down 25% to 40% PG&A Down 9% to 13% Gross Margins Up to 130 bpts improvement Operating expenses Reduction > $10 million - up as a percent of sales EPS - Diluted $2.50 - $3.00 (-29% to -14%) |

| Balance Sheet and Liquidity Profile - Remains Healthy $ In millions (except per share data) Q1 2009 +/- Q1 2008 Full Year / Year End 2009 Guidance Cash and cash equivalents $17.9 $0.3 Increase over 2008 Factory Inventory $245.6 -$33.7 Lower than 2008 Net Debt - ending (debt less cash balances) $226.1 -$16.3 Improved from 2008 Debt Interest Rate - ending 0.94% -2.23% Lower average rate than 2008 Credit Facility (expires December 2011) $450.0 - $450 (Adequate capacity) Operating cash flow -$33.1 -$1.7 Expected to decrease in line with net income Stock buyback $0.3 -$48.3 Minimal repurchases anticipated in 2009 Dividend $0.39 per share +$0.01 per share $1.56 per share (+3%) |

| 2008 2009 Sales 0.55 0.26 0 First Quarter 2009 Results Results in line with Company expectations Balance sheet remains strong Q1 EPS includes $0.18 per share impairment charge - KTM Investment 2008 2009 Sales 388.7 312 0 Diluted EPS $0.55 $0.26 - -53% $388.7 $312.0 - -20% Total Company Sales ($ in millions) |
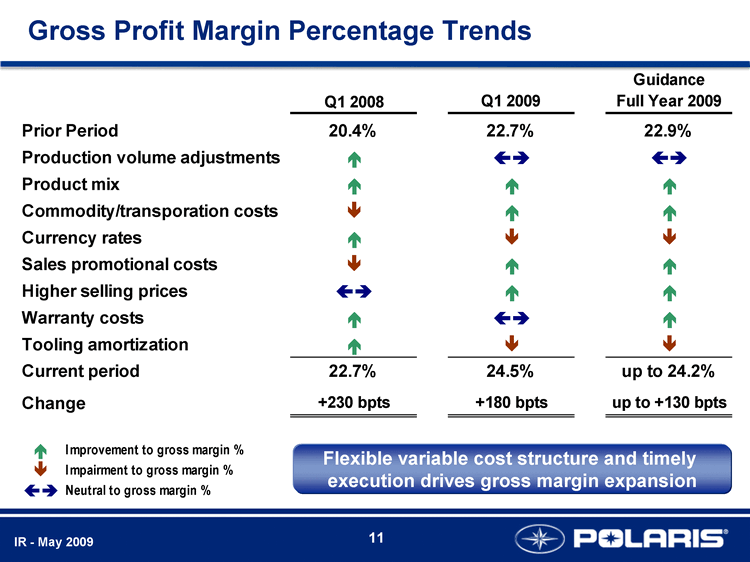
| Gross Profit Margin Percentage Trends Flexible variable cost structure and timely execution drives gross margin expansion |

| Research & Development / New Product Tooling Engineering and new product development is competitive advantage Objective: Best products and quality at the lowest cost Value engineering is key 4.6% 5.0% 5.4% 5.7% 5.5% RANGER RZR Sportsman XP RANGER HD Victory Vision RUSH Recent New Product Introductions: 2004 2005 2006 2007 2008 2009 Research & Development New Product Tooling guidance % of Total Company Sales 4.6% 5.0% 5.4% 5.7% 5.5% About Flat |

| Second Quarter 2009 Guidance Weak Industry retail sales expected to continue in Q2 2009 Cuts made for end of model year 2009 production for ORV and Victory Commodity cost and expense reduction will help offset weak demand Total Company Sales (in millions) Diluted EPS 2008 2009 Sales 455.7 300 50 $455.7 Down 25% to 30% Q2 Actual Q2 Guidance 2008 2009 Sales 0.72 0.38 0.12 $0.72 $0.40 to $0.50 Down 44% to 31% Q2 Actual Q2 Guidance |

| Off-Road Vehicle Division $264.5M - -19% $215.5M Full Year 2009 Sales Guidance: -17% to - 25% (unchanged) New Sportsman XP & Ranger Gained ORV share in Q1 2009 ORV Industry retail declined in Q1 - - ATVs down 30 percent range Side-by-sides down low double digits (estimate) International ORV sales down significantly Polaris Revenue ($000's) |
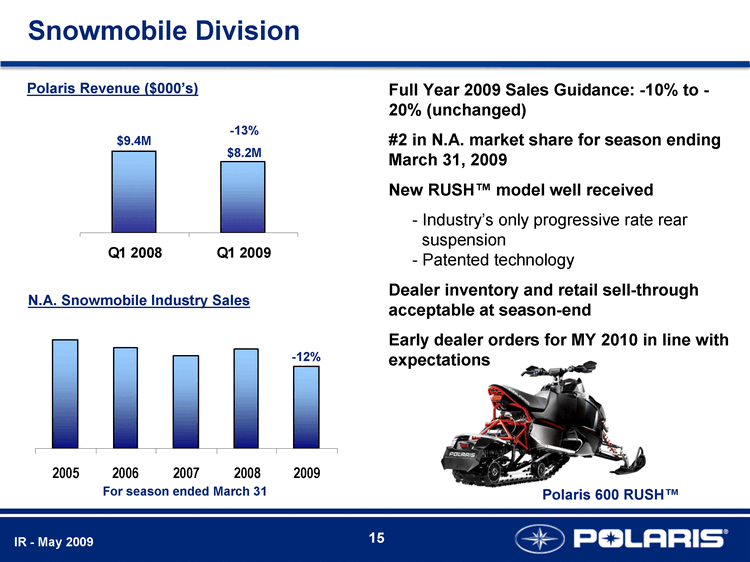
| Snowmobile Division $9.4M - -13% $8.2M Polaris Revenue ($000's) - -12% N.A. Snowmobile Industry Sales Full Year 2009 Sales Guidance: -10% to - 20% (unchanged) #2 in N.A. market share for season ending March 31, 2009 New RUSH(tm) model well received - - Industry's only progressive rate rear suspension - - Patented technology Dealer inventory and retail sell-through acceptable at season-end Early dealer orders for MY 2010 in line with expectations For season ended March 31 Polaris 600 RUSH(tm) |

| Victory Division $27.3M Polaris Revenue ($000's) N.A. Motorcycle Industry 1400cc+ - -49% $13.8M Full Year 2009 Sales Guidance: -25% to -40% (unchanged) Expect N.A. Industry >1400cc to be down 15% to 25% for Calendar 2009 Dealer inventory down 24% at Q1 2009 Aggressive supply reduction Industry leader in ownership satisfaction Introduced industry's first 5-Year Warranty New marketing strategy focused on retail acceleration with early priority on non- currents Down low double digits percent |

| PG&A Division $87.4M - -15% $74.5M Polaris Revenue ($000's) Full Year 2009 Sales Guidance: -9% to -13% (unchanged) Revenue impacted by wholegoods decline Highest gross margin business - expect gross margin percentage expansion in 2009 Expect to outperform wholegood sales in '09 Q1 2009 PG&A Revenue by Business Unit |
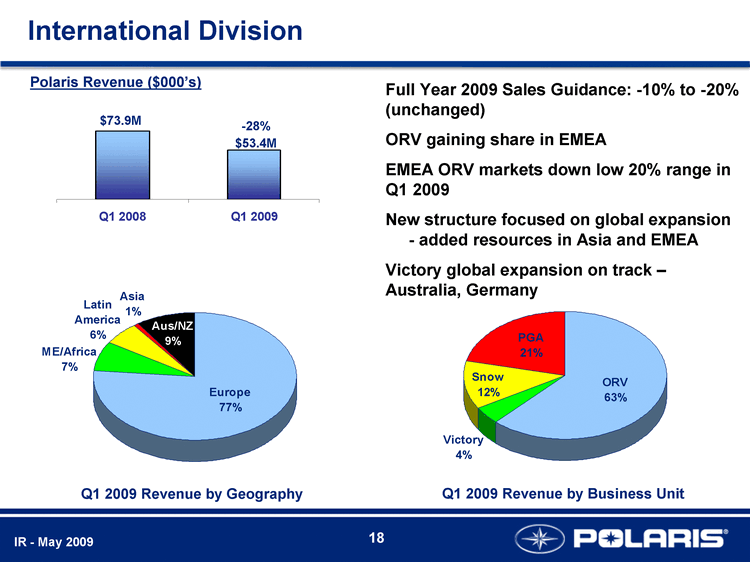
| Europe ME/Africa Latin America Asia Aus/NZ East 41 4 3.1 0.5 5 International Division ORV Victory Snow PGA East 33.1 2.4 6.5 11.4 Polaris Revenue ($000's) Q1 2009 Revenue by Geography Q1 2009 Revenue by Business Unit Full Year 2009 Sales Guidance: -10% to -20% (unchanged) ORV gaining share in EMEA EMEA ORV markets down low 20% range in Q1 2009 New structure focused on global expansion - added resources in Asia and EMEA Victory global expansion on track - Australia, Germany $73.9M - -28% $53.4M |

| Adjacencies Military Solid first quarter New customer penetration continues New customer quote activity and order backlog up significantly Global expansion / after sale support Bobcat Strategic Alliance #1 ORV manufacturer / #1 Compact construction manufacturer Technology sharing Co-development and supply of highly differentiated work vehicles New vehicles available second half of 2010 Expecting to announce at least one additional adjacency in 2009 +42% +50% to 100% Full Year Guidance |

| Financial Services Income FY 2009 Guidance: down about 50% of 2008 (unchanged) Q1 2009 Wholesale credit income similar to Q1 2008 Retail credit income down significantly again in Q1 2009 - as expected Sheffield quickly adding volume since February 2009 Q1 2008 Q1 2009 Retail Financing 3.3 0.3 Wholesale Credit 3.8 3.7 Other Activities 0.4 0.4 Q4 2008 Q4 2008 Q1 2009 Q1 2009 Sales 0.51 0 0.45 0.31 0.31 Financial Services Income by Category Retail Portfolio HSBC, GE and Sheffield Combined Penetration Rate Approval Rate 51% 31% $7.5 $4.4 $ in millions 44% 31% - -41% |
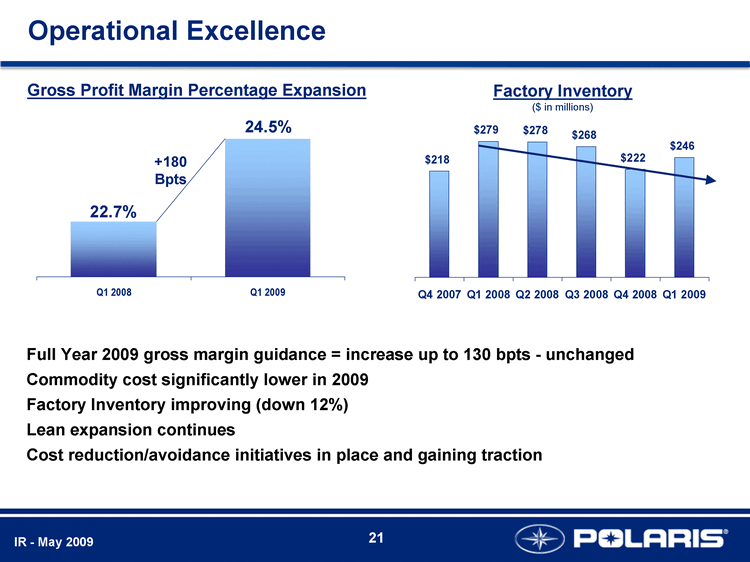
| Operational Excellence Full Year 2009 gross margin guidance = increase up to 130 bpts - unchanged Commodity cost significantly lower in 2009 Factory Inventory improving (down 12%) Lean expansion continues Cost reduction/avoidance initiatives in place and gaining traction Q1 2008 Q1 2009 East 22.7 24.5 West North 22.7% 24.5% Gross Profit Margin Percentage Expansion Q4 2007 Q1 2008 Q2 2008 Q3 2008 Q4 2008 Q1 2009 Factory Inventory 218 279.3 278.4 268.3 222 245.6 Factory Inventory ($ in millions) +180 Bpts |

| Polaris 5-Year Strategic Objectives Best in Powersports PLUS 5-8% organic growth Growth through Adjacencies $100 - 300M growth Global Market Leadership >25% of Polaris Revenue Operations is a Competitive Advantage Op Ex drives >200bpts Operating Margin improvement Strong Financial Performance Sustainable, Profitable Growth A Great Future for All Stakeholders |

| Appendix Our presentation and responses to your questions may contain certain statements which may be considered forward looking for the purposes of the Private Securities Litigation Reform Act of 1995. We caution you that actual results could differ materially from those projected in a forward looking statement which by their nature involve risk that results may differ from those anticipated. Additional information concerning the factors that could cause results to differ materially from those anticipated may be found in Polaris' annual report, 10-K, 8-K, 10-Q and form S-3 registration statements. Regulation G Reconciliation Private Securities Litigation Reform Act of 1995 - Polaris Industries Inc. Disclosure Litigation Statement |