Exhibit 99.1
Polaris Industries Inc. Analyst / Investor Meeting Richard Edwards, Director of Investor Relations Tuesday, July 27, 2010 Orlando, FL

July 27, 2010 ANALYST / INVESTOR MEETING AGENDA – July 27, 2010 8:00 Opening Remarks Scott Wine 8:10 Strategy Overview Bennett Morgan 8:25 Off-Road Vehicles, Bobcat, Military Matt Homan 8:55 Snowmobiles, PG&A, & Financial Services Scott Swenson 9:15 Sales & Mktg, MVP, On-Road Vehicles Mike Jonikas 9:30 Victory Motorcycles Steve Menneto 9:45 Break 10:00 Corporate Development Todd Balan 10:20 Operations / Supply Chain Suresh Krishna 10:50 International Mike Dougherty 11:20 Closing Comments Scott Wine 11:30 Q&A Wine/Morgan/Malone 12 Noon Lunch 2:30 – 4:30 pm ORV Demo Rides (optional) 4:30 pm Analyst meeting ends
July 27, 2010 Private Securities Litigation Reform Act of 1995 Polaris Industries Inc. Disclosure Litigation Statement Safe Harbor Except for historical information contained herein, the matters set forth in this document, including but not limited to management’s expectations regarding 2010 sales, shipments, net income, cash flow, and manufacturing realignment transition costs and savings, are forward-looking statements that involve certain risks and uncertainties that could cause actual results to differ materially from those forward-looking statements.Potential risks and uncertainties include such factors as product offerings, promotional activities and pricing strategies by competitors; manufacturing realignment transition costs, warranty expenses; foreign currency exchange rate fluctuations; effects of the KTM relationship; environmental and product safety regulatory activity; effects of weather; commodity costs; uninsured product liability claims; uncertainty in the retail and wholesale credit markets; changes in tax policy and overall economic conditions, including inflation, consumer confidence and spending and relationships with dealers and suppliers. Investors are also directed to consider other risks and uncertainties discussed in our 2009 annual report and Form 10-K filed by the Company with the Securities and Exchange Commission. The Company does not undertake any duty to any person to provide updates to its forward-looking statements. The data source for retail sales figures included in this presentation is registration information provided by Polaris dealers in North America and compiled by the Company or Company estimates. The Company must rely on information that its dealers supply concerning retail sales, and other retail sales data sources and this information is subject t o revision.
Polaris Industries Inc. Analyst / Investor Meeting Scott Wine, CEO July 27, 2010
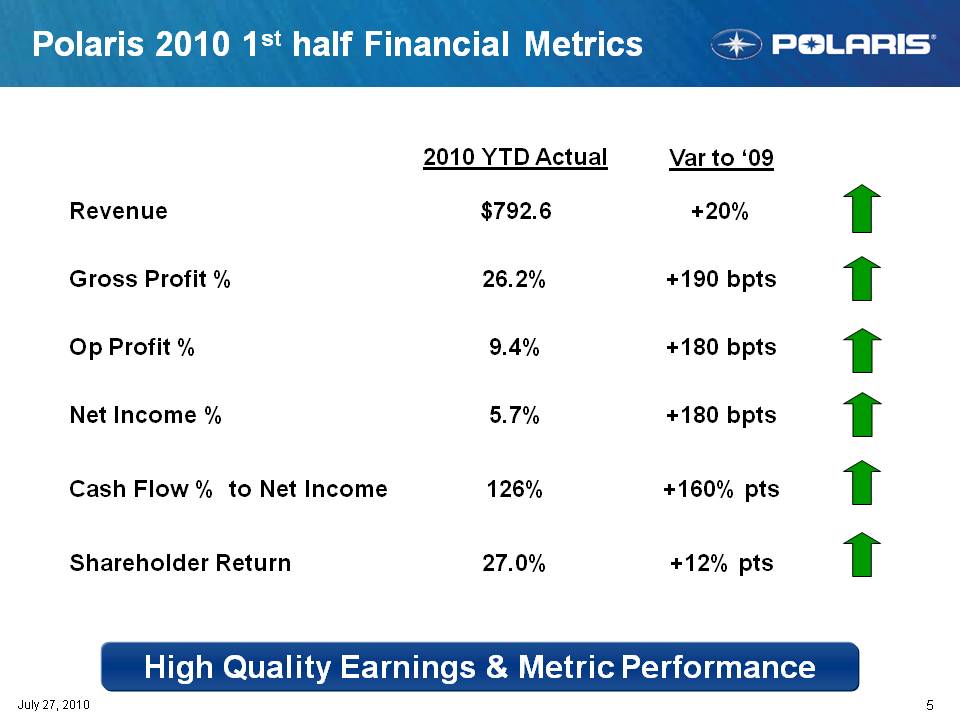
Polaris 2010 1st half Financial Metrics 2010 YTD Actual Var to ‘09 R $792 6 +20% Revenue 792.6 Gross Profit % 26.2% +190 bpts Op Profit % 9.4% +180 bpts 5 7% +Net Income % 5.7% 180 bpts Cash Flow % to Net Income 126% +160% pts Shareholder Return 27.0% +12% pts 5 July 27, 2010 High Quality Earnings & Metric Performance

Strategic Progress Continues… $3.0 Billion Grow Sales $3 Billion by 2014 1st Half Progress Best in Powersports PLUS 5-8% organic growth #1 in market share in ORV, and gaining $1.566 Billion Victory progress continues Growth through Adjacencies $100 - 300M growth Began shipping Bobcat product 2009 Actual 2014 Goal Expand net income margins M&A on track Global Market Leadership >25% of Polaris Revenue International growth of 36% China presence growing 6 5% 8.0% 8% of sales by 2014 Operations is a C ompetitive Advantage Op Ex drives >200bpts Op Margin improvement Operating margins up 180 bpts Manufacturing realignment underway Actual 2014 Goal 6.5% g y Strong Financial Performance Sustainable, Profitable Growth Net Income Margin >7.5% Sales up 20% Earnings up 75% Record EPS up 70% 6 July 27, 2010 2009 Consistent Strategy
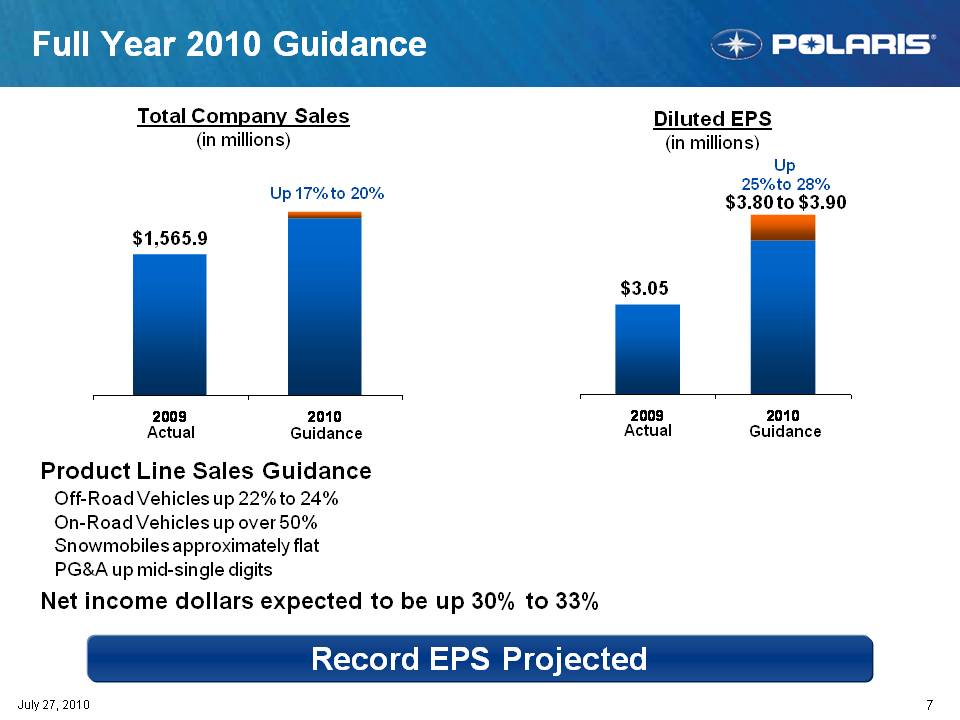
Full Year 2010 Guidance Total Company Sales (in millions) Diluted EPS (in millions) Up 17% to 20% Up 25% to 28% $3 80 3 90 $1,565.9 $3.05 3.80 to $3.90 2009 2010 2009 2010 Product Line Sales Guidance Off-Road Vehicles up 22% to 24% Actual Guidance Actual Guidance On-Road Vehicles up over 50% Snowmobiles approximately flat PG&A up mid-single digits Net income dollars expected to be up 30% to 33% 7 July 27, 2010 Record EPS Projected
Polaris Industries Inc. Analyst / Investor Meeting Morgan Bennett Morgan, President & COO July 27, 2010
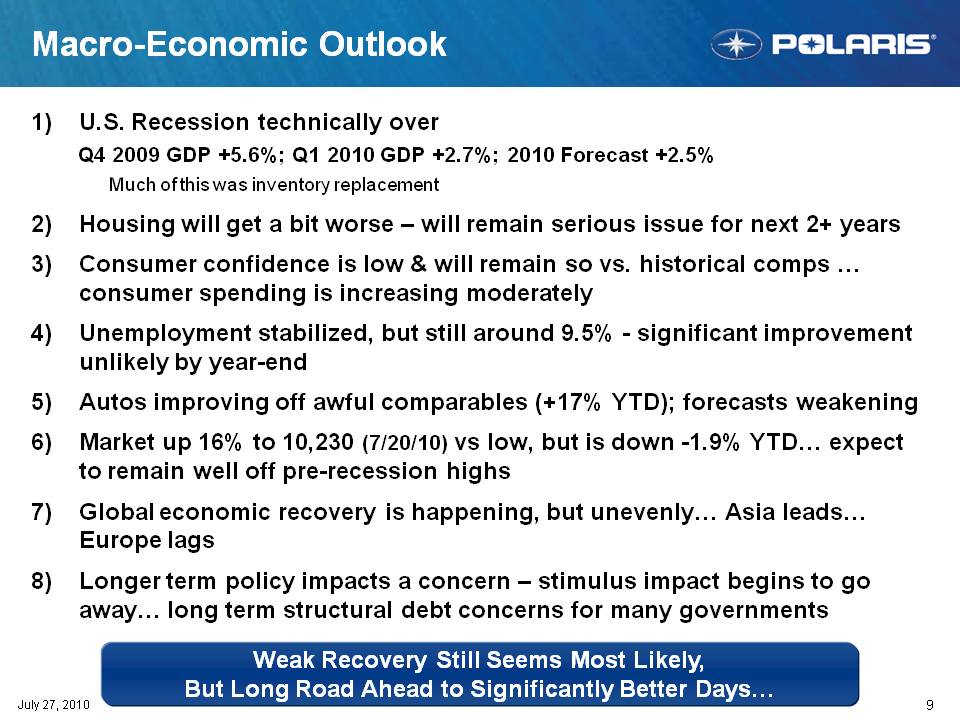
Macro-Economic Outlook 1) U.S. Recession technically over Q4 2009 GDP +5.6%; Q1 2010 GDP +2.7%; 2010 Forecast +2.5% Much of this was inventory replacement 2) Housing will get a bit worse – will remain serious issue for next 2+ years 3) Consumer confidence is low & will remain so vs. historical comps … consumer spending is increasing moderately 4) Unemployment stabilized, but still around 9.5% - significant improvement unlikely by year-end 5) Autos improving off awful comparables (+17% YTD); forecasts weakening ) p g p ( ); g 6) Market up 16% to 10,230 (7/20/10) vs low, but is down -1.9% YTD… expect to remain well off pre-recession highs 7) Global economic happ ening unevenly leads recovery is happening, but unevenly… Asia leads… Europe lags 8) Longer term policy impacts a concern – stimulus impact begins to go long term concerns many 9 July 27, 2010 away… structural debt for governments Weak Recovery Still Seems Most Likely, But Long Road Ahead to Significantly Better Days.
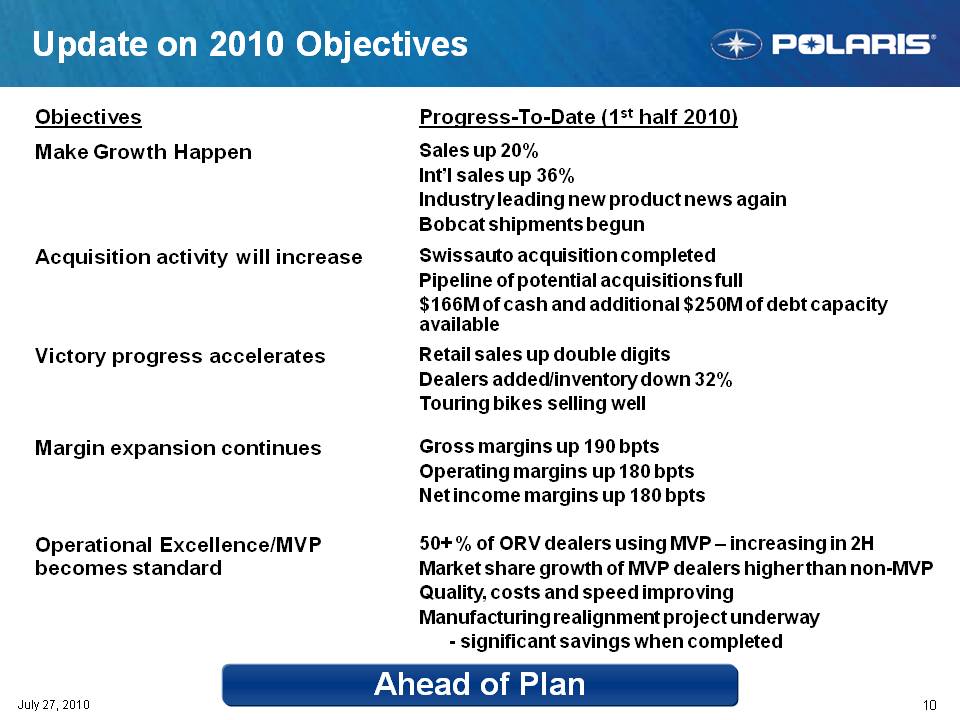
Update on 2010 Objectives Objectives Progress-To-Date (1st half 2010) Make Growth Happen Sales up 20% Int’l sales up 36% Industry product news again leading new Bobcat shipments begun Acquisition activity will increase Swissauto acquisition completed Pipeline of potential acquisitions full $166M of cash and additional $250M of debt capacity available Victory progress accelerates Retail sales up double digits Dealers added/inventory down 32% Touring bikes selling well g g Margin expansion continues Gross margins up 190 bpts Operating margins up 180 bpts Net income margins up 180 bpts Operational Excellence/MVP becomes stan dard 50+ % of ORV dealers using MVP – increasing in 2H Market share growth of MVP dealers higher than non-MVP Quality, costs and speed improving Manufacturing realignment project underway 10 July 27, 2010 - significant savings when completed Ahead of Plan
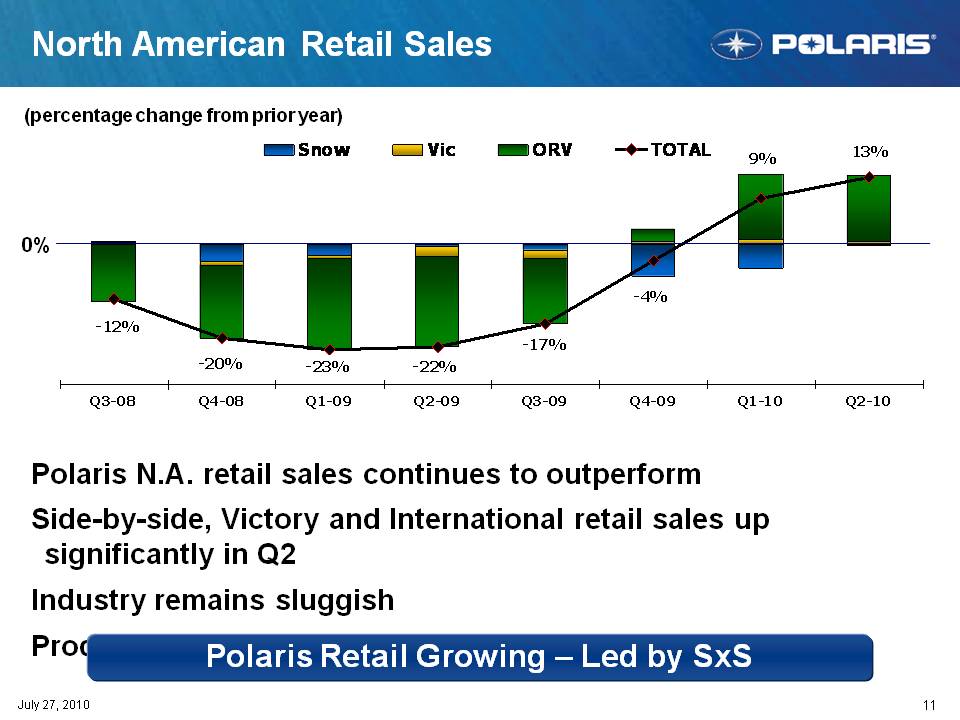
North American Retail Sales 9% 13% Snow Vic ORV TOTAL (percentage change from prior year) -4% 0% -23% -20% -12% -22% -17% Q3-08 Q4-08 Q1-09 Q2-09 Q3-09 Q4-09 Q1-10 Q2-10 Polaris N.A. retail sales continues to outperform Side-by-side, Victory and International retail sales up significantly in Q2 Industry remains sluggish 11 July 27, 2010 Product innovation and MVP continues to drive growth Polaris Retail Growing – Led by SxS
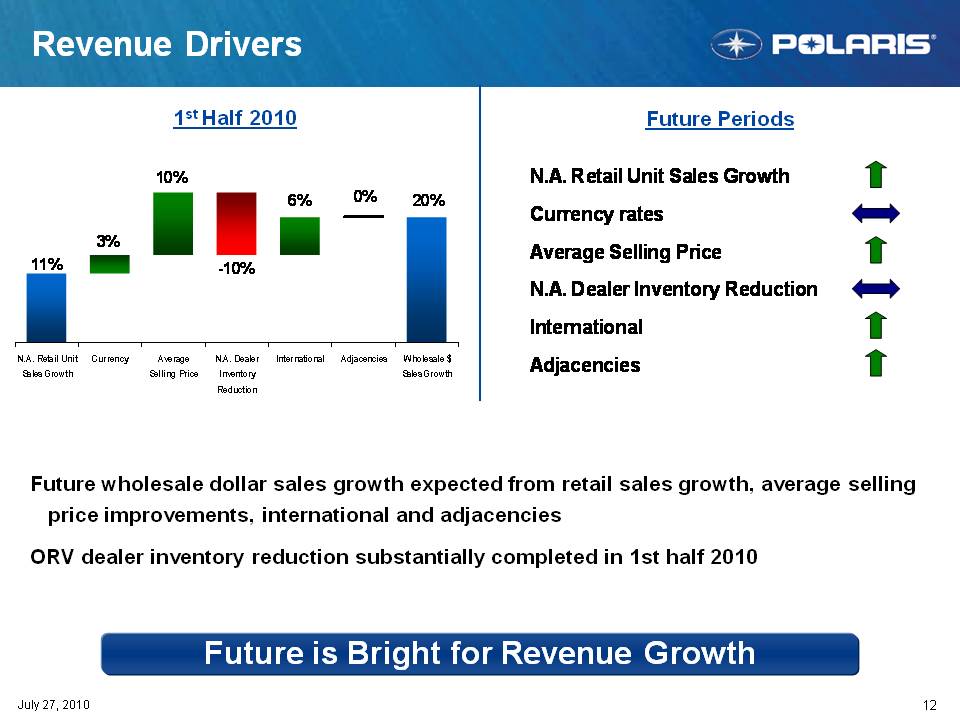
Revenue Drivers 20% 0% 6% 10% 1st Half 2010 Future Periods N.A. Retail Unit Sales Growth -10% 3% 11% Currency rates Average Selling Price N.A. Dealer Inventory Reduction N.A. Retail Unit Sales Growth Currency Average Selling Price N.A. Dealer Inventory Reduction International Adjacencies Wholesale $ Sales Growth International Adjacencies Future wholesale dollar sales growth expected from retail sales growth, average selling improvements price improvements, international and adjacencies ORV dealer inventory reduction substantially completed in 1st half 2010 & #160;12 July 27, 2010 Future is Bright for Revenue Growth
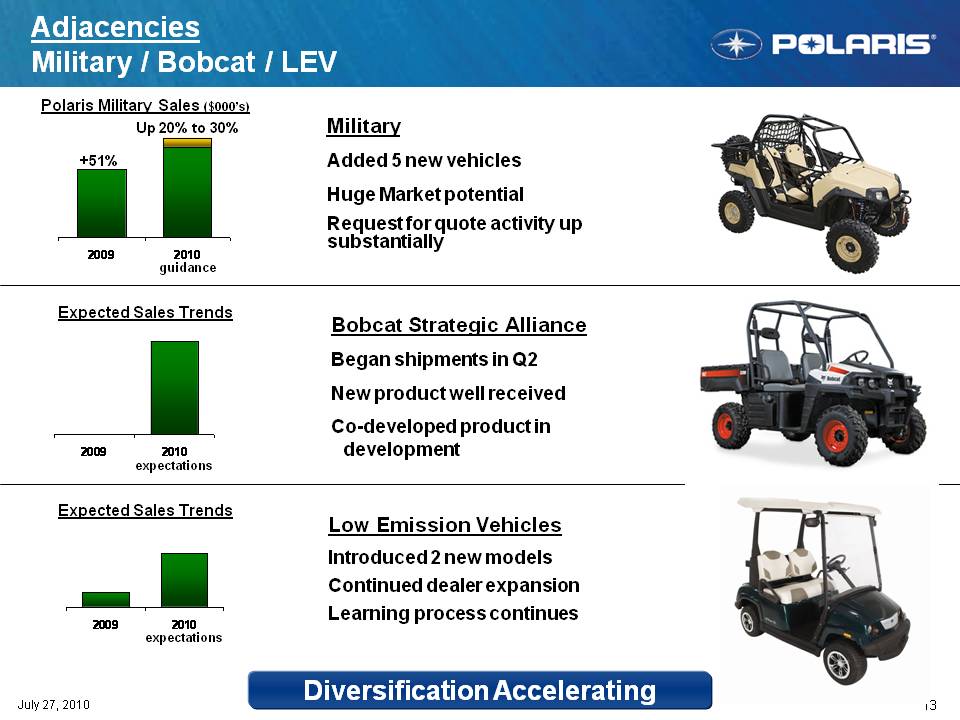
Adjacencies Military / Bobcat / LEV Polaris ($000’ ) Military Added 5 new vehicles Huge Market potential Military Sales s) +51% Up 20% to 30% 2009 2010 E tdSl T d Request for quote activity up substantially guidance Expected Sales Trends Bobcat Strategic Alliance Began shipments in Q2 New product well received 2009 2010 expectations Co-developed product in development Expected Sales Trends Low Emission Vehicles Introduced 2 new models Continued dealer expansion Learning 13 July 27, 2010 2009 2010 process continues Diver sification Accelerating expectations
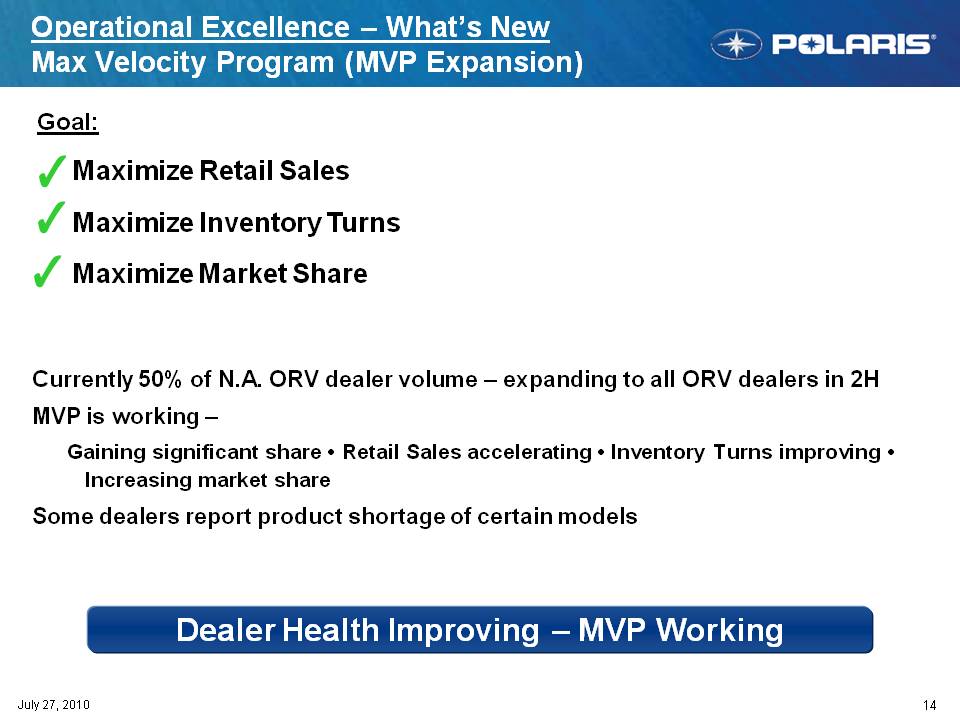
Operational Excellence – What’s New Max Velocity Program (MVP Expansion) Goal: Maximize Retail Sales Maximize Inventory Turns Maximize Market Share Currently 50% of N.A. ORV dealer volume – expanding to all ORV dealers in 2H MVP i ki is working – Gaining significant share Retail Sales accelerating Inventory Turns improving Increasing market share shortage of certain models Some dealers report product 14 July 27, 2010 Dealer Health Improving – MVP Working
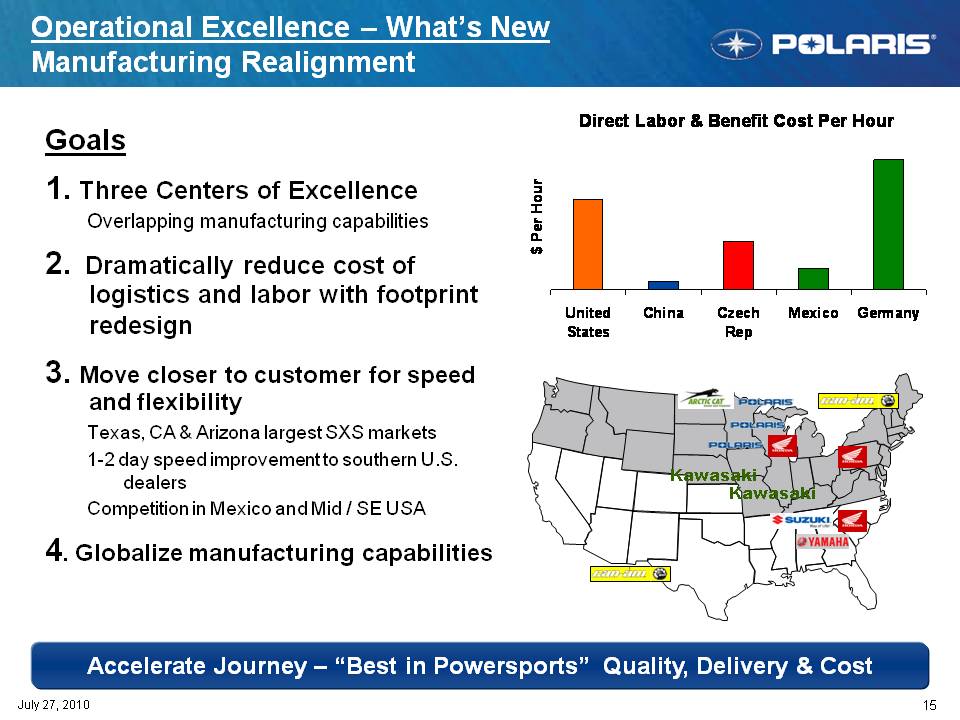
Operational Excellence – What’s New Manufacturing Realignment Goals 1. Three Centers of Excellence Direct Labor & Benefit Cost Per Hour Hour Overlapping manufacturing capabilities 2. Dramatically reduce cost of logistics and labor with footprint U it d Chi C h M i G $ Per H redesign 3. Move closer to customer for speed and flexibility United States China Czech Rep Mexico Germany y Texas, CA & Arizona largest SXS markets 1-2 day speed improvement to southern U.S. dealers Kawasaki Kawasaki Competition in Mexico and Mid / SE USA 4. Globalize manufacturing capabilities 15 July 27, 2010 Accelerate Journey – “Best in Powersports” Quality, Delivery & Cost
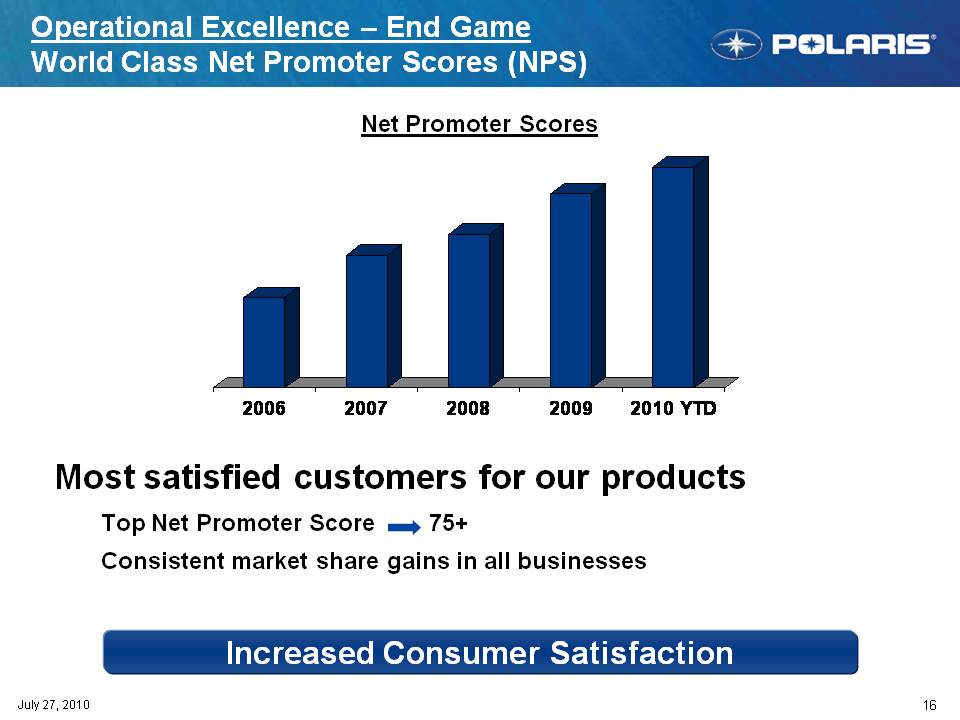
Operational Excellence – End Game World Class Net Promoter Scores (NPS) Net Promoter Scores 2006 2007 2008 2009 Most satisfied customers for our products 2010 YTD Top Net Promoter Score 75+ Consistent market share gains in all businesses 16 July 27, 2010 Increased Consumer Satisfaction
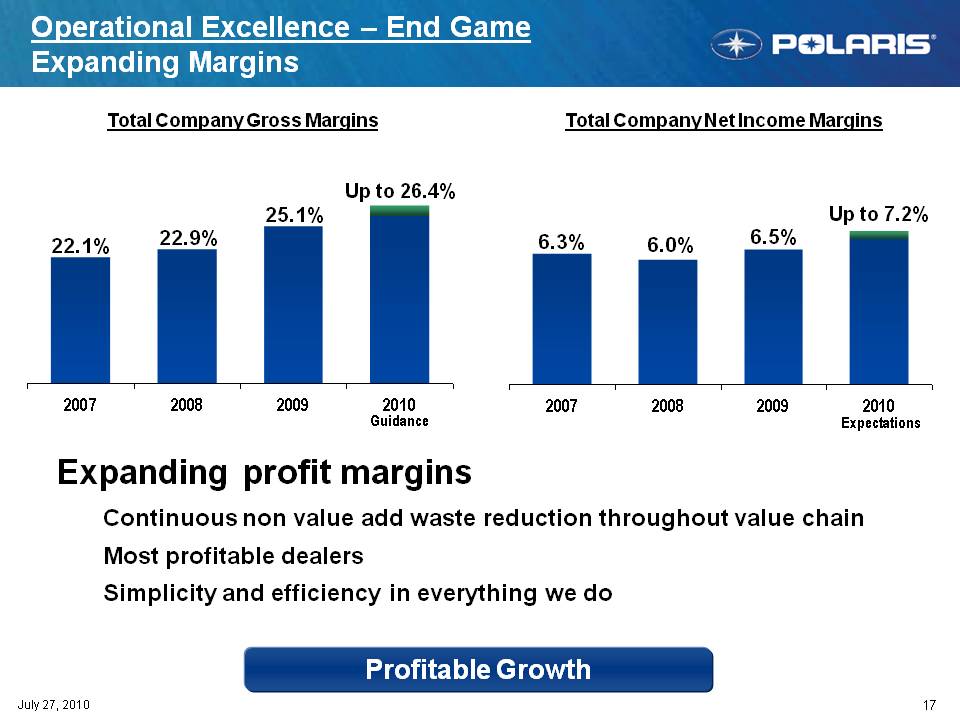
Operational Excellence – End Game Expanding Margins Total Company Gross Margins Total Company Net Income Margins Up to 26.4% 22.1% 22.9% 25.1% 6.3% 6.0% 6.5% Up to 7.2% 2007 2008 2009 2010 2007 2008 2009 2010 Expanding profit margins 2010 Expectations Continuous non value add waste reduction throughout value chain Most profitable dealers Simplicity and efficiency in everything we do 17 July 27, 2010 Profitable Growth
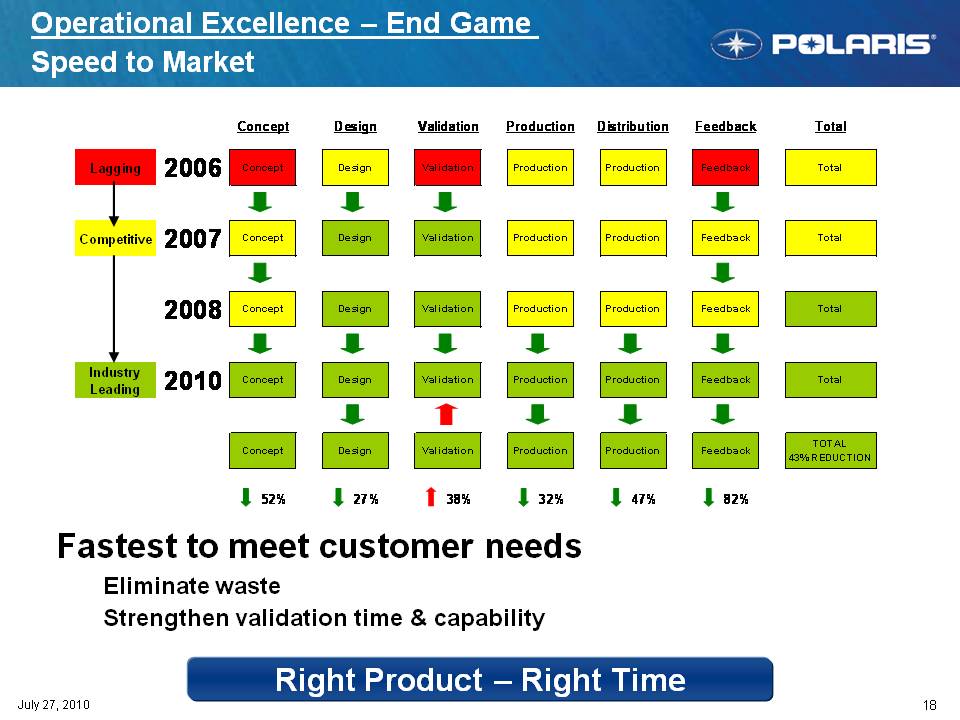
Operational Excellence – End Game Speed to Market Concept Design Validation Production Distribution Feedback Total Lagging 2006 Concept Design Validation Production Production Feedback Total Competitive 2007 Concept Design Validation Production Production Feedback Total 2008 Concept Design Validation Production Production Feedback Total Industry Leading 2010 Concept Design Validation Production Production Feedback Total Concept Design Validation Production Production Feedback TOTAL 43% REDUCTION 52% 27% 38% 32% 47% 82% Fastest to meet customer needs Eliminate waste 18 July 27, 2010 Strengthen validation time & capability Right Product R 11; Right Time
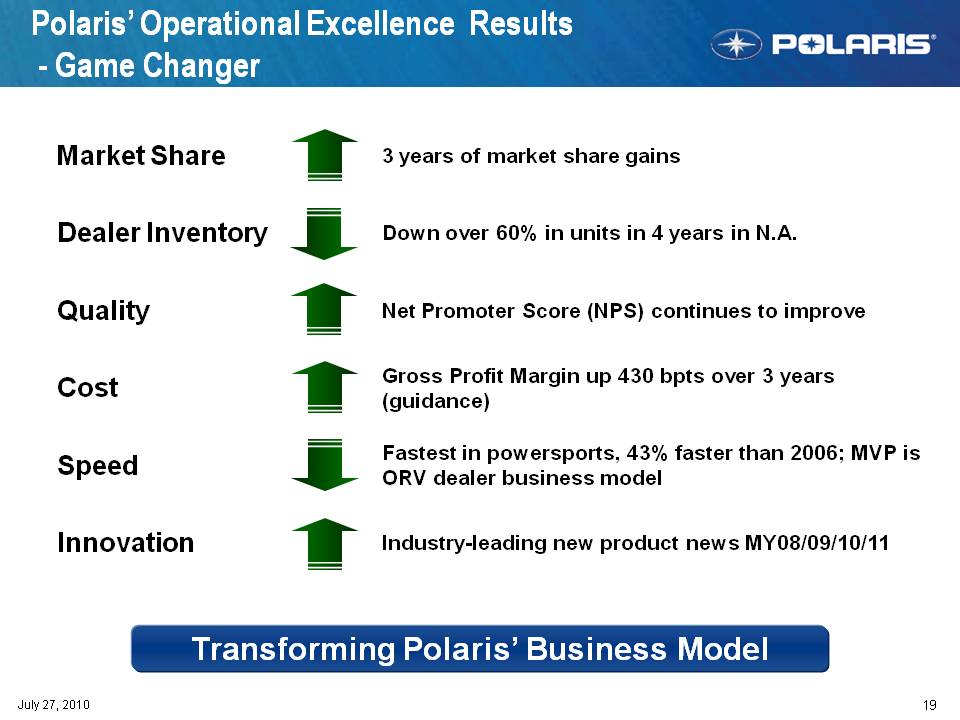
Polaris’ Operational Excellence Results - Game Changer Market Share 3 years of market share gains Dealer Inventory Down over 60% in units in 4 years in N.A. Quality Net Promoter Score (improve NPS) continues to Cost Gross Profit Margin up 430 bpts over 3 years (guidance) g ) Speed Fastest in powersports, 43% faster than 2006; MVP is ORV dealer business model Innovation Industry-leading new product news MY08/09/10/11 19 July 27, 2010 Transforming Polaris’ Business Model
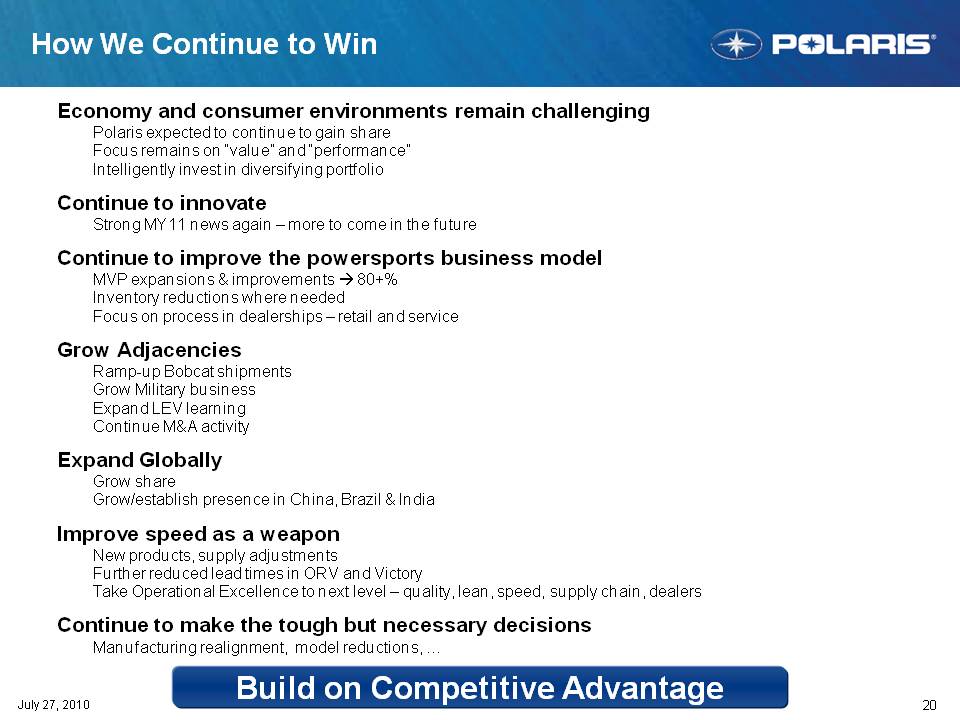
How We Continue to Win Economy and consumer environments remain challenging Polaris expected to continue to gain share Focus remains on “value” and “performance” Intelligently invest in diversifying portfolio innovate Continue to Strong MY11 news again – more to come in the future Continue to improve the power sports business model MVP expansions & improvements .. 80+% Inventory reductions where needed Focus on process in dealerships – retail and service Grow Adjacencies Ramp-up Bobcat shipments Grow Military business Expand LEV learning Continue M&A activity Expand Globally Grow shar e Grow/establish presence in China, Brazil & India Improve speed as a weapon New products, supply adjustments Further reduced lead times in ORV and Victory Take Operational Excellence to next level – quality, lean, speed, supply chain, dealers 20 July 27, 2010 Continue to make the tough but necessary decisions Manufacturing realignment, model reductions, … Build on Competitive Advantage

Q & A
POLARIS OFF-ROAD UPDATE Matt Homan Vice President Off-Road Vehicles JULY 27th, 2010
AGENDA Industry Overview Polaris Plans & Results MY2011 New Products Adjacent Markets

OFF-ROAD CUSTOMER PROFILES (North America) ATV RZR RANGER AGE INCOME MALE/FEMALE38 Yrs $60K 85% / 15% 24% #1 Trail Riding #2 Farm/Ranch #3 Hunt 1st TIME OWNER USAGE Differentiated Customer Ladder
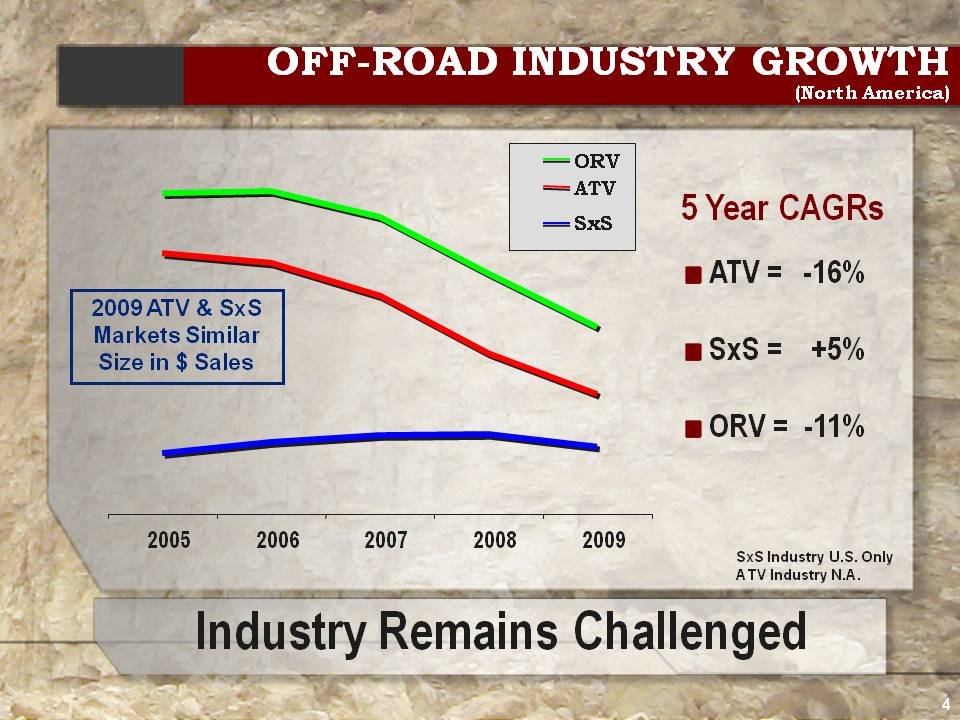
OFF-ROAD INDUSTRY GROWTH ( North America) ) ATV ORV ATV = -16% 5 Year CAGRs SxS 2009 ATV & SxS = +5% SxS Markets Similar Size in $ Sales ORV = -11% I d t R i Ch ll d 2005 2006 2007 2008 2009 SxS Industry U.S. Only ATV Industry N.A. 4 Industry Remains Challenged
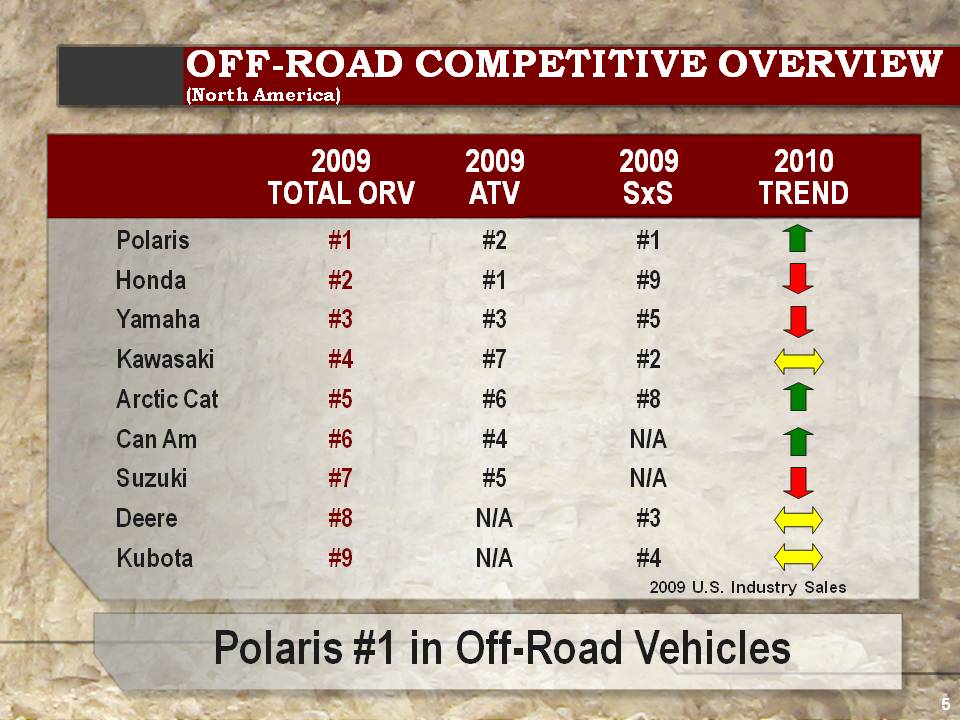
OFF-ROAD COMPETITIVE OVERVIEW ( North America) ) 2010 TREND 2009 SxS 2009 ATV 2009 TOTAL ORV #9 #1 #2 Honda #1 #2 #1 Polaris #8 #6 #5 Arctic Cat #2 #7 #4 Kawasaki #5 #3 #3 Yamaha #3 N/A #8 Deere N/A #5 #7 Suzuki N/A #4 #6 Can Am #4 N/A #9 Kubota 2009 U.S. Industry Sales
5
Polaris #1 in Off-Road Vehicles
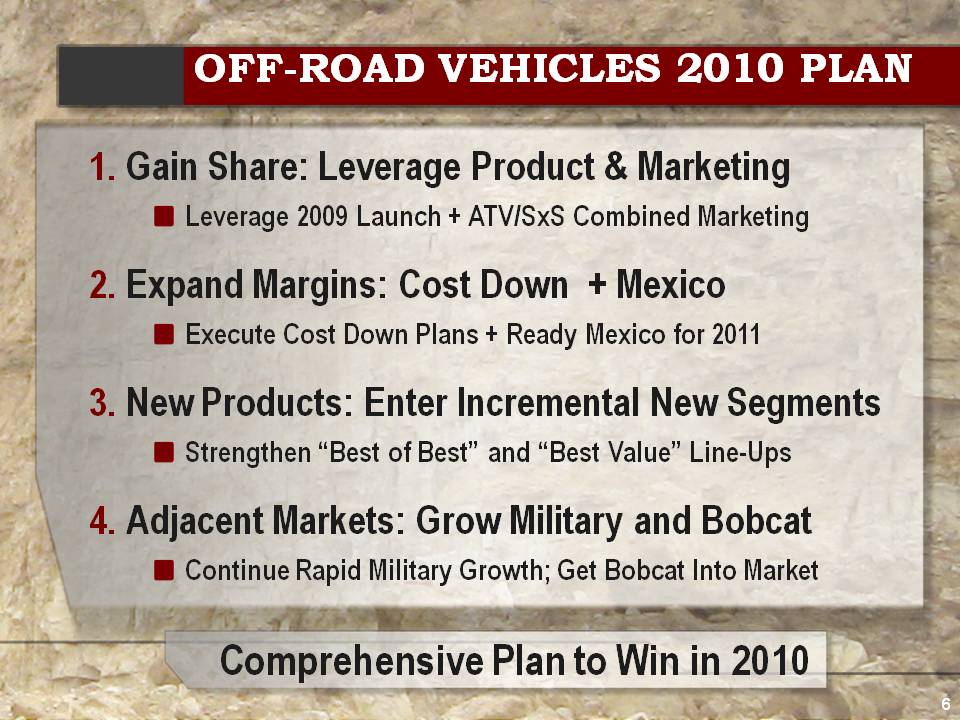
OFF-ROAD VEHICLES 2010 PLAN 1. Gain Share: Leverage Product & Marketing L 2009 L h ATV/S S C bi d M k ti Leverage Launch + SxS Combined Marketing 2. Expand Margins: Cost Down + Mexico Execute Cost Down Plans + Ready Mexico for 2011 3. New Products: Enter Incre mental New Segments Strengthen “Best of Best” and “Best Value” Line-Ups 4 4. Adjacent Markets: Grow Military and Bobcat Continue Rapid Military Growth; Get Bobcat Into Market 6 Comprehensive Plan to Win in 2010
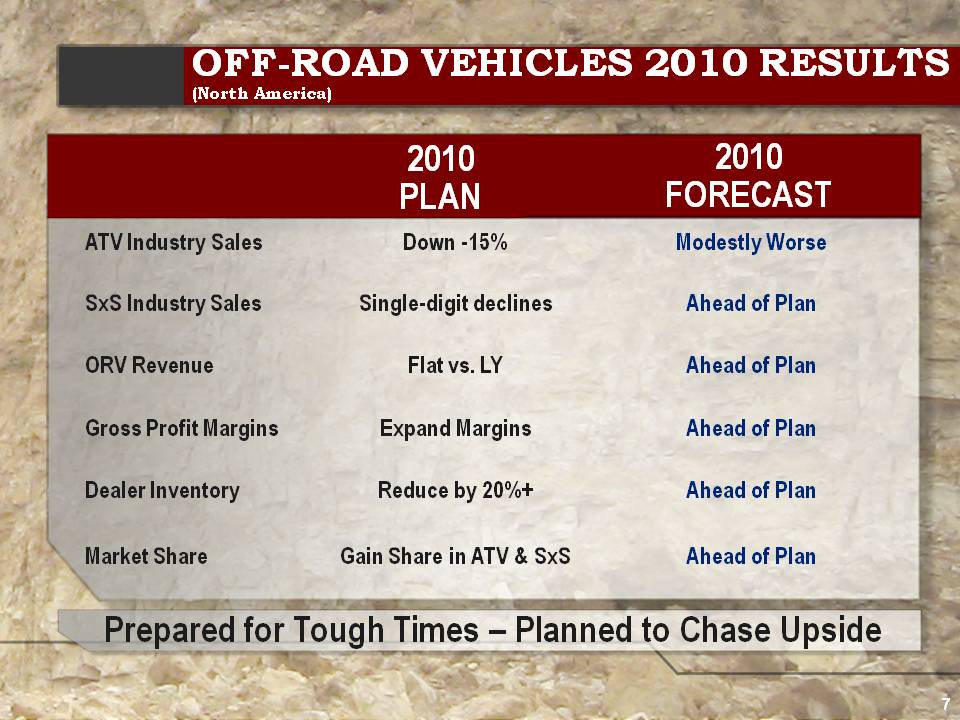
OFF-ROAD VEHICLES 2010 RESULTS ( North America) ) 2010 FORECAST 2010 PLAN Ahead of Plan Single-digit declines SxS Industry Sales Modestly Worse Down -15% ATV Industry Sales Ahead of Plan Flat vs. LY ORV Revenue Single Ahead of Plan Reduce by 20%+ Dealer Inventory Ahead of Plan Expand Margins Gross Profit Margins P d f T h Ti Pl d t Ch U id Ahead of Plan Gain Share in ATV & SxS Market Share 7 Prepared for To ugh Times – Planned to Chase Upside
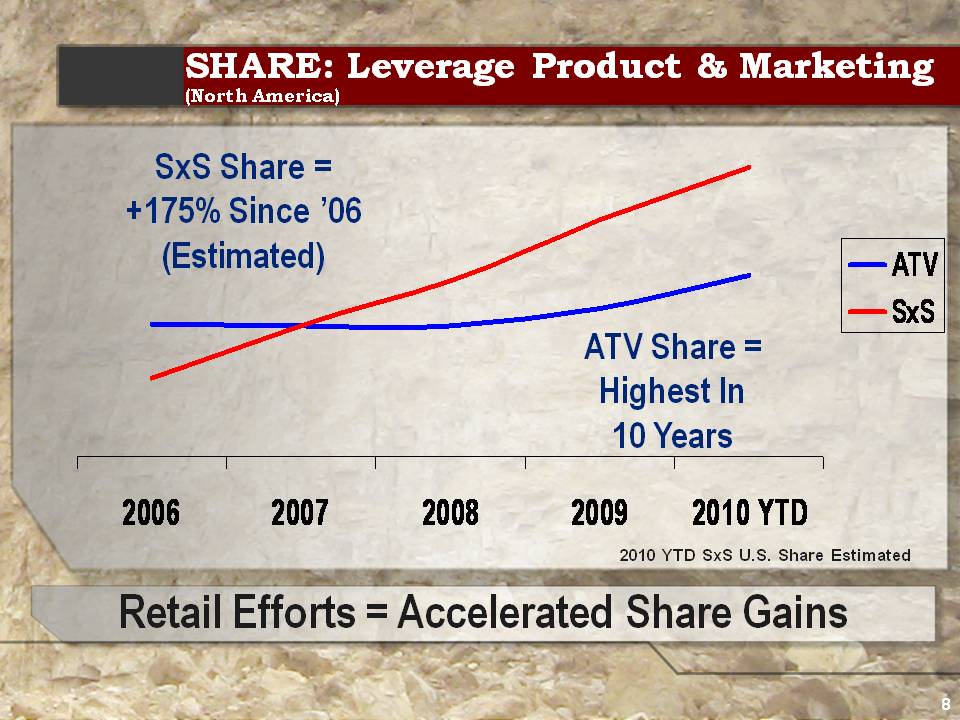
SHARE: Leverage Product & Marketing ( North America) ) SxS Share = +175% Since ’06 ATV SxS (Estimated) ATV Share = Highest In 2006 2007 2008 2009 2010 YTD 10 Years Retail Efforts = Accelerated Share Gains 2010 YTD SxS U.S. Share Estimated 8
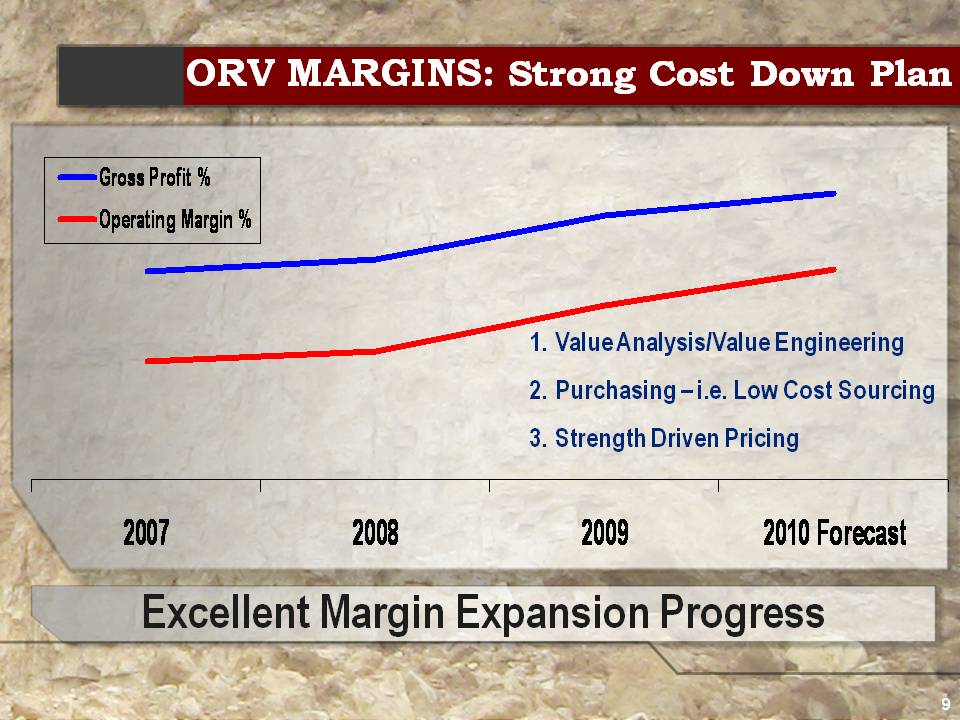
ORV MARGINS: Strong Cost Down Plan Gross Profit % Operating Margin % 1. Value Analysis/Value Engineering 2. Purchasing – i.e. Low Cost Sourcing 3. Strength Driven Pricing Excellent Margin Expansion Progress 2007 2008 2009 2010 Forecast 9
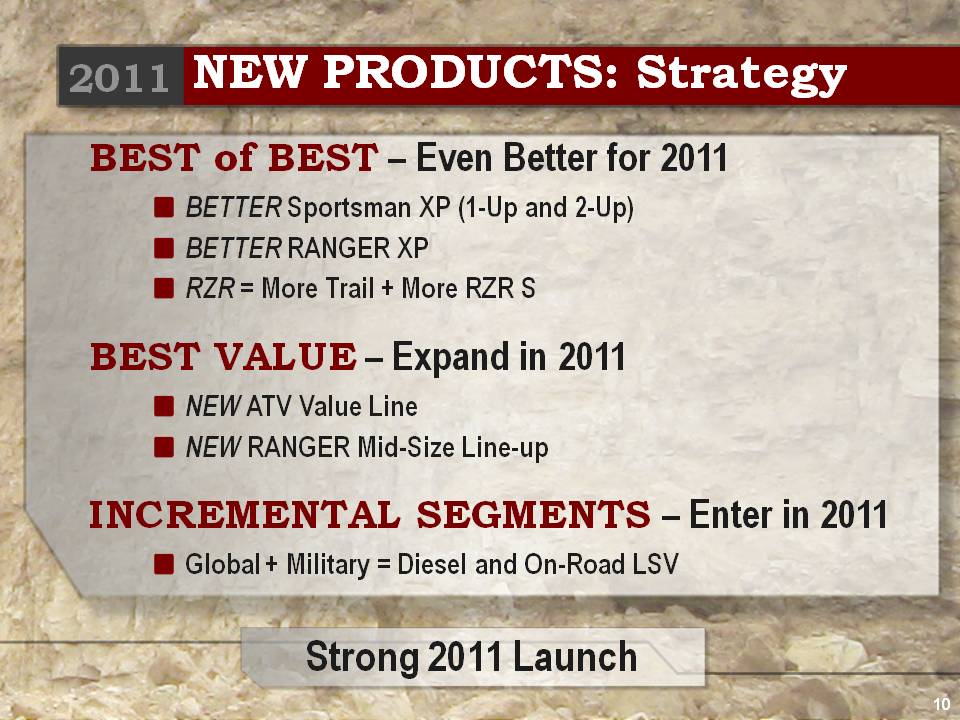
2011 NEW PRODUCTS: Strategy BEST of BEST – Even Better for 2011 BETTER Sportsman XP (1 Up and 2 Up) 1-2-BETTER RANGER XP RZR = More Trail + More RZR S BEST VALUE – Expand in 2011 NEW ATV Value Line NEW RANGER Mid-Size Line-up INCREMENTAL SEGMENTS Enter in 2011 – Global + Military = Diesel and On-Road LSV 10 Strong 2011 Launch
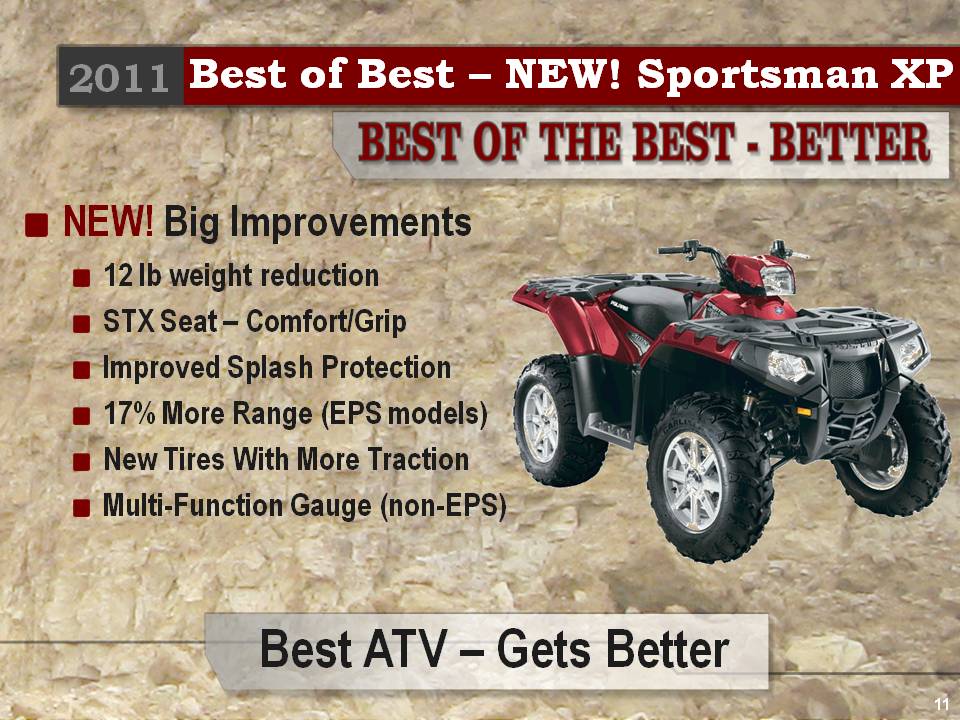
2011 Best of Best – NEW! Sportsman XP NEW! Bi I Big Improvements 12 lb weight reduction STX Seat – Comfort/Grip Improved Splash Protection 17% More Range (EPS models) New Tires With More Traction Multi-Function Gauge (non-EPS) Multi non 11 Best ATV – Gets Better
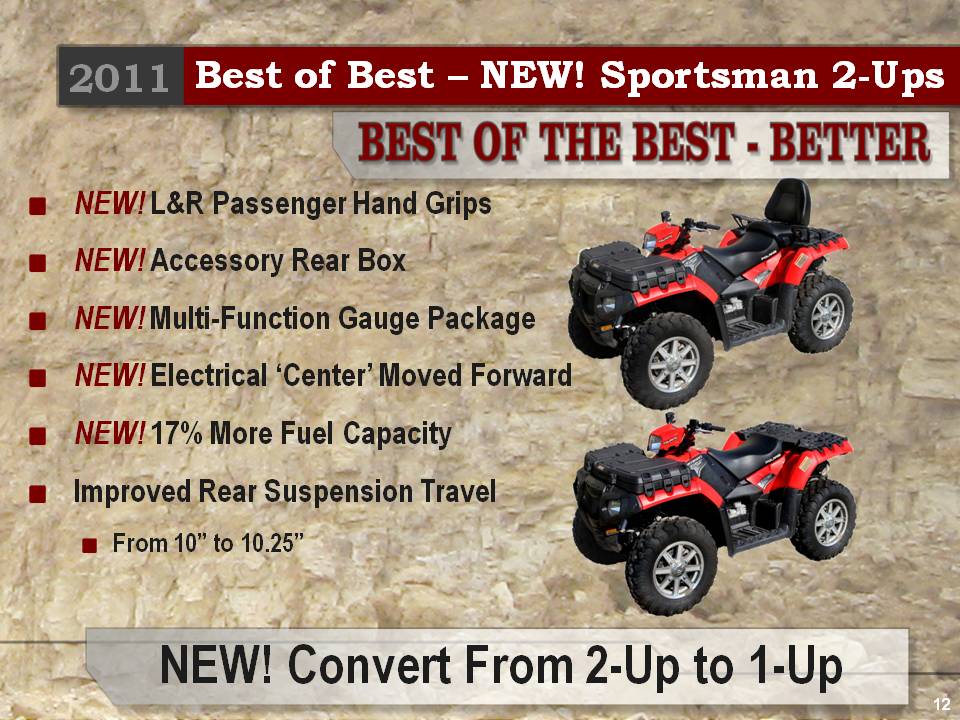
2011 Best of Best – NEW! Sportsman 2-Ups NEW! L&R Passenger Hand Grips NEW! Accessory Rear Box NEW! M ltiF ti G P k Multi-Function Gauge Package NEW! Electrical ‘Center’ Moved Forward NEW! 17% More Fuel Capacity Improved Rear Suspension Travel From 10” to 10.25” 12 NEW! Convert From 2-Up to 1-Up
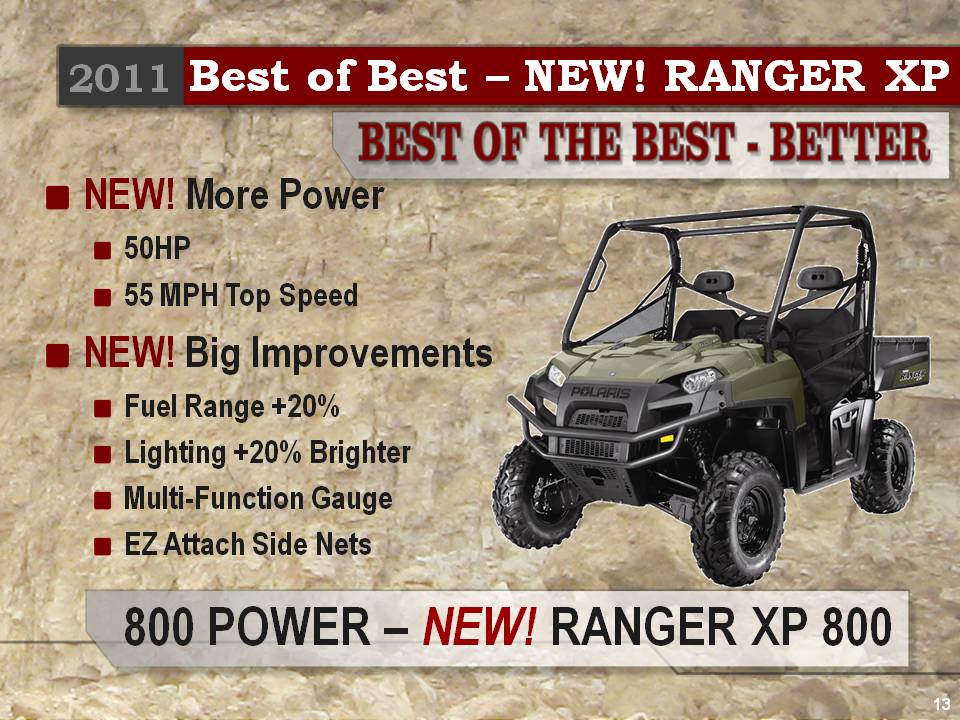
2011 Best of Best – NEW! RANGER XP NEW! More Power 50HP 55 MPH Top Speed p p NEW! Big Improvements Fuel Range +20% Lighting +20% Brighter Multi-Function Gauge 800 POWER NEW! RANGER XP 800 g EZ Attach Side Nets 13
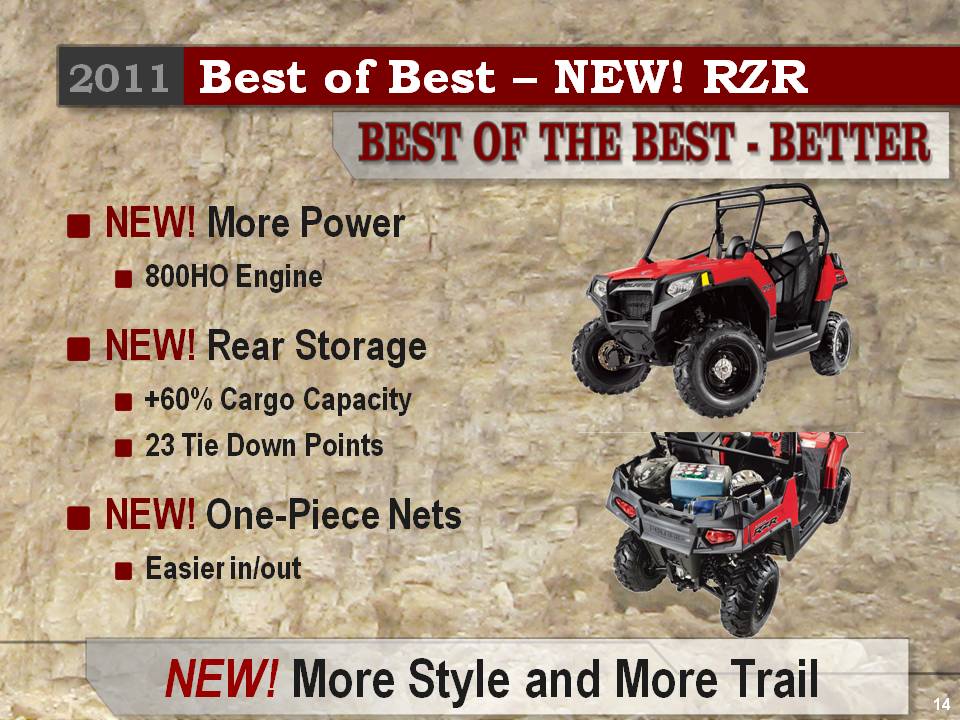
2011 Best of Best – NEW! RZR NEW! More Power 800HO Engine NEW! Rear Storage +60% Cargo Capacity % g p y 23 Tie Down Points NEW! One Piece Nets One-Easier in/out 14 NEW! More Style and More Trail

2011 Best of Best – NEW! RZR S NEW! Polaris Long Travel System Long-Equals More Value / Same Performance NEW! 2” Big Bore Sachs Shocks Incredibly Smooth Ride NEW! ITP 900 XCT Ti Tires Polaris SxS Exclusive NEW! O Pi N t One-Piece Nets Easier in/out 15 NEW! RZR S – Competitive Weapon @ $12,499
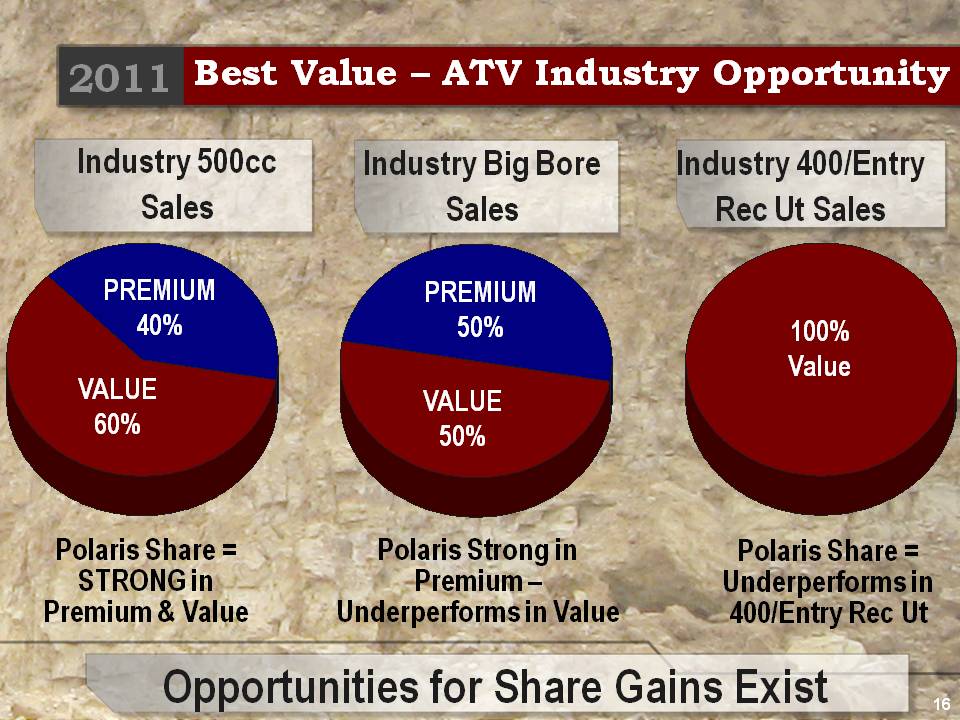
2011 Best Value – ATV Industry Opportunity Industry 500cc Sales Industry Big Bore Sales Industry 400/Entry Rec Ut Sales PREMIUM PREMIUM 40% VALUE 50% VALUE 100% Value 60% 50% Polaris Share = STRONG in Premium & Value Polaris Strong in Premium – Underperforms in Value Polaris Share = Underperforms in 400/Entry Rec Ut 16 Opportunities for Share Gains Exi st
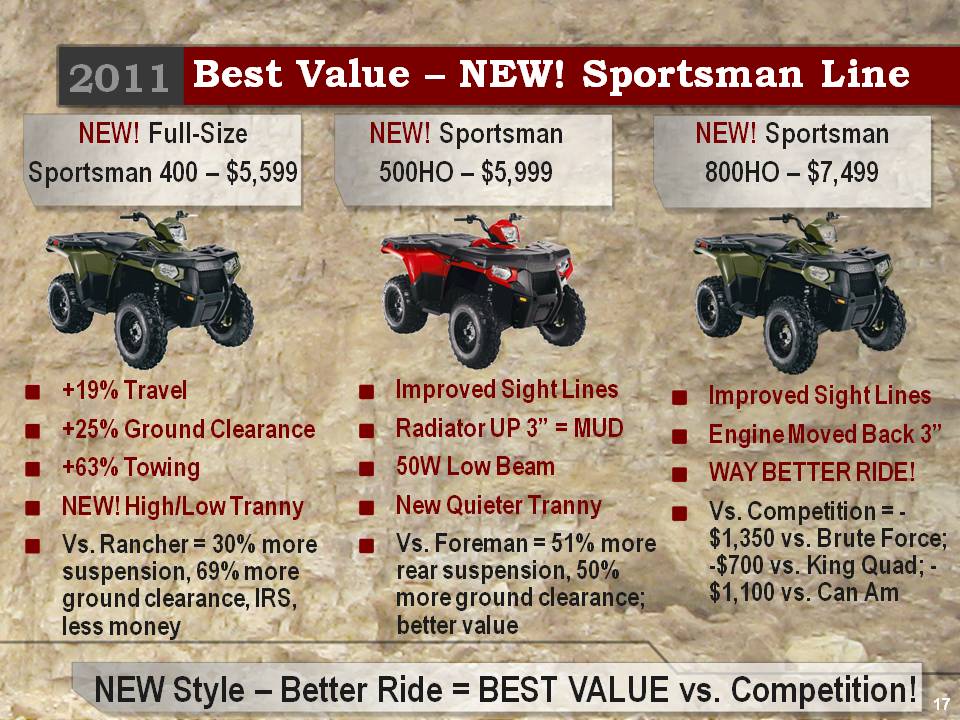
2011 Best Value – NEW! Sportsman Line NEW! Full-Size Sportsman 400 – $5,599 NEW! Sportsman 500HO – $5,999 NEW! Sportsman 800HO – $7,499 +19% Travel Improved Sight Lines Improved Sight Lines +25% Ground Clearance +63% Towing NEW! High/Low Tranny Radiator UP 3” = MUD 50W Low Beam New Quieter Tranny Engine Moved Back 3” WAY BETTER RIDE! Vs - Vs. Rancher = 30% more suspension, 69% more ground clearance, IRS, l e Quete a y Vs. Foreman = 51% more rear suspension, 50% more ground clearance; b tt l Vs. Competition = $1,350 vs. Brute Force; -$700 vs. King Quad; - $1,100 vs. Can Am 17 NEW Style – Better Ride = BEST VALUE vs. Competition! less money better value
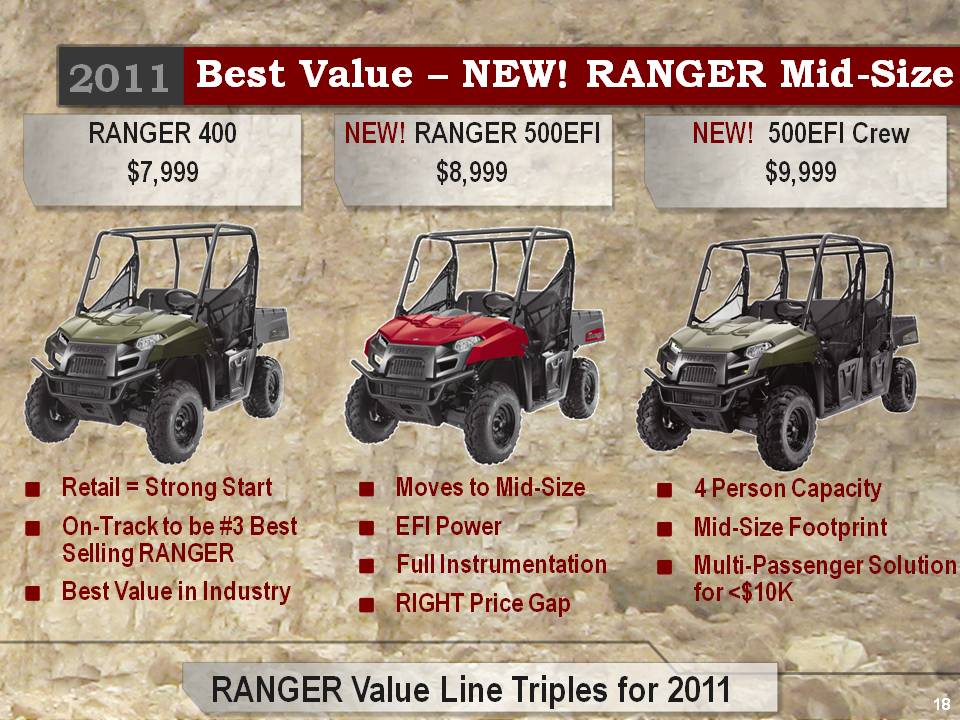
2011 Best Value – NEW! RANGER Mid-Size RANGER 400 $7,999 NEW! RANGER 500EFI $8,999 NEW! 500EFI Crew $9,999 Retail = Strong Start Moves to Mid-Size 4 Person Capacity On-Track to be #3 Best Selling RANGER Best Value in Industry EFI Power Full Instrumentation RIGHT Price Gap Mid-Size Footprint Multi-Passenger Sol ution for <$10K 18 RANGER Value Line Triples for 2011
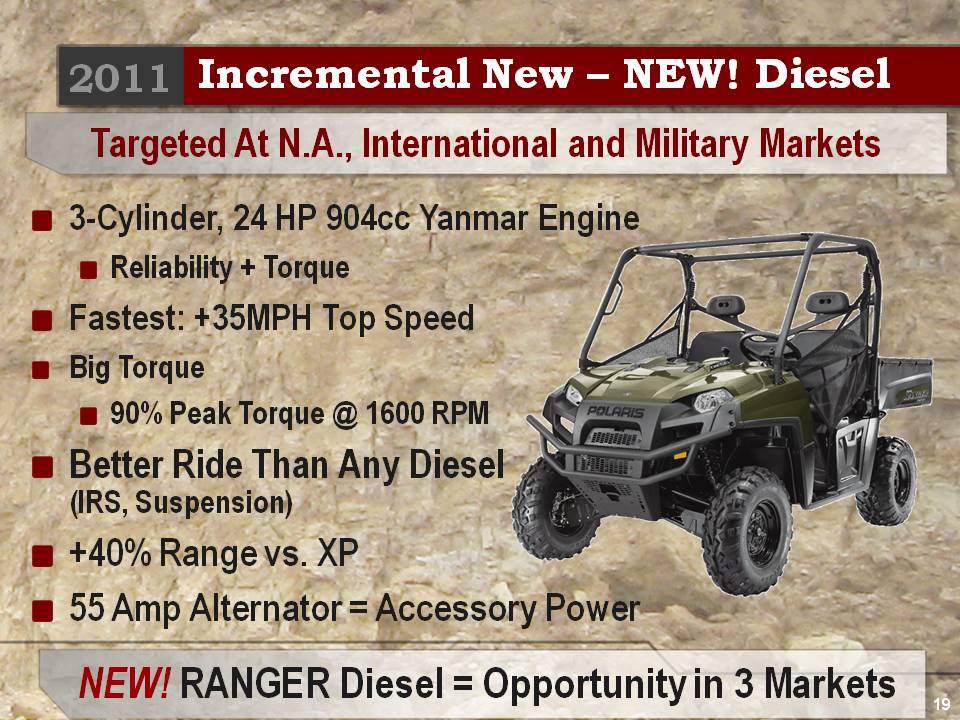
2011 Incremental New – NEW! Diesel 3 C li d 24 HP 904 Y E i Targeted At N.A., International and Military Markets 3-Cylinder, 904cc Yanmar Engine Reliability + Torque F t t +35MPH T S d Fastest: Top Speed Big Torque 90% Peak Torque @ 1600 RPM Better Ride Than Any Diesel ( IRS, Suspension) , p ) +40% Range vs. XP 55 Amp Alternator = Accessory 19 NEW! RANGER Diesel = Opportunity in 3 Markets Power
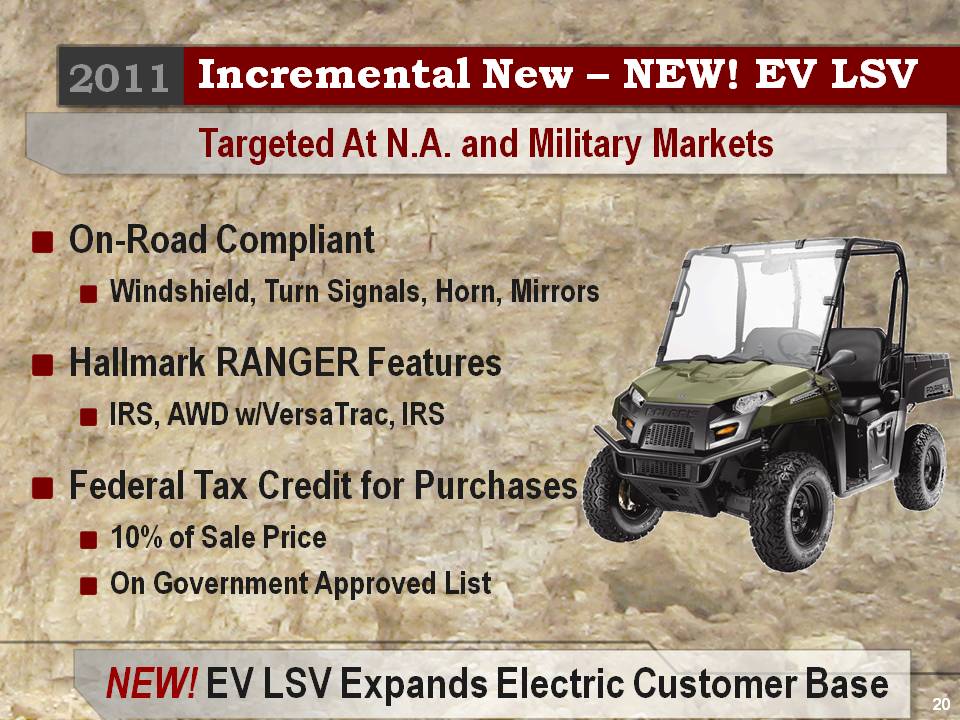
2011 Incremental New – NEW! EV LSV Targeted At N.A. and Military Markets On-Road Compliant Windshield, Turn Signals, Horn, Mirrors g Hallmark RANGER Features IRS AWD w/VersaTrac IRS, VersaTrac, IRS Federal Tax Credit for Purchases 10% of Sale Price On Government Approved List 20 NEW! EV LSV Expands Electric Customer Base
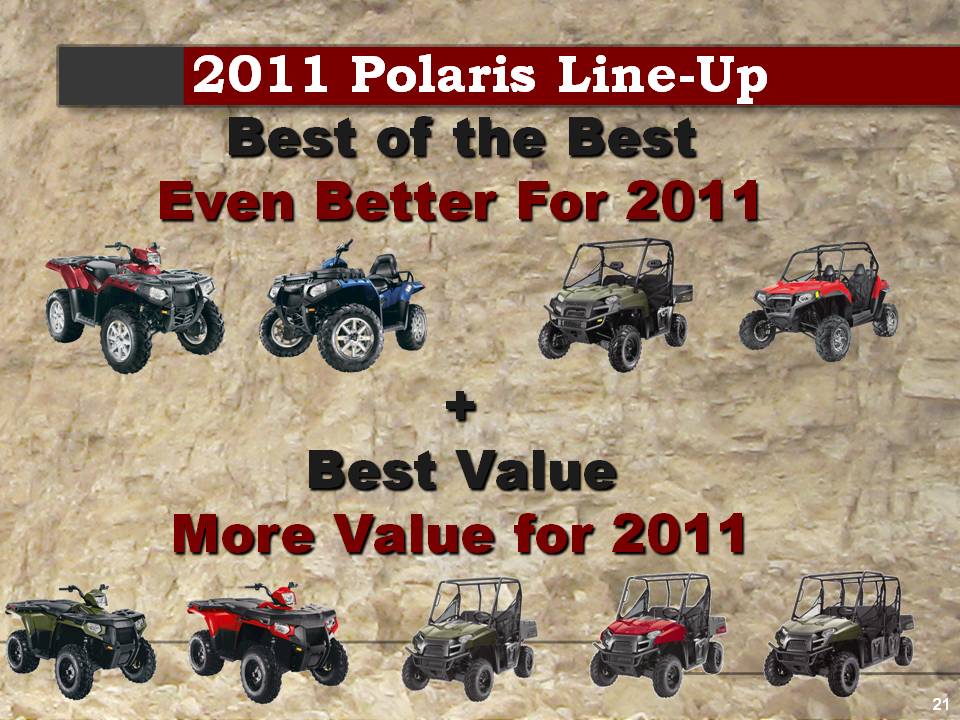
2011 Polaris Line-Up Best of the Best Better For 2011 p Even + Best Value M V l f 2011 More Value for 21
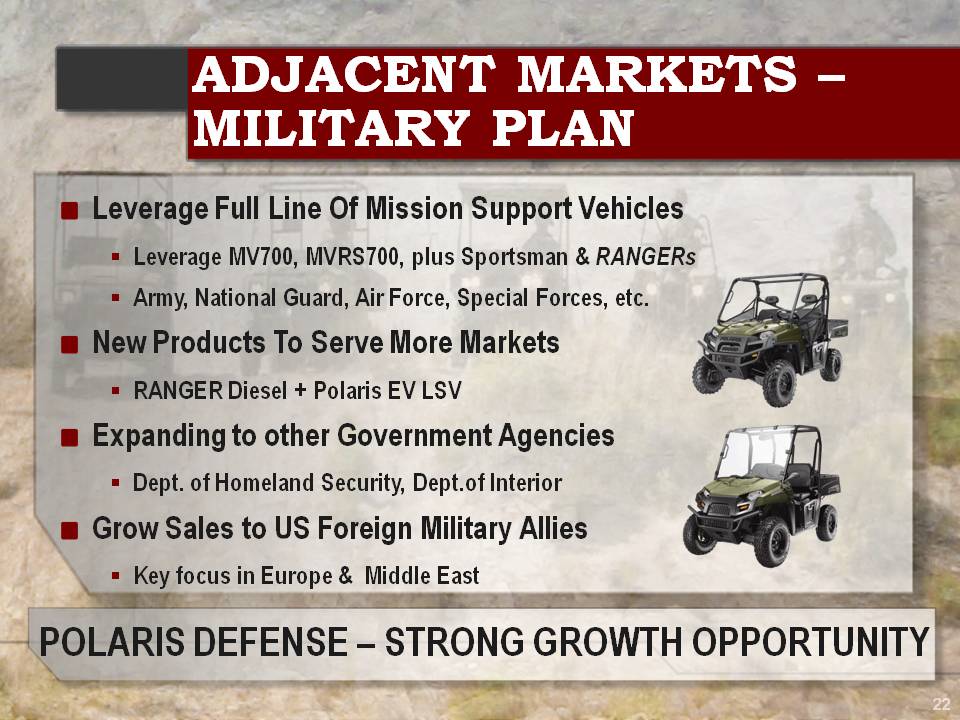
ADJACENT MARKETS – MILITARY PLAN Leverage Full Line Of Mission Support Vehicles .. Leverage MV700, MVRS700, plus Sportsman & RANGERs .. Army, National Guard, Air Force, Special Forces, etc. y, , , p , New Products To Serve More Markets .. RANGER Diesel + Polaris EV LSV Expanding to other Government Agencies .. Dept. of Homeland Security, Dept.of Interior Grow Sales to US Foreign Military Allies .. Key focus in Europe & Middle East 22 POLARIS DEFENSE – STRONG GROWTH OPPORTUNITY

ADJACENT MARKETS – MILITARY STRATEGY ATV SxS Dedicated B i U it Military M d l Polaris Defense Honda Business Unit Models John Deere Yamaha Kawasaki Kubota Club Car EZ-GO 23 POLARIS is Differentiated with Full Prod uct & Service
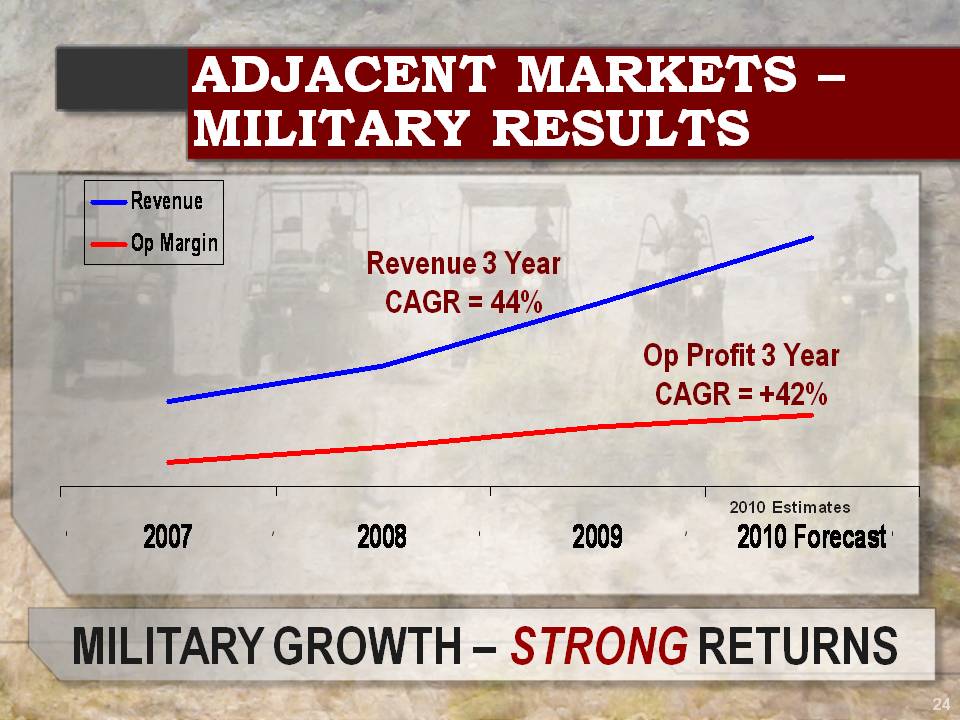
ADJACENT MARKETS – MILITARY RESULTS Revenue Revenue 3 Year CAGR = Op Margin 44% Op Profit 3 Year CAGR = +42% 2010 Estimates 2007 2008 2009 2010 Forecast 24 MILITARY GROWTH – STRONG RETURNS
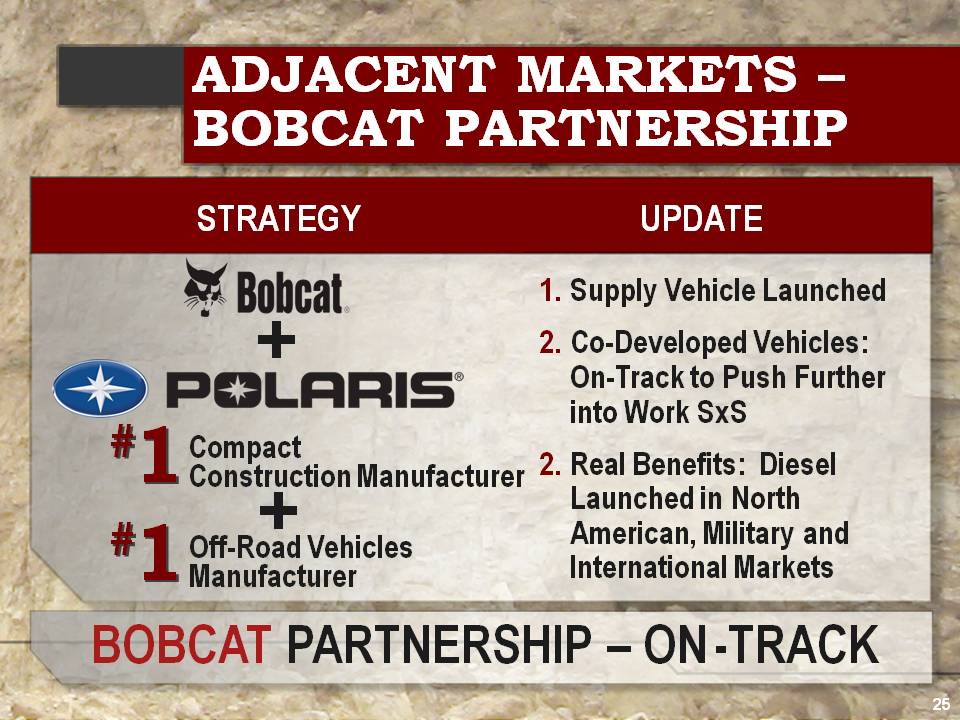
ADJACENT MARKETS – BOBCAT PARTNERSHIP STRATEGY UPDATE 1. Supply Vehicle Launched + 2. Co-Developed Vehicles: On-Track to Push Further into Work SxS 2. Real Benefits: Diesel Launched in North Compact Construction Manufacturer 1 # + American, Military and International Markets 1 # Off-Road Vehicles Manufacturer 25 BOBCAT PARTNERSHIP – ON-TRACK
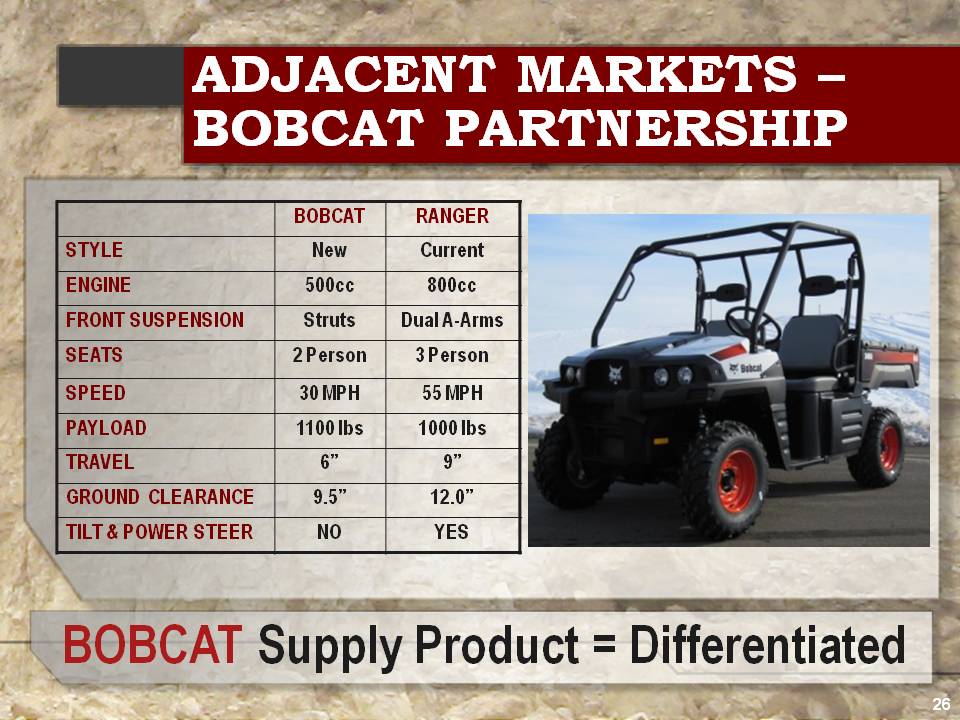
ADJACENT MARKETS – BOBCAT PARTNERSHIP BOBCAT RANGER STYLE New Current ENGINE 500cc 800cc FRONT SUSPENSION Struts Dual A-Arms SEATS 2 Person 3 Person SPEED 30 MPH 55 MPH PAYLOAD 1100 lbs 1000 lbs TRAVEL 6” 9” GROUND CLEARANCE 9.5” 12.0” TILT & POWER STEER NO YES 26 BOBCAT Supply Product = Differentiated
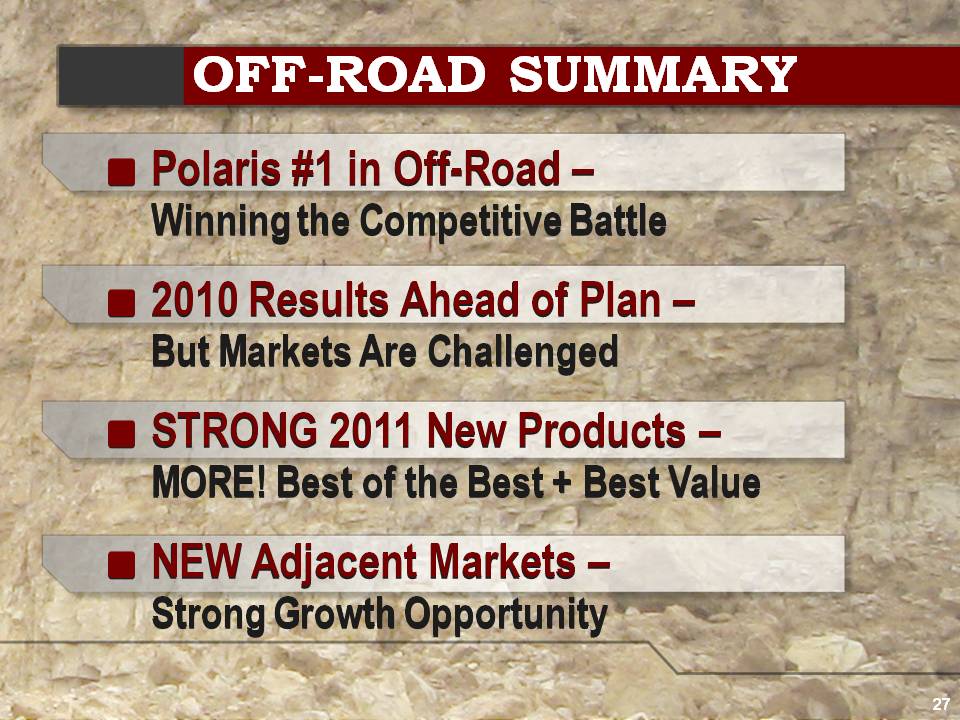
OFF-ROAD SUMMARY Polaris #1 in Off-Road – Wi i th C titi B ttl Winning the Competitive Battle 2010 Results Ahead of Plan – But Markets Are Challenged STRONG 2011 New Products – MORE! Best of the Best + Best Value NEW Adjacent Markets – Strong Growth Opportunity 27
Snowmobiles Parts, Garments & Accessories Financial Services Scott Swenson Vice President & General Manager Analyst Meeting Orlando, FL July 27, 2010
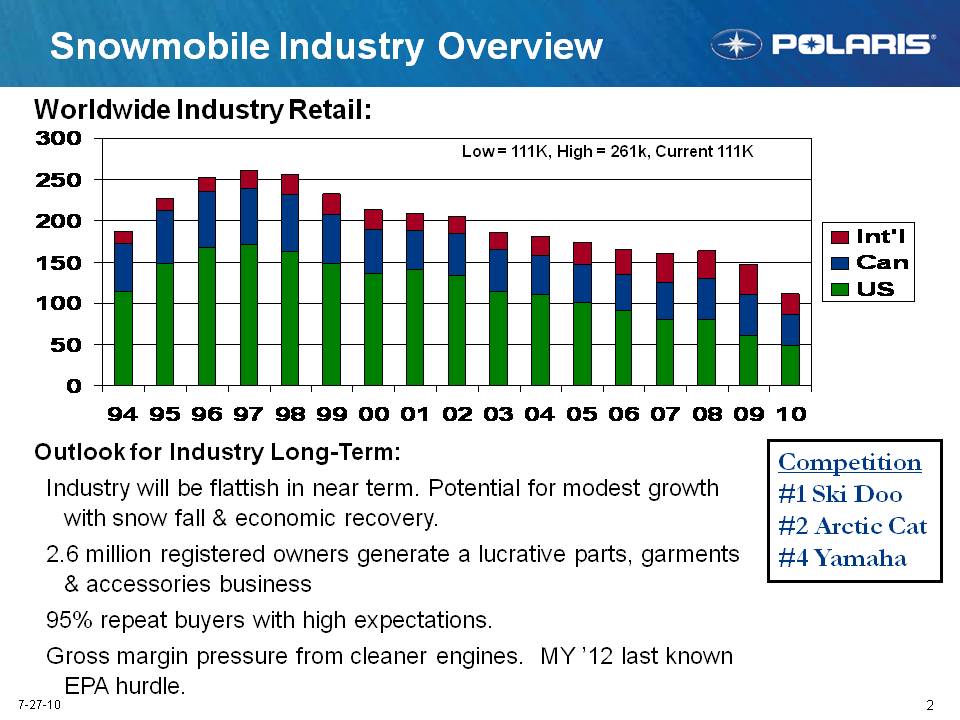
2 7-27-10 Snowmobile Industry Overview Worldwide Industry Retail: Outlook for Industry Long-Term: Industry will be flattish in near term. Potential for modest growth with snow fall & economic recovery. 2.6 million registered owners generate a lucrative parts, garments & accessories business 95% repeat buyers with high expectations.Gross margin pressure from cleaner engines. MY ’12 last known EPA hurdle. Low = 111K, High = 261k, Current 111K Competition #1 Ski Doo #2 Arctic Cat #4 Yamaha 94 95 96 97 98 99 00 01 02 03 04 05 06 07 08 03 10 0 50 100 150 200 250 300 Int’l Can US
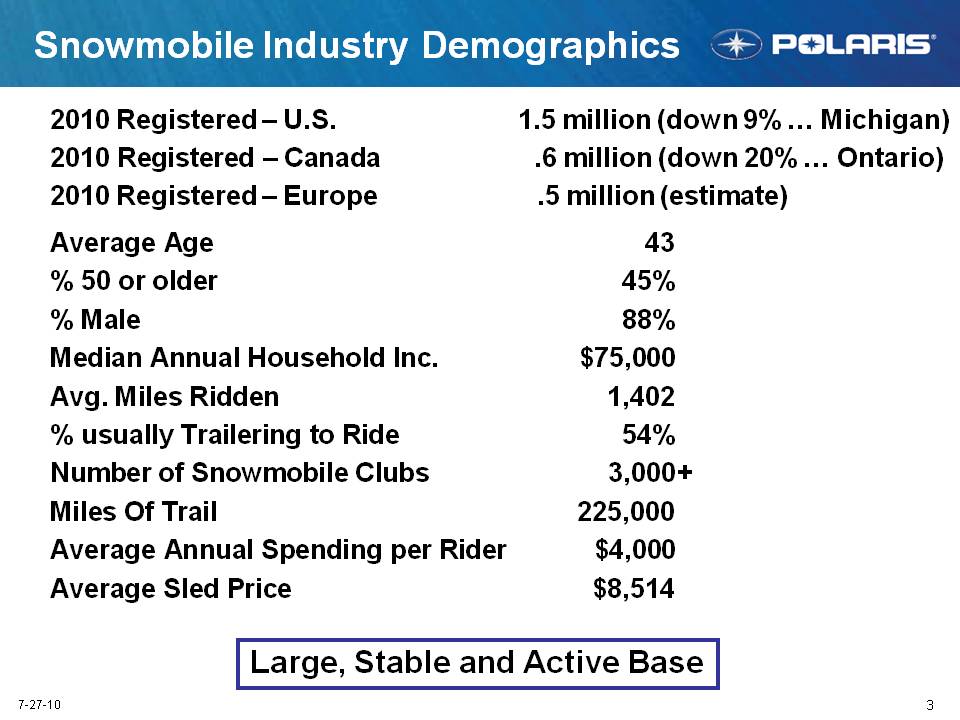
3 7-27-10 Snowmobile Industry Demographics 2010 Registered – U.S. 1.5 million (down 9% … Michigan) 2010 Registered – Canada .6 million (down 20% … Ontario) 2010 Registered – Europe .5 million (estimate) Average Age 43 % 50 or older 45% % Male 88% Median Annual Household Inc. $75,000 Avg. Miles Ridden 1,402 % usually Trailering to Ride 54% Number of Snowmobile Clubs3,000+ Miles Of Trail 225,000 Average Annual Spending per Rider $4,000 Average Sled Price $8,514 Large, Stable and Active Base

4 7-27-10 State of Snowmobile Market Snowfall inconsistent last winter: solid in Eastern US, spotty in Mountains, awful in Canada. Significant retail impact from macro-economic conditions last season. Minimal market share movement: Arctic Cat & Ski Doo up with Polaris & Yamaha down. Dealer inventory levels down. Levels now close to “right size”. Enthusiast base purchasing premium products. Entry sled is $6K. Promotional spending was reasonable last season. Dealer profitability OK due to service business & better inventory mix. Polaris dealer count stable. EPA impacts MY ’12. Polaris is positioned to meet requirements. Snowfall Remains the Key for The Industry

5 7-27-10 Snowmobile Industry (North America) Growth in Mountains, Crossover & Utility 2010/2011 Industry % 5 Year Trend Performance/Trail Mountain Crossover Utility Touring Kids Entry Core Ultimate 2 Stroke 4 Stroke Down Up Flat 34% 23% 17% 13% 11% 2% 27% 39% 34% 76% 24%
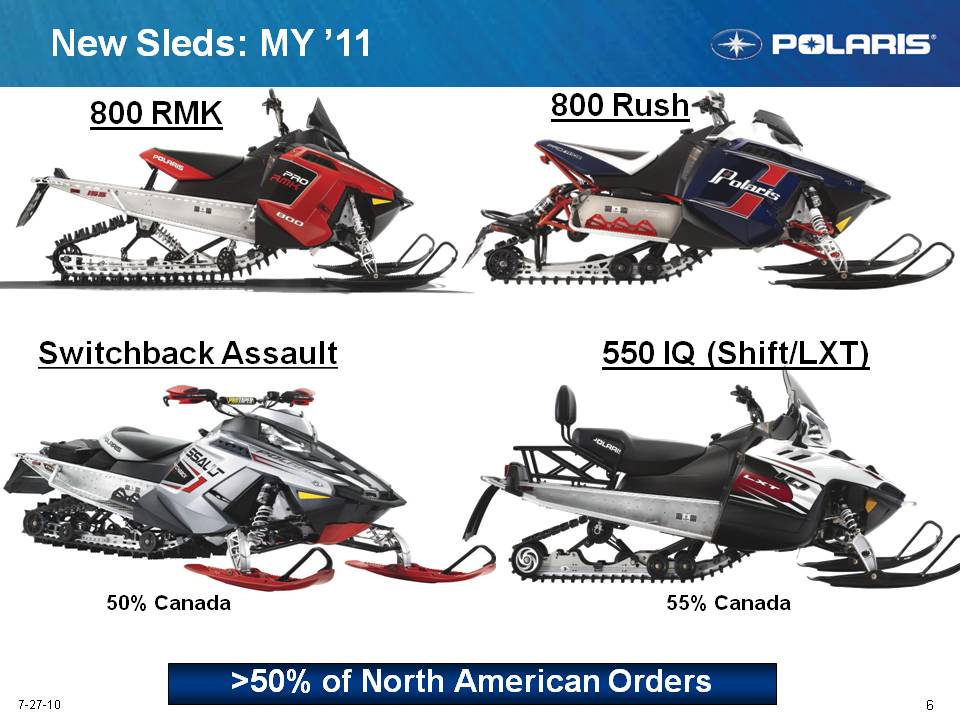
6 7-27-10 800 RMK Switchback Assault New Sleds: MY ’11 800 Rush 550 IQ (Shift/LXT) 55% Canada >50% of North American Orders 50% Canada
7 7-27-10 Snowmobile Quality Snowmobile quality, primarily 800s, still not meeting expectations: - Increased warranty reserve. Q2 financial impact. - Net promoter scores remain last in industry MY ’10 Rush quality results showed significant improvement. MY ’11 800 engine improvements. Highly confident in quality. - 110,000 miles of test, validation and demos - Chile validation in August Longer term focus: - Validation and testing … lab + field - Supply base and manufacturing - Program cadence Industry Leading Product Quality Remains Our #1 Goal
8 7-27-10 Snowmobile Outlook 2010 Calendar Year: - MY ’11 product intro exceeded expectations; RMK a huge hit & will drive growth in the mountains. - Revenues expected to be flat. - Snow check sales up over 200%. - International retail up slightly: Finland solid year; Russia recovering. - Retail focus on installed base; increased emphasis on demos. - Build on race success: won Pro Open and Semi-Pro Stock in ’09/’10. Longer Term Road Map … No Major Changes: - Drive towards industry leading quality with a powertrain focus. - Product: ride & handling = progressive rear suspension + light weight. - Grow market share while continuing to reduce dealer inventory. Innovation and Quality the Key to Success
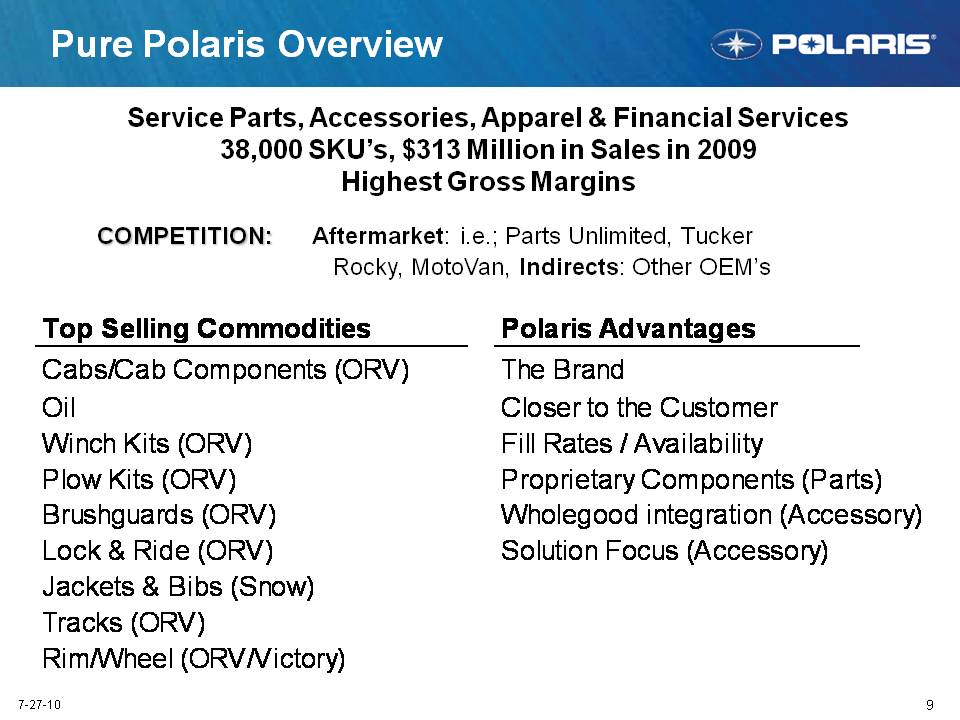
9 7-27-10 COMPETITION: Aftermarket: i.e.; Parts Unlimited, Tucker Rocky, MotoVan, Indirects: Other OEM’s Pure Polaris Overview Service Parts, Accessories, Apparel & Financial Services 38,000 SKU’s, $313 Million in Sales in 2009 Highest Gross Margins Top Selling Commodities Cabs/Cab Components (ORV) Oil Winch Kits (ORV) Plow Kits (ORV) Brushguards (ORV) Lock & Ride (ORV) Jackets & Bibs (Snow) Tracks (ORV) Rim/Wheel (ORV/Victory) Polaris Advantages The Brand Closer to the Customer Fill Rates / Availability Proprietary Components (Parts) Wholegood integration (Accessory) Solution Focus (Accessory)
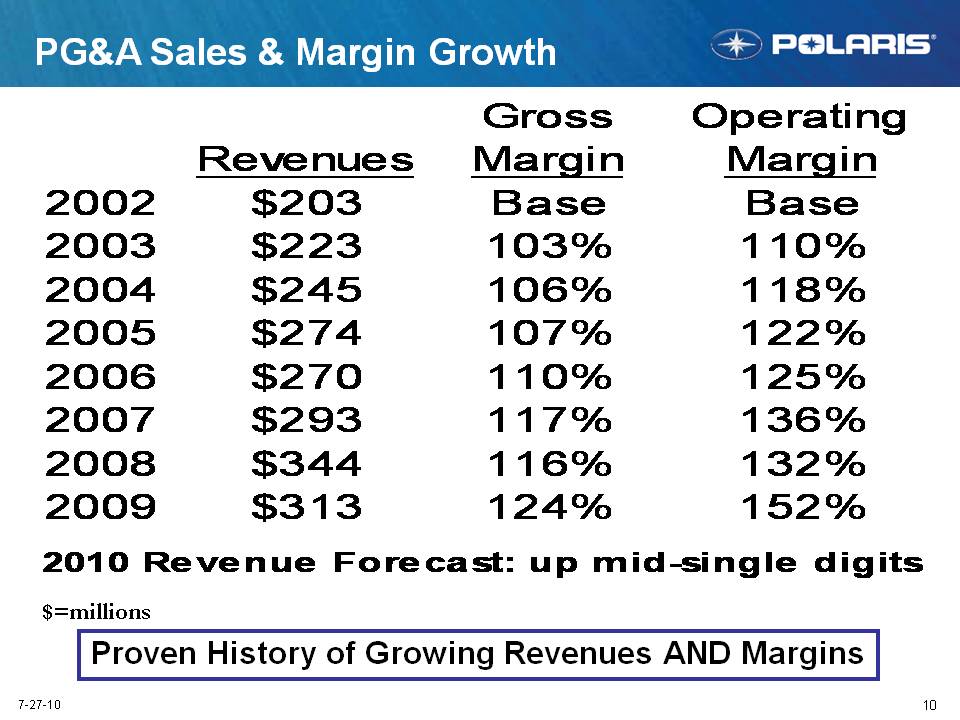
10 7-27-10 PG&A Sales & Margin Growth $=millions Proven History of Growing Revenues AND Margins Revenues Gross Margin Operating Margin 2002 2003 2004 2005 2006 2007 2008 2009 $203 $223 $245 $274 $270 $293 $344 $313 Base 103% 106% 107% 110% 117% 116% 124% 118% 122% 125% 136% 132% 152% 2010 Revenue Forecast: up mid-single digits
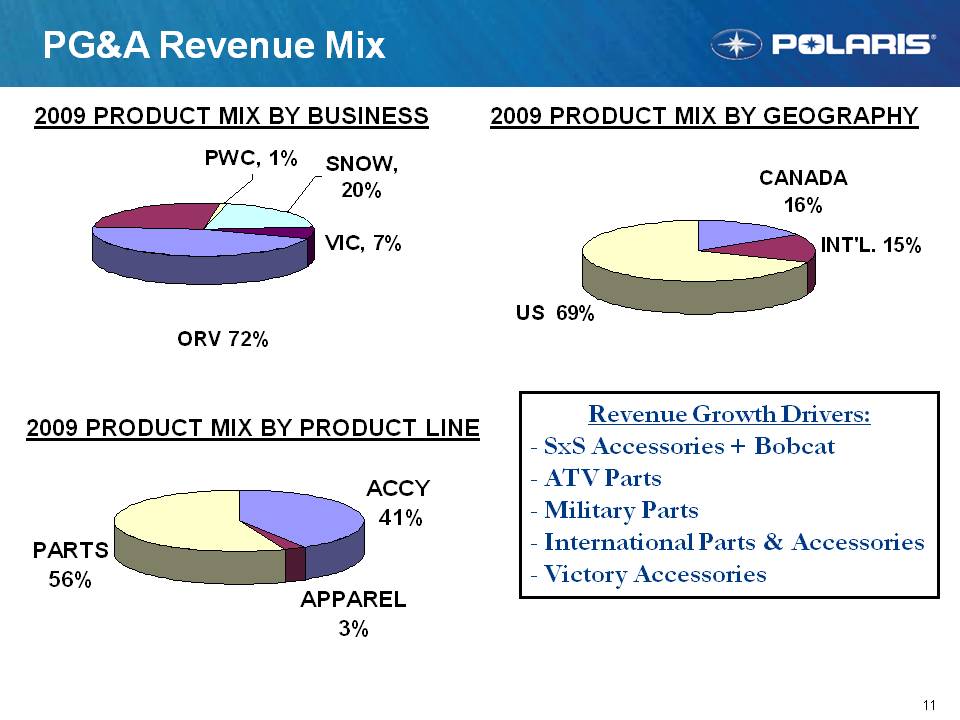
11 7-27-10 ORV 72% 2009 PRODUCT MIX BY GEOGRAPHY PG&A Revenue Mix 2009 PRODUCT MIX BY PRODUCT LINE 2009 PRODUCT MIX BY BUSINESS Revenue Growth Drivers: SxS Accessories + Bobcat ATV Parts Military Parts International Parts & Accessories Victory Accessories PWC, 1% Snow 20% VIC, 7% US 69% CANADA 16% INT’L 15% PARTS 56% ACCY 41% APPAREL 3%
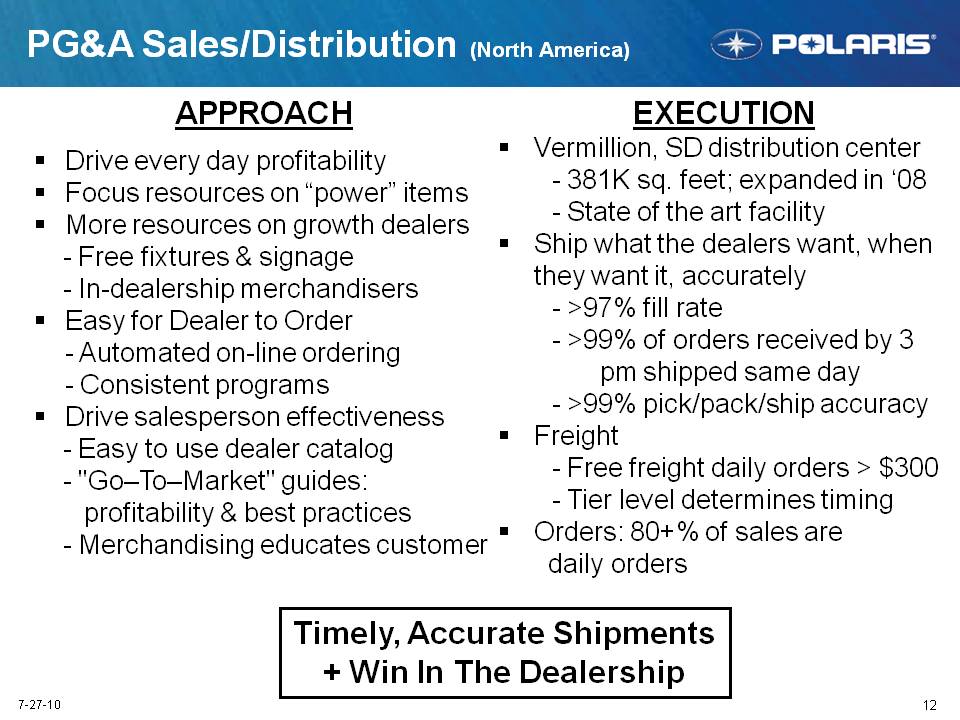
12 7-27-10 PG&A Sales/Distribution (North America) APPROACH Drive every day profitability Focus resources on “power” items More resources on growth dealers - Free fixtures & signage - In-dealership merchandisers Easy for Dealer to Order - Automated on-line ordering - Consistent programs Drive salesperson effectiveness - Easy to use dealer catalog - "Go–To–Market" guides: profitability & best practices - Merchandising educates customer EXECUTION Vermillion, SD distribution center - 381K sq. feet; expanded in ’08 - State of the art facility Ship what the dealers want, when they want it, accurately - >97% fill rate - >99% of orders received by 3 pm shipped same day - >99% pick/pack/ship accuracy Freight - Free freight daily orders > $300 - Tier level determines timing Orders: 80+% of sales are daily orders Timely, Accurate Shipments + Win In The Dealership
13 7-27-10 Innovation Drives Sales ATV: 80 New Accessories Glacier III plow Tire/Rim options: 27 combinations - ITP partnership - Luster rim Lock & Ride Windshields: 18 options VICTORY: 45 New Accessories Core Custom Experience Lock & Ride: Trunk, backrest, luggage rack, windshields Exhaust: Tri-Pro & X-Bow APPAREL Helmets: Demon 1.1 Partnerships: Oakley, FXR Victory: Value Helmets & Premium Touring & Leather Jackets RANGER: 40 New Accessories RangerWare Mid-size & crew cabs Door with sliding window Mid-size poly door Mid-size crew canvas cab Economy rear panel Sport, bimini & poly roofs RZR: 45 New Accessories Flip-out windshield Dual windshield Rangerware cab system LED light bars Overhead speaker system Aluminum roof
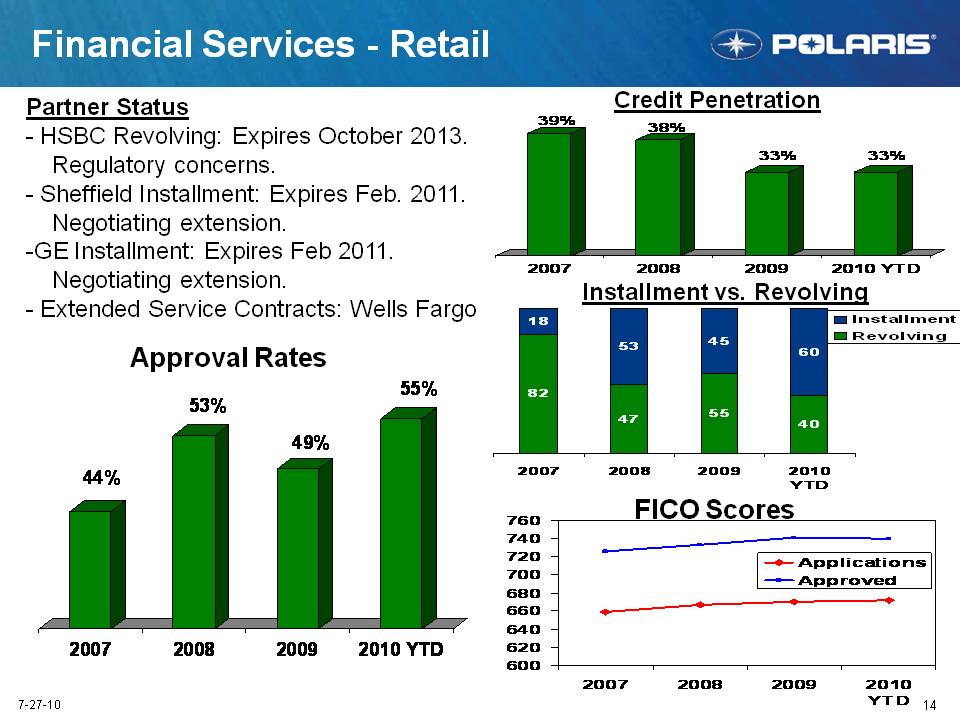
14 7-27-10 Financial Services – Retail Approval Rates Credit Penetration Installment vs. Revolving Partner Status - HSBC Revolving: Expires October 2013. Regulatory concerns. - Sheffield Installment: Expires Feb. 2011. Negotiating extension. - GE Installment: Expires Feb 2011. Negotiating extension. - Extended Service Contracts: Wells Fargo FICO Scores 44% 53% 49% 55% 2007 2008 2009 2010 YTD 39% 38% 33% Installment Revolving 18 82 53 47 45 55 60 40 600 620 640 660 680 700 720 740 760 Applications Approved
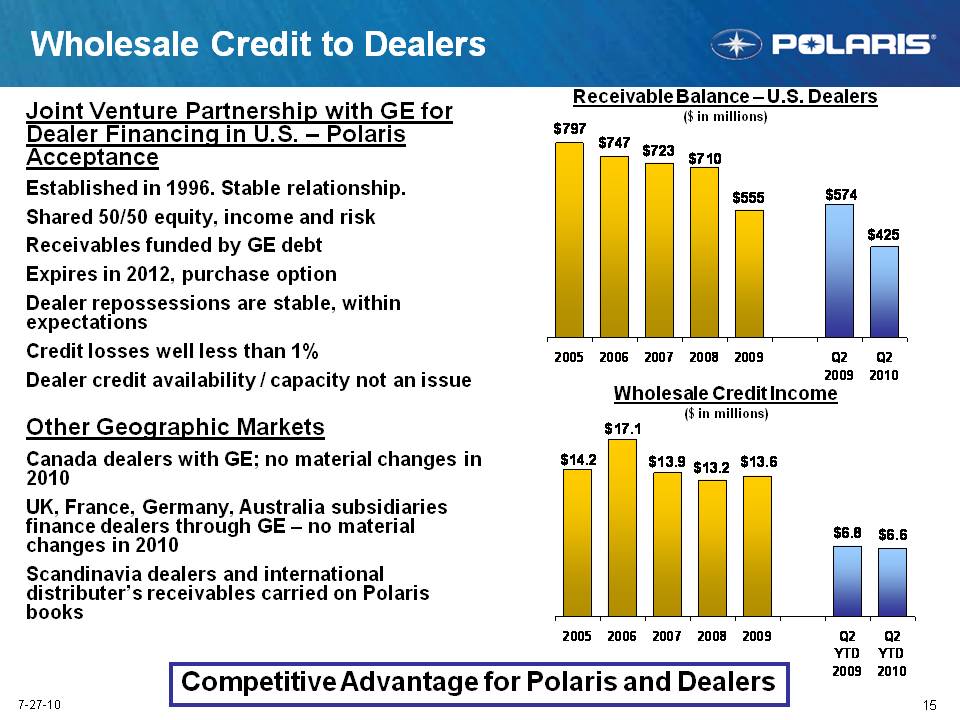
15 7-27-10 Wholesale Credit to Dealers Joint Venture Partnership with GE for Dealer Financing in U.S. – Polaris Acceptance Established in 1996. Stable relationship. Shared 50/50 equity, income and risk Receivables funded by GE debt Expires in 2012, purchase option Dealer repossessions are stable, within expectations Credit losses well less than 1% Dealer credit availability / capacity not an issue Other Geographic Markets Canada dealers with GE; no material changes in 2010 UK, France, Germany, Australia subsidiaries finance dealers through GE – no material changes in 2010 Scandinavia dealers and international distributer’s receivables carried on Polaris books Receivable Balance – U.S. Dealers ($ in millions) Wholesale Credit Income ($ in millions) Competitive Advantage for Polaris and De alers $797 $747 $723 $710 $555 $574 $425 $14.2 $17.1 $13.9 $13.2 $13.6 $6.8 $6.6 2005 2006 2007 2008 2009 Q2 2009 Q2 2010 Q2 YTD 2009 Q2 YTD 2010
16 7-27-10 Summary Snow - Product key to share growth … Rush/800 RMK are winners - Large, stable and active installed base - Nice cash flow business PG&A - Proven ability to grow sales AND margins - Innovation drives growth. Integration with vehicles at an all time high - Highest margin opportunity for both Polaris & our dealers - Great cash flow generator - Aggressively looking to grow the business Financial Services - External environment stable. Maintain partnerships. - Approval rate maximization focus. Selling Polaris products #1 goal. - No balance sheet risk for retail credit.
Sales & Corporate Marketing MVP On-Road Division Mike Jonikas, Vice President Tuesday, July 27, 2010 Analyst Meeting Orlando, FL

2 Agenda N.A. Sales & Corporate Marketing Roadmap Dealer Network Overview Max Velocity Program (MVP) Dealership Health On-Road Division Roadmap Low Emission Small Vehicles Motorcycles & Recreational Riding
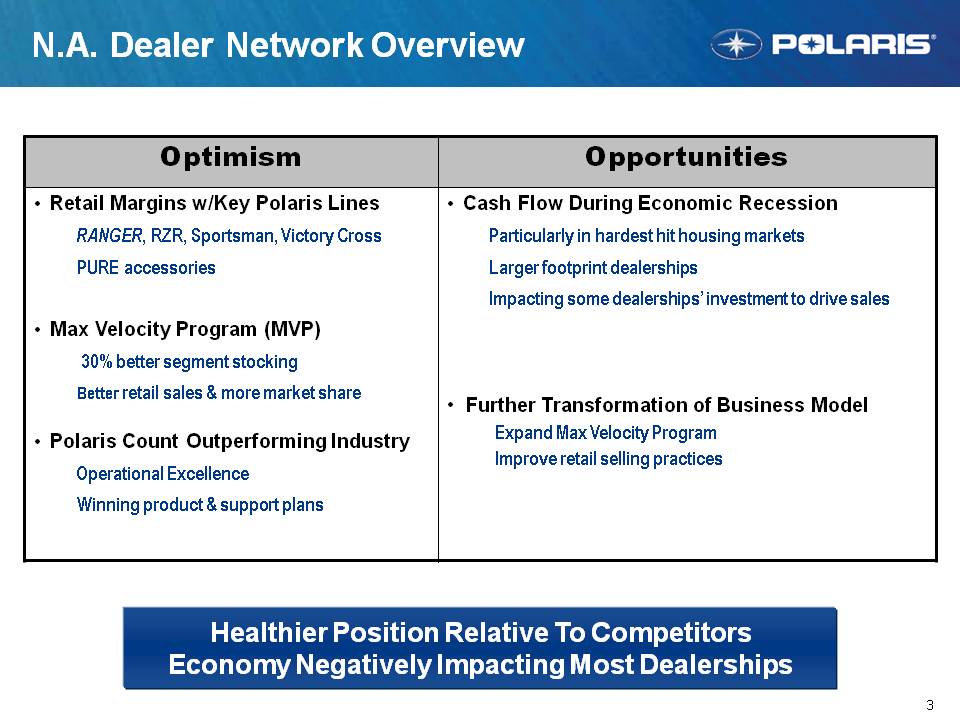
3 N.A. Dealer Network Overview Healthier Position Relative To Competitors Economy Negatively Impacting Most Dealerships Optimism Retail Margins w/Key Polaris Lines RANGER, RZR, Sportsman, Victory Cross PURE accessories Max Velocity Program (MVP) 30% better segment stocking Better retail sales & more market share Polaris Count Outperforming Industry Operational Excellence Winning product & support plans Opportunities Cash Flow During Economic Recession Particularly in hardest hit housing markets Larger footprint dealerships Impacting some dealerships’ investment to drive sales Further Transformation of Business Model Expand Max Velocity Program Improve retail selling practices
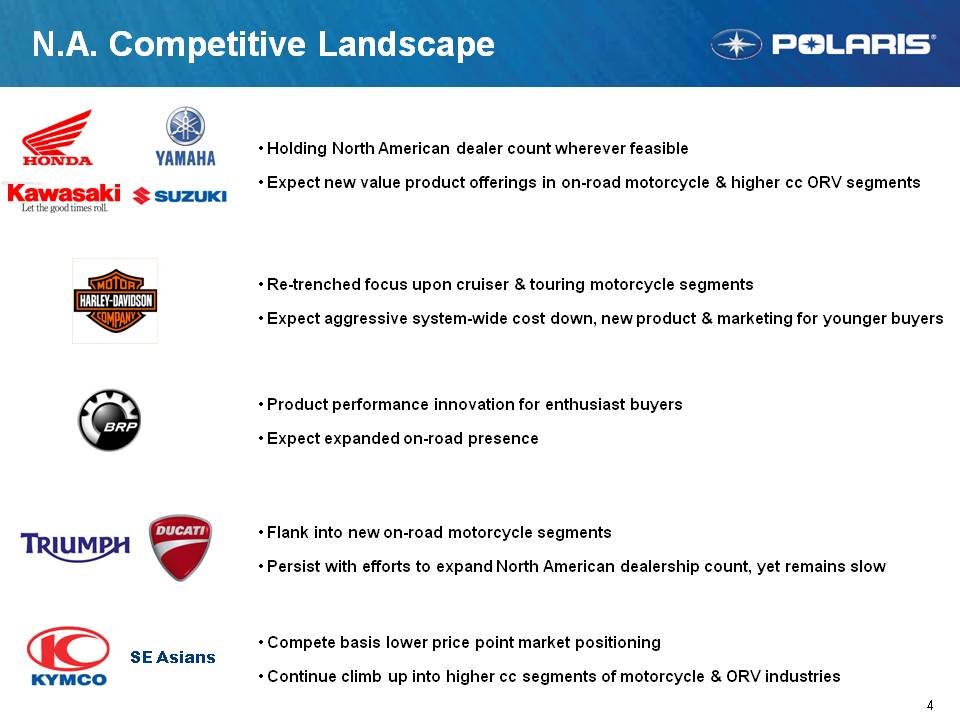
4 N.A. Competitive Landscape Holding North American dealer count wherever feasible Expect new value product offerings in on-road motorcycle & higher cc ORV segments Re-trenched focus upon cruiser & touring motorcycle segments Expect aggressive system-wide cost down, new product & marketing for younger buyers Product performance innovation for enthusiast buyers Expect expanded on-road presence Flank into new on-road motorcycle segments Persist with efforts to expand North American dealership count, yet remains slow Compete basis lower price point market positioning Continue climb up into higher cc segments of motorcycle & ORV industries SE Asians Honda Yamaha Kawasaki Suzuki Harley-Davidson Motor Company BRP Triumph Ducati Kymco
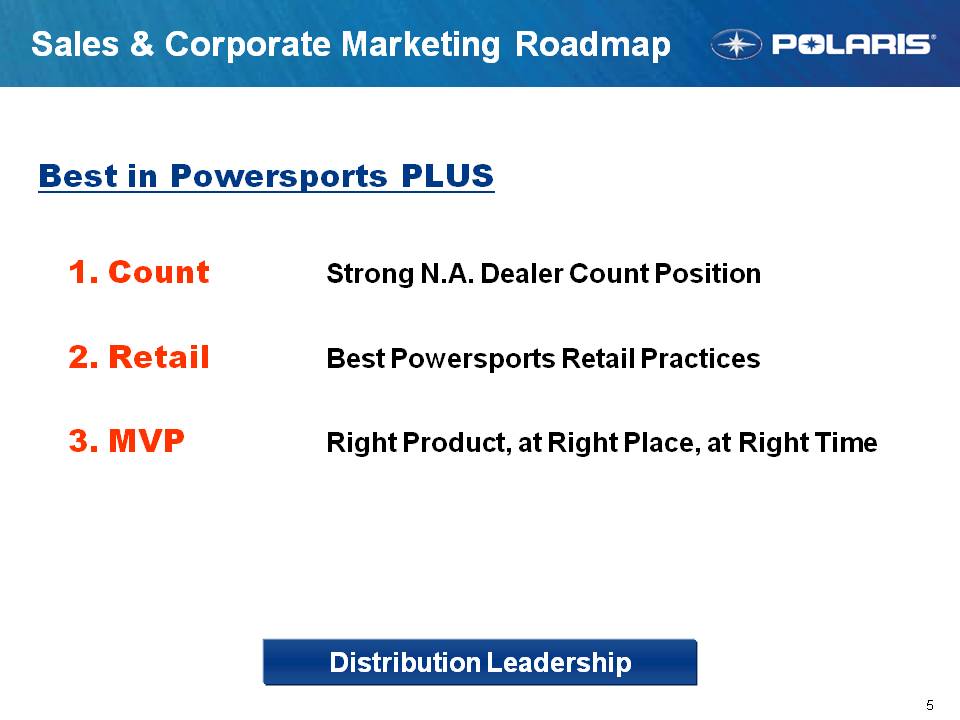
5 Sales & Corporate Marketing Roadmap Best in Powersports PLUS 1. Count Strong N.A. Dealer Count Position 2. RetailBest Powersports Retail Practices 3. MVP Right Product, at Right Place, at Right Time Distribution Leadership
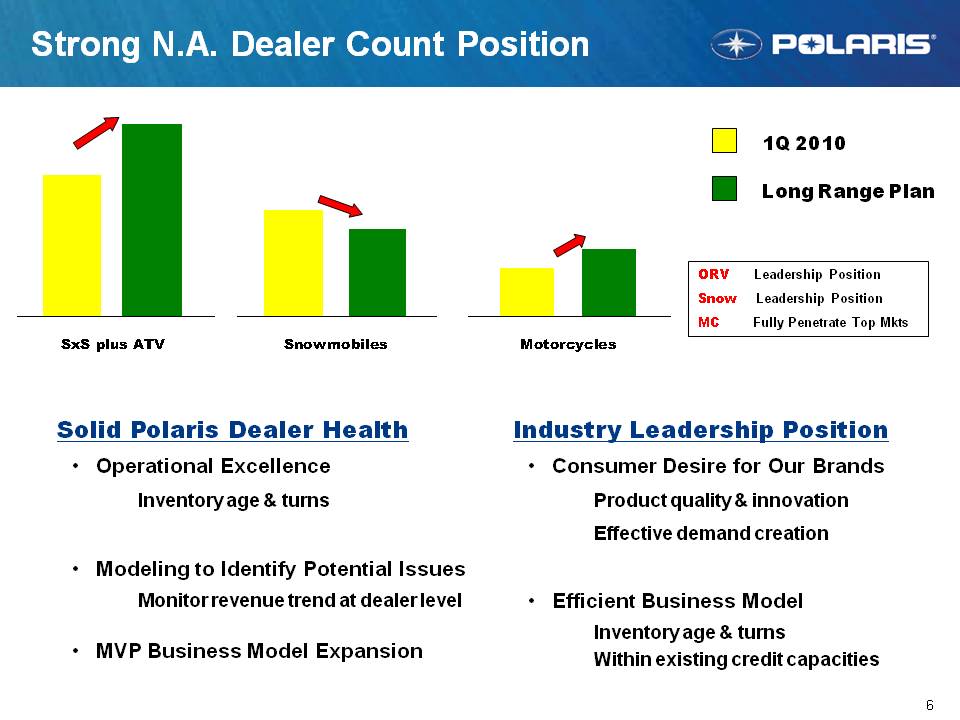
6 Strong N.A. Dealer Count Position Industry Leadership Position Consumer Desire for Our Brands Product quality & innovation Effective demand creation Efficient Business Model Inventory age & turns Within existing credit capacities ORV Leadership Position Snow Leadership Position MC Fully Penetrate Top Mkts 1Q 2010 Long Range Plan Solid Polaris Dealer Health Operational Excellence Inventory age & turns Modeling to Identify Potential Issues Monitor revenue trend at dealer level MVP Business Model Expansion SxS plus ATV Snowmobiles Motorcycles
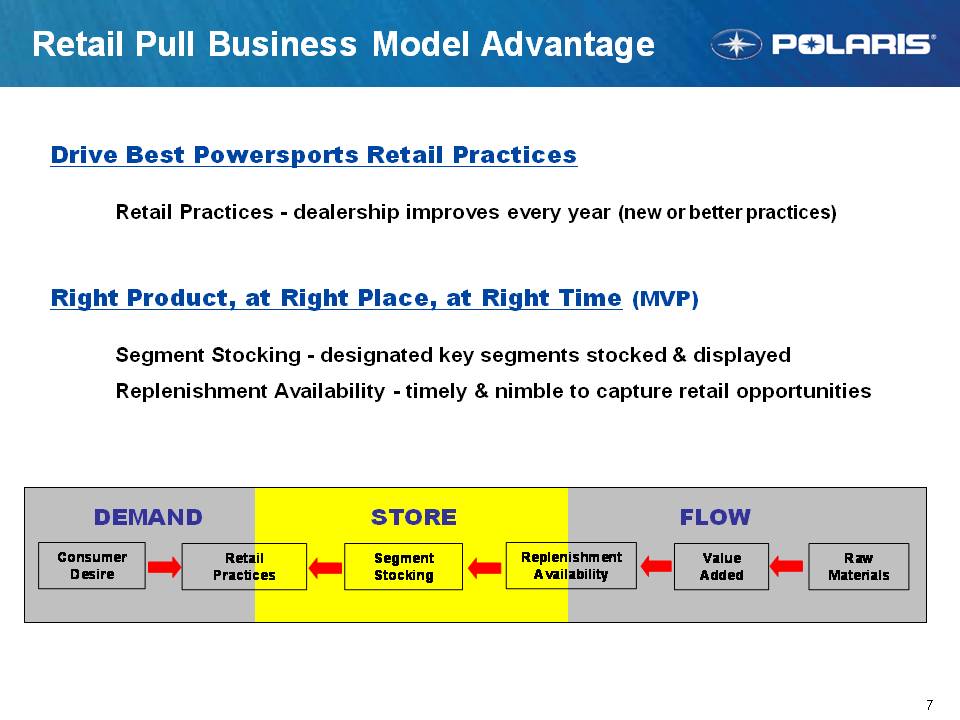
7 Retail Pull Business Model Advantage Drive Best Powersports Retail Practices Retail Practices – dealership improves every year (new or better practices) Right Product, at Right Place, at Right Time (MVP) Segment Stocking - designated key segments stocked & displayed Replenishment Availability - timely & nimble to capture retail opportunities DEMAND STORE FLOW Consumer Desire Retail Practices Segment Stocking Replenishment Availability Value Added Raw Materials
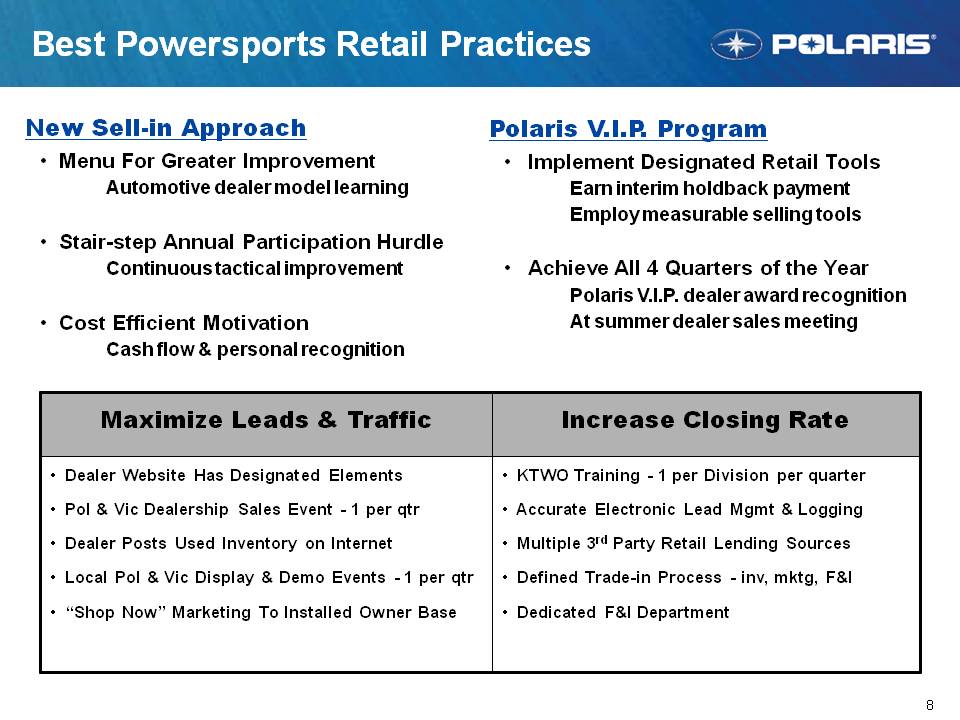
8 Best Powersports Retail Practices New Sell-in Approach Menu For Greater Improvement Automotive dealer model learning Stair-step Annual Participation Hurdle Continuous tactical improvement Cost Efficient Motivation Cash flow & personal recognition Polaris V.I.P. Program Implement Designated Retail Tools Earn interim holdback payment Employ measurable selling tools Achieve All 4 Quarters of the Year Polaris V.I.P. dealer award recognition At summer dealer sales meeting Maximize Leads & Traffic Dealer Website Has Designated Elements Pol & Vic Dealership Sales Event – 1 per qtr Dealer Posts Used Inventory on Internet Local Pol & Vic Display & Demo Events – 1 per qtr “Shop Now” Marketing To Installed Owner Base Increase Closing Rate KWTO Training – 1 per Division p er quarter Accurate Electronic Lead Mgmt & Logging Multiple 3rd Party Retail Lending Sources Defined Trade-in Process – inv, mktg, F&I Dedicated F&I Department

9 Right Product, Place, and Time (MVP) Segment Stocking Advantage Viable Product Segments Consumer desired for reasonable turns Designated segments by market Appropriate Flooring Support TermsMutual incentive for profitable turns Frequent Replenishment Orders Consistent DSM selling execution Nimble to capture retail opportunities Available to All ORV Dealers Can Be Earned by All Dealerships Volume Dictates Replen Frequency Higher volume dealer = bi-weekly Lower volume dealer = quarterly Product Replenishment Availability Raw material hedge management Make to order lead timesTargeted local DC network
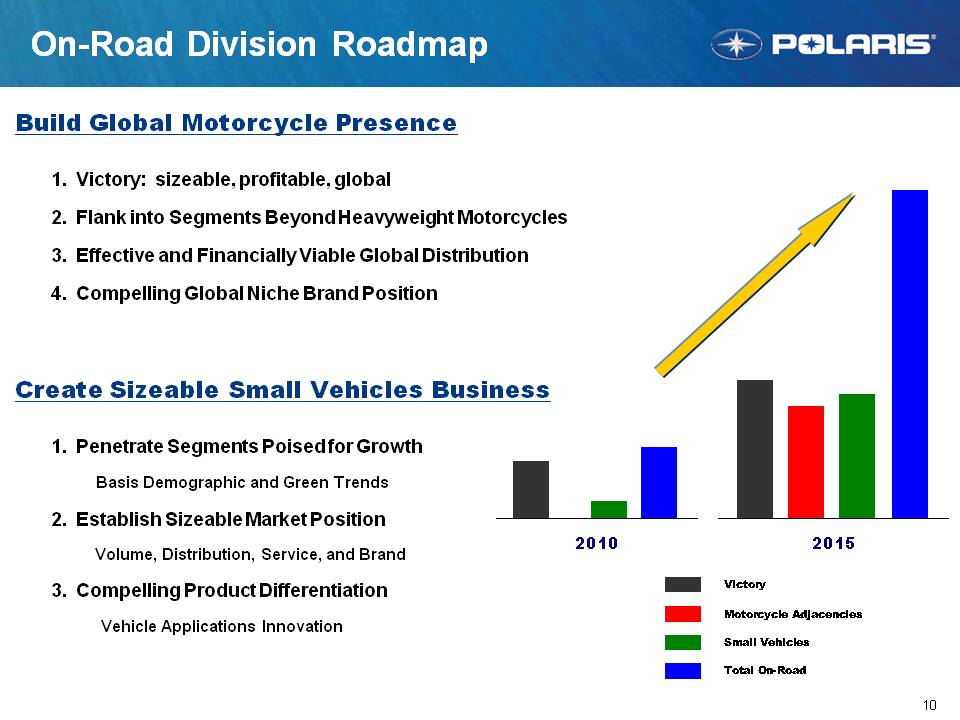
10 On-Road Division Roadmap Build Global Motorcycle Presence 1. Victory: sizeable, profitable, global 2. Flank into Segments Beyond Heavyweight Motorcycles 3. Effective and Financially Viable Global Distribution 4. Compelling Global Niche Brand Position Create Sizeable Small Vehicles Business 1. Penetrate Segments Poised for Growth Basis Demographic and Green Trends 2. Establish Sizeable Market Position Volume, Distribution, Service, and Brand 3. Compelling Product Differentiation Vehicle Applications Innovation 2010 2014 Victory Motorcycle Adjacencies Small Vehicles Total On-Road
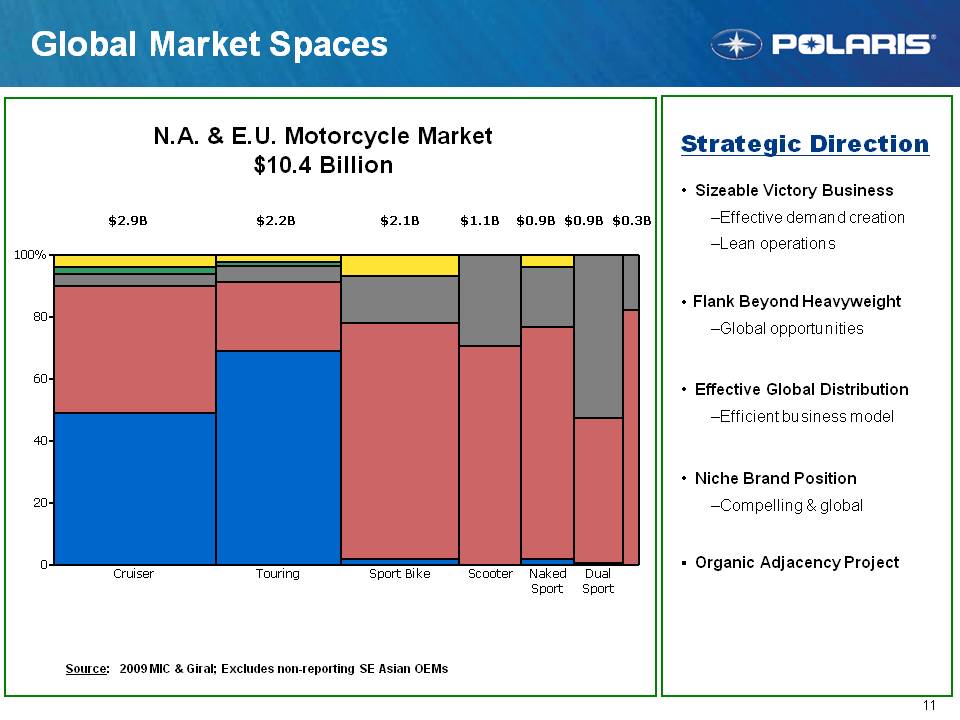
11 N.A. & E.U. Motorcycle Market $10.4 Billion Source: 2009 MIC & Giral; Excludes non-reporting SE Asian OEMs $2.2B $2.9B $2.1B $1.1B $0.9B $0.9B $0.3B Strategic Direction Sizeable Victory Business – Effective demand creation - Lean operations Flank Beyond Heavyweight - Global opportunities Effective Global Distribution - Efficient business model Niche Brand Position - Compelling & global Organic Adjacency Project Cruiser Touring Sport Bike Scooter Naked Sport Dual Sport 0 20 40 60 80 100%
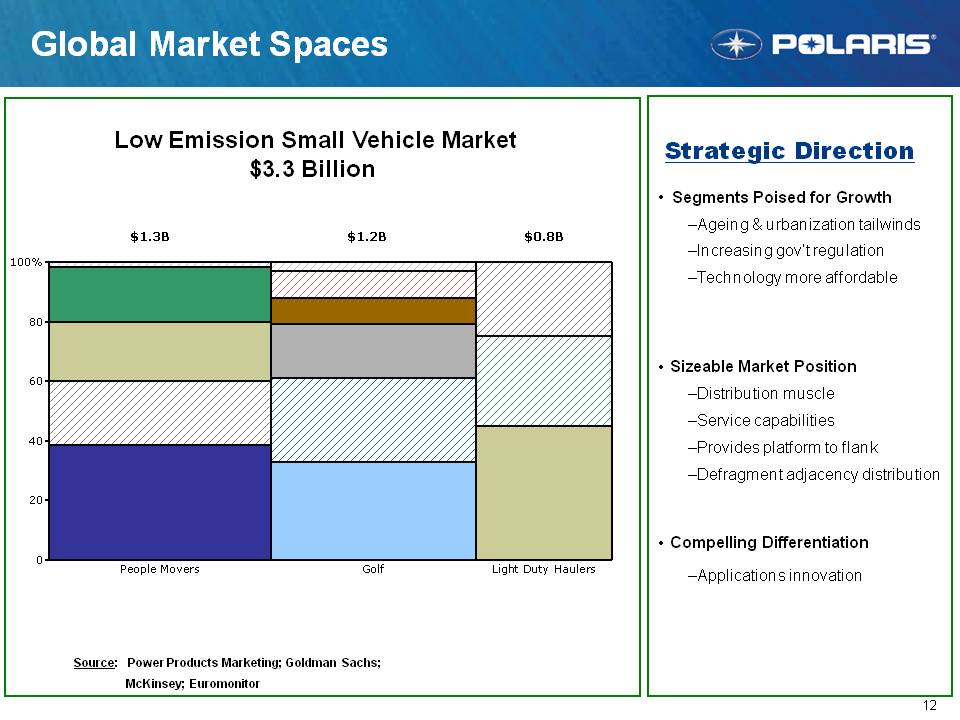
12 Low Emission Small Vehicle Market $3.3 Billion Source: Power Products Marketing; Goldman Sachs; McKinsey; Euromonitor $1.3B $1.2B $0.8B Strategic Direction Segments Poised for Growth - Ageing & urbanization tailwinds - Increasing gov’t regulation - Technology more affordable Sizeable Market Position - Distribution muscle - Service capabilities - Provides platform to flank - Defragment adjacency distribution Compelling Differentiation - Applications innovation 0 20 40 60 80 100% People Movers Golf Light Duty Haulers
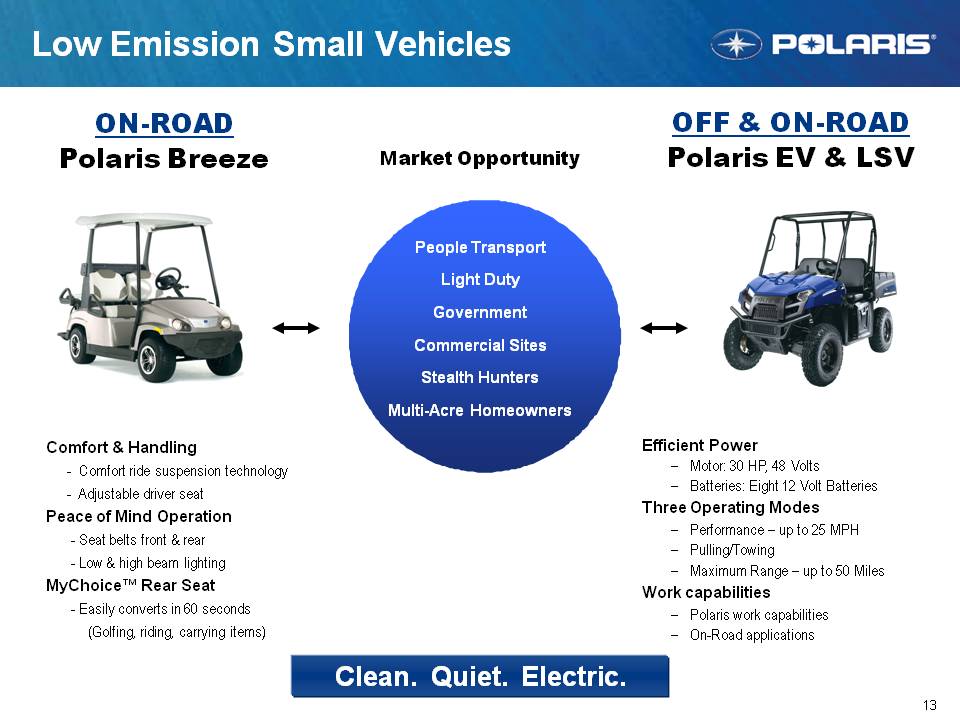
13 Low Emission Small Vehicles People Transport Light Duty Government Commercial Sites Stealth Hunters Multi-Acre Homeowners Comfort & Handling - Comfort ride suspension technology - Adjustable driver seat Peace of Mind Operation - Seat belts front & rear - Low & high beam lighting MyChoice™ Rear Seat - Easily converts in 60 seconds (Golfing, riding, carrying items) Market Opportunity ON-ROAD Polaris Breeze OFF & ON-ROAD Polaris EV & LSV Efficient Power - Motor: 30 HP, 48 Volts - Batteries: Eight 12 Volt Batteries Three Operating Modes - Performance – up to 25 MPH - Pulling/Towing - Maximum Range – up to 50 Miles Work capabilities - Polaris work capabilities - On-Road applications Clean. Quiet. Electric.
Steve Menneto, General Manager Tuesday, July 27, 2010 Analyst Meeting Orlando, FL Fuel It. Victory
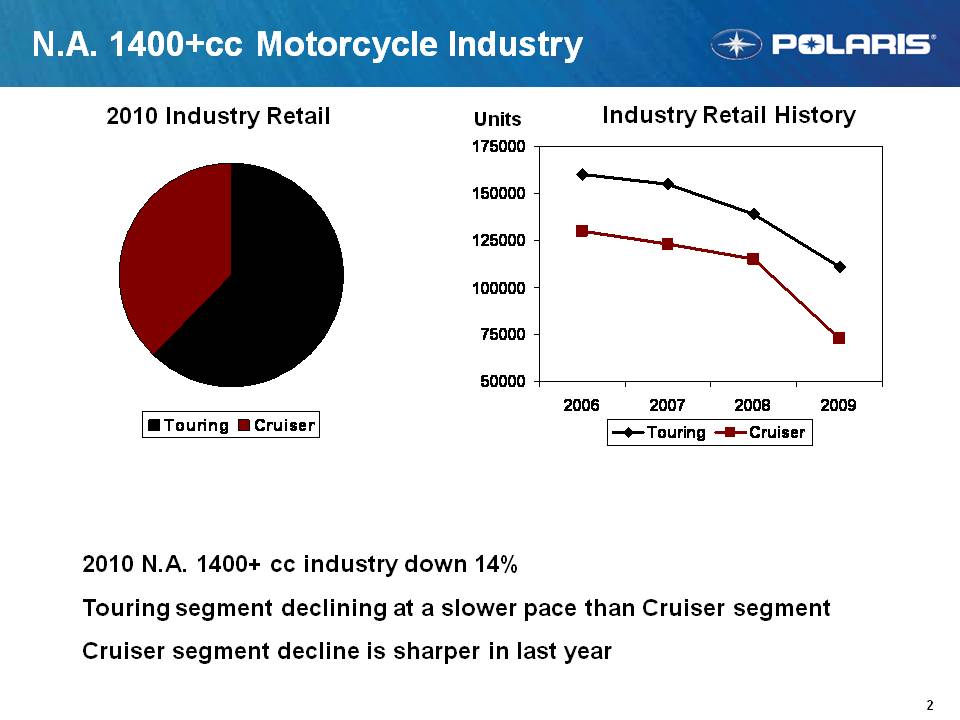
2 N.A. 1400+cc Motorcycle Industry Industry Retail History Units 2010 Industry Retail 2010 N.A. 1400+ cc industry down 14% Touring segment declining at a slower pace than Cruiser segment Cruiser segment decline is sharper in last year Touring Cruiser 2006 2007 2008 2009 50000 75000 100000 125000 150000 175000
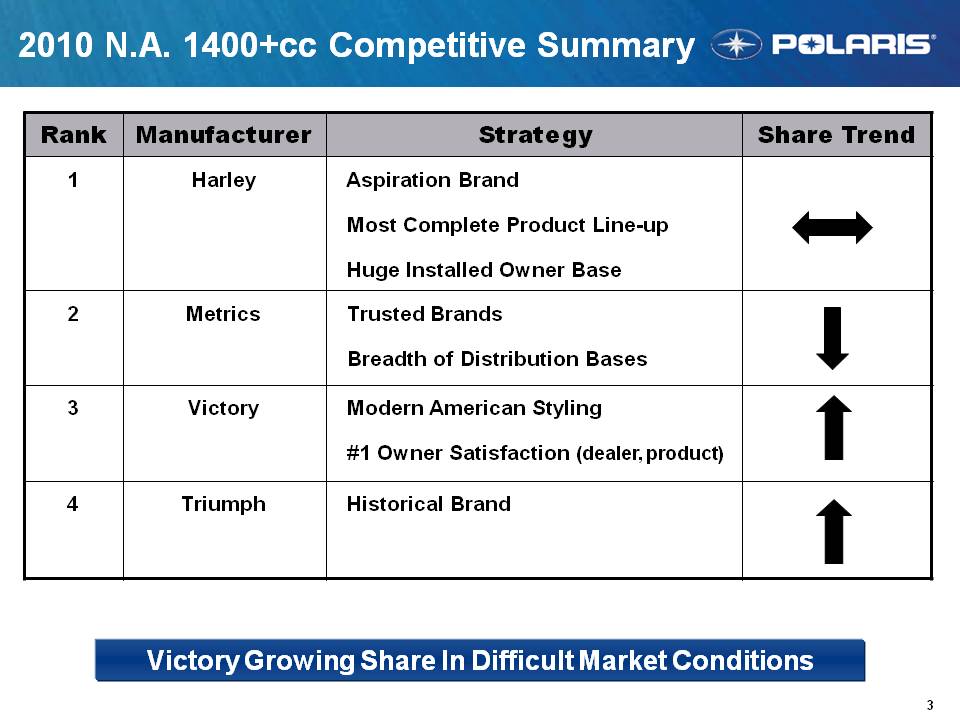
3 2010 N.A. 1400+cc Competitive Summary Victory Growing Share In Difficult Market Conditions Rank Manufacturer Strategy Share Trend 1 Harley Aspiration Brand Most Complete Product Line-up Huge Installed Owner Base 2 Metrics Trusted Brands Breadth of Distribution Bases 3 Victory Modern American Styling #1 Owner Satisfaction (dealer, product) 4 Triumph Historical Brand
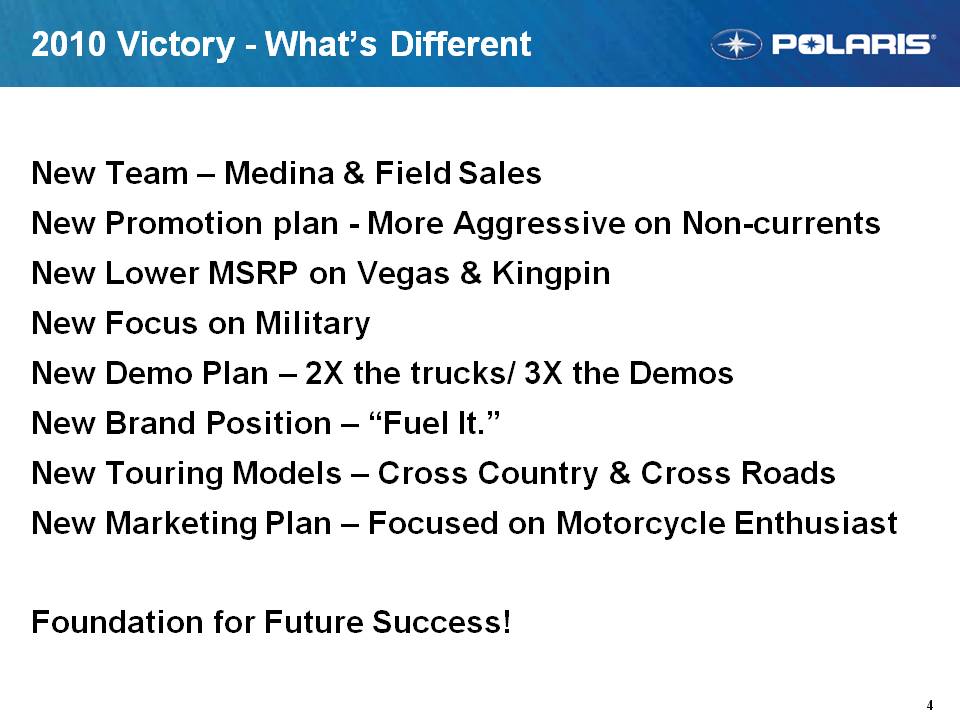
4 2010 Victory - What’s Different New Team – Medina & Field Sales New Promotion plan - More Aggressive on Non-currents New Lower MSRP on Vegas & Kingpin New Focus on Military New Demo Plan – 2X the trucks/3X the Demos New Brand Position – “Fuel It.” New Touring Models – Cross Country & Cross Roads New Marketing Plan – Focused on Motorcycle Enthusiast Foundation for Future Success!
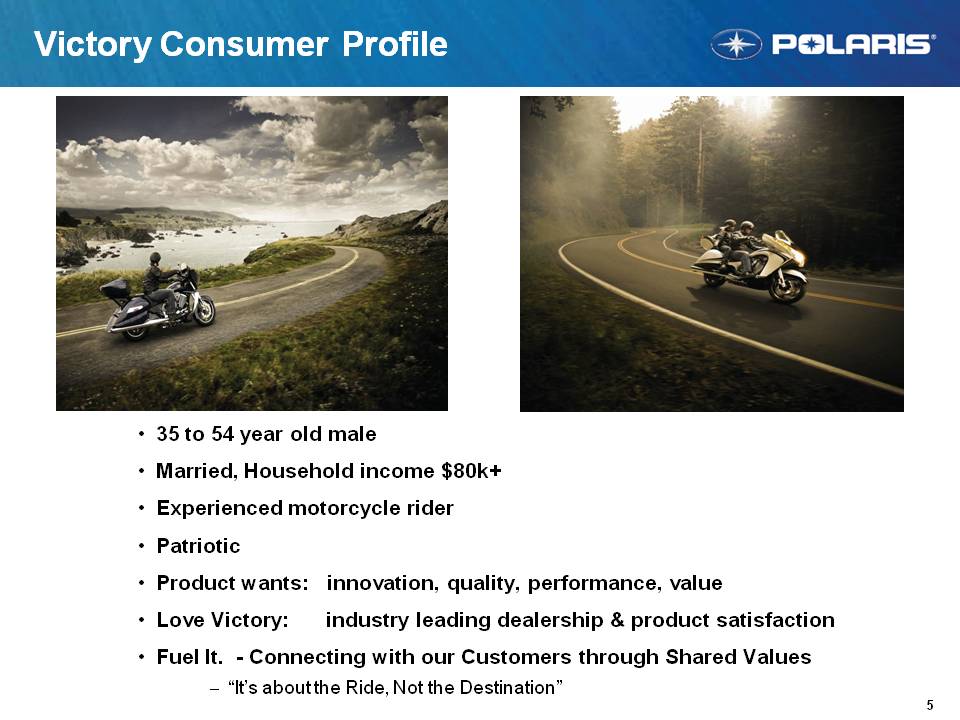
5 Victory Consumer Profile 35 to 54 year old male Married, Household income $80k+ Experienced motorcycle rider Patriotic Product wants: innovation, quality, performance, value Love Victory: industry leading dealership & product satisfaction Fuel It. - Connecting with our Customers through Shared Values - “It’s about the Ride, Not the Destination”
6 Victory Growth Strategy 1. Expand Victory Touring Business 2. Strengthen Victory Proposition With Core Customer 3. Lean Operations 4. International Sales 5. Expand Global Distribution Presence
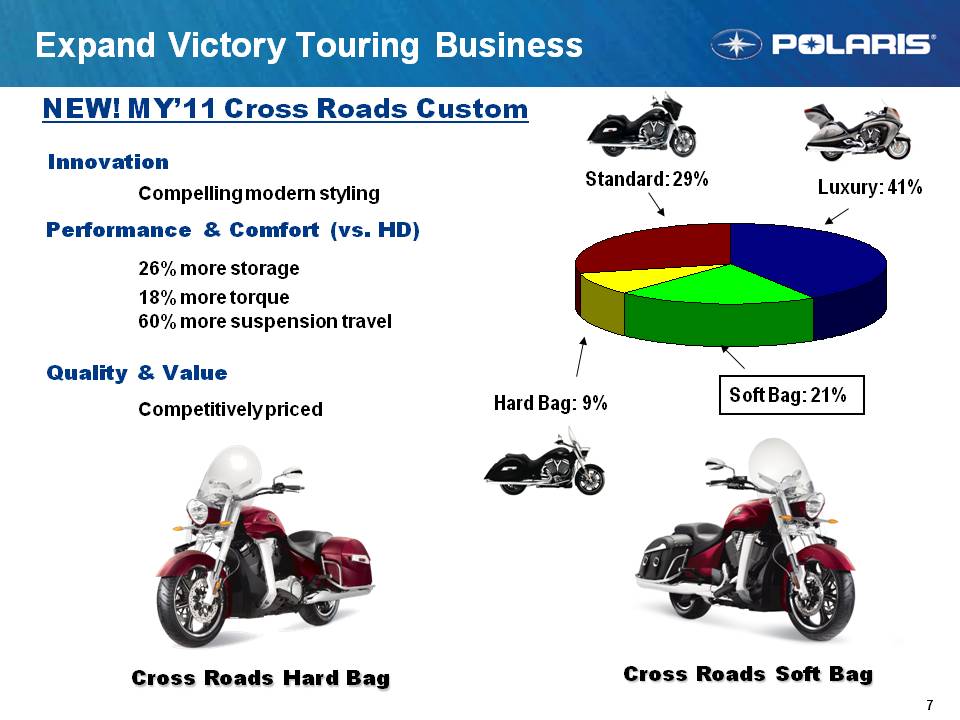
7 Expand Victory Touring Business NEW! MY’11 Cross Roads Custom Innovation Compelling modern styling Performance & Comfort (vs. HD) 26% more storage 18% more torque 60% more suspension travel Quality & Value Competitively priced Cross Roads Hard Bag Luxury: 41% Soft Bag: 21% Standard: 29% Hard Bag: 9% Cross Roads Soft Bag
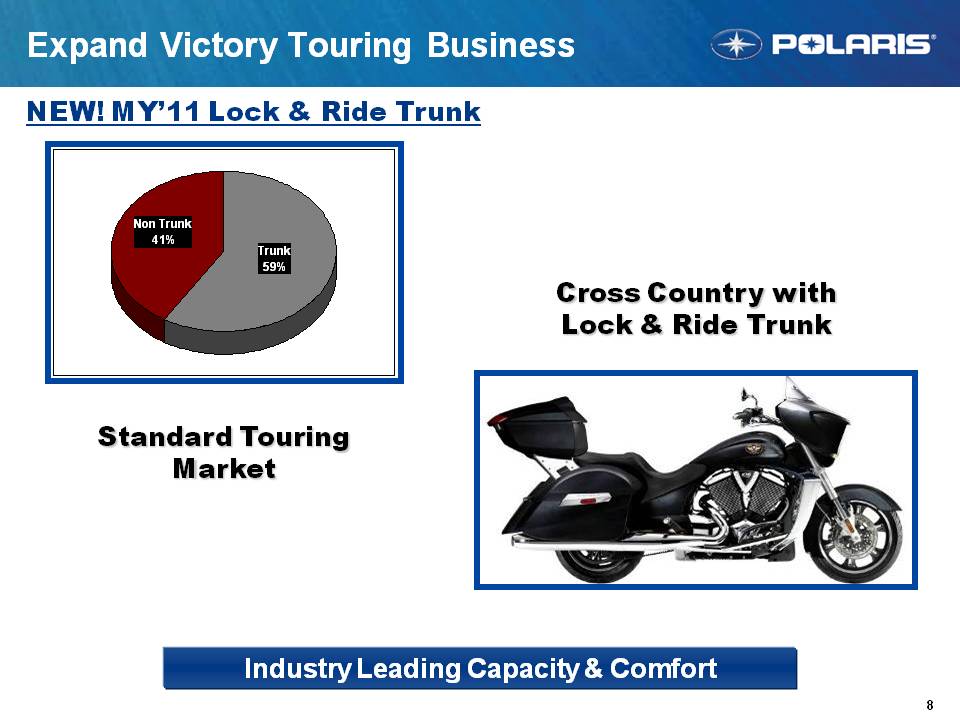
8 Expand Victory Touring Business Cross Country with Lock & Ride Trunk Standard Touring Market NEW! MY’11 Lock & Ride Trunk Industry Leading Capacity & Comfort
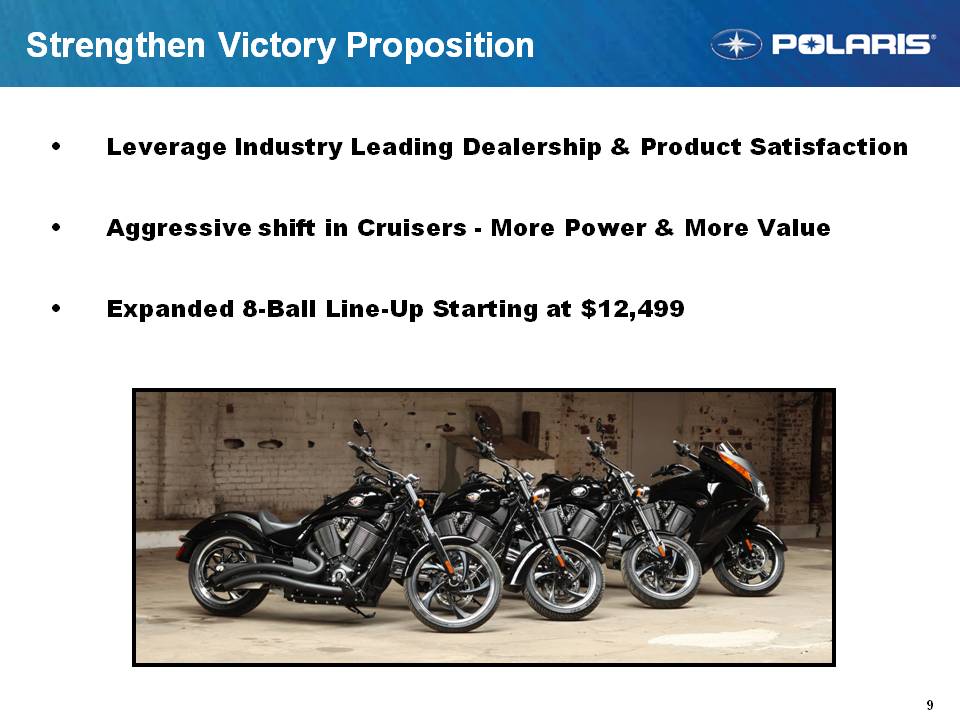
9 Strengthen Victory Proposition Leverage Industry Leading Dealership & Product Satisfaction Aggressive shift in Cruisers - More Power & More Value Expanded 8-Ball Line-Up Starting at $12,499
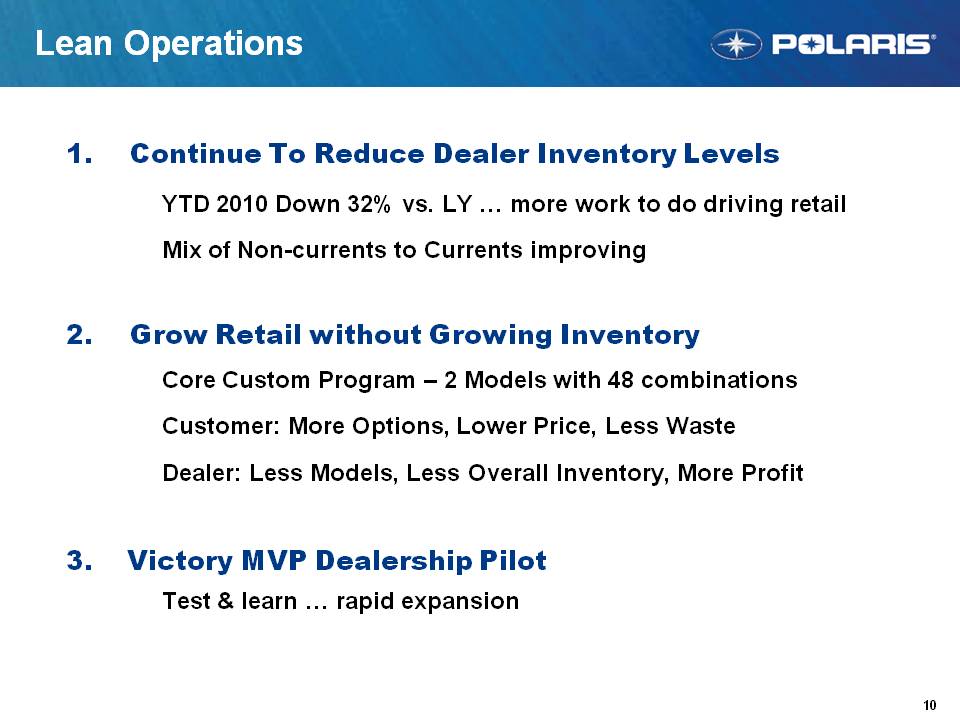
10 Lean Operations 1. Continue To Reduce Dealer Inventory Levels YTD 2010 Down 32% vs. LY … more work to do driving retail Mix of Non-currents to Currents improving 2. Grow Retail without Growing Inventory Core Custom Program – 2 Models with 48 combinations Customer: More Options, Lower Price, Less Waste Dealer: Less Models, Less Overall Inventory, More Profit 3. Victory MVP Dealership Pilot Test & learn … rapid expansion
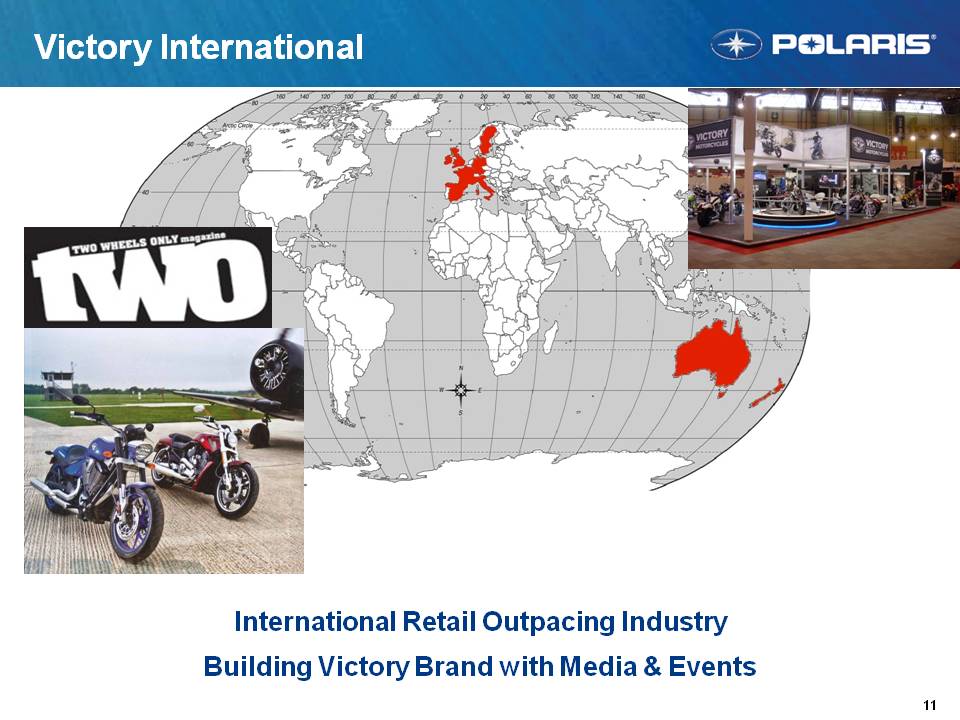
11 Victory International International Retail Outpacing Industry Building Victory Brand with Media & Events
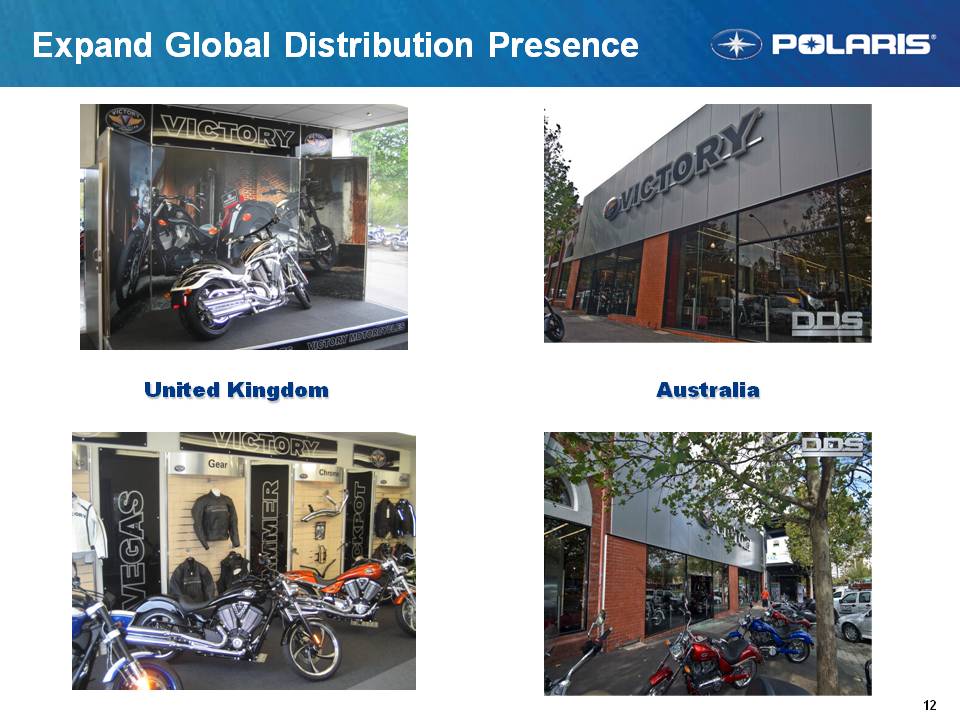
12 Expand Global Distribution Presence United Kingdom Australia
Corporate Development Todd Balan – VP Corporate Development July 27, 2010

2 Agenda Polaris acquisition impact Acquisition processes Target spaces Timing and magnitude Swissauto review Analyst meeting 7-27-10
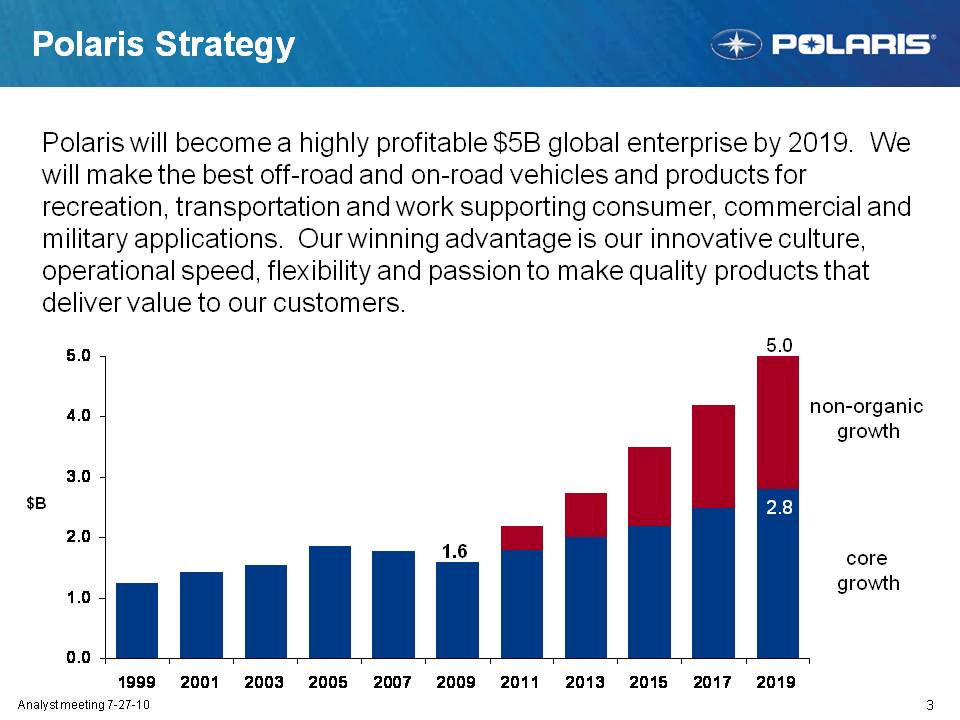
3 Polaris Strategy Polaris will become a highly profitable $5B global enterprise by 2019. We will make the best off-road and on-road vehicles and products for recreation, transportation and work supporting consumer, commercial and military applications. Our winning advantage is our innovative culture, operational speed, flexibility and passion to make quality products that deliver value to our customers. $B 1.6 5.0 2.8 non-organic growth core growth 0.0 1.0 2.0 3.0 4.0 5.0 1999 2001 2003 2005 2007 2009 2011 2013 2014 2017 2019 Analyst meeting 7-27-10
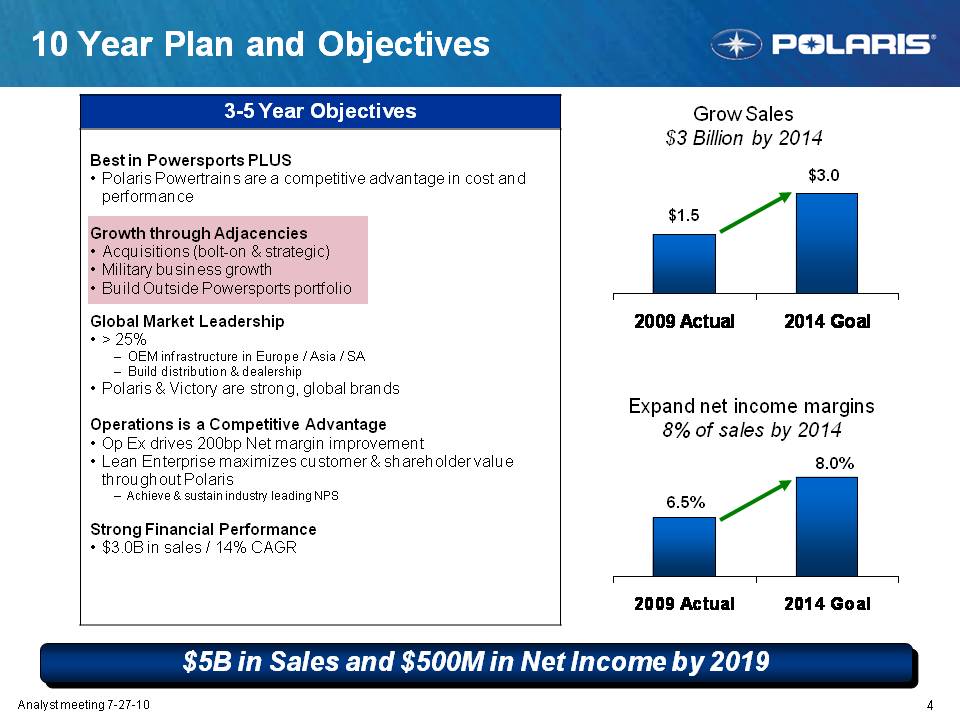
4 Analyst meeting 7-27-10 10 Year Plan and Objectives $5B in Sales and $500M in Net Income by 2019 $1.5 $3.0 Grow Sales $3 Billion by 2014 6.5% 8.0% Expand net income margins 8% of sales by 2014 2009 Actual 2014 Best in Powersports PLUS Polaris Powertrains are a competitive advantage in cost and performance Growth through Adjacencies Acquisitions (bolt-on & strategic) Military business growth Build Outside Powersports portfolio Global Market Leadership > 25% – OEM infrastructure in Europe / Asia / SA – Build distribution & dealership Polaris & Victory are strong, global brands Operations is a Competitive Advantage Op Ex drives 200bp Net margin improvement Lean Enterprise maximizes customer & shareholder value throughout Polaris – Achie ve & sustain industry leading NPS Strong Financial Performance $3.0B in sales / 14% CAGR
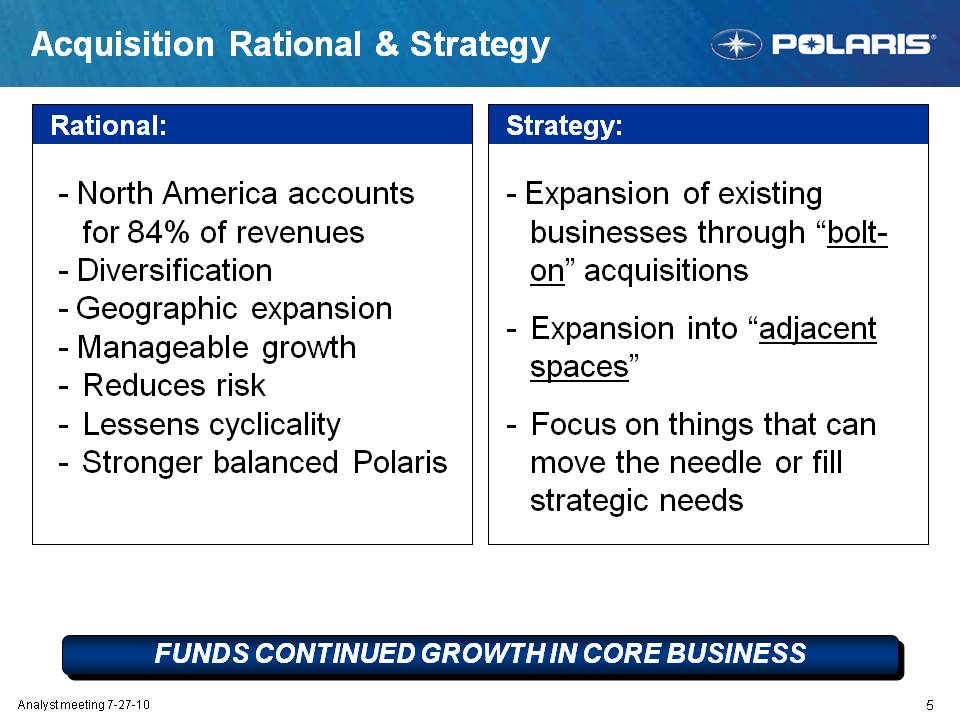
5 Analyst meeting 7-27-10 Rational: Acquisition Rational & Strategy - North America accounts for 84% of revenues – Diversification - Geographic expansion - Manageable growth Reduces risk Lessens cyclicality Stronger balanced Polaris FUNDS CONTINUED GROWTH IN CORE BUSINESS Strategy: - Expansion of existing businesses through “bolt-on” acquisitions - Expansion into “adjacent spaces” - Focus on things that can move the needle or fill strategic needs
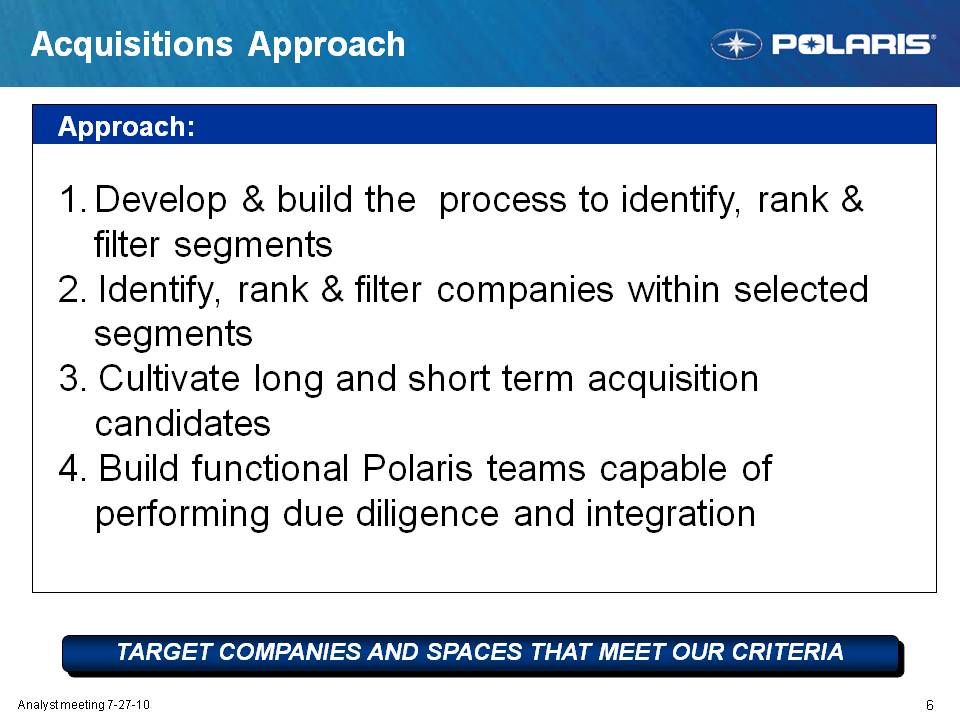
6 Analyst meeting 7-27-10 Acquisitions Approach Approach: 1. Develop & build the process to identify, rank & filter segments 2. Identify, rank & filter companies within selected segments 3. Cultivate long and short term acquisition candidates 4. Build functional Polaris teams capable of performing due diligence and integration TARGET COMPANIES AND SPACES THAT MEET OUR CRITERIA
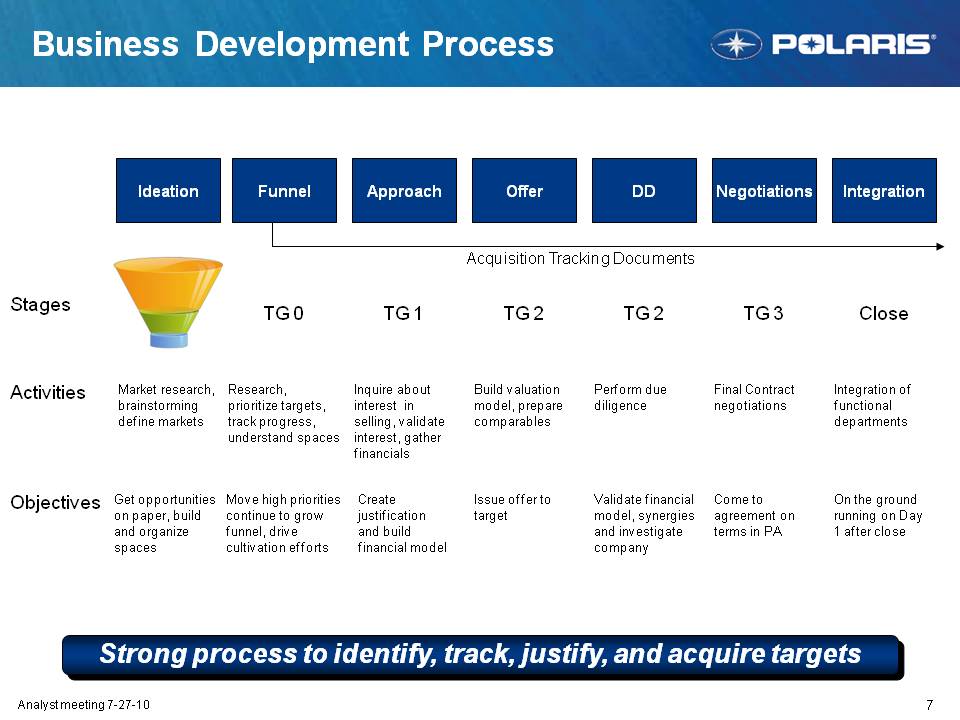
7 Analyst meeting 7-27-10 Ideation Funnel Approach Offer DD Negotiations Integration Activities Objectives Stages Market research, brainstorming define markets Get opportunities on paper, build and organize spaces Research, prioritize targets, track progress, understand spaces Move high priorities continue to grow funnel, drive cultivation efforts Inquire about interest in selling, validate interest, gather financials Create justification and build financial model Build valuation model, prepare comparables Issue offer to target Perform due diligence Validate financial model, synergies and investigate company Final Contract negotiations Come to agreement on terms in PA On the ground running on Day 1 after close Integration of functional departments Close TG 0 TG 1 TG 2 TG 2 TG 3 Acquisition Tracking Documents Strong process to identify, track, justify, and acquire targets Business Development Process
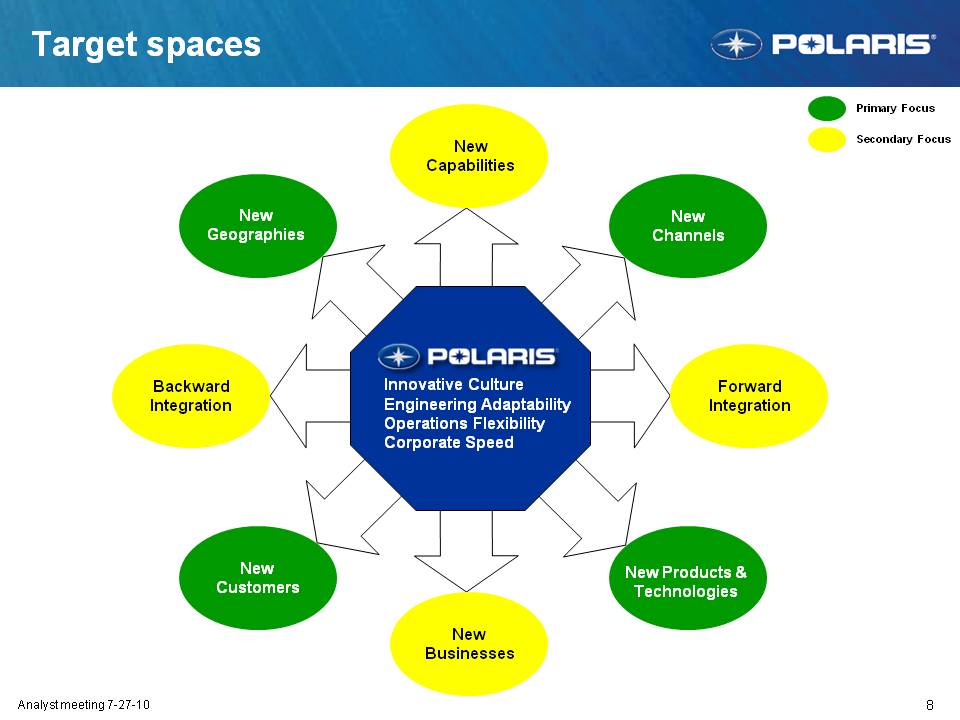
8 Analyst meeting 7-27-10 Target spaces New Customers New Channels New Geographies New Products & Technologies Innovative Culture Engineering Adaptability Operations Flexibility Corporate Speed New Businesses Forward Integration Backward Integration New Capabilities Primary Focus Secondary Focus
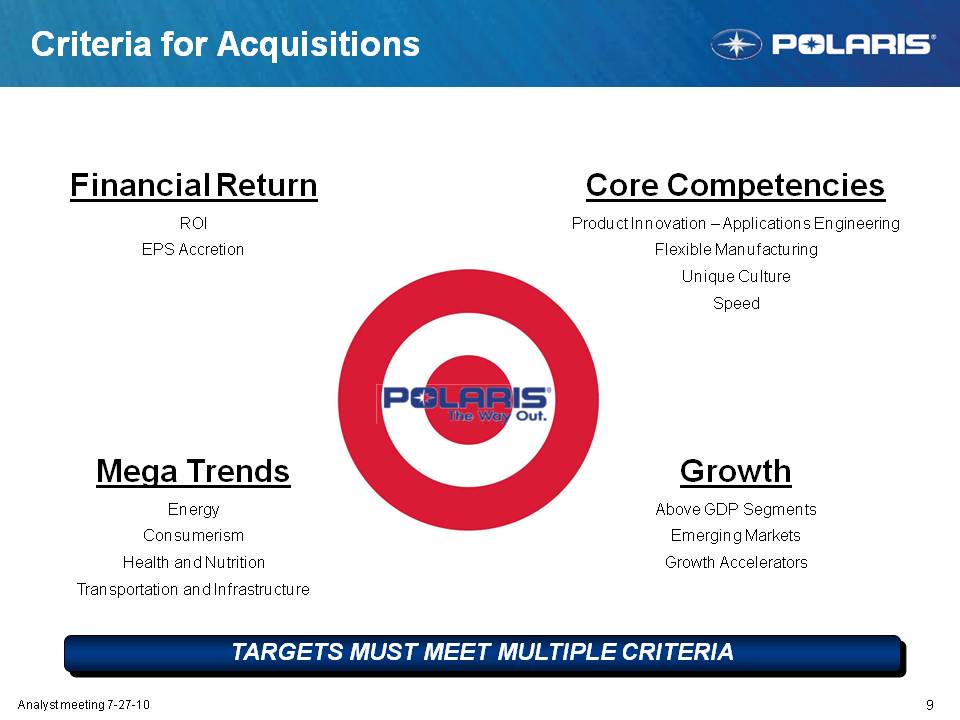
9 Analyst meeting 7-27-10 Core Competencies Product Innovation – Applications Engineering Flexible Manufacturing Unique Culture Speed Criteria for Acquisitions Financial Return ROI EPS Accretion Growth Above GDP Segments Emerging Markets Growth Accelerators Mega Trends Energy Consumerism Health and Nutrition Transportation and Infrastructure TARGETS MUST MEET MULTIPLE CRITERIA
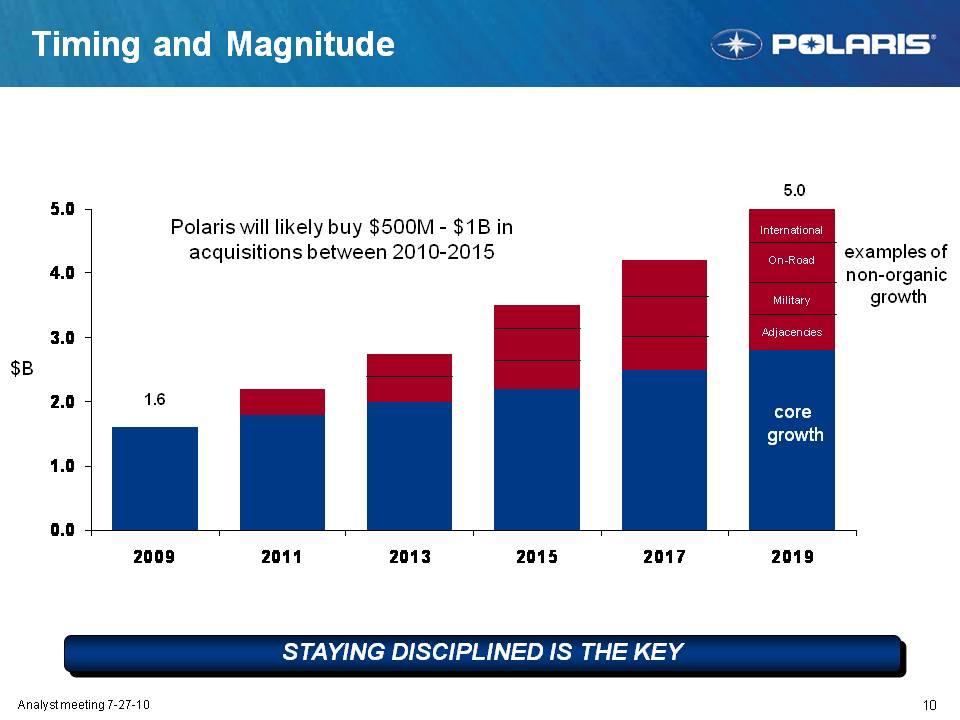
10 Analyst meeting 7-27-10 Timing and Magnitude $B 1.6 5.0 core growth Polaris will likely buy $500M - $1B in acquisitions between 2010-2015 International On-Road Military Adjacencies STAYING DISCIPLINED IS THE KEY examples of non-organic growth 0.0 1.0 2.0 3.0 4.0 5.0 2009 2011 2013 2015 2017 2019
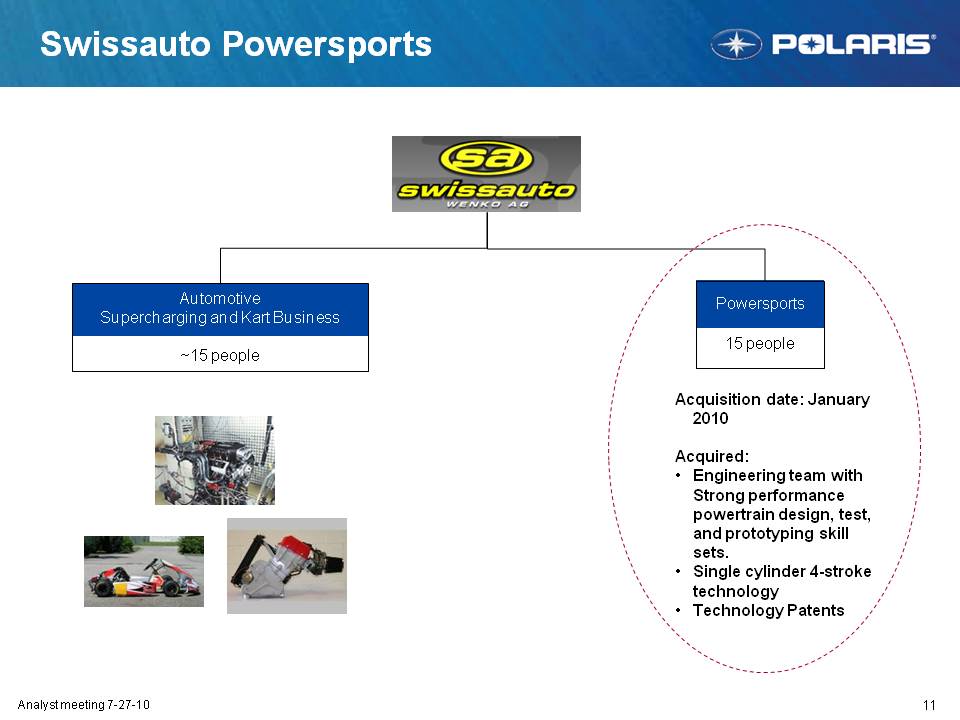
11 Analyst meeting 7-27-10 Swissauto Powersports Automotive Supercharging and Kart Business ~15 people Powersports 15 people Acquisition date: January 2010 Acquired: Engineering team with Strong performance powertrain design, test, and prototyping skill sets. Single cylinder 4-stroke technology Technology Patents
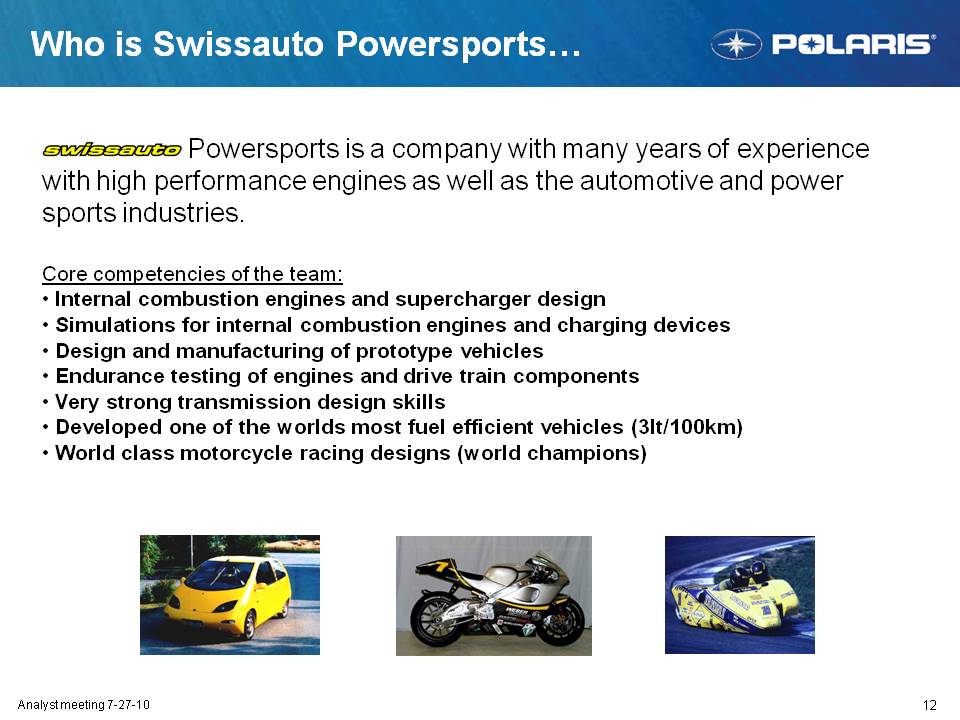
12 Analyst meeting 7-27-10 Who is Swissauto Powersports… Powersports is a company with many years of experience with high performance engines as well as the automotive and power sports industries. Core competencies of the team: Internal combustion engines and supercharger design Simulations for internal combustion engines and charging devices Design and manufacturing of prototype vehicles Endurance testing of engines and drive train components Very strong transmission design skills Developed one of the worlds most fuel efficient vehicles (3lt/100km) World class motorcycle racing designs (world champions)
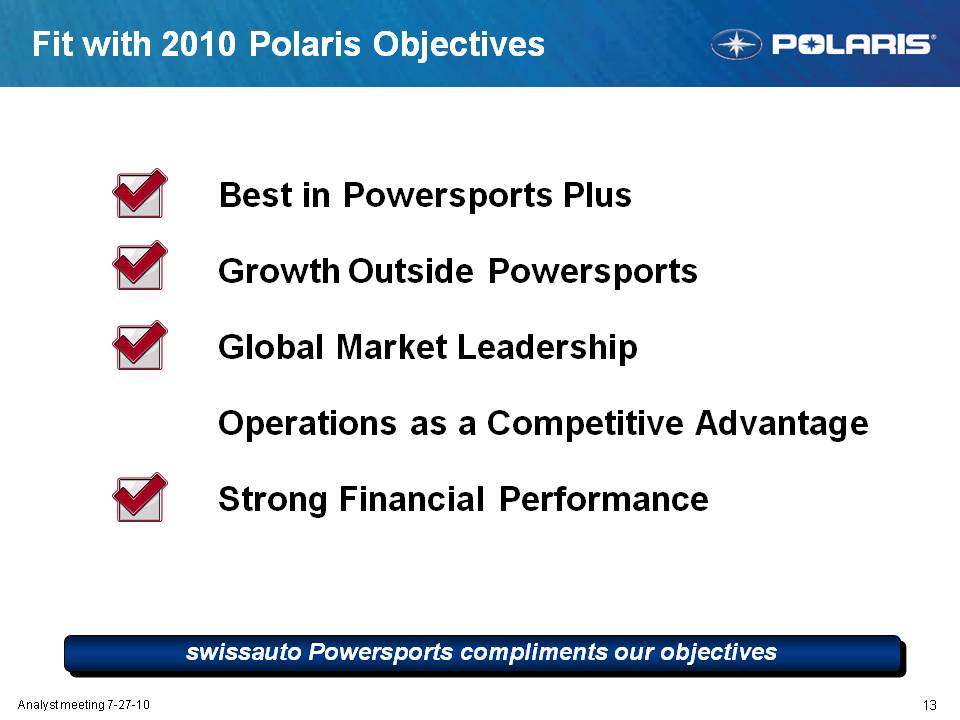
13 Analyst meeting 7-27-10 Fit with 2010 Polaris Objectives Best in Powersports Plus Growth Outside Powersports Global Market Leadership Operations as a Competitive Advantage Strong Financial Performance swissauto Powersports compliments our objectives
Polaris Industries Inc. Operational Excellence A Pathway To World Class Performance Suresh Krishna VP Integration & Chief Supply Chain Officer July 27, 2010
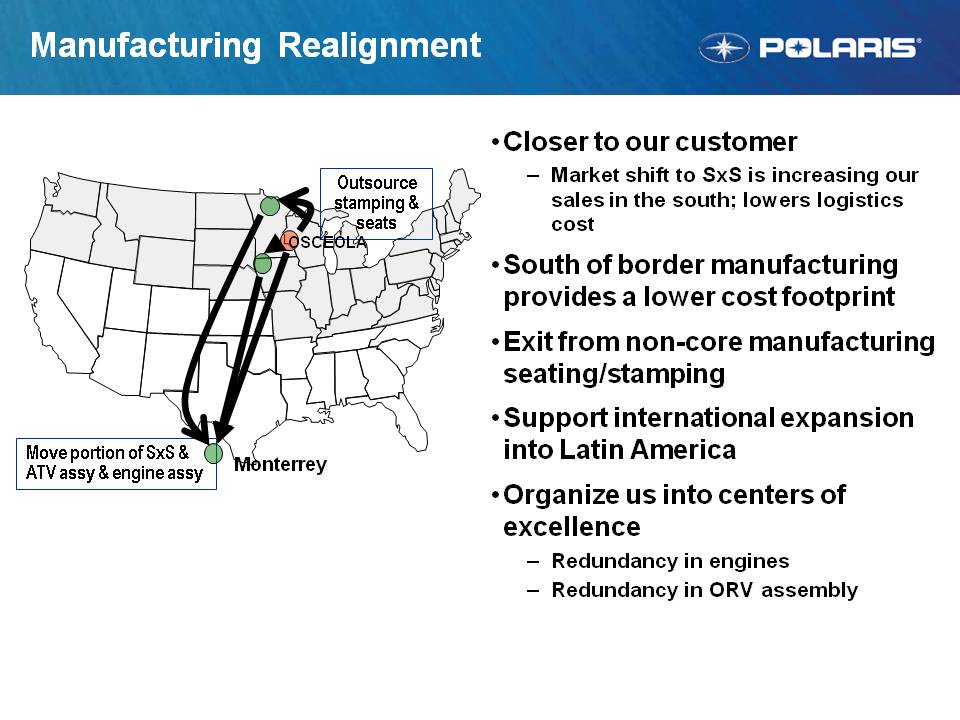
Manufacturing Realignment Closer to our customer - Market shift to SxS is increasing our sales in the south; lowers logistics cost South of border manufacturing provides a lower cost footprint Exit from non-core manufacturing seating/stamping Support international expansion into Latin America Organize us into centers of excellence - Redundancy in engines - Redundancy in ORV assembly Monterrey Move portion of SxS & ATV assy & engine assy Outsource stamping & seats OSCEOLA
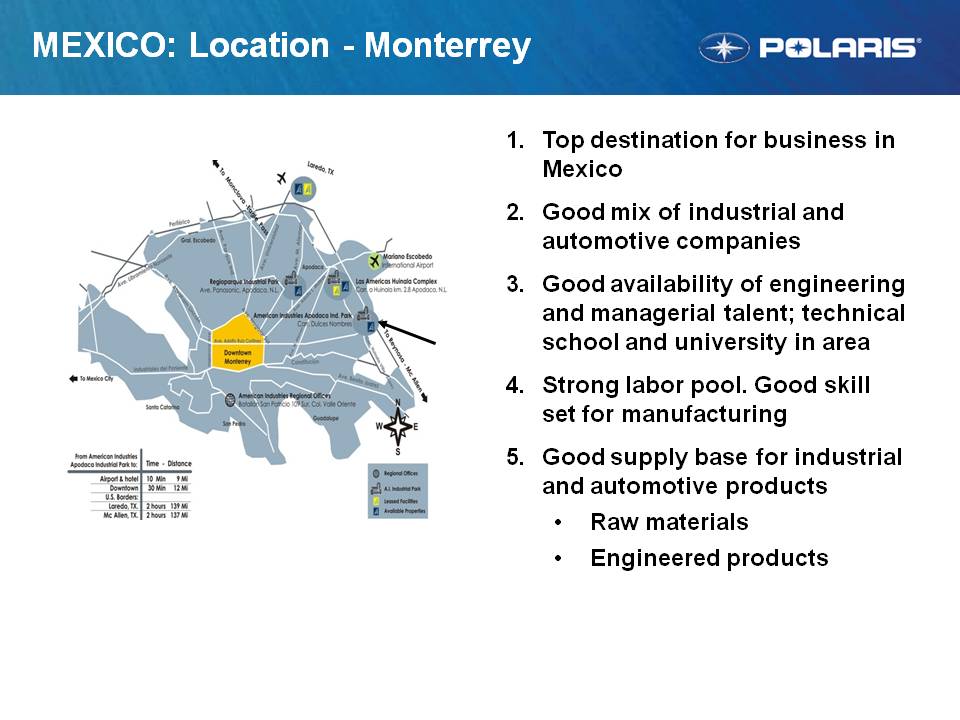
MEXICO: Location – Monterrey 1. Top destination for business in Mexico 2. Good mix of industrial and automotive companies 3. Good availability of engineering and managerial talent; technical school and university in area 4. Strong labor pool. Good skill set for manufacturing 5. Good supply base for industrial and automotive products Raw materials Engineered products
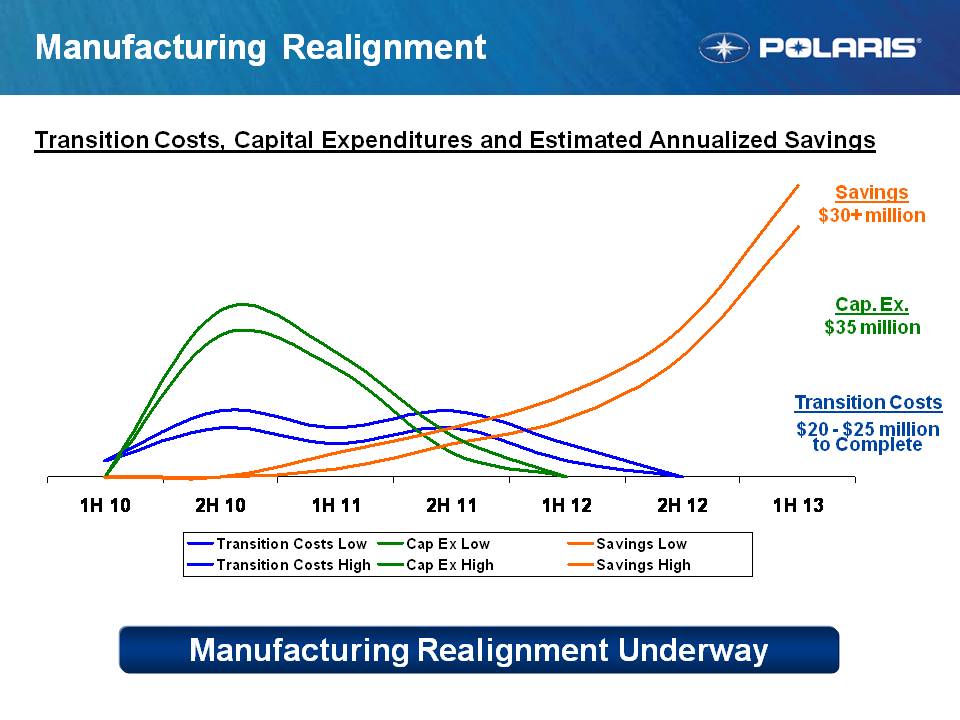
4 Manufacturing Realignment Manufacturing Realignment Underway Transition Costs, Capital Expenditures and Estimated Annualized Savings Cap. Ex. $35 million Savings $30+ million Transition Costs $20 - $25 million to Complete 1H 10 2H 10 1H 11 2H 11 1H 12 2H 12 1H 13 Transition Costs Low Transition Costs High Cap Ex Low Cap Ex High Savings Low Savings High
Supply Chain
Supply Chain Improvement Costs: 5% gross cost reduction in 2010 - Manufacturing productivity: up – Spend productivity due to value engineering LCC: up Flexibility/Speed - Reduction in Supplier lead times to support MVP - Reduction of Manufacturing lead times in factory Inventory - Right size inventory mix to enhance MVP execution
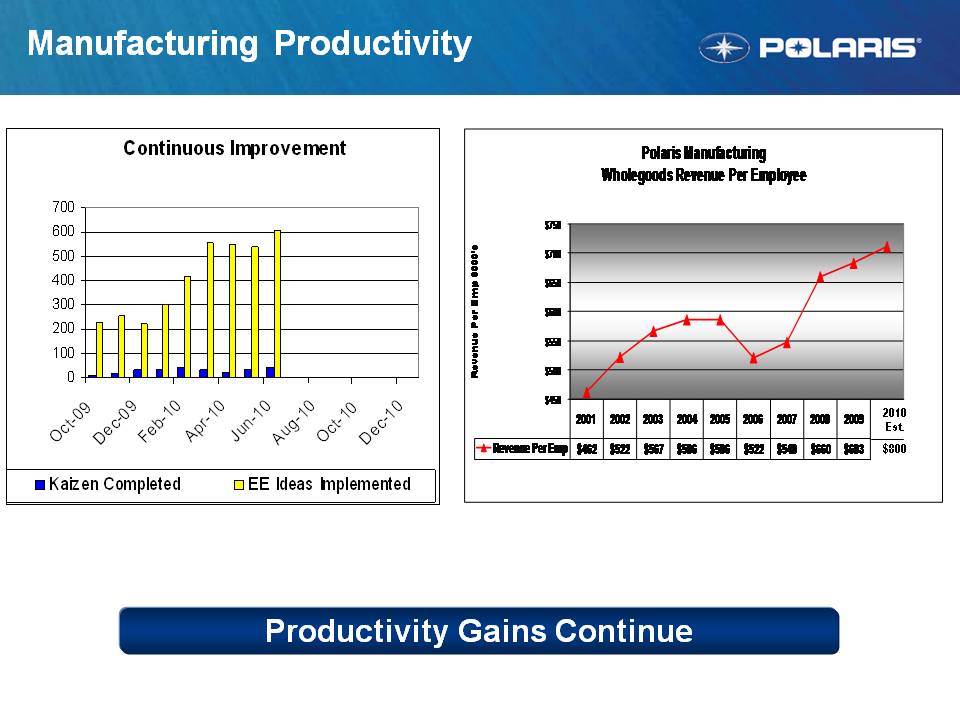
7 Manufacturing Productivity Productivity Gains Continue 2010 Est. $800 Continuous Improvement 700 Polaris Manufacturing Wholegoods Revenue Per Employee 300 400 500 600 $ $650 $700 $750 Emp $000's 0 100 200 09 09 10 10 10 10 10 10 2010 $450 $500 $550 600 Revenue Per 2010 Oct- Dec- Feb- Apr- Jun- Aug- Oct- Dec- Kaizen Completed EE Ideas Implemented 2001 2002 2003 2004 2005 2006 2007 2008 2009 Bud Revenue Per Emp $462 $522 $567 $586 $586 $522 $548 $660 $683 $712 Est. $800
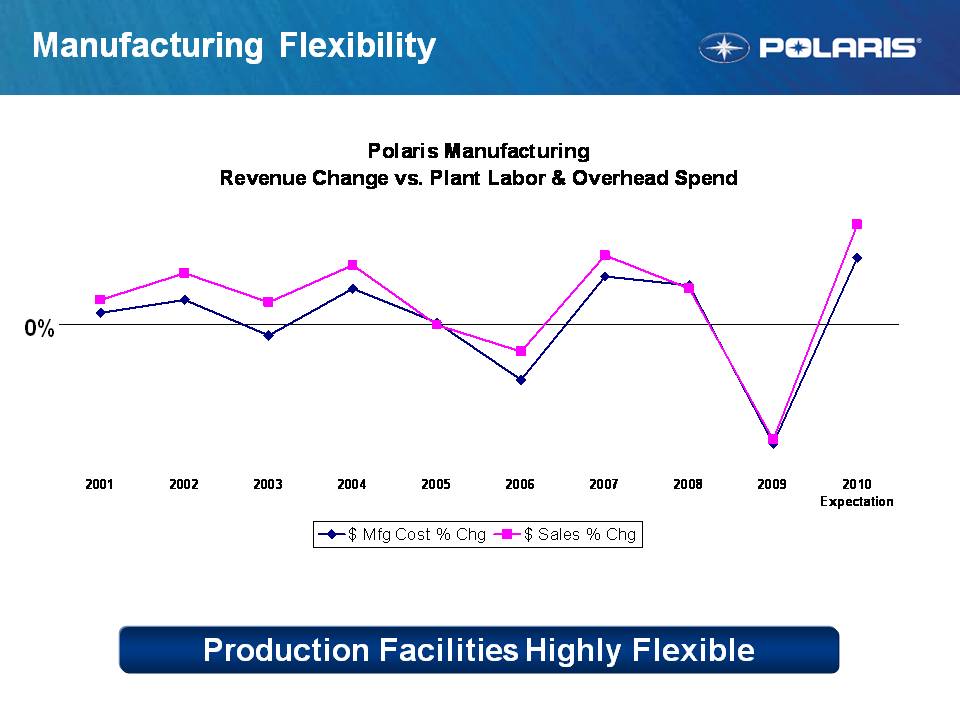
Manufacturing Flexibility Polaris Manufacturing Revenue Change vs. Plant Labor & Overhead Spend 0% 2001 2002 2003 2004 2005 2006 2007 2008 2009 2010 Expectation $ Mfg Cost % Chg $ Sales % Chg Production Facilities Highly Flexible
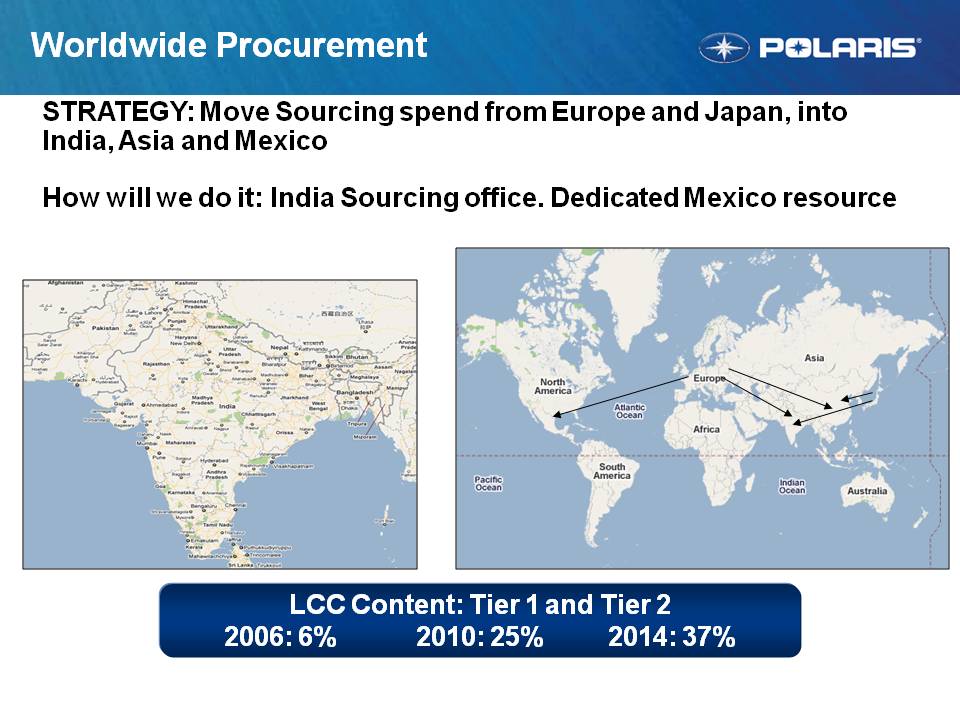
Worldwide Procurement STRATEGY: Move Sourcing spend from Europe and Japan, into India, Asia and Mexico How will we do it: India Sourcing office. Dedicated Mexico resource LCC Content: Tier 1 and Tier 2 2006: 6% 2010: 25% 2014: 37%
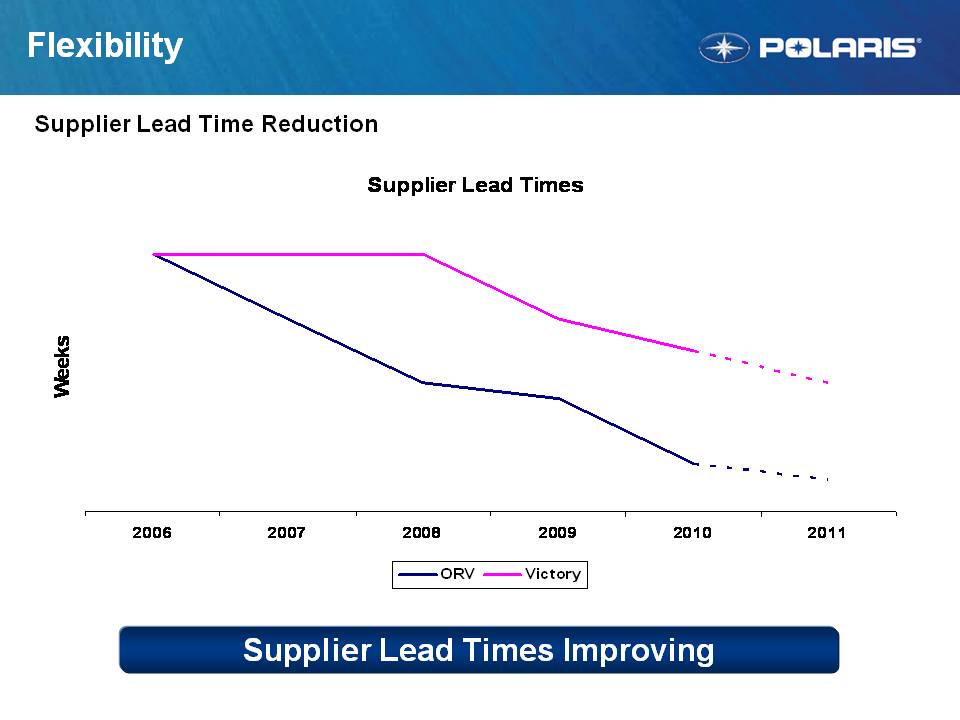
Flexibility Supplier Lead Time Reduction Supplier Lead Times Improving Weeks 2006 2007 2008 2009 2010 2011 ORV Victory Supplier Lead Times
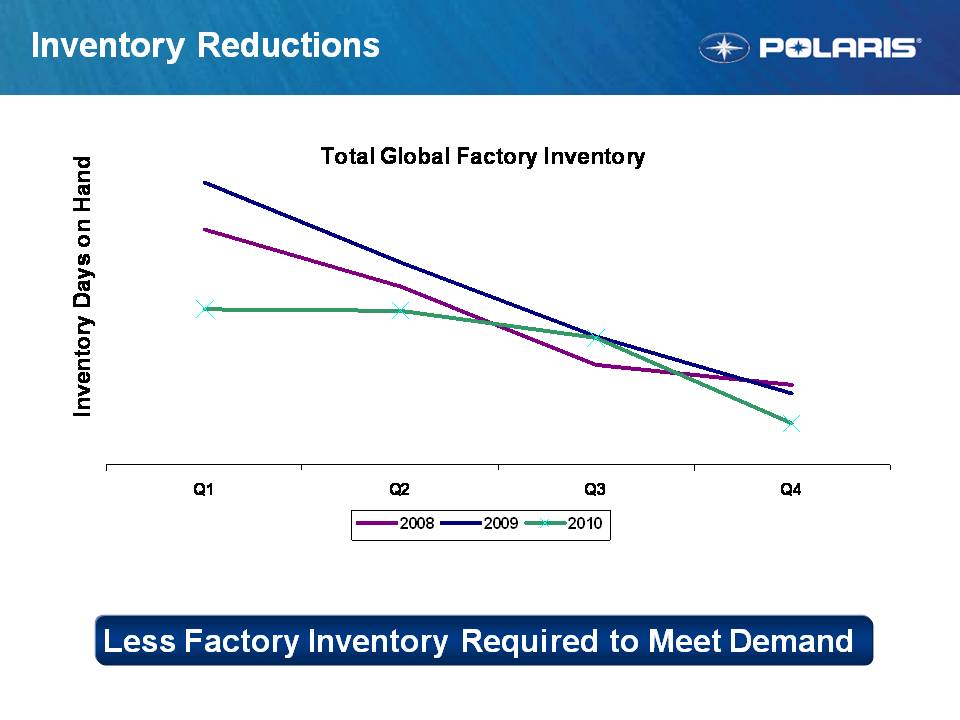
Inventory Reductions Less Factory Inventory Required to Meet Demand Total Global Factory Inventory Inventory Days on Hand Q1 Q2 Q3 Q4 2008 2009 2010

International Operations Mike Dougherty Vice President, Global New Market Development
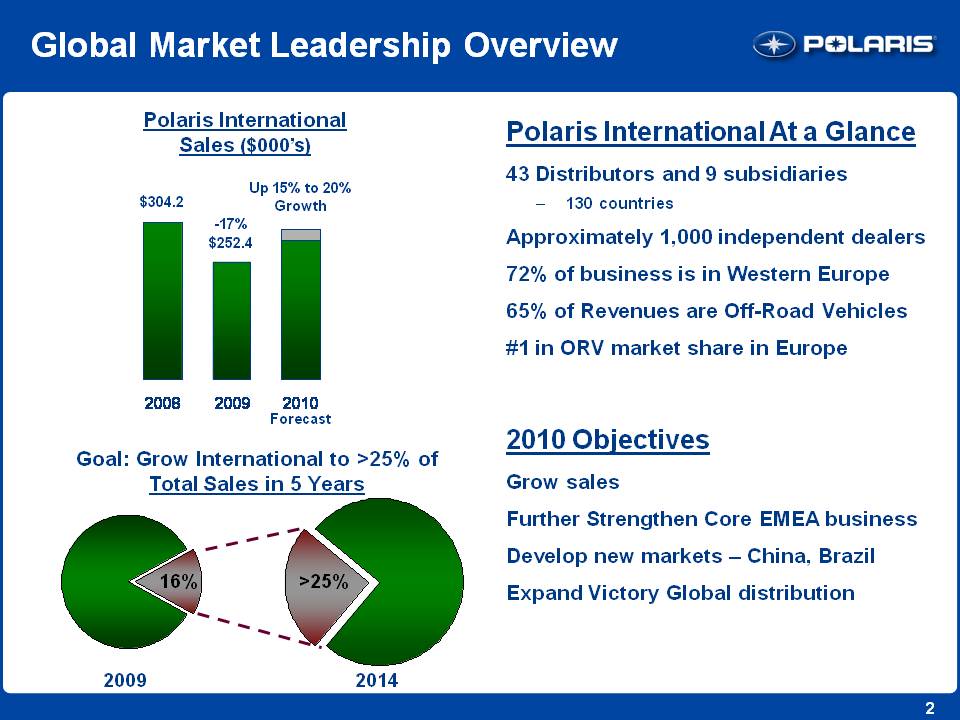
2 Global Market Leadership Overview Polaris International Sales ($000’s) $304.2 -17% $252.4 Up 15% to 20% Growth 2010 Forecast 2008 2009 2010 Objectives Grow sales Further Strengthen Core EMEA business Develop new markets – China, Brazil Expand Victory Global distribution Polaris International At a Glance 43 Distributors and 9 subsidiaries – 130 countries Approximately 1,000 independent dealers 72% of business is in Western Europe 65% of Revenues are Off-Road Vehicles #1 in ORV market share in Europe Goal: Grow International to >25% of Total Sales in 5 Years 2009 2014 >25% 16%
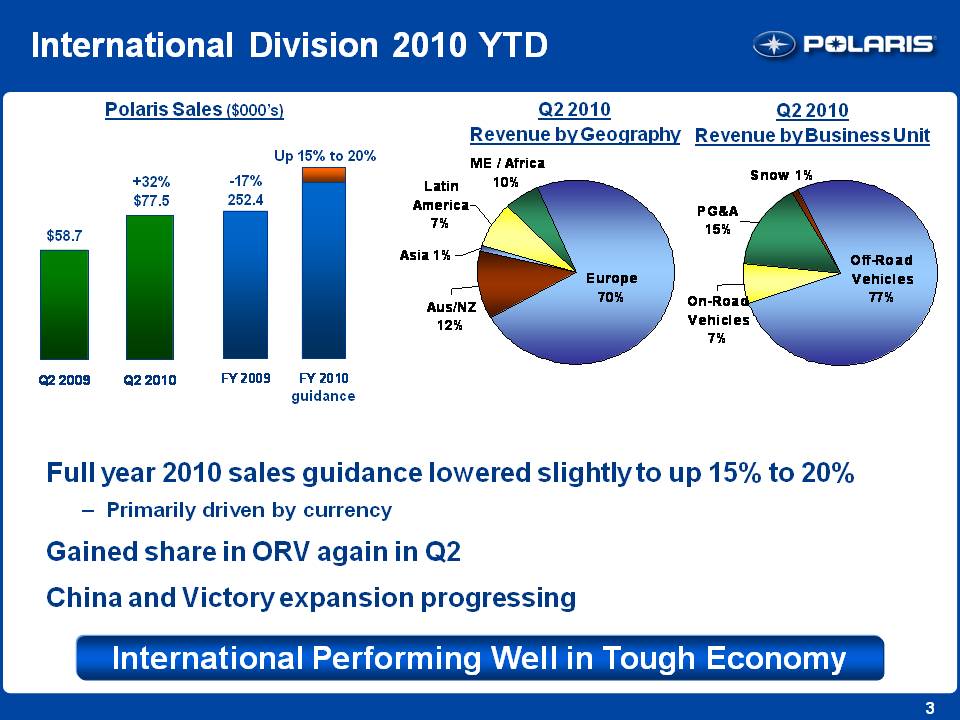
3 International Division 2010 YTD Polaris Sales ($000’s) $58.7 +32% $77.5 Q2 2010 Revenue by Geography Q2 2010 Revenue by Business Unit Full year 2010 sales guidance lowered slightly to up 15% to 20% – Primarily driven by currency Gained share in ORV again in Q2 China and Victory expansion progressing International Performing Well in Tough Economy -17% 252.4 Up 15% to 20% guidance Q2 2009 Q2 2010 FY 2009 FY 2010 ME / Africa 10% Latin America 7% Asia 1% Aus/NZ 12% Snow 1% PG&A 15% Off-Road Vehicles 77% On-Road Vehicles 7% Europe 70%
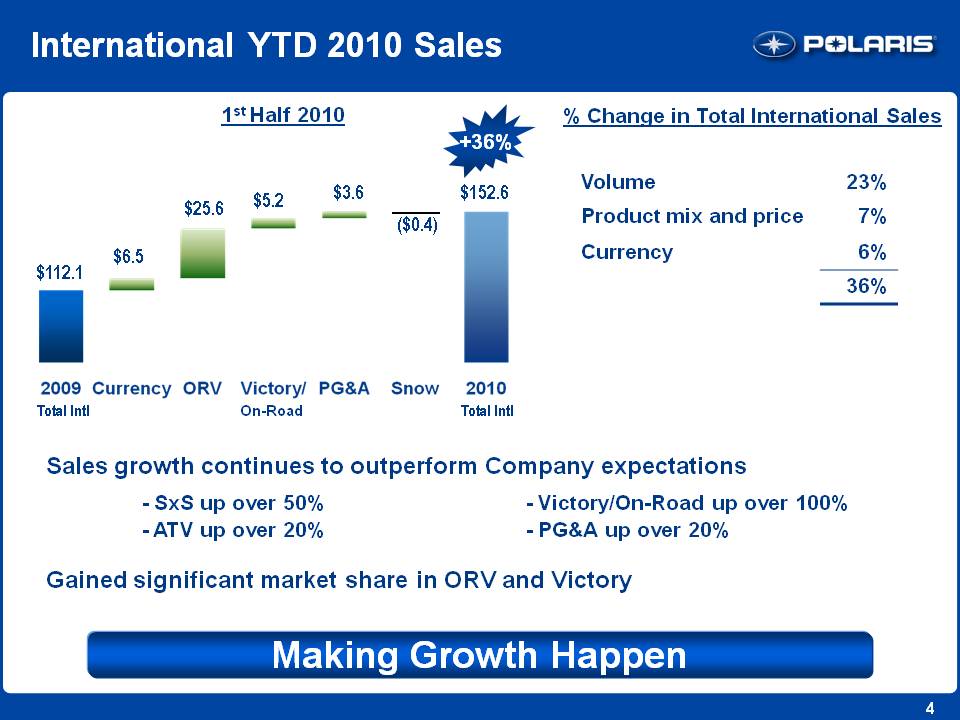
4 International YTD 2010 Sales 1st Half 2010 $112.1 $6.5 $25.6 $5.2 $3.6 ($0.4) $152.6 2009 Total Intl 2010 Total Intl % Change in Total International Sales Sales growth continues to outperform Company expectations - SxS up over 50% - Victory/On-Road up over 100% - ATV up over 20% - PG&A up over 20% Gained significant market share in ORV and Victory Making Growth Happen Currency ORV Victory/On-Road PG&A Snow Volume 23% Product mix and price 7% Currency 6% 36% +36%

5 European 2010 ORV Competitive Overview Top 8 Markets Traditional Brands 2010 YTD Market Estimate ˜ 16k units (down 8.1%) Top 8 Markets All Brands 2010 YTD Market Estimate ˜ 35k units (down 14.1%) Approximately 75% of the market is on-road Variety of street-legal homologation alternatives 3 points of market share gain for the traditional brands 2010 YTD Polaris outpacing marketplace and gaining share Revenue up due to richer ATV product mix Polaris Yamaha Honda Kawa Suzuki Bomb Arctic Cat Kymco Linhai Taiw/Chi 5% 13% 12% 6% 14% 21% 29% 41% 4% 9% 2% 3% 7% 10%
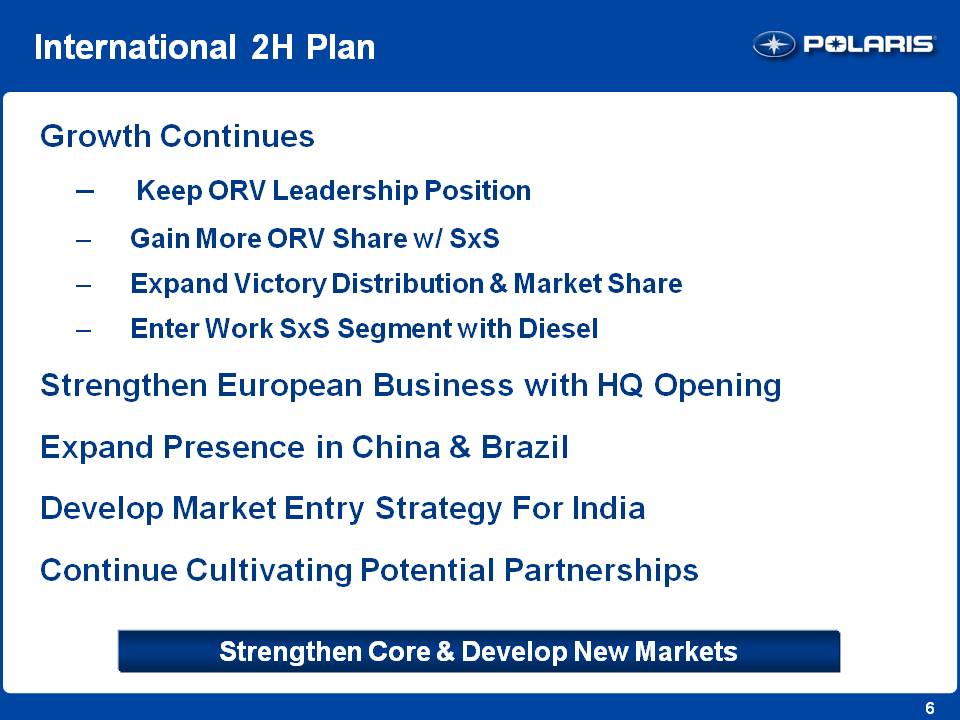
6 International 2H Plan Growth Continues – Keep ORV Leadership Position – Gain More ORV Share w/ SxS – Expand Victory Distribution & Market Share – Enter Work SxS Segment with Diesel Strengthen European Business with HQ Opening Expand Presence in China & Brazil Develop Market Entry Strategy For India Continue Cultivating Potential Partnerships Strengthen Core & Develop New Markets

7 MY11 International Product SPORTSMAN® XTREME PERFORMANCE NEW! SPORTSMAN® Forest 850 NEW! SPORTSMAN® Forest 550 SPORTSMAN® UTILITY NEW! SPORTSMAN® TRACTOR 500 EFI NEW! SPORTSMAN® Forest 500 NEW! SPORTSMAN® X2 550 Intl SPORTSMAN® 2-UP NEW! SPORTSMAN ® TOURING 500 HO Intl NEW! SPORTSMAN ® TOURING 550 EPS Intl NEW! SPORTSMAN® TOURING 850 EPS Intl ENTRY SCRAMBLER® 500 4X4 Intl TRAIL BLAZER ® 330 Intl TRAIL BOSS ® 330 Intl RZR ® NEW! RZR® S 800 EPS Intl RANGER ® RANGER ® EV Intl
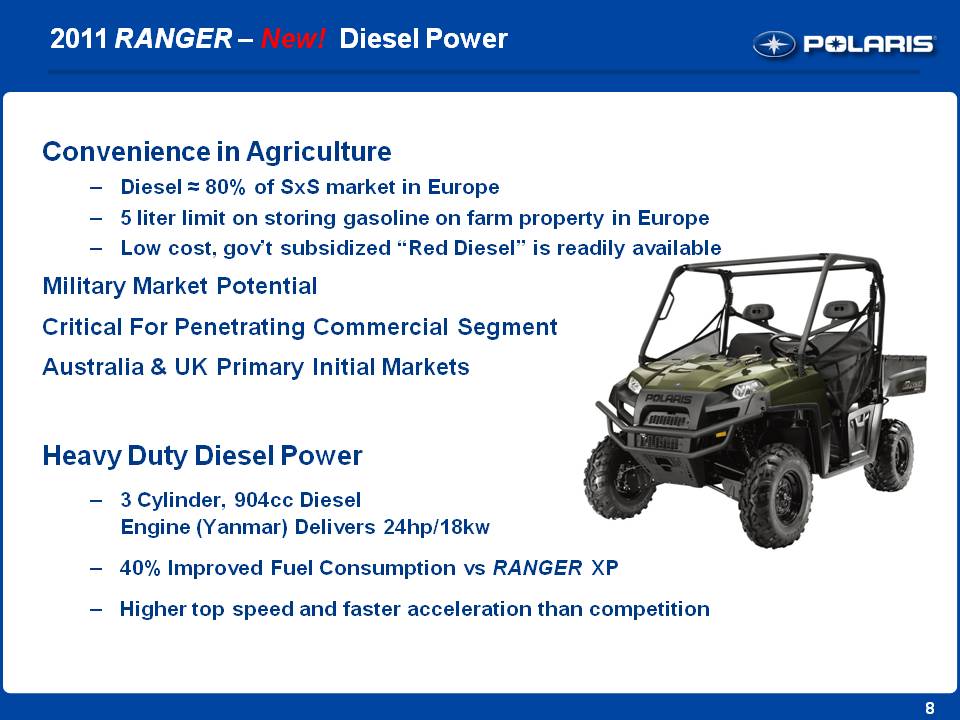
8 Convenience in Agriculture – Diesel ˜ 80% of SxS market in Europe – 5 liter limit on storing gasoline on farm property in Europe – Low cost, gov’t subsidized “Red Diesel” is readily available Military Market Potential Critical For Penetrating Commercial Segment Australia & UK Primary Initial Markets Heavy Duty Diesel Power – 3 Cylinder, 904cc Diesel Engine (Yanmar) Delivers 24hp/18kw – 40% Improved Fuel Consumption vs RANGER XP – Higher top speed and faster acceleration than competition 2011 RANGER – New! Diesel Power
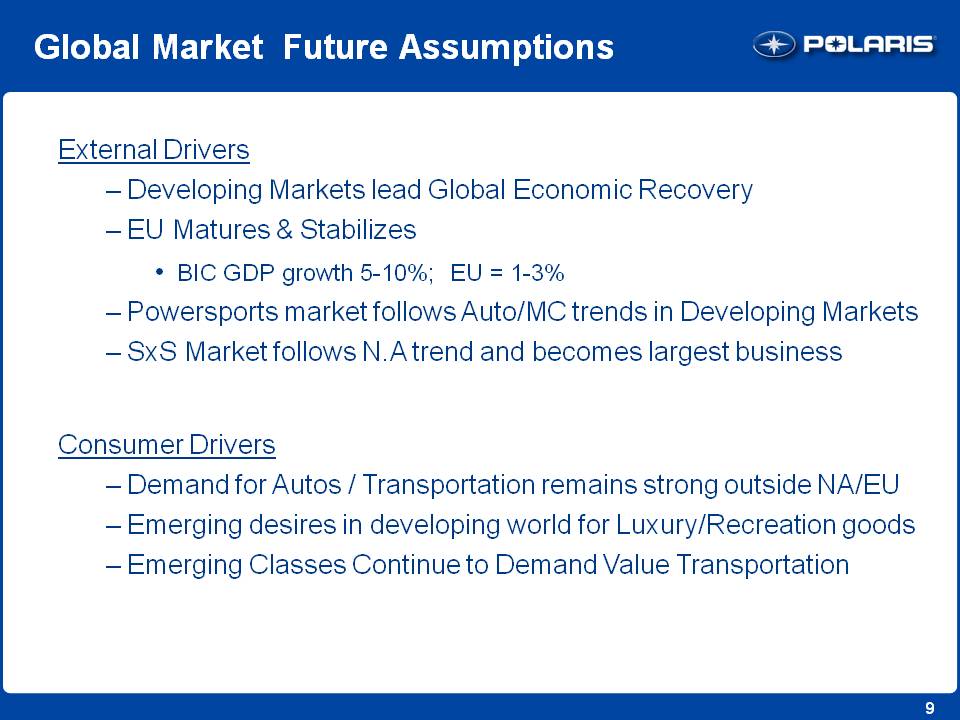
9 Global Market Future Assumptions External Drivers – Developing Markets lead Global Economic Recovery – EU Matures & Stabilizes BIC GDP growth 5-10%; EU = 1-3% – Powersports market follows Auto/MC trends in Developing Markets – SxS Market follows N.A trend and becomes largest business Consumer Drivers – Demand for Autos / Transportation remains strong outside NA/EU – Emerging desires in developing world for Luxury/Recreation goods – Emerging Classes Continue to Demand Value Transportation
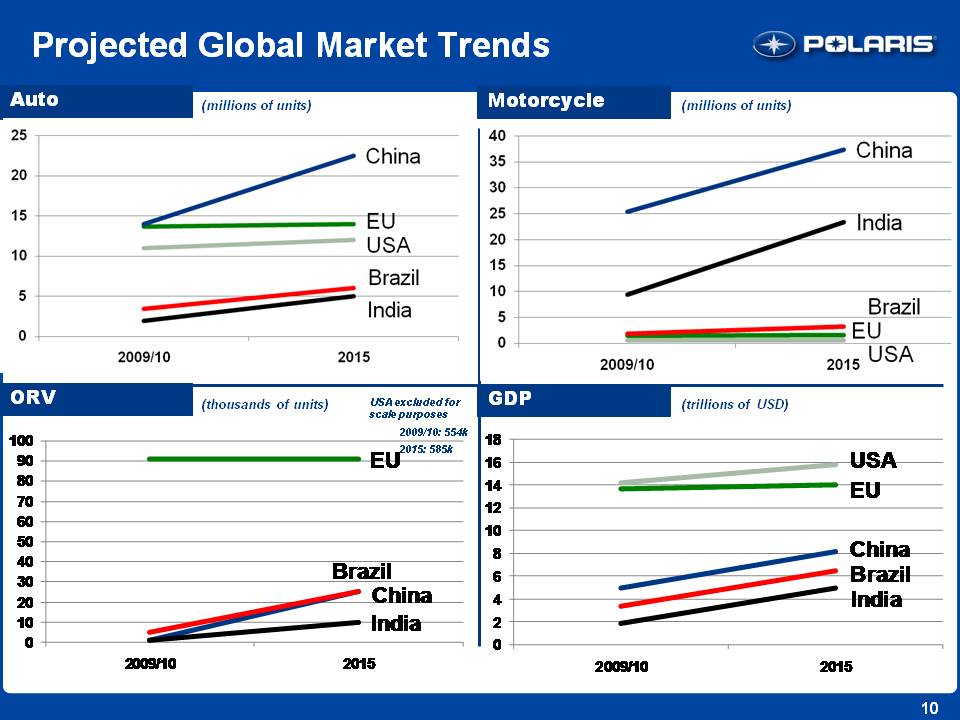
10 Projected Global Market Trends Auto ORV GDP Motorcycle (millions of units) (thousands of units) (millions of units)(trillions of USD) USA excluded for scale purposes 2009/10: 554k 2015: 585k China EU USA Brazil India 2009/10 2015 0 5 10 15 20 25 30 35 40 50 60 70 80 90 100 2 4 6 8012 14 16 18
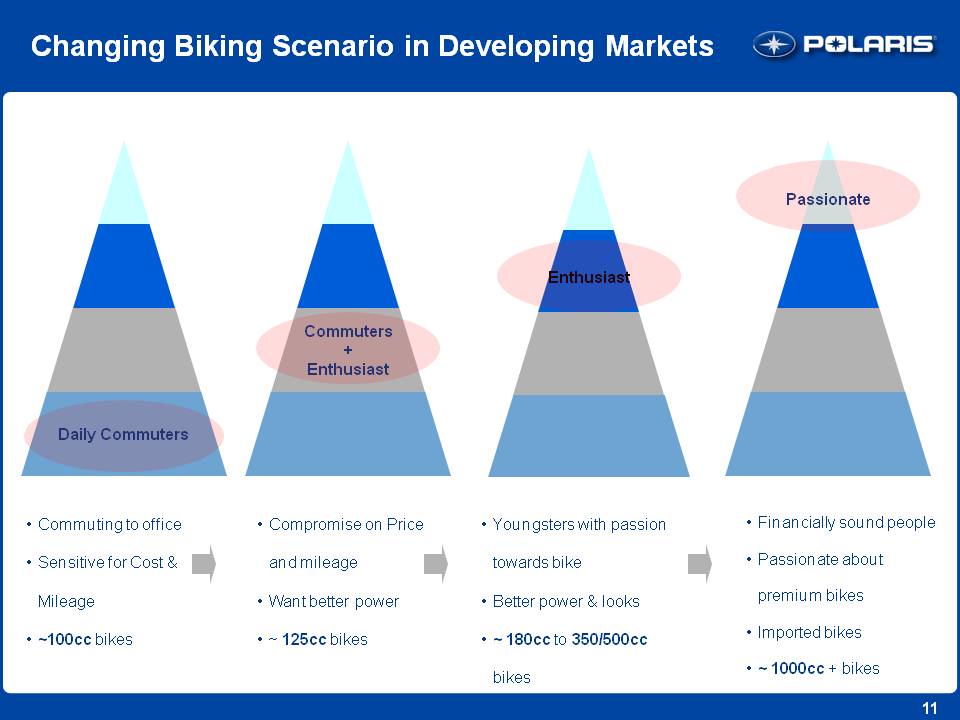
11 Changing Biking Scenario in Developing Markets Passionate Commuting to office Sensitive for Cost & Mileage ~100cc bikes Compromise on Price and mileage Want better power ~ 125cc bikes Youngsters with passion towards bike Better power & looks ~ 180cc to 350/500cc bikes Financially sound people Passionate about premium bikes Imported bikes ~ 1000cc + bikes Daily Commuters Commuters + Enthusiast Enthusiast
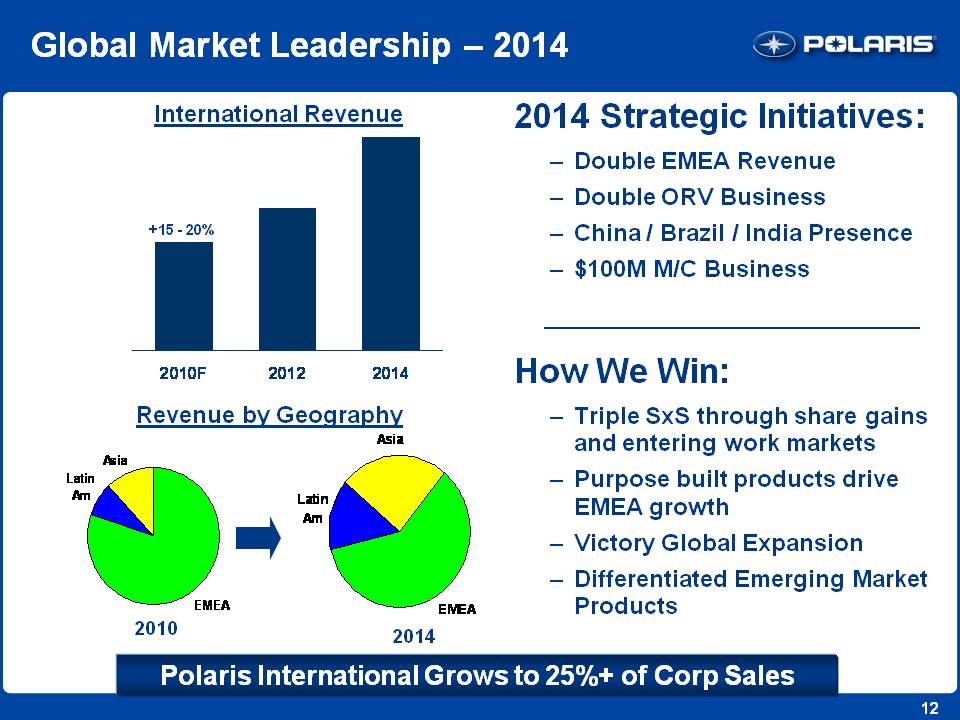
12 Global Market Leadership – 2014 2014 Strategic Initiatives: Double EMEA Revenue Double ORV Business China / Brazil / India Presence $100M M/C Business How We Win: – Triple SxS through share gains and entering work markets – Purpose built products drive EMEA growth – Victory Global Expansion – Differentiated Emerging Market Products Polaris International Grows to 25%+ of Corp Sales Revenue by Geography 2010 2014 +15 - 20% International Revenue 2010F 2012 2014 Asia Latin Am EMEA
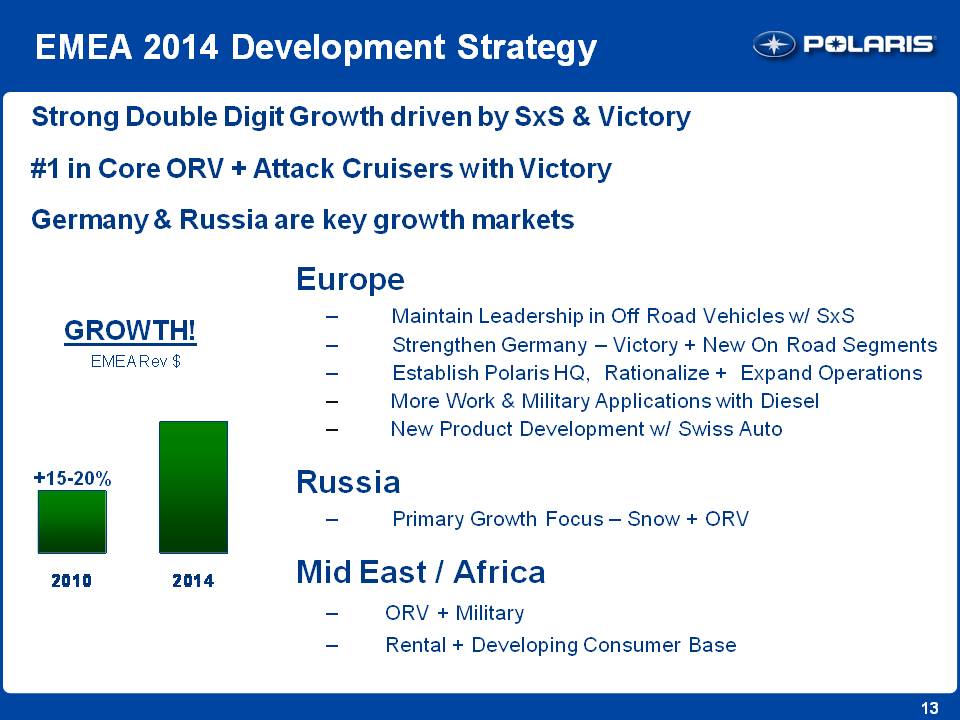
13 EMEA 2014 Development Strategy Europe – Maintain Leadership in Off Road Vehicles w/ SxS – Strengthen Germany – Victory + New On Road Segments – Establish Polaris HQ, Rationalize + Expand Operations – More Work & Military Applications with Diesel – New Product Development w/ Swiss Auto Russia – Primary Growth Focus – Snow + ORV Mid East / Africa – ORV + Military – Rental + Developing Consumer Base Strong Double Digit Growth driven by SxS & Victory #1 in Core ORV + Attack Cruisers with Victory Germany & Russia are key growth markets +15-20% GROWTH! EMEA Rev $ 2010 2014
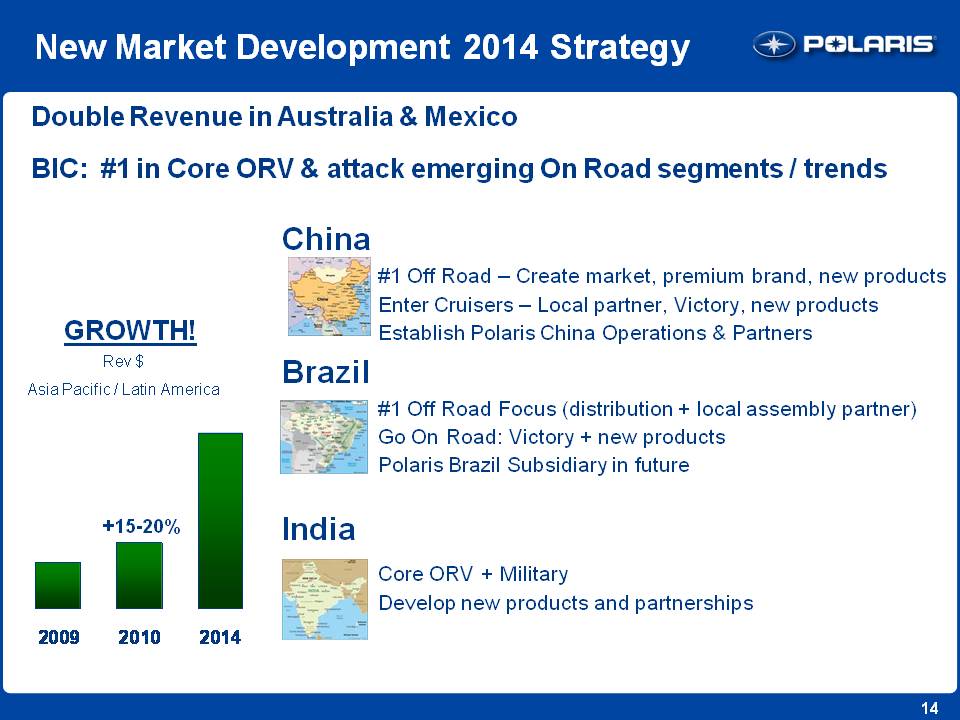
14 New Market Development 2014 Strategy China #1 Off Road – Create market, premium brand, new products Enter Cruisers – Local partner, Victory, new products Establish Polaris China Operations & Partners Brazil #1 Off Road Focus (distribution + local assembly partner) Go On Road: Victory + new productsPolaris Brazil Subsidiary in future India Core ORV + Military Develop new products and partnerships Double Revenue in Australia & Mexico BIC: #1 in Core ORV & attack emerging On Road segments / trends +15-20% GROWTH! Rev $ Asia Pacific / Latin America 2009 2010 2014
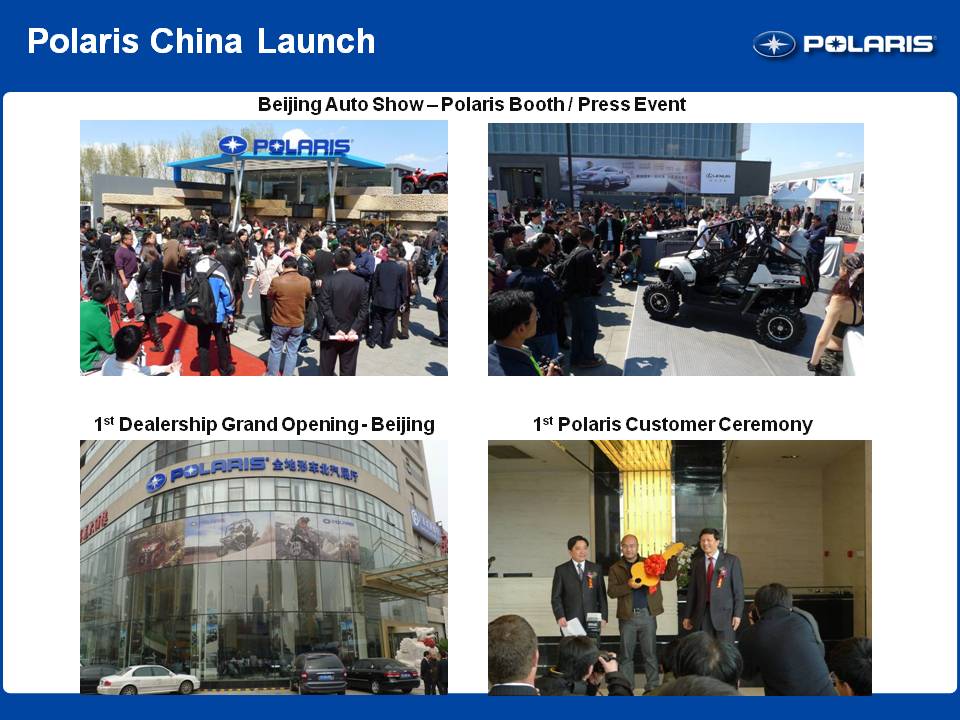
Polaris China Launch Beijing Auto Show – Polaris Booth / Press Event 1st Dealership Grand Opening – Beijing 1st Polaris Customer Ceremony
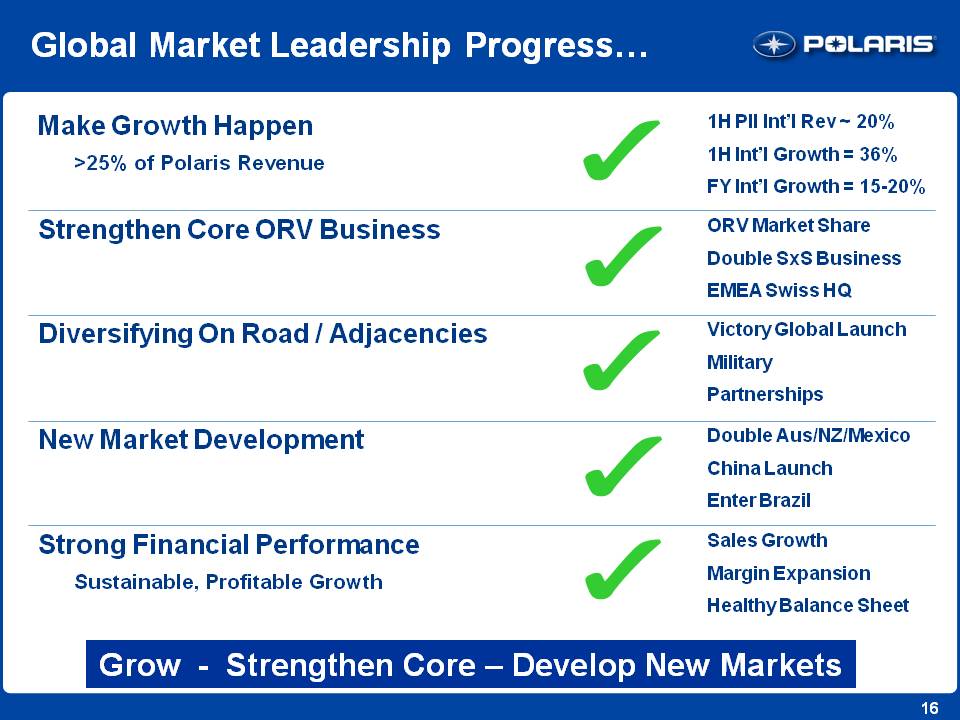
16 Global Market Leadership Progress… Grow - Strengthen Core – Develop New Markets Make Growth Happen >25% of Polaris Revenue 1H PII Int’l Rev ~ 20% 1H Int’l Growth = 36% FY Int’l Growth = 15-20% Strengthen Core ORV Business ORV Market Share Double SxS Business EMEA Swiss HQ Diversifying On Road / Adjacencies Victory Global Launch Military Partnerships New Market Development Double Aus/NZ/Mexico China Launch Enter Brazil Strong Financial Performance Sustainable, Profitable Growth Sales Growth Margin Expansion Healthy Balance Sheet
International Operations Q & A