Exhibit 99.1

Slide: 1
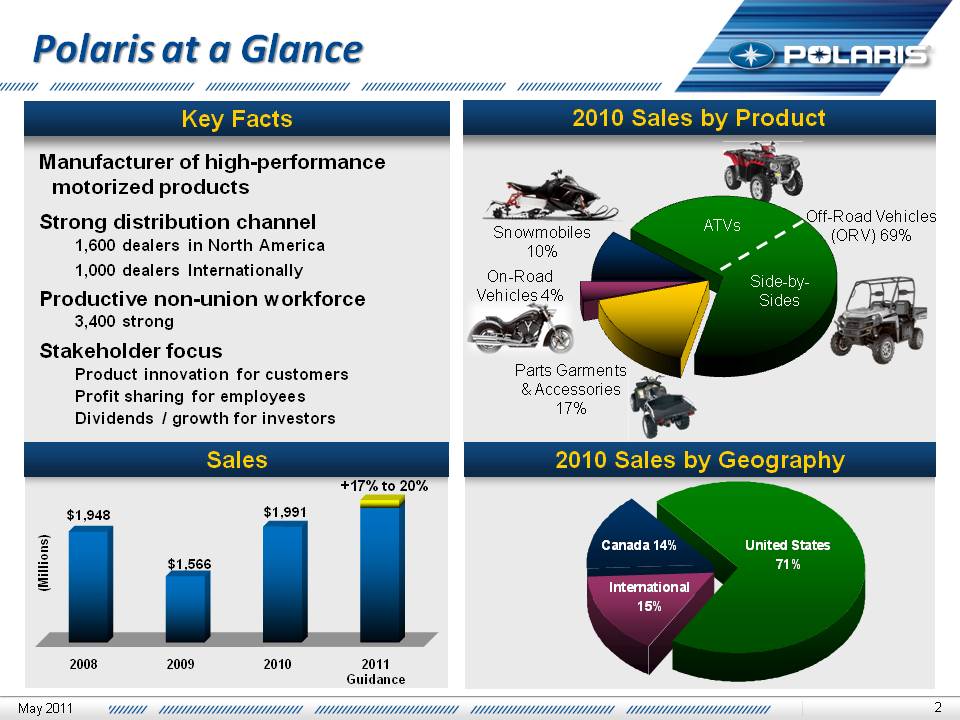
Slide: 2 2010 Sales by Product 2010 Sales by Geography Title: Polaris at a Glance Off-Road Vehicles (ORV) 69% On-RoadVehicles 4% Snowmobiles 10% Parts Garments & Accessories 17% ATVs Side-by-Sides Manufacturer of high-performance motorized products Strong distribution channel1,600 dealers in North America1,000 dealers InternationallyProductive non-union workforce3,400 strongStakeholder focusProduct innovation for customersProfit sharing for employeesDividends / growth for investors 2 Key Facts Sales +17% to 20% Other Placeholder: May 2011
Slide: 3 Excellent Start to 2011 Powersports momentum continuesRanger & RZR performance is strongSnow share gains and orders point to significant sales and profit growthVictory global growth plans on trackManufacturing realignment on planMonterrey Ranger production began in early April; engine production to start this summer Snow & Motorcycle engines to remain at Osceola, WI plantProject costs and savings adhering to budgetCommodity costs rising, but manageableOperational excellence and LEAN initiatives will help offset increasesJapanese supply chain challenges closely monitored, remain under controlAdjacency strategy gaining velocityIndian & GEM acquisitions Military and Bobcat will post significant year over year growth International growth and expansion ongoingAll regions generated revenue growth in Q1Margin expansion accelerating 3 Expect Record Performance in 2011 May 2011
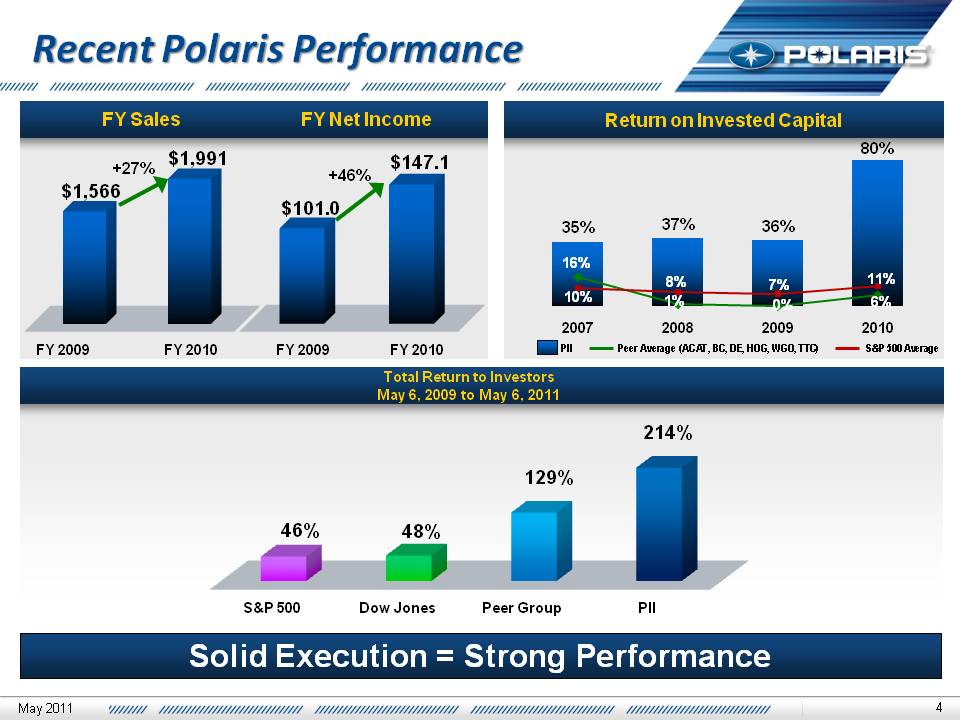
Slide: 4 Recent Polaris Performance Return on Invested Capital FY Sales $101.0 $147.1 $1,566 $1,991 FY 2010 FY 2009 Solid Execution = Strong Performance Total Return to InvestorsMay 6, 2009 to May 6, 2011 FY Net Income FY 2010 FY 2009 +27% +46% (Gp:) PII Peer Average (ACAT, BC, DE, HOG, WGO, TTC) S&P 500 Average May 2011
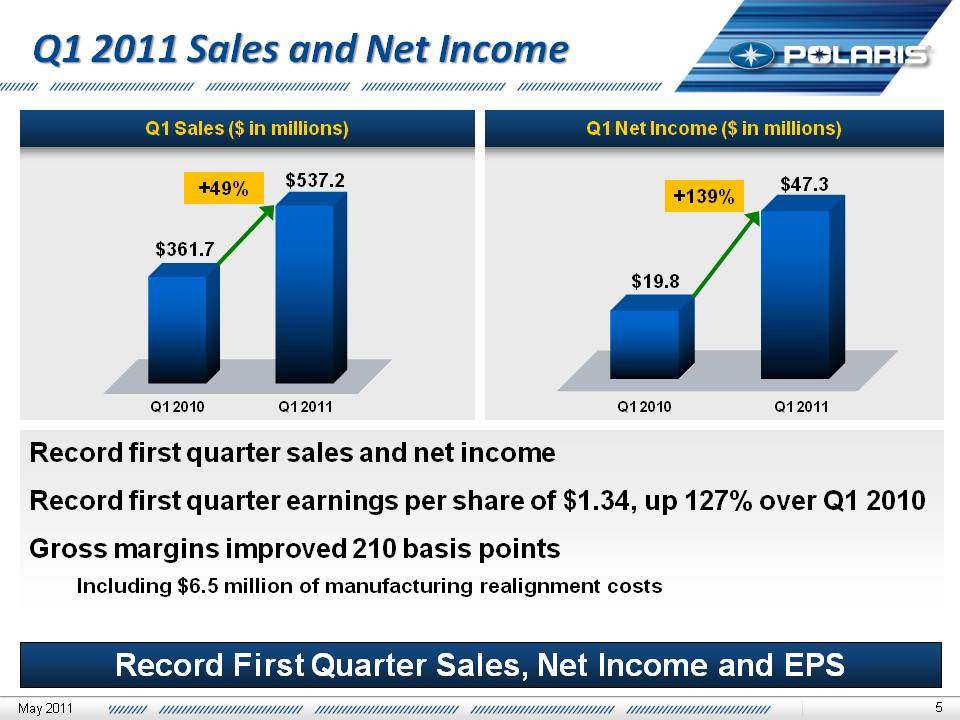
Slide: 5 Q1 2011 Sales and Net Income Q1 Net Income ($ in millions) Q1 Sales ($ in millions) $19.8 $47.3 +139% $361.7 $537.2 +49% Q1 2011 Q1 2010 Q1 2011 Q1 2010 Record first quarter sales and net incomeRecord first quarter earnings per share of $1.34, up 127% over Q1 2010Gross margins improved 210 basis pointsIncluding $6.5 million of manufacturing realignment costs Record First Quarter Sales, Net Income and EPS May 2011
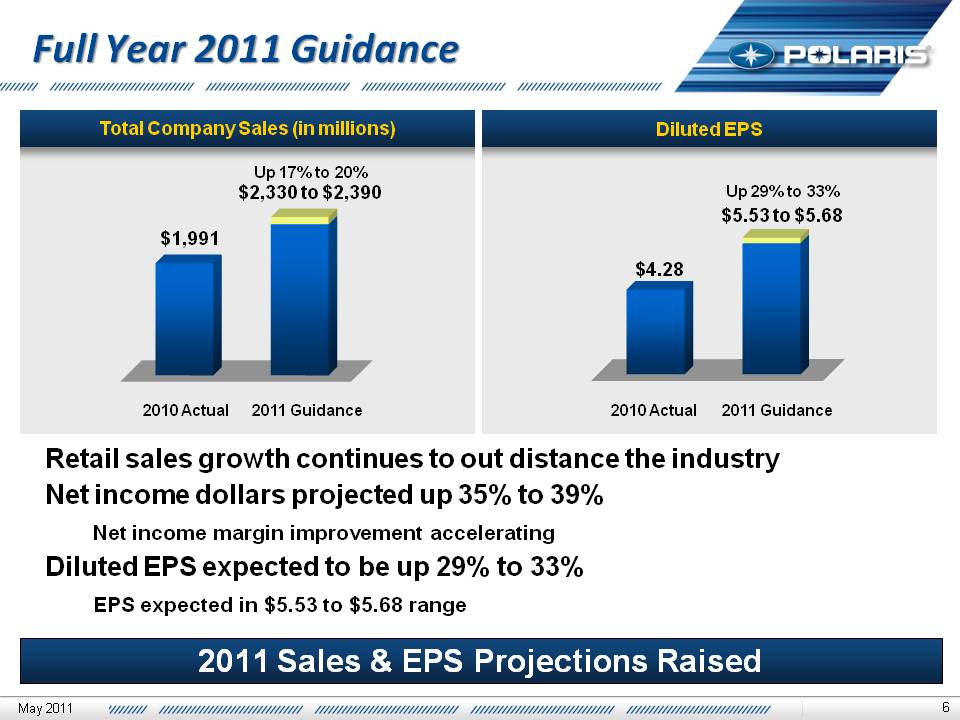
Slide: 6 Total Company Sales (in millions) Diluted EPS Full Year 2011 Guidance Other Placeholder: 6 $1,991 Up 17% to 20%$2,330 to $2,390 2010 Actual 2011 Guidance $4.28 Up 29% to 33% $5.53 to $5.68 2010 Actual 2011 Guidance Retail sales growth continues to out distance the industryNet income dollars projected up 35% to 39% Net income margin improvement acceleratingDiluted EPS expected to be up 29% to 33% EPS expected in $5.53 to $5.68 range 2011 Sales & EPS Projections Raised May 2011
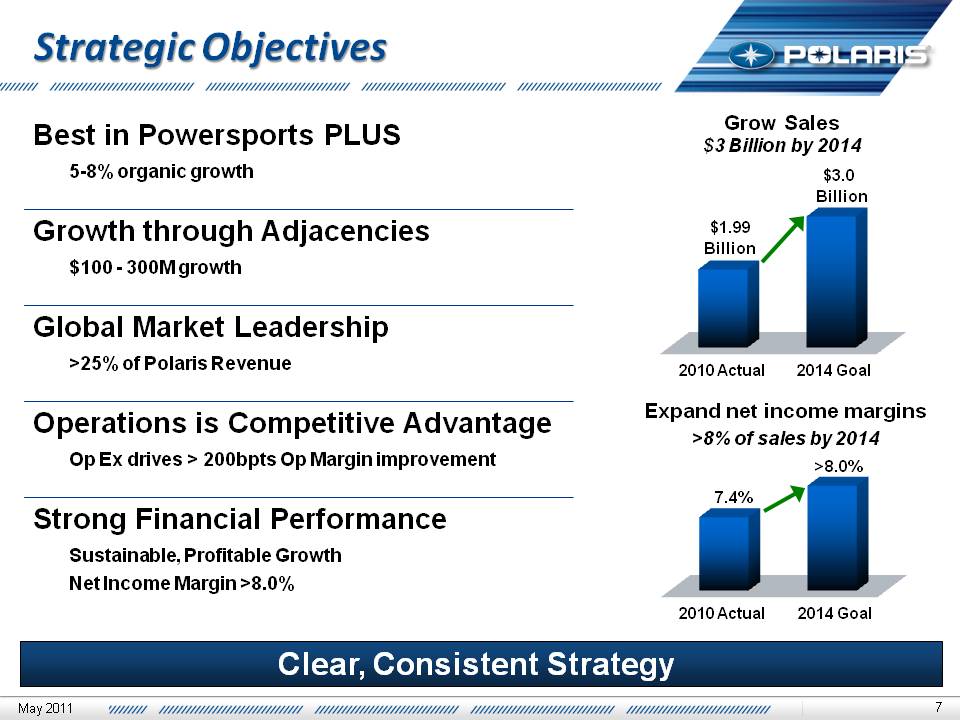
Slide: 7 Strategic Objectives $1.99 Billion $3.0 Billion Grow Sales $3 Billion by 2014 7.4% >8.0% Expand net income margins>8% of sales by 2014 Clear, Consistent Strategy 7 2014 Goal 2010 Actual 2014 Goal 2010 Actual May 2011
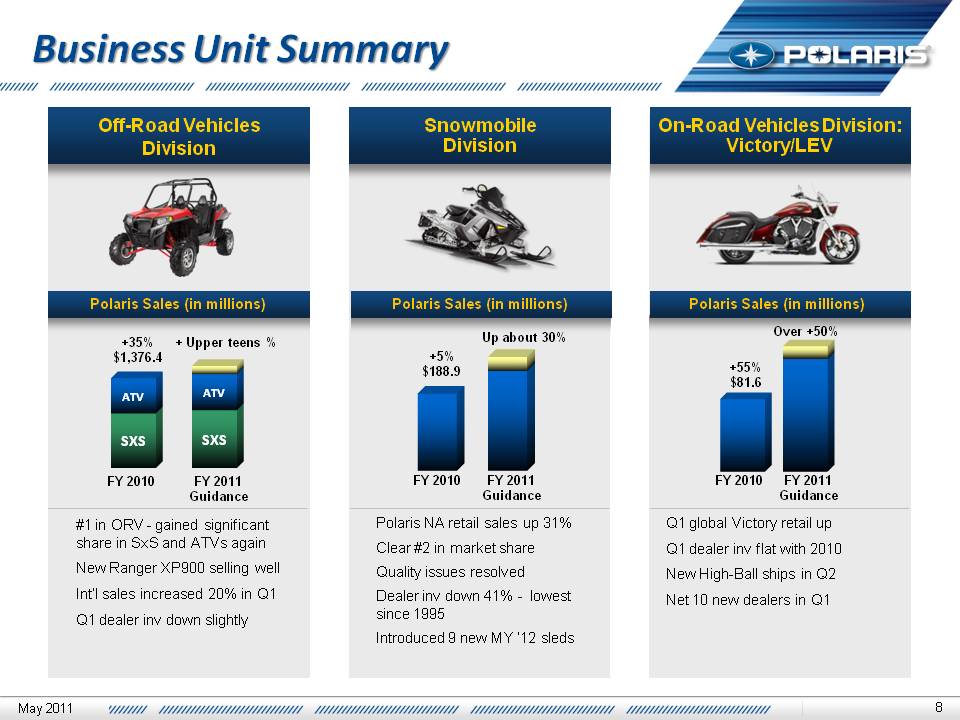
Slide: 8 Off-Road VehiclesDivision Business Unit Summary Snowmobile Division On-Road Vehicles Division: Victory/LEV Polaris Sales (in millions) Polaris Sales (in millions) Polaris Sales (in millions) #1 in ORV - gained significant share in SxS and ATVs againNew Ranger XP900 selling well Int’l sales increased 20% in Q1Q1 dealer inv down slightly Polaris NA retail sales up 31%Clear #2 in market shareQuality issues resolvedDealer inv down 41% - lowest since 1995Introduced 9 new MY ‘12 sleds Q1 global Victory retail upQ1 dealer inv flat with 2010New High-Ball ships in Q2Net 10 new dealers in Q1 FY 2011 Guidance FY 2010 +35%$1,376.4 + Upper teens % FY 2011Guidance +5%$188.9 Up about 30% FY 2010 +55%$81.6 Over +50% FY 2011Guidance FY 2010 8 May 2011
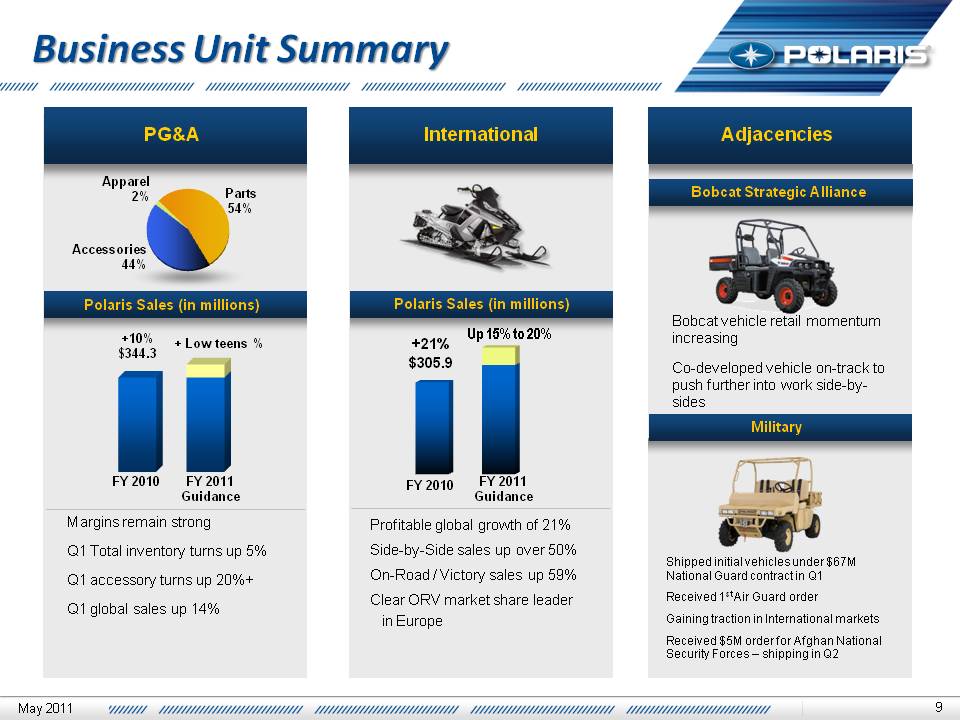
Slide: 9 Business Unit Summary International Adjacencies Polaris Sales (in millions) Military Profitable global growth of 21% Side-by-Side sales up over 50%On-Road / Victory sales up 59%Clear ORV market share leader in Europe Shipped initial vehicles under $67M National Guard contract in Q1Received 1st Air Guard orderGaining traction in International marketsReceived $5M order for Afghan National Security Forces – shipping in Q2 Margins remain strongQ1 Total inventory turns up 5%Q1 accessory turns up 20%+Q1 global sales up 14% PG&A Parts54% Accessories 44% Apparel2% Polaris Sales (in millions) FY 2011 Guidance FY 2010 +10% $344.3 + Low teens % 9 +21%$305.9 Up 15% to 20% FY 2011 Guidance FY 2010 Bobcat Strategic Alliance Bobcat vehicle retail momentum increasingCo-developed vehicle on-track to push further into work side-by-sides May 2011
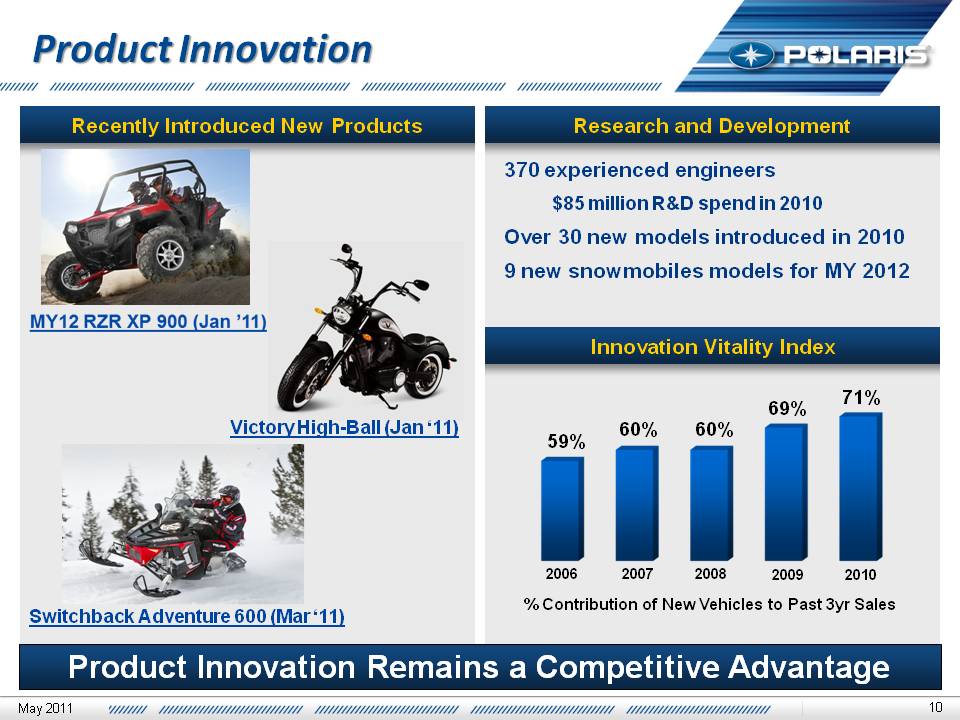
Slide: 10 Product Innovation 370 experienced engineers $85 million R&D spend in 2010 Over 30 new models introduced in 20109 new snowmobiles models for MY 2012 Switchback Adventure 600 (Mar ‘11) 59% 60% 60% 69% 71% Product Innovation Remains a Competitive Advantage 2006 2008 2009 2010 2007 % Contribution of New Vehicles to Past 3yr Sales 10 Recently Introduced New Products Research and Development Innovation Vitality Index Victory High-Ball (Jan ‘11) May 2011
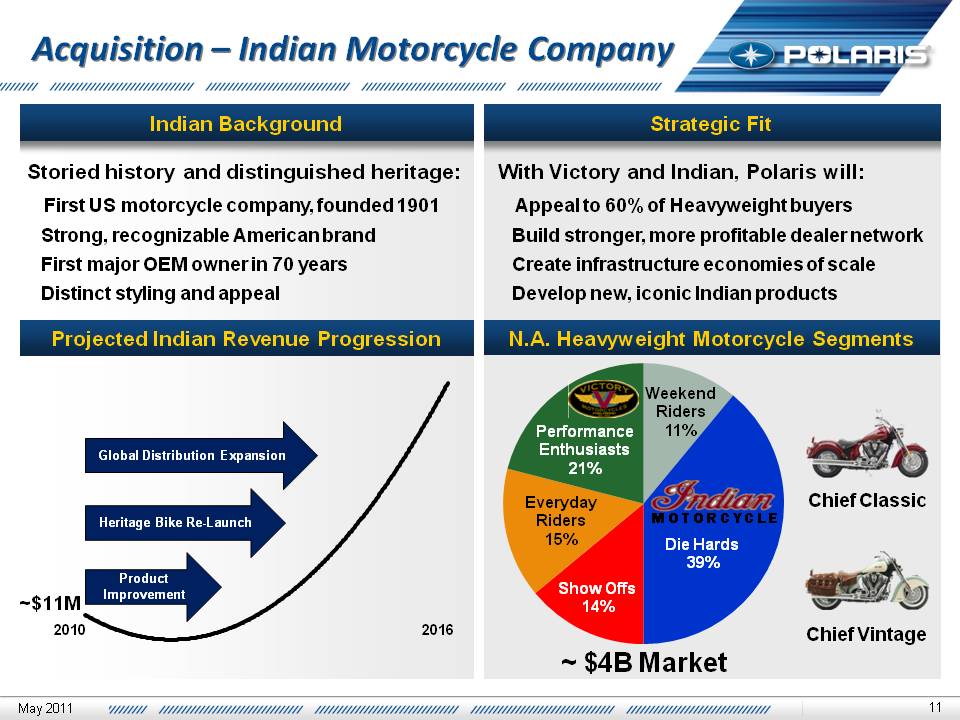
Slide: 11 Acquisition – Indian Motorcycle Company Storied history and distinguished heritage: First US motorcycle company, founded 1901 Strong, recognizable American brand First major OEM owner in 70 years Distinct styling and appeal Strategic Fit With Victory and Indian, Polaris will: Appeal to 60% of Heavyweight buyers Build stronger, more profitable dealer network Create infrastructure economies of scale Develop new, iconic Indian products Chief Classic Chief Vintage N.A. Heavyweight Motorcycle Segments Indian Background Projected Indian Revenue Progression Product Improvement Heritage Bike Re-Launch Global Distribution Expansion (Gp:) M O T O R C Y C L E ~ $4B Market May 2011
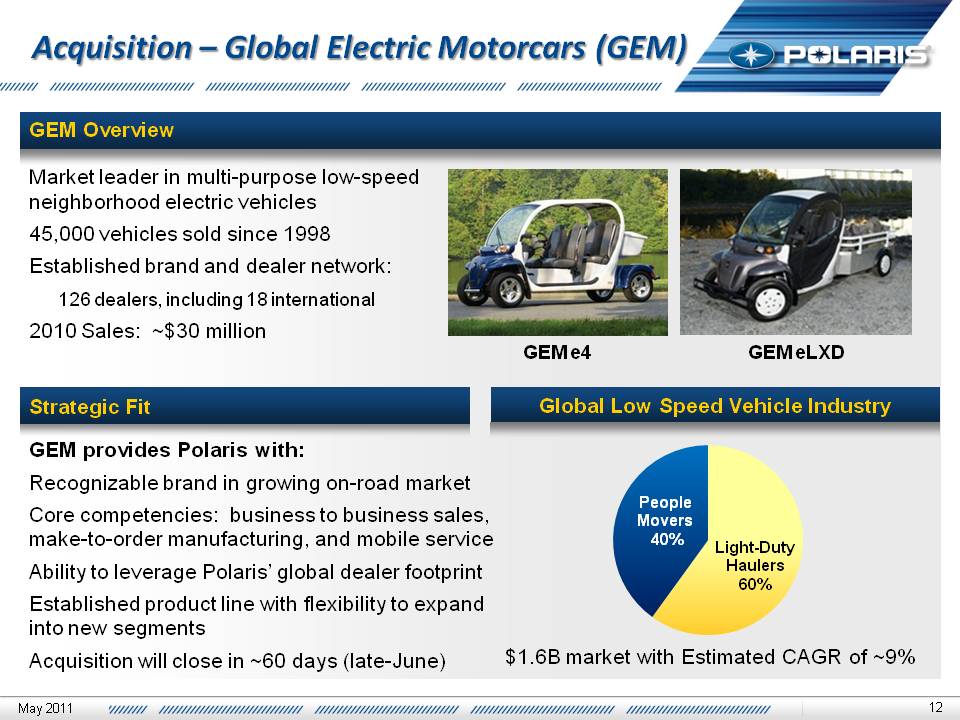
Slide: 12 Acquisition – Global Electric Motorcars (GEM) Market leader in multi-purpose low-speed neighborhood electric vehicles45,000 vehicles sold since 1998Established brand and dealer network: 126 dealers, including 18 international2010 Sales: ~$30 million GEM Overview GEM provides Polaris with:Recognizable brand in growing on-road marketCore competencies: business to business sales, make-to-order manufacturing, and mobile service Ability to leverage Polaris’ global dealer footprintEstablished product line with flexibility to expand into new segmentsAcquisition will close in ~60 days (late-June) GEM e4 Strategic Fit GEM eLXD Global Low Speed Vehicle Industry $1.6B market with Estimated CAGR of ~9% May 2011
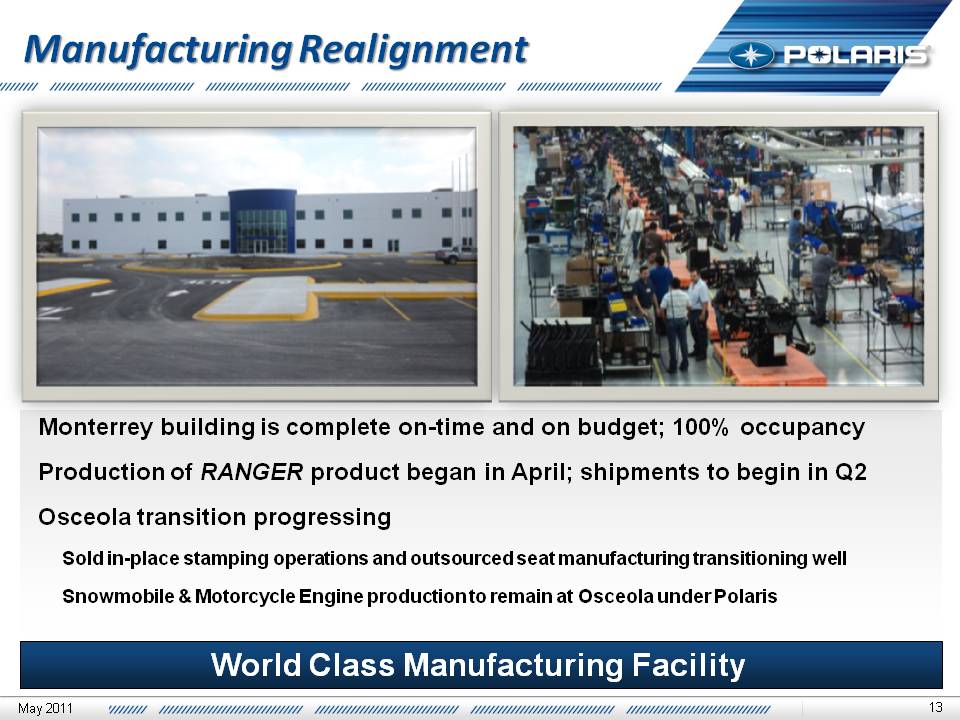
Slide: 13 Manufacturing Realignment Monterrey building is complete on-time and on budget; 100% occupancyProduction of RANGER product began in April; shipments to begin in Q2Osceola transition progressingSold in-place stamping operations and outsourced seat manufacturing transitioning wellSnowmobile & Motorcycle Engine production to remain at Osceola under Polaris World Class Manufacturing Facility May 2011
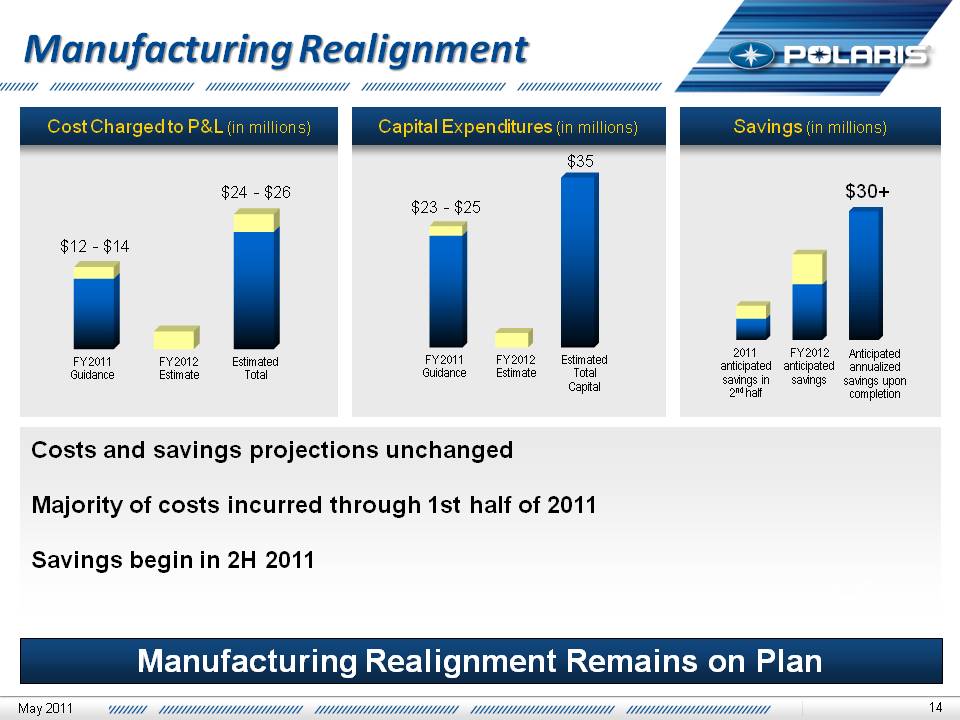
Slide: 14 Manufacturing Realignment Costs and savings projections unchanged Majority of costs incurred through 1st half of 2011Savings begin in 2H 2011 Manufacturing Realignment Remains on Plan Cost Charged to P&L (in millions) Aus/NZ 13% Capital Expenditures (in millions) Savings (in millions) Anticipated annualized savings upon completion 2011 anticipated savings in 2nd half $24 - $26 $12 - $14 $35 $30+ Estimated Total FY 2011 Guidance $23 - $25 FY 2012 Estimate FY 2012 anticipated savings Estimated Total Capital FY 2011 Guidance FY 2012 Estimate May 2011
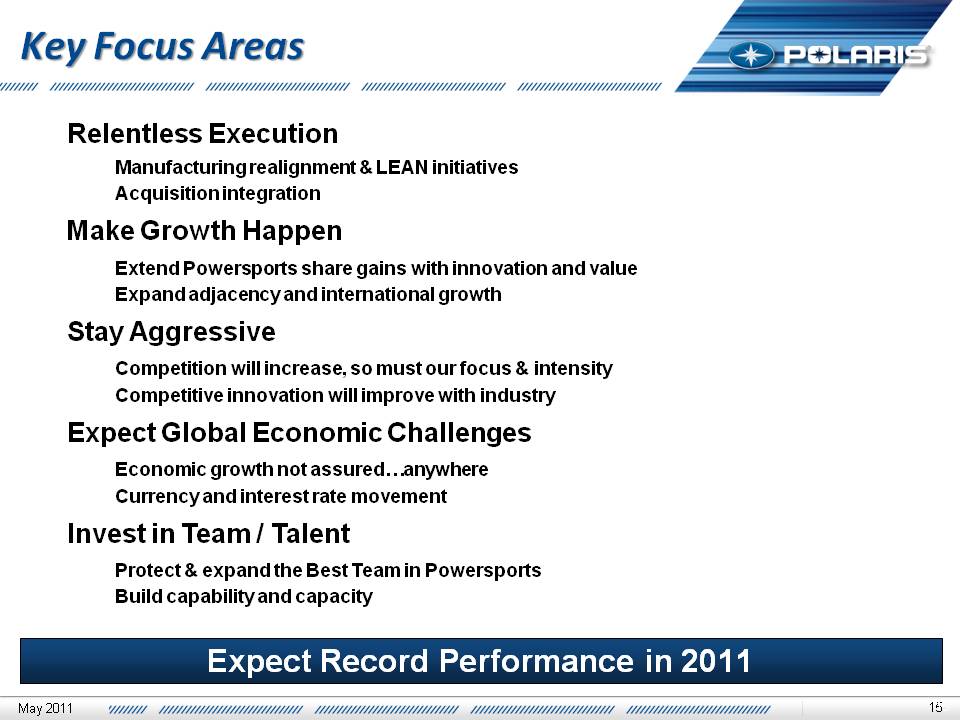
Slide: 15 Key Focus Areas Relentless ExecutionManufacturing realignment & LEAN initiatives Acquisition integrationMake Growth HappenExtend Powersports share gains with innovation and value Expand adjacency and international growthStay AggressiveCompetition will increase, so must our focus & intensityCompetitive innovation will improve with industry Expect Global Economic Challenges Economic growth not assured…anywhere Currency and interest rate movement Invest in Team / Talent Protect & expand the Best Team in PowersportsBuild capability and capacity 15 Expect Record Performance in 2011
Slide: 16 Thank you Questions May 2011
Slide: 17 Appendices 2011 Full Year GuidanceRevenue & N.A. Retail Sales – Q1 2011 Gross Margin Percentage Trends – Q1 2011Balance Sheet and Liquidity Profile – Q1 2011Management TeamSafe Harbor Statement May 2011
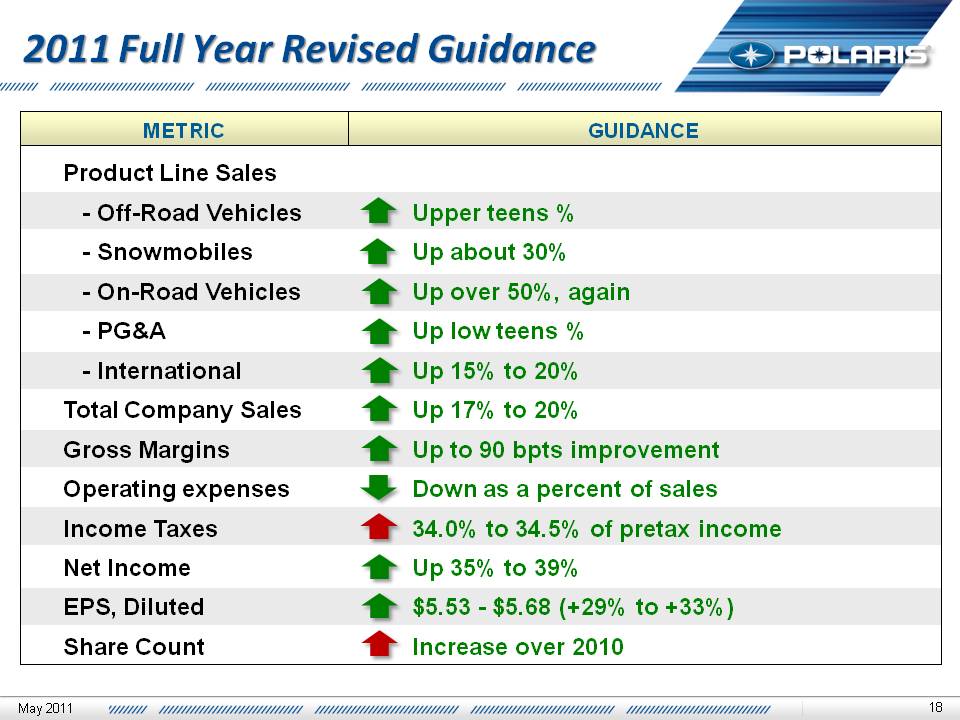
Slide: 18 2011 Full Year Revised Guidance Product Line Sales - Off-Road Vehicles - Snowmobiles - On-Road Vehicles - PG&A - InternationalTotal Company SalesGross MarginsOperating expensesIncome TaxesNet IncomeEPS, DilutedShare Count Upper teens %Up about 30%Up over 50%, againUp low teens %Up 15% to 20%Up 17% to 20% Up to 90 bpts improvement Down as a percent of sales34.0% to 34.5% of pretax income Up 35% to 39% $5.53 - $5.68 (+29% to +33%)Increase over 2010 METRIC GUIDANCE May 2011
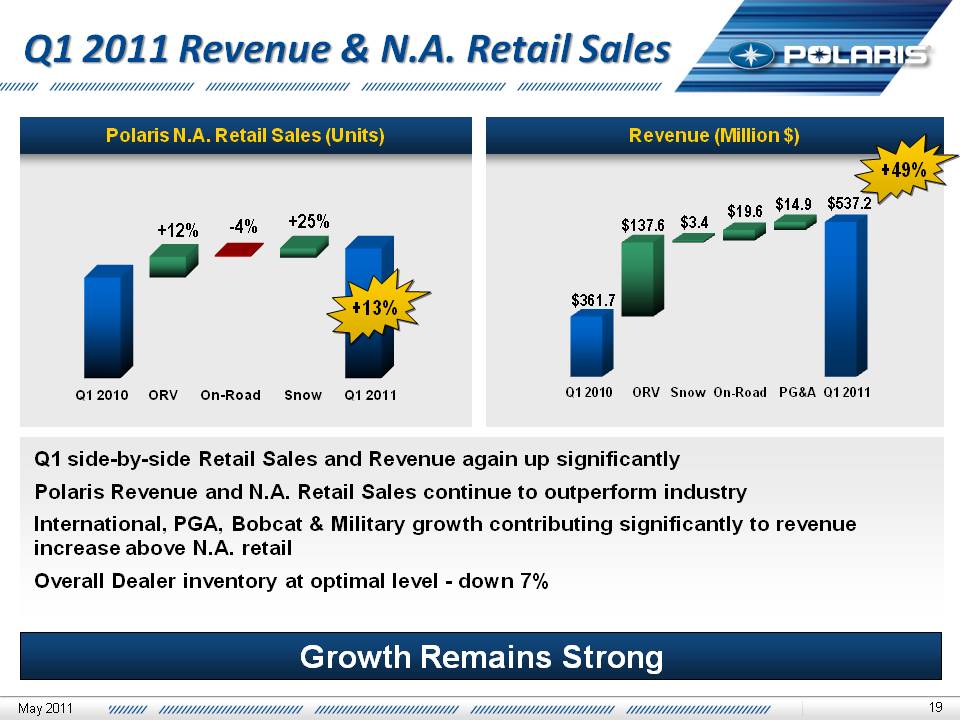
Slide: 19 Q1 2011 Revenue & N.A. Retail Sales Growth Remains Strong Revenue (Million $) Polaris N.A. Retail Sales (Units) $361.7 $137.6 $3.4 $19.6 $14.9 $537.2 +13% +12% -4% +25% +49% Q1 side-by-side Retail Sales and Revenue again up significantlyPolaris Revenue and N.A. Retail Sales continue to outperform industry International, PGA, Bobcat & Military growth contributing significantly to revenue increase above N.A. retailOverall Dealer inventory at optimal level - down 7% May 2011
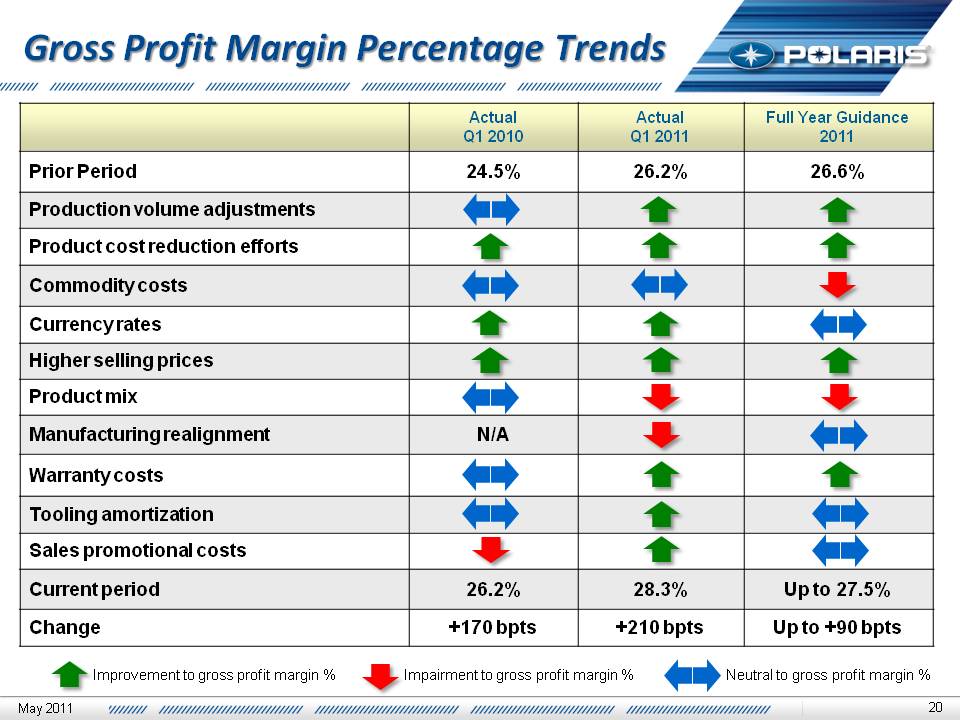
Slide: 20 Title: Gross Profit Margin Percentage Trends (Gp:) Improvement to gross profit margin % (Gp:) Impairment to gross profit margin % (Gp:) Neutral to gross profit margin % May 2011
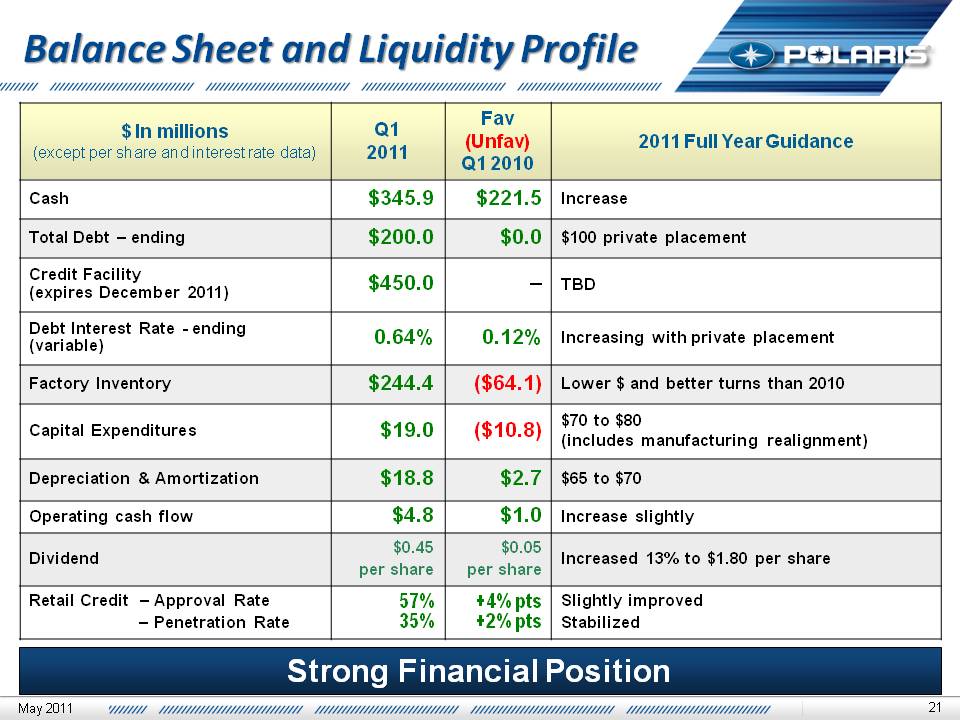
Slide: 21 Balance Sheet and Liquidity Profile Strong Financial Position May 2011
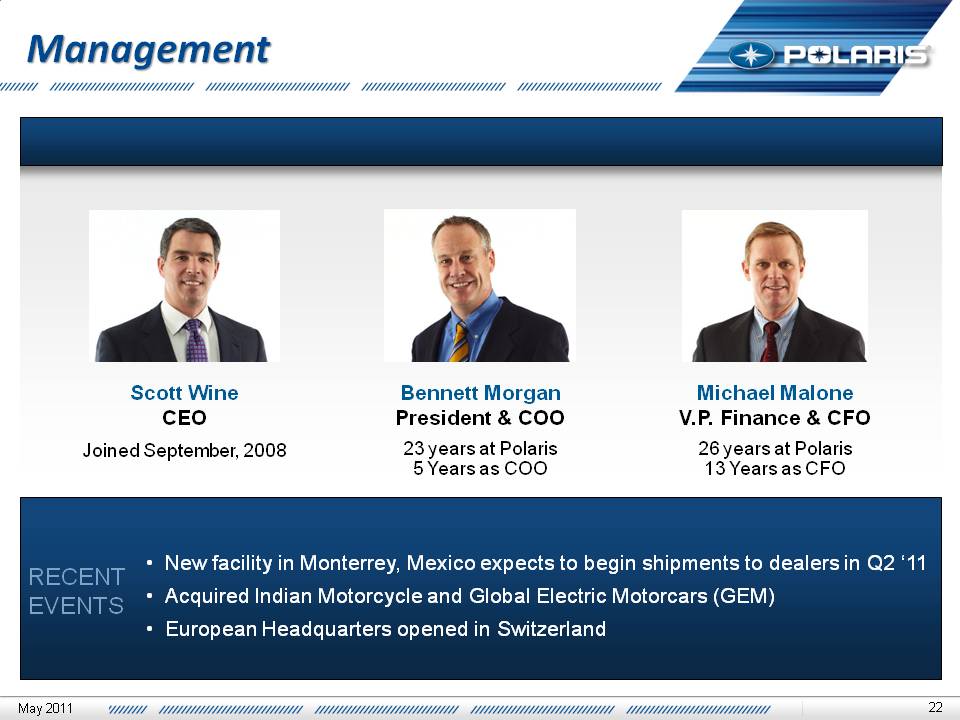
Slide: 22 Management Scott Wine CEOJoined September, 2008 Bennett Morgan President & COO23 years at Polaris 5 Years as COO Michael Malone V.P. Finance & CFO26 years at Polaris 13 Years as CFO RECENT EVENTS New facility in Monterrey, Mexico expects to begin shipments to dealers in Q2 ‘11 Acquired Indian Motorcycle and Global Electric Motorcars (GEM)European Headquarters opened in Switzerland May 2011
Slide: 23 Safe Harbor Except for historical information contained herein, the matters set forth in this document, including but not limited to management’s expectations regarding 2011 sales, shipments, net income, cash flow, and manufacturing realignment transition costs and savings, are forward-looking statements that involve certain risks and uncertainties that could cause actual results to differ materially from those forward-looking statements. Potential risks and uncertainties include such factors as product offerings, promotional activities and pricing strategies by competitors; manufacturing realignment transition costs; acquisition integration costs; warranty expenses; impact of changes in Polaris stock prices on incentive compensation; foreign currency exchange rate fluctuations; environmental and product safety regulatory activity; effects of weather; commodity costs; uninsured product liability claims; uncertainty in the retail and wholesale credit markets; changes in tax policy and overall economic conditions, including inflation, consumer confidence and spending and relationships with dealers and suppliers. Investors are also directed to consider other risks and uncertainties discussed in our 2009 annual report and Form 10-K filed by the Company with the Securities and Exchange Commission. The Company does not undertake any duty to any person to provide updates to its forward-looking statements.The data source for retail sales figures included in this presentation is registration information provided by Polaris dealers in North America and compiled by the Company or Company estimates. The Company must rely on information that its dealers supply concerning retail sales, and other retail sales data sources and this information is subject to revision. May 2011