Exhibit 99.1

Raymond James Institutional Investors Conference Scott W. Wine, Chairman & CEO March 7, 2017 POLARIS INDUSTRIES INC.
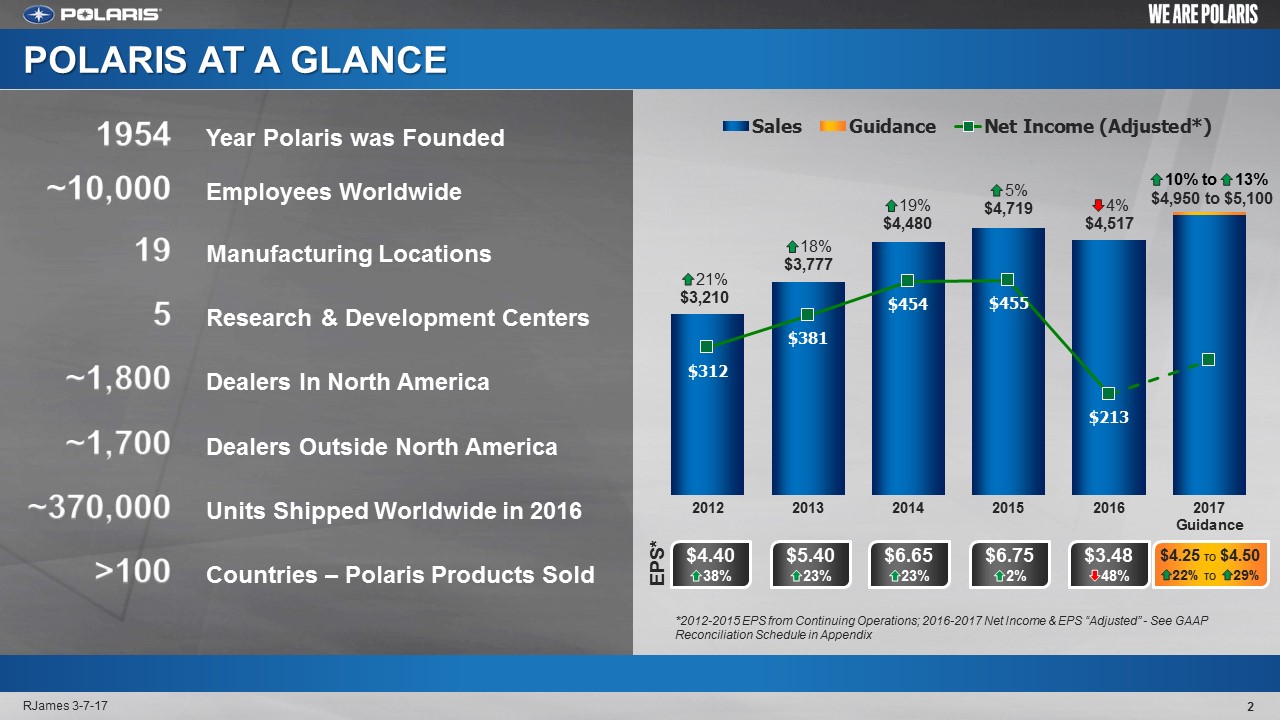
1954 Year Polaris was Founded ~10,000 Employees Worldwide 19 Manufacturing Locations 5 Research & Development Centers ~1,800 Dealers In North America ~1,700 Dealers Outside North America ~370,000 Units Shipped Worldwide in 2016 >100 Countries – Polaris Products Sold POLARIS AT A GLANCE *2012-2015 EPS from Continuing Operations; 2016-2017 Net Income & EPS “Adjusted” - See GAAP Reconciliation Schedule in Appendix EPS* $6.752% $4.25 TO $4.5022% TO 29% $4.4038% $5.4023% $6.6523% $3.4848% 10% to 13% $4,950 to $5,100 RJames 3-7-17 2

Recalls 13 safety bulletins / majority of $120M charge Oil/Ag Industry Oil mid-teens % / Ag mid-single digits % Currency NegativePre-tax Profit ~40 million ORV Share Loss 2+ points Dealer Sentiment 2016 YEAR IN REVIEW Indian Retail Growth 20%+ year-over-year VIP / Factory Inventory+$150M Gross VIP; Factory Inventory $110M* Transamerican Auto Parts~$750M Truck & Jeep Aftermarket Accessories New Safety & Quality OrganizationRecord recall effectiveness: RZR Turbo >85% Huntsville Plant Start-upOn time / on budget 2016 DIFFICULT YEAR; MANY LESSONS LEARNED SUCCESSES CHALLENGES RJames 3-7-17 3 *excluding acquisitions
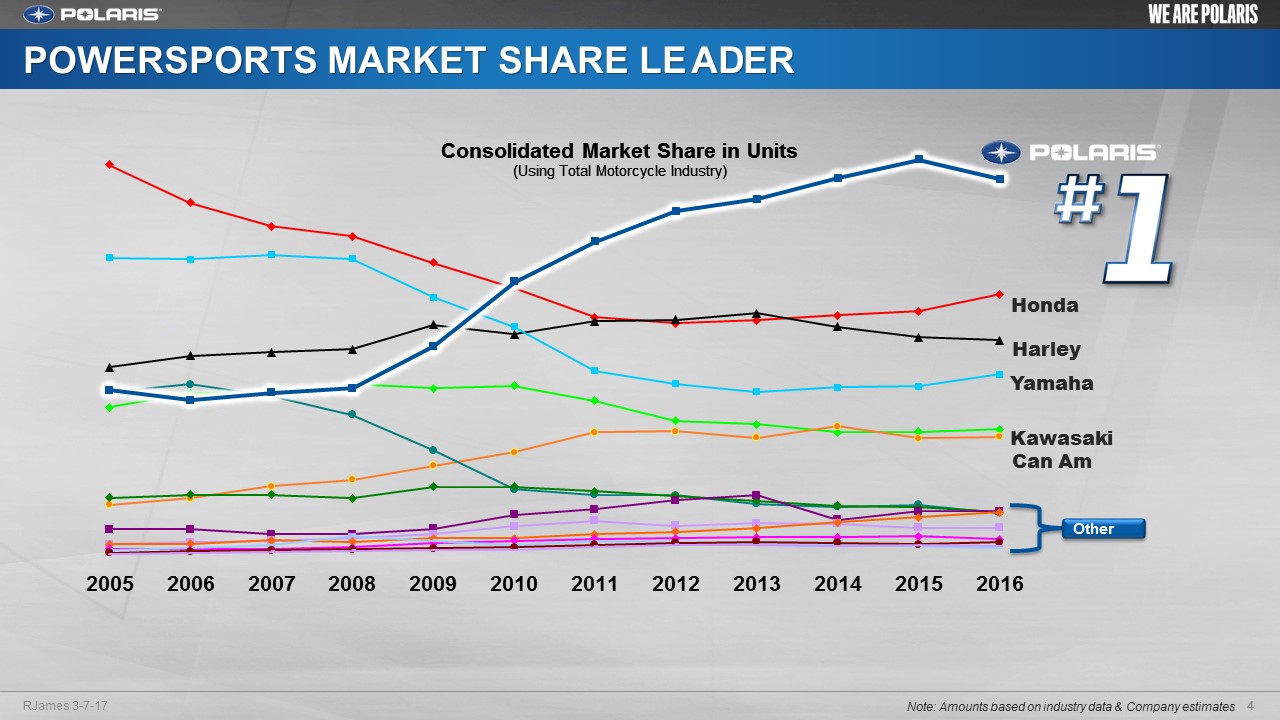
POWERSPORTS MARKET SHARE LEADER Honda Harley Yamaha Kawasaki Can Am Other RJames 3-7-17 4 Note: Amounts based on industry data & Company estimates

POLARIS 2017 – A MORE DIVERSE COMPANY 2017 Expectations* 2008 OVER $1 BILLION INVESTED IN ACQUISITIONS SINCE 2008 RJames 3-7-17 5 Global AdjacentMarkets Motorcycles Off-RoadVehicles/Snow *Based on mid-point of 2017 Guidance Range Aftermarket Motorcycles Off-RoadVehicles/Snow 2008 >> 2010 2011 2012 2013 2014 2015 2016 Private Limited TOTAL COMPANY SALES$5.0* BILLION TOTAL COMPANY SALES$1.9 BILLION

6 RJames 3-7-17 Strategic Objectives >$8 Billion by 2020 12% CAGR >10% of Sales by 2020 13% CAGR Best in Powersports PLUS 5-8% annual organic growthGrowth through Adjacencies >$2B from acquisitions & new marketsGlobal Market Leadership >33% of Polaris revenueLEAN Enterprise is Competitive Advantage Significant Quality, Delivery & Cost ImprovementStrong Financial Performance Sustainable, profitable growth Net Income Margin >10% = Under Review VISION & STRATEGY REMAIN UNCHANGED, REVIEWING FINANCIAL GOALS GIVEN RECENT PERFORMANCE 2016-2020 Required CAGR 15% 2016-2020 Required CAGR 39%

OFF-ROAD VEHICLES (ORV) / SNOWMOBILES 7 RJames 3-7-17 REGAINING FOOTING AS LEADING POWERSPORTS MANUFACTURER Move Past RecallsContinuous Improvement in Safety & Quality Improve Market Share TrajectoryRANGER, RZR, ATV and Snowmobiles Aggressively Market Portfolio Increased Advertising / Targeted Promotions Deliver Better Service & Improve Distribution Drive Accelerated Product Innovation 2017 FOCUS AREAS NEW! MY’18 Polaris Titan®

Technology Configurator RJames 3-7-17 8

VICTORY WIND DOWN 25 Industry Awards Industry-Leading NPS 74.4 Passionate Riders Laid Foundation for 1998 - 2016 RJames 3-7-17 9 EXPERIENCE AND KNOWLEDGE GAIN INVALUABLE

INDIAN MOTORCYCLE 10 RJames 3-7-17 GROW AMERICA’S OLDEST MOTORCYCLE BRAND Drive Awareness Continue to Grow Share Introduce Differentiated Product Build Brand Partnerships Reignite Indian Factory Racing NEW MY’18 Indian Roadmaster® Classic 2017 FOCUS AREAS

SLINGSHOT Increase Awareness of Brand & Lifestyle Fuel Slingshot Customization Utilize Partnerships/Influencers to Amplify the Brand Slingshot Racing in 2017 2017 FOCUS AREAS RJames 3-7-17 11 BUILD BRAND AWARENESS – GROW PROFITABILITY

INTERNATIONAL RJames 3-7-17 12 CONTINUE TO BUILD INTERNATIONAL BUSINESS FOUNDATION Latin America+12%(CC +27%) Asia Pacific(includes Australia/New Zealand)-5%(CC -3%) EMEAFLAT(CC +1%) 2016 Sales by Region Regain Off-Road Momentum Defend/Grow #1 Market Share Grow Motorcycles AggressivelyIndian/Slingshot Maximize Mexico – All Product LinesMexico Up 30%+ in 2016 Drive Global SynergiesOperations/Aftermarket /Adjacent Markets 2017 FOCUS AREAS 2016 SALES$652 MILLION CC = Constant Currency

TRANSAMERICAN AUTO PARTS (TAP) Founded in 1961; Acquired Nov. 2016 Leader in Truck & Jeep Aftermarket Vertically Integrated Model 7 Leading Brands 77 Retail 4-WHEEL PARTS Stores Omni-channel with Strong E-Commerce Platform FY 2016 Sales by Channel Wholesale E-Commerce/Direct Retail Stores RJames 3-7-17 13 2016 REVENUE OF ~$750 MILLION - PROFITABLE

SAFETY, QUALITY & INNOVATION R&D Investment DRIVING FOR BEST-IN-INDUSTRY PRODUCT INOVATION, SAFETY & QUALITY FOR CUSTOMERS 14 Innovation Vitality Index* 2017 FOCUS AREAS Established Central Safety & Quality TeamGDP goal in 2017 Proactive Safety Engineering & Product Plan Significant Increase In R&D RJames 3-7-17 ($ in millions) Up mid-teens % *Sales of products introduced in past 3 years

LEAN Inventory Reduction LEAN JOURNEY ACCELERATING – BECOMING STANDARD OPERATING PRACTICES 15 Value Improvement Process (VIP) 2017 FOCUS AREAS RFM Go-to-Market Process for SxS Material Flow / Plant Capabilities lead times / inventory / on-going VIP savings Product Development Process (PDP)Improved quality with Polaris speed/innovation LEAN Business ProcessesMore value / less waste throughout organization Flattish -8% RJames 3-7-17 ($110) *excluding acquisitions ($ in millions) ($ in millions) (Units) (in dollars)

16 RJames 3-7-17 CLOSING COMMENTS Get Back to #1 in Quality Accelerate Product Innovation Play Offense... Aggressively: Protect Share Successfully Integrate TAP Improve the Dealer Channel and Relationships Meet Our Commitments – Financial, Operational Quality, Product Innovation and Aggressively Defending in 2017

NON-GAAP INFORMATION DISCLOSED IN THIS PRESENTATIONPOLARIS CUSTOMER USAGE PROFILES2017 FULL YEAR GUIDANCE – SALES & EPS2017 FULL YEAR GUIDANCE BY SEGMENTSGROSS PROFIT MARGIN GUIDANCEOTHER FULL YEAR 2017 EXPECTATIONSN.A. POWERSPORTS RETAIL SALESN.A. DEALER INVENTORYINCOME FROM FINANCIAL SERVICES 2016 POLARIS FINANCIAL POSITION2016 PG&A / INTERNATIONALMANUFACTURING LOCATIONSGAAP / NON-GAAP RECONCILIATION SCHEDULESSAFE HARBOR 17 RJames 3-7-17 APPENDICES

NON-GAAP INFORMATION DISCLOSED IN THIS PRESENTATION 18 RJames 3-7-17 Throughout this presentation, the word “Adjusted” is used to refer to GAAP results minus the following: TAP inventory step-up purchase accountingTAP acquisition costs and integration expensesImpacts associated with the Victory wind downBeginning in 2017 a new reporting segment called “Aftermarket” was established which includes TAP plus our five aftermarket brands; 509, Klim, Kolpin, Pro Armor and Trail Tech, that were previously included in the ORV/Snowmobiles and Motorcycles reporting segments. 2016 sales and gross profit results will be reclassified to account for the fourth segment beginning in 2017 for comparison purposes.See “GAAP / NON-GAAP RECONCILIATION SCHEDULES” included in the appendix of this presentation.
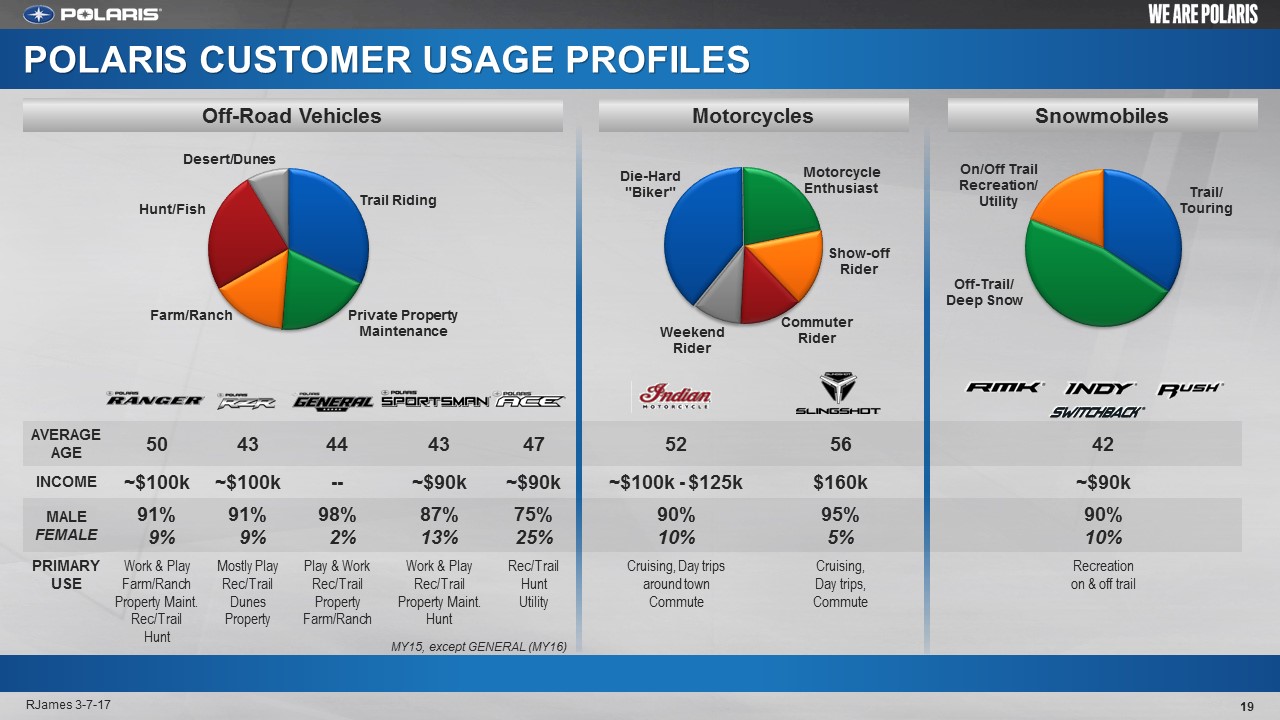
Snowmobiles Motorcycles POLARIS CUSTOMER USAGE PROFILES RJames 3-7-17 Off-Road Vehicles 19 AVERAGEAGE 50 43 44 43 47 52 56 42 INCOME ~$100k ~$100k -- ~$90k ~$90k ~$100k - $125k $160k ~$90k MALEFEMALE 91% 9% 91% 9% 98% 2% 87%13% 75%25% 90%10% 95%5% 90%10% PRIMARYUSE Work & PlayFarm/RanchProperty Maint.Rec/TrailHunt Mostly PlayRec/TrailDunesProperty Play & Work Rec/TrailPropertyFarm/Ranch Work & PlayRec/TrailProperty Maint.Hunt Rec/TrailHuntUtility Cruising, Day tripsaround townCommute Cruising, Day trips,Commute Recreationon & off trail MY15, except GENERAL (MY16)
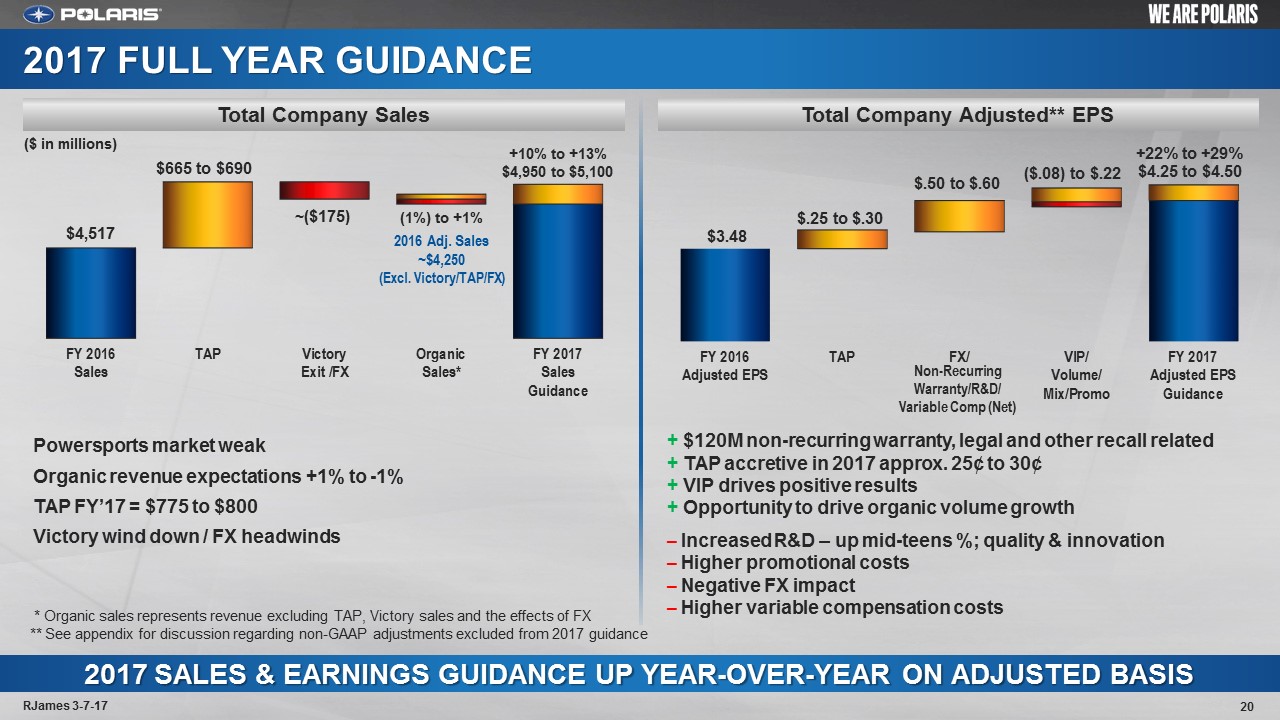
Powersports market weakOrganic revenue expectations +1% to -1%TAP FY’17 = $775 to $800Victory wind down / FX headwinds 2017 SALES & EARNINGS GUIDANCE UP YEAR-OVER-YEAR ON ADJUSTED BASIS Total Company Adjusted** EPS Total Company Sales 20 RJames 3-7-17 2017 FULL YEAR GUIDANCE + $120M non-recurring warranty, legal and other recall related+ TAP accretive in 2017 approx. 25¢ to 30¢+ VIP drives positive results+ Opportunity to drive organic volume growth– Increased R&D – up mid-teens %; quality & innovation– Higher promotional costs– Negative FX impact– Higher variable compensation costs ($ in millions) Non-Recurring Warranty/R&D/Variable Comp (Net) (1%) to +1% +10% to +13%$4,950 to $5,100 * Organic sales represents revenue excluding TAP, Victory sales and the effects of FX ** See appendix for discussion regarding non-GAAP adjustments excluded from 2017 guidance 2016 Adj. Sales ~$4,250 (Excl. Victory/TAP/FX)

Aftermarket ORV/Snowmobiles AFTERMARKET SEGMENT ADDITION IN 2017 TO INCLUDE TAP + OTHER AFTERMARKET BRANDS 21 RJames 3-7-17 2017 FULL YEAR GUIDANCE BY SEGMENTS Global Adjacent Markets Motorcycles Down low-single digits % $3,284 ORV PG&A Snow ORV PG&A Snow PG&A $699 VictoryIndianSlingshot PG&A Downlow-doubledigits %(2) IndianSlingshot PG&A PG&A W&TDefense W&TDefense Up low-single digits % $342 Up Significantly $192 ($ in millions) (1) (1) (1) Full Year 2016 sales have been reclassified to account for new Aftermarket segment reporting which includes aftermarket brands previously reported in their respective segments(2) On a comparable basis, motorcycle expectations is “Up low-double digits %” in 2017 after adjusting for Victory wholegood sales reported in 2016

Adjusted** Gross Margin 2017 Guidance Adjusted* Gross Margin FY 2016 22 RJames 3-7-17 Adjusted* Gross Margin Q4 2016 2017 GROSS MARGIN IMPROVEMENT DRIVEN PRIMARILY BY VIP & 2016 NON-RECURRING EVENTS GROSS PROFIT MARGIN GUIDANCE Increase up to ~180 bps KEY: Improvement Headwind Neutral * See appendix for non-GAAP reconciliations** See appendix for discussion regarding non-GAAP adjustments excluded from 2017 guidance Product Mix VIP Acquisitions Promos / Incentives Warranty FX VIP Product Mix Warranty Promos / Incentives FX VIP One-time warranty FX Promos / Incentives Product mix GM by Segment Q4 2015 Q4 2016 ORV/Snow 30.5% 28.6% Motorcycles 14.8% 1.5% Adjacent Markets 27.4% 29.5% GM by Segment FY 2015 FY 2016 ORV/Snow 32.1% 27.7% Motorcycles 13.9% 12.9% Adjacent Markets 27.0% 27.8% GM by Segment 2017 Expectations ORV/Snow Motorcycles Adjacent Markets Aftermarket

OTHER FY 2017 EXPECTATIONS 23 RJames 3-7-17 Adjusted operating expenses: increase mid-teens % (slight increase as a % of sales) R&D Legal and other related costs Operating expense from acquired companies Variable compensationIncome from financial services: down ~10% due to lower dealer inventory levelsInterest expense: more than double due to TAP acquisition funding Income taxes: approximately 34.5% of pretax profitsInternational sales: about flat with 2016 on a constant currency basisPG&A: up low-single digits %Diluted shares outstanding: approximately flatOperating cash flow: down significantly

Polaris N.A. retail down 4% for Q4 2016 vs. Q4 2015Indian Motorcycle retail up about 20% in Q4, total motorcycles down, primarily SlingshotORV down; RZR recall disruptions, competition and weak ATV industryNorth American Industry retail trends continued soft Oil/Gas, Ag remain weak MARKETS REMAIN WEAK / VOLATILE Q4’16 Retail Sales by Business (vs. Q4’15) Polaris Retail Sales & Market Share N.A. POWERSPORTS RETAIL SALES (# vehicle units) POLARIS INDUSTRY Off-Road Vehicles mid-single digits % ~flat* Side-by-Sides ATVs low-single digits % high-single digits % Motorcycles(900cc & above) mid-single digits % low-single digits % Snowmobiles about 1% ~flat *estimated Retail % change, # vehicle units Consolidated Market Share in UnitsUsing Total Motorcycle Industry RJames 3-7-17 24
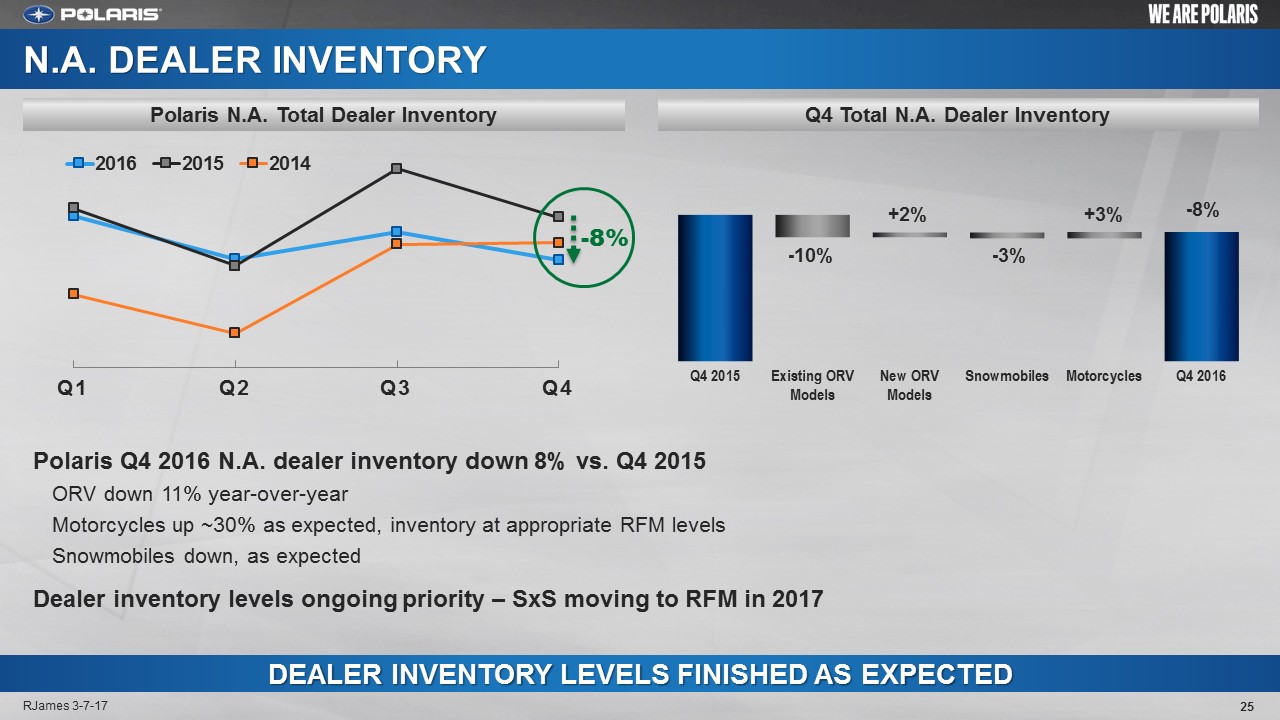
Polaris Q4 2016 N.A. dealer inventory down 8% vs. Q4 2015ORV down 11% year-over-yearMotorcycles up ~30% as expected, inventory at appropriate RFM levelsSnowmobiles down, as expectedDealer inventory levels ongoing priority – SxS moving to RFM in 2017 DEALER INVENTORY LEVELS FINISHED AS EXPECTED Q4 Total N.A. Dealer Inventory Polaris N.A. Total Dealer Inventory N.A. DEALER INVENTORY -8% -8% RJames 3-7-17 25
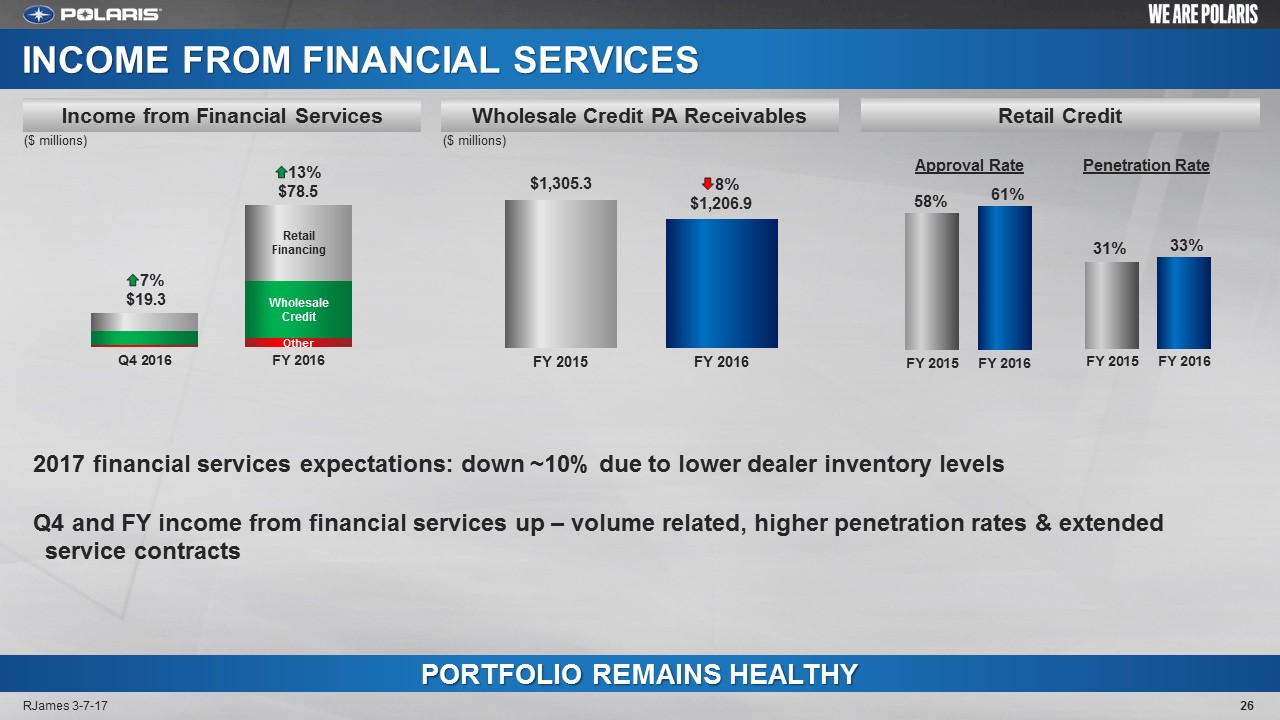
Retail Credit Wholesale Credit PA Receivables 26 RJames 3-7-17 Income from Financial Services PORTFOLIO REMAINS HEALTHY INCOME FROM FINANCIAL SERVICES 2017 financial services expectations: down ~10% due to lower dealer inventory levels Q4 and FY income from financial services up – volume related, higher penetration rates & extended service contracts 7%$19.3 13%$78.5 8%$1,206.9 $1,305.3 ($ millions) ($ millions) Approval Rate Penetration Rate
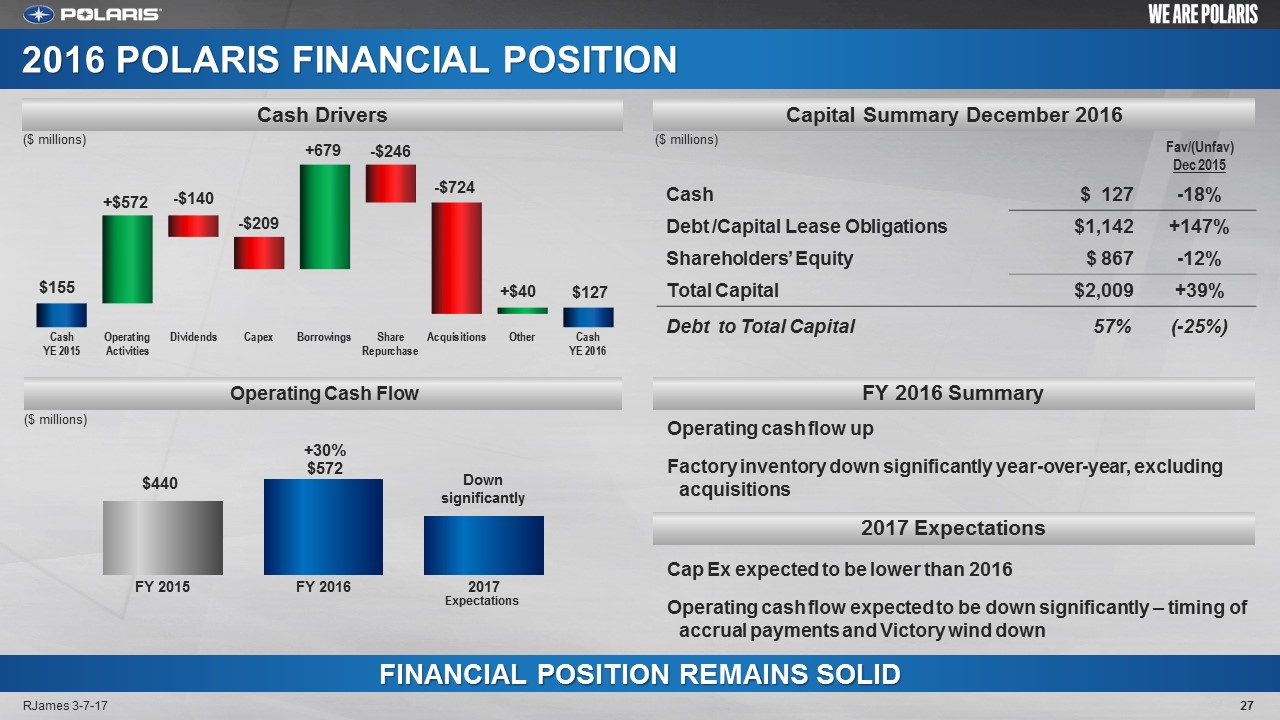
2016 POLARIS FINANCIAL POSITION 27 RJames 3-7-17 Capital Summary December 2016 Cash Drivers Fav/(Unfav)Dec 2015 Cash $ 127 -18% Debt /Capital Lease Obligations $1,142 +147% Shareholders’ Equity $ 867 -12% Total Capital $2,009 +39% Debt to Total Capital 57% (-25%) 2015Operating cash flow upFactory inventory down significantly year-over-year, excluding acquisitionsCap Ex expected to be lower than 2016Operating cash flow expected to be down significantly – timing of accrual payments and Victory wind down Operating Cash Flow FINANCIAL POSITION REMAINS SOLID Down significantly ($ millions) ($ millions) ($ millions) Expectations FY 2016 Summary 2017 Expectations

International Parts, Garments & Accessories (PG&A)* 28 RJames 3-7-17 Q4 2016 SUPPLEMENTAL SALES PERFORMANCE Motorcycles Global Adjacent Markets (GAM) Snowmobiles Motorcycles Global Adjacent Markets (GAM) Apparel 8% 23% LatinAmerica 24% 21% 7% 7% 6% 2% 4% 2% 6% 16% 2% Q4 Sales 9% to 214.4 Million ∆ from Q4'15 ∆ from Q4'15 Q4 Sales 2% to $178.2 Million (~flat constant currency) ∆ from Q4'15 ∆ from Q4'15 *Does not include TAP

19 IN-HOUSE MANUFACTURING FACILITIES WORLDWIDE MANUFACTURING LOCATIONS Monterrey MEXICOSxS, Engines 1) Spirit Lake & 2) Milford, IOWAMotorcycles,SxS, ACE, GEM RoseauMINNESOTASnow, ATV, SxS OsceolaWISCONSINEngines BourranFRANCEGoupil 1) Chanas &2) Aix-les-BainsFRANCEAixam Mega Cuyahoga FallsOHIO Kolpin Riverside, CALIFORNIA Pro Armor Shanghai, CHINAHammerhead HuntsvilleALABAMASxS, Slingshot OpolePOLANDATV, SxS JaipurINDIAEicher JV SandpointIDAHOTimbersled SpearfishSOUTH DAKOTAMotorcycle Paint Anaheim, CALIFORNIA Taylor-Dunn 1) Chula Vista, CA2) Banning, CA CALIFORNIA Transamerican Auto Parts RJames 3-7-17 29
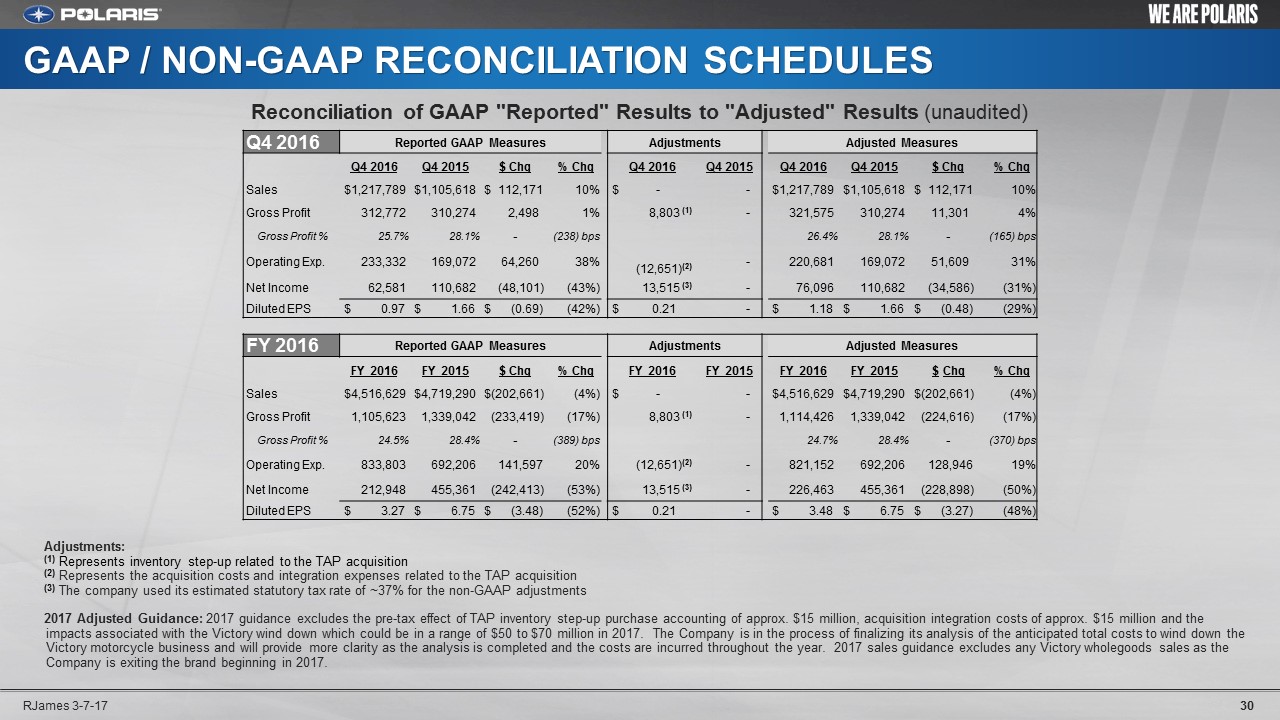
GAAP / NON-GAAP RECONCILIATION SCHEDULES 30 RJames 3-7-17 Adjustments:(1) Represents inventory step-up related to the TAP acquisition(2) Represents the acquisition costs and integration expenses related to the TAP acquisition(3) The company used its estimated statutory tax rate of ~37% for the non-GAAP adjustments2017 Adjusted Guidance: 2017 guidance excludes the pre-tax effect of TAP inventory step-up purchase accounting of approx. $15 million, acquisition integration costs of approx. $15 million and the impacts associated with the Victory wind down which could be in a range of $50 to $70 million in 2017. The Company is in the process of finalizing its analysis of the anticipated total costs to wind down the Victory motorcycle business and will provide more clarity as the analysis is completed and the costs are incurred throughout the year. 2017 sales guidance excludes any Victory wholegoods sales as the Company is exiting the brand beginning in 2017. Q4 2016 Reported GAAP Measures Adjustments Adjusted Measures Q4 2016 Q4 2015 $ Chg % Chg Q4 2016 Q4 2015 Q4 2016 Q4 2015 $ Chg % Chg Sales $1,217,789 $1,105,618 $ 112,171 10% $ - - $1,217,789 $1,105,618 $ 112,171 10% Gross Profit 312,772 310,274 2,498 1% 8,803 (1) - 321,575 310,274 11,301 4% Gross Profit % 25.7% 28.1% - (238) bps 26.4% 28.1% - (165) bps Operating Exp. 233,332 169,072 64,260 38% (12,651)(2) - 220,681 169,072 51,609 31% Net Income 62,581 110,682 (48,101) (43%) 13,515 (3) - 76,096 110,682 (34,586) (31%) Diluted EPS $ 0.97 $ 1.66 $ (0.69) (42%) $ 0.21 - $ 1.18 $ 1.66 $ (0.48) (29%) FY 2016 Reported GAAP Measures Adjustments Adjusted Measures FY 2016 FY 2015 $ Chg % Chg FY 2016 FY 2015 FY 2016 FY 2015 $ Chg % Chg Sales $4,516,629 $4,719,290 $(202,661) (4%) $ - - $4,516,629 $4,719,290 $(202,661) (4%) Gross Profit 1,105,623 1,339,042 (233,419) (17%) 8,803 (1) - 1,114,426 1,339,042 (224,616) (17%) Gross Profit % 24.5% 28.4% - (389) bps 24.7% 28.4% - (370) bps Operating Exp. 833,803 692,206 141,597 20% (12,651)(2) - 821,152 692,206 128,946 19% Net Income 212,948 455,361 (242,413) (53%) 13,515 (3) - 226,463 455,361 (228,898) (50%) Diluted EPS $ 3.27 $ 6.75 $ (3.48) (52%) $ 0.21 - $ 3.48 $ 6.75 $ (3.27) (48%) Reconciliation of GAAP "Reported" Results to "Adjusted" Results (unaudited)

SAFE HARBOR & NON-GAAP MEASURES 31 RJames 3-7-17 Except for historical information contained herein, the matters set forth in this presentation, including management’s expectations regarding 2017 future sales, shipments, net income, and net income per share, and operational initiatives are forward-looking statements that involve certain risks and uncertainties that could cause actual results to differ materially from those forward-looking statements. Potential risks and uncertainties include such factors as the Company’s ability to successfully implement its manufacturing operations expansion initiatives, product offerings, promotional activities and pricing strategies by competitors; economic conditions that impact consumer spending; acquisition integration costs; product recalls, warranty expenses; impact of changes in Polaris stock price on incentive compensation plan costs; foreign currency exchange rate fluctuations; environmental and product safety regulatory activity; effects of weather; commodity costs; uninsured product liability claims; uncertainty in the retail and wholesale credit markets; performance of affiliate partners; changes in tax policy and overall economic conditions, including inflation, consumer confidence and spending and relationships with dealers and suppliers. Investors are also directed to consider other risks and uncertainties discussed in documents filed by the Company with the Securities and Exchange Commission. The Company does not undertake any duty to any person to provide updates to its forward-looking statements. The data source for retail sales figures included in this presentation is registration information provided by Polaris dealers in North America and compiled by the Company or Company estimates. The Company must rely on information that its dealers supply concerning retail sales, and other retail sales data sources and this information is subject to revision.Non-GAAP Measures - Constant Currency Reporting. This presentation includes information regarding the Company’s 2016 actual results and 2017 full year expectations on a constant currency basis, which is a non-GAAP measure, as well as on a GAAP basis. For purpose of comparison, the results on a constant currency basis uses the respective prior year exchange rates for the comparative period to enhance the visibility of the underlying business trends, excluding the impact of translation arising from foreign currency exchange rate fluctuations.This presentation also contains certain non-GAAP financial measures, consisting of “adjusted” gross profit, operating expenses, net income and net income per diluted share” as measures of our operating performance. Management believes these measures may be useful in performing meaningful comparisons of past and present operating results, to understand the performance of its ongoing operations and how management views the business. Reconciliations of adjusted non-GAAP measures to reported GAAP measures are included in the appendix contained in this presentation. These measures, however, should not be construed as an alternative to any other measure of performance determined in accordance with GAAP.

32 RJames 3-7-17