Exhibit 99.2

First Quarter 2017 Earnings Results April 25, 2017 POLARIS INDUSTRIES INC.
SAFE HARBOR & NON-GAAP MEASURES 2 Q1'17 Earnings Except for historical information contained herein, the matters set forth in this presentation, including management’s expectations regarding 2017 future sales, shipments, net income, and net income per share, and operational initiatives are forward-looking statements that involve certain risks and uncertainties that could cause actual results to differ materially from those forward-looking statements. Potential risks and uncertainties include such factors as the Company’s ability to successfully implement its manufacturing operations expansion initiatives, product offerings, promotional activities and pricing strategies by competitors; economic conditions that impact consumer spending; acquisition integration costs; product recalls, warranty expenses; impact of changes in Polaris stock price on incentive compensation plan costs; foreign currency exchange rate fluctuations; environmental and product safety regulatory activity; effects of weather; commodity costs; uninsured product liability claims; uncertainty in the retail and wholesale credit markets; performance of affiliate partners; changes in tax policy and overall economic conditions, including inflation, consumer confidence and spending and relationships with dealers and suppliers. Investors are also directed to consider other risks and uncertainties discussed in documents filed by the Company with the Securities and Exchange Commission. The Company does not undertake any duty to any person to provide updates to its forward-looking statements. The data source for retail sales figures included in this presentation is registration information provided by Polaris dealers in North America and compiled by the Company or Company estimates. The Company must rely on information that its dealers supply concerning retail sales, and other retail sales data sources and this information is subject to revision.This presentation contains certain non-GAAP financial measures, consisting of “adjusted” sales, gross profit, operating expenses, net income and net income per diluted share” as measures of our operating performance. Management believes these measures may be useful in performing meaningful comparisons of past and present operating results, to understand the performance of its ongoing operations and how management views the business. Reconciliations of adjusted non-GAAP measures to reported GAAP measures are included in the appendix contained in this presentation. These measures, however, should not be construed as an alternative to any other measure of performance determined in accordance with GAAP.
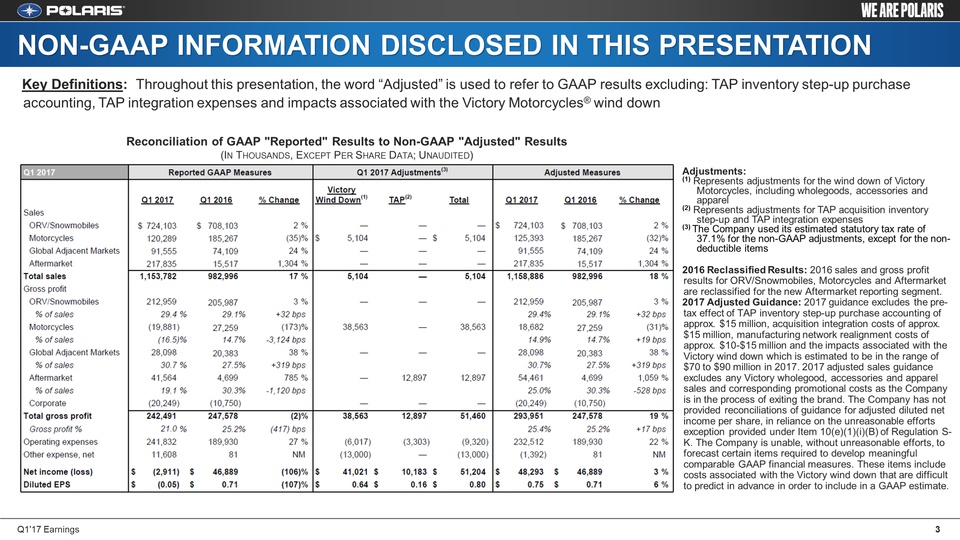
NON-GAAP INFORMATION DISCLOSED IN THIS PRESENTATION 3 Q1'17 Earnings Adjustments:(1) Represents adjustments for the wind down of Victory Motorcycles, including wholegoods, accessories and apparel(2) Represents adjustments for TAP acquisition inventory step-up and TAP integration expenses(3) The Company used its estimated statutory tax rate of 37.1% for the non-GAAP adjustments, except for the non-deductible items2016 Reclassified Results: 2016 sales and gross profit results for ORV/Snowmobiles, Motorcycles and Aftermarket are reclassified for the new Aftermarket reporting segment.2017 Adjusted Guidance: 2017 guidance excludes the pre-tax effect of TAP inventory step-up purchase accounting of approx. $15 million, acquisition integration costs of approx. $15 million, manufacturing network realignment costs of approx. $10-$15 million and the impacts associated with the Victory wind down which is estimated to be in the range of $70 to $90 million in 2017. 2017 adjusted sales guidance excludes any Victory wholegood, accessories and apparel sales and corresponding promotional costs as the Company is in the process of exiting the brand. The Company has not provided reconciliations of guidance for adjusted diluted net income per share, in reliance on the unreasonable efforts exception provided under Item 10(e)(1)(i)(B) of Regulation S-K. The Company is unable, without unreasonable efforts, to forecast certain items required to develop meaningful comparable GAAP financial measures. These items include costs associated with the Victory wind down that are difficult to predict in advance in order to include in a GAAP estimate. Key Definitions: Throughout this presentation, the word “Adjusted” is used to refer to GAAP results excluding: TAP inventory step-up purchase accounting, TAP integration expenses and impacts associated with the Victory Motorcycles® wind down Reconciliation of GAAP "Reported" Results to Non-GAAP "Adjusted" Results (In Thousands, Except Per Share Data; Unaudited)

Scott W. Wine, Chairman & CEO First Quarter 2017 Earnings Results April 25, 2017 POLARIS INDUSTRIES INC.
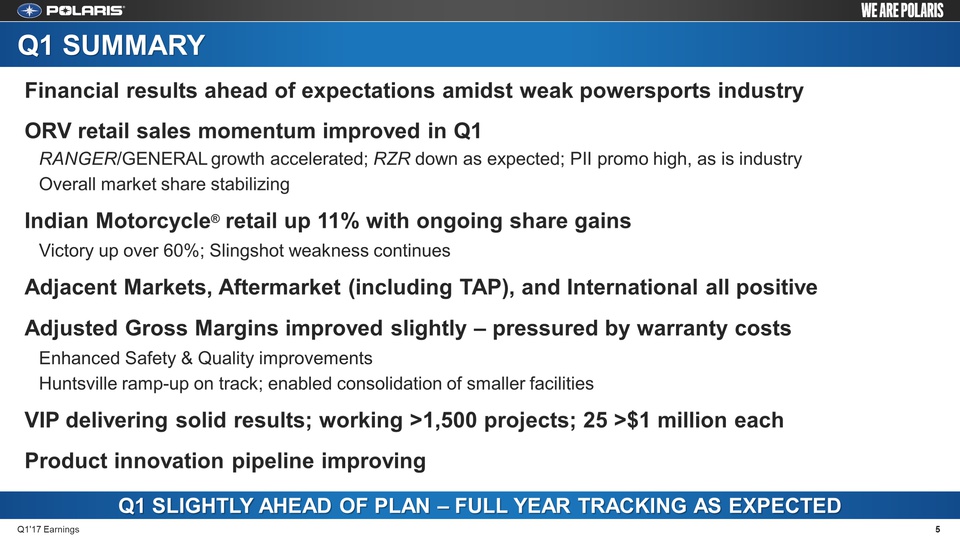
Q1 SUMMARY 5 Q1'17 Earnings Q1 slightly ahead OF Plan – Full Year Tracking As Expected Financial results ahead of expectations amidst weak powersports industry ORV retail sales momentum improved in Q1 RANGER/GENERAL growth accelerated; RZR down as expected; PII promo high, as is industry Overall market share stabilizing Indian Motorcycle® retail up 11% with ongoing share gains Victory up over 60%; Slingshot weakness continues Adjacent Markets, Aftermarket (including TAP), and International all positive Adjusted Gross Margins improved slightly – pressured by warranty costs Enhanced Safety & Quality improvements Huntsville ramp-up on track; enabled consolidation of smaller facilities VIP delivering solid results; working >1,500 projects; 25 >$1 million each Product innovation pipeline improving
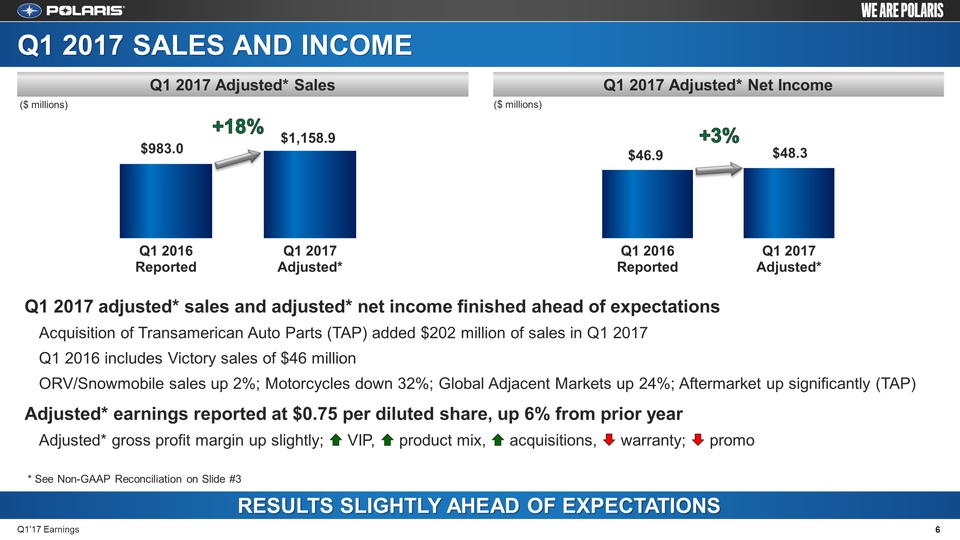
Q1 2017 Sales and Income Q1 2017 adjusted* sales and adjusted* net income finished ahead of expectations Acquisition of Transamerican Auto Parts (TAP) added $202 million of sales in Q1 2017 Q1 2016 includes Victory sales of $46 million ORV/Snowmobile sales up 2%; Motorcycles down 32%; Global Adjacent Markets up 24%; Aftermarket up significantly (TAP) Adjusted* earnings reported at $0.75 per diluted share, up 6% from prior year Adjusted* gross profit margin up slightly; VIP, product mix, acquisitions, warranty; promo RESULTS SLIGHTLY AHEAD OF EXPECTATIONS Q1 2017 Adjusted* Net Income Q1 2017 Adjusted* Sales +3% ($ millions) ($ millions) +18% Q1'17 Earnings 6 * See Non-GAAP Reconciliation on Slide #3
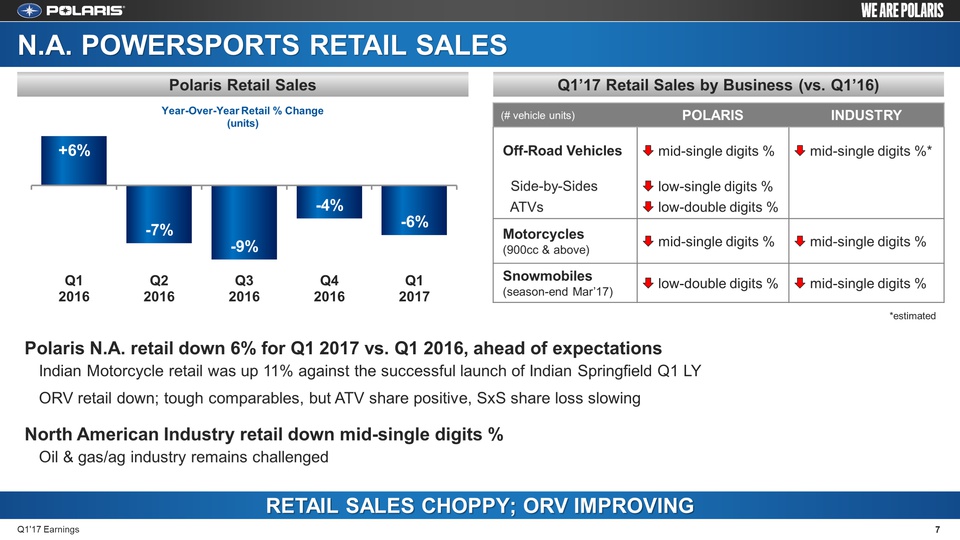
N.A. POWERSPORTS RETAIL SALES Polaris N.A. retail down 6% for Q1 2017 vs. Q1 2016, ahead of expectations Indian Motorcycle retail was up 11% against the successful launch of Indian Springfield Q1 LY ORV retail down; tough comparables, but ATV share positive, SxS share loss slowing North American Industry retail down mid-single digits % Oil & gas/ag industry remains challenged (# vehicle units) POLARIS INDUSTRY Off-Road Vehicles mid-single digits % mid-single digits %* Side-by-Sides ATVs low-single digits % low-double digits % Motorcycles(900cc & above) mid-single digits % mid-single digits % Snowmobiles(season-end Mar’17) low-double digits % mid-single digits % RETAIL SALES CHOPPY; ORV IMPROVING Q1’17 Retail Sales by Business (vs. Q1’16) Polaris Retail Sales Q1'17 Earnings 7 *estimated Year-Over-Year Retail % Change (units)
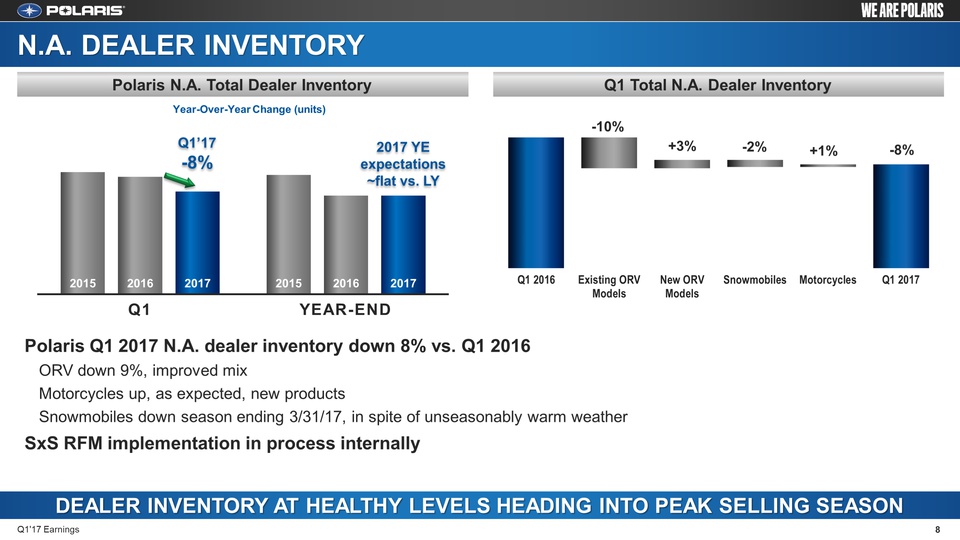
Polaris Q1 2017 N.A. dealer inventory down 8% vs. Q1 2016ORV down 9%, improved mix Motorcycles up, as expected, new products Snowmobiles down season ending 3/31/17, in spite of unseasonably warm weather SxS RFM implementation in process internally DEALER INVENTORY AT HEALTHY LEVELS HEADING INTO PEAK SELLING SEASON Q1 Total N.A. Dealer Inventory Polaris N.A. Total Dealer Inventory N.A. DEALER INVENTORY -8% Q1'17 Earnings 8 2017 YE expectations ~flat vs. LY Q1’17-8% Year-Over-Year Change (units) -10% +3% -2% +1%
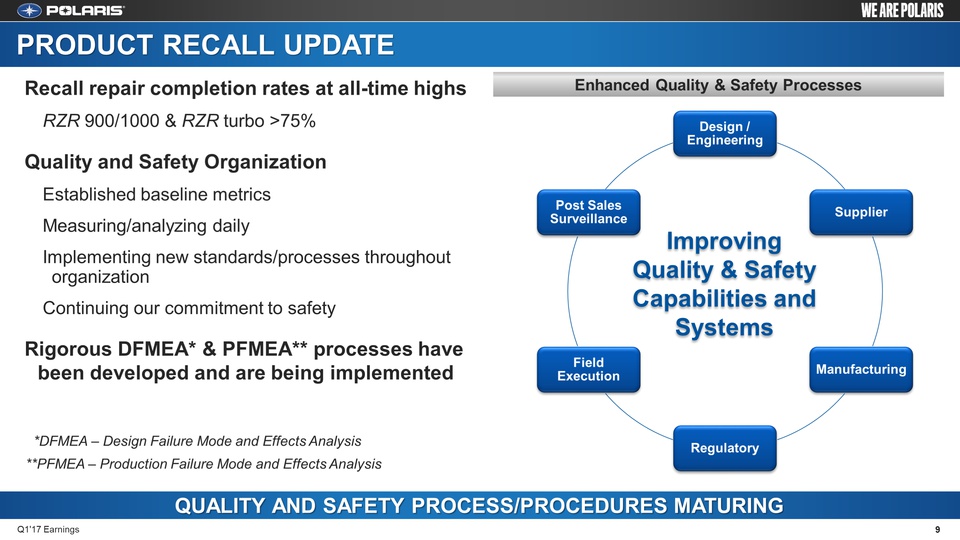
PRODUCT RECALL UPDATE Enhanced Quality & Safety Processes QUALITY AND SAFETY PROCESS/PROCEDURES MATURING Q1'17 Earnings 9 Recall repair completion rates at all-time highs RZR 900/1000 & RZR turbo >75% Quality and Safety Organization Established baseline metrics Measuring/analyzing daily Implementing new standards/processes throughout organization Continuing our commitment to safety Rigorous DFMEA* & PFMEA** processes have been developed and are being implemented *DFMEA – Design Failure Mode and Effects Analysis **PFMEA – Production Failure Mode and Effects Analysis Improving Quality & Safety Capabilities and Systems
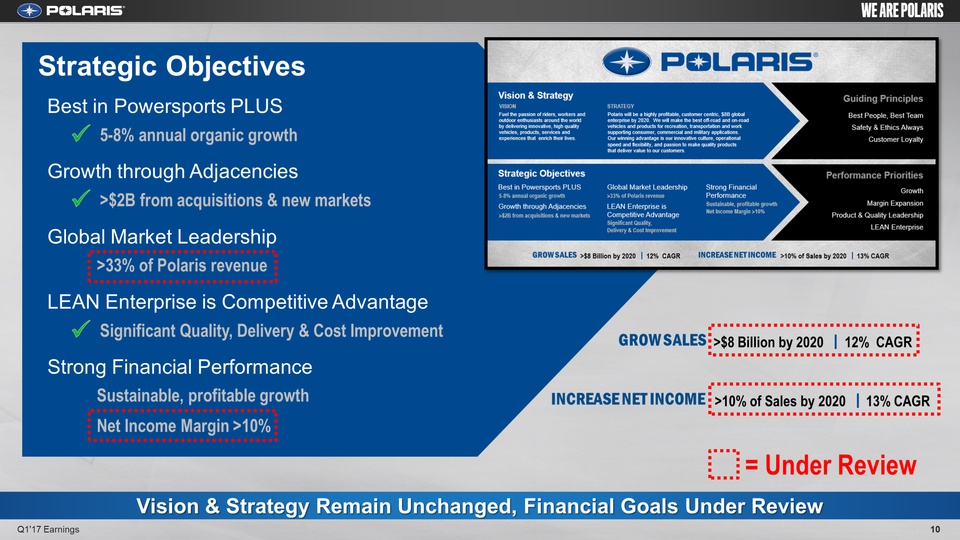
10 Q1'17 Earnings Strategic Objectives >$8 Billion by 2020 12% CAGR >10% of Sales by 2020 13% CAGR Best in Powersports PLUS 5-8% annual organic growthGrowth through Adjacencies >$2B from acquisitions & new marketsGlobal Market Leadership >33% of Polaris revenueLEAN Enterprise is Competitive Advantage Significant Quality, Delivery & Cost ImprovementStrong Financial Performance Sustainable, profitable growth Net Income Margin >10% Vision & Strategy Remain Unchanged, Financial Goals Under Review = Under Review

Mike Speetzen, EVP Finance & CFO First Quarter 2017 Earnings Results April 25, 2017 POLARIS INDUSTRIES INC.
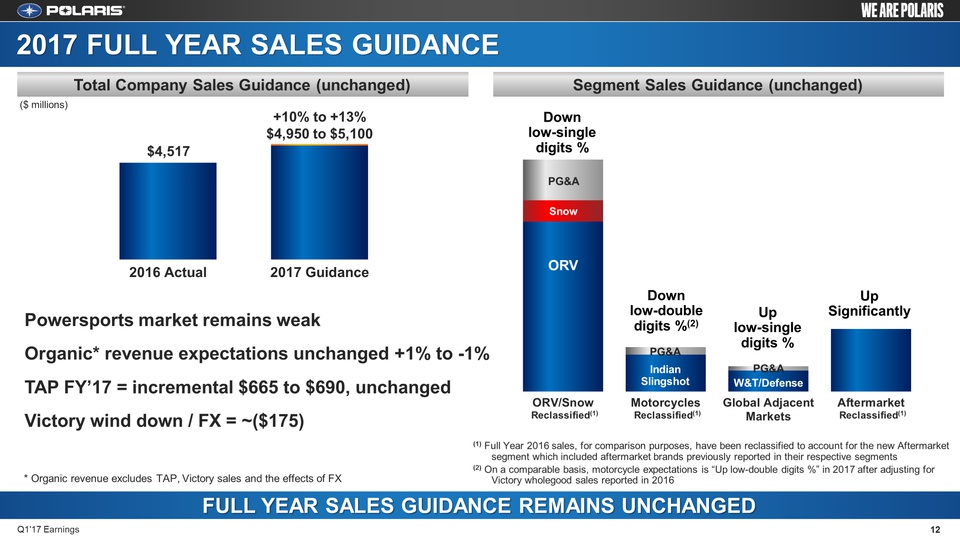
2017 FULL YEAR SALES GUIDANCE Segment Sales Guidance (unchanged) Total Company Sales Guidance (unchanged) Powersports market remains weak Organic* revenue expectations unchanged +1% to -1% TAP FY’17 = incremental $665 to $690, unchanged Victory wind down / FX = ~($175) FULL YEAR SALES GUIDANCE REMAINS UNCHANGED Q1'17 Earnings 12 ($ millions) +10% to +13%$4,950 to $5,100 Down low-single digits % Downlow-doubledigits %(2) Up low-single digits % Up Significantly ORV PG&A Snow PG&A IndianSlingshot PG&A W&T/Defense (1) Full Year 2016 sales, for comparison purposes, have been reclassified to account for the new Aftermarket segment which included aftermarket brands previously reported in their respective segments (2) On a comparable basis, motorcycle expectations is “Up low-double digits %” in 2017 after adjusting for Victory wholegood sales reported in 2016 * Organic revenue excludes TAP, Victory sales and the effects of FX Reclassified(1) Reclassified(1) Reclassified(1)
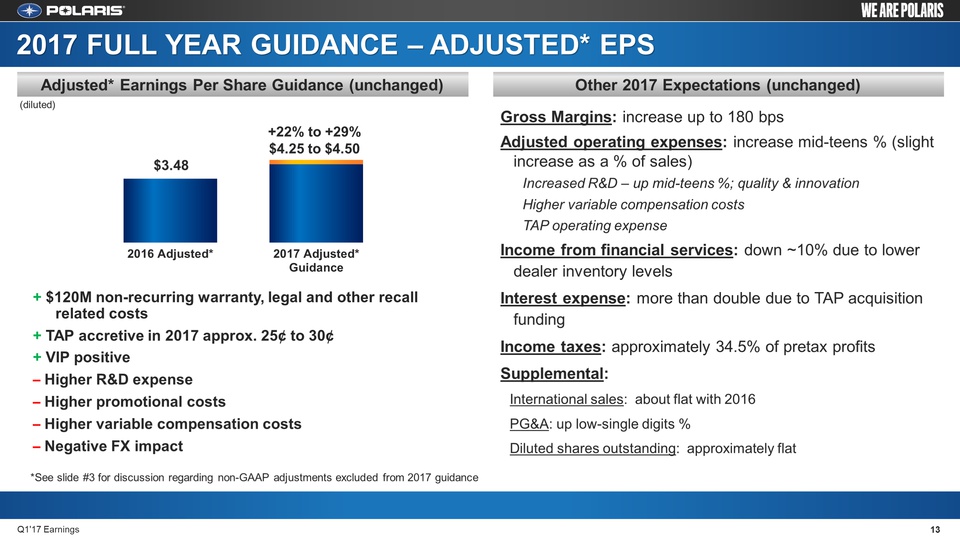
2017 FULL YEAR GUIDANCE – ADJUSTED* EPS Other 2017 Expectations (unchanged) Adjusted* Earnings Per Share Guidance (unchanged) Gross Margins: increase up to 180 bps Adjusted operating expenses: increase mid-teens % (slight increase as a % of sales) Increased R&D – up mid-teens %; quality & innovation Higher variable compensation costs TAP operating expense Income from financial services: down ~10% due to lower dealer inventory levels Interest expense: more than double due to TAP acquisition funding Income taxes: approximately 34.5% of pretax profits Supplemental: International sales: about flat with 2016 PG&A: up low-single digits % Diluted shares outstanding: approximately flat + $120M non-recurring warranty, legal and other recall related costs+ TAP accretive in 2017 approx. 25¢ to 30¢+ VIP positive– Higher R&D expense– Higher promotional costs– Higher variable compensation costs– Negative FX impact Q1'17 Earnings 13 +22% to +29%$4.25 to $4.50 (diluted) *See slide #3 for discussion regarding non-GAAP adjustments excluded from 2017 guidance
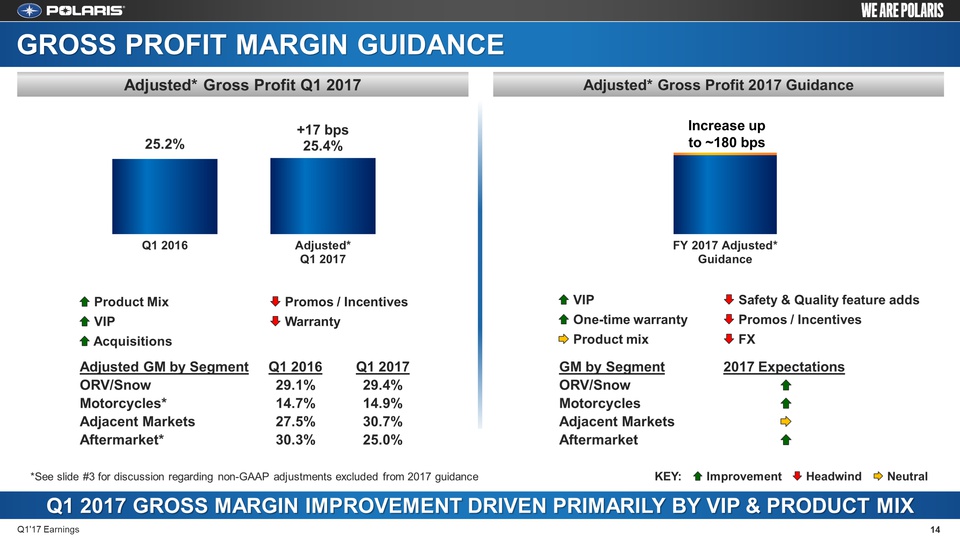
GROSS PROFIT MARGIN GUIDANCE Adjusted* Gross Profit 2017 Guidance Adjusted* Gross Profit Q1 2017 Product Mix VIP Acquisitions Promos / Incentives Warranty VIP One-time warranty Product mix Safety & Quality feature adds Promos / Incentives FX Q1 2017 GROSS MARGIN IMPROVEMENT DRIVEN PRIMARILY BY VIP & PRODUCT MIX Q1'17 Earnings 14 Increase up to ~180 bps KEY: Improvement Headwind Neutral Adjusted GM by Segment Q1 2016 Q1 2017 ORV/Snow 29.1% 29.4% Motorcycles* 14.7% 14.9% Adjacent Markets 27.5% 30.7% Aftermarket* 30.3% 25.0% GM by Segment 2017 Expectations ORV/Snow Motorcycles Adjacent Markets Aftermarket *See slide #3 for discussion regarding non-GAAP adjustments excluded from 2017 guidance
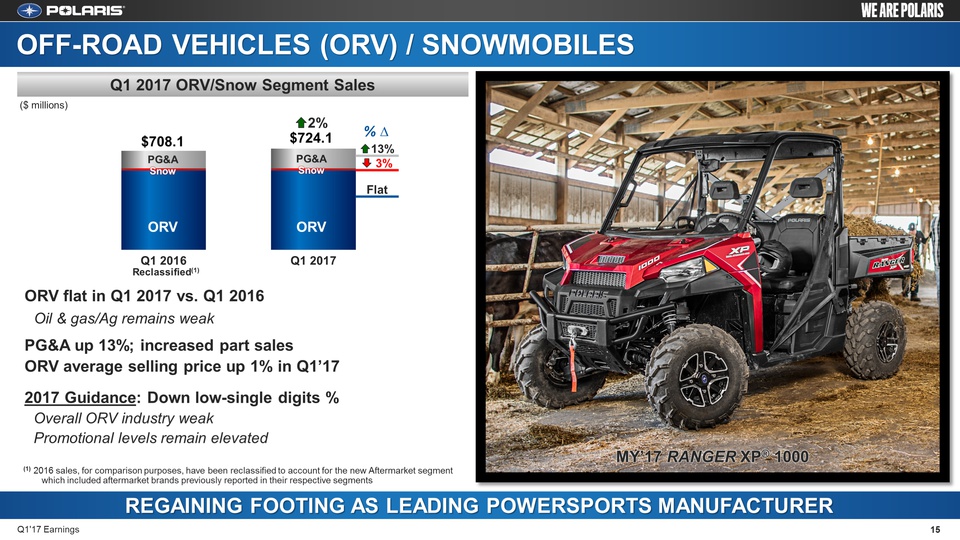
OFF-ROAD VEHICLES (ORV) / SNOWMOBILES Q1 2017 ORV/Snow Segment Sales ORV flat in Q1 2017 vs. Q1 2016 Oil & gas/Ag remains weak PG&A up 13%; increased part sales ORV average selling price up 1% in Q1’172017 Guidance: Down low-single digits % Overall ORV industry weak Promotional levels remain elevated REGAINING FOOTING AS LEADING POWERSPORTS MANUFACTURER Q1'17 Earnings 15 2%$724.1 ORV PG&A Snow $708.1 ORV PG&A Snow 13% 3% Flat % ∆ ($ millions) RANGER® 1000 ?? (1) 2016 sales, for comparison purposes, have been reclassified to account for the new Aftermarket segment which included aftermarket brands previously reported in their respective segments Reclassified(1) MY’17 RANGER XP® 1000
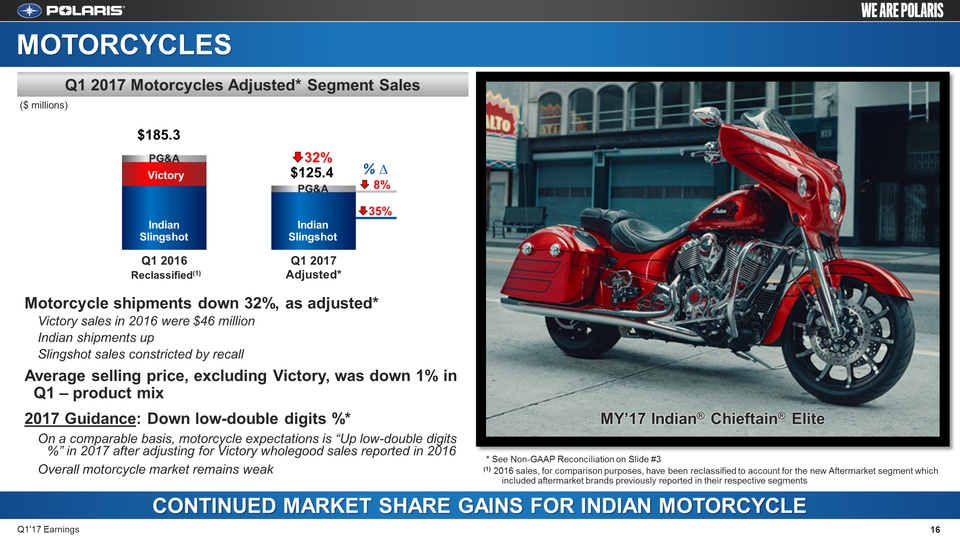
8% 35% % ∆ MOTORCYCLES Q1 2017 Motorcycles Adjusted* Segment Sales Motorcycle shipments down 32%, as adjusted* Victory sales in 2016 were $46 million Indian shipments up Slingshot sales constricted by recall Average selling price, excluding Victory, was down 1% in Q1 – product mix 2017 Guidance: Down low-double digits %* On a comparable basis, motorcycle expectations is “Up low-double digits %” in 2017 after adjusting for Victory wholegood sales reported in 2016 Overall motorcycle market remains weak CONTINUED MARKET SHARE GAINS FOR INDIAN MOTORCYCLE Q1'17 Earnings 16 32%$125.4 PG&A $185.3 PG&A IndianSlingshot IndianSlingshot ($ millions) MY’17 Indian® Chieftain® Elite Victory * See Non-GAAP Reconciliation on Slide #3(1) 2016 sales, for comparison purposes, have been reclassified to account for the new Aftermarket segment which included aftermarket brands previously reported in their respective segments Reclassified(1)
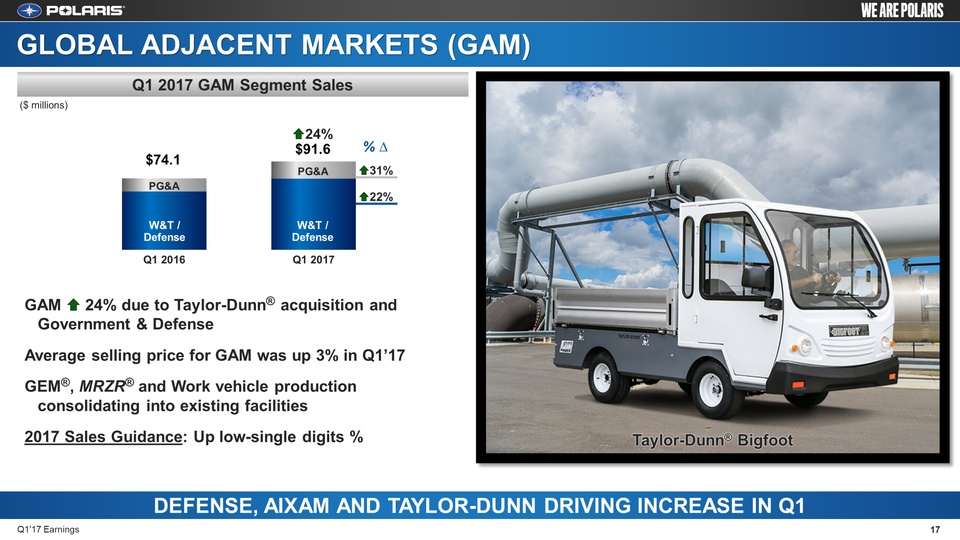
31% 22% GLOBAL ADJACENT MARKETS (GAM) Q1 2017 GAM Segment Sales GAM 24% due to Taylor-Dunn® acquisition and Government & Defense Average selling price for GAM was up 3% in Q1’17 GEM®, MRZR® and Work vehicle production consolidating into existing facilities 2017 Sales Guidance: Up low-single digits % DEFENSE, AIXAM AND TAYLOR-DUNN DRIVING INCREASE IN Q1 Q1'17 Earnings 17 24%$91.6 PG&A $74.1 PG&A % ∆ W&T /Defense W&T /Defense ($ millions) Taylor-Dunn® Bigfoot
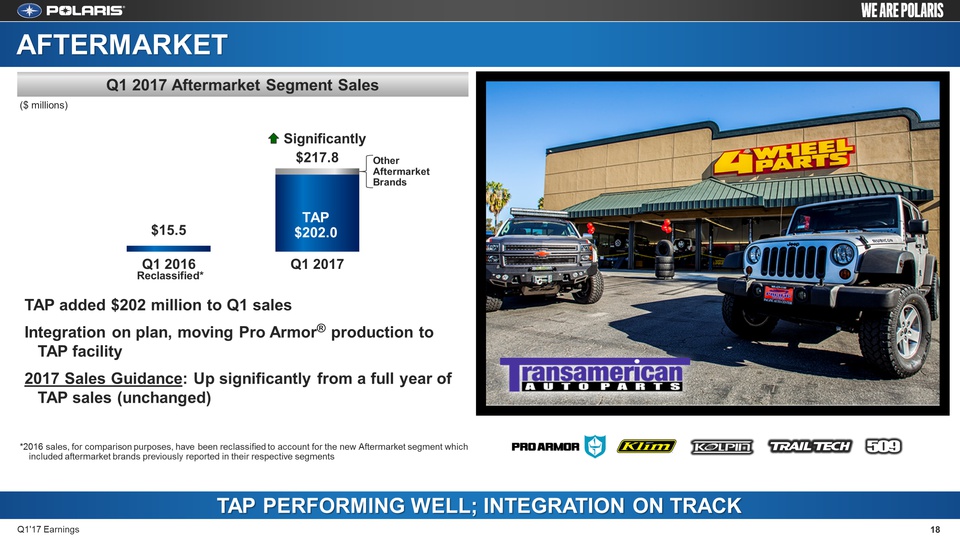
AFTERMARKET Q1 2017 Aftermarket Segment Sales TAP added $202 million to Q1 sales Integration on plan, moving Pro Armor® production to TAP facility 2017 Sales Guidance: Up significantly from a full year of TAP sales (unchanged) TAP PERFORMING WELL; INTEGRATION ON TRACK Q1'17 Earnings 18 ($ millions) Significantly TAP$202.0 Other AftermarketBrands Reclassified* *2016 sales, for comparison purposes, have been reclassified to account for the new Aftermarket segment which included aftermarket brands previously reported in their respective segments
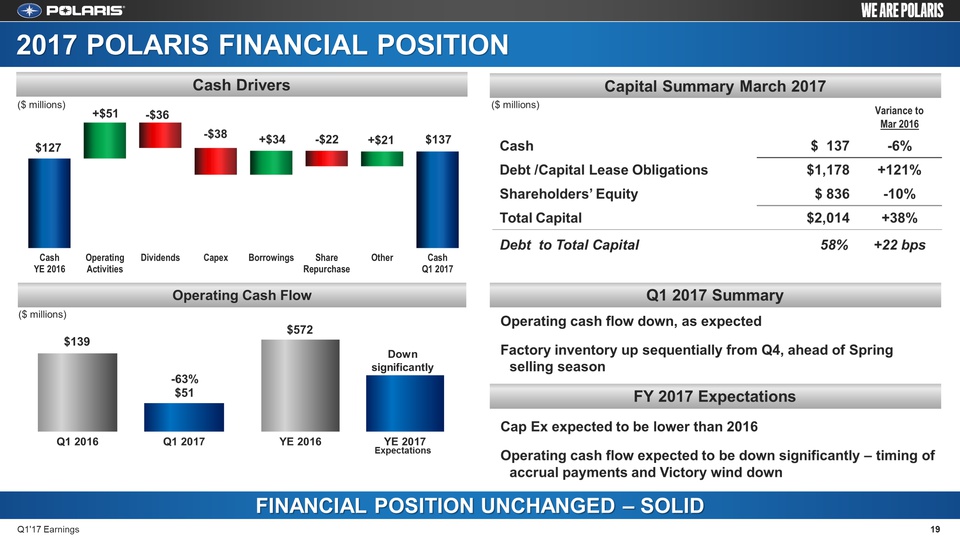
2017 POLARIS FINANCIAL POSITION 19 Q1'17 Earnings Capital Summary March 2017 Cash Drivers Variance toMar 2016 Cash $ 137 -6% Debt /Capital Lease Obligations $1,178 +121% Shareholders’ Equity $ 836 -10% Total Capital $2,014 +38% Debt to Total Capital 58% +22 bps 2015Operating cash flow down, as expected Factory inventory up sequentially from Q4, ahead of Spring selling season Cap Ex expected to be lower than 2016 Operating cash flow expected to be down significantly – timing of accrual payments and Victory wind down Operating Cash Flow FINANCIAL POSITION UNCHANGED – SOLID ($ millions) ($ millions) ($ millions) Q1 2017 Summary FY 2017 Expectations Down significantly Expectations
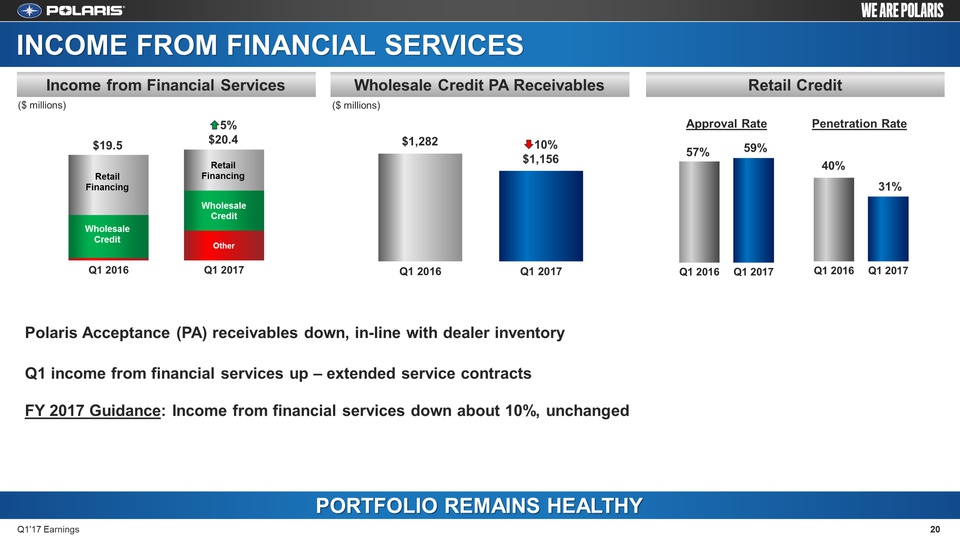
Retail Credit Wholesale Credit PA Receivables 20 Q1'17 Earnings Income from Financial Services PORTFOLIO REMAINS HEALTHY INCOME FROM FINANCIAL SERVICES Polaris Acceptance (PA) receivables down, in-line with dealer inventory Q1 income from financial services up – extended service contracts FY 2017 Guidance: Income from financial services down about 10%, unchanged $19.5 5%$20.4 10%$1,156 $1,282 ($ millions) ($ millions) Approval Rate Penetration Rate WholesaleCredit Retail Financing Retail Financing

Scott W. Wine, Chairman & CEO First Quarter 2017 Earnings Results April 25, 2017 POLARIS INDUSTRIES INC.
22 Q1'17 Earnings CLOSING COMMENTS Decent start to an important year ORV poised for improvement: Advances in innovation, inventory, sales & marketing focus Indian momentum continues into Spring selling season Enhanced quality and safety process maturing TAP represents solid growth potential POSITIVE START TO THE YEAR

Thank You Questions? POLARIS INDUSTRIES INC.
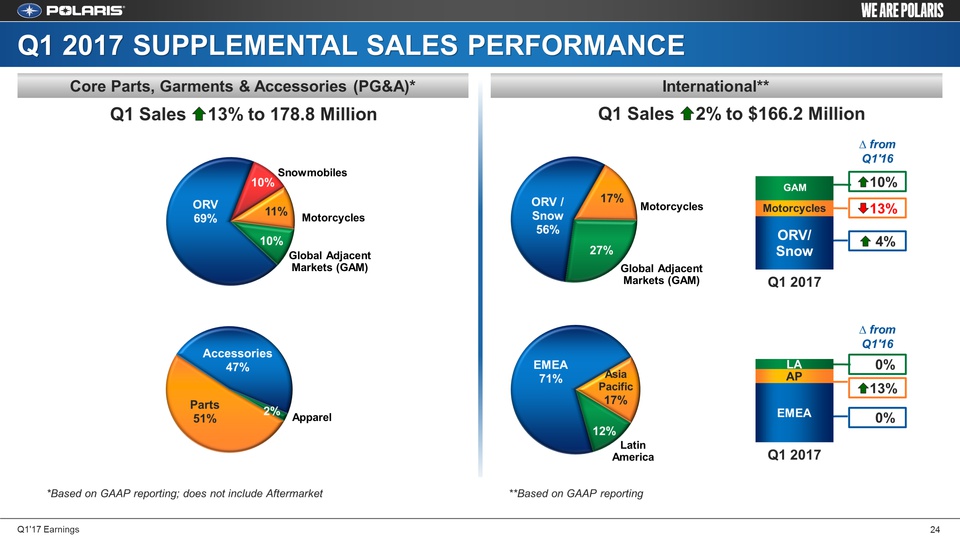
International** Core Parts, Garments & Accessories (PG&A)* 24 Q1'17 Earnings Q1 2017 SUPPLEMENTAL SALES PERFORMANCE Motorcycles Global Adjacent Markets (GAM) Snowmobiles Motorcycles Global Adjacent Markets (GAM) Apparel LatinAmerica 10% 13% 0% 13% 4% 0% Q1 Sales 13% to 178.8 Million Q1 Sales 2% to $166.2 Million ∆ from Q1'16 ∆ from Q1'16 *Based on GAAP reporting; does not include Aftermarket **Based on GAAP reporting

25 Q1'17 Earnings