Exhibit 99.2

Third Quarter 2017 Earnings Results October 24, 2017 POLARIS INDUSTRIES INC.
SAFE HARBOR & NON-GAAP MEASURES 2 Q3'17 Earnings Except for historical information contained herein, the matters set forth in this presentation, including management’s expectations regarding 2017 & 2018 future sales, shipments, net income, and net income per share, and operational initiatives are forward-looking statements that involve certain risks and uncertainties that could cause actual results to differ materially from those forward-looking statements. Potential risks and uncertainties include such factors as the Company’s ability to successfully implement its manufacturing operations expansion initiatives, product offerings, promotional activities and pricing strategies by competitors; economic conditions that impact consumer spending; acquisition integration costs; product recalls, warranty expenses; impact of changes in Polaris stock price on incentive compensation plan costs; foreign currency exchange rate fluctuations; environmental and product safety regulatory activity; effects of weather; commodity costs; uninsured product liability claims; uncertainty in the retail and wholesale credit markets; performance of affiliate partners; changes in tax policy and overall economic conditions, including inflation, consumer confidence and spending and relationships with dealers and suppliers. Investors are also directed to consider other risks and uncertainties discussed in documents filed by the Company with the Securities and Exchange Commission. The Company does not undertake any duty to any person to provide updates to its forward-looking statements. The data source for retail sales figures included in this presentation is registration information provided by Polaris dealers in North America and compiled by the Company or Company estimates. The Company must rely on information that its dealers supply concerning retail sales, and other retail sales data sources and this information is subject to revision.This presentation contains certain non-GAAP financial measures, consisting of “adjusted” sales (total and organic), gross profit, operating expenses, net income and net income per diluted share as measures of our operating performance. Management believes these measures may be useful in performing meaningful comparisons of past and present operating results, to understand the performance of its ongoing operations and how management views the business. Reconciliations of adjusted non-GAAP measures to reported GAAP measures for Q3 are included on slide 3 and Q3 year-to-date are included in the appendix contained in this presentation. These measures, however, should not be construed as an alternative to any other measure of performance determined in accordance with GAAP.
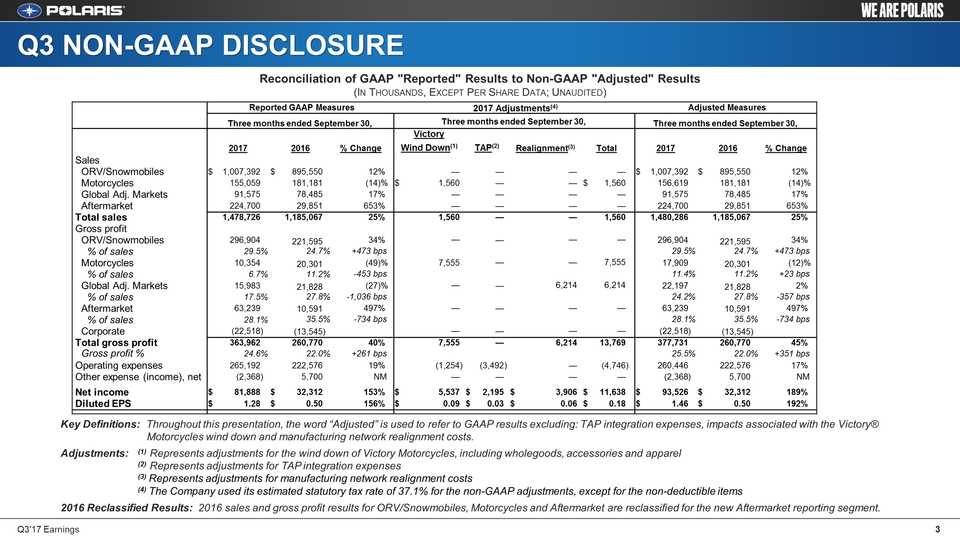
Q3 NON-GAAP DISCLOSURE 3 Q3'17 Earnings Reconciliation of GAAP "Reported" Results to Non-GAAP "Adjusted" Results (In Thousands, Except Per Share Data; Unaudited) Key Definitions: Throughout this presentation, the word “Adjusted” is used to refer to GAAP results excluding: TAP integration expenses, impacts associated with the Victory® Motorcycles wind down and manufacturing network realignment costs.Adjustments: (1) Represents adjustments for the wind down of Victory Motorcycles, including wholegoods, accessories and apparel (2) Represents adjustments for TAP integration expenses (3) Represents adjustments for manufacturing network realignment costs (4) The Company used its estimated statutory tax rate of 37.1% for the non-GAAP adjustments, except for the non-deductible items2016 Reclassified Results: 2016 sales and gross profit results for ORV/Snowmobiles, Motorcycles and Aftermarket are reclassified for the new Aftermarket reporting segment. Reported GAAP Measures Reported GAAP Measures 2017 Adjustments(4) 2017 Adjustments(4) Adjusted Measures Adjusted Measures Three months ended September 30, Three months ended September 30, Three months ended September 30, Three months ended September 30, Three months ended September 30, Three months ended September 30,2017 2017 2016 2016 % Change VictoryWind Down(1) VictoryWind Down(1) TAP(2) TAP(2) Realignment(3) Realignment(3) Total Total 2017 2017 2016 2016 % Change Sales ORV/Snowmobiles $ 1,007,392 $ 895,550 12 % — — — — $ 1,007,392 $ 895,550 12 % Motorcycles 155,059 181,181 (14 )% $ 1,560 — — $ 1,560 156,619 181,181 (14 )% Global Adj. Markets 91,575 78,485 17 % — — — — 91,575 78,485 17 % Aftermarket 224,700 29,851 653 % — — — — 224,700 29,851 653 % Total sales 1,478,726 1,185,067 25 % 1,560 — — 1,560 1,480,286 1,185,067 25 % Gross profit ORV/Snowmobiles 296,904 221,595 34 % — — — — 296,904 221,595 34 % % of sales 29.5 % 24.7 % +473 bps 29.5 % 24.7 % +473 bps Motorcycles 10,354 20,301 (49 )% 7,555 — — 7,555 17,909 20,301 (12 )% % of sales 6.7 % 11.2 % -453 bps 11.4 % 11.2 % +23 bps Global Adj. Markets 15,983 21,828 (27 )% — — 6,214 6,214 22,197 21,828 2 % % of sales 17.5 % 27.8 % -1,036 bps 24.2 % 27.8 % -357 bps Aftermarket 63,239 10,591 497 % — — — — 63,239 10,591 497 % % of sales 28.1 % 35.5 % -734 bps 28.1 % 35.5 % -734 bps Corporate (22,518 ) (13,545 ) — — — — (22,518 ) (13,545 ) Total gross profit 363,962 260,770 40 % 7,555 — 6,214 13,769 377,731 260,770 45 % Gross profit % 24.6 % 22.0 % +261 bps 25.5 % 22.0 % +351 bps Operating expenses 265,192 222,576 19 % (1,254 ) (3,492 ) — (4,746 ) 260,446 222,576 17 % Other expense (income), net (2,368 ) 5,700 NM — — — — (2,368 ) 5,700 NM Net income $ 81,888 $ 32,312 153 % $ 5,537 $ 2,195 $ 3,906 $ 11,638 $ 93,526 $ 32,312 189 % Diluted EPS $ 1.28 $ 0.50 156 % $ 0.09 $ 0.03 $ 0.06 $ 0.18 $ 1.46 $ 0.50 192 %

Scott W. Wine, Chairman & CEO Third Quarter 2017 Earnings Results October 24, 2017 POLARIS INDUSTRIES INC.
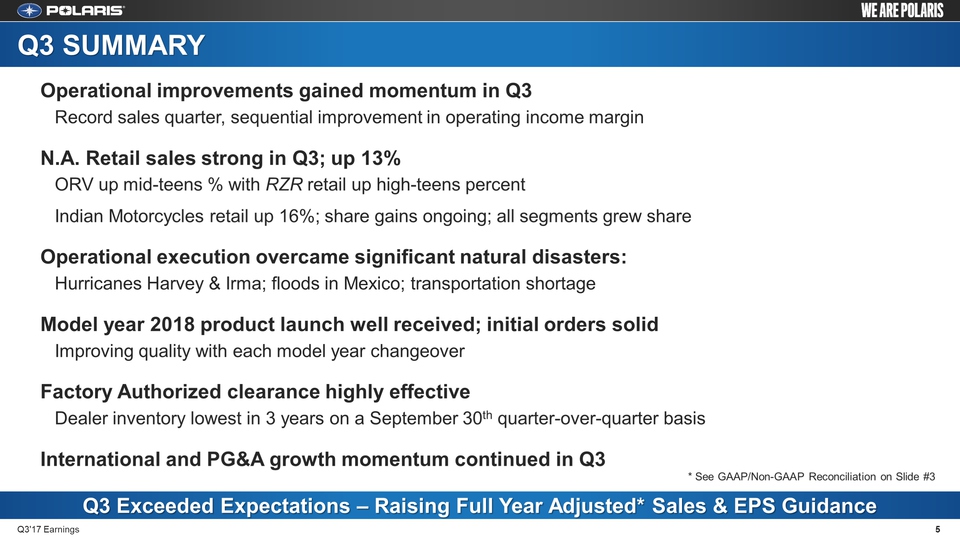
Q3 SUMMARY 5 Q3'17 Earnings Q3 Exceeded Expectations – Raising Full Year Adjusted* Sales & EPS Guidance Operational improvements gained momentum in Q3 Record sales quarter, sequential improvement in operating income marginN.A. Retail sales strong in Q3; up 13% ORV up mid-teens % with RZR retail up high-teens percentIndian Motorcycles retail up 16%; share gains ongoing; all segments grew shareOperational execution overcame significant natural disasters: Hurricanes Harvey & Irma; floods in Mexico; transportation shortageModel year 2018 product launch well received; initial orders solidImproving quality with each model year changeoverFactory Authorized clearance highly effectiveDealer inventory lowest in 3 years on a September 30th quarter-over-quarter basisInternational and PG&A growth momentum continued in Q3 * See GAAP/Non-GAAP Reconciliation on
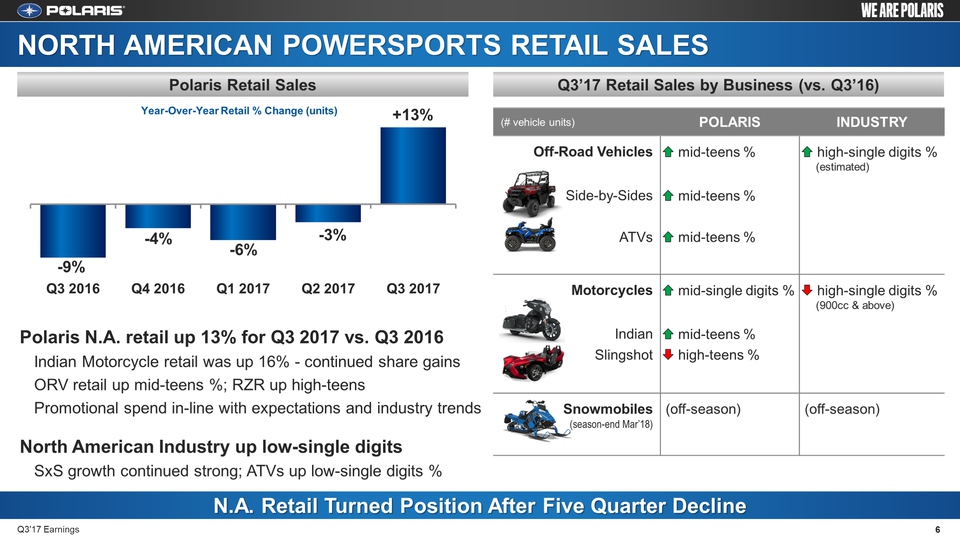
NORTH AMERICAN POWERSPORTS RETAIL SALES Polaris N.A. retail up 13% for Q3 2017 vs. Q3 2016Indian Motorcycle retail was up 16% - continued share gainsORV retail up mid-teens %; RZR up high-teensPromotional spend in-line with expectations and industry trendsNorth American Industry up low-single digitsSxS growth continued strong; ATVs up low-single digits % (# vehicle units) POLARIS INDUSTRY Off-Road Vehicles mid-teens % high-single digits % (estimated) Side-by-Sides ATVs mid-teens % mid-teens % Motorcycles mid-single digits % high-single digits % (900cc & above) Indian Slingshot mid-teens % high-teens % Snowmobiles(season-end Mar’18) (off-season) (off-season) N.A. Retail Turned Position After Five Quarter Decline Q3’17 Retail Sales by Business (vs. Q3’16) Polaris Retail Sales Q3'17 Earnings 6 Year-Over-Year Retail % Change (units)
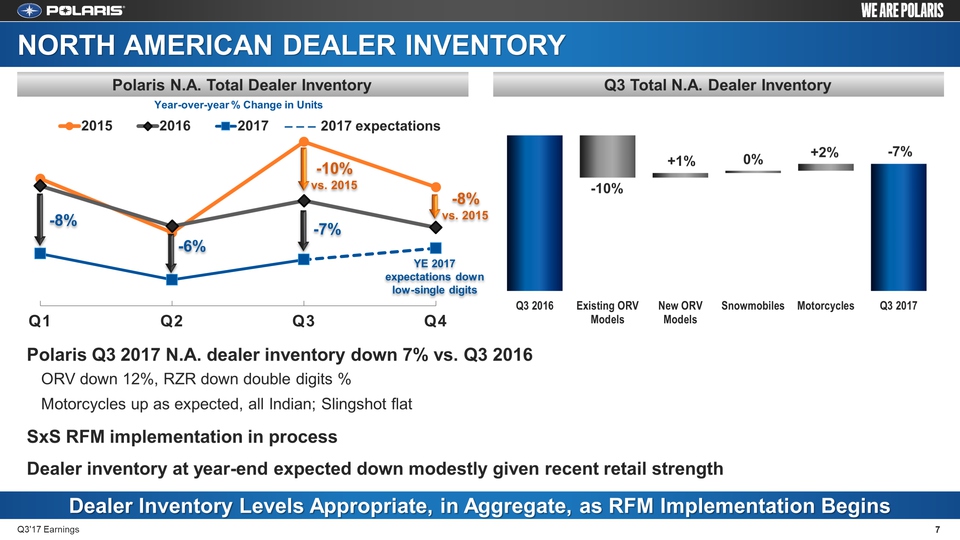
Polaris Q3 2017 N.A. dealer inventory down 7% vs. Q3 2016ORV down 12%, RZR down double digits %Motorcycles up as expected, all Indian; Slingshot flatSxS RFM implementation in processDealer inventory at year-end expected down modestly given recent retail strength Dealer Inventory Levels Appropriate, in Aggregate, as RFM Implementation Begins Q3 Total N.A. Dealer Inventory Polaris N.A. Total Dealer Inventory NORTH AMERICAN DEALER INVENTORY -7% Q3'17 Earnings 7 YE 2017expectations down low-single digits -6% Year-over-year % Change in Units -10% +1% 0% +2% -10%vs. 2015 -8%vs. 2015 -8% – – – 2017 expectations -7%
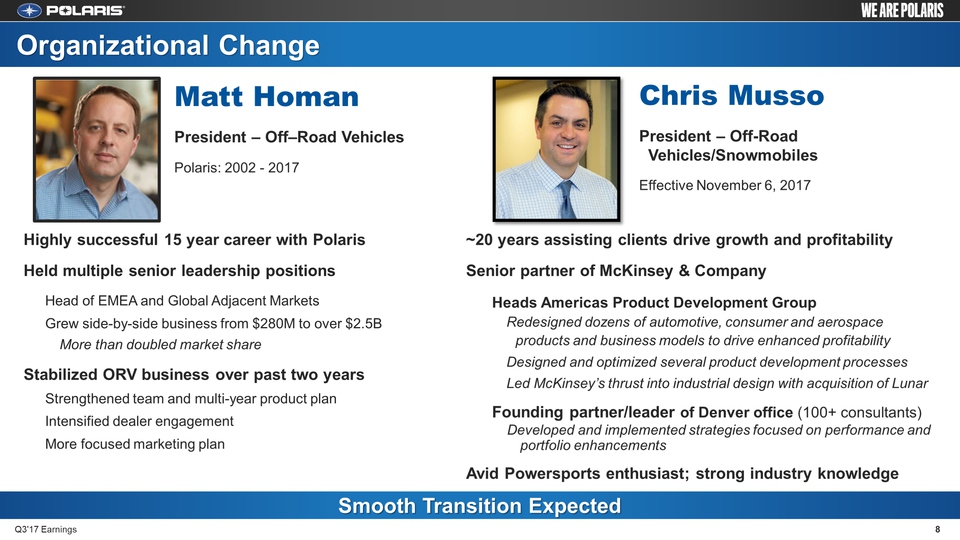
Organizational Change 8 Q3'17 Earnings Smooth Transition Expected Matt HomanPresident – Off–Road VehiclesPolaris: 2002 - 2017 Chris Musso President – Off-Road Vehicles/SnowmobilesEffective November 6, 2017 Highly successful 15 year career with PolarisHeld multiple senior leadership positions Head of EMEA and Global Adjacent Markets Grew side-by-side business from $280M to over $2.5BMore than doubled market shareStabilized ORV business over past two years Strengthened team and multi-year product plan Intensified dealer engagement More focused marketing plan ~20 years assisting clients drive growth and profitabilitySenior partner of McKinsey & Company Heads Americas Product Development GroupRedesigned dozens of automotive, consumer and aerospace products and business models to drive enhanced profitabilityDesigned and optimized several product development processesLed McKinsey’s thrust into industrial design with acquisition of Lunar Founding partner/leader of Denver office (100+ consultants)Developed and implemented strategies focused on performance and portfolio enhancementsAvid Powersports enthusiast; strong industry knowledge
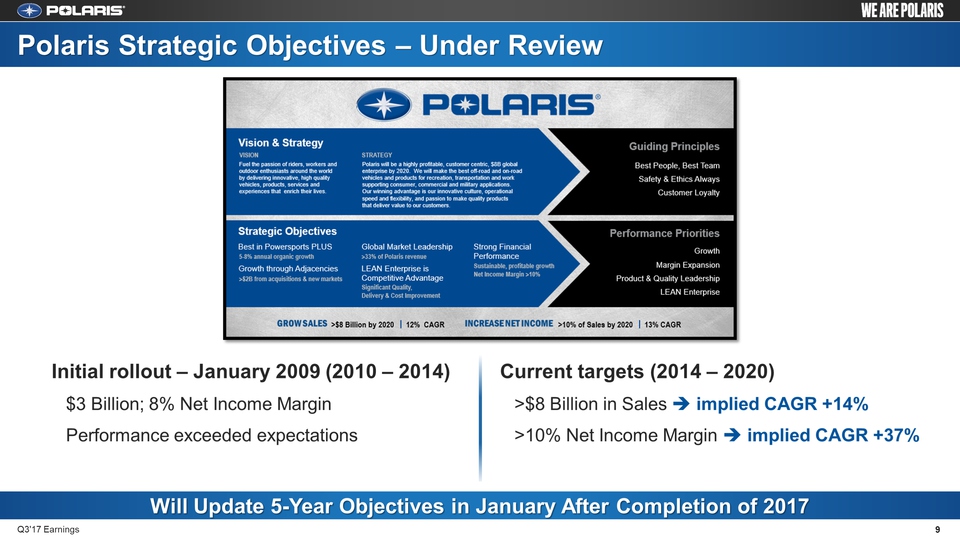
Polaris Strategic Objectives – Under Review Initial rollout – January 2009 (2010 – 2014)$3 Billion; 8% Net Income MarginPerformance exceeded expectations Current targets (2014 – 2020)>$8 Billion in Sales implied CAGR +14%>10% Net Income Margin implied CAGR +37% Q3'17 Earnings 9 Will Update 5-Year Objectives in January After Completion of 2017

Mike Speetzen, EVP Finance & CFO Third Quarter 2017 Earnings Results October 24, 2017 POLARIS INDUSTRIES INC.
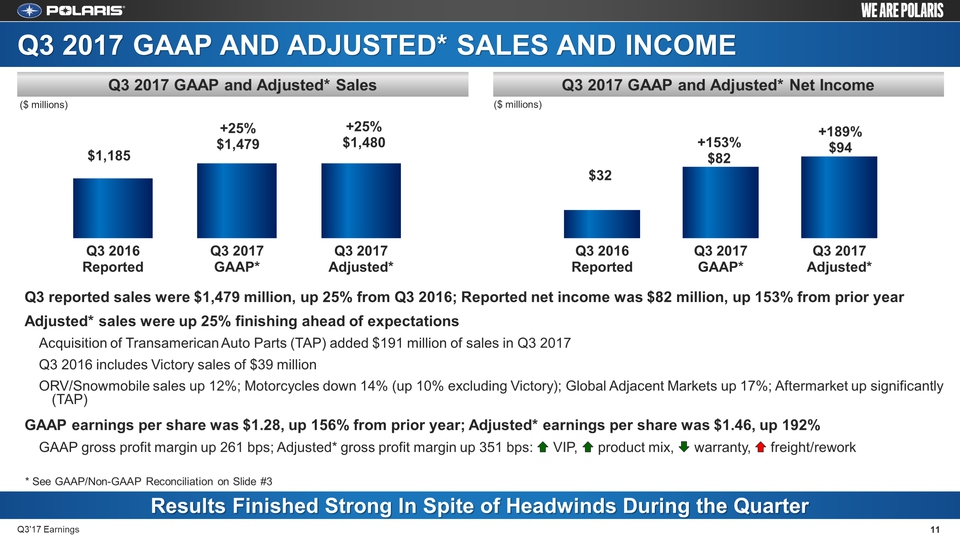
Q3 2017 GAAP and Adjusted* Sales and Income Q3 reported sales were $1,479 million, up 25% from Q3 2016; Reported net income was $82 million, up 153% from prior yearAdjusted* sales were up 25% finishing ahead of expectationsAcquisition of Transamerican Auto Parts (TAP) added $191 million of sales in Q3 2017Q3 2016 includes Victory sales of $39 million ORV/Snowmobile sales up 12%; Motorcycles down 14% (up 10% excluding Victory); Global Adjacent Markets up 17%; Aftermarket up significantly (TAP)GAAP earnings per share was $1.28, up 156% from prior year; Adjusted* earnings per share was $1.46, up 192%GAAP gross profit margin up 261 bps; Adjusted* gross profit margin up 351 bps: VIP, product mix, warranty, freight/rework Results Finished Strong In Spite of Headwinds During the Quarter Q3 2017 GAAP and Adjusted* Net Income Q3 2017 GAAP and Adjusted* Sales ($ millions) ($ millions) Q3'17 Earnings 11 * See GAAP/Non-GAAP Reconciliation on
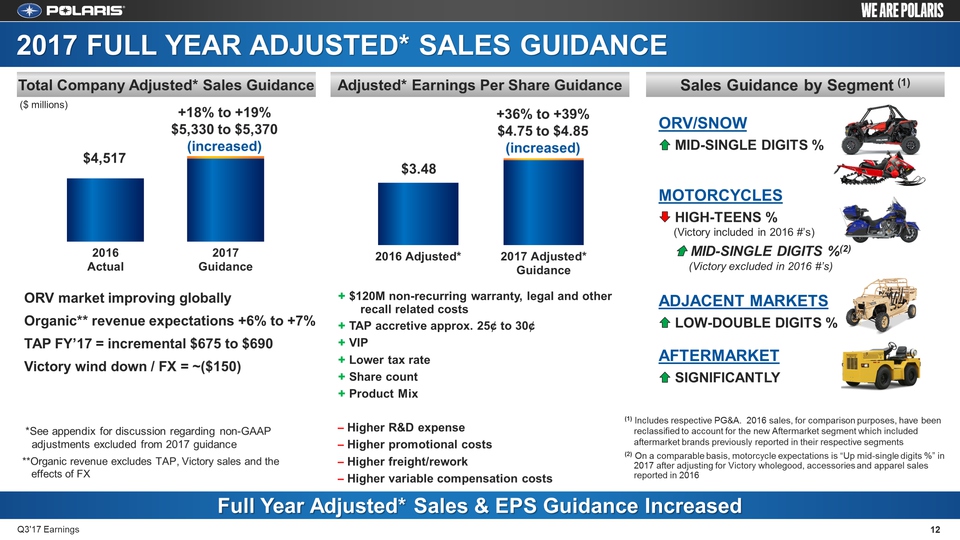
Sales Guidance by Segment (1) Adjusted* Earnings Per Share Guidance Q3'17 Earnings Total Company Adjusted* Sales Guidance Full Year Adjusted* Sales & EPS Guidance Increased 2017 FULL YEAR ADJUSTED* SALES GUIDANCE ORV market improving globallyOrganic** revenue expectations +6% to +7%TAP FY’17 = incremental $675 to $690Victory wind down / FX = ~($150) + $120M non-recurring warranty, legal and other recall related costs+ TAP accretive approx. 25¢ to 30¢+ VIP + Lower tax rate+ Share count+ Product Mix– Higher R&D expense– Higher promotional costs– Higher freight/rework– Higher variable compensation costs ($ millions) +18% to +19%$5,330 to $5,370(increased) +36% to +39%$4.75 to $4.85(increased) *See appendix for discussion regarding non-GAAP adjustments excluded from 2017 guidance**Organic revenue excludes TAP, Victory sales and the effects of FX ORV/SNOW MID-SINGLE DIGITS % MOTORCYCLES HIGH-TEENS % (Victory included in 2016 #’s) MID-SINGLE DIGITS %(2) (Victory excluded in 2016 #’s) ADJACENT MARKETS LOW-DOUBLE DIGITS % AFTERMARKET SIGNIFICANTLY (1) Includes respective PG&A. 2016 sales, for comparison purposes, have been reclassified to account for the new Aftermarket segment which included aftermarket brands previously reported in their respective segments(2) On a comparable basis, motorcycle expectations is “Up mid-single digits %” in 2017 after adjusting for Victory wholegood, accessories and apparel sales reported in 2016 12
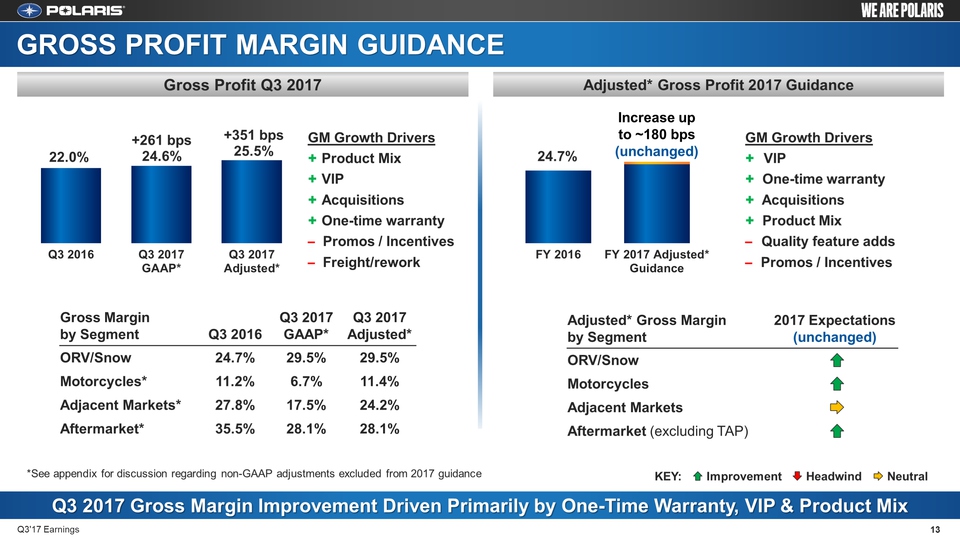
GROSS PROFIT MARGIN GUIDANCE Adjusted* Gross Profit 2017 Guidance Gross Profit Q3 2017 GM Growth Drivers+ VIP+ One-time warranty+ Acquisitions+ Product Mix– Quality feature adds – Promos / Incentives Q3 2017 Gross Margin Improvement Driven Primarily by One-Time Warranty, VIP & Product Mix Q3'17 Earnings 13 Increase up to ~180 bps(unchanged) KEY: Improvement Headwind Neutral Gross Margin by Segment Q3 2016 Q3 2017GAAP* Q3 2017Adjusted* ORV/Snow 24.7% 29.5% 29.5% Motorcycles* 11.2% 6.7% 11.4% Adjacent Markets* 27.8% 17.5% 24.2% Aftermarket* 35.5% 28.1% 28.1% Adjusted* Gross Margin by Segment 2017 Expectations(unchanged) ORV/Snow Motorcycles Adjacent Markets Aftermarket (excluding TAP) *See appendix for discussion regarding non-GAAP adjustments excluded from 2017 guidance GM Growth Drivers+ Product Mix+ VIP+ Acquisitions+ One-time warranty– Promos / Incentives– Freight/rework
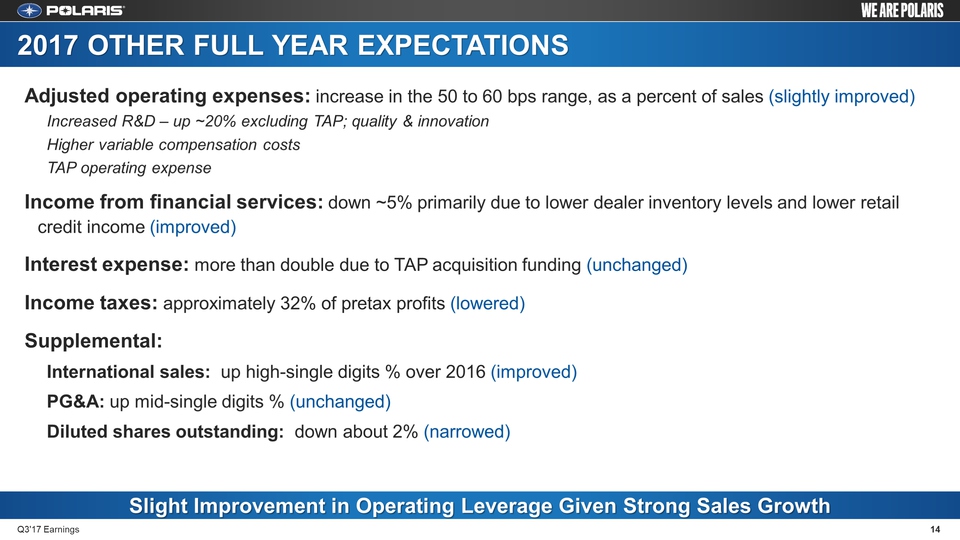
2017 OTHER FULL YEAR EXPECTATIONS 14 Q3'17 Earnings Slight Improvement in Operating Leverage Given Strong Sales Growth Adjusted operating expenses: increase in the 50 to 60 bps range, as a percent of sales (slightly improved) Increased R&D – up ~20% excluding TAP; quality & innovationHigher variable compensation costsTAP operating expenseIncome from financial services: down ~5% primarily due to lower dealer inventory levels and lower retail credit income (improved)Interest expense: more than double due to TAP acquisition funding (unchanged)Income taxes: approximately 32% of pretax profits (lowered)Supplemental:International sales: up high-single digits % over 2016 (improved)PG&A: up mid-single digits % (unchanged)Diluted shares outstanding: down about 2% (narrowed)
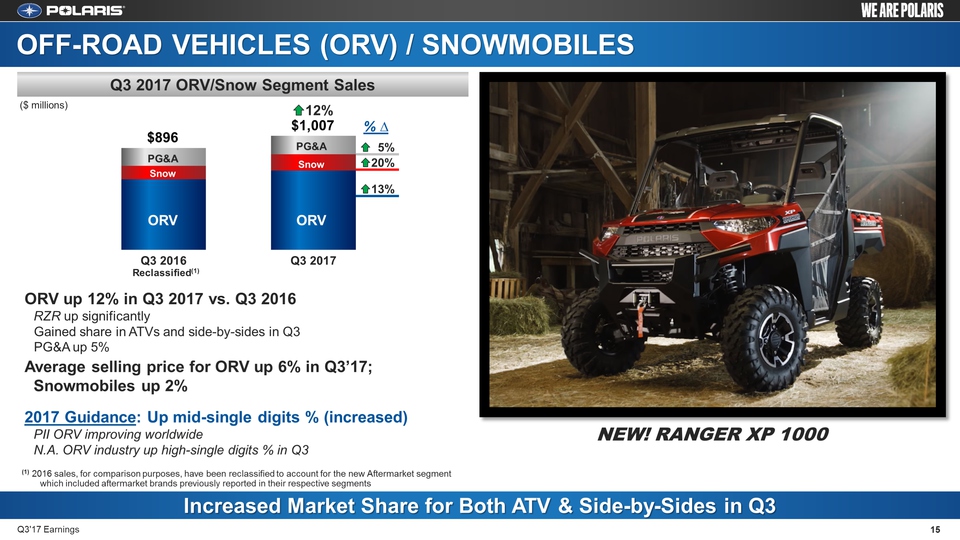
OFF-ROAD VEHICLES (ORV) / SNOWMOBILES Q3 2017 ORV/Snow Segment Sales ORV up 12% in Q3 2017 vs. Q3 2016RZR up significantlyGained share in ATVs and side-by-sides in Q3PG&A up 5%Average selling price for ORV up 6% in Q3’17; Snowmobiles up 2%2017 Guidance: Up mid-single digits % (increased)PII ORV improving worldwideN.A. ORV industry up high-single digits % in Q3 Increased Market Share for Both ATV & Side-by-Sides in Q3 Q3'17 Earnings 15 12%$1,007 ORV PG&A Snow $896 ORV PG&A Snow 5% 20% 13% % ∆ ($ millions) (1) 2016 sales, for comparison purposes, have been reclassified to account for the new Aftermarket segment which included aftermarket brands previously reported in their respective segments Reclassified(1) NEW! RANGER XP 1000
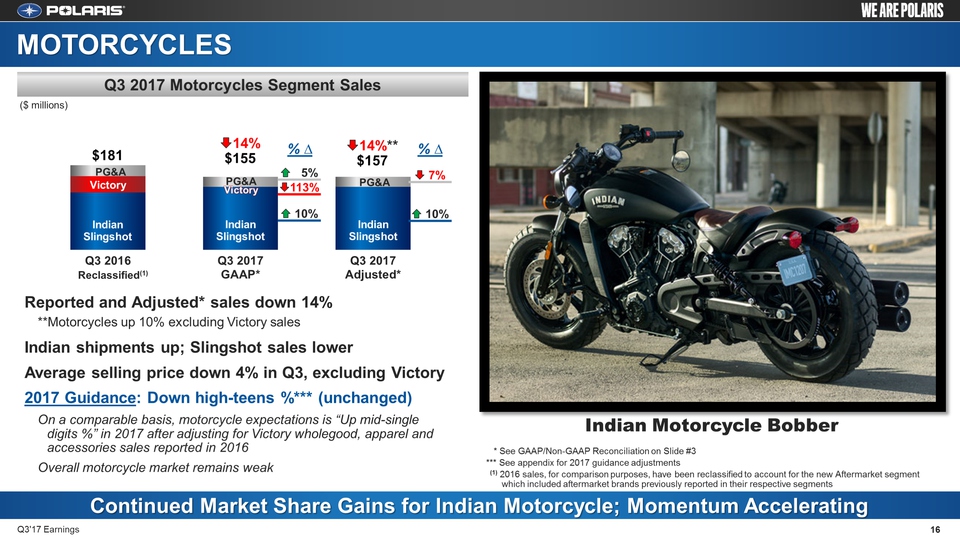
7% 10% 5% 113% 10% Reported and Adjusted* sales down 14%**Motorcycles up 10% excluding Victory salesIndian shipments up; Slingshot sales lowerAverage selling price down 4% in Q3, excluding Victory 2017 Guidance: Down high-teens %*** (unchanged)On a comparable basis, motorcycle expectations is “Up mid-single digits %” in 2017 after adjusting for Victory wholegood, apparel and accessories sales reported in 2016Overall motorcycle market remains weak % ∆ MOTORCYCLES Q3 2017 Motorcycles Segment Sales Continued Market Share Gains for Indian Motorcycle; Momentum Accelerating Q3'17 Earnings 16 14%**$157 PG&A $181 PG&A IndianSlingshot IndianSlingshot ($ millions) Victory * See GAAP/Non-GAAP Reconciliation on Slide #3 *** See appendix for 2017 guidance adjustments (1) 2016 sales, for comparison purposes, have been reclassified to account for the new Aftermarket segment which included aftermarket brands previously reported in their respective segments Reclassified(1) PG&A IndianSlingshot % ∆ 14%$155 Victory Indian Motorcycle Bobber
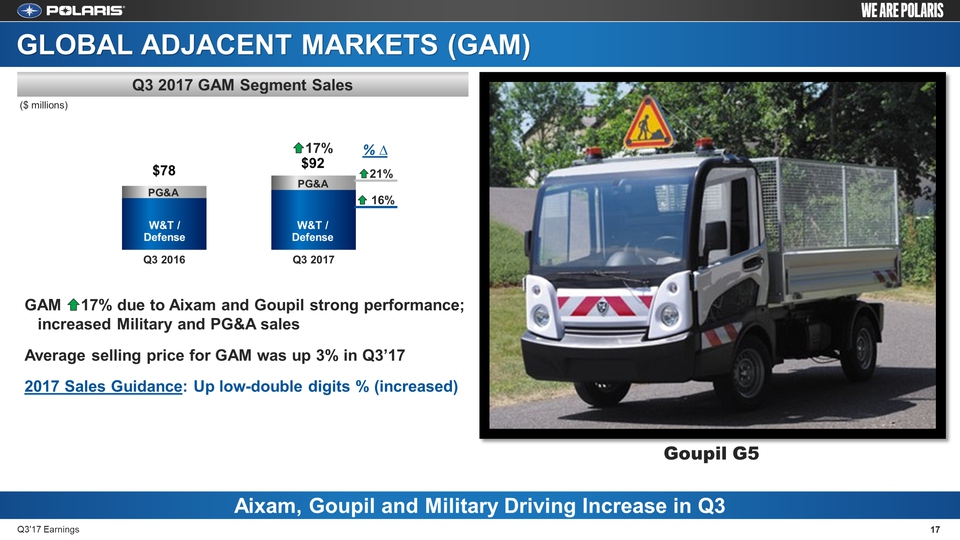
21% 16% GLOBAL ADJACENT MARKETS (GAM) Q3 2017 GAM Segment Sales GAM 17% due to Aixam and Goupil strong performance; increased Military and PG&A salesAverage selling price for GAM was up 3% in Q3’172017 Sales Guidance: Up low-double digits % (increased) Aixam, Goupil and Military Driving Increase in Q3 Q3'17 Earnings 17 17%$92 PG&A $78 PG&A % ∆ W&T /Defense W&T /Defense ($ millions) Goupil G5
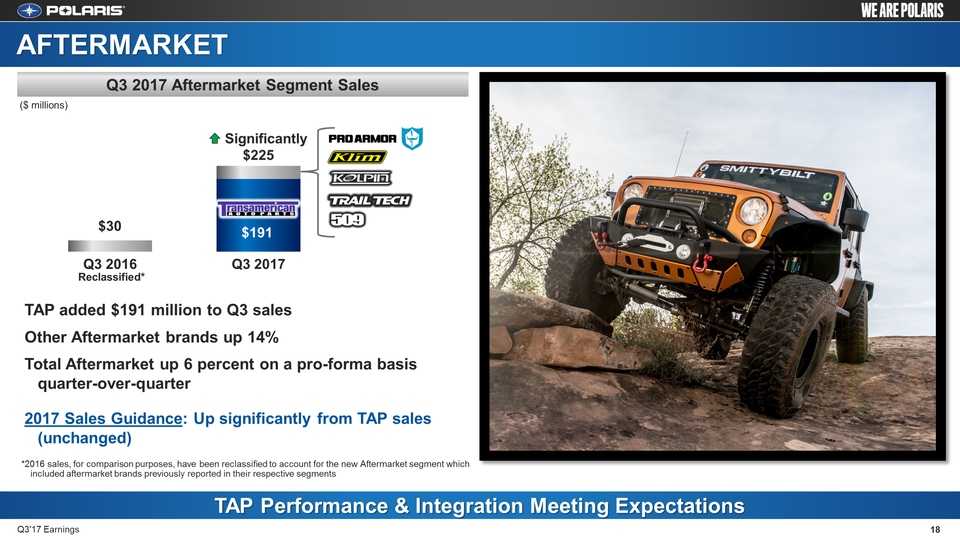
AFTERMARKET Q3 2017 Aftermarket Segment Sales TAP added $191 million to Q3 salesOther Aftermarket brands up 14%Total Aftermarket up 6 percent on a pro-forma basis quarter-over-quarter2017 Sales Guidance: Up significantly from TAP sales (unchanged) TAP Performance & Integration Meeting Expectations Q3'17 Earnings 18 ($ millions) Significantly $191 Other AftermarketBrands Reclassified 2016 sales, for comparison purposes, have been reclassified to account for the new Aftermarket segment which included aftermarket brands previously reported in their respective segments $30
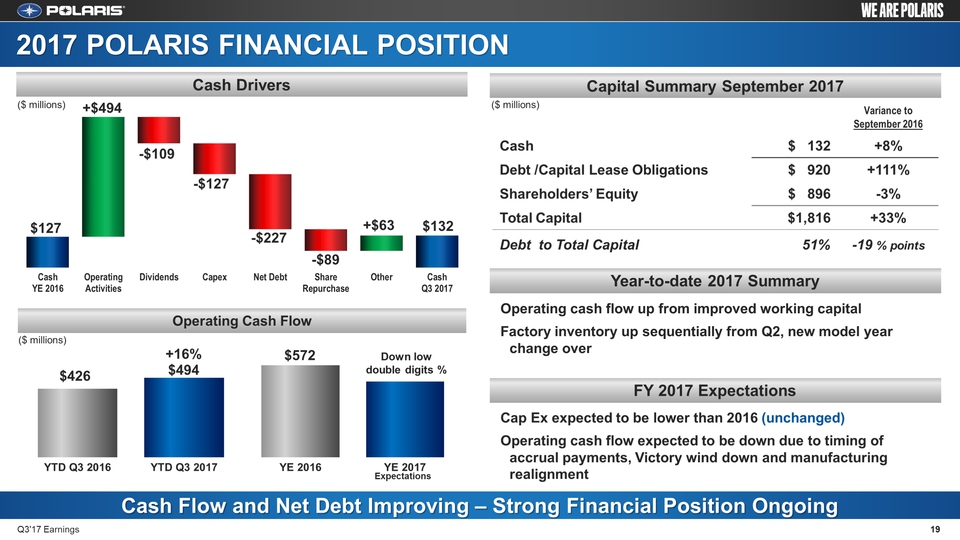
2017 POLARIS FINANCIAL POSITION 19 Q3'17 Earnings Capital Summary September 2017 Cash Drivers Variance toSeptember 2016 Cash $ 132 +8% Debt /Capital Lease Obligations $ 920 +111% Shareholders’ Equity $ 896 -3% Total Capital $1,816 +33% Debt to Total Capital 51% -19 % points Operating cash flow up from improved working capitalFactory inventory up sequentially from Q2, new model year change overCap Ex expected to be lower than 2016 (unchanged)Operating cash flow expected to be down due to timing of accrual payments, Victory wind down and manufacturing realignment Operating Cash Flow Cash Flow and Net Debt Improving – Strong Financial Position Ongoing ($ millions) ($ millions) ($ millions) Year-to-date 2017 Summary FY 2017 Expectations Down low double digits % Expectations +$494 -$109 -$127 -$227 -$89 +$63

Scott W. Wine, Chairman & CEO Third Quarter 2017 Earnings Results October 24, 2017 POLARIS INDUSTRIES INC.
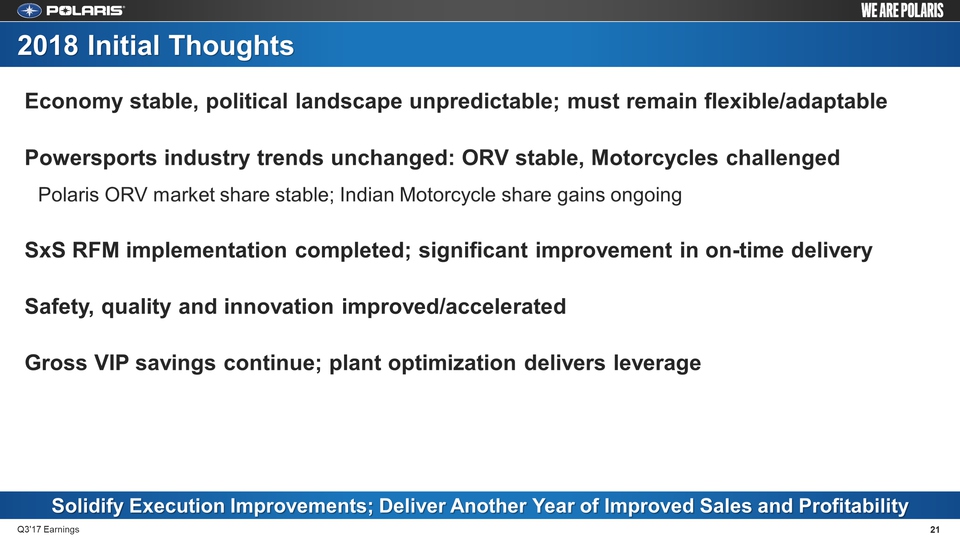
21 Q3'17 Earnings 2018 Initial Thoughts Solidify Execution Improvements; Deliver Another Year of Improved Sales and Profitability Economy stable, political landscape unpredictable; must remain flexible/adaptablePowersports industry trends unchanged: ORV stable, Motorcycles challengedPolaris ORV market share stable; Indian Motorcycle share gains ongoingSxS RFM implementation completed; significant improvement in on-time delivery Safety, quality and innovation improved/acceleratedGross VIP savings continue; plant optimization delivers leverage

Thank You Questions? POLARIS INDUSTRIES INC.
APPENDIX Q3 2017 SUPPLEMENTAL SALES PERFORMANCE (PG&A / INTERNATIONAL)Q3 FINANCIAL SERVICESQ3 YEAR-TO-DATE NON-GAAP DISCLOSURE2017 GUIDANCE ADJUSTMENTS Q3'17 Earnings 23
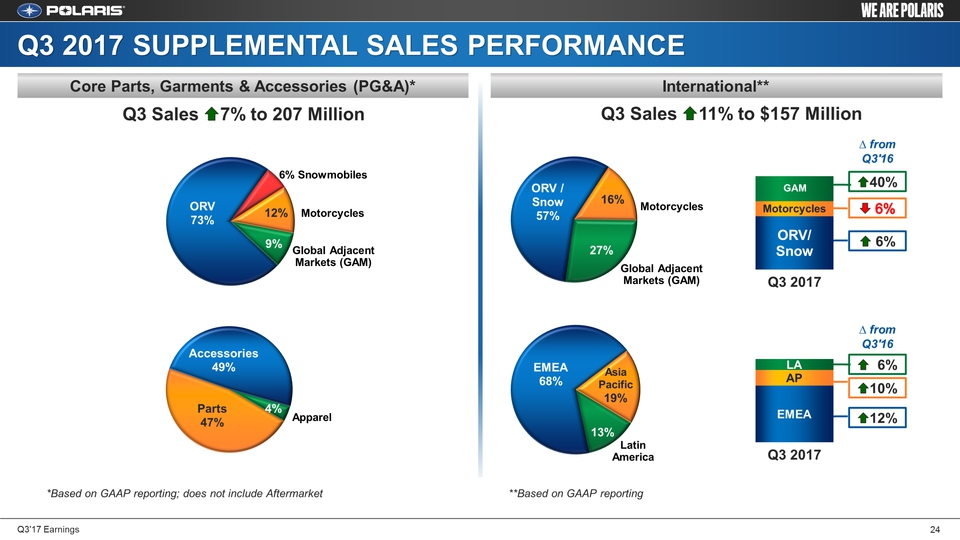
International** Core Parts, Garments & Accessories (PG&A)* 24 Q3'17 Earnings Q3 2017 SUPPLEMENTAL SALES PERFORMANCE Motorcycles Global Adjacent Markets (GAM) 6% Snowmobiles Motorcycles Global Adjacent Markets (GAM) Apparel LatinAmerica 40% 6% 6% 10% 6% 12% Q3 Sales 7% to 207 Million Q3 Sales 11% to $157 Million ∆ from Q3'16 from Q3'16 *Based on GAAP reporting; does not include Aftermarket **Based on GAAP reporting
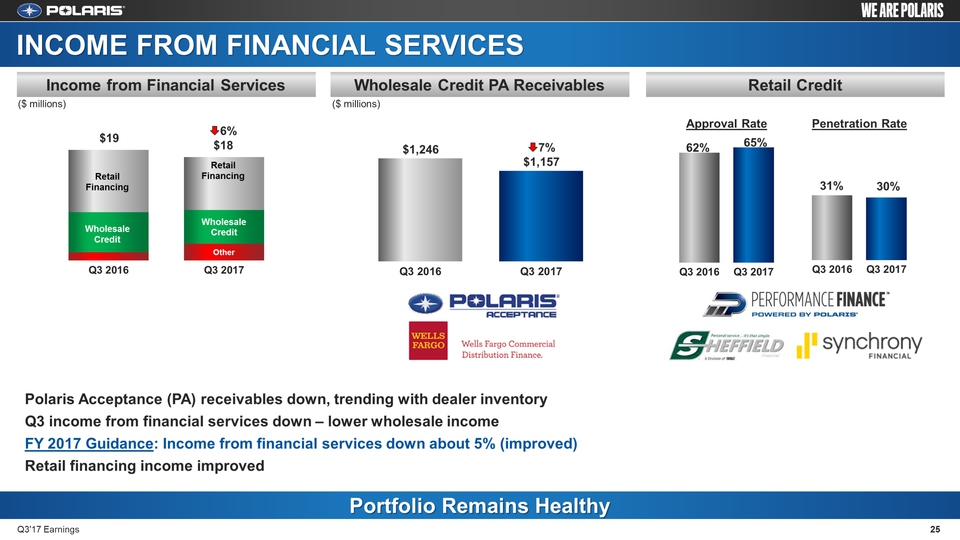
Retail Credit Wholesale Credit PA Receivables 25 Q3'17 Earnings Income from Financial Services Portfolio Remains Healthy INCOME FROM FINANCIAL SERVICES Polaris Acceptance (PA) receivables down, trending with dealer inventoryQ3 income from financial services down – lower wholesale incomeFY 2017 Guidance: Income from financial services down about 5% (improved)Retail financing income improved $19 6%$18 7%$1,157 $1,246 ($ millions) ($ millions) Approval Rate Penetration Rate WholesaleCredit Retail Financing Retail Financing
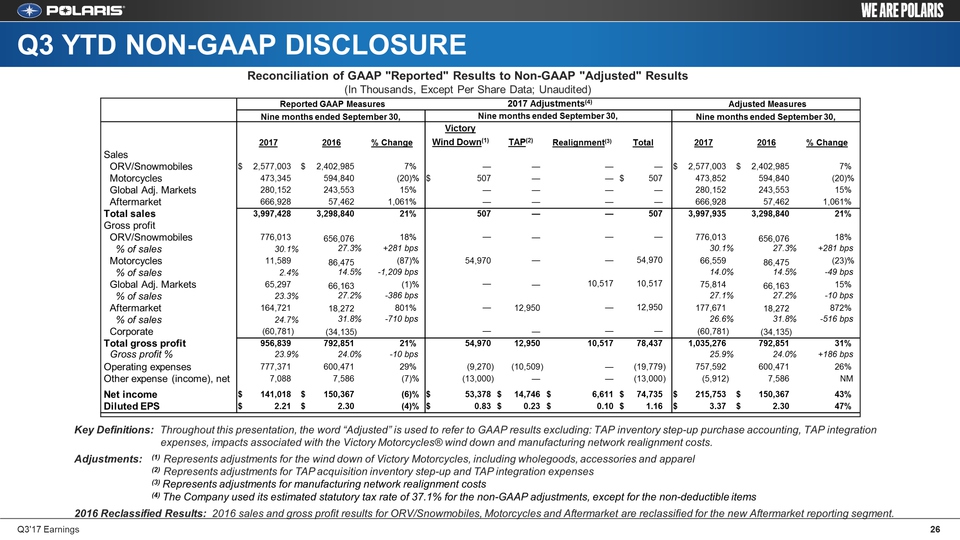
Q3 YTD NON-GAAP DISCLOSURE Reconciliation of GAAP "Reported" Results to Non-GAAP "Adjusted" Results (In Thousands, Except Per Share Data; Unaudited) Key Definitions: Throughout this presentation, the word “Adjusted” is used to refer to GAAP results excluding: TAP inventory step-up purchase accounting, TAP integration expenses, impacts associated with the Victory Motorcycles® wind down and manufacturing network realignment costs.Adjustments: (1) Represents adjustments for the wind down of Victory Motorcycles, including wholegoods, accessories and apparel (2) Represents adjustments for TAP acquisition inventory step-up and TAP integration expenses (3) Represents adjustments for manufacturing network realignment costs (4) The Company used its estimated statutory tax rate of 37.1% for the non-GAAP adjustments, except for the non-deductible items2016 Reclassified Results: 2016 sales and gross profit results for ORV/Snowmobiles, Motorcycles and Aftermarket are reclassified for the new Aftermarket reporting segment. Reported GAAP Measures Reported GAAP Measures 2017 Adjustments(4) 2017 Adjustments(4) Adjusted Measures Adjusted Measures Nine months ended September 30, Nine months ended September 30, Nine months ended September 30, Nine months ended September 30, Nine months ended September 30, Nine months ended September 30, 2017 2017 2016 2016 % Change VictoryWind Down(1) VictTAP(2) Realignment(3) Realignment(3) Total Total 2017 2017 2016 2016 % Change Sales ORV/Snowmobiles $ 2,577,003 $ 2,402,985 7 % — — — — $ 2,577,003 $ 2,402,985 7 % Motorcycles 473,345 594,840 (20 )% $ 507 — — $ 507 473,852 594,840 (20 )% Global Adj. Markets 280,152 243,553 15 % 280,152 243,553 15 % Aftermarket 666,928 57,462 1,061 % 666,928 57,462 �� 1,061 % Total sales 3,997,428 3,298,840 21 % 507 — — 507 3,997,935 3,298,840 21 % Gross profit ORV/Snowmobiles 776,013 656,076 18 % — — — — 776,013 656,076 18 % % of sales 30.1 % 27.3 % +281 bps 30.1 % 27.3 % +281 bps Motorcycles 11,589 86,475 (87 )% 54,970 — — 54,970 66,559 86,475 (23 )% % of sales 2.4 % 14.5 % -1,209 bps 14.0 % 14.5 % -49 bps Global Adj. Markets 65,297 66,163 (1 )% — — 10,517 10,517 75,814 66,163 15 % % of sales 23.3 % 27.2 % -386 bps 27.1 % 27.2 % -10 bps Aftermarket 164,721 18,272 801 % — 12,950 — 12,950 177,671 18,272 872 % % of sales 24.7 % 31.8 % -710 bps 26.6 % 31.8 % -516 bps Corporate (60,781 ) (34,135 ) — — — — (60,781 ) (34,135 ) Total gross profit 956,839 792,851 21 % 54,970 12,950 10,517 78,437 1,035,276 792,851 31 % Gross profit % 23.9 % 24.0 % -10 bps 25.9 % 24.0 % +186 bps Operating expenses 777,371 600,471 29 % (9,270 ) (10,509 ) — (19,779 ) 757,592 600,471 26 % Other expense (income), net 7,088 7,586 (7 )% (13,000 ) — — (13,000 ) (5,912 ) 7,586 NM Net income $ 141,018 $ 150,367 (6 )% $ 53,378 $ 14,746 $ 6,611 $ 74,735 $ 215,753 $ 150,367 43 % Diluted EPS $ 2.21 $ 2.30 (4 )% $ 0.83 $ 0.23 $ 0.10 $ 1.16 $ 3.37 $ 2.30 47 % Q3'17 Earnings 26
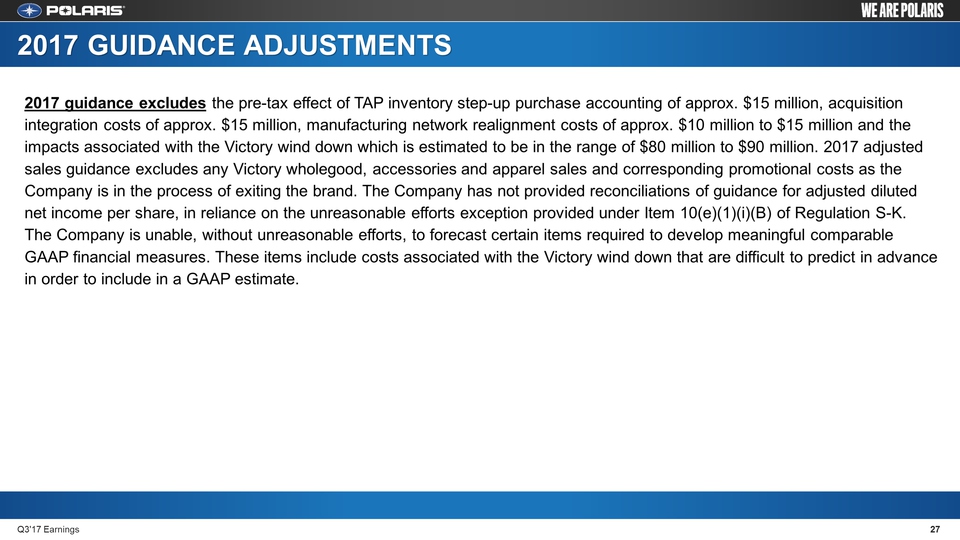
2017 GUIDANCE ADJUSTMENTS 27 Q3'17 Earnings 2017 guidance excludes the pre-tax effect of TAP inventory step-up purchase accounting of approx. $15 million, acquisition integration costs of approx. $15 million, manufacturing network realignment costs of approx. $10 million to $15 million and the impacts associated with the Victory wind down which is estimated to be in the range of $80 million to $90 million. 2017 adjusted sales guidance excludes any Victory wholegood, accessories and apparel sales and corresponding promotional costs as the Company is in the process of exiting the brand. The Company has not provided reconciliations of guidance for adjusted diluted net income per share, in reliance on the unreasonable efforts exception provided under Item 10(e)(1)(i)(B) of Regulation S-K. The Company is unable, without unreasonable efforts, to forecast certain items required to develop meaningful comparable GAAP financial measures. These items include costs associated with the Victory wind down that are difficult to predict in advance in order to include in a GAAP estimate.

28 Q3'17 Earnings