 July 27, 2011 July 27, 2011 Exhibit 99.1 |
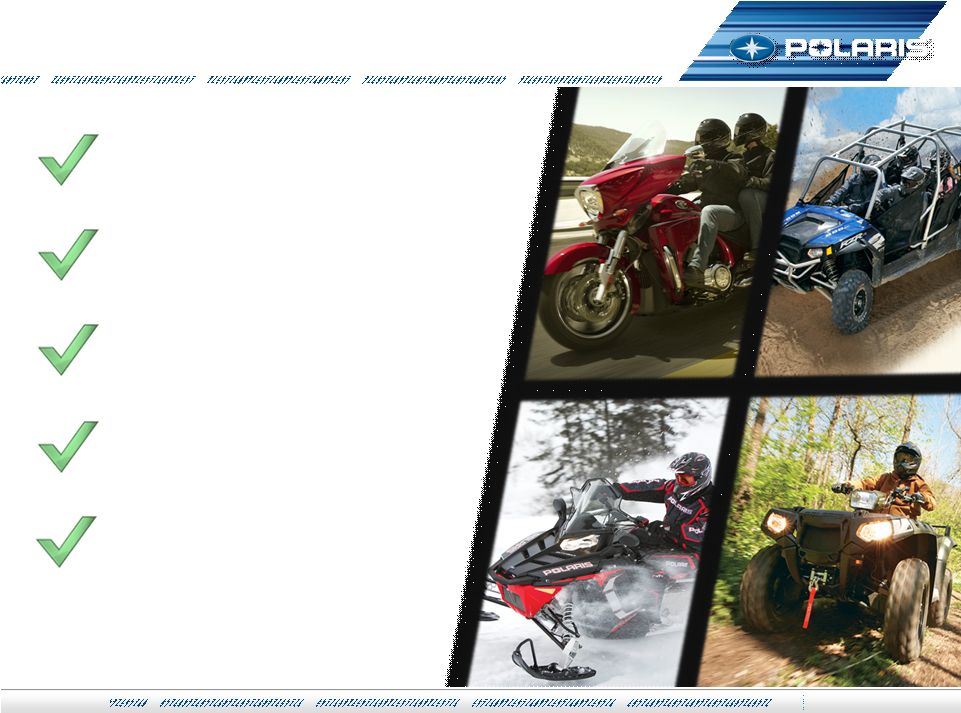
 July 27, 2011 – Gaylord Opryland Resort – Nashville, TN Analyst & Investor Meeting Agenda Analyst & Investor Meeting Agenda 8:00 Opening Remarks Scott Wine 8:10 Strategy Overview Bennett Morgan 8:25 Off-Road Vehicles, Bobcat Matt Homan 8:55 Snowmobiles, PG&A, & Financial Services Scott Swenson 9:15 Sales & Mktg / On-Road Vehicles (GEM) Mike Jonikas 9:35 Victory Motorcycles / Indian Steve Menneto 9:50 Break 10:05 Military / R&D / Powertrain David Longren 10:25 Global Market Development Mike Dougherty 10:55 Operations / Supply Chain / Monterrey / Suresh Krishna Acquisition Integration 11:25 Closing Comments Scott Wine 11:35 Q&A Wine/Morgan/Malone 2 2 2 Jul-2011 AM |
 3 Private Securities Litigation Reform Act of 1995 Polaris Industries Inc. Disclosure Litigation Statement Safe Harbor Safe Harbor Except for historical information contained herein, the matters set forth in this document, including but not limited to management’s expectations regarding 2011 and longer-term objectives for sales, shipments, net income, cash flow, and manufacturing realignment transition costs and savings, are forward-looking statements that involve certain risks and uncertainties that could cause actual results to differ materially from those forward-looking statements. Potential risks and uncertainties include such factors as product offerings, promotional activities and pricing strategies by competitors; manufacturing realignment transition costs; acquisition integration costs; warranty expenses; impact of changes in Polaris stock prices on incentive compensation; foreign currency exchange rate fluctuations; environmental and product safety regulatory activity; effects of weather; commodity costs; uninsured product liability claims; uncertainty in the retail and wholesale credit markets; changes in tax policy and overall economic conditions, including inflation, consumer confidence and spending and relationships with dealers and suppliers. Investors are also directed to consider other risks and uncertainties discussed in our 2010 annual report and Form 10-K filed by the Company with the Securities and Exchange Commission. The Company does not undertake any duty to any person to provide updates to its forward- looking statements. The data source for retail sales figures included in this presentation is registration information provided by Polaris dealers in North America and compiled by the Company or Company estimates. The Company must rely on information that its dealers supply concerning retail sales, and other retail sales data sources and this information is subject to revision. Jul-2011 AM |
 |
 2011 1st 2011 1st st Half Financial Metrics Half Financial Metrics 2011 YTD Actual Var. to ‘10 Sales $1,145 +44% Net Income $96.0 +112% Gross Profit % 28.8% +260 bpts Op Profit % 12.8% +340 bpts Net Income % 8.4% +270 bpts EPS $2.71 +102% Shareholder Return 44% +17% pts 5 Exceptional Start to 2011 Jul-2011 AM |
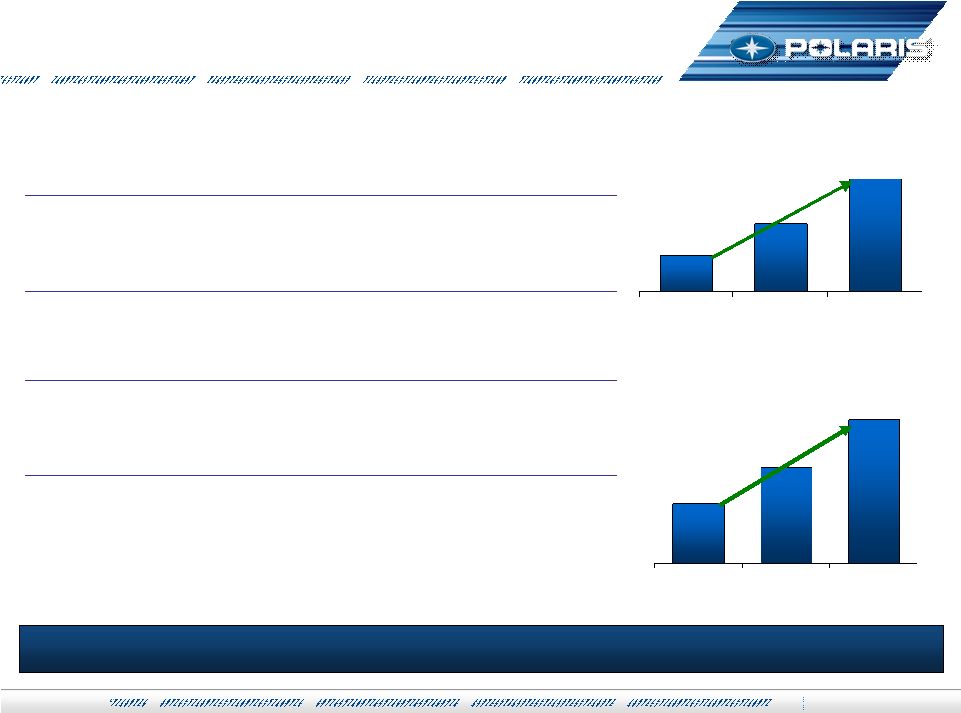
 Total Company Sales (in millions) Diluted EPS Full Year 2011 Guidance Full Year 2011 Guidance $1,991 Up 25% to 28% $2,490 to $2,540 2010 Actual 2011 Guidance $4.28 Up 39% to 41% $5.93 to $6.05 2010 Actual 2011 Guidance 2011 Sales & EPS Projections Raised, Again Retail sales growth continues to outpace the industry International, Military, and Bobcat businesses accelerating growth Net income dollars projected up 45% to 47% Net income margin improvement accelerating Diluted EPS expected to be up 39% to 41% EPS expected in $5.93 to $6.05 range 6 Jul-2011 AM |
 Strategic Objectives Strategic Objectives 7 2009 2014 2019 2009 2014 2019 $1.6 Billion $5.0 Billion Grow Sales $5 Billion by 2019 6.5% 10.0% Expand Net Income 10% of sales by 2019 Best in Powersports PLUS 5-8% organic growth to >$3B Growth through Adjacencies >$2B from acquisitions and new markets Global Market Leadership >33% of Polaris Revenue Operations is Competitive Advantage Lean Enterprise for world class quality, cost, lead times Strong Financial Performance Sustainable, Profitable Growth Net Income Margin to 10% Consistent Strategy, Continued Execution >8.0% $3.0 Billion Jul-2011 AM Goal Goal Goal Goal |
 |
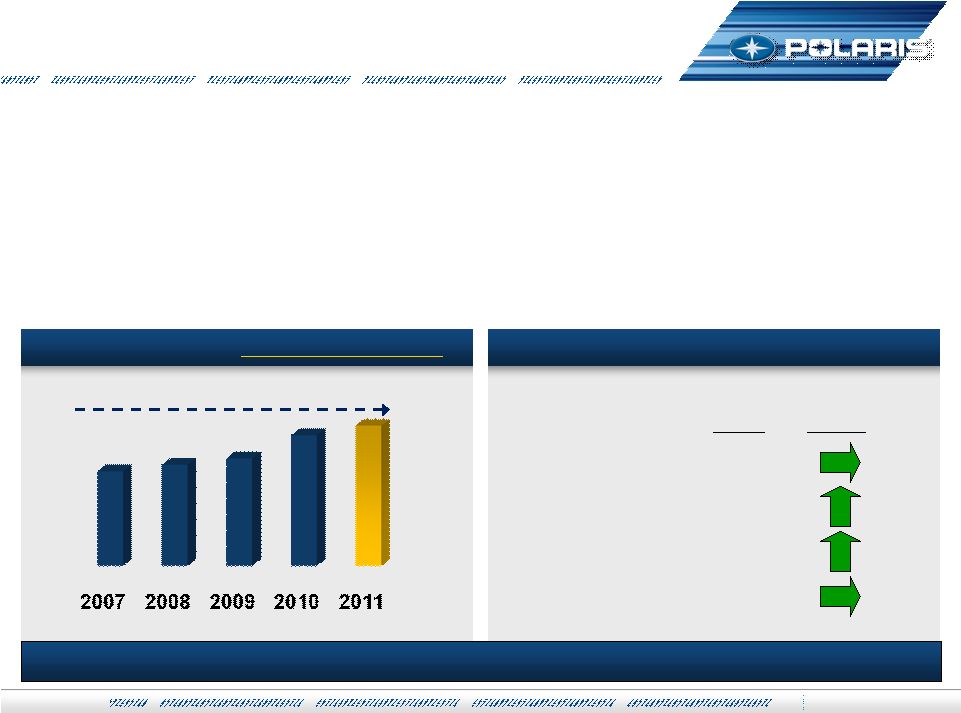
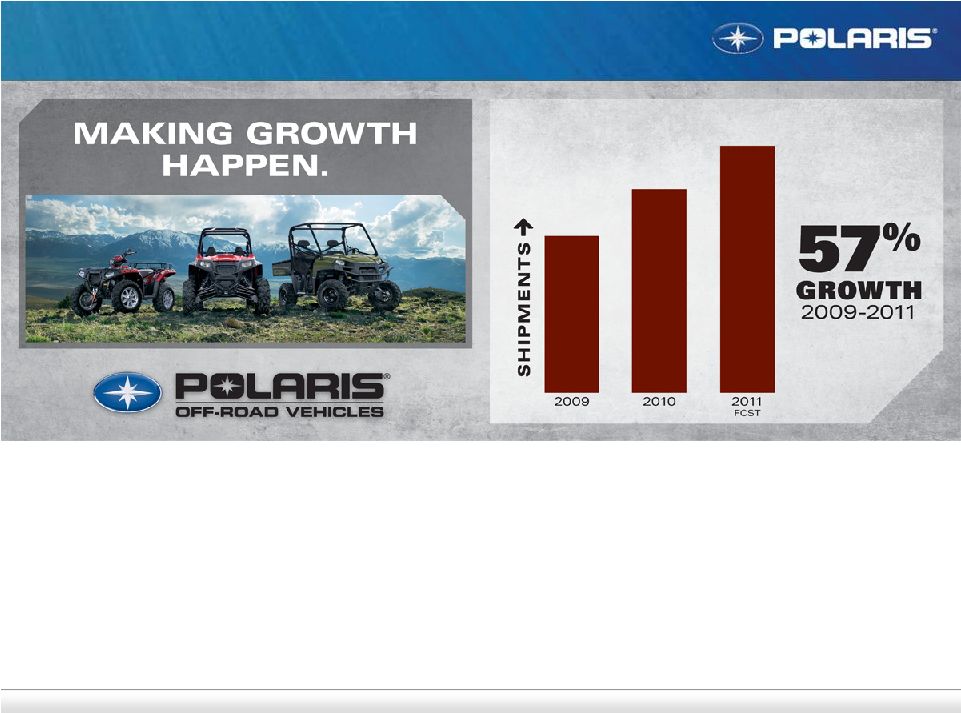
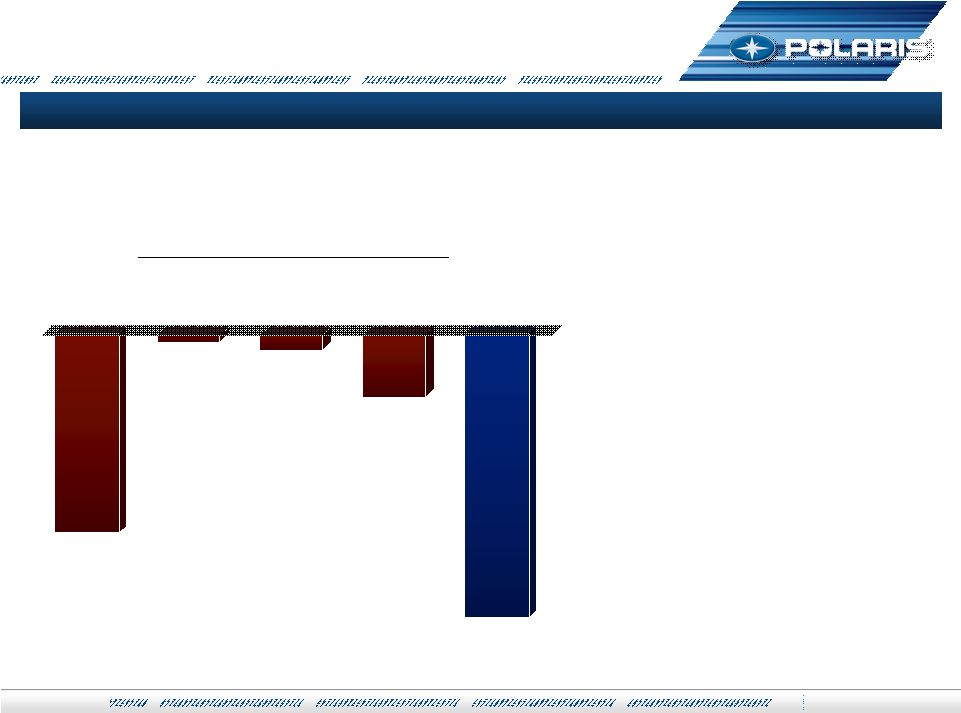 Jul-2011 AM 9 Making Growth Happen Making Growth Happen Industry is Industry is 34% Smaller 34% Smaller Since 2008 Since 2008 Industry has declined over the past 3 years 2008 vs. 2011 Global Industry Retail Sales (Units) 2008 – 2011 Sales Trends ATV ATV SxS SxS SNOW SNOW MOTOR MOTOR CYCLES CYCLES INDUSTRY INDUSTRY TOTAL TOTAL |
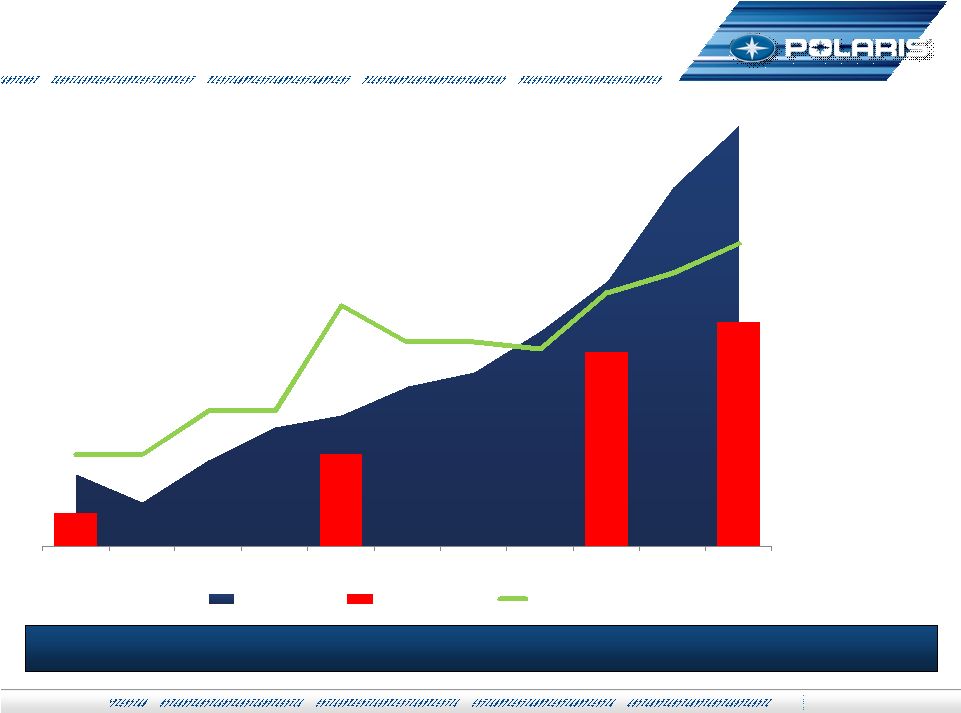
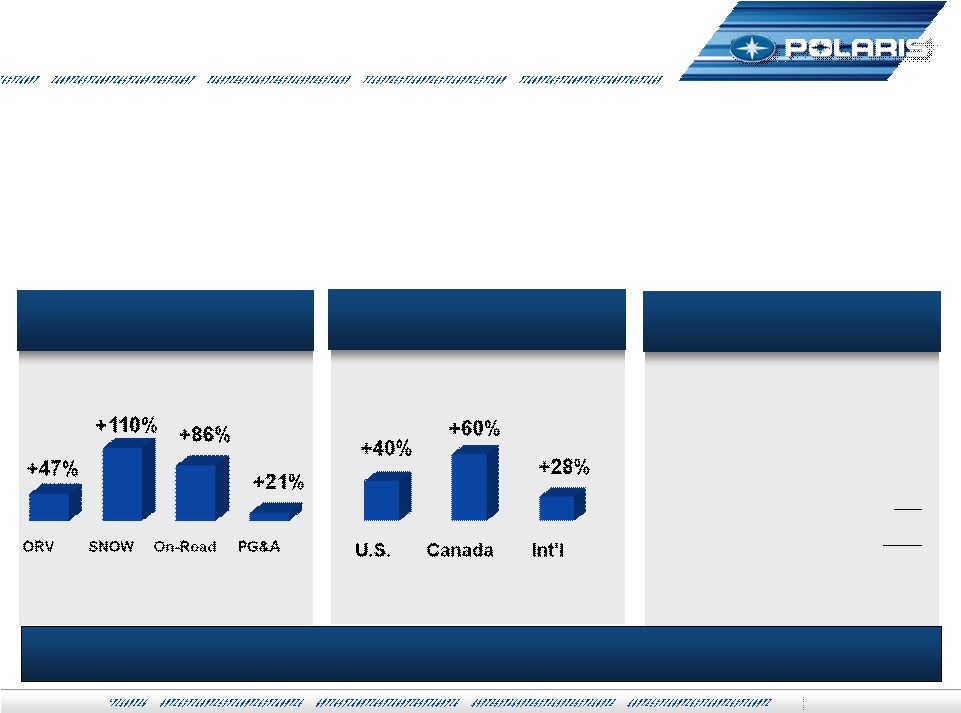
 Jul-2011 AM 10 Making Growth Happen Making Growth Happen Growth by Geographic Region Growth by Business/Product Line SxS & N.A. Driving; Newer Growth Initiatives Contributing In a declining industry… We Made Growth Happen! $500M of Growth!! 2008 – 2011 Sales Trends ATV ATV SxS SxS SNOW SNOW VICTORY VICTORY POLARIS POLARIS TOTAL TOTAL MILITARY MILITARY OSPS OSPS LEV/ LEV/ GEM GEM |
 Jul-2011 AM 11 Making Growth Happen Making Growth Happen Most of These Have Not Paid Back Yet! Aggressive Investments in Our Future New Product Development New Product Development SxS, ATVs, Motorcycles, Snowmobiles, PGA SxS, ATVs, Motorcycles, Snowmobiles, PGA More Advertising More Advertising MVP MVP Monterrey Monterrey EMEA HQ EMEA HQ SwissAuto SwissAuto Military Military LEV LEV GEM GEM Indian Indian China China Over $300M of capital invested in tooling, acquisition, operating expenses and/or people commitments Bobcat Bobcat Brazil Brazil India India International NPD International NPD Business Development Business Development And others… And others… |
 2011-2012 N.A. Macroeconomic Outlook 2011-2012 N.A. Macroeconomic Outlook Global – emerging economies lead . . . Europe lags North American GDP 2.5 to 3.0 for 2011 – slightly better in 2012 Housing, unemployment remain problematic Consumer confidence modestly improves Government policy, 2012 election uncertainties may sputter recovery 12 Slow recovery remains most likely scenario Jul-2011 AM |
 What’s Different From 1 Year Ago? What’s Different From 1 Year Ago? Market Cap has doubled to $4B with 1 st Half Sales (+44%) and EPS (+102%) growth SxS business significantly larger on huge market share gains and continued momentum Victory is profitable and has grown to # 2 in share YTD 2011 Monterrey is an operating plant with 630 employees vs. an empty field in July 2010 International expansion on schedule with EMEA HQ, growth in China, India & Brazil Indian & GEM make acquisitions real; Military & Bobcat adjacencies accelerating Jul-2011 AM 13 A Bigger, Stronger, more Profitable Business…Still Hungry and Humble |
 Drive organic growth - every business grows share ORV innovation delivers sales and profit growth Victory grows revenue and profits rapidly Snow is clear #2 with operating profit growth Polaris powertrain penetration grows 14 Best in Powersports PLUS Best in Powersports PLUS Jul-2011 AM |
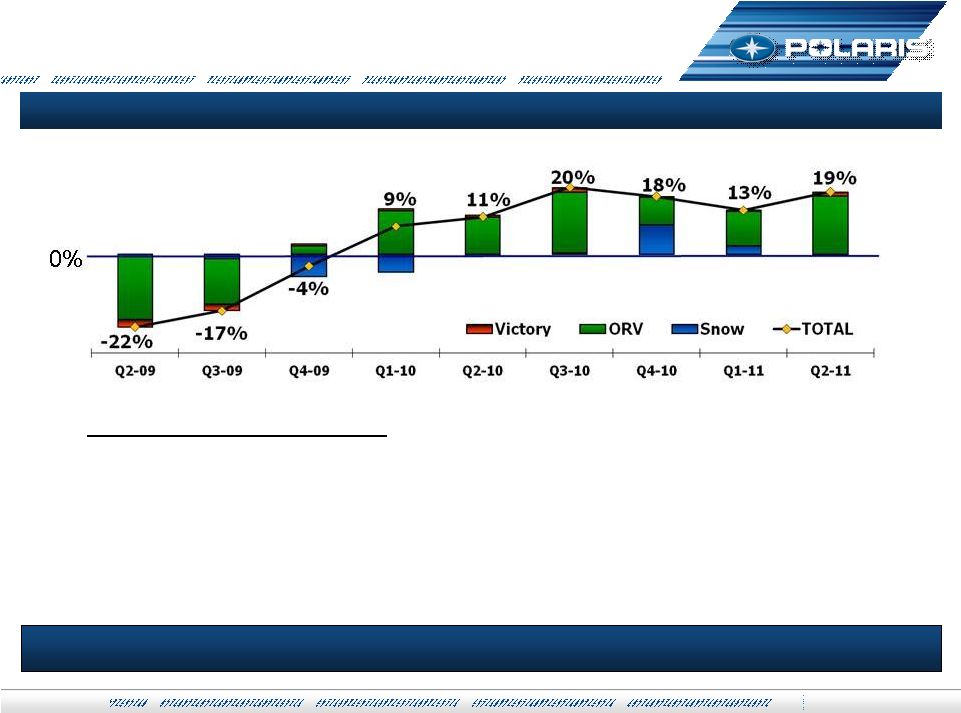 Jul-2011 AM 15 Best in Powersports PLUS Best in Powersports PLUS Powersports Highlights Industry on plan and stable at -1% in Q2 & YTD Polaris Q2 Retail: ORV up mid-teens; Victory +40% Polaris #1 Powersports OEM in 2010 & 1H 2011 RZR XP fastest turning new product launch ever Polaris Retail Trends Remain Strong; Industry Stable Positive North American Retail Sales Trends Continue |
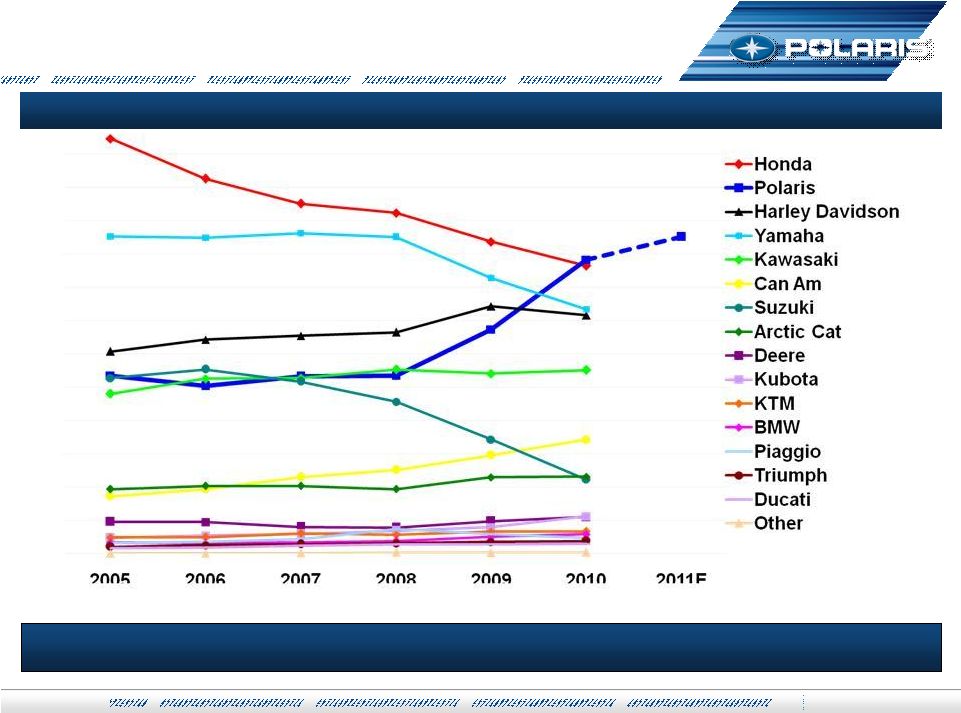 Jul-2011 AM 16 Best in Powersports PLUS Best in Powersports PLUS Polaris is #1 in N.A. Powersports Includes Total Motorcycle Industry Consolidated N.A. Market Share (Units) |
 Acquire or partner, then integrate profitable revenue Bobcat continues to grow revenue Expand Defense sales to >$50M with product innovation SwissAuto Technology applied outside powersports 17 Jul-2011 AM Bobcat Military Growth Accelerating Growth Through Adjacencies Growth Through Adjacencies |
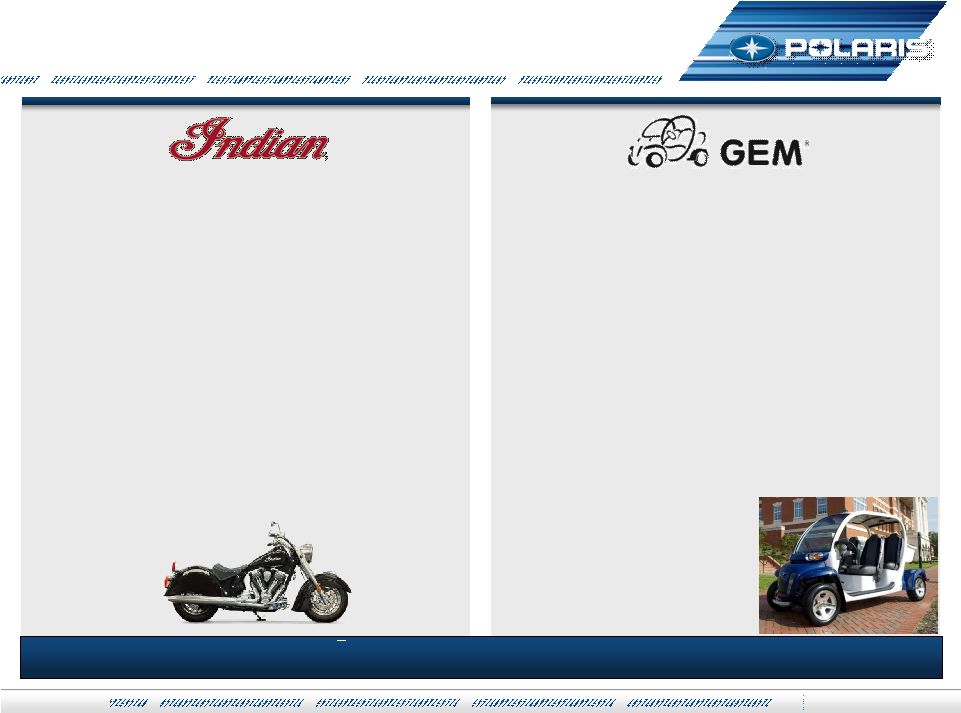 Jul-2011 AM 18 Growth Through Adjacencies Growth Through Adjacencies Strategic Acquisitions will Expand On-Road Presence Milestones: Closed acquisition June 2011 Hired GEM personnel Retained vast majority of GEM dealers Next Steps: Stabilize volume - Re-energize dealers Future Product Planning Spirit Lake assembly Cost reduction Milestones: Closed acquisition in April 2011 Exited Kings Mountain July 1st Hired/Contracted Indian personnel Next Steps: Develop & build clear brand strategy Spirit Lake assembly Product design/planning: Focus to deliver differentiated models with core Indian DNA Distribution planning for re-launch |
 Global Market Leadership Global Market Leadership Grow EMEA and expand #1 share leadership position China distribution & partnerships drive profitable sales Establish India business foundation & key partnership Continue rapid Victory growth 19 Jul-2011 AM $77.5 +35% $104.2 +21% $305.9 Polaris Sales (millions) FY 2011 guidance FY 2010 Q2 2011 Q2 2010 Up 20% to 25% International Investment & Expansion Continuing Making Aggressive Investments Outside N.A. EMEA HQ SwissAuto China Brazil India International Products And others . . . |
 Operations as a Competitive Advantage Operations as a Competitive Advantage Drives up to 220 basis points gross margin gain in FY 2011 Quality, delivery and performance targets delivered throughout manufacturing realignment Quality improvements drive Net Promoter Scores up and warranty down Reduce Polaris factory and dealer inventories LEAN and sourcing initiatives to deliver net cost improvement Reduce lead-time and improve delivery flexibility for Victory and ORV 20 Strong Start – Driving for Results in Future Growth Initiatives Net Promoter Scores % of Vehicles with No Warranty Claims Goal is 95% Forecast Industry Rank Trend SxS #1 ATV #2 Snow #2 Victory #1 Jul-2011 AM |
 Strong Financial Performance Strong Financial Performance $28.65 $43.63 $78.02 6.0% 6.5% 7.4% 8.4% 22.8% 27.3% 27.7% 29.2% Q4-'08 Q1-'09 Q2-'09 Q3-'09 Q4-'09 Q1-'10 Q2-'10 Q3-'10 Q4-'10 Q1-'11 Q2-'11 Stock Price FY NI Margin Gross Margin When We Expand Margins; Investors Will Reward Performance $118 21 Jul-2011 AM |
 June YTD % Change in Total Company Sales June YTD Sales Growth by Region Strong Financial Performance Strong Financial Performance 2011 Full Year Guidance Sales $2,490M to $2,540M (+25% to +28%) Net Income up 45% to 47% EPS of $5.93 to $6.05 22 Strong Start – Driving for Results in Future Growth Initiatives Volume 35% Product Mix & Price 7% Currency _2% 44% Jul-2011 AM June YTD Sales Growth by Business Unit |
 Jul-2011 AM 23 Polaris Industries Inc. Polaris Industries Inc. Q & A Q & A Polaris Industries Inc. Analyst & Investor Meeting July 27, 2011 |
 Matt Homan, VP Off-Road Vehicles July 27 th , 2011 |
 Off-Road Vehicles Agenda Industry and Competitive Update Off-Road Vehicle Plans and Results Bobcat Adjacency Update Off-Road Vehicles – The Future 25 |
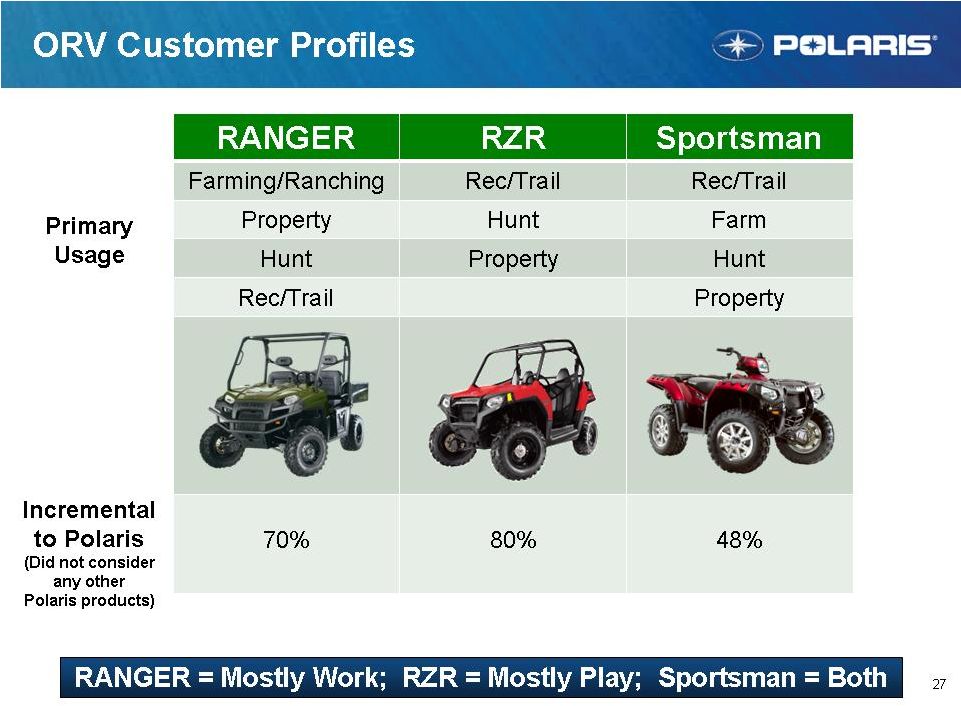
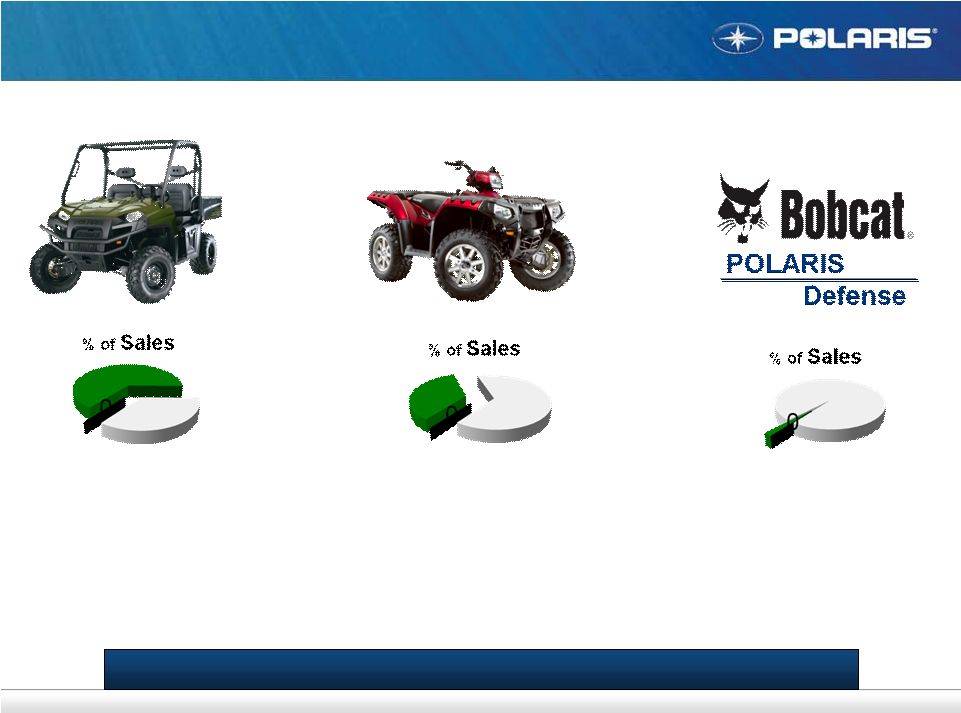 26 ORV Business Breakdown ATV SxS Military Bobcat #1 business for revenue and profits Large business with significant profits Incremental Growth Opportunity RANGER #1 Priority; Sportsman Remains Significant |
 |
 28 ATV SxS Military Bobcat Off-Road Vehicle Industry Trends ATV Industry Remains Weak – SxS Solid Growth in 2010 and 2011 SxS ATV Industry Trends 5 Year CAGR = -20% Modest improvement in 2010/2011 forecasted SxS Industry Trends 5 Year CAGR +2% – Driven by weak 2009 Solid growth in 2010/2011 forecasted at +8% |
 29 Off-Road Market Share Summary Polaris #1 in ORV; #1 in SxS; Closing in on #1 in ATV ORV SxS ATV Trend #1 #1 #2 #2 #7 #1 #3 #5 #3 #4 #2 #6 #5 #8 #4 #6 #6 #5 #7 #3 N/A #8 #4 N/A #9 N/A #7 2010 Powersports Research SxS Data 2011 YTD ATV Market Share Numbers |
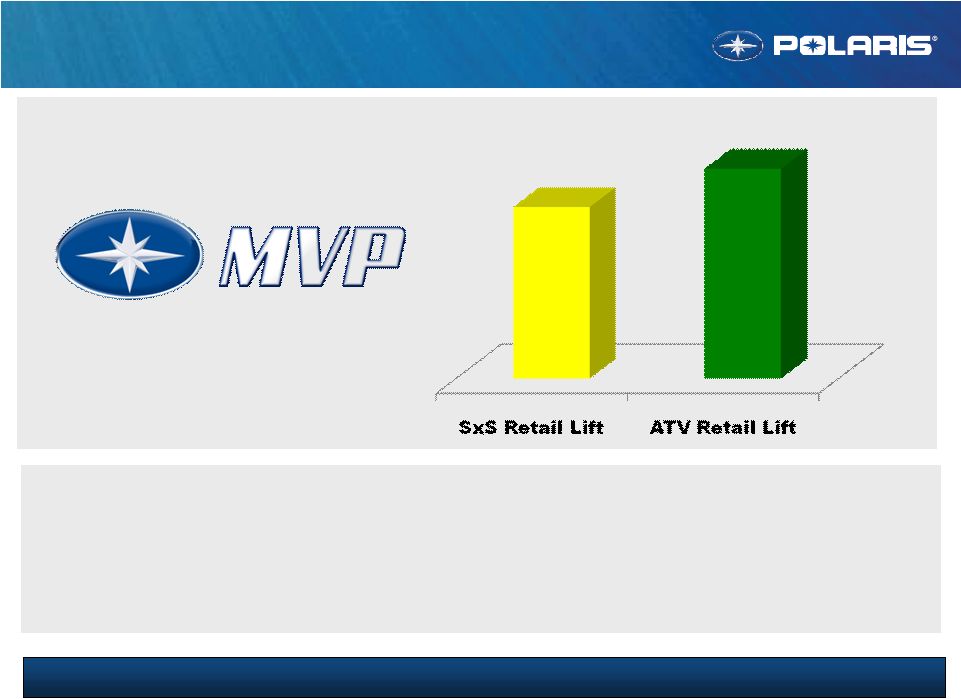
 30 Off-Road Vehicles Growth Strategy Strong Plan – Working to Drive Results New Products Drive Incremental SxS Growth Big News – RZR XP, RZR 570 Big Retail Drivers Improvements – RANGER Heat, Limited Editions More Incremental Opportunities – RANGER Diesel Crew Gain Profitable ATV Share – Protect Sportsman Big News – Sportsman 850HO Big Improvements – Sportsman Value Line Storage Profitable Growth – Significant Share Gains + Margin Expansion Aggressive MVP Plans to Drive Retail 99% 1H dealer retail plans 2H Retail plans enhanced – do 3 to 4 MORE things (advertise, in-store event, etc.) Improvements to product availability / mix in 2H of 2011 Improve Across Value Chain to Expand Margins Monterrey on-line – Off to great start Strong combination of cost down, pricing and expense management |
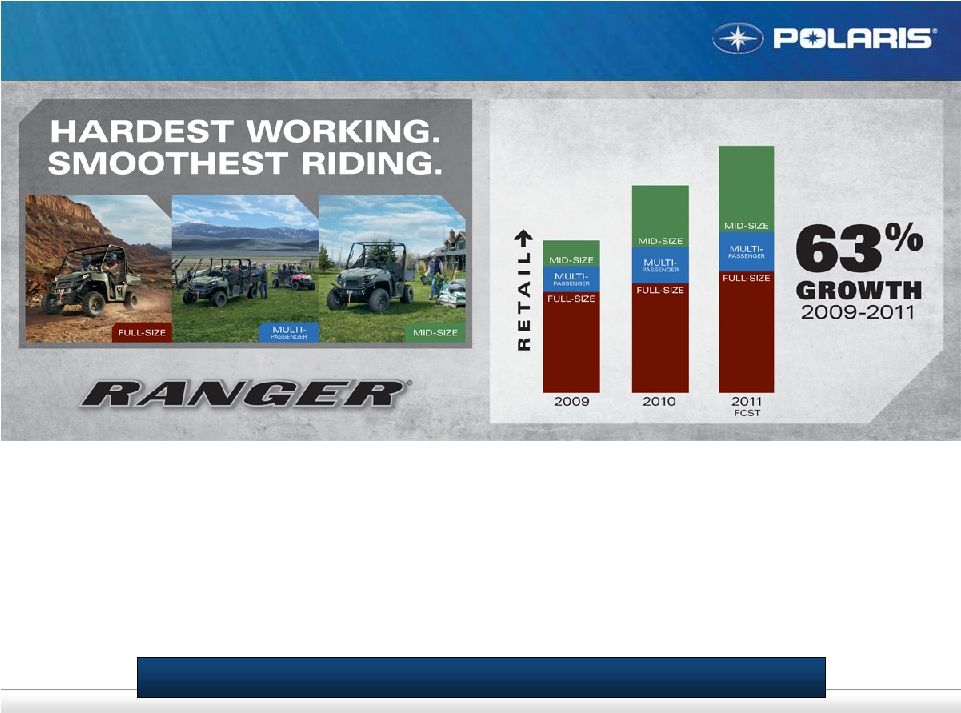 Strong Retail Results – Positioned Well to Continue ORV RANGER Retail Results 31 All RANGER segments growing Share growth has been very strong RANGER (no RZR) #1 in SxS by over 2X next closest competitor RANGER MY’12 product and marketing plan positioned well |
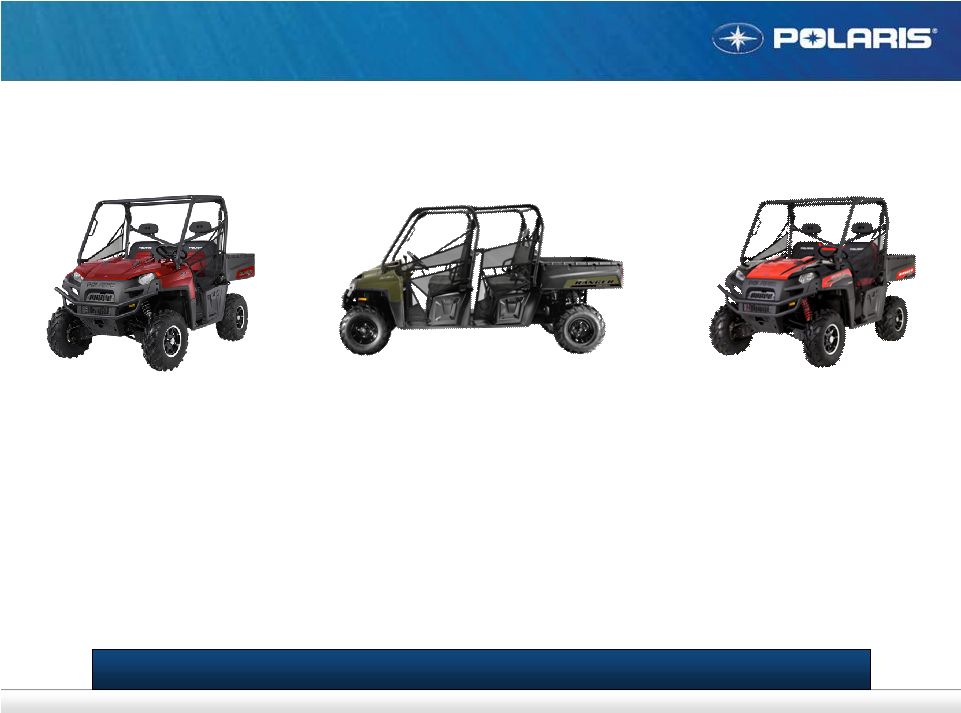 32 ATV SxS Military Bobcat RANGER MY’12 New Products Improvements and Incremental Opportunities Drive Growth RANGER = Top Customer Improvements Diesel Crew = Incremental Opportunity Limited Editions = Drive Retail Heat = Big Reduction Hills = HD Engine Braking Incremental Customer International/Military First Mid-Size LEs Opportunity First Walker Evans RANGER |
 2011 Ahead of Plan; Incremental New Plays Working ORV RZR Retail Results 33 Strong incremental RZR growth as new segments launched Clear leader in recreation segment RZR (no RANGER) is #2 in SxS market share (behind RANGER) |
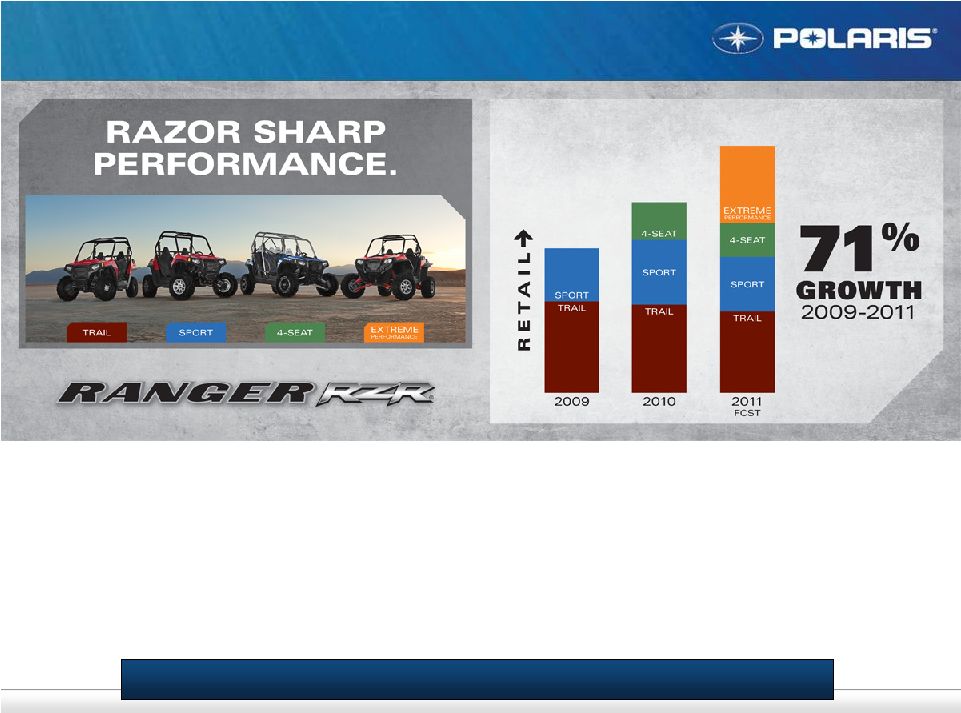
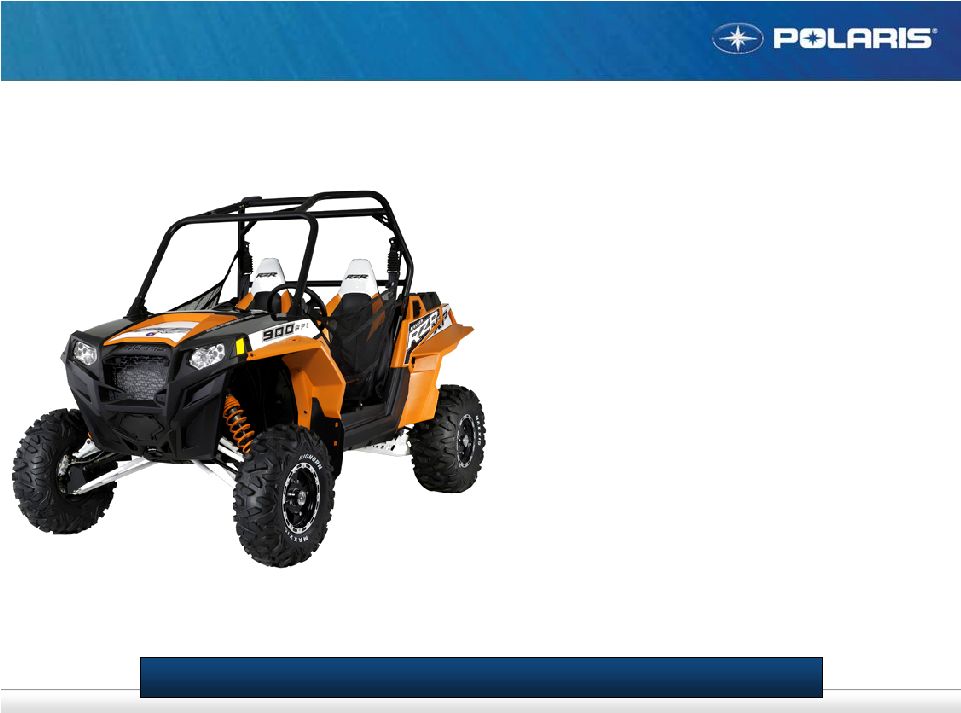 34 ATV SxS Military Bobcat RZR MY’12 New Products RZR XP – Razor Sharp EXTREME Performance NEW! RZR XP Fastest Turning in ORV History Highly Incremental to RZR Line No Competitor Is Close More Limited Edition News for ‘12 |
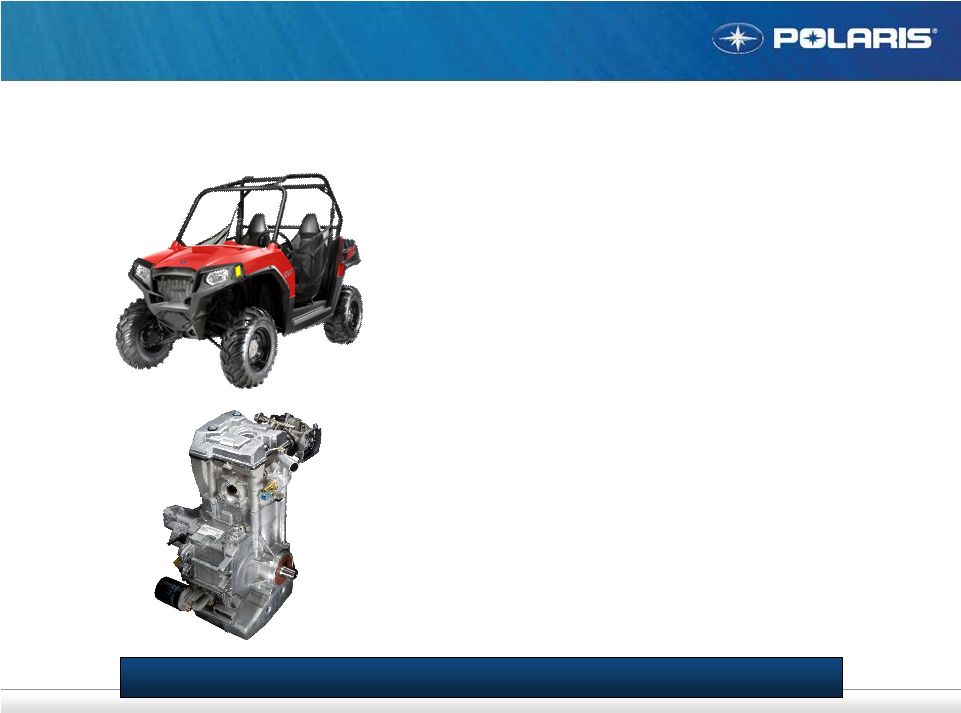 35 ATV SxS Military Bobcat RZR MY’12 New Product Trail Machines 2X – RZR 800 and NEW! RZR 570 NEW! RZR 570 Competitive Advantages of RZR 800 Patented low CG, 50” width, travel & suspension New ProStar 570 Engine 45HP single-cylinder, high revving DOHC RZR XP efficient transmission Outperforms the Competitors BIG SxSs 26% faster than a Teryx 325 lbs lighter than a Commander Razor Sharp Trail Value SxS $9,999 MSRP |
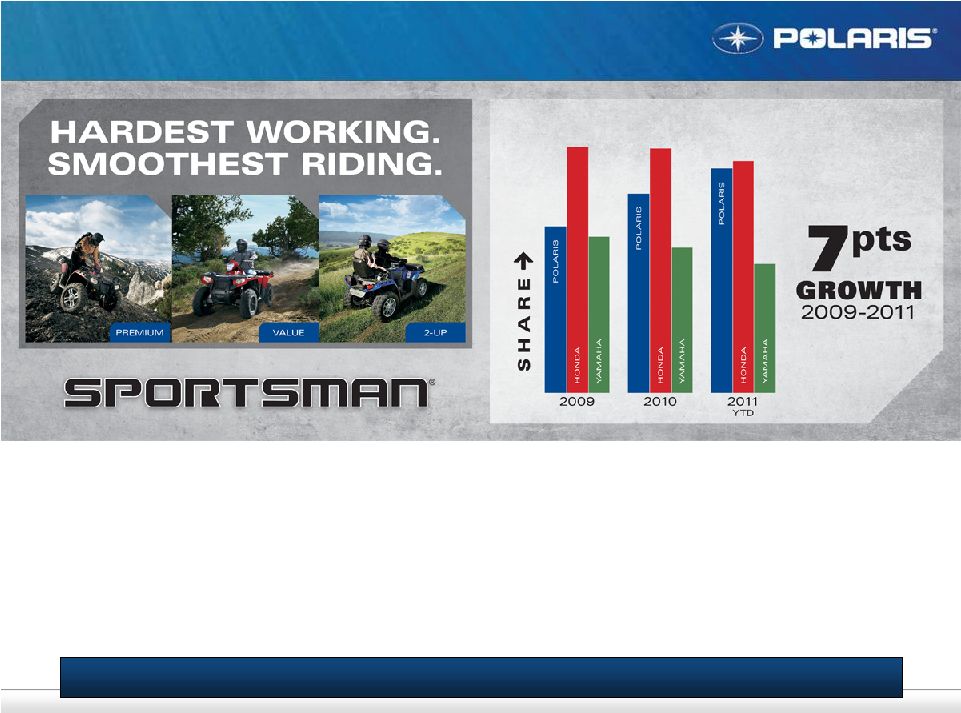 2011 Sportsman Ahead of Plan; Sportsman Strategy is Working ORV ATV Market Share Results 36 Significant share gains across Sportsman segments Sportsman leads in both “value” and “premium” segments Sportsman 500HO and Sportsman 850XP |
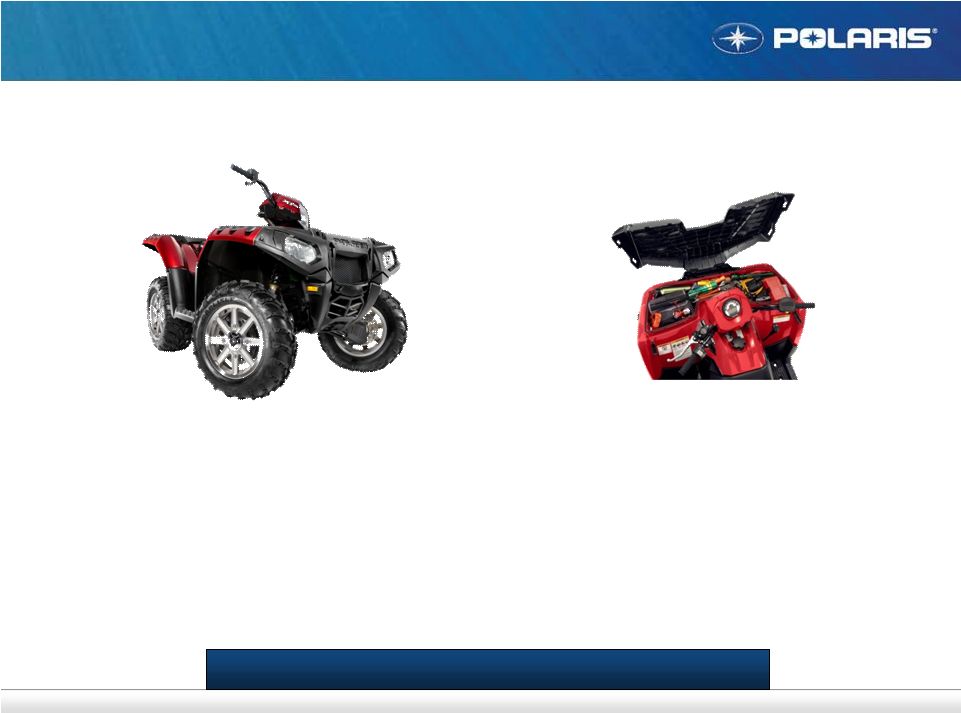 37 ATV SxS Military Bobcat Sportsman MY’12 New Products More Power and More Value for MY’12 NEW! MY’12 Sportsman 850H.0. NEW! MY’12 Sportsman 400, 500, 800 77HP – For the Same Money 20% More Acceleration #1 Customer Request 21% More Capacity New Kenda Tires #2 Customer Request |
 ORV Overall Results RANGER – Consistent incremental growth RZR – Consistent incremental growth Sportsman – Consistent share growth Bobcat – Partnership is on-track |
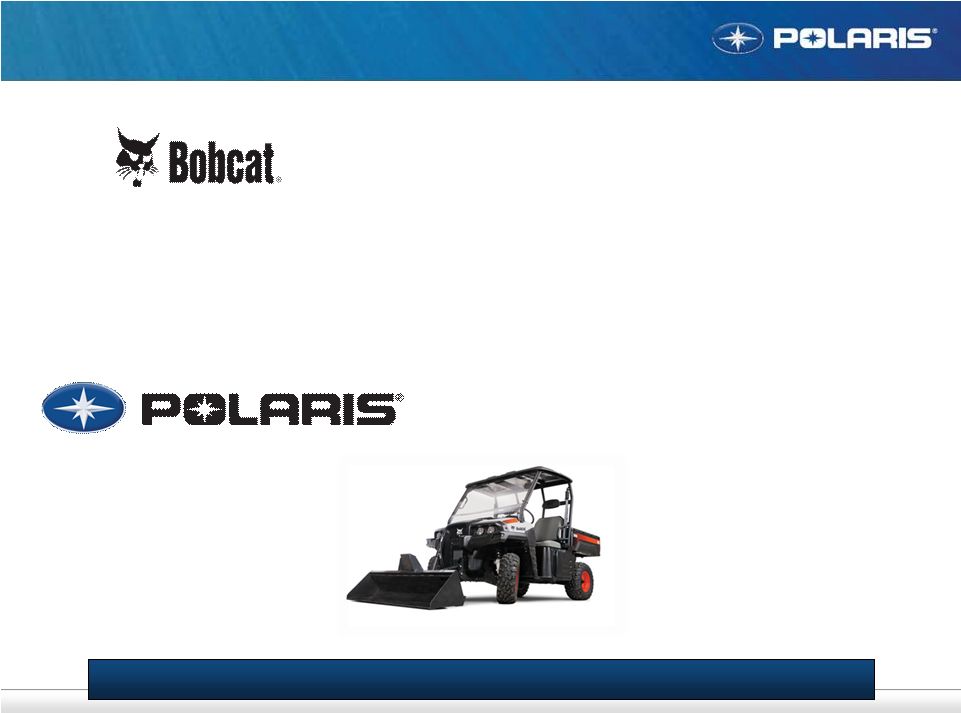 39 Bobcat Partnership Strategy Bobcat Partnership Strategy = Powerful Opportunity + Off-Road Vehicles Manufacturer Compact Construction Manufacturer 1 1 # # 1 1 # # |
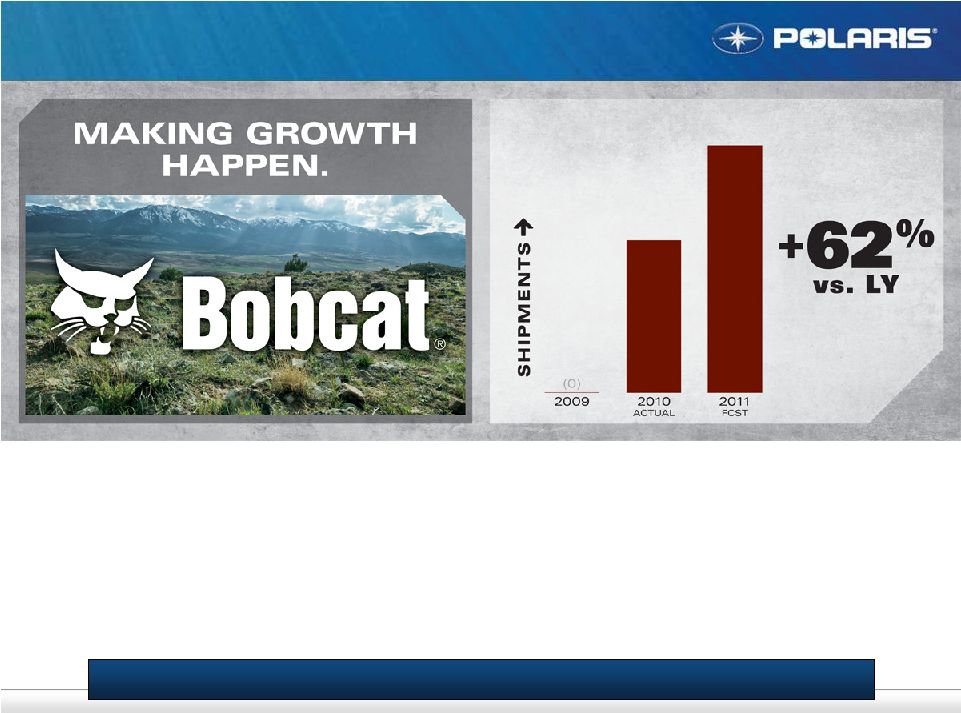 Bobcat Partnership Results Bobcat Retail – Gaining Momentum Bobcat Ship – Ahead of Plan Bobcat Co-Developed Products – On-Track Bobcat Delivering Results – Potential Remains |
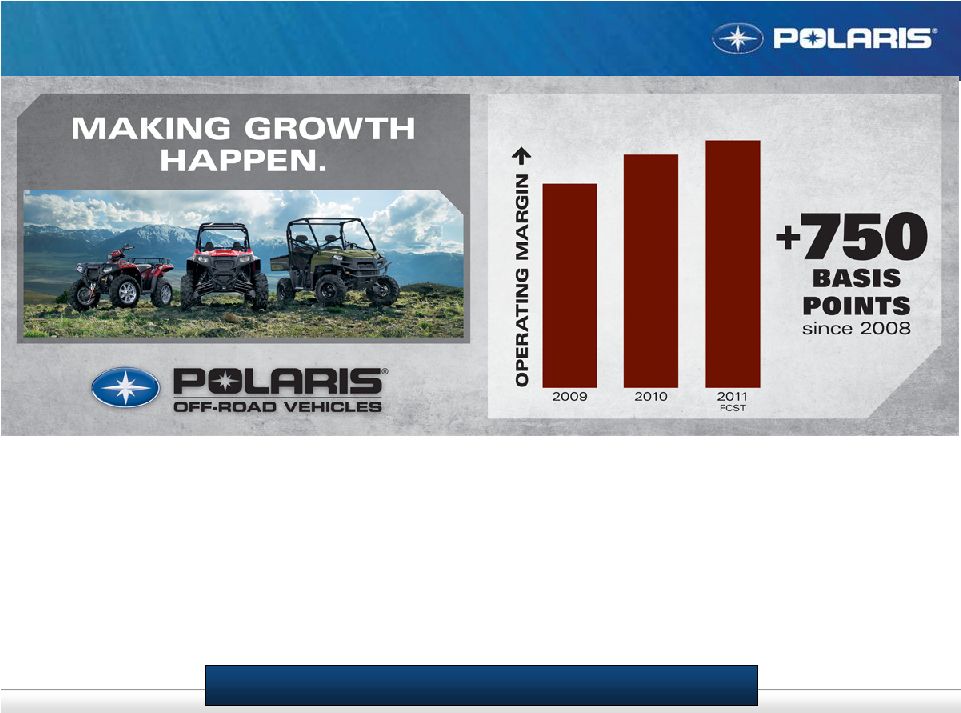 ORV Margin Expansion Cost Down – Engineering and purchasing Pricing – Leveraged targeted opportunities (remain competitive) Monterrey – Impact just beginning ORV = Strong Margin Expansion Results |
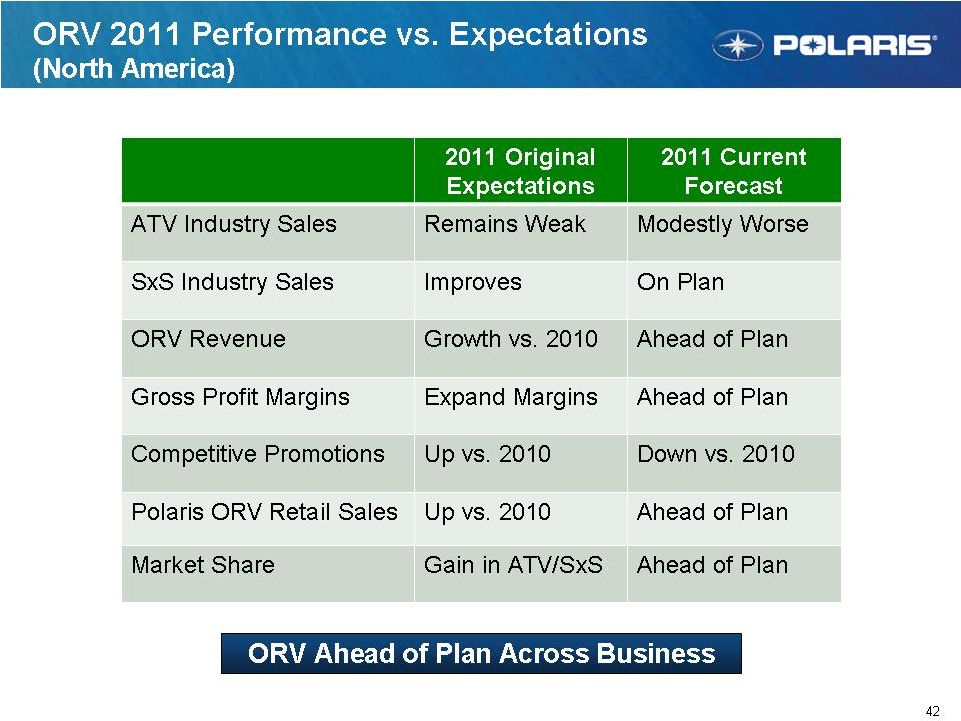 |
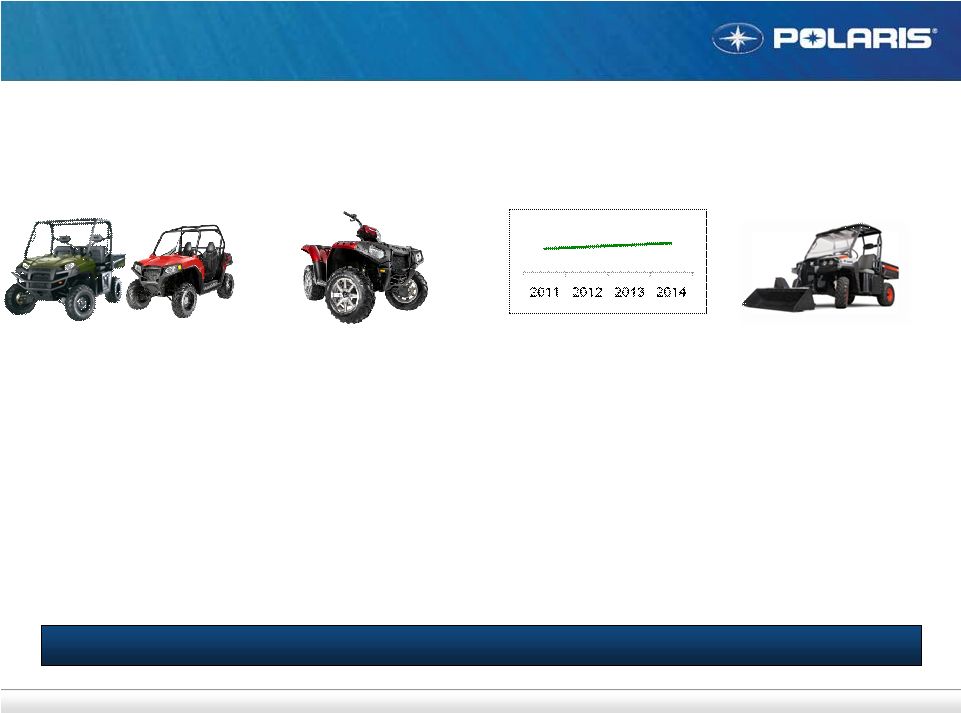 43 ATV SxS Military Bobcat ORV Future Strategy Summary The Future Looks Bright for Off-Road Vehicles Incremental SxS Growth Profitable ATV Share Expand Margins Bobcat Partnership Strong RGR product plan Strong RZR product plan SxS market has upside Sportsman strong Still room to innovate Margin plan strong Monterrey just starting Proven track record Dealer Inventory healthy Gaining momentum Co-developed next Strong commitment |
 RANGER – Ahead of plan and poised to grow RZR – Ahead of plan and poised to grow Sportsman – Ahead of plan and poised to continue winning Bobcat – Ahead of plan with lots of opportunity 44 |
 |
 46 7-27-10 VIDEO |
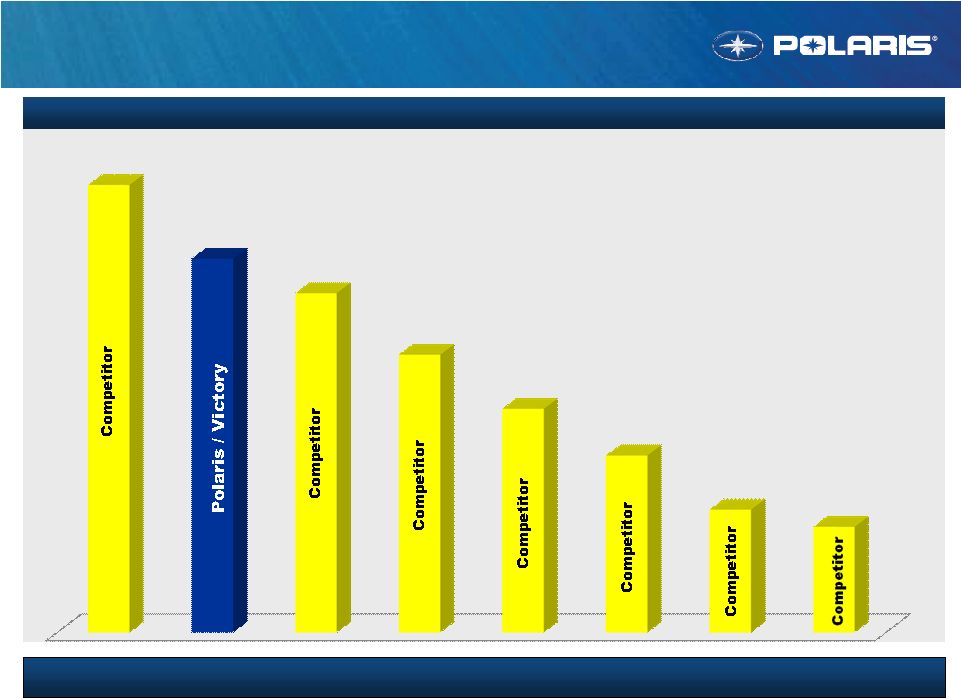
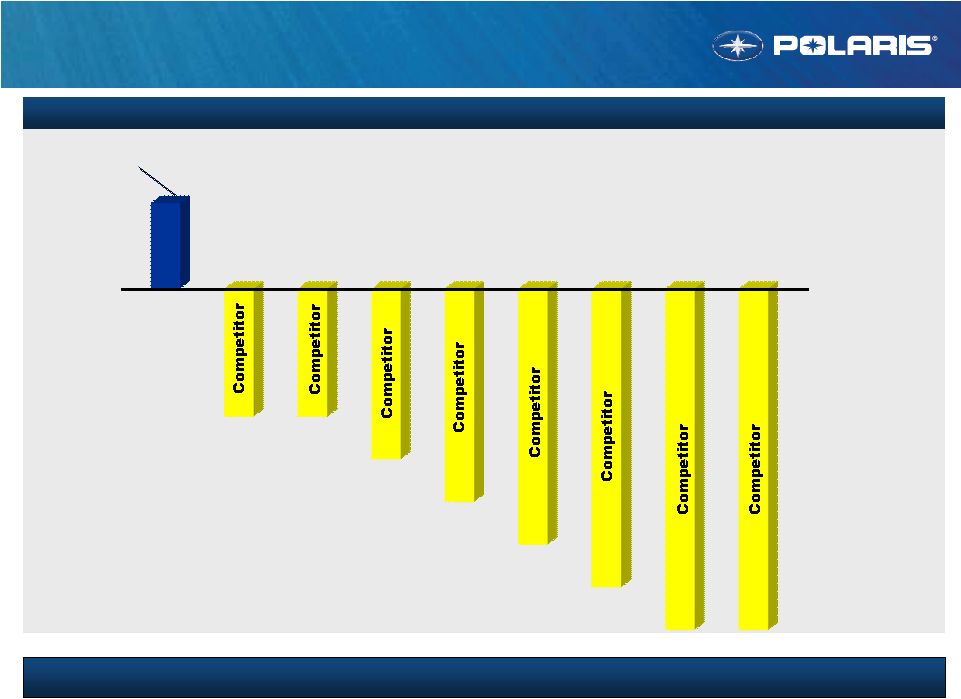
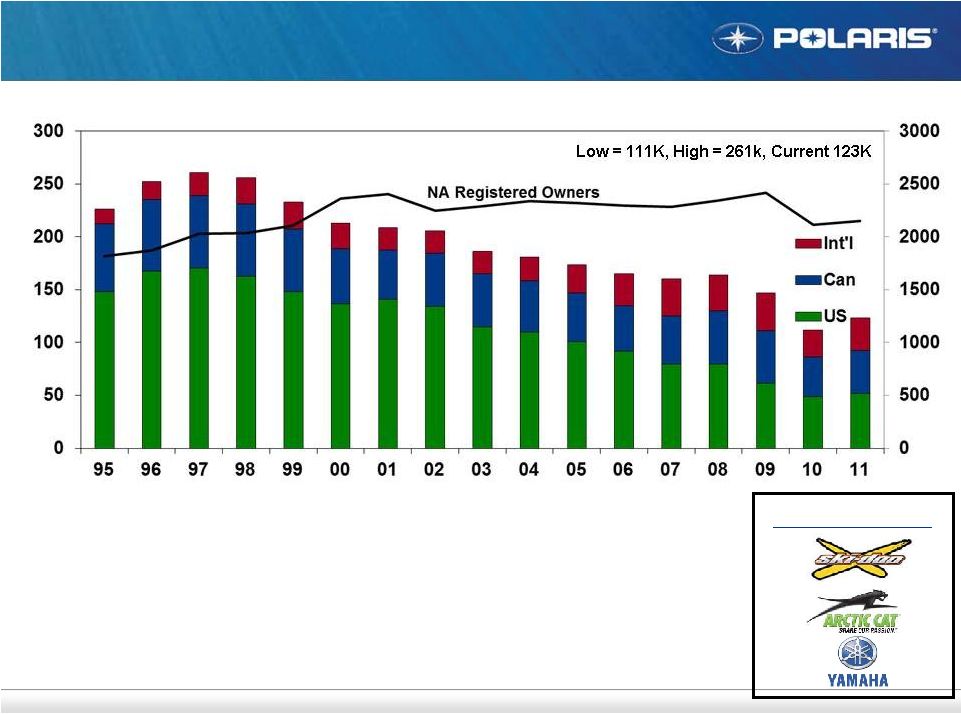 47 7-27-11 Snowmobile Industry Overview Worldwide Industry Retail: Outlook for Industry: Industry will be up slightly in near term. Potential for modest continued growth with snow fall & economic recovery. Large installed base generates lucrative parts, garments & accessories business 95% repeat buyers with high expectations. Competition #1 #3 #4 |
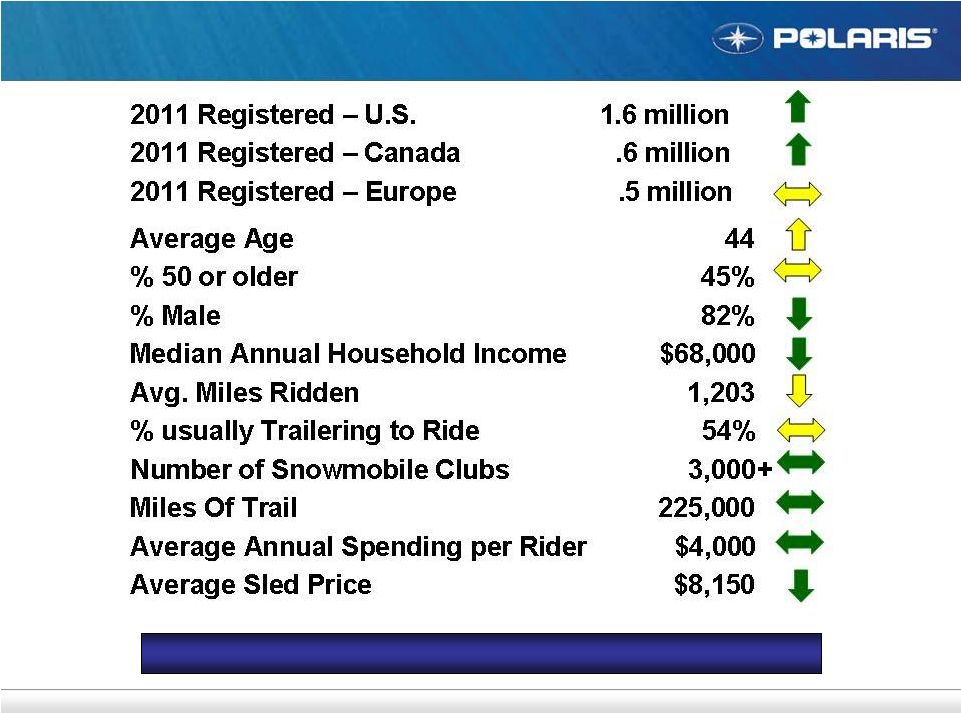 48 7-27-11 Snowmobile Industry Demographics Large, Stable and Active Base |
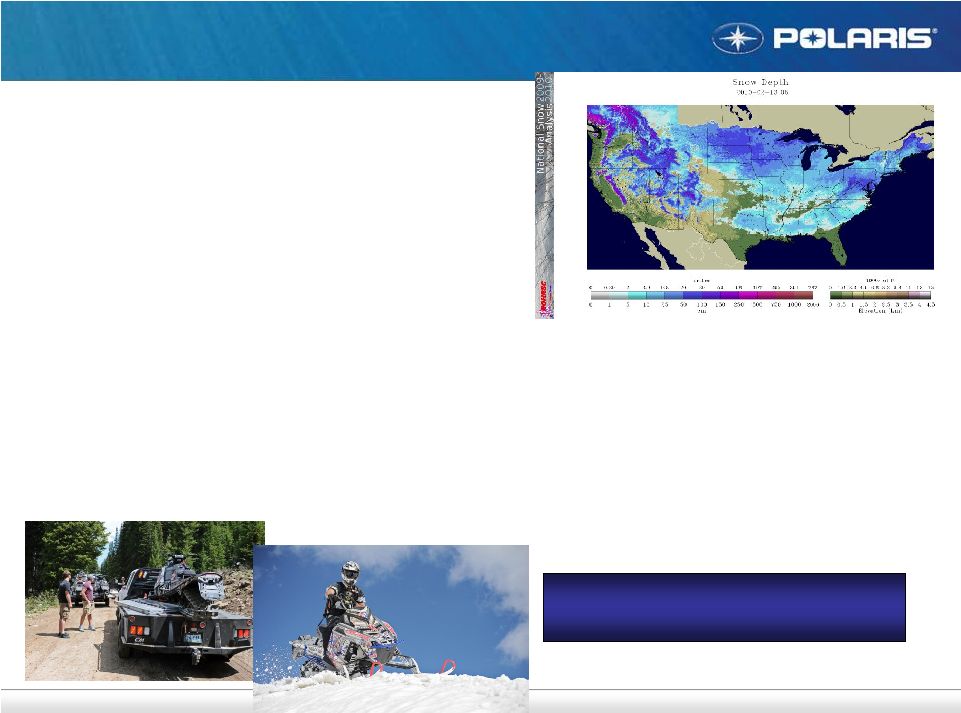 49 7-27-11 State of Snowmobile Market Snowfall good to great last winter across North America. Polaris only OEM to gain market share. Dealer inventory levels lowest since 1997. Enthusiast base purchasing premium products. Ultimate segment growing fastest. Promotional spending was reasonable last season. Dealer profitability OK due to service business & better inventory mix. Polaris dealer count stable. EPA impacts MY ’12. Polaris is positioned to meet requirements. Snowfall Remains the Key for The Industry |
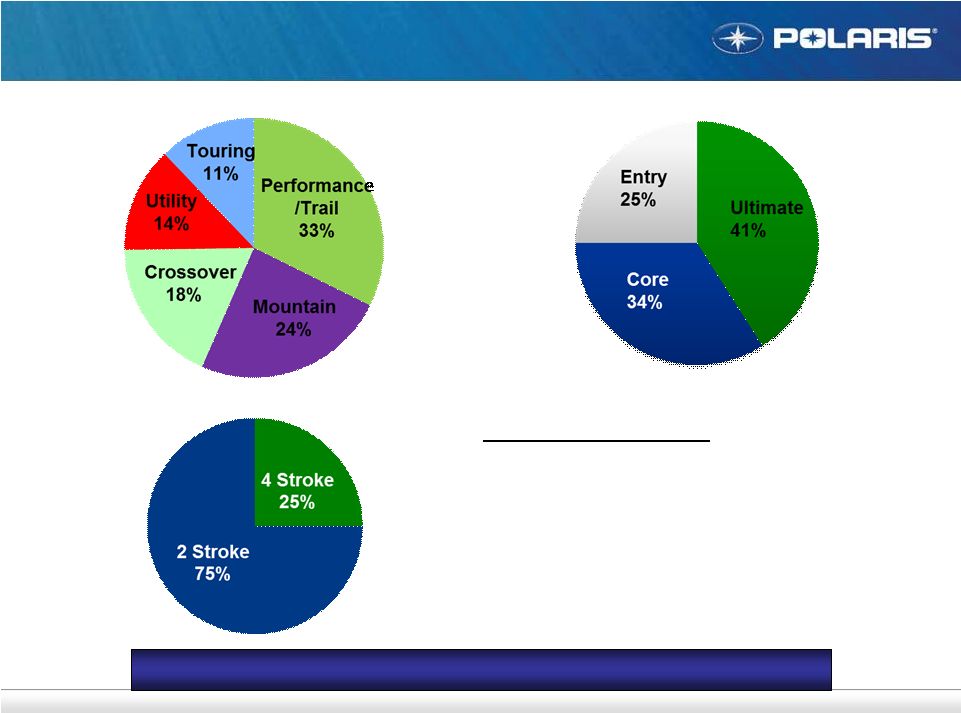 50 7-27-11 Snowmobile Industry: 2010/2011 North America Growth in Mountains, Crossover & Utility Industry By Segment Industry By Engine Size Industry By Engine Type Polaris Highlights Biggest retail % increase since 94/95 Dealer inventory lowest in 16 years 5 of top 6 selling models in the industry Ultimate market share up 10 points Gained market share in every region of NA Solid #2 in NA market share again |
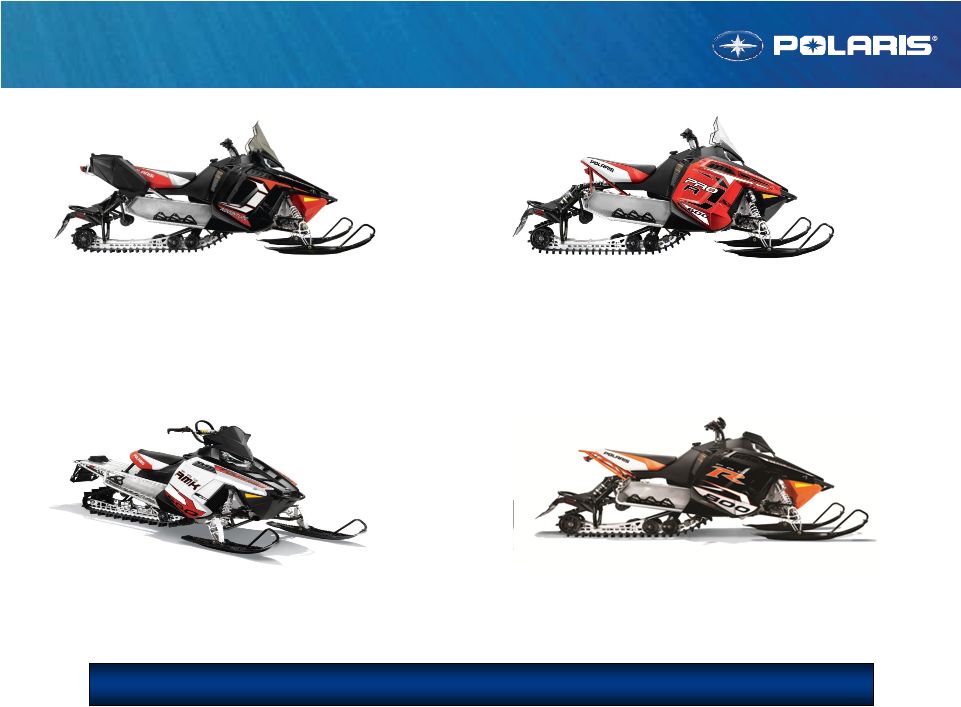 Selling Points 1) On Trail Performance: “Heart of a Rush” 2) Off Trail Capability: “Soul of a Crossover” 3) Consumer Built: Wind Protection, Seat, Storage 51 7-27-11 Adventure New Products: MY ’12 Selling Points 1) Performance without Compromise 2) Pro-Ride Chassis + Premium Features 3) Lock & Ride for Snowmobiles 30% of NA Orders; Big Share Growth Opportunity 800 Rush LE 600 RMK 600/800 Switchback Selling Points 1) Pro-Ride Chassis, 431 lbs 2) 600 LE engine: “Overachiever” Selling Points 1) Snow Check Exclusive 2) Cobra Track + Rox Riser + Premium Shocks + More |
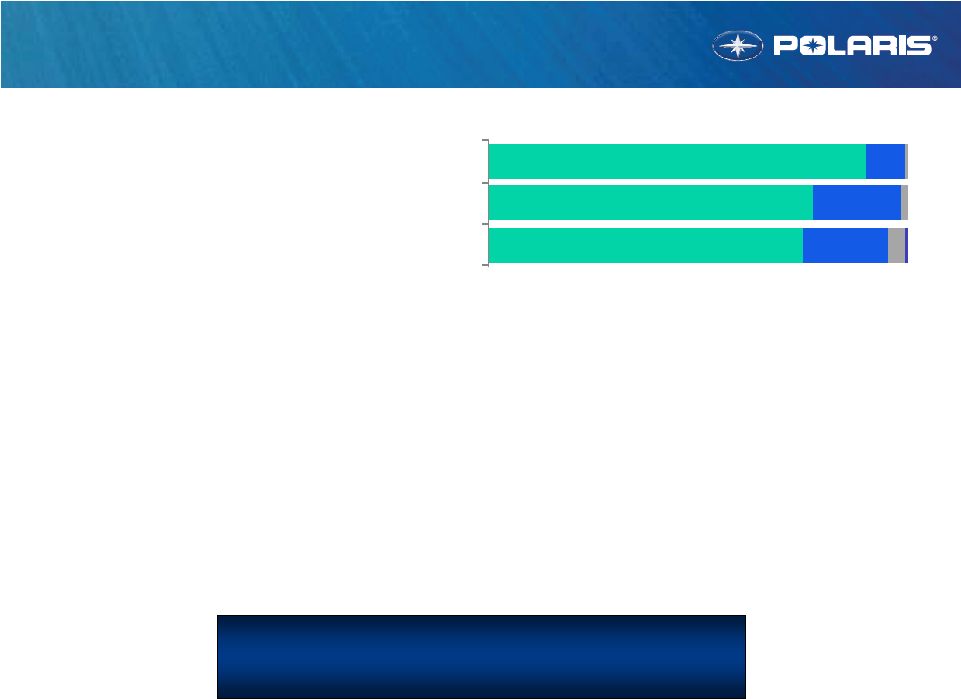  Snowmobile Quality 52 7-27-11 Reliability/Durability #1 key performance criteria for Polaris sled buyers Snowmobile quality has improved significantly! Net promoter scores (NPS) improved 15% to #2 in industry Warranty claim $ and problems per 100 vehicles down MY ’11 RMK NPS was industry leading in its segment. MY ’11 800 engine improvements worked. Longer term focus: Validation and testing … lab + field + “Real World” Supply base and manufacturing Industry Leading Product Quality Remains Our #1 Goal 75 77 90 20 21 9 41 2 1 0 0 It’s a brand I can trust Durable: Vehicle lasts over the long haul Reliable: I can always trust it not to breakdown |
 Snowmobile Outlook 53 7-27-11 2011 Calendar Year: MY ’12 product intro exceeded expectations, orders up > 30% Revenues expected to be up approximately 40% Snow check sales up over 70%. International retail up: Sweden/Norway solid year; Russia growing. Retail focus on installed base; expand demos. Longer Term Road Map … No Major Changes: Drive towards industry leading quality with a powertrain focus. Product: ride & handling = progressive rear suspension + light weight. Grow worldwide market share. Product Innovation & Quality Keys to Success |
 7-27-11 54 COMPETITION: COMPETITION: Aftermarket: i.e.; Parts Unlimited, Tucker Rocky, Western Powersports, MotoVan, Indirects: Other OEM’s Pure Polaris Overview Service Parts, Accessories, Apparel & Financial Services 49,000 SKU’s, $344 Million in Sales in 2010 Highest Gross Margins Top Selling Commodities Polaris Advantages Cabs/Cab Components (ORV) The Brand Winch Kits (ORV) Closer to the Customer Oil Fill Rates / Availability Plow Kits (ORV) Proprietary Components (Parts) Brushguards (ORV) Wholegood integration (Accessory) Lock & Ride (ORV) Solution Focus (Accessory) Rim/Wheel (ORV/Victory) Tracks (ORV) Jackets & Bibs (Snow) |
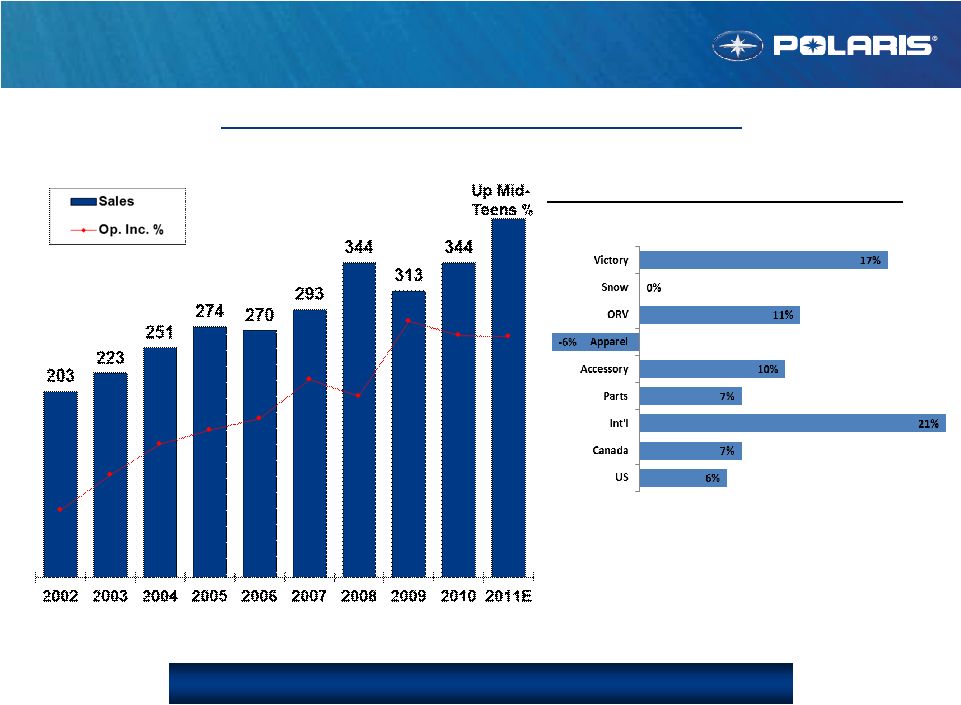 7-27-11 55 PG&A Strategic Trend – 2000s Decade of Growth and Margin Expansion 40+% Operating Profit Margin 10 Year Average Growth Rates: Revenue: 7% (detailed below) Operating Profit: 12% |
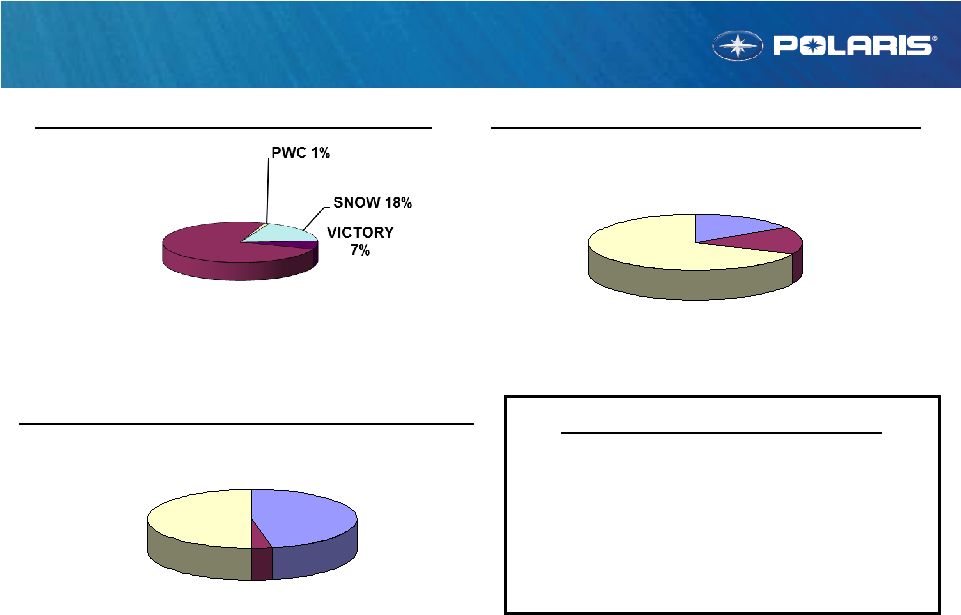 7-27-11 56 APPAREL 3% PARTS 50% ACCY 47% ORV 74% 2010 PRODUCT MIX BY GEOGRAPHY PG&A Revenue Mix 2010 PRODUCT MIX BY PRODUCT LINE 2010 PRODUCT MIX BY BUSINESS Revenue Growth Drivers: SxS Accessories + Bobcat International Parts & Accessories SxS Parts Victory Accessories Acquisitions: Indian, GEM INT'L. 16% CANADA 16% US 68% |
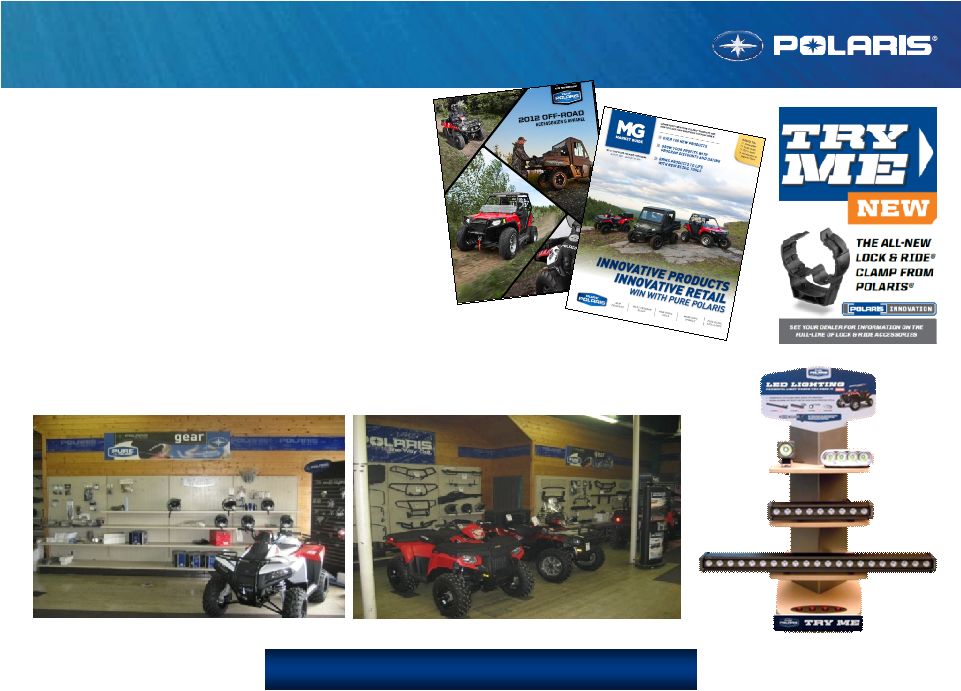 7-27-11 7-27-11 57 Marketing & Merchandising More resources on growth dealers In-dealership merchandisers Pure Retail Excellence Program Free fixtures & signage Drive salesperson effectiveness Easy to use dealer catalog "Go–To–Market" guides: New products, sales programs, retail tools & displays Win In The Dealership Before After |
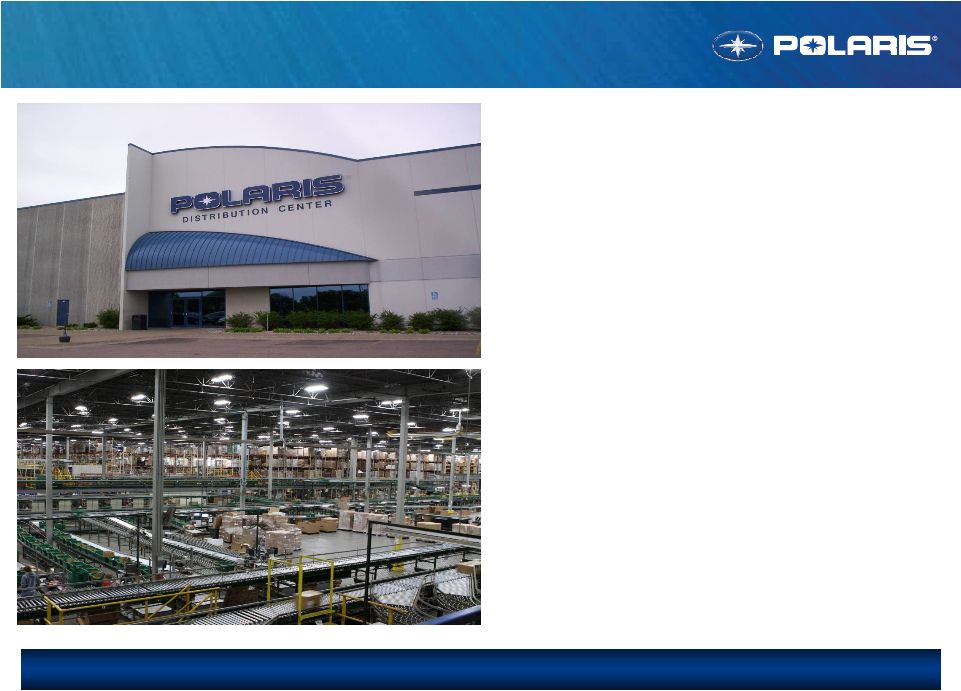 Vermillion, SD distribution center 381K sq. feet; expanded in ‘08 State of the art facility Ship to 130 countries 3,000 dealers worldwide 7 Subsidiaries, 40 distributors 2 shifts,140 people Complete, fast, accurate shipments 97+% fill rate 99+% of orders in by 3pm shipped same day 99+% pick/pack/ship accuracy Freight Free freight daily orders > $300 Tier level determines timing Orders: 80+% of sales are daily orders 500,000 orders processed 4,000,000 lines picked PG&A Distribution Timely, Accurate Shipments; Productivity Driven Operation |
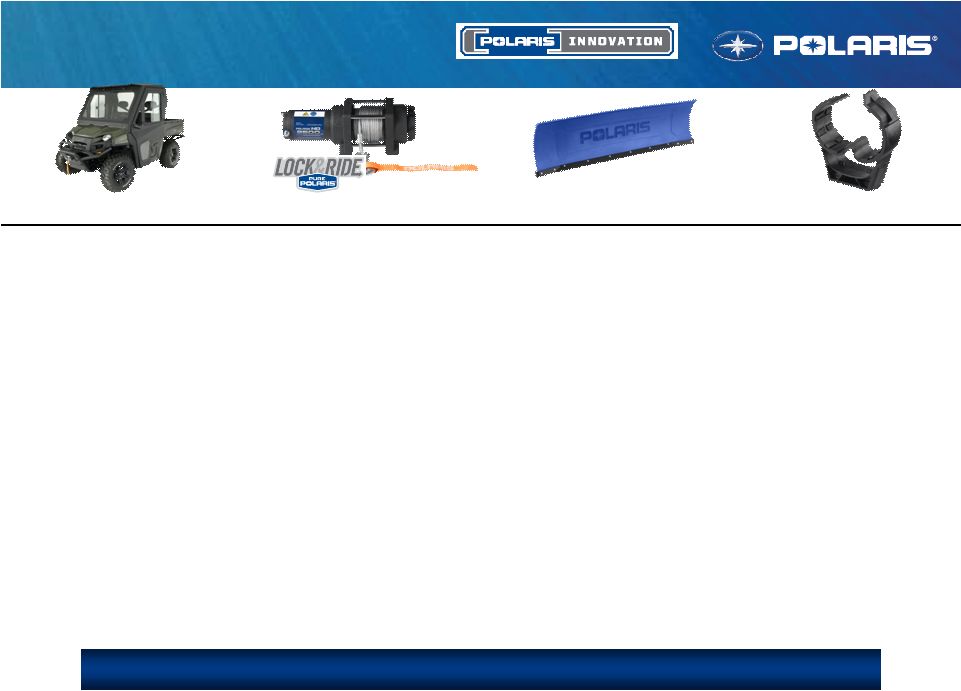 Innovation Drives Sales RANGER ® : 40 New Accessories Pro-Steel™ Cab Enclosure Crew Sport Roof Poly Flip-up Windshield Ranger SSV Overhead System RANGER RZR ® : 40 New Accessories Lock&Ride Tinted Roof Lock&Ride Half Windshield RZR 4 Aluminum Roof Low Profile Front Bumper LED Light Bars Sportsman ® : 20 New Accessories Polaris HD 2500lb Winch Sno-Glide Poly Blade 8-Spoke XP Rim Victory: 15 New Accessories Cross Bike Hard Lowers Klock Werks ® FLARE™ Windshield Stage 1 Tri-Pro Exhaust Stage 1 X-Bow Exhaust Apparel: 100+ New Items Tenacity Helmets Tekvest ® Protection Victory: Touring Textile Jacket Lock&Ride Fast Clamp Plow Blade Polaris HD 2500lb Winch Pro-Steel™ Cab Industry-Leading Quality, Fit & Ease of Installation |
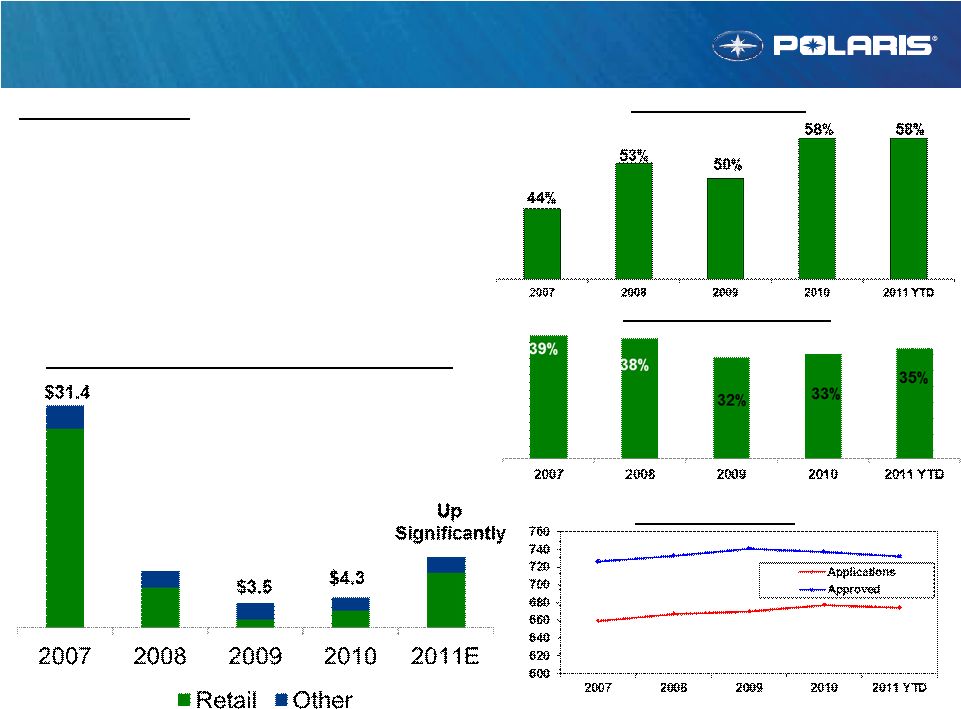 60 7-27-11 Retail Financial Services Retail Credit/Other Services Income Approval Rates Credit Penetration Partner Status: (No Credit / Funding Risk) HSBC Revolving: Expires October 2013. NA credit card business is for sale. Sheffield Installment: Expires Feb. 2016. ORV focus. Profit sharing opportunity. GE Installment: Expires Feb 2016. Motorcycle focus. Extended Service Contracts: Assurant FICO Scores $8.0 |
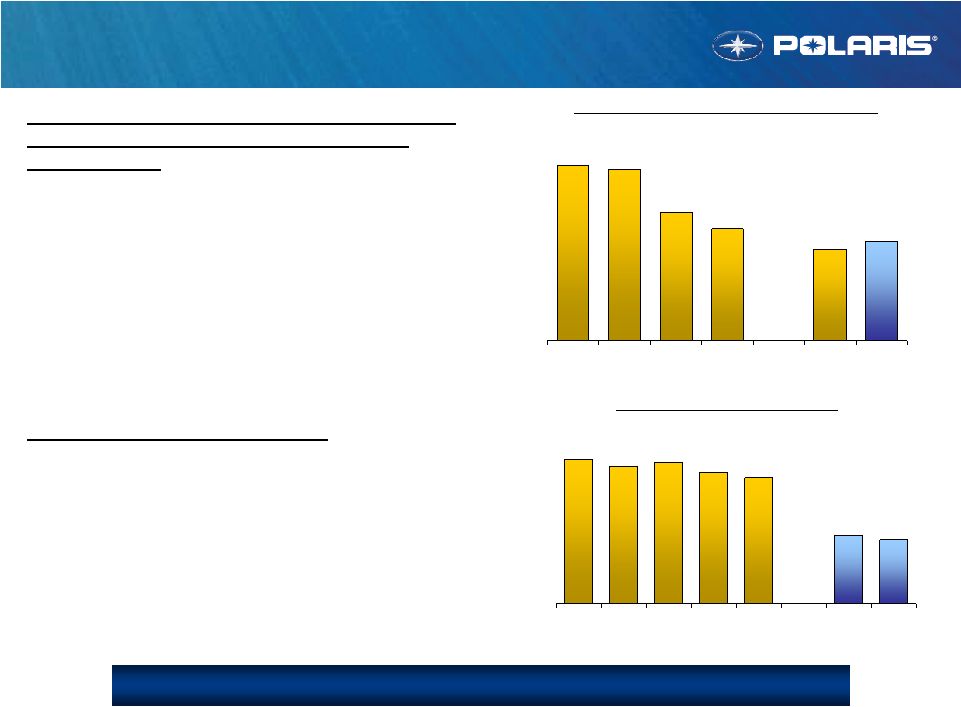 61 7-27-11 $455 $498 $555 $710 $723 2007 2008 2009 2010 Q2 2010 Q2 2011 $6.1 $6.5 $12.6 $13.6 $13.2 $13.9 2007 2008 2009 2010 2011E Q2 YTD 2010 Q2 YTD 2011 Wholesale Credit to Dealers Joint Venture Partnership with GE for Dealer Financing in U.S. – Polaris Acceptance Established in 1996. Stable relationship. Shared 50/50 equity, income and risk Receivables funded by GE debt Expires in 2017, purchase option Dealer repossessions are stable, within expectations Credit losses well less than 1% Dealer credit availability / capacity not an issue Other Geographic Markets Canada dealers with GE; new agreement signed in 2011; expires 2017. UK, France, Germany, Australia subsidiaries finance dealers through GE – no material changes in 2011 Other foreign subsidiary dealers & international distributer’s receivables carried on Polaris books Receivable Balance – U.S. Dealers ($ in millions) Wholesale Credit Income ($ in millions) Competitive Advantage for Polaris and Dealers $425 |
 62 7-27-11 Summary Summary Snow Product key to share growth … 90% of line-up new MY ’10 – MY ‘12 Large, stable and active installed base Solid cash flow business that is growing again PG&A Proven ability to grow sales and margins Innovation drives growth. Industry leading integration with vehicles Highest margin opportunity for both Polaris & our dealers Great cash flow generator Financial Services External environment stable. Maintain partnerships. Approval rate maximization focus. Selling Polaris products #1 goal. No balance sheet or funding risk for retail credit. |
 North American Sales & Corporate Marketing Mike Jonikas, Vice President July 27, 2011 |
 Agenda • Polaris North American Sales Results • Dealership Network Health Update • Polaris Roadmap 64 |
 Driving Retail Growth With Dealers 65 Winning Product + Winning Support Programs + Dealer Network Partnership -1% +17% Retail Before Orlando 2010 (R12 ending June 2010) Retail Since Orlando 2010 (R12 ending June 2010) Strong Polaris / Victory Retail Sales Growth in North America |
 Network Brand Value Much Stronger 66 Polaris Accelerated to Strong #2 Position within Powersports Strong Polaris / Victory Retail Sales Per N.A. Dealership (R12 ending March 2011) |
 Dealership Count Growth 67 Leveraging Polaris Momentum & Business Model Advantage to Win Polaris / Victory Polaris / Victory N.A. Dealership Count Growth (1Q’2011 % chg vs. 1Q’2010) |
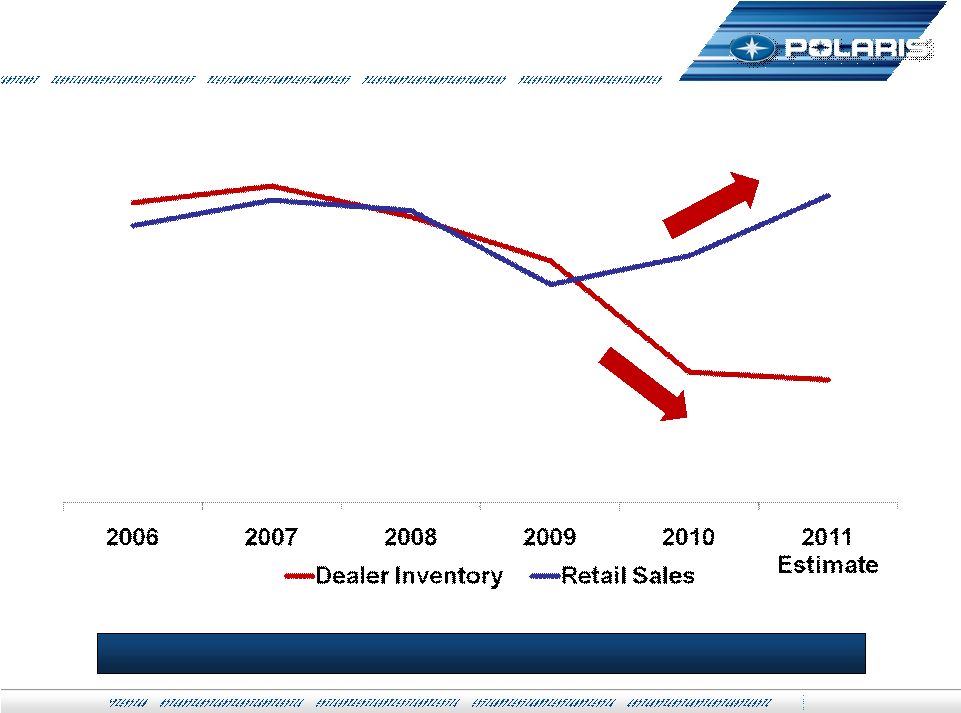
 Polaris N.A. Dealer Network Health 68 Polaris Positioned to Lead & Win • Polaris Retail Selling Margins RANGER, RZR, and Sportsman 500 HO Victory Cross and Highball RMK and RUSH snowmobiles PURE accessories • Dealer Inventory Levels Now in-line with retail sales trends For ATV, Victory, and Snowmobiles • Polaris Business Model Advantage MVP segment stocking V.I.P. retail selling program • Dealer Net Income is Stressed Dealers aligned expenses with revenue Most are reluctant to invest, yet Profitable outlook with industry growth • ORV Product Availability from Factory Challenging with strong retail results Improved ship date communication • Further Business Model Transformation Expand MVP segment stocking Shorten order to ship lead-times Improve retail selling practices Dealer Optimism Improvement Opportunities |
 Polaris Roadmap 69 N.A. Powersports Distribution Leadership Industry Leading Dealer Retail Selling Practices Strong Dealership Count Positions Right Product, at Right Place, at Right Time 1. Lead Best Dealership Retail Selling Practices Strong dealership participation with V.I.P. program More dealerships utilizing more retail selling tools 2. Build Strong Dealership Count Positions Leadership positions within key volume markets 3. Max Velocity Program Advantage Right product, at right place, at right time Leading customer satisfaction Best in Powersports PLUS |
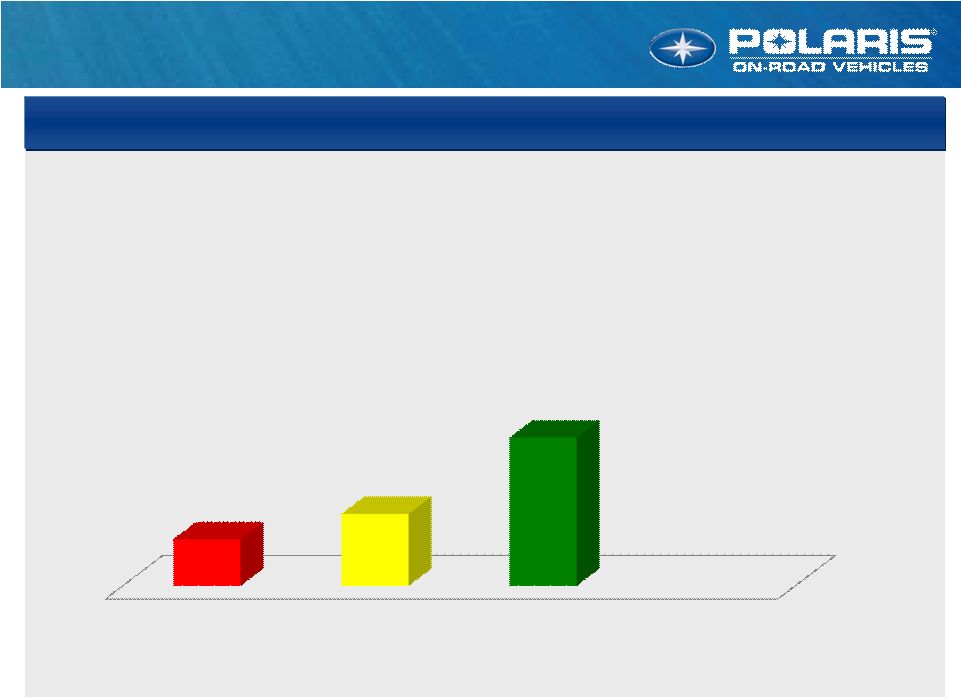
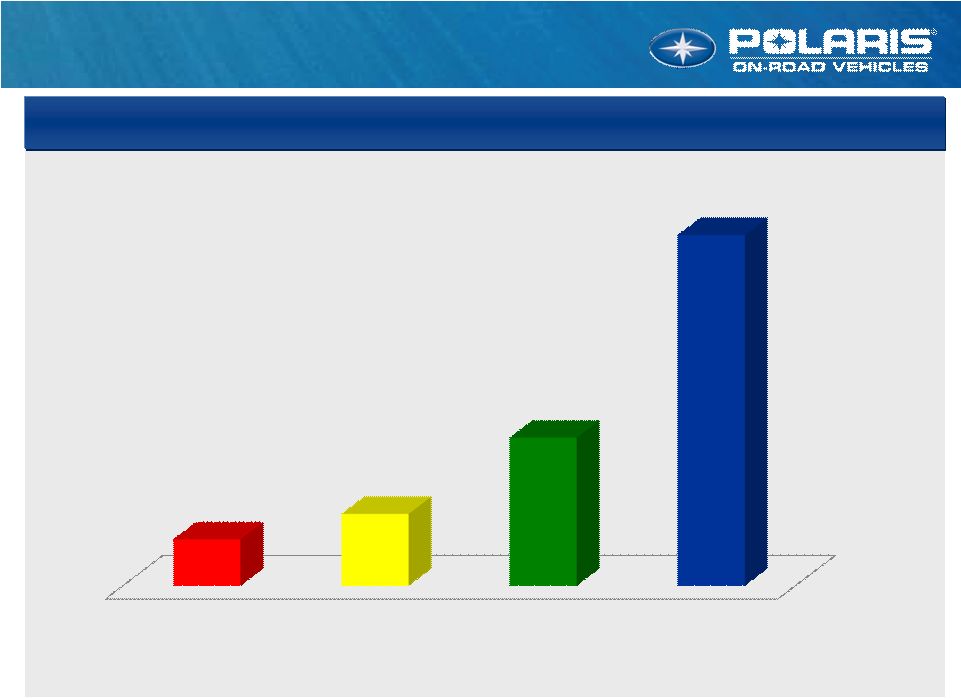
 Best Dealership Retail Selling Practices 70 1. Strong Dealership Participation with V.I.P. Program 2. Increase the Number of Retail Selling Tools Utilized by Each Dealership Build Towards Industry Leading Retail Behaviors + 28 pt. retail sales lift advantage Use more tools and sell more units 45 units 66 units 79 units 87 units 99 units |
 Stronger Dealership Count Position 71 Properly Penetrate Key Volume Markets 1Q 2011 Count Long Range Plan 1. Achieve Industry Market Segment Leadership Positions 2. With High Quality Dealership Partners SxS plus ATV Snowmobiles Motorcycles |
 Max Velocity Program 72 1. Improve ORV Product Availability from Factory 2. Phased Roll-out of MVP Segment Stocking for Victory Motorcycles Right Product, at Right Place, at Right Time +9 pts +11 pts |
 Mike Jonikas, Vice President July 27, 2011 *** *** *** *** *** *** *** *** *** *** *** *** *** *** *** *** *** *** *** *** *** *** * ******** ******** |
 74 Agenda • On-Road Vehicle Division Mission • People Mover & Light Duty Hauler Industry Overview • Global Electric Motorcars Roadmap |
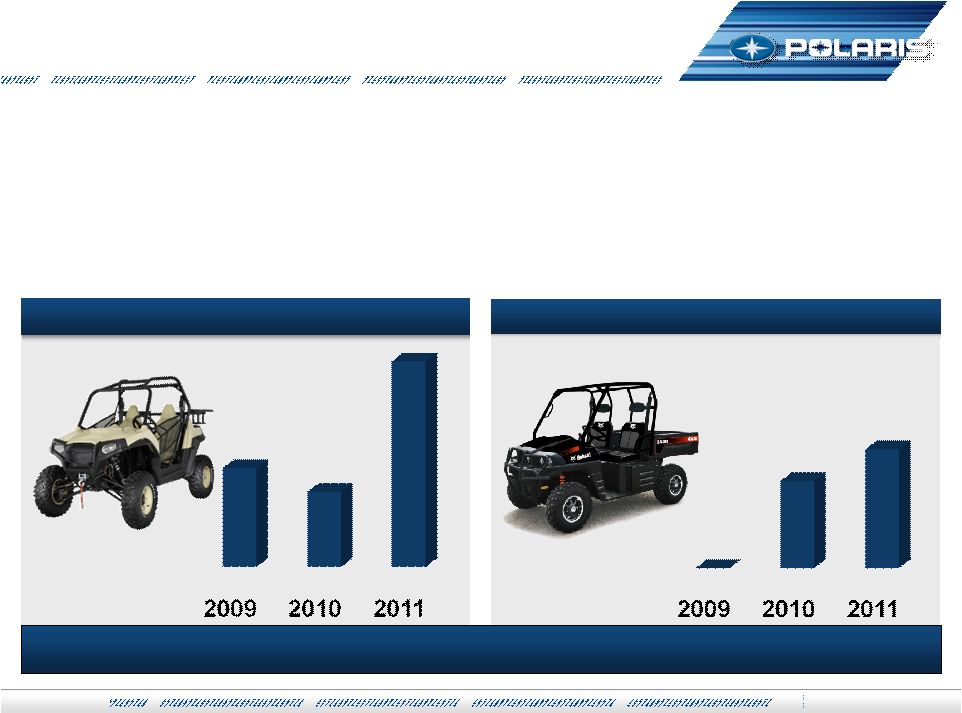
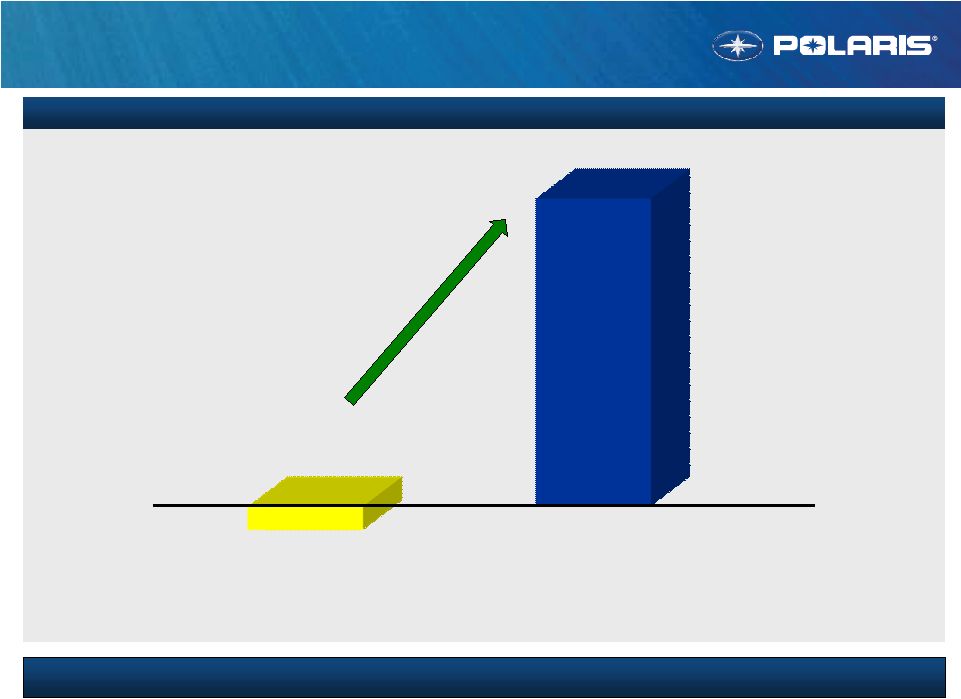
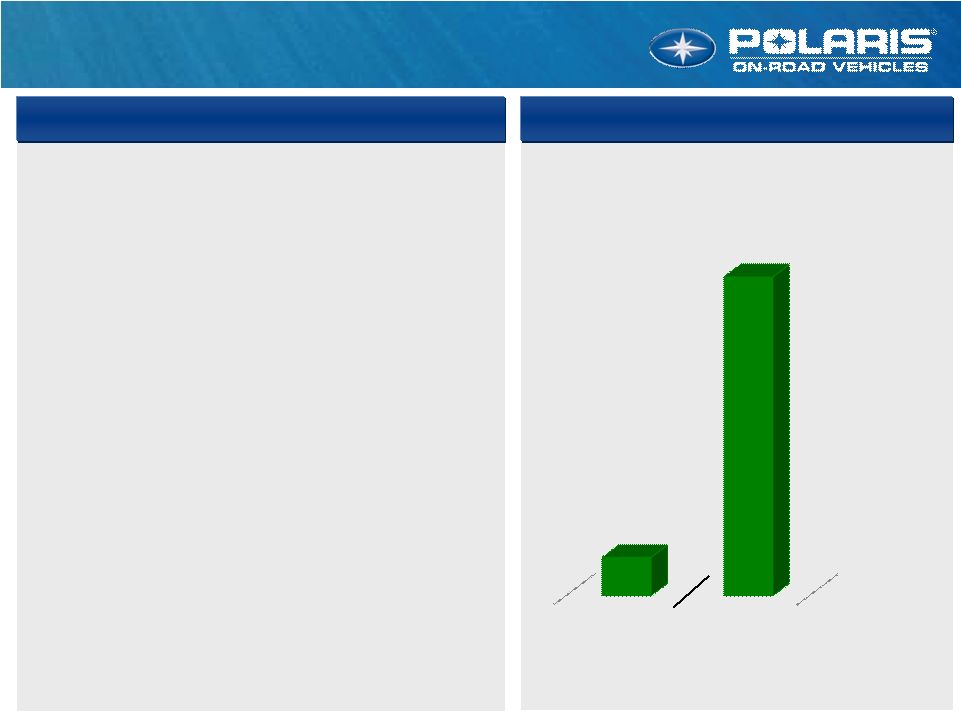
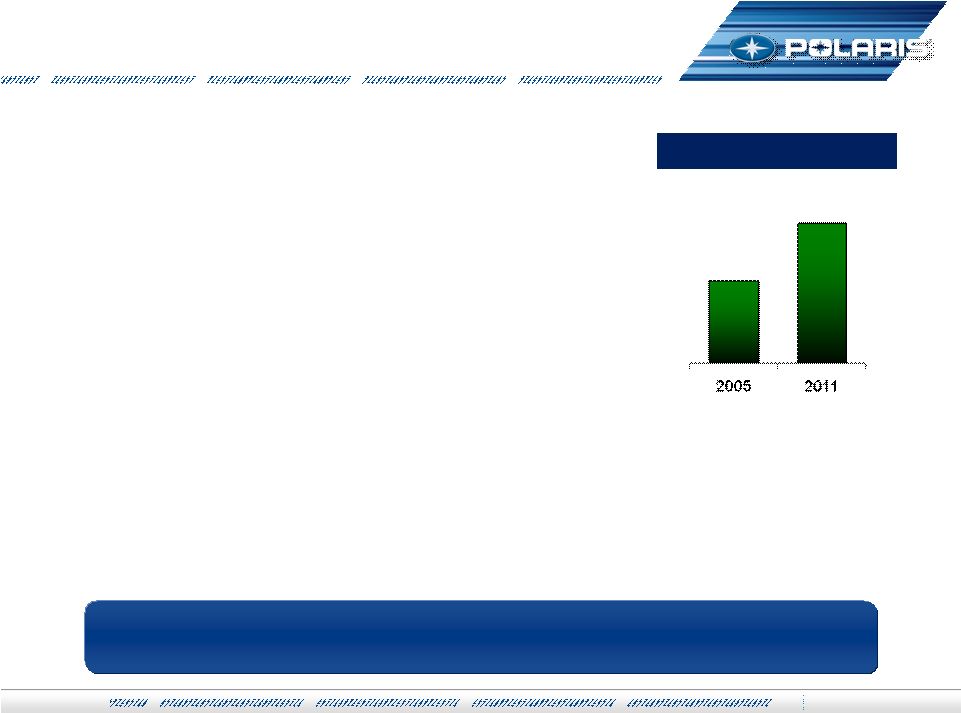
 75 On-Road Mission 2009 Actual 2011 Guidance $53M +60% to +65% Making Revenue Growth Happen Right Now $82M 2010 Actual |
 76 On-Road Mission 2009 Actual 2011 Guidance $53M +60% to +65% Pushing for More Growth to Deliver Our Aggressive Revenue Goal $82M 2010 Actual $700+M Long Range Plan |
 On-Road Roadmap 1. Develop Sizeable Heavyweight Motorcycle Business 2. Enter Segments Beyond Heavyweight Motorcycles 3. Create Global Brand and Distribution Presence 1. Penetrate Market Segments Poised for Growth 2. Pursue Leading Positions In Selected Growth Markets 3. Apply Polaris Vehicle Applications Innovation 77 Polaris Motorcycle Growth Small Vehicle Business Development |
 78 Small Vehicle Business Development ************* ************ *** *** *** *** *** *** *** *** *** *** *** *** *** *** *** *** *** *** *** *** *** *** *** |
 Small Vehicle Business Development 79 $300+M $1M 2009 Long Range Plan 1. Penetrate Segments Poised for Growth People Mover (PM) Light Duty Hauler (LDH) 2. Pursue Leading Marketing Positions 3. Apply Polaris Product Innovation Business Development Strategy Revenue Goal |
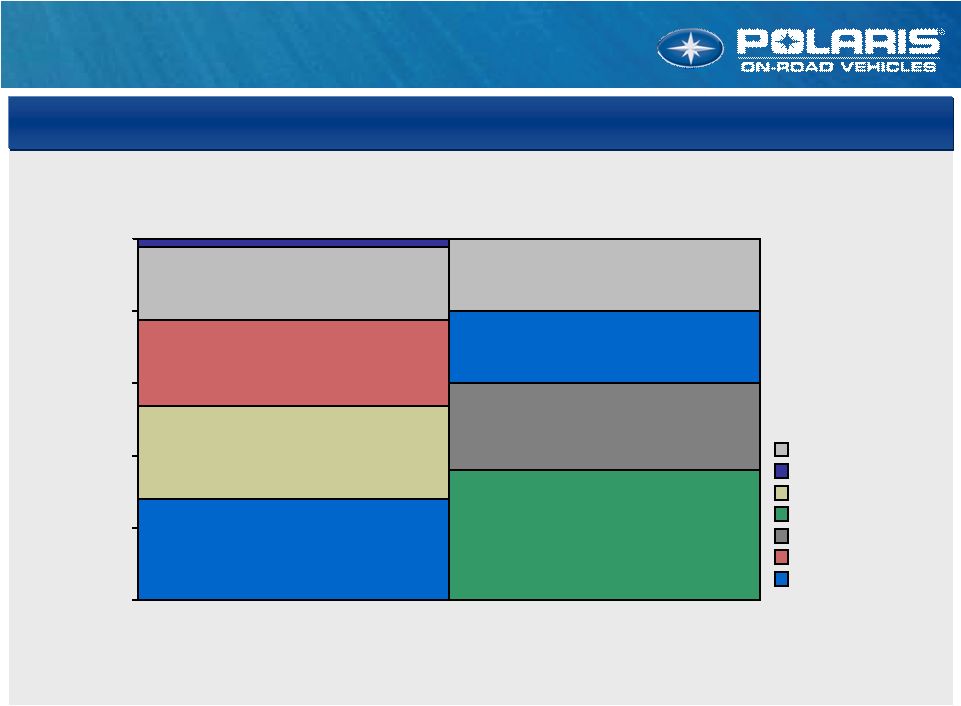 80 PM & LDH Market Overview $1.6 Billion Global People Mover & Light Duty Hauler Market $0.6B $0.6B 0 20 40 60 80 100% People Movers (PM) Used Golf Cars Low Speed Vehicles Utility Shuttle Vehicles Golf Cars Light Duty Haulers (LDH) Used Golf Cars Golf Cars Industrial Vehicles Utility Vehicles Golf Cars Low Speed Vehicles Industrial Vehicles UtilityVehicles UtilityShuttle Vehicles Others Used Golf Cars |
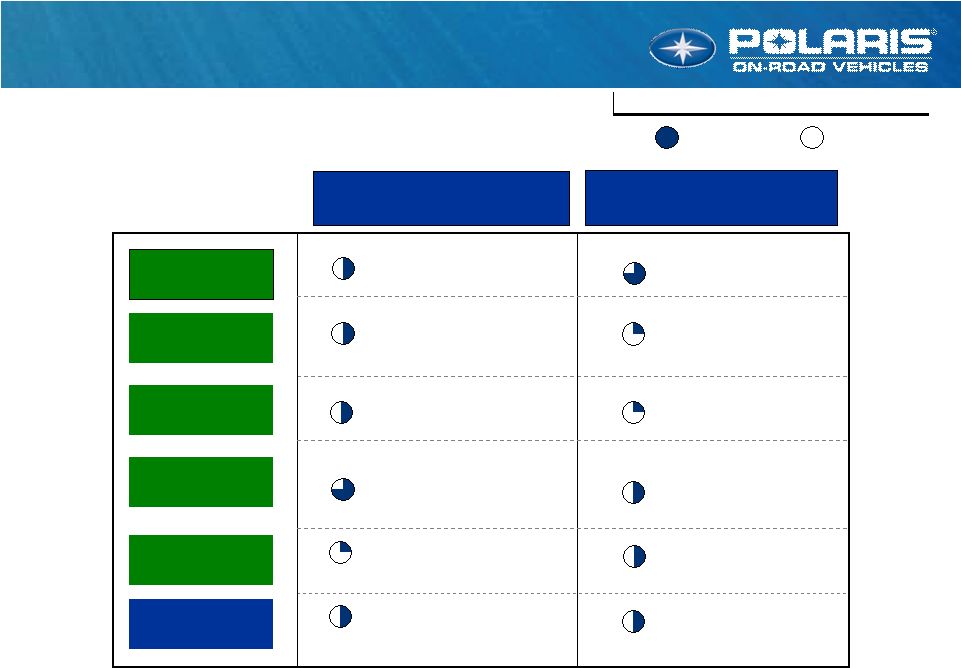 81 LRP Outlook is Basis for Assessment Highly unattractive Highly attractive Growth Outlook 5 - 10%, favorable ageing demographics 5 - 7% Competitive Conduct Fragmented, golf cars and purpose built vehicles Fragmented, and expect LCC OEM entrants Barriers to Entry Volume scale of used fleet golf cars Product varies largely by user application Customer Behavior Fleet TCO, 2 nd or 3 rd vehicle for consumers Durability, TCO Overall Attractiveness Attractive adjacency with distribution and innovation Attractive adjacency with distribution and innovation People Mover (PM) Light Duty Hauler (LDH) Operating Margin 10 - 15% 15+% PM & LDH Market Trends / Outlook |
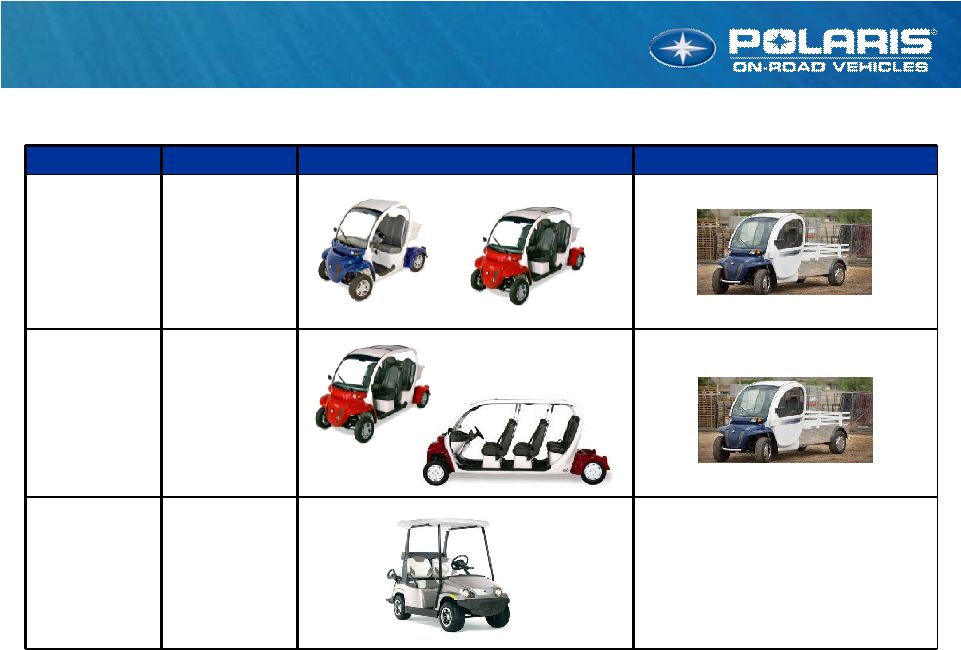
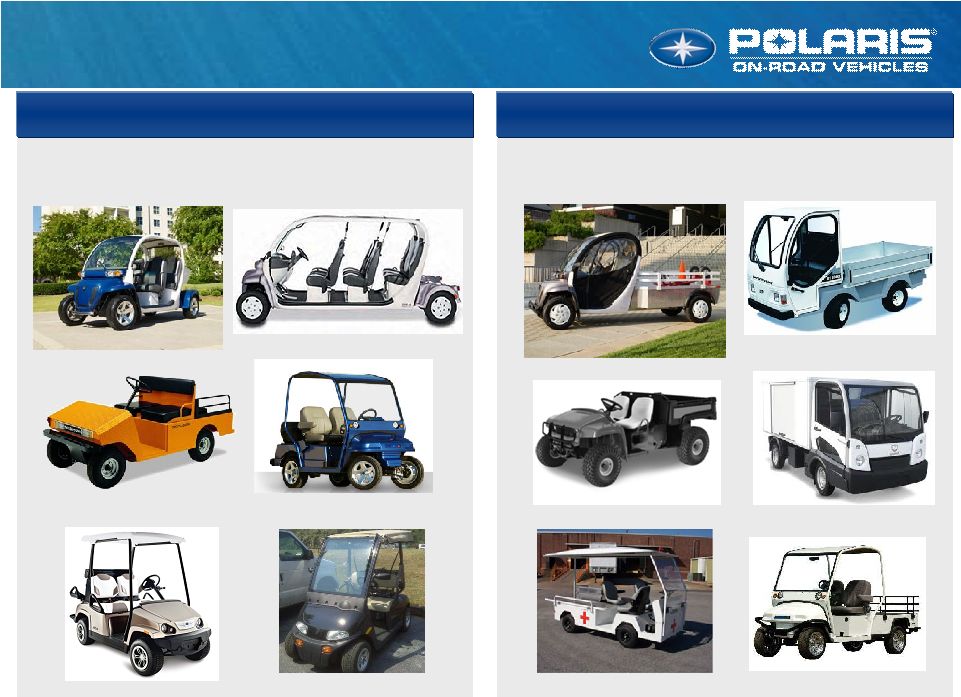 PM & LDH Vehicle Landscape 82 People Mover (PM) Light Duty Hauler (LDH) |
 83 PM & LDH Competitive Landscape Attractive dealer distribution network presence Primary business = price sensitive fleet golf buyer Also sell into PM & LDH markets (with new and used fleet golf units) Extensive dealer distribution network presence Trusted brand choice amongst purchasing agents Limited vehicle portfolio (gas powered) Leading niche players with small annual revenue levels Unique and complimentary electric vehicle portfolios Nominal product innovation historically Highly fragmented distribution network presence |
 PM & LDH Customer Profile 84 End User Distribution People Mover (PM) Light Duty Hauler (LDH) Private Fleet B2B Dealers Government B2B Dealers Master Planned Community Consumers Golf Dealers |
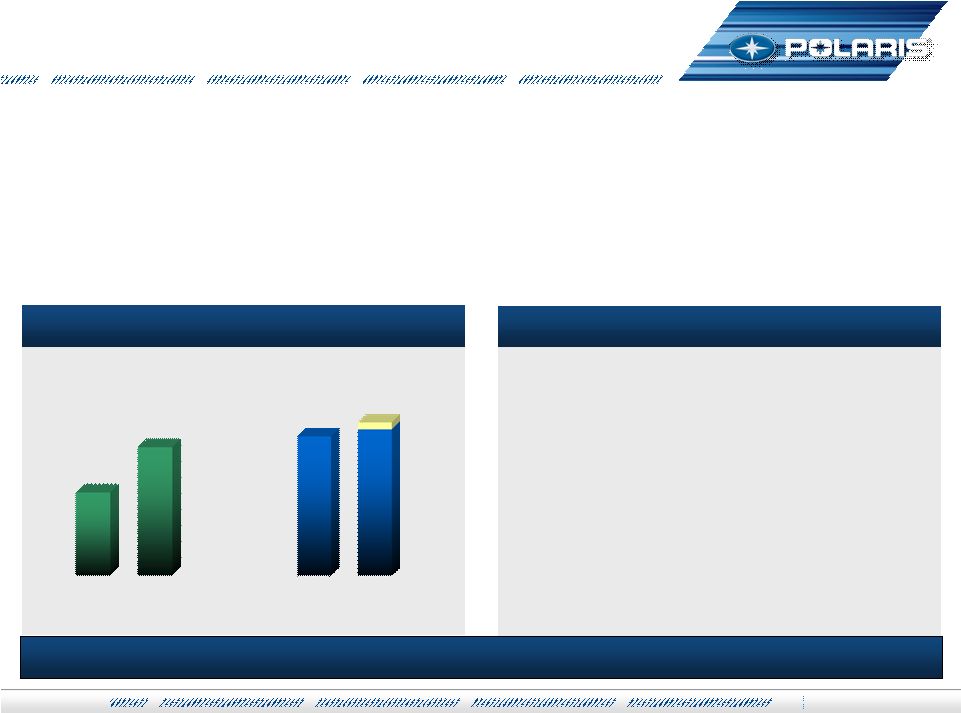
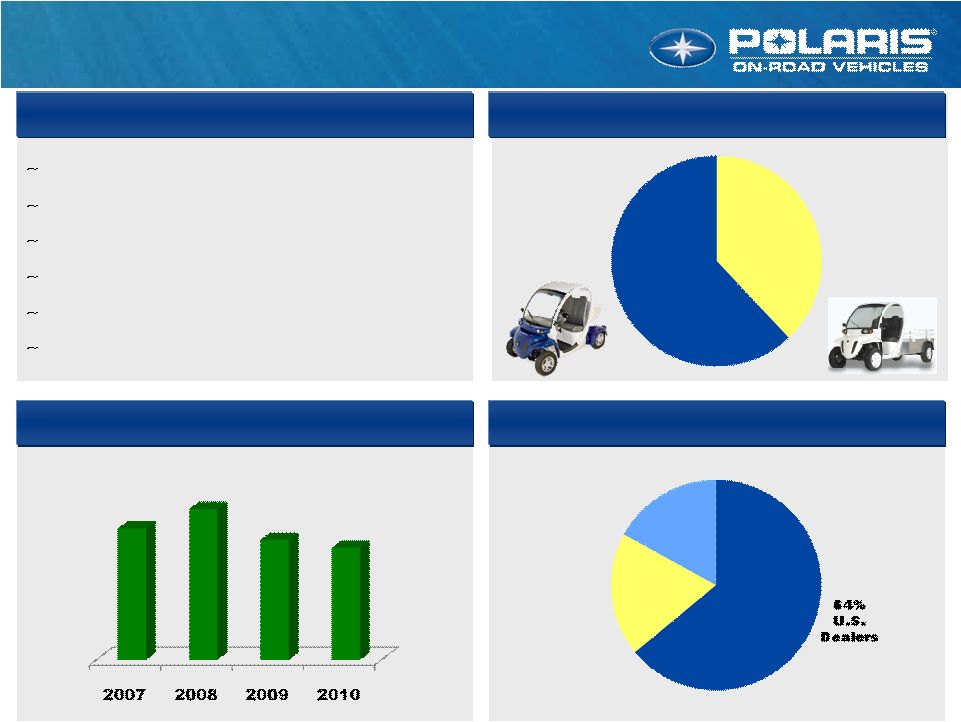 Market leader in low speed vehicles Existing business operations Well-known electric vehicle brand In-field mobile service expertise Make-to-order assembly capability Non-union workforce Global Electric Motorcars (GEM) 85 GEM at a Glance By Market Segment Distribution Channel Mix Sales Revenue $34M $39M $31M $29M 17% U.S. GSA 19% International 62% People Mover 38% Light Duty Hauler |
 GEM Roadmap 86 Drive Global Electric Motorcars Growth 1. Stronger and More Effective B2B Distribution Presence Globally 2. Effective Lead Management Marketing Process 3. Launch More Competitive Vehicle Offerings – grow share, enter new segments 4. Expand Profitable Mobile Service Business Model Platform for Polaris Growth |
 Motorcycles Motorcycles Steve Menneto, General Manager Steve Menneto, General Manager July 27, 2011 July 27, 2011 |
 88 N.A. 1400+cc Industry N.A. 1400+cc Industry 50000 75000 100000 125000 150000 175000 2006 2007 2008 2009 2010 Touring Cruiser Industry Retail History Units Touring Cruiser 2011 Industry Retail 2011 N.A. 1400+ cc Industry slightly up – +2% YTD Touring growing at over 10% Cruiser Industry decline is moderating vs. last year |
 N.A. Victory Performance N.A. Victory Performance 89 Driving a Healthy Retail/Inventory Balance +41% - 49% |
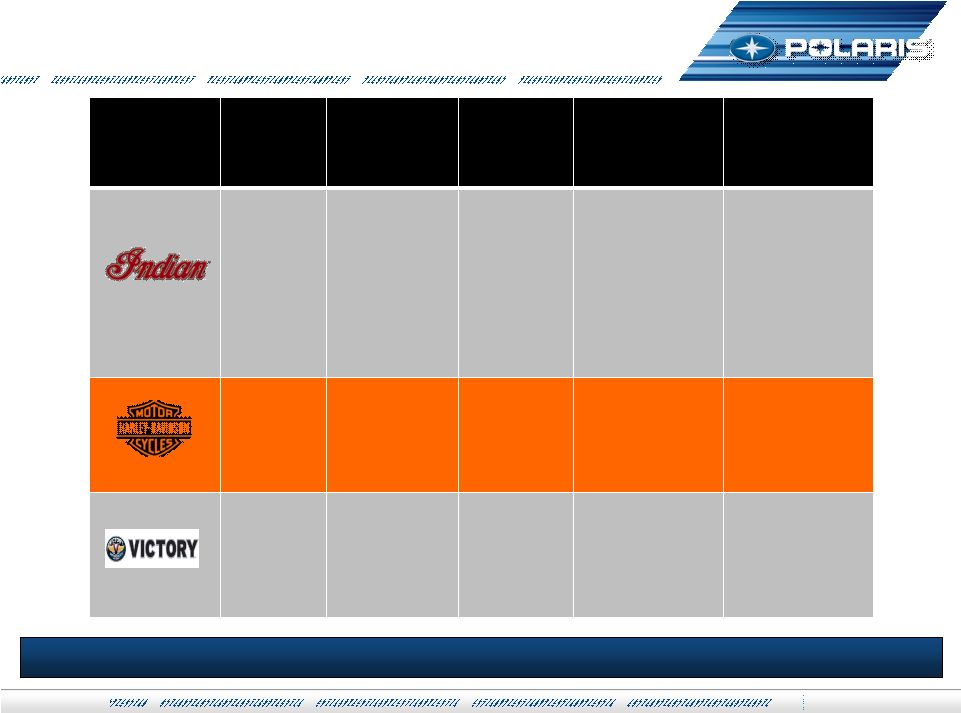
 90 2011 N.A. 1400+cc Competitive 2011 N.A. 1400+cc Competitive Summary Summary Rank Manufacturer Strategy Share Trend 1 Harley Aspiration Brand Most Complete Product Line-up Huge Installed Owner Base 2 Victory Modern American Styling #1 Owner Satisfaction (dealer, product) 3 Metrics Trusted Brands Breadth of Distribution Bases 4 Triumph Historical Brand Victory Growing Share In Difficult Market Conditions |
 Polaris Heavyweight Motorcycles Polaris Heavyweight Motorcycles Brand Position Customer Price Place - Distribution Product American Heritage Premium Die-Hard Prestige Accessible Exclusive “Classic” Quality Premium Product Experience American Heritage Die-Hard Market Benchmark “Exclusive Plus” “Classic” Improving Quality American Modern Attitude Performance Enthusiast Performance Growing Distribution Modern Performance Quality 91 Go To Market with Premium & Performance Brands |
 92 Indian Strategy Indian Strategy 1. Integrate Indian Operations into Spirit Lake 2. Improve Product Quality & Performance 3. Establish a Premium Global Distribution Network 4. Build a World Class Team |
 93 Victory Strategy Victory Strategy 1. Expand Victory Touring Business 2. Strengthen Victory Proposition With Core Customer 3. Lean Operations 4. International Sales Growth 5. Expand Global Distribution Presence |
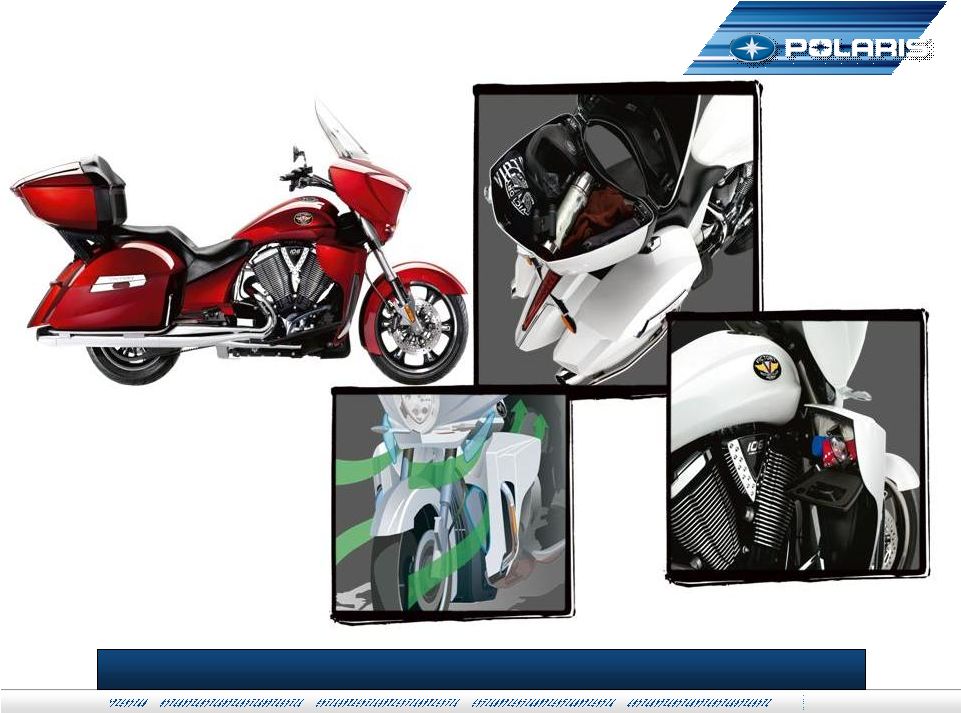 CROSS COUNTRY TOUR CROSS COUNTRY TOUR US MSRP: $21,999 W/ABS US MSRP: $21,999 W/ABS 94 Industry Leading Performance, Comfort and Storage |
 Victory Branding Victory Branding Video 95 |
 96 Strengthen Victory Proposition Strengthen Victory Proposition Leverage Industry Leading Dealership & Product Satisfaction Cruisers – New Styling & More Value “More powerful than the Harley and able to leap small curbs in a single bound, the High-Ball serves notice that there is more than one American in the game.” – CYCLE WORLD |
 97 Lean Operations Lean Operations Improve Dealer Inventory Turns Units per Dealer down 17% … time to Improve Stocking Mix of Non-currents to Currents… healthy at 80% current Victory MVP Southeast Pilot Test & Adjust … rapid expansion Improve Victory Flexibility to Meet Customer Demands Move to Pull Based Production System Reduce Victory Lead Times Enhance Worldwide Logistics |
 98 Victory International Victory International International Retail +59% 2011 YTD |
 99 Expand Global Distribution Expand Global Distribution Growing N.A. & International Distribution 1H 2011 added 26 new dealers in North America |
 Polaris Industries Inc. Polaris Industries Inc. 100 Q & A Steve Menneto General Manager Motorcycles July 2011 |
 Jul-2011 AM 101 Polaris Industries Inc. Polaris Industries Inc. Break Break Polaris Industries Inc. Analyst & Investor Meeting July 27, 2011 |
 Dave Longren Dave Longren V.P. – V.P. – Chief Technical Officer Chief Technical Officer |
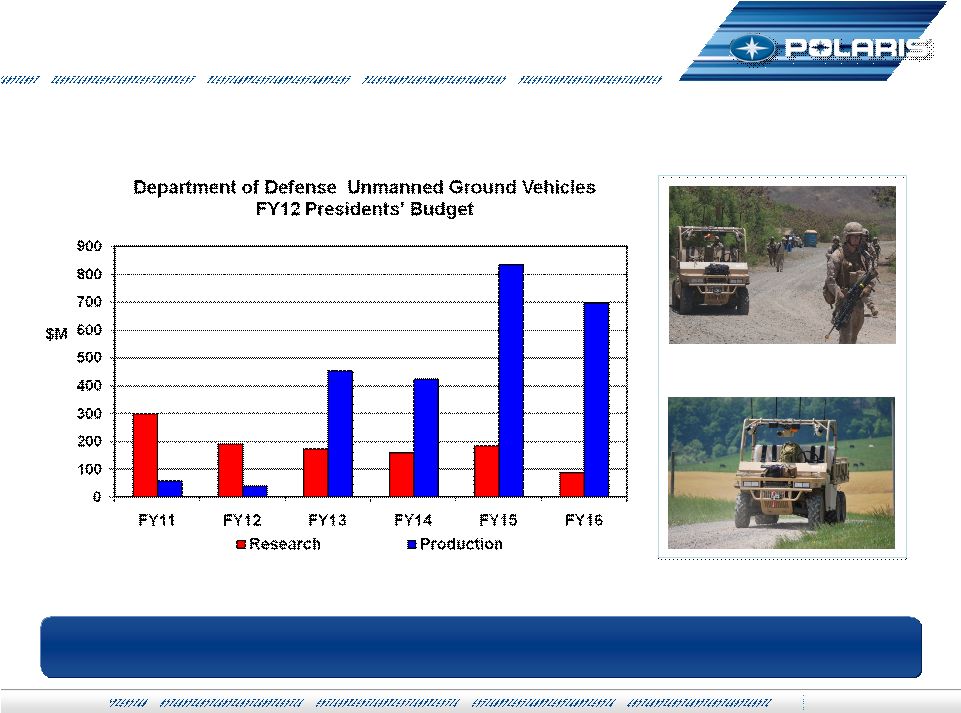
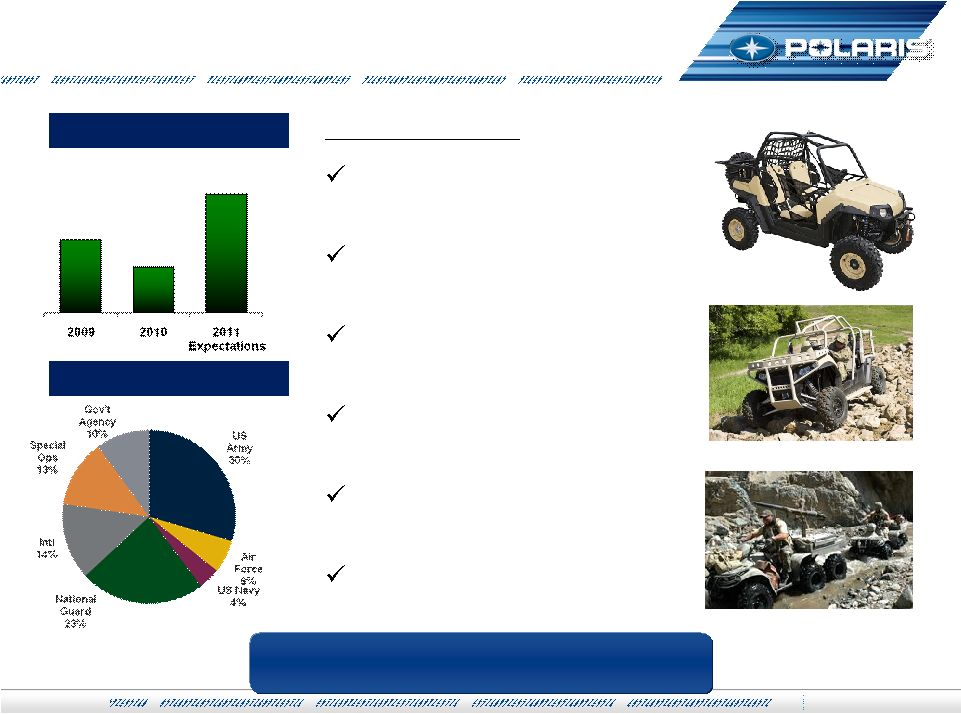 103 July 27, 2011 Military Business Military Business 2011 Highlights Added +150 Years of Defense Leadership Experience In 1H Began Delivery of National Guard 5 YR $67M Contract Awarded Ranger EV R&D Contract Won Afghan National Police & Israeli Defense Contracts Delivered 1st Unmanned Vehicle for Use In Afghanistan Over 3,000 Vehicles In Use In Afghanistan & Iraq Sales Up +100% Executing Our Plan Customer Mix |
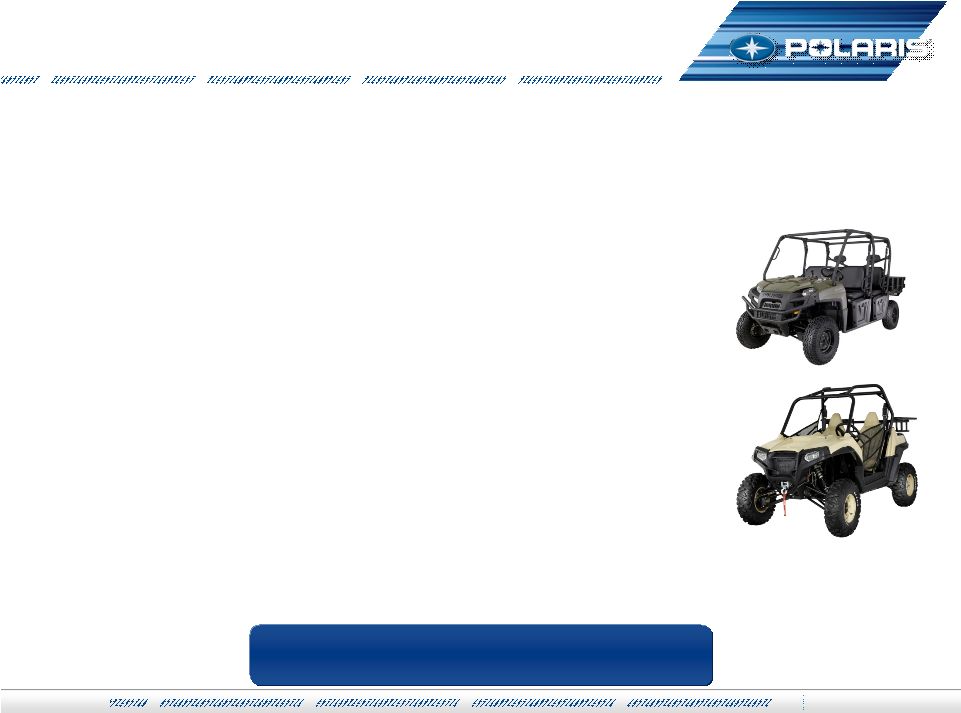 Military Plan Military Plan 104 July 27, 2011 Positioned For Growth Leverage Full Line of Ultra Light Mission Support Vehicles Leverage RZR SW, MVXP, MVRS700, plus Sportsman & RANGERs Army, National Guard, Air Force, Special Forces, etc. New Products to Serve More Markets RANGER Diesel, Electric & Hybrid Vehicles Unmanned + Very Light Vehicles Expand Other Government Agencies Partnerships to Expand Capabilities & Markets Grow Sales to U.S. Foreign Military Allies |
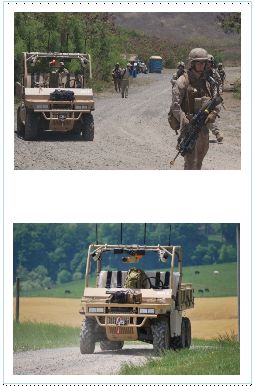
 • Emergency Response • Training Facility Support • Medical Evacuation • Search & Rescue • Counter Terrorism • Maintenance Support • Range Control • Border Patrol Support Tactical • Recon • Casualty Evacuation • Aviation Support • Police/Security Forces • Combat Engineers • Maintenance Support • Training • Special Operations Why POLARIS Ultra Light Vehicles? Why POLARIS Ultra Light Vehicles? • Low Cost, Affordable Mobility • Light Environmental Footprint • Rugged, Reliable Workhorse • Easily Transported • Go Anywhere • Global Parts Supply Practical Market Leader July 27, 2011 105 |
 Product Strategy Product Strategy Low Cost Mobility Solutions Leverage Off-Road Vehicle Capabilities Innovation Utilize the Polaris Innovation Model Develop Unique Military Solutions and Vehicles as Required Unmanned vehicles Speed to Market Close Work With Soldiers, Understand Their Needs & Trade Offs Rapid Development of Unique Technical Solutions 106 July 27, 2011 |
   Emerging Market Emerging Market Unmanned Ground Vehicles Unmanned Ground Vehicles Example Vehicle: Ground Unmanned Support Surrogate (GUSS) Increased Demand Safety & Reduced Soldier Payload July 27, 2011 107 |
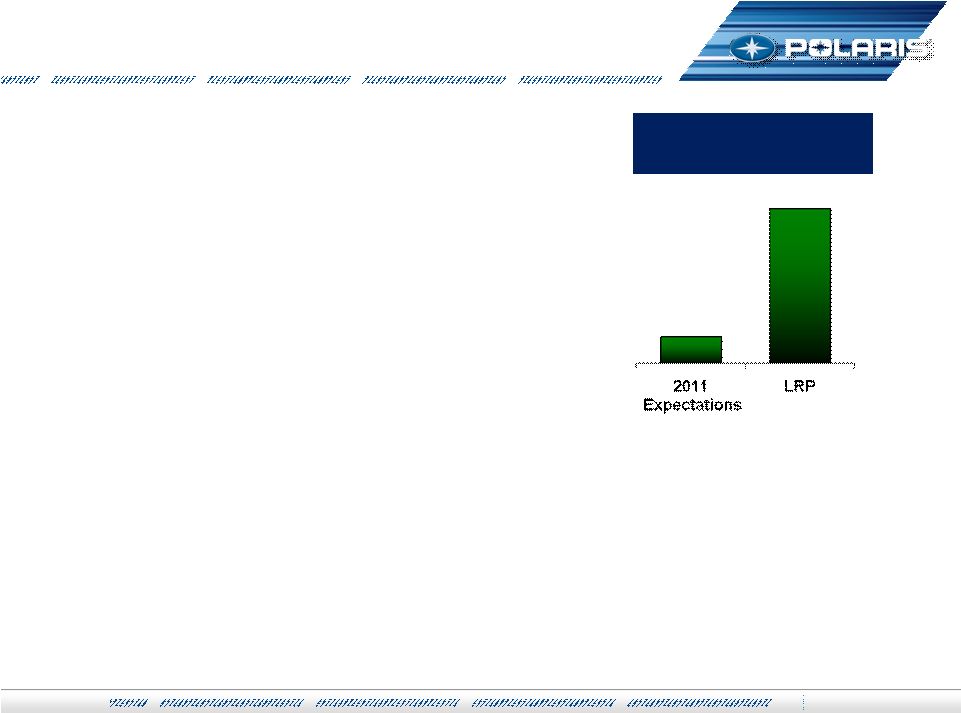 Military Summary Military Summary Polaris #1 Ultra Light Military Vehicle Winning the competitive battle Developing key technologies 2011 Results on Plan for a Record Year Government budget is a concern Positioned Well for Emerging Requirements Strong Growth Opportunity July 27, 2011 108 Long Range Sales Opportunity |
 Engineering Engineering Dave Longren Dave Longren V.P. – V.P. – Chief Technical Officer Chief Technical Officer |
 Making Growth Happen - Making Growth Happen - Engineering Engineering 1. Develop the Most Compelling Products in the Industry Deliver the right product at the right time Open new and adjacent markets 2. Create Loyal Customers that Promote the Product & Brand Industry leading Net Promoter Scores Maximize customer satisfaction & product reliability 3. Deliver Value for Customer & the Company Provide desired consumer features Create products at the right price & cost Relentless drive to eliminate waste 110 Driving Growth July 27, 2011 |
 The Right Product The Right Product Well Thought-out Product Plans Common Design & Architecture Plans Domestic & International Variants Development Processes Tailorable to Unique Product Needs Small Focused Teams Utilize Experts as Needed High Quality Designs Computer Modeling Advanced Testing Continuously Learn & Improve Actively Use Consumer Feedback Loop Information Systems that Promote Knowledge Sharing 111 July 27, 2011 +50 Percent Reduction In Time to Market Increased Market Share All Businesses Engineering Staffing Up +40% |
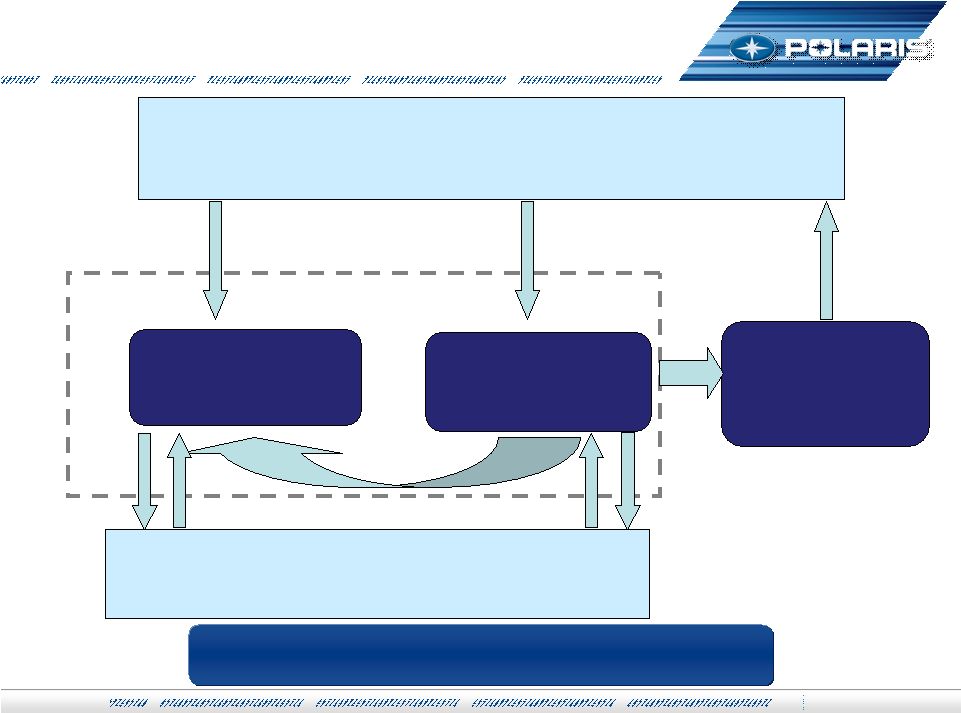 Business Strategy Growth Market Opportunities – Problem Identification Focus Group Research, Net Promoter Score New Growth Market/Customer Opportunities Disruptive Products Idea Screening Product Planning Investment Allocation Company-wide Product Planning Company-wide Product Planning Skunk Work Teams Individual Contributors Supplier Ideas, New technologies July 27, 2011 +3,000 Employees Generating Ideas 112 |
 Engineering Speed To Market Engineering Speed To Market World Class Development Staff & Process Internally Developed Design Tools & Models Analysis directly to production tooling Integrated tooling & part cost analysis Unique Product Segment Testing Capabilities Lean Engineering Eliminating Wasted Time & Expense Continuous Learning 113 Right Product at the Right Time July 27, 2011 |
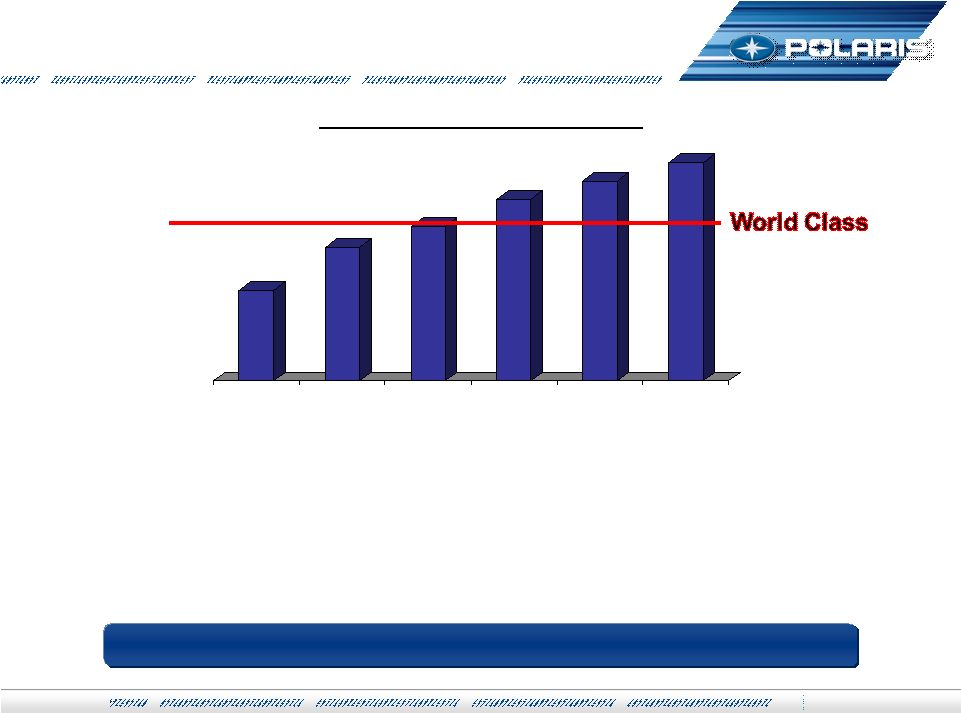 114 Most satisfied customers for our products Top Net Promoter Score 90+ Our consumers are recommending our products to friends and Family Consistent market share gains in all businesses Consumer Quality Consumer Quality World Class Net Promoter Scores (NPS) World Class Net Promoter Scores (NPS) 2006 2007 2008 2009 2010 2011 Polaris Net Promoter Scores Increased Consumer Satisfaction July 27, 2011 |
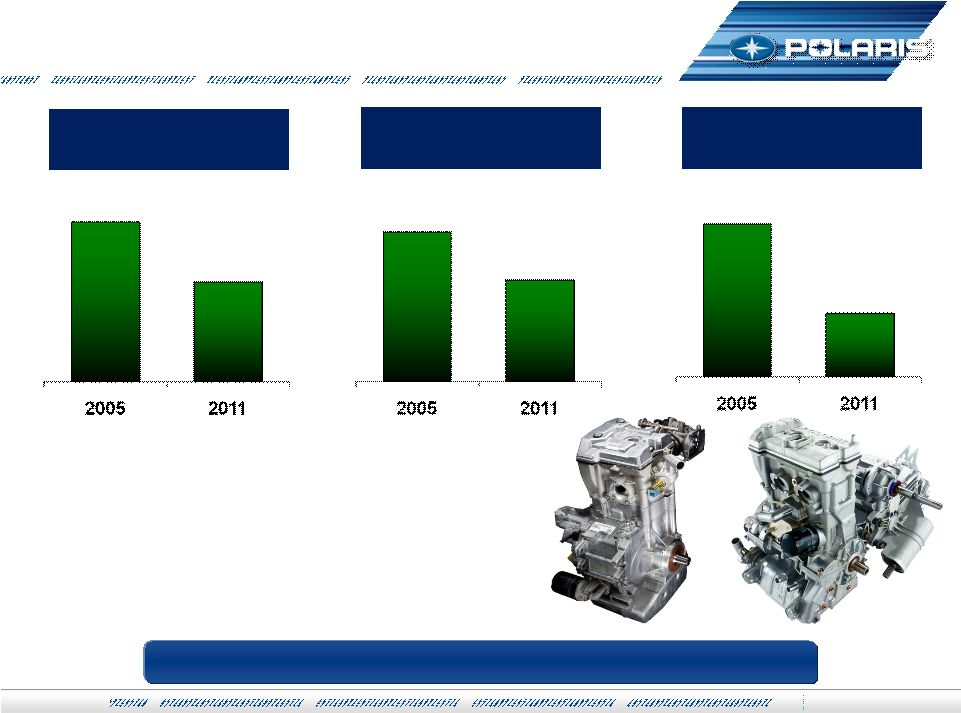 Powertrain Powertrain Heart of the vehicle Control Key Intellectual Property Common Architecture Designs Design for Manufacturability & Quality 115 Cost $’s Per Horsepower Consumer Warranty Claims Number of Engine Families Down 35% Down 25% Down 65% Controlling Our Destiny July 27, 2011 |
 Summary Summary Driving Growth In Emerging Military Markets Leveraging our proven innovation capability Advanced technology development & integrated vehicle designs Innovation Driving Sales And Market Share Gains Relentless Focus On Operational Excellence Speed to market Reduced costs Improved quality High Quality And Performance Powertrains Drive Future Growth Reliable, high performance, fuel efficient 116 July 27, 2011 |
 Polaris Industries Inc. Polaris Industries Inc. 117 Q & A Dave Longren VP - Chief Technical Officer July 27, 2011 |
 Global Market Development Global Market Development Mike Dougherty, Vice President Mike Dougherty, Vice President Analyst & Investor Meeting Analyst & Investor Meeting July 27, 2011 July 27, 2011 |
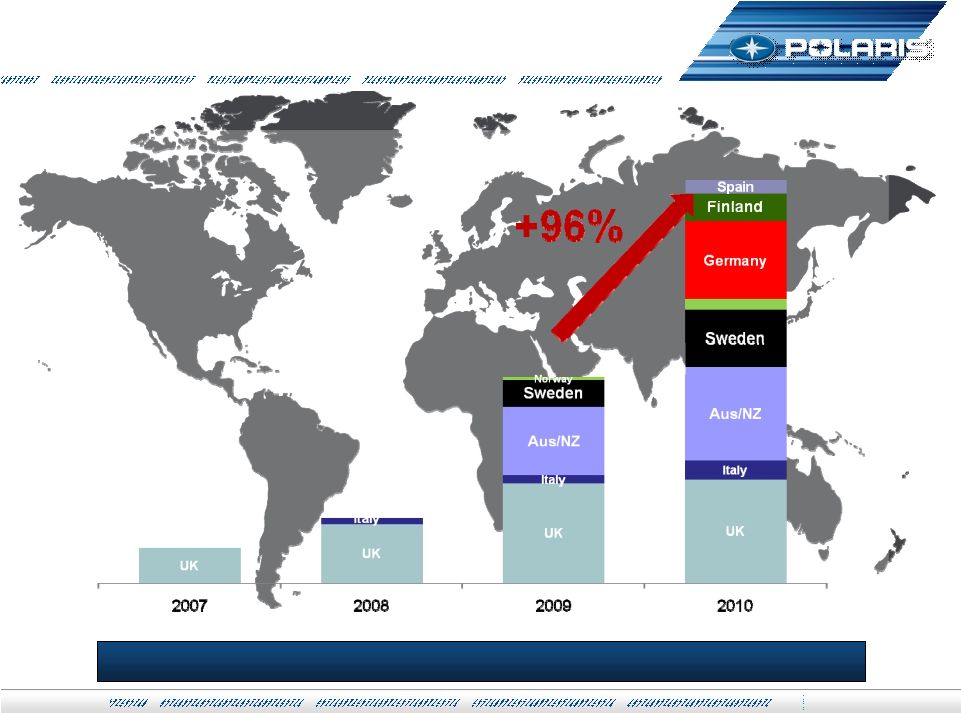
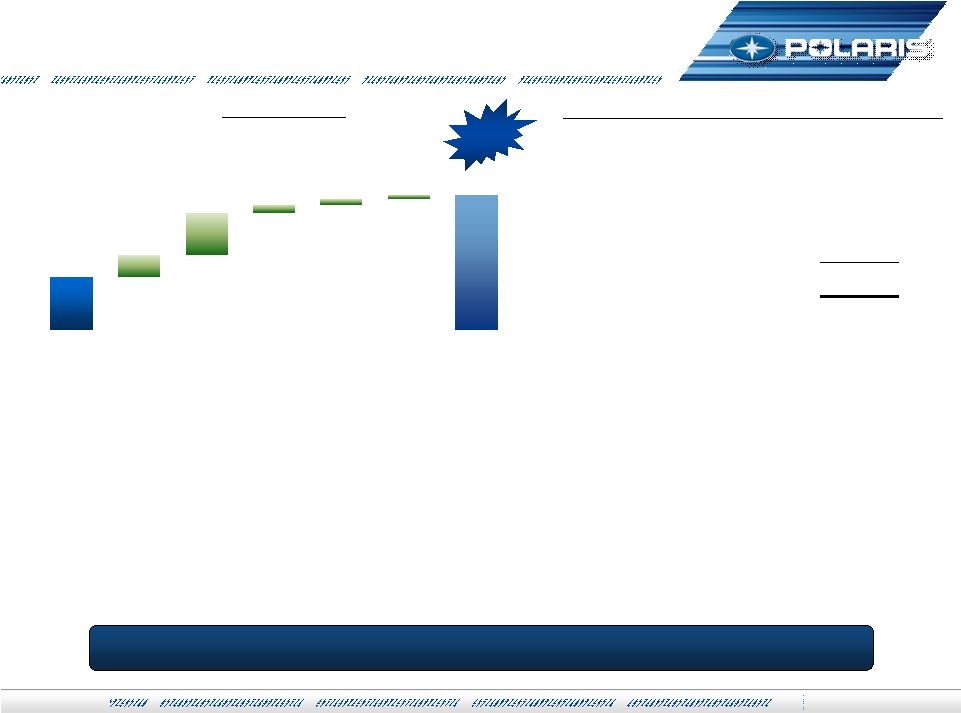
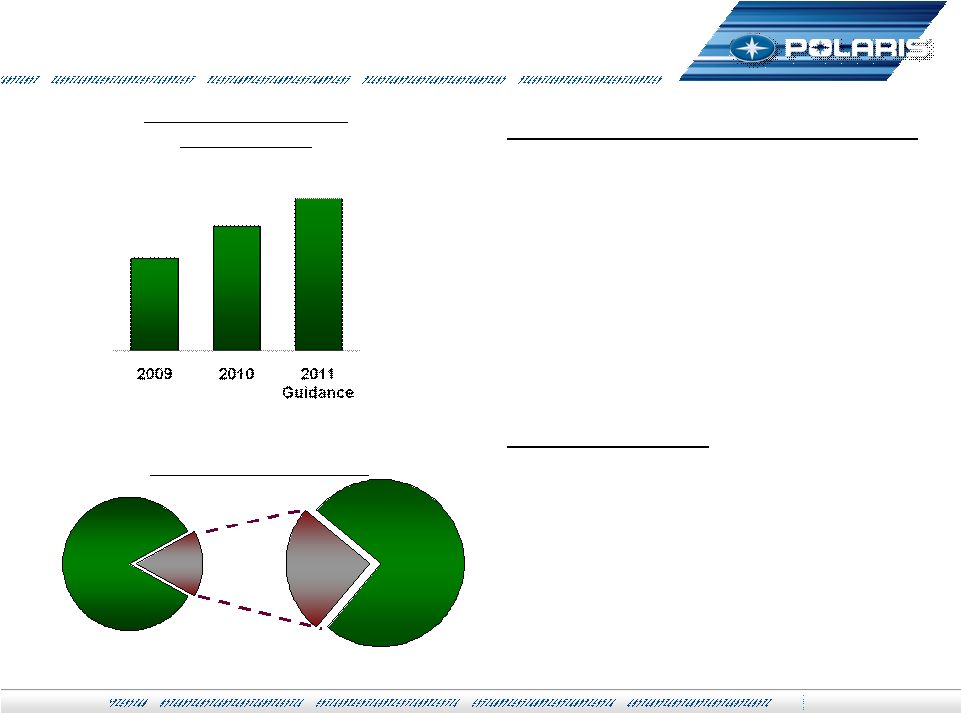 119 Global Market Leadership Overview Global Market Leadership Overview Polaris International Sales ($000’s) $306 $252 Up 20% to 25% Growth 2011 Objectives Double Digit Sales Growth Further Strengthen Core EMEA business Develop new markets – BRIC focus Develop new partnerships – China / India Polaris International At a Glance 43 Distributors and 9 subsidiaries – 130 countries Approximately 1,000 independent dealers 77% of business is in EMEA 67% of Revenues are Off-Road Vehicles #1 in ORV market share in Europe Goal: Grow International to >25% of Total Sales in 5 Years 2010 2015 >25% 15% |
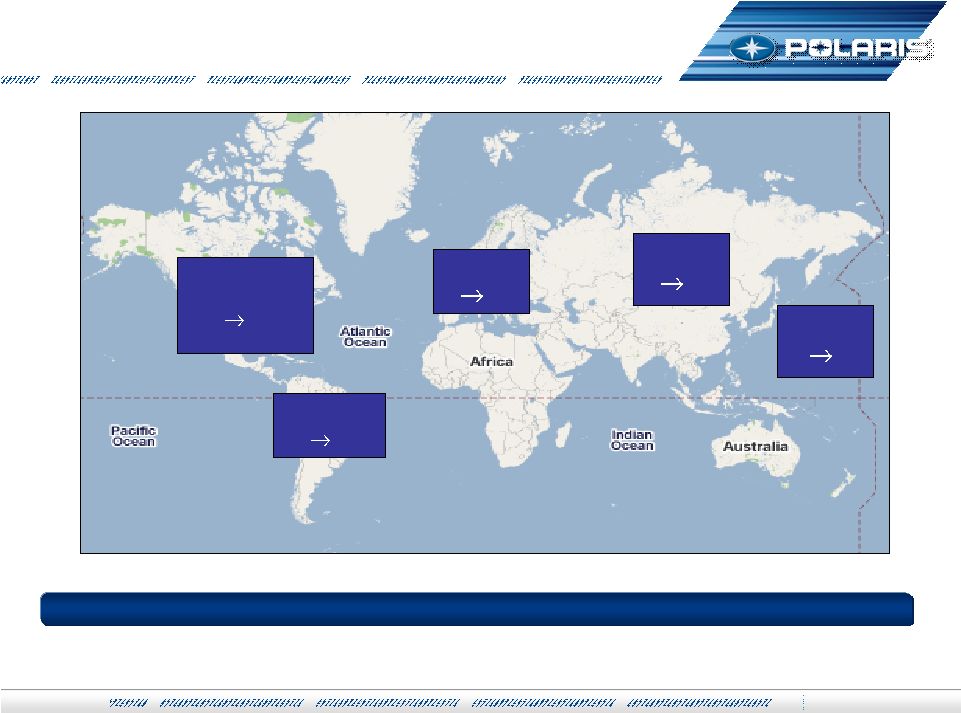
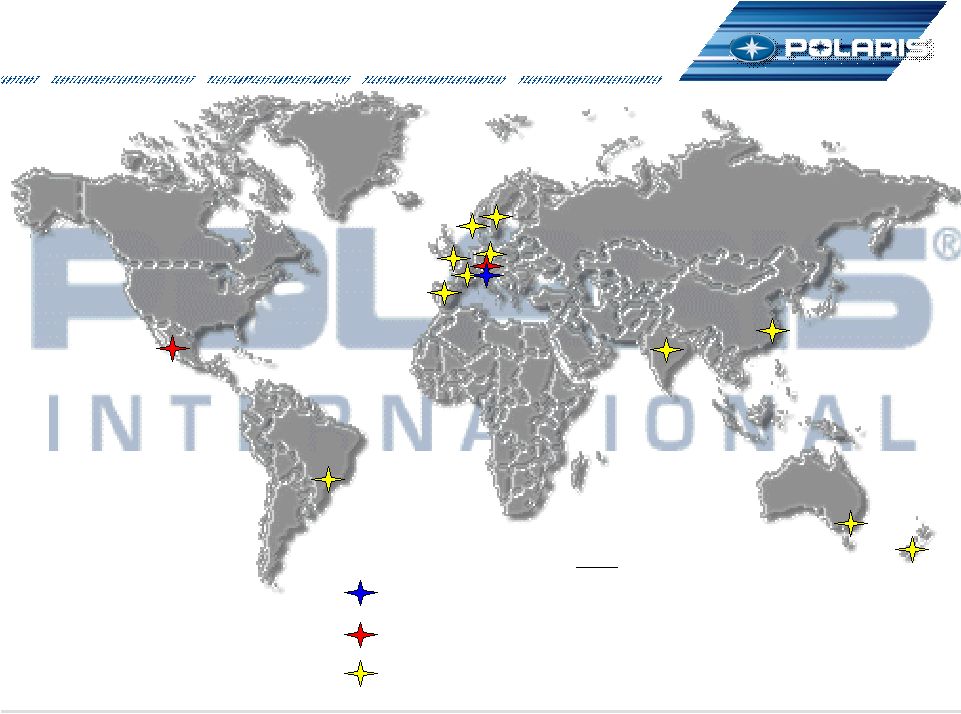 Global Footprint 2016 120 Regional HQs JV / Mfg / Eng Ops Subsidiaries 2011 1 2 12 Polaris International Locations Polaris International Locations |
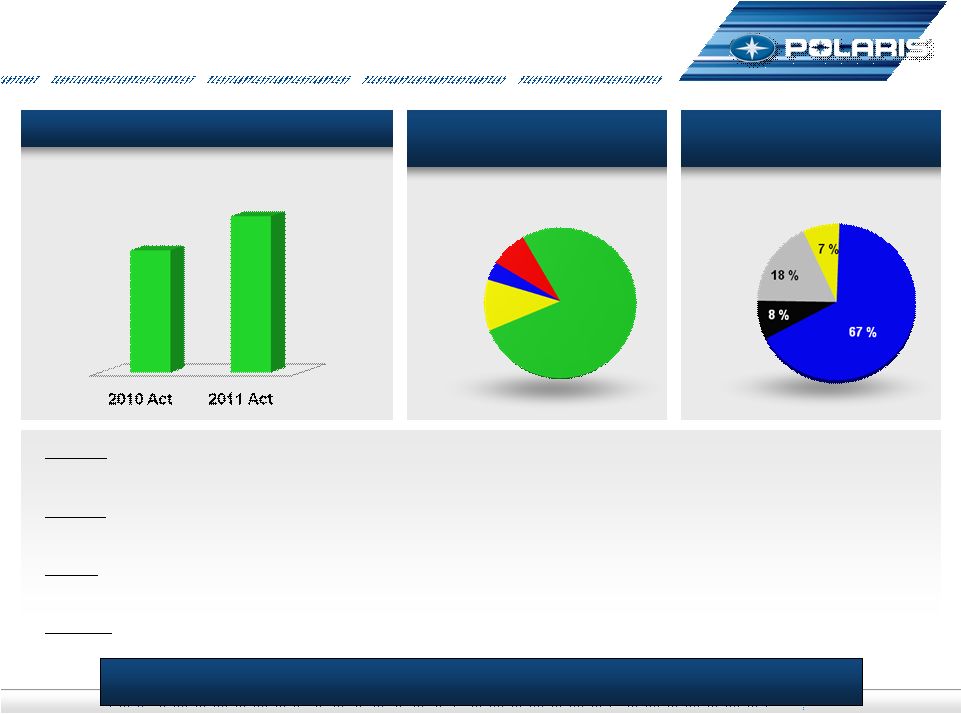 Solid Growth + New Market Development International Division 2011 – International Division 2011 – June YTD June YTD Grow: +28% SxS & Victory Driving Growth. All Products & Regions Growing. EMEA: +23% North European Subs + Russia & UAE APac: +54% Aus +47%, China gaining momentum, & Polaris India ready for 2H LatAm: +40% Regional SxS growth. Polaris Brazil ready for 2H Int’l Sales YTD ($ Millions) 2011 YTD Revenue by Geography 2011 YTD Revenue by Business Unit EMEA 77% Off-Road Vehicles On-Road Vehicles PG&A Snow 121 28% Growth $195 $153 AusNZ 11% Asia 4% LatAm 8% |
 122 International YTD 2011 Sales International YTD 2011 Sales 2010 Currency ORV PG&A Victory/ Snow 2011 1st Half 2011 $153 $11 $22 $3 $2 $195 Total Intl Total Intl % Change in Total International Sales Volume 12% Product mix and price 9% Currency 7% 28% Sales growth continues to outperform Company expectations - SxS up over 50% - Victory/On-Road up over 45% - ATV up over 10% - PG&A up over 20% Gained significant market share in Victory, stable global ORV Making Growth Happen On-Road $4 +28% |
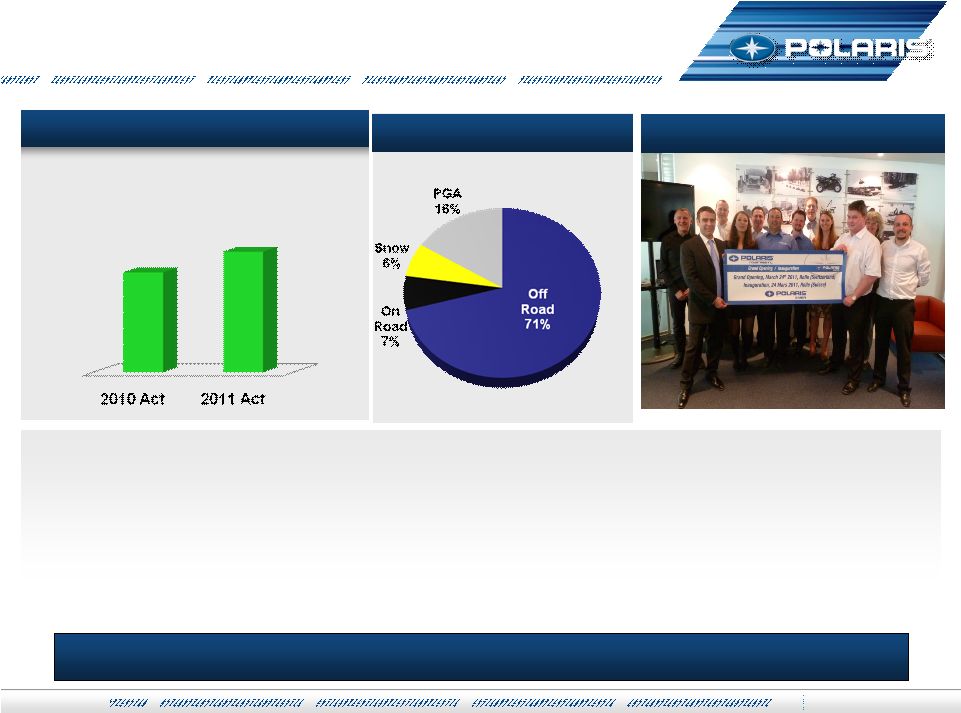 123 Business +23% YTD. Maintain growth in 2H. EMEA Update – EMEA Update – June YTD June YTD HQ : Opened in March near Geneva. Fully operational. Foundation for future growth High Growth Markets: Mid East & Russia, Germany On Road. Snow Scandinavia Protect ORV Markets: France, Italy, UK & Finland. Remain #1 and Gain Share. Key New Products: RZR XP, Diesel Ranger in UK. Victory gaining share throughout EU. Financial Performance YTD New Swiss HQ Revenue By Product 23% Growth $151 $123 |
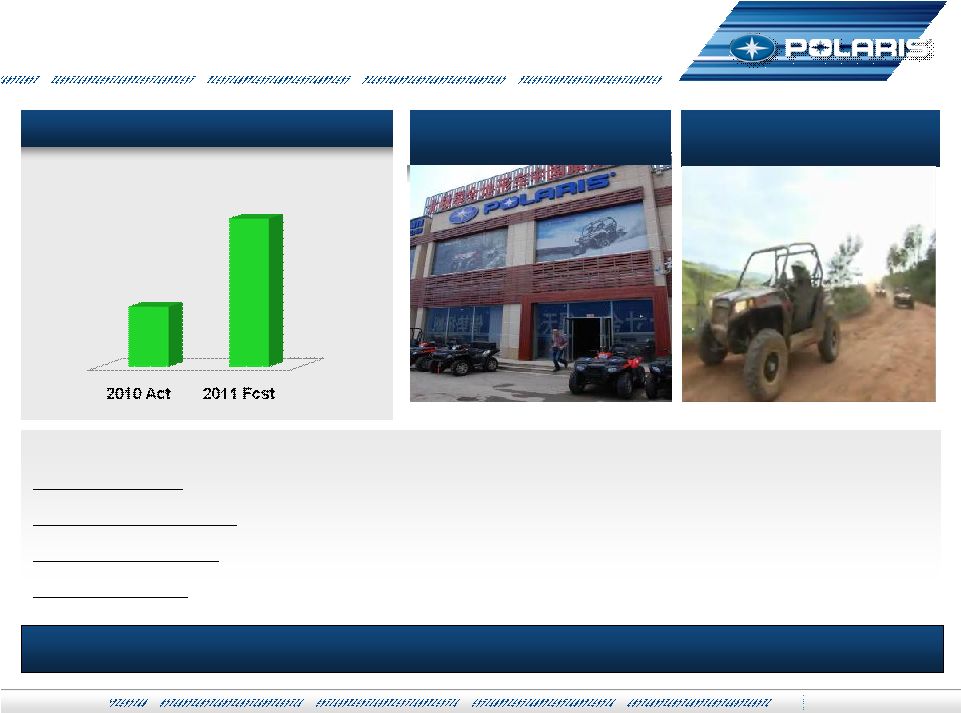 124 Making Growth Happen in Key Emerging Markets New Market Development 2011 New Market Development 2011 Russia Growth: Strong Snow and ORV business. On path to be #1. China Development - 10 Dealers. Yichun Province Order. Building ORV Market Brazil Penetration – Building Foundation. Team in Place. SKD production in Manaus India Footprint - Team in place. Launch ORV in August, 10 Dealers. Technical Center BRIC Sales (in millions) Brazil ORV Launch SxS Media Coverage Largest China Dealership New BAM Dealership $15M Up 100% to 200% Growth |
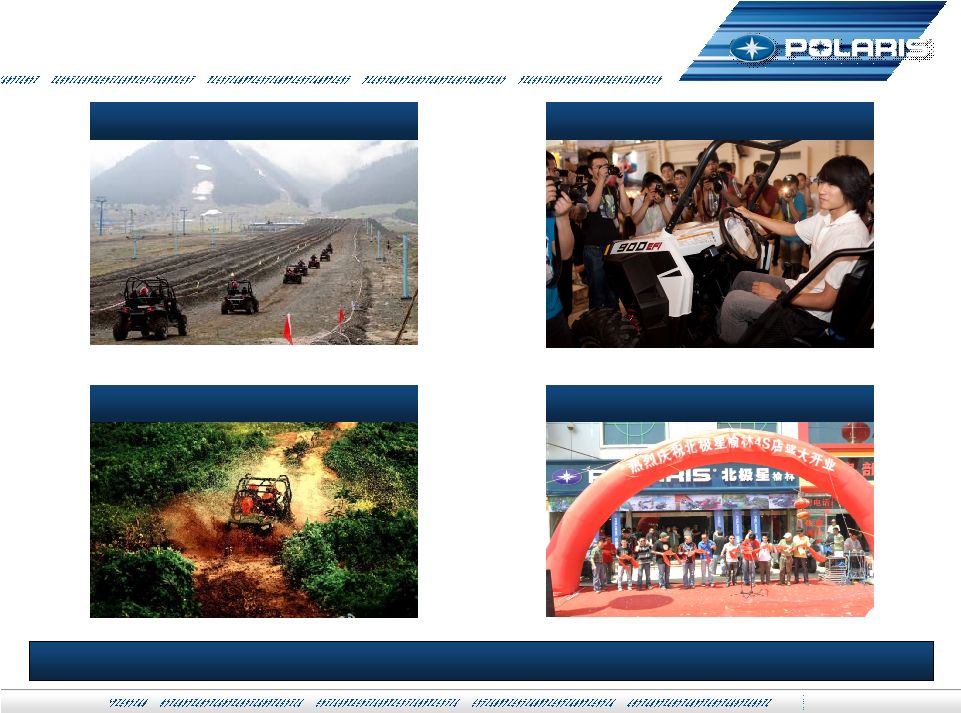 Building ORV Market in China Building ORV Market in China Continue to Energize Media, and Customers; Opening More Stores Urumqi Riding Famous Racer Han Han Endorsement Yulin Store Opening Shanghai Riding Event |
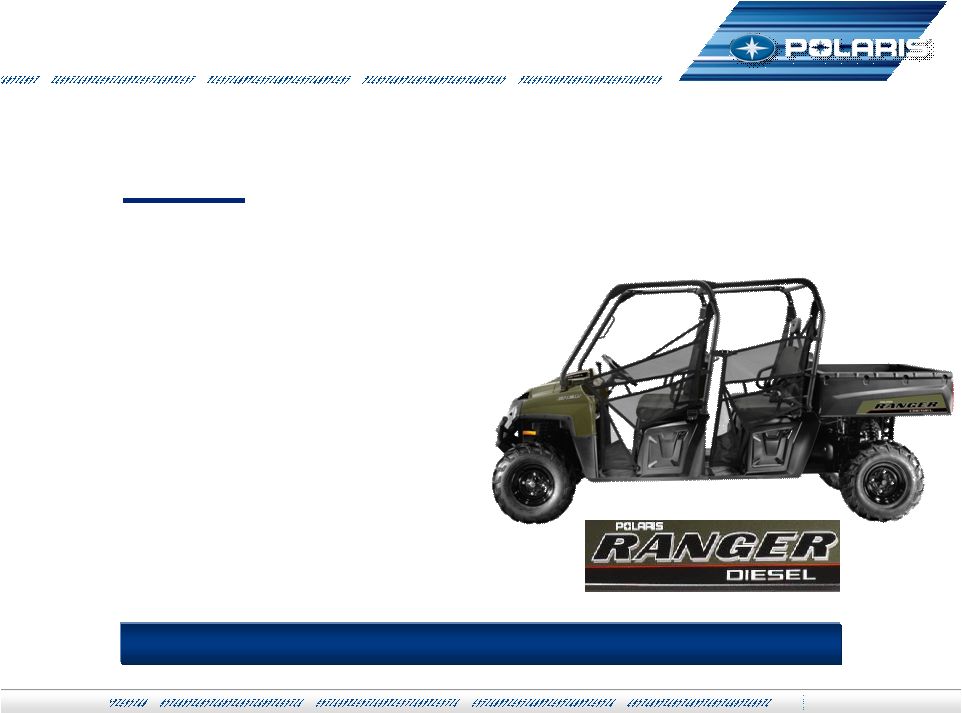 NEW RANGER RANGER CREW DIESEL CREW DIESEL Diesel is #2 Ranger by volume in 2011 for Int’l 90% Peak Torque @ 1600 RPM 900 Diesel – 24HP Yanmar 55 AMP Alternator 40% More Range Key MY12 Int’l Products Key MY12 Int’l Products Diesel Power for 6! |
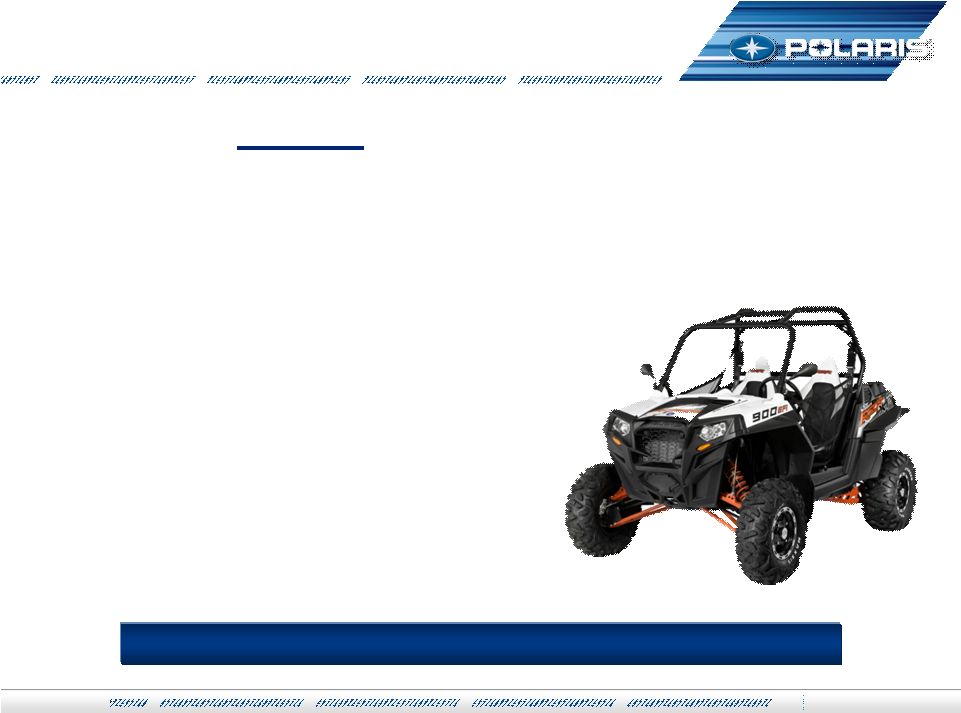 NEW! RZR XP 900 INTL All the features found on the RZR S & 4 Intl models E-Marked Maxxis Bighorns on Painted Aluminum Wheels Rear Differential Plus E-Marked LED Lights Electronic Power Steering Parking Brake Clicker Fox Shocks New Extreme Performance New Extreme Performance The Revolution Continues! |
 128 International 2H 2011 Plan International 2H 2011 Plan Growth Continues – Keep ORV Leadership Position – Gain More ORV Share w/ SxS – Expand Victory Distribution & Market Share – Enter Work SxS Segment with Diesel Strengthen European Business with HQ Opening Expand Presence in China & Brazil & India Continue Cultivating Potential Partnerships Strengthen Core & Develop New Markets |
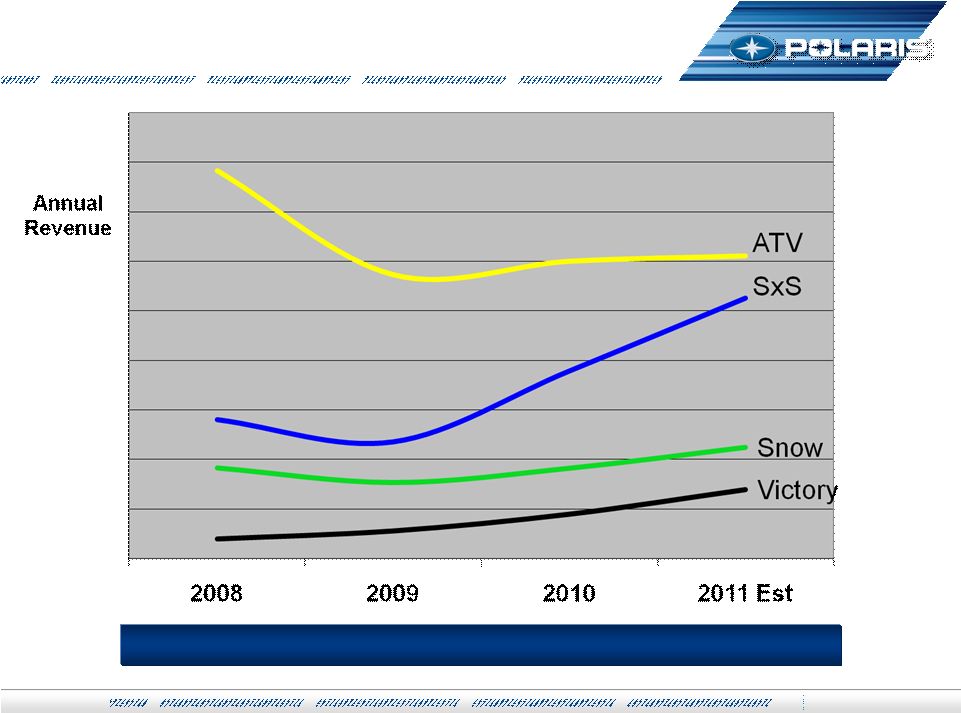 Int’l Rev Trends by Product Line Int’l Rev Trends by Product Line SxS > ATV in 2012 129 |
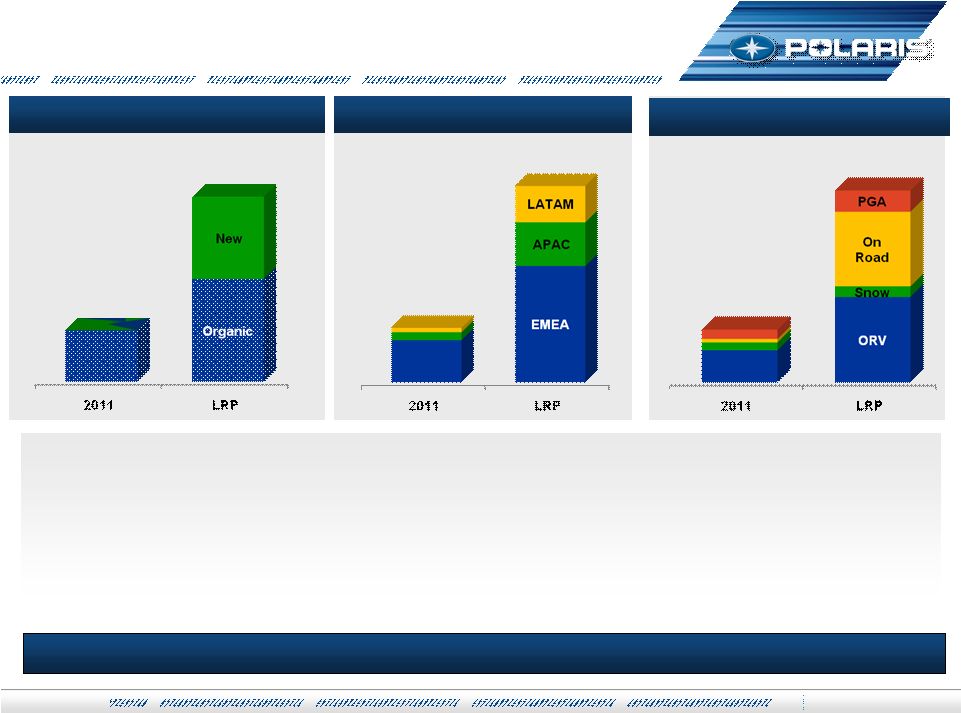 Polaris Int’l Sales ($Millions) $1B Revenue, Global Footprint, New Markets, On Road International Division Long Range Plan International Division Long Range Plan Triple revenue to $1B+ Double core business with SxS focus & motorcycle expansion Significant new business: On road, emerging market products EMEA still core. Emerging markets = 1/3 Int’l revenue. APAC / LATAM fastest growth. Revenue By Geography Revenue By Product Line $1B+ $1B+ $1B+ BOD Jul-2011 130 |
 131 Global Market Leadership Global Market Leadership 2011 YTD Progress… 2011 YTD Progress… Make Growth Happen >25% of Polaris Revenue 1H PII Int’l Rev ~ 15% 1H Int’l Growth = 28% FY Int’l Growth = 20-25% Strengthen Core ORV Business ORV Market Share Double SxS Business EMEA Swiss HQ Diversifying On Road / Adjacencies Victory Global Launch Military Partnerships New Market Development Building BRICs Develop New Products Cultivate New Partners Strong Financial Performance Sustainable, Profitable Growth Sales Growth Margin Expansion Healthy Balance Sheet Grow - Strengthen Core – Develop New Markets |
 Operational Excellence Operational Excellence A Pathway To World Class Performance A Pathway To World Class Performance Suresh Krishna Suresh Krishna VP – VP – Global Operations & Integration Global Operations & Integration July 27, 2011 July 27, 2011 |
 Agenda Agenda 1. NA Realignment 2. Manufacturing Excellence 3. Supply Chain Execution 4. Lean Deployment: Polaris Way 5. Acquisition Integration 133 Analyst - July 2011 |
 Engines & Exhausts to Monterrey Tube Fab to ROS Tube Fab to ROS RZRs to Monterrey RANGERs to Monterrey Seats & Stampings to Supplier Project Management & Teamwork Drive Success < 6 Months Analyst - July 2011 134 Manufacturing Realignment Manufacturing Realignment Manufacturing Realignment |
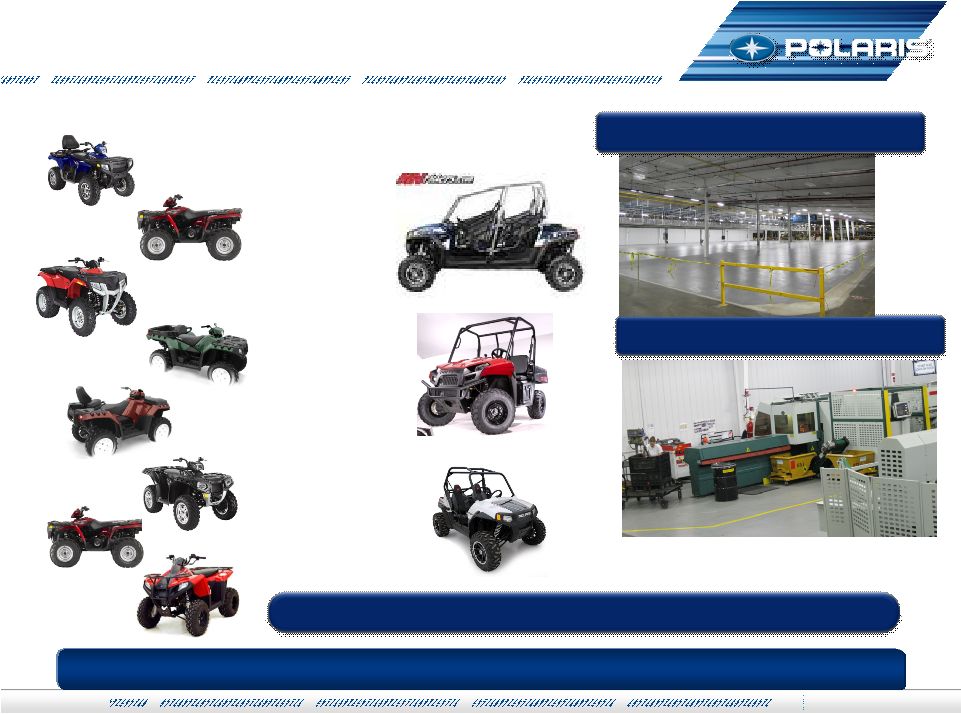 Analyst – Jul-11 135 Roseau Transition Roseau Transition Roseau Transition Consolidate all ATV to Line A Move SxS from Line D to B Huge Project Load With Many Transitions Installed Tube fab Target Investment in ROSEAU CENTER OF EXCELLENCE: $6M Emptied Line D and… |
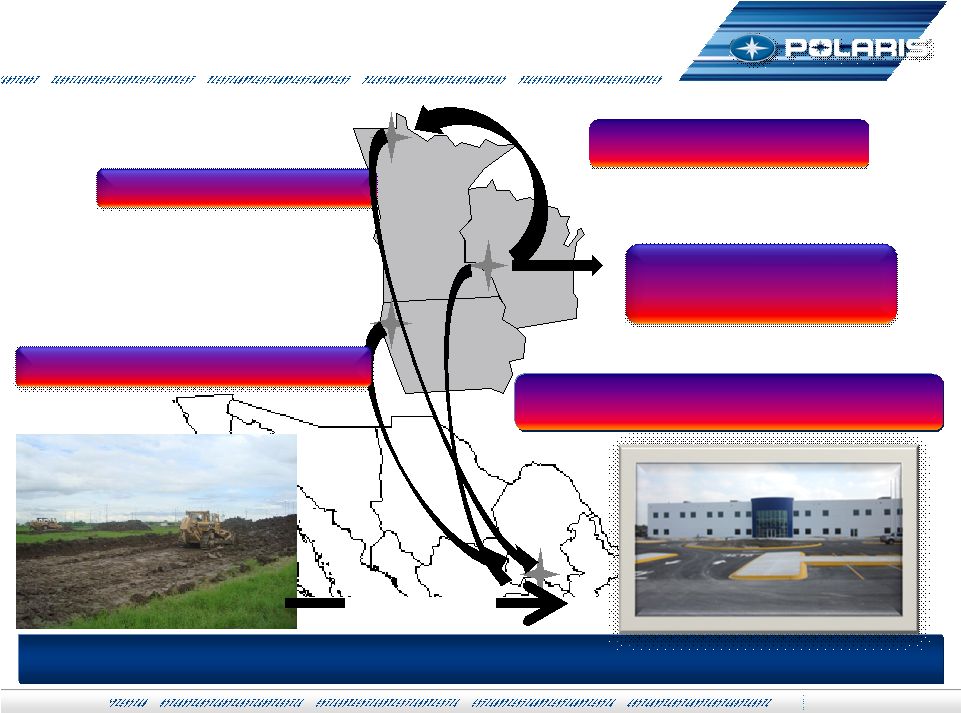
 Analyst – Jul-11 136 NA Realignment Update July 2011 NA Realignment Update July 2011 Financials Freight Watch: escorts northbound loads, 100% effective to date Emergency Response Plan developed and implemented GPS tracking installed on company & expat vehicles Facility complete Seat transitions to Supplier (Woodbridge) & Stampings (Kapco) complete Roseau Tube Fab transition complete, Monterrey pilots underway Monterrey Headcount: 554 Hourly, 80 Salaried Key Metrics Quality Solid Start – Significant Work Ahead Production Volume on Plan (in millions) One Time Expense $24 - $26 On track Est. Total Capital $35 On track Annualized Savings $30+ On track Monterrey Production Volume Wholegoods Warranty Project Status Security |
 Analyst – Jul-11 137 Monterrey Video Monterrey Video |
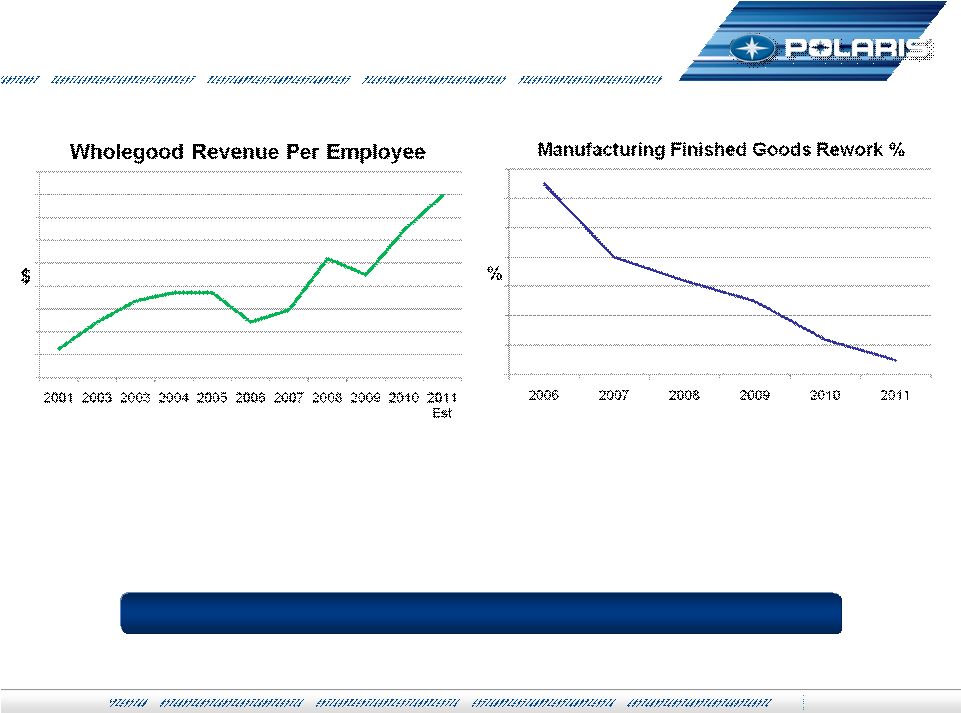 July 14, 2010 Lean Implementation providing Strong Results Analyst – Jul-11 138 Manufacturing Productivity Manufacturing Productivity |
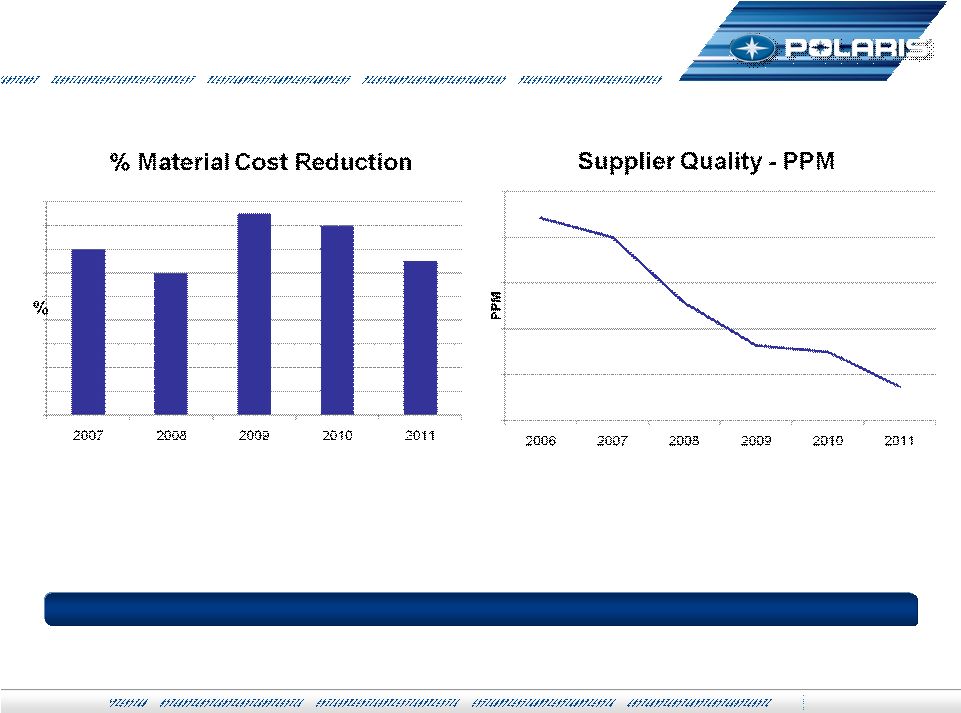 July 14, 2010 Deep supplier relationships driving cost & quality improvements Analyst – Jul-11 139 Supply Chain Execution Supply Chain Execution |
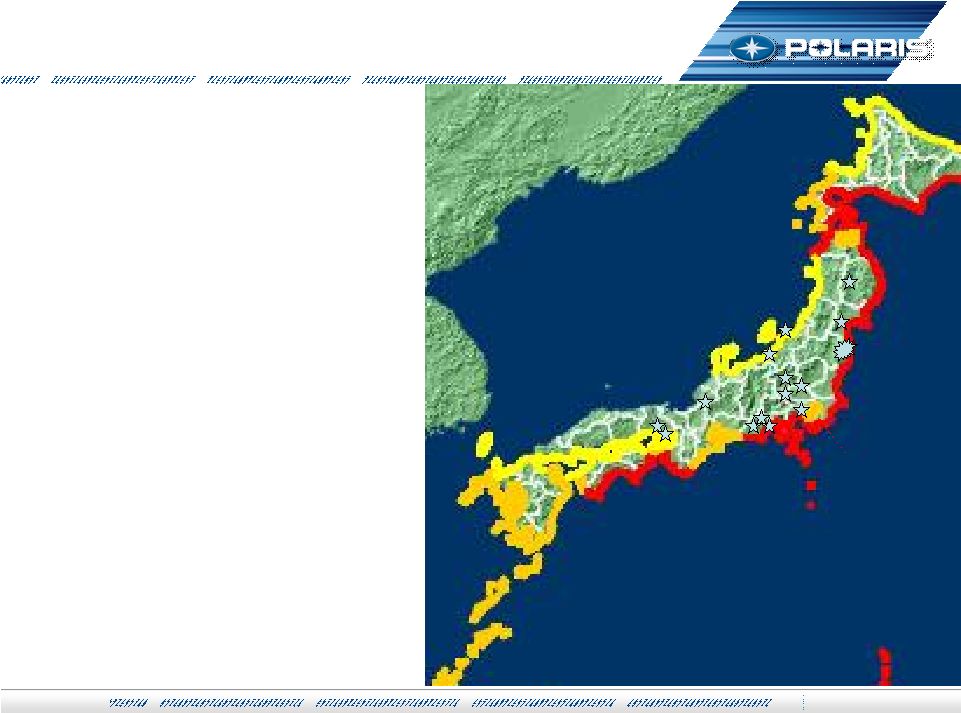 Japan: No disruption to Polaris parts supply Japan: No disruption to Polaris parts supply Fuji • Contacted all Tier 1 suppliers • Engaged tier 1s to identify parts availability from their Tier 2 & tier 3 suppliers • Daily calls to monitor parts availability at supplier’s factories • Monitored all shipments from suppliers for timely dispatch • Purchasing people were in Japan on site at key suppliers reviewing and monitoring situation 140 Analyst – Jul-11 |
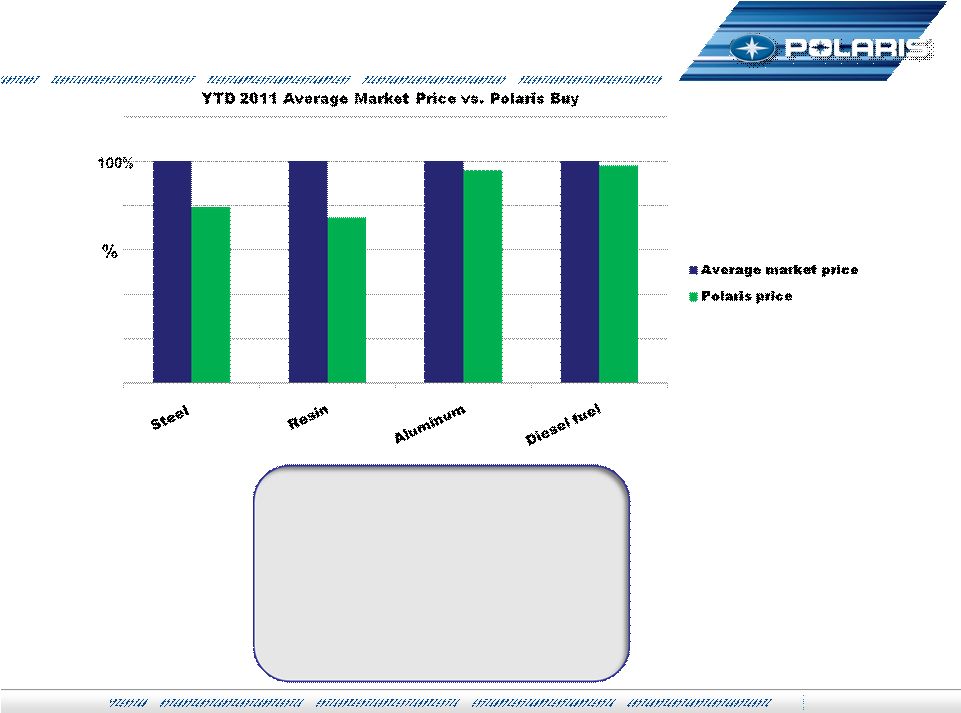 Commodities: Proactive Management Commodities: Proactive Management 141 Cost Mitigation Strategies: • Financial Hedges • Forward Buys • Reverse Auctions • Supplier Umbrella Contracts • Long-term Agreements Analyst – Jul-11 |
 NAFTA 61 63% Japan 11 5% Asia LCC 20 23% Europe 8 8% Direct OE & Aeon Purchases only – Tier I Country of Origin. 2011 - 2011 - 2014 World-wide Procurement 2014 World-wide Procurement S. America 0 1% 142 2011: LCC – 24% 2014: LCC – 28% Analyst – Jul-11 |
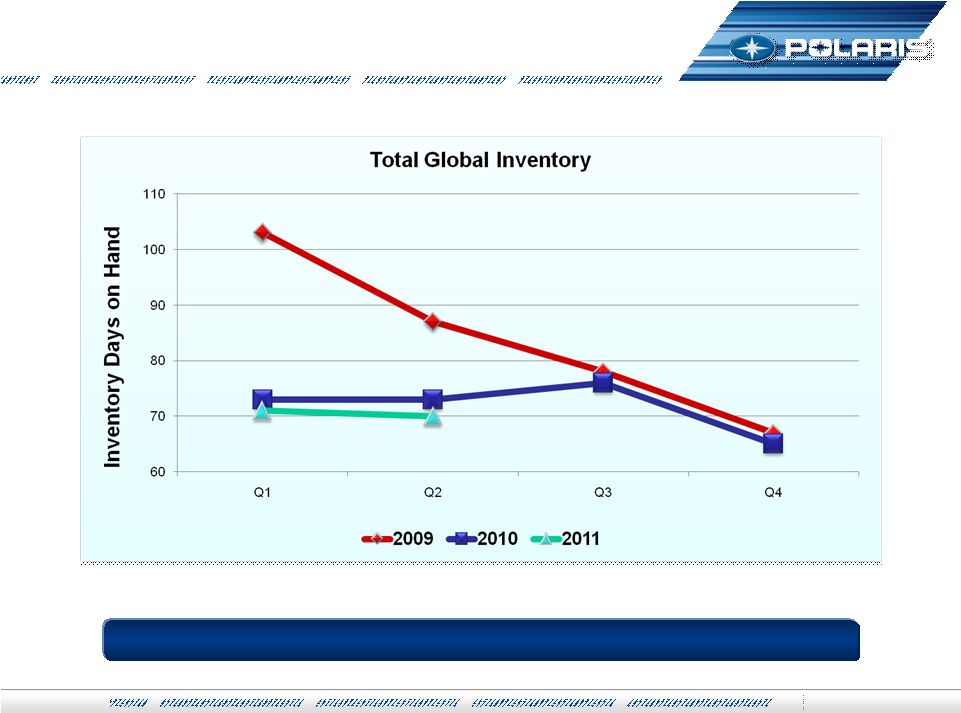 143 Inventory Reductions Inventory Reductions Analyst – Jul-11 At Stable Levels |
 • Eliminate Waste • Improve Quality • Improve Lead- time/Delivery • Reduce Cost Analyst – Jul-11 144 Lean Development: Polaris Way Lean Development: Polaris Way Driving Significant, Measurable Improvements to our Bottom Line! |
 145 VIDEO ON LEAN: ROSEAU STORY VIDEO ON LEAN: ROSEAU STORY Analyst – Jul-11 |
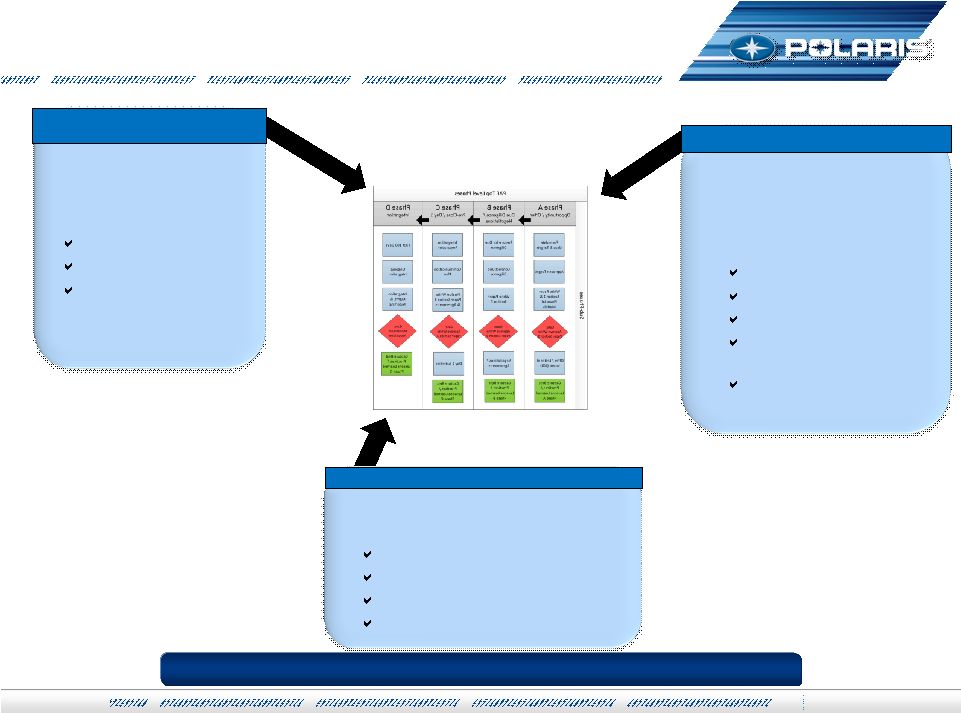 Integrating Acquisitions: Polaris Integrating Acquisitions: Polaris Acquisition Framework (PAF) Acquisition Framework (PAF) Stage / Gate Process for Integrated Product Development & Validation. This process enables: Speed Flexibility Cross-functional decision making PDP A disciplined methodology for transferring production processes from one site to another or supplier. This methodology enables: Consistency Risk mitigation Process validation Focus on product quality & performance Consistent approach NA Realignment Proven Ingredients – New Recipe for Success 146 PAF Analyst – Jul-11 Lean: Polaris Way Fully embrace the LEAN principles & tools to make Polaris better. Eliminate Waste Margin Expansion Product & Quality Leadership Reduce Customer Lead Time |
 Jul-2011 AM 147 Polaris Industries Inc. Polaris Industries Inc. Q & A Q & A Polaris Industries Inc. Analyst & Investor Meeting July 27, 2011 |
 Jul-2011 AM 148 Polaris Industries Inc. Polaris Industries Inc. Closing Comments Closing Comments Scott Wine, CEO Scott Wine, CEO Polaris Industries Inc. Analyst & Investor Meeting July 27, 2011 |
 Jul-2011 AM 149 Polaris Industries Inc. Polaris Industries Inc. Q & A Q & A Polaris Industries Inc. Analyst & Investor Meeting July 27, 2011 |