 Operations Strategy North American Realignment Polaris Industries Inc. March 15, 2012 Exhibit 99.1 |
 2 Strategic Objectives Strategic Objectives Best in Powersports PLUS 5-8% annual organic growth Growth through Adjacencies $200 - 500M growth Global Market Leadership >25% of Polaris revenue Operations is Competitive Advantage Op Ex drives > 200 bps operating margin improvement Strong Financial Performance Sustainable, profitable growth Net Income Margin >9.5% $1.6 Billion >$5.0 Billion >$3.0 Billion 2009 2014 2018 2009 2014 2018 6.5% 10.0% >9.5% >8.0% Clear, Consistent Strategy Grow Sales Grow Sales $5 Billion by 2018 $5 Billion by 2018 Expand Net Income Margins Expand Net Income Margins 10% of Sales by 2018 10% of Sales by 2018 |
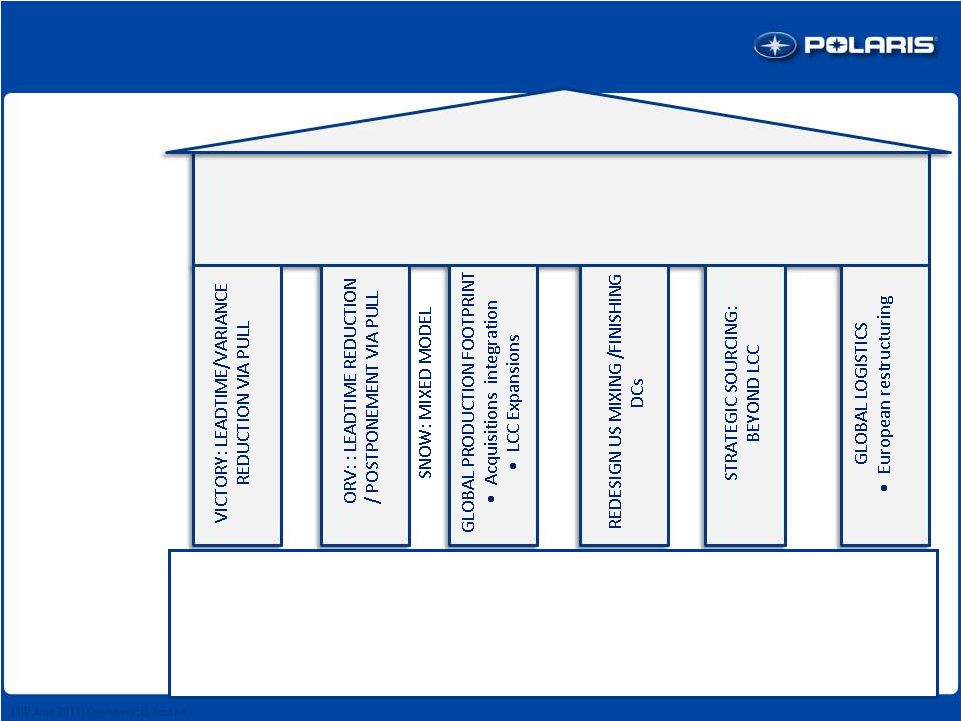 TOP LEVEL GDP GOALS MAJOR TRANSFORMATION INITIATIVES ESSENTIAL ENABLERS: Building Blocks for Success Developing the Next Generation Capabilities for People, Processes, Partners & Systems: 1.The Polaris Way – Lean Business & Production System (Includes Safety) 2.Polaris Quality Management System (PQMS) 3.Global Supply Chain Management 4.Global Talent Management 5.Common Processes, Tools & Systems ( Includes Innovative manufacturing technology) LRP June 2011; Operations; S. Krishna COSTS QUALITY SPEED INVENTORY SAFETY OPERATIONS AS A COMPETITIVE ADVANTAGE 3 Polaris Operations Strategy |
 Operations Characteristics 4 On-Time Delivery Journey Continues |
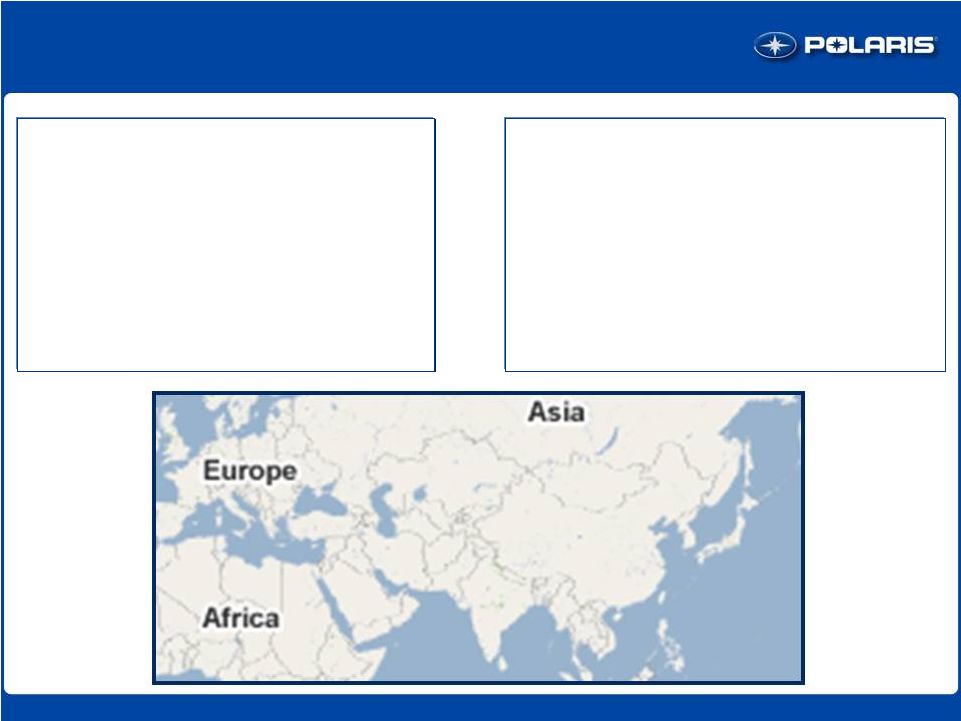 Global Growth Continues Assumptions EMEA growth justifies local production Brazil/S.A. supplied from Monterrey Strategies Leverage Monterrey best practices Brownfield or Greenfield China 5 Product LCC capacity India Significant organic and acquired growth expected 2012-2016 Asian acquisition and partnership opportunities Utilize FTO chassis/finish structure to meet growing market demands Focus on assembly, pursue low capital investment strategy |
 6 Why Mexico? Goals 1. Dramatically reduce cost of logistics and labor with footprint redesign Labor savings in Monterrey NA logistics optimized 2. Move closer to customer for speed and flexibility Texas, CA & Arizona largest SxS markets 1-2 day speed improvement to southern U.S. dealers Competition is already in Mexico and Mid / SE USA Operations as a Competitive Advantage Kawasaki Kawasaki |
 Mexico Monterrey Capital Mexico City Monterrey Population 107 Million 4.4 Million (4% of Mexico´s population) Government Federal Republic 31 States, 1 Federal District State Government GDP $1,086 Billion USD $86.5 Billion USD (8.0% of the country’s GDP) Exports $280 Billion USD $22 billion USD FDI $15 Billion USD $1.4 Billion USD Income per capita $10,181 USD $19,693 USD Twin Cities GDP ~$200B Why Monterrey? |
 8 • 93 colleges and universities with 150,000+ students • More than 60 bilingual schools • 213 technical careers with 52,000 students • 5,000 engineers graduated per year (avg.) • Workforce: 1.9 million: 45% of the total population 12 years without any strike Stable, productive, highly qualified labor force Monterrey Education and Labor Force Why Monterrey? Combination of high-tech manufacturing in a low cost region |
 9 Manage Risk & Deliver Long Term Goals Focus on Strategic Competencies Create Center of Excellence for weld, paint, assembly Outsource non-strategic processes Create sustainable Mexico plant with Polaris Culture Enhanced Process Designs Quality must be better at new location Lean design from start Best Project Management Principles Gated, phased approach with performance milestones Duplicate production lines Work stream teams Project Guiding Principles |
 10 Monterrey Facility Groundbreaking to Production in 9 months |
 11 Monterrey Operations Flexible Plan, Effective Logistics, Strong Labor Pool Facility 425,000 Square Feet 200,000 Square Feet Expansion 37 Dock Doors, 4 Ramps Two Story Office 28ft Clear Height Air Conditioned Facility Processes Vehicle Assembly (3 lines) Chassis Welding Metal Paint (Powder/E-coat) Tube Fabrication (Lasers/Benders/Formers) Exhaust Welding HT Exhaust Paint Engine Assembly (2 lines) |
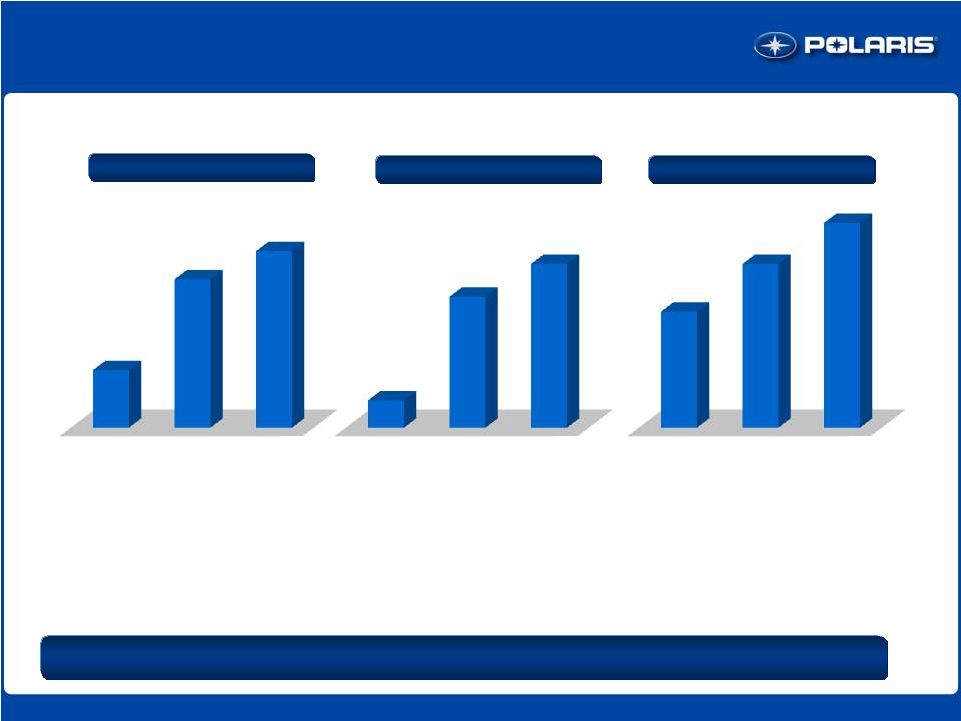 Monterrey Production Ramp Up 12 Great Start in 2011, Continued Growth Vehicle Assembly Engine Assembly Headcount 2011 Actual 2012 2013 2011 Actual 2012 2013 2011 Actual 2012 2013 22,500 20,000 850 Units Units Employees |
 13 NA Realignment: Financials Estimated total project costs FY 2011 actual FY 2012 guidance Project to-date Q4 2011 actual $27 - $28 $15 $1- $2 Anticipated annualized savings upon completion 2011 realized savings in 2 half FY 2012 anticipated savings guidance $12 - $15 $2 Manufacturing Realignment – Monterrey Cost Charged to P&L (in millions) $30+ Savings (in millions) Opportunity for Future Margin Expansion $3 $26 nd |
 Polaris North American Manufacturing Operations Roseau 745,500 Square feet Products: Snow, ATV, SxS Recent Initiatives: -ATV’s consolidated to one assembly line -SxS’s transitioned to high volume assembly -Metal fabrication processes added Osceola 285,800 Square feet Products: Engines Recent Initiatives: -Producing Indian Engines -Transitioned Metal Fab Processes -Outsourced Seats and Stamping -Transitioned portion of ORV Engines 14 Spirit Lake 565,00 Square feet Products: Motorcycles, SxS, Electric, Bobcat Recent Initiatives: -Indian production transferred -GEM Production Transferred Monterrey 425,000 Square feet Products: SxS, Engines, Exhausts Current Initiatives: -Adding 3 rd Assembly Line -Adding 2 nd Engine Line -Creating additional back shop capacity |
 Operations is Competitive Advantage Lean Enterprise for world class quality, cost, lead times Manufacturing realignment: excellent execution 29% Volume decrease / 56% volume increase 2+ Acquisition integrations completed Manufacturing productivity up >7% for each of last 3 years Inventory turns increased 18% Operating Margins up +380 bps 15 3-5 Year Objective: 3 Year Results: Excellent Progress, Significant Potential |
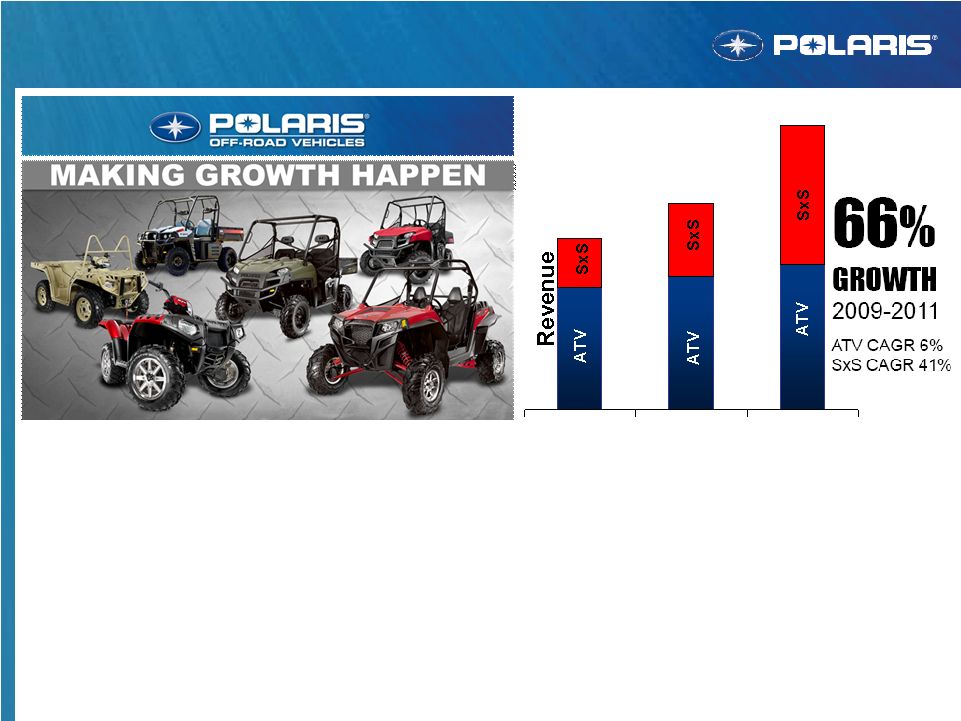
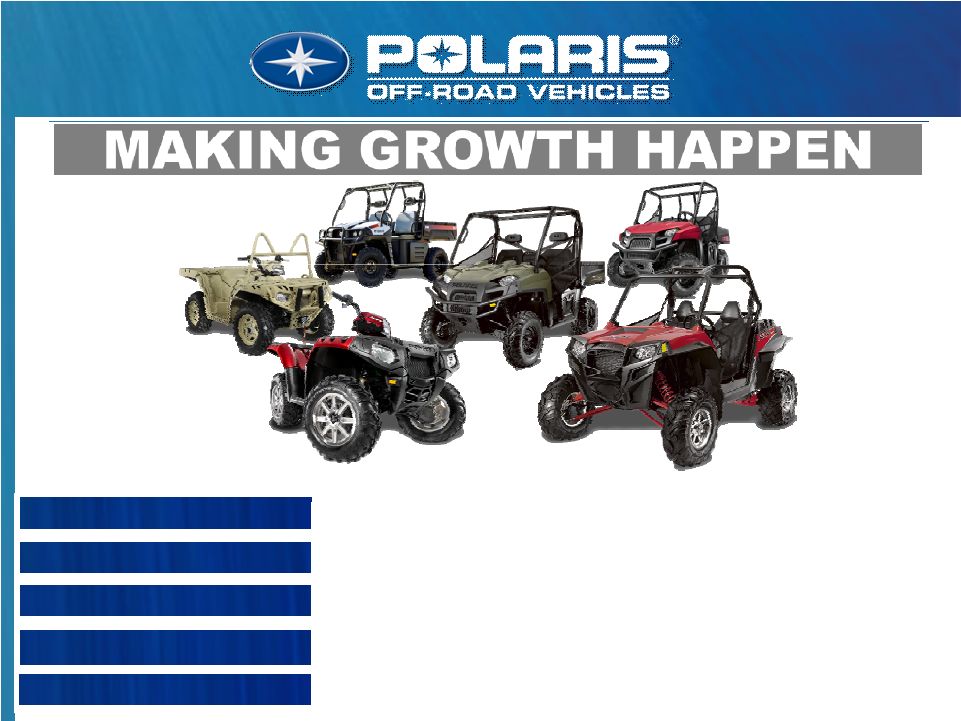
 MAKING GROWTH HAPPEN Dave Longren, VP Off-Road Vehicles March 15th, 2012 1 |
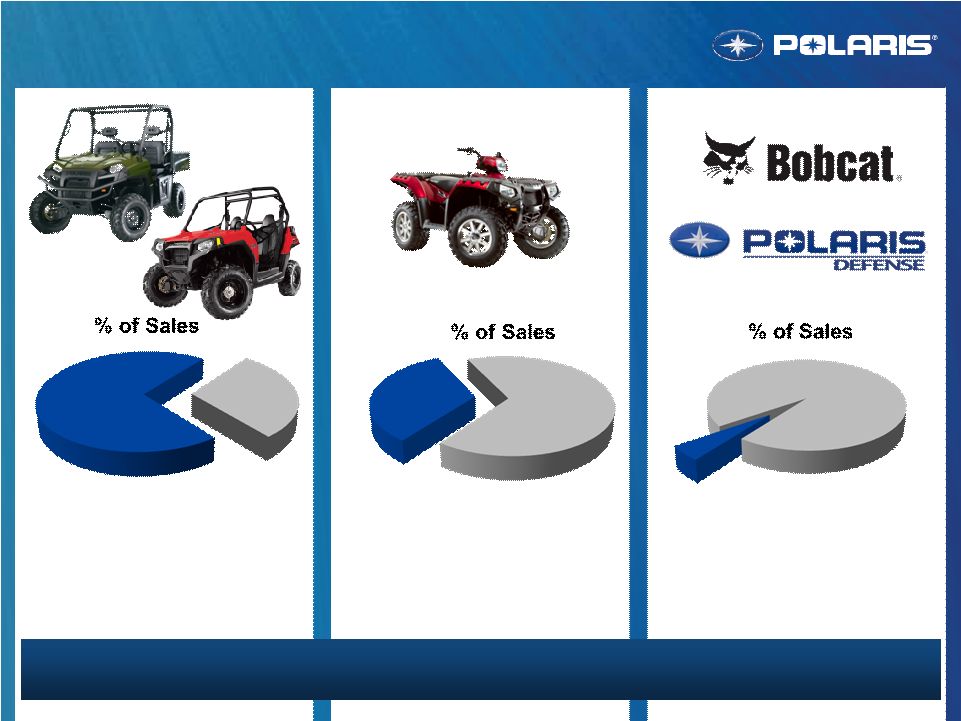 ORV Business Breakdown Bobcat #1 business for revenue and profits Large business with significant profits Incremental Growth Opportunity RANGER & RZR RANGER & RZR #1 PRIORITY; SPORTSMAN REMAINS SIGNIFICANT #1 PRIORITY; SPORTSMAN REMAINS SIGNIFICANT RANGER & RZR All Other ATV All Other Bobcat Defense ATV & SxS 2 |
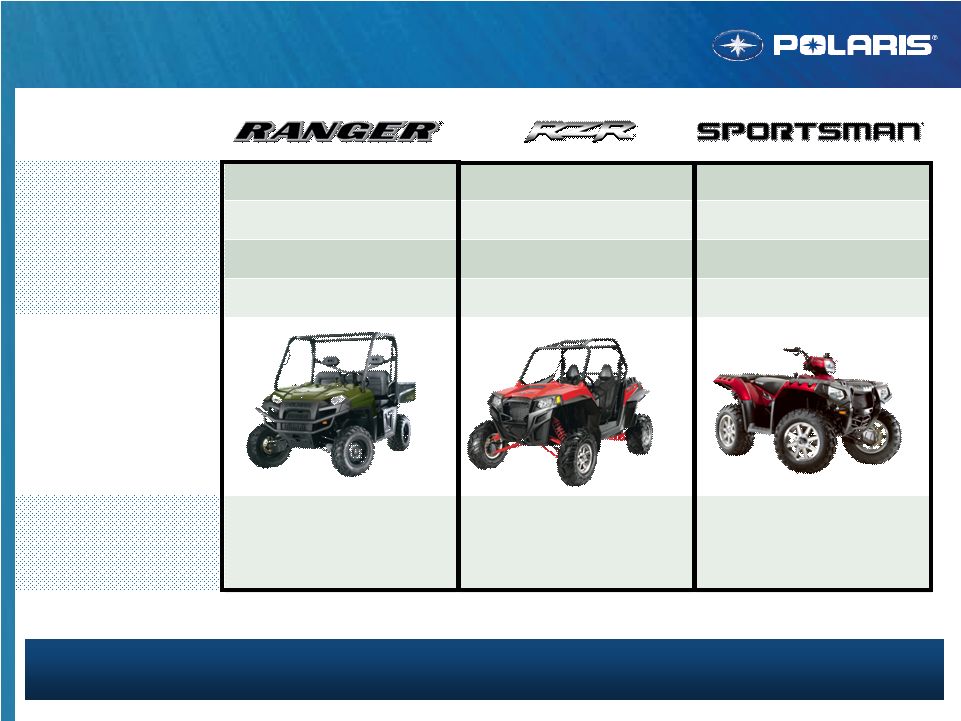 Farming/Ranching Recreation/Trail Recreation/Trail Property Dunes Farm Hunt Desert Hunt Rec/Trail Hunt Property 70% 80% 48% Incremental to Polaris (Did not consider any other Polaris products) RANGER = MOSTLY WORK; RZR RANGER = MOSTLY WORK; RZR = MOSTLY PLAY; SPORTSMAN = BOTH = MOSTLY PLAY; SPORTSMAN = BOTH ORV Customer Profiles Primary Usage 3 |
 ORV Industry Trends Expect Overall ORV Industry Flattish In 2012 Expect Overall ORV Industry Flattish In 2012 4 |
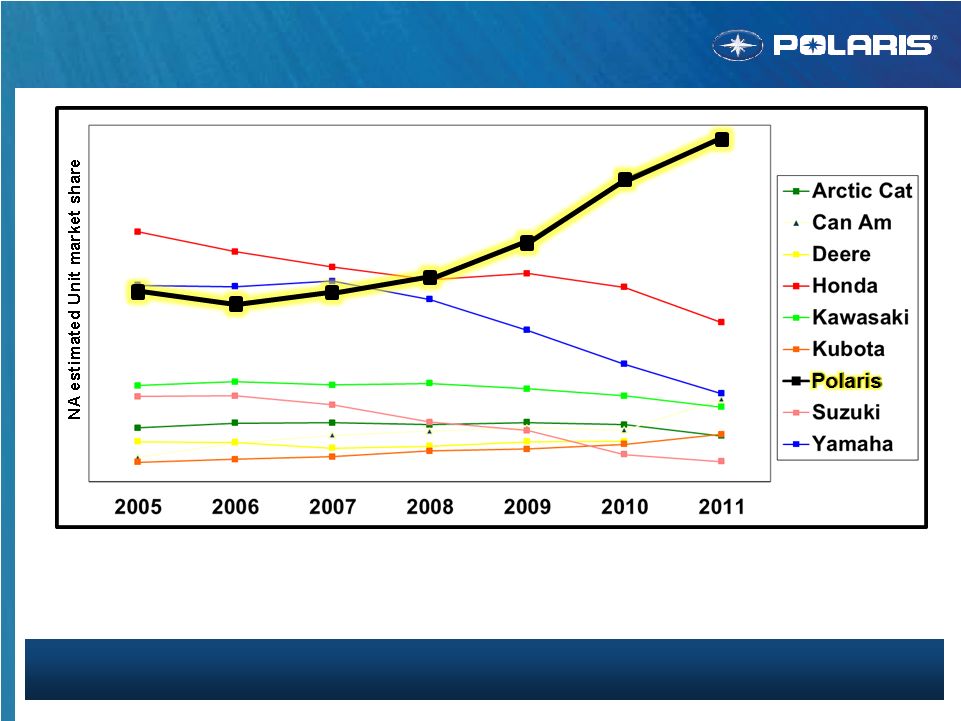 ORV Share Results TWO TIMES SHARE OF NEXT COMPETITOR TWO TIMES SHARE OF NEXT COMPETITOR Best Overall Share Performance In Polaris History Upper 20’s Share In ATV; SxS Estimated 40 Share Overall ORV Share Estimated at mid 30’s 5 |
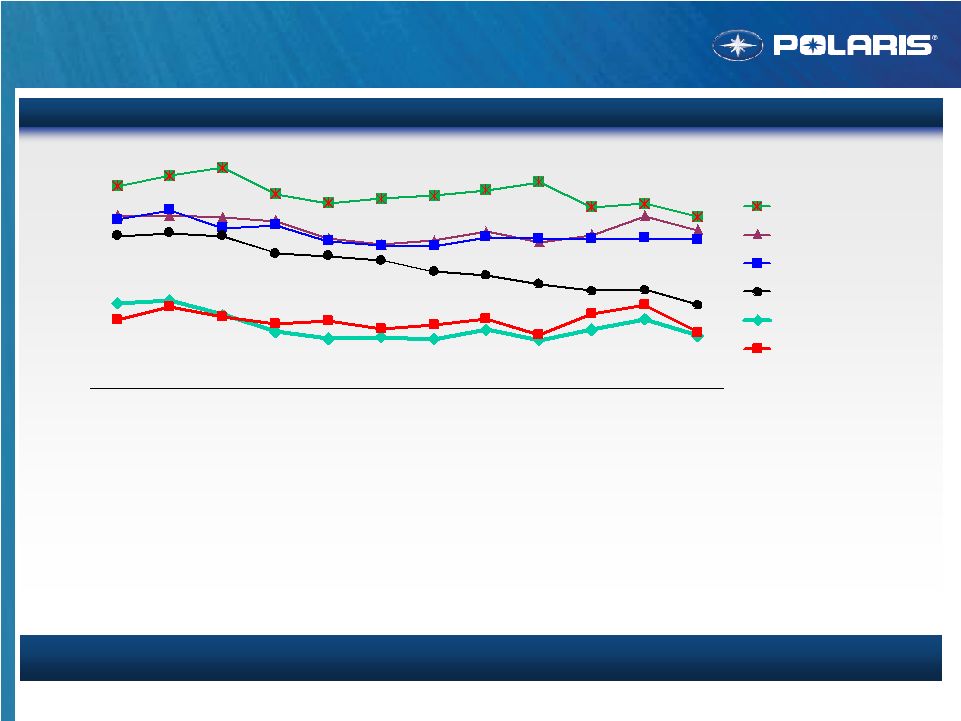
 Source: Crocker Data Honda John Deere Kawasaki Kawasaki Can-Am Arctic Cat John Deere Kubota Kubota Innovation Drives Share Gains Winning the Competitive Battle Winning the Competitive Battle Yamaha 6 |
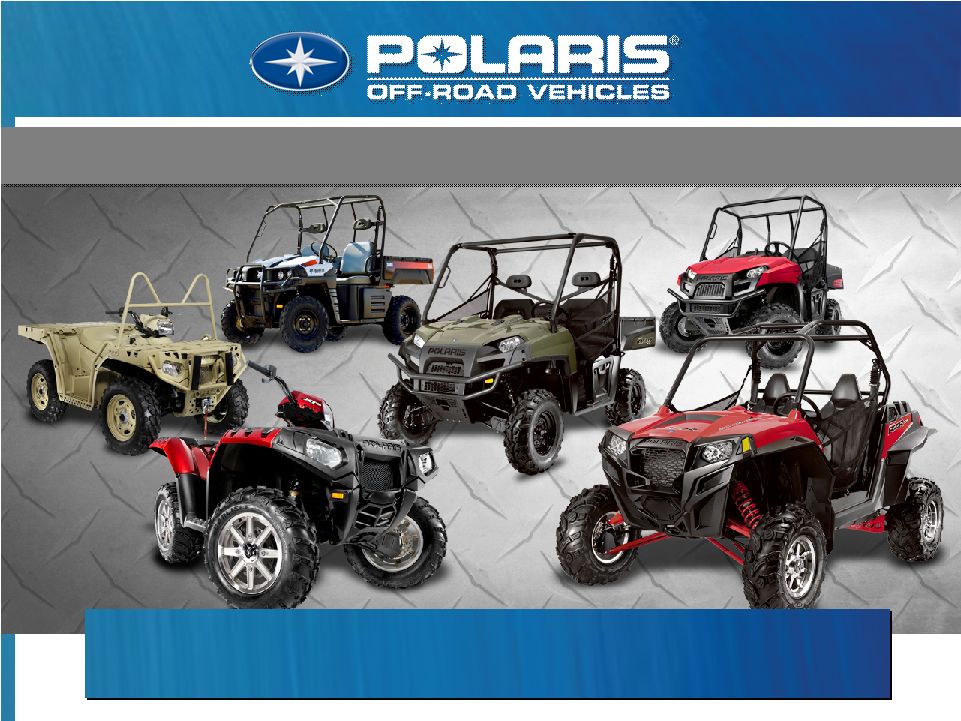
 7 ORV Product Armada Breadth & Depth of Product Offering Innovation Speed to Market Customer Focus |
 RANGER – Consistent incremental growth RZR – Consistent incremental high growth Sportsman – Consistent share growth Military & Bobcat – Adjacent high growth ORV Overall Results 2009 2010 2011 2012 Guidance 8 |
 ORV Growth Plan Aggressive Plan To Maintain Growth Aggressive Plan To Maintain Growth 9 m business p c d v l c |
 10 10 ORV N.A. Dealer Inventory Dealer Inventor y To Support Retail Sales 10 Jan Feb Mar Apr May Jun Jul Aug Sep Oct Nov Dec 2006 Actual 2007 Actual 2008 Actual 2009 Actual 2010 Actual 2011 Actual N.A. dealer inventory up 2% from 2010 ATV dealer inventory down 8% from 2010 Side-by-side inventory up due to continued strong retail demand Some ORV product availability remains tight MVP focus right product to the right market at the right time |
 RZR 570 Trail Value Sportsman 850 H.O. Xtreme Performance RANGER Crew Diesel Multi-Passenger Diesel Even Stronger MY13 Product News MY’12 MY’13 MY’12.5 RZR XP 4 900 Xtreme Performance For 4 STRONG PORTFOLIO, INTEGRATED ARCHITECTURES, SHORT LEAD TIMES STRONG PORTFOLIO, INTEGRATED ARCHITECTURES, SHORT LEAD TIMES ? ? ? Leverage New Products 11 |
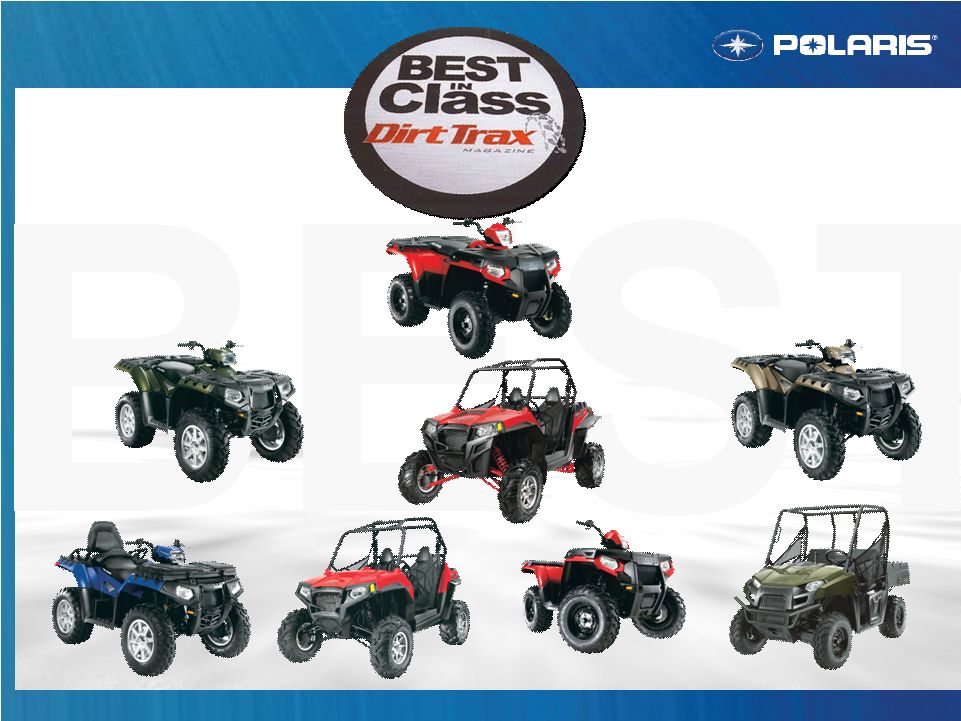 BEST 500 CLASS WINNER BEST 500 CLASS RUNNER UP BEST 2 UP BEST HARDCORE SXS BEST HARDCORE RUNNER UP BEST BIG BORE RUNNER UP BEST 400 CLASS SPORT UTILITY RUNNER UP BEST DUAL PURPOSE UTV RUNNER UP Sportsman 550 EPS Sportsman 500 H.O. Sportsman Touring 850 H.O. Sportsman 400 H.O. RANGER 500 EFI Sportsman 850 H.O. RZR S RZR XP 900 12 |
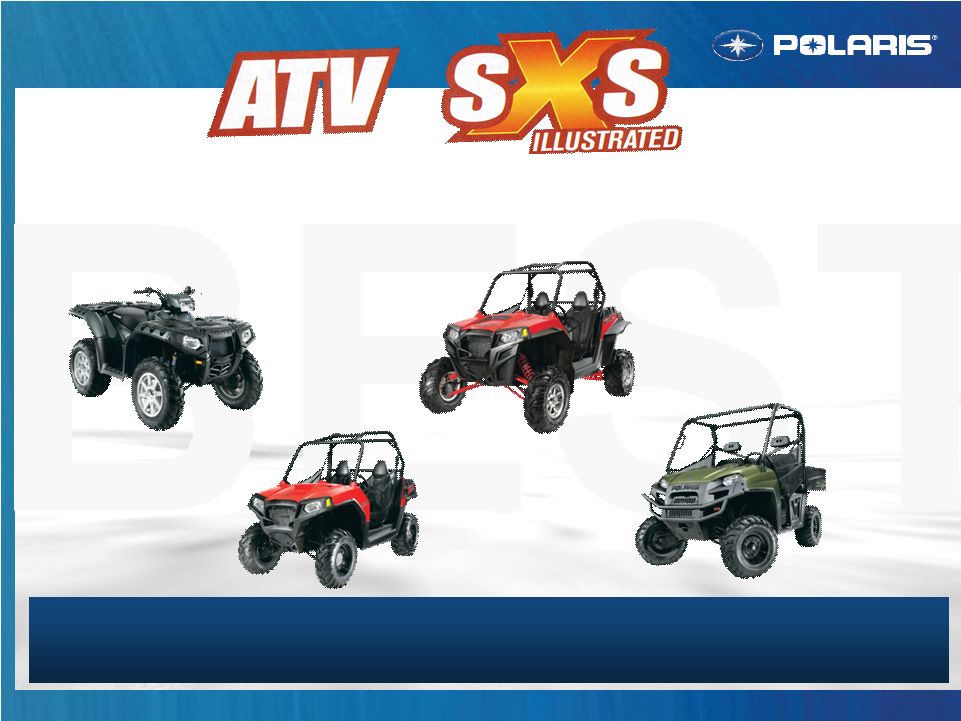 BEST 500 CLASS UTILITY OFF-ROAD VEHICLE OF THE YEAR BEST HIGH-PERFORMANCE SXS BEST RECREATION CLASS SXS Sportsman 550 RZR 570 RZR XP 900 RANGER XP 800 2012 OUTDOOR LIFE EDITORS CHOICE ATV 2012 CONSUMER DIGEST BEST BUY ATV & UTV 13 |
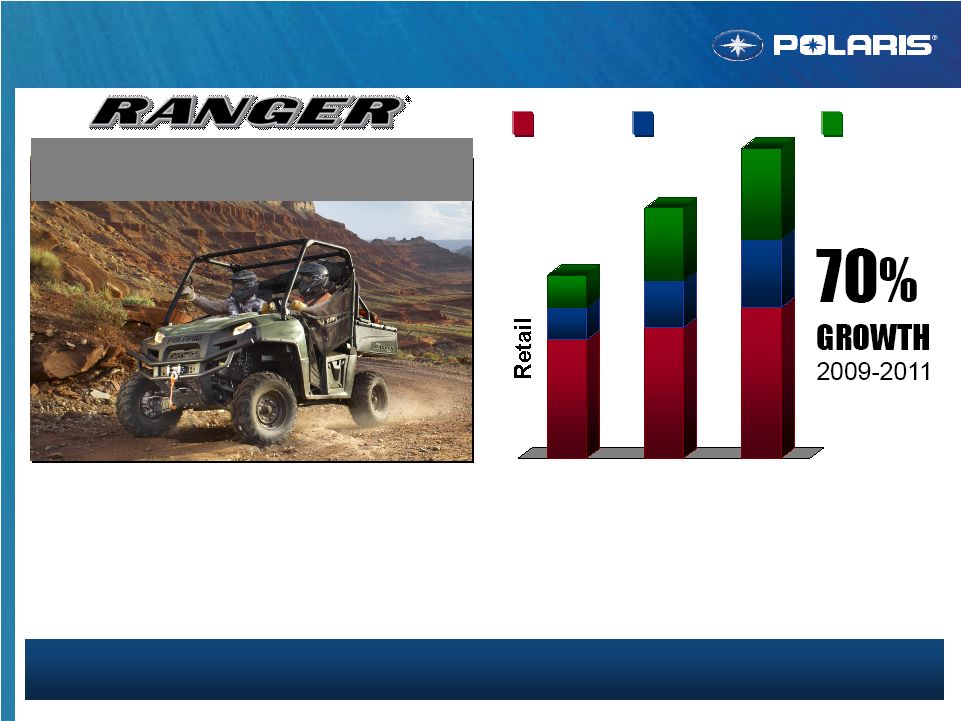    All RANGER segments growing Share growth has been very strong RANGER (no RZR) #1 in SxS by over 2X next closest competitor MY’12 RANGER product and marketing plan positioned well ORV RANGER Retail Results STRONG RETAIL RESULTS – STRONG RETAIL RESULTS – POSITIONED WELL TO CONTINUE POSITIONED WELL TO CONTINUE 2009 2010 2011 Full-Size Multi-Passenger Mid-Size HARDEST WORKING SMOOTHEST RIDING HARDEST WORKING SMOOTHEST RIDING 14 |
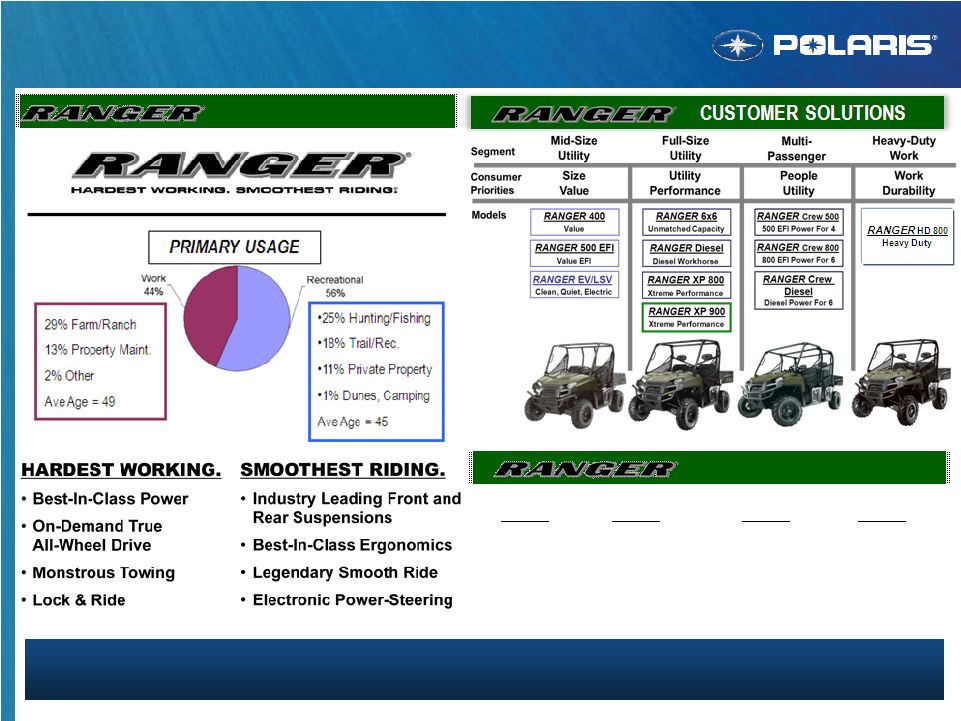 MARKET/BRAND POSITION 2009 2010 2011 2012 WILL CONTINUE TO WIN! XP 700 XP 800 400 Mid EV Diesel 500 EFI Mid Crew 500 Crew Diesel RANGER Family Branding/Positioning NEW SEGMENTS & DOMINANT PRODUCTS DRIVING GROWTH NEW SEGMENTS & DOMINANT PRODUCTS DRIVING GROWTH 15 |
 ATV SxS Bobcat RANGER = Top Customer Improvements Diesel Crew = Incremental Opportunity Limited Editions = Drive Retail Improved Consumer Comfort Hills = HD Engine Braking Incremental Customer International/Military �� Opportunity First Walker Evans RANGER First Mid-Size LEs RANGER MY’12 New Products Are Selling CONSUMER INSIGHTS DRIVE GROWTH CONSUMER INSIGHTS DRIVE GROWTH 16 |
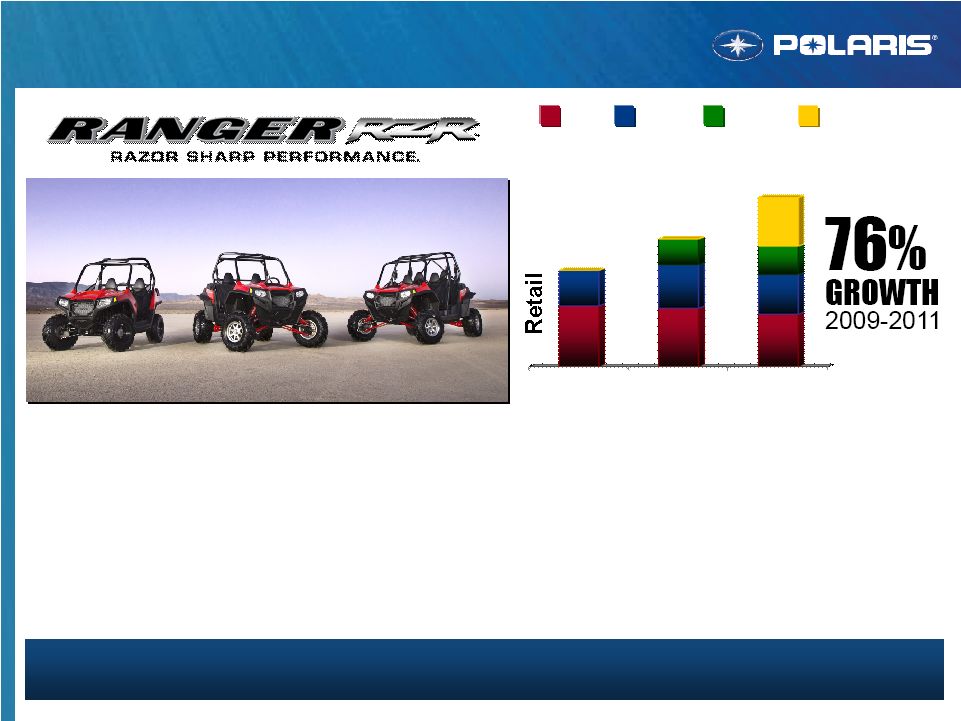 TRAIL TRAIL HIGH HIGH 4-SEAT 4-SEAT PERFORMANCE PERFORMANCE Strong incremental RZR growth as new segments launched Clear leader in all recreation segment RZR (no RANGER) is #2 in SxS market share (behind RANGER) ORV RZR Retail Results INCREMENTAL NEW PLAYS WORKING INCREMENTAL NEW PLAYS WORKING 2009 2010 2011 RZR Trail RZR Sport RZR 4 Seat RZR Extreme 17 |
 POSITIONING + CUSTOMER SOLUTIONS POSITIONING + CUSTOMER SOLUTIONS MARKET / BRAND POSITION MARKET / BRAND POSITION RZR is the ONLY Line of Recreational / Sport SXS’s with 2008 2009 2012 2010 2011 NEW 11/11 WHY WE CONTINUE TO WIN! WHY WE CONTINUE TO WIN! NEW 1/12 CUSTOMERS 1.High Performance & Recreational Enthusiasts 2.Wishes to Involve More People in Experience 3.Not Willing to Compromise Performance for Experience RZR Family Branding / Positioning INDUSTRY LEADING MARKET SEGMENTATION DRIVING GROWTH INDUSTRY LEADING MARKET SEGMENTATION DRIVING GROWTH 18 |
 Post-Launch Driving Awareness FULL GO-TO-MARKET FULL GO-TO-MARKET DEALER, DSM & CONSUMER DEALER, DSM & CONSUMER 19 |
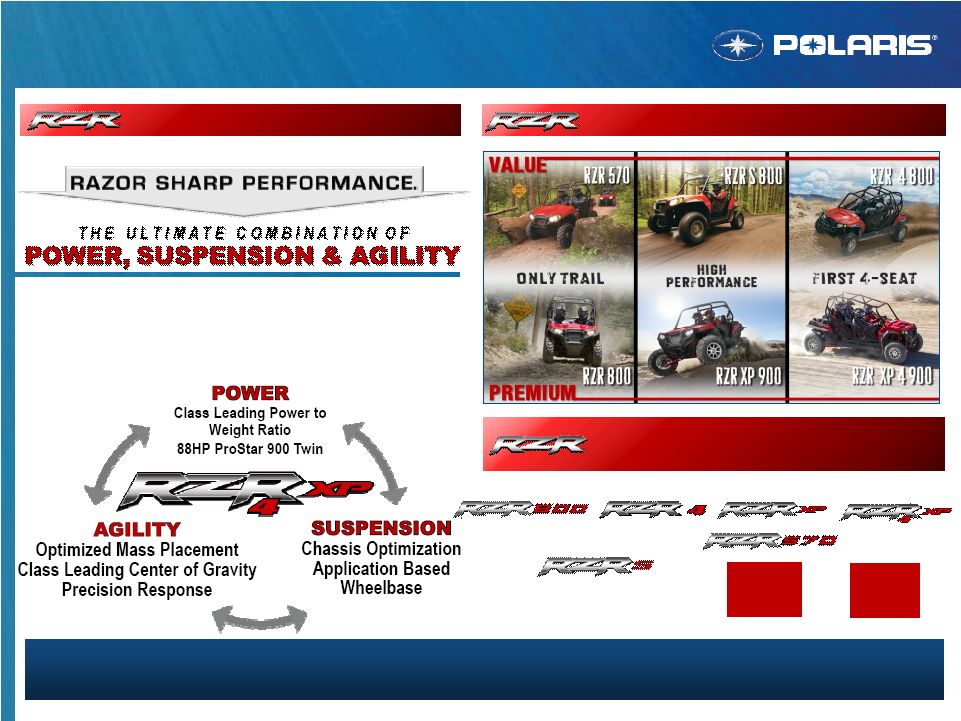
 20 ATV SxS Military Bobcat RZR MY’12 Xtreme Performance For 4 Unmatched Performance & Ride Quality For 4 NEW! RZR XP 4 900 Power – ProStar 900 EFI Engine 88HP twin-cylinder, 4 valve, high revving DOHC Lightweight, compact, durable transmission Suspension – Long Travel 3-Link Trailing Arm Independent Rear Suspension Independent Front A-Arm Suspension Agility Low Center of Gravity, Optimized Mass Placement Wide 64” Stance Ultimate Ride Extended Wheelbase – Pitch Control Premium Suspension – 2.5” Walker Evans Shocks |
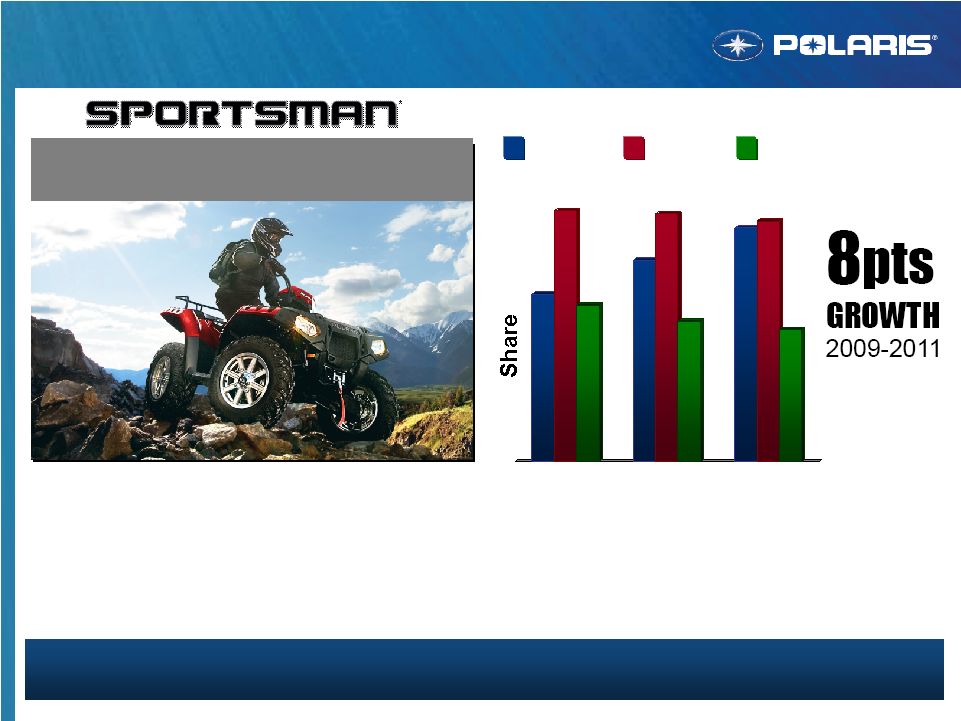    Significant share gains across Sportsman segments Sportsman leads in both “value” and “premium” segments Sportsman 500 H.O. and Sportsman 850 XP HARDEST WORKING SMOOTHEST RIDING ORV ATV Market Share Results SPORTSMAN STRATEGY IS WORKING SPORTSMAN STRATEGY IS WORKING 2009 2010 2011 Polaris Honda Yamaha 21 |
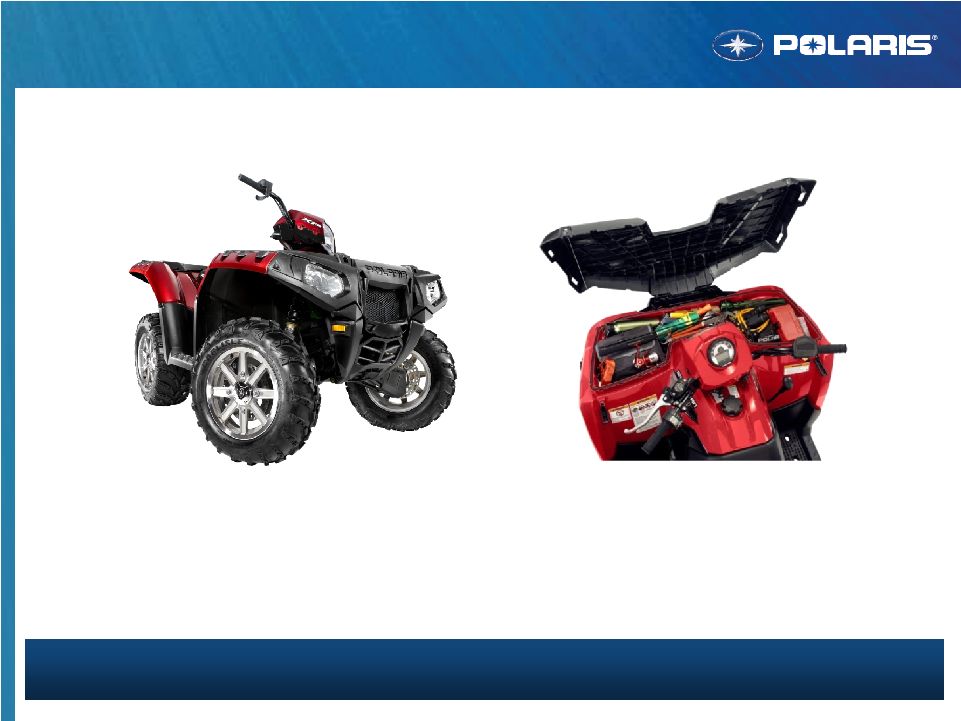 ATV SxS Military Bobcat NEW! MY’12 Sportsman 850 H.0. NEW! MY’12 Sportsman 400, 500, 800 77HP – For the Same Money 20% More Acceleration #1 Customer Request 21% More Capacity New Kenda Tires #2 Customer Request Sportsman MY’12 New Products LISTEN TO OUR CUSTOMERS 22 |
 International Growth EMEA – Continued strong growth, Developing unique market models SxS market hyper growth opportunity APLA – Developing market segments Brazil, China & India building market & establishing partners 2009 2010 2011 23 |
 Military Results Gaining momentum – support Special Operations Force demand Over 4,000 vehicles in theater Industry leader in the ultra light vehicle market Global growth opportunity 2009 2010 2011 POSITIONED FOR GLOBAL GROWTH 24 |
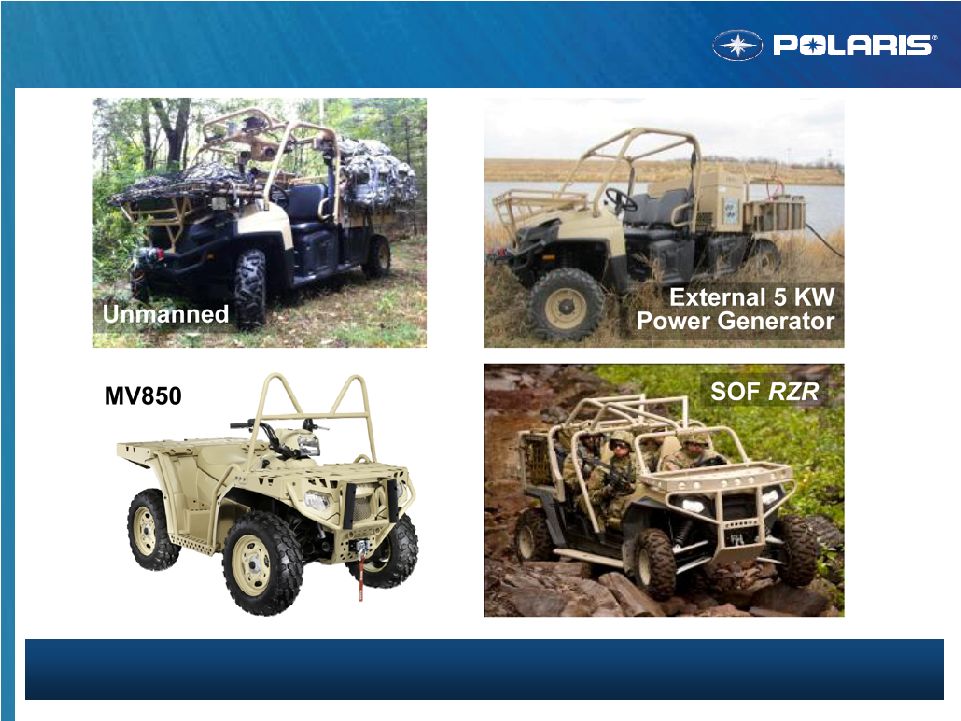 New Military Products #1 POSITION IN ULV MILITARY MARKETS 25 |
 + + Compact Construction Manufacturer 1 1 # # # Off-Road Vehicles Manufacturer 1 1 # # # Bobcat Partnership Results BOBCAT PARTNERSHIP STRATEGY = GROWTH OPPORTUNITY 26 |
 2009 2010 2011 Bobcat Partnership Results BOBCAT DELIVERING RESULTS – POTENTIAL REMAINS $300M market opportunity – Kubota market leader Bobcat retail – gaining momentum CY12 Revenue stable Next level of growth – Bobcat co-developed products on schedule for MY13 impact 27 |
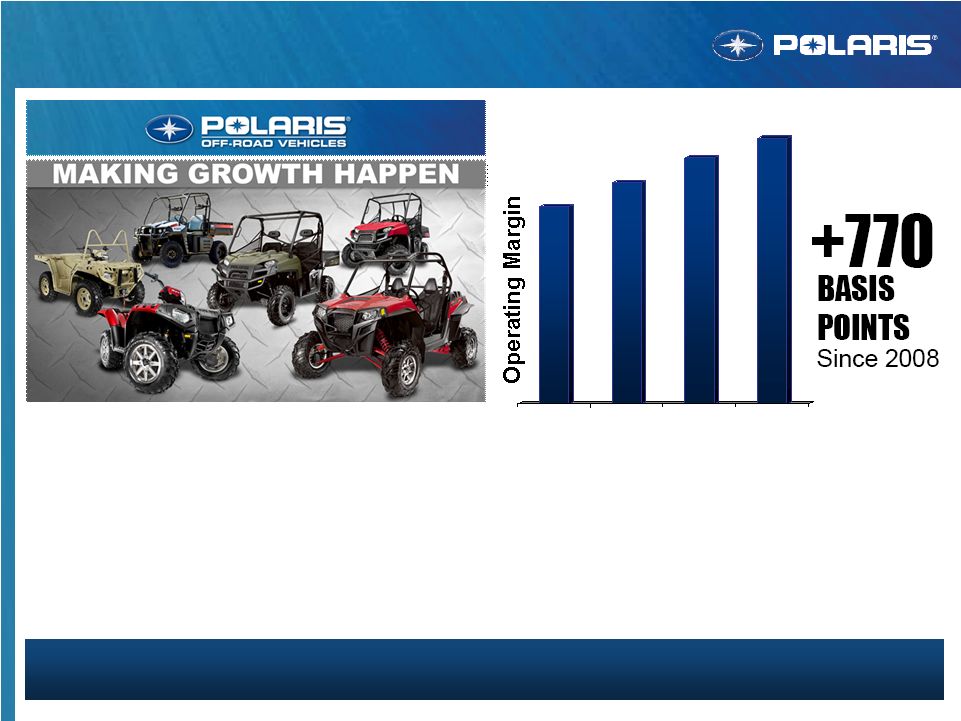 Cost down – engineering and purchasing Pricing – leveraged targeted opportunities (remain competitive) Monterrey – impact just beginning ORV = STRONG MARGIN EXPANSION RESULTS ORV Margin Expansion 2008 2009 2010 2011 28 |
 ATV SxS Military Bobcat Incremental SxS Growth Profitable ATV Share Expand Margins Military Bobcat & Int’l Strong RANGER product plan Strong RZR product plan SxS market has upside Sportsman strong Still room to innovate Margin plan strong Monterrey just starting Proven track record Dealer inventory healthy Gaining momentum Market specific products Next generation platforms ORV Future Strategy Summary THE FUTURE LOOKS BRIGHT FOR OFF-ROAD VEHICLES 29 |
 RANGER MILITARY & BOBCAT RZR SPORTSMAN Positioned well for continued growth Adjacent market growth opportunity Strong product portfolio continued high growth Entry value to high performance multi-passenger Continuing to win INTERNATIONAL Expanding SxS sales, new market opportunities 30 |