UNITED STATES
SECURITIES AND EXCHANGE COMMISSION
WASHINGTON, D.C. 20549
FORM 20-F
(Mark One)
| ¨ | REGISTRATION STATEMENT PURSUANT TO SECTION 12(b) OR (g) OF THE SECURITIES EXCHANGE ACT OF 1934 |
OR
| x | ANNUAL REPORT PURSUANT TO SECTION 13 OR 15(d) OF THE SECURITIES EXCHANGE ACT OF 1934 |
For the fiscal year endedDecember 31, 2012
OR
| ¨ | TRANSITION REPORT PURSUANT TO SECTION 13 OR 15(d) OF THE SECURITIES EXCHANGE ACT OF 1934 |
For the transition period from to
OR
| ¨ | SHELL COMPANY REPORT PURSUANT TO SECTION 13 OR 15(d) OF THE SECURITIES EXCHANGE ACT OF 1934 |
Date of event requiring this shell company report to
Commission file number 001-35222
Abbey National Treasury Services plc
(Exact name of Registrant as specified in its charter)
England
(Jurisdiction of incorporation or organization)
2 Triton Square, Regent’s Place, London NW1 3AN, England
(Address of principal executive offices)
Julian Curtis
2 Triton Square, Regent’s Place, London NW1 3AN, England
Tel +44 (0) 870 607 6000
Fax +44 (0) 20 7756 5628
(Name, Telephone, Email and/or Facsimile number and Address of Company Contact Person)
Securities registered or to be registered pursuant to Section 12(b) of the Act.
| | |
| 4.000% Notes due 2016 | | New York Stock Exchange |
| 2.875% Notes due 2014 | | New York Stock Exchange |
| Floating Rate Notes due 2014 | | New York Stock Exchange |
Securities registered or to be registered pursuant to Section 12 (g) of the Act.
None.
Securities registered or to be registered pursuant to Section 15 (d) of the Act.
None.
Indicate the number of outstanding shares of each of the issuer’s classes of capital or common stock as of the close of the period covered by the annual report.
| | |
| Ordinary shares of nominal value of £1 each* | | 2,549,000,000 |
| * | All of the issued and outstanding ordinary shares of Abbey National Treasury Services plc are held by Santander UK plc |
Indicate by check mark if the registrant is a well-known seasoned issuer, as defined in Rule 405 of the Securities Act. Yes x No ¨
If this report is an annual or transition report, indicate by check mark if the registrant is not required to file reports pursuant to Section 13 or 15(d) of the Securities Exchange Act of 1934. Yes ¨ No x
Indicate by check mark whether the registrant: (1) has filed all reports required to be filed by Section 13 or 15(d) of the Securities Exchange Act of 1934 during the preceding 12 months (or for such shorter period that the registrant was required to file such reports), and (2) has been subject to such filing requirements for the past 90 days. Yes x No ¨
Indicate by check mark whether the registrant has submitted electronically and posted on its corporate Web site, if any, every Interactive Data File required to be submitted and posted pursuant to Rule 405 of Regulation S-T (§232.405 of this chapter) during the preceding 12 months (or for such shorter period that the registrant was required to submit and post such files). Yes ¨ No ¨
Indicate by check mark whether the registrant is a large accelerated filer, an accelerated filer, or a non-accelerated filer. See definition of “accelerated filer and large accelerated filer��� in Rule 12b-2 of the Exchange Act. (Check one):
| | | | |
| Large accelerated filer ¨ | | Accelerated filer ¨ | | Non-accelerated filer x |
Indicate by check mark which basis of accounting the registrant has used to prepare the financial statements included in this filing:
| | | | |
| ¨ U.S. GAAP | | x International Financial Reporting Standards as issued by the International Accounting Standards Board | | ¨ Other |
If “Other” has been checked in response to the previous question, indicate by check mark which financial statement item the registrant has elected to follow. Item 17 ¨ Item 18 ¨
If this is an annual report, indicate by check mark whether the registrant is a shell company (as defined in Rule 12b-2 of the Exchange Act). Yes ¨ No x
2012 Annual Report on Form 20-F
Abbey National Treasury Services plc
PART OF THE SANTANDER GROUP
This page intentionally left blank
Abbey National Treasury Services plc
2012 Annual Report on Form 20-F
Index
| | |
Abbey National Treasury Services plc 2012 Annual Report | | 1 |
Our Business and Our Strategy
Our Business
Abbey National Treasury Services plc (the ‘Company’) and its subsidiaries (together, ‘ANTS’ or the ‘ANTS group’) operate primarily in the UK, under UK law and regulation and are part of the Santander UK group (together with its subsidiaries, ‘Santander UK’ or the ‘Santander UK group’) which is, in turn, part of the Banco Santander, S.A. group (together with its subsidiaries, the ‘Banco Santander group’). Banco Santander, S.A. is incorporated in Spain and is the ultimate parent company of ANTS.
Corporate purpose
ANTS provides treasury, corporate and wholesale banking services. ANTS provides these services to UK clients and also to the wider Santander UK group, of which ANTS is a significant part. ANTS is also the treasury support function for the Santander UK group. In this regard, ANTS’s role is to provide access to financial markets and central bank facilities in order to meet the Santander UK group’s liquidity, funding, capital and balance sheet management requirements. As such, ANTS is one of the main debt issuance vehicles in the Santander UK group.
ANTS contains part of a number of Santander UK’s business segments. Whether transactions are booked in ANTS or another Santander UK group entity reflects historical or operational reasons and does not necessarily reflect any particular business split.
The Company has given a full and unconditional guarantee in respect of the unsubordinated liabilities of Santander UK plc incurred prior to 30 June 2015 under a deed poll guarantee entered into by the Company on 10 May 2012. Santander UK plc has given a reciprocal guarantee in respect of the unsubordinated liabilities of the Company incurred prior to 30 June 2015.
As a result of these guarantees, the results and creditworthiness of ANTS should not be viewed in isolation. Account should also be taken of the position of the Santander UK group into which the assets and liabilities of ANTS are fully consolidated.
ANTS has also entered into agreements to provide capital and/or liquidity to Santander UK plc and other members of the Santander UK group, in accordance with UK regulatory requirements. For further details, see Note 44 to the Consolidated Financial Statements.
Business structure
ANTS is headed by Luis de Sousa, Chief Executive Officer of ANTS plc with the management structure consisting of three main business divisions, organised as follows:
| | |
Business division | | About |
Corporate Banking | | Corporate Banking offers a wide range of products and financial services to UK companies. Corporate Banking products and services include loans, bank accounts, deposits, and treasury services. The Large Corporates business offers specialist treasury services in fixed income and foreign exchange, lending, transactional banking services, capital markets and money markets to large multinational corporate customers. Lending includes syndicated loans and structured finance. Transactional banking includes trade finance and cash management. Money market activities include securities lending/borrowing and repos. |
| |
Markets | | Markets offers risk management and other services to financial institutions, as well as other Santander UK divisions. Its main product areas are fixed income and foreign exchange, equity, capital markets and institutional sales. |
| |
Corporate Centre | | Corporate Centre consists of Financial Management & Investor Relations (‘FMIR’, formerly known as Asset and Liability Management) and the non-core portfolios of social housing loans and structured credit assets. FMIR is responsible for managing capital and funding, balance sheet composition, structural market risk and strategic liquidity risk for the rest of the Santander UK group. The non-core portfolios are being run-down and/or managed for value. |
| | |
| 2 | | Abbey National Treasury Services plc 2012 Annual Report |
Our Business and Our Strategy
Our Businesscontinued
Our history
Abbey National Treasury Services plc was established in 1989 for the purpose of managing the liquidity, risk management and wholesale banking needs of Abbey National plc (subsequently renamed Santander UK plc) and its subsidiaries.
In 1997, Abbey National plc acquired the business and assets of Cater Allen Holdings plc (“CAH”) for £195m. The synergies between the ANTS group and the Cater Allen business provided the ANTS group with opportunities for growth in strategically important markets with Cater Allen’s principal businesses comprising money markets, a sharedealing service and onshore and offshore retail banking.
In 2010, all of the business and assets of Cater Allen International Limited, a subsidiary of CAH, and a significant participant in the repo and wholesale money markets, were transferred to the Company. The principal purpose of the transfer was to increase the efficiency of the ANTS group and the Santander UK group. No gain or loss was recognised on the transfer.
On 12 November 2004, Banco Santander, S.A., a company incorporated in Spain, completed the acquisition of the entire issued ordinary share capital of the parent company of ANTS, Santander UK plc, at which point the Company became an indirect subsidiary of Banco Santander, S.A..
Our Strategy
ANTS’s strategy is to continue to provide treasury support functions for the Santander UK group and to provide treasury, corporate and wholesale banking services to UK clients.
The structural relationship of ANTS and Santander UK with the Banco Santander group – the ‘subsidiary model’
The Banco Santander group operates a ‘subsidiary model’. This model involves autonomous units, such as the Santander UK group (of which ANTS is a part) operating in core markets with each unit being responsible for its own liquidity, funding and capital management on an ongoing basis. The model is designed to minimise the risk to the Banco Santander group and all its units from problems arising elsewhere in the Banco Santander group. The subsidiary model means that Banco Santander, S.A. has no obligation to provide any liquidity, funding or capital assistance, although it enables Banco Santander, S.A. to selectively take advantage of opportunities. As an FSA regulated group, the Santander UK group is expected to satisfy the FSA liquidity and capital requirements on a standalone basis.
Under the subsidiary model, the Santander UK group primarily generates funding and liquidity through UK retail and corporate deposits, as well as in the financial markets through its own debt programmes and facilities to support its business activities and liquidity requirements. It does this in reliance on the strength of its own balance sheet and profitability and its own network of investors. The Santander UK group does not rely on a guarantee from Banco Santander, S.A. or any other member of the Banco Santander group to generate this funding or liquidity. The Santander UK group does not raise funds to finance other members of the Banco Santander group or guarantee the debts of other members of the Banco Santander group.
Exposures to other Banco Santander group members are established and managed on an arm’s length commercial basis. All intergroup transactions are monitored by the Board Risk Committee of Santander UK and transactions which are not in the ordinary course of business must be pre-approved by the Board. In addition, the Santander UK group is subject to FSA limits on exposures to, and on liquidity generated from, other members of the Banco Santander group.
| | |
Abbey National Treasury Services plc 2012 Annual Report | | 3 |
Business Review
Group Performance and Divisional Results
GROUP SUMMARY
KEY PERFORMANCE INDICATORS
Key performance indicators are set at the Santander UK group level, rather than separately for the ANTS group.
SUMMARISED CONSOLIDATED INCOME STATEMENT
| | | | | | | | | | | | |
| | | 2012
£m | | | 2011(1)
£m | | | 2010
£m | |
Net interest income | | | 139 | | | | 511 | | | | 403 | |
Non-interest income | | | 423 | | | | 67 | | | | 490 | |
| | | | | | | | | | | | |
Total operating income | | | 562 | | | | 578 | | | | 893 | |
| | | | | | | | | | | | |
Administrative expenses | | | (198 | ) | | | (229 | ) | | | (209 | ) |
Depreciation, amortisation and impairment | | | (3 | ) | | | (7 | ) | | | (6 | ) |
| | | | | | | | | | | | |
Total operating expenses excluding provisions and charges | | | (201 | ) | | | (236 | ) | | | (215 | ) |
| | | | | | | | | | | | |
Impairment losses on loans and advances | | | (9 | ) | | | (54 | ) | | | (69 | ) |
Provisions for other liabilities and charges | | | (20 | ) | | | (20 | ) | | | — | |
| | | | | | | | | | | | |
Total operating provisions and charges | | | (29 | ) | | | (74 | ) | | | (69 | ) |
| | | | | | | | | | | | |
Profit before tax | | | 332 | | | | 268 | | | | 609 | |
Taxation charge | | | (68 | ) | | | (104 | ) | | | (149 | ) |
| | | | | | | | | | | | |
Profit for the year | | | 264 | | | | 164 | | | | 460 | |
| | | | | | | | | | | | |
| (1) | As restated, see Note 45 |
2012 compared to 2011
Profit before tax increased by £64m to £332m (2011: £268m). ANTS remained profitable in 2012, maintaining the strong track record of profitability and strengthening of the balance sheet. Profit before tax continued to be adversely impacted by structural market conditions, primarily low interest rates and increased term funding costs, which were more than offset by reversals of credit spread losses in 2011 on loans to UK social housing associations held at fair value. Material movements by line:
| | • | | Net interest income decreased by £372m to £139m (2011: £511m). The key drivers of the decrease were sustained lower interest rates which reduced income earned on the structural hedges put in place in 2008-2009 and now maturing in a much lower, static environment, and the increased cost of term funding. This was partially offset by increased net interest income driven by growth in corporate customer lending. Interest margins on new loans continued to improve as market pricing better reflected incremental higher funding and liquidity costs, even though the launch of the FLS in the last quarter of 2012 reduced funding costs and had a negative impact on asset pricing. |
| | • | | Non-interest income increased by £356m to £423m (2011: £67m), principally due to changes in the fair value of loans to UK social housing associations that are accounted for at fair value through profit or loss. In 2012, the mark-to-market movement amounted to £182m compared with a mark-to-market loss of £307m in 2011. The loss in 2011 was due to increased credit spreads, which partially reversed in 2012. Additional increases were driven by volume growth in the Large Corporate business, and a solid performance in Markets, with a much improved performance from the fixed income and equity businesses. This was partly offset by lower market volumes principally affecting the financial institutions business, decreases in money markets business, and increased costs associated with operational liquidity management. |
| | • | | Administrative expenses decreased by £31m to £198m (2011: £229m). The decrease was due to lower Markets staff remuneration costs, tight cost control in Corporate Banking and the delivery of efficiency savings in Corporate Centre. This was partially offset by continued investment in the growth of the Corporate Banking business. |
| | • | | Depreciation, amortisation and impairment costs decreased by £4m to £3m (2011: £7m), due to the relevant assets coming to the end of their useful lives. |
| | • | | Impairment losses on loans and advances decreased by £45m to £9m (2011: £54m), due to no new significant non performing loans being identified in 2012. |
| | • | | Provisions for other liabilities and charges were unchanged at £20m (2011: £20m) and primarily reflected provisions made in respect of the UK Bank Levy. |
| | • | | The taxation charge decreased by £36m to £68m (2011: £104m) as a result of an increase in credits in respect of non-equalised items (such as index-linked gilts) partially offset by an increase in pre-tax profits. |
| | |
| 4 | | Abbey National Treasury Services plc 2012 Annual Report |
Business Review
Group Performance and Divisional Results continued
2011 compared to 2010
Profit before tax decreased by £341m to £268m (2010: £609m). Material movements by line:
| | • | | Net interest income increased by £108m to £511m (2010: £403m). The key driver of the increase was the change in the funding mix which resulted in a reduction in net interest expense driven by reduction in funding through debt securities in issue. The debt securities were replaced by debt issuances held at fair value for which the expense is recognised in non-interest income. In addition, net interest income increased as a result of growth in corporate customer loans at a higher new business margin. |
| | • | | Non-interest income decreased by £423m to £67m (2010: £490m), driven by changes in the fair value of loans to UK social housing associations that are accounted for at fair value through profit or loss. In 2011, the mark-to-market loss amounted to £307m compared with a mark-to-market loss of £26m in 2010. The increased loss in 2011 was due to widening credit spreads. The remaining decrease of £166m was primarily driven by the change in funding mix as described above and due to reduced results in the market making desks driven by weak trading activities. A weaker trading environment reduced the results of the Markets businesses due to reduced volumes (linked to the sale of retail structured products through the Santander UK branch network). This was partially offset by growth with institutional clients and increased non-interest income generated by growing the loans business, supported by the short-term markets business and interest rate related sales. |
| | • | | Administrative expenses increased by £20m to £229m (2010: £209m), reflecting ongoing investment in the business. In Markets, investment related to new products, markets and customer segments. In Corporate Banking, investment focused on extending the product capability for customers. |
This was partially offset by an additional pension contribution made in 2010 relating to costs of the Santander UK defined benefit pension scheme not repeated in 2011, and the effect of operating cost savings in Corporate Centre.
| | • | | Depreciation and amortisation increased slightly by £1m to £7m (2010: £6m). |
| | • | | Impairment losses on loans and advances decreased by £15m to £54m (2010: £69m), due to lower losses experienced in Corporate Banking as transactions that originated at the peak of the market were either repaid or had already become NPLs in prior years. |
| | • | | Provisions for other liabilities and charges increased by £20m to £20m (2010: £nil), reflecting the introduction of the UK Bank Levy in 2011. |
| | • | | The taxation charge decreased by £45m to £104m (2010: £149m) as a result of the reduction in pre-tax profits partially offset by adjustments in respect of prior periods. |
THE ECONOMY
The UK economy experienced a volatile quarterly pattern of headline GDP during 2012, with almost no economic growth over the year as a whole. There was, however, a more positive employment picture, with total employment rising by 584,000 in the year and the unemployment rate falling from 8.4% to 7.8% over the same period.
In a year of continued economic uncertainty, especially with regards to the prospects for the eurozone, and with growth below expectations, additional quantitative easing was announced during the year by the Bank of England’s Monetary Policy Committee to support the economy. With a contraction in GDP of 0.3% in the final quarter of the year, the process of reducing the high level of public sector borrowing continuing and demand for credit remaining subdued, the Bank of England also announced a new policy measure in the form of the FLS. The consensus view at the start of 2013 is that the UK economy is likely to see growth of around 1%, giving another year of below trend growth, so this is likely to continue to be a challenging environment for households, companies and the banking sector.
LOOKING AHEAD
Despite significant economic and regulatory headwinds, we believe ANTS is well placed for the year ahead. In 2013, we will continue to invest in transforming our business to improve customer experience alongside our focus on efficiency. We are committed to growing our corporate banking business organically, by expanding its presence around the UK, hiring additional relationship managers and improving its capabilities. Our aim is to increase our market share to 8% across the Santander UK group in the medium-term. Alongside this, we will maintain our focus on improving productivity and efficiency.
We look forward to greater clarity on regulatory requirements regarding capital, liquidity, conduct and governance, as this will give us the certainty we need to continue to serve our customers and support the UK economy.
| | |
Abbey National Treasury Services plc 2012 Annual Report | | 5 |
Business and Financial Review
Group Performance and Divisional Resultscontinued
Critical factors affecting results
The preparation of our Consolidated Financial Statements requires management to make estimates and judgements that affect the reported amount of assets and liabilities at the balance sheet date and the reported amount of income and expenses during the reporting period. Management evaluates its estimates and judgements on an ongoing basis. Management bases its estimates and judgements on historical experience and other factors believed to be reasonable under the circumstances. Actual results may differ from these estimates under different assumptions or conditions. Estimates and judgements that are considered important to the portrayal of our financial condition including, where applicable, quantification of the effects of reasonably possible ranges of such estimates are set out in “Critical Accounting Policies” in Note 1 to the Consolidated Financial Statements.
This rest of this section contains a summary of the results, and commentary thereon, by Income Statement line item for each segment.
Basis of results presentation
The information in this Business and Financial Review reflects the reporting structure in place at the reporting date in accordance with which the segmental information in Note 2 to the Consolidated Financial Statements has been presented. The Company’s board of directors (the ‘Board’) is the chief operating decision maker for the ANTS group. The segment information below is presented on the basis used by the Board to evaluate performance and allocate resources. The Board reviews discrete financial information for each segment of the business which follows the ANTS group’s normal accounting policies and principles, including measures of operating results, assets and liabilities. The prior years’ segmental analyses have been adjusted to reflect the fact that reportable segments have changed, as described in Note 2.
PROFIT BEFORE TAX BY SEGMENT
| | | | | | | | | | | | | | | | |
31 December 2012 | | Corporate
Banking
£m | | | Markets
£m | | | Corporate
Centre
£m | | | Total
£m | |
Net interest income/(expense) | | | 93 | | | | (6 | ) | | | 52 | | | | 139 | |
Non-interest income/(expense) | | | 271 | | | | 184 | | | | (32 | ) | | | 423 | |
| | | | | | | | | | | | | | | | |
Total operating income | | | 364 | | | | 178 | | | | 20 | | | | 562 | |
| | | | | | | | | | | | | | | | |
Administration expenses | | | (84 | ) | | | (98 | ) | | | (16 | ) | | | (198 | ) |
Depreciation, amortisation and impairment | | | (1 | ) | | | (2 | ) | | | — | | | | (3 | ) |
| | | | | | | | | | | | | | | | |
Total operating expenses excluding provisions and charges | | | (85 | ) | | | (100 | ) | | | (16 | ) | | | (201 | ) |
| | | | | | | | | | | | | | | | |
Impairment losses on loans and advances | | | (9 | ) | | | — | | | | — | | | | (9 | ) |
Provisions for other liabilities and charges | | | (2 | ) | | | (2 | ) | | | (16 | ) | | | (20 | ) |
| | | | | | | | | | | | | | | | |
Total operating provisions and charges | | | (11 | ) | | | (2 | ) | | | (16 | ) | | | (29 | ) |
| | | | | | | | | | | | | | | | |
Profit/(loss) before tax | | | 268 | | | | 76 | | | | (12 | ) | | | 332 | |
| | | | | | | | | | | | | | | | |
| | | | | | | | | | | | | | | | |
31 December 2011 | | Corporate
Banking
£m | | | Markets
£m | | | Corporate
Centre
£m | | | Total(1)
£m | |
Net interest income/(expense) | | | 75 | | | | (3 | ) | | | 439 | | | | 511 | |
Non-interest income/(expense) | | | 275 | | | | 162 | | | | (370 | ) | | | 67 | |
| | | | | | | | | | | | | | | | |
Total operating income | | | 350 | | | | 159 | | | | 69 | | | | 578 | |
| | | | | | | | | | | | | | | | |
Administration expenses | | | (95 | ) | | | (109 | ) | | | (25 | ) | | | (229 | ) |
Depreciation, amortisation and impairment | | | (3 | ) | | | (2 | ) | | | (2 | ) | | | (7 | ) |
| | | | | | | | | | | | | | | | |
Total operating expenses excluding provisions and charges | | | (98 | ) | | | (111 | ) | | | (27 | ) | | | (236 | ) |
| | | | | | | | | | | | | | | | |
Impairment losses on loans and advances | | | (54 | ) | | | — | | | | — | | | | (54 | ) |
Provisions for other liabilities and charges | | | (3 | ) | | | (3 | ) | | | (14 | ) | | | (20 | ) |
| | | | | | | | | | | | | | | | |
Total operating provisions and charges | | | (57 | ) | | | (3 | ) | | | (14 | ) | | | (74 | ) |
| | | | | | | | | | | | | | | | |
Profit before tax | | | 195 | | | | 45 | | | | 28 | | | | 268 | |
| | | | | | | | | | | | | | | | |
| | | | | | | | | | | | | | | | |
31 December 2010 | | Corporate
Banking
£m | | | Markets
£m | | | Corporate
Centre
£m | | | Total
£m | |
Net interest income | | | 68 | | | | — | | | | 335 | | | | 403 | |
Non-interest income | | | 220 | | | | 221 | | | | 49 | | | | 490 | |
| | | | | | | | | | | | | | | | |
Total operating income | | | 288 | | | | 221 | | | | 384 | | | | 893 | |
| | | | | | | | | | | | | | | | |
Administration expenses | | | (89 | ) | | | (74 | ) | | | (46 | ) | | | (209 | ) |
Depreciation, amortisation and impairment | | | (1 | ) | | | (2 | ) | | | (3 | ) | | | (6 | ) |
| | | | | | | | | | | | | | | | |
Total operating expenses excluding provisions and charges | | | (90 | ) | | | (76 | ) | | | (49 | ) | | | (215 | ) |
| | | | | | | | | | | | | | | | |
Impairment losses on loans and advances | | | (69 | ) | | | — | | | | — | | | | (69 | ) |
| | | | | | | | | | | | | | | | |
Total operating provisions and charges | | | (69 | ) | | | — | | | | — | | | | (69 | ) |
| | | | | | | | | | | | | | | | |
Profit before tax | | | 129 | | | | 145 | | | | 335 | | | | 609 | |
| | | | | | | | | | | | | | | | |
| (1) | As restated, see Note 45 |
| | |
| 6 | | Abbey National Treasury Services plc 2012 Annual Report |
Business Review
Group Performance and Divisional Results continued
CORPORATE BANKING
Corporate Banking offers a wide range of products and financial services to UK companies. Corporate Banking products and services include loans, bank accounts, deposits, and treasury services.
The Large Corporates business offers specialist treasury services in fixed income and foreign exchange, lending, transactional banking services, capital markets and money markets to large multinational corporate customers. Lending includes syndicated loans and structured finance. Transactional banking includes trade finance and cash management. Money market activities include securities lending/borrowing and repos.
Summarised income statement
| | | | | | | | | | | | |
| | | 2012
£m | | | 2011
£m | | | 2010
£m | |
Net interest income | | | 93 | | | | 75 | | | | 68 | |
Non-interest income | | | 271 | | | | 275 | | | | 220 | |
| | | | | | | | | | | | |
Total operating income | | | 364 | | | | 350 | | | | 288 | |
| | | | | | | | | | | | |
Administration expenses | | | (84 | ) | | | (95 | ) | | | (89 | ) |
Depreciation, amortisation and impairment | | | (1 | ) | | | (3 | ) | | | (1 | ) |
| | | | | | | | | | | | |
Total operating expenses excluding provisions and charges | | | (85 | ) | | | (98 | ) | | | (90 | ) |
| | | | | | | | | | | | |
Impairment losses on loans and advances | | | (9 | ) | | | (54 | ) | | | (69 | ) |
Provisions for other liabilities and charges | | | (2 | ) | | | (3 | ) | | | — | |
| | | | | | | | | | | | |
Total operating provisions and charges | | | (11 | ) | | | (57 | ) | | | (69 | ) |
| | | | | | | | | | | | |
Profit before tax | | | 268 | | | | 195 | | | | 129 | |
| | | | | | | | | | | | |
Corporate Banking profit before tax
2012 compared to 2011
Profit before tax increased by £73m to £268m (2011: £195m). By income statement line, the movements were:
| | • | | Net interest income increased by £18m to £93m (2011: £75m) as a result of growth in customer lending. Interest margins on new loans continued to improve as market pricing better reflected incremental higher funding and liquidity costs, albeit the launch of the Funding for Lending Scheme (‘FLS’) in the last quarter of 2012 reduced funding costs and had a negative impact on asset pricing. |
| | • | | Non-interest income decreased by £4m to £271m (2011: £275m). Volume growth in the Large Corporate businesses resulted in an increase in non-interest income from treasury services. This was more than offset by lower income in retail structured products and money markets, reflecting volatile markets. |
| | • | | Administration expenses decreased by £11m to £84m (2011: £95m). The decrease reflected tight cost control during the year, partially offset by continued investment in the growth of business. |
| | • | | Depreciation and amortisation expenses were broadly flat at £1m (2011: £3m). |
| | • | | Impairment losses on loans and advances decreased by £45m to £9m (2011: £54m), due to no new significant non performing loans being identified in 2012. |
| | • | | Provisions for other liabilities and charges of £2m reflected the divisional allocation of provisions made in respect of the UK Bank Levy and remained broadly in line with 2011. |
| | |
Abbey National Treasury Services plc 2012 Annual Report | | 7 |
Business and Financial Review
Group Performance and Divisional Resultscontinued
2011 compared to 2010
Profit before tax increased by £66m to £195m (2010: £129m). By income statement line, the movements were:
| | • | | Net interest income increased by £7m to £75m (2010: £68m). Net interest income increased as a result of growth in customer loans at higher new business margins. |
| | • | | Non-interest income increased by £55m to £275m (2010: £220m), generated by growing the loans business, supported by the short-term markets business and interest rate related sales. In addition, underlying volume growth resulted in increased income from treasury services. |
| | • | | Administrative expenses increased by £6m to £95m (2010: £89m). The increase reflected investment focused on extending the product capability for customers, partially offset by some operating cost savings. |
| | • | | Depreciation and amortisation expenses were broadly flat at £3m (2010: £1m). |
| | • | | Impairment losses on loans and advances decreased by £15m to £54m (2010: £69m), due to lower losses experienced in Corporate Banking as transactions that originated at the peak of the market were either repaid or had already become NPLs in prior years. |
| | • | | Provisions for other liabilities and charges increased by £3m to £3m (2010: £nil), reflecting the introduction of the UK Bank Levy in 2011. |
| | |
| 8 | | Abbey National Treasury Services plc 2012 Annual Report |
Business Review
Group Performance and Divisional Resultscontinued
MARKETS
Markets offers risk management and other services to financial institutions, as well as other Santander UK divisions. Its main product areas are fixed income and foreign exchange, equity, capital markets and institutional sales.
Summarised income statement
| | | | | | | | | | | | |
| | | 2012
£m | | | 2011
£m | | | 2010
£m | |
Net interest expense | | | (6 | ) | | | (3 | ) | | | — | |
Non-interest income | | | 184 | | | | 162 | | | | 221 | |
| | | | | | | | | | | | |
Total operating income | | | 178 | | | | 159 | | | | 221 | |
| | | | | | | | | | | | |
Administration expenses | | | (98 | ) | | | (109 | ) | | | (74 | ) |
Depreciation, amortisation and impairment | | | (2 | ) | | | (2 | ) | | | (2 | ) |
| | | | | | | | | | | | |
Total operating expenses excluding provisions and charges | | | (100 | ) | | | (111 | ) | | | (76 | ) |
| | | | | | | | | | | | |
Provisions for other liabilities and charges | | | (2 | ) | | | (3 | ) | | | — | |
| | | | | | | | | | | | |
Total operating provisions and charges | | | (2 | ) | | | (3 | ) | | | — | |
| | | | | | | | | | | | |
Profit before tax | | | 76 | | | | 45 | | | | 145 | |
| | | | | | | | | | | | |
Markets profit before tax
2012 compared to 2011
Profit before tax increased by £31m to £76m (2011: £45m). By income statement line, the movements were:
| | • | | Net interest expense increased by £3m to £6m (2011: £3m) primarily due to a small increase in funding costs. |
| | • | | Non-interest income increased by £22m to £184m (2011: £162m), largely due to a solid performance in Markets. There was a much improved performance from the fixed income and equity businesses, which was partly offset by lower market volumes principally affecting the financial institutions business. |
| | • | | Administration expenses decreased by £11m to £98m (2011: £109m). The decrease was largely due to lower staff remuneration costs. |
| | • | | Depreciation and amortisation was unchanged at £2m. |
| | • | | Provisions for other liabilities and charges of £2m remained at a very low level (2011: £3m). |
2011 compared to 2010
Profit before tax decreased by £100m to £45m (2010: £145m). By income statement line, the movements were:
| | • | | Net interest expense increased by £3m to £3m (2010: £nil) due to increased funding costs reflecting the higher cost of new wholesale medium-term funding and holding higher liquid asset balances. |
| | • | | Non-interest income decreased by £59m to £162m (2010: £221m), largely due to reduced results in the market making desks driven by weak trading activities. A weaker trading environment reduced the results of the fixed income and foreign exchange, and equity businesses due to reduced volumes (linked to sale of retail structured products through the branch network). This was partially offset by growth with institutional clients. |
| | • | | Administration expenses increased by £35m to £109m (2010: £74m), reflecting ongoing investment in growth initiatives relating to new products, markets and customer segments. There was a 42% headcount increase across the customer transaction businesses compared to 31 December 2010. |
| | • | | Depreciation and amortisation was unchanged at £2m. |
| | • | | Provisions for other liabilities and charges increased by £3m to £3m (2010: £nil), reflecting the introduction of the UK Bank Levy in 2011. |
| | |
Abbey National Treasury Services plc 2012 Annual Report | | 9 |
Business and Financial Review
Group Performance and Divisional Resultscontinued
CORPORATE CENTRE
Corporate Centre consists of Financial Management & Investor Relations (‘FMIR’, formerly known as Asset and Liability Management) and the non-core portfolios of social housing loans and structured credit assets. FMIR is responsible for managing capital and funding, balance sheet composition, structural market risk and strategic liquidity risk for the rest of the Santander UK group. The non-core portfolios are being run-down and/or managed for value.
Summarised income statement
| | | | | | | | | | | | |
| | | 2012
£m | | | 2011(1)
£m | | | 2010
£m | |
Net interest income | | | 52 | | | | 439 | | | | 335 | |
Non-interest (expense)/income | | | (32 | ) | | | (370 | ) | | | 49 | |
| | | | | | | | | | | | |
Total operating income | | | 20 | | | | 69 | | | | 384 | |
| | | | | | | | | | | | |
Administration expenses | | | (16 | ) | | | (25 | ) | | | (46 | ) |
Depreciation, amortisation and impairment | | | — | | | | (2 | ) | | | (3 | ) |
| | | | | | | | | | | | |
Total operating expenses excluding provisions and charges | | | (16 | ) | | | (27 | ) | | | (49 | ) |
| | | | | | | | | | | | |
Provisions for other liabilities and charges | | | (16 | ) | | | (14 | ) | | | — | |
| | | | | | | | | | | | |
Total operating provisions and charges | | | (16 | ) | | | (14 | ) | | | — | |
| | | | | | | | | | | | |
(Loss)/profit before tax | | | (12 | ) | | | 28 | | | | 335 | |
| | | | | | | | | | | | |
| (1) | As restated, see Note 45 |
Corporate Centre profit/(loss) before tax
2012 compared to 2011
(Loss)/profit before tax decreased by £40m to £(12)m (2011: £28m). By income statement line, the movements were:
| | • | | Net interest income decreased by £387m to £52m (2011: £439m) principally due to sustained lower interest rates which reduced income earned on the structural hedges put in place in 2008-2009 and now maturing in a much interest rates static environment, and the increased cost of term funding both via higher issuance volumes and higher costs. The higher costs of funding were partially offset by the allocation of some of these impacts to business units to better reflect the cost of wholesale funding and liquidity. |
| | • | | Non-interest expense decreased by £338m to £(32)m (2011: £(370)m) principally due to changes in the fair value of loans to UK social housing associations that are accounted for at fair value through profit or loss. In 2012, the mark-to-market movement amounted to £182m compared with a mark-to-market loss of £307m in 2011. The loss in 2011 was due to increased credit spreads, which partially reversed in 2012. The mark-to-market gain in 2012 was partially offset by a decrease of £38m which was principally due to increased costs associated with operational liquidity management. |
| | • | | Administration expenses decreased by £9m to £16m (2011: £25m) due to the delivery of efficiency savings. |
| | • | | Depreciation and amortisation decreased by £2m to £nil (2011: £2m) due to the relevant assets coming to the end of their useful lives. |
| | • | | Provisions for other liabilities and charges increased by £2m to £16m (2011: £14m). The charge primarily reflected provisions made in respect of the UK Bank Levy and was broadly stable compared to the prior year. |
2011 compared to 2010
Profit before tax decreased by £307m to £28m (2010: £335m). By income statement line, the movements were:
| | • | | Net interest income increased by £104m to £439m (2010: £335m) principally due to the change in funding mix reflecting a reduction in funding through debt securities in issue. The debt securities were replaced by debt issuances held at fair value for which the expense is recognised in non-interest income. |
| | • | | Non-interest income/(expense) decreased by £419m to £(370)m (2010: £49m), driven by changes in the fair value of loans to UK social housing associations that are accounted for at fair value through profit or loss. In 2011, the mark-to-market loss amounted to £307m compared with a mark-to-market loss of £26m in 2010. The increased loss in 2011 was due to widening credit spreads. The remaining decrease of £138m was primarily driven by the change in funding mix described above. |
| | • | | Administration expenses decreased by £21m to £25m (2010: £46m), largely due to an additional pension contribution made in 2010 relating to costs of the Santander UK defined benefit pension scheme. |
| | • | | Depreciation and amortisation was broadly unchanged at £2m (2010: £3m). |
| | • | | Provisions for other liabilities and charges increased by £14m to £14m (2010: £nil), reflecting provisions made as a result of the introduction of the UK Bank Levy in 2011. |
| | |
| 10 | | Abbey National Treasury Services plc 2012 Annual Report |
Business Review
Balance Sheet Review
This Balance Sheet Review describes the ANTS group’s significant assets and liabilities and its strategy and reasons for entering into such transactions. Throughout this section, references to UK and non-UK, in the geographic analysis, refer to the location of the office where the transaction is recorded. The Balance Sheet Review is divided into the following sections:
INDEX
| | |
Abbey National Treasury Services plc 2012 Annual Report | | 11 |
Business Review
Balance Sheet Reviewcontinued
SUMMARISED CONSOLIDATED BALANCE SHEET
| | | | | | | | |
| | | 2012
£m | | | 2011(1)
£m | |
Assets | | | | | | | | |
Cash and balances at central banks | | | 388 | | | | 7,013 | |
Trading assets | | | 22,498 | | | | 21,891 | |
Derivative financial instruments | | | 33,276 | | | | 33,224 | |
Financial assets designated at fair value | | | 3,531 | | | | 4,429 | |
Loans and advances to banks | | | 106,986 | | | | 113,222 | |
Loans and advances to customers | | | 44,750 | | | | 38,826 | |
Available for sale securities | | | 5,113 | | | | — | |
Loans and receivables securities | | | 162 | | | | 278 | |
Macro hedge of interest rate risk | | | 1,171 | | | | 1,141 | |
Property, plant and equipment | | | 6 | | | | 5 | |
Tax, intangibles and other assets | | | 31 | | | | 63 | |
| | | | | | | | |
Total assets | | | 217,912 | | | | 220,092 | |
| | | | | | | | |
Liabilities | | | | | | | | |
Deposits by banks | | | 114,535 | | | | 114,019 | |
Deposits by customers | | | 6,249 | | | | 7,114 | |
Derivative financial instruments | | | 34,088 | | | | 35,417 | |
Trading liabilities | | | 21,109 | | | | 25,745 | |
Financial liabilities designated at fair value | | | 4,002 | | | | 6,836 | |
Debt securities in issue | | | 33,770 | | | | 26,943 | |
Tax, other liabilities and provisions | | | 364 | | | | 491 | |
| | | | | | | | |
Total liabilities | | | 214,117 | | | | 216,565 | |
| | | | | | | | |
Equity | | | | | | | | |
Total shareholders’ equity | | | 3,795 | | | | 3,527 | |
| | | | | | | | |
Total equity | | | 3,795 | | | | 3,527 | |
| | | | | | | | |
Total liabilities and equity | | | 217,912 | | | | 220,092 | |
| | | | | | | | |
| (1) | As restated, see Note 45 |
A more detailed consolidated balance sheet is contained in the Consolidated Financial Statements.
31 December 2012 compared to 31 December 2011
Assets
Cash and balances at central banks
Cash and balances held at central banks decreased by 95% to £388m at 31 December 2012 (2011: £7,013m). The decrease was due to the acquisition of debt securities for liquidity management purposes.
Trading assets
Trading assets increased by 3% to £22,498m at 31 December 2012 (2011: £21,891m). The increase was attributable to higher activity relating to securities purchased under resale agreements to both banks and customers partially offset by a decrease in debt securities as new liquid assets are held as available for sale.
Derivative assets
Derivative assets were broadly unchanged at £33,276m at 31 December 2012 (2011: £33,224m).
Financial assets designated at fair value through profit and loss
Financial assets designated at fair value through profit and loss decreased by 20% to £3,531m at 31 December 2012 (2011: £4,429m). The decrease was primarily attributable to the maturity of loans to UK Social Housing associations and new loans no longer being designated at fair value in accordance with ANTS group policy.
Loans and advances to banks
Loans and advances to banks decreased by 6% to £106,986m at 31 December 2012 (2011: £113,222m). The decrease was due to lower reverse purchase agreement activity with Banco Santander, S.A. and the Santander UK group as disclosed in Note 17 to the Consolidated Financial Statements.
Loans and advances to customers
Loans and advances to customers increased by 15% to £44,750m (2011: £38,826m) principally due to the funding of increased covered bond issuances.
| | |
| 12 | | Abbey National Treasury Services plc 2012 Annual Report |
Business Review
Balance Sheet Reviewcontinued
Available for sale securities
Available for sale securities increased to £5,113m (2011: £nil). The increase principally reflected the acquisition of debt securities as part of the Santander UK group’s liquidity management activities.
Loans and receivable securities
Loans and receivable securities decreased by 42% to £162m at 31 December 2012 (2011: £278m). The decrease principally reflected ongoing maturities and disposals of this portfolio in run down.
Macro hedge of interest rate risk
The macro (or portfolio) hedge of £1,171m at 31 December 2012 was broadly unchanged from the prior year (2011: £1,141m).
Property, plant and equipment
Property, plant and equipment increased by 20% to £6m at 31 December 2012 (2011: £5m). The increase was attributable to additions, partially offset by the depreciation charge for the year.
Tax, intangibles and other assets
Tax, intangibles and other assets decreased by 51% to £31m at 31 December 2012 (2011: £63m). The decrease principally reflected the decrease in other assets.
Liabilities
Deposits by banks
Deposits by banks were broadly unchanged at £114,535m at 31 December 2012 (2011: £114,019m).
Deposits by customers
Deposits by customers decreased to £6,249m at 31 December 2012 (2011: £7,114m). The decrease was attributable to lower demand for retail structured products sold by the ANTS group.
Derivatives
Derivative liabilities were broadly unchanged at £34,088m at 31 December 2012 (2011: £35,417m).
Trading liabilities
Trading liabilities decreased by 18% to £21,109m at 31 December 2012 (2011: £25,745m). The decrease was attributable to lower activity relating to securities sold under resale agreements to both banks and customers and lower short term deposits.
Financial liabilities designated at fair value
Financial liabilities designated at fair value decreased to £4,002m at 31 December 2012 (2011: £6,836m). The decrease was primarily attributable to the maturity of issuances under the US$20bn Medium Term Note Programme, with new issuances under the programme being accounted for at amortised cost and classified as debt securities in issue.
Debt securities in issue
Debt securities in issue increased by 25% to £33,770m at 31 December 2012 (2011: £26,943m). The increase reflected the ANTS group’s strategy of increasing the level of medium-term funding through the issuance of debt in the Covered Bond programme and the US$20bn Euro Medium Term Note programme. These increases were partially offset by decreases in short term funding in the US$20bn Commercial Paper Programme.
Tax, other liabilities and provisions
Tax, other liabilities and provisions decreased by 26% to £364m at 31 December 2012 (2011: £491m). The decrease principally reflected the decrease in tax liabilities.
Equity
Total shareholders equity increased by 8% to £3,795m at 31 December 2012 (2011: £3,527m). The increase was principally attributable to profit for the year of £264m (2011: £164m).
| | |
Abbey National Treasury Services plc 2012 Annual Report | | 13 |
Business Review
Balance Sheet Reviewcontinued
RECONCILIATION TO CLASSIFICATIONS IN THE CONSOLIDATED BALANCE SHEET
The classifications of assets and liabilities in the ANTS group’s consolidated balance sheet, including the note reference, and in the balance sheet review may be reconciled as follows:
| | | | | | | | | | | | | | | | | | | | | | | | | | | | | | |
| 31 December 2012 | | | | Balance Sheet Review section | | | | | | Group | |
Balance sheet line item and note | | Note | | Loans and
advances
to banks
£m | | | Loans and
advances to
customers
£m | | | Securities
£m | | | Derivatives
£m | | | Tangible
fixed
assets
£m | | | Other
£m | | | Balance
sheet total
£m | |
Assets | | | | | | | | | | | | | | | | | | | | | | | | | | | | | | |
Cash and balances at central banks | | 13 | | | — | | | | — | | | | — | | | | — | | | | — | | | | 388 | | | | 388 | |
Trading assets | | 14 | | | 9,988 | | | | 7,552 | | | | 4,958 | | | | — | | | | — | | | | — | | | | 22,498 | |
Derivative financial instruments | | 15 | | | — | | | | — | | | | — | | | | 33,276 | | | | — | | | | — | | | | 33,276 | |
Financial assets designated at fair value | | 16 | | | — | | | | 3,203 | | | | 328 | | | | — | | | | — | | | | — | | | | 3,531 | |
Loans and advances to banks | | 17 | | | 106,986 | | | | — | | | | — | | | | — | | | | — | | | | — | | | | 106,986 | |
Loans and advances to customers | | 18 | | | 2 | | | | 44,748 | | | | — | | | | — | | | | — | | | | — | | | | 44,750 | |
Available for sale securities | | 22 | | | — | | | | — | | | | 5,113 | | | | — | | | | — | | | | — | | | | 5,113 | |
Loans and receivables securities | | 20 | | | — | | | | 162 | | | | — | | | | — | | | | — | | | | — | | | | 162 | |
Macro hedge of interest rate risk | | | | | — | | | | — | | | | — | | | | — | | | | — | | | | 1,171 | | | | 1,171 | |
Property, plant and equipment | | 25 | | | — | | | | — | | | | — | | | | — | | | | 6 | | | | — | | | | 6 | |
Tax, intangibles and other assets | | | | | — | | | | — | | | | — | | | | — | | | | — | | | | 31 | | | | 31 | |
| | | | | | | | | | | | | | | | | | | | | | | | | | | | | | |
Total assets | | | | | 116,976 | | | | 55,665 | | | | 10,399 | | | | 33,276 | | | | 6 | | | | 1,590 | | | | 217,912 | |
| | | | | | | | | | | | | | | | | | | | | | | | | | | | | | |
| | | | | | | | |
| | | | | | | | Deposits by
banks
£m | | | Deposits by
customers
£m | | | Debt
securities
in issue
£m | | | Derivatives
£m | | | Other
£m | | | Balance
sheet total
£m | |
Liabilities | | | | | | | | | | | | | | | | | | | | | | | | | | | | | | |
Deposits by banks | | 28 | | | | | | | 114,535 | | | | — | | | | — | | | | — | | | | — | | | | 114,535 | |
Deposits by customers | | 29 | | | | | | | — | | | | 6,249 | | | | — | | | | — | | | | — | | | | 6,249 | |
Derivative financial instruments | | 15 | | | | | | | — | | | | — | | | | — | | | | 34,088 | | | | — | | | | 34,088 | |
Trading liabilities | | 30 | | | | | | | 9,742 | | | | 7,248 | | | | 4,119 | | | | — | | | | — | | | | 21,109 | |
Financial liabilities designated at fair value | | 31 | | | | | | | — | | | | — | | | | 4,002 | | | | — | | | | — | | | | 4,002 | |
Debt securities in issue | | 32 | | | | | | | — | | | | — | | | | 33,770 | | | | — | | | | — | | | | 33,770 | |
Tax, other liabilities and provisions | | | | | | | | | — | | | | — | | | | — | | | | — | | | | 364 | | | | 364 | |
| | | | | | | | | | | | | | | | | | | | | | | | | | | | | | |
Total liabilities | | | | | | | | | 124,277 | | | | 13,497 | | | | 41,891 | | | | 34,088 | | | | 364 | | | | 214,117 | |
| | | | | | | | | | | | | | | | | | | | | | | | | | | | | | |
| | | | |
| 31 December 2011 | | | | Balance Sheet Review section | | | | | | Group | |
Balance sheet line item and note | | Note | | Loans and
advances
to banks
£m | | | Loans and
advances to
customers
£m | | | Securities
£m | | | Derivatives
£m | | | Tangible
fixed
assets
£m | | | Other
£m | | | Balance
sheet total(1)
£m | |
Assets | | | | | | | | | | | | | | | | | | | | | | | | | | | | | | |
Cash and balances at central banks | | 13 | | | — | | | | — | | | | — | | | | — | | | | — | | | | 7,013 | | | | 7,013 | |
Trading assets | | 14 | | | 6,144 | | | | 6,687 | | | | 9,060 | | | | — | | | | — | | | | — | | | | 21,891 | |
Derivative financial instruments | | 15 | | | — | | | | — | | | | — | | | | 33,224 | | | | — | | | | — | | | | 33,224 | |
Financial assets designated at fair value | | 16 | | | — | | | | 4,050 | | | | 379 | | | | — | | | | — | | | | — | | | | 4,429 | |
Loans and advances to banks | | 17 | | | 113,222 | | | | — | | | | — | | | | — | | | | — | | | | — | | | | 113,222 | |
Loans and advances to customers | | 18 | | | — | | | | 38,826 | | | | — | | | | — | | | | — | | | | — | | | | 38,826 | |
Loans and receivables securities | | 20 | | | 212 | | | | 66 | | | | — | | | | — | | | | — | | | | — | | | | 278 | |
Macro hedge of interest rate risk | | | | | — | | | | — | | | | — | | | | — | | | | — | | | | 1,141 | | | | 1,141 | |
Property, plant and equipment | | 25 | | | — | | | | — | | | | — | | | | — | | | | 5 | | | | — | | | | 5 | |
Tax, intangibles and other assets | | | | | — | | | | — | | | | — | | | | — | | | | — | | | | 63 | | | | 63 | |
| | | | | | | | | | | | | | | | | | | | | | | | | | | | | | |
Total assets | | | | | 119,578 | | | | 49,629 | | | | 9,439 | | | | 33,224 | | | | 5 | | | | 8,217 | | | | 220,092 | |
| | | | | | | | | | | | | | | | | | | | | | | | | | | | | | |
| | | | | | | | |
| | | | | | | | Deposits by
banks
£m | | | Deposits by
customers
£m | | | Debt
securities
in issue
£m | | | Derivatives
£m | | | Other
£m | | | Balance
sheet total
£m | |
Liabilities | | | | | | | | | | | | | | | | | | | | | | | | | | | | | | |
Deposits by banks | | 28 | | | | | | | 114,019 | | | | — | | | | — | | | | — | | | | — | | | | 114,019 | |
Deposits by customers | | 29 | | | | | | | — | | | | 7,114 | | | | — | | | | — | | | | — | | | | 7,114 | |
Derivative financial instruments | | 15 | | | | | | | — | | | | — | | | | — | | | | 35,417 | | | | — | | | | 35,417 | |
Trading liabilities | | 30 | | | | | | | 14,508 | | | | 10,482 | | | | 755 | | | | — | | | | — | | | | 25,745 | |
Financial liabilities designated at fair value | | 31 | | | | | | | — | | | | — | | | | 6,836 | | | | — | | | | — | | | | 6,836 | |
Debt securities in issue | | 32 | | | | | | | — | | | | — | | | | 26,943 | | | | — | | | | — | | | | 26,943 | |
Tax, other liabilities and provisions | | | | | | | | | — | | | | — | | | | — | | | | — | | | | 491 | | | | 491 | |
| | | | | | | | | | | | | | | | | | | | | | | | | | | | | | |
Total liabilities | | | | | | | | | 128,527 | | | | 17,596 | | | | 34,534 | | | | 35,417 | | | | 491 | | | | 216,565 | |
| | | | | | | | | | | | | | | | | | | | | | | | | | | | | | |
| (1) | As restated, see Note 45 |
| | |
| 14 | | Abbey National Treasury Services plc 2012 Annual Report |
Business Review
Balance Sheet Reviewcontinued
SECURITIES
The ANTS group’s holdings of securities only represent a small proportion of its total assets. The ANTS group holds securities principally in its trading portfolio or classified as available-for-sale. These securities primarily consist of Government and Government-guaranteed securities held for liquidity purposes.
Securities analysis by type of issuer
The following table sets out the book and market values of securities at 31 December 2012, 2011 and 2010. For further information, see the Notes to the Consolidated Financial Statements.
| | | | | | | | | | | | |
| | | 2012
£m | | | 2011
£m | | | 2010
£m | |
Trading portfolio | | | | | | | | | | | | |
Debt securities: | | | | | | | | | | | | |
UK Government | | | 1,817 | | | | 1,078 | | | | 3,120 | |
US Treasury and other US Government agencies and corporations | | | 31 | | | | 65 | | | | 130 | |
Other OECD governments | | | 2,069 | | | | 1,800 | | | | 3,380 | |
Bank and building society: | | | | | | | | | | | | |
- Certificates of deposit - Other | | | 13 | | | | — | | | | 290 | |
Other issuers: | | | | | | | | | | | | |
- Fixed and floating rate notes - Government guaranteed | | | 426 | | | | 5,754 | | | | 10,586 | |
- Fixed and floating rate notes - Other | | | 138 | | | | 14 | | | | 315 | |
Ordinary shares and similar securities | | | 464 | | | | 349 | | | | 700 | |
| | | | | | | | | | | | |
| | | 4,958 | | | | 9,060 | | | | 18,521 | |
| | | | | | | | | | | | |
Available for sale securities | | | | | | | | | | | | |
Debt securities: | | | | | | | | | | | | |
UK Government | | | 3,844 | | | | — | | | | — | |
US Treasury and other US Government agencies and corporations | | | 363 | | | | — | | | | — | |
Other issuers - Germany and Japan | | | 906 | | | | — | | | | — | |
| | | | | | | | | | | | |
| | | 5,113 | | | | — | | | | — | |
| | | | | | | | | | | | |
Financial assets designated at fair value through profit and loss | | | | | | | | | | | | |
Debt securities: | | | | | | | | | | | | |
- Mortgage-backed securities | | | 250 | | | | 279 | | | | 859 | |
- Other asset-backed securities | | | 78 | | | | 100 | | | | 187 | |
| | | | | | | | | | | | |
| | | 328 | | | | 379 | | | | 1,046 | |
| | | | | | | | | | | | |
Total | | | 10,399 | | | | 9,439 | | | | 19,567 | |
| | | | | | | | | | | | |
UK Government securities
UK Government securities represent Treasury Bills and UK Government guaranteed issues by other UK banks. These securities are held for trading and liquidity purposes. For further information, see “Country Risk Exposure” in the Risk Management Report.
US Treasury and other US Government agencies and corporations
US Treasury and other US Government agencies’ and corporations’ securities represent US Treasury Bills, including cash management bills. These securities are held for trading and liquidity purposes. For further information, see “Country Risk Exposure” in the Risk Management Report.
Other OECD governments
Other OECD government securities represent issues by OECD governments other than the US and UK Governments, principally Switzerland, Germany and Japan (2011: principally Switzerland). These securities are held for trading and liquidity purposes. For further information, see “Country Risk Exposure” in the Risk Management Report.
Bank and building society certificates of deposit and bonds
Bank and building society certificates of deposit are fixed-rate securities with relatively short maturities issued by banks in UK, France, Switzerland and the Netherlands. These are managed within the overall position for the relevant book. These securities are held for trading and liquidity management purposes.
Fixed and floating rate notes
Fixed and floating rate notes have regular interest rate profiles and are either managed within the overall position for the relevant book or are hedged into one of the main currencies. Government-guaranteed fixed and floating rate notes almost all relate to the UK Government. These securities are held for trading and yield purposes. For further information on Government-guaranteed fixed and floating rate notes, see “Country Risk Exposure” in the Risk Management Report.
| | |
Abbey National Treasury Services plc 2012 Annual Report | | 15 |
Business Review
Balance Sheet Reviewcontinued
Mortgage-backed securities
This category principally comprises UK residential mortgage-backed securities. These securities are of good quality and contain no sub-prime element. These securities are held as part of the FMIR portfolio. See Note 16 to the Consolidated Financial Statements.
Other asset-backed securities
This category comprises a range of mostly floating-rate asset-backed securities including home equity loans, commercial mortgages, loans to car dealers, lease and credit card debtors and student loans, as well as a small balance of collateralised synthetic obligations. Some credit card debtors incorporate cap features. These securities are held as part of the FMIR portfolio. See Note 16 to the Consolidated Financial Statements.
Contractual maturities of securities
Contractual maturities for available-for-sale debt securities and contractual maturities of investments held for trading or classified as fair value through profit or loss are set out in Notes 22 and 43 to the Consolidated Financial Statements, respectively.
Significant exposures
The following table sets forth the book value (which equals market value) of securities of individual counterparties where the aggregate amount of those securities exceeded 10% of the ANTS group’s shareholders’ funds at 31 December 2012 as set out in the Consolidated Balance Sheet on page 113. The table also sets forth the classification of the securities in the Consolidated Balance Sheet.
| | | | | | | | | | | | |
| | | Trading assets
£m | | | Available-for-sale
£m | | | Total
£m | |
UK Government and UK Government guaranteed | | | 2,243 | | | | 3,844 | | | | 6,087 | |
LOANS AND ADVANCES TO BANKS
Loans and advances to banks principally comprise loans to Santander UK plc, but also include loans to banks and building societies and balances with central banks (excluding those central bank balances which can be withdrawn on demand).
Loans and advances to banks geographical analysis
The geographical analysis of loans and advances presented in the following table is based on the location of the office from which the loans and advances are made, rather than the domicile of the borrower. The balances below include loans and advances to banks that are classified in the balance sheet as trading assets, financial assets designated at fair value, or loans and receivables securities.
| | | | | | | | | | | | | | | | | | | | |
| | | 2012
£m | | | 2011
£m | | | 2010
£m | | | 2009
£m | | | 2008
£m | |
UK | | | 115,046 | | | | 118,176 | | | | 153,030 | | | | 196,894 | | | | 150,720 | |
Non-UK | | | 1,930 | | | | 1,402 | | | | 1,661 | | | | 93 | | | | 1,324 | |
| | | | | | | | | | | | | | | | | | | | |
| | | 116,976 | | | | 119,578 | | | | 154,691 | | | | 196,987 | | | | 152,044 | |
| | | | | | | | | | | | | | | | | | | | |
Further geographical analysis of loans and advances to banks based on the country of domicile of the borrower rather than the office of lending is contained in “Country Risk Exposure” in the Risk Management Report, including details of balances with other Santander UK group companies and other Banco Santander group companies.
| | |
| 16 | | Abbey National Treasury Services plc 2012 Annual Report |
Business Review
Balance Sheet Reviewcontinued
Loans and advances to banks maturity analysis
The following table sets forth loans and advances to banks by maturity at 31 December 2012.
| | | | | | | | | | | | | | | | | | | | | | | | | | | | |
| | | On
demand
£m | | | In not more
than three
months
£m | | | In more than
three months
but not more
than one year
£m | | | In more than
one year but
not more than
five years
£m | | | In more than
five years but
not more than
ten years
£m | | | In more
than ten
years
£m | | | Total
£m | |
UK | | | 29,643 | | | | 45,897 | | | | 13,526 | | | | 24,051 | | | | 676 | | | | 1,253 | | | | 115,046 | |
Non-UK | | | 1,919 | | | | 11 | | | | — | | | | — | | | | — | | | | — | | | | 1,930 | |
| | | | | | | | | | | | | | | | | | | | | | | | | | | | |
Total | | | 31,562 | | | | 45,908 | | | | 13,526 | | | | 24,051 | | | | 676 | | | | 1,253 | | | | 116,976 | |
| | | | | | | | | | | | | | | | | | | | | | | | | | | | |
Of which: | | | | | | | | | | | | | | | | | | | | | | | | | | | | |
- Fixed interest rate | | | 28,297 | | | | 11,877 | | | | 13,526 | | | | 24,051 | | | | 676 | | | | 340 | | | | 78,767 | |
- Variable interest rate | | | 2,268 | | | | 34,031 | | | | — | | | | — | | | | — | | | | 913 | | | | 37,212 | |
- Non interest-bearing | | | 997 | | | | — | | | | — | | | | — | | | | — | | | | — | | | | 997 | |
| | | | | | | | | | | | | | | | | | | | | | | | | | | | |
Total | | | 31,562 | | | | 45,908 | | | | 13,526 | | | | 24,051 | | | | 676 | | | | 1,253 | | | | 116,976 | |
| | | | | | | | | | | | | | | | | | | | | | | | | | | | |
LOANS AND ADVANCES TO CUSTOMERS
The ANTS group provides lending facilities primarily to corporate customers. Purchase and resale agreements represent sale and repurchase activity with professional non-bank customers by the short term markets business.
Loans and advances to customers geographical analysis
The geographical analysis of loans and advances presented in the following table is based on the location of the office from which the loans and advances are made. Further geographical analysis of loans and advances to customers based on the country of domicile of the borrower rather than the office of lending is contained in “Country Risk Exposure” in the Risk Management Report, including details of balances with other Santander companies.
The balances below are stated before the deduction for impairment loss allowances and include loans and advances to customers that are classified in the balance sheet as trading assets, financial assets designated at fair value, or loans and receivables securities.
| | | | | | | | | | | | | | | | | | | | |
| | | 2012
£m | | | 2011
£m | | | 2010
£m | | | 2009
£m | | | 2008
£m | |
UK | | | | | | | | | | | | | | | | | | | | |
Corporate loans | | | 15,475 | | | | 15,170 | | | | 13,129 | | | | 11,294 | | | | 10,763 | |
Other secured advances | | | — | | | | — | | | | — | | | | — | | | | 10 | |
Other unsecured advances | | | 64 | | | | 349 | | | | 7 | | | | 262 | | | | — | |
Purchase and resale agreements | | | 2,512 | | | | 6,150 | | | | 8,634 | | | | 8,827 | | | | 435 | |
Loans and receivables securities | | | 161 | | | | 66 | | | | 79 | | | | 896 | | | | — | |
Amounts due from Banco Santander group undertakings | | | 5 | | | | 5 | | | | 8 | | | | 4,382 | | | | 2,628 | |
Amounts due from Santander UK group undertakings | | | 32,584 | | | | 27,831 | | | | 26,942 | | | | 10,910 | | | | 16,616 | |
| | | | | | | | | | | | | | | | | | | | |
Total UK | | | 50,801 | | | | 49,571 | | | | 48,799 | | | | 36,571 | | | | 30,452 | |
| | | | | | | | | | | | | | | | | | | | |
Non-UK | | | | | | | | | | | | | | | | | | | | |
Other unsecured advances | | | 25 | | | | — | | | | — | | | | — | | | | 99 | |
Purchase and resale agreements | | | 4,951 | | | | 188 | | | | 18 | | | | — | | | | — | |
Amounts due from Santander UK group undertakings | | | — | | | | — | | | | — | | | | — | | | | 1,381 | |
| | | | | | | | | | | | | | | | | | | | |
Total non-UK | | | 4,976 | | | | 188 | | | | 18 | | | | — | | | | 1,480 | |
| | | | | | | | | | | | | | | | | | | | |
Total | | | 55,777 | | | | 49,759 | | | | 48,817 | | | | 36,571 | | | | 31,932 | |
Less: loan loss allowances | | | (112 | ) | | | (130 | ) | | | (108 | ) | | | (77 | ) | | | (26 | ) |
| | | | | | | | | | | | | | | | | | | | |
Total, net of impairment loss allowances | | | 55,665 | | | | 49,629 | | | | 48,709 | | | | 36,494 | | | | 31,906 | |
| | | | | | | | | | | | | | | | | | | | |
Detailed analysis of the loans and receivables securities included in the table above is set out in Note 20 to the Consolidated Financial Statements. Further analysis of the impairment loss allowance is set out on page 98 of the Risk Management Report.
No single concentration of loans and advances, with the exception of advances secured on residential properties and corporate loans, as disclosed above, accounts for more than 10% of total loans and advances and no individual country, other than the UK accounts for more than 10% of total loans and advances.
| | |
Abbey National Treasury Services plc 2012 Annual Report | | 17 |
Business Review
Balance Sheet Reviewcontinued
Loans and advances to customers maturity analysis
The following table sets forth loans and advances to customers by maturity at 31 December 2012. Overdrafts are included in the “on-demand” category. Loans and advances are included at their contractual maturity; no account is taken of a customer’s ability to repay early where it exists.
| | | | | | | | | | | | | | | | | | | | | | | | | | | | |
| | | On
demand
£m | | | In not
more than
three
months
£m | | | In more than
three months
but not more
than one year
£m | | | In more than
one year but
not more than
five years
£m | | | In more than
five years but
not more than
ten years
£m | | | In more
than ten
years
£m | | | Total
£m | |
UK | | | | | | | | | | | | | | | | | | | | | | | | | | | | |
Corporate loans | | | 20 | | | | 1,713 | | | | 724 | | | | 5,987 | | | | 923 | | | | 6,108 | | | | 15,475 | |
Other unsecured advances | | | — | | | | 1 | | | | — | | | | — | | | | — | | | | 63 | | | | 64 | |
Purchase and resale agreements | | | 1 | | | | 2,466 | | | | 45 | | | | — | | | | — | | | | — | | | | 2,512 | |
Loans and receivables securities | | | — | | | | — | | | | — | | | | — | | | | 46 | | | | 115 | | | | 161 | |
Amounts due from Banco Santander group undertakings | | | 5 | | | | — | | | | — | | | | — | | | | — | | | | — | | | | 5 | |
Amounts due from Santander UK group undertakings | | | 52 | | | | 6,994 | | | | 2,073 | | | | 11,276 | | | | 8,640 | | | | 3,549 | | | | 32,584 | |
| | | | | | | | | | | | | | | | | | | | | | | | | | | | |
Total UK | | | 78 | | | | 11,174 | | | | 2,842 | | | | 17,263 | | | | 9,609 | | | | 9,835 | | | | 50,801 | |
| | | | | | | | | | | | | | | | | | | | | | | | | | | | |
Non-UK | | | | | | | | | | | | | | | | | | | | | | | | | | | | |
Other secured advances | | | 24 | | | | — | | | | 1 | | | | — | | | | — | | | | — | | | | 25 | |
Purchase and resale agreements | | | 25 | | | | 4,926 | | | | — | | | | — | | | | — | | | | — | | | | 4,951 | |
| | | | | | | | | | | | | | | | | | | | | | | | | | | | |
Total non-UK | | | 49 | | | | 4,926 | | | | 1 | | | | — | | | | — | | | | — | | | | 4,976 | |
| | | | | | | | | | | | | | | | | | | | | | | | | | | | |
Total | | | 127 | | | | 16,100 | | | | 2,843 | | | | 17,263 | | | | 9,609 | | | | 9,835 | | | | 55,777 | |
| | | | | | | | | | | | | | | | | | | | | | | | | | | | |
Of which: | | | | | | | | | | | | | | | | | | | | | | | | | | | | |
- Fixed interest rate | | | 107 | | | | 8,764 | | | | 1,128 | | | | 9,995 | | | | 9,140 | | | | 7,247 | | | | 36,381 | |
- Variable interest rate | | | 20 | | | | 7,336 | | | | 1,715 | | | | 7,268 | | | | 469 | | | | 2,588 | | | | 19,396 | |
| | | | | | | | | | | | | | | | | | | | | | | | | | | | |
Total | | | 127 | | | | 16,100 | | | | 2,843 | | | | 17,263 | | | | 9,609 | | | | 9,835 | | | | 55,777 | |
| | | | | | | | | | | | | | | | | | | | | | | | | | | | |
The ANTS group’s policy is to hedge all fixed-rate loans and advances to customers using derivative instruments, or by matching with other on-balance sheet interest rate exposures.
The balance sheet is managed on a behavioural basis, rather than on the basis of contractual maturity, with many loans being prepaid prior to their legal maturity.
Impairment loss allowances on loans and advances to customers
Details of the ANTS group’s impairment loss allowances policy are set out in Note 1 to the Consolidated Financial Statements. An analysis of end-of-year impairment loss allowances on loans and advances to customers, movements in impairment loss allowances, and ANTS group non-performing loans and advances are set out in the “Loans and Advances” section of the Risk Management Report on page 94 and Note 18 to the Consolidated Financial Statements.
| | |
| 18 | | Abbey National Treasury Services plc 2012 Annual Report |
Business Review
Balance Sheet Reviewcontinued
Risk elements in the loan portfolio
The disclosure of credit risk elements in this section reflects US accounting practice and classifications. The purpose of the disclosure is to present within the US disclosure framework those elements of the loan portfolios with a greater risk of loss. The main classifications of credit risk elements presented are:
| • | | Unimpaired loans contractually past due 90 days or more as to interest or principal; |
| • | | Troubled debt restructurings; |
| • | | Potential problem loans and advances; and |
| • | | Cross border outstandings. |
Impaired loans
Loans are classified as impaired when there is objective evidence that not all contractual cash flows will be received. Under IFRS, separate disclosure is required of loans that are neither past due nor impaired, past due but not impaired and impaired. This disclosure may be found in the “Loans and advances” section on page 94 of the Risk Management Report.
In accordance with IFRS, the ANTS group recognises interest income on assets after they have been written down as a result of an impairment loss. Interest continues to be accrued on all loans and the element of interest that is not anticipated to be recovered is provided for. Interest income recognised on impaired loans is set out in the Consolidated Financial Statements. The income adjustment in respect of interest that is not anticipated to be recovered was £5m (2011: £5m, 2010: £4m).
Unimpaired loans contractually past due 90 days or more as to interest or principal
Loans and advances are classified as non-performing either when payments are three months or more past due or where there are reasonable doubts about full repayment (principal and interest) under the contractual terms.
Details of the ANTS group’s non-performing loans and advances, including separate disclosure about unimpaired loans contractually past due 90 days or more as to interest or principal, are set out on page 55 in the “Corporate Banking - Non-performing loans and advances” table in the Risk Management Report.
Forbearance
To support customers that encounter difficulties, the ANTS group operates forbearance programmes to amend contractual amounts or timings where a customer’s financial distress indicates the potential that satisfactory repayment may not be made within the original terms and conditions of the contract. A range of forbearance strategies are employed in order to improve the management of customer relationships, maximise collection opportunities and, if possible, avoid foreclosure or repossession. Further information can be found in the “Credit Risk - Corporate Banking” and “Credit Risk - Corporate Centre” sections of the Risk Management Report.
Troubled debt restructurings
The US Securities and Exchange Commission requires separate disclosure of any loans whose terms have been modified by the lender because of the borrower’s financial difficulties, as a concession that the lender would not otherwise consider. These are classified as troubled debt restructurings (‘TDR’s). Under IFRS, disclosure is required of loans that would otherwise have been classified as past due or impaired whose terms have been renegotiated. This disclosure may be found on page 86 in the “Credit Risk” section of the Risk Management Report.
Potential problem loans and advances
Credit risk elements also cover potential problem loans. These are loans where information on possible credit problems among borrowers causes management to seriously doubt their ability to comply with the loan repayment terms. There are no potential problem loans other than those discussed above, and as discussed in disclosures by division given in the “Credit Risk” section of the Risk Management Report.
Cross border outstandings
Cross border outstandings, as defined by bank regulatory rules, are amounts payable to ANTS by residents of foreign countries, regardless of the currency in which the claim is denominated, and local country claims in excess of local country obligations. Cross border outstandings consist mainly of loans and advances to customers and banks, finance lease debtors, interest-bearing investments and other monetary assets.
In addition to credit risk, cross border outstandings have the risk that, as a result of political or economic conditions in a country, borrowers may be unable to meet their contractual payment obligations of principal and or interest when due because of the unavailability of, or restrictions on, foreign exchange needed by borrowers to repay their obligations. These cross border outstandings are controlled through a well-developed system of country limits, which are reviewed to avoid concentrations of transfer, economic or political risks.
For further analysis of the ANTS group’s country risk exposures, including eurozone and peripheral eurozone exposures and redenomination risk, see the “Country Risk Exposure” section in the Risk Management Report on pages 84 to 91.
| | |
Abbey National Treasury Services plc 2012 Annual Report | | 19 |
Business Review
Balance Sheet Reviewcontinued
(i) Cross border outstandings exceeding 1% of total assets
At 31 December 2012, 2011 and 2010, the ANTS group had cross border outstandings exceeding 1% of total assets as follows:
| | | | | | | | | | | | | | | | |
31 December 2012 | | Governments and
official institutions
£bn | | | Banks and other
financial institutions
£bn | | | Other
£bn | | | Total
£bn | |
US | | | 0.8 | | | | 15.1 | | | | 0.1 | | | | 16.0 | |
Spain | | | — | | | | 2.5 | | | | 0.1 | | | | 2.6 | |
Switzerland | | | 0.5 | | | | 2.1 | | | | 0.2 | | | | 2.8 | |
Germany | | | 1.3 | | | | 3.5 | | | | 0.2 | | | | 5.0 | |
Denmark | | | — | | | | 2.3 | | | | — | | | | 2.3 | |
France | | | — | | | | 2.1 | | | | 0.1 | | | | 2.2 | |
| | | | |
31 December 2011 | | Governments and
official institutions
£bn | | | Banks and other
financial institutions
£bn | | | Other
£bn | | | Total
£bn | |
US | | | 7.1 | | | | 10.9 | | | | — | | | | 18.0 | |
Spain | | | — | | | | 5.1 | | | | 0.1 | | | | 5.2 | |
Switzerland | | | 1.2 | | | | 2.5 | | | | 0.3 | | | | 4.0 | |
Germany | | | 0.1 | | | | 3.1 | | | | 0.2 | | | | 3.4 | |
France | | | 0.1 | | | | 2.4 | | | | 0.2 | | | | 2.7 | |
| | | | |
31 December 2010 | | Governments and
official institutions
£bn | | | Banks and other
financial institutions
£bn | | | Other
£bn | | | Total
£bn | |
US | | | 5.2 | | | | 7.6 | | | | 0.1 | | | | 12.9 | |
Switzerland | | | 3.2 | | | | 1.7 | | | | — | | | | 4.9 | |
Spain | | | 0.2 | | | | 2.8 | | | | 0.2 | | | | 3.2 | |
(ii) Cross border outstandings between 0.75% and 1% of total assets
At 31 December 2012, 2011 and 2010, the ANTS group had cross border outstandings between 0.75% and 1% of total assets as follows:
31 December 2012 and 2011
None.
| | | | | | | | | | | | | | | | |
31 December 2010 | | Governments and
official institutions
£bn | | | Banks and other
financial institutions
£bn | | | Other
£bn | | | Total
£bn | |
Germany | | | 0.1 | | | | 2.1 | | | | 0.1 | | | | 2.3 | |
France | | | 0.2 | | | | 1.8 | | | | — | | | | 2.0 | |
(iii) Cross border outstandings between 0.5% and 0.75% of total assets
At 31 December 2012, 2011 and 2010, the ANTS group had cross border outstandings between 0.5% and 0.75% of total assets as follows:
| | | | | | | | | | | | | | | | |
31 December 2012 | | Governments and
official institutions
£bn | | | Banks and other
financial institutions
£bn | | | Other
£bn | | | Total
£bn | |
Japan | | | 1.2 | | | | 0.2 | | | | 0.2 | | | | 1.6 | |
31 December 2011
None.
31 December 2010
None.
| | |
| 20 | | Abbey National Treasury Services plc 2012 Annual Report |
Business Review
Balance Sheet Reviewcontinued
DERIVATIVE ASSETS AND LIABILITIES
| | | | | | | | | | | | |
| | | 2012
£m | | | 2011
£m | | | 2010
£m | |
Assets | | | | | | | | | | | | |
- held for trading | | | 32,873 | | | | 32,864 | | | | 22,951 | |
- held for fair value hedging | | | 403 | | | | 360 | | | | 286 | |
| | | | | | | | | | | | |
| | | 33,276 | | | | 33,224 | | | | 23,237 | |
| | | | | | | | | | | | |
Liabilities | | | | | | | | | | | | |
- held for trading | | | 32,493 | | | | 34,180 | | | | 23,168 | |
- held for fair value hedging | | | 1,595 | | | | 1,237 | | | | 1,875 | |
| | | | | | | | | | | | |
| | | 34,088 | | | | 35,417 | | | | 25,043 | |
| | | | | | | | | | | | |
Derivatives are held for trading or for risk management purposes. All derivatives are classified as held at fair value through profit or loss. For accounting purposes, the ANTS group chooses to designate certain derivatives as in a hedging relationship if they meet specific criteria. The main hedging derivatives are interest rate and cross-currency swaps, which are used to hedge fixed-rate lending and structured savings products and medium-term note issuances, capital issuances and other capital markets funding.
Corporate Banking deals with commercial customers who wish to enter into derivative contracts. Any market risk arising from such transactions is hedged by Markets. Markets is responsible for implementing ANTS group derivative hedging with the external market together with its own trading activities. Further details about market risk are set out in the Risk Management Report.
A summary of the ANTS group’s derivative activities, the related risks associated with such activities and the types of hedging derivatives used in managing such risks, as well as notional amounts and assets and liabilities analysed by contract type are contained in Note 15 of the Consolidated Financial Statements.
TANGIBLE FIXED ASSETS
| | | | | | | | | | | | |
| | | 2012
£m | | | 2011
£m | | | 2010
£m | |
Property, plant and equipment | | | 6 | | | | 5 | | | | 22 | |
| | | | | | | | | | | | |
Capital expenditure incurred during the year | | | 4 | | | | 2 | | | | 19 | |
| | | | | | | | | | | | |
Details of capital expenditure contracted but not provided for in respect of tangible fixed assets are set out in Note 25 to the Consolidated Financial Statements. The ANTS group had no property interests at 31 December 2012 (2011: none).
At 31 December 2012, the ANTS group operated from two principal Santander UK sites including its headquarters (2011: two). They are used for its business operations, including Corporate Banking; Markets; Corporate Centre; Marketing; Human Resources and Manufacturing.
Management believes its existing properties and those under construction, together with those it leases, are adequate and suitable for its business as presently conducted and to meet future business needs. All properties are adequately maintained.
DEPOSITS BY BANKS(1)
The balances below include deposits by banks that are classified in the balance sheet as trading liabilities and financial liabilities designated at fair value.
| | | | | | | | | | | | |
| | | 2012
£m | | | 2011
£m | | | 2010
£m | |
Year-end balance | | | 124,277 | | | | 128,527 | | | | 162,491 | |
Average balance(1) | | | 141,318 | | | | 162,558 | | | | 218,000 | |
Average interest rate(1) | | | 1.83 | % | | | 1.63 | % | | | 1.07 | % |
| (1) | Calculated using monthly data. |
At 31 December 2012, deposits by foreign banks amounted to £9,232m (2011: £7,912m, 2010: £18,306m).
| | |
Abbey National Treasury Services plc 2012 Annual Report | | 21 |
Business Review
Balance Sheet Reviewcontinued
The following tables set forth the average balances of deposits by banks by location.
| | | | | | | | | | | | |
| | | Average: year ended 31 December | |
| | | 2012
£m | | | 2011
£m | | | 2010
£m | |
UK | | | 141,171 | | | | 161,621 | | | | 216,644 | |
Non-UK | | | 147 | | | | 937 | | | | 1,356 | |
| | | | | | | | | | | | |
| | | 141,318 | | | | 162,558 | | | | 218,000 | |
| | | | | | | | | | | | |
DEPOSITS BY CUSTOMERS
The balances below include deposits by customers that are classified in the balance sheet as trading liabilities and financial liabilities designated at fair value.
| | | | | | | | | | | | |
| | | 2012
£m | | | 2011
£m | | | 2010
£m | |
Year-end balance | | | 13,497 | | | | 17,596 | | | | 23,032 | |
Average balance(1) | | | 16,720 | | | | 22,137 | | | | 14,352 | |
Average interest rate(1) | | | 1.38 | % | | | 0.77 | % | | | 0.59 | % |
| (1) | Calculated using monthly data. |
The following tables set forth the average balances of deposits by geography and customer type.
| | | | | | | | | | | | |
| | | Average: year ended 31 December | |
| | | 2012
£m | | | 2011
£m | | | 2010
£m | |
UK | | | | | | | | | | | | |
Wholesale deposits | | | 15,492 | | | | 19,645 | | | | 13,788 | |
| | | | | | | | | | | | |
| | | 15,492 | | | | 19,645 | | | | 13,788 | |
| | | | | | | | | | | | |
Non-UK | | | | | | | | | | | | |
Wholesale deposits | | | 1,228 | | | | 2,492 | | | | 564 | |
| | | | | | | | | | | | |
| | | 1,228 | | | | 2,492 | | | | 564 | |
| | | | | | | | | | | | |
| | | 16,720 | | | | 22,137 | | | | 14,352 | |
| | | | | | | | | | | | |
Wholesale deposits are those which either are obtained through the money markets or for which interest rates are quoted on request rather than being publicly advertised. These deposits are of fixed maturity and bear interest rates that reflect the inter-bank money market rates.
| | |
| 22 | | Abbey National Treasury Services plc 2012 Annual Report |
Business Review
Balance Sheet Reviewcontinued
SHORT-TERM BORROWINGS
The ANTS group includes short-term borrowings within deposits by banks, trading liabilities, financial liabilities designated at fair value and debt securities in issue and does not show short-term borrowings separately on the balance sheet. Short-term borrowings are defined by the US Securities and Exchange Commission as amounts payable for short-term obligations that are US Federal funds purchased and securities sold under repurchase agreements, commercial paper, borrowings from banks, borrowings from factors or other financial institutions and any other short-term borrowings reflected on the ANTS group’s balance sheet. The ANTS group’s only significant short-term borrowings are securities sold under repurchase agreements, commercial paper, borrowings from banks, negotiable certificates of deposit, and certain other debt securities in issue. Additional information on short-term borrowings is provided in the table below for each of the years ended 31 December 2012, 2011 and 2010.
| | | | | | | | | | | | |
| | | 2012
£m | | | 2011
£m | | | 2010
£m | |
Securities sold under repurchase agreements | | | | | | | | | | | | |
- Year-end balance | | | 23,433 | | | | 17,490 | | | | 30,813 | |
- Year-end interest rate | | | 0.38 | % | | | 0.49 | % | | | 0.61 | % |
- Average balance(1) | | | 29,486 | | | | 30,551 | | | | 24,080 | |
- Average interest rate(1) | | | 0.38 | % | | | 0.97 | % | | | 0.65 | % |
- Maximum balance(1) | | | 37,621 | | | | 36,842 | | | | 30,813 | |
Commercial paper | | | | | | | | | | | | |
- Year-end balance | | | 3,697 | | | | 3,500 | | | | 5,331 | |
- Year-end interest rate | | | 0.72 | % | | | 0.85 | % | | | 0.52 | % |
- Average balance(1) | | | 3,742 | | | | 4,787 | | | | 5,434 | |
- Average interest rate(1) | | | 0.98 | % | | | 0.97 | % | | | 0.46 | % |
- Maximum balance(1) | | | 3,921 | | | | 6,908 | | | | 6,703 | |
Borrowings from banks (Deposits by banks) | | | | | | | | | | | | |
- Year-end balance | | | 256 | | | | 835 | | | | 8,202 | |
- Year-end interest rate | | | 0.54 | % | | | 1.08 | % | | | 1.04 | % |
- Average balance(1) | | | 513 | | | | 797 | | | | 10,038 | |
- Average interest rate(1) | | | 1.44 | % | | | 1.13 | % | | | 0.59 | % |
- Maximum balance(1) | | | 2,262 | | | | 1,251 | | | | 12,212 | |
Negotiable certificates of deposit | | | | | | | | | | | | |
- Year-end balance | | | 4,499 | | | | 2,671 | | | | 8,925 | |
- Year-end interest rate | | | 1.97 | % | | | 1.38 | % | | | 1.31 | % |
- Average balance(1) | | | 2,208 | | | | 5,222 | | | | 11,093 | |
- Average interest rate(1) | | | 1.39 | % | | | 1.36 | % | | | 1.41 | % |
- Maximum balance(1) | | | 4,499 | | | | 8,083 | | | | 14,694 | |
Other debt securities in issue | | | | | | | | | | | | |
- Year-end balance | | | 2,305 | | | | 2,777 | | | | 2,003 | |
- Year-end interest rate | | | 2.46 | % | | | 2.63 | % | | | 1.74 | % |
- Average balance(1) | | | 4,757 | | | | 5,389 | | | | 2,893 | |
- Average interest rate(1) | | | 2.54 | % | | | 2.38 | % | | | 1.79 | % |
- Maximum balance(1) | | | 5,619 | | | | 7,453 | | | | 3,496 | |
| (1) | Calculated using monthly data. |
The ANTS group issues commercial paper generally in denominations of not less than US$50,000, with maturities of up to 365 days. Commercial paper is issued by the Company and its subsidiary Abbey National North America LLC.
Certificates of deposit and certain time deposits
The following table sets forth the maturities of the ANTS group’s certificates of deposit and other large wholesale time deposits from non-bank counterparties in excess of £50,000 (or the non-sterling equivalent of £50,000) at 31 December 2012. A proportion of the ANTS group’s retail time deposits also exceeds £50,000 at any given date; however, the ease of access and other terms of these accounts means that they may not have been in excess of £50,000 throughout 2012.
Furthermore, the customers may withdraw their funds on demand upon payment of an interest penalty. For these reasons, no maturity analysis is presented for such deposits.
| | | | | | | | | | | | | | | | | | | | |
| | | Not more than
three months
£m | | | In more than three
months but not more
than six months
£m | | | In more than six
months but not more
than one year
£m | | | In more than
one year
£m | | | Total
£m | |
Certificates of deposit: | | | | | | | | | | | | | | | | | | | | |
- UK | | | 2,728 | | | | 12 | | | | 64 | | | | 11 | | | | 2,815 | |
- Non-UK | | | 839 | | | | 815 | | | | 41 | | | | — | | | | 1,695 | |
Wholesale time deposits: | | | | | | | | | | | | | | | | | | | | |
- UK | | | 1,183 | | | | 252 | | | | 134 | | | | 209 | | | | 1,778 | |
| | | | | | | | | | | | | | | | | | | | |
| | | 4,750 | | | | 1,079 | | | | 239 | | | | 220 | | | | 6,288 | |
| | | | | | | | | | | | | | | | | | | | |
At 31 December 2012, in addition to the above, £12m (2011: £12m) of wholesale deposits were repayable on demand.
| | |
Abbey National Treasury Services plc 2012 Annual Report | | 23 |
Business Review
Balance Sheet Reviewcontinued
DEBT SECURITIES IN ISSUE
The ANTS group has issued debt securities in a range of maturities, interest rate structures and currencies, for purposes of meeting liquidity, funding and capital needs.
| | | | | | | | | | | | | | |
| | | Note | | 2012
£m | | | 2011
£m | | | 2010
£m | |
Trading liabilities | | 30 | | | 4,119 | | | | 755 | | | | 1,118 | |
Financial liabilities designated at fair value | | 31 | | | 4,002 | | | | 6,836 | | | | 3,656 | |
Debt securities in issue | | 32 | | | 33,770 | | | | 26,943 | | | | 33,659 | |
Subordinated liabilities | | | | | — | | | | — | | | | 331 | |
| | | | | | | | | | | | | | |
| | | | | 41,891 | | | | 34,534 | | | | 38,764 | |
| | | | | | | | | | | | | | |
Most of the debt securities that the ANTS group has issued are classified as “Debt securities in issue” in the balance sheet. The remaining debt securities issued by the ANTS group are classified separately in the balance sheet, either because they qualify as “Trading liabilities” or were designated upon initial recognition as “Financial liabilities designated at fair value”, or there are key differences in the legal terms of the securities, such as liquidation preferences, or subordination of the rights of holders to the rights of holders of certain other liabilities (‘Subordinated liabilities’). Further information is set out in Notes 30 to 32 to the Consolidated Financial Statements. The subordinated liabilities of the ANTS group were redeemed in 2011.
The ANTS group enters into cross-currency derivatives in connection with all funding raised through the issuance of debt securities in currencies other than sterling (principally euro, US dollars and Japanese yen) which swap foreign currency liabilities back into sterling as the ANTS group’s commercial balance sheet is almost entirely denominated in sterling.
CONTRACTUAL OBLIGATIONS
The amounts and maturities of contractual obligations in respect of guarantees are described in Note 35 to the Consolidated Financial Statements. Other contractual obligations, including payments of principal and interest where applicable, are set out in the table below. Interest payments are included in the maturity column of the interest payments themselves, and are calculated using current interest rates:
| | | | | | | | | | | | | | | | | | | | |
| | | Payments due by period | |
| | | Total
£m | | | Less than 1 year
£m | | | 1-3 years
£m | | | 3-5 years
£m | | | Over 5 years
£m | |
Deposits by banks(1) (2) | | | 124,277 | | | | 65,428 | | | | 31,129 | | | | 8,249 | | | | 19,471 | |
Deposits by customers - repos(1) | | | 1,230 | | | | 1,230 | | | | — | | | | — | | | | — | |
Deposits by customers - other(2) | | | 12,267 | | | | 7,196 | | | | 3,591 | | | | 361 | | | | 1,119 | |
Derivative financial instruments | | | 34,088 | | | | 2,732 | | | | 3,318 | | | | 4,917 | | | | 23,121 | |
Debt securities in issue(3) | | | 41,891 | | | | 13,344 | | | | 9,990 | | | | 6,378 | | | | 12,179 | |
Operating lease obligations | | | 46 | | | | 5 | | | | 10 | | | | 11 | | | | 20 | |
Purchase obligations | | | 18 | | | | 18 | | | | — | | | | — | | | | — | |
| | | | | | | | | | | | | | | | | | | | |
Total | | | 213,817 | | | | 89,953 | | | | 48,038 | | | | 19,916 | | | | 55,910 | |
| | | | | | | | | | | | | | | | | | | | |
| (1) | Securities sold under repurchase agreements. |
| (2) | Includes deposits by banks and deposits by customers that are classified in the balance sheet as trading liabilities. |
| (3) | Includes debt securities in issue that are classified in the balance sheet as trading liabilities and financial liabilities designated at fair value. |
The repayment terms of the above debt securities may be accelerated in line with the covenants contained within the individual loan agreements. Details of deposits by banks and deposits by customers can be found in Notes 28 and 29 to the Consolidated Financial Statements. The ANTS group has entered into outsourcing contracts where, in some circumstances, there is no minimum specified spending requirement. In these cases, anticipated spending volumes have been included within purchase obligations.
Under current conditions, the ANTS group’s working capital is expected to be sufficient for its present requirements and to pursue its planned business strategies.
OFF-BALANCE SHEET ARRANGEMENTS
In the ordinary course of business, the ANTS group issues guarantees. The significant types of guarantees are standby letters of credit which represent the taking on of credit on behalf of customers when actual funding is not required, normally because a third party is not prepared to accept the credit risk of the ANTS group’s customer. These are included in the normal impairment loss allowance assessment alongside other forms of credit exposure.
In addition, the ANTS group, as is normal in such activity, gives representations, indemnities and warranties on the sale of subsidiaries, businesses and other assets. The maximum potential amount of any claims made against these is usually significantly higher than actual settlements. Provisions are made with respect to management’s best estimate of the likely outcome, either at the time of sale, or subsequently if additional information becomes available.
See Note 19 to the Consolidated Financial Statements for further information regarding off-balance sheet arrangements. See Note 35 to the Consolidated Financial Statements for additional information regarding the ANTS group’s guarantees, commitments and contingencies.
| | |
| 24 | | Abbey National Treasury Services plc 2012 Annual Report |
Business Review
Balance Sheet Reviewcontinued
FUNDING AND LIQUIDITY
Sources and uses of funding and liquidity
ANTS is the treasury support function for the Santander UK group. In this regard, ANTS’s role is to provide access to financial markets and central bank facilities in order to meet the Santander UK group’s liquidity, funding, capital and balance sheet management requirements.
The Company has given a full and unconditional guarantee in respect of the unsubordinated liabilities of Santander UK plc incurred prior to 30 June 2015 under a deed poll guarantee entered into by the Company on 10 May 2012. Santander UK plc has given a reciprocal guarantee in respect of the unsubordinated liabilities of the Company incurred prior to 30 June 2015.
Liquidity and funding risk is managed on a Santander UK group basis and it is not therefore appropriate to consider these risks separately at an ANTS group level. In addition, under the FSA’s regulatory liquidity regime, Santander UK and ANTS together with Cater Allen Limited, a fellow subsidiary of Santander UK plc, form the Santander UK Defined Liquidity Group (‘DLG’). Under these arrangements, each member of the DLG is liable to support each other in terms of transferring or receiving surplus liquidity in times of stress. In considering the liquidity resources available to the ANTS group, both its own liquid assets and also those of rest of the Santander UK group are separately presented.
In addition, the Company, Santander UK plc, and Cater Allen Limited, which are the three FSA-regulated entities within the Santander UK group, are party to a capital support deed dated 14 December 2012 (the “Capital Support Deed”) with certain other non-regulated subsidiaries of Santander UK plc. The parties to the Capital Support Deed constitute a core UK group for the purposes of section 10 of the Prudential Sourcebook for Banks, Building Societies and Investment Firms (“BIPRU”) of the FSA Handbook. Under section 10.8 of BIPRU, exposures of each of the three regulated entities to other members of the core UK group are exempt from large exposure limits that would otherwise apply. The purpose of the Capital Support Deed is to facilitate the prompt transfer of available capital resources from, or repayment of liabilities by, the non-regulated parties to any of the regulated parties in the event that one of the regulated parties has breached or is at risk of breaching its capital resources requirements or risk concentrations requirements.
Santander UK primarily generates funding and liquidity through UK retail and corporate deposits, as well as in the financial markets through its own debt programmes and facilities to support its business activities and liquidity requirements. It does this in reliance on the strength of its balance sheet and profitability and its own network of investors.
Liquidity and funding risks are identified and encompassed within Santander UK’s Risk Framework and subject to Santander UK’s three-tier risk governance framework.
The debt issuance programmes managed by ANTS are set out in Note 32 to the Consolidated Financial Statements.
Further information is set out in “Liquidity and funding risk” in the Risk Management Report.
Cash flows
| | | | | | | | | | | | |
| | | 2012
£m | | | 2011
£m | | | 2010
£m | |
Net cash inflow/(outflow) from operating activities | | | 2,388 | | | | (4,555 | ) | | | 2,139 | |
Net cash (outflow)/inflow from investing activities | | | (5,134 | ) | | | 33 | | | | (40 | ) |
Net cash inflow/(outflow) from financing activities | | | 2,926 | | | | (2,004 | ) | | | 5,979 | |
| | | | | | | | | | | | |
Increase/(decrease) in cash and cash equivalents | | | 180 | | | | (6,526 | ) | | | 8,078 | |
| | | | | | | | | | | | |
The major activities and transactions that affected the ANTS group’s cash flows during 2012, 2011 and 2010 are as follows:
In 2012, the net cash inflow from operating activities of £2,388m resulted from the ANTS group’s continued de-leveraging process of legacy portfolios in run-off, offset by the reduction in securities held for trading. In 2011, the net cash outflow from operating activities of £4,555m resulted from the ANTS group’s lending activities, principally corporate lending (particularly SMEs), offset by the continued de-leveraging process of legacy portfolios in run-off. During 2010, the increase resulted from the ANTS group’s lending activities and the continued de-leveraging process which saw significant disposals and maturities in the Treasury asset portfolio as well as the sale of the majority of the ANTS group’s holdings of AAA-rated prime mortgage-backed securities.
In 2012, the net cash outflow from investing activities of £5,134m resulted primarily from the acquisition of UK Treasury bills. In 2011, the net cash inflow from investing activities of £33m resulted directly from the net inflow from the purchase and sale of property, plant and equipment and intangible assets. In 2010, the net cash outflow from investing activities of £40m resulted directly from the net outflow from the purchase of property, plant and equipment and intangible assets.
In 2012, the net cash inflow from financing activities of £2,926m reflected new issues of loan capital of £33,314m offset by repayments of loan capital maturing in the year of £28,388m. In 2011, the net cash outflow from financing activities of £2,004m reflected new issues of loan capital of £38,603m offset by repayments of loan capital maturing in the year of £40,607m. In 2010, the net cash inflow from financing activities of £5,979m reflected new issues of loan capital of £11,419m offset by repayments of loan capital maturing in the year of £4,840m and a dividend payment of £600m.
In 2012, cash and cash equivalents increased by £180m principally from the issue of new loan capital and the continued de-leveraging process of legacy portfolios in run-off offset by the purchase of Treasury bills. In 2011, cash and cash equivalents decreased by £6,526m, principally due to the increase from the ANTS group’s lending activities offset by the continued de-leveraging process of legacy portfolios in run-off and issuing of new loan capital. In 2010, cash and cash equivalents increased by £8,078m, principally due to the ANTS group holding significantly more high quality liquid assets in response to new UK regulatory requirements.
| | |
Abbey National Treasury Services plc 2012 Annual Report | | 25 |
Business Review
Balance Sheet Reviewcontinued
INTEREST RATE SENSITIVITY
Interest rate sensitivity refers to the relationship between interest rates and net interest income resulting from the periodic repricing of assets and liabilities. The ANTS group seeks to manage the risks associated with movements in interest rates as part of its management of the overall non-trading position. This is done within limits as described in the Risk Management Report beginning on page 28.
Changes in net interest income – volume and rate analysis
The following table allocates changes in interest income, interest expense and net interest income between changes in volume and changes in rate for the ANTS group for the years ended 31 December 2012, 2011 and 2010. Volume and rate variances have been calculated on the movement in the average balances and the change in the interest rates on average interest-earning assets and average interest-bearing liabilities. The variance caused by changes in both volume and rate has been allocated to rate changes.
| | | | | | | | | | | | | | | | | | | | | | | | |
| | | 2012/2011 | | | 2011/2010 | |
| | | Total change | | | Changes due to
increase/(decrease) in | | | Total change | | | Changes due to
increase/(decrease) in | |
| | | £m | | | Volume
£m | | | Rate
£m | | | £m | | | Volume
£m | | | Rate
£m | |
Interest income | | | | | | | | | | | | | | | | | | | | | | | | |
Loans and advances to banks: | | | | | | | | | | | | | | | | | | | | | | | | |
- UK | | | (457 | ) | | | (439 | ) | | | (18 | ) | | | 744 | | | | (802 | ) | | | 1,546 | |
- Non-UK | | | (20 | ) | | | (23 | ) | | | 3 | | | | 17 | | | | 20 | | | | (3 | ) |
Loans and advances to customers: | | | | | | | | | | | | | | | | | | | | | | | | |
- UK | | | 671 | | | | 107 | | | | 564 | | | | (118 | ) | | | 274 | | | | (392 | ) |
Other interest earning financial assets: | | | | | | | | | | | | | | | | | | | | | | | | |
- UK | | | 8 | | | | 201 | | | | (193 | ) | | | (21 | ) | | | (28 | ) | | | 7 | |
- Non-UK | | | 1 | | | | — | | | | 1 | | | | — | | | | — | | | | — | |
| | | | | | | | | | | | | | | | | | | | | | | | |
Total interest income | | | | | | | | | | | | | | | | | | | | | | | | |
- UK | | | 222 | | | | (131 | ) | | | 353 | | | | 605 | | | | (556 | ) | | | 1,161 | |
- Non-UK | | | (19 | ) | | | (23 | ) | | | 4 | | | | 17 | | | | 20 | | | | (3 | ) |
| | | | | | | | | | | | | | | | | | | | | | | | |
| | | 203 | | | | (154 | ) | | | 357 | | | | 622 | | | | (536 | ) | | | 1,158 | |
| | | | | | | | | | | | | | | | | | | | | | | | |
Interest expense | | | | | | | | | | | | | | | | | | | | | | | | |
Deposits by banks: | | | | | | | | | | | | | | | | | | | | | | | | |
- UK | | | (97 | ) | | | (206 | ) | | | 109 | | | | 389 | | | | (545 | ) | | | 934 | |
- Non-UK | | | — | | | | — | | | | — | | | | (1 | ) | | | (1 | ) | | | — | |
Deposits by customers - wholesale | | | | | | | | | | | | | | | | | | | | | | | | |
- UK | | | (27 | ) | | | 2 | | | | (29 | ) | | | 55 | | | | (6 | ) | | | 61 | |
Subordinated debt: | | | | | | | | | | | | | | | | | | | | | | | | |
- UK | | | (13 | ) | | | (13 | ) | | | — | | | | (20 | ) | | | (22 | ) | | | 2 | |
Debt securities in issue: | | | | | | | | | | | | | | | | | | | | | | | | |
- UK | | | 723 | | | | 77 | | | | 646 | | | | 106 | | | | 171 | | | | (65 | ) |
- Non UK | | | (13 | ) | | | (22 | ) | | | 9 | | | | (15 | ) | | | (26 | ) | | | 11 | |
Other interest-bearing financial liabilities: | | | | | | | | | | | | | | | | | | | | | | | | |
- UK | | | 2 | | | | — | | | | 2 | | | | — | | | | — | | | | — | |
| | | | | | | | | | | | | | | | | | | | | | | | |
Total interest expense | | | | | | | | | | | | | | | | | | | | | | | | |
- UK | | | 588 | | | | (140 | ) | | | 728 | | | | 530 | | | | (402 | ) | | | 932 | |
- Non-UK | | | (13 | ) | | | (22 | ) | | | 9 | | | | (16 | ) | | | (27 | ) | | | 11 | |
| | | | | | | | | | | | | | | | | | | | | | | | |
| | | 575 | | | | (162 | ) | | | 737 | | | | 514 | | | | (429 | ) | | | 943 | |
| | | | | | | | | | | | | | | | | | | | | | | | |
Net interest income | | | (372 | ) | | | (8 | ) | | | (380 | ) | | | 108 | | | | (107 | ) | | | 215 | |
| | | | | | | | | | | | | | | | | | | | | | | | |
| | |
| 26 | | Abbey National Treasury Services plc 2012 Annual Report |
Business Review
Balance Sheet Reviewcontinued
AVERAGE BALANCE SHEET
As year-end statements may not be representative of the ANTS group’s activity throughout the year, average balance sheets for the ANTS group are presented below. The average balance sheets summarise the significant categories of assets and liabilities, together with average interest rates.
| | | | | | | | | | | | | | | | | | | | | | | | | | | | | | | | | | | | |
| | | 2012 | | | 2011 | | | 2010 | |
| | | Average
Balance(1)
£m | | | Interest(4,5)
£m | | | Average
rate
% | | | Average
balance
£m | | | Interest
£m | | | Average
rate
% | | | Average
balance
£m | | | Interest
£m | | | Average
rate
% | |
Assets | | | | | | | | | | | | | | | | | | | | | | | | | | | | | | | | | | | | |
Loans and advances to banks: | | | | | | | | | | | | | | | | | | | | | | | | | | | | | | | | | | | | |
- UK | | | 118,670 | | | | 2,720 | | | | 2.29 | | | | 137,713 | | | | 3,177 | | | | 2.31 | | | | 205,485 | | | | 2,433 | | | | 1.18 | |
- Non-UK | | | 3,113 | | | | 12 | | | | 0.39 | | | | 11,675 | | | | 32 | | | | 0.27 | | | | 5,072 | | | | 15 | | | | 0.30 | |
Loans and advances to customers:(3) | | | | | | | | | | | | | | | | | | | | | | | | | | | | | | | | | | | | |
- UK | | | 44,368 | | | | 1,099 | | | | 2.48 | | | | 35,517 | | | | 428 | | | | 1.21 | | | | 23,637 | | | | 546 | | | | 2.31 | |
Other interest-earning financial assets | | | | | | | | | | | | | | | | | | | | | | | | | | | | | | | | | | | | |
- UK | | | 3,760 | | | | 38 | | | | 1.01 | | | | 489 | | | | 30 | | | | 6.13 | | | | 1,074 | | | | 51 | | | | 4.75 | |
- Non UK | | | 92 | | | | 1 | | | | 1.09 | | | | — | | | | — | | | | — | | | | — | | | | — | | | | — | |
| | | | | | | | | | | | | | | | | | | | | | | | | | | | | | | | | | | | |
Total average interest-earning assets, interest income(2) | | | 170,003 | | | | 3,870 | | | | 2.28 | | | | 185,394 | | | | 3,667 | | | | 1.98 | | | | 235,268 | | | | 3,045 | | | | 1.29 | |
| | | | | | | | | | | | | | | | | | | | | | | | | | | | | | | | | | | | |
Impairment loss allowances | | | (142 | ) | | | — | | | | — | | | | (111 | ) | | | — | | | | — | | | | (79 | ) | | | — | | | | — | |
Trading business | | | 26,444 | | | | — | | | | — | | | | 36,205 | | | | — | | | | — | | | | 28,562 | | | | — | | | | — | |
Assets designated at fair value through profit and loss | | | 4,152 | | | | — | | | | — | | | | 5,520 | | | | — | | | | — | | | | 7,843 | | | | — | | | | — | |
Other non-interest-earning assets | | | 39,971 | | | | — | | | | — | | | | 31,741 | | | | — | | | | — | | | | 32,377 | | | | — | | | | — | |
| | | | | | | | | | | | | | | | | | | | | | | | | | | | | | | | | | | | |
Total average assets | | | 240,428 | | | | — | | | | — | | | | 258,749 | | | | — | | | | — | | | | 303,971 | | | | — | | | | — | |
| | | | | | | | | | | | | | | | | | | | | | | | | | | | | | | | | | | | |
Non-UK assets as a % of total | | | 1.33 | | | | — | | | | — | | | | 4.51 | | | | — | | | | — | | | | 1.67 | | | | — | | | | — | |
| | | | | | | | | | | | | | | | | | | | | | | | | | | | | | | | | | | | |
Liabilities | | | | | | | | | | | | | | | | | | | | | | | | | | | | | | | | | | | | |
Deposits by banks: | | | | | | | | | | | | | | | | | | | | | | | | | | | | | | | | | | | | |
- UK | | | (128,254 | ) | | | (2,459 | ) | | | 1.92 | | | | (139,496 | ) | | | (2,554 | ) | | | 1.83 | | | | (186,377 | ) | | | (2,165 | ) | | | 1.16 | |
- Non-UK | | | (90 | ) | | | — | | | | — | | | | (14 | ) | | | — | | | | — | | | | (237 | ) | | | (1 | ) | | | 0.42 | |
Deposits by customers - wholesale: | | | | | | | | | | | | | | | | | | | | | | | | | | | | | | | | | | | | |
- UK | | | (6,879 | ) | | | (68 | ) | | | 0.99 | | | | (6,754 | ) | | | (95 | ) | | | 1.41 | | | | (7,982 | ) | | | (40 | ) | | | 0.5 | |
- Non-UK | | | (68 | ) | | | — | | | | — | | | | — | | | | — | | | | — | | | | — | | | | — | | | | — | |
Bonds and medium-term notes: | | | | | | | | | | | | | | | | | | | | | | | | | | | | | | | | | | | | |
- UK | | | (28,605 | ) | | | (1,179 | ) | | | 4.12 | | | | (24,479 | ) | | | (456 | ) | | | 1.86 | | | | (16,440 | ) | | | (350 | ) | | | 2.13 | |
- Non-UK | | | (3,043 | ) | | | (25 | ) | | | 0.82 | | | | (7,019 | ) | | | (38 | ) | | | 0.54 | | | | (13,825 | ) | | | (53 | ) | | | 0.38 | |
Dated and undated loan capital and other subordinated liabilities: | | | | | | | | | | | | | | | | | | | | | | | | | | | | | | | | | | | | |
- UK | | | — | | | | — | | | | — | | | | (102 | ) | | | (13 | ) | | | 12.75 | | | | (316 | ) | | | (33 | ) | | | 10.44 | |
| | | | | | | | | | | | | | | | | | | | | | | | | | | | | | | | | | | | |
Total average interest-bearing liabilities, interest expense(2) | | | (166,939 | ) | | | (3,731 | ) | | | 2.23 | | | | (177,864 | ) | | | (3,156 | ) | | | 1.77 | | | | (225,177 | ) | | | (2,642 | ) | | | 1.17 | |
| | | | | | | | | | | | | | | | | | | | | | | | | | | | | | | | | | | | |
Trading business | | | (27,947 | ) | | | — | | | | — | | | | (41,614 | ) | | | — | | | | — | | | | (40,071 | ) | | | — | | | | — | |
Liabilities designated at fair value through profit and loss | | | (5,152 | ) | | | — | | | | — | | | | (6,303 | ) | | | — | | | | — | | | | (5,715 | ) | | | — | | | | — | |
Non-interest-bearing liabilities: | | | | | | | | | | | | | | | | | | | | | | | | | | | | | | | | | | | | |
- Other | | | (36,654 | ) | | | — | | | | — | | | | (29,440 | ) | | | — | | | | — | | | | (29,657 | ) | | | — | | | | — | |
- Shareholders’ funds | | | (3,736 | ) | | | — | | | | — | | | | (3,528 | ) | | | — | | | | — | | | | (3,351 | ) | | | — | | | | — | |
| | | | | | | | | | | | | | | | | | | | | | | | | | | | | | | | | | | | |
Total average liabilities and shareholders’ funds | | | (240,428 | ) | | | — | | | | — | | | | (258,749 | ) | | | — | | | | — | | | | (303,971 | ) | | | — | | | | — | |
| | | | | | | | | | | | | | | | | | | | | | | | | | | | | | | | | | | | |
Non-UK liabilities as a % of total | | | 1.33 | | | | — | | | | — | | | | 2.72 | | | | — | | | | — | | | | 4.63 | | | | — | | | | — | |
| | | | | | | | | | | | | | | | | | | | | | | | | | | | | | | | | | | | |
| (1) | Average balances are based upon monthly data. |
| (2) | The ratio of average interest-earning assets to interest-bearing liabilities for the year ended 31 December 2012 was 101.84% (2011: 104.23%, 2010: 104.48%). |
| (3) | Loans and advances to customers include non-performing loans. See the “Credit Risk” section of the Risk Management Report. |
| (4) | The net interest margin for the year ended 31 December 2012 was 0.08% (2011: 0.28%, 2010: 0.17%). Net interest margin is calculated as net interest income divided by average interest-earning assets. |
| (5) | The interest spread for the year ended 31 December 2012 was 0.04% (2011: 0.2%, 2010: 0.12%). Interest spread is the difference between the rate of interest earned on average interest-earning assets and the rate of interest paid on average interest-bearing liabilities. |
| | |
Abbey National Treasury Services plc 2012 Annual Report | | 27 |
Business Review
Risk Management Report
RISK MANAGEMENT REPORT
This Risk Management Report contains audited financial information and forms an integral part of the Consolidated Financial Statements, except as marked unaudited in the non-financial risk sections and on pages 29, 36, 38, 39, 65 and 66.
The ANTS group provides treasury, corporate and wholesale banking services to UK clients and also to the wider Santander UK group, of which ANTS is a significant part. ANTS is also the treasury support function for the Santander UK group. In this regard, ANTS’s role is to provide access to financial markets and central bank facilities in order to meet the Santander UK group’s liquidity, funding, capital and balance sheet management requirements. As such, ANTS is one of the main debt issuance vehicles in the Santander UK group.
ANTS contains part of a number of Santander UK’s business segments. Specifically, ANTS consists of part of the Santander UK group’s Corporate Banking and Corporate Centre business segments and its entire Markets business segment. Whether transactions are booked in ANTS or another Santander UK group entity reflects historical or operational reasons and does not necessarily reflect any particular business split.
Santander UK plc has given a full and unconditional guarantee in respect of the liabilities of ANTS incurred up to 30 June 2015. The Company has given a reciprocal guarantee in respect of the liabilities of Santander UK plc incurred up to 30 June 2015. As a consequence of the reciprocal guarantee given by the Company in respect of the liabilities of Santander UK plc, the Company is exposed to the same risks as the Santander UK group, of which the Company and the ANTS group are part.
As a subsidiary of Santander UK plc, ANTS is subject to the Santander UK Risk Framework. As a consequence the ANTS group’s risks are managed at a Santander UK group level in accordance with the Santander UK group’s Risk Framework. The Risk Management Report describes the Santander UK group’s Risk Framework and includes more detail on the key risks (on a segmental basis or aggregated where relevant) to which the ANTS group is directly exposed. In addition, as a consequence of the guarantee given by the ANTS group in respect of the liabilities of Santander UK plc, the ANTS group is indirectly exposed to risks that arise in parts of the Santander UK group that are wholly outside the ANTS group. Those risks consist of retail credit risk and pension obligations risk.
The Risk Management Report consists of:
| • | | A description of Santander UK’s approach to the management of risk, including its Risk Framework, and |
| • | | Further detail on the ANTS group’s key risks, with separate discussions of: |
Throughout the Risk Management Report, except where stated otherwise, references to Santander UK should be taken to include ANTS and the ANTS group (reflecting both the risks that ANTS is directly exposed to through its own activities and the risks arising elsewhere in the Santander UK group that ANTS is indirectly exposed to due to the existence of the cross guarantees described above).
INDEX
| | |
| 28 | | Abbey National Treasury Services plc 2012 Annual Report |
Business Review
Risk Management Report continued
RISK MANAGEMENT
Introduction(unaudited)
As a significant financial services provider, risk is at the core of Santander UK’s day-to-day activities. The understanding and control of risk is critical for the effective management of the business. Santander UK aims to employ a prudent approach and advanced risk management techniques to facilitate the delivery of robust financial performance, and ultimately build sustainable value for all our stakeholders, including our staff, customers, fixed income investors, shareholders and the communities in which we operate.
Santander UK aims to maintain a predictable medium-low risk profile, consistent with its business model, which is key to the successful achievement of our strategic objectives.
RISK FRAMEWORK(unaudited)
During 2012, the Board of Santander UK plc (the “Santander UK Board”) approved a new Risk Framework (the “Risk Framework”), setting out enhancements to the management, control and oversight of all risk types in Santander UK. As a subsidiary of Santander UK plc, the Company is subject to this Risk Framework. The Risk Framework aims to continue to ensure that risk is managed and controlled on behalf of all our stakeholders.
The key components of this framework include:
| • | | Risk definition and structure, |
| • | | Governance, roles and responsibilities, and |
| • | | System of internal control. |
Risk definition and structure
Risk is defined as the uncertainty around Santander UK’s ability to achieve its business objectives, and specifically equates to a number of risk factors that have the potential to adversely impact on profitability.
The key risk types for the Santander UK group are defined in the next section. As set out in the diagram opposite, the key risk types are classified as:
| | |
Abbey National Treasury Services plc 2012 Annual Report | | 29 |
Business Review
Risk Management Reportcontinued
| | |
Financial Risk Types | | Definition |
| Credit Risk | | Credit Risk is the risk of financial loss arising from the default or credit quality deterioration of a customer or counterparty to which Santander UK has directly provided credit, or for which Santander UK has assumed a financial obligation. |
| |
| Traded Market Risk | | Traded Market Risk is the risk of losses in on- and off-balance sheet positions within Santander UK’s trading books, arising from movements in market prices. |
| |
| Structural Risks | | Non-traded Market Risk is Santander UK’s risk of loss of income or loss of economic value arising from changes to interest rates in the banking book or to changes in exchange rates, where such changes would affect Santander UK’s net worth through an adjustment to revenues, assets, liabilities and off balance sheet exposures in the banking book. Pension Risk is both the risk of the change in the accounting position and the risk of an unplanned increase in funding required by Santander UK’s defined benefit pension schemes, either because of a loss of net asset value or because of changes in legislation or regulatory action. Liquidity Riskis the risk that Santander UK, although solvent, either does not have available sufficient liquid financial resources to enable it to meet its obligations as they fall due, or can secure them only at excessive cost. Funding Risk is the risk that Santander UK does not have sufficiently stable and diverse sources of funding or the funding structure is inefficient or a funding programme such as debt issuance subsequently fails. Capital Risk is defined as the risk of Santander UK not having an adequate amount or quality of capital to meet its internal business objectives, regulatory requirements and market expectations. |
| | | | |
Non Financial Risks | | Definition |
| Conduct Risk | | The risk that the business and operational decisions Santander UK takes and the behaviours displayed lead to detriment or poor outcome for our customers. |
| |
| Operational Risk | | The risk of loss resulting from inadequate or failed internal processes, people and systems, or from external events. |
| |
| Regulatory Risk | | The risk of reductions in earnings and/or value, through financial or reputational loss, from failing to comply with applicable codes and regulatory rules. |
| |
| Strategic Risk | | The risk of material deviations in expected/target shareholder value as a result of poor definition or implementation of Santander UK’s strategy. |
| |
| Reputational Risk | | The risk that the reputation of Santander UK prevents the achievement of its strategic objectives. |
| |
| Human Resources Risk | | The risk of not having the sufficient number and quality of people to deliver Santander UK’s strategy or comply with legislative requirements. |
| |
| Accounting and Reporting Risk | | The failure to comply with regulatory and legal requirements for accounting and reporting of financial disclosures, which may lead to fines and/or restrictions and/or reputational damage. |
| |
| Legal Risk | | The risk of unexpected loss arising from a: |
| | • | | defective transaction; or |
| | • | | failure to take appropriate measures to protect assets; or |
| | • | | claim being made or some other event occurring which results in a liability for Santander UK or other loss; or |
| | • | | change in law. |
| | |
| 30 | | Abbey National Treasury Services plc 2012 Annual Report |
Business Review
Risk Management Report continued
Core principles
The following statements are the core principles which underpin the Risk Framework:
| • | | Each business area is held accountable for the management of the risks arising from its activities; |
| • | | Risk should be considered as part of the governance around every business decision; |
| • | | All material risk exposures must be identified, assessed, managed and reported in a timely and accurate manner; |
| • | | An internal control system should be in place to ensure that risk management and controls are executed in accordance with the guiding principles, minimum standards, risk appetite, limits and mandates; and |
| • | | Risk management should be included within objective setting, performance management and remuneration to ensure a balanced approach to risk taking at all levels and in all parts of Santander UK. |
Governance, roles and responsibilities
Committee structure
The diagram below sets out the main Santander UK Board and Santander UK management committees which underpin the Risk Framework. As a subsidiary of Santander UK plc, the ANTS group is subject to the Santander UK Risk Framework.
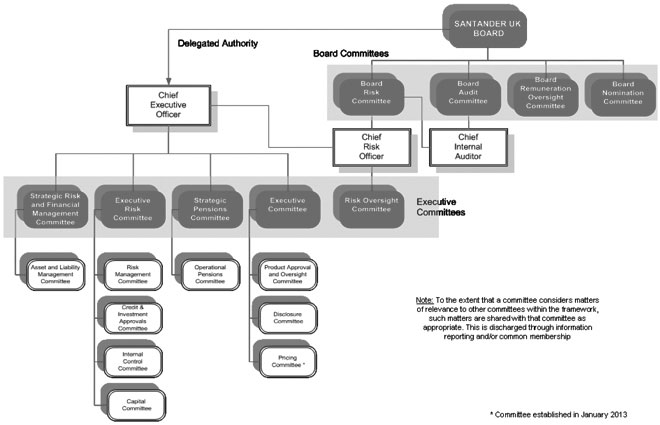
In addition, for larger value credit transactions and other significant risk exposures, reference is made to the “Comision delegada de riesgos” (‘CDR’ or Delegated Risk Committee) in the Banco Santander group.
| | |
Abbey National Treasury Services plc 2012 Annual Report | | 31 |
Business Review
Risk Management Reportcontinued
Key responsibilities
The key risk responsibilities of the Santander UK Board and its committees include:
| | | | |
Board/Board Committees | | Main risk responsibilities (within overall responsibilities) |
| | |
| The Santander UK Board | | • | | Overall responsibility for business execution and risk management. |
| | • | | Approval of the risk framework and Risk Appetite. |
| | |
| Santander UK Board Risk Committee | | • | | Advise the Santander UK Board on Santander UK’s overall Risk Appetite, tolerance and strategy, taking account of the current and prospective macroeconomic and financial environment. |
| | • | | Oversee and advise the Santander UK Board on current risk exposure and future risk strategy. |
| | • | | Review Risk Appetite for submission to Santander UK Board. |
| | • | | Review and recommend the Santander UK risk framework for the Santander UK Board’s approval. |
| | • | | Review and approve specific risk frameworks. |
| | • | | Consider and recommend actions in respect of all risk issues escalated by the Chief Risk Officer. |
| | • | | Review the effectiveness of risk management systems and internal controls. |
| | • | | Review significant transactions from a risk perspective. |
| | |
| Santander UK Board Audit Committee | | • | | Monitor and review the integrity of Santander UK’s financial statements, and any formal announcements relating to Santander UK’s financial performance, including significant financial reporting judgements contained in them. |
| | • | | Review Santander UK’s internal financial controls. |
| | • | | Assess the external auditor’s independence and objectivity and monitor the effectiveness of the audit process. |
| | • | | Monitor and review the effectiveness of Santander UK’s internal audit function. |
| | • | | Review whistle-blowing arrangements. |
| | |
| Santander UK Board Remuneration Oversight Committee | | • | | Oversee and supervise policies and frameworks covering remuneration and reward for Santander UK. |
| | • | | Review new or changed short-term or long-term incentive plans. |
| | • | | Ensure that measurement of performance includes adjustments for all types of current and future risks. |
| | |
| Santander UK Board Nomination Committee | | • | | Identify and nominate candidates to fill Santander UK Board vacancies. |
| | • | | Recommend membership of the Santander UK Board Risk Committee and Santander UK Board Audit Committee to the Santander UK Board. |
| | • | | Consider succession planning for directors and senior executives. |
| | |
| 32 | | Abbey National Treasury Services plc 2012 Annual Report |
Business Review
Risk Management Reportcontinued
The key risk responsibilities of the Santander UK executive committees include:
| | | | |
Executive Committees | | Main risk responsibilities |
| | |
| Executive Committee | | • | | Consider and approve business plans aligned with risk appetite and framework prior to submission to the Santander UK Board for approval. |
| | • | | Receive updates from CEO-level committees on key risk issues and monitor actions taken. |
| | |
| Strategic Risk and Financial Management Committee (‘SRFM’) | | • | | Ensure proactive measurement and control of structural balance sheet risks, capital, funding and liquidity, in accordance with the policies, strategies and future plans set by the Santander UK Board. |
| | • | | Review and monitor FMIR and ensure any exposures in excess of appetite are appropriately dealt with. |
| | |
| Executive Risk Committee | | • | | Review Santander UK’s Risk Appetite proposal prior to submission to the Santander UK Board. |
| | • | | Monitor compliance with Risk Framework, Risk Appetite and risk policies. |
| | • | | Review and monitor risk exposures and approve any corrective action required. |
| | • | | Approve credit and market risk transactions for exposures above £70m. |
| | |
| Strategic Pensions Committee (‘SPC’) | | • | | Review pension risk appetite proposals. |
| | • | | Approve actuarial valuations and related impacts on Santander UK’s contributions, capital and funding arrangements. |
| | • | | Consult with the pension scheme Trustees on scheme investment strategy. |
| | |
| Risk Oversight Committee | | • | | Challenge and monitor Risk Appetite consumption. |
| | • | | Review Risk Appetite framework, prior to submission to the Santander UK Board. |
| | • | | Review and challenge risk frameworks from an oversight perspective. |
| | • | | Provide advice on risk management, risk strategy and risk policy matters. |
The key risk responsibilities of other Santander UK committees include:
| | |
Other committees | | Main risk responsibilities |
| |
| Asset and Liability Management Committee | | Support SRFM by recommending non-traded market risk exposure of Santander UK’s balance sheet, composition of Santander UK’s capital structure and assess the management of funding and liquidity. |
| |
| Risk Management Committee | | Establish adequate and effective risk control processes, policies and reporting systems to ensure all financial risks are managed within the Risk Framework approved by the Santander UK Board. |
| |
| Credit & Investment Approvals Committee | | Approves corporate and wholesale credit and investment transactions over and above the levels delegated to individuals and below levels required to be submitted to Executive Risk Committee. |
| |
| Internal Control Committee | | Establish adequate and effective risk control processes, policies and reporting systems to ensure all non-financial risks are managed within the Risk Framework approved by the Santander UK Board. |
| |
| Capital Committee | | Establish adequate and effective risk control processes, reporting systems and processes to ensure that all material capital risks are managed within the Risk Framework approved by the Santander UK Board. |
| |
| Operational Pension Committee | | Support the SPC by recommending material amendments to Trust Deeds and Rules, significant changes to pension arrangements and funding strategies. Approve forward-looking plans, projects and initiatives, referring material matters to the SPC. |
| |
| Product Approval and Oversight Committee | | Approve customer, conduct, governance, operational, reputational, risk and control aspects relating to the external launch of new products and campaigns across all businesses and to material changes in existing products. |
| |
| Pricing Committee | | Approve pricing decisions for retail and corporate products. Understand the financial risks inherent in these products, ensuring they are adequately mitigated. This committee was established in January 2013. |
| |
| Disclosure Committee | | Ensure the adequacy and effectiveness of Santander UK’s disclosure controls and procedures and review and evaluate material financial information and announcements to be disclosed to the London Stock Exchange, US Securities and Exchange Commission and other recognised bodies. |
| | |
Abbey National Treasury Services plc 2012 Annual Report | | 33 |
Business Review
Risk Management Reportcontinued
The Chief Executive Officer
The Santander UK Board delegates responsibility to the Chief Executive Officer (references on this page to Chief Executive Officer are to the Santander UK Chief Executive Officer) for the execution of business activities and the management of risk on a day-to-day basis. The key responsibilities of the Chief Executive Officer relating to risk are to:
| | • | | Propose and execute Santander UK’s business plan and strategy, and manage the risks that arise in the execution of this strategy with a delegated authority from the Santander UK Board for this purpose. |
| | • | | Propose to the Santander UK Board the Risk Appetite to gain their agreement on the maximum level and type of risk Santander UK is willing and able to accept to achieve its strategic objectives and business plan. |
| | • | | Delegate authority to executives to enable the discharge of responsibilities for the management and control of risk. |
| | • | | Oversee the establishment and maintenance of appropriate risk management systems and controls. |
| | • | | Report on a regular basis to the Santander UK Board on the management of the key risks to achieving Santander UK’s strategic objectives and business plan. |
| | • | | Promote a corporate culture ensuring ethical practices and social responsibility are fostered, and that the policies and corporate values approved by the Santander UK Board are effectively communicated throughout Santander UK. |
The Chief Risk Officer
As the leader of the risk function for Santander UK, the Chief Risk Officer provides oversight and challenge. The Chief Risk Officer reports to the Santander UK Board and also has a reporting line to the Chief Executive Officer for operational purposes. The key responsibilities of the Chief Risk Officer are to:
| | • | | Propose to the Santander UK Board (via the Santander UK Board Risk Committee) a Risk Framework, which sets out how the risks arising from Santander UK’s activities are managed within Santander UK Board-approved Risk Appetite and limits. |
| | • | | Provide assurance to the Santander UK Board that all material risks incurred by Santander UK are appropriately identified measured and reported and that the systems, controls and delegated authorities for the management of these risks are both adequate and effective. |
| | • | | Provide assessment on key risks to the Chief Executive Officer, Santander UK Board Risk Committee and Santander UK Board, escalating any issue or breach of appetite or limit as necessary. |
The Chief Risk Management Officer
The Chief Risk Management Officer has dual reporting lines to both the Chief Executive Officer and the Chief Risk Officer. The Chief Risk Management Officer assists the Chief Executive Officer in proposing the Risk Appetite and overall risk policy. The other main responsibilities of the Chief Risk Management Officer are to:
| | • | | Establish and maintain adequate processes and controls to ensure that all financial risks are managed within the Risk Appetite, and in accordance with the principles established in the respective specific risk frameworks. |
| | • | | Ensure all financial risks are properly identified, assessed, managed and reported. |
| | • | | Control and manage financial risks by proposing risk limits and policies for review and agreement. |
| | • | | Monitor risk exposure and utilisation against risk limits; report and action as required. |
| | • | | Ensure the risk culture is embedded throughout the business. |
| | |
| 34 | | Abbey National Treasury Services plc 2012 Annual Report |
Business Review
Risk Management Reportcontinued
Risk organisational structure
Santander UK is structured into three lines of defence with clearly defined and segregated responsibilities with respect to risk:
| | | | |

| | Business Units which, through the execution of their business activities, originate risk. The head of each business unit is responsible for these risks and their primary management including: |
| | • | | Their identification, assessment, measurement and reporting, and |
| | • | | Management in line with Risk Appetite statements, policies and controls. |
| | Specialised Risk Unitswhich support the business in the management of complex and specialised risk. |
| |

| | Risk Control Units are independent from risk origination functions. They are under the executive responsibility of the Chief Executive Officer and also report to the Chief Risk Officer. They comprise theChief Risk Management Officer (‘CRMO’) Unit, theInternal Control Unit, andLegal and Secretariat. The risk control units are responsible for effectively controlling risks and ensuring they are managed within the risk limits and mandates approved by the Santander UK Board and Chief Executive Officer for which they: |
| | • | | Define and propose Risk Appetite and policies, ensuring an adequate link between them, |
| | • | | Use stress tests and scenario analysis to inform and assess Santander UK’s resilience with respect to its business objectives and risk statements and limits, |
| | • | | Measure and monitor risk exposures and profiles, and generate risk management information for senior management and committees, |
| | • | | Identify, assess and report risks including limit/threshold breaches and ensuring remedial actions are in place, |
| | • | | Define comprehensive but appropriate controls and ensure these are embedded, and |
| | • | | Maintain appropriate management information and risk reporting systems. |
| | TheRisk Oversight Unitassists the Chief Risk Officer in ensuring that risk management and control operates under the risk mandates and limits defined by the Santander UK Board and: |
| | • | | Provides independent risk assessment and advice to the Chief Risk Officer, Chief Executive Officer, Santander UK Board Risk Committee and Santander UK Board, |
| | • | | Defines and proposes the Risk Frameworks for Santander UK Board and Santander UK Board Risk Committee approval, |
| | • | | Oversees and challenges risk management and risk control, including the oversight of the Risk Appetite proposed, and the associated business plan, |
| | • | | Conducts and co-ordinates Risk Appetite stress testing, |
| | • | | Verifies the adequacy and completeness of the systems of controls, |
| | • | | Identifies and assesses key enterprise-wide risks and potential emerging and future risks, and |
| | • | | Validates models and methodologies used for risk management. |
| |

| | The third line of defence is carried out by theInternal Audit Unit, which reports to the Santander UK Board Audit Committee and the Santander UK Board Risk Committee. Its main functions are: |
| | • | | Independently supervise the fulfilment, effectiveness and efficiency of internal control systems, as well as the reliability and quality of the accounting, |
| | • | | Verify that the units responsible for exercising control over risks fulfil their purpose and respect the policies set by senior management, the procedures and the relevant internal and external regulations, and |
| | • | | Independently assure the adequacy and effectiveness of implementing risk policies. |
| | |
Abbey National Treasury Services plc 2012 Annual Report | | 35 |
Business Review
Risk Management Reportcontinued
The reporting lines of these units with respect to the management of risk are set out below:
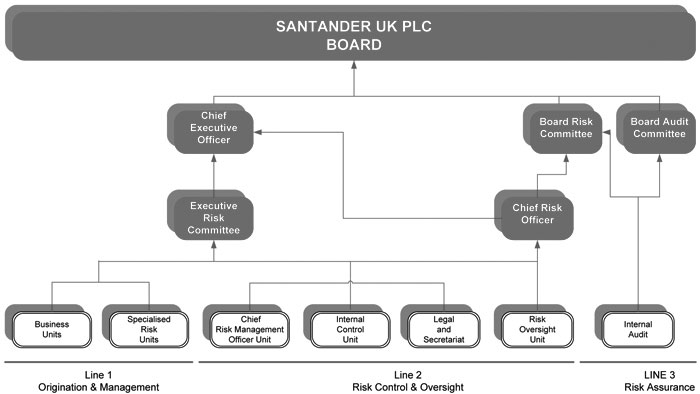
System of Internal Control
Santander UK’s system of internal control for risk comprises a hierarchy of risk frameworks, policies and limits for each specific risk type. Specific risk frameworks establish the principles, standards, rules and governance requirements for the management and control of each risk type. In support of these frameworks, each specific risk type has its own suite of policies and limits. These set out the rules and risk limits for the management of risk at a more granular level (e.g. credit portfolios). The risk limits employed in the management of each specific risk type are linked to the Santander UK’s overall Risk Appetite, as set out in the next section.
RISK APPETITE(unaudited)
The Risk Appetite defines the type and the level of risk that Santander UK is willing and able to accept in pursuit of its strategic objectives under a severe but plausible stress scenario. The Risk Appetite and the Santander UK strategy are inter-related. The strategy must be achievable within the agreed boundaries determined by the Santander UK Board-approved Risk Appetite statements.
The Risk Appetite is expressed through three types of mechanism:
| | • | | Primary metrics - These are the primary articulation of the Risk Appetite and cover losses, capital and liquidity. |
| | • | | Complementary metrics- These support the primary metrics with the aim of controlling risk concentrations. |
| | • | | Qualitative Statements - These express the Risk Appetite for risks that do not lend themselves to expression through a metric, for example in the area of reputational risk. |
| | |
| 36 | | Abbey National Treasury Services plc 2012 Annual Report |
Business Review
Risk Management Report continued
The table below sets out further detail on the nature of metrics employed.

Santander UK defines its Risk Appetite in accordance with the following principles:
| | • | | Maintain the trust of its customers, shareholders and employees, |
| | • | | Maintain a predictable, medium-low risk profile, |
| | • | | Maintain a moderate overall market risk appetite, |
| | • | | Maintain a stable policy of profit generation and dividend pay-out, |
| | • | | Preserve strong capital and liquidity ratios, |
| | • | | Provide effective diversification in the sources and tenor of funding, |
| | • | | Control large concentrations to customers and industries, |
| | • | | Comply with regulatory requirements, |
| | • | | Deliver target capital returns, driven by a strong risk culture, and |
| | • | | Maintain a remuneration policy that contains the necessary incentives to ensure that the individual interests of employees and executives are aligned to the Risk Appetite. |
| | |
Abbey National Treasury Services plc 2012 Annual Report | | 37 |
Business Review
Risk Management Reportcontinued
KEY TOOLS AND TECHNIQUES(unaudited)
In managing risk, Santander UK employs a number of tools and techniques. Certain of these are described in further detail in the later sections of this report. In summary, they comprise the following:
| | | | |

| | • | | Internal rating and scoring models which, by assessing the qualitative and quantitative risk components by customer and transaction or product, make it possible to measure risk. |
| | • | | Self-assessment techniques employed, for example, in operational risk and supplemented by use of loss data. |
| | • | | Market risk models, including Value at Risk (‘VaR’), used for controlling market risk and setting the market risk limits for the trading portfolios. |
| |

| | Economic capital requirements are a homogeneous measure of risk and the capital required to maintain the desired risk profile. They enable Santander UK to: |
| | • | | Quantify the consolidated risk profile taking into account the significant risks of the business, as well as the diversification effect inherent in a multi-business group such as Santander UK. |
| | • | | Prepare economic capital forecasts as part of its internal capital adequacy assessment. |
| | • | | Consider the concentration risk for corporate and markets portfolios, in terms of both the size of their exposure and their sector or geographic concentration. Product concentration in retail portfolios is captured through the application of an appropriate correlation model. |
| | • | | Monitor the economic capital position on a monthly basis. |
| |

| | Santander UK employs a return on risk-adjusted capital (‘RORAC’) methodology with the following activities and objectives: |
| | • | | Calculation of economic capital requirement and of the return thereon for Santander UK’s business units and for business segments and portfolios in order to facilitate an optimal allocation of economic capital. |
| | • | | Budgeting of capital requirement and RORAC of Santander UK’s business units. |
| | • | | Analysis and setting of prices in the decision-making process for transactions or products, such as loan approval. |
| | RORAC facilitates the comparison of the performance of transactions, customers, portfolios and businesses. It also identifies those which achieve a risk-adjusted return higher than the cost of capital, aligning risk management and business management with the aim of maximising value creation. |
| |

| | The main objective of scenario analysis and stress testing at Santander UK is to enhance senior management’s understanding of the sensitivity of Santander UK’s business plan, risk profile and financial resources to stress and scenario events. Scenario analysis and stress testing outputs form the basis for developing appropriate action plans that are ready to be deployed to mitigate as much of the impacts of the events as possible. |
| | The Santander UK Board views scenario analysis and stress testing as an intrinsic component of risk governance and has ultimate responsibility for its application and embedding it throughout Santander UK. The Stress Testing Framework aims to ensure that consistent and comprehensive stress testing is undertaken throughout Santander UK and that scenario analysis and stress testing is an integral part of: |
| | • | | The setting and review of Santander UK’s Risk Appetite; |
| | • | | The three year planning process; |
| | • | | The capital planning process; |
| | • | | Liquidity and contingency planning; and |
| | • | | Santander UK’s compliance with prevailing regulatory requirements. |
| |

| | The on-going independent validation of our risk models provides assurance in respect of their appropriateness and reliability. |
| | • | | The validation is conducted independently of the teams responsible for the development of the models, and has a separate reporting line. |
| | • | | It is specialised and expert, and reviews both the methodological aspects of the models, but also the technical environment and data employed. |
| | • | | Validation is undertaken to ensure all our regulatory obligations are met. |
| | |
| 38 | | Abbey National Treasury Services plc 2012 Annual Report |
Business Review
Risk Management Report continued
Allocation of risk across Santander UK
| | |
As a homogenous measure of risk, economic capital can be used to illustrate the distribution of risk across those risk types for which capital is considered an effective mitigant. | | 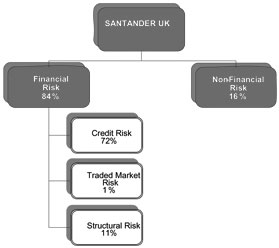 |
The diagram opposite sets out the distribution of economic capital requirements at 31 December 2012 by key risk type. This allocation does not make allowance for the effects of diversification across risks or assets. Figures are derived from the economic capital consumption at 31 December 2012. | |
Structural Risk includes Non-Traded Market Risk allocation of 8%. Non Financial Risk includes Operational Risk allocation of 10%. | |
RISK CULTURE(unaudited)
Our risk culture is founded on the core principles described above and is embedded into all business units through the implementation of the Santander UK Risk Framework:
| | • | | The Chief Executive Officer and Chief Risk Officer are responsible for promoting a corporate culture, promoting ethical practices and fostering social responsibility. Policies and corporate values, approved by the Santander UK Board, are communicated throughout Santander UK. |
| | • | | The Santander UK Risk Framework, implemented in 2012, provides a common acceptance throughout the organisation of the importance of continuous risk management, including clear accountability and ownership of risk areas. Minimum standards apply to each of the five core principles and are monitored through a documented attestation process. |
| | • | | The committee structure and governance process allows for timely risk information flow, challenge and escalation. |
| | • | | In 2012, new Santander UK corporate values were launched. These align behaviours to four key values in support of our risk culture: Teamwork, Excellence, Innovation and Commitment. |
| | • | | In 2012, risk training and briefings were given to Santander UK Board members, Executive Committee members and Operational Risk officers. |
| | • | | An established ‘Risk School’ supports learning and professional development across Risk whilst engendering risk understanding and capability across other areas of Santander UK. The Risk School’s objectives include sharing of risk best practice and the provision of quality risk training. In 2012: |
| | • | | 15,648 training hours were delivered to risk professionals by the Risk School. |
| | • | | A training programme aimed at non-risk professionals resulted in an increased level of risk knowledge and understanding across other Santander UK business areas. |
| | • | | 147 non-risk professionals received face-to-face training and 11,500 undertook e-learning development across a variety of risk-related topics. |
| | • | | From a communication perspective, policies and procedures articulate the application of risk management techniques to Risk Framework principles. |
| | • | | The Santander UK employee handbook documents expectations of employees in relation to business and financial integrity. |
During 2013, further work is planned as follows:
| | • | | A comprehensive risk awareness campaign is planned to be launched in 2013 to further strengthen and embed a risk management culture across Santander UK. |
| | • | | Risk awareness training and communication programme for all staff and face-to-face workshops for risk controllers and Directors. |
| | • | | Inclusion of risk behavioural competencies within job profiles and mandatory risk objectives within the performance management process. |
| | |
Abbey National Treasury Services plc 2012 Annual Report | | 39 |
Business Review
Risk Management Reportcontinued
CREDIT RISK
INTRODUCTION
Credit risk is the risk of financial loss arising from the default or credit quality deterioration of a customer or counterparty to which ANTS has directly provided credit, or for which the ANTS has assumed a financial obligation.
This section sets out further detail on:
|
• Credit risk classification, |
• Measurement across the credit cycle, |
• Approach to forbearance, and |
• Credit risk exposure at an ANTS group level. |
Credit risk classification
ANTS’s exposures to credit risk arise in the following businesses:
| | | | | | | | | | |
CORPORATE BANKING | | MARKETS | | CORPORATE CENTRE |
• | | Exposures arise from treasury, corporate and wholesale banking services. These services are provided to large corporates, UK SMEs and specialist businesses. | | • | | Exposures arise from financial services and treasury products provided to financial institutions and large corporates. | | • | | Exposures arise from asset and liability management of the balance sheet. This area is also responsible for managing credit risk on the non-core and legacy portfolios being run down. |
The credit risk arising in each of these businesses is covered in further detail in subsequent sections. Across these business segments, the management of credit risk is tailored according to the type of customer. These are typically classified as either non-standardised or standardised customers as follows:
| | |
STANDARDISED CUSTOMERS |
• | | Consists primarily of small businesses. Risk management is based on internal risk assessment and automatic decision-making models, supported by teams of analysts specialising in this type of risk. |
| |
• | | As a general rule, the following businesses deal with standardised customers: Corporate Banking and Corporate Centre (for certain non-core portfolios). |
| | |
NON-STANDARDISED CUSTOMERS |
• | | Consist mostly of medium and large corporate customers and financial institutions where risk management is performed through expert analysis supplemented by decision-making support tools based on internal risk assessment models. |
| |
• | | As a general rule, the following businesses deal with non-standardised customers: Corporate Banking, Markets and Corporate Centre. |
| | |
| 40 | | Abbey National Treasury Services plc 2012 Annual Report |
Business Review
Risk Management Report continued
Measurement across the credit cycle
The credit cycle comprises the following elements. Each element is described in further detail below:
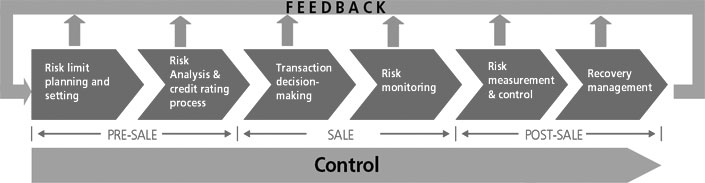
1. Risk limit planning and setting
This phase involves setting risk limits which:
| | • | | Are aligned to Santander UK’s business plan and strategic aims, |
| | • | | Ensure adherence to Santander UK’s Risk Appetite, and |
| | • | | Control the risk associated with any new product proposals. |
Risk limit planning and setting is a dynamic process involving the discussion of business proposals and the attitude to risk. This process is defined in the risk limit plan, a comprehensive document for the integrated management of the balance sheet and its inherent risks. The way in which risk limits are set is tailored to each risk classification as follows:
| | |
STANDARDISED CUSTOMERS |
• | | The risk limits are planned and set on a portfolio basis. |
| | |
| |
• | | For each portfolio, a credit management programme is produced. These documents contain the expected results of the portfolio in terms of risk and return, as well as the limits applicable to various activities and the related risk management. |
| | |
NON-STANDARDISED CUSTOMERS |
• | | A high-level risk limit is approved to support the customer’s overall financing needs. |
| |
• | | This limit covers a variety of products (such as lending, trade finance or derivatives) enabling Santander UK to define a total risk tolerance with the customer based on current and expected financial requirements. |
| |
• | | For global corporate groups, a system of pre-agreed limits (pre-classification) is used, based on an economic capital measurement and monitoring system. For large corporate customers, a simplified pre-classification model is applied. |
2. Risk analysis and credit rating process
Risk analysis is performed to establish the customer’s ability to meet its obligations. The analysis includes a review of customer credit quality, associated operational risk, and risk adjusted returns.
To aid this analysis, Santander UK uses a number of proprietary internal measurement tools including statistical models and rating systems. These are used for internal credit risk assessments, informing lending decisions, and for calculating regulatory and economic capital requirements. These are tailored to each risk classification as follows:
| | |
STANDARDISED CUSTOMERS |
• | | For standardised customers, Santander UK typically employs statistical models that automatically assign a score to the proposed transaction or customer. Such scorecards typically work in conjunction with other policy rules. |
| | |
NON-STANDARDISED CUSTOMERS |
• | | For many non-standardised counterparties with a global footprint, Santander UK employs rating tools, co-ordinated on a global basis by the Banco Santander group. Portfolios of this nature include sovereigns, large corporate and certain financial institutions. Ratings for non-standardised customers and financial institutions employ specific proprietary rating systems. |
| | |
Abbey National Treasury Services plc 2012 Annual Report | | 41 |
Business Review
Risk Management Reportcontinued
| | |
STANDARDISED CUSTOMERS |
• | | Most decisions are made via an automated route. There are cases however where additional qualification and manual intervention is necessary. Risk assessment is not constrained to decisions at origination, as often scorecards exist across the customer lifecycle. |
| |
• | | Scorecards and policies are monitored frequently, with both quantitative and qualitative triggers embedded. |
| | |
NON-STANDARDISED CUSTOMERS |
• | | The tools utilised have both quantitative and qualitative components. The qualitative stage involves the analysis of the relative financial performance of the customer, together with macro-economic data. This is supplemented in the qualitative stage with an analyst’s expert judgement. |
| |
• | | The ratings are reviewed at least annually or more frequently in cases where monitoring indicates this is appropriate. |
| |
• | | The rating tools are also reviewed in order to progressively fine-tune the ratings they provide |
Credit risk parameters
The Santander UK group (including the ANTS group) uses a number of internal measures and measurement tools for the purposes of making internal credit risk assessments and lending decisions and for calculating regulatory capital in accordance with Basel II requirements but these are not used in the calculation of impairment loss allowances for accounting purposes under IFRS. For the remainder of the Risk Management Report, impairments, impairment losses and impairment loss allowances refer to calculations in accordance with IFRS unless specified as relating to Basel II. For details of the accounting policies for impairment calculated in accordance with IFRS refer to pages 127 to 129.
The Basel II assessment of customers or transactions using rating or scoring systems constitutes a judgement of their credit quality, which is quantified through the probability of default (‘PD’). In addition to PD, the quantification of credit risk requires the estimation of other parameters, such as exposure at default (‘EAD’) and the percentage of EAD that will not be recovered (loss given default or ‘LGD’). PD, EAD and LGD are all calculated in accordance with the requirements of Basel II and include direct and indirect costs. In estimating the risk involved in transactions, other factors such as any off-balance sheet exposure and collateral valuations are also taken into account. The combination of these risk parameters (i.e. PD, LGD and EAD) enables calculation of the expected loss (‘EL’). The risk parameters are used to calculate the Basel II regulatory capital.
For portfolios with limited internal default experience (e.g. banks) parameter estimates are based on alternative sources, such as market prices or studies conducted by external agencies. These portfolios are known as “low default portfolios”. For all other portfolios, parameter estimates are based on internal risk models.
| | • | | PD is calculated by observing the cases of new defaults in relation to the final rating assigned to customers or to the scoring assigned to the related transactions. |
| | • | | EAD is calculated by comparing the use of committed facilities at the time of default and their use under normal (i.e. performing) circumstances, so as to estimate the eventual extent of use of the facilities in the event of default. |
| | • | | LGD is calculated by observing the recoveries of defaulted loans, taking into account not only the income and expenses associated with the recovery process, but also the timing and the indirect costs arising from the recovery process. |
The parameters estimated for global portfolios (e.g. banks) are the same throughout the Banco Santander group. Therefore, a financial institution will have the same PD for a specific rating, regardless of the Banco Santander group entity in which the exposure is booked. By contrast, local portfolios (e.g. residential mortgages) have specific score and rating systems. PDs are assessed specifically for each borrower within the portfolio.
3. Transaction decision-making
Having analysed the transactions and rated the customer, a decision is then made about whether or not to approve the transaction. This decision-making process takes account of:
| | • | | The credit quality of the customer, the underlying risk of the transaction and the extent of any risk mitigation (e.g. collateral), |
| | • | | Associated risk policy, limits and appetite, and |
| | • | | Achievement of the correct balance between risk and associated return. |
All decisions to approve credit transactions are made under authority delegated by the Santander UK Board. The approach to the decision-making process differs according to risk classification as follows:
| | |
STANDARDISED CUSTOMERS |
• | | In the standardised risk environment, automated decision models are used to facilitate the management of large volumes of credit transactions. |
| | |
NON-STANDARDISED CUSTOMERS |
• | | Credit approval decisions are made under a system of delegated authorities to individuals. Larger transactions above pre-defined limits are referred to governance committees. These include the Credit & Investment Approvals Committee and, for higher value transactions, the Executive Risk Committee. |
| | |
| 42 | | Abbey National Treasury Services plc 2012 Annual Report |
Business Review
Risk Management Reportcontinued
| | |
STANDARDISED CUSTOMERS |
• | | In certain cases this is supplemented by the use of manual underwriting to ensure adherence to risk policy and that the appropriate decision is made for both the customer and Santander UK. |
| | |
NON-STANDARDISED CUSTOMERS |
• | | This decision-making process is followed both for transactions under pre-classified limits and those which receive specific approval. |
4. Risk monitoring
The Risk Division has a specific monitoring function to enable early detection of issues. Monitoring is conducted at a portfolio, segment, customer and transactional level. Mitigating actions are proposed if deterioration is detected. Credit concentrations are also monitored. Concentration limits as defined by the Risk Appetite are reviewed and approved as necessary.
A specialised approach to monitoring is adopted for each risk classification:
| | |
STANDARDISED CUSTOMERS |
• | | For exposures to standardised customers, key indicators are monitored in order to detect any variance in the performance of portfolio compared to the forecasts contained in the credit management programmes. |
| |
• | | The scorecards, rating systems (including those necessary for Basel II), and associated policy are also monitored to check for stability and performance. |
| | |
NON-STANDARDISED CUSTOMERS |
• | | For Corporate and some other specific lines of business, a ‘watchlist’ system is employed of companies under special watch. For brevity, this is referred to by the internal Spanish acronym ‘FEVE’. |
| | |
The four stages in the ‘FEVE’ system are:
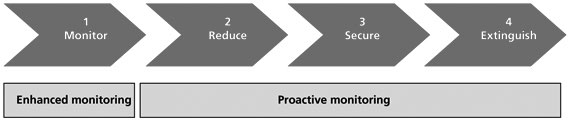
A customer can be classified as FEVE as a result of the monitoring process itself, a decision made by the manager responsible for that customer or the triggering of the automatic warning system. There are a range of indicators that may trigger a case being added to FEVE, including downturn in trade, covenant breaches, major contract loss, and resignation of key management. Such cases are assessed to determine the potential financial implications of these trigger events. Inclusion in the FEVE system does not automatically mean there has been a default, but will result in the following action:
| | • | | A specific and time-bound action plan will be put in place for this customer, together with the assignment of specific individuals for management. |
| | • | | Customers are reviewed monthly and the assigned rating is reviewed at least every six months, |
5. Risk measurement and control
Changes in Santander UK’s credit risk position are measured and controlled on an ongoing and systematic basis against budgets, limits and benchmarks. The potential future impact of these changes, both of an external nature and those arising from strategic decisions, is assessed in order to establish the required mitigating action needed.
Several metrics are used to measure and control credit risk during this phase. The two key metrics are:
| | | | |
KEY METRICS |
• | | Expected loss (‘EL’) | | EL is defined as the product of the three parameters: PD, EAD and LGD. It is an indication of the likely future costs of credit risk. |
| | |
• | | Net movement in non-performing loans (‘NPLs’) | | Defined as net movement in NPLs stock over a period (closing balance less opening balance) plus write-offs, minus assets recovered during the same period. This metric and its components play a decisive role as tracking variables used to detect early changes in the behaviour of portfolios. |
| | |
| Abbey National Treasury Services plc 2012 Annual Report | | 43 |
Business Review
Risk Management Reportcontinued
The risk control function assesses risks from various complementary perspectives, including geographical location, business area, management model and product and process, thus facilitating the detection of specific areas of action requiring remediation. Stress testing techniques are also employed to establish vulnerabilities to economic deterioration.
6. Recovery management
The macroeconomic environment directly affects the number of customers who default on an obligation. Recovery management is therefore critical to the success of our business, and is deployed through special recovery units.
Recovery management is a strategic, integrated business activity. The Banco Santander group has a global model which is applied and implemented by Santander UK. The objectives of the recovery process are as follows:
| | | | |
CREDIT RISK OBJECTIVES |
• | | Customer Relationship | | To maintain and strengthen the relationship with customers, paying attention to customer payment behaviour. Specifically to ensure that the individual circumstances and reasons for arrears are carefully considered when agreeing solutions with customers to ensure that arrangements are affordable and sustainable. |
| | |
• | | Payment Collection | | To collect payments in arrears so that accounts return to performing status. If this is not possible within a reasonable time period, the aim is to fully or partially recover debts, regardless of their status for accounting or management purposes. |
Effective collections and recoveries activity is dependent on:
| | | | |
ACTION | | DESCRIPTION |
• | | Supporting the customer | | Effective collections management is focused on assisting customers in finding affordable and sustainable repayment solutions based on their individual circumstances. |
| | |
• | | Predicting customer behaviours and treating customers fairly | | By monitoring and modelling customer profiles, and designing and implementing appropriate customer communication and repayment strategies, to enable effective support of customers in financial difficulty. |
| | |
• | | Negotiation | | Ongoing dialogue and negotiation with the customer to return the account to normal status in the shortest affordable and sustainable period. |
| | |
• | | Monitoring customer repayment promises | | It is essential that repayment agreements are monitored and evaluated to ensure they are reducing the customer’s indebtedness in line with agreed terms. |
Approach to forbearance
To support customers that encounter actual or apparent financial difficulties, Santander UK may enter into forbearance arrangements. Forbearance arrangements include the granting of temporary or permanent concessions to customers to amend contractual payment amounts or timings. These are made where a customer’s financial position indicates the possibility that satisfactory repayment may not be made within the original terms and conditions of the contract but where analysis suggests that repayment is possible within the revised terms of the loan.
A range of forbearance strategies are employed in order to improve the management of customer relationships, maximise collection opportunities and, if possible, avoid foreclosure or repossession.
Santander UK’s policies and practices are based on criteria which, in the judgement of management, indicate that repayment is likely to continue and that after the initial period of financial difficulties the customer can revert to the previous terms, with appropriate support where necessary. These agreements may be initiated by the customer, Santander UK or by a third party.
Further detail on the approaches and extent of forbearance in each business segment is set out in the subsequent sections.
| | |
| 44 | | Abbey National Treasury Services plc 2012 Annual Report |
Business Review
Risk Management Report continued
Credit risk exposure at an ANTS group level
The following table presents the ANTS group’s estimated maximum exposure to credit risk at 31 December 2012 and 2011 without taking account of any collateral held or other credit enhancements:
| | | | | | | | |
| | | 2012
£m | | | 2011
£m | |
Balances with central banks | | | 388 | | | | 7,013 | |
Trading assets | | | 7,789 | | | | 12,497 | |
Securities purchased under resale agreements | | | 14,941 | | | | 11,464 | |
Derivative financial instruments | | | 33,276 | | | | 33,224 | |
Financial assets designated at fair value | | | 3,531 | | | | 4,429 | |
Available for sale securities | | | 5,113 | | | | — | |
Loans and receivables securities | | | 162 | | | | 278 | |
Loans and advances to customers | | | 44,750 | | | | 38,826 | |
Loans and advances to banks | | | 106,753 | | | | 111,152 | |
Other | | | 24 | | | | 60 | |
| | | | | | | | |
Total exposure(1) | | | 216,727 | | | | 218,943 | |
| | | | | | | | |
| (1) | In addition the ANTS group is exposed to credit risk in respect of guarantees granted, loan commitments and stock borrowing and lending agreements. The estimated maximum exposure to credit risk is described in Note 35 to the Consolidated Financial Statements |
| | |
Abbey National Treasury Services plc 2012 Annual Report | | 45 |
Business Review
Risk Management Reportcontinued
CREDIT RISK – CORPORATE BANKING
INTRODUCTION
Corporate Banking offers a wide range of products and financial services to UK companies. Corporate Banking products and services include loans, bank accounts, deposits, and treasury services. The Large Corporates business offers specialist treasury services in fixed income and foreign exchange, lending, transactional banking services, capital markets and money markets to large multinational corporate customers. Lending includes syndicated loans and structured finance. Transactional banking includes trade finance and cash management. Money market activities include securities lending/borrowing and repos. Credit risk arises by Corporate Banking making loans, investing in other financial instruments or entering into financing transactions or derivatives.
This section sets out further detail on credit risk in Corporate Banking as follows:
| | |
• | | Management’s approach; |
| |
• | | Committed facilities; |
| |
• | | Credit risk mitigation; |
| |
• | | Monitoring and recovery management; |
| |
• | | Arrears; |
| |
• | | Forbearance; |
| |
• | | Other forms of debt management; and |
| |
• | | Non-performing loans and advances, and restructured/refinanced loans. |
| | |
MANAGEMENT’S APPROACH TO CREDIT RISK IN CORPORATE BANKING |
| | • | | Corporate Banking aims to achieve controlled corporate growth. It supports lending to the Mid-Corporate, SME and Real Estate sectors, as well as the large corporate market. Based on robust credit policies and risk appetite models, Corporate Banking focuses on the control of credit risks within its portfolio. |
| | • | | All transactions are considered using credit limits approved by the appropriate credit authority. The top Risk Committee in Santander UK in this respect is the Executive Risk Committee and it delegates authority to the Credit & Investment Approvals Committee (See ‘Key responsibilities’ on page 32). All transactions over £70m (and certain others) are approved by the Executive Risk Committee. Santander UK has a delegated authority framework which defines transaction submission levels for escalation to global committees. However, final sign-off is derived from the Executive Risk Committee whilst the portfolio is controlled by the respective credit risk portfolio team. |
| | • | | A set of risk appetite limits covering different types of risk (e.g. credit risk arising in Corporate Banking) are used to measure and control economic capital value. Santander UK’s credit risk appetite is measured and controlled by a maximum level of unexpected loss that Santander UK is willing to sustain over a one-year period. In addition, specific limits are set by the Santander UK Board in relation to single counterparty risk. |
| | • | | Analysis of credit exposures and credit risk trends are analysed on a monthly basis, with key issues escalated to the senior risk committees as required. Larger exposures are reported monthly to the Santander UK Board Risk Committee. |
| | |
| 46 | | Abbey National Treasury Services plc 2012 Annual Report |
Business Review
Risk Management Report continued
In Corporate Banking, credit risk arises on assets and off-balance sheet transactions. Consequently, the credit risk exposure below arises from on balance sheet assets, and off-balance sheet transactions such as committed and un-drawn credit facilities or guarantees.
CORPORATE BANKING – COMMITTED FACILITIES
COMMITTED FACILITIES BY CREDIT RATING OF THE ISSUER OR COUNTERPARTY(1)(2)
| | | | | | | | | | | | | | | | | | | | | | | | |
2012 | | Sovereign
£m | | | Large
Corporate
£m | | | Mid Corporate
and SME
£m | | | Real Estate
£m | | | Social Housing
£m | | | Total
£m | |
AAA | | | 1,131 | | | | 25 | | | | — | | | | 36 | | | | — | | | | 1,192 | |
AA | | | 960 | | | | 361 | | | | 197 | | | | 164 | | | | 39 | | | | 1,721 | |
A | | | 66 | | | | 2,893 | | | | 1,004 | | | | 1,320 | | | | 261 | | | | 5,544 | |
BBB | | | 1 | | | | 4,440 | | | | 3,169 | | | | 2,658 | | | | — | | | | 10,268 | |
BB | | | — | | | | 353 | | | | 758 | | | | 642 | | | | — | | | | 1,753 | |
B | | | — | | | | — | | | | 25 | | | | 202 | | | | 115 | | | | 342 | |
CCC | | | — | | | | — | | | | 10 | | | | 46 | | | | — | | | | 56 | |
D | | | — | | | | — | | | | 25 | | | | 281 | | | | — | | | | 306 | |
| | | | | | | | | | | | | | | | | | | | | | | | |
Total | | | 2,158 | | | | 8,072 | | | | 5,188 | | | | 5,349 | | | | 415 | | | | 21,182 | |
| | | | | | | | | | | | | | | | | | | | | | | | |
| | | | | | | | | | | | | | | | | | | | | | | | |
2011 | | Sovereign
£m | | | Large
Corporate
£m | | | Mid Corporate
and SME
£m | | | Real Estate
£m | | | Social Housing
£m | | | Total
£m | |
AAA | | | 6,965 | | | | 63 | | | | 42 | | | | — | | | | — | | | | 7,070 | |
AA | | | 819 | | | | 511 | | | | 147 | | | | 218 | | | | — | | | | 1,695 | |
A | | | 25 | | | | 2,967 | | | | 1,061 | | | | 1,395 | | | | — | | | | 5,448 | |
BBB | | | — | | | | 4,580 | | | | 2,961 | | | | 2,555 | | | | — | | | | 10,096 | |
BB | | | — | | | | — | | | | 252 | | | | 773 | | | | — | | | | 1,025 | |
B | | | — | | | | — | | | | 9 | | | | 159 | | | | — | | | | 168 | |
CCC | | | — | | | | — | | | | 11 | | | | — | | | | — | | | | 11 | |
D | | | — | | | | — | | | | 36 | | | | 216 | | | | — | | | | 252 | |
| | | | | | | | | | | | | | | | | | | | | | | | |
Total | | | 7,809 | | | | 8,121 | | | | 4,519 | | | | 5,316 | | | | — | | | | 25,765 | |
| | | | | | | | | | | | | | | | | | | | | | | | |
| (1) | The committed facilities exposure includes OTC derivatives. |
| (2) | All exposures are internally rated. External ratings are taken into consideration in the rating process, where available. |
COMMITTED FACILITIES BY GEOGRAPHICAL AREA
| | | | | | | | | | | | | | | | | | | | | | | | |
2012 | | Sovereign
£m | | | Large
Corporate
£m | | | Mid Corporate
and SME
£m | | | Real Estate
£m | | | Social Housing
£m | | | Total
£m | |
UK | | | — | | | | 6,885 | | | | 4,583 | | | | 5,349 | | | | 415 | | | | 17,232 | |
Peripheral eurozone | | | — | | | | 263 | | | | 73 | | | | — | | | | — | | | | 336 | |
Rest of Europe | | | 1,132 | | | | 551 | | | | 102 | | | | — | | | | — | | | | 1,785 | |
US | | | — | | | | 265 | | | | 90 | | | | — | | | | — | | | | 355 | |
Other, including non-OECD | | | 1,026 | | | | 108 | | | | 340 | | | | — | | | | — | | | | 1,474 | |
| | | | | | | | | | | | | | | | | | | | | | | | |
Total | | | 2,158 | | | | 8,072 | | | | 5,188 | | | | 5,349 | | | | 415 | | | | 21,182 | |
| | | | | | | | | | | | | | | | | | | | | | | | |
| | | | | | | | | | | | | | | | | | | | | | | | |
2011 | | Sovereign
£m | | | Large
Corporate
£m | | | Mid Corporate
and SME
£m | | | Real Estate
£m | | | Social Housing
£m | | | Total
£m | |
UK | | | 5,477 | | | | 5,634 | | | | 4,190 | | | | 5,316 | | | | — | | | | 20,617 | |
Peripheral eurozone | | | — | | | | 300 | | | | 61 | | | | — | | | | — | | | | 361 | |
Rest of Europe | | | 1,591 | | | | 1,226 | | | | 255 | | | | — | | | | — | | | | 3,072 | |
US | | | — | | | | 525 | | | | — | | | | — | | | | — | | | | 525 | |
Other, including non-OECD | | | 741 | | | | 436 | | | | 13 | | | | — | | | | — | | | | 1,190 | |
| | | | | | | | | | | | | | | | | | | | | | | | |
Total | | | 7,809 | | | | 8,121 | | | | 4,519 | | | | 5,316 | | | | — | | | | 25,765 | |
| | | | | | | | | | | | | | | | | | | | | | | | |
| (1) | The geographic location is classified by country of domicile of the counterparty. |
The increases in Mid Corporate and SME, and Real Estate exposures in 2012 arose from the continued development of a UK corporate banking franchise. The decrease in sovereign exposures principally reflected changes in holdings of UK and other Organisation of Economic Co-operation and Development (‘OECD’) government securities as part of Santander UK’s liquidity management activity.
| | |
Abbey National Treasury Services plc 2012 Annual Report | | 47 |
Business Review
Risk Management Reportcontinued
Commercial Real Estate loans
For the non-standardised commercial real estate portfolio of £5.3bn at 31 December 2012 the average loan to value ratio, weighted by exposure, was 52% (2011: 57%) with only 5% of cases having loan exposures in excess of the value of collateral.
Real estate non-performing loans and weighted average LTVs at 31 December 2012 and 2011 may be further analysed between loans originated pre-2009 and thereafter as follows:
| | | | | | | | | | | | |
| | | Original vintage | | | | |
2012 | | Pre-2009 | | | 2009 onwards | | | Total | |
Total loans | | £ | 1,299m | | | £ | 4,050m | | | £ | 5,349m | |
NPLs ratio | | | 19.0 | % | | | — | | | | 4.6 | % |
Weighted average LTV | | | 64 | % | | | 49 | % | | | 52 | % |
| | | | | | | | | | | | |
| | | Original vintage | | | | |
2011 | | Pre-2009 | | | 2009 onwards | | | Total | |
Total loans | | £ | 1,929m | | | £ | 3,387m | | | £ | 5,316m | |
NPLs ratio | | | 18.4 | % | | | — | | | | 6.7 | % |
Weighted average LTV | | | 70 | % | | | 50 | % | | | 57 | % |
The pre-2009 vintage loans were written on terms prevailing in the market at that time which, compared to more recent times, included higher original LTVs, lower interest coverage and exposure to development or letting risk. Following the significant downturn in the commercial real estate market in 2008 and 2009 some of these customers suffered financial stresses resulting in their inability to meet the contractual payment terms or to comply with covenants or to achieve refinancing/repayment at maturity. As a result, the pre-2009 sub-portfolio has experienced higher NPLs rates in recent years.
In light of the market deterioration, the Santander UK group’s lending criteria were significantly tightened from 2009 onwards, with lower LTVs and the avoidance of transactions with any material letting or development risks. In addition, while the market remains challenging, prices have not declined significantly further since the Santander UK group’s lending criteria were tightened. As a result, the sub-portfolio representing loans originating from 2009 onwards has performed significantly better than the pre-2009 sub-portfolio.
| | |
| 48 | | Abbey National Treasury Services plc 2012 Annual Report |
Business Review
Risk Management Report continued
CORPORATE BANKING �� CREDIT RISK MITIGATION
At 31 December 2012, ANTS held collateral against impaired loans amounting to 58% (2011: 58%) of the carrying amount of impaired loan balances.
| | | | |
PORTFOLIO | | DESCRIPTION |
• | | Sovereigns | | Assets held with Sovereign counterparties are mainly with issuers or counterparties with a AAA or AA rating. It is normal market practice that there is no collateral associated with these assets. |
| | |
• | | Large Corporates | | Primarily unsecured but credit agreements are underpinned by both financial and non-financial covenants. Typically for this type of business the initial, and ongoing, lending decision is based upon factors relating to the financial strength of the client, its position within its industry, its management strengths and other factors as evaluated by the specialised analyst assigned to each customer. |
| | |
• | | Structured Finance | | A small number of acquisition or project finance transactions where collateral is held in the form of a charge over the assets being acquired. This type of assignment of all assets is combined with other covenants to provide security to the lenders. |
| | |
• | | Mid- Corporate and SME | | Typically incorporates guarantee structures underpinned by both financial and non-financial covenants and debenture security. Guarantees are not classified as collateral and value is not attributed to them unless supported by tangible security. Lending decisions are assessed against trading cash flows and in the event of a default ANTS does not typically take possession of the assets of the business, although an Administrator may be appointed in more severe cases. The portfolio includes commercial mortgage lending where collateral is taken in the form of a charge over the property being mortgaged. A professional valuation of the real estate security is undertaken at the point of lending but no contractual right of revaluation exists. Revaluations are undertaken in the event that cases become distressed. Collateral is rarely taken into possession. ANTS seeks to ensure the disposal of the collateral, either consensually or via an insolvency process, as early as practical in order to minimise the loss to ANTS. |
| | |
• | | Real Estate | | Collateral is in the form of commercial real estate assets. Lending to commercial real estate is undertaken against an approved policy setting minimum criteria including such aspects as the quality (e.g. condition and age) and location of the property, the quality of the tenant, the terms and length of the lease, and the experience and creditworthiness of the sponsors. Properties are viewed by ANTS prior to lending and annually thereafter. An independent professional valuation is obtained prior to lending, providing both a value and an assessment of the property, the tenant and future demand for the property (e.g. market rent compared to the current rent). Loan agreements typically permit bi-annual valuations thereafter or more frequently if it is likely that the covenants may be breached. When a commercial real estate loan is transferred to FEVE (described in the section “Risk monitoring” in “Measurement across the credit cycle” on page 43) or Restructuring & Recoveries, ANTS typically undertakes a revaluation of the collateral as part of the process for determining the strategy to be pursued (e.g. whether to restructure/refinance the loan or to realise the collateral). An assessment is made of the need to establish an impairment loss allowance based on the valuation in relation to the loan amount outstanding while also taking into consideration any loan restructuring/refinancing solution to be adopted (e.g. whether provision of additional security or guarantees is available, the prospects of additional equity and the ability to enhance value through asset management initiatives etc.). Collateral is rarely taken into possession. Where collateral has been taken into possession, ANTS would seek to dispose of the collateral as early as practical in order to minimise the loss to ANTS. |
| | |
• | | Social Housing | | The portfolio is secured on residential real estate owned and let by UK Housing Associations. This collateral is revalued at least every five years and the valuation is based on standard housing methodologies, which generally involve the properties’ continued use as social housing. If the valuation were based upon normal residential use the value would be considerably higher. To date, Santander UK has suffered no defaults or losses on this type of lending and has not had to take possession of any collateral. The value of the collateral is in all cases in excess of the loan balance. Typically, the loan balance represents between 25% and 50% of the implied market value of collateral using Santander UK’s LGD methodology. |
| | |
Abbey National Treasury Services plc 2012 Annual Report | | 49 |
Business Review
Risk Management Reportcontinued
CORPORATE BANKING – MONITORING AND RECOVERY MANAGEMENT
Cases exhibiting potentially higher risk characteristics are subject to risk monitoring under the FEVE system (described in the section “Risk monitoring” in “Measurement across the credit cycle” on page 43). There are a range of indicators that may trigger a case being added to FEVE, including downturn in trade, covenant breaches, major contract loss, and resignation of key management. Such cases are assessed to determine the potential financial implications of these trigger events and in consultation with the borrower, a range of options available is considered which may include temporary forbearance.
In addition, cases that require specialist risk management expertise, including all NPLs, are transferred to a dedicated restructuring team and are categorised as ‘Workouts’.
Cases subject to risk monitoring under the FEVE system or in Workouts by portfolio and assessment of risk at 31 December 2012 and 2011 were:
| | | | | | | | | | | | | | | | | | | | | | | | | | | | | | | | | | | | | | | | | | | | |
| | | | | | | | | | | | | | | | | | | | | | | | | | | | | | Impairment loss
allowances | |
2012 | | Portfolio
£m | | | Enhanced
Monitoring
£m | | | Enhanced
Monitoring
% | | | Pro-
active
£m | | | Pro-
active
% | | | Workout
£m | | | Workout
% | | | NPLs(1)
£m | | | NPLs
% | | | Observed
£m | | | IBNO
£m | |
Large Corporates (including Sovereign) | | | 10,230 | | | | 142 | | | | 1.4 | | | | — | | | | — | | | | — | | | | — | | | | — | | | | — | | | | — | | | | — | |
Mid Corporate and SME | | | 5,188 | | | | 123 | | | | 2.4 | | | | 56 | | | | 1.1 | | | | 23 | | | | 0.4 | | | | 23 | | | | 0.4 | | | | 11 | | | | 4 | |
Real Estate | | | 5,349 | | | | 199 | | | | 3.7 | | | | 239 | | | | 4.5 | | | | 374 | | | | 7.0 | | | | 247 | | | | 4.6 | | | | 90 | | | | 7 | |
Social Housing | | | 415 | | | | — | | | | — | | | | — | | | | — | | | | — | | | | — | | | | — | | | | — | | | | — | | | | — | |
| | | | | | | | | | | | | | | | | | | | | | | | | | | | | | | | | | | | | | | | | | | | |
Total | | | 21,182 | | | | 464 | | | | 2.2 | | | | 295 | | | | 1.4 | | | | 397 | | | | 1.9 | | | | 270 | | | | 1.3 | | | | 101 | | | | 11 | |
| | | | | | | | | | | | | | | | | | | | | | | | | | | | | | | | | | | | | | | | | | | | |
| | | | | | | | | | | | | | | | | | | | | | | | | | | | | | | | | | | | | | | | | | | | |
| | | | | | | | | | | | | | | | | | | | | | | | | | | | | | Impairment loss
allowances | |
2011 | | Portfolio
£m | | | Enhanced
Monitoring
£m | | | Enhanced
Monitoring
% | | | Pro-
active
£m | | | Pro-
active
% | | | Workout
£m | | | Workout
% | | | NPLs(1)
£m | | | NPLs
% | | | Observed
£m | | | IBNO
£m | |
Large Corporates (including Sovereign) | | | 15,930 | | | | 87 | | | | 0.5 | | | | — | | | | — | | | | — | | | | — | | | | — | | | | — | | | | — | | | | — | |
Mid Corporate and SME | | | 4,519 | | | | 67 | | | | 1.5 | | | | 33 | | | | 0.7 | | | | 30 | | | | 0.7 | | | | 21 | | | | 0.5 | | | | 2 | | | | 8 | |
Real Estate | | | 5,316 | | | | 98 | | | | 1.8 | | | | 590 | | | | 11.1 | | | | 424 | | | | 8.0 | | | | 356 | | | | 6.7 | | | | 95 | | | | 25 | |
Social Housing | | | — | | | | — | | | | — | | | | — | | | | — | | | | — | | | | — | | | | — | | | | — | | | | — | | | | — | |
| | | | | | | | | | | | | | | | | | | | | | | | | | | | | | | | | | | | | | | | | | | | |
Total | | | 25,765 | | | | 252 | | | | 1.0 | | | | 623 | | | | 2.4 | | | | 454 | | | | 1.8 | | | | 377 | | | | 1.5 | | | | 97 | | | | 33 | |
| | | | | | | | | | | | | | | | | | | | | | | | | | | | | | | | | | | | | | | | | | | �� | |
| (1) | Includes committed facilities and swaps. |
In 2012, the level of cases in NPLs or with the workouts team fell as older real estate cases continued to work through the recovery process. There was an increase in watchlist cases, especially those in monitoring during the year driven by challenging economic conditions in both the real estate and the Mid Corporate and SME portfolios.
CORPORATE BANKING – ARREARS
| | | | | | | | | | | | |
| | | 2012
£m | | | 2011
£m | | | 2010
£m | |
Corporate Banking loans and advances to customers in arrears | | | 173 | | | | 266 | | | | 287 | |
Corporate Banking loans and advances to customers(1) | | | 6,356 | | | | 6,370 | | | | 5,270 | |
Corporate Banking loans and advances to customers in arrears as a % of Corporate Banking loans and advances to customers | | | 2.72 | % | | | 4.17 | % | | | 5.45 | % |
| (1) | Includes social housing loans. |
2012 compared to 2011
Loans and advances to customers in arrears decreased to £173m (2011: £266m) as a result of the successful implementation of restructuring/refinancing strategies, especially within the Commercial Real Estate portfolio. Consequently, loans and advances to customers in arrears as a percentage of loans and advances to customers decreased to 2.72% (2011: 4.17%).
2011 compared to 2010
Loans and advances to customers in arrears decreased slightly to £266m (2010: £287m) as the strategies for managing these cases began to deliver sustained results, especially for real estate exposures written pre-2009. Loans and advances to customers in arrears as a percentage of loans and advances to customers decreased to 4.17% (2010: 5.45%) as a result of the growth in the book exceeding the growth in arrears.
| | |
| 50 | | Abbey National Treasury Services plc 2012 Annual Report |
Business Review
Risk Management Report continued
Arrears management
The Restructuring & Recoveries department are responsible for debt management initiatives on the Corporate Banking loan portfolio.
| • | | Debt management strategies, which include negotiating restructuring/refinancing or repayment arrangements and concessions, often commence prior to actual payment default. Different collection strategies are applied to different segments of the portfolio in accordance with the perceived levels of risk and the individual circumstances of each case. |
| • | | Restructuring & Recoveries activities aim to ensure customers who have failed or are likely to fail to make their contractual payments when due or have exceeded their agreed credit limits are encouraged to pay back the required amounts, and in the event they are unable to do so to pursue recovery of the debt in order to maximise the net recovered balance. |
The overall aim is to minimise losses whilst not adversely affecting brand, customer loyalty, fee income, or compliance with relevant legal and regulatory standards.
Problem debt management activity is performed within ANTS:
| • | | Initially by the relationship manager and, for non standardised cases, the credit partner, and for standardised cases, the Business Support Unit; then |
| • | | Subsequently by Restructuring & Recoveries where the circumstances of the case become more critical or specialist expertise is required. |
ANTS seeks to detect weakening financial performance early through close monitoring of regular financial and trading information, periodic testing to ensure compliance with both financial and non-financial covenants and regular dialogue with corporate clients.
The FEVE process is used proactively on cases which need enhanced management activity ranging from increased frequency and intensity of monitoring through to more specific activities to reduce ANTS’s exposure, enhance ANTS’s security or in some cases seek to exit the position altogether.
Once categorised as FEVE, a strategy is agreed with Credit Risk and this is monitored through monthly FEVE meetings for each portfolio. Where circumstances dictate a more dedicated debt management expertise is required or where the case has been categorised as non-performing (be that through payment arrears or through management judgement that a payment default is likely), the case is transferred to Restructuring & Recoveries.
FORBEARANCE – LOANS RESTRUCTURED/REFINANCED
The factors considered when concluding whether a borrower is experiencing financial difficulties can include the results of covenant testing, reviews of trading and management information provided under the loan terms or directly from the customer as part of the ANTS’s ongoing relationship dialogue.
Restructurings/refinancings allow a customer, by negotiation, to vary the terms of their contractual obligations for an agreed period (such as interest-only period or term extensions). ANTS also aims to ensure that after the initial period of financial difficulties the customer can revert to the previous terms, with appropriate support where necessary. These agreements may be initiated by the customer, ANTS or by a third party.
Restructurings/refinancings are only granted due to financial difficulties and are reported as restructures/refinancings.
| | | | | | |
ACTION | | DESCRIPTION |
Restructuring/ refinancing | | Solutions in a restructuring/refinancing may include: |
| | • | | Term
extensions | | The term of the credit facility may be extended to reduce the regular periodic repayments, and where as a minimum, the interest can be serviced and there is a realistic prospect of full or improved recoveries in the foreseeable future. Customers may be offered a term extension where they are up-to-date but showing evidence of financial difficulties, or where the maturity of the loan is about to fall due and near term refinancing is not possible on current market terms. |
| | • | | Interest-only
concessions | | Regular periodic repayment may be reduced to interest payment only for a limited period with capital repayment deferred where other options are not appropriate and the issues are viewed as temporary. Customers may be offered an interest only concession where they are up-to-date but showing evidence of financial difficulties, or are already in the Restructuring & Recoveries process. Periodic reviews of the customer’s financial situation are undertaken to assess when the customer can afford to return to the repayment method. |
| | • | | Capitalisations | | The customer’s arrears may be capitalised and added to the loan balance. Capitalisation is always combined with term extensions and interest-only concessions. |
| | |
Abbey National Treasury Services plc 2012 Annual Report | | 51 |
Business Review
Risk Management Reportcontinued
ANTS may offer a term extension or interest only concession provided that the forecasts indicate that the borrower will be able to meet the revised payment arrangements. This applies particularly in the rare circumstances where a second restructuring/refinancing is required as the borrower needs a further term extension but is otherwise meeting revised terms.
The effectiveness of our restructuring/refinancing approach is kept under review. The programmes offered to customers may be adjusted to reflect market conditions, although the range of options is limited to term extensions and interest only concessions, together with other forms of debt management as described in “Other forms of debt management”.
Where a restructuring/refinancing in NPL has been agreed, the case is initially retained in the ‘non-performing’ loan category, until evidence of consistent compliance with the new terms is demonstrated (typically a minimum of three months) before being reclassified out of NPL.
For other restructured/refinanced loans, once a case has demonstrated continued compliance with the new terms and the risk profile is deemed to have improved, it may be reclassified as fully performing. Under ANTS’s restructuring/refinancing methodology, a case will remain as a restructured/refinanced asset even when full repayments are recommenced until full repayment is achieved.
The majority of corporate loan restructuring/refinancing to date have been by way of term extensions and payment re-profiling (e.g. interest only concessions), with only a limited number of debt-for-equity swaps. Loan loss allowances are assessed on a case-by-case basis taking into account amongst other factors, the value of collateral held as confirmed by third party professional valuations as well as the cash flow available to service debt over the period of the restructuring/refinancing. These loan loss allowances are assessed regularly and are independently reviewed. In the case of a debt-for-equity conversion, the converted debt is written off against the existing loan loss allowance upon completion of the restructuring/refinancing. The value of the equity acquired is initially held at nil value and reassessed periodically in light of subsequent performance of the restructured company.
Restructuring/refinancing commenced during the year
No arrangements have been entered into with respect to sovereign or large corporate counterparties. The accounts that entered restructuring/refinancing during the years ended 31 December 2012 and 2011 were:
| | | | | | | | | | | | |
| | | Mid Corporate
and SMEs | | | Real Estate | | | Total | |
2012 | | £m | | | £m | | | £m | |
Restructured/refinanced in NPLs | | | 1 | | | | — | | | | 1 | |
Other restructured/refinanced | | | — | | | | 99 | | | | 99 | |
| | | | | | | | | | | | |
| | | 1 | | | | 99 | | | | 100 | |
| | | | | | | | | | | | |
| | | | | | | | | | | | |
| | | Mid Corporate
and SMEs | | | Real Estate | | | Total | |
2011 | | £m | | | £m | | | £m | |
Restructured/refinanced in NPLs | | | 23 | | | | 58 | | | | 81 | |
Other restructured/refinanced | | | — | | | | 21 | | | | 21 | |
| | | | | | | | | | | | |
| | | 23 | | | | 79 | | | | 102 | |
| | | | | | | | | | | | |
Restructuring/refinancing cumulative number and value of accounts
At 31 December 2012, 86% of the restructuring/refinancing related to the Commercial Real Estate portfolio (2011: 80%).
a) Performance status when entering restructuring/refinancing
The status of the cumulative number of accounts in restructuring/refinancing at 31 December 2012 and 2011 when they originally entered restructuring/refinancing, analysed by type of restructuring/refinancing applied, was:
| | | | | | | | | | | | | | | | | | | | | | | | | | | | |
| | | Restructured/refinanced
in NPLs | | | Other
restructured/refinanced | | | Total | | | Impairment
allowance | |
2012 | | No. | | | £m | | | No. | | | £m | | | No. | | | £m | | | £m | |
Performing | | | — | | | | — | | | | 13 | | | | 335 | | | | 13 | | | | 335 | | | | 37 | |
In arrears | | | 3 | | | | 24 | | | | — | | | | — | | | | 3 | | | | 24 | | | | 11 | |
| | | | | | | | | | | | | | | | | | | | | | | | | | | | |
Total | | | 3 | | | | 24 | | | | 13 | | | | 335 | | | | 16 | | | | 359 | | | | 48 | |
| | | | | | | | | | | | | | | | | | | | | | | | | | | | |
| | | | | | | | | | | | | | | | | | | | | | | | | | | | |
| | | Restructured/refinanced
in NPLs | | | Other
restructured/refinanced | | | Total | | | Impairment
allowance | |
2011 | | No. | | | £m | | | No. | | | £m | | | No. | | | £m | | | £m | |
Performing | | | — | | | | — | | | | 10 | | | | 307 | | | | 10 | | | | 307 | | | | 15 | |
In arrears | | | 6 | | | | 122 | | | | — | | | | — | | | | 6 | | | | 122 | | | | 4 | |
| | | | | | | | | | | | | | | | | | | | | | | | | | | | |
Total | | | 6 | | | | 122 | | | | 10 | | | | 307 | | | | 16 | | | | 429 | | | | 19 | |
| | | | | | | | | | | | | | | | | | | | | | | | | | | | |
| | |
| 52 | | Abbey National Treasury Services plc 2012 Annual Report |
Business Review
Risk Management Reportcontinued
Debt-for-equity swaps
In addition to the restructuring/refinancing above, ANTS has entered into a small number of debt-for-equity swaps where, on occasion, ANTS may agree to exchange a proportion of the amount owed by the borrower for equity in that borrower. In circumstances where a borrower’s balance sheet is materially over-leveraged but the underlying business is viewed as capable of being turned around, ANTS may agree to reduce the debt by exchanging a portion of it for equity in the company. This will typically only be done alongside new cash equity being raised, the implementation of a detailed business plan to effect a turnaround in the prospects of the business, and satisfaction with management’s ability to deliver the strategy.
These debt-for-equity swaps amounted to £34m at 31 December 2012 (2011: £34m) and in view of their small size are not included in these analyses.
b) Performance status at the year-end
The current status of accounts in restructuring/refinancing analysed by type of restructuring/refinancing applied, at 31 December 2012 and 2011 was:
| | | | | | | | | | | | | | | | | | | | | | | | | | | | |
| | | Restructured/refinanced
in NPLs | | | Other
restructured/refinanced | | | Total | | | Impairment allowance | |
2012 | | No. | | | £m | | | No. | | | £m | | | No. | | | £m | | | £m | |
Performing | | | 1 | | | | 1 | | | | 11 | | | | 270 | | | | 12 | | | | 271 | | | | 2 | |
In arrears | | | 2 | | | | 23 | | | | 2 | | | | 65 | | | | 4 | | | | 88 | | | | 46 | |
| | | | | | | | | | | | | | | | | | | | | | | | | | | | |
Total | | | 3 | | | | 24 | | | | 13 | | | | 335 | | | | 16 | | | | 359 | | | | 48 | |
| | | | | | | | | | | | | | | | | | | | | | | | | | | | |
| | | | | | | | | | | | | | | | | | | | | | | | | | | | |
| | | Restructured/refinanced
in NPLs | | | Other
restructured/refinanced | | | Total | | | Impairment allowance | |
2011 | | No. | | | £m | | | No. | | | £m | | | No. | | | £m | | | £m | |
Performing | | | 4 | | | | 97 | | | | 8 | �� | | | 238 | | | | 12 | | | | 335 | | | | — | |
In arrears | | | 2 | | | | 25 | | | | 2 | | | | 69 | | | | 4 | | | | 94 | | | | 19 | |
| | | | | | | | | | | | | | | | | | | | | | | | | | | | |
Total | | | 6 | | | | 122 | | | | 10 | | | | 307 | | | | 16 | | | | 429 | | | | 19 | |
| | | | | | | | | | | | | | | | | | | | | | | | | | | | |
Accounts that are in restructuring/refinancing continue to be closely monitored as described above, to ensure that the restructuring/refinancing arrangements are sustainable. At 31 December 2012, 75% (2011: 78%) of the accounts in restructuring/refinancing were performing in accordance with the revised terms agreed under ANTS’s restructuring/refinancing arrangements. The decrease reflects the impact of the current challenging market conditions which resulted in it taking longer for cases to return to performing status after restructuring/refinancing.
In rare circumstances, these market conditions may, and may continue to, lead to a second term extension, for example in the case of commercial real estate where it remains difficult to sell or refinance the property. These loans are individually assessed for observed impairment loss allowances. The greater probability of ultimate loss in these circumstances is reflected in the calculation of impairment loss allowances.
A customer’s ability to adhere to any revised terms agreed is an indicator of the sustainability of ANTS’s restructuring/refinancing arrangements.
2012 compared to 2011
The level of restructured/refinanced in NPL decreased particularly in the Mid Corporate and SME portfolio as the volume of loans originated near the peak of the cycle (i.e. pre-2009) has reduced both in absolute and relative terms. The level of other restructured/refinanced rose particularly within commercial real estate as restructuring/refinancing strategies were being executed earlier in the credit cycle.
2011 compared to 2010
The level of restructured/refinanced in NPL increased which reflected the increasingly challenging economic environment with more limited options to achieve consensual outcomes giving rise to more cases requiring forbearance, especially in the care home sector. The level of other restructured/refinanced however fell slightly over the year as a result of a number of cases being successfully repaid and higher incidence of NPLs cases due to the economic conditions resulting in restructured/refinanced in NPL rather than other restructured/refinanced.
| | |
Abbey National Treasury Services plc 2012 Annual Report | | 53 |
Business Review
Risk Management Reportcontinued
OTHER FORMS OF DEBT MANAGEMENT
In addition to restructurings/refinancings, ANTS uses other forms of debt management which can include:
| | | | |
ACTION | | DESCRIPTION |
• | | Payment arrangements (including debt-for-equity swaps) | | Discretion exists to vary the repayment schedule to allow customers to bring the account up to date. The objective is to bring the account up to date as soon as possible. This can involve the partial forgiveness of debt and/or debt-for-equity swaps. At 31 December 2012 there were no outstanding loans where debt forgiveness had been applied. |
| | |
• | | Obtaining additional security or guarantees | | Where a borrower has unencumbered assets, these may be charged as new or additional security in return for ANTS restructuring/refinancing existing facilities. Alternatively, ANTS may take a guarantee from other companies within the borrower’s group and/or major shareholders provided it can be established the proposed guarantor has the resources to support such a commitment. |
| | |
• | | Resetting of covenants and trapping surplus cash flow | | Financial covenants may be reset at levels which more accurately reflect the current and forecast trading position of the borrower. This may also be accompanied by a requirement for all surplus cash after operating costs to be trapped and used in reduction of ANTS’s lending. |
| | |
• | | Seeking additional equity | | Where a business is over-leveraged, fresh equity capital will be sought from existing or new investors to adjust the capital structure in conjunction with ANTS agreeing to restructure/refinance the residual debt. |
EXIT THE POSITION CONSENSUALLY
Where it is not possible to agree a restructuring/refinancing, ANTS may seek to exit the position consensually by:
| • | | Agreeing with the borrower an orderly sale of assets outside insolvency to pay down ANTS’s debt; |
| • | | Arranging for the refinance of the debt with another lender; or |
| • | | Sale of the debt where a secondary market exists (either individual loans or on occasion as a portfolio sale). |
LITIGATION AND RECOVERY
Where it is not possible to agree a restructuring/refinancing or to exit the position consensually, ANTS will pursue recovery by:
| • | | Pursuing its rights through an insolvency process; |
| • | | Optimising the sale proceeds of any collateral held; and |
| • | | Seeking compensation from third parties, as appropriate. |
Where ANTS has to pursue recovery through the appointment of an Administrator (or a Receiver under the Law of Property Act in the case of real estate security), ANTS’s shortfall is assessed against the Administrator’s estimate of the outcome and an appropriate loan loss allowance is raised. In cases where a sale of the debt is deemed to offer the optimum recovery outcome, the shortfall, if the debt is sold below its par value, is written off upon sale.
| | |
| 54 | | Abbey National Treasury Services plc 2012 Annual Report |
Business Review
Risk Management Reportcontinued
CORPORATE BANKING – NON-PERFORMING LOANS AND ADVANCES(1)
An analysis of Corporate Banking NPLs is presented below.
| | | | | | | | | | | | | | | | | | | | |
| | | 2012
£m | | | 2011
£m | | | 2010
£m | | | 2009
£m | | | 2008
£m | |
Corporate Banking NPLs that are impaired - UK | | | 264 | | | | 260 | | | | 287 | | | | 122 | | | | 54 | |
Corporate Banking NPLs that are not impaired - UK | | | — | | | | 101 | | | | 84 | | | | 76 | | | | — | |
| | | | | | | | | | | | | | | | | | | | |
Corporate Banking NPLs(2) | | | 264 | | | | 361 | | | | 371 | | | | 198 | | | | 54 | |
| | | | | | | | | | | | | | | | | | | | |
Corporate Banking loans and advances to customers | | | 6,356 | | | | 6,370 | | | | 5,270 | | | | 4,565 | | | | 5,632 | |
| | | | | | | | | | | | | | | | | | | | |
Corporate Banking impairment loan loss allowances | | | 112 | | | | 130 | | | | 108 | | | | 77 | | | | 26 | |
| | | | | | | | | | | | | | | | | | | | |
| | | % | | | | % | | | | % | | | | % | | | | % | |
| | | | | | | | | | | | | | | | | | | | |
NPLs ratio | | | 4.16 | | | | 5.67 | | | | 7.05 | | | | 4.34 | | | | 0.96 | |
Coverage ratio | | | 42 | | | | 36 | | | | 29 | | | | 39 | | | | 48 | |
| (1) | Loans and advances are classified as non-performing typically when the counterparty fails to make payments when contractually due for three months or where it is deemed unlikely that the counterparty will be able to maintain payments. |
| (2) | All non-performing loans continue accruing interest. |
| (3) | Accrued interest is excluded for purposes of these analyses. |
2012 compared to 2011
During 2012, the NPLs ratio decreased to 4.16% (2011: 5.67%). This resulted from successful exits and restructures/refinances particularly in respect of the real estate cases originated at the peak of the market. The absolute level of NPLs also reduced which together with the growth in the portfolio being slower than in 2011 lowered the percentage.
2011 compared to 2010
During 2011, the NPLs ratio decreased to 5.67% (2010: 7.05%). This reflected the growth of the book exceeding the growth in stressed cases with several larger real estate loans moving out of non-performing status either via a full exit by way of a sale of the underlying collateral or the debt or a successful restructuring/refinancing and return to performing status. The level of new NPLs increased as the options available for managing them, particularly the ability to raise equity capital, to sell assets or to conclude refinancing, remained limited. The real estate market continued to be challenging with reduced sales activity, especially for development finance and land-bank transactions and for older transactions underwritten near the market peak.
2010 compared to 2009
During 2010, the NPLs ratio increased to 7.05% (2009: 4.34%) due to deterioration arising from market conditions. This particularly affected customers in the real estate sector. Both NPLs and impairment loss allowances increased. While the level of new NPLs was broadly in line with expectations, the options available for managing them were reduced compared to 2009. The real estate market became more challenging as the year progressed, with reduced sales activity, especially for development finance and land-bank transactions and for older transactions underwritten in 2008 and earlier years. The year-end position was also influenced by a small number of large value transactions which defaulted late in the year but were expected to be restructured/refinanced during 2011.
In 2012, interest income recognised on impaired loans amounted to £5m (2011: £5m, 2010: £4m).
CORPORATE BANKING – RESTRUCTURED/REFINANCED LOANS
As previously described, loans may be restructured/refinanced. At 31 December 2012, the carrying amount of financial assets that would otherwise be past due or impaired whose terms have been restructured/refinanced was £nil (2011: £130m).
CORPORATE BANKING – RATIO OF WRITE-OFFS TO AVERAGE LOANS
At 31 December 2012 the ratio of net write-offs during the year to average loans outstanding during the year was:
| | | | | | | | | | | | | | | | | | | | |
| | | 2012
% | | | 2011
% | | | 2010
% | | | 2009
% | | | 2008
% | |
Ratio of write-offs to average loans during the period | | | 0.44 | | | | 0.60 | | | | 1.12 | | | | — | | | | — | |
| | |
Abbey National Treasury Services plc 2012 Annual Report | | 55 |
Business Review
Risk Management Reportcontinued
CREDIT RISK – MARKETS
INTRODUCTION
Markets offers risk management and other services to financial institutions, as well as other Santander UK divisions. Its main product areas are fixed income and foreign exchange, equity, capital markets and institutional sales. Credit risk arises by Markets making loans, investing in other financial instruments, or entering into financing transactions or derivatives.
This section sets out further detail on credit risk in Markets as follows:
| | |
• | | Management’s approach; |
| |
• | | Commitments; |
| |
• | | Credit risk mitigation; |
| |
• | | Monitoring and recovery management; and |
| |
• | | Restructured/refinanced loans. |
| | |
MANAGEMENT’S APPROACH TO CREDIT RISK IN MARKETS |
• | | Credit risk on derivative instruments (OTC derivatives, repos and stock borrowing/lending) is taken under specific limits approved for each counterparty. This credit risk is controlled by the Wholesale Credit Risk department, and managed and reported on a counterparty basis, regardless of whether the exposure is incurred by Markets or by ANTS through its Corporate Centre activities. |
| |
• | | Credit risk on derivative instruments is calculated using the potential future mark-to-market exposure (‘PFE’) of the instruments at a 97.5% statistical confidence level and adding this value to the current mark-to-market value. The resulting PFE or credit risk is then included against the credit limits approved for individual counterparties along with other non-derivative exposures. |
| |
• | | In addition, there is a policy around the collateralisation of derivative instruments. If collateral is deemed necessary to reduce credit risk, any unsecured risk threshold, and the nature of any collateral to be accepted, is determined by the Wholesale Credit Risk department’s credit evaluation of the counterparty. |
| |
• | | All exposures are accommodated under credit limits approved by the appropriate credit authority. The relevant senior approving authorities are the Executive Risk Committee and the Credit & Investment Approvals Committee. Exposures which exceed a pre-defined limit are also referred to Banco Santander S.A., although the ultimate approval remains within Santander UK. Exposures and credit risk trends are analysed regularly, with key issues escalated to the Executive Risk Committee or to the Board Risk Committee, as required. Key developments in large exposures are also reported to these committees. |
| | |
| 56 | | Abbey National Treasury Services plc 2012 Annual Report |
Business Review
Risk Management Reportcontinued
MARKETS – COMMITMENTS
DERIVATIVE COMMITMENTS BY CREDIT RATING OF THE ISSUER OR COUNTERPARTY(1)
| | | | |
2012 | | £m | |
AAA | | | 38 | |
AA | | | 185 | |
A | | | 4,097 | |
BBB and below | | | 357 | |
| | | | |
Total | | | 4,677 | |
| | | | |
| | | | |
2011 | | £m | |
AAA | | | 97 | |
AA | | | 1,574 | |
A | | | 3,447 | |
BBB and below | | | 260 | |
| | | | |
Total | | | 5,378 | |
| | | | |
| (1) | External ratings are applied to all exposures where available. |
DERIVATIVE COMMITMENTS BY GEOGRAPHICAL AREA
| | | | |
2012 | | £m | |
UK | | | 1,635 | |
Peripheral eurozone | | | 364 | |
Rest of Europe | | | 1,409 | |
US | | | 974 | |
Rest of the world | | | 295 | |
| | | | |
Total | | | 4,677 | |
| | | | |
| | | | |
2011 | | £m | |
UK | | | 1,296 | |
Peripheral eurozone | | | 597 | |
Rest of Europe | | | 1,597 | |
US | | | 1,480 | |
Rest of the world | | | 408 | |
| | | | |
Total | | | 5,378 | |
| | | | |
| | |
Abbey National Treasury Services plc 2012 Annual Report | | 57 |
Business Review
Risk Management Reportcontinued
MARKETS – CREDIT RISK MITIGATION
Markets continued to focus its activities on derivative products, supported by increased collateralisation and use of central counterparties.
| | | | |
PORTFOLIO | | DESCRIPTION |
• | | Derivatives | | Netting arrangementsANTS restricts its credit risk by entering into transactions under industry standard agreements which facilitate netting of transactions in the jurisdictions where netting agreements are recognised and have legal force. The netting arrangements do not generally result in an offset of balance sheet assets and liabilities for accounting purposes, as transactions are usually settled on a gross basis. However, there is scope for the credit risk associated with favourable contracts to be reduced by netting arrangements embodied in the agreements to the extent that if an event of default occurs, all amounts with the counterparty under the specific agreement can be terminated and settled on a net basis. In line with industry practice, ANTS executes the standard documentation according to the type of contract being entered into. For example, derivatives will be contracted under the International Swaps and Derivatives Association (‘ISDA’) Master Agreements, repurchase and reverse repurchase transactions will be governed by Global Master Repurchase Agreement (‘GMRA’), stock borrowing/lending transactions and other securities financing transactions are covered by Global Master Securities Lending Agreement (‘GMSLA’). |
| | |
| | | | CollateralisationANTS also mitigates its credit risk to counterparties with which it primarily transacts financial instruments through collateralisation, using industry standard collateral agreements (i.e. the Credit Support Annex (‘CSA’)) in conjunction with the ISDA Master Agreement. Under these agreements, net exposures with counterparties are collateralised with cash, securities or equities. Exposures and collateral are generally re-valued daily and collateral is adjusted accordingly to reflect deficits/surpluses. Collateral taken must comply with Santander UK’s collateral parameters policy. This policy is designed to control the quality and concentration risk of collateral taken such that collateral held can be liquidated when a counterparty defaults. Cash collateral in respect of derivatives held at 31 December 2012 was £0.6bn (2011: £1.2bn), not all derivative arrangements being subject to collateral agreements. Collateral obtained during the period in respect of purchase and resale agreements (including securities financing) is equal to at least 100% of the amount of the exposure. |
| | |
| | | | Use of Central Counterparties (‘CCPs’)ANTS continues to use CCPs as an additional means to mitigate counterparty credit risk in derivative transactions. At 31 December 2012, CCPs were used in connection with 6.3% (2011: 0.3%) of ANTS’s OTC derivatives. |
MARKETS – MONITORING AND RECOVERY MANAGEMENT
Cases exhibiting potentially higher risk characteristics are subject to risk monitoring under the FEVE system (described in “Risk monitoring” in “Measurement across the credit cycle” on page 43). At 31 December 2012, there were no impaired or non-performing loans or exposures (2011: none) and the assets in the FEVE Active category amounted to only £33m (2011: £40m).
MARKETS – RESTRUCTURED/REFINANCED LOANS
At 31 December 2012 and 2011, there were no financial assets that would otherwise be past due or impaired whose terms have been restructured/refinanced.
| | |
| 58 | | Abbey National Treasury Services plc 2012 Annual Report |
Business Review
Risk Management Reportcontinued
CREDIT RISK – CORPORATE CENTRE
INTRODUCTION
Corporate Centre consists of FMIR and the non-core portfolios of social housing loans and structured credit assets. FMIR is responsible for managing capital and funding, balance sheet composition, structural market risk and strategic liquidity risk for the rest of the Santander UK group. The non-core portfolios are being run-down and/or managed for value. Credit risk arises by Corporate Centre making loans (including to other businesses within Santander UK) and investing in debt securities. Credit risk also arises by Corporate Centre investing in other financial instruments (including assets held for liquidity purposes) or entering into financing transactions or derivative contracts.
This section sets out further detail on credit risk in Corporate Centre as follows:
| | |
• | | Management’s approach; |
| |
• | | Exposures; |
| |
• | | Credit risk mitigation; |
| |
• | | Monitoring and recovery management; |
| |
• | | Arrears; |
| |
• | | Forbearance; and |
| |
• | | Non-performing loans and advances. |
| | |
MANAGEMENT’S APPROACH TO CREDIT RISK IN CORPORATE CENTRE |
| |
• | | Credit risk in Corporate Centre is actively controlled by the Wholesale Credit Risk Department and the Corporate and Commercial Credit Risk Department. This is done in accordance with the relevant policies, limits, asset quality plans and aspects of Santander UK Board-approved risk appetite. All exposures, including intra-group items, are captured in the risk management systems and fall within limits approved by the appropriate credit authority. For Corporate Centre exposures, the relevant senior approving authorities are the Executive Risk Committee and the Credit & Investment Approvals Committee. All transactions over £70m (and certain others) are approved by the Executive Risk Committee. Exposures which exceed a pre-defined limit are also referred to Banco Santander, S.A., although the ultimate approval remains within Santander UK. |
| |
• | | The non-core portfolios consist of social housing loans and structured credit assets. These portfolios are being run-down and/or managed for value. These assets are managed in a manner consistent with the Corporate Banking assets as described in the section “Credit Risk - Corporate Banking”. |
| | |
Abbey National Treasury Services plc 2012 Annual Report | | 59 |
Business Review
Risk Management Reportcontinued
The table below shows the exposures in Corporate Centre after taking into account the credit mitigation procedures described in Markets on page 58. In addition, on lending to customers, credit risk arises on assets and off-balance sheet transactions. Consequently, the credit risk exposure below arises from on balance sheet assets, and off-balance sheet transactions such as committed and undrawn credit facilities or guarantees.
CORPORATE CENTRE – EXPOSURES
CORPORATE CENTRE EXPOSURE BY CREDIT RATING OF THE ISSUER OR COUNTERPARTY(1)
| | | | | | | | | | | | | | | | | | | | |
2012 | | Sovereign
£m | | | Structured
Products
£m | | | Derivatives
£m | | | Social
Housing
£m | | | Total
£m | |
AAA | | | 3,368 | | | | 132 | | | | — | | | | — | | | | 3,500 | |
AA | | | 283 | | | | 4 | | | | — | | | | 2,305 | | | | 2,592 | |
A | | | — | | | | 29 | | | | 1,215 | | | | 5,899 | | | | 7,143 | |
BBB and below | | | — | | | | 71 | | | | — | | | | 1,408 | | | | 1,479 | |
| | | | | | | | | | | | | | | | | | | | |
Total | | | 3,651 | | | | 236 | | | | 1,215 | | | | 9,612 | | | | 14,714 | |
| | | | | | | | | | | | | | | | | | | | |
| | | | | | | | | | | | | | | | | | | | |
2011 | | Sovereign
£m | | | Structured
Products
£m | | | Derivatives
£m | | | Social
Housing
£m | | | Total
£m | |
AAA | | | 7,266 | | | | 255 | | | | — | | | | — | | | | 7,521 | |
AA | | | — | | | | 27 | | | | 587 | | | | 2,651 | | | | 3,265 | �� |
A | | | — | | | | 20 | | | | 716 | | | | 5,990 | | | | 6,726 | |
BBB and below | | | — | | | | 59 | | | | — | | | | 1,300 | | | | 1,359 | |
| | | | | | | | | | | | | | | | | | | | |
Total | | | 7,266 | | | | 361 | | | | 1,303 | | | | 9,941 | | | | 18,871 | |
| | | | | | | | | | | | | | | | | | | | |
| (1) | External ratings are applied to all exposures where available. |
CORPORATE CENTRE EXPOSURE BY GEOGRAPHICAL AREA(1)
| | | | | | | | | | | | | | | | | | | | |
2012 | | Sovereign
£m | | | Structured
Products
£m | | | Derivatives
£m | | | Social
Housing
£m | | | Total
£m | |
UK | | | 1,978 | | | | 16 | | | | 88 | | | | 9,612 | | | | 11,694 | |
Peripheral eurozone | | | — | | | | 85 | | | | — | | | | — | | | | 85 | |
Rest of Europe | | | 627 | | | | 135 | | | | 675 | | | | — | | | | 1,437 | |
US | | | 763 | | | | — | | | | 452 | | | | — | | | | 1,215 | |
Rest of world | | | 283 | | | | — | | | | — | | | | — | | | | 283 | |
| | | | | | | | | | | | | | | | | | | | |
Total | | | 3,651 | | | | 236 | | | | 1,215 | | | | 9,612 | | | | 14,714 | |
| | | | | | | | | | | | | | | | | | | | |
| | | | | | | | | | | | | | | | | | | | |
2011 | | Sovereign
£m | | | Structured
Products
£m | | | Derivatives
£m | | | Social
Housing
£m | | | Total
£m | |
UK | | | 218 | | | | 19 | | | | — | | | | 9,941 | | | | 10,178 | |
Peripheral eurozone | | | — | | | | 133 | | | | 457 | | | | — | | | | 590 | |
Rest of Europe | | | — | | | | 144 | | | | 654 | | | | — | | | | 798 | |
US | | | 7,048 | | | | — | | | | 192 | | | | — | | | | 7,240 | |
Rest of world | | | — | | | | 66 | | | | — | | | | — | | | | 66 | |
| | | | | | | | | | | | | | | | | | | | |
Total | | | 7,266 | | | | 361 | | | | 1,303 | | | | 9,941 | | | | 18,871 | |
| | | | | | | | | | | | | | | | | | | | |
| (1) | The geographic location is classified by country of domicile of the counterparty. |
The exposure to Sovereigns in the UK and US principally reflect the holdings of liquid assets.
| | |
| 60 | | Abbey National Treasury Services plc 2012 Annual Report |
Business Review
Risk Management Reportcontinued
CORPORATE CENTRE – CREDIT RISK MITIGATION
The specialist businesses in Corporate Centre service customers in various business sectors including Real Estate and Social Housing. Corporate Centre is also responsible for the non-core portfolios of social housing loans and structured credit assets.
| | | | |
PORTFOLIO | | DESCRIPTION |
• | | Sovereigns | | Assets held with sovereign counterparties are mainly with issuers or counterparties with a AAA or AA rating. It is normal market practice that there is no collateral associated with these assets. |
| | |
• | | Structured products | | Assets held within the Treasury asset portfolio include asset-backed securities (‘ABS’) (including mortgage-backed securities (‘MBS’)), Collateralised Loan Obligations (‘CLOs’) and certain credit derivatives. The instruments held are unsecured but benefit from senior positions in the creditor cascade and, in the case of structured products, their rating reflects the over collateralisation inherent in the structure and the assets that underpin the cashflows and repayment schedules. The Treasury Asset Portfolio is monitored for potential impairment through a detailed expected cashflow analysis taking into account the structure and underlying assets of each individual security. Once specific events give rise to a reasonable expectation that future anticipated cash flows may not be received, the asset originating these doubtful cash flows will be deemed to be impaired. Objective evidence of loss events includes significant financial difficulties of the issuer and default or delinquency in interest and principal payments (breach of contractual terms). |
| | |
• | | Derivatives | | Credit risk in derivatives is mitigated by netting agreements, collateralisation and the use of Central Counterparties. For more details, see “Markets -Credit Risk Mitigation” on page 58. |
| | |
• | | Social housing | | The portfolio is secured on residential real estate owned and let by UK Housing Associations. This collateral is revalued at least every five years and the valuation is based on standard housing methodologies, which generally involve the properties’ continued use as social housing. If the valuation were based upon normal residential use the value would be considerably higher. To date, ANTS has suffered no defaults or losses on this type of lending and has not had to take possession of any collateral. The value of the collateral is in all cases in excess of the loan balance. Typically, the loan balance represents between 25% and 50% of the implied market value of collateral using Santander UK’s LGD methodology. |
| | |
Abbey National Treasury Services plc 2012 Annual Report | | 61 |
Business Review
Risk Management Reportcontinued
CORPORATE CENTRE – MONITORING AND RECOVERY MANAGEMENT
Cases exhibiting potentially higher risk characteristics are subject to risk monitoring under the FEVE system (described in the section “Risk monitoring” in “Credit Risk Cycle” on page 43).
Cases subject to risk monitoring under the FEVE system or in Workouts by portfolio and assessment of risk at 31 December 2012 and 2011 were:
| | | | | | | | | | | | | | | | | | | | | | | | | | | | | | | | | | | | | | | | | | | | |
| | | | | | | | | | | | | | | | | | | | | | | | | | | | | | Impairment loss
allowances | |
2012 | | Portfolio
£m | | | Enhanced
Monitoring
£m | | | Enhanced
Monitoring
% | | | Pro-
active
£m | | | Pro-
active
% | | | Workout
£m | | | Workout
% | | | NPLs(1)
£m | | | NPLs
% | | | Observed
£m | | | IBNO
£m | |
Sovereign | | | 3,651 | | | | — | | | | — | | | | — | | | | — | | | | — | | | | — | | | | — | | | | — | | | | — | | | | — | |
Structured products | | | 236 | | | | — | | | | — | | | | — | | | | — | | | | — | | | | — | | | | — | | | | — �� | | | | — | | | | — | |
Derivatives | | | 1,215 | | | | — | | | | — | | | | — | | | | — | | | | — | | | | — | | | | — | | | | — | | | | — | | | | — | |
Social housing | | | 9,612 | | | | 632 | | | | 6.6 | | | | — | | | | — | | | | — | | | | — | | | | — | | | | — | | | | — | | | | — | |
| | | | | | | | | | | | | | | | | | | | | | | | | | | | | | | | | | | | | | | | | | | | |
Total | | | 14,714 | | | | 632 | | | | 4.3 | | | | — | | | | — | | | | — | | | | — | | | | — | | | | — | | | | — | | | | — | |
| | | | | | | | | | | | | | | | | | | | | | | | | | | | | | | | | | | | | | | | | | | | |
| | | | | | | | | | | | | | | | | | | | | | | | | | | | | | | | | | | | | | | | | | | | |
| | | | | | | | | | | | | | | | | | | | | | | | | | | | | | Impairment loss
allowances | |
2011 | | Portfolio
£m | | | Enhanced
Monitoring
£m | | | Enhanced
Monitoring
% | | | Pro-
active
£m | | | Pro-
active
% | | | Workout
£m | | | Workout
% | | | NPLs(1)
£m | | | NPLs
% | | | Observed
£m | | | IBNO
£m | |
Sovereign | | | 7,266 | | | | — | | | | — | | | | — | | | | — | | | | — | | | | — | | | | — | | | | — | | | | — | | | | — | |
Structured products | | | 361 | | | | 15 | | | | 4.2 | | | | — | | | | — | | | | — | | | | — | | | | — | | | | — | | | | — | | | | — | |
Derivatives | | | 1,303 | | | | — | | | | — | | | | — | | | | — | | | | — | | | | — | | | | — | | | | — | | | | — | | | | — | |
Social housing | | | 9,941 | | | | 212 | | | | 2.1 | | | | — | | | | — | | | | — | | | | — | | | | — | | | | — | | | | — | | | | — | |
| | | | | | | | | | | | | | | | | | | | | | | | | | | | | | | | | | | | | | | | | | | | |
Total | | | 18,871 | | | | 227 | | | | 1.2 | | | | — | | | | — | | | | — | | | | — | | | | — | | | | — | | | | — | | | | — | |
| | | | | | | | | | | | | | | | | | | | | | | | | | | | | | | | | | | | | | | | | | | | |
| (1) | Includes committed facilities and swaps. |
The value of cases in enhanced monitoring increased, although this was influenced by a few large value cases in the social housing book where the concerns were more around service standards and governance rather than financial matters and these are expected to return to the performing book in due course.
CORPORATE CENTRE – ARREARS
At 31 December 2012, 2011 and 2010, there were no loans and advances to customers in arrears in Corporate Centre.
FORBEARANCE – LOANS RESTRUCTURED/REFINANCED
Restructurings/refinancings allow a customer, by negotiation, to vary the terms of their contractual obligations for an agreed period (such as interest-only period or term extensions). ANTS also aims to ensure that after the initial period of financial difficulties the customer can revert to the previous terms, with appropriate support where necessary. These agreements may be initiated by the customer, ANTS or by a third party.
No restructuring/refinancing arrangements have been entered into with respect to sovereign, structured products, derivatives or social housing.
CORPORATE CENTRE – NON-PERFORMING LOANS AND ADVANCES
At 31 December 2012 and 2011, there were no non-performing loans in Corporate Centre.
| | |
| 62 | | Abbey National Treasury Services plc 2012 Annual Report |
Business Review
Risk Management Report continued
MARKET RISK
INTRODUCTION
Market risk is the risk of a variation to the capital, economic value or reported income resulting from changes in the variables of financial instruments including interest rate, inflation, equity, credit spread, property and foreign currency. Traded market risk is the risk of losses in on- and off-balance sheet positions arising from movements in market prices. Non-traded market risk includes exposures arising as a result of the structure of portfolios of assets and liabilities, or where the liquidity of the market is such that the exposure could not be closed out over a short-time horizon.
This section sets out further detail on:
| | |
• | | Traded market risk, |
| |
• | | Non-traded market risk (which is classified as a structural risk and presented in the Structural Risks section). |
| | |
MANAGEMENT’S APPROACH TO MARKET RISK |
| | |
• | | ANTS actively manages and controls traded market risk within clearly defined parameters by limiting the impact of adverse market movements whilst seeking to enhance earnings. The organisational structure ensures a segregation of responsibilities between the functions responsible for market risk origination, risk management and control, and risk oversight. |
| |
• | | A comprehensive set of Santander UK-wide policies, procedures and processes have been developed and implemented to identify, monitor and manage market risk. |
| |
• | | All material risk exposures must be measured and subject to monitoring against limits and triggers for management action and/or escalation. Market risk limits are approved under Board-delegated authority, and within the market risk appetite. |
TRADED MARKET RISK
INTRODUCTION
Traded market risk arises in connection with financial services for customers and the buying, selling and positioning mainly in fixed income, equities, foreign exchange and property markets. This trading activity may lead to a potential decline in net income due to variations in market factors including interest rates, inflation rates, equity, exchange rates, credit spreads and bond prices, property and other instruments. The most significant risk exposures in traded market risk are sensitivities to moves in interest rates, interest rate basis and the equities market.
The key areas where traded market risk is generated, controlled and managed are:
| | |
• | | Corporate Banking, and |
| |
• | | Markets. |
Market risks arising from structured products, including exposure to changes in the levels of equity markets, are managed within Markets.
| | |
Abbey National Treasury Services plc 2012 Annual Report | | 63 |
Business Review
Risk Management Reportcontinued
Risk measures
| | |
Value at Risk (‘VaR’) |
• | | One of the main tools to measure and control market risks is a statistical risk measure, VaR. VaR estimates the potential loss arising from unfavourable market moves and is calculated using a historical simulation method with two-years of daily price history, equally weighted time period. In accordance with the standard used throughout the Banco Santander group, the VaR calculation uses a one day time horizon and a 99% confidence level. This means that conditional on today’s positions, ANTS would expect to incur losses exceeding the predicted VaR estimate one in every 100 trading days, or about two to three times a year. |
| |
• | | VaR is calculated daily and includes all major risk exposures including interest rates and equities, and is subjected to governance, controls, regular reviews and internal assessments. |
| |
• | | Among the benefits of VaR is that it incorporates the majority of the material market risk factors and provides a comprehensive and consistent risk measure across the various factors and trading books. |
| |
• | | Limitations of VaR arise from the use of historical changes and the assumption that these historical changes are an indicator of the future distribution of potential market moves. VaR does not capture intra-day risk taking as it is based on positions as at close of business. Further, it does not indicate the potential loss beyond the 99th percentile. This risk is addressed by monitoring stress testing measures across the different business areas. |
| |
• | | The main risk exposures are monitored against limits at different levels: aggregated ANTS; business, asset class and individual desk levels. All limit breaches are reported and escalated in accordance with the Risk Framework. |
| |
• | | Daily back-testing is performed of VaR against its market risk related revenue. This back-testing does address the limitation with the intra-day trading activity revenues. |
| |
• | | Stressed VaR is an additional VaR measure calculated on a daily basis. The calculation methodology is approved by the FSA and uses a specific 250 day time window instead of the most recent two-year history. |
| | |
Stress scenarios |
• | | Stress scenarios and reverse stress scenarios are important tools for Santander UK to increase transparency, and measure and control risk of losses in stressed markets. |
| |
• | | Bespoke scenarios are considered to replicate past events but also to create plausible events of abnormal market conditions from changes in financial prices including interest rates, equity, exchange rates and credit spreads. Various degrees of severity are considered which, together with VaR, make it possible to obtain a more complete spectrum of the risk profile. Scenario shocks assuming different holding periods are used to illustrate stress exposures to various degrees of market liquidity. |
| |
• | | Limits are used to manage ANTS’s exposure and restrict the impact of stressed market conditions. Stress testing is also employed in cross-business risk management. The results of the stress calculations, trends and explanations based on current market risk positions are communicated to Santander UK’s senior management on a regular basis. |
| | |
Additional risk measures |
• | | Non-statistical risk measures as well as stress testing include sensitivities to variables used to value positions including credit spread sensitivities, interest rate basis point values and market values. |
| |
• | | All quantitative models are subject to an extensive review and approval process and any uncertainty factors are addressed with fair value adjustments. |
| | |
| 64 | | Abbey National Treasury Services plc 2012 Annual Report |
Business Review
Risk Management Report continued
TRADED MARKET RISK – CORPORATE BANKING
For trading activities, market risk is incorporated under the VaR risk measure as well as complimentary sensitivity and stress testing metrics. The following table shows the VaR-based consolidated exposures for the major risk classes at 31 December 2012, 2011 and 2010, together with the highest, lowest and average exposures for the year. Exposures within each risk class reflect a range of exposures associated with movements in that financial market. The main exposure is due to interest rate risks, e.g. the impact of absolute rate movements, and movements between interest rate bases.
The amounts below represent the potential change in market values of trading instruments. Since trading instruments are recorded at market value, these amounts also represent the potential effect on income.
| | | | | | | | | | | | |
| | | Actual exposure at 31 December | |
Trading instruments | | 2012
£m | | | 2011
£m | | | 2010
£m | |
Interest rate risks | | | 2.3 | | | | 1.9 | | | | 2.1 | |
Equity risks | | | 1.0 | | | | 0.5 | | | | 0.7 | |
Spread risks | | | — | | | | 0.2 | | | | 1.1 | |
| | | | | | | | | | | | |
Correlation offsets(1) | | | (0.6 | ) | | | (0.7 | ) | | | (0.3 | ) |
| | | | | | | | | | | | |
Total correlated one-day VaR | | | 2.6 | | | | 2.0 | | | | 3.1 | |
| | | | | | | | | | | | |
| | | | | | | | | | | | | | | | | | | | | | | | | | | | | | | | | | | | |
| | | Exposure for the year ended 31 December | |
| | | Average exposure | | | Highest exposure | | | Lowest exposure | |
Trading instruments | | 2012
£m | | | 2011
£m | | | 2010
£m | | | 2012
£m | | | 2011
£m | | | 2010
£m | | | 2012
£m | | | 2011
£m | | | 2010
£m | |
Interest rate risks | | | 2.3 | | | | 1.9 | | | | 2.1 | | | | 3.8 | | | | 2.6 | | | | 4.4 | | | | 1.7 | | | | 1.4 | | | | 0.9 | |
Equity risks | | | 1.0 | | | | 0.5 | | | | 0.7 | | | | 1.4 | | | | 0.7 | | | | 0.7 | | | | 0.6 | | | | 0.2 | | | | 0.7 | |
Spread risks | | | 0.2 | | | | 0.6 | | | | 1.1 | | | | 0.8 | | | | 0.9 | | | | 1.6 | | | | — | | | | 0.2 | | | | 0.6 | |
| | | | | | | | | | | | | | | | | | | | | | | | | | | | | | | | | | | | |
Correlation offsets(1) | | | (0.9 | ) | | | (0.6 | ) | | | (0.9 | ) | | | — | | | | — | | | | — | | | | — | | | | — | | | | — | |
| | | | | | | | | | | | | | | | | | | | | | | | | | | | | | | | | | | | |
Total correlated one-day VaR | | | 2.6 | | | | 2.4 | | | | 3.0 | | | | 3.9 | | | | 3.6 | | | | 5.0 | | | | 1.9 | | | | 1.6 | | | | 2.2 | |
| | | | | | | | | | | | | | | | | | | | | | | | | | | | | | | | | | | | |
| (1) | The highest and lowest exposure figures reported for each risk type did not necessarily occur on the same day as the highest and lowest total correlated one-day Value-at-Risk. A corresponding correlation offset effect cannot be calculated and is therefore omitted from the above tables. |
Corporate Banking daily VaR(unaudited)
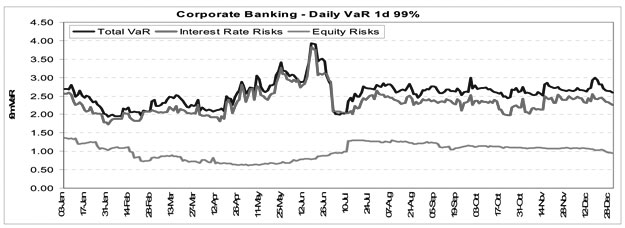
Movements in Total VaR and Interest Rates Risks during 2012 were driven by changing interest rate views taken by the desks.
| | |
Abbey National Treasury Services plc 2012 Annual Report | | 65 |
Business Review
Risk Management Reportcontinued
TRADED MARKET RISK – MARKETS
Market risk-taking is performed only within the constraints of the Market Risk Framework. The majority of the exposure is due to interest rate and equity exposure. Interest rate exposure is generated through trading activities. The main equity exposures are generated by the creation and risk management of structured products by Markets for the personal financial services market. Spread exposure arises indirectly from trading activities within Markets.
The following table shows the VaR-based consolidated exposures for the major risk classes at 31 December 2012, 2011 and 2010, together with the highest, lowest and average exposures for the year. Exposures within each risk class reflect a range of exposures associated with movements in that financial market.
The amounts below represent the potential change in market values of trading instruments. Since trading instruments are recorded at market value, these amounts also represent the potential effect on income.
| | | | | | | | | | | | |
| | | Actual Exposure at 31 December | |
Trading instruments | | 2012
£m | | | 2011
£m | | | 2010
£m | |
Interest rate risks | | | 3.3 | | | | 1.6 | | | | 2.0 | |
Equity risks | | | 4.4 | | | | 5.3 | | | | 1.1 | |
Property risks | | | 2.3 | | | | 2.1 | | | | 2.9 | |
Spread risks | | | 0.2 | | | | — | | | | — | |
Other risks(1) | | | 0.5 | | | | 1.9 | | | | 0.2 | |
| | | | | | | | | | | | |
Correlation offsets(2) | | | (1.9 | ) | | | (2.4 | ) | | | (0.8 | ) |
| | | | | | | | | | | | |
Total correlated one-day VaR | | | 8.7 | | | | 8.5 | | | | 5.5 | |
| | | | | | | | | | | | |
| | | | | | | | | | | | | | | | | | | | | | | | | | | | | | | | | | | | |
| | | Exposure for the year ended 31 December | |
| | | Average exposure | | | Highest exposure | | | Lowest exposure | |
Trading instruments | | 2012
£m | | | 2011
£m | | | 2010
£m | | | 2012
£m | | | 2011
£m | | | 2010
£m | | | 2012
£m | | | 2011
£m | | | 2010
£m | |
Interest rate risks | | | 3.0 | | | | 2.3 | | | | 2.4 | | | | 5.2 | | | | 3.8 | | | | 5.2 | | | | 1.7 | | | | 1.2 | | | | 1.2 | |
Equity risks | | | 5.0 | | | | 2.6 | | | | 1.2 | | | | 8.0 | | | | 6.9 | | | | 1.8 | | | | 3.5 | | | | 0.6 | | | | 0.7 | |
Property risks | | | 2.1 | | | | 2.2 | | | | 5.5 | | | | 2.5 | | | | 2.9 | | | | 9.1 | | | | 1.3 | | | | 1.9 | | | | 2.9 | |
Spread risks | | | 0.1 | | | | — | | | | — | | | | 0.4 | | | | — | | | | — | | | | — | | | | — | | | | — | |
Other risks(1) | | | 0.9 | | | | 0.4 | | | | 0.3 | | | | 2.3 | | | | 1.9 | | | | 0.8 | | | | 0.4 | | | | 0.2 | | | | 0.2 | |
| | | | | | | | | | | | | | | | | | | | | | | | | | | | | | | | | | | | |
Correlation offsets(2) | | | (2.4 | ) | | | (1.1 | ) | | | (0.9 | ) | | | — | | | | — | | | | — | | | | — | | | | — | | | | — | |
| | | | | | | | | | | | | | | | | | | | | | | | | | | | | | | | | | | | |
Total correlated one-day VaR | | | 8.8 | | | | 6.4 | | | | 8.5 | | | | 12.9 | | | | 10.0 | | | | 14.6 | | | | 6.9 | | | | 3.9 | | | | 4.8 | |
| | | | | | | | | | | | | | | | | | | | | | | | | | | | | | | | | | | | |
| (1) | Other risks include foreign exchange risk. |
| (2) | The highest and lowest exposure figures reported for each risk type did not necessarily occur on the same day as the highest and lowest total correlated one-day Value-at-Risk. A corresponding correlation offset effect cannot be calculated and is therefore omitted from the above tables. |
Markets daily VaR(unaudited)
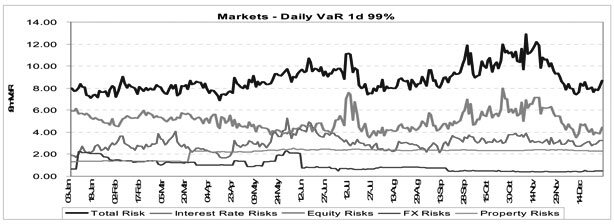
Movements in Total Risk and Equity Risks during 2012 were driven by changing trading volumes within the Equity Derivatives desk.
| | |
| 66 | | Abbey National Treasury Services plc 2012 Annual Report |
Business Review
Risk Management Report continued
STRUCTURAL RISK
INTRODUCTION
Structural risk includes exposures arising as a result of the structure of portfolios of assets and liabilities, or where the liquidity of the market is such that the exposure could not be closed out over a short-time horizon. The risk exposure is generated by features inherent in either a product or portfolio and normally presented over the life of the product or portfolio. Such exposures are a result of the decision to undertake specific business activities, can take a number of different forms, and are generally managed over a longer-time horizon.
Through the internal transfer pricing mechanism, material structural risks arising from divisions are transferred from the originating business to FMIR in Corporate Centre where they are monitored, controlled and managed holistically in conjunction with exposures arising from the funding, liquidity or capital management activities of FMIR.
There are three key areas of structural risk within ANTS which are discussed in the sections that follow. These are:
| | |
• | | Non-traded market risk; |
| |
• | | Liquidity and funding risk; and |
| |
• | | Capital risk. |
NON-TRADED MARKET RISK
Non-traded market risk mainly arises through the provision of banking products and services to personal and corporate/business customers, as well as structural exposures arising in Santander UK’s balance sheet.
The most significant non-traded market risk on a gross basis is interest rate risk, which includes both yield curve and basis risks. Yield curve risk arises from the timing mismatch in the re-pricing of fixed and variable rate assets, liabilities and off-balance sheet instruments, as well as the investment of non-interest-bearing liabilities in interest-bearing assets. Basis risk arises, to the extent that the underlying market rates impacting pricing within variable rate assets and liabilities are not precisely matched. This exposes the balance sheet to changes in the relationship between market rates, for example between LIBOR and Bank of England Base Rate.
Santander UK is also exposed to behavioural risks arising from features in retail products that give customers the right to alter the expected cash flows of a financial contract. For example prepayment risk where customers may prepay loans before their contractual maturity. Santander UK is also exposed to product launch risk, where the customers may not take the expected volume of new mortgages or other products.
There are two areas where non-traded market risk is permitted, controlled and managed:
| | |
• | | Corporate Banking; and |
| |
• | | Corporate Centre. |
All non-traded market risks arising from the Santander UK group’s Retail Banking and Corporate Banking divisions are substantially transferred from the originating business to FMIR in Corporate Centre.
Risk measures
For non-traded market risk, Santander UK predominantly measures its market risk exposures with both Net Interest Margin (‘NIM’) and Economic Value of Equity (‘EVE’) analysis supplemented by the risk measures described in the Market Risk section.
NIM and EVE measures are commonly used throughout the financial services industry as measures for managing market risk across non-traded portfolios. The calculations for NIM and EVE sensitivities involve many assumptions, including expected customer behaviour (e.g. early repayment of loans) and how interest rates may evolve. The behavioural assumptions form a key part of the overall control framework and are updated and reviewed on an ongoing basis.
| | |
Abbey National Treasury Services plc 2012 Annual Report | | 67 |
Business Review
Risk Management Reportcontinued
| | |
Net Interest Margin (‘NIM’) Sensitivity |
• | | NIM sensitivity is an income-based measure and is used to forecast the changes to the interest income and interest expense of Santander UK in different scenarios to provide a combined impact on margin over a specified time horizon, the most common being over an annual (i.e. 12 month) period. |
| |
• | | Typically scenarios compare the impact of an immediate parallel shift to interest rates (both up and down) from a specific expected path of interest rates, usually determined by the market’s expectation of interest rates. This method is adopted to provide an illustration or index as to the level of interest rate risk. |
| |
• | | NIM sensitivity analysis is also used to demonstrate the impact on income of contractual product features such as re-pricing and maturity dates and non-contractual features such as early product redemption. |
| | |
Economic Value of Equity (‘EVE’) Sensitivity |
• | | EVE sensitivities forecast the difference between scenarios, in a manner similar to NIM sensitivities but over the entire life of instruments currently within the balance sheet. Typically, scenarios compare the impact of an immediate parallel shift to interest rates (both up and down) from the market expected interest rates to give an illustration or index as to the level of interest rate risk. |
| |
• | | EVE sensitivity analysis is also used to demonstrate the whole life, or value impact of contractual product features such as re-pricing and maturity dates and non-contractual features such as early product redemption. |
NON-TRADED MARKET RISK – CORPORATE BANKING
Non-traded market risks originated in Corporate Banking are transferred from the originating business to FMIR in Corporate Centre. Funds received with respect to deposits taken are lent on to Corporate Centre on matching terms as regards interest rate re-pricing and maturity; in a similar manner loans are funded through matching borrowings. Any permitted retained market risk exposure is minimal, and is monitored against limits approved through the Market Risk Framework.
NON-TRADED MARKET RISK – CORPORATE CENTRE
As a consequence of the transfer process described above, all material non-trading market risk exposures are substantially transferred to and reside within Corporate Centre. Non-traded market risk is managed in line with the Risk Framework. The exposures at 31 December 2012 and 2011 are outlined below.
Analysis of non-traded market risk exposures
NIM and EVE measures are two of the key measures used by Santander UK that illustrate its exposure to yield curve risk. The following table reflects how the base case valuations would be affected by a 100 basis point parallel shift applied instantaneously to the yield curve. For comparison purposes these measures are shown at 31 December 2012, 2011 and 2010:
| | | | | | | | | | | | |
| | | 2012
£m | | | 2011
£m | | | 2010
£m | |
Net Interest Margin sensitivity to +100 basis points shift in yield curve | | | 343 | | | | 225 | | | | 309 | |
Economic Value of Equity sensitivity to +100 basis points shift in yield curve | | | 405 | | | | 387 | | | | 410 | |
The change in the sensitivities between 2011 and 2012 was largely attributable to the run off of the hedging strategy implemented during 2011 to lessen the impact of margin compression. Due to the protracted period of historically low interest rates, Santander UK remains exposed to a degree of margin compression. It is attributable to the combination of the historically low level of central bank base rates and to reduced earnings from the assets funded by Santander UK’s non-dated liabilities.
| | |
| 68 | | Abbey National Treasury Services plc 2012 Annual Report |
Business Review
Risk Management Report continued
LIQUIDITY AND FUNDING RISK
ANTS is the treasury support function for the Santander UK group. In this regard, ANTS’s role is to provide access to financial markets and central bank facilities in order to meet the Santander UK group’s liquidity, funding, capital and balance sheet management requirements.
Liquidity and funding risk is managed on a Santander UK group basis and it is not therefore appropriate to consider these risks separately at an ANTS group level. In addition, under the FSA’s regulatory liquidity regime, Santander UK and ANTS together with Cater Allen Limited, a fellow subsidiary of Santander UK plc, form the Santander UK Defined Liquidity Group (‘DLG’). Under these arrangements, each member of the DLG is liable to support each other in terms of transferring or receiving surplus liquidity in times of stress. In considering the liquidity resources available to the ANTS group, both its own liquid assets and also those of rest of the Santander UK group have been separately presented below.
INTRODUCTION
Santander UK views the essential elements of liquidity and funding risk management as managing potential cash outflows, maintaining prudent levels of highly liquid assets and ensuring that access to funding is available from a diverse range of sources. The Santander UK Board targets a funding strategy that avoids excessive reliance on wholesale funding and attracts enduring commercial deposits by understanding the behavioural aspects of customer deposits under different scenarios, appropriately reflecting product features and types of customers. The funding strategy aims to provide effective diversification in the sources and tenor of funding as well as establishing the capacity to raise additional unplanned funding from those sources quickly. An excessive concentration in either liquid assets or contractual liabilities also contributes to potential liquidity risk, and so limits on these have been defined under the Liquidity Risk Framework.
Santander UK primarily generates funding and liquidity through UK retail and corporate deposits, as well as in the financial markets through its own debt programmes and facilities to support its business activities and liquidity requirements. It does this in reliance on the strength of its balance sheet and profitability and its own network of investors. It does not rely on a guarantee from Banco Santander, S.A. or any other member of the Banco Santander group (other than certain of Santander UK plc’s own subsidiaries, such as ANTS) to generate this funding or liquidity. Santander UK does not raise funds to finance other members of the Banco Santander group or guarantee the debts of other members of the Banco Santander group (other than certain of Santander UK plc’s own subsidiaries, such as ANTS). Whilst Santander UK manages its funding and maintains adequate liquidity on a stand-alone basis, Santander UK co-ordinates issuance plans with the Banco Santander group where appropriate.
In addition to Santander UK’s liquidity risk being consolidated and centrally controlled, liquidity risk is also measured, monitored and controlled within the specific business area or the subsidiary where it arises. Liquidity and funding risks are identified and encompassed within Santander UK’s Risk Framework and subject to Santander UK’s three-tier risk governance framework. The Santander UK Board delegates day-to-day responsibility for liquidity risk to the Chief Executive Officer. The Chief Executive Officer has in turn delegated the responsibilities for liquidity and funding risk management to the Chief Financial Officer, (who in turn delegates to the Finance Director), and for risk oversight to the Chief Risk Officer.
Adherence to Santander UK’s liquidity and funding risk appetite is monitored on a daily, weekly and monthly basis through different committees and levels of management including the Strategic Risk and Financial Management Committee and the Risk Management Committee, and the Santander UK Board Risk Committee. The Strategic Risk and Financial Management Committee is responsible for overseeing the management of Santander UK’s balance sheet in accordance with the Santander UK Board-approved funding plan and for ensuring that the adequacy of liquidity and appropriateness of funding are consistent with risk appetite. This includes consideration of relevant macro-economic factors and conditions in the financial markets.
DEFINITIONS
| | |
LIQUIDITY RISK |
• | | Liquidity risk is the risk that Santander UK, although solvent, either does not have available sufficient financial resources to enable it to meet its obligations as they fall due, or can secure them only at excessive cost. Liquidity risks arise throughout Santander UK. Santander UK’s primary business activity is commercial banking and, as such, it engages in maturity transformation, whereby callable and short-term commercial deposits (including retail and corporate) are invested in longer-term customer loans. |
| | |
FUNDING RISK |
| • | | Funding risk is the risk that Santander UK does not have sufficiently stable and diverse sources of funding or the funding structure is inefficient or a funding programme such as debt issuance subsequently fails. For example, a securitisation arrangement may fail to operate as anticipated or the values of the assets transferred to a funding vehicle do not emerge as expected creating additional risks for Santander UK and its depositors. Risks arising from the encumbrance of assets are also included within this definition. |
| | |
Abbey National Treasury Services plc 2012 Annual Report | | 69 |
Business Review
Risk Management Reportcontinued
LIQUIDITY RISK
Santander UK’s key ongoing liquidity risks are:
| | | | |
KEY LIQUIDITY RISK | | DEFINITION |
• | | Retail funding risk | | Risk of loss of retail deposits. |
| | |
• | | Corporate funding risk | | Risk of loss of corporate deposits. |
| | |
• | | Wholesale secured and unsecured funding risk | | Risk of wholesale unsecured and secured deposits failing to roll over. |
| | |
• | | Derivatives and contingent liquidity risks | | Risk of ratings downgrades that could trigger events leading to increased outflows of financial resources, for example, to cover additional margin or collateral requirements. |
LIQUIDITY RISK APPETITE
The Santander UK Board’s risk objective is to be a risk resilient institution at all times, and to be perceived as such by stakeholders, preserving the short and long-term viability of Santander UK. While recognising that a bank engaging in maturity transformation cannot hold sufficient liquidity to cover all possible stress scenarios, the Santander UK Board requires Santander UK to hold sufficient liquidity to cover stress situations as set out in the stress testing section below. The requirements arising from the FSA’s regulatory liquidity regime are reflected in the Santander UK Board’s Liquidity Risk Appetite.
| | |
• | | The liquidity risk appetite has been recommended by the Chief Executive Officer and approved by the Santander UK Board, under advice from the Santander UK Board Risk Committee. The liquidity risk appetite, within the context of the overall Santander UK Risk Appetite, is reviewed and approved by the Santander UK Board at least annually or more frequently if necessary (e.g. in the case of significant methodological or business change). This is designed to ensure that the liquidity risk appetite will continue to be consistent with Santander UK’s current and planned business activities. |
| |
• | | The Chief Executive Officer, under advice from the Santander UK Board Risk Committee, approves more detailed allocation of liquidity risk limits. The Chief Risk Officer, supported by the Risk Division (including the Deputy Chief Risk Officer, Chief Risk Management Officer, and the Director of Liquidity and Banking Market Risk), is responsible for monitoring the ongoing compliance with the liquidity risk appetite. |
| | |
MANAGEMENT’S APPROACH TO LIQUIDITY RISK |
• | | Liquidity risk is managed under a comprehensive and prudent liquidity risk management framework. |
| |
• | | The primary objective of the framework is to ensure that Santander UK is liquidity risk resilient by holding sufficient financial resources to withstand a series of stresses as well as complying with internal Liquidity Risk Appetite (‘LRA’) and regulatory requirements. |
| |
• | | Liquidity management is the responsibility of the Chief Financial Officer, who delegates day-to-day responsibility to the Finance Director. |
| |
• | | Liquidity risk control and oversight are provided by the Chief Risk Officer, supported by the Chief Risk Management Officer and the Risk Division. |
| | |
| 70 | | Abbey National Treasury Services plc 2012 Annual Report |
Business Review
Risk Management Report continued
LIQUIDITY RISK MANAGEMENT
The key element of Santander UK’s liquidity risk management is focused on holding sufficient liquidity to withstand a series of stress tests. Within the framework of prudent funding and liquidity management, Santander UK manages its activities to minimise liquidity risk, differentiating between short-term and strategic activities.
| | | | |
Short-term, tactical liquidity management |
• | | Liquid assets | | A portfolio of liquid assets is held to cover unexpected demands on cash in extreme but plausible stress scenarios. In Santander UK’s case, the most significant stress events include large and unexpected deposit withdrawals by retail customers and a loss of unsecured wholesale funding. |
| | |
• | | Funding profile | | Metrics to help control the level of outflow within different maturity buckets. |
| | |
• | | Intra-day collateral management | | To ensure that adequate collateral is available to support payments in each payment or settlement system in which Santander UK participates, as they fall due. |
| | | | |
Strategic funding management |
• | | Structural balance sheet shape | | To manage the extent of maturity transformation (investment of shorter term funding in longer term assets), the funding of non-marketable assets with wholesale funding and the extent to which non-marketable assets can be used to generate liquidity. |
| | |
• | | Wholesale funding strategy | | To avoid over-reliance on any individual counterparty, currency, market or product, or group of counterparties, currencies, markets or products that may become highly correlated in a stress scenario; and to avoid excessive concentrations in the maturity of wholesale funding. |
| | |
• | | Wholesale funding capacity | | To maintain and promote counterparty relationships, monitor line availability and ensure funding capacity is maintained through ongoing use of lines and markets. |
Collateral calls on derivatives positions can pose a significant liquidity risk. Collateral calls may arise at times of market stress and when asset liquidity may be tightening. The timing of the cash flows on a derivative hedging an asset may be different to the timing of the cash flows of the asset being hedged, even if they are similar in all other respects. Collateral calls may be triggered by a credit downgrading. Santander UK manages these risks by including collateral calls in stress tests on liquidity, and by maintaining a portfolio of assets held for managing liquidity risk.
Risk limits and triggers are set for the key tactical and strategic liquidity risk drivers. These are monitored by the Risk Division and reported monthly to ALCO, SRFM, Risk Management Committee and the Santander UK Board.
Operational management of liquidity risk
Santander UK maintains, as part of its overall liquidity and funding risk management framework, strong operational and management governance that seeks to make the Santander UK strategy as resilient as possible to potential liquidity stresses by structuring the balance sheet in a prudent and sensible way. The Santander UK Board’s Liquidity Risk Appetite defines the balance sheet principles that operational management is tasked to deliver:
| | • | | Implementation of a funding structure that is consistent with the composition of Santander UK’s assets. |
| | • | | Well balanced growth of assets and liabilities. |
| | • | | Implementation of a funding strategy that: |
| | • | | Avoids excessive reliance on short-term wholesale funding and attracts sustainable commercial deposits, and |
| | • | | Provides effective diversification in the sources, products and tenor of funding. |
| | • | | Maintenance of an appropriate mix of ‘sticky’ and ‘non-sticky’ commercial deposit balances. |
| | • | | Use of short-term funding to manage short-term fluctuations in funding and the funding of short-term wholesale assets. |
| | • | | Use of Term funding to provide diversification of stable funding as well as an aid to help manage the liquidity structure of the balance sheet. |
The Chief Financial Officer has delegated responsibility for day-to-day management of liquidity risk to the Finance Director who in turn delegates to the Director, ALM; the Director, Funding; and the Head of Short Term Funding. These management processes are reviewed and challenged by the independent Risk function and overseen by the Asset and Liabilities Committee (‘ALCO’), Strategic Risk and Financial Management Committee (‘SRFM’) and Risk Management Committee.
| | |
Abbey National Treasury Services plc 2012 Annual Report | | 71 |
Business Review
Risk Management Reportcontinued
The Director, ALM is responsible for strategic liquidity management including:
| | • | | The externalisation of liquidity risks from the business into the Term Funding and Short Term Funding desks where it is operationally managed, |
| | • | | The internal liquidity transfer pricing that ensures the costs of liquidity are accurately reflected at business line and product level, |
| | • | | The production of the three year funding plan in line with strategic goals and taking account of the economic and market environment; this process incorporates the implementation where necessary of liquidity or funding risk actions arising from the tracking and delivery of the plan, |
| | • | | Forward liquidity gap analysis to ensure that future potential funding or liquidity risks are managed pro-actively, |
| | • | | The formulation and proposal of the Santander UK Liquidity Risk Appetite to executive management and the Santander UK Board, |
| | • | | The design and maintenance of the Santander UK Liquidity Recovery Framework that incorporates contingent actions that can be implemented to offset the potential impacts of a liquidity stress event; and |
| | • | | Detailed balance sheet analysis with contributions from the business areas supports the projection of daily stressed liquidity outflows for the purposes of the stress testing of risks. These stress outflow assumptions are subject to ongoing assessment and revision in line with market and economic developments. |
The Director, Funding covers all aspects of short and term funding in both secured and unsecured markets, delivering Santander UK’s strategic funding requirements in line with its detailed funding plan and risk appetite principles. The Director, Funding ensures that Santander UK has active involvement in a range of wholesale funding markets ensuring that sources of funding can be maximised and so a conservative level of diversification of the balance sheet across product and appropriate maturity profile maintained.
The Head of Short Term Funding is in charge of operational liquidity. This encompasses collateral management, the efficient maintenance of a portfolio of liquid assets to counter potential liquidity stress; the maintenance of Bank of England and US Federal Reserve accounts; and efficient operational intra-day liquidity management.
STRESS TESTING
In addition to regulatory requirements, Santander UK runs stress tests on a frequent basis to ensure it is holding sufficient financial resources. These stress tests consist of:
| | | | |
ACTIVITY | | DESCRIPTION |
• | | Santander UK Liquidity Risk Appetite stress | | A comprehensive stress test considering all risk drivers applicable to Santander UK during an idiosyncratic shock experienced during a protracted market-wide stress. |
| | |
• | | Funding plan review | | A thorough review and identification of vulnerabilities in Santander UK’s strategic funding plan aimed at assessing the sensitivity of Santander UK’s structural funding position to the different growth assumptions applied to each funding source and the impact of undershooting the targets set. |
| | |
• | | Overseas operations stress | | Stress tests examining the impact of liquidity stresses originating from Santander UK’s overseas entities or operations, in particular the effects on the rest of Santander UK. |
| | |
• | | Acute and protracted retail stress | | Stress tests designed to examine the impact of short-term acute as well as longer-term protracted idiosyncratic retail stress, where there are retail deposit outflows of varying severity over different time periods. |
| | |
• | | Wholesale stress | | A stress test that considers the wholesale and corporate risk drivers as they related to Santander UK during an idiosyncratic stress that results in a protracted leakage of deposits. |
| | |
• | | Santander UK credit ratings downgrade | | Santander UK assesses the impact on it of a downgrade of its credit ratings, including the effects on its collateral requirements and liquidity position, on both a standalone basis and as part of its suite of other stress tests that it runs. |
| | |
• | | Eurozone stress | | Given the continuing uncertainty in the eurozone, Santander UK also stress tests a more extreme scenario where eurozone contagion or collapse results in significant retail, corporate and wholesale deposit outflows, combined with a reduction in the management actions available. |
| | |
| 72 | | Abbey National Treasury Services plc 2012 Annual Report |
Business Review
Risk Management Report continued
These stress tests are supplemented with sensitivity analysis for instantaneous liquidity shocks by each major liquidity risk driver to understand the impact on internal liquidity risk appetite and regulatory liquidity metrics.
LIQUID ASSETS
Santander UK holds, at all times, a portfolio of unencumbered liquid assets to mitigate liquidity risk. The size and composition of this portfolio is determined both by internal stress tests as well as the FSA’s liquidity regime.
The following tables set forth liquid assets held by the ANTS group and additional liquid assets held by the rest of the Santander UK group (to which the ANTS group has access through the cross guarantee and defined liquidity group arrangements described earlier) by the geographic location of the issuer or counterparty at 31 December 2012 and 2011:
| | | | | | | | | | | | | | | | |
| | | Held by the ANTS group | | | Held elsewhere in Santander UK | |
| | | 31 December
2012
£bn | | | 31 December
2011
£bn | | | 31 December
2012
£bn | | | 31 December
2011
£bn | |
Core liquid assets (FSA eligible): | | | | | | | | | | | | | | | | |
Cash at central banks: | | | | | | | | | | | | | | | | |
- UK | | | — | | | | — | | | | 28 | | | | 18 | |
- US | | | — | | | | 7 | | | | — | | | | — | |
| | | | | | | | | | | | | | | | |
| | | — | | | | 7 | | | | 28 | | | | 18 | |
Government bonds: | | | | | | | | | | | | | | | | |
- UK | | | 4 | | | | 2 | | | | — | | | | — | |
- US | | | 3 | | | | — | | | | — | | | | — | |
- Japan | | | 1 | | | | — | | | | — | | | | — | |
- Germany | | | 1 | | | | — | | | | — | | | | — | |
- Other countries, each less than £1bn(1) | | | — | | | | 1 | | | | — | | | | — | |
| | | | | | | | | | | | | | | | |
| | | 9 | | | | 3 | | | | — | | | | — | |
| | | | | | | | | | | | | | | | |
Total core liquid assets (FSA eligible) | | | 9 | | | | 10 | | | | 28 | | | | 18 | |
| | | | | | | | | | | | | | | | |
High quality(2) corporate bonds and asset-backed securities: | | | | | | | | | | | | | | | | |
- UK | | | 1 | | | | 1 | | | | — | | | | — | |
- US | | | — | | | | — | | | | 1 | | | | 1 | |
| | | | | | | | | | | | | | | | |
| | | 1 | | | | 1 | | | | 1 | | | | 1 | |
Other liquid assets: | | | | | | | | | | | | | | | | |
- UK - Whole loans and own debt securities(3)(4) | | | — | | | | — | | | | 36 | | | | 24 | |
- UK - Other debt securities, bonds, and equities included in major indices | | | 1 | | | | 1 | | | | — | | | | — | |
- US - Debt securities and bonds | | | — | | | | 1 | | | | — | | | | — | |
| | | | | | | | | | | | | | | | |
| | | 1 | | | | 2 | | | | 36 | | | | 24 | |
| | | | | | | | | | | | | | | | |
Total liquid assets | | | 11 | | | | 13 | | | | 65 | | | | 43 | |
| | | | | | | | | | | | | | | | |
| (1) | Consists of US, Switzerland, France and Denmark. |
| (3) | Whole loans are loans acceptable on an unsecuritised basis to the Bank of England as collateral for its various funding arrangements. |
| (4) | Includes own debt securities (i.e. retained issuances) held by Santander UK of £1bn at 31 December 2012 (2011: £24bn). |
Core liquid assets are convertible into cash on demand. High quality bonds are convertible into cash through normal market channels. Whole loans and own debt securities are convertible into cash via discount at central banks, a process that, while it varies by asset class, typically takes four weeks. A significant proportion of these whole loans and own debt securities have been pre-positioned for discount at central banks and are therefore almost immediately convertible into cash.
The UK FSA’s liquidity regulatory regime requires the actual liquidity of assets classified as core liquid assets to be demonstrated through evidence of the actual ability to convert the assets into cash, rather than by restricting the permissible maximum contractual maturity of such assets. Santander UK periodically tests the liquidity of the core liquid assets portfolio, in accordance with the FSA requirement to realise a proportion of these assets through repo or outright sale to the market. In accordance with the FSA’s regulations, Santander UK ensures that the cumulative effect of its periodic realisation over any twelve month period is that a significant proportion of the assets in its core liquid assets portfolio is realised.
Santander UK also maintains a written policy setting out its approach to the periodic realisation of its assets, and ensures that it periodically tests its operational ability to raise funds, through the use of central bank liquidity facilities to which Santander UK has access, by using a proportion of those of its assets not in its liquid asset portfolio.
In deciding on the precise composition of its liquid asset portfolio, Santander UK ensures that it tailors the contents of the portfolio to the needs of its business and the liquidity risk that it potentially faces. In particular, Santander UK ensures that it holds assets in its liquid asset portfolio which can be realised with the speed necessary to meet its liabilities as they fall due.
Core liquid assets consist of assets that meet the definition of liquid assets for purposes of the FSA’s liquidity regime, as set out in the FSA’s Prudential Sourcebook for Banks, Building Societies and Investment Firms, known as BIPRU. Such assets comprise cash at central banks and government bonds, but only the central government or central bank of a highly-rated European Economic Area state, Canada, Australia, Japan, Switzerland or the United States of America, subject to minimum credit ratings.
| | |
Abbey National Treasury Services plc 2012 Annual Report | | 73 |
Business Review
Risk Management Reportcontinued
Liquidity developments in 2012
2012 represented another very challenging year for UK banks in terms of funding and liquidity risk management. Continued concerns about the eurozone kept risk premiums on the sovereign debt of many European countries in the first half of 2012 at the highest levels since the euro’s creation. This market disruption was felt by Santander UK both in terms of market-wide elevated wholesale, unsecured medium-term and secured medium-term funding rates and, as with other UK banks, in terms of credit rating downgrades. However, the second half of 2012 saw a gradual but significant reduction in funding rates, an easing of recent market liquidity constraints and a general improvement in market confidence.
Throughout 2012, Santander UK continued to strengthen its liquidity position despite the impact of the eurozone crisis. During 2012, Santander UK:
| | • | | Reduced reliance on specific short term and wholesale funds and increased the level of medium funding in the funding mix. |
| | • | | Developed and expanded Santander UK’s liquidity management capabilities through a revision of its risk management framework, imposition of a revised liquidity risk appetite with associated limits and controls, and the imposition of new policy covering such risks as balance sheet encumbrance. |
| | • | | Developed and tested an extensive rapid response framework of which Recovery and Resolution Plans form a part. The rapid response framework is designed to ensure that executive management and the Board are able to react to any unforeseen liquidity stresses and that there are effective mechanisms of communication and response to such a stress. As part of this process a series of specific management actions that could be leveraged in the event of a stress event are maintained in an ongoing basis. |
| | • | | Maintained a conservative portfolio of liquid assets that can be utilised to counter the potential impact of a liquidity stress on Santander UK balance sheet. |
| | • | | Increased total liquid assets to £76bn (2011: £56bn). The increase of core liquid assets was driven primarily by a reduction in the customer funding gap (customer liabilities less customer assets) as a result of deleveraging and increased debt issuance. Whole loans and own debt securities increased with the availability of “whole loans” pre-positioned at central banks pursuant to the Bank of England’s decision to accept loans on an unsecuritised basis (i.e. whole loans) as collateral for its various funding arrangements such as the Funding for Lending Scheme, the Extended Collateral Term Repo Facility and the Discount Window Facility. It was more efficient for Santander UK to use whole loans rather than securitisations as Santander UK is required to include the effect of a downgrade on its securitisation structures for the purposes of calculating liquidity requirements, which is not the case with whole loans. |
FUNDING RISK
Santander UK’s primary sources of funding include:
| | • | | Secured and unsecured money-market funding (including unsecured cash, repo, certificates of deposit and commercial paper issuance); |
| | • | | Senior debt issuance (including discrete bond issues and medium term notes); |
| | • | | Asset-backed funding (including securitisation and covered bond issuance); and |
| | • | | Subordinated debt and capital issuance (although the primary purpose is not funding). |
Retail Banking and Corporate Banking funding primarily comprises deposits by customers.
| | |
MANAGEMENT’S APPROACH TO FUNDING RISK |
• | | Funding risk is managed by the Finance Director, who is responsible for the production of strategic and tactical funding plans as part of Santander UK’s planning process. |
| |
• | | Funding plans are approved by the Board and the SRFM Committee and are controlled on a day-to-day basis by the Finance Director and within the framework of the Liquidity Risk Manual. |
| |
• | | The plans are stressed to ensure adverse conditions can be accommodated via a range of management levers. |
| |
• | | Funding management is the responsibility of the Chief Financial Officer who delegates day-to-day responsibility to the Finance Director, who in turn delegates to the Director, ALM and the Director, Funding. |
| | |
| 74 | | Abbey National Treasury Services plc 2012 Annual Report |
Business Review
Risk Management Report continued
FUNDING STRATEGY
Santander UK’s funding strategy continues to be based upon the maintenance of a conservatively structured balance sheet avoiding over-reliance on wholesale and short term funds whilst ensuring that sources of funding are not overly concentrated. Santander UK also maintains checks and controls to ensure that sources of secured funding are leveraged whilst managing and limiting the level of asset encumbrance that results from this.
The quality of retail, commercial and wholesale deposits continues to be enhanced with Santander UK focused on increasing the average maturity of deposits whilst de-emphasising transient balances. Across all customer segments, Santander UK looks to deepen customer relationships and so lengthen the contractual and behavioural profile of the liability base. In the retail bank this is complemented by the successful introduction of such market leading products as the 1|2|3 Current Account.
Throughout 2012, in response to the uncertainty surrounding the eurozone and associated market challenges, Santander UK held a high level of liquid assets to mitigate the short term impacts of any potential stress event. Santander UK seeks to hold adequate liquid resources at all times, to manage these efficiently and, as far as possible, not to impede the ability of the business to extend credit to the customer base.
FUNDING RISK MANAGEMENT
Operational management of funding risk
Santander UK maintains, as part of its overall liquidity and funding risk management framework, strong operational and management governance that seeks to make Santander UK’s strategy as resilient as possible to potential funding stresses by structuring the balance sheet in a prudent and sensible way. The framework applies to all aspects of both funding and liquidity risk to ensure that the two are managed in a consistent and complimentary way - in line with the Board’s Liquidity Risk Appetite. As with liquidity risk, operational management is tasked to deliver Santander UK’s strategy in line with the following principles that define the desired conservative balance sheet structure:
| | • | | Implementation of a funding structure that is consistent with the composition of assets. |
| | • | | Well balanced growth of assets and liabilities. |
| | • | | Implementation of a funding strategy that: |
| | • | | Avoids excessive reliance on short-term wholesale funding and attracts sustainable commercial deposits, and |
| | • | | Provides effective diversification in the sources, products and tenor of funding. |
| | • | | Maintenance of an appropriate mix of ‘sticky’ and ‘non-sticky’ retail deposit balances. |
| | • | | Use of short-term funding to manage short-term fluctuations in funding and the funding of short-term wholesale assets, and |
| | • | | Use of long-term funding to provide diversification of stable funding as well as an aid to help manage the liquidity structure of the balance sheet. |
Within Santander UK, the same operational management structure that manages funding risks is responsible for liquidity risk management because of the very close affinity of the two areas. The Chief Financial Officer has delegated responsibility for day-to-day management of Funding Risk to the Finance Director who in turn delegates to the Director, ALM, and the Director, Funding. These management processes are reviewed and challenged by the independent risk function and overseen by the ALCO, SRFM and Risk Management Committee.
The Director, Funding and the Head of Short Term Funding together cover all aspects of short and term funding in both secured and unsecured markets, delivering Santander UK’s strategic funding requirements in line with its detailed funding plan and risk appetite principles. The Director, Funding ensures that Santander UK has active involvement in a range of wholesale funding markets ensuring that sources of funding can be maximised and so a conservative level of diversification of the balance sheet across product and average maturity maintained.
| | |
Abbey National Treasury Services plc 2012 Annual Report | | 75 |
Business Review
Risk Management Reportcontinued
The Director, ALM is responsible for strategic liquidity management and funding risk analysis and carries out this responsibility through:
| | • | | The externalisation of funding risk from the business into the Term Funding and Short Term Funding desks where it is operationally managed. |
| | • | | the internal funding transfer pricing that ensures the costs of funding are accurately reflected at business line and product level; |
| | • | | The production of the three year funding plan in line with strategic goals and taking account of the economic and market environment; this process incorporates the implementation where necessary of liquidity or funding risk actions arising from the tracking and delivery of the plan; |
| | • | | Forward liquidity gap analysis to ensure that future potential funding or liquidity risks are managed pro-actively; |
| | • | | The formulation and proposal of the Liquidity Risk Appetite to executive management and the Board; |
| | • | | The design and maintenance of the Liquidity Recovery Framework that incorporates contingent actions to raise funds quickly and that can be implemented to offset the potential funding impacts of a liquidity stress event; and |
| | • | | Detailed balance sheet analysis with contributions from the business areas supports the projection of daily stressed liquidity outflows for the purposes of the stress testing of risks. These stress outflow assumptions are subject to ongoing assessment and revision in line with market and economic developments and provide control in terms of the minimum level of liquid assets that Santander UK desires to maintain at all times. |
The Head of Short Term Funding is in charge of operational liquidity. This encompasses collateral management, the maintenance of a portfolio of liquid assets to counter potential liquidity stress; the maintenance of Bank of England and US Federal Reserve accounts; and the efficient operation of intra-day liquidity management.
Financial adaptability
Santander UK also considers its ability to take effective action to alter the amounts and timing of cash flows so that it can respond to unexpected needs or opportunities. In determining its financial adaptability, Santander UK has considered its ability to:
| | | | |
ACTION | | DESCRIPTION |
• Obtain new sources of finance | | Santander UK minimises refinancing risk by sourcing funds from a variety of markets as appropriate and subject to consideration of the appropriate leverage ratio and funding mix for Santander UK, and in particular customer deposit levels and medium-term funding. Santander UK actively manages its relationships with existing providers of funding and considers new sources of funds as and when they arise. |
| | Day-to-day sources of finance consist primarily of retail deposits. To the extent that wholesale funding is required, a variety of sources are usually available from a range of markets, including: |
| | |
| | • | | money markets: both unsecured (including interbank and customer deposits, and issuances of certificates of deposit and commercial paper) and secured (including repos in open market operations); |
| | |
| | • | | debt capital markets (including discrete bond issues and medium term notes); |
| | |
| | • | | mortgage-backed funding (including securitisation and covered bond issuance); and |
| | |
| | • | | capital instruments (although primarily issued to maintain capital ratios). |
| |
| | In addition to day-to-day funding sources, Santander UK has access to contingent sources from central banks, including the Bank of England, the US Federal Reserve and the Swiss National Bank. Santander UK ensures that it has access to these contingent facilities as part of its prudent liquidity risk management. Santander UK minimises reliance on any one market by maintaining a diverse funding base, and avoiding concentrations by maturity, currency and institutional type. |
| |
• Obtain financial support from other Banco Santander group companies | | For capital, funding and liquidity purposes, Santander UK operates on a stand-alone basis. However, in case of stress conditions, it would consult with its ultimate parent company, Banco Santander, S.A. about financial support. |
| |
• Continue business by making limited reductions in operations or using alternative resources | | Santander UK maintains, within its Recovery and Resolution Plan, contingency funding plans to cover potential extreme scenarios. This includes the maintenance of specific management actions that can be executed in the event of a stress to rapidly raise funds. These actions are updated on a monthly basis. |
| | |
| 76 | | Abbey National Treasury Services plc 2012 Annual Report |
Business Review
Risk Management Report continued
WHOLESALE FUNDING
The tables below show ANTS’s primary wholesale funding sources excluding short-term repurchase agreements, together with a reconciliation of wholesale funding to the balance sheet at 31 December 2012 and 2011.
| | | | | | | | | | | | | | | | |
2012 | | Funding
analysis
£bn | | | Repos
£bn | | | Other(1)
£bn | | | Balance
sheet
£bn | |
Deposits by banks | | | 4.8 | | | | 1.1 | | | | 108.6 | | | | 114.5 | |
Deposits by customers(2) | | | 0.4 | | | | — | | | | — | | | | 0.4 | |
Debt securities in issue: | | | | | | | | | | | | | | | | |
- covered bonds | | | 19.2 | | | | — | | | | — | | | | 19.2 | |
- other debt securities | | | 13.1 | | | | — | | | | 1.4 | | | | 14.5 | |
| | | | | | | | | | | | | | | | |
| | | 37.5 | | | | 1.1 | | | | 110.0 | | | | 148.6 | |
| | | | | | | | | | | | | | | | |
Financial liabilities at fair value | | | 4.0 | | | | — | | | | — | | | | 4.0 | |
Trading liabilities | | | 0.9 | | | | 11.7 | | | | 8.5 | | | | 21.1 | |
| | | | | | | | | | | | | | | | |
Total wholesale funding | | | 42.4 | | | | 12.8 | | | | 118.5 | | | | 173.7 | |
| | | | | | | | | | | | | | | | |
| | | | |
2011 | | Funding
analysis
£bn | | | Repos
£bn | | | Other(1)
£bn | | | Balance
sheet
£bn | |
Deposits by banks | | | 5.0 | | | | 2.5 | | | | 106.5 | | | | 114.0 | |
Deposits by customers(2) | | | 0.4 | | | | — | | | | — | | | | 0.4 | |
Debt securities in issue: | | | | | | | | | | | | | | | | |
- covered bonds | | | 15.3 | | | | — | | | | — | | | | 15.3 | |
- other debt securities | | | 10.2 | | | | — | | | | 1.5 | | | | 11.7 | |
| | | | | | | | | | | | | | | | |
| | | 30.9 | | | | 2.5 | | | | 108.0 | | | | 141.4 | |
| | | | | | | | | | | | | | | | |
Financial liabilities at fair value | | | 6.8 | | | | — | | | | — | | | | 6.8 | |
Trading liabilities | | | 4.1 | | | | 15.6 | | | | 6.0 | | | | 25.7 | |
| | | | | | | | | | | | | | | | |
Total wholesale funding | | | 41.8 | | | | 18.1 | | | | 114.0 | | | | 173.9 | |
| | | | | | | | | | | | | | | | |
| (1) | Principally consists of intercompany funding. |
| (2) | Included in the balance sheet total of £44,750m (2011: £38,826m). |
| | |
Abbey National Treasury Services plc 2012 Annual Report | | 77 |
Business Review
Risk Management Reportcontinued
CAPITAL RISK
DEFINITION
Capital risk is defined as the risk that the ANTS does not have an adequate amount, or quality of, capital to:
| | • | | Adhere to the Santander UK Board’s Risk Appetite and support its internal business objectives; |
| | • | | Support market expectations and its credit rating; and |
| | • | | Meet regulatory requirements in the UK and other jurisdictions (such as the United States) where regulated activities are undertaken. |
Whilst the Company and its parent Santander UK plc are part of the wider Banco Santander group, both the Company and Santander UK plc are incorporated in the UK, regulated by the FSA and do not benefit from guarantees from Banco Santander, S.A. and. as such, Santander UK plc operates as an autonomous subsidiary. As such, responsibility for the management, control and assurance of capital risk lies with the Santander UK Board, and the ANTS Board with respect to its own capital.
The Company, Santander UK plc, and Cater Allen Limited are party to a defined liquidity group liquidity facility agreement (the “DLG Facility Agreement”). The DLG Facility Agreement supports a defined liquidity group for the purposes of section 12 of BIPRU. Section 12.8 of BIPRU permits a member of a defined liquidity group to rely on the liquid resources of other members of the defined liquidity group to comply with the liquidity adequacy requirements under section 12 of BIPRU. Under the DLG Facility Agreement, each party agrees to lend, subject to certain conditions and limitations, its excess liquidity to each other party.
The Santander UK Capital Management Framework, reviewed by the Santander UK Board annually, describes the high level arrangements for the management, control and assurance of Santander UK capital risk. Santander UK adopts a centralised capital management approach that is driven by its strategy and delivers the Santander UK Board approved Santander UK Risk Appetite. This approach takes into account the regulatory and commercial environment in which Santander UK operates the management strategy for each of its material risks and the impact of appropriate adverse scenarios and stresses on its capital position.
The key elements of Santander UK’s capital management are:
| | |
MANAGEMENT’S APPROACH TO CAPITAL RISK |
• | | Strategic capital risk managementwhere, in the form of an annual capital plan (contained within the Internal Capital Adequacy Assessment Process), the regulatory and internal capital requirements and capital resources are forecasted based on the medium term business plan. Alongside this capital plan, Santander UK stresses the capital requirements and resources using a suite of macroeconomic scenarios. |
| |
• | | Short term, tactical capital risk management, where frequent monitoring and reporting against the capital plan is performed to detect where any deterioration or change in the planned business performance may impact the capital levels. Additionally, monthly monitoring of the economic assumptions used to create and stress the capital plan against economic reality is undertaken to detect potential deterioration in the capital levels. |
| |
• | | Decisions on the allocation of capital resources are conducted as part of Santander UK’s strategic planning process based on the relative returns on capital using both economic and regulatory capital measures. |
| |
• | | Santander UK also defines management actions in the event that an extremely severe period of stress threatens its viability and solvency. |
ANTS manages its capital on a Basel II basis and in anticipation of the finalisation and adoption of Basel III. Capital demand is quantified for credit, traded market, non-traded market, and operational risk in accordance with FSA requirements. Santander UK produces and shares with the FSA its Internal Capital Adequacy Assessment Process document, which informs the supervisory and evaluation process by the FSA Pillar 2 of Basel II and can result in additional capital requirements.
| | |
| 78 | | Abbey National Treasury Services plc 2012 Annual Report |
Business Review
Risk Management Report continued
|
NON-FINANCIAL RISKS (unaudited) |
The key non-financial risks consist of:
|
• Operational risk, • Regulatory risk, • Conduct risk, • Strategic risk, • Reputational risk, • Human Resources risk, • Accounting and reporting risk, and • Legal risk. |
OPERATIONAL RISK(unaudited)
Operational risk is the risk of loss to ANTS resulting from inadequate or failed internal processes, people and systems, or from external events. As operational risk is inherent in the processes ANTS operates, in order to provide services to customers and generate profit for investors, an objective of operational risk management is not to remove operational risk altogether, but to manage the risk to an acceptable level, taking into account the cost/benefits of minimisation as opposed to the inherent risk levels. When such risks materialise they can have not only immediate financial consequences for ANTS, but also an effect on its business objectives, customer service and regulatory responsibilities. Examples of operational risks include fraud, process failures, system downtime or damage to assets due to fire or floods.
The Operational Risk Framework
Operational risk exposures arise across ANTS’s business divisions and operating units, and are managed on a consistent basis. ANTS aims to identify, measure/assess, control/mitigate and inform regarding this risk. ANTS’s priority is to identify and minimise the risk of loss wherever appropriate, irrespective of whether losses have occurred. Measurement of the risk contributes to the establishment of priorities in operational risk management.
The Operational Risk Framework creates the consistent approach to how Santander UK controls and manages its operational risks and helps everyone understand their responsibilities within this approach. It is a core component of the overall Risk Framework and facilitates the ongoing reassessment of risk, appetites and controls, in order to ensure that Santander UK manages its risks at all times in line with its business objectives.
The Operational Risk Framework defines the operational risk requirements and adopts the following principles:
| | • | | The Santander UK Board must understand the main aspects of operational risk and approve and review the management framework. |
| | • | | The operational risk framework must be subject to reviews by the Internal Audit Department. |
| | • | | Operational risk management is part of senior management’s responsibility across the business. They must ensure it is introduced into management frameworks throughout Santander UK. |
| | • | | All ANTS’s personnel are managers of the operational risk that is intrinsic to the products, processes and systems they work with every day. |
| | • | | Directly and actively managing operational risk is the responsibility of all ANTS’s entities, divisions and areas. |
| | • | | Operational risk control is a separate function from operational risk management. Operational risk control is carried out by operational risk areas, which use qualitative and quantitative tools to identify, assess, track, measure and mitigate operational risk. |
| | |
Abbey National Treasury Services plc 2012 Annual Report | | 79 |
Business Review
Risk Management Reportcontinued
| | • | | Operational risk managers must have adequate organisation, policies, methodologies and support to hedge the risks. |
| | • | | Business areas must have contingency plans in place to ensure continued operations and minimise losses should their business be interrupted. |
| | • | | Business areas must ensure they have the information available that is needed by the Board and the rest of the business. |
Santander UK obtains assurance that the appropriate standards of risk management are being maintained through the application of its “three lines of defence” Risk Governance Framework.
The management and oversight of Operational Risk is also covered by the “three lines of defence” model as described in the Risk Framework section. Within the first line of defence, all heads of business and management support units are accountable to the Chief Executive Officer for managing operational risks inherent in their products, activities, processes and systems and from external events. This is further supported by operational risk managers within the business areas and a specialised Operational Risk Unit under the office of the Chief Operating Officer. Within the second line there is the Operational Risk Control Unit (‘ORC’). The executive responsibility for the management of the ORC lies with the Head of Strategy & Internal Control who has responsibility for the overall Internal Control Unit. The Internal Control Unit is responsible for effectively controlling risks and ensuring they are managed within the risk limits and mandates approved by the Board and Chief Executive Officer. Operational Risks are reported in conjunction with all key non financial risk information firstly through to the Internal Control Committee which then escalates though to the Executive Risk, Risk Oversight and Board Risk Committees.
Operational risk management
The “three lines of defence” model applies throughout Santander UK and is implemented taking account of the materiality and perceived risk of the different business areas by following the Operational Risk Management process and using the following key operational risk management tools:
| | | | |
KEY TOOLS | | DESCRIPTION |
• Scenario Analysis | | Santander UK performs simulations of control failures that may cause the most extreme loss events. Simulations are developed around high impact risks likely to exceed Santander UK’s future appetite. The analysis allows management to better understand the potential impacts and remediate issues by: |
| | |
| | • | | identifying the high impact events that would cause most damage to Santander UK, both from a financial and reputational perspective; |
| | |
| | • | | ensuring that the business is focused on its most critical risks; and |
| | |
| | • | | facilitating the assessment of capital adequacy. |
| |
• Risk and Control Self Assessments | | Business units identify and assess their operational risks to ensure they are being effectively managed and controlled, and actions prioritised and aligned to Santander UK’s risk appetite. |
| |
• Key Risk Indicators | | Key Risk Indicator performance is monitored against tolerances and trigger points that prompt an early warning to potential exposures, whilst the creation of mitigation strategies help address potential concerns. Indicator metrics are used to provide insight into the changing risk profile of the organisation and are also used to assess the performance of key controls. |
| |
• Loss Data Management | | Loss data capture and analysis processes exist to capture all operational risk loss events. The data is used to identify and correct control weaknesses using events as opportunities to prevent or reduce the impacts of recurrence, identify emerging themes, inform risk and control assessments, scenario analysis and risk reporting. Escalation of single or aggregated events to senior management and appropriate committees is determined by threshold breaches. |
| |
• Reporting | | Reporting forms an integral part of operational risk management ensuring that issues are identified, escalated and managed on a timely basis. Exposures for each business area are reported through monthly risk and control reports which include details on risk exposures and mitigating plans. Events that have a material impact on Santander UK’s finances, reputation, or customers are prioritised and reported immediately to key executives. |
| | |
| 80 | | Abbey National Treasury Services plc 2012 Annual Report |
Business Review
Risk Management Reportcontinued
During 2012, ANTS continued to manage its key operational risks in the interest of all its stakeholders, responding to critical developments both within ANTS and in the environment in which it operates. Risk and any required changes to management controls are reported through the Risk Committee governance structure.
| | |
KEY RISKS | | DESCRIPTION |
• Operations and Technology Risk | | ANTS continues to invest in electronic information systems to protect customer, employee and other information to effectively manage the evolving risks associated with the loss of confidentiality, integrity and of availability of this information. Appropriate security is applied to protect all customer, employee and other data. Measures taken to reduce the risks include staff education, IT and data access controls and data integrity controls. |
| |
• Fraud Risk | | ANTS has continued to invest in staff education and improved fraud detection and prevention systems, in order to counter the increasing threat of financial crime. A suite of controls is in place to prevent and detect trading and position taking that is unauthorised or fraudulent. These controls are reviewed and enhanced as part of a programme of continual development. |
| |
• Supplier Risk | | Supplier risk is the risk of reductions in earnings and/or value, through financial or reputational loss associated with the failure of a service or goods provision by a third party organisation. Santander UK has arrangements with both Banco Santander group companies (including the provision of IT infrastructure, software development and banking operations) and external outsourced service providers. A comprehensive supplier risk management and control framework applies to the management of all suppliers contracted by Santander UK to provide services or goods. Santander UK uses written service level agreements with these entities that include key service performance metrics to support this governance. The high-level governance processes include relationship management, service delivery management and contract management. Across these, there are a number of more detailed processes. Santander UK works closely, and continues to enhance its interaction with outsourced service providers via the application of appropriate risk frameworks. These frameworks include processes and procedures designed to ensure continuity of critical services up to and including disaster scenarios and that these plans are regularly validated through testing. |
REGULATORY RISK(unaudited)
Regulatory risk is the risk of reductions in earnings and/or value, through financial or reputational loss, from failing to comply with applicable codes and regulatory rules.
ANTS seeks to ensure it fully meets all of its regulatory obligations. There are a number of legislative and regulatory developments both in the UK and abroad, going through a consultation and implementation process, which may have some effect on ANTS’s approach to regulatory risk. Details of the changes expected to have the greatest impact on the ANTS group’s operations are set out in the Supervision and Regulation section of the Directors’ Report on page 104.
There has been continued regulatory change following the financial crisis and the regulatory landscape continues to evolve. ANTS maintains a proactive approach to regulation and aims to provide constructive feedback on policy consultations and engage across the banking sector. ANTS takes compliance with regulatory requirements seriously and manages its arrangements accordingly.
| | |
Abbey National Treasury Services plc 2012 Annual Report | | 81 |
Business Review
Risk Management Reportcontinued
CONDUCT RISK(unaudited)
Conduct risk is the risk that the business and operational decisions ANTS takes and the behaviours displayed lead to poor outcomes for our customers. This is a key risk to ANTS in view of the evolving regulatory environment.
The ANTS group engages in discussion, and co-operates, with the FSA in its supervision of the ANTS group, including reviews exercised under statutory powers, regarding its interaction with past and present customers, both as part of the FSA’s general thematic work and in relation to specific products and services. The position is monitored with particular reference to those reviews currently in progress where it is not yet possible to reliably determine their outcome.
| | |
MANAGEMENT’S APPROACH TO CONDUCT RISK |
• | | ANTS takes a robust approach to managing conduct risk in accordance with the risk framework. |
| |
• | | ANTS has noted the significant change in the regulatory environment in recent years. Furthermore, with the transition from the FSA to the Financial Conduct Authority there is a further increase in the attention of the regulators on conduct risk to ensure firms demonstrate that they are providing appropriate outcomes for customers. Specific focus is being seen on how firms evidence that they actually deliver the right outcomes for customers and that this is in line with expectations, moving away from a focus on processes and procedures. |
| |
• | | In line with all other banks, the Santander UK group (including ANTS) initiated a series of activities to enhance the management of its conduct risks, which culminated in the Conduct Risk Programme. This has focused on the development of four key elements: Risk Policy, Products, Governance and Reporting and Culture. Changes have been made to specific business processes, as well as to the way the business considers, manages and reports conduct risks. In particular, all new products have to be approved by the Product Approval and Oversight Committee which seeks to ensure that new products are appropriately designed. |
| |
• | | ANTS will continue to place significant attention and resource on seeking to ensure that customers receive the right outcome in every instance and that the necessary controls are in place to mitigate the associated risks, and this has been embodied in ANTS’s approach. |
STRATEGIC RISK(unaudited)
Strategic Risk is the risk of material deviations in expected/target shareholder value as a result of poor definition or implementation of Santander UK’s strategy.
ANTS takes a robust approach to managing strategic risk in full alignment with the Strategic Risk framework. In setting the business’s strategy, risk policies are taken into consideration at all times and the strategy is stress tested against risk appetite statements. Both the strategy and Risk Appetite are approved by the Santander UK Board.
Strategic risk is managed on a monthly basis through the risk governance structure including the Strategic Risk and Financial Management Committee and the Board. Management assessment takes into consideration any relevant information across the whole business which may highlight either risks to the implementation of the bank’s strategy or where risks are being created due to poor definition of the strategy in order to inform the Executive Committee and Board of what further actions may be required.
REPUTATIONAL RISK(unaudited)
ANTS rigorously manages risks that may affect ANTS’s reputation and which may in turn impact upon its ability to achieve its strategic objectives. Reputational considerations are built into all the key risk and issue assessment tools.
| | |
| 82 | | Abbey National Treasury Services plc 2012 Annual Report |
Business Review
Risk Management Report continued
HUMAN RESOURCES RISK(unaudited)
Human Resources (‘HR’) risk is defined in Santander UK as the risk of not having the sufficient number and quality of people to deliver Santander UK’s strategy, whilst complying with legislative requirements. In managing HR risk, Santander UK has established a set of policies which outline our minimum standards in relation to the management of people issues. In 2012:
| | • | | Executive remuneration - As in previous years, pay levels and bonuses have continued to be a significant issue for the financial services sector and ANTS has ensured that all policies, processes, governance and practices are compliant with the FSA Remuneration Code. |
| | • | | Succession Plans - Santander UK continues to have in place robust succession plans for Executive Committee members and their staff who report directly to them. |
In addition, in 2012, Santander UK made significant improvements to its management of HR Risk. In particular, Santander UK developed and implemented a HR Risk Framework in accordance with Santander UK’s risk framework approach. This in turn has further strengthened the controls and monitoring mechanisms.
ACCOUNTING AND REPORTING RISK(unaudited)
Accounting and reporting risk is defined as the failure to comply with regulatory and legal requirements for accounting and reporting of financial disclosures, which may lead to fines and/or restrictions and/or reputational damage.
In order to facilitate the identification, measurement, monitoring and reporting of accounting and reporting risks, a comprehensive business-wide framework of controls has been established, supported by a programme of regular assessment and reporting designed to identify and remedy any deficiencies in process or practice. This includes the systems and controls developed to support management’s attestation on the effectiveness of disclosure controls and controls over financial reporting.
LEGAL RISK(unaudited)
ANTS takes a robust approach to managing legal risk in full alignment with the Legal Risk Framework. This framework has been developed through Santander UK’s overall Risk Framework and Operational Risk Framework, which include the core principles of risk management and control activities.
The Legal Risk Framework defines the overriding principles and responsibilities for the identification, management, measurement, monitoring, control, reporting and oversight of legal risk. It is the operation of, and outputs from, these risk management activities that enables ANTS to manage legal risk exposures within the tolerances outlined in the Santander UK Risk Appetite, Limits and Triggers Statement. It is expected that all Business Units will manage their team activities and processes to follow the principles and guidelines set out in the Legal Risk Framework, and with those detailed in the Santander UK Risk and Operational Risk Frameworks.
ANTS continues to monitor, assess and respond to developments concerning legal requirements intended to prevent future financial crises or otherwise assure the stability of financial institutions.
| | |
Abbey National Treasury Services plc 2012 Annual Report | | 83 |
Business Review
Risk Management Reportcontinued
CREDIT RISK – AREAS OF FOCUS AND OTHER ITEMS
Certain areas and/or specific views of credit risk deserve specialist attention, complementary to global risk management. These are described in the following section and consist of:
|
1. Country risk exposure; 2. Significant concentrations of credit risk; 3. Financial instruments of special interest; 4. Loans and advances; and 5. Impairment loss allowances on loans and advances. |
1. COUNTRY RISK EXPOSURE
The ANTS group manages its country risk exposure under its global limits framework. Within this framework, the ANTS group sets its individual risk appetite for each country, taking into account any factors that may influence the risk profile of each country, including political events, the macro-economic situation and the nature of the risk incurred. Exposures are actively managed if it is considered appropriate. Accordingly, and over recent years, the ANTS group has intensified its monitoring of exposures to sovereigns and counterparties in eurozone countries, and has proceeded to selectively divest assets directly or indirectly affected by events in those countries.Santander UK group and other Banco Santander group-related risk is considered separately.
The country risk tables below show the ANTS group’s exposures to central and local governments, government guaranteed counterparties, banks, other financial institutions, retail customers and corporate customers at 31 December 2012 and 2011. Total exposures consist of the total of balance sheet values and off-balance sheet values. Balance sheet values are calculated in accordance with IFRS (i.e. after the effect of netting agreements recognised in accordance with the requirements of IFRS, principally with respect to derivatives) except for credit provisions which have been added back. Off balance sheet values consist of undrawn facilities and letters of credit. The country of exposure has been assigned based on the counterparty’s country of incorporation except where the ANTS group is aware that a guarantee is in place, in which case the country of incorporation of the guarantor has been used. The exposures are presented by type of counterparty other than where the specific exposures have been guaranteed by a sovereign counterparty in which case they are presented within the “Government guaranteed” category.
Separate disclosure is presented individually for each country where the exposure exceeds £50m, and aggregated for exposures of less than £50m. Given the ongoing interest in eurozone economies, disclosures relating to those economies are presented first and highlighted separately.The tables exclude credit risk exposures to other Santander UK group companies and other Banco Santander group companies, which are presented separately on pages 89 to 91.
| | | | | | | | | | | | | | | | | | | | | | | | | | | | |
31 December 2012 | | Central and local
governments
£bn | | | Government
guaranteed
£bn | | | Banks(2)
£bn | | | Other financial
institutions
£bn | | | Retail
£bn | | | Corporate
£bn | | | Total(1)
£bn | |
Eurozone: | | | | | | | | | | | | | | | | | | | | | | | | | | | | |
Peripheral eurozone countries: | | | | | | | | | | | | | | | | | | | | | | | | | | | | |
Portugal | | | — | | | | — | | | | — | | | | — | | | | — | | | | 0.1 | | | | 0.1 | |
Ireland | | | — | | | | — | | | | — | | | | — | | | | — | | | | 0.1 | | | | 0.1 | |
Italy | | | — | | | | — | | | | 0.1 | | | | — | | | | — | | | | — | | | | 0.1 | |
Spain (excluding Santander) | | | — | | | | — | | | | — | | | | — | | | | — | | | | 0.1 | | | | 0.1 | |
Other eurozone countries: | | | | | | | | | | | | | | | | | | | | | | | | | | | | |
Germany | | | 1.3 | | | | — | | | | 3.5 | | | | — | | | | — | | | | 0.2 | | | | 5.0 | |
France | | | — | | | | — | | | | 2.1 | | | | — | | | | — | | | | 0.1 | | | | 2.2 | |
Netherlands | | | — | | | | — | | | | 0.2 | | | | 0.1 | | | | — | | | | 0.5 | | | | 0.8 | |
Luxembourg | | | — | | | | — | | | | — | | | | 0.1 | | | | — | | | | 0.5 | | | | 0.6 | |
Belgium | | | — | | | | — | | | | 0.4 | | | | — | | | | — | | | | — | | | | 0.4 | |
All other eurozone, each < £50m(3) | | | — | | | | — | | | | — | | | | — | | | | — | | | | — | | | | — | |
| | | | | | | | | | | | | | | | | | | | | | | | | | | | |
| | | 1.3 | | | | — | | | | 6.3 | | | | 0.2 | | | | — | | | | 1.6 | | | | 9.4 | |
| | | | | | | | | | | | | | | | | | | | | | | | | | | | |
All other countries: | | | | | | | | | | | | | | | | | | | | | | | | | | | | |
UK | | | 5.7 | | | | 0.4 | | | | 12.4 | | | | 11.7 | | | | — | | | | 17.5 | | | | 47.7 | |
US | | | 0.8 | | | | — | | | | 15.1 | | | | — | | | | — | | | | 0.1 | | | | 16.0 | |
Switzerland | | | 0.5 | | | | — | | | | 1.6 | | | | 0.5 | | | | — | | | | 0.2 | | | | 2.8 | |
Denmark | | | — | | | | — | | | | 2.3 | | | | — | | | | — | | | | — | | | | 2.3 | |
Japan | �� | | 1.2 | | | | — | | | | 0.2 | | | | — | | | | — | | | | 0.2 | | | | 1.6 | |
Canada | | | — | | | | — | | | | 0.3 | | | | — | | | | — | | | | — | | | | 0.3 | |
Australia | | | — | | | | — | | | | 0.1 | | | | — | | | | — | | | | 0.1 | | | | 0.2 | |
Norway | | | — | | | | — | | | | 0.1 | | | | — | | | | — | | | | 0.1 | | | | 0.2 | |
Lichtenstein | | | — | | | | — | | | | — | | | | — | | | | — | | | | 0.1 | | | | 0.1 | |
All others, each < £50m | | | — | | | | — | | | | 0.1 | | | | — | | | | — | | | | 0.4 | | | | 0.5 | |
| | | | | | | | | | | | | | | | | | | | | | | | | | | | |
| | | 8.2 | | | | 0.4 | | | | 32.2 | | | | 12.2 | | | | — | | | | 18.7 | | | | 71.7 | |
| | | | | | | | | | | | | | | | | | | | | | | | | | | | |
| (1) | Credit exposures exclude the macro hedge of interest rate risk, intangible assets, property, plant and equipment, current and deferred tax assets, and other assets. Loans and advances to customers are included gross of loan loss allowances. |
| (2) | Excludes balances with central banks. |
| (3) | Includes Greece of £3m and Cyprus of £nil. |
| | |
| 84 | | Abbey National Treasury Services plc 2012 Annual Report |
Business Review
Risk Management Reportcontinued
| | | | | | | | | | | | | | | | | | | | | | | | | | | | |
31 December 2011 | | Central and local
governments
£bn | | | Government
guaranteed
£bn | | | Banks(2)
£bn | | | Other financial
institutions
£bn | | | Retail
£bn | | | Corporate
£bn | | | Total(1)
£bn | |
Eurozone: | | | | | | | | | | | | | | | | | | | | | | | | | | | | |
Peripheral eurozone countries: | | | | | | | | | | | | | | | | | | | | | | | | | | | | |
Ireland | | | — | | | | — | | | | 0.1 | | | | — | | | | — | | | | 0.1 | | | | 0.2 | |
Italy | | | — | | | | — | | | | 0.1 | | | | — | | | | — | | | | — | | | | 0.1 | |
Portugal | | | — | | | | — | | | | — | | | | — | | | | — | | | | 0.1 | | | | 0.1 | |
Spain (excluding Santander) | | | — | | | | — | | | | — | | | | — | | | | — | | | | 0.1 | | | | 0.1 | |
Other eurozone countries: | | | | | | | | | | | | | | | | | | | | | | | | | | | | |
Germany | | | — | | | | 0.1 | | | | 3.1 | | | | — | | | | — | | | | 0.2 | | | | 3.4 | |
France | | | — | | | | 0.1 | | | | 1.4 | | | | 1.0 | | | | — | | | | 0.2 | | | | 2.7 | |
Netherlands | | | — | | | | — | | | | 0.1 | | | | 0.1 | | | | — | | | | 0.6 | | | | 0.8 | |
Luxembourg | | | — | | | | — | | | | — | | | | 0.4 | | | | — | | | | 0.3 | | | | 0.7 | |
Belgium | | | — | | | | — | | | | 0.1 | | | | — | | | | — | | | | — | | | | 0.1 | |
All other eurozone, each < £50m(3) | | | — | | | | — | | | | — | | | | — | | | | — | | | | — | | | | — | |
| | | | | | | | | | | | | | | | | | | | | | | | | | | | |
| | | — | | | | 0.2 | | | | 4.9 | | | | 1.5 | | | | — | | | | 1.6 | | | | 8.2 | |
| | | | | | | | | | | | | | | | | | | | | | | | | | | | |
All other countries: | | | | | | | | | | | | | | | | | | | | | | | | | | | | |
UK | | | 1.1 | | | | 5.2 | | | | 12.9 | | | | 5.6 | | | | — | | | | 23.7 | | | | 48.5 | |
US | | | 7.1 | | | | — | | | | 9.8 | | | | 1.1 | | | | — | | | | — | | | | 18.0 | |
Switzerland | | | 1.2 | | | | — | | | | 2.1 | | | | 0.4 | | | | — | | | | 0.3 | | | | 4.0 | |
Japan | | | 0.6 | | | | — | | | | — | | | | 0.4 | | | | — | | | | — | | | | 1.0 | |
Australia | | | — | | | | 0.1 | | | | 0.1 | | | | — | | | | — | | | | 0.1 | | | | 0.3 | |
Denmark | | | — | | | | 0.3 | | | | 0.3 | | | | — | | | | — | | | | — | | | | 0.6 | |
Canada | | | — | | | | — | | | | 0.4 | | | | — | | | | — | | | | — | | | | 0.4 | |
Lichtenstein | | | — | | | | — | | | | — | | | | — | | | | — | | | | 0.2 | | | | 0.2 | |
China | | | — | | | | — | | | | — | | | | — | | | | — | | | | 0.1 | | | | 0.1 | |
Jersey | | | — | | | | — | | | | — | | | | — | | | | — | | | | 0.1 | | | | 0.1 | |
Norway | | | — | | | | — | | | | 0.1 | | | | — | | | | — | | | | — | | | | 0.1 | |
All others, each < £50m | | | — | | | | — | | | | 0.1 | | | | — | | | | — | | | | 0.1 | | | | 0.2 | |
| | | | | | | | | | | | | | | | | | | | | | | | | | | | |
| | | 10.0 | | | | 5.6 | | | | 25.8 | | | | 7.5 | | | | — | | | | 24.6 | | | | 73.5 | |
| | | | | | | | | | | | | | | | | | | | | | | | | | | | |
| (1) | Credit exposures exclude the macro hedge of interest rate risk, intangible assets, property, plant and equipment, current and deferred tax assets, and other assets. Loans and advances to customers are included gross of loan loss allowances. |
| (2) | Excludes balances with central banks. |
| (3) | Includes Greece of £3m and Cyprus of £nil. |
31 December 2012 compared to 31 December 2011
Key changes in sovereign and other country risk exposures during the year ended 31 December 2012 were as follows:
| • | | A decrease of £2bn in exposure to the US to £16bn. This was primarily due to reduced deposits at the US Federal Reserve as deposits were placed at the Bank of England instead. This was partially offset by increased securities purchased under resale activity. |
| • | | A decrease of £1.2bn in exposure to Switzerland to £2.8bn. This was primarily due to reduced holdings of government securities as alternative securities were held. |
| • | | An increase of £1.7bn in exposure to Denmark to £2.3bn. This was primarily due to increased securities purchased under resale activity. |
| • | | An increase of £1.6bn in exposure to Germany to £5.0bn. This was primarily due to new holdings of government securities as part of the Santander UK group’s liquidity position. |
| • | | An increase of £0.6bn in exposure to Japan to £1.6bn. This was primarily due to new holdings of government securities as part of the Santander UK group’s liquidity position. |
| • | | Movements in remaining country risk exposures were minimal and exposures to these countries remained at low levels. |
| | |
Abbey National Treasury Services plc 2012 Annual Report | | 85 |
Business Review
Risk Management Reportcontinued
Further analysis of sovereign debt and other country risk exposures, including peripheral eurozone exposures
Presented below separately for sovereign debt and other country risk exposures is additional analysis of exposures into those that are accounted for on-balance sheet (further analysed into those measured at amortised cost and those measured at fair value) and those that are off-balance sheet.
The assets held at amortised cost are principally classified as loans to banks, loans to customers and loans and receivables securities. The ANTS group has no held-to-maturity securities.
The assets held at fair value are classified as either trading assets or have been designated as held at fair value through profit or loss, with the exception of UK, US, German, Swiss and Japanese Government debt held for liquidity purposes, which are classified as available-for-sale securities.
The ANTS group has made no reclassifications to/from the assets which are held at fair value from/to any other category.
Sovereign debt
| | | | | | | | | | | | | | | | | | | | | | | | | | | | | | | | | | | | |
| 31 December 2012 | | Assets held at Amortised Cost | | | Assets held at Fair Value | | | | | | | | | | |
| | | Central and
local
governments
£bn | | | Government
guaranteed
£bn | | | Total at
amortised
cost
£bn | | | Central and
local
governments(1)
£bn | | | Government
guaranteed
£bn | | | Total
at fair
value
£bn | | | Total on
Balance
Sheet
Asset
£bn | | | Commitments
and undrawn
facilities
£bn | | | Total(1)
£bn | |
Eurozone countries: | | | | | | | | | | | | | | | | | | | | | | | | | | | | | | | | | |
Germany | | | — | | | | — | | | | — | | | | 1.3 | | | | — | | | | 1.3 | | | | 1.3 | | | | — | | | | 1.3 | |
| | | | | | | | | | | | | | | | | | | | | | | | | | | | | | | | | | | | |
| | | — | | | | — | | | | — | | | | 1.3 | | | | — | | | | 1.3 | | | | 1.3 | | | | — | | | | 1.3 | |
| | | | | | | | | | | | | | | | | | | | | | | | | | | | | | | | | | | | |
All other countries: | | | | | | | | | | | | | | | | | | | | | | | | | | | | | | | | | | | | |
UK | | | 0.1 | | | | — | | | | 0.1 | | | | 5.6 | | | | 0.4 | | | | 6.0 | | | | 6.1 | | | | — | | | | 6.1 | |
Japan | | | — | | | | — | | | | — | | | | 1.2 | | | | — | | | | 1.2 | | | | 1.2 | | | | — | | | | 1.2 | |
US | | | 0.4 | | | | — | | | | 0.4 | | | | 0.4 | | | | — | | | | 0.4 | | | | 0.8 | | | | — | | | | 0.8 | |
Switzerland | | | — | | | | — | | | | — | | | | 0.5 | | | | — | | | | 0.5 | | | | 0.5 | | | | — | | | | 0.5 | |
| | | | | | | | | | | | | | | | | | | | | | | | | | | | | | | | | | | | |
| | | 0.5 | | | | — | | | | 0.5 | | | | 7.7 | | | | 0.4 | | | | 8.1 | | | | 8.6 | | | | — | | | | 8.6 | |
| | | | | | | | | | | | | | | | | | | | | | | | | | | | | | | | | | | | |
| (1) | There are no sovereign debt commitments and undrawn facilities. |
| | | | | | | | | | | | | | | | | | | | | | | | | | | | | | | | | | | | |
| 31 December 2011 | | Assets held at Amortised Cost | | | Assets held at Fair Value | | | | | | | | | | |
| | | Central and
local
governments(2)
£bn | | | Government
guaranteed
£bn | | | Total at
amortised
cost
£bn | | | Central and
local
governments(1)
£bn | | | Government
guaranteed
£bn | | | Total at
fair
value
£bn | | | Total on
Balance Sheet
Asset
£bn | | | Commitments
and undrawn
facilities
£bn | | | Total(1)
£bn | |
Eurozone countries: | | | | | | | | | | | | | | | | | | | | | | | | | | | | | | | | | |
France | | | — | | | | — | | | | — | | | | — | | | | 0.1 | | | | 0.1 | | | | 0.1 | | | | — | | | | 0.1 | |
Germany | | | — | | | | — | | | | — | | | | — | | | | 0.1 | | | | 0.1 | | | | 0.1 | | | | — | | | | 0.1 | |
| | | | | | | | | | | | | | | | | | | | | | | | | | | | | | | | | | | | |
| | | — | | | | — | | | | — | | | | — | | | | 0.2 | | | | 0.2 | | | | 0.2 | | | | — | | | | 0.2 | |
| | | | | | | | | | | | | | | | | | | | | | | | | | | | | | | | | | | | |
All other countries: | | | | | | | | | | | | | | | | | | | | | | | | | | | | | | | | | | | | |
US | | | 7.0 | | | | — | | | | 7.0 | | | | 0.1 | | | | — | | | | 0.1 | | | | 7.1 | | | | — | | | | 7.1 | |
UK | | | — | | | | — | | | | — | | | | 1.1 | | | | 5.2 | | | | 6.3 | | | | 6.3 | | | | — | | | | 6.3 | |
Switzerland | | | — | | | | — | | | | — | | | | 1.2 | | | | — | | | | 1.2 | | | | 1.2 | | | | — | | | | 1.2 | |
Japan | | | — | | | | — | | | | — | | | | 0.6 | | | | — | | | | 0.6 | | | | 0.6 | | | | — | | | | 0.6 | |
Denmark | | | — | | | | — | | | | — | | | | — | | | | 0.3 | | | | 0.3 | | | | 0.3 | | | | — | | | | 0.3 | |
Australia | | | — | | | | — | | | | — | | | | — | | | | 0.1 | | | | 0.1 | | | | 0.1 | | | | — | | | | 0.1 | |
| | | | | | | | | | | | | | | | | | | | | | | | | | | | | | | | | | | | |
| | | 7.0 | | | | — | | | | 7.0 | | | | 3.0 | | | | 5.6 | | | | 8.6 | | | | 15.6 | | | | — | | | | 15.6 | |
| | | | | | | | | | | | | | | | | | | | | | | | | | | | | | | | | | | | |
| (1) | There are no sovereign debt commitments and undrawn facilities. |
| (2) | Excludes the exposure on margin given with respect to the Bank of England’s Special Liquidity Scheme. |
The ANTS group has no direct sovereign exposures to any other countries. The ANTS group has not recognised any impairment losses against sovereign debt which is held at amortised cost, as this sovereign debt was all issued by the UK Government, US Government and governments of other OECD countries with strong credit ratings. The ANTS group has no exposures to credit default swaps (either written or purchased) which are directly referenced to sovereign debt or other instruments that are directly referenced to sovereign debt.
| | |
| 86 | | Abbey National Treasury Services plc 2012 Annual Report |
Business Review
Risk Management Report continued
Other country risk exposures(1)
| | | | | | | | | | | | | | | | | | | | | | | | | | | | | | | | | | | | | | | | | | | | | | | | | | | | |
31 December 2012 | | Assets held at Amortised Cost | | | Assets held at Fair Value(2) | | | | | | | | | | |
| | | Banks
£bn | | | Other
financial
institutions
£bn | | | Retail
£bn | | | Corporate
£bn | | | Total
£bn | | | Banks
£bn | | | Other
financial
institutions
£bn | | | Retail
£bn | | | Corporate
£bn | | | Total
£bn | | | Total on
Balance
Sheet Asset
£bn | | | Commitments
and undrawn
facilities
£bn(3) | | | Total
£bn | |
Eurozone: | | | | | | | | | | | | | | | | | | | | | | | | | | | | | | | | | | | | | | | | | | | | | | | | | | | | |
Peripheral eurozone countries: | | | | | | | | | | | | | | | | | | | | | | | | | | | | | | | | | | | | | | | | | | | | | | | | | | | | |
Spain | | | — | | | | — | | | | — | | | | 0.1 | | | | 0.1 | | | | — | | | | — | | | | — | | | | — | | | | — | | | | 0.1 | | | | — | | | | 0.1 | |
Ireland | | | — | | | | — | | | | — | | | | — | | | | — | | | | — | | | | — | | | | — | | | | — | | | | — | | | | — | | | | 0.1 | | | | 0.1 | |
Italy | | | — | | | | — | | | | — | | | | — | | | | — | | | | 0.1 | | | | — | | | | — | | | | — | | | | 0.1 | | | | 0.1 | | | | — | | | | 0.1 | |
Portugal | | | — | | | | — | | | | — | | | | 0.1 | | | | 0.1 | | | | — | | | | — | | | | — | | | | — | | | | — | | | | 0.1 | | | | — | | | | 0.1 | |
Other eurozone countries: | | | | | | | | | | | | | | | | | | | | | | | | | | | | | | | | | | | | | | | | | | | | | | | | | | | | |
Germany | | | — | | | | — | | | | — | | | | 0.2 | | | | 0.2 | | | | 3.5 | | | | — | | | | — | | | | — | | | | 3.5 | | | | 3.7 | | | | — | | | | 3.7 | |
France | | | — | | | | — | | | | — | | | | — | | | | — | | | | 2.1 | | | | — | | | | — | | | | 0.1 | | | | 2.2 | | | | 2.2 | | | | — | | | | 2.2 | |
Netherlands | | | — | | | | 0.1 | | | | — | | | | — | | | | 0.1 | | | | 0.2 | | | | — | | | | — | | | | — | | | | 0.2 | | | | 0.3 | | | | 0.5 | | | | 0.8 | |
Luxembourg | | | — | | | | 0.1 | | | | — | | | | 0.4 | | | | 0.5 | | | | — | | | | — | | | | — | | | | — | | | | — | | | | 0.5 | | | | 0.1 | | | | 0.6 | |
Belgium | | | — | | | | — | | | | — | | | | — | | | | — | | | | 0.4 | | | | — | | | | — | | | | — | | | | 0.4 | | | | 0.4 | | | | — | | | | 0.4 | |
Other<£50m | | | — | | | | — | | | | — | | | | — | | | | — | | | | — | | | | — | | | | — | | | | — | | | | — | | | | — | | | | — | | | | — | |
| | | | | | | | | | | | | | | | | | | | | | | | | | | | | | | | | | | | | | | | | | | | | | | | | | | | |
| | | — | | | | 0.2 | | | | — | | | | 0.8 | | | | 1.0 | | | | 6.3 | | | | — | | | | — | | | | 0.1 | | | | 6.4 | | | | 7.4 | | | | 0.7 | | | | 8.1 | |
| | | | | | | | | | | | | | | | | | | | | | | | | | | | | | | | | | | | | | | | | | | | | | | | | | | | |
All other countries: | | | | | | | | | | | | | | | | | | | | | | | | | | | | | | | | | | | | | | | | | | | | | | | | | | | | |
UK | | | — | | | | 4.7 | | | | — | | | | 6.4 | | | | 11.1 | | | | 12.1 | | | | 7.0 | | | | — | | | | 3.0 | | | | 22.1 | | | | 33.2 | | | | 8.4 | | | | 41.6 | |
US | | | 1.3 | | | | — | | | | — | | | | — | | | | 1.3 | | | | 13.8 | | | | — | | | | — | | | | 0.1 | | | | 13.9 | | | | 15.2 | | | | — | | | | 15.2 | |
Switzerland | | | — | | | | — | | | | — | | | | 0.1 | | | | 0.1 | | | | 1.6 | | | | 0.5 | | | | — | | | | — | | | | 2.1 | | | | 2.2 | | | | 0.1 | | | | 2.3 | |
Denmark | | | — | | | | — | | | | — | | | | — | | | | — | | | | 2.3 | | | | — | | | | — | | | | — | | | | 2.3 | | | | 2.3 | | | | — | | | | 2.3 | |
Japan | | | — | | | | — | | | | — | | | | — | | | | — | | | | 0.2 | | | | — | | | | — | | | | 0.2 | | | | 0.4 | | | | 0.4 | | | | — | | | | 0.4 | |
Australia | | | — | | | | — | | | | — | | | | — | | | | — | | | | 0.1 | | | | — | | | | — | | | | — | | | | 0.1 | | | | 0.1 | | | | 0.1 | | | | 0.2 | |
Canada | | | — | | | | — | | | | — | | | | — | | | | — | | | | 0.3 | | | | — | | | | — | | | | — | | | | 0.3 | | | | 0.3 | | | | — | | | | 0.3 | |
Lichtenstein | | | — | | | | — | | | | — | | | | 0.1 | | | | 0.1 | | | | — | | | | — | | | | — | | | | — | | | | — | | | | 0.1 | | | | — | | | | 0.1 | |
Norway | | | — | | | | — | | | | — | | | | — | | | | — | | | | 0.1 | | | | — | | | | — | | | | — | | | | 0.1 | | | | 0.1 | | | | 0.1 | | | | 0.2 | |
Other<£50m | | | — | | | | — | | | | — | | | | 0.3 | | | | 0.3 | | | | — | | | | — | | | | — | | | | — | | | | — | | | | 0.3 | | | | 0.2 | | | | 0.5 | |
| | | | | | | | | | | | | | | | | | | | | | | | | | | | | | | | | | | | | | | | | | | | | | | | | | | | |
| | | 1.3 | | | | 4.7 | | | | — | | | | 6.9 | | | | 12.9 | | | | 30.5 | | | | 7.5 | | | | — | | | | 3.3 | | | | 41.3 | | | | 54.2 | | | | 8.9 | | | | 63.1 | |
| | | | | | | | | | | | | | | | | | | | | | | | | | | | | | | | | | | | | | | | | | | | | | | | | | | | |
| (1) | Excluding other Banco Santander group companies. |
| (2) | The assets held at fair value were classified as either trading assets or designated as held at fair value through profit or loss. The ANTS group did not hold any significant available-for-sale securities, with the exception of government debt held for liquidity purposes, as described on the previous page. |
| (3) | Includes £8.5bn classified as Corporate and £0.4bn classified as Banks. |
| | | | | | | | | | | | | | | | | | | | | | | | | | | | | | | | | | | | | | | | | | | | | | | | | | | | |
31 December 2011 | | Assets held at Amortised Cost | | | Assets held at Fair Value(2) | | | | | | | | | | |
| | | Banks
£bn | | | Other
financial
institutions
£bn | | | Retail
£bn | | | Corporate
£bn | | | Total
£bn | | | Banks
£bn | | | Other
financial
institutions
£bn | | | Retail
£bn | | | Corporate
£bn | | | Total
£bn | | | Total on
Balance
Sheet Asset
£bn | | | Commitments
and undrawn
facilities
£bn(3 | | | Total
£bn | |
Eurozone: | | | | | | | | | | | | | | | | | | | | | | | | | | | | | | | | | | | | | | | | | | | | | | | | | | | | |
Peripheral eurozone countries: | | | | | | | | | | | | | | | | | | | | | | | | | | | | | | | | | | | | | | | | | | | | | | | | | | | | |
Spain | | | — | | | | — | | | | — | | | | 0.1 | | | | 0.1 | | | | — | | | | — | | | | — | | | | — | | | | — | | | | 0.1 | | | | — | | | | 0.1 | |
Ireland | | | — | | | | — | | | | — | | | | — | | | | — | | | | 0.1 | | | | — | | | | — | | | | — | | | | 0.1 | | | | 0.1 | | | | 0.1 | | | | 0.2 | |
Italy | | | — | | | | — | | | | — | | | | — | | | | — | | | | 0.1 | | | | — | | | | — | | | | — | | | | 0.1 | | | | 0.1 | | | | — | | | | 0.1 | |
Portugal | | | — | | | | — | | | | — | | | | 0.1 | | | | 0.1 | | | | — | | | | — | | | | — | | | | — | | | | — | | | | 0.1 | | | | — | | | | 0.1 | |
Other eurozone countries: | | | | | | | | | | | | | | | | | | | | | | | | | | | | | | | | | | | | | | | | | | | | | | | | | | | | |
Germany | | | — | | | | — | | | | — | | | | 0.1 | | | | 0.1 | | | | 3.1 | | | | — | | | | — | | | | 0.1 | | | | 3.2 | | | | 3.3 | | | | — | | | | 3.3 | |
France | | | — | | | | — | | | | — | | | | — | | | | — | | | | 1.4 | | | | 1.0 | | | | — | | | | — | | | | 2.4 | | | | 2.4 | | | | 0.2 | | | | 2.6 | |
Luxembourg | | | — | | | | 0.4 | | | | — | | | | 0.3 | | | | 0.7 | | | | — | | | | — | | | | — | | | | — | | | | — | | | | 0.7 | | | | — | | | | 0.7 | |
Netherlands | | | — | | | | 0.1 | | | | — | | | | — | | | | 0.1 | | | | 0.1 | | | | — | | | | — | | | | — | | | | 0.1 | | | | 0.2 | | | | 0.6 | | | | 0.8 | |
Belgium | | | — | | | | — | | | | — | | | | — | | | | — | | | | 0.1 | | | | — | | | | — | | | | — | | | | 0.1 | | | | 0.1 | | | | — | | | | 0.1 | |
Other < £50m | | | — | | | | — | | | | — | | | | — | | | | — | | | | — | | | | — | | | | — | | | | — | | | | — | | | | — | | | | — | | | | — | |
| | | | | | | | | | | | | | | | | | | | | | | | | | | | | | | | | | | | | | | | | | | | | | | | | | | | |
| | | — | | | | 0.5 | | | | — | | | | 0.6 | | | | 1.1 | | | | 4.9 | | | | 1.0 | | | | — | | | | 0.1 | | | | 6.0 | | | | 7.1 | | | | 0.9 | | | | 8.0 | |
| | | | | | | | | | | | | | | | | | | | | | | | | | | | | | | | | | | | | | | | | | | | | | | | | | | | |
All other countries: | | | | | | | | | | | | | | | | | | | | | | | | | | | | | | | | | | | | | | | | | | | | | | | | | | | | |
UK | | | 1.1 | | | | — | | | | — | | | | 9.9 | | | | 11 | | | | 11.8 | | | | 5.6 | | | | — | | | | 5.5 | | | | 22.9 | | | | 33.9 | | | | 8.3 | | | | 42.2 | |
US | | | — | | | | — | | | | — | | | | — | | | | — | | | | 9.8 | | | | 1.1 | | | | — | | | | — | | | | 10.9 | | | | 10.9 | | | | — | | | | 10.9 | |
Switzerland | | | — | | | | — | | | | — | | | | 0.1 | | | | 0.1 | | | | 2.1 | | | | 0.4 | | | | — | | | | — | | | | 2.5 | | | | 2.6 | | | | 0.2 | | | | 2.8 | |
Australia | | | — | | | | — | | | | — | | | | — | | | | — | | | | 0.1 | | | | — | | | | — | | | | — | | | | 0.1 | | | | 0.1 | | | | 0.1 | | | | 0.2 | |
Canada | | | — | | | | — | | | | — | | | | — | | | | — | | | | 0.4 | | | | — | | | | — | | | | — | | | | 0.4 | | | | 0.4 | | | | — | | | | 0.4 | |
Denmark | | | — | | | | — | | | | — | | | | — | | | | — | | | | 0.3 | | | | — | | | | — | | | | — | | | | 0.3 | | | | 0.3 | | | | — | | | | 0.3 | |
Japan | | | — | | | | — | | | | — | | | | — | | | | — | | | | — | | | | 0.4 | | | | — | | | | — | | | | 0.4 | | | | 0.4 | | | | — | | | | 0.4 | |
Lichtenstein | | | — | | | | — | | | | — | | | | 0.2 | | | | 0.2 | | | | — | | | | — | | | | — | | | | — | | | | — | | | | 0.2 | | | | — | | | | 0.2 | |
China | | | — | | | | — | | | | — | | | | 0.1 | | | | 0.1 | | | | — | | | | — | | | | — | | | | — | | | | — | | | | 0.1 | | | | — | | | | 0.1 | |
Jersey | | | — | | | | — | | | | — | | | | — | | | | — | | | | — | | | | — | | | | — | | | | — | | | | — | | | | — | | | | 0.1 | | | | 0.1 | |
Norway | | | — | | | | — | | | | — | | | | — | | | | — | | | | 0.1 | | | | — | | | | — | | | | — | | | | 0.1 | | | | 0.1 | | | | — | | | | 0.1 | |
Other < £50m | | | — | | | | — | | | | — | | | | — | | | | — | | | | 0.1 | | | | — | | | | — | | | | — | | | | 0.1 | | | | 0.1 | | | | 0.1 | | | | 0.2 | |
| | | | | | | | | | | | | | | | | | | | | | | | | | | | | | | | | | | | | | | | | | | | | | | | | | | | |
| | | 1.1 | | | | — | | | | — | | | | 10.3 | | | | 11.4 | | | | 24.7 | | | | 7.5 | | | | — | | | | 5.5 | | | | 37.7 | | | | 49.1 | | | | 8.8 | | | | 57.9 | |
| | | | | | | | | | | | | | | | | | | | | | | | | | | | | | | | | | | | | | | | | | | | | | | | | | | | |
| (1) | Excluding other Banco Santander group companies. |
| (2) | The assets held at fair value were classified as either trading assets or designated as held at fair value through profit or loss. The ANTS group did not hold any significant available-for-sale securities. |
| (3) | Consists of £8.8bn classified as Corporate. |
Commitments and undrawn facilities principally consist of formal standby facilities and credit lines in the ANTS group’s Corporate Banking operations. A summary of the key terms and a maturity analysis of formal standby facilities, credit lines and other commitments are set out in Note 35 to the Consolidated Financial Statements.
| | |
Abbey National Treasury Services plc 2012 Annual Report | | 87 |
Business Review
Risk Management Reportcontinued
Maturity analyses of loans and advances to banks and customers, which represent almost all of the ANTS group’s assets held at amortised cost (excluding cash and balances at central banks) by country are set out on pages 17 and 18.
Peripheral eurozone countries
The tables below further analyse the ANTS group’s direct exposure to peripheral eurozone countries at 31 December 2012 by type of financial instrument.The tables below exclude balances with other Santander UK group companies and other Banco Santander group companies, which are presented separately on pages 89 to 91.
(i) Portugal
| | | | | | | | | | | | | | | | | | | | |
31 December 2012 | | Banks
£bn | | | Other financial
institutions
£bn | | | Corporate
£bn | | | Retail
£bn | | | Total
£bn | |
Loans and advances to customers | | | — | | | | — | | | | 0.1 | | | | — | | | | 0.1 | |
| | | | | | | | | | | | | | | | | | | | |
| | | | | |
31 December 2011 | | Banks
£bn | | | Other financial
institutions
£bn | | | Corporate
£bn | | | Retail
£bn | | | Total
£bn | |
Loans and advances to customers | | | — | | | | — | | | | 0.1 | | | | — | | | | 0.1 | |
| | | | | | | | | | | | | | | | | | | | |
(ii) Ireland
| | | | | | | | | | | | | | | | | | | | |
31 December 2012 | | Banks
£bn | | | Other financial
institutions
£bn | | | Corporate
£bn | | | Retail
£bn | | | Total
£bn | |
Commitment and undrawn facilities | | | — | | | | — | | | | 0.1 | | | | — | | | | 0.1 | |
| | | | | | | | | | | | | | | | | | | | |
| | | | | |
31 December 2011 | | Banks
£bn | | | Other financial
institutions
£bn | | | Corporate
£bn | | | Retail
£bn | | | Total
£bn | |
Trading Assets | | | 0.1 | | | | — | | | | — | | | | — | | | | 0.1 | |
| | | | | | | | | | | | | | | | | | | | |
Commitment and undrawn facilities | | | — | | | | — | | | | 0.1 | | | | — | | | | 0.1 | |
| | | | | | | | | | | | | | | | | | | | |
| | | 0.1 | | | | — | | | | 0.1 | | | | — | | | | 0.2 | |
| | | | | | | | | | | | | | | | | | | | |
(iii) Italy
| | | | | | | | | | | | | | | | | | | | |
31 December 2012 | | Banks
£bn | | | Other financial
institutions
£bn | | | Corporate
£bn | | | Retail
£bn | | | Total
£bn | |
Derivatives | | | | | | | | | | | | | | | | | | | | |
- Derivative assets | | | 0.1 | | | | — | | | | — | | | | — | | | | 0.1 | |
- Derivative liabilities | | | (0.1 | ) | | | — | | | | — | | | | — | | | | (0.1 | ) |
| | | | | | | | | | | | | | | | | | | | |
Net derivatives position | | | — | | | | — | | | | — | | | | — | | | | — | |
| | | | | | | | | | | | | | | | | | | | |
| | | | | |
31 December 2011 | | Banks
£bn | | | Other financial
institutions
£bn | | | Corporate
£bn | | | Retail
£bn | | | Total
£bn | |
Derivatives | | | | | | | | | | | | | | | | | | | | |
- Derivative assets | | | 0.1 | | | | — | | | | — | | | | — | | | | 0.1 | |
| | | | | | | | | | | | | | | | | | | | |
Net derivatives position | | | 0.1 | | | | — | | | | — | | | | — | | | | 0.1 | |
| | | | | | | | | | | | | | | | | | | | |
(iv) Spain
| | | | | | | | | | | | | | | | | | | | |
31 December 2012 | | Banks
£bn | | | Other financial
institutions
£bn | | | Corporate
£bn | | | Retail
£bn | | | Total
£bn | |
Loans and advances to customers | | | — | | | | — | | | | 0.1 | | | | — | | | | 0.1 | |
| | | | | | | | | | | | | | | | | | | | |
| | | | | |
31 December 2011 | | Banks
£bn | | | Other financial
institutions
£bn | | | Corporate
£bn | | | Retail
£bn | | | Total
£bn | |
Loans and advances to customers | | | — | | | | — | | | | 0.1 | | | | — | | | | 0.1 | |
| | | | | | | | | | | | | | | | | | | | |
| | |
| 88 | | Abbey National Treasury Services plc 2012 Annual Report |
Business Review
Risk Management Report continued
Indirect exposures to peripheral eurozone countries
Indirect exposures to peripheral eurozone countries are considered to exist where our direct counterparties outside the peripheral eurozone countries themselves have a direct exposure to one or more peripheral eurozone countries.
Indirect exposures are identified as part of our ongoing credit analysis and monitoring of our counterparty base by the review of available financial information to determine the countries where the material parts of a counterparty’s assets, operations or profits arise.
Our indirect exposures to peripheral eurozone countries consist of:
| | • | | A small number of corporate loans to large multinational companies based in the UK that derive a proportion of their profits from one or more peripheral eurozone countries. |
| | • | | Trading transactions and hedging transactions with financial institutions based in the UK and Europe that derive a proportion of their profits from or have a proportion of their assets in one or more peripheral eurozone countries. |
| | • | | A small number of loans to other corporate entities which have either a proportion of their operations within, or profits from, one or more peripheral eurozone countries. |
Direct and indirect risk exposures via large multinational companies and financial institutions are monitored on a regular basis by the Wholesale Credit Risk Department as part of the overall risk management process. Indirect exposures via other corporates are monitored on a regular basis by the Corporate Credit Risk Department.
The large corporates portfolio is mainly comprised of multinational UK companies which are considered to be geographically well diversified in terms of their assets, operations and profits. This enables them to mitigate any country risk concentration that they may have in peripheral eurozone countries. In addition, the risk is further mitigated by the fact that credit agreements are underpinned by both financial and non-financial covenants.
The risk arising from indirect exposures from our transactions with financial institutions is mitigated by the short-term tenor of the transactions, and by the fact that many such transactions contain margin calls and/or collateral requirements, and are subject to standard ISDA Master Agreements permitting offsetting.
The risk arising from indirect exposures from our transactions with other corporates is mitigated by standard financial and non-financial guarantees and the fact that the companies are geographically well diversified in terms of their assets, operations and profits.
Balances with other Santander UK group companies
The ANTS group enters into transactions with other Santander UK group companies in the ordinary course of business. ANTS provides treasury, corporate and wholesale banking services to the wider Santander UK group, of which ANTS is a significant part. ANTS is also the treasury support function for the Santander UK group. In this regard, ANTS’s role is to provide access to financial markets and central bank facilities in order to meet the Santander UK group’s liquidity, funding, capital and balance sheet management requirements. As such, ANTS is one of the main debt issuance vehicles in the Santander UK group.
At 31 December 2012 and 31 December 2011, the ANTS group had gross balances (without taking account of netting, collateral or any other credit risk mitigants) with other Santander UK group companies as follows:
| | | | | | | | | | | | | | | | |
31 December 2012 | | Banks
£bn | | | Other financial institutions
£bn | | | Corporate
£bn | | | Total
£bn | |
Assets: | | | | | | | | | | | | | | | | |
- UK | | | 105.4 | | | | 32.6 | | | | — | | | | 138.0 | |
- Other < £50m | | | — | | | | — | | | | — | | | | — | |
| | | | | | | | | | | | | | | | |
| | | 105.4 | | | | 32.6 | | | | — | | | | 138.0 | |
| | | | | | | | | | | | | | | | |
Liabilities: | | | | | | | | | | | | | | | | |
- UK | | | (106.6 | ) | | | (2.9 | ) | | | — | | | | (109.5 | ) |
- Jersey | | | (3.9 | ) | | | — | | | | — | | | | (3.9 | ) |
- Isle of Man | | | (2.9 | ) | | | — | | | | — | | | | (2.9 | ) |
- Other < £50m | | | (0.1 | ) | | | — | | | | — | | | | (0.1 | ) |
| | | | | | | | | | | | | | | | |
| | | (113.5 | ) | | | (2.9 | ) | | | — | | | | (116.4 | ) |
| | | | | | | | | | | | | | | | |
| | | | |
31 December 2011 | | Banks
£bn | | | Other financial institutions
£bn | | | Corporate
£bn | | | Total
£bn | |
Assets: | | | | | | | | | | | | | | | | |
- UK | | | 110.0 | | | | 27.9 | | | | — | | | | 137.9 | |
- Other < £50m | | | — | | | | — | | | | — | | | | — | |
| | | | | | | | | | | | | | | | |
| | | 110.0 | | | | 27.9 | | | | — | | | | 137.9 | |
| | | | | | | | | | | | | | | | |
Liabilities: | | | | | | | | | | | | | | | | |
- UK | | | (102.2 | ) | | | (2.8 | ) | | | — | | | | (105.0 | ) |
- Jersey | | | (5.3 | ) | | | — | | | | — | | | | (5.3 | ) |
- Isle of Man | | | (3.6 | ) | | | — | | | | — | | | | (3.6 | ) |
| | | | | | | | | | | | | | | | |
| | | (111.1 | ) | | | (2.8 | ) | | | — | | | | (113.9 | ) |
| | | | | | | | | | | | | | | | |
| | |
Abbey National Treasury Services plc 2012 Annual Report | | 89 |
Business Review
Risk Management Reportcontinued
The above balances with other Santander UK group companies at 31 December 2012 principally arose from ANTS’s role as treasury support function for the Santander UK group. ANTS provides access to financial markets and central bank facilities in order to meet the Santander UK group’s liquidity, funding, capital and balance sheet management requirements.
The above activities are conducted in a manner that appropriately manages the credit risk arising against such other Santander UK group companies within limits acceptable to the FSA. The tables below further analyse the balances with other Santander UK group companies at 31 December 2012 and 2011 by type of financial instrument and country of the counterparty, including the additional mitigating impact of collateral arrangements (which are not included in the summary tables above, as they are accounted for off-balance sheet) and the resulting net credit exposures:
(i) UK
| | | | | | | | | | | | | | | | |
31 December 2012 | | Banks
£bn | | | Other financial institutions
£bn | | | Corporate
£bn | | | Total
£bn | |
Loans and advances | | | 104.8 | | | | 32.6 | | | | — | | | | 137.4 | |
| | | | | | | | | | | | | | | | |
Repurchase agreements | | | | | | | | | | | | | | | | |
- Asset balance - reverse repo | | | 0.6 | | | | — | | | | — | | | | 0.6 | |
| | | | | | | | | | | | | | | | |
- Net repo asset | | | 0.6 | | | | — | | | | — | | | | 0.6 | |
| | | | | | | | | | | | | | | | |
- Liability balance - repo | | | (1.0 | ) | | | — | | | | — | | | | (1.0 | ) |
| | | | | | | | | | | | | | | | |
- Net repo | | | (1.0 | ) | | | — | | | | — | | | | (1.0 | ) |
| | | | | | | | | | | | | | | | |
Net repurchase agreement position | | | (0.4 | ) | | | — | | | | — | | | | (0.4 | ) |
| | | | | | | | | | | | | | | | |
Derivatives | | | | | | | | | | | | | | | | |
- Derivative liabilities | | | (4.2 | ) | | | (1.2 | ) | | | — | | | | (5.4 | ) |
| | | | | | | | | | | | | | | | |
Net derivatives position | | | (4.2 | ) | | | (1.2 | ) | | | — | | | | (5.4 | ) |
| | | | | | | | | | | | | | | | |
Total assets, after the impact of collateral | | | 100.2 | | | | 31.4 | | | | — | | | | 131.6 | |
| | | | | | | | | | | | | | | | |
| | | | |
Deposits by customers | | | — | | | | (1.7 | ) | | | — | | | | (1.7 | ) |
Deposits by banks | | | (101.4 | ) | | | — | | | | — | | | | (101.4 | ) |
| | | | | | | | | | | | | | | | |
Total liabilities | | | (101.4 | ) | | | (1.7 | ) | | | — | | | | (103.1 | ) |
| | | | | | | | | | | | | | | | |
| | | | | | | | | | | | | | | | |
| | | | | | | | | | | | | | | | |
Net balance | | | (1.2 | ) | | | 29.7 | | | | — | | | | 28.5 | |
| | | | | | | | | | | | | | | | |
| | | | | | | | | | | | | | | | |
31 December 2011 | | Banks
£bn | | | Other financial institutions
£bn | | | Corporate
£bn | | | Total
£bn | |
Loans and advances | | | 106.8 | | | | 27.8 | | | | — | | | | 134.6 | |
| | | | | | | | | | | | | | | | |
Repurchase agreements | | | | | | | | | | | | | | | | |
- Asset balance - reverse repo | | | 3.2 | | | | — | | | | — | | | | 3.2 | |
| | | | | | | | | | | | | | | | |
Net repo asset | | | 3.2 | | | | — | | | | — | | | | 3.2 | |
| | | | | | | | | | | | | | | | |
Net repurchase agreement position | | | 3.2 | | | | — | | | | — | | | | 3.2 | |
| | | | | | | | | | | | | | | | |
Derivatives | | | | | | | | | | | | | | | | |
- Derivative liabilities | | | (5.4 | ) | | | (0.9 | ) | | | — | | | | (6.3 | ) |
| | | | | | | | | | | | | | | | |
Net derivatives position | | | (5.4 | ) | | | (0.9 | ) | | | — | | | | (6.3 | ) |
| | | | | | | | | | | | | | | | |
Floating rate notes | | | — | | | | 0.1 | | | | — | | | | 0.1 | |
| | | | | | | | | | | | | | | | |
Total assets, after the impact of collateral | | | 104.6 | | | | 27.0 | | | | — | | | | 131.6 | |
| | | | | | | | | | | | | | | | |
| | | | |
Deposits by customers | | | — | | | | (1.9 | ) | | | — | | | | (1.9 | ) |
Deposits by banks | | | (96.8 | ) | | | — | | | | — | | | | (96.8 | ) |
| | | | | | | | | | | | | | | | |
Total liabilities | | | (96.8 | ) | | | (1.9 | ) | | | — | | | | (98.7 | ) |
| | | | | | | | | | | | | | | | |
Net balance | | | 7.8 | | | | 25.1 | | | | — | | | | 32.9 | |
| | | | | | | | | | | | | | | | |
(ii) Jersey
| | | | | | | | | | | | | | | | |
31 December 2012 | | Banks
£bn | | | Other financial institutions
£bn | | | Corporate
£bn | | | Total
£bn | |
Deposits by banks | | | (3.9 | ) | | | — | | | | — | | | | (3.9 | ) |
| | | | |
31 December 2011 | | Banks
£bn | | | Other financial institutions
£bn | | | Corporate
£bn | | | Total
£bn | |
Deposits by banks | | | (5.3 | ) | | | — | | | | — | | | | (5.3 | ) |
(iii) Isle of Man
| | | | | | | | | | | | | | | | |
31 December 2012 | | Banks
£bn | | | Other financial institutions
£bn | | | Corporate
£bn | | | Total
£bn | |
Deposits by banks | | | (2.9 | ) | | | — | | | | — | | | | (2.9 | ) |
| | | | |
31 December 2011 | | Banks
£bn | | | Other financial institutions
£bn | | | Corporate
£bn | | | Total
£bn | |
Deposits by banks | | | (3.6 | ) | | | — | | | | — | | | | (3.6 | ) |
| | |
| 90 | | Abbey National Treasury Services plc 2012 Annual Report |
Business Review
Risk Management Report continued
Balances with other Banco Santander group companies outside the Santander UK group
The ANTS group enters into transactions with other Banco Santander group companies outside the Santander UK group in the ordinary course of business. Such transactions are undertaken in areas of business where the ANTS group has a particular advantage or expertise and where Banco Santander group companies can offer commercial opportunities, substantially on the same terms as for comparable transactions with third party counterparties. These transactions also arise in support of the activities of, or with, larger multinational corporate clients and financial institutions which may have relationships with a number of entities in the Banco Santander group. In early 2012, ANTS raised funding directly from certain members of the Banco Santander group through repo transactions and debt issuance to take advantage of the commercial opportunities available at the time, and in accordance with the subsidiary model set out on page 3. All such activities are conducted in a manner that manages the credit risk arising against such other Santander companies and within limits acceptable to the FSA. The repo balances have now been repaid, and the remaining debt issuances will mature or be repaid in 2013.
At 31 December 2012 and 2011, the ANTS group had gross balances (without taking account of netting, collateral or any other credit risk mitigants) with other Banco Santander group companies as follows:
| | | | | | | | | | | | | | | | |
31 December 2012 | | Banks
£bn | | | Other financial institutions
£bn | | | Corporate
£bn | | | Total
£bn | |
Assets: | | | | | | | | | | | | | | | | |
- Spain | | | 2.5 | | | | — | | | | — | | | | 2.5 | |
- Chile | | | 0.1 | | | | — | | | | — | | | | 0.1 | |
- Other < £50m | | | — | | | | 0.1 | | | | — | | | | 0.1 | |
| | | | | | | | | | | | | | | | |
| | | 2.6 | | | | 0.1 | | | | — | | | | 2.7 | |
| | | | | | | | | | | | | | | | |
Liabilities: | | | | | | | | | | | | | | | | |
- Spain | | | (4.3 | ) | | | (0.1 | ) | | | — | | | | (4.4 | ) |
- Italy | | | — | | | | (0.6 | ) | | | — | | | | (0.6 | ) |
- Ireland | | | — | | | | (0.2 | ) | | | — | | | | (0.2 | ) |
- Chile | | | (0.1 | ) | | | — | | | | — | | | | (0.1 | ) |
- Other < £50m | | | — | | | | — | | | | — | | | | — | |
| | | | | | | | | | | | | | | | |
| | | (4.4 | ) | | | (0.9 | ) | | | — | | | | (5.3 | ) |
| | | | | | | | | | | | | | | | |
| | | | |
31 December 2011 | | Banks
£bn | | | Other financial institutions
£bn | | | Corporate
£bn | | | Total
£bn | |
Assets: | | | | | | | | | | | | | | | | |
- Spain | | | 5.0 | | | | 0.1 | | | | — | | | | 5.1 | |
- Other < £50m | | | — | | | | — | | | | — | | | | — | |
| | | | | | | | | | | | | | | | |
| | | 5.0 | | | | 0.1 | | | | — | | | | 5.1 | |
| | | | | | | | | | | | | | | | |
Liabilities: | | | | | | | | | | | | | | | | |
- Spain | | | (5.3 | ) | | | (0.1 | ) | | | — | | | | (5.4 | ) |
- UK | | | — | | | | (0.2 | ) | | | — | | | | (0.2 | ) |
- Belgium | | | — | | | | (0.6 | ) | | | — | | | | (0.6 | ) |
- Ireland | | | — | | | | (0.2 | ) | | | — | | | | (0.2 | ) |
- Other < £50m | | | — | | | | — | | | | — | | | | — | |
| | | | | | | | | | | | | | | | |
| | | (5.3 | ) | | | (1.1 | ) | | | — | | | | (6.4 | ) |
| | | | | | | | | | | | | | | | |
The above activities are conducted in a manner that appropriately manages the credit risk arising against such other Banco Santander group companies within limits acceptable to the FSA.
Redenomination risk
ANTS considers the total dissolution of the eurozone to be extremely unlikely and therefore believes widespread redenomination of its euro-denominated assets and liabilities to be highly improbable. However, for contingency planning purposes it has analysed the redenomination risk that might arise from an exit of a member state from the euro or a total dissolution of the euro and how that exit or dissolution would be implemented. It is not possible to predict what the total financial impact on ANTS might be of a eurozone member state exit or the dissolution of the euro. The determination of which assets and liabilities would be legally redenominated is potentially complex and depends on a numbers of factors, including the precise exit scenario, as the consequences on external contracts of a disorderly exit or one sanctioned under EU law may be different. ANTS has already identified and is monitoring these risks and has taken steps to mitigate them and/or reduce ANTS’s overall exposure to losses that might arise in the event of a redenomination, which include reducing ANTS’s exposures and funding mismatches.
As part of its objective of maintaining a diversified funding base, ANTS raises funding in a number of currencies, including euro, and converts these back into sterling, to fund its commercial assets which are largely sterling denominated. ANTS’s net position denominated in euro, reflecting assets and liabilities and associated swaps (which primarily comprise cross-currency derivatives entered into to swap funding raised in euro back into sterling for reasons set out above) arising in connection with contracts denominated in euro, amounted to £0.1bn at 31 December 2012. This comprised debt securities (covered bonds) of £22.7bn issued by ANTS as part of its medium term funding activities, net loans and advances of £18.5bn to other Santander UK group companies (principally representing the on lending of these net funds to other Santander UK group companies), net repos of £1.3bn, other deposits of £0.7bn, other loans and securities of £2.2bn, and related cross-currency swaps of £4.1bn which swap the resultant euro exposures back into sterling in order to ensure that assets and liabilities are currency matched in sterling. Disclosures of ANTS’s exposure to individual eurozone countries and total exposures to counterparties in those countries, which amounts include any euro-denominated contracts with those counterparties, are set out on pages 84 to 91.
| | |
Abbey National Treasury Services plc 2012 Annual Report | | 91 |
Business Review
Risk Management Reportcontinued
2. SIGNIFICANT CONCENTRATIONS OF CREDIT RISK
The management of risk concentration is a key part of risk management. The ANTS group tracks the degree of concentration of its credit risk portfolios using various criteria, including geographic areas and countries, economic sectors, products and groups of customers.
During 2012, the ANTS group’s most significant exposures to credit risk derived from:
| | • | | secured lending and derivatives exposures to companies in Corporate Banking; |
| | • | | derivatives exposure to financial institutions in Markets; and |
| | • | | the non-core portfolios of social housing loans and structured credit assets in Corporate Centre. |
In Corporate Banking, the business consists of a relatively small number of high value balances where a problem with one customer may cause a relatively large impact. Details of the committed facilities exposure to these portfolios are set out in the “Corporate Banking – committed facilities”, “Markets - commitments” and “Corporate Centre - exposures” sections of the Risk Management Report.
Details of credit risk mitigation techniques employed by the ANTS group, including the holding of collateral, are set out in the “Corporate Banking - Credit Risk mitigation”, “Markets - Credit Risk mitigation” and “Corporate Centre - Credit Risk mitigation” sections of the Risk Management Report.
Although the operations of Corporate Banking, Markets and Corporate Centre are based mainly in the UK, they have built up exposures to various entities around the world and are therefore exposed to concentrations of risk related to geographic area. These are further analysed below:
| | | | | | | | | | | | | | | | | | | | | | | | | | | | | | | | |
| | | 2012 | | | 2011 | |
| | | | | | Markets | | | | | | | | | Markets | | | | |
Country | | Corporate
Banking
% | | | Non
derivatives
% | | | Derivatives
% | | | Corporate
Centre
% | | | Corporate
Banking
% | | | Non
derivatives
% | | | Derivatives
% | | | Corporate
Centre
% | |
UK | | | 79 | | | | 16 | | | | 35 | | | | 79 | | | | 85 | | | | 68 | | | | 23 | | | | 55 | |
Peripheral eurozone | | | 2 | | | | 10 | | | | 8 | | | | 1 | | | | — | | | | 6 | | | | 11 | | | | 3 | |
Rest of Europe | | | 10 | | | | 25 | | | | 30 | | | | 10 | | | | 10 | | | | 12 | | | | 30 | | | | 4 | |
US | | | 2 | | | | — | | | | 21 | | | | 8 | | | | 2 | | | | 14 | | | | 28 | | | | 38 | |
Other, including non-OECD | | | 7 | | | | 49 | | | | 6 | | | | 2 | | | | 3 | | | | — | | | | 8 | | | | — | |
| | | | | | | | | | | | | | | | | | | | | | | | | | | | | | | | |
| | | 100 | | | | 100 | | | | 100 | | | | 100 | | | | 100 | | | | 100 | | | | 100 | | | | 100 | |
| | | | | | | | | | | | | | | | | | | | | | | | | | | | | | | | |
Geographical exposures are governed by country limits set by Banco Santander, S.A. centrally and determined according to the classification of the country (whether it is a developed OECD country or not), the rating of the country, its gross domestic product and the type of business activities and products the Banco Santander, S.A. group wishes to engage in within that country. The ANTS group is constrained in its country risk exposure, within the Banco Santander, S.A. group limits, and by its capital base. Detailed disclosures of the ANTS group’s geographical exposures are set out in the preceding section “Country risk exposures”.
| | |
| 92 | | Abbey National Treasury Services plc 2012 Annual Report |
Business Review
Risk Management Report continued
3. FINANCIAL INSTRUMENTS OF SPECIAL INTEREST
This section summarises the types of financial instruments which have been of special interest as a result of the economic environment of the last few years. The table below shows the type of financial instrument and where they are classified on the ANTS group’s Consolidated Balance Sheet. It also provides cross references to the Notes to the Consolidated Financial Statements containing additional analysis of the significant assets.
The ANTS group’s financial instruments which are considered to have been most affected by the current credit environment include floating rate notes (‘FRNs’), asset-backed securities (‘ABS’) (including mortgage-backed securities (‘MBS’) and the ANTS group’s exposures to monoline insurers), loans to banks, certain credit derivatives in the Treasury asset portfolio, and off-balance sheet entities. The ANTS group has no investments in Collateralised Debt Obligations (‘CDOs’) or Collateralised Loan Obligations (‘CLOs’) and has no holdings in Structured Investment Vehicles.
For completeness, all the ANTS group’s loans to banks have been included in the following analysis, even though almost all of the ANTS group’s loans and advances to banks are transactions with other Santander UK group companies in the ordinary course of business, and there are no particular concerns about these transactions. ANTS provides treasury, corporate and wholesale banking services to the wider Santander UK group, of which ANTS is a significant part. ANTS is also the treasury support function for the Santander UK group. In this regard, ANTS’s role is to provide access to financial markets and central bank facilities in order to meet the Santander UK group’s liquidity, funding, capital and balance sheet management requirements.
The ANTS group aims to actively manage these exposures.
Classification in the Consolidated Balance Sheet
The classification of these assets in the ANTS group’s Consolidated Balance Sheet, and cross references to the Notes to the Consolidated Financial Statements containing additional analysis of the significant assets, is as follows:
| | | | | | | | | | | | | | | | | | | | | | | | | | |
| 2012 | | Type of Financial Instrument | | | Total | |
| | | Note | | FRNs | | | ABS | | | Loans | | | OECD Govt
debts | | | Others | | | | |
Balance sheet line item | | | | £m | | | £m | | | £m | | | £m | | | £m | | | £m | |
Trading assets - debt securities | | 14 | | | 564 | | | | — | | | | — | | | | 3,917 | | | | 13 | | | | 4,494 | |
Derivatives - equity & credit contracts | | 15 | | | — | | | | — | | | | — | | | | — | | | | 17 | | | | 17 | |
Financial assets designated at fair value - debt securities | | 16 | | | — | | | | 328 | | | | — | | | | — | | | | — | | | | 328 | |
Loans and advances to banks | | 17 | | | — | | | | — | | | | 106,986 | | | | — | | | | — | | | | 106,986 | |
Available for sale - debt securities | | 22 | | | — | | | | — | | | | — | | | | 5,113 | | | | — | | | | 5,113 | |
Loans and receivables securities | | 20 | | | — | | | | 162 | | | | — | | | | — | | | | — | | | | 162 | |
| | | | | | | | | | | | | | | | | | | | | | | | | | |
| | | | | 564 | | | | 490 | | | | 106,986 | | | | 9,030 | | | | 30 | | | | 117,100 | |
| | | | | | | | | | | | | | | | | | | | | | | | | | |
| | |
| 2011 | | Type of Financial Instrument | | | Total | |
| | | Note | | FRNs | | | ABS | | | Loans | | | OECD Govt
debts | | | Others | | | | |
Balance sheet line item | | | | £m | | | £m | | | £m | | | £m | | | £m | | | £m | |
Trading assets - debt securities | | 14 | | | 5,768 | | | | — | | | | — | | | | 2,943 | | | | — | | | | 8,711 | |
Derivatives - equity & credit contracts | | 15 | | | — | | | | — | | | | — | | | | — | | | | 16 | | | | 16 | |
Financial assets designated at fair value - debt securities | | 16 | | | — | | | | 379 | | | | — | | | | — | | | | — | | | | 379 | |
Loans and advances to banks | | 17 | | | — | | | | — | | | | 113,222 | | | | — | | | | — | | | | 113,222 | |
Loans and receivables securities | | 20 | | | — | | | | 278 | | | | — | | | | — | | | | — | | | | 278 | |
| | | | | | | | | | | | | | | | | | | | | | | | | | |
| | | | | 5,768 | | | | 657 | | | | 113,222 | | | | 2,943 | | | | 16 | | | | 122,606 | |
| | | | | | | | | | | | | | | | | | | | | | | | | | |
Exposure to off-balance sheet entities sponsored by the ANTS group
Certain Special Purpose Entities (‘SPE’s) are formed by the ANTS group to accomplish specific and well-defined objectives, such as securitising financial assets. The ANTS group consolidates these SPEs when the substance of the relationship indicates control, as described in Note 1 of the Consolidated Financial Statements. Details of SPEs sponsored by the ANTS group (including SPEs not consolidated by the ANTS group) are set out in Note 19 to the Consolidated Financial Statements.
The only SPEs sponsored but not consolidated by the ANTS group are SPEs which issue shares that back retail structured products. The ANTS group’s arrangements with these entities comprise the provision of equity derivatives and a secondary market-making service to those retail customers who wish to exit early from these products. Further information on these entities is set out in Note 19 to the Consolidated Financial Statements.
| | |
Abbey National Treasury Services plc 2012 Annual Report | | 93 |
Business Review
Risk Management Reportcontinued
4. LOANS AND ADVANCES
The following tables categorise the ANTS group’s loans and advances into three categories as:
| • | | neither past due nor impaired; |
| • | | past due but not individually impaired; or |
For certain homogeneous portfolios of loans and advances, impairment is assessed on a collective basis and each loan is not individually assessed for impairment. Loans in this category are classified as neither past due nor impaired, or past due but not individually impaired, depending upon their arrears status. The impairment loss allowances include allowances against financial assets that have been individually assessed for impairment and those that are subject to collective assessment for impairment.
| | | | | | | | | | | | | | | | | | | | | | | | |
2012 | | Group | |
| | Neither past
due nor
impaired | | | Past due but
not individually
impaired | | | Individually
impaired | | | Total | | | Impairment
loss
allowances | | | Total
carrying
value | |
Statutory balance sheet line items | | £m | | | £m | | | £m | | | £m | | | £m | | | £m | |
Trading assets | | | | | | | | | | | | | | | | | | | | | | | | |
- Loans and advances to banks | | | 9,988 | | | | — | | | | — | | | | 9,988 | | | | — | | | | 9,988 | |
- Loans and advances to customers | | | 7,552 | | | | — | | | | — | | | | 7,552 | | | | — | | | | 7,552 | |
Financial assets designated at fair value through profit and loss | | | | | | | | | | | | | | | | | | | | | | | | |
- Loans and advances to customers | | | 3,203 | | | | — | | | | — | | | | 3,203 | | | | — | | | | 3,203 | |
Loans and advances to banks | | | | | | | | | | | | | | | | | | | | | | | | |
- Placements with other banks | | | 1,290 | | | | — | | | | — | | | | 1,290 | | | | — | | | | 1,290 | |
- Amounts due from parent | | | 237 | | | | — | | | | — | | | | 237 | | | | — | | | | 237 | |
Loans and advances to customers | | | | | | | | | | | | | | | | | | | | | | | | |
- Corporate loans | | | 6,892 | | | | — | | | | 742 | | | | 7,634 | | | | (112 | ) | | | 7,522 | |
- Other secured advances | | | 4,855 | | | | — | | | | — | | | | 4,855 | | | | — | | | | 4,855 | |
- Amounts due from subsidiaries | | | 32,368 | | | | — | | | | — | | | | 32,368 | | | | — | | | | 32,368 | |
- Amounts due from Banco Santander group undertakings | | | 5 | | | | — | | | | — | | | | 5 | | | | — | | | | 5 | |
Loans and receivables securities | | | 162 | | | | — | | | | — | | | | 162 | | | | — | | | | 162 | |
| | | | | | | | | | | | | | | | | | | | | | | | |
Total loans and advances | | | 66,552 | | | | — | | | | 742 | | | | 67,294 | | | | (112 | ) | | | 67,182 | |
| | | | | | | | | | | | | | | | | | | | | | | | |
| |
| | | Company | |
2012 | | Neither past
due nor
impaired | | | Past due but
not individually
impaired | | | Individually
impaired | | | Total | | | Impairment
loss
allowances | | | Total
carrying
value | |
Statutory balance sheet line items | | £m | | | £m | | | £m | | | £m | | | £m | | | £m | |
Trading assets | | | | | | | | | | | | | | | | | | | | | | | | |
- Loans and advances to banks | | | 9,988 | | | | — | | | | — | | | | 9,988 | | | | — | | | | 9,988 | |
- Loans and advances to customers | | | 7,551 | | | | — | | | | — | | | | 7,551 | | | | — | | | | 7,551 | |
Financial assets designated at fair value through profit and loss | | | | | | | | | | | | | | | | | | | | | | | | |
- Loans and advances to customers | | | 3,203 | | | | — | | | | — | | | | 3,203 | | | | — | | | | 3,203 | |
Loans and advances to banks | | | | | | | | | | | | | | | | | | | | | | | | |
- Placements with other banks | | | 1,285 | | | | — | | | | — | | | | 1,285 | | | | — | | | | 1,285 | |
- Amounts due from parent | | | 237 | | | | — | | | | — | | | | 237 | | | | — | | | | 237 | |
Loans and advances to customers | | | | | | | | | | | | | | | | | | | | | | | | |
- Corporate loans | | | 6,892 | | | | — | | | | 742 | | | | 7,634 | | | | (112 | ) | | | 7,522 | |
- Other secured advances | | | 4,849 | | | | — | | | | — | | | | 4,849 | | | | — | | | | 4,849 | |
- Amounts due from subsidiaries | | | 32,482 | | | | — | | | | — | | | | 32,482 | | | | — | | | | 32,482 | |
- Amounts due from Banco Santander group undertakings | | | 5 | | | | — | | | | — | | | | 5 | | | | — | | | | 5 | |
Loans and receivables securities | | | 162 | | | | — | | | | — | | | | 162 | | | | — | | | | 162 | |
| | | | | | | | | | | | | | | | | | | | | | | | |
Total loans and advances | | | 66,654 | | | | — | | | | 742 | | | | 67,396 | | | | (112 | ) | | | 67,284 | |
| | | | | | | | | | | | | | | | | | | | | | | | |
| | |
| 94 | | Abbey National Treasury Services plc 2012 Annual Report |
Business Review
Risk Management Report continued
| | | | | | | | | | | | | | | | | | | | | | | | |
| | | Group | |
| | | | |
2011 | | Neither past
due nor
impaired | | | Past due but
not individually
impaired | | | Individually
impaired | | | Total | | | Impairment
loss
allowances | | | Total
carrying
value | |
Statutory balance sheet line items | | £m | | | £m | | | £m | | | £m | | | £m | | | £m | |
Trading assets | | | | | | | | | | | | | | | | | | | | | | | | |
- Loans and advances to banks | | | 6,144 | | | | — | | | | — | | | | 6,144 | | | | — | | | | 6,144 | |
- Loans and advances to customers | | | 6,687 | | | | — | | | | — | | | | 6,687 | | | | — | | | | 6,687 | |
Financial assets designated at fair value through profit and loss | | | | | | | | | | | | | | | | | | | | | | | | |
- Loans and advances to customers | | | 4,050 | | | | — | | | | — | | | | 4,050 | | | | — | | | | 4,050 | |
Loans and advances to banks | | | | | | | | | | | | | | | | | | | | | | | | |
- Placements with other banks | | | 1,136 | | | | — | | | | — | | | | 1,136 | | | | — | | | | 1,136 | |
- Amounts due from parent | | | 2,082 | | | | — | | | | — | | | | 2,082 | | | | — | | | | 2,082 | |
Loans and advances to customers | | | | | | | | | | | | | | | | | | | | | | | | |
- Corporate loans | | | 7,273 | | | | 95 | | | | 260 | | | | 7,628 | | | | (130 | ) | | | 7,498 | |
- Other secured advances | | | 3,492 | | | | — | | | | — | | | | 3,492 | | | | — | | | | 3,492 | |
- Amounts due from subsidiaries | | | 27,831 | | | | — | | | | — | | | | 27,831 | | | | — | | | | 27,831 | |
- Amounts due from Banco Santander group undertakings | | | 5 | | | | — | | | | — | | | | 5 | | | | — | | | | 5 | |
Loans and receivables securities | | | 278 | | | | — | | | | — | | | | 278 | | | | — | | | | 278 | |
| | | | | | | | | | | | | | | | | | | | | | | | |
Total loans and advances | | | 58,978 | | | | 95 | | | | 260 | | | | 59,333 | | | | (130 | ) | | | 59,203 | |
| | | | | | | | | | | | | | | | | | | | | | | | |
| |
| | | Company | |
| | | | |
2011 | | Neither past
due nor
impaired | | | Past due but
not individually
impaired | | | Individually
impaired | | | Total | | | Impairment
loss
allowances | | | Total
carrying
value | |
Statutory balance sheet line items | | £m | | | £m | | | £m | | | £m | | | £m | | | £m | |
Trading assets | | | | | | | | | | | | | | | | | | | | | | | | |
- Loans and advances to banks | | | 6,144 | | | | — | | | | — | | | | 6,144 | | | | — | | | | 6,144 | |
- Loans and advances to customers | | | 6,686 | | | | — | | | | — | | | | 6,686 | | | | — | | | | 6,686 | |
Financial assets designated at fair value through profit and loss | | | | | | | | | | | | | | | | | | | | | | | | |
- Loans and advances to customers | | | 4,050 | | | | — | | | | — | | | | 4,050 | | | | — | | | | 4,050 | |
Loans and advances to banks | | | | | | | | | | | | | | | | | | | | | | | | |
- Placements with other banks | | | 1,130 | | | | — | | | | — | | | | 1,130 | | | | — | | | | 1,130 | |
- Amounts due from parent | | | 2,081 | | | | — | | | | — | | | | 2,081 | | | | — | | | | 2,081 | |
Loans and advances to customers | | | | | | | | | | | | | | | | | | | | | | | | |
- Corporate loans | | | 7,273 | | | | 95 | | | | 260 | | | | 7,628 | | | | (130 | ) | | | 7,498 | |
- Other secured advances | | | 3,485 | | | | — | | | | — | | | | 3,485 | | | | — | | | | 3,485 | |
- Amounts due from subsidiaries | | | 27,938 | | | | — | | | | — | | | | 27,938 | | | | — | | | | 27,938 | |
- Amounts due from Banco Santander group undertakings | | | 5 | | | | — | | | | — | | | | 5 | | | | — | | | | 5 | |
Loans and receivables securities | | | 278 | | | | — | | | | — | | | | 278 | | | | — | | | | 278 | |
| | | | | | | | | | | | | | | | | | | | | | | | |
Total loans and advances | | | 59,070 | | | | 95 | | | | 260 | | | | 59,425 | | | | (130 | ) | | | 59,295 | |
| | | | | | | | | | | | | | | | | | | | | | | | |
Credit quality of loans and advances that are neither past due nor individually impaired
The credit quality of loans and advances that are neither past due nor individually impaired is as follows:
| | | | | | | | | | | | | | | | |
2012 | | Group | |
| | Good | | | Satisfactory | | | Higher Risk | | | Total | |
| | £m | | | £m | | | £m | | | £m | |
Trading assets | | | | | | | | | | | | | | | | |
- Loans and advances to banks | | | 9,781 | | | | 190 | | | | 17 | | | | 9,988 | |
- Loans and advances to customers | | | 7,552 | | | | — | | | | — | | | | 7,552 | |
Financial assets designated at fair value through profit and loss | | | | | | | | | | | | | | | | |
- Loans and advances to customers | | | 3,203 | | | | — | | | | — | | | | 3,203 | |
Loans and advances to banks | | | | | | | | | | | | | | | | |
- Placements with other banks | | | 1,290 | | | | — | | | | — | | | | 1,290 | |
- Amounts due from parent | | | 237 | | | | — | | | | — | | | | 237 | |
Loans and advances to customers | | | | | | | | | | | | | | | | |
- Corporate loans | | | 6,185 | | | | 701 | | | | 6 | | | | 6,892 | |
- Other secured advances | | | 4,855 | | | | — | | | | — | | | | 4,855 | |
- Amounts due from subsidiaries | | | 32,368 | | | | — | | | | — | | | | 32,368 | |
- Amounts due from Banco Santander group undertakings | | | 5 | | | | — | | | | — | | | | 5 | |
Loans and receivables securities | | | 162 | | | | — | | | | — | | | | 162 | |
| | | | | | | | | | | | | | | | |
Total loans and advances | | | 65,638 | | | | 891 | | | | 23 | | | | 66,552 | |
| | | | | | | | | | | | | | | | |
| | |
Abbey National Treasury Services plc 2012 Annual Report | | 95 |
Business Review
Risk Management Reportcontinued
| | | | | | | | | | | | | | | | |
| | | Company | |
| | | | |
2012 | | Good
£m | | | Satisfactory
£m | | | Higher Risk
£m | | | Total
£m | |
Trading assets | | | | | | | | | | | | | | | | |
- Loans and advances to banks | | | 9,988 | | | | — | | | | — | | | | 9,988 | |
- Loans and advances to customers | | | 7,551 | | | | — | | | | — | | | | 7,551 | |
Financial assets designated at fair value through profit and loss | | | | | | | | | | | | | | | | |
- Loans and advances to customers | | | 3,203 | | | | — | | | | — | | | | 3,203 | |
Loans and advances to banks | | | | | | | | | | | | | | | | |
- Placements with other banks | | | 1,285 | | | | — | | | | — | | | | 1,285 | |
- Amounts due from parent | | | 237 | | | | — | | | | — | | | | 237 | |
Loans and advances to customers | | | | | | | | | | | | | | | | |
- Corporate loans | | | 6,185 | | | | 701 | | | | 6 | | | | 6,892 | |
- Other secured advances | | | 4,849 | | | | — | | | | — | | | | 4,849 | |
- Amounts due from subsidiaries | | | 32,482 | | | | — | | | | — | | | | 32,482 | |
- Amounts due from Banco Santander group undertakings | | | 5 | | | | — | | | | — | | | | 5 | |
Loans and receivables securities | | | 162 | | | | — | | | | — | | | | 162 | |
| | | | | | | | | | | | | | | | |
Total loans and advances | | | 65,947 | | | | 701 | | | | 6 | | | | 66,654 | |
| | | | | | | | | | | | | | | | |
| |
| | | Group | |
| | | | |
2011 | | Good
£m | | | Satisfactory
£m | | | Higher Risk
£m | | | Total
£m | |
Trading assets | | | | | | | | | | | | | | | | |
- Loans and advances to banks | | | 5,647 | | | | 486 | | | | 11 | | | | 6,144 | |
- Loans and advances to customers | | | 6,678 | | | | 9 | | | | — | | | | 6,687 | |
Financial assets designated at fair value through profit and loss | | | | | | | | | | | | | | | | |
- Loans and advances to customers | | | 4,050 | | | | — | | | | — | | | | 4,050 | |
Loans and advances to banks | | | | | | | | | | | | | | | | |
- Placements with other banks | | | 1,136 | | | | — | | | | — | | | | 1,136 | |
- Amounts due from parent | | | 2,082 | | | | — | | | | — | | | | 2,082 | |
Loans and advances to customers | | | | | | | | | | | | | | | | |
- Corporate loans | | | 6,429 | | | | 802 | | | | 42 | | | | 7,273 | |
- Other secured advances | | | 3,492 | | | | — | | | | — | | | | 3,492 | |
- Amounts due from subsidiaries | | | 27,831 | | | | — | | | | — | | | | 27,831 | |
- Amounts due from Banco Santander group undertakings | | | 5 | | | | — | | | | — | | | | 5 | |
Loans and receivables securities | | | 278 | | | | — | | | | — | | | | 278 | |
| | | | | | | | | | | | | | | | |
Total loans and advances | | | 57,628 | | | | 1,297 | | | | 53 | | | | 58,978 | |
| | | | | | | | | | | | | | | | |
| |
| | | Company | |
| | | | |
2011 | | Good
£m | | | Satisfactory
£m | | | Higher Risk
£m | | | Total
£m | |
Trading assets | | | | | | | | | | | | | | | | |
- Loans and advances to banks | | | 5,647 | | | | 486 | | | | 11 | | | | 6,144 | |
- Loans and advances to customers | | | 6,677 | | | | 9 | | | | — | | | | 6,686 | |
Financial assets designated at fair value through profit and loss | | | | | | | | | | | | | | | | |
- Loans and advances to customers | | | 4,050 | | | | — | | | | — | | | | 4,050 | |
Loans and advances to banks | | | | | | | | | | | | | | | | |
- Placements with other banks | | | 1,130 | | | | — | | | | — | | | | 1,130 | |
- Amounts due from parent | | | 2,081 | | | | — | | | | — | | | | 2,081 | |
Loans and advances to customers | | | | | | | | | | | | | | | | |
- Corporate loans | | | 6,429 | | | | 802 | | | | 42 | | | | 7,273 | |
- Other secured advances | | | 3,485 | | | | — | | | | — | | | | 3,485 | |
- Amounts due from subsidiaries | | | 27,938 | | | | — | | | | — | | | | 27,938 | |
- Amounts due from Banco Santander group undertakings | | | 5 | | | | — | | | | — | | | | 5 | |
Loans and receivables securities | | | 278 | | | | — | | | | — | | | | 278 | |
| | | | | | | | | | | | | | | | |
Total loans and advances | | | 57,720 | | | | 1,297 | | | | 53 | | | | 59,070 | |
| | | | | | | | | | | | | | | | |
Internal measures of credit quality have been used in the table analysing credit quality above, as follows:
| | |
Financial statements description | | Probability of default |
Good | | 0.0 - 0.5% |
Satisfactory | | 0.5 - 12.5% |
Higher Risk | | 12.5%+ |
| | |
| 96 | | Abbey National Treasury Services plc 2012 Annual Report |
Business Review
Risk Management Report continued
Summarised descriptions of credit quality used in the financial statements relating to corporate lending are as follows:
| | |
RATING | | DESCRIPTION |
Good | | There is a very high likelihood that the asset will not default and will be recovered in full. The exposure has a negligible or low probability of default. Such exposure also exhibits a strong capacity to meet financial commitments and only exceptionally shows any period of delinquency. |
| |
Satisfactory | | There is a high likelihood that the asset will be recovered and is therefore of no cause for concern to Santander UK. The asset has low to moderate probability of default, strong recovery rates and may typically show only short periods of delinquency. Moderate to high application scores, credit bureau scores or behavioural scores characterise this credit quality. |
| |
Higher Risk | | All rated accounts that are not viewed as Good or Satisfactory are rated as Higher Risk. The assets are characterised by some concern over the obligor’s ability to make payments when due. There may also be doubts over the value of collateral or security provided. However, the borrower or counterparty is continuing to make payments when due i.e. the assets have not yet converted to actual delinquency and is expected to settle all outstanding amounts of principal and interest. |
Maturity analysis of loans and advances that are past due but not individually impaired
A maturity analysis of loans and advances that are past due but not individually impaired is set out below.
In the corporate loan portfolio, a loan or advance is considered past due when it is 90 days or more in arrears, and also when ANTS has reason to believe that full repayment of the loan is in doubt.
| | | | | | | | | | | | | | | | | | | | | | | | |
| | | Group | |
| | | | |
2011 | | Past due up
to 1 month
£m | | | Past due 1-2
months
£m | | | Past due 2-3
months
£m | | | Past due 3-6
months
£m | | | Past due 6
months and over
£m | | | Total
£m | |
Loans and advances to customers | | | | | | | | | | | | | | | | | | | | | | | | |
- Corporate loans | | | — | | | | — | | | | — | | | | 95 | | | | — | | | | 95 | |
| | | | | | | | | | | | | | | | | | | | | | | | |
Total loans and advances | | | — | | | | — | | | | — | | | | 95 | | | | — | | | | 95 | |
| | | | | | | | | | | | | | | | | | | | | | | | |
| | | | | | | | | | | | | | | | | | | | | | | | |
| | | Company | |
| | | | |
2011 | | Past due up
to 1 month
£m | | | Past due 1-2
months
£m | | | Past due 2-3
months
£m | | | Past due 3-6
months
£m | | | Past due 6
months and over
£m | | | Total
£m | |
Loans and advances to customers | | | | | | | | | | | | | | | | | | | | | | | | |
- Corporate loans | | | — | | | | — | | | | — | | | | 95 | | | | — | | | | 95 | |
| | | | | | | | | | | | | | | | | | | | | | | | |
Total loans and advances | | | — | | | | — | | | | — | | | | 95 | | | | — | | | | 95 | |
| | | | | | | | | | | | | | | | | | | | | | | | |
| | |
Abbey National Treasury Services plc 2012 Annual Report | | 97 |
Business Review
Risk Management Reportcontinued
5. IMPAIRMENT LOSS ALLOWANCES ON LOANS AND ADVANCES TO CUSTOMERS
IMPAIRMENT LOSS ALLOWANCES ON LOANS AND ADVANCES TO CUSTOMERS
The only impairment loss allowances arise in Corporate Banking. An analysis of the Corporate Banking impairment loss allowances on loans and advances to customers is presented below.
| | | | | | | | | | | | | | | | | | | | |
| | | 2012
£m | | | 2011
£m | | | 2010
£m | | | 2009
£m | | | 2008
£m | |
Observed impairment loss allowances | | | | | | | | | | | | | | | | | | | | |
Corporate loans - UK | | | 109 | | | | 97 | | | | 79 | | | | 63 | | | | 13 | |
| | | | | | | | | | | | | | | | | | | | |
Total observed impairment loss allowances | | | 109 | | | | 97 | | | | 79 | | | | 63 | | | | 13 | |
| | | | | | | | | | | | | | | | | | | | |
Incurred but not yet observed impairment loss allowances | | | | | | | | | | | | | | | | | | | | |
Corporate loans - UK | | | 3 | | | | 33 | | | | 29 | | | | 14 | | | | 13 | |
| | | | | | | | | | | | | | | | | | | | |
Total incurred but not yet observed impairment loss allowances | | | 3 | | | | 33 | | | | 29 | | | | 14 | | | | 13 | |
| | | | | | | | | | | | | | | | | | | | |
Total impairment loss allowances | | | 112 | | | | 130 | | | | 108 | | | | 77 | | | | 26 | |
| | | | | | | | | | | | | | | | | | | | |
Movements in impairment loss allowances on loans and advances
An analysis of movements in the Corporate Banking impairment loss allowances on loans and advances is presented below.
| | | | | | | | | | | | | | | | | | | | |
| | | 2012
£m | | | 2011
£m | | | 2010
£m | | | 2009
£m | | | 2008
£m | |
Impairment loss allowances at 1 January | | | 130 | | | | 108 | | | | 77 | | | | 26 | | | | — | |
Amounts written off: | | | | | | | | | | | | | | | | | | | | |
Corporate loans - UK | | | (27 | ) | | | (32 | ) | | | (49 | ) | | | — | | | | — | |
| | | | | | | | | | | | | | | | | | | | |
Total amounts written off | | | (27 | ) | | | (32 | ) | | | (49 | ) | | | — | | | | — | |
| | | | | | | | | | | | | | | | | | | | |
Observed impairment losses charged against profit: | | | | | | | | | | | | | | | | | | | | |
Corporate loans - UK | | | 40 | | | | 50 | | | | 65 | | | | 50 | | | | 13 | |
| | | | | | | | | | | | | | | | | | | | |
Total observed impairment losses charged against profit | | | 40 | | | | 50 | | | | 65 | | | | 50 | | | | 13 | |
| | | | | | | | | | | | | | | | | | | | |
Incurred but not yet observed impairment losses charged against/ (released into) profit | | | (31 | ) | | | 4 | | | | 15 | | | | 1 | | | | 13 | |
| | | | | | | | | | | | | | | | | | | | |
Total impairment losses charged against profit | | | 9 | | | | 54 | | | | 80 | | | | 51 | | | | 26 | |
| | | | | | | | | | | | | | | | | | | | |
Impairment loss allowances at 31 December | | | 112 | | | | 130 | | | | 108 | | | | 77 | | | | 26 | |
| | | | | | | | | | | | | | | | | | | | |
Recoveries
An analysis of Corporate Banking recoveries is presented below.
| | | | | | | | | | | | | | | | | | | | |
| | | 2012
£m | | | 2011
£m | | | 2010
£m | | | 2009
£m | | | 2008
£m | |
Corporate loans - UK | | | — | | | | — | | | | 11 | | | | 21 | | | | — | |
| | | | | | | | | | | | | | | | | | | | |
Total amount recovered | | | — | | | | — | | | | 11 | | | | 21 | | | | — | |
| | | | | | | | | | | | | | | | | | | | |
| | |
| 98 | | Abbey National Treasury Services plc 2012 Annual Report |
Governance
Directors
BOARD OF DIRECTORS
At 31 December 2012
EXECUTIVE DIRECTORS
Luis de Sousa
Chief Executive Officer
Luis de Sousa (age 45) is Chief Executive Officer of the Company and Head of Santander Global Banking & Markets, UK. He has been a Director of the Company since 11 May 2009. Luis joined the Banco Santander group in 2006, as Managing Director, European Cash Securitisation in Madrid. He became Managing Director and Treasurer for Santander Totta and Banco Santander de Negócios in Portugal in June 2007, before moving to the UK and his current position in January 2009. Prior to joining Santander he held various positions with Citibank based in Lisbon and Madrid.
Steve Pateman
Director
Steve Pateman (age 49) was appointed as an Executive Director of the Company on 3 June 2009. He is also an Executive Director of Santander UK plc and is Head of UK Banking with responsibility for Corporate Banking, Retail Banking and Retail Products and Marketing. Steve joined Santander UK plc in June 2008 as Head of UK Corporate and Commercial Banking and is an Executive Committee member. Previously he worked at National Westminster Bank plc and the Royal Bank of Scotland plc where he was Chief Executive Officer of Business Banking, Managing Director of Commercial Banking and Managing Director of Corporate Banking. Steve also worked on a variety of financings, restructurings, capital market and equity issues during his time in NatWest Markets where he specialised in the leisure and retail sectors.
David Green
Director
David Green (age 57) was appointed as an Executive Director of the Company on 28 February 2008. He is the Principal Financial Officer of the Company and is also Director of Financial Reporting and Accounting for Santander UK plc. Previously, David qualified as a Chartered Accountant with Touche Ross & Co (now Deloitte LLP) and then worked for First National Bank of Chicago, and Lloyds Bank before becoming Financial Controller and then Director of Finance and Operations for Guinness Mahon (1995-1998). David joined Abbey National plc (now Santander UK plc) in 1998 as Head of Financial Reporting.
APPOINTMENTS POST 31 DECEMBER 2012
Justo Gómez López
Director
Justo Gómez López (age 52) was appointed as an Executive Director of the Company on 7 March 2013. He is also a member of the Executive Committee of Santander UK plc. Justo joined Santander UK plc in January 2011 as Finance Director. He joined Banco Santander de Negocios, part of the Banco Santander, S.A. group, in January 1991 where he was responsible for Investor Relations and held the role of Deputy Chief Finance Officer. Prior to that, he held various positions in the financial industry, based in Madrid.
| | |
Abbey National Treasury Services plc 2012 Annual Report | | 99 |
Governance
Directors’ Report
INTRODUCTION
The Directors submit their report together with the financial statements for Abbey National Treasury Services plc (the ‘Company’) company number 2338548, and its subsidiaries (together ‘ANTS’ or the ‘ANTS group’) for the year ended 31 December 2012.
The purpose of this report is to provide information to the members of the Company and as such it is only addressed to those members. The report may contain certain forward-looking statements with respect to the operations, performance and financial conditions of the ANTS group. By their nature, these statements involve inherent risks and uncertainties since future events, circumstances and other factors can cause results and developments to differ materially from the plans, objectives, expectations and intentions expressed in such forward-looking statements. Members should consider this when relying on any forward-looking statements. The forward-looking statements reflect knowledge and information available at the date of preparation of this report and the Company undertakes no obligation to update any forward-looking statement during the year. Nothing in this report should be construed as a profit forecast.
CORPORATE STRUCTURE
The Company is a wholly-owned subsidiary of Santander UK plc. Note 23 to the Consolidated Financial Statements provides a list of the principal subsidiaries of the Company and the nature of each subsidiary’s business as well as details of overseas branches.
CORPORATE GOVERNANCE
The shares of the Company are not traded on the London Stock Exchange and as a result the Company is not subject to the disclosure requirements applicable to listed companies in the UK. This exemption applies, among other things, to corporate governance and certain Directors’ remuneration disclosures.
New York Stock Exchange (“NYSE”) Corporate Governance – differences in UK/NYSE corporate governance practice
Under the NYSE corporate governance listing standards the Company must disclose any significant ways in which its corporate governance practices differ from those followed by US companies under the NYSE listing standards. We believe the following to be the significant differences between our current practices and those applicable to US companies under the NYSE listing standards.
Under the NYSE listing standards, Independent directors must comprise a majority of the Board. As the Company does not have shares listed on the London Stock Exchange it is not required to, and does not, have Independent Directors. Our Board currently comprises four executive directors (including the Chief Executive Officer).
The NYSE listing standards require that US listed companies have a nominating or corporate governance committee composed entirely of Independent Directors and with a written charter addressing certain corporate governance matters. As the Company does not have equity shares listed on the London Stock Exchange it is not required to have a nominating committee and the Company does not have such a committee.
The NYSE listing standards require that US listed companies have a compensation committee composed entirely of Independent Directors and with a written charter addressing certain corporate governance matters. As the Company does not have shares listed on the London Stock Exchange, it is not required to have a compensation committee and does not have such a committee. However, the Company’s parent, Santander UK plc, has a Board Remuneration Oversight Committee established with effect from 1 January 2010. Under its written Terms of Reference, this committee is primarily responsible for overseeing and supervising the Santander UK group’s policies and frameworks covering remuneration and reward, which also includes those relating to the Company’s employees.
The NYSE listing standards require that US listed companies have an audit committee that satisfies the requirements of Rule 10A-3 under the US Exchange Act of 1934, as amended, with a written charter addressing certain corporate governance matters, and whose members are all independent. Pursuant to the Exchange Act Rule 10A-3(c)(2), which applies to direct and indirect subsidiaries of companies with common equity securities listed on a national security exchange that are subject to Rule 10A-3 the Company is exempt from these requirements. As the Company does not have shares listed on the London Stock Exchange, it is not required to have an Audit Committee and the Company does not have such a committee. The Company’s parent company, Santander UK plc, is also exempt from the requirements of Rule 10A-3 pursuant to the exemption provided by Rule 10A-3(c)(2). However, Santander UK plc does have a Board Audit Committee, composed of Independent Non-Executive Directors, the responsibilities of which cover all businesses and subsidiaries of the Santander UK group, including the Company. The scope of the Santander UK plc Board Audit Committee’s Terms of Reference as well as the duties and responsibilities of the committee are more limited than that required of audit committees under the NYSE listing standards. For example, the Santander UK plc Board Audit Committee does not provide an audit committee report as required by the NYSE listing standards to be included in the Company’s annual proxy statement.
A Chief Executive Officer of a US company listed on the NYSE must annually certify that he or she is not aware of any violation by the company of NYSE corporate government standards. In accordance with NYSE listing rules applicable to foreign private issuers, our Chief Executive Officer is not required to provide the NYSE with such an annual compliance certification.
| | |
| 100 | | Abbey National Treasury Services plc 2012 Annual Report |
Governance
Directors’ Reportcontinued
In addition, as a wholly-owned subsidiary of an NYSE-listed company, the Company is exempt from two NYSE listing standards otherwise applicable to foreign listed companies as well as US listed companies. The first requires the Chief Executive Officer of any NYSE-listed foreign company to notify promptly the NYSE in writing after any executive of the issuer becomes aware of any material non-compliance with any applicable NYSE corporate governance standards. The second requires NYSE-listed foreign companies to submit executed Written Affirmations annually to the NYSE.
PRINCIPAL ACTIVITIES AND BUSINESS REVIEW
The principal activity of the ANTS group is to provide treasury, corporate and wholesale banking services. ANTS provides these services to clients and also to the wider Santander UK group, of which ANTS is a significant part. ANTS is also the treasury support function for the Santander UK group. In this regard, ANTS’s role is to provide access to financial markets and central bank facilities in order to meet the Santander UK group’s liquidity, funding, capital and balance sheet management requirements. As such, ANTS is one of the main debt issuance vehicles in the Santander UK group.
The Company is required to set out in this report a fair review of the development and performance of the business of the ANTS group during the year ended 31 December 2012 and of the position of the ANTS group at the end of the year, as well as factors likely to affect its future development, performance and position. The information that fulfils this requirement can be found in the relevant sections of the Business Review referred to below, which are incorporated into and form part of this Directors’ Report. When reading the Business Review, reference should be made to the Forward-looking Statements section on page 214.
Information on the development and performance of the business of the ANTS group, both at a consolidated level and analysed by division can be found in the “Group Performance and Divisional Results” on pages 4 to 10.
Information on the position of the ANTS group at the end of the year can be found in the Balance Sheet Review on pages 11 to 27, including details of contractual obligations and off-balance sheet arrangements on page 24, and a review of funding and liquidity on page 25.
The Company is also required to describe the principal risks and uncertainties facing the ANTS group. Both financial and non-financial risks are described in the Risk Management Report by type of risk, with further analysis by segment on pages 28 to 98, and material risk factors are described in the Risk Factors section on pages 190 to 205.
RESULTS AND DIVIDENDS
The results of the ANTS group are discussed above. The Directors do not recommend the payment of a final dividend (2011: £nil) on the ordinary shares in issue.
EVENTS AFTER THE BALANCE SHEET DATE
None.
GOING CONCERN
The Directors confirm that they are satisfied that the ANTS group has adequate resources to continue in business for the foreseeable future. For this reason, they continue to adopt a going concern basis of accounting in preparing the financial statements.
As outlined above, the ANTS group’s business activities, together with the factors likely to affect its future development, performance and position are set out in the Business Review on pages 4 to 98. The financial position of the ANTS group, its cash flows, liquidity position and borrowing facilities are set out in the Balance Sheet Review on pages 11 to 27. In addition, Note 44 to the Consolidated Financial Statements includes the ANTS group’s objectives, policies and processes for managing its capital. As also outlined above, in respect of the principal risks and uncertainties facing the ANTS group, both financial and non-financial risks are described in the Risk Management Report on pages 28 to 98, and material risk factors are described in the Risk Factors section on pages 190 to 205.
The ANTS group is reliant on Santander UK plc and other companies in the Santander UK group for a significant proportion of its funding. The Santander UK Board has confirmed that Santander UK plc is a going concern, and that it will provide funding to the ANTS group for the foreseeable future. In giving this commitment to provide funding to the ANTS group, the Santander UK plc Board has considered the uncertainties within the ANTS group when preparing the forecasts and budgets of the combined business of Santander UK.
The Company has given a full and unconditional guarantee in respect of the unsubordinated liabilities of Santander UK plc incurred prior to 30 June 2015 under a deed poll guarantee entered into by the Company on 10 May 2012. Santander UK plc has given a reciprocal guarantee in respect of the unsubordinated liabilities of the Company incurred prior to 30 June 2015.
After making enquiries, the Directors have a reasonable expectation that the Company and the ANTS group have adequate resources to continue in operational existence for the foreseeable future. Accordingly, they continue to adopt the going concern basis of accounting in preparing the Annual Report and Accounts.
| | |
Abbey National Treasury Services plc 2012 Annual Report | | 101 |
Governance
Directors’ Reportcontinued
DIRECTORS
The members of the Company’s board of directors (the ‘Board’) at the date of this report are named on page 99. At 31 December 2012 the Board comprised three Executive Directors including the Chief Executive Officer.
For each Director, the date of appointment and the period served on the Board (at 31 December 2012) is shown below:
| | | | |
Name of Director | | Date of appointment | | Length of Board service |
Luis de Sousa | | 11 May 2009 | | 3 years 7 months |
Steve Pateman | | 3 June 2009 | | 3 years 6 months |
David Green | | 28 February 2008 | | 4 years 6 months |
During the year, the following director resigned:
| | | | |
Name of Director | | Title | | Date of resignation |
B W Morrison | | Director | | 1 October 2012 |
When he was appointed, Luis de Sousa was proposed by Banco Santander, S.A.. None of the Directors have service contracts with the ANTS group. All are employed by companies within the Banco Santander, S.A. group and have employment contacts which are for an indefinite term. Details of the Directors’ remuneration and interests are disclosed in Note 10 to the Consolidated Financial Statements. A Director may be paid instead of being required to work during their notice period. None of the Directors’ employment contracts provide for benefits to be paid on termination of employment.
Justo Gómez López was appointed as an additional Executive Director of the Company on 7 March 2013.
BOARD COMMITTEES
The Board does not maintain any standing committees. However, Santander UK plc maintains a standing Board Audit Committee, Board Risk Committee and Board Remuneration Oversight Committee, the responsibilities of which cover Santander UK group as a whole, including the Company. Further information regarding these committees and their membership is included in the Annual Report and Accounts of Santander UK plc.
THIRD PARTY INDEMNITIES
Indemnities are provided to the Directors of the Company, its subsidiaries and associated companies by Santander UK plc against liabilities and associated costs which they could incur in the course of their duties to the Company. A copy of each of the indemnities is kept at the registered address shown on page 206.
FINANCIAL INSTRUMENTS
The ANTS group’s risks are managed on a group level by the ultimate UK parent company, Santander UK plc. The financial risk management objectives of and policies of the ANTS group; the policy for hedging each major type of forecasted transaction for which hedge accounting is used; and the exposure of the Company to price risk, market risk, credit risk, liquidity risk and cash flow risk are outlined in the Risk Management Report on pages 28 to 98.
DISABILITY
The ANTS group is committed to equality of access and quality of service for disabled people and embraces the spirit of the UK Equality Act 2010 throughout its business operations. The ANTS group has processes in place to help train, develop, retain and promote employees with disabilities. It is committed to giving full and fair consideration to applications for employment made by disabled persons, and for continuing the employment of employees who have become disabled by arranging appropriate training and making reasonable adjustments within the workplace.
| | |
| 102 | | Abbey National Treasury Services plc 2012 Annual Report |
Governance
Directors’ Report continued
EMPLOYEE INVOLVEMENT
At 31 December 2012, the total number of employees calculated on a full time equivalent basis was 717 (2011: 817). Details of the related costs can be found in Note 6 to the Consolidated Financial Statements.
Employee share ownership
Santander UK currently operates two all-employee HMRC-approved share schemes: a Save-As-You-Earn (‘Sharesave’) Scheme and a Share Incentive Plan (‘SIP’), the latter of which allows employees to purchase Banco Santander, S.A. shares from gross salary. Shares have also been granted to eligible employees in receipt of vested deferred bonus awards. All the share options and awards relate to shares in Banco Santander, S.A.. See Note 41 to the Consolidated Financial Statements for a description of the plans and the related costs and obligations.
Communication
The ANTS group participates in Santander UK’s policies and wants to involve and inform employees on matters that affect them. The intranet is a focal point for communications with daily updates on what is happening across Santander UK, an online question and answer site and ‘The Village’ a site for staff to share information, ideas and best practice. On 1 November 2012, a new site was launched which connects staff to all the information they need about working for Santander UK in one easy to navigate place that is accessible from work and home. Santander UK also uses face-to-face communication, such as team meetings, regional roadshows and annual staff conventions for strategic updates, as well as a quarterly online and print staff magazine with in-depth business features. All these channels are designed to keep employees fully informed of news and developments which may have an impact on them, and also to keep them up to date on financial, economic and other factors which affect the ANTS group’s performance. Santander UK considers employees’ opinions and asks for their views on a range of issues through regular Company-wide surveys.
Consultation
The Santander UK group has a long history of trade union recognition governed by a partnership agreement with Advance, the independent trade union that it recognises to act as the voice of Santander UK employees. Advance is affiliated to the Trades Union Congress. Senior trade union officials are consulted on significant proposals within the business at both national and local levels. Regular Joint Consultative and Negotiating Committee meetings are held to enable collaborative working and ensure that communication is open and two-way.
DONATIONS
The ANTS group supports a wide range of charitable projects, particularly through Santander UK Foundation Limited, details of which are reported in the Annual Report and Accounts of Santander UK plc. There were no direct donations by the Company or its subsidiaries in 2012 (2011: £nil).
POLITICAL CONTRIBUTIONS
In 2012 and 2011, no contributions were made for political purposes and no political expenditure was incurred.
SUPPLIERS
The Santander UK group has a Cost Management & Procurement Policy and process that is enforced across all significant purchases from suppliers to provide a consistent approach. Checks are made that the Company’s suppliers act in an ethical and responsible way, as part of the supplier selection process and by requiring suppliers to adhere to the Santander UK group’s Corporate Social Responsibility Protocol, unless it is not relevant to the type of work being undertaken. The protocol covers human rights, labour standards, environment and anti-corruption, in line with the principles in the UN Global Compact.
Policy and practice on payment of creditors
It is our policy to make payments in accordance with the terms and conditions agreed, except where the supplier fails to comply with those terms and conditions. The ANTS group’s practice on payment of creditors has been quantified under the terms of Schedule 7 of The Large and Medium-sized Companies and Groups (Accounts and Reports) Regulations 2008. Based on the ratio of the aggregate amounts owed to trade creditors at the end of the year to the aggregate amounts invoiced by suppliers during the year at 31 December 2012, trade creditor days for the ANTS group were 38 days (2011: 36 days).
| | |
Abbey National Treasury Services plc 2012 Annual Report | | 103 |
Governance
Directors’ Reportcontinued
CODE OF CONDUCT
The ANTS group is committed to maintaining high ethical standards – adhering to laws and regulations, conducting business in a responsible way and treating all stakeholders with honesty and integrity. These principles are further reflected in Banco Santander, S.A.’s General Code of Conduct applicable to the Santander UK group.
Under their terms and conditions of employment, staff are required to act at all times with the highest standards of business conduct in order to protect the Santander UK group’s reputation and ensure a company culture which is free from any risk of corruption, compromise or conflicts of interest. Staff are also required to comply with all Santander UK group policies, including the Anti-Bribery and Corruption Policy. These terms and conditions require that employees must:
| • | | Abide by all relevant laws and regulations; |
| • | | Act with integrity in all their business actions on the ANTS group’s behalf; |
| • | | Not use their authority or office for personal gain; |
| • | | Conduct business relationships in a transparent manner; and |
| • | | Reject all improper practices or dealings they may be exposed to. |
The SEC requires companies to disclose whether they have a code of ethics that applies to the Chief Executive Officer and senior financial officers that promotes honest and ethical conduct, full, fair, accurate, timely and understandable disclosures, compliance with applicable governmental laws, rules and regulations, prompt internal reporting violations and accountability for adherence to such a code of ethics. The ANTS group meets these requirements through the Banco Santander, S.A. General Code of Conduct, the Anti-Bribery and Corruption Policy, the Whistleblowing Policy, the FSA’s Principles for Business, and the FSA’s Principles and Code of Practice for Approved Persons, with which the Chief Executive Officer and senior financial officers must comply. These include requirements to manage conflicts of interest appropriately and to disclose any information the FSA may want to know about. The ANTS group provides a copy of these documents to anyone, free of charge, on application to the address on page 206.
SUPERVISION AND REGULATION
As a firm authorised by the FSA, the Company is subject to UK financial services laws and regulations. The key UK requirements to which the Company is subject are discussed below. While Santander UK (of which the ANTS group is a significant part) operates primarily in the UK, it is also subject to the laws and regulations of the other jurisdictions in which it operates, such as the requirements of the SEC for its activities in the US.
Recent significant regulatory developments expected to have the greatest impact on the ANTS group’s operations are highlighted below.
Material risk factors (including supervision and regulatory risks and risks relating to taxation) are described in the Risk Factors section on pages 190 to 205.
Current Supervision and Regulation
UK
The FSA
In the UK, the FSA is the single independent regulator for the regulation of deposit taking, investment business, mortgages and insurance. The FSA was set up by the government and exercises statutory powers under the Financial Services and Markets Act 2000 (‘FSMA’). The Company, together with several of its subsidiaries, is authorised by the FSA to carry on a range of regulated activities in the UK, which include mortgages, banking, insurance and investment business.
The FSA must adhere to four regulatory objectives, as prescribed in FSMA, which set out the parameters of regulation: market confidence; public awareness; the protection of consumers; and the reduction of financial crime. Based on these regulatory objectives, the FSA has formulated an extensive handbook of rules and guidance to which authorised firms are subject.
The UK Government has announced a new regulatory framework which will take effect in 2013 under the Financial Services Act (the ‘Act’). Under the Act, the FSA will be replaced by two regulatory bodies, the Prudential Regulatory Authority (the ‘PRA’), which will have responsibility for the prudential regulation of deposit takers and insurance companies, and the Financial Conduct Authority (the ‘FCA’), which will supervise conduct of business and maintain orderly financial markets for consumers. The FSA began transition to the new structure on 4 April 2011.
Liquidity
The FSA’s liquidity regime for banks was established in 2009. It specifies the maintenance of a minimum level of liquid assets that are required to be held as a buffer against a defined liquidity stress. Additionally banks are required to perform an annual assessment of the adequacy of liquidity risk measurement, management and control processes that they have in place. This review is subject to supervisory review. Santander UK maintains a liquidity risk appetite and framework that is complimentary and more extensive than the FSA requirements.
| | |
| 104 | | Abbey National Treasury Services plc 2012 Annual Report |
Governance
Directors’ Report continued
UK Bank Levy
HM Treasury introduced an annual UK bank levy (the “Bank Levy”) via legislation in the Finance Act 2011. The Bank Levy is imposed on (amongst other entities) UK banking groups and subsidiaries, and therefore applies to Santander UK (of which the ANTS group is a significant part). The amount of the Bank Levy is based on a bank’s total liabilities, excluding (amongst other things) Tier 1 Capital, insured retail deposits and repos secured on sovereign debt. A reduced rate is applied to longer-term liabilities. The UK Government intends that the Bank Levy should raise at least £2.5bn each year. To offset the shortfall in Bank Levy receipts, and also to take account of the benefit to the banking sector of reductions in the rate of corporation tax, there was an increase in the rates of Bank Levy from 1 January 2012 with a further increase from 1 January 2013. For further information refer to Note 34 to the Consolidated Financial Statements.
European Union
The ANTS group is directly affected by laws emanating from the European Union, primarily through directives that must be implemented by the UK as a member state of the European Union.
Basel II
Basel II is a supervisory framework for the risk and capital management of banks and is structured around three pillars. Pillar 1 specifies minimum capital requirements for banks and methodologies for calculating risk weighted assets. Pillar 2 describes the supervisory review process and outlines the ICAAP required by banks applying Pillar 1 methodologies. Pillar 3 requires disclosure of risk and capital information. The ANTS group’s capital and risk management disclosures are set out in Note 44 to the Consolidated Financial Statements.
In the European Union, Basel II was implemented by the Capital Requirements Directive (the ‘CRD’) with effect from 1 January 2007. In the UK, the FSA implemented the CRD by including it in FSA rules. These new FSA rules took effect from 1 January 2007. Throughout 2012, the ANTS group applied the Basel II framework to its capital calculations, its ICAAP and to its risk and capital disclosures to the market.
Regulatory Developments
UK
Independent Commission on Banking (‘ICB’)
The Government has appointed an Independent Commission on Banking (‘ICB’) to review possible measures to reform the banking system and promote stability and competition. The ICB published its final report on the 12 September 2011 putting forward recommendations to require ring-fencing of the retail activities of banks from their investment banking activities and additional capital requirements beyond those required under current drafts of CRD IV. The report also makes recommendations in relation to the competitiveness of the UK banking market, including enhancing the competition remit of the new FCA, implementing a new industry-wide switching solution by September 2013, and improving transparency.
The ICB recommended that ring-fenced banks should hold a common equity capital base of at least 10% and primary loss-absorbing capacity of at least 17% to absorb the impact of potential losses or financial crises. The ICB, which following the final report completed its mandate, had the authority only to make recommendations, which the Government could choose to accept or reject.
The Government published its response to the ICB recommendations on 19 December 2011 and, following an extensive first consultation, it published a White Paper on 14 June 2012, setting out its more detailed proposals for implementing the ICB’s recommendations. The content of the White Paper was broadly in line with expectations following the response, with ring-fencing to be implemented as set out in the ICB recommendations and loss-absorbency requirements also largely consistent. A further period of consultation was established, which ran until 6 September 2012.
The Parliamentary Commission on Banking Standards (the ‘PCBS’) conducted pre-legislative scrutiny on the draft bill to implement the ICB recommendations, which was published in October 2012. Following publication of the PCBS’s first report in December 2012, the Financial Services (Banking Reform) Bill was introduced to Parliament on 4 February 2013, in the form of framework legislation to put in place the architecture to effect the reforms with detailed policy being provided for through secondary legislation. The Government intends to complete primary and secondary legislation before the end of the current Parliamentary term in May 2015 and for banks to comply with all the measures proposed in the paper by 2019, as the ICB recommended. The Government also reaffirmed its determination that changes to the account switching process should be completed by September 2013, as already scheduled.
Given that Santander UK (of which the ANTS group is a significant part) is predominantly a retail and commercial bank, it would expect to be less affected by the implementation of a retail ring fence, but believes it will be important for any transition period to be flexible in order to minimise any impact on economic growth, and for banks to implement the required structural changes.
| | |
Abbey National Treasury Services plc 2012 Annual Report | | 105 |
Governance
Director’s Reportcontinued
Other
There are a number of other regulatory developments going through a consultation and implementation process which may have some effect on the ANTS group’s business. These include the financial stability and conduct of business arrangements. Consultation will also commence on the new FCA high level conduct of business rules in 2013.
Financial Policy Committee(‘FPC’): In January 2012, legislation was introduced to parliament that created the FPC with specific powers for regulation from December 2012. The FPC is charged with identifying, monitoring and taking action to remove or reduce systemic risks to the stability of the financial system and has a secondary objective to support the economic policy of the Government. In the interim, the FPC made a number of recommendations that have been implemented through the FSA. This included recommendations on year end 2012 disclosure of pro-forma CRD IV capital and leverage disclosures and specific FSA studies upon fair value, provisions, expected losses and risk-weighted assets. The FPC is expected in 2013 to be granted powers to set the UK counter-cyclical capital buffer under CRD IV and may be granted additional powers to set sectoral capital buffers.
European Union
Basel III
Basel III is a comprehensive set of reform measures, developed by the Basel Committee on Banking Supervision, to strengthen the regulation, supervision and risk management of the banking sector. These measures aim to: (i) improve the banking sector’s ability to absorb shocks arising from financial and economic stress, whatever the source; (ii) improve risk management and governance; and (iii) strengthen banks’ transparency and disclosures. The reforms target: (a) bank-level, or micro-prudential, regulation, with the aim of helping raise the resilience of individual banking institutions to periods of stress, and (b) macro-prudential, system-wide risks that can build up across the banking sector as well as the pro-cyclical amplification of these risks over time. These two approaches to supervision are complementary as greater resilience at the individual bank level reduces the risk of system-wide shocks.
The European Commission published its proposed legislation for the CRD and the Capital Requirements Regulation, which together form the CRD IV package, in July 2011. As well as reflecting the Basel III capital proposals, the CRD IV package also includes new proposals on sanctions for non-compliance with prudential rules, corporate governance and remuneration. These changes are expected to be implemented beginning in January 2014. ANTS is currently engaged in the assessment of the impact of the Basel III measures.
In addition to the changes to the capital adequacy framework published in December 2010, the Basel Committee also published its global quantitative liquidity framework, comprising the Liquidity Coverage Ratio (‘LCR’) and Net Stable Funding Ratio (‘NSFR’) metrics, with objectives to (1) promote the short-term resilience of banks’ liquidity risk profiles by ensuring they have sufficient high-quality liquid assets to survive a significant stress scenario; and (2) promote resilience over a longer time horizon by creating incentives for banks to fund their activities with more stable sources of funding on an ongoing basis. The LCR was subsequently revised by the Basel Committee in January 2013 which amended the definition of high-quality liquid assets and agreed a revised timetable for phase-in of the standard from 2015 to 2019, as well as making some technical changes to some of the stress scenario assumptions.
As with the Basel Committee’s proposed changes to the capital adequacy framework, the draft liquidity framework remains under discussion within the EU and the final framework to be established could differ from Basel III in certain areas. The implementation date is still subject to uncertainty.
Crisis Management Directive and European Banking Union
On 6 June 2012, the European Commission published a legislative proposal known as the Crisis Management Directive for the recovery and resolution of credit institutions and investment firms (the ‘CMD’). The CMD framework set out necessary steps and powers to ensure that bank failures across the EU are managed in a way which avoids financial instability and minimises costs for the taxpayer. The CMD lays out proposals under three themes. These are: (i) preparation and prevention, which includes a requirement for the completion by banks of recovery and resolution plans that restore the long term viability of a firm or can ensure that failing entities are resolvable; (ii) early intervention, which proposes powers for supervisory authorities to intervene when a firm ceases to or is unlikely to meet regulatory capital requirements; and (iii) resolution tools which summarise the options that will be available to resolution authorities to deal with a failing entity including a ‘bail-in’ tool whereby specific unsecured liabilities of a firm are convertible to equity. The proposals are expected to come into force from 1 January 2015, although the ‘bail-in’ regime will be delayed until 1 January 2018. Santander UK maintains its own recovery and resolution plans which have been communicated to the FSA.
In June 2012, the European Commission published ideas for a European Banking Union for eurozone banks to help pave the way towards deeper economic integration. The Commission proposed (i) an integrated system for the supervision of cross-border banks, (ii) a single deposit guarantee scheme and (iii) an EU resolution fund. Later that month the President of the European Council published a report on establishing a stable economic and monetary union. The report proposed a vision for a stable and prosperous union based on a number of essential building blocks: (i) an integrated financial framework; (ii) an integrated budgetary framework; and (iii) an integrated economic policy framework. In December 2012, eurozone countries agreed the framework for the European Central Bank to become a common bank supervisor for eurozone banks with assets in excess of euro 30bn. Consultations with member states and EU institutions regarding the implementation of the proposals continue.
| | |
| 106 | | Abbey National Treasury Services plc 2012 Annual Report |
Governance
Director’s Report continued
DISCLOSURE CONTROLS AND PROCEDURES
The ANTS group has evaluated with the participation of its Chief Executive Officer and Principal Financial Officer the effectiveness of the ANTS group’s disclosure controls and procedures as of 31 December 2012. There are inherent limitations to the effectiveness of any system of disclosure controls and procedures, including the possibility of human error and the circumvention or overriding of the controls and procedures. Accordingly, even effective disclosure controls and procedures can only provide reasonable assurance of achieving their control objectives.
Based upon the ANTS group’s evaluation, the Chief Executive Officer and the Principal Financial Officer have concluded that, as of 31 December 2012, the Group’s disclosure controls and procedures were effective to provide reasonable assurance that information required to be disclosed by the ANTS group in the reports that the ANTS group files and submits under the US Securities Exchange Act of 1934 is recorded, processed, summarised and reported within the time periods specified in the applicable rules and forms, and that it is accumulated and communicated to the ANTS group’s management, including the Group’s Chief Executive Officer and Principal Financial Officer, as appropriate, to allow timely decisions regarding disclosure.
MANAGEMENT’S REPORT ON INTERNAL CONTROL OVER FINANCIAL REPORTING
Internal control over financial reporting is a component of an overall system of internal control. The ANTS group’s internal control over financial reporting is a process designed to provide reasonable assurance regarding the reliability of financial reporting, the preparation and fair presentation of financial statements for external purposes in accordance with International Financial Reporting Standards (‘IFRS’) as issued by the International Accounting Standards Board, and as endorsed by the European Union.
The ANTS group’s internal control over financial reporting includes:
| • | | Policies and procedures that relate to the maintenance of records that fairly and accurately reflect the transactions and disposition of assets. |
| • | | Controls providing reasonable assurance that transactions are recorded as necessary to permit the preparation of financial statements in accordance with IFRS, and that receipts and expenditures are being made only as authorised by management. |
| • | | Controls providing reasonable assurance regarding prevention or timely detection of unauthorised acquisition, use or disposition of assets that could have a material effect on the financial statements. |
Because of its inherent limitations, internal control over financial reporting may not prevent or detect misstatements. In addition, projections of any evaluation of effectiveness to future periods are subject to the risk that controls may become inadequate because of changes in conditions or because the degree of compliance with policies or procedures may deteriorate.
Management is responsible for establishing and maintaining adequate internal control over the financial reporting of the ANTS group. Management assessed the effectiveness of the ANTS group’s internal control over financial reporting as of 31 December 2012 based on the criteria established in the Internal Control - Integrated Framework issued by the Committee of Sponsoring Organizations of the Treadway Commission. Based on this assessment, management believes that, as of 31 December 2012, the ANTS group’s internal control over financial reporting is effective.
CHANGES TO INTERNAL CONTROL OVER FINANCIAL REPORTING
As set out in Note 45, the Consolidated Financial Statements for the ANTS group for the year ended 31 December 2011 have been restated. This restatement resulted from a misstatement in the measurement for the Company’s loans secured on residential property to UK housing associations that are designated at fair value, and has resulted in restatements of previously reported amounts in respect of “Net Trading and Other Income”, “Financial assets designated at fair value” and the related tax effects. During the first half of 2012, management identified a weakness in internal control over financial reporting which was determined to be material to the ANTS group. As a result, management implemented additional internal control procedures during the second half of 2012 to address the material weakness identified in the financial reporting and close process which resulted in the misstatement. These additional internal control procedures included timely and specific review of inputs used in the fair value measurements of loans secured on residential property to UK housing associations that are designated at fair value. After completing the testing of the design and operating effectiveness of the revised internal controls procedures that were implemented during the second half of 2012, management has concluded that the previously identified internal control weakness was remediated at 31 December 2012. There have not been any further changes in the ANTS group’s internal control over financial reporting during the ANTS group’s 2012 fiscal year that have materially affected, or are reasonably likely to materially affect the ANTS group’s internal controls over financial reporting.
| | |
Abbey National Treasury Services plc 2012 Annual Report | | 107 |
Governance
Director’s Reportcontinued
RELEVANT AUDIT INFORMATION
Each of the Directors at the date of approval of this report confirms that:
| • | | So far as the Director is aware, there is no relevant audit information of which the ANTS group’s auditor is unaware; and |
| • | | The Director has taken all steps that he ought to have taken as a Director to make himself aware of any relevant audit information and to establish that the ANTS group’s auditor is aware of that information. |
This confirmation is given and should be interpreted in accordance with the provisions of Section 418 of the UK Companies Act 2006.
STATEMENT OF DIRECTORS’ RESPONSIBILITIES
The Directors are responsible for preparing the Annual Report and Accounts including the financial statements in accordance with applicable law and regulations.
Company law requires the Directors to prepare financial statements for each financial year. The Directors are required by the International Accounting Standards (‘IAS’) Regulation to prepare the group financial statements under IFRS, as adopted by the European Union, and have also elected to prepare the parent company financial statements in accordance with IFRS, as adopted by the European Union. The financial statements are also required by law to be properly prepared in accordance with the UK Companies Act 2006 and Article 4 of the IAS Regulation. In addition, in order to meet certain US requirements, the Directors are required to prepare the ANTS group’s financial statements in accordance with IFRS, as issued by the International Accounting Standards Board.
The Directors acknowledge their responsibility to ensure the financial statements give a true and fair view of the assets, liabilities, financial position and profit or loss presented and that the management report, which is incorporated into this report, includes a fair review of the development and performance of the business and a description of the principal risks and uncertainties the business faces.
International Accounting Standard 1 requires that financial statements present fairly for each financial year the Company’s financial position, financial performance and cash flows. This requires the faithful representation of the effects of transactions, other events and conditions in accordance with the definitions and recognition criteria for assets, liabilities, income and expenses set out in the International Accounting Standards Board’s ‘Framework for the preparation and presentation of financial statements’.
In virtually all circumstances, a fair presentation will be achieved by compliance with all applicable IFRS. However, the Directors are also required to:
| • | | Properly select and apply accounting policies; |
| • | | Present information, including accounting policies, in a manner that provides relevant, reliable, comparable and understandable information; |
| • | | Provide additional disclosures when compliance with the specific requirements in IFRS are insufficient to enable users to understand the impact of particular transactions, other events and conditions on the entity’s financial position and financial performance; and |
| • | | Make an assessment of the Company’s ability to continue as a going concern. |
The Directors are responsible for keeping adequate accounting records that are sufficient to show and explain the Company’s transactions and disclose with reasonable accuracy at any time the financial position of the Company and enable them to ensure that the financial statements comply with the UK Companies Act 2006. They are also responsible for safeguarding the assets of the Company and hence for taking reasonable steps for the prevention and detection of fraud and other irregularities.
The Directors are responsible for the maintenance and integrity of the corporate and financial information included on the Company’s website. Legislation in the United Kingdom governing the preparation and dissemination of financial statements may differ from legislation in other jurisdictions.
AUDITOR
Deloitte LLP have expressed their willingness to continue in office as auditor and a resolution to reappoint them will be proposed at the Company’s forthcoming Annual General Meeting.
|
By Order of the Board |
|

|
Karen M. Fortunato |
Company Secretary and General Counsel |
18 March 2013 |
2 Triton Square, Regent’s Place, London NW1 3AN |
| | |
| 108 | | Abbey National Treasury Services plc 2012 Annual Report |
Governance
Director’s Responsibilities Statement
We confirm to the best of our knowledge:
| 1. | The financial statements, prepared in accordance with International Financial Reporting Standards, as adopted by the EU, give a true and fair view of the assets, liabilities, financial position and profit or loss of the Company and the undertakings included in the consolidation taken as a whole; and |
| 2. | The management report, which is incorporated into the Directors’ Report, includes a fair review of the development and performance of the business and the position of the Company and the undertakings included in the consolidation taken as a whole, together with a description of the principal risks and uncertainties they face. |
|
By Order of the Board |
|

|
Luis de Sousa |
Chief Executive Officer |
18 March 2013 |
| | |
Abbey National Treasury Services plc 2012 Annual Report | | 109 |
Financial Statements
Contents to Financial Statements
| | |
| 110 | | Abbey National Treasury Services plc 2012 Annual Report |
REPORT OF INDEPENDENT REGISTERED PUBLIC ACCOUNTING FIRM
To the Board of Directors and Shareholders of Abbey National Treasury Services plc
We have audited the accompanying consolidated balance sheets of Abbey National Treasury Services plc and subsidiaries (the “Group”) as of 31 December 2012 and 2011, and the related Consolidated Income Statements, Consolidated Statements of Comprehensive Income, Changes in Equity, and Cash Flows for each of the three years in the period ended 31 December 2012, the related Notes 1 to 45 and the information on pages 40 to 78 and 84 to 98 of the Risk Management Report, except for those items marked as unaudited. These financial statements are the responsibility of the Group’s management. Our responsibility is to express an opinion on these financial statements based on our audits.
We conducted our audits in accordance with the standards of the Public Company Accounting Oversight Board (United States). Those standards require that we plan and perform the audit to obtain reasonable assurance about whether the financial statements are free of material misstatement. The Group is not required to have, nor were we engaged to perform, an audit of its internal control over financial reporting. Our audits included consideration of internal control over financial reporting as a basis for designing audit procedures that are appropriate in the circumstances, but not for the purpose of expressing an opinion on the effectiveness of the Group’s internal control over financial reporting. Accordingly, we express no such opinion. An audit also includes examining, on a test basis, evidence supporting the amounts and disclosures in the financial statements, assessing the accounting principles used and significant estimates made by management, as well as evaluating the overall financial statement presentation. We believe that our audits provide a reasonable basis for our opinion.
In our opinion, such consolidated financial statements present fairly, in all material respects, the financial position of Abbey National Treasury Services plc and subsidiaries as of 31 December 2012 and 2011, and the results of their operations and their cash flows for each of the three years in the period ended 31 December 2012, in conformity with International Financial Reporting Standards (“IFRS”) as adopted by the European Union and IFRS as issued by the International Accounting Standards Board (“IASB”).
As discussed in Note 45 to the consolidated financial statements, the accompanying 2011 consolidated financial statements have been restated to correct a misstatement.
|

|
Deloitte LLP |
London, UK |
March 18, 2013 |
| | |
Abbey National Treasury Services plc 2012 Annual Report | | 111 |
Financial Statements
Notes to the Financial Statements
CONSOLIDATED INCOME STATEMENT
For the years ended 31 December 2012, 2011 and 2010
| | | | | | | | | | | | | | |
| | | Notes | | 2012
£m | | | 2011(1)
£m | | | 2010
£m | |
Interest and similar income | | | | | 3,870 | | | | 3,667 | | | | 3,045 | |
Interest expense and similar charges | | | | | (3,731 | ) | | | (3,156 | ) | | | (2,642 | ) |
| | | | | | | | | | | | | | |
Net interest income | | 3 | | | 139 | | | | 511 | | | | 403 | |
| | | | | | | | | | | | | | |
Net fee and commission income | | 4 | | | 119 | | | | 113 | | | | 28 | |
Net trading and other income | | 5 | | | 304 | | | | (46 | ) | | | 462 | |
| | | | | | | | | | | | | | |
Total operating income | | | | | 562 | | | | 578 | | | | 893 | |
| | | | | | | | | | | | | | |
Administration expenses | | 6 | | | (198 | ) | | | (229 | ) | | | (209 | ) |
Depreciation and amortisation | | 7 | | | (3 | ) | | | (7 | ) | | | (6 | ) |
| | | | | | | | | | | | | | |
Total operating expenses excluding provisions and charges | | | | | (201 | ) | | | (236 | ) | | | (215 | ) |
| | | | | | | | | | | | | | |
Impairment losses on loans and advances | | 8 | | | (9 | ) | | | (54 | ) | | | (69 | ) |
Provisions for other liabilities and charges | | 8 | | | (20 | ) | | | (20 | ) | | | — | |
| | | | | | | | | | | | | | |
Total operating provisions and charges | | | | | (29 | ) | | | (74 | ) | | | (69 | ) |
| | | | | | | | | | | | | | |
Profit before tax | | | | | 332 | | | | 268 | | | | 609 | |
Taxation charge | | 11 | | | (68 | ) | | | (104 | ) | | | (149 | ) |
| | | | | | | | | | | | | | |
Profit for the year | | | | | 264 | | | | 164 | | | | 460 | |
| | | | | | | | | | | | | | |
Attributable to: | | | | | | | | | | | | | | |
Equity holders of the parent | | | | | 264 | | | | 164 | | | | 460 | |
| | | | | | | | | | | | | | |
| (1) | As restated, see Note 45 |
All profits during the year were generated from continuing operations.
CONSOLIDATED STATEMENT OF COMPREHENSIVE INCOME
For the years ended 31 December 2012, 2011 and 2010
| | | | | | | | | | | | | | |
| | | Notes | | 2012
£m | | | 2011(1)
£m | | | 2010
£m | |
Profit for the year | | | | | 264 | | | | 164 | | | | 460 | |
| | | | | | | | | | | | | | |
Other comprehensive income: | | | | | | | | | | | | | | |
Gains on available-for-sale securities | | 22 | | | 5 | | | | — | | | | — | |
Tax on above items | | 11 | | | (1 | ) | | | — | | | | — | |
| | | | | | | | | | | | | | |
Net gain recognised directly in other comprehensive income | | | | | 4 | | | | — | | | | — | |
| | | | | | | | | | | | | | |
Gains on available-for-sale securities transferred to profit or loss on sale | | | | | — | | | | — | | | | — | |
Tax on items transferred to profit or loss | | 11 | | | — | | | | — | | | | — | |
| | | | | | | | | | | | | | |
Net transfers to profit | | | | | — | | | | — | | | | — | |
| | | | | | | | | | | | | | |
Total other comprehensive income for the year before tax | | | | | 5 | | | | — | | | | — | |
Tax relating to components of other comprehensive income | | 11 | | | (1 | ) | | | — | | | | — | |
| | | | | | | | | | | | | | |
Total comprehensive income for the year | | | | | 268 | | | | 164 | | | | 460 | |
| | | | | | | | | | | | | | |
Attributable to: | | | | | | | | | | | | | | |
Equity holders of the parent | | | | | 268 | | | | 164 | | | | 460 | |
| | | | | | | | | | | | | | |
| (1) | As restated, see Note 45 |
The accompanying Notes on pages 118 to 189 and the audited sections of the Risk Management Report on pages 28 to 98 form an integral part of these Consolidated Financial Statements.
| | |
| 112 | | Abbey National Treasury Services plc 2012 Annual Report |
Financial Statements
Primary Financial Statementscontinued
CONSOLIDATED BALANCE SHEET
At 31 December 2012 and 2011
| | | | | | | | | | |
| | | Notes | | 2012
£m | | | 2011(1)
£m | |
Assets | | | | | | | | | | |
Cash and balances at central banks | | 13 | | | 388 | | | | 7,013 | |
Trading assets | | 14 | | | 22,498 | | | | 21,891 | |
Derivative financial instruments | | 15 | | | 33,276 | | | | 33,224 | |
Financial assets designated at fair value | | 16 | | | 3,531 | | | | 4,429 | |
Loans and advances to banks | | 17 | | | 106,986 | | | | 113,222 | |
Loans and advances to customers | | 18 | | | 44,750 | | | | 38,826 | |
Loans and receivables securities | | 20 | | | 162 | | | | 278 | |
Available-for-sale securities | | 22 | | | 5,113 | | | | — | |
Macro hedge of interest rate risk | | | | | 1,171 | | | | 1,141 | |
Intangible assets | | 24 | | | 7 | | | | 3 | |
Property, plant and equipment | | 25 | | | 6 | | | | 5 | |
Deferred tax assets | | 26 | | | 20 | | | | 17 | |
Other assets | | 27 | | | 4 | | | | 43 | |
| | | | | | | | | | |
Total assets | | | | | 217,912 | | | | 220,092 | |
| | | | | | | | | | |
Liabilities | | | | | | | | | | |
Deposits by banks | | 28 | | | 114,535 | | | | 114,019 | |
Deposits by customers | | 29 | | | 6,249 | | | | 7,114 | |
Derivative financial instruments | | 15 | | | 34,088 | | | | 35,417 | |
Trading liabilities | | 30 | | | 21,109 | | | | 25,745 | |
Financial liabilities designated at fair value | | 31 | | | 4,002 | | | | 6,836 | |
Debt securities in issue | | 32 | | | 33,770 | | | | 26,943 | |
Other liabilities | | 33 | | | 169 | | | | 142 | |
Provisions | | 34 | | | 20 | | | | 20 | |
Current tax liabilities | | | | | 175 | | | | 329 | |
| | | | | | | | | | |
Total liabilities | | | | | 214,117 | | | | 216,565 | |
| | | | | | | | | | |
Equity | | | | | | | | | | |
Share capital | | 36 | | | 2,549 | | | | 2,549 | |
Retained earnings | | | | | 1,226 | | | | 962 | |
Other reserves | | | | | 20 | | | | 16 | |
| | | | | | | | | �� | |
Total shareholders’ equity | | | | | 3,795 | | | | 3,527 | |
| | | | | | | | | | |
Total liabilities and equity | | | | | 217,912 | | | | 220,092 | |
| | | | | | | | | | |
| (1) | As restated, see Note 45 |
The accompanying Notes on pages 118 to 189 and the audited sections of the Risk Management Report on pages 28 to 98 form an integral part of these Consolidated Financial Statements.
The Financial Statements on pages 112 to 189 were approved and authorised for issue by the Board on 18 March 2013 and signed on its behalf by:
|

|
| David Green |
| Director |
Company Registered Number 2338548
| | |
Abbey National Treasury Services plc 2012 Annual Report | | 113 |
Financial Statements
Primary Financial Statements continued
CONSOLIDATED STATEMENT OF CHANGES IN EQUITY
For the years ended 31 December 2012, 2011 and 2010
| | | | | | | | | | | | | | | | | | | | | | |
| | | | | | | | Other reserves | | | | | | | |
| | | Notes | | Share
Capital
£m | | | Available
for sale
reserve
£m | | | Foreign
currency
translation
reserve
£m | | | Retained
earnings(1)
£m | | | Total(1)
£m | |
1 January 2012 | | | | | 2,549 | | | | — | | | | 16 | | | | 962 | | | | 3,527 | |
Total comprehensive income: | | | | | | | | | | | | | | | | | | | | | | |
- Profit for the year | | | | | — | | | | — | | | | — | | | | 264 | | | | 264 | |
- Other comprehensive income for the year | | | | | — | | | | 5 | | | | — | | | | — | | | | 5 | |
- Tax on other comprehensive income | | | | | — | | | | (1 | ) | | | — | | | | — | | | | (1 | ) |
| | | | | | | | | | | | | | | | | | | | | | |
| | | | | — | | | | 4 | | | | — | | | | 264 | | | | 268 | |
| | | | | | | | | | | | | | | | | | | | | | |
Dividends and other distributions | | | | | — | | | | — | | | | — | | | | — | | | | — | |
| | | | | | | | | | | | | | | | | | | | | | |
31 December 2012 | | | | | 2,549 | | | | 4 | | | | 16 | | | | 1,226 | | | | 3,795 | |
| | | | | | | | | | | | | | | | | | | | | | |
1 January 2011 | | | | | 2,549 | | | | — | | | | 16 | | | | 798 | | | | 3,363 | |
Total comprehensive income: | | | | | | | | | | | | | | | | | | | | | | |
- Profit for the year | | | | | — | | | | — | | | | — | | | | 164 | | | | 164 | |
| | | | | | | | | | | | | | | | | | | | | | |
| | | | | — | | | | — | | | | — | | | | 164 | | | | 164 | |
| | | | | | | | | | | | | | | | | | | | | | |
Dividends and other distributions | | | | | — | | | | — | | | | — | | | | — | | | | — | |
| | | | | | | | | | | | | | | | | | | | | | |
31 December 2011 | | | | | 2,549 | | | | — | | | | 16 | | | | 962 | | | | 3,527 | |
| | | | | | | | | | | | | | | | | | | | | | |
1 January 2010 | | | | | 2,549 | | | | — | | | | 16 | | | | 938 | | | | 3,503 | |
Total comprehensive income: | | | | | | | | | | | | | | | | | | | | | | |
- Profit for the year | | | | | — | | | | — | | | | — | | | | 460 | | | | 460 | |
| | | | | | | | | | | | | | | | | | | | | | |
| | | | | — | | | | — | | | | — | | | | 460 | | | | 460 | |
| | | | | | | | | | | | | | | | | | | | | | |
Dividends and other distributions | | | | | — | | | | — | | | | — | | | | (600 | ) | | | (600 | ) |
| | | | | | | | | | | | | | | | | | | | | | |
31 December 2010 | | | | | 2,549 | | | | — | | | | 16 | | | | 798 | | | | 3,363 | |
| | | | | | | | | | | | | | | | | | | | | | |
| (1) | As restated, see Note 45 |
CONSOLIDATED CASH FLOW STATEMENT
For the years ended 31 December 2012, 2011 and 2010
| | | | | | | | | | | | | | |
| | | Notes | | 2012
£m | | | 2011(1)
£m | | | 2010
£m | |
Net cash flow (used in)/from operating activities | | | | | | | | | | | | | | |
Profit for the year | | | | | 264 | | | | 164 | | | | 460 | |
Adjustments for: | | | | | | | | | | | | | | |
Non cash items included in profit | | | | | 101 | | | | 4 | | | | 125 | |
Change in operating assets | | | | | 7,518 | | | | 26,669 | | | | 38,039 | |
Change in operating liabilities | | | | | (4,600 | ) | | | (30,962 | ) | | | (36,856 | ) |
Corporation taxes paid | | | | | (42 | ) | | | (13 | ) | | | (28 | ) |
Effect of exchange rate differences | | | | | (853 | ) | | | (417 | ) | | | 399 | |
| | | | | | | | | | | | | | |
Net cash flow from/(used in) operating activities | | 38 | | | 2,388 | | | | (4,555 | ) | | | 2,139 | |
| | | | | | | | | | | | | | |
Net cash flow (used in)/from investing activities | | | | | | | | | | | | | | |
Purchase of property, plant and equipment and intangible assets | | 24,25 | | | (10 | ) | | | (9 | ) | | | (40 | ) |
Proceeds from sale of property, plant and equipment and intangible assets | | | | | 2 | | | | 42 | | | | — | |
Purchase of securities | | | | | (5,990 | ) | | | — | | | | — | |
Proceeds from sale and redemption of securities | | | | | 864 | | | | — | | | | — | |
| | | | | | | | | | | | | | |
Net cash flow (used in)/from investing activities | | | | | (5,134 | ) | | | 33 | | | | (40 | ) |
| | | | | | | | | | | | | | |
Net cash flow from/(used in) financing activities | | | | | | | | | | | | | | |
Issue of long-term debt | | | | | 31,314 | | | | 38,603 | | | | 11,419 | |
Repayments of long-term debt | | | | | (28,388 | ) | | | (40,607 | ) | | | (4,840 | ) |
Dividends paid | | | | | — | | | | — | | | | (600 | ) |
| | | | | | | | | | | | | | |
Net cash flow from/(used in) financing activities | | | | | 2,926 | | | | (2,004 | ) | | | 5,979 | |
| | | | | | | | | | | | | | |
Net (decrease)/increase in cash and cash equivalents | | | | | 180 | | | | (6,526 | ) | | | 8,078 | |
Cash and cash equivalents at beginning of the year | | | | | 79,858 | | | | 86,729 | | | | 78,510 | |
Effect of exchange rate changes on cash and cash equivalents | | | | | (624 | ) | | | (345 | ) | | | 141 | |
| | | | | | | | | | | | | | |
Cash and cash equivalents at the end of the year | | 38 | | | 79,414 | | | | 79,858 | | | | 86,729 | |
| | | | | | | | | | | | | | |
| (1) | As restated, see Note 45 |
The accompanying Notes on pages 118 to 189 and the audited sections of the Risk Management Report on pages 28 to 98 form an integral part of these Consolidated Financial Statements.
| | |
| 114 | | Abbey National Treasury Services plc 2012 Annual Report |
Financial Statements
Primary Financial Statementscontinued
COMPANY BALANCE SHEET
At 31 December 2012 and 2011
| | | | | | | | | | |
| | | Notes | | 2012(2)
£m | | | 2011(1, 2)
£m | |
Assets | | | | | | | | | | |
Cash and balances at central banks | | 13 | | | 388 | | | | 7,013 | |
Trading assets | | 14 | | | 22,155 | | | | 21,564 | |
Derivative financial instruments | | 15 | | | 33,312 | | | | 33,242 | |
Financial assets designated at fair value | | 16 | | | 3,531 | | | | 4,429 | |
Loans and advances to banks | | 17 | | | 106,972 | | | | 113,211 | |
Loans and advances to customers | | 18 | | | 44,858 | | | | 38,926 | |
Loans and receivable securities | | 20 | | | 162 | | | | 278 | |
Available-for-sale securities | | 22 | | | 5,113 | | | | — | |
Macro hedge of interest rate risk | | | | | 1,171 | | | | 1,141 | |
Investment in subsidiary undertakings | | 23 | | | 2,184 | | | | 2,187 | |
Intangible assets | | 24 | | | 7 | | | | 3 | |
Property, plant and equipment | | 25 | | | 6 | | | | 5 | |
Deferred tax assets | | 26 | | | 20 | | | | 17 | |
Other assets | | 27 | | | 4 | | | | 43 | |
| | | | | | | | | | |
Total assets | | | | | 219,883 | | | | 222,059 | |
| | | | | | | | | | |
Liabilities | | | | | | | | | | |
Deposits by banks | | 28 | | | 114,535 | | | | 114,018 | |
Deposits by customers | | 29 | | | 10,599 | | | | 12,276 | |
Derivative financial instruments | | 15 | | | 34,088 | | | | 35,417 | |
Trading liabilities | | 30 | | | 21,109 | | | | 25,745 | |
Financial liabilities designated at fair value | | 31 | | | 4,002 | | | | 6,780 | |
Debt securities in issue | | 32 | | | 31,481 | | | | 23,869 | |
Other liabilities | | 33 | | | 166 | | | | 137 | |
Provisions | | 34 | | | 20 | | | | 20 | |
Current tax liabilities | | | | | 175 | | | | 320 | |
| | | | | | | | | | |
Total liabilities | | | | | 216,175 | | | | 218,582 | |
| | | | | | | | | | |
Equity | | | | | | | | | | |
Share capital | | 36 | | | 2,549 | | | | 2,549 | |
Retained earnings | | | | | 1,140 | | | | 914 | |
Other reserves | | | | | 19 | | | | 14 | |
| | | | | | | | | | |
Total shareholders equity | | | | | 3,708 | | | | 3,477 | |
| | | | | | | | | | |
Total liabilities and equity | | | | | 219,883 | | | | 222,059 | |
| | | | | | | | | | |
| (1) | As restated, see Note 45 |
| (2) | The Company financial statements and all related footnotes have not been audited under the standards of the Public Company Accounting Oversight Board. |
The accompanying Notes on pages 118 to 189 and the audited sections of the Risk Management Report on pages 28 to 98 form an integral part of these Consolidated Financial Statements.
The Financial Statements on pages 112 to 189 were approved and authorised for issue by the Board on 18 March 2013 and signed on its behalf by:
|
|
David Green |
| Director |
Company Registered Number 2338548
| | |
Abbey National Treasury Services plc 2012 Annual Report | | 115 |
Financial Statements
Primary Financial Statementscontinued
COMPANY STATEMENT OF CHANGES IN EQUITY
For the years ended 31 December 2012, 2011 and 2010
| | | | | | | | | | | | | | | | | | | | | | |
| | | | | | | | Other reserves | | | | | | | |
| | | Notes | | Share
Capital
£m | | | Available for
sale reserve
£m | | | Foreign
currency
translation
reserve
£m | | | Retained
earnings (1)
£m | | | Total (1, 2)
£m | |
1 January 2012 | | | | | 2,549 | | | | — | | | | 14 | | | | 914 | | | | 3,477 | |
Total comprehensive income: | | | | | | | | | | | | | | | | | | | | | | |
- Profit for the year | | | | | — | | | | — | | | | — | | | | 226 | | | | 226 | |
- Other comprehensive income for the year before tax | | | | | — | | | | 5 | | | | 1 | | | | — | | | | 6 | |
- Tax on other comprehensive income | | | | | — | | | | (1 | ) | | | — | | | | — | | | | (1 | ) |
| | | | | | | | | | | | | | | | | | | | | | |
| | | | | — | | | | 4 | | | | 1 | | | | 226 | | | | 231 | |
| | | | | | | | | | | | | | | | | | | | | | |
Dividends and other distributions | | | | | — | | | | — | | | | — | | | | — | | | | — | |
| | | | | | | | | | | | | | | | | | | | | | |
31 December 2012 | | | | | 2,549 | | | | 4 | | | | 15 | | | | 1,140 | | | | 3,708 | |
| | | | | | | | | | | | | | | | | | | | | | |
1 January 2011 | | | | | 2,549 | | | | — | | | | 14 | | | | 692 | | | | 3,255 | |
Total comprehensive income: | | | | | | | | | | | | | | | | | | | | | | |
- Profit for the year | | | | | — | | | | — | | | | — | | | | 222 | | | | 222 | |
| | | | | | | | | | | | | | | | | | | | | | |
| | | | | — | | | | — | | | | — | | | | 222 | | | | 222 | |
| | | | | | | | | | | | | | | | | | | | | | |
Dividends and other distributions | | | | | — | | | | — | | | | — | | | | — | | | | — | |
| | | | | | | | | | | | | | | | | | | | | | |
31 December 2011 | | | | | 2,549 | | | | — | | | | 14 | | | | 914 | | | | 3,477 | |
| | | | | | | | | | | | | | | | | | | | | | |
1 January 2010 | | | | | 2,549 | | | | — | | | | 15 | | | | 622 | | | | 3,186 | |
Total comprehensive income/(expense): | | | | | | | | | | | | | | | | | | | | | | |
- Profit for the year | | | | | — | | | | — | | | | — | | | | 670 | | | | 670 | |
- Other comprehensive income for the year before tax | | | | | — | | | | — | | | | (1 | ) | | | — | | | | (1 | ) |
- Tax on other comprehensive income | | | | | — | | | | — | | | | — | | | | — | | | | — | |
| | | | | | | | | | | | | | | | | | | | | | |
| | | | | — | | | | — | | | | (1 | ) | | | 670 | | | | 669 | |
| | | | | | | | | | | | | | | | | | | | | | |
Dividends and other distributions | | | | | — | | | | — | | | | — | | | | (600 | ) | | | (600 | ) |
| | | | | | | | | | | | | | | | | | | | | | |
31 December 2010 | | | | | 2,549 | | | | — | | | | 14 | | | | 692 | | | | 3,255 | |
| | | | | | | | | | | | | | | | | | | | | | |
| (1) | As restated, see Note 45 |
| (2) | The Company financial statements and all related footnotes have not been audited under the standards of the Public Company Accounting Oversight Board. |
The accompanying Notes on pages 118 to 189 and the audited sections of the Risk Management Report on pages 28 to 98 form an integral part of these Consolidated Financial Statements.
| | |
| 116 | | Abbey National Treasury Services plc 2012 Annual Report |
Financial Statements
Primary Financial Statementscontinued
COMPANY CASH FLOW STATEMENT
For the years ended 31 December 2012, 2011 and 2010
| | | | | | | | | | | | | | |
| | | Notes | | 2012(2)
£m | | | 2011(1, 2)
£m | | | 2010(2)
£m | |
Net cash flow from/(used in) operating activities | | | | | | | | | | | | | | |
Profit for the year | | | | | 226 | | | | 222 | | | | 670 | |
Adjustments for: | | | | | | | | | | | | | | |
Non cash items included in profit | | | | | 115 | | | | 137 | | | | 157 | |
Change in operating assets | | | | | 7,741 | | | | 26,374 | | | | 33,019 | |
Change in operating liabilities | | | | | (4,762 | ) | | | (31,385 | ) | | | (2,824 | ) |
Corporation taxes paid | �� | | | | (12 | ) | | | (13 | ) | | | (17 | ) |
Effects of exchange rate differences | | | | | (598 | ) | | | (685 | ) | | | 154 | |
| | | | | | | | | | | | | | |
Net cash flow from/(used in) operating activities | | 38 | | | 2,710 | | | | (5,350 | ) | | | 31,159 | |
| | | | | | | | | | | | | | |
Net cash flow (used in)/from investing activities | | | | | | | | | | | | | | |
Purchase of property, plant and equipment and intangible assets | | 24,25 | | | (9 | ) | | | (9 | ) | | | — | |
Proceeds from sale of property, plant and equipment and intangible assets | | | | | 2 | | | | 42 | | | | (40 | ) |
Investment in associate | | | | | 3 | | | | — | | | | — | |
Purchase of securities | | | | | (5,990 | ) | | | — | | | | — | |
Proceeds from sale and redemption of securities | | | | | 863 | | | | — | | | | — | |
| | | | | | | | | | | | | | |
Net cash flow (used in)/from investing activities | | | | | (5,131 | ) | | | 33 | | | | (40 | ) |
| | | | | | | | | | | | | | |
Net cash flow from/(used in) financing activities | | | | | | | | | | | | | | |
Issue of long term debt | | | | | 31,314 | | | | 38,607 | | | | 11,419 | |
Repayments of long term debt | | | | | (28,364 | ) | | | (40,307 | ) | | | (4,840 | ) |
Dividends paid | | | | | — | | | | — | | | | (600 | ) |
| | | | | | | | | | | | | | |
Net cash flow from/(used in) financing activities | | | | | 2,950 | | | | (1,700 | ) | | | 5,979 | |
| | | | | | | | | | | | | | |
Net (decrease)/increase in cash and cash equivalents | | | | | 529 | | | | (7,017 | ) | | | 37,098 | |
Cash and cash equivalents at beginning of the year | | | | | 79,747 | | | | 86,712 | | | | 49,327 | |
Effect of exchange rate changes on cash and cash equivalents | | | | | (876 | ) | | | 52 | | | | 287 | |
| | | | | | | | | | | | | | |
Cash and cash equivalents at the end of the year | | 38 | | | 79,400 | | | | 79,747 | | | | 86,712 | |
| | | | | | | | | | | | | | |
| (1) | As restated, see Note 45 |
| (2) | The Company financial statements and all related footnotes have not been audited under the standards of the Public Company Accounting Oversight Board. |
The accompanying Notes on pages 118 to 189 and the audited sections of the Risk Management Report on pages 28 to 98 form an integral part of these Consolidated Financial Statements.
| | |
Abbey National Treasury Services plc 2012 Annual Report | | 117 |
Financial Statements
Notes to the Financial Statements
1. ACCOUNTING POLICIES
These financial statements are prepared for Abbey National Treasury Services plc (the ‘Company’) and its subsidiaries (together, the ‘ANTS group’) under the Companies Act 2006. The principal activity of the ANTS group is to provide treasury, corporate and wholesale banking services. The ANTS group provides these services to UK clients and also to the wider Santander UK group, of which the ANTS group is a significant part. The ANTS group is also the treasury support function for the Santander UK group. In this regard, The ANTS group’s role is to provide access to financial markets and central bank facilities in order to meet the Santander UK group’s liquidity, funding, capital and balance sheet management requirements. As such, ANTS is one of the main debt issuance vehicles in the Santander UK group.
Abbey National Treasury Services plc is a public limited company, incorporated in England and Wales, having a registered office in England and is the holding company of the ANTS group as well as undertaking business transactions.
BASIS OF PREPARATION
These consolidated financial statements incorporate the financial statements of the Company and entities controlled by the Company (its subsidiaries) made up to 31 December each year. The financial statements have been prepared under the historical cost convention, as modified by the revaluation of available for sale financial assets, financial assets and financial liabilities held at fair value through profit or loss and all derivative contracts, and on the going concern basis of accounting as set out below.
Compliance with International Financial Reporting Standards
The ANTS group consolidated financial statements have been prepared in accordance with International Financial Reporting Standards as issued by the International Accounting Standards Board (‘IASB’), including interpretations issued by the IFRS Interpretations Committee (‘IFRIC’) of the IASB (together ‘IFRS’). The ANTS group has also complied with its legal obligation to comply with International Financial Reporting Standards as adopted by the European Union as there are no applicable differences between the two frameworks for the periods presented.
The Company financial statements have been prepared in accordance with International Financial Reporting Standards as adopted by the European Union, as applied in accordance with the provision of the Companies Act 2006.
Disclosures required by IFRS 7 ‘Financial Instruments: Disclosures’ relating to the nature and extent of risks arising from financial instruments can be found in the Risk Management Report on pages 28 to 98 which form an integral part of these financial statements.
Recent accounting developments
In 2012, the ANTS group adopted the following amendments to standards which became effective for financial years beginning on 1 January 2012.
| a) | IFRS 7 ‘Financial Instruments: Disclosures’ - In October 2010, the IASB issued amendments to IFRS 7 that increase the disclosure requirements for transactions involving transfers of financial assets. The amendments are intended to provide greater transparency around risk exposures when a financial asset is transferred but the transferor retains some level of continuing exposure in the asset. The amendments also require disclosures where transfers of financial assets are not evenly distributed throughout the period. The amendments to IFRS 7 are effective for annual periods beginning on or after 1 July 2011, with earlier application permitted. Disclosures are not required for comparative periods before the date of initial application of the amendments. The disclosures required by the amendment to IFRS 7 may be found on pages 151. |
| b) | There are a number of other changes to IFRS that were effective from 1 January 2012. Those changes did not have a significant impact on the ANTS group’s financial statements. |
Future accounting developments
The ANTS group has not yet adopted the following significant new or revised standards and interpretations, and amendments thereto, which have been issued but which are not yet effective for the ANTS group:
| a) | IAS 1 ‘Presentation of Financial Statements’ - In June 2011, the IASB issued amendments to IAS 1 that retain the option to present profit or loss and other comprehensive income in either a single statement or in two separate but consecutive statements. However, the amendments to IAS 1 require additional disclosures to be made in the other comprehensive income section such that items of other comprehensive income are grouped into two categories: (i) items that will not be reclassified subsequently to profit or loss; and (ii) items that will be reclassified subsequently to profit or loss when specific conditions are met. Income tax on items of other comprehensive income is required to be allocated on the same basis. The amendments to IAS 1 are effective for annual periods beginning on or after 1 July 2012. |
The ANTS group anticipates that IAS 1 (2011) will be adopted in the ANTS group’s financial statements for the annual period beginning on 1 January 2013 and that the application of the new Standard will modify the presentation of items of other comprehensive income accordingly. Retrospective application is required. The ANTS group does not anticipate that these amendments to IAS 1 will have a significant impact on the ANTS group’s disclosures.
| | |
| 118 | | Abbey National Treasury Services plc 2012 Annual Report |
Financial Statements
Notes to the Financial Statementscontinued
| b) | IFRS 10 ’Consolidated Financial Statements’, IFRS 11 ‘Joint Arrangements’, IFRS 12 ‘Disclosure of Interests in Other Entities’, IAS 27 ‘Separate Financial Statements’ and IAS 28 ‘Investments in Associates and Joint Ventures’ – In May 2011, the IASB issued new and amended guidance on consolidated financial statements and joint arrangements. IFRS 10, IFRS 11 and IFRS 12 were new standards issued while IAS 27 and IAS 28 were amended. Each of the standards issued is effective for annual periods beginning on or after 1 January 2013 with earlier application permitted as long as each of the other standards is also applied earlier. |
| | • | | Under IFRS 10 ‘Consolidated Financial Statements’, control is the single basis for consolidation, irrespective of the nature of the investee; this standard therefore eliminates the risks-and-rewards approach. IFRS 10 identifies the three elements of control as power over the investee, exposure, or rights, to variable returns from involvement with the investee and the ability to use power over the investee to affect the amount of the investor’s returns. An investor must possess all three elements to conclude that it controls an investee. The assessment of control is based on all facts and circumstances, and the conclusion is reassessed if there are changes to at least one of the three elements. Retrospective application is required subject to certain transitional provisions. |
| | • | | IFRS 11 applies to all entities that are parties to a joint arrangement. A joint arrangement is an arrangement of which two or more parties have joint control. IFRS 11 establishes two types of joint arrangements, joint operations and joint ventures, which are distinguished by the rights and obligations of the parties to the arrangement. In a joint operation, the parties to the joint arrangement (referred to as ‘joint operators’) have rights to the assets and obligations for the liabilities of the arrangement. By contrast, in a joint venture, the parties to the arrangement (referred to as ‘joint venturers’) have rights to the net assets of the arrangement. IFRS 11 requires that a joint operator recognise its share of the assets, liabilities, revenues, and expenses in accordance with applicable IFRSs; however, a joint venturer would account for its interest by using the equity method of accounting under IAS 28 (2011). Transitional provisions vary depending on how an interest is accounted for under IAS 31 and what its nature is under IFRS 11. |
| | • | | IFRS 12 integrates the disclosure requirements on interests in other entities, currently included in several standards to make it easier to understand and apply the disclosure requirements for subsidiaries, joint arrangements, associates and unconsolidated structured entities. The standard also contains additional requirements on a number of topics. Under IFRS 12, an entity should disclose information about significant judgements and assumptions (and any changes to those assumptions) made in determining whether it has control, joint control, or significant influence over another entity and the type of joint arrangement. IFRS 12 also requires additional disclosures to provide information to enable users to assess the nature of, and risks associated with the Company’s interests in other entities and the effect of those interests on the Company’s financial position, performance and cash flow. Disclosures shall be aggregated or disaggregated so that useful information is not obscured by either the inclusion of a large amount of insignificant detail or the aggregation of items that have different characteristics. The standard applies prospectively from the beginning of the annual period in which it is adopted. |
In June 2012, the IASB issued amendments to IFRS 10, IFRS 11 and IFRS 12 that clarify the transitional guidance in IFRS 10 Consolidated Financial Statements, IFRS 11 Joints Arrangements and IFRS 12 Disclosure of Interest in Other Entities. The amendments provide additional transition relief in IFRS 10, IFRS 11 and IFRS 12 by limiting the requirement to provide adjusted comparative information to only the preceding comparative period, and are in response to constituent requests for clarification on certain aspects of the transition guidance.
The ANTS group anticipates that IFRS 10, IFRS 11 and IFRS 12 will be adopted in the ANTS group’s financial statements for the annual period beginning on 1 January 2013. The ANTS group is still completing its analysis but does not anticipate that the application of the new standards will have a significant impact on its profit or loss or financial position but expects to enhance its disclosures around holdings of structured entities as a result of IFRS 12.
| | • | | IAS 27 was amended for the issuance of IFRS 10 but retains the current guidance on separate financial statements. |
| | • | | IAS 28 was amended for conforming changes on the basis of the issuance of IFRS 10 and IFRS 11. |
The ANTS group anticipates that IAS 27 (2011) and IAS 28 (2011) will be adopted in the Company’s financial statements for the annual period beginning on 1 January 2013. The ANTS group is still completing its analysis but does not anticipate that these amendments to IAS 27 and IAS 28 will have a significant impact on its disclosures and on amounts reported in respect of the ANTS group’s profit or loss, financial position or disclosures.
| c) | IFRS 13 ‘Fair Value Measurement’ - In May 2011, the IASB issued IFRS 13, which establishes a single source of guidance for fair value measurement. IFRS 13 defines fair value, establishes a framework for measuring fair value, and requires disclosures about fair value measurements. IFRS 13 applies to both financial instrument items and non-financial instrument items for which other IFRSs require or permit fair value measurements and disclosures about fair value measurements, except in specified circumstances. In general, the disclosure requirements in IFRS 13 are more extensive than those required in the current accounting standards. IFRS 13 is effective for annual periods beginning on or after 1 January 2013, with early adoption permitted, and applies prospectively from the beginning of the annual period in which it is adopted. |
The ANTS group anticipates that IFRS 13 will be adopted in the ANTS group’s financial statements for the annual period beginning on 1 January 2013. The ANTS group is still completing its analysis but does not anticipate that the application of the new standards will have a significant impact on its profit or loss, financial position or disclosures.
| | |
Abbey National Treasury Services plc 2012 Annual Report | | 119 |
Financial Statements
Notes to the Financial Statementscontinued
| d) | IFRS 9 ‘Financial Instruments’ - In November 2009, the IASB issued IFRS 9 ‘Financial Instruments (‘IFRS 9’) which introduced new requirements for the classification and measurement of financial assets. In October 2010, the IASB issued an amendment to IFRS 9 incorporating requirements for financial liabilities. Together, these changes represent the first phase in the IASB’s planned replacement of IAS 39 ‘Financial Instruments: Recognition and Measurement’ (‘IAS 39’) with a less complex and improved standard for financial instruments. |
Following the IASB’s decision in December 2011 to defer the effective date, the standard is effective for annual periods beginning on or after 1 January 2015 with early adoption permitted. IFRS 9 is required to be applied retrospectively but prior periods need not be restated.
The second and third phases in the IASB’s project to replace IAS 39 will address impairment of financial assets measured at amortised cost and hedge accounting.
The IASB re-opened the requirements for classification and measurement in IFRS 9 in 2012 to address practice and other issues, with an exposure draft of revised proposals issued in November 2012.
The ANTS group anticipates that IFRS 9 will be adopted in the ANTS group’s financial statements for the annual period beginning on 1 January 2015 and that the application of the new Standard may have a significant impact on amounts reported in respect of the ANTS group’s financial assets and financial liabilities. However, it is not practicable to provide a reasonable estimate of that effect until a detailed review has been completed.
| e) | IAS 19 ‘Employee Benefits’ - In June 2011, the IASB issued amendments to IAS 19 that change the accounting for defined benefit plans and termination benefits. The most significant change relates to the accounting for changes in defined benefit obligations and plan assets. The amendments require the recognition of changes in defined benefit obligations and in fair value of plan assets when they occur, and hence eliminate the ‘corridor approach’ permitted under the previous version of IAS 19 and accelerate the recognition of past service costs. The amendments require all actuarial gains and losses to be recognised immediately through other comprehensive income in order for the net pension asset or liability recognised in the consolidated statement of financial position to reflect the full value of the plan deficit or surplus. The amendments to IAS 19 are effective for annual periods beginning on or after 1 January 2013 and require retrospective application with certain exceptions. |
The ANTS group anticipates that IAS 19 (2011) will be adopted in the ANTS group’s financial statements for the annual period beginning on 1 January 2013. The ANTS group does not anticipate that these amendments to IAS 19 will have a significant impact on its profit or loss or financial position as the ANTS group does not account for any of its employee benefits as defined benefit plans.
| f) | In December 2011, the IASB issued amendments to IFRS 7 ‘Disclosures - Offsetting Financial Assets and Financial Liabilities’ which requires the disclosures about the effect or potential effects of offsetting financial assets and financial liabilities and related arrangements on an entity’s financial position. The amendments are effective for annual periods beginning on or after 1 January 2013 and interim periods within those annual periods. The amendments are required to be applied retrospectively. |
| g) | In December 2011, the IASB issued amendments to IAS 32 ‘Offsetting Financial Assets and Financial Liabilities’ which clarified the requirements for offsetting financial instruments and addressed inconsistencies in current practice when applying the offsetting criteria in IAS 32 ‘Financial Instruments: Presentation’. The amendments are effective for annual periods beginning on or after 1 January 2014 with early adoption permitted and are required to be applied retrospectively. |
The ANTS group is currently assessing the impact of these clarifications but it is not practicable to quantify the effect as at the date of the publication of these financial statements.
| h) | There are a number of other standards which have been issued or amended that are expected to be effective in future periods. However, it is not practicable to provide a reasonable estimate of their effects on the ANTS group’s financial statements until a detailed review has been completed. |
b) Comparative information
As required by US public company reporting requirements, these Consolidated Financial Statements include two years of comparative information for the consolidated income statement, consolidated statement of comprehensive income, consolidated statement of changes in equity, consolidated statement of cash flows and related Notes.
GOING CONCERN
The ANTS group’s objectives, policies and processes for managing its capital are described in Note 44. Details of the ANTS group’s financial risk management objectives, its financial instruments and hedging activities; and its exposures to credit risk, interest rate risk, liquidity risk, operational risk and other risks are set out in the Risk Management Report on pages 28 to 98.
The ANTS group is reliant on Santander UK plc and other companies in the Santander UK group of companies (‘Santander UK’) for a significant proportion of its funding. The Santander UK Board has confirmed that Santander UK plc is a going concern, and that it will provide funding to the ANTS group for the foreseeable future. In giving this commitment to provide funding to the ANTS group, the Santander UK Board has considered the uncertainties that affect the ANTS group when preparing the forecasts and budgets of the combined business of Santander UK.
| | |
| 120 | | Abbey National Treasury Services plc 2012 Annual Report |
Financial Statements
Notes to the Financial Statementscontinued
The Company has given a full and unconditional guarantee in respect of the unsubordinated liabilities of Santander UK plc incurred prior to 30 June 2015 under a deed poll guarantee entered into by the Company on 10 May 2012. Santander UK plc has given a reciprocal guarantee in respect of the unsubordinated liabilities of the Company incurred prior to 30 June 2015.
The Company, Santander UK plc, and Cater Allen Limited, which are the three FSA-regulated entities within the Santander UK group, are party to a capital support deed dated 14 December 2012 (the “Capital Support Deed”) with certain other non-regulated subsidiaries of Santander UK plc. The parties to the Capital Support Deed constitute a core UK group for the purposes of section 10 of the Prudential Sourcebook for Banks, Building Societies and Investment Firms (“BIPRU”) of the FSA Handbook. Under section 10.8 of BIPRU, exposures of each of the three regulated entities to other members of the core UK group are exempt from large exposure limits that would otherwise apply. The purpose of the Capital Support Deed is to facilitate the prompt transfer of available capital resources from, or repayment of liabilities by, the non-regulated parties to any of the regulated parties in the event that one of the regulated parties has breached or is at risk of breaching its capital resources requirements or risk concentrations requirements.
In addition, the Company, Santander UK plc, and Cater Allen Limited are party to a defined liquidity group liquidity facility agreement dated 28 May 2010 (the “DLG Facility Agreement”). The DLG Facility Agreement supports a defined liquidity group for the purposes of section 12 of BIPRU. Section 12.8 of BIPRU permits a member of a defined liquidity group to rely on the liquid resources of other members of the defined liquidity group to comply with the liquidity adequacy requirements under section 12 of BIPRU. Under the DLG Facility Agreement, each party agrees to lend, subject to certain conditions and limitations, its excess liquidity to each other party.
After making enquiries, the Directors have a reasonable expectation that the Company and the ANTS group have adequate resources to continue in operational existence for the foreseeable future. Accordingly, they continue to adopt the going concern basis of accounting in preparing the financial statements.
CONSOLIDATION
Subsidiaries, which are those companies and other entities (including Special Purpose Entities (‘SPEs’)) over which the ANTS group, directly or indirectly, has power to govern the financial and operating policies, are consolidated. The existence and effect of potential voting rights that are currently exercisable or currently convertible are considered when assessing whether the ANTS group controls another entity. The Company recognises investments in subsidiaries at cost less impairment.
Subsidiaries are consolidated from the date on which control is transferred to the ANTS group and are no longer consolidated from the date that control ceases. The acquisition method of accounting is used to account for the acquisition of subsidiaries. The cost of an acquisition is measured at the fair value of the assets given up, shares issued or liabilities undertaken at the date of acquisition. Acquisition related costs are expensed as incurred. The excess of the cost of acquisition, as well as the fair value of any interest previously held, over the fair value of the ANTS group’s share of the identifiable net assets of the acquired subsidiary, associate or business at the date of acquisition is recorded as goodwill. Inter-company transactions, balances and unrealised gains on transactions between ANTS group companies are eliminated; unrealised losses are also eliminated unless the cost cannot be recovered. The accounting reference date of the Company and its subsidiary undertakings is 31 December, with the exception of those investment and funding companies which, because of commercial considerations, have various accounting reference dates. The Financial Statements of these subsidiaries have been consolidated on the basis of interim Financial Statements for the period to 31 December.
In the context of SPE’s, the following circumstances may indicate a relationship in which, in substance, the ANTS group controls and consequently consolidates an SPE:
| • | | the activities of the SPE are being conducted on behalf of the ANTS group according to the ANTS group’s specific business needs so that it obtains benefits from the SPE’s operation; |
| • | | the ANTS group has the decision-making powers to obtain the majority of the benefits of the activities of the SPE or, by setting up an ‘autopilot’ mechanism, the ANTS group has delegated those decision-making powers; |
| • | | the ANTS group has rights to obtain the majority of the benefits of the SPE and therefore may be exposed to risks arising from the activities of the SPE; or |
| • | | the ANTS group retains the majority of the residual or ownership risks related to the SPE or its assets in order to obtain benefits from its activities. |
Assessments of control are made based on the initial arrangements in place, but these are reconsidered if there are subsequent changes to the substance of the arrangements, such as the nature of the ANTS group’s involvement, the contractual arrangements or the governing rules of the SPE.
Transactions between entities under common control are outside the scope of IFRS 3 - Business Combinations, and there is no other guidance for such situations under IFRS. The ANTS group elects to account for transactions between entities under common control for cash consideration in a manner consistent with the approach under IFRS 3, unless the transaction represents a reorganisation of entities within the ANTS group, in which case the transaction is accounted for at its historical cost.
| | |
Abbey National Treasury Services plc 2012 Annual Report | | 121 |
Financial Statements
Notes to the Financial Statementscontinued
FOREIGN CURRENCY TRANSLATION
Items included in the Financial Statements of each entity (including foreign branch operations) in the ANTS group are measured using the currency that best reflects the economic substance of the underlying events and circumstances relevant to that entity (‘the functional currency’). The Consolidated Financial Statements are presented in pounds sterling, which is the functional currency of the parent.
Income statements and cash flows of foreign entities are translated into the ANTS group’s reporting currency at average exchange rates for the year and their balance sheets are translated at the exchange rates ruling on 31 December. Exchange differences arising from the translation of the net investment in foreign entities are taken to shareholders’ equity. When a foreign entity is sold, such exchange differences are recognised in the income statement as part of the gain or loss on sale.
Foreign currency transactions are translated into the functional currency of the entity involved at the exchange rates prevailing at the dates of the transactions. Foreign exchange gains and losses resulting from the settlement of such transactions and from the translation of monetary assets and liabilities denominated in foreign currencies are recognised in the income statement unless recognised in other comprehensive income in connection with a cash flow hedge.
The amount of exchange rate differences recognised in profit or loss on items not at fair value through profit and loss was £649m income (2011: £526m income). This was partially offset by charges on items held at fair value.
REVENUE RECOGNITION
(a) Interest income and expense
Interest income on financial assets that are classified as loans and receivables and interest expense on financial liabilities other than those at fair value through profit and loss are determined using the effective interest method. The effective interest rate is the rate that discounts the estimated future cash payments or receipts over the expected life of the instrument or when appropriate a shorter period to the net carrying amount of the financial asset or financial liability. When calculating the effective interest rate the future cash flows are estimated after considering all the contractual terms of the instrument excluding future credit losses. The calculation includes all amounts paid or received by the ANTS group that are an integral part of the overall return direct incremental transaction costs related to the acquisition issue or disposal of the financial instrument and all other premiums or discounts. Interest income on assets classified as loans and receivables, interest expense on liabilities classified at amortised cost and interest income and expense on hedging derivatives are recognised in interest and similar income and interest expense and similar charges in the income statement.
In accordance with IFRS, the ANTS group recognises interest income on assets after they have been written down as a result of an impairment loss. Interest continues to be accrued on all loans, and the element of interest that is not anticipated to be recovered is provided for.
(b) Fee and commission income
Fees and commissions that are not an integral part of the effective interest rate are recognised when the service is provided. Fee and commission income which forms an integral part of the effective interest rate of a financial instrument (for example, certain loan commitment fees) is recognised as an adjustment to the effective interest rate and recorded in ‘Interest income’ (See (a) above).
(c) Dividend income
Except for equity securities classified as trading assets or financial assets held at fair value through profit or loss, described below, dividend income is recognised when the right to receive payment is established. This is the ex-dividend date for equity securities.
(d) Net trading and other income
Net trading and other income comprises all gains and losses from changes in the fair value of financial assets and liabilities held at fair value through profit or loss (including financial assets and financial liabilities held for trading and designated as fair value through profit or loss), together with related interest income, expense and dividends. It also includes income from operating lease assets, and profits/(losses) on the sales of property, plant and equipment and intangible assets and subsidiary undertakings.
Changes in the fair value of financial assets and liabilities held for trading, including trading derivatives, are recognised in the income statement as net trading and other income together with dividends and interest income and expense. Changes in the fair value of assets and liabilities designated as fair value through profit or loss are recognised in net trading and other income together with dividends, accrued interest income and expense and changes in fair value of derivatives managed in conjunction with these assets and liabilities. Changes in fair value of derivatives in a hedging relationship are recognised in net trading and other income along with the fair value of the hedged item if designated in a fair value hedge or macro hedging relationship.
| | |
| 122 | | Abbey National Treasury Services plc 2012 Annual Report |
Financial Statements
Notes to the Financial Statementscontinued
BORROWING COSTS
Borrowing costs directly attributable to the acquisition, construction or production of qualifying assets, including computer software, which are assets that necessarily take a substantial period of time to develop for their intended use, are added to the cost of those assets, until such time as the assets are substantially ready for their intended use. All other borrowing costs are recognised in profit or loss in the period in which they occur.
PENSIONS AND OTHER POST RETIREMENT BENEFITS
The ANTS group participates in various Santander UK group defined benefit and defined contribution pension schemes in operation. Details of the schemes are disclosed in the Annual Report and Accounts of Santander UK plc. There is no contractual agreement or stated policy for charging the net defined benefit cost of the Santander UK defined benefit schemes. Therefore in accordance with IAS 19 the defined benefit asset or liability has been recognised in the financial statements of the sponsoring employer of the scheme and the ANTS group accounts for its contributions as a defined contribution scheme. The contribution to be paid by the ANTS group is calculated as the contributions made by Santander UK plc to the schemes in respect of the ANTS group’s employees.
INTANGIBLE ASSETS
Software development costs are capitalised when they are direct costs associated with identifiable and unique software products that are expected to provide future economic benefits and the cost of these products can be measured reliably. These costs include payroll, the costs of materials and services, and directly attributable overheads. Internally developed software meeting these criteria and externally purchased software are classified in intangible assets on the balance sheet and amortised on a straight-line basis over their useful life of 3 years, unless the software is an integral part of the related computer hardware, in which case it is treated as property, plant and equipment as described below. Capitalisation of costs cease when the software is capable of operating as intended. Costs associated with maintaining software programmes are expensed as incurred.
PROPERTY, PLANT AND EQUIPMENT
Property, plant and equipment include owner-occupied properties (including leasehold properties), office fixtures and equipment and computer software. Property, plant and equipment are carried at cost less accumulated depreciation and accumulated impairment losses. A review for indications of impairment is carried out at each reporting date. Gains and losses on disposal are determined by reference to the carrying amount and are reported in net trading and other income. Repairs and renewals are charged to the income statement when the expenditure is incurred.
Internally developed software meeting the criteria set out in “intangible assets” and externally purchased software are classified in property, plant and equipment on the balance sheet where the software is an integral part of the related computer hardware. Classes of property, plant and equipment are depreciated on a straight-line basis over their useful life as follows:
| | |
Owner-occupied properties | | Not exceeding 50 years |
Office fixtures and equipment | | 5 to 8 years |
Computer software | | 3 years |
Depreciation is not charged on freehold land and assets under construction.
FINANCIAL ASSETS
The ANTS group classifies its financial assets as: financial assets at fair value through profit or loss, loans and receivables and held-to-maturity financial assets. Management determines the classification of its investments at initial recognition. Financial assets that are classified at fair value through profit or loss, which have not been designated as such or are not accounted for as derivatives, may subsequently in rare circumstances, be reclassified from the fair value through profit or loss category to the loans and receivables, available for sale or held to maturity categories.
In order to meet the criteria for reclassification, the asset must no longer be held for the purpose of selling or repurchasing in the near term and must also meet the definition of the category into which it is to be reclassified had it not been required to classify it at fair value through profit or loss at initial recognition. The reclassified value is the fair value of the asset at the date of reclassification. The ANTS group has not utilised this option and therefore has not reclassified any assets from the fair value through profit or loss category that were classified as such at initial recognition.
| | |
Abbey National Treasury Services plc 2012 Annual Report | | 123 |
Financial Statements
Notes to the Financial Statementscontinued
(a) Financial assets at fair value through profit or loss
Financial assets are classified as fair value through profit or loss if they are either held for trading or otherwise designated at fair value through profit or loss on initial recognition. A financial asset is classified as held for trading if it is a derivative or it is acquired principally for the purpose of selling in the near term, or forms part of a portfolio of financial instruments that are managed together and for which there is evidence of short-term profit taking.
In certain circumstances financial assets other than those that are held for trading are designated at fair value through profit or loss where this results in more relevant information because it significantly reduces a measurement inconsistency that would otherwise arise from measuring assets or recognising the gains or losses on them on a different basis, where the assets are managed and their performance evaluated on a fair value basis, or where a financial asset contains one or more embedded derivatives which are not closely related to the host contract.
Trading assets, derivative financial instruments (except where in a hedging relationship) and financial assets designated at fair value are classified as fair value through profit or loss. They are derecognised when the rights to receive cash flows from the asset have expired or when the ANTS group has transferred substantially all the risks and rewards of ownership.
(b) Loans and receivables
Loans and receivables are non-derivative financial assets with fixed or determinable payments, that are not quoted in an active market and which are not classified as available for sale or fair value through profit or loss. They arise when the ANTS group provides money or services directly to a customer with no intention of trading the loan. Loans and receivables are initially recognised at fair value including direct and incremental transaction costs. They are subsequently valued at amortised cost, using the effective interest method. They are derecognised when the rights to receive cash flows have expired or the ANTS group has transferred substantially all of the risks and rewards of ownership. Loans and receivables consist of loans and advances to banks and loans and advances to customers and Loans and receivables securities.
c) Available-for-sale financial assets
Available-for-sale financial assets are non-derivative financial assets that are designated as available-for-sale and are not categorised into any of the other categories described. They are initially recognised at fair value including direct and incremental transaction costs. They are subsequently held at fair value. Gains and losses arising from changes in fair value are recognised in other comprehensive income until sale when the cumulative gain or loss is transferred to the income statement. Where the financial asset is interest-bearing, interest is determined using the effective interest method.
Income on investments in equity shares, debt instruments and other similar interests is recognised in the income statement as and when dividends are declared and interest is accrued. Impairment losses and foreign exchange translation differences on monetary items are recognised in the income statement. The investments are derecognised when the rights to receive cash flows have expired or the ANTS group has transferred substantially all the risks and rewards of ownership.
(d) Held to maturity investments
Held to maturity investments are non-derivative financial assets with fixed or determinable payments and fixed maturity that an entity has the positive intention and ability to hold to maturity. Held to maturity investments are initially recognised at fair value including direct and incremental transaction costs. They are subsequently valued at amortised cost, using the effective interest method. They are derecognised when the rights to receive cash flows have expired or the ANTS group has transferred substantially all of the risks and rewards of ownership. Were the ANTS group to sell other than an insignificant amount of held to maturity assets, the entire category would be tainted and reclassified as available for sale.
The ANTS group does not hold any held to maturity financial assets.
VALUATION OF FINANCIAL INSTRUMENTS
Financial instruments that are classified at fair value through profit or loss (‘FVTPL’) including those held for trading purposes and all derivatives are stated at fair value. The fair value of such financial instruments is the estimated amount at which the instrument could be exchanged in a current transaction between knowledgeable willing parties other than in a forced or liquidation sale.
Changes in the valuation of such financial instruments, including derivatives, are included in the line item ‘Net trading and other income’ in the income statement or in ‘Other comprehensive income’ in the statement of comprehensive income as applicable.
(a) Initial measurement
The best evidence of the fair value of a financial instrument at initial recognition is the transaction price unless the valuation is evidenced by comparison with other observable current market transactions in the same instrument or based on a valuation technique whose variables include significant data from observable markets. Any difference between the transaction price and the value based on a valuation technique where the inputs are not based on data from observable current markets is not recognised in profit or loss on initial recognition. Subsequent gains or losses are only recognised to the extent that they arise from a change in a factor that market participants would consider in setting a price.
| | |
| 124 | | Abbey National Treasury Services plc 2012 Annual Report |
Financial Statements
Notes to the Financial Statementscontinued
(b) Subsequent measurement
The ANTS group applies the following fair value hierarchy that prioritises the inputs to valuation techniques used in measuring fair value. The hierarchy establishes three categories for valuing financial instruments, giving the highest priority to unadjusted quoted prices in active markets for identical assets or liabilities and the lowest priority to unobservable inputs. The three categories are: quoted prices in active markets (Level 1); internal models based on observable market data (Level 2); and internal models based on other than observable market data (Level 3). If the inputs used to measure an asset or a liability fall to different levels within the hierarchy, the classification of the entire asset or liability will be based on the lowest level input that is significant to the overall fair value measurement of the asset or liability.
The ANTS group categorises assets and liabilities measured at fair value within the fair value hierarchy based on the inputs to the valuation techniques as follows:
| | |
Level 1: | | Unadjusted quoted prices for identical assets or liabilities in an active market that the ANTS group has the ability to access at the measurement date. Level 1 positions include debt securities, equity securities, exchange traded derivatives and short positions in securities. |
| |
Level 2: | | Quoted prices in markets that are not active, quoted prices for similar assets or liabilities, recent market transactions, inputs other than quoted market prices for the asset or liability that are observable either directly or indirectly for substantially the full term, and inputs to valuation techniques that are derived principally from or corroborated by observable market data through correlation or other statistical means for substantially the full term of the asset or liability. Level 2 positions include loans and advances to banks, loans and advances to customers, equity securities, exchange rate derivatives, interest rate derivatives, equity and credit derivatives, debt securities, deposits by banks, deposits by customers and debt securities in issue. |
| |
Level 3: | | Inputs to the pricing or valuation techniques that are significant to the overall fair value measurement of the asset or liability are unobservable. Level 3 positions include equity securities, exchange rate derivatives, equity and credit derivatives, loans and advances to customers, debt securities, and debt securities in issue. |
The ANTS group assesses active markets for equity instruments based on the average daily trading volume both in absolute terms and relative to the market capitalisation for the instrument. The ANTS group assesses active markets for debt instruments based on both the average daily trading volume and the number of days with trading activity. The ANTS group assesses active markets for exchange traded derivatives based on the average daily trading volume both in absolute terms and relative to the market capitalisation for the instrument.
Market activity and liquidity is discussed in the relevant monthly Risk Forum as well as being part of the daily update given by each business at the start of the trading day. This information, together with the observation of active trading and the magnitude of the bid/offer spreads allow consideration of the liquidity of a financial instrument. Underlying assets and liabilities are reviewed to consider the appropriate adjustment to mark the mid price reported in the trading systems to a realisable value.
This process takes into account the liquidity of the position in the size of the adjustment required. These liquidity adjustments are presented and discussed at the monthly Risk Forum.
In determining the appropriate measurement levels, the ANTS group performs regular analyses on the assets and liabilities. Underlying assets and liabilities are regularly reviewed to determine whether a position should be regarded as illiquid; the most important practical consideration being the observability of trading. Where the bid-offer spread is observable, this is tested against actual trades. Changes in the observability of significant valuation inputs during the reporting period may result in a reclassification of certain assets and liabilities within the fair value hierarchy.
Financial instruments valued using observable market prices
If a quoted market price in an active market is available for an instrument, the fair value is calculated as the current bid price multiplied by the number of units of the instrument held.
Financial instruments valued using a valuation technique
In the absence of a quoted market price in an active market, management uses internal models to make its best estimate of the price that the market would set for that financial instrument. In order to make these estimations, various techniques are employed, including extrapolation from observable market data and observation of similar financial instruments with similar characteristics. Wherever possible, valuation parameters for each product are based on prices directly observable in active markets or that can be derived from directly observable market prices. Valuation parameters for each type of financial instrument are discussed in Note 43.
Unrecognised gains as a result of the use of valuation models using unobservable inputs (“Day One profits”)
The timing of recognition of deferred day one profit and loss is determined individually. It is deferred until either the instrument’s fair value can be determined using market observable inputs or is realised through settlement. The financial instrument is subsequently measured at fair value adjusted for the deferred day one profit and loss. Subsequent changes in fair value are recognised immediately in the consolidated income statement without immediate reversal of deferred day one profits and losses.
| | |
Abbey National Treasury Services plc 2012 Annual Report | | 125 |
Financial Statements
Notes to the Financial Statementscontinued
“REGULAR WAY” PURCHASES OF FINANCIAL ASSETS AND ISSUES OF FINANCIAL LIABILITIES
A regular way purchase is a purchase of a financial asset under a contract whose terms require delivery of the asset within the timeframe established generally by regulation or convention in the market place concerned.
Regular way purchases of financial assets classified as loans and receivables are recognised on settlement date; all other regular way purchases are recognised on trade date. The assets are derecognised when the rights to receive cash flows have expired or the ANTS group has transferred substantially all the risks and rewards of ownership.
Issues of equity or financial liabilities measured at amortised cost are recognised on settlement date; all other regular way issues are recognised on trade date. The liabilities are derecognised when extinguished.
OFFSETTING FINANCIAL ASSETS AND LIABILITIES
Financial assets and liabilities including derivatives are offset and the net amount reported in the balance sheet when there is a legally enforceable right to set off the recognised amounts and there is an intention to settle on a net basis or realise the asset and settle the liability simultaneously.
The ANTS group is party to a number of arrangements, including master netting arrangements under industry standard agreements which facilitate netting of transactions in jurisdictions where netting agreements are recognised and have legal force. The netting arrangements do not generally result in an offset of balance sheet assets and liabilities for accounting purposes, as transactions are usually settled on a gross basis.
SALE AND REPURCHASE AGREEMENTS (INCLUDING STOCK BORROWING AND LENDING)
Securities sold subject to a commitment to repurchase them at a predetermined price (‘repos’) under which substantially all the risks and rewards of ownership are retained by the ANTS group remain on the balance sheet as trading assets and a liability is recorded in trading liabilities in respect of the consideration received. Securities purchased under commitments to resell (‘reverse repos’) are not recognised on the balance sheet and the consideration paid is recorded in trading assets. The difference between the sale and repurchase price is treated as trading income in the income statement.
Securities lending and borrowing transactions are generally secured, with collateral taking the form of securities or cash advanced or received. Securities lent or borrowed are not reflected on the balance sheet. Collateral in the form of cash received or advanced is recorded as a deposit or a loan. Collateral in the form of securities is not recognised.
DERIVATIVE FINANCIAL INSTRUMENTS
Derivative financial instruments (‘derivatives’) are contracts or agreements whose value is derived from one or more underlying indices or asset values inherent in the contract or agreement, which require no or little initial net investment and are settled at a future date. Transactions are undertaken in interest rate, cross currency, equity, residential property and other index-related swaps, forwards, caps, floors, swaptions, as well as credit default and total return swaps, equity index contracts and exchange traded interest rate futures, and equity index options.
Derivatives are held for trading or for risk management purposes. Derivatives are classified as held for trading unless they are designated as being in a hedge relationship. The ANTS group chooses to designate certain derivatives as in a hedging relationship if they meet specific criteria, as further described within ‘hedge accounting’ below.
Derivatives are recognised initially (on the date on which a derivative contract is entered into), and are subsequently remeasured, at their fair value. Fair values of exchange-traded derivatives are obtained from quoted market prices. Fair values of over-the-counter derivatives are obtained using valuation techniques, including discounted cash flow and option pricing models.
Derivatives may be embedded in other financial instruments, such as the conversion option in a convertible bond. Embedded derivatives are treated as separate derivatives when their economic characteristics and risks are not closely related to those of the host contract; the terms of the embedded derivative would meet the definition of a stand-alone derivative if they were contained in a separate contract; and the combined contract is not held for trading or designated at fair value. These embedded derivatives are measured at fair value with changes in fair value recognised in the income statement. Contracts containing embedded derivatives are not subsequently reassessed for separation unless either there has been a change in the terms of the contract which significantly modifies the cash flows (in which case the contract is reassessed at the time of modification) or the contract has been reclassified (in which case the contract is reassessed at the time of reclassification).
All derivatives are carried as assets when their fair value is positive and as liabilities when their fair value is negative, except where netting is permitted.
The method of recognising fair value gains and losses depends on whether derivatives are held for trading or are designated as hedging instruments and, if the latter, the nature of the risks being hedged. All gains and losses from changes in the fair value of derivatives held for trading are recognised in the income statement, and included within net trading and other income.
| | |
| 126 | | Abbey National Treasury Services plc 2012 Annual Report |
Financial Statements
Notes to the Financial Statementscontinued
HEDGE ACCOUNTING
In certain circumstances, derivatives may be designated as hedges and classified as: (i) hedges of the change in fair value of recognised assets or liabilities or firm commitments (‘fair value hedges’); (ii) hedges of the variability in highly probable future cash flows attributable to a recognised asset or liability, or a forecast transaction (‘cash flow hedges’); or (iii) a hedge of a net investment in a foreign operation (‘net investment hedges’). The ANTS group enters into derivatives as fair value hedges, but not as cash flow hedges or net investment hedges. Hedge accounting is used for derivatives designated in this way provided certain criteria are met.
At the time a financial instrument is designated as a hedge (i.e., at the inception of the hedge), the ANTS group formally documents the relationship between the hedging instrument(s) and hedged item(s), its risk management objective and strategy for undertaking the hedge. The documentation includes the identification of each hedging instrument and respective hedged item, the nature of the risk being hedged (including the benchmark interest rate being hedged in a hedge of interest rate risk) and how the hedging instrument’s effectiveness in offsetting the exposure to changes in the hedged item’s fair value attributable to the hedged risk is to be assessed. Accordingly, the ANTS group formally assesses, both at the inception of the hedge and on an ongoing basis, whether the hedging derivatives have been and will be highly effective in offsetting changes in the fair value attributable to the hedged risk during the period that the hedge is designated. A hedge is normally regarded as highly effective if, at inception and throughout its life, the ANTS group can expect, and actual results indicate, that changes in the fair value of the hedged items are effectively offset by changes in the fair value of the hedging instrument.
The main derivatives held for risk management purposes are interest rate and cross-currency swaps, which are used to hedge fixed-rate lending and structured savings products and medium-term note issuances, capital issuances and other capital markets funding. The ANTS group discontinues hedge accounting when it is determined that: a derivative is not, or has ceased to be, highly effective as a hedge; when the derivative expires, or is sold, terminated or exercised; or when the hedged item matures or is sold or repaid. On discontinuance of hedge accounting, amortisation of the adjustment to the hedged item is included in net trading and other income.
The hedge adjustment for fair value hedges is classified in the balance sheet in the same category as the hedged item, unless it relates to a macro hedging relationship where the hedge adjustment is recognised as a macro hedge on the face of the balance sheet. For fair value hedges, changes in the fair value of the hedging instrument and hedged item are recognised in net trading and other income. Hedge ineffectiveness represents the amount by which the changes in the fair value of the hedging derivative differ from changes in the fair value of the hedged item. Such gains and losses are recorded in current period profit and loss within net trading and other income.
Gains and losses on components of a hedging derivative that are not part of the hedging relationship and are therefore excluded from the hedge effectiveness assessment are also included in net trading and other income.
IMPAIRMENT OF FINANCIAL ASSETS
At each balance sheet date the ANTS group assesses whether, as a result of one or more events occurring after initial recognition, there is objective evidence that a financial asset or group of financial assets classified as loans and receivables, available-for-sale or loans and receivables securities have become impaired. Evidence of impairment varies across different portfolios and may include indications that the borrower or group of borrowers have defaulted, are experiencing significant financial difficulty, or the debt has been restructured potentially reducing the burden to the borrower. Impairment losses are recorded as charges in the income statement and the carrying amount of the financial asset or group of financial assets is reduced by establishing an impairment loss allowance. Impairment loss allowances are maintained at the level that management deems sufficient to absorb probable incurred losses in the ANTS group’s loans. Losses expected from future events are not recognised.
Impairment losses are assessed individually for financial assets that are individually significant and individually or collectively for assets that are not individually significant. An impairment loss allowance for incurred observed losses is established for all past due loans after a specified period of repayment default where it is probable that some of the capital or interest will not be repaid or recovered through enforcement of any applicable security. An allowance for incurred inherent losses is established for loans for which no evidence of loss has been specifically identified on an individual basis because the loans are not yet past due (i.e. incurred but not observed (‘IBNO’)) but are known from past experience to have deteriorated since the initial decision to lend was made. An example of this situation is where a borrower has not yet missed a payment but is experiencing financial difficulties at the reporting date, e.g. due to loss of employment or divorce. In these circumstances, an inherent loss had been incurred at the reporting date.
Impairment loss allowances for loans and advances, less amounts released and recoveries of amounts written off are charged to the line item ‘Impairment losses on loans and advances’ in the income statement. The impairment loss allowances are deducted from the ‘Loans and advances to banks’, ‘Loans and advances to customers’ and ‘Loans and receivables securities’ line items on the balance sheet.
| | |
Abbey National Treasury Services plc 2012 Annual Report | | 127 |
Financial Statements
Notes to the Financial Statementscontinued
(i) Corporate assets
Corporate assets are assessed either individually or collectively for impairment. An impairment loss is incurred if there is objective evidence that a loss event has occurred since initial recognition of the assets that has an impact on the estimated future cash flows of the assets.
Potential indicators of loss events
Potential indicators of loss events which may be evidence of financial difficulty for a corporate borrower may include the borrower notifying the ANTS group of current or likely financial distress; corporate results not meeting forecasts, missed repayments, requests for additional funding; breaches of covenants and changes in business plans.
Individual assessment
Impairment reviews are conducted monthly for individually significant assets:
| • | | where an asset has a payment default which has been outstanding for 90 days or more; |
| • | | where non-payment defaults have occurred and/or where it has become evident that a restructuring exercise will be undertaken; or |
| • | | where it has become evident that the value of any security is no longer considered adequate. |
In such situations the asset is transferred to the Corporate Banking Restructuring & Recoveries team. As part of their impairment reviews, an assessment is undertaken of the expected future cash flows (including a revaluation of collateral held) in relation to the relevant asset, appropriately discounted. The result is compared to the current net book value of the asset. Any shortfall evidenced as a result of such a review will be assessed against the opportunities to enhance future cash flows and the need for an observed impairment loss allowance established.
Collective assessment
A collective impairment loss allowance is established for all loans that have experienced a loss event. For individually significant loans this is undertaken as detailed above. Loans which are not individually significant but are not performing are grouped together according to their credit risk characteristics and the allowance for observed losses is determined on a collective basis by applying an estimated loss given default. Loans for which evidence of potential loss has been specifically identified and that are on the Santander UK group’s watchlist are grouped together according to their credit risk characteristics for the purpose of calculating an estimated allowance for observed losses. This is assessed on a collective basis using an estimate of the propensity for these loans to enter non performing loan status and the potential loss per case.
Incurred but not observed impairment loss allowances
Loans for which no evidence of loss has been specifically identified on an individual basis are grouped together according to their credit risk characteristics for the purpose of calculating an estimated allowance for incurred inherent losses. Such losses will only be individually identified in the future. As soon information becomes available which identifies incurred losses on individual loans within the group, those loans are removed from the group and assessed for observed losses.
The allowance for incurred losses is determined on a portfolio basis using the following factors:
| • | | historical loss experience in portfolios of similar credit risk characteristics (for example, similar sector or product); |
| • | | the estimated period between an impairment event occurring and establishment of the loss event (known as the emergence period, as discussed below); and |
| • | | management’s judgement as to whether current economic and credit conditions are such that the actual level of inherent losses at the balance sheet date is likely to be greater or less than that suggested by historical experience. |
The emergence period
This is the period in which losses that had been incurred but have not been separately identified become evident. The emergence period of 6 months is estimated having regard to historic experience and loan characteristics across the portfolio. The factors considered in determining the length of the emergence period include the frequency of the management information received or any change in account utilisation behaviour.
Reversals of impairment
If in a subsequent period, the amount of an impairment loss reduces and the reduction can be related objectively to an event occurring after the impairment was recognised, the excess is written back by reducing the impairment loss allowance account accordingly. The write-back is recognised in the income statement.
Write-off
For secured loans, a write-off is made when all collection procedures have been exhausted and the security has been sold. For unsecured loans, a write-off is made when all avenues for collecting the debt have been exhausted. There may be occasions where a write-off occurs for other reasons, for example, following a consensual restructure of the debt or where the debt is sold for strategic reasons into the secondary market at a value lower than the face value of the debt. Write-offs are charged against previously established impairment loss allowances. There are no thresholds based on past due status beyond which all secured or unsecured loans are written-off.
| | |
| 128 | | Abbey National Treasury Services plc 2012 Annual Report |
Financial Statements
Notes to the Financial Statementscontinued
Recoveries
Recoveries of impairment losses are not included in the impairment loss allowance, but are taken to income and offset against impairment losses. Recoveries of impairment losses are classified in the income statement as ‘Impairment losses on loans and advances’.
Impairment losses on restructured/renegotiated corporate assets (forbearance)
To support corporate customers that encounter actual or apparent financial difficulties, the ANTS group may grant a concession, whether temporary or permanent, to accept less than contractual amounts where financial distress would otherwise prevent satisfactory repayment within the original terms and conditions of the contract. These arrangements are known as forbearance.
There are different risk characteristics associated with loans that are subject to forbearance as compared to loans that are not. A range of forbearance arrangements may be entered into by the ANTS group, reflecting the different risk characteristics of such loans. The ANTS group’s forbearance programmes are described in the credit risk section in the Risk Management Report.
For corporate borrowers, the main types of forbearance offered are payment arrangements, refinancing (principally, either a term extension or an interest only concession) and in limited circumstances other forms of restructuring policies (principally a debt for equity swap), subject to customer negotiation and vetting.
If such accounts were classified in the “non-performing” loan category prior to the restructuring, they continue to be classified as non-performing until evidence of compliance with the new terms is demonstrated (typically over a period of at least three months) before being reclassified as “substandard”. If the account was not categorised as non-performing at the time the revised arrangements were agreed, the case is considered to be a renegotiation and is reclassified to “substandard” upon completion of the restructuring agreement.
Once a substandard asset has demonstrated continued compliance with the new terms and the risk profile is deemed to have improved it may be reclassified as a “performing asset”. When such accounts are reclassified as performing assets, they continue to be assessed for impairment collectively for inherent losses under the ANTS group’s normal collective assessment methodology. Until then, impairment loss allowances for such restructured loans are assessed individually, taking into account the value of collateral held as confirmed by third party professional valuations and the available cashflow to service debt over the period of the restructuring. These impairment loss allowances are assessed and reviewed regularly. In the case of a debt for equity conversion, the converted debt is written off against the existing impairment loss allowance upon completion of the restructuring. The value of the equity acquired is reassessed periodically in light of subsequent performance of the restructured company.
Where an account is in forbearance, its additional risk characteristics are reflected by way of a management’s best estimate as the only practical means of factoring recent conditions into impairment calculations until the ANTS group’s models can be recalibrated. As more comprehensive data on the performance of loans in forbearance is gathered, the ANTS group’s models will be recalibrated.
(ii) Loans and receivables securities
Loans and receivables securities are assessed individually for impairment. An impairment loss is incurred if there is objective evidence that a loss event has occurred since initial recognition of the assets that has an impact on the estimated future cash flows of the loans and receivables securities. Potential indicators of loss events include significant financial distress of the issuer and default or delinquency in interest and principal payments (breach of contractual terms).
Loans and receivables securities are monitored for potential impairment through a detailed expected cashflow analysis taking into account the structure and underlying assets of each individual security. Once specific events give rise to a reasonable expectation that future anticipated cash flows may not be received, the asset originating these doubtful cash flows will be deemed to be impaired.
IMPAIRMENT OF NON-FINANCIAL ASSETS
At each balance sheet date, or more frequently when events or changes in circumstances dictate, property plant and equipment (including operating lease assets) and intangible assets are assessed for indicators of impairment. If indications are present, these assets are subject to an impairment review.
The impairment review comprises a comparison of the carrying amount of the asset or cash generating unit with its recoverable amount: the higher of the asset’s or cash-generating unit’s fair value less costs to sell and its value in use.
The fair value is calculated by reference to the amount at which the asset could be disposed of in a binding sale agreement in an arm’s length transaction evidenced by an active market or recent transactions for similar assets, less costs to sell. Value in use is calculated by discounting the expected future cash flows obtainable as a result of the asset’s continued use, including those resulting from its ultimate disposal, at a market based discount rate on a pre tax basis.
The carrying values of property, plant and equipment are written down by the amount of any impairment and the loss is recognised in the income statement in the period in which it occurs. A previously recognised impairment loss relating to property, plant and equipment may be reversed in part or in full when a change in circumstances leads to a change in the estimates used to determine the property, plant and equipments recoverable amount. The carrying amount of the property, plant and equipment will only be increased up to the amount that would have been had the original impairment not been recognised. For conducting impairment reviews, cash generating units are the lowest level at which management monitors the return on investment on assets.
| | |
Abbey National Treasury Services plc 2012 Annual Report | | 129 |
Financial Statements
Notes to the Financial Statementscontinued
LEASES
a) The ANTS group as lessor
Operating lease assets are recorded at deemed cost and depreciated over the life of the asset after taking into account anticipated residual values. Operating lease rental income and depreciation is recognised on a straight-line basis over the life of the asset.
b) The ANTS group as lessee
The ANTS group enters into operating leases for the rental of equipment or real estate. Payments made under such leases are charged to the income statement on a straight-line basis over the period of the lease. When an operating lease is terminated before the lease period has expired, any payment to be made to the lessor by way of penalty is recognised as an expense in the period in which termination takes place.
If the lease agreement transfers the risk and rewards of the asset, the lease is recorded as a finance lease and the related asset is capitalised. At inception, the asset is recorded at the lower of the present value of the minimum lease payments or fair value and depreciated over the lower of the estimated useful life and the life of the lease. The corresponding rental obligations are recorded as borrowings. The aggregate benefit of incentives, if any, is recognised as a reduction of rental expense over the lease term on a straight-line basis.
INCOME TAXES, INCLUDING DEFERRED TAXES
The tax expense represents the sum of the income tax currently payable and deferred income tax.
Income tax payable on profits, based on the applicable tax law in each jurisdiction, is recognised as an expense in the period in which profits arise. Taxable profit differs from net profit as reported in the income statement because it excludes items of income or expense that are taxable or deductible in other years and it further excludes items that are never taxable or deductible. The liability for current tax is calculated using tax rates that have been enacted or substantively enacted by the balance sheet date.
Deferred income tax is the tax expected to be payable or recoverable on income tax losses available to carry forward and on temporary differences arising between the tax bases of assets and liabilities and their carrying amounts in the Consolidated Financial Statements and is accounted for using the balance sheet liability method.
Deferred tax liabilities are generally recognised for all taxable temporary differences and deferred tax assets are recognised to the extent that it is probable that taxable profits will be available against which the assets may be utilised as they reverse. Such deferred tax liabilities are not recognised if the temporary difference arises from the initial recognition of goodwill. Deferred tax assets and liabilities are not recognised if the temporary difference arises from the initial recognition of other assets (other than in a business combination) and liabilities in a transaction that affects neither the taxable profit nor the accounting profit.
Deferred tax is calculated at the tax rates that are expected to apply in the period when the liability is settled or the asset is realised based on rates enacted or substantively enacted at the balance sheet date. Deferred tax is charged or credited in the income statement, except when it relates to items charged or credited directly to equity, in which case the deferred tax is also dealt with in equity or directly in equity. Deferred tax liabilities are recognised for taxable temporary differences arising on investments in subsidiaries except where the ANTS group is able to control reversal of the temporary difference and it is probable that it will not reverse in the foreseeable future.
The ANTS group reviews the carrying amount of deferred tax assets at each balance sheet date and reduces it to the extent that it is no longer probable that sufficient taxable profits will be available to allow all or part of the asset to be recovered.
Deferred and current tax assets and liabilities are only offset when they arise in the same tax reporting group and where there is both the legal right and the intention to settle on a net basis or to realise the asset and settle the liability simultaneously.
CASH AND CASH EQUIVALENTS
For the purposes of the cash flow statement, cash and cash equivalents comprise balances with less than three months’ maturity from the date of acquisition, including cash and non restricted balances with central banks, treasury bills and other eligible bills, loans and advances to banks and short term investments in securities.
| | |
| 130 | | Abbey National Treasury Services plc 2012 Annual Report |
Financial Statements
Notes to the Financial Statementscontinued
FINANCIAL LIABILITIES
Financial liabilities are initially recognised when the ANTS group becomes contractually bound to the transfer of economic benefits in the future. Financial liabilities are derecognised when extinguished.
(a) Financial liabilities at fair value through profit or loss
Financial liabilities are classified as fair value through profit or loss if they are either held for trading or otherwise designated at fair value through profit or loss on initial recognition. A financial liability is classified as held for trading if it is a derivative or is incurred principally for the purpose of repurchasing or being unwound in the near term, or forms part of a portfolio of financial instruments that are managed together and for which there is evidence of short term profit taking.
In certain circumstances financial liabilities other than those that are held for trading are designated at fair value through profit or loss where this results in more relevant information because it significantly reduces a measurement inconsistency that would otherwise arise from measuring assets and liabilities or recognising the gains or losses on them on a different basis, or where a financial liability contains one or more embedded derivatives which are not closely related to the host contract. These liabilities are initially recognised at fair value and transactions costs are taken directly to the income statement. Gains and losses arising from changes in fair value are included directly in the income statement.
Derivative financial instruments, Trading liabilities and Financial liabilities designated at fair value are classified as fair value through profit or loss.
(b) Other financial liabilities
All other financial liabilities are initially recognised at fair value net of transaction costs incurred. They are subsequently stated at amortised cost and the redemption value recognised in the income statement over the period of the liability using the effective interest method.
Deposits by banks, Deposits by customers, and Debt securities in issue (unless designated at fair value) are classified as amortised cost.
Equity index-linked deposits
Contracts involving the receipt of cash on which customers receive an index-linked return are accounted for as equity index-linked deposits. The principal products are capital guaranteed/protected products which give the customers a limited participation in the upside growth of an equity index. In the event the index falls in price, a cash principal element is guaranteed/protected. The equity index-linked deposits contain embedded derivatives. These embedded derivatives, in combination with the principal cash deposit element, are designed to replicate the investment performance profile tailored to the return agreed in the contracts with customers.
Until 2009, equity index-linked deposits were managed within the equity derivatives trading book as an integral part of the equity derivatives portfolio, and classified as deposits by customers within trading liabilities. For products sold until 2009, the embedded derivatives are not separated from the host instrument and are not separately accounted for as a derivative financial instrument, as the entire contract embodies both the embedded derivative and the host instrument and is remeasured at fair value at each reporting date. As such, there is no requirement to bifurcate the embedded derivatives in those equity index-linked deposits.
Following a change in management’s trading strategy in 2009, products sold subsequently are not accounted for as fair value through profit and loss nor classified as trading liabilities. These products are accounted for as deposits by customers at amortised cost. The embedded derivatives are separated from the host instrument and are separately accounted for as a derivative financial instrument. The embedded derivatives are economically hedged internally with the equity derivatives trading desk. These internal transactions are managed as part of the overall positions of the equity derivatives trading desk. This activity is managed and recorded on a fair value trading basis, with exposures managed on a value-at-risk basis, as described in “Traded market risk” in the Risk Management Report.
There is no difference between the products sold until 2009 which are accounted for fair value through profit and loss and classified as trading liabilities, and the subsequent products sold that are accounted for as deposits by customers and related embedded derivatives.
BORROWINGS
Borrowings (which include deposits by banks, deposits by customers and debt securities in issue) are recognised initially at fair value, being their issue proceeds (fair value of consideration received) net of transaction costs incurred. Borrowings are subsequently stated at amortised cost or fair value dependent on designation at initial recognition.
| | |
Abbey National Treasury Services plc 2012 Annual Report | | 131 |
Financial Statements
Notes to the Financial Statementscontinued
PROVISIONS
Provisions are recognised for present obligations arising as consequences of past events where it is more likely than not that a transfer of economic benefits will be necessary to settle the obligation, and it can be reliably estimated.
Provision is made for the anticipated cost of restructuring, including redundancy costs, when an obligation exists. An obligation exists when the ANTS group has a detailed formal plan for restructuring a business, has raised valid expectations in those affected by the restructuring, and has started to implement the plan or announce its main features.
When a leasehold property ceases to be used in the business, provision is made where the unavoidable costs of the future obligations relating to the lease are expected to exceed anticipated rental income. The net costs are discounted using market rates of interest to reflect the long-term nature of the cash flows.
Provision is made for loan commitments, other than those classified as held for trading, within impairment loss allowances if it is probable that the facility will be drawn and the resulting loan will be recognised at a value less than the cash advanced.
Contingent liabilities are possible obligations whose existence will be confirmed only by certain future events or present obligations where the transfer of economic benefit is uncertain or cannot be reliably measured. Contingent liabilities are not recognised but are disclosed unless they are remote.
FINANCIAL GUARANTEE CONTRACTS
Financial guarantee contracts are contracts that require the issuer to make specified payments to reimburse the holder for a loss it incurs because a specified debtor fails to make payments when due in accordance with the terms of a debt instrument. The ANTS group accounts for guarantees that meet the definition of a financial guarantee contract at fair value on initial recognition. In subsequent periods, these guarantees are measured at the higher of the initial fair value less cumulative amortisation and the amount that would be recognised as an impairment loss allowance as described in the accounting policies above.
SHARE CAPITAL
Incremental external costs directly attributable to the issue of new shares are deducted from equity net of related income taxes.
DIVIDENDS
Dividends on ordinary shares are recognised in equity in the period in which the right to receive payment is established.
| | |
| 132 | | Abbey National Treasury Services plc 2012 Annual Report |
Financial Statements
Notes to the Financial Statementscontinued
CRITICAL ACCOUNTING POLICIES AND AREAS OF SIGNIFICANT MANAGEMENT JUDGEMENT
The preparation of the ANTS group’s Consolidated Financial Statements requires management to make estimates and judgements that affect the reported amount of assets and liabilities at the date of the financial statements and the reported amount of income and expenses during the reporting period. Management evaluates its estimates and judgements on an ongoing basis. Management bases its estimates and judgements on historical experience and on various other factors that are believed to be reasonable under the circumstances. Actual results may differ from these estimates under different assumptions or conditions.
The following accounting estimates and judgements are considered important to the portrayal of the ANTS group’s financial results and financial condition because: (i) they are highly susceptible to change from period to period as assumptions are made to calculate the estimates, and (ii) any significant difference between the ANTS group’s estimated amounts and actual amounts could have a material impact on the ANTS group’s future financial results and financial condition.
In calculating each estimate, a range of outcomes was calculated based principally on management’s conclusions regarding the input assumptions relative to historic experience. The actual estimates were based on what management concluded to be the most probable assumptions within the range of reasonably possible assumptions:
Valuation of financial instruments
The ANTS group trades in a wide variety of financial instruments in the major financial markets. When estimating the value of its financial instruments, including derivatives where quoted market prices are not available, management therefore considers a range of interest rates, volatility, exchange rates, counterparty credit ratings, valuation adjustments and other similar inputs, all of which vary across maturity bands. These are chosen to best reflect the particular characteristics of each transaction.
Had management used different assumptions, a larger or smaller change in the valuation of financial instruments including derivatives where quoted market prices are not available would have resulted that could have had a material impact on the ANTS group’s reported profit before tax.
Detailed disclosures on financial instruments, including sensitivities, can be found in Note 43. Further information about sensitivities to market risk (including Value-at-Risk (‘VaR’)) arising from financial instrument trading activities can be found in the Risk Management Report on page 63.
| | |
Abbey National Treasury Services plc 2012 Annual Report | | 133 |
Financial Statements
Notes to the Financial Statementscontinued
2. SEGMENTS
The principal activity of the ANTS group is financial services. The ANTS group’s business is managed and reported on the basis of the following segments:
In the first half of 2012, certain non-core portfolios were transferred to Corporate Centre where this was felt to be more appropriate for the management of these assets and liabilities. The non-core portfolios transferred into Corporate Centre included the Social Housing assets previously managed within Corporate Banking. With respect to these, even though there are no credit concerns, the terms of these loans are unfavourable in the current funding environment and offer little prospect for renegotiation. The ANTS group’s intention is to hold these assets to maturity and as such the balances will gradually decrease over time. In addition, the management of hedging and other variances has been transferred to Corporate Centre. The prior period’s segmental analysis has been adjusted to reflect the fact that reportable segments have changed.
The ANTS group’s segments are strategic business units that offer different products and services. They are managed separately because each business requires different technology and marketing strategies. The ANTS group has three segments:
| • | | Corporate Banking offers a wide range of products and financial services to UK companies. Corporate Banking products and services include loans, bank accounts, deposits, and treasury services. |
The Large Corporates business offers specialist treasury services in fixed income and foreign exchange, lending, transactional banking services, capital markets and money markets to large multinational corporate customers. Lending includes syndicated loans and structured finance. Transactional banking includes trade finance and cash management. Money market activities include securities lending/borrowing and repos.
| • | | Markets offers risk management and other services to financial institutions, as well as other Santander UK divisions. Its main product areas are fixed income and foreign exchange, equity, capital markets and institutional sales. |
| • | | Corporate Centre consists of Financial Management & Investor Relations (‘FMIR’, formerly known as Asset and Liability Management) and the non-core portfolios of social housing loans and structured credit assets. FMIR is responsible for managing capital and funding, balance sheet composition, structural market risk and strategic liquidity risk for the rest of the Santander UK group. The non-core portfolios are being run-down and/or managed for value. |
The Company’s board of directors (the ‘Board’) is the chief operating decision maker for the ANTS group. The segment information below is presented on the basis used by the Board to evaluate performance and allocate resources. The Board reviews discrete financial information for each segment of the business, including measures of operating results, assets and liabilities. The segment information reviewed by the Board is prepared on a statutory basis of accounting rather than on an adjusted internal management basis as in prior periods.
Transactions between the business segments are on normal commercial terms and conditions. The accounting policies of the segments are the same as those described in the summary of significant accounting policies. Internal charges and transfer pricing adjustments have been reflected in the performance of each business. Revenue sharing agreements are used to allocate external customer revenues to a business segment on a reasonable basis. Funds are ordinarily reallocated between segments, resulting in funding cost transfers disclosed in operating income. Interest charged for these funds is based on the ANTS group’s cost of wholesale funding.
Interest income and interest expense have not been reported separately. The majority of the revenues from the segments presented below are interest income in nature and the Board relies primarily on net interest income to both assess the performance of the segment and to make decisions regarding allocation of segmental resources.
| | |
| 134 | | Abbey National Treasury Services plc 2012 Annual Report |
Financial Statements
Notes to the Financial Statementscontinued
a) Segmental information
| | | | | | | | | | | | | | | | |
2012 | | Corporate
Banking
£m | | | Markets
£m | | | Corporate
Centre
£m | | | Total
£m | |
Net interest income/(expense) | | | 93 | | | | (6 | ) | | | 52 | | | | 139 | |
Non-interest income/(expense) | | | 271 | | | | 184 | | | | (32 | ) | | | 423 | |
| | | | | | | | | | | | | | | | |
Total operating income | | | 364 | | | | 178 | | | | 20 | | | | 562 | |
| | | | | | | | | | | | | | | | |
Administration expenses | | | (84 | ) | | | (98 | ) | | | (16 | ) | | | (198 | ) |
Depreciation and amortisation | | | (1 | ) | | | (2 | ) | | | — | | | | (3 | ) |
| | | | | | | | | | | | | | | | |
Total operating expenses excluding provisions and charges | | | (85 | ) | | | (100 | ) | | | (16 | ) | | | (201 | ) |
| | | | | | | | | | | | | | | | |
Impairment losses on loans and advances | | | (9 | ) | | | — | | | | — | | | | (9 | ) |
Provisions for other liabilities and charges | | | (2 | ) | | | (2 | ) | | | (16 | ) | | | (20 | ) |
| | | | | | | | | | | | | | | | |
Total operating provisions and charges | | | (11 | ) | | | (2 | ) | | | (16 | ) | | | (29 | ) |
| | | | | | | | | | | | | | | | |
Profit before tax | | | 268 | | | | 76 | | | | (12 | ) | | | 332 | |
| | | | | | | | | | | | | | | | |
Average number of staff(1) | | | 305 | | | | 275 | | | | 122 | | | | 702 | |
| | | | | | | | | | | | | | | | |
Total assets | | | 22,509 | | | | 28,173 | | | | 167,230 | | | | 217,912 | |
| | | | | | | | | | | | | | | | |
| | | | | | | | | | | | | | | | |
2011 | | Corporate
Banking
£m | | | Markets
£m | | | Corporate
Centre
£m | | | Total
£m | |
Net interest income/(expense) | | | 75 | | | | (3 | ) | | | 439 | | | | 511 | |
Non-interest income/(expense) | | | 275 | | | | 162 | | | | (370 | ) | | | 67 | |
| | | | | | | | | | | | | | | | |
Total operating income | | | 350 | | | | 159 | | | | 69 | | | | 578 | |
| | | | | | | | | | | | | | | | |
Administration expenses | | | (95 | ) | | | (109 | ) | | | (25 | ) | | | (229 | ) |
Depreciation and amortisation | | | (3 | ) | | | (2 | ) | | | (2 | ) | | | (7 | ) |
| | | | | | | | | | | | | | | | |
Total operating expenses excluding provisions and charges | | | (98 | ) | | | (111 | ) | | | (27 | ) | | | (236 | ) |
| | | | | | | | | | | | | | | | |
Impairment losses on loans and advances | | | (54 | ) | | | — | | | | — | | | | (54 | ) |
Provisions for other liabilities and charges | | | (3 | ) | | | (3 | ) | | | (14 | ) | | | (20 | ) |
| | | | | | | | | | | | | | | | |
Total operating provisions and charges | | | (57 | ) | | | (3 | ) | | | (14 | ) | | | (74 | ) |
| | | | | | | | | | | | | | | | |
Profit before tax | | | 195 | | | | 45 | | | | 28 | | | | 268 | |
| | | | | | | | | | | | | | | | |
Average number of staff(1) | | | 399 | | | | 263 | | | | 99 | | | | 761 | |
| | | | | | | | | | | | | | | | |
Total assets | | | 25,768 | | | | 28,652 | | | | 165,672 | | | | 220,092 | |
| | | | | | | | | | | | | | | | |
| | | | | | | | | | | | | | | | |
2010 | | Corporate
Banking
£m | | | Markets
£m | | | Corporate
Centre
£m | | | Total
£m | |
Net interest income | | | 68 | | | | — | | | | 335 | | | | 403 | |
Non-interest income | | | 220 | | | | 221 | | | | 49 | | | | 490 | |
| | | | | | | | | | | | | | | | |
Total operating income | | | 288 | | | | 221 | | | | 384 | | | | 893 | |
| | | | | | | | | | | | | | | | |
Administration expenses | | | (89 | ) | | | (74 | ) | | | (46 | ) | | | (209 | ) |
Depreciation and amortisation | | | (1 | ) | | | (2 | ) | | | (3 | ) | | | (6 | ) |
| | | | | | | | | | | | | | | | |
Total operating expenses excluding provisions and charges | | | (90 | ) | | | (76 | ) | | | (49 | ) | | | (215 | ) |
| | | | | | | | | | | | | | | | |
Impairment losses on loans and advances | | | (69 | ) | | | — | | | | — | | | | (69 | ) |
| | | | | | | | | | | | | | | | |
Total operating provisions and charges | | | (69 | ) | | | — | | | | — | | | | (69 | ) |
| | | | | | | | | | | | | | | | |
Profit before tax | | | 129 | | | | 145 | | | | 335 | | | | 609 | |
| | | | | | | | | | | | | | | | |
Average number of staff(1) | | | 343 | | | | 187 | | | | 91 | | | | 621 | |
| | | | | | | | | | | | | | | | |
Total assets | | | 28,678 | | | | 22,070 | | | | 202,512 | | | | 253,260 | |
| | | | | | | | | | | | | | | | |
b) By geographical region
| | | | | | | | | | | | |
| | | Group | |
| | | 2012
£m | | | 2011
£m | | | 2010
£m | |
Total operating income/(expenses | | | | | | | | | | | | |
United Kingdom | | | 566 | | | | 570 | | | | 900 | |
Other | | | (4 | ) | | | 8 | | | | (7 | ) |
| | | | | | | | | | | | |
| | | 562 | | | | 578 | | | | 893 | |
| | | | | | | | | | | | |
| | | |
Total assets other than financial instruments and current and deferred tax assets | | | | | | | | | | | | |
United Kingdom | | | 13 | | | | 8 | | | | 48 | |
Other | | | — | | | | — | | | | — | |
| | | | | | | | | | | | |
| | | 13 | | | | 8 | | | | 48 | |
| | | | | | | | | | | | |
| | |
Abbey National Treasury Services plc 2012 Annual Report | | 135 |
Financial Statements
Notes to the Financial Statementscontinued
Revenue by products and services
Details of revenue by product and service are disclosed in Notes 3 to 5.
3. NET INTEREST INCOME
| | | | | | | | | | | | |
| | | Group | |
| | | 2012
£m | | | 2011
£m | | | 2010
£m | |
Interest and similar income: | | | | | | | | | | | | |
On loans and advances to Santander UK group undertakings | | | 3,415 | | | | 3,326 | | | | 2,796 | |
On loans and advances to Banco Santander, S.A. | | | 4 | | | | 12 | | | | 15 | |
On loans and advances to other Banco Santander group undertakings | | | 1 | | | | 2 | | | | 24 | |
Other interest earning financial assets | | | 450 | | | | 327 | | | | 210 | |
| | | | | | | | | | | | |
Total interest and similar income | | | 3,870 | | | | 3,667 | | | | 3,045 | |
| | | | | | | | | | | | |
Interest expense and similar charges: | | | | | | | | | | | | |
On deposits by Santander UK group undertakings | | | (2,326 | ) | | | (2,474 | ) | | | (2,254 | ) |
On deposits by Banco Santander, S.A. | | | (30 | ) | | | (15 | ) | | | (2 | ) |
On deposits by other Banco Santander group undertakings | | | (4 | ) | | | (7 | ) | | | (7 | ) |
Other interest bearing financial liabilities | | | (1,371 | ) | | | (660 | ) | | | (379 | ) |
| | | | | | | | | | | | |
Total interest expense and similar charges | | | (3,731 | ) | | | (3,156 | ) | | | (2,642 | ) |
| | | | | | | | | | | | |
Net interest income | | | 139 | | | | 511 | | | | 403 | |
| | | | | | | | | | | | |
4. NET FEE AND COMMISSION INCOME
| | | | | | | | | | | | |
| | | Group | |
| | | 2012
£m | | | 2011
£m | | | 2010
£m | |
Fee and commission income: | | | | | | | | | | | | |
Corporate Products | | | 119 | | | | 115 | | | | 28 | |
| | | | | | | | | | | | |
Fee and commission expense: | | | | | | | | | | | | |
Other fees paid | | | — | | | | (2 | ) | | | — | |
| | | | | | | | | | | | |
Net fee and commission income | | | 119 | | | | 113 | | | | 28 | |
| | | | | | | | | | | | |
5. NET TRADING AND OTHER INCOME
| | | | | | | | | | | | |
| | | Group | |
| | | 2012
£m | | | 2011(1)
£m | | | 2010
£m | |
Net trading and funding of other items by the trading book | | | 344 | | | | 254 | | | | 378 | |
Income on assets designated at fair value through profit or loss | | | 545 | | | | 223 | | | | 246 | |
Expense on liabilities designated at fair value through profit or loss | | | (180 | ) | | | (105 | ) | | | (111 | ) |
Losses on derivatives managed with assets/liabilities held at fair value through profit or loss | | | (439 | ) | | | (458 | ) | | | (150 | ) |
Profit on sale of available for sale assets | | | 7 | | | | — | | | | — | |
Hedge ineffectiveness and other | | | 27 | | | | 40 | | | | 99 | |
| | | | | | | | | | | | |
| | | 304 | | | | (46 | ) | | | 462 | |
| | | | | | | | | | | | |
| (1) | As restated, see Note 45 |
“Net trading and funding of other items by the trading book” includes fair value gains/(losses) of £(149)m (2011: £(125)m, 2010: £(250)m) on embedded derivatives bifurcated from certain equity index-linked deposits, as described in the Accounting Policies. The embedded derivatives are economically hedged internally with the equity derivatives trading desk. These internal transactions are managed as part of the overall positions of the equity derivatives trading desk, the results of which are also included in this line item, and amounted to £150m (2011: £127m, 2010: £263m). As a result, the net fair value movements recognised on the equity index-linked deposits and the related economic hedges were £1m (2011: £2m, 2010: £13m).
| | |
| 136 | | Abbey National Treasury Services plc 2012 Annual Report |
Financial Statements
Notes to the Financial Statementscontinued
6. ADMINISTRATION EXPENSES
| | | | | | | | | | | | |
| | | Group | |
| | | 2012
£m | | | 2011
£m | | | 2010
£m | |
Staff costs: | | | | | | | | | | | | |
Wages and salaries | | | 111 | | | | 119 | | | | 91 | |
Social security costs | | | 15 | | | | 14 | | | | 11 | |
Pensions costs: | | | | | | | | | | | | |
- defined contribution plans | | | 6 | | | | 5 | | | | 41 | |
Other personnel costs | | | 7 | | | | 9 | | | | 4 | |
| | | | | | | | | | | | |
| | | 139 | | | | 147 | | | | 147 | |
| | | | | | | | | | | | |
Property and equipment expenses | | | 7 | | | | 5 | | | | 5 | |
Information technology expenses | | | 44 | | | | 43 | | | | 37 | |
Other administrative expenses | | | 8 | | | | 34 | | | | 20 | |
| | | | | | | | | | | | |
| | | 198 | | | | 229 | | | | 209 | |
| | | | | | | | | | | | |
7. DEPRECIATION AND AMORTISATION
| | | | | | | | | | | | |
| | | Group | |
| | | 2012
£m | | | 2011
£m | | | 2010
£m | |
Depreciation of property, plant and equipment | | | 3 | | | | 3 | | | | 3 | |
Amortisation of intangible assets | | | — | | | | 4 | | | | 3 | |
| | | | | | | | | | | | |
| | | 3 | | | | 7 | | | | 6 | |
| | | | | | | | | | | | |
8. IMPAIRMENT LOSSES AND PROVISIONS
| | | | | | | | | | | | |
| | | Group | |
| | | 2012
£m | | | 2011
£m | | | 2010
£m | |
Impairment losses on loans and advances: | | | | | | | | | | | | |
- loans and advances to customers (Note 18) | | | 9 | | | | 54 | | | | 80 | |
Recoveries of loans and advances | | | — | | | | — | | | | (11 | ) |
| | | | | | | | | | | | |
| | | 9 | | | | 54 | | | | 69 | |
| | | | | | | | | | | | |
Provisions for other liabilities and charges | | | | | | | | | | | | |
- New and increased allowances (Note 34) | | | 20 | | | | 20 | | | | — | |
| | | | | | | | | | | | |
Total impairment losses and provisions charged to the income statement | | | 29 | | | | 74 | | | | 69 | |
| | | | | | | | | | | | |
9. AUDIT AND OTHER SERVICES
The fees for audit and other services payable to the Company’s auditor, Deloitte LLP, is analysed as follows:
| | | | | | | | | | | | |
| | | Group | |
| | | 2012
£m | | | 2011
£m | | | 2010
£m | |
Fees payable to the Company’s auditor for the audit of the ANTS group’s annual accounts | | | 0.6 | | | | 0.7 | | | | 0.4 | |
Fees payable to the Company’s auditor and its associates for the audit of the Company’s subsidiaries pursuant to legislation | | | 0.1 | | | | 0.1 | | | | 0.2 | |
| | | | | | | | | | | | |
Total audit fees | | | 0.7 | | | | 0.8 | | | | 0.6 | |
| | | | | | | | | | | | |
Other assurance fees – Debt issuance | | | 0.7 | | | | 0.6 | | | | 0.4 | |
| | | | | | | | | | | | |
Total fees | | | 1.4 | | | | 1.4 | | | | 1.0 | |
| | | | | | | | | | | | |
| | |
Abbey National Treasury Services plc 2012 Annual Report | | 137 |
Financial Statements
Notes to the Financial Statementscontinued
Other assurance relates to services performed in connection with debt issuances work which accords with the definition ‘Audit related fees’ per SEC guidance. No information technology, internal audit, valuation and actuarial, litigation, recruitment and remuneration or corporate finance services were provided by the external auditor during these years. A framework for ensuring auditor’s independence has been adopted which defines unacceptable non-audit assignments, pre-approval of acceptable non-audit assignments and procedures for approval of acceptable non-audit assignments by the Santander UK Board Audit Committee. Services provided by the ANTS group’s external auditor are subject to approval by the Santander UK Board Audit Committee.
10. DIRECTORS’ REMUNERATION AND INTERESTS
The aggregate remuneration received by the Directors of the ANTS group was:
| | | | | | | | | | | | |
| | | Group | |
| | | 2012
£ | | | 2011
£ | | | 2010
£ | |
Salaries and fees | | | 640,914 | | | | 638,567 | | | | 509,931 | |
Performance-related payments | | | 858,387 | | | | 865,293 | | | | 832,374 | |
| | | | | | | | | | | | |
Total remuneration excluding pension contributions | | | 1,499,301 | | | | 1,503,860 | | | | 1,342,305 | |
Pension contributions | | | 79,889 | | | | 75,298 | | | | 44,523 | |
| | | | | | | | | | | | |
| | | 1,579,190 | | | | 1,579,158 | | | | 1,386,828 | |
| | | | | | | | | | | | |
The aggregate emoluments above exclude emoluments received by Directors in respect of their primary duties as Directors or officers of Banco Santander, S.A. and Santander UK plc. Salaries and performance-related payments comprise payments to three (2011: three, 2010: three) Directors serving during the year.
The Company ensures that it is compliant with the mandatory deferral requirements of the FSA’s Remuneration Code for staff who meet the relevant criteria (“Code Staff”) and the amount of bonus to be deferred is based on the total variable pay received. The FSA Remuneration Code prescribes that at least 40% of variable pay must be made over a period of at least three years and, for staff earning more than £500,000 in variable remuneration, at least 60% of a bonus must be deferred over the same period.
All UK bonus awards in 2012 are subject to deferral principles that have been set at Banco Santander, S.A. group level. Such principles, as applied to the Company, are subject to ratification by the Santander UK Board Remuneration Oversight Committee and can be overridden by UK national requirements to meet any criteria set by the FSA or other regulator/law. However, the general deferral principles are as follows:
| • | | a proportion of an individual’s bonus (on a sliding scale) will become subject to deferral if the bonus exceeds certain levels depending on the nature of the role; |
| • | | any deferred amount will be issued in shares over a three year period (in three equal deferral tranches); and |
| • | | deferrals are subject to continued employment with the Banco Santander, S.A. group in the UK and on the condition that none of the prescribed circumstances of forfeiture occur. |
Remuneration of highest paid Director
The remuneration, excluding pension contributions, of the highest paid Director was £1,045,170 (2011: £1,023,956, 2010: £990,993) of which £625,000 (2011: £625,000, 2010: £650,001) was performance-related. In 2012, 2011 and 2010, no amounts were paid with respect to a defined contribution scheme on behalf of the highest paid director.
At 31 December 2012, 2011 and 2010, there was no accrued pension benefit for the highest paid Director and there was no lump sum accrued by the highest paid director. One Director will be receiving benefits under a defined benefit scheme (2011: two, 2010: two) and no Director (2011: nil, 2010: nil) will be receiving benefits under a defined contribution scheme.
Long-Term Incentive Plan
In 2012 and 2011, no Directors were granted conditional awards of shares in Banco Santander, S.A. under the Santander Long-Term Incentive Plan (‘LTIP’) (2010: three directors). Under the Santander LTIPs granted in previous years, certain Executive Directors, Key Management Personnel (as defined in Note 41) and other nominated individuals were granted conditional awards of shares in Banco Santander, S.A.. Further details can be found in Note 41.
| | |
| 138 | | Abbey National Treasury Services plc 2012 Annual Report |
Financial Statements
Notes to the Financial Statementscontinued
11. TAXATION CHARGE
| | | | | | | | | | | | |
| | | Group | |
| | | 2012
£m | | | 2011(1)
£m | | | 2010
£m | |
Current tax: | | | | | | | | | | | | |
UK corporation tax on profit for the year | | | 42 | | | | 63 | | | | 175 | |
Adjustments in respect of prior years | | | 30 | | | | 32 | | | | (21 | ) |
| | | | | | | | | | | | |
Total current tax | | | 72 | | | | 95 | | | | 154 | |
| | | | | | | | | | | | |
Deferred tax(Note 26) | | | | | | | | | | | | |
Origination and reversal of temporary differences | | | 4 | | | | 9 | | | | (7 | ) |
Change in rate of UK corporation tax | | | 1 | | | | 1 | | | | 1 | |
Adjustments in respect of prior years | | | (9 | ) | | | (1 | ) | | | 1 | |
| | | | | | | | | | | | |
Total deferred tax | | | (4 | ) | | | 9 | | | | (5 | ) |
| | | | | | | | | | | | |
Tax on profit for the year | | | 68 | | | | 104 | | | | 149 | |
| | | | | | | | | | | | |
| (1) | As restated, see Note 45 |
UK corporation tax is calculated at 24.5% (2011: 26.5%, 2010: 28%) of the estimated assessable profits for the year. The standard rate of UK corporation tax was reduced from 26% to 24% with effect from 1 April 2012. Taxation for other jurisdictions is calculated at the rates prevailing in the relevant jurisdictions.
The Finance Act 2012, which provides for a reduction in the main rate of UK corporation tax to 23% effective from 1 April 2013 was enacted on 17 July 2012. As this change in rate was substantively enacted prior to 31 December 2012, it has been reflected in the deferred tax balance at 31 December 2012. The UK Government has also indicated that it intends to enact a further reduction in the main tax rate down to 21% by 1 April 2014. These changes in the rate had not been substantively enacted at the balance sheet date and, therefore, are not included in these financial statements. The estimated financial effect of these changes is insignificant.
The effective tax rate for 2012 based on profit before tax was 20.5% (2011: 38.9%, 2010: 24.1%). The tax on the ANTS group’s profit before tax differs from the theoretical amount that would arise using the basic corporation tax rate of the Company as follows:
| | | | | | | | | | | | |
| | | Group | |
| | | 2012
£m | | | 2011(1)
£m | | | 2010
£m | |
Profit before tax | | | 332 | | | | 268 | | | | 609 | |
| | | | | | | | | | | | |
Tax calculated at a tax rate of 24.5% (2011: 26.5%, 2010: 28%) | | | 81 | | | | 71 | | | | 171 | |
Non-taxable dividend income | | | (3 | ) | | | (3 | ) | | | (4 | ) |
Non-deductible UK Bank Levy | | | 5 | | | | 5 | | | | — | |
Other non-equalised items (including index-linked gilts) | | | (29 | ) | | | (1 | ) | | | (1 | ) |
Utilisation of capital losses for which credit not previously recognised | | | (8 | ) | | | — | | | | — | |
Effect of change in tax rate on deferred tax provision | | | 1 | | | | 1 | | | | 1 | |
Adjustment in respect of prior periods | | | 21 | | | | 31 | | | | (18 | ) |
| | | | | | | | | | | | |
Tax expense | | | 68 | | | | 104 | | | | 149 | |
| | | | | | | | | | | | |
| (1) | As restated, see Note 45 |
In addition to the corporation tax expense charged to profit or loss, tax of £1m (2011: £nil, 2010: £nil) has been charged in other comprehensive income in the year, as follows:
| | | | | | | | | | | | | | |
| | | | | Group | |
| | | | | Before tax amount
£m | | | Total tax
£m | | | After tax amount
£m | |
Movements in available-for-sale securities: | | - Gains due to changes in fair value | | | 5 | | | | (1 | ) | | | 4 | |
| | | | | | | | | | | | | | |
Other comprehensive income | | | 5 | | | | (1 | ) | | | 4 | |
| | | | | | | | | | | | | | |
Further information about deferred tax is presented in Note 26.
12. PROFIT ON ORDINARY ACTIVITIES AFTER TAX
The profit after tax of the Company attributable to the shareholders was £226m (2011: £222m, 2010: £670m). As permitted by Section 408 of the UK Companies Act 2006, the Company’s individual income statement has not been presented.
| | |
Abbey National Treasury Services plc 2012 Annual Report | | 139 |
Financial Statements
Notes to the Financial Statementscontinued
13. CASH AND BALANCES AT CENTRAL BANKS
| | | | | | | | | | | | | | | | |
| | | Group | | | Company | |
| | | 2012
£m | | | 2011
£m | | | 2012
£m | | | 2011
£m | |
Balances with central banks | | | 388 | | | | 7,013 | | | | 388 | | | | 7,013 | |
| | | | | | | | | | | | | | | | |
For regulatory purposes, certain minimum cash balances are required to be maintained with the Bank of England. At 31 December 2012, these amounted to £23m (2011: £18m) for the ANTS group and £23m (2011: £18m) for the Company. Balances with central banks above represent amounts held with the US Federal Reserve and the Bank of England as part of the Santander UK group’s liquidity management activities. This is described further in the Risk Management Report.
14. TRADING ASSETS
| | | | | | | | | | | | | | | | | | |
| | | | | Group | | | Company | |
| | | | | 2012
£m | | | 2011
£m | | | 2012
£m | | | 2011
£m | |
Loans and advances to banks | | - securities purchased under resale agreements | | | 7,245 | | | | 3,056 | | | | 7,245 | | | | 3,056 | |
Loans and advances to banks | | - other(1) | | | 2,743 | | | | 3,088 | | | | 2,743 | | | | 3,088 | |
Loans and advances to customers | | - securities purchased under resale agreements | | | 7,463 | | | | 6,338 | | | | 7,463 | | | | 6,338 | |
Loans and advances to customers | | - other(2) | | | 89 | | | | 349 | | | | 88 | | | | 348 | |
Debt securities | | | | | 4,494 | | | | 8,711 | | | | 4,494 | | | | 8,711 | |
Equity securities | | | | | 464 | | | | 349 | | | | 122 | | | | 23 | |
| | | | | | | | | | | | | | | | | | |
| | | | | 22,498 | | | | 21,891 | | | | 22,155 | | | | 21,564 | |
| | | | | | | | | | | | | | | | | | |
| (1) | Comprises short-term loans of £2m (2011: £84m) and cash collateral of £2,741m (2011: £3,004m). |
| (2) | Comprises short-term loans |
Debt securities can be analysed by type of issuer as follows:
| | | | | | | | | | | | | | | | |
| | | Group | | | Company | |
| | | 2012
£m | | | 2011
£m | | | 2012
£m | | | 2011
£m | |
Issued by public bodies: | | | | | | | | | | | | | | | | |
- Government securities | | | 3,917 | | | | 2,943 | | | | 3,917 | | | | 2,943 | |
Issued by other issuers: | | | | | | | | | | | | | | | | |
- Bank and building society certificates of deposit: Other | | | 13 | | | | — | | | | 13 | | | | — | |
- Fixed and floating rate notes(1): Government guaranteed | | | 426 | | | | 5,754 | | | | 426 | | | | 5,754 | |
- Fixed and floating rate notes(1): Other | | | 138 | | | | 14 | | | | 138 | | | | 14 | |
| | | | | | | | | | | | | | | | |
| | | 4,494 | | | | 8,711 | | | | 4,494 | | | | 8,711 | |
| | | | | | | | | | | | | | | | |
| (1) | The FRNs are 75% AAA rated,18% A and above rated, and 7% BBB and below rated (2011: all AAA rated). |
Debt securities and equity securities can be analysed by listing status as follows:
| | | | | | | | | | | | | | | | |
| | | Group | | | Company | |
| | | 2012
£m | | | 2011
£m | | | 2012
£m | | | 2011
£m | |
Debt securities: | | | | | | | | | | | | | | | | |
- Listed in the UK | | | 2,145 | | | | 5,904 | | | | 2,145 | | | | 5,904 | |
- Listed elsewhere | | | 687 | | | | 1,165 | | | | 687 | | | | 1,165 | |
- Unlisted | | | 1,662 | | | | 1,642 | | | | 1,662 | | | | 1,642 | |
| | | | | | | | | | | | | | | | |
| | | 4,494 | | | | 8,711 | | | | 4,494 | | | | 8,711 | |
| | | | | | | | | | | | | | | | |
Equity securities: | | | | | | | | | | | | | | | | |
- Listed in the UK | | | 372 | | | | 335 | | | | 34 | | | | 11 | |
- Listed elsewhere | | | 92 | | | | 14 | | | | 88 | | | | 12 | |
| | | | | | | | | | | | | | | | |
| | | 464 | | | | 349 | | | | 122 | | | | 23 | |
| | | | | | | | | | | | | | | | |
Included in the above balances are amounts owed to the ANTS group by Banco Santander, S.A. and by fellow subsidiaries of Banco Santander, S.A. outside the ANTS group of £206m (2011: £270m) and £nil (2011: £14m) respectively.
| | |
| 140 | | Abbey National Treasury Services plc 2012 Annual Report |
Financial Statements
Notes to the Financial Statementscontinued
15. DERIVATIVE FINANCIAL INSTRUMENTS
Derivatives are financial instruments whose value is derived from the price of one or more underlying items such as equities, equity indices, interest rates, foreign exchange rates, property indices, commodities and credit spreads. Derivatives enable users to manage exposure to credit or market risks. The ANTS group sells derivatives to its customers and uses derivatives to manage its own exposure to credit and market risks.
Use of derivatives
The ANTS group transacts derivatives for four primary purposes:
| • | | to create risk management solutions for customers, |
| • | | to manage the portfolio risks arising from customer business, |
| • | | to manage and hedge the ANTS group’s own risks, and |
| • | | to generate profits through sales activities. |
Under IAS 39, all derivatives are classified as “held for trading” (except for derivatives which are designated as effective hedging instruments in accordance with the detailed requirements of IAS 39) even if this is not the purpose of the transaction. The held for trading classification therefore includes two types of derivatives:
| • | | those used in sales activities, and |
| • | | those used for risk management purposes but, for various reasons, either the ANTS group does not elect to claim hedge accounting for or they do not meet the qualifying criteria for hedge accounting. These consist of: |
| | • | | non-qualifying hedging derivatives (known as “economic hedges”), whose terms match other on-balance sheet instruments but do not meet the technical criteria for hedge accounting, or which use natural offsets within other on-balance sheet instruments containing the same risk features as part of an integrated approach to risk management, and hence do not require the application of hedge accounting to achieve a reduction in income statement volatility, |
| | • | | derivatives managed in conjunction with financial instruments designated at fair value (known as the “fair value option”). The fair value option is described more fully in the Accounting Policy “Financial assets” and Notes 16 and 31. The ANTS group’s business model is primarily structured to maximise use of the fair value option, rather than electing to apply hedge accounting, in order to reduce the administrative burden on the ANTS group associated with complying with the detailed hedge accounting requirements of IAS 39, |
| | • | | derivatives that do not meet the qualifying criteria for hedge accounting, including ineffective hedging derivatives and any components of hedging derivatives that are excluded from assessing hedge effectiveness, and |
| | • | | derivative contracts that represent the closing-out of existing positions through the use of matching deals. |
The following table summarises the activities undertaken, the related risks associated with such activities and the types of hedging derivatives used in managing such risks. These risks may also be managed using on-balance sheet instruments as part of an integrated approach to risk management.
| | | | |
Activity | | Risk | | Type of derivative |
| Management of the return on variable rate assets financed by shareholders’ funds and net non-interest-bearing liabilities. | | Reduced profitability due to falls in interest rates. | | Receive fixed interest rate swaps. |
| | |
| Management of the basis between administered rate assets and liabilities and wholesale market rates. | | Reduced profitability due to adverse changes in the basis spread. | | Basis swaps. |
| | |
| Management of repricing profile of wholesale funding. | | Reduced profitability due to adverse movement in wholesale interest rates when large volumes of wholesale funding are repriced. | | Forward rate agreements. |
| | |
| Fixed rate lending and investments. | | Sensitivity to increases in interest rates. | | Pay fixed interest rate swaps. |
| | |
| Fixed rate retail and wholesale funding. | | Sensitivity to falls in interest rates. | | Receive fixed interest rate swaps. |
| | |
| Equity-linked retail funding. | | Sensitivity to increases in equity market indices. | | Receive equity swaps. |
| | |
| Management of other net interest income on retail activities. | | Sensitivity of income to changes in interest rates. | | Interest rate swaps. |
| | |
| Issuance of products with embedded equity options. | | Sensitivity to changes in underlying index and index volatility causing option exercise. | | Interest rate swaps combined with equity options. |
| | |
| Lending and investments. | | Sensitivity to weakening credit quality. | | Purchase credit default swaps and total return swaps. |
| | |
| Borrowing funds in foreign currencies. | | Sensitivity to changes in foreign exchange rates. | | Cross currency swaps. |
| | |
| Lending and issuance of products with embedded interest rate options. | | Sensitivity to changes in underlying rate and rate volatility causing option exercise. | | Interest rate swaps plus caps/floors. |
| | |
| Investment in, and issuance of, bonds with put/call features. | | Sensitivity to changes in rates causing option exercise. | | Interest rate swaps combined with swaptions(1)and other matched options. |
| (1) | A swaption is an option on a swap that gives the holder the right but not the obligation to buy or sell a swap. |
| | |
Abbey National Treasury Services plc 2012 Annual Report | | 141 |
Financial Statements
Notes to the Financial Statementscontinued
The ANTS group’s derivative activities do not give rise to significant open positions in portfolios of derivatives. Any residual position is managed to ensure that it remains within acceptable risk levels, with matching deals being utilised to achieve this where necessary. When entering into derivative transactions, the ANTS group employs the same credit risk management procedures to assess and approve potential credit exposures that are used for traditional lending.
The hedging classification consists of derivatives that the ANTS group has chosen to designate as in a hedging relationship because they meet the specific criteria in IAS 39.
All derivatives are required to be held at fair value through profit or loss, and shown in the balance sheet as separate totals of assets and liabilities. A description of how the fair values of derivatives are derived is set out in Note 43. This is described in more detail in the accounting policies “Derivative financial instruments” and “Hedge accounting” on pages 126 and 127. Derivative assets and liabilities on different transactions are only set off if the transactions are with the same counterparty, a legal right of set-off or netting exists and the cash flows are intended to be settled on a net basis.
Trading derivatives
Most of the ANTS group’s derivative transactions relate to sales activities and derivative contracts that represent the closing-out of existing positions through the use of matching deals. Sales activities include the structuring and marketing of derivative products to customers to enable them to take, transfer, modify or reduce current or expected risks. Limited positions may be traded actively or be held over a period of time to benefit from expected changes in exchange rates, interest rates, equity prices or other market parameters. Trading includes market-making, positioning and arbitrage activities. Market-making entails quoting bid and offer prices to other market participants for the purpose of generating revenues based on spread and volume; positioning means managing market risk positions in the expectation of benefiting from favourable movements in prices, rates or indices; arbitrage involves identifying and profiting from price differentials between markets and products.
Trading derivatives include interest rate, cross currency, equity, property and other index related swaps, forwards, caps, floors, swaptions, as well as credit default and total return swaps, equity index contracts and exchange traded interest rate futures and options and equity index options.
Corporate Banking deals with commercial customers who wish to enter into derivative contracts. Any market risk arising from such transactions is hedged by Markets. Markets is responsible for implementing ANTS group derivative hedging with the external market together with its own trading activities. For trading activities, its objectives are to gain value by:
| • | | marketing derivatives to end users and hedging the resulting exposures efficiently; and |
| • | | the management of trading exposure reflected on the ANTS group’s balance sheet. |
As mentioned above, other derivatives classified as held for trading include non-qualifying hedging derivatives (economic hedges), ineffective hedging derivatives and any components of hedging derivatives that are excluded from assessing hedge effectiveness, derivatives managed in conjunction with financial instruments designated at fair value and derivative contracts that represent the closing-out of existing positions through the use of matching deals.
Hedging derivatives
The ANTS group uses derivatives (principally interest rate swaps and cross-currency swaps) for hedging purposes in the management of its own asset and liability portfolios, including fixed-rate lending, fixed-rate asset purchases, medium-term note issues, capital issues, and structural positions. This enables the ANTS group to optimise the overall cost to it of accessing debt capital markets, and to mitigate the market risk which would otherwise arise from structural imbalances in the maturity and other profiles of its assets and liabilities.
The accounting for these derivatives is described in the accounting policy “Hedge accounting” on page 127. Such risks may also be managed using natural offsets within other on-balance sheet instruments as part of an integrated approach to risk management.
Derivative products which are combinations of more basic derivatives (such as swaps with embedded option features), or which have leverage features, may be used in circumstances where the underlying position being hedged contains the same risk features. In such cases, the derivative used will be structured to match the risks of the underlying asset or liability. Exposure to market risk on such contracts is therefore hedged.
The fair values of derivative instruments classified as held for trading and hedging purposes are set out in the following tables. The tables show the contract or underlying principal amounts, and positive and negative fair values of derivatives analysed by contract. The contract/notional amounts of derivatives indicate the nominal value of transactions outstanding at the balance sheet date; they do not represent actual exposures. The fair values represent the amount at which a contract could be exchanged in an arm’s length transaction, calculated at market rates at the balance sheet date.
As described above, derivatives classified as held for trading in the table below consist of those used in sales and trading activities, and those used for risk management purposes but which, for various reasons, either for which the ANTS group does not elect to claim hedge accounting or which do not meet the qualifying criteria for hedge accounting. Derivatives classified as held for hedging in the table below consist of those that have been designated as in a hedging relationship in accordance with IAS 39.
| | |
| 142 | | Abbey National Treasury Services plc 2012 Annual Report |
Financial Statements
Notes to the Financial Statementscontinued
| | | | | | | | | | | | |
| | | Group | |
2012 Derivatives held for trading | | Contract/notional amount
£m | | | Fair value assets
£m | | | Fair value liabilities
£m | |
Exchange rate contracts: | | | | | | | | | | | | |
- Cross-currency swaps | | | 120,339 | | | | 2,768 | | | | 3,613 | |
- Forward exchange swaps, options and forwards | | | 19,093 | | | | 928 | | | | 620 | |
| | | | | | | | | | | | |
| | | 139,432 | | | | 3,696 | | | | 4,233 | |
| | | | | | | | | | | | |
Interest rate contracts: | | | | | | | | | | | | |
- Interest rate swaps | | | 572,558 | | | | 24,044 | | | | 22,559 | |
- Caps, floors and swaptions(1) | | | 61,904 | | | | 3,582 | | | | 3,612 | |
- Futures | | | 19,273 | | | | 54 | | | | 31 | |
- Forward rate agreements | | | 123,132 | | | | 9 | | | | 13 | |
| | | | | | | | | | | | |
| | | 776,867 | | | | 27,689 | | | | 26,215 | |
| | | | | | | | | | | | |
Equity and credit contracts: | | | | | | | | | | | | |
- Equity index swaps and similar products | | | 44,083 | | | | 1,292 | | | | 1,945 | |
- Equity index options | | | 29,652 | | | | 152 | | | | 86 | |
- Credit default swaps and similar products | | | 381 | | | | 37 | | | | 7 | |
| | | | | | | | | | | | |
| | | 74,116 | | | | 1,481 | | | | 2,038 | |
| | | | | | | | | | | | |
Commodity contracts: | | | | | | | | | | | | |
- swaps | | | 227 | | | | 7 | | | | 7 | |
| | | | | | | | | | | | |
| | | 227 | | | | 7 | | | | 7 | |
| | | | | | | | | | | | |
Total derivative assets and liabilities held for trading | | | 990,642 | | | | 32,873 | | | | 32,493 | |
| | | | | | | | | | | | |
| | | | | | | | | | | | |
| | | Group | |
2012 Derivatives held for fair value hedging | | Contract/notional amount
£m | | | Fair value assets
£m | | | Fair value liabilities
£m | |
Exchange rate contracts: | | | | | | | | | | | | |
- Cross-currency swaps | | | 4,270 | | | | — | | | | 319 | |
Interest rate contracts: | | | | | | | | | | | | |
- Interest rate swaps | | | 67,111 | | | | 403 | | | | 1,276 | |
| | | | | | | | | | | | |
Total derivative assets and liabilities held for fair value hedging | | | 71,381 | | | | 403 | | | | 1,595 | |
| | | | | | | | | | | | |
Total recognised derivative assets and liabilities | | | 1,062,023 | | | | 33,276 | | | | 34,088 | |
| | | | | | | | | | | | |
| | | | | | | | | | | | |
| | | Group | |
2011 Derivatives held for trading | | Contract/notional amount
£m | | | Fair value assets
£m | | | Fair value liabilities
£m | |
Exchange rate contracts: | | | | | | | | | | | | |
- Cross-currency swaps | | | 104,519 | | | | 1,507 | | | | 2,839 | |
- Forward exchange swaps, options and forwards | | | 19,497 | | | | 149 | | | | 248 | |
| | | | | | | | | | | | |
| | | 124,016 | | | | 1,656 | | | | 3,087 | |
| | | | | | | | | | | | |
Interest rate contracts: | | | | | | | | | | | | |
- Interest rate swaps | | | 566,365 | | | | 25,949 | | | | 24,700 | |
- Caps, floors and swaptions(1) | | | 63,100 | | | | 3,484 | | | | 3,522 | |
- Futures | | | 32,503 | | | | 54 | | | | 41 | |
- Forward rate agreements | | | 78,090 | | | | 21 | | | | 31 | |
| | | | | | | | | | | | |
| | | 740,058 | | | | 29,508 | | | | 28,294 | |
| | | | | | | | | | | | |
Equity and credit contracts: | | | | | | | | | | | | |
- Equity index swaps and similar products | | | 32,330 | | | | 1,491 | | | | 2,755 | |
- Equity index options | | | 43,708 | | | | 152 | | | | 12 | |
- Credit default swaps and similar products | | | 550 | | | | 45 | | | | 21 | |
| | | | | | | | | | | | |
| | | 76,588 | | | | 1,688 | | | | 2,788 | |
| | | | | | | | | | | | |
Commodity contracts: | | | | | | | | | | | | |
- swaps | | | 542 | | | | 12 | | | | 11 | |
| | | | | | | | | | | | |
| | | 542 | | | | 12 | | | | 11 | |
| | | | | | | | | | | | |
Total derivative assets and liabilities held for trading | | | 941,204 | | | | 32,864 | | | | 34,180 | |
| | | | | | | | | | | | |
| | | | | | | | | | | | |
| | | Group | |
2011 Derivatives held for fair value hedging | | Contract/notional amount
£m | | | Fair value assets
£m | | | Fair value liabilities
£m | |
Exchange rate contracts: | | | | | | | | | | | | |
- Cross-currency swaps | | | 437 | | | | 32 | | | | — | |
Interest rate contracts: | | | | | | | | | | | | |
- Interest rate swaps | | | 35,848 | | | | 328 | | | | 1,237 | |
| | | | | | | | | | | | |
Total derivative assets and liabilities held for fair value hedging | | | 36,285 | | | | 360 | | | | 1,237 | |
| | | | | | | | | | | | |
Total recognised derivative assets and liabilities | | | 977,489 | | | | 33,224 | | | | 35,417 | |
| | | | | | | | | | | | |
| (1) | A swaption is an option on a swap that gives the holder the right but not the obligation to buy or sell a swap. |
| | |
Abbey National Treasury Services plc 2012 Annual Report | | 143 |
Financial Statements
Notes to the Financial Statementscontinued
| | | | | | | | | | | | |
| | | Company | |
2012 Derivatives held for trading | | Contract/notional amount
£m | | | Fair value assets
£m | | | Fair value liabilities
£m | |
Exchange rate contracts: | | | | | | | | | | | | |
- Cross-currency swaps | | | 120,339 | | | | 2,769 | | | | 3,613 | |
- Forward exchange swaps, options and forwards | | | 19,093 | | | | 927 | | | | 620 | |
| | | | | | | | | | | | |
| | | 139,432 | | | | 3,696 | | | | 4,233 | |
| | | | | | | | | | | | |
Interest rate contracts: | | | | | | | | | | | | |
- Interest rate swaps | | | 572,558 | | | | 24,059 | | | | 22,559 | |
- Caps, floors and swaptions(1) | | | 61,904 | | | | 3,582 | | | | 3,612 | |
- Futures | | | 19,273 | | | | 54 | | | | 31 | |
- Forward rate agreements | | | 123,132 | | | | 9 | | | | 13 | |
| | | | | | | | | | | | |
| | | 776,867 | | | | 27,704 | | | | 26,215 | |
| | | | | | | | | | | | |
Equity and credit contracts: | | | | | | | | | | | | |
- Equity index swaps and similar products | | | 44,383 | | | | 1,313 | | | | 1,945 | |
- Equity index options | | | 29,652 | | | | 152 | | | | 86 | |
- Credit default swaps and similar products | | | 381 | | | | 37 | | | | 7 | |
| | | | | | | | | | | | |
| | | 74,416 | | | | 1,502 | | | | 2,038 | |
| | | | | | | | | | | | |
Commodity contracts: | | | | | | | | | | | | |
- swaps | | | 227 | | | | 7 | | | | 7 | |
| | | | | | | | | | | | |
| | | 227 | | | | 7 | | | | 7 | |
| | | | | | | | | | | | |
Total derivative assets and liabilities held for trading | | | 990,942 | | | | 32,909 | | | | 32,493 | |
| | | | | | | | | | | | |
| | | | | | | | | | | | |
| | | Company | |
2012 Derivatives held for fair value hedging | | Contract/notional amount
£m | | | Fair value assets
£m | | | Fair value liabilities
£m | |
Exchange rate contracts: | | | | | | | | | | | | |
- Cross-currency swaps | | | 4,270 | | | | — | | | | 320 | |
Interest rate contracts: | | | | | | | | | | | | |
- Interest rate swaps | | | 67,111 | | | | 403 | | | | 1,275 | |
| | | | | | | | | | | | |
Total derivative assets and liabilities held for fair value hedging | | | 71,381 | | | | 403 | | | | 1,595 | |
| | | | | | | | | | | | |
Total recognised derivative assets and liabilities | | | 1,062,323 | | | | 33,312 | | | | 34,088 | |
| | | | | | | | | | | | |
| | | | | | | | | | | | |
| | | Company | |
2011 Derivatives held for trading | | Contract/notional amount
£m | | | Fair value assets
£m | | | Fair value liabilities
£m | |
Exchange rate contracts: | | | | | | | | | | | | |
- Cross-currency swaps | | | 104,519 | | | | 1,506 | | | | 2,839 | |
- Forward exchange swaps, options and forwards | | | 19,497 | | | | 149 | | | | 248 | |
| | | | | | | | | | | | |
| | | 124,016 | | | | 1,655 | | | | 3,087 | |
| | | | | | | | | | | | |
Interest rate contracts: | | | | | | | | | | | | |
- Interest rate swaps | | | 566,365 | | | | 25,951 | | | | 24,700 | |
- Caps, floors and swaptions(1) | | | 63,100 | | �� | | 3,484 | | | | 3,522 | |
- Futures | | | 32,503 | | | | 54 | | | | 41 | |
- Forward rate agreements | | | 78,090 | | | | 21 | | | | 31 | |
| | | | | | | | | | | | |
| | | 740,058 | | | | 29,510 | | | | 28,294 | |
| | | | | | | | | | | | |
Equity and credit contracts: | | | | | | | | | | | | |
- Equity index swaps and similar products | | | 32,629 | | | | 1,504 | | | | 2,755 | |
- Equity index options | | | 43,708 | | | | 156 | | | | 12 | |
- Credit default swaps and similar products | | | 612 | | | | 45 | | | | 21 | |
| | | | | | | | | | | | |
| | | 76,949 | | | | 1,705 | | | | 2,788 | |
| | | | | | | | | | | | |
Commodity contracts: | | | | | | | | | | | | |
- swaps | | | 542 | | | | 12 | | | | 11 | |
| | | | | | | | | | | | |
| | | 542 | | | | 12 | | | | 11 | |
| | | | | | | | | | | | |
Total derivative assets and liabilities held for trading | | | 941,565 | | | | 32,882 | | | | 34,180 | |
| | | | | | | | | | | | |
| | | | | | | | | | | | |
| | | Company | |
2011 Derivatives held for fair value hedging | | Contract/notional amount
£m | | | Fair value assets
£m | | | Fair value liabilities
£m | |
Exchange rate contracts: | | | | | | | | | | | | |
- Cross-currency swaps | | | 437 | | | | 32 | | | | — | |
Interest rate contracts: | | | | | | | | | | | | |
- Interest rate swaps | | | 35,848 | | | | 328 | | | | 1,237 | |
| | | | | | | | | | | | |
Total derivative assets and liabilities held for fair value hedging | | | 36,285 | | | | 360 | | | | 1,237 | |
| | | | | | | | | | | | |
Total recognised derivative assets and liabilities | | | 977,850 | | | | 33,242 | | | | 35,417 | |
| | | | | | | | | | | | |
| (1) | A swaption is an option on a swap that gives the holder the right but not the obligation to buy or sell a swap. |
| | |
| 144 | | Abbey National Treasury Services plc 2012 Annual Report |
Financial Statements
Notes to the Financial Statementscontinued
Net gains or losses arising from fair value hedges included in net trading and other income
| | | | | | | | | | | | |
| | | Group | |
| | | 2012
£m | | | 2011
£m | | | 2010
£m | |
Net gains/(losses): | | | | | | | | | | | | |
- on hedging instruments | | | (100 | ) | | | (36 | ) | | | (169 | ) |
- on hedged items attributable to hedged risks | | | 169 | | | | 31 | | | | 171 | |
| | | | | | | | | | | | |
| | | 69 | | | | (5 | ) | | | 2 | |
| | | | | | | | | | | | |
The ANTS group hedges its exposures to various risks, including interest rate risk and foreign currency risk, in connection with covered bond issuances, and subordinated and senior debt securities in issue. The gains/(losses) arising on these assets and liabilities are presented in the table above on a combined basis.
In addition, in the ordinary course of business, the ANTS group entered into long-term interest rate contracts as economic hedges with five investment vehicles whose underlying assets comprise debt securities, bank loans and energy and infrastructure financings. Although the vehicles themselves are not externally rated, the counterparty exposure ranks super-senior to the most senior notes issued by the vehicles and these notes are rated AAA or AA. The total mark-to-market exposure at 31 December 2012 was £50m (2011: £67m).
Included in the above balances are amounts owed to the ANTS group by Banco Santander, S.A. and by fellow subsidiaries of Banco Santander, S.A. outside the ANTS group of £2,025m (2011: £2,640m), £1,899m (2011: £904m) and £2,983m (2011: £3,598m) respectively and amounts owed by the ANTS group to Banco Santander, S.A. and to fellow subsidiaries of Banco Santander, S.A. outside the ANTS group of £1,914m (2011: £2,144m), £4,094m (2011: £5,277m) and £1,473m (2011: £1,125m). The net exposures after collateral to the Banco Santander, S.A. and fellow subsidiaries of Banco Santander, S.A. outside the ANTS group at 31 December 2012 amounted to £137m (2011: £146m) and £3,697m (2011: £2,422m) respectively.
16. FINANCIAL ASSETS DESIGNATED AT FAIR VALUE
| | | | | | | | | | | | | | | | |
| | | Group | | | Company | |
| | | 2012
£m | | | 2011 (1)
£m | | | 2012
£m | | | 2011 (1)
£m | |
Loans and advances to customers | | | 3,203 | | | | 4,050 | | | | 3,203 | | | | 4,050 | |
Debt securities | | | 328 | | | | 379 | | | | 328 | | | | 379 | |
| | | | | | | | | | | | | | | | |
| | | 3,531 | | | | 4,429 | | | | 3,531 | | | | 4,429 | |
| | | | | | | | | | | | | | | | |
| (1) | As restated, see Note 45 |
Financial assets are designated at fair value through profit or loss where this results in more relevant information because it significantly reduces a measurement inconsistency that would otherwise arise from measuring the assets or liabilities or recognising gains or losses on them on a different basis, or where the assets are managed and their performance evaluated on a fair value basis.
The following assets have been designated at fair value through profit or loss:
| • | | Loans and advances to customers,representing loans secured on residential property to housing associations of £3,142m (2011: £3,992m) and other loans of £61m (2011: £58m). |
| | • | | Loans secured on residential property to housing associations of £3,142m (2011: £3,992m) which, at the date of their origination, were managed, and their performance evaluated, on a fair value basis in accordance with a documented investment strategy, and information about them was provided on that basis to management. Since 2009, the ANTS group’s policy has been not to designate similar new loans at fair value through profit or loss. |
| | • | | Other loans of £61m (2011: £58m), representing a portfolio of roll-up mortgages, are managed, and their performance evaluated, on a fair value basis in accordance with a documented investment strategy, and information about them is provided on that basis to management. |
| • | | Debt securities, representing holdings of asset-backed securities of £328m (2011: £379m): |
| | • | | Mortgage-backed securities of £250m (2011: £279m) and other asset backed debt securities of £31m (2011: £49m) are managed and their performance evaluated on a fair value basis in accordance with a documented strategy, and information about them is provided on that basis to management. |
| | • | | Other asset-backed securities of £47m (2011: £51m) which, at the date of their acquisition, were managed, and their performance evaluated, on a fair value basis in accordance with a documented investment strategy, and information about them was provided on that basis to management. Almost all of these securities are now managed on an accrual basis, but are not eligible for reclassification under IAS 39. These securities were issued by Banco Santander entities in Spain. |
The maximum exposure to credit risk on loans and advances designated as held at fair value through profit or loss at the balance sheet date was £3,203m (2011: £4,050m) for the ANTS group and £3,203m (2011: £4,050m) for the Company. The maximum exposure was mitigated by the ANTS group having a charge over residential properties in respect of lending to housing associations amounting to £3,343m (2011: £4,556m) for the ANTS group and £3,343m (2011: £4,556m) for the Company.
| | |
Abbey National Treasury Services plc 2012 Annual Report | | 145 |
Financial Statements
Notes to the Financial Statementscontinued
The net movement during the year attributable to changes in credit risk for loans and advances designated at fair value was £182m (2011: net loss of £307m, 2010: net loss £26m) for the ANTS group. The cumulative net loss attributable to changes in credit risk for loans and advances designated at fair value at 31 December 2012 was £356m (2011: net loss of £538m, 2010: net loss of £231m).
Included in the above balances are amounts owed to the ANTS group by Banco Santander, S.A. and by fellow subsidiaries of Banco Santander, S.A. outside the ANTS group of £nil (2011: £nil) and £47m (2011: £49m) respectively.
Debt securities can be analysed by type of issuer as follows:
| | | | | | | | | | | | | | | | |
| | | Group | | | Company | |
| | | 2012
£m | | | 2011
£m | | | 2012
£m | | | 2011
£m | |
Mortgage-backed securities | | | 250 | | | | 279 | | | | 250 | | | | 279 | |
Other asset-backed securities | | | 78 | | | | 100 | | | | 78 | | | | 100 | |
| | | | | | | | | | | | | | | | |
| | | 328 | | | | 379 | | | | 328 | | | | 379 | |
| | | | | | | | | | | | | | | | |
Debt securities can be analysed by listing status as follows:
| | | | | | | | | | | | | | | | |
| | | Group | | | Company | |
| | | 2012
£m | | | 2011
£m | | | 2012
£m | | | 2011
£m | |
Listed UK | | | 237 | | | | 256 | | | | 237 | | | | 256 | |
Listed elsewhere | | | 80 | | | | 107 | | | | 80 | | | | 107 | |
Unlisted(1) | | | 11 | | | | 16 | | | | 11 | | | | 16 | |
| | | | | | | | | | | | | | | | |
| | | 328 | | | | 379 | | | | 328 | | | | 379 | |
| | | | | | | | | | | | | | | | |
| (1) | Comprises Social Housing. |
Asset-backed securities can be analysed by the geographical location of the issuer or counterparty as follows:
| | | | | | | | | | | | | | | | | | | | | | | | | | | | | | | | | | | | | | | | |
| | | 31 December 2012 | | | 31 December 2011 | | | Income statement | |
| | | Nominal
value | | | Book
value | | | Fair
value | | | Fair value as
% of nominal | | | Nominal
value | | | Book
value | | | Fair
value | | | Fair value as
% of nominal | | | 2012 | | | 2011 | |
Country | | £m | | | £m | | | £m | | | % | | | £m | | | £m | | | £m | | | % | | | £m | | | £m | |
UK | | | | | | | | | | | | | | | | | | | | | | | | | | | | | | | | | | | | | | | | |
MBS | | | 171 | | | | 238 | | | | 238 | | | | 139 | | | | 187 | | | | 263 | | | | 263 | | | | 141 | | | | 8 | | | | 26 | |
| | | | | | | | | | | | | | | | | | | | | | | | | | | | | | | | | | | | | | | | |
| | | 171 | | | | 238 | | | | 238 | | | | 139 | | | | 187 | | | | 263 | | | | 263 | | | | 141 | | | | 8 | | | | 26 | |
| | | | | | | | | | | | | | | | | | | | | | | | | | | | | | | | | | | | | | | | |
US | | | | | | | | | | | | | | | | | | | | | | | | | | | | | | | | | | | | | | | | |
MBS | | | 8 | | | | 11 | | | | 11 | | | | 138 | | | | 8 | | | | 9 | | | | 9 | | | | 113 | | | | 4 | | | | (4 | ) |
| | | | | | | | | | | | | | | | | | | | | | | | | | | | | | | | | | | | | | | | |
| | | 8 | | | | 11 | | | | 11 | | | | 138 | | | | 8 | | | | 9 | | | | 9 | | | | 113 | | | | 4 | | | | (4 | ) |
| | | | | | | | | | | | | | | | | | | | | | | | | | | | | | | | | | | | | | | | |
Rest of Europe | | | | | | | | | | | | | | | | | | | | | | | | | | | | | | | | | | | | | | | | |
ABS | | | 98 | | | | 78 | | | | 78 | | | | 80 | | | | 105 | | | | 100 | | | | 100 | | | | 95 | | | | (13 | ) | | | 11 | |
MBS | | | 1 | | | | 1 | | | | 1 | | | | 100 | | | | 10 | | | | 7 | | | | 7 | | | | 70 | | | | — | | | | 1 | |
| | | | | | | | | | | | | | | | | | | | | | | | | | | | | | | | | | | | | | | | |
| | | 99 | | | | 79 | | | | 79 | | | | 80 | | | | 115 | | | | 107 | | | | 107 | | | | 93 | | | | (13 | ) | | | 12 | |
| | | | | | | | | | | | | | | | | | | | | | | | | | | | | | | | | | | | | | | | |
Total | | | 278 | | | | 328 | | | | 328 | | | | 118 | | | | 310 | | | | 379 | | | | 379 | | | | 122 | | | | (1 | ) | | | 34 | |
| | | | | | | | | | | | | | | | | | | | | | | | | | | | | | | | | | | | | | | | |
Asset-backed securities can be analysed by the credit rating of the issuer or counterparty as follows:
| | | | | | | | | | | | | | | | | | | | | | | | | | | | | | | | | | | | | | | | |
| | | 31 December 2012 | | | 31 December 2011 | | | Income statement | |
| | | Nominal
value | | | Book
value | | | Fair
value | | | Fair value as
% of nominal | | | Nominal
value | | | Book
value | | | Fair
value | | | Fair value as
% of nominal | | | 2012 | | | 2011 | |
Credit rating(1) | | £m | | | £m | | | £m | | | % | | | £m | | | £m | | | £m | | | % | | | £m | | | £m | |
AAA | | | | | | | | | | | | | | | | | | | | | | | | | | | | | | | | | | | | | | | | |
ABS | | | — | | | | — | | | | — | | | | — | | | | 28 | | | | 16 | | | | 16 | | | | 57 | | | | — | | | | — | |
MBS | | | 159 | | | | 222 | | | | 222 | | | | 140 | | | | 175 | | | | 247 | | | | 247 | | | | 141 | | | | 10 | | | | 18 | |
| | | | | | | | | | | | | | | | | | | | | | | | | | | | | | | | | | | | | | | | |
| | | 159 | | | | 222 | | | | 222 | | | | 140 | | | | 203 | | | | 263 | | | | 263 | | | | 130 | | | | 10 | | | | 18 | |
| | | | | | | | | | | | | | | | | | | | | | | | | | | | | | | | | | | | | | | | |
AA+ | | | | | | | | | | | | | | | | | | | | | | | | | | | | | | | | | | | | | | | | |
ABS | | | — | | | | — | | | | — | | | | — | | | | 46 | | | | 30 | | | | 30 | | | | 65 | | | | — | | | | 1 | |
| | | | | | | | | | | | | | | | | | | | | | | | | | | | | | | | | | | | | | | | |
| | | — | | | | — | | | | — | | | | ��� | | | | 46 | | | | 30 | | | | 30 | | | | 65 | | | | — | | | | 1 | |
| | | | | | | | | | | | | | | | | | | | | | | | | | | | | | | | | | | | | | | | |
AA | | | | | | | | | | | | | | | | | | | | | | | | | | | | | | | | | | | | | | | | |
ABS | | | 54 | | | | 49 | | | | 49 | | | | 91 | | | | 28 | | | | 52 | | | | 52 | | | | 186 | | | | (15 | ) | | | 10 | |
MBS | | | 20 | | | | 27 | | | | 27 | | | | 135 | | | | 21 | | | | 27 | | | | 27 | | | | 129 | | | | 2 | | | | 5 | |
| | | | | | | | | | | | | | | | | | | | | | | | | | | | | | | | | | | | | | | | |
| | | 74 | | | | 76 | | | | 76 | | | | 103 | | | | 49 | | | | 79 | | | | 79 | | | | 161 | | | | (13 | ) | | | 15 | |
| | | | | | | | | | | | | | | | | | | | | | | | | | | | | | | | | | | | | | | | |
A | | | | | | | | | | | | | | | | | | | | | | | | | | | | | | | | | | | | | | | | |
ABS | | | 42 | | | | 28 | | | | 28 | | | | 67 | | | | 3 | | | | 2 | | | | 2 | | | | 67 | | | | 2 | | | | — | |
MBS | | | 1 | | | | 1 | | | | 1 | | | | 100 | | | | — | | | | — | | | | — | | | | — | | | | — | | | | — | |
| | | | | | | | | | | | | | | | | | | | | | | | | | | | | | | | | | | | | | | | |
| | | 43 | | | | 29 | | | | 29 | | | | 67 | | | | 3 | | | | 2 | | | | 2 | | | | 67 | | | | 2 | | | | — | |
| | | | | | | | | | | | | | | | | | | | | | | | | | | | | | | | | | | | | | | | |
BBB | | | | | | | | | | | | | | | | | | | | | | | | | | | | | | | | | | | | | | | | |
ABS | | | 2 | | | | 1 | | | | 1 | | | | 50 | | | | — | | | | — | | | | — | | | | — | | | | — | | | | — | |
| | | | | | | | | | | | | | | | | | | | | | | | | | | | | | | | | | | | | | | | |
| | | 2 | | | | 1 | | | | 1 | | | | 50 | | | | — | | | | — | | | | — | | | | — | | | | — | | | | — | |
| | | | | | | | | | | | | | | | | | | | | | | | | | | | | | | | | | | | | | | | |
Below BBB | | | | | | | | | | | | | | | | | | | | | | | | | | | | | | | | | | | | | | | | |
MBS | | | — | | | | — | | | | — | | | | — | | | | 9 | | | | 5 | | | | 5 | | | | 56 | | | | — | | | | — | |
| | | | | | | | | | | | | | | | | | | | | | | | | | | | | | | | | | | | | | | | |
Total | | | 278 | | | | 328 | | | | 328 | | | | 118 | | | | 310 | | | | 379 | | | | 379 | | | | 122 | | | | (1 | ) | | | 34 | |
| | | | | | | | | | | | | | | | | | | | | | | | | | | | | | | | | | | | | | | | |
| (1) | All exposures are internally rated. External ratings are taken into consideration in the rating process, where available. |
| | |
| 146 | | Abbey National Treasury Services plc 2012 Annual Report |
Financial Statements
Notes to the Financial Statementscontinued
17. LOANS AND ADVANCES TO BANKS
| | | | | | | | | | | | | | | | |
| | | Group | | | Company | |
| | | 2012
£m | | | 2011
£m | | | 2012
£m | | | 2011
£m | |
Amounts due from Santander UK group undertakings - securities purchased under resale agreements | | | 566 | | | | 3,193 | | | | 564 | | | | 3,193 | |
-other | | | 104,893 | | | | 106,811 | | | | 104,886 | | | | 106,807 | |
Amounts due from Banco Santander - securities purchased under resale agreements | | | 233 | | | | 2,071 | | | | 233 | | | | 2,070 | |
-other | | | 4 | | | | 11 | | | | 4 | | | | 11 | |
Other loans and advances | | | 1,290 | | | | 1,136 | | | | 1,285 | | | | 1,130 | |
| | | | | | | | | | | | | | | | |
| | | 106,986 | | | | 113,222 | | | | 106,972 | | | | 113,211 | |
| | | | | | | | | | | | | | | | |
Almost all of the ANTS group’s loans and advances to banks are transactions with other Santander UK group companies in the ordinary course of business. ANTS provides treasury, corporate and wholesale banking services to the wider Santander UK group. The ANTS group is also the treasury support function for the Santander UK group.
During the year, no impairment losses were incurred (2011: £nil). Loans and advances to banks are repayable as follows:
| | | | | | | | | | | | | | | | |
| | | Group | | | Company | |
Repayable: | | 2012
£m | | | 2011
£m | | | 2012
£m | | | 2011
£m | |
On demand | | | 28,177 | | | | 18,507 | | | | 28,163 | | | | 18,500 | |
In not more than 3 months | | | 39,887 | | | | 40,763 | | | | 39,887 | | | | 40,762 | |
In more than 3 months but not more than 1 year | | | 12,704 | | | | 9,911 | | | | 12,704 | | | | 9,911 | |
In more than 1 year but not more than 5 years | | | 24,040 | | | | 35,214 | | | | 24,040 | | | | 35,214 | |
In more than 5 years | | | 2,178 | | | | 8,827 | | | | 2,178 | | | | 8,824 | |
| | | | | | | | | | | | | | | | |
| | | 106,986 | | | | 113,222 | | | | 106,972 | | | | 113,211 | |
| | | | | | | | | | | | | | | | |
Loans and advances to banks can be analysed by the geographical location of the issuer or counterparty as follows:
| | | | | | | | |
| | | Group | |
Country | | 2012
£m | | | 2011
£m | |
UK | | | 105,466 | | | | 110,531 | |
Spain | | | 237 | | | | 2,082 | |
France | | | 13 | | | | — | |
Rest of Europe | | | — | | | | 89 | |
US | | | 1,237 | | | | 245 | |
Rest of world | | | 33 | | | | 275 | |
| | | | | | | | |
Total | | | 106,986 | | | | 113,222 | |
| | | | | | | | |
Loans and advances to banks can be analysed by the credit rating of the issuer or counterparty as follows:
| | | | | | | | |
| | | Group | |
Credit rating(1) | | 2012
£m | | | 2011
£m | |
AAA | | | 5 | | | | 238 | |
AA- | | | 203 | | | | 112,087 | |
A+ | | | 30 | | | | — | |
A | | | 105,614 | | | | — | |
A- | | | 897 | | | | 897 | |
BB+ | | | 237 | | | | — | |
| | | | | | | | |
Total | | | 106,986 | | | | 113,222 | |
| | | | | | | | |
| (1) | All exposures are internally rated. External ratings are taken into consideration in the rating process, where available. |
| | |
Abbey National Treasury Services plc 2012 Annual Report | | 147 |
Financial Statements
Notes to the Financial Statementscontinued
18. LOANS AND ADVANCES TO CUSTOMERS
| | | | | | | | | | | | | | | | |
| | | Group | | | Company | |
| | | 2012
£m | | | 2011
£m | | | 2012
£m | | | 2011
£m | |
Amounts due from Santander UK group undertakings | | | 32,368 | | | | 27,831 | | | | 32,482 | | | | 27,938 | |
Amounts due from Banco Santander group undertakings | | | 5 | | | | 5 | | | | 5 | | | | 5 | |
Other loans and advances | | | 12,489 | | | | 11,120 | | | | 12,483 | | | | 11,113 | |
| | | | | | | | | | | | | | | | |
Loans and advances to customers | | | 44,862 | | | | 38,956 | | | | 44,970 | | | | 39,056 | |
Less: impairment loss allowances | | | (112 | ) | | | (130 | ) | | | (112 | ) | | | (130 | ) |
| | | | | | | | | | | | | | | | |
Loans and advances to customers, net of impairment loss allowances | | | 44,750 | | | | 38,826 | | | | 44,858 | | | | 38,926 | |
| | | | | | | | | | | | | | | | |
| | | | | | | | | | | | | | | | |
| | | Group | | | Company | |
Repayable: | | 2012
£m | | | 2011
£m | | | 2012
£m | | | 2011
£m | |
On demand | | | 71 | | | | 1,026 | | | | 122 | | | | 1,078 | |
In no more than 3 months | | | 7,377 | | | | 6,692 | | | | 7,434 | | | | 6,736 | |
In more than 3 months but not more than a year | | | 2,751 | | | | 2,110 | | | | 2,750 | | | | 2,112 | |
In more than 1 year but not more than 5 years | | | 16,973 | | | | 15,970 | | | | 16,968 | | | | 15,965 | |
In more than 5 years | | | 17,690 | | | | 13,158 | | | | 17,696 | | | | 13,165 | |
| | | | | | | | | | | | | | | | |
Loans and advances to customers | | | 44,862 | | | | 38,956 | | | | 44,970 | | | | 39,056 | |
Less: impairment loss allowance | | | (112 | ) | | | (130 | ) | | | (112 | ) | | | (130 | ) |
| | | | | | | | | | | | | | | | |
Loans and advances to customers, net of impairment loss allowances | | | 44,750 | | | | 38,826 | | | | 44,858 | | | | 38,926 | |
| | | | | | | | | | | | | | | | |
The loans and advances to customers in the above table have the following interest rate structure:
| | | | | | | | | | | | | | | | |
| | | Group | | | Company | |
| | | 2012
£m | | | 2011
£m | | | 2012
£m | | | 2011
£m | |
Fixed rate | | | 25,803 | | | | 19,349 | | | | 25,918 | | | | 19,454 | |
Variable rate | | | 19,059 | | | | 19,607 | | | | 19,052 | | | | 19,602 | |
Less: impairment loss allowances | | | (112 | ) | | | (130 | ) | | | (112 | ) | | | (130 | ) |
| | | | | | | | | | | | | | | | |
| | | 44,750 | | | | 38,826 | | | | 44,858 | | | | 38,926 | |
| | | | | | | | | | | | | | | | |
Movement in impairment loss allowances:
| | | | | | | | | | | | |
| | | Group | |
| | | 2012
£m | | | 2011
£m | | | 2010
£m | |
At 1 January: | | | | | | | | | | | | |
- Observed | | | 97 | | | | 79 | | | | 63 | |
- Incurred but not yet observed | | | 33 | | | | 29 | | | | 14 | |
| | | | | | | | | | | | |
At 1 January | | | 130 | | | | 108 | | | | 77 | |
| | | | | | | | | | | | |
Charge/(release) to the income statement: | | | | | | | | | | | | |
- Observed | | | 40 | | | | 50 | | | | 65 | |
- Individual | | | 32 | | | | 50 | | | | 65 | |
- Collective | | | 8 | | | | — | | | | — | |
- Incurred but not yet observed | | | (31 | ) | | | 4 | | | | 15 | |
| | | | | | | | | | | | |
Charge/(release) to the income statement | | | 9 | | | | 54 | | | | 80 | |
| | | | | | | | | | | | |
Write offs: | | | | | | | | | | | | |
- Observed | | | (27 | ) | | | (32 | ) | | | (49 | ) |
- Incurred but not yet observed | | | — | | | | — | | | | — | |
| | | | | | | | | | | | |
Write offs | | | (27 | ) | | | (32 | ) | | | (49 | ) |
| | | | | | | | | | | | |
At 31 December: | | | | | | | | | | | | |
- Observed | | | 110 | | | | 97 | | | | 79 | |
- Incurred but not yet observed | | | 2 | | | | 33 | | | | 29 | |
| | | | | | | | | | | | |
At 31 December | | | 112 | | | | 130 | | | | 108 | |
| | | | | | | | | | | | |
| | | | | | | | | | | | |
| | | Company | |
| | | 2012
£m | | | 2011
£m | | | 2010
£m | |
At 1 January | | | 130 | | | | 108 | | | | 77 | |
Charge to the income statement | | | 9 | | | | 54 | | | | 86 | |
Write offs | | | (27 | ) | | | (32 | ) | | | (55 | ) |
| | | | | | | | | | | | |
At 31 December | | | 112 | | | | 130 | | | | 108 | |
| | | | | | | | | | | | |
| | |
| 148 | | Abbey National Treasury Services plc 2012 Annual Report |
Financial Statements
Notes to the Financial Statementscontinued
19. SPECIAL PURPOSE ENTITIES
Special Purpose Entities (‘SPEs’) are formed by the ANTS group to accomplish specific and well-defined objectives. The ANTS group consolidates these SPEs when the substance of the relationship indicates control, as described in Note 1.
Consolidated special purpose entities
The only SPE sponsored and consolidated by the ANTS group is Guaranteed Investment Products 1 PCC Limited, a Guernsey-incorporated, closed-ended, protected cell company. The objective of each cell is to achieve capital growth. In order to achieve the investment objective, Guaranteed Investment Products 1 PCC Limited, on behalf of the respective cell, has entered into transactions with the ANTS group. Santander Guarantee Company, a Santander UK group company, also guarantees the shareholders of cells a fixed return on their investment and/or the investment amount. Guaranteed Investment Products 1 PCC Limited has no third party assets.
Off balance sheet special purpose entities
The only SPEs sponsored but not consolidated by the ANTS group are SPEs which issue shares that back retail structured products. At 31 December 2012, the total value of products issued by these SPEs was £25m (2011: £36m). The ANTS group’s arrangements with these entities comprise the provision of equity derivatives and a secondary market-making service to those retail customers who wish to exit early from these products.
The maximum exposure to the SPEs sponsored but not consolidated by the ANTS group consists of trading assets (repurchases held by the ANTS group) of £10m (2011: £17m).
| | |
Abbey National Treasury Services plc 2012 Annual Report | | 149 |
Financial Statements
Notes to the Financial Statementscontinued
20. LOANS AND RECEIVABLE SECURITIES
| | | | | | | | | | | | | | | | |
| | | Group | | | Company | |
| | | 2012
£m | | | 2011
£m | | | 2012
£m | | | 2011
£m | |
Loans and receivable securities | | | 162 | | | | 278 | | | | 162 | | | | 278 | |
| | | | | | | | | | | | | | | | |
These asset-backed securities were acquired as part of an alignment of portfolios across the Banco Santander group in 2010 and are being run down. Detailed analysis of these securities is set out below.
Included in the above balances are amounts owed to the ANTS group by Banco Santander, S.A. and by fellow subsidiaries of Banco Santander, S.A. outside the ANTS group of £nil (2011: £nil) and £nil (2011: £87m) respectively.
Asset-backed securities can be analysed by the geographic location of the issuer or counterparty as follows:
| | | | | | | | | | | | | | | | | | | | | | | | | | | | | | | | | | | | | | | | |
| | | 31 December 2012 | | | 31 December 2011 | | | Income statement | |
| | | Nominal
value | | | Book
value | | | Fair
value | | | Fair value as
% of nominal | | | Nominal
value | | | Book
value | | | Fair
value | | | Fair value as
% of nominal | | | 2012 | | | 2011 | |
Country | | £m | | | £m | | | £m | | | % | | | £m | | | £m | | | £m | | | % | | | £m | | | £m | |
UK | | | | | | | | | | | | | | | | | | | | | | | | | | | | | | | | | | | | | | | | |
MBS | | | 5 | | | | 5 | | | | 5 | | | | 100 | | | | 91 | | | | 91 | | | | 91 | | | | 100 | | | | — | | | | 1 | |
| | | | | | | | | | | | | | | | | | | | | | | | | | | | | | | | | | | | | | | | |
| | | 5 | | | | 5 | | | | 5 | | | | 100 | | | | 91 | | | | 91 | | | | 91 | | | | 100 | | | | — | | | | 1 | |
| | | | | | | | | | | | | | | | | | | | | | | | | | | | | | | | | | | | | | | | |
US | | | | | | | | | | | | | | | | | | | | | | | | | | | | | | | | | | | | | | | | |
ABS | | | 27 | | | | 21 | | | | 21 | | | | 78 | | | | 29 | | | | 22 | | | | 22 | | | | 76 | | | | 1 | | | | 1 | |
| | | | | | | | | | | | | | | | | | | | | | | | | | | | | | | | | | | | | | | | |
| | | 27 | | | | 21 | | | | 21 | | | | 78 | | | | 29 | | | | 22 | | | | 22 | | | | 76 | | | | 1 | | | | 1 | |
| | | | | | | | | | | | | | | | | | | | | | | | | | | | | | | | | | | | | | | | |
Rest of Europe | | | | | | | | | | | | | | | | | | | | | | | | | | | | | | | | | | | | | | | | |
ABS | | | 2 | | | | 2 | | | | 2 | | | | 100 | | | | 3 | | | | 3 | | | | 3 | | | | 100 | | | | — | | | | — | |
MBS | | | 131 | | | | 125 | | | | 125 | | | | 95 | | | | 151 | | | | 143 | | | | 143 | | | | 95 | | | | 4 | | | | 4 | |
| | | | | | | | | | | | | | | | | | | | | | | | | | | | | | | | | | | | | | | | |
| | | 133 | | | | 127 | | | | 127 | | | | 95 | | | | 154 | | | | 146 | | | | 146 | | | | 95 | | | | 4 | | | | 4 | |
| | | | | | | | | | | | | | | | | | | | | | | | | | | | | | | | | | | | | | | | |
Rest of world | | | | | | | | | | | | | | | | | | | | | | | | | | | | | | | | | | | | | | | | |
ABS | | | 10 | | | | 9 | | | | 9 | | | | 90 | | | | 21 | | | | 19 | | | | 19 | | | | 90 | | | | 1 | | | | 4 | |
| | | | | | | | | | | | | | | | | | | | | | | | | | | | | | | | | | | | | | | | |
| | | 10 | | | | 9 | | | | 9 | | | | 90 | | | | 21 | | | | 19 | | | | 19 | | | | 90 | | | | 1 | | | | 4 | |
| | | | | | | | | | | | | | | | | | | | | | | | | | | | | | | | | | | | | | | | |
Total | | | 175 | | | | 162 | | | | 162 | | | | 93 | | | | 295 | | | | 278 | | | | 278 | | | | 94 | | | | 6 | | | | 10 | |
| | | | | | | | | | | | | | | | | | | | | | | | | | | | | | | | | | | | | | | | |
Asset-backed securities can be analysed by the credit rating of the issuer or counterparty as follows:
| | | | | | | | | | | | | | | | | | | | | | | | | | | | | | | | | | | | | | | | |
| | | 31 December 2012 | | | 31 December 2012 | | | Income statement | |
| | | Nominal
value | | | Book
value | | | Fair
value | | | Fair value as
% of nominal | | | Nominal
value | | | Book
value | | | Fair
value | | | Fair value as
% of nominal | | | 2012 | | | 2011 | |
Credit rating(1) | | £m | | | £m | | | £m | | | % | | | £m | | | £m | | | £m | | | % | | | £m | | | £m | |
AAA | | | | | | | | | | | | | | | | | | | | | | | | | | | | | | | | | | | | | | | | |
ABS | | | 4 | | | | 4 | | | | 4 | | | | 100 | | | | 19 | | | | 16 | | | | 16 | | | | 84 | | | | — | | | | 2 | |
MBS | | | 120 | | | | 115 | | | | 115 | | | | 96 | | | | 147 | | | | 143 | | | | 143 | | | | 97 | | | | 3 | | | | 3 | |
| | | | | | | | | | | | | | | | | | | | | | | | | | | | | | | | | | | | | | | | |
| | | 124 | | | | 119 | | | | 119 | | | | 96 | | | | 166 | | | | 159 | | | | 159 | | | | 96 | | | | 3 | | | | 5 | |
| | | | | | | | | | | | | | | | | | | | | | | | | | | | | | | | | | | | | | | | |
AA+ | | | | | | | | | | | | | | | | | | | | | | | | | | | | | | | | | | | | | | | | |
ABS | | | 2 | | | | 2 | | | | 2 | | | | 100 | | | | — | | | | — | | | | — | | | | — | | | | — | | | | — | |
MBS | | | — | | | | — | | | | — | | | | — | | | | 84 | | | | 80 | | | | 80 | | | | 95 | | | | — | | | | 2 | |
| | | | | | | | | | | | | | | | | | | | | | | | | | | | | | | | | | | | | | | | |
| | | 2 | | | | 2 | | | | 2 | | | | 100 | | | | 84 | | | | 80 | | | | 80 | | | | 95 | | | | — | | | | 2 | |
| | | | | | | | | | | | | | | | | | | | | | | | | | | | | | | | | | | | | | | | |
AA | | | | | | | | | | | | | | | | | | | | | | | | | | | | | | | | | | | | | | | | |
MBS | | | 16 | | | | 15 | | | | 15 | | | | 94 | | | | 5 | | | | 5 | | | | 5 | | | | 100 | | | | 1 | | | | — | |
| | | | | | | | | | | | | | | | | | | | | | | | | | | | | | | | | | | | | | | | |
| | | 16 | | | | 15 | | | | 15 | | | | 94 | | | | 5 | | | | 5 | | | | 5 | | | | 100 | | | | 1 | | | | — | |
| | | | | | | | | | | | | | | | | | | | | | | | | | | | | | | | | | | | | | | | |
A | | | | | | | | | | | | | | | | | | | | | | | | | | | | | | | | | | | | | | | | |
ABS | | | 15 | | | | 13 | | | | 13 | | | | 87 | | | | 19 | | | | 16 | | | | 16 | | | | 84 | | | | 1 | | | | 2 | |
MBS | | | — | | | | — | | | | — | | | | — | | | | 6 | | | | 6 | | | | 6 | | | | 100 | | | | — | | | | — | |
| | | | | | | | | | | | | | | | | | | | | | | | | | | | | | | | | | | | | | | | |
| | | 15 | | | | 13 | | | | 13 | | | | 87 | | | | 25 | | | | 22 | | | | 22 | | | | 88 | | | | 1 | | | | 2 | |
| | | | | | | | | | | | | | | | | | | | | | | | | | | | | | | | | | | | | | | | |
Below BBB | | | | | | | | | | | | | | | | | | | | | | | | | | | | | | | | | | | | | | | | |
ABS | | | 18 | | | | 13 | | | | 13 | | | | 72 | | | | 15 | | | | 12 | | | | 12 | | | | 80 | | | | 1 | | | | 1 | |
| | | | | | | | | | | | | | | | | | | | | | | | | | | | | | | | | | | | | | | | |
| | | 18 | | | | 13 | | | | 13 | | | | 72 | | | | 15 | | | | 12 | | | | 12 | | | | 80 | | | | 1 | | | | 1 | |
| | | | | | | | | | | | | | | | | | | | | | | | | | | | | | | | | | | | | | | | |
Total | | | 175 | | | | 162 | | | | 162 | | | | 93 | | | | 295 | | | | 278 | | | | 278 | | | | 94 | | | | 6 | | | | 10 | |
| | | | | | | | | | | | | | | | | | | | | | | | | | | | | | | | | | | | | | | | |
| (1) | All exposures are internally rated. External ratings are taken into consideration in the rating process, where available. |
Asset-backed securities above include the following:
| | • | | ALT-A US asset-backed securities - the ANTS group holds no ALT-A US asset-backed securities. |
| | • | | Monoline insurer exposures - the ANTS group has a £30m (2011: £44m) exposure to corporate bonds and securitisations which are wrapped by monoline insurers. The principal risk exposures are recorded against the securitisations, with the monoline wraps being viewed as contingent exposures. |
| | |
| 150 | | Abbey National Treasury Services plc 2012 Annual Report |
Financial Statements
Notes to the Financial Statementscontinued
21. TRANSFERS OF FINANCIAL ASSETS NOT QUALIFYING FOR DERECOGNITION
The ANTS group enters into transactions in the normal course of business by which it transfers recognised financial assets directly to third parties or to SPEs. These transfers may give rise to the full or partial derecognition of the financial assets concerned.
| • | | Full derecognition occurs when the ANTS group transfers its contractual right to receive cash flows from the financial assets, or retains the right but assumes an obligation to pass on the cash flows from the asset, and transfers substantially all the risks and rewards of ownership. The risks include credit, interest rate, currency, prepayment and other price risks. |
| • | | Partial derecognition occurs when the ANTS group sells or otherwise transfers financial assets in such a way that some but not substantially all of the risks and rewards of ownership are transferred but control is retained. These financial assets are recognised on the balance sheet to the extent of the ANTS group’s continuing involvement. |
Financial assets that do not qualify for derecognition consist of (i) securities held by counterparties as collateral under repurchase agreements, (ii) securities lent under securities lending agreements, and (iii) loans that have been securitised under arrangements by which the ANTS group retains a continuing involvement in such transferred assets.
As the substance of these transactions is secured borrowings, the asset collateral continues to be recognised in full and the related liability reflecting the ANTS group’s obligation to repurchase the transferred assets for a fixed price at a future date is recognised in deposits from banks or customers, as appropriate. As a result of these transactions, the ANTS group is unable to use, sell or pledge the transferred assets for the duration of the transaction. The ANTS group remains exposed to interest rate risk and credit risk on these pledged instruments. The counterparty’s recourse is not limited to the transferred assets.
The following table analyses the carrying amount of financial assets that did not qualify for derecognition and their associated financial liabilities:
| | | | | | | | | | | | | | | | |
| | | Group | |
| | | 2012
£m | | | 2012
£m | | | 2011
£m | | | 2011
£m | |
Nature of transaction | | Carrying
amount of
transferred
assets | | | Carrying
amount of
associated
liabilities | | | Carrying
amount of
transferred
assets | | | Carrying
amount of
associated
liabilities | |
Sale and repurchase agreements | | | 1,293 | | | | 1,372 | | | | 3,678 | | | | 3,905 | |
Securities lending agreements | | | 2,422 | | | | 2,603 | | | | 2,913 | | | | 2,964 | |
| | | | | | | | | | | | | | | | |
| | | 3,715 | | | | 3,975 | | | | 6,591 | | | | 6,869 | |
| | | | | | | | | | | | | | | | |
22. AVAILABLE-FOR-SALE SECURITIES
| | | | | | | | | | | | | | | | |
| | | Group | | | Company | |
| | | 2012
£m | | | 2011
£m | | | 2012
£m | | | 2011
£m | |
Debt securities | | | 5,113 | | | | — | | | | 5,113 | | | | — | |
| | | | | | | | | | | | | | | | |
| | | 5,113 | | | | — | | | | 5,113 | | | | — | |
| | | | | | | | | | | | | | | | |
Debt securities can be analysed by listing status as follows:
| | | | | | | | | | | | | | | | |
| | | Group | | | Company | |
| | | 2012
£m | | | 2011
£m | | | 2012
£m | | | 2011
£m | |
Debt securities: | | | | | | | | | | | | | | | | |
- Listed in the UK | | | 3,844 | | | | — | | | | 3,844 | | | | — | |
- Listed elsewhere | | | 623 | | | | — | | | | 623 | | | | — | |
- Unlisted | | | 646 | | | | — | | | | 646 | | | | — | |
| | | | | | | | | | | | | | | | |
| | | 5,113 | | | | — | | | | 5,113 | | | | — | |
| | | | | | | | | | | | | | | | |
Debt securities at 31 December 2012 by contractual maturity and the related yield:
| | | | | | | | | | | | | | | | | | | | | | | | |
2012 | | On
demand
£m | | | In not more
than 3
months
£m | | | In more than 3
months but not
more than 1 year
£m | | | In more than 1
year but not more
than 5 years
£m | | | In more than
five years
£m | | | Total
£m | |
Issued by public bodies: | | | | | | | | | | | | | | | | | | | | | | | | |
- UK Government | | | — | | | | — | | | | 995 | | | | 2,849 | | | | — | | | | 3,844 | |
- Other OECD | | | — | | | | — | | | | 905 | | | | — | | | | 364 | | | | 1,269 | |
| | | | | | | | | | | | | | | | | | | | | | | | |
| | | — | | | | — | | | | 1,900 | | | | 2,849 | | | | 364 | | | | 5,113 | |
| | | | | | | | | | | | | | | | | | | | | | | | |
Weighted average yield for year % | | | — | | | | — | | | | 0.80 | % | | | 1.08 | % | | | 0.24 | % | | | 2.12 | % |
| | | | | | | | | | | | | | | | | | | | | | | | |
| | |
Abbey National Treasury Services plc 2012 Annual Report | | 151 |
Financial Statements
Notes to the Financial Statementscontinued
The movement in available-for-sale securities can be summarised as follows:
| | | | | | | | |
| | | Group
£m | | | Company
£m | |
At 1 January 2012 | | | — | | | | — | |
Additions | | | 5,990 | | | | 5,990 | |
Redemptions and maturities | | | (869 | ) | | | (869 | ) |
Exchange adjustments | | | (13 | ) | | | (13 | ) |
Movement in fair value | | | 5 | | | | 5 | |
| | | | | | | | |
At 31 December 2012 | | | 5,113 | | | | 5,113 | |
| | | | | | | | |
23. INVESTMENT IN SUBSIDIARY UNDERTAKINGS
Investments in subsidiaries are held at cost subject to impairment. The movement in investments in subsidiaries was as follows:
| | | | | | | | | | | | |
| | | Company | |
| | | Cost
£m | | | Impairment
£m | | | Net book value
£m | |
At 1 January 2012 | | | 2,213 | | | | (26 | ) | | | 2,187 | |
Reversal of impairment | | | — | | | | 5 | | | | 5 | |
Capital reduction of subsidiary | | | (8 | ) | | | — | | | | (8 | ) |
| | | | | | | | | | | | |
At 31 December 2012 | | | 2,205 | | | | (21 | ) | | | 2,184 | |
| | | | | | | | | | | | |
| | | | | | | | | | | | |
| | | Company | |
| | | Cost
£m | | | Impairment
£m | | | Net book value
£m | |
At 1 January and 31 December 2011 | | | 2,213 | | | | (26 | ) | | | 2,187 | |
| | | | | | | | | | | | |
In 2012, the reversal of impairment and capital reduction of subsidiary represented changes in the capital invested in certain subsidiaries as a result of an internal reorganisation within the ANTS group.
The principal subsidiaries of the Company that comprise related undertakings under the UK Companies Act 2006 (and so exclude certain securitisation companies) at 31 December 2012 are shown below, all of which are directly held, except where noted, and are unlisted. The Directors consider that to give full particulars of all subsidiary undertakings would lead to a statement of excessive length. In accordance with Section 410(2) of the UK Companies Act 2006, the following information relates to those subsidiary undertakings whose results or financial position, in the opinion of the Directors, principally affect the results of the ANTS group. Full particulars of all subsidiary undertakings will be annexed to the Company’s next annual return in accordance with Section 410(3)(b) of the UK Companies Act 2006.
| | | | | | | | |
| | | Nature of business | | % Interest held | | | Country of Incorporation or registration |
Abbey National Treasury Services Overseas Holdings * | | Investment | | | 100 | | | England & Wales |
Abbey National North America LLC * | | Commercial paper issue | | | 100 | | | United States |
Abbey National Treasury Services Investments Limited | | Investment | | | 100 | | | England & Wales |
Abbey National (Holdings) Limited | | Holding Company | | | 100 | | | England & Wales |
Abbey National American Investments Limited | | Investment | | | 100 | | | England & Wales |
Abbey National Treasury Investments | | Investment | | | 100 | | | England & Wales |
| * | Held indirectly or partly indirectly through subsidiary companies. |
All the above companies are included in the Consolidated Financial Statements. All companies operate principally in their country of incorporation or registration. The Company also has branch offices in the US and the Cayman Islands.
| | |
| 152 | | Abbey National Treasury Services plc 2012 Annual Report |
Financial Statements
Notes to the Financial Statementscontinued
24. INTANGIBLE ASSETS
| | | | | | | | |
| | | Group | | | Company | |
| | | 2012
£m | | | 2012
£m | |
Cost | | | | | | | | |
At 1 January 2012 | | | 26 | | | | 10 | |
Additions | | | 6 | | | | 6 | |
Disposals | | | (8 | ) | | | (8 | ) |
| | | | | | | | |
At 31 December 2012 | | | 24 | | | | 8 | |
| | | | | | | | |
Accumulated amortisation / impairment | | | | | | | | |
At 1 January 2012 | | | 23 | | | | 7 | |
Disposals | | | (6 | ) | | | (6 | ) |
| | | | | | | | |
31 December 2012 | | | 17 | | | | 1 | |
| | | | | | | | |
Net book value | | | 7 | | | | 7 | |
| | | | | | | | |
| | | | | | | | |
| | | Group | | | Company | |
| | | 2011
£m | | | 2011
£m | |
Cost | | | | | | | | |
At 1 January 2011 | | | 45 | | | | 29 | |
Additions | | | 7 | | | | 7 | |
Disposals | | | (26 | ) | | | (26 | ) |
| | | | | | | | |
At 31 December 2011 | | | 26 | | | | 10 | |
| | | | | | | | |
Accumulated amortisation / impairment | | | | | | | | |
At 1 January 2011 | | | 19 | | | | 3 | |
Charge for the year | | | 4 | | | | 4 | |
| | | | | | | | |
31 December 2011 | | | 23 | | | | 7 | |
| | | | | | | | |
Net book value | | | 3 | | | | 3 | |
| | | | | | | | |
The intangible assets of the ANTS group and the Company consist of computer software.
25. PROPERTY, PLANT AND EQUIPMENT
| | | | | | | | | | | | | | | | |
| | | Group | |
| | | Property
£m | | | Office fixtures
and equipment
£m | | | Computer
software
£m | | | Total
£m | |
Cost | | | | | | | | | | | | | | | | |
At 1 January 2012 | | | 1 | | | | 20 | | | | 61 | | | | 82 | |
Additions | | | — | | | | 4 | | | | — | | | | 4 | |
| | | | | | | | | | | | | | | | |
At 31 December 2012 | | | 1 | | | | 24 | | | | 61 | | | | 86 | |
| | | | | | | | | | | | | | | | |
Accumulated depreciation | | | | | | | | | | | | | | | | |
At 1 January 2012 | | | 1 | | | | 16 | | | | 60 | | | | 77 | |
Charge for the year | | | — | | | | 3 | | | | — | | | | 3 | |
| | | | | | | | | | | | | | | | |
At 31 December 2012 | | | 1 | | | | 19 | | | | 60 | | | | 80 | |
| | | | | | | | | | | | | | | | |
Net book value | | | | | | | | | | | | | | | | |
| | | | | | | | | | | | | | | | |
At 31 December 2012 | | | — | | | | 5 | | | | 1 | | | | 6 | |
| | | | | | | | | | | | | | | | |
| | | | | | | | | | | | | | | | |
| | | Group | |
| | | Property
£m | | | Office fixtures
and equipment
£m | | | Computer
software
£m | | | Total
£m | |
Cost | | | | | | | | | | | | | | | | |
At 1 January 2011 | | | 1 | | | | 29 | | | | 66 | | | | 96 | |
Additions | | | — | | | | 2 | | | | — | | | | 2 | |
Disposals | | | — | | | | (11 | ) | | | (5 | ) | | | (16 | ) |
| | | | | | | | | | | | | | | | |
At 31 December 2011 | | | 1 | | | | 20 | | | | 61 | | | | 82 | |
| | | | | | | | | | | | | | | | |
Accumulated depreciation | | | | | | | | | | | | | | | | |
At 1 January 2011 | | | 1 | | | | 13 | | | | 60 | | | | 74 | |
Charge for the year | | | — | | | | 3 | | | | — | | | | 3 | |
| | | | | | | | | | | | | | | | |
At 31 December 2011 | | | 1 | | | | 16 | | | | 60 | | | | 77 | |
| | | | | | | | | | | | | | | | |
Net book value | | | | | | | | | | | | | | | | |
| | | | | | | | | | | | | | | | |
At 31 December 2011 | | | — | | | | 4 | | | | 1 | | | | 5 | |
| | | | | | | | | | | | | | | | |
| | |
Abbey National Treasury Services plc 2012 Annual Report | | 153 |
Financial Statements
Notes to the Financial Statementscontinued
| | | | | | | | | | | | | | | | |
| | | Company | |
| | | Property
£m | | | Office fixtures
and equipment
£m | | | Computer
software
£m | | | Total
£m | |
Cost | | | | | | | | | | | | | | | | |
At 1 January 2012 | | | — | | | | 18 | | | | 60 | | | | 78 | |
Additions | | | — | | | | 3 | | | | — | | | | 3 | |
Disposals | | | — | | | | — | | | | — | | | | — | |
| | | | | | | | | | | | | | | | |
At 31 December 2012 | | | — | | | | 21 | | | | 60 | | | | 81 | |
| | | | | | | | | | | | | | | | |
Accumulated depreciation | | | | | | | | | | | | | | | | |
At 1 January 2012 | | | — | | | | 14 | | | | 59 | | | | 73 | |
Charge for the year | | | — | | | | 2 | | | | — | | | | 2 | |
| | | | | | | | | | | | | | | | |
At 31 December 2012 | | | — | | | | 16 | | | | 59 | | | | 75 | |
| | | | | | | | | | | | | | | | |
Net book value | | | | | | | | | | | | | | | | |
| | | | | | | | | | | | | | | | |
At 31 December 2012 | | | — | | | | 5 | | | | 1 | | | | 6 | |
| | | | | | | | | | | | | | | | |
| | | | | | | | | | | | | | | | |
| | | Company | |
| | | Property
£m | | | Office fixtures
and equipment
£m | | | Computer
software
£m | | | Total
£m | |
Cost | | | | | | | | | | | | | | | | |
At 1 January 2011 | | | — | | | | 27 | | | | 65 | | | | 92 | |
Additions | | | — | | | | 2 | | | | — | | | | 2 | |
Disposals | | | — | | | | (11 | ) | | | (5 | ) | | | (16 | ) |
| | | | | | | | | | | | | | | | |
At 31 December 2011 | | | — | | | | 18 | | | | 60 | | | | 78 | |
| | | | | | | | | | | | | | | | |
Accumulated depreciation | | | | | | | | | | | | | | | | |
At 1 January 2011 | | | — | | | | 11 | | | | 59 | | | | 70 | |
Charge for the year | | | — | | | | 3 | | | | — | | | | 3 | |
| | | | | | | | | | | | | | | | |
At 31 December 2011 | | | — | | | | 14 | | | | 59 | | | | 73 | |
| | | | | | | | | | | | | | | | |
Net book value | | | | | | | | | | | | | | | | |
| | | | | | | | | | | | | | | | |
At 31 December 2011 | | | — | | | | 4 | | | | 1 | | | | 5 | |
| | | | | | | | | | | | | | | | |
At 31 December 2012, capital expenditure contracted, but not provided for was £nil (2011: £1m) in respect of property, plant and equipment. There were no disposals in 2012 (2011: £16m disposals of were made to Santander UK at book value).
26. DEFERRED TAX
Deferred income taxes are calculated on temporary differences under the liability method using the tax rates expected to apply when the liability is settled or the asset is realised.
The movement on the deferred tax account is as follows:
| | | | | | | | | | | | | | | | |
| | | Group | | | Company | |
| | | 2012
£m | | | 2011
£m | | | 2012
£m | | | 2011
£m | |
At 1 January | | | 17 | | | | 25 | | | | 17 | | | | 25 | |
Income statement credit /(charge) | | | 4 | | | | (9 | ) | | | 3 | | | | (8 | ) |
Charged to other comprehensive income: - available-for-sale financial assets | | | (1 | ) | | | — | | | | — | | | | — | |
| | | | | | | | | | | | | | | | |
Intra group transfer | | | — | | | | 1 | | | | — | | | | — | |
| | | | | | | | | | | | | | | | |
At 31 December | | | 20 | | | | 17 | | | | 20 | | | | 17 | |
| | | | | | | | | | | | | | | | |
Deferred tax assets and liabilities are attributable to the following items:
| | | | | | | | | | | | | | | | |
| | | Group | | | Company | |
| | | 2012
£m | | | 2011
£m | | | 2012
£m | | | 2011
£m | |
Deferred income tax liabilities | | | | | | | | | | | | | | | | |
Other temporary differences | | | — | | | | — | | | | — | | | | — | |
| | | | | | | | | | | | | | | | |
| | | — | | | | — | | | | — | | | | — | |
| | | | | | | | | | | | | | | | |
Deferred income tax assets | | | | | | | | | | | | | | | | |
Accelerated book depreciation | | | 1 | | | | 2 | | | | 1 | | | | 2 | |
IAS 32 and 39 transition adjustments | | | 5 | | | | 7 | | | | 5 | | | | 7 | |
Other temporary differences | | | 14 | | | | 8 | | | | 14 | | | | 8 | |
| | | | | | | | | | | | | | | | |
| | | 20 | | | | 17 | | | | 20 | | | | 17 | |
| | | | | | | | | | | | | | | | |
| | |
| 154 | | Abbey National Treasury Services plc 2012 Annual Report |
Financial Statements
Notes to the Financial Statementscontinued
The deferred tax assets scheduled above have been recognised in both the Company and the ANTS group on the basis that sufficient future taxable profits are forecast within the foreseeable future, in excess of the profits arising from the reversal of existing taxable temporary differences, to allow for the utilisation of the assets as they reverse.
The deferred tax (credit)/charge in the income statement comprises the following temporary differences:
| | | | | | | | | | | | |
| | | Group | |
| | | 2012
£m | | | 2011
£m | | | 2010
£m | |
Accelerated tax depreciation | | | 1 | | | | — | | | | — | |
IAS 32 and 39 transitional adjustments | | | 2 | | | | 4 | | | | 2 | |
Other temporary differences | | | (7 | ) | | | 5 | | | | (7 | ) |
| | | | | | | | | | | | |
| | | (4 | ) | | | 9 | | | | (5 | ) |
| | | | | | | | | | | | |
At 31 December 2012, the ANTS group had UK capital losses carried forward of £23m (2011: £59m). These losses are available for offset against future UK chargeable gains and under current UK tax legislation do not time expire. No deferred tax asset has been recognised in respect of these capital losses on the basis that future capital gains required to utilise the losses are not probable.
27. OTHER ASSETS
| | | | | | | | | | | | | | | | |
| | | Group | | | Company | |
| | | 2012
£m | | | 2011
£m | | | 2012
£m | | | 2011
£m | |
Trade and other receivables | | | 4 | | | | 43 | | | | 4 | | | | 43 | |
| | | | | | | | | | | | | | | | |
28. DEPOSITS BY BANKS
| | | | | | | | | | | | | | | | |
| | | Group | | | Company | |
| | | 2012
£m | | | 2011
£m | | | 2012
£m | | | 2011
£m | |
Amounts due to Santander UK undertakings | | | 109,306 | | | | 105,713 | | | | 109,306 | | | | 105,713 | |
Amounts due to fellow Banco Santander subsidiaries (not with Banco Santander, S.A.) | | | — | | | | 603 | | | | — | | | | 603 | |
Securities sold under agreements to repurchase | | | 4,799 | | | | 4,955 | | | | 4,799 | | | | 4,955 | |
Amounts due to Banco Santander, S.A. - securities sold under agreements to repurchase | | | 140 | | | | 2,517 | | | | 140 | | | | 2,517 | |
Time and demand deposits | | | 290 | | | | 231 | | | | 290 | | | | 230 | |
| | | | | | | | | | | | | | | | |
Total deposits by banks | | | 114,535 | | | | 114,019 | | | | 114,535 | | | | 114,018 | |
| | | | | | | | | | | | | | | | |
| | | | | | | | | | | | | | | | |
| | | Group | | | Company | |
| | | 2012
£m | | | 2011
£m | | | 2012
£m | | | 2011
£m | |
Repayable: | | | | | | | | | | | | | | | | |
On demand | | | 6,360 | | | | 4,784 | | | | 6,360 | | | | 4,783 | |
In not more than 3 months | | | 25,055 | | | | 30,705 | | | | 25,055 | | | | 30,705 | |
In more than 3 months but not more than 1 year | | | 24,621 | | | | 25,136 | | | | 24,621 | | | | 25,136 | |
In more than 1 year but not more than 5 years | | | 39,178 | | | | 38,388 | | | | 39,178 | | | | 38,388 | |
In more than 5 years | | | 19,321 | | | | 15,006 | | | | 19,321 | | | | 15,006 | |
| | | | | | | | | | | | | | | | |
| | | 114,535 | | | | 114,019 | | | | 114,535 | | | | 114,018 | |
| | | | | | | | | | | | | | | | |
| | |
Abbey National Treasury Services plc 2012 Annual Report | | 155 |
Financial Statements
Notes to the Financial Statementscontinued
29. DEPOSITS BY CUSTOMERS
| | | | | | | | | | | | | | | | |
| | | Group | | | Company | |
| | | 2012
£m | | | 2011
£m | | | 2012
£m | | | 2011
£m | |
Current and demand accounts | | | | | | | | | | | | | | | | |
- interest bearing | | | — | | | | 10 | | | | — | | | | 10 | |
- non interest bearing | | | — | | | | 1 | | | | — | | | | 1 | |
Amounts due to Santander UK subsidiaries | | | 1,697 | | | | 1,847 | | | | 6,047 | | | | 6,973 | |
Amounts due to Banco Santander group subsidiaries | | | 165 | | | | 345 | | | | 165 | | | | 381 | |
Securities sold under agreements to repurchase | | | 406 | | | | 418 | | | | 406 | | | | 418 | |
Wholesale funds and deposits(1) | | | 3,981 | | | | 4,493 | | | | 3,981 | | | | 4,493 | |
| | | | | | | | | | | | | | | | |
| | | 6,249 | | | | 7,114 | | | | 10,599 | | | | 12,276 | |
| | | | | | | | | | | | | | | | |
Repayable: | | | | | | | | | | | | | | | | |
On demand | | | 145 | | | | 101 | | | | 254 | | | | 247 | |
In no more than 3 months | | | 551 | | | | 884 | | | | 2,643 | | | | 3,309 | |
In more than 3 months but no more than 1 year | | | 1,016 | | | | 781 | | | | 1,314 | | | | 1,486 | |
In more than 1 year but no more than 5 years | | | 3,484 | | | | 5,248 | | | | 5,335 | | | | 7,134 | |
In more than 5 years | | | 1,053 | | | | 100 | | | | 1,053 | | | | 100 | |
| | | | | | | | | | | | | | | | |
| | | 6,249 | | | | 7,114 | | | | 10,599 | | | | 12,276 | |
| | | | | | | | | | | | | | | | |
| (1) | Consists of equity index-linked deposits of £3,981m (2011: £4,493m). The capital amount guaranteed/protected and the amount of return guaranteed in respect of the equity index-linked deposits were £3,981m and £224m, respectively (2011: £4,493m and £254m, respectively). |
Wholesale deposits by customers are interest bearing.
30. TRADING LIABILITIES
| | | | | | | | | | | | | | | | | | |
| | | | | Group | | | Company | |
| | | | | 2012
£m | | | 2011
£m | | | 2012
£m | | | 2011
£m | |
Deposits by banks | | - securities sold under repurchase agreements | | | 6,833 | | | | 10,105 | | | | 6,833 | | | | 10,105 | |
| | - other(1) | | | 2,909 | | | | 4,403 | | | | 2,909 | | | | 4,403 | |
Deposits by customers | | - securities sold under repurchase agreements | | | 4,847 | | | | 5,519 | | | | 4,847 | | | | 5,519 | |
| | - other(2) | | | 2,401 | | | | 4,963 | | | | 2,401 | | | | 4,963 | |
Short positions in securities and unsettled trades | | | 4,119 | | | | 755 | | | | 4,119 | | | | 755 | |
| | | | | | | | | | | | | | | | | | |
| | | | | 21,109 | | | | 25,745 | | | | 21,109 | | | | 25,745 | |
| | | | | | | | | | | | | | | | | | |
| (1) | Comprises cash collateral £2,269m (2011: £2,401m) and short-term deposits £640m (2011: £2,002m). |
| (2) | Comprises short-term deposits £1,702m (2011: £3,662m) and equity linked deposits £699m (2011: £1,301m). The capital amount guaranteed/protected and the amount of return guaranteed in respect of the equity index-linked deposits were £559m and £109m, respectively (2011: £1,005m and £207m, respectively). |
Included in the above balances are amounts owed by the ANTS group to Banco Santander, S.A. of £180m (2011: £620m) and to fellow subsidiaries of Banco Santander, S.A. outside the ANTS group of £45m (2011: £51m).
31. FINANCIAL LIABILITIES DESIGNATED AT FAIR VALUE
| | | | | | | | | | | | | | | | |
| | | Group | | | Company | |
| | | 2012
£m | | | 2011
£m | | | 2012
£m | | | 2011
£m | |
Debt securities in issue: | | | | | | | | | | | | | | | | |
- US$10bn Euro Commercial Paper Programme | | | 1,403 | | | | 429 | | | | 1,403 | | | | 429 | |
- US$20bn Euro Medium Term Note Programme | | | 655 | | | | 4,594 | | | | 655 | | | | 4,594 | |
- Euro 10bn Structured Notes | | | 1,740 | | | | 1,744 | | | | 1,740 | | | | 1,744 | |
- Other bonds | | | — | | | | 61 | | | | — | | | | 5 | |
Warrants | | | 204 | | | | 8 | | | | 204 | | | | 8 | |
| | | | | | | | | | | | | | | | |
| | | 4,002 | | | | 6,836 | | | | 4,002 | | | | 6,780 | |
| | | | | | | | | | | | | | | | |
Financial liabilities are designated at fair value through profit or loss where this results in more relevant information because it significantly reduces a measurement inconsistency that would otherwise arise from measuring assets and liabilities or recognising the gains or losses on them on a different basis or where a contract contains one or more embedded derivatives that would otherwise require separate recognition. The ‘fair value option’ has been used where debt securities in issue and warrants would otherwise be measured at amortised cost and any embedded derivatives or associated derivatives used to economically hedge the risk are held at fair value.
| | |
| 156 | | Abbey National Treasury Services plc 2012 Annual Report |
Financial Statements
Notes to the Financial Statementscontinued
Where the ANTS group records its own debt securities in issue at fair value, the fair value is based on quoted prices in an active market for the specific instrument concerned, if available. When quoted market prices are unavailable, the own debt security in issue is valued using valuation techniques, the inputs for which are either based upon quoted prices in an inactive market for the instrument, or are estimated by comparison with quoted prices in an active market for similar instruments. In both cases, the fair value includes the effect of applying the credit spread which is appropriate to the ANTS group’s liabilities.
The change in fair value of issued debt securities attributable to the ANTS group’s own credit spread is computed as follows: for each security at each reporting date, an externally verifiable price is obtained or a price is derived using credit spreads for similar securities for the same issuer or credit default swaps. Each security is then valued using discounted cash flows, incorporating a LIBOR-based discount curve. The difference in the valuations is attributable to the ANTS group’s own credit spread. This methodology is applied consistently across all securities where it is believed that counterparties would consider the ANTS group’s creditworthiness when pricing trades.
Gains and losses arising from changes in the credit spread of liabilities issued by the ANTS group reverse over the contractual life of the debt, provided that the debt is not repaid at a premium or a discount.
The net loss during the year attributable to changes in the ANTS group’s own credit risk on the above debt securities in issue was £86m (2011: net gain of £64m, 2010: net gain of £2m) for the ANTS group and £86m (2011: net gain of £64m, net gain of £2m) for the Company. The cumulative net gain attributable to changes in the ANTS group’s own credit risk on the above debt securities in issue at 31 December 2012 was £7m (2011: £93m, 2010: £29m) for the ANTS group and £7m (2011: £93m, 2010: £29m) for the Company.
The amount that would be required to be contractually paid at maturity of the debt securities in issue above is £531m (2011: £366m) higher than the carrying value.
US$10bn Euro Commercial Paper Programme
The Company may from time to time issue commercial paper under the US$10bn Euro Commercial Paper Programme that may be denominated in any currency as agreed between the Company and the relevant dealer. The commercial paper ranks at least pari passu with all other unsecured and unsubordinated obligations of the Company. The payments of all amounts due in respect of the commercial paper have been unconditionally and irrevocably guaranteed by Santander UK plc.
The commercial paper is issued in bearer form, subject to a minimum maturity of 1 day and a maximum maturity of 364 days. The commercial paper may be issued on a discounted basis or may bear fixed or floating rate interest or a coupon calculated by reference to an index or formula. The maximum aggregate nominal amount of all commercial paper outstanding from time to time under the Programme will not exceed US$10bn (or its equivalent in other currencies). This was increased from US$4bn in January 2011. The commercial paper is not listed on any stock exchange.
US$20bn Euro Medium Term Note Programme
The Company may from time to time issue notes denominated in any currency as agreed between the issuer and the relevant dealer under the US$20bn Euro Medium Term Note Programme. The payment of all amounts payable in respect of the notes is unconditionally and irrevocably guaranteed by Santander UK plc. The programme provides for issuance of fixed rate notes, floating rate notes, variable interest notes and zero coupon/discount notes.
The maximum aggregate nominal amount of all notes outstanding under the programme may not exceed US$20bn (or its equivalent in other currencies) subject to any modifications in accordance with the terms of the programme agreement. Notes may be issued in bearer or registered form and can be listed on the London Stock Exchange or any other stock exchange(s) or may be unlisted, as agreed.
Euro 10bn Note, Certificate and Warrant Programme
The Company may from time to time issue structured notes and redeemable certificates (together the ‘N&C Securities’) and warrants (together with the N&C Securities, the ‘Securities’) denominated in any currency as agreed between the Company and the relevant dealers under the euro 10bn note, certificate and warrant programme (the ‘Omnibus Programme’). The securities are direct, senior and unsecured obligations of the Company that rank pari passu without preference among themselves and, subject as to any applicable statutory provisions or judicial order, at least equally with all other present and future senior and unsecured obligations of the Company. The payment of all amounts due in respect of the Securities has been unconditionally and irrevocably guaranteed by Santander UK plc.
The Omnibus Programme provides for the issuance of commodity linked N&C Securities, credit-linked N&C Securities, currency-linked Securities, equity-linked Securities, equity index-linked Securities, fixed rate notes, floating rate N&C Securities, floating rate N&C Securities, fund-linked Securities, inflation-linked Securities, property-linked Securities, zero-coupon/discount N&C Securities and any other structured Securities as agreed between the Company and the relevant dealers. Securities issued under the Omnibus Programme are governed by English law.
The maximum aggregate outstanding nominal amount of all N&C Securities and the aggregate issue prices of outstanding warrants from time to time issued under the Omnibus Programme will not exceed euro 10bn (or its equivalent in other currencies).
Warrants programme
The Company established a warrants programme (the ‘Warrants Programme’) in 2009 for the issuance of structured warrants denominated in any currency as agreed between the Company and the relevant dealers under the Warrants Programme. Warrants are direct, unsecured and unconditional obligations of the Company that rank pari passu without preference among themselves and, subject as to any applicable statutory provisions or judicial order, rank at least equally with all other present and future unsecured and unsubordinated obligations of the Company.
| | |
Abbey National Treasury Services plc 2012 Annual Report | | 157 |
Financial Statements
Notes to the Financial Statementscontinued
As at the date of this report, the Company has discontinued the issue of new warrants under the Warrants Programme as new issuances are being made under the Omnibus Programme. The payments of all amounts due in respect of the previously issued warrants have been unconditionally and irrevocably guaranteed by Santander UK plc.
32. DEBT SECURITIES IN ISSUE
| | | | | | | | | | | | | | | | |
| | | Group | | | Company | |
| | | 2012
£m | | | 2011(1)
£m | | | 2012
£m | | | 2011
£m | |
Euro 35bn Global Covered Bond Programme | | | 20,576 | | | | 16,945 | | | | 20,576 | | | | 16,945 | |
US$20bn Euro Medium Term Note Programme (see Note 31) | | | 6,396 | | | | 4,258 | | | | 6,396 | | | | 4,253 | |
US$20bn Commercial Paper Programme | | | 2,289 | | | | 3,069 | | | | — | | | | — | |
Certificates of deposit in issue | | | 4,509 | | | | 2,671 | | | | 4,509 | | | | 2,671 | |
| | | | | | | | | | | | | | | | |
| | | 33,770 | | | | 26,943 | | | | 31,481 | | | | 23,869 | |
| | | | | | | | | | | | | | | | |
| (1) | As restated, see Note 45 |
Included in the above balances are amounts owed by the ANTS group to Banco Santander, S.A. and to fellow subsidiaries of Banco Santander, S.A. outside the ANTS group of £2,040m (2011: £84m) and £698m (2011: £134m) respectively.
Euro 35bn Global Covered Bond Programme
The Company issues covered bonds under the euro 35bn Global Covered Bond Programme that may be denominated in any currency as agreed between the Company and the relevant dealers. The programme provides that covered bonds may be listed or admitted to trading, on the official list of the UK Listing Authority and on the London Stock Exchange or any other stock exchanges or regulated or unregulated markets. The Company may also issue unlisted covered bonds and/or covered bonds not admitted to trading on any regulated or unregulated market.
The payments of all amounts due in respect of the covered bonds have been unconditionally guaranteed by Santander UK plc. Abbey Covered Bonds LLP (“LLP”), together with Santander UK plc has guaranteed payments of interest and principal under the covered bonds pursuant to a guarantee which is secured over the LLP’s portfolio of mortgages and its other assets. Recourse against the LLP under its guarantee is limited to its portfolio of mortgages and such assets.
Covered bonds may be issued in bearer or registered form. The maximum aggregate nominal amount of all covered bonds from time to time outstanding under the programme will not exceed euro 35bn (or its equivalent in other currencies), subject to any modifications in accordance with the programme. On 11 November 2008, the Company was admitted to the register of issuers and the programme and the covered bonds issued previously under the programme were admitted to the register of regulated covered bonds, pursuant to Regulation 14 of the Regulated Covered Bonds Regulations 2008 (SI 2008/346).
US$20bn Commercial Paper Programme
Abbey National North America LLC may from time to time issue unsecured notes denominated in United States dollars as agreed between Abbey National North America LLC and the relevant dealers under the US$20bn US commercial paper programme. The Notes will rank at least pari passu with all other unsecured and unsubordinated indebtedness of Abbey National North America LLC and Santander UK plc. The payments of all amounts due in respect of the Notes have been unconditionally and irrevocably guaranteed by Santander UK plc. The Notes are not redeemable prior to maturity or subject to voluntary prepayment. The maximum aggregate nominal amount of all Notes from time to time outstanding under the Programme will not exceed US$20bn (or its equivalent in other currencies).
US SEC registered debt shelf
The Company issues notes in the US from time to time pursuant to a shelf registration statement on Form F-3 filed with the US Securities and Exchange Commission. The notes may be issued in any currency agreed between the Company and the relevant underwriters in any particular issuance under the registration statement.
| | |
| 158 | | Abbey National Treasury Services plc 2012 Annual Report |
Financial Statements
Notes to the Financial Statementscontinued
A breakdown, by issue currency, of the above is as follows:
| | | | | | | | | | | | | | | | | | | | | | |
| | | | | | | | Group | | | Company | |
| | | Interest Rate | | Maturity | | | 2012
£m | | | 2011
£m | | | 2012
£m | | | 2011
£m | |
Euro | | 0.00% - 3.99% | | | Up to 2012 | | | | — | | | | 741 | | | | — | | | | 736 | |
| | | | | 2012 - 2013 | | | | 3,497 | | | | 2,212 | | | | 3,497 | | | | 2,212 | |
| | | | | 2014 - 2019 | | | | 8,089 | | | | 7,827 | | | | 8,089 | | | | 7,827 | |
| | | | | 2020 - 2029 | | | | 2,622 | | | | 211 | | | | 2,622 | | | | 211 | |
| | | | | 2030 - 2039 | | | | 90 | | | | — | | | | 90 | | | | — | |
| | 4.00% - 4.99% | | | 2014 - 2019 | | | | 1,775 | | | | 945 | | | | 1,775 | | | | 945 | |
| | | | | 2020 - 2029 | | | | 1,830 | | | | 1,661 | | | | 1,830 | | | | 1,661 | |
| | | | | 2030 - 2039 | | | | 172 | | | | 101 | | | | 172 | | | | 101 | |
| | | | | | | | | | | | | | | | | | | | | | |
US dollar | | 0.00% - 3.99% | | | Up to 2012 | | | | — | | | | 3,628 | | | | — | | | | 559 | |
| | | | | 2012 - 2013 | | | | 3,456 | | | | 592 | | | | 1,167 | | | | 592 | |
| | | | | 2014 - 2019 | | | | 1,900 | | | | 1,347 | | | | 1,900 | | | | 1,347 | |
| | 4.00% - 5.99% | | | 2014 - 2019 | | | | 654 | | | | 676 | | | | 654 | | | | 676 | |
| | | | | | | | | | | | | | | | | | | | | | |
Pounds sterling | | 0.00% - 3.99% | | | Up to 2012 | | | | — | | | | 1,850 | | | | — | | | | 1,850 | |
| | | | | 2012 - 2013 | | | | 3,312 | | | | 516 | | | | 3,312 | | | | 516 | |
| | | | | 2014 - 2019 | | | | 1,679 | | | | 675 | | | | 1,679 | | | | 675 | |
| | | | | 2020 - 2029 | | | | 75 | | | | — | | | | 75 | | | | — | |
| | 4.00% - 5.99% | | | 2014 - 2019 | | | | 1,023 | | | | 1,013 | | | | 1,023 | | | | 1,013 | |
| | | | | 2020 - 2029 | | | | 2,984 | | | | 2,330 | | | | 2,984 | | | | 2,330 | |
| | | | | | | | | | | | | | | | | | | | | | |
Other currencies | | 0.00% - 5.99% | | | 2012 - 2013 | | | | 244 | | | | 251 | | | | 244 | | | | 251 | |
| | | | | 2014 - 2019 | | | | 190 | | | | 194 | | | | 190 | | | | 194 | |
| | | | | 2020 - 2029 | | | | 178 | | | | 173 | | | | 178 | | | | 173 | |
| | | | | | | | | | | | | | | | | | | | | | |
| | | | | | | | | 33,770 | | | | 26,943 | | | | 31,481 | | | | 23,869 | |
| | | | | | | | | | | | | | | | | | | | | | |
33. OTHER LIABILITIES
| | | | | | | | | | | | | | | | |
| | | Group | | | Company | |
| | | 2012
£m | | | 2011
£m | | | 2012
£m | | | 2011
£m | |
Trade and other payables | | | 35 | | | | 39 | | | | 32 | | | | 34 | |
Accrued expense | | | 134 | | | | 103 | | | | 134 | | | | 103 | |
| | | | | | | | | | | | | | | | |
| | | 169 | | | | 142 | | | | 166 | | | | 137 | |
| | | | | | | | | | | | | | | | |
Included in the above balances are amounts owed by the ANTS group to Banco Santander, S.A. and to fellow subsidiaries of Banco Santander, S.A. outside the ANTS group of £nil (2011: £nil) and £2m (2011: £1m) respectively.
| | |
Abbey National Treasury Services plc 2012 Annual Report | | 159 |
Financial Statements
Notes to the Financial Statementscontinued
34. PROVISIONS
| | | | | | | | |
| | | Group
£m | | | Company
£m | |
At 1 January 2012 | | | 20 | | | | 20 | |
Additional provisions | | | 20 | | | | 20 | |
Used during the year | | | (20 | ) | | | (20 | ) |
| | | | | | | | |
At 31 December 2012 | | | 20 | | | | 20 | |
| | | | | | | | |
| | |
To be settled: | | | | | | | | |
Within 12 months | | | 20 | | | | 20 | |
In more than 12 months | | | — | | | | — | |
| | | | | | | | |
| | | 20 | | | | 20 | |
| | | | | | | | |
| | |
| | | Group
£m | | | Company
£m | |
At 1 January 2011 | | | — | | | | — | |
Additional provisions | | | 20 | | | | 20 | |
Used during the year | | | — | | | | — | |
| | | | | | | | |
At 31 December 2011 | | | 20 | | | | 20 | |
| | | | | | | | |
| | |
To be settled: | | | | | | | | |
Within 12 months | | | 20 | | | | 20 | |
In more than 12 months | | | — | | | | — | |
| | | | | | | | |
| | | 20 | | | | 20 | |
| | | | | | | | |
The charge disclosed in the income statement in respect of provisions for other liabilities and charges of £20m (2011: £20m), comprises the additional provisions of £20m (2011: £20m), relating to the UK Bank Levy.
UK Bank Levy
The Finance Act 2011 introduced an annual bank levy in the UK which is collected through the existing quarterly Corporation Tax collection mechanism. The first chargeable period for the ANTS group was the year ended 31 December 2011.
The UK Bank Levy is based on the total aggregated chargeable equity and liabilities as reported in the balance sheet of a Relevant Group at the end of a chargeable period. The Relevant Group for this purpose is a Foreign Banking Group whose ultimate parent is Banco Santander, S.A.. The Bank Levy is calculated principally on the aggregation of the consolidated balance sheet of the UK sub-group parented by Santander UK plc, of which this Company is a part. In determining the chargeable equity and liabilities the following amounts are excluded: adjusted Tier 1 capital; certain “protected deposits” (for example those protected under the Financial Services Compensation Scheme); liabilities that arise from certain insurance business within banking groups; liabilities in respect of currency notes in circulation; Financial Services Compensation Scheme liabilities; liabilities representing segregated client money; and deferred tax liabilities, current tax liabilities, liabilities in respect of the UK Bank Levy, revaluation of property liabilities, liabilities representing the revaluation of business premises and defined benefit retirement liabilities.
It is also permitted in specified circumstances to reduce certain liabilities: by netting them against certain assets; offsetting assets on the relevant balance sheets that would qualify as high quality liquid assets (in accordance with the FSA definition); and repo liabilities secured against sovereign and supranational debt.
The UK Bank Levy will be set at a rate of 0.130% from 2013. During 2012 a rate of 0.088% was applied and three different rates applied during 2011 which averaged to 0.075%. Certain liabilities are subject to only a half rate, namely any deposits not otherwise excluded, (except for those from financial institutions and financial traders) and liabilities with a maturity greater than one year at the balance sheet date. The UK Bank Levy is not charged on the first £20bn of chargeable liabilities of the Relevant Group.
The cost of the UK Bank Levy to the ANTS group for 2012 was £20m (2011: £20m). In accordance with IFRS’s, the UK Bank Levy is not accrued over each year but is recognised on 31 December of each year.
| | |
| 160 | | Abbey National Treasury Services plc 2012 Annual Report |
Financial Statements
Notes to the Financial Statementscontinued
35. CONTINGENT LIABILITIES AND COMMITMENTS
| | | | | | | | | | | | | | | | |
| | | Group | | | Company | |
| | | 2012
£m | | | 2011
£m | | | 2012
£m | | | 2011
£m | |
Guarantees given on behalf of the Company’s UK parent, fellow subsidiaries and subsidiaries | | | 153,047 | | | | 150,742 | | | | 155,336 | | | | 153,811 | |
Guarantees given to third parties | | | 505 | | | | 457 | | | | 505 | | | | 457 | |
Formal standby facilities, credit lines and other commitments: | | | | | | | | | | | | | | | | |
- Original term to maturity of one year or less | | | 1,186 | | | | 678 | | | | 1,186 | | | | 678 | |
- Original term to maturity of more than one year | | | 8,167 | | | | 8,601 | | | | 8,167 | | | | 8,601 | |
| | | | | | | | | | | | | | | | |
| | | 162,905 | | | | 160,478 | | | | 165,194 | | | | 163,547 | |
| | | | | | | | | | | | | | | | |
Guarantees given on behalf of the Company’s parent
The Company has given a full and unconditional guarantee in respect of the unsubordinated liabilities of Santander UK plc incurred prior to 30 June 2015 under a deed poll guarantee entered into by the Company on 10 May 2012. A copy of this guarantee is included on pages 208 to 210.
Capital Support Deed
The Company, Santander UK plc, and Cater Allen Limited, which are the three FSA-regulated entities within the Santander UK group, are party to a capital support deed dated 14 December 2012 (the “Capital Support Deed”) with certain other non-regulated subsidiaries of Santander UK plc. The parties to the Capital Support Deed constitute a core UK group for the purposes of section 10 of the Prudential Sourcebook for Banks, Building Societies and Investment Firms (“BIPRU”) of the FSA Handbook. Under section 10.8 of BIPRU, exposures of each of the three regulated entities to other members of the core UK group are exempt from large exposure limits that would otherwise apply. The purpose of the Capital Support Deed is to facilitate the prompt transfer of available capital resources from, or repayment of liabilities by, the non-regulated parties to any of the regulated parties in the event that one of the regulated parties has breached or is at risk of breaching its capital resources requirements or risk concentrations requirements.
Defined Liquidity Group liquidity facility
The Company, Santander UK plc, and Cater Allen Limited are party to a defined liquidity group liquidity facility agreement dated 28 May 2010 (the “DLG Facility Agreement”). The DLG Facility Agreement supports a defined liquidity group for the purposes of section 12 of BIPRU. Section 12.8 of BIPRU permits a member of a defined liquidity group to rely on the liquid resources of other members of the defined liquidity group to comply with the liquidity adequacy requirements under section 12 of BIPRU. Under the DLG Facility Agreement, each party agrees to lend, subject to certain conditions and limitations, its excess liquidity to each other party.
Guarantees given to fellow subsidiaries and subsidiaries
Via the guarantee given to the Company’s parent described above, the Company has also indirectly guaranteed the obligations of Cater Allen Limited, Abbey National International Limited and Alliance & Leicester International Limited that have been or will be incurred before 30 June 2015.
Guarantees given to third parties
Guarantees given to third parties consist primarily of letters of credit, bonds and guarantees granted by Corporate Banking as part of normal product facilities which are offered to customers.
Formal standby facilities, credit lines and other commitments
Standby facilities, credit lines and other commitments are granted by Corporate Banking. Corporate facilities comprise standby facilities which are subject to the ongoing compliance with covenants and the provision of agreed security, failure to comply with these terms can result in the withdrawal of the unutilised facility headroom.
Overseas tax claim
A claim was filed against the Company by tax authorities abroad in relation to the refund of certain tax credits and other associated amounts. A favourable judgement at first instance was handed down in September 2006, although the judgement was appealed against by the tax authorities in January 2007 and the court found in favour of the latter in June 2010. The Company appealed against this decision at a higher court and in December 2011 the tax authorities confirmed their intention to file the related pleadings. Although the matter remained in dispute, in January 2012, following a demand from the tax authorities, the Company paid £67m, for which it already held a provision. The higher court hearing took place in April 2012 and the judgement found in favour of the tax authorities upholding their appeal. There is no recourse for further appeal.
| | |
Abbey National Treasury Services plc 2012 Annual Report | | 161 |
Financial Statements
Notes to the Financial Statementscontinued
Regulatory
The ANTS group engages in discussion, and co-operates, with the FSA in its supervision of the ANTS group, including reviews exercised under statutory powers, regarding its interaction with past and present customers, both as part of the FSA’s general thematic work and in relation to specific products and services. A provision established with respect to interest rate derivatives is held by Santander UK plc.
Other
As part of the sale of subsidiaries, and as is normal in such circumstances, the ANTS group has given warranties and indemnities to the purchasers.
Obligations under stock borrowing and lending agreements
Obligations under stock borrowing and lending agreements represent contractual commitments to return stock borrowed. These obligations totalled £9,309m at 31 December 2012 (2011: £10,850m) and are offset by a contractual right to receive stock under other contractual agreements.
Other off-balance sheet commitments
The ANTS group has commitments to lend at fixed interest rates which expose it to interest rate risk.
Operating lease commitments
| | | | | | | | | | | | | | | | |
| | | Group | | | Company | |
| | | 2012
£m | | | 2011
£m | | | 2012
£m | | | 2011
£m | |
Rental commitments under non-cancellable operating leases: | | | | | | | | | | | | | | | | |
- No later than 1 year | | | 5 | | | | 5 | | | | 5 | | | | 5 | |
- Later than 1 year but no later than 5 years | | | 21 | | | | 17 | | | | 21 | | | | 17 | |
- Later than 5 years | | | 20 | | | | 19 | | | | 20 | | | | 19 | |
| | | | | | | | | | | | | | | | |
| | | 46 | | | | 41 | | | | 46 | | | | 41 | |
| | | | | | | | | | | | | | | | |
ANTS group rental expense comprises:
| | | | | | | | |
| | | Group | |
| | | 2012
£m | | | 2011
£m | |
In respect of minimum rentals | | | 7 | | | | 5 | |
Less: sub-lease rentals | | | — | | | | — | |
| | | | | | | | |
| | | 7 | | | | 5 | |
| | | | | | | | |
In 2012 and 2011, there was no contingent rent expense included in the above ANTS group rental expense.
36. SHARE CAPITAL
| | | | | | | | | | | | | | | | |
| | | Ordinary shares
of £1 each
£m | | | Tracker shares
of £1 each
£m | | | B Tracker shares
of £1 each
£m | | | Total
£m | |
Issued and fully paid share capital: | | | | | | | | | | | | | | | | |
At 1 January and 31 December 2012 and 2011(1) | | | 2,549 | | | | — | | | | — | | | | 2,549 | |
| | | | | | | | | | | | | | | | |
| (1) | The number of ordinary shares in issuance is 2,549,000,000. |
In 2008, the Company issued 1,000 Tracker Shares of £1 each at par to its parent company for £1,000. The Tracker Shares entitled the holders to dividends related to certain cashflows that were received by the Company in the period up to 7 April 2010. The Tracker Shares are not redeemable and do not confer any rights to participate in the assets of the Company on winding up (beyond the amount subscribed). The Tracker Shares carry no voting rights.
In 2010, the Company issued 1,000 B Tracker Shares of £1 each at par to its parent company for £1,000. The B Tracker Shares entitled the holders to dividends related to certain cashflows expected to be received by the Company in the period up to 31 December 2011. The B Tracker Shares are not redeemable and do not confer any rights to participate in the assets of the company on a winding up (beyond the amount subscribed). The B Tracker Shares carry no voting rights.
| | |
| 162 | | Abbey National Treasury Services plc 2012 Annual Report |
Financial Statements
Notes to the Financial Statementscontinued
37. DIVIDENDS
No dividends were declared on the Company’s ordinary shares in the years ended 31 December 2012, 2011 and 2010.
In addition, the terms of the Tracker Shares and the B Tracker Shares are such that the issue of those shares (or in the case of the B Tracker Shares entry by the Company into contractual arrangements relating to the future issue of these shares) caused a derecognition of certain cashflows expected to be received by the Company. The amounts derecognised equate to the fair value of the cashflows involved and are shown in the Statement of Changes to Equity as amounts representative of contractual obligations for the year in which the derecognition occurs. Subsequent declaration and payment of dividends in respect of these cashflows is not further reflected in the Company’s financial statements.
38. CONSOLIDATED CASH FLOW STATEMENT
a) Reconciliation of profit after tax to net cash (outflow)/inflow from operating activities:
| | | | | | | | | | | | | | | | | | | | | | | | |
| | | Group | | | Company | |
| | | 2012
£m | | | 2011 (1)
£m | | | 2010
£m | | | 2012
£m | | | 2011 (1)
£m | | | 2010
£m | |
Profit for the year | | | 264 | | | | 164 | | | | 460 | | | | 226 | | | | 222 | | | | 670 | |
Non-cash items included in net profit | | | | | | | | | | | | | | | | | | | | | | | | |
Depreciation and amortisation | | | 3 | | | | 7 | | | | 6 | | | | 3 | | | | 7 | | | | 6 | |
(Increase)/decrease in prepayments and accrued income | | | (116 | ) | | | 86 | | | | (191 | ) | | | (119 | ) | | | 85 | | | | (205 | ) |
Increase/(decrease) in accruals and deferred income | | | 57 | | | | (56 | ) | | | 197 | | | | 57 | | | | (23 | ) | | | 252 | |
Impairment losses | | | 9 | | | | 54 | | | | 80 | | | | 9 | | | | 54 | | | | 80 | |
Amortization of premiums/(discounts) on debt securities | | | 18 | | | | — | | | | — | | | | 18 | | | | — | | | | — | |
Provisions for liabilities and charges | | | 20 | | | | 20 | | | | — | | | | 20 | | | | 20 | | | | — | |
Corporation tax charge | | | 68 | | | | 104 | | | | 149 | | | | 88 | | | | 116 | | | | 138 | |
Other non-cash items | | | 42 | | | | (211 | ) | | | (116 | ) | | | 39 | | | | (122 | ) | | | (114 | ) |
| | | | | | | | | | | | | | | | | | | | | | | | |
Net cash flow (used in)/from trading activities | | | 365 | | | | 168 | | | | 585 | | | | 341 | | | | 359 | | | | 827 | |
Changes in operating assets and liabilities | | | | | | | | | | | | | | | | | | | | | | | | |
Net increase in cash and balances held at central banks | | | (5 | ) | | | (5 | ) | | | — | | | | (5 | ) | | | (5 | ) | | | — | |
Net (increase)/ decrease in trading assets | | | (2,787 | ) | | | 11,008 | | | | (1,453 | ) | | | (2,682 | ) | | | 10,773 | | | | (4,711 | ) |
Net decrease/(increase) in financial assets designated at fair value | | | 898 | | | | 2,037 | | | | 5,560 | | | | 898 | | | | 2,037 | | | | 5,560 | |
Net (increase)/decrease in derivative assets | | | (52 | ) | | | (9,987 | ) | | | (36 | ) | | | (70 | ) | | | (9,965 | ) | | | (148 | ) |
Net decrease/(increase) in loans and advances to banks and customers | | | 9,427 | | | | 23,254 | | | | 34,002 | | | | 9,562 | | | | 23,504 | | | | 32,320 | |
Net decrease/(increase) in other assets | | | 37 | | | | 362 | | | | (34 | ) | | | 38 | | | | 30 | | | | (2 | ) |
Net (decrease)/increase in deposits by banks and customers | | | (250 | ) | | | (22,660 | ) | | | (32,097 | ) | | | (1,060 | ) | | | (24,375 | ) | | | (33,265 | ) |
Net (decrease)/increase in derivative liabilities | | | (1,329 | ) | | | 10,374 | | | | 588 | | | | (1,329 | ) | | | 10,374 | | | | 713 | |
Net (decrease)/increase in trading liabilities | | | (4,629 | ) | | | (17,068 | ) | | | (3,310 | ) | | | (4,629 | ) | | | (17,068 | ) | | | 29,500 | |
Net (decrease)/increase in financial liabilities designated at fair value | | | (22 | ) | | | (185 | ) | | | (669 | ) | | | 9 | | | | (184 | ) | | | (673 | ) |
Net increase/(decrease) in debt issued | | | 1,806 | | | | (1,291 | ) | | | (1,413 | ) | | | 2,462 | | | | — | | | | 761 | |
Net (decrease)/increase in other liabilities | | | (176 | ) | | | (132 | ) | | | 45 | | | | (215 | ) | | | (132 | ) | | | 140 | |
Effects of exchange rate differences | | | (853 | ) | | | (417 | ) | | | 399 | | | | (598 | ) | | | (685 | ) | | | 154 | |
| | | | | | | | | | | | | | | | | | | | | | | | |
Net cash flow from/(used in) operating activities before tax | | | 2,430 | | | | (4,542 | ) | | | 2,167 | | | | 2,722 | | | | (5,337 | ) | | | 31,176 | |
Corporation tax paid | | | (42 | ) | | | (13 | ) | | | (28 | ) | | | (12 | ) | | | (13 | ) | | | (17 | ) |
| | | | | | | | | | | | | | | | | | | | | | | | |
Net cash flow from/(used in) operating activities | | | 2,388 | | | | (4,555 | ) | | | 2,139 | | | | 2,710 | | | | (5,350 | ) | | | 31,159 | |
| | | | | | | | | | | | | | | | | | | | | | | | |
| (1) | As restated, see Note 45 |
b) Analysis of the balances of cash and cash equivalents in the balance sheet
| | | | | | | | | | | | | | | | |
| | | Group | | | Company | |
| | | 2012
£m | | | 2011
£m | | | 2012
£m | | | 2011
£m | |
Cash and balances at central banks | | | 388 | | | | 7,013 | | | | 388 | | | | 7,013 | |
Less: regulatory minimum cash balances (See Note 13) | | | (23 | ) | | | (18 | ) | | | (23 | ) | | | (18 | ) |
| | | | | | | | | | | | | | | | |
| | | 365 | | | | 6,995 | | | | 365 | | | | 6,995 | |
| | | | | | | | | | | | | | | | |
Debt securities - Trading | | | 1,196 | | | | 4,093 | | | | 1,196 | | | | 4,093 | |
Loans and advances to banks - Trading | | | 6,425 | | | | 3,140 | | | | 6,425 | | | | 3,140 | |
Loans and advances to customers - Trading | | | 3,363 | | | | 6,360 | | | | 3,363 | | | | 6,360 | |
| | | | | | | | | | | | | | | | |
Net trading other cash equivalents | | | 10,984 | | | | 13,593 | | | | 10,984 | | | | 13,593 | |
| | | | | | | | | | | | | | | | |
Loans and advances to banks - Non trading | | | 68,065 | | | | 59,270 | | | | 68,051 | | | | 59,159 | |
| | | | | | | | | | | | | | | | |
Net non-trading other cash equivalents | | | 68,065 | | | | 59,270 | | | | 68,051 | | | | 59,159 | |
| | | | | | | | | | | | | | | | |
Cash and cash equivalents at year end | | | 79,414 | | | | 79,858 | | | | 79,400 | | | | 79,747 | |
| | | | | | | | | | | | | | | | |
| | |
Abbey National Treasury Services plc 2012 Annual Report | | 163 |
Financial Statements
Notes to the Financial Statementscontinued
39. ASSETS CHARGED AS SECURITY FOR LIABILITIES AND COLLATERAL ACCEPTED AS SECURITY FOR ASSETS
The following transactions are conducted under terms that are usual and customary to collateralised transactions, including, where relevant, standard securities lending and repurchase agreements.
a) Financial assets pledged to secure liabilities
The financial assets below are analysed between those assets accounted for on the balance sheet and off-balance sheet in accordance with IFRS.
| | | | | | | | |
| | | Group | |
| | | 2012
£m | | | 2011
£m | |
On balance sheet: | | | | | | | | |
Treasury bills and other eligible securities | | | 2,924 | | | | 6,141 | |
Cash | | | 2,741 | | | | 3,004 | |
Debt securities | | | 483 | | | | 129 | |
Equity securities | | | 309 | | | | 321 | |
| | | | | | | | |
| | | 6,457 | | | | 9,595 | |
| | | | | | | | |
Off balance sheet: | | | | | | | | |
Treasury bills and other eligible securities | | | 17,666 | | | | 14,046 | |
Debt securities | | | 6,784 | | | | 17,217 | |
Equity securities | | | 105 | | | | 196 | |
| | | | | | | | |
| | | 24,555 | | | | 31,459 | |
| | | | | | | | |
The ANTS group provides assets as collateral in the following areas of the business.
Sale and repurchase agreements
The Company and certain of its subsidiaries enter into sale and repurchase agreements and similar transactions of equity and debt securities, which are accounted for as secured borrowings. Upon entering into such transactions, the Company and subsidiaries provide collateral equal to 100%-131% of the borrowed amount. The carrying amount of assets that were so provided at 31 December 2012 was £18,269m (2011: £26,232m).
Stock borrowing and lending agreements
Asset balances under stock borrowing and lending agreements represent stock lent by the ANTS group. These balances amounted to £10,002m at 31 December 2012 (2011: £12,180m) and are offset by contractual commitments to return stock borrowed or cash received.
Derivatives business
In addition to the arrangements described above, collateral is also provided in the normal course of derivative business to counterparties. At 31 December 2012, £2,741m (2011: £2,642m) of such collateral in the form of cash had been provided by the ANTS group and is included in the table above.
b) Collateral held as security for assets:
| | | | | | | | |
| | | Group | |
| | | 2012
£m | | | 2011
£m | |
On balance sheet: | | | | | | | | |
Trading liabilities | | | 2,269 | | | | 3,004 | |
| | | | | | | | |
| | | 2,269 | | | | 3,004 | |
| | | | | | | | |
Off balance sheet: | | | | | | | | |
Trading liabilities | | | 23,865 | | | | 19,552 | |
Deposits by banks | | | 233 | | | | 2,054 | |
| | | | | | | | |
| | | 24,098 | | | | 21,606 | |
| | | | | | | | |
Purchase and resale agreements
The Company and certain of its subsidiaries also enter into purchase and resale agreements and similar transactions of equity and debt securities, which are accounted for as collateralised loans. Upon entering into such transactions, the Company and subsidiaries receive collateral equal to 100%-105% of the loan amount. The level of collateral held is monitored daily and if required, further calls are made to ensure the market values of collateral remains at least equal to the loan balance. The Company and subsidiaries are permitted to sell or repledge the collateral held in the absence of default. At 31 December 2012, the fair value of such collateral received was £14,789m (2011: £11,776m), almost all of which was sold or repledged. The Company and its subsidiaries have an obligation to return collateral that they have sold or pledged.
| | |
| 164 | | Abbey National Treasury Services plc 2012 Annual Report |
Financial Statements
Notes to the Financial Statementscontinued
Stock borrowing and lending agreements
Obligations under stock borrowing and lending agreements represent contractual commitments to return stock borrowed. These obligations totalling £9,309m at 31 December 2012 (2011: £9,830m) and are offset by a contractual right to receive stock lent by the ANTS group.
Derivatives business
In addition to the arrangements described above, collateral is also received in the normal course of derivative business from counterparties. At 31 December 2012, £2,269m (2011: £2,642m) of such collateral in the form of cash had been received by the ANTS group and is included in the table above.
Lending activities
In addition to the above collateral held as security for assets, the ANTS group may obtain a charge over a customer’s property in connection with its lending activities. Details of these arrangements are set out in the “Credit Risk” section of the Risk Management Report.
40. PENSIONS AND OTHER POST-RETIREMENT BENEFITS
The ANTS group participates in various Santander UK defined benefit and defined contribution pension schemes in operation. There is no contractual agreement of stated policy for charging the net defined benefit cost of the Santander UK defined benefit schemes. Therefore, in accordance with IAS 19, the defined benefit asset or liability has been recognised in the financial statements of the sponsoring employer of the scheme and the ANTS group accounts for its contributions as a defined contribution scheme. The contribution to be paid by the ANTS group is calculated as the contributions made by Santander UK plc to the schemes in respect of the ANTS group’s employees. An amount of £6m (2011: £5m) was recognised as an expense for these contributions and is included in staff costs within administration expenses in the income statement.
41. RELATED PARTY DISCLOSURES
Transactions with Directors, Key Management Personnel and their connected persons
Other than as disclosed below, there were no other related party transactions during the year, or existing at the balance sheet date with the Company or parent company’s Key Management Personnel. Key Management Personnel are defined as the Directors of the Company.
Remuneration of Key Management Personnel
The remuneration of the Directors is set out in aggregate for each of the categories specified in IAS 24 Related Party Disclosures. Further information about the aggregate remuneration of the Directors is provided in Note 10.
| | | | | | | | | | | | |
Key management compensation | | 2012
£ | | | 2011
£ | | | 2010
£ | |
Short-term employee benefits | | | 1,499,301 | | | | 1,503,860 | | | | 1,342,305 | |
Post employment benefits | | | 79,889 | | | | 75,298 | | | | 44,523 | |
Share-based payments | | | 32,927 | | | | 68,075 | | | | 116,711 | |
| | | | | | | | | | | | |
Total key management compensation | | | 1,612,117 | | | | 1,647,233 | | | | 1,503,539 | |
| | | | | | | | | | | | |
Of the Directors that served during the year, three were remunerated in relation to their services as directors of this Company and the amounts included above are based on an estimated time allocation basis.
Long-Term Incentive Plan
In 2012, no Executive Directors (2011: none, 2010: three) were granted conditional awards of shares in Banco Santander, S.A. under the Santander Long-Term Incentive Plan (2010: total fair value of £59,414 based on a share price of euro 5.57). Under the Santander Long-Term Incentive Plans granted on 1 July 2010, 1 July 2009, 21 June 2008 and 31 December 2007, certain Executive Directors, Key Management Personnel and other nominated individuals were granted conditional awards of shares in Banco Santander, S.A..
| | |
Abbey National Treasury Services plc 2012 Annual Report | | 165 |
Financial Statements
Notes to the Financial Statementscontinued
The number of shares participants will receive depends on the performance of Banco Santander, S.A. during this period. The vesting of awards under the Santander Long-Term Incentive Plan depends on Santander’s Total Shareholder Return performance against a competitor benchmark group. Awards made prior to 2009 also depend on Santander’s Earnings Per Share performance against a competitor benchmark group. 90.79% of the 40% of the 2007 conditional award of shares vested in July 2009 and 90.79% of the remaining 60% of the 2007 conditional award vested in July 2010. Subject to performance conditions being met, 100% of the 2008 conditional award vested in July 2011, 100% of the 2009 conditional award vested in July 2012 and 100% of the 2010 conditional award will vest in July 2013. In 2012, Long-Term Incentive Plan shares awarded in 2009 vested for three Director(s) (2011: two).
Parent undertaking and controlling party
The Company’s immediate parent is Santander UK plc. The ultimate parent and controlling party is Banco Santander, S.A., a company incorporated in Spain. The smallest and largest groups into which the Company’s results are included are the group accounts of Santander UK plc and Banco Santander, S.A. respectively. A copy of the accounts of Santander UK plc may be obtained from Secretariat, Santander UK plc, 2 Triton Square, Regent’s Place, London NW1 3AN. A copy of the accounts of Banco Santander, S.A. may be obtained from Santander Shareholder Relations, 2 Triton Square, Regent’s Place, London NW1 3AN or on the Santander UK corporate website (www.aboutsantander.co.uk).
Transactions with related parties
Transactions with related parties during the year and balances outstanding at the year end:
| | | | | | | | | | | | | | | | | | | | | | | | | | | | | | | | | | | | | | | | |
| | | Group | |
| | | Interest, fees and
other income received | | | Interest, fees and
other expense paid | | | Amounts owed by
related parties | | | Amounts owed
to related parties | |
| | | 2012
£m | | | 2011
£m | | | 2010
£m | | | 2012
£m | | | 2011
£m | | | 2010
£m | | | 2012
£m | | | 2011
£m | | | 2012
£m | | | 2011
£m | |
Ultimate parent company | | | (53 | ) | | | (163 | ) | | | (322 | ) | | | 151 | | | | 12 | | | | 12 | | | | 2,470 | | | | 4,991 | | | | (4,274 | ) | | | (5,364 | ) |
Immediate parent | | | (2,687 | ) | | | (3,169 | ) | | | (3,280 | ) | | | 2,010 | | | | 2,118 | | | | 1,998 | | | | 107,324 | | | | 110,848 | | | | (101,231 | ) | | | (94,801 | ) |
Fellow subsidiaries | | | (1,210 | ) | | | (833 | ) | | | (499 | ) | | | 458 | | | | 448 | | | | 349 | | | | 35,653 | | | | 31,644 | | | | (16,247 | ) | | | (20,296 | ) |
| | | | | | | | | | | | | | | | | | | | | | | | | | | | | | | | | | | | | | | | |
| | | (3,950 | ) | | | (4,165 | ) | | | (4,101 | ) | | | 2,619 | | | | 2,578 | | | | 2,359 | | | | 145,447 | | | | 147,483 | | | | (121,752 | ) | | | (120,461 | ) |
| | | | | | | | | | | | | | | | | | | | | | | | | | | | | | | | | | | | | | | | |
| |
| | | Company | |
| | | Interest, fees and
other income received | | | Interest, fees and
other expense paid | | | Amounts owed by
related parties | | | Amounts owed
to related parties | |
| | | 2012
£m | | | 2011
£m | | | 2010
£m | | | 2012
£m | | | 2011
£m | | | 2010
£m | | | 2012
£m | | | 2011
£m | | | 2012
£m | | | 2011
£m | |
Ultimate parent company | | | (53 | ) | | | (107 | ) | | | (313 | ) | | | 151 | | | | 12 | | | | 11 | | | | 2,470 | | | | 4,991 | | | | (4,274 | ) | | | (5,360 | ) |
Immediate parent | | | (2,687 | ) | | | (3,156 | ) | | | (3,188 | ) | | | 2,010 | | | | 2,118 | | | | 1,998 | | | | 107,319 | | | | 110,848 | | | | (101,231 | ) | | | (94,800 | ) |
Subsidiaries | | | (4 | ) | | | (88 | ) | | | (323 | ) | | | 22 | | | | 30 | | | | 29 | | | | 151 | | | | 126 | | | | (4,351 | ) | | | (5,163 | ) |
Fellow subsidiaries | | | (1,210 | ) | | | (832 | ) | | | (496 | ) | | | 458 | | | | 448 | | | | 346 | | | | 35,649 | | | | 31,638 | | | | (16,247 | ) | | | (20,296 | ) |
| | | | | | | | | | | | | | | | | | | | | | | | | | | | | | | | | | | | | | | | |
| | | (3,954 | ) | | | (4,183 | ) | | | (4,320 | ) | | | 2,641 | | | | 2,608 | | | | 2,384 | | | | 145,589 | | | | 147,603 | | | | (126,103 | ) | | | (125,619 | ) |
| | | | | | | | | | | | | | | | | | | | | | | | | | | | | | | | | | | | | | | | |
Further information on balances due from/(to) other Santander group companies is set out in the section “Balances with other Santander UK group companies” and “Balances with other Banco Santander group companies” in the Risk Management Report on pages 89 to 91. The above transactions were made in the ordinary course of business and substantially on the same terms as for comparable transactions with third party counterparties and within limits acceptable to the UK Financial Services Authority. Such transactions do not involve more than the normal risk of collectability or present any unfavourable features.
42. EVENTS AFTER THE BALANCE SHEET DATE
None.
| | |
| 166 | | Abbey National Treasury Services plc 2012 Annual Report |
Financial Statements
Notes to the Financial Statementscontinued
43. FINANCIAL INSTRUMENTS
a) Measurement basis of financial assets and liabilities
Financial assets and financial liabilities are measured on an ongoing basis either at fair value or at amortised cost. Note 1 describes how the classes of financial instruments are measured, and how income and expenses, including fair value gains and losses, are recognised. The following tables analyse the ANTS group’s financial instruments into those measured at fair value and those measured at amortised cost in the balance sheet:
| | | | | | | | | | | | | | | | | | | | | | | | | | | | | | | | |
| | | Group | |
| | | Held at fair value | | | Held at amortised cost | | | Non- | | | Total | |
31 December 2012 | | Trading | | | Derivatives
designated
as hedges | | | Designated
at fair value
through P&L | | | Available-
for-sale | | | Financial
assets at
amortised cost | | | Financial
liabilities at
amortised cost | | | financial
assets /
liabilities | | |
| | | £m | | | £m | | | £m | | | £m | | | £m | | | £m | | | £m | | | £m | |
Assets | | | | | | | | | | | | | | | | | | | | | | | | | | | | | | | | |
Cash and balances at central banks | | | — | | | | — | | | | — | | | | — | | | | 388 | | | | — | | | | — | | | | 388 | |
Trading assets | | | 22,498 | | | | — | | | | — | | | | — | | | | — | | | | — | | | | — | | | | 22,498 | |
Derivative financial instruments | | | 32,873 | | | | 403 | | | | — | | | | — | | | | — | | | | — | | | | — | | | | 33,276 | |
Financial assets designated at FV | | | — | | | | — | | | | 3,531 | | | | — | | | | — | | | | — | | | | — | | | | 3,531 | |
Loans and advances to banks | | | — | | | | — | | | | — | | | | — | | | | 106,986 | | | | — | | | | — | | | | 106,986 | |
Loans and advances to customers | | | — | | | | — | | | | — | | | | — | | | | 44,750 | | | | — | | | | — | | | | 44,750 | |
Available-for-sale securities | | | — | | | | — | | | | — | | | | 5,113 | | | | — | | | | — | | | | — | | | | 5,113 | |
Loans and receivables securities | | | — | | | | — | | | | — | | | | — | | | | 162 | | | | — | | | | — | | | | 162 | |
Macro hedge of interest rate risk | | | — | | | | — | | | | — | | | | — | | | | 1,171 | | | | — | | | | — | | | | 1,171 | |
Intangible assets | | | — | | | | — | | | | — | | | | — | | | | — | | | | — | | | | 7 | | | | 7 | |
Property, plant and equipment | | | — | | | | — | | | | — | | | | — | | | | — | | | | — | | | | 6 | | | | 6 | |
Deferred tax assets | | | — | | | | — | | | | — | | | | — | | | | — | | | | — | | | | 20 | | | | 20 | |
Other assets | | | — | | | | — | | | | — | | | | — | | | | — | | | | — | | | | 4 | | | | 4 | |
| | | | | | | | | | | | | | | | | | | | | | | | | | | | | | | | |
| | | 55,371 | | | | 403 | | | | 3,531 | | | | 5,113 | | | | 153,457 | | | | — | | | | 37 | | | | 217,912 | |
| | | | | | | | | | | | | | | | | | | | | | | | | | | | | | | | |
Liabilities | | | | | | | | | | | | | | | | | | | | | | | | | | | | | | | | |
Deposits by banks | | | — | | | | — | | | | — | | | | — | | | | — | | | | 114,535 | | | | — | | | | 114,535 | |
Deposits by customers | | | — | | | | — | | | | — | | | | — | | | | — | | | | 6,249 | | | | — | | | | 6,249 | |
Derivative financial liabilities | | | 32,493 | | | | 1,595 | | | | — | | | | — | | | | — | | | | — | | | | — | | | | 34,088 | |
Trading liabilities | | | 21,109 | | | | — | | | | — | | | | — | | | | — | | | | — | | | | — | | | | 21,109 | |
Financial liabilities at FVTPL | | | — | | | | — | | | | 4,002 | | | | — | | | | — | | | | — | | | | — | | | | 4,002 | |
Debt securities in issue | | | — | | | | — | | | | — | | | | — | | | | — | | | | 33,770 | | | | — | | | | 33,770 | |
Other liabilities | | | — | | | | — | | | | — | | | | — | | | | — | | | | — | | | | 169 | | | | 169 | |
Provisions | | | — | | | | — | | | | — | | | | — | | | | — | | | | — | | | | 20 | | | | 20 | |
Current tax liabilities | | | — | | | | — | | | | — | | | | — | | | | — | | | | — | | | | 175 | | | | 175 | |
| | | | | | | | | | | | | | | | | | | | | | | | | | | | | | | | |
| | | 53,602 | | | | 1,595 | | | | 4,002 | | | | — | | | | — | | | | 154,554 | | | | 364 | | | | 214,117 | |
| | | | | | | | | | | | | | | | | | | | | | | | | | | | | | | | |
| | | | | | | | | | | | | | | | | | | | | | | | | | | | | | | | |
| | | Company | |
| | | Held at fair value | | | Held at amortised cost | | | Non- | | | Total | |
31 December 2012 | | Trading | | | Derivatives
designated
as hedges | | | Designated at
fair value
through P&L | | | Available-
for-sale | | | Financial
assets at
amortised cost | | | Financial
liabilities at
amortised cost | | | financial
assets /
liabilities | | |
| | | £m | | | £m | | | £m | | | £m | | | £m | | | £m | | | £m | | | £m | |
Assets | | | | | | | | | | | | | | | | | | | | | | | | | | | | | | | | |
Cash and balances at central banks | | | — | | | | — | | | | — | | | | — | | | | 388 | | | | — | | | | — | | | | 388 | |
Trading assets | | | 22,155 | | | | — | | | | — | | | | — | | | | — | | | | — | | | | — | | | | 22,155 | |
Derivative financial instruments | | | 32,909 | | | | 403 | | | | — | | | | — | | | | — | | | | — | | | | — | | | | 33,312 | |
Financial assets designated at FV | | | — | | | | — | | | | 3,531 | | | | — | | | | — | | | | — | | | | — | | | | 3,531 | |
Loans and advances to banks | | | — | | | | — | | | | — | | | | — | | | | 106,972 | | | | — | | | | — | | | | 106,972 | |
Loans and advances to customers | | | — | | | | — | | | | — | | | | — | | | | 44,858 | | | | — | | | | — | | | | 44,858 | |
Available-for-sale securities | | | — | | | | — | | | | — | | | | 5,113 | | | | — | | | | — | | | | — | | | | 5,113 | |
Loans and receivables securities | | | — | | | | — | | | | — | | | | — | | | | 162 | | | | — | | | | — | | | | 162 | |
Macro hedge of interest rate risk | | | — | | | | — | | | | — | | | | — | | | | 1,171 | | | | — | | | | — | | | | 1,171 | |
Intangible assets | | | — | | | | — | | | | — | | | | — | | | | — | | | | — | | | | 7 | | | | 7 | |
Investment in subsidiary undertakings | | | — | | | | — | | | | — | | | | — | | | | — | | | | — | | | | 2,184 | | | | 2,184 | |
Property, plant and equipment | | | — | | | | — | | | | — | | | | — | | | | — | | | | — | | | | 6 | | | | 6 | |
Deferred tax assets | | | — | | | | — | | | | — | | | | — | | | | — | | | | — | | | | 20 | | | | 20 | |
Other assets | | | — | | | | — | | | | — | | | | — | | | | — | | | | — | | | | 4 | | | | 4 | |
| | | | | | | | | | | | | | | | | | | | | | | | | | | | | | | | |
| | | 55,064 | | | | 403 | | | | 3,531 | | | | 5,113 | | | | 153,551 | | | | — | | | | 2,221 | | | | 219,883 | |
| | | | | | | | | | | | | | | | | | | | | | | | | | | | | | | | |
Liabilities | | | | | | | | | | | | | | | | | | | | | | | | | | | | | | | | |
Deposits by banks | | | — | | | | — | | | | — | | | | — | | | | — | | | | 114,535 | | | | — | | | | 114,535 | |
Deposits by customers | | | — | | | | — | | | | — | | | | — | | | | — | | | | 10,599 | | | | — | | | | 10,599 | |
Derivative financial liabilities | | | 32,493 | | | | 1,595 | | | | — | | | | — | | | | — | | | | — | | | | — | | | | 34,088 | |
Trading liabilities | | | 21,109 | | | | — | | | | — | | | | — | | | | — | | | | — | | | | — | | | | 21,109 | |
Financial liabilities at FVTPL | | | — | | | | — | | | | 4,002 | | | | — | | | | — | | | | — | | | | — | | | | 4,002 | |
Debt securities in issue | | | — | | | | — | | | | — | | | | — | | | | — | | | | 31,481 | | | | — | | | | 31,481 | |
Other liabilities | | | — | | | | — | | | | — | | | | — | | | | — | | | | — | | | | 166 | | | | 166 | |
Provisions | | | — | | | | — | | | | — | | | | — | | | | — | | | | — | | | | 20 | | | | 20 | |
Current tax liabilities | | | — | | | | — | | | | — | | | | — | | | | — | | | | — | | | | 175 | | | | 175 | |
| | | | | | | | | | | | | | | | | | | | | | | | | | | | | | | | |
| | | 53,602 | | | | 1,595 | | | | 4,002 | | | | — | | | | — | | | | 156,615 | | | | 361 | | | | 216,175 | |
| | | | | | | | | | | | | | | | | | | | | | | | | | | | | | | | |
| | |
Abbey National Treasury Services plc 2012 Annual Report | | 167 |
Financial Statements
Notes to the Financial Statementscontinued
| | | | | | | | | | | | | | | | | | | | | | | | | | | | |
| | | Group | |
| | | Held at fair value | | | Held at amortised cost | | | Non- | | | | |
31 December 2011 | | Trading | | | Derivatives
designated
as hedges | | | Designated
at fair value
through P&L | | | Financial
assets at
amortised cost | | | Financial
liabilities at
amortised cost | | | financial
assets /
liabilities | | | Total | |
| | | £m | | | £m | | | £m | | | £m | | | £m | | | £m | | | £m | |
Assets | | | | | | | | | | | | | | | | | | | | | | | | | | | | |
Cash and balances at central banks | | | — | | | | — | | | | — | | | | 7,013 | | | | — | | | | — | | | | 7,013 | |
Trading assets | | | 21,891 | | | | — | | | | — | | | | — | | | | — | | | | — | | | | 21,891 | |
Derivative financial instruments | | | 32,864 | | | | 360 | | | | — | | | | — | | | | — | | | | — | | | | 33,224 | |
Financial assets designated at FV | | | — | | | | — | | | | 4,429 | | | | — | | | | — | | | | — | | | | 4,429 | |
Loans and advances to banks | | | — | | | | — | | | | — | | | | 113,222 | | | | — | | | | — | | | | 113,222 | |
Loans and advances to customers | | | — | | | | — | | | | — | | | | 38,826 | | | | — | | | | — | | | | 38,826 | |
Loans and receivables securities | | | — | | | | — | | | | — | | | | 278 | | | | — | | | | — | | | | 278 | |
Macro hedge of interest rate risk | | | — | | | | — | | | | — | | | | 1,141 | | | | — | | | | — | | | | 1,141 | |
Intangible assets | | | — | | | | — | | | | — | | | | — | | | | — | | | | 3 | | | | 3 | |
Property, plant and equipment | | | — | | | | — | | | | — | | | | — | | | | — | | | | 5 | | | | 5 | |
Deferred tax assets | | | — | | | | — | | | | — | | | | — | | | | — | | | | 17 | | | | 17 | |
Other assets | | | — | | | | — | | | | — | | | | — | | | | — | | | | 43 | | | | 43 | |
| | | | | | | | | | | | | | | | | | | | | | | | | | | | |
| | | 54,755 | | | | 360 | | | | 4,429 | | | | 160,480 | | | | — | | | | 68 | | | | 220,092 | |
| | | | | | | | | | | | | | | | | | | | | | | | | | | | |
Liabilities | | | | | | | | | | | | | | | | | | | | | | | | | | | | |
Deposits by banks | | | — | | | | — | | | | — | | | | — | | | | 114,019 | | | | — | | | | 114,019 | |
Deposits by customers | | | — | | | | —�� | | | | — | | | | — | | | | 7,114 | | | | — | | | | 7,114 | |
Derivative financial liabilities | | | 34,180 | | | | 1,237 | | | | — | | | | — | | | | — | | | | — | | | | 35,417 | |
Trading liabilities | | | 25,745 | | | | — | | | | — | | | | — | | | | — | | | | — | | | | 25,745 | |
Financial liabilities at FVTPL | | | — | | | | — | | | | 6,836 | | | | — | | | | — | | | | — | | | | 6,836 | |
Debt securities in issue | | | — | | | | — | | | | — | | | | — | | | | 26,943 | | | | — | | | | 26,943 | |
Other liabilities | | | — | | | | — | | | | — | | | | — | | | | — | | | | 142 | | | | 142 | |
Provisions | | | — | | | | — | | | | — | | | | — | | | | — | | | | 20 | | | | 20 | |
Current tax liabilities | | | — | | | | — | | | | — | | | | — | | | | — | | | | 329 | | | | 329 | |
| | | | | | | | | | | | | | | | | | | | | | | | | | | | |
| | | 59,925 | | | | 1,237 | | | | 6,836 | | | | — | | | | 148,076 | | | | 491 | | | | 216,565 | |
| | | | | | | | | | | | | | | | | | | | | | | | | | | | |
| |
| | | Company | |
| | | Held at fair value | | | Held at amortised cost | | | Non- | | | | |
31 December 2011 | | Trading | | | Derivatives
designated
as hedges | | | Designated
at fair value
through P&L | | | Financial
assets at
amortised cost | | | Financial
liabilities at
amortised cost | | | financial
assets /
liabilities | | | Total | |
| | | £m | | | £m | | | £m | | | £m | | | £m | | | £m | | | £m | |
Assets | | | | | | | | | | | | | | | | | | | | | | | | | | | | |
Cash and balances at central banks | | | — | | | | — | | | | — | | | | 7,013 | | | | — | | | | — | | | | 7,013 | |
Trading assets | | | 21,564 | | | | — | | | | — | | | | — | | | | — | | | | — | | | | 21,564 | |
Derivative financial instruments | | | 32,882 | | | | 360 | | | | — | | | | — | | | | — | | | | — | | | | 33,242 | |
Financial assets designated at FV | | | — | | | | — | | | | 4,429 | | | | — | | | | — | | | | — | | | | 4,429 | |
Loans and advances to banks | | | — | | | | — | | | | — | | | | 113,211 | | | | — | | | | — | | | | 113,211 | |
Loans and advances to customers | | | — | | | | — | | | | — | | | | 38,926 | | | | — | | | | — | | | | 38,926 | |
Loans and receivables securities | | | — | | | | — | | | | — | | | | 278 | | | | — | | | | — | | | | 278 | |
Macro hedge of interest rate risk | | | — | | | | — | | | | — | | | | 1,141 | | | | — | | | | — | | | | 1,141 | |
Investment in subsidiary undertakings | | | — | | | | — | | | | — | | | | — | | | | — | | | | 2,187 | | | | 2,187 | |
Intangible assets | | | — | | | | — | | | | — | | | | — | | | | — | | | | 3 | | | | 3 | |
Property, plant and equipment | | | — | | | | — | | | | — | | | | — | | | | — | | | | 5 | | | | 5 | |
Deferred tax assets | | | — | | | | — | | | | — | | | | — | | | | — | | | | 17 | | | | 17 | |
Other assets | | | — | | | | — | | | | — | | | | — | | | | — | | | | 43 | | | | 43 | |
| | | | | | | | | | | | | | | | | | | | | | | | | | | | |
| | | 54,446 | | | | 360 | | | | 4,429 | | | | 160,569 | | | | — | | | | 2,255 | | | | 222,059 | |
| | | | | | | | | | | | | | | | | | | | | | | | | | | | |
Liabilities | | | | | | | | | | | | | | | | | | | | | | | | | | | | |
Deposits by banks | | | — | | | | — | | | | — | | | | — | | | | 114,018 | | | | — | | | | 114,018 | |
Deposits by customers | | | — | | | | — | | | | — | | | | — | | | | 12,276 | | | | — | | | | 12,276 | |
Derivative financial liabilities | | | 34,180 | | | | 1,237 | | | | — | | | | — | | | | — | | | | — | | | | 35,417 | |
Trading liabilities | | | 25,745 | | | | — | | | | — | | | | — | | | | — | | | | — | | | | 25,745 | |
Financial liabilities at FVTPL | | | — | | | | — | | | | 6,780 | | | | — | | | | — | | | | — | | | | 6,780 | |
Debt securities in issue | | | — | | | | — | | | | — | | | | — | | | | 23,869 | | | | — | | | | 23,869 | |
Other liabilities | | | — | | | | — | | | | — | | | | — | | | | — | | | | 137 | | | | 137 | |
Provisions | | | — | | | | — | | | | — | | | | — | | | | — | | | | 20 | | | | 20 | |
Current tax liabilities | | | — | | | | — | | | | — | | | | — | | | | — | | | | 320 | | | | 320 | |
| | | | | | | | | | | | | | | | | | | | | | | | | | | | |
| | | 59,925 | | | | 1,237 | | | | 6,780 | | | | — | | | | 150,163 | | | | 477 | | | | 218,582 | |
| | | | | | | | | | | | | | | | | | | | | | | | | | | | |
| | |
| 168 | | Abbey National Treasury Services plc 2012 Annual Report |
Financial Statements
Notes to the Financial Statementscontinued
b) Fair values of financial instruments carried at amortised cost
The following tables analyse the fair value of financial instruments not measured at fair value in the balance sheet:
| | | | | | | | | | | | |
| | | Group | |
31 December 2012 | | Carrying value
£m | | | Fair value
£m | | | Surplus/(deficit)
£m | |
Assets | | | | | | | | | | | | |
Cash and balances at central banks | | | 388 | | | | 388 | | | | — | |
Loans and advances to banks | | | 106,986 | | | | 107,145 | | | | 159 | |
Loans and advances to customers | | | 44,750 | | | | 47,533 | | | | 2,783 | |
Loans and receivable securities | | | 162 | | | | 154 | | | | (8 | ) |
Liabilities | | | | | | | | | | | | |
Deposits by banks | | | 114,535 | | | | 118,208 | | | | (3,673 | ) |
Deposits by customers | | | 6,249 | | | | 6,264 | | | | (15 | ) |
Debt securities in issue | | | 33,770 | | | | 35,071 | | | | (1,301 | ) |
| |
| | | Company | |
31 December 2012 | | Carrying value
£m | | | Fair value
£m | | | Surplus/(deficit)
£m | |
Assets | | | | | | | | | | | | |
Cash and balances at central banks | | | 388 | | | | 388 | | | | — | |
Loans and advances to banks | | | 106,972 | | | | 107,131 | | | | 159 | |
Loans and advances to customers | | | 44,858 | | | | 47,641 | | | | 2,783 | |
Loans and receivable securities | | | 162 | | | | 154 | | | | (8 | ) |
Liabilities | | | | | | | | | | | | |
Deposits by banks | | | 114,535 | | | | 118,208 | | | | (3,673 | ) |
Deposits by customers | | | 10,599 | | | | 10,615 | | | | (16 | ) |
Debt securities in issue | | | 31,481 | | | | 32,783 | | | | (1,302 | ) |
| |
| | | Group | |
31 December 2011 | | Carrying value
£m | | | Fair value
£m | | | Surplus/(deficit)
£m | |
Assets | | | | | | | | | | | | |
Cash and balances at central banks | | | 7,013 | | | | 7,013 | | | | — | |
Loans and advances to banks | | | 113,222 | | | | 114,915 | | | | 1,693 | |
Loans and advances to customers | | | 38,826 | | | | 41,133 | | | | 2,307 | |
Loans and receivable securities | | | 278 | | | | 280 | | | | 2 | |
Liabilities | | | | | | | | | | | | |
Deposits by banks | | | 114,019 | | | | 115,060 | | | | (1,041 | ) |
Deposits by customers | | | 7,114 | | | | 7,213 | | | | (99 | ) |
Debt securities in issue | | | 26,943 | | | | 27,788 | | | | (845 | ) |
| |
| | | Company | |
31 December 2011 | | Carrying value
£m | | | Fair value
£m | | | Surplus/(deficit)
£m | |
Assets | | | | | | | | | | | | |
Cash and balances at central banks | | | 7,013 | | | | 7,013 | | | | — | |
Loans and advances to banks | | | 113,211 | | | | 114,905 | | | | 1,694 | |
Loans and advances to customers | | | 38,926 | | | | 41,233 | | | | 2,307 | |
Loans and receivable securities | | | 278 | | | | 281 | | | | 3 | |
Liabilities | | | | | | | | | | | | |
Deposits by banks | | | 114,018 | | | | 115,058 | | | | (1,040 | ) |
Deposits by customers | | | 12,276 | | | | 12,362 | | | | (86 | ) |
Debt securities in issue | | | 23,869 | | | | 24,714 | | | | (845 | ) |
The surplus/(deficit) in the table above represents the surplus/(deficit) of fair value compared to the carrying amount of those financial instruments for which fair values have been estimated. The carrying value above of any financial assets and liabilities that are designated as hedged items in a portfolio (or macro) fair value hedge relationship excludes gains and losses attributable to the hedged risk, as this is presented as a single separate line item on the balance sheet.
Valuation methodology
The fair value of financial instruments is the estimated amount at which the instrument could be exchanged in a current transaction between willing parties, other than in a forced or liquidation sale. If a quoted market price is available for an instrument, the fair value is calculated based on the market price. Where quoted market prices are not available, fair value is determined using pricing models which use a mathematical methodology based on accepted financial theories, depending on the product type and its components. Further information on fair value measurement can be found in Note 1 and the valuation techniques section below.
| | |
Abbey National Treasury Services plc 2012 Annual Report | | 169 |
Financial Statements
Notes to the Financial Statementscontinued
Fair value management
The fair value exposures, as tabled above, are managed by using a combination of hedging derivatives and offsetting on balance sheet positions. The approach to specific categories of financial instruments is described below.
Assets
Cash and balances at central banks
This consists of demand deposits with the Bank of England and the US Federal Reserve, together with cash in tills and ATMs.The carrying amount of cash and balances at central banks is deemed a reasonable approximation of the fair value.
Loans and advances to banks
These comprise secured loans, short term placements with banks including collateral, and unsettled financial transactions. The secured loans have been valued on the basis of spreads on credit default swaps for the term of the loans. The carrying amount of the other items is deemed a reasonable approximation of their fair value, as the transactions are very short-term in duration.
Loans and advances to customers
The approach to estimating the fair value of the principal products and portfolios of loans and advances to customers was as follows:
i) Corporate lending
Following the transfer of the non-core portfolios to Corporate Centre, the remaining corporate assets are written at current interest rates and margins and are considered appropriately provided for. A shortfall in Large Corporates relates to certain infrastructure assets which have not been transferred to Corporate Centre.
With respect to the non-core portfolios, an exercise has been undertaken to estimate their market value, based on an orderly disposal process over a period of three years. This portfolio is well provided for, and this is reflected in a relatively small mark-to-market deficit.
ii) Social housing
Part of this portfolio is held for historic reasons at fair value and the methodology used to value the fair value part of the portfolio has been used to calculate the market value of the amortised cost part of the portfolio.
Loans and receivables securities
These debt securities consist primarily of asset-backed securities which are complex products and are valued with the assistance of an independent, specialist valuation firm. These fair values are determined using industry-standard valuation techniques, including discounted cash-flow models. The inputs to these models used in these valuation techniques include quotes from market makers, prices of similar assets, adjustments for differences in credit spreads, and additional quantitative and qualitative research. Disposals of these securities since 2008 have demonstrated that actual sales prices achieved have been close to fair values estimated under this method.
Liabilities
Deposits by banks
The fair value of deposits by banks, including repos, has been estimated using “valuation technique A” as described in the valuation technique section below.
Deposits by customers
The majority of deposit liabilities are payable on demand and therefore can be deemed short-term in nature with the fair value equal to the carrying value. However, given the long-term and continuing nature of the relationships with the ANTS group’s customers, the Directors believe there is significant value to the ANTS group in this source of funds. Certain of the deposit liabilities are at a fixed rate until maturity. The deficit of fair value over carrying value of these liabilities has been estimated by reference to the market rates available at the balance sheet date for similar deposit liabilities of similar maturities. The fair value of such deposits liabilities has been estimated using “valuation technique A” as described in the valuation technique section below.
Debt securities in issue
Where reliable prices are available, the fair value of debt securities in issue has been calculated using quoted market prices. Other market values have been determined using “valuation technique A” as described in the valuation technique section below.
| | |
| 170 | | Abbey National Treasury Services plc 2012 Annual Report |
Financial Statements
Notes to the Financial Statementscontinued
c) Fair value valuation bases of financial instruments carried at fair value
The following tables summarise the fair values at 31 December 2012 and 2011 of the financial asset and liability classes accounted for at fair value, analysed by the valuation methodology used by the ANTS group to determine their fair value. The tables also disclose the percentages that the recorded fair values of financial assets and liabilities represent of the total assets and liabilities, respectively, that are recorded at fair value in the balance sheet:
| | | | | | | | | | | | | | | | | | | | | | | | | | | | | | | | | | | | | | |
| 31 December 2012 | | | | | | | | | | Internal models based on | | | | | | | | | | |
| Balance sheet category | | Quoted prices in
active markets
(Level 1) | | | Market
observable data
(Level 2) | | | Significant
unobservable data
(Level 3) | | | Total | | | Valuation
technique | |
| | | | | £m | | | % | | | £m | | | % | | | £m | | | % | | | £m | | | % | | | | |
Assets | | | | | | | | | | | | | | | | | | | | | | | | | | | | | | | | | | | | | | |
Trading assets | | Loans and advances to banks | | | — | | | | — | | | | 9,988 | | | | 16 | | | | — | | | | — | | | | 9,988 | | | | 16 | | | | A | |
| | Loans and advances to customers | | | — | | | | — | | | | 7,552 | | | | 12 | | | | — | | | | — | | | | 7,552 | | | | 12 | | | | A | |
| | Debt securities | | | 4,494 | | | | 7 | | | | — | | | | — | | | | — | | | | — | | | | 4,494 | | | | 7 | | | | — | |
| | Equity securities | | | 464 | | | | 1 | | | | — | | | | — | | | | — | | | | — | | | | 464 | | | | 1 | | | | — | |
Derivative assets | | Exchange rate contracts | | | — | | | | — | | | | 3,660 | | | | 6 | | | | 36 | | | | — | | | | 3,696 | | | | 6 | | | | A | |
| | Interest rate contracts | | | 54 | | | | — | | | | 28,038 | | | | 43 | | | | — | | | | — | | | | 28,092 | | | | 43 | | | | A & C | |
| | Equity and credit contracts | | | 152 | | | | — | | | | 957 | | | | 1 | | | | 372 | | | | 1 | | | | 1,481 | | | | 2 | | | | B | |
| | Commodity contracts | | | — | | | | — | | | | 7 | | | | — | | | | — | | | | — | | | | 7 | | | | — | | | | A | |
Financial assets at FVTPL | | Loans and advances to customers | | | — | | | | — | | | | 3,142 | | | | 5 | | | | 61 | | | | — | | | | 3,203 | | | | 5 | | | | A | |
| | Debt securities | | | — | | | | — | | | | 279 | | | | — | | | | 49 | | | | — | | | | 328 | | | | — | | | | A | |
AFS Financial assets | | Debt securities | | | 5,113 | | | | 8 | | | | — | | | | — | | | | — | | | | — | | | | 5,113 | | | | 8 | | | | — | |
| | | | | | | | | | | | | | | | | | | | | | | | | | | | | | | | | | | | | | |
Total assets at fair value | | | | | 10,277 | | | | 16 | | | | 53,623 | | | | 83 | | | | 518 | | | | 1 | | | | 64,418 | | | | 100 | | | | | |
| | | | | | | | | | | | | | | | | | | | | | | | | | | | | | | | | | | | | | |
Liabilities | | | | | | | | | | | | | | | | | | | | | | | | | | | | | | | | | | | | | | |
Trading liabilities | | Deposits by banks | | | — | | | | — | | | | 9,742 | | | | 16 | | | | — | | | | — | | | | 9,742 | | | | 16 | | | | A | |
| | Deposits by customers | | | — | | | | — | | | | 7,248 | | | | 12 | | | | — | | | | — | | | | 7,248 | | | | 12 | | | | A | |
| | Short positions | | | 4,119 | | | | 7 | | | | — | | | | — | | | | — | | | | — | | | | 4,119 | | | | 7 | | | | — | |
Derivative liabilities | | Exchange rate contracts | | | — | | | | — | | | | 4,552 | | | | 8 | | | | — | | | | — | | | | 4,552 | | | | 8 | | | | A | |
| | Interest rate contracts | | | 31 | | | | — | | | | 27,460 | | | | 47 | | | | — | | | | — | | | | 27,491 | | | | 47 | | | | A & C | |
| | Equity and credit contracts | | | 86 | | | | — | | | | 1,880 | | | | 3 | | | | 72 | | | | — | | | | 2,038 | | | | 3 | | | | B | |
| | Commodity contracts | | | — | | | | — | | | | 7 | | | | — | | | | — | | | | — | | | | 7 | | | | — | | | | A | |
Financial liabilities at FVTPL | | Debt securities in issue | | | — | | | | — | | | | 3,916 | | | | 7 | | | | 86 | | | | — | | | | 4,002 | | | | 7 | | | | A | |
| | | | | | | | | | | | | | | | | | | | | | | | | | | | | | | | | | | | | | |
Total liabilities at fair value | | | | | 4,236 | | | | 7 | | | | 54,805 | | | | 93 | | | | 158 | | | | — | | | | 59,199 | | | | 100 | | | | | |
| | | | | | | | | | | | | | | | | | | | | | | | | | | | | | | | | | | | | | |
| | | | | | | |
| 31 December 2011 | | | | | | | | | | Internal models based on | | | | | | | | | | |
| Balance sheet category | | Quoted prices in
active markets
(Level 1) | | | Market
observable data
(Level 2) | | | Significant
unobservable data
(Level 3) | | | Total | | | Valuation
technique | |
| | | | | £m | | | % | | | £m | | | % | | | £m | | | % | | | £m | | | % | | | | |
Assets | | | | | | | | | | | | | | | | | | | | | | | | | | | | | | | | | | | | | | |
Trading assets | | Loans and advances to banks | | | — | | | | — | | | | 6,144 | | | | 10 | | | | — | | | | — | | | | 6,144 | | | | 10 | | | | A | |
| | Loans and advances to customers | | | — | | | | — | | | | 6,687 | | | | 11 | | | | — | | | | — | | | | 6,687 | | | | 11 | | | | A | |
| | Debt securities | | | 8,711 | | | | 14 | | | | — | | | | — | | | | — | | | | — | | | | 8,711 | | | | 14 | | | | — | |
| | Equity securities | | | 349 | | | | 1 | | | | — | | | | — | | | | — | | | | — | | | | 349 | | | | 1 | | | | — | |
Derivative assets | | Exchange rate contracts | | | — | | | | — | | | | 1,618 | | | | 3 | | | | 70 | | | | — | | | | 1,688 | | | | 3 | | | | A | |
| | Interest rate contracts | | | 54 | | | | — | | | | 29,782 | | | | 50 | | | | — | | | | — | | | | 29,836 | | | | 50 | | | | A & C | |
| | Equity and credit contracts | | | 152 | | | | — | | | | 1,176 | | | | 2 | | | | 360 | | | | 1 | | | | 1,688 | | | | 3 | | | | B | |
| | Commodity contracts | | | — | | | | — | | | | 12 | | | | — | | | | — | | | | — | | | | 12 | | | | — | | | | A | |
Financial assets at FVTPL | | Loans and advances to customers | | | — | | | | — | | | | 3,992 | | | | 7 | | | | 58 | | | | — | | | | 4,050 | | | | 7 | | | | A | |
| | Debt securities | | | — | | | | — | | | | 328 | | | | 1 | | | | 51 | | | | — | | | | 379 | | | | 1 | | | | A | |
| | | | | | | | | | | | | | | | | | | | | | | | | | | | | | | | | | | | | | |
Total assets at fair value | | | | | 9,266 | | | | 15 | | | | 49,739 | | | | 84 | | | | 539 | | | | 1 | | | | 59,544 | | | | 100 | | | | | |
| | | | | | | | | | | | | | | | | | | | | | | | | | | | | | | | | | | | | | |
Liabilities | | | | | | | | | | | | | | | | | | | | | | | | | | | | | | | | | | | | | | |
Trading liabilities | | Deposits by banks | | | — | | | | — | | | | 14,508 | | | | 21 | | | | — | | | | — | | | | 14,508 | | | | 21 | | | | A | |
| | Deposits by customers | | | — | | | | — | | | | 10,482 | | | | 15 | | | | — | | | | — | | | | 10,482 | | | | 15 | | | | A | |
| | Short positions | | | 755 | | | | 1 | | | | — | | | | — | | | | — | | | | — | | | | 755 | | | | 1 | | | | — | |
Derivative liabilities | | Exchange rate contracts | | | — | | | | — | | | | 3,087 | | | | 5 | | | | — | | | | — | | | | 3,087 | | | | 5 | | | | A | |
| | Interest rate contracts | | | 41 | | | | — | | | | 29,490 | | | | 44 | | | | — | | | | — | | | | 29,531 | | | | 44 | | | | A & C | |
| | Equity and credit contracts | | | 12 | | | | — | | | | 2,687 | | | | 4 | | | | 89 | | | | — | | | | 2,788 | | | | 4 | | | | B | |
| | Commodity contracts | | | — | | | | — | | | | 11 | | | | — | | | | — | | | | — | | | | 11 | | | | — | | | | A | |
Financial liabilities at FVTPL | | Debt securities in issue | | | — | | | | — | | | | 6,695 | | | | 10 | | | | 141 | | | | — | | | | 6,836 | | | | 10 | | | | A | |
| | | | | | | | | | | | | | | | | | | | | | | | | | | | | | | | | | | | | | |
Total liabilities at fair value | | | | | 808 | | | | 1 | | | | 66,960 | | | | 99 | | | | 230 | | | | — | | | | 67,998 | | | | 100 | | | | | |
| | | | | | | | | | | | | | | | | | | | | | | | | | | | | | | | | | | | | | |
| | |
Abbey National Treasury Services plc 2012 Annual Report | | 171 |
Financial Statements
Notes to the Financial Statementscontinued
| | | | | | | | | | | | | | | | | | | | | | | | | | | | | | | | | | | | | | |
| | | | | Company | |
| 31 December 2012 | | | | | | | | | | Internal models based on | | | | | | | | | | |
| Balance sheet category | | Quoted prices in
active markets
(Level 1) | | | Market
observable data
(Level 2) | | | Significant
unobservable data
(Level 3) | | | Total | | | Valuation
technique | |
| | | | | £m | | | % | | | £m | | | % | | | £m | | | % | | | £m | | | % | | | | |
Assets | | | | | | | | | | | | | | | | | | | | | | | | | | | | | | | | | | | | | | |
Trading assets | | Loans and advances to banks | | | — | | | | — | | | | 9,988 | | | | 16 | | | | — | | | | — | | | | 9,988 | | | | 16 | | | | A | |
| | Loans and advances to customers | | | — | | | | — | | | | 7,551 | | | | 12 | | | | — | | | | — | | | | 7,551 | | | | 12 | | | | A | |
| | Debt securities | | | 4,494 | | | | 7 | | | | — | | | | — | | | | — | | | | — | | | | 4,494 | | | | 7 | | | | — | |
| | Equity securities | | | 122 | | | | — | | | | — | | | | — | | | | — | | | | | | | | 122 | | | | — | | | | — | |
Derivative assets | | Exchange rate contracts | | | — | | | | — | | | | 3,660 | | | | 6 | | | | 36 | | | | — | | | | 3,696 | | | | 6 | | | | A | |
| | Interest rate contracts | | | 54 | | | | — | | | | 28,053 | | | | 43 | | | | — | | | | — | | | | 28,107 | | | | 43 | | | | A & C | |
| | Equity and credit contracts | | | 152 | | | | — | | | | 978 | | | | 2 | | | | 372 | | | | 1 | | | | 1,502 | | | | 3 | | | | B | |
| | Commodity contracts | | | — | | | | — | | | | 7 | | | | — | | | | — | | | | — | | | | 7 | | | | — | | | | A | |
Financial assets at FVTPL | | Loans and advances to customers | | | — | | | | — | | | | 3,142 | | | | 5 | | | | 61 | | | | — | | | | 3,203 | | | | 5 | | | | A | |
| | Debt securities | | | — | | | | — | | | | 279 | | | | — | | | | 49 | | | | — | | | | 328 | | | | — | | | | A | |
Available-for-sale financial assets | | Debt securities | | | 5,113 | | | | 8 | | | | — | | | | — | | | | — | | | | — | | | | 5,113 | | | | 8 | | | | — | |
| | | | | | | | | | | | | | | | | | | | | | | | | | | | | | | | | | | | | | |
Total assets at fair value | | | | | 9,935 | | | | 15 | | | | 53,658 | | | | 84 | | | | 518 | | | | 1 | | | | 64,111 | | | | 100 | | | | | |
| | | | | | | | | | | | | | | | | | | | | | | | | | | | | | | | | | | | | | |
Liabilities | | | | | | | | | | | | | | | | | | | | | | | | | | | | | | | | | | | | | | |
Trading liabilities | | Deposits by banks | | | — | | | | — | | | | 9,742 | | | | 16 | | | | — | | | | — | | | | 9,742 | | | | 16 | | | | A | |
| | Deposits by customers | | | — | | | | — | | | | 7,248 | | | | 12 | | | | — | | | | — | | | | 7,248 | | | | 12 | | | | A | |
| | Short positions | | | 4,119 | | | | 7 | | | | — | | | | — | | | | — | | | | — | | | | 4,119 | | | | 7 | | | | — | |
Derivative liabilities | | Exchange rate contracts | | | — | | | | — | | | | 4,552 | | | | 8 | | | | — | | | | — | | | | 4,552 | | | | 8 | | | | A | |
| | Interest rate contracts | | | 31 | | | | — | | | | 27,460 | | | | 46 | | | | — | | | | — | | | | 27,491 | | | | 46 | | | | A & C | |
| | Equity and credit contracts | | | 86 | | | | — | | | | 1,880 | | | | 4 | | | | 72 | | | | — | | | | 2,038 | | | | 4 | | | | B | |
| | Commodity contracts | | | — | | | | — | | | | 7 | | | | — | | | | — | | | | — | | | | 7 | | | | — | | | | A | |
Financial liabilities at FVTPL | | Debt securities in issue | | | — | | | | — | | | | 3,916 | | | | 7 | | | | 86 | | | | — | | | | 4,002 | | | | 7 | | | | A | |
| | | | | | | | | | | | | | | | | | | | | | | | | | | | | | | | | | | | | | |
Total liabilities at fair value | | | | | 4,236 | | | | 7 | | | | 54,805 | | | | 93 | | | | 158 | | | | — | | | | 59,199 | | | | 100 | | | | | |
| | | | | | | | | | | | | | | | | | | | | | | | | | | | | | | | | | | | | | |
| | |
| | | | | Company | |
| 31 December 2011 | | | | | | | | | | Internal models based on | | | | | | | | | | |
| Balance sheet category | | Quoted prices in
active markets
(Level 1) | | | Market
observable data
(Level 2) | | | Significant
unobservable data
(Level 3) | | | Total | | | Valuation
technique | |
| | | | | £m | | | % | | | £m | | | % | | | £m | | | % | | | £m | | | % | | | | |
Assets | | | | | | | | | | | | | | | | | | | | | | | | | | | | | | | | | | | | | | |
Trading assets | | Loans and advances to banks | | | — | | | | — | | | | 6,144 | | | | 10 | | | | — | | | | — | | | | 6,144 | | | | 10 | | | | A | |
| | Loans and advances to customers | | | — | | | | — | | | | 6,686 | | | | 11 | | | | — | | | | — | | | | 6,686 | | | | 11 | | | | A | |
| | Debt securities | | | 8,711 | | | | 15 | | | | — | | | | — | | | | — | | | | — | | | | 8,711 | | | | 15 | | | | — | |
| | Equity securities | | | 23 | | | | — | | | | — | | | | — | | | | — | | | | — | | | | 23 | | | | — | | | | — | |
Derivative assets | | Exchange rate contracts | | | — | | | | — | | | | 1,617 | | | | 3 | | | | 70 | | | | — | | | | 1,687 | | | | 3 | | | | A | |
| | Interest rate contracts | | | 54 | | | | — | | | | 29,784 | | | | 50 | | | | — | | | | — | | | | 29,838 | | | | 50 | | | | A & C | |
| | Equity and credit contracts | | | 156 | | | | — | | | | 1,189 | | | | 2 | | | | 360 | | | | 1 | | | | 1,705 | | | | 3 | | | | B | |
| | Commodity contracts | | | — | | | | — | | | | 12 | | | | — | | | | — | | | | — | | | | 12 | | | | — | | | | A | |
Financial assets at FVTPL | | Loans and advances to customers | | | — | | | | — | | | | 3,992 | | | | 7 | | | | 58 | | | | — | | | | 4,050 | | | | 7 | | | | A | |
| | Debt securities | | | — | | | | — | | | | 328 | | | | 1 | | | | 51 | | | | — | | | | 379 | | | | 1 | | | | A | |
Available-for-sale financial assets | | Equity securities | | | — | | | | — | | | | — | | | | — | | | | — | | | | — | | | | — | | | | — | | | | — | |
| | | | | | | | | | | | | | | | | | | | | | | | | | | | | | | | | | | | | | |
Total assets at fair value | | | | | 8,944 | | | | 15 | | | | 49,752 | | | | 84 | | | | 539 | | | | 1 | | | | 59,235 | | | | 100 | | | | | |
| | | | | | | | | | | | | | | | | | | | | | | | | | | | | | | | | | | | | | |
Liabilities | | | | | | | | | | | | | | | | | | | | | | | | | | | | | | | | | | | | | | |
Trading liabilities | | Deposits by banks | | | — | | | | — | | | | 14,508 | | | | 21 | | | | — | | | | — | | | | 14,508 | | | | 21 | | | | A | |
| | Deposits by customers | | | — | | | | — | | | | 10,482 | | | | 15 | | | | — | | | | — | | | | 10,482 | | | | 15 | | | | A | |
| | Short positions | | | 755 | | | | 1 | | | | — | | | | — | | | | — | | | | — | | | | 755 | | | | 1 | | | | — | |
Derivative liabilities | | Exchange rate contracts | | | — | | | | — | | | | 3,087 | | | | 5 | | | | — | | | | — | | | | 3,087 | | | | 5 | | | | A | |
| | Interest rate contracts | | | 41 | | | | — | | | | 29,490 | | | | 44 | | | | — | | | | — | | | | 29,531 | | | | 44 | | | | A & C | |
| | Equity and credit contracts | | | 12 | | | | — | | | | 2,687 | | | | 4 | | | | 89 | | | | — | | | | 2,788 | | | | 4 | | | | B | |
| | Commodity contracts | | | — | | | | — | | | | 11 | | | | — | | | | — | | | | — | | | | 11 | | | | — | | | | A | |
Financial liabilities at FVTPL | | Debt securities in issue | | | — | | | | — | | | | 6,639 | | | | 10 | | | | 141 | | | | — | | | | 6,780 | | | | 10 | | | | A | |
| | | | | | | | | | | | | | | | | | | | | | | | | | | | | | | | | | | | | | |
Total liabilities at fair value | | | | | 808 | | | | 1 | | | | 66,904 | | | | 99 | | | | 230 | | | | — | | | | 67,942 | | | | 100 | | | | | |
| | | | | | | | | | | | | | | | | | | | | | | | | | | | | | | | | | | | | | |
| | |
| 172 | | Abbey National Treasury Services plc 2012 Annual Report |
Financial Statements
Notes to the Financial Statementscontinued
The following tables present the fair values at 31 December 2012 and 2011 of the above financial assets and liabilities by product, analysed by the valuation methodology used by the ANTS group to determine their fair value. The tables also disclose the percentages that the recorded fair values of products represent of the total assets and liabilities, respectively, that are recorded at fair value in the balance sheet:
| | | | | | | | | | | | | | | | | | | | | | | | | | | | | | | | |
| | | Group | |
| 31 December 2012 | | | | | Internal models based on | | | | |
| Product | | Quoted prices in
active markets | | | Market
observable data | | | Significant
unobservable data | | | Total | |
| | | £m | | | % | | | £m | | | % | | | £m | | | % | | | £m | | | % | |
Assets | | | | | | | | | | | | | | | | | | | | | | | | | | | | | | | | |
Government and government-guaranteed debt securities | | | 3,917 | | | | 6 | | | | — | | | | — | | | | — | | | | — | | | | 3,917 | | | | 6 | |
Asset-backed securities | | | — | | | | — | | | | 279 | | | | — | | | | 49 | | | | — | | | | 328 | | | | — | |
Certificates of deposits | | | 13 | | | | — | | | | — | | | | — | | | | — | | | | — | | | | 13 | | | | — | |
Floating rate notes | | | 564 | | | | 1 | | | | — | | | | — | | | | — | | | | — | | | | 564 | | | | 1 | |
Other debt securities | | | 5,113 | | | | 8 | | | | — | | | | — | | | | — | | | | — | | | | 5,113 | | | | 8 | |
UK Social housing association loans | | | — | | | | — | | | | 3,142 | | | | 5 | | | | — | | | | — | | | | 3,142 | | | | 5 | |
Other loans | | | — | | | | — | | | | — | | | | — | | | | 61 | | | | — | | | | 61 | | | | — | |
Term deposits and money market instruments | | | — | | | | — | | | | 17,540 | | | | 28 | | | | — | | | | — | | | | 17,540 | | | | 28 | |
Exchange rate derivatives | | | — | | | | — | | | | 3,660 | | | | 6 | | | | 36 | | | | — | | | | 3,696 | | | | 6 | |
Interest rate derivatives | | | 54 | | | | — | | | | 28,038 | | | | 43 | | | | — | | | | — | | | | 28,092 | | | | 43 | |
Equity & credit derivatives | | | 152 | | | | — | | | | 957 | | | | 1 | | | | 372 | | | | 1 | | | | 1,481 | | | | 2 | |
Commodity derivatives | | | — | | | | — | | | | 7 | | | | — | | | | — | | | | — | | | | 7 | | | | — | |
Ordinary shares and similar securities | | | 464 | | | | 1 | | | | — | | | | — | | | | — | | | | — | | | | 464 | | | | 1 | |
| | | | | | | | | | | | | | | | | | | | | | | | | | | | | | | | |
| | | 10,277 | | | | 16 | | | | 53,623 | | | | 83 | | | | 518 | | | | 1 | | | | 64,418 | | | | 100 | |
| | | | | | | | | | | | | | | | | | | | | | | | | | | | | | | | |
Liabilities | | | | | | | | | | | | | | | | | | | | | | | | | | | | | | | | |
Exchange rate derivatives | | | — | | | | — | | | | 4,552 | | | | 8 | | | | — | | | | — | | | | 4,552 | | | | 8 | |
Interest rate derivatives | | | 31 | | | | — | | | | 27,460 | | | | 47 | | | | — | | | | — | | | | 27,491 | | | | 47 | |
Equity & credit derivatives | | | 86 | | | | — | | | | 1,880 | | | | 3 | | | | 72 | | | | — | | | | 2,038 | | | | 3 | |
Commodity derivatives | | | — | | | | — | | | | 7 | | | | — | | | | — | | | | — | | | | 7 | | | | — | |
Deposits | | | — | | | | — | | | | 16,990 | | | | 28 | | | | — | | | | — | | | | 16,990 | | | | 28 | |
Debt securities in issue | | | 4,119 | | | | 7 | | | | 3,916 | | | | 7 | | | | 86 | | | | — | | | | 8,121 | | | | 14 | |
| | | | | | | | | | | | | | | | | | | | | | | | | | | | | | | | |
| | | 4,236 | | | | 7 | | | | 54,805 | | | | 93 | | | | 158 | | | | — | | | | 59,199 | | | | 100 | |
| | | | | | | | | | | | | | | | | | | | | | | | | | | | | | | | |
| |
| | | Group | |
| 31 December 2011 | | | | | Internal models based on | | | | |
| Product | | Quoted prices in
active markets | | | Market
observable data | | | Significant
unobservable data | | | Total | |
| | | £m | | | % | | | £m | | | % | | | £m | | | % | | | £m | | | % | |
Assets | | | | | | | | | | | | | | | | | | | | | | | | | | | | | | | | |
Government and government-guaranteed debt securities | | | 2,943 | | | | 6 | | | | — | | | | — | | | | — | | | | — | | | | 2,943 | | | | 6 | |
Asset-backed securities | | | — | | | | — | | | | 328 | | | | 1 | | | | 51 | | | | — | | | | 379 | | | | 1 | |
Floating rate notes | | | 5,768 | | | | 9 | | | | — | | | | — | | | | — | | | | — | | | | 5,768 | | | | 9 | |
UK Social housing association loans | | | — | | | | — | | | | 3,992 | | | | 7 | | | | — | | | | — | | | | 3,992 | | | | 7 | |
Other loans | | | — | | | | — | | | | — | | | | — | | | | 58 | | | | — | | | | 58 | | | | — | |
Term deposits and money market instruments | | | — | | | | — | | | | 12,831 | | | | 21 | | | | — | | | | — | | | | 12,831 | | | | 21 | |
Exchange rate derivatives | | | — | | | | — | | | | 1,618 | | | | 3 | | | | 70 | | | | — | | | | 1,688 | | | | 3 | |
Interest rate derivatives | | | 54 | | | | — | | | | 29,782 | | | | 50 | | | | — | | | | — | | | | 29,836 | | | | 50 | |
Equity & credit derivatives | | | 152 | | | | — | | | | 1,176 | | | | 2 | | | | 360 | | | | 1 | | | | 1,688 | | | | 3 | |
Commodity derivatives | | | — | | | | — | | | | 12 | | | | — | | | | — | | | | — | | | | 12 | | | | — | |
Ordinary shares and similar securities | | | 349 | | | | — | | | | — | | | | — | | | | — | | | | — | | | | 349 | | | | — | |
| | | | | | | | | | | | | | | | | | | | | | | | | | | | | | | | |
| | | 9,266 | | | | 15 | | | | 49,739 | | | | 84 | | | | 539 | | | | 1 | | | | 59,544 | | | | 100 | |
| | | | | | | | | | | | | | | | | | | | | | | | | | | | | | | | |
Liabilities | | | | | | | | | | | | | | | | | | | | | | | | | | | | | | | | |
Exchange rate derivatives | | | — | | | | — | | | | 3,087 | | | | 5 | | | | — | | | | — | | | | 3,087 | | | | 5 | |
Interest rate derivatives | | | 41 | | | | — | | | | 29,490 | | | | 44 | | | | — | | | | — | | | | 29,531 | | | | 44 | |
Equity & credit derivatives | | | 12 | | | | — | | | | 2,687 | | | | 4 | | | | 89 | | | | — | | | | 2,788 | | | | 4 | |
Commodity derivatives | | | — | | | | — | | | | 11 | | | | — | | | | — | | | | — | | | | 11 | | | | — | |
Deposits | | | — | | | | — | | | | 24,990 | | | | 36 | | | | — | | | | — | | | | 24,990 | | | | 36 | |
Debt securities in issue | | | 755 | | | | 1 | | | | 6,695 | | | | 10 | | | | 141 | | | | — | | | | 7,591 | | | | 11 | |
| | | | | | | | | | | | | | | | | | | | | | | | | | | | | | | | |
| | | 808 | | | | 1 | | | | 66,960 | | | | 99 | | | | 230 | | | | — | | | | 67,998 | | | | 100 | |
| | | | | | | | | | | | | | | | | | | | | | | | | | | | | | | | |
| | |
Abbey National Treasury Services plc 2012 Annual Report | | 173 |
Financial Statements
Notes to the Financial Statementscontinued
| | | | | | | | | | | | | | | | | | | | | | | | | | | | | | | | |
| | | Company | |
| 31 December 2012 | | | | | Internal models based on | | | | |
| Product | | Quoted prices in
active markets | | | Market
observable data | | | Significant
unobservable data | | | Total | |
| | | £m | | | % | | | £m | | | % | | | £m | | | % | | | £m | | | % | |
Assets | | | | | | | | | | | | | | | | | | | | | | | | | | | | | | | | |
Government and government-guaranteed debt securities | | | 3,917 | | | | 6 | | | | — | | | | — | | | | — | | | | — | | | | 3,917 | | | | 6 | |
Asset-backed securities | | | — | | | | — | | | | 279 | | | | — | | | | 49 | | | | — | | | | 328 | | | | — | |
Certificates of deposits | | | 13 | | | | — | | | | — | | | | — | | | | — | | | | — | | | | 13 | | | | — | |
Floating rate notes | | | 564 | | | | 1 | | | | — | | | | — | | | | — | | | | — | | | | 564 | | | | 1 | |
Other debt securities | | | 5,113 | | | | 8 | | | | — | | | | — | | | | — | | | | — | | | | 5,113 | | | | 8 | |
UK Social housing association loans | | | — | | | | — | | | | 3,142 | | | | 5 | | | | — | | | | — | | | | 3,142 | | | | 5 | |
Other loans | | | — | | | | — | | | | — | | | | — | | | | 61 | | | | — | | | | 61 | | | | — | |
Term deposits and money market instruments | | | — | | | | — | | | | 17,539 | | | | 28 | | | | — | | | | — | | | | 17,539 | | | | 28 | |
Exchange rate derivatives | | | — | | | | — | | | | 3,660 | | | | 6 | | | | 36 | | | | — | | | | 3,696 | | | | 6 | |
Interest rate derivatives | | | 54 | | | | — | | | | 28,053 | | | | 43 | | | | — | | | | — | | | | 28,107 | | | | 43 | |
Equity & credit derivatives | | | 152 | | | | — | | | | 978 | | | | 2 | | | | 372 | | | | 1 | | | | 1,502 | | | | 3 | |
Commodity derivatives | | | — | | | | — | | | | 7 | | | | — | | | | — | | | | — | | | | 7 | | | | — | |
Ordinary shares and similar securities | | | 122 | | | | — | | | | — | | | | — | | | | — | | | | — | | | | 122 | | | | — | |
| | | | | | | | | | | | | | | | | | | | | | | | | | | | | | | | |
| | | 9,935 | | | | 15 | | | | 53,658 | | | | 84 | | | | 518 | | | | 1 | | | | 64,111 | | | | 100 | |
| | | | | | | | | | | | | | | | | | | | | | | | | | | | | | | | |
Liabilities | | | | | | | | | | | | | | | | | | | | | | | | | | | | | | | | |
Exchange rate derivatives | | | — | | | | — | | | | 4,552 | | | | 8 | | | | — | | | | — | | | | 4,552 | | | | 8 | |
Interest rate derivatives | | | 31 | | | | — | | | | 27,460 | | | | 46 | | | | — | | | | — | | | | 27,491 | | | | 46 | |
Equity & credit derivatives | | | 86 | | | | — | | | | 1,880 | | | | 4 | | | | 72 | | | | — | | | | 2,038 | | | | 4 | |
Commodity derivatives | | | — | | | | — | | | | 7 | | | | — | | | | — | | | | — | | | | 7 | | | | — | |
Deposits | | | — | | | | — | | | | 16,990 | | | | 28 | | | | — | | | | — | | | | 16,990 | | | | 28 | |
Debt securities in issue | | | 4,119 | | | | 7 | | | | 3,916 | | | | 7 | | | | 86 | | | | — | | | | 8,121 | | | | 14 | |
| | | | | | | | | | | | | | | | | | | | | | | | | | | | | | | | |
| | | 4,236 | | | | 7 | | | | 54,805 | | | | 93 | | | | 158 | | | | — | | | | 59,199 | | | | 100 | |
| | | | | | | | | | | | | | | | | | | | | | | | | | | | | | | | |
| |
| | | Company | |
| 31 December 2011 | | | | | Internal models based on | | | | |
| Product | | Quoted prices in
active markets | | | Market
observable data | | | Significant
unobservable data | | | Total | |
| | | £m | | | % | | | £m | | | % | | | £m | | | % | | | £m | | | % | |
Assets | | | | | | | | | | | | | | | | | | | | | | | | | | | | | | | | |
Government and government-guaranteed debt securities | | | 2,943 | | | | 6 | | | | — | | | | — | | | | — | | | | — | | | | 2,943 | | | | 6 | |
Asset-backed securities | | | — | | | | — | | | | 328 | | | | 1 | | | | 51 | | | | — | | | | 379 | | | | 1 | |
Floating rate notes | | | 5,768 | | | | 9 | | | | — | | | | — | | | | — | | | | — | | | | 5,768 | | | | 9 | |
UK Social housing association loans | | | — | | | | — | | | | 3,992 | | | | 7 | | | | — | | | | — | | | | 3,992 | | | | 7 | |
Other loans | | | — | | | | — | | | | — | | | | — | | | | 58 | | | | — | | | | 58 | | | | — | |
Term deposits and money market instruments | | | — | | | | — | | | | 12,830 | | | | 21 | | | | — | | | | — | | | | 12,830 | | | | 21 | |
Exchange rate derivatives | | | — | | | | — | | | | 1,617 | | | | 3 | | | | 70 | | | | — | | | | 1,687 | | | | 3 | |
Interest rate derivatives | | | 54 | | | | — | | | | 29,784 | | | | 50 | | | | — | | | | — | | | | 29,838 | | | | 50 | |
Equity & credit derivatives | | | 156 | | | | — | | | | 1,189 | | | | 2 | | | | 360 | | | | 1 | | | | 1,705 | | | | 3 | |
Commodity derivatives | | | — | | | | — | | | | 12 | | | | — | | | | — | | | | — | | | | 12 | | | | — | |
Ordinary shares and similar securities | | | 23 | | | | — | | | | — | | | | — | | | | — | | | | — | | | | 23 | | | | — | |
| | | | | | | | | | | | | | | | | | | | | | | | | | | | | | | | |
| | | 8,944 | | | | 15 | | | | 49,752 | | | | 84 | | | | 539 | | | | 1 | | | | 59,235 | | | | 100 | |
| | | | | | | | | | | | | | | | | | | | | | | | | | | | | | | | |
Liabilities | | | | | | | | | | | | | | | | | | | | | | | | | | | | | | | | |
Exchange rate derivatives | | | — | | | | — | | | | 3,087 | | | | 5 | | | | — | | | | — | | | | 3,087 | | | | 5 | |
Interest rate derivatives | | | 41 | | | | — | | | | 29,490 | | | | 44 | | | | — | | | | — | | | | 29,531 | | | | 44 | |
Equity & credit derivatives | | | 12 | | | | — | | | | 2,687 | | | | 4 | | | | 89 | | | | — | | | | 2,788 | | | | 4 | |
Commodity derivatives | | | — | | | | — | | | | 11 | | | | — | | | | — | | | | — | | | | 11 | | | | — | |
Deposits | | | — | | | | — | | | | 24,990 | | | | 36 | | | | — | | | | — | | | | 24,990 | | | | 36 | |
Debt securities in issue | | | 755 | | | | 1 | | | | 6,639 | | | | 10 | | | | 141 | | | | — | | | | 7,535 | | | | 11 | |
| | | | | | | | | | | | | | | | | | | | | | | | | | | | | | | | |
| | | 808 | | | | 1 | | | | 66,904 | | | | 99 | | | | 230 | | | | — | | | | 67,942 | | | | 100 | |
| | | | | | | | | | | | | | | | | | | | | | | | | | | | | | | | |
During 2012, 2011 and 2010, there were no transfers between Level 1, Level 2 and Level 3 financial instruments.
d) Valuation techniques
The main valuation techniques employed in the ANTS group’s internal models to measure the fair value of the financial instruments disclosed above at 31 December 2012 and 2011 are set out below. In substantially all cases, the principal inputs into these models are derived from observable market data. The ANTS group did not make any material changes to the valuation techniques and internal models it used during the years ended 31 December 2012 and 2011.
| A | In the valuation of financial instruments requiring static hedging (for example interest rate, currency derivatives and commodity swaps) and in the valuation of loans and advances and deposits, the ‘present value’ method is used. Expected future cash flows are discounted using the interest rate curves of the applicable currencies or forward commodity prices as appropriate. The interest rate curves are generally observable market data and reference yield curves derived from quoted interest rates in appropriate time bandings, which match the timings of the cashflows and maturities of the instruments. The forward commodity prices are generally observable market data. |
| | |
| 174 | | Abbey National Treasury Services plc 2012 Annual Report |
Financial Statements
Notes to the Financial Statementscontinued
| B | In the valuation of equity financial instruments requiring dynamic hedging (principally equity securities, options and other structured instruments), proprietary local volatility and stochastic volatility models are used. These types of models are widely accepted in the financial services industry. Observable market inputs used in these models include the bid-offer spread, foreign currency exchange rates, volatility and correlation between indices. In limited circumstances, other inputs may be used in these models that are based on data other than observable market data, such as the Halifax’s UK House Price Index (‘HPI’) volatility, HPI forward growth, HPI spot rate and mortality. |
| C | In the valuation of financial instruments exposed to interest rate risk that require either static or dynamic hedging (such as interest rate futures, caps and floors, and options), the present value method (futures), Black’s model (caps/floors) and the Hull/White and Markov functional models (Bermudan options) are used. These types of models are widely accepted in the financial services industry. The significant inputs used in these models are observable market data, including appropriate interest rate curves, volatilities, correlations and exchange rates. In limited circumstances, other inputs may be used in these models that are based on data other than observable market data, such as HPI volatility, HPI forward growth, HPI spot rate and mortality. |
The fair values of the financial instruments arising from the ANTS group’s internal models take into account, among other things, contract terms and observable market data, which include such factors as bid-offer spread, interest rates, credit risk, exchange rates, the quoted market price of raw materials and equity securities, volatility and prepayments. In all cases, when it is not possible to derive a valuation for a particular feature of an instrument, management uses judgement to determine the fair value of the particular feature. In exercising this judgement, a variety of tools are used including proxy observable data, historical data and extrapolation techniques. Extrapolation techniques take into account behavioural characteristics of equity markets that have been observed over time, and for which there is a strong case to support an expectation of a continuing trend in the future. Estimates are calibrated to observable market prices when they become available.
The estimates thus obtained could vary if other valuation methods or assumptions were used. The ANTS group believes its valuation methods are appropriate and consistent with other market participants. Nevertheless, the use of different valuation methods or assumptions, including imprecision in estimating unobservable market inputs, to determine the fair value of certain financial instruments could result in different estimates of fair value at the reporting date and the amount of gain or loss recorded for a particular instrument. Most of the valuation models are not significantly subjective, because they can be tested and, if necessary, recalibrated by the internal calculation of and subsequent comparison to market prices of actively traded securities, where available.
e) Fair value adjustments
The internal models incorporate assumptions that the ANTS group believes would be made by a market participant to establish fair value. Fair value adjustments are adopted when the ANTS group considers that there are additional factors that would be considered by a market participant in the determination of fair value of the instrument that are not incorporated in the valuation model. The magnitude of fair value adjustments depends upon many entity-specific factors, including modelling sophistication, the nature of products traded, and the size and type of risk exposures. For this reason, fair value adjustments may not be comparable across the banking industry.
The ANTS group classifies fair value adjustments as either ‘risk-related’ or ‘model-related’. The fair value adjustments form part of the portfolio fair value and are included in the balance sheet values of the product types to which they have been applied. The majority of these adjustments relate to Markets. The magnitude and types of fair value adjustment adopted by Markets are listed in the following table:
| | | | | | | | |
| | | 2012
£m | | | 2011
£m | |
Risk-related: | | | | | | | | |
- Bid-offer and trade specific adjustments | | | 26 | | | | 71 | |
- Uncertainty | | | 22 | | | | 47 | |
- Credit risk adjustment | | | 107 | | | | 70 | |
| | | | | | | | |
| | | 155 | | | | 188 | |
| | | | | | | | |
Model-related: | | | | | | | | |
- Model limitation | | | 17 | | | | 23 | |
| | |
Day One profits | | | — | | | | — | |
| | | | | | | | |
| | | 172 | | | | 211 | |
| | | | | | | | |
| | |
Abbey National Treasury Services plc 2012 Annual Report | | 175 |
Financial Statements
Notes to the Financial Statementscontinued
Risk-related adjustments
‘Risk-related’ adjustments are driven, in part, by the magnitude of the ANTS group’s market or credit risk exposure, and by external market factors, such as the size of market spreads.
(i) Bid-offer and trade specific adjustments
IAS 39 requires that portfolios are marked at bid or offer, as appropriate. Bid prices represent the price at which a long position could be sold and offer prices represent the price at which a short position could be bought back. Valuation models will typically generate mid market values. The bid-offer adjustment reflects the cost that would be incurred if substantially all residual net portfolio market risks were closed using available hedging instruments or by disposing of or unwinding the actual position.
The majority of the bid-offer adjustment relates to OTC derivative portfolios. For each portfolio, the major risk types are identified. These may include, inter alia, delta (the sensitivity to changes in the price of an underlying), vega (the sensitivity to changes in volatilities) and basis risk (the sensitivity to changes in the spread between two rates). For each risk type, the net portfolio risks are first classified into buckets, and then a bid-offer spread is applied to each risk bucket based upon the market bid-offer spread for the relevant hedging instrument.
The granularity of the risk bucketing is determined by reference to several factors, including the actual risk management practice undertaken by the ANTS group, the granularity of risk bucketing within the risk reporting process, and the extent of correlation between risk buckets. Within a risk type, the bid-offer adjustment for each risk bucket may be aggregated without offset or limited netting may be applied to reflect correlation between buckets. There is no netting applied between risk types or between portfolios that are not managed together for risk management purposes. There is no netting across legal entities.
As bid-offer spreads vary by maturity and risk type to reflect different spreads in the market, for positions where there is no observable quote, a trade specific adjustment is further made. This is to reflect widened spreads in comparison to proxies due to reduced liquidity or observability. Trade specific adjustments can also be made to incorporate liquidity triggers whereby wider spreads are applied to risks above pre-defined thresholds or on exotic products to ensure overall reserves match market close-out costs. These market close-out costs inherently incorporate risk decay and cross-effects which are unlikely to be adequately reflected in the static hedge based on vanilla instruments.
(ii) Uncertainty
Certain model inputs may be less readily determinable from market data, and/or the choice of model itself may be more subjective, with less market evidence available from which to determine general market practice. In these circumstances, there exists a range of possible values that the financial instrument or market parameter may assume and an adjustment may be necessary to reflect the likelihood that in estimating the fair value of the financial instrument, market participants would adopt rather more conservative values for uncertain parameters and/or model assumptions than those used in the valuation model. Uncertainty adjustments are derived by considering the potential range of derivative portfolio valuation given the available market data. The objective of an uncertainty adjustment is to arrive at a fair value that is not overly prudent but rather reflects a level of prudence believed to be consistent with market pricing practice.
Uncertainty adjustments are applied to various types of exotic OTC derivative. For example, the mean reversion speed of interest rates may be an important component of an exotic derivative value and an uncertainty adjustment may be taken to reflect the range of possible values that market participants may assume for this parameter.
(iii) Credit risk adjustment
The ANTS group adopts a credit risk adjustment (also frequently known as a ‘credit valuation adjustment’) against OTC derivative transactions to reflect within fair value the possibility that the counterparty may default, and the ANTS group may not receive the full market value of the transactions. The ANTS group calculates a separate credit risk adjustment for each Santander UK legal entity, and within each entity for each counterparty to which the entity has exposure. The ANTS group attempts to mitigate credit risk to third parties by entering into netting and collateral arrangements. The net counterparty exposure (i.e. counterparty positions netted by offsetting transactions and both cash and securities collateral) is then assessed for counterparty creditworthiness.
The ANTS group calculates the credit risk adjustment by applying the probability of default of the counterparty to the expected positive exposure to the counterparty, and multiplying the result by the loss expected in the event of default (i.e. the loss given default or ‘LGD’). The timing of the expected losses is reflected by using a discount factor. The calculation is performed over the life of the potential exposure i.e. the credit risk adjustment is measured as a lifetime expected loss.
The expected positive exposure is calculated at a trade level. The main drivers of the expected positive exposure are the size of the risk position with the counterparty along with the prevailing market environment. Probabilities of default are calculated using credit default swap prices where available. Where these are not available, probabilities of default are based upon analysis of historic default rates. The credit rating used for a particular counterparty is that determined by the Group’s internal credit process. The LGD is calculated at the facility level and takes into account the counterparty characteristics. Credit ratings and LGD are updated by the credit team as new relevant information becomes available and at periodic reviews performed at least annually.
| | |
| 176 | | Abbey National Treasury Services plc 2012 Annual Report |
Financial Statements
Notes to the Financial Statementscontinued
The ANTS group also considers its own creditworthiness when determining the fair value of an instrument, including OTC derivative instruments and financial liabilities held at fair value through profit or loss if the ANTS group believes market participants would take that into account when transacting the respective instrument. The approach to measuring the impact of the ANTS group’s credit risk on an instrument is done in the same manner as for third party credit risk. The impact of the ANTS group’s credit risk is considered when calculating the fair value of an instrument, even when credit risk is not readily observable such as in OTC derivatives. The ANTS group has not realised any profit or loss on revaluing fair values of derivatives to reflect its own creditworthiness. If the ANTS group had reflected such adjustments it would not have had a material impact on the valuations. Consequently, the ANTS group does not derive the adjustment on a bilateral basis and has a zero adjustment against derivative liabilities, often referred to as a ‘debit valuation adjustment’.
For certain types of exotic derivatives where the products are not currently supported by the standard methodology, the ANTS group adopts an alternative methodology. Alternative methodologies used by the ANTS group fall into two categories. One method maps transactions against the results for similar products which are accommodated by the standard methodology. Where such a mapping approach is not appropriate, a bespoke methodology is used, generally following the same principles as the standard methodology, reflecting the key characteristics of the instruments but in a manner that is computationally less intensive. The calculation is applied at a trade level, with more limited recognition of credit mitigants such as netting or collateral agreements than used in the standard methodology described previously.
The methodologies do not, in general, account for ‘wrong-way risk’. Wrong-way risk arises where the underlying value of the derivative prior to any credit risk adjustment is related to the probability of default of the counterparty. A more detailed description of wrong-way risk is set out below.
The ANTS group includes all third-party counterparties in the credit risk adjustment calculation and the ANTS group does not net credit risk adjustments across ANTS group entities.
Wrong-way risk
Wrong-way risk arises when there is a strong correlation between the counterparty’s probability of default and the mark-to-market value of the underlying transaction. Wrong-way risk can be seen in the following examples:
| • | | When the counterparty is resident and/or incorporated in an emerging market and seeks to sell a non-domestic currency in exchange for its home currency; |
| • | | When the trade involves the purchase of an equity put option from a counterparty whose shares are the subject of the option; |
| • | | The purchase of credit protection from a counterparty who is closely associated with the reference entity of the credit default swap or total return swap; and |
| • | | The purchase of credit protection on an asset type which is highly concentrated in the exposure of the counterparty selling the credit protection. |
Exposure to ‘wrong-way risk’ is limited via internal governance processes and deal pricing. The ANTS group considers that an appropriate adjustment to reflect wrong-way risk is currently nil (2011: £nil).
Model-related adjustments
These adjustments are primarily related to internal factors, such as the ability of the ANTS group’s models to incorporate all material market characteristics. A description of each adjustment type is given below:
(i) Model limitation
Models used for portfolio valuation purposes, particularly for exotic derivative products, may be based upon a simplifying set of assumptions that do not capture all material market characteristics or may be less reliable under certain market conditions. Additionally, markets evolve, and models that were adequate in the past may require development to capture all material market characteristics in current market conditions. In these circumstances, model limitation adjustments are adopted outside the core valuation model. The adjustment methodologies vary according to the nature of the model. The Quantitative Risk Group (‘QRG’), an independent quantitative support function reporting into the Risk Department, highlights the requirement for model limitation adjustments and develops the methodologies employed. Over time, as model development progresses, model limitations are addressed within the core revaluation models and a model limitation adjustment is no longer needed.
Day One profits adjustments
Day One profit adjustments are adopted where the fair value estimated by a valuation model is based on one or more significant unobservable inputs, in accordance with IAS 39. Day One profits adjustments are amounts that have yet to be recognised in the income statement, which represent the difference between a transaction price (i.e. the fair value at initial recognition) and the amount that would have arisen had valuation models using unobservable inputs been used on initial recognition), less amounts subsequently recognised. Day One profits adjustments are calculated and reported on a portfolio basis. At 31 December 2012 and 2011, the Day One profits adjustments were less than £1m.
| | |
Abbey National Treasury Services plc 2012 Annual Report | | 177 |
Financial Statements
Notes to the Financial Statementscontinued
f) Control framework
Fair values are subject to a control framework designed to ensure that they are either determined or validated by a function independent of the risk-taker. To this end, ultimate responsibility for the determination of fair values lies jointly with the Risk Department and the Finance Department. For all financial instruments where fair values are determined by reference to externally quoted prices or observable pricing inputs to models, independent price determination or validation is utilised. In inactive markets, direct observation of a traded price may not be possible. In these circumstances, the ANTS group will source alternative market information to validate the financial instrument’s fair value, with greater weight given to information that is considered to be more relevant and reliable.
The factors that are considered in this regard include:
| • | | The extent to which prices may be expected to represent genuine traded or tradeable prices; |
| • | | The degree of similarity between financial instruments; |
| • | | The degree of consistency between different sources; |
| • | | The process followed by the pricing provider to derive the data; |
| • | | The elapsed time between the date to which the market data relates and the balance sheet date; and |
| • | | The manner in which the data was sourced. |
The source of pricing data is considered as part of the process that determines the classification of the level of a financial instrument. Consideration is given to the quality of the information available that provides the current mark-to-model valuation and estimates of how different these valuations could be on an actual trade, taking into consideration how active the market is. For spot assets that cannot be sold due to illiquidity, forward estimates are discounted to provide an estimate of a realisable value over time. All adjustments for illiquid positions are regularly reviewed to reflect changing market conditions.
Internal valuation model review
Models provide a logical framework for the capture and processing of necessary valuation inputs. For fair values determined using a valuation model, the control framework may include, as applicable, independent development or validation of:
| • | | The logic within valuation models; |
| • | | The inputs to those models; |
| • | | Any adjustments required outside the valuation models; and |
| • | | Where possible, model outputs. |
All internal valuation models are validated independently by QRG. A validation report is produced for each model-derived valuation that assesses the mathematical assumptions behind the model and the implementation of the model and its integration within the trading system. Where there is observable market data, the models calibrate to market. Where pricing data is unobservable then the input parameters are regularly reviewed by QRG.
The results of the independent valuation process are presented to the Models Committee UK for formal approval. Various Risk functions are represented including QRG and Trading Market Risk in addition to senior management. The members of the Models Committee UK consider the appropriateness of the model and whether model risk fair value adjustments are required. Any changes to the fair value adjustments methodology must also be approved by the Models Committee UK.
g) Internal models based on observable market data (Level 2)
1. Trading Assets
Loans and advances to banks and loans and advances to customers – securities purchased under resale agreements
These instruments consist of reverse repos with both professional non-bank customers and bank counterparties as part of the ANTS group’s trading activities. The fair value of reverse repos is estimated by using the ‘present value’ method. Future cash flows are evaluated taking into consideration any derivative features of the reverse repos and are then discounted using the appropriate market rates for the applicable maturity and currency. Under these agreements, the ANTS group receives collateral with a market value equal to, or in excess of, the principal amount loaned. The level of collateral held is monitored daily and if required, further calls are made to ensure the market values of collateral remains at least equal to the loan balance. As a result, there would be no adjustment, or an immaterial adjustment, to reflect the credit quality of the counterparty related to these agreements. As the inputs used in the valuation are based on observable market data, these reverse repos are classified within level 2 of the valuation hierarchy.
Loans and advances to banks and loans and advances to customers – other
These instruments consist of term deposits placed which are short-term in nature and are both utilised and managed as part of the funding requirements of the trading book. The fair value of loans and advances to banks and loans and advances to customers is estimated using the ‘present value’ method. Expected future cash flows are discounted using the interest rate curves of the applicable currencies. The interest rate curves are generally observable market data and reference yield curves derived from quoted interest rates in appropriate time bandings, which match the timings of the cashflows and maturities of the instruments. As the inputs used in the valuation are based on observable market data, these loans are classified within level 2 of the valuation hierarchy.
| | |
| 178 | | Abbey National Treasury Services plc 2012 Annual Report |
Financial Statements
Notes to the Financial Statementscontinued
2. Derivative assets and liabilities
These instruments consist of exchange rate contracts, interest rate contracts, equity and credit contracts and equity derivatives. The models used in estimating the fair value of these derivatives do not contain a high level of subjectivity as the methodologies used in the models do not require significant judgement, and the inputs used in the models are observable market data such as plain vanilla interest rate swaps and option contracts. As the inputs used in the valuation are based on observable market data, these derivatives are classified within level 2 of the valuation hierarchy.
Certain derivatives which represent cross currency swaps, reversionary property interests, credit default swaps and options and forwards contain significant unobservable inputs or are traded less actively or traded in less-developed markets, and so are classified within level 3 of the valuation hierarchy. The valuation of such instruments is further discussed in the ‘internal models based on information other than market data’ section below.
3. Financial assets at fair value through profit or loss (‘FVTPL’)
Loans and advances to customers
These instruments consist of loans secured on residential property to housing associations. The fair value of these social housing loans is estimated using the ‘present value’ model based on a credit curve derived from current market spreads observable in the social housing loan data. Observable market data include current market spreads for new accepted mandates and bids for comparable loans and are used to support or challenge the benchmark level.
This provides a range of reasonably possible estimates of fair value. As the inputs used in the valuation are based on market observable data, these loans are classified within level 2 of the valuation hierarchy.
Certain loans and advances to customers which represent a portfolio of roll-up mortgages contain significant unobservable inputs and so are classified within level 3 of the valuation hierarchy. The valuation of such instruments is further discussed below.
Debt securities
These instruments consist of holdings of asset-backed securities. A significant portion of these securities are priced using the ‘present value’ models, based on observable market data e.g. LIBOR, credit spreads. Where there are quoted prices for these instruments, the model value is checked against the quoted prices for reference purposes, but is not used as the fair value as the market for these instruments are lacking in liquidity and depth. As the inputs used in the valuation are based on observable market data, these debt securities are classified within level 2 of the valuation hierarchy.
Certain debt securities which represent reversionary property securities and securities issued by Banco Santander entities contain significant unobservable inputs, and so are classified within level 3 of the valuation hierarchy. The valuation of such instruments is further discussed below.
4. Trading liabilities
Deposits by banks and deposits by customers – securities sold under repurchase agreements
These instruments consist of repos with both professional non-bank customers and bank counterparties as part of the ANTS group’s trading activities. The fair value of repos is estimated using the same technique as those reverse repos in trading assets discussed above. Under these agreements, the ANTS group is required to provide and maintain collateral with a market value equal to, or in excess of, the principal amount borrowed. As a result, there would be no adjustment, or an immaterial adjustment, to reflect the credit quality of the ANTS group related to these agreements. As the inputs used in the valuation are based on observable market data, these repos are classified within level 2 of the valuation hierarchy.
Deposits by banks and deposits by customers – other
These instruments consist of certain term and time deposits which tend to be short-term in nature and are both utilised and managed as part of the funding requirements of the trading book. These instruments are valued using the same techniques as those instruments in trading assets - loans and advances to banks and loans and advances to customers discussed above. As the inputs used in the valuation are based on observable market data, these deposits are classified within level 2 of the valuation hierarchy.
5. Financial liabilities at FVTPL
Debt securities in issue
These instruments include commercial paper, medium term notes and other bonds and are valued using the same techniques as those instruments in financial assets at FVTPL - debt securities discussed above. As the inputs used in the valuation are based on observable market data, these debt securities are classified within level 2 of the valuation hierarchy.
Certain debt securities in issue which represent the more exotic senior debt issuances, consisting of power reverse dual currency (‘PRDC’) notes contain significant unobservable inputs and so are classified within level 3 of the valuation hierarchy. The valuation of such instruments is further discussed below.
| | |
Abbey National Treasury Services plc 2012 Annual Report | | 179 |
Financial Statements
Notes to the Financial Statementscontinued
h) Internal models based on information other than market data (Level 3)
The table below provides an analysis of financial instruments valued using internal models based on information other than market data together with the subsequent valuation technique used for each type of instrument. Each instrument is initially valued at transaction price:
| | | | | | | | | | | | | | | | | | | | | | | | |
| | | | | | | Balance sheet
value | | | Amount recognised in
income/(expense) | |
| | | | | | | 2012 | | | 2011 | | | 2012 | | | 2011 | | | 2010 | |
Balance sheet line item | | Category | | Financial instrument product type | | £m | | | £m | | | £m | | | £m | | | £m | |
1. Derivative assets | | Exchange rate contracts | | Cross-currency swaps | | | 36 | | | | 70 | | | | (5 | ) | | | 6 | | | | 42 | |
2. Derivative assets | | Equity and credit contracts | | Reversionary property interests | | | 76 | | | | 78 | | | | 2 | | | | 15 | | | | (6 | ) |
3. Derivative assets | | Equity and credit contracts | | Credit default swaps | | | 17 | | | | 16 | | | | 1 | | | | 1 | | | | — | |
4. Derivative assets | | Equity contracts | | Options and forwards | | | 279 | | | | 266 | | | | 6 | | | | 5 | | | | (20 | ) |
5. FVTPL | | Loans and advances to customers | | Roll-up mortgage portfolio | | | 61 | | | | 58 | | | | 3 | | | | 8 | | | | 5 | |
6. FVTPL | | Debt securities | | Mortgage-backed securities | | | 49 | | | | 51 | | | | 4 | | | | (8 | ) | | | 53 | |
7. Derivative liabilities | | Equity contracts | | Options and forwards | | | (72 | ) | | | (89 | ) | | | 3 | | | | 8 | | | | 99 | |
8. FVTPL | | Debt securities in issue | | Non-vanilla debt securities | | | (86 | ) | | | (141 | ) | | | 7 | | | | (6 | ) | | | (42 | ) |
| | | | | | | | | | | | | | | | | | | | | | | | |
Total net assets | | | | | | | 360 | | | | 309 | | | | — | | | | — | | | | — | |
| | | | | | | | | | | | | | | | | | | | | | | | |
Total income | | | | | | | — | | | | — | | | | 21 | | | | 29 | | | | 131 | |
| | | | | | | | | | | | | | | | | | | | | | | | |
Valuation technique
1. Derivative assets – Exchange rate contracts
These cross currency swaps are used to hedge the foreign currency risks arising from the power reverse dual currency (‘PRDC’) notes issued by the ANTS group, as described in Instrument 8 below. These derivatives are valued using a standard valuation model valuing each leg of the swap, with expected future cash flows less notional amount exchanged at maturity date discounted using an appropriate floating rate. The floating rate is adjusted by the relevant cross currency basis spread. Interest rates, foreign exchange rates, cross currency basis spread and long-dated foreign exchange (‘FX’) volatility are used as inputs to determine fair value. Interest rates, foreign exchange rates are observable on the market. Cross currency spreads may be market observable or unobservable depending on the liquidity of the cross currency pair. As the Japanese Yen-US dollar cross currency pair related to the PRDC notes is liquid, the cross currency spreads (including long-dated cross currency spread) for these swaps are market observable.
The significant unobservable inputs for the valuation of these financial instruments are the long-dated FX volatility and the correlation between the underlying assets. The correlation between the underlying assets is assumed to be zero, as there are no actively traded options from which correlations between the underlying assets could be implied. Furthermore, the zero correlation assumption implies that the sources of the long-dated FX volatility are independent.
Long-dated FX volatility
Long-dated FX volatility is extrapolated from shorter-dated FX volatilities which are directly observable on the market. Short dated FX volatility is observable from the trading of FX options. As there is no active market for FX options with maturities greater than five years (long-dated FX options), long-dated FX volatility is not market observable. Furthermore, as historical prices are not relevant in determining the cost of hedging long-dated FX risk, long-dated FX volatility cannot be inferred from historical volatility. The ANTS group extrapolates the long-dated FX volatility from the shorter-dated FX volatilities using Black’s model.
FX volatility is modelled as the composition of the domestic interest rate, foreign interest rates and FX spot volatilities using standard Hull-White formulae. The Hull-White approach is used for estimating the future distribution of domestic and foreign zero-coupon rates, constructed from the relevant yield curves. Using short dated FX options, the FX spot volatility is calculated which is then extrapolated to derive the long-dated FX volatility.
2. Derivative assets – Equity and credit contracts
These reversionary property derivatives are valued using a probability weighted set of HPI forward prices, which are assumed to be a reasonable representation of the increase in value of the ANTS group’s reversionary interest portfolio underlying the derivatives. The probability used reflects the likelihood of the home owner vacating the property and is calculated from mortality rates and acceleration rates which are a function of age and gender, obtained from the relevant mortality tables. Indexing is felt to be appropriate due to the size and geographical dispersion of the ANTS group’s reversionary interest portfolio. These are determined using HPI Spot Rates adjusted to reflect estimated forward growth. Launched in 1984, the Halifax’s UK HPI is the UK’s longest running monthly house price data series covering the whole country. The indices calculated are standardised and represent the price of a typically transacted house. Both national and regional HPI are published. The national HPI is published monthly. The regional HPI reflects the national HPI disaggregated into 12 UK regions and is published quarterly. Both indices are published on two bases, including and excluding seasonal adjustments in the housing market. The ANTS group uses the non-seasonally adjusted (‘NSA’) national and regional HPI in its valuation model to avoid any subjective judgement in the adjustment process which is made by Halifax.
The inputs used to determine the value of the reversionary property derivatives are HPI spot, HPI forward growth and mortality rates. The principal pricing parameter is HPI forward growth.
| | |
| 180 | | Abbey National Treasury Services plc 2012 Annual Report |
Financial Statements
Notes to the Financial Statementscontinued
HPI Spot Rate
The HPI spot rate used in the model is a weighted average of NSA regional HPI spot rates i.e. adjusted for difference in the actual regional composition of the property underlying the ANTS group’s reversionary interest portfolio and the composition of the published regional indices. The regional HPI spot rate (which is observable market data) is only published on specific quarterly dates. In between these dates, its value is estimated by applying the growth rate over the relevant time period inferred from the national HPI spot rates (which are observable market data and published monthly) to the most recently calculated weighted average regional HPI spot rate based on published regional indices.
An adjustment is also made to reflect the specific property risk i.e. possible deviation between the actual growth in the house prices underlying the ANTS group’s reversionary interest portfolio and their assumed index-linked growth, which is based on the regional HPI. This adjustment is based on the average historical deviation of price changes of the ANTS group’s actual property portfolio from that of the published indices over the time period since the last valuation date.
HPI Forward Growth Rate
Long-dated HPI forward growth rate is not directly observable in the market but is estimated from broker quotes and traded forward contracts. A specific spread is applied to the long-dated forward growth rate to reflect the uncertainty surrounding long dated data. This spread is calculated by analysing the historical volatility of the HPI, whilst incorporating mean reversion. An adjustment is made to reflect the specific property risk as for the HPI spot rate above.
Mortality Rate
Mortality rates are obtained from the PNMA00 and PNFA00 Continuous Mortality Investigation Tables published by the UK Institute and Faculty of Actuaries. These mortality rates are adjusted by acceleration rates to reflect the mortality profile of the holders of ANTS group’s reversionary property products underlying the derivatives.
3. Derivative assets – Equity and credit contracts
These derivative assets are credit default swaps held against certain bonds. The credit default swaps are valued using the credit spreads of the referenced bonds. These referenced bonds are valued with the assistance of valuations prepared by an independent, specialist valuation firm as a deep and liquid market does not exist.
In valuing the credit default swaps, the main inputs used to determine the underlying cost of credit are quoted risk premiums and the correlation between the quoted credit derivatives of various issuers. The assumptions relating to the correlation between the values of quoted and unquoted assets are based on historical correlations between the impact of adverse changes in market variables and the corresponding valuation of the associated unquoted assets. The measurement of the assets will vary depending on whether a more or less conservative scenario is selected. The other main input is the probability of default of the referenced bonds. The significant unobservable input for the valuation of these financial instruments is the probability of default.
Probability of default
The probability of default is assessed by considering the credit quality of the underlying referenced bonds. However, as no deep and liquid market exists for these assets the assessment of the probability of default is not directly observable and instead an estimate is calculated using the Standard Gaussian Copula model.
4. Derivative assets – Equity contracts
There are three types of derivatives within this category:
European options –These derivatives are valued using a modified Black-Scholes model where the HPI is log-normally distributed with the forward rates determined from the HPI forward growth.
Asian options –Asian (or average value) options are valued using a modified Black-Scholes model, with an amended strike price and volatility assumption to account for the average exercise period, through a closed form adjustment that reflects the strike price relative to the distribution of stock prices at each relevant date. This is also known as the Curran model.
Forward contracts –Forward contracts are valued using a standard forward pricing model.
The inputs used to determine the value of the above instruments are HPI spot rate, HPI forward growth rate and HPI volatility. The principal pricing parameter is HPI forward growth rate.
HPI Spot Rate
The HPI spot rate used is the NSA national HPI spot rate which is published monthly and directly observable in the market. This HPI rate used is different from the weighted average regional HPI spot rate used in the valuation of Instrument 2 above, as the underlying of these derivatives is the UK national HPI spot rate.
HPI Forward Growth Rate
The HPI forward growth rate used is unobservable and is the same as used in the valuation of Instrument 2 above.
HPI Volatility
Long-dated HPI volatility is not directly observable in the market but is estimated from the most recent traded values. An adjustment is applied to the long-dated HPI volatility rate to reflect the uncertainty surrounding long-dated data. This adjustment is based on the empirical standard deviation of historical volatility over a range of time horizons.
| | |
Abbey National Treasury Services plc 2012 Annual Report | | 181 |
Financial Statements
Notes to the Financial Statementscontinued
5. FVTPL – Loans and advances to customers
These loans and advances to customers represent roll-up mortgages, which are an equity release scheme under which a property owner takes out a loan secured against their home. The owner does not make any interest payments during their lifetime and the fixed interest payments are rolled up into the mortgage. The loan or mortgage (capital and rolled-up interest) is repaid upon the owner’s vacation of the property and the value of the loan is only repaid from the value of the property. This is known as a ‘no negative pledge’. The ANTS group suffers a loss if the sale proceeds from the property are insufficient to repay the loan, as it is unable to pursue the homeowner’s estate or beneficiaries for the shortfall.
The value of the mortgage ‘rolls up’ or accretes until the owner vacates the property. In order to value the roll-up mortgages, the ANTS group uses a probability-weighted set of European option prices (puts) determined using the Black-Scholes model, in which the ‘no negative pledges’ are valued as short put options. The probability weighting applied is calculated from mortality rates and acceleration rates as a function of age and gender, taken from mortality tables.
The inputs used to determine the value of these instruments are HPI spot, HPI forward growth, HPI volatility, mortality rates and repayment rates. The principal pricing parameter is HPI forward growth. The HPI forward growth rate used is unobservable and is the same as used in the valuation of Instrument 2 above. The other parameters do not have a significant effect on the value of the instruments.
6. FVTPL – Debt securities
These securities consist of residential mortgage-backed securities issued by Banco Santander entities. Each instrument is valued with reference to the price from a consensus pricing service. This is then corroborated against the price from another consensus pricing service due to the lack of depth in the number of available market quotes. An average price is used where there is a more than insignificant difference between the two sources.
The significant unobservable input is the adjustment to the credit spread embedded in the pricing consensus quotes.
7. Derivative liabilities – Equity contracts
These derivatives are the same as Instrument 4 with the exception that they have a negative fair value.
8. FVTPL – Debt securities in issue
These debt securities in issue are power reverse dual currency notes. These notes are financial structured products where an investor is seeking a better return and a borrower/issuer a lower rate by taking advantage of the interest rate differential between two countries. The note pays a foreign interest rate in the investor’s domestic currency. The power component of the name denotes higher initial coupons and the fact that coupons rise as the domestic/foreign exchange rate depreciates. The power feature comes with a higher risk for the investor. Cash flows may have a digital cap feature where the rate gets locked once it reaches a certain threshold. Other add-on features are barriers such as knockouts and cancellation provisions for the issuer. These debt securities in issue are valued using a three-factor Gaussian Model. The three factors used in the valuation are domestic interest rates, foreign interest rates and foreign exchange rates. The correlations between the factors are assumed to be zero within the valuation.
The Hull-White approach is used for estimating the future distribution of domestic and foreign zero-coupon rates, constructed from the relevant yield curves. A Geometric Brownian Motion model is used for estimating the future distribution of spot foreign exchange rates. The foreign exchange and interest rate volatilities are the most crucial pricing parameters; the model calibrates to the relevant swaption volatility surface.
The significant unobservable inputs for the valuation of these financial instruments are the long dated FX volatility and the correlation between the underlying assets and are the same as Instrument 1.
Reconciliation of fair value measurements in Level 3 of the fair value hierarchy
The following table provides a reconciliation of the movement between opening and closing balances of Level 3 financial instruments, measured at fair value using a valuation technique with significant unobservable inputs:
| | | | | | | | | | | | | | | | | | | | | | | | |
| | | Assets | | | Liabilities | |
| | | Derivatives | | | Fair value
through P&L | | | Total | | | Derivatives | | | Fair value
through P&L | | | Total | |
| | | £m | | | £m | | | £m | | | £m | | | £m | | | £m | |
At 1 January 2012 | | | 430 | | | | 109 | | | | 539 | | | | (89 | ) | | | (141 | ) | | | (230 | ) |
Total gains/(losses) recognised in profit/(loss): | | | | | | | | | | | | | | | | | | | | | | | | |
- Fair value movements | | | 4 | | | | 7 | | | | 11 | | | | 3 | | | | 7 | | | | 10 | |
- Foreign exchange and other movements | | | (12 | ) | | | (1 | ) | | | (13 | ) | | | — | | | | 16 | | | | 16 | |
Issues | | | 10 | | | | — | | | | 10 | | | | — | | | | — | | | | — | |
Sales | | | — | | | | — | | | | — | | | | — | | | | — | | | | — | |
Settlements | | | (24 | ) | | | (5 | ) | | | (29 | ) | | | 14 | | | | 32 | | | | 46 | |
| | | | | | | | | | | | | | | | | | | | | | | | |
At 31 December 2012 | | | 408 | | | | 110 | | | | 518 | | | | (72 | ) | | | (86 | ) | | | (158 | ) |
| | | | | | | | | | | | | | | | | | | | | | | | |
Total gains/(losses) recognised in profit/(loss) relating to assets and liabilities held at the end of the year | | | (8 | ) | | | 6 | | | | (2 | ) | | | 3 | | | | 23 | | | | 26 | |
| | | | | | | | | | | | | | | | | | | | | | | | |
| | |
| 182 | | Abbey National Treasury Services plc 2012 Annual Report |
Financial Statements
Notes to the Financial Statementscontinued
| | | | | | | | | | | | | | | | | | | | | | | | |
| | | Assets | | | Liabilities | |
| | | Derivatives | | | Fair value
through P&L | | | Total | | | Derivatives | | | Fair value
through P&L | | | Total | |
| | | £m | | | £m | | | £m | | | £m | | | £m | | | £m | |
At 1 January 2011 | | | 408 | | | | 118 | | | | 526 | | | | (102 | ) | | | (137 | ) | | | (239 | ) |
Total gains/(losses) recognised in profit/(loss): | | | | | | | | | | | | | | | | | | | | | | | | |
- Fair value movements | | | 27 | | | | — | | | | 27 | | | | 8 | | | | (6 | ) | | | 2 | |
- Foreign exchange and other movements | | | 4 | | | | (2 | ) | | | 2 | | | | — | | | | (7 | ) | | | (7 | ) |
Purchases | | | 27 | | | | — | | | | 27 | | | | (6 | ) | | | — | | | | (6 | ) |
Settlements | | | (1 | ) | | | — | | | | (1 | ) | | | — | | | | — | | | | — | |
Transfers out | | | (35 | ) | | | (7 | ) | | | (42 | ) | | | 11 | | | | 9 | | | | 20 | |
| | | | | | | | | | | | | | | | | | | | | | | | |
At 31 December 2011 | | | 430 | | | | 109 | | | | 539 | | | | (89 | ) | | | (141 | ) | | | (230 | ) |
| | | | | | | | | | | | | | | | | | | | | | | | |
Total gains/(losses) recognised in profit/(loss) relating to assets and liabilities held at the end of the year | | | 31 | | | | (2 | ) | | | 29 | | | | 8 | | | | (13 | ) | | | (5 | ) |
| | | | | | | | | | | | | | | | | | | | | | | | |
Financial instrument assets and liabilities at 31 December 2012
Financial instrument assets valued using internal models based on information other than market data were 1% (2011: 1%) of total assets measured at fair value and 0.2% (2011: 0.2%) of total assets at 31 December 2012.
Derivative assets decreased in 2012 principally due to settlements and foreign exchange movements offset by purchases. Assets designated at fair value through profit or loss increased marginally in 2012 principally due to fair value movements offset by sales and settlements.
Financial instrument liabilities valued using internal models based on information other than market data were 0.3% (2011: 0.3%) of total liabilities measured at fair value and 0.1% (2011: 0.1%) of total liabilities at 31 December 2012.
Derivative liabilities decreased in 2012 primarily due to settlements. Liabilities designated at fair value through profit or loss decreased in 2012 principally due to fair value and foreign exchange movements and settlements.
Gains and losses for the year ended 31 December 2012
Losses of £8m in respect of derivatives assets principally reflected changes in credit spreads and the HPI Index and unfavourable movements in foreign exchange rates. Gains of £6m in respect of assets designated at fair value through profit or loss primarily reflects the mark to market volatility on a reduced portfolio of mortgage backed securities.
Gains of £3m in respect of derivatives liabilities principally reflected changes in credit spreads and the HPI Index. Gains of £23m in respect of liabilities designated at fair value through profit or loss principally reflected changes in foreign exchange. They are fully matched with derivatives.
Gains and losses for the year ended 31 December 2011
Gains of £31m in respect of derivatives assets principally reflected changes in credit spreads and the HPI Index. Losses of £2m in respect of assets designated at fair value through profit or loss principally reflected favourable changes in foreign exchange rates during the year.
Gains of £8m in respect of derivatives liabilities principally reflected changes in credit spreads and the HPI Index. Losses of £13m in respect of liabilities designated at fair value through profit or loss principally reflected changes in foreign exchange and interest rates. They are fully matched with derivatives.
| | |
Abbey National Treasury Services plc 2012 Annual Report | | 183 |
Financial Statements
Notes to the Financial Statementscontinued
Effect of changes in significant unobservable assumptions to reasonably possible alternatives (Level 3)
As discussed above, the fair value of financial instruments are, in certain circumstances, measured using valuation techniques that incorporate assumptions that are not evidenced by prices from observable current market transactions in the same instrument and are not based on observable market data and, as such require the application of a degree of judgement. Changing one or more of the inputs to the valuation models to reasonably possible alternative assumptions would change the fair values significantly. The following table shows the sensitivity of these fair values to reasonably possible alternative assumptions.
Favourable and unfavourable changes are determined on the basis of changes in the value of the instrument as a result of varying the levels of the unobservable input as described in the table below. The potential effects do not take into effect any offsetting or hedged positions.
At 31 December 2012
| | | | | | | | | | | | | | | | | | |
| | | | | | | | | | | Reflected in income statement | |
Balance sheet note line item and product | | Fair value | | | Assumptions | | Shift | | | Favourable
changes | | | Unfavourable
changes | |
| | | £m | | | | | | | | £m | | | £m | |
2. Derivative assets - Equity and credit contracts: | | | 76 | | | HPI Forward growth rate | | | 1 | % | | | 11 | | | | (11 | ) |
–Reversionary property derivatives | | | | | | HPI Spot rate | | | 10 | % | | | 8 | | | | (8 | ) |
| | | | | | Mortality rate | | | 2 yrs | | | | 1 | | | | (1 | ) |
3. Derivative assets - Equity and credit contracts: | | | 17 | | | Probability of default | | | 20 | % | | | 3 | | | | (3 | ) |
– Credit default swaps | | | | | | | | | | | | | | | | | | |
4. Derivative assets - Equity and credit contracts: | | | 279 | | | HPI Forward growth rate | | | 1 | % | | | 7 | | | | (7 | ) |
– Options and forwards | | | | | | HPI Spot rate | | | 10 | % | | | 12 | | | | (11 | ) |
| | | | | | HPI Volatility | | | 1 | % | | | 1 | | | | (1 | ) |
5. FVTPL - Loans and advances to customers: | | | 61 | | | HPI Forward growth rate | | | 1 | % | | | 2 | | | | (2 | ) |
– Roll-up mortgage portfolio | | | | | | | | | | | | | | | | | | |
6. FVTPL - Debt securities: | | | 49 | | | Credit spread | | | 10 | % | | | 5 | | | | (5 | ) |
– Mortgage-backed securities | | | | | | | | | | | | | | | | | | |
7. Derivative liabilities - Equity and credit contracts: | | | (72 | ) | | HPI Forward growth rate | | | 1 | % | | | 3 | | | | (3 | ) |
– Options and forwards | | | | | | HPI Spot rate | | | 10 | % | | | 6 | | | | (9 | ) |
| | | | | | HPI Volatility | | | 1 | % | | | 1 | | | | (1 | ) |
At 31 December 2011
| | | | | | | | | | | | | | | | | | |
| | | | | | | | | | | Reflected in income statement | |
Balance sheet note line item and product | | Fair value | | | Assumptions | | Shift | | | Favourable
changes | | | Unfavourable
changes | |
| | | £m | | | | | | | | £m | | | £m | |
2. Derivative assets – Equity and credit contracts: | | | 78 | | | HPI Forward growth rate | | | 1 | % | | | 11 | | | | (11 | ) |
–Reversionary property derivatives | | | | | | HPI Spot rate | | | 10 | % | | | 8 | | | | (8 | ) |
| | | | | | Mortality rate | | | 2 yrs | | | | — | | | | — | |
3. Derivative assets – Equity and credit contracts: | | | 16 | | | Probability of default | | | 20 | % | | | 3 | | | | (3 | ) |
– Credit default swaps | | | | | | | | | | | | | | | | | | |
4. Derivative assets – Equity and credit contracts: | | | 266 | | | HPI Forward growth rate | | | 1 | % | | | 7 | | | | (7 | ) |
– Options and forwards | | | | | | HPI Spot rate | | | 10 | % | | | 4 | | | | (3 | ) |
| | | | | | HPI Volatility | | | 1 | % | | | 1 | | | | (1 | ) |
5. FVTPL – Loans and advances to customers: | | | 58 | | | HPI Forward growth rate | | | 1 | % | | | 2 | | | | (2 | ) |
– Roll-up mortgage portfolio | | | | | | | | | | | | | | | | | | |
6. FVTPL – Debt securities: | | | 51 | | | Credit spread | | | 10 | % | | | 5 | | | | (5 | ) |
– Mortgage-backed securities | | | | | | | | | | | | | | | | | | |
7. Derivative liabilities - Equity and credit contracts: | | | (89 | ) | | HPI Forward growth rate | | | 1 | % | | | 4 | | | | (4 | ) |
– Options and forwards | | | | | | HPI Spot rate | | | 10 | % | | | 13 | | | | (17 | ) |
| | | | | | HPI Volatility | | | 1 | % | | | 2 | | | | (2 | ) |
No sensitivities are presented for the FVTPL - debt securities in issue (instrument 8) per page 182 and related exchange rate derivatives (instrument 1) per page 180 as the terms of these instruments are fully matched. As a result, any changes in the valuation of the debt securities in issue would be exactly offset by an equal and opposite change in the valuation of the exchange rate derivatives.
| | |
| 184 | | Abbey National Treasury Services plc 2012 Annual Report |
Financial Statements
Notes to the Financial Statementscontinued
i) Maturities of financial assets, liabilities and off-balance sheet commitments
The table below analyses the maturities of the undiscounted cash flows relating to financial assets, liabilities and off-balance sheet commitments of the ANTS group based on the remaining period to the contractual maturity date at the balance sheet date.
There are no significant financial liabilities related to financial guarantee contracts. This table is not intended to show the liquidity of the ANTS group.
| | | | | | | | | | | | | | | | | | | | | | | | | | | | | | | | |
| At 31 December 2012 | | Group | |
| | | On
demand
£m | | | Within
1 month
£m | | | 1-3
months
£m | | | 3-12
months
£m | | | 1-3
years
£m | | | 3-5
years
£m | | | Over 5
years
£m | | | Total
£m | |
Assets by balance sheet category | | | | | | | | | | | | | | | | | | | | | | | | | | | | | | | | |
Cash and balances at central banks | | | 365 | | | | — | | | | — | | | | 23 | | | | — | | | | — | | | | — | | | | 388 | |
Trading assets | | | 1 | | | | 13,013 | | | | 4,800 | | | | 3,391 | | | | 30 | | | | 485 | | | | 867 | | | | 22,587 | |
Derivative financial instruments | | | 104 | | | | 590 | | | | 562 | | | | 1,487 | | | | 3,673 | | | | 4,035 | | | | 24,488 | | | | 34,939 | |
Financial assets designated at fair value | | | — | | | | — | | | | — | | | | — | | | | — | | | | 124 | | | | 3,694 | | | | 3,818 | |
Loans and advances to banks | | | 28,177 | | | | 2,040 | | | | 37,883 | | | | 12,747 | | | | 12,373 | | | | 12,057 | | | | 2,238 | | | | 107,515 | |
Loans and advances to customers | | | 71 | | | | 2,858 | | | | 4,556 | | | | 2,815 | | | | 8,135 | | | | 10,797 | | | | 20,973 | | | | 50,205 | |
Available-for-sale securities | | | — | | | | — | | | | — | | | | 1,902 | | | | — | | | | 2,936 | | | | 395 | | | | 5,233 | |
Loans and receivables securities | | | — | | | | — | | | | — | | | | — | | | | — | | | | — | | | | 175 | | | | 175 | |
Macro hedge of interest rate risk | | | — | | | | 20 | | | | 18 | | | | 12 | | | | 151 | | | | 192 | | | | 778 | | | | 1,171 | |
| | | | | | | | | | | | | | | | | | | | | | | | | | | | | | | | |
Total financial assets | | | 28,718 | | | | 18,521 | | | | 47,819 | | | | 22,377 | | | | 24,362 | | | | 30,626 | | | | 53,608 | | | | 226,031 | |
Other assets | | | 37 | | | | — | | | | — | | | | — | | | | — | | | | — | | | | — | | | | 37 | |
| | | | | | | | | | | | | | | | | | | | | | | | | | | | | | | | |
Total assets | | | 28,755 | | | | 18,521 | | | | 47,819 | | | | 22,377 | | | | 24,362 | | | | 30,626 | | | | 53,608 | | | | 226,068 | |
| | | | | | | | | | | | | | | | | | | | | | | | | | | | | | | | |
| | | | | | | | |
Liabilities by balance sheet category | | | | | | | | | | | | | | | | | | | | | | | | | | | | | | | | |
Deposits by banks | | | 6,360 | | | | 12,846 | | | | 12,468 | | | | 25,244 | | | | 32,424 | | | | 8,963 | | | | 20,425 | | | | 118,730 | |
Deposits by customers | | | 145 | | | | 164 | | | | 406 | | | | 1,066 | | | | 3,272 | | | | 388 | | | | 1,125 | | | | 6,566 | |
Derivative financial instruments | | | 337 | | | | 256 | | | | 274 | | | | 1,274 | | | | 5,144 | | | | 4,113 | | | | 26,997 | | | | 38,395 | |
Trading liabilities | | | 4,377 | | | | 5,574 | | | | 4,668 | | | | 1,993 | | | | 982 | | | | 560 | | | | 3,233 | | | | 21,387 | |
Financial liabilities designated at fair value | | | — | | | | 735 | | | | 341 | | | | 628 | | | | 954 | | | | 616 | | | | 836 | | | | 4,110 | |
Debt securities in issue | | | — | | | | 5,183 | | | | 2,367 | | | | 4,228 | | | | 10,050 | | | | 6,369 | | | | 10,619 | | | | 38,816 | |
| | | | | | | | | | | | | | | | | | | | | | | | | | | | | | | | |
Total financial liabilities | | | 11,219 | | | | 24,758 | | | | 20,524 | | | | 34,433 | | | | 52,826 | | | | 21,009 | | | | 63,235 | | | | 228,004 | |
Other liabilities | | | — | | | | 152 | | | | — | | | | — | | | | — | | | | — | | | | — | | | | 152 | |
Equity | | | — | | | | — | | | | — | | | | — | | | | — | | | | — | | | | 3,808 | | | | 3,808 | |
| | | | | | | | | | | | | | | | | | | | | | | | | | | | | | | | |
Total liabilities and Shareholders equity | | | 11,219 | | | | 24,910 | | | | 20,524 | | | | 34,433 | | | | 52,826 | | | | 21,009 | | | | 67,043 | | | | 231,964 | |
| | | | | | | | | | | | | | | | | | | | | | | | | | | | | | | | |
Off-balance sheet commitments given | | | 25 | | | | 139 | | | | 64 | | | | 958 | | | | 2,438 | | | | 3,789 | | | | 1,940 | | | | 9,353 | |
| | | | | | | | | | | | | | | | | | | | | | | | | | | | | | | | |
| | |
Abbey National Treasury Services plc 2012 Annual Report | | 185 |
Financial Statements
Notes to the Financial Statementscontinued
| | | | | | | | | | | | | | | | | | | | | | | | | | | | | | | | |
| At 31 December 2011 | | Group | |
| | | On
demand
£m | | | Within
1 month
£m | | | 1-3
months
£m | | | 3-12
months
£m | | | 1-3
years
£m | | | 3-5
years
£m | | | Over 5
years
£m | | | Total
£m | |
Assets by balance sheet category | | | | | | | | | | | | | | | | | | | | | | | | | | | | | | | | |
Cash and balances at central banks | | | 6,995 | | | | — | | | | — | | | | 18 | | | | — | | | | — | | | | — | | | | 7,013 | |
Trading assets | | | — | | | | 11,654 | | | | 5,183 | | | | 3,851 | | | | 215 | | | | 13 | | | | 1,138 | | | | 22,054 | |
Derivative financial instruments | | | 2,169 | | | | 172 | | | | 409 | | | | 1,604 | | | | 4,135 | | | | 3,887 | | | | 22,380 | | | | 34,756 | |
Financial assets designated at fair value | | | — | | | | — | | | | — | | | | — | | | | — | | | | — | | | | 5,030 | | | | 5,030 | |
Loans and advances to banks | | | 18,507 | | | | 19,159 | | | | 21,628 | | | | 9,941 | | | | 19,911 | | | | 15,785 | | | | 9,036 | | | | 113,967 | |
Loans and advances to customers | | | 1,026 | | | | 4,396 | | | | 2,324 | | | | 2,159 | | | | 7,408 | | | | 10,437 | | | | 15,619 | | | | 43,369 | |
Available-for-sale securities | | | — | | | | — | | | | — | | | | — | | | | — | | | | — | | | | — | | | | — | |
Loans and receivables securities | | | — | | | | — | | | | — | | | | — | | | | 2 | | | | — | | | | 313 | | | | 315 | |
Macro hedge of interest rate risk | | | — | | | | 1 | | | | 10 | | | | 104 | | | | 247 | | | | 122 | | | | 657 | | | | 1,141 | |
| | | | | | | | | | | | | | | | | | | | | | | | | | | | | | | | |
Total financial assets | | | 28,697 | | | | 35,382 | | | | 29,554 | | | | 17,677 | | | | 31,918 | | | | 30,244 | | | | 54,173 | | | | 227,645 | |
Other assets | | | 68 | | | | — | | | | — | | | | — | | | | — | | | | — | | | | — | | | | 68 | |
| | | | | | | | | | | | | | | | | | | | | | | | | | | | | | | | |
Total assets | | | 28,765 | | | | 35,382 | | | | 29,554 | | | | 17,677 | | | | 31,918 | | | | 30,244 | | | | 54,173 | | | | 227,713 | |
| | | | | | | | | | | | | | | | | | | | | | | | | | | | | | | | |
Liabilities by balance sheet category | | | | | | | | | | | | | | | | | | | | | | | | | | | | | | | | |
Deposits by banks | | | 4,784 | | | | 10,623 | | | | 20,353 | | | | 25,768 | | | | 9,992 | | | | 31,255 | | | | 15,928 | | | | 118,703 | |
Deposits by customers | | | 101 | | | | 280 | | | | 623 | | | | 832 | | | | 3,120 | | | | 2,345 | | | | 107 | | | | 7,408 | |
Derivative financial instruments | | | — | | | | — | | | | 6 | | | | 24 | | | | 442 | | | | 55 | | | | 803 | | | | 1,330 | |
Trading liabilities | | | 7,781 | | | | 9,697 | | | | 4,786 | | | | 1,415 | | | | 1,121 | | | | 433 | | | | 656 | | | | 25,889 | |
Financial liabilities designated at fair value | | | — | | | | 1,445 | | | | 187 | | | | 1,634 | | | | 2,406 | | | | 668 | | | | 1,015 | | | | 7,355 | |
Debt securities in issue | | | — | | | | 2,542 | | | | 1,991 | | | | 2,575 | | | | 8,428 | | | | 7,189 | | | | 7,846 | | | | 30,571 | |
| | | | | | | | | | | | | | | | | | | | | | | | | | | | | | | | |
Total financial liabilities | | | 12,666 | | | | 24,587 | | | | 27,946 | | | | 32,248 | | | | 25,509 | | | | 41,945 | | | | 26,355 | | | | 191,256 | |
Other liabilities | | | — | | | | 142 | | | | — | | | | — | | | | — | | | | — | | | | — | | | | 142 | |
Equity | | | — | | | | — | | | | — | | | | — | | | | — | | | | — | | | | 3,500 | | | | 3,500 | |
| | | | | | | | | | | | | | | | | | | | | | | | | | | | | | | | |
Total liabilities and Shareholders equity | | | 12,666 | | | | 24,729 | | | | 27,946 | | | | 32,248 | | | | 25,509 | | | | 41,945 | | | | 29,855 | | | | 194,898 | |
| | | | | | | | | | | | | | | | | | | | | | | | | | | | | | | | |
Off-balance sheet commitments given | | | 10 | | | | — | | | | 2 | | | | 666 | | | | 1,731 | | | | 4,548 | | | | 2,322 | | | | 9,279 | |
| | | | | | | | | | | | | | | | | | | | | | | | | | | | | | | | |
| | | | | | | | | | | | | | | | | | | | | | | | | | | | | | | | |
| At 31 December 2012 | | Company | |
| | | On
demand
£m | | | Within
1 month
£m | | | 1-3
months
£m | | | 3-12
months
£m | | | 1-3
years
£m | | | 3-5
years
£m | | | Over 5
years
£m | | | Total
£m | |
Assets by balance sheet category | | | | | | | | | | | | | | | | | | | | | | | | | | | | | | | | |
Cash and balances at central banks | | | 365 | | | | — | | | | — | | | | 23 | | | | — | | | | — | | | | — | | | | 388 | |
Trading assets | | | 1 | | | | 13,012 | | | | 4,800 | | | | 3,391 | | | | 31 | | | | 485 | | | | 497 | | | | 22,217 | |
Derivative financial instruments | | | 105 | | | | 590 | | | | 562 | | | | 1,487 | | | | 3,710 | | | | 4,035 | | | | 24,489 | | | | 34,978 | |
Financial assets designated at fair value | | | — | | | | — | | | | — | | | | — | | | | — | | | | 124 | | | | 3,694 | | | | 3,818 | |
Loans and advances to banks | | | 28,163 | | | | 2,038 | | | | 37,884 | | | | 12,747 | | | | 12,373 | | | | 12,057 | | | | 2,238 | | | | 107,500 | |
Loans and advances to customers | | | 122 | | | | 2,877 | | | | 4,594 | | | | 2,814 | | | | 8,130 | | | | 10,797 | | | | 20,981 | | | | 50,315 | |
Available-for-sale securities | | | — | | | | — | | | | — | | | | 1,902 | | | | — | | | | 2,936 | | | | 395 | | | | 5,233 | |
Loans and receivables securities | | | — | | | | — | | | | — | | | | — | | | | — | | | | — | | | | 175 | | | | 175 | |
Macro hedge of interest rate risk | | | — | | | | 20 | | | | 18 | | | | 12 | | | | 151 | | | | 192 | | | | 778 | | | | 1,171 | |
| | | | | | | | | | | | | | | | | | | | | | | | | | | | | | | | |
Total financial assets | | | 28,756 | | | | 18,537 | | | | 47,858 | | | | 22,376 | | | | 24,395 | | | | 30,626 | | | | 53,247 | | | | 225,795 | |
Other assets | | | 2,221 | | | | — | | | | — | | | | — | | | | — | | | | — | | | | — | | | | 2,221 | |
| | | | | | | | | | | | | | | | | | | | | | | | | | | | | | | | |
Total assets | | | 30,977 | | | | 18,537 | | | | 47,858 | | | | 22,376 | | | | 24,395 | | | | 30,626 | | | | 53,247 | | | | 228,016 | |
| | | | | | | | | | | | | | | | | | | | | | | | | | | | | | | | |
Liabilities by balance sheet category | | | | | | | | | | | | | | | | | | | | | | | | | | | | | | | | |
Deposits by banks | | | 6,360 | | | | 12,846 | | | | 12,468 | | | | 25,244 | | | | 32,424 | | | | 8,963 | | | | 20,425 | | | | 118,730 | |
Deposits by customers | | | 254 | | | | 1,732 | | | | 937 | | | | 1,383 | | | | 3,322 | | | | 2,311 | | | | 1,125 | | | | 11,064 | |
Derivative financial instruments | | | 337 | | | | 256 | | | | 274 | | | | 1,274 | | | | 5,144 | | | | 4,113 | | | | 26,997 | | | | 38,395 | |
Trading liabilities | | | 4,377 | | | | 5,574 | | | | 4,668 | | | | 1,993 | | | | 982 | | | | 560 | | | | 3,233 | | | | 21,387 | |
Financial liabilities designated at fair value | | | — | | | | 735 | | | | 341 | | | | 628 | | | | 954 | | | | 616 | | | | 836 | | | | 4,110 | |
Debt securities in issue | | | — | | | | 3,646 | | | | 1,865 | | | | 3,926 | | | | 10,050 | | | | 6,369 | | | | 10,619 | | | | 36,475 | |
| | | | | | | | | | | | | | | | | | | | | | | | | | | | | | | | |
Total financial liabilities | | | 11,328 | | | | 24,789 | | | | 20,553 | | | | 34,448 | | | | 52,876 | | | | 22,932 | | | | 63,235 | | | | 230,161 | |
Other liabilities | | | — | | | | 149 | | | | — | | | | — | | | | — | | | | — | | | | — | | | | 149 | |
Equity | | | — | | | | — | | | | — | | | | — | | | | — | | | | — | | | | 3,721 | | | | 3,721 | |
| | | | | | | | | | | | | | | | | | | | | | | | | | | | | | | | |
Total liabilities and Shareholders equity | | | 11,328 | | | | 24,938 | | | | 20,553 | | | | 34,448 | | | | 52,876 | | | | 22,932 | | | | 66,956 | | | | 234,031 | |
| | | | | | | | | | | | | | | | | | | | | | | | | | | | | | | | |
Off-balance sheet commitments given | | | 25 | | | | 139 | | | | 64 | �� | | | 958 | | | | 2,438 | | | | 3,789 | | | | 1,940 | | | | 9,353 | |
| | | | | | | | | | | | | | | | | | | | | | | | | | | | | | | | |
| | |
| 186 | | Abbey National Treasury Services plc 2012 Annual Report |
Financial Statements
Notes to the Financial Statementscontinued
| | | | | | | | | | | | | | | | | | | | | | | | | | | | | | | | |
| At 31 December 2011 | | Company | |
| | | On
demand
£m | | | Within
1 month
£m | | | 1-3
months
£m | | | 3-12
months
£m | | | 1-3
years
£m | | | 3-5
years
£m | | | Over 5
years
£m | | | Total
£m | |
Assets by balance sheet category | | | | | | | | | | | | | | | | | | | | | | | | | | | | | | | | |
Cash and balances at central banks | | | 6,995 | | | | — | | | | — | | | | 18 | | | | — | | | | — | | | | — | | | | 7,013 | |
Trading assets | | | — | | | | 11,654 | | | | 5,183 | | | | 3,851 | | | | 215 | | | | 13 | | | | 767 | | | | 21,683 | |
Derivative financial instruments | | | 2,169 | | | | 172 | | | | 409 | | | | 1,604 | | | | 4,153 | | | | 3,887 | | | | 22,380 | | | | 34,774 | |
Financial assets designated at fair value | | | — | | | | — | | | | — | | | | — | | | | — | | | | — | | | | 5,030 | | | | 5,030 | |
Loans and advances to banks | | | 18,500 | | | | 19,159 | | | | 21,628 | | | | 9,944 | | | | 19,911 | | | | 15,785 | | | | 9,034 | | | | 113,961 | |
Loans and advances to customers | | | 1,078 | | | | 4,420 | | | | 2,345 | | | | 2,161 | | | | 7,402 | | | | 10,437 | | | | 15,628 | | | | 43,471 | |
Available-for-sale securities | | | — | | | | — | | | | — | | | | — | | | | — | | | | — | | | | — | | | | — | |
Loans and receivables securities | | | — | | | | — | | | | — | | | | — | | | | 2 | | | | — | | | | 313 | | | | 315 | |
Macro hedge of interest rate risk | | | — | | | | 1 | | | | 10 | | | | 104 | | | | 247 | | | | 122 | | | | 657 | | | | 1,141 | |
| | | | | | | | | | | | | | | | | | | | | | | | | | | | | | | | |
Total financial assets | | | 28,742 | | | | 35,406 | | | | 29,575 | | | | 17,682 | | | | 31,930 | | | | 30,244 | | | | 53,809 | | | | 227,388 | |
Other assets | | | 2,255 | | | | — | | | | — | | | | — | | | | —�� | | | | — | | | | — | | | | 2,255 | |
| | | | | | | | | | | | | | | | | | | | | | | | | | | | | | | | |
Total assets | | | 30,997 | | | | 35,406 | | | | 29,575 | | | | 17,682 | | | | 31,930 | | | | 30,244 | | | | 53,809 | | | | 229,643 | |
| | | | | | | | | | | | | | | | | | | | | | | | | | | | | | | | |
Liabilities by balance sheet category | | | | | | | | | | | | | | | | | | | | | | | | | | | | | | | | |
Deposits by banks | | | 4,783 | | | | 10,623 | | | | 20,353 | | | | 25,768 | | | | 9,992 | | | | 31,255 | | | | 15,928 | | | | 118,702 | |
Deposits by customers | | | 247 | | | | 2,029 | | | | 1,368 | | | | 1,726 | | | | 3,730 | | | | 4,966 | | | | 1,384 | | | | 15,450 | |
Derivative financial instruments | | | — | | | | — | | | | 6 | | | | 24 | | | | 442 | | | | 55 | | | | 803 | | | | 1,330 | |
Trading liabilities | | | 7,781 | | | | 9,697 | | | | 4,786 | | | | 1,415 | | | | 1,121 | | | | 433 | | | | 656 | | | | 25,889 | |
Financial liabilities designated at fair value | | | — | | | | 1,444 | | | | 187 | | | | 1,574 | | | | 2,406 | | | | 668 | | | | 1,015 | | | | 7,294 | |
Debt securities in issue | | | — | | | | 894 | | | | 1,258 | | | | 1,879 | | | | 8,423 | | | | 7,189 | | | | 7,846 | | | | 27,489 | |
| | | | | | | | | | | | | | | | | | | | | | | | | | | | | | | | |
Total financial liabilities | | | 12,811 | | | | 24,687 | | | | 27,958 | | | | 32,386 | | | | 26,114 | | | | 44,566 | | | | 27,632 | | | | 196,154 | |
Other liabilities | | | — | | | | 137 | | | | — | | | | — | | | | — | | | | — | | | | — | | | | 137 | |
Equity | | | — | | | | — | | | | — | | | | — | | | | — | | | | — | | | | 3,450 | | | | 3,450 | |
| | | | | | | | | | | | | | | | | | | | | | | | | | | | | | | | |
Total liabilities and Shareholders equity | | | 12,811 | | | | 24,824 | | | | 27,958 | | | | 32,386 | | | | 26,114 | | | | 44,566 | | | | 31,082 | | | | 199,741 | |
| | | | | | | | | | | | | | | | | | | | | | | | | | | | | | | | |
Off-balance sheet commitments given | | | 10 | | | | — | | | | 2 | | | | 666 | | | | 1,731 | | | | 4,548 | | | | 2,322 | | | | 9,279 | |
| | | | | | | | | | | | | | | | | | | | | | | | | | | | | | | | |
As the above table is based on contractual maturities, no account is taken of a customer’s ability to repay early where it exists. The repayment terms of debt securities may be accelerated in line with the covenants described in Note 32 to the Consolidated Financial Statements. In addition, no account is taken of the possible early repayment of the ANTS group’s mortgage-backed non-recourse finance which is redeemed by the Santander UK group as funds become available from redemptions of the residential mortgages. The Santander UK group has no control over the timing and amount of redemptions of residential mortgages.
44. CAPITAL MANAGEMENT AND RESOURCES
Capital management and capital allocation
Within the Santander UK group, capital is managed on a Santander UK group basis. The Santander UK Board is responsible for capital management strategy and policy and ensuring that capital resources are appropriately monitored and controlled within regulatory and internal limits within the Santander UK group. Authority for capital management flows to the Chief Executive Officer and from her to specific individuals who are members of Santander UK’s group’s Strategic Risk and Financial Management Committee (‘SRFM’) and Asset and Liability Management Committee (‘ALCO’).
SRFM and ALCO adopt a centralised capital management approach that is driven by Santander UK’s corporate purpose and strategy. This approach takes into account the regulatory and commercial environment in which Santander UK operates, Santander UK’s risk appetite, the management strategy for each of Santander UK’s material risks (including whether or not capital provides an appropriate risk mitigant) and the impact of appropriate adverse scenarios and stresses on Santander UK’s capital requirements. This approach is reviewed annually as part of Santander UK’s Internal Capital Adequacy Assessment Process (‘ICAAP’).
Santander UK manages its capital requirements, debt funding and liquidity on the basis of policies and plans reviewed regularly at SRFM and ALCO and as part of the ICAAP process while debt funding and liquidity are also reviewed as part of the Internal Liquidity Adequacy Assessment (‘ILAA’) process. To support its capital and senior debt issuance programmes, the Company is rated on a stand alone basis.
On an ongoing basis and in accordance with the latest ICAAP review, Santander UK forecasts its regulatory and internal capital requirements based on the approved capital volumes allocated to business units as part of the corporate planning process and the need to have access to a capital buffer. Capital allocation decisions are made as part of planning based on the relative returns on capital using both economic and regulatory capital measures. Capital allocations are reviewed in response to changes in risk appetite and risk management strategy, changes to the commercial environment, changes in key economic indicators or when additional capital requests are received.
The combination of regulatory and economic capital ratios and limits, internal buffers and restrictions, together with the relevant costs of differing capital instruments and a consideration of various other capital management techniques are used to shape the most cost-effective structure to fulfil Santander UK’s capital needs.
| | |
Abbey National Treasury Services plc 2012 Annual Report | | 187 |
Financial Statements
Notes to the Financial Statementscontinued
Capital adequacy
From 1 January 2008, the ANTS group has managed its capital on a Basel II basis. Throughout 2012 and 2011, the ANTS group held capital over and above its regulatory requirements.
The Company, Santander UK plc, and Cater Allen Limited, which are the three FSA-regulated entities within the Santander UK group, are party to a capital support deed dated 14 December 2012 (the “Capital Support Deed”) with certain other non-regulated subsidiaries of Santander UK plc. The parties to the Capital Support Deed constitute a core UK group for the purposes of section 10 of the Prudential Sourcebook for Banks, Building Societies and Investment Firms (“BIPRU”) of the FSA Handbook. Under section 10.8 of BIPRU, exposures of each of the three regulated entities to other members of the core UK group are exempt from large exposure limits that would otherwise apply. The purpose of the Capital Support Deed is to facilitate the prompt transfer of available capital resources from, or repayment of liabilities by, the non-regulated parties to any of the regulated parties in the event that one of the regulated parties has breached or is at risk of breaching its capital resources requirements or risk concentrations requirements.
Group Capital
| | | | | | | | |
| | | 31 December 2012
£m | | | 31 December 2011(1)
£m | |
Tier 1 capital | | | 3,785 | | | | 3,457 | |
Deductions from Tier 1 capital | | | (29 | ) | | | (44 | ) |
| | | | | | | | |
Total Tier 1 capital | | | 3,756 | | | | 3,413 | |
Tier 2 Capital | | | 2 | | | | — | |
| | | | | | | | |
Total capital resources | | | 3,758 | | | | 3,413 | |
| | | | | | | | |
| (1) | As restated, see Note 45 |
Tier 2 capital consists of collectively assessed impairment allowances on standardised portfolios. Tier 1 capital consists of shareholders’ equity and audited profits for the years ended 31 December 2012 and 2011 after adjustment to comply with UK Financial Services Authority rules.
Tier 1 deductions relate to intangible assets and expected losses. The expected loss deduction represents the difference between expected loss calculated in accordance with the ANTS group’s Basel II IRB models, and the impairment losses calculated in accordance with IFRS. The ANTS group’s accounting policy for impairment loss allowances is set out in Note 1. Regulatory expected losses are higher than the impairment losses as the expected loss amount includes all losses that are anticipated to arise over the twelve months following the balance sheet date, not just those incurred at the balance sheet date. In addition, the ANTS group has elected to deduct certain securitisation positions from capital rather than treat these exposures as a risk weighted asset.
The increase in Tier 1 capital is due to the inclusion of audited profits for the year ended 31 December 2012.
| | |
| 188 | | Abbey National Treasury Services plc 2012 Annual Report |
Financial Statements
Notes to the Financial Statementscontinued
45. RESTATEMENTS
The financial statements have been revised to correct misstatements in the measurement of the Company’s loans secured on residential property to UK housing associations that are designated at fair value of £281m and the measurement of the fair value hedge adjustment for debt securities of £37m. The misstatements resulted in restatements of previously reported amounts in respect of “Net Trading and Other Income”, “Financial assets designated at fair value”, “Debt securities in issue” and “Retained earnings”, and their related tax effects, as follows:
Net Trading and Other Income
| | | | | | | | |
| | | 2011
(Restated)
£m | | | 2011
(Original)
£m | |
Net trading and other (expense)/income | | | (46 | ) | | | 198 | |
| | | | | | | | |
Taxation Charge
| | | | | | | | |
| | | 2011
(Restated)
£m | | | 2011
(Original)
£m | |
Tax on profit for the year | | | 104 | | | | 168 | |
| | | | | | | | |
Financial assets designated at fair value
| | | | | | | | |
| | | 2011
(Restated)
£m | | | 2011
(Original)
£m | |
Loans and advances to customers | | | 4,050 | | | | 4,331 | |
Debt securities | | | 379 | | | | 379 | |
| | | | | | | | |
| | | 4,429 | | | | 4,710 | |
| | | | | | | | |
Debt securities in issue
| | | | | | | | |
| | | 2011
(Restated)
£m | | | 2011
(Original)
£m | |
Debt securities in issue | | | 26,943 | | | | 26,980 | |
| | | | | | | | |
Current tax liabilities
| | | | | | | | |
| | | 2011
(Restated)
£m | | | 2011
(Original)
£m | |
Current tax liabilities | | | 329 | | | | 393 | |
| | | | | | | | |
Retained earnings
| | | | | | | | |
| | | 2011
(Restated)
£m | | | 2011
(Original)
£m | |
Retained earnings | | | 962 | | | | 1,142 | |
| | | | | | | | |
| | |
Abbey National Treasury Services plc 2012 Annual Report | | 189 |
Shareholder Information
Risk Factors
An investment in Abbey National Treasury Services plc (the “Company”) and together with its subsidiaries (“us” or “we”) involves a number of risks, the material ones of which are set forth below. As a consequence of the reciprocal guarantee given by the Company in respect of the liabilities of Santander UK plc, we are exposed to the same risk factors as Santander UK, of which we are part.
Santander UK’s operating results, financial condition and prospects may be materially impacted by economic conditions in the UK.
Santander UK’s business activities, of which we form a part, are concentrated in the UK and on the offering of mortgage, loan and savings-related products and services. As a consequence, its operating results, financial condition and prospects are significantly affected by economic conditions in the UK generally, and by the UK property market in particular.
The outlook for the UK economy has remained challenging over the last year, with the UK economy dipping back into recession in the course of 2012. Though the economy returned to growth in the third quarter of 2012, this was in part due to one-off factors (such as the Olympics) and prospects for the 2013-2014 financial year remain challenging. Uncertainty surrounding the future of the eurozone, although less acute than before, may continue to pose a risk of further slowdown in economic activity in the UK’s principal export markets which would have an effect on the broader UK economy. Domestically, both public and household spending are being constrained by austerity measures, and there is a risk of higher levels of unemployment combined with a decline in real disposable incomes.
Adverse changes in the credit quality of our and Santander UK’s borrowers and counterparties or a general deterioration in UK or global economic conditions could reduce the recoverability and value of our and Santander UK’s assets and require an increase in the level of provisions for bad and doubtful debts. Likewise, a significant reduction in the demand for our and Santander UK’s products and services could negatively impact our and Santander UK’s business and financial condition. UK economic conditions and uncertainties may have an adverse effect on the quality of our and Santander UK’s loan portfolio and may result in a rise in delinquency and default rates. There can be no assurance that we will not have to increase our provisions for loan losses in the future as a result of increases in non-performing loans or for other reasons beyond our control. Material increases in our provisions for loan losses and write-offs/charge-offs could have an adverse effect on our operating results, financial condition and prospects.
As in several other economies, the UK Government has taken measures to address the exceptionally high level of national debt, including tax increases and public spending cuts. These measures have contributed to a slower recovery than other recent recessions. Political involvement in the regulatory process, in the behaviour and governance of the UK banking sector and in the major financial institutions in which the UK Government has a direct financial interest is set to continue. Credit quality could be adversely affected by a further increase in unemployment. This, plus the combination of slow economic recovery and UK Government intervention, together with any related significant reduction in the demand for our and Santander UK’s products and services, could have a material adverse effect on our and Santander UK’s operating results, financial condition and prospects.
We are vulnerable to the current disruptions and volatility in the global financial markets.
In the past five years, the financial systems worldwide have experienced difficult credit and liquidity conditions and disruptions leading to less liquidity, greater volatility, a general widening of spreads and, in some cases, lack of price transparency on interbank lending rates. Global economic conditions deteriorated significantly between 2007 and 2009 and many countries, including the United Kingdom, have been in recession. Many major financial institutions, including some of the world’s largest global commercial banks, investment banks, mortgage lenders, mortgage guarantors and insurance companies, experienced significant difficulties. Around the world, there have also been runs on deposits at several financial institutions, numerous institutions have sought additional capital or have been assisted by central banks and governments providing liquidity, whilst many lenders and institutional investors have reduced or ceased providing funding to borrowers (including to other financial institutions). The global economic slowdown, and the downturn in the UK in particular, have had a negative impact on the UK economy and adversely affected our business.
In particular, we may face, among others, the following risks related to the economic downturn:
| • | | We potentially face increased regulation of our industry. Compliance with such regulation may increase our costs, may affect the pricing for our products and services, and limit our ability to pursue business opportunities. |
| • | | Reduced demand for our products and services. |
| • | | Inability of our borrowers or counterparties to comply fully or in a timely manner with their existing obligations. |
| • | | The process we use to estimate losses inherent in our credit exposure requires complex judgements, including forecasts of economic conditions and how these economic conditions might impair the ability of our borrowers to repay their loans. The degree of uncertainty concerning economic conditions may adversely affect the accuracy of our estimates, which may, in turn, impact the reliability of the process and the quality of our assets. |
| • | | The value and liquidity of the portfolio of investment securities that we hold may be adversely affected. |
| • | | A worsening of the global economic conditions may delay the recovery of the international financial industry and impact our financial condition and results of operations. |
Uncertainty remains concerning the future economic environment and there is no assurance when conditions will significantly improve. While certain segments of the global economy are currently experiencing some modest recovery, we expect conditions to continue to have an ongoing negative impact on our business and results of operations. Investors remain cautious and downgrades of the sovereign debt of certain eurozone countries have induced greater volatility in the capital markets. A slowing or failing of the economic recovery would likely aggravate the adverse effects of these difficult economic and market conditions on us and on others in the financial services industry.
Continued or worsening disruption and volatility in the global financial markets could have a material adverse effect on us, including our ability to access capital and liquidity on financial terms acceptable to us, if at all. If capital markets financing ceases to become available, or becomes excessively expensive, Santander UK may be forced to raise the rates it pays on deposits to attract more customers and become unable to maintain certain liability maturities. Any such increase in capital markets funding costs or deposit rates could have a material adverse effect on our or Santander UK’s interest margins.
If all or some of the foregoing risks were to materialise, this could have a material adverse effect on us.
| | |
| 190 | | Abbey National Treasury Services plc 2012 Annual Report |
Shareholder Information
Risk Factorscontinued
We are subject to regulatory capital requirements that could limit our operations, and changes to these requirements may further limit and adversely affect our operating results, financial condition and prospects.
As a bank we are subject to capital adequacy requirements adopted by the Financial Services Authority (“FSA”) which provide for a minimum ratio of total capital to risk-adjusted assets both on a consolidated basis and on a solo-consolidated basis (the basis used by the FSA solely for the purpose of the calculation of capital resources and capital resources requirements, which measure the capital of the Company) and a minimum ratio of Core Tier 1 capital to risk-adjusted assets on a consolidated basis. Any failure by us to maintain our ratios may result in administrative actions or sanctions which may affect our ability to fulfil our obligations.
In response to the recent financial crisis, the FSA has imposed more stringent capital adequacy requirements, and the FSA or its prudential regulation successor, the Prudential Regulation Authority (“PRA”), may continue to require more stringent adequacy standards including increasing the minimum regulatory capital requirements demanded of us. For instance, the FSA has adopted a supervisory approach in relation to certain UK banks, including us, under which those banks are expected to maintain Core Tier 1 capital in excess of the minimum levels required by the existing rules and guidance of the FSA. In future, the FSA or the PRA may also impose higher capital requirements and target capital ratios as part of the implementation of UK macroprudential tools.
In December 2010, the Basel Committee on Banking Supervision (the “Basel Committee”) proposed comprehensive changes to the capital adequacy framework, known as Basel III. A revised version of these proposals was issued in June 2011. The reforms to the regulatory capital framework were proposed to raise the resilience of the banking sector, through increasing both the quality and quantity of the regulatory capital base and enhancing the risk coverage of the capital framework. As part of these, the amount and quality of Tier 1 capital that institutions are required to hold was raised, innovative Tier 1 capital instruments with an incentive to redeem are to be phased out and the rules for determining Tier 2 capital instruments are harmonised. Basel III also requires institutions to build counter-cyclical capital buffers that may be drawn upon in stress periods and to hold a capital conservation buffer above minimum capital ratio levels, which have the effect of raising the minimum level of tangible common equity capital from 2 per cent. to 7 per cent. of risk-weighted assets. In addition a leverage ratio was proposed for institutions as a backstop, which would be applied alongside current risk-based regulatory capital requirements. The changes in Basel III are proposed to be phased in gradually between January 2013 and January 2022.
The implementation of Basel III in the European Union is being performed through the Capital Requirements Directive IV and Capital Requirements Regulation (“CRDIV/CRR”) legislative package. In early 2013 the draft legislation remains under discussion between the European Parliament, the European Commission and the Council of Ministers. The final capital framework to be established in the EU under CRDIV/CRR is likely to differ from Basel III in certain areas and the implementation date is still subject to uncertainty.
In addition to Basel III, regulators in the UK and world-wide have produced a range of proposals for future legislative and regulatory changes which could force us to comply with certain operational restrictions or take steps to raise further capital, or could increase our expenses, or otherwise adversely affect our operating results, financial condition and prospects. These include
| • | | the introduction of recovery and resolution planning requirements (popularly known as ‘living wills’) for banks and other financial institutions as contingency planning for the failure of a financial institution that may affect the stability of the financial system; |
| • | | implementation of the Financial Services Act 2012, which enhances the FSA’s disciplinary and enforcement powers; |
| • | | the introduction of more regular and detailed reporting obligations; |
| • | | a move to pre-funding of the deposit protection scheme in the UK, which affects Santander UK as a whole; |
| • | | a proposal in the Independent Commission on Banking’s recommendations to require large UK retail banks to hold a minimum Core Tier 1 to risk-weighted assets ratio of at least 10 per cent., which is broadly 3 per cent. higher than the minimum capital levels required under Basel III, and to have a minimum primary loss-absorbing capacity of 17 per cent. of risk-weighted assets, and |
| • | | proposed revisions to the approaches for determining trading book capital requirements and banking book risk-weighted assets from the Basel Committee. |
These measures could have a material adverse effect on our operating results, financial condition and prospects. There is a risk that changes to the UK’s capital adequacy regime (including any introduction of a minimum leverage ratio) may result in increased minimum capital requirements, which could reduce available capital and thereby adversely affect our profitability and ability to pay dividends, continue organic growth (including increased lending), or pursue acquisitions or other strategic opportunities (alternatively we could restructure our balance sheet to reduce the capital charges incurred pursuant to the FSA’s rules in relation to the assets held, or raise additional capital but at increased cost and subject to prevailing market conditions). In addition, changes to the eligibility criteria for Tier 1 and Tier 2 capital may affect our ability to raise Tier 1 and Tier 2 capital and impact the recognition of existing Tier 1 and Tier 2 capital resources in the calculation of our capital position.
Our business could be affected if our capital is not managed effectively or if these measures limit our ability to manage our balance sheet and capital resources effectively or to access funding on commercially acceptable terms. Effective management of our capital position is important to our ability to operate our business, to continue to grow organically and to pursue our business strategy.
We are subject to liquidity requirements that could limit our operations, and changes to these requirements may further limit and adversely affect our operating results, financial condition and prospects.
On 5 October 2009, the FSA published liquidity rules which significantly broadened the scope of the existing liquidity regime. These were designed to enhance regulated firms’ liquidity risk management practices. As part of these reforms, the FSA has implemented requirements for financial institutions to hold prescribed levels of specified liquid assets and have in place other sources of liquidity to address the institution-specific and market-wide liquidity risks that institutions may face in short-term and prolonged stress scenarios. These rules have applied to us since June 2010 with some subsequent technical revisions.
In addition to the changes to the capital adequacy framework published in December 2010 described above, the Basel Committee also published its global quantitative liquidity framework, comprising the Liquidity Coverage Ratio (“LCR”) and Net Stable Funding Ratio (“NSFR”) metrics, with objectives to (1) promote the short-term resilience of banks’ liquidity risk profiles by ensuring they have sufficient high-quality liquid assets to survive a significant stress scenario; and (2) promote resilience over a longer time horizon by creating incentives for banks to fund their activities with more stable sources of funding on an ongoing basis. The LCR has subsequently been revised by the Basel Committee in January 2013 which amended the definition of high-quality liquid assets and agreed a revised timetable for phase-in of the standard from 2015 to 2019, as well as making some technical changes to some of the stress scenario assumptions.
| | |
Abbey National Treasury Services plc 2012 Annual Report | | 191 |
Shareholder Information
Risk Factorscontinued
As with the Basel Committee’s proposed changes to the capital adequacy framework, the draft liquidity framework remains under discussion within the EU and the final framework to be established could differ from Basel III in certain areas. The implementation date is still subject to uncertainty.
There is also a risk that implementing and maintaining enhanced liquidity risk management systems may incur significant costs, and more stringent requirements to hold liquid assets may materially affect our lending business as more funds may be required to acquire or maintain a liquidity buffer, thereby reducing future profitability.
Exposure to UK Government debt could have a material adverse effect on us.
Like many other UK banks, Santander UK invests in debt securities of the UK Government largely for liquidity purposes. As of 31 December 2012, approximately 2% of its total assets and 51% of its securities portfolio were comprised of debt securities issued by the UK Government. Any failure by the UK Government to make timely payments under the terms of these securities, or a significant decrease in their market value, will have a material adverse effect on Santander UK.
We may suffer adverse effects as a result of the continued economic and sovereign debt tensions in the eurozone.
Eurozone markets and economies continue to show signs of fragility and volatility, with recession in several economies and only sporadic access to capital markets in others. Interest rate differentials among eurozone countries indicate continued doubts about some governments’ ability to fund themselves and affect borrowing rates in those economies.
The European Central Bank and European Council took actions in 2012 to aim to reduce the risk of contagion throughout and beyond the eurozone. These included the creation of the Open Market Transaction facility of the ECB and the decision by eurozone governments to create a banking union. Nonetheless, a significant number of financial institutions throughout Europe have substantial exposures to sovereign debt issued by nations which are under financial pressure. Should any of those nations default on their debt, or experience a significant widening of credit spreads, major financial institutions and banking systems throughout Europe could be destabilised, resulting in the further spread of the ongoing economic crisis.
The continued high cost of capital for some European governments was felt in the wholesale markets in the UK, which has resulted in an increase in the cost of retail funding and greater competition in a savings market that is growing slowly by historical standards. In the absence of a permanent resolution of the eurozone crisis, conditions could deteriorate.
Although we conduct the majority of our business in the UK, we have direct and indirect exposure to financial and economic conditions throughout the eurozone economies. For further description of our country risk exposures, including eurozone and peripheral eurozone exposures, see the “Country Risk Exposure” section in the Risk Management Report on pages 84 to 91. In addition, general financial and economic conditions in the UK, which directly affect our operating results, financial condition and prospects, may deteriorate as a result of conditions in the eurozone.
Though the possibility may be more remote following the measures taken in 2012, a wide-scale break-up of the eurozone would most likely be associated with a deterioration in the economic and financial environment in the UK and could have a material adverse impact on the whole financial sector, creating new challenges in sovereign and corporate lending and resulting in significant disruptions in financial activities at both the market and retail levels. This could materially and adversely affect our operating results, financial position and prospects.
We may suffer adverse effects should eurozone member states exit the euro or the euro be totally abandoned.
The departure or risk of departure from the euro by one or more eurozone countries and/or the abandonment of the euro as a currency could have negative effects on both existing contractual relations and the fulfilment of obligations by us, our counterparties and/or our customers, which would have a significant negative impact on our activity, operating results and capital and financial position.
There is currently no established legal framework within the European treaties to facilitate a member state exiting from the euro; consequently, it is not possible to predict the course of events and legal consequences that would ensue. Uncertainties that heighten the risk of re-denomination include how an exiting member state would deal with its existing euro-denominated assets and liabilities, the valuation of any newly-adopted currency against the euro and the process of exiting the euro. These uncertainties make it impossible to predict what our losses might be as a result of any country’s decision to exit the euro. The significant upheaval in the eurozone that might arise from any such member state exit, or from the wholesale abandonment of the euro by the eurozone states could materially and adversely affect our operating results, financial condition and prospects.
We are exposed to risks faced by other financial institutions.
We routinely transact with counterparties in the financial services industry, including brokers and dealers, commercial banks, investment banks, mutual funds, hedge funds and other institutional clients. Defaults by, and even rumours or questions about the solvency of, certain financial institutions and the financial services industry generally have led to market-wide liquidity problems and could lead to losses or defaults by other institutions. Many of the routine transactions we enter into expose us to significant credit risk in the event of default by one of our significant counterparties. The European sovereign debt crisis and the risk it poses to financial institutions throughout Europe have had, and may continue to have, an adverse effect on interbank financial transactions in general. A default by a significant financial counterparty, or liquidity problems in the financial services industry generally, could have a material adverse effect on us.
Liquidity and funding risks are inherent in our business and could have a material adverse effect on us.
Liquidity risk is the risk that we, although solvent, either do not have available sufficient financial resources to meet our obligations as they fall due or can secure them only at excessive cost. This risk is inherent in any retail and commercial banking business as carried out by Santander UK and can be heightened by a number of enterprise-specific factors, including over-reliance on a particular source of funding, changes in credit ratings or market-wide phenomena such as market dislocation. While we implement liquidity management processes to seek to mitigate and control these risks, unforeseen systemic market factors in particular make it difficult to eliminate completely these risks. Adverse and continued constraints in the supply of liquidity, including inter-bank lending, has affected and may again materially and adversely affect the cost of funding our business, and extreme liquidity constraints may affect our current operations as well as limit growth possibilities.
| | |
| 192 | | Abbey National Treasury Services plc 2012 Annual Report |
Shareholder Information
Risk Factorscontinued
Continued or worsening disruption and volatility in the global financial markets could have a material adverse effect on our ability to access capital and liquidity on financial terms acceptable to us.
Our cost of obtaining funding is directly related to prevailing market interest rates and to our credit spreads. Increases in interest rates and our credit spreads can significantly increase the cost of our funding. Changes in our credit spreads are market-driven, and may be influenced by market perceptions of our creditworthiness. Changes to interest rates and our credit spreads occur continuously and may be unpredictable and highly volatile.
If wholesale markets financing ceases to become available, or becomes excessively expensive, we may be forced to raise the rates we pay on deposits, with a view to attracting more customers, and/or to sell assets, potentially at depressed prices. The persistence or worsening of these adverse market conditions or an increase in base interest rates could have a material adverse effect on our ability to access liquidity and cost of funding (whether directly or indirectly).
Although central banks around the world have made coordinated efforts to increase liquidity in the financial markets, by taking measures such as increasing the amounts they lend directly to financial institutions, lowering interest rates and significantly increasing temporary reciprocal currency arrangements (or swap lines), it is not known how long central bank schemes will continue or on what terms. The Bank of England’s Special Liquidity Scheme expired at the end of January 2012, although the Bank of England has implemented the Extended Collateral Term Repo facility (‘ECTR’) which aims to increase liquidity in the market, and the Funding for Lending Scheme (the “FLS”) which aims to reduce cost of funding for participating financial institutions, like Santander UK plc. As at 31 December 2012, Santander UK plc had drawn £1.0bn of UK treasury bills under the FLS and it may make further usage of the FLS before the drawdown period ends on 31 January 2014.
The availability of Bank of England facilities for UK financial institutions, to the extent that they provide us with access to cheaper and more attractive funding than other sources, reduces our reliance on retail or wholesale markets. To the extent that we make use of Bank of England facilities, any significant reduction or withdrawal of those facilities would increase our funding costs. In addition, other financial institutions who have relied significantly on Government support to meet their funding needs will also need to find alternative sources of funding and, in such a scenario, we would expect to face increased competition for funding, particularly retail funding on which we rely. This competition could further increase our funding costs and so adversely impact our results of operations and financial position. Our cost of funding could also increase as a result of an increase in interest rates by the Bank of England.
Each of the factors described above – the persistence or worsening of adverse market conditions, and the lack of availability, or withdrawal, of such central bank schemes or an increase in base interest rates – could have a material adverse effect on our ability to access liquidity and cost of funding (whether directly or indirectly).
We aim for a funding structure that is consistent with our assets, avoids excessive reliance on short term wholesale funding, attracts enduring commercial deposits and provides diversification in products and tenor. We therefore rely, and will continue to rely, on commercial deposits to fund a significant proportion of lending activities. The ongoing availability of this type of funding is sensitive to a variety of factors outside our control, such as general economic conditions and the confidence of commercial depositors in the economy, in general, and the financial services industry in particular, and the availability and extent of deposit guarantees, as well as competition between banks for deposits. Any of these factors could significantly increase the amount of commercial deposit withdrawals in a short period of time, thereby reducing our ability to access commercial deposit funding on appropriate terms, or at all, in the future.
For additional information about our liquidity position and other liquidity matters, including the policies and procedures we use to manage our liquidity risks, see ‘Balance Sheet Review – Liquidity and Funding’ on page 25 and ‘Risk Management Report – Liquidity and Funding risk’ on pages 70 to 77.
A sudden or unexpected shortage of funds in the banking system could lead to increased funding costs, a reduction in the term of funding instruments or require us to liquidate certain assets. If these circumstances were to arise, this could have a material adverse effect on our operating results, financial condition and prospects.
Credit, market and liquidity risk may have an adverse effect on our credit ratings and our cost of funds. A downgrade of our credit rating would likely increase our cost of funding, require us to post additional collateral or take other actions under some of our derivative contracts and adversely affect our interest margins and results of operations.
Credit ratings can in some instances affect the cost and other terms upon which we are able to obtain funding. Credit rating agencies regularly evaluate us or Santander UK, the group we are part of, and their credit ratings of us and Santander UK and our debt in issue are based on a number of factors, including our financial strength as well as conditions affecting the financial services industry generally.
Any downgrade in our credit ratings could increase our borrowing costs and could require us to post additional collateral or take other actions under some of our derivative contracts, and could limit our access to capital markets and adversely affect our commercial business. For example, a credit rating downgrade could adversely affect our ability to sell or market certain of our products, engage in certain longer-term and derivatives transactions and retain our customers, particularly customers who need a minimum rating threshold in order to invest. In addition, under the terms of certain of our derivative contracts, we may be required to maintain a minimum credit rating or otherwise terminate such contracts. Any of these results of a credit rating downgrade could, in turn, reduce our liquidity and have an adverse effect on us, including our operating results and financial condition.
For example, Santander UK estimated that as at 31 December 2012, if all the rating agencies were to downgrade its long-term credit ratings by one notch, and thereby trigger a short-term credit rating downgrade, this could result in outflows from its total liquid assets of £2.0bn of cash and £6.6bn in additional collateral that it would be required to post under the terms of its secured funding and derivative contracts. A hypothetical two notch downgrade would result in an additional outflow of £0.4bn of cash and £1.4bn of collateral under its secured funding and derivative contracts. However, while certain potential impacts are contractual and quantifiable, the full consequences of a credit rating downgrade are inherently uncertain, as they depend upon numerous dynamic, complex and inter-related factors and assumptions, including market conditions at the time of any downgrade, whether any downgrade of a firm’s long-term credit rating precipitates downgrades to its short-term credit rating, and assumptions about the potential behaviours of various customers, investors and counterparties. Actual outflows could be higher or lower than this hypothetical example, depending upon certain factors including which credit rating agency had downgraded Santander UK plc’s credit rating, any management or restructuring actions that could be taken to reduce cash outflows and the potential liquidity impact from loss of unsecured funding (such as from money market funds) or loss of secured funding capacity. Although, unsecured and secured funding stresses are included in our and Santander UK’s stress testing scenarios and a portion of our and its total liquid assets is held against these risks, it is still the case that a credit rating downgrade could have a material adverse effect on us and Santander UK. In addition, if we or Santander UK were required to cancel our derivatives contracts with certain counterparties and were unable to replace such contracts, our market risk profile could be altered.
| | |
Abbey National Treasury Services plc 2012 Annual Report | | 193 |
Shareholder Information
Risk Factorscontinued
A downgrade of the UK sovereign credit rating, or the perception that such a downgrade may occur, may have a material adverse effect on our operating results, financial condition, prospects and the marketability and trading value of our securities. This might also impact on our own credit rating, borrowing costs and our ability to secure funding. A UK sovereign credit rating downgrade or the perception that such a downgrade may occur could also have a material effect in depressing consumer confidence, restricting the availability, and increasing the cost, of funding for individuals and companies, further depressing economic activity, increasing unemployment and/or reducing asset prices.
In light of the difficulties in the financial services industry and the financial markets, there can be no assurance that the credit rating agencies will maintain our current credit ratings or outlooks. Our failure to maintain favourable credit ratings and outlooks would likely increase our cost of funding and adversely affect our interest margins, which could have a material negative effect on us.
Our financial results are constantly exposed to market risk. We are subject to fluctuations in interest rates and other market risks, which may materially adversely affect us.
Market risk refers to the probability of variations in our net interest income or in the market value of our assets and liabilities due to volatility of interest rate, exchange rate or equity price. Changes in interest rates affect the following areas, among others, of our business:
| • | | the volume of loans originated; |
| • | | the market value of our securities holdings; and |
| • | | gains from sales of loans and securities. |
Variations in short-term interest rates could affect our net interest income, which comprises the majority of our revenue. When interest rates rise, we may be required to pay higher interest on our floating-rate borrowings while interest earned on our fixed-rate assets does not rise as quickly, which could cause profits to grow at a reduced rate or decline in some parts of our portfolio. Interest rate variations could adversely affect us, including our net interest income, reducing its growth rate or even resulting in losses. Interest rates are highly sensitive to many factors beyond our control, including increased regulation of the financial sector, monetary policies, domestic and international economic and political conditions and other factors.
Increases in interest rates may reduce the volume of loans we originate. Sustained high interest rates have historically discouraged customers from borrowing and have resulted in increased delinquencies in outstanding loans and deterioration in the quality of assets. Increases in interest rates may also reduce the propensity of our customers to prepay or refinance fixed-rate loans, reduce the value of our financial assets and reduce gains or require us to record losses on sales of our loans or securities.
If interest rates decrease, although this is likely to reduce our funding costs, it is likely to adversely impact the income we receive arising from our investments in securities as well as loans with similar maturities.
The market value of a security with a fixed interest rate generally decreases when the prevailing interest rates rise, which may have an adverse effect on our earnings and financial condition. In addition, we may incur costs (which, in turn, will impact our results) as we implement strategies to reduce future interest rate exposure. The market value of an obligation with a floating interest rate can be adversely affected when interest rates increase, due to a lag in the implementation of repricing terms or an inability to refinance at lower rates.
We are also exposed to foreign exchange rate risk as a result of mismatches between assets and liabilities denominated in different currencies. Fluctuations in the exchange rate between currencies may negatively affect our earnings and value of our assets and securities. Our capital is stated in pound sterling and we do not fully hedge our capital position against changes in currency exchange rates. Although we seek to hedge most of our currency risk through hedging and purchase of cross-currency swaps, these hedges do not eliminate currency risk and we can make no assurance that we will not suffer adverse financial consequences as a result of currency fluctuations. Significant exchange rate volatility and the depreciation of the pound sterling in particular could have an adverse impact on our results of operations and our ability to meet our US dollar and euro-denominated obligations, and could have a material adverse effect on our operating results, financial condition and prospects.
We are also exposed to equity price risk in connection with our trading investments in equity securities as part of our normal course of business as a commercial bank. The performance of financial markets may cause changes in the value of our investment and trading portfolios. The volatility of world equity markets, due to the continued economic uncertainty and sovereign debt tensions, has had a particularly strong impact on the financial sector. Continued volatility may affect the value of our investments in entities in this sector and, depending on their fair value and future recovery expectations, could become a permanent impairment which would be subject to write-offs against our results. To the extent any of these risks materialise, our net interest income or the market value of our assets and liabilities could be adversely affected.
Market conditions have, and could result, in material changes to the estimated fair values of our financial assets. Negative fair value adjustments could have a material adverse effect on our operating results, financial condition and prospects.
In the past five years, financial markets have been subject to significant stress resulting in steep falls in perceived or actual financial asset values, particularly due to volatility in global financial markets and the resulting widening of credit spreads. We have material exposures to securities and other investments that are recorded at fair value and are therefore exposed to potential negative fair value adjustments. Asset valuations in future periods, reflecting then prevailing market conditions, may result in negative changes in the fair values of our financial assets and these may also translate into increased impairments. In addition, the value ultimately realised by us on disposal may be lower than the current fair value. Any of these factors could require us to record negative fair value adjustments, which may have a material adverse effect on our operating results, financial condition or prospects.
In addition, to the extent that fair values are determined using financial valuation models, such values may be inaccurate or subject to change, as the data used by such models may not be available or may become unavailable due to changes in market conditions, particularly for illiquid assets, and particularly in times of economic instability. In such circumstances, our valuation methodologies require us to make assumptions, judgements and estimates in order to establish fair value. This is a challenging task as reliable assumptions are difficult to make and are inherently uncertain. Moreover valuation models are complex, making them inherently imperfect predictors of actual results. Any consequential impairments or write-downs could have a material adverse effect on our operating results, financial condition and prospects.
| | |
| 194 | | Abbey National Treasury Services plc 2012 Annual Report |
Shareholder Information
Risk Factorscontinued
Failure to successfully implement and continue to improve our credit risk management system could materially and adversely affect us.
As a commercial bank one of the main types of risks inherent in our business is credit risk. For example, an important feature of our credit risk management system is to employ our own credit rating system to assess the particular risk profile of a customer. This system is primarily generated internally but, in the case of counterparties with a global presence, also builds off the credit assessment assigned by other Banco Santander group members. As this process involves detailed analyses of the customer or credit risk, taking into account both quantitative and qualitative factors, it is subject to human error. In exercising their judgement, our employees may not always be able to assign an accurate credit rating to a customer or credit risk, which may result in our exposure to higher credit risks than indicated by our risk rating system.
In addition, we have been trying to refine our credit policies and guidelines to address potential risks associated with particular industries or types of customers, such as affiliated entities and group customers. However, we may not be able to timely detect these risks before they occur, or due to limited tools available to us, our employees may not be able to effectively implement them, which may increase our credit risk. Failure to effectively implement, consistently follow or continuously refine our credit risk management system may result in an increase in the level of non-performing loans and a higher risk exposure for us, which could have a material adverse effect on us.
We are subject to market, operational and other related risks associated with our derivative transactions that could have a material adverse effect on us.
We enter into derivative transactions for trading purposes as well as for hedging purposes. We are subject to market and operational risks associated with these transactions, including basis risk (the risk of loss associated with variations in the spread between the asset yield and the funding and/or hedge cost) and credit or default risk (the risk of insolvency or other inability of the counterparty to a particular transaction to perform its obligations thereunder, including providing sufficient collateral). Any downgrade in our ratings could increase our borrowing costs and require us to post additional collateral or take other actions under some of our derivative contracts, and could limit our access to capital markets and adversely affect our commercial business.
Market practices and documentation for derivative transactions in the UK may differ from those in other countries. In addition, the execution and performance of these transactions depends on our ability to develop adequate control and administration systems and to hire and retain qualified personnel. Moreover, our ability to adequately monitor, analyse and report derivative transactions continues to depend, to a great extent, on our information technology systems. This factor further increases the risks associated with these transactions and could have a material adverse effect on us.
Operational risks, including risks relating to data collection, processing and storage systems are inherent in our business.
Our businesses depend on the ability to process a large number of transactions efficiently and accurately, and on our ability to rely on our digital technologies, computer and email services, software and networks, as well as on the secure processing, storage and transmission of confidential and other information in our computer systems and networks. The proper functioning of financial control, accounting or other data collection and processing systems is critical to our businesses and to our ability to compete effectively. Losses can result from inadequate personnel, human error, inadequate or failed internal control processes and systems, or from external events that interrupt normal business operations. We also face the risk that the design of our controls and procedures prove to be inadequate or are circumvented. Although we work with our clients, vendors, service providers, counterparties and other third parties to develop secure transmission capabilities and prevent against cyber attacks, we routinely exchange personal, confidential and proprietary information by electronic means, and we may be the target of attempted cyber attacks. If we cannot maintain an effective data collection, management and processing system, we may be materially and adversely affected.
We take protective measures and continuously monitor and develop our systems to protect our technology infrastructure and data from misappropriation or corruption, but our systems, software and networks nevertheless may be vulnerable to unauthorised access, misuse, computer viruses or other malicious code and other events that could have a security impact. An interception, misuse or mishandling of personal, confidential or proprietary information sent to or received from a client, vendor, service provider, counterparty or third party could result in legal liability, regulatory action and reputational harm. Furthermore, these may require us to expend significant additional resources to modify our protective measures or to investigate and remediate vulnerabilities or other exposures. There can be no assurance that we will not suffer material losses from operational risk in the future, including relating to cyber attacks or other such security breaches. Further, as cyber attacks continue to evolve, we may incur significant costs in our attempt to modify or enhance our protective measures or investigate or remediate any vulnerabilities.
We manage and hold confidential personal information of customers in the conduct of our banking operations. Although we have procedures and controls to safeguard personal information in our possession, unauthorised disclosures could subject us to legal actions and administrative sanctions as well as damages that could materially and adversely affect our results of operations and financial condition.
In addition, our businesses are exposed to risk from potential non-compliance with policies, employee misconduct or negligence and fraud, which could result in regulatory sanctions and serious reputational or financial harm. In recent years, a number of multinational financial institutions have suffered material losses due to the actions of ‘rogue traders’ or other employees. It is not always possible to deter employee misconduct and the precautions we take to prevent and detect this activity may not always be effective.
We are required to report every event related to information security issues, such as hacking or hacking attempts, events where customer information may be compromised, unauthorised access and other security breaches, to the Information Commissioner. As of the date of this report, we have not experienced information security problems and we have not had to report any such events to the Information Commissioner. Any material disruption or slowdown of our systems could cause information, including data related to customer requests, to be lost or to be delivered to our clients with delays or errors, which could reduce demand for our services and products and could materially and adversely affect us.
| | |
Abbey National Treasury Services plc 2012 Annual Report | | 195 |
Shareholder Information
Risk Factorscontinued
Despite our risk management policies, procedures and methods, we may nonetheless be exposed to unidentified or unanticipated risks.
The management of risk is an integral part of our activities. We seek to monitor and manage our risk exposure through a variety of separate but complementary financial, credit, market, operational, compliance and legal reporting systems. For further description of our risk management policies see the Risk Management Report on pages 28 to 98. While we employ a broad and diversified set of risk monitoring and risk mitigation techniques, such techniques and strategies may not be fully effective in mitigating our risk exposure in all economic market environments or against all types of risk, including risks that we fail to identify or anticipate.
Some of our qualitative tools and metrics for managing risk are based upon our use of observed historical market behaviour. We apply statistical and other tools to these observations to arrive at quantifications of our risk exposures. These qualitative tools and metrics may fail to predict future risk exposures. These risk exposures could, for example, arise from factors we did not anticipate or correctly evaluate in its statistical models. This would limit our ability to manage our risks. Our losses thus could be significantly greater than the historical measures indicate. In addition, our quantified modelling does not take all risks into account. Our more qualitative approach to managing those risks could prove insufficient, exposing us to material unanticipated losses. If existing or potential customers believe our risk management is inadequate, they could take their business elsewhere. This could harm our reputation as well as our revenues and profits.
Competition with other financial institutions could adversely affect us.
Santander UK, which includes us, faces substantial competition in all parts of its business, including in originating loans and in attracting deposits. The competition in originating loans comes principally from other domestic and foreign banks, mortgage banking companies, consumer finance companies, insurance companies and other lenders and purchasers of loans. The market for UK financial services is highly competitive and the recent financial crisis has reshaped the banking landscape in the UK, particularly the financial services and mortgage markets, reinforcing both the importance of a retail deposit funding base and strong capitalisation. Lenders have moved increasingly towards a policy of concentrating on the highest quality customers, judged by credit score and loan to value criteria, and there is strong competition for these customers. The supply of credit is much more limited for those potential customers without a large deposit or good credit history.
We expect competition to intensify in response to consumer demand, technological changes, the impact of consolidation, regulatory actions and other factors. If financial markets remain unstable, financial institution consolidation may continue (whether as a result of the UK Government taking ownership and control over other financial institutions in the UK or otherwise). Financial institution consolidation could also result from the UK Government disposing of its stakes in those financial institutions it currently controls. Such consolidation could adversely affect Santander UK’s operating results, financial condition and prospects. There can be no assurance that this increased competition will not adversely affect its growth prospects, and therefore its operations. Santander UK also faces competition from non-bank competitors, such as supermarkets and department stores for some credit products and generally from other loan providers.
Increasing competition could require that Santander UK increases its rates offered on deposits or lower the rates it charges on loans, which could also have a material adverse effect on it, including its profitability. It may also negatively affect Santander UK’s business results and prospects by, among other things, limiting its ability to increase its customer base and expand its operations and increasing competition for investment opportunities.
In addition, if Santander UK’s customer service levels were perceived by the market to be materially below those of our competitor financial institutions, it could lose existing and potential business. If Santander UK is not successful in retaining and strengthening customer relationships, it may lose market share, incur losses on some or all of its activities or fail to attract new deposits or retain existing deposits, which could have a material adverse effect on its operating results, financial condition and prospects.
Our ability to maintain our competitive position depends, in part, on the success of new products and services we offer our customers and our ability to continue offering products and services from third parties, and we may not be able to manage various risks we face as we expand our range of products and services that could have a material adverse effect on us.
The success of our operations and our profitability depends, in part, on the success of new products and services we offer our customers. However, we cannot guarantee that our new products and services will be responsive to customer demands or successful once they are offered to our customers, or that they will be successful in the future. In addition, our customers’ needs or desires may change over time, and such changes may render our products and services obsolete, outdated or unattractive and we may not be able to develop new products that meet our customers’ changing needs. If we cannot respond in a timely fashion to the changing needs of our customers, we may lose customers, which could in turn materially and adversely affect us.
As we expand the range of our products and services, some of which may be at an early stage of development in the UK market, we will be exposed to new and potentially increasingly complex risks and development expenses, with respect to which our experience and the experience of our partners may not be helpful. Our employees and our risk management systems may not be adequate to handle such risks. In addition, the cost of developing products that are not launched is likely to affect our results of operations. Any or all of these factors, individually or collectively, could have a material adverse effect on us.
If we are unable to effectively control the level of non-performing or poor credit quality loans in the future, or if our loan loss reserves are insufficient to cover future loan losses, this could have a material adverse effect on us.
Risks arising from changes in credit quality and the recoverability of loans and amounts due from counterparties are inherent in a wide range of our businesses and those of the wide Santander UK group. Non-performing or low credit quality loans can negatively impact our results of operations. We cannot be sure that we will be able to effectively control the level of the impaired loans in our total loan portfolio. In particular, the amount of our reported non-performing loans may increase in the future as a result of growth in our total loan portfolio, including as a result of loan portfolios that we may acquire in the future, or factors beyond our control, such as adverse changes in the credit quality of our borrowers and counterparties or a general deterioration in the UK or global economic conditions, impact of political events, events affecting certain industries or events affecting financial markets and global economies.
| | |
| 196 | | Abbey National Treasury Services plc 2012 Annual Report |
Shareholder Information
Risk Factors continued
Our current loan loss reserves may not be adequate to cover an increase in the amount of non-performing loans or any future deterioration in the overall credit quality of our total loan portfolio. Our loan loss reserves are based on our current assessment of and expectations concerning various factors affecting the quality of our loan portfolio. These factors include, among other things, our borrowers’ financial condition, repayment abilities and repayment intentions, the realisable value of any collateral, the prospects for support from any guarantor, government macroeconomic policies, interest rates and the legal and regulatory environment. As the recent global financial crisis has demonstrated, many of these factors are beyond our control. As a result, there is no precise method for predicting loan and credit losses, and we cannot assure you that our loan loss reserves will be sufficient to cover actual losses. If our assessment of and expectations concerning the above mentioned factors differ from actual developments, if the quality of our total loan portfolio deteriorates, for any reason, or if the future actual losses exceed our estimates of incurred losses, we may be required to increase our loan loss reserves, which may adversely affect us. If we are unable to control or reduce the level of our non-performing or poor credit quality loans, this could have a material adverse effect on us
Interest rates payable on a significant portion of Santander UK’s outstanding mortgage loan products fluctuate over time due to, among other factors, changes in the Bank of England base rate. As a result borrowers with variable interest rate mortgage loans are exposed to increased monthly payments when the related mortgage interest rate adjusts upward. Similarly, borrowers of mortgage loans with fixed or introductory rates adjusting to variable rates after an initial period are exposed to the risk of increased monthly payments at the end of this period. Over the last few years both variable and fixed interest rates have been at relatively low levels, which has benefited borrowers of new loans and those repaying existing variable rate loans regardless of special or introductory rates. Future increases in borrowers’ required monthly payments may result in higher delinquency rates and losses in the future. Borrowers seeking to avoid these increased monthly payments by refinancing their mortgage loans may no longer be able to find available replacement loans at comparably low interest rates. Recent declines in housing prices and/or any further declines in housing prices may also leave borrowers with insufficient equity in their homes to permit them to refinance. These events, alone or in combination, may contribute to higher delinquency rates and losses.
Our loan portfolio is subject to risk of prepayment, which could have a material adverse effect on us.
Our loan portfolio is subject to prepayment risk, which results from the ability of a borrower or issuer to pay a debt obligation prior to maturity. Generally, in a declining interest rate environment, prepayment activity increases, which reduces the weighted average lives of our earning assets and could have a material adverse effect on us. We would also be required to amortise net premiums into income over a shorter period of time, thereby reducing the corresponding asset yield and net interest income. Prepayment risk also has a significant adverse impact on credit card and collateralised mortgage loans, since prepayments could shorten the weighted average life of these assets, which may result in a mismatch in our funding obligations and reinvestment at lower yields. Prepayment risk is inherent to our commercial activity and an increase in prepayments could have a material adverse effect on us.
The value of the collateral, including real estate, securing Santander UK’s loans may not be sufficient, and it may be unable to realise the full value of the collateral securing its loan portfolio.
The value of the collateral securing the Santander UK loan portfolio may significantly fluctuate or decline due to factors beyond our control, including macroeconomic factors affecting the UK’s economy. The real estate market is particularly vulnerable in the current economic climate and the residential mortgage loan portfolio is one of Santander UK’s principal assets, comprising 85% of its loan portfolio as of 31 December 2012. As a result, it is highly exposed to developments in the residential property market in the UK.
The UK housing market has remained muted throughout 2012, with transaction levels well below historic norms and house prices broadly flat for the past two years. An increase in house prices may be limited by the high level of prices relative to household earnings and the more restricted availability of mortgage credit relative to pre-crisis levels. The depth of the previous house price declines as well as the continuing uncertainty as to the timing and extent of the economic recovery will mean that losses could be incurred on loans should they go into possession. The UK commercial property market conditions remain extremely challenging. After some recovery, commercial property capital values have seen further steady declines since Q4 2011 and the investment market has had lower transaction levels in 2012 as a result of weak demand. These developments mean that the outlook for the UK commercial property market remains uncertain.
The continued effect of margin pressure and exposure to both retail and commercial loan impairment charges resulting from the impact of general economic conditions means that Santander UK may continue to experience low levels of profitability and growth, and there remains the possibility of further downward pressure on profitability depending on a number of external influences, such as the consequences of a more austere economic environment. The value of the collateral securing its loan portfolio may also be adversely affected by force majeure events, such as natural disasters like floods or landslides which may cause widespread damage, could have an adverse impact on the economy of the affected region and may impair the asset quality of Santander UK’s loan portfolio in that area.
Santander UK may also not have sufficiently recent information on the value of collateral, which may result in an inaccurate assessment for impairment losses of its loans secured by such collateral. If this were to occur, it may need to make additional provisions to cover actual impairment losses of its loans, which may materially and adversely affect its results of operations and financial condition.
The credit card industry is highly competitive and entails significant risks, including the possibility of over-indebtedness of customers, which could have a material adverse effect on us.
Santander UK’s credit card business is subject to a number of risks and uncertainties, including the possibility of over-indebtedness of its customers, despite its focus on low-risk, medium- and high-income customers.
The credit card industry is characterised by higher consumer default than other credit industries, and defaults are highly correlated with macroeconomic indicators that are beyond Santander UK’s control. Part of the current growth strategy is to increase volume in the credit card portfolio which may increase Santander UK’s exposure to risk in its loan portfolio. If UK economic growth slows or declines, or if it fails to effectively analyse the creditworthiness of its customers (including by targeting certain sectors), Santander UK may be faced with unexpected losses that could have a material adverse effect on it.
| | |
Abbey National Treasury Services plc 2012 Annual Report | | 197 |
Shareholder Information
Risk Factorscontinued
We have a core strategy to grow our operations but if we are unable to manage such growth effectively, this could have an adverse impact on our profitability.
We allocate management and planning resources to develop strategic plans for organic growth, and to identify possible acquisitions and disposals and areas for restructuring our businesses. We cannot provide assurance that we will, in all cases, be able to manage our growth effectively or deliver our strategic growth objectives. Challenges that may result from our strategic growth decisions include our ability to:
| • | | manage efficiently the operations and employees of expanding businesses; |
| • | | maintain or grow our existing customer base; |
| • | | assess the value, strengths and weaknesses of investment or acquisition candidates; |
| • | | finance strategic opportunities, investments or acquisitions; |
| • | | fully integrate strategic investments, or newly-established entities or acquisitions, in line with our strategy; |
| • | | align our current information technology systems adequately with those of an enlarged Group; |
| • | | apply our risk management policy effectively to an enlarged Group; and |
| • | | manage a growing number of entities without over-committing management or losing key personnel. |
Any failure to manage growth effectively, including relating to any or all of the above challenges associated with our growth plans, could have a material adverse effect on our operating results, financial condition and prospects.
Future acquisitions may not be successful and maybe disruptive to Santander UK’s business.
From time to time, we evaluate acquisition and partnership opportunities that we believe could offer additional value to our shareholders and are consistent with our business strategy. However, we may not be able to identify suitable acquisition or partnership candidates, and we may not be able to acquire promising targets or form partnerships on favourable terms or at all. Furthermore preparations for acquisitions which do not complete can be disruptive. We base our assessment of potential acquisitions and partnerships on limited and potentially inexact information and on assumptions with respect to value, operations, profitability and other matters that may prove to be incorrect. Our ability to benefit from any such acquisitions and partnerships will depend in part on our successful integration of those businesses. We can give no assurances that our expectations with regards to integration and synergies will materialise. The integration of acquired businesses or partners’ businesses entails significant risks, including:
| • | | unforeseen difficulties in integrating operations and systems; |
| • | | inability to modify accounting standards rapidly; |
| • | | problems assimilating or retaining the employees of acquired businesses or partners’ businesses; |
| • | | challenges retaining customers of acquired businesses or partners’ businesses; |
| • | | unexpected liabilities or contingencies relating to the acquired businesses, including legal claims; |
| • | | the possibility that management may be distracted from day-to-day business concerns by integration activities and related problem-solving; and |
| • | | the possibility of regulatory restrictions that prevent us from achieving the expected benefits of the acquisition or venture. |
In addition, an acquisition or venture could result in the loss of key employees and inconsistencies in standards, controls, procedures and policies. Moreover, the success of the acquisition or venture will at least in part be subject to a number of political, economic and other factors that are beyond our control. Any or all of these factors, individually or collectively, could have a material adverse effect on us.
Goodwill impairments may be required in relation to acquired businesses.
Santander UK has made business acquisitions in recent years and may make further in the future. It is possible that the goodwill which has been attributed, or may be attributed, to these businesses may have to be written-down if its valuation assumptions are required to be reassessed as a result of any deterioration in their underlying profitability, asset quality and other relevant matters. Although no impairment of goodwill was recognised by Santander UK plc in 2012, in 2011 there was a £60m impairment as a result of a reassessment of the value of certain parts of the business in light of market conditions and regulatory developments. Impairment testing in respect of goodwill is performed annually, more frequently if there are impairment indicators present, and comprises a comparison of the carrying amount of the cash-generating unit with its recoverable amount. Goodwill impairment does not however affect Santander UK’s regulatory capital. There can be no assurances that Santander UK will not have to write down the value attributed to goodwill in the future, which would adversely affect its results and net assets.
We are subject to substantial regulation and governmental oversight which could adversely affect our business and operations.
As a financial institution, we are subject to extensive financial services laws, regulations, administrative actions and policies in the UK and each location in which we operate (including in the US and, indirectly, in Spain by the Banco de España (the Bank of Spain) as a result of being part of the Banco Santander, S.A. group) which materially affects our businesses. Statutes, regulations and policies to which we are subject, in particular those relating to the banking sector and financial institutions, may be changed at any time, and the interpretation and the application of those laws and regulations by regulators is also subject to change. Any legislative or regulatory actions and any required changes to our business operations resulting from such legislation and regulations could result in significant loss of revenue, limit our ability to pursue business opportunities in which we might otherwise consider engaging, affect the value of assets that we hold, require us to increase our prices and therefore reduce demand for our products, impose additional costs on us or otherwise adversely affect our businesses. Accordingly, there can be no assurance that future changes in regulations or in their interpretation or application will not adversely affect us.
During the recent market turmoil, there have been unprecedented levels of government and regulatory intervention and scrutiny, and changes to the regulations governing financial institutions and the conduct of business. In addition, in light of the financial crisis, regulatory and governmental authorities are considering, or may consider, further enhanced or new legal or regulatory requirements intended to prevent future crises or otherwise assure the stability of institutions under their supervision. It is anticipated that this intensive approach to supervision will be continued by the successor regulatory authorities to the FSA.
| | |
| 198 | | Abbey National Treasury Services plc 2012 Annual Report |
Shareholder Information
Risk Factors continued
Recent proposals and measures taken by governmental, tax and regulatory authorities and future changes in supervision and regulation, in particular in the UK, which are beyond our control, could materially affect our business, value of assets and operations, and result in significant increases in operational costs. Products and services offered by us could also be affected. Changes in UK legislation and regulation to address the stability of the financial sector may also affect the competitive position of the UK banks, including the Company, particularly if such changes are implemented before international consensus is reached on key issues affecting the industry, for instance in relation to the FSA’s regulations on liquidity risk management and also the UK Government’s introduction of the bank levy. Although we work closely with our regulators and continually monitor the situation, future changes in law, regulation, fiscal or other policies can be unpredictable and are beyond our control. No assurance can be given generally that laws or regulations will be adopted, enforced or interpreted in a manner that will not have an adverse effect on our business.
On 16 June 2010, the Chancellor of the Exchequer announced the creation of the Independent Commission on Banking (the ‘ICB’), chaired by Sir John Vickers. The ICB was asked to consider structural and related non-structural reforms to the UK banking sector to promote financial stability and competition, and to make recommendations to the UK Government. The ICB gave its recommendations on 12 September 2011 and proposed: (i) implementation of a retail ring fence; (ii) increased capital requirements; and (iii) improvement of competition – which were broadly endorsed by the Government in its response published on 19 December 2011. A White Paper was published on 14 June 2012 detailing how the Government intends to implement the recommendations of the ICB. A draft of the initial bill to implement the ICB recommendations was published on 12 October 2012, in the format of framework legislation to put in place the architecture to effect the reforms, with detailed policy being provided for through secondary legislation.
On 4 February 2013, the Financial Services (Banking Reform) Bill was introduced to Parliament. The Government expects the legislation to be in place by 2015 and to take effect by 2019. Implementation of the proposals may require us to make changes to our structure and business.
In the United States, the Dodd-Frank Wall Street Reform and Consumer Protection Act, enacted 21 July 2010 (the “Dodd-Frank Act”), has been implemented in part and continues to be implemented by various US federal regulatory agencies. The Dodd-Frank Act, among other things, imposes a new regulatory framework on swap transactions, including swaps of the sort that we enter into, requires regulators to adopt new rules governing the retention of credit risk by securitisers or originators of securitisations, significantly expands the coverage and scope of regulations that limit affiliate transactions within a banking organisation and prohibits certain forms of proprietary trading. Each of these aspects of the Dodd-Frank Act, as well as others, may directly and indirectly impact various aspects of our business. The full spectrum of risks that the Dodd-Frank Act poses to us is not yet known, however, such risks could be material and we could be materially and adversely affected by them.
The resolution of a number of issues, including regulatory reforms, investigations and reviews and court cases, affecting the UK financial services industry could have an adverse effect on our operating results, financial condition and prospects, or our relations with our customers and potential customers.
The structure of the financial regulatory authorities in the UK and the UK regulatory framework that applies to us is the subject of reform and reorganisation.
Under the Financial Services Act (the “Act”) which received Royal Assent on 19 December 2012 the Government has announced a range of structural reforms to UK financial regulatory bodies to be implemented in early 2013, as follows:
| • | | the FSA will cease to exist in its current form; |
| • | | a new Financial Policy Committee will be established in the Bank of England which will be responsible for macroprudential regulation, or regulation of stability and resilience of the financial system as a whole; |
| • | | an independent subsidiary of the Bank of England, the Prudential Regulation Authority (“PRA”), will be established to oversee micro-prudential regulation of financial institutions that manage significant risks on their balance sheets; and |
| • | | the Financial Conduct Authority (“FCA”) will be established and will have the responsibility for conduct of business and markets regulation. |
In addition, the Act, also contains provisions enabling consumer credit regulation to be transferred from the OFT to the FCA. This decision will be subject to further consultation. The FCA will also represent the UK’s interests in markets regulation at the new European Securities and Markets Authority.
This substantial reorganisation of the regulatory framework could cause administrative and operational disruption for the regulatory authorities concerned. This disruption could impact on the resources which the FSA or the successor authorities are able to devote to the supervision of regulated financial services firms, the nature of their approach to supervision and accordingly, the ability of regulated financial sector firms (including us) to deal effectively with their supervisors and to anticipate and respond appropriately to developments in regulatory policy.
It is anticipated that future changes in the nature of, or policies for, prudential and conduct of business supervision, as performed by the successor authorities to the FSA, will differ from the current approach taken by the FSA and that this could lead to a period of some uncertainty for us. The implementation of the Act could result both in further increased regulatory oversight of our activities as a financial services firm, resulting in constraints in our business activities and/or increases in regulatory capital requirements, and/or increased amounts of our time and resources required to be committed to compliance with the requirements of two new regulators with separate approaches and objectives, which could result in a material increase in compliance costs. No assurance can be given that further changes will not be made to the regulatory regime in the UK generally, our particular business sectors in the market or specifically in relation to us. Any or all of these factors could have a material adverse effect on the conduct of our business and, therefore, also on our strategy and profitability, and ability to respond to and satisfy the supervisory requirements of the relevant UK regulatory authorities.
| | |
Abbey National Treasury Services plc 2012 Annual Report | | 199 |
Shareholder Information
Risk Factorscontinued
Various reforms to the mortgage lending and personal loans market have been proposed which could require significant implementation costs or changes to Santander UK’s business strategy.
In March 2009, the Turner Review, “A regulatory response to the global banking crisis”, was published and set out a detailed analysis of how the global financial crisis began along with a number of recommendations for future reforms and proposals for consultation. As part of the Turner Review, the FSA published a discussion paper outlining proposals for reform of the mortgage market. Subsequently the FSA commenced a wide ranging consultation on mortgage lending – the FSA’s Mortgage Market Review (“MMR”). The MMR concluded with the publication of Final Rules by the FSA on 25 October 2012 that will amend existing conduct rules for mortgage lending in the FSA Handbook. The new rules will come into effect on 26 April 2014. Principal changes centre upon responsible lending and include:
| • | | more thorough verification of borrowers income (no self-certification of income, mandatory third party evidence of income required); |
| • | | assessment of affordability of interest-only loans on a capital and interest basis unless there is a clearly understood and believable alternative source of capital repayment; |
| • | | application of interest rate stress tests - lenders must consider likely interest rate movements over a minimum period of 5 years from the start of the mortgage term; |
| • | | when making underwriting assessments lenders must take account of future changes to income and expenditure that a lender knows of or should have been aware of from information gathered in the application process; and |
| • | | lenders may base their assessment of customers’ income on actual expected retirement age rather than state pension age. Lenders will be expected to assess income into retirement to judge whether the affordability tests can be met. |
There are also significant changes to mortgage distribution and advice requirements in sales, arrears management and requirements on contract variations such as when additional borrowing is requested.
The impact of the changes is now clear and the reforms have presaged a period of significant change for Santander UK’s mortgage lending business which will mean reforms to its mortgage sales delivery systems, changes to its mortgage documentation and significant reform of its approach to risk assessment of prospective mortgage customers. These could have an adverse effect on Santander UK’s operating results, financial condition and prospects.
Separately, throughout 2012, HM Treasury announced a number of measures with the aim of enhancing consumer protection in unsecured and secured credit lending. The measures provide for the transfer of responsibility for consumer credit control and supervision from the OFT to the new Financial Conduct Authority. The intention of HM Treasury is that transfer of control will take place in April 2014. It is expected that HM Treasury will publish results of a Regulatory Impact Assessment together with a consultation on legislative change and the details of the high level regime in early 2013. The FSA will also commence a consultation on the new FCA consumer credit regime and high level conduct of business rules in early 2013.
A likely consequence of these pending changes is that Santander UK will have to review and reform the sales processes and documentation of its consumer credit products including its credit card and unsecured personal loan products before April 2014. This review and the changes Santander UK may have to make could adversely affect its business.
We and Santander UK are exposed to risk of loss from legal and regulatory proceedings.
We, and the wider Santander UK group of which we are part, face various issues that may give rise to risk of loss from legal and regulatory proceedings. These issues, including appropriately dealing with potential conflicts of interest, and legal and regulatory requirements, could increase the amount of damages asserted against us or subject us to regulatory enforcement actions, fines and penalties. The current regulatory environment, with its increased supervisory focus on enforcement, combined with uncertainty about the evolution of the regulatory regime, may lead to material operational and compliance costs. These risks include that:
| • | | certain aspects of our business may be determined by the Bank of England, the FSA (and in due course, PRA and the FCA), HM Treasury, the OFT, the Financial Ombudsman Service (‘FOS’) or the courts as not being conducted in accordance with applicable laws or regulations, or, in the case of the FOS, with what is fair and reasonable in the Ombudsman’s opinion; |
| • | | the alleged misselling of financial products, such as payment protection insurance, including as a result of having sales practices and/or rewards structures that are deemed to have been inappropriate, resulting in disciplinary action (including significant fines) or requirements to amend sales processes, withdraw products, or provide restitution to affected customers, all of which may require additional provisions to be recorded in our financial statements and could adversely impact future revenues from affected products; |
| • | | we hold accounts for entities that might be or are subject to interest from various regulators, including the UK’s Serious Fraud Office, regulators in the US and elsewhere. We are not aware of any current investigation into us as a result of any such enquiries, but cannot exclude the possibility of our conduct being reviewed as part of any such investigation; and |
| • | | we may be liable for damages to third parties harmed by the conduct of our business. |
We are from time to time subject to certain claims and party to certain legal proceedings incidental to the normal course of our business, including in connection with our lending activities, relationships with our employees and other commercial or tax matters. These can be brought against us under UK regulatory processes or in the UK courts, or those in other jurisdictions where we operate including other European countries and the United States. In view of the inherent difficulty of predicting the outcome of legal matters, particularly where the claimants seek very large or indeterminate damages, or where the cases present novel legal theories, involve a large number of parties or are in the early stages of discovery, we cannot state with confidence what the eventual outcome of these pending matters will be or what the eventual loss, fines or penalties related to each pending matter may be. We believe that we have made adequate reserves related to the costs anticipated to be incurred in connection with these various claims and legal proceedings. However, the amount of these reserves is substantially less than the total amount of the claims asserted against us and in light of the uncertainties involved in such claims and proceedings, there is no assurance that the ultimate resolution of these matters will not significantly exceed the reserves currently accrued by us. As a result, the outcome of a particular matter may be material to our operating results for a particular period, depending upon, among other factors, the size of the loss or liability imposed and our level of income for that period.
The FSA carries out regular and frequent reviews of the conduct of business by financial institutions including banks. An adverse finding by the regulator could result in the need for extensive changes in systems and controls, business policies, and practices coupled with customer redress, fines and reputational damage.
Failure to manage these risks adequately could have a material adverse effect on our reputation, operating results, financial condition and prospects.
| | |
| 200 | | Abbey National Treasury Services plc 2012 Annual Report |
Shareholder Information
Risk Factors continued
Potential intervention by the UK Financial Services Authority (or an overseas regulator) may occur, particularly in response to customer complaints.
Following the onset of the recent financial crisis, the FSA has adopted a more intrusive and direct style of regulation which it has termed “intensive supervision”. This strategy, combined with the FSA’s outcome focused regulatory approach, more proactive enforcement and more punitive penalties for infringements means that FSA-authorised firms are facing increasing supervisory intrusion and scrutiny (resulting in increasing internal compliance costs and FSA supervision fees) and in the event of a breach of their regulatory obligations are likely to face more stringent penalties. It is anticipated that this intensive approach to supervision will be continued by the PRA and FCA.
The regulatory regime requires us to be in compliance across all aspects of our business, including the training, authorisation and supervision of personnel, systems, processes and documentation. If we fail to be compliant with relevant regulations, there is a risk of an adverse impact on our business from sanctions, fines or other action imposed by the regulatory authorities. Customers of financial services institutions, including our customers, may seek redress if they consider that they have suffered loss as a result of the misselling of a particular product, or through incorrect application of the terms and conditions of a particular product. Given the inherent unpredictability of litigation and the evolution of judgements by the FOS, it is possible that an adverse outcome in some matters could have a material adverse effect on our operating results, financial condition and prospects arising from any penalties imposed or compensation awarded, together with the costs of defending such an action.
The Financial Services Act 2010 provided a new power for the FSA which enables the FSA to require authorised firms, including us, to establish a consumer redress scheme if it considers that consumers have suffered loss or damage as a consequence of a widespread or regular regulatory failing, including misselling.
In recent years there have been several industry-wide issues in which the FSA has intervened directly. One such issue is the misselling of payment protection insurance (‘PPI’). In August 2010, the FSA published a policy statement entitled “The assessment and redress of Payment Protection Insurance complaints”. This policy statement contained rules from the FSA which altered the basis on which FSA regulated firms (including Santander UK plc) must consider and deal with complaints in relation to the sale of PPI and potentially increased the amount of compensation payable to customers whose complaints are upheld.
A legal challenge of these rules by the British Bankers’ Association (the ‘BBA’) was unsuccessful. In light of this and the consequential increase in claims levels Santander UK performed a detailed review of its provision requirements and as a result, revised its provision for PPI complaint liabilities to reflect the new information. The overall effect of the above was a substantial increase in the provision requirement for 2011.
The ultimate financial impact on Santander UK of the claims arising from PPI complaints is uncertain and will depend on a number of factors, including the implementation of the FSA’s Policy Statement, the rate at which new complaints arise, the content and quality of the complaints (including the availability of supporting evidence), the role of claims management companies and the average uphold rates and redress costs. Santander UK can make no assurance that expenses associated with PPI complaints will not exceed the provision it has made relating to these claims. More generally, Santander UK can make no assurance that its estimates for potential liabilities are correct, and the reserves taken as a result may prove inadequate. If Santander UK were to incur additional expenses that exceed provisions for PPI liabilities or other provisions, these expenses could have a material adverse effect on its operating results, financial condition and prospects.
All the above is similarly relevant to any future industry-wide misselling or other issues that could affect us. This may lead from time to time to: (i) significant direct costs or liabilities (including in relation to misselling); and (ii) changes in the practices of such businesses which benefit customers at a cost to shareholders.
Decisions taken by the FOS (or any overseas equivalent that has jurisdiction) could, if applied to a wider class or grouping of customers, have a material adverse effect on our operating results, financial condition and prospects.
The Banking Act, and similar European Union legislation, may adversely affect our business.
The Banking Act came into force on 12 February 2009. The special resolution regime set out in the Banking Act provides HM Treasury, the Bank of England and the FSA with a variety of powers for dealing with UK deposit taking institutions that are failing or likely to fail, including: (i) to take a bank or bank holding company into temporary public ownership; (ii) to transfer all or part of the business of a bank to a private sector purchaser; or (iii) to transfer all or part of the business of a bank to a “bridge bank”. The special resolution regime also comprises a separate insolvency procedure and administration procedure each of which is of specific application to banks. These insolvency and administration measures may be invoked prior to the point at which an application for insolvency proceedings with respect to a relevant institution could be made.
If an instrument or order were made under the Banking Act in respect of the Company, such instrument or order (as the case may be) may (among other things): (i) result in a compulsory transfer of shares or other securities or property of the Company; (ii) impact on the rights of the holders of shares or other securities in the Company or result in the nullification or modification of the terms and conditions of such shares or securities; or (iii) result in the de-listing of the Company’s shares and/or other securities. In addition, such an order may affect matters in respect of the Company and/or other aspects of the Company’s shares or other securities which may negatively affect the ability of the Company to meet its obligations in respect of such shares or securities.
At present, no instruments or orders have been made under the Banking Act relating to us and there has been no indication that any such order will be made, but there can be no assurance that holders of shares or other securities in the Company would not be adversely affected by any such order if made in the future.
In June 2012, the European Commission published a legislative proposal for a directive providing for the establishment of an EU-wide framework for the recovery and resolution of credit institutions and investment firms (the “CMD”). The stated aim of the draft CMD is to provide authorities with common tools and powers to address banking crises pre-emptively in order to safeguard financial stability and minimise taxpayers’ exposure to losses. The draft CMD currently contains similar resolution tools and powers to the Banking Act, including a ‘bail-in’ power which gives resolution authorities the power to write down the claims of unsecured creditors of a failing institution and to convert unsecured debt claims to equity (subject to certain parameters). The draft CMD currently contemplates that it will be applied by Member States from 1 January 2015 except for the bail-in tool (in relation to certain instruments) which is to be applied from 1 January 2018.
The powers currently set out in the draft CMD would impact how credit institutions and investment firms are managed as well as, in certain circumstances, the rights of creditors. However, the proposed directive is not in final form and changes may be made to it in the course of the legislative process. In addition, many of the proposals contained in the draft CMD have already been implemented in the Banking Act and it is currently unclear as to what extent, if any, the provisions of the Banking Act may need to change once the draft CMD is implemented. Accordingly, it is not yet possible to assess the full impact of the draft CMD on us and there can be no assurance that, once it is implemented, the fact of its implementation or the taking of any actions currently contemplated in it would not materially and adversely affect our operating results, financial position and prospects.
| | |
Abbey National Treasury Services plc 2012 Annual Report | | 201 |
Shareholder Information
Risk Factorscontinued
Santander UK is responsible for contributing to compensation schemes in the UK in respect of banks and other authorised financial services firms that are unable to meet their obligations to customers.
In the UK, the Financial Services Compensation Scheme (‘FSCS’) was established under the Financial Services and Markets Act 2000 and is the UK’s statutory fund of last resort for customers of authorised financial services firms. The FSCS can pay compensation to customers if an FSA-authorised firm is unable, or likely to be unable, to pay claims against it (for instance, an authorised bank is unable to pay claims by depositors). The FSCS is funded by levies on firms authorised by the FSA, including Santander UK plc.
In the event that the FSCS raises funds from authorised firms, raises those funds more frequently or significantly increases the levies to be paid by such firms, the associated cost to Santander UK may have a material adverse effect on its operating results, financial condition and prospects. The recent measures taken to protect the depositors of deposit-taking institutions involving the FSCS have resulted in a significant increase in the levies made by the FSCS on the industry and such levies may continue to go up if similar measures are required to protect depositors of other institutions.
In addition, regulatory reform initiatives in the UK and internationally may result in further changes to the FSCS, which could result in additional costs and risks for Santander UK. For instance, the FSA announced in October 2011 that it was restarting its review of the funding of the FSCS and on 25 July 2012 it announced a consultation on proposed changes to the funding of the FSCS, with comments due by 25 October 2012. Following this consultation, whilst most of the proposals will be taken forward and will come into effect from 1 April 2013, other proposals relating to intermediaries and investment providers were revised and a consultation on these revised proposals closed on 18 February 2013. Changes as a result of this may affect the profitability of Santander UK.
As a result of the structural reorganisation and reform of the UK financial regulatory authorities, it is proposed that the FSCS levies will be collected by the FCA under the new regime. It is possible that future policy of the FSCS and future levies on the firms authorised by the FSA may differ from those at present and that this could lead to a period of some uncertainty for Santander UK. In addition, it is possible that other jurisdictions where Santander UK operates could introduce or amend their similar compensation, contributory or reimbursement schemes. As a result of any such developments, it may incur additional costs and liabilities which may adversely affect its operating results, financial condition and prospects.
We may not be able to detect money laundering and other illegal or improper activities fully or on a timely basis, which could expose us to additional liability and could have a material adverse effect on us.
We are required to comply with applicable anti-money laundering, anti-terrorism and other laws and regulations in the jurisdictions in which we operate. These laws and regulations require us, among other things, to adopt and enforce “know-your-customer” policies and procedures and to report suspicious and large transactions to the applicable regulatory authorities. These laws and regulations have become increasingly complex and detailed, require improved systems and sophisticated monitoring and compliance personnel and have become the subject of enhanced government supervision.
While we have adopted policies and procedures aimed at detecting and preventing the use of our banking network for money laundering and related activities, such policies and procedures have in some cases only been recently adopted and may not completely eliminate instances where we may be used by other parties to engage in money laundering and other illegal or improper activities. In addition, the personnel we employ in supervising these activities may not have experience that is comparable to the level of sophistication of criminal organisations. To the extent we fail to fully comply with applicable laws and regulations, the relevant government agencies to which we report have the power and authority to impose fines and other penalties on us, including the revocation of licenses. In addition, our business and reputation could suffer if customers use our banking network for money laundering or illegal or improper purposes.
In addition, while we review our relevant counterparties’ internal policies and procedures with respect to such matters, we, to a large degree, rely upon our relevant counterparties to maintain and properly apply their own appropriate anti-money laundering procedures. Such measures, procedures and compliance may not be completely effective in preventing third parties from using our (and our relevant counterparties) as a conduit for money laundering (including illegal cash operations) without our (and our relevant counterparties’) knowledge. If we are associated with, or even accused of being associated with, or become a party to, money laundering, then our reputation could suffer and/or we could become subject to fines, sanctions and/or legal enforcement (including being added to any “black lists” that would prohibit certain parties from engaging in transactions with us), any one of which could have a material adverse effect on our operating results, financial condition and prospects.
Changes in taxes and other assessments may adversely affect us.
The tax and other assessment regimes to which we and our customers are subject are regularly reformed, or subject to proposed reforms. Such reforms include changes in the rate of assessments and, occasionally, enactment of temporary taxes, the proceeds of which are earmarked for designated governmental purposes. The effects of these changes and any other changes that result from enactment of additional tax reforms have not been, and cannot be, quantified and there can be no assurance that these reforms will not, once implemented, have an adverse effect upon our business. Furthermore, such changes may produce uncertainty in the financial system, increasing the cost of borrowing and contributing to the increase in our non-performing credit portfolio.
The following paragraphs discuss three major reforms (the UK bank levy, FATCA and possible future changes in the taxation of banking groups in the European Union) which could have a material adverse effect on our operating results, financial condition and prospects, and the competitive position of UK banks, including the Company.
UK Bank Levy: HM Treasury introduced an annual UK bank levy (“the Bank Levy”) via legislation in the Finance Act 2011. The Bank Levy is imposed on (amongst other entities) UK banking groups and subsidiaries, and therefore applies to Santander UK. The amount of the Bank Levy is based on a bank’s total liabilities, excluding (amongst other things) Tier 1 Capital, insured retail deposits and repos secured on sovereign debt. A reduced rate is applied to longer-term liabilities. The UK Government intends that the Bank Levy should raise at least £2.5bn each year. To offset the shortfall in Bank Levy receipts, and also to take account of the benefit to the banking sector of reductions in the rate of corporation tax, there was an increase in the rates of Bank Levy from 1 January 2012 with a further increase from 1 January 2013.
| | |
| 202 | | Abbey National Treasury Services plc 2012 Annual Report |
Shareholder Information
Risk Factors continued
FATCA: Sections 1471 through 1474 of the US Internal Revenue Code (“FATCA”) impose a new reporting regime and potentially a 30% withholding tax with respect to certain payments to any non-US financial institution (a “foreign financial institution” or “FFI” (as defined by FATCA)) that (i) does not become a “Participating FFI” by entering into an agreement with the US Internal Revenue Service (the “IRS”) to provide the IRS with certain information in respect of its account holders and investors; or (ii) is not otherwise exempt from or in deemed compliance with FATCA. The Company is classified as an FFI.
Final regulations implementing FATCA were promulgated in January 2013. The new reporting and withholding regime will be phased in over time (with withholding beginning 1 January 2014 for certain payments from sources within the United States and 1 January 2017 for payments of gross proceeds on assets that could generate US source dividend or interest and “foreign pass thru payments” (a term not yet defined)).
The United States and the United Kingdom have entered into an agreement (the “US-UK IGA”) under which we expect to be treated as a Reporting FI and accordingly do not anticipate being required to deduct any tax under FATCA. We will, however, be required to comply with certain due diligence and reporting requirements to HMRC. There can be no assurance that we will be treated as a Reporting FI or that in the future we would not be required to deduct tax under FATCA from payments we make on certain financial products. The Regulations implementing the UK-US IGA and accompanying guidance on their application were published in draft form in December 2012 and remain subject to further consultation and revision.
European Taxation: In September 2011, the European Commission (the “Commission”) tabled a proposal for a common system of financial transactions taxes (“FTT”). Despite intense discussions on this proposal there was no unanimity amongst the 27 Member States. Eleven Member States (“participating Member State”) requested enhanced cooperation on a FTT based upon the Commission’s original proposal. The Commission presented a Decision to this effect and this Decision was adopted by the EU’s Council of Finance Ministers at its committee meeting on 22 January 2013. The formal Directive was published on 14 February 2013, under which participating Member States may charge a FTT on all financial transactions with effect from 1 January 2014 where (i) at least one party to the transaction is established in the territory of a participating Member State and (ii) a financial institution established in the territory of a participating Member State is a party to the transaction acting either for its own account or for the account of another person, or is acting in the name of a party to the transaction. Whilst the UK is not a participating Member State, the Directive proposals are broad and as such may impact transactions completed by financial institutions operating in non-participating Member States. We are still assessing the proposals to determine the likely impact on us.
Changes in Santander UK’s pension liabilities and obligations could have a materially adverse effect on it.
Santander UK provides retirement benefits for many of our former and current employees, and those of the wider Santander UK group, in the United Kingdom through a number of defined benefit pension schemes established under trust. Santander UK has only limited control over the rate at which it pays into such schemes. Under the UK statutory funding requirements, employers are usually required to contribute to the schemes at the rate they agree with the scheme trustees, although if they cannot agree, such rate can be set by the Pensions Regulator. The scheme trustees may, in the course of discussions about future valuations, seek higher employer contributions. The scheme trustees’ power in relation to the payment of pension contributions depends on the terms of the trust deed and rules governing the pension schemes.
The UK Pensions Regulator has the power to issue a financial support direction to companies within a group in respect of the liability of employers participating in the UK defined benefit pension plans where that employer is a service company, or is otherwise “insufficiently resourced” (as defined for the purposes of the relevant legislation). As some of the employers within Santander UK are service companies, if they become insufficiently resourced, other companies within Santander UK which are connected with or an associate of those employers are at risk of a financial support direction in respect of those employers’ liabilities to the defined benefit pension schemes in circumstances where the Pensions Regulator properly considers it reasonable to issue one. Such a financial support direction could require the companies to guarantee or provide security for the pension liabilities of those employers, or could require additional amounts to be paid into the relevant pension schemes in respect of them.
The UK courts have decided that liabilities under financial support directions issued by the Pensions Regulator against companies after they have gone into administration were payable as an expense of the administration, and did not rank as provable debts. This means that such liabilities will have to be satisfied before any distributions to unsecured creditors could be made. It is understood that leave to appeal to the Supreme Court has been requested and therefore it is likely that there will be a further decision to come.
The Pensions Regulator can also issue contribution notices if it is of the opinion that an employer has taken actions, or failed to take actions, deliberately designed to avoid meeting its pension promises or which are materially detrimental to the scheme’s ability to meet its pension promises. A contribution notice can be moved to any company which is connected with or an associate of such employer in circumstances where the Regulator considers it reasonable to issue. The risk of a contribution notice being imposed may inhibit Santander UK’s freedom to restructure or to undertake certain corporate activities.
Changes in the size of the deficit in the defined benefit schemes operated by Santander UK, due to reduction in the value of the pension fund assets (depending on the performance of financial markets) or an increase in the pension fund liabilities due to changes in mortality assumptions, the rate of increase of salaries, discount rate assumptions, inflation, the expected rate of return on plan assets, or other factors, could result in Santander UK having to make increased contributions to reduce or satisfy the deficits which would divert resources from use in other areas of Santander UK’s business and reduce the capital resources of the relevant employing company. While we can control a number of the above factors, there are some over which we have no or limited control. Although the trustees of the defined benefit pension schemes are obliged to consult with Santander UK before changing the pension schemes’ investment strategy, the trustees have the final say. Increases in Santander UK’s pension liabilities and obligations could have a material adverse effect on its operating results, financial condition and prospects.
The ongoing changes in the UK supervision and regulatory regime and particularly the implementation of the ICB’s recommendations may require Santander UK to make changes to its structure and business which could have an impact on its pension schemes or liabilities. For a discussion of the ICB’s recommendations see “We are subject to substantial regulation and governmental oversight which could adversely affect our business and operations” on pages 198 to 199.
| | |
Abbey National Treasury Services plc 2012 Annual Report | | 203 |
Shareholder Information
Risk Factorscontinued
We rely on recruiting, retaining and developing appropriate senior management and skilled personnel.
Our continued success depends in part on the continued service of key members of our management team. The ability to continue to attract, train, motivate and retain highly qualified and talented professionals is a key element of our strategy. The successful implementation of our growth strategy depends on the availability of skilled management, both at our head office and at each of our business units. If we or one of our business units or other functions fails to staff its operations appropriately or loses one or more of its key senior executives and fails to replace them in a satisfactory and timely manner, our business, financial condition and results of operations, including control and operational risks, may be adversely affected.
In addition, the financial industry has and may continue to experience more stringent regulation of employee compensation, which could have an adverse effect on our ability to hire or retain the most qualified employees. If we fail or are unable to attract and appropriately train, motivate and retain qualified professionals, our business may also be adversely affected.
Damage to our reputation could cause harm to our business prospects.
Maintaining a positive reputation is critical to our attracting and maintaining customers, investors and employees and conducting business transactions with counterparties. Damage to our reputation, the reputation of Banco Santander, S.A. (as the majority shareholder in the Company), or the reputation of affiliates operating under the “Santander” brand or any of our other brands, can therefore cause significant harm to our business and prospects. Harm to our reputation can arise from numerous sources, including, among others, employee misconduct, litigation, failure to deliver minimum standards of service and quality, compliance failures, breach of legal or regulatory requirements, unethical behaviour (including giving adopted inappropriate sales and trading practices), and the activities of customers and counterparties. Further, negative publicity regarding us, whether or not true, may result in harm to our operating results, financial condition and prospects.
Actions by the financial services industry generally or by certain members of, or individuals in, the industry can also affect our reputation. For example, the role played by financial services firms in the financial crisis and the seeming shift toward increasing regulatory supervision and enforcement has caused public perception of us and others in the financial services industry to decline.
We could suffer significant reputational harm if we fail to properly identify and manage potential conflicts of interest. Management of potential conflicts of interest has become increasingly complex as we expand our business activities through more numerous transactions, obligations and interests with and among our customers. The failure to adequately address, or the perceived failure to adequately address, conflicts of interest could affect the willingness of customers to deal with us, or give rise to litigation or enforcement actions against us. Therefore, there can be no assurance that conflicts of interest will not arise in the future that could cause material harm to us.
Our financial statements are based in part on assumptions and estimates which, if inaccurate, could cause material misstatement of the results of our operations and financial position.
The preparation of financial statements requires management to make judgements, estimates and assumptions that affect the reported amounts of assets, liabilities, income and expenses. Due to the inherent uncertainty in making estimates, actual results reported in future periods may be based upon amounts which differ from those estimates. Estimates, judgements and assumptions are continually evaluated and are based on historical experience and other factors, including expectations of future events that are believed to be reasonable under the circumstances. Revisions to accounting estimates are recognised in the period in which the estimate is revised and in any future periods affected. The accounting policies deemed critical to our results and financial position, based upon materiality and significant judgements and estimates, include impairment of loans and advances, valuation of financial instruments, goodwill impairment, provision for conduct remediation and pensions.
The valuation of financial instruments measured at fair value can be subjective, in particular where models are used which include unobservable inputs. Given the uncertainty and subjectivity associated with valuing such instruments it is possible that the results of our operations and financial position could be materially misstated if the estimates and assumptions used prove to be inaccurate.
If the judgement, estimates and assumptions we use in preparing our consolidated financial statements are subsequently found to be incorrect, there could be a material effect on our results of operations and a corresponding effect on our funding requirements and capital ratios.
Changes in accounting standards could impact reported earnings.
The accounting standard setters and other regulatory bodies periodically change the financial accounting and reporting standards that govern the preparation of our consolidated financial statements. These changes can materially impact how we record and report our financial condition and results of operations. In some cases, we could be required to apply a new or revised standard retroactively, resulting in the restatement of prior period financial statements.
Different disclosure and accounting principles between the UK and the US may provide you with different or less information about us than you expect.
There may be less publicly available information about us than is regularly published about companies in the United States. Issuers of securities in the UK are required to make public disclosures that are different from, and that may be reported under presentations that are not consistent with, disclosures required in countries with more developed capital markets, including the United States. While we are subject to the periodic reporting requirements of the Securities Exchange Act of 1934 (the “Exchange Act”), the disclosure required from foreign private issuers under the Exchange Act is more limited than the disclosure required from US issuers. In addition, for regulatory purposes, we currently prepare and will continue to prepare and make available to our shareholders statutory financial statements in accordance with UK GAAP, which differs from IFRS in a number of respects. In addition, as a foreign private issuer, we are not subject to the same disclosure requirements in the United States as a domestic US registrant under the Exchange Act, including the requirements to prepare and issue quarterly reports, or the proxy rules applicable to domestic US registrants under Section 14 of the Exchange Act or the insider reporting and short-swing profit rules under Section 16 of the Exchange Act. Accordingly, the information about us available to you will not be the same as the information available to shareholders of a US company and may be reported in a manner that you are not familiar with.
| | |
| 204 | | Abbey National Treasury Services plc 2012 Annual Report |
Shareholder Information
Risk Factors continued
Any failure to effectively improve or upgrade our information technology infrastructure and management information systems in a timely manner could have a material adverse effect on us.
Our ability to remain competitive depends to a significant extent upon the functionality of our information technology systems (including Partenon, the global banking informational technology platform utilised by Banco Santander, S.A and Santander UK), and on our ability to upgrade and expand the capacity of our information technology on a timely and cost-effective basis. The proper functioning of our financial control, risk management, credit analysis and reporting, accounting, customer service and other information technology systems, as well as the communication networks between the Santander UK branches and main data processing centres, are critical to our business and our ability to compete. We must continually make significant investments and improvements in our information technology infrastructure in order to remain competitive. We cannot assure you that in the future we will be able to maintain the level of capital expenditures necessary to support the improvement, expansion or upgrading of our information technology infrastructure as effectively as its competitors, this may result in a loss of the competitive advantages that we believe our information technology systems provide. Any failure to effectively improve, expand or upgrade our information technology infrastructure and management information systems in a timely manner could have a material adverse effect on us.
We rely on third parties for important infrastructure support products and services.
Third party vendors provide key components of our business infrastructure such as loan and deposit servicing systems, internet connections and network access. Any problems caused by these third parties, including as a result of their not providing us their services for any reason or their performing their services poorly, could adversely affect our ability to deliver products and services to customers and otherwise to conduct business. Replacing these third party vendors could also entail significant delays and expense.
We engage in transactions with our subsidiaries or affiliates that others may not consider to be on an arm’s-length basis.
We and our subsidiaries and affiliates have entered into a number of services agreements pursuant to which we render services, such as administrative, accounting, finance, treasury, legal services and others. We rely upon certain outsourced services (including information technology support, maintenance and consultancy services in connection with Partenon) provided by certain other members of the Banco Santander, S.A. group.
English law applicable to public companies and financial groups and institutions, as well as our articles of association, provide for several procedures designed to ensure that the transactions entered into with or among our financial subsidiaries do not deviate from prevailing market conditions for those types of transactions, including the requirement that our board of directors approve such transactions. We are likely to continue to engage in transactions with our subsidiaries or affiliates (including our controlling shareholder). Future conflicts of interests between us and any of our subsidiaries or affiliates, or among our subsidiaries and affiliates, may arise, which conflicts are not required to be and may not be resolved in our favour.
Risks concerning enforcement of judgements made in the United States.
Abbey National Treasury Services plc is a public limited company registered in England and Wales. All of the Company’s Directors live outside the United States of America. As a result, it may not be possible to serve process on such persons in the United States of America or to enforce judgements obtained in US courts against them or us based on the civil liability provisions of the US federal securities laws or other laws of the United States of America or any state thereof. The Directors’ Report on pages 100 to 108 of our 2012 Annual Report has been prepared and presented in accordance with and in reliance upon English company law and the liabilities of the Directors in connection with that Report shall be subject to the limitations and restrictions provided by such law. Under the UK Companies Act 2006, a safe harbour limits the liability of Directors in respect of statements in and omissions from the Directors’ Report on pages 100 to 108 of our 2012 Annual Report. Under this safe harbour, the Directors would be liable to the Company (but not to any third party) if the Directors’ Report contains errors as a result of recklessness or knowing misstatement or dishonest concealment of a material fact, but would not otherwise be liable.
| | |
Abbey National Treasury Services plc 2012 Annual Report | | 205 |
Shareholder Information
Contact Information
Abbey National Treasury Services plc registered office, principal office and investor relations department
| | |
2 Triton Square Regent’s Place London, NW1 3AN | | Phone number: 0870-607-6000 |
The designated agent for service of process on the ANTS group in the United States is Abbey National Treasury Services plc (Connecticut branch), 400 Atlantic Street, Stamford, CT 06901.
Santander shareholder department
| | | | |
Santander Shareholder Relations 2 Triton Square Regent’s Place London, NW1 3AN | | Phone numbers: 0871-384-2000 +44 (0) 121-415-7188 (outside the UK) | | Email: shareholders@santander.com |
Other information
Documents on display
The Company is subject to the information requirements of the US Securities Exchange Act of 1934. In accordance with these requirements, the Company files its Annual Report and Accounts and other related documents with the US Securities and Exchange Commission. These documents may be inspected by US investors at the US Securities and Exchange Commission’s public reference rooms, which are located at 100 F Street NE, Room 1580, Washington, DC 20549-0102. Information on the operation of the public reference rooms can be obtained by calling the US Securities and Exchange Commission on +1-202-551-8090 or by looking at the US Securities and Exchange Commission’s website at www.sec.gov.
Legal proceedings
ANTS is party to various legal proceedings in the ordinary course of business, the ultimate resolution of which is not expected to have a material adverse effect on the financial position or the results of operations of ANTS. See Note 35 to the Consolidated Financial Statements.
Material contracts
The ANTS group is party to various contracts in the ordinary course of business. For the three years ended 31 December 2012 there have been no material contracts entered into outside the ordinary course of business, except for the contracts described below.
The Company has given a full and unconditional guarantee in respect of the unsubordinated liabilities of Santander UK plc incurred prior to 30 June 2015 under a deed poll guarantee entered into by the Company on 10 May 2012. Santander UK plc has given a reciprocal guarantee in respect of the unsubordinated liabilities of the Company incurred prior to 30 June 2015.
The Company, Santander UK plc, and Cater Allen Limited, which are the three FSA-regulated entities within the Santander UK group, are party to a capital support deed dated 14 December 2012 (the “Capital Support Deed”) with certain other non-regulated subsidiaries of Santander UK plc. The parties to the Capital Support Deed constitute a core UK group for the purposes of section 10 of the Prudential Sourcebook for Banks, Building Societies and Investment Firms (“BIPRU”) of the FSA Handbook. Under section 10.8 of BIPRU, exposures of each of the three regulated entities to other members of the core UK group are exempt from large exposure limits that would otherwise apply. The purpose of the Capital Support Deed is to facilitate the prompt transfer of available capital resources from, or repayment of liabilities by, the non-regulated parties to any of the regulated parties in the event that one of the regulated parties has breached or is at risk of breaching its capital resources requirements or risk concentrations requirements.
The Company, Santander UK plc, and Cater Allen Limited are party to a defined liquidity group liquidity facility agreement dated 28 May 2010 (the “DLG Facility Agreement”). The DLG Facility Agreement supports a defined liquidity group for the purposes of section 12 of BIPRU. Section 12.8 of BIPRU permits a member of a defined liquidity group to rely on the liquid resources of other members of the defined liquidity group to comply with the liquidity adequacy requirements under section 12 of BIPRU. Under the DLG Facility Agreement, each party agrees to lend, subject to certain conditions and limitations, its excess liquidity to each other party.
Audit fees
See Note 9 to the Consolidated Financial Statements
Profit on sale of subsidiaries
No profits arose on sales of ANTS group undertakings during the years ended 31 December 2012, 2011 and 2010.
Significant acquisitions and disposals
The results were not materially affected by acquisitions or disposals during the years ended 31 December 2012, 2011 and 2010.
Current and future accounting developments under IFRS
Details can be found in Note 1 to the Consolidated Financial Statements.
| | |
| 206 | | Abbey National Treasury Services plc 2012 Annual Report |
Shareholder Information
Articles of Association
The following is a summary of the Articles of Association (the “Articles”) of the Company.
Abbey National Treasury Services plc is a public company registered in England & Wales with registered number 2338548. The Articles do not specifically state or limit the objects of the Company which are therefore unrestricted.
The board may authorise any conflict of interest of a director and may impose conditions on the director for the purpose of dealing with the conflict, but the relevant director may not count towards the quorum for the meeting nor vote on any resolution giving such authority. Subject to this and, where applicable, to disclosure in accordance with the Companies Act 2006 (the “Act”) a director shall be entitled to vote in respect of any contract or proposed contract in which he is interested and he shall be considered in determining whether a quorum is present. A director may not vote in respect of his own appointment.
The Company’s Tracker Shares entitle the holder, in priority to any payment to Ordinary Shareholders, to receive a non-cumulative dividend linked to cash flows from certain interest rate swaps (defined in the Articles as “Swaps”) received by the Company to the extent that such Tracker Share Dividends can be lawfully paid out of distributable reserves. The original Swaps listed in the Articles no longer remain in existence (see also Note 36 to the Consolidated Financial Statements) and no dividends are currently paid on the Tracker Shares although the Articles provide that other interest rate swaps may be approved as Swaps from time to time by ordinary resolution of the Company. The holders of the Tracker Shares shall be entitled to receive notice of general meetings of the Company and to attend and speak at such meetings but have no entitlement to vote. Tracker Shares are not redeemable.
The Company’s B Tracker Shares entitle the holder, in priority to any payment to Ordinary Shareholders and pari passu to any payment of any dividend to the holders of the Tracker Shares, to receive a non-cumulative dividend linked to cash flows from certain interest rate swaps (defined in the Articles as “B Swaps”) received by the Company to the extent that such B Tracker Share Dividends can be lawfully paid out of distributable reserves. The original B Swaps listed in the Articles no longer remain in existence (see also Note 36 to the Consolidated Financial Statements) and no dividends are currently paid on the B Tracker Shares although the Articles provide that other interest rate swaps may be approved as B Swaps from time to time by ordinary resolution of the Company. The holders of the B Tracker Shares shall be entitled to receive notice of general meetings of the Company and to attend and speak at such meetings but have no entitlement to vote. B Tracker Shares are not redeemable.
The Company’s Ordinary Shares are entitled to receive such dividends as the directors may from time to time declare or the members may resolve by ordinary resolution to pay out of the distributable assets of the Company, after the payment of any dividends on the Tracker Shares and B Tracker Shares. Holders of Ordinary Shares are entitled to attend general meetings and on a show of hands every Ordinary Shareholder who is present in person shall have one vote and every proxy present who has been duly appointed by an Ordinary Shareholder shall have one vote. On a poll every Ordinary Shareholder who is present in person or by proxy shall have one vote for every share of which he is the holder.
On a return of capital on a winding up or otherwise (other than a conversion, redemption or purchase of shares) the assets of the Company available for distribution shall be applied (a) firstly, in paying to the holders of the Tracker Shares and B Tracker Shares, pari passu, an amount equal to the amount paid up thereon and; (b) secondly, in paying to the holders of the Ordinary Shares an amount equal to the amount paid up thereon and thereafter an amount representing the surplus assets remaining, such amounts to be distributed pari passu to the holders of the Ordinary Shares in proportion to the amounts paid up on the Ordinary Shares.
There are no sinking fund provisions. Where any shares are partly paid, the Board may make further calls upon the holders. There are no provisions discriminating against any existing or prospective shareholder as a result of such shareholder owning a substantial number of shares.
An annual general meeting shall be called by at least 21 clear days’ notice (that is, excluding the day of the meeting and the day on which the notice is given) and any other general meeting shall be called by at least 14 clear days’ notice. A general meeting may be called by shorter notice if it is so agreed, in the case of an annual general meeting, by all the shareholders having a right to attend and vote or, in other cases, by a majority in number of the shareholders having a right to attend and vote, being a majority together holding not less than 95 per cent in nominal value of the shares giving the right. The notice shall specify the date, time and place of the meeting and the general nature of the business to be transacted.
Subject to the provisions of the Act, the rights attached to any class of shares (unless otherwise provided in the terms of issue of the shares of that class) may at any time be varied with the consent in writing of the holders of three quarters of the issued shares of that class, or by a special resolution passed at a general meeting of holders of the shares of that class. The same provisions relating to general meetings of the Company apply to any general meeting of the holders of any one class of shares.
There are no restrictions on the rights to own securities for either resident or non-resident shareholders, other than those to which they may be subject as a result of laws and regulations in their home jurisdiction.
| | |
Abbey National Treasury Services plc 2012 Annual Report | | 207 |
Shareholder Information
Guarantees
GUARANTEE of Santander UK plc by Abbey National Treasury Services plc
THIS INSTRUMENT by way of deed poll is executed on 10 May 2012 by ABBEY NATIONAL TREASURY SERVICES plc (registered in England No. 2338548) whose registered office is at 2 Triton Square, Regent’s Place, London NW1 3AN (the “Guarantor”)
WHEREAS:
Santander UK plc, a company incorporated in England (number 2294747) whose registered office is at 2 Triton Square, Regent’s Place, London NW1 3AN (“Santander UK”), has requested the Guarantor and the Guarantor has agreed to guarantee payment of all Obligations (as hereinafter defined) in accordance with, and as limited by, the terms and conditions of this Deed (this “Guarantee”).
NOW THEREOF the Guarantor hereby covenants and agrees as follows:
| 1. | In this Guarantee, unless the context otherwise requires: |
| | |
“Creditor” | | means any person (other than Santander UK or any subsidiary of Santander UK (as defined in section 1159 of the Companies Act 2006 (the “Act”)) or any individual who is a connected person of Santander UK (within the meaning of section 254 of the Act)) to whom an Obligation is from time to time owed. |
| |
“Obligation” | | means any obligation or liability (whether actual or contingent or for the payment of any amount or delivery of any property) incurred by Santander UK (whether as principal or surety) to any person on or before 30 June 2015 (whether before or after the execution of this Guarantee) under or in respect of any dealing, transaction or engagement whatsoever, including without prejudice to the generality of the foregoing, for: |
| |
| | (i) any moneys lent, advanced or otherwise made available to Santander UK (including, without limitation to the generality of the foregoing, the liability of Santander UK for drawing or issuing bills of exchange, promissory notes, bonds, debentures, certificates of deposit, commercial paper or other negotiable instruments or securities); |
| |
| | (ii) any moneys lent, advanced or otherwise made available to any person, the repayment or payments in respect of which have been guaranteed by Santander UK or in respect of which Santander UK has given an indemnity (including, without limitation to the generality of the foregoing, guarantees and letters of credit issued by Santander UK and bills of exchange or other negotiable instruments accepted or endorsed by Santander UK); |
| |
| | (iii) any moneys which any person shall pay or become liable to pay, for or on account of Santander UK, by reason of entering into or being party to any bond, indemnity, bill of exchange, guarantee, letter of credit or other engagement for the benefit or at the request of Santander UK; |
| |
| | (iv) deposits made with Santander UK (including, without limitation of the generality of the foregoing, certificates of deposit issued by Santander UK); |
| |
| | (v) any rate swap transaction, swap option, basis swap, forward rate transaction, commodity swap, commodity option, equity or equity index swap, equity or equity index option, bond option, interest rate option, foreign exchange transaction, cap transaction, collar transaction, floor transaction, currency swap transaction, cross-currency rate swap transaction, currency option, credit protection transaction, credit swap, credit default swap, credit default option, total return swap, credit spread transaction, repurchase transaction, reverse repurchase transaction, buy/sell back transaction, securities lending transaction or forward purchase or sale of a security, commodity or other financial instrument or interest (including any option with respect to any such transactions) or any other derivative transaction on one or more rates, currencies, commodities, equity securities or other equity instruments, debt securities or other debt instruments, indices, or measures of economic risk or value, in each case, to which Santander UK is party (including, for the avoidance of doubt, any obligation or liability under any master agreement that governs any such transactions); |
| |
| | (vi) any such obligation or liability assumed under or incurred pursuant to any novation, transfer, assignment or other similar agreement between Santander UK and any other person; ; |
| |
| | (vii) any obligation or liability under any transaction entered into by Santander UK after 30 June 2015 as a result of the exercise of any right or option granted by or to Santander UK on or prior to 30 June 2015; and |
| |
| | (viii) any payments of interest due from Santander UK with respect to any of the foregoing transactions (whether or not the liability to pay such interest arises on or before 30 June 2015) together with all reasonable costs, commissions and other expenses incurred by any person in connection with the enforcement of this Guarantee, but excluding: (a) any such obligations or liabilities of Santander UK (including under any guarantee or indemnity given by Santander UK) which by their terms are expressed (in whatever manner) to be conditional upon the solvency of Santander UK or subordinated to, or payable only after full satisfaction of, all or any obligations of Santander UK to all or any of its unsubordinated creditors; and |
| | |
| 208 | | Abbey National Treasury Services plc 2012 Annual Report |
Shareholder Information
Guarantees continued
| | |
| | (b) any such obligations or liabilities of Santander UK transferred to, or assumed by, any other person whether pursuant to any novation or transfer or other similar agreement, any statutory transfer (pursuant to Part VII of The Financial Services and Markets Act 2000 or otherwise), any scheme of arrangement or otherwise. |
| |
“person” | | means any person, firm, trust estate, corporation, association, cooperative, government or government agency or other entity. |
| 2. | (a) The Guarantor hereby unconditionally and irrevocably guarantees, for the benefit of each Creditor, in accordance with the terms and conditions of this Guarantee, the full payment or performance by Santander UK when due (whether at stated maturity, upon acceleration or otherwise) of each and every Obligation and in the event that Santander UK shall default in the due and punctual payment or performance of any Obligation, undertakes to pay, or procure the payment of, such Obligation in the currency in which the particular Obligation is denominated in the case of a payment or perform, or procure the performance of such Obligation, upon written demand being made under this Guarantee by the relevant Creditor. |
| | (b) | The Guarantor waives any right it may have of first requiring any Creditor to make demand, proceed or enforce any rights or security against Santander UK or any other person before making a claim against the Guarantor under this Guarantee. |
| 3. | A Creditor shall only be entitled to take or obtain the benefit of this Guarantee upon the condition that, after receipt by the Guarantor of a written demand from the Creditor, the Guarantor shall be entitled to deal with the Creditor, and the Creditor shall be obliged to deal with the Guarantor with respect to the Obligation due to the Creditor and this Guarantee without the necessity or duty to rely on, act through or otherwise involve or deal with Santander UK to the intent that the Guarantor and the Creditor shall deal with one another as principals in relation to the same provided that the rights, powers, privileges and remedies of the Creditor under this Guarantee shall not thereby be in any way limited or otherwise affected. |
| 4. | No delay or omission on the part of the Creditor in exercising any right, power, privilege or remedy (hereinafter together called “Rights”) in respect of this Guarantee shall impair any such Rights or be construed as a waiver of any thereof nor shall any single or partial exercise of any such Rights preclude any further exercise of any other Rights. The Rights herein provided are cumulative and not exclusive of any rights, powers, privileges or remedies provided by law. Nothing in this Guarantee shall be construed as voiding, negating or restricting any right of set-off or any other right whatsoever existing in favour of a Creditor or arising at common law, by statute or otherwise howsoever. |
| 5. | This Guarantee is a continuing guarantee and shall not be satisfied, discharged or affected by any intermediate payment or settlement of account. |
| 6. | The Guarantor will not exercise any rights of subrogation or any other rights or remedy (including, without limiting the generality of the foregoing, the benefit of any security or right of set-off) which it may acquire due to its payment or performance of any Obligation pursuant to the terms of this Guarantee and will not prove in the liquidation of Santander UK in competition with any Creditor unless and until all Obligations in respect of the relevant Creditor hereby guaranteed have been satisfied in full by the Guarantor or Santander UK. In the event that the Guarantor shall receive any payment on account of such rights while any Obligation remains outstanding, the Guarantor shall pay all amounts so received to the relevant Creditor. |
| 7. | Payments hereunder shall be made free and clear of any deduction or withholding other than those required by law and in that event the Guarantor shall pay such additional amount to the relevant Creditor as may be necessary in order that the actual amount received after all such deductions and withholdings shall equal the amount that would have been received if no such deduction or withholding were required provided that the Guarantor shall not be obliged to pay any such additional amount which would not have been payable if the payment which is the subject of the withholding or deduction had been made by Santander UK. If the Guarantor makes a payment of an additional amount in compliance with its obligations under this paragraph and the Creditor determines that it has received or been granted a credit against or relief or payment of any tax paid or payable by it in respect thereof the Creditor shall to the extent that it can do so without prejudice to the retention of the amount of such credit, relief or repayment pay to the Guarantor such amount as shall be attributable to such deduction provided that nothing contained in this paragraph shall interfere with the right of any Creditor to arrange its tax affairs in whatsoever manner it thinks fit and, in particular, no Creditor shall be under any obligation to claim relief in respect of any such deduction in priority to any other claims for relief available to it. |
| 8. | Any demand or notice hereunder shall be given in writing or by cable, telex or facsimile transmission addressed to the Guarantor or to the person to or upon whom the demand is to be made or the notice served at the registered or principal office or last known place of abode of the Guarantor or of such person, as the case may be. A demand so made shall be deemed to have been duly made if left at such address on the day it was so left or, if sent by post, two working days after the time when the same was put in the post and in proving delivery it shall be sufficient to prove that the same was properly addressed and put in the post. Any such demand sent by cable, telex or facsimile transmission shall be deemed to have been duly made at the time of despatch. |
| | |
Abbey National Treasury Services plc 2012 Annual Report | | 209 |
Shareholder Information
Guaranteescontinued
| 9. | The liability of the Guarantor under this Guarantee shall not be affected by the liquidation, winding-up or other incapacity of Santander UK. In the event that any payment or delivery to a Creditor from Santander UK in respect of an Obligation is avoided or reduced by virtue of any enactments for the time being in force relating to liquidation or insolvency of Santander UK, the Creditor shall be entitled to recover the value or amount thereof from the Guarantor as if such payment or delivery by Santander UK had not been made. |
| 10. | This Guarantee shall remain in full force and effect irrespective of: |
(a) the validity, regularity, legality or enforceability against Santander UK of, or of any defence or counter-claim whatsoever available to Santander UK in relation to, any Obligation;
(b) whether or not any action has been taken to enforce any Obligation or any judgement obtained against Santander UK or any other person;
(c) whether or not the terms of any Obligation has been modified, supplemented, extended or restated in any way (in each case, however fundamental and of whatsoever nature);
(d) whether or not any time or indulgence has been granted to Santander UK or any other person by or on behalf of any Creditor;
(e) whether or not there have been any dealings or transactions between Santander UK or any other person and any Creditor;
(f) whether or not Santander UK or any other person has been dissolved, liquidated, merged, consolidated, become bankrupt or has changed its status, functions, control or ownership;
(g) whether or not Santander UK or any other person has been prevented from making payment by foreign exchange provisions applicable at its place of registration or incorporation; and
(h) whether or not any circumstances have occurred which might otherwise constitute a legal or equitable discharge of or defence to a guarantor.
| 11. | This Guarantee shall remain in full force and effect in relation to an Obligation notwithstanding that it becomes due for payment or performance after 30 June 2015. |
| 12. | In the event that any of the terms or provisions of this Guarantee are or shall become invalid, illegal or unenforceable, the remaining terms and provisions hereof shall survive unaffected. |
| 13. | The Guarantor shall be permitted from time to time and at any time to amend or vary the terms of this Guarantee PROVIDED THAT the liability of the Guarantor to a Creditor in respect of any Obligation incurred before, or arising out of an Obligation entered into before, the date of such variation or amendment, shall not be in any way reduced or limited by such variation or amendment. Any person shall be entitled to rely on a certificate given by a director or other duly authorised officer of the Guarantor as to the existence and extent of this Guarantee and any such variation and/or amendment of this Guarantee on entering into any dealing, transaction or arrangement with Santander UK under or in respect of which an Obligation would or might be incurred by Santander UK to that person. |
| 14. | This Guarantee and any non-contractual obligations arising out of or in connection with this Guarantee are governed by, and shall be construed in accordance with, the laws of England and the courts of England are to have exclusive jurisdiction to settle any disputes which may arise out of or in connection with this Guarantee (including in respect of any non-contractual obligations arising out of or in connection with this Guarantee) and accordingly any suit, action or proceedings arising out of or in connection with this Guarantee (including in respect of any non-contractual obligations arising out of or in connection with this Guarantee) shall be brought in such courts. |
IN WITNESS whereof, this Guarantee has been executed as of the day and year first written above.
| | |
THE COMMON SEAL of | | ) |
ABBEY NATIONAL | | ) |
TREASURY SERVICES PLC | | ) |
was hereunto affixed | | ) |
in the presence of: | | ) |
Shaun Coles
Deputy Company Secretary
| | |
| 210 | | Abbey National Treasury Services plc 2012 Annual Report |
Shareholder Information
Guarantees continued
GUARANTEE of Abbey National Treasury Services plc by Santander UK plc
THIS INSTRUMENT by way of deed poll is executed on 10 May 2012 by SANTANDER UK plc (registered in England No. 2294747) whose registered office is at 2 Triton Square, Regent’s Place, London NW1 3AN (the ‘Guarantor’).
WHEREAS:
Abbey National Treasury Services plc, a company incorporated in England (number 2338548) whose registered office is at 2 Triton Square, Regent’s Place, London NW1 3AN (‘ANTS’), has requested the Guarantor and the Guarantor has agreed to guarantee payment of all Obligations (as hereinafter defined) in accordance with, and as limited by, the terms and conditions of this Deed (the ‘Guarantee’).
NOW THEREOF the Guarantor hereby covenants and agrees as follows:
| 1. | In this Guarantee, unless the context otherwise requires: |
| | |
‘Creditor’ | | means any person (other than the Guarantor or any subsidiary of ANTS (as defined in section 1159 of the Companies Act 2006 (the ‘Act’)) or any individual who is a connected person of ANTS within the meaning of section 254 of the Act) to whom an Obligation is from time to time owed; |
| |
‘Obligation’ | | means any obligation or liability, (whether actual or contingent or for the payment of any amount or delivery of any property) incurred by ANTS (whether as principal or surety) to any person on or before 30 June 2015 (whether before or after the execution of this Guarantee) under or in respect of any dealing, transaction or engagement whatsoever, including without prejudice to the generality of the foregoing, for |
| |
| | (i) any moneys lent, advanced or otherwise made available to ANTS (including, without limitation to the generality of the foregoing, the liability of ANTS for drawing or issuing bills of exchange, promissory notes, bonds, debentures, certificates of deposit, commercial paper or other negotiable instruments or securities); |
| |
| | (ii) any moneys lent, advanced or otherwise made available to any person, the repayment or payments in respect of which have been guaranteed by ANTS or in respect of which ANTS has given an indemnity (including, without limitation to the generality of the foregoing, guarantees and letters of credit issued by ANTS and bills of exchange or other negotiable instruments accepted or endorsed by ANTS); |
| |
| | (iii) any moneys which any person shall pay or become liable to pay, for or on account of ANTS, by reason of entering into or being party to any bond, indemnity, bill of exchange, guarantee, letter of credit or other engagement for the benefit or at the request of ANTS; |
| |
| | (iv) deposits made with ANTS (including, without limitation of the generality of the foregoing, certificates of deposit issued by ANTS); |
| |
| | (v) any rate swap transaction, swap option, basis swap, forward rate transaction, commodity swap, commodity option, equity or equity index swap, equity or equity index option, bond option, interest rate option, foreign exchange transaction, cap transaction, collar transaction, floor transaction, currency swap transaction, cross-currency rate swap transaction, currency option, credit protection transaction, credit swap, credit default swap, credit default option, total return swap, credit spread transaction, repurchase transaction, reverse repurchase transaction, buy/sell back transaction, securities lending transaction or forward purchase or sale of a security, commodity or other financial instrument or interest (including any option with respect to any such transactions) or any other derivative transaction on one or more rates, currencies, commodities, equity securities or other equity instruments, debt securities or other debt instruments, indices, or measures of economic risk or value, in each case, to which ANTS is party (including, for the avoidance of doubt, any obligation or liability under any master agreement that governs any such transactions); |
| |
| | (vi) any such obligation or liability assumed under or incurred pursuant to any novation, transfer, assignment or other similar agreement between ANTS and any other person; and |
| |
| | (vii) any obligation or liability under any transaction entered into by ANTS after 30 June 2015 as a result of the exercise of any right or option granted by or to ANTS on or prior to 30 June 2015; |
| |
| | (vii) any payments of interest due from ANTS with respect to any of the foregoing transactions (whether or not the liability to pay such interest arises on or before 30 June 2015) together with all reasonable costs, commissions and other expenses incurred by any person in connection with the enforcement of this Guarantee, but excluding: (a) any such obligations or liabilities of ANTS (including under any guarantee or indemnity given by ANTS) which by their terms are expressed (in whatever manner) to be conditional upon the solvency of ANTS or subordinated to, or payable only after full satisfaction of, all or any obligations of ANTS to all or any of its unsubordinated creditors; and (b) any such obligations or liabilities of ANTS transferred to, or assumed by, any other person whether pursuant to any novation or transfer or other similar agreement, any statutory transfer (pursuant to Part VII of The Financial Services and Markets Act 2000 or otherwise), any scheme of arrangement or otherwise. |
| |
‘person’ | | means any person, firm, trust estate, corporation, association, cooperative, government or government agency or other entity. |
| | |
Abbey National Treasury Services plc 2012 Annual Report | | 211 |
Shareholder Information
Guaranteescontinued
| | | | |
2. | | (a) | | The Guarantor hereby unconditionally and irrevocably guarantees, for the benefit of each Creditor, in accordance with the terms and conditions of this Guarantee, the full payment by ANTS when due (whether at stated maturity, upon acceleration or otherwise) of each and every Obligation and in the event that ANTS shall default in the due and punctual payment of any Obligation, undertakes to pay, or procure the payment of, such Obligations in the currency in which the particular Obligation is denominated in the case of a payment upon written demand being made under this Guarantee by the relevant Creditor. |
| | |
| | (b) | | The Guarantor waives any right it may have of first requiring any Creditor to make demand, proceed or enforce any rights or security against ANTS or any other person before making a claim against the Guarantor under this Guarantee. |
| |
3. | | A Creditor shall only be entitled to take or obtain the benefit of this Guarantee upon the condition that, after receipt by the Guarantor of a written demand from the Creditor, the Guarantor shall be entitled to deal with the Creditor, and the Creditor shall be obliged to deal with the Guarantor with respect to the Obligation due to the Creditor and this Guarantee without the necessity or duty to rely on, act through or otherwise involve or deal with ANTS to the intent that the Guarantor and the Creditor shall deal with one another as principals in relation to the same provided that the rights, powers, privileges and remedies of the Creditor under this Guarantee shall not thereby be in any way limited or otherwise affected. |
| |
4. | | No delay or omission on the part of the Creditor in exercising any right, power, privilege or remedy (hereinafter together called ‘Rights’) in respect of this Guarantee shall impair any such Rights or be construed as a waiver of any thereof nor shall any single or partial exercise of any such Rights preclude any further exercise of any other Rights. The Rights herein provided are cumulative and not exclusive of any rights, powers, privileges or remedies provided by law. Nothing in this Guarantee shall be construed as voiding, negating or restricting any right of set-off or any other right whatsoever existing in favour of a Creditor or arising at common law, by statute or otherwise howsoever. |
| |
5. | | This Guarantee is a continuing guarantee and shall not be satisfied, discharged or affected by any intermediate payment or settlement of account. |
| |
6. | | The Guarantor will not exercise any rights of subrogation or any other rights or remedy (including, without limiting the generality of the foregoing, the benefit of any security or right of set-off) which it may acquire due to its payment of any Obligation pursuant to the terms of this Guarantee and will not prove in the liquidation of ANTS in competition with any Creditor unless and until all Obligations in respect of the relevant Creditor hereby guaranteed have been satisfied in full by the Guarantor or ANTS. In the event that the Guarantor shall receive any payment on account of such rights while any Obligation remains outstanding, the Guarantor shall pay all amounts so received to the relevant Creditor. |
| |
7. | | Payments hereunder shall be made free and clear of any deduction or withholdings other than those required by law and in that event the Guarantor shall pay such additional amount to the relevant Creditor as may be necessary in order that the actual amount received after all such deductions and withholdings shall equal the amount that would have been received if no such deduction or withholding were required provided that the Guarantor shall not be obliged to pay any such additional amount which would not have been payable if the payment which is the subject of the withholding or deduction had been made by ANTS. If the Guarantor makes a payment of an additional amount in compliance with its obligations under this paragraph and the Creditor determines that it has received or been granted a credit against or relief or payment of any tax paid or payable by it in respect thereof the Creditor shall to the extent that it can do so without prejudice to the retention of the amount of such credit, relief or repayment pay to the Guarantor such amount as shall be attributable to such deduction provided that nothing contained in this paragraph shall interfere with the right of any Creditor to arrange its tax affairs in whatsoever manner it thinks fit and, in particular, no Creditor shall be under any obligation to claim relief in respect of any such deduction in priority to any other claims for relief available to it. |
| |
8. | | Any demand or notice hereunder shall be given in writing or by cable, telex or facsimile transmission addressed to the Guarantor or to the person to or upon whom the demand is to be made or the notice served at the registered or principal office or last known place of abode of the Guarantor or of such person, as the case may be. A demand so made shall be deemed to have been duly made if left at such address on the day it was so left or, if sent by post, two working days after the time when the same was put in the post and in proving delivery it shall be sufficient to prove that the same was properly addressed and put in the post. Any such demand sent by cable, telex or facsimile transmission shall be deemed to have been duly made at the time of despatch. |
| |
9. | | The liability of the Guarantor under this Guarantee shall not be affected by the liquidation, winding-up or other incapacity of ANTS. In the event that any payment or delivery to a Creditor from ANTS in respect of an Obligation is avoided or reduced by virtue of any enactments for the time being in force relating to liquidation or insolvency of ANTS, the Creditor shall be entitled to recover the value or amount thereof from the Guarantor as if such payment or delivery by ANTS had not been made. |
| | |
| 212 | | Abbey National Treasury Services plc 2012 Annual Report |
Shareholder Information
Guarantees continued
| | | | |
10. | | This Guarantee shall remain in full force and effect irrespective of: |
| | |
| | a) | | the validity, regularity, legality or enforceability against ANTS of, or of any defence or counter-claim whatsoever available to ANTS in relation to, any Obligation; |
| | |
| | b) | | whether or not any action has been taken to enforce any Obligation or any judgement obtained against ANTS or any other person; |
| | |
| | c) | | whether or not the terms of any Obligation has been modified, supplemented, extended or restated in any way (in each case, however fundamental and of whatsoever nature); |
| | |
| | d) | | whether or not any time or indulgence has been granted to ANTS or any other person by or on behalf of any Creditor; |
| | |
| | e) | | whether or not there have been any dealings or transactions between ANTS or any other person and any Creditor; |
| | |
| | f) | | whether or not ANTS or any other person has been dissolved, liquidated, merged, consolidated, become bankrupt or has changed its status, functions, control or ownership; |
| | |
| | g) | | whether or not ANTS or any other person has been prevented from making payment by foreign exchange provisions applicable at its place of registration or incorporation; and |
| | |
| | h) | | whether or not any circumstances have occurred which might otherwise constitute a legal or equitable discharge of or defence to a guarantor. |
| |
11. | | This Guarantee shall remain in full force and effect in relation to an Obligation notwithstanding that it becomes due for payment or performance after 30 June 2015. |
| |
12. | | In the event that any of the terms or provisions of this Guarantee are or shall become invalid, illegal or unenforceable, the remaining terms and provisions hereof shall survive unaffected. |
| |
13. | | The Guarantor shall be permitted from time to time and at any time to amend or vary the terms of this Guarantee PROVIDED THAT the liability of the Guarantor to a Creditor in respect of any Obligation incurred before, or arising out of an Obligation entered into before, the date of such variation or amendment, shall not be in any way reduced or limited by such variation or amendment. Any person shall be entitled to rely on a certificate given by a director or other duly authorised officer of the Guarantor as to the existence and extent of this Guarantee and any such variation and/or amendment of this Guarantee on entering into any dealing, transaction or arrangement with ANTS under or in respect of which an Obligation would or might be incurred by ANTS to that person. |
| |
14. | | This Guarantee and any non-contractual obligations arising out of or in connection with this Guarantee are governed by, and shall be construed in accordance with, the laws of England and the courts of England are to have exclusive jurisdiction to settle any disputes which may arise out of or in connection with this Guarantee (including in respect of any non-contractual obligations arising out of or in connection with this Guarantee) and accordingly any suit, action or proceedings arising out of or in connection with this Guarantee (including in respect of any non-contractual obligations arising out of or in connection with this Guarantee) shall be brought in such courts. |
IN WITNESS whereof, this Guarantee has been executed as of the day and year first written above.
| | |
THE COMMON SEAL of | | ) |
SANTANDER UK PLC | | ) |
was hereunto affixed | | ) |
in the presence of: | | ) |
Shaun Coles
Deputy Company Secretary
| | |
Abbey National Treasury Services plc 2012 Annual Report | | 213 |
Other Information for US Investors
Forward-looking Statements
Abbey National Treasury Services plc (the ‘Company’) and its subsidiaries (together the ‘ANTS group’) may from time to time make written or oral forward-looking statements. Examples of such forward-looking statements include, but are not limited to:
| • | | projections or expectations of revenues, costs, profit (or loss), earnings (or loss) per share, dividends, capital structure or other financial items or ratios; |
| • | | statements of plans, objectives or goals of Santander UK or its management, including those related to products or services; |
| • | | statements of future economic performance; and |
| • | | statements of assumptions underlying such statements. |
Words such as ‘believes’, ‘anticipates’, ‘expects’, ‘intends’, ‘aims’, ‘plans’, ‘targets’ and similar expressions are intended to identify forward-looking statements, but are not the exclusive means of identifying such statements.
By their very nature, forward-looking statements are not statements of historical or current facts; they cannot be objectively verified, are speculative and involve inherent risks and uncertainties, both general and specific, and risks exist that the predictions, forecasts, projections and other forward-looking statements will not be achieved. Santander UK cautions readers that a number of important factors could cause actual results to differ materially from the plans, objectives, expectations, estimates and intentions expressed in such forward-looking statements made by Santander UK or on Santander UK’s behalf. Some of these factors, which could affect the Group’s business, financial condition and/or results of operations, are considered in detail in the Risk Management Report on page 28 and the Risk Factors section on page 190 and they include:
| • | | the effects of UK economic conditions (e.g. lack of growth in the UK economy, rising unemployment, increased taxation and reduced consumer and public spending) and particularly the UK real estate market; |
| • | | the effects of conditions in global financial markets (e.g. increased market volatility and disruption, reduced credit availability and increased commercial and consumer loan delinquencies); |
| • | | the extent to which regulatory capital and liquidity requirements and any changes to these requirements may limit the Group’s operations; |
| • | | the Group’s ability to access liquidity and funding on acceptable financial terms ; |
| • | | the Group’s exposure to UK Government debt and to the risks faced by other financial institutions;; |
| • | | the effects of the ongoing economic and sovereign debt tensions in the eurozone; |
| • | | the effects of any changes to the credit rating assigned to the Group, any member of the Group or any of their respective debt securities; |
| • | | the effects of fluctuations in interest rates, currency exchange rates, basis spreads, bond and equity prices and other market factors; |
| • | | the extent to which the Group may be required to record negative fair value adjustments for its financial assets due to changes in market conditions; |
| • | | the credit quality of borrowers, the Group’s ability to assess this and control the level of non-performing loans, loan prepayment and the enforceability of collateral, including real-estate securing such loans; |
| • | | the extent which the Group may be exposed to operational losses (e.g. failed internal or external processes, people and systems); |
| • | | risks associated with the Group’s derivative transactions; |
| • | | the effects of competition, or intensification of such competition, in the financial services markets in which the Group conducts business and the impact of customer perception of the Group’s customer service levels on existing or potential business; |
| • | | the Group’s exposure to certain sectors or customers, such as SMEs and individuals; |
| • | | the ability of the Group to manage any future growth effectively (e.g. efficiently managing the operations and employees of expanding businesses and maintaining or growing its existing customer base); |
| • | | the ability of the Group to realise the anticipated benefits of its business combinations and the exposure, if any, of the Group to any unknown liabilities or goodwill impairments relating to acquired businesses; |
| • | | the effects of the financial services laws, regulations, governmental oversight, administrative actions and policies and any changes thereto in each location or market in which the Group operates; |
| • | | the effects of the proposed reform and reorganisation of the structure of the UK Financial Services Authority and of the UK regulatory framework that applies to members of the Group; |
| • | | the effects of any new reforms to the UK mortgage lending and the personal loans market; |
| • | | the power of the UK Financial Services Authority (or any overseas regulator) to intervene in response to attempts by customers to seek redress from financial service institutions, including the Group, in case of industry-wide issues; |
| • | | the extent to which members of the Group may be responsible for contributing to compensation schemes in the UK in respect of banks and other authorised financial services firms that are unable to meet their obligations to customers; |
| • | | the effects which the UK Banking Act 2009 may have, should the HM Treasury, the Bank of England and/or the FSA exercise their powers under this Act in the future against the Company; |
| • | | the risk of third parties using the Group as a conduit for illegal activities without the Group’s knowledge; |
| • | | the effects of taxation requirements and other assessments and any changes thereto in each location in which the Group operates; |
| • | | the effects of any changes in the pension liabilities and obligations of the Group; |
| • | | the ability of the Group to recruit, retain and develop appropriate senior management and skilled personnel; |
| • | | the effects of any changes to the reputation of the Group, any member of the Group or any affiliate operating under the Group’s brands; |
| • | | the basis of the preparation of the Company’s and Group’s financial statements and information available about the Group; |
| • | | the Group’s dependency on its information technology systems and on other group companies and third parties for essential services; |
| • | | The Group’s success at managing the risks to which it is exposed, including the items above. |
Undue reliance should not be placed on forward-looking statements when making decisions with respect to Santander UK and/or its securities. Investors and others should take into account the inherent risks and uncertainties of forward-looking statements and should carefully consider the foregoing non-exhaustive list of important factors. Forward-looking statements speak only as of the date on which they are made and are based on the knowledge, information available and views taken on the date on which they are made; such knowledge, information and views may change at any time. Santander UK does not undertake any obligation to update or revise any forward-looking statement, whether as a result of new information, future events or otherwise.
Written forward-looking statements may appear in documents filed with the US Securities and Exchange Commission, including this Annual Report and Accounts, reports to shareholders and other communications. The US Private Securities Litigation Reform Act of 1995 contains a safe harbour for forward-looking statements on which Santander UK relies in making such disclosures
| | |
| 214 | | Abbey National Treasury Services plc 2012 Annual Report |
Other Information for US Investors
Selected Financial Data
The financial information set forth below for the years ended 31 December 2012, 2011 and 2010 and at 31 December 2012 and 2011 has been derived from the audited Consolidated Financial Statements of Abbey National Treasury Services plc (the ‘Company’) and its subsidiaries (together, the ‘ANTS group’) prepared in accordance with IFRS included elsewhere in this Annual Report and Accounts. The information should be read in connection with, and is qualified in its entirety by reference to, the ANTS group’s Consolidated Financial Statements and the notes thereto. Financial information set forth below for the years ended 31 December 2009 and 2008, and at 31 December 2010, 2009 and 2008, has been derived from the audited Consolidated Financial Statements of the ANTS group for 2010, 2009 and 2008 not included in this Annual Report and Accounts. The financial information in this selected consolidated financial and statistical data does not constitute statutory accounts within the meaning of the Companies Act 2006. The auditor’s report on the Consolidated Financial Statements for each of the five years ended 31 December 2012 was unmodified and did not include a statement under sections 237(2) and 237(3) of the Companies Act 1985 or sections 498(2) and 498(3) of the Companies Act 2006, as applicable. The Consolidated Financial Statements of the ANTS group for the years ended 31 December 2012, 2011, 2010, 2009 and 2008 were audited by Deloitte LLP.
BALANCE SHEETS
| | | | | | | | | | | | | | | | | | | | | | | | |
| | | 2012(1)
US$m | | | 2012
£m | | | 2011(*)
£m | | | 2010
£m | | | 2009
£m | | | 2008
£m | |
Assets | | | | | | | | | | | | | | | | | | | | | | | | |
Cash and balances at central banks | | | 631 | | | | 388 | | | | 7,013 | | | | 5,088 | | | | 448 | | | | 8 | |
Trading assets | | | 36,586 | | | | 22,498 | | | | 21,891 | | | | 35,461 | | | | 33,290 | | | | 26,268 | |
Derivative financial instruments | | | 54,113 | | | | 33,276 | | | | 33,224 | | | | 23,237 | | | | 23,201 | | | | 32,866 | |
Financial assets designated at fair value | | | 5,742 | | | | 3,531 | | | | 4,429 | | | | 6,468 | | | | 12,000 | | | | 11,005 | |
Loans and advances to banks | | | 173,983 | | | | 106,986 | | | | 113,222 | | | | 146,412 | | | | 191,749 | | | | 147,089 | |
Loans and advances to customers | | | 72,772 | | | | 44,750 | | | | 38,826 | | | | 34,550 | | | | 20,175 | | | | 24,204 | |
Held-to-maturity securities | | | — | | | | — | | | | — | | | | 331 | | | | 300 | | | | 300 | |
Loans and receivables securities | | | 263 | | | | 162 | | | | 278 | | | | 626 | | | | 896 | | | | 526 | |
Available-for-sale securities | | | 8,315 | | | | 5,113 | | | | — | | | | — | | | | — | | | | — | |
Macro hedge of interest rate risk | | | 1,904 | | | | 1,171 | | | | 1,141 | | | | 908 | | | | 682 | | | | 1,475 | |
Intangible assets | | | 11 | | | | 7 | | | | 3 | | | | 26 | | | | 8 | | | | 6 | |
Property, plant and equipment | | | 10 | | | | 6 | | | | 5 | | | | 22 | | | | 6 | | | | 9 | |
Current tax assets | | | — | | | | — | | | | — | | | | 40 | | | | 3 | | | | — | |
Deferred tax assets | | | 33 | | | | 20 | | | | 17 | | | | 26 | | | | 21 | | | | 77 | |
Other assets | | | 7 | | | | 4 | | | | 43 | | | | 65 | | | | 67 | | | | 45 | |
| | | | | | | | | | | | | | | | | | | | | | | | |
Total assets | | | 354,370 | | | | 217,912 | | | | 220,092 | | | | 253,260 | | | | 282,846 | | | | 243,878 | |
| | | | | | | | | | | | | | | | | | | | | | | | |
Liabilities | | | | | | | | | | | | | | | | | | | | | | | | |
Deposits by banks | | | 186,257 | | | | 114,535 | | | | 114,019 | | | | 136,753 | | | | 166,305 | | | | 123,496 | |
Deposits by customers | | | 10,162 | | | | 6,249 | | | | 7,114 | | | | 7,061 | | | | 9,461 | | | | 2,933 | |
Derivative financial instruments | | | 55,434 | | | | 34,088 | | | | 35,417 | | | | 25,043 | | | | 24,455 | | | | 34,132 | |
Trading liabilities | | | 34,327 | | | | 21,109 | | | | 25,745 | | | | 42,827 | | | | 46,139 | | | | 39,998 | |
Financial liabilities designated at fair value | | | 6,508 | | | | 4,002 | | | | 6,836 | | | | 3,657 | | | | 4,340 | | | | 4,945 | |
Debt securities in issue | | | 54,917 | | | | 33,770 | | | | 26,943 | | | | 33,659 | | | | 27,997 | | | | 33,927 | |
Subordinated liabilities | | | — | | | | — | | | | — | | | | 331 | | | | 331 | | | | 432 | |
Other liabilities | | | 275 | | | | 169 | | | | 142 | | | | 191 | | | | 147 | | | | 407 | |
Provisions | | | 33 | | | | 20 | | | | 20 | | | | — | | | | — | | | | — | |
Current tax liabilities | | | 285 | | | | 175 | | | | 329 | | | | 374 | | | | 167 | | | | 333 | |
Deferred tax liabilities | | | — | | | | — | | | | — | | | | 1 | | | | 1 | | | | 1 | |
| | | | | | | | | | | | | | | | | | | | | | | | |
Total liabilities | | | 348,198 | | | | 214,117 | | | | 216,565 | | | | 249,897 | | | | 279,343 | | | | 240,604 | |
| | | | | | | | | | | | | | | | | | | | | | | | |
Share capital | | | 4,145 | | | | 2,549 | | | | 2,549 | | | | 2,549 | | | | 2,549 | | | | 2,549 | |
Retained earnings | | | 1,994 | | | | 1,226 | | | | 962 | | | | 798 | | | | 938 | | | | 704 | |
Other reserves | | | 33 | | | | 20 | | | | 16 | | | | 16 | | | | 16 | | | | 21 | |
| | | | | | | | | | | | | | | | | | | | | | | | |
Total shareholders’ equity | | | 6,172 | | | | 3,795 | | | | 3,527 | | | | 3,363 | | | | 3,503 | | | | 3,274 | |
| | | | | | | | | | | | | | | | | | | | | | | | |
Total liabilities and equity | | | 354,370 | | | | 217,912 | | | | 220,092 | | | | 253,260 | | | | 282,846 | | | | 243,878 | |
| | | | | | | | | | | | | | | | | | | | | | | | |
| (*) | As restated, see Note 45 |
| (1) | Amounts stated in US dollars have been translated from sterling at the rate of £1.00 - US$1.63, the noon buying rate on 31 December 2012. |
| | |
Abbey National Treasury Services plc 2012 Annual Report | | 215 |
Other Information for US Investors
Selected Financial Datacontinued
INCOME STATEMENTS
| | | | | | | | | | | | | | | | | | | | | | | | |
| | | 2012(1)
US$m | | | 2012
£m | | | 2011(*)
£m | | | 2010
£m | | | 2009
£m | | | 2008
£m | |
Net interest income | | | 227 | | | | 139 | | | | 511 | | | | 403 | | | | 376 | | | | 391 | |
Net fee and commission income | | | 194 | | | | 119 | | | | 113 | | | | 28 | | | | 25 | | | | 16 | |
Net trading and other income | | | 495 | | | | 304 | | | | (46 | ) | | | 462 | | | | 250 | | | | 114 | |
| | | | | | | | | | | | | | | | | | | | | | | | |
Total operating income | | | 916 | | | | 562 | | | | 578 | | | | 893 | | | | 651 | | | | 521 | |
| | | | | | | | | | | | | | | | | | | | | | | | |
Administration expenses | | | (323 | ) | | | (198 | ) | | | (229 | ) | | | (209 | ) | | | (162 | ) | | | (158 | ) |
Depreciation, amortisation and impairment | | | (5 | ) | | | (3 | ) | | | (7 | ) | | | (6 | ) | | | (3 | ) | | | (3 | ) |
| | | | | | | | | | | | | | | | | | | | | | | | |
Total operating expenses, exc provisions and charges | | | (328 | ) | | | (201 | ) | | | (236 | ) | | | (215 | ) | | | (165 | ) | | | (161 | ) |
| | | | | | | | | | | | | | | | | | | | | | | | |
Impairment losses on loans and advances | | | (15 | ) | | | (9 | ) | | | (54 | ) | | | (69 | ) | | | (30 | ) | | | (26 | ) |
Provisions for other liabilities and charges | | | (33 | ) | | | (20 | ) | | | (20 | ) | | | — | | | | — | | | | — | |
| | | | | | | | | | | | | | | | | | | | | | | | |
Total operating provisions and charges | | | (48 | ) | | | (29 | ) | | | (74 | ) | | | (69 | ) | | | (30 | ) | | | (26 | ) |
| | | | | | | | | | | | | | | | | | | | | | | | |
Profit on continuing operations before tax | | | 540 | | | | 332 | | | | 268 | | | | 609 | | | | 456 | | | | 334 | |
Tax on profit on continuing operations | | | (111 | ) | | | (68 | ) | | | (104 | ) | | | (149 | ) | | | (78 | ) | | | (86 | ) |
| | | | | | | | | | | | | | | | | | | | | | | | |
Profit on continuing operations after tax | | | 429 | | | | 264 | | | | 164 | | | | 460 | | | | 378 | | | | 248 | |
| | | | | | | | | | | | | | | | | | | | | | | | |
Profit for the year from discontinued operations | | | — | | | | — | | | | — | | | | — | | | | — | | | | 82 | |
| | | | | | | | | | | | | | | | | | | | | | | | |
Profit for the year | | | 429 | | | | 264 | | | | 164 | | | | 460 | | | | 378 | | | | 330 | |
| | | | | | | | | | | | | | | | | | | | | | | | |
Attributable to: | | | | | | | | | | | | | | | | | | | | | | | | |
Equity holders of the parent | | | 429 | | | | 264 | | | | 164 | | | | 460 | | | | 378 | | | | 330 | |
| | | | | | | | | | | | | | | | | | | | | | | | |
| (*) | As restated, see Note 45 |
| (1) | Amounts stated in US dollars have been translated from sterling at the rate of £1.00—US$1.63, the noon buying rate on 31 December 2012. |
EXCHANGE RATES
The following tables set forth, for the periods indicated, certain information concerning the exchange rate for pounds sterling based on the noon buying rate in New York City for cable transfers in foreign currencies, as certified for customs purposes by the Federal Reserve Bank of New York, expressed in US dollars per £1.00. No representation is made that amounts in pounds sterling have been, could have been or could be converted into US dollars at the noon buying rate or at any other rate. The noon buying rate for US dollars on 15 March 2013 was US$1.51.
| | | | | | | | | | | | | | | | |
Calendar period | | High
US$ Rate | | | Low
US$ Rate | | | Average (1)
US$ Rate | | | Period end
US$ Rate | |
Years ended 31 December: | | | | | | | | | | | | | | | | |
2012 | | | 1.63 | | | | 1.53 | | | | 1.59 | | | | 1.63 | |
2011 | | | 1.67 | | | | 1.54 | | | | 1.60 | | | | 1.55 | |
2010 | | | 1.64 | | | | 1.43 | | | | 1.55 | | | | 1.54 | |
2009 | | | 1.70 | | | | 1.37 | | | | 1.57 | | | | 1.62 | |
2008 | | | 2.03 | | | | 1.44 | | | | 1.85 | | | | 1.46 | |
Months ended: | | | | | | | | | | | | | | | | |
March 2013(2) | | | 1.51 | | | | 1.49 | | | | 1.50 | | | | 1.51 | |
February 2013 | | | 1.58 | | | | 1.51 | | | | 1.55 | | | | 1.52 | |
January 2013 | | | 1.63 | | | | 1.57 | | | | 1.60 | | | | 1.58 | |
December 2012 | | | 1.63 | | | | 1.60 | | | | 1.61 | | | | 1.63 | |
November 2012 | | | 1.61 | | | | 1.58 | | | | 1.60 | | | | 1.60 | |
October 2012 | | | 1.62 | | | | 1.59 | | | | 1.61 | | | | 1.61 | |
September 2012 | | | 1.63 | | | | 1.59 | | | | 1.61 | | | | 1.61 | |
| (1) | The average of the noon buying rates on the last business day of each month during the relevant period. |
| (2) | With respect to March 2013 for the period from 1 March to 15 March. |
SELECTED STATISTICAL INFORMATION
| | | | | | | | | | | | | | | | | | | | |
| | | 2012
% | | | 2011(5)
% | | | 2010
% | | | 2009
% | | | 2008
% | |
Profitability ratios: | | | | | | | | | | | | | | | | | | | | |
Return on assets (1) | | | 0.11 | | | | 0.06 | | | | 0.15 | | | | 0.14 | | | | 0.17 | |
Dividend payout ratio(2) | | | — | | | | — | | | | 130 | | | | 38 | | | | 49 | |
| | | | | |
Capital ratios: | | | | | | | | | | | | | | | | | | | | |
Equity to assets ratio(3) | | | 1.55 | | | | 1.36 | | | | 1.1 | | | | 1.29 | | | | 1.64 | |
| | | | | |
Ratio of earnings to fixed charges:(4) | | | | | | | | | | | | | | | | | | | | |
- Excluding interest on retail deposits | | | 109 | | | | 108 | | | | 123 | | | | 113 | | | | 105 | |
- Including interest on retail deposits | | | 109 | | | | 108 | | | | 123 | | | | 113 | | | | 105 | |
| (1) | Profit after tax divided by average total assets. |
| (2) | Ordinary equity dividends declared divided by profit after tax. |
| (3) | Average ordinary shareholders’ funds divided by average total assets. |
| (4) | For the purpose of calculating the ratios of earnings to fixed charges, earnings consist of profit before tax plus fixed charges. Fixed charges consist of interest payable, including the amortisation of discounts and premiums on debt securities in issue. |
| (5) | As restated, see Note 45 |
| | |
| 216 | | Abbey National Treasury Services plc 2012 Annual Report |
Other Information for US Investors
Taxation for US Investors
The following is a summary, under current law, of the principal UK tax considerations relating to the beneficial ownership by a US taxpayer of the securities of the Company. The following summary is provided for general guidance and does not address investors that are subject to special rules or that do not hold the perpetual securities as capital assets. US residents should consult their local tax advisers, particularly in connection with any potential liability to pay US taxes on disposal, lifetime gift or bequest of their perpetual securities.
United Kingdom taxation on dividends
Under UK law, income tax is not withheld from dividends paid by UK companies. Shareholders, whether resident in the UK or not, receive the full amount of the dividend actually declared.
United Kingdom taxation on capital gains
Under UK law, when you sell shares you may be liable to pay either capital gains tax or corporation tax on chargeable gains. However if you are either:
| • | | an individual who is neither resident nor ordinarily resident in the UK; or |
| • | | a company which is not resident in the UK, |
you will not be liable to UK tax on any capital gains made on disposal of your shares. The exception is if the shares are held in connection with a trade or business that is conducted in the UK through a branch or agency (for capital gains tax purposes) or a permanent establishment (for corporation tax purposes).
United Kingdom inheritance tax
Under the current estate and gift tax convention between the US and the UK, shares held by an individual shareholder who is:
| • | | domiciled for the purposes of the convention in the US; and |
| • | | is not for the purposes of the convention a national of the UK; |
will not be subject to UK inheritance tax on:
| • | | the individual’s death; or |
| • | | on a gift of the shares during the individual’s lifetime. |
The exception is if the shares are part of the business property of a permanent establishment of the individual in the UK or, in the case of a shareholder who performs independent personal services, pertain to a fixed base situated in the UK.
Share Information
Major shareholders
At 31 December 2012, the Company was a wholly-owned subsidiary of Santander UK plc. The Company and its subsidiaries are indirect subsidiaries of Banco Santander, S.A, which is incorporated in Spain and is the ultimate parent company.
Exchange controls
There are no UK laws, decrees or regulations that restrict Santander UK’s export or import of capital, including the availability of cash and cash equivalents for use by Santander UK, or that affect the remittance of dividends or other shareholder payments to non-UK holders of Company shares, except as outlined in the section on Taxation for US Investors above.
| | |
Abbey National Treasury Services plc 2012 Annual Report | | 217 |
Other Information for US Investors
Disclosure pursuant to Section 219 of the Iran Threat Reduction and Syria Human Rights Act
Pursuant to Section 219 of the Iran Threat Reduction and Syria Human Rights Act of 2012, which added Section 13(r) to the Securities Exchange Act of 1934, as amended, an issuer is required to disclose in its annual or quarterly reports, as applicable, whether it or any of its affiliates knowingly engaged in certain activities, transactions or dealings relating to Iran or with individuals or entities designated pursuant to certain Executive Orders. Disclosure is generally required even where the activities, transactions or dealings were conducted in compliance with applicable law.
During the period covered by this annual report, the ANTS Group did not engage in any activities or transactions requiring disclosure pursuant to Section 13(r).
The following activities are disclosed in response to Section 13(r) with respect to affiliates of Abbey National Treasury Services plc within the Banco Santander group:
During the period covered by this annual report an Iranian national, resident in the UK, who is currently designated by the U.S. and the UK under the Iran Sanctions regime held a mortgage with Santander UK plc that was issued prior to any such designation. No further drawdown has been made (or would be allowed) under this mortgage although we continue to receive repayment instalments. In 2012, total revenue in connection with the mortgage was £10,768.38 whilst net profits were negligible relative to the overall profits of Santander UK. Santander UK does not intend to enter into any new relationships with this customer and any disbursements will only be made in accordance with applicable sanctions. This same Iranian national also holds two investment accounts with Santander Asset Management UK Limited. The accounts have remained frozen throughout 2012. The investment returns are being automatically reinvested, and no disbursements have been made to the customer. Total revenue in connection with the investment accounts was £208.15 whilst net profits were negligible in 2012 relative to the overall profits of Banco Santander, S.A.
In addition, the Banco Santander group has certain legacy export credits and performance guarantees with Bank Sepah and Bank Mellat, which are included in the U.S. Department of the Treasury’s Office of Foreign Assets Control’s Specially Designated Nationals and Blocked Persons List.
| • | | With respect to Bank Sepah, Banco Santander, S.A. entered into bilateral credit facilities in May 1996 and in February 2004 of US$95.7m and US$4.2m, respectively. The former matured on May 29, 2012 and the latter matures on September 11, 2013. As of December 31, 2012, euro 0.5m remained outstanding under the 2004 bilateral credit facility. |
| • | | With respect to Bank Mellat, Banco Santander, S.A. entered into two bilateral credit facilities in February 2000 in an aggregate principal amount of euro 25.9m. Both credit facilities matured in 2012. In addition, in 2005 Banco Santander, S.A. participated in a syndicated credit facility for Bank Mellat of euro 15.5m, which matures on July 6, 2015. As of December 31, 2012, the Banco Santander group was owed euro 6.5 million under this credit facility. |
Both Bank Sepah and Bank Mellat have been in default under all of these agreements in recent years and Banco Santander, SA has been and expects to continue to be repaid any amounts due by official export credit agencies, which insure between 95% and 99% of the outstanding amounts under these credit facilities. No funds have been extended by Banco Santander, S.A. under these facilities since they were granted.
The Banco Santander group also has certain legacy performance guarantees for the benefit of Bank Sepah and Bank Mellat (stand-by letters of credit to guarantee the obligations – either under tender documents or under contracting agreements – of contractors who participated in public bids in Iran) that were in place prior to April 27, 2007. However, should any of the contractors default in their obligations under the public bids, the Banco Santander group would not be able to pay any amounts due to Bank Sepah or Bank Mellat because any such payments would be frozen pursuant to Council Regulation (EU) No. 961/2010.
In the aggregate, all of the transactions described above resulted in approximately euro 120,000 gross revenues and approximately euro 15,000 net loss to the Banco Santander group in 2012, which primarily resulted from the performance of export credit agencies rather than any Iranian entity. Banco Santander, S.A. has undertaken significant steps to withdraw from the Iranian market such as closing its representative office in Iran and ceasing all banking activities therein, including correspondent relationships, deposit taking from Iranian entities and issuing export letters of credit, except for the legacy transactions described above. Banco Santander, S.A. is not contractually permitted to cancel these arrangements without either (i) paying the guaranteed amount – which payment would be frozen as explained above (in the case of the performance guarantees), or (ii) forfeiting the outstanding amounts due to it (in the case of the export credits). As such, Banco Santander, S.A. intends to continue to provide the guarantees and hold these assets in accordance with company policy and applicable laws.
| | |
Abbey National Treasury Services plc 2012 Annual Report | | 218 |
Other Information for US Investors
Cross-reference to Form 20-F
| | | | | | |
| Part I |
1 | | Identity of Directors, Senior Management and Advisers | | * |
2 | | Offer Statistics and Expected Timetable | | | | * |
3 | | Key Information | | Selected Financial Data | | 215 |
| | | | Capitalisation and Indebtedness | | * |
| | | | Reasons for the Offer and use of Proceeds | | * |
| | | | | Risk Factors | | 190 |
4 | | Information on the Company | | History and Development of the Company | | 3 |
| | | | Business Overview | | 2, 101 |
| | | | Organisational Structure | | 2 |
| | | | | Property, Plant and Equipment | | 21 |
4A | | Unresolved Staff Comments | | | | N/a |
5 | | Operating and Financial Review and Prospects | | Operating Results | | 4 |
| | | | Liquidity and Capital Resources | | 25, 187 |
| | | | Research and Development, Patents and Licenses, etc | | N/a |
| | | | Trend Information | | 4 |
| | | | Off-Balance Sheet Arrangements | | 24 |
| | | | | Contractual Obligations | | 24 |
6 | | Directors, Senior Management and Employees | | Directors and senior management | | 99 |
| | | | Compensation | | 138 |
| | | | Board Practices | | 102 |
| | | | Employees | | 103 |
| | | | | Share Ownership | | 138 |
7 | | Major Shareholders and Related Party Transactions | | Major Shareholders | | 217 |
| | | | Related Party Transactions | | 165 |
| | | | | Interests of Experts and Counsel | | * |
8 | | Financial Information | | Consolidated Statements and Other Financial Information | | 112 |
| | | | | Significant Changes | | 206 |
9 | | The Offer and Listing | | Offer Listing and Details | | * |
| | | | Plan of Distribution | | * |
| | | | Markets | | N/a |
| | | | Selling shareholders | | * |
| | | | Dilution | | * |
| | | | | Expenses of the Issue | | * |
10 | | Additional Information | | Share Capital | | * |
| | | | Articles of Association | | 207 |
| | | | Material Contracts | | 206 |
| | | | Exchange Controls | | N/a |
| | | | Taxation | | 217 |
| | | | Dividends and Paying Agents | | * |
| | | | Statements by Experts | | * |
| | | | Documents on Display | | 206 |
| | | | | Subsidiary Information | | N/a |
11 | | Quantitative and Qualitative Disclosures about Market Risk | | 63 |
12 | | Description of Securities Other Than Equity Securities | | Debt Securities | | * |
| | | | Warrants and Rights | | * |
| | | | Other Securities | | * |
| | | | American Depositary Shares | | * |
Part II | | | | | | |
13 | | Defaults, Dividend Arrearages and Delinquencies | | N/a |
14 | | Material Modifications to the Rights of Security Holders and Use of Proceeds | | N/a |
15 | | Controls and Procedures | | Disclosure Controls and Procedures | | 107 |
| | | | Management’s Annual Report on Internal Control over Financial Reporting | | 107 |
| | | | Attestation Report of the Registered Public Accounting Firm | | N/a |
| | | | | Changes in Internal Control Over Financial Reporting | | 107 |
16A | | Board Audit Committee Financial Expert | | | | 102 |
16B | | Code of Ethics | | | | 104 |
16C | | Principal Accountant Fees and Services | | | | 137 |
16D | | Exemptions from the Listing Standards for Board Audit Committees | | 100 |
16E | | Purchases of Equity Securities by the Issuer and Affiliated Purchasers | | N/a |
16F | | Change in Registrant’s Certifying Accountant | | N/a |
16G | | Corporate Governance | | 100 |
Part III | | | | | | |
17 | | Financial Statements | | | | N/a |
18 | | Financial Statements | | | | 112 |
19 | | Exhibits | | | | Filed with SEC |
| * | Not required for an Annual Report. |
| | |
| 219 | | Abbey National Treasury Services plc 2012 Annual Report |
SIGNATURE
The registrant hereby certifies that it meets all the requirements for filing on Form 20-F and that it has duly caused and authorized the undersigned to sign this annual report on its behalf.
ABBEY NATIONAL TREASURY SERVICES plc
| | |
| By: | | /s/ Luis de Sousa |
| | Luis de Sousa |
| | Chief Executive Officer |
Dated: 22 March 2013
EXHIBIT INDEX
| | |
| Exhibits1 | | |
| |
| 1.1 | | Articles of Association of Abbey National Treasury Services plc |
| |
| 4.1 | | Guarantee by Santander UK plc for the benefit of Abbey National Treasury Services plc dated 10 May 2012 |
| |
| 4.2 | | Guarantee by Abbey National Treasury Services plc for the benefit of Santander UK plc dated 10 May 2012 |
| |
| 4.3 | | Facility Agreement dated 28 May 2010 between Santander UK plc, Abbey National Treasury Services plc, Alliance & Leicester plc, Cater Allen International Limited and Cater Allen Limited |
| |
| 4.4 | | Capital Support Deed dated 14 December 2012 between the Regulated Entities (as named therein, including Abbey National Treasury Services plc), the Unregulated Entities (as named therein) and Santander UK plc |
| |
| 7.1 | | Statement of ratio of earnings to fixed charges2 |
| |
| 8.1 | | List of Subsidiaries of Abbey National Treasury Services plc |
| |
| 12.1 | | CEO Certificate pursuant to Section 302 of the Sarbanes-Oxley Act of 2002 |
| |
| 12.2 | | CFO Certificate pursuant to Section 302 of the Sarbanes-Oxley Act of 2002 |
| |
| 13.1 | | Certificate pursuant to Section 906 of the Sarbanes-Oxley Act of 2002 |
| |
| 15.1 | | Consent of Deloitte LLP2 |
| 1 | Documents concerning Abbey National Treasury Services plc referred to within the Annual Report on Form 20-F 2012 may be inspected at 2 Triton Square, Regent’s Place, London NW1 3AN, the principal executive offices and registered address of Abbey National Treasury Services plc. |
| 2 | Incorporated by reference into Registration Statement No. 333-172925 on Form F-3. |