Table of Contents
FORM 6-K
SECURITIES AND EXCHANGE COMMISSION
Washington, D.C. 20549
Report of Foreign Issuer
Pursuant to Rule 13a-16 or 15d-16 of
Securities Exchange Act of 1934
For the month of August 2013
ABBEY NATIONAL TREASURY SERVICES PLC
(Translation of registrant’s name into English)
2 Triton Square, Regent’s
Place, London NW1 3AN, England
(Address of principal executive offices)
Indicate by check mark whether the registrant files or will file annual reports under cover Form 20-F or Form 40-F.
Form 20-F x Form 40-F ¨
Indicate by check mark whether the registrant by furnishing the information contained in this Form is also thereby furnishing the information to the Commission pursuant to Rule 12g3-2(b) under the Securities Exchange Act of 1934.
Yes ¨ No x
The Registrant hereby incorporates all parts of this Report on Form 6-K by reference in Registration Statement no. 333-190509-01 filed by the Registrant with the Securities and Exchange Commission on Form F-3ASR under the Securities Act of 1933.
Table of Contents
2013 Half Yearly Financial Report
Abbey National Treasury Services plc
PART OF THE SANTANDER GROUP
Table of Contents
This page intentionally left blank
Table of Contents
Abbey National Treasury Services plc
2013 Half Yearly Financial Report
Index
| 2 | ||||
| 3 | ||||
| 4 | ||||
| 9 | ||||
| 15 | ||||
| 51 | ||||
| 54 | ||||
| 57 | ||||
| 85 | ||||
| 85 | ||||
| 86 | ||||
| 92 | ||||
| 93 | ||||
Abbey National Treasury Services plc 2013 Half Yearly Financial Report | 1 |
Table of Contents
Abbey National Treasury Services plc (the ‘Company’) and its subsidiaries (together, ‘ANTS’ or the ‘ANTS group’) operate primarily in the UK, under UK law and regulation and are part of the Santander UK group (together with its subsidiaries, ‘Santander UK’ or the ‘Santander UK group’) which is, in turn, part of the Banco Santander, S.A. group (together with its subsidiaries, the ‘Banco Santander group’). Banco Santander, S.A. is incorporated in Spain and is the ultimate parent company of ANTS.
Corporate purpose
ANTS provides treasury, corporate and wholesale banking services. ANTS provides these services to UK external clients and also to the wider Santander UK group, of which ANTS is a part. ANTS is also the treasury support function for the Santander UK group. In this regard, ANTS’s role is to provide access to financial markets and central bank facilities in order to meet the Santander UK group’s liquidity, funding, capital and balance sheet management requirements. As such, ANTS is one of the main debt issuance vehicles in the Santander UK group.
ANTS contains part of a number of Santander UK’s business segments. Whether transactions are booked in ANTS or another Santander UK group entity reflects historical or operational reasons and does not necessarily reflect any particular business split.
The Company has given a full and unconditional guarantee in respect of the unsubordinated liabilities of Santander UK plc incurred prior to 30 June 2015 under a deed poll guarantee entered into by the Company on 10 May 2012. Santander UK plc has given a reciprocal guarantee in respect of the unsubordinated liabilities of the Company incurred prior to 30 June 2015.
As a result of these guarantees, the results and creditworthiness of ANTS should not be viewed in isolation. Account should also be taken of the position of the Santander UK group into which the assets and liabilities of ANTS are fully consolidated.
ANTS has also entered into agreements to provide capital and/or liquidity to Santander UK plc and other members of the Santander UK group, in accordance with UK regulatory requirements. For further details, see Note 28 to the Condensed Consolidated Interim Financial Statements.
Business structure
ANTS consists of three business divisions, organised as follows:
| Business division | About | |
Corporate Banking | Corporate Banking offers a wide range of products and financial services to customers through a network of regional business centres and through telephony and e-commerce channels. Corporate Banking products and services include loans, bank accounts, deposits, treasury services, invoice discounting, cash transmission and asset finance.
The SME and mid corporate business principally serves small and medium enterprises with an annual turnover of more than £250,000 up to £50m (‘SMEs’), and other corporate customers with an annual turnover of up to £500m. This also includes real estate lending.
The Large Corporates business offers specialist treasury services in fixed income and foreign exchange, lending, transactional banking services, capital markets and money markets to large multinational corporate customers with an annual turnover of more than £500m. Lending includes syndicated loans and structured finance. Transactional banking includes trade finance and cash management. Money market activities include securities lending/borrowing and repos. | |
Markets | Markets offers risk management and other services to financial institutions, as well as to other Santander UK divisions. Its main product areas are fixed income and foreign exchange, equity, capital markets and institutional sales. | |
Corporate Centre | Corporate Centre includes of Financial Management & Investor Relations (‘FMIR’) and the non-core portfolios of Social Housing loans and structured credit assets. FMIR is responsible for managing capital and funding, balance sheet composition, structural market risk and strategic liquidity risk for the Santander UK group. The non-core portfolios are being run-down and/or managed for value. | |
2 | Abbey National Treasury Services plc 2013 Half Yearly Financial Report |
Table of Contents
Our Business and Our Strategy
ANTS’s strategy is to continue to provide treasury support functions for the Santander UK group and to provide treasury, corporate and wholesale banking services to UK clients.
The structural relationship of ANTS and Santander UK with the Banco Santander group – the ‘subsidiary model’
The Banco Santander group operates a ‘subsidiary model’. This model involves autonomous units, such as the Santander UK group (of which ANTS is a part) operating in core markets, with each unit being responsible for its own liquidity, funding and capital management on an ongoing basis. The model is designed to minimise the risk to the Banco Santander group and all its units from problems arising elsewhere in the Banco Santander group. The subsidiary model means that Banco Santander, S.A. has no obligation to provide any liquidity, funding or capital assistance, although it enables Banco Santander, S.A. to selectively take advantage of opportunities. As a PRA regulated group, the Santander UK group is expected to satisfy the PRA liquidity and capital requirements on a standalone basis.
Under the subsidiary model, the Santander UK group primarily generates funding and liquidity through UK retail and corporate deposits, as well as in the financial markets through its own debt programmes and facilities to support its business activities and liquidity requirements. It does this in reliance on the strength of its own balance sheet and profitability and its own network of investors. The Santander UK group does not rely on a guarantee from Banco Santander, S.A. or any other member of the Banco Santander group (other than certain of Santander UK plc’s own subsidiaries, including Abbey National Treasury Services plc) to generate this funding or liquidity. The Santander UK group does not raise funds to finance other members of the Banco Santander group or guarantee the debts of other members of the Banco Santander group (other than certain of Santander UK plc’s own subsidiaries, including Abbey National Treasury Services plc).
Exposures to other Banco Santander group members are established and managed on an arm’s length commercial basis. All intergroup transactions are monitored by the Santander UK Board Risk Committee and transactions which are not in the ordinary course of business must be pre-approved by the Board. In addition, the Santander UK group is subject to PRA limits on exposures to, and on liquidity generated from, other members of the Banco Santander group.
Abbey National Treasury Services plc 2013 Half Yearly Financial Report | 3 |
Table of Contents
GROUP SUMMARY
KEY PERFORMANCE INDICATORS
Key performance indicators are set at the Santander UK group level, rather than separately for the ANTS group.
SUMMARISED CONSOLIDATED INCOME STATEMENT
| Six months ended 30 June 2013 £m | Six months ended 30 June 2012 £m | |||||||
Net interest expense | (8 | ) | (26 | ) | ||||
Non-interest income | 436 | 287 | ||||||
|
|
|
| |||||
Total operating income | 428 | 261 | ||||||
|
|
|
| |||||
Administrative expenses | (108 | ) | (105 | ) | ||||
Depreciation, amortisation and impairment | (1 | ) | (1 | ) | ||||
|
|
|
| |||||
Total operating expenses excluding provisions and charges | (109 | ) | (106 | ) | ||||
|
|
|
| |||||
Impairment losses on loans and advances | (18 | ) | (20 | ) | ||||
Provisions for other liabilities and charges | — | — | ||||||
|
|
|
| |||||
Total operating provisions and charges | (18 | ) | (20 | ) | ||||
|
|
|
| |||||
Profit before tax | 301 | 135 | ||||||
Taxation charge | (45 | ) | (15 | ) | ||||
|
|
|
| |||||
Profit for the period | 256 | 120 | ||||||
|
|
|
| |||||
Six months ended 30 June 2013 compared to six months ended 30 June 2012
Profit before tax increased by £166m to £301m (2012: £135m). By income statement line, the movements were:
| • | Net interest expense decreased by £18m to £8m (2012: £26m) partly as a result of continued growth and improving new business margins in customer loans. This was partially offset by an increase in net interest expense as a consequence of continued low interest rate environment. |
| • | Non-interest income increased by £149m to £436m (2012: £287m) principally due to mark-to-market gains on certain derivatives, which are only treated as hedging for Santander UK group purposes, partially offset by a decrease of £97m in non-interest income in Markets compared to a particularly strong first half of 2012, and lower ancillary fees from Large Corporates. |
| • | Administrative expenses increased by £3m to £108m (2012: £105m). The increase principally reflected selective investment in growth opportunities for Corporate Banking. This increase was partially offset by effective cost control. |
| • | Depreciation, amortisation and impairment costs were unchanged at £1m (2012: £1m). |
| • | Impairment losses on loans and advances decreased by £2m to £18m (2012: £20m) mainly due to the continued resilient credit quality in the Corporate Banking loan books. |
| • | The taxation charge was significantly higher than for the first half of 2012, in line with increased profits before tax. |
4 | Abbey National Treasury Services plc 2013 Half Yearly Financial Report |
Table of Contents
Business Review
Group and Divisional Resultscontinued
Critical factors affecting results
The preparation of our Condensed Consolidated Interim Financial Statements requires management to make estimates and judgements that affect the reported amount of assets and liabilities at the balance sheet date and the reported amount of income and expenses during the reporting period. Management evaluates its estimates and judgements on an ongoing basis, and bases its estimates and judgements on historical experience and other factors believed to be reasonable under the circumstances. Actual results may differ from these estimates under different assumptions or conditions. Estimates and judgements that are considered important to the portrayal of our financial condition including, where applicable, quantification of the effects of reasonably possible ranges of such estimates are set out in “Critical Accounting Policies” in Note 1 to the Condensed Consolidated Interim Financial Statements.
The rest of this section contains a summary of the results, and commentary thereon, by Income Statement line item for each segment.
Basis of results presentation
The segmental information in this Half Yearly Financial Report reflects the reporting structure in place at the reporting date in accordance with which the segmental information in Note 2 to the Condensed Consolidated Interim Financial Statements has been presented. The Company’s board of directors (the ‘Board’) is the chief operating decision maker for the ANTS group. The segmental information below is presented on the basis used by the Board to evaluate performance and allocate resources. The Board reviews discrete financial information for each segment of the business which follows the ANTS group’s normal accounting policies and principles, including measures of operating results, assets and liabilities.
PROFIT BEFORE TAX BY SEGMENT
30 June 2013 | Corporate Banking £m | Markets £m | Corporate Centre £m | Total £m | ||||||||||||
Net interest income/(expense) | 69 | (1 | ) | (76 | ) | (8 | ) | |||||||||
Non-interest income | 114 | 40 | 282 | 436 | ||||||||||||
|
|
|
|
|
|
|
| |||||||||
Total operating income | 183 | 39 | 206 | 428 | ||||||||||||
|
|
|
|
|
|
|
| |||||||||
Administration expenses | (42 | ) | (48 | ) | (18 | ) | (108 | ) | ||||||||
Depreciation, amortisation and impairment | — | (1 | ) | — | (1 | ) | ||||||||||
|
|
|
|
|
|
|
| |||||||||
Total operating expenses excluding provisions and charges | (42 | ) | (49 | ) | (18 | ) | (109 | ) | ||||||||
|
|
|
|
|
|
|
| |||||||||
Impairment losses on loans and advances | (18 | ) | — | — | (18 | ) | ||||||||||
|
|
|
|
|
|
|
| |||||||||
Total operating provisions and charges | (18 | ) | — | — | (18 | ) | ||||||||||
|
|
|
|
|
|
|
| |||||||||
Profit/(loss) before tax | 123 | (10 | ) | 188 | 301 | |||||||||||
|
|
|
|
|
|
|
| |||||||||
30 June 2012 | Corporate Banking £m | Markets £m | Corporate Centre £m | Total £m | ||||||||||||
Net interest income/(expense) | 29 | (3 | ) | (52 | ) | (26 | ) | |||||||||
Non-interest income | 141 | 137 | 9 | 287 | ||||||||||||
|
|
|
|
|
|
|
| |||||||||
Total operating income | 170 | 134 | (43 | ) | 261 | |||||||||||
|
|
|
|
|
|
|
| |||||||||
Administration expenses | (37 | ) | (54 | ) | (14 | ) | (105 | ) | ||||||||
Depreciation, amortisation and impairment | — | (1 | ) | — | (1 | ) | ||||||||||
|
|
|
|
|
|
|
| |||||||||
Total operating expenses excluding provisions and charges | (37 | ) | (55 | ) | (14 | ) | (106 | ) | ||||||||
|
|
|
|
|
|
|
| |||||||||
Impairment losses on loans and advances | (20 | ) | — | — | (20 | ) | ||||||||||
|
|
|
|
|
|
|
| |||||||||
Total operating provisions and charges | (20 | ) | — | — | (20 | ) | ||||||||||
|
|
|
|
|
|
|
| |||||||||
Profit/(loss) before tax | 113 | 79 | (57 | ) | 135 | |||||||||||
|
|
|
|
|
|
|
| |||||||||
Abbey National Treasury Services plc 2013 Half Yearly Financial Report | 5 |
Table of Contents
Business Review
Group and Divisional Resultscontinued
CORPORATE BANKING
Corporate Banking offers a wide range of products and financial services to customers through a network of regional business centres and through telephony and e-commerce channels. Corporate Banking products and services include loans, bank accounts, deposits, treasury services, invoice discounting, cash transmission and asset finance.
The SME and mid corporate business principally serves small and medium enterprises with an annual turnover of more than £250,000 up to £50m (‘SMEs’), and other corporate customers with an annual turnover of up to £500m. This also includes real estate lending.
The Large Corporates business offers specialist treasury services in fixed income and foreign exchange, lending, transactional banking services, capital markets and money markets to large multinational corporate customers with an annual turnover of more than £500m. Lending includes syndicated loans and structured finance. Transactional banking includes trade finance and cash management. Money market activities include securities lending/borrowing and repos.
Summarised income statement
| Six months ended 30 June 2013 £m | Six months ended 30 June 2012 £m | |||||||
Net interest income | 69 | 29 | ||||||
Non-interest income | 114 | 141 | ||||||
|
|
|
| |||||
Total operating income | 183 | 170 | ||||||
|
|
|
| |||||
Administration expenses | (42 | ) | (37 | ) | ||||
|
|
|
| |||||
Total operating expenses excluding provisions and charges | (42 | ) | (37 | ) | ||||
|
|
|
| |||||
Impairment losses on loans and advances | (18 | ) | (20 | ) | ||||
|
|
|
| |||||
Total operating provisions and charges | (18 | ) | (20 | ) | ||||
|
|
|
| |||||
Profit before tax | 123 | 113 | ||||||
|
|
|
| |||||
Corporate Banking profit before tax
Six months ended 30 June 2013 compared to six months ended 30 June 2012
Profit before tax increased by £10m to £123m (2012: £113m). By income statement line, the movements were:
| • | Net interest income increased by £40m to £69m (2012: £29m), partly as a result of continued growth in customer loans generated through our trade finance business (invoice discounting programmes) with Large Corporates. Net interest income also benefitted from the impact of improving new business margins. |
| • | Non-interest income decreased by £27m to £114m (2012: £141m) reflecting lower ancillary fees from Large Corporates, notably as a result of lower demand for interest rate and foreign exchange risk management products. |
| • | Administration expenses increased by £5m to £42m (2012: £37m). The increase reflected selective investment in growth opportunities for Corporate Banking. |
| • | Impairment losses on loans and advances decreased by £2m to £18m (2012: £20m), with the credit quality of business continuing to perform well. |
6 | Abbey National Treasury Services plc 2013 Half Yearly Financial Report |
Table of Contents
Business Review
Group and Divisional Resultscontinued
MARKETS
Markets offers risk management and other services to financial institutions, as well as other Santander UK divisions. Its main product areas are fixed income and foreign exchange, equity, capital markets and institutional sales.
Summarised income statement
| Six months ended 30 June 2013 £m | Six months ended 30 June 2012 £m | |||||||
Net interest expense | (1 | ) | (3 | ) | ||||
Non-interest income | 40 | 137 | ||||||
|
|
|
| |||||
Total operating income | 39 | 134 | ||||||
|
|
|
| |||||
Administration expenses | (48 | ) | (54 | ) | ||||
Depreciation, amortisation and impairment | (1 | ) | (1 | ) | ||||
|
|
|
| |||||
Total operating expenses excluding provisions and charges | (49 | ) | (55 | ) | ||||
|
|
|
| |||||
Provisions for other liabilities and charges | — | — | ||||||
|
|
|
| |||||
Total operating provisions and charges | — | — | ||||||
|
|
|
| |||||
(Loss)/profit before tax | (10 | ) | 79 | |||||
|
|
|
| |||||
Markets (loss)/profit before tax
Six months ended 30 June 2013 compared to six months ended 30 June 2012
(Loss)/profit before tax decreased by £89m to a loss of £10m (2012: profit of £79m). By income statement line, the movements were:
| • | Net interest expense was broadly unchanged at £1m in 2013 (2012: £3m). |
| • | Non-interest income decreased by £97m to £40m in 2013 (2012: £137m), compared to a particularly strong first half of 2012. This reflected a return to more normalised levels of Market Making activity with reduced corporate and institutional sales in the relatively stable, low interest rate environment. |
| • | Administration expenses decreased by £6m to £48m in 2013 (2012: £54m), reflecting tight cost control, which was partially offset by investment in developing interest rate and foreign exchange product capabilities. |
| • | Depreciation and amortisation was unchanged at £1m (2012: £1m). |
Abbey National Treasury Services plc 2013 Half Yearly Financial Report | 7 |
Table of Contents
Business Review
Group and Divisional Resultscontinued
CORPORATE CENTRE
Corporate Centre consists of Financial Management & Investor Relations (‘FMIR’) and the non-core portfolios of Social Housing loans and structured credit assets. FMIR is responsible for managing capital and funding, balance sheet composition, structural market risk and strategic liquidity risk for the rest of the Santander UK group. The non-core portfolios are being run-down and/or managed for value.
Summarised income statement
| Six months ended 30 June 2013 £m | Six months ended 30 June 2012 £m | |||||||
Net interest income/(expense) | (76 | ) | (52 | ) | ||||
Non-interest income | 282 | 9 | ||||||
|
|
|
| |||||
Total operating income | 206 | (43 | ) | |||||
|
|
|
| |||||
Administration expenses | (18 | ) | (14 | ) | ||||
|
|
|
| |||||
Total operating expenses excluding provisions and charges | (18 | ) | (14 | ) | ||||
|
|
|
| |||||
Provisions for other liabilities and charges | — | — | ||||||
|
|
|
| |||||
Total operating provisions and charges | — | — | ||||||
|
|
|
| |||||
Profit/(loss) before tax | 188 | (57 | ) | |||||
|
|
|
| |||||
Corporate Centre profit/(loss) before tax
Six months ended 30 June 2013 compared to six months ended 30 June 2012
Profit/(loss) before tax increased by £245m to a profit of £188m (2012: loss of £57m). By income statement line, the movements were:
| • | Net interest expense increased by £24m to £76m (2012: £52m) as a consequence of continued low interest rates, which reduced income earned on the structural hedges put in place in 2008 and 2009 and now maturing in a much lower, static environment. This has been partially offset by the same static interest rate environment reducing the costs of maintaining the liquid asset portfolio and a change in the internal UK transfer pricing mechanism to other Santander UK group companies. |
| • | Non-interest income increased by £273m to £282m (2012: £9m) principally due to mark-to-market gains on derivatives, which are only treated as hedging for Santander UK group purposes, and the £44m credit arising from the debit valuation adjustment on derivatives written by the ANTS group. This adjustment was introduced in 2013 in accordance with the requirements of IFRS 13. These increases were partially offset by a £3m net loss on the rebalancing of the liquidity and balance sheet management portfolios and related funding. |
| • | Administration expenses increased by £4m to £18m (2012: £14m), reflecting increased regulatory compliance and control costs. |
8 | Abbey National Treasury Services plc 2013 Half Yearly Financial Report |
Table of Contents
Business Review
Throughout this Balance Sheet Review, references to UK and non-UK, in the geographic analysis, refer to the location of the office where the transaction is recorded.
The Balance Sheet Review is divided into the following sections:
INDEX
| Page | ||||
| 9 | ||||
| 11 | ||||
| 12 | ||||
| 13 | ||||
| 14 | ||||
This Balance Sheet Review focuses on those areas that have changed significantly during the first half of 2013, and represents an update to the Balance Sheet Review in the Company’s Annual Report and Accounts for the year ended 31 December 2012 (“2012 Annual Report”), with which it should be read in conjunction. The Balance Sheet Review in the 2012 Annual Report contains additional disclosures which have not changed significantly during the first half of 2013.
SUMMARISED CONDENSED CONSOLIDATED BALANCE SHEET
| 30 June 2013 £m | 31 December 2012 £m | |||||||
Assets | ||||||||
Cash and balances at central banks | 9,284 | 388 | ||||||
Trading assets | 31,163 | 22,498 | ||||||
Derivative financial instruments | 27,268 | 33,276 | ||||||
Financial assets designated at fair value | 2,567 | 3,531 | ||||||
Loans and advances to banks | 108,584 | 106,986 | ||||||
Loans and advances to customers | 40,963 | 44,750 | ||||||
Available for sale securities | 4,313 | 5,113 | ||||||
Loans and receivables securities | 165 | 162 | ||||||
Macro hedge of interest rate risk | 808 | 1,171 | ||||||
Property, plant and equipment | 6 | 6 | ||||||
Tax, intangibles and other assets | 111 | 31 | ||||||
|
|
|
| |||||
Total assets | 225,232 | 217,912 | ||||||
|
|
|
| |||||
Liabilities | ||||||||
Deposits by banks | 118,010 | 114,535 | ||||||
Deposits by customers | 5,820 | 6,249 | ||||||
Derivative financial instruments | 27,934 | 34,088 | ||||||
Trading liabilities | 34,790 | 21,109 | ||||||
Financial liabilities designated at fair value | 5,277 | 4,002 | ||||||
Debt securities in issue | 28,982 | 33,770 | ||||||
Tax, other liabilities and provisions | 396 | 364 | ||||||
|
|
|
| |||||
Total liabilities | 221,209 | 214,117 | ||||||
|
|
|
| |||||
Equity | ||||||||
Total shareholders’ equity | 4,023 | 3,795 | ||||||
|
|
|
| |||||
Total equity | 4,023 | 3,795 | ||||||
|
|
|
| |||||
Total liabilities and equity | 225,232 | 217,912 | ||||||
|
|
|
| |||||
A more detailed consolidated balance sheet is contained in the Condensed Consolidated Interim Financial Statements.
30 June 2013 compared to 31 December 2012
Assets
Cash and balances at central banks
Cash and balances held at central banks increased to £9,284m at 30 June 2013 (2012: £388m), principally reflecting an increase in the element of the liquid asset portfolio held as cash at central banks as part of the rebalancing of the liquid asset portfolio.
Abbey National Treasury Services plc 2013 Half Yearly Financial Report | 9 |
Table of Contents
Business Review
Balance Sheet Reviewcontinued
Trading assets
Trading assets increased by 39% to £31,163m at 30 June 2013 (2012: £22,498m), reflecting increased trading activity relating to securities purchased under resale agreements to customers and increased holdings of debt securities, although securities purchased under resale agreements remained lower than at 30 June 2012.
Derivative assets
Derivative assets decreased by 18% to £27,268m at 30 June 2013 (2012: £33,276m). The decrease was attributable to a decrease in the fair values of interest rate derivative assets as a result of upward moves in longer term yield curves. There was a corresponding decrease in derivative liabilities.
Financial assets designated at fair value through profit and loss
Financial assets designated at fair value through profit and loss decreased by 27% to £2,567m at 30 June 2013 (2012: £3,531m). The decrease was primarily attributable to the maturity and refinancing of loans to UK Social Housing associations and new loans not being designated at fair value, in accordance with the ANTS group’s policy.
Loans and advances to banks
Loans and advances to banks increased by 1% to £108,584m at 30 June 2013 (2012: £106,986m).
Loans and advances to customers
Loans and advances to customers decreased by 8% to £40,963m at 30 June 2013 (2012: £44,750m) principally due to reductions in balances with other Santander UK group companies. These reductions were partially offset by increases in lending to small and medium enterprises (‘SME’), and increased customer loans to large corporate clients through our trade finance business.
Available for sale securities
Available for sale securities decreased by 16% to £4,313m at 30 June 2013 (2012: £5,113m). The movement reflected both purchases and sales as part of the rebalancing of the liquid asset portfolio.
Tax, intangibles and other assets
Tax, intangibles and other assets increased by 258% to £111m at 30 June 2013 (2012: £31m). The increase primarily reflected the increase in accrued income within other assets.
Liabilities
Deposits by banks
Deposits by banks increased by 3% to £118,010m at 30 June 2013 (2012: £114,535m). The increase was principally driven by increased deposits by customers in the Santander UK group which are then placed with the ANTS group.
Deposits by customers
Deposits by customers decreased by 7% to £5,820m at 30 June 2013 (2012: £6,249m), reflecting the maturities of, and decreased demand for retail structured products sold by the ANTS group.
Derivative liabilities
Derivative liabilities decreased by 18% to £27,934m at 30 June 2013 (2012: £34,088m). The decrease was attributable to a decrease in the fair values of interest rate derivative liabilities as a result of upward moves in longer term yield curves.
Trading liabilities
Trading liabilities increased by 65% to £34,790m at 30 June 2013 (2012: £21,109m). The increase was principally attributable to increased trading activity relating to securities sold under resale agreements to both banks and customers.
Financial liabilities designated at fair value
Financial liabilities designated at fair value increased by 32% to £5,277m at 30 June 2013 (2012: £4,002m). The increase principally reflected new issuances in the US$4bn Commercial Paper Programme.
Debt securities in issue
Debt securities in issue decreased by 14% to £28,982m at 30 June 2013 (2012: £33,770m) as surplus liquidity was utilised to fund maturing medium term funding.
Equity
Total shareholders equity increased by 6% to £4,023m at 30 June 2013 (2012: £3,795m). The increase was principally attributable to the retained profit for the period.
10 | Abbey National Treasury Services plc 2013 Half Yearly Financial Report |
Table of Contents
Business Review
Balance Sheet Reviewcontinued
The ANTS group includes short-term borrowings within deposits by banks, trading liabilities, financial liabilities designated at fair value, and debt securities in issue and does not show short-term borrowings separately on the balance sheet. Short-term borrowings are defined by the US Securities and Exchange Commission (‘SEC’) as amounts payable for short-term obligations that are US Federal funds purchased and securities sold under repurchase agreements, commercial paper, borrowings from banks, borrowings from factors or other financial institutions and any other short-term borrowings reflected on the ANTS group’s balance sheet. The ANTS group’s only significant short-term borrowings are securities sold under repurchase agreements, commercial paper, borrowings from banks, negotiable certificates of deposit, and certain other debt securities in issue. Additional information on short-term borrowings is provided in the table below for each of the six months ended 30 June 2013 and 30 June 2012.
| Six months ended 30 June 2013 £m | Six months ended 30 June 2012 £m | |||||||
Securities sold under repurchase agreements | ||||||||
- Period-end balance | 23,664 | 32,742 | ||||||
- Period-end interest rate | 0.35 | % | 0.46 | % | ||||
- Average balance(1) | 19,607 | 32,416 | ||||||
- Average interest rate(1) | 0.39 | % | 0.39 | % | ||||
- Maximum balance(1) | 23,664 | 37,621 | ||||||
Commercial paper | ||||||||
- Period-end balance | 4,687 | 3,701 | ||||||
- Period-end interest rate | 0.47 | % | 0.82 | % | ||||
- Average balance(1) | 4,223 | 3,803 | ||||||
- Average interest rate(1) | 0.53 | % | 0.87 | % | ||||
- Maximum balance(1) | 4,687 | 3,921 | ||||||
Borrowings from banks (Deposits by banks) | ||||||||
- Period-end balance | 223 | 414 | ||||||
- Period-end interest rate | 0.45 | % | 1.44 | % | ||||
- Average balance(1) | 563 | 684 | ||||||
- Average interest rate(1) | 0.27 | % | 1.09 | % | ||||
- Maximum balance(1) | 1,149 | 2,262 | ||||||
Negotiable certificates of deposit | ||||||||
- Period-end balance | 2,336 | 2,054 | ||||||
- Period-end interest rate | 1.96 | % | 1.67 | % | ||||
- Average balance(1) | 2,299 | 2,344 | ||||||
- Average interest rate(1) | 1.77 | % | 1.52 | % | ||||
- Maximum balance(1) | 2,724 | 2,576 | ||||||
Other debt securities in issue | ||||||||
- Period-end balance | 4,661 | 4,002 | ||||||
- Period-end interest rate | 2.92 | % | 2.91 | % | ||||
- Average balance(1) | 6,211 | 4,015 | ||||||
- Average interest rate(1) | 2.95 | % | 2.92 | % | ||||
- Maximum balance(1) | 7,888 | 4,084 | ||||||
| (1) | Calculated using monthly data. |
The ANTS group issues commercial paper generally in denominations of not less than US$50,000, with maturities of up to 365 days. Commercial paper is issued by the Company and its subsidiary Abbey National North America LLC.
Abbey National Treasury Services plc 2013 Half Yearly Financial Report | 11 |
Table of Contents
Business Review
Balance Sheet Reviewcontinued
Sources and uses of liquidity and funding
ANTS is the treasury support function for the Santander UK group. In this regard, ANTS’s role is to provide access to financial markets and central bank facilities in order to meet the Santander UK group’s liquidity, funding, capital and balance sheet management requirements.
The Company has given a full and unconditional guarantee in respect of the unsubordinated liabilities of Santander UK plc incurred prior to 30 June 2015 under a deed poll guarantee entered into by the Company on 10 May 2012. Santander UK plc has given a reciprocal guarantee in respect of the unsubordinated liabilities of the Company incurred prior to 30 June 2015.
Liquidity and funding risk is managed on a Santander UK group basis and it is not therefore appropriate to consider these risks separately at an ANTS group level. In addition, under the PRA’s regulatory regime for liquidity, Santander UK and ANTS, together with Cater Allen Limited, a fellow subsidiary of Santander UK plc, form the Santander UK Defined Liquidity Group (‘DLG’). Under these arrangements, each member of the DLG is liable to support each other in terms of transferring or receiving surplus liquidity in times of stress. In considering the liquidity resources available to the ANTS group, its own liquid assets and also those of rest of the Santander UK group are separately presented.
In addition, the Company, Santander UK plc, and Cater Allen Limited, which are the three PRA-regulated entities within the Santander UK group, are party to a capital support deed dated 14 December 2012 (the “Capital Support Deed”) with certain other non-regulated subsidiaries of Santander UK plc. The parties to the Capital Support Deed constitute a core UK group for the purposes of section 10 of the Prudential Sourcebook for Banks, Building Societies and Investment Firms (“BIPRU”) of the PRA Handbook. Under section 10.8 of BIPRU, exposures of each of the three regulated entities to other members of the core UK group are exempt from large exposure limits that would otherwise apply. The purpose of the Capital Support Deed is to facilitate the prompt transfer of available capital resources from, or repayment of liabilities by, the non-regulated parties to any of the regulated parties in the event that one of the regulated parties has breached or is at risk of breaching its capital resources requirements or risk concentrations requirements.
Santander UK primarily generates funding and liquidity through UK retail and corporate deposits, as well as in the financial markets through its own debt programmes and facilities to support its business activities and liquidity requirements. It does this in reliance on the strength of its balance sheet and profitability and its own network of investors.
Liquidity and funding risks are identified and encompassed within Santander UK’s Risk Framework and subject to Santander UK’s three-tier risk governance framework.
The debt issuance programmes managed by ANTS are set out in Notes 18 and 19 to the Condensed Consolidated Interim Financial Statements.
Further information is set out in “Liquidity and funding risk” in the Risk Management Report on pages 31 to 33.
Cash flows
| Six months ended 30 June 2013 £m | Six months ended 30 June 2012 £m | |||||||
Net cash (outflow)/inflow from operating activities | (1,771 | ) | 13,121 | |||||
Net cash flow from/(used in) investing activities | 843 | (4,710 | ) | |||||
Net cash flow (used in)/from financing activities | (3,596 | ) | 3,894 | |||||
|
|
|
| |||||
Net (decrease)/increase in cash and cash equivalents | (4,524 | ) | 12,305 | |||||
|
|
|
| |||||
The major activities and transactions that affected ANTS’s cash flows during the first six months of 2013 were as follows:
In the six months ended 30 June 2013, the net cash outflow from operating activities of £1,771m due to reductions in balances with other Santander UK group companies. These reductions were partially offset by increases in SME lending, and increased customer loans to large corporate clients through our trade finance business.
In the six months ended 30 June 2013, the net cash inflow from investing activities of £843m resulted primarily from purchases and sales of available-for-sale securities as part of the rebalancing of the liquid asset portfolio.
In the six months ended 30 June 2013, the net cash outflow from financing activities of £3,596m reflected primarily the issue of debt securities of £13,001m and repayments of debt securities of £16,597m.
Lower activity relating to securities purchased under resale agreements also meant that cash and cash equivalents were lower at 30 June 2013 than at 30 June 2012.
12 | Abbey National Treasury Services plc 2013 Half Yearly Financial Report |
Table of Contents
Business Review
Balance Sheet Reviewcontinued
Interest rate sensitivity refers to the relationship between interest rates and net interest income resulting from the periodic repricing of assets and liabilities. The ANTS group seeks to manage the risks associated with movements in interest rates as part of its management of the overall non-trading position. This is done within limits as described in the Risk Management Report beginning on page 15.
Changes in net interest income – volume and rate analysis
The following table allocates changes in interest income, interest expense and net interest income between changes in volume and changes in rate for the ANTS group for the six months ended 30 June 2013 and 30 June 2012. Volume and rate variances have been calculated on the movement in the average balances and the change in the interest rates on average interest-earning assets and average interest-bearing liabilities. The variance caused by changes in both volume and rate has been allocated to rate changes.
| Six months ended 30 June 2013 compared to Six months ended 30 June 2012 | Six months ended 30 June 2012 compared to Six months ended 30 June 2011 | |||||||||||||||||||||||
| Total change | Changes due to increase/(decrease) in | Total change | Changes due to increase/(decrease) in | |||||||||||||||||||||
| £m | Volume £m | Rate £m | £m | Volume £m | Rate £m | |||||||||||||||||||
Interest income | ||||||||||||||||||||||||
Loans and advances to banks: | ||||||||||||||||||||||||
- UK | (267 | ) | (266 | ) | (1 | ) | (319 | ) | (598 | ) | 279 | |||||||||||||
- Non-UK | 2 | 3 | (1 | ) | (9 | ) | (21 | ) | 12 | |||||||||||||||
Loans and advances to customers: | ||||||||||||||||||||||||
- UK | 14 | (79 | ) | 93 | 239 | 138 | 101 | |||||||||||||||||
Other interest earning financial assets: | ||||||||||||||||||||||||
- UK | 4 | 35 | (31 | ) | (8 | ) | 102 | (110 | ) | |||||||||||||||
- Non-UK | 1 | — | 1 | — | — | — | ||||||||||||||||||
|
|
|
|
|
|
|
|
|
|
|
| |||||||||||||
Total interest income | ||||||||||||||||||||||||
- UK | (249 | ) | (310 | ) | 61 | (88 | ) | (358 | ) | 270 | ||||||||||||||
- Non-UK | 3 | 3 | — | (9 | ) | (21 | ) | 12 | ||||||||||||||||
|
|
|
|
|
|
|
|
|
|
|
| |||||||||||||
| (246 | ) | (307 | ) | 61 | (97 | ) | (379 | ) | 282 | |||||||||||||||
|
|
|
|
|
|
|
|
|
|
|
| |||||||||||||
Interest expense | ||||||||||||||||||||||||
Deposits by banks: | ||||||||||||||||||||||||
- UK | (279 | ) | (272 | ) | (7 | ) | (6 | ) | (336 | ) | 330 | |||||||||||||
Deposits by customers - wholesale deposits: | ||||||||||||||||||||||||
- UK | 15 | (19 | ) | 34 | 9 | — | 9 | |||||||||||||||||
Debt securities in issue: | ||||||||||||||||||||||||
- UK | 6 | (51 | ) | 57 | 125 | 78 | 47 | |||||||||||||||||
- Non-UK | (4 | ) | 8 | (12 | ) | (8 | ) | (29 | ) | 21 | ||||||||||||||
Other interest-bearing liabilities: | ||||||||||||||||||||||||
- UK | (2 | ) | — | (2 | ) | 2 | — | 2 | ||||||||||||||||
|
|
|
|
|
|
|
|
|
|
|
| |||||||||||||
Total interest expense | ||||||||||||||||||||||||
- UK | (260 | ) | (342 | ) | 82 | 130 | (258 | ) | 388 | |||||||||||||||
- Non-UK | (4 | ) | 8 | (12 | ) | (8 | ) | (29 | ) | 21 | ||||||||||||||
|
|
|
|
|
|
|
|
|
|
|
| |||||||||||||
| (264 | ) | (334 | ) | 70 | 122 | (287 | ) | 409 | ||||||||||||||||
|
|
|
|
|
|
|
|
|
|
|
| |||||||||||||
Net interest income | 18 | 27 | (9 | ) | (219 | ) | (92 | ) | (127 | ) | ||||||||||||||
|
|
|
|
|
|
|
|
|
|
|
| |||||||||||||
Abbey National Treasury Services plc 2013 Half Yearly Financial Report | 13 |
Table of Contents
Business Review
Balance Sheet Reviewcontinued
As period-end statements may not be representative of the ANTS group’s activity throughout the period, average balance sheets for the ANTS group are presented below. The average balance sheets summarise the significant categories of assets and liabilities, together with average interest rates.
| Six months ended 30 June 2013 | Six months ended 30 June 2012 | |||||||||||||||||||||||
| Average Balance(1) £m | Interest(4) (5) £m | Average rate % | Average Balance(1) £m | Interest(4) (5) £m | Average rate % | |||||||||||||||||||
Assets | ||||||||||||||||||||||||
Loans and advances to banks: | ||||||||||||||||||||||||
- UK | 110,903 | 1,021 | 1.84 | 123,661 | 1,288 | 2.08 | ||||||||||||||||||
- Non-UK | 5,634 | 9 | 0.32 | 4,537 | 7 | 0.31 | ||||||||||||||||||
Loans and advances to customers:(3) | ||||||||||||||||||||||||
- UK | 41,078 | 542 | 2.64 | 44,396 | 528 | 2.38 | ||||||||||||||||||
- Non-UK | — | — | — | — | — | — | ||||||||||||||||||
Other interest-earning financial assets: | ||||||||||||||||||||||||
- UK | 4,464 | 20 | 0.90 | 2,120 | 16 | 1.51 | ||||||||||||||||||
- Non-UK | 289 | 1 | 0.69 | — | �� | — | — | |||||||||||||||||
|
|
|
|
|
|
|
|
|
|
|
| |||||||||||||
Total average interest-earning assets, interest income(2) | 162,368 | 1,593 | 1.96 | 174,714 | 1,839 | 2.11 | ||||||||||||||||||
|
|
|
|
|
|
|
|
|
|
|
| |||||||||||||
Impairment loss allowances | (114 | ) | — | — | (143 | ) | — | — | ||||||||||||||||
Trading business | 26,320 | — | — | 27,707 | — | — | ||||||||||||||||||
Assets designated at fair value through profit and loss | 3,236 | — | — | 4,518 | — | — | ||||||||||||||||||
Other non-interest-earning assets | 37,147 | — | — | 38,693 | — | — | ||||||||||||||||||
|
|
|
|
|
|
|
|
|
|
|
| |||||||||||||
Total average assets | 228,957 | — | — | 245,489 | — | — | ||||||||||||||||||
|
|
|
|
|
|
|
|
|
|
|
| |||||||||||||
Non-UK assets as a % of total | 2.59 | % | — | — | 1.85 | % | — | — | ||||||||||||||||
|
|
|
|
|
|
|
|
|
|
|
| |||||||||||||
Liabilities | ||||||||||||||||||||||||
Deposits by banks: | ||||||||||||||||||||||||
- UK | (117,862 | ) | (998 | ) | 1.69 | (131,905 | ) | (1,277 | ) | 1.94 | ||||||||||||||
- Non-UK | (2 | ) | — | — | (148 | ) | — | — | ||||||||||||||||
Deposits by customers – wholesale: | ||||||||||||||||||||||||
- UK | (5,665 | ) | (67 | ) | 2.37 | (6,918 | ) | (52 | ) | 1.50 | ||||||||||||||
Bonds and medium-term notes: | ||||||||||||||||||||||||
- UK | (27,099 | ) | (525 | ) | 3.87 | (28,495 | ) | (519 | ) | 3.64 | ||||||||||||||
- Non-UK | (4,357 | ) | (11 | ) | 0.50 | (3,415 | ) | (15 | ) | 0.88 | ||||||||||||||
Other interest-bearing liabilities UK | — | — | — | — | (2 | ) | — | |||||||||||||||||
|
|
|
|
|
|
|
|
|
|
|
| |||||||||||||
Total average interest-bearing liabilities, interest expense(2) | (154,985 | ) | (1,601 | ) | 2.07 | (170,881 | ) | (1,865 | ) | 2.18 | ||||||||||||||
|
|
|
|
|
|
|
|
|
|
|
| |||||||||||||
Trading business | (31,233 | ) | — | — | (30,333 | ) | — | — | ||||||||||||||||
Liabilities designated at fair value through profit and loss | (4,902 | ) | — | — | (5,225 | ) | — | — | ||||||||||||||||
Non-interest-bearing liabilities: | ||||||||||||||||||||||||
- Other | (33,935 | ) | — | — | (35,346 | ) | — | — | ||||||||||||||||
- Shareholders’ funds | (3,902 | ) | — | — | (3,704 | ) | — | — | ||||||||||||||||
|
|
|
|
|
|
|
|
|
|
|
| |||||||||||||
Total average liabilities and shareholders’ funds | (228,957 | ) | — | — | (245,489 | ) | — | — | ||||||||||||||||
|
|
|
|
|
|
|
|
|
|
|
| |||||||||||||
Non-UK liabilities as a % of total | 1.90 | % | — | — | 1.45 | % | — | — | ||||||||||||||||
|
|
|
|
|
|
|
|
|
|
|
| |||||||||||||
| (1) | Average balances are based upon monthly data. |
| (2) | The ratio of average interest-earning assets to interest-bearing liabilities for the six months ended 30 June 2013 was 104.76% (Six months ended 30 June 2012: 102.24%). |
| (3) | Loans and advances to customers include non-performing loans. See the “Credit Risk” section of the Risk Management Report. |
| (4) | The net interest margin for the six months ended 30 June 2013 was 0.01% (Six months ended 30 June 2012: 0.03%). Net interest margin is calculated as net interest income divided by average interest earning assets. |
| (5) | The interest spread for the six months ended 30 June 2013 was 0.1% (Six months ended 30 June 2012: 0.08%). Interest spread is the difference between the rate of interest earned on average interest-earning assets and the rate of interest paid on average interest-bearing liabilities. |
14 | Abbey National Treasury Services plc 2013 Half Yearly Financial Report |
Table of Contents
Business Review
Risk Management Report
This Risk Management Report contains information that forms an integral part of the Condensed Consolidated Interim Financial Statements.
The ANTS group provides treasury, corporate and wholesale banking services to UK clients and also to the wider Santander UK group, of which ANTS is a part. ANTS is also the treasury support function for the Santander UK group. In this regard, ANTS’s role is to provide access to financial markets and central bank facilities in order to meet the Santander UK group’s liquidity, funding, capital and balance sheet management requirements. As such, ANTS is one of the main debt issuance vehicles in the Santander UK group.
ANTS contains part of a number of Santander UK’s business segments. Specifically, ANTS consists of part of the Santander UK group’s Corporate Banking and Corporate Centre business segments and its entire Markets business segment. Whether transactions are booked in ANTS or another Santander UK group entity reflects historical or operational reasons and does not necessarily reflect any particular business split.
Santander UK plc has given a full and unconditional guarantee in respect of the liabilities of ANTS incurred up to 30 June 2015. The Company has given a reciprocal guarantee in respect of the liabilities of Santander UK plc incurred up to 30 June 2015. As a consequence of the reciprocal guarantee given by the Company in respect of the liabilities of Santander UK plc, the Company is exposed to the same risks as the Santander UK group, of which the Company and the ANTS group are part.
As a subsidiary of Santander UK plc, ANTS is subject to the Santander UK Risk Framework. As a consequence the ANTS group’s risks are managed at a Santander UK group level in accordance with the Santander UK group’s Risk Framework. The Risk Management Report describes the Santander UK group’s Risk Framework and includes more detail on the key risks (on a segmental basis or aggregated where relevant) to which the ANTS group is directly exposed. In addition, as a consequence of the guarantee given by the ANTS group in respect of the liabilities of Santander UK plc, the ANTS group is indirectly exposed to risks that arise in parts of the Santander UK group that are wholly outside the ANTS group. Those risks consist of retail credit risk and pension obligations risk.
The Risk Management Report consists of:
| • | A description of Santander UK’s approach to the management of risk, including its Risk Framework; and |
| • | Further detail on the ANTS group’s key risks, with separate discussions of: |
| • | Financial risks; and |
| • | Non-financial risks. |
Throughout the Risk Management Report, except where stated otherwise, references to Santander UK should be taken to include ANTS and the ANTS group (reflecting both the risks that ANTS is directly exposed to through its own activities and the risks arising elsewhere in the Santander UK group that ANTS is indirectly exposed to due to the existence of the cross guarantees described above).
This Risk Management Report focuses on those areas that have changed significantly during the first half of 2013, and represents an update to the Risk Management Report in the 2012 Annual Report, with which it should be read in conjunction. The Risk Management Report in the 2012 Annual Report contains more detailed narrative explanations on the framework, methodologies and processes used which were unchanged during the first half of 2013.
INDEX
• | 16 | |||||||
• | 16 | |||||||
• | 16 | |||||||
| • | 17 | |||||||
| • | 22 | |||||||
| • | 24 | |||||||
• | 27 | |||||||
| • | 27 | |||||||
• | 30 | |||||||
| • | 30 | |||||||
| • | 31 | |||||||
• | 34 | |||||||
• | 36 | |||||||
• | 39 | |||||||
• | 39 | |||||||
• | 48 | |||||||
Abbey National Treasury Services plc 2013 Half Yearly Financial Report | 15 |
Table of Contents
Business Review
Risk Management Reportcontinued
As a significant financial services provider, risk is at the core of Santander UK’s day-to-day activities. The understanding and control of risk is critical for the effective management of the business. Santander UK aims to employ a prudent approach and advanced risk management techniques to facilitate the delivery of robust financial performance, and ultimately build sustainable value for all our stakeholders, including our staff, customers, fixed income investors, shareholders and the communities in which we operate.
Santander UK aims to maintain a predictable medium-low risk profile, consistent with its business model, which is key to the successful achievement of our strategic objectives.
During 2012, the Board of Santander UK plc (the ‘Santander UK Board’) approved a new Risk Framework (the ‘Risk Framework’), setting out enhancements to the management, control and oversight of all risk types in Santander UK.As a subsidiary of Santander UK plc, the Company is subject to this Risk Framework. The Risk Framework aims to continue to ensure that risk is managed and controlled on behalf of all our stakeholders. There were no changes to the Risk Framework during the first half of 2013. The key components of this framework include:
| • | Risk definition and structure; |
| • | Core principles; |
| • | Governance, roles and responsibilities; and |
| • | Systems of internal control. |
Refer to the 2012 Annual Report for full details of the Risk Framework.
| FINANCIAL RISKS |
INTRODUCTION
Credit risk is the risk of financial loss arising from the default or credit quality deterioration of a customer or counterparty to which ANTS has directly provided credit, or for which ANTS has assumed a financial obligation.
Refer to the 2012 Annual Report for full details of credit risk classification and measurement across the credit cycle which is unchanged during 2013.
Approach to forbearance
To support customers that encounter actual or apparent financial difficulties, Santander UK may enter into forbearance arrangements (previously described as restructuring/refinancing). Forbearance arrangements include the granting of temporary or permanent concessions to customers to amend contractual payment amounts or timings. These are made where a customer’s financial position indicates the possibility that satisfactory repayment may not be made within the original terms and conditions of the contract but where analysis suggests that repayment is possible based on revised terms of the loan.
A range of forbearance strategies are employed in order to improve the management of customer relationships, maximise collection opportunities and, if possible, avoid foreclosure or repossession.
Santander UK’s policies and practices are based on criteria which, in the judgement of management, indicate that repayment is likely to continue and that after the initial period of financial difficulties the customer can revert to the previous terms, with appropriate support where necessary. These agreements may be initiated by the customer, Santander UK or by a third party.
Further detail on the approaches and extent of forbearance in each business segment is set out in the subsequent sections of this report. There have been no changes to the definition of forbearance (previously described as restructuring/refinancing in NPL) during the period.
16 | Abbey National Treasury Services plc 2013 Half Yearly Financial Report |
Table of Contents
Business Review
Risk Management Reportcontinued
CREDIT RISK – CORPORATE BANKING
INTRODUCTION
Corporate Banking offers a wide range of products and financial services to customers through a network of regional business centres and through telephony and e-commerce channels. Corporate Banking products and services include loans, bank accounts, deposits, treasury services, invoice discounting, cash transmission and asset finance.
The SME and mid corporate business principally serves small and medium enterprises with an annual turnover of more than £250,000 up to £50m (‘SMEs’), and other corporate customers with an annual turnover of up to £500m. This also includes real estate lending.
The Large Corporates business offers specialist treasury services in fixed income and foreign exchange, lending, transactional banking services, capital markets and money markets to large multinational corporate customers with an annual turnover of more than £500m. Lending includes syndicated loans and structured finance. Transactional banking includes trade finance and cash management. Money market activities include securities lending/borrowing and repos.
Credit risk arises by Corporate Banking making loans, investing in other financial instruments or entering into financing transactions or derivatives. This section sets out further detail on credit risk in Corporate Banking as follows:
• | Committed exposures; | |
• | Credit risk mitigation; | |
• | Monitoring and recovery management; | |
• | Arrears; | |
• | Forbearance; and | |
• | Non-performing loans and advances and forbearance. | |
In Corporate Banking, credit risk arises on assets and off-balance sheet transactions. Consequently, the credit risk exposure below arises from on balance sheet assets, and off-balance sheet transactions such as committed and un-drawn credit facilities or guarantees.
MANAGEMENT’S APPROACH TO CREDIT RISK IN CORPORATE BANKING | ||
Management’s approach to credit risk in Corporate Banking has not changed during 2013. For further details refer to page 46 of the 2012 Annual Report.
CORPORATE BANKING – COMMITTED EXPOSURES
COMMITTED EXPOSURES BY CREDIT RATING OF THE ISSUER OR COUNTERPARTY(1)(2)
30 June 2013 | Sovereign £m | Large Corporate £m | Mid Corporate and SME £m | Real Estate £m | Social Housing £m | Total £m | ||||||||||||||||||
AAA | 1,104 | — | — | 1 | — | 1,105 | ||||||||||||||||||
AA | 3,848 | 1,112 | 56 | 185 | 291 | 5,492 | ||||||||||||||||||
A | 48 | 3,141 | 634 | 1,198 | 320 | 5,341 | ||||||||||||||||||
BBB | 501 | 4,356 | 3,097 | 2,579 | 115 | 10,648 | ||||||||||||||||||
BB | — | 407 | 1,639 | 589 | — | 2,635 | ||||||||||||||||||
B | — | — | 15 | 166 | — | 181 | ||||||||||||||||||
CCC | — | — | 7 | 203 | — | 210 | ||||||||||||||||||
D | — | — | 3 | 7 | — | 10 | ||||||||||||||||||
|
|
|
|
|
|
|
|
|
|
|
| |||||||||||||
Total | 5,501 | 9,016 | 5,451 | 4,928 | 726 | 25,622 | ||||||||||||||||||
|
|
|
|
|
|
|
|
|
|
|
| |||||||||||||
31 December 2012 | Sovereign £m | Large Corporate £m | Mid Corporate and SME £m | Real Estate £m | Social Housing £m | Total £m | ||||||||||||||||||
AAA | 1,131 | 25 | — | 36 | — | 1,192 | ||||||||||||||||||
AA | 960 | 361 | 197 | 164 | 39 | 1,721 | ||||||||||||||||||
A | 66 | 2,893 | 1,004 | 1,320 | 261 | 5,544 | ||||||||||||||||||
BBB | 1 | 4,440 | 3,169 | 2,658 | — | 10,268 | ||||||||||||||||||
BB | — | 353 | 758 | 642 | — | 1,753 | ||||||||||||||||||
B | — | — | 25 | 202 | 115 | 342 | ||||||||||||||||||
CCC | — | — | 10 | 46 | — | 56 | ||||||||||||||||||
D | — | — | 25 | 281 | — | 306 | ||||||||||||||||||
|
|
|
|
|
|
|
|
|
|
|
| |||||||||||||
Total | 2,158 | 8,072 | 5,188 | 5,349 | 415 | 21,182 | ||||||||||||||||||
|
|
|
|
|
|
|
|
|
|
|
| |||||||||||||
| (1) | The committed exposure includes Over-The-Counter (‘OTC’) derivatives. |
| (2) | All exposures are internally rated. External ratings are taken into consideration in the rating process, where available. |
Abbey National Treasury Services plc 2013 Half Yearly Financial Report | 17 |
Table of Contents
Business Review
Risk Management Reportcontinued
COMMITTED EXPOSURES BY GEOGRAPHICAL AREA(1)
30 June 2013 | Sovereign £m | Large Corporate £m | Mid Corporate and SME £m | Real Estate £m | Social Housing £m | Total £m | ||||||||||||||||||
UK | — | 7,531 | 5,061 | 4,928 | 726 | 18,246 | ||||||||||||||||||
Peripheral eurozone | 501 | 325 | 41 | — | — | 867 | ||||||||||||||||||
Rest of Europe | 2,729 | 560 | 96 | — | — | 3,385 | ||||||||||||||||||
US | — | 238 | — | — | — | 238 | ||||||||||||||||||
Other, including non-OECD | 2,271 | 362 | 253 | — | — | 2,886 | ||||||||||||||||||
|
|
|
|
|
|
|
|
|
|
|
| |||||||||||||
Total | 5,501 | 9,016 | 5,451 | 4,928 | 726 | 25,622 | ||||||||||||||||||
|
|
|
|
|
|
|
|
|
|
|
| |||||||||||||
31 December 2012 | Sovereign £m | Large Corporate £m | Mid Corporate and SME £m | Real Estate £m | Social Housing £m | Total £m | ||||||||||||||||||
UK | — | 6,885 | 4,583 | 5,349 | 415 | 17,232 | ||||||||||||||||||
Peripheral eurozone | — | 263 | 73 | — | — | 336 | ||||||||||||||||||
Rest of Europe | 1,132 | 551 | 102 | — | — | 1,785 | ||||||||||||||||||
US | — | 265 | 90 | — | — | 355 | ||||||||||||||||||
Other, including non-OECD | 1,026 | 108 | 340 | — | — | 1,474 | ||||||||||||||||||
Total | 2,158 | 8,072 | 5,188 | 5,349 | 415 | 21,182 | ||||||||||||||||||
| (1) | The geographic location is classified by country of domicile of the counterparty. |
30 June 2013 compared to 31 December 2012
During the first half of 2013, total commitments increased by £4.4bn or 21% to £25.6bn reflecting continued development of a UK corporate banking franchise.
The increase in sovereign holdings reflected the development of the business in this area. The increased exposures were mainly in the AA category (Japan and France). The increase in BBB exposures reflected the purchase of Italian Government bonds with less than one year maturity as part of short-term markets trading activity.
Large Corporates exposures increased by 12% as a result of the development of the franchise. Growth was focused on the UK, with some diversification in other European and non-European countries with counterparties with good credit quality.
In the Mid Corporate and SME portfolio growth was primarily due to new lending. The increase in exposures in the Social Housing portfolio was primarily due to refinancing. The Real Estate portfolio decreased by 8% reflecting exits and restructurings.
Commercial Real Estate loans
Real estate non-performing loans at 30 June 2013 and 31 December 2012 may be further analysed between loans originated pre-2009 and thereafter as follows:
| Original vintage | ||||||||||||
30 June 2013 | Pre-2009 | 2009 onwards | Total | |||||||||
Total loans | £ | 957m | £ | 3,972m | £ | 4,928m | ||||||
NPLs ratio | �� | 19.4 | % | — | 3.8 | % | ||||||
| Original vintage | ||||||||||||
31 December 2012 | Pre-2009 | 2009 onwards | Total | |||||||||
Total loans | £ | 1,299m | £ | 4,050m | £ | 5,349m | ||||||
NPLs ratio | 19.0 | % | — | 4.6 | % | |||||||
All the NPL balance relates to deals originated pre-2009. The pre-2009 vintage loans were written on terms prevailing in the market at that time which, compared to more recent times, included higher original LTVs, lower interest coverage and exposure to development or letting risk. Following the significant downturn in the commercial real estate market in 2008 and 2009, some of these customers suffered financial stresses resulting in their inability to meet the contractual payment terms or to comply with covenants or to achieve refinancing/repayment at maturity. As a result, the pre-2009 sub-portfolio has experienced higher NPL rates in recent years.
In light of the market deterioration, Santander UK’s lending criteria were significantly tightened from 2009 onwards, with lower LTVs and the avoidance of transactions with material letting or development risks (at 30 June 2013, this element of the portfolio represented only 3% of the total Real Estate portfolio). In addition, while the market remains challenging, prices have not declined significantly further since Santander UK’s lending criteria were tightened. As a result, the sub-portfolio representing loans originating from 2009 onwards continues to perform significantly better than the pre-2009 sub-portfolio.
The weighted average LTV of new deals written in the first half of 2013 was 54% with no deals written with an LTV of 70% or more.
18 | Abbey National Treasury Services plc 2013 Half Yearly Financial Report |
Table of Contents
Business Review
Risk Management Report continued
CORPORATE BANKING – CREDIT RISK MITIGATION
At 30 June 2013, the estimated value of collateral held against impaired loans amounted to 41% (2012: 68%) of the carrying amount of impaired loan balances.
CORPORATE BANKING – MONITORING AND RECOVERY MANAGEMENT
Cases exhibiting potentially higher risk characteristics are subject to risk monitoring under the Watchlist (FEVE) process. There are a range of indicators that may trigger a case being added to Watchlist (FEVE), including downturn in trade, covenant breaches, major contract loss, and resignation of key management etc. Such cases are assessed to determine the potential financial implications of these trigger events and in consultation with the borrower, a range of options available is considered which may include temporary forbearance. In addition, cases that require specialist risk management expertise, including all NPLs, are transferred to a dedicated restructuring team.
Cases subject to risk monitoring under the Watchlist (FEVE) process or classified as NPL by portfolio at 30 June 2013 and 31 December 2012 were:
| Watchlist (FEVE) | Observed impairment loss allowances | |||||||||||||||||||||||||||||||||||||||
30 June 2013 | Portfolio | Enhanced monitoring | Proactive monitoring | Total | NPL | NPL | Watchlist | NPL | ||||||||||||||||||||||||||||||||
| £m | £m | % | £m | % | £m | £m | % | £m | £m | |||||||||||||||||||||||||||||||
Large Corporate | 14,517 | 105 | 0.7 | — | — | 105 | — | — | — | — | ||||||||||||||||||||||||||||||
(including Sovereign) | ||||||||||||||||||||||||||||||||||||||||
Mid Corporate and SME | 5,451 | 209 | 3.8 | 16 | 0.3 | 225 | 5 | 0.1 | 2 | 3 | ||||||||||||||||||||||||||||||
Real Estate | 4,928 | 147 | 3.0 | 269 | 5.5 | 416 | 185 | 3.8 | 14 | 91 | ||||||||||||||||||||||||||||||
Social Housing | 726 | — | — | — | — | — | — | — | — | — | ||||||||||||||||||||||||||||||
|
|
|
|
|
|
|
|
|
|
|
|
|
|
|
|
|
|
|
| |||||||||||||||||||||
Total | 25,622 | 461 | 1.8 | 285 | �� | 1.1 | 746 | 190 | 0.7 | 16 | 94 | |||||||||||||||||||||||||||||
|
|
|
|
|
|
|
|
|
|
|
|
|
|
|
|
|
|
|
| |||||||||||||||||||||
| Watchlist (FEVE) | Observed impairment loss allowances | |||||||||||||||||||||||||||||||||||||||
31 December 2012 | Portfolio | Enhanced monitoring | Proactive monitoring | Total | NPL | NPL | Watchlist | NPL | ||||||||||||||||||||||||||||||||
| £m | £m | % | £m | % | £m | £m | % | £m | £m | |||||||||||||||||||||||||||||||
Large Corporate | 10,230 | 142 | 1.4 | — | — | 142 | — | — | — | — | ||||||||||||||||||||||||||||||
(including Sovereign) | ||||||||||||||||||||||||||||||||||||||||
Mid Corporate and SME | 5,188 | 123 | 2.4 | 56 | 1.1 | 179 | 23 | 0.4 | 4 | 11 | ||||||||||||||||||||||||||||||
Real Estate | 5,349 | 199 | 3.7 | 239 | 4.5 | 438 | 247 | 4.6 | 21 | 73 | ||||||||||||||||||||||||||||||
Social Housing | 415 | — | — | — | — | — | — | — | — | — | ||||||||||||||||||||||||||||||
Total | 21,182 | 464 | 2.2 | 295 | 1.4 | 759 | 270 | 1.3 | 25 | 84 | ||||||||||||||||||||||||||||||
NPLs in the tables above include committed facilities and derivative exposures and therefore are larger than the NPLs in the table on page 21 which only includes drawn balances.
30 June 2013 compared to 31 December 2012
During the first half of 2013, exposures across the majority of Watchlist categories decreased, as older cases were either successfully returned to performing status or were restructured, in some cases through to an exit. In the Large Corporates portfolio, there were no exposures in proactive monitoring status and the decrease of the enhanced monitoring status from 31 December was due to the exit from the relationship with one counterparty. In the Real Estate portfolio, the overall level of Watchlist cases decreased slightly with a switch of cases subject to enhanced monitoring into proactive monitoring reflecting a small number of cases where concerns have risen, rather than any wider trend of deterioration across the portfolio. In the Mid Corporate and SME portfolio, the level of Watchlist cases showed a decrease of 71% in proactive monitoring as cases have been successfully managed through the process.
During the first half of 2013, NPLs reduced as cases continued to be worked out, particularly within the Real Estate portfolio.
CORPORATE BANKING – ARREARS(1)
| 30 June 2013 £m | 31 December 2012 £m | |||||||
Corporate Banking loans and advances to customers in arrears | 208 | 173 | ||||||
Corporate Banking loans and advances to customers(2) | 6,394 | 6,356 | ||||||
Corporate Banking loans and advances to customers in arrears as a % of Corporate Banking loans and advances to customers | 3.26 | % | 2.72 | % | ||||
| (1) | Accrued interest is excluded for purposes of these analyses. (2) Includes Social Housing loans. |
30 June 2013 compared to 31 December 2012
Loans and advances to customers in arrears increased to £208m (2012: £173m) reflecting a small number of cases where payments have been missed. Consequently, loans and advances to customers in arrears as a percentage of loans and advances to customers increased to 3.26% (2012: 2.72%).
Abbey National Treasury Services plc 2013 Half Yearly Financial Report | 19 |
Table of Contents
Business Review
Risk Management Reportcontinued
FORBEARANCE
Forbearance commenced during the period/year
No arrangements have been entered into with respect to sovereign or large corporate counterparties. The accounts that entered forbearance during the period ended 30 June 2013 and year ended 31 December 2012 were:
| Mid Corporate and SMEs | Real Estate | Total | ||||||||||
30 June 2013 | £m | £m | £m | |||||||||
Forbearance of NPL | — | 1 | 1 | |||||||||
Forbearance of Non-NPL | — | 55 | 55 | |||||||||
|
|
|
|
|
| |||||||
| — | 56 | 56 | ||||||||||
|
|
|
|
|
| |||||||
| Mid Corporate and SMEs | Real Estate | Total | ||||||||||
31 December 2012 | £m | £m | £m | |||||||||
Forbearance of NPL | 1 | — | 1 | |||||||||
Forbearance of Non-NPL | — | 99 | 99 | |||||||||
|
|
|
|
|
| |||||||
| 1 | 99 | 100 | ||||||||||
|
|
|
|
|
| |||||||
Forbearance cumulative number and value of accounts
At 30 June 2013, 91% of the forbearance related to Commercial Real Estate Portfolio (31 December 2012: 86%).
a) Performance status when entering forbearance
The status of the cumulative number of accounts in forbearance at 30 June 2013 and 31 December 2012 when they originally entered forbearance, analysed by their payment status, was:
| Forbearance of NPL | Forbearance of Non-NPL | Total | Impairment allowance | |||||||||||||||||||||||||
30 June 2013 | No. | £m | No. | £m | No. | £m | £m | |||||||||||||||||||||
Performing | — | — | 15 | 424 | 15 | 424 | 56 | |||||||||||||||||||||
In arrears | 3 | 7 | — | — | 3 | 7 | 4 | |||||||||||||||||||||
|
|
|
|
|
|
|
|
|
|
|
|
|
| |||||||||||||||
Total | 3 | 7 | 15 | 424 | 18 | 431 | 60 | |||||||||||||||||||||
|
|
|
|
|
|
|
|
|
|
|
|
|
| |||||||||||||||
| Forbearance of NPL | Forbearance of Non-NPL | Total | Impairment allowance | |||||||||||||||||||||||||
31 December 2012 | No. | £m | No. | £m | No. | £m | £m | |||||||||||||||||||||
Performing | — | — | 13 | 335 | 13 | 335 | 37 | |||||||||||||||||||||
In arrears | 3 | 24 | — | — | 3 | 24 | 11 | |||||||||||||||||||||
|
|
|
|
|
|
|
|
|
|
|
|
|
| |||||||||||||||
Total | 3 | 24 | 13 | 335 | 16 | 359 | 48 | |||||||||||||||||||||
|
|
|
|
|
|
|
|
|
|
|
|
|
| |||||||||||||||
Debt-for-equity swaps
In addition to the forbearance above, ANTS has entered into a small number of debt-for-equity swaps where, on occasion, ANTS may agree to exchange a proportion of the amount owed by the borrower for equity in that borrower. In circumstances where a borrower’s balance sheet is materially over-leveraged but the underlying business is viewed as capable of being turned around, ANTS may agree to reduce the debt by exchanging a portion of it for equity in the company. This will typically only be done alongside new cash equity being raised, the implementation of a detailed business plan to effect a turnaround in the prospects of the business, and satisfaction with management’s ability to deliver the strategy.
These debt-for-equity swaps amounted to £39m at 30 June 2013 (2012: £34m) and in view of their small size are not included in these analyses.
b) Performance status at the period/year-end
The current status of accounts in forbearance analysed by their payment status at 30 June 2013 and 31 December 2012 was:
| Forbearance of NPL | Forbearance of Non-NPL | Total | Impairment allowance | |||||||||||||||||||||||||
30 June 2013 | No. | £m | No. | £m | No. | £m | £m | |||||||||||||||||||||
Performing | — | — | 13 | 358 | 13 | 358 | 11 | |||||||||||||||||||||
In arrears | 3 | 7 | 2 | 6 | 5 | 73 | 49 | |||||||||||||||||||||
|
|
|
|
|
|
|
|
|
|
|
|
|
| |||||||||||||||
Total | 3 | 7 | 15 | 424 | 18 | 431 | 60 | |||||||||||||||||||||
|
|
|
|
|
|
|
|
|
|
|
|
|
| |||||||||||||||
| Forbearance of NPL | Forbearance of Non-NPL | Total | Impairment allowance | |||||||||||||||||||||||||
31 December 2012 | No. | £m | No. | £m | No. | £m | £m | |||||||||||||||||||||
Performing | 1 | 1 | 11 | 270 | 12 | 271 | 2 | |||||||||||||||||||||
In arrears | 2 | 23 | 2 | 65 | 4 | 88 | 46 | |||||||||||||||||||||
|
|
|
|
|
|
|
|
|
|
|
|
|
| |||||||||||||||
Total | 3 | 24 | 13 | 335 | 16 | 359 | 48 | |||||||||||||||||||||
|
|
|
|
|
|
|
|
|
|
|
|
|
| |||||||||||||||
20 | Abbey National Treasury Services plc 2013 Half Yearly Financial Report |
Table of Contents
Business Review
Risk Management Report continued
30 June 2013 compared to 31 December 2012
The level of forbearance increased during the period, influenced by a small number of commercial real estate deals of pre-2009 vintage. Pre-2009 loans were written on terms prevailing in the market at that time which, compared to more recent times, included higher original LTVs, lower interest coverage and exposure to development or letting risk.
Accounts that are in forbearance continue to be closely monitored as described above, to ensure that the forbearance arrangements are sustainable. At 30 June 2013, 72% (2012: 75%) of the accounts in forbearance were performing in accordance with the revised terms agreed under ANTS’s forbearance arrangements. The decrease reflects the impact of the current challenging market conditions which resulted in it taking longer for cases to return to performing status after forbearance.
In rare circumstances, these market conditions may, and may continue to, lead to a second term extension, for example in the case of commercial real estate where it remains difficult to sell or refinance the property. These loans are individually assessed for observed impairment loss allowances. The greater probability of ultimate loss in these circumstances is reflected in the calculation of impairment loss allowances.
A customer’s ability to adhere to any revised terms agreed is an indicator of the sustainability of ANTS’s forbearance arrangements, although the forbearance is unlikely to be successful in all cases.
CORPORATE BANKING – NON-PERFORMING LOANS AND ADVANCES(1) (2) (3)
An analysis of Corporate Banking NPLs is presented below.
| 30 June 2013 £m | 31 December 2012 £m | |||||||
Corporate Banking NPLs – impaired(4) | 189 | 264 | ||||||
|
|
|
| |||||
Corporate Banking NPLs | 189 | 264 | ||||||
|
|
|
| |||||
Corporate Banking loans and advances to customers | 6,394 | 6,356 | ||||||
|
|
|
| |||||
Corporate Banking impairment loan loss allowances | 112 | 112 | ||||||
|
|
|
| |||||
| % | % | |||||||
|
|
|
| |||||
NPLs ratio(5) | 2.96 | 4.16 | ||||||
Coverage ratio(6) | 59 | 42 | ||||||
| (1) | Loans and advances are classified as non-performing typically when the counterparty fails to make payments when contractually due for three months or where it is deemed probable that this will occur in the near future. |
| (2) | Corporate Banking loans and advances to customers include Social Housing loans. |
| (3) | All Corporate Banking NPL balances are UK and continue accruing interest. The data presented excludes accrued interest. |
| (4) | NPLs against which an impairment loss allowance has been established. |
| (5) | Corporate Banking NPLs as a percentage of Corporate Banking loans and advances to customers. |
| (6) | Impairment loan loss allowances as a percentage of NPLs. |
Movements in NPLs during the period are set out in the table below. Transfers ‘in’ represent loans which have fallen into arrears during the period and have missed three or more monthly payments. Transfers ‘out’ represent loans that have returned to performing status, or have been redeemed in full, or have proceeded to litigation and the property repossessed and sold, and the loan written off.
| 2013 £m | ||||
At 1 January | 264 | |||
Transfers in to NPL | 31 | |||
Transfers out of NPL: | ||||
- Loan repayments/redemptions | (88 | ) | ||
- Write-offs | (18 | ) | ||
|
| |||
At 30 June | 189 | |||
|
| |||
30 June 2013 compared to 31 December 2012
During the first half of 2013, the NPLs ratio decreased to 2.96% (2012: 4.16%) reflecting lower levels of NPLs as a result of several older vintage cases in the Real Estate portfolio having been successfully restructured during the period.
In the first half of 2013, interest income recognised on impaired loans amounted to £1m (six months ended 30 June 2012: £4m).
CORPORATE BANKING – FORBEARANCE
As previously described, loans may be forborne. At 30 June 2013, the carrying amount of financial assets that would otherwise be past due or impaired whose terms have been forborne was £nil (2012: £nil).
CORPORATE BANKING – RATIO OF WRITE-OFFS TO AVERAGE LOANS
At 30 June 2013 the ratio of net write-offs to average loans outstanding during the period was 0.42% (2012: 0.44%).
Abbey National Treasury Services plc 2013 Half Yearly Financial Report | 21 |
Table of Contents
Business Review
Risk Management Reportcontinued
INTRODUCTION
Markets offers risk management and other services to financial institutions, as well as other Santander UK divisions. Its main product areas are fixed income and foreign exchange, equity, capital markets and institutional sales. Credit risk arises by Markets making loans, investing in other financial instruments, or entering into financing transactions or derivatives.
This section sets out further detail on credit risk in Markets as follows:
• | Committed exposures; | |
• | Credit risk mitigation; | |
• | Monitoring and recovery management; and | |
• | Forbearance. | |
MANAGEMENT’S APPROACH TO CREDIT RISK IN MARKETS | ||
Management’s approach to credit risk in Markets has not changed during 2013. For further details refer to page 56 of the 2012 Annual Report.
MARKETS – COMMITTED EXPOSURES
DERIVATIVE COMMITTED EXPOSURES BY CREDIT RATING OF THE ISSUER OR COUNTERPARTY(1)
| 30 June 2013 £m | 31 December 2012 £m | |||||||
AAA | 43 | 38 | ||||||
AA | 1,714 | 185 | ||||||
A | 2,625 | 4,097 | ||||||
BBB and below | 640 | 357 | ||||||
|
|
|
| |||||
Total | 5,022 | 4,677 | ||||||
|
|
|
| |||||
| (1) | External ratings are applied to all committed exposures where available. |
DERIVATIVE COMMITTED EXPOSURES BY GEOGRAPHICAL AREA
| 30 June 2013 £m | 31 December 2012 £m | |||||||
UK | 2,249 | 1,635 | ||||||
Peripheral eurozone | 516 | 364 | ||||||
Rest of Europe | 1,128 | 1,409 | ||||||
US | 1,000 | 974 | ||||||
Rest of the world | 129 | 295 | ||||||
|
|
|
| |||||
Total | 5,022 | 4,677 | ||||||
|
|
|
| |||||
30 June 2013 compared to 31 December 2012
The change in the mix of exposures from A to AA during the first half of 2013 principally reflected a continued focus on counterparties with higher credit quality.
22 | Abbey National Treasury Services plc 2013 Half Yearly Financial Report |
Table of Contents
Business Review
Risk Management Reportcontinued
MARKETS – CREDIT RISK MITIGATION
Markets continued to focus its activities on derivative products, supported by increased collateralisation and use of central counterparties.
PORTFOLIO | DESCRIPTION | |||
• | Derivatives | Collateralisation Cash collateral in respect of derivatives held at 30 June 2013 was £0.5bn (2012: £0.6bn), not all derivative arrangements being subject to collateral agreements. Collateral obtained during the period in respect of purchase and resale agreements (including securities financing) is equal to at least 100% of the amount of the exposure. | ||
Use of Central Counterparties (‘CCPs’)ANTS continues to use CCPs as an additional means to mitigate counterparty credit risk in derivative transactions. At 30 June 2013, CCPs were used in connection with 16.3% (2012: 6.3%) of Santander UK’s OTC derivatives. This increase was a result of regulatory requirements and market convention driving more business through CCPs. | ||||
MARKETS – MONITORING AND RECOVERY MANAGEMENT
Cases exhibiting potentially higher risk characteristics are subject to risk monitoring under the Watchlist (FEVE) system. At 30 June 2013, there were no impaired or non-performing loans or exposures (2012: none) and the assets in the Watchlist (FEVE) Active category amounted to only £33m (2012: £33m).
MARKETS – FORBEARANCE
At 30 June 2013 and 31 December 2012, there were no financial assets that would otherwise be past due or impaired whose terms have been forborne.
Abbey National Treasury Services plc 2013 Half Yearly Financial Report | 23 |
Table of Contents
Business Review
Risk Management Reportcontinued
CREDIT RISK – CORPORATE CENTRE
INTRODUCTION
Corporate Centre consists of Financial Management & Investor Relations (‘FMIR’) and the non-core portfolios of Social Housing loans and structured credit assets. FMIR is responsible for managing capital and funding, balance sheet composition, structural market risk and strategic liquidity risk for the rest of the Santander UK group. The non-core portfolios are being run-down and/or managed for value. Credit risk arises by Corporate Centre making loans (including to other businesses within Santander UK) and investing in debt securities. Credit risk also arises by Corporate Centre investing in other financial instruments (including assets held for liquidity purposes) or entering into financing transactions or derivative contracts.
This section sets out further detail on credit risk in Corporate Centre as follows:
• | Committed exposures; | |
• | Credit risk mitigation; | |
• | Monitoring and recovery management; | |
• | Arrears; | |
• | Forbearance; and | |
• | Non-performing loans and advances. | |
MANAGEMENT’S APPROACH TO CREDIT RISK IN CORPORATE CENTRE | ||
Management’s approach to credit risk in Corporate Centre has not changed during 2013. For further details refer to page 59 of the 2012 Annual Report.
The table below shows the committed exposures in Corporate Centre after taking into account the credit mitigation procedures described in Markets on page 23. In addition, on lending to customers, credit risk arises on assets and off-balance sheet transactions. Consequently, the credit risk exposure below arises from on balance sheet assets, and off-balance sheet transactions such as committed and undrawn credit facilities or guarantees.
CORPORATE CENTRE – COMMITTED EXPOSURES
CORPORATE CENTRE COMMITTED EXPOSURE BY CREDIT RATING OF THE ISSUER OR COUNTERPARTY(1)
30 June 2013 | Sovereign £m | Structured Products £m | Derivatives £m | Social Housing £m | Total £m | |||||||||||||||
AAA | 9,457 | — | — | — | 9,457 | |||||||||||||||
AA | 3,907 | 508 | 133 | 2,296 | 6,844 | |||||||||||||||
A | — | 50 | 1,448 | 5,623 | 7,121 | |||||||||||||||
BBB and below | — | 38 | — | 1,386 | 1,424 | |||||||||||||||
|
|
|
|
|
|
|
|
|
| |||||||||||
Total | 13,364 | 596 | 1,581 | 9,305 | 24,846 | |||||||||||||||
|
|
|
|
|
|
|
|
|
| |||||||||||
31 December 2012 | Sovereign £m | Structured Products £m | Derivatives £m | Social Housing £m | Total £m | |||||||||||||||
AAA | 3,368 | 132 | — | — | 3,500 | |||||||||||||||
AA | 283 | 4 | — | 2,305 | 2,592 | |||||||||||||||
A | — | 29 | 1,215 | 5,899 | 7,143 | |||||||||||||||
BBB and below | — | 71 | — | 1,408 | 1,479 | |||||||||||||||
|
|
|
|
|
|
|
|
|
| |||||||||||
Total | 3,651 | 236 | 1,215 | 9,612 | 14,714 | |||||||||||||||
|
|
|
|
|
|
|
|
|
| |||||||||||
| (1) | All exposures are internally rated. External ratings are taken into consideration in the rating process, where available. |
24 | Abbey National Treasury Services plc 2013 Half Yearly Financial Report |
Table of Contents
Business Review
Risk Management Reportcontinued
CORPORATE CENTRE COMMITTED EXPOSURE BY GEOGRAPHICAL AREA(1)
30 June 2013 | Sovereign £m | Structured Products £m | Derivatives £m | Social Housing £m | Total £m | |||||||||||||||
UK | 3,784 | 110 | 331 | 9,305 | 13,530 | |||||||||||||||
Peripheral eurozone | — | 71 | — | — | 71 | |||||||||||||||
Rest of Europe | — | 117 | 740 | — | 857 | |||||||||||||||
US | 9,457 | — | 510 | — | 9,967 | |||||||||||||||
Rest of world | 123 | 298 | — | — | 421 | |||||||||||||||
|
|
|
|
|
|
|
|
|
| |||||||||||
Total | 13,364 | 596 | 1,581 | 9,305 | 24,846 | |||||||||||||||
|
|
|
|
|
|
|
|
|
| |||||||||||
31 December 2012 | Sovereign £m | Structured Products £m | Derivatives £m | Social Housing £m | Total £m | |||||||||||||||
UK | 1,978 | 16 | 88 | 9,612 | 11,694 | |||||||||||||||
Peripheral eurozone | — | 85 | — | — | 85 | |||||||||||||||
Rest of Europe | 627 | 135 | 675 | — | 1,437 | |||||||||||||||
US | 763 | — | 452 | — | 1,215 | |||||||||||||||
Rest of world | 283 | — | — | — | 283 | |||||||||||||||
|
|
|
|
|
|
|
|
|
| |||||||||||
Total | 3,651 | 236 | 1,215 | 9,612 | 14,714 | |||||||||||||||
|
|
|
|
|
|
|
|
|
| |||||||||||
| (1) | The geographic location is classified by country of domicile of the counterparty. |
30 June 2013 compared to 31 December 2012
The committed exposures to Sovereigns principally reflect cash at central banks and holdings of highly rated liquid assets as part of normal liquid asset portfolio management, and are concentrated in UK and US exposures. During the first half of 2013, there was an increase of Sovereign exposure in AA as a result of the UK’s Sovereign downgrade in early 2013. In addition, AAA Sovereign exposure increased to £9.5bn reflecting US Sovereign holdings at 30 June 2013. Similarly, exposures to Structured Products reflect holdings of high quality corporate bonds and floating rate notes as part of normal liquid asset portfolio management.
The Social Housing portfolio reduced as a result of successful refinancings.
CORPORATE CENTRE – MONITORING AND RECOVERY MANAGEMENT
Cases exhibiting potentially higher risk characteristics are subject to risk monitoring under the Watchlist (FEVE) process. There are a range of indicators that may trigger a case being added to Watchlist (FEVE), including deteriorating rating, security value concerns, declining trends, debt service under pressure, downturn in trade, covenant breaches, major contract loss, and resignation of key management. Such cases are assessed to determine the potential financial implications of these trigger events and in consultation with the borrower, a range of options available is considered which may include temporary forbearance.
In addition, cases that require specialist risk management expertise, including all NPLs, are transferred to a dedicated restructuring team.
Abbey National Treasury Services plc 2013 Half Yearly Financial Report | 25 |
Table of Contents
Business Review
Risk Management Reportcontinued
Cases subject to risk monitoring under the Watchlist (FEVE) process or classified as NPL by portfolio and assessment of risk at 30 June 2013 and 31 December 2012 were:
| Watchlist (FEVE) | Observed impairment loss allowances | |||||||||||||||||||||||||||||||||||||||
| Portfolio | Enhanced monitoring | Proactive monitoring | Total | NPL | NPL | Watchlist | NPL | |||||||||||||||||||||||||||||||||
30 June 2013 | £m | £m | % | £m | % | £m | £m | % | £m | £m | ||||||||||||||||||||||||||||||
Sovereign | 13,364 | — | — | — | — | — | — | — | — | — | ||||||||||||||||||||||||||||||
Structured products | 596 | — | — | — | — | — | — | — | — | — | ||||||||||||||||||||||||||||||
Derivatives | 1,581 | — | — | — | — | — | — | — | — | — | ||||||||||||||||||||||||||||||
Social Housing | 9,305 | 83 | 0.9 | — | — | 83 | — | — | — | — | ||||||||||||||||||||||||||||||
|
|
|
|
|
|
|
|
|
|
|
|
|
|
|
|
|
|
|
| |||||||||||||||||||||
Total | 24,846 | 83 | 0.7 | — | — | 83 | — | — | — | — | ||||||||||||||||||||||||||||||
|
|
|
|
|
|
|
|
|
|
|
|
|
|
|
|
|
|
|
| |||||||||||||||||||||
| Watchlist (FEVE) | Observed impairment loss allowances | |||||||||||||||||||||||||||||||||||||||
| Portfolio | Enhanced monitoring | Proactive monitoring | Total | NPL | NPL | Watchlist | NPL | |||||||||||||||||||||||||||||||||
31 December 2012 | £m | £m | % | £m | % | £m | £m | % | £m | £m | ||||||||||||||||||||||||||||||
Sovereign | 3,651 | — | — | — | — | — | — | — | — | — | ||||||||||||||||||||||||||||||
Structured products | 236 | — | — | — | — | — | — | — | — | — | ||||||||||||||||||||||||||||||
Derivatives | 1,215 | — | — | — | — | — | — | — | — | — | ||||||||||||||||||||||||||||||
Social Housing | 9,612 | 632 | 6.6 | — | — | 632 | — | — | — | — | ||||||||||||||||||||||||||||||
|
|
|
|
|
|
|
|
|
|
|
|
|
|
|
|
|
|
|
| |||||||||||||||||||||
Total | 14,714 | 632 | 4.3 | — | — | 632 | — | — | — | — | ||||||||||||||||||||||||||||||
|
|
|
|
|
|
|
|
|
|
|
|
|
|
|
|
|
|
|
| |||||||||||||||||||||
30 June 2013 compared to 31 December 2012
During the first half of 2013, in Social Housing, the value of cases in enhanced monitoring decreased as a result of a small number of large value cases returning to performing status following resolution of governance issues as anticipated.
CORPORATE CENTRE – ARREARS
At 30 June 2013 and 31 December 2012, there were no loans and advances to customers in arrears in Corporate Centre.
FORBEARANCE
Forbearance allows a customer, by negotiation, to vary the terms of their contractual obligations for an agreed period (such as interest-only period or term extensions). ANTS also aims to ensure that after the initial period of financial difficulties the customer can revert to the previous terms, with appropriate support where necessary. These agreements may be initiated by the customer, ANTS or by a third party.
No forbearance arrangements have been entered into.
CORPORATE CENTRE – NON-PERFORMING LOANS AND ADVANCES
At 30 June 2013 and 31 December 2012, there were no non-performing loans in Corporate Centre.
26 | Abbey National Treasury Services plc 2013 Half Yearly Financial Report |
Table of Contents
Business Review
Risk Management Reportcontinued
INTRODUCTION
Market risk is the risk of a variation to the capital, economic value or reported income resulting from changes in the variables of financial instruments including interest rate, inflation, equity, credit spread, property and foreign currency. Traded market risk is the risk of losses in on- and off-balance sheet positions arising from movements in market prices. Non-traded market risk includes exposures arising as a result of the structure of portfolios of assets and liabilities, or where the liquidity of the market is such that the exposure could not be closed out over a short-time horizon.
This section sets out further detail on:
• | Traded market risk; and | |
• | Non-traded market risk (which is classified as a structural risk and presented in the Structural Risks section). | |
MANAGEMENT’S APPROACH TO MARKET RISK | ||
• | ANTS actively manages and controls traded market risk within clearly defined parameters by limiting the impact of adverse market movements whilst seeking to enhance earnings. The organisational structure ensures a segregation of responsibilities between the functions responsible for market risk origination, risk management and control, and risk oversight. | |
• | A comprehensive set of Santander UK-wide policies, procedures and processes have been developed and implemented to identify, monitor and manage market risk. | |
• | All material risk exposures must be measured and subject to monitoring against limits and triggers for management action and/or escalation. Market risk limits are approved under Board-delegated authority, and within the market risk appetite. | |
INTRODUCTION
Traded market risk arises in connection with financial services for customers and the buying, selling and positioning mainly in fixed income, equities, foreign exchange and property markets. This trading activity may lead to a potential decline in net income due to variations in market factors including interest rates, inflation rates, equity, exchange rates, credit spreads and bond prices, property and other instruments. The most significant risk exposures in traded market risk are sensitivities to moves in interest rates, interest rate basis and the equities market.
The key areas where traded market risk is generated, controlled and managed are:
• | Corporate Banking (in the short-term markets business); and | |
• | Markets. |
Market risks arising from structured products, including exposure to changes in the levels of equity markets, are managed in Markets.
Abbey National Treasury Services plc 2013 Half Yearly Financial Report | 27 |
Table of Contents
Business Review
Risk Management Reportcontinued
TRADED MARKET RISK – CORPORATE BANKING
For trading activities (in the short-term markets business), market risk is measured using Value-At-Risk (‘VaR’) as well as complimentary sensitivity and stress testing metrics. Risks not captured in the VaR model are reported and monitored using non-VaR based limits and controls. The following table shows the 1 day 99% VaR-based consolidated exposures for the major risk classes at 30 June 2013 and 31 December 2012, together with the highest, lowest and average exposures for the period. Exposures within each risk class reflect a range of exposures associated with movements in that financial market. The main exposure is due to interest rate risks, e.g. the impact of absolute rate movements, and movements between interest rate bases.
The amounts below represent the potential change in market values of trading instruments. Since trading instruments are recorded at market value, these amounts also represent the potential effect on income.
| Actual Exposure | ||||||||
Trading instruments | 30 June 2013 £m | 31 December 2012 £m | ||||||
Interest rate risks | 3.4 | 2.3 | ||||||
Equity risks | 0.8 | 1.0 | ||||||
|
|
|
| |||||
Correlation offsets(1) | (0.6 | ) | (0.6 | ) | ||||
|
|
|
| |||||
Total correlated one-day VaR | 3.6 | 2.7 | ||||||
|
|
|
| |||||
| Exposure for the period ended | ||||||||||||||||||||||||
| Average exposure | Highest exposure | Lowest exposure | ||||||||||||||||||||||
Trading instruments | 30 June 2013 £m | 31 December 2012 £m | 30 June 2013 £m | 31 December 2012 £m | 30 June 2013 £m | 31 December 2012 £m | ||||||||||||||||||
Interest rate risks | 3.0 | 2.3 | 4.3 | 3.8 | 1.9 | 1.7 | ||||||||||||||||||
Equity risks | 0.8 | 1.0 | 1.2 | 1.4 | 0.6 | 0.6 | ||||||||||||||||||
Spread risks | — | 0.2 | — | 0.8 | — | — | ||||||||||||||||||
|
|
|
|
|
|
|
|
|
|
|
| |||||||||||||
Correlation offsets(1) | (0.9 | ) | (0.9 | ) | — | — | — | — | ||||||||||||||||
|
|
|
|
|
|
|
|
|
|
|
| |||||||||||||
Total correlated one-day VaR | 2.9 | 2.6 | 4.3 | 3.9 | 1.7 | 1.9 | ||||||||||||||||||
|
|
|
|
|
|
|
|
|
|
|
| |||||||||||||
| (1) | The highest and lowest exposure figures reported for each risk type did not necessarily occur on the same day as the highest and lowest total correlated one-day Value-at-Risk. A corresponding correlation offset effect cannot be calculated and is therefore omitted from the above tables. |
Corporate Banking daily VaR (short-term markets business)
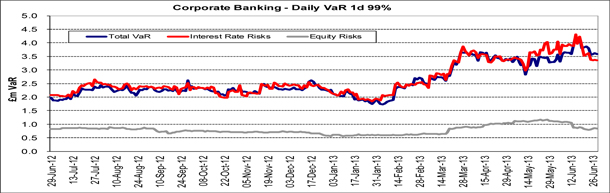
The principal component of the movements in Total VaR was changes in Interest Rate risks. Movements in Interest Rates risks in the first half of 2013 were driven by changing interest rate views taken by the trading desks. The increase in 2013 was due to increased risk positioning in line with business plans.
28 | Abbey National Treasury Services plc 2013 Half Yearly Financial Report |
Table of Contents
Business Review
Risk Management Reportcontinued
TRADED MARKET RISK – MARKETS
Market risk-taking is performed only within the constraints of the Market Risk Framework. The majority of the exposure is due to interest rate and equity exposure. Interest rate exposure is generated through trading activities. The current equity exposures are generated by risk management of two types of client business: vanilla risk through the flow business and more exotic risk from structured products. Spread exposure arises indirectly from trading activities within Markets.
For trading activities, market risk is measured using VaR as well as complementary sensitivity and stress testing metrics. Risks not captured in the VaR model are reported and monitored using non-VaR based limits and controls. The following table shows the 1 day 99% VaR-based consolidated exposures for the major risk classes at 30 June 2013 and 31 December 2012, together with the highest, lowest and average exposures for the period. Exposures within each risk class reflect a range of exposures associated with movements in that financial market.
The amounts below represent the potential change in market values of trading instruments. Since trading instruments are recorded at market value, these amounts also represent the potential effect on income.
| Actual Exposure | ||||||||
Trading instruments | 30 June 2013 £m | 31 December 2012 £m | ||||||
Interest rate risks | 1.8 | 3.3 | ||||||
Equity risks | 2.6 | 4.4 | ||||||
Property risks | 0.1 | 2.3 | ||||||
Spread risks | 0.4 | 0.2 | ||||||
Other risks(1) | — | 0.5 | ||||||
|
|
|
| |||||
Correlation offsets(2) | (2.1 | ) | (1.9 | ) | ||||
|
|
|
| |||||
Total correlated one-day VaR | 2.8 | 8.8 | ||||||
|
|
|
| |||||
| Exposure for the period ended | ||||||||||||||||||||||||
| Average exposure | Highest exposure | Lowest exposure | ||||||||||||||||||||||
Trading instruments | 30 June 2013 £m | 31 December 2012 £m | 30 June 2013 £m | 31 December 2012 £m | 30 June 2013 £m | 31 December 2012 £m | ||||||||||||||||||
Interest rate risks | 2.8 | 3.0 | 4.4 | 5.2 | 1.8 | 1.7 | ||||||||||||||||||
Equity risks | 2.2 | 5.0 | 4.6 | 8.0 | 1.4 | 3.5 | ||||||||||||||||||
Property risks | 0.1 | 2.1 | 0.2 | 2.5 | — | 1.3 | ||||||||||||||||||
Spread risks | 0.5 | 0.1 | 1.0 | 0.4 | 0.2 | — | ||||||||||||||||||
Other risks(1) | 0.2 | 0.9 | 0.5 | 2.3 | — | 0.4 | ||||||||||||||||||
|
|
|
|
|
|
|
|
|
|
|
| |||||||||||||
Correlation offsets(2) | (2.2 | ) | (2.4 | ) | — | — | — | — | ||||||||||||||||
|
|
|
|
|
|
|
|
|
|
|
| |||||||||||||
Total correlated one-day VaR | 3.6 | 8.8 | 6.5 | 12.9 | 2.3 | 6.9 | ||||||||||||||||||
|
|
|
|
|
|
|
|
|
|
|
| |||||||||||||
| (1) | Other risks include foreign exchange risk. |
| (2) | The highest and lowest exposure figures reported for each risk type did not necessarily occur on the same day as the highest and lowest total correlated one-day Value-at-Risk. A corresponding correlation offset effect cannot be calculated and is therefore omitted from the above tables. |
With effect from 1 January 2013, the tables above consist of VaR-based metrics. In prior years, the tables consisted of both VaR and non-VaR-based metrics. If the current year presentation were applied to the 2012 data, the total correlated one-day VaR would decrease by £5.1m to £3.6m.
Markets daily VaR
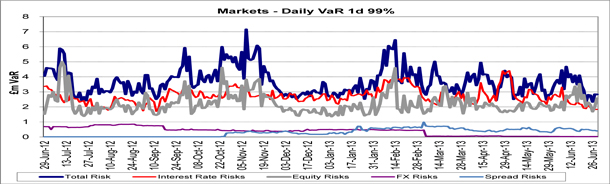
The principal components of the movements in Total VaR were changes in Interest Rate risks and Equity risks. Movements in Interest Rate risks and Equity risks in the first half of 2013 were driven by changing interest rate views taken by the trading desks and also changing trading volumes within the Equity Derivatives desk.
Abbey National Treasury Services plc 2013 Half Yearly Financial Report | 29 |
Table of Contents
Business Review
Risk Management Reportcontinued
INTRODUCTION
Structural risk includes exposures arising as a result of the structure of portfolios of assets and liabilities, or where the liquidity of the market is such that the exposure could not be closed out over a short-time horizon. The risk exposure is generated by features inherent in either a product or portfolio and normally presented over the life of the product or portfolio. Such exposures are a result of the decision to undertake specific business activities, can take a number of different forms, and are generally managed over a longer-time horizon.
Through the internal transfer pricing mechanism, material structural risks arising from divisions are transferred from the originating business to FMIR in Corporate Centre where they are monitored, controlled and managed holistically in conjunction with exposures arising from the funding, liquidity or capital management activities of FMIR.
There are three key areas of structural risk within ANTS which are discussed in the sections that follow. These are:
• | Non-traded market risk; | |
• | Liquidity and funding risk; and | |
• | Capital risk. | |
Non-traded market risk mainly arises through the provision of banking products and services to personal and corporate/business customers, as well as structural exposures arising in Santander UK’s balance sheet.
The most significant non-traded market risk on a gross basis is interest rate risk, which includes both yield curve and basis risks. Yield curve risk arises from the timing mismatch in the re-pricing of fixed and variable rate assets, liabilities and off-balance sheet instruments, as well as the investment of non-interest-bearing liabilities in interest-bearing assets. Basis risk arises, to the extent that the underlying market rates impacting pricing within variable rate assets and liabilities are not precisely matched. This exposes the balance sheet to changes in the relationship between market rates, for example between LIBOR and Bank of England Base Rate.
Santander UK is also exposed to behavioural risks arising from features in retail products that give customers the right to alter the expected cash flows of a financial contract. For example, prepayment risk, where customers may prepay loans before their contractual maturity. Santander UK is also exposed to product launch risk, where the customers may not take the expected volume of new mortgages or other products.
There are two areas where non-traded market risk is permitted, controlled and managed:
• | Corporate Banking; and | |
• | Corporate Centre. | |
All non-traded market risks arising from the Santander UK group’s Retail Banking and Corporate Banking divisions are substantially transferred from the originating business to FMIR in Corporate Centre.
NON-TRADED MARKET RISK – CORPORATE BANKING
Non-traded market risks originated in Corporate Banking are transferred from the originating business to FMIR in Corporate Centre. Funds received with respect to deposits taken are lent on to Corporate Centre on matching terms as regards interest rate re-pricing and maturity; in a similar manner loans are funded through matching borrowings. Any permitted retained market risk exposure is minimal, and is monitored against limits approved through the Market Risk Framework.
NON-TRADED MARKET RISK – CORPORATE CENTRE
As a consequence of the transfer process described above, all material non-trading market risk exposures are substantially transferred to and reside within Corporate Centre. Non-traded market risk is managed in line with the Risk Framework. The exposures at 30 June 2013 and 31 December 2012 are outlined below.
30 | Abbey National Treasury Services plc 2013 Half Yearly Financial Report |
Table of Contents
Business Review
Risk Management Reportcontinued
Analysis of non-traded market risk exposures
Net Interest Margin (‘NIM’) and Economic Value of Equity (‘EVE’) measures are two of the key measures used by Santander UK that illustrate its exposure to yield curve risk. The following table reflects how the base case valuations would be affected by a 100 basis point parallel shift applied instantaneously to the yield curve. For comparison purposes these measures are shown at 30 June 2013 and 31 December 2012:
| 30 June 2013 £m | 31 December 2012 £m | |||||||
NIM sensitivity to +100 basis points shift in yield curve | 298 | 343 | ||||||
EVE sensitivity to +100 basis points shift in yield curve | 282 | 405 | ||||||
The reduction in sensitivities over the first half of 2013 was due to the net addition of fixed rate assets onto the balance sheet which reduced the positive impact from an interest rate rise but also provide protection in the event of rates remaining lower than currently expected. Due to the protracted period of historically low interest rates, Santander UK remains exposed to a degree of margin compression. This is attributable to the combination of the historically low level of central bank base rates and to reduced earnings from the assets funded by Santander UK’s non-dated liabilities.
ANTS is the treasury support function for the Santander UK group. In this regard, ANTS’s role is to provide access to financial markets and central bank facilities in order to meet the Santander UK group’s liquidity, funding, capital and balance sheet management requirements.
Liquidity and funding risk is managed on a Santander UK group basis and it is not therefore appropriate to consider these risks separately at an ANTS group level. In addition, under the PRA’s regulatory regime for liquidity, Santander UK and ANTS together with Cater Allen Limited, a fellow subsidiary of Santander UK plc, form the Santander UK Defined Liquidity Group (‘DLG’). Under these arrangements, each member of the DLG is liable to support each other in terms of transferring or receiving surplus liquidity in times of stress. In considering the liquidity resources available to the ANTS group, both its own liquid assets and also those of the rest of the Santander UK group have been separately presented below.
These stress tests are supplemented with sensitivity analysis for instantaneous liquidity shocks by each major liquidity risk driver to understand the impact on internal liquidity risk appetite and regulatory liquidity metrics.
Abbey National Treasury Services plc 2013 Half Yearly Financial Report | 31 |
Table of Contents
Business Review
Risk Management Reportcontinued
LIQUIDITY RISK
LIQUID ASSETS
Santander UK holds, at all times, a portfolio of unencumbered liquid assets to mitigate liquidity risk. The size and composition of this portfolio is determined both by internal stress tests as well as the PRA’s regulatory regime for liquidity.
The following tables set out liquid assets held by the ANTS group and additional liquid assets held by the rest of the Santander UK group (to which the ANTS group has access through the cross guarantee and defined liquidity group arrangements described earlier) by the geographic location of the issuer or counterparty at 30 June 2013 and 31 December 2012:
| Held by the ANTS group | Held elsewhere in Santander UK | |||||||||||||||
| 30 June 2013 £bn | 31 December 2012 £bn | 30 June 2013 £bn | 31 December 2012 £bn | |||||||||||||
Core liquid assets (PRA eligible): | ||||||||||||||||
Cash at central banks: | ||||||||||||||||
- UK | — | — | 24 | 28 | ||||||||||||
- US | 9 | — | — | — | ||||||||||||
|
|
|
|
|
|
|
| |||||||||
| 9 | — | 24 | 28 | |||||||||||||
Government bonds: | ||||||||||||||||
- UK | 1 | 4 | — | — | ||||||||||||
- US | — | 3 | — | — | ||||||||||||
- Japan | — | 1 | — | — | ||||||||||||
- Germany | — | 1 | — | — | ||||||||||||
- Other countries, each less than £1bn(1) | 1 | — | — | — | ||||||||||||
|
|
|
|
|
|
|
| |||||||||
| 2 | 9 | — | — | |||||||||||||
|
|
|
|
|
|
|
| |||||||||
Total core liquid assets (PRA eligible) | 11 | 9 | 24 | 28 | ||||||||||||
|
|
|
|
|
|
|
| |||||||||
High quality(2)corporate bonds and asset-backed securities: | ||||||||||||||||
- UK | 1 | 1 | 1 | — | ||||||||||||
- US | — | — | — | 1 | ||||||||||||
- Other countries, each less than £1bn(3) | 1 | — | — | — | ||||||||||||
|
|
|
|
|
|
|
| |||||||||
| 2 | 1 | 1 | 1 | |||||||||||||
Other liquid assets: | ||||||||||||||||
- UK – Whole loans and own debt securities | — | — | 39 | 36 | ||||||||||||
- UK – Other debt securities, bonds, and equities included in major indices | 1 | 1 | — | — | ||||||||||||
- Other countries, each less than £1bn(3) | — | — | — | — | ||||||||||||
|
|
|
|
|
|
|
| |||||||||
| 1 | 1 | 39 | 36 | |||||||||||||
|
|
|
|
|
|
|
| |||||||||
Total liquid assets | 14 | 11 | 64 | 65 | ||||||||||||
|
|
|
|
|
|
|
| |||||||||
| (1) | Consists of Belgium, Switzerland, Japan, France, Denmark and designated multilateral development banks. |
| (2) | A- rated or above. |
| (3) | Consists of Austria, Switzerland, Germany, France, Ireland, Luxembourg and Netherlands. |
Liquidity developments in the first half of 2013
The first half of 2013 saw the continuation of the improvement in funding rates and market confidence observed in late 2012. Sentiment was driven primarily by the view that the current easing in monetary policy by central banks will continue into the medium term. Santander UK experienced this improvement both in terms of market-wide reduced wholesale, unsecured medium-term and secured medium-term funding rates and, as with other UK banks, in terms of confidence in its own current credit ratings. Throughout 2012, Santander UK continued to strengthen its liquidity position. Following the beneficial conditions prevailing in late 2012 and in the first half of 2013 Santander UK reduced its liquidity position whilst maintaining a conservative balance sheet structure (i.e. maintaining high levels of high quality liquid assets) and risk management controls to monitor and manage the levels of the liquid asset portfolio and encumbrance.
During the first half of 2013, Santander UK:
| • | Maintained a conservative portfolio of liquid assets that can be utilised to counter the potential impact of a liquidity stress on Santander UK’s balance sheet whilst avoiding the holding of excess liquidity that could be better utilised in meeting strategic objectives and business plans. |
| • | Maintained the level of medium term funding in the mix at 20.3%, which continues to be balanced with the management of encumbrance risk. |
| • | Improved the mix of retail and corporate liabilities available for funding, backed by a strategy of rewarding the most stable and behaviourally long-term deposits. |
| • | Continued to improve and refine Santander UK’s liquidity management capabilities and contingency planning framework, following the revision of its risk management framework in 2012. |
32 | Abbey National Treasury Services plc 2013 Half Yearly Financial Report |
Table of Contents
Business Review
Risk Management Reportcontinued
FUNDING RISK
WHOLESALE FUNDING
The tables below show ANTS’s primary wholesale funding sources, excluding short-term repurchase agreements, together with a reconciliation of wholesale funding to the balance sheet at 30 June 2013 and 31 December 2012.
30 June 2013 | Funding analysis £bn | Repos £bn | Other £bn | Balance sheet £bn | ||||||||||||
Deposits by banks | 5.0 | 1.1 | 111.9 | (1) | 118.0 | |||||||||||
Deposits by customers(2) | 0.4 | — | — | 0.4 | ||||||||||||
Debt securities in issue: | ||||||||||||||||
- covered bonds | 17.0 | — | — | 17.0 | ||||||||||||
- other debt securities | 12.0 | — | — | 12.0 | ||||||||||||
|
|
|
|
|
|
|
| |||||||||
| 34.4 | 1.1 | 111.9 | 147.4 | |||||||||||||
|
|
|
|
|
|
|
| |||||||||
Financial liabilities at fair value | 5.0 | — | 0.3 | 5.3 | ||||||||||||
Trading liabilities | 2.6 | 22.7 | 9.5 | (3) | 34.8 | |||||||||||
|
|
|
|
|
|
|
| |||||||||
Total wholesale funding | 42.0 | 23.8 | 121.7 | 187.5 | ||||||||||||
|
|
|
|
|
|
|
| |||||||||
31 December 2012 | Funding analysis £bn | Repos £bn | Other £bn | Balance sheet £bn | ||||||||||||
Deposits by banks | 4.8 | 1.1 | 108.6 | (1) | 114.5 | |||||||||||
Deposits by customers(2) | 0.4 | — | — | 0.4 | ||||||||||||
Debt securities in issue: | ||||||||||||||||
- covered bonds | 20.6 | — | — | 20.6 | ||||||||||||
- other debt securities | 13.1 | — | 0.1 | 13.2 | ||||||||||||
|
|
|
|
|
|
|
| |||||||||
| 38.9 | 1.1 | 108.7 | 148.7 | |||||||||||||
|
|
|
|
|
|
|
| |||||||||
Financial liabilities at fair value | 4.0 | — | — | 4.0 | ||||||||||||
Trading liabilities | 0.9 | 11.7 | 8.5 | (3) | 21.1 | |||||||||||
|
|
|
|
|
|
|
| |||||||||
Total wholesale funding | 43.8 | 12.8 | 117.2 | 173.8 | ||||||||||||
|
|
|
|
|
|
|
| |||||||||
| (1) | Principally consists of items in the course of transmission and other deposits. See Note 16 to the Condensed Consolidated Interim Financial Statements. |
| (2) | Included in the balance sheet total of £5,820m (2012: £6,249m). |
| (3) | Consists of short positions in securities and unsettled trades, cash collateral and short-term deposits. See Note 17 to the Condensed Consolidated Interim Financial Statements. |
Funding developments in the first half of 2013
Santander UK’s overall funding strategy is to develop and maintain a diversified funding base, which allows us access to a variety of funding sources. In 2012, we primarily focused on secured issuance, in particular residential mortgage-backed securities and covered bonds, two forms of financing that permit us to benefit from our prime UK mortgage assets. This strategy minimised the cost of funding and provided protection against an uncertain and volatile market funding environment. In the second half of 2012, stability returned to the wholesale funding markets. The return of stable markets meant that in the full year 2013 medium term funding issuance is expected to be a more balanced mix of secured and unsecured issuance.
Within our balance sheet management strategy, we aim to align the sources and uses of funding. Customer loans and advances are largely funded by customer deposits, with any excess being funded by long-term wholesale debt and equity.
Abbey National Treasury Services plc 2013 Half Yearly Financial Report | 33 |
Table of Contents
Business Review
Risk Management Reportcontinued
| NON-FINANCIAL RISKS |
The key non-financial risks consist of:
• Operational risk;
• Regulatory risk;
• Conduct risk;
• Strategic risk;
• Reputational risk;
• Human Resources risk;
• Accounting and reporting risk; and
• Legal risk. |
Operational risk is the risk of loss to ANTS resulting from inadequate or failed internal processes, people and systems, or from external events. As operational risk is inherent in the processes ANTS operates, in order to provide services to customers and generate profit for investors, an objective of operational risk management is not to remove operational risk altogether, but to manage the risk to an acceptable level, taking into account the cost/benefits of minimisation as opposed to the inherent risk levels. When such risks materialise they can have not only immediate financial consequences for ANTS, but also an effect on its business objectives, customer service and regulatory responsibilities. Examples of operational risks include fraud, process failures, system downtime or damage to assets due to fire or floods.
The Operational Risk Framework
Operational risk exposures arise across ANTS’s business divisions and operating units, and are managed on a consistent basis. ANTS aims to identify, measure/assess, control/mitigate and inform regarding this risk. ANTS’s priority is to identify and minimise the risk of loss wherever appropriate, irrespective of whether losses have occurred. Measurement of the risk contributes to the establishment of priorities in operational risk management.
The Operational Risk Framework creates the consistent approach to how Santander UK controls and manages its operational risks and helps everyone understand their responsibilities within this approach. It is a core component of the overall Risk Framework and facilitates the ongoing reassessment of risk, appetites and controls, in order to ensure that Santander UK manages its risks at all times in line with its business objectives.
The Operational Risk Framework defines the operational risk requirements and adopts the following principles:
| • | The Santander UK Board must understand the main aspects of operational risk and approve and review the management framework. |
| • | The operational risk framework must be subject to reviews by the Internal Audit Department. |
| • | Operational risk management is part of senior management’s responsibility across the business. They must ensure it is introduced into management frameworks throughout Santander UK. |
| • | All ANTS’s personnel are managers of the operational risk that is intrinsic to the products, processes and systems they work with every day. |
| • | Directly and actively managing operational risk is the responsibility of all ANTS’s entities, divisions and areas. |
| • | Operational risk control is a separate function from operational risk management. Operational risk control is carried out by operational risk areas, which use qualitative and quantitative tools to identify, assess, track, measure and mitigate operational risk. |
34 | Abbey National Treasury Services plc 2013 Half Yearly Financial Report |
Table of Contents
Business Review
Risk Management Reportcontinued
| • | Operational risk managers must have adequate organisation, policies, methodologies and support to hedge the risks. |
| • | Business areas must have contingency plans in place to ensure continued operations and minimise losses should their business be interrupted. |
| • | Business areas must ensure they have the information available that is needed by the Board and the rest of the business. |
Santander UK obtains assurance that the appropriate standards of risk management are being maintained through the application of its “three lines of defence” Risk Governance Framework in the Risk Management Report of the 2012 Annual Report.
The management and oversight of Operational Risk is also covered by the “three lines of defence” model as described in the Risk Framework section. Within the first line of defence, all heads of business and management support units are accountable to the Chief Executive Officer for managing operational risks inherent in their products, activities, processes and systems and from external events. This is further supported by operational risk managers within the business areas and a specialised Operational Risk Unit under the office of the Chief Operating Officer. Within the second line there is the Operational Risk Control Unit (‘ORC’). The executive responsibility for the management of the ORC lies with the Head of Strategy & Internal Control who has responsibility for the overall Internal Control Unit. The Internal Control Unit is responsible for effectively controlling risks and ensuring they are managed within the risk limits and mandates approved by the Board and Chief Executive Officer. Operational Risks are reported in conjunction with all key non financial risk information firstly through to the Internal Control Committee which then escalates though to the Executive Risk, Risk Oversight and Board Risk Committees.
Operational risk management
The “three lines of defence” model applies throughout Santander UK and is implemented taking account of the materiality and perceived risk of the different business areas by following the Operational Risk Management process and using the following key operational risk management tools:
KEY TOOLS | DESCRIPTION | |||
• Scenario Analysis | Santander UK performs simulations of control failures that may cause the most extreme loss events. Simulations are developed around high impact risks likely to exceed Santander UK’s future appetite. The analysis allows management to better understand the potential impacts and remediate issues by: | |||
• | identifying the high impact events that would cause most damage to Santander UK, both from a financial and reputational perspective; | |||
• | ensuring that the business is focused on its most critical risks; and | |||
• | facilitating the assessment of capital adequacy. | |||
• Risk and Control Self Assessments | Business units identify and assess their operational risks to ensure they are being effectively managed and controlled, and actions prioritised and aligned to Santander UK’s risk appetite. | |||
• Key Risk Indicators | Key Risk Indicator performance is monitored against tolerances and trigger points that prompt an early warning to potential exposures, whilst the creation of mitigation strategies help address potential concerns. Indicator metrics are used to provide insight into the changing risk profile of the organisation and are also used to assess the performance of key controls. | |||
• Loss Data Management | Loss data capture and analysis processes exist to capture all operational risk loss events. The data is used to identify and correct control weaknesses using events as opportunities to prevent or reduce the impacts of recurrence, identify emerging themes, inform risk and control assessments, scenario analysis and risk reporting. Escalation of single or aggregated events to senior management and appropriate committees is determined by threshold breaches. | |||
• Reporting | Reporting forms an integral part of operational risk management ensuring that issues are identified, escalated and managed on a timely basis. Exposures for each business area are reported through monthly risk and control reports which include details on risk exposures and mitigating plans. Events that have a material impact on Santander UK’s finances, reputation, or customers are prioritised and reported immediately to key executives. | |||
Abbey National Treasury Services plc 2013 Half Yearly Financial Report | 35 |
Table of Contents
Business Review
Risk Management Reportcontinued
During the first half of 2013, ANTS continued to manage its key operational risks in the interest of all its stakeholders, responding to critical developments both within ANTS and in the environment in which it operates. Risk and any required changes to management controls are reported through the Risk Committee governance structure.
KEY RISKS | DESCRIPTION | |
• Operations and Technology Risk | ANTS continues to invest in electronic information systems to protect customer, employee and other information to effectively manage the evolving risks associated with the loss of confidentiality, integrity and of availability of this information.
Appropriate security is applied to protect all customer, employee and other data. Measures taken to reduce the risks include staff education, IT and data access controls and data integrity controls. | |
• Fraud Risk | ANTS has continued to invest in staff education and improved fraud detection and prevention systems, in order to counter the increasing threat of financial crime. A suite of controls is in place to prevent and detect trading and position taking that is unauthorised or fraudulent. These controls are reviewed and enhanced as part of a programme of continual development. | |
• Supplier Risk | Supplier risk is the risk of reductions in earnings and/or value, through financial or reputational loss associated with the failure of a service or goods provision by a third party organisation.
Santander UK has arrangements with both Banco Santander group companies (including the provision of IT infrastructure, software development and banking operations) and external outsourced service providers. A comprehensive supplier risk management and control framework applies to the management of all suppliers contracted by Santander UK to provide services or goods.
Santander UK uses written service level agreements with these entities that include key service performance metrics to support this governance. The high-level governance processes include relationship management, service delivery management and contract management. Across these, there are a number of more detailed processes.
Santander UK works closely, and continues to enhance its interaction with outsourced service providers via the application of appropriate risk frameworks. These frameworks include processes and procedures designed to ensure continuity of critical services up to and including disaster scenarios and that these plans are regularly validated through testing. | |
Regulatory risk is the risk of reductions in earnings and/or value, through financial or reputational loss, from failing to comply with applicable codes and regulatory rules.
ANTS seeks to ensure it fully meets all of its regulatory obligations. There are a number of legislative and regulatory developments both in the UK and abroad, going through a consultation and implementation process, which may have some effect on ANTS’s approach to regulatory risk. Details of the changes expected to have the greatest impact on the ANTS group’s operations are set out in the Supervision and Regulation section of the Directors’ Report on page 104 of the 2012 Annual Report.
There has been continued regulatory change following the financial crisis and the regulatory landscape continues to evolve. ANTS maintains a proactive approach to regulation and aims to provide constructive feedback on policy consultations and engage across the banking sector. ANTS takes compliance with regulatory requirements seriously and manages its arrangements accordingly.
36 | Abbey National Treasury Services plc 2013 Half Yearly Financial Report |
Table of Contents
Business Review
Risk Management Reportcontinued
CONDUCT RISK
Conduct risk is the risk that the business and operational decisions ANTS takes and the behaviours displayed lead to poor outcomes for our customers. This is a key risk to ANTS in view of the evolving regulatory environment.
The ANTS group engages in discussion, and co-operates, with the FCA in its supervision of the ANTS group, including reviews exercised under statutory powers, regarding its interaction with past and present customers, both as part of the FCA’s general thematic work and in relation to specific products and services. The position is monitored with particular reference to those reviews currently in progress where it is not yet possible to reliably determine their outcome.
MANAGEMENT’S APPROACH TO CONDUCT RISK | ||
• | ANTS takes a robust approach to managing conduct risk in accordance with the risk framework. | |
• | ANTS has noted the significant change in the regulatory environment in recent years. Furthermore, with the transition from the FSA to the Financial Conduct Authority there is a further increase in the attention of the regulators on conduct risk to ensure firms demonstrate that they are providing appropriate outcomes for customers. Specific focus is being seen on how firms evidence that they actually deliver the right outcomes for customers and that this is in line with expectations, moving away from a focus on processes and procedures. | |
• | In line with all other banks, the Santander UK group (including ANTS) initiated a series of activities to enhance the management of its conduct risks, which culminated in the Conduct Risk Programme. This has focused on the development of four key elements: Risk Policy, Products, Governance and Reporting and Culture. Changes have been made to specific business processes, as well as to the way the business considers, manages and reports conduct risks. In particular, all new products have to be approved by the Product Approval and Oversight Committee which seeks to ensure that new products are appropriately designed. | |
• | ANTS will continue to place significant attention and resource on seeking to ensure that customers receive the right outcome in every instance and that the necessary controls are in place to mitigate the associated risks, and this has been embodied in ANTS’s approach. | |
STRATEGIC RISK
Strategic Risk is the risk of material deviations in expected/target shareholder value as a result of poor definition or implementation of Santander UK’s strategy.
ANTS takes a robust approach to managing strategic risk in full alignment with the Strategic Risk framework. In setting the business’s strategy, risk policies are taken into consideration at all times and the strategy is stress tested against risk appetite statements. Both the strategy and Risk Appetite are approved by the Santander UK Board.
Strategic risk is managed on a monthly basis through the risk governance structure including the Strategic Risk and Financial Management Committee and the Board. Management assessment takes into consideration any relevant information across the whole business which may highlight either risks to the implementation of the bank’s strategy or where risks are being created due to poor definition of the strategy in order to inform the Executive Committee and Board of what further actions may be required.
REPUTATIONAL RISK
ANTS rigorously manages risks that may affect ANTS’s reputation and which may in turn impact upon its ability to achieve its strategic objectives. Reputational considerations are built into all the key risk and issue assessment tools.
HUMAN RESOURCES RISK
Human Resources (‘HR’) risk is defined in Santander UK as the risk of not having the sufficient number and quality of people to deliver Santander UK’s strategy, whilst complying with legislative requirements. In managing HR risk, Santander UK has established a set of policies which outline our minimum standards in relation to the management of people issues.
Abbey National Treasury Services plc 2013 Half Yearly Financial Report | 37 |
Table of Contents
Business Review
Risk Management Reportcontinued
ACCOUNTING AND REPORTING RISK
Accounting and reporting risk is defined as the failure to comply with regulatory and legal requirements for accounting and reporting of financial disclosures, which may lead to fines and/or restrictions and/or reputational damage.
In order to facilitate the identification, measurement, monitoring and reporting of accounting and reporting risks, a comprehensive business-wide framework of controls has been established, supported by a programme of regular assessment and reporting designed to identify and remedy any deficiencies in process or practice. This includes the systems and controls developed to support management’s attestation on the effectiveness of disclosure controls and controls over financial reporting.
LEGAL RISK
ANTS takes a robust approach to managing legal risk in full alignment with the Legal Risk Framework. This framework has been developed through Santander UK’s overall Risk Framework and Operational Risk Framework, which include the core principles of risk management and control activities.
The Legal Risk Framework defines the overriding principles and responsibilities for the identification, management, measurement, monitoring, control, reporting and oversight of legal risk. It is the operation of, and outputs from, these risk management activities that enables ANTS to manage legal risk exposures within the tolerances outlined in the Santander UK Risk Appetite, Limits and Triggers Statement. It is expected that all Business Units will manage their team activities and processes to follow the principles and guidelines set out in the Legal Risk Framework, and with those detailed in the Santander UK Risk and Operational Risk Frameworks.
ANTS continues to monitor, assess and respond to developments concerning legal requirements intended to prevent future financial crises or otherwise assure the stability of financial institutions.
38 | Abbey National Treasury Services plc 2013 Half Yearly Financial Report |
Table of Contents
Business Review
Risk Management Reportcontinued
CREDIT RISK – AREAS OF FOCUS AND OTHER ITEMS
Certain areas and/or specific views of credit risk deserve specialist attention, complementary to global risk management. These consist of country risk exposure, significant concentrations of credit risk, financial instruments of special interest, loans and advances, and impairment loss allowances, and are described on pages 84 to 98 of the 2012 Annual Report. The areas and/or specific views which have changed significantly during the first half of 2013 are described in the following section and consist of:
1. Country risk exposure; and
2. Loans and advances. |
The ANTS group manages its country risk exposure under its global limits framework. Within this framework, the ANTS group sets its individual risk appetite for each country, taking into account any factors that may influence the risk profile of each country, including political events, the macro-economic situation and the nature of the risk incurred. Exposures are actively managed if it is considered appropriate. Accordingly, and over recent years, the ANTS group has intensified its monitoring of exposures to sovereigns and counterparties in eurozone countries, and has proceeded to selectively divest assets directly or indirectly affected by events in those countries.Santander UK group and other Banco Santander group-related risk is considered separately.
The country risk tables below show the ANTS group’s exposures to central and local governments, government guaranteed counterparties, banks, other financial institutions, retail customers and corporate customers at 30 June 2013 and 31 December 2012. Total exposures consist of the total of balance sheet values and off-balance sheet values. Balance sheet values are calculated in accordance with IFRS (i.e. after the effect of netting agreements recognised in accordance with the requirements of IFRS, principally with respect to derivatives) except for credit provisions which have been added back. Off balance sheet values consist of undrawn facilities and letters of credit. The country of exposure has been assigned based on the counterparty’s country of incorporation except where the ANTS group is aware that a guarantee is in place, in which case the country of incorporation of the guarantor has been used. The exposures are presented by type of counterparty other than where the specific exposures have been guaranteed by a sovereign counterparty in which case they are presented within the “Government guaranteed” category.
Separate disclosure is presented individually for each country where the exposure exceeds £50m, and aggregated for exposures of less than £50m. Given the ongoing interest in eurozone economies, disclosures relating to those economies are presented first and highlighted separately.
The tables exclude credit risk exposures to other Santander UK group companies and other Banco Santander group companies, which are presented separately on pages 45 to 47.
30 June 2013 | Central and local governments £bn | Government guaranteed £bn | Banks (2) £bn | Other financial institutions £bn | Retail £bn | Corporate £bn | Total(1) £bn | |||||||||||||||||||||
Eurozone: | ||||||||||||||||||||||||||||
Peripheral eurozone countries: | ||||||||||||||||||||||||||||
Italy | 0.5 | — | 0.1 | — | — | 0.1 | 0.7 | |||||||||||||||||||||
Portugal | — | — | — | — | — | 0.1 | 0.1 | |||||||||||||||||||||
Ireland | — | — | — | — | — | 0.1 | 0.1 | |||||||||||||||||||||
Other eurozone countries: | ||||||||||||||||||||||||||||
France | 1.4 | — | 2.5 | — | — | 0.1 | 4.0 | |||||||||||||||||||||
Germany | 0.1 | — | 2.5 | — | — | 0.2 | 2.8 | |||||||||||||||||||||
Luxembourg | 0.1 | — | 0.3 | — | — | 0.4 | 0.8 | |||||||||||||||||||||
Netherlands | — | — | 0.1 | — | — | 0.6 | 0.7 | |||||||||||||||||||||
Belgium | — | — | 0.2 | — | — | 0.1 | 0.3 | |||||||||||||||||||||
Finland | — | — | 0.1 | — | — | — | 0.1 | |||||||||||||||||||||
All other eurozone, each < £50m(3) | — | — | — | — | — | — | — | |||||||||||||||||||||
|
|
|
|
|
|
|
|
|
|
|
|
|
| |||||||||||||||
| 2.1 | — | 5.8 | — | — | 1.7 | 9.6 | ||||||||||||||||||||||
|
|
|
|
|
|
|
|
|
|
|
|
|
| |||||||||||||||
All other countries: | ||||||||||||||||||||||||||||
UK | 5.5 | — | 11.2 | 16.8 | — | 20.0 | 53.5 | |||||||||||||||||||||
US | 9.4 | 0.1 | 11.1 | 1.9 | — | 0.2 | 22.7 | |||||||||||||||||||||
Japan | 2.3 | — | 0.3 | — | — | — | 2.6 | |||||||||||||||||||||
Switzerland | 0.6 | — | 1.2 | 0.4 | — | 0.1 | 2.3 | |||||||||||||||||||||
Denmark | 1.8 | — | 0.3 | — | — | — | 2.1 | |||||||||||||||||||||
Norway | — | — | 0.3 | — | — | 0.1 | 0.4 | |||||||||||||||||||||
Canada | — | — | 0.3 | — | — | — | 0.3 | |||||||||||||||||||||
Australia | — | — | 0.1 | — | — | 0.2 | 0.3 | |||||||||||||||||||||
Lichtenstein | — | — | — | — | — | 0.1 | 0.1 | |||||||||||||||||||||
All others, each < £50m | — | — | — | — | — | 0.5 | 0.5 | |||||||||||||||||||||
|
|
|
|
|
|
|
|
|
|
|
|
|
| |||||||||||||||
| 19.6 | 0.1 | 24.8 | 19.1 | — | 21.2 | 84.8 | ||||||||||||||||||||||
|
|
|
|
|
|
|
|
|
|
|
|
|
| |||||||||||||||
| (1) | Credit exposures exclude the macro hedge of interest rate risk, intangible assets, property, plant and equipment, current and deferred tax assets, and other assets. Loans and advances to customers are included gross of loan loss allowances. |
| (2) | Excludes balances with central banks. |
| (3) | Includes Greece of £nil and Cyprus of £nil. |
Abbey National Treasury Services plc 2013 Half Yearly Financial Report | 39 |
Table of Contents
Business Review
Risk Management Reportcontinued
31 December 2012 | Central and local governments £bn | Government guaranteed £bn | Banks(2) £bn | Other financial institutions £bn | Retail £bn | Corporate £bn | Total(1) £bn | |||||||||||||||||||||
Eurozone: | ||||||||||||||||||||||||||||
Peripheral eurozone countries: | ||||||||||||||||||||||||||||
Portugal | — | — | — | — | — | 0.1 | 0.1 | |||||||||||||||||||||
Ireland | — | — | — | — | — | 0.1 | 0.1 | |||||||||||||||||||||
Italy | — | — | 0.1 | — | — | — | 0.1 | |||||||||||||||||||||
Spain (excluding Santander) | — | — | — | — | — | 0.1 | 0.1 | |||||||||||||||||||||
Other eurozone countries: | ||||||||||||||||||||||||||||
Germany | 1.3 | — | 3.5 | — | — | 0.2 | 5.0 | |||||||||||||||||||||
France | — | — | 2.1 | — | — | 0.1 | 2.2 | |||||||||||||||||||||
Netherlands | — | — | 0.2 | 0.1 | — | 0.5 | 0.8 | |||||||||||||||||||||
Luxembourg | — | — | — | 0.1 | — | 0.5 | 0.6 | |||||||||||||||||||||
Belgium | — | — | 0.4 | — | — | — | 0.4 | |||||||||||||||||||||
All other eurozone, each < £50m(3) | — | — | — | — | — | — | — | |||||||||||||||||||||
|
|
|
|
|
|
|
|
|
|
|
|
|
| |||||||||||||||
| 1.3 | — | 6.3 | 0.2 | — | 1.6 | 9.4 | ||||||||||||||||||||||
|
|
|
|
|
|
|
|
|
|
|
|
|
| |||||||||||||||
All other countries: | ||||||||||||||||||||||||||||
UK | 5.7 | 0.4 | 12.4 | 11.7 | — | 17.5 | 47.7 | |||||||||||||||||||||
US | 0.8 | — | 15.1 | — | — | 0.1 | 16.0 | |||||||||||||||||||||
Switzerland | 0.5 | — | 1.6 | 0.5 | — | 0.2 | 2.8 | |||||||||||||||||||||
Denmark | — | — | 2.3 | — | — | — | 2.3 | |||||||||||||||||||||
Japan | 1.2 | — | 0.2 | — | — | 0.2 | 1.6 | |||||||||||||||||||||
Canada | — | — | 0.3 | — | — | — | 0.3 | |||||||||||||||||||||
Australia | — | — | 0.1 | — | — | 0.1 | 0.2 | |||||||||||||||||||||
Norway | — | — | 0.1 | — | — | 0.1 | 0.2 | |||||||||||||||||||||
Lichtenstein | — | — | — | — | — | 0.1 | 0.1 | |||||||||||||||||||||
All others, each < £50m | — | — | 0.1 | — | — | 0.4 | 0.5 | |||||||||||||||||||||
|
|
|
|
|
|
|
|
|
|
|
|
|
| |||||||||||||||
| 8.2 | 0.4 | 32.2 | 12.2 | — | 18.7 | 71.7 | ||||||||||||||||||||||
|
|
|
|
|
|
|
|
|
|
|
|
|
| |||||||||||||||
| (1) | Credit exposures exclude the macro hedge of interest rate risk, intangible assets, property, plant and equipment, current and deferred tax assets, and other assets. Loans and advances to customers are included gross of loan loss allowances. |
| (2) | Excludes balances with central banks. |
| (3) | Includes Greece of £3m and Cyprus of £nil. |
30 June 2013 compared to 31 December 2012
Key changes in sovereign and other country risk exposures during the six months ended 30 June 2013 were as follows:
| • | An increase of £5.8bn in exposure to the UK to £53.5bn. This was due to increased securities purchased under resale activity. |
| • | An increase of £6.7bn in exposure to the US to £22.7bn. This was primarily due to increased deposits at the US Federal Reserve as part of liquid asset portfolio management activity. This was partially offset by decreased securities purchased under resale activity. |
| • | An increase of £1.8bn in exposure to France to £4.0bn. This was primarily due to new holdings of government securities as part of the Santander UK group’s liquidity position. |
| • | A decrease of £0.5bn in exposure to Switzerland to £2.3bn. This was primarily due to reduced holdings of government securities as alternative securities were held. |
| • | A decrease of £2.2bn in exposure to Germany to £2.8bn. This was primarily due to reduced holdings of government securities as alternative securities were held. |
| • | An increase of £1.0bn in exposure to Japan to £2.6bn. This was primarily due to new holdings of government securities as part of the Santander UK group’s liquidity position. |
| • | An increase of £0.6bn in exposures to Italy to £0.7bn. This principally reflected the purchase of Italian Government bonds with less than one year maturity as part of short-term markets trading activity. |
| • | Movements in remaining country risk exposures were minimal and exposures to these countries remained at low levels. |
40 | Abbey National Treasury Services plc 2013 Half Yearly Financial Report |
Table of Contents
Business Review
Risk Management Reportcontinued
Further analysis of sovereign debt and other country risk exposures, including peripheral eurozone exposures
Presented below separately for sovereign debt and other country risk exposures is additional analysis of exposures into those that are accounted for on-balance sheet (further analysed into those measured at amortised cost and those measured at fair value) and those that are off-balance sheet.
The assets held at amortised cost are principally classified as loans to banks, loans to customers and loans and receivables securities. The ANTS group has no held-to-maturity securities.
The assets held at fair value are classified as either trading assets or have been designated as held at fair value through profit or loss, with the exception of government debt securities held for liquidity purposes, which are classified as available-for-sale securities.
The ANTS group has made no reclassifications to/from the assets which are held at fair value from/to any other category.
Sovereign debt
| 30 June 2013 | Assets held at Amortised Cost | Assets held at Fair Value | ||||||||||||||||||||||||||||||||||
| Central and local governments £bn | Government guaranteed £bn | Total at amortised cost £bn | Central and local governments(1) £bn | Government guaranteed £bn | Total at fair value £bn | Total Balance Sheet Asset £bn | Commitments and undrawn facilities £bn | Total(1) £bn | ||||||||||||||||||||||||||||
Eurozone countries: | ||||||||||||||||||||||||||||||||||||
France | — | — | — | 1.4 | — | 1.4 | 1.4 | — | 1.4 | |||||||||||||||||||||||||||
Italy | — | — | — | 0.5 | — | 0.5 | 0.5 | — | 0.5 | |||||||||||||||||||||||||||
Germany | — | — | — | 0.1 | — | 0.1 | 0.1 | — | 0.1 | |||||||||||||||||||||||||||
Luxembourg | — | — | — | 0.1 | — | 0.1 | 0.1 | — | 0.1 | |||||||||||||||||||||||||||
|
|
|
|
|
|
|
|
|
|
|
|
|
|
|
|
|
| |||||||||||||||||||
| — | — | — | 2.1 | — | 2.1 | 2.1 | — | 2.1 | ||||||||||||||||||||||||||||
|
|
|
|
|
|
|
|
|
|
|
|
|
|
|
|
|
| |||||||||||||||||||
All other countries: | ||||||||||||||||||||||||||||||||||||
US | 9.2 | — | 9.2 | 0.2 | 0.1 | 0.3 | 9.5 | — | 9.5 | |||||||||||||||||||||||||||
UK | — | — | — | 5.5 | — | 5.5 | 5.5 | — | 5.5 | |||||||||||||||||||||||||||
Japan | — | — | — | 2.3 | — | 2.3 | 2.3 | — | 2.3 | |||||||||||||||||||||||||||
Denmark | — | — | — | 1.8 | — | 1.8 | 1.8 | — | 1.8 | |||||||||||||||||||||||||||
Switzerland | — | — | — | 0.6 | — | 0.6 | 0.6 | — | 0.6 | |||||||||||||||||||||||||||
|
|
|
|
|
|
|
|
|
|
|
|
|
|
|
|
|
| |||||||||||||||||||
| 9.2 | — | 9.2 | 10.4 | 0.1 | 10.5 | 19.7 | — | 19.7 | ||||||||||||||||||||||||||||
|
|
|
|
|
|
|
|
|
|
|
|
|
|
|
|
|
| |||||||||||||||||||
| (1) | There are no sovereign debt commitments and undrawn facilities. |
| (2) | There are no impairment losses against sovereign debt at amortised cost. |
| 31 December 2012 | Assets held at Amortised Cost | Assets held at Fair Value | ||||||||||||||||||||||||||||||||||
| Central and local governments £bn | Government guaranteed £bn | Total at amortised cost £bn | Central and local governments(1) £bn | Government guaranteed £bn | Total at fair value £bn | Total Balance Sheet Asset £bn | Commitments and undrawn facilities £bn | Total(1) £bn | ||||||||||||||||||||||||||||
Eurozone countries: |
| |||||||||||||||||||||||||||||||||||
Germany | — | — | — | 1.3 | — | 1.3 | 1.3 | — | 1.3 | |||||||||||||||||||||||||||
|
|
|
|
|
|
|
|
|
|
|
|
|
|
|
|
|
| |||||||||||||||||||
| — | — | — | 1.3 | — | 1.3 | 1.3 | — | 1.3 | ||||||||||||||||||||||||||||
|
|
|
|
|
|
|
|
|
|
|
|
|
|
|
|
|
| |||||||||||||||||||
All other countries: |
| |||||||||||||||||||||||||||||||||||
UK | 0.1 | — | 0.1 | 5.6 | 0.4 | 6.0 | 6.1 | — | 6.1 | |||||||||||||||||||||||||||
Japan | — | — | — | 1.2 | — | 1.2 | 1.2 | — | 1.2 | |||||||||||||||||||||||||||
US | 0.4 | — | 0.4 | 0.4 | — | 0.4 | 0.8 | — | 0.8 | |||||||||||||||||||||||||||
Switzerland | — | — | — | 0.5 | — | 0.5 | 0.5 | — | 0.5 | |||||||||||||||||||||||||||
|
|
|
|
|
|
|
|
|
|
|
|
|
|
|
|
|
| |||||||||||||||||||
| 0.5 | — | 0.5 | 7.7 | 0.4 | 8.1 | 8.6 | — | 8.6 | ||||||||||||||||||||||||||||
|
|
|
|
|
|
|
|
|
|
|
|
|
|
|
|
|
| |||||||||||||||||||
| (1) | There are no sovereign debt commitments and undrawn facilities. |
| (2) | There are no impairment losses against sovereign debt at amortised cost. |
The ANTS group has no direct sovereign exposures to any other countries. The ANTS group has not recognised any impairment losses against sovereign debt which is held at amortised cost, as this sovereign debt was all issued by the UK Government and US Government. The ANTS group has no exposures to credit default swaps (either written or purchased) which are directly referenced to sovereign debt or other instruments that are directly referenced to sovereign debt.
Abbey National Treasury Services plc 2013 Half Yearly Financial Report | 41 |
Table of Contents
Business Review
Risk Management Reportcontinued
Other country risk exposures(1)
| 30 June 2013 | Assets held at Amortised Cost | Assets held at Fair Value(2) | ||||||||||||||||||||||||||||||||||||||||||||||||||
| Banks £bn | Other financial institutions £bn | Retail £bn | Corporate £bn | Total £bn | Banks £bn | Other financial institutions £bn | Retail £bn | Corporate £bn | Total £bn | Total Balance Sheet Asset £bn | Commitments and undrawn facilities(3) £bn | Total £bn | ||||||||||||||||||||||||||||||||||||||||
Eurozone: | ||||||||||||||||||||||||||||||||||||||||||||||||||||
Peripheral eurozone countries: | ||||||||||||||||||||||||||||||||||||||||||||||||||||
Ireland | — | — | — | — | — | — | — | — | — | — | — | 0.1 | 0.1 | |||||||||||||||||||||||||||||||||||||||
Italy | — | — | — | 0.1 | 0.1 | 0.1 | — | — | — | 0.1 | 0.2 | — | 0.2 | |||||||||||||||||||||||||||||||||||||||
Portugal | — | — | — | 0.1 | 0.1 | — | — | — | — | — | 0.1 | — | 0.1 | |||||||||||||||||||||||||||||||||||||||
Other eurozone countries: | ||||||||||||||||||||||||||||||||||||||||||||||||||||
Germany | — | — | — | 0.1 | 0.1 | 2.5 | — | — | 0.1 | 2.6 | 2.7 | — | 2.7 | |||||||||||||||||||||||||||||||||||||||
France | — | — | — | — | — | 2.5 | — | — | 0.1 | 2.6 | 2.6 | — | 2.6 | |||||||||||||||||||||||||||||||||||||||
Netherlands | — | — | — | — | — | 0.1 | — | — | — | 0.1 | 0.1 | 0.6 | 0.7 | |||||||||||||||||||||||||||||||||||||||
Luxembourg | — | — | — | 0.3 | 0.3 | 0.3 | — | — | — | 0.3 | 0.6 | 0.1 | 0.7 | |||||||||||||||||||||||||||||||||||||||
Belgium | — | — | — | — | — | 0.2 | — | — | — | 0.2 | 0.2 | 0.1 | 0.3 | |||||||||||||||||||||||||||||||||||||||
Finland | — | — | — | — | — | 0.1 | — | — | — | 0.1 | 0.1 | — | 0.1 | |||||||||||||||||||||||||||||||||||||||
Other<£50m | — | — | — | — | — | — | — | — | — | — | — | — | — | |||||||||||||||||||||||||||||||||||||||
|
|
|
|
|
|
|
|
|
|
|
|
|
|
|
|
|
|
|
|
|
|
|
|
|
| |||||||||||||||||||||||||||
| — | — | — | 0.6 | 0.6 | 5.8 | — | — | 0.2 | 6.0 | 6.6 | 0.9 | 7.5 | ||||||||||||||||||||||||||||||||||||||||
|
|
|
|
|
|
|
|
|
|
|
|
|
|
|
|
|
|
|
|
|
|
|
|
|
| |||||||||||||||||||||||||||
All other countries: | ||||||||||||||||||||||||||||||||||||||||||||||||||||
UK | 0.2 | 5.5 | — | 6.7 | 12.4 | 11.1 | 11.3 | — | 4.5 | 26.9 | 39.3 | 8.8 | 48.1 | |||||||||||||||||||||||||||||||||||||||
US | 0.9 | 0.2 | — | 0.1 | 1.2 | 10.1 | 1.7 | — | — | 11.8 | 13.0 | 0.1 | 13.1 | |||||||||||||||||||||||||||||||||||||||
Switzerland | — | — | — | 0.1 | 0.1 | 1.2 | 0.4 | — | — | 1.6 | 1.7 | — | 1.7 | |||||||||||||||||||||||||||||||||||||||
Denmark | — | — | — | — | — | 0.3 | — | — | — | 0.3 | 0.3 | — | 0.3 | |||||||||||||||||||||||||||||||||||||||
Japan | — | — | — | — | — | 0.3 | — | — | — | 0.3 | 0.3 | — | 0.3 | |||||||||||||||||||||||||||||||||||||||
Australia | — | — | — | 0.1 | 0.1 | 0.1 | — | — | — | 0.1 | 0.2 | 0.1 | 0.3 | |||||||||||||||||||||||||||||||||||||||
Canada | — | — | — | — | — | 0.3 | — | — | — | 0.3 | 0.3 | — | 0.3 | |||||||||||||||||||||||||||||||||||||||
Lichtenstein | — | — | — | 0.1 | 0.1 | — | — | — | — | — | 0.1 | — | 0.1 | |||||||||||||||||||||||||||||||||||||||
Norway | — | — | — | — | — | 0.3 | — | — | — | 0.3 | 0.3 | 0.1 | 0.4 | |||||||||||||||||||||||||||||||||||||||
Other<£50m | — | — | — | 0.2 | 0.2 | — | — | — | 0.1 | 0.1 | 0.3 | 0.2 | 0.5 | |||||||||||||||||||||||||||||||||||||||
|
|
|
|
|
|
|
|
|
|
|
|
|
|
|
|
|
|
|
|
|
|
|
|
|
| |||||||||||||||||||||||||||
| 1.1 | 5.7 | — | 7.3 | 14.1 | 23.7 | 13.4 | — | 4.6 | 41.7 | 55.8 | 9.3 | 65.1 | ||||||||||||||||||||||||||||||||||||||||
|
|
|
|
|
|
|
|
|
|
|
|
|
|
|
|
|
|
|
|
|
|
|
|
|
| |||||||||||||||||||||||||||
| (1) | Excluding other Banco Santander group companies. |
| (2) | The assets held at fair value were classified as either trading assets or designated as held at fair value through profit or loss. The ANTS group did not hold any significant available-for-sale securities, with the exception of government debt held for liquidity purposes, as described on the previous page. |
| (3) | Comprises £10.2bn classified as Corporate Banking. |
31 December 2012 | Assets held at Amortised Cost | Assets held at Fair Value(2) | ||||||||||||||||||||||||||||||||||||||||||||||||||
| Banks £bn | Other financial institutions £bn | Retail £bn | Corporate £bn | Total £bn | Banks £bn | Other financial institutions £bn | Retail £bn | Corporate £bn | Total £bn | Total Balance Sheet Asset £bn | Commitments and undrawn facilities(3) £bn | Total £bn | ||||||||||||||||||||||||||||||||||||||||
Eurozone: | ||||||||||||||||||||||||||||||||||||||||||||||||||||
Peripheral eurozone countries: | ||||||||||||||||||||||||||||||||||||||||||||||||||||
Spain | — | — | — | 0.1 | 0.1 | — | — | — | — | — | 0.1 | — | 0.1 | |||||||||||||||||||||||||||||||||||||||
Ireland | — | — | — | — | — | — | — | — | — | — | — | 0.1 | 0.1 | |||||||||||||||||||||||||||||||||||||||
Italy | — | — | — | — | — | 0.1 | — | — | — | 0.1 | 0.1 | — | 0.1 | |||||||||||||||||||||||||||||||||||||||
Portugal | — | — | — | 0.1 | 0.1 | — | — | — | — | — | 0.1 | — | 0.1 | |||||||||||||||||||||||||||||||||||||||
Other eurozone countries: | ||||||||||||||||||||||||||||||||||||||||||||||||||||
Germany | — | — | — | 0.2 | 0.2 | 3.5 | — | — | — | 3.5 | 3.7 | — | 3.7 | |||||||||||||||||||||||||||||||||||||||
France | — | — | — | — | — | 2.1 | — | — | 0.1 | 2.2 | 2.2 | — | 2.2 | |||||||||||||||||||||||||||||||||||||||
Netherlands | — | 0.1 | — | — | 0.1 | 0.2 | — | — | — | 0.2 | 0.3 | 0.5 | 0.8 | |||||||||||||||||||||||||||||||||||||||
Luxembourg | — | 0.1 | — | 0.4 | 0.5 | — | — | — | — | — | 0.5 | 0.1 | 0.6 | |||||||||||||||||||||||||||||||||||||||
Belgium | — | — | — | — | — | 0.4 | — | — | — | 0.4 | 0.4 | — | 0.4 | |||||||||||||||||||||||||||||||||||||||
Other<£50m | — | — | — | — | — | — | — | — | — | — | — | — | — | |||||||||||||||||||||||||||||||||||||||
|
|
|
|
|
|
|
|
|
|
|
|
|
|
|
|
|
|
|
|
|
|
|
|
|
| |||||||||||||||||||||||||||
| — | 0.2 | — | 0.8 | 1.0 | 6.3 | — | — | 0.1 | 6.4 | 7.4 | 0.7 | 8.1 | ||||||||||||||||||||||||||||||||||||||||
|
|
|
|
|
|
|
|
|
|
|
|
|
|
|
|
|
|
|
|
|
|
|
|
|
| |||||||||||||||||||||||||||
All other countries: | ||||||||||||||||||||||||||||||||||||||||||||||||||||
UK | — | 4.7 | — | 6.4 | 11.1 | 12.1 | 7.0 | — | 3.0 | 22.1 | 33.2 | 8.4 | 41.6 | |||||||||||||||||||||||||||||||||||||||
US | 1.3 | — | — | — | 1.3 | 13.8 | — | — | 0.1 | 13.9 | 15.2 | — | 15.2 | |||||||||||||||||||||||||||||||||||||||
Switzerland | — | — | — | 0.1 | 0.1 | 1.6 | 0.5 | — | — | 2.1 | 2.2 | 0.1 | 2.3 | |||||||||||||||||||||||||||||||||||||||
Denmark | — | — | — | — | — | 2.3 | — | — | — | 2.3 | 2.3 | — | 2.3 | |||||||||||||||||||||||||||||||||||||||
Japan | — | — | — | — | — | 0.2 | — | — | 0.2 | 0.4 | 0.4 | — | 0.4 | |||||||||||||||||||||||||||||||||||||||
Australia | — | — | — | — | — | 0.1 | — | — | — | 0.1 | 0.1 | 0.1 | 0.2 | |||||||||||||||||||||||||||||||||||||||
Canada | — | — | — | — | — | 0.3 | — | — | — | 0.3 | 0.3 | — | 0.3 | |||||||||||||||||||||||||||||||||||||||
Lichtenstein | — | — | — | 0.1 | 0.1 | — | — | — | — | — | 0.1 | — | 0.1 | |||||||||||||||||||||||||||||||||||||||
Norway | — | — | — | — | — | 0.1 | — | — | — | 0.1 | 0.1 | 0.1 | 0.2 | |||||||||||||||||||||||||||||||||||||||
Other<£50m | — | — | — | 0.3 | 0.3 | — | — | — | — | — | 0.3 | 0.2 | 0.5 | |||||||||||||||||||||||||||||||||||||||
|
|
|
|
|
|
|
|
|
|
|
|
|
|
|
|
|
|
|
|
|
|
|
|
|
| |||||||||||||||||||||||||||
| 1.3 | 4.7 | — | 6.9 | 12.9 | 30.5 | 7.5 | — | 3.3 | 41.3 | 54.2 | 8.9 | 63.1 | ||||||||||||||||||||||||||||||||||||||||
|
|
|
|
|
|
|
|
|
|
|
|
|
|
|
|
|
|
|
|
|
|
|
|
|
| |||||||||||||||||||||||||||
| (1) | Excluding other Banco Santander group companies. |
| (2) | The assets held at fair value were classified as either trading assets or designated as held at fair value through profit or loss. The ANTS group did not hold any significant available-for-sale securities, with the exception of government debt held for liquidity purposes, as described on the previous page. |
| (3) | Comprises £9.6bn classified as Corporate Banking. |
Commitments and undrawn facilities principally consist of formal standby facilities and credit lines in the ANTS group’s Corporate Banking operations. A summary of the key terms and a maturity analysis of formal standby facilities, credit lines and other commitments are set out in Note 35 to the 2012 Annual Report.
42 | Abbey National Treasury Services plc 2013 Half Yearly Financial Report |
Table of Contents
Business Review
Risk Management Reportcontinued
Peripheral eurozone countries
The tables below further analyse the ANTS group’s direct exposure to peripheral eurozone countries at 30 June 2013 and 31 December 2012 by type of financial instrument.The tables below exclude balances with other Santander UK group companies and other Banco Santander group companies, which are presented separately on pages 45 to 47. This section also discusses our indirect exposures to peripheral eurozone countries
Direct and indirect risk exposures via large multinational companies and financial institutions are monitored on a regular basis by the Wholesale Credit Risk Department as part of the overall risk management process. Indirect exposures via other corporates are monitored on a regular basis by the Corporate Credit Risk Department.
The Large Corporates portfolio is mainly comprised of multinational UK companies which are considered to be geographically well diversified in terms of their assets, operations and profits. This enables them to mitigate any country risk concentration that they may have in peripheral eurozone countries. In addition, the risk is further mitigated by the fact that credit agreements are underpinned by both financial and non-financial covenants.
The risk arising from indirect exposures from our transactions with financial institutions is mitigated by the short-term tenor of the transactions, and by the fact that many such transactions contain margin calls and/or collateral requirements, and are subject to standard ISDA Master Agreements permitting offsetting.
The risk arising from indirect exposures from our transactions with other corporates is mitigated by standard financial and non-financial guarantees and the fact that the companies are geographically well diversified in terms of their assets, operations and profits.
Direct exposures to peripheral eurozone countries
(i) Italy
30 June 2013 | Central and local governments £bn | Banks £bn | Other financial institutions £bn | Retail £bn | Corporate £bn | Total £bn | ||||||||||||||||||
Trading assets | 0.5 | — | — | — | — | 0.5 | ||||||||||||||||||
Derivatives | ||||||||||||||||||||||||
- Derivative assets | — | 0.1 | — | — | — | 0.1 | ||||||||||||||||||
- Derivative liabilities | — | (0.1 | ) | — | — | — | (0.1 | ) | ||||||||||||||||
|
|
|
|
|
|
|
|
|
|
|
| |||||||||||||
Net derivatives position | — | — | — | — | — | — | ||||||||||||||||||
|
|
|
|
|
|
|
|
|
|
|
| |||||||||||||
Loans and advances to customers | — | — | — | — | 0.1 | 0.1 | ||||||||||||||||||
|
|
|
|
|
|
|
|
|
|
|
| |||||||||||||
Total | 0.5 | — | — | — | 0.1 | 0.6 | ||||||||||||||||||
|
|
|
|
|
|
|
|
|
|
|
| |||||||||||||
31 December 2012 | Central and local governments £bn | Banks £bn | Other financial institutions £bn | Retail £bn | Corporate £bn | Total £bn | ||||||||||||||||||
Derivatives | ||||||||||||||||||||||||
- Derivative assets | — | 0.1 | — | — | — | 0.1 | ||||||||||||||||||
- Derivative liabilities | — | (0.1 | ) | — | — | — | (0.1 | ) | ||||||||||||||||
|
|
|
|
|
|
|
|
|
|
|
| |||||||||||||
Net derivatives position | — | — | — | — | — | — | ||||||||||||||||||
|
|
|
|
|
|
|
|
|
|
|
| |||||||||||||
Total | — | — | — | — | — | — | ||||||||||||||||||
|
|
|
|
|
|
|
|
|
|
|
| |||||||||||||
(ii) Portugal
30 June 2013 | Banks £bn | Other financial institutions £bn | Retail £bn | Corporate £bn | Total £bn | |||||||||||||||
Loans and advances to customers | — | — | — | 0.1 | 0.1 | |||||||||||||||
|
|
|
|
|
|
|
|
|
| |||||||||||
31 December 2012 | Banks £bn | Other financial institutions £bn | Retail £bn | Corporate £bn | Total £bn | |||||||||||||||
Loans and advances to customers | — | — | — | 0.1 | 0.1 | |||||||||||||||
|
|
|
|
|
|
|
|
|
| |||||||||||
Abbey National Treasury Services plc 2013 Half Yearly Financial Report | 43 |
Table of Contents
Business Review
Risk Management Reportcontinued
(iii) Ireland
30 June 2013 | Banks £bn | Other financial institutions £bn | Retail £bn | Corporate £bn | Total £bn | |||||||||||||||
Commitment and undrawn facilities | — | — | — | 0.1 | 0.1 | |||||||||||||||
31 December 2012 | Banks £bn | Other financial institutions £bn | Retail £bn | Corporate £bn | Total £bn | |||||||||||||||
Commitment and undrawn facilities | — | — | — | 0.1 | 0.1 | |||||||||||||||
(iv) Spain
At 30 June 2013, the ANTS group had no balances with Spain.
31 December 2012 | Banks £bn | Other financial institutions £bn | Retail £bn | Corporate £bn | Total £bn | |||||||||||||||
Loans and advances to customers | — | — | — | 0.1 | 0.1 | |||||||||||||||
Indirect exposures to peripheral eurozone countries
Indirect exposures to peripheral eurozone countries are considered to exist where our direct counterparties outside the peripheral eurozone countries themselves have a direct exposure to one or more peripheral eurozone countries.
Indirect exposures are identified as part of our ongoing credit analysis and monitoring of our counterparty base by the review of available financial information to determine the countries where the material parts of a counterparty’s assets, operations or profits arise.
Our indirect exposures to peripheral eurozone countries consist of:
| • | A small number of corporate loans to large multinational companies based in the UK that derive a proportion of their profits from one or more peripheral eurozone countries. |
| • | Trading transactions and hedging transactions with financial institutions based in the UK and Europe that derive a proportion of their profits from or have a proportion of their assets in one or more peripheral eurozone countries. |
| • | A small number of loans to other corporate entities which have either a proportion of their operations within, or profits from, one or more peripheral eurozone countries. |
44 | Abbey National Treasury Services plc 2013 Half Yearly Financial Report |
Table of Contents
Business Review
Risk Management Reportcontinued
Balances with other Santander UK group companies
The ANTS group enters into transactions with other Santander UK group companies in the ordinary course of business. ANTS provides treasury, corporate and wholesale banking services to the wider Santander UK group, of which ANTS is a part. ANTS is also the treasury support function for the Santander UK group. In this regard, ANTS’s role is to provide access to financial markets and central bank facilities in order to meet the Santander UK group’s liquidity, funding, capital and balance sheet management requirements. As such, ANTS is one of the main debt issuance vehicles in the Santander UK group.
At 30 June 2013 and 31 December 2012, the ANTS group had gross balances (without taking account of netting, collateral or any other credit risk mitigants) with other Santander UK group companies as follows:
30 June 2013 | Banks £bn | Other financial institutions £bn | Corporate £bn | Total £bn | ||||||||||||
Assets: | ||||||||||||||||
- UK | 107.2 | 27.6 | — | 134.8 | ||||||||||||
- Other < £50m | — | — | — | — | ||||||||||||
|
|
|
|
|
|
|
| |||||||||
| 107.2 | 27.6 | — | 134.8 | |||||||||||||
|
|
|
|
|
|
|
| |||||||||
Liabilities: | ||||||||||||||||
- UK | (112.1 | ) | (3.3 | ) | — | (115.4 | ) | |||||||||
- Jersey | (3.4 | ) | — | — | (3.4 | ) | ||||||||||
- Other < £50m | — | — | — | — | ||||||||||||
|
|
|
|
|
|
|
| |||||||||
| (115.5 | ) | (3.3 | ) | — | (118.8 | ) | ||||||||||
|
|
|
|
|
|
|
| |||||||||
31 December 2012 | Banks £bn | Other financial institutions £bn | Corporate £bn | Total £bn | ||||||||||||
Assets: | ||||||||||||||||
- UK | 105.4 | 32.6 | — | 138.0 | ||||||||||||
- Other < £50m | — | — | — | — | ||||||||||||
|
|
|
|
|
|
|
| |||||||||
| 105.4 | 32.6 | — | 138.0 | |||||||||||||
|
|
|
|
|
|
|
| |||||||||
Liabilities: | ||||||||||||||||
- UK | (106.6 | ) | (2.9 | ) | — | (109.5 | ) | |||||||||
- Jersey | (3.9 | ) | — | — | (3.9 | ) | ||||||||||
- Isle of Man | (2.9 | ) | — | — | (2.9 | ) | ||||||||||
- Other < £50m | (0.1 | ) | — | — | (0.1 | ) | ||||||||||
|
|
|
|
|
|
|
| |||||||||
| (113.5 | ) | (2.9 | ) | — | (116.4 | ) | ||||||||||
|
|
|
|
|
|
|
| |||||||||
The above balances with other Santander UK group companies at 30 June 2013 principally arose from ANTS’s role as treasury support function for the Santander UK group.
The above activities are conducted in a manner that appropriately manages the credit risk arising against such other Santander UK group companies within limits acceptable to the PRA. The tables below further analyse the balances with other Santander UK group companies at 30 June 2013 and 31 December 2012 by type of financial instrument and country of the counterparty, including the additional mitigating impact of collateral arrangements (which are not included in the summary tables above, as they are accounted for off-balance sheet) and the resulting net credit exposures:
(i) UK
30 June 2013 | Banks £bn | Other financial institutions £bn | Corporate £bn | Total £bn | ||||||||||||
Loans and advances | 106.8 | 27.6 | — | 134.4 | ||||||||||||
|
|
|
|
|
|
|
| |||||||||
Repurchase agreements | ||||||||||||||||
- Asset balance - reverse repo | 0.4 | — | — | 0.4 | ||||||||||||
- Liability balance - repo | (1.0 | ) | — | — | (1.0 | ) | ||||||||||
|
|
|
|
|
|
|
| |||||||||
Net repurchase agreement position | (0.6 | ) | — | — | (0.6 | ) | ||||||||||
|
|
|
|
|
|
|
| |||||||||
Derivatives | ||||||||||||||||
- Derivative liabilities | (2.9 | ) | (1.5 | ) | — | (4.4 | ) | |||||||||
|
|
|
|
|
|
|
| |||||||||
Net derivatives position | (2.9 | ) | (1.5 | ) | — | (4.4 | ) | |||||||||
|
|
|
|
|
|
|
| |||||||||
Total assets, after the impact of collateral | 103.3 | 26.1 | — | 129.4 | ||||||||||||
|
|
|
|
|
|
|
| |||||||||
Deposits by customers | — | (1.8 | ) | — | (1.8 | ) | ||||||||||
Deposits by banks | (108.2 | ) | — | — | (108.2 | ) | ||||||||||
|
|
|
|
|
|
|
| |||||||||
Total liabilities | (108.2 | ) | (1.8 | ) | — | (110.0 | ) | |||||||||
|
|
|
|
|
|
|
| |||||||||
|
|
|
|
|
|
|
| |||||||||
Net balance | (4.9 | ) | 24.3 | — | 19.4 | |||||||||||
|
|
|
|
|
|
|
| |||||||||
Abbey National Treasury Services plc 2013 Half Yearly Financial Report | 45 |
Table of Contents
Business Review
Risk Management Reportcontinued
31 December 2012 | Banks £bn | Other financial institutions £bn | Corporate £bn | Total £bn | ||||||||||||
Loans and advances | 104.8 | 32.6 | — | 137.4 | ||||||||||||
|
|
|
|
|
|
|
| |||||||||
Repurchase agreements | ||||||||||||||||
- Asset balance - reverse repo | 0.6 | — | — | 0.6 | ||||||||||||
- Liability balance - repo | (1.0 | ) | — | — | (1.0 | ) | ||||||||||
|
|
|
|
|
|
|
| |||||||||
Net repurchase agreement position | (0.4 | ) | — | — | (0.4 | ) | ||||||||||
|
|
|
|
|
|
|
| |||||||||
Derivatives | ||||||||||||||||
- Derivative liabilities | (4.2 | ) | (1.2 | ) | — | (5.4 | ) | |||||||||
|
|
|
|
|
|
|
| |||||||||
Net derivatives position | (4.2 | ) | (1.2 | ) | — | (5.4 | ) | |||||||||
|
|
|
|
|
|
|
| |||||||||
Total assets, after the impact of collateral | 100.2 | 31.4 | — | 131.6 | ||||||||||||
|
|
|
|
|
|
|
| |||||||||
Deposits by customers | — | (1.7 | ) | — | (1.7 | ) | ||||||||||
Deposits by banks | (101.4 | ) | — | — | (101.4 | ) | ||||||||||
|
|
|
|
|
|
|
| |||||||||
Total liabilities | (101.4 | ) | (1.7 | ) | — | (103.1 | ) | |||||||||
|
|
|
|
|
|
|
| |||||||||
Net balance | (1.2 | ) | 29.7 | — | 28.5 | |||||||||||
|
|
|
|
|
|
|
| |||||||||
(ii) Jersey
30 June 2013 | Banks £bn | Other financial institutions £bn | Corporate £bn | Total £bn | ||||||||||||
Deposits by banks | (3.4 | ) | — | — | (3.4 | ) | ||||||||||
|
|
|
|
|
|
|
| |||||||||
31 December 2012 | Banks £bn | Other financial institutions £bn | Corporate £bn | Total £bn | ||||||||||||
Deposits by banks | (3.9 | ) | — | — | (3.9 | ) | ||||||||||
|
|
|
|
|
|
|
| |||||||||
(iii) Isle of Man
At 30 June 2013, the ANTS group had no balances with the Isle of Man.
31 December 2012 | Banks £bn | Other financial institutions £bn | Corporate £bn | Total £bn | ||||||||||||
Deposits by banks | (2.9 | ) | — | — | (2.9 | ) | ||||||||||
|
|
|
|
|
|
|
| |||||||||
46 | Abbey National Treasury Services plc 2013 Half Yearly Financial Report |
Table of Contents
Business Review
Risk Management Reportcontinued
Balances with other Banco Santander group companies outside the Santander UK group
The ANTS group enters into transactions with other Banco Santander group companies outside the Santander UK group in the ordinary course of business. Such transactions are undertaken in areas of business where the ANTS group has a particular advantage or expertise and where Banco Santander group companies can offer commercial opportunities, substantially on the same terms as for comparable transactions with third party counterparties. These transactions also arise in support of the activities of, or with, larger multinational corporate clients and financial institutions which may have relationships with a number of entities in the Banco Santander group.
At 30 June 2013 and 31 December 2012, the ANTS group had gross balances (without taking account of netting, collateral or any other credit risk mitigants) with other Banco Santander group companies as follows:
30 June 2013 | Banks £bn | Other financial institutions £bn | Corporate £bn | Total £bn | ||||||||||||
Assets: | ||||||||||||||||
- Spain | 2.1 | 0.1 | — | 2.2 | ||||||||||||
- Chile | 0.1 | — | — | 0.1 | ||||||||||||
- Other < £ 50m | — | — | — | — | ||||||||||||
|
|
|
|
|
|
|
| |||||||||
| 2.2 | 0.1 | — | 2.3 | |||||||||||||
|
|
|
|
|
|
|
| |||||||||
Liabilities: | ||||||||||||||||
- Spain | (1.9 | ) | (0.1 | ) | — | (2.0 | ) | |||||||||
- Italy | — | (0.7 | ) | — | (0.7 | ) | ||||||||||
- Ireland | — | (0.2 | ) | — | (0.2 | ) | ||||||||||
- Chile | (0.1 | ) | — | — | (0.1 | ) | ||||||||||
- Other < £ 50m | (0.1 | ) | — | — | (0.1 | ) | ||||||||||
|
|
|
|
|
|
|
| |||||||||
| (2.1 | ) | (1.0 | ) | — | (3.1 | ) | ||||||||||
|
|
|
|
|
|
|
| |||||||||
31 December 2012 | Banks £bn | Other financial institutions £bn | Corporate £bn | Total £bn | ||||||||||||
Assets: | ||||||||||||||||
- Spain | 2.5 | — | — | 2.5 | ||||||||||||
- Chile | 0.1 | — | — | 0.1 | ||||||||||||
- Other < £ 50m | — | 0.1 | — | 0.1 | ||||||||||||
|
|
|
|
|
|
|
| |||||||||
| 2.6 | 0.1 | — | 2.7 | |||||||||||||
|
|
|
|
|
|
|
| |||||||||
Liabilities: | ||||||||||||||||
- Spain | (4.3 | ) | (0.1 | ) | — | (4.4 | ) | |||||||||
- Italy | — | (0.6 | ) | — | (0.6 | ) | ||||||||||
- Ireland | — | (0.2 | ) | — | (0.2 | ) | ||||||||||
- Chile | (0.1 | ) | — | — | (0.1 | ) | ||||||||||
- Other < £ 50m | — | — | — | — | ||||||||||||
|
|
|
|
|
|
|
| |||||||||
| (4.4 | ) | (0.9 | ) | — | (5.3 | ) | ||||||||||
|
|
|
|
|
|
|
| |||||||||
The above activities are conducted in a manner that appropriately manages the credit risk arising against such other Banco Santander group companies within limits acceptable to the PRA.
Redenomination risk
ANTS considers the total dissolution of the eurozone to be extremely unlikely and therefore believes widespread redenomination of its euro-denominated assets and liabilities to be highly improbable. However, for contingency planning purposes it has analysed the redenomination risk that might arise from an exit of a member state from the euro or a total dissolution of the euro and how that exit or dissolution would be implemented. It is not possible to predict what the total financial impact on ANTS might be of a eurozone member state exit or the dissolution of the euro. The determination of which assets and liabilities would be legally redenominated is potentially complex and depends on a numbers of factors, including the precise exit scenario, as the consequences on external contracts of a disorderly exit or one sanctioned under EU law may be different. ANTS has already identified and is monitoring these risks and has taken steps to mitigate them and/or reduce ANTS’s overall exposure to losses that might arise in the event of a redenomination, which include reducing ANTS’s exposures and funding mismatches.
As part of its objective of maintaining a diversified funding base, ANTS raises funding in a number of currencies, including euro, and converts these back into sterling, to fund its commercial assets which are largely sterling denominated. ANTS’s net liability position denominated in euro, reflecting assets and liabilities and associated swaps (which primarily comprise cross-currency derivatives entered into to swap funding raised in euro back into sterling for reasons set out above) arising in connection with contracts denominated in euro, amounted to net liabilities of £0.2bn at 30 June 2013 (2012: net assets of £0.1bn). This comprised debt securities (covered bonds) of £20.5bn (2012: £22.7bn) issued by ANTS as part of its medium term funding activities, net loans and advances of £21.1bn (2012: £18.5bn) to other Santander UK group companies (principally representing the on lending of these net funds to other Santander UK group companies), net repo liabilities of £3.9bn (2012: £1.3bn), other deposits of £0.7bn (2012: £0.7bn), other loans and securities of £2.5bn (2012: £2.2bn), and related cross-currency swap assets of £1.3bn (2012: £4.1bn) which swap the resultant euro exposures back into sterling in order to ensure that assets and liabilities are currency matched in sterling. Disclosures of ANTS’s exposure to individual eurozone countries and total exposures to counterparties in those countries, which amounts include any euro-denominated contracts with those counterparties, are set out on pages 39 to 47.
Abbey National Treasury Services plc 2013 Half Yearly Financial Report | 47 |
Table of Contents
Business Review
Risk Management Reportcontinued
The following tables categorise ANTS’s loans and advances at 30 June 2013 and 31 December 2012 into three categories:
| • | neither past due nor impaired; |
| • | past due but not individually impaired; or |
| • | individually impaired. |
For certain homogeneous portfolios of loans and advances, impairment is assessed on a collective basis and each loan is not individually assessed for impairment. Loans in this category are classified as neither past due nor impaired, or past due but not individually impaired, depending upon their arrears status. The impairment loss allowances include allowances against financial assets that have been individually assessed for impairment and those that are subject to collective assessment for impairment.
30 June 2013 | Neither past due nor impaired | Past due but not individually impaired | Individually impaired | Total | Impairment loss allowances | Total carrying value | ||||||||||||||||||
Statutory balance sheet line items | £m | £m | £m | £m | £m | £m | ||||||||||||||||||
Trading assets | ||||||||||||||||||||||||
- Loans and advances to banks | 9,826 | — | — | 9,826 | — | 9,826 | ||||||||||||||||||
- Loans and advances to customers | 11,906 | — | — | 11,906 | — | 11,906 | ||||||||||||||||||
Financial assets designated at fair value through P&L | ||||||||||||||||||||||||
- Loans and advances to customers | 2,239 | — | — | 2,239 | — | 2,239 | ||||||||||||||||||
Loans and advances to banks | ||||||||||||||||||||||||
- Placements with other banks | 1,166 | — | — | 1,166 | — | 1,166 | ||||||||||||||||||
- Amounts due from parent | 234 | — | — | 234 | — | 234 | ||||||||||||||||||
Loans and advances to customers | ||||||||||||||||||||||||
- Corporate loans | 7,215 | — | 764 | 7,979 | (112 | ) | 7,867 | |||||||||||||||||
- Other secured advances | 5,545 | — | — | 5,545 | — | 5,545 | ||||||||||||||||||
- Amounts due from fellow subsidiaries | 27,533 | — | — | 27,533 | — | 27,533 | ||||||||||||||||||
- Amounts due from Banco Santander group undertakings | 18 | — | — | 18 | — | 18 | ||||||||||||||||||
Loans and receivables securities | 165 | — | — | 165 | — | 165 | ||||||||||||||||||
|
|
|
|
|
|
|
|
|
|
|
| |||||||||||||
Total loans and advances | 65,847 | — | 764 | 66,611 | (112 | ) | 66,499 | |||||||||||||||||
|
|
|
|
|
|
|
|
|
|
|
| |||||||||||||
31 December 2012 | Neither past due nor impaired | Past due but not individually impaired | Individually impaired | Total | Impairment loss allowances | Total carrying value | ||||||||||||||||||
Statutory balance sheet line items | £m | £m | £m | £m | £m | £m | ||||||||||||||||||
Trading assets | ||||||||||||||||||||||||
- Loans and advances to banks | 9,988 | — | — | 9,988 | — | 9,988 | ||||||||||||||||||
- Loans and advances to customers | 7,552 | — | — | 7,552 | — | 7,552 | ||||||||||||||||||
Financial assets designated at fair value through P&L | ||||||||||||||||||||||||
- Loans and advances to customers | 3,203 | — | — | 3,203 | — | 3,203 | ||||||||||||||||||
Loans and advances to banks | ||||||||||||||||||||||||
- Placements with other banks | 1,290 | — | — | 1,290 | — | 1,290 | ||||||||||||||||||
- Amounts due from parent | 237 | — | — | 237 | — | 237 | ||||||||||||||||||
Loans and advances to customers | ||||||||||||||||||||||||
- Corporate loans | 6,892 | — | 742 | 7,634 | (112 | ) | 7,522 | |||||||||||||||||
- Other secured advances | 4,855 | — | — | 4,855 | — | 4,855 | ||||||||||||||||||
- Amounts due from fellow subsidiaries | 32,368 | — | — | 32,368 | — | 32,368 | ||||||||||||||||||
- Amounts due from Banco Santander group undertakings | 5 | — | — | 5 | — | 5 | ||||||||||||||||||
Loans and receivables securities | 162 | — | — | 162 | — | 162 | ||||||||||||||||||
|
|
|
|
|
|
|
|
|
|
|
| |||||||||||||
Total loans and advances | 66,552 | — | 742 | 67,294 | (112 | ) | 67,182 | |||||||||||||||||
|
|
|
|
|
|
|
|
|
|
|
| |||||||||||||
31 December 2011 | Neither past due nor impaired | Past due but not individually impaired | Individually impaired | Total | Impairment loss allowances | Total carrying value | ||||||||||||||||||
Statutory balance sheet line items | £m | £m | £m | £m | £m | £m | ||||||||||||||||||
Trading assets | ||||||||||||||||||||||||
- Loans and advances to banks | 6,144 | — | — | 6,144 | — | 6,144 | ||||||||||||||||||
- Loans and advances to customers | 6,687 | — | — | 6,687 | — | 6,687 | ||||||||||||||||||
Financial assets designated at fair value through P&L | ||||||||||||||||||||||||
- Loans and advances to customers | 4,050 | — | — | 4,050 | — | 4,050 | ||||||||||||||||||
Loans and advances to banks | ||||||||||||||||||||||||
- Placements with other banks | 1,136 | — | — | 1,136 | — | 1,136 | ||||||||||||||||||
- Amounts due from parent | 2,082 | — | — | 2,082 | — | 2,082 | ||||||||||||||||||
Loans and advances to customers | ||||||||||||||||||||||||
- Corporate loans | 7,273 | 95 | 260 | 7,628 | (130 | ) | 7,498 | |||||||||||||||||
- Other secured advances | 3,492 | — | — | 3,492 | — | 3,492 | ||||||||||||||||||
- Amounts due from fellow subsidiaries | 27,831 | — | — | 27,831 | — | 27,831 | ||||||||||||||||||
- Amounts due from Banco Santander group undertakings | 5 | — | — | 5 | — | 5 | ||||||||||||||||||
Loans and receivables securities | 278 | — | — | 278 | — | 278 | ||||||||||||||||||
|
|
|
|
|
|
|
|
|
|
|
| |||||||||||||
Total loans and advances | 58,978 | 95 | 260 | 59,333 | (130 | ) | 59,203 | |||||||||||||||||
|
|
|
|
|
|
|
|
|
|
|
| |||||||||||||
Further discussion and analysis of the preceding tables, including cross references to more granular disclosures on a segmental basis elsewhere in the financial statements, including this Risk Management Report, are set out on the following pages.
48 | Abbey National Treasury Services plc 2013 Half Yearly Financial Report |
Table of Contents
Business Review
Risk Management Reportcontinued
Credit quality of loans and advances that are neither past due nor individually impaired
The credit quality of loans and advances that are neither past due nor individually impaired as set out in the table on page 48 is as follows:
30 June 2013 | Good £m | Satisfactory £m | Higher Risk £m | Total £m | ||||||||||||
Trading assets | ||||||||||||||||
- Loans and advances to banks | 9,605 | 163 | 58 | 9,826 | ||||||||||||
- Loans and advances to customers | 11,906 | — | — | 11,906 | ||||||||||||
Financial assets designated at fair value through profit and loss | ||||||||||||||||
- Loans and advances to customers | 2,239 | — | — | 2,239 | ||||||||||||
Loans and advances to banks | ||||||||||||||||
- Placements with other banks | 1,166 | — | — | 1,166 | ||||||||||||
- Amounts due from parent | 234 | — | — | 234 | ||||||||||||
Loans and advances to customers | ||||||||||||||||
- Corporate loans | 5,497 | 1,717 | 1 | 7,215 | ||||||||||||
- Other secured advances | 5,545 | — | — | 5,545 | ||||||||||||
- Amounts due from fellow subsidiaries | 27,533 | — | — | 27,533 | ||||||||||||
- Amounts due from Banco Santander group undertakings | 18 | — | — | 18 | ||||||||||||
Loans and receivables securities | 165 | — | — | 165 | ||||||||||||
|
|
|
|
|
|
|
| |||||||||
Total loans and advances | 63,908 | 1,880 | 59 | 65,847 | ||||||||||||
|
|
|
|
|
|
|
| |||||||||
31 December 2012 | Good £m | Satisfactory £m | Higher Risk £m | Total £m | ||||||||||||
Trading assets | ||||||||||||||||
- Loans and advances to banks | 9,781 | 190 | 17 | 9,988 | ||||||||||||
- Loans and advances to customers | 7,552 | — | — | 7,552 | ||||||||||||
Financial assets designated at fair value through profit and loss | ||||||||||||||||
- Loans and advances to customers | 3,203 | — | — | 3,203 | ||||||||||||
Loans and advances to banks | ||||||||||||||||
- Placements with other banks | 1,290 | — | — | 1,290 | ||||||||||||
- Amounts due from parent | 237 | — | — | 237 | ||||||||||||
Loans and advances to customers | ||||||||||||||||
- Corporate loans | 6,185 | 701 | 6 | 6,892 | ||||||||||||
- Other secured advances | 4,855 | — | — | 4,855 | ||||||||||||
- Amounts due from fellow subsidiaries | 32,368 | — | — | 32,368 | ||||||||||||
- Amounts due from Banco Santander group undertakings | 5 | — | — | 5 | ||||||||||||
Loans and receivables securities | 162 | — | — | 162 | ||||||||||||
|
|
|
|
|
|
|
| |||||||||
Total loans and advances | 65,638 | 891 | 23 | 66,552 | ||||||||||||
|
|
|
|
|
|
|
| |||||||||
31 December 2011 | Good £m | Satisfactory £m | Higher Risk £m | Total £m | ||||||||||||
Trading assets | ||||||||||||||||
- Loans and advances to banks | 5,647 | 486 | 11 | 6,144 | ||||||||||||
- Loans and advances to customers | 6,678 | 9 | — | 6,687 | ||||||||||||
Financial assets designated at fair value through profit and loss | ||||||||||||||||
- Loans and advances to customers | 4,050 | — | — | 4,050 | ||||||||||||
Loans and advances to banks | ||||||||||||||||
- Placements with other banks | 1,136 | — | — | 1,136 | ||||||||||||
- Amounts due from parent | 2,082 | — | — | 2,082 | ||||||||||||
Loans and advances to customers | ||||||||||||||||
- Corporate loans | 6,429 | 802 | 42 | 7,273 | ||||||||||||
- Other secured advances | 3,492 | — | — | 3,492 | ||||||||||||
- Amounts due from fellow subsidiaries | 27,831 | — | — | 27,831 | ||||||||||||
- Amounts due from Banco Santander group undertakings | 5 | — | — | 5 | ||||||||||||
Loans and receivables securities | 278 | — | — | 278 | ||||||||||||
|
|
|
|
|
|
|
| |||||||||
Total loans and advances | 57,628 | 1,297 | 53 | 58,978 | ||||||||||||
|
|
|
|
|
|
|
| |||||||||
During the first half of 2013, there was an increase in corporate loan assets in the “satisfactory” category. This was due to a combination of factors. Approximately half of the increase reflected the adoption of an enhanced mapping from our internal ratings to the external equivalent used to determine “good” or “satisfactory”. The balance related to rating migrations undertaken in the normal course of business.
Internal measures of credit quality have been used in the table analysing credit quality above, as follows:
Financial statements description | Probability of default | |
Good | 0.0 - 0.5% | |
Satisfactory | 0.5 - 12.5% | |
Higher Risk | 12.5%+ |
Abbey National Treasury Services plc 2013 Half Yearly Financial Report | 49 |
Table of Contents
Business Review
Risk Management Reportcontinued
Summarised descriptions of credit quality used in the financial statements relating to corporate lending are as follows:
RATING | DESCRIPTION | |
Good | There is a very high likelihood that the asset will not default and will be recovered in full. The exposure has a negligible or low probability of default. Such exposure also exhibits a strong capacity to meet financial commitments and only exceptionally shows any period of delinquency. | |
Satisfactory | There is a high likelihood that the asset will be recovered and is therefore of no cause for concern to Santander UK. The asset has low to moderate probability of default, strong recovery rates and may typically show only short periods of delinquency. Moderate to high application scores, credit bureau scores or behavioural scores characterise this credit quality. | |
Higher Risk | All rated accounts that are not viewed as Good or Satisfactory are rated as Higher Risk. The assets are characterised by some concern over the obligor’s ability to make payments when due. There may also be doubts over the value of collateral or security provided. However, the borrower or counterparty is continuing to make payments when due i.e. the assets have not yet converted to actual delinquency and is expected to settle all outstanding amounts of principal and interest. | |
Maturity analysis of loans and advances that are past due but not individually impaired
A maturity analysis of loans and advances that are past due but not individually impaired as set out in the table on page 48 is set out below.
In the corporate loan portfolio, a loan or advance is considered past due when it is 90 days or more in arrears, and also when Santander UK has reason to believe that full repayment of the loan is in doubt.
30 June 2013 and 31 December 2012
There were no loans and advances that were past due but not individually impaired.
31 December 2011 | Past due up to 1 month £m | Past due 1-2 months £m | Past due 2-3 months £m | Past due 3-6 months £m | Past due 6 months and over £m | Total £m | ||||||||||||||||||
Loans and advances to customers | ||||||||||||||||||||||||
- Corporate loans | — | — | — | 95 | — | 95 | ||||||||||||||||||
|
|
|
|
|
|
|
|
|
|
|
| |||||||||||||
Total loans and advances | — | — | — | 95 | — | 95 | ||||||||||||||||||
|
|
|
|
|
|
|
|
|
|
|
| |||||||||||||
Individually impaired loans
A summary of the key movements in individually impaired loans as set out in the table on page 48 is set out below.
Corporate loans
Corporate loans are managed in Corporate Banking and Corporate Centre. These balances consist of loans classified as NPLs and loans that have experienced a loss event and have been transferred to risk monitoring under the Watchlist (FEVE) process. Cases in the earliest stages of enhanced monitoring on the Watchlist (FEVE) which have not exhibited signs of a loss event are not classified as individually impaired. As a result, the balance of “individually impaired” Corporate loans of £764m (2012: £742m) represents a sub-set of the NPL and Watchlist (FEVE) data presented in the Corporate Banking and Corporate Centre tables on pages 19 and 26, respectively, totalling £1,019m (2012: £1,661m) which also include cases in the earliest stages of enhanced monitoring on the Watchlist (FEVE) which have not exhibited signs of a loss event, as well as undrawn commitments and off balance sheet exposures.
During the six months ended 30 June 2013, “individually impaired” corporate loans were largely unchanged at £764m (2012: £742m).
In 2012, “individually impaired” loans increased to £742m (2012: £260m) as a result of a refinement of the provision approach applied in the year, as a result of ANTS’s longer track record of historic loss experience on which to base impairment loss calculations as a result of the prolonged economic downturn. This enhanced track record of historic loss data in 2012 enabled ANTS to reliably extend the definition of loans considered to be individually impaired to include loans exhibiting earlier signs of stress more than was previously possible. In the past, such loans were typically assessed as part of the incurred but not observed (‘IBNO’) provision. The effects of this change were that loans which have missed a payment (and are therefore “past due”), and loans that have not missed payments (and therefore are not “past due”) but are exhibiting other earlier signs of stress (i.e. Watchlist (FEVE) loans), are now all assessed under a collective observed provision and therefore classified as “Individually impaired”. Applying the enhanced provision approach to the 2011 data did not result in a material change year on year i.e. there was not a significant deterioration in credit quality in 2012.
Further information on Corporate Banking NPLs is set out in the section “Corporate Banking – Non-performing loans and advances” on page 21. Further information on Corporate Banking cases subject to risk monitoring under the Watchlist (FEVE) system by portfolio is set out in the section “Corporate Banking – Monitoring and recovery management” on page 19.
There are no Corporate Centre NPLs. Further information on Corporate Centre cases subject to risk monitoring under the Watchlist (FEVE) system by portfolio is set out in the section “Corporate Centre – Monitoring and recovery management” on page 25.
50 | Abbey National Treasury Services plc 2013 Half Yearly Financial Report |
Table of Contents
The Directors of Abbey National Treasury Services plc are listed in the 2012 Annual Report. In addition to those listed, John Hennessy was appointed as a Director of Abbey National Treasury Services plc with effect from 23 July 2013. Luis de Sousa resigned as a director and CEO of the Company with effect from 30 June 2013. Jacques Ripoll is serving as the Company’s CEO designate, subject to regulatory approval.
EXECUTIVE DIRECTORS
John Hennessy
Director
John Hennessy (age 50) is an experienced Senior Risk professional, with over 20 years of international and front office experience gained at a senior level. He has a broad range of risk disciplines including financial, liquidity, market and credit risk. John Hennessy is currently the Deputy Chief Risk Officer & Oversight Director of Santander UK plc. Formerly, he was with Banco Santander, S.A. in their Madrid head office and in the New York Branch where he held a number of senior positions.
Abbey National Treasury Services plc 2013 Half Yearly Financial Report | 51 |
Table of Contents
Contents to Financial Statements
| 52 | Abbey National Treasury Services plc 2013 Half Yearly Financial Report |
Table of Contents
This page intentionally left blank.
Abbey National Treasury Services plc 2013 Half Yearly Financial Report | 53 |
Table of Contents
Financial Statements
Condensed Consolidated Income Statement
For the six months ended 30 June 2013 and 2012
| Notes | Six months ended 30 June 2013 £m | Six months ended 30 June 2012 £m | ||||||||
Interest and similar income | 1,593 | 1,839 | ||||||||
Interest expense and similar charges | (1,601 | ) | (1,865 | ) | ||||||
|
|
|
| |||||||
Net interest income | (8 | ) | (26 | ) | ||||||
|
|
|
| |||||||
Net fee and commission income | 61 | 72 | ||||||||
Net trading and other income | 3 | 375 | 215 | |||||||
|
|
|
| |||||||
Total operating income | 428 | 261 | ||||||||
|
|
|
| |||||||
Administration expenses | (108 | ) | (105 | ) | ||||||
Depreciation, amortisation and impairment | (1 | ) | (1 | ) | ||||||
|
|
|
| |||||||
Total operating expenses excluding provisions and charges | (109 | ) | (106 | ) | ||||||
|
|
|
| |||||||
Impairment losses on loans and advances | 4 | (18 | ) | (20 | ) | |||||
|
|
|
| |||||||
Total operating provisions and charges | (18 | ) | (20 | ) | ||||||
|
|
|
| |||||||
Profit before tax | 301 | 135 | ||||||||
|
|
|
| |||||||
Taxation charge | 5 | (45 | ) | (15 | ) | |||||
|
|
|
| |||||||
Profit for the period | 256 | 120 | ||||||||
|
|
|
| |||||||
Attributable to: | ||||||||||
Equity holders of the parent | 256 | 120 | ||||||||
|
|
|
| |||||||
All profits during each period were generated from continuing operations.
Condensed Consolidated Statement of Comprehensive Income
For the six months ended 30 June 2013 and 2012
| Six months ended 30 June 2013 £m | Six months ended 30 June 2012 £m | |||||||
Profit for the period | 256 | 120 | ||||||
|
|
|
| |||||
Other comprehensive (expense)/income: | ||||||||
Other comprehensive income that may be reclassified to profit or loss subsequently: | ||||||||
Gains/(losses) on available-for-sale securities | 26 | (25 | ) | |||||
Losses on cash flow hedges | (53 | ) | — | |||||
Exchange differences on translation of foreign operations | (1 | ) | — | |||||
Tax on above items | (5 | ) | 6 | |||||
|
|
|
| |||||
Net other comprehensive expense that may be reclassified to profit or loss subsequently | (33 | ) | (19 | ) | ||||
|
|
|
| |||||
Profits on available-for-sale securities transferred to profit or loss on sale | (53 | ) | — | |||||
Gains on cash flow hedges transferred to profit or loss | 45 | — | ||||||
Tax on items transferred to profit or loss | 13 | — | ||||||
|
|
|
| |||||
Net transfers to profit | 5 | — | ||||||
|
|
|
| |||||
Total other comprehensive expense for the period before tax | (36 | ) | (25 | ) | ||||
Tax relating to components of other comprehensive expense | 8 | 6 | ||||||
|
|
|
| |||||
Total comprehensive income for the period | 228 | 101 | ||||||
|
|
|
| |||||
Attributable to: | ||||||||
Equity holders of the parent | 228 | 101 | ||||||
|
|
|
| |||||
The notes on pages 57 to 84 and the Risk Management Report on pages 15 to 50 form an integral part of these Condensed Consolidated Interim Financial Statements.
54 | Abbey National Treasury Services plc 2013 Half Yearly Financial Report |
Table of Contents
Financial Statements
Primary Financial Statementscontinued
Condensed Consolidated Balance Sheet
At 30 June 2013 and 31 December 2012
| Notes | 30 June 2013 £m | 31 December 2012 £m | ||||||||
Assets | ||||||||||
Cash and balances at central banks | 9,284 | 388 | ||||||||
Trading assets | 7 | 31,163 | 22,498 | |||||||
Derivative financial instruments | 8 | 27,268 | 33,276 | |||||||
Financial assets designated at fair value | 9 | 2,567 | 3,531 | |||||||
Loans and advances to banks | 10 | 108,584 | 106,986 | |||||||
Loans and advances to customers | 11 | 40,963 | 44,750 | |||||||
Available-for-sale securities | 12 | 4,313 | 5,113 | |||||||
Loans and receivables securities | 165 | 162 | ||||||||
Macro hedge of interest rate risk | 808 | 1,171 | ||||||||
Intangible assets | 13 | 8 | 7 | |||||||
Property, plant and equipment | 14 | 6 | 6 | |||||||
Deferred tax assets | 15 | 20 | 20 | |||||||
Other assets | 83 | 4 | ||||||||
|
|
|
| |||||||
Total assets | 225,232 | 217,912 | ||||||||
|
|
|
| |||||||
Liabilities | ||||||||||
Deposits by banks | 16 | 118,010 | 114,535 | |||||||
Deposits by customers | 5,820 | 6,249 | ||||||||
Derivative financial instruments | 8 | 27,934 | 34,088 | |||||||
Trading liabilities | 17 | 34,790 | 21,109 | |||||||
Financial liabilities designated at fair value | 18 | 5,277 | 4,002 | |||||||
Debt securities in issue | 19 | 28,982 | 33,770 | |||||||
Other liabilities | 179 | 169 | ||||||||
Provisions | 20 | — | 20 | |||||||
Current tax liabilities | 217 | 175 | ||||||||
|
|
|
| |||||||
Total liabilities | 221,209 | 214,117 | ||||||||
|
|
|
| |||||||
Equity | ||||||||||
Share capital | 2,549 | 2,549 | ||||||||
Retained earnings | 1,482 | 1,226 | ||||||||
Other reserves | (8 | ) | 20 | |||||||
|
|
|
| |||||||
Total shareholders’ equity | 4,023 | 3,795 | ||||||||
|
|
|
| |||||||
Total liabilities and equity | 225,232 | 217,912 | ||||||||
|
|
|
| |||||||
The notes on pages 57 to 84 and the Risk Management Report on pages 15 to 50 form an integral part of these Condensed Consolidated Interim Financial Statements.
Abbey National Treasury Services plc 2013 Half Yearly Financial Report | 55 |
Table of Contents
Financial Statements
Primary Financial Statementscontinued
Condensed Consolidated Statement of Changes in Equity
For the six months ended 30 June 2013 and 2012
| Other reserves | ||||||||||||||||||||||||
| Share Capital £m | Available for sale reserve £m | Foreign currency translation reserve £m | Cash flow hedging reserve £m | Retained earnings £m | Total £m | |||||||||||||||||||
1 January 2013 | 2,549 | 4 | 16 | — | 1,226 | 3,795 | ||||||||||||||||||
Total comprehensive income/(expense): | ||||||||||||||||||||||||
- Profit for the period | — | — | — | — | 256 | 256 | ||||||||||||||||||
- Other comprehensive expense for the period | — | (27 | ) | (1 | ) | (8 | ) | — | (36 | ) | ||||||||||||||
- Tax on other comprehensive expense | — | 6 | — | 2 | — | 8 | ||||||||||||||||||
|
|
|
|
|
|
|
|
|
|
|
| |||||||||||||
| — | (21 | ) | (1 | ) | (6 | ) | 256 | 228 | ||||||||||||||||
|
|
|
|
|
|
|
|
|
|
|
| |||||||||||||
30 June 2013 | 2,549 | (17 | ) | 15 | (6 | ) | 1,482 | 4,023 | ||||||||||||||||
|
|
|
|
|
|
|
|
|
|
|
| |||||||||||||
1 January 2012 | 2,549 | — | 16 | — | 962 | 3,527 | ||||||||||||||||||
Total comprehensive income/(expense): | ||||||||||||||||||||||||
- Profit for the period | — | — | — | — | 120 | 120 | ||||||||||||||||||
- Other comprehensive expense for the period | — | (25 | ) | — | — | — | (25 | ) | ||||||||||||||||
- Tax on other comprehensive expense | — | 6 | — | — | — | 6 | ||||||||||||||||||
|
|
|
|
|
|
|
|
|
|
|
| |||||||||||||
| — | (19 | ) | — | — | 120 | 101 | ||||||||||||||||||
|
|
|
|
|
|
|
|
|
|
|
| |||||||||||||
30 June 2012 | 2,549 | (19 | ) | 16 | — | 1,082 | 3,628 | |||||||||||||||||
|
|
|
|
|
|
|
|
|
|
|
| |||||||||||||
Condensed Consolidated Cash Flow Statement
For the six months ended 30 June 2013 and 2012
| Notes | Six months ended 30 June 2013 £m | Six months ended 30 June 2012 £m | ||||||||
Net cash flow from operating activities | ||||||||||
Profit for the period | 256 | 120 | ||||||||
Adjustments for: | ||||||||||
Non cash items included in profit | 256 | 147 | ||||||||
Change in operating assets | (13,088 | ) | (13,054 | ) | ||||||
Change in operating liabilities | 9,655 | 26,712 | ||||||||
Income taxes | — | (2 | ) | |||||||
Effects of exchange rate differences | 1,150 | (802 | ) | |||||||
|
|
|
| |||||||
Net cash flow (used in)/from operating activities | 23 | (1,771 | ) | 13,121 | ||||||
|
|
|
| |||||||
Net cash flow from/(used in) investing activities | ||||||||||
Purchase of property, plant and equipment and intangible fixed assets | (2 | ) | (2 | ) | ||||||
Purchase of available-for-sale securities | (1,920 | ) | (4,708 | ) | ||||||
Proceeds from sale and redemption of available-for-sale securities | 2,765 | — | ||||||||
|
|
|
| |||||||
Net cash flow from/(used in) investing activities | 843 | (4,710 | ) | |||||||
|
|
|
| |||||||
Net cash flow (used in)/from financing activities | ||||||||||
Issue of debt securities | 13,001 | 16,805 | ||||||||
Repayments of debt securities | (16,597 | ) | (12,911 | ) | ||||||
|
|
|
| |||||||
Net cash flow (used in)/from financing activities | (3,596 | ) | 3,894 | |||||||
|
|
|
| |||||||
Net (decrease)/increase in cash and cash equivalents | (4,524 | ) | 12,305 | |||||||
|
|
|
| |||||||
Cash and cash equivalents at beginning of the period | 79,414 | 79,858 | ||||||||
Effects of exchange rate changes on cash and cash equivalents | 516 | (345 | ) | |||||||
|
|
|
| |||||||
Cash and cash equivalents at the end of the period | 23 | 75,406 | 91,818 | |||||||
|
|
|
| |||||||
The notes on pages 57 to 84 and the Risk Management Report on pages 15 to 50 form an integral part of these Condensed Consolidated Interim Financial Statements.
56 | Abbey National Treasury Services plc 2013 Half Yearly Financial Report |
Table of Contents
Financial Statements
Notes to the Financial Statements
1. ACCOUNTING POLICIES
These Condensed Consolidated Interim Financial Statements are prepared for Abbey National Treasury Services plc (the ‘Company’) and its subsidiaries (together, the ‘ANTS group’) under the Companies Act 2006. The principal activity of the ANTS group is to provide treasury, corporate and wholesale banking services. The ANTS group provides these services to UK external clients and also to the wider Santander UK group, of which the ANTS group is a part. The ANTS group is also the treasury support function for the Santander UK group. In this regard, the ANTS group’s role is to provide access to financial markets and central bank facilities in order to meet the Santander UK group’s liquidity, funding, capital and balance sheet management requirements. As such, ANTS is one of the main debt issuance vehicles in the Santander UK group.
Abbey National Treasury Services plc is a public limited company, incorporated in England and Wales, having a registered office in England and is the holding company of the ANTS group as well as undertaking business transactions.
BASIS OF PREPARATION
These Condensed Consolidated Interim Financial Statements are not a form of statutory accounts. The information for the year ended 31 December 2012 does not constitute statutory accounts as defined in section 434 of the Companies Act 2006. A copy of the statutory accounts for that financial year has been delivered to the Registrar of Companies. The auditor’s report on those accounts was unqualified, did not draw attention to any matters by way of emphasis and did not contain a statement under section 498(2) or (3) of the Companies Act 2006.
a) Compliance with International Financial Reporting Standards
The Condensed Consolidated Interim Financial Statements have been prepared in accordance with International Accounting Standard (‘IAS’) 34 ‘Interim Financial Reporting’, as issued by the International Accounting Standards Board (‘IASB’), including interpretations issued by the IFRS Interpretations Committee (‘IFRIC’) of the IASB (together ‘IFRS’). The ANTS group has also complied with its legal obligation to comply with International Financial Reporting Standards as adopted by the European Union as there are no applicable differences between the two frameworks for the periods presented. Accordingly, certain information and disclosures normally required to be included in the notes to the annual financial statements have been omitted or condensed. The Consolidated Financial Statements should be read in conjunction with the Financial Statements of the ANTS group for the year ended 31 December 2012 which were prepared in accordance with International Financial Reporting Standards (‘IFRS’) as issued by the IASB in addition to being consistent with IFRS as adopted for use in the European Union.
The same accounting policies, presentation and methods of computation are followed in these Condensed Consolidated Interim Financial Statements as were applied in the presentation of the ANTS group’s 2012 Annual Report except as described below:
Recent accounting developments
In 2013, the ANTS group adopted the following amendments to standards which became effective for financial years beginning on 1 January 2013.
| a) | IAS 1 ‘Presentation of Financial Statements’ – In June 2011, the IASB issued amendments to IAS 1 that retain the option to present profit or loss and other comprehensive income in either a single statement or in two separate but consecutive statements. However, the amendments to IAS 1 require additional disclosures to be made in the other comprehensive income section such that items of other comprehensive income are grouped into two categories: (i) items that will not be reclassified subsequently to profit or loss; and (ii) items that may be reclassified subsequently to profit or loss when specific conditions are met. Income tax on items of other comprehensive income is required to be allocated on the same basis. The amendments to IAS 1 are effective for annual periods beginning on or after 1 July 2012. |
The amendments have been applied retrospectively and hence the presentation of items of other comprehensive income has been modified to reflect the changes. Other than the above mentioned presentation changes, the application of the amendments to IAS 1 does not result in any impact on profit or loss, other comprehensive income and total comprehensive income.
| b) | IAS 19 ‘Employee Benefits’ – In June 2011, the IASB issued amendments to IAS 19 that change the accounting for defined benefit plans and termination benefits. The most significant change relates to the accounting for changes in defined benefit obligations and plan assets. The amendments require the recognition of changes in defined benefit obligations and in the fair value of plan assets when they occur, and hence eliminate the ‘corridor approach’ permitted under the previous version of IAS 19 and accelerate the recognition of past service costs. All actuarial gains and losses are recognised immediately through other comprehensive income in order for the net pension asset or liability recognised in the consolidated statement of financial position to reflect the full value of the plan deficit or surplus. Furthermore, the interest cost and expected return on plan assets used in the previous version of IAS 19 are replaced with a ‘net interest’ amount under IAS 19 (as revised in 2011), which is calculated by applying the discount rate to the net defined benefit liability or asset. In addition, IAS 19 (as revised in 2011) introduces certain changes in the presentation of the defined benefit cost including more extensive disclosures. |
These amendments to IAS 19 had no significant impact on the ANTS group’s profit or loss or financial position.
Abbey National Treasury Services plc 2013 Half Yearly Financial Report | 57 |
Table of Contents
Financial Statements
Notes to the Financial Statementscontinued
| c) | In December 2011, the IASB issued amendments to IFRS 7 ‘Disclosures – Offsetting Financial Assets and Financial Liabilities’ which requires the disclosures about the effect or potential effects of offsetting financial assets and financial liabilities and related arrangements on an entity’s financial position. The amendments are effective for annual periods beginning on or after 1 January 2013 but not for interim periods within those annual periods. |
| d) | IFRS 10 ‘Consolidated Financial Statements’, IFRS 11 ‘Joint Arrangements’, IFRS 12 ‘Disclosure of Interests in Other Entities’, IAS 27 ‘Separate Financial Statements’ and IAS 28 ‘Investments in Associates and Joint Ventures’ – In May 2011, the package of five standards on consolidation, joint arrangements, associates and disclosures was issued. Subsequent to the issue of these standards, amendments to IFRS 10, IFRS 11 and IFRS 12 were issued to clarify certain transitional guidance on the first-time application of the standards. |
| • | Under IFRS 10, control is the single basis for consolidation, irrespective of the nature of the investee; this standard therefore eliminates the risks-and-rewards approach. IFRS 10 identifies the three elements of control as power over the investee, exposure, or rights, to variable returns from involvement with the investee and the ability to use power over the investee to affect the amount of the investor’s returns. An investor must possess all three elements to conclude that it controls an investee. The assessment of control is based on all facts and circumstances, and the conclusion is reassessed if there are changes to at least one of the three elements. Retrospective application is required subject to certain transitional provisions. |
The ANTS group has reviewed its control assessments from 1 January, 2013 in accordance with IFRS 10 and determined that the adoption of IFRS 10 did not result in any change in the consolidation status of any of its subsidiaries and investees held during the period or comparative periods covered by these Condensed Consolidated Interim Financial Statements. The other amendments to IAS 27 did not affect the Company.
| • | IFRS 11 applies to all entities that are parties to a joint arrangement. A joint arrangement is an arrangement of which two or more parties have joint control. IFRS 11 establishes two types of joint arrangements, joint operations and joint ventures, which are distinguished by the rights and obligations of the parties to the arrangement. In a joint operation, the parties to the joint arrangement (referred to as ‘joint operators’) have rights to the assets and obligations for the liabilities of the arrangement. By contrast, in a joint venture, the parties to the arrangement (referred to as ‘joint venturers’) have rights to the net assets of the arrangement. IFRS 11 requires that a joint operator recognise its share of the assets, liabilities, revenues and expenses in accordance with applicable IFRSs; however, a joint venturer would account for its interest by using the equity method of accounting under IAS 28 (2011). The amendments to IAS 28 did not affect the Company. |
The adoption of IFRS 11 did not affect the Company.
| • | IFRS 12 integrates the disclosure requirements on interests in other entities, currently included in several standards to make it easier to understand and apply the disclosure requirements for subsidiaries, joint arrangements, associates and unconsolidated structured entities. The standard also contains additional requirements on a number of topics. Under IFRS 12, an entity should disclose information about significant judgements and assumptions (and any changes to those assumptions) made in determining whether it has control, joint control, or significant influence over another entity and the type of joint arrangement. IFRS 12 also requires additional disclosures to provide information to enable users to assess the nature of, and risks associated with the Company’s interests in other entities and the effect of those interests on the Company’s financial position, performance and cash flow. Disclosures shall be aggregated or disaggregated so that useful information is not obscured by either the inclusion of a large amount of insignificant detail or the aggregation of items that have different characteristics. The standard has been applied prospectively from 1 January 2013. |
Disclosures for the six months ended 30 June 2013 as a result of the adoption of IFRS 12 can be found in Note 27.
58 | Abbey National Treasury Services plc 2013 Half Yearly Financial Report |
Table of Contents
Financial Statements
Notes to the Financial Statementscontinued
| e) | IFRS 13 ‘Fair Value Measurement’ - In May 2011, the IASB issued IFRS 13, which establishes a single source of guidance for fair value measurements and disclosures about fair value measurements. IFRS 13 defines fair value, establishes a framework for measuring fair value, and requires disclosures about fair value measurements. IFRS 13 applies to both financial instrument items and non-financial instrument items for which other IFRSs require or permit fair value measurements and disclosures about fair value measurements, except in specified circumstances. |
IFRS 13 defines fair value as the price that would be received to sell an asset or paid to transfer a liability in an orderly transaction in the principal (or most advantageous) market at the measurement date under current market conditions. Fair value under IFRS is an exit price regardless of whether that price is directly observable or estimated using another valuation technique.
IFRS 13 requires prospective application from 1 January 2013. In addition, specific transitional provisions were given to entities such that they need not apply the disclosure requirements set out in the Standard in comparative information provided for periods before the initial application of the Standard. In accordance with these transitional provisions, the Santander UK group has not made any new disclosures required by IFRS 13 for the 2012 comparative period. In addition to the new disclosure requirements and enhancements to existing disclosures, which are reflected in Note 26, the application of IFRS 13 has resulted in a debit valuation adjustment against derivative liabilities of £44m.
| f) | There are a number of other changes to IFRS that were effective from 1 January 2013. Those changes did not have a significant impact on the ANTS group’s Condensed Consolidated Interim Financial Statements. |
Future accounting developments
The ANTS group has not yet adopted the following significant new or revised standards and interpretations, and amendments thereto, which have been issued but which are not yet effective for the ANTS group:
| a) | IFRS 9 ‘Financial Instruments’ - In November 2009, the IASB issued IFRS 9 ‘Financial Instruments (‘IFRS 9’) which introduced new requirements for the classification and measurement of financial assets. In October 2010, the IASB issued an amendment to IFRS 9 incorporating requirements for financial liabilities. Together, these changes represent the first phase in the IASB’s planned replacement of IAS 39 ‘Financial Instruments: Recognition and Measurement’ (‘IAS 39’) with a less complex and improved standard for financial instruments. |
Following the IASB’s decision in December 2011 to defer the effective date, the standard is effective for annual periods beginning on or after 1 January 2015 with early adoption permitted. IFRS 9 is required to be applied retrospectively but prior periods need not be restated.
The second and third phases in the IASB’s project to replace IAS 39 will address impairment of financial assets measured at amortised cost and hedge accounting.
The IASB re-opened the requirements for classification and measurement in IFRS 9 in 2012 to address practice and other issues, with an exposure draft of revised proposals issued in November 2012. The proposals have yet to be finalised and it is therefore not yet possible to estimate the financial effects. The current effective date is 1 January 2015, but may be delayed.
| b) | In December 2011, the IASB issued amendments to IAS 32 ‘Offsetting Financial Assets and Financial Liabilities’ which clarified the requirements for offsetting financial instruments and addressed inconsistencies in current practice when applying the offsetting criteria in IAS 32 ‘Financial Instruments: Presentation’. The amendments are effective for annual periods beginning on or after 1 January 2014 with early adoption permitted and are required to be applied retrospectively. |
The ANTS group is currently assessing the impact of these clarifications but it is not practicable to quantify the effect as at the date of the publication of these Condensed Consolidated Interim Financial Statements.
| c) | There are a number of other standards which have been issued or amended that are expected to be effective in future periods. However, it is not practicable to provide a reasonable estimate of their effects on the ANTS group’s Condensed Consolidated Interim Financial Statements until a detailed review has been completed. |
The Condensed Consolidated Interim Financial Statements reflect all adjustments that, in the opinion of management of the ANTS group, are necessary for a fair presentation of the results of operations for the interim period. All such adjustments to the financial information are of a normal, recurring nature. Because the results from common banking activities are so closely related and responsive to changes in market conditions, the results for any interim period are not necessarily indicative of the results that can be expected for the year.
Abbey National Treasury Services plc 2013 Half Yearly Financial Report | 59 |
Table of Contents
Financial Statements
Notes to the Financial Statementscontinued
GOING CONCERN
The ANTS group’s objectives, policies and processes for managing its capital are described in Note 28 of the 2012 Annual Report. Details of the ANTS group’s financial risk management objectives, its financial instruments and hedging activities; and its exposures to credit risk, interest rate risk, liquidity risk, operational risk and other risks are set out in the Risk Management Report on pages 15 to 50.
The ANTS group is reliant on Santander UK plc and other companies in the Santander UK group of companies (‘Santander UK’) for a significant proportion of its funding. The Santander UK Board has confirmed that Santander UK plc is a going concern, and that it will provide funding to the ANTS group for the foreseeable future. In giving this commitment to provide funding to the ANTS group, the Santander UK Board has considered the uncertainties that affect the ANTS group when preparing the forecasts and budgets of the combined business of Santander UK.
The Company has given a full and unconditional guarantee in respect of the unsubordinated liabilities of Santander UK plc incurred prior to 30 June 2015 under a deed poll guarantee entered into by the Company on 10 May 2012. Santander UK plc has given a reciprocal guarantee in respect of the unsubordinated liabilities of the Company incurred prior to 30 June 2015.
The Company, Santander UK plc, and Cater Allen Limited, which are the three entities regulated by the Prudential Regulatory Authority “PRA” within the Santander UK group, are party to a capital support deed dated 14 December 2012 (the “Capital Support Deed”) with certain other non-regulated subsidiaries of Santander UK plc. The parties to the Capital Support Deed constitute a core UK group for the purposes of section 10 of the Prudential Sourcebook for Banks, Building Societies and Investment Firms (“BIPRU”) of the PRA Handbook. Under section 10.8 of BIPRU, exposures of each of the three regulated entities to other members of the core UK group are exempt from large exposure limits that would otherwise apply. The purpose of the Capital Support Deed is to facilitate the prompt transfer of available capital resources from, or repayment of liabilities by, the non-regulated parties to any of the regulated parties in the event that one of the regulated parties has breached or is at risk of breaching its capital resources requirements or risk concentrations requirements.
In addition, the Company, Santander UK plc, and Cater Allen Limited are party to a defined liquidity group liquidity facility agreement dated 28 May 2010 (the “DLG Facility Agreement”). The DLG Facility Agreement supports a defined liquidity group for the purposes of section 12 of BIPRU. Section 12.8 of BIPRU permits a member of a defined liquidity group to rely on the liquid resources of other members of the defined liquidity group to comply with the liquidity adequacy requirements under section 12 of BIPRU. Under the DLG Facility Agreement, each party agrees to lend, subject to certain conditions and limitations, its excess liquidity to each other party.
After making enquiries, the Directors have a reasonable expectation that the Company and the ANTS group have adequate resources to continue in operational existence for the foreseeable future. Accordingly, they continue to adopt the going concern basis of accounting in preparing the Condensed Consolidated Interim Financial Statements.
CONSOLIDATION
a) Subsidiaries
The Condensed Consolidated Interim Financial Statements incorporate the financial statements of ANTS plc and entities (including structured entities) controlled by the Company and its subsidiaries. Control is achieved where the Company has (i) power over the investee; (ii) is exposed, or has rights, to variable returns from its involvement with the investee; and (iii) has the ability to use its power to affect its returns. The Company reassesses whether or not it controls an investee if facts and circumstances indicate that there are changes to one or more of the three elements of control listed above.
Consolidation of a subsidiary begins when the Company obtains control over the subsidiary and ceases when the Company loses control of the subsidiary. Specifically, the results of a subsidiary acquired or disposed of during the year are included in the consolidated statement of profit or loss and other comprehensive income from the date the Company gains control until the date when the Company ceases to control the subsidiary. Inter-company transactions, balances and unrealised gains on transactions between ANTS group companies are eliminated; unrealised losses are also eliminated unless the cost cannot be recovered.
The acquisition method of accounting is used to account for the acquisition of subsidiaries. The cost of an acquisition is measured at the fair value of the assets given up, shares issued or liabilities undertaken at the date of acquisition. Acquisition related costs are expensed as incurred. The excess of the cost of acquisition, as well as the fair value of any interest previously held, over the fair value of the ANTS group’s share of the identifiable net assets of the acquired subsidiary, associate or business at the date of acquisition is recorded as goodwill. When the group loses control of a subsidiary, the profit or loss on disposal is calculated as the difference between (i) the aggregate of the fair value of the consideration received and the fair value of any retained interest and (ii) the previous carrying amount of the assets (including goodwill), less liabilities of the subsidiary and any non-controlling interests. Amounts previously recognised in other comprehensive income in relation to the subsidiary are accounted for (i.e. reclassified to profit or loss or transferred directly to retained earnings) in the same manner as would be required if the relevant assets or liabilities are disposed of. The fair value of any investment retained in the former subsidiary at the date when control is lost is regarded as the fair value on initial recognition for subsequent accounting under IAS 39 “Financial Instruments: Recognition and Measurement” or, when applicable, the costs on initial recognition of an investment in an associate or jointly controlled entity.
Transactions between entities under common control, i.e. fellow subsidiaries of Santander UK plc are outside the scope of IFRS 3 – “Business Combinations”, and there is no other guidance for such situations under IFRS. The ANTS group elects to
60 | Abbey National Treasury Services plc 2013 Half Yearly Financial Report |
Table of Contents
Financial Statements
Notes to the Financial Statementscontinued
account for transactions between entities under common control for cash consideration in a manner consistent with the approach under IFRS 3R, except for the continued disclosure of those IBNO provisions for a portfolio that cannot easily be allocated to individual loans, unless the transaction represents a reorganisation of entities within the ANTS group, in which case the transaction is accounted for at its historical cost. Business combinations between entities under common control transacted for non-cash consideration are accounted for by the ANTS group in a manner consistent with group reconstruction relief under UK GAAP (merger accounting).
b) Associates and joint ventures
Associates are entities over which the ANTS group has significant influence and that is neither a subsidiary nor an interest in a joint venture. Significant influence is the power to participate in the financial and operating policy decisions of the investee but is not control or joint control over those policies. Unrealised gains on transactions between the ANTS group and its associates are eliminated to the extent of the ANTS group’s interest in the associates; unrealised losses are also eliminated unless the transaction provides evidence of an impairment of the asset transferred. The ANTS group’s investment in associates includes goodwill on acquisition.
Joint ventures are joint arrangements whereby the parties that have joint control of the arrangement have rights to the net assets of the joint arrangement. Joint control is the contractually agreed sharing of control of an arrangement, which exists only when decisions about the relevant activities require unanimous consent of the parties sharing control.
The ANTS group’s investments in associates and joint ventures are accounted for by the equity method of accounting and are initially recorded at cost and adjusted each year to reflect the ANTS group’s share of the post-acquisition results of the joint venture or associate. The share of any losses is restricted to a level that reflects an obligation to fund such losses. The ANTS group does not hold significant investments in associates or joint ventures.
HEDGE ACCOUNTING
ANTS group applies hedge accounting to represent, to the maximum possible extent permitted under accounting standards, the economic effects of its risk management strategies. Derivatives are used to hedge interest rate, exchange rate, commodity, and equity exposures and exposures to certain indices such as house price indices and retail price indices related to non-trading positions.
At the time a financial instrument is designated as a hedge (i.e., at the inception of the hedge), the ANTS group formally documents the relationship between the hedging instrument(s) and hedged item(s), its risk management objective and strategy for undertaking the hedge. The documentation includes the identification of each hedging instrument and respective hedged item, the nature of the risk being hedged (including the benchmark interest rate being hedged in a hedge of interest rate risk) and how the hedging instrument’s effectiveness in offsetting the exposure to changes in the hedged item’s fair value attributable to the hedged risk is to be assessed. Accordingly, the Santander UK group formally assesses, both at the inception of the hedge and on an ongoing basis, whether the hedging derivatives have been and will be highly effective in offsetting changes in the fair value attributable to the hedged risk during the period that the hedge is designated. A hedge is normally regarded as highly effective if, at inception and throughout its life, the Santander UK group can expect, and actual results indicate, that changes in the fair value or cash flow of the hedged items are effectively offset by changes in the fair value or cash flow of the hedging instrument. If at any point it is concluded that it is no longer highly effective in achieving its documented objective, hedge accounting is discontinued.
Where derivatives are held for risk management purposes, and when transactions meet the required criteria for documentation and hedge effectiveness, the derivatives may be designated as either: (i) hedges of the change in fair value of recognised assets or liabilities or firm commitments (‘fair value hedges’); (ii) hedges of the variability in highly probable future cash flows attributable to a recognised asset or liability, or a forecast transaction (‘cash flow hedges’); or (iii) a hedge of a net investment in a foreign operation (‘net investment hedges���). ANTS group applies fair value hedge accounting and cash flow hedge accounting but not hedging of a net investment in a foreign operation.
Abbey National Treasury Services plc 2013 Half Yearly Financial Report | 61 |
Table of Contents
Financial Statements
Notes to the Financial Statementscontinued
a) Fair value hedge accounting
Changes in the fair value of derivatives that are designated and qualify as fair value hedges are recorded in the income statement, together with the changes in the fair value of the hedged asset or liability that are attributable to the hedged risk. Where the hedged item is measured at amortised cost, the fair value changes adjust the carrying amount of the hedged asset or liability. Changes in the fair value of portfolio hedged items are presented separately in the statement of financial position and recognised in the statement of comprehensive income as gains or losses on financial assets and liabilities held for trading. If the hedge no longer meets the criteria for hedge accounting, changes in the fair value of the hedged item attributable to the hedged risk are no longer recognised in the income statement. For fair value hedges of interest rate risk, the cumulative adjustment that has been made to the carrying amount of the hedged item is amortised to the income statement using the effective interest method over the period to maturity. For portfolio hedged items, the cumulative adjustment is amortised to the income statement using the straight line method over the period to maturity.
b) Cash flow hedge accounting
The effective portion of changes in the fair value of qualifying cash flow hedges is recognised in other comprehensive income in the cash flow hedging reserve. The gain or loss relating to the ineffective portion is recognised immediately in the income statement. Amounts accumulated in equity are reclassified to the income statement in the periods in which the hedged item affects profit or loss. When a hedging instrument expires or is sold, or when a hedge no longer meets the criteria for hedge accounting, any cumulative gain or loss existing in equity at that time remains in equity and is recognised in the income statement. When a forecast transaction is no longer expected to occur, the cumulative gain or loss that was reported in equity is immediately transferred to the income statement.
CRITICAL ACCOUNTING POLICIES AND AREAS OF SIGNIFICANT MANAGEMENT JUDGEMENT
The preparation of the ANTS group’s Condensed Consolidated Interim Financial Statements requires management to make estimates and judgements that affect the reported amount of assets and liabilities at the date of the Condensed Consolidated Interim Financial Statements and the reported amount of income and expenses during the reporting period. Management evaluates its estimates and judgements on an ongoing basis. Management bases its estimates and judgements on historical experience and on various other factors that are believed to be reasonable under the circumstances. Actual results may differ from these estimates under different assumptions or conditions.
The following accounting estimates and judgements are considered important to the portrayal of the ANTS group’s financial results and financial condition because: (i) they are highly susceptible to change from period to period as assumptions are made to calculate the estimates, and (ii) any significant difference between the ANTS group’s estimated amounts and actual amounts could have a material impact on the ANTS group’s future financial results and financial condition.
In calculating each estimate, a range of outcomes was calculated based principally on management’s conclusions regarding the input assumptions relative to historic experience. The actual estimates were based on what management concluded to be the most probable assumptions within the range of reasonably possible assumptions:
Valuation of financial instruments
The ANTS group trades in a wide variety of financial instruments in the major financial markets. When estimating the value of its financial instruments, including derivatives where quoted market prices are not available, management therefore considers a range of interest rates, volatility, exchange rates, counterparty credit ratings, valuation adjustments and other similar inputs, all of which vary across maturity bands. These are chosen to best reflect the particular characteristics of each transaction.
Had management used different assumptions, a larger or smaller change in the valuation of financial instruments including derivatives where quoted market prices are not available would have resulted that could have had a material impact on the ANTS group’s reported profit before tax.
Detailed disclosures on financial instruments, including sensitivities, can be found in Note 26 of the 2012 Annual Report. Further information about sensitivities to market risk (including Value-at-Risk (‘VaR’)) arising from financial instrument trading activities can be found in the Risk Management Report on 27.
62 | Abbey National Treasury Services plc 2013 Half Yearly Financial Report |
Table of Contents
Financial Statements
Notes to the Financial Statementscontinued
2. SEGMENTS
The principal activity of the ANTS group is financial services. The ANTS group’s business is managed and reported on the basis of the following segments:
| • | Corporate Banking; |
| • | Markets; and |
| • | Corporate Centre. |
The ANTS group’s segments are strategic business units that offer different products and services. They are managed separately because each business requires different technology and marketing strategies. The ANTS group has three segments:
| • | Corporate Banking offers a wide range of products and financial services to customers through a network of regional business centres and through telephony and e-commerce channels. Corporate Banking products and services include loans, bank accounts, deposits, treasury services, invoice discounting, cash transmission and asset finance. |
The SME and mid corporate business principally serves small and medium enterprises with an annual turnover of more than £250,000 up to £50m (‘SMEs’), and other corporate customers with an annual turnover of up to £500m. This also includes real estate lending.
The Large Corporates business offers specialist treasury services in fixed income and foreign exchange, lending, transactional banking services, capital markets and money markets to large multinational corporate customers with an annual turnover of more than £500m. Lending includes syndicated loans and structured finance. Transactional banking includes trade finance and cash management. Money market activities include securities lending/borrowing and repos.
| • | Markets offers risk management and other services to financial institutions, as well as other Santander UK divisions. Its main product areas are fixed income and foreign exchange, equity, capital markets and institutional sales. |
| • | Corporate Centre consists of Financial Management & Investor Relations (‘FMIR’) and the non-core portfolios of Social Housing loans and structured credit assets. FMIR is responsible for managing capital and funding, balance sheet composition, structural market risk and strategic liquidity risk for the Santander UK group. The non-core portfolios are being run-down and/or managed for value. |
The Company’s board of directors (the ‘Board’) is the chief operating decision maker for the ANTS group. The segment information below is presented on the basis used by the Board to evaluate performance and allocate resources. The Board reviews discrete financial information for each segment of the business, including measures of operating results, assets and liabilities. The segment information reviewed by the Board is prepared on a statutory basis of accounting.
Transactions between the business segments are on normal commercial terms and conditions. The accounting policies of the segments are the same as those described in the summary of significant accounting policies. Internal charges and internal UK transfer pricing adjustments have been reflected in the performance of each business. Revenue sharing agreements are used to allocate external customer revenues to a business segment on a reasonable basis. Funds are ordinarily reallocated between segments, resulting in funding cost transfers disclosed in operating income. Interest charged for these funds is based on the ANTS group’s cost of wholesale funding.
Interest income and interest expense have not been reported separately. The majority of the revenues from the segments presented below are interest income in nature and the Board relies primarily on net interest income to both assess the performance of the segment and to make decisions regarding allocation of segmental resources.
a) Segmental information
Six months ended 30 June 2013 | Corporate Banking £m | Markets £m | Corporate Centre £m | Total £m | ||||||||||||
Net interest income/(expense) | 69 | (1 | ) | (76 | ) | (8 | ) | |||||||||
Non-interest income | 114 | 40 | 282 | 436 | ||||||||||||
|
|
|
|
|
|
|
| |||||||||
Total operating income | 183 | 39 | 206 | 428 | ||||||||||||
|
|
|
|
|
|
|
| |||||||||
Administration expenses | (42 | ) | (48 | ) | (18 | ) | (108 | ) | ||||||||
Depreciation and amortisation | — | (1 | ) | — | (1 | ) | ||||||||||
|
|
|
|
|
|
|
| |||||||||
Total operating expenses excluding provisions and charges | (42 | ) | (49 | ) | (18 | ) | (109 | ) | ||||||||
|
|
|
|
|
|
|
| |||||||||
Impairment losses on loans and advances | (18 | ) | — | — | (18 | ) | ||||||||||
Provisions for other liabilities and charges | — | — | — | — | ||||||||||||
|
|
|
|
|
|
|
| |||||||||
Total operating provisions and charges | (18 | ) | — | — | (18 | ) | ||||||||||
|
|
|
|
|
|
|
| |||||||||
Profit/(loss) before tax | 123 | (10 | ) | 188 | 301 | |||||||||||
|
|
|
|
|
|
|
| |||||||||
Total assets | 35,065 | 24,873 | 165,294 | 225,232 | ||||||||||||
|
|
|
|
|
|
|
| |||||||||
Average number of staff(1) | 321 | 255 | 144 | 720 | ||||||||||||
|
|
|
|
|
|
|
| |||||||||
| (1) | Full-time equivalents |
Abbey National Treasury Services plc 2013 Half Yearly Financial Report | 63 |
Table of Contents
Financial Statements
Notes to the Financial Statementscontinued
Six months ended 30 June 2012 | Corporate Banking £m | Markets £m | Corporate Centre £m | Total £m | ||||||||||||
Net interest income/(expense) | 29 | (3 | ) | (52 | ) | (26 | ) | |||||||||
Non-interest income | 141 | 137 | 9 | 287 | ||||||||||||
|
|
|
|
|
|
|
| |||||||||
Total operating income/(expense) | 170 | 134 | (43 | ) | 261 | |||||||||||
|
|
|
|
|
|
|
| |||||||||
Administration expenses | (37 | ) | (54 | ) | (14 | ) | (105 | ) | ||||||||
Depreciation and amortisation | — | (1 | ) | — | (1 | ) | ||||||||||
|
|
|
|
|
|
|
| |||||||||
Total operating expenses excluding provisions and charges | (37 | ) | (55 | ) | (14 | ) | (106 | ) | ||||||||
|
|
|
|
|
|
|
| |||||||||
Impairment losses on loans and advances | (20 | ) | — | — | (20 | ) | ||||||||||
Provisions for other liabilities and charges | — | — | — | — | ||||||||||||
|
|
|
|
|
|
|
| |||||||||
Total operating provisions and charges | (20 | ) | — | — | (20 | ) | ||||||||||
|
|
|
|
|
|
|
| |||||||||
Profit/(loss) before tax | 113 | 79 | (57 | ) | 135 | |||||||||||
|
|
|
|
|
|
|
| |||||||||
At 31 December 2012 | ||||||||||||||||
Total assets | 22,509 | 28,173 | 167,230 | 217,912 | ||||||||||||
|
|
|
|
|
|
|
| |||||||||
Average number of staff(1) | 301 | 281 | 111 | 693 | ||||||||||||
|
|
|
|
|
|
|
| |||||||||
| (1) | Full-time equivalents |
3. NET TRADING AND OTHER INCOME
| Six months ended 30 June 2013 £m | Six months ended 30 June 2012 £m | |||||||
Net trading and funding of other items by the trading book | 359 | 227 | ||||||
(Losses)/income on assets designated at fair value through profit or loss | (178 | ) | 100 | |||||
Expense on liabilities designated at fair value through profit or loss | (12 | ) | (11 | ) | ||||
Gains/(losses) on derivatives managed with assets/liabilities held at fair value through profit or loss | 189 | (87 | ) | |||||
Profit on sale of available-for-sale assets | 53 | — | ||||||
Hedge ineffectiveness and other | (36 | ) | (14 | ) | ||||
|
|
|
| |||||
| 375 | 215 | |||||||
|
|
|
| |||||
“Net trading and funding of other items by the trading book” includes fair value gains/(losses) of £137m (six months ended 30 June 2012: £(57)m) on embedded derivatives bifurcated from certain equity index-linked deposits. The embedded derivatives are economically hedged internally with the equity derivatives trading desk. These internal transactions are managed as part of the overall positions of the equity derivatives trading desk, the results of which are also included in this line item, and amounted to £136m (six months ended 30 June 2012: £(58)m). As a result, the net fair value movements recognised on the equity index-linked deposits and the related economic hedges were £1m (six months ended 30 June 2012: £1m).
4. IMPAIRMENT LOSSES AND PROVISIONS
| Six months ended 30 June 2013 £m | Six months ended 30 June 2012 £m | |||||||
Impairment losses on loans and advances: | ||||||||
- loans and advances to customers (Note 11) | 18 | 20 | ||||||
|
|
|
| |||||
Total impairment losses and provisions charged to the income statement | 18 | 20 | ||||||
|
|
|
| |||||
64 | Abbey National Treasury Services plc 2013 Half Yearly Financial Report |
Table of Contents
Financial Statements
Notes to the Financial Statementscontinued
5. TAXATION CHARGE
| Six months ended 30 June 2013 £m | Six months ended 30 June 2012 £m | |||||||
Current tax: | ||||||||
UK corporation tax on profit of the period | 56 | 17 | ||||||
Adjustments in respect of prior years | (13 | ) | (4 | ) | ||||
|
|
|
| |||||
Total current tax | 43 | 13 | ||||||
|
|
|
| |||||
Deferred tax: | ||||||||
Origination and reversal of temporary differences | 2 | 2 | ||||||
|
|
|
| |||||
Total deferred tax | 2 | 2 | ||||||
|
|
|
| |||||
Tax on profit for the period | 45 | 15 | ||||||
|
|
|
| |||||
Interim period corporation tax is accrued based on the estimated average annual effective corporation tax rate for the year of 19.3% (2012: 13.4%). The standard rate of UK corporation tax was 23.25% (2012: 24.5%).
The standard rate of UK corporation tax was reduced from 24% to 23% with effect from 1 April 2013. Taxation for other jurisdictions is calculated at the rates prevailing in the relevant jurisdictions.
The Finance Act 2012, which provided for a reduction in the main rate of UK corporation tax to 23% effective from 1 April 2013 was enacted on 17 July 2012. The UK Government has also indicated that it intends to enact a further reduction in the main tax rate down to 21% on 1 April 2014 and then to 20% on 1 April 2015. These changes in rate had not been substantively enacted at the balance sheet date and, therefore, are not included in these Condensed Consolidated Interim Financial Statements. The estimated financial statement impact of these changes is insignificant.
The tax expense differs from the theoretical amount that would arise using the UK statutory tax rate as follows:
| Six months ended 30 June 2013 £m | Six months ended 30 June 2012 £m | |||||||
Profit before tax | 301 | 135 | ||||||
|
|
|
| |||||
Tax calculated at a tax rate of 23.25% (2012: 24.5%) | 70 | 33 | ||||||
Non deductible UK Bank Levy | 1 | 1 | ||||||
Other non-equalised items (including UK index-linked gilts) | (11 | ) | (15 | ) | ||||
Utilisation of capital losses for which credit was not previously recognised | (2 | ) | — | |||||
Adjustment to prior year provisions | (13 | ) | (4 | ) | ||||
|
|
|
| |||||
Tax expense | 45 | 15 | ||||||
|
|
|
| |||||
Further information about deferred tax is presented in Note 15.
6. DIVIDENDS
No dividends were declared on the Company’s ordinary shares in the six months ended 30 June 2013 and 30 June 2012.
In addition, the terms of the Tracker Shares and the B Tracker Shares are such that the issue of those shares (or in the case of the B Tracker Shares entry by the Company into contractual arrangements relating to the future issue of these shares) caused a derecognition of certain cashflows expected to be received by the Company. The amounts derecognised equate to the fair value of the cashflows involved and are shown in the Statement of Changes in Equity as amounts representative of contractual obligations for the period in which the derecognition occurs. Subsequent declaration and payment of dividends in respect of these cashflows is not further reflected in the Company’s financial statements. The final dividend on the Tracker Shares was declared and paid at the end of 2011.
Abbey National Treasury Services plc 2013 Half Yearly Financial Report | 65 |
Table of Contents
Financial Statements
Notes to the Financial Statementscontinued
7. TRADING ASSETS
| 30 June 2013 £m | 31 December 2012 £m | |||||||
Loans and advances to banks – securities purchased under resale agreements | 7,632 | 7,245 | ||||||
Loans and advances to banks – other(1) | 2,194 | 2,743 | ||||||
Loans and advances to customers – securities purchased under resale agreements | 11,802 | 7,463 | ||||||
Loans and advances to customers – other(2) | 104 | 89 | ||||||
Debt securities | 8,985 | 4,494 | ||||||
Equity securities | 446 | 464 | ||||||
|
|
|
| |||||
| 31,163 | 22,498 | |||||||
|
|
|
| |||||
| (1) | Comprises cash collateral of £2,193m (2012: £2,741m) and short-term loans of £1m (2012: £2m). |
| (2) | Comprises short-term loans. |
Included in the above balances are amounts owed to the ANTS group by Banco Santander, S.A. and other subsidiaries of Banco Santander, S.A. outside the ANTS group of £128m (2012: £206m) and £41m (2012: £nil) respectively.
8. DERIVATIVE FINANCIAL INSTRUMENTS
Derivatives are financial instruments whose value is derived from the price of one or more underlying items such as equities, equity indices, interest rates, foreign exchange rates, property indices, commodities and credit spreads. Derivatives enable users to manage exposure to credit or market risks. The group sells derivatives to its customers and uses derivatives to manage its own exposure to credit and market risks. Details of the group’s uses of derivatives are set out in Note 15 of the 2012 Annual Report.
30 June 2013
Derivatives held for trading | Contract/notional amount £m | Fair value assets £m | Fair value liabilities £m | |||||||||
Exchange rate contracts: | ||||||||||||
- Cross-currency swaps | 111,604 | 2,512 | 3,608 | |||||||||
- Forward exchange swaps, options and forwards | 27,055 | 493 | 281 | |||||||||
|
|
|
|
|
| |||||||
| 138,659 | 3,005 | 3,889 | ||||||||||
|
|
|
|
|
| |||||||
Interest rate contracts: | ||||||||||||
- Interest rate swaps | 580,720 | 18,272 | 16,992 | |||||||||
- Caps, floors and swaptions(1) | 59,868 | 3,231 | 3,272 | |||||||||
- Futures (exchange traded) | 37,127 | 65 | — | |||||||||
- Forward rate agreements | 65,387 | 2 | 6 | |||||||||
|
|
|
|
|
| |||||||
| 743,102 | 21,570 | 20,270 | ||||||||||
|
|
|
|
|
| |||||||
Equity and credit contracts: | ||||||||||||
- Equity index swaps and similar products | 30,288 | 1,658 | 2,344 | |||||||||
- Equity index options (exchange traded) | 30,655 | 307 | — | |||||||||
- Credit default swaps and similar products | 224 | 35 | 4 | |||||||||
|
|
|
|
|
| |||||||
| 61,167 | 2,000 | 2,348 | ||||||||||
|
|
|
|
|
| |||||||
Commodity contracts: | ||||||||||||
- OTC swaps | 144 | 5 | 5 | |||||||||
|
|
|
|
|
| |||||||
| 144 | 5 | 5 | ||||||||||
|
|
|
|
|
| |||||||
Total derivative assets and liabilities held for trading | 943,072 | 26,580 | 26,512 | |||||||||
|
|
|
|
|
| |||||||
30 June 2013
Derivatives held for hedging | Contract/notional amount £m | Fair value assets £m | Fair value liabilities £m | |||||||||
Derivatives designated as fair value hedges: | ||||||||||||
Exchange rate contracts: | ||||||||||||
- Cross-currency swaps | 2,799 | 36 | 261 | |||||||||
Interest rate contracts: | ||||||||||||
- Interest rate swaps | 95,422 | 620 | 1,161 | |||||||||
|
|
|
|
|
| |||||||
| 98,221 | 656 | 1,422 | ||||||||||
|
|
|
|
|
| |||||||
Derivatives designated as cash flow hedges: | ||||||||||||
Exchange rate contracts: | ||||||||||||
- Cross-currency swaps | 856 | 32 | — | |||||||||
|
|
|
|
|
| |||||||
| 856 | 32 | — | ||||||||||
|
|
|
|
|
| |||||||
Total derivative assets and liabilities held for hedging | 99,077 | 688 | 1,422 | |||||||||
|
|
|
|
|
| |||||||
Total recognised derivative assets and liabilities | 1,042,149 | 27,268 | 27,934 | |||||||||
|
|
|
|
|
| |||||||
| (1) | A swaption is an option on a swap that gives the holder the right but not the obligation to buy or sell a swap. |
66 | Abbey National Treasury Services plc 2013 Half Yearly Financial Report |
Table of Contents
Financial Statements
Notes to the Financial Statementscontinued
31 December 2012
Derivatives held for trading | Contract/notional amount £m | Fair value assets £m | Fair value liabilities £m | |||||||||
Exchange rate contracts: | ||||||||||||
- Cross-currency swaps | 120,339 | 2,768 | 3,613 | |||||||||
- Forward exchange swaps, options and forwards | 19,093 | 928 | 620 | |||||||||
|
|
|
|
|
| |||||||
| 139,432 | 3,696 | 4,233 | ||||||||||
|
|
|
|
|
| |||||||
Interest rate contracts: | ||||||||||||
- Interest rate swaps | 572,558 | 24,044 | 22,559 | |||||||||
- Caps, floors and swaptions(1) | 61,904 | 3,582 | 3,612 | |||||||||
- Futures (exchange traded) | 19,273 | 54 | 31 | |||||||||
- Forward rate agreements | 123,132 | 9 | 13 | |||||||||
|
|
|
|
|
| |||||||
| 776,867 | 27,689 | 26,215 | ||||||||||
|
|
|
|
|
| |||||||
Equity and credit contracts: | ||||||||||||
- Equity index swaps and similar products | 44,083 | 1,292 | 1,945 | |||||||||
- Equity index options (exchange traded) | 29,652 | 152 | 86 | |||||||||
- Credit default swaps and similar products | 381 | 37 | 7 | |||||||||
|
|
|
|
|
| |||||||
| 74,116 | 1,481 | 2,038 | ||||||||||
|
|
|
|
|
| |||||||
Commodity contracts: | ||||||||||||
- OTC swaps | 227 | 7 | 7 | |||||||||
|
|
|
|
|
| |||||||
| 227 | 7 | 7 | ||||||||||
|
|
|
|
|
| |||||||
Total derivative assets and liabilities held for trading | 990,642 | 32,873 | 32,493 | |||||||||
|
|
|
|
|
| |||||||
31 December 2012
Derivatives held for hedging | Contract/notional amount £m | Fair value assets £m | Fair value liabilities £m | |||||||||
Fair value hedges: | ||||||||||||
Exchange rate contracts: | ||||||||||||
- Cross-currency swaps | 4,270 | — | 319 | |||||||||
Interest rate contracts: | ||||||||||||
- Interest rate swaps | 67,111 | 403 | 1,276 | |||||||||
|
|
|
|
|
| |||||||
Total derivative assets and liabilities held for fair value hedging | 71,381 | 403 | 1,595 | |||||||||
|
|
|
|
|
| |||||||
Total recognised derivative assets and liabilities | 1,062,023 | 33,276 | 34,088 | |||||||||
|
|
|
|
|
| |||||||
| (1) | A swaption is an option on a swap that gives the holder the right but not the obligation to buy or sell a swap. |
Included in the above balances are amounts owed to the ANTS group by Banco Santander, S.A. and by fellow subsidiaries of Banco Santander, S.A. outside the ANTS group of £1,720m (2012: £2,025m), £1,890m (2012: £1,899m) and £1,052m (2012: £2,983m) respectively and amounts owed by the ANTS group to Banco Santander, S.A. and to fellow subsidiaries of Banco Santander, S.A. outside the ANTS group of £1,598m (2012: £1,914m), £2,823m (2012: £4,094m) and £1,759m (2012: £1,473m). The net exposures after collateral to the Banco Santander, S.A. and fellow subsidiaries of Banco Santander, S.A. outside the ANTS group amounted to £81m (2012: £137m) and £42m ( 2012: £3,697m) respectively.
Net gains or losses arising from fair value and cash flow hedges included in net trading and other income
| Six months ended 30 June 2013 £m | Six months ended 30 June 2012 £m | |||||||
Fair value hedging: | ||||||||
Gains on hedging instruments | 300 | 640 | ||||||
Losses on hedged items attributable to hedged risks | (332 | ) | (364 | ) | ||||
|
|
|
| |||||
Fair value hedging ineffectiveness | (32 | ) | 276 | |||||
Cash flow hedging ineffectiveness | 1 | — | ||||||
|
|
|
| |||||
| (31 | ) | 276 | ||||||
|
|
|
| |||||
The ANTS group hedges its exposures to various risks, including interest rate risk and foreign currency risk, in connection with covered bond issuances, and subordinated and senior debt securities in issue. The gains/(losses) arising on these assets and liabilities are presented in the table above on a combined basis.
In addition, in the ordinary course of business, the ANTS group entered into long-term interest rate contracts as economic hedges with five investment vehicles whose underlying assets comprise debt securities, bank loans and energy and infrastructure financings. Although the vehicles themselves are not externally rated, the counterparty exposure ranks super-senior to the most senior notes issued by the vehicles and these notes are rated AAA or AA. The total mark-to-market exposure at the balance sheet date was £42m (2012: £50m). These long-term interest rate contracts are included within “derivatives held for trading - interest rate contracts” shown above.
Abbey National Treasury Services plc 2013 Half Yearly Financial Report | 67 |
Table of Contents
Financial Statements
Notes to the Financial Statementscontinued
Hedged cash flows
The following tables show when the ANTS group’s hedged cash flows are expected to occur and when they will affect income for designated cash flow hedges.
30 June 2013 | 0-1 years £m | 1 - 2 years £m | 2 - 3 years £m | 3 - 4 years £m | 4 - 5 years £m | 5 -10 years £m | 10 - 20 years £m | Total £m | ||||||||||||||||||||||||
Hedged forecast cash flows expected to occur: | ||||||||||||||||||||||||||||||||
Forecast receivable cash flows | 16 | 17 | 21 | 27 | 23 | — | — | 104 | ||||||||||||||||||||||||
Forecast payable cash flows | (15 | ) | (15 | ) | (15 | ) | (15 | ) | (871 | ) | — | — | (931 | ) | ||||||||||||||||||
Hedged forecast cash flows affect profit or loss: | ||||||||||||||||||||||||||||||||
Forecast receivable cash flows | 16 | 17 | 21 | 27 | 20 | — | — | 101 | ||||||||||||||||||||||||
Forecast payable cash flows | (15 | ) | (15 | ) | (15 | ) | (15 | ) | (864 | ) | — | — | (924 | ) | ||||||||||||||||||
There were no hedging instruments designated as cash flow hedges during the year ended 31 December 2012.
There were no transactions for which cash flow hedge accounting had to be ceased during the six months ended 30 June 2013 as a result of the highly probable cash flows no longer being expected to occur.
Gains and losses transferred from the cash flow hedging reserve in the current period to net interest income was a £2m gains (six months ended 30 June 2012: £nil) and net trading and other income was a £43m gain (six months ended 30 June 2012: £nil).
9. FINANCIAL ASSETS DESIGNATED AT FAIR VALUE
| 30 June 2013 £m | 31 December 2012 £m | |||||||
Loans and advances to customers | 2,239 | 3,203 | ||||||
Debt securities | 328 | 328 | ||||||
|
|
|
| |||||
| 2,567 | 3,531 | |||||||
|
|
|
| |||||
Financial assets are designated at fair value through profit or loss where this results in more relevant information because it significantly reduces a measurement inconsistency that would otherwise arise from measuring the assets or liabilities or recognising gains or losses on them on a different basis, or where the assets are managed and their performance evaluated on a fair value basis.
Included in the above balances are amounts owed to the ANTS group by Banco Santander, S.A. and by fellow subsidiaries of Banco Santander, S.A. outside the ANTS group of £nil (2012: £nil) and £56m (2012: £47m) respectively.
The maximum exposure to credit risk on loans and advances designated as held at fair value through profit or loss at the balance sheet date was £2,239m (2012: £3,203m). The maximum exposure was mitigated by the ANTS group having a charge over residential properties in respect of lending to housing associations amounting to £2,401m (2012: £3,343m).
The net gain during the period attributable to changes in credit risk for loans and advances designated at fair value was £7m (six months ended 30 June 2012: net loss of £19m). The cumulative net loss attributable to changes in credit risk for loans and advances designated at fair value at 30 June 2013 was £349m (2012: net loss of £356m).
10. LOANS AND ADVANCES TO BANKS
| 30 June 2013 £m | 31 December 2012 £m | |||||||
Amounts due from Banco Santander - securities purchased under resale agreements | 234 | 233 | ||||||
- other | — | 4 | ||||||
Amounts due from Santander UK group undertakings - securities purchased under resale agreements | 404 | 566 | ||||||
- other | 106,780 | 104,893 | ||||||
Other loans and advances(1) | 1,166 | 1,290 | ||||||
|
|
|
| |||||
| 108,584 | 106,986 | |||||||
|
|
|
| |||||
| (1) | Principally comprises time deposits, cash in the course of collection, cash held with foreign banks and unsettled financial transactions. |
68 | Abbey National Treasury Services plc 2013 Half Yearly Financial Report |
Table of Contents
Financial Statements
Notes to the Financial Statementscontinued
11. LOANS AND ADVANCES TO CUSTOMERS
| 30 June | 31 December | |||||||
| 2013 £m | 2012 £m | |||||||
Amounts due from Santander UK group undertakings | 27,533 | 32,368 | ||||||
Amounts due from Banco Santander group undertakings | 18 | 5 | ||||||
Other loans and advances | 13,524 | 12,489 | ||||||
|
|
|
| |||||
Loans and advances to customers | 41,075 | 44,862 | ||||||
Less: impairment loss allowances | (112 | ) | (112 | ) | ||||
|
|
|
| |||||
Loans and advances to customers, net of impairment loss allowances | 40,963 | 44,750 | ||||||
|
|
|
| |||||
Movement in impairment loss allowances:
| £m | ||||
At 1 January 2013 | 112 | |||
Charge to the income statement: | ||||
- Observed | 18 | |||
|
| |||
| 18 | ||||
|
| |||
Write offs and other items | (18 | ) | ||
|
| |||
At 30 June 2013 | 112 | |||
|
| |||
At 1 January 2012 | 130 | |||
Charge to the income statement: | ||||
- Observed | 40 | |||
- Incurred but not yet observed | (31 | ) | ||
|
| |||
| 9 | ||||
|
| |||
Write offs and other items | (27 | ) | ||
|
| |||
At 31 December 2012 | 112 | |||
|
| |||
12. AVAILABLE-FOR-SALE SECURITIES
| 30 June 2013 £m | 31 December 2012 £m | |||||||
Debt securities | 4,313 | 5,113 | ||||||
|
|
|
| |||||
13. INTANGIBLE ASSETS
During the period, the ANTS group spent approximately £1m (six months ended 30 June 2012: £2m) on computer software. The ANTS group made no disposals in the period (six months ended 30 June 2012: £9m).
14. PROPERTY, PLANT AND EQUIPMENT
During the period, the ANTS group spent approximately £nil (six months ended 30 June 2012: £nil) on owner-occupied properties, £1m (six months ended 30 June 2012: £2m) on additions to its office fixtures and equipment and £nil (six months ended 30 June 2012: £nil) on computer software. The ANTS group made no disposals in the period (six months ended 30 June 2012: £nil).
At 30 June 2013, capital expenditure contracted, but not provided for was £1m (2012: £nil) in respect of property, plant and equipment.
Abbey National Treasury Services plc 2013 Half Yearly Financial Report | 69 |
Table of Contents
Financial Statements
Notes to the Financial Statementscontinued
15. DEFERRED TAX
Deferred income taxes are calculated on temporary differences under the liability method using the tax rates expected to apply when the liability is settled or the asset is realised. The movement on the deferred tax account is as follows:
| 30 June 2013 | 31 December 2012 | |||||||
| £m | £m | |||||||
At 1 January | 20 | 17 | ||||||
Income statement credit /(charge) | (2 | ) | 4 | |||||
Charged to other comprehensive income: | ||||||||
- available-for-sale financial assets | — | (1 | ) | |||||
- cash flow hedging reserve | 2 | — | ||||||
|
|
|
| |||||
At 30 June/ 31 December | 20 | 20 | ||||||
|
|
|
| |||||
Deferred tax assets are attributable to the following items:
| 30 June 2013 | 31 December 2012 | |||||||
| £m | £m | |||||||
Deferred income tax assets | ||||||||
Accelerated book depreciation | 1 | 1 | ||||||
IAS 32 and 39 transition adjustments | 4 | 5 | ||||||
Other temporary differences | 15 | 14 | ||||||
|
|
|
| |||||
| 20 | 20 | |||||||
|
|
|
| |||||
The deferred tax assets scheduled above have been recognised on the basis that sufficient future taxable profits are forecast within the foreseeable future, in excess of the profits arising from the reversal of existing taxable temporary differences, to allow for the utilisation of the assets as they reverse. The deferred tax charge in the income statement comprises the following temporary differences:
| Six months ended | Six months ended | |||||||
| 30 June 2013 | 30 June 2012 | |||||||
| £m | £m | |||||||
IAS 32 and 39 transitional adjustments | (1 | ) | (1 | ) | ||||
Other temporary differences | (1 | ) | (1 | ) | ||||
|
|
|
| |||||
| (2 | ) | (2 | ) | |||||
|
|
|
| |||||
At 30 June 2013, the ANTS group had UK capital losses carried forward of £15m (2012: £23m). These losses are available for offset against future UK chargeable gains and under current UK tax legislation do not time expire. No deferred tax asset has been recognised in respect of these capital losses on the basis that future capital gains required to utilise the losses are not probable.
16. DEPOSITS BY BANKS
| 30 June 2013 | 31 December 2012 | |||||||
| £m | £m | |||||||
Amounts due to Santander UK undertakings | 112,631 | 109,306 | ||||||
Securities sold under agreements to repurchase | 4,976 | 4,799 | ||||||
Amounts due to Banco Santander, S.A. - securities sold under agreements to repurchase | 119 | 140 | ||||||
Time and demand deposits | 284 | 290 | ||||||
|
|
|
| |||||
Total deposits by banks | 118,010 | 114,535 | ||||||
|
|
|
| |||||
70 | Abbey National Treasury Services plc 2013 Half Yearly Financial Report |
Table of Contents
Financial Statements
Notes to the Financial Statementscontinued
17. TRADING LIABILITIES
| 30 June 2013 | 31 December 2012 | |||||||||
| £m | £m | |||||||||
Deposits by banks | - securities sold under repurchase agreements | 11,185 | �� | 6,833 | ||||||
- other(1) | 3,974 | 2,909 | ||||||||
Deposits by customers | - securities sold under repurchase agreements | 11,516 | 4,847 | |||||||
- other(2) | 2,212 | 2,401 | ||||||||
Short positions in securities and unsettled trades | 5,903 | 4,119 | ||||||||
|
|
|
| |||||||
| 34,790 | 21,109 | |||||||||
|
|
|
| |||||||
| (1) | Comprises cash collateral £1,914m (2012: £2,269m) and short-term deposits £2,060m (2012: £640m). |
| (2) | Comprises short-term deposits £1,831m (2012: £1,702m) and equity linked deposits £381m (2012: £699m). The capital amount guaranteed/protected and the amount of return guaranteed in respect of the equity index-linked deposits were £283m and £44m, respectively (2012: £559m and £109m, respectively). |
Included in the above balances are amounts owed by the ANTS group to Banco Santander, S.A. of £170m (2012: £180m) and to fellow subsidiaries of Banco Santander, S.A. outside the ANTS group of £1m (2012: £45m).
18. FINANCIAL LIABILITIES DESIGNATED AT FAIR VALUE
| 30 June 2013 | 31 December 2012 | |||||||
| £m | £m | |||||||
Debt securities in issue: | ||||||||
- US$10bn Euro Commercial Paper Programme | 2,619 | 1,403 | ||||||
- US$20bn Euro Medium Term Note Programme | 474 | 655 | ||||||
- Euro 10bn Structured Notes | 1,986 | 1,740 | ||||||
Warrants | 198 | 204 | ||||||
|
|
|
| |||||
| 5,277 | 4,002 | |||||||
|
|
|
| |||||
Financial liabilities are designated at fair value through profit or loss where this results in more relevant information because it significantly reduces a measurement inconsistency that would otherwise arise from measuring assets and liabilities or recognising the gains or losses on them on a different basis or where a contract contains one or more embedded derivatives that would otherwise require separate recognition.
Gains and losses arising from changes in the credit spread of liabilities issued by the ANTS group reverse over the contractual life of the debt, provided that the debt is not repaid at a premium or a discount.
The net gain during the period attributable to changes in the ANTS group’s own credit risk on the above debt securities in issue was £18m (six months ended 30 June 2012: net loss of £23m). The cumulative net gain attributable to changes in the ANTS group’s own credit risk on the above debt securities in issue at 30 June 2013 was £25m (2012: net gain of £7m).
The amount that would be required to be contractually paid at maturity of the debt securities in issue above was £359m (2012: £531m) higher than the carrying value.
Abbey National Treasury Services plc 2013 Half Yearly Financial Report | 71 |
Table of Contents
Financial Statements
Notes to the Financial Statementscontinued
19. DEBT SECURITIES IN ISSUE
| 30 June 2013 | 31 December 2012 | |||||||
| £m | £m | |||||||
Euro 35bn Global Covered Bond Programme | 17,111 | 20,576 | ||||||
US$20bn Euro Medium Term Note Programme | 7,474 | 6,396 | ||||||
US$20bn Commercial Paper Programme | 3,346 | 2,289 | ||||||
Certificates of deposit in issue | 1,051 | 4,509 | ||||||
|
|
|
| |||||
| 28,982 | 33,770 | |||||||
|
|
|
| |||||
Included in the above balances are amounts owed by the ANTS group to Banco Santander, S.A. and to fellow subsidiaries of Banco Santander, S.A. outside the ANTS group of £51m (2012: £2,040m) and £790m (2012: £698m) respectively.
20. PROVISIONS
| £m | ||||
At 1 January 2013 | 20 | |||
Additional provisions | — | |||
Used during the period | (20 | ) | ||
|
| |||
At 30 June 2013 | — | |||
|
| |||
| £ | m | |||
|
| |||
At 1 January 2012 | 20 | |||
Additional provisions | 20 | |||
Used during the year | (20 | ) | ||
|
| |||
At 31 December 2012 | 20 | |||
|
| |||
To be settled: | ||||
Within 12 months | 20 | |||
In more than 12 months | — | |||
|
| |||
| 20 | ||||
|
| |||
21. PENSIONS AND OTHER POST-RETIREMENT BENEFITS
The ANTS group participates in various Santander UK defined benefit and defined contribution pension schemes in operation. There is no contractual agreement of stated policy for charging the net defined benefit cost of the Santander UK defined benefit schemes. Therefore, in accordance with IAS 19, the defined benefit asset or liability has been recognised in the Condensed Consolidated Interim Financial Statements of the sponsoring employer of the scheme and the ANTS group accounts for its contributions as a defined contribution scheme. The contribution to be paid by the ANTS group is calculated as the contributions made by Santander UK plc to the schemes in respect of the ANTS group’s employees (many of whom are seconded from Santander UK). For the six months ended 30 June 2013 an amount of £0.8m (six months ended 30 June 2012: £0.8m) was recognised as an expense for these contributions and is included in staff costs within administration expenses in the income statement.
22. CONTINGENT LIABILITIES AND COMMITMENTS
| 30 June 2013 | 31 December 2012 | |||||||
| £m | £m | |||||||
Guarantees given on behalf of the Company’s UK parent, fellow subsidiaries and subsidiaries | 154,313 | 153,047 | ||||||
Guarantees given to third parties | 420 | 505 | ||||||
Formal standby facilities, credit lines and other commitments with original term to maturity of: | ||||||||
- One year or less | 530 | 1,186 | ||||||
- More than one year | 9,111 | 8,167 | ||||||
|
|
|
| |||||
| 164,374 | 162,905 | |||||||
|
|
|
| |||||
72 | Abbey National Treasury Services plc 2013 Half Yearly Financial Report |
Table of Contents
Financial Statements
Notes to the Financial Statementscontinued
Regulatory
The ANTS group engages in discussion, and co-operates, with the FCA in their supervision of the ANTS group, including reviews exercised under statutory powers, regarding its interaction with past and present customers, both as part of the FCA’s general thematic work and in relation to specific products and services.
A provision established with respect to interest rate derivatives is held by Santander UK plc.
23. CASH FLOW STATEMENT
a) Reconciliation of profit after tax to net cash (outflow)/inflow from operating activities:
| Six months ended | Six months ended | |||||||
| 30 June 2013 | 30 June 2012 | |||||||
| £m | £m | |||||||
Profit for the period | 256 | 120 | ||||||
Non-cash items included in net profit | ||||||||
Depreciation and amortisation | 1 | 1 | ||||||
Decrease in prepayments and accrued income | 236 | (21 | ) | |||||
(Decrease)/increase in accruals and deferred income | (254 | ) | 75 | |||||
Amortisation of premiums on debt securities | (12 | ) | — | |||||
Provisions for impairment | 18 | 20 | ||||||
Corporation tax charge | 45 | 15 | ||||||
Other non-cash items | 222 | 57 | ||||||
|
|
|
| |||||
Net cash flow from trading activities | 512 | 267 | ||||||
Changes in operating assets and liabilities | ||||||||
Net increase in cash and balances held at central banks | (8 | ) | (1 | ) | ||||
Net (increase)/ decrease in trading assets | (8,540 | ) | 1,295 | |||||
Net decrease/(increase) in derivative assets | 6,009 | (296 | ) | |||||
Net decrease in financial assets designated at fair value | 962 | 494 | ||||||
Net decrease in debt securities, treasury bills and other eligible bills | 12 | — | ||||||
Net increase in loans and advances to banks and customers | (11,462 | ) | (14,564 | ) | ||||
Net (increase)/decrease in other assets | (61 | ) | 18 | |||||
Net increase in deposits by banks and customers accounts | 3,225 | 23,705 | ||||||
Net decrease in derivative liabilities | (6,154 | ) | (483 | ) | ||||
Net increase in trading liabilities | 13,682 | 2,495 | ||||||
Net decrease in financial liabilities designated at fair value | (152 | ) | (226 | ) | ||||
Net (decrease)/increase in debt issued | (932 | ) | 1,264 | |||||
Net decrease in other liabilities | (14 | ) | (43 | ) | ||||
Effects of exchange rate differences | 1,150 | (802 | ) | |||||
|
|
|
| |||||
Net cash flow (used in)/from operating activities before tax | (1,771 | ) | 13,123 | |||||
Corporation tax paid | — | (2 | ) | |||||
|
|
|
| |||||
Net cash flow (used in)/from operating activities | (1,771 | ) | 13,121 | |||||
|
|
|
| |||||
b) Analysis of the balances of cash and cash equivalents in the balance sheet
| 30 June 2013 | 31 December 2012 | |||||||
| £m | £m | |||||||
Cash and balances at central banks | 9,284 | 388 | ||||||
Less: regulatory minimum cash balances | (31 | ) | (23 | ) | ||||
|
|
|
| |||||
| 9,253 | 365 | |||||||
|
|
|
| |||||
Debt securities - Trading | 3,143 | 1,196 | ||||||
Loans and advances to banks - Trading | 5,661 | 6,425 | ||||||
Loans and advances to customers - Trading | 2,508 | 3,363 | ||||||
|
|
|
| |||||
Net trading other cash equivalents | 11,312 | 10,984 | ||||||
|
|
|
| |||||
Loans and advances to banks - Non trading | 54,841 | 68,065 | ||||||
|
|
|
| |||||
Net non-trading other cash equivalents | 54,841 | 68,065 | ||||||
|
|
|
| |||||
Cash and cash equivalents at period end | 75,406 | 79,414 | ||||||
|
|
|
| |||||
Abbey National Treasury Services plc 2013 Half Yearly Financial Report | 73 |
Table of Contents
Financial Statements
Notes to the Financial Statementscontinued
24. ASSETS CHARGED AS SECURITY FOR LIABILITIES AND COLLATERAL ACCEPTED AS SECURITY FOR ASSETS
The following transactions are conducted under terms that are usual and customary to collateralised transactions, including, where relevant, standard securities lending and repurchase agreements.
a) Financial assets pledged to secure liabilities
The financial assets below are analysed between those assets accounted for on the balance sheet and off-balance sheet in accordance with IFRS.
| 30 June 2013 £m | 31 December 2012 £m | |||||||
On balance sheet: | ||||||||
Treasury bills and other eligible securities | 5,544 | 2,924 | ||||||
Cash | 2,193 | 2,741 | ||||||
Debt securities | 560 | 483 | ||||||
Equity securities | 439 | 309 | ||||||
|
|
|
| |||||
| 8,736 | 6,457 | |||||||
|
|
|
| |||||
Off balance sheet: | ||||||||
Treasury bills and other eligible securities | 20,118 | 17,666 | ||||||
Debt securities | 2,971 | 6,784 | ||||||
Equity securities | 389 | 105 | ||||||
|
|
|
| |||||
| 23,478 | 24,555 | |||||||
|
|
|
| |||||
The ANTS group provides assets as collateral in the following areas of the business.
Sale and repurchase agreements
The Company and certain of its subsidiaries enter into sale and repurchase agreements and similar transactions of equity and debt securities, which are accounted for as secured borrowings. Upon entering into such transactions, the Company and subsidiaries provide collateral equal to 100%-131% of the borrowed amount. The carrying amount of assets that were so provided at 30 June 2013 was £24,086m (2012: £18,269m).
Stock borrowing and lending agreements
Asset balances under stock borrowing and lending agreements represent stock lent by the ANTS group. These balances amounted to £5,934m at 30 June 2013 (2012: £10,002m) and are offset by contractual commitments to return stock borrowed or cash received.
Derivatives business
In addition to the arrangements described above, collateral is also provided in the normal course of derivative business to counterparties. At 30 June 2013, £2,193m (2012: £2,741m) of such collateral in the form of cash had been provided by the ANTS group and is included in the table above.
b) Collateral held as security for assets
The collateral held as security for assets below are analysed between those liabilities accounted for on the balance sheet and off-balance sheet in accordance with IFRS.
| 30 June 2013 £m | 31 December 2012 £m | |||||||
On balance sheet: | ||||||||
Trading liabilities | 1,913 | 2,269 | ||||||
|
|
|
| |||||
| 1,913 | 2,269 | |||||||
|
|
|
| |||||
Off balance sheet: | ||||||||
Trading liabilities | 29,901 | 23,865 | ||||||
Deposits by banks | 119 | 233 | ||||||
|
|
|
| |||||
| 30,020 | 24,098 | |||||||
|
|
|
| |||||
Purchase and resale agreements
The Company and certain of its subsidiaries also enter into purchase and resale agreements and similar transactions of equity and debt securities, which are accounted for as collateralised loans. Upon entering into such transactions, the Company and subsidiaries receive collateral equal to 100%-105% of the loan amount. The level of collateral held is monitored daily and if required, further calls are made to ensure the market values of collateral remains at least equal to the loan balance. The Company and subsidiaries are permitted to sell or repledge the collateral held in the absence of default. At 30 June 2013, the fair value of such collateral received was £24,898m (2012: £14,789m), almost all of which was sold or repledged. The Company and its subsidiaries have an obligation to return collateral that they have sold or pledged.
74 | Abbey National Treasury Services plc 2013 Half Yearly Financial Report |
Table of Contents
Financial Statements
Notes to the Financial Statementscontinued
Stock borrowing and lending agreements
Obligations under stock borrowing and lending agreements represent contractual commitments to return stock borrowed. These obligations totalling £5,122m at 30 June 2013 (2012: £9,309m) and are offset by a contractual right to receive stock lent by the ANTS group.
Derivatives business
In addition to the arrangements described above, collateral is also received in the normal course of derivative business from counterparties. At 30 June 2013, £1,913m (2012: £2,269m) of such collateral in the form of cash had been received by the ANTS group and is included in the table above.
Lending activities
In addition to the above collateral held as security for assets, the ANTS group may obtain a charge over a customer’s property in connection with its lending activities. Details of these arrangements are set out in the “Credit Risk” section of the Risk Management Report.
25. RELATED PARTY DISCLOSURES
The financial position and performance of ANTS group have not been materially affected in the first six months of the year by any related party transactions, or changes to related party transactions, except as disclosed in Note 19 “Debt securities in issue”.
Information on balances due from/(to) other Banco Santander group companies is set out in the section “Balances with other Banco Santander group companies” in the Risk Management Report on pages 45 to 47. In addition, transactions with pension schemes operated by the Santander UK group are described in Note 21. These transactions were made in the ordinary course of business and substantially on the same terms as for comparable transactions with third party counterparties and within limits acceptable to the UK Prudential Regulatory Authority. Such transactions do not involve more than the normal risk of collectability or present any unfavourable features.
Abbey National Treasury Services plc 2013 Half Yearly Financial Report | 75 |
Table of Contents
Financial Statements
Notes to the Financial Statementscontinued
26. FINANCIAL INSTRUMENTS
a) Fair values of financial instruments measured at amortised cost on a recurring basis
The following tables analyse the fair value of financial instruments not measured at fair value in the balance sheet:
30 June 2013 | Carrying value £m | Fair value £m | Surplus/(deficit) £m | |||||||||
Assets | ||||||||||||
Cash and balances at central banks | 9,284 | 9,284 | — | |||||||||
Loans and advances to banks | 108,584 | 109,042 | 458 | |||||||||
Loans and advances to customers | 40,963 | 41,922 | 959 | |||||||||
Loans and receivable securities | 165 | 158 | (7 | ) | ||||||||
Liabilities | ||||||||||||
Deposits by banks | 118,010 | 121,753 | (3,743 | ) | ||||||||
Deposits by customers | 5,820 | 5,833 | (13 | ) | ||||||||
Debt securities in issue | 28,982 | 30,163 | (1,181 | ) | ||||||||
31 December 2012 | Carrying value £m | Fair value £m | Surplus/(deficit) £m | |||||||||
Assets | ||||||||||||
Cash and balances at central banks | 388 | 388 | — | |||||||||
Loans and advances to banks | 106,986 | 107,145 | 159 | |||||||||
Loans and advances to customers | 44,750 | 47,533 | 2,783 | |||||||||
Loans and receivable securities | 162 | 154 | (8 | ) | ||||||||
Liabilities | ||||||||||||
Deposits by banks | 114,535 | 118,208 | (3,673 | ) | ||||||||
Deposits by customers | 6,249 | 6,264 | (15 | ) | ||||||||
Debt securities in issue | 33,770 | 35,071 | (1,301 | ) | ||||||||
The surplus/(deficit) in the table above represents the surplus/(deficit) of fair value compared to the carrying amount of those financial instruments for which fair values have been estimated. The carrying value above of any financial assets and liabilities that are designated as hedged items in a portfolio (or macro) fair value hedge relationship excludes gains and losses attributable to the hedged risk, as this is presented as a single separate line item on the balance sheet.
b) Fair values of financial instruments measured at fair value on a recurring basis
The following tables summarise the fair values at 30 June 2013 and 31 December 2012 of the financial asset and liability classes accounted for at fair value, analysed by the valuation methodology used by the ANTS group to determine their fair value. The tables also disclose the percentages that the recorded fair values of financial assets and liabilities represent of the total assets and liabilities, respectively, that are recorded at fair value in the balance sheet:
76 | Abbey National Treasury Services plc 2013 Half Yearly Financial Report |
Table of Contents
Financial Statements
Notes to the Financial Statementscontinued
| 30 June 2013 | Internal models based on | |||||||||||||||||||||||||||||||||||||
| Balance sheet category | Quoted prices in active markets (Level 1) | Market observable data (Level 2) | Significant unobservable data (Level 3) | Total | Valuation technique | |||||||||||||||||||||||||||||||||
| £m | % | £m | % | £m | % | £m | % | |||||||||||||||||||||||||||||||
Assets | ||||||||||||||||||||||||||||||||||||||
Trading assets | Loans and advances to banks | — | — | 9,826 | 15 | — | — | 9,826 | 15 | A | ||||||||||||||||||||||||||||
Loans and advances to customers | — | — | 11,906 | 18 | — | — | 11,906 | 18 | A | |||||||||||||||||||||||||||||
Debt securities | 8,985 | 14 | — | — | — | — | 8,985 | 14 | — | |||||||||||||||||||||||||||||
Equity securities | 446 | 1 | — | — | — | — | 446 | 1 | — | |||||||||||||||||||||||||||||
Derivative assets | Exchange rate contracts | — | — | 3,058 | 5 | 15 | — | 3,073 | 5 | A | ||||||||||||||||||||||||||||
Interest rate contracts | 65 | — | 22,125 | 34 | — | — | 22,190 | 34 | A & C | |||||||||||||||||||||||||||||
Equity and credit contracts | 307 | — | 1,360 | 2 | 333 | 1 | 2,000 | 3 | B & D | |||||||||||||||||||||||||||||
Commodity contracts | — | — | 5 | — | — | — | 5 | — | A | |||||||||||||||||||||||||||||
Financial assets at FVTPL | Loans and advances to customers | — | — | 2,187 | 3 | 52 | — | 2,239 | 3 | A | ||||||||||||||||||||||||||||
Debt securities | — | — | 270 | — | 58 | — | 328 | — | A & B | |||||||||||||||||||||||||||||
AFS Financial assets | Debt securities | 4,313 | 7 | — | — | — | — | 4,313 | 7 | — | ||||||||||||||||||||||||||||
|
|
|
|
|
|
|
|
|
|
|
|
|
|
|
| |||||||||||||||||||||||
Total assets at fair value | 14,116 | 22 | 50,737 | 77 | 458 | 1 | 65,311 | 100 | ||||||||||||||||||||||||||||||
|
|
|
|
|
|
|
|
|
|
|
|
|
|
|
| |||||||||||||||||||||||
Liabilities | ||||||||||||||||||||||||||||||||||||||
Trading liabilities | Deposits by banks | — | — | 15,159 | 22 | — | — | 15,159 | 22 | A | ||||||||||||||||||||||||||||
Deposits by customers | — | — | 13,728 | 20 | — | — | 13,728 | 20 | A | |||||||||||||||||||||||||||||
Short positions | 5,903 | 9 | — | — | — | — | 5,903 | 9 | — | |||||||||||||||||||||||||||||
Derivative liabilities | Exchange rate contracts | — | — | 4,150 | 6 | — | — | 4,150 | 6 | A | ||||||||||||||||||||||||||||
Interest rate contracts | — | — | 21,431 | 32 | — | — | 21,431 | 32 | A & C | |||||||||||||||||||||||||||||
Equity and credit contracts | — | — | 2,282 | 3 | 66 | — | 2,348 | 3 | B & D | |||||||||||||||||||||||||||||
Commodity contracts | — | — | 5 | — | — | — | 5 | — | A | |||||||||||||||||||||||||||||
Financial liabilities at FVTPL | Debt securities in issue | — | — | 5,217 | 8 | 60 | — | 5,277 | 8 | A | ||||||||||||||||||||||||||||
|
|
|
|
|
|
|
|
|
|
|
|
|
|
|
| |||||||||||||||||||||||
Total liabilities at fair value | 5,903 | 9 | 61,972 | 91 | 126 | — | 68,001 | 100 | ||||||||||||||||||||||||||||||
|
|
|
|
|
|
|
|
|
|
|
|
|
|
|
| |||||||||||||||||||||||
| 31 December 2012 | Internal models based on | |||||||||||||||||||||||||||||||||||||
| Balance sheet category | Quoted prices in active markets (Level 1) | Market observable data (Level 2) | Significant unobservable data (Level 3) | Total | Valuation technique | |||||||||||||||||||||||||||||||||
| £m | % | £m | % | £m | % | £m | % | |||||||||||||||||||||||||||||||
Assets | ||||||||||||||||||||||||||||||||||||||
Trading assets | Loans and advances to banks | — | — | 9,988 | 16 | — | — | 9,988 | 16 | A | ||||||||||||||||||||||||||||
Loans and advances to customers | — | — | 7,552 | 12 | — | — | 7,552 | 12 | A | |||||||||||||||||||||||||||||
Debt securities | 4,494 | 7 | — | — | — | — | 4,494 | 7 | — | |||||||||||||||||||||||||||||
Equity securities | 464 | 1 | — | — | — | — | 464 | 1 | — | |||||||||||||||||||||||||||||
Derivative assets | Exchange rate contracts | — | — | 3,660 | 6 | 36 | — | 3,696 | 6 | A | ||||||||||||||||||||||||||||
Interest rate contracts | 54 | — | 28,038 | 43 | — | — | 28,092 | 43 | A & C | |||||||||||||||||||||||||||||
Equity and credit contracts | 152 | — | 957 | 1 | 372 | 1 | 1,481 | 2 | B & D | |||||||||||||||||||||||||||||
Commodity contracts | — | — | 7 | — | — | — | 7 | — | A | |||||||||||||||||||||||||||||
Financial assets at FVTPL | Loans and advances to customers | — | — | 3,142 | 5 | 61 | — | 3,203 | 5 | A | ||||||||||||||||||||||||||||
Debt securities | — | — | 279 | — | 49 | — | 328 | — | A & B | |||||||||||||||||||||||||||||
AFS Financial assets | Debt securities | 5,113 | 8 | — | — | — | — | 5,113 | 8 | |||||||||||||||||||||||||||||
|
|
|
|
|
|
|
|
|
|
|
|
|
|
|
| |||||||||||||||||||||||
Total assets at fair value | 10,277 | 16 | 53,623 | 83 | 518 | 1 | 64,418 | 100 | — | |||||||||||||||||||||||||||||
|
|
|
|
|
|
|
|
|
|
|
|
|
|
|
| |||||||||||||||||||||||
Liabilities | ||||||||||||||||||||||||||||||||||||||
Trading liabilities | Deposits by banks | — | — | 9,742 | 16 | — | — | 9,742 | 16 | A | ||||||||||||||||||||||||||||
Deposits by customers | — | — | 7,248 | 12 | — | — | 7,248 | 12 | A | |||||||||||||||||||||||||||||
Short positions | 4,119 | 7 | — | — | — | — | 4,119 | 7 | — | |||||||||||||||||||||||||||||
Derivative liabilities | Exchange rate contracts | — | — | 4,552 | 8 | — | — | 4,552 | 8 | A | ||||||||||||||||||||||||||||
Interest rate contracts | 31 | — | 27,460 | 47 | — | — | 27,491 | 47 | A & C | |||||||||||||||||||||||||||||
Equity and credit contracts | 86 | — | 1,880 | 3 | 72 | — | 2,038 | 3 | B & D | |||||||||||||||||||||||||||||
Commodity contracts | — | — | 7 | — | — | — | 7 | — | A | |||||||||||||||||||||||||||||
Financial liabilities at FVTPL | Debt securities in issue | — | — | 3,916 | 7 | 86 | — | 4,002 | 7 | A | ||||||||||||||||||||||||||||
|
|
|
|
|
|
|
|
|
|
|
|
|
|
|
| |||||||||||||||||||||||
Total liabilities at fair value | 4,236 | 7 | 54,805 | 93 | 158 | — | 59,199 | 100 | ||||||||||||||||||||||||||||||
|
|
|
|
|
|
|
|
|
|
|
|
|
|
|
| |||||||||||||||||||||||
During the six months ended 30 June 2013 and the year ended 31 December 2012, there were no transfers between Level 1, Level 2 and Level 3 financial instruments.
Abbey National Treasury Services plc 2013 Half Yearly Financial Report | 77 |
Table of Contents
Financial Statements
Notes to the Financial Statementscontinued
c) Valuation techniques
The main valuation techniques employed in the ANTS group’s internal models to measure the fair value of the financial instruments disclosed above at 30 June 2013 and 31 December 2012 are set out below. In substantially all cases, the principal inputs into these models are derived from observable market data. From 1 January 2013, the ANTS group revised its valuation techniques and internal models to include own credit risk in the valuation of derivatives.
| A | In the valuation of financial instruments requiring static hedging (for example interest rate, currency derivatives and commodity swaps) and in the valuation of loans and advances and deposits, the ‘present value’ method is used. Expected future cash flows are discounted using the interest rate curves of the applicable currencies or forward commodity prices as appropriate. The interest rate curves are generally observable market data and reference yield curves derived from quoted interest rates in appropriate time bandings, which match the timings of the cash flows and maturities of the instruments. The forward commodity prices are generally observable market data. |
| B | In the valuation of equity financial instruments requiring dynamic hedging (principally equity securities, options and other structured instruments), proprietary local volatility and stochastic volatility models are used. These types of models are widely accepted in the financial services industry. Observable market inputs used in these models include the bid-offer spread, foreign currency exchange rates, volatility and correlation between indices. In limited circumstances, other inputs may be used in these models that are based on data other than observable market data, such as the Halifax’s UK House Price Index (‘HPI’) volatility, HPI forward growth, HPI spot rate and mortality. |
| C | In the valuation of financial instruments exposed to interest rate risk that require either static or dynamic hedging (such as interest rate futures, caps and floors, and options), the present value method (futures), Black’s model (caps/floors) and the Hull/White and Markov functional models (Bermudan options) are used. These types of models are widely accepted in the financial services industry. The significant inputs used in these models are observable market data, including appropriate interest rate curves, volatilities, correlations and exchange rates. In limited circumstances, other inputs may be used in these models that are based on data other than observable market data, such as HPI volatility, HPI forward growth, HPI spot rate and mortality. |
| D | In the valuation of linear instruments such as credit risk and fixed-income derivatives, credit risk is measured using dynamic models similar to those used in the measurement of interest rate risk. In the case of non-linear instruments, if the portfolio is exposed to credit risk such as credit derivatives, the probability of default is determined using the par spread level. The main inputs used to determine the underlying cost of credit of credit derivatives are quoted credit risk premiums and the correlation between the quoted credit derivatives of various issuers. |
The fair values of the financial instruments arising from the ANTS group’s internal models take into account, among other things, contract terms and observable market data, which include such factors as bid-offer spread, interest rates, credit risk (including own credit risk), exchange rates, the quoted market price of raw materials and equity securities, volatility and prepayments. In all cases, when it is not possible to derive a valuation for a particular feature of an instrument, management uses judgement to determine the fair value of the particular feature. In exercising this judgement, a variety of tools are used including proxy observable data, historical data and extrapolation techniques. Extrapolation techniques take into account behavioural characteristics of equity markets that have been observed over time, and for which there is a strong case to support an expectation of a continuing trend in the future. Estimates are calibrated to observable market prices when they become available.
The estimates thus obtained could vary if other valuation methods or assumptions were used. The ANTS group believes its valuation methods are appropriate and consistent with other market participants. Nevertheless, the use of different valuation methods or assumptions, including imprecision in estimating unobservable market inputs, to determine the fair value of certain financial instruments could result in different estimates of fair value at the reporting date and the amount of gain or loss recorded for a particular instrument. Most of the valuation models are not significantly subjective, because they can be tested and, if necessary, recalibrated by the internal calculation of and subsequent comparison to market prices of actively traded securities, where available.
d) Fair value adjustments
The internal models incorporate assumptions that the ANTS group believes would be made by a market participant to establish fair value. Fair value adjustments are adopted when the ANTS group considers that there are additional factors that would be considered by a market participant in the determination of fair value of the instrument that are not incorporated in the valuation model. The magnitude of fair value adjustments depends upon many entity-specific factors, including modelling sophistication, the nature of products traded, and the size and type of risk exposures. For this reason, fair value adjustments may not be comparable across the banking industry.
78 | Abbey National Treasury Services plc 2013 Half Yearly Financial Report |
Table of Contents
Financial Statements
Notes to the Financial Statementscontinued
The ANTS group classifies fair value adjustments as either ‘risk-related’ or ‘model-related’. The fair value adjustments form part of the portfolio fair value and are included in the balance sheet values of the product types to which they have been applied. The majority of these adjustments relate to Markets. The magnitude and types of fair value adjustment adopted by Markets are listed in the following table:
| 30 June 2013 £m | 31 December 2012 £m | |||||||
Risk-related: | ||||||||
- Bid-offer and trade specific adjustments | 31 | 26 | ||||||
- Uncertainty | 21 | 22 | ||||||
- Credit risk adjustment(1) | 52 | 107 | ||||||
|
|
|
| |||||
| 104 | 155 | |||||||
|
|
|
| |||||
Model-related: | ||||||||
- Model limitation | 13 | 17 | ||||||
Day One profits | — | — | ||||||
|
|
|
| |||||
| 117 | 172 | |||||||
|
|
|
| |||||
| (1) | In accordance with the requirements of IFRS 13, with effect from 1 January 2013 this includes the debit valuation adjustment described below. |
Risk-related adjustments
‘Risk-related’ adjustments are driven, in part, by the magnitude of the ANTS group’s market or credit risk exposure, and by external market factors, such as the size of market spreads. Following the implementation of IFRS 13, the credit risk adjustments are as follows.
The ANTS group adopts a credit risk adjustment (also frequently known as a ‘credit valuation adjustment’) against OTC derivative transactions to reflect within fair value the possibility that the counterparty may default, and the ANTS group may not receive the full market value of the transactions. The ANTS group calculates a credit risk adjustment for each counterparty to which the entity has exposure. The ANTS group attempts to mitigate credit risk to third parties by entering into netting and collateral arrangements. The net counterparty exposure (i.e. counterparty positions netted by offsetting transactions and both cash and securities collateral) is then assessed for counterparty creditworthiness. The ANTS group has only a limited exposure to monolines, consisting of exposure to securitisations which are wrapped by monoline insurers. The principal risk exposures are recorded against the securitisations, with the monoline wraps being viewed as contingent exposures, as described in Note 20 of the 2012 Annual Report. The description below relates to the credit risk adjustment taken against counterparties other than monolines.
The ANTS group calculates the credit risk adjustment by applying the probability of default of the counterparty to the expected positive exposure to the counterparty, and multiplying the result by the loss expected in the event of default (i.e. the loss given default (‘LGD’)). The timing of the expected losses is reflected by using a discount factor. The calculation is performed over the life of the potential exposure, i.e. the credit risk adjustment is measured as a lifetime expected loss.
The expected positive exposure is calculated at a trade level. The main drivers of the expected positive exposure are the size of the risk position with the counterparty along with the prevailing market environment. Probabilities of default are calculated using credit default swap prices where available. Where these are not available, probabilities of default are based upon analysis of historic default rates. The credit rating used for a particular counterparty is that determined by the ANTS group’s internal credit process. The LGD is calculated at the facility level and takes into account the counterparty characteristics. Credit ratings and LGD are updated by the credit team as new relevant information becomes available and at periodic reviews performed at least annually.
The ANTS group also considers its own creditworthiness when determining the fair value of an instrument, including OTC derivative instruments and financial liabilities held at fair value through profit or loss if the ANTS group believes market participants would take that into account when transacting the respective instrument. The approach to measuring the impact of the ANTS group’s credit risk on an instrument is done in the same manner as for third party credit risk. The impact of the ANTS group’s credit risk is considered when calculating the fair value of an instrument, even when credit risk is not readily observable such as in OTC derivatives. Consequently, the ANTS group’s adjustment against derivative liabilities was £44m at 30 June 2013, often referred to as a ‘debit valuation adjustment’.
For certain types of exotic derivatives where the products are not currently supported by the standard methodology, the ANTS group adopts an alternative methodology. Alternative methodologies used by the ANTS group fall into two categories. One method maps transactions against the results for similar products which are accommodated by the standard methodology. Where such a mapping approach is not appropriate, a bespoke methodology is used, generally following the same principles as the standard methodology, reflecting the key characteristics of the instruments but in a manner that is computationally less intensive. The calculation is applied at a trade level, with more limited recognition of credit mitigants such as netting or collateral agreements than used in the standard methodology described previously.
The methodologies do not, in general, account for ‘wrong-way risk’. Wrong-way risk arises where the underlying value of the derivative prior to any credit risk adjustment is related to the probability of default of the counterparty. A more detailed description of wrong-way risk is set out in the 2012 Annual Report.
The ANTS group includes all third-party counterparties in the credit risk adjustment calculation.
Abbey National Treasury Services plc 2013 Half Yearly Financial Report | 79 |
Table of Contents
Financial Statements
Notes to the Financial Statementscontinued
e) Internal models based on information other than market data (Level 3)
The table below provides an analysis of financial instruments valued using internal models based on information other than market data together with the subsequent valuation technique used for each type of instrument. Each instrument is initially valued at transaction price:
Balance sheet value | Amount recognised in income/(expense) | |||||||||||||||||||
| 30 June 2013 | 31 December 2012 | H1 2013 | H1 2012 | |||||||||||||||||
Balance sheet line item | Category | Financial instrument product type | £m | £m | £m | £m | ||||||||||||||
1. Derivative assets | Exchange rate contracts | Cross-currency swaps | 15 | 36 | (6 | ) | (5 | ) | ||||||||||||
2. Derivative assets | Equity and credit contracts | Reversionary property interests | 72 | 76 | (2 | ) | 2 | |||||||||||||
3. Derivative assets | Equity and credit contracts | Credit default swaps | 16 | 17 | (1 | ) | 1 | |||||||||||||
4. Derivative assets | Equity contracts | Options and forwards | 245 | 279 | 2 | 6 | ||||||||||||||
5. Assets at FVTPL | Loans and advances to customers | Roll-up mortgage portfolio | 52 | 61 | (3 | ) | 3 | |||||||||||||
6. Assets at FVTPL | Debt securities | Mortgage-backed securities | 58 | 49 | 9 | 4 | ||||||||||||||
7. Derivative liabilities | Equity contracts | Options and forwards | (66 | ) | (72 | ) | 3 | 3 | ||||||||||||
8. Liabilities at FVTPL | Debt securities in issue | Non-vanilla debt securities | (60 | ) | (86 | ) | 5 | 7 | ||||||||||||
|
|
|
|
|
|
|
| |||||||||||||
Total net assets | 332 | 360 | — | — | ||||||||||||||||
|
|
|
|
|
|
|
| |||||||||||||
Total income | — | — | 7 | 21 | ||||||||||||||||
|
|
|
|
|
|
|
| |||||||||||||
Valuation techniques
1. Derivative assets – Exchange rate contracts
These cross currency swaps are used to hedge the foreign currency risks arising from the power reverse dual currency (‘PRDC’) notes issued by the ANTS group, as described in Instrument 8 below. These derivatives are valued using a standard valuation model valuing each leg of the swap, with expected future cash flows less notional amount exchanged at maturity date discounted using an appropriate floating rate. The floating rate is adjusted by the relevant cross currency basis spread. Interest rates, foreign exchange rates, cross currency basis spread and long-dated foreign exchange (‘FX’) volatility are used as inputs to determine fair value. Interest rates, foreign exchange rates are observable on the market. Cross currency spreads may be market observable or unobservable depending on the liquidity of the cross currency pair. As the Japanese Yen-US dollar cross currency pair related to the PRDC notes is liquid, the cross currency spreads (including long-dated cross currency spread) for these swaps are market observable.
The significant unobservable inputs for the valuation of these financial instruments are the long-dated FX volatility and the correlation between the underlying assets. The correlation between the underlying assets is assumed to be zero, as there are no actively traded options from which correlations between the underlying assets could be implied. Furthermore, the zero correlation assumption implies that the sources of the long-dated FX volatility are independent.
Long-dated FX volatility
Long-dated FX volatility is extrapolated from shorter-dated FX volatilities which are directly observable on the market. Short dated FX volatility is observable from the trading of FX options. As there is no active market for FX options with maturities greater than five years (long-dated FX options), long-dated FX volatility is not market observable. Furthermore, as historical prices are not relevant in determining the cost of hedging long-dated FX risk, long-dated FX volatility cannot be inferred from historical volatility. The ANTS group extrapolates the long-dated FX volatility from the shorter-dated FX volatilities using Black’s model.
FX volatility is modelled as the composition of the domestic interest rate, foreign interest rates and FX spot volatilities using standard Hull-White formulae. The Hull-White approach is used for estimating the future distribution of domestic and foreign zero-coupon rates, constructed from the relevant yield curves. Using short dated FX options, the FX spot volatility is calculated which is then extrapolated to derive the long-dated FX volatility.
2. Derivative assets – Equity and credit contracts
These reversionary property derivatives are valued using a probability weighted set of HPI forward prices, which are assumed to be a reasonable representation of the increase in value of the ANTS group’s reversionary interest portfolio underlying the derivatives. The probability used reflects the likelihood of the home owner vacating the property and is calculated from mortality rates and acceleration rates which are a function of age and gender, obtained from the relevant mortality tables. Indexing is felt to be appropriate due to the size and geographical dispersion of the ANTS group’s reversionary interest portfolio. These are determined using HPI Spot Rates adjusted to reflect estimated forward growth. Launched in 1984, the Halifax’s UK HPI is the UK’s longest running monthly house price data series covering the whole country. The indices calculated are standardised and represent the price of a typically transacted house. Both national and regional HPI are published. The national HPI is published monthly. The regional HPI reflects the national HPI disaggregated into 12 UK regions and is published quarterly. Both indices are published on two bases, including and excluding seasonal adjustments in the housing market. The ANTS group uses the non-seasonally adjusted (‘NSA’) national and regional HPI in its valuation model to avoid any subjective judgement in the adjustment process which is made by Halifax.
The inputs used to determine the value of the reversionary property derivatives are HPI spot, HPI forward growth and mortality rates. The principal pricing parameter is HPI forward growth.
80 | Abbey National Treasury Services plc 2013 Half Yearly Financial Report |
Table of Contents
Financial Statements
Notes to the Financial Statementscontinued
HPI Spot Rate
The HPI spot rate used in the model is a weighted average of NSA regional HPI spot rates i.e. adjusted for difference in the actual regional composition of the property underlying the ANTS group’s reversionary interest portfolio and the composition of the published regional indices. The regional HPI spot rate (which is observable market data) is only published on specific quarterly dates. In between these dates, its value is estimated by applying the growth rate over the relevant time period inferred from the national HPI spot rates (which are observable market data and published monthly) to the most recently calculated weighted average regional HPI spot rate based on published regional indices.
An adjustment is also made to reflect the specific property risk, i.e. possible deviation between the actual growth in the house prices underlying the ANTS group’s reversionary interest portfolio and their assumed index-linked growth, which is based on the regional HPI. This adjustment is based on the average historical deviation of price changes of the ANTS group’s actual property portfolio from that of the published indices over the time period since the last valuation date.
HPI Forward Growth Rate
Long-dated HPI forward growth rate is not directly observable in the market but is estimated from broker quotes and traded forward contracts. A specific spread is applied to the long-dated forward growth rate to reflect the uncertainty surrounding long dated data. This spread is calculated by analysing the historical volatility of the HPI, whilst incorporating mean reversion. An adjustment is made to reflect the specific property risk as for the HPI spot rate above.
Mortality Rate
Mortality rates are obtained from the PNMA00 and PNFA00 Continuous Mortality Investigation Tables published by the UK Institute and Faculty of Actuaries. These mortality rates are adjusted by acceleration rates to reflect the mortality profile of the holders of ANTS group’s reversionary property products underlying the derivatives.
3. Derivative assets – Equity and credit contracts
These derivative assets are credit default swaps held against certain bonds. The credit default swaps are valued using the credit spreads of the referenced bonds. These referenced bonds are valued with the assistance of valuations prepared by an independent, specialist valuation firm as a deep and liquid market does not exist.
In valuing the credit default swaps, the main inputs used to determine the underlying cost of credit are quoted risk premiums and the correlation between the quoted credit derivatives of various issuers. The assumptions relating to the correlation between the values of quoted and unquoted assets are based on historical correlations between the impact of adverse changes in market variables and the corresponding valuation of the associated unquoted assets. The measurement of the assets will vary depending on whether a more or less conservative scenario is selected. The other main input is the probability of default of the referenced bonds. The significant unobservable input for the valuation of these financial instruments is the probability of default.
Probability of default
The probability of default is assessed by considering the credit quality of the underlying referenced bonds. However, as no deep and liquid market exists for these assets the assessment of the probability of default is not directly observable and instead an estimate is calculated using the Standard Gaussian Copula model.
4. Derivative assets – Equity contracts
There are three types of derivatives within this category:
European options –These derivatives are valued using a modified Black-Scholes model where the HPI is log-normally distributed with the forward rates determined from the HPI forward growth.
Asian options –Asian (or average value) options are valued using a modified Black-Scholes model, with an amended strike price and volatility assumption to account for the average exercise period, through a closed form adjustment that reflects the strike price relative to the distribution of stock prices at each relevant date. This is also known as the Curran model.
Forward contracts –Forward contracts are valued using a standard forward pricing model.
The inputs used to determine the value of the above instruments are HPI spot rate, HPI forward growth rate and HPI volatility. The principal pricing parameter is HPI forward growth rate.
HPI Spot Rate
The HPI spot rate used is the NSA national HPI spot rate which is published monthly and directly observable in the market. This HPI rate used is different from the weighted average regional HPI spot rate used in the valuation of Instrument 2 above, as the underlying of these derivatives is the UK national HPI spot rate.
HPI Forward Growth Rate
The HPI forward growth rate used is unobservable and is the same as used in the valuation of Instrument 2 above.
HPI Volatility
Long-dated HPI volatility is not directly observable in the market but is estimated from the most recent traded values. An adjustment is applied to the long-dated HPI volatility rate to reflect the uncertainty surrounding long-dated data. This adjustment is based on the empirical standard deviation of historical volatility over a range of time horizons.
Abbey National Treasury Services plc 2013 Half Yearly Financial Report | 81 |
Table of Contents
Financial Statements
Notes to the Financial Statementscontinued
5. Assets at FVTPL – Loans and advances to customers
These loans and advances to customers represent roll-up mortgages, which are an equity release scheme under which a property owner takes out a loan secured against their home. The owner does not make any interest payments during their lifetime and the fixed interest payments are rolled up into the mortgage. The loan or mortgage (capital and rolled-up interest) is repaid upon the owner’s vacation of the property and the value of the loan is only repaid from the value of the property. This is known as a ‘no negative pledge’. The ANTS group suffers a loss if the sale proceeds from the property are insufficient to repay the loan, as it is unable to pursue the homeowner’s estate or beneficiaries for the shortfall.
The value of the mortgage ‘rolls up’ or accretes until the owner vacates the property. In order to value the roll-up mortgages, the ANTS group uses a probability-weighted set of European option prices (puts) determined using the Black-Scholes model, in which the ‘no negative pledges’ are valued as short put options. The probability weighting applied is calculated from mortality rates and acceleration rates as a function of age and gender, taken from mortality tables.
The inputs used to determine the value of these instruments are HPI spot, HPI forward growth, HPI volatility, mortality rates and repayment rates. The principal pricing parameter is HPI forward growth. The HPI forward growth rate used is unobservable and is the same as used in the valuation of Instrument 2 above. The other parameters do not have a significant effect on the value of the instruments.
6. Assets at FVTPL – Debt securities
These securities consist of residential mortgage-backed securities issued by Banco Santander entities. Each instrument is valued with reference to the price from a consensus pricing service. This is then corroborated against the price from another consensus pricing service due to the lack of depth in the number of available market quotes. An average price is used where there is a more than insignificant difference between the two sources.
The significant unobservable input is the adjustment to the credit spread embedded in the pricing consensus quotes.
7. Derivative liabilities – Equity contracts
These derivatives are the same as Instrument 4 with the exception that they have a negative fair value.
8. Liabilities at FVTPL – Debt securities in issue
These debt securities in issue are power reverse dual currency notes. These notes are financial structured products where an investor is seeking a better return and a borrower/issuer a lower rate by taking advantage of the interest rate differential between two countries. The note pays a foreign interest rate in the investor’s domestic currency. The power component of the name denotes higher initial coupons and the fact that coupons rise as the domestic/foreign exchange rate depreciates. The power feature comes with a higher risk for the investor. Cash flows may have a digital cap feature where the rate gets locked once it reaches a certain threshold. Other add-on features are barriers such as knockouts and cancellation provisions for the issuer. These debt securities in issue are valued using a three-factor Gaussian Model. The three factors used in the valuation are domestic interest rates, foreign interest rates and foreign exchange rates. The correlations between the factors are assumed to be zero within the valuation.
The Hull-White approach is used for estimating the future distribution of domestic and foreign zero-coupon rates, constructed from the relevant yield curves. A Geometric Brownian Motion model is used for estimating the future distribution of spot foreign exchange rates. The foreign exchange and interest rate volatilities are the most crucial pricing parameters; the model calibrates to the relevant swaption volatility surface.
The significant unobservable inputs for the valuation of these financial instruments are the long dated FX volatility and the correlation between the underlying assets and are the same as Instrument 1.
Reconciliation of fair value measurements in Level 3 of the fair value hierarchy
The following table provides a reconciliation of the movement between opening and closing balances of Level 3 financial instruments, measured at fair value using a valuation technique with significant unobservable inputs:
| Assets | Liabilities | |||||||||||||||||||||||
| Derivatives | Fair value through P&L | Total | Derivatives | Fair value through P&L | Total | |||||||||||||||||||
| £m | £m | £m | £m | £m | £m | |||||||||||||||||||
At 1 January 2013 | 408 | 110 | 518 | (72 | ) | (86 | ) | (158 | ) | |||||||||||||||
Total gains/(losses) recognised in profit/(loss): | ||||||||||||||||||||||||
- Fair value movements | (7 | ) | 6 | (1 | ) | 3 | 5 | 8 | ||||||||||||||||
- Foreign exchange and other movements | (8 | ) | 2 | (6 | ) | — | 6 | 6 | ||||||||||||||||
Settlements | (45 | ) | (8 | ) | (53 | ) | 3 | 15 | 18 | |||||||||||||||
|
|
|
|
|
|
|
|
|
|
|
| |||||||||||||
At 30 June 2013 | 348 | 110 | 458 | (66 | ) | (60 | ) | (126 | ) | |||||||||||||||
|
|
|
|
|
|
|
|
|
|
|
| |||||||||||||
Total gains/(losses) recognised in profit/(loss) relating to assets and liabilities held at the end of the period | (15 | ) | 8 | (7 | ) | 3 | 11 | 14 | ||||||||||||||||
|
|
|
|
|
|
|
|
|
|
|
| |||||||||||||
82 | Abbey National Treasury Services plc 2013 Half Yearly Financial Report |
Table of Contents
Financial Statements
Notes to the Financial Statementscontinued
| Assets | Liabilities | |||||||||||||||||||||||
| Derivatives | Fair value through P&L | Total | Derivatives | Fair value through P&L | Total | |||||||||||||||||||
| £m | £m | £m | £m | £m | £m | |||||||||||||||||||
At 1 January 2012 | 430 | 109 | 539 | (89 | ) | (141 | ) | (230 | ) | |||||||||||||||
Total gains/(losses) recognised in profit/(loss): | ||||||||||||||||||||||||
- Fair value movements | 4 | 7 | 11 | 3 | 7 | 10 | ||||||||||||||||||
- Foreign exchange and other movements | (12 | ) | (1 | ) | (13 | ) | — | 16 | 16 | |||||||||||||||
Issues | 10 | — | 10 | — | — | — | ||||||||||||||||||
Settlements | (24 | ) | (5 | ) | (29 | ) | 14 | 32 | 46 | |||||||||||||||
|
|
|
|
|
|
|
|
|
|
|
| |||||||||||||
At 31 December 2012 | 408 | 110 | 518 | (72 | ) | (86 | ) | (158 | ) | |||||||||||||||
|
|
|
|
|
|
|
|
|
|
|
| |||||||||||||
Total gains/(losses) recognised in profit/(loss) relating to assets and liabilities held at the end of the year | (8 | ) | 6 | (2 | ) | 3 | 23 | 26 | ||||||||||||||||
|
|
|
|
|
|
|
|
|
|
|
| |||||||||||||
Effect of changes in significant unobservable assumptions to reasonably possible alternatives (Level 3)
The fair value of financial instruments are, in certain circumstances, measured using valuation techniques that incorporate assumptions that are not evidenced by prices from observable current market transactions in the same instrument and are not based on observable market data and, as such require the application of a degree of judgement. Changing one or more of the inputs to the valuation models to reasonably possible alternative assumptions would change the fair values significantly. There have been no significant changes to the sensitivity of these fair values to reasonably possible alternative assumptions from those shown in the 2012 Annual Report on page 184.
27. INTERESTS IN OTHER ENTITIES
a) Interests in subsidiaries
The ANTS group consists of a parent company, Abbey National Treasury Services plc, incorporated in the United Kingdom and a number of subsidiaries held directly and indirectly by ANTS plc, which operate principally in their country of incorporation or registration. Details of the material interests in subsidiaries are in the 2012 Annual Report.
All of the ANTS group’s subsidiaries are wholly-owned and do not have any non-controlling interests, except for the special purpose entities described in the 2012 Annual Report. There are no significant restrictions on the ability of the ANTS group to access or use assets and settle liabilities.
b) Interests in associates and joint ventures
The ANTS group did not have any interests in associates and joint ventures at 30 June 2013.
Abbey National Treasury Services plc 2013 Half Yearly Financial Report | 83 |
Table of Contents
Financial Statements
Notes to the Financial Statementscontinued
28. CAPITAL MANAGEMENT AND RESOURCES
Capital adequacy
The ANTS group manages its capital on a Basel II basis. During the six months ended 30 June 2013 and the year ended 31 December 2012, the ANTS group held capital over and above its regulatory requirements.
The Company, Santander UK plc, and Cater Allen Limited, which are the three PRA-regulated entities within the Santander UK group, are party to a capital support deed dated 14 December 2012 (the “Capital Support Deed”) with certain other non-regulated subsidiaries of Santander UK plc. The parties to the Capital Support Deed constitute a core UK group for the purposes of section 10 of the Prudential Sourcebook for Banks, Building Societies and Investment Firms (“BIPRU”) of the PRA Handbook. Under section 10.8 of BIPRU, exposures of each of the three regulated entities to other members of the core UK group are exempt from large exposure limits that would otherwise apply. The purpose of the Capital Support Deed is to facilitate the prompt transfer of available capital resources from, or repayment of liabilities by, the non-regulated parties to any of the regulated parties in the event that one of the regulated parties has breached or is at risk of breaching its capital resources requirements or risk concentrations requirements.
Group Capital
| 30 June 2013 £m | 31 December 2012 £m | |||||||
Tier 1 capital | 3,984 | 3,785 | ||||||
Deductions from Tier 1 capital | (29 | ) | (29 | ) | ||||
|
|
|
| |||||
Total Tier 1 capital | 3,955 | 3,756 | ||||||
Tier 2 capital | 2 | 2 | ||||||
|
|
|
| |||||
Total capital resources | 3,957 | 3,758 | ||||||
|
|
|
| |||||
The increase in Tier 1 capital is due to the inclusion of profits for the six months ended 30 June 2013.
29. EVENTS AFTER THE BALANCE SHEET DATE
None.
84 | Abbey National Treasury Services plc 2013 Half Yearly Financial Report |
Table of Contents
An investment in Abbey National Treasury Services plc (the “Company”) and together with its subsidiaries (“us” or “we”) involves a number of risks, the material ones of which are set forth in the 2012 Annual Report on pages 190 to 205. As a consequence of the reciprocal guarantee given by the Company in respect of the liabilities of Santander UK plc, we are exposed to the same risk factors as Santander UK, of which we are part.
These risk factors are unchanged except that references to the “FSA” or “Financial Services Authority” shall, where appropriate and where the context so permits, be deemed to be references to any relevant body or bodies which, pursuant to the Financial Services Act 2012 as described in the risk factor on page 119 of the 2012 Annual Report, exercise any function previously exercised by the Financial Services Authority.
Abbey National Treasury Services plc registered office, principal office and investor relations department
2 Triton Square Regent’s Place London, NW1 3AN | Phone number: 0870-607-6000 |
The designated agent for service of process on the ANTS group in the United States is Abbey National Treasury Services plc (Connecticut branch), 400 Atlantic Street, Stamford, CT 06901.
Santander shareholder department
Santander Shareholder Relations 2 Triton Square Regent’s Place London, NW1 3AN | Phone numbers: 0871-384-2000 +44 (0) 121-415-7188 (outside the UK) | Email: shareholders@santander.com |
Abbey National Treasury Services plc 2013 Half Yearly Financial Report | 85 |
Table of Contents
Shareholder Information
GUARANTEE of Santander UK plc by Abbey National Treasury Services plc
THIS INSTRUMENT by way of deed poll is executed on 10 May 2012 by ABBEY NATIONAL TREASURY SERVICES plc (registered in England No. 2338548) whose registered office is at 2 Triton Square, Regent’s Place, London NW1 3AN (the “Guarantor”).
WHEREAS:
Santander UK plc, a company incorporated in England (number 2294747) whose registered office is at 2 Triton Square, Regent’s Place, London NW1 3AN (“Santander UK”), has requested the Guarantor and the Guarantor has agreed to guarantee payment of all Obligations (as hereinafter defined) in accordance with, and as limited by, the terms and conditions of this Deed (this “Guarantee”).
NOW THEREOF the Guarantor hereby covenants and agrees as follows:
| 1. | In this Guarantee, unless the context otherwise requires: |
“Creditor” | means any person (other than Santander UK or any subsidiary of Santander UK (as defined in section 1159 of the Companies Act 2006 (the “Act”)) or any individual who is a connected person of Santander UK (within the meaning of section 254 of the Act)) to whom an Obligation is from time to time owed. | |
“Obligation” | means any obligation or liability (whether actual or contingent or for the payment of any amount or delivery of any property) incurred by Santander UK (whether as principal or surety) to any person on or before 30 June 2015 (whether before or after the execution of this Guarantee) under or in respect of any dealing, transaction or engagement whatsoever, including without prejudice to the generality of the foregoing, for: | |
(i) any moneys lent, advanced or otherwise made available to Santander UK (including, without limitation to the generality of the foregoing, the liability of Santander UK for drawing or issuing bills of exchange, promissory notes, bonds, debentures, certificates of deposit, commercial paper or other negotiable instruments or securities); | ||
(ii) any moneys lent, advanced or otherwise made available to any person, the repayment or payments in respect of which have been guaranteed by Santander UK or in respect of which Santander UK has given an indemnity (including, without limitation to the generality of the foregoing, guarantees and letters of credit issued by Santander UK and bills of exchange or other negotiable instruments accepted or endorsed by Santander UK); | ||
(iii) any moneys which any person shall pay or become liable to pay, for or on account of Santander UK, by reason of entering into or being party to any bond, indemnity, bill of exchange, guarantee, letter of credit or other engagement for the benefit or at the request of Santander UK; | ||
(iv) deposits made with Santander UK (including, without limitation of the generality of the foregoing, certificates of deposit issued by Santander UK); | ||
(v) any rate swap transaction, swap option, basis swap, forward rate transaction, commodity swap, commodity option, equity or equity index swap, equity or equity index option, bond option, interest rate option, foreign exchange transaction, cap transaction, collar transaction, floor transaction, currency swap transaction, cross-currency rate swap transaction, currency option, credit protection transaction, credit swap, credit default swap, credit default option, total return swap, credit spread transaction, repurchase transaction, reverse repurchase transaction, buy/sell back transaction, securities lending transaction or forward purchase or sale of a security, commodity or other financial instrument or interest (including any option with respect to any such transactions) or any other derivative transaction on one or more rates, currencies, commodities, equity securities or other equity instruments, debt securities or other debt instruments, indices, or measures of economic risk or value, in each case, to which Santander UK is party (including, for the avoidance of doubt, any obligation or liability under any master agreement that governs any such transactions); | ||
(vi) any such obligation or liability assumed under or incurred pursuant to any novation, transfer, assignment or other similar agreement between Santander UK and any other person; | ||
(vii) any obligation or liability under any transaction entered into by Santander UK after 30 June 2015 as a result of the exercise of any right or option granted by or to Santander UK on or prior to 30 June 2015; and | ||
(viii) any payments of interest due from Santander UK with respect to any of the foregoing transactions (whether or not the liability to pay such interest arises on or before 30 June 2015) together with all reasonable costs, commissions and other expenses incurred by any person in connection with the enforcement of this Guarantee,
but excluding: | ||
(a) any such obligations or liabilities of Santander UK (including under any guarantee or indemnity given by Santander UK) which by their terms are expressed (in whatever manner) to be conditional upon the solvency of Santander UK or subordinated to, or payable only after full satisfaction of, all or any obligations of Santander UK to all or any of its unsubordinated creditors; and | ||
86 | Abbey National Treasury Services plc 2013 Half Yearly Financial Report |
Table of Contents
Shareholder Information
Guaranteescontinued
(b) any such obligations or liabilities of Santander UK transferred to, or assumed by, any other person whether pursuant to any novation or transfer or other similar agreement, any statutory transfer (pursuant to Part VII of The Financial Services and Markets Act 2000 or otherwise), any scheme of arrangement or otherwise. | ||
“person” | means any person, firm, trust estate, corporation, association, cooperative, government or government agency or other entity. | |
| 2. | (a) The Guarantor hereby unconditionally and irrevocably guarantees, for the benefit of each Creditor, in accordance with the terms and conditions of this Guarantee, the full payment or performance by Santander UK when due (whether at stated maturity, upon acceleration or otherwise) of each and every Obligation and in the event that Santander UK shall default in the due and punctual payment or performance of any Obligation, undertakes to pay, or procure the payment of, such Obligation in the currency in which the particular Obligation is denominated in the case of a payment or perform, or procure the performance of such Obligation, upon written demand being made under this Guarantee by the relevant Creditor. |
| (b) | The Guarantor waives any right it may have of first requiring any Creditor to make demand, proceed or enforce any rights or security against Santander UK or any other person before making a claim against the Guarantor under this Guarantee. |
| 3. | A Creditor shall only be entitled to take or obtain the benefit of this Guarantee upon the condition that, after receipt by the Guarantor of a written demand from the Creditor, the Guarantor shall be entitled to deal with the Creditor, and the Creditor shall be obliged to deal with the Guarantor with respect to the Obligation due to the Creditor and this Guarantee without the necessity or duty to rely on, act through or otherwise involve or deal with Santander UK to the intent that the Guarantor and the Creditor shall deal with one another as principals in relation to the same provided that the rights, powers, privileges and remedies of the Creditor under this Guarantee shall not thereby be in any way limited or otherwise affected. |
| 4. | No delay or omission on the part of the Creditor in exercising any right, power, privilege or remedy (hereinafter together called “Rights”) in respect of this Guarantee shall impair any such Rights or be construed as a waiver of any thereof nor shall any single or partial exercise of any such Rights preclude any further exercise of any other Rights. The Rights herein provided are cumulative and not exclusive of any rights, powers, privileges or remedies provided by law. Nothing in this Guarantee shall be construed as voiding, negating or restricting any right of set-off or any other right whatsoever existing in favour of a Creditor or arising at common law, by statute or otherwise howsoever. |
| 5. | This Guarantee is a continuing guarantee and shall not be satisfied, discharged or affected by any intermediate payment or settlement of account. |
| 6. | The Guarantor will not exercise any rights of subrogation or any other rights or remedy (including, without limiting the generality of the foregoing, the benefit of any security or right of set-off) which it may acquire due to its payment or performance of any Obligation pursuant to the terms of this Guarantee and will not prove in the liquidation of Santander UK in competition with any Creditor unless and until all Obligations in respect of the relevant Creditor hereby guaranteed have been satisfied in full by the Guarantor or Santander UK. In the event that the Guarantor shall receive any payment on account of such rights while any Obligation remains outstanding, the Guarantor shall pay all amounts so received to the relevant Creditor. |
| 7. | Payments hereunder shall be made free and clear of any deduction or withholding other than those required by law and in that event the Guarantor shall pay such additional amount to the relevant Creditor as may be necessary in order that the actual amount received after all such deductions and withholdings shall equal the amount that would have been received if no such deduction or withholding were required provided that the Guarantor shall not be obliged to pay any such additional amount which would not have been payable if the payment which is the subject of the withholding or deduction had been made by Santander UK. If the Guarantor makes a payment of an additional amount in compliance with its obligations under this paragraph and the Creditor determines that it has received or been granted a credit against or relief or payment of any tax paid or payable by it in respect thereof the Creditor shall to the extent that it can do so without prejudice to the retention of the amount of such credit, relief or repayment pay to the Guarantor such amount as shall be attributable to such deduction provided that nothing contained in this paragraph shall interfere with the right of any Creditor to arrange its tax affairs in whatsoever manner it thinks fit and, in particular, no Creditor shall be under any obligation to claim relief in respect of any such deduction in priority to any other claims for relief available to it. |
| 8. | Any demand or notice hereunder shall be given in writing or by cable, telex or facsimile transmission addressed to the Guarantor or to the person to or upon whom the demand is to be made or the notice served at the registered or principal office or last known place of abode of the Guarantor or of such person, as the case may be. A demand so made shall be deemed to have been duly made if left at such address on the day it was so left or, if sent by post, two working days after the time when the same was put in the post and in proving delivery it shall be sufficient to prove that the same was properly addressed and put in the post. Any such demand sent by cable, telex or facsimile transmission shall be deemed to have been duly made at the time of despatch. |
Abbey National Treasury Services plc 2013 Half Yearly Financial Report | 87 |
Table of Contents
Shareholder Information
Guaranteescontinued
9. | The liability of the Guarantor under this Guarantee shall not be affected by the liquidation, winding-up or other incapacity of Santander UK. In the event that any payment or delivery to a Creditor from Santander UK in respect of an Obligation is avoided or reduced by virtue of any enactments for the time being in force relating to liquidation or insolvency of Santander UK, the Creditor shall be entitled to recover the value or amount thereof from the Guarantor as if such payment or delivery by Santander UK had not been made. | |||
10. | This Guarantee shall remain in full force and effect irrespective of: | |||
(a) | the validity, regularity, legality or enforceability against Santander UK of, or of any defence or counter-claim whatsoever available to Santander UK in relation to, any Obligation; | |||
(b) | whether or not any action has been taken to enforce any Obligation or any judgement obtained against Santander UK or any other person; | |||
(c) | whether or not the terms of any Obligation has been modified, supplemented, extended or restated in any way (in each case, however fundamental and of whatsoever nature); | |||
(d) | whether or not any time or indulgence has been granted to Santander UK or any other person by or on behalf of any Creditor; | |||
(e) | whether or not there have been any dealings or transactions between Santander UK or any other person and any Creditor; | |||
(f) | whether or not Santander UK or any other person has been dissolved, liquidated, merged, consolidated, become bankrupt or has changed its status, functions, control or ownership; | |||
(g) | whether or not Santander UK or any other person has been prevented from making payment by foreign exchange provisions applicable at its place of registration or incorporation; and | |||
(h) | whether or not any circumstances have occurred which might otherwise constitute a legal or equitable discharge of or defence to a guarantor. | |||
11. | This Guarantee shall remain in full force and effect in relation to an Obligation notwithstanding that it becomes due for payment or performance after 30 June 2015. | |||
12. | In the event that any of the terms or provisions of this Guarantee are or shall become invalid, illegal or unenforceable, the remaining terms and provisions hereof shall survive unaffected. | |||
13. | The Guarantor shall be permitted from time to time and at any time to amend or vary the terms of this Guarantee PROVIDED THAT the liability of the Guarantor to a Creditor in respect of any Obligation incurred before, or arising out of an Obligation entered into before, the date of such variation or amendment, shall not be in any way reduced or limited by such variation or amendment. Any person shall be entitled to rely on a certificate given by a director or other duly authorised officer of the Guarantor as to the existence and extent of this Guarantee and any such variation and/or amendment of this Guarantee on entering into any dealing, transaction or arrangement with Santander UK under or in respect of which an Obligation would or might be incurred by Santander UK to that person. | |||
14. | This Guarantee and any non-contractual obligations arising out of or in connection with this Guarantee are governed by, and shall be construed in accordance with, the laws of England and the courts of England are to have exclusive jurisdiction to settle any disputes which may arise out of or in connection with this Guarantee (including in respect of any non-contractual obligations arising out of or in connection with this Guarantee) and accordingly any suit, action or proceedings arising out of or in connection with this Guarantee (including in respect of any non-contractual obligations arising out of or in connection with this Guarantee) shall be brought in such courts. | |||
IN WITNESS whereof, this Guarantee has been executed as of the day and year first written above.
THE COMMON SEAL of | ) | |
ABBEY NATIONAL | ) | |
TREASURY SERVICES PLC | ) | |
was hereunto affixed | ) | |
in the presence of: | ) |
Shaun Coles
Deputy Company Secretary
88 | Abbey National Treasury Services plc 2013 Half Yearly Financial Report |
Table of Contents
Shareholder Information
Guaranteescontinued
GUARANTEE of Abbey National Treasury Services plc by Santander UK plc
THIS INSTRUMENT by way of deed poll is executed on 10 May 2012 by SANTANDER UK plc (registered in England No. 2294747) whose registered office is at 2 Triton Square, Regent’s Place, London NW1 3AN (the ‘Guarantor’).
WHEREAS:
Abbey National Treasury Services plc, a company incorporated in England (number 2338548) whose registered office is at 2 Triton Square, Regent’s Place, London NW1 3AN (‘ANTS’), has requested the Guarantor and the Guarantor has agreed to guarantee payment of all Obligations (as hereinafter defined) in accordance with, and as limited by, the terms and conditions of this Deed (the ‘Guarantee’).
NOW THEREOF the Guarantor hereby covenants and agrees as follows:
| 1. | In this Guarantee, unless the context otherwise requires: |
‘Creditor’ | ‘means any person (other than the Guarantor or any subsidiary of ANTS (as defined in section 1159 of the Companies Act 2006 (the ‘Act’)) or any individual who is a connected person of ANTS within the meaning of section 254 of the Act) to whom an Obligation is from time to time owed; | |
‘Obligation’ | means any obligation or liability, (whether actual or contingent or for the payment of any amount or delivery of any property) incurred by ANTS (whether as principal or surety) to any person on or before 30 June 2015 (whether before or after the execution of this Guarantee) under or in respect of any dealing, transaction or engagement whatsoever, including without prejudice to the generality of the foregoing, for | |
(i) any moneys lent, advanced or otherwise made available to ANTS (including, without limitation to the generality of the foregoing, the liability of ANTS for drawing or issuing bills of exchange, promissory notes, bonds, debentures, certificates of deposit, commercial paper or other negotiable instruments or securities); | ||
(ii) any moneys lent, advanced or otherwise made available to any person, the repayment or payments in respect of which have been guaranteed by ANTS or in respect of which ANTS has given an indemnity (including, without limitation to the generality of the foregoing, guarantees and letters of credit issued by ANTS and bills of exchange or other negotiable instruments accepted or endorsed by ANTS); | ||
(iii) any moneys which any person shall pay or become liable to pay, for or on account of ANTS, by reason of entering into or being party to any bond, indemnity, bill of exchange, guarantee, letter of credit or other engagement for the benefit or at the request of ANTS; | ||
(iv) deposits made with ANTS (including, without limitation of the generality of the foregoing, certificates of deposit issued by ANTS); | ||
(v) any rate swap transaction, swap option, basis swap, forward rate transaction, commodity swap, commodity option, equity or equity index swap, equity or equity index option, bond option, interest rate option, foreign exchange transaction, cap transaction, collar transaction, floor transaction, currency swap transaction, cross-currency rate swap transaction, currency option, credit protection transaction, credit swap, credit default swap, credit default option, total return swap, credit spread transaction, repurchase transaction, reverse repurchase transaction, buy/sell back transaction, securities lending transaction or forward purchase or sale of a security, commodity or other financial instrument or interest (including any option with respect to any such transactions) or any other derivative transaction on one or more rates, currencies, commodities, equity securities or other equity instruments, debt securities or other debt instruments, indices, or measures of economic risk or value, in each case, to which ANTS is party (including, for the avoidance of doubt, any obligation or liability under any master agreement that governs any such transactions); | ||
(vi) any such obligation or liability assumed under or incurred pursuant to any novation, transfer, assignment or other similar agreement between ANTS and any other person; and
(vii) any obligation or liability under any transaction entered into by ANTS after 30 June 2015 as a result of the exercise of any right or option granted by or to ANTS on or prior to 30 June 2015; | ||
(vii) any payments of interest due from ANTS with respect to any of the foregoing transactions (whether or not the liability to pay such interest arises on or before 30 June 2015) together with all reasonable costs, commissions and other expenses incurred by any person in connection with the enforcement of this Guarantee, but excluding: | ||
(a) any such obligations or liabilities of ANTS (including under any guarantee or indemnity given by ANTS) which by their terms are expressed (in whatever manner) to be conditional upon the solvency of ANTS or subordinated to, or payable only after full satisfaction of, all or any obligations of ANTS to all or any of its unsubordinated creditors; and | ||
(b) any such obligations or liabilities of ANTS transferred to, or assumed by, any other person whether pursuant to any novation or transfer or other similar agreement, any statutory transfer (pursuant to Part VII of The Financial Services and Markets Act 2000 or otherwise), any scheme of arrangement or otherwise. | ||
‘person’ | means any person, firm, trust estate, corporation, association, cooperative, government or government agency or other entity. | |
Abbey National Treasury Services plc 2013 Half Yearly Financial Report | 89 |
Table of Contents
Shareholder Information
Guaranteescontinued
2. | (a) | The Guarantor hereby unconditionally and irrevocably guarantees, for the benefit of each Creditor, in accordance with the terms and conditions of this Guarantee, the full payment by ANTS when due (whether at stated maturity, upon acceleration or otherwise) of each and every Obligation and in the event that ANTS shall default in the due and punctual payment of any Obligation, undertakes to pay, or procure the payment of, such Obligations in the currency in which the particular Obligation is denominated in the case of a payment upon written demand being made under this Guarantee by the relevant Creditor. | ||
(b) | The Guarantor waives any right it may have of first requiring any Creditor to make demand, proceed or enforce any rights or security against ANTS or any other person before making a claim against the Guarantor under this Guarantee. | |||
3. | A Creditor shall only be entitled to take or obtain the benefit of this Guarantee upon the condition that, after receipt by the Guarantor of a written demand from the Creditor, the Guarantor shall be entitled to deal with the Creditor, and the Creditor shall be obliged to deal with the Guarantor with respect to the Obligation due to the Creditor and this Guarantee without the necessity or duty to rely on, act through or otherwise involve or deal with ANTS to the intent that the Guarantor and the Creditor shall deal with one another as principals in relation to the same provided that the rights, powers, privileges and remedies of the Creditor under this Guarantee shall not thereby be in any way limited or otherwise affected. | |||
4. | No delay or omission on the part of the Creditor in exercising any right, power, privilege or remedy (hereinafter together called ‘Rights’) in respect of this Guarantee shall impair any such Rights or be construed as a waiver of any thereof nor shall any single or partial exercise of any such Rights preclude any further exercise of any other Rights. The Rights herein provided are cumulative and not exclusive of any rights, powers, privileges or remedies provided by law. Nothing in this Guarantee shall be construed as voiding, negating or restricting any right of set-off or any other right whatsoever existing in favour of a Creditor or arising at common law, by statute or otherwise howsoever. | |||
5. | This Guarantee is a continuing guarantee and shall not be satisfied, discharged or affected by any intermediate payment or settlement of account. | |||
6. | The Guarantor will not exercise any rights of subrogation or any other rights or remedy (including, without limiting the generality of the foregoing, the benefit of any security or right of set-off) which it may acquire due to its payment of any Obligation pursuant to the terms of this Guarantee and will not prove in the liquidation of ANTS in competition with any Creditor unless and until all Obligations in respect of the relevant Creditor hereby guaranteed have been satisfied in full by the Guarantor or ANTS. In the event that the Guarantor shall receive any payment on account of such rights while any Obligation remains outstanding, the Guarantor shall pay all amounts so received to the relevant Creditor. | |||
7. | Payments hereunder shall be made free and clear of any deduction or withholdings other than those required by law and in that event the Guarantor shall pay such additional amount to the relevant Creditor as may be necessary in order that the actual amount received after all such deductions and withholdings shall equal the amount that would have been received if no such deduction or withholding were required provided that the Guarantor shall not be obliged to pay any such additional amount which would not have been payable if the payment which is the subject of the withholding or deduction had been made by ANTS. If the Guarantor makes a payment of an additional amount in compliance with its obligations under this paragraph and the Creditor determines that it has received or been granted a credit against or relief or payment of any tax paid or payable by it in respect thereof the Creditor shall to the extent that it can do so without prejudice to the retention of the amount of such credit, relief or repayment pay to the Guarantor such amount as shall be attributable to such deduction provided that nothing contained in this paragraph shall interfere with the right of any Creditor to arrange its tax affairs in whatsoever manner it thinks fit and, in particular, no Creditor shall be under any obligation to claim relief in respect of any such deduction in priority to any other claims for relief available to it. | |||
8. | Any demand or notice hereunder shall be given in writing or by cable, telex or facsimile transmission addressed to the Guarantor or to the person to or upon whom the demand is to be made or the notice served at the registered or principal office or last known place of abode of the Guarantor or of such person, as the case may be. A demand so made shall be deemed to have been duly made if left at such address on the day it was so left or, if sent by post, two working days after the time when the same was put in the post and in proving delivery it shall be sufficient to prove that the same was properly addressed and put in the post. Any such demand sent by cable, telex or facsimile transmission shall be deemed to have been duly made at the time of despatch. | |||
9. | The liability of the Guarantor under this Guarantee shall not be affected by the liquidation, winding-up or other incapacity of ANTS. In the event that any payment or delivery to a Creditor from ANTS in respect of an Obligation is avoided or reduced by virtue of any enactments for the time being in force relating to liquidation or insolvency of ANTS, the Creditor shall be entitled to recover the value or amount thereof from the Guarantor as if such payment or delivery by ANTS had not been made. | |||
90 | Abbey National Treasury Services plc 2013 Half Yearly Financial Report |
Table of Contents
Shareholder Information
Guaranteescontinued
10. | This Guarantee shall remain in full force and effect irrespective of: | |||||
a) | the validity, regularity, legality or enforceability against ANTS of, or of any defence or counter-claim whatsoever available to ANTS in relation to, any Obligation; | |||||
b) | whether or not any action has been taken to enforce any Obligation or any judgement obtained against ANTS or any other person; | |||||
c) | whether or not the terms of any Obligation has been modified, supplemented, extended or restated in any way (in each case, however fundamental and of whatsoever nature); | |||||
d) | whether or not any time or indulgence has been granted to ANTS or any other person by or on behalf of any Creditor; | |||||
e) | whether or not there have been any dealings or transactions between ANTS or any other person and any Creditor; | |||||
f) | whether or not ANTS or any other person has been dissolved, liquidated, merged, consolidated, become bankrupt or has changed its status, functions, control or ownership; | |||||
g) | whether or not ANTS or any other person has been prevented from making payment by foreign exchange provisions applicable at its place of registration or incorporation; and | |||||
h) | whether or not any circumstances have occurred which might otherwise constitute a legal or equitable discharge of or defence to a guarantor. | |||||
11. | This Guarantee shall remain in full force and effect in relation to an Obligation notwithstanding that it becomes due for payment or performance after 30 June 2015. | |||||
12. | In the event that any of the terms or provisions of this Guarantee are or shall become invalid, illegal or unenforceable, the remaining terms and provisions hereof shall survive unaffected. | |||||
13. | The Guarantor shall be permitted from time to time and at any time to amend or vary the terms of this Guarantee PROVIDED THAT the liability of the Guarantor to a Creditor in respect of any Obligation incurred before, or arising out of an Obligation entered into before, the date of such variation or amendment, shall not be in any way reduced or limited by such variation or amendment. Any person shall be entitled to rely on a certificate given by a director or other duly authorised officer of the Guarantor as to the existence and extent of this Guarantee and any such variation and/or amendment of this Guarantee on entering into any dealing, transaction or arrangement with ANTS under or in respect of which an Obligation would or might be incurred by ANTS to that person. | |||||
14. | This Guarantee and any non-contractual obligations arising out of or in connection with this Guarantee are governed by, and shall be construed in accordance with, the laws of England and the courts of England are to have exclusive jurisdiction to settle any disputes which may arise out of or in connection with this Guarantee (including in respect of any non-contractual obligations arising out of or in connection with this Guarantee) and accordingly any suit, action or proceedings arising out of or in connection with this Guarantee (including in respect of any non-contractual obligations arising out of or in connection with this Guarantee) shall be brought in such courts. | |||||
IN WITNESS whereof, this Guarantee has been executed as of the day and year first written above.
THE COMMON SEAL of | ) | |
SANTANDER UK PLC | ) | |
was hereunto affixed | ) | |
in the presence of: | ) |
Shaun Coles
Deputy Company Secretary
Abbey National Treasury Services plc 2013 Half Yearly Financial Report | 91 |
Table of Contents
Shareholder Information
Abbey National Treasury Services plc (the ‘Company’) and its subsidiaries (together the ‘ANTS group’) may from time to time make written or oral forward-looking statements. The ANTS group is part of the Santander UK group (Santander UK plc and its subsidiaries, together ‘Santander UK’ or the ‘Santander UK group’). The Company makes written forward-looking statements in this Half-Yearly Financial Report and may also make forward-looking statements in its periodic reports to the SEC on Forms 20-F and 6-K, in its annual report to shareholders, in its offering circulars and prospectuses, in press releases and other written materials and in oral statements made by its officers, directors or employees to third parties.
Examples of such forward-looking statements include, but are not limited to:
| • | Projections or expectations of revenues, costs, profit (or loss), earnings (or loss) per share, dividends, capital structure or other financial items or ratios; |
| • | Statements of plans, objectives or goals of Santander UK or its management, including those related to products or services; |
| • | Statements of future economic performance; and |
| • | Statements of assumptions underlying such statements. |
Words such as ‘believes’, ‘anticipates’, ‘expects’, ‘intends’, ‘aims’, ‘plans’, ‘targets’ and similar expressions are intended to identify forward-looking statements, but are not the exclusive means of identifying such statements.
By their very nature, forward-looking statements are not statements of historical or current facts; they cannot be objectively verified, are speculative and involve inherent risks and uncertainties, both general and specific, and risks exist that the predictions, forecasts, projections and other forward-looking statements will not be achieved. Santander UK cautions readers that a number of important factors could cause actual results to differ materially from the plans, objectives, expectations, estimates and intentions expressed in such forward-looking statements made by Santander UK or on its behalf. As a consequence of the reciprocal guarantee given by the company in respect of the liabilities of Santander UK plc, we are exposed to the same risk factors as Santander UK, of which we are a part. Some of these factors, which could affect the ANTS group’s business, financial condition and/or results of operations, are considered in detail in the Company’s 2012 Annual Report under the Risk Management Report on page 28 to 98 and the Risk Factors section on pages 190 to 205, such sections as updated in this Half-Yearly Financial Report. They include:
| • | The effects of UK economic conditions; |
| • | The effects of conditions in global financial markets (e.g. increased market volatility and disruption, reduced credit availability and increased commercial and consumer loan delinquencies); |
| • | The extent to which regulatory capital and liquidity requirements and any changes to these requirements may limit the ANTS group’s operations; |
| • | The ANTS group’s ability to access liquidity and funding on acceptable financial terms ; |
| • | The ANTS group’s exposure to UK Government debt and to the risks faced by other financial institutions; |
| • | The effects of the ongoing economic and sovereign debt tensions in the eurozone; |
| • | The effects of any changes to the credit rating assigned to the ANTS group, any member of the ANTS group or any of their respective debt securities; |
| • | The effects of fluctuations in interest rates, currency exchange rates, basis spreads, bond and equity prices and other market factors; |
| • | The extent to which the ANTS group may be required to record negative fair value adjustments for its financial assets due to changes in market conditions; |
| • | The credit quality of borrowers, the ANTS group’s ability to assess this and control the level of non-performing loans, loan prepayment and the enforceability of collateral, including real-estate securing such loans; |
| • | The extent which the ANTS group may be exposed to operational losses (e.g. failed internal or external processes, people and systems); |
| • | Risks associated with the ANTS group’s derivative transactions; |
| • | The effects of competition, or intensification of such competition, in the financial services markets in which the ANTS group conducts business and the impact of customer perception of the ANTS group’s customer service levels on existing or potential business; |
| • | The ANTS group’s exposure to certain sectors or customers, such as SMEs and individuals; |
| • | The ability of the ANTS group to manage any future growth effectively (e.g. efficiently managing the operations and employees of expanding businesses and maintaining or growing its existing customer base); |
| • | The ability of the ANTS group to realise the anticipated benefits of its business combinations and the exposure, if any, of the ANTS group to any unknown liabilities or goodwill impairments relating to acquired businesses; |
| • | The effects of the financial services laws, regulations, governmental oversight, administrative actions and policies and any changes thereto in each location or market in which the ANTS group operates; |
| • | The effects of the proposed reform and reorganisation of the structure of the UK Prudential Regulatory Authority and of the UK regulatory framework that applies to members of the ANTS group; |
| • | The effects of any new reforms to the UK mortgage lending and the personal loans market; |
| • | The power of the UK Prudential Regulatory Authority (or any overseas regulator) to intervene in response to attempts by customers to seek redress from financial service institutions, including the ANTS group, in case of industry-wide issues; |
| • | The extent to which members of the ANTS group may be responsible for contributing to compensation schemes in the UK in respect of banks and other authorised financial services firms that are unable to meet their obligations to customers; |
| • | The effects which the UK Banking Act 2009 may have, should the HM Treasury, the Bank of England and/or the PRA exercise their powers under this Act in the future against the Company; |
| • | The risk of third parties using the ANTS group as a conduit for illegal activities without the ANTS group’s knowledge; |
| • | The effects of taxation requirements and other assessments and any changes thereto in each location in which the ANTS group operates; |
| • | The effects of any changes in the pension liabilities and obligations of the ANTS group; |
| • | The ability of the ANTS group to recruit, retain and develop appropriate senior management and skilled personnel; |
| • | The effects of any changes to the reputation of the ANTS group, any member of the ANTS group or any affiliate operating under the ANTS group’s brands; |
| • | The basis of the preparation of the Company’s and ANTS group’s Condensed Consolidated Interim Financial statements and information available about the ANTS group; |
| • | The ANTS group’s dependency on its information technology systems and on other ANTS group companies and third parties for essential services; |
| • | The ANTS group’s success at managing the risks to which it is exposed, including the items above. |
Undue reliance should not be placed on forward-looking statements when making decisions with respect to Santander UK and/or its securities. Investors and others should take into account the inherent risks and uncertainties of forward-looking statements and should carefully consider the foregoing non-exhaustive list of important factors. Forward-looking statements speak only as of the date on which they are made and are based on the knowledge, information available and views taken on the date on which they are made; such knowledge, information and views may change at any time. Santander UK does not undertake any obligation to update or revise any forward-looking statement, whether as a result of new information, future events or otherwise.
92 | Abbey National Treasury Services plc 2013 Half Yearly Financial Report |
Table of Contents
Other Information for US Investors
Selected Statistical Information
| Six months ended 30 June 2013 % | Six months ended 30 June 2012 % | |||||||
Ratio of earnings to fixed charges:(1) | ||||||||
- Excluding interest on retail deposits | 117 | 107 | ||||||
- Including interest on retail deposits | 117 | 107 | ||||||
|
|
|
| |||||
| (1) | For the purpose of calculating the ratios of earnings to fixed charges, earnings consist of profit before tax plus fixed charges. Fixed charges consist of interest payable, including the amortisation of discounts and premiums on debt securities in issue. Abbey National Treasury Services plc has no retail deposits. |
Abbey National Treasury Services plc 2013 Half Yearly Financial Report | 93 |
Table of Contents
SIGNATURES
Pursuant to the requirements of the Securities Exchange Act of 1934, the registrant has duly caused this report to be signed on its behalf by the undersigned, thereunto duly authorized.
| ABBEY NATIONAL TREASURY SERVICES PLC | ||||||
Dated: 16 August 2013 | By | /s/ Jessica Petrie | ||||
| (Authorised Signatory) | ||||||
Table of Contents
EXHIBIT INDEX
| Exhibit | ||
| 7.1 | Computation of Ratio of Earnings to Fixed Charges for the six months ended 30 June 2013. | |