SECURITIES AND EXCHANGE COMMISSION
Washington, D.C. 20549
FORM 6-K
Report of Foreign Issuer
Pursuant to Rule 13a-16 or 15d-16 of
Securities Exchange Act of 1934
For the month of August 2014
ABBEY NATIONAL TREASURY SERVICES PLC
(Translation of registrant’s name into English)
2 Triton Square, Regent’s
Place, London NW1 3AN, England
(Address of principal executive offices)
Indicate by check mark whether the registrant files or will file annual reports under cover Form 20-F or Form 40-F.
Form 20-F x Form 40-F ¨
Indicate by check mark whether the registrant by furnishing the information contained in this Form is also thereby furnishing the information to the Commission pursuant to Rule 12g3-2(b) under the Securities Exchange Act of 1934.
Yes ¨ No x
The Registrant hereby incorporates all parts of this Report on Form 6-K by reference in Registration Statement no. 333-190509-01 filed by the Registrant with the Securities and Exchange Commission on Form F-3ASR under the Securities Act of 1933.
2014 Half Yearly Financial Report
Abbey National Treasury Services plc
PART OF THE SANTANDER GROUP
This page intentionally left blank
Abbey National Treasury Services plc
2014 Half Yearly Financial Report
| 2 | ||||
| 3 | ||||
| 4 | ||||
| 9 | ||||
| 14 | ||||
| 39 | ||||
| 42 | ||||
| 45 | ||||
| 66 | ||||
| 66 | ||||
| 67 | ||||
| 68 | ||||
| Abbey National Treasury Services plc 2014 Half Yearly Financial Report | 1 |
Our Business and our Corporate Purpose
Our heritage
Abbey National Treasury Services plc (the ‘Company’) and its subsidiaries (collectively, ‘ANTS’ or the ‘ANTS group’) was established in 1989 for the purpose of managing the liquidity, risk management and wholesale banking needs of Abbey National plc (subsequently renamed Santander UK plc) and its subsidiaries (collectively, ‘Santander UK’ or the ‘Santander UK group’).
In 1997, Abbey National plc acquired the business and assets of Cater Allen Holdings plc (“CAH”) for £195m. The synergies between the ANTS group and the CAH business provided ANTS with opportunities for growth in strategically important markets comprising money markets, sharedealing, and onshore and offshore retail banking.
In 2010, all of the business and assets of Cater Allen International Limited, a subsidiary of CAH, and a significant participant in the repo and wholesale money markets, were transferred to the Company. The principal purpose of the transfer was to increase the efficiency of the ANTS group and the Santander UK group. No gain or loss was recognised on the transfer.
On 12 November 2004, Banco Santander, S.A., a company incorporated in Spain, completed the acquisition of the entire issued ordinary share capital of the parent company of ANTS, Santander UK plc, at which point the Company became an indirect subsidiary of Banco Santander, S.A..
The structural relationship of ANTS and Santander UK with the Banco Santander group
The Banco Santander group operates a ‘subsidiary model’. This model involves autonomous units, such as the Santander UK group (of which ANTS is a significant part) operating in core markets with each unit being responsible for its own liquidity, funding and capital management on an ongoing basis. The model is designed to minimise the risk to the Banco Santander group and all its units from problems arising elsewhere in the Banco Santander group.
The subsidiary model gives both ANTS and Santander UK considerable financial flexibility, yet enables them to continue to take advantage of the significant synergies and strengths that come from being part of the global Banco Santander group, in brand, products, systems, platforms, development capacity and management capability. In the subsidiary model, the Banco Santander group facilitates the sharing of best practice and provides common technology, operations and support services to all of its subsidiaries via independent operating entities, themselves established by the Banco Santander group so as to be able to continue operating as viable standalone businesses.
On 10 January 2014, Santander UK Group Holdings Limited became the holding company of Santander UK plc following its acquisition of Santander UK plc from Banco Santander S.A.. The acquisition was satisfied by the issue of shares in Santander UK Group Holdings Limited. The new holding company was put in place in light of UK regulatory developments relating to Banking Reform and Resolution and Recovery planning under which having a holding company above the operating banking companies is considered preferable.
For more information, see the Directors’ Report on page 99 of the Annual Report and Accounts for the year ended 31 December 2013 (the ‘2013 Annual Report’).
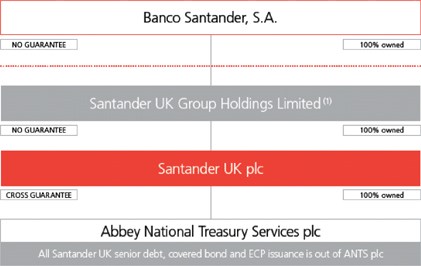
| (1) | From 10 January 2014. |
| 2 | Abbey National Treasury Services plc 2014 Half Yearly Financial Report |
About us
ANTS today
ANTS is regulated by the UK Prudential Regulation Authority (‘PRA’) and the Financial Conduct Authority (‘FCA’) and is part of the Santander UK group which is, in turn, part of the Banco Santander, S.A. group (comprising Banco Santander, S.A. and its subsidiaries, the ‘Banco Santander group’). Banco Santander, S.A. is incorporated in Spain and is the ultimate parent company of ANTS.
Corporate purpose
ANTS provides treasury, corporate and wholesale banking services. ANTS provides these services to the wider Santander UK group, of which ANTS is a significant part, and also to UK clients. ANTS is also the treasury support function for the Santander UK group. In this regard, ANTS’s role is to provide access to financial markets and central bank facilities in order to meet the Santander UK group’s liquidity, funding, capital and balance sheet management requirements. As such, ANTS is one of the main debt issuance vehicles in the Santander UK group.
ANTS contains part of a number of Santander UK’s business segments. Whether transactions are booked in ANTS or another Santander UK group entity reflects historic or operational reasons and does not necessarily reflect any particular business split.
The Company has given a full and unconditional guarantee in respect of the unsubordinated liabilities of Santander UK plc incurred prior to 30 June 2015 under a deed poll guarantee entered into by the Company on 10 May 2012. Santander UK plc has given a reciprocal guarantee in respect of the unsubordinated liabilities of the Company incurred prior to 30 June 2015.
As a result of these guarantees, the results and creditworthiness of ANTS should not be viewed in isolation. Account should also be taken of the position of the Santander UK group into which the assets and liabilities of ANTS are fully consolidated.
ANTS has also entered into agreements to provide capital and/or liquidity to Santander UK plc and other members of the Santander UK group, in accordance with UK regulatory requirements. For further details, see Note 25 to the Condensed Consolidated Interim Financial Statements.
Our businesses
ANTS is headed by Jacques Ripoll, Chief Executive Officer, and operates three business divisions as follows:
Business division | About | |
| Commercial Banking | Commercial Banking offers a wide range of products and financial services to UK companies. Commercial Banking products and services include loans, bank accounts, deposits, and treasury services.
The Large Corporates business offers specialist treasury services in fixed income and foreign exchange, lending, transactional banking services, capital markets and money markets to large multinational corporate customers. Lending includes syndicated loans and structured finance. Transactional banking includes trade finance and cash management. Money market activities include securities lending/borrowing and repos. | |
| Markets | Markets offers risk management and other services to financial institutions, as well as to other Santander UK divisions. Its main product areas are fixed income and foreign exchange, equity, capital markets and institutional sales. | |
| Corporate Centre | Corporate Centre consists of Financial Management & Investor Relations (‘FMIR’) and the non-core portfolios of social housing loans and structured credit assets. FMIR is responsible for managing capital and funding, balance sheet composition and structure, and strategic liquidity risk for the Santander UK group. The non-core portfolios are being run-down and/or managed for value. | |
Our strategy
ANTS’s strategy is to continue to provide treasury support functions for the Santander UK group and to provide treasury, corporate and wholesale banking services to UK clients.
| Abbey National Treasury Services plc 2014 Half Yearly Financial Report | 3 |
GROUP SUMMARY
KEY PERFORMANCE INDICATORS
Key performance indicators are set at the Santander UK group level, rather than separately for the ANTS group.
SUMMARISED CONSOLIDATED INCOME STATEMENT
| Six months ended 30 June 2014 £m | Six months ended 30 June 2013 £m | |||||||
Net interest expense | (50 | ) | (8 | ) | ||||
Non-interest income | 240 | 436 | ||||||
|
|
|
| |||||
Total operating income | 190 | 428 | ||||||
|
|
|
| |||||
Administrative expenses | (125 | ) | (108 | ) | ||||
Depreciation, amortisation and impairment | (1 | ) | (1 | ) | ||||
|
|
|
| |||||
Total operating expenses excluding impairment losses | (126 | ) | (109 | ) | ||||
|
|
|
| |||||
Impairment losses on loans and advances | — | (18 | ) | |||||
|
|
|
| |||||
Total operating impairment losses | — | (18 | ) | |||||
|
|
|
| |||||
Profit before tax | 64 | 301 | ||||||
Taxation credit/(charge) | 1 | (45 | ) | |||||
|
|
|
| |||||
Profit for the period | 65 | 256 | ||||||
|
|
|
| |||||
Six months ended 30 June 2014 compared to six months ended 30 June 2013
Profit before tax decreased by £237m to £64m in the first half of 2014 (2013: £301m). By income statement line, the movements were:
| • | Net interest expense increased by £42m to £50m in the first half of 2014 (2013: £8m) as the returns on our structural hedge strategy were lower than in the first half of 2013 following the maturity of historic contracts that benefited from higher returns. This was partially offset by increased interest income as a result of continued growth in customer loans at improved spreads. |
| • | Non-interest income decreased by £196m to £240m in the first half of 2014 (2013: £436m) principally due to reduced mark-to-market gains on certain derivatives, which are only treated as hedging for Santander UK group purposes. In addition, non-interest income decreased due to a significantly reduced credit arising from the debit valuation adjustments on derivatives written by ANTS. |
| • | Administrative expenses increased by £17m to £125m in the first half of 2014 (2013: £108m). The increase reflected the continued investment in the Commercial Banking and Markets businesses, partially offset by effective cost control. |
| • | Depreciation, amortisation and impairment costs were unchanged at £1m in the first half of 2014 (2013: £1m). |
| • | Impairment losses on loans and advances decreased by £18m to £nil in the first half of 2014 (2013: £18m). Credit quality in the loan books continued to be good, supported by the improving economic environment. |
| • | The taxation charge decreased by £46m to a credit of £1m in the first half of 2014 (2013: £45m) principally due to reduced profits. The tax charge in both periods was also reduced by the effect of other non-equalised items and adjustments in respect of prior year provisions. |
| 4 | Abbey National Treasury Services plc 2014 Half Yearly Financial Report |
Detailed Business Review
Group and Divisional Results continued
Critical factors affecting results
The preparation of our Condensed Consolidated Interim Financial Statements requires management to make estimates and judgements that affect the reported amount of assets and liabilities at the balance sheet date and the reported amount of income and expenses during the reporting period. Management evaluates its estimates and judgements on an ongoing basis. Management bases its estimates and judgements on historical experience and other factors believed to be reasonable under the circumstances. Actual results may differ from these estimates under different assumptions or conditions. Estimates and judgements that are considered important to the portrayal of our financial condition including, where applicable, quantification of the effects of reasonably possible ranges of such estimates are set out in “Critical Accounting Policies” in Note 1 on page 127 of the 2013 Annual Report.
The rest of this section contains a summary of the results, and commentary thereon, by Income Statement line item for each segment.
Basis of results presentation
The segmental information in this Half Yearly Financial Report reflects the reporting structure in place at the reporting date in accordance with which the segmental information in Note 2 to the Condensed Consolidated Interim Financial Statements has been presented. The Company’s board of directors (the ‘Board’) is the chief operating decision maker for the ANTS group. The segment information below is presented on the basis used by the Board to evaluate performance and allocate resources. The Board reviews discrete financial information for each segment of the business which follows the ANTS group’s normal accounting policies and principles, including measures of operating results, assets and liabilities.
PROFIT BEFORE TAX BY SEGMENT
30 June 2014 | Commercial Banking £m | Markets £m | Corporate Centre £m | Total £m | ||||||||||||
Net interest income/(expense) | 90 | 1 | (141 | ) | (50 | ) | ||||||||||
Non-interest income | 110 | 57 | 73 | 240 | ||||||||||||
|
|
|
|
|
|
|
| |||||||||
Total operating income | 200 | 58 | (68 | ) | 190 | |||||||||||
|
|
|
|
|
|
|
| |||||||||
Administration expenses | (50 | ) | (56 | ) | (19 | ) | (125 | ) | ||||||||
Depreciation, amortisation and impairment | — | (1 | ) | — | (1 | ) | ||||||||||
|
|
|
|
|
|
|
| |||||||||
Total operating expenses excluding impairment losses | (50 | ) | (57 | ) | (19 | ) | (126 | ) | ||||||||
|
|
|
|
|
|
|
| |||||||||
Impairment losses on loans and advances | — | — | — | — | ||||||||||||
|
|
|
|
|
|
|
| |||||||||
Total operating impairment losses | — | — | — | — | ||||||||||||
|
|
|
|
|
|
|
| |||||||||
Profit/(loss) before tax | 150 | 1 | (87 | ) | 64 | |||||||||||
|
|
|
|
|
|
|
| |||||||||
30 June 2013 | Commercial Banking £m | Markets £m | Corporate Centre £m | Total £m | ||||||||||||
Net interest income/(expense) | 69 | (1 | ) | (76 | ) | (8 | ) | |||||||||
Non-interest income | 114 | 40 | 282 | 436 | ||||||||||||
|
|
|
|
|
|
|
| |||||||||
Total operating income | 183 | 39 | 206 | 428 | ||||||||||||
|
|
|
|
|
|
|
| |||||||||
Administration expenses | (42 | ) | (48 | ) | (18 | ) | (108 | ) | ||||||||
Depreciation, amortisation and impairment | — | (1 | ) | — | (1 | ) | ||||||||||
|
|
|
|
|
|
|
| |||||||||
Total operating expenses excluding impairment losses | (42 | ) | (49 | ) | (18 | ) | (109 | ) | ||||||||
|
|
|
|
|
|
|
| |||||||||
Impairment losses on loans and advances | (18 | ) | — | — | (18 | ) | ||||||||||
|
|
|
|
|
|
|
| |||||||||
Total operating impairment losses | (18 | ) | — | — | (18 | ) | ||||||||||
|
|
|
|
|
|
|
| |||||||||
Profit/(loss) before tax | 123 | (10 | ) | 188 | 301 | |||||||||||
|
|
|
|
|
|
|
| |||||||||
| Abbey National Treasury Services plc 2014 Half Yearly Financial Report | 5 |
Detailed Business Review
Group and Divisional Resultscontinued
COMMERCIAL BANKING
Commercial Banking offers a wide range of products and financial services to customers through a network of regional CBCs and through telephony and e-commerce channels. Commercial Banking products and services include loans, bank accounts, deposits and treasury services. The management of our customers is organised according to the annual turnover of their business, enabling us to offer a differentiated service to small and medium enterprises (‘SMEs’), mid and large corporate customers.
The SME and mid corporate business principally serves SMEs with an annual turnover of more than £250,000 up to £50m, and other corporate customers with an annual turnover of up to £500m. This also includes real estate lending.
The Large Corporates business offers specialist treasury services in fixed income and foreign exchange, lending, transactional banking services, capital markets and money markets to large multinational corporate customers with an annual turnover of more than £500m. Lending includes syndicated loans and structured finance. Transactional banking includes trade finance and cash management. Money market activities include securities lending/borrowing and repos.
Summarised income statement
| Six months ended 30 June 2014 £m | Six months ended 30 June 2013 £m | |||||||
Net interest income | 90 | 69 | ||||||
Non-interest income | 110 | 114 | ||||||
|
|
|
| |||||
Total operating income | 200 | 183 | ||||||
|
|
|
| |||||
Administration expenses | (50 | ) | (42 | ) | ||||
Depreciation, amortisation and impairment | — | — | ||||||
|
|
|
| |||||
Total operating expenses excluding impairment losses | (50 | ) | (42 | ) | ||||
|
|
|
| |||||
Impairment losses on loans and advances | — | (18 | ) | |||||
|
|
|
| |||||
Total operating impairment losses | — | (18 | ) | |||||
|
|
|
| |||||
Profit before tax | 150 | 123 | ||||||
|
|
|
| |||||
Commercial Banking profit before tax
Six months ended 30 June 2014 compared to six months ended 30 June 2013
Profit before tax increased by £27m to £150m in the first half of 2014 (2013: £123m). By income statement line, the movements were:
| • | Net interest income increased by £21m to £90m in the first half of 2014 (2013: £69m), principally as a result of continued growth in customer loans at improved spreads. |
| • | Non-interest income decreased by £4m to £110m in the first half of 2014 (2013: £114m) reflecting lower income from Large Corporates, primarily as a result of lower demand for interest rate risk management products in a relatively stable, low interest rate environment, partially offset by increased client short-term market activity. |
| • | Administration expenses increased by £8m to £50m in the first half of 2014 (2013: £42m). The increase reflected the continued investment in the Commercial Banking business. |
| • | Depreciation, amortisation and impairment were unchanged at £nil in the first half of 2014 (2013: £nil). |
| • | Impairment losses on loans and advances decreased by £18m to £nil in the first half of 2014 (2013: £18m). Credit quality in the loan books continued to be good, supported by the improving economic environment. |
| 6 | Abbey National Treasury Services plc 2014 Half Yearly Financial Report |
Detailed Business Review
Group and Divisional Results continued
MARKETS
Markets offers risk management and other services to financial institutions, as well as to other Santander UK divisions. Its main product areas are fixed income and foreign exchange, equity, capital markets and institutional sales.
Summarised income statement
| Six months ended 30 June 2014 £m | Six months ended 30 June 2013 £m | |||||||
Net interest income/(expense) | 1 | (1 | ) | |||||
Non-interest income | 57 | 40 | ||||||
|
|
|
| |||||
Total operating income | 58 | 39 | ||||||
|
|
|
| |||||
Administration expenses | (56 | ) | (48 | ) | ||||
Depreciation, amortisation and impairment | (1 | ) | (1 | ) | ||||
|
|
|
| |||||
Total operating expenses excluding impairment losses | (57 | ) | (49 | ) | ||||
|
|
|
| |||||
Impairment losses on loans and advances | — | — | ||||||
|
|
|
| |||||
Total operating impairment losses | — | — | ||||||
|
|
|
| |||||
Profit/(loss) before tax | 1 | (10 | ) | |||||
|
|
|
| |||||
Markets profit/(loss) before tax
Six months ended 30 June 2014 compared to six months ended 30 June 2013
Profit/(loss) before tax increased by £11m to £1m in the first half of 2014 (2013: loss of £10m). By income statement line, the movements were:
| • | Net interest income/(expense) increased by £2m to £1m in the first half of 2014 (2013: expense of £1m), primarily due to a decrease in funding costs. |
| • | Non-interest income increased by £17m to £57m in the first half of 2014 (2013: £40m). Following a refocusing of the Equity Derivatives and Securities Financing businesses in 2013, non-interest income recovered to more normalised levels. |
| • | Administration expenses increased by £8m to £56m in the first half of 2014 (2013: £48m), reflecting investment in developing interest rate and fixed income product capabilities offset by tight cost control. |
| • | Depreciation, amortisation and impairment remained unchanged at £1m in the first half of 2014 (2013: £1m). |
| Abbey National Treasury Services plc 2014 Half Yearly Financial Report | 7 |
Detailed Business Review
Group and Divisional Resultscontinued
CORPORATE CENTRE
Corporate Centre consists of FMIR and the non-core portfolios of social housing loans and structured credit assets. FMIR is responsible for managing capital and funding, balance sheet composition and structure, and strategic liquidity risk for the Santander UK group. The non-core portfolios are being run-down and/or managed for value.
Summarised income statement
| Six months ended 30 June 2014 £m | Six months ended 30 June 2013 £m | |||||||
Net interest expense | (141 | ) | (76 | ) | ||||
Non-interest income | 73 | 282 | ||||||
|
|
|
| |||||
Total operating (expense)/income | (68 | ) | 206 | |||||
|
|
|
| |||||
Administration expenses | (19 | ) | (18 | ) | ||||
Depreciation, amortisation and impairment | — | — | ||||||
|
|
|
| |||||
Total operating expenses excluding impairment losses | (19 | ) | (18 | ) | ||||
|
|
|
| |||||
Impairment losses on loans and advances | — | — | ||||||
|
|
|
| |||||
Total operating impairment losses | — | — | ||||||
|
|
|
| |||||
(Loss)/profit before tax | (87 | ) | 188 | |||||
|
|
|
| |||||
Corporate Centre (loss)/profit before tax
Six months ended 30 June 2014 compared to six months ended 30 June 2013
(Loss)/profit before tax decreased by £275m to £(87)m in the first half of 2014 (2013: £188m). By income statement line, the movements were:
| • | Net interest expense increased by £65m to £141m in the first half of 2014 (2013: £76m) as the returns on our structural hedge strategy were lower than in the first half of 2013 following the maturity of historic contracts that benefited from higher returns. |
| • | Non-interest income decreased by £209m to income of £73m in the first half of 2014 (2013: £282m) principally due to reduced mark-to-market gains on certain derivatives, which are only treated as hedging for Santander UK group purposes. In addition, non-interest income decreased due to a significantly reduced credit arising from the debit valuation adjustments on derivatives written by ANTS. |
| • | Administration expenses increased by £1m to £19m in the first half of 2014 (2013: £18m) reflecting effective cost control. |
| 8 | Abbey National Treasury Services plc 2014 Half Yearly Financial Report |
Detailed Business Review
This Balance Sheet Review describes the ANTS group’s significant assets and liabilities and its strategy and reasons for entering into such transactions. Throughout this section, references to UK and non-UK, in the geographic analysis, refer to the location of the office where the transaction is recorded.
| Index | ||
| 9 | ||
| 11 | ||
| 12 | ||
| 13 |
This Balance Sheet Review focuses on those areas that have changed significantly during the first half of 2014, and represents an update to the Balance Sheet Review in the 2013 Annual Report, with which it should be read in conjunction. The Balance Sheet Review in the 2013 Annual Report contains additional disclosures which have not changed significantly during the first half of 2014.
SUMMARISED CONDENSED CONSOLIDATED BALANCE SHEET
| 30 June 2014 £m | 31 December 2013 £m | |||||||
Assets | ||||||||
Cash and balances at central banks | 7,452 | 4,911 | ||||||
Trading assets | 18,307 | 21,897 | ||||||
Derivative financial instruments | 21,379 | 21,550 | ||||||
Financial assets designated at fair value | 2,543 | 2,534 | ||||||
Loans and advances to banks | 110,454 | 113,649 | ||||||
Loans and advances to customers | 38,032 | 41,108 | ||||||
Loans and receivables securities | 96 | 128 | ||||||
Available for sale securities | 2,550 | 2,962 | ||||||
Macro hedge of interest rate risk | 399 | 379 | ||||||
Property, plant and equipment | 7 | 6 | ||||||
Tax, intangibles and other assets | 201 | 203 | ||||||
|
|
|
| |||||
Total assets | 201,420 | 209,327 | ||||||
|
|
|
| |||||
Liabilities | ||||||||
Deposits by banks | 118,326 | 120,698 | ||||||
Deposits by customers | 4,824 | 7,780 | ||||||
Trading liabilities | 17,848 | 21,275 | ||||||
Derivative financial instruments | 21,607 | 21,496 | ||||||
Financial liabilities designated at fair value | 3,252 | 3,407 | ||||||
Debt securities in issue | 31,717 | 30,889 | ||||||
Tax, other liabilities and provisions | 549 | 614 | ||||||
|
|
|
| |||||
Total liabilities | 198,123 | 206,159 | ||||||
|
|
|
| |||||
Equity | ||||||||
Total shareholders’ equity | 3,297 | 3,168 | ||||||
|
|
|
| |||||
Total equity | 3,297 | 3,168 | ||||||
|
|
|
| |||||
Total liabilities and equity | 201,420 | 209,327 | ||||||
|
|
|
| |||||
A more detailed consolidated balance sheet is contained in the Condensed Consolidated Interim Financial Statements.
30 June 2014 compared to 31 December 2013
Assets
Cash and balances at central banks
Cash and balances held at central banks increased to £7,452m at 30 June 2014 (2013: £4,911m). The increase was due to additional cash placed with the Federal Reserve Bank of New York as part of normal liquid asset portfolio management activity.
Trading assets
Trading assets decreased by 16% to £18,307m at 30 June 2014 (2013: £21,897m) reflecting lower levels of activity relating to securities purchased under resale agreements to both banks and customers partially offset by increased holdings of equity instruments as part of short-term markets trading activity.
Derivative financial instruments - assets
Derivative assets remained broadly unchanged at £21,379m at 30 June 2014 (2013: £21,550m).
Financial assets designated at fair value through profit and loss
Financial assets designated at fair value through profit and loss remained broadly unchanged at £2,543m at 30 June 2014 (2013: £2,534m).
| Abbey National Treasury Services plc 2014 Half Yearly Financial Report | 9 |
Business Review
Balance Sheet Review continued
Loans and advances to banks
Loans and advances to banks decreased by 3% at £110,454m at 30 June 2014 (2013: £113,649m). These balances largely consisted of loans to Santander UK to support its retail and commercial banking activities.
Loans and advances to customers
Loans and advances to customers decreased by 7% to £38,032m at 30 June 2014 (2013: £41,108m) due to reduced on-lending of covered bond issuances.
Available for sale securities
Available for sale securities decreased to £2,550m at 30 June 2014 (2013: £2,962m) as part of normal liquid asset portfolio management activity.
Loans and receivables securities
Loans and receivables securities decreased by 25% to £96m at 30 June 2014 (2013: £128m). The decrease principally reflected the continuing run-down of the Treasury asset portfolio.
Tax, intangibles and other assets
Tax, intangibles and other assets remained broadly unchanged at £201m at 30 June 2014 (2013: £203m).
Liabilities
Deposits by banks
Deposits by banks were relatively stable at £118,326m at 30 June 2014 (2013: £120,698m). This largely consisted of deposits by Santander UK representing on-lending to ANTS of retail and commercial deposits.
Deposits by customers
Deposits by customers decreased by 38% to £4,824m at 30 June 2014 (2013: £7,780m). The decrease was attributable to lower levels of deposits as part of a plan for the management of our less relationship driven deposit base.
Trading liabilities
Trading liabilities decreased by 16% to £17,848m at 30 June 2014 (2013: £21,275m). A decrease in securities sold under repurchase activities and the cash collateral received as part of normal trading activity were offset by an increase in short-term deposits and short positions in securities.
Derivative financial instruments - liabilities
Derivative liabilities were broadly unchanged at £21,607m at 30 June 2014 (2013: £21,496m).
Financial liabilities designated at fair value
Financial liabilities designated at fair value decreased by 5% to £3,252m at 30 June 2014 (2013: £3,407m). The decrease principally reflected a slight reduction in issuances of structured notes.
Debt securities in issue
Debt securities in issue increased by 3% to £31,717m at 30 June 2014 (2013: £30,889m) with increases in issuance of certificates of deposit, partially offset by maturities under the covered bond programme.
Equity
Total shareholders equity increased by 4% to £3,297m at 30 June 2014 (2013: £3,168m). The increase was principally attributable to retained profit for the period and an increase in the cash flow hedging reserve.
| 10 | Abbey National Treasury Services plc 2014 Half Yearly Financial Report |
Business Review
Balance Sheet Review continued
The ANTS group includes short-term borrowings within deposits by banks, trading liabilities, financial liabilities designated at fair value and debt securities in issue and does not show short-term borrowings separately on the balance sheet. Short-term borrowings are defined by the US Securities and Exchange Commission (the ‘SEC’) as amounts payable for short-term obligations that are US Federal funds purchased and securities sold under repurchase agreements, commercial paper, borrowings from banks, borrowings from factors or other financial institutions and any other short-term borrowings reflected on the ANTS group’s balance sheet. The ANTS group’s only significant short-term borrowings are securities sold under repurchase agreements, commercial paper, borrowings from banks, negotiable certificates of deposit, and certain other debt securities in issue. Additional information on short-term borrowings is provided in the table below for each of the six months ended 30 June 2014 and 30 June 2013.
| Six months ended 30 June 2014 £m | Six months ended 30 June 2013 £m | |||||||
Securities sold under repurchase agreements | ||||||||
- Period end balance | 13,217 | 23,664 | ||||||
- Period-end interest rate | 0.63 | % | 0.35 | % | ||||
- Average balance(1) | 22,872 | 19,607 | ||||||
- Average interest rate(1) | 0.44 | % | 0.39 | % | ||||
- Maximum balance(1) | 25,927 | 23,664 | ||||||
Commercial paper | ||||||||
- Period-end balance | 3,862 | 4,687 | ||||||
- Period-end interest rate | 0.61 | % | 0.47 | % | ||||
- Average balance(1) | 4,043 | 4,223 | ||||||
- Average interest rate(1) | 0.39 | % | 0.53 | % | ||||
- Maximum balance(1) | 4,610 | 4,687 | ||||||
Borrowings from banks (Deposits by banks) | ||||||||
- Period-end balance | 602 | 223 | ||||||
- Period-end interest rate | 0.50 | % | 0.45 | % | ||||
- Average balance(1) | 467 | 563 | ||||||
- Average interest rate(1) | 1.27 | % | 0.27 | % | ||||
- Maximum balance(1) | 602 | 1,149 | ||||||
Negotiable certificates of deposit | ||||||||
- Period-end balance | 4,119 | 2,336 | ||||||
- Period-end interest rate | 2.00 | % | 1.96 | % | ||||
- Average balance(1) | 3,588 | 2,299 | ||||||
- Average interest rate(1) | 2.51 | % | 1.77 | % | ||||
- Maximum balance(1) | 4,119 | 2,724 | ||||||
Other debt securities in issue | ||||||||
- Period-end balance | 4,793 | 4,661 | ||||||
- Period-end interest rate | 2.87 | % | 2.92 | % | ||||
- Average balance(1) | 4,922 | 6,211 | ||||||
- Average interest rate(1) | 3.11 | % | 2.95 | % | ||||
- Maximum balance(1) | 5,938 | 7,888 | ||||||
| (1) | Calculated using monthly data. |
The ANTS group issues commercial paper generally in denominations of not less than US$50,000, with maturities of up to 365 days. Commercial paper is issued by the Company and its subsidiary Abbey National North America LLC.
| Abbey National Treasury Services plc 2014 Half Yearly Financial Report | 11 |
Business Review
Balance Sheet Review continued
Sources and uses of liquidity and funding
ANTS is the treasury support function for the Santander UK group. In this regard, ANTS’s role is to provide access to financial markets and central bank facilities in order to meet the Santander UK group’s liquidity, funding, capital and balance sheet management requirements.
The Company has given a full and unconditional guarantee in respect of the unsubordinated liabilities of Santander UK plc incurred prior to 30 June 2015 under a deed poll guarantee entered into by the Company on 10 May 2012. Santander UK plc has given a reciprocal guarantee in respect of the unsubordinated liabilities of the Company incurred prior to 30 June 2015.
Liquidity and funding risk is managed on a Santander UK group basis and it is not therefore appropriate to consider these risks separately at an ANTS group level. In addition, under the PRA’s regulatory liquidity regime, Santander UK and ANTS together with Cater Allen Limited, a fellow subsidiary of Santander UK plc, form the Santander UK Defined Liquidity Group (‘DLG’). Under these arrangements, each member of the DLG is liable to support each other in terms of transferring or receiving surplus liquidity in times of stress. In considering the liquidity resources available to the ANTS group, both its own liquid assets and also those of the rest of the Santander UK group are separately presented.
In addition, the Company, Santander UK plc, and Cater Allen Limited, which are the three PRA-regulated entities within the Santander UK group, are party to a capital support deed dated 14 December 2012 (the “Capital Support Deed”) with certain other non-regulated subsidiaries of Santander UK plc. The parties to the Capital Support Deed constitute a core UK group for the purposes of the large exposures provisions of CRD IV. Under article 4001(f) of the Capital Requirements Regulations, exposures of each of the three regulated entities to other members of the core UK group are exempt from large exposure limits that would otherwise apply. The purpose of the Capital Support Deed is to facilitate the prompt transfer of available capital resources from, or repayment of liabilities by, the non-regulated parties to any of the regulated parties in the event that one of the regulated parties has breached or is at risk of breaching its capital resources requirements or risk concentrations requirements.
Santander UK primarily generates funding and liquidity through UK retail and corporate deposits, as well as in the financial markets through its own debt programmes and facilities to support its business activities and liquidity requirements. It does this in reliance on the strength of its balance sheet and profitability and its own network of investors.
Liquidity and funding risks are identified and encompassed within Santander UK’s Risk Framework and subject to Santander UK’s three-tier risk governance framework.
The debt issuance programmes managed by ANTS are set out in Notes 30 and 31 to the Consolidated Financial Statements in the 2013 Annual Report.
Further information is set out in “Liquidity and funding risk” in the Risk Management Report.
Cash flows
| Six months ended 30 June 2014 £m | Six months ended 30 June 2013 £m | |||||||
Net cash inflow/(outflow) from operating activities | 11,450 | (1,771 | ) | |||||
Net cash inflow from investing activities | 381 | 843 | ||||||
Net cash inflow/(outflow) from financing activities | 405 | (3,596 | ) | |||||
|
|
|
| |||||
Increase/(decrease) in cash and cash equivalents | 12,236 | (4,524 | ) | |||||
|
|
|
| |||||
The major activities and transactions that affected the ANTS group’s cash flows during the first six months of 2014 were as follows:
In the six months ended 30 June 2014, the net cash inflow from operating activities of £11,450m resulted from decreased loans and advances to banks and customers.
In the six months ended 30 June 2014, the net cash inflow from investing activities of £381m resulted primarily from the net proceeds of acquisitions and disposals of UK Treasury bills and other government securities.
In the six months ended 30 June 2014, the net cash inflow from financing activities of £405m reflected new issues of debt securities of £9,977m, partially offset by repayments of debt securities maturing in the period of £9,572m.
In the six months ended 30 June 2014, cash and cash equivalents increased by £11,657m resulted principally from an increase in short-term loans and advances to banks, and an increase in cash and balances at central banks.
| 12 | Abbey National Treasury Services plc 2014 Half Yearly Financial Report |
Business Review
Balance Sheet Review continued
As period-end statements may not be representative of the ANTS group’s activity throughout the period, average balance sheets for the ANTS group are presented below. The average balance sheets summarise the significant categories of assets and liabilities, together with average interest rates.
| Six months ended 30 June 2014 | Six months ended 30 June 2013 | |||||||||||||||||||||||
| Average Balance(1) £m | Interest(4) (5) £m | Average rate % | Average balance(1) £m | Interest(4) (5) £m | Average rate % | |||||||||||||||||||
Assets | ||||||||||||||||||||||||
Loans and advances to banks: | ||||||||||||||||||||||||
- UK | 102,469 | 628 | 1.23 | 110,903 | 1,021 | 1.84 | ||||||||||||||||||
- Non-UK | 13,380 | 15 | 0.22 | 5,634 | 9 | 0.32 | ||||||||||||||||||
Loans and advances to customers:(3) | ||||||||||||||||||||||||
- UK | 40,195 | 523 | 2.60 | 41,078 | 542 | 2.64 | ||||||||||||||||||
Other interest-earning financial assets | ||||||||||||||||||||||||
- UK | 2,717 | 18 | 1.32 | 4,464 | 20 | 0.90 | ||||||||||||||||||
- Non-UK | — | — | — | 289 | 1 | 0.69 | ||||||||||||||||||
|
|
|
|
|
|
|
|
|
|
|
| |||||||||||||
Total average interest-earning assets, interest income(2) | 158,761 | 1,184 | 1.49 | 162,368 | 1,593 | 1.96 | ||||||||||||||||||
|
|
|
|
|
|
|
|
|
|
|
| |||||||||||||
Impairment loss allowances | (56 | ) | — | — | (114 | ) | — | — | ||||||||||||||||
Trading business | 18,930 | — | — | 26,320 | — | — | ||||||||||||||||||
Assets designated at FVTPL | 2,605 | — | — | 3,236 | — | — | ||||||||||||||||||
Other non-interest-earning assets | 28,840 | — | — | 37,147 | — | — | ||||||||||||||||||
|
|
|
|
|
|
|
|
|
|
|
| |||||||||||||
Total average assets | 209,080 | — | — | 228,957 | — | — | ||||||||||||||||||
|
|
|
|
|
|
|
|
|
|
|
| |||||||||||||
Non-UK assets as a % of total | 6.40 | % | — | — | 2.59 | % | — | — | ||||||||||||||||
|
|
|
|
|
|
|
|
|
|
|
| |||||||||||||
Liabilities | ||||||||||||||||||||||||
Deposits by banks: | ||||||||||||||||||||||||
- UK | (113,290 | ) | (666 | ) | 1.18 | (117,862 | ) | (998 | ) | 1.69 | ||||||||||||||
- Non-UK | (9 | ) | — | — | (2 | ) | — | — | ||||||||||||||||
Deposits by customers – wholesale: | ||||||||||||||||||||||||
- UK | (6,341 | ) | (72 | ) | 2.27 | (5,665 | ) | (67 | ) | 2.37 | ||||||||||||||
- Non-UK | — | — | — | — | — | — | ||||||||||||||||||
Bonds and medium-term notes: | ||||||||||||||||||||||||
- UK | (28,451 | ) | (491 | ) | 3.45 | (27,099 | ) | (525 | ) | 3.87 | ||||||||||||||
- Non-UK | (4,287 | ) | (5 | ) | 0.23 | (4,357 | ) | (11 | ) | 0.50 | ||||||||||||||
Dated and undated loan capital and other subordinated liabilities: | ||||||||||||||||||||||||
- UK | — | — | — | — | — | — | ||||||||||||||||||
|
|
|
|
|
|
|
|
|
|
|
| |||||||||||||
Total average interest-bearing liabilities, interest expense(2) | (152,378 | ) | (1,234 | ) | 1.62 | (154,985 | ) | (1,601 | ) | 2.07 | ||||||||||||||
|
|
|
|
|
|
|
|
|
|
|
| |||||||||||||
Trading business | (25,891 | ) | — | — | (31,233 | ) | — | — | ||||||||||||||||
Liabilities designated at FVTPL | (4,085 | ) | — | — | (4,902 | ) | — | — | ||||||||||||||||
Non-interest-bearing liabilities: | ||||||||||||||||||||||||
- Other | (23,486 | ) | — | — | (33,935 | ) | — | — | ||||||||||||||||
- Shareholders’ funds | (3,240 | ) | — | — | (3,902 | ) | — | — | ||||||||||||||||
|
|
|
|
|
|
|
|
|
|
|
| |||||||||||||
Total average liabilities and shareholders’ funds | (209,080 | ) | — | — | (228,957 | ) | — | — | ||||||||||||||||
|
|
|
|
|
|
|
|
|
|
|
| |||||||||||||
Non-UK liabilities as a % of total | 2.05 | % | — | — | 1.90 | % | — | — | ||||||||||||||||
|
|
|
|
|
|
|
|
|
|
|
| |||||||||||||
| (1) | Average balances are based upon monthly data. |
| (2) | The ratio of average interest-earning assets to interest-bearing liabilities for the six months ended 30 June 2014 was 104.19% (Six months ended 30 June 2013: 104.76%). |
| (3) | Loans and advances to customers include non-performing loans. See the “Credit Risk” section of the Risk Management Report. |
| (4) | The net interest margin for the six months ended 30 June 2014 was (0.06)% (Six months ended 30 June 2013: (0.01)%). Net interest margin is calculated as net interest income divided by average interest-earning assets. |
| (5) | The interest spread for the six months ended 30 June 2014 was (0.13)% (Six months ended 30 June 2013: (0.1)%). Interest spread is the difference between the rate of interest earned on average interest-earning assets and the rate of interest paid on average interest-bearing liabilities. |
| Abbey National Treasury Services plc 2014 Half Yearly Financial Report | 13 |
Detailed Business Review
| Index | ||
| Risk Management | 15 | |
| 16 | ||
| 16 | ||
Credit Risk | 17 | |
| 17 | ||
| 17 | ||
| 19 | ||
• Markets | 26 | |
| 27 | ||
| 29 | ||
| 29 | ||
| 31 | ||
| 31 | ||
| 32 | ||
| 34 | ||
| 34 | ||
| 34 | ||
| 34 | ||
| 34 | ||
| Areas of focus and other items | 35 | |
| 35 |
This Risk Management Report contains information that forms an integral part of the Condensed Consolidated Interim Financial Statements.
This Risk Management Report focuses on those areas that have changed significantly during the first half of 2014, and represents an update to the Risk Management Report in the 2013 Annual Report, with which it should be read in conjunction. The Risk Management Report in the 2013 Annual Report contains additional disclosures which have not changed significantly during the first half of 2014.
| 14 | Abbey National Treasury Services plc 2014 Half Yearly Financial Report |
Detailed Business Review
Risk Management Report continued
RISK MANAGEMENT REPORT
This Risk Management Report contains information that forms an integral part of the Condensed Consolidated Interim Financial Statements
The ANTS group provides treasury, corporate and wholesale banking services to UK clients and also to the wider Santander UK group, of which ANTS is a significant part. ANTS is also the treasury support function for the Santander UK group. In this regard, ANTS’s role is to provide access to financial markets and central bank facilities in order to meet the Santander UK group’s liquidity, funding, capital and balance sheet management requirements. As such, ANTS is one of the main debt issuance vehicles in the Santander UK group.
ANTS contains part of a number of Santander UK’s business segments. Specifically, ANTS consists of part of the Santander UK group’s Commercial Banking and Corporate Centre business segments and its entire Markets business segment. Whether transactions are booked in ANTS or another Santander UK group entity reflects historical or operational reasons and does not necessarily reflect any particular business split.
Santander UK plc has given a full and unconditional guarantee in respect of the liabilities of ANTS incurred up to 30 June 2015. The Company has given a reciprocal guarantee in respect of the unsubordinated liabilities of Santander UK plc incurred up to 30 June 2015. As a consequence of the reciprocal guarantee given by the Company in respect of the unsubordinated liabilities of Santander UK plc, the Company is exposed to the same risks as the Santander UK group, of which ANTS is a significant part.
As a subsidiary of Santander UK plc, ANTS has adopted the Santander UK Risk Framework. As a consequence, the ANTS group’s risks are managed at a Santander UK group level in accordance with the Santander UK group’s Risk Framework. The Risk Management Report describes the Santander UK group’s Risk Framework and includes more detail on the key risks (on a segmental basis or aggregated where relevant) to which the ANTS group is directly exposed. In addition, as a consequence of the guarantee given by the ANTS group in respect of the liabilities of Santander UK plc, the ANTS group is indirectly exposed to risks that arise in parts of the Santander UK group that are wholly outside the ANTS group. Those risks consist of retail credit risk and pension obligations risk.
Throughout the Risk Management Report, except where stated otherwise, references to Santander UK should be taken to include the ANTS group (reflecting both the risks that ANTS is directly exposed to through its own activities and the risks arising elsewhere in the Santander UK group that ANTS is indirectly exposed to due to the existence of the cross guarantees described above).
| Abbey National Treasury Services plc 2014 Half Yearly Financial Report | 15 |
Detailed Business Review
Risk Management Reportcontinued
As a significant financial services provider, risk is at the core of Santander UK’s day-to-day activities. The understanding and control of risk is critical for the effective management of the business. Santander UK aims to employ a prudent approach and advanced risk management techniques to facilitate the delivery of robust financial performance, and ultimately build sustainable value for all our stakeholders, including our people, customers, shareholders and the communities in which we operate. Santander UK aims to maintain a predictable medium-low risk profile.
The Risk Framework in place at 30 June 2014 was based upon the following key components:
| • | Risk definition and structure; |
| • | Risk Culture, overriding principles and minimum standards; |
| • | Governance, roles and responsibilities; and |
| • | System of internal control for risk. |
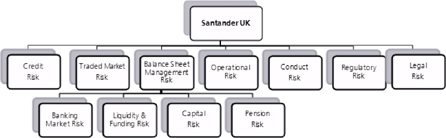
In December 2013, the Board of Santander UK plc (the “Santander UK Board”) approved an updated Risk Framework, which operated throughout the first half of 2014.As a subsidiary group of Santander UK, ANTS has adopted this Risk Framework. The key risk types were simplified and the lines of defence model streamlined. There was no change to the overriding principles. The main changes were:
| • | With respect to risk definition and structure, the key risk types were reorganised as: Credit, Traded Market, Balance Sheet Management (previously known as Structural) including Banking Market (previously known as Non-traded Market), Operational, Conduct, Regulatory and Legal, as set out diagrammatically below; and |
| • | The additional classification of financial / non-financial risks was removed; |
| • | With respect to governance, roles and responsibilities, a Conduct & Regulatory Risk Committee was created which reports to the Executive Risk Committee; and |
| • | A Risk Culture statement was included. |
Risk definition and structure
| 16 | Abbey National Treasury Services plc 2014 Half Yearly Financial Report |
Detailed Business Review
Risk Management Report continued
Maximum exposure to credit risk
The tables below set out the ANTS group’s maximum exposure to credit risk. For balance sheet assets, the maximum exposure to credit risk represents the carrying value after allowance for impairment losses. Off-balance sheet exposures comprise guarantees, formal standby facilities, credit lines and other commitments. For off-balance sheet guarantees, the maximum exposure is the maximum amount that ANTS would have to pay if the guarantees were to be called upon. For formal standby facilities, credit lines and other commitments that are irrevocable over the life of the respective facilities, the maximum exposure is the full amount of the committed facilities.
The table presented below include only those financial assets subject to credit risk, and therefore excludes equity securities.
| 30 June 2014 | 31 December 2013 | |||||||||||||||
| Maximum exposure | Maximum exposure | |||||||||||||||
| Balance sheet asset £bn | Off-balance sheet(1) £bn | Balance sheet asset £bn | Off-balance sheet(1) £bn | |||||||||||||
Cash and balances at central banks | 7.5 | — | 4.9 | — | ||||||||||||
Trading assets | 15.5 | — | 21.6 | — | ||||||||||||
Financial assets designated at fair value | 2.5 | 0.2 | 2.5 | 0.2 | ||||||||||||
Available-for-sale debt securities | 2.6 | — | 3.0 | — | ||||||||||||
Derivative financial instruments | 21.4 | — | 21.6 | — | ||||||||||||
Loans and advances to banks | 110.5 | 155.3 | 113.6 | 149.9 | ||||||||||||
Loans and advances to customers | 38.0 | 11.9 | 41.1 | 10.7 | ||||||||||||
Loans and receivables securities | 0.1 | — | 0.1 | — | ||||||||||||
|
|
|
|
|
|
|
| |||||||||
Total | 198.1 | 167.4 | 208.4 | 160.8 | ||||||||||||
|
|
|
|
|
|
|
| |||||||||
| (1) | Off balance sheet exposure includes the cross guarantee of the liabilities of Santander UK plc, as set out in Note 20 to the Condensed Consolidated Interim Financial Statements. |
Credit quality
ANTS uses a single rating scale to provide a consistent approach for reporting default risk across all the credit risk portfolios. The scale is comprised of eight grades for non-defaulted exposures numbered from 9 (lowest risk) to 2 (highest risk). Each grade is defined by an upper and lower probability of default (‘PD’) value and is scaled so that the default risk increases by a factor of 10 for every 2 step reduction in the grade number. For example, risk grade 9 equates to an average PD of 0.01%, and risk grade 7 equates to an average PD of 0.1%. Defaulted exposures are assigned to grade 1 and a PD value of 100%. An approximation to the equivalent credit rating grade used by Standard and Poor’s Rating Services (‘S&P’) is shown in the final column of the table.
| PD range | ||||||||||||||||
ANTS risk grade | Mid % | Lower % | Upper % | S&P equivalent | ||||||||||||
9 | 0.010 | 0.000 | 0.021 | AAA to AA- | ||||||||||||
8 | 0.032 | 0.021 | 0.066 | A+ to A | ||||||||||||
7 | 0.100 | 0.066 | 0.208 | A- to BBB+ | ||||||||||||
6 | 0.316 | 0.208 | 0.658 | BBB to BBB- | ||||||||||||
5 | 1.000 | 0.658 | 2.081 | BB+ to BB- | ||||||||||||
4 | 3.162 | 2.081 | 6.581 | B+ to B | ||||||||||||
3 | 10.000 | 6.581 | 20.811 | B- to CCC | ||||||||||||
2 | 31.623 | 20.811 | 99.999 | CC TO C | ||||||||||||
1 Default | 100.000 | 100.000 | 100.000 | D | ||||||||||||
| Abbey National Treasury Services plc 2014 Half Yearly Financial Report | 17 |
Detailed Business Review
Risk Management Reportcontinued
Non-performing loans and advances(1)(2)
An analysis of ANTS’s NPLs is presented below. The information is presented for Commercial Banking only as there are no NPLs in other business divisions.
| 30 June 2014 £m | 31 December 2013 £m | |||||||
Loans and advances to customers of which:(2) | 6,838 | 6,317 | ||||||
Commercial Banking Arrears including NPLs(3) | 130 | 94 | ||||||
Commercial Banking NPLs - impaired(3) (4) (5) | 130 | 94 | ||||||
Commercial Banking NPLs - not impaired(3) (4) | — | — | ||||||
|
|
|
| |||||
Commercial Banking NPLs | 130 | 94 | ||||||
|
|
|
| |||||
Impairment loan loss allowances | 50 | 63 | ||||||
|
|
|
| |||||
| % | % | |||||||
|
|
|
| |||||
Arrears ratio(6) | 1.90 | 1.49 | ||||||
NPLs ratio(7) | 1.90 | 1.49 | ||||||
Coverage ratio(8) | 38 | 67 | ||||||
|
|
|
| |||||
| (1) | Loans and advances are classified as non-performing typically when the counterparty fails to make payments when contractually due for three months or where it is deemed probable that this will occur in the near future. |
| (2) | All Commercial Banking NPL balances are UK and continue accruing interest. For the data presented, the balances include interest charged to the customer’s account, but exclude interest accrued but not yet charged to the account. |
| (3) | Commercial Banking loans and advances to customers include finance leases. |
| (4) | All the Non-Performing Loans are impaired for purposes of provisioning. |
| (5) | NPLs against which an impairment loss allowance has been established. |
| (6) | Commercial Banking loans and advances to customers in arrears as a percentage of Commercial Banking loans and advances to customers. |
| (7) | Commercial Banking NPLs as a percentage of Commercial Banking loans and advances to customers. |
| (8) | Impairment loan loss allowances as a percentage of NPLs. |
Concentrations of credit risk exposures
The management of risk concentration is a key part of risk management. ANTS tracks the degree of concentration of its credit risk portfolios using various criteria, including geographic areas and countries, economic sectors, products and groups of customers. Although ANTS’s operations are based mainly in the UK, it has built up exposures to various entities around the world and is therefore exposed to concentrations of risk related to geographic area.
Geographic concentrations
As part of its approach to credit risk management and risk appetite, ANTS sets exposure limits to countries and certain geographic areas. These limits are set with reference to the country limits set by Banco Santander, S.A. These are determined according to the classification of the country (whether it is a developed OECD country or not), the rating of the country, its gross domestic product and the type of business activities and products the Banco Santander group wishes to engage in within that country. For additional geographic information, see “Country Risk Exposure” on pages 35 to 38.
Credit risk exposures by industry
As part of its approach to credit risk management and risk appetite, ANTS sets exposure limits to certain key industry sectors. For additional industry information, see “Country Risk Exposure” on pages 35 to 38.
Forbearance
Commercial Banking is the only business division that undertakes forbearance activities. Discussion and analysis of forbearance activities in Commercial Banking are set out on page 22.
| 18 | Abbey National Treasury Services plc 2014 Half Yearly Financial Report |
Detailed Business Review
Risk Management Report continued
CREDIT RISK – COMMERCIAL BANKING
In Commercial Banking, credit risk arises on asset balances and on committed off-balance sheet transactions such as credit facilities or guarantees. Consequently, committed exposures are typically higher than asset balances. However, in the following committed exposures tables, Sovereigns are presented net of short positions and include Sovereign exposures established for liquidity management purposes managed by Short Term Markets on behalf of Corporate Centre. Large Corporate reverse repos are presented net of repo liabilities and include OTC derivatives. As a result, the committed exposures are smaller than the asset balances recognised on the balance sheet.
COMMERCIAL BANKING - COMMITTED EXPOSURES
Rating distribution
The rating distribution tables show the credit risk exposure by ANTS’s internal rating scale (see page 17) for each portfolio within Commercial Banking. Within this scale, the higher the rating, the better the quality of the counterparty.
30 June 2014 | Sovereign and Supranational(2) £m | Large Corporate £m | Mid Corporate and SME £m | Commercial Real Estate £m | Social Housing £m | Total £m | ||||||||||||||||||
9 | 1,483 | 3 | 90 | — | 339 | 1,915 | ||||||||||||||||||
8 | 3,614 | 1,664 | 377 | 259 | 385 | 6,299 | ||||||||||||||||||
7 | 680 | 2,738 | 1,655 | 793 | 219 | 6,085 | ||||||||||||||||||
6 | — | 4,022 | 2,984 | 2,580 | 90 | 9,676 | ||||||||||||||||||
5 | — | 1,271 | 1,400 | 1,202 | — | 3,873 | ||||||||||||||||||
4 | — | 100 | 125 | 159 | — | 384 | ||||||||||||||||||
1 to 3 | — | 85 | 115 | 99 | — | 299 | ||||||||||||||||||
Other(1) | — | — | 3 | 4 | — | 7 | ||||||||||||||||||
|
|
|
|
|
|
|
|
|
|
|
| |||||||||||||
Total | 5,777 | 9,883 | 6,749 | 5,096 | 1,033 | 28,538 | ||||||||||||||||||
|
|
|
|
|
|
|
|
|
|
|
| |||||||||||||
31 December 2013 | Sovereign and Supranational(2) £m | Large Corporate £m | Mid Corporate and SME £m | Commercial Real Estate £m | Social Housing £m | Total £m | ||||||||||||||||||
9 | 1,295 | 14 | 139 | 126 | 263 | 1,837 | ||||||||||||||||||
8 | 3,894 | 1,242 | 280 | 278 | 359 | 6,053 | ||||||||||||||||||
7 | 860 | 3,122 | 1,571 | 1,419 | 231 | 7,203 | ||||||||||||||||||
6 | — | 3,454 | 2,830 | 1,797 | 115 | 8,196 | ||||||||||||||||||
5 | — | 1,336 | 899 | 1,061 | — | 3,296 | ||||||||||||||||||
4 | — | — | 84 | 200 | — | 284 | ||||||||||||||||||
1 to 3 | — | — | 10 | 112 | — | 122 | ||||||||||||||||||
Other(1) | — | — | 12 | 1 | — | 13 | ||||||||||||||||||
|
|
|
|
|
|
|
|
|
|
|
| |||||||||||||
Total | 6,049 | 9,168 | 5,825 | 4,994 | 968 | 27,004 | ||||||||||||||||||
|
|
|
|
|
|
|
|
|
|
|
| |||||||||||||
| (1) | Represents smaller exposures predominantly within the commercial mortgages portfolio which are subject to scorecards rather than a rating model. |
| (2) | An international organisation, whereby member states transcend national boundaries or interests to share in the decision-making and vote on issues pertaining to the to the geographical focus of the organisation. |
Geographical distribution
The geographic location is classified by country of risk, being the country where each counterparty’s main business activity or assets are located. For clients whose operations are more geographically dispersed, the country of incorporation is applied.
30 June 2014 | Sovereign and Supranational(1) £m | Large Corporate £m | Mid Corporate and SME £m | Commercial Real Estate £m | Social Housing £m | Total £m | ||||||||||||||||||
UK | — | 7,710 | 6,477 | 5,096 | 1,033 | 20,316 | ||||||||||||||||||
Peripheral eurozone | 680 | 323 | 8 | — | — | 1,011 | ||||||||||||||||||
Rest of Europe | 1,191 | 1,393 | 237 | — | — | 2,821 | ||||||||||||||||||
US | — | 358 | 4 | — | — | 362 | ||||||||||||||||||
Rest of world | 3,906 | 99 | 23 | — | — | 4,028 | ||||||||||||||||||
|
|
|
|
|
|
|
|
|
|
|
| |||||||||||||
Total | 5,777 | 9,883 | 6,749 | 5,096 | 1,033 | 28,538 | ||||||||||||||||||
|
|
|
|
|
|
|
|
|
|
|
| |||||||||||||
31 December 2013 | Sovereign and Supranational(1) £m | Large Corporate £m | Mid Corporate and SME £m | Commercial Real Estate £m | Social Housing £m | Total £m | ||||||||||||||||||
UK | — | 7,520 | 5,601 | 4,994 | 968 | 19,083 | ||||||||||||||||||
Peripheral eurozone | 860 | 317 | 18 | — | — | 1,195 | ||||||||||||||||||
Rest of Europe | 1,029 | 861 | 87 | — | — | 1,977 | ||||||||||||||||||
US | — | 284 | — | — | — | �� | 284 | |||||||||||||||||
Rest of world | 4,160 | 186 | 119 | — | — | 4,465 | ||||||||||||||||||
|
|
|
|
|
|
|
|
|
|
|
| |||||||||||||
Total | 6,049 | 9,168 | 5,825 | 4,994 | 968 | 27,004 | ||||||||||||||||||
|
|
|
|
|
|
|
|
|
|
|
| |||||||||||||
| (1) | An international organisation, whereby member states transcend national boundaries or interests to share in the decision-making and vote on issues pertaining to the to the geographical focus of the organisation. |
30 June 2014 compared to 31 December 2013
During the first half of 2014, total committed exposures increased by £1.5bn or 6% to £28.5bn principally within the Large Corporate, and Mid Corporate and SME portfolios. Large Corporate exposures increased by 8% as a result of the development of the franchise focused in high-rated multinational companies. Growth was focused on the UK and other European countries with counterparties with good credit quality and primarily reflects the provision of financial products to support the working capital and liquidity needs of our clients. The Mid Corporate and SME portfolio grew by 16%, reflecting the continued development of the franchise especially in the SME segment. This was reflected in the rise in the mid-range rating bands as this is where counterparties in this segment typically rate.
| Abbey National Treasury Services plc 2014 Half Yearly Financial Report | 19 |
Detailed Business Review
Risk Management Reportcontinued
COMMERCIAL BANKING - CREDIT RISK MITIGATION
At 30 June 2014, collateral held against impaired loans amounted to 54% (2013: 61%) of the carrying amount of impaired loan balances.
COMMERCIAL BANKING – CREDIT PERFORMANCE
Exposures exhibiting potentially higher risk characteristics are subject to risk monitoring under the Watchlist process (described in “The Credit Cycle” section under “Risk monitoring” on page 39 in the 2013 Annual Report). The table below sets out the portfolio showing exposures subject to risk monitoring under the Watchlist process and those classified as non-performing by portfolio at 30 June 2014 and 31 December 2013.
30 June 2014 | Sovereign and Supranational(7) £m | Large Corporate £m | Mid Corporate and SME £m | Commercial Real Estate £m | Social Housing £m | Total £m | ||||||||||||||||||
Total Committed Exposure of which:(1) | 5,777 | 9,883 | 6,749 | 5,096 | 1,033 | 28,538 | ||||||||||||||||||
-Watchlist: Enhanced Monitoring | — | 99 | 225 | 147 | 30 | 501 | ||||||||||||||||||
-Watchlist: Proactive Management | — | — | 201 | 104 | — | 305 | ||||||||||||||||||
-Remaining Performing Exposure | 5,777 | 9,784 | 6,323 | 4,713 | 1,003 | 27,600 | ||||||||||||||||||
Subtotal Performing Exposure | 5,777 | 9,883 | 6,749 | 4,964 | 1,033 | 28,406 | ||||||||||||||||||
Non-Performing Exposure(2) | — | — | — | 132 | — | 132 | ||||||||||||||||||
|
|
|
|
|
|
|
|
|
|
|
| |||||||||||||
Total Impaired Exposure of which:(3) | — | — | 242 | 383 | 30 | 655 | ||||||||||||||||||
-Performing – Watchlist | — | — | 242 | 251 | 30 | 523 | ||||||||||||||||||
-Non-Performing Exposure(2) | — | — | — | 132 | — | 132 | ||||||||||||||||||
|
|
|
|
|
|
|
|
|
|
|
| |||||||||||||
Total Observed impairment loss allowances of which:(4) | — | — | 1 | 44 | — | 45 | ||||||||||||||||||
-Performing – Watchlist | — | — | 1 | 15 | — | 16 | ||||||||||||||||||
-Non-Performing Exposure(2) | — | — | — | 29 | — | 29 | ||||||||||||||||||
|
|
|
|
|
|
|
|
|
|
|
| |||||||||||||
IBNO(5)(6) | 5 | |||||||||||||||||||||||
Total Impairment loss allowance | 50 | |||||||||||||||||||||||
|
|
|
|
|
|
|
|
|
|
|
| |||||||||||||
31 December 2013 | Sovereign and Supranational(7) £m | Large Corporate £m | Mid Corporate and SME £m | Commercial Real Estate £m | Social Housing £m | Total £m | ||||||||||||||||||
Total Committed Exposure of which:(1) | 6,049 | 9,168 | 5,825 | 4,994 | 968 | 27,004 | ||||||||||||||||||
-Watchlist: Enhanced Monitoring | — | 111 | 143 | 130 | 35 | 419 | ||||||||||||||||||
-Watchlist: Proactive Management | — | — | 77 | 193 | — | 270 | ||||||||||||||||||
-Remaining Performing Exposure | 6,049 | 9,057 | 5,600 | 4,582 | 933 | 26,221 | ||||||||||||||||||
Subtotal Performing Exposure | 6,049 | 9,168 | 5,820 | 4,905 | 968 | �� | 26,910 | |||||||||||||||||
Non-Performing Exposure(2) | — | — | 5 | 89 | — | 94 | ||||||||||||||||||
|
|
|
|
|
|
|
|
|
|
|
| |||||||||||||
Total Impaired Exposure of which:(3) | — | — | 225 | 412 | 35 | 672 | ||||||||||||||||||
-Performing – Watchlist | — | — | 220 | 323 | 35 | 578 | ||||||||||||||||||
-Non-Performing Exposure(2) | — | — | 5 | 89 | — | 94 | ||||||||||||||||||
|
|
|
|
|
|
|
|
|
|
|
| |||||||||||||
Total Observed impairment loss allowances of which:(4) | — | — | 6 | 55 | — | 61 | ||||||||||||||||||
-Performing – Watchlist | — | — | 1 | 16 | — | 17 | ||||||||||||||||||
-Non-Performing Exposure(2) | — | — | 5 | 39 | — | 44 | ||||||||||||||||||
|
|
|
|
|
|
|
|
|
|
|
| |||||||||||||
IBNO(5)(6) | 2 | |||||||||||||||||||||||
Total Impairment loss allowance | 63 | |||||||||||||||||||||||
|
|
|
|
|
|
|
|
|
|
|
| |||||||||||||
| (1) | Includes committed facilities and derivatives. The terms ‘Enhanced Monitoring’ and ‘Proactive Management’ are defined on page 41 of the 2013 Annual Report. |
| (2) | Non-Performing Exposure in the table above include committed facilities and derivative exposures and therefore are larger than the NPLs in the tables on page 21 which only include drawn balances. All the Non-Performing Exposures are impaired for the purposes of provisioning. |
| (3) | Corporate loans are assessed individually or collectively assessed for impairment. Assets reported as impaired represent, for collective assessment, that portion of the loan portfolio where it is estimated that a loss has been incurred, plus those assets individually impaired. |
| (4) | Excludes IBNO provision. |
| (5) | Allowance for incurred inherent losses (i.e. incurred but not observed (‘IBNO’)) as described in Note 1 to the Consolidated Financial Statements in the 2013 Annual Report. |
| (6) | There is no impairment allowance attributable to Sovereign and Supranational, Large Corporate or Social Housing. |
| (7) | An international organisation, whereby member states transcend national boundaries or interests to share in the decision-making and vote on issues pertaining to the to the geographical focus of the organisation. |
| 20 | Abbey National Treasury Services plc 2014 Half Yearly Financial Report |
Detailed Business Review
Risk Management Report continued
Non-performing loans and advances (1) (2)
An analysis of Commercial Banking NPLs is presented below.
| 30 June 2014 £m | 31 December 2013 £m | |||||||
Loans and advances to customers of which:(2) | 6,838 | 6,317 | ||||||
Commercial Banking Arrears including NPLs(3) | 130 | 94 | ||||||
Commercial Banking NPLs - impaired(3)(4)(5) | 130 | 94 | ||||||
Commercial Banking NPLs - not impaired(3)(4) | — | — | ||||||
|
|
|
| |||||
Commercial Banking NPLs | 130 | 94 | ||||||
|
|
|
| |||||
Impairment loss allowances | 50 | 63 | ||||||
|
|
|
| |||||
| % | % | |||||||
|
|
|
| |||||
Arrears ratio(6) | 1.90 | 1.49 | ||||||
NPLs ratio(7) | 1.90 | 1.49 | ||||||
Coverage ratio(8) | 38 | 67 | ||||||
|
|
|
| |||||
| (1) | Loans and advances are classified as non-performing typically when the counterparty fails to make payments when contractually due for three months or where it is deemed probable that this will occur in the near future. |
| (2) | Commercial Banking loans and advances to customers include finance leases. |
| (3) | All Commercial Banking balances are UK and continue accruing interest. For the data presented, the balances include interest charged to the customer’s account, but exclude interest accrued but not yet charged to the account. |
| (4) | All the Non-Performing Loans are impaired for purposes of provisioning. |
| (5) | NPLs against which an impairment loss allowance has been established. |
| (6) | Commercial Banking loans and advances to customers in arrears as a percentage of Commercial Banking loans and advances to customers. |
| (7) | Commercial Banking NPLs as a percentage of Commercial Banking loans and advances to customers. |
| (8) | Impairment loss allowances as a percentage of NPLs. |
Movements in NPLs during the first six months are set out in the table below. ‘Transfers in’ represent loans which have become classified as NPLs during the period. ‘Exits (including repayments)’ represent that element of loans to customers that have been repaid (in full or in part) plus those returned to performing status. ‘Write-offs’ represent the unrecovered element of a loan where recovery options, including realisation of any collateral, have been exhausted. Forbearance activity does not result in a change in the NPL status.
| £m | ||||
At 1 January 2014 | 94 | |||
Transfers in to NPL: | ||||
- Entries | 85 | |||
Transfers out of NPL: | ||||
- Exits (including repayments) | (35 | ) | ||
- Write-Offs | (14 | ) | ||
|
| |||
At 30 June 2014 | 130 | |||
|
| |||
30 June 2014 compared to 31 December 2013
During the first six months of 2014, Watchlist exposures subject to proactive management increased to £305m (2013: £270m), largely driven by an increase in the Mid Corporate and SME portfolio, partially offset by a reduction in Commercial Real Estate. Watchlist exposures subject to enhanced monitoring increased slightly. In the Sovereign and Supranational, Large Corporate, and Social Housing portfolios, there were no exposures subject to proactive management with only 1% (2013: 1%) of these portfolio exposures subject to enhanced monitoring.
Loans and advances to customers in arrears increased to £130m (2013: £94m) largely due to a single long-standing loan of £65m which moved to non-performance. A successful restructure of this loan is still anticipated and a conservative provision is held against it. Consequently, loans and advances to customers in arrears as a percentage of loans and advances to customers increased to 1.90% (2013: 1.49%).
During the first six months of 2014, the NPLs ratio also increased slightly to 1.90% (2013: 1.49%) due to the same single long-standing loan noted above.
In the first half of 2014, interest income recognised on impaired loans amounted to £1m (six months ended 30 June 2013: £1m).
| Abbey National Treasury Services plc 2014 Half Yearly Financial Report | 21 |
Detailed Business Review
Risk Management Reportcontinued
COMMERCIAL BANKING LOANS - FORBEARANCE
Forbearance commenced during the period/year(1)
No arrangements have been entered into with respect to Sovereign and Supranational, Large Corporate or Social Housing counterparties. The exposures that entered forbearance during the six months period ended 30 June 2014 and the year ended 31 December 2013 were:
| Mid Corporate and SME | Commercial Real Estate | Total | ||||||||||
30 June 2014 | £m | £m | £m | |||||||||
Forbearance of NPL | — | — | — | |||||||||
Forbearance of Non-NPL | 7 | 58 | 65 | |||||||||
|
|
|
|
|
| |||||||
| 7 | 58 | 65 | ||||||||||
|
|
|
|
|
| |||||||
| Mid Corporate and SME | Commercial Real Estate | Total | ||||||||||
31 December 2013 | £m | £m | £m | |||||||||
Forbearance of NPL | — | 31 | 31 | |||||||||
Forbearance of Non-NPL | — | 72 | 72 | |||||||||
|
|
|
|
|
| |||||||
| — | 103 | 103 | ||||||||||
|
|
|
|
|
| |||||||
| (1) | The figures by period/year reflect the amount of forbearance activity undertaken during the period/year irrespective of whether any forbearance activity has previously been undertaken on the forborne accounts. |
Forbearance cumulative position
At 30 June 2014, 97% (2013: 98%) of the forbearance related to the Commercial Real Estate portfolio.
a) Performance status when entering forbearance
The status of forborne exposures at 30 June 2014 and 31 December 2013 when they originally entered forbearance, analysed by their payment status, was:
30 June 2014 | Forbearance of NPL £m | Forbearance of Non-NPL £m | Total £m | Impairment allowance £m | ||||||||||||
Performing | — | 224 | 224 | 18 | ||||||||||||
In arrears (inc. NPLs) | 16 | — | 16 | 2 | ||||||||||||
|
|
|
|
|
|
|
| |||||||||
Total | 16 | 224 | 240 | 20 | ||||||||||||
|
|
|
|
|
|
|
| |||||||||
31 December 2013 | Forbearance of NPL £m | Forbearance of Non-NPL £m | Total £m | Impairment allowance £m | ||||||||||||
Performing | — | 201 | 201 | 13 | ||||||||||||
In arrears (inc. NPLs) | 51 | — | 51 | 19 | ||||||||||||
|
|
|
|
|
|
|
| |||||||||
Total | 51 | 201 | 252 | 32 | ||||||||||||
|
|
|
|
|
|
|
| |||||||||
b) Performance status at the period/year-end
The current status of forborne exposures analysed by their payment status, at 30 June 2014 and 31 December 2013 was:
30 June 2014 | Forbearance of NPL £m | Forbearance of Non-NPL £m | Total £m | Impairment allowance £m | ||||||||||||
Performing | — | 139 | 139 | 8 | ||||||||||||
In arrears (inc. NPLs) | 16 | 85 | 101 | 12 | ||||||||||||
|
|
|
|
|
|
|
| |||||||||
Total | 16 | 224 | 240 | 20 | ||||||||||||
|
|
|
|
|
|
|
| |||||||||
31 December 2013 | Forbearance of NPL £m | Forbearance of Non-NPL £m | Total £m | Impairment allowance £m | ||||||||||||
Performing | — | 201 | 201 | 13 | ||||||||||||
In arrears (inc. NPLs) | 51 | — | 51 | 19 | ||||||||||||
|
|
|
|
|
|
|
| |||||||||
Total | 51 | 201 | 252 | 32 | ||||||||||||
|
|
|
|
|
|
|
| |||||||||
| 22 | Abbey National Treasury Services plc 2014 Half Yearly Financial Report |
Detailed Business Review
Risk Management Report continued
30 June 2014 compared to 31 December 2013
The incidence of forbearance that commenced in the period remained stable compared to 2013, and related to a small number of Commercial Real Estate exposure originated in the pre-2009 vintage where a further forbearance was required. The volume of forborne exposures decreased as the number of pre-2009 cases continued to work their way through the process.
Accounts that are in forbearance continue to be closely monitored, to ensure that the forbearance arrangements are sustainable. Not all forbearance will prove effective, and in certain circumstances, market conditions may lead either to a case remaining in NPL even post-forbearance or to the need for a second forbearance action as, for example, in the case of Commercial Real Estate where it remains difficult to sell or refinance certain properties. At 30 June 2014, 58% (2013: 80%) of forborne exposure was performing in accordance with the revised terms agreed under the forbearance arrangements. This decrease is largely due to the aforementioned single long-standing loan of £65m which moved to non-performance. A successful restructure of this loan is still anticipated.
The level of compliance with revised terms agreed under forbearance arrangements is influenced by market conditions and, as a consequence of the economic conditions, it is taking longer for cases to return to performing status after forbearance. Those cases where forbearance occurs prior to default, which at 30 June 2014 represented 94% (2013: 80%) of exposure, are generally more effective as highlighted in the tables above. Forborne exposures are assessed for observed impairment loss allowances. The greater probability of a loss when compared to the performing book is reflected in the calculation of impairment loss allowances. A customer’s ability to adhere to any revised terms agreed is an indicator of the sustainability of ANTS’s forbearance arrangements, although the forbearance is unlikely to be successful in all cases.
Debt-for-equity swaps
Debt-for-equity swaps amounted to £24m at 30 June 2014 (2013: £34m) and in view of their small size are not included in these analyses.
Financial assets that would otherwise be past due or impaired
At 30 June 2014, the carrying amount of financial assets that would otherwise be past due or impaired whose terms have been forborne was £nil (2013: £nil).
| Abbey National Treasury Services plc 2014 Half Yearly Financial Report | 23 |
Detailed Business Review
Risk Management Reportcontinued
HIGHER RISK LOANS AND OTHER SEGMENTS OF PARTICULAR INTEREST
The Commercial Real Estate market has experienced a particularly challenging environment over recent years following the financial crisis. Within this sector, Commercial Real Estate loans originated prior to 2009 represent a segment of relatively higher risk.
Credit performance
Commercial Real Estate non-performing exposures and weighted average LTVs at 30 June 2014 and 31 December 2013 may be further analysed between loans originated pre-2009 and thereafter as follows:
| Original vintage | ||||||||||||
30 June 2014 | Pre-2009 | 2009 onwards | Total | |||||||||
Total committed exposure | £ | 594m | £ | 4,502m | £ | 5,096m | ||||||
Non-performing exposure ratio | 22.2 | % | — | 2.6 | % | |||||||
Weighted average LTV | 71 | % | 54 | % | 56 | % | ||||||
| Original vintage | ||||||||||||
31 December 2013 | Pre-2009 | 2009 onwards | Total | |||||||||
Total committed exposure | £ | 684m | £ | 4,310m | £ | 4,994m | ||||||
Non-performing exposure ratio | 13.0 | % | — | 1.8 | % | |||||||
Weighted average LTV | 69 | % | 54 | % | 56 | % | ||||||
30 June 2014 compared to 31 December 2013
At 30 June 2014, all of the non-performing exposures related to deals originated pre-2009. The pre-2009 vintage loans were written on terms prevailing in the market at that time which, compared to more recent times, included higher original LTVs, lower interest coverage and exposure to development or letting risk. Following the significant downturn in the commercial real estate market in 2008 and 2009, some of these customers suffered financial stresses resulting in their inability to meet the contractual payment terms, comply with covenants, or achieve refinancing/repayment at maturity. As a result, the pre-2009 sub-portfolio has experienced higher NPL rates in recent years.
In light of the market deterioration, ANTS’s lending criteria were significantly tightened from 2009 onwards, with lower LTVs and the avoidance of transactions with material letting or development risks. In addition, while the market remains challenging, prices have not declined significantly further since ANTS’s lending criteria were tightened. As a result, the sub-portfolio representing loans originating from 2009 onwards continues to perform significantly better than the pre-2009 sub-portfolio which continues to decline both in absolute terms and as a proportion of the total Commercial Real Estate portfolio. At 30 June 2014, the pre-2009 sub-portfolio represented 12% (2013: 14%) of the total Commercial Real Estate portfolio.
Further detail on the entire Commercial Real Estate portfolio is contained in the following section.
| 24 | Abbey National Treasury Services plc 2014 Half Yearly Financial Report |
Detailed Business Review
Risk Management Report continued
Commercial Real Estate loans
The Commercial Real Estate portfolio remained well diversified by sector at 30 June 2014 and 31 December 2013, as set out below.
Sector | 30 June 2014 % | 31 December 2013 % | ||||||
Office | 27 | 27 | ||||||
Retail | 29 | 28 | ||||||
Industrial | 16 | 13 | ||||||
Residential | 4 | 4 | ||||||
Mixed Use | 10 | 9 | ||||||
Student Accommodation | 4 | 7 | ||||||
Hotels & Leisure | 5 | 6 | ||||||
Other | 5 | 6 | ||||||
|
|
|
| |||||
| 100 | 100 | |||||||
|
|
|
| |||||
Loan-to-value analysis
In Commercial Real Estate lending, the main form of credit mitigation is collateral. The table below analyses the loan to value ratios of loans within the Commercial Real Estate portfolio at 30 June 2014 and 31 December 2013.
30 June 2014 | Stock % | New Business % | ||||||
Up to 50% | 33 | 16 | ||||||
50% to 60% | 33 | 36 | ||||||
60% to 70% | 23 | 48 | ||||||
70% to 80% | 6 | — | ||||||
80% to 90% | 1 | — | ||||||
90% to 100% | 2 | — | ||||||
> 100% i.e. negative equity | 2 | — | ||||||
|
|
|
| |||||
Total | 100 | 100 | ||||||
|
|
|
| |||||
31 December 2013 | Stock % | New Business % | ||||||
Up to 50% | 36 | 23 | ||||||
50% to 60% | 34 | 54 | ||||||
60% to 70% | 15 | 12 | ||||||
70% to 80% | 7 | 11 | ||||||
80% to 90% | 4 | — | ||||||
90% to 100% | — | — | ||||||
> 100% i.e. negative equity | 4 | — | ||||||
|
|
|
| |||||
Total | 100 | 100 | ||||||
|
|
|
| |||||
30 June 2014 compared to 31 December 2013
At 30 June 2014, the profile of the portfolio remained conservative in terms of LTV with 66% (2013: 70%) of the portfolio at or below 60% LTV. This reflected the more recent vintage of the portfolio with 90% (2013: 86%) originated in 2009 or subsequent years. The majority of higher LTV deals represent older deals which remain in the portfolio.
New business is rarely written above 65% LTV. During the first half of 2014, all new business was originated at 65% LTV or lower. The majority of the cases with negative equity form part of the forborne element of the portfolio and are managed by the Restructuring & Recoveries team.
At 30 June 2014 the average LTV, weighted by exposure, remained stable at 56% (2013: 56%). The weighted average LTV of new deals written in the first half of 2014 was 57% (2013: 57%).
Refinancing risk
As part of the annual review process, for commercial real estate loans that are approaching maturity, consideration is given to the prospects of refinancing the loan at prevailing market terms and applicable credit policy. The review will consider this and other aspects (e.g. covenant compliance) which could result in the case being placed on the Watchlist. Additionally, where an acceptable refinancing proposal has not been received within six months prior to maturity, the case will be placed on the Watchlist.
At 30 June 2014, there was £887m (2013: £620m) of commercial real estate loans due to mature within 12 months. Of these, £135m i.e. 15% (2013: £153m i.e. 25%) have an LTV ratio above that which would be considered acceptable under current credit policy, all of which has been placed on the Watchlist or recorded as NPL and has an impairment loss allowance of £25m (2013: £27m) associated with it.
| Abbey National Treasury Services plc 2014 Half Yearly Financial Report | 25 |
Detailed Business Review
Risk Management Reportcontinued
Derivative risk exposures in the tables below are lower than the balance sheet position because the overall risk exposure is monitored and therefore consideration is taken of margin posted, Credit Support Annexes within ISDA Master Agreements, and master netting agreements and other financial instruments which reduce the Santander UK group’s exposures. Derivative asset balances recognised on the balance sheet reflect only the more restrictive netting permitted by IAS 32.
MARKETS – COMMITTED EXPOSURES
Rating and geographical distribution
The tables below reflect the total credit risk exposures of Markets by ANTS’s internal rating scale (see page 17) and by geographical areas. The exposures include committed facilities as well as the uncommitted drawn facilities. The geographic location is defined as the counterparty’s country of domicile except where a full risk transfer guarantee is in place, in which case the country of domicile of the guarantor is used.
30 June 2014 | UK £m | Peripheral eurozone £m | Rest of Europe £m | US £m | Rest of world £m | Total £m | ||||||||||||||||||
9 | 295 | — | 19 | 128 | 9 | 451 | ||||||||||||||||||
8 | 2,109 | 28 | 678 | 530 | 105 | 3,450 | ||||||||||||||||||
7 | 597 | 650 | 103 | 640 | — | 1,990 | ||||||||||||||||||
6 | 97 | 1 | 1 | 4 | — | 103 | ||||||||||||||||||
5 | 1 | 4 | 11 | — | — | 16 | ||||||||||||||||||
4 | 58 | — | — | — | — | 58 | ||||||||||||||||||
1 to 3 | — | — | — | — | — | — | ||||||||||||||||||
|
|
|
|
|
|
|
|
|
|
|
| |||||||||||||
Total | 3,157 | 683 | 812 | 1,302 | 114 | 6,068 | ||||||||||||||||||
|
|
|
|
|
|
|
|
|
|
|
| |||||||||||||
31 December 2013 | UK £m | Peripheral eurozone £m | Rest of Europe £m | US £m | Rest of world £m | Total £m | ||||||||||||||||||
9 | — | — | 2 | — | 56 | 58 | ||||||||||||||||||
8 | 1,410 | 10 | 897 | 746 | 87 | 3,150 | ||||||||||||||||||
7 | 1,064 | 582 | 169 | 227 | — | 2,042 | ||||||||||||||||||
6 | 76 | 3 | — | 23 | — | 102 | ||||||||||||||||||
5 | 1 | 5 | 11 | — | 1 | 18 | ||||||||||||||||||
4 | — | — | — | — | — | — | ||||||||||||||||||
1 to 3 | 28 | — | — | — | — | 28 | ||||||||||||||||||
|
|
|
|
|
|
|
|
|
|
|
| |||||||||||||
Total | 2,579 | 600 | 1,079 | 996 | 144 | 5,398 | ||||||||||||||||||
|
|
|
|
|
|
|
|
|
|
|
| |||||||||||||
30 June 2014 compared to 31 December 2013
As a continued effort to mitigate counterparty credit risk in derivative transactions, ANTS increased the use of Central Counterparties (‘CCPs’) during the first half of 2014. This was reflected by the increased exposure in rating categories 8 and 9 in the UK resulting in an overall improved credit rating profile.
MARKETS – CREDIT RISK MITIGATION
Market focuses on derivative products and mitigates its credit risk to counterparties through netting arrangements, collateralisation and the use of CCPs. For details of the approach to credit risk mitigation, see “Credit Risk Management – Markets” on page 46 of the 2013 Annual Report.
The top 20 clients with which ANTS had the biggest derivative exposures were Banks and CCPs. These top 20 clients’ derivative exposure accounted for 79% of the total derivative exposure in Markets at 30 June 2014 (2013: 74%). Cash collateral related to the Top 20 at 30 June 2014 was £0.9bn (2013: £1.8bn) and the risk exposure weighted average credit rating was 7.4 (2013: 7.6).
The total notional amount of OTC derivatives at 30 June 2014 was £1,023.3bn (2013: £1,006.2bn) and 38% (2013: 34%) was cleared through CCPs. By mark-to-market terms (i.e. the credit risk exposure including mark-to-market value plus a volatility add-on that reflects the future volatility of the derivatives), CCPs were used in connection with 22% (2013: 19%) of OTC derivatives. CCP transaction values as a percentage of the total portfolio are higher in notional amount than in mark-to-market terms due to their higher collateralisation and lower volatility.
MARKETS – CREDIT PERFORMANCE
At 30 June 2014, there were no impaired or non-performing loans or exposures (2013: none) and the assets in the Watchlist proactive management category amounted to only £69m (2013: £36m).
MARKETS – FORBEARANCE
At 30 June 2014 and 31 December 2013, there was no forbearance activity in Markets.
| 26 | Abbey National Treasury Services plc 2014 Half Yearly Financial Report |
Detailed Business Review
Risk Management Report continued
CREDIT RISK - CORPORATE CENTRE
Credit risk arises on assets in the balance sheet and in off-balance sheet transactions. Consequently, the committed exposure (which takes into account credit mitigation procedures) is shown in the table below. It also excludes Sovereign and Supranational exposures managed by Short Term Markets within Commercial Banking.
CORPORATE CENTRE – COMMITTED EXPOSURES
Rating distribution
The rating distribution tables below show the credit risk exposure by ANTS’s internal rating scale (see page 17) for each portfolio. Within this scale the higher the rating the better the quality of the counterparty.
30 June 2014 | Sovereign and Supranational(2) £m | Structured Products £m | Derivatives £m | Social Housing £m | Total £m | |||||||||||||||
9 | 11,037 | 108 | — | 2,622 | 13,767 | |||||||||||||||
8 | — | 98 | 436 | 4,354 | 4,888 | |||||||||||||||
7 | — | 12 | 290 | 1,753 | 2,055 | |||||||||||||||
6 | — | 2 | — | 223 | 225 | |||||||||||||||
5 | — | — | — | — | — | |||||||||||||||
4 | — | — | — | — | — | |||||||||||||||
1 to 3 | — | 9 | — | — | 9 | |||||||||||||||
Other(1) | — | — | — | — | — | |||||||||||||||
|
|
|
|
|
|
|
|
|
| |||||||||||
Total | 11,037 | 229 | 726 | 8,952 | 20,944 | |||||||||||||||
|
|
|
|
|
|
|
|
|
| |||||||||||
31 December 2013 | Sovereign and Supranational(2) £m | Structured Products £m | Derivatives £m | Social Housing £m | Total £m | |||||||||||||||
9 | 8,305 | 84 | — | 2,654 | 11,043 | |||||||||||||||
8 | — | 104 | 901 | 4,382 | 5,387 | |||||||||||||||
7 | — | 14 | — | 1,713 | 1,727 | |||||||||||||||
6 | — | 4 | 14 | 238 | 256 | |||||||||||||||
5 | — | 5 | 1 | — | 6 | |||||||||||||||
4 | — | 46 | — | — | 46 | |||||||||||||||
1 to 3 | — | 3 | — | — | 3 | |||||||||||||||
Other(1) | — | 1 | 2 | — | 3 | |||||||||||||||
|
|
|
|
|
|
|
|
|
| |||||||||||
Total | 8,305 | 261 | 918 | 8,987 | 18,471 | |||||||||||||||
|
|
|
|
|
|
|
|
|
| |||||||||||
| (1) | Represents smaller exposure predominantly within the commercial mortgages portfolio which are subject to scorecards rather than a rating model. |
| (2) | An international organisation, whereby member states transcend national boundaries or interests to share in the decision-making and vote on issues pertaining to the geographical focus of the organisation. |
Geographical distribution
The geographic location is classified by country of risk being the country where each counterparty’s main business activity or assets are located. For clients whose operations are more geographically dispersed the country of incorporation is applied.
30 June 2014 | Sovereign and Supranational(1) £m | Structured Products £m | Derivatives £m | Social Housing £m | Total £m | |||||||||||||||
UK | 3,441 | 99 | — | 8,952 | 12,492 | |||||||||||||||
Peripheral eurozone | — | 68 | — | — | 68 | |||||||||||||||
Rest of Europe | — | 62 | 276 | — | 338 | |||||||||||||||
US | 7,498 | — | 450 | — | 7,948 | |||||||||||||||
Rest of world | 98 | — | — | — | 98 | |||||||||||||||
|
|
|
|
|
|
|
|
|
| |||||||||||
Total | 11,037 | 229 | 726 | 8,952 | 20,944 | |||||||||||||||
|
|
|
|
|
|
|
|
|
| |||||||||||
31 December 2013 | Sovereign and Supranational(1) £m | Structured Products £m | Derivatives £m | Social Housing £m | Total £m | |||||||||||||||
UK | 2,777 | 107 | 15 | 8,987 | 11,886 | |||||||||||||||
Peripheral eurozone | — | 69 | — | — | 69 | |||||||||||||||
Rest of Europe | — | 85 | 601 | — | 686 | |||||||||||||||
US | 5,230 | — | 300 | — | 5,530 | |||||||||||||||
Rest of world | 298 | — | 2 | — | 300 | |||||||||||||||
|
|
|
|
|
|
|
|
|
| |||||||||||
Total | 8,305 | 261 | 918 | 8,987 | 18,471 | |||||||||||||||
|
|
|
|
|
|
|
|
|
| |||||||||||
| (1) | An international organisation, whereby member states transcend national boundaries or interests to share in the decision-making and vote on issues pertaining to the geographical focus of the organisation. |
30 June 2014 compared to 31 December 2013
During the first half of 2014, total committed exposures increased by £2.4bn or 13% to £20.9bn principally within the Sovereign and Supranational portfolio, partially offset by decreases in the Derivatives portfolio. Committed exposures to Sovereigns and Supranationals principally reflect cash at central banks and holdings of highly rated liquid assets as part of normal liquid asset portfolio management, and remained concentrated in the UK and US. Derivative exposures decreased due to a managed reduction of the portfolio.
| Abbey National Treasury Services plc 2014 Half Yearly Financial Report | 27 |
Detailed Business Review
Risk Management Reportcontinued
CORPORATE CENTRE – CREDIT RISK MITIGATION
Structured Products are unsecured but benefit from senior positions in the creditor cascade. Credit risk in derivatives is mitigated by netting agreements, collateralisation and the use of CCPs. For details of the approach to credit risk mitigation, see “Credit Risk Management – Markets” on page 46 of the 2013 Annual Report.
CORPORATE CENTRE – CREDIT PERFORMANCE
Exposures exhibiting potentially higher risk characteristics are subject to risk monitoring under the Watchlist process (described in “The Credit Cycle” section under “Risk monitoring” on page 39 in the 2013 Annual Report). The table below sets out the portfolio showing exposures subject to risk monitoring under the Watchlist process and those classified as non-performing by portfolio at 30 June 2014 and 31 December 2013:
30 June 2014 | Sovereign and Supranational(5) £m | Structured Products £m | Derivatives £m | Social Housing £m | Total £m | |||||||||||||||
Total Committed Exposure of which:(1) | 11,037 | 229 | 726 | 8,952 | 20,944 | |||||||||||||||
-Watchlist: Enhanced Monitoring | — | — | — | 35 | 35 | |||||||||||||||
-Watchlist: Proactive Management | — | — | — | — | — | |||||||||||||||
-Remaining Performing Exposure | 11,037 | 229 | 726 | 8,917 | 20,909 | |||||||||||||||
Subtotal Performing Exposure | 11,037 | 229 | 726 | 8,952 | 20,944 | |||||||||||||||
Non-Performing Exposure | — | — | — | — | — | |||||||||||||||
|
|
|
|
|
|
|
|
|
| |||||||||||
Total Impaired Exposure of which:(2) | — | — | — | 35 | 35 | |||||||||||||||
-Performing – Watchlist | — | — | — | 35 | 35 | |||||||||||||||
-Non-Performing Exposure | — | — | — | — | — | |||||||||||||||
|
|
|
|
|
|
|
|
|
| |||||||||||
Total Observed impairment loss allowances of which:(3) | — | — | — | — | — | |||||||||||||||
-Performing – Watchlist | — | — | — | — | — | |||||||||||||||
-Non-Performing Exposure | — | — | — | — | — | |||||||||||||||
|
|
|
|
|
|
|
|
|
| |||||||||||
IBNO(4) | — | |||||||||||||||||||
Total Impairment loss allowance | — | |||||||||||||||||||
|
|
|
|
|
|
|
|
|
| |||||||||||
31 December 2013 | Sovereign and Supranational(5) £m | Structured Products £m | Derivatives £m | Social Housing £m | Total £m | |||||||||||||||
Total Committed Exposure of which:(1) | 8,305 | 261 | 918 | 8,987 | 18,471 | |||||||||||||||
-Watchlist: Enhanced Monitoring | — | — | — | 118 | 118 | |||||||||||||||
-Watchlist: Proactive Management | — | — | — | — | — | |||||||||||||||
-Remaining Performing Exposure | 8,305 | 261 | 918 | 8,869 | 18,353 | |||||||||||||||
Subtotal Performing Exposure | 8,305 | 261 | 918 | 8,987 | 18,471 | |||||||||||||||
Non-Performing Exposure | — | — | — | — | — | |||||||||||||||
|
|
|
|
|
|
|
|
|
| |||||||||||
Total Impaired Exposure of which:(2) | — | — | — | 118 | 118 | |||||||||||||||
-Performing – Watchlist | — | — | — | 118 | 118 | |||||||||||||||
-Non-Performing Exposure | — | — | — | — | — | |||||||||||||||
|
|
|
|
|
|
|
|
|
| |||||||||||
Total Observed impairment loss allowances of which:(3) | — | — | — | — | — | |||||||||||||||
-Performing – Watchlist | — | — | — | — | — | |||||||||||||||
-Non-Performing Exposure | — | — | — | — | — | |||||||||||||||
|
|
|
|
|
|
|
|
|
| |||||||||||
IBNO(4) | — | |||||||||||||||||||
Total Impairment loss allowance | — | |||||||||||||||||||
|
|
|
|
|
|
|
|
|
| |||||||||||
| (1) | Includes committed facilities and derivatives. The terms ‘Enhanced Monitoring’ and ‘Proactive Management’ are defined on page 41 of the 2013 Annual Report. |
| (2) | Corporate loans are assessed individually or collectively assessed for impairment. Assets reported as impaired represent, for collective assessment, that portion of the loan portfolio where it is estimated that a loss has been incurred, plus those assets individually impaired. |
| (3) | Excludes IBNO provision. |
| (4) | Allowance for incurred inherent losses (i.e. incurred but not observed (‘IBNO’)) as described in Note 1 to the Consolidated Financial Statements in the 2013 Annual Report. |
| (5) | An international organisation, whereby member states transcend national boundaries or interests to share in the decision-making and vote on issues pertaining to the geographical focus of the organisation. |
30 June 2014 compared to 31 December 2013
During the first half of 2014, Social Housing exposure subject to enhanced monitoring decreased as a result of a number of cases returning to performing status following resolution of governance issues as anticipated. There was no Watchlist exposure subject to enhanced monitoring in Sovereign and Supranational, Structured Products and Derivatives. At 30 June 2014 and 31 December 2013, there were no loans and advances to customers in arrears in Corporate Centre.
Non-performing loans and advances
At 30 June 2014 and 31 December 2013, there were no non-performing loans in Corporate Centre.
CORPORATE CENTRE- FORBEARANCE
At 30 June 2014 and 31 December 2013, there was no forbearance activity in Corporate Centre.
| 28 | Abbey National Treasury Services plc 2014 Half Yearly Financial Report |
Detailed Business Review
Risk Management Report continued
TRADED MARKET RISK – COMMERCIAL BANKING
The amounts below represent the potential change in market values of trading instruments. Since trading instruments are recorded at market value, these amounts also represent the potential effect on income.
| Actual exposure at | ||||||||
Trading instruments | 30 June 2014 £m | 31 December 2013 £m | ||||||
Interest rate risks(1) | 1.4 | 1.7 | ||||||
Equity risks(2) | 0.5 | 0.5 | ||||||
Spread risks(3) | — | — | ||||||
|
|
|
| |||||
Correlation offsets(4) | (0.5 | ) | (0.5 | ) | ||||
|
|
|
| |||||
Total correlated one-day VaR | 1.4 | 1.7 | ||||||
|
|
|
| |||||
| Actual exposure for the period ended | ||||||||||||||||||||||||
| Average exposure | Highest exposure | Lowest exposure | ||||||||||||||||||||||
Trading instruments | 30 June 2014 £m | 31 December 2013 £m | 30 June 2014 £m | 31 December 2013 £m | 30 June 2014 £m | 31 December 2013 £m | ||||||||||||||||||
Interest rate risks(1) | 2.5 | 3.1 | 3.9 | 4.6 | 1.3 | 1.6 | ||||||||||||||||||
Equity risks(2) | 0.5 | 0.8 | 0.6 | 1.2 | 0.4 | 0.5 | ||||||||||||||||||
Spread risks(3) | — | — | — | 1.1 | — | — | ||||||||||||||||||
|
|
|
|
|
|
|
|
|
|
|
| |||||||||||||
Correlation offsets(4) | (0.4 | ) | (0.8 | ) | — | — | — | — | ||||||||||||||||
|
|
|
|
|
|
|
|
|
|
|
| |||||||||||||
Total correlated one-day VaR | 2.6 | 3.1 | 3.9 | 5.0 | 1.4 | 1.7 | ||||||||||||||||||
|
|
|
|
|
|
|
|
|
|
|
| |||||||||||||
| (1) | Interest rate risk measures the impact of interest rate and volatility changes on cash instruments, securities and derivatives. This includes swap spread risk (the difference between swap rates and the government bond rates), basis risk (changes in interest rate floating benchmark levels) and inflation risk (changes in inflation rates). |
| (2) | Equity risk measures the impact on equity stocks and derivatives from changes in equity prices, volatilities and dividends. |
| (3) | Spread risk measures the impact of changes in the credit spread of corporate bonds or credit derivatives. |
| (4) | The highest and lowest exposure figures reported for each risk type did not necessarily occur on the same day as the highest and lowest total correlated one-day VaR. A corresponding correlation offset effect cannot be calculated and is therefore omitted from the above table. |
Commercial Banking daily total correlated one day VaR 2014 (short-term markets business))

The principal component of VaR in Commercial Banking is interest rate risk. The increase in risk seen in the first quarter of 2014 was due to changes in interest rate positioning which also accounted for the decrease in the second quarter.
| Abbey National Treasury Services plc 2014 Half Yearly Financial Report | 29 |
Detailed Business Review
Risk Management Reportcontinued
TRADED MARKET RISK – MARKETS
The amounts below represent the potential change in market values of trading instruments. Since trading instruments are recorded at market value, these amounts also represent the potential effect on income.
| Actual exposure at | ||||||||
Trading instruments | 30 June 2014 £m | 31 December 2013 £m | ||||||
Interest rate risks(1) | 2.0 | 2.3 | ||||||
Equity risks(2) | 0.9 | 1.4 | ||||||
Property risks(3) | 0.1 | 0.1 | ||||||
Spread risks(4) | 0.3 | 0.3 | ||||||
Other risks(5) | — | — | ||||||
|
|
|
| |||||
Correlation offsets(6) | (1.1 | ) | (1.6 | ) | ||||
|
|
|
| |||||
Total correlated one-day VaR | 2.2 | 2.5 | ||||||
|
|
|
| |||||
| Actual exposure for the period ended | ||||||||||||||||||||||||
| Average exposure | Highest exposure | Lowest exposure | ||||||||||||||||||||||
Trading instruments | 30 June 2014 £m | 31 December 2013 £m | 30 June 2014 £m | 31 December 2013 £m | 30 June 2014 £m | 31 December 2013 £m | ||||||||||||||||||
Interest rate risks(1) | 3.3 | 2.6 | 6.1 | 4.4 | 1.8 | 1.7 | ||||||||||||||||||
Equity risks(2) | 1.2 | 1.9 | 1.9 | 4.6 | 0.7 | 0.7 | ||||||||||||||||||
Property risks(3) | 0.1 | 0.1 | 0.1 | 0.2 | 0.1 | — | ||||||||||||||||||
Spread risks(4) | 0.4 | 0.4 | 0.6 | 1.0 | 0.2 | 0.2 | ||||||||||||||||||
Other risks(5) | — | 0.1 | 0.1 | 0.5 | — | — | ||||||||||||||||||
|
|
|
|
|
|
|
|
|
|
|
| |||||||||||||
Correlation offsets(6) | (1.6 | ) | (1.9 | ) | — | — | — | — | ||||||||||||||||
|
|
|
|
|
|
|
|
|
|
|
| |||||||||||||
Total correlated one-day VaR | 3.4 | 3.2 | 5.9 | 6.5 | 1.7 | 1.9 | ||||||||||||||||||
|
|
|
|
|
|
|
|
|
|
|
| |||||||||||||
| (1) | Interest rate risk measures the impact of interest rate and volatility changes on cash instruments, securities and derivatives. This includes swap spread risk (the difference between swap rates and the government bond rates), basis risk (changes in interest rate floating benchmark levels) and inflation risk (changes in inflation rates). |
| (2) | Equity risk measures the impact on equity stocks and derivatives from changes in equity prices, volatilities and dividends. |
| (3) | Property risk measures the impact of changes in the property indices. |
| (4) | Spread risk measures the impact of changes in the credit spread of corporate bonds or credit derivatives. |
| (5) | Other risks include foreign exchange risk. Foreign exchange risk measures the impact of changes in foreign exchange rates and volatilities. |
| (6) | The highest and lowest exposure figures reported for each risk type did not necessarily occur on the same day as the highest and lowest total correlated one-day VaR. A corresponding correlation offset effect cannot be calculated and is therefore omitted from the above table. |
Markets daily total correlated one day VaR 2014
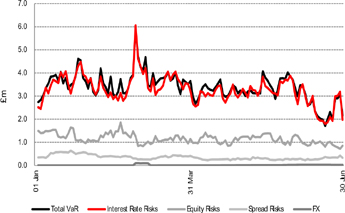
The principal component of VaR in Markets is interest rate risk. The VaR volatility in the first half of 2014 was predominately due to short-term changes in interest rate positioning during the period.
| 30 | Abbey National Treasury Services plc 2014 Half Yearly Financial Report |
Detailed Business Review
Risk Management Report continued
INTRODUCTION
Balance sheet management risk includes exposures arising as a result of the structure of portfolios of assets and liabilities, or where the liquidity of the market is such that the exposure could not be closed out over a short-time horizon. The risk exposure is generated by features inherent in either a product or portfolio and normally presented over the life of the product or portfolio. Such exposures are a result of the decision to undertake specific business activities, can take a number of different forms, and are generally managed over a longer-time horizon. Through the internal transfer pricing mechanism, material balance sheet management risks arising from divisions are transferred from the originating business to FMIR in Corporate Centre where they are monitored, controlled and managed holistically in conjunction with exposures arising from the funding, liquidity or capital management activities of FMIR.
There are three key areas of balance sheet management risk within ANTS, which are discussed in the sections that follow. These are:
| • | Banking Market risk; |
| • | Liquidity and funding risk; and |
| • | Capital risk. |
Types of Banking Market risk
Yield Curve Risk
The table below reflects how base case income and valuation across the Santander UK group would be affected by a 100 basis point parallel shift (both upwards and downwards) applied instantaneously to the yield curve. Sensitivity to parallel shifts represents the quantum of risk in a manner that is considered to be both simple and scaleable. 100 basis points is the stress which is typically focussed on for Banking Market risk controls across the Santander UK group (although sensitivities to other parallel shifts are also regularly monitored). For comparison purposes these measures are shown at 30 June 2014 and 31 December 2013:
| 30 June 2014 | 31 December 2013 | |||||||||||||||
| +100bps £m | -100bps £m | +100bps £m | -100bps £m | |||||||||||||
NIM sensitivity | 236 | (20 | ) | 181 | 87 | |||||||||||
EVE sensitivity | 176 | (231 | ) | 49 | (16 | ) | ||||||||||
The change in the sensitivities between 31 December 2013 and 30 June 2014 was largely attributable to changes in product mix, the forecast timing of Base Rate movements and their impact on customer rates.
Basis Risk
The Santander UK Basis Risk VaR (99% confidence level, 1 day) at 30 June 2014 was £6m (2013: £8m) and was broadly unchanged from the year-end position.
Inflation and Spread Risks
The available-for-sale volatility from the Santander UK ALCO Portfolio and Liquid Asset Portfolio positions VaR (95% confidence level, 1 day) at 30 June 2014 was £4.9m (2013: £4.7m) and was broadly unchanged from the year-end position. This included the inflation and spread risk exposures of these positions. VaR for the individual risk types is not reported separately.
As in previous periods, the portfolio of securities held for liquidity and investment purposes is regularly stress tested against a variety of historical and hypothetical scenarios. There are limits established against the potential losses estimated by the stress tests that complement the VaR-based limits discussed above. At 30 June 2014, the worst 3 month stressed loss for the Santander UK available-for-sale accounted portfolios was estimated to be £190m using historic deterministic stress tests (2013: £139m). The increase in VaR over the period was due to changes in the composition of the bond portfolio as part of normal liquidity management activities.
| Abbey National Treasury Services plc 2014 Half Yearly Financial Report | 31 |
Detailed Business Review
Risk Management Reportcontinued
ANTS is the treasury support function for the Santander UK group. In this regard, ANTS’s role is to provide access to financial markets and central bank facilities in order to meet the Santander UK group’s liquidity, funding, capital and balance sheet management requirements.
Liquidity and funding risk is managed on a Santander UK group basis and it is not therefore appropriate to consider these risks separately at an ANTS group level. In addition, under the PRA’s regulatory liquidity regime, Santander UK and ANTS together with Cater Allen Limited, a fellow subsidiary of Santander UK plc, form the Santander UK Defined Liquidity Group (‘DLG’). Under these arrangements, each member of the DLG is liable to support each other in terms of transferring or receiving surplus liquidity in times of stress. In considering the liquidity resources available to the ANTS group, both its own liquid assets and also those of rest of the Santander UK group have been separately presented below.
These stress tests are supplemented with sensitivity analysis for instantaneous liquidity shocks by each major liquidity risk driver to understand the impact on internal Liquidity Risk Appetite and regulatory liquidity metrics.
LIQUID ASSETS
Santander UK holds, at all times, a portfolio of unencumbered liquid assets to mitigate liquidity risk. The size and composition of this portfolio is determined by Santander UK’s Liquidity Risk Appetite and regulatory requirements.
The table below shows liquid assets held by the ANTS group and additional liquid assets held by the rest of the Santander UK group (to which the ANTS group has access through the cross guarantee and DLG arrangements described above) by the geographic location of the issuer or counterparty at 30 June 2014 and 31 December 2013:
| Held by the ANTS group | Held elsewhere in Santander UK | |||||||||||||||
| 30 June 2014 £bn | 31 December 2013 £bn | 30 June 2014 £bn | 31 December 2013 £bn | |||||||||||||
Eligible liquid assets: | ||||||||||||||||
Cash at central banks: | ||||||||||||||||
- UK | — | — | 18 | 20 | ||||||||||||
- US | 7 | 5 | — | — | ||||||||||||
|
|
|
|
|
|
|
| |||||||||
| 7 | 5 | 18 | 20 | |||||||||||||
|
|
|
|
|
|
|
| |||||||||
Government bonds: | ||||||||||||||||
- UK | 2 | 2 | 1 | — | ||||||||||||
- US | 3 | 2 | — | — | ||||||||||||
- Supranational | — | — | 1 | — | ||||||||||||
|
|
|
|
|
|
|
| |||||||||
| 5 | 4 | 2 | — | |||||||||||||
|
|
|
|
|
|
|
| |||||||||
Total Eligible liquid assets | 12 | 9 | 20 | 20 | ||||||||||||
|
|
|
|
|
|
|
| |||||||||
High quality(1)corporate bonds and asset-backed securities: | ||||||||||||||||
- UK | 1 | 1 | — | — | ||||||||||||
- US | — | — | — | 1 | ||||||||||||
- Other countries, each less than £1bn(2) | — | — | 3 | 1 | ||||||||||||
|
|
|
|
|
|
|
| |||||||||
| 1 | 1 | 3 | 2 | |||||||||||||
|
|
|
|
|
|
|
| |||||||||
Other liquid assets: | ||||||||||||||||
- UK – Whole loans and own debt securities | 4 | 4 | 30 | 35 | ||||||||||||
- UK – Other debt securities, bonds, and equities included in major indices | 1 | 1 | — | — | ||||||||||||
- Other countries, each less than £1bn(3) | — | — | 1 | 1 | ||||||||||||
|
|
|
|
|
|
|
| |||||||||
| 5 | 5 | 31 | 36 | |||||||||||||
|
|
|
|
|
|
|
| |||||||||
Total liquid assets | 18 | 15 | 54 | 58 | ||||||||||||
|
|
|
|
|
|
|
| |||||||||
| (1) | A- rated or above. |
| (2) | Consists of Austria, Belgium, Canada, Switzerland, Germany, France, Norway, Sweden, Ireland, Luxembourg, Denmark and Netherlands. |
| (3) | Consists of Canada, Spain, Italy, France, Denmark, Portugal and Australia. |
Liquidity developments in the first half of 2014
The first half of 2014 was characterised by steadily improving sentiment regarding the UK, US and, to a lesser extent, eurozone economies. In addition, overall investor sentiment continued to strengthen. A developing trend towards the search for enhanced yield and increased risk appetite was observed.
During the first half of 2014, Santander UK benefited from low wholesale, unsecured medium-term and secured medium-term funding rates and increased confidence both in the UK banking sector and wider economic environment. Throughout the first half of 2014, Santander UK continued to maintain a strong liquidity position and a conservative balance sheet structure (i.e. maintaining high levels of high quality liquid assets) as well as robust risk management controls to monitor and manage the levels of the liquid asset portfolio and encumbrance. Eligible liquid assets continued to significantly exceed wholesale funding of less than one year, with a coverage ratio of 127% at 30 June 2014 (2013: 139%). The change in the ratio, which is expected to be volatile due to the management of normal short term business commitments, was driven by an increase in eligible liquid assets by £2.7bn to £32.2bn at 30 June 2014 (2013: £29.5bn) offset by an increase in wholesale funding with a residual maturity of less than one year of £4.1bn to £25.3bn at 30 June 2014 (2013: £21.2bn), due to the phasing of secured funding maturities.
In addition, Santander UK’s LCR improved to 107% at 30 June 2014 (2013: 103%). The rules relating to the LCR, which is expected to be effective from the start of 2015, remain to be finalised. We continue to monitor the ratio based on our interpretation of the rules but it will be subject to revision as the regulatory process develops further. The ratio will also not necessarily be comparable with those of our peers.
| 32 | Abbey National Treasury Services plc 2014 Half Yearly Financial Report |
Detailed Business Review
Risk Management Report continued
FUNDING RISK
Santander UK’s primary sources of funding, approach to funding risk management and funding strategy and structure are described on pages 76 to 77 of the 2013 Annual Report.
DEPOSIT FUNDING
Santander UK’s Retail Banking and Commercial Banking activities are largely funded by customer deposits with the remaining funded with long-term debt and equity (including funding secured against customer loans and advances).
WHOLESALE FUNDING
Reconciliation of wholesale funding to the balance sheet
The tables below show ANTS’s primary wholesale funding sources, excluding short-term repurchase agreements, together with a reconciliation of wholesale funding to the balance sheet at 30 June 2014.
30 June 2014 | Balance sheet line item | |||||||||||||||||||||||
| Funding analysis £bn | Deposits by banks £bn | Deposits by customers(2) £bn | Debt securities in issue £bn | Financial liabilities at fair value £bn | Trading liabilities £bn | |||||||||||||||||||
Deposits by banks (non-customer deposits) | 1.9 | — | — | — | — | 1.9 | ||||||||||||||||||
CDs and Commercial Paper | 8.2 | — | — | 7.3 | 0.9 | — | ||||||||||||||||||
Senior unsecured - public benchmark | 7.4 | — | — | 7.4 | — | — | ||||||||||||||||||
- privately placed | 3.2 | — | — | 0.8 | 2.4 | — | ||||||||||||||||||
Covered bonds | 16.5 | — | — | 16.5 | — | — | ||||||||||||||||||
Securitisation & structured funding | 4.3 | 3.9 | 0.4 | — | — | — | ||||||||||||||||||
|
|
|
|
|
|
|
|
|
|
|
| |||||||||||||
Total wholesale funding | 41.5 | 3.9 | 0.4 | 32.0 | 3.3 | 1.9 | ||||||||||||||||||
Repos | 8.9 | — | — | — | — | 8.9 | ||||||||||||||||||
Foreign exchange and hedge accounting | (0.3 | ) | — | — | (0.3 | ) | — | — | ||||||||||||||||
Other | 121.5 | 114.4 | (1) | — | — | — | 7.1 | (3) | ||||||||||||||||
|
|
|
|
|
|
|
|
|
|
|
| |||||||||||||
Balance sheet total | 171.6 | 118.3 | 0.4 | 31.7 | 3.3 | 17.9 | ||||||||||||||||||
|
|
|
|
|
|
|
|
|
|
|
| |||||||||||||
31 December 2013 | Balance sheet line item | |||||||||||||||||||||||
| Funding analysis £bn | Deposits by banks £bn | Deposits by customers(2) £bn | Debt securities in issue £bn | Financial liabilities at fair value £bn | Trading liabilities £bn | |||||||||||||||||||
Deposits by banks (non-customer deposits) | 1.3 | — | — | — | — | 1.3 | ||||||||||||||||||
CDs and Commercial Paper | 6.6 | — | — | 5.8 | 0.8 | — | ||||||||||||||||||
Senior unsecured - public benchmark | 7.5 | — | — | 7.5 | — | — | ||||||||||||||||||
- privately placed | 2.9 | — | — | 0.3 | 2.6 | — | ||||||||||||||||||
Covered bonds | 17.0 | — | — | 17.0 | — | — | ||||||||||||||||||
Securitisation & structured funding | 4.6 | 4.2 | 0.4 | — | — | — | ||||||||||||||||||
|
|
|
|
|
|
|
|
|
|
|
| |||||||||||||
Total wholesale funding | 39.9 | 4.2 | 0.4 | 30.6 | 3.4 | 1.3 | ||||||||||||||||||
Repos | 12.9 | — | — | — | — | 12.9 | ||||||||||||||||||
Foreign exchange and hedge accounting | 0.3 | — | — | 0.3 | — | — | ||||||||||||||||||
Other | 123.6 | 116.5 | (1) | — | — | — | 7.1 | (3) | ||||||||||||||||
|
|
|
|
|
|
|
|
|
|
|
| |||||||||||||
Balance sheet total | 176.7 | 120.7 | 0.4 | 30.9 | 3.4 | 21.3 | ||||||||||||||||||
|
|
|
|
|
|
|
|
|
|
|
| |||||||||||||
| (1) | Principally consists of amounts due to Santander UK subsidiaries, see Note 14 to the Condensed Consolidated Interim Financial Statements. Also includes items in the course of transmission and other deposits. |
| (2) | Included in the balance sheet total of £4,824m (2013: £7,780m). |
| (3) | Consists of short positions in securities and unsettled trades, cash collateral and short-term deposits. See Note 15 to the Condensed Consolidated Interim Financial Statements. |
Funding developments in the first half of 2014
Santander UK’s overall funding strategy remains to develop and maintain a diversified funding base, which allows us access to a variety of funding sources. As part of this strategy, Santander UK raises funding in a number of currencies, including US dollars and euro, and converts these back into sterling to fund its commercial assets which are largely sterling denominated.
In keeping with the pattern of new issuance in 2013, the focus of new issuance in the first half of 2014 was in the unsecured markets. In total, we issued three public US Dollar unsecured securities and one public Euro unsecured security. In addition to the unsecured issuance, we issued residential mortgage-backed securities and a benchmark Sterling covered bond, two forms of financing that permit us to benefit from our prime UK mortgage assets. The improvement in market sentiment over the medium term continued in the first half of 2014. The wholesale funding markets that we operate in continued to be stable, offering us economically viable sources of funding. This stable market backdrop allowed us to continue to have a more balanced mix of wholesale unsecured and secured new issuance than in recent years. Overall, the cost of wholesale funding continued to fall due to the replacement of expensive medium-term funding maturities with lower cost new issuance in the now more stable capital markets environment.
In the first half of 2014, Santander UK’s medium-term funding issuance was £6.7bn (2013: £6.6bn). This included £500m Perpetual Capital Securities issued to Santander UK plc’s immediate parent company in June 2014, which issued a similar security to Banco Santander, S.A.. During the first half of 2014, a further £500m of Treasury Bills were drawn under the Bank of England and HM Treasury Funding for Lending Scheme. Maturities in the first half of 2014 were approximately £7.6bn (2013: £16.3bn). At 30 June 2014, 62% (2013: 68%) of wholesale funding had a maturity of greater than one year, with an overall residual duration for wholesale funding of 1,046 days (2013: 1,090 days).
During the first half of 2014, Santander UK’s continuing strategy of building closer customer relationships through the 1|2|3 World retail offering created additional current account liabilities that further strengthened this stable funding source. At the same time, the level of less stable retail and corporate instant access accounts reduced as a constituent of the funding mix.
| Abbey National Treasury Services plc 2014 Half Yearly Financial Report | 33 |
Detailed Business Review
Risk Management Reportcontinued
ANTS manages its capital based on an assessment of both regulatory requirements and the economic capital impacts of our businesses. The regulatory capital position at 30 June 2014 is based on the CRD IV rules, which implement Basel III in the EU and came into force on 1 January 2014. Regulatory capital demand is quantified for credit, traded market, banking market, operational, pension obligation and securitisation risk in accordance with PRA requirements. Santander UK produces and shares with the PRA its Internal Capital Adequacy Assessment Process document, which informs the supervisory review and evaluation process by the PRA which can result in additional capital requirements.
The Basel III and CRD IV rules include proposals for the use of a leverage ratio as a backstop measure to risk-based capital ratios. This is managed at a Santander UK group level. The methodology for calculation of the Leverage Ratio and the required minimum level for banks have not been finalised by the EU and are subject to further modification and calibration. A required minimum level significantly above the Basel III proposed level of 3% could require Santander UK to undertake leverage ratio-enhancing actions. Santander UK and other major UK banks and building societies are currently subjected to a PRA-specified leverage ratio minimum level of 3%; however the FPC are consulting upon measures that could increase this minimum level significantly.
During 2014, the Bank of England is conducting concurrent stress tests on major UK banks and building societies, in which Santander UK is participating. The results of this exercise could have a material impact upon minimum capital levels and are expected to be announced towards the end of 2014.
A revised Operational Risk Framework was approved at the start of 2014. A comprehensive supporting programme has been developed to ensure that Santander UK manages its operational risk in line with best practice. This programme has enhanced the key toolset elements of Risk Control Self Assessments, Scenario Analysis and Incident & Loss Management. The programme is being rolled out and will also ensure all the associated initiatives are embedded to a Basel II Advanced Measurement Approach equivalent standard by the end of 2016.
Conduct risk is the risk that Santander UK’s decisions and behaviours lead to a detriment or poor outcome for our customers. Santander UK considers conduct risk to be a primary risk type and takes a forward-looking approach to managing the risk in alignment with the Conduct Risk Framework. This framework has been developed through Santander UK’s overall Risk Framework and Operational Risk Framework, which include the core principles of risk management and control activities.
The Conduct Risk Framework defines the overriding principles and responsibilities for the identification, management, reporting and oversight of conduct risk. It is the operation of, and outputs from, these risk management activities that enables Santander UK to manage conduct risk exposures. All business units are required to manage their activities in accordance with the principles and guidelines set out in the Conduct Risk Framework, together with those detailed in the Santander UK Risk and Operational Risk Frameworks.
Key business decisions, including product approval, business strategy developments and conduct related remediation programmes are monitored and reported through formal governance committees. A programme of work is planned to continue throughout 2014 to further embed the effective management of conduct risk throughout the business, including a comprehensive cultural change project.
Regulatory risk is the risk of reductions in earnings and/or value, through financial or reputational loss, from failing to comply with applicable codes and regulatory rules. The risk was broadly unchanged from the year-end position
ANTS considers legal risk to be a key risk type and manages it in full alignment with the Santander UK Legal Risk Framework. This Framework has been developed under the Santander UK Risk Framework and explains how Santander UK manages and controls legal risk. Effective management of legal risk continued and was expanded throughout the first half of 2014.
| 34 | Abbey National Treasury Services plc 2014 Half Yearly Financial Report |
Detailed Business Review
Risk Management Report continued
AREAS OF FOCUS AND OTHER ITEMS
The ANTS group manages its country risk exposure under its global limits framework. Within this framework, the ANTS group sets its individual risk appetite for each country, taking into account any factors that may influence the risk profile of each country, including political events, the macro-economic situation and the nature of the risk incurred. Exposures are actively managed if it is considered appropriate. Accordingly, and over recent years, ANTS has intensified its monitoring of exposures to sovereigns and counterparties in eurozone countries, and has proceeded to selectively divest assets directly or indirectly affected by events in those countries.Santander UK group and Banco Santander group-related risk is considered separately.
The country risk tables below show the ANTS group’s exposures to central and local governments, government guaranteed counterparties, banks, other financial institutions and corporate customers at 30 June 2014 and 31 December 2013. Total exposures consist of the total of balance sheet values and off-balance sheet values. Balance sheet values are calculated in accordance with IFRS (i.e. after the effect of netting agreements recognised in accordance with the requirements of IFRS), except for credit provisions which have been added back. Off balance sheet values consist of undrawn facilities and letters of credit.
The country of exposure has been assigned based on the counterparty’s country of incorporation except where the ANTS group is aware that a guarantee is in place, in which case the country of incorporation of the guarantor has been used. The exposures are presented by type of counterparty other than where the specific exposures have been guaranteed by a sovereign counterparty in which case they are presented within the ‘Government guaranteed’ category.
Given the ongoing interest in eurozone economies, disclosures relating to those economies are presented first and highlighted separately.
The tables exclude credit risk exposures to other Santander UK group companies and other Banco Santander group companies, which are presented separately on pages 37 to 38.
30 June 2014 | Central and local governments £bn | Government guaranteed £bn | Banks (2) £bn | Other financial institutions £bn | Corporate £bn | Total(1) £bn | ||||||||||||||||||
Eurozone: | ||||||||||||||||||||||||
Peripheral eurozone countries: | ||||||||||||||||||||||||
Ireland | — | — | — | — | 0.3 | 0.3 | ||||||||||||||||||
Italy | 0.7 | — | 0.1 | — | 0.1 | 0.9 | ||||||||||||||||||
Spain (excluding Banco Santander) | — | — | 0.1 | — | — | 0.1 | ||||||||||||||||||
Other eurozone countries: | ||||||||||||||||||||||||
Germany | — | — | 1.3 | — | 0.3 | 1.6 | ||||||||||||||||||
France | — | 0.5 | 1.1 | 0.1 | — | 1.7 | ||||||||||||||||||
All other eurozone(3) | — | 0.3 | 0.3 | — | 1.5 | 2.1 | ||||||||||||||||||
|
|
|
|
|
|
|
|
|
|
|
| |||||||||||||
| 0.7 | 0.8 | 2.9 | 0.1 | 2.2 | 6.7 | |||||||||||||||||||
|
|
|
|
|
|
|
|
|
|
|
| |||||||||||||
All other countries: | ||||||||||||||||||||||||
UK | 3.6 | 0.4 | 10.0 | 3.0 | 26.6 | 43.6 | ||||||||||||||||||
US | 7.6 | — | 7.9 | 0.3 | 0.1 | 15.9 | ||||||||||||||||||
Switzerland | 0.7 | — | 0.3 | 0.1 | 0.1 | 1.2 | ||||||||||||||||||
Denmark | — | — | — | — | 0.2 | 0.2 | ||||||||||||||||||
Japan | 3.5 | — | 0.1 | 0.1 | — | 3.7 | ||||||||||||||||||
All others(4) | — | — | 0.4 | 0.2 | 2.1 | 2.7 | ||||||||||||||||||
|
|
|
|
|
|
|
|
|
|
|
| |||||||||||||
| 15.4 | 0.4 | 18.7 | 3.7 | 29.1 | 67.3 | |||||||||||||||||||
|
|
|
|
|
|
|
|
|
|
|
| |||||||||||||
Total | 16.1 | 1.2 | 21.6 | 3.8 | 31.3 | 74.0 | ||||||||||||||||||
|
|
|
|
|
|
|
|
|
|
|
| |||||||||||||
| (1) | Credit exposures exclude cash at hand, the macro hedge of interest rate risk, intangible assets, property, plant and equipment, current and deferred tax assets, and other assets. Loans and advances to customers are included gross of loan loss allowances. |
| (2) | Excludes balances with central banks. |
| (3) | Includes Luxembourg, Netherlands, Belgium and Finland as well as Greece of £nil and Cyprus of £nil. |
| (4) | Includes Russia of £nil and Ukraine of £nil. |
| Abbey National Treasury Services plc 2014 Half Yearly Financial Report | 35 |
Detailed Business Review
Risk Management Reportcontinued
31 December 2013 | Central and local governments £bn | Government guaranteed £bn | Banks (2) £bn | Other financial institutions £bn | Corporate £bn | Total(1) £bn | ||||||||||||||||||
Eurozone: | ||||||||||||||||||||||||
Peripheral eurozone countries: | ||||||||||||||||||||||||
Portugal | — | — | — | — | 0.1 | 0.1 | ||||||||||||||||||
Ireland | — | — | — | — | 0.1 | 0.1 | ||||||||||||||||||
Italy | 0.8 | — | 0.1 | — | 0.1 | 1.0 | ||||||||||||||||||
Spain (excluding Banco Santander) | — | — | 0.1 | — | — | 0.1 | ||||||||||||||||||
Other eurozone countries: | ||||||||||||||||||||||||
Germany | — | — | 1.5 | — | 0.1 | 1.6 | ||||||||||||||||||
France | — | 0.4 | 1.6 | — | — | 2.0 | ||||||||||||||||||
All other eurozone(3) | 0.1 | 0.2 | 1.0 | — | 1.2 | 2.5 | ||||||||||||||||||
|
|
|
|
|
|
|
|
|
|
|
| |||||||||||||
| 0.9 | 0.6 | 4.3 | — | 1.6 | 7.4 | |||||||||||||||||||
|
|
|
|
|
|
|
|
|
|
|
| |||||||||||||
All other countries: | ||||||||||||||||||||||||
UK | 3.7 | 0.4 | 10.2 | 4.9 | 25.4 | 44.6 | ||||||||||||||||||
US | 5.3 | — | 8.1 | 0.1 | 0.1 | 13.6 | ||||||||||||||||||
Switzerland | 0.5 | — | 1.0 | — | 0.1 | 1.6 | ||||||||||||||||||
Denmark | — | — | 1.4 | — | — | 1.4 | ||||||||||||||||||
Japan | 3.8 | — | 0.1 | — | 0.1 | 4.0 | ||||||||||||||||||
All others(4) | — | — | 0.4 | 0.1 | 1.5 | 2.0 | ||||||||||||||||||
|
|
|
|
|
|
|
|
|
|
|
| |||||||||||||
| 13.3 | 0.4 | 21.2 | 5.1 | 27.2 | 67.2 | |||||||||||||||||||
|
|
|
|
|
|
|
|
|
|
|
| |||||||||||||
Total | 14.2 | 1.0 | 25.5 | 5.1 | 28.8 | 74.6 | ||||||||||||||||||
|
|
|
|
|
|
|
|
|
|
|
| |||||||||||||
| (1) | Credit exposures exclude cash at hand, the macro hedge of interest rate risk, intangible assets, property, plant and equipment, current and deferred tax assets, and other assets. Loans and advances to customers are included gross of loan loss allowances. |
| (2) | Excludes balances with central banks. |
| (3) | Includes Luxembourg, Netherlands, Belgium and Finland as well as Greece of £nil and Cyprus of £nil. |
| (4) | Includes Russia of £nil and Ukraine of £nil. |
30 June 2014 compared to 31 December 2013
Key changes in sovereign and other country risk exposures during the six months ended 30 June 2014 were as follows:
| • | A decrease of £1.0bn in exposure to the UK to £43.6bn (2013: £44.6bn). This was due to lower securities purchased under resale activity. |
| • | An increase of £2.3bn in exposure to the US to £15.9bn (2013: £13.6bn). This was primarily due an increase in deposits at the US Federal Reserve as part of normal liquid asset portfolio management activity. |
| • | A decrease of £0.4bn in exposure to Switzerland to £1.2bn (2013: £1.6bn). This was due to reduced securities purchased under resale activity and lower gross derivative exposures. |
| • | An increase of £0.2bn in exposure to Ireland to £0.3bn (2013: £0.1bn). This was due to increased securities purchased under resale activity and additional corporate facilities provided. |
| • | A decrease of £0.3bn in exposure to Japan to £3.7bn (2013: £4.0bn). This was primarily due to reduced holdings of government securities as part of normal liquid asset portfolio management activity. |
| • | A decrease of £0.1bn in exposures to Italy to £0.9bn (2013: £1.0bn). This principally reflected the sale of Italian Government bonds with less than one year maturity as part of short-term markets trading activity. |
| • | A decrease of £1.2bn in exposures to Denmark to £0.2bn (2013: £1.4bn). This was principally due to the disposal of securities purchased. |
| • | Movements in remaining country risk exposures were minimal and exposures to these countries remained at low levels. |
| 36 | Abbey National Treasury Services plc 2014 Half Yearly Financial Report |
Detailed Business Review
Risk Management Report continued
Peripheral eurozone countries
This section discusses ANTS’s direct exposure to peripheral eurozone countries at 30 June 2014 and 31 December 2013 by type of financial instrument.It excludes balances with Santander UK group and other Banco Santander group companies which are presented separately on pages 37 to 38. This section also discusses our indirect exposures to peripheral eurozone countries.
Direct and indirect risk exposures to peripheral eurozone countries arise primarily in the large corporate element of the portfolio via large multinational companies and financial institutions, which are monitored on a regular basis by the Wholesale Credit Risk Department as part of the overall risk management process. The corporate portfolio is mainly comprised of multinational UK companies which are considered to be geographically well diversified in terms of their assets, operations and profits. The remainder of the Commercial Banking portfolio is predominately UK based with no material peripheral eurozone exposure. In addition, the risk is further mitigated by the fact that credit agreements are underpinned by both financial and non-financial covenants.
The risk arising from indirect exposures from our transactions with financial institutions is mitigated by the short-term tenor of the transactions, and by the fact that many such transactions contain margin calls and/or collateral requirements, and are subject to standard ISDA Master Agreements permitting offsetting.
The risk arising from indirect exposures from our transactions with other corporates is mitigated by standard financial and non-financial guarantees and the fact that the companies are geographically well diversified in terms of their assets, operations and profits.
Direct exposures to peripheral eurozone countries
Balances with respect to Italy at 30 June 2014 comprised trading assets issued by central and local governments of £0.7bn (2013: £0.8bn), Loans and advances to corporate customers of £0.1bn (2013: £0.1bn) and derivative assets issued by banks of £0.1bn (2013: £0.1bn). Balances with respect to Spain at 30 June 2014 comprised derivative assets issued by banks of £0.1bn (2013: £0.1bn). Balances with respect to Ireland at 30 June 2014 comprised trading assets issued by corporate institutions of £0.2bn (2013: £nil), commitments and undrawn facilities with corporate customers of £0.1bn (2013: £nil) and loans and advances to corporate customers of £nil (2013: £0.1bn). Balances with respect to Portugal at 30 June 2014 comprised loans and advances to corporate customers of £nil (2013: £0.1bn).
Indirect exposures to peripheral eurozone countries
Indirect exposures to peripheral eurozone countries are considered to exist where our direct counterparties outside the peripheral eurozone countries themselves have a direct exposure to one or more peripheral eurozone countries. Indirect exposures are identified as part of our ongoing credit analysis and monitoring of our counterparty base by the review of available financial information to determine the countries where the material parts of a counterparty’s assets, operations or profits arise.
Our indirect exposures to peripheral eurozone countries consist of a small number of corporate loans to large multinational companies based in the UK that derive a proportion of their profits from one or more peripheral eurozone countries; trading transactions and hedging transactions with financial institutions based in the UK and Europe that derive a proportion of their profits from or have a proportion of their assets in one or more peripheral eurozone countries; and a small number of loans to other corporate entities which have either a proportion of their operations within, or profits from, one or more peripheral eurozone countries.
Balances with other Santander UK group companies
The ANTS group enters into transactions with other Santander UK group companies in the ordinary course of business. ANTS provides treasury, corporate and wholesale banking services to the wider Santander UK group, of which ANTS is a significant part. ANTS is also the treasury support function for the Santander UK group. In this regard, ANTS’s role is to provide access to financial markets and central bank facilities in order to meet the Santander UK group’s liquidity, funding, capital and balance sheet management requirements. As such, ANTS is one of the main debt issuance vehicles in the Santander UK group. At 30 June 2014 and 31 December 2013, the ANTS group had gross balances with other Santander UK group companies as follows:
30 June 2014 | Banks £bn | Other financial institutions £bn | Corporate £bn | Total £bn | ||||||||||||
Assets: | ||||||||||||||||
- UK | 110.6 | 26.0 | — | 136.6 | ||||||||||||
|
|
|
|
|
|
|
| |||||||||
| 110.6 | 26.0 | — | 136.6 | |||||||||||||
|
|
|
|
|
|
|
| |||||||||
Liabilities: | ||||||||||||||||
- UK | (113.7 | ) | (1.9 | ) | — | (115.6 | ) | |||||||||
- Jersey | (2.3 | ) | — | — | (2.3 | ) | ||||||||||
|
|
|
|
|
|
|
| |||||||||
| (116.0 | ) | (1.9 | ) | — | (117.9 | ) | ||||||||||
|
|
|
|
|
|
|
| |||||||||
31 December 2013 | Banks £bn | Other financial institutions £bn | Corporate £bn | Total £bn | ||||||||||||
Assets: | ||||||||||||||||
- UK | 113.8 | 28.8 | — | 142.6 | ||||||||||||
|
|
|
|
|
|
|
| |||||||||
| 113.8 | 28.8 | — | 142.6 | |||||||||||||
|
|
|
|
|
|
|
| |||||||||
Liabilities: | ||||||||||||||||
- UK | (115.5 | ) | (3.3 | ) | — | (118.8 | ) | |||||||||
- Jersey | (2.5 | ) | — | — | (2.5 | ) | ||||||||||
- Isle of Man | (0.1 | ) | — | — | (0.1 | ) | ||||||||||
|
|
|
|
|
|
|
| |||||||||
| (118.1 | ) | (3.3 | ) | — | (121.4 | ) | ||||||||||
|
|
|
|
|
|
|
| |||||||||
| Abbey National Treasury Services plc 2014 Half Yearly Financial Report | 37 |
Detailed Business Review
Risk Management Reportcontinued
Balances with other Banco Santander group companies outside the Santander UK group
The ANTS group enters into transactions with other Banco Santander group companies outside the Santander UK group in the ordinary course of business. Such transactions are undertaken in areas of business where the ANTS group has a particular advantage or expertise and where Banco Santander group companies can offer commercial opportunities, substantially on the same terms as for comparable transactions with third party counterparties. These transactions also arise in support of the activities of, or with, larger multinational corporate clients and financial institutions which may have relationships with a number of entities in the Banco Santander group.
At 30 June 2014 and 31 December 2013, the ANTS group had gross balances with other Banco Santander group companies outside the Santander UK group as follows:
30 June 2014 | Banks £bn | Other financial institutions £bn | Corporate £bn | Total £bn | ||||||||||||
Assets: | ||||||||||||||||
- Spain | 2.2 | — | — | 2.2 | ||||||||||||
- UK | — | — | 0.2 | 0.2 | ||||||||||||
- Chile | 0.2 | — | — | 0.2 | ||||||||||||
- Other < £100m | — | 0.1 | — | 0.1 | ||||||||||||
|
|
|
|
|
|
|
| |||||||||
| 2.4 | 0.1 | 0.2 | 2.7 | |||||||||||||
|
|
|
|
|
|
|
| |||||||||
Liabilities: | ||||||||||||||||
- Spain | (2.2 | ) | (0.1 | ) | — | (2.3 | ) | |||||||||
- Italy | — | (0.2 | ) | — | (0.2 | ) | ||||||||||
- Chile | (0.1 | ) | — | — | (0.1 | ) | ||||||||||
- Other < £100m | (0.1 | ) | (0.1 | ) | — | (0.2 | ) | |||||||||
|
|
|
|
|
|
|
| |||||||||
| (2.4 | ) | (0.4 | ) | — | (2.8 | ) | ||||||||||
|
|
|
|
|
|
|
| |||||||||
31 December 2013 | Banks £bn | Other financial institutions £bn | Corporate £bn | Total £bn | ||||||||||||
Assets: | ||||||||||||||||
- Spain | 2.2 | 0.1 | — | 2.3 | ||||||||||||
- Chile | 0.1 | — | — | 0.1 | ||||||||||||
- Other < £100m | 0.1 | — | 0.1 | 0.2 | ||||||||||||
|
|
|
|
|
|
|
| |||||||||
| 2.4 | 0.1 | 0.1 | 2.6 | |||||||||||||
|
|
|
|
|
|
|
| |||||||||
Liabilities: | ||||||||||||||||
- Spain | (2.2 | ) | (0.1 | ) | — | (2.3 | ) | |||||||||
- Italy | — | (0.2 | ) | — | (0.2 | ) | ||||||||||
- Chile | (0.1 | ) | — | — | (0.1 | ) | ||||||||||
- Other < £100m | (0.1 | ) | — | — | (0.1 | ) | ||||||||||
|
|
|
|
|
|
|
| |||||||||
| (2.4 | ) | (0.3 | ) | — | (2.7 | ) | ||||||||||
|
|
|
|
|
|
|
| |||||||||
The above activities are conducted in a manner that appropriately manages the credit risk arising against such other Banco Santander group companies within limits acceptable to the PRA.
| 38 | Abbey National Treasury Services plc 2014 Half Yearly Financial Report |
The Directors of Abbey National Treasury Services plc are listed in the 2013 Annual Report. In addition to those listed, Antonio Roman was appointed as an Executive Director with effect from 31 July 2014. Antonio Roman’s biographical details are shown below. Justo Gómez López resigned as an Executive Director of the Company with effect from 30 June 2014 and Jorge de la Vega resigned as a Non-executive Director of the Company with effect from 16 July 2014.
EXECUTIVE DIRECTORS
Antonio Roman
Director
Antonio Roman (age 47) is an experienced finance professional with over 20 years’ experience of strategic banking management gained at a senior level. Antonio Roman is currently Finance Director of Santander UK plc having been Deputy Finance Director from May 2013 until 30 June 2014. Previously, he was with Banesto, S.A. in Spain, part of the Banco Santander, S.A. group, in a variety of senior finance roles after joining in June 2011, and a member of the Executive Committee from April 2012. Prior to that, Antonio worked in various senior banking roles including financial control and financial management, including at Caja Madrid (Spain) (1983 – 2011).
| Abbey National Treasury Services plc 2014 Half Yearly Financial Report | 39 |
Index
| 40 | Abbey National Treasury Services plc 2014 Half Yearly Financial Report |
Financial Statements
This page intentionally left blank
| Abbey National Treasury Services plc 2014 Half Yearly Financial Report | 41 |
Financial Statements
Condensed Consolidated Income Statement
For the six months ended 30 June 2014 and 2013
| Notes | Six months ended 30 June 2014 £m | Six months ended 30 June 2013 £m | ||||||||
Interest and similar income | 1,184 | 1,593 | ||||||||
Interest expense and similar charges | (1,234 | ) | (1,601 | ) | ||||||
|
|
|
| |||||||
Net interest expense | (50 | ) | (8 | ) | ||||||
|
|
|
| |||||||
Net fee and commission income | 56 | 61 | ||||||||
Net trading and other income | 3 | 184 | 375 | |||||||
|
|
|
| |||||||
Total operating income | 190 | 428 | ||||||||
|
|
|
| |||||||
Administration expenses | (125 | ) | (108 | ) | ||||||
Depreciation and amortisation | (1 | ) | (1 | ) | ||||||
|
|
|
| |||||||
Total operating expenses excluding impairment losses, provisions and charges | (126 | ) | (109 | ) | ||||||
|
|
|
| |||||||
Impairment losses on loans and advances | 4 | — | (18 | ) | ||||||
Provisions for other liabilities and charges | — | — | ||||||||
|
|
|
| |||||||
Total operating impairment losses, provisions and charges | — | (18 | ) | |||||||
|
|
|
| |||||||
Profit before tax | 64 | 301 | ||||||||
Taxation credit/(charge) | 5 | 1 | (45 | ) | ||||||
|
|
|
| |||||||
Profit for the period | 65 | 256 | ||||||||
|
|
|
| |||||||
Attributable to: | ||||||||||
Equity holders of the parent | 65 | 256 | ||||||||
|
|
|
| |||||||
All profits during each period were generated from continuing operations.
Condensed Consolidated Statement of Comprehensive Income
For the six months ended 30 June 2014 and 2013
| Six months ended 30 June 2014 £m | Six months ended 30 June 2013 £m | |||||||
Profit for the period | 65 | 256 | ||||||
|
|
|
| |||||
Other comprehensive income/(expense): | ||||||||
Other comprehensive income that may be reclassified to profit or loss subsequently: | ||||||||
Available-for-sale securities | ||||||||
- Gains on available-for-sale securities | 7 | 26 | ||||||
- Gains on available-for-sale securities transferred to profit or loss | — | (53 | ) | |||||
- Tax on above items | (2 | ) | 6 | |||||
|
|
|
| |||||
| 5 | (21 | ) | ||||||
|
|
|
| |||||
Cash flow hedges | ||||||||
- Losses on cash flow hedges | (58 | ) | (53 | ) | ||||
- Losses on cash flow hedges transferred to profit or loss | 130 | 45 | ||||||
- Tax on above items | (14 | ) | 2 | |||||
|
|
|
| |||||
| 58 | (6 | ) | ||||||
|
|
|
| |||||
Exchange differences on translation of foreign operations | 1 | (1 | ) | |||||
|
|
|
| |||||
Total other comprehensive income/(expense) for the period net of tax | 64 | (28 | ) | |||||
|
|
|
| |||||
Total comprehensive income for the period | 129 | 228 | ||||||
|
|
|
| |||||
Attributable to: | ||||||||
Equity holders of the parent | 129 | 228 | ||||||
|
|
|
| |||||
The accompanying Notes on pages 45 to 65 and the Risk Management Report on pages 14 to 38 form an integral part of these Condensed Consolidated Interim Financial Statements.
| 42 | Abbey National Treasury Services plc 2014 Half Yearly Financial Report |
Financial Statements
Primary Financial Statements continued
Condensed Consolidated Balance Sheet
At 30 June 2014 and 31 December 2013
| Notes | 30 June 2014 £m | 31 December 2013 £m | ||||||||
Assets | ||||||||||
Cash and balances at central banks | 7,452 | 4,911 | ||||||||
Trading assets | 7 | 18,307 | 21,897 | |||||||
Derivative financial instruments | 8 | 21,379 | 21,550 | |||||||
Financial assets designated at fair value | 9 | 2,543 | 2,534 | |||||||
Loans and advances to banks | 10 | 110,454 | 113,649 | |||||||
Loans and advances to customers | 11 | 38,032 | 41,108 | |||||||
Loans and receivables securities | 96 | 128 | ||||||||
Available-for-sale securities | 12 | 2,550 | 2,962 | |||||||
Macro hedge of interest rate risk | 399 | 379 | ||||||||
Intangible assets | 8 | 8 | ||||||||
Property, plant and equipment | 7 | 6 | ||||||||
Deferred tax assets | 13 | — | 15 | |||||||
Other assets | 193 | 180 | ||||||||
|
|
|
| |||||||
Total assets | 201,420 | 209,327 | ||||||||
|
|
|
| |||||||
Liabilities | ||||||||||
Deposits by banks | 14 | 118,326 | 120,698 | |||||||
Deposits by customers | 4,824 | 7,780 | ||||||||
Trading liabilities | 15 | 17,848 | 21,275 | |||||||
Derivative financial instruments | 8 | 21,607 | 21,496 | |||||||
Financial liabilities designated at fair value | 16 | 3,252 | 3,407 | |||||||
Debt securities in issue | 17 | 31,717 | 30,889 | |||||||
Other liabilities | 324 | 368 | ||||||||
Provisions | 18 | — | 23 | |||||||
Current tax liabilities | 225 | 223 | ||||||||
|
|
|
| |||||||
Total liabilities | 198,123 | 206,159 | ||||||||
|
|
|
| |||||||
Equity | ||||||||||
Share capital | 2,549 | 2,549 | ||||||||
Retained earnings | 705 | 640 | ||||||||
Other reserves | 43 | (21 | ) | |||||||
|
|
|
| |||||||
Total shareholders’ equity | 3,297 | 3,168 | ||||||||
|
|
|
| |||||||
Total liabilities and equity | 201,420 | 209,327 | ||||||||
|
|
|
| |||||||
The accompanying Notes on pages 45 to 65 and the Risk Management Report on pages 14 to 38 form an integral part of these Condensed Consolidated Interim Financial Statements.
| Abbey National Treasury Services plc 2014 Half Yearly Financial Report | 43 |
Financial Statements
Primary Financial Statementscontinued
Consolidated Statement of Changes in Equity
For the six months ended 30 June 2014 and 2013
| Other reserves | ||||||||||||||||||||||||
| Share capital £m | Available for sale reserve £m | Cash flow hedging reserve £m | Foreign currency translation reserve £m | Retained earnings £m | Total £m | |||||||||||||||||||
1 January 2014 | 2,549 | (23 | ) | (14 | ) | 16 | 640 | 3,168 | ||||||||||||||||
Total comprehensive income: | ||||||||||||||||||||||||
- Profit for the period | — | — | — | — | 65 | 65 | ||||||||||||||||||
- Other comprehensive income/(expense) for the period: | ||||||||||||||||||||||||
- Gains on available-for-sale securities | — | 7 | — | — | — | 7 | ||||||||||||||||||
- Losses on cash flow hedges | — | — | (58 | ) | — | — | (58 | ) | ||||||||||||||||
- Losses on cash flow hedges transferred to profit or loss | — | — | 130 | — | — | 130 | ||||||||||||||||||
- Exchange differences on translation of foreign operations | — | — | — | 1 | — | 1 | ||||||||||||||||||
- Tax on other comprehensive income | — | (2 | ) | (14 | ) | — | — | (16 | ) | |||||||||||||||
|
|
|
|
|
|
|
|
|
|
|
| |||||||||||||
Other comprehensive income net of tax | — | 5 | 58 | 1 | — | 64 | ||||||||||||||||||
|
|
|
|
|
|
|
|
|
|
|
| |||||||||||||
Dividends | — | — | — | — | — | — | ||||||||||||||||||
|
|
|
|
|
|
|
|
|
|
|
| |||||||||||||
30 June 2014 | 2,549 | (18 | ) | 44 | 17 | 705 | 3,297 | |||||||||||||||||
|
|
|
|
|
|
|
|
|
|
|
| |||||||||||||
1 January 2013 | 2,549 | 4 | — | 16 | 1,226 | 3,795 | ||||||||||||||||||
Total comprehensive income/(expense): | ||||||||||||||||||||||||
- Profit for the period | — | — | — | — | 256 | 256 | ||||||||||||||||||
- Other comprehensive income/(expense) for the period: | ||||||||||||||||||||||||
- Gains on available-for-sale securities | — | 26 | — | — | — | 26 | ||||||||||||||||||
- Gains on available-for-sale securities transferred to profit or loss | — | (53 | ) | — | — | — | (53 | ) | ||||||||||||||||
- Losses on cash flow hedges | — | — | (53 | ) | — | — | (53 | ) | ||||||||||||||||
- Losses on cash flow hedges transferred to profit or loss | — | — | 45 | — | — | 45 | ||||||||||||||||||
- Exchange differences on translation of foreign operations | — | — | — | (1 | ) | — | (1 | ) | ||||||||||||||||
- Tax on other comprehensive income/(expenses) | — | 6 | 2 | — | — | 8 | ||||||||||||||||||
|
|
|
|
|
|
|
|
|
|
|
| |||||||||||||
Other comprehensive expense net of tax | — | (21 | ) | (6 | ) | (1 | ) | — | (28 | ) | ||||||||||||||
|
|
|
|
|
| �� |
|
|
|
|
| |||||||||||||
Dividends | — | — | — | — | — | — | ||||||||||||||||||
|
|
|
|
|
|
|
|
|
|
|
| |||||||||||||
30 June 2013 | 2,549 | (17 | ) | (6 | ) | 15 | 1,482 | 4,023 | ||||||||||||||||
|
|
|
|
|
|
|
|
|
|
|
| |||||||||||||
Condensed Consolidated Cash Flow Statement
For the six months ended 30 June 2014 and 2013
| Notes | Six months ended 30 June 2014 £m | Six months ended 30 June 2013 £m | ||||||||
Net cash flow from/(used in) operating activities | ||||||||||
Profit for the period | 65 | 256 | ||||||||
Adjustments for: | ||||||||||
Non cash items included in profit | 584 | 256 | ||||||||
Change in operating assets | 19,058 | (13,088 | ) | |||||||
Change in operating liabilities | (7,464 | ) | 9,655 | |||||||
Effect of exchange rate differences | (793 | ) | 1,150 | |||||||
|
|
|
| |||||||
Net cash flow from/(used in) operating activities | 21 | 11,450 | (1,771 | ) | ||||||
|
|
|
| |||||||
Net cash flow from investing activities | ||||||||||
Purchase of property, plant and equipment and intangible assets | (2 | ) | (2 | ) | ||||||
Proceeds from sale of property, plant and equipment and intangible assets | (4 | ) | — | |||||||
Purchase of available-for-sale securities | (10 | ) | (1,920 | ) | ||||||
Proceeds from sale and redemption of available-for-sale securities | 397 | 2,765 | ||||||||
|
|
|
| |||||||
Net cash flow from investing activities | 381 | 843 | ||||||||
|
|
|
| |||||||
Net cash flow from/(used in) financing activities | ||||||||||
Issue of debt securities | 9,977 | 13,001 | ||||||||
Repayments of debt securities | (9,572 | ) | (16,597 | ) | ||||||
|
|
|
| |||||||
Net cash flow from/(used in) financing activities | 405 | (3,596 | ) | |||||||
|
|
|
| |||||||
Net increase/(decrease) in cash and cash equivalents | 12,236 | (4,524 | ) | |||||||
Cash and cash equivalents at beginning of the period | 102,951 | 79,414 | ||||||||
Effect of exchange rate changes on cash and cash equivalents | (579 | ) | 516 | |||||||
|
|
|
| |||||||
Cash and cash equivalents at the end of the period | 21 | 114,608 | 75,406 | |||||||
|
|
|
| |||||||
The accompanying Notes on pages 45 to 65 and the Risk Management Report on pages 14 to 38 form an integral part of these Condensed Consolidated Interim Financial Statements.
| 44 | Abbey National Treasury Services plc 2014 Half Yearly Financial Report |
Financial Statements
Notes to the Financial Statements
1. ACCOUNTING POLICIES
These Condensed Consolidated Interim Financial Statements are prepared for Abbey National Treasury Services plc (the ‘Company’) and its subsidiaries (together, the ‘ANTS group’) under the Companies Act 2006. The principal activity of the ANTS group is to provide treasury, corporate and wholesale banking services. The ANTS group provides these services to UK external clients and also to the wider Santander UK group, of which the ANTS group is a part. The ANTS group is also the treasury support function for the Santander UK group. In this regard, the ANTS group’s role is to provide access to financial markets and central bank facilities in order to meet the Santander UK group’s liquidity, funding, capital and balance sheet management requirements. As such, ANTS is one of the main debt issuance vehicles in the Santander UK group.
Abbey National Treasury Services plc is a public limited company, incorporated in England and Wales, having a registered office in England. It is an operating company undertaking banking and financial services transactions, as well as the holding company of the ANTS group.
BASIS OF PREPARATION
The financial information in these Condensed Consolidated Interim Financial Statements does not constitute statutory accounts as defined in section 434 of the Companies Act 2006. Statutory accounts for the year ended 31 December 2013 have been delivered to the Registrar of Companies. The auditor’s report on those accounts was unqualified, did not draw attention to any matters by way of emphasis and did not contain a statement under section 498(2) or (3) of the Companies Act 2006.
Compliance with International Financial Reporting Standards
The Condensed Consolidated Interim Financial Statements have been prepared in accordance with International Accounting Standard (‘IAS’) 34 ‘Interim Financial Reporting’, as adopted by the European Union and the Disclosure Rules and Transparency Rules of the Financial Conduct Authority (‘FCA’). They do not include all the information and disclosures normally required for full annual financial statements and should be read in conjunction with the Consolidated Financial Statements of the ANTS group for the year ended 31 December 2013 which were prepared in accordance with International Financial Reporting Standards (‘IFRS’) as adopted by the European Union. Those Consolidated Financial Statements were also prepared in accordance with IFRS as issued by the International Accounting Standards Board (‘IASB’). There were no applicable differences between the two frameworks for the periods presented.
The same accounting policies, presentation and methods of computation are followed in these Condensed Consolidated Interim Financial Statements as were applied in the presentation of the ANTS group’s 2013 Annual Report, except as otherwise described below. Copies of the ANTS group’s 2013 Annual Report are available on the Santander UK group’s website or upon request from Investor Relations, Santander UK plc, 2 Triton Square, Regent’s Place, London NW1 3AN.
Recent accounting developments
In 2014, the ANTS group adopted the following amendments to standards which became effective.
| a) | IAS 32 ‘Financial Instruments: Presentation’—In December 2011, the IASB issued amendments to IAS 32 entitled ‘Offsetting Financial Assets and Financial Liabilities’ which clarified the requirements for offsetting financial instruments and addressed inconsistencies in current practice when applying the offsetting criteria in IAS 32 ‘Financial Instruments: Presentation’. The amendments are effective for annual periods beginning on or after 1 January 2014 with early adoption permitted and are required to be applied retrospectively. The amendments did not have a material effect on the Condensed Consolidated Interim Financial Statements. |
| b) | There are a number of other changes to IFRS that were effective from 1 January 2014. Those changes did not have a significant impact on the Condensed Consolidated Interim Financial Statements. |
Future accounting developments
The ANTS group has not yet adopted the following significant new or revised standards and interpretations, and amendments thereto, which have been issued but which are not yet effective for the ANTS group:
| a) | IFRS 9 ‘Financial Instruments’ (‘IFRS 9’) – In July 2014, the IASB issued the final version of IFRS 9 which includes the completion of all phases of the project to replace IAS 39 ‘Financial Instruments: Recognition and Measurement’ as discussed below. |
Phase 1: Classification and measurement of financial assets and financial liabilities. Financial assets are classified on the basis of the business model within which they are held and their contractual cash flow characteristics. The standard also introduces a ‘fair value through other comprehensive income’ measurement category for particular simple debt instruments. The requirements for the classification and measurement of financial liabilities were carried forward unchanged from IAS 39, however, the requirements relating to the fair value option for financial liabilities were changed to address own credit risk and, in particular, the presentation of gains and losses within other comprehensive income.
Phase 2: Impairment methodology. IFRS 9 fundamentally changes the impairment requirements relating to the accounting for an entity’s expected credit losses on its financial assets and commitments to extend credit. It is no longer necessary for a credit event to have occurred before credit losses are recognised. Instead, an entity always accounts for expected credit losses, and changes in those expected credit losses. The amount of expected credit losses is updated at each reporting date to reflect changes in credit risk since initial recognition.
Phase 3: Hedge accounting. These requirements align hedge accounting more closely with risk management and establish a more principle-based approach to hedge accounting. Dynamic hedging of open portfolios is being dealt with as a separate project and until such time as that project is complete, entities can choose between applying the hedge accounting requirements of IFRS 9 or to continue to apply the existing hedge accounting requirements in IAS 39. The revised hedge accounting requirements in IFRS 9 are applied prospectively.
| Abbey National Treasury Services plc 2014 Half Yearly Financial Report | 45 |
Financial Statements
Notes to the Financial Statementscontinued
The effective date of IFRS 9 is 1 January 2018. For annual periods beginning before 1 January 2018, an entity may elect to early apply only the requirements for the presentation of gains and losses on financial liabilities designated at fair value through profit or loss. At the date of publication of these Condensed Consolidated Interim Financial Statements the standard is awaiting EU endorsement and the impact of the standard is currently being assessed. It is not yet practicable to quantify the effect of IFRS 9 on these Condensed Consolidated Interim Financial Statements.
| b) | IFRS 15 ‘Revenue from Contracts with Customers’ (‘IFRS 15’) – In May 2014, the IASB issued IFRS 15. The effective date of IFRS 15 is 1 January 2017. The standard establishes the principles that shall be applied in connection with revenue from contracts with customers including the core principle that the recognition of revenue must depict the transfer of promised goods or services to customers in an amount that reflects the entitlement to consideration in exchange for those good and services. IFRS 15 applies to all contracts with customers but does not apply to lease contracts, insurance contracts, financial instruments and certain non-monetary exchanges. At the date of publication of these Condensed Consolidated Interim Financial Statements the standard is awaiting EU endorsement. Whilst it is expected that a significant proportion of the Santander UK group’s revenue will be outside the scope of IFRS 15, the impact of the standard is currently being assessed. It is not yet practicable to quantify the effect the effect of IFRS 15 on these Condensed Consolidated Interim Financial Statements. |
| c) | There are a number of other standards which have been issued or amended that are expected to be effective in future periods. However, it is not practicable to provide a reasonable estimate of their effects on the ANTS group’s Condensed Consolidated Interim Financial Statements until a detailed review has been completed. |
The Condensed Consolidated Interim Financial Statements reflect all adjustments that, in the opinion of management of the ANTS group, are necessary for a fair presentation of the results of operations for the interim period. All such adjustments to the financial information are of a normal, recurring nature. Because the results from common banking activities are so closely related and responsive to changes in market conditions, the results for any interim period are not necessarily indicative of the results that can be expected for the year.
GOING CONCERN
The ANTS group’s objectives, policies and processes for managing its capital are described in Note 43 to the Consolidated Financial Statements in the 2013 Annual Report. Details of the ANTS group’s financial risk management objectives, its financial instruments and hedging activities; and its exposures to credit risk, interest rate risk, liquidity risk, operational risk and other risks are set out in the Risk Management Report on pages 14 to 38.
The ANTS group is reliant on Santander UK plc and other companies in the Santander UK group of companies (‘Santander UK’) for a significant proportion of its funding. The Santander UK Board has confirmed that Santander UK plc is a going concern, and that it will provide funding to the ANTS group for the foreseeable future. In giving this commitment to provide funding to the ANTS group, the Santander UK Board has considered the uncertainties that affect the ANTS group when preparing the forecasts and budgets of the combined business of Santander UK.
The Company has given a full and unconditional guarantee in respect of the unsubordinated liabilities of Santander UK plc incurred prior to 30 June 2015 under a deed poll guarantee entered into by the Company on 10 May 2012. Santander UK plc has given a reciprocal guarantee in respect of the unsubordinated liabilities of the Company incurred prior to 30 June 2015.
The Company, Santander UK plc, and Cater Allen Limited, which are the three PRA-regulated entities within the Santander UK group, are party to a capital support deed dated 14 December 2012 (the “Capital Support Deed”) with certain other non-regulated subsidiaries of Santander UK plc. The parties to the Capital Support Deed constitute a core UK group for the purposes of the large exposures provisions of CRD IV. Under article 4001(f) of the Capital Requirements Regulations, exposures of each of the three regulated entities to other members of the core UK group are exempt from large exposure limits that would otherwise apply. The purpose of the Capital Support Deed is to facilitate the prompt transfer of available capital resources from, or repayment of liabilities by, the non-regulated parties to any of the regulated parties in the event that one of the regulated parties has breached or is at risk of breaching its capital resources requirements or risk concentrations requirements.
In addition, the Company, Santander UK plc, and Cater Allen Limited are party to a defined liquidity group facility agreement dated 28 May 2010 (the “DLG Facility Agreement”). The DLG Facility Agreement supports a defined liquidity group for the purposes of section 12 of BIPRU. Section 12.8 of BIPRU permits a member of a defined liquidity group to rely on the liquid resources of other members of the defined liquidity group to comply with the liquidity adequacy requirements under section 12 of BIPRU. Under the DLG Facility Agreement, each party agrees to lend, subject to certain conditions and limitations, its excess liquidity to each other party.
After making enquiries, the Directors have a reasonable expectation that the Company and the ANTS group have adequate resources to continue in operational existence for the foreseeable future. Accordingly, they continue to adopt the going concern basis of accounting in preparing the financial statements.
CRITICAL ACCOUNTING POLICIES AND AREAS OF SIGNIFICANT MANAGEMENT JUDGEMENT
The preparation of the ANTS group’s Condensed Consolidated Interim Financial Statements requires management to make estimates and judgements that affect the reported amount of assets and liabilities at the date of the financial statements and the reported amount of income and expenses during the reporting period. Management evaluates its estimates and judgements on an ongoing basis. Management bases its estimates and judgements on historical experience and on various other factors that are believed to be reasonable under the circumstances. Actual results may differ from these estimates under different assumptions or conditions.
There have been no significant changes in the basis upon which estimates have been determined, compared to that applied in the 2013 Annual Report.
| 46 | Abbey National Treasury Services plc 2014 Half Yearly Financial Report |
Financial Statements
Notes to the Financial Statementscontinued
2. SEGMENTS
The principal activity of the ANTS group is financial services. The ANTS group’s business is managed and reported on the basis of the following segments:
| • | Commercial Banking; |
| • | Markets; and |
| • | Corporate Centre. |
The ANTS group’s segments are strategic business units that offer different products and services. They are managed separately because each business requires different technology and marketing strategies. The ANTS group has three segments:
| • | Commercial Banking offers a wide range of products and financial services to customers through a network of regional business centres and through telephony and e-commerce channels. Commercial Banking products and services include loans, bank accounts, deposits and treasury services. The management of our customers is organised according to the annual turnover of their business, enabling us to offer a differentiated service to small and medium enterprises (‘SMEs’), mid and large corporate customers. |
The SME and mid corporate business principally serves small and medium enterprises with an annual turnover of more than £250,000 up to £50m, and other corporate customers with an annual turnover of up to £500m. This also includes real estate lending.
The Large Corporates business offers specialist treasury services in fixed income and foreign exchange, lending, transactional banking services, capital markets and money markets to large multinational corporate customers with an annual turnover of more than £500m. Lending includes syndicated loans and structured finance. Transactional banking includes trade finance and cash management. Money market activities include securities lending/borrowing and repos.
| • | Markets offers risk management and other services to financial institutions, as well as other Santander UK divisions. Its main business areas are fixed income and foreign exchange, equity, capital markets and institutional sales. |
| • | Corporate Centre consists of Financial Management & Investor Relations (‘FMIR’) and the non-core portfolios of social housing loans and structured credit assets. FMIR is responsible for managing capital and funding, balance sheet composition and structure, and strategic liquidity risk for the Santander UK group. The non-core portfolios are being run-down and/or managed for value. |
The Company’s board of directors (the ‘Board’) is the chief operating decision maker for the ANTS group. The segment information below is presented on the basis used by the Board to evaluate performance and allocate resources. The Board reviews discrete financial information for each segment of the business, including measures of operating results, assets and liabilities. The segment information reviewed by the Board is prepared on a statutory basis of accounting.
Transactions between the business segments are on normal commercial terms and conditions. The accounting policies of the segments are the same as those applied in the presentation of the ANTS group’s 2013 Annual Report as described in Note 1. Internal charges and internal UK transfer pricing adjustments have been reflected in the performance of each segment. Revenue sharing agreements are used to allocate external customer revenues to a business segment on a reasonable basis. Funds are ordinarily reallocated between segments, resulting in funding cost transfers disclosed in operating income. Interest charged for these funds is based on the ANTS group’s cost of wholesale funding.
Interest income and interest expense have not been reported separately. The majority of the revenues from the segments presented below are interest income in nature and the Board relies primarily on net interest income to both assess the performance of the segment and to make decisions regarding allocation of segmental resources.
| Abbey National Treasury Services plc 2014 Half Yearly Financial Report | 47 |
Financial Statements
Notes to the Financial Statementscontinued
30 June 2014 | Commercial Banking £m | Markets £m | Corporate Centre £m | Total £m | ||||||||||||
Net interest income/(expense) | 90 | 1 | (141 | ) | (50 | ) | ||||||||||
Non-interest income | 110 | 57 | 73 | 240 | ||||||||||||
|
|
|
|
|
|
|
| |||||||||
Total operating income/(expense) | 200 | 58 | (68 | ) | 190 | |||||||||||
|
|
|
|
|
|
|
| |||||||||
Administration expenses | (50 | ) | (56 | ) | (19 | ) | (125 | ) | ||||||||
Depreciation and amortisation | — | (1 | ) | — | (1 | ) | ||||||||||
|
|
|
|
|
|
|
| |||||||||
Total operating expenses excluding impairment losses, provisions and charges | (50 | ) | (57 | ) | (19 | ) | (126 | ) | ||||||||
|
|
|
|
|
|
|
| |||||||||
Impairment losses on loans and advances | — | — | — | — | ||||||||||||
|
|
|
|
|
|
|
| |||||||||
Total operating impairment losses, provisions and charges | — | — | — | — | ||||||||||||
|
|
|
|
|
|
|
| |||||||||
Profit before tax | 150 | 1 | (87 | ) | 64 | |||||||||||
|
|
|
|
|
|
|
| |||||||||
Total assets | 12,896 | 17,333 | 171,191 | 201,420 | ||||||||||||
|
|
|
|
|
|
|
| |||||||||
Average number of staff(1) | 332 | 329 | 149 | 810 | ||||||||||||
|
|
|
|
|
|
|
| |||||||||
| (1) | Full-time equivalents |
30 June 2013 | Commercial Banking £m | Markets £m | Corporate Centre £m | Total £m | ||||||||||||
Net interest income/(expense) | 69 | (1 | ) | (76 | ) | (8 | ) | |||||||||
Non-interest income | 114 | 40 | 282 | 436 | ||||||||||||
|
|
|
|
|
|
|
| |||||||||
Total operating income | 183 | 39 | 206 | 428 | ||||||||||||
|
|
|
|
|
|
|
| |||||||||
Administration expenses | (42 | ) | (48 | ) | (18 | ) | (108 | ) | ||||||||
Depreciation and amortisation | — | (1 | ) | — | (1 | ) | ||||||||||
|
|
|
|
|
|
|
| |||||||||
Total operating expenses excluding impairment losses, provisions and charges | (42 | ) | (49 | ) | (18 | ) | (109 | ) | ||||||||
|
|
|
|
|
|
|
| |||||||||
Impairment losses on loans and advances | (18 | ) | — | — | (18 | ) | ||||||||||
|
|
|
|
|
|
|
| |||||||||
Total operating impairment losses, provisions and charges | (18 | ) | — | — | (18 | ) | ||||||||||
|
|
|
|
|
|
|
| |||||||||
Profit before tax | 123 | (10 | ) | 188 | 301 | |||||||||||
|
|
|
|
|
|
|
| |||||||||
At 31 December 2013 | ||||||||||||||||
Total assets | 17,364 | 19,329 | 172,634 | 209,327 | ||||||||||||
|
|
|
|
|
|
|
| |||||||||
Average number of staff(1) | 284 | 282 | 155 | 721 | ||||||||||||
|
|
|
|
|
|
|
| |||||||||
| (1) | Full-time equivalents |
3. NET TRADING AND OTHER INCOME
| Six months ended 30 June 2014 £m | Six months ended 30 June 2013 £m | |||||||
Net trading and funding of other items by the trading book | 255 | 359 | ||||||
Gains/(losses) on assets designated at fair value through profit or loss | 100 | (178 | ) | |||||
Losses on liabilities designated at fair value through profit or loss | (82 | ) | (12 | ) | ||||
(Losses)/gains on derivatives managed with assets/liabilities held at fair value through profit or loss | (71 | ) | 189 | |||||
Profit on sale of available for sale assets | — | 53 | ||||||
Hedge ineffectiveness and other | (18 | ) | (36 | ) | ||||
|
|
|
| |||||
| 184 | 375 | |||||||
|
|
|
| |||||
Net trading and funding of other items by the trading book includes fair value gains/(losses) of £(15)m (six months ended 30 June 2013: £137m) on embedded derivatives bifurcated from certain equity index-linked deposits. The embedded derivatives are economically hedged internally with the equity derivatives trading desk. These internal transactions are managed as part of the overall positions of the equity derivatives trading desk, the results of which are also included in this line item, and amounted to £16m (six months ended 30 June 2013: £136m). As a result, the net fair value movements recognised on the equity index-linked deposits and the related economic hedges were £1m (six months ended 30 June 2013: £1m).
4. IMPAIRMENT LOSSES AND PROVISIONS
| Six months ended 30 June 2014 £m | Six months ended 30 June 2013 £m | |||||||
Impairment losses on loans and advances: | ||||||||
- loans and advances to customers (Note 11) | 1 | 18 | ||||||
Recoveries of loans and advances | (1 | ) | — | |||||
|
|
|
| |||||
Total impairment losses and provisions charged to the income statement | — | 18 | ||||||
|
|
|
| |||||
| 48 | Abbey National Treasury Services plc 2014 Half Yearly Financial Report |
Financial Statements
Notes to the Financial Statementscontinued
5. TAXATION
| Six months ended 30 June 2014 £m | Six months ended 30 June 2013 £m | |||||||
Current tax: | ||||||||
UK corporation tax on profit for the period | 8 | 56 | ||||||
Adjustments in respect of prior years | (10 | ) | (13 | ) | ||||
|
|
|
| |||||
Total current tax | (2 | ) | 43 | |||||
|
|
|
| |||||
Deferred tax(Note 13) | ||||||||
Origination and reversal of temporary differences | 1 | 2 | ||||||
|
|
|
| |||||
Total deferred tax | 1 | 2 | ||||||
|
|
|
| |||||
Tax on profit for the period | (1 | ) | 45 | |||||
|
|
|
| |||||
Interim period corporation tax is accrued based on the estimated average annual effective corporation tax rate for the year of 13.1% (2013: 19.3%). The standard rate of UK corporation tax was 21.5% (2013: 23.25%). The standard rate of UK corporation tax was reduced from 23% to 21% with effect from 1 April 2014. Taxation for other jurisdictions is calculated at the rates prevailing in the relevant jurisdictions.
The Finance Act 2013, which provides for a reduction in the main rate of UK corporation tax to 21% effective from 1 April 2014 and 20% effective from 1 April 2015 was enacted on 17 July 2013. As the changes in rates were substantively enacted prior to 30 June 2014, they have been reflected in the deferred tax balance at 30 June 2014.
The tax expense differs from the theoretical amount that would arise using the basic corporation tax rate of the Company as follows:
| Six months ended 30 June 2014 £m | Six months ended 30 June 2013 £m | |||||||
Profit before tax | 64 | 301 | ||||||
|
|
|
| |||||
Tax calculated at a tax rate of 21.5% (2013: 23.25%) | 14 | 70 | ||||||
Non-deductible UK Bank Levy | 1 | 1 | ||||||
Other non-equalised items (including index-linked gilts) | (6 | ) | (11 | ) | ||||
Utilisation of capital losses for which credit not previously recognised | — | (2 | ) | |||||
Adjustment in respect of prior year provisions | (10 | ) | (13 | ) | ||||
|
|
|
| |||||
Tax expense | (1 | ) | 45 | |||||
|
|
|
| |||||
Further information about deferred tax is presented in Note 13.
6. DIVIDENDS
No dividends were declared on the Company’s ordinary shares in the six months ended 30 June 2014 and 30 June 2013.
7. TRADING ASSETS
| 30 June 2014 £m | 31 December 2013 £m | |||||||
Loans and advances to banks – securities purchased under resale agreements | 532 | 4,219 | ||||||
– other(1) | 5,668 | 5,107 | ||||||
Loans and advances to customers – securities purchased under resale agreements | 1,187 | 4,210 | ||||||
– other(1) | 579 | 192 | ||||||
Debt securities | 7,522 | 7,859 | ||||||
Equity securities | 2,819 | 310 | ||||||
|
|
|
| |||||
| 18,307 | 21,897 | |||||||
|
|
|
| |||||
| (1) | Total “other” comprises short-term loans of £478m (2013: £193m) and cash collateral of £5,769m (2013: £5,106m). |
Included in the above balances are amounts owed to the ANTS group by Banco Santander, S.A. of £86m (2013: £80m), fellow subsidiaries of Banco Santander, S.A. of £17m (2013: £32m), Santander UK plc of £nil (2013: £nil) and subsidiaries of the Santander UK group outside the ANTS group of £nil (2013: £nil) respectively.
| Abbey National Treasury Services plc 2014 Half Yearly Financial Report | 49 |
Financial Statements
Notes to the Financial Statementscontinued
8. DERIVATIVE FINANCIAL INSTRUMENTS
Derivatives are financial instruments whose value is derived from the price of one or more underlying items such as equities, equity indices, interest rates, foreign exchange rates, property indices, commodities and credit spreads. Derivatives enable users to manage exposure to credit or market risks. The ANTS group sells derivatives to its customers and uses derivatives to manage its own exposure to credit and market risks. Details of the ANTS group’s uses of derivatives are set out in Note 15 to the Consolidated Financial Statements in the 2013 Annual Report.
30 June 2014
Derivatives held for trading | Contract/notional amount £m | Fair value assets £m | Fair value liabilities £m | |||||||||
Exchange rate contracts: | ||||||||||||
- Cross-currency swaps | 125,470 | 2,974 | 3,622 | |||||||||
- Foreign exchange swaps, options and forwards | 36,797 | 502 | 225 | |||||||||
|
|
|
|
|
| |||||||
| 162,267 | 3,476 | 3,847 | ||||||||||
|
|
|
|
|
| |||||||
Interest rate contracts: | ||||||||||||
- Interest rate swaps | 657,428 | 12,831 | 11,933 | |||||||||
- Caps, floors and swaptions | 54,038 | 1,497 | 1,486 | |||||||||
- Futures (exchange traded) | 96,307 | 6 | 23 | |||||||||
- Forward rate agreements | 29,945 | 6 | 3 | |||||||||
|
|
|
|
|
| |||||||
| 837,718 | 14,340 | 13,445 | ||||||||||
|
|
|
|
|
| |||||||
Equity and credit contracts: | ||||||||||||
- Equity index swaps and similar products | 37,192 | 2,570 | 3,161 | |||||||||
- Equity index options (exchange traded) | 25,709 | 360 | 1 | |||||||||
- Credit default swaps and similar products | 138 | 28 | 2 | |||||||||
|
|
|
|
|
| |||||||
| 63,039 | 2,958 | 3,164 | ||||||||||
|
|
|
|
|
| |||||||
Commodity contracts: | ||||||||||||
- OTC swaps | 37 | 4 | 4 | |||||||||
|
|
|
|
|
| |||||||
| 37 | 4 | 4 | ||||||||||
|
|
|
|
|
| |||||||
Total derivative assets and liabilities held for trading | 1,063,061 | 20,778 | 20,460 | |||||||||
|
|
|
|
|
| |||||||
30 June 2014
Derivatives held for hedging | Contract/notional amount £m | Fair value assets £m | Fair value liabilities £m | |||||||||
Derivatives designated as fair value hedges: | ||||||||||||
Exchange rate contracts: | ||||||||||||
- Cross-currency swaps | 2,539 | — | 100 | |||||||||
Interest rate contracts: | ||||||||||||
- Interest rate swaps | 71,685 | 531 | 862 | |||||||||
|
|
|
|
|
| |||||||
| 74,224 | 531 | 962 | ||||||||||
|
|
|
|
|
| |||||||
Derivatives designated as cash flow hedges: | ||||||||||||
Exchange rate contracts: | ||||||||||||
- Cross-currency swaps | 4,404 | — | 149 | |||||||||
Interest rate contracts: | ||||||||||||
- Interest rate swaps | 3,631 | 70 | 36 | |||||||||
|
|
|
|
|
| |||||||
| 8,035 | 70 | 185 | ||||||||||
|
|
|
|
|
| |||||||
Total derivative assets and liabilities held for hedging | 82,259 | 601 | 1,147 | |||||||||
|
|
|
|
|
| |||||||
Total recognised derivative assets and liabilities | 1,145,320 | 21,379 | 21,607 | |||||||||
|
|
|
|
|
| |||||||
31 December 2013
Derivatives held for trading | Contract/notional amount £m | Fair value assets £m | Fair value liabilities £m | |||||||||
Exchange rate contracts: | ||||||||||||
- Cross-currency swaps | 131,609 | 2,553 | 3,321 | |||||||||
- Foreign exchange swaps, options and forwards | 40,131 | 1,110 | 393 | |||||||||
|
|
|
|
|
| |||||||
| 171,740 | 3,663 | 3,714 | ||||||||||
|
|
|
|
|
| |||||||
Interest rate contracts: | ||||||||||||
- Interest rate swaps | 622,441 | 12,647 | 11,646 | |||||||||
- Caps, floors and swaptions | 56,239 | 1,910 | 1,878 | |||||||||
- Futures (exchange traded) | 31,137 | 11 | 30 | |||||||||
- Forward rate agreements | 29,379 | 1 | 1 | |||||||||
|
|
|
|
|
| |||||||
| 739,196 | 14,569 | 13,555 | ||||||||||
|
|
|
|
|
| |||||||
Equity and credit contracts: | ||||||||||||
- Equity index swaps and similar products | 33,430 | 2,333 | 3,010 | |||||||||
- Equity index options (exchange traded) | 13,115 | 311 | 1 | |||||||||
- Credit default swaps and similar products | 158 | 32 | 3 | |||||||||
|
|
|
|
|
| |||||||
| 46,703 | 2,676 | 3,014 | ||||||||||
|
|
|
|
|
| |||||||
Commodity contracts: | ||||||||||||
- OTC swaps | 54 | 2 | 2 | |||||||||
|
|
|
|
|
| |||||||
| 54 | 2 | 2 | ||||||||||
|
|
|
|
|
| |||||||
Total derivative assets and liabilities held for trading | 957,693 | 20,910 | 20,285 | |||||||||
|
|
|
|
|
| |||||||
| 50 | Abbey National Treasury Services plc 2014 Half Yearly Financial Report |
Financial Statements
Notes to the Financial Statementscontinued
31 December 2013
Derivatives held for hedging | Contract/notional amount £m | Fair value assets £m | Fair value liabilities £m | |||||||||
Derivatives designated as fair value hedges: | ||||||||||||
Exchange rate contracts: | ||||||||||||
- Cross-currency swaps | 2,545 | 3 | 190 | |||||||||
Interest rate contracts: | ||||||||||||
- Interest rate swaps | 86,079 | 612 | 960 | |||||||||
|
|
|
|
|
| |||||||
| 88,624 | 615 | 1,150 | ||||||||||
|
|
|
|
|
| |||||||
Derivatives designated as cash flow hedges: | ||||||||||||
Exchange rate contracts: | ||||||||||||
- Cross-currency swaps | 2,068 | 22 | 56 | |||||||||
Interest rate contracts: | ||||||||||||
- Interest rate swaps | 2,079 | 3 | 5 | |||||||||
|
|
|
|
|
| |||||||
| 4,147 | 25 | 61 | ||||||||||
|
|
|
|
|
| |||||||
Total derivative assets and liabilities held for hedging | 92,771 | 640 | 1,211 | |||||||||
|
|
|
|
|
| |||||||
Total recognised derivative assets and liabilities | 1,050,464 | 21,550 | 21,496 | |||||||||
|
|
|
|
|
| |||||||
Included in the above balances are amounts owed to the ANTS group by Banco Santander, S.A. of £2,031m (2013: £2,053m), fellow subsidiaries of Banco Santander, S.A. of £201m (2013: £165m), Santander UK plc of £1,655m (2013: £1,617m), and subsidiaries of Santander UK group outside the ANTS group of £1,570m (2013: £1,198m) respectively and amounts owed by the ANTS group to Banco Santander, S.A. of £2,026m (2013: £1,932m), fellow subsidiaries of Banco Santander, S.A. of £191m (2013: £882m), Santander UK plc of £2,217m (2013: £2,047m) and subsidiaries of the Santander UK group outside the ANTS group of £737m (2013: £192m). The net exposures after collateral to Banco Santander, S.A. and fellow subsidiaries of Banco Santander, S.A. outside the ANTS group at 30 June 2014 amounted to £15m (2013: £520m) and £nil (2013: £nil) respectively.
Net gains or losses arising from fair value and cash flow hedges included in net trading and other income
| Six months ended 30 June 2014 £m | Six months ended 30 June 2013 £m | |||||||
Fair value hedging: | ||||||||
- (Losses)/Gains on hedging instruments | (88 | ) | 300 | |||||
- Gains/(Losses) on hedged items attributable to hedged risks | 68 | (332 | ) | |||||
|
|
|
| |||||
Fair value hedging ineffectiveness | (20 | ) | (32 | ) | ||||
Cash flow hedging ineffectiveness | 4 | 1 | ||||||
|
|
|
| |||||
| (16 | ) | (31 | ) | |||||
|
|
|
| |||||
The ANTS group hedges its exposures to various risks, including interest rate risk and foreign currency risk, in connection with covered bond issuances, and subordinated and senior debt securities in issue. The gains/(losses) arising on these assets and liabilities are presented in the table above on a combined basis.
9. FINANCIAL ASSETS DESIGNATED AT FAIR VALUE
| 30 June 2014 £m | 31 December 2013 £m | |||||||
Loans and advances to customers | 2,229 | 2,218 | ||||||
Debt securities | 314 | 316 | ||||||
|
|
|
| |||||
| 2,543 | 2,534 | |||||||
|
|
|
| |||||
Included in the above balances are amounts owed to the ANTS group by Banco Santander, S.A. of £nil (31 December 2013: £nil), fellow subsidiaries of Banco Santander, S.A. of £57m (31 December 2013: £56m), Santander UK plc of £nil (31 December 2013: £nil) and subsidiaries of the Santander UK group outside the ANTS group of £nil (31 December 2013: £nil).
The maximum exposure to credit risk on loans and advances designated as held at fair value through profit or loss at the balance sheet date was mitigated by the ANTS group having a charge over residential properties in respect of lending to housing associations. See ‘Maximum exposure to credit risk’ on page 17.
The net gain during the period attributable to changes in credit risk for loans and advances designated at fair value was £10m (six months ended 30 June 2013: net gain of £7m). The cumulative net loss attributable to changes in credit risk for loans and advances designated at fair value at 30 June 2014 was £248m (31 December 2013: cumulative net loss of £258m).
| Abbey National Treasury Services plc 2014 Half Yearly Financial Report | 51 |
Financial Statements
Notes to the Financial Statementscontinued
10. LOANS AND ADVANCES TO BANKS
| 30 June 2014 £m | 31 December 2013 £m | |||||||||
Placements with other banks | - securities purchased under resale agreements | 273 | 273 | |||||||
| - other | 1,323 | 1,257 | ||||||||
Amounts due from Santander UK group undertakings | - securities purchased under resale agreements | 541 | 468 | |||||||
| - other | 108,313 | 111,601 | ||||||||
Amounts due from Banco Santander | - securities purchased under resale agreements | — | 50 | |||||||
| - other | 4 | — | ||||||||
|
|
|
| |||||||
| 110,454 | 113,649 | |||||||||
|
|
|
| |||||||
11. LOANS AND ADVANCES TO CUSTOMERS
| 30 June 2014 £m | 31 December 2013 £m | |||||||
Loans and advances | 13,529 | 13,541 | ||||||
Amounts due from Santander UK group undertakings | 24,376 | 27,477 | ||||||
Amounts due from Banco Santander group undertakings | 177 | 153 | ||||||
|
|
|
| |||||
Loans and advances to customers | 38,082 | 41,171 | ||||||
Less: impairment loss allowances | (50 | ) | (63 | ) | ||||
|
|
|
| |||||
Loans and advances to customers, net of impairment loss allowances | 38,032 | 41,108 | ||||||
|
|
|
| |||||
Movement in impairment loss allowances:
| 30 June 2014 £m | 31 December 2013 £m | |||||||
At 1 January: | ||||||||
- Observed | 61 | 110 | ||||||
- Incurred but not yet observed | 2 | 2 | ||||||
|
|
|
| |||||
| 63 | 112 | |||||||
|
|
|
| |||||
Charge/(release) to the income statement: | ||||||||
- Observed | (1 | ) | 31 | |||||
- Individual | (1 | ) | 37 | |||||
- Collective | — | (6 | ) | |||||
- Incurred but not yet observed | 2 | — | ||||||
|
|
|
| |||||
| 1 | 31 | |||||||
|
|
|
| |||||
Write offs | (14 | ) | (80 | ) | ||||
|
|
|
| |||||
At 30 June/31 December: | ||||||||
- Observed | 46 | 61 | ||||||
- Incurred but not yet observed | 4 | 2 | ||||||
|
|
|
| |||||
| 50 | 63 | |||||||
|
|
|
| |||||
12. AVAILABLE-FOR-SALE SECURITIES
| 30 June 2014 £m | 31 December 2013 £m | |||||||
Debt securities | 2,550 | 2,962 | ||||||
|
|
|
| |||||
| 2,550 | 2,962 | |||||||
|
|
|
| |||||
| 52 | Abbey National Treasury Services plc 2014 Half Yearly Financial Report |
Financial Statements
Notes to the Financial Statementscontinued
13. DEFERRED TAX
Deferred taxes are calculated on temporary differences under the liability method using the tax rates expected to apply when the liability is settled or the asset is realised. The movement on the deferred tax account was as follows:
| 30 June 2014 £m | 31 December 2013 £m | |||||||
At 1 January | 15 | 20 | ||||||
Income statement charge | (1 | ) | (10 | ) | ||||
(Charged)/credited to other comprehensive income: | ||||||||
- available-for-sale financial assets | — | 1 | ||||||
- cash flow hedges | (14 | ) | 4 | |||||
|
|
|
| |||||
At 30 June/31 December | — | 15 | ||||||
|
|
|
| |||||
Deferred tax assets and liabilities are attributable to the following items:
| 30 June 2014 £m | 31 December 2013 £m | |||||||
Deferred tax assets/(liabilities) | ||||||||
Accelerated tax depreciation | 1 | 1 | ||||||
IFRS transitional adjustments | 2 | 3 | ||||||
Other temporary differences | (3 | ) | 11 | |||||
|
|
|
| |||||
| — | 15 | |||||||
|
|
|
| |||||
The deferred tax assets scheduled above have been recognised in the ANTS group on the basis that sufficient future taxable profits are forecast within the foreseeable future, in excess of the profits arising from the reversal of existing taxable temporary differences, to allow for the utilisation of the assets as they reverse. The deferred tax (credit)/charge in the income statement comprises the following temporary differences:
| Six months ended 30 June 2014 £m | Six months ended 30 June 2013 £m | |||||||
IFRS transitional adjustments | (1 | ) | (1 | ) | ||||
Other temporary differences | — | (1 | ) | |||||
|
|
|
| |||||
| (1 | ) | (2 | ) | |||||
|
|
|
| |||||
14. DEPOSITS BY BANKS
| 30 June 2014 £m | 31 December 2013 £m | |||||||
Amounts due to Santander UK subsidiaries | 113,791 | 115,986 | ||||||
Securities sold under agreements to repurchase | 3,932 | 4,164 | ||||||
Amounts due to Banco Santander, S.A. - securities sold under repurchase agreements | — | 49 | ||||||
- Other | — | 7 | ||||||
Time and demand deposits | 603 | 492 | ||||||
|
|
|
| |||||
Total deposits by banks | 118,326 | 120,698 | ||||||
|
|
|
| |||||
15. TRADING LIABILITIES
| 30 June 2014 £m | 31 December 2013 £m | |||||||
Deposits by banks - securities sold under repurchase agreements | 6,076 | 7,793 | ||||||
- other(1) | 2,447 | 3,496 | ||||||
Deposits by customers - securities sold under repurchase agreements | 2,810 | 6,329 | ||||||
- other(1)(2) | 2,285 | 740 | ||||||
Short positions in securities and unsettled trades | 4,230 | 2,917 | ||||||
|
|
|
| |||||
| 17,848 | 21,275 | |||||||
|
|
|
| |||||
| (1) | Comprises cash collateral of £1,451m (2013: £1,841m) and short-term deposits of £3,281m (2013: £2,336m). |
| (2) | Comprises equity index-linked deposits of £nil (2013: £59m). The capital amount guaranteed/protected and the amount of return guaranteed in respect of the equity index-linked deposits were £nil for both commitments (2013: £127m and £17m, respectively). |
Included in the above balances are amounts owed by the ANTS group to Banco Santander, S.A. of £76m (2013: £193m), fellow subsidiaries of Banco Santander, S.A. of £48m (2013: £13m), Santander UK plc of £nil (2013: £nil) and subsidiaries of the Santander UK group outside the ANTS group of £nil (2013: £nil) respectively.
| Abbey National Treasury Services plc 2014 Half Yearly Financial Report | 53 |
Financial Statements
Notes to the Financial Statementscontinued
16. FINANCIAL LIABILITIES DESIGNATED AT FAIR VALUE
| 30 June 2014 £m | 31 December 2013 £m | |||||||
Debt securities in issue: | ||||||||
- US$10bn Euro Commercial Paper Programme | 940 | 865 | ||||||
- US$20bn Euro Medium Term Note Programme | 633 | 591 | ||||||
- Euro 10bn Note, Certificate and Warrant Programme | 1,571 | 1,832 | ||||||
Warrants | 108 | 119 | ||||||
|
|
|
| |||||
| 3,252 | 3,407 | |||||||
|
|
|
| |||||
Included in the above balances are amounts owed by the ANTS group to Banco Santander, S.A. £26m (2013: £17m) to fellow subsidiaries of Banco Santander S.A. £245m (2013: £172m), Santander UK plc £nil (2013: £nil) and subsidiaries of the Santander UK group outside the ANTS group of £nil (2013: £nil).
Gains and losses arising from changes in the credit spread of liabilities issued by the ANTS group reverse over the contractual life of the debt, provided that the debt is not repaid at a premium or a discount.
The net loss during the period attributable to changes in the ANTS group’s own credit risk on the above debt securities in issue was £8m (six months ended 30 June 2013: net gain of £18m). The cumulative loss attributable to changes in the ANTS group’s own credit risk on the above debt securities in issue at 30 June 2014 was £14m (31 December 2013: cumulative net loss £6m).
The amount that would be required to be contractually paid at maturity of the debt securities in issue above is £197m (31 December 2013: £216m) higher than the carrying value.
17. DEBT SECURITIES IN ISSUE
| 30 June 2014 £m | 31 December 2013 £m | |||||||
Euro 35bn Global Covered Bond Programme | 16,378 | 17,422 | ||||||
US$20bn Euro Medium Term Note Programme (see Note 16) | 8,111 | 7,690 | ||||||
US$20bn Commercial Paper Programme | 2,922 | 3,131 | ||||||
Euro 5bn Guaranteed French Certificates of Deposit Programme | 1,318 | 890 | ||||||
Certificates of deposit in issue | 2,988 | 1,756 | ||||||
|
|
|
| |||||
| 31,717 | 30,889 | |||||||
|
|
|
| |||||
Included in the above balances are amounts owed by the ANTS group to Banco Santander, S.A. of £43m (2013: £29m), fellow subsidiaries of Banco Santander, S.A. of £68m (2013: £74m), Santander UK plc of £nil (2013: £nil) and subsidiaries of the Santander UK group outside the ANTS group of £nil (2013: £nil) respectively.
18. PROVISIONS
| £m | ||||
At 1 January 2014 | 23 | |||
Additional provisions | — | |||
Used during the period | (23 | ) | ||
|
| |||
At 30 June 2014 | — | |||
|
| |||
To be settled: | ||||
Within 12 months | — | |||
In more than 12 months | — | |||
|
| |||
| — | ||||
|
|
| £m | ||||
At 1 January 2013 | 20 | |||
Additional provisions | 23 | |||
Used during the year | (20 | ) | ||
|
| |||
At 31 December 2013 | 23 | |||
|
| |||
To be settled: | ||||
Within 12 months | 23 | |||
In more than 12 months | — | |||
|
| |||
| 23 | ||||
|
|
| 54 | Abbey National Treasury Services plc 2014 Half Yearly Financial Report |
Financial Statements
Notes to the Financial Statementscontinued
19. PENSIONS AND OTHER POST-RETIREMENT BENEFITS
The ANTS group participates in various Santander UK defined benefit and defined contribution pension schemes in operation. Details of each scheme required by IAS 19 are disclosed in Note 37 in the 2013 Annual Report of Santander UK plc. There is no contractual agreement of stated policy for charging the net defined benefit cost of the Santander UK defined benefit schemes. Therefore, in accordance with IAS 19, the defined benefit asset or liability has been recognised in the financial statements of the sponsoring employer of the scheme and the ANTS group accounts for its contributions as a defined contribution scheme. The contribution to be paid by the ANTS group is calculated as the contributions made by Santander UK plc to the schemes in respect of the ANTS group’s employees. For the six months ended 30 June 2014, an amount of £0.7m (six months ended 30 June 2013: £0.8m) was recognised as an expense for these contributions and is included in staff costs within administration expenses in the income statement.
20. CONTINGENT LIABILITIES AND COMMITMENTS
| 30 June 2014 £m | 31 December 2013 £m | |||||||
Guarantees given on behalf of the Company’s immediate UK parent, fellow subsidiaries and subsidiaries | 155,315 | 149,891 | ||||||
Guarantees given to third parties | 278 | 367 | ||||||
Formal standby facilities, credit lines and other commitments with original term to maturity of: | ||||||||
– one year or less | 754 | 739 | ||||||
– more than one year | 11,052 | 9,766 | ||||||
|
|
|
| |||||
| 167,399 | 160,763 | |||||||
|
|
|
| |||||
There have been no significant changes to the contingent liabilities as set out in Note 35 in the 2013 Annual Report.
21. CASH FLOW STATEMENT
a) Reconciliation of profit after tax to net cash inflow/(outflow) from operating activities:
| Six months ended 30 June 2014 £m | Six months ended 30 June 2013 £m | |||||||
Profit for the period | 65 | 256 | ||||||
Non-cash items included in net profit | ||||||||
Depreciation, amortisation and impairment | 1 | 1 | ||||||
Change in prepayments and accrued income | 460 | 236 | ||||||
Change in accruals and deferred income | 147 | (254 | ) | |||||
Amortisation of discounts on debt securities | — | (12 | ) | |||||
Impairment losses | 1 | 18 | ||||||
Corporation tax charge | (1 | ) | 45 | |||||
Other non-cash items | (24 | ) | 222 | |||||
|
|
|
| |||||
| 649 | 512 | |||||||
Changes in operating assets and liabilities | ||||||||
Net change in cash and balances held at central banks | (2 | ) | (8 | ) | ||||
Net change in trading assets | (1,206 | ) | (8,540 | ) | ||||
Net change in derivative assets | 171 | 6,009 | ||||||
Net change in financial assets designated at fair value | (34 | ) | 962 | |||||
Net change in debt securities, treasury bills and other eligible bills | — | 12 | ||||||
Net change in loans and advances to banks and customers | 20,111 | (11,462 | ) | |||||
Net change in other assets | 18 | (61 | ) | |||||
Net change in deposits by banks and customers accounts | (5,450 | ) | 3,225 | |||||
Net change in derivative liabilities | 111 | (6,154 | ) | |||||
Net change in trading liabilities | (3,431 | ) | 13,682 | |||||
Net change in financial liabilities designated at fair value | 307 | (152 | ) | |||||
Net change in debt issued | 1,010 | (932 | ) | |||||
Net change in other liabilities | (11 | ) | (14 | ) | ||||
Effects of exchange rate differences | (793 | ) | 1,150 | |||||
|
|
|
| |||||
Net cash flow from/(used in) operating activities before tax | 11,450 | (1,771 | ) | |||||
Corporation tax paid | — | — | ||||||
|
|
|
| |||||
Net cash flow from/(used in) operating activities | 11,450 | (1,771 | ) | |||||
|
|
|
| |||||
| Abbey National Treasury Services plc 2014 Half Yearly Financial Report | 55 |
Financial Statements
Notes to the Financial Statementscontinued
b) Analysis of the balances of cash and cash equivalents in the balance sheet
| 30 June 2014 £m | 31 December 2013 £m | |||||||
Cash and balances at central banks | 7,452 | 4,911 | ||||||
Less: regulatory minimum cash balances | (39 | ) | (37 | ) | ||||
|
|
|
| |||||
| 7,413 | 4,874 | |||||||
Net trading other cash equivalents | 5,004 | 9,853 | ||||||
Net non-trading other cash equivalents | 102,191 | 88,224 | ||||||
|
|
|
| |||||
Cash and cash equivalents | 114,608 | 102,951 | ||||||
|
|
|
| |||||
22. ASSETS CHARGED AS SECURITY FOR LIABILITIES AND COLLATERAL ACCEPTED AS SECURITY FOR ASSETS
The following transactions are conducted under terms that are usual and customary to collateralised transactions, including, where relevant, standard securities lending and repurchase agreements.
a) Financial assets pledged to secure liabilities
The financial assets below are analysed between those assets accounted for on balance sheet and off-balance sheet in accordance with IFRS.
| 30 June 2014 £m | 31 December 2013 £m | |||||||
On balance sheet: | ||||||||
Treasury bills and other eligible securities | 6,255 | 6,070 | ||||||
Cash | 5,769 | 5,106 | ||||||
Loans and advances to customers | 615 | — | ||||||
Debt securities | 1,224 | 1,129 | ||||||
Equity securities | 880 | 603 | ||||||
|
|
|
| |||||
| 14,743 | 12,908 | |||||||
|
|
|
| |||||
Off balance sheet: | ||||||||
Treasury bills and other eligible securities | 7,789 | 10,023 | ||||||
Debt securities | 6,025 | 6,236 | ||||||
Equity securities | 1,785 | 181 | ||||||
|
|
|
| |||||
| 15,599 | 16,440 | |||||||
|
|
|
| |||||
The ANTS group provides assets as collateral in the following areas of the business.
Sale and repurchase agreements
The Company and certain of its subsidiaries enter into sale and repurchase agreements and similar transactions of equity and debt securities, which are accounted for as secured borrowings. Upon entering into such transactions, the Company and subsidiaries provide collateral equal to 100%-131% of the borrowed amount. The carrying amount of assets that were so provided at 30 June 2014 was £14,811m (2013: £13,296m).
Stock borrowing and lending agreements
Asset balances under stock borrowing and lending agreements represent stock lent by the ANTS group. These balances amounted to £9,762m at 30 June 2014 (2013: £10,946m) and are offset by contractual commitments to return stock borrowed or cash received.
Derivatives business
In addition to the arrangements described above, collateral is also provided in the normal course of derivative business to counterparties. At 30 June 2014, £5,769m (2013: £5,106m) of such collateral in the form of cash had been provided by the ANTS group and is included in the table above.
b) Collateral held as security for assets:
The collateral held as security for assets below are analysed between those liabilities accounted for on the balance sheet and off-balance sheet in accordance with IFRS.
| 30 June 2014 £m | 31 December 2013 £m | |||||||
On balance sheet: | ||||||||
Trading liabilities | 1,451 | 1,841 | ||||||
|
|
|
| |||||
| 1,451 | 1,841 | |||||||
|
|
|
| |||||
Off balance sheet: | ||||||||
Trading liabilities | 17,529 | 24,192 | ||||||
Deposits by banks | 80 | 49 | ||||||
|
|
|
| |||||
| 17,609 | 24,241 | |||||||
|
|
|
| |||||
| 56 | Abbey National Treasury Services plc 2014 Half Yearly Financial Report |
Financial Statements
Notes to the Financial Statementscontinued
Purchase and resale agreements
The Company and certain of its subsidiaries also enter into purchase and resale agreements and similar transactions of equity and debt securities, which are accounted for as collateralised loans. Upon entering into such transactions, the Company and subsidiaries receive collateral equal to 100%-105% of the loan amount. The level of collateral held is monitored daily and if required, further calls are made to ensure the market values of collateral remains at least equal to the loan balance. The Company and subsidiaries are permitted to sell or repledge the collateral held in the absence of default. At 30 June 2014, the fair value of such collateral received was £8,499m (2013: £14,118m). Of the collateral received, almost all was sold or repledged. The Company and its subsidiaries have an obligation to return collateral that they have sold or pledged.
Stock borrowing and lending agreements
Obligations under stock borrowing and lending agreements represent contractual commitments to return stock borrowed. These obligations totalled £9,110m at 30 June 2014 (2013: £10,123m) and are offset by a contractual right to receive stock lent by the ANTS group.
Derivatives business
In addition to the arrangements described above, collateral is also received from counterparties in the normal course of derivative business. At 30 June 2014, £1,451m (2013: £1,841m) of such collateral in the form of cash had been received by the ANTS group and is included in the table above.
Lending activities
In addition to the above collateral held as security for assets, the ANTS group may obtain a charge over a customer’s property in connection with its lending activities. Details of these arrangements are set out in the “Credit Risk” section of the Risk Management Report.
23. RELATED PARTY DISCLOSURES
The financial position and performance of the ANTS group have not been materially affected in the first six months of the year by any related party transactions, or changes to related party transactions, except as disclosed in the other Notes to these Condensed Consolidated Interim Financial Statements or otherwise described below.
Information on balances due from/(to) other Banco Santander group companies is set out in the sections “Balances with other Santander UK group companies” and “Balances with other Banco Santander group companies outside the Santander UK group” in the Risk Management Report on pages 37 to 38. In addition, transactions with pension schemes operated by the Santander UK group are described in Note 19. These transactions were made in the ordinary course of business and substantially on the same terms as for comparable transactions with third party counterparties and within limits acceptable to the PRA. Such transactions do not involve more than the normal risk of collectability or present any unfavourable features.
| Abbey National Treasury Services plc 2014 Half Yearly Financial Report | 57 |
Financial Statements
Notes to the Financial Statementscontinued
24. FINANCIAL INSTRUMENTS
a) Fair values of financial instruments measured at fair value on a recurring basis
The following tables summarise the fair values at 30 June 2014 and 31 December 2013 of the financial asset and liability classes accounted for at fair value, analysed by the valuation methodology used by the ANTS group to determine their fair value. The tables also disclose the percentages that the recorded fair values of financial assets and liabilities represent of the total assets and liabilities, respectively, that are recorded at fair value in the balance sheet:
| 30 June 2014 | Internal models based on | |||||||||||||||||||||||||||||||||||||
| Quoted prices in active markets (Level 1) | Market observable data (Level 2) | Significant unobservable data (Level 3) | Total | Valuation technique | ||||||||||||||||||||||||||||||||||
Balance sheet category | £m | % | £m | % | £m | % | £m | % | ||||||||||||||||||||||||||||||
Assets | ||||||||||||||||||||||||||||||||||||||
Trading assets | Loans and advances to banks | — | — | 6,200 | 14 | — | — | 6,200 | 14 | A | ||||||||||||||||||||||||||||
| Loans and advances to customers | — | — | 1,766 | 4 | — | — | 1,766 | 4 | A | |||||||||||||||||||||||||||||
| Debt securities | 7,522 | 17 | — | — | — | — | 7,522 | 17 | — | |||||||||||||||||||||||||||||
| Equity securities | 2,819 | 6 | — | — | — | — | 2,819 | 6 | — | |||||||||||||||||||||||||||||
Derivative assets | Exchange rate contracts | — | — | 3,465 | 8 | 11 | — | 3,476 | 8 | A | ||||||||||||||||||||||||||||
| Interest rate contracts | 6 | — | 14,910 | 33 | 25 | — | 14,941 | 33 | A & C | |||||||||||||||||||||||||||||
| Equity and credit contracts | 360 | 1 | 2,263 | 5 | 335 | 1 | 2,958 | 7 | B | |||||||||||||||||||||||||||||
| Commodity contracts | — | — | 4 | — | — | — | 4 | — | A | |||||||||||||||||||||||||||||
Financial assets at FVTPL | Loans and advances to customers | — | — | 2,177 | 5 | 52 | — | 2,229 | 5 | A | ||||||||||||||||||||||||||||
| Debt securities | — | — | 314 | — | — | — | 314 | — | A | |||||||||||||||||||||||||||||
AFS Financial assets | Debt securities | 2,550 | 6 | — | — | — | — | 2,550 | 6 | — | ||||||||||||||||||||||||||||
|
|
|
|
|
|
|
|
|
|
|
|
|
|
|
| |||||||||||||||||||||||
Total assets at fair value | 13,257 | 30 | 31,099 | 69 | 423 | 1 | 44,779 | 100 | ||||||||||||||||||||||||||||||
|
|
|
|
|
|
|
|
|
|
|
|
|
|
|
| |||||||||||||||||||||||
Liabilities | ||||||||||||||||||||||||||||||||||||||
Trading liabilities | Deposits by banks | — | — | 8,523 | 20 | — | — | 8,523 | 20 | A | ||||||||||||||||||||||||||||
| Deposits by customers | — | — | 5,095 | 12 | — | — | 5,095 | 12 | A | |||||||||||||||||||||||||||||
| Short positions | 4,230 | 10 | — | — | — | — | 4,230 | 10 | — | |||||||||||||||||||||||||||||
Derivative liabilities | Exchange rate contracts | — | — | 4,096 | 9 | — | — | 4,096 | 9 | A | ||||||||||||||||||||||||||||
| Interest rate contracts | 23 | — | 14,311 | 34 | 9 | — | 14,343 | 34 | A & C | |||||||||||||||||||||||||||||
| Equity and credit contracts | 2 | — | 3,104 | 7 | 58 | — | 3,164 | 7 | B | |||||||||||||||||||||||||||||
| Commodity contracts | — | — | 4 | — | — | — | 4 | — | A | |||||||||||||||||||||||||||||
Financial liabilities at FVTPL | Debt securities in issue | — | — | 3,228 | 8 | 24 | — | 3,252 | 8 | A | ||||||||||||||||||||||||||||
|
|
|
|
|
|
|
|
|
|
|
|
|
|
|
| |||||||||||||||||||||||
Total liabilities at fair value | 4,255 | 10 | 38,361 | 90 | 91 | — | 42,707 | 100 | ||||||||||||||||||||||||||||||
|
|
|
|
|
|
|
|
|
|
|
|
|
|
|
| |||||||||||||||||||||||
| 31 December 2013 | Internal models based on | |||||||||||||||||||||||||||||||||||||
| Quoted prices in active markets (Level 1) | Market observable data (Level 2) | Significant unobservable data (Level 3) | Total | Valuation technique | ||||||||||||||||||||||||||||||||||
Balance sheet category | £m | % | £m | % | £m | % | £m | % | ||||||||||||||||||||||||||||||
Assets | ||||||||||||||||||||||||||||||||||||||
Trading assets | Loans and advances to banks | — | — | 9,326 | 19 | — | — | 9,326 | 19 | A | ||||||||||||||||||||||||||||
| Loans and advances to customers | — | — | 4,402 | 9 | — | — | 4,402 | 9 | A | |||||||||||||||||||||||||||||
| Debt securities | 7,859 | 16 | — | — | — | — | 7,859 | 16 | — | |||||||||||||||||||||||||||||
| Equity securities | 310 | 1 | — | — | — | — | 310 | 1 | — | |||||||||||||||||||||||||||||
Derivative assets | Exchange rate contracts | — | — | 3,674 | 7 | 14 | — | 3,688 | 7 | A | ||||||||||||||||||||||||||||
| Interest rate contracts | 11 | — | 15,173 | 31 | — | — | 15,184 | 31 | A & C | |||||||||||||||||||||||||||||
| Equity and credit contracts | 311 | 1 | 2,032 | 4 | 333 | 1 | 2,676 | 6 | B | |||||||||||||||||||||||||||||
| Commodity contracts | — | — | 2 | — | — | — | 2 | — | A | |||||||||||||||||||||||||||||
Financial assets at FVTPL | Loans and advances to customers | — | — | 2,167 | 4 | 51 | — | 2,218 | 4 | A | ||||||||||||||||||||||||||||
| Debt securities | — | — | 258 | 1 | 58 | — | 316 | 1 | A | |||||||||||||||||||||||||||||
AFS Financial assets | Debt securities | 2,962 | 6 | — | — | — | — | 2,962 | 6 | — | ||||||||||||||||||||||||||||
|
|
|
|
|
|
|
|
|
|
|
|
|
|
|
| |||||||||||||||||||||||
Total assets at fair value | 11,453 | 24 | 37,034 | 75 | 456 | 1 | 48,943 | 100 | ||||||||||||||||||||||||||||||
|
|
|
|
|
|
|
|
|
|
|
|
|
|
|
| |||||||||||||||||||||||
Liabilities | ||||||||||||||||||||||||||||||||||||||
Trading liabilities | Deposits by banks | — | — | 11,289 | 24 | — | — | 11,289 | 24 | A | ||||||||||||||||||||||||||||
| Deposits by customers | — | — | 7,069 | 15 | — | — | 7,069 | 15 | A | |||||||||||||||||||||||||||||
| Short positions | 2,917 | 6 | — | — | — | — | 2,917 | 6 | — | |||||||||||||||||||||||||||||
Derivative liabilities | Exchange rate contracts | — | — | 3,960 | 9 | — | — | 3,960 | 9 | A | ||||||||||||||||||||||||||||
| Interest rate contracts | 30 | — | 14,490 | 32 | — | — | 14,520 | 32 | A & C | |||||||||||||||||||||||||||||
| Equity and credit contracts | 771 | 2 | 2,175 | 5 | 68 | — | 3,014 | 7 | B | |||||||||||||||||||||||||||||
| Commodity contracts | — | — | 2 | — | — | — | 2 | — | A | |||||||||||||||||||||||||||||
Financial liabilities at FVTPL | Debt securities in issue | — | — | 3,370 | 7 | 37 | — | 3,407 | 7 | A | ||||||||||||||||||||||||||||
|
|
|
|
|
|
|
|
|
|
|
|
|
|
|
| |||||||||||||||||||||||
Total liabilities at fair value | 3,718 | 8 | 42,355 | 92 | 105 | — | 46,178 | 100 | ||||||||||||||||||||||||||||||
|
|
|
|
|
|
|
|
|
|
|
|
|
|
|
| |||||||||||||||||||||||
| 58 | Abbey National Treasury Services plc 2014 Half Yearly Financial Report |
Financial Statements
Notes to the Financial Statementscontinued
Transfers between levels of the fair value hierarchy
Transfers between levels of the fair value hierarchy are reported at the beginning of the reporting period in which they occur. During the six months ended 30 June 2014, the following financial instruments were transferred between Level 2 and Level 3 in the fair value hierarchy:
| • | Bermudan swaptions shown within derivative assets and derivative liabilities with fair values of £29m and £10m, respectively, were transferred from Level 2 to Level 3 principally due to a lack of market transactions in these instruments. The valuation technique applied to estimate the fair value of these financial instruments are described in section e below as ‘instruments 2 and 8’. |
| • | Certain asset-backed securities issued by Banco Santander group entities, with a fair value of £58m designated as fair value through profit and loss, were transferred from Level 3 to Level 2 principally due to improved transparency of market prices as a result of market transactions in these instruments. The valuation technique applied to estimate the fair value of these financial instruments is described in section e below as ‘instrument 7’. |
During the year ended 31 December 2013, there were no transfers of financial instruments between Levels 2 and 3.
During the six months ended 30 June 2014, there were no transfers of financial instruments between Levels 1 and 2 (year ended 31 December 2013: Nil).
b) Fair values of financial instruments measured at amortised cost on a recurring basis
The following tables analyse the fair value of financial instruments not measured at fair value in the balance sheet:
30 June 2014 | Carrying value £m | Fair value £m | Surplus/(deficit) £m | |||||||||
Assets | ||||||||||||
Loans and advances to banks | 110,454 | 110,417 | (37 | ) | ||||||||
Loans and advances to customers | 38,032 | 37,389 | (643 | ) | ||||||||
Loans and receivable securities | 96 | 92 | (4 | ) | ||||||||
Liabilities | ||||||||||||
Deposits by banks | 118,326 | 118,508 | (182 | ) | ||||||||
Deposits by customers | 4,824 | 4,827 | (3 | ) | ||||||||
Debt securities in issue | 31,717 | 33,281 | (1,564 | ) | ||||||||
31 December 2013 | Carrying value £m | Fair value £m | Surplus/(deficit) £m | |||||||||
Assets | ||||||||||||
Loans and advances to banks | 113,649 | 113,609 | (40 | ) | ||||||||
Loans and advances to customers | 41,108 | 40,442 | (666 | ) | ||||||||
Loans and receivable securities | 128 | 126 | (2 | ) | ||||||||
Liabilities | ||||||||||||
Deposits by banks | 120,698 | 120,850 | (152 | ) | ||||||||
Deposits by customers | 7,780 | 7,787 | (7 | ) | ||||||||
Debt securities in issue | 30,889 | 32,344 | (1,455 | ) | ||||||||
The surplus/(deficit) in the table above represents the surplus/(deficit) of fair value compared to the carrying amount of those financial instruments for which fair values have been estimated. The carrying value above of any financial assets and liabilities that are designated as hedged items in a portfolio (or macro) fair value hedge relationship excludes gains and losses attributable to the hedged risk, as this is presented as a single separate line item on the balance sheet.
The fair value exposures set out in the tables above are managed by using a combination of hedging derivatives and offsetting on balance sheet positions. The approach to specific categories of financial instruments is described on page 165 of the 2013 Annual Report.
c) Valuation techniques
The main valuation techniques employed in the ANTS group’s internal models to measure the fair value of the financial instruments disclosed above at 30 June 2014 and 31 December 2013 are set out below. In substantially all cases, the principal inputs into these models are derived from observable market data. The ANTS group did not make any material changes to the valuation techniques and internal models it used during the six months ended 30 June 2014 and the year ended 31 December 2013.
| A | In the valuation of financial instruments requiring static hedging (for example interest rate, currency derivatives and commodity swaps) and in the valuation of loans and advances and deposits, the ‘present value’ method is used. Expected future cash flows are discounted using the interest rate curves of the applicable currencies or forward commodity prices as appropriate. The interest rate curves are generally observable market data and reference yield curves derived from quoted interest rates in appropriate time bandings, which match the timings of the cash flows and maturities of the instruments. The forward commodity prices are generally observable market data. |
| B | In the valuation of equity financial instruments requiring dynamic hedging (principally equity securities, options and other structured instruments), proprietary local volatility and stochastic volatility models are used. These types of models are widely accepted in the financial services industry. Observable market inputs used in these models include the bid-offer spread, foreign currency exchange rates, volatility and correlation between indices. In limited circumstances, other inputs may be used in these models that are based on data other than observable market data, such as the Halifax’s UK House Price Index (‘HPI’) volatility, HPI forward growth, HPI spot rate, mortality and mean reversion. |
| Abbey National Treasury Services plc 2014 Half Yearly Financial Report | 59 |
Financial Statements
Notes to the Financial Statementscontinued
| C | In the valuation of financial instruments exposed to interest rate risk that require either static or dynamic hedging (such as interest rate futures, caps and floors, and options), the present value method (futures), Black-Scholes model (caps/floors) and the Hull/White and Markov functional models (Bermudan options) are used. These types of models are widely accepted in the financial services industry. The significant inputs used in these models are observable market data, including appropriate interest rate curves, volatilities, correlations and exchange rates. In limited circumstances, other inputs may be used in these models that are based on data other than observable market data, such as HPI volatility, HPI forward growth, HPI spot rate and mortality. |
| D | In the valuation of linear instruments such as credit risk and fixed-income derivatives, credit risk is measured using dynamic models similar to those used in the measurement of interest rate risk. In the case of non-linear instruments, if the portfolio is exposed to credit risk such as credit derivatives, the probability of default is determined using the par spread level. The main inputs used to determine the underlying cost of credit of credit derivatives are quoted credit risk premiums and the correlation between the quoted credit derivatives of various issuers. |
The fair values of the financial instruments arising from the ANTS group’s internal models take into account, among other things, contract terms and observable market data, which include such factors as bid-offer spread, interest rates, credit risk, exchange rates, the quoted market price of raw materials and equity securities, volatility and prepayments. In all cases, when it is not possible to derive a valuation for a particular feature of an instrument, management uses judgement to determine the fair value of the particular feature. In exercising this judgement, a variety of tools are used including proxy observable data, historical data and extrapolation techniques. Extrapolation techniques take into account behavioural characteristics of equity markets that have been observed over time, and for which there is a strong case to support an expectation of a continuing trend in the future. Estimates are calibrated to observable market prices when they become available.
The estimates thus obtained could vary if other valuation methods or assumptions were used. The ANTS group believes its valuation methods are appropriate and consistent with other market participants. Nevertheless, the use of different valuation methods or assumptions, including imprecision in estimating unobservable market inputs, to determine the fair value of certain financial instruments could result in different estimates of fair value at the reporting date and the amount of gain or loss recorded for a particular instrument. Most of the valuation models are not significantly subjective, because they can be tested and, if necessary, recalibrated by the internal calculation of and subsequent comparison to market prices of actively traded securities, where available.
d) Fair value adjustments
The internal models incorporate assumptions that the ANTS group believes would be made by a market participant to establish fair value. Fair value adjustments are adopted when the ANTS group considers that there are additional factors that would be considered by a market participant in the determination of fair value of the instrument that are not incorporated in the valuation model. The magnitude of fair value adjustments depends upon many entity-specific factors, including modelling sophistication, the nature of products traded, and the size and type of risk exposures. For this reason, fair value adjustments may not be comparable across the banking industry.
The ANTS group classifies fair value adjustments as either ‘risk-related’ or ‘model-related’. The fair value adjustments form part of the portfolio fair value and are included in the balance sheet values of the product types to which they have been applied. The majority of these adjustments relate to Markets. The magnitude and types of fair value adjustment adopted by Markets are listed in the following table:
| 30 June 2014 £m | 31 December 2013 £m | |||||||
Risk-related: | ||||||||
- Bid-offer and trade specific adjustments | 19 | 27 | ||||||
- Uncertainty | 17 | 18 | ||||||
- Credit risk adjustment | 41 | 45 | ||||||
|
|
|
| |||||
| 77 | 90 | |||||||
|
|
|
| |||||
Model-related: | ||||||||
- Model limitation | 11 | 12 | ||||||
Day One profits | 1 | — | ||||||
|
|
|
| |||||
| 89 | 102 | |||||||
|
|
|
| |||||
Risk-related adjustments
‘Risk-related’ adjustments are driven, in part, by the magnitude of the ANTS group’s market or credit risk exposure, and by external market factors, such as the size of market spreads. For further details, see the ‘Risk-related adjustments’ section on page 171 of the 2013 Annual Report.
| 60 | Abbey National Treasury Services plc 2014 Half Yearly Financial Report |
Financial Statements
Notes to the Financial Statementscontinued
e) Internal models based on information other than market data (Level 3)
The table below provides an analysis of financial instruments valued using internal models based on information other than market data together with the subsequent valuation technique used for each type of instrument. Each instrument is initially valued at transaction price:
| Balance sheet value | Amount recognised in income/(expense) | |||||||||||||||||||
30 June 2014 | 31 December 2013 | H1 2014 | H1 2013 | |||||||||||||||||
Balance sheet line item | Category | Financial instrument product type | £m | £m | £m | £m | ||||||||||||||
1. Derivative assets | Exchange rate contracts | Cross-currency swaps | 11 | 14 | (1 | ) | (6 | ) | ||||||||||||
2. Derivative assets | Interest rate contracts | Bermudan swaptions | 25 | — | (4 | ) | — | |||||||||||||
3. Derivative assets | Equity and credit contracts | Reversionary property interests | 75 | 71 | 6 | (2 | ) | |||||||||||||
4. Derivative assets | Credit contracts | Credit default swaps | 9 | 13 | 3 | (1 | ) | |||||||||||||
5. Derivative assets | Equity contracts | Options and forwards | 251 | 249 | 4 | 2 | ||||||||||||||
6. FVTPL | Loans and advances to customers | Roll-up mortgage portfolio | 52 | 51 | 2 | (3 | ) | |||||||||||||
7. FVTPL | Debt securities | Asset-backed securities | — | 58 | — | 9 | ||||||||||||||
8. Derivative liabilities | Interest rate contracts | Bermudan swaptions | (9 | ) | — | 2 | — | |||||||||||||
9. Derivative liabilities | Equity contracts | Options and forwards | (58 | ) | (68 | ) | (5 | ) | 3 | |||||||||||
10. FVTPL | Debt securities in issue | Non-vanilla debt securities | (24 | ) | (37 | ) | 1 | 5 | ||||||||||||
Total net assets | 332 | 351 | — | — | ||||||||||||||||
Total (expense)/income | — | — | 8 | 7 | ||||||||||||||||
Valuation techniques
1. Derivative assets - Exchange rate contracts
These cross currency swaps are used to hedge the foreign currency risks arising from the PRDC notes issued by the ANTS group, as described in Instrument 10 below. These derivatives are valued using a standard valuation model valuing each leg of the swap, with expected future cash flows less notional amount exchanged at maturity date discounted using an appropriate floating rate. The floating rate is adjusted by the relevant cross currency basis spread. Interest rates, foreign exchange rates, cross currency basis spread and long-dated foreign exchange (‘FX’) volatility are used as inputs to determine fair value. Interest rates and foreign exchange rates are observable on the market.
Cross currency spreads may be market observable or unobservable depending on the liquidity of the cross currency pair. As the Japanese Yen-US dollar cross currency pair related to the PRDC notes is liquid, the cross currency spreads (including long-dated cross currency spread) for these swaps are market observable.
The significant unobservable inputs for the valuation of these financial instruments are the long-dated FX volatility and the correlation between the underlying assets. The correlation between the underlying assets is assumed to be zero, as there are no actively traded options from which correlations between the underlying assets could be implied. Furthermore, the zero correlation assumption implies that the sources of the long-dated FX volatility are independent.
Long-dated FX volatility
Long-dated FX volatility is extrapolated from shorter-dated FX volatilities which are directly observable on the market. Short dated FX volatility is observable from the trading of FX options. As there is no active market for FX options with maturities greater than five years (long-dated FX options), long-dated FX volatility is not market observable. Furthermore, as historical prices are not relevant in determining the cost of hedging long-dated FX risk, long-dated FX volatility cannot be inferred from historical volatility. The ANTS group extrapolates the long-dated FX volatility from the shorter-dated FX volatilities using Black-Scholes model.
FX volatility is modelled as the composition of the domestic interest rate, foreign interest rates and FX spot volatilities using standard Hull-White formulae. The Hull-White approach is used for estimating the future distribution of domestic and foreign zero-coupon rates, constructed from the relevant yield curves. Using short dated FX options, the FX spot volatility is calculated which is then extrapolated to derive the long-dated FX volatility.
2. Derivative assets - Interest rate contracts
These derivatives assets are options giving the holder the right to enter into an interest rate swap on any one of a number of predetermined dates. These Bermudan swaptions are valued using a standard valuation model.
In determining the value of Bermudan swaptions, the main inputs used are market observable information in the vanilla swaption market and a mean reversion parameter. The significant unobservable input for the valuation of these financial instruments is mean reversion.
Mean reversion
The mean reversion input used in valuing Bermudan swaptions reflects the level of de-correlation in the swaption market. This parameter is not directly observable in the market but can be deduced from broker quotes or using expert judgement. An adjustment is made to reflect this uncertainty by stressing the parameter.
3. Derivative assets - Equity and credit contracts
These reversionary property derivatives are valued using a probability weighted set of HPI forward prices, which are assumed to be a reasonable representation of the increase in value of the ANTS group’s reversionary interest portfolio underlying the derivatives. The probability used reflects the likelihood of the home owner vacating the property and is calculated from mortality rates and acceleration rates which are a function of age and gender, obtained from the relevant mortality tables. Indexing is felt to be appropriate due to the size and geographical dispersion of the ANTS group’s reversionary interest portfolio. These are determined using HPI Spot Rates adjusted to reflect estimated forward growth. Launched in 1984, the Halifax’s UK HPI is the UK’s longest running monthly house price data series covering the whole country. The indices calculated are standardised and represent the price of a typically transacted house. Both national and regional HPI are published. The national HPI is published monthly. The regional HPI reflects the national HPI disaggregated into 12 UK regions and is published quarterly. Both indices are published on two bases, including and excluding seasonal adjustments in the housing market. The ANTS group uses the non-seasonally adjusted (‘NSA’) national and regional HPI in its valuation model to avoid any subjective judgement in the adjustment process which is made by Halifax.
The inputs used to determine the value of the reversionary property derivatives are HPI spot, HPI forward growth and mortality rates. The principal pricing parameter is HPI forward growth.
| Abbey National Treasury Services plc 2014 Half Yearly Financial Report | 61 |
Financial Statements
Notes to the Financial Statementscontinued
HPI Spot Rate
The HPI spot rate used in the model is a weighted average of NSA regional HPI spot rates i.e. adjusted for difference in the actual regional composition of the property underlying the ANTS group’s reversionary interest portfolio and the composition of the published regional indices. The regional HPI spot rate (which is observable market data) is only published on specific quarterly dates. In between these dates, its value is estimated by applying the growth rate over the relevant time period inferred from the national HPI spot rates (which are observable market data and published monthly) to the most recently calculated weighted average regional HPI spot rate based on published regional indices.
An adjustment is also made to reflect the specific property risk i.e. possible deviation between the actual growth in the house prices underlying the ANTS group’s reversionary interest portfolio and their assumed index-linked growth, which is based on the regional HPI. This adjustment is based on the average historical deviation of price changes of the ANTS group’s actual property portfolio from that of the published indices over the time period since the last valuation date.
HPI Forward Growth Rate
Long-dated HPI forward growth rate is not directly observable in the market but is estimated from traded forward contracts. A specific spread is applied to the long-dated forward growth rate to reflect the uncertainty surrounding long-dated data. This spread is calculated by analysing the historical volatility of the HPI, whilst incorporating mean reversion. An adjustment is made to reflect the specific property risk as for the HPI spot rate above.
Mortality Rate
Mortality rates are obtained from the PNMA00 and PNFA00 Continuous Mortality Investigation Tables published by the UK Institute and Faculty of Actuaries. These mortality rates are adjusted by acceleration rates to reflect the mortality profile of the holders of ANTS group’s reversionary property products underlying the derivatives. Mortality rates do not have a significant effect on the value of the instruments.
4. Derivative assets - Credit contracts
These derivative assets are credit default swaps held against certain bonds. The credit default swaps are valued using the credit spreads of the referenced bonds. These referenced bonds are valued with the assistance of valuations prepared by an independent, specialist valuation firm as a deep and liquid market does not exist.
In valuing the credit default swaps, the main inputs used to determine the underlying cost of credit are quoted risk premiums and the correlation between the quoted credit derivatives of various issuers. The assumptions relating to the correlation between the values of quoted and unquoted assets are based on historical correlations between the impact of adverse changes in market variables and the corresponding valuation of the associated unquoted assets. The measurement of the assets will vary depending on whether a more or less conservative scenario is selected. The other main input is the probability of default of the referenced bonds. The significant unobservable input for the valuation of these financial instruments is the probability of default.
Probability of default
The probability of default is assessed by considering the credit quality of the underlying referenced bonds. However, as no deep and liquid market exists for these assets the assessment of the probability of default is not directly observable and instead an estimate is calculated using the Standard Gaussian Copula model.
5. Derivative assets – Equity contracts
There are three types of derivatives within this category:
European options - These derivatives are valued using a modified Black-Scholes model where the HPI is log-normally distributed with the forward rates determined from the HPI forward growth.
Asian options - Asian (or average value) options are valued using a modified Black-Scholes model, with an amended strike price and volatility assumption to account for the average exercise period, through a closed form adjustment that reflects the strike price relative to the distribution of stock prices at each relevant date. This is also known as the Curran model.
Forward contracts- Forward contracts are valued using a standard forward pricing model.
The inputs used to determine the value of the above instruments are HPI spot rate, HPI forward growth rate and HPI volatility. The principal pricing parameter is HPI forward growth rate.
HPI Spot Rate
The HPI spot rate used is the NSA national HPI spot rate which is published monthly and directly observable in the market. This HPI rate used is different from the weighted average regional HPI spot rate used in the valuation of Instrument 3 above, as the underlying of these derivatives is the UK national HPI spot rate.
HPI Forward Growth Rate
The HPI forward growth rate used is unobservable and is the same as used in the valuation of Instrument 3 above.
HPI Volatility
Long-dated HPI volatility is not directly observable in the market but is estimated from the most recent traded values. An adjustment is applied to the long-dated HPI volatility rate to reflect the uncertainty surrounding long-dated data. This adjustment is based on the empirical standard deviation of historical volatility over a range of time horizons. HPI volatility rates do not have a significant effect on the value of the instruments.
| 62 | Abbey National Treasury Services plc 2014 Half Yearly Financial Report |
Financial Statements
Notes to the Financial Statementscontinued
6. FVTPL – Loans and advances to customers
These loans and advances to customers represent roll-up mortgages (sometimes referred to as “lifetime” mortgages), which are an equity release scheme under which a property owner takes out a loan secured against their home. The owner does not make any interest payments during their lifetime and the fixed interest payments are rolled up into the mortgage. The loan or mortgage (capital and rolled-up interest) is repaid upon the owner’s vacation of the property and the value of the loan is only repaid from the value of the property. This is known as a ‘no negative pledge’. The ANTS group suffers a loss if the sale proceeds from the property are insufficient to repay the loan, as it is unable to pursue the homeowner’s estate or beneficiaries for the shortfall.
The value of the mortgage ‘rolls up’ or accretes until the owner vacates the property. In order to value the roll-up mortgages, the ANTS group uses a probability-weighted set of European option prices (puts) determined using the Black-Scholes model, in which the ‘no negative pledges’ are valued as short put options. The probability weighting applied is calculated from mortality rates and acceleration rates as a function of age and gender, taken from mortality tables.
The inputs used to determine the value of these instruments are HPI spot, HPI forward growth, HPI volatility, mortality rates and repayment rates. The principal pricing parameter is HPI forward growth. The HPI forward growth rate used is unobservable and is the same as used in the valuation of Instrument 3 above. The other parameters do not have a significant effect on the value of the instruments.
7. FVTPL – Debt securities
These securities consist of asset-backed securities issued by Banco Santander group entities. Each instrument is valued with reference to the price from a consensus pricing service. This is then corroborated against the price from another consensus pricing service due to the lack of depth in the number of available market quotes. An average price is used where there is a more than insignificant difference between the two sources. The significant unobservable input is the adjustment to the credit spread embedded in the pricing consensus quotes.
8. Derivative liabilities - Interest rate contracts
These derivatives are the same as Instrument 2 with the exception that they have a negative fair value.
9. Derivative liabilities - Equity contracts
These derivatives are the same as Instrument 5 with the exception that they have a negative fair value.
10. FVTPL - Debt securities in issue
These debt securities in issue are PRDC notes. These notes are financial structured products where an investor is seeking a better return and a borrower/issuer a lower rate by taking advantage of the interest rate differential between two countries. The note pays a foreign interest rate in the investor’s domestic currency. The power component of the name denotes higher initial coupons and the fact that coupons rise as the domestic/foreign exchange rate depreciates. The power feature comes with a higher risk for the investor. Cash flows may have a digital cap feature where the rate gets locked once it reaches a certain threshold. Other add-on features are barriers such as knockouts and cancellation provisions for the issuer.
These debt securities in issue are valued using a three-factor Gaussian Model. The three factors used in the valuation are domestic interest rates, foreign interest rates and foreign exchange rates. The correlations between the factors are assumed to be zero within the valuation.
The Hull-White approach is used for estimating the future distribution of domestic and foreign zero-coupon rates, constructed from the relevant yield curves. A Geometric Brownian Motion model is used for estimating the future distribution of spot foreign exchange rates. The foreign exchange and interest rate volatilities are the most crucial pricing parameters; the model calibrates to the relevant swaption volatility surface.
The significant unobservable inputs for the valuation of these financial instruments are the long dated FX volatility and the correlation between the underlying assets and are the same as Instrument 1.
Reconciliation of fair value measurements in Level 3 of the fair value hierarchy
The following table provides a reconciliation of the movement between opening and closing balances of Level 3 financial instruments, measured at fair value using a valuation technique with significant unobservable inputs:
| Assets | Liabilities | |||||||||||||||||||||||
| Derivatives | Fair value through P&L | Total | Derivatives | Fair value through P&L | Total | |||||||||||||||||||
| £m | £m | £m | £m | £m | £m | |||||||||||||||||||
At 1 January 2014 | 347 | 109 | 456 | (68 | ) | (37 | ) | (105 | ) | |||||||||||||||
Total gains/(losses) recognised in profit/(loss): | ||||||||||||||||||||||||
- Fair value movements | 8 | 2 | 10 | (3 | ) | 1 | (2 | ) | ||||||||||||||||
- Foreign exchange and other movements | — | (1 | ) | (1 | ) | — | — | — | ||||||||||||||||
Transfers in | 29 | — | 29 | (11 | ) | — | (11 | ) | ||||||||||||||||
Transfers out | — | (58 | ) | (58 | ) | — | — | — | ||||||||||||||||
Settlements | (13 | ) | — | (13 | ) | 15 | 12 | 27 | ||||||||||||||||
|
|
|
|
|
|
|
|
|
|
|
| |||||||||||||
At 30 June 2014 | 371 | 52 | 423 | (67 | ) | (24 | ) | (91 | ) | |||||||||||||||
|
|
|
|
|
|
|
|
|
|
|
| |||||||||||||
Gains/(losses) recognised in profit/(loss) relating to assets and liabilities held at the end of the period | 8 | 1 | 9 | (3 | ) | 1 | (2 | ) | ||||||||||||||||
|
|
|
|
|
|
|
|
|
|
|
| |||||||||||||
| Assets | Liabilities | |||||||||||||||||||||||
| Derivatives | Fair value through P&L | Total | Derivatives | Fair value through P&L | Total | |||||||||||||||||||
| £m | £m | £m | £m | £m | £m | |||||||||||||||||||
At 1 January 2013 | 408 | 110 | 518 | (72 | ) | (86 | ) | (158 | ) | |||||||||||||||
Total gains/(losses) recognised in profit/(loss): | ||||||||||||||||||||||||
- Fair value movements | (10 | ) | 7 | (3 | ) | 8 | 7 | 15 | ||||||||||||||||
- Foreign exchange and other movements | (11 | ) | 6 | (5 | ) | (12 | ) | 12 | — | |||||||||||||||
Settlements | (40 | ) | (14 | ) | (54 | ) | 8 | 30 | 38 | |||||||||||||||
|
|
|
|
|
|
|
|
|
|
|
| |||||||||||||
At 31 December 2013 | 347 | 109 | 456 | (68 | ) | (37 | ) | (105 | ) | |||||||||||||||
|
|
|
|
|
|
|
|
|
|
|
| |||||||||||||
Gains/(losses) recognised in profit/(loss) relating to assets and liabilities held at the end of the year | (21 | ) | 13 | (8 | ) | (4 | ) | 19 | 15 | |||||||||||||||
|
|
|
|
|
|
|
|
|
|
|
| |||||||||||||
| Abbey National Treasury Services plc 2014 Half Yearly Financial Report | 63 |
Financial Statements
Notes to the Financial Statementscontinued
Effect of changes in significant unobservable assumptions to reasonably possible alternatives (Level 3)
As discussed above, the fair value of financial instruments are, in certain circumstances, measured using valuation techniques that incorporate assumptions that are not evidenced by prices from observable current market transactions in the same instrument and are not based on observable market data and, as such require the application of a degree of judgement. Changing one or more of the inputs to the valuation models to reasonably possible alternative assumptions would change the fair values significantly. The following table shows the sensitivity of these fair values to reasonably possible alternative assumptions.
Favourable and unfavourable changes are determined on the basis of changes in the value of the instrument as a result of varying the levels of the unobservable input as described in the table below. The potential effects do not take into effect any hedged positions.
30 June 2014
| Reflected in income statement | ||||||||||||||||||||||||||
| Fair value | Significant unobservable input | Favourable | Unfavourable | |||||||||||||||||||||||
Balance sheet note line item and product | £m | Assumptive value | Shift | changes | changes | |||||||||||||||||||||
| Range(1) | Weighted Average | £m | £m | |||||||||||||||||||||||
2. Derivative assets – Interest rate contracts: | 25 | Mean reversion parameter | 4% | 4% | 1% | 1 | (1 | ) | ||||||||||||||||||
– Bermudan swaptions | ||||||||||||||||||||||||||
3. Derivative assets – Equity and credit contracts: | 75 | HPI Forward growth rate | 0%-5% | 2.66% | 1% | (10 | ) | (10 | ) | |||||||||||||||||
– Reversionary property derivatives | HPI Spot rate | n/a | 578 | (2) | 10% | 8 | (8 | ) | ||||||||||||||||||
4. Derivative assets – Credit contracts: | 9 | Probability of default | 0%-4.9% | 0.3% | 20% | 2 | (2 | ) | ||||||||||||||||||
– Credit default swaps | ||||||||||||||||||||||||||
5. Derivative assets – Equity contracts: | 251 | HPI Forward growth rate | 0%-5% | 2% | 1% | 3 | (3 | ) | ||||||||||||||||||
– Options and forwards | HPI Spot rate | n/a | 565 | (2) | 10% | 2 | — | |||||||||||||||||||
6. FVTPL – Loans and advances to customers: | 52 | HPI Forward growth rate | 0%-5% | 2.82% | 1% | 2 | (2 | ) | ||||||||||||||||||
– Roll-up mortgage portfolio | ||||||||||||||||||||||||||
8. Derivative liabilities – Interest rate contracts: | (9 | ) | Mean reversion parameter | 4% | 4% | 1% | 1 | (1 | ) | |||||||||||||||||
– Bermudan swaptions | ||||||||||||||||||||||||||
9. Derivative liabilities – Equity contracts: | (58 | ) | HPI Forward growth rate | 0%-5% | 2% | 1% | 4 | (4 | ) | |||||||||||||||||
– Options and forwards | HPI Spot rate | n/a | 565 | (2) | 10% | 15 | (18 | ) | ||||||||||||||||||
| (1) | The range of actual assumption values used to calculate the weighted average disclosure. |
| (2) | Represents the HPI spot rate index level at 30 June 2014. |
31 December 2013
| Reflected in income statement | ||||||||||||||||||||||||||||
Balance sheet note line item and product | Fair value | Significant unobservable input | �� | Favourable | Unfavourable | |||||||||||||||||||||||
| £m | Assumptive value | Shift | changes | changes | ||||||||||||||||||||||||
| Range(1) | Weighted Average | £m | £m | |||||||||||||||||||||||||
3. Derivative assets – Equity and credit contracts: | 71 | HPI Forward growth rate | 0%-5% | 2.67% | 1% | 11 | (11 | ) | ||||||||||||||||||||
– Reversionary property derivatives | HPI Spot rate | n/a | 578 | (2) | 10% | 8 | (8 | ) | ||||||||||||||||||||
4. Derivative assets – Credit contracts: | 13 | Probability of default | 0.1%-1.2% | 0.7% | 20% | 3 | (3 | ) | ||||||||||||||||||||
– Credit default swaps | ||||||||||||||||||||||||||||
5. Derivative assets – Equity contracts: | 249 | HPI Forward growth rate | 0%-5% | 1.62% | 1% | 5 | (5 | ) | ||||||||||||||||||||
– Options and forwards | HPI Spot rate | n/a | 565 | (2) | 10% | 11 | (10 | ) | ||||||||||||||||||||
6. FVTPL – Loans and advances to customers: | 51 | HPI Forward growth rate | 0%-5% | 2.85% | 1% | 1 | (1 | ) | ||||||||||||||||||||
– Roll-up mortgage portfolio | ||||||||||||||||||||||||||||
7. FVTPL – Debt securities: | 58 | Credit spread | 0%-15% | 5% | 10% | 6 | (6 | ) | ||||||||||||||||||||
– Mortgage-backed securities | ||||||||||||||||||||||||||||
9. Derivative liabilities—Equity contracts: | (68 | ) | HPI Forward growth rate | 0%-5% | 1.62% | 1% | 2 | (2 | ) | |||||||||||||||||||
– Options and forwards | HPI Spot rate | n/a | 565 | (2) | 10% | 7 | (10 | ) | ||||||||||||||||||||
| (1) | The range of actual assumption values used to calculate the weighted average disclosure. |
| (2) | Represents the HPI spot rate index level at 31 December 2013. |
No sensitivities are presented for the FVTPL—debt securities in issue (instrument 10) and related exchange rate derivatives (instrument 1), as the terms of these instruments are fully matched. As a result, any changes in the valuation of the debt securities in issue would be exactly offset by an equal and opposite change in the valuation of the exchange rate derivatives.
| 64 | Abbey National Treasury Services plc 2014 Half Yearly Financial Report |
Financial Statements
Notes to the Financial Statementscontinued
25. CAPITAL MANAGEMENT AND RESOURCES
This note reflects the transactions and amounts reported on a basis consistent with the ANTS group’s regulatory filings at 30 June 2014, following the adoption of CRD IV with effect from 1 January 2014. The amounts presented for 2013 have been prepared on a consistent basis, to aid comparability.
Capital adequacy
The ANTS group manages its capital on a Basel III basis. During the six months ended 30 June 2014 and the year ended 31 December 2013, ANTS held capital over and above its regulatory requirements, and managed internal capital allocations and targets in accordance with its capital and risk management policies.
The Company, Santander UK plc, and Cater Allen Limited, which are the three PRA-regulated entities within the Santander UK group, are party to a capital support deed dated 14 December 2012 (the “Capital Support Deed”) with certain other non-regulated subsidiaries of Santander UK plc. The parties to the Capital Support Deed constitute a core UK group for the purposes of the large exposures provisions of CRD IV. Under article 4001(f) of the Capital Requirements Regulations, exposures of each of the three regulated entities to other members of the core UK group are exempt from large exposure limits that would otherwise apply. The purpose of the Capital Support Deed is to facilitate the prompt transfer of available capital resources from, or repayment of liabilities by, the non-regulated parties to any of the regulated parties in the event that one of the regulated parties has breached or is at risk of breaching its capital resources requirements or risk concentrations requirements. As a subsidiary of Santander UK plc, ANTS only has CET 1 capital.
Group capital
| 30 June 2014 £m | 31 December 2013 £m | |||||||
Core Equity Tier 1 (‘CET 1’) capital before regulatory adjustments | 3,146 | 3,059 | ||||||
Regulatory adjustments to CET 1 capital | (14 | ) | (14 | ) | ||||
|
|
|
| |||||
CET 1 capital | 3,132 | 3,045 | ||||||
|
|
|
| |||||
Total capital | 3,132 | 3,045 | ||||||
|
|
|
| |||||
During the first half of 2014, capital increased by £87m to £3,132m (2013: £3,045m). This increase was largely due to retained profits of £65m.
26. EVENTS AFTER THE BALANCE SHEET DATE
None.
| Abbey National Treasury Services plc 2014 Half Yearly Financial Report | 65 |
An investment in Abbey National Treasury Services plc (the ‘Company’) and its subsidiaries (‘us’, ‘we’ or ‘ANTS group’) involves a number of risks, the material ones of which are set out in the 2013 Annual Report on pages 184 to 201. As a consequence of the reciprocal guarantee given by the Company in respect of the liabilities of Santander UK plc, we are exposed to the same risk factors as Santander UK, of which we are a significant part. The principal risks described in these risk factors, a summary of which can be found on page 67, remain unchanged.
Abbey National Treasury Services plc registered office and principal office
2 Triton Square Regent’s Place London, NW1 3AN | Phone number: 0870-607-6000 |
Designated agent
The designated agent for service of process on the ANTS group in the United States is Abbey National Treasury Services plc (Connecticut branch), 400 Atlantic Street, Stamford, CT 06901.
Santander Shareholder Relations
2 Triton Square Regent’s Place London, NW1 3AN | Phone numbers: 0871-384-2000 +44 (0) 121-415-7188 (outside the UK) | Email: shareholders@santander.com |
| 66 | Abbey National Treasury Services plc 2014 Half Yearly Financial Report |
Shareholder Information
Abbey National Treasury Services plc (the ‘Company’) and its subsidiaries (together ‘ANTS’ or the ‘ANTS group’) may from time to time make written or oral forward-looking statements. The Company makes written forward-looking statements in this Half Yearly Financial Report and may also make forward-looking statements in its periodic reports to the SEC on Forms 20-F and 6-K, in its offering circulars and prospectuses, in press releases and other written materials and in oral statements made by its officers, directors or employees to third parties. Examples of such forward-looking statements include, but are not limited to:
| • | projections or expectations of revenues, costs, profit (or loss), earnings (or loss) per share, dividends, capital structure or other financial items or ratios; |
| • | statements of plans, objectives or goals of ANTS or its management, including those related to products or services; |
| • | statements of future economic performance; and |
| • | statements of assumptions underlying such statements. |
Words such as ‘believes’, ‘anticipates’, ‘expects’, ‘intends’, ‘aims’, ‘plans’, ‘targets’ and similar expressions are intended to identify forward-looking statements, but are not the exclusive means of identifying such statements.
By their very nature, forward-looking statements are not statements of historical or current facts; they cannot be objectively verified, are speculative and involve inherent risks and uncertainties, both general and specific, and risks exist that the predictions, forecasts, projections and other forward-looking statements will not be achieved. ANTS cautions readers that a number of important factors could cause actual results to differ materially from the plans, objectives, expectations, estimates and intentions expressed in such forward-looking statements made by ANTS or on ANTS’ behalf. Some of these factors, which could affect the business, financial condition and/or results of operations of the Santander UK group (of which ANTS is a significant part), are considered in detail in the Risk Management Report on pages 14 to 38 of this report and the Risk Factors section on pages 184 to 201 of the 2013 Annual Report. They include:
| • | the disruptions and volatility in the global financial markets; |
| • | the effects of UK economic conditions; |
| • | our exposure to UK political developments; |
| • | the extent to which regulatory capital and leverage requirements and any changes to these requirements may limit our operations; |
| • | the extent to which liquidity requirements and any changes to these requirements may limit Santander UK’s operations; |
| • | Santander UK’s exposure to UK Government debt; |
| • | the effects of the ongoing economic and sovereign debt tensions in the eurozone; |
| • | our exposure to risks faced by other financial institutions; |
| • | our ability to access liquidity and funding on acceptable financial terms ; |
| • | the effects of any movement in the external credit rating assigned to the Santander UK group, any Santander UK group member or any of their respective debt securities; |
| • | the effects of fluctuations in interest rates, exchange rates, equity prices and other market risks; |
| • | the extent to which we may be required to record negative fair value adjustments for our financial assets due to changes in market conditions; |
| • | the risk of failing to successfully implement and continue to improve our credit risk management systems; |
| • | the risks associated with our derivative transactions; |
| • | the extent which we may be exposed to operational losses (e.g. failed internal or external processes, people and systems); |
| • | the risk of failing to effectively improve or upgrade our information technology infrastructure and management information systems in a timely manner; |
| • | our exposure to unidentified or unanticipated risks despite its risk management policies, procedures and methods; |
| • | the effects of competition, or intensification of such competition, in the financial services markets in which Santander UK conducts business and the impact of customer perception of Santander UK’s customer service levels on existing or potential business; |
| • | the various risks facing us as we expand our range of products and services (e.g. risk of new products and services not being responsive to customer demands or successful, risk of changing customer needs); |
| • | Santander UK’s ability to assess the credit quality of borrowers and control the level of non-performing loans, loan prepayment and the enforceability of collateral, including real-estate securing such loans; |
| • | our ability to manage any future development effectively (e.g. efficiently managing the operations and employees of expanding businesses and maintaining or growing our existing customer base); |
| • | the ability of Santander UK to realise the anticipated benefits of its business combinations and the exposure, if any, of Santander UK to any unknown liabilities or goodwill impairments relating to acquired businesses; |
| • | the effects of the financial services laws, regulations, governmental oversight, administrative actions and policies and any changes thereto in each location or market in which Santander UK operates; |
| • | our exposure to any potential uncertainly and changes to the UK regulatory regime as a result of the reform and reorganisation of the UK financial regulatory authorities and the UK regulatory framework; |
| • | the effects of any new reforms to the UK mortgage lending and the personal loans market; |
| • | our exposure to any risk of loss form legal and regulatory proceedings; |
| • | the power of the FCA, the PRA or an overseas regulator to potentially intervene in response to e.g. attempts by customers to seek redress from financial service institutions, including Santander UK, in case of industry-wide issues; |
| • | the effects which the UK Banking Act 2009 (as amended), the UK Financial Services (Banking Reform) Act 2013 and similar European legislation may have on Santander UK’s business; |
| • | the extent to which members of the Santander UK group may be responsible for contributing to compensation schemes in the UK in respect of banks and other authorised financial services firms that are unable to meet their obligations to customers; |
| • | the risk of third parties using us as a conduit for illegal or improper activities without our knowledge; |
| • | the effects of taxation requirements and other assessments and any changes thereto in each location in which Santander UK operates; |
| • | the effects of any changes in the pension liabilities and obligations of Santander UK; |
| • | our ability to recruit, retain and develop appropriate senior management and skilled personnel; |
| • | the effects of any changes to the reputation of the Santander UK group, any Santander UK group member or any affiliate operating under the Santander UK brands; |
| • | the effects of any changes to accounting and reporting standards applicable to preparation of the Company or the Santander UK’s group’s financial statements; |
| • | the basis of the preparation of the Company’s and the Santander UK group’s financial statements and information available about the Santander UK group, including the extent to which assumptions and estimates made during such preparation are accurate; |
| • | the extent to which disclosure controls and procedures over financial reporting may prevent errors or acts of fraud; |
| • | the extent to which Santander UK relies on third parties for important infrastructure support, products and services; |
| • | the possibility of risk arising in the future in relation to transactions between the Company and its parent, subsidiaries or affiliates; and |
| • | our success at managing the risks to which it is exposed, including the items above. |
Undue reliance should not be placed on forward-looking statements when making decisions with respect to ANTS and/or its securities. Investors and others should take into account the inherent risks and uncertainties of forward-looking statements and should carefully consider the foregoing non-exhaustive list of important factors. Forward-looking statements speak only as of the date on which they are made and are based on the knowledge, information available and views taken on the date on which they are made; such knowledge, information and views may change at any time. ANTS does not undertake any obligation to update or revise any forward-looking statement, whether as a result of new information, future events or otherwise.
| Abbey National Treasury Services plc 2014 Half Yearly Financial Report | 67 |
Other Information for US Investors
Selected Statistical Information
| Six months ended 30 June 2014 % | Six months ended 30 June 2013 % | |||||||
Ratio of earnings to fixed charges:(1) | ||||||||
- Excluding interest on retail deposits | 105 | 119 | ||||||
- Including interest on retail deposits | 105 | 119 | ||||||
| (1) | For the purpose of calculating the ratios of earnings to fixed charges, earnings consist of profit before tax plus fixed charges. Fixed charges consist of interest payable, including the amortisation of discounts and premiums on debt securities in issue. Abbey National Treasury Services plc has no retail deposits. |
| 68 | Abbey National Treasury Services plc 2014 Half Yearly Financial Report |
SIGNATURES
Pursuant to the requirements of the Securities Exchange Act of 1934, the registrant has duly caused this report to be signed on its behalf by the undersigned, thereunto duly authorized.
| ABBEY NATIONAL TREASURY SERVICES PLC | ||||||
| Dated: 18 August 2014 | By | /s/ Jessica Petrie | ||||
| (Authorised Signatory) | ||||||
EXHIBIT INDEX
| Exhibit | ||
| 7.1 | Computation of Ratio of Earnings to Fixed Charges for the six months ended 30 June 2014. | |