Credit Suisse 31st Annual Basic Materials Conference September 12 – 13, 2018
Forward-looking Statements NOTE ON FORWARD-LOOKING STATEMENTS: This presentation and related discussions may contain forward looking statements that reflect our current views with respect to, among other things, future events and financial performance. You can identify these forward looking statements by the use of forward looking words such as “will,” “may,” “plan,” “estimate,” “project,” “believe,” “expect,” “intend,” “should,” “would,” “could,” “target,” “goal,” “continue to,” "optimistic" or the negative version of those words or other comparable words. Any forward looking statements contained in this presentation are based upon our historical performance and on our current plans, estimates and expectations in light of information currently available to us. We do not undertake any obligation to publicly update or review any forward-looking statement except as required by law, whether as a result of new information, future developments or otherwise. Our expectations and targets are not predictions of actual performance and historically our performance has deviated, often significantly, from our expectations and targets. Actual future events, circumstances, performance and trends could differ materially, positively or negatively, due to various factors, including: our history of net losses and the possibility that we may not achieve or maintain profitability in the future; the possibility that we may be unable to implement our business strategies, including our initiative to secure and maintain longer-term customer contracts, in an effective manner; the possibility that new tax legislation could adversely affect us or our stockholders; the fact that pricing for graphite electrodes has historically been cyclical and, in the future, the price of graphite electrodes will likely decline from recent record highs; the sensitivity of our business and operating results to economic conditions; our dependence on the global steel industry generally and the EAF steel industry in particular; the possibility that global graphite electrode overcapacity may adversely affect graphite electrode prices; the competitiveness of the graphite electrode industry; our dependence on the supply of petroleum needle coke; our dependence on supplies of raw materials (in addition to petroleum needle coke) and energy; the legal, economic, social and political risks associated with our substantial operations in multiple countries; the possibility that fluctuation of foreign currency exchange rates could materially harm our financial results; the possibility that our results of operations could deteriorate if our manufacturing operations were substantially disrupted for an extended period, including as a result of equipment failure, climate change, natural disasters, public health crises, political crises or other catastrophic events; the possibility that plant capacity expansions may be delayed or may not achieve the expected benefits; our dependence on third parties for certain construction, maintenance, engineering, transportation, warehousing and logistics services; the possibility that we are unable to recruit or retain key management and plant operating personnel or successfully negotiate with the representatives of our employees, including labor unions; the possibility that we may divest or acquire businesses, which could require significant management attention or disrupt our business; the sensitivity of goodwill on our balance sheet to changes in the market; the possibility that we are subject to information technology systems failures, cybersecurity attacks, network disruptions and breaches of data security; our dependence on protecting our intellectual property; the possibility that third parties may claim that our products or processes infringe their intellectual property rights; the possibility that our manufacturing operations are subject to hazards; changes in, or more stringent enforcement of, health, safety and environmental regulations applicable to our manufacturing operations and facilities; the possibility that significant changes in our jurisdictional earnings mix or in the tax laws of those jurisdictions could adversely affect our business; the possibility that our indebtedness could limit our financial and operating activities or that our cash flows may not be sufficient to service our indebtedness; the possibility that restrictive covenants in our financing agreements could restrict or limit our operations; the possibility that our cash flows could be insufficient to service our indebtedness; the fact that borrowings under certain of our existing financing agreements subjects us to interest rate risk; the possibility of a lowering or withdrawal of the ratings assigned to our debt; the possibility that disruptions in the capital and credit markets adversely affect our results of operations, cash flows and financial condition, or those of our customers and suppliers; the possibility that highly concentrated ownership of our common stock may prevent minority stockholders from influencing significant corporate decisions; the fact that certain of our stockholders have the right to engage or invest in the same or similar businesses as us; the possibility that we may not pay cash dividends on our common stock in the future; the fact that certain provisions of our Amended and Restated Certificate of Incorporation and our Amended and Restated By Laws could hinder, delay or prevent a change of control; the fact that the Court of Chancery of the State of Delaware will be the exclusive forum for substantially all disputes between us and our stockholders; our status as a “controlled company” within the meaning of the NYSE corporate governance standards, which allows us to qualify for exemptions from certain corporate governance requirements; and other risks described in the “Risk Factors” section of our quarterly reports on Form 10-Q and other SEC filings. 1
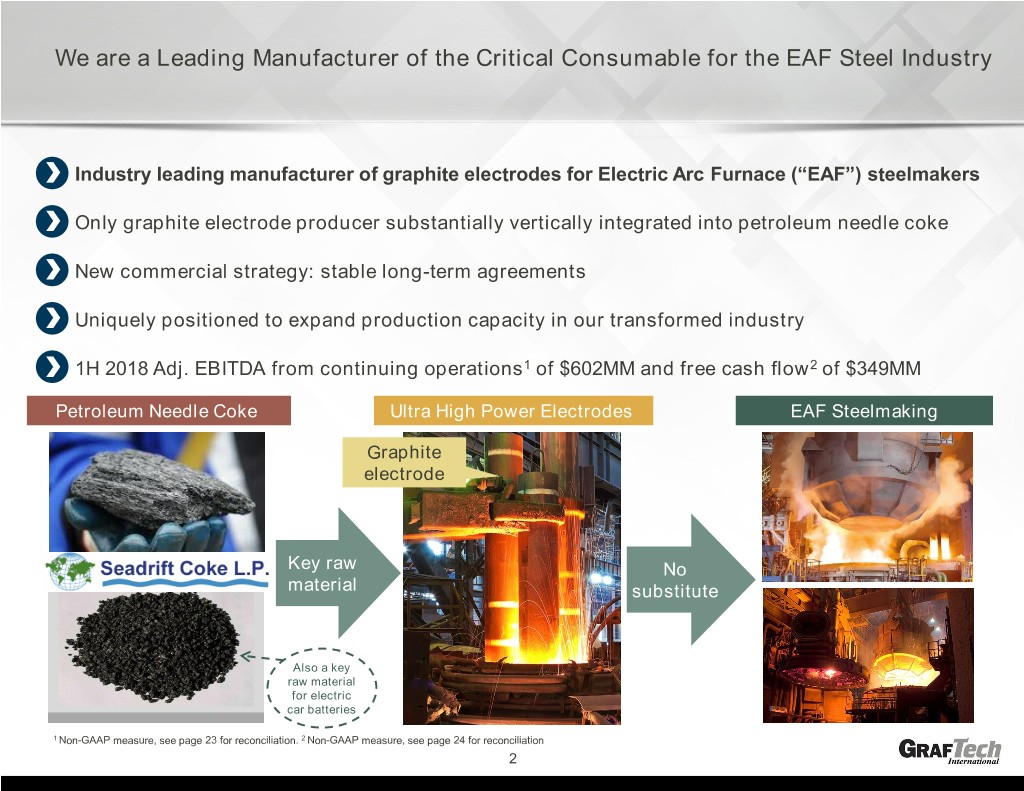
We are a Leading Manufacturer of the Critical Consumable for the EAF Steel Industry Industry leading manufacturer of graphite electrodes for Electric Arc Furnace (“EAF”) steelmakers Only graphite electrode producer substantially vertically integrated into petroleum needle coke New commercial strategy: stable long-term agreements Uniquely positioned to expand production capacity in our transformed industry 1H 2018 Adj. EBITDA from continuing operations1 of $602MM and free cash flow2 of $349MM Petroleum Needle Coke Ultra High Power Electrodes EAF Steelmaking Graphite electrode Key raw No material substitute Also a key raw material for electric car batteries 1 Non-GAAP measure, see page 23 for reconciliation. 2 Non-GAAP measure, see page 24 for reconciliation 2
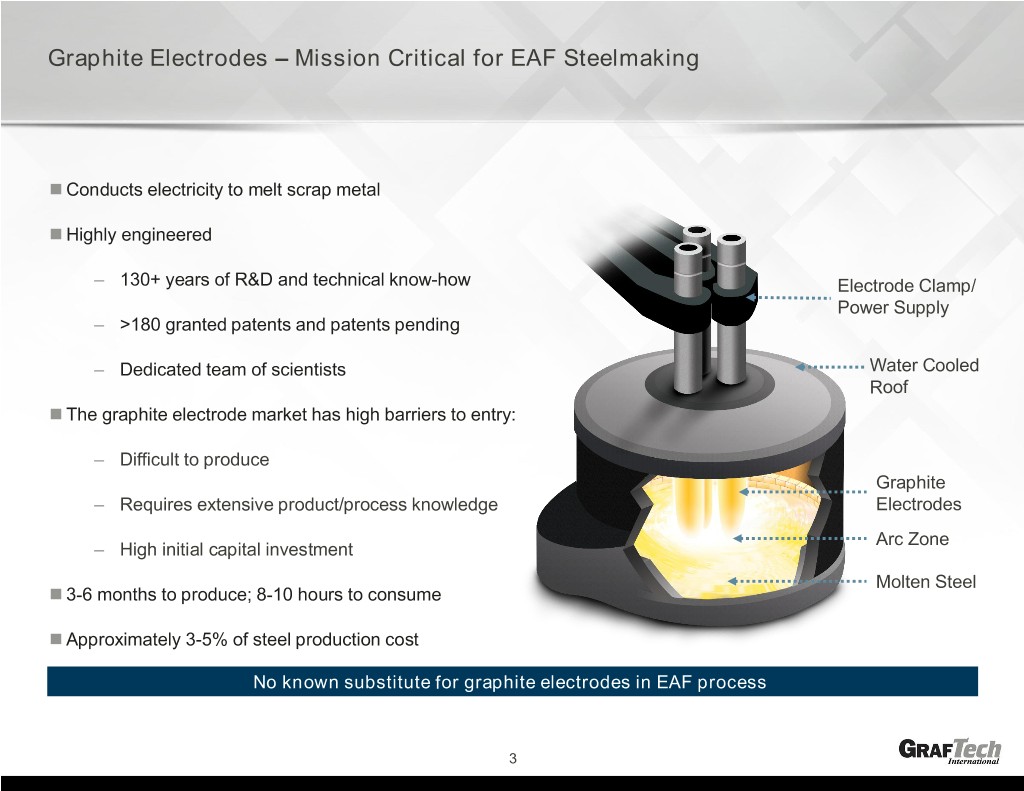
Graphite Electrodes – Mission Critical for EAF Steelmaking Conducts electricity to melt scrap metal Highly engineered ‒ 130+ years of R&D and technical know-how Electrode Clamp/ Power Supply ‒ >180 granted patents and patents pending ‒ Dedicated team of scientists Water Cooled Roof The graphite electrode market has high barriers to entry: ‒ Difficult to produce Graphite ‒ Requires extensive product/process knowledge Electrodes Arc Zone ‒ High initial capital investment Molten Steel 3-6 months to produce; 8-10 hours to consume Approximately 3-5% of steel production cost No known substitute for graphite electrodes in EAF process 3
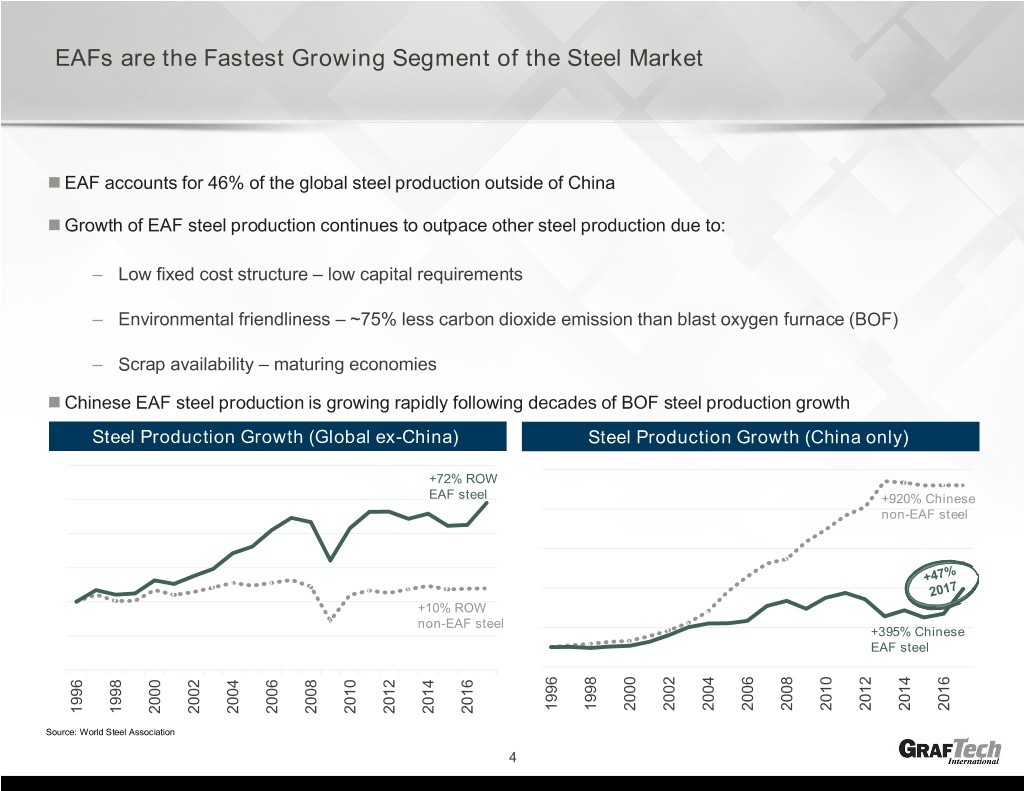
EAFs are the Fastest Growing Segment of the Steel Market EAF accounts for 46% of the global steel production outside of China Growth of EAF steel production continues to outpace other steel production due to: ‒ Low fixed cost structure – low capital requirements ‒ Environmental friendliness – ~75% less carbon dioxide emission than blast oxygen furnace (BOF) ‒ Scrap availability – maturing economies Chinese EAF steel production is growing rapidly following decades of BOF steel production growth Steel Production Growth (Global ex-China) Steel Production Growth (China only) +72% ROW EAF steel +920% Chinese non-EAF steel +10% ROW non-EAF steel +395% Chinese EAF steel 2002 1996 1998 2000 2004 2006 2008 2010 2012 2014 2016 2016 1996 1998 2000 2002 2004 2006 2008 2010 2012 2014 Source: World Steel Association 4

Global Shift to EAF Steel Production 67% 47% 42% 40% 9% 2017 EAF % of a asEAF Total ProductionSteel 2017 2017 % of World Steel Production North America All other Asia (ex-China) European Union China Estimated EAF steel production growth implies approximately 60,000-70,000 MT additional graphite electrodes per year* Source: World Steel Association, *Assumes approximately 3% per annum GDP and steel production growth, at least 80% of new steel production is EAF, and EAF steel production consumes 1.7 kilograms of graphite electrode per metric tonne of EAF steel production 5
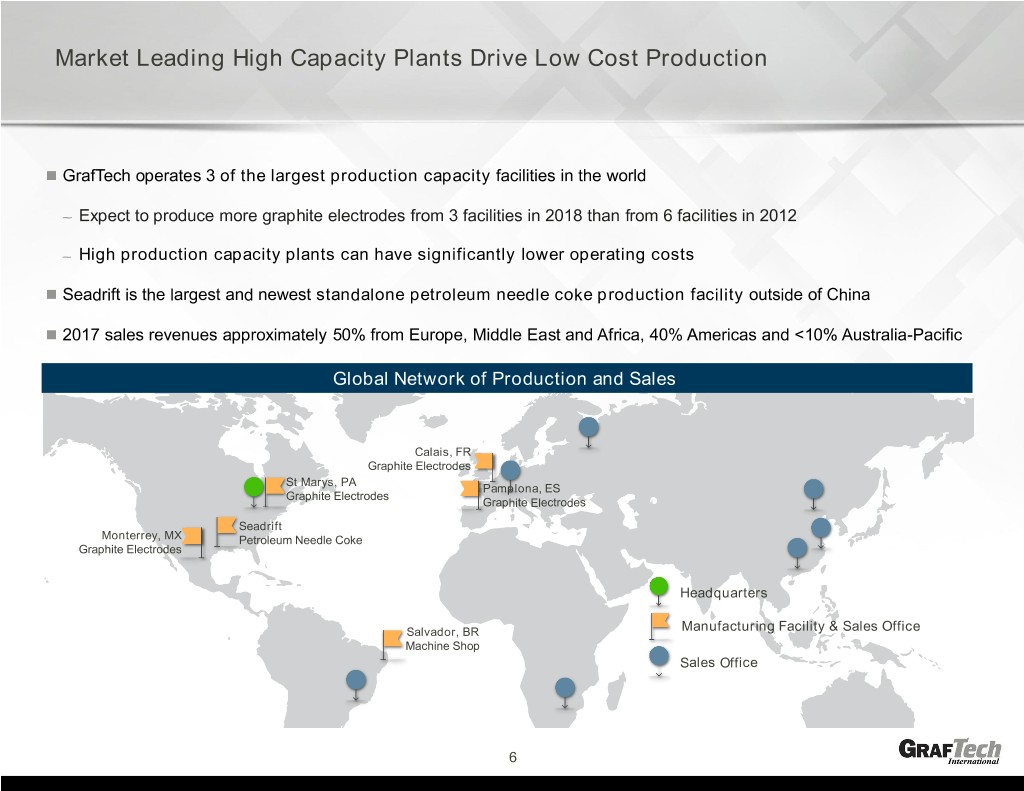
Market Leading High Capacity Plants Drive Low Cost Production GrafTech operates 3 of the largest production capacity facilities in the world – Expect to produce more graphite electrodes from 3 facilities in 2018 than from 6 facilities in 2012 – High production capacity plants can have significantly lower operating costs Seadrift is the largest and newest standalone petroleum needle coke production facility outside of China 2017 sales revenues approximately 50% from Europe, Middle East and Africa, 40% Americas and <10% Australia-Pacific Global Network of Production and Sales Calais, FR Graphite Electrodes St Marys, PA Pamplona, ES Graphite Electrodes Graphite Electrodes Seadrift Monterrey, MX Petroleum Needle Coke Graphite Electrodes Headquarters Salvador, BR Manufacturing Facility & Sales Office Machine Shop Sales Office 6
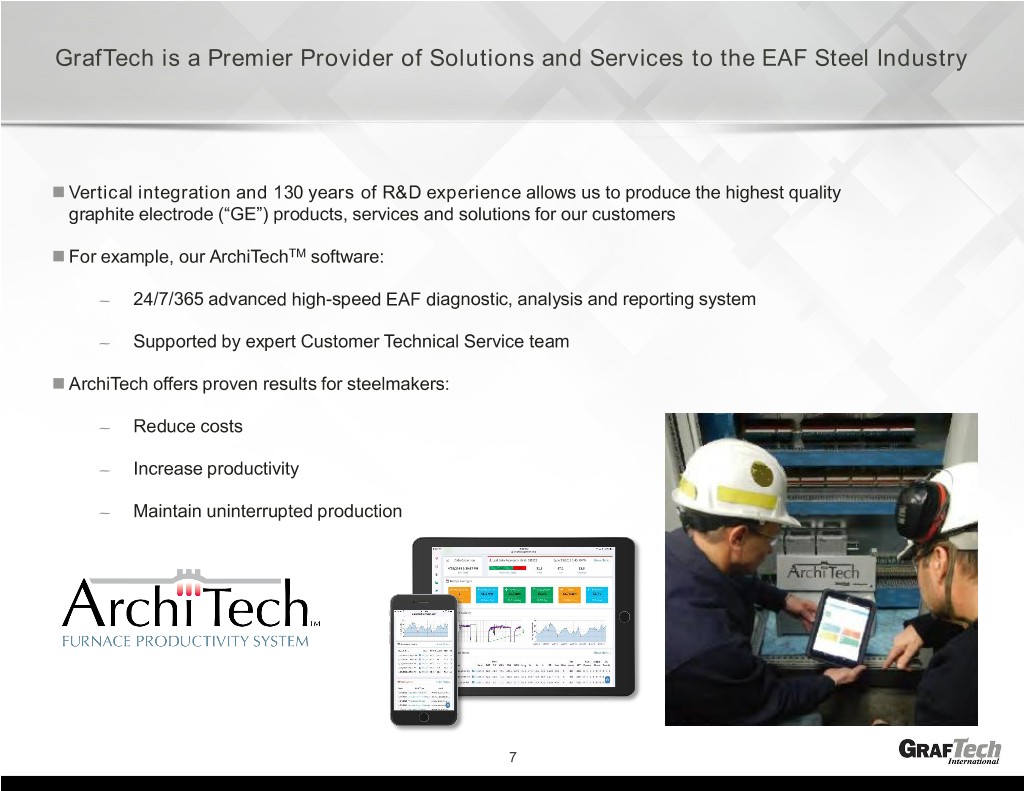
GrafTech is a Premier Provider of Solutions and Services to the EAF Steel Industry Vertical integration and 130 years of R&D experience allows us to produce the highest quality graphite electrode (“GE”) products, services and solutions for our customers For example, our ArchiTechTM software: – 24/7/365 advanced high-speed EAF diagnostic, analysis and reporting system – Supported by expert Customer Technical Service team ArchiTech offers proven results for steelmakers: – Reduce costs – Increase productivity – Maintain uninterrupted production $16 / MT 7
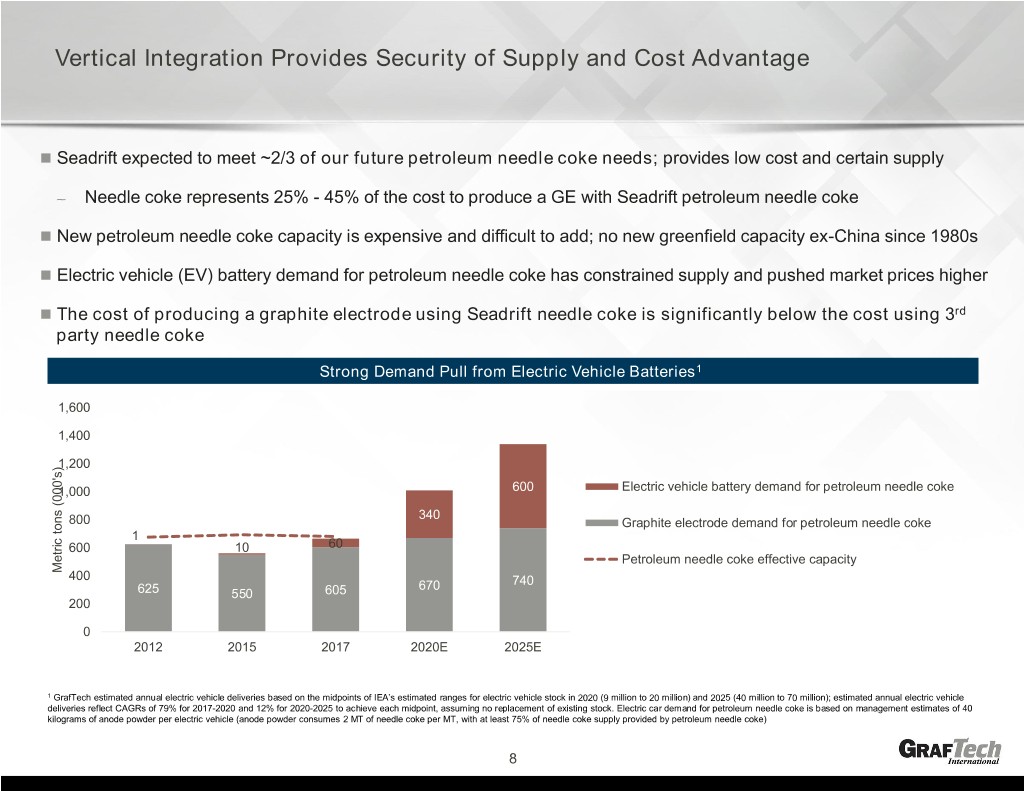
Vertical Integration Provides Security of Supply and Cost Advantage Seadrift expected to meet ~2/3 of our future petroleum needle coke needs; provides low cost and certain supply – Needle coke represents 25% - 45% of the cost to produce a GE with Seadrift petroleum needle coke New petroleum needle coke capacity is expensive and difficult to add; no new greenfield capacity ex-China since 1980s Electric vehicle (EV) battery demand for petroleum needle coke has constrained supply and pushed market prices higher The cost of producing a graphite electrode using Seadrift needle coke is significantly below the cost using 3rd party needle coke Strong Demand Pull from Electric Vehicle Batteries1 1,600 1,400 1,200 1,000 600 Electric vehicle battery demand for petroleum needle coke 340 800 Graphite electrode demand for petroleum needle coke 1 600 10 60 Petroleum needle coke effective capacity Metric Metric tons (000's) 400 670 740 625 550 605 200 0 2012 2015 2017 2020E 2025E 1 GrafTech estimated annual electric vehicle deliveries based on the midpoints of IEA’s estimated ranges for electric vehicle stock in 2020 (9 million to 20 million) and 2025 (40 million to 70 million); estimated annual electric vehicle deliveries reflect CAGRs of 79% for 2017-2020 and 12% for 2020-2025 to achieve each midpoint, assuming no replacement of existing stock. Electric car demand for petroleum needle coke is based on management estimates of 40 kilograms of anode powder per electric vehicle (anode powder consumes 2 MT of needle coke per MT, with at least 75% of needle coke supply provided by petroleum needle coke) 8
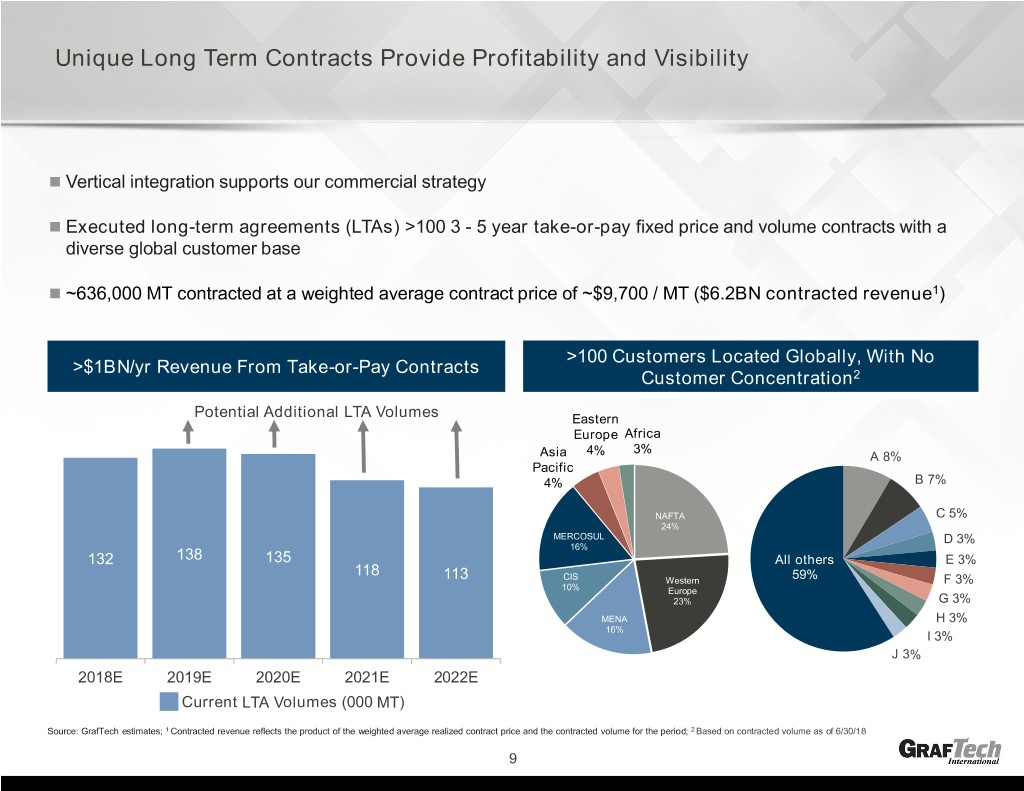
Unique Long Term Contracts Provide Profitability and Visibility Vertical integration supports our commercial strategy Executed long-term agreements (LTAs) >100 3 - 5 year take-or-pay fixed price and volume contracts with a diverse global customer base ~636,000 MT contracted at a weighted average contract price of ~$9,700 / MT ($6.2BN contracted revenue1) >100 Customers Located Globally, With No >$1BN/yr Revenue From Take-or-Pay Contracts Customer Concentration2 Potential Additional LTA Volumes Eastern Europe Africa 4% 3% Asia A 8% Pacific 4% B 7% NAFTA C 5% 24% MERCOSUL D 3% 16% 132 138 135 All others E 3% 118 113 CIS Western 59% F 3% 10% Europe 23% G 3% MENA H 3% 16% I 3% J 3% 2018E 2019E 2020E 2021E 2022E Current LTA Volumes (000 MT) Source: GrafTech estimates; 1 Contracted revenue reflects the product of the weighted average realized contract price and the contracted volume for the period; 2 Based on contracted volume as of 6/30/18 9
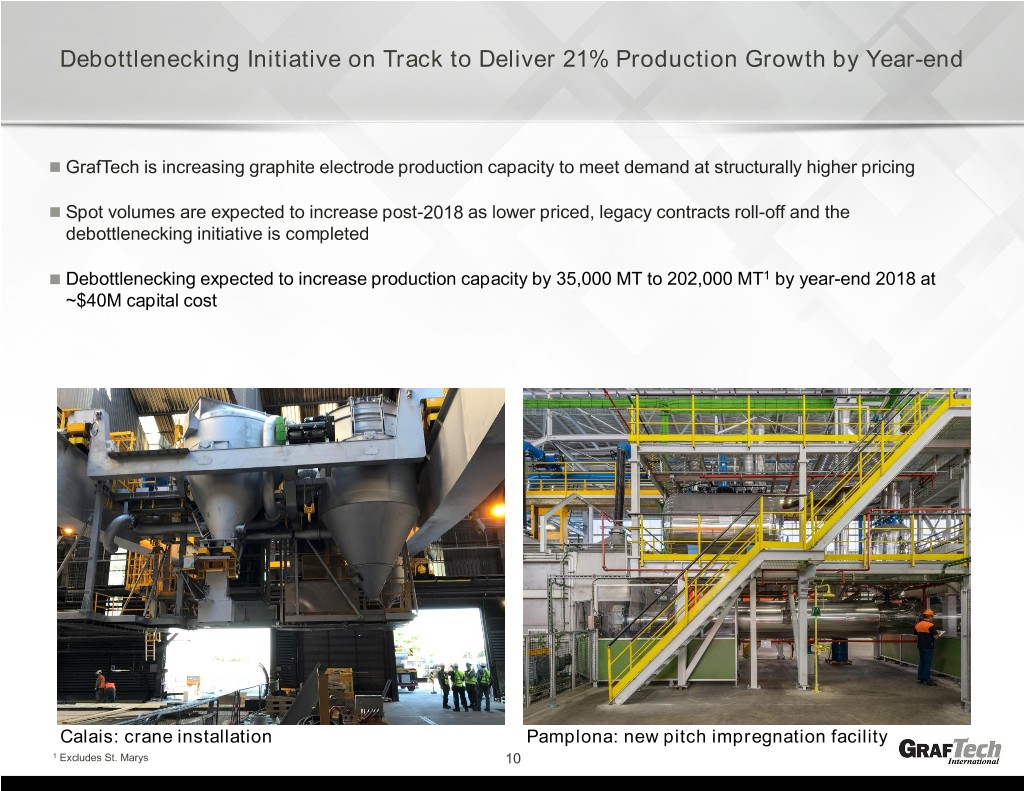
Debottlenecking Initiative on Track to Deliver 21% Production Growth by Year-end GrafTech is increasing graphite electrode production capacity to meet demand at structurally higher pricing Spot volumes are expected to increase post-2018 as lower priced, legacy contracts roll-off and the debottlenecking initiative is completed Debottlenecking expected to increase production capacity by 35,000 MT to 202,000 MT1 by year-end 2018 at ~$40M capital cost Calais: crane installation Pamplona: new pitch impregnation facility 1 Excludes St. Marys 10

Delivering Value Through Strategic Execution Weighted Avg. Realized Price Sales Volumes (000 MT)1 Net Sales ($MM) ($/MT)2 88 908 85 $10,027 $2,362 221 1H 17 1H 18 1H 17 1H 18 1H 17 1H 18 Earnings Per Share3 Adj. EBITDA Cont’g Ops ($MM)4 Free Cash Flow ($MM)5 602 349 $1.41 16 ($0.14) (10) 1H 17 1H 18 1H 17 1H 18 1H 17 1H 18 1 Total volume of graphite electrode sales for which revenue was recognized during the period 2 Total revenues from sales of graphite electrodes divided by graphite electrode sales volume during the period 3 Earnings per share represents diluted earnings per share after giving effect to the April 12, 2018 stock split; 4 Non-GAAP measure, see page 23 for reconciliation 5 Non-GAAP measure, see page 24 for reconciliation 11
Committed to a Responsible and Shareholder Friendly Financial Policy Strong liquidity and cash flows 1H 2018 Adjusted EBITDA from continuing operations1 of $602MM and free cash flow2 of $349MM Undrawn revolving credit facility of $250MM Manage the business in a responsible manner Continued focus on operational improvement with appropriate levels of capital investment Deploy capital for shareholder returns in a disciplined manner Board approved quarterly dividend of $0.085 per share Will continue to evaluate special cash dividends and share repurchase options3 Maintain prudent capital structure to ensure operational and strategic flexibility Current leverage4 of approximately 1.8x; comfortably below maximum targeted range of 2.0x - 2.5x June debt refinancing reduced interest expense; no change to debt levels Assess growth and investment opportunities and capital returns consistent with BB rated company 1 Non-GAAP measure, see page 23 for reconciliation 2 Non-GAAP measure, see page 24 for reconciliation 3 Any dividends or share repurchases are subject to the discretion and approval by the Board of Directors and may vary in amounts from prior periods due to circumstances considered by the Board of Directors at the time of such approval. 4 Leverage is defined as total debt divided by Adjusted EBITDA from continuing operations; Current leverage calculated using annualized H1 2018 Adjusted EBITDA from continuing operations of $602MM and total debt of $2,104MM. 12
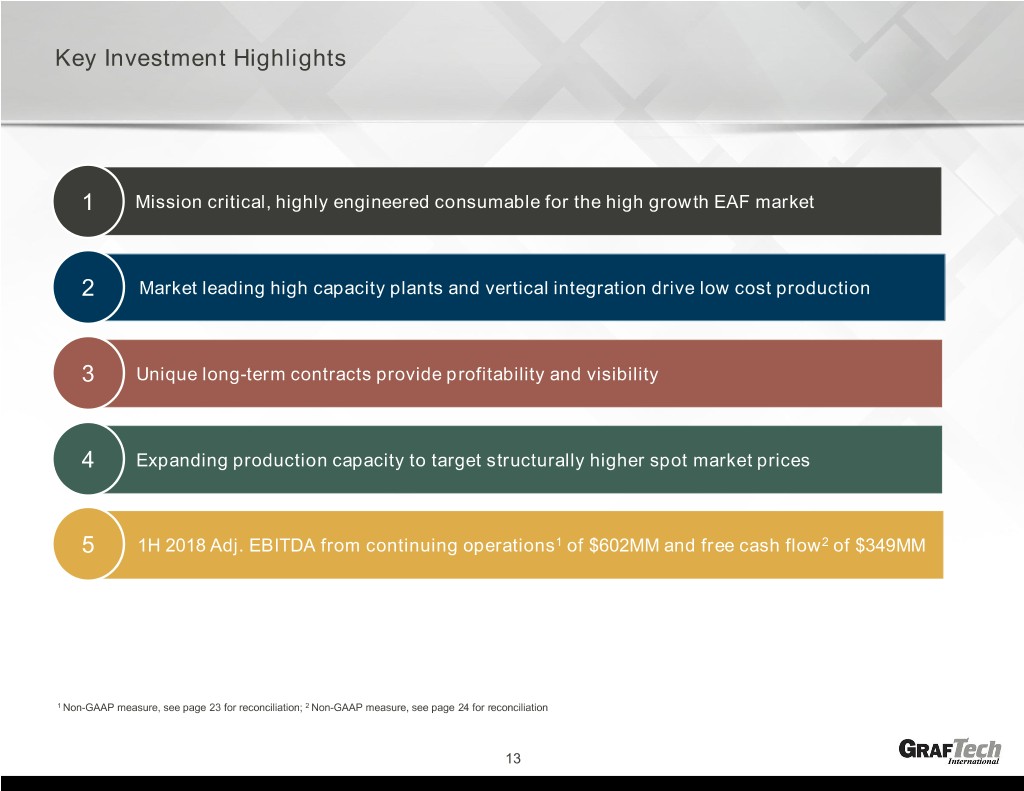
Key Investment Highlights 1 Mission critical, highly engineered consumable for the high growth EAF market 2 Market leading high capacity plants and vertical integration drive low cost production 3 Unique long-term contracts provide profitability and visibility 4 Expanding production capacity to target structurally higher spot market prices 5 1H 2018 Adj. EBITDA from continuing operations1 of $602MM and free cash flow2 of $349MM 1 Non-GAAP measure, see page 23 for reconciliation; 2 Non-GAAP measure, see page 24 for reconciliation 13
Appendix
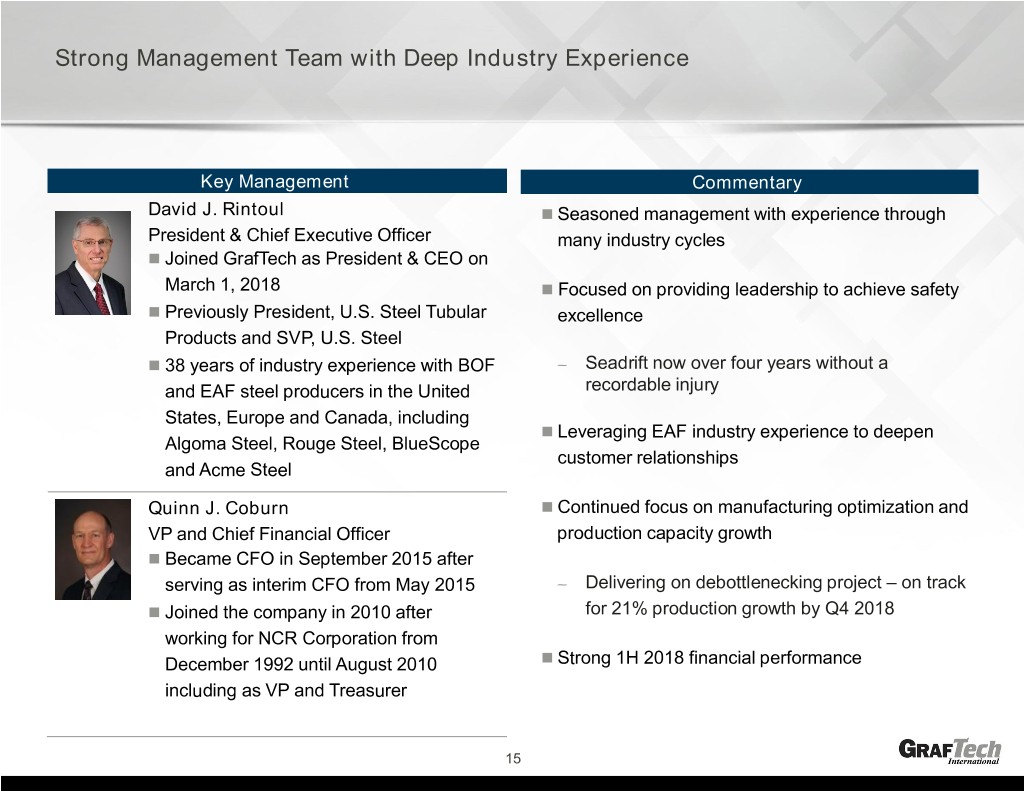
Strong Management Team with Deep Industry Experience Key Management Commentary David J. Rintoul Seasoned management with experience through President & Chief Executive Officer many industry cycles Joined GrafTech as President & CEO on March 1, 2018 Focused on providing leadership to achieve safety Previously President, U.S. Steel Tubular excellence Products and SVP, U.S. Steel 38 years of industry experience with BOF – Seadrift now over four years without a and EAF steel producers in the United recordable injury States, Europe and Canada, including Leveraging EAF industry experience to deepen Algoma Steel, Rouge Steel, BlueScope customer relationships and Acme Steel Quinn J. Coburn Continued focus on manufacturing optimization and VP and Chief Financial Officer production capacity growth Became CFO in September 2015 after serving as interim CFO from May 2015 – Delivering on debottlenecking project – on track Joined the company in 2010 after for 21% production growth by Q4 2018 working for NCR Corporation from December 1992 until August 2010 Strong 1H 2018 financial performance including as VP and Treasurer 15
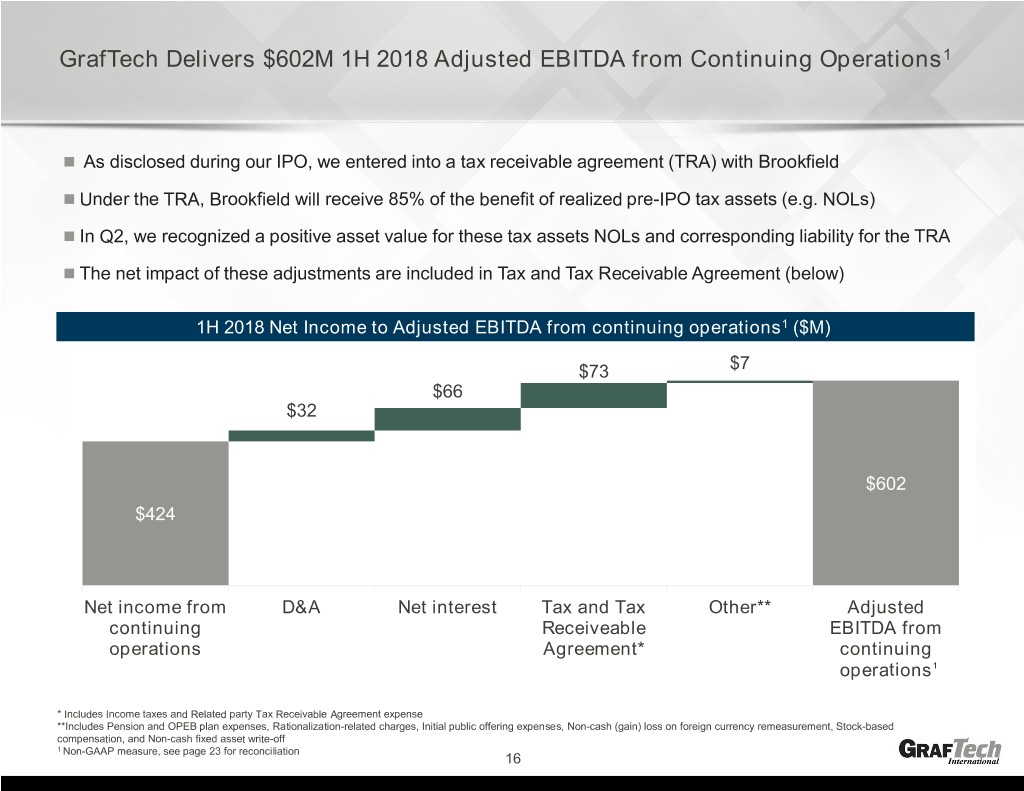
GrafTech Delivers $602M 1H 2018 Adjusted EBITDA from Continuing Operations1 As disclosed during our IPO, we entered into a tax receivable agreement (TRA) with Brookfield Under the TRA, Brookfield will receive 85% of the benefit of realized pre-IPO tax assets (e.g. NOLs) In Q2, we recognized a positive asset value for these tax assets NOLs and corresponding liability for the TRA The net impact of these adjustments are included in Tax and Tax Receivable Agreement (below) 1H 2018 Net Income to Adjusted EBITDA from continuing operations1 ($M) $73 $7 $66 $32 $602 $424 Net income from D&A Net interest Tax and Tax Other** Adjusted continuing Receiveable EBITDA from operations Agreement* continuing operations1 * Includes Income taxes and Related party Tax Receivable Agreement expense **Includes Pension and OPEB plan expenses, Rationalization-related charges, Initial public offering expenses, Non-cash (gain) loss on foreign currency remeasurement, Stock-based compensation, and Non-cash fixed asset write-off 1 Non-GAAP measure, see page 23 for reconciliation 16
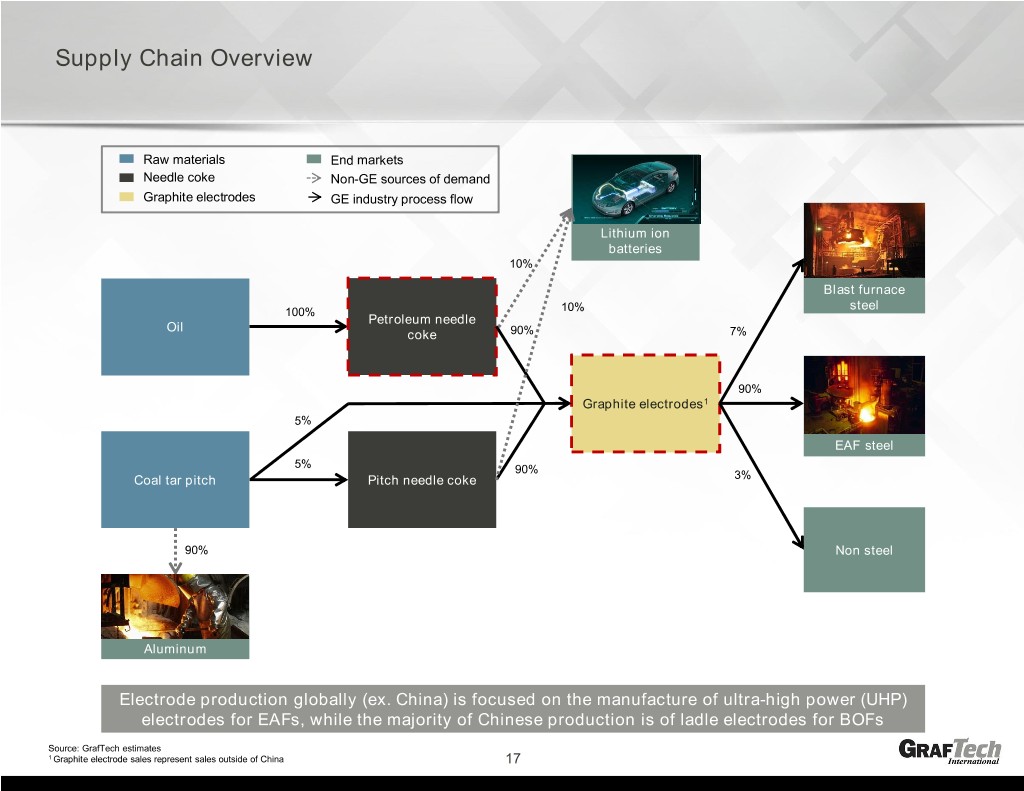
Supply Chain Overview Raw materials End markets Needle coke Non-GE sources of demand Graphite electrodes GE industry process flow Lithium ion batteries 10% Blast furnace steel 100% 10% Petroleum needle Oil coke 90% 7% 90% Graphite electrodes1 5% EAF steel 5% 90% Coal tar pitch Pitch needle coke 3% 90% Non steel Aluminum Electrode production globally (ex. China) is focused on the manufacture of ultra-high power (UHP) electrodes for EAFs, while the majority of Chinese production is of ladle electrodes for BOFs Source: GrafTech estimates 1 Graphite electrode sales represent sales outside of China 17
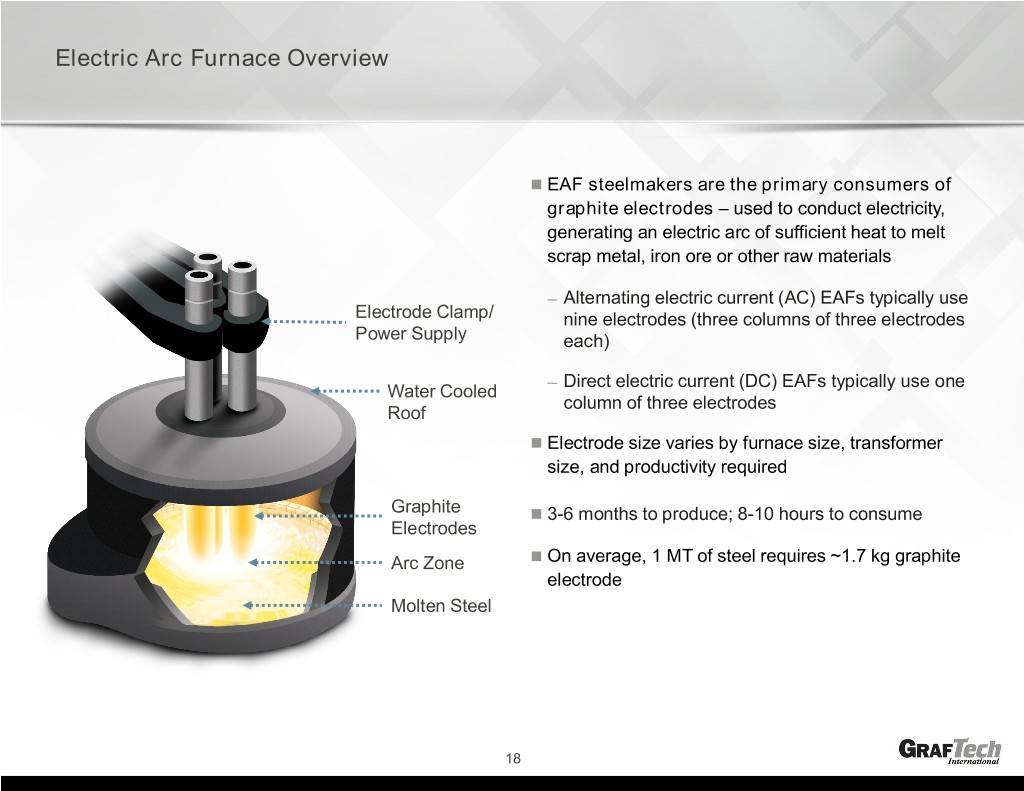
Electric Arc Furnace Overview EAF steelmakers are the primary consumers of graphite electrodes – used to conduct electricity, generating an electric arc of sufficient heat to melt scrap metal, iron ore or other raw materials – Alternating electric current (AC) EAFs typically use Electrode Clamp/ nine electrodes (three columns of three electrodes Power Supply each) Direct electric current (DC) EAFs typically use one Water Cooled – column of three electrodes Roof Electrode size varies by furnace size, transformer size, and productivity required Graphite 3-6 months to produce; 8-10 hours to consume Electrodes Arc Zone On average, 1 MT of steel requires ~1.7 kg graphite electrode Molten Steel 18
Graphite Electrode Manufacturing Process 19

Market Leading High Capacity Plants Drive Low Cost Production Approximately 200,000 MT (20%) of global production capacity was closed or repurposed since the beginning of 2014 – With the exception of our warm idled St. Marys plant, which benefits from logistical and energy cost advantages, capacity reductions have been permanent Management Estimates of 2017 Graphite Electrode Industry Production Capacity and Closures (ex China) (MT)1 GrafTech Competitor Plant closure GrafTech idled St. Marys AVG: 72,100 MT 18K Closed; partial Closed; in Repurposed for 80,000 repurposed remediation and remediation Closed; land equipment sold specialty graphite 70,000 products AVG: 53,750 MT and equipment Closed; sold in 60,000 sold two separate 22K 50,000 pieces repurposed AVG: 32,250 MT Closed 40,000 AVG: 19,615 MT 30,000 20,000 10,000 0 GIL GIL GIL GIL SGL SGL SGL SDK SDK SEC SDK SDK SDK NCK HEG UGC – – – – Tokai Tokai Tokai Tokai – – – – – – – – – – – – Energo – – – – Superior – GrafTech GrafTech GrafTech GrafTech GrafTech GrafTech – – – – – – – Narni Narni Hofu Hofu Kyoto Kyoto Nashik Steeg Steeg Shiga Shiga Banting Banting Omachi Lachute Lachute Numberg Numberg Toyama Toyama Durgapur Durgapur Bangalore Bangalore A Coruña ACoruña Ridgeville Ridgeville Griesheim Griesheim Electrocarbon Electrocarbon SA Calais Calais Mandideep Mandideep Zaporozhye Zaporozhye – Salvador Salvador Meyerton Meyerton St. Marys St. Marys Grevenbroich Grevenbroich Pamplona Pamplona Monterrey Monterrey Russellville Russellville st nd rd Ozark/Hickman th 1 Quartile 2 Quartile Novocherkassk 3 Quartile 4 Quartile Source: GrafTech estimates Slantina 1 GrafTech estimates reflect debottlenecking initiatives to be completed by Q4 2018 20
Disclosures
Non-GAAP financial measures Investors are encouraged to read the information contained in this presentation in conjunction with the following information, the Forward-looking statements information on slide 1 and the factors described under the “Risk Factors” section of the Company’s quarterly reports on Form 10-Q and disclosure in the Company’s other recent SEC filings. Adjusted EBITDA from continuing operations is the primary metric used by our management and our board of directors to establish budgets and operational goals for managing our business and evaluating our performance. We define Adjusted EBITDA from continuing operations as EBITDA from continuing operations plus any pension and other post-employment benefit plan expenses, impairments, rationalization related charges, costs related to our initial public offering, non-cash gains or losses from foreign currency remeasurement of non-operating liabilities in our foreign subsidiaries where the functional currency is the U.S. dollar and non-cash fixed asset write offs. We define EBITDA from continuing operations as net income or loss plus interest expense, minus interest income, plus income taxes, discontinued operations and depreciation and amortization from continuing operations. We believe Adjusted EBITDA from continuing operations is useful to present to investors because we believe that it facilitates evaluation of our period to period operating performance by eliminating items that are not operational in nature, allowing comparison of our recurring core business operating results over multiple periods unaffected by differences in capital structure, capital investment cycles and fixed asset base. In addition, we believe Adjusted EBITDA from continuing operations and similar measures are widely used by investors, securities analysts, ratings agencies, and other parties in evaluating companies in our industry as a measure of financial performance and debt service capabilities. Free cash flow is a metric used by our management and our board of directors to analyze cash flows generated from operations. We define free cash flow as net cash provided by operating activities less capital expenditures. We believe free cash flow is useful to present to investors because we believe that it facilitates comparison of the Company’s performance with its competitors. Although Adjusted EBITDA from continuing operations, free cash flow and similar measures are frequently used by other companies, our calculation of these measures is not necessarily comparable to such other similarly titled measures of other companies. The presentations of Adjusted EBITDA from continuing operations and non-GAAP free cash flow are not meant to be considered in isolation or as a substitute for analysis of our results as reported under GAAP. When evaluating our performance, you should consider these measures alongside other measures of financial performance and liquidity, including our net income (loss) and cash flow from operating activities, respectively, and other GAAP measures. 22
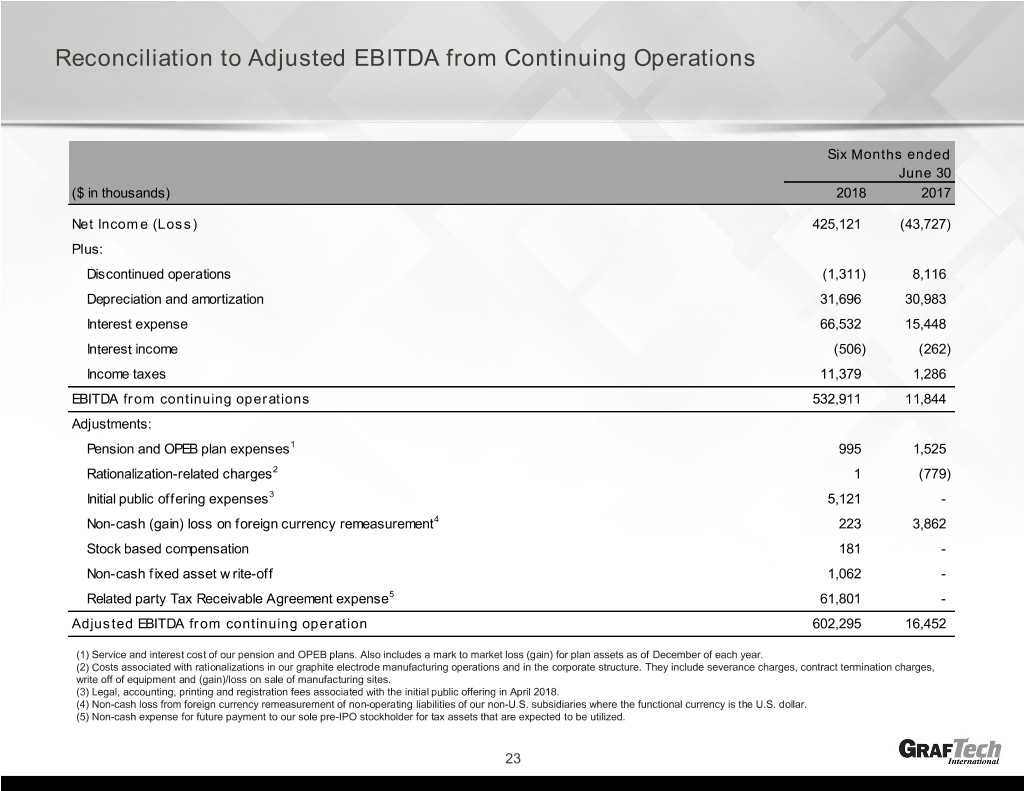
Reconciliation to Adjusted EBITDA from Continuing Operations Six Months ended June 30 ($ in thousands) 2018 2017 Net Income (Loss) 425,121 (43,727) Plus: Discontinued operations (1,311) 8,116 Depreciation and amortization 31,696 30,983 Interest expense 66,532 15,448 Interest income (506) (262) Income taxes 11,379 1,286 EBITDA from continuing operations 532,911 11,844 Adjustments: Pension and OPEB plan expenses1 995 1,525 Rationalization-related charges2 1 (779) Initial public offering expenses3 5,121 - Non-cash (gain) loss on foreign currency remeasurement4 223 3,862 Stock based compensation 181 - Non-cash fixed asset w rite-off 1,062 - Related party Tax Receivable Agreement expense5 61,801 - Adjusted EBITDA from continuing operation 602,295 16,452 (1) Service and interest cost of our pension and OPEB plans. Also includes a mark to market loss (gain) for plan assets as of December of each year. (2) Costs associated with rationalizations in our graphite electrode manufacturing operations and in the corporate structure. They include severance charges, contract termination charges, write off of equipment and (gain)/loss on sale of manufacturing sites. (3) Legal, accounting, printing and registration fees associated with the initial public offering in April 2018. (4) Non-cash loss from foreign currency remeasurement of non-operating liabilities of our non-U.S. subsidiaries where the functional currency is the U.S. dollar. (5) Non-cash expense for future payment to our sole pre-IPO stockholder for tax assets that are expected to be utilized. 23
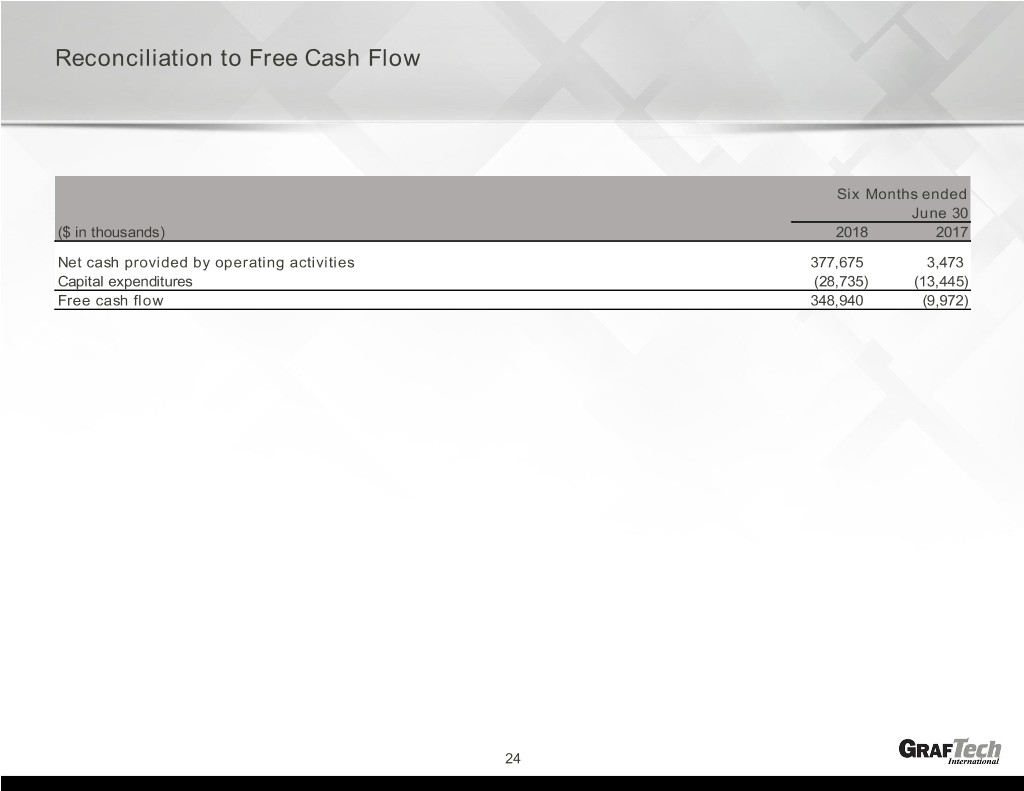
Reconciliation to Free Cash Flow Six Months ended June 30 ($ in thousands) 2018 2017 Net cash provided by operating activities 377,675 3,473 Capital expenditures (28,735) (13,445) Free cash flow 348,940 (9,972) 24


