UNITED STATES
SECURITIES AND EXCHANGE COMMISSION
Washington, D.C. 20549
FORM N-CSR
CERTIFIED SHAREHOLDER REPORT OF REGISTERED
MANAGEMENT INVESTMENT COMPANIES
Investment Company Act File Number: 811-07225
T. Rowe Price U.S. Equity Research Fund, Inc.
(Exact name of registrant as specified in charter)
100 East Pratt Street, Baltimore, MD 21202
(Address of principal executive offices)
David Oestreicher
100 East Pratt Street, Baltimore, MD 21202
(Name and address of agent for service)
Registrant’s telephone number, including area code: (410) 345-2000
Date of fiscal year end: December 31
Date of reporting period: December 31, 2024
Item 1. Reports to Shareholders
(a) Report pursuant to Rule 30e-1
Annual Shareholder Report
December 31, 2024
U.S. Equity Research Fund
This annual shareholder report contains important information about U.S. Equity Research Fund (the "fund") for the period of January 1, 2024 to December 31, 2024. You can find the fund’s prospectus, financial information on Form N‑CSR (which includes required tax information for dividends), holdings, proxy voting information, and other information atwww.troweprice.com/prospectus. You can also request this information without charge by contacting T. Rowe Price at 1‑800‑638‑5660 or info@troweprice.com or contacting your intermediary.
What were the fund costs for the last year? (based on a hypothetical $10,000 investment)
| | Costs of a $10,000 investment | Costs paid as a percentage of a $10,000 investment |
|---|
| U.S. Equity Research Fund - Investor Class | $51 | 0.45% |
|---|
What drove fund performance during the past 12 months?
U.S. stocks advanced during the period, buoyed by generally favorable corporate earnings and continuing interest in companies expected to benefit from artificial intelligence (AI) developments.
Versus the S&P 500 Index, the leading contributor to the portfolio’s relative performance was stock selection in information technology. An overweight position in NVIDIA was beneficial. Shares rose as investors rewarded the company’s product suite for its potential to facilitate growth in the popular AI space during much of the period. Within communication services, security choices were also beneficial, led by an overweight position in T-Mobile US. Shares rose on investor optimism following the news that T-Mobile will acquire most of U.S. Cellular’s wireless operations and after the company reported strong second- and third-quarter results.
Conversely, the leading detractor from relative performance was the energy sector, due to stock selection. Not owning ONEOK hurt relative performance as shares rose on investor expectations that the company could benefit from an increase in energy consumption by data centers. Later in the period, shares were boosted by investor optimism over several recent strategic initiatives. The portfolio’s overweight allocation to health care also weighed on relative returns as the sector underperformed the index during the year.
The U.S. Equity Research Fund invests primarily in U.S. stocks and implements an analyst-driven approach to security selection. Analysts are allocated capital in proportion to the weight of the stocks they follow within the S&P 500 Index, and they have decision-making authority for their respective portion of the portfolio.
How has the fund performed?
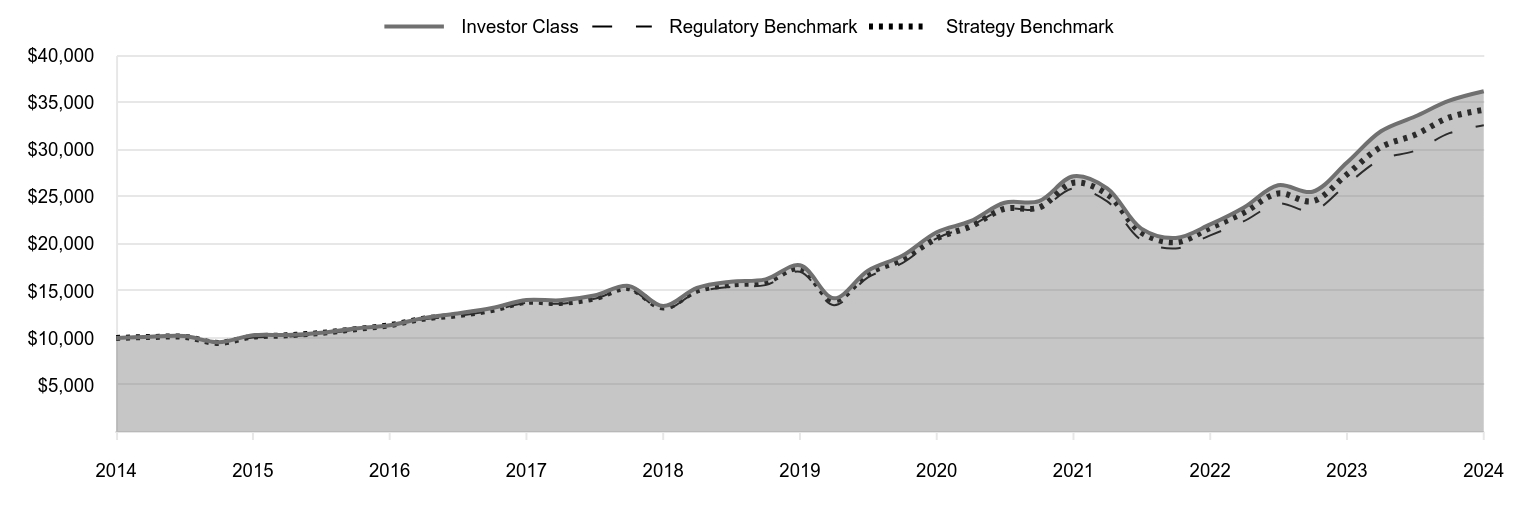
Cumulative Returns of a Hypothetical $10,000 Investment as of December 31, 2024
| Investor Class | Regulatory Benchmark | Strategy Benchmark |
|---|
| 2014 | 10,000 | 10,000 | 10,000 |
|---|
| 2015 | 10,134 | 10,180 | 10,095 |
|---|
| 2015 | 10,194 | 10,194 | 10,123 |
|---|
| 2015 | 9,551 | 9,455 | 9,471 |
|---|
| 2015 | 10,290 | 10,048 | 10,138 |
|---|
| 2016 | 10,309 | 10,145 | 10,275 |
|---|
| 2016 | 10,549 | 10,412 | 10,527 |
|---|
| 2016 | 11,009 | 10,870 | 10,933 |
|---|
| 2016 | 11,343 | 11,327 | 11,351 |
|---|
| 2017 | 12,103 | 11,978 | 12,039 |
|---|
| 2017 | 12,602 | 12,339 | 12,411 |
|---|
| 2017 | 13,175 | 12,903 | 12,967 |
|---|
| 2017 | 14,034 | 13,721 | 13,829 |
|---|
| 2018 | 14,002 | 13,633 | 13,724 |
|---|
| 2018 | 14,503 | 14,163 | 14,195 |
|---|
| 2018 | 15,526 | 15,172 | 15,290 |
|---|
| 2018 | 13,384 | 13,002 | 13,223 |
|---|
| 2019 | 15,319 | 14,828 | 15,027 |
|---|
| 2019 | 15,983 | 15,435 | 15,674 |
|---|
| 2019 | 16,222 | 15,614 | 15,940 |
|---|
| 2019 | 17,728 | 17,035 | 17,386 |
|---|
| 2020 | 14,215 | 13,475 | 13,979 |
|---|
| 2020 | 17,144 | 16,443 | 16,850 |
|---|
| 2020 | 18,731 | 17,957 | 18,355 |
|---|
| 2020 | 21,240 | 20,593 | 20,585 |
|---|
| 2021 | 22,410 | 21,900 | 21,856 |
|---|
| 2021 | 24,367 | 23,705 | 23,724 |
|---|
| 2021 | 24,541 | 23,681 | 23,863 |
|---|
| 2021 | 27,183 | 25,877 | 26,494 |
|---|
| 2022 | 25,891 | 24,512 | 25,276 |
|---|
| 2022 | 21,624 | 20,418 | 21,206 |
|---|
| 2022 | 20,626 | 19,506 | 20,170 |
|---|
| 2022 | 22,072 | 20,907 | 21,696 |
|---|
| 2023 | 23,872 | 22,408 | 23,322 |
|---|
| 2023 | 26,239 | 24,288 | 25,361 |
|---|
| 2023 | 25,545 | 23,497 | 24,531 |
|---|
| 2023 | 28,650 | 26,334 | 27,399 |
|---|
| 2024 | 31,968 | 28,973 | 30,291 |
|---|
| 2024 | 33,537 | 29,904 | 31,589 |
|---|
| 2024 | 35,218 | 31,767 | 33,448 |
|---|
| 2024 | 36,218 | 32,604 | 34,254 |
|---|
202501-4140694, 202502-4108238
Average Annual Total Returns
| | 1 Year | 5 Years | 10 Years |
|---|
| U.S. Equity Research Fund (Investor Class) | 26.42% | 15.36% | 13.73% |
|---|
| Russell 3000 Index (Regulatory Benchmark) | 23.81 | 13.86 | 12.55 |
|---|
| S&P 500 Index (Strategy Benchmark) | 25.02 | 14.53 | 13.10 |
|---|
The preceding line graph shows the value of a hypothetical $10,000 investment in the fund over the past 10 fiscal year periods or since inception (for funds lacking 10-year records). The fund’s performance information included in the line graph and table above is compared with a regulatory required index that represents an overall securities market (Regulatory Benchmark). In addition, the line graph and table may also include one or more indexes that more closely aligns to the fund's investment strategy (Strategy Benchmark(s)). Due to new SEC Rules on shareholder reporting the fund adopted a new broad-based securities market index, referred to as the Regulatory Benchmark. Market index returns do not include expenses, which are deducted from fund returns. The fund's total return figures reflect the reinvestment of dividends and capital gains, if any.Neither the fund’s returns nor the index returns reflect the deduction of taxes that a shareholder would pay on fund distributions or redemptions of fund shares.The fund’s past performance is not a good predictor of the fund’s future performance.Updated performance information can be found at www.troweprice.com.
What are some fund statistics?
- Total Net Assets (000s)$13,610,813
- Number of Portfolio Holdings305
- Investment Advisory Fees Paid (000s)$37,648
- Portfolio Turnover Rate37.6%
What did the fund invest in?
Sector Allocation (as a % of Net Assets)
| Information Technology | 32.4% |
| Financials | 14.0 |
| Consumer Discretionary | 11.3 |
| Health Care | 10.2 |
| Communication Services | 9.4 |
| Industrials & Business Services | 7.3 |
| Consumer Staples | 5.4 |
| Energy | 3.2 |
| Utilities | 2.3 |
| Other | 4.5 |
Top Ten Holdings (as a % of Net Assets)
| Apple | 8.1% |
| NVIDIA | 7.1 |
| Microsoft | 6.5 |
| Amazon.com | 4.3 |
| Alphabet | 4.1 |
| Broadcom | 2.8 |
| Meta Platforms | 2.7 |
| Tesla | 2.3 |
| Eli Lilly | 1.9 |
| JPMorgan Chase | 1.3 |
If you invest directly with T. Rowe Price, you can elect to receive future shareholder reports or other important documents through electronic delivery by enrolling at www.troweprice.com/paperless. If you invest through a financial intermediary such as an investment advisor, a bank, retirement plan sponsor or a brokerage firm, please contact that organization and ask if it can provide electronic delivery.
Frank Russell Company "LSE" and S&P do not accept any liability for any errors or omissions in the indexes or data, and hereby expressly disclaim all warranties of originality, accuracy, completeness, timeliness, merchantability and fitness for a particular purpose. No party may rely on any indexes or data contained in this communication. Visit www.troweprice.com/en/us/market-data-disclosures for additional legal notices & disclaimers.
U.S. Equity Research Fund
Investor Class (PRCOX)
T. Rowe Price Investment Services, Inc.
100 East Pratt Street
Baltimore, MD 21202
Annual Shareholder Report
December 31, 2024
U.S. Equity Research Fund
This annual shareholder report contains important information about U.S. Equity Research Fund (the "fund") for the period of January 1, 2024 to December 31, 2024. You can find the fund’s prospectus, financial information on Form N‑CSR (which includes required tax information for dividends), holdings, proxy voting information, and other information atwww.troweprice.com/prospectus. You can also request this information without charge by contacting T. Rowe Price at 1‑800‑638‑5660 or info@troweprice.com or contacting your intermediary.
What were the fund costs for the last year? (based on a hypothetical $10,000 investment)
| | Costs of a $10,000 investment | Costs paid as a percentage of a $10,000 investment |
|---|
| U.S. Equity Research Fund - Advisor Class | $94 | 0.83% |
|---|
What drove fund performance during the past 12 months?
U.S. stocks advanced during the period, buoyed by generally favorable corporate earnings and continuing interest in companies expected to benefit from artificial intelligence (AI) developments.
Versus the S&P 500 Index, the leading contributor to the portfolio’s relative performance was stock selection in information technology. An overweight position in NVIDIA was beneficial. Shares rose as investors rewarded the company’s product suite for its potential to facilitate growth in the popular AI space during much of the period. Within communication services, security choices were also beneficial, led by an overweight position in T-Mobile US. Shares rose on investor optimism following the news that T-Mobile will acquire most of U.S. Cellular’s wireless operations and after the company reported strong second- and third-quarter results.
Conversely, the leading detractor from relative performance was the energy sector, due to stock selection. Not owning ONEOK hurt relative performance as shares rose on investor expectations that the company could benefit from an increase in energy consumption by data centers. Later in the period, shares were boosted by investor optimism over several recent strategic initiatives. The portfolio’s overweight allocation to health care also weighed on relative returns as the sector underperformed the index during the year.
The U.S. Equity Research Fund invests primarily in U.S. stocks and implements an analyst-driven approach to security selection. Analysts are allocated capital in proportion to the weight of the stocks they follow within the S&P 500 Index, and they have decision-making authority for their respective portion of the portfolio.
How has the fund performed?
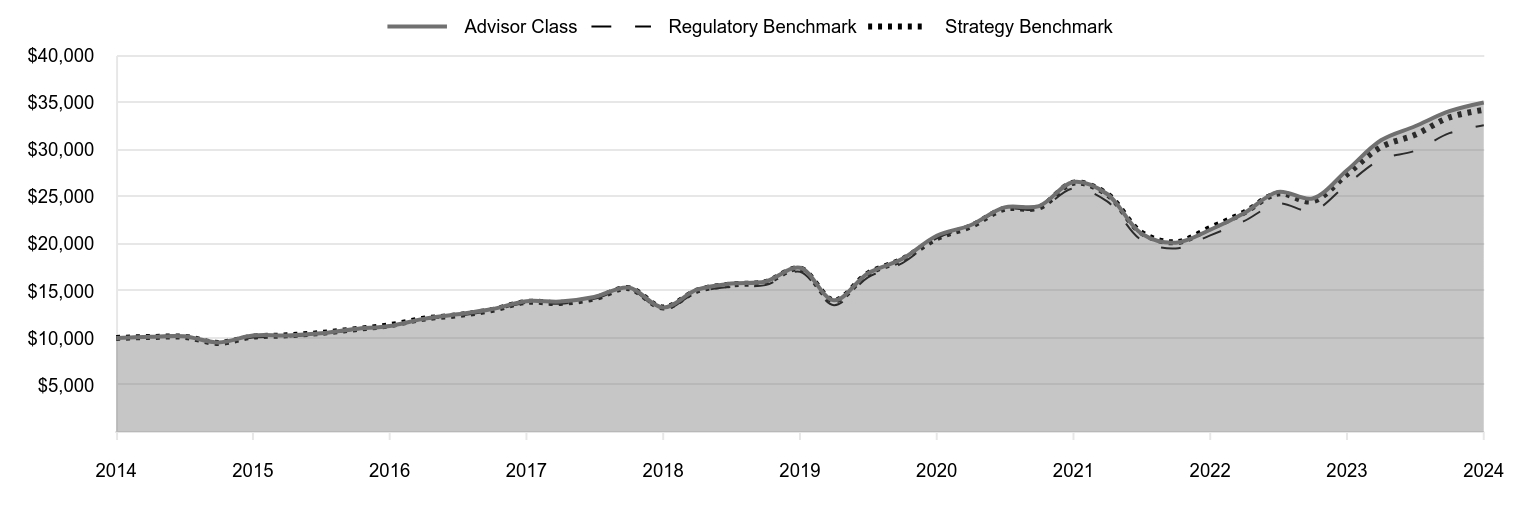
Cumulative Returns of a Hypothetical $10,000 Investment as of December 31, 2024
| Advisor Class | Regulatory Benchmark | Strategy Benchmark |
|---|
| 2014 | 10,000 | 10,000 | 10,000 |
|---|
| 2015 | 10,121 | 10,180 | 10,095 |
|---|
| 2015 | 10,177 | 10,194 | 10,123 |
|---|
| 2015 | 9,524 | 9,455 | 9,471 |
|---|
| 2015 | 10,257 | 10,048 | 10,138 |
|---|
| 2016 | 10,271 | 10,145 | 10,275 |
|---|
| 2016 | 10,501 | 10,412 | 10,527 |
|---|
| 2016 | 10,951 | 10,870 | 10,933 |
|---|
| 2016 | 11,277 | 11,327 | 11,351 |
|---|
| 2017 | 12,026 | 11,978 | 12,039 |
|---|
| 2017 | 12,513 | 12,339 | 12,411 |
|---|
| 2017 | 13,071 | 12,903 | 12,967 |
|---|
| 2017 | 13,907 | 13,721 | 13,829 |
|---|
| 2018 | 13,870 | 13,633 | 13,724 |
|---|
| 2018 | 14,357 | 14,163 | 14,195 |
|---|
| 2018 | 15,358 | 15,172 | 15,290 |
|---|
| 2018 | 13,231 | 13,002 | 13,223 |
|---|
| 2019 | 15,131 | 14,828 | 15,027 |
|---|
| 2019 | 15,777 | 15,435 | 15,674 |
|---|
| 2019 | 16,002 | 15,614 | 15,940 |
|---|
| 2019 | 17,470 | 17,035 | 17,386 |
|---|
| 2020 | 13,997 | 13,475 | 13,979 |
|---|
| 2020 | 16,871 | 16,443 | 16,850 |
|---|
| 2020 | 18,410 | 17,957 | 18,355 |
|---|
| 2020 | 20,867 | 20,593 | 20,585 |
|---|
| 2021 | 21,981 | 21,900 | 21,856 |
|---|
| 2021 | 23,875 | 23,705 | 23,724 |
|---|
| 2021 | 24,017 | 23,681 | 23,863 |
|---|
| 2021 | 26,582 | 25,877 | 26,494 |
|---|
| 2022 | 25,300 | 24,512 | 25,276 |
|---|
| 2022 | 21,108 | 20,418 | 21,206 |
|---|
| 2022 | 20,114 | 19,506 | 20,170 |
|---|
| 2022 | 21,501 | 20,907 | 21,696 |
|---|
| 2023 | 23,251 | 22,408 | 23,322 |
|---|
| 2023 | 25,530 | 24,288 | 25,361 |
|---|
| 2023 | 24,829 | 23,497 | 24,531 |
|---|
| 2023 | 27,816 | 26,334 | 27,399 |
|---|
| 2024 | 31,013 | 28,973 | 30,291 |
|---|
| 2024 | 32,503 | 29,904 | 31,589 |
|---|
| 2024 | 34,102 | 31,767 | 33,448 |
|---|
| 2024 | 35,032 | 32,604 | 34,254 |
|---|
202501-4140694, 202502-4108238
Average Annual Total Returns
| | 1 Year | 5 Years | 10 Years |
|---|
| U.S. Equity Research Fund (Advisor Class) | 25.94% | 14.93% | 13.36% |
|---|
| Russell 3000 Index (Regulatory Benchmark) | 23.81 | 13.86 | 12.55 |
|---|
| S&P 500 Index (Strategy Benchmark) | 25.02 | 14.53 | 13.10 |
|---|
The preceding line graph shows the value of a hypothetical $10,000 investment in the fund over the past 10 fiscal year periods or since inception (for funds lacking 10-year records). The fund’s performance information included in the line graph and table above is compared with a regulatory required index that represents an overall securities market (Regulatory Benchmark). In addition, the line graph and table may also include one or more indexes that more closely aligns to the fund's investment strategy (Strategy Benchmark(s)). Due to new SEC Rules on shareholder reporting the fund adopted a new broad-based securities market index, referred to as the Regulatory Benchmark. Market index returns do not include expenses, which are deducted from fund returns. The fund's total return figures reflect the reinvestment of dividends and capital gains, if any.Neither the fund’s returns nor the index returns reflect the deduction of taxes that a shareholder would pay on fund distributions or redemptions of fund shares.The fund’s past performance is not a good predictor of the fund’s future performance.Updated performance information can be found at www.troweprice.com.
What are some fund statistics?
- Total Net Assets (000s)$13,610,813
- Number of Portfolio Holdings305
- Investment Advisory Fees Paid (000s)$37,648
- Portfolio Turnover Rate37.6%
What did the fund invest in?
Sector Allocation (as a % of Net Assets)
| Information Technology | 32.4% |
| Financials | 14.0 |
| Consumer Discretionary | 11.3 |
| Health Care | 10.2 |
| Communication Services | 9.4 |
| Industrials & Business Services | 7.3 |
| Consumer Staples | 5.4 |
| Energy | 3.2 |
| Utilities | 2.3 |
| Other | 4.5 |
Top Ten Holdings (as a % of Net Assets)
| Apple | 8.1% |
| NVIDIA | 7.1 |
| Microsoft | 6.5 |
| Amazon.com | 4.3 |
| Alphabet | 4.1 |
| Broadcom | 2.8 |
| Meta Platforms | 2.7 |
| Tesla | 2.3 |
| Eli Lilly | 1.9 |
| JPMorgan Chase | 1.3 |
If you invest directly with T. Rowe Price, you can elect to receive future shareholder reports or other important documents through electronic delivery by enrolling at www.troweprice.com/paperless. If you invest through a financial intermediary such as an investment advisor, a bank, retirement plan sponsor or a brokerage firm, please contact that organization and ask if it can provide electronic delivery.
Frank Russell Company "LSE" and S&P do not accept any liability for any errors or omissions in the indexes or data, and hereby expressly disclaim all warranties of originality, accuracy, completeness, timeliness, merchantability and fitness for a particular purpose. No party may rely on any indexes or data contained in this communication. Visit www.troweprice.com/en/us/market-data-disclosures for additional legal notices & disclaimers.
U.S. Equity Research Fund
Advisor Class (PACOX)
T. Rowe Price Investment Services, Inc.
100 East Pratt Street
Baltimore, MD 21202
Annual Shareholder Report
December 31, 2024
U.S. Equity Research Fund
This annual shareholder report contains important information about U.S. Equity Research Fund (the "fund") for the period of January 1, 2024 to December 31, 2024. You can find the fund’s prospectus, financial information on Form N‑CSR (which includes required tax information for dividends), holdings, proxy voting information, and other information atwww.troweprice.com/prospectus. You can also request this information without charge by contacting T. Rowe Price at 1‑800‑638‑5660 or info@troweprice.com or contacting your intermediary.
What were the fund costs for the last year? (based on a hypothetical $10,000 investment)
| | Costs of a $10,000 investment | Costs paid as a percentage of a $10,000 investment |
|---|
| U.S. Equity Research Fund - R Class | $132 | 1.17% |
|---|
What drove fund performance during the past 12 months?
U.S. stocks advanced during the period, buoyed by generally favorable corporate earnings and continuing interest in companies expected to benefit from artificial intelligence (AI) developments.
Versus the S&P 500 Index, the leading contributor to the portfolio’s relative performance was stock selection in information technology. An overweight position in NVIDIA was beneficial. Shares rose as investors rewarded the company’s product suite for its potential to facilitate growth in the popular AI space during much of the period. Within communication services, security choices were also beneficial, led by an overweight position in T-Mobile US. Shares rose on investor optimism following the news that T-Mobile will acquire most of U.S. Cellular’s wireless operations and after the company reported strong second- and third-quarter results.
Conversely, the leading detractor from relative performance was the energy sector, due to stock selection. Not owning ONEOK hurt relative performance as shares rose on investor expectations that the company could benefit from an increase in energy consumption by data centers. Later in the period, shares were boosted by investor optimism over several recent strategic initiatives. The portfolio’s overweight allocation to health care also weighed on relative returns as the sector underperformed the index during the year.
The U.S. Equity Research Fund invests primarily in U.S. stocks and implements an analyst-driven approach to security selection. Analysts are allocated capital in proportion to the weight of the stocks they follow within the S&P 500 Index, and they have decision-making authority for their respective portion of the portfolio.
How has the fund performed?
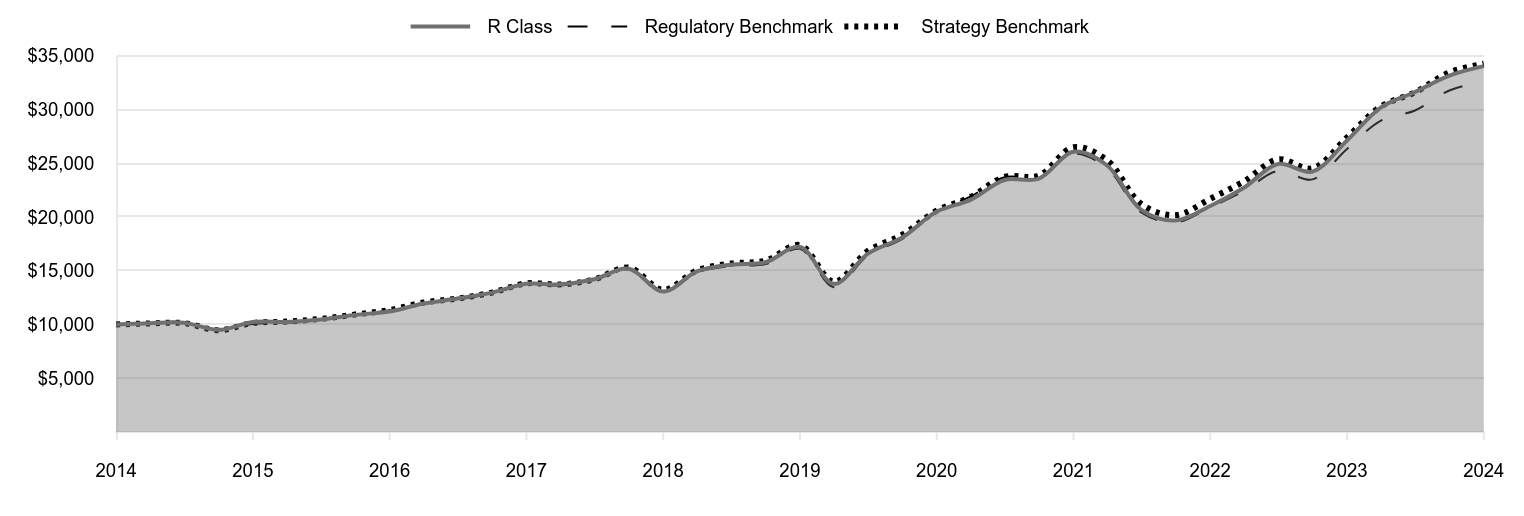
Cumulative Returns of a Hypothetical $10,000 Investment as of December 31, 2024
| R Class | Regulatory Benchmark | Strategy Benchmark |
|---|
| 2014 | 10,000 | 10,000 | 10,000 |
|---|
| 2015 | 10,117 | 10,180 | 10,095 |
|---|
| 2015 | 10,165 | 10,194 | 10,123 |
|---|
| 2015 | 9,506 | 9,455 | 9,471 |
|---|
| 2015 | 10,231 | 10,048 | 10,138 |
|---|
| 2016 | 10,231 | 10,145 | 10,275 |
|---|
| 2016 | 10,455 | 10,412 | 10,527 |
|---|
| 2016 | 10,896 | 10,870 | 10,933 |
|---|
| 2016 | 11,207 | 11,327 | 11,351 |
|---|
| 2017 | 11,947 | 11,978 | 12,039 |
|---|
| 2017 | 12,422 | 12,339 | 12,411 |
|---|
| 2017 | 12,967 | 12,903 | 12,967 |
|---|
| 2017 | 13,790 | 13,721 | 13,829 |
|---|
| 2018 | 13,737 | 13,633 | 13,724 |
|---|
| 2018 | 14,210 | 14,163 | 14,195 |
|---|
| 2018 | 15,188 | 15,172 | 15,290 |
|---|
| 2018 | 13,071 | 13,002 | 13,223 |
|---|
| 2019 | 14,938 | 14,828 | 15,027 |
|---|
| 2019 | 15,563 | 15,435 | 15,674 |
|---|
| 2019 | 15,785 | 15,614 | 15,940 |
|---|
| 2019 | 17,219 | 17,035 | 17,386 |
|---|
| 2020 | 13,782 | 13,475 | 13,979 |
|---|
| 2020 | 16,598 | 16,443 | 16,850 |
|---|
| 2020 | 18,103 | 17,957 | 18,355 |
|---|
| 2020 | 20,501 | 20,593 | 20,585 |
|---|
| 2021 | 21,593 | 21,900 | 21,856 |
|---|
| 2021 | 23,445 | 23,705 | 23,724 |
|---|
| 2021 | 23,575 | 23,681 | 23,863 |
|---|
| 2021 | 26,067 | 25,877 | 26,494 |
|---|
| 2022 | 24,788 | 24,512 | 25,276 |
|---|
| 2022 | 20,670 | 20,418 | 21,206 |
|---|
| 2022 | 19,681 | 19,506 | 20,170 |
|---|
| 2022 | 21,023 | 20,907 | 21,696 |
|---|
| 2023 | 22,721 | 22,408 | 23,322 |
|---|
| 2023 | 24,928 | 24,288 | 25,361 |
|---|
| 2023 | 24,226 | 23,497 | 24,531 |
|---|
| 2023 | 27,119 | 26,334 | 27,399 |
|---|
| 2024 | 30,204 | 28,973 | 30,291 |
|---|
| 2024 | 31,632 | 29,904 | 31,589 |
|---|
| 2024 | 33,154 | 31,767 | 33,448 |
|---|
| 2024 | 34,032 | 32,604 | 34,254 |
|---|
202501-4140694, 202502-4108238
Average Annual Total Returns
| | 1 Year | 5 Years | 10 Years |
|---|
| U.S. Equity Research Fund (R Class) | 25.49% | 14.60% | 13.03% |
|---|
| Russell 3000 Index (Regulatory Benchmark) | 23.81 | 13.86 | 12.55 |
|---|
| S&P 500 Index (Strategy Benchmark) | 25.02 | 14.53 | 13.10 |
|---|
The preceding line graph shows the value of a hypothetical $10,000 investment in the fund over the past 10 fiscal year periods or since inception (for funds lacking 10-year records). The fund’s performance information included in the line graph and table above is compared with a regulatory required index that represents an overall securities market (Regulatory Benchmark). In addition, the line graph and table may also include one or more indexes that more closely aligns to the fund's investment strategy (Strategy Benchmark(s)). Due to new SEC Rules on shareholder reporting the fund adopted a new broad-based securities market index, referred to as the Regulatory Benchmark. Market index returns do not include expenses, which are deducted from fund returns. The fund's total return figures reflect the reinvestment of dividends and capital gains, if any.Neither the fund’s returns nor the index returns reflect the deduction of taxes that a shareholder would pay on fund distributions or redemptions of fund shares.The fund’s past performance is not a good predictor of the fund’s future performance.Updated performance information can be found at www.troweprice.com.
What are some fund statistics?
- Total Net Assets (000s)$13,610,813
- Number of Portfolio Holdings305
- Investment Advisory Fees Paid (000s)$37,648
- Portfolio Turnover Rate37.6%
What did the fund invest in?
Sector Allocation (as a % of Net Assets)
| Information Technology | 32.4% |
| Financials | 14.0 |
| Consumer Discretionary | 11.3 |
| Health Care | 10.2 |
| Communication Services | 9.4 |
| Industrials & Business Services | 7.3 |
| Consumer Staples | 5.4 |
| Energy | 3.2 |
| Utilities | 2.3 |
| Other | 4.5 |
Top Ten Holdings (as a % of Net Assets)
| Apple | 8.1% |
| NVIDIA | 7.1 |
| Microsoft | 6.5 |
| Amazon.com | 4.3 |
| Alphabet | 4.1 |
| Broadcom | 2.8 |
| Meta Platforms | 2.7 |
| Tesla | 2.3 |
| Eli Lilly | 1.9 |
| JPMorgan Chase | 1.3 |
If you invest directly with T. Rowe Price, you can elect to receive future shareholder reports or other important documents through electronic delivery by enrolling at www.troweprice.com/paperless. If you invest through a financial intermediary such as an investment advisor, a bank, retirement plan sponsor or a brokerage firm, please contact that organization and ask if it can provide electronic delivery.
Frank Russell Company "LSE" and S&P do not accept any liability for any errors or omissions in the indexes or data, and hereby expressly disclaim all warranties of originality, accuracy, completeness, timeliness, merchantability and fitness for a particular purpose. No party may rely on any indexes or data contained in this communication. Visit www.troweprice.com/en/us/market-data-disclosures for additional legal notices & disclaimers.
U.S. Equity Research Fund
R Class (RRCOX)
T. Rowe Price Investment Services, Inc.
100 East Pratt Street
Baltimore, MD 21202
Annual Shareholder Report
December 31, 2024
U.S. Equity Research Fund
This annual shareholder report contains important information about U.S. Equity Research Fund (the "fund") for the period of January 1, 2024 to December 31, 2024. You can find the fund’s prospectus, financial information on Form N‑CSR (which includes required tax information for dividends), holdings, proxy voting information, and other information atwww.troweprice.com/prospectus. You can also request this information without charge by contacting T. Rowe Price at 1‑800‑638‑5660 or info@troweprice.com or contacting your intermediary.
What were the fund costs for the last year? (based on a hypothetical $10,000 investment)
| | Costs of a $10,000 investment | Costs paid as a percentage of a $10,000 investment |
|---|
| U.S. Equity Research Fund - I Class | $39 | 0.34% |
|---|
What drove fund performance during the past 12 months?
U.S. stocks advanced during the period, buoyed by generally favorable corporate earnings and continuing interest in companies expected to benefit from artificial intelligence (AI) developments.
Versus the S&P 500 Index, the leading contributor to the portfolio’s relative performance was stock selection in information technology. An overweight position in NVIDIA was beneficial. Shares rose as investors rewarded the company’s product suite for its potential to facilitate growth in the popular AI space during much of the period. Within communication services, security choices were also beneficial, led by an overweight position in T-Mobile US. Shares rose on investor optimism following the news that T-Mobile will acquire most of U.S. Cellular’s wireless operations and after the company reported strong second- and third-quarter results.
Conversely, the leading detractor from relative performance was the energy sector, due to stock selection. Not owning ONEOK hurt relative performance as shares rose on investor expectations that the company could benefit from an increase in energy consumption by data centers. Later in the period, shares were boosted by investor optimism over several recent strategic initiatives. The portfolio’s overweight allocation to health care also weighed on relative returns as the sector underperformed the index during the year.
The U.S. Equity Research Fund invests primarily in U.S. stocks and implements an analyst-driven approach to security selection. Analysts are allocated capital in proportion to the weight of the stocks they follow within the S&P 500 Index, and they have decision-making authority for their respective portion of the portfolio.
How has the fund performed?
Cumulative Returns of a Hypothetical $500,000 Investment as of December 31, 2024
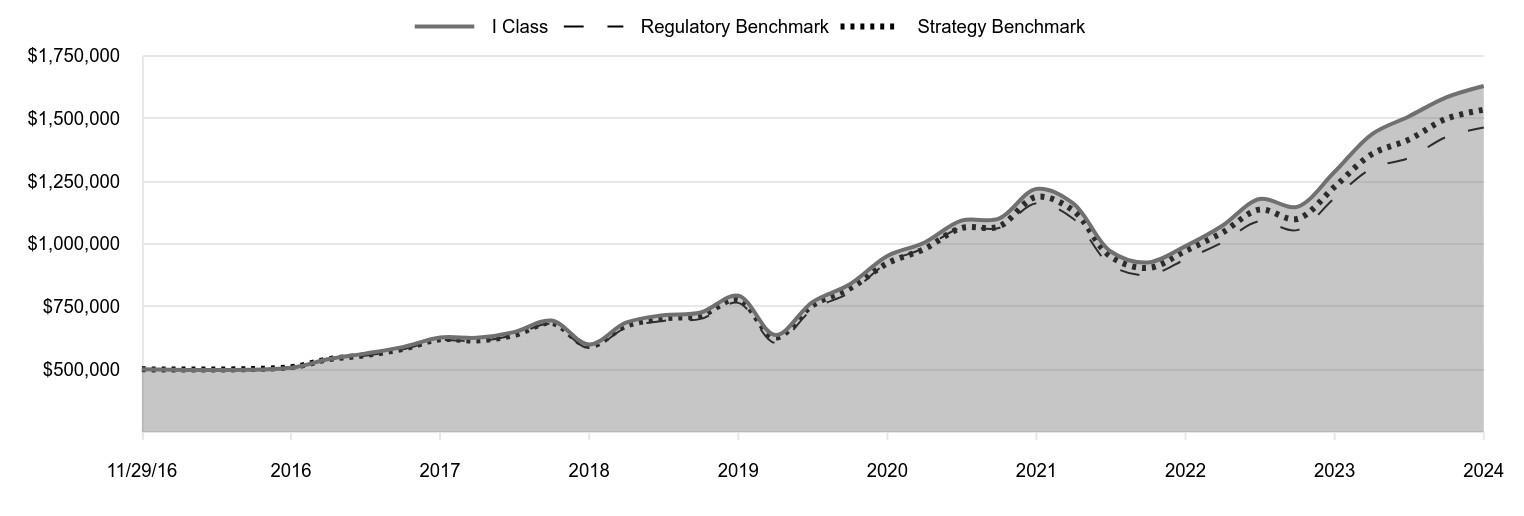
| I Class | Regulatory Benchmark | Strategy Benchmark |
|---|
| 11/29/16 | 500,000 | 500,000 | 500,000 |
|---|
| 12/31/16 | 505,949 | 508,515 | 508,640 |
|---|
| 3/31/17 | 540,069 | 537,720 | 539,495 |
|---|
| 6/30/17 | 562,515 | 553,935 | 556,155 |
|---|
| 9/30/17 | 588,329 | 579,257 | 581,073 |
|---|
| 12/31/17 | 626,633 | 615,967 | 619,684 |
|---|
| 3/31/18 | 625,670 | 611,997 | 614,980 |
|---|
| 6/30/18 | 648,282 | 635,796 | 636,097 |
|---|
| 9/30/18 | 694,227 | 681,090 | 685,145 |
|---|
| 12/31/18 | 598,767 | 583,679 | 592,515 |
|---|
| 3/31/19 | 685,612 | 665,648 | 673,381 |
|---|
| 6/30/19 | 715,575 | 692,907 | 702,362 |
|---|
| 9/30/19 | 726,494 | 700,962 | 714,290 |
|---|
| 12/31/19 | 793,644 | 764,731 | 779,076 |
|---|
| 3/31/20 | 636,609 | 604,904 | 626,393 |
|---|
| 6/30/20 | 767,984 | 738,150 | 755,075 |
|---|
| 9/30/20 | 839,061 | 806,115 | 822,499 |
|---|
| 12/31/20 | 951,871 | 924,466 | 922,417 |
|---|
| 3/31/21 | 1,004,292 | 983,141 | 979,376 |
|---|
| 6/30/21 | 1,092,524 | 1,064,150 | 1,063,101 |
|---|
| 9/30/21 | 1,100,569 | 1,063,067 | 1,069,289 |
|---|
| 12/31/21 | 1,219,211 | 1,161,694 | 1,187,201 |
|---|
| 3/31/22 | 1,161,551 | 1,100,375 | 1,132,607 |
|---|
| 6/30/22 | 970,519 | 916,599 | 950,245 |
|---|
| 9/30/22 | 925,792 | 875,677 | 903,848 |
|---|
| 12/31/22 | 991,020 | 938,568 | 972,188 |
|---|
| 3/31/23 | 1,072,103 | 1,005,960 | 1,045,074 |
|---|
| 6/30/23 | 1,178,849 | 1,090,328 | 1,136,436 |
|---|
| 9/30/23 | 1,147,726 | 1,054,851 | 1,099,236 |
|---|
| 12/31/23 | 1,287,405 | 1,182,191 | 1,227,754 |
|---|
| 3/31/24 | 1,436,929 | 1,300,639 | 1,357,354 |
|---|
| 6/30/24 | 1,507,960 | 1,342,467 | 1,415,501 |
|---|
| 9/30/24 | 1,583,966 | 1,426,091 | 1,498,825 |
|---|
| 12/31/24 | 1,629,367 | 1,463,644 | 1,534,934 |
|---|
202501-4140694, 202502-4108238
Average Annual Total Returns
| | 1 Year | 5 Years | Since Inception 11/29/16 |
|---|
| U.S. Equity Research Fund (I Class) | 26.56% | 15.47% | 15.73% |
|---|
| Russell 3000 Index (Regulatory Benchmark) | 23.81 | 13.86 | 14.20 |
|---|
| S&P 500 Index (Strategy Benchmark) | 25.02 | 14.53 | 14.88 |
|---|
The preceding line graph shows the value of a hypothetical $500,000 investment in the fund over the past 10 fiscal year periods or since inception (for funds lacking 10-year records). The fund’s performance information included in the line graph and table above is compared with a regulatory required index that represents an overall securities market (Regulatory Benchmark). In addition, the line graph and table may also include one or more indexes that more closely aligns to the fund's investment strategy (Strategy Benchmark(s)). Due to new SEC Rules on shareholder reporting the fund adopted a new broad-based securities market index, referred to as the Regulatory Benchmark. Market index returns do not include expenses, which are deducted from fund returns. The fund's total return figures reflect the reinvestment of dividends and capital gains, if any.Neither the fund’s returns nor the index returns reflect the deduction of taxes that a shareholder would pay on fund distributions or redemptions of fund shares.The fund’s past performance is not a good predictor of the fund’s future performance.Updated performance information can be found at www.troweprice.com.
What are some fund statistics?
- Total Net Assets (000s)$13,610,813
- Number of Portfolio Holdings305
- Investment Advisory Fees Paid (000s)$37,648
- Portfolio Turnover Rate37.6%
What did the fund invest in?
Sector Allocation (as a % of Net Assets)
| Information Technology | 32.4% |
| Financials | 14.0 |
| Consumer Discretionary | 11.3 |
| Health Care | 10.2 |
| Communication Services | 9.4 |
| Industrials & Business Services | 7.3 |
| Consumer Staples | 5.4 |
| Energy | 3.2 |
| Utilities | 2.3 |
| Other | 4.5 |
Top Ten Holdings (as a % of Net Assets)
| Apple | 8.1% |
| NVIDIA | 7.1 |
| Microsoft | 6.5 |
| Amazon.com | 4.3 |
| Alphabet | 4.1 |
| Broadcom | 2.8 |
| Meta Platforms | 2.7 |
| Tesla | 2.3 |
| Eli Lilly | 1.9 |
| JPMorgan Chase | 1.3 |
If you invest directly with T. Rowe Price, you can elect to receive future shareholder reports or other important documents through electronic delivery by enrolling at www.troweprice.com/paperless. If you invest through a financial intermediary such as an investment advisor, a bank, retirement plan sponsor or a brokerage firm, please contact that organization and ask if it can provide electronic delivery.
Frank Russell Company "LSE" and S&P do not accept any liability for any errors or omissions in the indexes or data, and hereby expressly disclaim all warranties of originality, accuracy, completeness, timeliness, merchantability and fitness for a particular purpose. No party may rely on any indexes or data contained in this communication. Visit www.troweprice.com/en/us/market-data-disclosures for additional legal notices & disclaimers.
U.S. Equity Research Fund
I Class (PCCOX)
T. Rowe Price Investment Services, Inc.
100 East Pratt Street
Baltimore, MD 21202
Annual Shareholder Report
December 31, 2024
U.S. Equity Research Fund
This annual shareholder report contains important information about U.S. Equity Research Fund (the "fund") for the period of January 1, 2024 to December 31, 2024. You can find the fund’s prospectus, financial information on Form N‑CSR (which includes required tax information for dividends), holdings, proxy voting information, and other information atwww.troweprice.com/prospectus. You can also request this information without charge by contacting T. Rowe Price at 1‑800‑638‑5660 or info@troweprice.com or contacting your intermediary.
What were the fund costs for the last year? (based on a hypothetical $10,000 investment)
| | Costs of a $10,000 investment | Costs paid as a percentage of a $10,000 investment |
|---|
| U.S. Equity Research Fund - Z Class | $0 | 0.00% |
|---|
What drove fund performance during the past 12 months?
U.S. stocks advanced during the period, buoyed by generally favorable corporate earnings and continuing interest in companies expected to benefit from artificial intelligence (AI) developments.
Versus the S&P 500 Index, the leading contributor to the portfolio’s relative performance was stock selection in information technology. An overweight position in NVIDIA was beneficial. Shares rose as investors rewarded the company’s product suite for its potential to facilitate growth in the popular AI space during much of the period. Within communication services, security choices were also beneficial, led by an overweight position in T-Mobile US. Shares rose on investor optimism following the news that T-Mobile will acquire most of U.S. Cellular’s wireless operations and after the company reported strong second- and third-quarter results.
Conversely, the leading detractor from relative performance was the energy sector, due to stock selection. Not owning ONEOK hurt relative performance as shares rose on investor expectations that the company could benefit from an increase in energy consumption by data centers. Later in the period, shares were boosted by investor optimism over several recent strategic initiatives. The portfolio’s overweight allocation to health care also weighed on relative returns as the sector underperformed the index during the year.
The U.S. Equity Research Fund invests primarily in U.S. stocks and implements an analyst-driven approach to security selection. Analysts are allocated capital in proportion to the weight of the stocks they follow within the S&P 500 Index, and they have decision-making authority for their respective portion of the portfolio.
How has the fund performed?
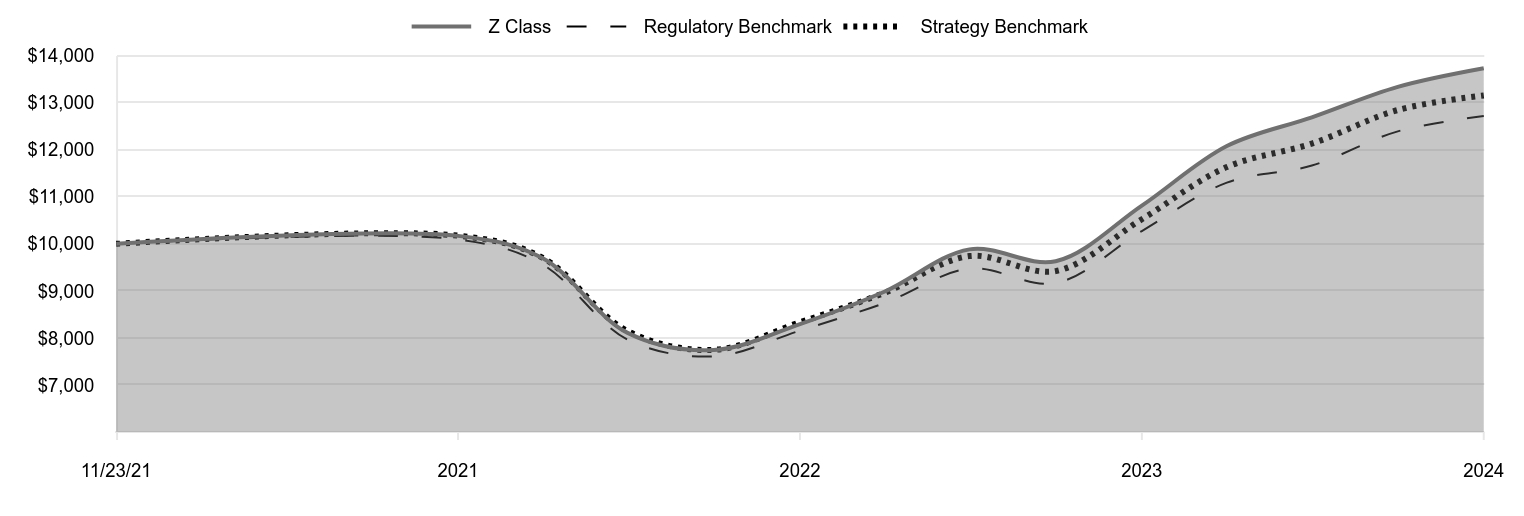
Cumulative Returns of a Hypothetical $10,000 Investment as of December 31, 2024
| Z Class | Regulatory Benchmark | Strategy Benchmark |
|---|
| 11/23/21 | 10,000 | 10,000 | 10,000 |
|---|
| 12/31/21 | 10,170 | 10,094 | 10,175 |
|---|
| 3/31/22 | 9,698 | 9,562 | 9,707 |
|---|
| 6/30/22 | 8,108 | 7,965 | 8,144 |
|---|
| 9/30/22 | 7,743 | 7,609 | 7,747 |
|---|
| 12/31/22 | 8,294 | 8,156 | 8,332 |
|---|
| 3/31/23 | 8,982 | 8,741 | 8,957 |
|---|
| 6/30/23 | 9,883 | 9,474 | 9,740 |
|---|
| 9/30/23 | 9,631 | 9,166 | 9,421 |
|---|
| 12/31/23 | 10,813 | 10,273 | 10,523 |
|---|
| 3/31/24 | 12,080 | 11,302 | 11,634 |
|---|
| 6/30/24 | 12,690 | 11,665 | 12,132 |
|---|
| 9/30/24 | 13,339 | 12,392 | 12,846 |
|---|
| 12/31/24 | 13,735 | 12,718 | 13,156 |
|---|
202501-4140694, 202502-4108238
Average Annual Total Returns
| | 1 Year | Since Inception 11/23/21 |
|---|
| U.S. Equity Research Fund (Z Class) | 27.02% | 10.77% |
|---|
| Russell 3000 Index (Regulatory Benchmark) | 23.81 | 8.05 |
|---|
| S&P 500 Index (Strategy Benchmark) | 25.02 | 9.24 |
|---|
The preceding line graph shows the value of a hypothetical $10,000 investment in the fund over the past 10 fiscal year periods or since inception (for funds lacking 10-year records). The fund’s performance information included in the line graph and table above is compared with a regulatory required index that represents an overall securities market (Regulatory Benchmark). In addition, the line graph and table may also include one or more indexes that more closely aligns to the fund's investment strategy (Strategy Benchmark(s)). Due to new SEC Rules on shareholder reporting the fund adopted a new broad-based securities market index, referred to as the Regulatory Benchmark. Market index returns do not include expenses, which are deducted from fund returns. The fund's total return figures reflect the reinvestment of dividends and capital gains, if any.Neither the fund’s returns nor the index returns reflect the deduction of taxes that a shareholder would pay on fund distributions or redemptions of fund shares.The fund’s past performance is not a good predictor of the fund’s future performance.Updated performance information can be found at www.troweprice.com.
What are some fund statistics?
- Total Net Assets (000s)$13,610,813
- Number of Portfolio Holdings305
- Investment Advisory Fees Paid (000s)$37,648
- Portfolio Turnover Rate37.6%
What did the fund invest in?
Sector Allocation (as a % of Net Assets)
| Information Technology | 32.4% |
| Financials | 14.0 |
| Consumer Discretionary | 11.3 |
| Health Care | 10.2 |
| Communication Services | 9.4 |
| Industrials & Business Services | 7.3 |
| Consumer Staples | 5.4 |
| Energy | 3.2 |
| Utilities | 2.3 |
| Other | 4.5 |
Top Ten Holdings (as a % of Net Assets)
| Apple | 8.1% |
| NVIDIA | 7.1 |
| Microsoft | 6.5 |
| Amazon.com | 4.3 |
| Alphabet | 4.1 |
| Broadcom | 2.8 |
| Meta Platforms | 2.7 |
| Tesla | 2.3 |
| Eli Lilly | 1.9 |
| JPMorgan Chase | 1.3 |
If you invest directly with T. Rowe Price, you can elect to receive future shareholder reports or other important documents through electronic delivery by enrolling at www.troweprice.com/paperless. If you invest through a financial intermediary such as an investment advisor, a bank, retirement plan sponsor or a brokerage firm, please contact that organization and ask if it can provide electronic delivery.
Frank Russell Company "LSE" and S&P do not accept any liability for any errors or omissions in the indexes or data, and hereby expressly disclaim all warranties of originality, accuracy, completeness, timeliness, merchantability and fitness for a particular purpose. No party may rely on any indexes or data contained in this communication. Visit www.troweprice.com/en/us/market-data-disclosures for additional legal notices & disclaimers.
U.S. Equity Research Fund
Z Class (PCUZX)
T. Rowe Price Investment Services, Inc.
100 East Pratt Street
Baltimore, MD 21202
Item 1. (b) Notice pursuant to Rule 30e-3.
Not applicable.
Item 2. Code of Ethics.
The registrant has adopted a code of ethics, as defined in Item 2 of Form N-CSR, applicable to its principal executive officer, principal financial officer, principal accounting officer or controller, or persons performing similar functions. A copy of this code of ethics is filed as an exhibit to this Form N-CSR. No substantive amendments were approved or waivers were granted to this code of ethics during the period covered by this report.
Item 3. Audit Committee Financial Expert.
The registrant’s Board of Directors has determined that Mr. Paul F. McBride qualifies as an audit committee financial expert, as defined in Item 3 of Form N-CSR. Mr. McBride is considered independent for purposes of Item 3 of Form N-CSR.
Item 4. Principal Accountant Fees and Services.
(a) – (d) Aggregate fees billed for the last two fiscal years for professional services rendered to, or on behalf of, the registrant by the registrant’s principal accountant were as follows:
| | | | | | | | | | |
| | | 2024 | | | 2023 | | | |
| | | | | | | |
Audit Fees | | | $23,525 | | | | $23,064 | |
Audit-Related Fees | | | - | | | | - | |
Tax Fees | | | - | | | | - | |
All Other Fees | | | - | | | | - | | | |
Audit fees include amounts related to the audit of the registrant’s annual financial statements and services normally provided by the accountant in connection with statutory and regulatory filings. Audit-related fees include amounts reasonably related to the performance of the audit of the registrant’s financial statements and specifically include the issuance of a report on internal controls and, if applicable, agreed-upon procedures related to fund acquisitions. Tax fees include amounts related to services for tax compliance, tax planning, and tax advice. The nature of these services specifically includes the review of distribution calculations and the preparation of Federal, state, and excise tax returns. All other fees include the registrant’s pro-rata share of amounts for agreed-upon procedures in conjunction with service contract approvals by the registrant’s Board of Directors/Trustees.
(e)(1) The registrant’s audit committee has adopted a policy whereby audit and non-audit services performed by the registrant’s principal accountant for the registrant, its investment adviser, and any entity controlling, controlled by, or under common control with the investment adviser that provides ongoing services to the registrant require pre-approval in advance at regularly scheduled audit committee meetings. If such a service is required between regularly scheduled audit committee meetings, pre-approval may be authorized by one audit committee member with ratification at the next scheduled audit committee meeting. Waiver of pre-approval for audit or non-audit services requiring fees of a de minimis amount is not permitted.
(2) No services included in (b) – (d) above were approved pursuant to paragraph (c)(7)(i)(C) of Rule 2-01 of Regulation S-X.
(f) Less than 50 percent of the hours expended on the principal accountant’s engagement to audit the registrant’s financial statements for the most recent fiscal year were attributed to work performed by persons other than the principal accountant’s full-time, permanent employees.
(g) The aggregate fees billed for the most recent fiscal year and the preceding fiscal year by the registrant’s principal accountant for non-audit services rendered to the registrant, its investment adviser, and any entity controlling, controlled by, or under common control with the investment adviser that provides ongoing services to the registrant were $1,262,000 and $1,524,000, respectively.
(h) All non-audit services rendered in (g) above were pre-approved by the registrant’s audit committee. Accordingly, these services were considered by the registrant’s audit committee in maintaining the principal accountant’s independence.
(i) Not applicable.
(j) Not applicable.
Item 5. Audit Committee of Listed Registrants.
Not applicable.
Item 6. Investments.
(a) Not applicable. The complete schedule of investments is included in Item 7 of this Form N-CSR.
(b) Not applicable.
Item 7. Financial Statements and Financial Highlights for Open-End Management Investment Companies.
(a – b) Report pursuant to Regulation S-X.
Financial
Highlights
Portfolio
of
Investments
Financial
Statements
and
Notes
Additional
Fund
Information
Financial
Statements
and
Other
Information
For
more
insights
from
T.
Rowe
Price
investment
professionals,
go
to
troweprice.com
.
T.
ROWE
PRICE
PRCOX
U.S.
Equity
Research
Fund
PACOX
U.S.
Equity
Research
Fund–
.
Advisor Class
RRCOX
U.S.
Equity
Research
Fund–
.
R Class
PCCOX
U.S.
Equity
Research
Fund–
.
I Class
PCUZX
U.S.
Equity
Research
Fund–
.
Z Class
T.
ROWE
PRICE
U.S.
Equity
Research
Fund
For
a
share
outstanding
throughout
each
period
The
accompanying
notes
are
an
integral
part
of
these
financial
statements.
Investor
Class
..
Year
..
..
Ended
.
12/31/24
12/31/23
12/31/22
12/31/21
12/31/20
NET
ASSET
VALUE
Beginning
of
period
$
46.54
$
36.28
$
45.23
$
36.67
$
30.93
Investment
activities
Net
investment
income
(1)(2)
0.41
0.42
0.36
0.34
0.46
Net
realized
and
unrealized
gain/loss
11.89
10.38
(8.85)
9.90
5.66
Total
from
investment
activities
12.30
10.80
(8.49)
10.24
6.12
Distributions
Net
investment
income
(0.37)
(0.54)
(0.32)
(0.31)
(0.32)
Net
realized
gain
—
—
(0.14)
(1.37)
(0.06)
Total
distributions
(0.37)
(0.54)
(0.46)
(1.68)
(0.38)
NET
ASSET
VALUE
End
of
period
$
58.47
$
46.54
$
36.28
$
45.23
$
36.67
Ratios/Supplemental
Data
Total
return
(2)(3)
26.42%
29.80%
(18.80)%
27.98%
19.81%
Ratios
to
average
net
assets:
(2)
Gross
expenses
before
waivers/payments
by
Price
Associates
0.45%
0.44%
0.45%
0.42%
0.45%
Net
expenses
after
waivers/
payments
by
Price
Associates
0.45%
0.44%
0.45%
0.42%
0.45%
Net
investment
income
0.75%
1.02%
0.92%
0.80%
1.47%
Portfolio
turnover
rate
37.6%
47.0%
45.4%
27.5%
35.6%
Net
assets,
end
of
period
(in
millions)
$7,029
$4,377
$3,155
$4,047
$2,210
0%
0%
0%
0%
0%
(1)
Per
share
amounts
calculated
using
average
shares
outstanding
method.
(2)
Includes
the
impact
of
expense-related
arrangements
with
Price
Associates.
(3)
Total
return
reflects
the
rate
that
an
investor
would
have
earned
on
an
investment
in
the
fund
during
each
period,
assuming
reinvestment
of
all
distributions,
and
payment
of
no
redemption
or
account
fees,
if
applicable.
T.
ROWE
PRICE
U.S.
Equity
Research
Fund
For
a
share
outstanding
throughout
each
period
The
accompanying
notes
are
an
integral
part
of
these
financial
statements.
Advisor
Class
..
Year
..
..
Ended
.
12/31/24
12/31/23
12/31/22
12/31/21
12/31/20
NET
ASSET
VALUE
Beginning
of
period
$
46.47
$
36.24
$
45.21
$
36.69
$
30.88
Investment
activities
Net
investment
income
(1)(2)
0.20
0.28
0.22
0.16
0.36
Net
realized
and
unrealized
gain/loss
11.86
10.36
(8.85)
9.87
5.64
Total
from
investment
activities
12.06
10.64
(8.63)
10.03
6.00
Distributions
Net
investment
income
(0.16)
(0.41)
(0.20)
(0.14)
(0.13)
Net
realized
gain
—
—
(0.14)
(1.37)
(0.06)
Total
distributions
(0.16)
(0.41)
(0.34)
(1.51)
(0.19)
NET
ASSET
VALUE
End
of
period
$
58.37
$
46.47
$
36.24
$
45.21
$
36.69
Ratios/Supplemental
Data
Total
return
(2)(3)
25.94%
29.37%
(19.11)%
27.39%
19.44%
Ratios
to
average
net
assets:
(2)
Gross
expenses
before
waivers/payments
by
Price
Associates
0.83%
0.78%
0.82%
0.86%
0.77%
Net
expenses
after
waivers/payments
by
Price
Associates
0.83%
0.78%
0.82%
0.86%
0.77%
Net
investment
income
0.37%
0.68%
0.55%
0.37%
1.17%
Portfolio
turnover
rate
37.6%
47.0%
45.4%
27.5%
35.6%
Net
assets,
end
of
period
(in
thousands)
$62,380
$48,264
$36,895
$35,556
$16,053
0%
0%
0%
0%
0%
(1)
Per
share
amounts
calculated
using
average
shares
outstanding
method.
(2)
Includes
the
impact
of
expense-related
arrangements
with
Price
Associates.
(3)
Total
return
reflects
the
rate
that
an
investor
would
have
earned
on
an
investment
in
the
fund
during
each
period,
assuming
reinvestment
of
all
distributions,
and
payment
of
no
redemption
or
account
fees,
if
applicable.
T.
ROWE
PRICE
U.S.
Equity
Research
Fund
For
a
share
outstanding
throughout
each
period
The
accompanying
notes
are
an
integral
part
of
these
financial
statements.
R
Class
..
Year
..
..
Ended
.
12/31/24
12/31/23
12/31/22
12/31/21
12/31/20
NET
ASSET
VALUE
Beginning
of
period
$
45.97
$
35.90
$
44.82
$
36.42
$
30.76
Investment
activities
Net
investment
income
(1)(2)
0.01
0.15
0.10
0.07
0.25
Net
realized
and
unrealized
gain/loss
11.71
10.26
(8.77)
9.80
5.61
Total
from
investment
activities
11.72
10.41
(8.67)
9.87
5.86
Distributions
Net
investment
income
—
(0.34)
(0.11)
(0.10)
(0.14)
Net
realized
gain
—
—
(0.14)
(1.37)
(0.06)
Total
distributions
—
(0.34)
(0.25)
(1.47)
(0.20)
NET
ASSET
VALUE
End
of
period
$
57.69
$
45.97
$
35.90
$
44.82
$
36.42
Ratios/Supplemental
Data
Total
return
(2)(3)
25.49%
29.00%
(19.35)%
27.15%
19.06%
Ratios
to
average
net
assets:
(2)
Gross
expenses
before
waivers/payments
by
Price
Associates
1.17%
1.08%
1.12%
1.09%
1.09%
Net
expenses
after
waivers/payments
by
Price
Associates
1.17%
1.08%
1.12%
1.09%
1.09%
Net
investment
income
0.02%
0.38%
0.25%
0.17%
0.82%
Portfolio
turnover
rate
37.6%
47.0%
45.4%
27.5%
35.6%
Net
assets,
end
of
period
(in
thousands)
$133,468
$117,609
$81,938
$97,801
$13,750
0%
0%
0%
0%
0%
(1)
Per
share
amounts
calculated
using
average
shares
outstanding
method.
(2)
Includes
the
impact
of
expense-related
arrangements
with
Price
Associates.
(3)
Total
return
reflects
the
rate
that
an
investor
would
have
earned
on
an
investment
in
the
fund
during
each
period,
assuming
reinvestment
of
all
distributions,
and
payment
of
no
redemption
or
account
fees,
if
applicable.
T.
ROWE
PRICE
U.S.
Equity
Research
Fund
For
a
share
outstanding
throughout
each
period
The
accompanying
notes
are
an
integral
part
of
these
financial
statements.
I
Class
..
Year
..
..
Ended
.
12/31/24
12/31/23
12/31/22
12/31/21
12/31/20
NET
ASSET
VALUE
Beginning
of
period
$
46.58
$
36.30
$
45.25
$
36.68
$
30.93
Investment
activities
Net
investment
income
(1)(2)
0.46
0.46
0.40
0.37
0.48
Net
realized
and
unrealized
gain/loss
11.92
10.39
(8.85)
9.91
5.68
Total
from
investment
activities
12.38
10.85
(8.45)
10.28
6.16
Distributions
Net
investment
income
(0.41)
(0.57)
(0.36)
(0.34)
(0.35)
Net
realized
gain
—
—
(0.14)
(1.37)
(0.06)
Total
distributions
(0.41)
(0.57)
(0.50)
(1.71)
(0.41)
NET
ASSET
VALUE
End
of
period
$
58.55
$
46.58
$
36.30
$
45.25
$
36.68
Ratios/Supplemental
Data
Total
return
(2)(3)
26.56%
29.91%
(18.72)%
28.09%
19.94%
Ratios
to
average
net
assets:
(2)
Gross
expenses
before
waivers/payments
by
Price
Associates
0.34%
0.35%
0.35%
0.34%
0.35%
Net
expenses
after
waivers/payments
by
Price
Associates
0.34%
0.35%
0.35%
0.34%
0.35%
Net
investment
income
0.86%
1.11%
1.03%
0.88%
1.50%
Portfolio
turnover
rate
37.6%
47.0%
45.4%
27.5%
35.6%
Net
assets,
end
of
period
(in
millions)
$6,386
$4,830
$4,162
$4,519
$3,650
0%
0%
0%
0%
0%
(1)
Per
share
amounts
calculated
using
average
shares
outstanding
method.
(2)
Includes
the
impact
of
expense-related
arrangements
with
Price
Associates.
(3)
Total
return
reflects
the
rate
that
an
investor
would
have
earned
on
an
investment
in
the
fund
during
each
period,
assuming
reinvestment
of
all
distributions,
and
payment
of
no
redemption
or
account
fees,
if
applicable.
T.
ROWE
PRICE
U.S.
Equity
Research
Fund
For
a
share
outstanding
throughout
each
period
The
accompanying
notes
are
an
integral
part
of
these
financial
statements.
Z
Class
(1)
..
Year
..
..
Ended
.
11/23/21
(1)
Through
12/31/21
12/31/24
12/31/23
12/31/22
NET
ASSET
VALUE
Beginning
of
period
$
46.44
$
36.17
$
45.09
$
46.17
Investment
activities
Net
investment
income
(2)(3)
0.55
0.58
0.54
0.06
Net
realized
and
unrealized
gain/loss
12.00
10.39
(8.83)
0.70
Total
from
investment
activities
12.55
10.97
(8.29)
0.76
Distributions
Net
investment
income
—
(0.70)
(0.49)
(0.47)
Net
realized
gain
—
—
(0.14)
(1.37)
Total
distributions
—
(0.70)
(0.63)
(1.84)
NET
ASSET
VALUE
End
of
period
$
58.99
$
46.44
$
36.17
$
45.09
Ratios/Supplemental
Data
Total
return
(3)(4)
27.02%
30.37%
(18.44)%
1.70%
Ratios
to
average
net
assets:
(3)
Gross
expenses
before
waivers/payments
by
Price
Associates
0.33%
0.34%
0.34%
0.33%
(5)
Net
expenses
after
waivers/payments
by
Price
Associates
0.00%
0.00%
0.00%
0.00%
(5)
Net
investment
income
1.12%
1.43%
1.42%
1.33%
(5)
Portfolio
turnover
rate
37.6%
47.0%
45.4%
27.5%
Net
assets,
end
of
period
(in
thousands)
$14
$1,325,814
$3,922,679
$787,784
0%
0%
0%
0%
(1)
Inception
date
(2)
Per
share
amounts
calculated
using
average
shares
outstanding
method.
(3)
Includes
the
impact
of
expense-related
arrangements
with
Price
Associates.
(4)
Total
return
reflects
the
rate
that
an
investor
would
have
earned
on
an
investment
in
the
fund
during
each
period,
assuming
reinvestment
of
all
distributions,
and
payment
of
no
redemption
or
account
fees,
if
applicable.
Total
return
is
not
annualized
for
periods
less
than
one
year.
(5)
Annualized
T.
ROWE
PRICE
U.S.
Equity
Research
Fund
December
31,
2024
Shares/Par
$
Value
(Cost
and
value
in
$000s)
‡
COMMON
STOCKS
99.1%
COMMUNICATION
SERVICES
9.4%
Diversified
Telecommunication
Services
0.1%
AT&T
379,587
8,643
8,643
Entertainment
1.3%
Netflix (1)
149,200
132,985
Spotify
Technology (1)
26,199
11,721
Walt
Disney
244,895
27,269
171,975
Interactive
Media
&
Services
6.8%
Alphabet,
Class
A
1,175,550
222,532
Alphabet,
Class
C
1,744,173
332,160
Meta
Platforms,
Class
A
625,550
366,266
Pinterest,
Class
A (1)
374,668
10,865
931,823
Media
0.5%
Charter
Communications,
Class
A (1)
91,284
31,289
Comcast,
Class
A
1,106,813
41,539
72,828
Wireless
Telecommunication
Services
0.7%
T-Mobile
U.S.
420,214
92,754
92,754
Total
Communication
Services
1,278,023
CONSUMER
DISCRETIONARY
11.3%
Automobiles
2.3%
Tesla (1)
777,859
314,131
314,131
Broadline
Retail
4.3%
Amazon.com (1)
2,643,974
580,061
580,061
Hotels,
Restaurants
&
Leisure
2.1%
Airbnb,
Class
A (1)
30,689
4,033
Booking
Holdings
9,537
47,384
Chipotle
Mexican
Grill (1)
623,359
37,589
Domino's
Pizza
15,614
6,554
Hilton
Worldwide
Holdings
93,956
23,222
Las
Vegas
Sands
352,480
18,103
Marriott
International,
Class
A
90,464
25,234
T.
ROWE
PRICE
U.S.
Equity
Research
Fund
Shares/Par
$
Value
(Cost
and
value
in
$000s)
‡
McDonald's
233,072
67,565
Norwegian
Cruise
Line
Holdings (1)
237,113
6,101
Royal
Caribbean
Cruises
107,796
24,868
Starbucks
100,471
9,168
Wingstop
21,903
6,225
Wynn
Resorts
67,622
5,826
281,872
Household
Durables
0.2%
NVR (1)
3,732
30,524
30,524
Specialty
Retail
2.0%
AutoZone (1)
6,388
20,454
Bath
&
Body
Works
83,293
3,229
Burlington
Stores (1)
46,668
13,303
Home
Depot
298,607
116,155
Lowe's
141,433
34,906
O'Reilly
Automotive (1)
20,844
24,717
Ross
Stores
173,388
26,229
TJX
252,380
30,490
Ulta
Beauty (1)
13,439
5,845
275,328
Textiles,
Apparel
&
Luxury
Goods
0.4%
Deckers
Outdoor (1)
51,300
10,419
Lululemon
Athletica (1)
73,414
28,074
NIKE,
Class
B
64,040
4,846
Tapestry
264,949
17,309
60,648
Total
Consumer
Discretionary
1,542,564
CONSUMER
STAPLES
5.4%
Beverages
1.4%
Coca-Cola
1,372,705
85,465
Constellation
Brands,
Class
A
45,221
9,994
Keurig
Dr
Pepper
1,190,860
38,250
Monster
Beverage (1)
123,551
6,494
PepsiCo
346,878
52,746
192,949
Consumer
Staples
Distribution
&
Retail
1.9%
Costco
Wholesale
118,153
108,260
Dollar
General
150,942
11,444
Sysco
44,124
3,374
Target
125,143
16,917
T.
ROWE
PRICE
U.S.
Equity
Research
Fund
Shares/Par
$
Value
(Cost
and
value
in
$000s)
‡
Walmart
1,240,395
112,070
252,065
Food
Products
0.1%
Lamb
Weston
Holdings
35,000
2,339
Mondelez
International,
Class
A
175,606
10,489
12,828
Household
Products
1.1%
Clorox
59,000
9,582
Colgate-Palmolive
264,509
24,047
Kimberly-Clark
93,120
12,202
Procter
&
Gamble
585,221
98,112
143,943
Personal
Care
Products
0.2%
Kenvue
1,283,734
27,408
27,408
Tobacco
0.7%
Altria
Group
250,760
13,112
Philip
Morris
International
644,654
77,584
90,696
Total
Consumer
Staples
719,889
ENERGY
3.2%
Energy
Equipment
&
Services
0.2%
Schlumberger
855,126
32,785
32,785
Oil,
Gas
&
Consumable
Fuels
3.0%
Chevron
415,050
60,116
ConocoPhillips
530,662
52,626
Diamondback
Energy
96,395
15,792
EOG
Resources
210,170
25,762
EQT
212,789
9,812
Expand
Energy
48,249
4,803
Exxon
Mobil
1,212,870
130,468
Hess
34,727
4,619
Marathon
Petroleum
138,322
19,296
Phillips
66
42,120
4,799
Suncor
Energy
144,341
5,150
Targa
Resources
126,011
22,493
Texas
Pacific
Land
5,500
6,083
Valero
Energy
142,910
17,519
T.
ROWE
PRICE
U.S.
Equity
Research
Fund
Shares/Par
$
Value
(Cost
and
value
in
$000s)
‡
Williams
568,195
30,751
410,089
Total
Energy
442,874
FINANCIALS
14.0%
Banks
3.5%
Bank
of
America
2,460,372
108,133
Citigroup
991,938
69,823
Fifth
Third
Bancorp
373,893
15,808
Huntington
Bancshares
1,058,727
17,225
JPMorgan
Chase
753,079
180,521
KeyCorp
538,545
9,231
Popular
64,920
6,106
Truist
Financial
97,484
4,229
Wells
Fargo
814,216
57,191
Western
Alliance
Bancorp
78,673
6,572
474,839
Capital
Markets
2.8%
Ares
Management,
Class
A
89,883
15,912
Bank
of
New
York
Mellon
280,513
21,552
Blackrock
35,399
36,288
Blackstone
65,473
11,289
Cboe
Global
Markets
46,194
9,026
Charles
Schwab
699,971
51,805
CME
Group
129,755
30,133
Goldman
Sachs
Group
73,138
41,880
KKR
226,559
33,510
Moody's
16,225
7,681
Morgan
Stanley
285,944
35,949
S&P
Global
88,134
43,893
State
Street
174,428
17,120
TPG (2)
125,940
7,914
Tradeweb
Markets,
Class
A
96,619
12,649
376,601
Consumer
Finance
0.5%
American
Express
128,467
38,128
Capital
One
Financial
76,986
13,728
Synchrony
Financial
269,203
17,498
69,354
Financial
Services
5.1%
Apollo
Global
Management
149,448
24,683
Berkshire
Hathaway,
Class
B (1)
352,508
159,785
T.
ROWE
PRICE
U.S.
Equity
Research
Fund
Shares/Par
$
Value
(Cost
and
value
in
$000s)
‡
Block (1)
90,557
7,696
Corebridge
Financial
910,731
27,258
Corpay (1)
138,552
46,889
Equitable
Holdings
398,435
18,794
Fiserv (1)
344,603
70,788
Global
Payments
183,379
20,550
Mastercard,
Class
A
243,293
128,111
Visa,
Class
A
539,976
170,654
Voya
Financial
235,651
16,220
691,428
Insurance
2.1%
Allstate
199,439
38,450
American
International
Group
440,459
32,065
Axis
Capital
Holdings
91,267
8,088
Chubb
234,591
64,818
Hartford
Financial
Services
Group
237,906
26,027
Marsh
&
McLennan
162,215
34,456
MetLife
417,851
34,214
Progressive
33,864
8,114
RenaissanceRe
Holdings
73,724
18,343
Travelers
80,563
19,407
283,982
Mortgage
Real
Estate
Investment
Trusts
0.0%
Annaly
Capital
Management,
REIT
376,038
6,881
6,881
Total
Financials
1,903,085
HEALTH
CARE
10.2%
Biotechnology
1.5%
AbbVie
409,790
72,820
Amgen
128,295
33,439
BeiGene,
ADR (1)
52,722
9,738
Biogen (1)
88,959
13,604
Gilead
Sciences
253,183
23,387
Regeneron
Pharmaceuticals (1)
51,930
36,991
Vertex
Pharmaceuticals (1)
45,998
18,523
208,502
Health
Care
Equipment
&
Supplies
1.9%
Abbott
Laboratories
191,995
21,717
Becton
Dickinson
&
Company
126,811
28,770
Boston
Scientific (1)
333,279
29,768
Cooper (1)
149,373
13,732
T.
ROWE
PRICE
U.S.
Equity
Research
Fund
Shares/Par
$
Value
(Cost
and
value
in
$000s)
‡
Edwards
Lifesciences (1)
195,100
14,443
Intuitive
Surgical (1)
124,109
64,780
Medtronic
177,002
14,139
Stryker
133,365
48,018
Zimmer
Biomet
Holdings
235,266
24,851
260,218
Health
Care
Providers
&
Services
2.1%
Cencora
82,657
18,571
Cigna
Group
113,928
31,460
CVS
Health
242,262
10,875
Elevance
Health
90,351
33,331
McKesson
40,473
23,066
Molina
Healthcare (1)
36,310
10,568
Quest
Diagnostics
92,498
13,954
Tenet
Healthcare (1)
104,724
13,219
UnitedHealth
Group
269,690
136,426
291,470
Life
Sciences
Tools
&
Services
1.4%
Danaher
290,293
66,637
ICON (1)
31,668
6,641
Mettler-Toledo
International (1)
16,629
20,348
Repligen (1)
98,632
14,197
Thermo
Fisher
Scientific
151,661
78,899
186,722
Pharmaceuticals
3.3%
AstraZeneca,
ADR
200,840
13,159
Bristol-Myers
Squibb
132,922
7,518
Eli
Lilly
338,282
261,154
Johnson
&
Johnson
433,017
62,623
Merck
529,047
52,630
Pfizer
780,675
20,711
Sanofi,
ADR
227,227
10,959
Viatris
1,415,378
17,621
Zoetis
22,333
3,639
450,014
Total
Health
Care
1,396,926
INDUSTRIALS
&
BUSINESS
SERVICES
7.3%
Aerospace
&
Defense
1.7%
Boeing (1)
286,429
50,698
General
Electric
375,306
62,597
Howmet
Aerospace
177,421
19,404
T.
ROWE
PRICE
U.S.
Equity
Research
Fund
Shares/Par
$
Value
(Cost
and
value
in
$000s)
‡
L3Harris
Technologies
97,492
20,501
Lockheed
Martin
13,144
6,387
Northrop
Grumman
68,844
32,308
RTX
154,367
17,863
TransDigm
Group
14,182
17,973
227,731
Air
Freight
&
Logistics
0.1%
FedEx
48,166
13,551
13,551
Building
Products
0.4%
Carrier
Global
271,165
18,510
Johnson
Controls
International
143,084
11,294
Trane
Technologies
57,064
21,076
Trex (1)
19,500
1,346
52,226
Commercial
Services
&
Supplies
0.5%
Cintas
110,491
20,187
Copart (1)
260,048
14,924
Republic
Services
36,362
7,315
Waste
Connections
64,044
10,989
Waste
Management
72,158
14,561
67,976
Electrical
Equipment
0.8%
Emerson
Electric
102,260
12,673
GE
Vernova
114,356
37,615
Hubbell
47,142
19,747
Rockwell
Automation
93,865
26,826
Vertiv
Holdings,
Class
A
71,498
8,123
104,984
Ground
Transportation
1.2%
CSX
1,389,087
44,826
Norfolk
Southern
153,556
36,039
Old
Dominion
Freight
Line
200,244
35,323
Saia (1)
37,185
16,946
Uber
Technologies (1)
538,374
32,475
165,609
Industrial
Conglomerates
0.5%
Honeywell
International
186,654
42,163
Roper
Technologies
48,002
24,954
67,117
T.
ROWE
PRICE
U.S.
Equity
Research
Fund
Shares/Par
$
Value
(Cost
and
value
in
$000s)
‡
Machinery
1.5%
Caterpillar
45,886
16,646
Cummins
112,359
39,168
Deere
80,981
34,312
Dover
102,631
19,254
Esab
79,977
9,592
Fortive
320,108
24,008
IDEX
68,918
14,424
Ingersoll
Rand
151,019
13,661
Stanley
Black
&
Decker
410,040
32,922
Xylem
17,729
2,057
206,044
Passenger
Airlines
0.1%
Delta
Air
Lines
90,641
5,484
United
Airlines
Holdings (1)
110,976
10,776
16,260
Professional
Services
0.3%
Booz
Allen
Hamilton
Holding
35,897
4,620
Equifax
53,341
13,594
Paylocity
Holding (1)
50,741
10,121
Verisk
Analytics
53,968
14,865
43,200
Trading
Companies
&
Distributors
0.2%
Fastenal
188,794
13,576
SiteOne
Landscape
Supply (1)
71,831
9,465
WW
Grainger
7,565
7,974
31,015
Total
Industrials
&
Business
Services
995,713
INFORMATION
TECHNOLOGY
32.4%
Communications
Equipment
0.5%
Arista
Networks (1)
167,889
18,557
Cisco
Systems
755,816
44,744
63,301
Electronic
Equipment,
Instruments
&
Components
0.9%
Amphenol,
Class
A
451,593
31,363
Keysight
Technologies (1)
185,537
29,803
TE
Connectivity
60,818
8,695
Teledyne
Technologies (1)
53,178
24,681
Zebra
Technologies,
Class
A (1)
56,099
21,667
116,209
T.
ROWE
PRICE
U.S.
Equity
Research
Fund
Shares/Par
$
Value
(Cost
and
value
in
$000s)
‡
IT
Services
0.9%
Accenture,
Class
A
235,751
82,935
Gartner (1)
10,759
5,212
International
Business
Machines
129,221
28,407
Shopify,
Class
A (1)
33,808
3,595
120,149
Semiconductors
&
Semiconductor
Equipment
11.1%
Analog
Devices
187,782
39,896
Broadcom
1,639,630
380,132
First
Solar (1)
42,100
7,420
KLA
6,691
4,216
Marvell
Technology
446,869
49,357
Micron
Technology
32,454
2,731
NVIDIA
7,174,460
963,458
QUALCOMM
437,533
67,214
1,514,424
Software
10.7%
Adobe (1)
115,557
51,386
Autodesk (1)
81,830
24,186
Cadence
Design
Systems (1)
144,485
43,412
Crowdstrike
Holdings,
Class
A (1)
49,197
16,833
Descartes
Systems
Group (1)
29,846
3,390
Dynatrace (1)
175,993
9,565
Fair
Isaac (1)
9,277
18,470
Fortinet (1)
548,449
51,817
Gen
Digital
853,543
23,370
HubSpot (1)
12,431
8,662
Intuit
77,483
48,698
Microsoft
2,084,175
878,480
Oracle
432,360
72,048
Palo
Alto
Networks (1)
74,900
13,629
Salesforce
369,556
123,554
ServiceNow (1)
43,260
45,861
Synopsys (1)
47,111
22,866
Zscaler (1)
32,303
5,828
1,462,055
Technology
Hardware,
Storage
&
Peripherals
8.3%
Apple
4,404,487
1,102,972
Pure
Storage,
Class
A (1)
124,488
7,647
Western
Digital (1)
235,034
14,015
1,124,634
Total
Information
Technology
4,400,772
T.
ROWE
PRICE
U.S.
Equity
Research
Fund
Shares/Par
$
Value
(Cost
and
value
in
$000s)
‡
MATERIALS
1.8%
Chemicals
1.0%
CF
Industries
Holdings
171,395
14,623
Linde
191,969
80,372
Mosaic
296,316
7,284
RPM
International
23,324
2,870
Sherwin-Williams
79,040
26,868
132,017
Construction
Materials
0.1%
Vulcan
Materials
61,446
15,806
15,806
Containers
&
Packaging
0.3%
Ball
226,805
12,504
International
Paper
147,740
7,951
Packaging
Corp.
of
America
67,216
15,132
35,587
Metals
&
Mining
0.3%
Franco-Nevada
119,608
14,065
Freeport-McMoRan
496,342
18,901
Steel
Dynamics
129,405
14,761
47,727
Paper
&
Forest
Products
0.1%
West
Fraser
Timber (2)
156,356
13,533
13,533
Total
Materials
244,670
REAL
ESTATE
1.8%
Health
Care
Real
Estate
Investment
Trusts
0.2%
Welltower,
REIT
199,477
25,140
25,140
Industrial
Real
Estate
Investment
Trusts
0.4%
Prologis,
REIT
290,180
30,672
Rexford
Industrial
Realty,
REIT
485,234
18,759
49,431
Real
Estate
Management
&
Development
0.1%
CBRE
Group,
Class
A (1)
83,830
11,006
CoStar
Group (1)
75,493
5,405
16,411
Residential
Real
Estate
Investment
Trusts
0.3%
American
Homes
4
Rent,
Class
A,
REIT
147,492���
5,519
T.
ROWE
PRICE
U.S.
Equity
Research
Fund
Shares/Par
$
Value
(Cost
and
value
in
$000s)
‡
AvalonBay
Communities,
REIT
37,226
8,189
Camden
Property
Trust,
REIT
21,354
2,478
Essex
Property
Trust,
REIT
41,415
11,821
Sun
Communities,
REIT
100,959
12,415
40,422
Retail
Real
Estate
Investment
Trusts
0.2%
Kimco
Realty,
REIT
331,209
7,760
Regency
Centers,
REIT
95,448
7,056
Simon
Property
Group,
REIT
51,819
8,924
23,740
Specialized
Real
Estate
Investment
Trusts
0.6%
American
Tower,
REIT
156,641
28,729
CubeSmart,
REIT
119,091
5,103
Equinix,
REIT
37,548
35,404
Public
Storage,
REIT
64,755
19,390
88,626
Total
Real
Estate
243,770
UTILITIES
2.3%
Electric
Utilities
1.8%
Constellation
Energy
172,491
38,588
Duke
Energy
18,497
1,993
Entergy
203,024
15,393
Evergy
126,556
7,789
Exelon
831,466
31,296
FirstEnergy
151,124
6,012
NextEra
Energy
834,786
59,846
PG&E
2,140,543
43,196
Southern
213,580
17,582
Xcel
Energy
438,179
29,586
251,281
Gas
Utilities
0.1%
Atmos
Energy
96,579
13,451
13,451
Independent
Power
&
Renewable
Electricity
Producers
0.1%
Vistra
85,730
11,820
11,820
Multi-Utilities
0.3%
Ameren
343,936
30,658
CMS
Energy
145,824
9,719
T.
ROWE
PRICE
U.S.
Equity
Research
Fund
Shares/Par
$
Value
(Cost
and
value
in
$000s)
‡
Sempra
16,720
1,467
41,844
Total
Utilities
318,396
Total
Common
Stocks
(Cost
$9,327,927)
13,486,682
SHORT-TERM
INVESTMENTS
0.6%
Money
Market
Funds
0.6%
T.
Rowe
Price
Treasury
Reserve
Fund,
4.52% (3)(4)
86,821,803
86,822
86,822
U.S.
Treasury
Obligations
0.0%
U.S.
Treasury
Bills,
4.25%,
3/18/25 (5)
600,000
595
U.S.
Treasury
Bills,
4.289%,
2/20/25 (5)
590,000
587
U.S.
Treasury
Bills,
4.441%,
2/25/25 (5)
420,000
417
U.S.
Treasury
Bills,
4.622%,
3/13/25 (5)
2,800,000
2,777
4,376
Total
Short-Term
Investments
(Cost
$91,195)
91,198
SECURITIES
LENDING
COLLATERAL
0.1%
INVESTMENTS
IN
A
POOLED
ACCOUNT
THROUGH
SECURITIES
LENDING
PROGRAM
WITH
STATE
STREET
BANK
AND
TRUST
COMPANY 0.1%
Money
Market
Funds 0.1%
T.
Rowe
Price
Government
Reserve
Fund,
4.53% (3)(4)
8,557,219
8,557
Total
Investments
in
a
Pooled
Account
through
Securities
Lending
Program
with
State
Street
Bank
and
Trust
Company
8,557
Total
Securities
Lending
Collateral
(Cost
$8,557)
8,557
Total
Investments
in
Securities
99.8%
of
Net
Assets
(Cost
$9,427,679)
$
13,586,437
‡
Shares/Par
and
Notional
Amount
are
denominated
in
U.S.
dollars
unless
otherwise
noted.
(1)
Non-income
producing
(2)
See
Note
4
.
All
or
a
portion
of
this
security
is
on
loan
at
December
31,
2024.
(3)
Seven-day
yield
(4)
Affiliated
Companies
T.
ROWE
PRICE
U.S.
Equity
Research
Fund
.
.
.
.
.
.
.
.
.
.
(5)
At
December
31,
2024,
all
or
a
portion
of
this
security
is
pledged
as
collateral
and/or
margin
deposit
to
cover
future
funding
obligations.
ADR
American
Depositary
Receipts
REIT
A
domestic
Real
Estate
Investment
Trust
whose
distributions
pass-through
with
original
tax
character
to
the
shareholder
T.
ROWE
PRICE
U.S.
Equity
Research
Fund
FUTURES
CONTRACTS
($000s)
Expiration
Date
Notional
Amount
Value
and
Unrealized
Gain
(Loss)
Long,
279
S&P
500
E-Mini
Index
contracts
3/25
82,804
$
(2,616)
Net
payments
(receipts)
of
variation
margin
to
date
2,295
Variation
margin
receivable
(payable)
on
open
futures
contracts
$
(321)
T.
ROWE
PRICE
U.S.
Equity
Research
Fund
The
accompanying
notes
are
an
integral
part
of
these
financial
statements.
AFFILIATED
COMPANIES
($000s)
The
fund
may
invest
in
certain
securities
that
are
considered
affiliated
companies.
As
defined
by
the
1940
Act,
an
affiliated
company
is
one
in
which
the
fund
owns
5%
or
more
of
the
outstanding
voting
securities,
or
a
company
that
is
under
common
ownership
or
control.
The
following
securities
were
considered
affiliated
companies
for
all
or
some
portion
of
the
year
ended
December
31,
2024.
Net
realized
gain
(loss),
investment
income,
change
in
net
unrealized
gain/loss,
and
purchase
and
sales
cost
reflect
all
activity
for
the
period
then
ended.
Affiliate
Net
Realized
Gain
(Loss)
Change
in
Net
Unrealized
Gain/Loss
Investment
Income
T.
Rowe
Price
Government
Reserve
Fund,
4.53%
$
—
$
—
$
—++
T.
Rowe
Price
Treasury
Reserve
Fund,
4.52%
—
—
2,763
Totals
$
—#
$
—
$
2,763+
Supplementary
Investment
Schedule
Affiliate
Value
12/31/23
Purchase
Cost
Sales
Cost
Value
12/31/24
T.
Rowe
Price
Government
Reserve
Fund,
4.53%
$
20,562
¤
¤
$
8,557
T.
Rowe
Price
Treasury
Reserve
Fund,
4.52%
51,266
¤
¤
86,822
Total
$
95,379^
#
Capital
gain
distributions
from
underlying
Price
funds
represented
$0
of
the
net
realized
gain
(loss).
++
Excludes
earnings
on
securities
lending
collateral,
which
are
subject
to
rebates
and
fees
as
described
in
Note
4
.
+
Investment
income
comprised
$2,763
of
dividend
income
and
$0
of
interest
income.
¤
Purchase
and
sale
information
not
shown
for
cash
management
funds.
^
The
cost
basis
of
investments
in
affiliated
companies
was
$95,379.
T.
ROWE
PRICE
U.S.
Equity
Research
Fund
December
31,
2024
Statement
of
Assets
and
Liabilities
($000s,
except
shares
and
per
share
amounts)
Assets
Investments
in
securities,
at
value
(cost
$9,427,679)
$
13,586,437
Receivable
for
shares
sold
50,473
Dividends
and
interest
receivable
6,921
Receivable
for
investment
securities
sold
2,770
Cash
1
Other
assets
652
Total
assets
13,647,254
Liabilities
Payable
for
investment
securities
purchased
16,597
Obligation
to
return
securities
lending
collateral
8,557
Payable
for
shares
redeemed
6,325
Investment
management
fees
payable
3,777
Variation
margin
payable
on
futures
contracts
321
Due
to
affiliates
163
Payable
to
directors
10
Other
liabilities
691
Total
liabilities
36,441
NET
ASSETS
$
13,610,813
T.
ROWE
PRICE
U.S.
Equity
Research
Fund
December
31,
2024
Statement
of
Assets
and
Liabilities
($000s,
except
shares
and
per
share
amounts)
The
accompanying
notes
are
an
integral
part
of
these
financial
statements.
Net
Assets
Consist
of:
Total
distributable
earnings
(loss)
$
4,001,247
Paid-in
capital
applicable
to
232,668,588
shares
of
$0.0001
par
value
capital
stock
outstanding;
1,000,000,000
shares
authorized
9,609,566
NET
ASSETS
$
13,610,813
NET
ASSET
VALUE
PER
SHARE
Investor
Class
(Net
assets:
$7,029,373;
Shares
outstanding:
120,228,270)
$
58.47
Advisor
Class
(Net
assets:
$62,380;
Shares
outstanding:
1,068,626)
$
58.37
R
Class
(Net
assets:
$133,468;
Shares
outstanding:
2,313,360)
$
57.69
I
Class
(Net
assets:
$6,385,578;
Shares
outstanding:
109,058,098)
$
58.55
Z
Class
(Net
assets:
$14;
Shares
outstanding:
234)
$
58.99
T.
ROWE
PRICE
U.S.
Equity
Research
Fund
Year
Ended
12/31/24
Investment
Income
(Loss)
Income
Dividend
(net
of
foreign
taxes
of
$169)
$
141,898
Securities
lending
222
.
Interest
182
Other
1
Total
income
142,303
Expenses
Investment
management
38,403
Shareholder
servicing
Investor
Class
$
6,686
Advisor
Class
146
R
Class
443
I
Class
396
7,671
Rule
12b-1
fees
Advisor
Class
149
R
Class
650
799
Prospectus
and
shareholder
reports
Investor
Class
168
Advisor
Class
2
R
Class
2
I
Class
132
304
Custody
and
accounting
395
Registration
348
Directors
38
Legal
and
audit
2
9
Miscellaneous
51
Waived
/
paid
by
Price
Associates
(755)
Total
expenses
47,283
Net
investment
income
95,020
T.
ROWE
PRICE
U.S.
Equity
Research
Fund
The
accompanying
notes
are
an
integral
part
of
these
financial
statements.
Year
Ended
12/31/24
Realized
and
Unrealized
Gain
/
Loss
–
Net
realized
gain
(loss)
Securities
874,371
Futures
10,411
Foreign
currency
transactions
(5)
Net
realized
gain
884,777
Change
in
net
unrealized
gain
/
loss
Securities
1,717,810
Futures
(3,681)
Change
in
net
unrealized
gain
/
loss
1,714,129
Net
realized
and
unrealized
gain
/
loss
2,598,906
INCREASE
IN
NET
ASSETS
FROM
OPERATIONS
$
2,693,926
T.
ROWE
PRICE
U.S.
Equity
Research
Fund
Statement
of
Changes
in
Net
Assets
Year
.
.
.
.
.
.
.
.
.
.
.
.
.
.
Ended
.
.
.
.
.
.
.
.
.
.
.
.
.
.
12/31/24
12/31/23
Increase
(Decrease)
in
Net
Assets
Operations
Net
investment
income
$
95,020
$
132,352
Net
realized
gain
884,777
1,729,483
Change
in
net
unrealized
gain
/
loss
1,714,129
1,116,694
Increase
in
net
assets
from
operations
2,693,926
2,978,529
Distributions
to
shareholders
Net
earnings
Investor
Class
(44,295)
(49,998)
Advisor
Class
(173)
(422)
R
Class
–
(854)
I
Class
(44,644)
(58,838)
Z
Class
–
(19,969)
Decrease
in
net
assets
from
distributions
(89,112)
(130,081)
Capital
share
transactions
*
Shares
sold
Investor
Class
2,656,920
1,296,096
Advisor
Class
15,279
8,460
R
Class
19,844
32,617
I
Class
1,934,975
812,226
Z
Class
6,727
227,112
Distributions
reinvested
Investor
Class
43,783
49,428
Advisor
Class
172
420
R
Class
–
852
I
Class
44,020
58,228
Z
Class
–
19,969
Shares
redeemed
Investor
Class
(1,309,537)
(1,000,087)
Advisor
Class
(14,471)
(7,872)
R
Class
(33,099)
(21,746)
I
Class
(1,654,670)
(1,291,138)
Z
Class
(1,403,050)
(3,691,610)
Increase
(decrease)
in
net
assets
from
capital
share
transactions
306,893
(3,507,045)
T.
ROWE
PRICE
U.S.
Equity
Research
Fund
Statement
of
Changes
in
Net
Assets
The
accompanying
notes
are
an
integral
part
of
these
financial
statements.
Year
.
.
.
.
.
.
.
.
.
.
.
.
.
.
Ended
.
.
.
.
.
.
.
.
.
.
.
.
.
.
12/31/24
12/31/23
Net
Assets
Increase
(decrease)
during
period
2,911,707
(658,597)
Beginning
of
period
10,699,106
11,357,703
End
of
period
$
13,610,813
$
10,699,106
*Share
information
(000s)
Shares
sold
Investor
Class
49,890
30,206
Advisor
Class
294
204
R
Class
379
791
I
Class
35,503
19,282
Z
Class
139
5,846
Distributions
reinvested
Investor
Class
729
1,077
Advisor
Class
3
9
R
Class
–
19
I
Class
732
1,267
Z
Class
–
436
Shares
redeemed
Investor
Class
(24,452)
(24,178)
Advisor
Class
(267)
(192)
R
Class
(624)
(534)
I
Class
(30,864)
(31,518)
Z
Class
(28,687)
(86,190)
Increase
(decrease)
in
shares
outstanding
2,775
(83,475)
T.
ROWE
PRICE
U.S.
Equity
Research
Fund
NOTES
TO
FINANCIAL
STATEMENTS
T.
Rowe
Price
U.S.
Equity
Research
Fund,
Inc. (the
fund) is
registered
under
the
Investment
Company
Act
of
1940
(the
1940
Act)
as a
diversified, open-
end
management
investment
company. The
fund
seeks to
provide
long-
term
capital
growth
by
investing
primarily
in
U.S.
common
stocks.
The
fund
has five classes
of
shares:
the
U.S.
Equity
Research
Fund
(Investor
Class),
the
U.S.
Equity
Research
Fund–Advisor
Class
(Advisor
Class),
the
U.S.
Equity
Research
Fund–R
Class
(R
Class),
the
U.S.
Equity
Research
Fund–I
Class
(I
Class)
and
the
U.S.
Equity
Research
Fund–Z
Class
(Z
Class).
Advisor
Class
shares
are
sold
only
through
various
brokers
and
other
financial
intermediaries,
and
R
Class
shares
are
available
through
financial
intermediaries
for
employer-sponsored
defined
contribution
retirement
plans
and
certain
other
retirement
accounts.
I
Class
shares
require
a
$500,000
initial
investment
minimum,
although
the
minimum
generally
is
waived
or
reduced
for
financial
intermediaries,
eligible
retirement
plans,
and
certain
other
accounts.
The
Z
Class
is
only
available
to
funds
advised
by
T.
Rowe
Price
Associates,
Inc.
and
its
affiliates
and
other
clients
that
are
subject
to
a
contractual
fee
for
investment
management
services.
The
Advisor
Class
and
R
Class
each
operate
under
separate
Board-approved
Rule
12b-1
plans,
pursuant
to
which
each
class
compensates
financial
intermediaries
for
distribution,
shareholder
servicing,
and/
or
certain
administrative
services;
the
Investor,
I
and
Z
Classes
do
not
pay
Rule
12b-1
fees. Each
class
has
exclusive
voting
rights
on
matters
related
solely
to
that
class;
separate
voting
rights
on
matters
that
relate
to
all
classes;
and,
in
all
other
respects,
the
same
rights
and
obligations
as
the
other
classes.
NOTE
1
-
SIGNIFICANT
ACCOUNTING
POLICIES
Basis
of
Preparation
The fund
is
an
investment
company
and
follows
accounting
and
reporting
guidance
in
the
Financial
Accounting
Standards
Board
(FASB)
Accounting
Standards
Codification
Topic
946
(ASC
946).
The
accompanying
financial
statements
were
prepared
in
accordance
with
accounting
principles
generally
accepted
in
the
United
States
of
America
(GAAP),
including,
but
not
limited
to,
ASC
946.
GAAP
requires
the
use
of
estimates
made
by
management.
Management
believes
that
estimates
and
valuations
are
appropriate;
however,
actual
results
may
differ
from
those
estimates,
and
the
valuations
reflected
in
the
accompanying
financial
statements
may
differ
from
the
value
ultimately
realized
upon
sale
or
maturity.
T.
ROWE
PRICE
U.S.
Equity
Research
Fund
Investment
Transactions,
Investment
Income,
and
Distributions
Investment
transactions
are
accounted
for
on
the
trade
date
basis.
Income
and
expenses
are
recorded
on
the
accrual
basis.
Realized
gains
and
losses
are
reported
on
the
identified
cost
basis. Premiums
and
discounts
on
debt
securities
are
amortized
for
financial
reporting
purposes. Income
tax-related
interest
and
penalties,
if
incurred,
are
recorded
as
income
tax
expense. Dividends
received
from other
investment
companies are
reflected
as
dividend income;
capital
gain
distributions
are
reflected
as
realized
gain/loss. Dividend
income and
capital
gain
distributions
are
recorded
on
the
ex-dividend
date. Distributions
from
REITs
are
initially
recorded
as
dividend
income
and,
to
the
extent
such
represent
a
return
of
capital
or
capital
gain
for
tax
purposes,
are
reclassified
when
such
information
becomes
available. Non-cash
dividends,
if
any,
are
recorded
at
the
fair
market
value
of
the
asset
received. Proceeds
from
litigation
payments,
if
any,
are
included
in
either
net
realized
gain
(loss)
or
change
in
net
unrealized
gain/loss
from
securities. Distributions
to
shareholders
are
recorded
on
the
ex-dividend
date. Income
distributions,
if
any,
are
declared
and
paid
by
each
class annually. A
capital
gain
distribution,
if
any, may
also
be
declared
and
paid
by
the
fund
annually.
Currency
Translation
Assets,
including
investments,
and
liabilities
denominated
in
foreign
currencies
are
translated
into
U.S.
dollar
values
each
day
at
the
prevailing
exchange
rate,
using
the
mean
of
the
bid
and
asked
prices
of
such
currencies
against
U.S.
dollars
as
provided
by
an
outside
pricing
service.
Purchases
and
sales
of
securities,
income,
and
expenses
are
translated
into
U.S.
dollars
at
the
prevailing
exchange
rate
on
the
respective
date
of
such
transaction.
The
effect
of
changes
in
foreign
currency
exchange
rates
on
realized
and
unrealized
security
gains
and
losses
is
not
bifurcated
from
the
portion
attributable
to
changes
in
market
prices.
Class
Accounting
Shareholder
servicing,
prospectus,
and
shareholder
report
expenses
incurred
by
each
class
are
charged
directly
to
the
class
to
which
they
relate.
Expenses
common
to
all
classes,
investment
income,
and
realized
and
unrealized
gains
and
losses
are
allocated
to
the
classes
based
upon
the
relative
daily
net
assets
of
each
class.
The
Advisor
Class
and
R
Class
each
pay
Rule
12b-1
fees,
in
an
amount
not
exceeding
0.25%
and
0.50%,
respectively,
of
the
class’s
average
daily
net
assets.
In-Kind
Redemptions
In
accordance
with
guidelines
described
in
the
fund’s
prospectus,
and
when
considered
to
be
in
the
best
interest
of
all
shareholders,
the
fund
may
distribute
portfolio
securities
rather
than
cash
as
payment
for
a
redemption
of
fund
shares
(in-kind
redemption).
Gains
and
losses
T.
ROWE
PRICE
U.S.
Equity
Research
Fund
realized
on
in-kind
redemptions
are
not
recognized
for
tax
purposes
and
are
reclassified
from
undistributed
realized
gain
(loss)
to
paid-in
capital.
During
the
year ended
December
31,
2024,
the
fund
realized
$574,614,000 of
net
gain
on
$1,376,346,000
of
in-kind
redemptions.
Capital
Transactions
Each
investor’s
interest
in
the
net
assets
of the
fund
is
represented
by
fund
shares. The
fund’s
net
asset
value
(NAV)
per
share
is
computed
at
the
close
of
the
New
York
Stock
Exchange
(NYSE),
normally
4
p.m.
Eastern
time,
each
day
the
NYSE
is
open
for
business.
However,
the
NAV
per
share
may
be
calculated
at
a
time
other
than
the
normal
close
of
the
NYSE
if
trading
on
the
NYSE
is
restricted,
if
the
NYSE
closes
earlier,
or
as
may
be
permitted
by
the
SEC.
Purchases
and
redemptions
of
fund
shares
are
transacted
at
the
next-computed
NAV
per
share,
after
receipt
of
the
transaction
order
by
T.
Rowe
Price
Associates,
Inc.,
or
its
agents.
New
Accounting
Guidance
In December
2023,
the
FASB
issued
Accounting
Standards
Update
(ASU),
ASU
2023-09,
Income
Taxes
(Topic
740)
–
Improvements
to
Income
Taxes
Disclosures,
which
enhances
the
transparency
of
income
tax
disclosures.
The
ASU
requires
public
entities,
on
an
annual
basis,
to
provide
disclosure
of
specific
categories
in
the
rate
reconciliation,
as
well
as
disclosure
of
income
taxes
paid
disaggregated
by
jurisdiction.
The
amendments
under
this
ASU
are
required
to
be
applied
prospectively
and
are
effective
for
fiscal
years
beginning
after
December
15,
2024.
Management
expects
that
adoption
of
the
guidance
will
not
have
a
material
impact
on
the
fund’s
financial
statements.
Indemnification
In
the
normal
course
of
business, the
fund
may
provide
indemnification
in
connection
with
its
officers
and
directors,
service
providers,
and/or
private
company
investments. The
fund’s
maximum
exposure
under
these
arrangements
is
unknown;
however,
the
risk
of
material
loss
is
currently
considered
to
be
remote.
NOTE
2
-
VALUATION
Fair
Value
The
fund’s
financial
instruments
are
valued
at
the
close
of
the
NYSE
and
are
reported
at
fair
value,
which
GAAP
defines
as
the
price
that
would
be
received
to
sell
an
asset
or
paid
to
transfer
a
liability
in
an
orderly
transaction
between
market
participants
at
the
measurement
date. The fund’s
Board
of
Directors
(the
Board)
has
designated
T.
Rowe
Price
Associates,
Inc.
as
the
fund’s
valuation
designee
(Valuation
Designee).
Subject
to
oversight
by
the
Board,
the
Valuation
Designee
performs
the
following
functions
in
T.
ROWE
PRICE
U.S.
Equity
Research
Fund
performing
fair
value
determinations:
assesses
and
manages
valuation
risks;
establishes
and
applies
fair
value
methodologies;
tests
fair
value
methodologies;
and
evaluates
pricing
vendors
and
pricing
agents.
The
duties
and
responsibilities
of
the
Valuation
Designee
are
performed
by
its
Valuation
Committee. The
Valuation
Designee provides
periodic
reporting
to
the
Board
on
valuation
matters.
Various
valuation
techniques
and
inputs
are
used
to
determine
the
fair
value
of
financial
instruments.
GAAP
establishes
the
following
fair
value
hierarchy
that
categorizes
the
inputs
used
to
measure
fair
value:
Level
1
–
quoted
prices
(unadjusted)
in
active
markets
for
identical
financial
instruments
that
the
fund
can
access
at
the
reporting
date
Level
2
–
inputs
other
than
Level
1
quoted
prices
that
are
observable,
either
directly
or
indirectly
(including,
but
not
limited
to,
quoted
prices
for
similar
financial
instruments
in
active
markets,
quoted
prices
for
identical
or
similar
financial
instruments
in
inactive
markets,
interest
rates
and
yield
curves,
implied
volatilities,
and
credit
spreads)
Level
3
–
unobservable
inputs
(including
the Valuation
Designee’s assumptions
in
determining
fair
value)
Observable
inputs
are
developed
using
market
data,
such
as
publicly
available
information
about
actual
events
or
transactions,
and
reflect
the
assumptions
that
market
participants
would
use
to
price
the
financial
instrument.
Unobservable
inputs
are
those
for
which
market
data
are
not
available
and
are
developed
using
the
best
information
available
about
the
assumptions
that
market
participants
would
use
to
price
the
financial
instrument.
GAAP
requires
valuation
techniques
to
maximize
the
use
of
relevant
observable
inputs
and
minimize
the
use
of
unobservable
inputs.
When
multiple
inputs
are
used
to
derive
fair
value,
the
financial
instrument
is
assigned
to
the
level
within
the
fair
value
hierarchy
based
on
the
lowest-level
input
that
is
significant
to
the
fair
value
of
the
financial
instrument.
Input
levels
are
not
necessarily
an
indication
of
the
risk
or
liquidity
associated
with
financial
instruments
at
that
level
but
rather
the
degree
of
judgment
used
in
determining
those
values.
Valuation
Techniques
Equity
securities,
including
exchange-traded
funds, listed
or
regularly
traded
on
a
securities
exchange
or
in
the
over-the-
counter
(OTC)
market
are
valued
at
the
last
quoted
sale
price
or,
for
certain
markets,
the
official
closing
price
at
the
time
the
valuations
are
made.
OTC
Bulletin
Board
securities
are
valued
at
the
mean
of
the
closing
bid
and
asked
prices.
A
security
that
is
listed
or
traded
on
more
than
one
exchange
is
valued
T.
ROWE
PRICE
U.S.
Equity
Research
Fund
at
the
quotation
on
the
exchange
determined
to
be
the
primary
market
for
such
security.
Listed
securities
not
traded
on
a
particular
day
are
valued
at
the
mean
of
the
closing
bid
and
asked
prices
for
domestic
securities.
Debt
securities
generally
are
traded
in
the over-the-counter
(OTC)
market
and
are
valued
at
prices
furnished
by
independent
pricing
services
or
by
broker
dealers
who
make
markets
in
such
securities.
When
valuing
securities,
the
independent
pricing
services
consider
factors
such
as,
but
not
limited
to,
the
yield
or
price
of
bonds
of
comparable
quality,
coupon,
maturity,
and
type,
as
well
as
prices
quoted
by
dealers
who
make
markets
in
such
securities.
Investments
in
mutual
funds
are
valued
at
the
mutual
fund’s
closing
NAV
per
share
on
the
day
of
valuation.
Futures
contracts
are
valued
at
closing
settlement
prices.
Assets
and
liabilities
other
than
financial
instruments,
including
short-
term
receivables
and
payables,
are
carried
at
cost,
or
estimated
realizable
value,
if
less,
which
approximates
fair
value.
Investments
for
which
market
quotations are
not
readily
available
or
deemed
unreliable
are
valued
at
fair
value
as
determined
in
good
faith
by
the
Valuation
Designee.
The
Valuation
Designee
has
adopted
methodologies
for
determining
the
fair
value
of
investments
for
which
market
quotations
are
not
readily
available
or
deemed
unreliable,
including
the
use
of
other
pricing
sources.
Factors
used
in
determining
fair
value
vary
by
type
of
investment
and
may
include
market
or
investment
specific
considerations.
The
Valuation
Designee typically
will
afford
greatest
weight
to
actual
prices
in
arm’s
length
transactions,
to
the
extent
they
represent
orderly
transactions
between
market
participants,
transaction
information
can
be
reliably
obtained,
and
prices
are
deemed
representative
of
fair
value.
However,
the
Valuation
Designee may
also
consider
other
valuation
methods
such
as
market-based
valuation
multiples;
a
discount
or
premium
from
market
value
of
a
similar,
freely
traded
security
of
the
same
issuer;
discounted
cash
flows;
yield
to
maturity;
or
some
combination.
Fair
value
determinations
are
reviewed
on
a
regular
basis.
Because
any
fair
value
determination
involves
a
significant
amount
of
judgment,
there
is
a
degree
of
subjectivity
inherent
in
such
pricing
decisions. Fair
value
prices
determined
by
the
Valuation
Designee could
differ
from
those
of
other
market
participants,
and
it
is
possible
that
the
fair
value
determined
for
a
security
may
be
materially
different
from
the
value
that
could
be
realized
upon
the
sale
of
that
security.
T.
ROWE
PRICE
U.S.
Equity
Research
Fund
Valuation
Inputs
The
following
table
summarizes
the
fund’s
financial
instruments,
based
on
the
inputs
used
to
determine
their
fair
values
on
December
31,
2024
(for
further
detail
by
category,
please
refer
to
the
accompanying
Portfolio
of
Investments):
NOTE
3
-
DERIVATIVE
INSTRUMENTS
During
the
year ended
December
31,
2024,
the
fund
invested
in
derivative
instruments.
As
defined
by
GAAP,
a
derivative
is
a
financial
instrument
whose
value
is
derived
from
an
underlying
security
price,
foreign
exchange
rate,
interest
rate,
index
of
prices
or
rates,
or
other
variable;
it
requires
little
or
no
initial
investment
and
permits
or
requires
net
settlement
or
delivery
of
cash
or
other
assets.
The
fund
invests
in
derivatives
only
if
the
expected
risks
and
rewards
are
consistent
with
its
investment
objectives,
policies,
and
overall
risk
profile,
as
described
in
its
prospectus
and
Statement
of
Additional
Information.
The
fund
may
use
derivatives
for
a
variety
of
purposes
and
may
use
them
to
establish
both
long
and
short
positions
within
the
fund’s
portfolio.
Potential
uses
include
to
hedge
against
declines
in
principal
value,
increase
yield,
invest
in
an
asset
with
greater
efficiency
and
at
a
lower
cost
than
is
possible
through
direct
investment,
to
enhance
return,
or
to
adjust
credit
exposure.
The
risks
associated
($000s)
Level
1
Level
2
Level
3
Total
Value
Assets
Common
Stocks
$
13,486,682
$
—
$
—
$
13,486,682
Short-Term
Investments
86,822
4,376
—
91,198
Securities
Lending
Collateral
8,557
—
—
8,557
Total
$
13,582,061
$
4,376
$
—
$
13,586,437
Liabilities
Futures
Contracts*
$
2,616
$
—
$
—
$
2,616
*
The
fair
value
presented
includes
cumulative
gain
(loss)
on
open
futures
contracts;
however,
the
net
value
reflected
on
the
accompanying
Portfolio
of
Investments
is
only
the
unsettled
variation
margin
receivable
(payable)
at
that
date.
T.
ROWE
PRICE
U.S.
Equity
Research
Fund
with
the
use
of
derivatives
are
different
from,
and
potentially
much
greater
than,
the
risks
associated
with
investing
directly
in
the
instruments
on
which
the
derivatives
are
based.
The
fund
values
its
derivatives
at
fair
value
and
recognizes
changes
in
fair
value
currently
in
its
results
of
operations.
Accordingly,
the
fund
does
not
follow
hedge
accounting,
even
for
derivatives
employed
as
economic
hedges.
Generally,
the
fund
accounts
for
its
derivatives
on
a
gross
basis.
It
does
not
offset
the
fair
value
of
derivative
liabilities
against
the
fair
value
of
derivative
assets
on
its
financial
statements,
nor
does
it
offset
the
fair
value
of
derivative
instruments
against
the
right
to
reclaim
or
obligation
to
return
collateral.
The
following
table
summarizes
the
fair
value
of
the
fund’s
derivative
instruments
held
as
of
December
31,
2024,
and
the
related
location
on
the
accompanying
Statement
of
Assets
and
Liabilities,
presented
by
primary
underlying
risk
exposure:
Additionally,
the
amount
of
gains
and
losses
on
derivative
instruments
recognized
in
fund
earnings
during
the
year ended
December
31,
2024,
and
the
related
location
on
the
accompanying
Statement
of
Operations
is
summarized
in
the
following
table
by
primary
underlying
risk
exposure:
($000s)
Location
on
Statement
of
Assets
and
Liabilities
Fair
Value*
*
Liabilities
Equity
derivatives
Futures
$
2,616
Total
$
2,616
*
The
fair
value
presented
includes
cumulative
gain
(loss)
on
open
futures
contracts;
however,
the
value
reflected
on
the
accompanying
Statement
of
Assets
and
Liabilities
is
only
the
unsettled
variation
margin
receivable
(payable)
at
that
date.
($000s)
Location
of
Gain
(Loss)
on
Statement
of
Operations
Futures
Realized
Gain
(Loss)
Equity
derivatives
$
10,411
Total
$
10,411
T.
ROWE
PRICE
U.S.
Equity
Research
Fund
Counterparty
Risk
and
Collateral
The
fund
invests
in
exchange-traded
and/or
centrally
cleared
derivative
contracts,
such
as
futures,
exchange-traded
options,
and
centrally
cleared
swaps.
Counterparty
risk
on
such
derivatives
is
minimal
because
the
clearinghouse
provides
protection
against
counterparty
defaults.
For
futures
and
centrally
cleared
swaps,
the
fund
is
required
to
deposit
collateral
in
an
amount
specified
by
the
clearinghouse
and
the
clearing
firm
(margin
requirement),
and
the
margin
requirement
must
be
maintained
over
the
life
of
the
contract.
Each
clearinghouse
and
clearing
firm,
in
its
sole
discretion,
may
adjust
the
margin
requirements
applicable
to
the
fund.
Collateral may
be
in
the
form
of
cash
or
debt
securities
issued
by
the
U.S.
government
or
related
agencies.
Cash
posted
by
the
fund
is
reflected
as
cash
deposits
in
the
accompanying
financial
statements
and
generally
is
restricted
from
withdrawal
by
the
fund;
securities
posted
by
the
fund
are
so
noted
in
the
accompanying
Portfolio
of
Investments;
both
remain
in
the
fund’s
assets.
While
typically
not
sold
in
the
same
manner
as
equity
or
fixed
income
securities,
exchange-traded
or
centrally
cleared
derivatives
may
be
closed
out
only
on
the
exchange
or
clearinghouse
where
the
contracts
were
cleared.
This
ability
is
subject
to
the
liquidity
of
underlying
positions. As
of
December
31,
2024,
securities
valued
at $4,281,000
had
been
posted
by
the
fund
for
exchange-
traded
and/or
centrally
cleared
derivatives.
Futures
Contracts
The
fund
is
subject
to equity
price
risk in
the
normal
course
of
pursuing
its
investment
objectives
and
uses
futures
contracts
to
help
manage
such
risk.
The fund
may
enter
into
futures
contracts
to
manage
exposure
to
interest
rates,
security
prices,
and
foreign
currencies;
as
an
efficient
means
of
adjusting
exposure
to
all
or
part
of
a
target
market;
or
as
a
cash
management
tool. A
futures
contract
provides
for
the
future
sale
by
one
party
and
purchase
by
another
of
a
specified
amount
of
a
specific
underlying
financial
instrument
at
an
agreed-upon
price,
date,
time,
and
place.
The
fund
currently
invests
only
in
exchange-traded
futures,
which
generally
are
standardized
as
to
maturity
date,
underlying
financial
instrument,
and
other
contract
terms.
Payments
are
($000s)
Location
of
Gain
(Loss)
on
Statement
of
Operations
Futures
Change
in
Unrealized
Gain
(Loss)
Equity
derivatives
$
(3,681)
Total
$
(3,681)
T.
ROWE
PRICE
U.S.
Equity
Research
Fund
made
or
received
by
the
fund
each
day
to
settle
daily
fluctuations
in
the
value
of
the
contract
(variation
margin),
which
reflect
changes
in
the
value
of
the
underlying
financial
instrument.
Variation
margin
is
recorded
as
unrealized
gain
or
loss
until
the
contract
is
closed.
The
value
of
a
futures
contract
included
in
net
assets
is
the
amount
of
unsettled
variation
margin;
net
variation
margin
receivable
is
reflected
as
an
asset
and
net
variation
margin
payable
is
reflected
as
a
liability
on
the
accompanying
Statement
of
Assets
and
Liabilities.
When
a
contract
is
closed,
a
realized
gain
or
loss
is
recorded
on
the
accompanying
Statement
of
Operations.
Risks
related
to
the
use
of
futures
contracts
include
possible
illiquidity
of
the
futures
markets,
contract
prices
that
can
be
highly
volatile
and
imperfectly
correlated
to
movements
in
hedged
security
values,
and
potential
losses
in
excess
of
the
fund’s
initial
investment.
During
the
year ended
December
31,
2024,
the
volume
of
the
fund’s
activity
in
futures,
based
on
underlying
notional
amounts,
was
generally
less
than
1%
of
net
assets.
NOTE
4
-
OTHER
INVESTMENT
TRANSACTIONS
Consistent
with
its
investment
objective, the
fund
engages
in
the
following
practices
to
manage
exposure
to
certain
risks
and/or
to
enhance
performance.
The
investment
objective,
policies,
program,
and
risk
factors
of the
fund
are
described
more
fully
in the
fund’s prospectus
and
Statement
of
Additional
Information.
Securities
Lending
The fund
may
lend
its
securities
to
approved
borrowers
to
earn
additional
income.
Its
securities
lending
activities
are
administered
by
a
lending
agent
in
accordance
with
a
securities
lending
agreement.
Security
loans
generally
do
not
have
stated
maturity
dates,
and
the
fund
may
recall
a
security
at
any
time.
The
fund
receives
collateral
in
the
form
of
cash
or
U.S.
government
securities.
Collateral
is
maintained
over
the
life
of
the
loan
in
an
amount
not
less
than
the
value
of
loaned
securities;
any
additional
collateral
required
due
to
changes
in
security
values
is
delivered
to
the
fund
the
next
business
day.
Cash
collateral
is
invested
in
accordance
with
investment
guidelines
approved
by
fund
management.
Additionally,
the
lending
agent
indemnifies
the
fund
against
losses
resulting
from
borrower
default.
Although
risk
is
mitigated
by
the
collateral
and
indemnification,
the
fund
could
experience
a
delay
in
recovering
its
securities
and
a
possible
loss
of
income
or
value
if
the
borrower
fails
to
return
the
securities,
collateral
investments
decline
in
value,
and
the
lending
agent
fails
to
perform.
Securities
lending
revenue
consists
of
earnings
on
invested
collateral
and
borrowing
fees,
net
of
any
rebates
to
the
borrower,
compensation
to
the
lending
agent,
and
other
administrative
costs.
In
accordance
with
GAAP,
T.
ROWE
PRICE
U.S.
Equity
Research
Fund
investments
made
with
cash
collateral
are
reflected
in
the
accompanying
financial
statements,
but
collateral
received
in
the
form
of
securities
is
not.
At
December
31,
2024,
the
value
of
loaned
securities
was
$8,406,000;
the
value
of
cash
collateral
and
related
investments
was
$8,557,000.
Other
Purchases
and
sales
of
portfolio
securities
other
than
in-kind
transactions,
if
any,
and short-term securities
aggregated $6,063,460,000 and
$4,425,359,000,
respectively,
for
the
year ended
December
31,
2024.
NOTE
5
-
FEDERAL
INCOME
TAXES
Generally,
no
provision
for
federal
income
taxes
is
required
since
the
fund
intends
to continue
to
qualify
as
a
regulated
investment
company
under
Subchapter
M
of
the
Internal
Revenue
Code
and
distribute
to
shareholders
all
of
its taxable
income
and
gains.
Distributions
determined
in
accordance
with
federal
income
tax
regulations
may
differ
in
amount
or
character
from
net
investment
income
and
realized
gains
for
financial
reporting
purposes.
The
fund
files
U.S.
federal,
state,
and
local
tax
returns
as
required.
The
fund’s
tax
returns
are
subject
to
examination
by
the
relevant
tax
authorities
until
expiration
of
the
applicable
statute
of
limitations,
which
is
generally
three
years
after
the
filing
of
the
tax
return
but
which
can
be
extended
to
six
years
in
certain
circumstances.
Tax
returns
for
open
years
have
incorporated
no
uncertain
tax
positions
that
require
a
provision
for
income
taxes.
Capital
accounts
within
the
financial
reporting
records
are
adjusted
for
permanent
book/tax
differences
to
reflect
tax
character
but
are
not
adjusted
for
temporary
differences.
The
permanent
book/tax
adjustments,
if
any,
have
no
impact
on
results
of
operations
or
net
assets.
The
permanent
book/tax
adjustments
relate
primarily
to
redemptions
in
kind.
The
tax
character
of
distributions
paid
for
the
periods
presented
was
as
follows:
($000s)
December
31,
2024
December
31,
2023
Ordinary
income
(including
short-term
capital
gains,
if
any)
$
89,112
$
130,081
T.
ROWE
PRICE
U.S.
Equity
Research
Fund
At
December
31,
2024,
the
tax-basis
cost
of
investments
(including
derivatives,
if
any)
and
gross
unrealized
appreciation
and
depreciation
were as
follows:
At
December
31,
2024,
the
tax-basis
components
of
accumulated
net
earnings
(loss)
were
as
follows:
Temporary
differences
between
book-basis
and
tax-basis
components
of
total
distributable
earnings
(loss)
arise
when
certain
items
of
income,
gain,
or
loss
are
recognized
in
different
periods
for
financial
statement
purposes
versus
for
tax
purposes;
these
differences
will
reverse
in
a
subsequent
reporting
period.
The
temporary
differences
relate
primarily
to
the
deferral
of
losses
from
wash
sales.
The
loss
carryforwards
and
deferrals
primarily
relate
to
capital
loss
carryforwards
and
late-year
ordinary
loss
deferrals.
Capital
loss
carryforwards
are
available
indefinitely
to
offset
future
realized
capital
gains.
The
fund
has
elected
to
defer
certain
losses
to
the
first
day
of
the
following
fiscal
year
for
late-year
ordinary
loss
deferrals.
During
the
year
ended
December
31,
2024,
the
fund
utilized
$287,465,000
of
capital
loss
carryforwards.
Other
temporary
differences
relate
primarily
to
differences
in
treatment
of
corporate
actions.
NOTE
6
-
FOREIGN TAXES
The
fund
is
subject
to
foreign
income
taxes
imposed
by
certain
countries
in
which
it
invests.
Additionally,
capital
gains
realized
upon
disposition
of
securities
issued
in
or
by
certain
foreign
countries
are
subject
to
capital
gains
tax
imposed
by
those
countries.
All
taxes
are
computed
in
accordance
with
the
applicable
foreign
tax
law,
and,
to
the
extent
permitted,
capital
losses
are
used
to
offset
($000s)
Cost
of
investments
$
9,535,680
Unrealized
appreciation
$
4,290,484
Unrealized
depreciation
(239,729)
Net
unrealized
appreciation
(depreciation)
$
4,050,755
($000s)
Net
unrealized
appreciation
(depreciation)
$
4,050,755
Loss
carryforwards
and
deferrals
(49,498)
Other
temporary
differences
(10)
Total
distributable
earnings
(loss)
$
4,001,247
T.
ROWE
PRICE
U.S.
Equity
Research
Fund
capital
gains.
Taxes
attributable
to
income
are
accrued
by
the
fund
as
a
reduction
of
income.
Current
and
deferred
tax
expense
attributable
to
capital
gains
is
reflected
as
a
component
of
realized
or
change
in
unrealized
gain/
loss
on
securities
in
the
accompanying
financial
statements.
To
the
extent
that
the
fund
has
country
specific
capital
loss
carryforwards,
such
carryforwards
are
applied
against
net
unrealized
gains
when
determining
the
deferred
tax
liability.
Any
deferred
tax
liability
incurred
by
the
fund
is
included
in
either
Other
liabilities
or
Deferred
tax
liability
on
the
accompanying
Statement
of
Assets
and
Liabilities.
NOTE
7
-
RELATED
PARTY
TRANSACTIONS
The
fund
is
managed
by
T.
Rowe
Price
Associates,
Inc.
(Price
Associates),
a
wholly
owned
subsidiary
of
T.
Rowe
Price
Group,
Inc.
(Price
Group).
The
investment
management
agreement
between
the
fund
and
Price
Associates
provides
for
an
annual
investment
management
fee,
which
is
computed
daily
and
paid
monthly. The
fee
consists
of
an
individual
fund
fee,
equal
to
0.04%
of
the
fund’s
average
daily
net
assets,
and
a
group
fee.
The
group
fee
rate
is
calculated
based
on
the
combined
net
assets
of
certain
mutual
funds
sponsored
by
Price
Associates
(the
group)
applied
to
a
graduated
fee
schedule,
with
rates
ranging
from
0.48%
for
the
first
$1
billion
of
assets
to
0.260%
for
assets
in
excess
of
$845
billion.
The
fund’s
group
fee
is
determined
by
applying
the
group
fee
rate
to
the
fund’s
average
daily
net
assets. At
December
31,
2024,
the
effective
annual
group
fee
rate
was
0.28%. Price
Associates
has
agreed
to
permanently
waive
a
portion
of
the
fund’s
annual
investment
management
fee
in
order
to
limit
the
fund’s
management
fees
to
0.33%
of
the
fund’s
average
daily
net
assets.
This
agreement
can
only
be
modified
or
terminated
with
approval
by
the
fund’s
shareholders.
The
fund
has
no
obligation
to
repay
fees
waived
under
this
arrangement. No
management
fees
were
waived
under
this
arrangement
for
the
year ended
December
31,
2024.
The
Investor
Class, Advisor
Class,
and R
Class are
each
subject
to
a
contractual
expense
limitation
through
the
expense
limitation
dates
indicated
in
the
table
below.
This
agreement
will
continue
through
the
expense
limitation
dates
indicated
in
the
table
below,
and
may
be
renewed,
revised,
or
revoked
only
with
approval
of
the
fund’s
Board.
During
the
limitation
period,
Price
Associates
is required
to
waive
or
pay
any
expenses
(excluding
interest;
expenses
related
to
borrowings,
taxes,
and
brokerage;
non-recurring,
extraordinary
expenses;
and
acquired
fund
fees
and
expenses)
that
would
otherwise
cause
the class’s ratio
of
annualized
total
expenses
to
average
T.
ROWE
PRICE
U.S.
Equity
Research
Fund
net
assets
(net
expense
ratio)
to
exceed
its
expense
limitation.
Each
class
is
required
to
repay
Price
Associates
for
expenses
previously
waived/paid
to
the
extent
the
class’s net
assets
grow
or
expenses
decline
sufficiently
to
allow
repayment
without
causing
the class’s net
expense
ratio
(after
the
repayment
is
taken
into
account)
to
exceed
the
lesser
of:
(1)
the
expense
limitation
in
place
at
the
time
such
amounts
were
waived;
or
(2)
the class’s
current
expense
limitation.
However,
no
repayment
will
be
made
more
than
three
years
after
the
date
of
a
payment
or
waiver.
The
I
Class
is
also
subject
to
an
operating
expense
limitation
(I
Class
Limit)
pursuant
to
which
Price
Associates
is
contractually
required
to
pay
all
operating
expenses
of
the
I
Class,
excluding
management
fees;
interest;
expenses
related
to
borrowings,
taxes,
and
brokerage; non-recurring,
extraordinary expenses; and
acquired
fund
fees
and
expenses, to
the
extent
such
operating
expenses,
on
an
annualized
basis,
exceed
the
I
Class
Limit. This
agreement
will
continue
through
the
expense
limitation
date
indicated
in
the
table
below,
and
may
be
renewed,
revised,
or
revoked
only
with
approval
of
the
fund’s
Board.
The
I
Class
is
required
to
repay
Price
Associates
for
expenses
previously
paid
to
the
extent
the
class’s
net
assets
grow
or
expenses
decline
sufficiently
to
allow
repayment
without
causing
the
class’s
operating
expenses
(after
the
repayment
is
taken
into
account)
to
exceed
the
lesser
of:
(1)
the
I
Class
Limit
in
place
at
the
time
such
amounts
were
paid;
or
(2)
the
current
I
Class
Limit.
However,
no
repayment
will
be
made
more
than
three
years
after
the
date
of
a
payment
or
waiver.
The
Z
Class
is
also
subject
to
a
contractual
expense
limitation
agreement
whereby
Price
Associates
has
agreed
to
waive
and/or
bear
all
of
the
Z
Class’
expenses
(excluding
interest;
expenses
related
to
borrowings,
taxes,
and
brokerage;
non-recurring,
extraordinary
expenses;
and
acquired
fund
fees
and
expenses)
in
their
entirety.
This
fee
waiver
and/or
expense
reimbursement
arrangement
is
expected
to
remain
in
place
indefinitely,
and
the
agreement
may
only
be
amended
or
terminated
with
approval
by
the
fund’s
Board.
Expenses
of
the
fund
waived/paid
by
the
manager
are
not
subject
to
later
repayment
by
the
fund.
Pursuant
to
these
agreements,
expenses
were waived/paid
by
and/or
repaid
to
Price
Associates
during
the year
ended December
31,
2024 as
indicated
in
the
table
below.
At
December
31,
2024,
there
were
no
amounts
subject
to
repayment
by
the
fund. Any
repayment
of
expenses
previously
waived/
T.
ROWE
PRICE
U.S.
Equity
Research
Fund
paid
by
Price
Associates
during
the
period
would
be
included
in
the
net
investment
income
and
expense
ratios
presented
on
the
accompanying
Financial
Highlights.
In
addition,
the
fund
has
entered
into
service
agreements
with
Price
Associates
and
two
wholly
owned
subsidiaries
of
Price
Associates,
each
an
affiliate
of
the
fund
(collectively,
Price).
Price
Associates
provides
certain
accounting
and
administrative
services
to
the
fund.
T.
Rowe
Price
Services,
Inc.
provides
shareholder
and
administrative
services
in
its
capacity
as
the
fund’s
transfer
and
dividend-disbursing
agent.
T.
Rowe
Price
Retirement
Plan
Services,
Inc.
provides
subaccounting
and
recordkeeping
services
for
certain
retirement
accounts
invested
in
the
Investor
Class,
R
Class
and
Advisor
Class.
For
the
year
ended
December
31,
2024,
expenses
incurred
pursuant
to
these
service
agreements
were
$116,000
for
Price
Associates;
$1,460,000
for
T.
Rowe
Price
Services,
Inc.;
and
$28,000
for
T.
Rowe
Price
Retirement
Plan
Services,
Inc.
All
amounts
due
to
and
due
from
Price,
exclusive
of
investment
management
fees
payable,
are
presented
net
on
the
accompanying
Statement
of
Assets
and
Liabilities.
T.
Rowe
Price
Investment
Services,
Inc.
(Investment
Services)
serves
as
distributor
to
the
fund.
Pursuant
to
an
underwriting
agreement,
no
compensation
for
any
distribution
services
provided
is
paid
to
Investment
Services
by
the
fund
(except
for
12b-1
fees
under
a
Board-approved
Rule
12b-1
plan).
Additionally,
the
fund
is
one
of
several
mutual
funds
in
which
certain
college
savings
plans
managed
by
Price
Associates invests.
As
approved
by
the
fund’s
Board
of
Directors,
shareholder
servicing
costs
associated
with
each
college
savings
plan
are
borne
by
the
fund
in
proportion
to
the
average
daily
value
of
its
shares
owned
by
the
college
savings
plan.
Price
has
agreed
to waive/reimburse
Investor
Class
Advisor
Class
R
Class
I
Class
Z
Class
Expense
limitation/I
Class
Limit
0.68%
0.93%
1.18%
0.04%
0.00%
Expense
limitation
date
04/30/26
04/30/26
04/30/26
04/30/26
N/A
(Waived)/
repaid
during
the
period
($000s)
$—
$—
$—
$—
$(755)
T.
ROWE
PRICE
U.S.
Equity
Research
Fund
shareholder
servicing
costs in
excess
of
0.05%
of
the
fund’s
average
daily
value
of
its
shares
owned
by
the
college
savings
plan.
Any
amounts
waived/
paid
by
Price
under
this
voluntary
agreement
are
not
subject
to
repayment
by
the
fund.
Price
may
amend
or
terminate
this
voluntary
arrangement
at
any
time
without
prior
notice.
For
the
year ended
December
31,
2024,
the
fund
was
charged $66,000 for
shareholder
servicing
costs
related
to
the
college
savings
plans, of
which
$23,000
was
for
services
provided
by
Price.
All
amounts
due
to
and
due
from
Price,
exclusive
of
investment
management
fees
payable,
are
presented
net
on
the
accompanying
Statement
of
Assets
and
Liabilities. At
December
31,
2024,
no
shares
of
the
I
Class
were
held
by
college
savings
plans.
The fund
may
invest
its
cash
reserves
in
certain
open-end
management
investment
companies
managed
by
Price
Associates
and
considered
affiliates
of
the
fund:
the
T.
Rowe
Price
Government
Reserve
Fund
or
the
T.
Rowe
Price
Treasury
Reserve
Fund,
organized
as
money
market
funds
(together,
the
Price
Reserve
Funds).
The
Price
Reserve
Funds
are
offered
as
short-term
investment
options
to
mutual
funds,
trusts,
and
other
accounts
managed
by
Price
Associates
or
its
affiliates
and
are
not
available
for
direct
purchase
by
members
of
the
public.
Cash
collateral
from
securities
lending,
if
any,
is
invested
in
the
T.
Rowe
Price
Government
Reserve Fund. The
Price
Reserve
Funds
pay
no
investment
management
fees.
As
of
December
31,
2024,
T.
Rowe
Price
Group,
Inc.,
or
its
wholly
owned
subsidiaries,
owned
234
shares
of
the
Z
Class,
representing
100%
of
the
Z
Class's
net
assets.
The fund may
participate
in
securities
purchase
and
sale
transactions
with
other
funds
or
accounts
advised
by
Price
Associates
(cross
trades),
in
accordance
with
procedures
adopted
by the
fund’s
Board
and
Securities
and
Exchange
Commission
rules,
which
require,
among
other
things,
that
such
purchase
and
sale
cross
trades
be
effected
at
the
independent
current
market
price
of
the
security.
During
the
year
ended
December
31,
2024,
the
aggregate
value
of
purchases
and
sales
cross
trades
with
other
funds
or
accounts
advised
by
Price
Associates
was
less
than
1%
of
the
fund’s
net
assets
as
of
December
31,
2024.
T.
ROWE
PRICE
U.S.
Equity
Research
Fund
NOTE
8
-
SEGMENT
REPORTING
Operating
segments
are
defined
as
components
of
a
company
that
engage
in
business
activities
and
for
which
discrete
financial
information
is
available
and
regularly
reviewed
by
the
chief
operating
decision
maker
(CODM)
in
deciding
how
to
allocate
resources
and
assess
performance.
The
Management
Committee
of
Price
Associates
acts
as
the
fund’s
CODM.
The
fund
makes
investments
in
accordance
with
its
investment
objective
as
outlined
in
the
Prospectus
and
is
considered
one
reportable
segment
because
the
CODM
allocates
resources
and
assesses
the
operating
results
of
the
fund
on
the
whole.
The
fund’s
revenue
is
derived
from
investments
in
portfolio
of
securities.
The
CODM
allocates
resources
and
assesses
performance
based
on
the
operating
results
of
the
fund,
which
is
consistent
with
the
results
presented
in
the
statement
of
operations,
statement
of
changes
in
net
assets
and
financial
highlights.
The
CODM
compares
the
fund’s
performance
to
its
benchmark
index
and
evaluates
the
positioning
of
the
fund
in
relation
to
its
investment
objective.
The
measure
of
segment
assets
is
net
assets
of
the
fund
which
is
disclosed
in
the
statement
of
assets
and
liabilities.
The
accounting
policies
of
the
segment
are
the
same
as
those
described
in
the
summary
of
significant
accounting
policies.
The
financial
statements
include
all
details
of
the
segment
assets,
segment
revenue
and
expenses;
and
reflect
the
financial
results
of
the
segment.
NOTE
9
-
OTHER
MATTERS
Unpredictable environmental,
political,
social
and
economic
events,
including
but
not
limited
to,
environmental
or
natural
disasters,
war
and
conflict
(including
Russia’s
military
invasion
of
Ukraine
and
the
conflict
in
Israel,
Gaza
and
surrounding
areas),
terrorism,
geopolitical
developments
(including
trading
and
tariff
arrangements,
sanctions
and
cybersecurity
attacks),
and
public
health
epidemics
(including
the
global
outbreak
of
COVID-19)
and
similar
public
health
threats,
may
significantly
affect
the
economy
and
the
markets
and
issuers
in
which
a
fund
invests.
The
extent
and
duration
of
such
events
and
resulting
market
disruptions
cannot
be
predicted.
These
and
other
similar
events
may
cause
instability
across
global
markets,
including
reduced
liquidity
and
disruptions
in
trading
markets,
while
some
events
may
affect
certain
geographic
regions,
countries,
sectors,
and
industries
more
significantly
than
others,
and
exacerbate
other
pre-existing
political,
social,
and
economic
risks.
The
fund’s
T.
ROWE
PRICE
U.S.
Equity
Research
Fund
performance
could
be
negatively
impacted
if
the
value
of
a
portfolio
holding
were
harmed
by
these
or
such
events.
Management
actively
monitors
the
risks
and
financial
impacts
arising
from
such
events.
T.
ROWE
PRICE
U.S.
Equity
Research
Fund
REPORT
OF
INDEPENDENT
REGISTERED
PUBLIC
ACCOUNTING
FIRM
To
the
Board
of
Directors
and
Shareholders
of
T.
Rowe
Price
U.S.
Equity
Research
Fund,
Inc.
Opinion
on
the
Financial
Statements
We
have
audited
the
accompanying
statement
of
assets
and
liabilities,
including
the
portfolio
of
investments,
of
T.
Rowe
Price
U.S.
Equity
Research
Fund,
Inc.
(the
"Fund")
as
of
December
31,
2024,
the
related
statement
of
operations
for
the
year
ended
December
31,
2024,
the
statement
of
changes
in
net
assets
for
each
of
the
two
years
in
the
period
ended
December
31,
2024,
including
the
related
notes,
and
the
financial
highlights
for
each
of
the
periods
indicated
therein
(collectively
referred
to
as
the
“financial
statements”).
In
our
opinion,
the
financial
statements
present
fairly,
in
all
material
respects,
the
financial
position
of
the
Fund
as
of
December
31,
2024,
the
results
of
its
operations
for
the
year
then
ended,
the
changes
in
its
net
assets
for
each
of
the
two
years
in
the
period
ended
December
31,
2024
and
the
financial
highlights
for
each
of
the
periods
indicated
therein,
in
conformity
with
accounting
principles
generally
accepted
in
the
United
States
of
America.
Basis
for
Opinion
These
financial
statements
are
the
responsibility
of
the
Fund’s
management.
Our
responsibility
is
to
express
an
opinion
on
the
Fund’s
financial
statements
based
on
our
audits.
We
are
a
public
accounting
firm
registered
with
the
Public
Company
Accounting
Oversight
Board
(United
States)
(PCAOB)
and
are
required
to
be
independent
with
respect
to
the
Fund
in
accordance
with
the
U.S.
federal
securities
laws
and
the
applicable
rules
and
regulations
of
the
Securities
and
Exchange
Commission
and
the
PCAOB.
We
conducted
our
audits
of
these
financial
statements
in
accordance
with
the
standards
of
the
PCAOB.
Those
standards
require
that
we
plan
and
perform
the
audit
to
obtain
reasonable
assurance
about
whether
the
financial
statements
are
free
of
material
misstatement,
whether
due
to
error
or
fraud.
T.
ROWE
PRICE
U.S.
Equity
Research
Fund
Our
audits
included
performing
procedures
to
assess
the
risks
of
material
misstatement
of
the
financial
statements,
whether
due
to
error
or
fraud,
and
performing
procedures
that
respond
to
those
risks.
Such
procedures
included
examining,
on
a
test
basis,
evidence
regarding
the
amounts
and
disclosures
in
the
financial
statements.
Our
audits
also
included
evaluating
the
accounting
principles
used
and
significant
estimates
made
by
management,
as
well
as
evaluating
the
overall
presentation
of
the
financial
statements.
Our
procedures
included
confirmation
of
securities
owned
as
of
December
31,
2024
by
correspondence
with
the
custodian,
transfer
agent
and
brokers;
when
replies
were
not
received
from
brokers,
we
performed
other
auditing
procedures.
We
believe
that
our
audits
provide
a
reasonable
basis
for
our
opinion.
/s/
PricewaterhouseCoopers
LLP
Baltimore,
Maryland
February
18,
2025
We
have
served
as
the
auditor
of
one
or
more
investment
companies
in
the
T.
Rowe
Price
group
of
investment
companies
since
1973.
REPORT
OF
INDEPENDENT
REGISTERED
PUBLIC
ACCOUNTING
FIRM
(continued)
T.
ROWE
PRICE
U.S.
Equity
Research
Fund
TAX
INFORMATION
(UNAUDITED)
FOR
THE
TAX
YEAR
ENDED 12/31/24
We
are
providing
this
information
as
required
by
the
Internal
Revenue
Code.
The
amounts
shown
may
differ
from
those
elsewhere
in
this
report
because
of
differences
between
tax
and
financial
reporting
requirements.
For
taxable
non-corporate
shareholders,
$131,444,000
of
the
fund's
income
represents
qualified
dividend
income
subject
to
a
long-term
capital
gains
tax
rate
of
not
greater
than
20%.
For
corporate
shareholders,
$125,089,000
of
the
fund's
income
qualifies
for
the
dividends-received
deduction.
100
East
Pratt
Street
Baltimore,
MD
21202
T.
Rowe
Price
Investment
Services,
Inc.
Call
1-800-225-5132
to
request
a
prospectus
or
summary
prospectus;
each
includes
investment
objectives,
risks,
fees,
expenses,
and
other
information
that
you
should
read
and
consider
carefully
before
investing.
F108-050
2/25
Item 8. Changes in and Disagreements with Accountants for Open-End Management Investment Companies.
Not applicable.
Item 9. Proxy Disclosures for Open-End Management Investment Companies.
Not applicable.
Item 10. Remuneration Paid to Directors, Officers, and Others of Open-End Management Investment Companies.
Remuneration paid to Directors is included in Item 7 of this Form N-CSR.
Item 11. Statement Regarding Basis for Approval of Investment Advisory Contract.
If applicable, see Item 7.
Item 12. Disclosure of Proxy Voting Policies and Procedures for Closed-End Management Investment Companies.
Not applicable.
Item 13. Portfolio Managers of Closed-End Management Investment Companies.
Not applicable.
Item 14. Purchases of Equity Securities by Closed-End Management Investment Company and Affiliated Purchasers.
Not applicable.
Item 15. Submission of Matters to a Vote of Security Holders.
There has been no change to the procedures by which shareholders may recommend nominees to the registrant’s board of directors.
Item 16. Controls and Procedures.
(a) The registrant’s principal executive officer and principal financial officer have evaluated the registrant’s disclosure controls and procedures within 90 days of this filing and have concluded that the registrant’s disclosure controls and procedures were effective, as of that date, in ensuring that information required to be disclosed by the registrant in this Form N-CSR was recorded, processed, summarized, and reported timely.
(b) The registrant’s principal executive officer and principal financial officer are aware of no change in the registrant’s internal control over financial reporting that occurred during the period covered by this report that has materially affected, or is reasonably likely to materially affect, the registrant’s internal control over financial reporting.
Item 17. Disclosure of Securities Lending Activities for Closed-End Management Investment Companies.
Not applicable.
Item 18. Recovery of Erroneously Awarded Compensation.
Not applicable.
Item 19. Exhibits.
SIGNATURES
Pursuant to the requirements of the Securities Exchange Act of 1934 and the Investment Company Act of 1940, the registrant has duly caused this report to be signed on its behalf by the undersigned, thereunto duly authorized.
| | | | |
| T. Rowe Price U.S. Equity Research Fund, Inc. |
| | |
| By | | /s/ David Oestreicher | | |
| | David Oestreicher | | |
| | Principal Executive Officer | | |
| | |
| Date | | February 18, 2025 | | |
Pursuant to the requirements of the Securities Exchange Act of 1934 and the Investment Company Act of 1940, this report has been signed below by the following persons on behalf of the registrant and in the capacities and on the dates indicated.
| | | | |
| By | | /s/ David Oestreicher | | |
| | David Oestreicher | | |
| | Principal Executive Officer | | |
| | |
| Date | | February 18, 2025 | | |
| | | | |
| By | | /s/ Alan S. Dupski | | |
| | Alan S. Dupski | | |
| | Principal Financial Officer | | |
| | |
| Date | | February 18, 2025 | | |