UNITED STATES
SECURITIES AND EXCHANGE COMMISSION
Washington, D.C. 20549
FORM N-CSR
CERTIFIED SHAREHOLDER REPORT OF REGISTERED
MANAGEMENT INVESTMENT COMPANIES
Investment Company Act File Number: 811-07225
| T. Rowe Price Capital Opportunity Fund, Inc. |
|
| (Exact name of registrant as specified in charter) |
| |
| 100 East Pratt Street, Baltimore, MD 21202 |
|
| (Address of principal executive offices) |
| |
| David Oestreicher |
| 100 East Pratt Street, Baltimore, MD 21202 |
|
| (Name and address of agent for service) |
Registrant’s telephone number, including area code: (410) 345-2000
Date of fiscal year end: December 31
Date of reporting period: December 31, 2012
Item 1. Report to Shareholders
| Capital Opportunity Fund | December 31, 2012 |

The views and opinions in this report were current as of December 31, 2012. They are not guarantees of performance or investment results and should not be taken as investment advice. Investment decisions reflect a variety of factors, and the managers reserve the right to change their views about individual stocks, sectors, and the markets at any time. As a result, the views expressed should not be relied upon as a forecast of the fund’s future investment intent. The report is certified under the Sarbanes-Oxley Act, which requires mutual funds and other public companies to affirm that, to the best of their knowledge, the information in their financial reports is fairly and accurately stated in all material respects.
REPORTS ON THE WEB
Sign up for our E-mail Program, and you can begin to receive updated fund reports and prospectuses online rather than through the mail. Log in to your account at troweprice.com for more information.
Manager’s Letter
Fellow Shareholders
The S&P 500 Index rose 16.00% in 2012 after central banks in Europe and the U.S. took forceful action to shore up their economies in the face of weakening global growth. After retreating for most of the spring, the S&P 500 surged to its highest level in almost five years in September after the Federal Reserve announced a third round of quantitative easing, also known as QE3. The rally soon faded as the November 6 election results led to worries that a political impasse would lead to a fiscal crisis. But by mid-November, hopes that lawmakers would reach a budget deal in time to avoid the fiscal cliff sent stock prices soaring once more before the new year. Meanwhile, the U.S. economy continued its modest recovery as housing prices rose and the unemployment rate declined.
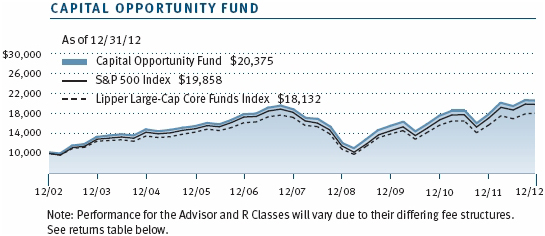
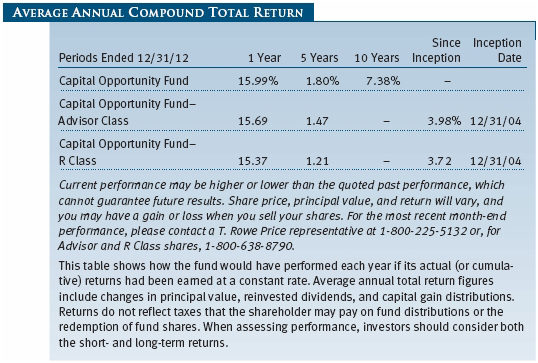
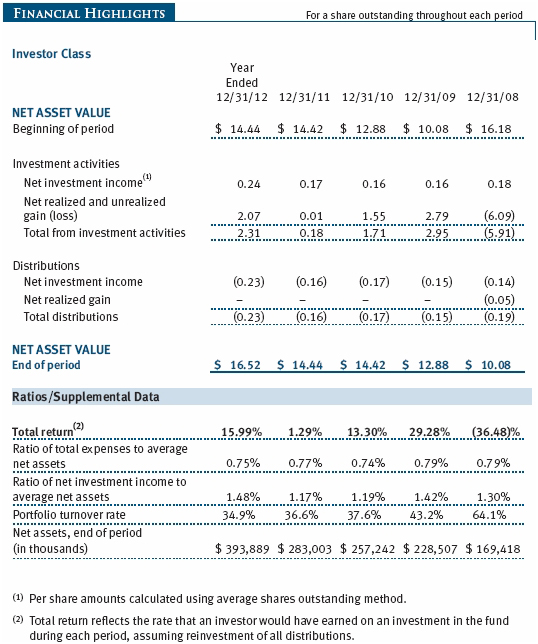
The Capital Opportunity Fund returned 15.99% for the 12 months ended December 31, 2012, in line with the return of its benchmark, the S&P 500 and exceeding the return of the Lipper Large-Cap Core Funds Index. (Returns for Advisor and R Class shares reflected their different fee structures.) The fund’s long-term performance has held up well against its peers. Based on cumulative total return, Lipper ranked the Capital Opportunity Fund 360 out of 941, 254 out of 864, 183 out of 753, and 112 out of 491 large-cap core funds for the 1-, 3-, 5-, and 10-year periods ended December 31, 2012, respectively, placing it in the top quartile of its peer group in the latter two periods. (Past performance cannot guarantee future results.)
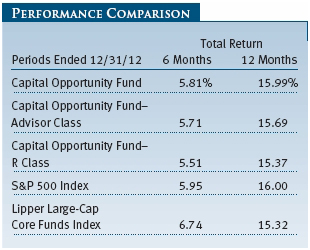
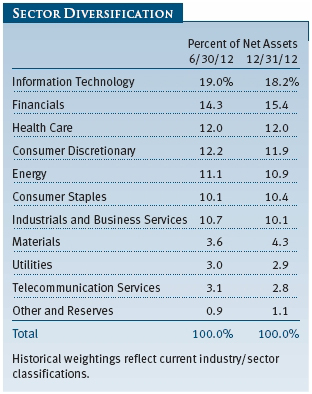
Our objective is to outperform the S&P 500 by investing in our research analysts’ highest-conviction stocks while keeping sector and industry allocations close to their index weights. Excellent stock selection in materials and telecommunication services contributed most to relative performance, despite each sector’s relatively small allocation in the S&P 500. On the other hand, unfavorable stock picking within the consumer discretionary sector hurt relative returns most.
MARKET ENVIRONMENT
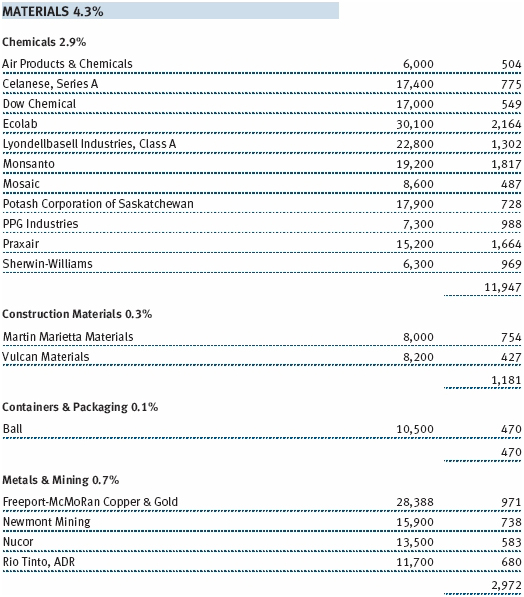
Investor sentiment brightened considerably over the past six months. The U.S. economy continued its modest recovery over the past year. The jobless rate remained above 8% for much of 2012 before unexpectedly dropping to 7.8% in September, its lowest level since January 2009 but still far above pre-financial crisis levels. On a more encouraging note, the long-suffering housing market showed solid improvement, aided by low interest rates and rising home prices. The housing recovery benefited several of our holdings that are tied to the strength of residential construction, such as paint producer and seller Sherwin-Williams and coatings manufacturer PPG Industries.
All sectors within the S&P 500 gained over the reporting period. Financials and consumer discretionary stocks were the top-performing sectors in the S&P, with gains of at least 20% for the year, followed by telecommunication services and health care, both of which outperformed the broad market. Utilities and energy gained the least, with each sector posting single-digit returns. Utilities underperformed as their expensive valuations and below-average earnings growth, as well as uncertainty about potential tax policy changes on dividends, appeared to deter investors. Energy stocks lagged the market amid growing concerns about unfavorable supply/demand trends facing the industry, which is grappling with lower oil and gas prices as a result of record-high domestic production. Our returns in consumer discretionary and energy trailed their respective sector returns due to a few unfavorable picks in each sector, such as Groupon and EOG Resources.
PORTFOLIO REVIEW
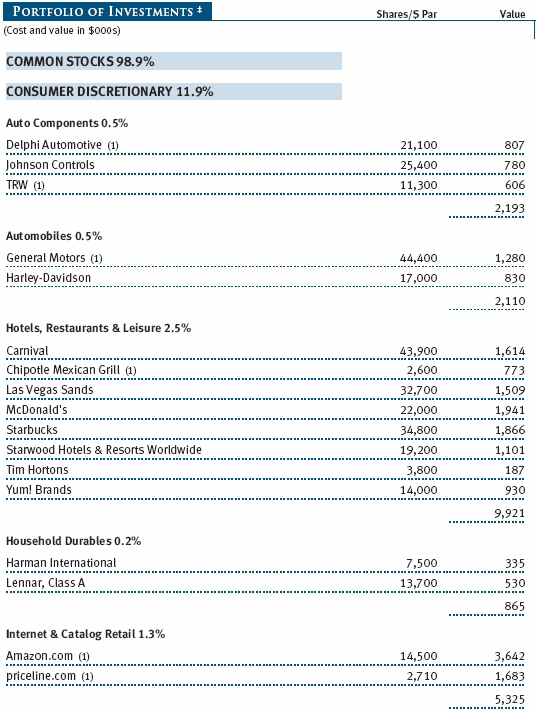
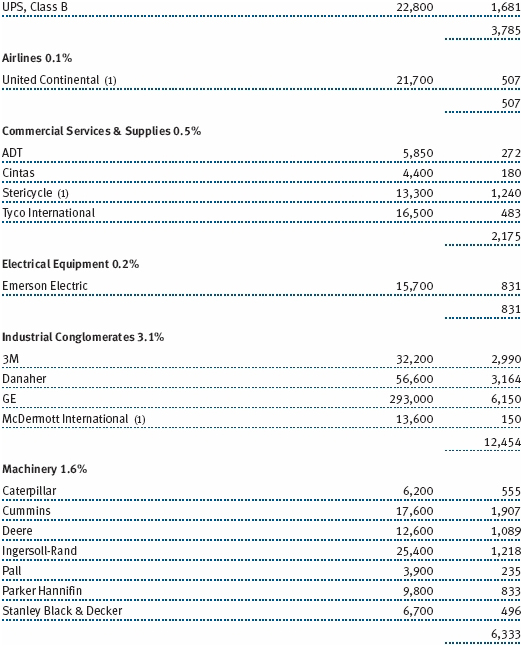
Materials stocks modestly trailed the S&P 500 Index last year, but skillful stock selection made this sector the biggest contributor to relative returns in 2012. LyondellBasell Industries was the sector’s top contributor versus the benchmark. This Rotterdam-based chemicals company listed on U.S. financial markets in 2010 after it filed for bankruptcy in 2009. Our materials analyst upgraded the company in 2011, theorizing that it would benefit from low natural gas prices even in an economic downturn. This hypothesis proved correct, as a surge in natural gas production over the past two years caused gas prices to plummet, benefiting chemicals producers and other consumers of natural gas. LyondellBasell shares have more than doubled since it emerged from bankruptcy, and we believe the shares have further upside potential. Other significant contributors in the materials sector were paint makers Sherwin-Williams and PPG Industries. Shares of both companies performed strongly as housing sales picked up last year, spurring paint sales. We maintain positions in both companies but recently reduced our PPG holding to buy other materials names with greater potential for price appreciation. (Please refer to our portfolio of investments for a complete list of holdings and the amount each represents in the portfolio.)
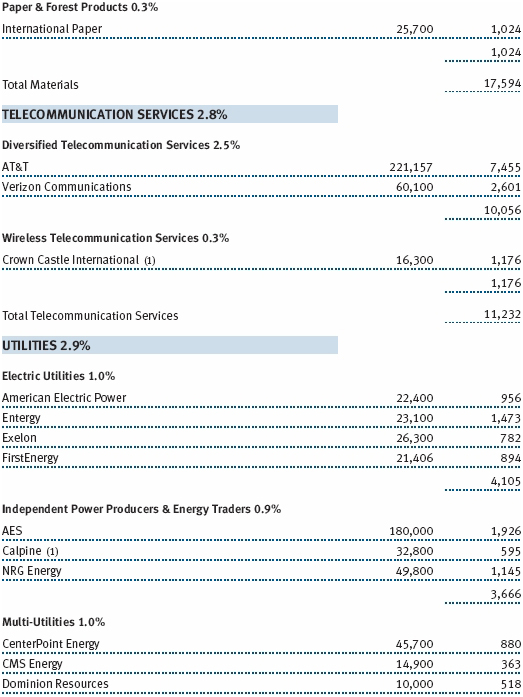
Stock selection in the telecommunications sector also lifted relative performance, as our longstanding investment in Sprint Nextel finally paid off. Shares of Sprint, the third-largest U.S. wireless carrier, rallied this year as the company executed a turnaround after many years of losses and began to reap the benefits of a major network upgrade and a $15.5 billion deal with Apple to sell the iPhone. Many telecommunications analysts believed as recently as last February that Sprint would go bankrupt. However, our analyst has followed Sprint for many years and understood in early 2011 that it was in the midst of a multiyear turnaround and offered a promising opportunity for long-term investors. His foresight was rewarded this year. Sprint Nextel shares more than doubled over 2012, making it the S&P 500’s second-biggest gainer for the year. We eliminated our Sprint position in October to lock in gains after the company agreed to sell a large stake to Japan’s Softbank. Tower operator Crown Castle International was another strong contributor in telecom. Shares of this company, which leases space on communications towers to wireless companies, climbed to record highs over the year as it benefited from increasing voice and data traffic driven by soaring smartphone and tablet use. We continue to maintain an overweight position in Crown Castle. Tower operators are benefiting from increased revenue as mobile devices become more widespread, and we believe they are poised to reap further gains as all the major U.S. carriers are upgrading their networks to accommodate more mobile data traffic.
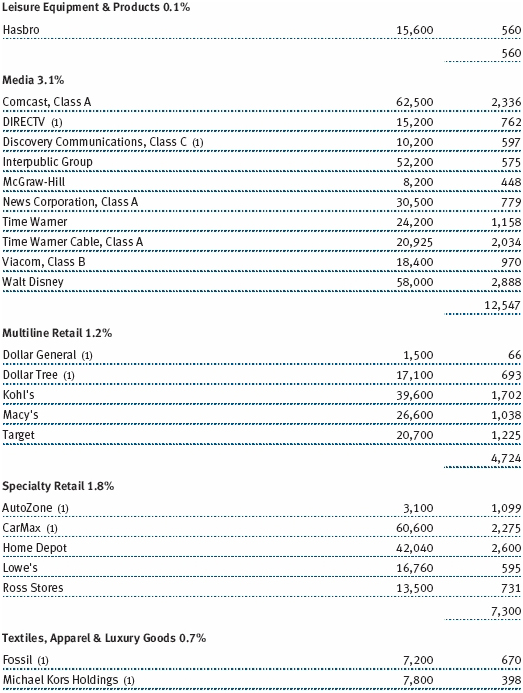
Our stock selection proved to be less helpful in consumer discretionary, the biggest detractor from relative returns. Our underweight in media conglomerate News Corp. led detractors in this sector. News Corp. shares rallied in June after it said it would split into two publicly traded companies in response to shareholder pressure following a phone-hacking scandal in the UK. Although our positioning in News Corp. hurt us last year, we have long maintained an underweight position in favor of other media companies with more transparent and shareholder-friendly management. Groupon was another large detractor. We held a modest out-of-benchmark position in this online coupon company, which has struggled to translate growth into profit since it went public last November. We eliminated Groupon in the fall after it became clear that the business was struggling and heading in a direction sharply at odds with our analyst’s original expectations. An underweight in home improvement retailer Lowe’s also weighed on relative returns as its shares rallied amid the housing market rebound. Our positioning in Lowe’s stemmed from our misgivings about its management, which we believed failed to focus on fixing company-specific problems. However, management has recently addressed some of our concerns, leading us to increase our position size. In addition, we think Lowe’s will benefit from the ongoing housing market recovery.
Despite these disappointments, we also had some notable successes in the consumer discretionary sector. Our overweight in CarMax paid off as its shares rose to a record level in December, driven by rising demand and sales of used cars. Our out-of-benchmark position in General Motors (GM) also lifted results as the carmaker’s turnaround gained momentum since it exited bankruptcy in 2009. In December, GM said it would spend $5.5 billion to buy 40% of the U.S. government’s stake in the company, a move that we believe should remove some of the overhang on its shares. Both CarMax and GM ranked among the fund’s biggest relative contributors for 2012.
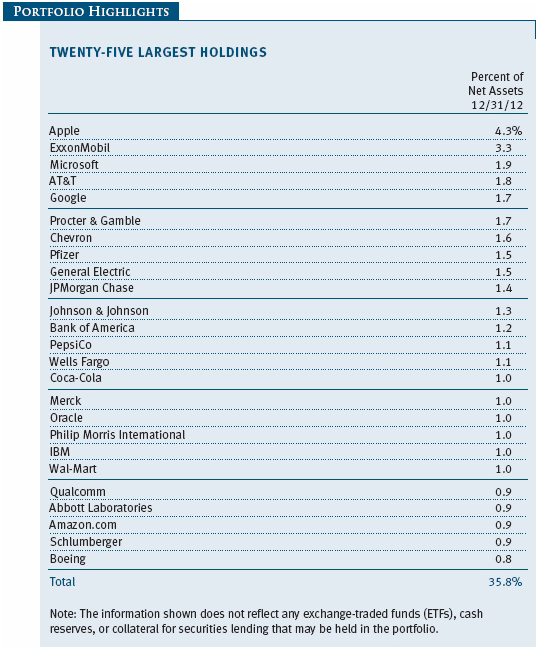
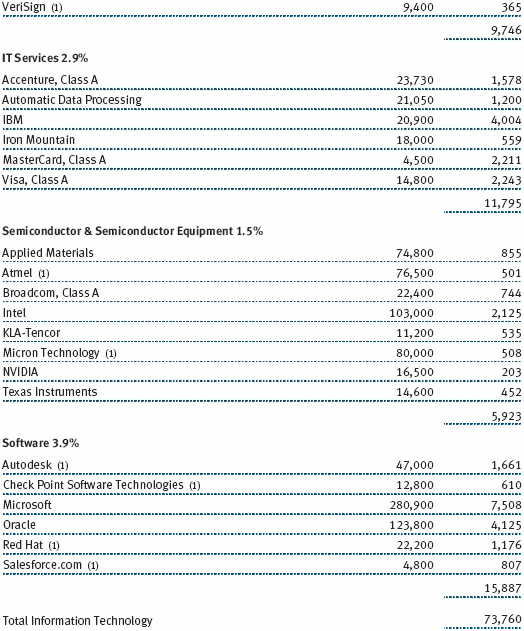
Our recent trades reflect our continued efforts to add value by taking advantage of changing market conditions to buy high-conviction stocks and trim names whose shares appear fully valued. In the last three months of 2012, we increased our position in Apple following a decline in its shares. Apple has been an outstanding performer for several years, and we believe the iPhone 5, iPad Mini, and other new products will continue to drive strong growth for the company. Apple’s ability to innovate is unmatched in the technology industry, and it is one of our larger overweight positions versus the S&P 500. The company has also instituted a capital management plan including dividends and buybacks that is more shareholder friendly. We also increased our position in Wal-Mart. Shares of the discount retailer have disappointed for several years as it lost its dominance in the U.S., but we believe Wal-Mart is in the early stages of a multiyear turnaround as it returns to its “everyday low price” roots, which we believe will drive share gains and margin expansion over time. Wal-Mart’s management is also proving to be more thoughtful about its capital allocation.
As for major sales, we eliminated our position in insurance provider Travelers Companies after its shares rose to record levels in the fall, using the proceeds to buy State Street and other financials with greater upside potential. We also reduced our holdings in discount retailer Dollar General, which we believe will see stiffer competition and a potentially weaker customer base as disposable incomes among low-income consumers may deteriorate if the economy stalls. Finally, we reduced our position in Emerson Electric, a maker of electrical and other industrial equipment. Emerson is a solid company with diversified businesses and a strong position in fast-growing emerging markets, but we believe that the company’s slowing earnings growth did not justify its stock price.
OUTLOOK
We are optimistic about the outlook for U.S. stocks, although the strong performance of U.S. large-cap stocks in 2012 has slightly tempered our near-term outlook. The economy is slowly recovering, and we are encouraged by recent improvement in the housing and job markets. Financial stresses in Europe have eased for now, and China’s economy appears to have stabilized after a sharp slowdown over the summer. However, numerous risks continue to weigh on the global growth outlook. Chief among them is the uncertainty stemming from the nation’s unsolved fiscal problems, which will likely continue to affect stock market performance in the coming months and years. Although U.S. lawmakers skirted the fiscal cliff in January, they still have to negotiate spending cuts and an agreement to raise the nation’s debt ceiling, which will create more uncertainty into the spring. Outside the U.S., we believe that the extent of China’s slowdown and developments in Europe are the main risks for global growth. Over the longer term, when the nation’s fiscal outlook is more settled, we believe investors will refocus on the economy’s improving fundamentals, which will benefit U.S. stocks.
One positive development we have noted is that gauges of market correlation—which measure how much stocks rise and fall in unison—have subsided from the record levels that prevailed for most of 2011, indicating that investors have shifted their focus from macroeconomic events to company-specific factors like earnings, cash flow, competitive positioning, and management. Given that our strategy strives to add value by focusing on individual companies’ fundamentals, we prefer environments with wider dispersions of returns within sectors. Such environments allow us to leverage the in-depth research of our team of experienced industry analysts and are conducive to our strategy of adding value over the S&P 500 in the long run.
Thank you for investing with T. Rowe Price.
Respectfully submitted,

Anna M. Dopkin
President of the fund and chairman of its Investment Advisory Committee
January 10, 2013
The committee chairman has day-to-day responsibility for managing the portfolio and works with committee members in developing and executing the fund’s investment program.
RISKS OF INVESTING
As with all stock mutual funds, the fund’s share price can fall because of weakness in the stock market, a particular industry, or specific holdings. Stock markets can decline for many reasons, including adverse political or economic developments, changes in investor psychology, or heavy institutional selling. The prospects for an industry or company may deteriorate because of a variety of factors, including disappointing earnings or changes in the competitive environment.
GLOSSARY
Lipper indexes: Track the performance of the largest mutual funds in a particular category as determined by Lipper Inc.
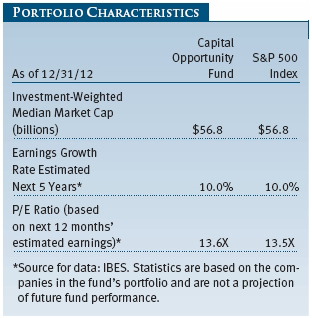
Price/earnings (P/E) ratio: A valuation measure calculated by dividing the price of a stock by its current or projected earnings per share. This ratio gives investors an idea of how much they are paying for current or future earnings power.
Price/earnings (P/E) ratio–12 months forward: A valuation measure calculated by dividing the price of a stock by the analysts’ forecast of the next 12 months’ expected earnings. This ratio is a measure of how much investors are willing to pay for the company’s future earnings. The higher this P/E, the more investors are paying for a company’s earnings growth in the next 12 months.
Projected earnings growth rate: A company’s expected earnings per share growth rate for a given time period based on the forecast from the Institutional Brokers’ Estimate System, which is commonly referred to as IBES.
S&P 500 Index: Tracks the stocks of 500 mostly large-cap U.S. companies.

Performance and Expenses
This chart shows the value of a hypothetical $10,000 investment in the fund over the past 10 fiscal year periods or since inception (for funds lacking 10-year records). The result is compared with benchmarks, which may include a broad-based market index and a peer group average or index. Market indexes do not include expenses, which are deducted from fund returns as well as mutual fund averages and indexes.
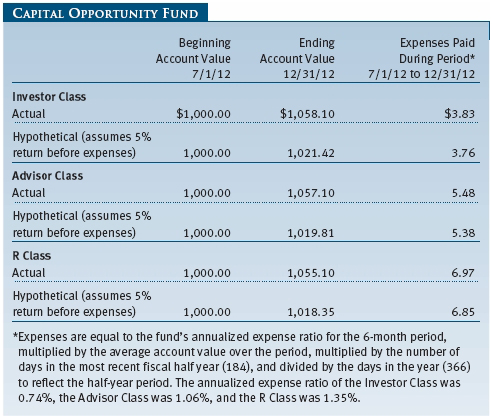
As a mutual fund shareholder, you may incur two types of costs: (1) transaction costs, such as redemption fees or sales loads, and (2) ongoing costs, including management fees, distribution and service (12b-1) fees, and other fund expenses. The following example is intended to help you understand your ongoing costs (in dollars) of investing in the fund and to compare these costs with the ongoing costs of investing in other mutual funds. The example is based on an investment of $1,000 invested at the beginning of the most recent six-month period and held for the entire period.
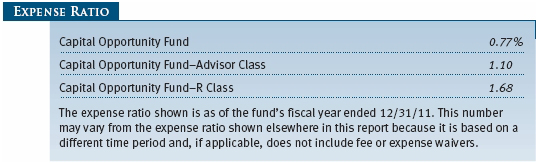
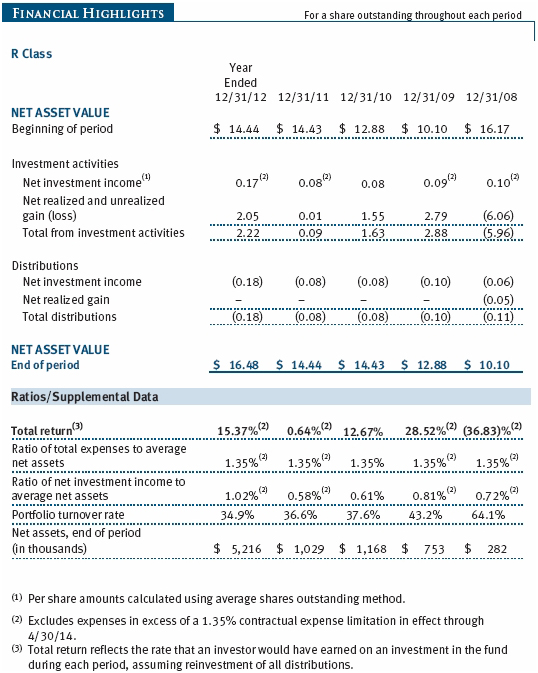
Please note that the fund has three share classes: The original share class (Investor Class) charges no distribution and service (12b-1) fee, Advisor Class shares are offered only through unaffiliated brokers and other financial intermediaries and charge a 0.25% 12b-1 fee, and R Class shares are available to retirement plans serviced by intermediaries and charge a 0.50% 12b-1 fee. Each share class is presented separately in the table.
Actual Expenses
The first line of the following table (Actual) provides information about actual account values and expenses based on the fund’s actual returns. You may use the information on this line, together with your account balance, to estimate the expenses that you paid over the period. Simply divide your account value by $1,000 (for example, an $8,600 account value divided by $1,000 = 8.6), then multiply the result by the number on the first line under the heading “Expenses Paid During Period” to estimate the expenses you paid on your account during this period.
Hypothetical Example for Comparison Purposes
The information on the second line of the table (Hypothetical) is based on hypothetical account values and expenses derived from the fund’s actual expense ratio and an assumed 5% per year rate of return before expenses (not the fund’s actual return). You may compare the ongoing costs of investing in the fund with other funds by contrasting this 5% hypothetical example and the 5% hypothetical examples that appear in the shareholder reports of the other funds. The hypothetical account values and expenses may not be used to estimate the actual ending account balance or expenses you paid for the period.
Note: T. Rowe Price charges an annual account service fee of $20, generally for accounts with less than $10,000. The fee is waived for any investor whose T. Rowe Price mutual fund accounts total $50,000 or more; accounts electing to receive electronic delivery of account statements, transaction confirmations, prospectuses, and shareholder reports; or accounts of an investor who is a T. Rowe Price Preferred Services, Personal Services, or Enhanced Personal Services client (enrollment in these programs generally requires T. Rowe Price assets of at least $100,000). This fee is not included in the accompanying table. If you are subject to the fee, keep it in mind when you are estimating the ongoing expenses of investing in the fund and when comparing the expenses of this fund with other funds.
You should also be aware that the expenses shown in the table highlight only your ongoing costs and do not reflect any transaction costs, such as redemption fees or sales loads. Therefore, the second line of the table is useful in comparing ongoing costs only and will not help you determine the relative total costs of owning different funds. To the extent a fund charges transaction costs, however, the total cost of owning that fund is higher.
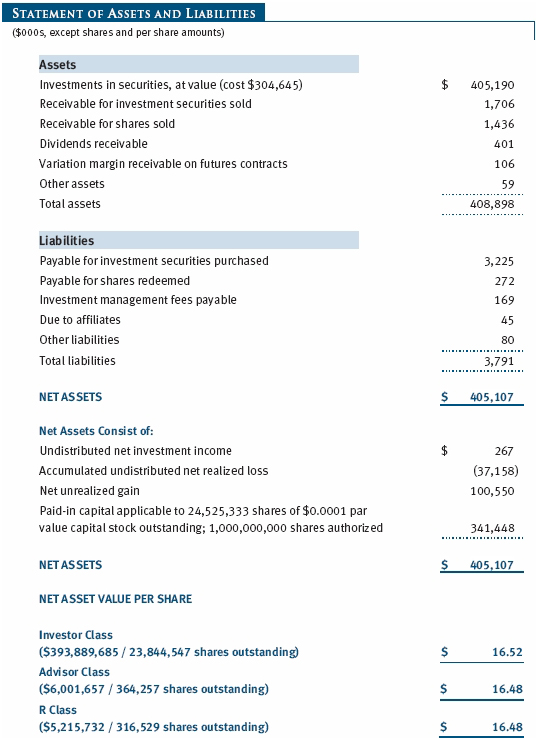
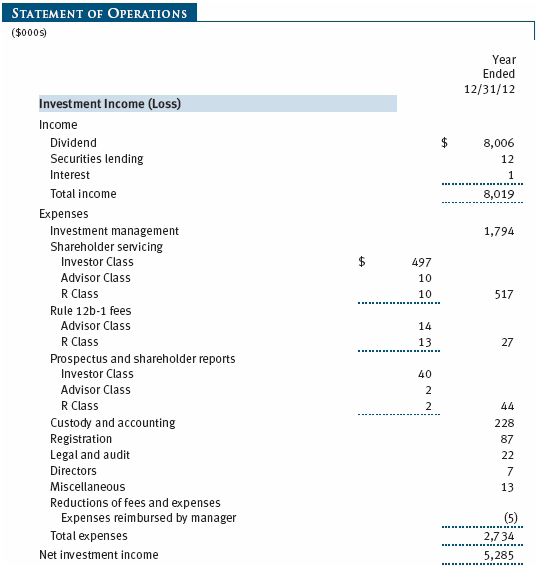
The accompanying notes are an integral part of these financial statements.

The accompanying notes are an integral part of these financial statements.
The accompanying notes are an integral part of these financial statements.


The accompanying notes are an integral part of these financial statements.
The accompanying notes are an integral part of these financial statements.
The accompanying notes are an integral part of these financial statements.

The accompanying notes are an integral part of these financial statements.
| Notes to Financial Statements |
T. Rowe Price Capital Opportunity Fund, Inc. (the fund), is registered under the Investment Company Act of 1940 (the 1940 Act) as a diversified, open-end management investment company. The fund seeks to provide long-term capital growth by investing primarily in U.S. common stocks. The fund has three classes of shares: the Capital Opportunity Fund original share class, referred to in this report as the Investor Class, offered since November 30, 1994; the Capital Opportunity Fund–Advisor Class (Advisor Class), offered since December 31, 2004; and the Capital Opportunity Fund–R Class (R Class), offered since December 31, 2004. Advisor Class shares are sold only through unaffiliated brokers and other unaffiliated financial intermediaries, and R Class shares are available to retirement plans serviced by intermediaries. The Advisor Class and R Class each operate under separate Board-approved Rule 12b-1 plans, pursuant to which each class compensates financial intermediaries for distribution, shareholder servicing, and/or certain administrative services. Each class has exclusive voting rights on matters related solely to that class; separate voting rights on matters that relate to all classes; and, in all other respects, the same rights and obligations as the other classes.
NOTE 1 - SIGNIFICANT ACCOUNTING POLICIES
Basis of Preparation The accompanying financial statements were prepared in accordance with accounting principles generally accepted in the United States of America (GAAP), which require the use of estimates made by management. Management believes that estimates and valuations are appropriate; however, actual results may differ from those estimates, and the valuations reflected in the accompanying financial statements may differ from the value ultimately realized upon sale or maturity.
Investment Transactions, Investment Income, and Distributions Income and expenses are recorded on the accrual basis. Premiums and discounts on debt securities are amortized for financial reporting purposes. Dividends received from mutual fund investments are reflected as dividend income; capital gain distributions are reflected as realized gain/loss. Dividend income and capital gain distributions are recorded on the ex-dividend date. Income tax-related interest and penalties, if incurred, would be recorded as income tax expense. Investment transactions are accounted for on the trade date. Realized gains and losses are reported on the identified cost basis. Distributions to shareholders are recorded on the ex-dividend date. Income distributions are declared and paid by each class annually. Capital gain distributions, if any, are generally declared and paid by the fund annually.
Class Accounting The Advisor Class and R Class each pay distribution, shareholder servicing, and/or certain administrative expenses in the form of Rule 12b-1 fees, in an amount not exceeding 0.25% and 0.50%, respectively, of the class’s average daily net assets. Shareholder servicing, prospectus, and shareholder report expenses incurred by each class are charged directly to the class to which they relate. Expenses common to all classes, investment income, and realized and unrealized gains and losses are allocated to the classes based upon the relative daily net assets of each class.
Rebates and Credits Subject to best execution, the fund may direct certain security trades to brokers who have agreed to rebate a portion of the related brokerage commission to the fund in cash. Commission rebates are reflected as realized gain on securities in the accompanying financial statements and totaled $8,000 for the year ended December 31, 2012. Additionally, the fund earns credits on temporarily uninvested cash balances held at the custodian, which reduce the fund’s custody charges. Custody expense in the accompanying financial statements is presented before reduction for credits.
New Accounting Pronouncements In December 2011, the FASB issued amended guidance to enhance disclosure for offsetting assets and liabilities. The guidance is effective for fiscal years and interim periods beginning on or after January 1, 2013. Adoption will have no effect on the fund’s net assets or results of operations.
NOTE 2 - VALUATION
The fund’s financial instruments are reported at fair value as defined by GAAP. The fund determines the values of its assets and liabilities and computes each class’s net asset value per share at the close of the New York Stock Exchange (NYSE), normally 4 p.m. ET, each day that the NYSE is open for business.
Valuation Methods Equity securities listed or regularly traded on a securities exchange or in the over-the-counter (OTC) market are valued at the last quoted sale price or, for certain markets, the official closing price at the time the valuations are made, except for OTC Bulletin Board securities, which are valued at the mean of the latest bid and asked prices. A security that is listed or traded on more than one exchange is valued at the quotation on the exchange determined to be the primary market for such security. Listed securities not traded on a particular day are valued at the mean of the latest bid and asked prices for domestic securities and the last quoted sale price for international securities. Debt securities with remaining maturities of less than one year at the time of acquisition generally use amortized cost in local currency to approximate fair value. However, if amortized cost is deemed not to reflect fair value or the fund holds a significant amount of such securities with remaining maturities of more than 60 days, the securities are valued at prices furnished by dealers who make markets in such securities or by an independent pricing service.
Investments in mutual funds are valued at the mutual fund’s closing net asset value per share on the day of valuation. Financial futures contracts are valued at closing settlement prices.
Other investments, including restricted securities and private placements, and those financial instruments for which the above valuation procedures are inappropriate or are deemed not to reflect fair value, are stated at fair value as determined in good faith by the T. Rowe Price Valuation Committee, established by the fund’s Board of Directors (the Board). Subject to oversight by the Board, the Valuation Committee develops pricing-related policies and procedures and approves all fair-value determinations. The Valuation Committee regularly makes good faith judgments, using a wide variety of sources and information, to establish and adjust valuations of certain securities as events occur and circumstances warrant. For instance, in determining the fair value of private-equity instruments, the Valuation Committee considers a variety of factors, including the company’s business prospects, its financial performance, strategic events impacting the company, relevant valuations of similar companies, new rounds of financing, and any negotiated transactions of significant size between other investors in the company. Because any fair-value determination involves a significant amount of judgment, there is a degree of subjectivity inherent in such pricing decisions.
Valuation Inputs Various inputs are used to determine the value of the fund’s financial instruments. These inputs are summarized in the three broad levels listed below:
Level 1 – quoted prices in active markets for identical financial instruments
Level 2 – observable inputs other than Level 1 quoted prices (including, but not limited to, quoted prices for similar financial instruments, interest rates, prepayment speeds, and credit risk)
Level 3 – unobservable inputs
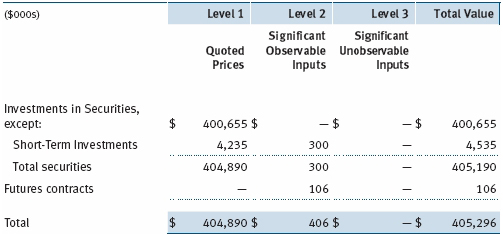
Observable inputs are those based on market data obtained from sources independent of the fund, and unobservable inputs reflect the fund’s own assumptions based on the best information available. The input levels are not necessarily an indication of the risk or liquidity associated with financial instruments at that level. The following table summarizes the fund’s financial instruments, based on the inputs used to determine their values on December 31, 2012:
NOTE 3 - DERIVATIVE INSTRUMENTS
During the year ended December 31, 2012, the fund invested in derivative instruments. As defined by GAAP, a derivative is a financial instrument whose value is derived from an underlying security price, foreign exchange rate, interest rate, index of prices or rates, or other variable; it requires little or no initial investment and permits or requires net settlement. The fund invests in derivatives only if the expected risks and rewards are consistent with its investment objectives, policies, and overall risk profile, as described in its prospectus and Statement of Additional Information. The fund may use derivatives for a variety of purposes, such as seeking to hedge against declines in principal value, increase yield, invest in an asset with greater efficiency and at a lower cost than is possible through direct investment, or to adjust credit exposure. The risks associated with the use of derivatives are different from, and potentially much greater than, the risks associated with investing directly in the instruments on which the derivatives are based. Investments in derivatives can magnify returns positively or negatively; however, the fund at all times maintains sufficient cash reserves, liquid assets, or other SEC-permitted asset types to cover the settlement obligations under its open derivative contracts.
The fund values its derivatives at fair value, as described below and in Note 2, and recognizes changes in fair value currently in its results of operations. Accordingly, the fund does not follow hedge accounting, even for derivatives employed as economic hedges. The fund does not offset the fair value of derivative instruments against the right to reclaim or obligation to return collateral. As of December 31, 2012, the fund held equity futures with cumulative unrealized gain of $5,000; the value reflected on the accompanying Statement of Assets and Liabilities is the related unsettled variation margin.
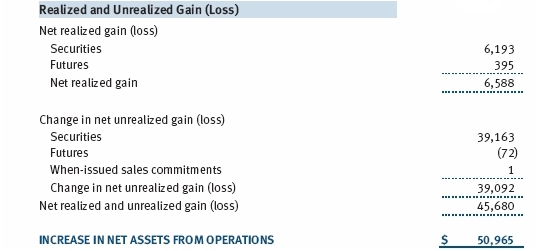
Additionally, during the year ended December 31, 2012, the fund recognized $395,000 of realized gain on Futures and a $72,000 change in unrealized loss on Futures related to its investments in equity derivatives; such amounts are included on the accompanying Statement of Operations.
Futures Contracts The fund is subject to equity price risk in the normal course of pursuing its investment objectives and uses futures contracts to help manage such risk. The fund may enter into futures contracts to manage exposure to interest rates, security prices, foreign currencies, and credit quality; as an efficient means of adjusting exposure to all or part of a target market; to enhance income; as a cash management tool; and/or to adjust credit exposure. A futures contract provides for the future sale by one party and purchase by another of a specified amount of a particular underlying financial instrument at an agreed-upon price, date, time, and place. The fund currently invests only in exchange-traded futures, which generally are standardized as to maturity date, underlying financial instrument, and other contract terms. Upon entering into a futures contract, the fund is required to deposit collateral with the broker in the form of cash or securities in an amount equal to a certain percentage of the contract value (margin requirement); the margin requirement must then be maintained at the established level over the life of the contract. Subsequent payments are made or received by the fund each day to settle daily fluctuations in the value of the contract (variation margin), which reflect changes in the value of the underlying financial instrument. Variation margin is recorded as unrealized gain or loss until the contract is closed. The value of a futures contract included in net assets is the amount of unsettled variation margin; net variation margin receivable is reflected as an asset, and net variation margin payable is reflected as a liability on the accompanying Statement of Assets and Liabilities. Risks related to the use of futures contracts include possible illiquidity of the futures markets, contract prices that can be highly volatile and imperfectly correlated to movements in hedged security values and/or interest rates, and potential losses in excess of the fund’s initial investment. During the year ended December 31, 2012, the fund’s exposure to futures, based on underlying notional amounts, was generally less than 1% of net assets.
NOTE 4 - OTHER INVESTMENT TRANSACTIONS
Consistent with its investment objective, the fund engages in the following practices to manage exposure to certain risks and/or to enhance performance. The investment objective, policies, program, and risk factors of the fund are described more fully in the fund’s prospectus and Statement of Additional Information.
Securities Lending The fund lends its securities to approved brokers to earn additional income. It receives as collateral cash and U.S. government securities valued at 102% to 105% of the value of the securities on loan. Collateral is maintained over the life of the loan in an amount not less than the value of loaned securities as determined at the close of fund business each day; any additional collateral required due to changes in security values is delivered to the fund the next business day. Cash collateral is invested by the fund’s lending agent(s) in accordance with investment guidelines approved by management. Although risk is mitigated by the collateral, the fund could experience a delay in recovering its securities and a possible loss of income or value if the borrower fails to return the securities or if collateral investments decline in value. Securities lending revenue recognized by the fund consists of earnings on invested collateral and borrowing fees, net of any rebates to the borrower and compensation to the lending agent. In accordance with GAAP, investments made with cash collateral are reflected in the accompanying financial statements, but collateral received in the form of securities is not. At December 31, 2012, there were no securities on loan.
When-Issued Securities The fund may enter into when-issued purchases and/or sales commitments, pursuant to which it agrees to purchase or sell, respectively, the underlying security for a fixed unit price, with payment and delivery at a scheduled future date generally beyond the customary settlement period for such securities. When-issued refers to securities that have not yet been issued but will be issued in the future and may include new securities or securities obtained through a corporate action on a current holding. The fund normally purchases when-issued securities with the intention of taking possession but may enter into a separate agreement to sell the securities before the settlement date. Until settlement, the fund maintains cash reserves and liquid assets sufficient to settle its when-issued commitments. Amounts realized on when-issued transactions are included with realized gain/loss on securities in the accompanying financial statements.
Counterparty Risk and Collateral Counterparty risk related to exchange-traded futures and options contracts is minimal because the exchange’s clearing-house provides protection against counterparty defaults. Generally, for exchange-traded derivatives such as futures and options, each broker, in its sole discretion, may change margin requirements applicable to the fund. Cash posted by the fund to meet margin requirements is reflected as restricted cash in the accompanying financial statements and securities posted by the fund are so noted in the accompanying Portfolio of Investments; both remain in the fund’s assets. As of December 31, 2012, securities valued at $230,000 had been posted by the fund to the broker for exchange-traded derivatives.
Other Purchases and sales of portfolio securities other than short-term securities aggregated $193,490,000 and $124,573,000, respectively, for the year ended December 31, 2012.
NOTE 5 - FEDERAL INCOME TAXES
No provision for federal income taxes is required since the fund intends to continue to qualify as a regulated investment company under Subchapter M of the Internal Revenue Code and distribute to shareholders all of its taxable income and gains. Distributions determined in accordance with federal income tax regulations may differ in amount or character from net investment income and realized gains for financial reporting purposes. Financial reporting records are adjusted for permanent book/tax differences to reflect tax character but are not adjusted for temporary differences.
The fund files U.S. federal, state, and local tax returns as required. The fund’s tax returns are subject to examination by the relevant tax authorities until expiration of the applicable statute of limitations, which is generally three years after the filing of the tax return but which can be extended to six years in certain circumstances. Tax returns for open years have incorporated no uncertain tax positions that require a provision for income taxes.
Distributions during the years ended December 31, 2012 and December 31, 2011, totaled $5,532,000 and $3,232,000, respectively, and were characterized as ordinary income for tax purposes. At December 31, 2012, the tax-basis cost of investments and components of net assets were as follows:

The difference between book-basis and tax-basis net unrealized appreciation (depreciation) is attributable to the deferral of losses from wash sales for tax purposes. The fund intends to retain realized gains to the extent of available capital loss carryforwards. As a result of the Regulated Investment Company Modernization Act of 2010, net capital losses realized on or after January 1, 2011 (effective date) may be carried forward indefinitely to offset future realized capital gains; however, post-effective losses must be used before pre-effective capital loss carryforwards with expiration dates. Accordingly, it is possible that all or a portion of the fund’s pre-effective capital loss carryforwards could expire unused. Additionally, all or a portion of the fund’s capital loss carryforwards may be from losses realized between November 1 and the fund’s fiscal year-end, which are deferred for tax purposes until the subsequent year but recognized for financial reporting purposes in the year realized. During the year ended December 31, 2012, the fund utilized $6,204,000 of capital loss carryforwards. The fund’s available capital loss carryforwards as of December 31, 2012, expire as follows: $507,000 in fiscal 2016 and $25,950,000 in fiscal 2017; $144,000 have no expiration.
NOTE 6 - RELATED PARTY TRANSACTIONS
The fund is managed by T. Rowe Price Associates, Inc. (Price Associates), a wholly owned subsidiary of T. Rowe Price Group, Inc. (Price Group). The investment management agreement between the fund and Price Associates provides for an annual investment management fee, which is computed daily and paid monthly. The fee consists of an individual fund fee, equal to 0.20% of the fund’s average daily net assets, and a group fee. The group fee rate is calculated based on the combined net assets of certain mutual funds sponsored by Price Associates (the group) applied to a graduated fee schedule, with rates ranging from 0.48% for the first $1 billion of assets to 0.28% for assets in excess of $300 billion. The fund’s group fee is determined by applying the group fee rate to the fund’s average daily net assets. At December 31, 2012, the effective annual group fee rate was 0.30%.
The R Class is also subject to a contractual expense limitation through April 30, 2014. During the limitation period, Price Associates is required to waive its management fee and/or reimburse expenses, excluding interest, taxes, brokerage commissions, and extraordinary expenses, that would otherwise cause the class’s ratio of annualized total expenses to average net assets (expense ratio) to exceed its expense limitation of 1.35%. The class is required to repay Price Associates for expenses previously reimbursed and management fees waived to the extent the class’s net assets have grown or expenses have declined sufficiently to allow repayment without causing the class’s expense ratio to exceed its expense limitation. However, no repayment will be made more than three years after the date of any reimbursement or waiver or later than April 30, 2016. Pursuant to this agreement, expenses in the amount of $5,000 were reimbursed by Price Associates during the year ended December 31, 2012. Including these amounts, expenses previously reimbursed by Price Associates in the amount of $9,000 remain subject to repayment at December 31, 2012.
In addition, the fund has entered into service agreements with Price Associates and two wholly owned subsidiaries of Price Associates (collectively, Price). Price Associates computes the daily share prices and provides certain other administrative services to the fund. T. Rowe Price Services, Inc., provides shareholder and administrative services in its capacity as the fund’s transfer and dividend disbursing agent. T. Rowe Price Retirement Plan Services, Inc., provides subaccounting and recordkeeping services for certain retirement accounts invested in the Investor Class and R Class. For the year ended December 31, 2012, expenses incurred pursuant to these service agreements were $166,000 for Price Associates; $121,000 for T. Rowe Price Services, Inc.; and $14,000 for T. Rowe Price Retirement Plan Services, Inc. The total amount payable at period-end pursuant to these service agreements is reflected as Due to Affiliates in the accompanying financial statements.
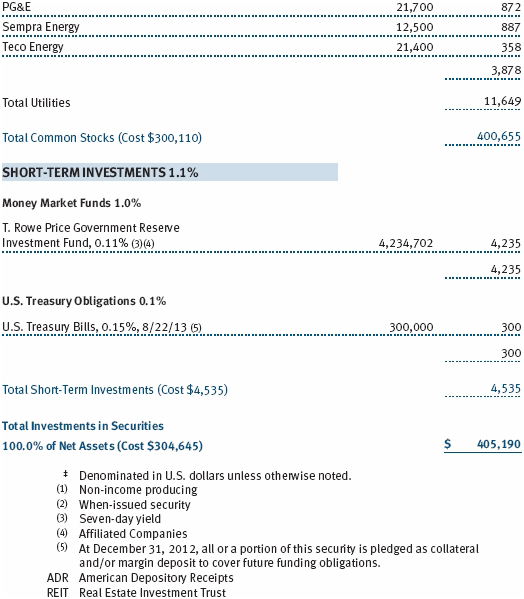
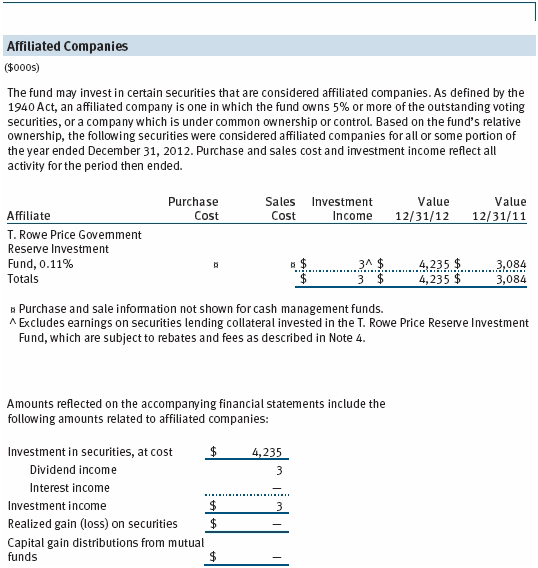
The fund may invest in the T. Rowe Price Reserve Investment Fund and the T. Rowe Price Government Reserve Investment Fund (collectively, the T. Rowe Price Reserve Investment Funds), open-end management investment companies managed by Price Associates and considered affiliates of the fund. The T. Rowe Price Reserve Investment Funds are offered as cash management options to mutual funds, trusts, and other accounts managed by Price Associates and/or its affiliates and are not available for direct purchase by members of the public. The T. Rowe Price Reserve Investment Funds pay no investment management fees.
As of December 31, 2012, T. Rowe Price Group, Inc., and/or its wholly owned subsidiaries owned 1,227,569 shares of the Investor Class, representing 5% of the fund’s net assets.
| Report of Independent Registered Public Accounting Firm |
To the Board of Directors and Shareholders of
T. Rowe Price Capital Opportunity Fund, Inc.
In our opinion, the accompanying statement of assets and liabilities, including the portfolio of investments, and the related statements of operations and of changes in net assets and the financial highlights present fairly, in all material respects, the financial position of T. Rowe Price Capital Opportunity Fund, Inc. (the “Fund”) at December 31, 2012, and the results of its operations, the changes in its net assets and the financial highlights for each of the periods indicated therein, in conformity with accounting principles generally accepted in the United States of America. These financial statements and financial highlights (hereafter referred to as “financial statements”) are the responsibility of the Fund’s management; our responsibility is to express an opinion on these financial statements based on our audits. We conducted our audits of these financial statements in accordance with the standards of the Public Company Accounting Oversight Board (United States). Those standards require that we plan and perform the audit to obtain reasonable assurance about whether the financial statements are free of material misstatement. An audit includes examining, on a test basis, evidence supporting the amounts and disclosures in the financial statements, assessing the accounting principles used and significant estimates made by management, and evaluating the overall financial statement presentation. We believe that our audits, which included confirmation of securities at December 31, 2012 by correspondence with the custodian and brokers, and confirmation of the underlying funds by correspondence with the transfer agent, provide a reasonable basis for our opinion.
PricewaterhouseCoopers LLP
Baltimore, Maryland
February 15, 2013
| Tax Information (Unaudited) for the Tax Year Ended 12/31/12 |
We are providing this information as required by the Internal Revenue Code. The amounts shown may differ from those elsewhere in this report because of differences between tax and financial reporting requirements.
For taxable non-corporate shareholders, $5,285,000 of the fund’s income represents qualified dividend income subject to the 15% rate category.
For corporate shareholders, $5,285,000 of the fund’s income qualifies for the dividends-received deduction.
| Information on Proxy Voting Policies, Procedures, and Records |
A description of the policies and procedures used by T. Rowe Price funds and portfolios to determine how to vote proxies relating to portfolio securities is available in each fund’s Statement of Additional Information, which you may request by calling 1-800-225-5132 or by accessing the SEC’s website, sec.gov. The description of our proxy voting policies and procedures is also available on our website, troweprice.com. To access it, click on the words “Our Company” at the top of our corporate homepage. Then, when the next page appears, click on the words “Proxy Voting Policies” on the left side of the page.
Each fund’s most recent annual proxy voting record is available on our website and through the SEC’s website. To access it through our website, follow the directions above, then click on the words “Proxy Voting Records” on the right side of the Proxy Voting Policies page.
| How to Obtain Quarterly Portfolio Holdings |
The fund files a complete schedule of portfolio holdings with the Securities and Exchange Commission for the first and third quarters of each fiscal year on Form N-Q. The fund’s Form N-Q is available electronically on the SEC’s website (sec.gov); hard copies may be reviewed and copied at the SEC’s Public Reference Room, 100 F St. N.E., Washington, DC 20549. For more information on the Public Reference Room, call 1-800-SEC-0330.
| About the Fund’s Directors and Officers |
Your fund is overseen by a Board of Directors (Board) that meets regularly to review a wide variety of matters affecting the fund, including performance, investment programs, compliance matters, advisory fees and expenses, service providers, and other business affairs. The Board elects the fund’s officers, who are listed in the final table. At least 75% of the Board’s members are independent of T. Rowe Price Associates, Inc. (T. Rowe Price), and its affiliates; “inside” or “interested” directors are employees or officers of T. Rowe Price. The business address of each director and officer is 100 East Pratt Street, Baltimore, Maryland 21202. The Statement of Additional Information includes additional information about the fund directors and is available without charge by calling a T. Rowe Price representative at 1-800-638-5660.
| Independent Directors | | |
| |
| Name | | |
| (Year of Birth) | | |
| Year Elected* | | |
| [Number of T. Rowe Price | | Principal Occupation(s) and Directorships of Public Companies and |
| Portfolios Overseen] | | Other Investment Companies During the Past Five Years |
| | | |
| William R. Brody, M.D., | | President and Trustee, Salk Institute for Biological Studies (2009 |
| Ph.D. | | to present); Director, Novartis, Inc. (2009 to present); Director, IBM |
| (1944) | | (2007 to present); President and Trustee, Johns Hopkins University |
| 2009 | | (1996 to 2009); Chairman of Executive Committee and Trustee, |
| [142] | | Johns Hopkins Health System (1996 to 2009) |
| | | |
| Anthony W. Deering | | Chairman, Exeter Capital, LLC, a private investment firm (2004 |
| (1945) | | to present); Director, Under Armour (2008 to present); Director, |
| 2001 | | Vornado Real Estate Investment Trust (2004 to present); Director |
| [142] | | and Member of the Advisory Board, Deutsche Bank North America |
| | (2004 to present); Director, Mercantile Bankshares (2002 to 2007) |
| | | |
| Donald W. Dick, Jr. | | Principal, EuroCapital Partners, LLC, an acquisition and management |
| (1943) | | advisory firm (1995 to present) |
| 1994 | | |
| [142] | | |
| | | |
| Robert J. Gerrard, Jr. | | Chairman of Compensation Committee and Director, Syniverse |
| (1952) | | Holdings, Inc. (2008 to 2011); Executive Vice President and General |
| 2012 | | Counsel, Scripps Networks, LLC (1997 to 2009); Advisory Board |
| [90] | | Member, Pipeline Crisis/Winning Strategies (1997 to present) |
| | | |
| Karen N. Horn | | Senior Managing Director, Brock Capital Group, an advisory and |
| (1943) | | investment banking firm (2004 to present); Director, Eli Lilly and |
| 2003 | | Company (1987 to present); Director, Simon Property Group (2004 |
| [142] | | to present); Director, Norfolk Southern (2008 to present); Director, |
| | Fannie Mae (2006 to 2008) |
| | | |
| Theo C. Rodgers | | President, A&R Development Corporation (1977 to present) |
| (1941) | | |
| 2005 | | |
| [142] | | |
| | | |
| Cecilia E. Rouse, Ph.D. | | Professor and Researcher, Princeton University (1992 to present); |
| (1963) | | Director, MDRC (2011 to present); Member, National Academy of |
| 2012 | | Education (2010 to present); Research Associate, National Bureau |
| [90] | | of Economic Research’s Labor Studies Program (1998 to 2009 |
| | and 2011 to present); Member, President’s Council of Economic |
| | Advisors (2009 to 2011); Member, The MacArthur Foundation |
| | Network on the Transition to Adulthood and Public Policy (2000 to |
| | 2008); Member, National Advisory Committee for the Robert Wood |
| | Johnson Foundation’s Scholars in Health Policy Research Program |
| | (2008); Director and Member, National Economic Association |
| | (2006 to 2008); Member, Association of Public Policy Analysis and |
| | Management Policy Council (2006 to 2008); Member, Hamilton |
| | Project’s Advisory Board at The Brookings Institute (2006 to 2008); |
| | Chair of Committee on the Status of Minority Groups in the Economic |
| | Profession, American Economic Association (2006 to 2008) |
| | | |
| John G. Schreiber | | Owner/President, Centaur Capital Partners, Inc., a real estate |
| (1946) | | investment company (1991 to present); Cofounder and Partner, |
| 2001 | | Blackstone Real Estate Advisors, L.P. (1992 to present); Director, |
| [142] | | General Growth Properties, Inc. (2010 to present) |
| | | |
| Mark R. Tercek | | President and Chief Executive Officer, The Nature Conservancy (2008 |
| (1957) | | to present); Managing Director, The Goldman Sachs Group, Inc. |
| 2009 | | (1984 to 2008) |
| [142] | | |
| |
| *Each independent director serves until retirement, resignation, or election of a successor. |
| Inside Directors | | |
| |
| Name | | |
| (Year of Birth) | | |
| Year Elected* | | |
| [Number of T. Rowe Price | | Principal Occupation(s) and Directorships of Public Companies and |
| Portfolios Overseen] | | Other Investment Companies During the Past Five Years |
| | | |
| Edward C. Bernard | | Director and Vice President, T. Rowe Price; Vice Chairman of the |
| (1956) | | Board, Director, and Vice President, T. Rowe Price Group, Inc.; |
| 2006 | | Chairman of the Board, Director, and President, T. Rowe Price |
| [142] | | Investment Services, Inc.; Chairman of the Board and Director, |
| | T. Rowe Price Retirement Plan Services, Inc., T. Rowe Price Savings |
| | Bank, and T. Rowe Price Services, Inc.; Chairman of the Board, Chief |
| | Executive Officer, and Director, T. Rowe Price International; Chief |
| | Executive Officer, Chairman of the Board, Director, and President, |
| | T. Rowe Price Trust Company; Chairman of the Board, all funds |
| | | |
| John H. Laporte, CFA | | Vice President, T. Rowe Price, T. Rowe Price Group, Inc., and |
| (1945) | | T. Rowe Price Trust Company |
| 1994 | | |
| [16] | | |
| |
| *Each inside director serves until retirement, resignation, or election of a successor. |
| Officers | | |
| |
| Name (Year of Birth) | | |
| Position Held With Capital Opportunity Fund | | Principal Occupation(s) |
| | | |
| Kennard W. Allen (1977) | | Vice President, T. Rowe Price and T. Rowe Price |
| Vice President | | Group, Inc. |
| | | |
| Peter J. Bates, CFA (1974) | | Vice President, T. Rowe Price and T. Rowe Price |
| Vice President | | Group, Inc. |
| | | |
| Christopher W. Carlson (1967) | | Vice President, T. Rowe Price and T. Rowe Price |
| Vice President | | Group, Inc. |
| | | |
| Anna M. Dopkin, CFA (1967) | | Vice President, T. Rowe Price, T. Rowe Price |
| President | | Group, Inc., T. Rowe Price International, and |
| | T. Rowe Price Trust Company |
| | | |
| Roger L. Fiery III, CPA (1959) | | Vice President, Price Hong Kong, Price |
| Vice President | | Singapore, T. Rowe Price, T. Rowe Price Group, |
| | Inc., T. Rowe Price International, and T. Rowe |
| | Price Trust Company |
| | | |
| John R. Gilner (1961) | | Chief Compliance Officer and Vice President, |
| Chief Compliance Officer | | T. Rowe Price; Vice President, T. Rowe Price |
| | Group, Inc., and T. Rowe Price Investment |
| | Services, Inc. |
| | | |
| Gregory S. Golczewski (1966) | | Vice President, T. Rowe Price and T. Rowe Price |
| Vice President | | Trust Company |
| | | |
| Gregory K. Hinkle, CPA (1958) | | Vice President, T. Rowe Price, T. Rowe Price |
| Treasurer | | Group, Inc., and T. Rowe Price Trust Company |
| | | |
| Ann M. Holcomb, CFA (1972) | | Vice President, T. Rowe Price, T. Rowe Price |
| Vice President | | Group, Inc., and T. Rowe Price Trust Company |
| | | |
| Patricia B. Lippert (1953) | | Assistant Vice President, T. Rowe Price and |
| Secretary | | T. Rowe Price Investment Services, Inc. |
| | | |
| Jennifer Martin (1972) | | Vice President, T. Rowe Price and T. Rowe Price |
| Vice President | | Group, Inc. |
| | | |
| David Oestreicher (1967) | | Director, Vice President, and Secretary, T. Rowe |
| Vice President | | Price Investment Services, Inc., T. Rowe |
| | Price Retirement Plan Services, Inc., T. Rowe |
| | Price Services, Inc., and T. Rowe Price Trust |
| | Company; Vice President and Secretary, |
| | T. Rowe Price, T. Rowe Price Group, Inc., and |
| | T. Rowe Price International; Vice President, |
| | Price Hong Kong and Price Singapore |
| | | |
| Timothy E. Parker, CFA (1974) | | Vice President, T. Rowe Price and T. Rowe Price |
| Vice President | | Group, Inc. |
| | | |
| Charles G. Pepin (1966) | | Director, T. Rowe Price Trust Company; Vice |
| Vice President | | President, T. Rowe Price and T. Rowe Price |
| | Group, Inc. |
| | | |
| Jason B. Polun, CFA (1974) | | Vice President, T. Rowe Price and T. Rowe Price |
| Vice President | | Group, Inc. |
| | | |
| Robert T. Quinn, Jr. (1972) | | Vice President, T. Rowe Price and T. Rowe Price |
| Vice President | | Group, Inc. |
| | | |
| Deborah D. Seidel (1962) | | Vice President, T. Rowe Price, T. Rowe Price |
| Vice President | | Group, Inc., T. Rowe Price Investment Services, |
| | Inc., and T. Rowe Price Services, Inc. |
| | | |
| Gabriel Solomon (1977) | | Vice President, T. Rowe Price and T. Rowe Price |
| Vice President | | Group, Inc. |
| | | |
| Joshua K. Spencer, CFA (1973) | | Vice President, T. Rowe Price and T. Rowe Price |
| Vice President | | Group, Inc. |
| | | |
| Taymour R. Tamaddon, CFA (1976) | | Vice President, T. Rowe Price and T. Rowe Price |
| Vice President | | Group, Inc. |
| | | |
| Eric L. Veiel, CFA (1972) | | Vice President, T. Rowe Price and T. Rowe Price |
| Vice President | | Group, Inc. |
| | | |
| Julie L. Waples (1970) | | Vice President, T. Rowe Price |
| Vice President | | |
| |
| Unless otherwise noted, officers have been employees of T. Rowe Price or T. Rowe Price International for at least 5 years. |
Item 2. Code of Ethics.
The registrant has adopted a code of ethics, as defined in Item 2 of Form N-CSR, applicable to its principal executive officer, principal financial officer, principal accounting officer or controller, or persons performing similar functions. A copy of this code of ethics is filed as an exhibit to this Form N-CSR. No substantive amendments were approved or waivers were granted to this code of ethics during the period covered by this report.
Item 3. Audit Committee Financial Expert.
The registrant’s Board of Directors/Trustees has determined that Mr. Anthony W. Deering qualifies as an audit committee financial expert, as defined in Item 3 of Form N-CSR. Mr. Deering is considered independent for purposes of Item 3 of Form N-CSR.
Item 4. Principal Accountant Fees and Services.
(a) – (d) Aggregate fees billed for the last two fiscal years for professional services rendered to, or on behalf of, the registrant by the registrant’s principal accountant were as follows:
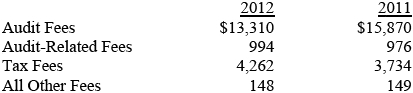
Audit fees include amounts related to the audit of the registrant’s annual financial statements and services normally provided by the accountant in connection with statutory and regulatory filings. Audit-related fees include amounts reasonably related to the performance of the audit of the registrant’s financial statements and specifically include the issuance of a report on internal controls and, if applicable, agreed-upon procedures related to fund acquisitions. Tax fees include amounts related to services for tax compliance, tax planning, and tax advice. The nature of these services specifically includes the review of distribution calculations and the preparation of Federal, state, and excise tax returns. All other fees include the registrant’s pro-rata share of amounts for agreed-upon procedures in conjunction with service contract approvals by the registrant’s Board of Directors/Trustees.
(e)(1) The registrant’s audit committee has adopted a policy whereby audit and non-audit services performed by the registrant’s principal accountant for the registrant, its investment adviser, and any entity controlling, controlled by, or under common control with the investment adviser that provides ongoing services to the registrant require pre-approval in advance at regularly scheduled audit committee meetings. If such a service is required between regularly scheduled audit committee meetings, pre-approval may be authorized by one audit committee member with ratification at the next scheduled audit committee meeting. Waiver of pre-approval for audit or non-audit services requiring fees of a de minimis amount is not permitted.
(2) No services included in (b) – (d) above were approved pursuant to paragraph (c)(7)(i)(C) of Rule 2-01 of Regulation S-X.
(f) Less than 50 percent of the hours expended on the principal accountant’s engagement to audit the registrant’s financial statements for the most recent fiscal year were attributed to work performed by persons other than the principal accountant’s full-time, permanent employees.
(g) The aggregate fees billed for the most recent fiscal year and the preceding fiscal year by the registrant’s principal accountant for non-audit services rendered to the registrant, its investment adviser, and any entity controlling, controlled by, or under common control with the investment adviser that provides ongoing services to the registrant were $1,802,000 and $1,764,000, respectively.
(h) All non-audit services rendered in (g) above were pre-approved by the registrant’s audit committee. Accordingly, these services were considered by the registrant’s audit committee in maintaining the principal accountant’s independence.
Item 5. Audit Committee of Listed Registrants.
Not applicable.
Item 6. Investments.
(a) Not applicable. The complete schedule of investments is included in Item 1 of this Form N-CSR.
(b) Not applicable.
Item 7. Disclosure of Proxy Voting Policies and Procedures for Closed-End Management Investment Companies.
Not applicable.
Item 8. Portfolio Managers of Closed-End Management Investment Companies.
Not applicable.
Item 9. Purchases of Equity Securities by Closed-End Management Investment Company and Affiliated Purchasers.
Not applicable.
Item 10. Submission of Matters to a Vote of Security Holders.
Not applicable.
Item 11. Controls and Procedures.
(a) The registrant’s principal executive officer and principal financial officer have evaluated the registrant’s disclosure controls and procedures within 90 days of this filing and have concluded that the registrant’s disclosure controls and procedures were effective, as of that date, in ensuring that information required to be disclosed by the registrant in this Form N-CSR was recorded, processed, summarized, and reported timely.
(b) The registrant’s principal executive officer and principal financial officer are aware of no change in the registrant’s internal control over financial reporting that occurred during the registrant’s second fiscal quarter covered by this report that has materially affected, or is reasonably likely to materially affect, the registrant’s internal control over financial reporting.
Item 12. Exhibits.
(a)(1) The registrant’s code of ethics pursuant to Item 2 of Form N-CSR is attached.
(2) Separate certifications by the registrant's principal executive officer and principal financial officer, pursuant to Section 302 of the Sarbanes-Oxley Act of 2002 and required by Rule 30a-2(a) under the Investment Company Act of 1940, are attached.
(3) Written solicitation to repurchase securities issued by closed-end companies: not applicable.
(b) A certification by the registrant's principal executive officer and principal financial officer, pursuant to Section 906 of the Sarbanes-Oxley Act of 2002 and required by Rule 30a-2(b) under the Investment Company Act of 1940, is attached.
SIGNATURES
Pursuant to the requirements of the Securities Exchange Act of 1934 and the Investment Company Act of 1940, the registrant has duly caused this report to be signed on its behalf by the undersigned, thereunto duly authorized.
T. Rowe Price Capital Opportunity Fund, Inc.
| | By | /s/ Edward C. Bernard |
| | Edward C. Bernard |
| | Principal Executive Officer |
| |
| Date February 15, 2013 | | |
Pursuant to the requirements of the Securities Exchange Act of 1934 and the Investment Company Act of 1940, this report has been signed below by the following persons on behalf of the registrant and in the capacities and on the dates indicated.
| | By | /s/ Edward C. Bernard |
| | Edward C. Bernard |
| | Principal Executive Officer |
| |
| Date February 15, 2013 | | |
| |
| |
| By | /s/ Gregory K. Hinkle |
| | Gregory K. Hinkle |
| | Principal Financial Officer |
| |
| Date February 15, 2013 | | |