 FOCUS June 2013 Exhibit 99.1 |
 Forward-looking statements The following statements made in this presentation are “forward-looking” and are made pursuant to the safe harbor provision of the Private Securities Litigation Reform Act of 1995: statements relating to (1) projected sales (including specific product lines and the company as a whole), profit margins, net income, earnings per share, and covenant compliance, (2) our branding initiatives, (3) our innovation and research and development plans, (4) our cost-savings initiatives, including plant closures and route reductions, and our ability to accelerate any such initiatives, (5) our plans related to our leverage and cash flow, (6) our planned capital expenditures, (7) the status of our litigation matters, (8) the impact of divestitures including the sale of Morningstar and tax payments related thereto, and the spin-off of a portion of our interest in The WhiteWave Foods Company, and (9) the timing or amount of any future disposition of our remaining interest in The WhiteWave Foods Company. These statements involve risks and uncertainties that may cause results to differ materially from those set forth in this presentation. Financial projections are based on a number of assumptions. Actual results could be materially different than projected if those assumptions are erroneous. Sales, operating income, net income, debt covenant compliance, financial performance and adjusted earnings per share can vary based on a variety of economic, governmental and competitive factors, which are identified in our filings with the Securities and Exchange Commission, including our Forms 10- K and 10-Q (which can be accessed on our website at www.deanfoods.com or on the website of the Securities and Exchange Commission at www.sec.gov). Our ability to profit from our branding initiatives depends on a number of factors, including consumer acceptance of our products. All forward-looking statements in this presentation speak only as of the date of this presentation. We expressly disclaim any obligation or undertaking to release publicly any updates or revisions to any such statements to reflect any change in our expectations with regard thereto or any changes in the events, conditions or circumstances on which any such statement is based. Any disposition of the Company’s remaining ownership interest in The WhiteWave Foods Company would be subject to various conditions, including the existence of satisfactory market conditions and Board approval, and in the case of a tax-free disposition, the maintenance of the Company’s private letter ruling from the Internal Revenue Service. Certain pro forma adjusted and historical non-GAAP financial measures contained in this presentation, including adjusted diluted earnings per share, free cash flow, adjusted EBITDA, consolidated adjusted operating income and consolidated adjusted net income, are from continuing operations and have been adjusted to eliminate the net expense or net gain related to certain items identified in our earnings press releases, including the Morningstar divestiture. A full reconciliation of these measures calculated according to GAAP and on an adjusted basis is contained in such press release, which is publicly available on our website at www.deanfoods.com/investors and at the end of this presentation. 2 |
 Today’s agenda Who we are Leadership team, vision and direction Business strategy and company advantages Financial performance Conclusion 3 |
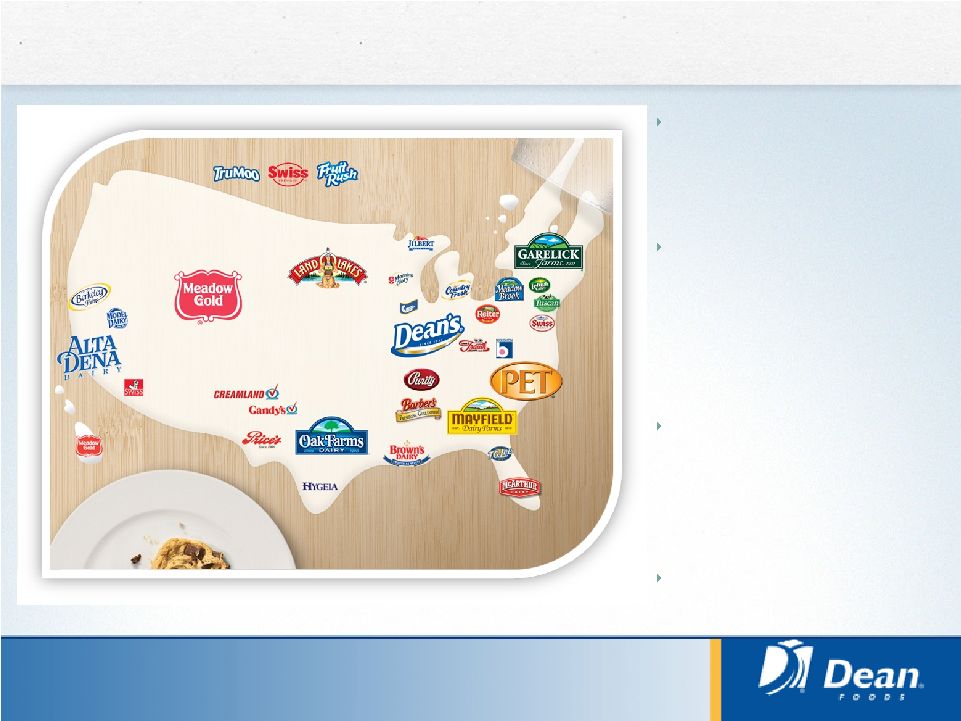
 Who we are Trusted regional brands: 50+ Manufacturing facilities: 75+ Total employees: 19,000 3.0B gallons produced annually Over 37,000 points of distribution More than 2/3 of U.S. households purchase a Dean Foods branded product annually 1 NYSE: DF Market cap: $2.0B 2 Revenues: $9.0+B Headquarters: Dallas 4 1. Source IRI 2. As of 6/3/2013 |
 Today’s agenda Who we are Leadership team, vision and direction Business strategy and company advantages Financial performance Conclusion 5 |
 Marty Devine Chief Operating Officer Strong management team and vision Gregg Tanner Chief Executive Officer Rachel Gonzalez EVP, General Counsel Barbara Carlini Chief Information Officer Kim Warmbier EVP, Chief HR Officer Shay Braun SVP, Procurement & Operations Support Chris Bellairs EVP, Chief Financial Officer To be the most admired and trusted provider of wholesome, great- tasting dairy products at every occasion 6 |
 Operational imperatives Never compromise on quality, safety or customer service Volume Performance Cost Productivity Effective Pricing Drive volume growth at appropriate economic returns Gain share through low cost, high service, valued brands model Augment volumes with differentiated products like TruMoo® Build on unique opportunities to create a cost-advantaged position Expedite closure of under-utilized plants, routes Use cost savings to enable future growth Improve pricing tools and protocols to ensure pass-through of commodity inflation Reduce commodity- driven volatility 2012 success drives 2013 performance 7 |
 Today’s agenda Who we are Leadership team, vision and direction Business strategy and company advantages Financial performance Conclusion 8 |
 Dean Foods at a glance Largest U.S. processor and distributor of fluid milk, 5x the size of the next largest competitor Portfolio of trusted brands, complementary products – milk, ice cream, cultured dairy products, creamers, ice cream mix, and other dairy Best-in-class nationwide distribution platform with extensive refrigerated “direct store delivery” systems Cost control is part of our DNA 9 |
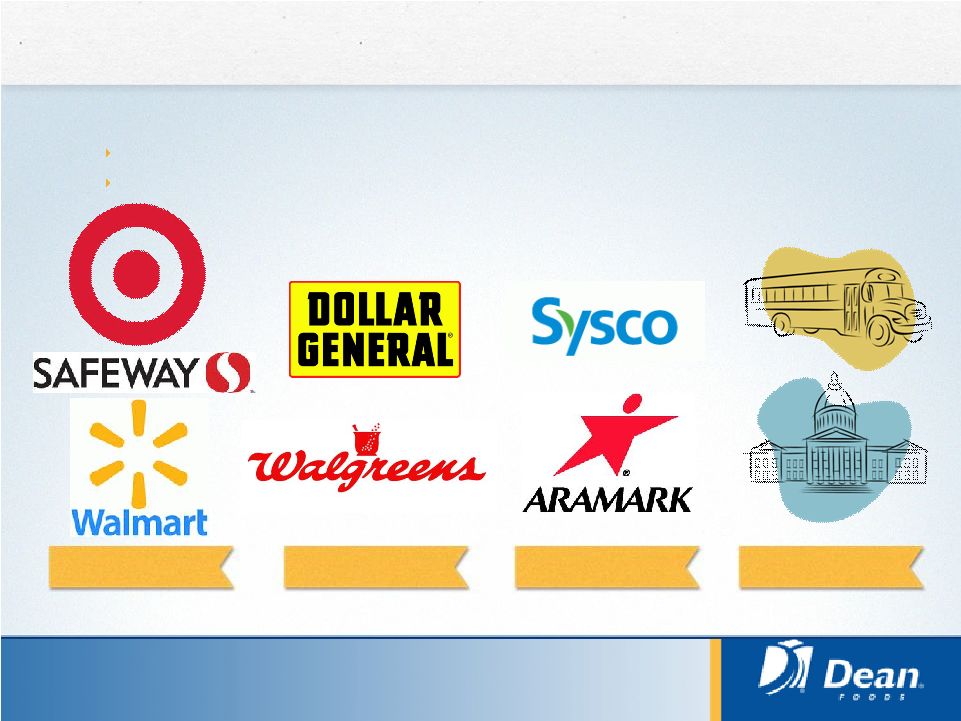 Distribution: Broad nationwide distribution across channels The country’s only coast-to-coast processor and distributor of fresh milk 75+ manufacturing facilities 6,500 direct-store-delivery routes Large Format 69% Small Format 11% Foodservice 13% School/Govt 7% 10 |
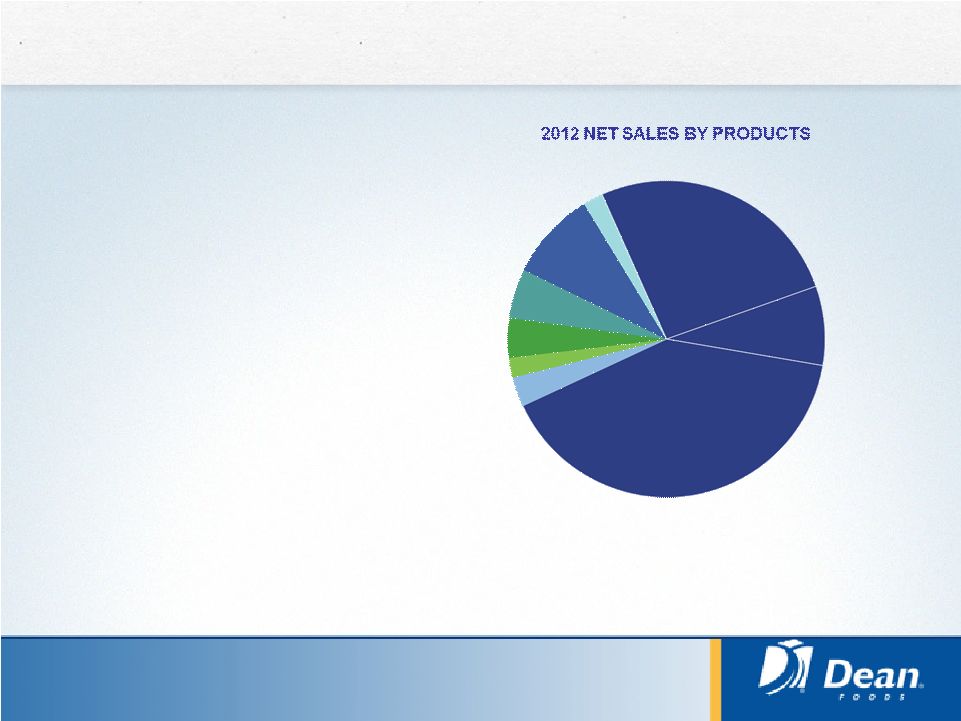 Portfolio: Strength across the dairy case Dean Foods - fluid milk and more Dean Foods’ percent of national branded share has increased over the past three years Ice cream, cultured products, creamers, juice, tea and water fill out the Dean Foods portfolio 3% FRESH CREAM (1) 2% ESL & ESL CREAMERS (2) 4% CULTURED 5% OTHER BEVERAGES (3) 9% ICE CREAM (4) 2% OTHER (5) 26% DEAN BRANDED WHITE 40% PL WHITE AND FLAVORED 74% FLUID MILK (1) Includes half-and-half and whipping cream (2) Includes creamers and other ESL fluids (3) Includes fruit juice, fruit-flavored drinks, iced tea and water (4) Includes ice cream, ice cream mix and ice cream novelties (5) Includes items for resale such as butter, cheese, eggs and milkshakes 8% TRUMOO 11 |
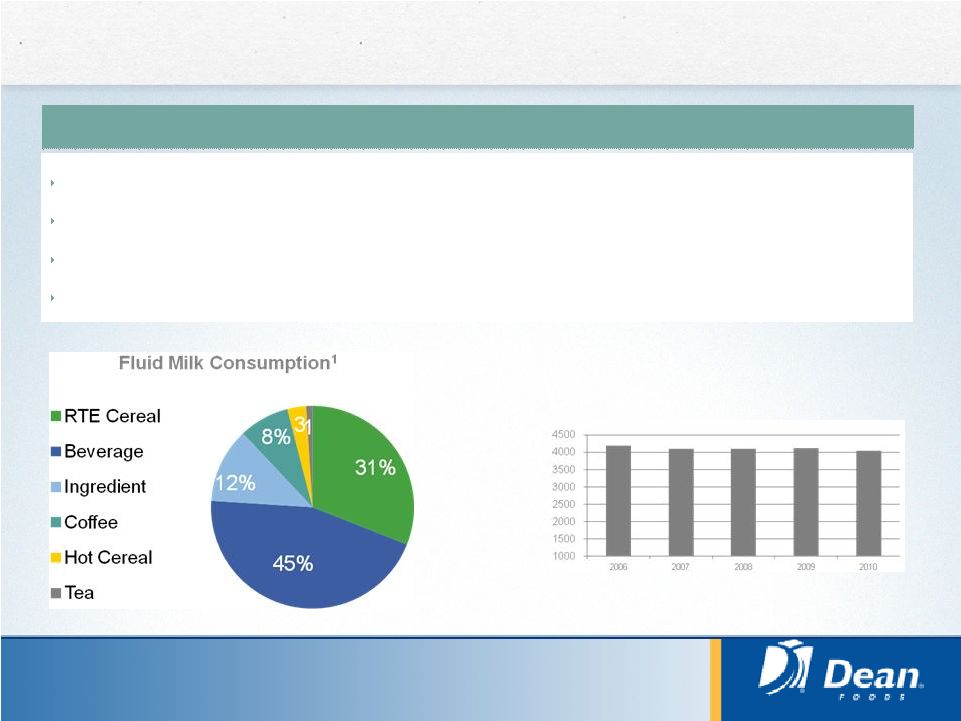 White milk is a compelling, sustainable market opportunity Fluid Milk Category Dynamics Ubiquitous: in 90% of U.S. homes, over $20B of annual U.S. retail sales¹ Strong health & wellness credentials One of the largest, most profitable categories for retailers Industry remains fragmented, large sophisticated platform provides significant competitive advantages Relatively Stable Long-term White Milk Consumption Trend² 12 1. Symphony IRI Group, “Refrigerated Conventional White Milk Overview: Category Decline Review”, July, 2010. 2. IRI Panel, Total All Outlet, Calendar Year 2009 – 2012, 2006-2008 from IRI study published in 2011 |
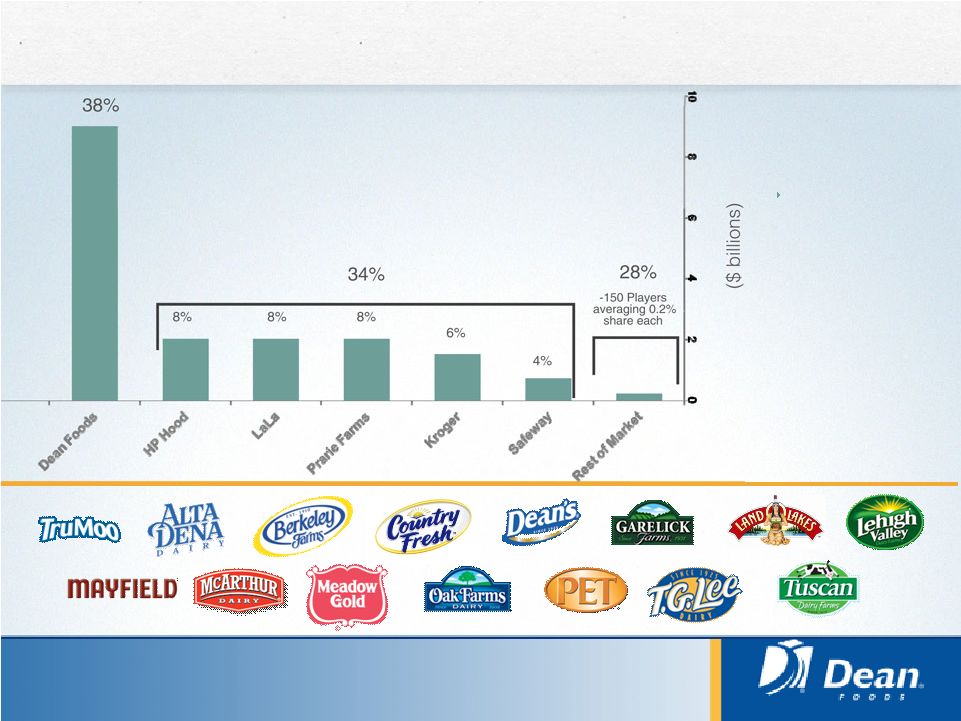 Scale: Dean Foods is the largest player in milk We have the #1 or #2 position, as measured by sales of branded white milk, in 80% of the IRI defined geographies in which we operate 13 |
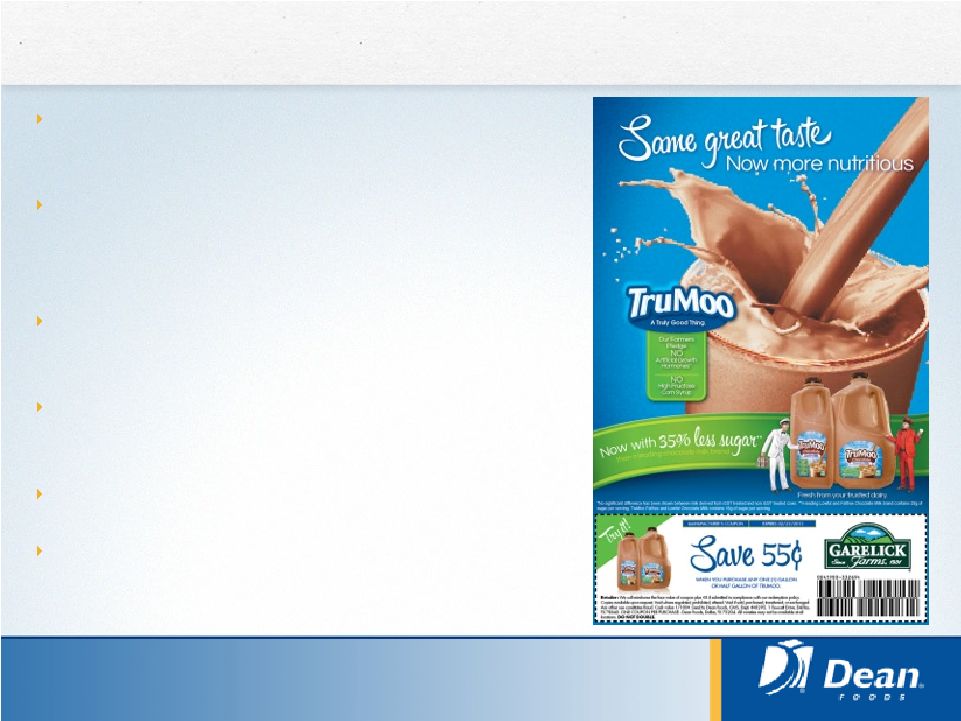 Brands: Leveraging TruMoo Flavored milk is a $1B category, and TruMoo is the largest flavored milk brand TruMoo was recently ranked as the fourth most successful consumer packaged goods brand of 2012 by Information Resources, Inc. (IRI) TruMoo is Dean Foods’ largest national brand at $636M of retail and school sales in 2012 No high fructose corn syrup, lower total sugar, low fat, all the great nutrition of milk Retail volumes up 7.6% in 2012 Marketing is working: TruMoo is at 75% HH awareness, 14% trial, and repeat rates are at 60% and growing (above CPG norms) 1.SymphonyIRI MULO data ending 52 W/E 12/31/12 14 1 |
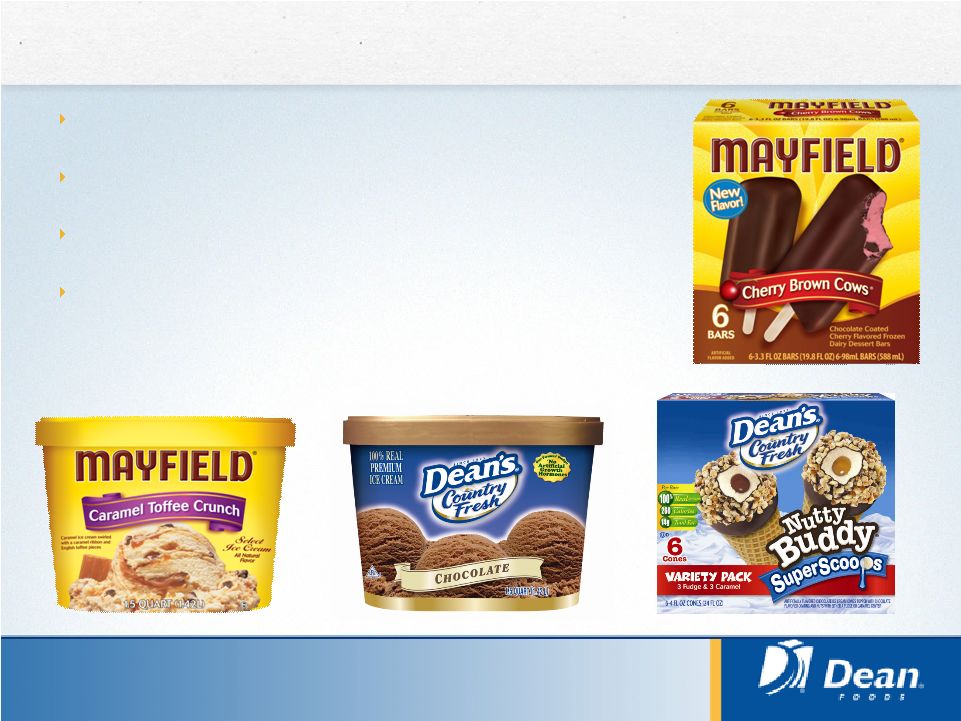 Portfolio: Ice cream Strong regional ice cream business Over $800 million in annual sales Mix of regional brands, foodservice, and private label Company-owned frozen distribution network 15 |
 Dean Foods: Focused, disciplined, profitable Extend our sustainable competitive advantages Our relative size and capabilities afford us significant advantages versus our competitive set – we plan to extend those advantages Continued focus on cost, volume outperformance, effective pricing Lay the foundation for longer-term growth Focus on cash flow generation and total shareholder returns 16 |
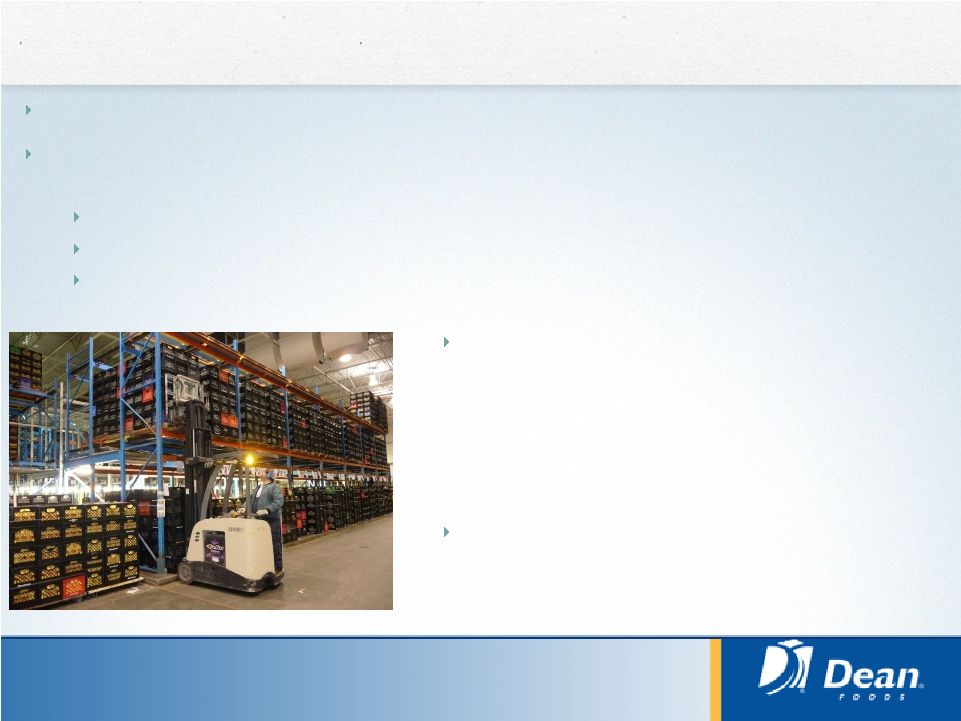 Extend our sustainable competitive advantages: Manufacturing and Procurement Accelerating cost reduction across the P&L – targeting $120 million in 2013 savings Large network provides opportunities to reduce capacity to drive efficiency and unit costs lower – in the process of closing 10-15% of production facilities Three plant closures announced late last year Buena Park fluid milk, Shreveport announced this year Two additional announcements this week 17 Leading network drives in-plant efficiency through ongoing continuous improvement program that works to alleviate efficiency bottlenecks and propagate best practices through employee-led initiatives Leveraging the volume of our overall purchases to obtain favorable pricing across non-dairy commodities – typically a 10-15% cost advantage |
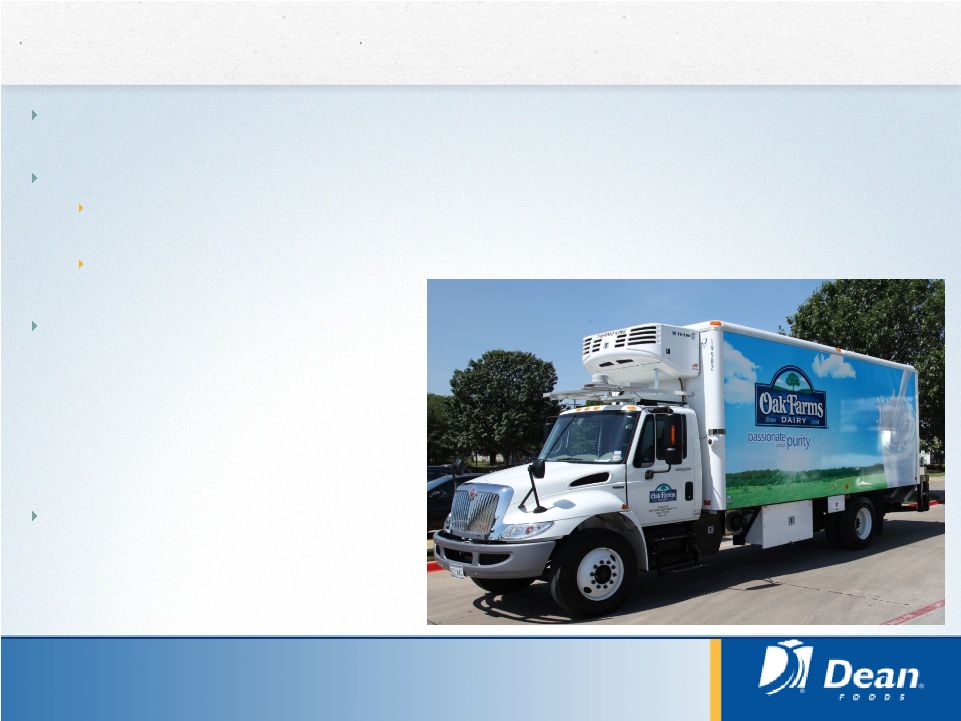 Extend our sustainable competitive advantages: Distribution We have a significant opportunity to drive additional distribution savings Leveraging technology XataNet GPS units provide detailed analysis of location, speed, stop length, etc. Also eliminates roughly 45 min per day of driver paperwork RoadNet enables significant improvements in routing efficiency We are instituting the same continuous improvement processes in distribution that have been delivering manufacturing savings Large opportunity to reduce and variablize our distribution assets 18 |
 Extend our sustainable competitive advantages: Pricing and Selling Passthrough is an effective hedge against most milk commodity volatility Prices are reset monthly in concert with changes in Class I mover Customers expect and accept these changes We have developed and are implementing technology to increase precision of pricing across all SKUs Leveraging risk management capabilities to offer customers innovative pricing solutions Reducing overhead to drive competitiveness 19 |
 Building long-term opportunities to grow Investing in the R&D pipeline Historical spending was skewed toward WhiteWave and Morningstar We have the opportunity to utilize our broad manufacturing and distribution capabilities for expansion into new value-added products and extensions Expect to begin increasing the innovation we bring to market in 24+ months TruMoo demonstrates that consumers value additional benefits in fluid dairy Open to strategic partnering with others to drive growth and further leverage our DSD network 20 |
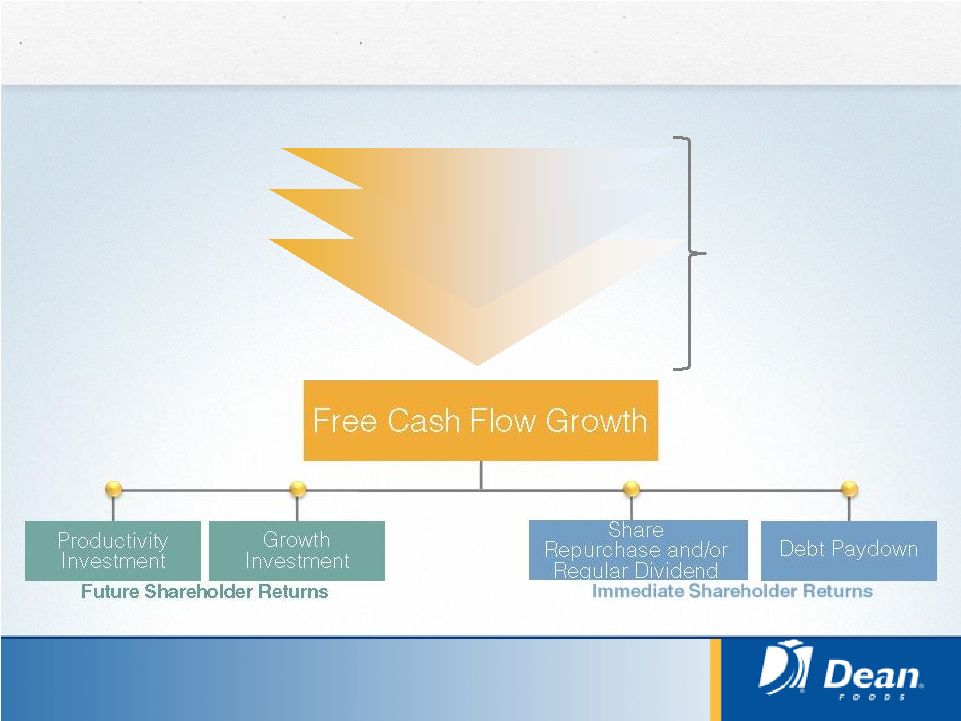 Focus on cash flow generation & total shareholder returns Mid-single Avg EBIT Growth Liability Mgmt Cap-Ex Reduction Over Time 21 We expect $75-$100 million of normalized 2013 Free Cash Flow before one-time items and litigation payments Next 3-5 Years Expect to provide more clarity on go-forward capital priorities by year end *Free cash flow is a non-GAAP measure and is defined as net cash provided by continuing operations less capital expenditures |
 Today’s agenda Who we are Leadership team, vision and direction Business strategy and company advantages Financial performance Conclusion 22 |
 Financial performance Net Sales $2.3B** $9.3B* $74M** +12% $256M* 727M 3.0B Operating Profit 2012 Total Shareholder Return: +47% 3/31/13 Leverage Ratio *** : 2.13x Market Capitalization: $2.0B 1 Quarter 2012 *On a rebased basis, excluding among other items the results of Morningstar and WhiteWave, See Reconciliation of Non-GAAP Financial Measures in the appendix to this presentation for computation and reconciliations **See Reconciliation of Non-GAAP Financial Measures in the first quarter 2013 press release earnings tables for computations and reconciliations *** Excludes WhiteWave stand-alone debt and any amount that may be payable in connection with taxes related to the Morningstar sale 23 Gallons st |
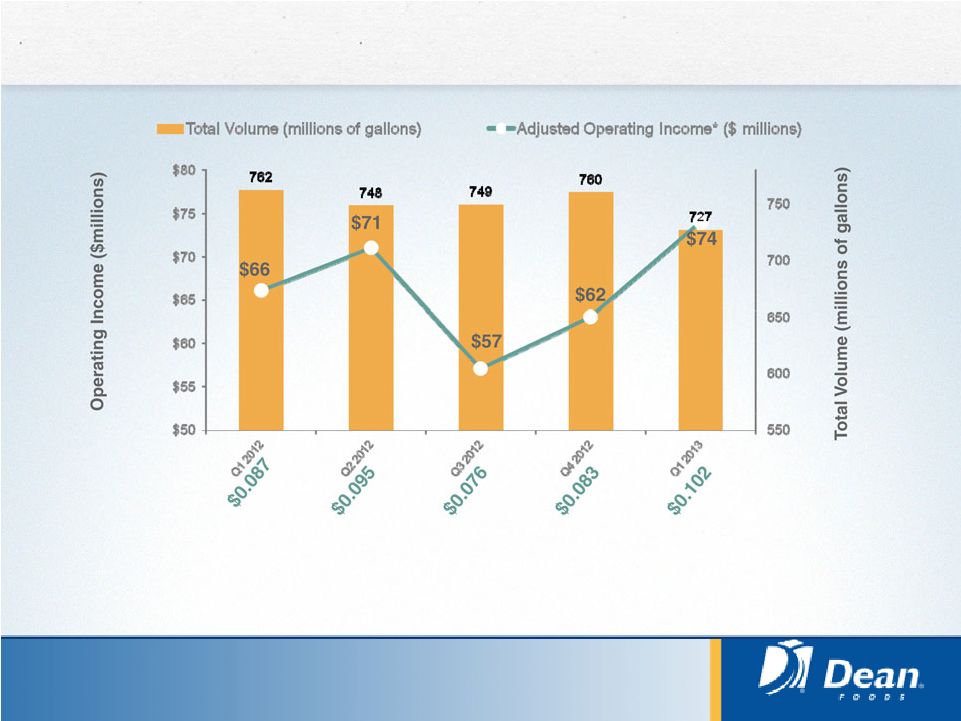 Volume and operating profit performance Adjusted Operating Income per Gallon ($) *See Reconciliation of Non-GAAP Financial Measures in our earnings releases for the relevant quarters and in the appendix to this presentation for computations and reconciliations 24 |
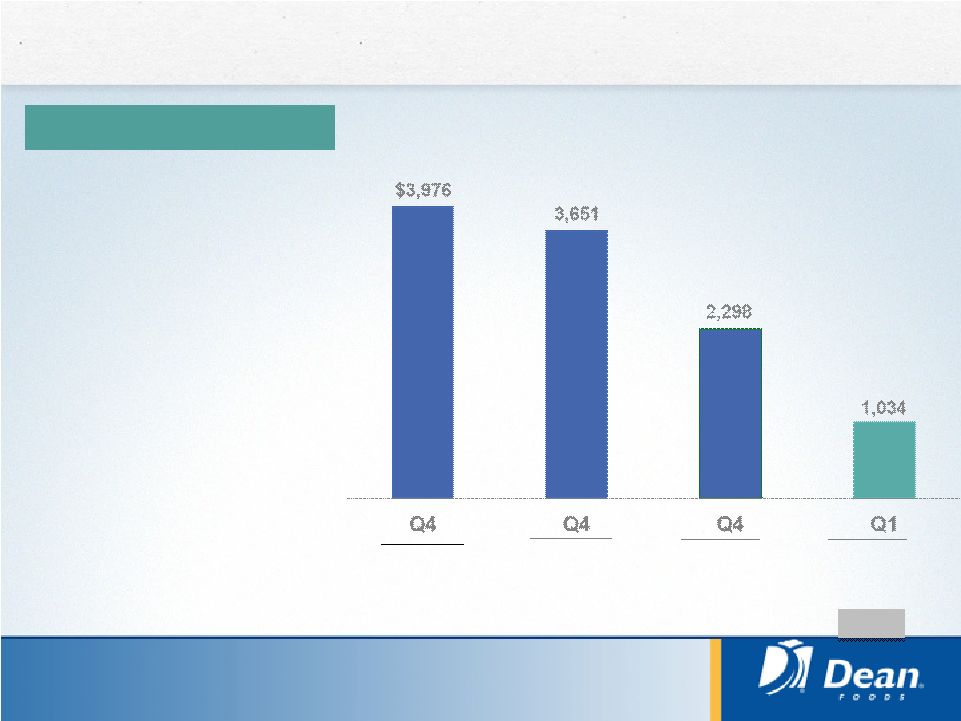 2010 Dramatic debt and leverage reduction Ongoing Dean Foods Net Debt $ Millions Total Leverage Ratio 5.13x 4.64x 3.54x* 2.13x* • 3/31 Net debt of $1.0B, excluding WWAV, leverage at 2.13x* • $2.6B of Dean Foods’ net debt reduction over past 12 months driven by Morningstar sale, WWAV IPO and strong operating cash flows • Upcoming tax payments primarily related to the Morningstar sale will increase leverage • Opportunity to monetize 34.4 million WWAV shares to further reduce debt Overview 2011 2012 2013 * Excludes WhiteWave stand-alone debt and any amount that may be payable in connection with taxes related to the Morningstar sale 25 |
 2013 Expectations Low-to-Mid single digit growth $0.45 to $0.55 per share Approximately $430 – 460 million Approximately $150 – 175 million FY 13 Capital Expenditures FY 13 Adjusted Diluted EPS* FY 13 Adjusted Operating Income* FY 13 Adjusted EBITDA* 26 $0.11 - $0.15 Q2 Adjusted Diluted EPS* * See Reconciliation of Non-GAAP Financial Measures in the Q1 2013 earnings release earnings tables for computation |
 Today’s agenda 27 Who we are Leadership team, vision and direction Business strategy and company advantages Financial performance Conclusion |
 Summary We have built sustainable competitive advantages through our scale and capabilities. We are working to extend these advantages. We are putting pieces in place to build for the future through: Reducing and variablizing our cost structure Improving pricing tools and protocols to reduce volatility Increasing R&D and innovation efforts We believe profit growth, combined with a focus on free cash flow generation and rewarding shareholders will result in superior returns We aim to be a predictable, sustainable creator of value for shareholders, with fewer surprises and less volatility Thank you for your interest 28 |
 Appendix: Reconciliation of Non-GAAP Financial Measures 29 DEAN FOODS COMPANY Reconciliation of GAAP to Adjusted Operating Income (Unaudited) (In thousands) Three months ended March 31, 2013 Adjustments to GAAP GAAP Asset write-down and (gain) loss on sale of assets Facility closing and reorganization costs Deal, integration and separation costs WhiteWave separation and discontinued operations Adjusted Operating income (loss): Ongoing Dean Foods 68,981 $ 290 $ 4,620 $ 340 $ - $ 74,231 $ WhiteWave 41,994 - - 5,479 (47,473) - Facility closing and reorganization costs (5,610) - 5,610 - - - Other operating income (expense) (33,915) 33,915 - - - - Total operating income 71,450 $ 34,205 $ 10,230 $ 5,819 $ (47,473) $ 74,231 $ Twelve months ended December 31, 2012 Adjustments to GAAP GAAP Asset write-down and (gain) loss on sale of assets Facility closing and reorganization costs Deal, integration and separation costs WhiteWave separation and discontinued operations Adjusted Operating income (loss): Ongoing Dean Foods 233,558 $ 5,983 $ - $ 24,654 $ (8,111) $ 256,084 $ WhiteWave 192,557 - - 1,085 (193,642) - Facility closing and reorganization costs (55,787) - 55,787 - - - Other operating income (expense) 57,459 (57,459) - - - - Total operating income 427,787 $ (51,476) $ 55,787 $ 25,739 $ (201,753) $ 256,084 $ |
 Appendix: Reconciliation of Non-GAAP Financial Measures (cont) 30 Three months ended March 31, 2012 Adjustments to GAAP GAAP Asset write-down and (gain) loss on sale of assets Facility closing and reorganization costs Deal, integration and separation costs WhiteWave separation and discontinued operations Adjusted Operating income (loss): Ongoing Dean Foods 68,079 $ - $ - $ - $ (2,234) $ 65,845 $ WhiteWave 46,995 - - - (46,995) - Facility closing and reorganization costs (25,435) - 25,435 - - - Other operating income (expense) - - - - - - Total operating income 89,639 $ - $ 25,435 $ - $ (49,229) $ 65,845 $ Three months ended June 30, 2012 Adjustments to GAAP GAAP Asset write-down and (gain) loss on sale of assets Facility closing and reorganization costs Deal, integration and separation costs WhiteWave separation and discontinued operations Adjusted Operating income (loss): Ongoing Dean Foods 69,001 $ - $ - $ 4,000 $ (1,262) $ 71,739 $ WhiteWave 45,085 - - - (45,085) - Facility closing and reorganization costs (6,217) - 6,217 - - - Other operating income (expense) - - - - - - Total operating income 107,869 $ - $ 6,217 $ 4,000 $ (46,347) $ 71,739 $ |
 Appendix: Reconciliation of Non-GAAP Financial Measures (cont) 31 Three months ended September 30, 2012 Adjustments to GAAP GAAP Asset write-down and (gain) loss on sale of assets Facility closing and reorganization costs Deal, integration and separation costs WhiteWave separation and discontinued operations Adjusted Operating income (loss): Ongoing Dean Foods 46,224 $ 5,983 $ - $ 8,000 $ (3,448) $ 56,759 $ WhiteWave 50,435 - - - (50,435) - Facility closing and reorganization costs (6,080) - 6,080 - - - Other operating income (expense) 56,339 (56,339) - - - - Total operating income 146,918 $ (50,356) $ 6,080 $ 8,000 $ (53,883) $ 56,759 $ Three months ended December 31, 2012 Adjustments to GAAP GAAP Asset write-down and (gain) loss on sale of assets Facility closing and reorganization costs Deal, integration and separation costs WhiteWave separation and discontinued operations Adjusted Operating income (loss): Ongoing Dean Foods 50,254 $ - $ - $ 12,654 $ (1,167) $ 61,741 $ WhiteWave 50,042 - - 1,085 (51,127) - Facility closing and reorganization costs (18,055) - 18,055 - - - Other operating income (expense) 1,120 (1,120) - - - - Total operating income 83,361 $ (1,120) $ 18,055 $ 13,739 $ (52,294) $ 61,741 $ |
 FOCUS June 2013 |