 FOCUS May 2014 Exhibit 99.1 |
 The following statements made in this presentation are “forward-looking” and are made pursuant to the safe harbor provision of the Private Securities Litigation Reform Act of 1995: statements relating to (1) projected sales (including specific product lines and the company as a whole), profit margins, net income, earnings per share, free cash flow and debt covenant compliance, (2) our regional and national branding initiatives, (3) our innovation, and research and development plans, (4) commodity prices and other input costs, (5) our cost-savings initiatives, including plant closures and route reductions, and our ability to accelerate any such initiatives, (6) our plans related to our leverage, (7) our planned capital expenditures, (8) the status of our litigation matters, (9) the impact of divestitures including the sale of Morningstar and tax payments related thereto and the divestiture and spin-off of our former subsidiary, The WhiteWave Foods Company, (10) our dividend policy, and (11) possible repurchases of shares of our common stock. These statements involve risks and uncertainties that may cause results to differ materially from those set forth in this presentation. Financial projections are based on a number of assumptions. Actual results could be materially different than projected if those assumptions are erroneous. The cost and supply of commodities and other raw materials are determined by market forces over which we have limited or no control. Sales, operating income, net income, debt covenant compliance, financial performance and adjusted earnings per share can vary based on a variety of economic, governmental and competitive factors, which are identified in our filings with the Securities and Exchange Commission, including our most recent Forms 10-K and 10-Q (which can be accessed on our website at www.deanfoods.com or on the website of the Securities and Exchange Commission at www.sec.gov). Our ability to profit from our branding initiatives depends on a number of factors including consumer acceptance of our products. The declaration and payment of cash dividends under our dividend policy remains at the sole discretion of the Board of Directors or a committee thereof and will depend upon our financial results, cash requirements, future prospects, applicable law and other factors that may be deemed relevant by the Board or such committee. All forward-looking statements in this presentation speak only as of the date of this presentation. We expressly disclaim any obligation or undertaking to release publicly any updates or revisions to any such statements to reflect any change in our expectations with regard thereto or any changes in the events, conditions or circumstances on which any such statement is based. Certain non-GAAP financial measures contained in this presentation, including adjusted diluted earnings per share, free cash flow, adjusted free cash flow, adjusted EBITDA, consolidated adjusted operating income and consolidated adjusted net income, are from continuing operations and have been adjusted to eliminate the net expense or net gain related to certain items identified in our earnings press release, including the Morningstar divestiture and the spin-off of our former subsidiary, The WhiteWave Foods Company. A full reconciliation of these measures calculated according to GAAP and on an adjusted basis is contained in such press release, which is publicly available on our website at www.deanfoods.com. 2 Forward-looking Statements |
 Today’s agenda Who we are Business strategy and company advantages Financial performance Conclusion 3 |
 Who we are Largest U.S. processor and distributor of fluid milk with 50+ trusted regional brands Manufacturing facilities: 70+ Total employees: 18,000 ; HQ: Dallas Volume ~ 2.8B gallons annually Best-in-class nationwide refrigerated DSD distribution system More than 2/3 of U.S. households purchase a Dean Foods branded product annually ¹ NYSE:DF $1.4B ² Mkt Cap Revenues: $9.0+B 4 1. Source IRI 2. As of 5/15/2014 |
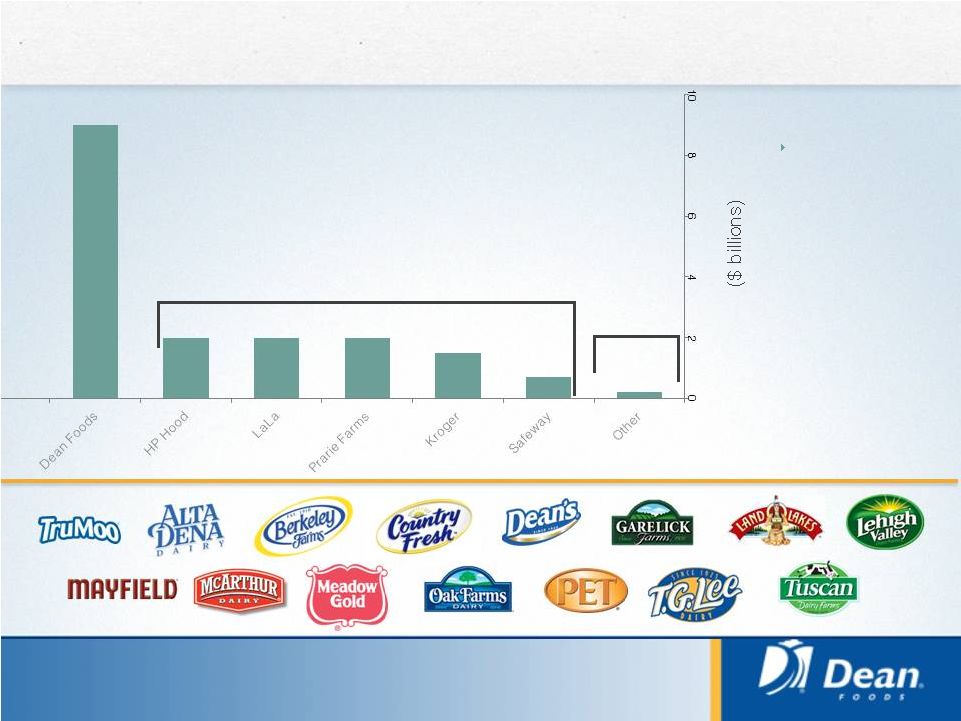 Scale: Dean Foods is the largest player in milk We have the #1 or #2 position, as measured by sales of branded white milk, in 80% of the IRI defined geographies in which we operate 36% 34% 30% ~150 Players averaging 0.2% share each 5 |
 Today’s agenda Who we are Business strategy and company advantages Financial performance Conclusion 6 |
 Operational imperatives Never compromise on quality, safety or customer service Volume Performance Cost Productivity Effective Pricing Drive volume growth at appropriate economic returns Gain share through low cost, high service, valued brands model Augment volumes with differentiated products like TruMoo ® Build on unique opportunities to create a cost-advantaged position Expedite closure of under-utilized plants, routes Use cost savings to enable future growth Improve pricing tools and protocols to ensure pass-through of commodity inflation Reduce commodity- driven volatility Protect margins 7 |
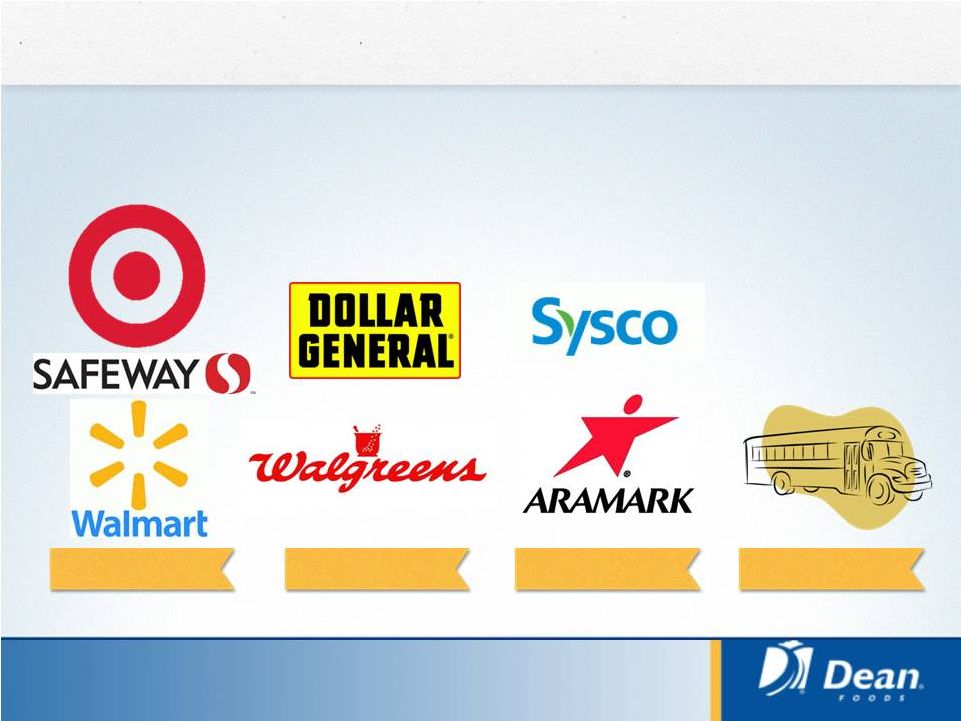 Distribution: Broad nationwide distribution across channels The country’s only coast-to-coast processor and distributor of fresh milk* 8 * Totals are based on DF fluid milk volumes Schools 6% Foodservice and Other 15% Small Format 12% Large Format 67% |
 Brands: Growing TruMoo 9 Flavored milk is a $1B category, and TruMoo is the largest flavored milk brand TruMoo is Dean Foods’ largest national brand at approximately $650M of retail and school sales in 2013 No high fructose corn syrup, lower total sugar, low fat, all the great nutrition of milk Launching TruMoo Protein nationally in 2H 2014 |
 Dean Foods: Focused, disciplined, profitable Extend our sustainable competitive advantages Our relative size and capabilities afford us significant advantages versus our competitive set – we plan to extend those advantages Continued focus on cost, volume outperformance, effective pricing Lay the foundation for longer-term growth Focus on cash flow generation and total shareholder returns 10 |
 Today’s agenda Who we are Business strategy and company advantages Financial performance Conclusion 11 |
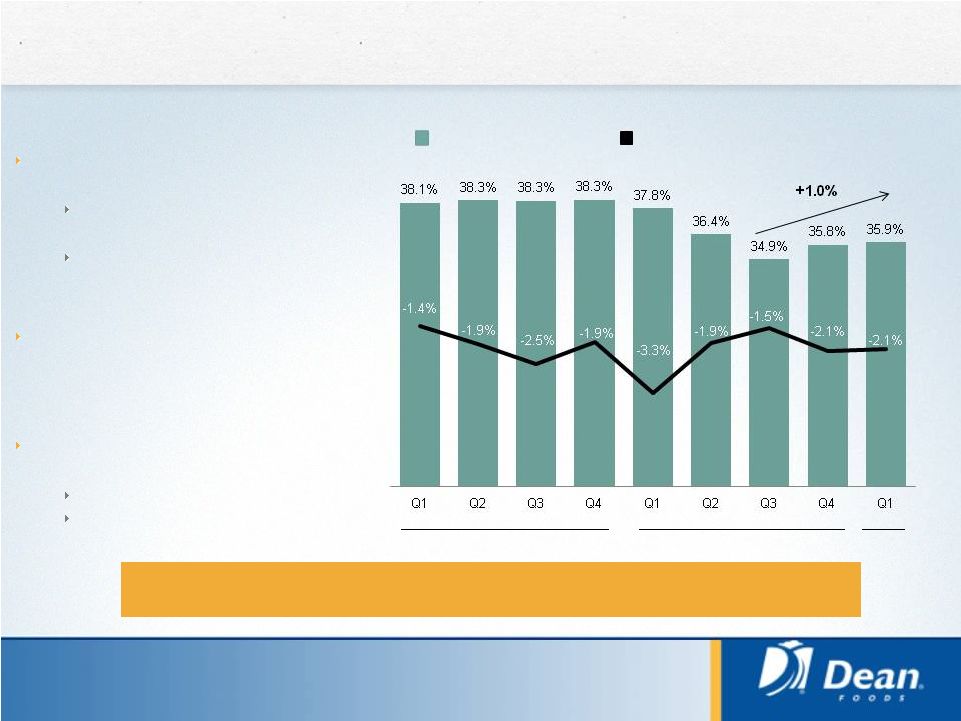 Fluid milk share performance 12 Dean Foods Share Recent wins continue to positively impact volumes in Q1 Small format volume plus 7.6% versus prior year 11 consecutive quarters of growth in the dollar channel Dean’s share of Branded White Milk at retail increased 130 basis points versus prior year [2] Remain cautious on fluid milk category volumes Historic high raw milk prices SNAP benefit reductions 2012 2013 2014 DF fluid milk volume up 1.1% excluding RFP and customer vertical integration impact – significantly better than 2.1% category decline Dean Fluid Milk Share USDA Fluid Milk Volume YoY [1] 1 1Q14 USDA includes March month estimates based on Federal Milk Marketing Order receipts and Class I utilization. 2 Source: IRI |
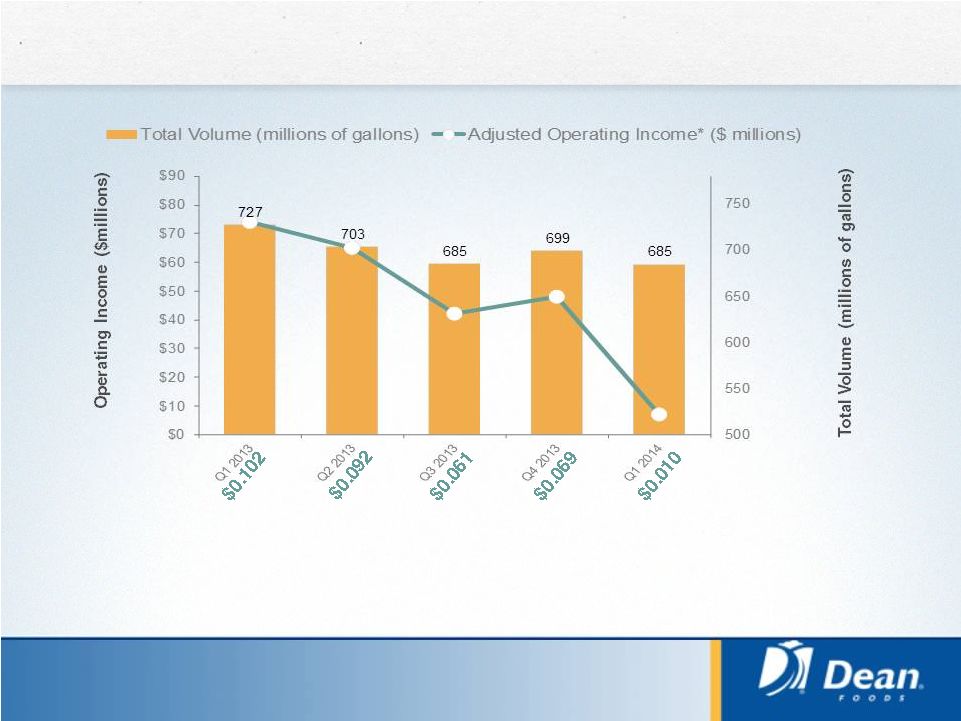 Volume and operating profit performance Adjusted Operating Income per Gallon ($) * See Reconciliation of Non-GAAP Financial Measures in our earnings releases for the relevant quarters and in the appendix to this presentation for computations and reconciliations $48 $7 $74 13 $65 $42 |
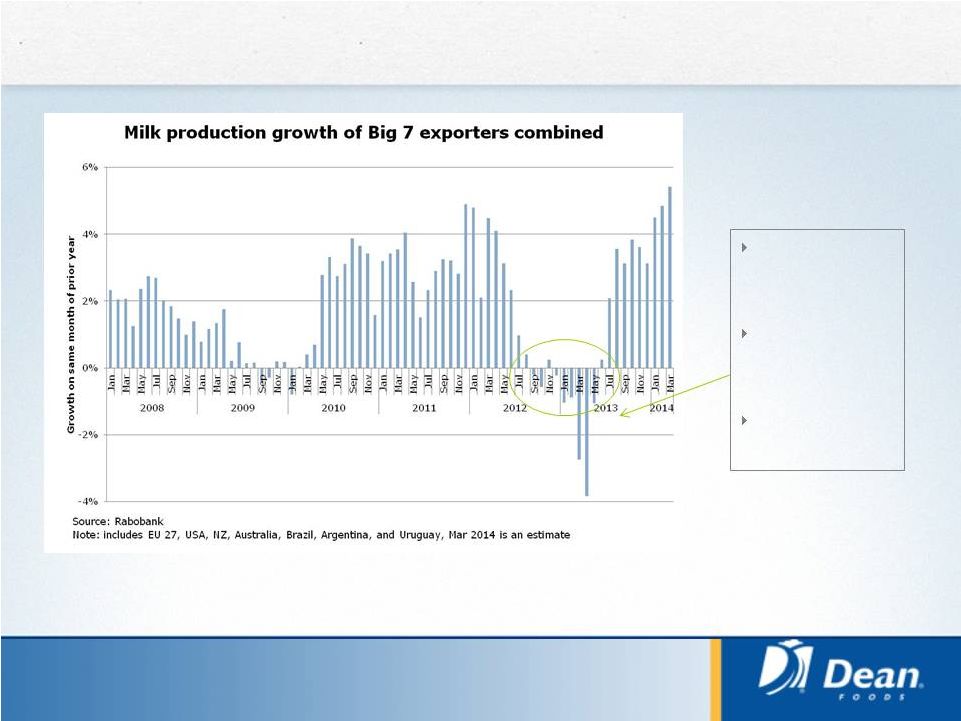 In 2013, milk supply fell in export regions, reducing supply on the international market 14 Milk prices were low Feed costs were high Weather was poor * Source: Rabobank |
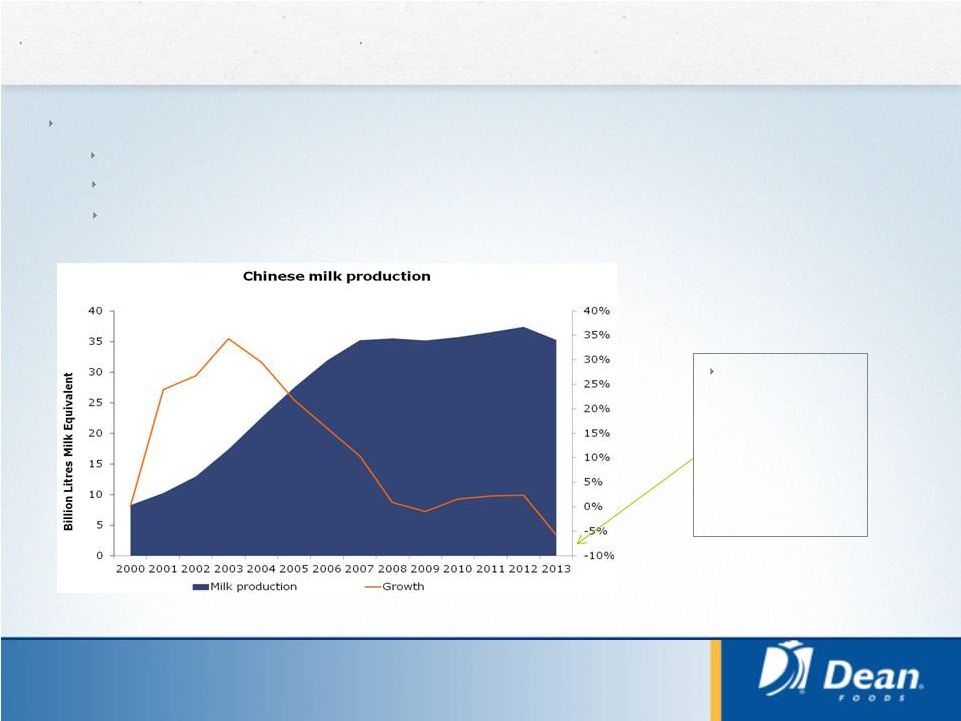 Meanwhile, Chinese milk production fell heavily 15 Drivers: Structural: high costs of production Medium term: exit of small farmers, challenges of operating large farms Temporary: weather and disease Milk production appears to have fallen around 6% in 2013 * Source: Rabobank |
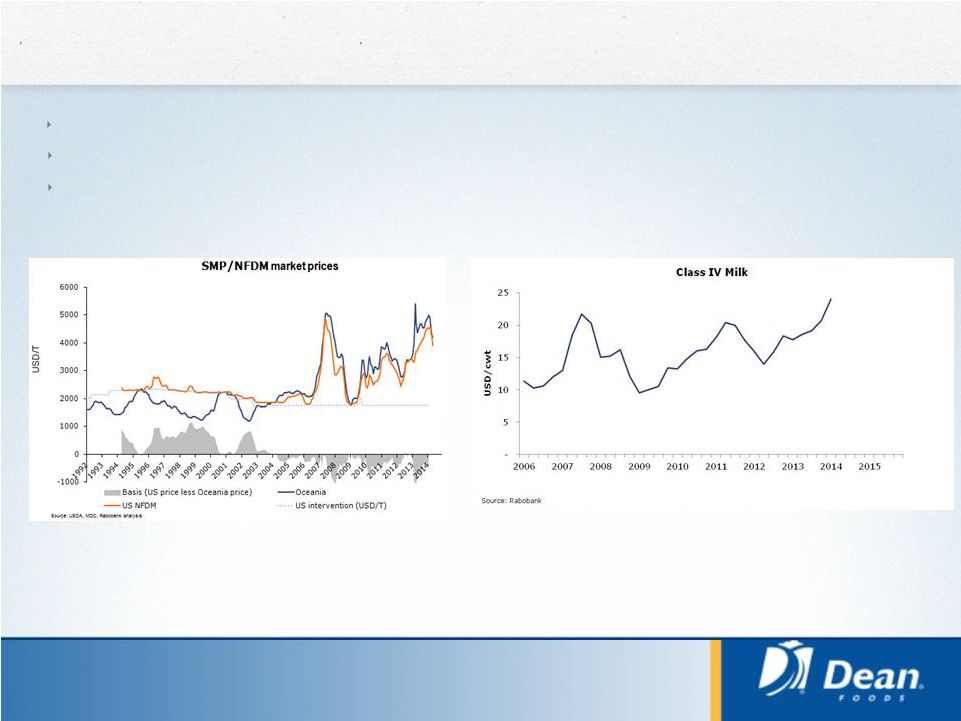 US milk prices were thus driven up in line with international market pricing 16 Exports have surged U.S. stocks have been reduced Commodity prices dragged up by world market * Source: Rabobank |
 Focus on cash flow generation & total shareholder returns Future Shareholder Returns Mid-single Avg EBIT Growth Liability Mgmt Cap-Ex Reduction Over Time Productivity Investment Growth Investment Debt Paydown Share Repurchase and Regular Dividend 17 We expect at least $125 million of Adjusted 2014 Free Cash Flow before one-time items and litigation payments Next 3-5 Years We define Adjusted Free Cash Flow as Free Cash Flow adjusted for the impact on operating cash flows related to certain significant or non-recurring items, including income taxes paid on the divestiture of Morningstar; litigation payments; payments associated with our restructuring, reorganization and realignment activities Immediate Shareholder Returns Free Cash Flow Growth |
 2014 Expectations At least $0.60 per share Approximately $150 – 175 million FY 13 Capital Expenditures FY 14 Adjusted Diluted EPS* 18 ($0.02) – ($0.08) per share Q2 Adjusted Diluted EPS* * See Reconciliation of Non-GAAP Financial Measures in the Q1 2014 earnings release earnings tables for computation 2014 Considerations: Challenging volume overlaps through Q2 All time high class I raw milk prices At least $125 million FY 13 Adjusted FCF |
 Today’s agenda 19 Who we are Business strategy and company advantages Financial performance Conclusion |
 Summary We have built sustainable competitive advantages through our scale and capabilities. We are working to extend these advantages. We are putting pieces in place to build for the future through: Reducing and variablizing our cost structure Improving pricing tools and protocols to reduce volatility Increasing R&D and innovation efforts We believe profit growth, combined with a focus on free cash flow generation and rewarding shareholders will result in superior returns We aim to be a sustainable creator of value for shareholders Thank you for your interest 20 |
 Appendix: Reconciliation of Non-GAAP Financial Measures 21 Three months ended March 31, 2014 Asset write-downs Facility closing, and (gain) loss on reorganization & Morningstar WhiteWave Other Income sale of assets realignment costs sale spin-off adjustments tax GAAP (a) (b) (c) (d) (e) (f) Adjusted * Operating income (loss): Dean Foods 3,753 $ 426 $ 3,654 $ - $ - $ (979) $ - $ 6,854 $ Facility closing and reorganization costs (977) - 977 - - - - - Litigation settlements 2,521 - - - - (2,521) - - Total operating income 5,297 426 4,631 - - (3,500) - 6,854 - - Interest expense 15,023 - - - - (446) - 14,577 Other income, net (321) - - - - - - (321) Income tax expense 387 - - - - - (3,200) (2,813) Income (loss) from continuing operations (9,792) 426 4,631 - - (3,054) 3,200 (4,589) - - Income from discontinued operations, net of tax 836 - - - - (836) - - Net income (loss) attributable to Dean Foods Company (8,956) $ 426 $ 4,631 $ - $ - $ (3,890) $ 3,200 $ (4,589) $ - - Diluted earnings (loss) per share (0.09) $ - $ 0.05 $ - $ - $ (0.04) $ 0.03 $ (0.05) $ - - Three months ended March 31, 2013 Asset write-downs Facility closing, and (gain) loss on reorganization and Morningstar WhiteWave Other Income sale of assets realignment costs sale spin-off adjustments tax GAAP (a) (b) (c) (d) (e) (f) Adjusted * Operating income (loss): Dean Foods 69,321 $ - $ 4,620 $ - $ $ 290 $ - $ 74,231 $ Facility closing and reorganization costs (5,610) - 5,610 - - - - Impairment of long-lived assets (33,915) 33,915 - - - - - Total operating income 29,796 33,915 10,230 - 290 - 74,231 - - Interest expense 59,649 - - (29,430) (3,261) (518) - 26,440 Other expense, net 165 - - - - - - 165 Income tax expense (benefit) (9,278) - - - - - 27,375 18,097 Income (loss) from continuing operations (20,740) 33,915 10,230 29,430 3,261 808 (27,375) 29,529 - - Income from discontinued operations, net of tax 516,537 - - (492,571) (24,272) 306 - - Net income attributable to non-controlling interest in discontinued operations (3,192) - - - 3,192 - - - Net income attributable to Dean Foods Company 492,605 $ 33,915 $ 10,230 $ (463,141) $ (17,819) $ 1,114 $ (27,375) $ 29,529 $ - - Diluted earnings per share (g) 5.30 $ 0.36 $ 0.11 $ (4.98) $ (0.19) $ 0.01 $ (0.30) $ 0.31 $ - - - - |
 Appendix: Reconciliation of Non-GAAP Financial Measures (cont) 22 DEAN FOODS COMPANY Reconciliation of GAAP to Pro Forma Adjusted Earnings (Unaudited) (In thousands, except per share data) Twelve months ended December 31, 2013 Asset write-downs Facility closing, Deal, integration Loss on early Disposition of and (gain) loss on reorganization & and separation retirement of WWAV common Morningstar WhiteWave Other Income sale of assets realignment costs costs debt stock sale spin-off adjustments tax GAAP (a) (b) (c) (d) (e) (f) (g) (h) (i) Adjusted * Operating income (loss): Dean Foods 202,720 $ 4,926 $ 10,787 $ 10,558 $ - $ - (545) $ - $ - $ - $ 228,446 $ Facility closing and reorganization costs (27,008) - 27,008 - - - - - - - - Litigation settlements 1,019 - - - - - - - (1,019) - - Impairment of long-lived assets (43,441) 43,441 - - - - - - - - - Other operating loss (2,494) 2,494 - - - - - - - - - Total operating income 130,796 50,861 37,795 10,558 - - (545) - (1,019) - 228,446 - - Interest expense 200,558 - - - - (649) (29,430) (66,684) (7,109) - 96,686 Gain on disposition of WhiteWave common stock (415,783) - - - - 415,783 - - - - - Loss on early retirement of debt 63,387 - - - (63,387) - - - - - - Other income, net (400) - - - - - - - - - (400) Income tax expense (benefit) (42,325) - - - - - - - - 92,544 50,219 Income from continuing operations 325,359 50,861 37,795 10,558 63,387 (415,134) 28,885 66,684 6,090 (92,544) 81,941 - - Income from discontinued operations, net of tax 493,998 - - - - - (491,887) (2,815) 704 - - Net income attributable to non-controlling interest in discontinued operations (6,179) - - - - - - - 6,179 - - Net income attributable to Dean Foods Company 813,178 $ 50,861 $ 37,795 $ 10,558 $ 63,387 $ (415,134) $ (463,002) $ 63,869 $ 12,973 $ (92,544) $ 81,941 $ Diluted earnings per share 8.58 $ 0.54 $ 0.40 $ 0.11 $ 0.67 $ (4.38) $ (4.89) $ 0.67 $ 0.14 $ (0.98) $ 0.86 $ $ |
 FOCUS May 2014 |