| Item 6. Investments | | | | |
| | | | | | | |
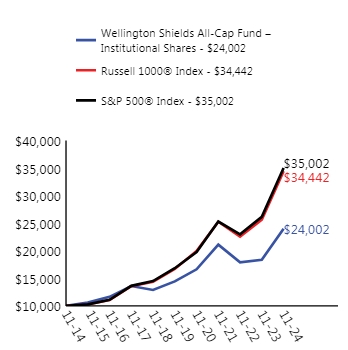
| Wellington Shields All-Cap Fund | | | |
| | | | | Schedule of Investments |
| | | | November 30, 2024 |
| Shares | | | | Fair Value | | % of Net Assets |
| | | | | | | |
| COMMON STOCKS | | | | |
| | | | | | | |
| Aerospace & Defense | | | | |
| 3,000 | | Curtiss-Wright Corporation | | $ 1,120,890 | | 1.80% |
| | | | | | | |
| Automobiles | | | | | | |
| 4,000 | | Tesla, Inc. * | | 1,380,640 | | 2.21% |
| | | | | | | |
| Capital Markets | | | | |
| 1,900 | | BlackRock, Inc. | | 1,943,320 | | |
| 8,000 | | Blackstone Inc. | | 1,528,720 | | |
| | | | | 3,472,040 | | 5.57% |
| | | | | | | |
| Chemicals | | | | | | |
| 5,000 | | Linde PLC (United Kingdom) | | 2,304,950 | | |
| 1,900 | | The Sherwin-Williams Company | | 755,060 | | |
| | | | | 3,060,010 | | 4.91% |
| | | | | | | |
| Construction & Engineering | | | | |
| 1,500 | | Comfort Systems USA, Inc. | | 739,905 | | |
| 5,600 | | Quanta Services, Inc. | | 1,929,312 | | |
| | | | | 2,669,217 | | 4.28% |
| | | | | | | |
| Crude Petroleum & Natural Gas | | | | |
| 4,000 | | Diamondback Energy, Inc. | | 710,360 | | 1.14% |
| | | | | | | |
| Electric Utilities | | | | |
| 5,500 | | Constellation Energy Corporation | | 1,411,080 | | |
| 11,000 | | NextEra Energy, Inc. | | 865,370 | | |
| | | | | 2,276,450 | | 3.65% |
| | | | | | | |
| Electrical Equipment | | | | |
| 6,000 | | Emerson Electric Co. | | 795,600 | | 1.28% |
| | | | | | | |
| Electronic Computers | | | | |
| 7,900 | | Apple Inc. | | 1,874,907 | | 3.01% |
| | | | | | | |
| Financial Services | | | | |
| 12,000 | | Apollo Global Management Inc. | | 2,100,360 | | |
| 3,000 | | Berkshire Hathaway Inc. - Class B * | | 1,449,060 | | |
| 15,000 | | PayPal Holdings, Inc. * | | 1,301,550 | | |
| | | | | 4,850,970 | | 7.78% |
| | | | | | | |
| Food & Staples Retailing | | | | |
| 22,200 | | Walmart Inc. | | 2,053,500 | | 3.29% |
| | | | | | | |
| Health Care Equipment & Supplies | | | | |
| 2,200 | | Intuitive Surgical, Inc. * | | 1,192,400 | | 1.91% |
| | | | | | | |
| Health Care Providers & Services | | | | |
| 2,050 | | McKesson Corporation | | 1,288,425 | | 2.07% |
| | | | | | | |
| Hotels, Restaurants & Leisure | | | | |
| 6,000 | | Flutter Entertainment PLC (Ireland) * | | 1,657,920 | | 2.66% |
| | | | | | | |
| Industrial Conglomerates | | | | |
| 3,500 | | Honeywell International Inc. | | 815,255 | | 1.31% |
| | | | | | | |
| Interactive Media Services | | | | |
| 3,500 | | Meta Platforms, Inc. - Class A | | 2,010,120 | | 3.22% |
| | | | | | | |
| Internet & Direct Marketing Retail | | | | |
| 12,000 | | Alphabet, Inc. - Class A | | 2,027,400 | | |
| 11,000 | | Amazon.com, Inc. * | | 2,286,790 | | |
| | | | | 4,314,190 | | 6.92% |
| | | | | | | |
| IT Services | | | | | | |
| 2,750 | | Accenture PLC - Class A (United Kingdom) | | 996,517 | | |
| 7,000 | | International Business Machines Corporation | 1,591,870 | | |
| | | | | 2,588,387 | | 4.15% |
| | | | | | | |
| Life Sciences Tools & Services | | | | |
| 1,300 | | Thermo Fisher Scientific Inc. | | 688,519 | | 1.10% |
| | | | | | | |
| National Commercial Banks | | | | |
| 8,500 | | JPMorgan Chase & Co. | | 2,122,620 | | 3.41% |
| | | | | | | |
| Oil, Gas & Consumable Fuels | | | | |
| 6,500 | | Cheniere Energy, Inc. | | 1,456,065 | | |
| 5,652 | | Exxon Mobil Corporation | | 666,710 | | |
| | | | | 2,122,775 | | 3.41% |
| | | | | | | |
| Pharmaceuticals | | | | |
| 1,600 | | Eli Lilly And Company | | 1,272,560 | | 2.04% |
| | | | | | | |
| Semiconductors & Semiconductor Equipment | | | | |
| 4,375 | | Applied Materials, Inc. | | 764,356 | | |
| 875 | | ASML Holding N.V. ADR | | 600,784 | | |
| 20,000 | | NVIDIA Corporation | | 2,765,000 | | |
| | | | | 4,130,140 | | 6.62% |
| | | | | | | |
| Software | | | | | | |
| 5,500 | | Microsoft Corporation | | 2,329,030 | | |
| 5,000 | | Palo Alto Networks, Inc. * | | 1,939,100 | | |
| 25,000 | | QXO, Inc. | | 416,000 | | |
| 1,700 | | Roper Technologies, Inc. | | 962,948 | | |
| 3,150 | | Salesforce, Inc. | | 1,039,469 | | |
| | | | | 6,686,547 | | 10.72% |
| | | | | | | |
| Transportation Services | | | | |
| 13,000 | | GXO Logistics, Inc. * | | 790,790 | | 1.27% |
| | | | | | | |
| Total for Common Stocks (Cost $33,733,705) | | 55,945,232 | | 89.73% |
| | | | | | | |
| EXCHANGE TRADED FUNDS | | | | |
| Equity Funds | | | | | | |
| 24,000 | | Global X Uranium ETF | | 776,400 | | |
| 7,500 | | Invesco S&P 500® Equal Weight ETF | | 1,407,150 | | |
| 9,000 | | The Health Care Select Sector SPDR® Fund ETF | 1,326,690 | | |
| 3,150 | | VanEck Semiconductors ETF | | 762,709 | | |
| | | | | 4,272,949 | | |
| | | | | | | |
| Crypto Funds | | | | | | |
| 20,000 | | iShares® Bitcoin Trust ETF * | | 1,104,200 | | |
| Total Exchange Traded Funds (Cost $4,454,272) | | 5,377,149 | | 8.63% |
| | | | | | | |
| REAL ESTATE INVESTMENT TRUSTS | | | | |
| 3,000 | | Equity Residential | | 229,980 | | |
| 4,000 | | Simon Property Group Inc. | | 734,400 | | |
| Total Real Estate Investment Trusts (Cost $885,128) | | 964,380 | | 1.55% |
| | | | | | | |
| MONEY MARKET FUNDS | | | | |
| 89,524 | | Goldman Sachs FS Government Fund Institutional | | | |
| | | Portfolio Institutional Class 4.49% ** | | 89,524 | | |
| Total Money Market Funds (Cost $89,524) | | 89,524 | | 0.14% |
| | | | | | | |
| Investments at Fair Value (Cost $39,162,629) | | 62,376,285 | | 100.05% |
| | | | | | | |
| Liabilities in Excess of Other Assets | | (30,213) | | -0.05% |
| | | | | | | |
| Net Assets | | | | $ 62,346,072 | | 100.00% |
| | | | | | | |
| | | | | | | |
| | | | | | | |
| | | | | | | |
| * Non-Income Producing Securities. | | | | |
| ** The rate shown represents the 7-day yield at November 30, 2024. | | | |
| ADR - American Depositary Receipt. | | | | |
| The accompanying notes are an integral part of these financial statements. | | | |
| NOTES TO FINANCIAL STATEMENTS |
| WELLINGTON SHIELDS ALL-CAP FUND |
| November 30, 2024 |
| | | | | | | | | | |
| 1. ORGANIZATION | | | | | | | | | |
Wellington Shields All-Cap Fund (the “Fund”) is a diversified series of the Capital Management Investment Trust (the “Trust”), a registered open-end management investment company. The Trust was organized on October 14, 1994, as a Massachusetts business trust and may offer shares of beneficial interest in a number of separate series, each series representing a distinct fund with its own investment objectives and policies. As of November 30, 2024, there is one series authorized by the Trust. Prior to March 29, 2018, the Fund was known as the Capital Management Mid-Cap Fund. The Fund’s investment advisor is Capital Management Associates, Inc. (“CMA” or “Advisor”). The Fund currently offers Institutional shares. The Fund commenced operations on January 27, 1995. The investment objective of the Fund is to seek capital appreciation.
|
| | | | | | | | | | |
| 2. SIGNIFICANT ACCOUNTING POLICIES | | | | | | | |
The following accounting policies have been consistently followed by the Fund and are in conformity with accounting principles generally accepted in the United States of America (“GAAP”) in the investment company industry. The Fund is an investment company that follows the accounting and reporting guidance of Accounting Standards Codification Topic 946 applicable to investment companies.
|
| | | | | | | | | | |
| INVESTMENT VALUATION | | | | | | | | | |
All investments in securities are recorded at their estimated fair value, as described in Note 3. The Trust’s Board of Trustees (“Board”) has designated the Advisor as “Valuation Designee” pursuant to Rule 2a-5 under the Investment Company Act of 1940, as amended (“1940 Act”).
|
| | | | | | | | | | |
| SHARE VALUATION | | | | | | | | | |
The net asset value (the “NAV”) is generally calculated as of the close of trading on the New York Stock Exchange (the “Exchange”) (normally 4:00 p.m. Eastern time) every day the Exchange is open. The NAV is calculated by taking the total value of the Fund’s assets, subtracting its liabilities, and then dividing by the total number of shares outstanding, rounded to the nearest cent. The offering price and redemption price per share is equal to the NAV per share.
|
| | | | | | | | | | |
| INVESTMENT TRANSACTIONS AND INVESTMENT INCOME | | | | | |
Investment transactions are accounted for as of the date purchased or sold (trade date). Dividend income is recorded on the ex-dividend date. Certain dividends from foreign securities will be recorded as soon as the Trust is informed of the dividend if such information is obtained subsequent to the ex-dividend date. Interest income, if any, is recorded on the accrual basis and includes amortization of discounts and premiums. Payments received from certain investments, such as Real Estate Investment Trusts ("REITs"), held by the Fund may be comprised of dividends, capital gains and return of capital. The Fund estimates the expected classification of such payments. These amounts may subsequently be reclassified upon receipt of information from the issuer. Gains and losses are determined on the identified cost basis, which is the same basis used for federal income tax purposes.
|
| | | | | | | | | | |
| DIVIDEND DISTRIBUTIONS | | | | | | | | | |
Dividends paid by the Fund derived from net investment income (if any) will generally be paid annually. Distributions from capital gains (if any) are generally declared and distributed annually. The Fund may also make a supplemental distribution subsequent to the end of its fiscal year. Dividends and distributions to shareholders are recorded on the ex-dividend date.
|
| | | | | | | | | |
| ESTIMATES | | | | | | | | | |
The preparation of financial statements in conformity with GAAP requires management to make estimates and assumptions that affect the reported amounts of assets and liabilities and disclosure of contingent assets and liabilities at the date of the financial statements and the reported amounts of increases and decreases in the net assets from operations during the reported year. Actual results could differ from those estimates.
|
| | | | | | | | | | |
| FEDERAL INCOME TAXES | | | | | | | | | |
The Fund is considered a personal holding company as defined under Section 542 of the Internal Revenue Code since 50% of the value of the Fund’s shares were owned directly or indirectly by five or fewer individuals at certain times during the last half of the year. As a personal holding company, a 20% tax would be imposed for each tax year on undistributed personal holding company income. Generally, provisions for income taxes are not included in the financial statements as the Fund intends to distribute to shareholders all taxable investment income and realized gains and otherwise comply with Subchapter M of the Internal Revenue Code applicable to regulated investment companies.
|
| | | | | | | | | | |
As of and during the fiscal year ended November 30, 2024, the Fund did not have a liability for any unrecognized tax expense. The Fund recognizes interest and penalties, if any, related to unrecognized tax expense as income tax expense in the Statement of Operations. As of November 30, 2024, the Fund did not incur any interest or penalties. As required, management has analyzed the Fund’s tax positions taken on Federal income tax returns for all open tax years and expected to be taken during the fiscal year ended November 30, 2024, and has concluded that no provision for income tax is required in these financial statements.
|
| | | | | | | | | | |
| 3. SECURITIES VALUATIONS | | | | | | | | | |
The Fund utilizes various methods to measure the fair value of its investments on a recurring basis. GAAP establishes a hierarchy that prioritizes inputs to valuation methods. The three levels of inputs are:
|
| | | | | | | | | | |
Level 1 - Unadjusted quoted prices in active markets for identical assets or liabilities that the Fund has the ability to access.
|
| | | | | | | | | | |
Level 2 - Observable inputs other than quoted prices included in level 1 that are observable for the asset or liability, either directly or indirectly. These inputs may include quoted prices for the identical instrument on an inactive market, prices for similar instruments, interest rates, prepayment speeds, credit risk, yield curves, default rates and similar data.
|
| | | | | | | | | | |
Level 3 - Unobservable inputs for the asset or liability, to the extent relevant observable inputs are not available, representing the Fund’s own assumptions about the assumptions a market participant would use in valuing the asset or liability, and would be based on the best information available.
|
| | | | | | | | | | |
The availability of observable inputs can vary from security to security and is affected by a wide variety of factors, including, for example, the type of security, whether the security is new and not yet established in the marketplace, the liquidity of markets, and other characteristics particular to the security. To the extent that valuation is based on models or inputs that are less observable or unobservable in the market, the determination of fair value requires more judgment. Accordingly, the degree of judgment exercised in determining fair value is greatest for instruments categorized in level 3.
|
| | | | | | | | | | |
The inputs used to measure fair value may fall into different levels of the fair value hierarchy. In such cases, for disclosure purposes, the level in the fair value hierarchy within which the fair value measurement falls in its entirety, is determined based on the lowest level input that is significant to the fair value measurement in its entirety.
|
| | | | | | | | | | |
| FAIR VALUE MEASUREMENTS | | | | | | | | | |
A description of the valuation techniques applied to the Fund’s major categories of assets and liabilities measured at fair value on a recurring basis follows.
|
| | | | | | | | | | |
Equity securities (common stocks, exchange traded funds and REITs). Equity securities generally are valued by using market quotations but may be valued on the basis of prices furnished by a pricing service when the Valuation Designee believes such prices accurately reflect the fair market value of such securities. Securities that are traded on any stock exchange or on the NASDAQ over-the-counter market are generally valued by the pricing service at the last quoted sale price on the primary exchange or market on which the security trades. Lacking a last sale price, an equity security is generally valued by the pricing service at its last bid price. In the event of a short sale of an equity security, lacking a last sale price, an equity security is generally valued by the pricing service at its last ask price. Generally, if the security is traded in an active market and is valued at the last sale price, the security is categorized as a level 1 security, and if an equity security is valued by the pricing service at its last bid price, it is generally categorized as a level 2 security. When market quotations are not readily available or when the Valuation Designee determines that the market quotation or the price provided by the pricing service does not accurately reflect the current market value, or when restricted or illiquid securities are being valued, such securities are valued pursuant to the fair value pricing procedures.
|
| | | | | | | | | | |
Money market funds. Shares of money market funds are valued at net asset value provided by the underlying fund and are classified in level 1 of the fair value hierarchy.
|
| | | | | | | | | | |
In accordance with the Trust’s good faith pricing guidelines, the Valuation Committee, which includes the Valuation Designee, shall consider all appropriate factors relevant to the value of securities for which market quotations are not readily available. There is no single standard for determining fair value, since fair value depends upon the circumstances of each individual case. As a general principle, the current fair value of an issue of securities being valued by the Valuation Committee would appear to be the price at which the security could reasonably be sold in a current market transaction. Methods which are in accordance with this principle may, for example, be based on (i) a multiple of earnings; (ii) a discount from market of a similar freely traded security (including a derivative security or a basket of securities traded on other markets, exchanges or among dealers); or (iii) yield to maturity with respect to debt issues, or a combination of these and other methods.
|
| | | | | | | | | | |
The following table summarizes the inputs used to value the Fund’s assets measured at fair value as of November 30, 2024:
|
| | | | | | | | | | |
| Valuation Input of Assets | | Level 1 | | Level 2 | | Level 3 | | Total | |
| Common Stocks | | $ 55,945,232 | | $ - | | $ - | | $ 55,945,232 | |
| Exchange Traded Funds | | 5,377,149 | | - | | - | | 5,377,149 | |
| Real Estate Investment Trusts | | 964,380 | | - | | - | | 964,380 | |
| Money Market Funds | | 89,524 | | - | | - | | 89,524 | |
| Total | | $ 62,376,285 | | $ - | | $ - | | $ 62,376,285 | |
| | | | | | | | | | |
Refer to the Fund’s Schedule of Investments for a listing of securities by industry. The Fund did not hold any Level 3 assets during the fiscal year ended November 30, 2024.
|
| | | | | | | | | | |
During the fiscal year ended November 30, 2024, there were no derivative transactions in the Fund.
|
| | | | | | | | | | |
| 4. INVESTMENT ADVISORY AGREEMENT | | | | | | | |
The Trust, on behalf of the Fund, has entered into an Investment Advisory Agreement with CMA. Under the terms of the Investment Advisory Agreement, the Advisor manages the investment portfolio of the Fund, subject to policies adopted by the Trust’s Board of Trustees. Under the Investment Advisory Agreement, the Advisor provides guidance and policy direction in connection with its daily management of the Fund’s assets. The Advisor manages the investment and reinvestment of the Fund’s assets. The Advisor is also responsible for the selection of broker-dealers through which the Fund executes portfolio transactions, subject to the brokerage policies established by the Trustees, and it provides certain executive personnel to the Fund.
|
| | | | | | | | | | |
The Advisor earns an annual management fee of 1.00% of the Fund’s first $100 million of the Fund’s net assets, 0.90% of the next $150 million, 0.85% of the next $250 million and 0.80% of all assets over $500 million. For the fiscal year ended November 30, 2024, the Advisor earned management fees totaling $558,257. As of November 30, 2024, the Fund owed the Advisor $49,860. The Advisor has agreed to waive or limit its fees and to assume other expenses so that the total annual operating expenses of the Fund (other than interest, taxes, brokerage commissions, other expenditures that are capitalized in accordance with generally accepted accounting principles, other extraordinary expenses not incurred in the ordinary course of each Fund’s business, Acquired Fund Fees and Expenses and amounts, if any, payable pursuant to a Rule 12b-1 Plan) are limited to 1.50% of the average daily net assets of the Fund through the period ending April 1, 2025 (“Expense Limitation Agreement”). It is expected that the Expense Limitation Agreement will continue from year-to-year thereafter, provided such continuance is specifically approved by a majority of the Trustees who (i) are not “interested persons” of the Trust or any other party to the Expense Limitation Agreement, as defined in the 1940 Act; and (ii) have no direct or indirect financial interest in the operation of this Expense Limitation Agreement. The Expense Limitation Agreement may also be terminated by the Advisor and the Trust at the end of the then current term upon not less than 90-days’ notice to the other party as set forth in the Expense Limitation Agreement.
|
| | | | | | | | | | |
| The Fund may, at a later date, reimburse the Advisor the management fees waived or limited and other expenses assumed and paid by the Advisor pursuant to the Expense Limitation Agreement for a period of three years from the date of the actual waiver or expense reimbursement, provided the Fund has reached a sufficient asset size to permit such reimbursement to be made without causing the total annual expense ratio of the Fund to exceed the percentage limits stated above. Consequently, no reimbursement by the Fund will be made unless: (i) the Fund’s assets exceed $10 million; (ii) the Fund’s total annual expense ratio is less than the percentage limit stated above; and (iii) the payment of such reimbursement has been approved by the Trustees on a quarterly basis. No waivers or reimbursements were incurred during the fiscal year ended November 30, 2024. Additionally, as of November 30, 2024, there were no previously waived fees available for reimbursement to the Advisor. Certain officers and directors of the Advisor are also officers and/or Trustees of the Trust. |
| | | | | | | | | | |
| 5. OTHER TRANSACTIONS WITH AFFILIATES | | | | | | | |
| Distributor | | | | | | | | | |
Wellington Shields & Co., LLC (the “Distributor”) is the Fund’s principal underwriter and distributor. The Distributor is also the introducing broker-dealer and is used by the Fund for its investment transactions. For the fiscal year ended November 30, 2024, there were commissions on investment transactions paid to the Distributor of $5,935. Certain Trustees and officers of the Trust are also officers of the Distributor.
|
| | | | | | | | | | |
| Administrator | | | | | | | | | |
Premier Fund Solutions, Inc. (“PFS” or “Administrator”) serves as the Administrator for the Trust pursuant to a written agreement with the Trust. PFS provides day-to-day administrative services to the Fund. For PFS’s services to the Fund, the Fund pays PFS an annualized asset-based fee of 0.07% of average daily net assets up to $200 million, with lower rates at higher asset levels, subject to a minimum monthly fee of $2,500, plus reimbursement of out-of-pocket expenses. For its services, during the fiscal year ended November 30, 2024, PFS earned $39,078. As of November 30, 2024, the Fund owed the Administrator $3,491. Certain officers of the Trust are also officers of the Administrator.
|
| | | | | | | | | | |
| 6. PURCHASES AND SALES OF INVESTMENT SECURITIES | | | | | |
For the fiscal year ended November 30, 2024, purchases and sales of investment securities other than U.S. Government obligations and short-term investments aggregated $24,979,546 and $25,785,311, respectively. Purchases and sales of U.S. Government obligations aggregated $0 and $0, respectively.
|
| | | | | | | | | | |
| 7. CONTROL OWNERSHIP | | | | | | | | | |
The beneficial ownership, either directly or indirectly, of more than 25% of the voting shares of a fund creates a presumption of control of the fund, under Section 2(a)(9) of the 1940 Act. As of November 30, 2024, W.H. Flowers, Jr. Foundation, Inc., owned of record approximately 30.62% of the Fund and therefore, may be deemed to control the Fund.
|
| | | | | | | | | | |
| 8. TAX MATTERS | | | | | | | | | |
For Federal income tax purposes, the cost of investments owned at November 30, 2024, was $39,162,629.
|
| | | | | | | | | | |
At November 30, 2024, the composition of gross unrealized appreciation (the excess of value over tax cost) and depreciation (the excess of tax cost over value) of investments on a tax basis was as follows:
|
| | | | | | | | | | |
| Appreciation | | Depreciation | Net Appreciation/(Depreciation) |
| $23,226,206 | | ($12,550) | | $23,213,656 | |
| | | | | | | | | | |
| The tax character of distributions was as follows: |
| | | | | | | | | | |
| | Year ended | | Year ended | | |
| | November 30, 2024 | | November 30, 2023 | | |
| Ordinary Income: | | $ 229,085 | | | | $ 91,065 | | | |
| Long-term Capital Gain: | | - | | | | 1,102,327 | | | |
| | | $ 229,085 | | | | $ 1,193,392 | | | |
| | | | | | | | | | |
Subsequent to November 30, 2024, there was a dividend paid on December 26, 2024 to the shareholders of record on December 24, 2024, of $0.002744 per share ordinary income and $1.172187 per share long-term capital gains.
|
| | | | | | | | | | |
As of November 30, 2024, the components of distributable earnings (accumulated losses) on a tax basis were as follows:
|
| | | | | | | | | | |
| Accumulated Undistributed Ordinary Income | $ 5,708 | | | | |
| Other Accumulated Losses | | | (253,646) | | | | |
| Accumulated Undistributed Capital Gains | 2,435,200 | | | | |
| Unrealized Appreciation (Depreciation) - Net | 23,213,656 | | | | |
| Total Distributable Earnings | | | $ 25,400,918 | | | | |
| | | | | | | | | | |
As of November 30, 2024, there were no differences between book basis and tax basis unrealized appreciation. As of November 30, 2024, other accumulated losses above are attributable to deferred late year ordinary losses and deferred post-October losses, which totaled $112,118 and $141,528, respectively. During the year ended November 30, 2024, the Fund utilized short-term capital loss carryforward of $290,405.
|
| | | | | | | | | | |
| 9. COMMITMENTS AND CONTINGENCIES | | | | | | | |
Under the Trust’s organizational documents, its officers and Trustees are indemnified against certain liabilities arising out of the performance of their duties to the Fund. In addition, in the normal course of business, the Trust entered into contracts with its vendors, on behalf of the Fund, and others that provide for general indemnifications. The Fund’s maximum exposure under these arrangements is unknown, as this would involve future claims that may be made against the Fund. The Fund expects the risk of loss to be remote.
|
| | | | | | | | | | |
| 10. SUBSEQUENT EVENTS | | | | | | | | | |
Management has evaluated the impact of all subsequent events on the Fund through the date the financial statements were issued, and has determined that, other than the December 26, 2024 distributions reported in Note 8, there are no events requiring adjustment to or disclosure in the financial statements.
|
| Item 11. Statement Regarding Basis for Approval of Investment Advisory Contract. | |
| | | | | | | | | | |
| On October 9, 2024, the Board of Trustees (the “Board”) considered the renewal of the Advisory Agreement between Capital Management Associates, Inc. (“CMA”) and the Trust with respect to the Wellington Shields All-Cap Fund (the "Fund"). Counsel discussed with the Board the types of information and factors that should be considered by the Board in order to make an informed decision regarding the approval of the Advisory Agreement, including the following material factors: (i) the nature and extent of the services provided by CMA; (ii) the investment performance of the Fund; (iii) the costs of the services provided and profits realized by CMA from the relationship with the Fund; (iv) the extent to which economies of scale would be realized if the Fund grows and whether advisory fee levels reflect those economies of scale for the benefit of the investors of the Fund; and (v) CMA’s practices regarding possible conflicts of interest and other benefits derived by CMA. |
| | | | | | | | | | |
| In assessing these factors and reaching its decisions, the Board took into consideration information furnished for the Board’s review and consideration throughout the year at regular Board meetings, including information presented to the Board in CMA’s presentation earlier in the Meeting. The Board requested and was provided with information and reports relevant to the consideration of the Advisory Agreement, including: (i) reports regarding the services and support provided to the Fund and its shareholders by CMA; (ii) quarterly assessments of the investment performance of the Fund from CMA; (iii) periodic commentary on the reasons for the performance; (iv) presentations by the Fund’s management addressing CMA’s investment philosophy, investment strategy, personnel and operations; (v) compliance and audit reports concerning the Fund and CMA; (vi) disclosure information contained in the registration statement of the Trust and the Form ADV of CMA; and (vii) the memorandum from Counsel summarizing the fiduciary duties and responsibilities of the Board in reviewing and approving the Advisory Agreement, including the material factors set forth above and the types of information included in each factor that should be considered by the Board in order to make an informed decision. |
| | | | | | | | | | |
| The Board also requested and received various informational materials including, without limitation: (i) documents containing information about CMA, including financial information, a description of personnel and the services provided to the Fund, information on investment advice, performance, summaries of the Fund’s expenses, compliance program, current legal matters and other general information; (ii) comparative expense and performance information for other mutual funds with strategies similar to the Fund; (iii) the anticipated effect of size on the Fund’s expenses; and (iv) benefits to be realized by CMA from its relationship with the Fund. The Board did not identify any particular information that was most relevant to its consideration to approve the Advisory Agreement. |
| |
| 1. The nature, extent and quality of the services provided by CMA. |
| | | | | | | | | | |
| In this regard, the Board considered the responsibilities CMA has under the Advisory Agreement and the services provided by CMA to the Fund including CMA’s processes for formulating investment recommendations and assuring compliance with the Fund’s investment objectives and limitations. The Board considered: CMA’s staffing, personnel and methods of operating; the education and experience of CMA’s personnel; and CMA’s compliance program, policies and procedures. After reviewing the foregoing and further information from CMA, the Board concluded that the quality, extent and nature of the services provided by CMA was satisfactory and adequate for the Fund. |
| | | | | | | | | | |
| 2. Investment performance of the Fund and CMA. |
| In considering the investment performance of the Fund and CMA, the Trustees compared the performance of the Fund with the performance of its benchmark index and comparable funds with similar objectives and size managed by other investment advisers. |
| | | | | | | | | | |
The Board considered the consistency of CMA’s management of the Fund with its investment objective and policies. The Trustees also considered that Morningstar has placed the Fund in its US Fund Large Growth category. The Board noted that while the Fund underperformed its Morningstar category for the one-month, three-month periods, 1-year, 3-year, 5-year and 10-year periods ended August 31, 2024, the Fund’s relative underweighting to the technology sector as compared to the US Fund Large Growth category and benchmark index was a factor in the Fund’s comparative performance. Based on the foregoing, the Board concluded that the investment performance information presented for the Fund was acceptable at this time.
|
| | | | | | | | | | |
| 3. The costs of the services provided and profits realized by CMA from the relationship with the Fund. |
| | | | | | | | | | |
| In considering the costs of the services provided and profits realized by CMA from the relationship with the Fund, the Board considered: CMA’s staffing, personnel and methods of operating; the financial condition of CMA and the level of commitment to the Fund by CMA; the expected asset levels of the Fund; and the overall expenses of the Fund. The Board considered financial statements of CMA and discussed the financial stability and profitability of the firm. The Board considered that the management fee and net expense ratio for the Fund was above the category median for the Morningstar Large Growth Category but within the range of the category. The Board noted the management fee was in the highest 20th percentile in its category. The Board noted that the Fund’s assets are significantly smaller than the majority of the funds in the Morningstar category. The Board considered that CMA does not have any separate accounts which are managed similarly to the Fund but that the advisory fees charged to the Fund are comparable to those charged to CMA’s other clients with equity portfolios. Following this analysis and upon further consideration and discussion of the foregoing, the Board concluded that the fees paid to CMA by the Fund were fair and reasonable. |
| | | | | | | | | | |
| 4. The extent to which economies of scale would be realized as the Fund grows and whether advisory fee levels reflect these economies of scale for the benefit of the investors of the Fund. |
| | | | | | | | | | |
| In this regard, the Board considered the Fund’s fee arrangements with CMA. The Trustees noted that CMA has agreed to breakpoint fee schedules in the Advisory Agreement and to an expense limitation agreement for the Fund. The Board noted that CMA also has waived its recoupment rights under the expense limitation agreement. The Board further noted that each of these arrangements is a benefit to the Fund’s shareholders. Following further discussion of the Fund’s expected asset levels, expectations for growth, and levels of fees, the Board determined that the Fund’s fee arrangements, in light of all the facts and circumstances, were fair and reasonable and that the breakpoint schedule and expense limitation arrangements provided potential savings or protection for the benefit of the Fund’s shareholders. |
| | | | | | | | | | |
| 5. Possible conflicts of interest and benefits derived by CMA. | | | | |
| | | | | | | | | | |
| In considering CMA’s practices regarding conflicts of interest, the Board evaluated the potential for conflicts of interest and considered such matters as: the experience and ability of the advisory and compliance personnel assigned to the Fund; the fact that CMA does not utilize soft dollars; the basis of decisions to buy or sell securities for the Fund; and the substance and administration of CMA’s code of ethics. The Board considered that the Adviser benefits, indirectly from the relationship with the Fund in that commissions are paid to its affiliate, Wellington Shields & Co. Based on the foregoing, the Board determined that CMA’s standards and practices relating to the identification and mitigation of possible conflicts of interest were satisfactory. |
| | | | | | | | | | |
After additional consideration of the factors delineated in the memorandum provided by Counsel and further analysis by the Board, that in reliance on the information provided by CMA, the continuation of the Advisory Agreement between the Trust, on behalf of the Fund, and CMA,is approved and renewed for a period of one year ending October 31, 2025.
|