SECURITIES AND EXCHANGE COMMISSION
Washington, D.C. 20549
FORM 6-K
REPORT OF FOREIGN ISSUER
Pursuant to Rule 13a-16 or 15d-16
of the Securities Exchange Act of 1934
For the month of: March 2007
ADECCO SA
(Exact name of Registrant as specified in its charter)
Commission # 0-25004
Sägereistrasse 10
CH-8152 Glattbrugg
Switzerland
+41 1 878 88 88
(Address of principal executive offices)
[Indicate by check mark whether the registrant files or will file annual reports under cover Form 20-F or 40-F]
Form 20-F X Form 40-F
[Indicate by check mark whether the registrant by furnishing the information contained in this Form is also thereby furnishing the information to the Commission pursuant to Rule 12g3-2(b) under the Securities Exchange Act of 1934]
Yes No X
Attached:
- Adecco on track to reach 2009 targets: Q4 & FY 2006 Results
 |

Adecco on track to reach 2009 targets
Operating income margin improved 60 bps to 4.0% in FY 2006
FY 2006 HIGHLIGHTS (2006 vs. 2005)
• | Revenues of EUR 20.4 billion, up 12% (9% organically1) |
| • | Gross margin improvement of 50 bps to 17.4% |
| • | Operating income of EUR 816 million, up 33% (27% organically) |
| • | Operating margin improvement of 60 bps to 4.0% |
| • | Net income of EUR 611 million, up 35%; basic EPS of EUR 3.28 (2005: EUR 2.43) |
| • | Dividend of CHF 1.20 per share proposed (2005: CHF 1.00) |
Q4 HIGHLIGHTS (Q4 06 vs. Q4 05)
| • | Revenues of EUR 5.3 billion, up 8% (8% organically) |
| • | Gross margin improvement of 40 bps to 17.7% |
| • | Operating income of EUR 222 million, up 36% (32% organically) |
| • | Strong operating margin improvement of 90 bps to 4.2% |
| • | Net income of EUR 212 million, up 23%; supported by one time tax benefit |
Chéserex, Switzerland – March 2, 2007:The Adecco Group, the worldwide leader in Human Resource services, today announced results for the full year 2006 as well as for the fourth quarter. For the full year net income increased by 35% to EUR 611 million compared to EUR 453 million a year earlier. Revenues were up 12% to EUR 20.4 billion from EUR 18.3 billion in 2005.
Dieter Scheiff, Chief Executive Officer, Adecco Group said: “In 2006 Adecco delivered strong results. With 9% organic revenue growth we reached the upper end of our growth target. During the year we have made good progress in enhancing the gross margin, while maintaining disciplined cost management. This led to an encouraging operating income margin improvement of 60 bps to 4.0% in 2006.”
“Our value oriented management approach and focus on professional and specialised staffing, combined with the continued favourable economic environment for the industry as a whole, make me optimistic about Adecco’s future growth and returns. We are well on track to reach our long-term goals of 7 to 9% annual revenue growth, as well as an operating margin of over 5% and a return on capital employed of above 25% by 2009.”
| 1 | Organic growth is a non US GAAP measure and excludes the impact of currency and acquisitions. |
| Adecco SA – FY and Q4 2006 Results | Page 1 of 11 | 02/03/2007 |
|
FY 2006 and Q4 2006 FINANCIAL PERFORMANCE
Revenues
Group revenues for the fiscal year of 2006 were EUR 20.4 billion, a 12% increase or a 9% increase organically compared to the fiscal year 2005. Revenues for the fourth quarter increased to EUR 5.3 billion, which is an 8% rise on a reported and organic basis.
Gross Profit
Gross margin in the full year 2006 improved 50 bps to 17.4% versus 2005 due to a combination of acquisitions, higher permanent placement revenues and good growth in the higher margin professional business. In the fourth quarter, mainly as a result of the DIS acquisition, gross margin improved by 40 bps to 17.7% compared to the same quarter last year. Favourable changes in estimates for French payroll provisions had a 20 bps positive impact on the quarter’s gross margin in 2006 and 2005.
Selling, General and Administrative Expenses (SG&A)
SG&A were up 10% for the full year. SG&A as a percentage of revenues for the full year decreased 20 bps to 13.3% and by 40 bps organically. In the fourth quarter SG&A increased 4%, which represents, as a percentage of revenues, a drop of 50 bps to 13.4% versus the same quarter last year. Additional corporate expenses increased the fourth quarter’s 2006 SG&A as a percentage of revenues by 20 bps compared to Q3 2006. On an organic basis SG&A grew 3%, the office network 5% (+310 offices) and FTEs 2% (+550 FTEs) compared to the same quarter last year. At the end of 2006, Adecco had over 35,000 FTEs and over 6,700 offices.
Operating Income
Operating income for the fiscal year 2006 was EUR 816 million, an increase of 33% (27% organically) compared to 2005. Operating income margin improved to 4.0% versus 3.4% last year. In the fourth quarter Adecco’s operating income grew 36% (32% organically) to EUR 222 million, which corresponds to an operating margin improvement of 90 bps to 4.2%.
Interest Expense and Other Income / (Expenses), net
Interest expense was EUR 51 million in 2006 and EUR 13 million in the fourth quarter (2005: EUR 52 million; Q4 2005: EUR 12 million). Interest expenses are expected to be approximately EUR 56 million for the full year 2007. Other income / (expenses), net were EUR 20 million in 2006 and EUR 8 million for the period from October to December. This is EUR 37 million less compared to the same quarter last year, in which Adecco realized a EUR 42 million gain on the divestment of a minority holding in PSI (Professional Service Industries).
Provision for Income Taxes
The effective tax rate for the fiscal year 2006 was 21% compared with 25% in the prior year. The fourth quarter of 2006 was positively impacted by a tax benefit related to the release of a valuation allowance on deferred tax assets in the US. Excluding the effect of this release the underlying tax rate for 2006 was approximately 29%. For the full year 2007, Adecco expects an effective tax rate of around 29%.
Net Income and EPS
Net income was up 35% to EUR 611 million in 2006 (2005: EUR 453 million). Basic EPS was EUR 3.28 for 2006 (EUR 2.43 for 2005). In the fourth quarter, Adecco reported a net income of EUR 212 million, representing a net income margin of 4.0%. The release of the tax valuation allowance in the US positively impacted full year and fourth quarter 2006 basic EPS by EUR 0.34.
| Adecco SA – FY and Q4 2006 Results | Page 2 of 11 | 02/03/2007 |
|
Balance Sheet, Cash-flow, and Net Debt1
The Group generated EUR 747 million of operating cash flow in 2006, compared with EUR 298 million in 2005. The main reasons for this increase are a higher net income as well as the timing of cash payments due to an additional trading week in 2004, which negatively impacted the operating cash flow in 2005. Net debt increased by EUR 132 million to EUR 556 million at the end of December 2006 compared to the year end of 2005. This increase was mainly due to the purchase of DIS AG (EUR 552 million net of cash acquired) and treasury shares (EUR 123 million), capital expenditures (EUR 83 million) as well as the payment of dividends (EUR 120 million), partially compensated by the operating cash flow. In 2006 DSO improved 1 day to 59 days compared to 2005. Return on capital employed (ROCE) reached 20.3% versus 18.5% in 2005.
Currency Impact
Currency fluctuations had a minimal impact on the fiscal year 2006 revenues and operating income, while there was a 3% negative impact in the fourth quarter mainly due to the weakness of the US dollar and the Japanese yen.
Dividend payout
The Board of Directors will propose a dividend of CHF 1.20 per share for 2006 (2005: CHF 1.00) for approval by shareholders at the Annual General Meeting. The proposal implies a dividend payout ratio on net income of 25%, when excluding the release of a valuation allowance on deferred tax assets in the US. It is planned that the dividend for the shares will be paid on May 22, 2007, the dividend for the ADRs will be paid on June 25, 2007.
GEOGRAPHICAL PERFORMANCE
InFrance Adecco posted revenue growth of 8% to EUR 6.8 billion in 2006 and 7% in the fourth quarter. Gross margin increased by 10 bps compared to 2005. The 2005 acquisition of Altedia as well as higher permanent placement revenues more than compensated for the gross margin decline in the temporary business. In the fourth quarter gross margin declined 10 bps compared to Q4 2005 when excluding the impact of provision releases. Disciplined cost management led to an operating income increase by 8% in 2006 and 20% in the fourth quarter.
In theUSA & Canada Adecco increased revenues in constant currency by 1% to EUR 3.7 billion in 2006. Strong demand for permanent placement and an improved customer and skill mix in the temporary business resulted in 110 bps higher gross margin and an operating margin improvement to 4.2% (2005: 3.8%). In the fourth quarter revenues declined by 4% in constant currency and 3% adjusted for trading days. Adecco remained price disciplined in a softening market environment. Due to favourable workers compensation cost development in the fourth quarter of 2006 and 2005 operating margin remained stable at 5.2%.
In 2006UK & Ireland added 19% in revenues in constant currency mainly driven by good demand in the IT business line. In the fourth quarter the revenue addition in constant currency was 13%. Changes in business and customer mix had a negative impact on gross margin, which were not fully compensated by efficiency improvements. As a result operating income grew 11% in 2006 and 2% in constant currency in the fourth quarter compared to last year.
InJapanrevenues in constant currency grew 8% in 2006 and 7% in the fourth quarter, while operating margin expanded to 5.9% and 5.6% (2005: 4.6%; Q4 2005: 4.6%). The general shortage of candidates, combined with the continued solid economic environment and good permanent placement revenues led to better gross margins in the full year as well as the fourth quarter.
| 1 | Net debt is a non-US GAAP measure and comprises short-term and long-term debt less cash and cash equivalents and short-term investments. |
| Adecco SA – FY and Q4 2006 Results | Page 3 of 11 | 02/03/2007 |
|
InGermany and theNordics Adecco added 111% and 45% respectively in constant currency (30% and 39% organically) to revenues in 2006. In the fourth quarter revenue addition was 114% and 49% in constant currency (20% and 41% organically). Changes in regional legislation and higher acceptance levels of temporary staffing combined with a favourable economic environment continue to be the main drivers behind this organic growth.Italy, Iberia andBeneluxgrew revenues by 10%, 23% and 12% respectively in 2006 (Iberia organically 10%) and 8%, 13% and 7% in the fourth quarter. In Iberia the fourth quarter had 3% less trading days, in Italy and Germany 2%, compared to 2005.
BUSINESS LINE PERFORMANCE
| FY 2006 Revenues in percent | FY 2006 Gross Profit in percent | |
|
|
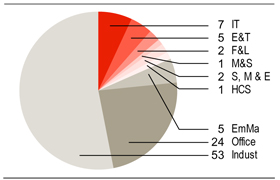
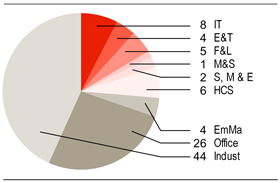
Adecco’sOffice and Industrial businesses grew revenues in constant currency by 10% to EUR 15.6 billion in 2006 and 10% in the last three months (9% and 8% organically). In the Industrial business there has been particularly good demand in France, Iberia and Italy in the fourth quarter. Revenues declined in the USA & Canada as demand softened. For the same period in the Office business, revenue additions remained strong in UK & Ireland and the Nordics. In the two business lines combined Adecco enhanced gross margin by 40 bps to 15.8% in 2006 and by 30 bps to 16.1% in the fourth quarter.
Revenues in theProfessional Business1 grew 16% in constant currency (10% organically) in 2006 and 12% (5% organically) in the fourth quarter. Gross margin improved 60 bps to 25.2% in 2006 (Q4 2006: +40 bps to 25.5%):
InInformation Technology (IT) Adecco increased revenues by 15% in constant currency (13% organically) in 2006 compared to 2005. In the fourth quarter revenue growth was 9% in constant currency and 5% organically. For both periods Adecco experienced strong demand in the UK & Ireland, while in the USA & Canada revenues declined.
Adecco’sEngineering & Technical (E&T) business grew revenues by 19% in constant currency (6% organically) in 2006. In the last three months of the year revenues increased by 25% in constant currency and 6% organically. UK & Ireland continued to see good demand. In the USA & Canada revenues remained stable in constant currency.
InFinance & Legal (F&L) Adecco achieved a revenue growth of 20% in constant currency (14% organically) in 2006 driven by strong demand in the USA & Canada. During the fourth quarter Adecco added 13% in constant currency and 5% on an organic basis.
| 1 | Professional business refers to Adecco’s Information Technology, Engineering & Technical, Finance & Legal, Medical & Science, Sales, Marketing & Events and Human Capital Solutions business. |
| Adecco SA – FY and Q4 2006 Results | Page 4 of 11 | 02/03/2007 |
|
In 2006 Adecco’sHuman Capital Solutions (HCS) business grew revenues by 12% in constant currency and declined 4% when excluding the impact of acquisitions and currency. In the fourth quarter the revenue decline was 3% in constant currency.Sales, Marketing & Events (S,M&E) andMedical & Science (M&S)both added in constant currency 15% to revenues (7% and 15% organically) in 2006 and 5% and 20% in the fourth quarter.
MANAGEMENT OUTLOOK
Current trading conditions combined with the key indicators for the global staffing services market continue to point to a favourable growth for the industry. The Group therefore remains committed to its objective of revenue growth of at least 7-9% per annum on average for the coming years providing no material changes to the macroeconomic environment. At the same time management continues to be confident that the focus on value based management and professional and specialized business fields will allow Adecco to continuously improve 2009 operating income margin to over 5% and return on capital employed (ROCE) to above 25%.
In January 2007 revenues continued to grow 8% when excluding the impact of trading days, currency and acquisitions.
Financial Agenda 2007
Q1 2007 results & Annual General Meeting | May 8, 2007 | |
Q2 2007 results | August 10, 2007 | |
Q3 2007 results | November 2, 2007 |
Forward-looking statements
Information in this release may involve guidance, expectations, beliefs, plans, intentions or strategies regarding the future. These forward-looking statements involve risks and uncertainties. All forward-looking statements included in this release are based on information available to Adecco S.A. as of the date of this release, and we assume no duty to update any such forward-looking statements. The forward-looking statements in this release are not guarantees of future performance and actual results could differ materially from our current expectations. Numerous factors could cause or contribute to such differences. Factors that could affect the Company’s forward-looking statements include, among other things: global GDP trends and the demand for temporary work; changes in regulation of temporary work; intense competition in the markets in which the Company competes; changes in the Company’s ability to attract and retain qualified temporary personnel; the resolution of the French anti-trust investigation and the resolution of the US class action; and any adverse developments in existing commercial relationships, disputes or legal and tax proceedings.
Please refer to the Company’s most recent Annual Report on Form 20-F and other reports filed with or submitted to the US Securities and Exchange Commission from time to time, for further discussion of the factors and risks associated with our business.
About Adecco
Adecco S.A. is a Fortune Global 500 company and the global leader in HR services. The Adecco Group network connects over 700,000 associates with business clients each day through its network of over35,000 employees and6,700 offices in over70 countries and territories around the world. Registered in Switzerland, and managed by a multinational team with expertise in markets spanning the globe, the Adecco Group delivers an unparalleled range of flexible staffing and career resources to corporate clients and qualified associates.
| Adecco SA – FY and Q4 2006 Results | Page 5 of 11 | 02/03/2007 |
|
Adecco S.A. is registered in Switzerland (ISIN: CH001213860) and listed on the Swiss Stock Exchange with trading on Virt-x (SWX/VIRT-X:ADEN), the New York Stock Exchange (NYSE:ADO) and Euronext Paris - Premier Marché (EURONEXT: ADE).
Contacts:
Adecco Corporate Investor Relations
Investor.relations@adecco.com or +41 (0) 44 878 8925
Adecco Corporate Press Office
Press.office@adecco.com or +41 (0) 44 878 8832
There will be an audiocast of the media conference at 9am CET as well as a webcast of the analyst presentation at 11 am CET, details of which can be found at our Investor Relations section athttp://webcast.adecco.com.
| Adecco SA – FY and Q4 2006 Results | Page 6 of 11 | 02/03/2007 |
Annexes
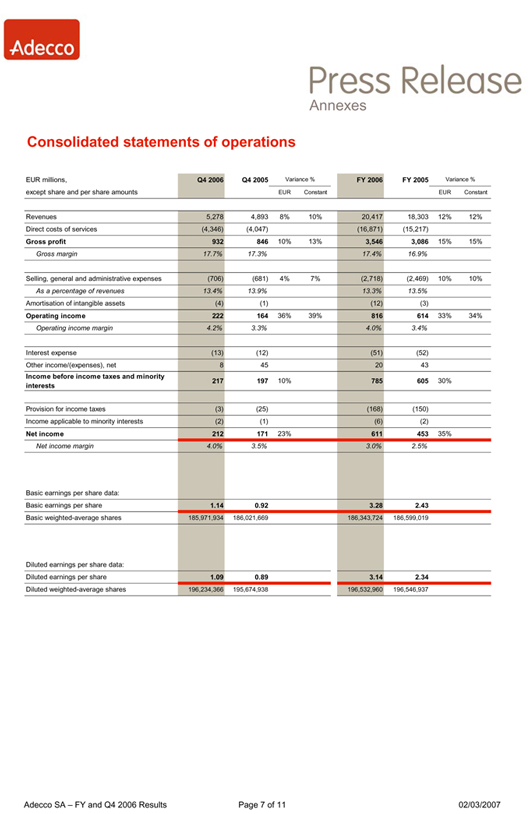
Consolidated statements of operations
EUR millions, except share and per share amounts | Q4 2006 | Q4 2005 | Variance % | FY 2006 | FY 2005 | Variance % | ||||||||||||||||||
EUR | Constant | EUR | Constant | |||||||||||||||||||||
Revenues | 5,278 |
| 4,893 |
| 8 | % | 10 | % | 20,417 |
| 18,303 |
| 12 | % | 12 | % | ||||||||
Direct costs of services | (4,346 | ) | (4,047 | ) | (16,871 | ) | (15,217 | ) | ||||||||||||||||
Gross profit | 932 |
| 846 |
| 10 | % | 13 | % | 3,546 |
| 3,086 |
| 15 | % | 15 | % | ||||||||
Gross margin | 17.7 | % | 17.3 | % | 17.4 | % | 16.9 | % | ||||||||||||||||
Selling, general and administrative expenses | (706 | ) | (681 | ) | 4 | % | 7 | % | (2,718 | ) | (2,469 | ) | 10 | % | 10 | % | ||||||||
As a percentage of revenues | 13.4 | % | 13.9 | % | 13.3 | % | 13.5 | % | ||||||||||||||||
Amortisation of intangible assets | (4 | ) | (1 | ) | (12 | ) | (3 | ) | ||||||||||||||||
Operating income | 222 |
| 164 |
| 36 | % | 39 | % | 816 |
| 614 |
| 33 | % | 34 | % | ||||||||
Operating income margin | 4.2 | % | 3.3 | % | 4.0 | % | 3.4 | % | ||||||||||||||||
Interest expense | (13 | ) | (12 | ) | (51 | ) | (52 | ) | ||||||||||||||||
Other income/(expenses), net | 8 |
| 45 |
| 20 |
| 43 |
| ||||||||||||||||
Income before income taxes and minority interests | 217 |
| 197 |
| 10 | % | 785 |
| 605 |
| 30 | % | ||||||||||||
Provision for income taxes | (3 | ) | (25 | ) | (168 | ) | (150 | ) | ||||||||||||||||
Income applicable to minority interests | (2 | ) | (1 | ) | (6 | ) | (2 | ) | ||||||||||||||||
Net income | 212 |
| 171 |
| 23 | % | 611 |
| 453 |
| 35 | % | ||||||||||||
Net income margin | 4.0 | % | 3.5 | % | 3.0 | % | 2.5 | % | ||||||||||||||||
Basic earnings per share data: | ||||||||||||||||||||||||
Basic earnings per share | 1.14 |
| 0.92 |
| 3.28 |
| 2.43 |
| ||||||||||||||||
Basic weighted-average shares | 185,971,934 |
| 186,021,669 |
| 186,343,724 |
| 186,599,019 |
| ||||||||||||||||
Diluted earnings per share data: | ||||||||||||||||||||||||
Diluted earnings per share | 1.09 |
| 0.89 |
| 3.14 |
| 2.34 |
| ||||||||||||||||
Diluted weighted-average shares | 196,234,366 |
| 195,674,938 |
| 196,532,960 |
| 196,546,937 |
| ||||||||||||||||
Adecco SA – FY and Q4 2006 Results | Page 7 of 11 | 02/03/2007 |
Annexes
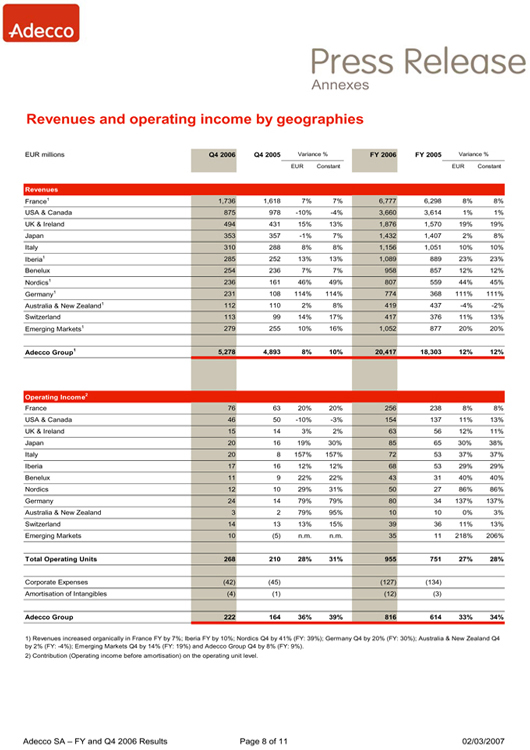
Revenues and operating income by geographies
EUR millions | Q4 2006 | Q4 2005 | Variance % | FY 2006 | FY 2005 | Variance % | ||||||||||||||||||
EUR | Constant | EUR | Constant | |||||||||||||||||||||
Revenues | ||||||||||||||||||||||||
France1 | 1,736 |
| 1,618 |
| 7 | % | 7 | % | 6,777 |
| 6,298 |
| 8 | % | 8 | % | ||||||||
USA & Canada | 875 |
| 978 |
| -10 | % | -4 | % | 3,660 |
| 3,614 |
| 1 | % | 1 | % | ||||||||
UK & Ireland | 494 |
| 431 |
| 15 | % | 13 | % | 1,876 |
| 1,570 |
| 19 | % | 19 | % | ||||||||
Japan | 353 |
| 357 |
| -1 | % | 7 | % | 1,432 |
| 1,407 |
| 2 | % | 8 | % | ||||||||
Italy | 310 |
| 288 |
| 8 | % | 8 | % | 1,156 |
| 1,051 |
| 10 | % | 10 | % | ||||||||
Iberia1 | 285 |
| 252 |
| 13 | % | 13 | % | 1,089 |
| 889 |
| 23 | % | 23 | % | ||||||||
Benelux | 254 |
| 236 |
| 7 | % | 7 | % | 958 |
| 857 |
| 12 | % | 12 | % | ||||||||
Nordics1 | 236 |
| 161 |
| 46 | % | 49 | % | 807 |
| 559 |
| 44 | % | 45 | % | ||||||||
Germany1 | 231 |
| 108 |
| 114 | % | 114 | % | 774 |
| 368 |
| 111 | % | 111 | % | ||||||||
Australia & New Zealand1 | 112 |
| 110 |
| 2 | % | 8 | % | 419 |
| 437 |
| -4 | % | -2 | % | ||||||||
Switzerland | 113 |
| 99 |
| 14 | % | 17 | % | 417 |
| 376 |
| 11 | % | 13 | % | ||||||||
Emerging Markets1 | 279 |
| 255 |
| 10 | % | 16 | % | 1,052 |
| 877 |
| 20 | % | 20 | % | ||||||||
Adecco Group1 | 5,278 |
| 4,893 |
| 8 | % | 10 | % | 20,417 |
| 18,303 |
| 12 | % | 12 | % | ||||||||
Operating Income2 | ||||||||||||||||||||||||
France | 76 |
| 63 |
| 20 | % | 20 | % | 256 |
| 238 |
| 8 | % | 8 | % | ||||||||
USA & Canada | 46 |
| 50 |
| -10 | % | -3 | % | 154 |
| 137 |
| 11 | % | 13 | % | ||||||||
UK & Ireland | 15 |
| 14 |
| 3 | % | 2 | % | 63 |
| 56 |
| 12 | % | 11 | % | ||||||||
Japan | 20 |
| 16 |
| 19 | % | 30 | % | 85 |
| 65 |
| 30 | % | 38 | % | ||||||||
Italy | 20 |
| 8 |
| 157 | % | 157 | % | 72 |
| 53 |
| 37 | % | 37 | % | ||||||||
Iberia | 17 |
| 16 |
| 12 | % | 12 | % | 68 |
| 53 |
| 29 | % | 29 | % | ||||||||
Benelux | 11 |
| 9 |
| 22 | % | 22 | % | 43 |
| 31 |
| 40 | % | 40 | % | ||||||||
Nordics | 12 |
| 10 |
| 29 | % | 31 | % | 50 |
| 27 |
| 86 | % | 86 | % | ||||||||
Germany | 24 |
| 14 |
| 79 | % | 79 | % | 80 |
| 34 |
| 137 | % | 137 | % | ||||||||
Australia & New Zealand | 3 |
| 2 |
| 79 | % | 95 | % | 10 |
| 10 |
| 0 | % | 3 | % | ||||||||
Switzerland | 14 |
| 13 |
| 13 | % | 15 | % | 39 |
| 36 |
| 11 | % | 13 | % | ||||||||
Emerging Markets | 10 |
| (5 | ) | n.m. |
| n.m. |
| 35 |
| 11 |
| 218 | % | 206 | % | ||||||||
Total Operating Units | 268 |
| 210 |
| 28 | % | 31 | % | 955 |
| 751 |
| 27 | % | 28 | % | ||||||||
Corporate Expenses | (42 | ) | (45 | ) | (127 | ) | (134 | ) | ||||||||||||||||
Amortisation of Intangibles | (4 | ) | (1 | ) | (12 | ) | (3 | ) | ||||||||||||||||
Adecco Group | 222 |
| 164 |
| 36 | % | 39 | % | 816 |
| 614 |
| 33 | % | 34 | % | ||||||||
1) Revenues increased organically in France FY by 7%; Iberia FY by 10%; Nordics Q4 by 41% (FY: 39%); Germany Q4 by 20% (FY: 30%); Australia & New Zealand Q4 by 2% (FY: -4%); Emerging Markets Q4 by 14% (FY: 19%) and Adecco Group Q4 by 8% (FY: 9%).
2) Contribution (Operating income before amortisation) on the operating unit level.
Adecco SA – FY and Q4 2006 Results | Page 8 of 11 | 02/03/2007 |
Annexes
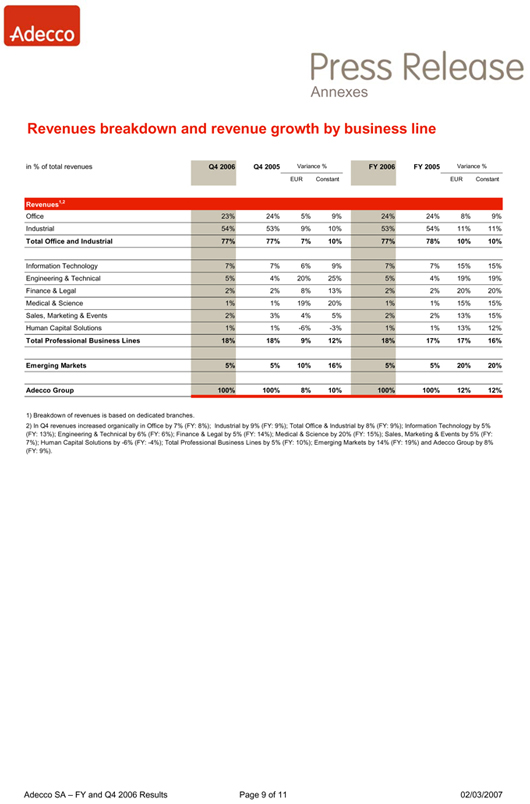
Revenues breakdown and revenue growth by business line
in % of total revenues | Q4 2006 | Q4 2005 | Variance % | FY 2006 | FY 2005 | Variance % | ||||||||||||||||||
EUR | Constant | EUR | Constant | |||||||||||||||||||||
Revenues1,2 | ||||||||||||||||||||||||
Office | 23 | % | 24 | % | 5 | % | 9 | % | 24 | % | 24 | % | 8 | % | 9 | % | ||||||||
Industrial | 54 | % | 53 | % | 9 | % | 10 | % | 53 | % | 54 | % | 11 | % | 11 | % | ||||||||
Total Office and Industrial | 77 | % | 77 | % | 7 | % | 10 | % | 77 | % | 78 | % | 10 | % | 10 | % | ||||||||
Information Technology | 7 | % | 7 | % | 6 | % | 9 | % | 7 | % | 7 | % | 15 | % | 15 | % | ||||||||
Engineering & Technical | 5 | % | 4 | % | 20 | % | 25 | % | 5 | % | 4 | % | 19 | % | 19 | % | ||||||||
Finance & Legal | 2 | % | 2 | % | 8 | % | 13 | % | 2 | % | 2 | % | 20 | % | 20 | % | ||||||||
Medical & Science | 1 | % | 1 | % | 19 | % | 20 | % | 1 | % | 1 | % | 15 | % | 15 | % | ||||||||
Sales, Marketing & Events | 2 | % | 3 | % | 4 | % | 5 | % | 2 | % | 2 | % | 13 | % | 15 | % | ||||||||
Human Capital Solutions | 1 | % | 1 | % | -6 | % | -3 | % | 1 | % | 1 | % | 13 | % | 12 | % | ||||||||
Total Professional Business Lines | 18 | % | 18 | % | 9 | % | 12 | % | 18 | % | 17 | % | 17 | % | 16 | % | ||||||||
Emerging Markets | 5 | % | 5 | % | 10 | % | 16 | % | 5 | % | 5 | % | 20 | % | 20 | % | ||||||||
Adecco Group | 100 | % | 100 | % | 8 | % | 10 | % | 100 | % | 100 | % | 12 | % | 12 | % | ||||||||
1) Breakdown of revenues is based on dedicated branches.
2) In Q4 revenues increased organically in Office by 7% (FY: 8%); Industrial by 9% (FY: 9%); Total Office & Industrial by 8% (FY: 9%); Information Technology by 5% (FY: 13%); Engineering & Technical by 6% (FY: 6%); Finance & Legal by 5% (FY: 14%); Medical & Science by 20% (FY: 15%); Sales, Marketing & Events by 5% (FY: 7%); Human Capital Solutions by -6% (FY: -4%); Total Professional Business Lines by 5% (FY: 10%); Emerging Markets by 14% (FY: 19%) and Adecco Group by 8% (FY: 9%).
Adecco SA – FY and Q4 2006 Results | Page 9 of 11 | 02/03/2007 |
Annexes
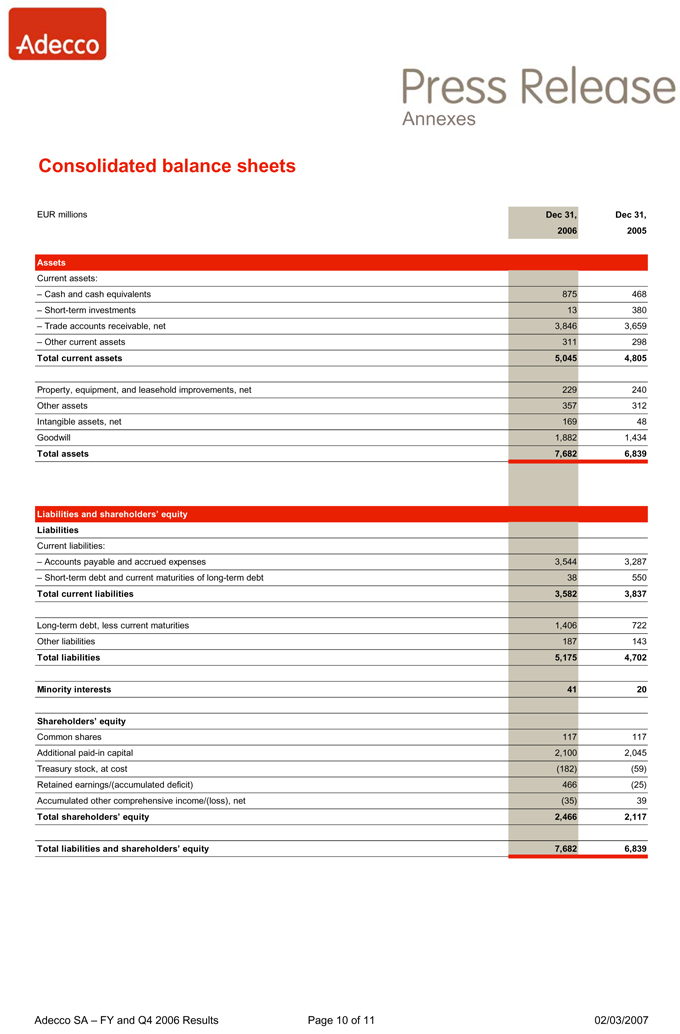
Consolidated balance sheets
EUR millions | Dec 31, | Dec 31, | ||||
Assets | ||||||
Current assets: | ||||||
– Cash and cash equivalents | 875 |
| 468 |
| ||
– Short-term investments | 13 |
| 380 |
| ||
– Trade accounts receivable, net | 3,846 |
| 3,659 |
| ||
– Other current assets | 311 |
| 298 |
| ||
Total current assets | 5,045 |
| 4,805 |
| ||
Property, equipment, and leasehold improvements, net | 229 |
| 240 |
| ||
Other assets | 357 |
| 312 |
| ||
Intangible assets, net | 169 |
| 48 |
| ||
Goodwill | 1,882 |
| 1,434 |
| ||
Total assets | 7,682 |
| 6,839 |
| ||
Liabilities and shareholders’ equity | ||||||
Liabilities | ||||||
Current liabilities: | ||||||
– Accounts payable and accrued expenses | 3,544 |
| 3,287 |
| ||
– Short-term debt and current maturities of long-term debt | 38 |
| 550 |
| ||
Total current liabilities | 3,582 |
| 3,837 |
| ||
Long-term debt, less current maturities | 1,406 |
| 722 |
| ||
Other liabilities | 187 |
| 143 |
| ||
Total liabilities | 5,175 |
| 4,702 |
| ||
Minority interests | 41 |
| 20 |
| ||
Shareholders’ equity | ||||||
Common shares | 117 |
| 117 |
| ||
Additional paid-in capital | 2,100 |
| 2,045 |
| ||
Treasury stock, at cost | (182 | ) | (59 | ) | ||
Retained earnings/(accumulated deficit) | 466 |
| (25 | ) | ||
Accumulated other comprehensive income/(loss), net | (35 | ) | 39 |
| ||
Total shareholders’ equity | 2,466 |
| 2,117 |
| ||
Total liabilities and shareholders’ equity | 7,682 |
| 6,839 |
|
Adecco SA – FY and Q4 2006 Results | Page 10 of 11 | 02/03/2007 |
Annexes
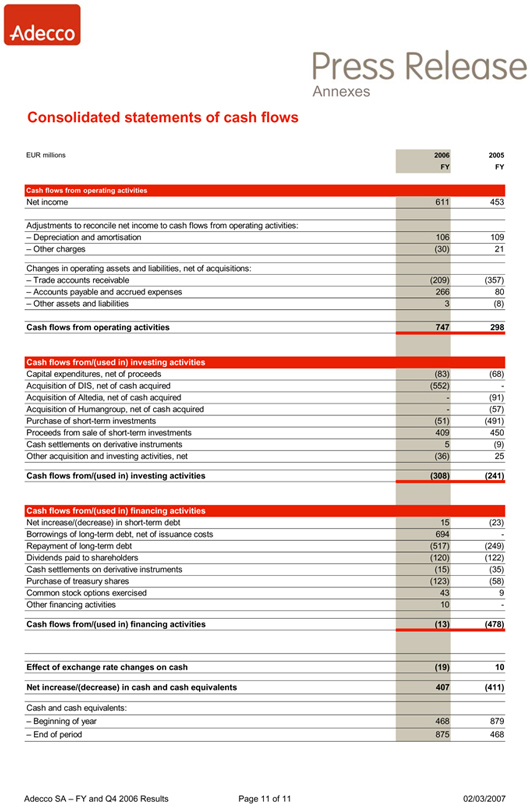
Consolidated statements of cash flows
EUR millions | 2006 | 2005 | ||||
Cash flows from operating activities | ||||||
Net income | 611 |
| 453 |
| ||
Adjustments to reconcile net income to cash flows from operating activities: | ||||||
– Depreciation and amortisation | 106 |
| 109 |
| ||
– Other charges | (30 | ) | 21 |
| ||
Changes in operating assets and liabilities, net of acquisitions: | ||||||
– Trade accounts receivable | (209 | ) | (357 | ) | ||
– Accounts payable and accrued expenses | 266 |
| 80 |
| ||
– Other assets and liabilities | 3 |
| (8 | ) | ||
Cash flows from operating activities | 747 |
| 298 |
| ||
Cash flows from/(used in) investing activities | ||||||
Capital expenditures, net of proceeds | (83 | ) | (68 | ) | ||
Acquisition of DIS, net of cash acquired | (552 | ) | — |
| ||
Acquisition of Altedia, net of cash acquired | — |
| (91 | ) | ||
Acquisition of Humangroup, net of cash acquired | — |
| (57 | ) | ||
Purchase of short-term investments | (51 | ) | (491 | ) | ||
Proceeds from sale of short-term investments | 409 |
| 450 |
| ||
Cash settlements on derivative instruments | 5 |
| (9 | ) | ||
Other acquisition and investing activities, net | (36 | ) | 25 |
| ||
Cash flows from/(used in) investing activities | (308 | ) | (241 | ) | ||
Cash flows from/(used in) financing activities | ||||||
Net increase/(decrease) in short-term debt | 15 |
| (23 | ) | ||
Borrowings of long-term debt, net of issuance costs | 694 |
| — |
| ||
Repayment of long-term debt | (517 | ) | (249 | ) | ||
Dividends paid to shareholders | (120 | ) | (122 | ) | ||
Cash settlements on derivative instruments | (15 | ) | (35 | ) | ||
Purchase of treasury shares | (123 | ) | (58 | ) | ||
Common stock options exercised | 43 |
| 9 |
| ||
Other financing activities | 10 |
| — |
| ||
Cash flows from/(used in) financing activities | (13 | ) | (478 | ) | ||
Effect of exchange rate changes on cash | (19 | ) | 10 |
| ||
Net increase/(decrease) in cash and cash equivalents | 407 |
| (411 | ) | ||
Cash and cash equivalents: | ||||||
– Beginning of year | 468 |
| 879 |
| ||
– End of period | 875 |
| 468 |
|
Adecco SA – FY and Q4 2006 Results | Page 11 of 11 | 02/03/2007 |
SIGNATURES
Pursuant to the requirements of the Securities Exchange Act of 1934, the registrant has duly caused this report to be signed on its behalf by the undersigned, thereunto duly authorized.
| ADECCO SA | ||||||||
| (Registrant) | ||||||||
Dated: | March 2, 2007 | By: | /s/ Dominik de Daniel | |||||
| Dominik de Daniel | ||||||||
| Chief Financial Officer | ||||||||
Dated: | March 2, 2007 | By: | /s/ Hans R. Brütsch | |||||
| Hans R. Brütsch | ||||||||
| Corporate Secretary | ||||||||