Investor Presentation Growing Advanced Alloys May 2018 NASDAQ: USAP Exhibit 99.2 univstainless.com |
© Copyright 2018 Universal Stainless & Alloy Products, Inc. All Rights Reserved. Forward Looking Statement Except for historical information contained herein, the statements in this presentation are forward-looking statements that are made pursuant to the “safe harbor” provision of the Private Securities Litigation Reform Act of 1995. Forward-looking statements involve known and unknown risks and uncertainties that may cause the Company's actual results in future periods to differ materially from forecasted results. Those risks include, among others, the concentrated nature of the Company’s customer base to date and the Company’s dependence on its significant customers; the receipt, pricing and timing of future customer orders; changes in product mix; the limited number of raw material and energy suppliers and significant fluctuations that may occur in raw material and energy prices; risks related to property, plant and equipment, including the Company’s reliance on the continuing operation of critical manufacturing equipment; risks associated with labor matters; the Company’s ongoing requirement for continued compliance with laws and regulations, including applicable safety and environmental regulations; the ultimate outcome of the Company’s current and future litigation and matters; risks related to acquisitions that the Company may make; and the impact of various economic, credit and market risk uncertainties. Many of these factors are not within the Company’s control and involve known and unknown risks and uncertainties that may cause the Company’s actual results in future periods to be materially different from any future performance suggested herein. Any unfavorable change in the foregoing or other factors could have a material adverse effect on the Company’s business, financial condition and results of operations. Further, the Company operates in an industry sector where securities values may be volatile and may be influenced by economic and other factors beyond the Company’s control. Certain of these risks and other risks are described in the Company's filings with the Securities and Exchange Commission (SEC) over the last 12 months, copies of which are available from the SEC or may be obtained upon request from the Company. Non-GAAP Financial Measures Some of the information included in this presentation is derived from the Company’s consolidated financial information but is not presented in the Company’s financial statements prepared in accordance with U.S. Generally Accepted Accounting Principles (GAAP). Some of this data is considered “non-GAAP financial measures” under SEC rules. These non-GAAP financial measures supplement our GAAP disclosures and should not be considered an alternative to the GAAP measure. Reconciliation to the most directly comparable GAAP financial measure is provided. 2 |

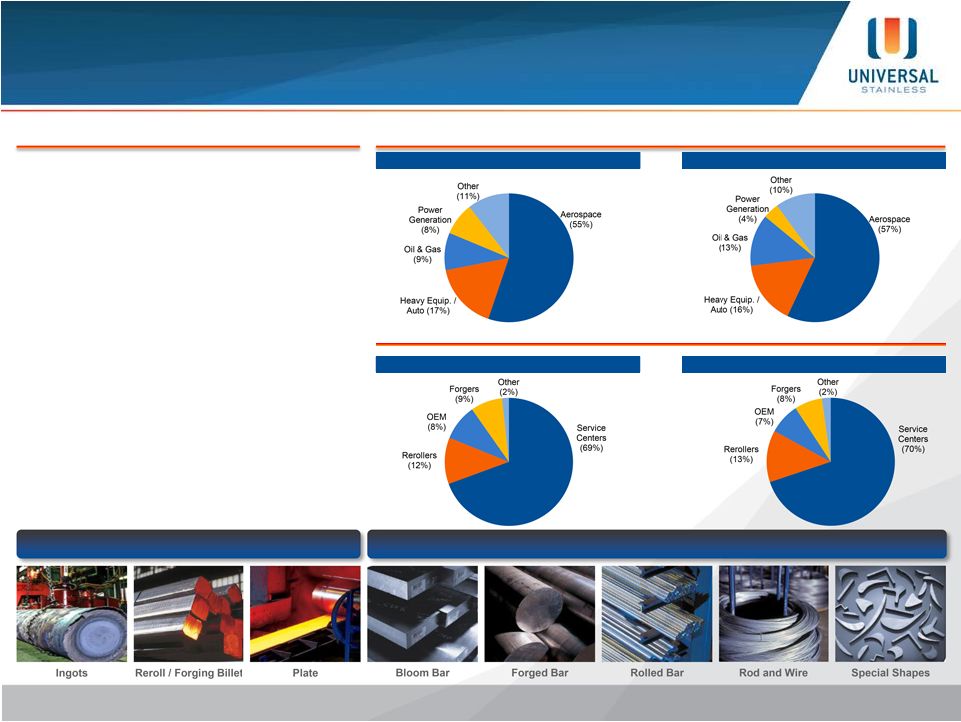
Universal Stainless At a Glance • Leading manufacturer of specialty steel products focused on creating sustainable value for all stakeholders • Fully integrated and geographically contiguous operations designed to ensure quality and consistency of products to meet customer demands • Products are specifically tailored to address the aerospace, heavy equipment / auto, power generation and oil & gas markets through service centers, OEMs, forgers and rerollers 3 Overview © Copyright 2018 Universal Stainless & Alloy Products, Inc. All Rights Reserved. Semi-Finished Products Semi-Finished Products Finished Products Finished Products Sales by End Market Q1 2018 2017 2017 Q1 2018 Sales by Customer Type |
Company History — Transformational Acquisitions; Expansion in Premium Alloys Unfolding 4 Acquired Bridgeville, PA Facility • Company was founded in conjunction with the acquisition of the Bridgeville Facility • Capabilities included melting and rolling semi-finished specialty steel products Acquired Titusville, PA Facility • Expanded production capability for aerospace and power generation applications Acquired Dunkirk, NY Facility • Purchase of a finishing facility transformed the Company into a fully integrated manufacturer of specialty steel products Acquired North Jackson, OH Facility • Construction-stage facility with state-of-the-art radial forge, Vacuum Induction Melting (VIM) furnace, Vacuum Arc Remelting (VAR) furnaces and other heat treating / finishing equipment — now fully operational • Fast-tracks the Company’s move toward technologically advanced alloys for aerospace, power generation and oil & gas markets; accelerates profit growth Poised for Growth • USAP continues to grow premium alloy sales and is focused on margin expansion through process integration and improving product mix • Significant additional available capacity to deliver growth © Copyright 2018 Universal Stainless & Alloy Products, Inc. All Rights Reserved. |
Strategic Objectives 5 Grow our portfolio of technologically advanced, higher-margin alloys Increase and broaden penetration in key, growing end markets Optimize Universal’s integrated manufacturing system Targeted capital investment Relentless focus on operational improvement Expand targeted customer approvals for new products 1 5 6 2 3 4 © Copyright 2018 Universal Stainless & Alloy Products, Inc. All Rights Reserved. |
Increase USAP Margins • Improve cycle times, yields company-wide • Reduce 3rd party costs with internal forge & finish capability • Eliminate capacity constraints in re-melting • Move up value chain with Vacuum Induction Melting (VIM) of technologically advanced premium metals • Expand product and tolling reach with advanced radial hydraulic forging technology Expand Addressable Markets • Selected premium alloy markets in aerospace, power generation, oil & gas & high end manufacturing • Larger and longer squares, rounds, bars and custom shapes • International markets Excel in Industry Lead-times and Customer Service Acquisition of North Jackson — Fast Track Key Strategic Initiatives 6 New Customer Approvals Received 2016 — 2017: 38 New Products Under Development as of the end of Q1 2018: 14 Premium Alloys as Percentage Sales: New Products Developed January 2017 through Q1 2018: 14 Q1 2018 2017 13.5% 18.6% 1 2 3 © Copyright 2018 Universal Stainless & Alloy Products, Inc. All Rights Reserved. |
Moving Toward Higher-Value Alloys 7 1. Premium alloys represent all Vacuum Induction Melted (VIM) products. Acquisition of North Jackson in 2011 • State-of-the-art hydraulic radial forge; VIM furnace • Added key capabilities in aerospace, power generation and oil & gas applications o Successful market entry into aerospace parts, landing gear, helicopter rotor masts and gears, and drill shafts for oil & gas applications Continue to Penetrate Key End Markets • Opportunity for continued growth in aerospace due to a more comprehensive product offering • Oil & gas presents an upside opportunity given market recovery • Growth in high end industrial applications and infrastructure Premium Alloys to Drive Margin Accretion • Continued growth in higher-value premium alloy sales expected to be accretive to gross margin Strong Momentum for Premium Alloys • Accelerated sales growth for Q1 2018 premium alloys, which grew 83.2% compared with Q1 2017, contributed to overall sales growth © Copyright 2018 Universal Stainless & Alloy Products, Inc. All Rights Reserved. |
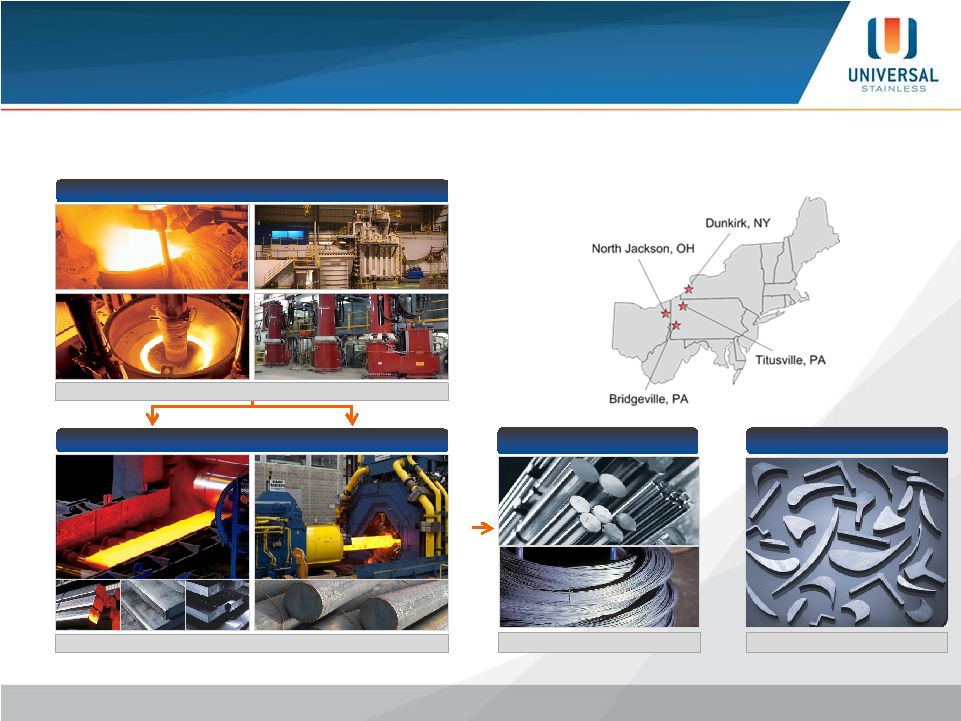
© Copyright 2018 Universal Stainless & Alloy Products, Inc. All Rights Reserved. Integrated Manufacturing Process 8 *AOD: Argon Oxygen Decarburization VIM: Vacuum Induction Melting VAR: Vacuum-Arc Remelting ESR: Electro-Slag Remelting VIM AOD VAR ESR Primary Melt / Remelt* Primary Melt / Remelt* Rotary Forge Large Diameter Forged Bar Rolling Mill Reroll / Forging Billet Plate Bloom Bar Bridgeville / North Jackson / Dunkirk Hot Working Hot Working Bridgeville / North Jackson / Titusville Bar Rod & Wire Shapes Dunkirk / North Jackson Titusville Finishing Finishing Specialty Shapes Specialty Shapes • Delivering a broad set of product offerings starting from either VIM or AOD melt capability • Consistent operating model; integrated quality systems; sharing best practices |
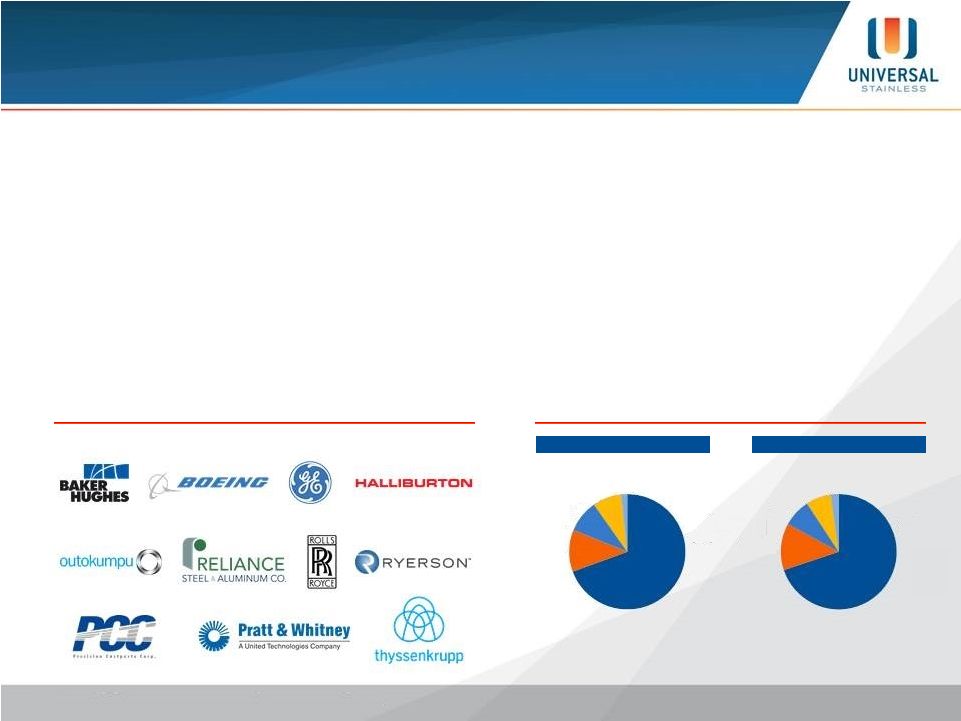
Business Model Provides Unique Leverage to Market Improvements 9 Unique Leverage to Market Recoveries • A majority of sales are made to service centers, forgers and re-rollers • Higher concentration of service center sales translates into greater benefit in recovering markets Representative Customers — Direct and Indirect Sales by Customer Type Delivering Growth in 2018 • Aerospace market is strong; increasing optimism among oil & gas customers; tool steel plate market remains healthy • Q1 2018 sales of $63.7 million up 30.4% from Q1 2017 • Q1 2018 backlog of $90.6 million, up 16.7% sequentially, and up 58.8% from Q1 2017 o Highest backlog levels since Q2 2012 • Bookings at the highest level since Q1 2012 2017 Q1 2018 Service Centers (69%) Rerollers (12%) OEM (8%) Forgers (9%) Other (2%) Rerollers (13%) OEM (7%) Forgers (8%) Other (2%) Service Centers (70%) © Copyright 2018 Universal Stainless & Alloy Products, Inc. All Rights Reserved. |
End Markets — Overview 10 Aerospace Aerospace • Airbus / Boeing record backlog equal to ~8 years of production 1 • Passenger traffic growth rate at record levels, driving aftermarket demand • Industry and our customers are healthy • Expanding OEM participation • Light vehicle production levels are expected to remain strong • Off-road equipment sector in strong recovery • Tool steel requirements expected to continue shift to domestic supply • Natural gas continues to supplant coal as a source of electricity generation • Solid maintenance business on higher utilization • Short term weakness in new turbine market as evidenced by recent GE & Siemens announcements Power Generation Power Generation • Increasing customer optimism in improving market with stronger oil prices ($60+ per barrel), growing US rig count and better international outlook • Uptick in oil & gas demand represents an upside opportunity Oil & Gas Oil & Gas Sales by Customer Type Q1 2018 Source: Wall Street research, Boeing, Airbus. 1. Years of production is calculated by adding the total backlog for Boeing and Airbus and dividing by the cumulative average annual production for 2018E-2020E © Copyright 2018 Universal Stainless & Alloy Products, Inc. All Rights Reserved. Heavy Equipment / Auto |
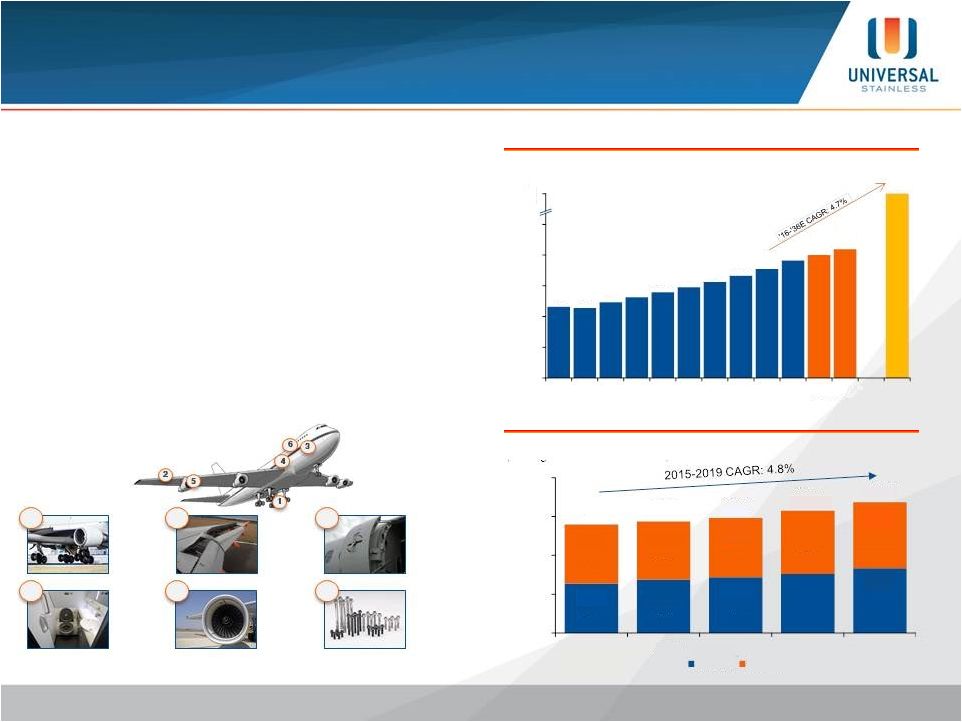
End Markets — Aerospace 11 Source: Wall Street research, IATA, Boeing Current Market Outlook 2017-2036. 1. Revenue per Kilometers figures are estimates based on historical figures and forecasted RPK growth rates. Robust Aircraft Delivery Schedule The USAP Opportunity • Aircraft production growth rates, combined with new customer approvals, are driving increased demand for premium alloys from USAP • USAP’s alloys are used across a variety of aircraft applications, from the airframe to the engines Aerospace Market Remains Robust • Airbus and Boeing delivery schedules expected to continue recent growth — combined backlog is equal to ~8 years of production • Passenger traffic remains strong, growing above expectations in 2017, which is driving strong aftermarket demand for specialty metals • Defense spending supports specialty metal demand Illustrative Product Applications in Aero Passenger Traffic Growth Remains Strong (RPK) 1 Landing Gear Hinges & Actuators Rings & Casings; Bearings Hydraulic Systems Forged Titanium Components Lavatory Flush Systems 1 1 2 2 3 3 4 4 5 5 6 6 635 688 718 761 833 762 748 763 813 850 1,397 1,436 1,481 1,574 1,683 0 500 1,000 1,500 2,000 2015 2016 2017 2018E 2019E Airbus Boeing (Boeing and Airbus Deliveries) 4.6 4.6 4.9 5.3 5.6 5.9 6.2 6.7 7.1 7.6 8.0 8.4 17.8 0.0 2.0 4.0 6.0 8.0 10.0 '08 '09 '10 '11 '12 '13 '14 '15 '16 '17 '18E '19E '36E (RPKs in trillions) © Copyright 2018 Universal Stainless & Alloy Products, Inc. All Rights Reserved. 18.0 |
U.S. Light Vehicle Population and Avg Vehicle Age End Markets — Heavy Equipment / Auto Source: Wall Street Research, U.S. Bureau of Economic Analysis, Light Weight Vehicle Sales retrieved from Federal Reserve Bank of St. Louis as of December 2017. Robust U.S. Light Vehicle Sales The USAP Opportunity • While opportunity for tool steel is primarily driven by the auto sector, off-road / large vehicles also require significant tooling • Demand for tool steel is heavily correlated with cadence of new model introductions — new models require OEMs to re-tool factories • Higher unit production levels also drive demand, as re- tooling is required for existing models Positive Demand Dynamics for Tool Steel • New model introductions are expected to accelerate in the next few years, bolstering tool steel demand • Strong levels of North American light vehicle production FY 2017 at 17.2 million units; 16% greater than the ten year average production rate • Average age of light vehicles continues to increase. However, this is expected to plateau given anticipated ramp in future light vehicle sales • Significant recovery in off-road equipment sales in 2017 (i.e. Caterpillar) • Share capture from imported tool steel product 12 © Copyright 2018 Universal Stainless & Alloy Products, Inc. All Rights Reserved. |
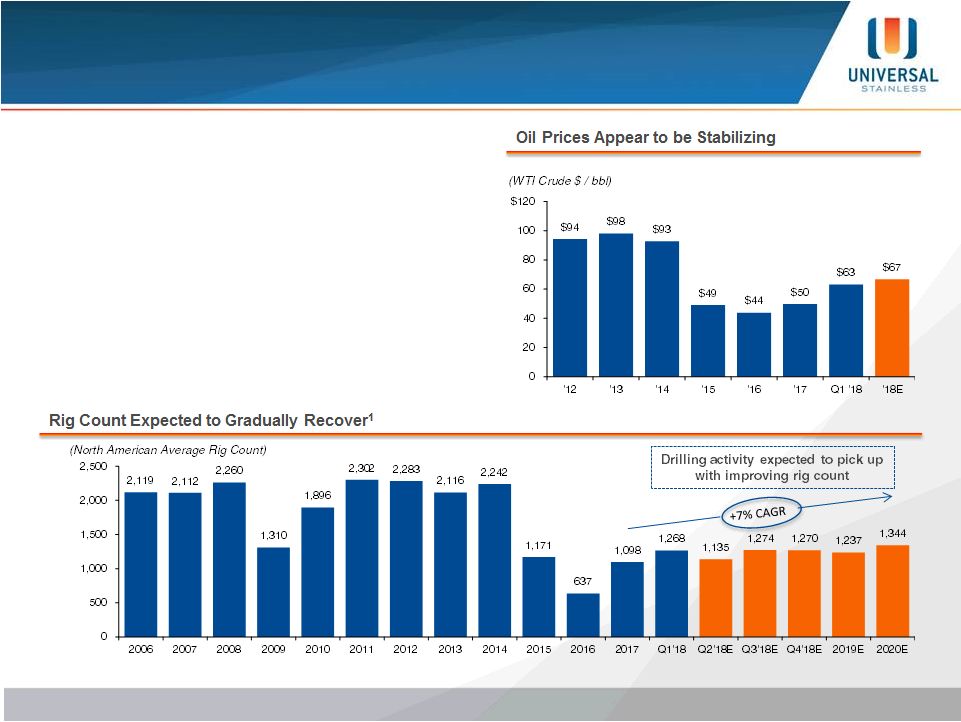
End Markets — Oil & Gas 13 The USAP Opportunity • Oil & gas sales have accounted for ~10% of revenue since 2013 — customer optimism continues to increase • Expanded North Jackson high-value product offering; positioned to seize opportunities in oil & gas market Oil & Gas Showing Signs of Recovery, but Remains Below 2014 Highs • Current oil prices in $60+/bbl range recently up ~50% since bottoming in 2016 • Firmer commodity prices are driving higher rig counts and drilling activity; year-end 2017 US rig count up 72.4% vs. PY Source: Wall Street research, Capital IQ, Baker Hughes, U.S. EIA and Bloomberg Estimates as of April 2018. 1. 2006-2016 Average Rig Count is the sum of the average weekly and monthly rig counts for the U.S. and Canada, respectively. 2017-2020E sourced through Wall Street research. © Copyright 2018 Universal Stainless & Alloy Products, Inc. All Rights Reserved. |
End Markets — Power Generation 14 Source: Capital IQ, U.S. Energy Information Administration Annual Energy Outlook – Reference Case (2017), Bloomberg Estimates as of April 2018. The USAP Opportunity • Continued emphasis on increased efficiency and reduced emissions necessitate higher operating temperatures and therefore more advanced alloys • USAP’s specialty and premium alloys are used in critical gas-powered turbine components Shift Toward Natural Gas Power Generation • Natural gas continues to supplant coal as a leading fuel for electricity generation, led by demand from the industrial and electric power sectors • By 2040, natural gas is expected to account for nearly 40% of U.S. power generation • Current demand is driven primarily by maintenance business — upside potential from new turbine market in the long term © Copyright 2018 Universal Stainless & Alloy Products, Inc. All Rights Reserved. Natural Gas Prices Support Shift to Gas Turbines |
Universal Stainless — Advancing Our Position to Serve Clients and Achieve Profitable Growth Successful progress in strategy execution has strengthened operations, expanded product offerings Transformative acquisition of North Jackson expands addressable markets + moves up value chain in products Growing ability to capture aerospace, oil & gas, and power generation opportunities and better serve all end markets Commitment to responsible capital investment supported by solid operating cash flow and balance sheet Experienced management team relentlessly focused on operational improvement, customer service, profitable growth 15 © Copyright 2018 Universal Stainless & Alloy Products, Inc. All Rights Reserved. |
Financial Performance Review univstainless.com |
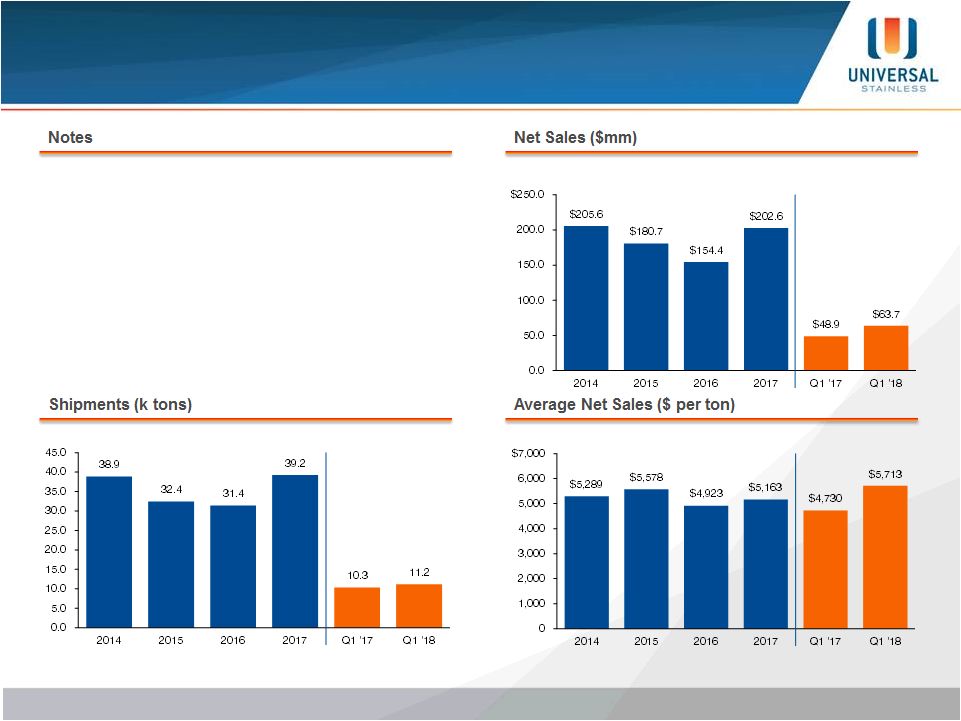
Historical Financial Performance 17 • Net sales increase of 30.4% for Q1 2018 driven by improvements in nearly all end markets compared with PY • Accelerated sales growth for Q1 2018 premium alloys, which grew 103.1% compared with Q1 2017, contributed to overall sales growth • Improved average dollar per ton shipped in FY 2017 was primarily a result of increased sales of higher value premium alloys © Copyright 2018 Universal Stainless & Alloy Products, Inc. All Rights Reserved. |
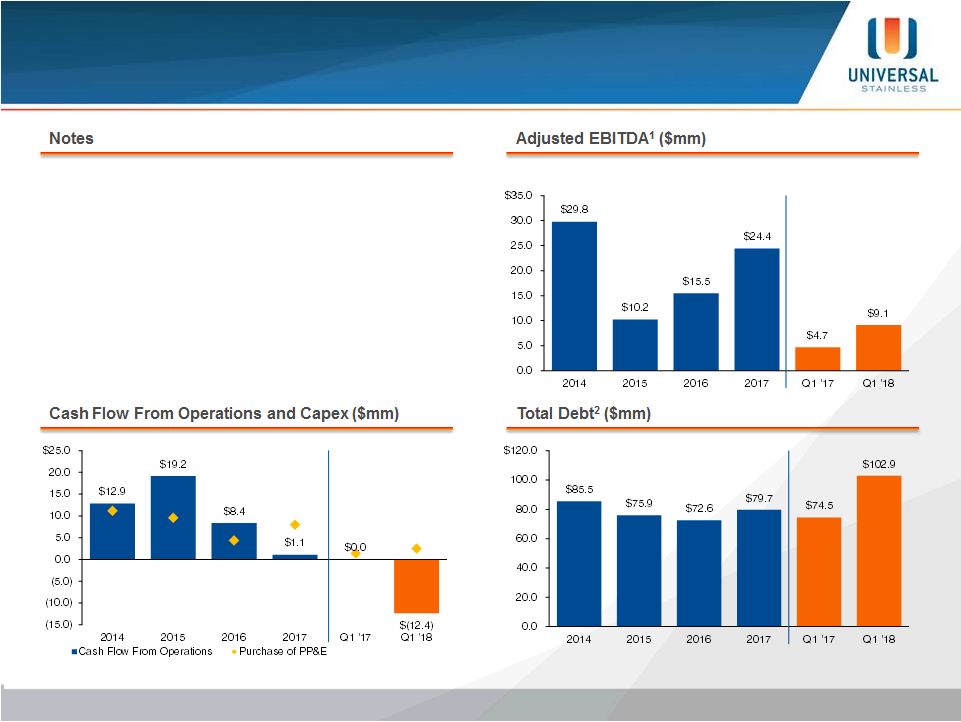
© Copyright 2018 Universal Stainless & Alloy Products, Inc. All Rights Reserved. Historical Financial Performance (Cont.) 18 • Increase in Q1 2018 EBITDA driven by top-line growth, operational productivity enhancements, improved operating leverage and favorable product mix • Capex remains focused on high-return manufacturing enhancements and maintenance projects • In Q1 2018 Cash Flow from Ops was impacted by an increase in working capital to support topline growth o Increased sales drove $8.6 million in Accounts Receivables o Inventory increased $3.8 million on increased backlog 1. See page 23 for reconciliation to GAAP Net Income. 2. Represents Long-Term Debt plus Current Portion of Long-Term Debt less Deferred Financing Costs. Q1 ’18 includes Long-Term NMTC Liability of $3.0m © Copyright 2018 Universal Stainless & Alloy Products, Inc. All Rights Reserved. |
Gross Margin % Commodity Price Per Pound Commodities & Gross Margin % 19 • Gross margin increase in recent quarters was primarily attributable to operational productivity enhancements, improved operating leverage combined with significant improvement in the alignment of customer surcharges and commodity input costs • Recent increases in core commodities resulted in improved alignment of input costs and customer surcharges • Gross margin for the full year of 2017 negatively impacted by temporarily higher maintenance and outsourcing costs, as well as impact of facility fires in second half of year Source: Internal Company Commodity Analysis. Misalignment of input costs and customer surcharges Low volumes / poor operating leverage - 0.02 0.04 0.06 0.08 0.10 0.12 0.14 0.16 0.18 $0.20 - 2 4 6 8 10 12 $14 Mar-16 Jul-16 Nov-16 Mar-17 Jul-17 Nov-17 Mar-18 Nickel (left) Moly (left) Iron Scrap (right) 15.6% 10.2% 10.5% -0.9% -2.8% 3.4% 10.6% 11.9% 9.1% 8.7% 13.6% 10.7% 12.3% 14.5% -5.0% 0.0% 5.0% 10.0% 15.0% 20.0% 2014 Q1 '15 Q2 '15 Q3 '15 Q4 '15 Q1 '16 Q2 '16 Q3 '16 Q4 '16 Q1 '17 Q2 '17 Q3 '17 Q4 '17 Q1 '18 © Copyright 2018 Universal Stainless & Alloy Products, Inc. All Rights Reserved. |
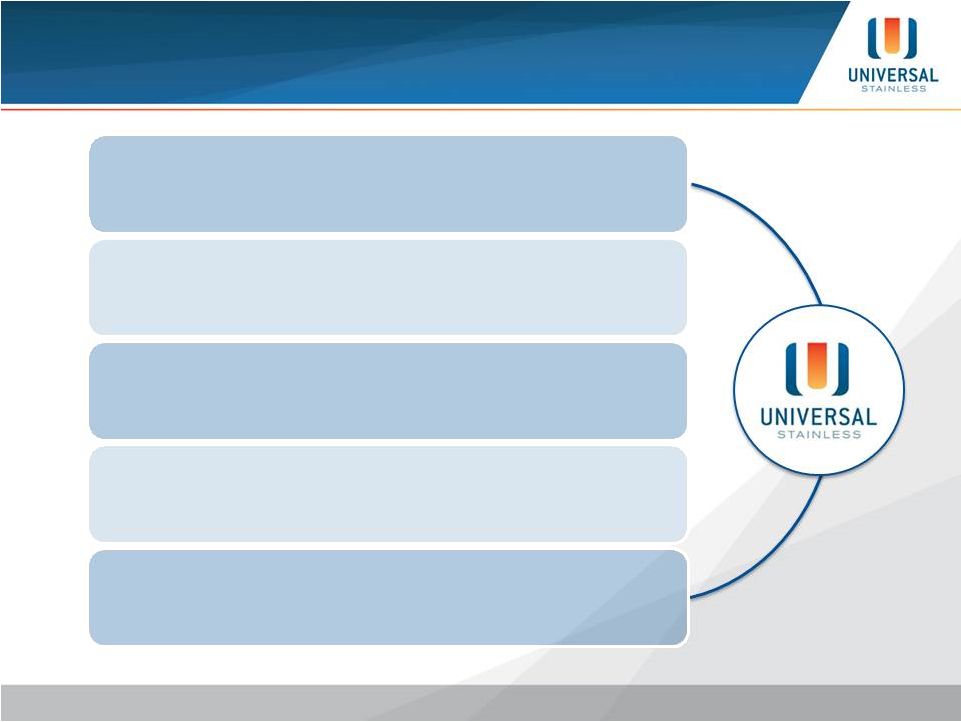
Universal Stainless — A Leader in Specialty Metals 20 Leading Manufacturer of Specialty Steel Products Fully Integrated, Geographically Contiguous Operations Improve Supply Chain Efficiency Transitioning to Higher-Value Premium Alloy Sales Well-Positioned to Further Penetrate Attractive End Markets Meaningful Leverage to Improving Market Environment Significant Financial Flexibility Provided by Recent Refinancing Experienced Management Team Relentlessly Focused on Operational Improvement, Customer Service and Safety © Copyright 2018 Universal Stainless & Alloy Products, Inc. All Rights Reserved. |
Appendix univstainless.com |
Adjusted EBITDA Reconciliation to GAAP Net Income 22 Adjusted EBITDA is not a recognized term under GAAP and does not purport to be an alternative to our net (loss) income determined in accordance with GAAP. We believe that Adjusted EBITDA provides information that is useful to investors because it allows for a more direct comparison of our performance for the period reported with our performance in prior periods. Because all companies do not use identical calculations, the presentation of our Adjusted EBITDA may not be comparable to similarly titled measures of other companies. ($ in thousands) 2010 2011 2012 2013 2014 2015 2016 2017 Q1 2017 Q1 2018 Net (loss) income $13,242 $18,122 $14,617 ($4,062) $4,050 ($20,672) ($5,347) $7,610 ($1,219) $2,125 Interest expense 435 1,265 2,284 2,598 3,035 2,324 3,659 4,022 939 1,142 Provision (benefit) for income taxes 6,821 10,356 6,334 (2,504) 3,149 (12,144) (3,526) (7,601) (262) 777 Depreciation and amortization 5,486 8,851 14,368 16,280 17,476 18,608 18,533 18,823 4,717 4,756 EBITDA $25,984 $38,594 $37,603 $12,312 $27,710 ($11,884) $13,319 $22,854 $4,175 $8,800 Adjustments to EBITDA Share-based compensation expense 1,819 1,580 1,649 1,827 2,082 1,865 1,405 1,564 534 326 Write-off of deferred financing costs - - - - - - 768 - - - Goodwill impairment - - - - - 20,268 - - - - Adjusted EBITDA $27,803 $40,174 $39,252 $14,139 $29,792 $10,249 $15,492 $24,418 $4,709 $9,126 © Copyright 2018 Universal Stainless & Alloy Products, Inc. All Rights Reserved. |
Questions & Answers Thank You! univstainless.com |