| | |
| UNITED STATES
SECURITIES AND EXCHANGE COMMISSION |
| | |
| CERTIFIED SHAREHOLDER REPORT OF REGISTERED
MANAGEMENT INVESTMENT COMPANIES
|
| | |
| Investment Company Act file number: | (811-07237) |
| | |
| Exact name of registrant as specified in charter: | Putnam Investment Funds |
| | |
| Address of principal executive offices: | One Post Office Square, Boston, Massachusetts 02109 |
| | |
| Name and address of agent for service: | Robert T. Burns, Vice President
One Post Office Square
Boston, Massachusetts 02109 |
| | |
| Copy to: | Bryan Chegwidden, Esq.
Ropes & Gray LLP
1211 Avenue of the Americas
New York, New York 10036 |
| | |
| Registrant's telephone number, including area code: | (617) 292-1000 |
| | |
| Date of fiscal year end: | April 30, 2018 |
| | |
| Date of reporting period: | May 1, 2017 — October 31, 2017 |
| | |
|
Item 1. Report to Stockholders: | |
| | |
| The following is a copy of the report transmitted to stockholders pursuant to Rule 30e-1 under the Investment Company Act of 1940: | |
Putnam
Capital Opportunities
Fund
Semiannual report
10 | 31 | 17
Consider these risks before investing: Investments in small and/or midsize companies increase the risk of greater price fluctuations. Growth stocks may be more susceptible to earnings disappointments, and value stocks may fail to rebound. Stock prices may fall or fail to rise over time for several reasons, including general financial market conditions, changing market perceptions, changes in government intervention in the financial markets, and factors related to a specific issuer or industry. These and other factors may lead to increased volatility and reduced liquidity in the fund’s portfolio holdings. You can lose money by investing in the fund.
Message from the Trustees
December 11, 2017
Dear Fellow Shareholder:
A fair amount of investor optimism has helped keep financial markets on a steady course throughout 2017. Global stock markets have generally made solid advances with low volatility, while bond market performance has been a bit more uneven. As we look ahead to the new year, it is important to note that a number of macroeconomic and geopolitical risks around the world could disrupt market momentum.
In all market environments, we believe investors should remain focused on time-tested strategies: maintain a well-diversified portfolio, think about long-term goals, and speak regularly with your financial advisor. In the following pages, you will find an overview of your fund’s performance for the reporting period as well as an outlook for the coming months.
We would like to take this opportunity to recognize and thank Robert J. Darretta, John A. Hill, and W. Thomas Stephens, who recently retired from your fund’s Board of Trustees. We are grateful for their years of work on behalf of you and your fellow shareholders, and we wish them well in their future endeavors.
Thank you for investing with Putnam.


Current performance may be lower or higher than the quoted past performance, which cannot guarantee future results. Share price, principal value, and return will fluctuate, and you may have a gain or a loss when you sell your shares. Performance of class A shares assumes reinvestment of distributions and does not account for taxes. Fund returns in the bar chart do not reflect a sales charge of 5.75%; had they, returns would have been lower. See below and pages 7–9 for additional performance information. For a portion of the periods, the fund had expense limitations, without which returns would have been lower. To obtain the most recent month-end performance, visit putnam.com.
* Returns for the six-month period are not annualized, but cumulative.
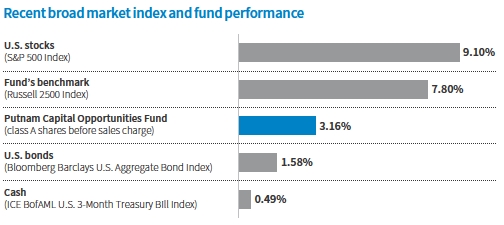
This comparison shows your fund’s performance in the context of broad market indexes for the six months ended 10/31/17. See above and pages 7–9 for additional fund performance information. Index descriptions can be found on pages 12–13.
|
| 2 Capital Opportunities Fund |
Interview with your fund’s portfolio manager

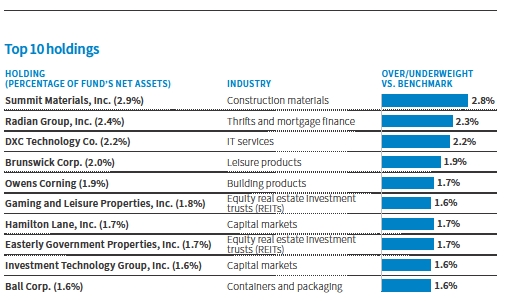
Sam is Co-Director of Equity Research. He holds an M.B.A. from Sloan School of Management, Massachusetts Institute of Technology, and a B.A. from the University of Pennsylvania. Sam joined Putnam in 2014 and has been in the investment industry since 2002.
In addition to Sam, your fund is managed by Co-Director of Equity Research Kathryn B. Lakin and Portfolio Managers Joshua H. Fillman, Elizabeth C. McGuire, and William C. Rives.
Sam, how was the market environment for U.S. small- and mid-cap stocks for the six-month reporting period?
U.S. stocks delivered solid performance during the period, continuing the rally that began in late 2016. The market strength was due in large part to expectations for broad pro-business reforms following the election of President Trump. Investors gradually became more realistic about the pace of pro-growth reform as attempts at passing health-care legislation stalled and it became apparent that changes to the tax code and financial regulations wouldn’t happen quickly. At the same time, market volatility remained very low, and investors seemingly took geopolitical tensions and extreme weather events in stride.
Small- and mid-cap stocks returned slightly less than large-cap stocks during the period, and investors displayed a notable preference for growth stocks, which is somewhat unusual considering the length of this bull market. From a sector perspective, within small- and mid-cap stocks, consumer staples, energy, and telecommunication services were relatively weak performers during the reporting period. But with consistent gross domestic product
|
| Capital Opportunities Fund 3 |

Allocations are shown as a percentage of the fund’s net assets as of 10/31/17. Cash and net other assets, if any, represent the market value weights of cash, derivatives, short-term securities, and other unclassified assets in the portfolio. Summary information may differ from the portfolio schedule included in the financial statements due to the inclusion of derivative securities, any interest accruals, the exclusion of as-of trades, if any, the use of different classifications of securities for presentation purposes, and rounding. Holdings and allocations may vary over time.
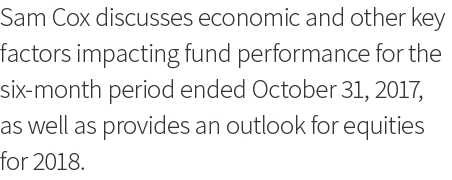
This table shows the fund’s top 10 holdings by percentage of the fund’s net assets as of 10/31/17. Short-term investments and derivatives, if any, are excluded. Holdings may vary over time.
| |
| 4 Capital Opportunities Fund |
[GDP] growth, continued strong employment, and muted inflation, investors remained positive about both the broader economy and the ability of companies to produce attractive earnings.
Your team has been managing the fund since March 31, 2017. Can you provide a recap of your investment approach?
We seek to bring a concentrated focus on fundamental research, with the goal of ensuring that stock selection is the most important aspect of the fund’s investment process. Each manager specializes in a specific sector and takes a bottom-up approach to selecting stocks. This means that our decisions are based primarily on characteristics of individual companies rather than on broader events, trends, or conditions in the economy or financial markets.
Since assuming management, we have significantly reduced the number of stocks in the fund’s portfolio. We believe this more concentrated approach allows us to invest in what we consider our best ideas. We are able to emphasize those companies about which we have the strongest conviction, and to give these stocks a greater weighting in the portfolio. By period-end, we had trimmed the fund’s holdings to approximately 100 stocks, and we will aim to further reduce the number of holdings over time.
How did the fund perform during the period?
It was a challenging period for the fund, which had a positive return of 3.16%, but underperformed its benchmark, the Russell 2500 Index, which returned 7.80%, as well as its Lipper peer group. Our stock selection within the consumer discretionary, health-care, and technology sectors was the leading cause of underperformance. Stock selection in the consumer staples and financials sectors produced better results.
Did derivative strategies have an impact on performance?
During the period, futures used to equitize cash contributed to positive fund performance.

What were some specific holdings that contributed to performance during the period?
The top contributor was Hamilton Lane, an asset manager that had a successful initial public offering [IPO] earlier in the year. We believed that the company’s business model was somewhat misunderstood and its growth potential was strong. Our thesis was rewarded with strong performance from the stock during the period.
Instructure, another top performer for the period, is an educational software company that contracts with major academic institutions. We believed that the company had an attractive business model and a rich product line that would enable it to attract business from competitors. Owens Corning, a manufacturer of building materials, was another top contributor, benefiting from a pickup in industrials sector growth, particularly in housing and construction.
What were some holdings that detracted from performance?
Another recent IPO, J. Jill, is a relatively small women’s specialty clothing retailer. Sales suffered when its fall fashion line failed to impress consumers. In addition, brick-and-mortar retail businesses such as J. Jill have been under pressure as competition intensifies from online retailers. By the close of the period, we had trimmed the fund’s position in this stock.
Pacira Pharmaceuticals specializes in non-opioid medical pain management, with drugs such as Exparel, a local analgesic. Sales for the company have been somewhat disappointing due to the complexities of how
|
| Capital Opportunities Fund 5 |
hospital departments purchase products. Despite its recent underperformance, the stock remained in the portfolio at the close of the period, and we are optimistic about the company’s developing partnerships with health-care providers.
The Medicines Company was another fund holding with weak performance in the period. The company specializes in antibiotics and is also developing a treatment for high cholesterol. The stock struggled as sales declined and speculation emerged about a sale of the company. We still own the stock and are positive about the firm’s prospects whether it is sold or not.
What is your outlook for the months ahead?
A potentially positive development for the smaller companies we target would be corporate tax reform. However, it is too early to determine what, if any, reforms will be enacted in the United States. As is always the case, there could be increased volatility in the markets if tax reform stalls or if geopolitical issues arise or worsen.
In the current environment, it has been more challenging to find attractively priced stocks of small and midsize companies with stable business models. However, as always, we remain focused on our active, research-centric approach, which, in our view, is especially beneficial when investing in smaller companies. Unlike large companies that are widely followed by Wall Street analysts, smaller companies tend to be underfollowed and underresearched. For this reason, we believe that our in-house team of industry experts, with years of experience covering small- and mid-cap stocks, can give the fund a competitive edge in finding opportunities.
Thank you, Sam, for your time and insights today.
The views expressed in this report are exclusively those of Putnam Management and are subject to change. They are not meant as investment advice.
Please note that the holdings discussed in this report may not have been held by the fund for the entire period. Portfolio composition is subject to review in accordance with the fund’s investment strategy and may vary in the future. Current and future portfolio holdings are subject to risk.
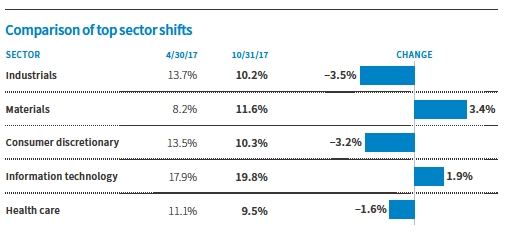
This chart shows the fund’s largest allocation shifts, by percentage, over the past six months. Allocations are shown as a percentage of the fund’s net assets. Current period summary information may differ from the portfolio schedule included in the financial statements due to the inclusion of derivative securities, any interest accruals, the exclusion of as-of trades, if any, the use of different classifications of securities for presentation purposes, and rounding. Holdings and allocations may vary over time.
|
| 6 Capital Opportunities Fund |
Your fund’s performance
This section shows your fund’s performance, price, and distribution information for periods ended October 31, 2017, the end of the first half of its current fiscal year. In accordance with regulatory requirements for mutual funds, we also include performance information as of the most recent calendar quarter-end and expense information taken from the fund’s current prospectus. Performance should always be considered in light of a fund’s investment strategy. Data represent past performance. Past performance does not guarantee future results. More recent returns may be less or more than those shown. Investment return and principal value will fluctuate, and you may have a gain or a loss when you sell your shares. Performance information does not reflect any deduction for taxes a shareholder may owe on fund distributions or on the redemption of fund shares. For the most recent month-end performance, please visit the Individual Investors section at putnam.com or call Putnam at 1-800-225-1581. Class R, R5, R6, and Y shares are not available to all investors. See the Terms and definitions section in this report for definitions of the share classes offered by your fund.
Fund performance Total return for periods ended 10/31/17
| | | | | | | | | |
| | Annual | | | | | | | | |
| | average | | Annual | | Annual | | Annual | | |
| | (life of fund) | 10 years | average | 5 years | average | 3 years | average | 1 year | 6 months |
| Class A (6/1/98) | | | | | | | | | |
| Before sales charge | 7.80% | 94.84% | 6.90% | 67.19% | 10.83% | 15.71% | 4.99% | 19.17% | 3.16% |
| After sales charge | 7.47 | 83.64 | 6.27 | 57.58 | 9.52 | 9.06 | 2.93 | 12.32 | –2.77 |
| Class B (6/29/98) | | | | | | | | | |
| Before CDSC | 7.47 | 83.47 | 6.26 | 61.03 | 10.00 | 13.17 | 4.21 | 18.29 | 2.78 |
| After CDSC | 7.47 | 83.47 | 6.26 | 59.03 | 9.72 | 10.53 | 3.39 | 13.29 | –2.22 |
| Class C (7/26/99) | | | | | | | | | |
| Before CDSC | 7.00 | 80.72 | 6.10 | 60.96 | 9.99 | 13.16 | 4.21 | 18.32 | 2.74 |
| After CDSC | 7.00 | 80.72 | 6.10 | 60.96 | 9.99 | 13.16 | 4.21 | 17.32 | 1.74 |
| Class M (6/29/98) | | | | | | | | | |
| Before sales charge | 7.26 | 85.37 | 6.37 | 63.13 | 10.28 | 14.04 | 4.48 | 18.62 | 2.90 |
| After sales charge | 7.06 | 78.89 | 5.99 | 57.42 | 9.50 | 10.05 | 3.24 | 14.47 | –0.70 |
| Class R (1/21/03) | | | | | | | | | |
| Net asset value | 7.53 | 90.09 | 6.63 | 65.17 | 10.56 | 14.84 | 4.72 | 18.84 | 3.05 |
| Class R5 (7/2/12) | | | | | | | | | |
| Net asset value | 8.01 | 98.72 | 7.11 | 68.40 | 10.99 | 15.70 | 4.98 | 18.44 | 3.34 |
| Class R6 (7/2/12) | | | | | | | | | |
| Net asset value | 8.10 | 101.79 | 7.27 | 71.00 | 11.33 | 17.19 | 5.43 | 19.67 | 3.37 |
| Class Y (10/2/00) | | | | | | | | | |
| Net asset value | 8.05 | 99.83 | 7.17 | 69.34 | 11.11 | 16.59 | 5.25 | 19.45 | 3.25 |
Current performance may be lower or higher than the quoted past performance, which cannot guarantee future results. After-sales-charge returns for class A and M shares reflect the deduction of the maximum 5.75% and 3.50% sales charge, respectively, levied at the time of purchase. Class B share returns after contingent deferred sales charge (CDSC) reflect the applicable CDSC, which is 5% in the first year, declining over time to 1% in the sixth year, and is eliminated thereafter. Class C share returns after CDSC reflect a 1% CDSC for the first year that is eliminated thereafter. Class R, R5, R6, and Y shares have no initial sales charge or CDSC. Performance for class B, C, M, R, and Y shares before their inception is derived from the historical performance of class A shares, adjusted for the applicable sales charge (or CDSC) and the higher operating expenses for such shares, except for class Y shares, for which 12b-1 fees are not applicable. Performance for class R5 and R6 shares prior to their inception is derived from the historical performance
|
| Capital Opportunities Fund 7 |
of class Y shares and has not been adjusted for the lower investor servicing fees applicable to class R5 and R6 shares; had it, returns would have been higher.
For a portion of the periods, the fund had expense limitations, without which returns would have been lower.
Class B share performance reflects conversion to class A shares after eight years.
Comparative index returns For periods ended 10/31/17
| | | | | | | | | |
| | Annual | | | | | | | | |
| | average | | Annual | | Annual | | Annual | | |
| | (life of fund) | 10 years | average | 5 years | average | 3 years | average | 1 year | 6 months |
| Russell 2500 Index | 8.90% | 117.51% | 8.08% | 96.40% | 14.45% | 31.58% | 9.58% | 24.68% | 7.80% |
| Lipper Small-Cap | | | | | | | | | |
| Core Funds category | 8.48 | 101.21 | 7.14 | 87.71 | 13.33 | 28.83 | 8.74 | 24.56 | 6.80 |
| average* | | | | | | | | | |
Index and Lipper results should be compared with fund performance before sales charge, before CDSC, or at net asset value.
* Over the 6-month, 1-year, 3-year, 5-year, 10-year, and life-of-fund periods ended 10/31/17, there were 1,062, 1,020, 839, 715, 511, and 141 funds, respectively, in this Lipper category.
Fund price and distribution information For the six-month period ended 10/31/17
| | | | | | | | | | |
| | Class A | Class B | Class C | Class M | Class R | Class R5 | Class R6 | Class Y |
| | Before | After | Net | Net | Before | After | Net | Net | Net | Net |
| | sales | sales | asset | asset | sales | sales | asset | asset | asset | asset |
| Share value | charge | charge | value | value | charge | charge | value | value | value | value |
| 4/30/17 | $15.52 | $16.47 | $13.29 | $13.49 | $14.13 | $14.64 | $15.10 | $15.85 | $16.03 | $15.99 |
| 10/31/17 | 16.01 | 16.99 | 13.66 | 13.86 | 14.54 | 15.07 | 15.56 | 16.38 | 16.57 | 16.51 |
The classification of distributions, if any, is an estimate. Before-sales-charge share value and current dividend rate for class A and M shares, if applicable, do not take into account any sales charge levied at the time of purchase. After-sales-charge share value, current dividend rate, and current 30-day SEC yield, if applicable, are calculated assuming that the maximum sales charge (5.75% for class A shares and 3.50% for class M shares) was levied at the time of purchase. Final distribution information will appear on your year-end tax forms.
The fund made no distributions during the period.
|
| 8 Capital Opportunities Fund |
Fund performance as of most recent calendar quarter Total return for periods ended 9/30/17
| | | | | | | | | |
| | Annual | | | | | | | | |
| | average | | Annual | | Annual | | Annual | | |
| | (life of fund) | 10 years | average | 5 years | average | 3 years | average | 1 year | 6 months |
| Class A (6/1/98) | | | | | | | | | |
| Before sales charge | 7.90% | 98.17% | 7.08% | 66.71% | 10.76% | 22.10% | 6.88% | 15.23% | 4.58% |
| After sales charge | 7.57 | 86.78 | 6.45 | 57.12 | 9.46 | 15.08 | 4.79 | 8.60 | –1.43 |
| Class B (6/29/98) | | | | | | | | | |
| Before CDSC | 7.57 | 86.59 | 6.44 | 60.53 | 9.93 | 19.35 | 6.07 | 14.34 | 4.14 |
| After CDSC | 7.57 | 86.59 | 6.44 | 58.53 | 9.65 | 16.56 | 5.24 | 9.34 | –0.86 |
| Class C (7/26/99) | | | | | | | | | |
| Before CDSC | 7.10 | 83.74 | 6.27 | 60.58 | 9.94 | 19.42 | 6.09 | 14.32 | 4.15 |
| After CDSC | 7.10 | 83.74 | 6.27 | 60.58 | 9.94 | 19.42 | 6.09 | 13.32 | 3.15 |
| Class M (6/29/98) | | | | | | | | | |
| Before sales charge | 7.36 | 88.52 | 6.55 | 62.58 | 10.21 | 20.27 | 6.34 | 14.61 | 4.32 |
| After sales charge | 7.16 | 81.93 | 6.17 | 56.89 | 9.43 | 16.06 | 5.09 | 10.60 | 0.67 |
| Class R (1/21/03) | | | | | | | | | |
| Net asset value | 7.64 | 93.25 | 6.81 | 64.70 | 10.49 | 21.20 | 6.62 | 14.89 | 4.44 |
| Class R5 (7/2/12) | | | | | | | | | |
| Net asset value | 8.12 | 102.05 | 7.29 | 67.80 | 10.91 | 22.06 | 6.87 | 14.42 | 4.74 |
| Class R6 (7/2/12) | | | | | | | | | |
| Net asset value | 8.20 | 105.14 | 7.45 | 70.37 | 11.24 | 23.61 | 7.32 | 15.68 | 4.75 |
| Class Y (10/2/00) | | | | | | | | | |
| Net asset value | 8.15 | 103.15 | 7.35 | 68.72 | 11.03 | 22.93 | 7.12 | 15.45 | 4.64 |
See the discussion following the fund performance table on page 7 for information about the calculation of fund performance.
|
| Capital Opportunities Fund 9 |
Your fund’s expenses
As a mutual fund investor, you pay ongoing expenses, such as management fees, distribution fees (12b-1 fees), and other expenses. Using the following information, you can estimate how these expenses affect your investment and compare them with the expenses of other funds. You may also pay one-time transaction expenses, including sales charges (loads) and redemption fees, which are not shown in this section and would have resulted in higher total expenses. For more information, see your fund’s prospectus or talk to your financial representative.
Expense ratios
| | | | | | | | |
| | Class A | Class B | Class C | Class M | Class R | Class R5 | Class R6 | Class Y |
| Total annual operating | | | | | | | | |
| expenses for the fiscal year | | | | | | | | |
| ended 4/30/17 | 1.37% | 2.12% | 2.12% | 1.87% | 1.62% | 1.05% | 0.95% | 1.12% |
| Annualized expense ratio | | | | | | | | |
| for the six-month period | | | | | | | | |
| ended 10/31/17 | 1.19% | 1.94% | 1.94% | 1.69% | 1.44% | 0.88% | 0.78% | 0.94% |
Fiscal-year expense information in this table is taken from the most recent prospectus, is subject to change, and may differ from that shown for the annualized expense ratio and in the financial highlights of this report.
Prospectus expense information also includes the impact of acquired fund fees and expenses of 0.17%, which is not included in the financial highlights or annualized expense ratios. Expenses are shown as a percentage of average net assets.
Expenses per $1,000
The following table shows the expenses you would have paid on a $1,000 investment in each class of the fund from 5/1/17 to 10/31/17. It also shows how much a $1,000 investment would be worth at the close of the period, assuming actual returns and expenses.
| | | | | | | | |
| | Class A | Class B | Class C | Class M | Class R | Class R5 | Class R6 | Class Y |
| Expenses paid per $1,000 *† | $6.09 | $9.92 | $9.91 | $8.64 | $7.37 | $4.51 | $4.00 | $4.82 |
| Ending value (after expenses) | $1,031.60 | $1,027.80 | $1,027.40 | $1,029.00 | $1,030.50 | $1,033.40 | $1,033.70 | $1,032.50 |
* Expenses for each share class are calculated using the fund’s annualized expense ratio for each class, which represents the ongoing expenses as a percentage of average net assets for the six months ended 10/31/17. The expense ratio may differ for each share class.
† Expenses are calculated by multiplying the expense ratio by the average account value for the period; then multiplying the result by the number of days in the period; and then dividing that result by the number of days in the year.
| |
| 10 Capital Opportunities Fund |
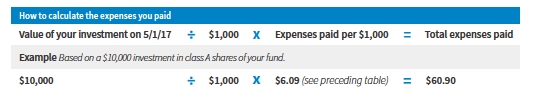
Estimate the expenses you paid
To estimate the ongoing expenses you paid for the six months ended 10/31/17, use the following calculation method. To find the value of your investment on 5/1/17, call Putnam at 1-800-225-1581.
Compare expenses using the SEC’s method
The Securities and Exchange Commission (SEC) has established guidelines to help investors assess fund expenses. Per these guidelines, the following table shows your fund’s expenses based on a $1,000 investment, assuming a hypothetical 5% annualized return. You can use this information to compare the ongoing expenses (but not transaction expenses or total costs) of investing in the fund with those of other funds. All mutual fund shareholder reports will provide this information to help you make this comparison. Please note that you cannot use this information to estimate your actual ending account balance and expenses paid during the period.
| | | | | | | | |
| | Class A | Class B | Class C | Class M | Class R | Class R5 | Class R6 | Class Y |
| Expenses paid per $1,000 *† | $6.06 | $9.86 | $9.86 | $8.59 | $7.32 | $4.48 | $3.97 | $4.79 |
| Ending value (after expenses) | $1,019.21 | $1,015.43 | $1,015.43 | $1,016.69 | $1,017.95 | $1,020.77 | $1,021.27 | $1,020.47 |
* Expenses for each share class are calculated using the fund’s annualized expense ratio for each class, which represents the ongoing expenses as a percentage of average net assets for the six months ended 10/31/17. The expense ratio may differ for each share class.
† Expenses are calculated by multiplying the expense ratio by the average account value for the six-month period; then multiplying the result by the number of days in the six-month period; and then dividing that result by the number of days in the year.
|
| Capital Opportunities Fund 11 |
Terms and definitions
Important terms
Total return shows how the value of the fund’s shares changed over time, assuming you held the shares through the entire period and reinvested all distributions in the fund.
Before sales charge, or net asset value, is the price, or value, of one share of a mutual fund, without a sales charge. Before-sales-charge figures fluctuate with market conditions, and are calculated by dividing the net assets of each class of shares by the number of outstanding shares in the class.
After sales charge is the price of a mutual fund share plus the maximum sales charge levied at the time of purchase. After-sales-charge performance figures shown here assume the 5.75% maximum sales charge for class A shares and 3.50% for class M shares.
Contingent deferred sales charge (CDSC) is generally a charge applied at the time of the redemption of class B or C shares and assumes redemption at the end of the period. Your fund’s class B CDSC declines over time from a 5% maximum during the first year to 1% during the sixth year. After the sixth year, the CDSC no longer applies. The CDSC for class C shares is 1% for one year after purchase.
Share classes
Class A shares are generally subject to an initial sales charge and no CDSC (except on certain redemptions of shares bought without an initial sales charge).
Class B shares are closed to new investments and are only available by exchange from another Putnam fund or through dividend and/or capital gains reinvestment. They are not subject to an initial sales charge and may be subject to a CDSC.
Class C shares are not subject to an initial sales charge and are subject to a CDSC only if the shares are redeemed during the first year.
Class M shares have a lower initial sales charge and a higher 12b-1 fee than class A shares and no CDSC.
Class R shares are not subject to an initial sales charge or CDSC and are only available to employer-sponsored retirement plans.
Class R5 and R6 shares are not subject to an initial sales charge or CDSC, and carry no 12b-1 fee. They are only available to employer-sponsored retirement plans.
Class Y shares are not subject to an initial sales charge or CDSC, and carry no 12b-1 fee. They are generally only available to corporate and institutional clients and clients in other approved programs.
Comparative indexes
Bloomberg Barclays U.S. Aggregate Bond Index is an unmanaged index of U.S. investment-grade fixed-income securities.
ICE BofAML U.S. 3-Month Treasury Bill Index is an unmanaged index that seeks to measure the performance of U.S. Treasury bills available in the marketplace.
Russell 2500 Index is an unmanaged index of 2,500 small and midsize companies in the Russell 3000 Index.
S&P 500 Index is an unmanaged index of common stock performance.
Indexes assume reinvestment of all distributions and do not account for fees. Securities and performance of a fund and an index will differ. You cannot invest directly in an index.
Frank Russell Company is the source and owner of the trademarks, service marks, and copyrights related to the Russell Indexes. Russell® is a trademark of Frank Russell Company.
ICE Data Indices, LLC (“ICE BofAML”), used with permission. ICE BofAML permits use of the ICE BofAML indices and related data on an “as is” basis; makes no warranties regarding same; does not guarantee the suitability, quality, accuracy, timeliness, and/or completeness of the ICE BofAML indices or any data included in, related to, or derived therefrom, assumes no liability in connection with the use of the foregoing, and does not
| |
| 12 Capital Opportunities Fund |
sponsor, endorse, or recommend Putnam Investments, or any of its products or services.
Lipper is a third-party industry-ranking entity that ranks mutual funds. Its rankings do not reflect sales charges. Lipper rankings are based on total return at net asset value relative to other funds that have similar current investment styles or objectives as determined by Lipper. Lipper may change a fund’s category assignment at its discretion. Lipper category averages reflect performance trends for funds within a category.
Other information for shareholders
Important notice regarding delivery of shareholder documents
In accordance with Securities and Exchange Commission (SEC) regulations, Putnam sends a single copy of annual and semiannual shareholder reports, prospectuses, and proxy statements to Putnam shareholders who share the same address, unless a shareholder requests otherwise. If you prefer to receive your own copy of these documents, please call Putnam at 1-800-225-1581, and Putnam will begin sending individual copies within 30 days.
Proxy voting
Putnam is committed to managing our mutual funds in the best interests of our shareholders. The Putnam funds’ proxy voting guidelines and procedures, as well as information regarding how your fund voted proxies relating to portfolio securities during the 12-month period ended June 30, 2017, are available in the Individual Investors section of putnam.com, and on the SEC’s website, www.sec.gov. If you have questions about finding forms on the SEC’s website, you may call the SEC at 1-800-SEC-0330. You may also obtain the Putnam funds’ proxy voting guidelines and procedures at no charge by calling Putnam’s Shareholder Services at 1-800-225-1581.
Fund portfolio holdings
The fund will file a complete schedule of its portfolio holdings with the SEC for the first and third quarters of each fiscal year on Form N-Q. Shareholders may obtain the fund’s Form N-Q on the SEC’s website at www.sec.gov. In addition, the fund’s Form N-Q may be reviewed and copied at the SEC’s Public Reference Room in Washington, D.C. You may call the SEC at 1-800-SEC-0330 for information about the SEC’s website or the operation of the Public Reference Room.
Trustee and employee fund ownership
Putnam employees and members of the Board of Trustees place their faith, confidence, and, most importantly, investment dollars in Putnam mutual funds. As of October 31, 2017, Putnam employees had approximately $515,000,000 and the Trustees had approximately $91,000,000 invested in Putnam mutual funds. These amounts include investments by the Trustees’ and employees’ immediate family members as well as investments through retirement and deferred compensation plans.
|
| Capital Opportunities Fund 13 |
Trustee approval of management contract
General conclusions
The Board of Trustees of The Putnam Funds oversees the management of each fund and, as required by law, determines annually whether to approve the continuance of your fund’s management contract with Putnam Investment Management, LLC (“Putnam Management”) and the sub-management contract with respect to your fund between Putnam Management and its affiliate, Putnam Investments Limited (“PIL”). The Board, with the assistance of its Contract Committee, requests and evaluates all information it deems reasonably necessary under the circumstances in connection with its annual contract review. The Contract Committee consists solely of Trustees who are not “interested persons” (as this term is defined in the Investment Company Act of 1940, as amended (the “1940 Act”)) of The Putnam Funds (“Independent Trustees”).
At the outset of the review process, members of the Board’s independent staff and independent legal counsel discussed with representatives of Putnam Management the annual contract review materials furnished to the Contract Committee during the course of the previous year’s review, identifying possible changes in these materials that might be necessary or desirable for the coming year. Following these discussions and in consultation with the Contract Committee, the Independent Trustees’ independent legal counsel requested that Putnam Management and its affiliates furnish specified information, together with any additional information that Putnam Management considered relevant, to the Contract Committee. Over the course of several months ending in June 2017, the Contract Committee met on a number of occasions with representatives of Putnam Management, and separately in executive session, to consider the information that Putnam Management provided. Throughout this process, the Contract Committee was assisted by the members of the Board’s independent staff and by independent legal counsel for The Putnam Funds and the Independent Trustees.
In May 2017, the Contract Committee met in executive session to discuss and consider its recommendations with respect to the continuance of the contracts. At the Trustees’ June 2017 meeting, the Contract Committee met in executive session with the other Independent Trustees to review a summary of the key financial, performance and other data that the Contract Committee considered in the course of its review. The Contract Committee then presented its written report, which summarized the key factors that the Committee had considered and set forth its recommendations. The Contract Committee recommended, and the Independent Trustees approved, the continuance of your fund’s management and sub-management contracts, effective July 1, 2017. (Because PIL is an affiliate of Putnam Management and Putnam Management remains fully responsible for all services provided by PIL, the Trustees have not attempted to evaluate PIL as a separate entity, and all subsequent references to Putnam Management below should be deemed to include reference to PIL as necessary or appropriate in the context.)
The Independent Trustees’ approval was based on the following conclusions:
• That the fee schedule in effect for your fund represented reasonable compensation in light of the nature and quality of the services being provided to the fund, the fees paid by competitive funds, the costs incurred by Putnam Management in providing services to the fund, and the continued application of certain reductions and waivers noted below; and
• That the fee schedule in effect for your fund represented an appropriate sharing between fund shareholders and Putnam Management of such economies of scale as may exist in the management of the fund at current asset levels.
These conclusions were based on a comprehensive consideration of all information provided to the Trustees and were not the result of any single factor. Some of the factors that figured particularly in the Trustees’ deliberations and how the Trustees considered these factors are described below, although individual Trustees may have evaluated the information presented differently, giving different weights to various factors. It is also important to recognize that the management arrangements for your fund and the other Putnam funds are the result of many years of review and discussion between the Independent Trustees and Putnam Management, that some aspects of the arrangements may receive greater scrutiny in some years than others, and that the Trustees’ conclusions may be based, in part, on their consideration of fee arrangements in previous
| |
| 14 Capital Opportunities Fund |
years. For example, with some minor exceptions, the funds’ current fee arrangements under the management contracts were first implemented at the beginning of 2010 following extensive review by the Contract Committee and discussions with representatives of Putnam Management, as well as approval by shareholders.
Management fee schedules and total expenses
The Trustees reviewed the management fee schedules in effect for all Putnam funds, including fee levels and breakpoints. The Trustees also reviewed the total expenses of each Putnam fund, recognizing that in most cases management fees represented the major, but not the sole, determinant of total costs to fund shareholders. (In a few instances, funds have implemented so-called “all-in” management fees covering substantially all routine fund operating costs.)
In reviewing fees and expenses, the Trustees generally focus their attention on material changes in circumstances — for example, changes in assets under management, changes in a fund’s investment strategy, changes in Putnam Management’s operating costs or profitability, or changes in competitive practices in the mutual fund industry — that suggest that consideration of fee changes might be warranted. The Trustees concluded that the circumstances did not indicate that changes to the management fee structure for your fund would be appropriate at this time.
Under its management contract, your fund has the benefit of breakpoints in its management fee schedule that provide shareholders with economies of scale in the form of reduced fee rates as assets under management in the Putnam family of funds increase. The Trustees concluded that the fee schedule in effect for your fund represented an appropriate sharing of economies of scale between fund shareholders and Putnam Management.
As in the past, the Trustees also focused on the competitiveness of each fund’s total expense ratio. In order to support the effort to have fund expenses meet competitive standards, the Trustees and Putnam Management have implemented certain expense limitations that were in effect during your fund’s fiscal year ending in 2016. These expense limitations were: (i) a contractual expense limitation applicable to specified retail open-end funds, including your fund, of 25 basis points (until September 1, 2016, this limitation was 32 basis points) on investor servicing fees and expenses and (ii) a contractual expense limitation applicable to specified open-end funds, including your fund, of 20 basis points on so-called “other expenses” (i.e., all expenses exclusive of management fees, distribution fees, investor servicing fees, investment-related expenses, interest, taxes, brokerage commissions, acquired fund fees and expenses and extraordinary expenses). These expense limitations attempt to maintain competitive expense levels for the funds. Most funds, including your fund, had sufficiently low expenses that these expense limitations were not operative during their fiscal years ending in 2016. Putnam Management has agreed to maintain the 25 basis points expense limitation until at least August 31, 2018 and to maintain the 20 basis points expense limitation until at least August 30, 2018. Putnam Management’s support for these expense limitation arrangements was an important factor in the Trustees’ decision to approve the continuance of your fund’s management and sub-management contracts.
The Trustees reviewed comparative fee and expense information for a custom group of competitive funds selected by Broadridge Financial Solutions, Inc. (“Broadridge”). This comparative information included your fund’s percentile ranking for effective management fees and total expenses (excluding any applicable 12b-1 fee), which provides a general indication of your fund’s relative standing. In the custom peer group, your fund ranked in the first quintile in effective management fees (determined for your fund and the other funds in the custom peer group based on fund asset size and the applicable contractual management fee schedule) and in the first quintile in total expenses (excluding any applicable 12b-1 fees) as of December 31, 2016. The first quintile represents the least expensive funds and the fifth quintile the most expensive funds. The fee and expense data reported by Broadridge as of December 31, 2016 reflected the most recent fiscal year-end data available in Broadridge’s database at that time.
In connection with their review of fund management fees and total expenses, the Trustees also reviewed the costs of the services provided and the profits realized by Putnam Management and its affiliates from their contractual relationships with the funds. This information included trends in revenues, expenses and profitability of Putnam Management and its affiliates relating to the investment management, investor servicing and
|
| Capital Opportunities Fund 15 |
distribution services provided to the funds. In this regard, the Trustees also reviewed an analysis of Putnam Management’s revenues, expenses and profitability, allocated on a fund-by-fund basis, with respect to the funds’ management, distribution, and investor servicing contracts. For each fund, the analysis presented information about revenues, expenses and profitability for each of the agreements separately and for the agreements taken together on a combined basis. The Trustees concluded that, at current asset levels, the fee schedules in place represented reasonable compensation for the services being provided and represented an appropriate sharing between fund shareholders and Putnam Management of such economies of scale as may exist in the management of the Putnam funds at that time.
The information examined by the Trustees in connection with their annual contract review for the Putnam funds included information regarding fees charged by Putnam Management and its affiliates to institutional clients, including defined benefit pension and profit-sharing plans, charities, college endowments, foundations, sub-advised third-party mutual funds, state, local and non-U.S. government entities, and corporations. This information included, in cases where an institutional product’s investment strategy corresponds with a fund’s strategy, comparisons of those fees with fees charged to the Putnam funds, as well as an assessment of the differences in the services provided to these different types of clients as compared to the services provided to the Putnam Funds. The Trustees observed that the differences in fee rates between these clients and the Putnam funds are by no means uniform when examined by individual asset sectors, suggesting that differences in the pricing of investment management services to these types of clients may reflect, among other things, historical competitive forces operating in separate markets. The Trustees considered the fact that in many cases fee rates across different asset classes are higher on average for mutual funds than for institutional clients, as well as the differences between the services that Putnam Management provides to the Putnam funds and those that it provides to its other clients. The Trustees did not rely on these comparisons to any significant extent in concluding that the management fees paid by your fund are reasonable.
Investment performance
The quality of the investment process provided by Putnam Management represented a major factor in the Trustees’ evaluation of the quality of services provided by Putnam Management under your fund’s management contract. The Trustees were assisted in their review of the Putnam funds’ investment process and performance by the work of the investment oversight committees of the Trustees, which meet on a regular basis with the funds’ portfolio teams and with the Chief Investment Officers and other senior members of Putnam Management’s Investment Division throughout the year. In addition, in response to a request from the Independent Trustees, Putnam Management provided the Trustees with in-depth presentations regarding each of the equity and fixed income investment teams, including the operation of the teams and their investment approaches. The Trustees concluded that Putnam Management generally provides a high-quality investment process — based on the experience and skills of the individuals assigned to the management of fund portfolios, the resources made available to them, and in general Putnam Management’s ability to attract and retain high-quality personnel — but also recognized that this does not guarantee favorable investment results for every fund in every time period.
The Trustees considered that 2016 was a challenging year for the performance of the Putnam funds, with generally disappointing results for the international and global equity funds and taxable fixed income funds, mixed results for small-cap equity, Spectrum, global asset allocation, equity research and tax exempt fixed income funds, but generally strong results for U.S. equity funds. The Trustees noted, however, that they were encouraged by the positive performance trend since mid-year 2016 across most Putnam Funds. In particular, from May 1, 2016 through April 30, 2017, 51% of Putnam Fund assets were in the top quartile and 87% were above the median of the Putnam Funds’ competitive industry rankings. They noted that the longer-term performance of the Putnam funds generally continued to be strong, exemplified by the fact that the Putnam funds were ranked by the Barron’s/Lipper Fund Families survey as the 5th-best performing mutual fund complex out of 54 complexes for the five-year period ended December 31, 2016. In addition, while the survey ranked the Putnam Funds 52nd out of 61 mutual fund complexes for the one-year period ended 2016, the Putnam Funds have ranked 1st or 2nd in the survey for the one-year period three times since 2009 (most recently in 2013). They also noted, however, the disappointing investment
|
| 16 Capital Opportunities Fund |
performance of some funds for periods ended December 31, 2016 and considered information provided by Putnam Management regarding the factors contributing to the underperformance and actions being taken to improve the performance of these particular funds. The Trustees indicated their intention to continue to monitor closely the performance of those funds, including the effectiveness of any efforts Putnam Management has undertaken to address underperformance and whether additional actions to address areas of underperformance are warranted.
For purposes of the Trustees’ evaluation of the Putnam Funds’ investment performance, the Trustees generally focus on a competitive industry ranking of each fund’s total net return over a one-year, three-year and five-year period. For a number of Putnam funds with relatively unique investment mandates for which Putnam Management informed the Trustees that meaningful competitive performance rankings are not considered to be available, the Trustees evaluated performance based on their total gross and net returns and, in most cases, comparisons of those returns with the returns of selected investment benchmarks. In the case of your fund, the Trustees considered that its class A share cumulative total return performance at net asset value was in the following quartiles of its Lipper Inc. (“Lipper”) peer group (Lipper Small-Cap Core Funds) for the one-year, three-year and five-year periods ended December 31, 2016 (the first quartile representing the best-performing funds and the fourth quartile the worst-performing funds):
| |
| One-year period | 4th |
| Three-year period | 4th |
| Five-year period | 4th |
Over the one-year, three-year and five-year periods ended December 31, 2016, there were 874, 735 and 640 funds, respectively, in your fund’s Lipper peer group. (When considering performance information, shareholders should be mindful that past performance is not a guarantee of future results.)
The Trustees expressed concern about your fund’s fourth quartile performance over the one-year, three-year and five-year periods ended December 31, 2016 and considered the circumstances that may have contributed to this disappointing performance. The Trustees considered Putnam Management’s view that the fund’s underperformance during those periods was largely attributable to poor stock selection.
The Trustees also noted that the fund’s performance over the three-year and five-year periods was negatively impacted by the fund’s relative emphasis on investing in securities that the fund’s portfolio managers believed were of high quality and undervalued by the market, which did not prove to be a successful strategy during the period. Additionally, the Trustees noted that the fund’s one-year performance was negatively impacted by an overweight (relative to the benchmark) to the health care sector.
The Trustees considered that Putnam Management made portfolio manager changes in February 2016 and March 2017 and that, since March 2017, the new portfolio managers have managed the fund using a research-driven approach. The Trustees noted that Putnam Investments was confident in the investment process of the fund’s new portfolio managers. The Trustees also considered Putnam Management’s continued efforts to support fund performance through initiatives including structuring compensation for portfolio managers and research analysts to enhance accountability for fund performance, emphasizing accountability in the portfolio management process, and affirming its commitment to a fundamental-driven approach to investing. The Trustees noted further that Putnam Management continued to strengthen its fundamental research capabilities by adding new investment personnel.
As a general matter, the Trustees believe that cooperative efforts between the Trustees and Putnam Management represent the most effective way to address investment performance concerns that may arise from time to time. The Trustees noted that investors in the Putnam funds have, in effect, placed their trust in the Putnam organization, under the oversight of the funds’ Trustees, to make appropriate decisions regarding the management of the funds. Based on Putnam Management’s willingness to take appropriate measures to address fund performance issues and Putnam Management’s responsiveness to Trustee concerns about investment performance, the Trustees concluded that it continues to be advisable to seek change within Putnam Management to address performance shortcomings. In the Trustees’ view, the alternative of engaging a new investment adviser for an underperforming fund would entail significant disruptions and would not likely provide any greater assurance of improved investment performance.
|
| Capital Opportunities Fund 17 |
Brokerage and soft-dollar allocations; investor servicing
The Trustees considered various potential benefits that Putnam Management may receive in connection with the services it provides under the management contract with your fund. These include benefits related to brokerage allocation and the use of soft dollars, whereby a portion of the commissions paid by a fund for brokerage may be used to acquire research services that are expected to be useful to Putnam Management in managing the assets of the fund and of other clients. Subject to policies established by the Trustees, soft dollars generated by these means are used predominantly to acquire brokerage and research services (including third-party research and market data) that enhance Putnam Management’s investment capabilities and supplement Putnam Management’s internal research efforts. However, the Trustees noted that a portion of available soft dollars continues to be used to pay fund expenses. The Trustees indicated their continued intent to monitor regulatory and industry developments in this area with the assistance of their Brokerage Committee, including any developments with respect to the European Union’s updated Markets in Financial Instruments Directive and its potential impact on PIL’s use of client commissions to obtain investment research. The Trustees also indicated their continued intent to monitor the allocation of the Putnam funds’ brokerage in order to ensure that the principle of seeking best price and execution remains paramount in the portfolio trading process.
Putnam Management may also receive benefits from payments that the funds make to Putnam Management’s affiliates for investor or distribution services. In conjunction with the annual review of your fund’s management and sub-management contracts, the Trustees reviewed your fund’s investor servicing agreement with Putnam Investor Services, Inc. (“PSERV”) and its distributor’s contracts and distribution plans with Putnam Retail Management Limited Partnership (“PRM”), both of which are affiliates of Putnam Management. The Trustees concluded that the fees payable by the funds to PSERV and PRM, as applicable, for such services are fair and reasonable in relation to the nature and quality of such services, the fees paid by competitive funds, and the costs incurred by PSERV and PRM, as applicable, in providing such services. Furthermore, the Trustees were of the view that the services provided were required for the operation of the funds, and that they were of a quality at least equal to those provided by other providers.
| |
| 18 Capital Opportunities Fund |
Financial statements
These sections of the report, as well as the accompanying Notes, constitute the fund’s financial statements.
The fund’s portfolio lists all the fund’s investments and their values as of the last day of the reporting period. Holdings are organized by asset type and industry sector, country, or state to show areas of concentration and diversification.
Statement of assets and liabilities shows how the fund’s net assets and share price are determined. All investment and non-investment assets are added together. Any unpaid expenses and other liabilities are subtracted from this total. The result is divided by the number of shares to determine the net asset value per share, which is calculated separately for each class of shares. (For funds with preferred shares, the amount subtracted from total assets includes the liquidation preference of preferred shares.)
Statement of operations shows the fund’s net investment gain or loss. This is done by first adding up all the fund’s earnings — from dividends and interest income — and subtracting its operating expenses to determine net investment income (or loss). Then, any net gain or loss the fund realized on the sales of its holdings — as well as any unrealized gains or losses over the period — is added to or subtracted from the net investment result to determine the fund’s net gain or loss for the fiscal period.
Statement of changes in net assets shows how the fund’s net assets were affected by the fund’s net investment gain or loss, by distributions to shareholders, and by changes in the number of the fund’s shares. It lists distributions and their sources (net investment income or realized capital gains) over the current reporting period and the most recent fiscal year-end. The distributions listed here may not match the sources listed in the Statement of operations because the distributions are determined on a tax basis and may be paid in a different period from the one in which they were earned. Dividend sources are estimated at the time of declaration. Actual results may vary. Any non-taxable return of capital cannot be determined until final tax calculations are completed after the end of the fund’s fiscal year.
Financial highlights provide an overview of the fund’s investment results, per-share distributions, expense ratios, net investment income ratios, and portfolio turnover in one summary table, reflecting the five most recent reporting periods. In a semiannual report, the highlights table also includes the current reporting period.
|
| Capital Opportunities Fund 19 |
The fund’s portfolio 10/31/17 (Unaudited)
| | |
| COMMON STOCKS (97.8%)* | Shares | Value |
| Aerospace and defense (1.3%) | | |
| L3 Technologies, Inc. | 22,500 | $4,211,550 |
| | | 4,211,550 |
| Auto components (0.8%) | | |
| Goodyear Tire & Rubber Co. (The) | 82,839 | 2,534,045 |
| | | 2,534,045 |
| Banks (7.4%) | | |
| East West Bancorp, Inc. | 68,064 | 4,072,950 |
| First Republic Bank | 45,275 | 4,409,785 |
| Old National Bancorp | 113,400 | 2,063,880 |
| PacWest Bancorp | 32,100 | 1,551,072 |
| Peoples Bancorp, Inc. | 130,537 | 4,323,385 |
| Popular, Inc. (Puerto Rico) | 42,377 | 1,554,388 |
| Texas Capital Bancshares, Inc. † | 20,200 | 1,738,210 |
| Umpqua Holdings Corp. | 176,800 | 3,617,328 |
| | | 23,330,998 |
| Biotechnology (3.8%) | | |
| Array BioPharma, Inc. † S | 161,300 | 1,685,585 |
| Bioverativ, Inc. † | 31,600 | 1,785,400 |
| Clovis Oncology, Inc. † | 63,900 | 4,816,143 |
| Mirati Therapeutics, Inc. † S | 137,000 | 1,787,850 |
| Prothena Corp. PLC (Ireland) † S | 28,400 | 1,648,620 |
| | | 11,723,598 |
| Building products (4.2%) | | |
| AO Smith Corp. | 45,900 | 2,717,280 |
| JELD-WEN Holding, Inc. † | 119,226 | 4,397,055 |
| Owens Corning | 71,500 | 5,912,335 |
| | | 13,026,670 |
| Capital markets (4.0%) | | |
| Hamilton Lane, Inc. Class A S | 193,700 | 5,324,813 |
| Investment Technology Group, Inc. | 217,300 | 5,100,031 |
| St. James’s Place PLC (United Kingdom) | 125,278 | 1,958,386 |
| | | 12,383,230 |
| Chemicals (2.9%) | | |
| Orion Engineered Carbons SA (Luxembourg) | 186,572 | 4,412,428 |
| W.R. Grace & Co. | 60,300 | 4,612,347 |
| | | 9,024,775 |
| Communications equipment (1.4%) | | |
| EchoStar Corp. Class A † | 75,700 | 4,235,415 |
| | | 4,235,415 |
| Construction and engineering (0.9%) | | |
| Valmont Industries, Inc. | 17,800 | 2,828,420 |
| | | 2,828,420 |
| Construction materials (2.9%) | | |
| Summit Materials, Inc. Class A † | 291,595 | 9,156,083 |
| | | 9,156,083 |
| |
| 20 Capital Opportunities Fund |
| | |
| COMMON STOCKS (97.8%)* cont. | Shares | Value |
| Containers and packaging (4.4%) | | |
| Ball Corp. S | 117,600 | $5,048,568 |
| Graphic Packaging Holding Co. | 248,500 | 3,849,265 |
| RPC Group PLC (United Kingdom) | 386,317 | 4,835,844 |
| | | 13,733,677 |
| Diversified consumer services (1.0%) | | |
| Service Corp. International/US S | 92,100 | 3,265,866 |
| | | 3,265,866 |
| Electric utilities (1.9%) | | |
| ALLETE, Inc. | 47,700 | 3,737,295 |
| OGE Energy Corp. | 56,400 | 2,077,776 |
| | | 5,815,071 |
| Energy equipment and services (0.9%) | | |
| Oceaneering International, Inc. S | 15,500 | 313,410 |
| Patterson-UTI Energy, Inc. | 73,000 | 1,443,940 |
| Select Energy Services, Inc. Class A † S | 67,092 | 1,092,258 |
| | | 2,849,608 |
| Equity real estate investment trusts (REITs) (8.6%) | | |
| Colony NorthStar, Inc. Class A | 389,639 | 4,784,767 |
| Easterly Government Properties, Inc. | 257,200 | 5,174,864 |
| Gaming and Leisure Properties, Inc. | 150,400 | 5,495,616 |
| New York REIT, Inc. † | 584,200 | 4,410,710 |
| SBA Communications Corp. † | 26,900 | 4,228,142 |
| WP Carey, Inc. | 37,800 | 2,576,070 |
| | | 26,670,169 |
| Food products (2.4%) | | |
| Sanderson Farms, Inc. S | 27,630 | 4,132,619 |
| Simply Good Foods Co. (The) † | 279,100 | 3,215,232 |
| | | 7,347,851 |
| Gas utilities (1.0%) | | |
| ONE Gas, Inc. | 42,200 | 3,248,556 |
| | | 3,248,556 |
| Health-care equipment and supplies (1.2%) | | |
| GenMark Diagnostics, Inc. † S | 193,500 | 1,441,575 |
| Penumbra, Inc. † S | 21,381 | 2,149,860 |
| | | 3,591,435 |
| Hotels, restaurants, and leisure (2.1%) | | |
| Dave & Buster’s Entertainment, Inc. † S | 54,200 | 2,612,440 |
| Wyndham Worldwide Corp. | 37,300 | 3,985,505 |
| | | 6,597,945 |
| Independent power and renewable electricity producers (0.2%) | | |
| NRG Energy, Inc. | 29,600 | 740,000 |
| | | 740,000 |
| Insurance (2.1%) | | |
| Assured Guaranty, Ltd. | 74,700 | 2,771,370 |
| Employers Holdings, Inc. | 78,245 | 3,732,287 |
| | | 6,503,657 |
|
| Capital Opportunities Fund 21 |
| | |
| COMMON STOCKS (97.8%)* cont. | Shares | Value |
| Internet software and services (8.3%) | | |
| ANGI Homeservices, Inc. Class A † S | 375,027 | $4,687,838 |
| GoDaddy, Inc. Class A † | 92,600 | 4,324,420 |
| GTT Communications, Inc. † S | 98,200 | 3,579,390 |
| Instructure, Inc. † S | 143,334 | 4,988,023 |
| J2 Global, Inc. S | 45,997 | 3,410,218 |
| MuleSoft, Inc. Class A † S | 102,800 | 2,404,492 |
| Rightmove PLC (United Kingdom) | 45,999 | 2,537,827 |
| | | 25,932,208 |
| IT Services (3.4%) | | |
| CSRA, Inc. | 106,300 | 3,400,537 |
| DXC Technology Co. | 73,900 | 6,763,328 |
| Switch, Inc. Class A † S | 19,010 | 363,661 |
| | | 10,527,526 |
| Leisure products (3.3%) | | |
| Brunswick Corp. | 122,500 | 6,204,625 |
| Callaway Golf Co. | 45,500 | 656,565 |
| Malibu Boats, Inc. Class A † | 109,302 | 3,410,222 |
| | | 10,271,412 |
| Life sciences tools and services (0.6%) | | |
| Bio-Rad Laboratories, Inc. Class A † | 8,300 | 1,824,257 |
| | | 1,824,257 |
| Machinery (3.2%) | | |
| Astec Industries, Inc. | 53,800 | 2,794,910 |
| KION Group AG (Germany) | 27,500 | 2,201,012 |
| Oshkosh Corp. | 54,800 | 5,017,488 |
| | | 10,013,410 |
| Media (0.8%) | | |
| Live Nation Entertainment, Inc. † S | 54,900 | 2,403,522 |
| | | 2,403,522 |
| Metals and mining (1.4%) | | |
| Alcoa Corp. † | 88,600 | 4,233,308 |
| | | 4,233,308 |
| Mortgage real estate investment trusts (REITs) (0.4%) | | |
| Hannon Armstrong Sustainable Infrastructure Capital, Inc. | 47,007 | 1,130,988 |
| | | 1,130,988 |
| Oil, gas, and consumable fuels (3.6%) | | |
| EnCana Corp. (Canada) | 189,900 | 2,221,830 |
| NuVista Energy, Ltd. (Canada) † | 293,600 | 1,825,186 |
| Parsley Energy, Inc. Class A † | 81,400 | 2,165,240 |
| Rice Energy, Inc. † | 27,600 | 782,460 |
| Seven Generations Energy, Ltd. Class A (Canada) † | 130,700 | 1,973,518 |
| Targa Resources Corp. | 24,500 | 1,016,750 |
| WPX Energy, Inc. † | 108,500 | 1,223,880 |
| | | 11,208,864 |
| Personal products (1.1%) | | |
| Edgewell Personal Care Co. † S | 53,200 | 3,454,276 |
| | | 3,454,276 |
| |
| 22 Capital Opportunities Fund |
| | |
| COMMON STOCKS (97.8%)* cont. | Shares | Value |
| Pharmaceuticals (4.0%) | | |
| Aclaris Therapeutics, Inc. † S | 139,200 | $3,509,232 |
| Jazz Pharmaceuticals PLC † | 25,024 | 3,541,647 |
| Medicines Co. (The) † S | 129,684 | 3,727,118 |
| Pacira Pharmaceuticals, Inc. † S | 50,749 | 1,626,505 |
| | | 12,404,502 |
| Semiconductors and semiconductor equipment (3.1%) | | |
| Cavium, Inc. † S | 49,700 | 3,428,803 |
| Qorvo, Inc. † | 29,400 | 2,228,814 |
| Teradyne, Inc. | 94,600 | 4,057,394 |
| | | 9,715,011 |
| Software (3.8%) | | |
| Ellie Mae, Inc. † | 28,800 | 2,590,560 |
| Everbridge, Inc. † | 186,703 | 4,973,768 |
| RealPage, Inc. † | 97,500 | 4,221,750 |
| | | 11,786,078 |
| Specialty retail (2.2%) | | |
| Burlington Stores, Inc. † | 29,200 | 2,741,588 |
| Dick’s Sporting Goods, Inc. | 40,100 | 981,247 |
| DSW, Inc. Class A S | 130,800 | 2,504,820 |
| J. Jill, Inc. † S | 150,360 | 768,340 |
| | | 6,995,995 |
| Thrifts and mortgage finance (2.4%) | | |
| Radian Group, Inc. | 350,353 | 7,343,399 |
| | | 7,343,399 |
| Trading companies and distributors (0.5%) | | |
| H&E Equipment Services, Inc. | 48,757 | 1,606,056 |
| | | 1,606,056 |
| Water utilities (0.3%) | | |
| California Water Service Group | 19,100 | 802,199 |
| | | 802,199 |
| Total common stocks (cost $279,489,760) | | $304,471,630 |
| | | | |
| PURCHASED OPTIONS | Expiration | | | |
| OUTSTANDING (—%)* | date/strike | Notional | Contract | |
| Counterparty | price | amount | amount | Value |
| Barclays Bank PLC | | | | |
| Sealed Air Corp. (Call) | Jan-18/$50.00 | $4,081,544 | $92,280 | $24,230 |
| Total purchased options outstanding (cost $83,052) | | | $24,230 |
| | | |
| | Principal amount/ | |
| SHORT-TERM INVESTMENTS (19.9%)* | | shares | Value |
| Putnam Cash Collateral Pool, LLC 1.31% d | Shares | 53,722,086 | $53,722,086 |
| Putnam Short Term Investment Fund 1.22% L | Shares | 7,777,521 | 7,777,521 |
| U.S. Treasury Bills 1.017%, 12/7/17 # | | $307,000 | 306,698 |
| U.S. Treasury Bills 1.050%, 1/11/18 | | 77,000 | 76,842 |
| U.S. Treasury Bills 1.052%, 2/1/18 # | | 17,000 | 16,951 |
| Total short-term investments (cost $61,900,098) | | | $61,900,098 |
| |
| TOTAL INVESTMENTS | |
| Total investments (cost $341,472,910) | $366,395,958 |
|
| Capital Opportunities Fund 23 |
Notes to the fund’s portfolio
Unless noted otherwise, the notes to the fund’s portfolio are for the close of the fund’s reporting period, which ran from May 1, 2017 through October 31, 2017 (the reporting period). Within the following notes to the portfolio, references to “ASC 820” represent Accounting Standards Codification 820 Fair Value Measurements and Disclosures, references to “Putnam Management” represent Putnam Investment Management, LLC, the fund’s manager, an indirect wholly-owned subsidiary of Putnam Investments, LLC and references to “OTC”, if any, represent over-the-counter.
* Percentages indicated are based on net assets of $311,389,749.
† This security is non-income-producing.
# This security, in part or in entirety, was pledged and segregated with the broker to cover margin requirements for futures contracts at the close of the reporting period. Collateral at period end totaled $114,865 and is included in Investments in securities on the Statement of assets and liabilities (Notes 1 and 8).
d Affiliated company. See Notes 1 and 5 to the financial statements regarding securities lending. The rate quoted in the security description is the annualized 7-day yield of the fund at the close of the reporting period.
L Affiliated company (Note 5). The rate quoted in the security description is the annualized 7-day yield of the fund at the close of the reporting period.
S Security on loan, in part or in entirety, at the close of the reporting period (Note 1).
Unless otherwise noted, the rates quoted in Short-term investments security descriptions represent the weighted average yield to maturity.
| | | | | | |
| FUTURES CONTRACTS OUTSTANDING at 10/31/17 (Unaudited) | | | | |
| | | | | | | Unrealized |
| | Number of | Notional | | | Expiration | appreciation/ |
| | contracts | amount | Value | | date | (depreciation) |
| Russell 2000 Index E-Mini (Long) | 16 | $1,202,028 | $1,202,160 | | Dec-17 | $9,082 |
| S&P 500 Index E-Mini (Long) | 3 | 386,289 | 385,905 | | Dec-17 | 249 |
| S&P Mid Cap 400 Index E-Mini (Long) | 4 | 734,040 | 733,560 | | Dec-17 | 3,408 |
| Unrealized appreciation | | | | | | 12,739 |
| Unrealized depreciation | | | | | | — |
| Total | | | | | | $12,739 |
| | | | |
| WRITTEN OPTIONS OUTSTANDING at 10/31/17 (premiums $16,610) (Unaudited) | |
| | Expiration | Notional | Contract | |
| Counterparty | date/strike price | amount | amount | Value |
| Barclays Bank PLC | | | | |
| Sealed Air Corp. (Call) | Jan-18/$55.00 | $4,081,544 | $92,280 | $4,050 |
| Total | | | | $4,050 |
| |
| 24 Capital Opportunities Fund |
ASC 820 establishes a three-level hierarchy for disclosure of fair value measurements. The valuation hierarchy is based upon the transparency of inputs to the valuation of the fund’s investments. The three levels are defined as follows:
Level 1: Valuations based on quoted prices for identical securities in active markets.
Level 2: Valuations based on quoted prices in markets that are not active or for which all significant inputs are observable, either directly or indirectly.
Level 3: Valuations based on inputs that are unobservable and significant to the fair value measurement.
The following is a summary of the inputs used to value the fund’s net assets as of the close of the reporting period:
| | | |
| | | Valuation inputs |
| Investments in securities: | Level 1 | Level 2 | Level 3 |
| Common stocks *: | | | |
| Consumer discretionary | $32,068,785 | $— | $— |
| Consumer staples | 10,802,127 | — | — |
| Energy | 14,058,472 | — | — |
| Financials | 50,692,272 | — | — |
| Health care | 29,543,792 | — | — |
| Industrials | 31,686,106 | — | — |
| Information technology | 62,196,238 | — | — |
| Materials | 36,147,843 | — | — |
| Real estate | 26,670,169 | — | — |
| Utilities | 10,605,826 | — | — |
| Total common stocks | 304,471,630 | — | — |
| | | | |
| Purchased options outstanding | — | 24,230 | — |
| Short-term investments | 7,777,521 | 54,122,577 | — |
| Totals by level | $312,249,151 | $54,146,807 | $— |
| | | |
| | | Valuation inputs |
| Other financial instruments: | Level 1 | Level 2 | Level 3 |
| Futures contracts | $12,739 | $— | $— |
| Written options outstanding | — | (4,050) | — |
| Totals by level | $12,739 | $(4,050) | $— |
* Common stock classifications are presented at the sector level, which may differ from the fund’s portfolio presentation.
During the reporting period, transfers within the fair value hierarchy, if any (other than certain transfers involving non-U.S. equity securities as described in Note 1), did not represent, in the aggregate, more than 1% of the fund’s net assets measured as of the end of the period. Transfers are accounted for using the end of period pricing valuation method.
The accompanying notes are an integral part of these financial statements.
|
| Capital Opportunities Fund 25 |
Statement of assets and liabilities 10/31/17 (Unaudited)
| |
| ASSETS | |
| Investment in securities, at value, including $52,841,970 of securities on loan (Notes 1 and 8): | |
| Unaffiliated issuers (identified cost $279,973,303) | $304,896,351 |
| Affiliated issuers (identified cost $61,499,607) (Notes 1 and 5) | 61,499,607 |
| Cash | 2,462,347 |
| Dividends, interest and other receivables | 183,840 |
| Receivable for shares of the fund sold | 70,181 |
| Receivable for variation margin on futures contracts (Note 1) | 15,288 |
| Prepaid assets | 53,401 |
| Total assets | 369,181,015 |
| |
| LIABILITIES | |
| Payable for investments purchased | 2,935,828 |
| Payable for shares of the fund repurchased | 540,750 |
| Payable for compensation of Manager (Note 2) | 166,642 |
| Payable for custodian fees (Note 2) | 17,496 |
| Payable for investor servicing fees (Note 2) | 86,732 |
| Payable for Trustee compensation and expenses (Note 2) | 160,594 |
| Payable for administrative services (Note 2) | 1,339 |
| Payable for distribution fees (Note 2) | 76,132 |
| Written options outstanding, at value (premiums $16,610) (Note 1) | 4,050 |
| Collateral on securities loaned, at value (Note 1) | 53,722,086 |
| Other accrued expenses | 79,617 |
| Total liabilities | 57,791,266 |
| | |
| Net assets | $311,389,749 |
| |
| REPRESENTED BY | |
| Paid-in capital (Unlimited shares authorized) (Notes 1 and 4) | $238,376,677 |
| Undistributed net investment income (Note 1) | 338,364 |
| Accumulated net realized gain on investments and foreign currency transactions (Note 1) | 47,726,330 |
| Net unrealized appreciation of investments and assets and liabilities in foreign currencies | 24,948,378 |
| Total — Representing net assets applicable to capital shares outstanding | $311,389,749 |
(Continued on next page)
| |
| 26 Capital Opportunities Fund |
Statement of assets and liabilities cont.
| |
| COMPUTATION OF NET ASSET VALUE AND OFFERING PRICE | |
| Net asset value and redemption price per class A share | |
| ($235,336,804 divided by 14,700,643 shares) | $16.01 |
| Offering price per class A share (100/94.25 of $16.01)* | $16.99 |
| Net asset value and offering price per class B share ($7,117,729 divided by 520,988 shares)** | $13.66 |
| Net asset value and offering price per class C share ($17,419,142 divided by 1,256,565 shares)** | $13.86 |
| Net asset value and redemption price per class M share ($3,768,781 divided by 259,198 shares) | $14.54 |
| Offering price per class M share (100/96.50 of $14.54)* | $15.07 |
| Net asset value, offering price and redemption price per class R share | |
| ($9,857,404 divided by 633,447 shares) | $15.56 |
| Net asset value, offering price and redemption price per class R5 share | |
| ($17,384 divided by 1,061 shares) | $16.38 |
| Net asset value, offering price and redemption price per class R6 share | |
| ($10,938,878 divided by 660,256 shares) | $16.57 |
| Net asset value, offering price and redemption price per class Y share | |
| ($26,933,627 divided by 1,631,060 shares) | $16.51 |
* On single retail sales of less than $50,000. On sales of $50,000 or more the offering price is reduced.
** Redemption price per share is equal to net asset value less any applicable contingent deferred sales charge.
The accompanying notes are an integral part of these financial statements.
|
| Capital Opportunities Fund 27 |
Statement of operations Six months ended 10/31/17 (Unaudited)
| |
| INVESTMENT INCOME | |
| Dividends (net of foreign tax of $14,386) | $2,119,540 |
| Interest (including interest income of $50,914 from investments in affiliated issuers) (Note 5) | 52,139 |
| Securities lending (net of expenses) (Notes 1 and 5) | 80,634 |
| Total investment income | 2,252,313 |
| |
| EXPENSES | |
| Compensation of Manager (Note 2) | 995,271 |
| Investor servicing fees (Note 2) | 331,980 |
| Custodian fees (Note 2) | 30,487 |
| Trustee compensation and expenses (Note 2) | 7,635 |
| Distribution fees (Note 2) | 456,234 |
| Administrative services (Note 2) | 4,071 |
| Other | 132,391 |
| Total expenses | 1,958,069 |
| | |
| Expense reduction (Note 2) | (44,118) |
| Net expenses | 1,913,951 |
| |
| Net investment income | 338,362 |
| |
| Net realized gain on securities from unaffiliated issuers (Notes 1 and 3) | 2,046,019 |
| Net realized gain on foreign currency transactions (Note 1) | 6,906 |
| Net realized gain on futures contracts (Note 1) | 835,572 |
| Net unrealized appreciation of securities in unaffiliated issuers during the period | 6,443,893 |
| Net unrealized appreciation of assets and liabilities in foreign currencies during the period | 31 |
| Net unrealized appreciation of futures contracts during the period | 12,739 |
| Net unrealized appreciation of written options during the period | 12,560 |
| Net gain on investments | 9,357,720 |
| |
| Net increase in net assets resulting from operations | $9,696,082 |
The accompanying notes are an integral part of these financial statements.
| |
| 28 Capital Opportunities Fund |
Statement of changes in net assets
| | |
| DECREASE IN NET ASSETS | Six months ended 10/31/17* | Year ended 4/30/17 |
| Operations | | |
| Net investment income | $338,362 | $1,434,743 |
| Net realized gain on investments | | |
| and foreign currency transactions | 2,888,497 | 66,802,570 |
| Net unrealized appreciation (depreciation) of investments | | |
| and assets and liabilities in foreign currencies | 6,469,223 | (8,317,934) |
| Net increase in net assets resulting from operations | 9,696,082 | 59,919,379 |
| Distributions to shareholders (Note 1): | | |
| From ordinary income | | |
| Net investment income | | |
| Class A | — | (1,516,393) |
| Class B | — | (4,178) |
| Class C | — | (16,523) |
| Class M | — | (11,160) |
| Class R | — | (42,061) |
| Class R5 | — | (99,359) |
| Class R6 | — | (104,370) |
| Class Y | — | (299,126) |
| From net realized long-term gain on investments | | |
| Class A | — | (14,719,483) |
| Class B | — | (590,609) |
| Class C | — | (1,487,036) |
| Class M | — | (263,054) |
| Class R | — | (717,939) |
| Class R5 | — | (642,910) |
| Class R6 | — | (615,037) |
| Class Y | — | (2,130,468) |
| Decrease from capital share transactions (Note 4) | (23,574,241) | (39,755,365) |
| Total decrease in net assets | (13,878,159) | (3,095,692) |
| |
| NET ASSETS | | |
| Beginning of period | 325,267,908 | 328,363,600 |
| End of period (including undistributed net investment | | |
| income of $338,364 and $2, respectively) | $311,389,749 | $325,267,908 |
* Unaudited.
The accompanying notes are an integral part of these financial statements.
|
| Capital Opportunities Fund 29 |
Financial highlights (For a common share outstanding throughout the period)
| | | | | | | | | | | | | | |
| | INVESTMENT OPERATIONS | | | LESS DISTRIBUTIONS | | | | | RATIOS AND SUPPLEMENTAL DATA | |
| | | | | | | | | | | | | Ratio of | Ratio of net | |
| | Net asset | | Net realized | | | From | | | | | | expenses | investment | |
| | value, | | and unrealized | Total from | From | net realized | | | Net asset | Total return | Net assets, | to average | income (loss) | Portfolio |
| | beginning | Net investment | gain (loss) on | investment | net investment | gain on | Total | Redemption | value, end | at net asset | end of period | net assets | to average | turnover |
| Period ended | of period | income (loss) a | investments | operations | income | investments | distributions | fees | of period | value (%) b | (in thousands) | (%) c | net assets (%) | (%) |
| Class A | | | | | | | | | | | | | | |
| October 31, 2017** | $15.52 | .02 | .47 | .49 | — | — | — | — | $16.01 | 3.16* | $235,337 | .60 * | .12* | 52* |
| April 30, 2017 | 13.86 | .07 | 2.68 | 2.75 | (.10) | (.99) | (1.09) | — | 15.52 | 20.03 | 231,335 | 1.20 | .46 | 167 |
| April 30, 2016 | 15.53 | .07 | (1.59) | (1.52) | (.13) | (.02) | (.15) | — | 13.86 | (9.84) | 228,846 | 1.16e | .46e | 55 |
| April 30, 2015 | 17.21 | .12 | .79 | .91 | (.08) | (2.51) | (2.59) | — | 15.53 | 5.58 | 289,869 | 1.16 | .72 | 17 |
| April 30, 2014 | 14.01 | .04 | 3.22 | 3.26 | (.06) | — | (.06) | —f | 17.21 | 23.27 | 304,761 | 1.18 | .22 | 90 |
| April 30, 2013 | 12.56 | .07 | 1.39 | 1.46 | (.01) | — | (.01) | —f | 14.01 | 11.59 | 268,152 | 1.25 | .52 | 70 |
| Class B | | | | | | | | | | | | | | |
| October 31, 2017** | $13.29 | (.03) | .40 | .37 | — | — | — | — | $13.66 | 2.78* | $7,118 | .98 * | (.25)* | 52* |
| April 30, 2017 | 12.01 | (.04) | 2.32 | 2.28 | (.01) | (.99) | (1.00) | — | 13.29 | 19.11 | 7,913 | 1.95 | (.28) | 167 |
| April 30, 2016 | 13.48 | (.04) | (1.38) | (1.42) | (.03) | (.02) | (.05) | — | 12.01 | (10.56) | 8,220 | 1.91e | (.29) e | 55 |
| April 30, 2015 | 15.29 | (.01) | .71 | .70 | — | (2.51) | (2.51) | — | 13.48 | 4.84 | 11,207 | 1.91 | (.04) | 17 |
| April 30, 2014 | 12.50 | (.07) | 2.86 | 2.79 | — | — | — | —f | 15.29 | 22.32 | 12,727 | 1.93 | (.53) | 90 |
| April 30, 2013 | 11.29 | (.03) | 1.24 | 1.21 | — | — | — | —f | 12.50 | 10.72 | 12,546 | 2.00 | (.24) | 70 |
| Class C | | | | | | | | | | | | | | |
| October 31, 2017** | $13.49 | (.03) | .40 | .37 | — | — | — | — | $13.86 | 2.74* | $17,419 | .98 * | (.25)* | 52* |
| April 30, 2017 | 12.18 | (.04) | 2.35 | 2.31 | (.01) | (.99) | (1.00) | — | 13.49 | 19.13 | 20,371 | 1.95 | (.29) | 167 |
| April 30, 2016 | 13.67 | (.04) | (1.40) | (1.44) | (.03) | (.02) | (.05) | — | 12.18 | (10.57) | 20,113 | 1.91e | (.29) e | 55 |
| April 30, 2015 | 15.47 | (.01) | .72 | .71 | — | (2.51) | (2.51) | — | 13.67 | 4.84 | 27,815 | 1.91 | (.03) | 17 |
| April 30, 2014 | 12.64 | (.08) | 2.91 | 2.83 | — | — | — | —f | 15.47 | 22.39 | 28,256 | 1.93 | (.53) | 90 |
| April 30, 2013 | 11.42 | (.03) | 1.25 | 1.22 | — | — | — | —f | 12.64 | 10.68 | 24,203 | 2.00 | (.24) | 70 |
| Class M | | | | | | | | | | | | | | |
| October 31, 2017** | $14.13 | (.02) | .43 | .41 | — | — | — | — | $14.54 | 2.90 * | $3,769 | .86* | (.13)* | 52* |
| April 30, 2017 | 12.71 | (.01) | 2.46 | 2.45 | (.04) | (.99) | (1.03) | — | 14.13 | 19.45 | 3,977 | 1.70 | (.05) | 167 |
| April 30, 2016 | 14.26 | (.01) | (1.46) | (1.47) | (.06) | (.02) | (.08) | — | 12.71 | (10.32) | 3,661 | 1.66e | (.04) e | 55 |
| April 30, 2015 | 16.01 | .03 | .73 | .76 | — | (2.51) | (2.51) | — | 14.26 | 5.01 | 4,417 | 1.66 | .21 | 17 |
| April 30, 2014 | 13.05 | (.04) | 3.00 | 2.96 | — | — | — | —f | 16.01 | 22.68 | 4,945 | 1.68 | (.28) | 90 |
| April 30, 2013 | 11.75 | —f | 1.30 | 1.30 | — | — | — | —f | 13.05 | 11.06 | 4,323 | 1.75 | .01 | 70 |
| Class R | | | | | | | | | | | | | | |
| October 31, 2017** | $15.10 | —f | .46 | .46 | — | — | — | — | $15.56 | 3.05* | $9,857 | .73* | — *f | 52* |
| April 30, 2017 | 13.51 | .03 | 2.61 | 2.64 | (.06) | (.99) | (1.05) | — | 15.10 | 19.68 | 10,097 | 1.45 | .23 | 167 |
| April 30, 2016 | 15.12 | .03 | (1.56) | (1.53) | (.06) | (.02) | (.08) | — | 13.51 | (10.10) | 12,015 | 1.41e | .24e | 55 |
| April 30, 2015 | 16.82 | .08 | .78 | .86 | (.05) | (2.51) | (2.56) | — | 15.12 | 5.36 | 22,148 | 1.41 | .47 | 17 |
| April 30, 2014 | 13.71 | —f | 3.14 | 3.14 | (.03) | — | (.03) | —f | 16.82 | 22.93 | 21,754 | 1.43 | (.03) | 90 |
| April 30, 2013 | 12.32 | .03 | 1.36 | 1.39 | — | — | — | —f | 13.71 | 11.28 | 17,077 | 1.50 | .26 | 70 |
See notes to financial highlights at the end of this section.
The accompanying notes are an integral part of these financial statements.
| |
| 30 Capital Opportunities Fund | Capital Opportunities Fund 31 |
Financial highlights cont.
| | | | | | | | | | | | | | |
| | INVESTMENT OPERATIONS | | | LESS DISTRIBUTIONS | | | | | RATIOS AND SUPPLEMENTAL DATA | |
| | | | | | | | | | | | | Ratio of | Ratio of net | |
| | Net asset | | Net realized | | | From | | | | | | expenses | investment | |
| | value, | | and unrealized | Total from | From | net realized | | | Net asset | Total return | Net assets, | to average | income (loss) | Portfolio |
| | beginning | Net investment | gain (loss) on | investment | net investment | gain on | Total | Redemption | value, end | at net asset | end of period | net assets | to average | turnover |
| Period ended | of period | income (loss) a | investments | operations | income | investments | distributions | fees | of period | value (%) b | (in thousands) | (%) c | net assets (%) | (%) |
| Class R5 | | | | | | | | | | | | | | |
| October 31, 2017** | $15.85 | .05 | .48 | .53 | — | — | — | — | $16.38 | 3.34* | $17 | .45* | .28* | 52* |
| April 30, 2017 | 14.27 | .16d | 2.56 | 2.72 | (.15) | (.99) | (1.14) | — | 15.85 | 19.18 | 17 | .88 | 1.09d | 167 |
| April 30, 2016 | 15.99 | .11 | (1.64) | (1.53) | (.17) | (.02) | (.19) | — | 14.27 | (9.59) | 9,295 | .85e | .77e | 55 |
| April 30, 2015 | 17.65 | .17 | .83 | 1.00 | (.15) | (2.51) | (2.66) | — | 15.99 | 5.96 | 10,891 | .85 | 1.02 | 17 |
| April 30, 2014 | 14.37 | (.04) g | 3.44 | 3.40 | (.12) | — | (.12) | —f | 17.65 | 23.69 | 11,497 | .84 | (.26) g | 90 |
| April 30, 2013† | 12.08 | .11 | 2.20 | 2.31 | (.02) | — | (.02) | —f | 14.37 | 19.11* | 12 | .71* | .81* | 70 |
| Class R6 | | | | | | | | | | | | | | |
| October 31, 2017** | $16.03 | .05 | .49 | .54 | — | — | — | — | $16.57 | 3.37* | $10,939 | .40 * | .33* | 52* |
| April 30, 2017 | 14.28 | .13 | 2.78 | 2.91 | (.17) | (.99) | (1.16) | — | 16.03 | 20.56 | 10,525 | .78 | .87 | 167 |
| April 30, 2016 | 16.00 | .13 | (1.64) | (1.51) | (.19) | (.02) | (.21) | — | 14.28 | (9.48) | 9,617 | .75e | .86e | 55 |
| April 30, 2015 | 17.66 | .19 | .82 | 1.01 | (.16) | (2.51) | (2.67) | — | 16.00 | 6.01 | 11,625 | .75 | 1.12 | 17 |
| April 30, 2014 | 14.38 | .11 | 3.30 | 3.41 | (.13) | — | (.13) | —f | 17.66 | 23.80 | 10,785 | .74 | .66 | 90 |
| April 30, 2013† | 12.08 | .04 | 2.28 | 2.32 | (.02) | — | (.02) | —f | 14.38 | 19.25* | 8,922 | .63* | .25* | 70 |
| Class Y | | | | | | | | | | | | | | |
| October 31, 2017** | $15.99 | .04 | .48 | .52 | — | — | — | — | $16.51 | 3.25* | $26,934 | .48* | .25* | 52* |
| April 30, 2017 | 14.24 | .10 | 2.78 | 2.88 | (.14) | (.99) | (1.13) | — | 15.99 | 20.40 | 41,033 | .95 | .68 | 167 |
| April 30, 2016 | 15.96 | .11 | (1.65) | (1.54) | (.16) | (.02) | (.18) | — | 14.24 | (9.66) | 36,596 | .91e | .71e | 55 |
| April 30, 2015 | 17.62 | .16 | .82 | .98 | (.13) | (2.51) | (2.64) | — | 15.96 | 5.82 | 52,940 | .91 | .97 | 17 |
| April 30, 2014 | 14.34 | .08 | 3.29 | 3.37 | (.09) | — | (.09) | —f | 17.62 | 23.56 | 49,516 | .93 | .48 | 90 |
| April 30, 2013 | 12.85 | .10 | 1.43 | 1.53 | (.04) | — | (.04) | —f | 14.34 | 11.91 | 49,378 | 1.00 | .77 | 70 |
* Not annualized.
** Unaudited.
† For the period July 3, 2012 (commencement of operations) to April 30, 2013.
a Per share net investment income (loss) has been determined on the basis of the weighted average number of shares outstanding during the period.
b Total return assumes dividend reinvestment and does not reflect the effect of sales charges.
c Includes amounts paid through expense offset and/or brokerage/service arrangements, if any (Note 2). Also excludes acquired fund fees and expenses, if any.
d The net investment income ratio and per share amount shown for the period ending April 30, 2017 may not correspond with the expected class specific differences for the period due to the timing of redemptions from the class.
e Reflects a voluntary waiver of certain fund expenses in effect during the period . As a result of such waivers, the expenses of each class reflect a reduction of less than 0.01% as a percentage of average net assets.
f Amount represents less than $0.01 per share.
g The net investment income ratio and per share amount shown for the period ending April 30, 2014 may not correspond with the expected class specific differences for the period due to the timing of subscriptions into the class.
The accompanying notes are an integral part of these financial statements.
| |
| 32 Capital Opportunities Fund | Capital Opportunities Fund 33 |
Notes to financial statements 10/31/17 (Unaudited)
Within the following Notes to financial statements, references to “State Street” represent State Street Bank and Trust Company, references to “the SEC” represent the Securities and Exchange Commission, references to “Putnam Management” represent Putnam Investment Management, LLC, the fund’s manager, an indirect wholly-owned subsidiary of Putnam Investments, LLC and references to “OTC”, if any, represent over-the-counter. Unless otherwise noted, the “reporting period” represents the period from May 1, 2017 through October 31, 2017.
Putnam Capital Opportunities Fund (the fund) is a diversified series of Putnam Investment Funds (the Trust), a Massachusetts business trust registered under the Investment Company Act of 1940, as amended, as an open-end management investment company. The goal of the fund is to seek long-term growth of capital. The fund invests mainly in common stocks (growth or value stocks or both) of small and midsize U.S. companies that Putnam Management believes have favorable investment potential. For example, the fund may purchase stocks of companies with stock prices that reflect a value lower than that which Putnam Management places on the company. Putnam Management may also consider other factors it believes will cause the stock price to rise. Putnam Management may consider, among other factors, a company’s valuation, financial strength, growth potential, competitive position in its industry, projected future earnings, cash flows and dividends when deciding whether to buy or sell investments.
The fund offers class A, class B, class C, class M, class R, class R5, class R6 and class Y shares. The fund registered class T shares in February 2017, however, as of the date of this report, class T shares had not commenced operations and are not available for purchase. Purchases of class B shares are closed to new and existing investors except by exchange from class B shares of another Putnam fund or through dividend and/or capital gains reinvestment. Class A and class M shares are sold with a maximum front-end sales charge of 5.75% and 3.50%, respectively. Class A shares generally are not subject to a contingent deferred sales charge, and class M, class R, class R5, class R6 and class Y shares are not subject to a contingent deferred sales charge. Class B shares, which convert to class A shares after approximately eight years, are not subject to a front-end sales charge and are subject to a contingent deferred sales charge if those shares are redeemed within six years of purchase. Class C shares are subject to a one-year 1.00% contingent deferred sales charge and do not convert to class A shares. Class R shares, which are not available to all investors, are sold at net asset value. The expenses for class A, class B, class C, class M and class R shares may differ based on the distribution fee of each class, which is identified in Note 2. Class R5, class R6 and class Y shares, which are sold at net asset value, are generally subject to the same expenses as class A, class B, class C, class M and class R shares, but do not bear a distribution fee and in the case of class R5 and class R6 shares, bear a lower investor servicing fee, which is identified in Note 2. Class R5, class R6 and class Y shares are not available to all investors.
In the normal course of business, the fund enters into contracts that may include agreements to indemnify another party under given circumstances. The fund’s maximum exposure under these arrangements is unknown as this would involve future claims that may be, but have not yet been, made against the fund. However, the fund’s management team expects the risk of material loss to be remote.
The fund has entered into contractual arrangements with an investment adviser, administrator, distributor, shareholder servicing agent and custodian, who each provide services to the fund. Unless expressly stated otherwise, shareholders are not parties to, or intended beneficiaries of these contractual arrangements, and these contractual arrangements are not intended to create any shareholder right to enforce them against the service providers or to seek any remedy under them against the service providers, either directly or on behalf of the fund.
Under the fund’s Declaration of Trust, any claims asserted against or on behalf of the Putnam Funds, including claims against Trustees and Officers, must be brought in state and federal courts located within the Commonwealth of Massachusetts.
Note 1: Significant accounting policies
The following is a summary of significant accounting policies consistently followed by the fund in the preparation of its financial statements. The preparation of financial statements is in conformity with accounting principles generally accepted in the United States of America and requires management to make estimates and assumptions that affect the reported amounts of assets and liabilities in the financial statements and the reported amounts of increases and decreases in net assets from operations. Actual results could differ from those estimates. Subsequent events after the Statement of assets and liabilities date through the date that the financial statements were issued have been evaluated in the preparation of the financial statements.
Investment income, realized and unrealized gains and losses and expenses of the fund are borne pro-rata based on the relative net assets of each class to the total net assets of the fund, except that each class bears expenses
| |
| 34 Capital Opportunities Fund |
unique to that class (including the distribution fees applicable to such classes). Each class votes as a class only with respect to its own distribution plan or other matters on which a class vote is required by law or determined by the Trustees. If the fund were liquidated, shares of each class would receive their pro-rata share of the net assets of the fund. In addition, the Trustees declare separate dividends on each class of shares.
Security valuation Portfolio securities and other investments are valued using policies and procedures adopted by the Board of Trustees. The Trustees have formed a Pricing Committee to oversee the implementation of these procedures and have delegated responsibility for valuing the fund’s assets in accordance with these procedures to Putnam Management. Putnam Management has established an internal Valuation Committee that is responsible for making fair value determinations, evaluating the effectiveness of the pricing policies of the fund and reporting to the Pricing Committee.
Investments for which market quotations are readily available are valued at the last reported sales price on their principal exchange, or official closing price for certain markets, and are classified as Level 1 securities under Accounting Standards Codification 820 Fair Value Measurements and Disclosures (ASC 820). If no sales are reported, as in the case of some securities that are traded OTC, a security is valued at its last reported bid price and is generally categorized as a Level 2 security.
Investments in open-end investment companies (excluding exchange-traded funds), if any, which can be classified as Level 1 or Level 2 securities, are valued based on their net asset value. The net asset value of such investment companies equals the total value of their assets less their liabilities and divided by the number of their outstanding shares.
Many securities markets and exchanges outside the U.S. close prior to the scheduled close of the New York Stock Exchange and therefore the closing prices for securities in such markets or on such exchanges may not fully reflect events that occur after such close but before the scheduled close of the New York Stock Exchange. Accordingly, on certain days, the fund will fair value certain foreign equity securities taking into account multiple factors including movements in the U.S. securities markets, currency valuations and comparisons to the valuation of American Depository Receipts, exchange-traded funds and futures contracts. The foreign equity securities, which would generally be classified as Level 1 securities, will be transferred to Level 2 of the fair value hierarchy when they are valued at fair value. The number of days on which fair value prices will be used will depend on market activity and it is possible that fair value prices will be used by the fund to a significant extent. Securities quoted in foreign currencies, if any, are translated into U.S. dollars at the current exchange rate. Short-term securities with remaining maturities of 60 days or less are valued using an independent pricing service approved by the Trustees, and are classified as Level 2 securities.
To the extent a pricing service or dealer is unable to value a security or provides a valuation that Putnam Management does not believe accurately reflects the security’s fair value, the security will be valued at fair value by Putnam Management in accordance with policies and procedures approved by the Trustees. Certain investments, including certain restricted and illiquid securities and derivatives, are also valued at fair value following procedures approved by the Trustees. These valuations consider such factors as significant market or specific security events such as interest rate or credit quality changes, various relationships with other securities, discount rates, U.S. Treasury, U.S. swap and credit yields, index levels, convexity exposures, recovery rates, sales and other multiples and resale restrictions. These securities are classified as Level 2 or as Level 3 depending on the priority of the significant inputs.
To assess the continuing appropriateness of fair valuations, the Valuation Committee reviews and affirms the reasonableness of such valuations on a regular basis after considering all relevant information that is reasonably available. Such valuations and procedures are reviewed periodically by the Trustees. The fair value of securities is generally determined as the amount that the fund could reasonably expect to realize from an orderly disposition of such securities over a reasonable period of time. By its nature, a fair value price is a good faith estimate of the value of a security in a current sale and does not reflect an actual market price, which may be different by a material amount.
Security transactions and related investment income Security transactions are recorded on the trade date (the date the order to buy or sell is executed). Gains or losses on securities sold are determined on the identified cost basis.
Interest income, net of any applicable withholding taxes, is recorded on the accrual basis. Dividend income, net of any applicable withholding taxes, is recognized on the ex-dividend date except that certain dividends from foreign securities, if any, are recognized as soon as the fund is informed of the ex-dividend date. Non-cash dividends, if any, are recorded at the fair value of the securities received. Dividends representing a return of capital or capital gains, if any, are reflected as a reduction of cost and/or as a realized gain.
|
| Capital Opportunities Fund 35 |
Foreign currency translation The accounting records of the fund are maintained in U.S. dollars. The fair value of foreign securities, currency holdings, and other assets and liabilities is recorded in the books and records of the fund after translation to U.S. dollars based on the exchange rates on that day. The cost of each security is determined using historical exchange rates. Income and withholding taxes are translated at prevailing exchange rates when earned or incurred. The fund does not isolate that portion of realized or unrealized gains or losses resulting from changes in the foreign exchange rate on investments from fluctuations arising from changes in the market prices of the securities. Such gains and losses are included with the net realized and unrealized gain or loss on investments. Net realized gains and losses on foreign currency transactions represent net realized exchange gains or losses on disposition of foreign currencies, currency gains and losses realized between the trade and settlement dates on securities transactions and the difference between the amount of investment income and foreign withholding taxes recorded on the fund’s books and the U.S. dollar equivalent amounts actually received or paid. Net unrealized appreciation and depreciation of assets and liabilities in foreign currencies arise from changes in the value of assets and liabilities other than investments at the period end, resulting from changes in the exchange rate.
Options contracts The fund uses options contracts to hedge against changes in values of securities it owns, owned or expects to own and to manage downside risk.
The potential risk to the fund is that the change in value of options contracts may not correspond to the change in value of the hedged instruments. In addition, losses may arise from changes in the value of the underlying instruments if there is an illiquid secondary market for the contracts, if interest or exchange rates move unexpectedly or if the counterparty to the contract is unable to perform. Realized gains and losses on purchased options are included in realized gains and losses on investment securities. If a written call option is exercised, the premium originally received is recorded as an addition to sales proceeds. If a written put option is exercised, the premium originally received is recorded as a reduction to the cost of investments.
Exchange-traded options are valued at the last sale price or, if no sales are reported, the last bid price for purchased options and the last ask price for written options. OTC traded options are valued using prices supplied by dealers.
Options on swaps are similar to options on securities except that the premium paid or received is to buy or grant the right to enter into a previously agreed upon interest rate or credit default contract. Forward premium swap option contracts include premiums that have extended settlement dates. The delayed settlement of the premiums is factored into the daily valuation of the option contracts. In the case of interest rate cap and floor contracts, in return for a premium, ongoing payments between two parties are based on interest rates exceeding a specified rate, in the case of a cap contract, or falling below a specified rate in the case of a floor contract.
Written option contracts outstanding at period end, if any, are listed after the fund’s portfolio.
Futures contracts The fund uses futures contracts to equitize cash.
The potential risk to the fund is that the change in value of futures contracts may not correspond to the change in value of the hedged instruments. In addition, losses may arise from changes in the value of the underlying instruments, if there is an illiquid secondary market for the contracts, if interest or exchange rates move unexpectedly or if the counterparty to the contract is unable to perform. With futures, there is minimal counterparty credit risk to the fund since futures are exchange traded and the exchange’s clearinghouse, as counterparty to all exchange traded futures, guarantees the futures against default. Risks may exceed amounts recognized on the Statement of assets and liabilities. When the contract is closed, the fund records a realized gain or loss equal to the difference between the value of the contract at the time it was opened and the value at the time it was closed.
Futures contracts are valued at the quoted daily settlement prices established by the exchange on which they trade. The fund and the broker agree to exchange an amount of cash equal to the daily fluctuation in the value of the futures contract. Such receipts or payments are known as “variation margin.”
Futures contracts outstanding at period end, if any, are listed after the fund’s portfolio.
Master agreements The fund is a party to ISDA (International Swaps and Derivatives Association, Inc.) Master Agreements (Master Agreements) with certain counterparties that govern OTC derivative and foreign exchange contracts entered into from time to time. The Master Agreements may contain provisions regarding, among other things, the parties’ general obligations, representations, agreements, collateral requirements, events of default and early termination. With respect to certain counterparties, in accordance with the terms of the Master Agreements, collateral posted to the fund is held in a segregated account by the fund’s custodian and, with respect to those amounts which can be sold or repledged, is presented in the fund’s portfolio.
| |
| 36 Capital Opportunities Fund |
Collateral pledged by the fund is segregated by the fund’s custodian and identified in the fund’s portfolio. Collateral can be in the form of cash or debt securities issued by the U.S. Government or related agencies or other securities as agreed to by the fund and the applicable counterparty. Collateral requirements are determined based on the fund’s net position with each counterparty.
Termination events applicable to the fund may occur upon a decline in the fund’s net assets below a specified threshold over a certain period of time. Termination events applicable to counterparties may occur upon a decline in the counterparty’s long-term and short-term credit ratings below a specified level. In each case, upon occurrence, the other party may elect to terminate early and cause settlement of all derivative and foreign exchange contracts outstanding, including the payment of any losses and costs resulting from such early termination, as reasonably determined by the terminating party. Any decision by one or more of the fund’s counterparties to elect early termination could impact the fund’s future derivative activity.
At the close of the reporting period, the fund did not have a net liability position on open derivative contracts subject to the Master Agreements.
Securities lending The fund may lend securities, through its agent, to qualified borrowers in order to earn additional income. The loans are collateralized by cash in an amount at least equal to the fair value of the securities loaned. The fair value of securities loaned is determined daily and any additional required collateral is allocated to the fund on the next business day. The remaining maturities of the securities lending transactions are considered overnight and continuous. The risk of borrower default will be borne by the fund’s agent; the fund will bear the risk of loss with respect to the investment of the cash collateral. Income from securities lending, net of expenses, is included in investment income on the Statement of operations. Cash collateral is invested in Putnam Cash Collateral Pool, LLC, a limited liability company managed by an affiliate of Putnam Management. Investments in Putnam Cash Collateral Pool, LLC are valued at its closing net asset value each business day. There are no management fees charged to Putnam Cash Collateral Pool, LLC. At the close of the reporting period, the fund received cash collateral of $53,722,086 and the value of securities loaned amounted to $52,841,970.
Interfund lending The fund, along with other Putnam funds, may participate in an interfund lending program pursuant to an exemptive order issued by the SEC. This program allows the fund to borrow from or lend to other Putnam funds that permit such transactions. Interfund lending transactions are subject to each fund’s investment policies and borrowing and lending limits. Interest earned or paid on the interfund lending transaction will be based on the average of certain current market rates. During the reporting period, the fund did not utilize the program.
Lines of credit The fund participates, along with other Putnam funds, in a $317.5 million unsecured committed line of credit and a $235.5 million unsecured uncommitted line of credit, both provided by State Street. Borrowings may be made for temporary or emergency purposes, including the funding of shareholder redemption requests and trade settlements. Interest is charged to the fund based on the fund’s borrowing at a rate equal to 1.25% plus the higher of (1) the Federal Funds rate and (2) the overnight LIBOR for the committed line of credit and the Federal Funds rate plus 1.30% for the uncommitted line of credit. A closing fee equal to 0.04% of the committed line of credit plus a $25,000 flat fee and 0.04% of the uncommitted line of credit has been paid by the participating funds. In addition, a commitment fee of 0.21% per annum on any unutilized portion of the committed line of credit is allocated to the participating funds based on their relative net assets and paid quarterly. During the reporting period, the fund had no borrowings against these arrangements.
Federal taxes It is the policy of the fund to distribute all of its taxable income within the prescribed time period and otherwise comply with the provisions of the Internal Revenue Code of 1986, as amended (the Code), applicable to regulated investment companies. It is also the intention of the fund to distribute an amount sufficient to avoid imposition of any excise tax under Section 4982 of the Code.
The fund is subject to the provisions of Accounting Standards Codification 740 Income Taxes (ASC 740). ASC 740 sets forth a minimum threshold for financial statement recognition of the benefit of a tax position taken or expected to be taken in a tax return. The fund did not have a liability to record for any unrecognized tax benefits in the accompanying financial statements. No provision has been made for federal taxes on income, capital gains or unrealized appreciation on securities held nor for excise tax on income and capital gains. Each of the fund’s federal tax returns for the prior three fiscal years remains subject to examination by the Internal Revenue Service.
The fund may also be subject to taxes imposed by governments of countries in which it invests. Such taxes are generally based on either income or gains earned or repatriated. The fund accrues and applies such taxes to net investment income, net realized gains and net unrealized gains as income and/or capital gains are earned. In some cases, the fund may be entitled to reclaim all or a portion of such taxes, and such reclaim amounts, if any,
|
| Capital Opportunities Fund 37 |
are reflected as an asset on the fund’s books. In many cases, however, the fund may not receive such amounts for an extended period of time, depending on the country of investment.
Tax cost of investments includes adjustments to net unrealized appreciation (depreciation) which may not necessarily be final tax cost basis adjustments, but closely approximate the tax basis unrealized gains and losses that may be realized and distributed to shareholders. The aggregate identified cost on a tax basis is $341,801,706, resulting in gross unrealized appreciation and depreciation of $36,276,328 and $11,673,387, respectively, or net unrealized appreciation of $24,602,941.
Distributions to shareholders Distributions to shareholders from net investment income are recorded by the fund on the ex-dividend date. Distributions from capital gains, if any, are recorded on the ex-dividend date and paid at least annually. The amount and character of income and gains to be distributed are determined in accordance with income tax regulations, which may differ from generally accepted accounting principles. Dividend sources are estimated at the time of declaration. Actual results may vary. Any non-taxable return of capital cannot be determined until final tax calculations are completed after the end of the fund’s fiscal year. Reclassifications are made to the fund’s capital accounts to reflect income and gains available for distribution (or available capital loss carryovers) under income tax regulations.
Expenses of the Trust Expenses directly charged or attributable to any fund will be paid from the assets of that fund. Generally, expenses of the Trust will be allocated among and charged to the assets of each fund on a basis that the Trustees deem fair and equitable, which may be based on the relative assets of each fund or the nature of the services performed and relative applicability to each fund.
Note 2: Management fee, administrative services and other transactions
The fund pays Putnam Management a management fee (based on the fund’s average net assets and computed and paid monthly) at annual rates that may vary based on the average of the aggregate net assets of all open-end mutual funds sponsored by Putnam Management (excluding net assets of funds that are invested in, or that are invested in by, other Putnam funds to the extent necessary to avoid “double counting” of those assets). Such annual rates may vary as follows:
| | | | |
| 0.780% | of the first $5 billion, | | 0.580% | of the next $50 billion, |
| 0.730% | of the next $5 billion, | | 0.560% | of the next $50 billion, |
| 0.680% | of the next $10 billion, | | 0.550% | of the next $100 billion and |
| 0.630% | of the next $10 billion, | | 0.545% | of any excess thereafter. |
For the reporting period, the management fee represented an effective rate (excluding the impact from any expense waivers in effect) of 0.315% of the fund’s average net assets.
Putnam Management has contractually agreed, through August 30, 2018, to waive fees or reimburse the fund’s expenses to the extent necessary to limit the cumulative expenses of the fund, exclusive of brokerage, interest, taxes, investment-related expenses, extraordinary expenses, acquired fund fees and expenses and payments under the fund’s investor servicing contract, investment management contract and distribution plans, on a fiscal year-to-date basis to an annual rate of 0.20% of the fund’s average net assets over such fiscal year-to-date period. During the reporting period, the fund’s expenses were not reduced as a result of this limit.
Putnam Investments Limited (PIL), an affiliate of Putnam Management, is authorized by the Trustees to manage a separate portion of the assets of the fund as determined by Putnam Management from time to time. PIL did not manage any portion of the assets of the fund during the reporting period. If Putnam Management were to engage the services of PIL, Putnam Management would pay a quarterly sub-management fee to PIL for its services at an annual rate of 0.35% of the average net assets of the portion of the fund managed by PIL.
The fund reimburses Putnam Management an allocated amount for the compensation and related expenses of certain officers of the fund and their staff who provide administrative services to the fund. The aggregate amount of all such reimbursements is determined annually by the Trustees.
Custodial functions for the fund’s assets are provided by State Street. Custody fees are based on the fund’s asset level, the number of its security holdings and transaction volumes.
Putnam Investor Services, Inc., an affiliate of Putnam Management, provides investor servicing agent functions to the fund. Putnam Investor Services, Inc. received fees for investor servicing for class A, class B, class C, class M, class R and class Y shares that included (1) a per account fee for each direct and underlying non-defined
| |
| 38 Capital Opportunities Fund |
contribution account (“retail account”) of the fund; (2) a specified rate of the fund’s assets attributable to defined contribution plan accounts; and (3) a specified rate based on the average net assets in retail accounts. Putnam Investor Services, Inc. has agreed that the aggregate investor servicing fees for each fund’s retail and defined contribution accounts for these share classes will not exceed an annual rate of 0.25% of the fund’s average assets attributable to such accounts.
Class R5 shares paid a monthly fee based on the average net assets of class R5 shares at an annual rate of 0.15%.
Class R6 shares paid a monthly fee based on the average net assets of class R6 shares at an annual rate of 0.05%.
During the reporting period, the expenses for each class of shares related to investor servicing fees were as follows:
| | | | |
| Class A | $243,591 | | Class R5 | 13 |
| Class B | 8,030 | | Class R6 | 2,677 |
| Class C | 20,139 | | Class Y | 42,661 |
| Class M | 4,182 | | Total | $331,980 |
| Class R | 10,687 | | | |
The fund has entered into expense offset arrangements with Putnam Investor Services, Inc. and State Street whereby Putnam Investor Services, Inc.’s and State Street’s fees are reduced by credits allowed on cash balances. The fund also reduced expenses through brokerage/service arrangements. For the reporting period, the fund’s expenses were reduced by $506 under the expense offset arrangements and by $43,612 under the brokerage/service arrangements.
Each Independent Trustee of the fund receives an annual Trustee fee, of which $233, as a quarterly retainer, has been allocated to the fund, and an additional fee for each Trustees meeting attended. Trustees also are reimbursed for expenses they incur relating to their services as Trustees.
The fund has adopted a Trustee Fee Deferral Plan (the Deferral Plan) which allows the Trustees to defer the receipt of all or a portion of Trustees fees payable on or after July 1, 1995. The deferred fees remain invested in certain Putnam funds until distribution in accordance with the Deferral Plan.
The fund has adopted an unfunded noncontributory defined benefit pension plan (the Pension Plan) covering all Trustees of the fund who have served as a Trustee for at least five years and were first elected prior to 2004. Benefits under the Pension Plan are equal to 50% of the Trustee’s average annual attendance and retainer fees for the three years ended December 31, 2005. The retirement benefit is payable during a Trustee’s lifetime, beginning the year following retirement, for the number of years of service through December 31, 2006. Pension expense for the fund is included in Trustee compensation and expenses in the Statement of operations. Accrued pension liability is included in Payable for Trustee compensation and expenses in the Statement of assets and liabilities. The Trustees have terminated the Pension Plan with respect to any Trustee first elected after 2003.
The fund has adopted distribution plans (the Plans) with respect to the following share classes pursuant to Rule 12b–1 under the Investment Company Act of 1940. The purpose of the Plans is to compensate Putnam Retail Management Limited Partnership, an indirect wholly-owned subsidiary of Putnam Investments, LLC, for services provided and expenses incurred in distributing shares of the fund. The Plans provide payments by the fund to Putnam Retail Management Limited Partnership at an annual rate of up to the following amounts (“Maximum %”) of the average net assets attributable to each class. The Trustees have approved payment by the fund at the following annual rate (“Approved %”) of the average net assets attributable to each class. During the reporting period, the class-specific expenses related to distribution fees were as follows:
| | | |
| | Maximum % | Approved % | Amount |
| Class A | 0.35% | 0.25% | $284,730 |
| Class B | 1.00% | 1.00% | 37,578 |
| Class C | 1.00% | 1.00% | 94,270 |
| Class M | 1.00% | 0.75% | 14,671 |
| Class R | 1.00% | 0.50% | 24,985 |
| Total | | | $456,234 |
|
| Capital Opportunities Fund 39 |
For the reporting period, Putnam Retail Management Limited Partnership, acting as underwriter, received net commissions of $9,676 and $42 from the sale of class A and class M shares, respectively, and received $1,491 and $69 in contingent deferred sales charges from redemptions of class B and class C shares, respectively.
A deferred sales charge of up to 1.00% is assessed on certain redemptions of class A shares. For the reporting period, Putnam Retail Management Limited Partnership, acting as underwriter, received no monies on class A redemptions.
Note 3: Purchases and sales of securities
During the reporting period, the cost of purchases and the proceeds from sales, excluding short-term investments, were as follows:
| | |
| | Cost of purchases | Proceeds from sales |
| Investments in securities (Long-term) | $161,575,214 | $188,106,700 |
| U.S. government securities (Long-term) | — | — |
| Total | $161,575,214 | $188,106,700 |
The fund may purchase or sell investments from or to other Putnam funds in the ordinary course of business, which can reduce the fund’s transaction costs, at prices determined in accordance with SEC requirements and policies approved by the Trustees. During the reporting period, purchases or sales of long-term securities from or to other Putnam funds, if any, did not represent more than 5% of the fund’s total cost of purchases and/or total proceeds from sales.
Note 4: Capital shares
At the close of the reporting period, there were an unlimited number of shares of beneficial interest authorized. Transactions in capital shares were as follows:
| | | | |
| | SIX MONTHS ENDED 10/31/17 | YEAR ENDED 4/30/17 |
| Class A | Shares | Amount | Shares | Amount |
| Shares sold | 1,215,482 | $19,321,402 | 1,079,560 | $16,228,777 |
| Shares issued in connection with | | | | |
| reinvestment of distributions | — | — | 1,021,903 | 15,522,710 |
| | 1,215,482 | 19,321,402 | 2,101,463 | 31,751,487 |
| Shares repurchased | (1,421,603) | (22,313,510) | (3,708,840) | (55,482,679) |
| Net decrease | (206,121) | $(2,992,108) | (1,607,377) | $(23,731,192) |
| |
| | SIX MONTHS ENDED 10/31/17 | YEAR ENDED 4/30/17 |
| Class B | Shares | Amount | Shares | Amount |
| Shares sold | 9,154 | $121,662 | 67,279 | $869,250 |
| Shares issued in connection with | | | | |
| reinvestment of distributions | — | — | 44,201 | 576,820 |
| | 9,154 | 121,662 | 111,480 | 1,446,070 |
| Shares repurchased | (83,384) | (1,116,092) | (200,621) | (2,580,842) |
| Net decrease | (74,230) | $(994,430) | (89,141) | $(1,134,772) |
| |
| 40 Capital Opportunities Fund |
| | | | |
| | SIX MONTHS ENDED 10/31/17 | YEAR ENDED 4/30/17 |
| Class C | Shares | Amount | Shares | Amount |
| Shares sold | 66,774 | $904,686 | 200,635 | $2,669,652 |
| Shares issued in connection with | | | | |
| reinvestment of distributions | — | — | 107,161 | 1,418,807 |
| | 66,774 | 904,686 | 307,796 | 4,088,459 |
| Shares repurchased | (320,355) | (4,344,037) | (449,267) | (5,892,174) |
| Net decrease | (253,581) | $(3,439,351) | (141,471) | $(1,803,715) |
| |
| | SIX MONTHS ENDED 10/31/17 | YEAR ENDED 4/30/17 |
| Class M | Shares | Amount | Shares | Amount |
| Shares sold | 5,949 | $85,699 | 21,525 | $298,296 |
| Shares issued in connection with | | | | |
| reinvestment of distributions | — | — | 18,996 | 263,289 |
| | 5,949 | 85,699 | 40,521 | 561,585 |
| Shares repurchased | (28,195) | (395,222) | (47,086) | (640,538) |
| Net decrease | (22,246) | $(309,523) | (6,565) | $(78,953) |
| |
| | SIX MONTHS ENDED 10/31/17 | YEAR ENDED 4/30/17 |
| Class R | Shares | Amount | Shares | Amount |
| Shares sold | 61,068 | $928,205 | 168,188 | $2,418,060 |
| Shares issued in connection with | | | | |
| reinvestment of distributions | — | — | 41,444 | 613,376 |
| | 61,068 | 928,205 | 209,632 | 3,031,436 |
| Shares repurchased | (96,132) | (1,465,977) | (430,627) | (6,189,631) |
| Net decrease | (35,064) | $(537,772) | (220,995) | $(3,158,195) |
| |
| | SIX MONTHS ENDED 10/31/17 | YEAR ENDED 4/30/17 |
| Class R5 | Shares | Amount | Shares | Amount |
| Shares sold | — | $— | 34,045 | $514,265 |
| Shares issued in connection with | | | | |
| reinvestment of distributions | — | — | 47,429 | 742,269 |
| | — | — | 81,474 | 1,256,534 |
| Shares repurchased | — | — | (731,975) | (11,651,702) |
| Net decrease | — | $— | (650,501) | $(10,395,168) |
| |
| | SIX MONTHS ENDED 10/31/17 | YEAR ENDED 4/30/17 |
| Class R6 | Shares | Amount | Shares | Amount |
| Shares sold | 45,507 | $737,513 | 133,709 | $2,135,873 |
| Shares issued in connection with | | | | |
| reinvestment of distributions | — | — | 45,939 | 719,407 |
| | 45,507 | 737,513 | 179,648 | 2,855,280 |
| Shares repurchased | (41,883) | (677,128) | (196,552) | (3,009,369) |
| Net increase (decrease) | 3,624 | $60,385 | (16,904) | $(154,089) |
|
| Capital Opportunities Fund 41 |
| | | | |
| | SIX MONTHS ENDED 10/31/17 | YEAR ENDED 4/30/17 |
| Class Y | Shares | Amount | Shares | Amount |
| Shares sold | 253,620 | $4,103,225 | 1,329,923 | $20,926,725 |
| Shares issued in connection with | | | | |
| reinvestment of distributions | — | — | 149,050 | 2,329,653 |
| | 253,620 | 4,103,225 | 1,478,973 | 23,256,378 |
| Shares repurchased | (1,189,094) | (19,464,667) | (1,481,562) | (22,555,659) |
| Net increase (decrease) | (935,474) | $(15,361,442) | (2,589) | $700,719 |
At the close of the reporting period, Putnam Investments, LLC owned the following shares of the fund:
| | | |
| | Shares owned | Percentage of ownership | Value |
| Class R5 | 1,061 | 100.00% | $17,384 |
| Class R6 | 1,065 | 0.16 | 17,647 |
Note 5: Affiliated Transactions
Transactions during the reporting period with any company which is under common ownership or control were as follows:
| | | | | |
| | | | | | Shares |
| | | | | | outstanding |
| | | | | | and fair |
| | Fair value as | Purchase | Sale | Investment | value as |
| Name of affiliate | of 4/30/17 | cost | proceeds | income | of 10/31/17 |
| Short-term investments | | | | | |
| Putnam Cash Collateral | | | | | |
| Pool, LLC* | $46,944,265 | $133,514,157 | $126,736,336 | $297,328 | $53,722,086 |
| Putnam Short Term | | | | | |
| Investment Fund** | $6,362,147 | 85,615,488 | 84,200,114 | 50,914 | $7,777,521 |
| Total Short-term | | | | | |
| investments | $53,306,412 | $219,129,645 | $210,936,450 | $348,242 | $61,499,607 |
* No management fees are charged to Putnam Cash Collateral Pool, LLC (Note 1). Investment income shown is included in securities lending income on the Statement of operations. There were no realized or unrealized gains or losses during the period.
** Management fees charged to Putnam Short Term Investment Fund have been waived by Putnam Management. There were no realized or unrealized gains or losses during the period.
Note 6: Market, credit and other risks
In the normal course of business, the fund trades financial instruments and enters into financial transactions where risk of potential loss exists due to changes in the market (market risk) or failure of the contracting party to the transaction to perform (credit risk). The fund may be exposed to additional credit risk that an institution or other entity with which the fund has unsettled or open transactions will default. Investments in foreign securities involve certain risks, including those related to economic instability, unfavorable political developments, and currency fluctuations.
|
| 42 Capital Opportunities Fund |
Note 7: Summary of derivative activity
The volume of activity for the reporting period for any derivative type that was held during the period is listed below and was based on an average of the holdings at the end of each fiscal quarter:
| |
| Purchased equity option contracts (contract amount) | $79,000 |
| Written equity option contracts (contract amount) | $79,000 |
| Futures contracts (number of contracts) | 10 |
The following is a summary of the fair value of derivative instruments as of the close of the reporting period:
| | | | |
| Fair value of derivative instruments as of the close of the reporting period | |
| | ASSET DERIVATIVES | LIABILITY DERIVATIVES |
| Derivatives not | | | | |
| accounted for as | Statement of | | Statement of | |
| hedging instruments | assets and | | assets and | |
| under ASC 815 | liabilities location | Fair value | liabilities location | Fair value |
| | Investments, | | | |
| | Receivables, Net | | | |
| | assets — Unrealized | | | |
| Equity contracts | appreciation | $36,969* | Payables | $4,050 |
| Total | | $36,969 | | $4,050 |
* Includes cumulative appreciation/depreciation of futures contracts as reported in the fund’s portfolio. Only current day’s variation margin is reported within the Statement of assets and liabilities.
The following is a summary of realized and change in unrealized gains or losses of derivative instruments in the Statement of operations for the reporting period (Note 1):
| | |
| Amount of realized gain or (loss) on derivatives recognized in net gain or (loss) on investments | |
| Derivatives not accounted for as | | |
| hedging instruments under ASC 815 | Futures | Total |
| Equity contracts | $835,572 | $835,572 |
| Total | $835,572 | $835,572 |
| | | |
| Change in unrealized appreciation or (depreciation) on derivatives recognized in net gain or (loss) |
| on investments | | | |
| Derivatives not accounted for as hedging | | | |
| instruments under ASC 815 | Options | Futures | Total |
| Equity contracts | $(46,262) | $12,739 | $(33,523) |
| Total | $(46,262) | $12,739 | $(33,523) |
|
| Capital Opportunities Fund 43 |
Note 8: Offsetting of financial and derivative assets and liabilities
The following table summarizes any derivatives, repurchase agreements and reverse repurchase agreements, at the end of the reporting period, that are subject to an enforceable master netting agreement or similar agreement. For securities lending transactions or borrowing transactions associated with securities sold short, if any, see Note 1. For financial reporting purposes, the fund does not offset financial assets and financial liabilities that are subject to the master netting agreements in the Statement of assets and liabilities.
| | | |
| | Barclays Bank
PLC | Merrill Lynch,
Pierce,
Fenner &
Smith, Inc. | Total |
| Assets: | | | |
| Futures contracts§ | $— | $ 15,288 | $ 15,288 |
| Purchased options **# | 24,230 | — | 24,230 |
| Total Assets | $24,230 | $15,288 | $39,518 |
| Liabilities: | | | |
| Futures contracts§ | — | — | — |
| Written options # | 4,050 | — | 4,050 |
| Total Liabilities | $4,050 | $— | $4,050 |
| Total Financial and Derivative Net Assets | $20,180 | $15,288 | $35,468 |
| Total collateral received (pledged)†## | $— | $— | |
| Net amount | $20,180 | $15,288 | |
| Controlled collateral received (including | | | |
| TBA commitments)** | $— | $— | $— |
| Uncontrolled collateral received | $— | $— | $— |
| Collateral (pledged) (including TBA commitments)** | $— | $— | $— |
** Included with Investments in securities on the Statement of assets and liabilities.
† Additional collateral may be required from certain brokers based on individual agreements.
# Covered by master netting agreement (Note 1).
## Any over-collateralization of total financial and derivative net assets is not shown. Collateral may include amounts related to unsettled agreements.
§ Includes current day’s variation margin only as reported on the Statement of assets and liabilities, which is not collateralized. Cumulative appreciation/(depreciation) for futures contracts is represented in the tables listed after the fund’s portfolio. Collateral pledged for initial margin on futures contracts, which is not included in the table above, amounted to $114,865.
| |
| 44 Capital Opportunities Fund |
Fund information
Founded over 80 years ago, Putnam Investments was built around the concept that a balance between risk and reward is the hallmark of a well-rounded financial program. We manage over 100 funds across income, value, blend, growth, asset allocation, absolute return, and global sector categories.
| | |
| Investment Manager | Trustees | Michael J. Higgins |
| Putnam Investment | Jameson A. Baxter, Chair | Vice President, Treasurer, |
| Management, LLC | Kenneth R. Leibler, Vice Chair | and Clerk |
| One Post Office Square | Liaquat Ahamed | |
| Boston, MA 02109 | Ravi Akhoury | Janet C. Smith |
| | Barbara M. Baumann | Vice President, |
| Investment Sub-Advisor | Katinka Domotorffy | Principal Financial Officer, |
| Putnam Investments Limited | Catharine Bond Hill | Principal Accounting Officer, |
| 16 St James’s Street | Paul L. Joskow | and Assistant Treasurer |
| London, England SW1A 1ER | Robert E. Patterson | |
| | George Putnam, III | Susan G. Malloy |
| Marketing Services | Robert L. Reynolds | Vice President and |
| Putnam Retail Management | Manoj P. Singh | Assistant Treasurer |
| One Post Office Square | | |
| Boston, MA 02109 | Officers | Mark C. Trenchard |
| | Robert L. Reynolds | Vice President and |
| Custodian | President | BSA Compliance Officer |
| State Street Bank | | |
| and Trust Company | Jonathan S. Horwitz | Nancy E. Florek |
| | Executive Vice President, | Vice President, Director of |
| Legal Counsel | Principal Executive Officer, | Proxy Voting and Corporate |
| Ropes & Gray LLP | and Compliance Liaison | Governance, Assistant Clerk, |
| | | and Assistant Treasurer |
| | Robert T. Burns | |
| | Vice President and | Denere P. Poulack |
| | Chief Legal Officer | Assistant Vice President, Assistant |
| | | Clerk, and Assistant Treasurer |
| | James F. Clark | |
| | Vice President and | |
| | Chief Compliance Officer | |
This report is for the information of shareholders of Putnam Capital Opportunities Fund. It may also be used as sales literature when preceded or accompanied by the current prospectus, the most recent copy of Putnam’s Quarterly Performance Summary, and Putnam’s Quarterly Ranking Summary. For more recent performance, please visit putnam.com. Investors should carefully consider the investment objectives, risks, charges, and expenses of a fund, which are described in its prospectus. For this and other information or to request a prospectus or summary prospectus, call 1-800-225-1581 toll free. Please read the prospectus carefully before investing. The fund’s Statement of Additional Information contains additional information about the fund’s Trustees and is available without charge upon request by calling 1-800-225-1581.

| |
|
Item 3. Audit Committee Financial Expert: |
| |
|
Item 4. Principal Accountant Fees and Services: |
| |
|
Item 5. Audit Committee of Listed Registrants |
| |
|
Item 6. Schedule of Investments: |
| |
| The registrant's schedule of investments in unaffiliated issuers is included in the report to shareholders in Item 1 above. |
| |
|
Item 7. Disclosure of Proxy Voting Policies and Procedures For Closed-End Management Investment Companies: |
| |
|
Item 8. Portfolio Managers of Closed-End Investment Companies |
| |
|
Item 9. Purchases of Equity Securities by Closed-End Management Investment Companies and Affiliated Purchasers: |
| |
|
Item 10. Submission of Matters to a Vote of Security Holders: |
| |
|
Item 11. Controls and Procedures: |
| |
| (a) The registrant's principal executive officer and principal financial officer have concluded, based on their evaluation of the effectiveness of the design and operation of the registrant's disclosure controls and procedures as of a date within 90 days of the filing date of this report, that the design and operation of such procedures are generally effective to provide reasonable assurance that information required to be disclosed by the registrant in this report is recorded, processed, summarized and reported within the time periods specified in the Commission's rules and forms. |
| |
| (b) Changes in internal control over financial reporting: Not applicable |
| |
| (a)(2) Separate certifications for the principal executive officer and principal financial officer of the registrant as required by Rule 30a-2(a) under the Investment Company Act of 1940, as amended, are filed herewith. |
| |
| (b) The certifications required by Rule 30a-2(b) under the Investment Company Act of 1940, as amended, are filed herewith. |
| |
| Pursuant to the requirements of the Securities Exchange Act of 1934 and the Investment Company Act of 1940, the registrant has duly caused this report to be signed on its behalf by the undersigned, thereunto duly authorized. |
| |
| By (Signature and Title): |
| |
| /s/ Janet C. Smith
Janet C. Smith
Principal Accounting Officer
|
| |
| Pursuant to the requirements of the Securities Exchange Act of 1934 and the Investment Company Act of 1940, this report has been signed below by the following persons on behalf of the registrant and in the capacities and on the dates indicated. |
| |
| By (Signature and Title): |
| |
| /s/ Jonathan S. Horwitz
Jonathan S. Horwitz
Principal Executive Officer
|
| |
| By (Signature and Title): |
| |
| /s/ Janet C. Smith
Janet C. Smith
Principal Financial Officer
|