| | |
| UNITED STATES
SECURITIES AND EXCHANGE COMMISSION |
| | |
| CERTIFIED SHAREHOLDER REPORT OF REGISTERED
MANAGEMENT INVESTMENT COMPANIES
|
| | |
| Investment Company Act file number: | (811-07237) |
| | |
| Exact name of registrant as specified in charter: | Putnam Investment Funds |
| | |
| Address of principal executive offices: | 100 Federal Street, Boston, Massachusetts 02110 |
| | |
| Name and address of agent for service: | Robert T. Burns, Vice President
100 Federal Street
Boston, Massachusetts 02110 |
| | |
| Copy to: | Bryan Chegwidden, Esq.
Ropes & Gray LLP
1211 Avenue of the Americas
New York, New York 10036 |
| | |
| Registrant's telephone number, including area code: | (617) 292-1000 |
| | |
| Date of fiscal year end: | February 28, 2019 |
| | |
| Date of reporting period: | March 1, 2018 — August 31, 2018 |
| | |
|
Item 1. Report to Stockholders: | |
| | |
| The following is a copy of the report transmitted to stockholders pursuant to Rule 30e-1 under the Investment Company Act of 1940: | |
Putnam
Small Cap Value
Fund
Semiannual report
8 | 31 | 18
Consider these risks before investing: Investments in small and/or midsize companies increase the risk of greater price fluctuations. Value stocks may fail to rebound, and the market may not favor value-style investing. Stock prices may fall or fail to rise over extended periods of time for a variety of reasons, including general financial market conditions, changing market perceptions, changes in government intervention in the financial markets, and factors related to a specific issuer, industry, or sector. These and other factors may lead to increased volatility and reduced liquidity in the fund’s portfolio holdings. These risks are generally greater for small and midsize companies. From time to time, the fund may invest a significant portion of its assets in companies in one or more related industries or sectors, which would make the fund more vulnerable to adverse developments affecting those industries or sectors. You can lose money by investing in the fund.
Message from the Trustees
October 11, 2018
Dear Fellow Shareholder:
During 2018, we have seen conditions for global financial markets begin to move in different directions. The S&P 500 Index rose to a record high during the summer after a choppy start in January and February. International stocks have lagged behind, however, due in part to uncertainty surrounding U.S. trade policy and interest rates. In addition, fixed-income markets have faced new headwinds as the Federal Reserve has continued its path of normalizing policy. Fortunately, navigating a change in market trends is nothing new to Putnam’s experienced investment professionals, who continue to monitor risks and seek opportunities.
We would like to take this opportunity to extend our thanks to Jameson A. Baxter, who retired from her position as Chair of your Board of Trustees on June 30, 2018. It is hard to express in a few words the extent of Jamie’s commitment to protecting the interests of Putnam shareholders like you. In addition to her professional and directorship experience, Jamie brought intelligence, insight, and compassion to a board she served for decades. Jamie began as a Trustee in 1994, served as Vice Chair for six years, and became Chair in 2011. We are also pleased to announce the appointment of Kenneth R. Leibler as your new Board of Trustees Chair. Ken became a Trustee in 2006, has served as Vice Chair since 2016, and now leads the Board in overseeing your fund and protecting your interests.
Thank you for investing with Putnam.

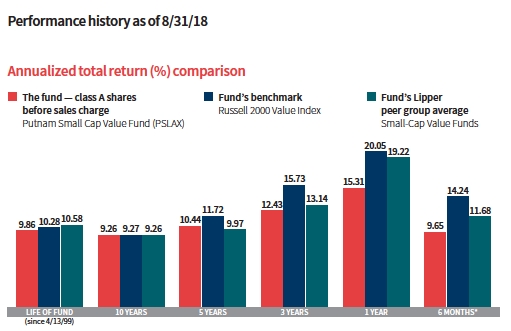
Current performance may be lower or higher than the quoted past performance, which cannot guarantee future results. Share price, principal value, and return will fluctuate, and you may have a gain or a loss when you sell your shares. Performance of class A shares assumes reinvestment of distributions and does not account for taxes. Fund returns in the bar chart do not reflect a sales charge of 5.75%; had they, returns would have been lower. See below and pages 8–10 for additional performance information. For a portion of the periods, the fund had expense limitations, without which returns would have been lower. To obtain the most recent month-end performance, visit putnam.com.
* Returns for the six-month period are not annualized, but cumulative.

This comparison shows your fund’s performance in the context of broad market indexes for the six months ended 8/31/18. See above and pages 8–10 for additional fund performance information. Index descriptions can be found on pages 13–14.


Dave has a B.S. from Brown University. He served in the investment industry from 1986 to 2005 and reentered the industry when he joined Putnam in 2017.
How was the environment for stock market investing during the reporting period?
Despite solid economic performance and higher corporate earnings, stock market volatility appeared in isolated bursts during the period, which began in March 2018. A short-lived market downturn in early February 2018 pushed stocks into correction territory, and in March, U.S. stocks posted losses following a month of volatility.
Stocks fell at the start of April, when the introduction of U.S. trade tariffs on aluminum and steel sparked fears of a global trade war. However, economic data remained positive, and stock market indexes advanced in June and July. The unemployment rate and filings for new jobless claims continued to remain near multiyear lows. Amid the uncertainty, several defensive sectors outperformed, including consumer staples, real estate, and utilities. In August, the final month of the period, the rally in U.S. stocks grew to become the longest bull run in the market’s history.
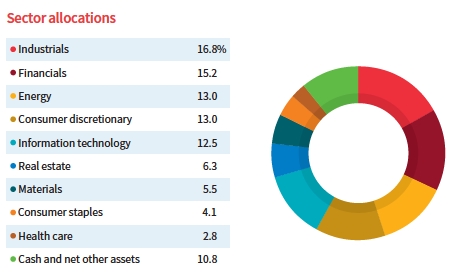
Allocations are shown as a percentage of the fund’s net assets as of 8/31/18. Cash and net other assets, if any, represent the market value weights of cash, derivatives, short-term securities, and other unclassified assets in the portfolio. Summary information may differ from the portfolio schedule included in the financial statements due to the inclusion of derivative securities, any interest accruals, the exclusion of as-of trades, if any, the use of different classifications of securities for presentation purposes, and rounding. Holdings and allocations may vary over time.
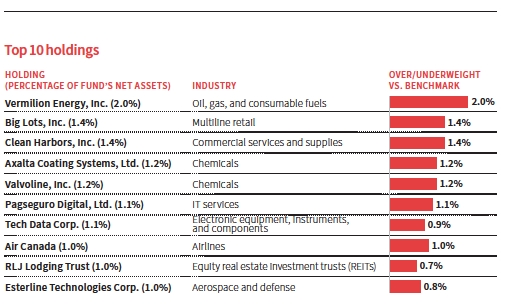
This table shows the fund’s top 10 holdings by percentage of the fund’s net assets as of 8/31/18. Short-term investments and derivatives, if any, are excluded. Holdings may vary over time.
How did small-cap value stocks and the fund perform for the period?
Small-cap value stocks — the focus of this fund — outperformed the broader U.S. stock market for the six-month period. These stocks, as measured by the fund’s benchmark, the Russell 2000 Value Index, returned 14.24%, compared with a return of 7.96% for the S&P 500 Index. For the six-month period, the fund’s class A shares returned 9.65%. Our investment approach resulted in a relatively higher level of portfolio turnover during the reporting period. Our goal is to actively seek opportunities based on changing market dynamics, business fundamentals, and company-specific valuation levels.
Could you discuss some stocks that helped performance results for the period?
Penn Virginia, an independent oil and gas company engaged in exploration, development, and production in a number of U.S. regions, was the top contributor to fund performance for the period. Penn Virginia’s recent earnings results topped analyst estimates, and the company has benefited from a rally in oil prices. In addition, investors responded positively to the company’s plans to explore strategic changes, including a potential sale of the company. By the close of the period, we had sold this stock from the portfolio to take profits.
Another portfolio highlight was our investment in Clean Harbors, a company that specializes in hazardous waste management, emergency spill response, industrial cleaning and maintenance, and recycling services. The company benefited from increased demand for its disposal network as well as from favorable trends in chemical, manufacturing, and energy markets. We believe Clean Harbor’s potential is underappreciated, particularly the company’s ownership of hazardous waste disposal sites.
Another contributor to performance was Bridgepoint Education, a for-profit education company that offers online and on-campus graduate and undergraduate degree programs. New enrollment growth boosted its financial performance, and continued improvement in the U.S. economy supported the for-profit education industry as a whole. In addition, investors expect that the Trump administration will ease for-profit education industry regulations. Our decision to add this stock to the portfolio at what we believed was a very attractive valuation proved beneficial, and by the close of the period, we had sold the position, taking profits as it reached our valuation target range.
What were some holdings that detracted from the fund’s performance?
The top detractor for the period was our investment in U.S. Concrete, a company that provides concrete and other construction products in markets across the United States. Winter weather conditions had a negative effect on profitability in the company’s northeast markets, weakening its stock performance. We believe the fundamental long-term drivers of this business remain strong and should improve further in 2019, and U.S. Concrete remained in the portfolio at period-end.
Another disappointment for the period was Major Drilling Group International, which supplies drilling rigs and crews to mining companies. During the period, the company struggled with weaker revenues as a result of competitive pressures. In addition, global trade tensions led to a collapse in gold and copper prices, which hurt the profitability of mining companies. We originally added this stock to the portfolio because we believed it was undervalued as the mining industry was coming out of a multiyear recession. We continue to believe the long-term outlook is good for the company,
but recognize that lower commodity prices could continue to dampen its stock performance in the near term. By the close of the period, we had sold the stock from the portfolio.
Chaparral Energy, an Oklahoma City-based oil and natural gas producer, also detracted from fund performance for the period. The company, which recently came out of bankruptcy, now has a clean balance sheet as well as a solid position in the STACK Play in central Oklahoma. We believe Chaparral stock trades below private market valuation and at a considerable discount to peers in the same area. In addition, the company was recently relisted on a major stock exchange, which we believe will enhance its visibility.
As the fund begins the second half of its fiscal year, what is your outlook?
Small-cap stocks have performed well this year, and fundamental business trends for small companies have been strong, in our view. These stocks have also been helped by the perception that small U.S. companies are more immune to global trade conflicts than larger international businesses. While we don’t believe this is entirely true, it has helped boost investor sentiment in this area of the market.
Within the universe of small-cap stocks, we have seen a significant increase in passive investments — money from ETFs and other portfolios that are not actively managed but simply track an index. Unlike with our active management approach, this capital, we believe, is essentially blind to fundamentals. These passive assets don’t move based on research and judgements about earnings growth, balance sheets, or valuations. We think this can create mispricings that could be investment opportunities for the fund.
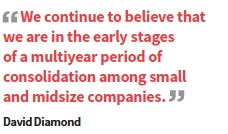
As we focus on actively managing the fund’s portfolio, we believe that we are in the early stages of a multiyear period of consolidation across the stock market, including among smaller companies. We believe merger-and-acquisition activity is positive for stocks, and our process includes looking for companies that offer innovative products, service offerings, or expertise in a specific area of business. These companies may offer characteristics that could appeal to larger businesses that are seeking to grow via acquisition. Also, as value investors, we look for what we believe are undervalued stocks that may have — or offer the potential for — improving fundamentals
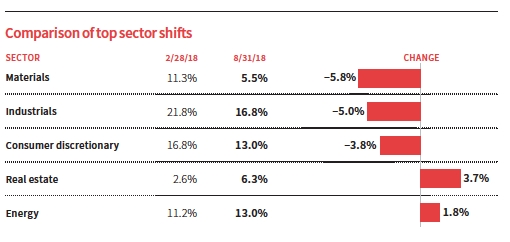
This chart shows the fund’s largest allocation shifts, by percentage, over the past six months. Allocations are shown as a percentage of the fund’s net assets. Current period summary information may differ from the portfolio schedule included in the financial statements due to the inclusion of derivative securities, any interest accruals, the exclusion of as-of trades, if any, the use of different classifications of securities for presentation purposes, and rounding. Holdings and allocations may vary over time.
and perhaps some form of a catalyst to unlock growth potential.
Thank you for your time and insights today.
The views expressed in this report are exclusively those of Putnam Management and are subject to change. They are not meant as investment advice.
Please note that the holdings discussed in this report may not have been held by the fund for the entire period. Portfolio composition is subject to review in accordance with the fund’s investment strategy and may vary in the future. Current and future portfolio holdings are subject to risk.
Your fund’s performance
This section shows your fund’s performance, price, and distribution information for periods ended August 31, 2018, the end of the first half of its current fiscal year. In accordance with regulatory requirements for mutual funds, we also include performance information as of the most recent calendar quarter-end and expense information taken from the fund’s current prospectus. Performance should always be considered in light of a fund’s investment strategy. Data represent past performance. Past performance does not guarantee future results. More recent returns may be less or more than those shown. Investment return and principal value will fluctuate, and you may have a gain or a loss when you sell your shares. Performance information does not reflect any deduction for taxes a shareholder may owe on fund distributions or on the redemption of fund shares. For the most recent month-end performance, please visit the Individual Investors section at putnam.com or call Putnam at 1-800-225-1581. Class R, R5, R6, and Y shares are not available to all investors. See the Terms and definitions section in this report for definitions of the share classes offered by your fund.
Fund performance Total return for periods ended 8/31/18
| | | | | | | | | |
| | Annual | | | | | | | | |
| | average | | Annual | | Annual | | Annual | | |
| | (life of fund) | 10 years | average | 5 years | average | 3 years | average | 1 year | 6 months |
| Class A (4/13/99) | | | | | | | | | |
| Before sales charge | 9.86% | 142.44% | 9.26% | 64.28% | 10.44% | 42.13% | 12.43% | 15.31% | 9.65% |
| After sales charge | 9.53 | 128.50 | 8.61 | 54.83 | 9.14 | 33.95 | 10.23 | 8.68 | 3.34 |
| Class B (5/3/99) | | | | | | | | | |
| Before CDSC | 9.61 | 131.80 | 8.77 | 58.25 | 9.62 | 39.09 | 11.62 | 14.53 | 9.21 |
| After CDSC | 9.61 | 131.80 | 8.77 | 56.34 | 9.35 | 36.44 | 10.91 | 10.70 | 4.21 |
| Class C (7/26/99) | | | | | | | | | |
| Before CDSC | 9.44 | 125.13 | 8.45 | 58.17 | 9.60 | 38.95 | 11.59 | 14.49 | 9.15 |
| After CDSC | 9.44 | 125.13 | 8.45 | 58.17 | 9.60 | 38.95 | 11.59 | 13.73 | 8.15 |
| Class M (3/29/00) | | | | | | | | | |
| Before sales charge | 9.32 | 130.77 | 8.72 | 60.21 | 9.88 | 40.02 | 11.88 | 14.74 | 9.35 |
| After sales charge | 9.12 | 122.69 | 8.34 | 54.60 | 9.10 | 35.12 | 10.55 | 10.73 | 5.53 |
| Class R (3/30/07) | | | | | | | | | |
| Net asset value | 9.59 | 136.47 | 8.99 | 62.13 | 10.15 | 41.06 | 12.15 | 15.02 | 9.48 |
| Class R5 (11/1/13) | | | | | | | | | |
| Net asset value | 10.14 | 149.81 | 9.59 | 66.92 | 10.79 | 43.64 | 12.83 | 15.73 | 9.79 |
| Class R6 (11/1/13) | | | | | | | | | |
| Net asset value | 10.16 | 150.80 | 9.63 | 67.58 | 10.88 | 43.94 | 12.91 | 15.86 | 9.87 |
| Class Y (1/3/01) | | | | | | | | | |
| Net asset value | 10.12 | 148.77 | 9.54 | 66.22 | 10.70 | 43.23 | 12.72 | 15.59 | 9.68 |
Current performance may be lower or higher than the quoted past performance, which cannot guarantee future results. After-sales-charge returns for class A and M shares reflect the deduction of the maximum 5.75% and 3.50% sales charge, respectively, levied at the time of purchase. Class B share returns after contingent deferred sales charge (CDSC) reflect the applicable CDSC, which is 5% in the first year, declining over time to 1% in the sixth year, and is eliminated thereafter. Class C share returns after CDSC reflect a 1% CDSC for the first year that is eliminated thereafter. Class R, R5, R6, and Y shares have no initial sales charge or CDSC. Performance for class B, C, M, R, and Y shares before their inception is derived from the historical performance of class A shares, adjusted for the applicable sales charge (or CDSC) and the higher operating expenses for such shares, except for class Y shares, for which 12b-1 fees are not applicable. Performance for class R5 and R6 shares prior to their inception is derived from the historical performance
of class Y shares and has not been adjusted for the lower investor servicing fees applicable to class R5 and R6 shares; had it, returns would have been higher.
For a portion of the periods, the fund had expense limitations, without which returns would have been lower.
Class B share performance reflects conversion to class A shares after six years.
Class C share performance reflects conversion to class A shares after 10 years.
Comparative index returns For periods ended 8/31/18
| | | | | | | | | |
| | Annual | | | | | | | | |
| | average | | Annual | | Annual | | Annual | | |
| | (life of fund) | 10 years | average | 5 years | average | 3 years | average | 1 year | 6 months |
| Russell 2000 | | | | | | | | | |
| Value Index | 10.28% | 142.74% | 9.27% | 74.01% | 11.72% | 55.01% | 15.73% | 20.05% | 14.24% |
| Lipper Small-Cap | | | | | | | | | |
| Value Funds | 10.58 | 144.72 | 9.26 | 61.69 | 9.97 | 45.08 | 13.14 | 19.22 | 11.68 |
| category average* | | | | | | | | | |
Index and Lipper results should be compared with fund performance before sales charge, before CDSC, or at net asset value.
* Over the 6-month, 1-year, 3-year, 5-year, 10-year, and life-of-fund periods ended 8/31/18, there were 299, 290, 252, 222, 156, and 51 funds, respectively, in this Lipper category.
Fund price and distribution information For the six-month period ended 8/31/18
| | | | | | | | | | |
| | Class A | Class B | Class C | Class M | Class R | ClassR5 | ClassR6 | Class Y |
| | Before | After | Net | Net | Before | After | Net | Net | Net | Net |
| | sales | sales | asset | asset | sales | sales | asset | asset | asset | asset |
| Share value | charge | charge | value | value | charge | charge | value | value | value | value |
| 2/28/18 | $13.06 | $13.86 | $10.21 | $10.16 | $11.44 | $11.85 | $12.76 | $13.79 | $13.78 | $13.74 |
| 8/31/18 | 14.32 | 15.19 | 11.15 | 11.09 | 12.51 | 12.96 | 13.97 | 15.14 | 15.14 | 15.07 |
The classification of distributions, if any, is an estimate. Before-sales-charge share value and current dividend rate for class A and M shares, if applicable, do not take into account any sales charge levied at the time of purchase. After-sales-charge share value, current dividend rate, and current 30-day SEC yield, if applicable, are calculated assuming that the maximum sales charge (5.75% for class A shares and 3.50% for class M shares) was levied at the time of purchase. Final distribution information will appear on your year-end tax forms.
The fund made no distributions during the period.
Fund performance as of most recent calendar quarter Total return for periods ended 9/30/18
| | | | | | | | | |
| | Annual | | | | | | | | |
| | average | | Annual | | Annual | | Annual | | |
| | (life of fund) | 10 years | average | 5 years | average | 3 years | average | 1 year | 6 months |
| Class A (4/13/99) | | | | | | | | | |
| Before sales charge | 9.74% | 152.98% | 9.73% | 53.70% | 8.98% | 45.32% | 13.27% | 7.56% | 8.78% |
| After sales charge | 9.41 | 138.44 | 9.08 | 44.86 | 7.69 | 36.97 | 11.06 | 1.38 | 2.52 |
| Class B (5/3/99) | | | | | | | | | |
| Before CDSC | 9.50 | 142.00 | 9.24 | 48.09 | 8.17 | 42.03 | 12.41 | 6.73 | 8.38 |
| After CDSC | 9.50 | 142.00 | 9.24 | 46.29 | 7.91 | 39.33 | 11.69 | 3.16 | 3.38 |
| Class C (7/26/99) | | | | | | | | | |
| Before CDSC | 9.32 | 134.81 | 8.91 | 48.15 | 8.18 | 42.13 | 12.43 | 6.83 | 8.42 |
| After CDSC | 9.32 | 134.81 | 8.91 | 48.15 | 8.18 | 42.13 | 12.43 | 6.12 | 7.42 |
| Class M (3/29/00) | | | | | | | | | |
| Before sales charge | 9.21 | 140.80 | 9.19 | 49.96 | 8.44 | 43.17 | 12.71 | 7.06 | 8.53 |
| After sales charge | 9.01 | 132.37 | 8.80 | 44.71 | 7.67 | 38.16 | 11.38 | 3.31 | 4.73 |
| Class R (3/30/07) | | | | | | | | | |
| Net asset value | 9.47 | 146.75 | 9.45 | 51.75 | 8.70 | 44.17 | 12.97 | 7.27 | 8.68 |
| Class R5 (11/1/13) | | | | | | | | | |
| Net asset value | 10.02 | 160.57 | 10.05 | 56.23 | 9.33 | 46.68 | 13.62 | 7.91 | 8.97 |
| Class R6 (11/1/13) | | | | | | | | | |
| Net asset value | 10.04 | 161.60 | 10.09 | 56.85 | 9.42 | 47.09 | 13.73 | 7.98 | 9.05 |
| Class Y (1/3/01) | | | | | | | | | |
| Net asset value | 10.00 | 159.65 | 10.01 | 55.67 | 9.26 | 46.36 | 13.54 | 7.83 | 9.01 |
See the discussion following the fund performance table on page 8 for information about the calculation of fund performance.
Your fund’s expenses
As a mutual fund investor, you pay ongoing expenses, such as management fees, distribution fees (12b-1 fees), and other expenses. Using the following information, you can estimate how these expenses affect your investment and compare them with the expenses of other funds. You may also pay one-time transaction expenses, including sales charges (loads) and redemption fees, which are not shown in this section and would have resulted in higher total expenses. For more information, see your fund’s prospectus or talk to your financial representative.
Expense ratios
| | | | | | | | |
| | Class A | Class B | Class C | Class M | Class R | Class R5 | Class R6 | Class Y |
| Total annual operating | | | | | | | | |
| expenses for the fiscal year | | | | | | | | |
| ended 2/28/18 | 1.48% | 2.23% | 2.23% | 1.98% | 1.73% | 1.16% | 1.06% | 1.23% |
| Annualized expense ratio | | | | | | | | |
| for the six-month period | | | | | | | | |
| ended 8/31/18 | 1.21% | 1.96% | 1.96% | 1.71% | 1.46% | 0.89% | 0.79% | 0.96% |
Fiscal-year expense information in this table is taken from the most recent prospectus, is subject to change, and may differ from that shown for the annualized expense ratio and in the financial highlights of this report.
Prospectus expense information also includes the impact of acquired fund fees and expenses of 0.27%, which is not included in the financial highlights or annualized expense ratios. Expenses are shown as a percentage of average net assets.
Expenses per $1,000
The following table shows the expenses you would have paid on a $1,000 investment in each class of the fund from 3/1/18 to 8/31/18. It also shows how much a $1,000 investment would be worth at the close of the period, assuming actual returns and expenses.
| | | | | | | | |
| | Class A | Class B | Class C | Class M | Class R | Class R5 | Class R6 | Class Y |
| Expenses paid per $1,000*† | $6.39 | $10.34 | $10.33 | $9.02 | $7.71 | $4.71 | $4.18 | $5.07 |
| Ending value (after expenses) | $1,096.50 | $1,092.10 | $1,091.50 | $1,093.50 | $1,094.80 | $1,097.90 | $1,098.70 | $1,096.80 |
* Expenses for each share class are calculated using the fund’s annualized expense ratio for each class, which represents the ongoing expenses as a percentage of average net assets for the six months ended 8/31/18. The expense ratio may differ for each share class.
† Expenses are calculated by multiplying the expense ratio by the average account value for the period; then multiplying the result by the number of days in the period; and then dividing that result by the number of days in the year.
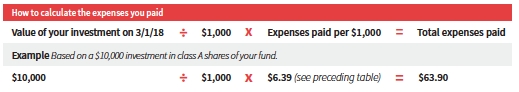
Estimate the expenses you paid
To estimate the ongoing expenses you paid for the six months ended 8/31/18, use the following calculation method. To find the value of your investment on 3/1/18, call Putnam at 1-800-225-1581.
Compare expenses using the SEC’s method
The Securities and Exchange Commission (SEC) has established guidelines to help investors assess fund expenses. Per these guidelines, the following table shows your fund’s expenses based on a $1,000 investment, assuming a hypothetical 5% annualized return. You can use this information to compare the ongoing expenses (but not transaction expenses or total costs) of investing in the fund with those of other funds. All mutual fund shareholder reports will provide this information to help you make this comparison. Please note that you cannot use this information to estimate your actual ending account balance and expenses paid during the period.
| | | | | | | | |
| | Class A | Class B | Class C | Class M | Class R | Class R5 | Class R6 | Class Y |
| Expenses paid per $1,000*† | $6.16 | $9.96 | $9.96 | $8.69 | $7.43 | $4.53 | $4.02 | $4.89 |
| Ending value (after expenses) | $1,019.11 | $1,015.32 | $1,015.32 | $1,016.59 | $1,017.85 | $1,020.72 | $1,021.22 | $1,020.37 |
* Expenses for each share class are calculated using the fund’s annualized expense ratio for each class, which represents the ongoing expenses as a percentage of average net assets for the six months ended 8/31/18. The expense ratio may differ for each share class.
† Expenses are calculated by multiplying the expense ratio by the average account value for the six-month period; then multiplying the result by the number of days in the six-month period; and then dividing that result by the number of days in the year.
Terms and definitions
Important terms
Total return shows how the value of the fund’s shares changed over time, assuming you held the shares through the entire period and reinvested all distributions in the fund.
Before sales charge, or net asset value, is the price, or value, of one share of a mutual fund, without a sales charge. Before-sales-charge figures fluctuate with market conditions, and are calculated by dividing the net assets of each class of shares by the number of outstanding shares in the class.
After sales charge is the price of a mutual fund share plus the maximum sales charge levied at the time of purchase. After-sales-charge performance figures shown here assume the 5.75% maximum sales charge for class A shares and 3.50% for class M shares.
Contingent deferred sales charge (CDSC) is generally a charge applied at the time of the redemption of class B or C shares and assumes redemption at the end of the period. Your fund’s class B CDSC declines over time from a 5% maximum during the first year to 1% during the sixth year. After the sixth year, the CDSC no longer applies. The CDSC for class C shares is 1% for one year after purchase.
Share classes
Class A shares are generally subject to an initial sales charge and no CDSC (except on certain redemptions of shares bought without an initial sales charge).
Class B shares are closed to new investments and are only available by exchange from another Putnam fund or through dividend and/or capital gains reinvestment. They are not subject to an initial sales charge and may be subject to a CDSC.
Class C shares are not subject to an initial sales charge and are subject to a CDSC only if the shares are redeemed during the first year.
Class M shares have a lower initial sales charge and a higher 12b-1 fee than class A shares and no CDSC.
Class R shares are not subject to an initial sales charge or CDSC and are available only to employer-sponsored retirement plans.
Class R5 shares are not subject to an initial sales charge or CDSC and carry no 12b-1 fee. They are only available to employer-sponsored retirement plans.
Class R6 shares are not subject to an initial sales charge or CDSC and carry no 12b-1 fee. They are generally only available to employer-sponsored retirement plans, corporate and institutional clients, and clients in other approved programs.
Class Y shares are not subject to an initial sales charge or CDSC and carry no 12b-1 fee. They are generally only available to corporate and institutional clients and clients in other approved programs.
Comparative indexes
Bloomberg Barclays U.S. Aggregate Bond Index is an unmanaged index of U.S. investment-grade fixed-income securities.
ICE BofAML (Intercontinental Exchange Bank of America Merrill Lynch) U.S. 3-Month Treasury Bill Index is an unmanaged index that seeks to measure the performance of U.S. Treasury bills available in the marketplace.
Russell 2000 Value Index is an unmanaged index of those companies in the small-cap Russell 2000 Index chosen for their value orientation.
S&P 500 Index is an unmanaged index of common stock performance.
ICE Data Indices, LLC (“ICE BofAML”), used with permission. ICE BofAML permits use of the ICE BofAML indices and related data on an “as is” basis; makes no warranties regarding same; does not guarantee the suitability, quality, accuracy, timeliness, and/or completeness of the ICE BofAML indices or any data included in, related
to, or derived therefrom; assumes no liability in connection with the use of the foregoing; and does not sponsor, endorse, or recommend Putnam Investments, or any of its products or services.
Indexes assume reinvestment of all distributions and do not account for fees. Securities and performance of a fund and an index will differ. You cannot invest directly in an index.
Frank Russell Company is the source and owner of the trademarks, service marks, and copyrights related to the Russell Indexes. Russell® is a trademark of Frank Russell Company.
Lipper is a third-party industry-ranking entity that ranks mutual funds. Its rankings do not reflect sales charges. Lipper rankings are based on total return at net asset value relative to other funds that have similar current investment styles or objectives as determined by Lipper. Lipper may change a fund’s category assignment at its discretion. Lipper category averages reflect performance trends for funds within a category.
Other information for shareholders
Important notice regarding delivery of shareholder documents
In accordance with Securities and Exchange Commission (SEC) regulations, Putnam sends a single copy of annual and semiannual shareholder reports, prospectuses, and proxy statements to Putnam shareholders who share the same address, unless a shareholder requests otherwise. If you prefer to receive your own copy of these documents, please call Putnam at 1-800-225-1581, and Putnam will begin sending individual copies within 30 days.
Proxy voting
Putnam is committed to managing our mutual funds in the best interests of our shareholders. The Putnam funds’ proxy voting guidelines and procedures, as well as information regarding how your fund voted proxies relating to portfolio securities during the 12-month period ended June 30, 2018, are available in the Individual Investors section of putnam.com and on the SEC’s website, www.sec.gov. If you have questions about finding forms on the SEC’s website, you may call the SEC at 1-800-SEC-0330. You may also obtain the Putnam funds’ proxy voting guidelines and procedures at no charge by calling Putnam’s Shareholder Services at 1-800-225-1581.
Fund portfolio holdings
The fund will file a complete schedule of its portfolio holdings with the SEC for the first and third quarters of each fiscal year on Form N-Q. Shareholders may obtain the fund’s Form N-Q on the SEC’s website at www.sec.gov. In addition, the fund’s Form N-Q may be reviewed and copied at the SEC’s Public Reference Room in Washington, D.C. You may call the SEC at 1-800-SEC-0330 for information about the SEC’s website or the operation of the Public Reference Room.
Trustee and employee fund ownership
Putnam employees and members of the Board of Trustees place their faith, confidence, and, most importantly, investment dollars in Putnam mutual funds. As of August 31, 2018, Putnam employees had approximately $508,000,000 and the Trustees had approximately $69,000,000 invested in Putnam mutual funds. These amounts include investments by the Trustees’ and employees’ immediate family members as well as investments through retirement and deferred compensation plans.
Trustee approval of management contract
General conclusions
The Board of Trustees of The Putnam Funds oversees the management of each fund and, as required by law, determines annually whether to approve the continuance of your fund’s management contract with Putnam Investment Management, LLC (“Putnam Management”) and the sub-management contract with respect to your fund between Putnam Management and its affiliate, Putnam Investments Limited (“PIL”). The Board, with the assistance of its Contract Committee, requests and evaluates all information it deems reasonably necessary under the circumstances in connection with its annual contract review. The Contract Committee consists solely of Trustees who are not “interested persons” (as this term is defined in the Investment Company Act of 1940, as amended (the “1940 Act”)) of The Putnam Funds (“Independent Trustees”).
At the outset of the review process, members of the Board’s independent staff and independent legal counsel discussed with representatives of Putnam Management the annual contract review materials furnished to the Contract Committee during the course of the previous year’s review, identifying possible changes in these materials that might be necessary or desirable for the coming year. Following these discussions and in consultation with the Contract Committee, the Independent Trustees’ independent legal counsel requested that Putnam Management and its affiliates furnish specified information, together with any additional information that Putnam Management considered relevant, to the Contract Committee. Over the course of several months ending in June 2018, the Contract Committee met on a number of occasions with representatives of Putnam Management, and separately in executive session, to consider the information that Putnam Management provided. Throughout this process, the Contract Committee was assisted by the members of the Board’s independent staff and by independent legal counsel for The Putnam Funds and the Independent Trustees.
In May 2018, the Contract Committee met in executive session to discuss and consider its recommendations with respect to the continuance of the contracts. At the Trustees’ June 2018 meeting, the Contract Committee met in executive session with the other Independent Trustees to review a summary of the key financial, performance and other data that the Contract Committee considered in the course of its review. The Contract Committee then presented its written report, which summarized the key factors that the Committee had considered and set forth its recommendations. The Contract Committee recommended, and the Independent Trustees approved, the continuance of your fund’s management and sub-management contracts, effective July 1, 2018. (Because PIL is an affiliate of Putnam Management and Putnam Management remains fully responsible for all services provided by PIL, the Trustees have not attempted to evaluate PIL as a separate entity, and all subsequent references to Putnam Management below should be deemed to include reference to PIL as necessary or appropriate in the context.)
The Independent Trustees’ approval was based on the following conclusions:
• That the fee schedule in effect for your fund represented reasonable compensation in light of the nature and quality of the services being provided to the fund, the fees paid by competitive funds, the costs incurred by Putnam Management in providing services to the fund, and the application of certain reductions and waivers noted below; and
• That the fee schedule in effect for your fund represented an appropriate sharing between fund shareholders and Putnam Management of such economies of scale as may exist in the management of the fund at current asset levels.
These conclusions were based on a comprehensive consideration of all information provided to the Trustees and were not the result of any single factor. Some of the factors that figured particularly in the Trustees’ deliberations and how the Trustees considered these factors are described below, although individual Trustees may have evaluated the information presented differently, giving different weights to various factors. It is also important to recognize that the management arrangements for your fund and the other Putnam funds are the result of many years of review and discussion between the Independent Trustees and Putnam Management, that some aspects of the arrangements may receive greater scrutiny in some years than others, and that the Trustees’ conclusions may be based, in part, on their consideration of fee arrangements in previous
years. For example, with some minor exceptions, the funds’ current fee arrangements under the management contracts were first implemented at the beginning of 2010 following extensive review by the Contract Committee and discussions with representatives of Putnam Management, as well as approval by shareholders.
Management fee schedules and total expenses
The Trustees reviewed the management fee schedules in effect for all Putnam funds, including fee levels and breakpoints. The Trustees also reviewed the total expenses of each Putnam fund, recognizing that in most cases management fees represented the major, but not the sole, determinant of total costs to fund shareholders. (In a few instances, funds have implemented so-called “all-in” management fees covering substantially all routine fund operating costs.)
In reviewing fees and expenses, the Trustees generally focus their attention on material changes in circumstances — for example, changes in assets under management, changes in a fund’s investment strategy, changes in Putnam Management’s operating costs or profitability, or changes in competitive practices in the mutual fund industry — that suggest that consideration of fee changes might be warranted. The Trustees concluded that the circumstances did not indicate that changes to the management fee structure for your fund would be appropriate at this time.
Under its management contract, your fund has the benefit of breakpoints in its management fee schedule that provide shareholders with economies of scale in the form of reduced fee rates as assets under management in the Putnam family of funds increase. The Trustees concluded that the fee schedule in effect for your fund represented an appropriate sharing of economies of scale between fund shareholders and Putnam Management.
As in the past, the Trustees also focused on the competitiveness of each fund’s total expense ratio. In order to support the effort to have fund expenses meet competitive standards, the Trustees and Putnam Management have implemented expense limitations that were in effect during your fund’s fiscal year ending in 2017. These expense limitations were: (i) a contractual expense limitation applicable to all open-end funds of 25 basis points on investor servicing fees and expenses and (ii) a contractual expense limitation applicable to specified open-end funds, including your fund, of 20 basis points on so-called “other expenses” (i.e., all expenses exclusive of management fees, distribution fees, investor servicing fees, investment-related expenses, interest, taxes, brokerage commissions, acquired fund fees and expenses and extraordinary expenses). These expense limitations attempt to maintain competitive expense levels for the funds. Most funds, including your fund, had sufficiently low expenses that these expense limitations were not operative during their fiscal years ending in 2017. Putnam Management has agreed to maintain these expense limitations until at least June 30, 2019. Putnam Management’s support for these expense limitation arrangements was an important factor in the Trustees’ decision to approve the continuance of your fund’s management and sub-management contracts.
The Trustees reviewed comparative fee and expense information for a custom group of competitive funds selected by Broadridge Financial Solutions, Inc. (“Broadridge”). This comparative information included your fund’s percentile ranking for effective management fees and total expenses (excluding any applicable 12b-1 fee), which provides a general indication of your fund’s relative standing. In the custom peer group, your fund ranked in the first quintile in effective management fees (determined for your fund and the other funds in the custom peer group based on fund asset size and the applicable contractual management fee schedule) and in the first quintile in total expenses (excluding any applicable 12b-1 fees) as of December 31, 2017. The first quintile represents the least expensive funds and the fifth quintile the most expensive funds. The fee and expense data reported by Broadridge as of December 31, 2017 reflected the most recent fiscal year-end data available in Broadridge’s database at that time.
In connection with their review of fund management fees and total expenses, the Trustees also reviewed the costs of the services provided and the profits realized by Putnam Management and its affiliates from their contractual relationships with the funds. This information included trends in revenues, expenses and profitability of Putnam Management and its affiliates relating to the investment management, investor servicing and distribution services provided to the funds. In this regard, the Trustees also reviewed an analysis of Putnam Management’s revenues, expenses and profitability, allocated on a fund-by-fund basis,
with respect to the funds’ management, distribution, and investor servicing contracts. For each fund, the analysis presented information about revenues, expenses and profitability for each of the agreements separately and for the agreements taken together on a combined basis. The Trustees concluded that, at current asset levels, the fee schedules in place represented reasonable compensation for the services being provided and represented an appropriate sharing between fund shareholders and Putnam Management of such economies of scale as may exist in the management of the Putnam funds at that time.
The information examined by the Trustees in connection with their annual contract review for the Putnam funds included information regarding fees charged by Putnam Management and its affiliates to institutional clients, including defined benefit pension and profit-sharing plans and sub-advised mutual funds. This information included, in cases where an institutional product’s investment strategy corresponds with a fund’s strategy, comparisons of those fees with fees charged to the Putnam funds, as well as an assessment of the differences in the services provided to these different types of clients as compared to the services provided to the Putnam funds. The Trustees observed that the differences in fee rates between these clients and the Putnam funds are by no means uniform when examined by individual asset sectors, suggesting that differences in the pricing of investment management services to these types of clients may reflect, among other things, historical competitive forces operating in separate markets. The Trustees considered the fact that in many cases fee rates across different asset classes are higher on average for mutual funds than for institutional clients, as well as the differences between the services that Putnam Management provides to the Putnam funds and those that it provides to its other clients. The Trustees did not rely on these comparisons to any significant extent in concluding that the management fees paid by your fund are reasonable.
Investment performance
The quality of the investment process provided by Putnam Management represented a major factor in the Trustees’ evaluation of the quality of services provided by Putnam Management under your fund’s management contract. The Trustees were assisted in their review of the Putnam funds’ investment process and performance by the work of the investment oversight committees of the Trustees and the full Board of Trustees, which meet on a regular basis with the funds’ portfolio teams and with the Chief Investment Officers and other senior members of Putnam Management’s Investment Division throughout the year. The Trustees concluded that Putnam Management generally provides a high-quality investment process — based on the experience and skills of the individuals assigned to the management of fund portfolios, the resources made available to them, and in general Putnam Management’s ability to attract and retain high-quality personnel — but also recognized that this does not guarantee favorable investment results for every fund in every time period.
The Trustees considered that 2017 was a strong year for the performance of the Putnam funds, with generally favorable results for most asset classes, including U.S. equity, international and global equity, taxable and tax exempt fixed income, and global asset allocation Funds. In this regard, the Trustees considered that, for the one-year period ended December 31, 2017, the Putnam open-end Funds’ performance, on an asset-weighted basis, ranked in the 32nd percentile of their Lipper peers (excluding those Putnam funds that are evaluated based on their total returns and/or comparisons of those returns versus selected investment benchmarks or targeted annual returns). The Trustees observed that this strong performance has continued a positive trend that began in mid-year 2016 across most Putnam funds. They noted that the longer-term performance of the Putnam funds continued to be strong, exemplified by the fact that the Putnam funds were ranked by the Barron’s/Lipper Fund Families survey as the 7th-best performing mutual fund complex out of 55 complexes for the five-year period ended December 31, 2017 and the 9th-best performing mutual fund complex out of 50 complexes for the ten-year period ended 2017. In addition, the survey ranked the Putnam funds 7th out of 59 mutual fund complexes for the one-year period ended 2017; the Putnam funds have ranked 1st or 2nd in the survey for the one-year period three times since 2009 (most recently in 2013). They also noted, however, the disappointing investment performance of some funds for periods ended December 31, 2017 and considered information provided by Putnam Management regarding the factors contributing to the underperformance and actions being taken to improve the performance
of these particular funds. The Trustees indicated their intention to continue to monitor closely the performance of those funds, including the effectiveness of any efforts Putnam Management has undertaken to address underperformance and whether additional actions to address areas of underperformance are warranted.
For purposes of the Trustees’ evaluation of the Putnam Funds’ investment performance, the Trustees generally focus on a competitive industry ranking of each fund’s total net return over a one-year, three-year and five-year period. For a number of Putnam funds with relatively unique investment mandates for which Putnam Management informed the Trustees that meaningful competitive performance rankings are not considered to be available, the Trustees evaluated performance based on their total gross and net returns and, in most cases, comparisons of those returns with the returns of selected investment benchmarks. In the case of your fund, the Trustees considered that its class A share cumulative total return performance at net asset value was in the following quartiles of its Lipper Inc. (“Lipper”) peer group (Lipper Small-Cap Value Funds) for the one-year, three-year and five-year periods ended December 31, 2017 (the first quartile representing the best-performing funds and the fourth quartile the worst-performing funds):
| |
| One-year period | 3rd |
| Three-year period | 2nd |
| Five-year period | 2nd |
Over the one-year, three-year and five-year periods ended December 31, 2017, there were 269, 239 and 210 funds, respectively, in your fund’s Lipper peer group. (When considering performance information, shareholders should be mindful that past performance is not a guarantee of future results.)
The Trustees considered Putnam Management’s continued efforts to support fund performance through initiatives including structuring compensation for portfolio managers and research analysts to enhance accountability for fund performance, emphasizing accountability in the portfolio management process, and affirming its commitment to a fundamental-driven approach to investing. The Trustees noted further that Putnam Management continued to strengthen its fundamental research capabilities by adding new investment personnel.
Brokerage and soft-dollar allocations; investor servicing
The Trustees considered various potential benefits that Putnam Management may receive in connection with the services it provides under the management contract with your fund. These include benefits related to brokerage allocation and the use of soft dollars, whereby a portion of the commissions paid by a fund for brokerage may be used to acquire research services that are expected to be useful to Putnam Management in managing the assets of the fund and of other clients. Subject to policies established by the Trustees, soft dollars generated by these means are used predominantly to acquire brokerage and research services (including third-party research and market data) that enhance Putnam Management’s investment capabilities and supplement Putnam Management’s internal research efforts. However, the Trustees noted that a portion of available soft dollars continues to be used to pay fund expenses. The Trustees indicated their continued intent to monitor regulatory and industry developments in this area with the assistance of their Brokerage Committee. The Trustees also indicated their continued intent to monitor the allocation of the Putnam funds’ brokerage in order to ensure that the principle of seeking best price and execution remains paramount in the portfolio trading process.
Putnam Management may also receive benefits from payments that the funds make to Putnam Management’s affiliates for investor or distribution services. In conjunction with the annual review of your fund’s management and sub-management contracts, the Trustees reviewed your fund’s investor servicing agreement with Putnam Investor Services, Inc. (“PSERV”) and its distributor’s contracts and distribution plans with Putnam Retail Management Limited Partnership (“PRM”), both of which are affiliates of Putnam Management. The Trustees concluded that the fees payable by the funds to PSERV and PRM, as applicable, for such services are fair and reasonable in relation to the nature and quality of such services, the fees paid by competitive funds, and the costs incurred by PSERV and PRM, as applicable, in providing such services. Furthermore, the Trustees were of the view that the services provided were required for the operation of the funds, and that they were of a quality at least equal to those provided by other providers.
Financial statements
These sections of the report, as well as the accompanying Notes, constitute the fund’s financial statements.
The fund’s portfolio lists all the fund’s investments and their values as of the last day of the reporting period. Holdings are organized by asset type and industry sector, country, or state to show areas of concentration and diversification.
Statement of assets and liabilities shows how the fund’s net assets and share price are determined. All investment and non-investment assets are added together. Any unpaid expenses and other liabilities are subtracted from this total. The result is divided by the number of shares to determine the net asset value per share, which is calculated separately for each class of shares. (For funds with preferred shares, the amount subtracted from total assets includes the liquidation preference of preferred shares.)
Statement of operations shows the fund’s net investment gain or loss. This is done by first adding up all the fund’s earnings — from dividends and interest income — and subtracting its operating expenses to determine net investment income (or loss). Then, any net gain or loss the fund realized on the sales of its holdings — as well as any unrealized gains or losses over the period — is added to or subtracted from the net investment result to determine the fund’s net gain or loss for the fiscal period.
Statement of changes in net assets shows how the fund’s net assets were affected by the fund’s net investment gain or loss, by distributions to shareholders, and by changes in the number of the fund’s shares. It lists distributions and their sources (net investment income or realized capital gains) over the current reporting period and the most recent fiscal year-end. The distributions listed here may not match the sources listed in the Statement of operations because the distributions are determined on a tax basis and may be paid in a different period from the one in which they were earned. Dividend sources are estimated at the time of declaration. Actual results may vary. Any non-taxable return of capital cannot be determined until final tax calculations are completed after the end of the fund’s fiscal year.
Financial highlights provide an overview of the fund’s investment results, per-share distributions, expense ratios, net investment income ratios, and portfolio turnover in one summary table, reflecting the five most recent reporting periods. In a semiannual report, the highlights table also includes the current reporting period.
The fund’s portfolio 8/31/18 (Unaudited)
| | |
| COMMON STOCKS (85.2%)* | Shares | Value |
| Aerospace and defense (1.5%) | | |
| Esterline Technologies Corp. † | 40,200 | $3,455,190 |
| Vectrus, Inc. † | 49,593 | 1,627,642 |
| | | 5,082,832 |
| Air freight and logistics (0.5%) | | |
| Atlas Air Worldwide Holdings, Inc. † | 31,571 | 1,922,674 |
| | | 1,922,674 |
| Airlines (1.4%) | | |
| Air Canada (Canada) † | 173,800 | 3,571,890 |
| JetBlue Airways Corp. † | 63,900 | 1,219,212 |
| | | 4,791,102 |
| Auto components (0.2%) | | |
| VOXX International Corp. † | 140,483 | 758,608 |
| | | 758,608 |
| Banks (7.5%) | | |
| Bancorp, Inc. (The) † | 114,200 | 1,145,426 |
| Blue Hills Bancorp, Inc. | 45,340 | 1,042,820 |
| Coastal Financial Corp. (WA) † | 76,216 | 1,236,224 |
| FCB Financial Holdings, Inc. Class A † | 45,099 | 2,336,128 |
| First Horizon National Crop. | 60,600 | 1,116,252 |
| Fulton Financial Corp. | 15,200 | 276,640 |
| Hancock Whitney Corp. | 25,200 | 1,299,060 |
| Home BancShares, Inc. | 26,600 | 622,706 |
| Hope Bancorp, Inc | 39,900 | 698,649 |
| Independent Bank Group, Inc. | 34,961 | 2,421,049 |
| Investors Bancorp, Inc. | 194,500 | 2,489,600 |
| Pacific City Financial Corp. | 104,172 | 2,084,482 |
| Pinnacle Financial Partners, Inc. | 17,800 | 1,148,990 |
| Signature Bank | 16,000 | 1,851,840 |
| South State Corp. | 22,800 | 1,879,860 |
| Sterling Bancorp | 96,900 | 2,214,165 |
| TriCo Bancshares | 27,687 | 1,076,471 |
| Valley National Bancorp | 91,800 | 1,106,190 |
| | | 26,046,552 |
| Beverages (0.2%) | | |
| Craft Brew Alliance, Inc. † | 43,991 | 833,629 |
| | | 833,629 |
| Building products (0.3%) | | |
| JELD-WEN Holding, Inc. † | 40,100 | 975,232 |
| | | 975,232 |
| Capital markets (1.1%) | | |
| Artisan Partners Asset Management, Inc. Class A | 16,700 | 553,605 |
| Legg Mason, Inc. | 37,300 | 1,163,760 |
| Medley Management, Inc. Class A | 151,511 | 795,433 |
| Oaktree Capital Group, LLC (Units) | 12,172 | 494,792 |
| Victory Capital Holdings, Inc. Class A † | 86,815 | 857,732 |
| | | 3,865,322 |
| | |
| COMMON STOCKS (85.2%)* cont. | Shares | Value |
| Chemicals (3.6%) | | |
| Axalta Coating Systems, Ltd. † | 137,000 | $4,178,500 |
| Ferro Corp. † | 34,900 | 766,055 |
| OMNOVA Solutions, Inc. † | 53,400 | 483,270 |
| Sensient Technologies Corp. | 22,400 | 1,590,848 |
| Valvoline, Inc. | 194,149 | 4,178,086 |
| Venator Materials PLC (United Kingdom) † | 28,918 | 349,329 |
| W.R. Grace & Co. | 11,700 | 826,722 |
| | | 12,372,810 |
| Commercial services and supplies (3.4%) | | |
| ABM Industries, Inc. | 70,600 | 2,239,432 |
| CECO Environmental Corp. | 273,207 | 2,305,867 |
| Clean Harbors, Inc. † | 69,650 | 4,777,294 |
| Steelcase, Inc. Class A | 90,300 | 1,318,380 |
| Stericycle, Inc. † | 20,300 | 1,252,307 |
| | | 11,893,280 |
| Communications equipment (2.0%) | | |
| Acacia Communications, Inc. † S | 34,800 | 1,418,796 |
| Ceragon Networks, Ltd. (Israel) † | 412,776 | 1,333,266 |
| EMCORE Corp. † S | 43,705 | 211,969 |
| Sierra Wireless, Inc. (Canada) † S | 90,300 | 1,702,155 |
| Tessco Technologies, Inc. | 85,615 | 1,528,228 |
| ViaSat, Inc. † S | 14,800 | 929,736 |
| | | 7,124,150 |
| Construction and engineering (0.8%) | | |
| Granite Construction, Inc. | 17,100 | 781,128 |
| Great Lakes Dredge & Dock Corp. † | 209,285 | 1,145,835 |
| Northwest Pipe, Co. † | 10,200 | 184,212 |
| Orion Group Holdings, Inc. † | 97,455 | 840,062 |
| | | 2,951,237 |
| Construction materials (1.0%) | | |
| Eagle Materials, Inc. | 6,700 | 618,611 |
| Summit Materials, Inc. Class A | 71,100 | 1,512,297 |
| U.S. Concrete, Inc. † S | 25,000 | 1,205,000 |
| | | 3,335,908 |
| Containers and packaging (0.2%) | | |
| Bemis Co., Inc. | 16,012 | 789,071 |
| | | 789,071 |
| Diversified financial services (0.8%) | | |
| Capitol Investment Corp. IV (Units) † | 201,186 | 2,088,311 |
| Jefferies Financial Group, Inc. | 33,700 | 782,514 |
| | | 2,870,825 |
| Electrical equipment (1.1%) | | |
| GrafTech International, Ltd. | 116,000 | 2,143,680 |
| LSI Industries, Inc. | 143,200 | 740,344 |
| Powell Industries, Inc. | 24,100 | 943,515 |
| | | 3,827,539 |
| | |
| COMMON STOCKS (85.2%)* cont. | Shares | Value |
| Electronic equipment, instruments, and components (2.6%) | | |
| Flex, Ltd. † | 105,900 | $1,460,361 |
| Knowles Corp. † | 184,428 | 3,343,680 |
| Sunny Optical Technology Group Co., Ltd. (China) | 28,700 | 364,749 |
| Tech Data Corp. † | 51,452 | 3,743,133 |
| | | 8,911,923 |
| Energy equipment and services (3.7%) | | |
| Geospace Technologies Corp. † S | 48,863 | 690,434 |
| Gulf Island Fabrication, Inc. | 65,095 | 615,148 |
| Independence Contract Drilling, Inc. † | 40,922 | 178,829 |
| Key Energy Services, Inc. † | 91,500 | 1,222,440 |
| Mullen Group, Ltd. (Canada) | 66,345 | 816,984 |
| Natural Gas Services Group, Inc. † | 42,086 | 930,101 |
| North American Construction Group, Ltd. (Canada) | 57,678 | 444,121 |
| Ocean Rig UDW, Inc. Class A (Cayman Islands) † | 60,931 | 1,650,011 |
| Patterson-UTI Energy, Inc. | 64,076 | 1,097,622 |
| ProPetro Holding Corp. † | 42,600 | 648,372 |
| Select Energy Services, Inc. Class A † | 138,600 | 1,891,890 |
| Shelf Drilling, Ltd. (United Arab Emirates) † | 233,259 | 1,582,662 |
| Trinidad Drilling, Ltd. (Canada) † | 849,620 | 1,158,869 |
| | | 12,927,483 |
| Equity real estate investment trusts (REITs) (5.7%) | | |
| CorePoint Lodging, Inc. † | 52,700 | 1,098,795 |
| DiamondRock Hospitality Co. | 115,700 | 1,383,772 |
| Forest City Realty Trust, Inc. Class A | 69,500 | 1,747,925 |
| Gaming and Leisure Properties, Inc. | 63,000 | 2,254,770 |
| Hersha Hospitality Trust | 96,392 | 2,274,851 |
| InfraREIT, Inc. | 83,594 | 1,746,279 |
| MedEquities Realty Trust, Inc. | 107,600 | 1,152,396 |
| Outfront Media, Inc. | 52,436 | 1,041,903 |
| RLJ Lodging Trust | 158,700 | 3,477,117 |
| Spirit Realty Capital, Inc. | 139,400 | 1,166,778 |
| Summit Hotel Properties, Inc. | 186,200 | 2,556,526 |
| | | 19,901,112 |
| Food and staples retail (1.5%) | | |
| Casey’s General Stores, Inc. | 12,779 | 1,458,978 |
| Smart & Final Stores, Inc. † | 83,565 | 584,955 |
| Sprouts Farmers Market, Inc. † S | 117,667 | 3,114,645 |
| | | 5,158,578 |
| Food products (2.2%) | | |
| Dean Foods Co. | 101,881 | 776,333 |
| Gruma SAB de CV Class B (Mexico) | 166,193 | 2,102,590 |
| Hain Celestial Group, Inc. (The) † | 78,305 | 2,236,391 |
| Pilgrim’s Pride Corp. † | 63,200 | 1,168,568 |
| SunOpta, Inc. (Canada) † | 172,500 | 1,324,483 |
| | | 7,608,365 |
| Health-care equipment and supplies (0.6%) | | |
| Accuray, Inc. † | 187,166 | 748,664 |
| Varex Imaging Corp. † | 46,231 | 1,451,653 |
| | | 2,200,317 |
| | |
| COMMON STOCKS (85.2%)* cont. | Shares | Value |
| Health-care providers and services (1.5%) | | |
| Acadia Healthcare Co., Inc. † S | 34,137 | $1,417,710 |
| Brookdale Senior Living, Inc. † | 269,200 | 2,670,464 |
| Select Medical Holdings Corp. † | 52,700 | 1,043,460 |
| | | 5,131,634 |
| Hotels, restaurants, and leisure (3.2%) | | |
| Bloomin’ Brands, Inc. | 173,000 | 3,338,900 |
| Dave & Buster’s Entertainment, Inc. † | 30,590 | 1,779,420 |
| Hilton Grand Vacations, Inc. † | 33,100 | 1,081,046 |
| International Game Technology PLC | 42,700 | 898,408 |
| Potbelly Corp. † S | 118,636 | 1,607,518 |
| Red Robin Gourmet Burgers, Inc. † S | 56,028 | 2,313,956 |
| | | 11,019,248 |
| Household durables (0.5%) | | |
| Tempur Sealy International, Inc. † S | 28,400 | 1,573,076 |
| | | 1,573,076 |
| Insurance (1.1%) | | |
| American Equity Investment Life Holding Co. | 63,000 | 2,336,670 |
| Aspen Insurance Holdings, Ltd. | 36,158 | 1,487,902 |
| | | 3,824,572 |
| Internet and direct marketing retail (0.5%) | | |
| Groupon, Inc. † | 379,707 | 1,621,349 |
| | | 1,621,349 |
| Internet software and services (0.7%) | | |
| Cars.com, Inc. † S | 42,175 | 1,134,929 |
| Endurance International Group Holdings, Inc. † | 136,600 | 1,318,190 |
| | | 2,453,119 |
| IT Services (2.2%) | | |
| Booz Allen Hamilton Holding Corp. | 13,552 | 693,320 |
| CSG Systems International, Inc. | 56,600 | 2,114,010 |
| MoneyGram International, Inc. † | 72,766 | 473,707 |
| Pagseguro Digital, Ltd. Class A (Brazil) † S | 130,400 | 3,767,256 |
| Perspecta, Inc. | 22,900 | 532,654 |
| | | 7,580,947 |
| Leisure products (1.5%) | | |
| Clarus Corp. † | 179,390 | 1,856,687 |
| Mattel, Inc. S | 126,396 | 1,950,290 |
| Nautilus, Inc. † | 99,900 | 1,463,535 |
| | | 5,270,512 |
| Machinery (5.6%) | | |
| American Railcar Industries, Inc. | 32,239 | 1,477,191 |
| Colfax Corp. † | 69,300 | 2,419,956 |
| Deutz AG (Germany) | 110,275 | 963,853 |
| Evoqua Water Technologies Corp. † S | 174,700 | 3,385,686 |
| Hyster-Yale Materials Handling, Inc. | 16,866 | 1,040,632 |
| Manitex International, Inc. † S | 187,291 | 1,981,539 |
| Manitowoc Co., Inc. (The) † | 79,539 | 1,844,509 |
| NN, Inc. | 137,874 | 2,757,480 |
| NSK, Ltd. (Japan) | 126,900 | 1,440,203 |
| Oshkosh Corp. | 8,748 | 614,634 |
| | |
| COMMON STOCKS (85.2%)* cont. | Shares | Value |
| Machinery cont. | | |
| Spartan Motors, Inc. | 37,731 | $545,213 |
| Trinity Industries, Inc. | 24,000 | 860,160 |
| | | 19,331,056 |
| Media (1.9%) | | |
| Beasley Broadcast Group, Inc. Class A | 82,270 | 621,139 |
| Central European Media Enterprises, Ltd. Class A (Czech Republic) † | 155,900 | 592,420 |
| Lions Gate Entertainment Corp. Class A S | 93,516 | 2,199,496 |
| TEGNA, Inc. | 101,800 | 1,184,952 |
| Tribune Media Co. Class A | 40,800 | 1,505,112 |
| tronc, Inc. † | 40,900 | 674,850 |
| | | 6,777,969 |
| Metals and mining (0.5%) | | |
| Ferroglobe Representation & Warranty Insurance Trust † | 270,395 | — |
| Haynes International, Inc. | 20,400 | 803,760 |
| Nevsun Resources, Ltd. (Canada) | 72,500 | 274,050 |
| Nevsun Resources, Ltd. (Canada) | 56,100 | 212,363 |
| TimkenSteel Corp. † S | 37,356 | 523,358 |
| | | 1,813,531 |
| Mortgage real estate investment trusts (REITs) (0.4%) | | |
| Hannon Armstrong Sustainable Infrastructure Capital, Inc. S | 65,300 | 1,407,868 |
| | | 1,407,868 |
| Multiline retail (1.8%) | | |
| Big Lots, Inc. | 112,314 | 4,835,118 |
| Dillards, Inc. Class A S | 17,870 | 1,404,225 |
| | | 6,239,343 |
| Oil, gas, and consumable fuels (9.3%) | | |
| Amplify Energy Corp. † | 43,077 | 423,878 |
| Berry Petroleum Corp. † | 57,528 | 942,884 |
| Bonanza Creek Energy, Inc. † | 5,400 | 167,400 |
| Callon Petroleum Co. † | 60,000 | 678,000 |
| Chaparral Energy, Inc. Class A † | 134,829 | 2,480,854 |
| EQT Midstream Partners LP (Units) | 12,401 | 708,841 |
| Gran Tierra Energy, Inc. (Colombia) † S | 164,800 | 568,560 |
| Holly Energy Partners LP | 30,711 | 889,391 |
| Lilis Energy, Inc. † | 223,346 | 1,188,201 |
| Linn Energy, Inc. † | 34,018 | 588,511 |
| Midstates Petroleum Co., Inc. † | 130,364 | 1,516,133 |
| Newfield Exploration Co. † | 64,100 | 1,748,648 |
| Panhandle Oil and Gas, Inc. Class A | 49,287 | 919,203 |
| Range Resources Corp. S | 42,806 | 702,875 |
| Riviera Resources, Inc./Linn † | 97,640 | 2,099,260 |
| SandRidge Energy, Inc. † | 171,159 | 2,714,582 |
| Seven Generations Energy, Ltd. Class A (Canada) † | 224,100 | 2,637,683 |
| Shell Midstream Partners LP | 104,800 | 2,344,376 |
| Sunoco LP (Units) | 76,200 | 2,064,258 |
| Vermilion Energy, Inc. (Canada) | 221,556 | 7,035,464 |
| | | 32,419,002 |
| | |
| COMMON STOCKS (85.2%)* cont. | Shares | Value |
| Paper and forest products (0.3%) | | |
| PH Glatfelter Co. | 56,400 | $1,084,572 |
| | | 1,084,572 |
| Personal products (0.1%) | | |
| e.l.f. Beauty, Inc. † S | 35,786 | 497,068 |
| | | 497,068 |
| Pharmaceuticals (0.5%) | | |
| China Traditional Chinese Medicine Holdings Co., Ltd. (China) | 2,422,000 | 1,765,101 |
| | | 1,765,101 |
| Professional services (0.2%) | | |
| BancTec, Inc. 144A CVR F | 160,833 | — |
| Willdan Group, Inc. † | 21,702 | 680,792 |
| | | 680,792 |
| Real estate management and development (0.3%) | | |
| Consolidated-Tomoka Land, Co. | 12,082 | 758,508 |
| Trinity Place Holdings, Inc. † | 74,086 | 451,925 |
| | | 1,210,433 |
| Road and rail (1.4%) | | |
| Knight-Swift Transportation Holdings, Inc. | 27,924 | 953,046 |
| US Xpress Enterprises, Inc. Class A † | 225,622 | 3,336,949 |
| YRC Worldwide, Inc. † | 46,100 | 441,177 |
| | | 4,731,172 |
| Semiconductors and semiconductor equipment (2.0%) | | |
| Advanced Energy Industries, Inc. † | 10,600 | 631,548 |
| AXT, Inc. † | 27,968 | 220,947 |
| MACOM Technology Solutions Holdings, Inc. † | 37,905 | 873,710 |
| NeoPhotonics Corp. † S | 177,056 | 1,556,322 |
| SCREEN Holdings Co., Ltd. (Japan) | 5,900 | 446,575 |
| Synaptics, Inc. † | 24,349 | 1,175,083 |
| Tower Semiconductor, Ltd. (Israel) † S | 32,252 | 703,094 |
| Ultra Clean Holdings, Inc. † | 77,792 | 1,187,106 |
| | | 6,794,385 |
| Software (1.6%) | | |
| Datawatch Corp. † | 76,475 | 975,056 |
| Micro Focus International PLC ADR (United Kingdom) S | 128,700 | 2,191,761 |
| Nuance Communications, Inc. † | 99,213 | 1,619,156 |
| TiVo Corp. | 45,400 | 619,710 |
| | | 5,405,683 |
| Specialty retail (3.8%) | | |
| Cato Corp. (The) Class A | 26,000 | 557,700 |
| Chico’s FAS, Inc. | 231,600 | 2,112,192 |
| Foot Locker, Inc. | 46,587�� | 2,296,739 |
| Francesca’s Holdings Corp. † | 108,200 | 679,496 |
| Guess?, Inc. | 42,900 | 1,051,050 |
| Hudson, Ltd. Class A † | 69,000 | 1,421,400 |
| Kirkland’s, Inc. † | 91,015 | 827,326 |
| Michaels Cos., Inc. (The) † | 81,963 | 1,392,551 |
| Sportsman’s Warehouse Holdings, Inc. † S | 281,100 | 1,605,081 |
| TravelCenters of America, LLC † | 278,616 | 1,211,980 |
| | | 13,155,515 |
| | |
| COMMON STOCKS (85.2%)* cont. | Shares | Value |
| Technology hardware, storage, and peripherals (0.2%) | | |
| Cray, Inc. † | 30,600 | $664,020 |
| | | 664,020 |
| Textiles, apparel, and luxury goods (0.3%) | | |
| Delta Apparel, Inc. † | 59,849 | 1,110,199 |
| | | 1,110,199 |
| Thrifts and mortgage finance (1.1%) | | |
| Kearny Financial Corp./MD | 58,565 | 802,341 |
| Meridian Bancorp, Inc. | 74,200 | 1,328,180 |
| Sterling Bancorp, Inc./MI | 47,974 | 587,682 |
| Territorial Bancorp, Inc. | 34,546 | 1,032,233 |
| | | 3,750,436 |
| Trading companies and distributors (0.8%) | | |
| Herc Holdings, Inc. † | 51,000 | 2,681,580 |
| | | 2,681,580 |
| Total common stocks (cost $292,802,930) | | $296,142,731 |
| |
| INVESTMENT COMPANIES (2.9%)* | Shares | Value |
| Ares Capital Corp. | 166,500 | $2,907,090 |
| Golub Capital BDC, Inc. | 89,901 | 1,717,109 |
| MVC Capital, Inc. | 118,848 | 1,107,663 |
| Solar Capital, Ltd. | 63,282 | 1,376,384 |
| TriplePoint Venture Growth BDC Corp. S | 219,112 | 2,874,749 |
| Total investment companies (cost $9,719,158) | | $9,982,995 |
| | | | |
| PURCHASED OPTIONS | Expiration | | | |
| OUTSTANDING (0.3%)* | date/strike | Notional | Contract | |
| Counterparty | price | amount | amount | Value |
| Barclays Bank PLC | | | | |
| Callon Petroleum Co. (Call) | Oct-18/$8.00 | $493,584 | $43,680 | $145,781 |
| Citibank, N.A. | | | | |
| ABM Industries, Inc. (Call) | Jan-19/25.00 | 549,866 | 17,335 | 123,774 |
| Credit Suisse International | | | | |
| iShares Russell 2000 ETF (Put) | Sep-18/150.00 | 131,037,735 | 757,356 | 60,660 |
| JPMorgan Chase Bank N.A. | | | | |
| Bloomin’ Brands, Inc. (Call) | Oct-18/15.00 | 535,189 | 27,730 | 121,175 |
| CommScope Holding Co., Inc. (Call) | Nov-18/25.00 | 941,890 | 29,722 | 205,967 |
| Red Robin Gourmet Burgers, | | | | |
| Inc. (Call) | Dec-18/40.00 | 285,961 | 6,924 | 32,543 |
| UBS AG | | | | |
| iShares Russell 2000 ETF (Put) | Oct-18/160.00 | 51,731,250 | 298,990 | 188,364 |
| Total purchased options outstanding (cost $2,221,522) | | | $878,264 |
| | | |
| | Principal amount/ | |
| SHORT-TERM INVESTMENTS (19.4%)* | | shares | Value |
| Putnam Cash Collateral Pool, LLC 2.24% d | Shares | 30,648,431 | $30,648,431 |
| Putnam Short Term Investment Fund 2.16% L | Shares | 35,378,752 | 35,378,752 |
| State Street Institutional U.S. Government Money Market Fund, | | | |
| Premier Class 1.87% P | Shares | 440,000 | 440,000 |
| U.S. Treasury Bills 1.962%, 10/11/18 # ∆ | | $213,000 | 212,570 |
| U.S. Treasury Bills 2.044%, 11/8/18 # | | 269,000 | 268,010 |
| | |
| | Principal amount/ | |
| SHORT-TERM INVESTMENTS (19.4%)* cont. | shares | Value |
| U.S. Treasury Bills 2.061%, 11/15/18 # | $495,000 | $492,982 |
| U.S. Treasury Bills 2.075%, 11/23/18 # | 8,000 | 7,963 |
| Total short-term investments (cost $67,448,584) | | $67,448,708 |
| |
| TOTAL INVESTMENTS | | |
| Total investments (cost $372,192,194) | | $374,452,698 |
Key to holding’s abbreviations
| |
| ADR | American Depository Receipts: represents ownership of foreign securities on deposit with a custodian bank |
| CVR | Contingent Value Rights |
| ETF | Exchange Traded Fund |
Notes to the fund’s portfolio
Unless noted otherwise, the notes to the fund’s portfolio are for the close of the fund’s reporting period, which ran from March 1, 2018 through August 31, 2018 (the reporting period). Within the following notes to the portfolio, references to “Putnam Management” represent Putnam Investment Management, LLC, the fund’s manager, an indirect wholly-owned subsidiary of Putnam Investments, LLC and references to “ASC 820” represent Accounting Standards Codification 820 Fair Value Measurements and Disclosures.
* Percentages indicated are based on net assets of $347,637,514.
† This security is non-income-producing.
# This security, in part or in entirety, was pledged and segregated with the broker to cover margin requirements for futures contracts at the close of the reporting period. Collateral at period end totaled $940,407 and is included in Investments in securities on the Statement of assets and liabilities (Notes 1 and 8).
∆ This security, in part or in entirety, was pledged and segregated with the custodian for collateral on certain derivative contracts at the close of the reporting period. Collateral at period end totaled $40,910 and is included in Investments in securities on the Statement of assets and liabilities (Notes 1 and 8).
d Affiliated company. See Notes 1 and 5 to the financial statements regarding securities lending. The rate quoted in the security description is the annualized 7-day yield of the fund at the close of the reporting period.
F This security is valued by Putnam Management at fair value following procedures approved by the Trustees. Securities are classified as Level 3 for ASC 820 based on the securities’ valuation inputs (Note 1).
L Affiliated company (Note 5). The rate quoted in the security description is the annualized 7-day yield of the fund at the close of the reporting period.
P This security was pledged, or purchased with cash that was pledged, to the fund for collateral on certain derivative contracts. The rate quoted in the security description is the annualized 7-day yield of the fund at the close of the reporting period (Note 1).
S Security on loan, in part or in entirety, at the close of the reporting period (Note 1).
At the close of the reporting period, the fund maintained liquid assets totaling $5,797,074 to cover certain derivative contracts.
Unless otherwise noted, the rates quoted in Short-term investments security descriptions represent the weighted average yield to maturity.
144A after the name of an issuer represents securities exempt from registration under Rule 144A of the Securities Act of 1933, as amended. These securities may be resold in transactions exempt from registration, normally to qualified institutional buyers.
| | | | | |
| FUTURES CONTRACTS OUTSTANDING at 8/31/18 (Unaudited) | | | |
| | | | | | Unrealized |
| | Number of | Notional | | Expiration | appreciation/ |
| | contracts | amount | Value | date | (depreciation) |
| Russell 2000 Index E-Mini (Long) | 141 | $12,272,309 | $12,271,230 | Sep-18 | $51,824 |
| S&P 500 Index E-Mini (Long) | 1 | 145,076 | 145,105 | Sep-18 | 28 |
| Unrealized appreciation | | | | | 51,852 |
| Unrealized (depreciation) | | | | | — |
| Total | | | | | $51,852 |
| | | | |
| WRITTEN OPTIONS OUTSTANDING at 8/31/18 (premiums $1,277,999) (Unaudited) |
| | Expiration | Notional | Contract | |
| Counterparty | date/strike price | amount | amount | Value |
| Bank of America N.A. | | | | |
| Callon Petroleum Co. (Put) | Sep-18/$11.00 | $250,736 | $22,189 | $5,547 |
| Cypress Semiconductor | | | | |
| Corp. (Put) | Sep-18/17.00 | 103,811 | 6,032 | 2,564 |
| Cypress Semiconductor | | | | |
| Corp. (Put) | Sep-18/16.00 | 186,075 | 10,812 | 1,621 |
| Dave & | | | | |
| Buster’s Entertainment, Inc. (Put) | Sep-18/57.00 | 282,357 | 4,854 | 2,548 |
| Guess?, Inc. (Call) | Sep-18/25.00 | 169,883 | 6,934 | 3,815 |
| Guess?, Inc. (Put) | Sep-18/24.00 | 355,054 | 14,492 | 10,340 |
| Newfield Exploration Co. (Put) | Sep-18/27.00 | 175,820 | 6,445 | 4,511 |
| Barclays Bank PLC | | | | |
| Advanced Energy | | | | |
| Industries, Inc. (Put) | Sep-18/60.00 | 239,571 | 4,021 | 6,894 |
| Big Lots, Inc. (Put) | Sep-18/42.50 | 298,509 | 6,934 | 6,849 |
| Casey’s General Stores, Inc. (Put) | Sep-18/110.00 | 720,527 | 6,311 | 7,383 |
| Casey’s General Stores, Inc. (Put) | Sep-18/115.00 | 174,223 | 1,526 | 6,525 |
| Casey’s General Stores, Inc. (Put) | Sep-18/105.00 | 182,101 | 1,595 | 1,037 |
| Cato Corp. Class A (Put) | Sep-18/22.50 | 163,578 | 7,626 | 13,517 |
| Dave & | | | | |
| Buster’s Entertainment, Inc. (Put) | Sep-18/58.00 | 173,463 | 2,982 | 2,565 |
| MACOM Technology Solutions | | | | |
| Holdings, Inc. (Put) | Sep-18/22.50 | 212,475 | 9,218 | 7,693 |
| Pagseguro Digital, Ltd. | | | | |
| Class A (Put) | Sep-18/30.00 | 380,626 | 13,175 | 28,422 |
| Range Resources Corp. (Put) | Sep-18/16.50 | 241,358 | 14,699 | 8,819 |
| Range Resources Corp. (Put) | Sep-18/16.00 | 213,953 | 13,030 | 5,212 |
| Citibank, N.A. | | | | |
| Cypress Semiconductor | | | | |
| Corp. (Put) | Sep-18/17.00 | 175,404 | 10,192 | 4,333 |
| Francesca’s Holdings Corp. (Put) | Sep-18/6.00 | 239,469 | 38,132 | 13,347 |
| Newfield Exploration Co. (Put) | Sep-18/28.00 | 100,227 | 3,674 | 4,579 |
| Range Resources Corp. (Put) | Sep-18/16.50 | 136,631 | 8,321 | 2,651 |
| Tower Semiconductor, Ltd. (Put) | Sep-18/22.00 | 438,398 | 20,110 | 13,572 |
| Credit Suisse International | | | | |
| iShares Russell 2000 ETF (Put) | Sep-18/146.00 | 131,037,735 | 757,356 | 49,237 |
| | | | |
| WRITTEN OPTIONS OUTSTANDING at 8/31/18 (premiums $1,277,999) (Unaudited) cont. |
| | Expiration | Notional | Contract | |
| Counterparty | date/strike price | amount | amount | Value |
| JPMorgan Chase Bank N.A. | | | | |
| Guess?, Inc. (Call) | Sep-18/$24.00 | $254,825 | $10,401 | $10,776 |
| Red Robin Gourmet Burgers, | | | | |
| Inc. (Call) | Sep-18/40.00 | 211,993 | 5,133 | 10,774 |
| UBS AG | | | | |
| iShares Russell 2000 ETF (Put) | Oct-18/150.00 | 51,731,250 | 298,990 | 83,716 |
| Total | | | | $318,847 |
ASC 820 establishes a three-level hierarchy for disclosure of fair value measurements. The valuation hierarchy is based upon the transparency of inputs to the valuation of the fund’s investments. The three levels are defined as follows:
Level 1: Valuations based on quoted prices for identical securities in active markets.
Level 2: Valuations based on quoted prices in markets that are not active or for which all significant inputs are observable, either directly or indirectly.
Level 3: Valuations based on inputs that are unobservable and significant to the fair value measurement.
The following is a summary of the inputs used to value the fund’s net assets as of the close of the reporting period:
| | | |
| | | | Valuation inputs | |
| Investments in securities: | Level 1 | Level 2 | Level 3 |
| Common stocks*: | | | |
| Consumer discretionary | $47,525,819 | $— | $— |
| Consumer staples | 14,097,640 | — | — |
| Energy | 45,346,485 | — | — |
| Financials | 41,765,575 | — | — |
| Health care | 9,097,052 | — | — |
| Industrials | 58,868,496 | — | —** |
| Information technology | 38,934,227 | — | — |
| Materials | 19,395,892 | — | — |
| Real estate | 21,111,545 | — | — |
| Total common stocks | 296,142,731 | — | — |
| Investment companies | 9,982,995 | — | — |
| Purchased options outstanding | — | 878,264 | — |
| Short-term investments | 35,818,752 | 31,629,956 | — |
| Totals by level | $341,944,478 | $32,508,220 | $— |
| | | | |
| | | | Valuation inputs | |
| Other financial instruments: | Level 1 | Level 2 | Level 3 |
| Futures contracts | $51,852 | $— | $— |
| Written options outstanding | — | (318,847) | — |
| Totals by level | $51,852 | $(318,847) | $— |
* Common stock classifications are presented at the sector level, which may differ from the fund’s portfolio presentation.
** Value of Level 3 security is $—.
During the reporting period, transfers within the fair value hierarchy, if any (other than certain transfers involving non-U.S. equity securities as described in Note 1), did not represent, in the aggregate, more than 1% of the fund’s net assets measured as of the end of the period. Transfers are accounted for using the end of period pricing valuation method.
At the start and close of the reporting period, Level 3 investments in securities represented less than 1% of the fund’s net assets and were not considered a significant portion of the fund’s portfolio.
The accompanying notes are an integral part of these financial statements.
Statement of assets and liabilities 8/31/18 (Unaudited)
| |
| ASSETS | |
| Investment in securities, at value, including $27,732,017 of securities on loan (Notes 1 and 8): | |
| Unaffiliated issuers (identified cost $306,165,011) | $308,425,515 |
| Affiliated issuers (identified cost $66,027,183) (Notes 1 and 5) | 66,027,183 |
| Cash | 560,286 |
| Foreign currency (cost $2,366) (Note 1) | 2,352 |
| Dividends, interest and other receivables | 404,327 |
| Receivable for shares of the fund sold | 186,107 |
| Receivable for investments sold | 27,706,497 |
| Receivable for investor servicing fees (Note 2) | 160,923 |
| Receivable for variation margin on futures contracts (Note 1) | 83,155 |
| Prepaid assets | 54,230 |
| Total assets | 403,610,575 |
| |
| LIABILITIES | |
| Payable for investments purchased | 23,520,078 |
| Payable for shares of the fund repurchased | 496,771 |
| Payable for compensation of Manager (Note 2) | 181,700 |
| Payable for custodian fees (Note 2) | 83,239 |
| Payable for Trustee compensation and expenses (Note 2) | 121,358 |
| Payable for administrative services (Note 2) | 1,358 |
| Payable for distribution fees (Note 2) | 86,562 |
| Written options outstanding, at value (premiums $1,277,999) (Note 1) | 318,847 |
| Collateral on securities loaned, at value (Note 1) | 30,648,431 |
| Collateral on certain derivative contracts, at value (Notes 1 and 9) | 440,000 |
| Other accrued expenses | 74,717 |
| Total liabilities | 55,973,061 |
| | |
| Net assets | $347,637,514 |
| |
| REPRESENTED BY | |
| Paid-in capital (Unlimited shares authorized) (Notes 1 and 4) | $301,451,870 |
| Undistributed net investment income (Note 1) | 3,444,779 |
| Accumulated net realized gain on investments and foreign currency transactions (Note 1) | 39,469,867 |
| Net unrealized appreciation of investments and assets and liabilities in foreign currencies | 3,270,998 |
| Total — Representing net assets applicable to capital shares outstanding | $347,637,514 |
(Continued on next page)
Statement of assets and liabilities cont.
| |
| COMPUTATION OF NET ASSET VALUE AND OFFERING PRICE | |
| Net asset value and redemption price per class A share | |
| ($169,256,994 divided by 11,817,687 shares) | $14.32 |
| Offering price per class A share (100/94.25 of $14.32)* | $15.19 |
| Net asset value and offering price per class B share ($2,386,429 divided by 214,122 shares)** | $11.15 |
| Net asset value and offering price per class C share ($12,888,053 divided by 1,162,028 shares)** | $11.09 |
| Net asset value and redemption price per class M share ($1,447,075 divided by 115,671 shares) | $12.51 |
| Offering price per class M share (100/96.50 of $12.51)* | $12.96 |
| Net asset value, offering price and redemption price per class R share | |
| ($1,230,603 divided by 88,092 shares) | $13.97 |
| Net asset value, offering price and redemption price per class R5 share | |
| ($549,591 divided by 36,309 shares) | $15.14 |
| Net asset value, offering price and redemption price per class R6 share | |
| ($48,439,326 divided by 3,200,131 shares) | $15.14 |
| Net asset value, offering price and redemption price per class Y share | |
| ($111,439,443 divided by 7,392,456 shares) | $15.07 |
* On single retail sales of less than $50,000. On sales of $50,000 or more the offering price is reduced.
** Redemption price per share is equal to net asset value less any applicable contingent deferred sales charge.
The accompanying notes are an integral part of these financial statements.
Statement of operations Six months ended 8/31/18 (Unaudited)
| |
| INVESTMENT INCOME | |
| Dividends (net of foreign tax of $35,258) | $4,629,160 |
| Interest (including interest income of $234,055 from investments in affiliated issuers) (Note 5) | $242,972 |
| Securities lending (net of expenses) (Notes 1 and 5) | 282,090 |
| Total investment income | 5,154,222 |
| |
| EXPENSES | |
| Compensation of Manager (Note 2) | 1,111,454 |
| Investor servicing fees (Note 2) | 341,303 |
| Custodian fees (Note 2) | 71,582 |
| Trustee compensation and expenses (Note 2) | 10,342 |
| Distribution fees (Note 2) | 301,213 |
| Administrative services (Note 2) | 3,892 |
| Other | 132,986 |
| Total expenses | 1,972,772 |
| Expense reduction (Note 2) | (263,330) |
| Net expenses | 1,709,442 |
| | |
| Net investment income | 3,444,780 |
| |
| REALIZED AND UNREALIZED GAIN (LOSS) | |
| Net realized gain (loss) on: | |
| Securities from unaffiliated issuers (Notes 1 and 3) | 18,668,704 |
| Foreign currency transactions (Note 1) | (2,303) |
| Futures contracts (Note 1) | 589,369 |
| Written options (Note 1) | 3,261,813 |
| Total net realized gain | 22,517,583 |
| Change in net unrealized appreciation (depreciation) on: | |
| Securities from unaffiliated issuers | 5,324,826 |
| Assets and liabilities in foreign currencies | (1,977) |
| Futures contracts | 51,852 |
| Written options | 1,465,848 |
| Total change in net unrealized appreciation | 6,840,549 |
| | |
| Net gain on investments | 29,358,132 |
| |
| Net increase in net assets resulting from operations | $32,802,912 |
The accompanying notes are an integral part of these financial statements.
Statement of changes in net assets
| | |
| DECREASE IN NET ASSETS | Six months ended 8/31/18* | Year ended 2/28/18 |
| Operations | | |
| Net investment income | $3,444,780 | $1,332,165 |
| Net realized gain on investments | | |
| and foreign currency transactions | 22,517,583 | 111,426,373 |
| Net unrealized appreciation (depreciation) of investments | | |
| and assets and liabilities in foreign currencies | 6,840,549 | (100,608,932) |
| Net increase in net assets resulting from operations | 32,802,912 | 12,149,606 |
| Distributions to shareholders (Note 1): | | |
| From ordinary income | | |
| Net investment income | | |
| Class A | — | (734,076) |
| Class B | — | — |
| Class C | — | — |
| Class M | — | (1,580) |
| Class R | — | (2,598) |
| Class R5 | — | (3,851) |
| Class R6 | — | (448,698) |
| Class Y | — | (873,027) |
| Net realized short-term gain on investments | | |
| Class A | — | (10,893,320) |
| Class B | — | (216,480) |
| Class C | — | (1,540,987) |
| Class M | — | (111,734) |
| Class R | — | (65,056) |
| Class R5 | — | (32,372) |
| Class R6 | — | (3,329,232) |
| Class Y | — | (9,046,357) |
| From net realized long-term gain on investments | | |
| Class A | — | (35,181,255) |
| Class B | — | (699,147) |
| Class C | — | (4,976,799) |
| Class M | — | (360,858) |
| Class R | — | (210,104) |
| Class R5�� | — | (104,551) |
| Class R6 | — | (10,752,144) |
| Class Y | — | (29,216,269) |
| Decrease from capital share transactions (Note 4) | (47,199,593) | (25,460,431) |
| Total decrease in net assets | (14,396,681) | (122,111,320) |
| |
| NET ASSETS | | |
| Beginning of period | 362,034,195 | 484,145,515 |
| End of period (including undistributed net investment | | |
| income of $3,444,779 and distributions in excess of net | | |
| investment income of $1, respectively) | $347,637,514 | $362,034,195 |
* Unaudited.
The accompanying notes are an integral part of these financial statements.
Financial highlights (For a common share outstanding throughout the period)
| | | | | | | | | | | | | | | |
| | INVESTMENT OPERATIONS | LESS DISTRIBUTIONS | RATIOS AND SUPPLEMENTAL DATA |
| | | | | | | | | | | | | | | Ratio of net | |
| | Net asset | Net | Net realized | | | From | | | | | | | Ratio of | investment | |
| | value, | investment | and unrealized | Total from | From | net realized | From | | | Net asset | Total return | Net assets, | expenses | income (loss) | |
| | beginning | income | gain (loss) on | investment | net investment | gain on | return | Total | Redemption | value, end | at net asset | end of period | to average | to average | Portfolio |
| Period ended | of period | (loss)a | investments | operations | income | investments | of capital | distributions | fees | of period | value (%)b | (in thousands) | net assets (%)c | net assets (%) | turnover (%) |
| Class A | | | | | | | | | | | | | | | |
| August 31, 2018** | $13.06 | .13 | 1.13 | 1.26 | — | — | — | — | — | $14.32 | 9.65* | $169,256 | .61* | .94* | 274* |
| February 28, 2018 | 17.69 | .03 | .50 | .53 | (.08) | (5.08) | — | (5.16) | — | 13.06 | 2.85 | 159,252 | 1.21 | .18 | 469 |
| February 28, 2017 | 12.82 | .08 | 4.91 | 4.99 | (.12) | — | — | (.12) | — | 17.69 | 38.90 | 187,839 | 1.18d | .53d | 63 |
| February 29, 2016 | 15.34 | .10 | (1.87) | (1.77) | (.13) | (.58) | (.04) | (.75) | — | 12.82 | (12.04) | 142,656 | 1.15 | .70 | 62 |
| February 28, 2015 | 15.45 | .09 | .42 | .51 | (.12) | (.50) | — | (.62) | — | 15.34 | 3.40 | 172,363 | 1.18 | .60 | 54 |
| February 28, 2014 | 12.05 | .05 | 3.51 | 3.56 | (.10) | (.06) | — | (.16) | —e | 15.45 | 29.58 | 171,473 | 1.21 | .33 | 68 |
| Class B | | | | | | | | | | | | | | | |
| August 31, 2018** | $10.21 | .06 | .88 | .94 | — | — | — | — | — | $11.15 | 9.21* | $2,386 | .99* | .53* | 274* |
| February 28, 2018 | 14.93 | (.08) | .44 | .36 | — | (5.08) | — | (5.08) | — | 10.21 | 2.21 | 2,594 | 1.96 | (.56) | 469 |
| February 28, 2017 | 10.86 | (.03) | 4.14 | 4.11 | (.04) | — | — | (.04) | — | 14.93 | 37.80 | 3,424 | 1.93d | (.25) d | 63 |
| February 29, 2016 | 13.10 | —e | (1.59) | (1.59) | (.05) | (.58) | (.02) | (.65) | — | 10.86 | (12.68) | 2,398 | 1.90 | (.03) | 62 |
| February 28, 2015 | 13.28 | (.02) | .35 | .33 | (.01) | (.50) | — | (.51) | — | 13.10 | 2.60 | 3,398 | 1.93 | (.16) | 54 |
| February 28, 2014 | 10.39 | (.05) | 3.01 | 2.96 | (.01) | (.06) | — | (.07) | —e | 13.28 | 28.55 | 4,215 | 1.96 | (.41) | 68 |
| Class C | | | | | | | | | | | | | | | |
| August 31, 2018** | $10.16 | .05 | .88 | .93 | — | — | — | — | — | $11.09 | 9.15* | $12,888 | .99* | .52* | 274* |
| February 28, 2018 | 14.88 | (.08) | .44 | .36 | — | (5.08) | — | (5.08) | — | 10.16 | 2.21 | 18,306 | 1.96 | (.57) | 469 |
| February 28, 2017 | 10.82 | (.03) | 4.13 | 4.10 | (.04) | — | — | (.04) | — | 14.88 | 37.88 | 22,025 | 1.93d | (.23)d | 63 |
| February 29, 2016 | 13.09 | (.01) | (1.60) | (1.61) | (.06) | (.58) | (.02) | (.66) | — | 10.82 | (12.78) | 15,527 | 1.90 | (.05) | 62 |
| February 28, 2015 | 13.29 | (.02) | .36 | .34 | (.04) | (.50) | — | (.54) | — | 13.09 | 2.68 | 17,701 | 1.93 | (.15) | 54 |
| February 28, 2014 | 10.41 | (.05) | 3.02 | 2.97 | (.03) | (.06) | — | (.09) | —e | 13.29 | 28.58 | 14,732 | 1.96 | (.43) | 68 |
| Class M | | | | | | | | | | | | | | | |
| August 31, 2018** | $11.44 | .08 | .99 | 1.07 | — | — | — | — | — | $12.51 | 9.35* | $1,447 | .86* | .69* | 274* |
| February 28, 2018 | 16.12 | (.05) | .47 | .42 | (.02) | (5.08) | — | (5.10) | — | 11.44 | 2.39 | 1,368 | 1.71 | (.32) | 469 |
| February 28, 2017 | 11.70 | —e | 4.48 | 4.48 | (.06) | — | — | (.06) | — | 16.12 | 38.26 | 1,482 | 1.68d | .03d | 63 |
| February 29, 2016 | 14.06 | .03 | (1.72) | (1.69) | (.07) | (.58) | (.02) | (.67) | — | 11.70 | (12.51) | 1,097 | 1.65 | .21 | 62 |
| February 28, 2015 | 14.22 | .01 | .38 | .39 | (.05) | (.50) | — | (.55) | — | 14.06 | 2.85 | 1,524 | 1.68 | .10 | 54 |
| February 28, 2014 | 11.11 | (.02) | 3.22 | 3.20 | (.03) | (.06) | — | (.09) | —e | 14.22 | 28.87 | 1,460 | 1.71 | (.16) | 68 |
| Class R | | | | | | | | | | | | | | | |
| August 31, 2018** | $12.76 | .11 | 1.10 | 1.21 | — | — | — | — | — | $13.97 | 9.48* | $1,231 | .74* | .81* | 274* |
| February 28, 2018 | 17.40 | (.02) | .51 | .49 | (.05) | (5.08) | — | (5.13) | — | 12.76 | 2.64 | 1,146 | 1.46 | (.10) | 469 |
| February 28, 2017 | 12.62 | .04 | 4.82 | 4.86 | (.08) | — | — | (.08) | — | 17.40 | 38.55 | 977 | 1.43d | .29d | 63 |
| February 29, 2016 | 15.12 | .06 | (1.85) | (1.79) | (.10) | (.58) | (.03) | (.71) | — | 12.62 | (12.28) | 743 | 1.40 | .39 | 62 |
| February 28, 2015 | 15.25 | .05 | .41 | .46 | (.09) | (.50) | — | (.59) | — | 15.12 | 3.14 | 772 | 1.43 | .35 | 54 |
| February 28, 2014 | 11.91 | .01 | 3.46 | 3.47 | (.07) | (.06) | — | (.13) | —e | 15.25 | 29.20 | 567 | 1.46 | .07 | 68 |
See notes to financial highlights at the end of this section.
The accompanying notes are an integral part of these financial statements.
| |
| 34 Small Cap Value Fund | Small Cap Value Fund 35 |
Financial highlights cont.
| | | | | | | | | | | | | | | |
| | INVESTMENT OPERATIONS | LESS DISTRIBUTIONS | RATIOS AND SUPPLEMENTAL DATA |
| | | | | | | | | | | | | | | Ratio of net | |
| | Net asset | Net | Net realized | | | From | | | | | | | Ratio of | investment | |
| | value, | investment | and unrealized | Total from | From | net realized | From | | | Net asset | Total return | Net assets, | expenses | income (loss) | |
| | beginning | income | gain (loss) on | investment | net investment | gain on | return | Total | Redemption | value, end | at net asset | end of period | to average | to average | Portfolio |
| Period ended | of period | (loss)a | investments | operations | income | investments | of capital | distributions | fees | of period | value (%)b | (in thousands) | net assets (%)c | net assets (%) | turnover (%) |
| Class R5 | | | | | | | | | | | | | | | |
| August 31, 2018** | $13.79 | .16 | 1.19 | 1.35 | — | — | — | — | — | $15.14 | 9.79* | $550 | .45* | 1.11* | 274* |
| February 28, 2018 | 18.39 | .08 | .54 | .62 | (.14) | (5.08) | — | (5.22) | — | 13.79 | 3.29 | 555 | .89 | .48 | 469 |
| February 28, 2017 | 13.32 | .13 | 5.11 | 5.24 | (.17) | — | — | (.17) | — | 18.39 | 39.36 | 469 | .87d | .80d | 63 |
| February 29, 2016 | 15.90 | .15 | (1.94) | (1.79) | (.16) | (.58) | (.05) | (.79) | — | 13.32 | (11.73) | 14 | .86 | .96 | 62 |
| February 28, 2015 | 15.98 | .15 | .43 | .58 | (.16) | (.50) | — | (.66) | — | 15.90 | 3.76 | 12 | .88 | .90 | 54 |
| February 28, 2014† | 14.98 | .03 | 1.13 | 1.16 | (.10) | (.06) | — | (.16) | — | 15.98 | 7.78* | 11 | .29 * | .22* | 68 |
| Class R6 | | | | | | | | | | | | | | | |
| August 31, 2018** | $13.78 | .16 | 1.20 | 1.36 | — | — | — | — | — | $15.14 | 9.87* | $48,439 | .40* | 1.11* | 274* |
| February 28, 2018 | 18.39 | .10 | .53 | .63 | (.16) | (5.08) | — | (5.24) | — | 13.78 | 3.33 | 52,510 | .79 | .59 | 469 |
| February 28, 2017 | 13.31 | .14 | 5.12 | 5.26 | (.18) | — | — | (.18) | — | 18.39 | 39.54 | 56,106 | .77d | .85d | 63 |
| February 29, 2016 | 15.90 | .15 | (1.94) | (1.79) | (.17) | (.58) | (.05) | (.80) | — | 13.31 | (11.71) | 21,860 | .76 | .97 | 62 |
| February 28, 2015 | 15.99 | .16 | .43 | .59 | (.18) | (.50) | — | (.68) | — | 15.90 | 3.81 | 13,129 | .78 | 1.00 | 54 |
| February 28, 2014† | 14.98 | .01 | 1.16 | 1.17 | (.10) | (.06) | — | (.16) | — | 15.99 | 7.87* | 14,260 | .25* | .08* | 68 |
| Class Y | | | | | | | | | | | | | | | |
| August 31, 2018** | $13.74 | .15 | 1.18 | 1.33 | — | — | — | — | — | $15.07 | 9.68* | $111,439 | .48* | 1.02* | 274* |
| February 28, 2018 | 18.33 | .08 | .53 | .61 | (.12) | (5.08) | — | (5.20) | — | 13.74 | 3.20 | 126,302 | .96 | .45 | 469 |
| February 28, 2017 | 13.27 | .12 | 5.09 | 5.21 | (.15) | — | — | (.15) | — | 18.33 | 39.30 | 211,823 | .93d | .76d | 63 |
| February 29, 2016 | 15.86 | .14 | (1.94) | (1.80) | (.16) | (.58) | (.05) | (.79) | — | 13.27 | (11.86) | 146,979 | .90 | .94 | 62 |
| February 28, 2015 | 15.95 | .14 | .43 | .57 | (.16) | (.50) | — | (.66) | — | 15.86 | 3.68 | 148,321 | .93 | .86 | 54 |
| February 28, 2014 | 12.44 | .08 | 3.62 | 3.70 | (.13) | (.06) | — | (.19) | —e | 15.95 | 29.82 | 96,735 | .96 | .51 | 68 |
* Not annualized.
** Unaudited.
† For the period November 1, 2013 (commencement of operations) to February 28, 2014.
a Per share net investment income (loss) has been determined on the basis of the weighted average number of shares outstanding during the period.
b Total return assumes dividend reinvestment and does not reflect the effect of sales charges.
c Includes amounts paid through expense offset and brokerage/service arrangements, if any (Note 2). Also excludes acquired fund fees, if any.
d Reflects a voluntary waiver of certain fund expenses in effect during the period. As a result of such waiver, the expenses of each class reflect a reduction of less than 0.01% as a percentage of average net assets.
e Amount represents less than $0.01 per share.
The accompanying notes are an integral part of these financial statements.
| |
| 36 Small Cap Value Fund | Small Cap Value Fund 37 |
Notes to financial statements 8/28/18 (Unaudited)
Within the following Notes to financial statements, references to “State Street” represent State Street Bank and Trust Company, references to “the SEC” represent the Securities and Exchange Commission, references to “Putnam Management” represent Putnam Investment Management, LLC, the fund’s manager, an indirect wholly-owned subsidiary of Putnam Investments, LLC and references to “OTC”, if any, represent over-the-counter. Unless otherwise noted, the “reporting period” represents the period from March 1, 2018 through August 31, 2018.
Putnam Small Cap Value Fund (the fund) is a diversified series of Putnam Investment Funds (the Trust), a Massachusetts business trust registered under the Investment Company Act of 1940, as amended, as an open-end management investment company. The goal of the fund is to seek capital appreciation. The fund invests mainly in common stocks of small U.S. companies, with a focus on value stocks. Value stocks are issued by companies that Putnam Management believes are currently undervalued by the market. If Putnam Management is correct and other investors ultimately recognize the value of the company, the price of its stock may rise. Under normal circumstances, the fund invests at least 80% of its net assets in companies of a size similar to those in the Russell 2000 Value Index. This policy may be changed only after 60 days’ notice to shareholders. As of April 30, 2018, the index was composed of companies having market capitalizations of between approximately $16.9 million and $8.5 billion. Putnam Management may consider, among other factors, a company’s valuation, financial strength, growth potential, competitive position in its industry, projected future earnings, cash flows and dividends when deciding whether to buy or sell investments.
The fund offers class A, class B, class C, class M, class R, class R5, class R6 and class Y shares. Purchases of class B shares are closed to new and existing investors except by exchange from class B shares of another Putnam fund or through dividend and/or capital gains reinvestment. Class A and class M shares are sold with a maximum front-end sales charge of 5.75% and 3.50%, respectively. Class A shares generally are not subject to a contingent deferred sales charge, and class M, class R, class R5, class R6 and class Y shares are not subject to a contingent deferred sales charge. Class B shares, which convert to class A shares after approximately six years, are not subject to a front-end sales charge and are subject to a contingent deferred sales charge if those shares are redeemed within six years of purchase. Class C shares are subject to a one-year 1.00% contingent deferred sales charge and generally convert to class A shares after approximately ten years. Prior to April 1, 2018, class C shares did not convert to class A shares. Class R shares, which are not available to all investors, are sold at net asset value. The expenses for class A, class B, class C, class M and class R shares may differ based on the distribution fee of each class, which is identified in Note 2. Class R5, class R6 and class Y shares, which are sold at net asset value, are generally subject to the same expenses as class A, class B, class C, class M and class R shares, but do not bear a distribution fee, and in the case of class R5 and class R6 shares, bear a lower investor servicing fee, which is identified in Note 2. Class R5, class R6 and class Y shares are not available to all investors.
In the normal course of business, the fund enters into contracts that may include agreements to indemnify another party under given circumstances. The fund’s maximum exposure under these arrangements is unknown as this would involve future claims that may be, but have not yet been, made against the fund. However, the fund’s management team expects the risk of material loss to be remote.
The fund has entered into contractual arrangements with an investment adviser, administrator, distributor, shareholder servicing agent and custodian, who each provide services to the fund. Unless expressly stated otherwise, shareholders are not parties to, or intended beneficiaries of these contractual arrangements, and these contractual arrangements are not intended to create any shareholder right to enforce them against the service providers or to seek any remedy under them against the service providers, either directly or on behalf of the fund.
Under the fund’s Amended and Restated Agreement and Declaration of Trust, any claims asserted against or on behalf of the Putnam Funds, including claims against Trustees and Officers, must be brought in state and federal courts located within the Commonwealth of Massachusetts.
Note 1: Significant accounting policies
The following is a summary of significant accounting policies consistently followed by the fund in the preparation of its financial statements. The preparation of financial statements is in conformity with accounting principles generally accepted in the United States of America and requires management to make estimates and assumptions that affect the reported amounts of assets and liabilities in the financial statements and the reported amounts of increases and decreases in net assets from operations. Actual results could differ from those estimates. Subsequent events after the Statement of assets and liabilities date through the date that the financial statements were issued have been evaluated in the preparation of the financial statements.
Investment income, realized and unrealized gains and losses and expenses of the fund are borne pro-rata based on the relative net assets of each class to the total net assets of the fund, except that each class bears expenses unique to that class (including the distribution fees applicable to such classes). Each class votes as a class only with respect to its own distribution plan or other matters on which a class vote is required by law or determined by the Trustees. If the fund were liquidated, shares of each class would receive their pro-rata share of the net assets of the fund. In addition, the Trustees declare separate dividends on each class of shares.
Security valuation Portfolio securities and other investments are valued using policies and procedures adopted by the Board of Trustees. The Trustees have formed a Pricing Committee to oversee the implementation of these procedures and have delegated responsibility for valuing the fund’s assets in accordance with these procedures to Putnam Management. Putnam Management has established an internal Valuation Committee that is responsible for making fair value determinations, evaluating the effectiveness of the pricing policies of the fund and reporting to the Pricing Committee.
Investments for which market quotations are readily available are valued at the last reported sales price on their principal exchange, or official closing price for certain markets, and are classified as Level 1 securities under Accounting Standards Codification 820 Fair Value Measurements and Disclosures (ASC 820). If no sales are reported, as in the case of some securities that are traded OTC, a security is valued at its last reported bid price and is generally categorized as a Level 2 security.
Investments in open-end investment companies (excluding exchange-traded funds), if any, which can be classified as Level 1 or Level 2 securities, are valued based on their net asset value. The net asset value of such investment companies equals the total value of their assets less their liabilities and divided by the number of their outstanding shares.
Market quotations are not considered to be readily available for certain debt obligations (including short-term investments with remaining maturities of 60 days or less) and other investments; such investments are valued on the basis of valuations furnished by an independent pricing service approved by the Trustees or dealers selected by Putnam Management. Such services or dealers determine valuations for normal institutional-size trading units of such securities using methods based on market transactions for comparable securities and various relationships, generally recognized by institutional traders, between securities (which consider such factors as security prices, yields, maturities and ratings). These securities will generally be categorized as Level 2.
Many securities markets and exchanges outside the U.S. close prior to the scheduled close of the New York Stock Exchange and therefore the closing prices for securities in such markets or on such exchanges may not fully reflect events that occur after such close but before the scheduled close of the New York Stock Exchange. Accordingly, on certain days, the fund will fair value certain foreign equity securities taking into account multiple factors including movements in the U.S. securities markets, currency valuations and comparisons to the valuation of American Depository Receipts, exchange-traded funds and futures contracts. The foreign equity securities, which would generally be classified as Level 1 securities, will be transferred to Level 2 of the fair value hierarchy when they are valued at fair value. The number of days on which fair value prices will be used will depend on market activity and it is possible that fair value prices will be used by the fund to a significant extent. At the close of the reporting period, fair value pricing was used for certain foreign securities in the portfolio. Securities quoted in foreign currencies, if any, are translated into U.S. dollars at the current exchange rate.
To the extent a pricing service or dealer is unable to value a security or provides a valuation that Putnam Management does not believe accurately reflects the security’s fair value, the security will be valued at fair value by Putnam Management in accordance with policies and procedures approved by the Trustees. Certain investments, including certain restricted and illiquid securities and derivatives, are also valued at fair value following procedures approved by the Trustees. These valuations consider such factors as significant market or specific security events such as interest rate or credit quality changes, various relationships with other securities, discount rates, U.S. Treasury, U.S. swap and credit yields, index levels, convexity exposures, recovery rates, sales and other multiples and resale restrictions. These securities are classified as Level 2 or as Level 3 depending on the priority of the significant inputs.
To assess the continuing appropriateness of fair valuations, the Valuation Committee reviews and affirms the reasonableness of such valuations on a regular basis after considering all relevant information that is reasonably available. Such valuations and procedures are reviewed periodically by the Trustees. The fair value of securities is generally determined as the amount that the fund could reasonably expect to realize from an orderly disposition of such securities over a reasonable period of time. By its nature, a fair value price is a good faith estimate of the value of a security in a current sale and does not reflect an actual market price, which may be different by a material amount.
Security transactions and related investment income Security transactions are recorded on the trade date (the date the order to buy or sell is executed). Gains or losses on securities sold are determined on the identified cost basis.
Interest income, net of any applicable withholding taxes, is recorded on the accrual basis. Dividend income, net of any applicable withholding taxes, is recognized on the ex-dividend date except that certain dividends from foreign securities, if any, are recognized as soon as the fund is informed of the ex-dividend date. Non-cash dividends, if any, are recorded at the fair value of the securities received. Dividends representing a return of capital or capital gains, if any, are reflected as a reduction of cost and/or as a realized gain. All premiums/discounts are amortized/accreted on a yield-to-maturity basis.
Foreign currency translation The accounting records of the fund are maintained in U.S. dollars. The fair value of foreign securities, currency holdings, and other assets and liabilities is recorded in the books and records of the fund after translation to U.S. dollars based on the exchange rates on that day. The cost of each security is determined using historical exchange rates. Income and withholding taxes are translated at prevailing exchange rates when earned or incurred. The fund does not isolate that portion of realized or unrealized gains or losses resulting from changes in the foreign exchange rate on investments from fluctuations arising from changes in the market prices of the securities. Such gains and losses are included with the net realized and unrealized gain or loss on investments. Net realized gains and losses on foreign currency transactions represent net realized exchange gains or losses on disposition of foreign currencies, currency gains and losses realized between the trade and settlement dates on securities transactions and the difference between the amount of investment income and foreign withholding taxes recorded on the fund’s books and the U.S. dollar equivalent amounts actually received or paid. Net unrealized appreciation and depreciation of assets and liabilities in foreign currencies arise from changes in the value of assets and liabilities other than investments at the period end, resulting from changes in the exchange rate.
Options contracts The fund uses options contracts to generate additional income for the portfolio, to enhance the return on a security owned, to gain exposure to securities and to manage downside risks.
The potential risk to the fund is that the change in value of options contracts may not correspond to the change in value of the hedged instruments. In addition, losses may arise from changes in the value of the underlying instruments if there is an illiquid secondary market for the contracts, if interest or exchange rates move unexpectedly or if the counterparty to the contract is unable to perform. Realized gains and losses on purchased options are included in realized gains and losses on investment securities. If a written call option is exercised, the premium originally received is recorded as an addition to sales proceeds. If a written put option is exercised, the premium originally received is recorded as a reduction to the cost of investments.
Exchange-traded options are valued at the last sale price or, if no sales are reported, the last bid price for purchased options and the last ask price for written options. OTC traded options are valued using prices supplied by dealers.
Options on swaps are similar to options on securities except that the premium paid or received is to buy or grant the right to enter into a previously agreed upon interest rate or credit default contract. Forward premium swap option contracts include premiums that have extended settlement dates. The delayed settlement of the premiums is factored into the daily valuation of the option contracts. In the case of interest rate cap and floor contracts, in return for a premium, ongoing payments between two parties are based on interest rates exceeding a specified rate, in the case of a cap contract, or falling below a specified rate in the case of a floor contract. Written option contracts outstanding at period end, if any, are listed after the fund’s portfolio.
Futures contracts The fund uses futures contracts to equitize cash.
The potential risk to the fund is that the change in value of futures contracts may not correspond to the change in value of the hedged instruments. In addition, losses may arise from changes in the value of the underlying instruments, if there is an illiquid secondary market for the contracts, if interest or exchange rates move unexpectedly or if the counterparty to the contract is unable to perform. With futures, there is minimal counterparty credit risk to the fund since futures are exchange traded and the exchange’s clearinghouse, as counterparty to all exchange traded futures, guarantees the futures against default. Risks may exceed amounts recognized on the Statement of assets and liabilities. When the contract is closed, the fund records a realized gain or loss equal to the difference between the value of the contract at the time it was opened and the value at the time it was closed.
Futures contracts are valued at the quoted daily settlement prices established by the exchange on which they trade. The fund and the broker agree to exchange an amount of cash equal to the daily fluctuation in the value of the futures contract. Such receipts or payments are known as “variation margin.”
Futures contracts outstanding at period end, if any, are listed after the fund’s portfolio.
Master agreements The fund is a party to ISDA (International Swaps and Derivatives Association, Inc.) Master Agreements (Master Agreements) with certain counterparties that govern OTC derivative and foreign exchange contracts entered into from time to time. The Master Agreements may contain provisions regarding, among other things, the parties’ general obligations, representations, agreements, collateral requirements, events of default and early termination. With respect to certain counterparties, in accordance with the terms of the Master Agreements, collateral posted to the fund is held in a segregated account by the fund’s custodian and, with respect to those amounts which can be sold or repledged, is presented in the fund’s portfolio. Collateral posted to the fund which cannot be sold or repledged totaled $154,013 at the close of the reporting period.
Collateral pledged by the fund is segregated by the fund’s custodian and identified in the fund’s portfolio. Collateral can be in the form of cash or debt securities issued by the U.S. Government or related agencies or other securities as agreed to by the fund and the applicable counterparty. Collateral requirements are determined based on the fund’s net position with each counterparty.
Termination events applicable to the fund may occur upon a decline in the fund’s net assets below a specified threshold over a certain period of time. Termination events applicable to counterparties may occur upon a decline in the counterparty’s long-term and short-term credit ratings below a specified level. In each case, upon occurrence, the other party may elect to terminate early and cause settlement of all derivative and foreign exchange contracts outstanding, including the payment of any losses and costs resulting from such early termination, as reasonably determined by the terminating party. Any decision by one or more of the fund’s counterparties to elect early termination could impact the fund’s future derivative activity.
At the close of the reporting period, the fund had a net liability position of $30,946 on open derivative contracts subject to the Master Agreements. Collateral posted by the fund at period end for these agreements totaled $40,910 and may include amounts related to unsettled agreements.
Securities lending The fund may lend securities, through its agent, to qualified borrowers in order to earn additional income. The loans are collateralized by cash in an amount at least equal to the fair value of the securities loaned. The fair value of securities loaned is determined daily and any additional required collateral is allocated to the fund on the next business day. The remaining maturities of the securities lending transactions are considered overnight and continuous. The risk of borrower default will be borne by the fund’s agent; the fund will bear the risk of loss with respect to the investment of the cash collateral. Income from securities lending, net of expenses, is included in investment income on the Statement of operations. Cash collateral is invested in Putnam Cash Collateral Pool, LLC, a limited liability company managed by an affiliate of Putnam Management. Investments in Putnam Cash Collateral Pool, LLC are valued at its closing net asset value each business day. There are no management fees charged to Putnam Cash Collateral Pool, LLC. At the close of the reporting period, the fund received cash collateral of $30,648,431 and the value of securities loaned amounted to $30,450,005. Certain of these securities were sold prior to the close of the reporting period and are included in Receivable for investments sold on the Statement of assets and liabilities.
Interfund lending The fund, along with other Putnam funds, may participate in an interfund lending program pursuant to an exemptive order issued by the SEC. This program allows the fund to borrow from or lend to other Putnam funds that permit such transactions. Interfund lending transactions are subject to each fund’s investment policies and borrowing and lending limits. Interest earned or paid on the interfund lending transaction will be based on the average of certain current market rates. During the reporting period, the fund did not utilize the program.
Lines of credit The fund participates, along with other Putnam funds, in a $317.5 million unsecured committed line of credit and a $235.5 million unsecured uncommitted line of credit, both provided by State Street. Borrowings may be made for temporary or emergency purposes, including the funding of shareholder redemption requests and trade settlements. Interest is charged to the fund based on the fund’s borrowing at a rate equal to 1.25% plus the higher of (1) the Federal Funds rate and (2) the overnight LIBOR for the committed line of credit and the Federal Funds rate plus 1.30% for the uncommitted line of credit. A closing fee equal to 0.04% of the committed line of credit and 0.04% of the uncommitted line of credit has been paid by the participating funds. In addition, a commitment fee of 0.21% per annum on any unutilized portion of the committed line of credit is
allocated to the participating funds based on their relative net assets and paid quarterly. During the reporting period, the fund had no borrowings against these arrangements.
Federal taxes It is the policy of the fund to distribute all of its taxable income within the prescribed time period and otherwise comply with the provisions of the Internal Revenue Code of 1986, as amended (the Code), applicable to regulated investment companies. It is also the intention of the fund to distribute an amount sufficient to avoid imposition of any excise tax under Section 4982 of the Code.
The fund is subject to the provisions of Accounting Standards Codification 740 Income Taxes (ASC 740). ASC 740 sets forth a minimum threshold for financial statement recognition of the benefit of a tax position taken or expected to be taken in a tax return. The fund did not have a liability to record for any unrecognized tax benefits in the accompanying financial statements. No provision has been made for federal taxes on income, capital gains or unrealized appreciation on securities held nor for excise tax on income and capital gains. Each of the fund’s federal tax returns for the prior three fiscal years remains subject to examination by the Internal Revenue Service.
The fund may also be subject to taxes imposed by governments of countries in which it invests. Such taxes are generally based on either income or gains earned or repatriated. The fund accrues and applies such taxes to net investment income, net realized gains and net unrealized gains as income and/or capital gains are earned. In some cases, the fund may be entitled to reclaim all or a portion of such taxes, and such reclaim amounts, if any, are reflected as an asset on the fund’s books. In many cases, however, the fund may not receive such amounts for an extended period of time, depending on the country of investment.
Tax cost of investments includes adjustments to net unrealized appreciation (depreciation) which may not necessarily be final tax cost basis adjustments, but closely approximate the tax basis unrealized gains and losses that may be realized and distributed to shareholders. The aggregate identified cost on a tax basis is $372,705,740, resulting in gross unrealized appreciation and depreciation of $12,749,637 and $11,269,674, respectively, or net unrealized appreciation of $1,479,963.
Distributions to shareholders Distributions to shareholders from net investment income are recorded by the fund on the ex-dividend date. Distributions from capital gains, if any, are recorded on the ex-dividend date and paid at least annually. The amount and character of income and gains to be distributed are determined in accordance with income tax regulations, which may differ from generally accepted accounting principles. Dividend sources are estimated at the time of declaration. Actual results may vary. Any non-taxable return of capital cannot be determined until final tax calculations are completed after the end of the fund’s fiscal year. Reclassifications are made to the fund’s capital accounts to reflect income and gains available for distribution (or available capital loss carryovers) under income tax regulations.
Expenses of the Trust Expenses directly charged or attributable to any fund will be paid from the assets of that fund. Generally, expenses of the Trust will be allocated among and charged to the assets of each fund on a basis that the Trustees deem fair and equitable, which may be based on the relative assets of each fund or the nature of the services performed and relative applicability to each fund.
Note 2: Management fee, administrative services and other transactions
The fund pays Putnam Management a management fee (based on the fund’s average net assets and computed and paid monthly) at annual rates that may vary based on the average of the aggregate net assets of all open-end mutual funds sponsored by Putnam Management (excluding net assets of funds that are invested in, or that are invested in by, other Putnam funds to the extent necessary to avoid “double counting” of those assets). Such annual rates may vary as follows:
| | | | |
| 0.780% | of the first $5 billion, | | 0.580% | of the next $50 billion, |
| 0.730% | of the next $5 billion, | | 0.560% | of the next $50 billion, |
| 0.680% | of the next $10 billion, | | 0.550% | of the next $100 billion and |
| 0.630% | of the next $10 billion, | | 0.545% | of any excess thereafter. |
For the reporting period, the management fee represented an effective rate (excluding the impact from any expense waivers in effect) of 0.314% of the fund’s average net assets.
Putnam Management has contractually agreed, through June 30, 2019, to waive fees and/or reimburse the fund’s expenses to the extent necessary to limit the cumulative expenses of the fund, exclusive of brokerage, interest, taxes, investment-related expenses, extraordinary expenses, acquired fund fees and expenses and payments under the fund’s investor servicing contract, investment management contract and distribution plans, on a fiscal
year-to-date basis to an annual rate of 0.20% of the fund’s average net assets over such fiscal year-to-date period. During the reporting period, the fund’s expenses were not reduced as a result of this limit.
Putnam Investments Limited (PIL), an affiliate of Putnam Management, is authorized by the Trustees to manage a separate portion of the assets of the fund as determined by Putnam Management from time to time. PIL did not manage any portion of the assets of the fund during the reporting period. If Putnam Management were to engage the services of PIL, Putnam Management would pay a quarterly sub-management fee to PIL for its services at an annual rate of 0.35% of the average net assets of the portion of the fund managed by PIL.
The fund reimburses Putnam Management an allocated amount for the compensation and related expenses of certain officers of the fund and their staff who provide administrative services to the fund. The aggregate amount of all such reimbursements is determined annually by the Trustees.
Custodial functions for the fund’s assets are provided by State Street. Custody fees are based on the fund’s asset level, the number of its security holdings and transaction volumes.
Putnam Investor Services, Inc., an affiliate of Putnam Management, provides investor servicing agent functions to the fund. Putnam Investor Services, Inc. received fees for investor servicing for class A, class B, class C, class M, class R, and class Y shares that included (1) a per account fee for each direct and underlying non-defined contribution account (retail account) of the fund; (2) a specified rate of the fund’s assets attributable to defined contribution plan accounts; and (3) a specified rate based on the average net assets in retail accounts. Putnam Investor Services, Inc. has agreed that the aggregate investor servicing fees for each fund’s retail and defined contribution accounts for these share classes will not exceed an annual rate of 0.25% of the fund’s average assets attributable to such accounts.
Class R5 shares paid a monthly fee based on the average net assets of class R5 shares at an annual rate of 0.15%.
Class R6 shares paid a monthly fee based on the average net assets of class R6 shares at an annual rate of 0.05%.
During the reporting period, the expenses for each class of shares related to investor servicing fees were as follows:
| | | | |
| Class A | $179,342 | | Class R5 | 395 |
| Class B | 2,683 | | Class R6 | 12,894 |
| Class C | 15,496 | | Class Y | 127,668 |
| Class M | 1,524 | | Total | $341,303 |
| Class R | 1,301 | | | |
The fund has entered into expense offset arrangements with Putnam Investor Services, Inc. and State Street whereby Putnam Investor Services, Inc.’s and State Street’s fees are reduced by credits allowed on cash balances. The fund also reduced expenses through brokerage/service arrangements. For the reporting period, the fund’s expenses were reduced by $2,997 under the expense offset arrangements and by $260,333 under the brokerage/service arrangements.
Each Independent Trustee of the fund receives an annual Trustee fee, of which $259, as a quarterly retainer, has been allocated to the fund, and an additional fee for each Trustees meeting attended. Trustees also are reimbursed for expenses they incur relating to their services as Trustees.
The fund has adopted a Trustee Fee Deferral Plan (the Deferral Plan) which allows the Trustees to defer the receipt of all or a portion of Trustees fees payable on or after July 1, 1995. The deferred fees remain invested in certain Putnam funds until distribution in accordance with the Deferral Plan.
The fund has adopted an unfunded noncontributory defined benefit pension plan (the Pension Plan) covering all Trustees of the fund who have served as a Trustee for at least five years and were first elected prior to 2004. Benefits under the Pension Plan are equal to 50% of the Trustee’s average annual attendance and retainer fees for the three years ended December 31, 2005. The retirement benefit is payable during a Trustee’s lifetime, beginning the year following retirement, for the number of years of service through December 31, 2006. Pension expense for the fund is included in Trustee compensation and expenses in the Statement of operations. Accrued pension liability is included in Payable for Trustee compensation and expenses in the Statement of assets and liabilities. The Trustees have terminated the Pension Plan with respect to any Trustee first elected after 2003.
The fund has adopted distribution plans (the Plans) with respect to the following share classes pursuant to Rule 12b–1 under the Investment Company Act of 1940. The purpose of the Plans is to compensate Putnam Retail Management Limited Partnership, an indirect wholly-owned subsidiary of Putnam Investments, LLC, for services provided and expenses incurred in distributing shares of the fund. The Plans provide payments by the fund to Putnam Retail Management Limited Partnership at an annual rate of up to the following amounts (Maximum %) of the average net assets attributable to each class. The Trustees have approved payment by the fund at the following annual rate (Approved %) of the average net assets attributable to each class. During the reporting period, the class-specific expenses related to distribution fees were as follows:
| | | |
| | Maximum % | Approved % | Amount |
| Class A | 0.35% | 0.25% | $208,425 |
| Class B | 1.00% | 1.00% | 12,468 |
| Class C | 1.00% | 1.00% | 71,982 |
| Class M | 1.00% | 0.75% | 5,314 |
| Class R | 1.00% | 0.50% | 3,024 |
| Total | | | $301,213 |
For the reporting period, Putnam Retail Management Limited Partnership, acting as underwriter, received net commissions of $7,073 and $76 from the sale of class A and class M shares, respectively, and received $260 and $257 in contingent deferred sales charges from redemptions of class B and class C shares, respectively.
A deferred sales charge of up to 1.00% is assessed on certain redemptions of class A shares. For the reporting period, Putnam Retail Management Limited Partnership, acting as underwriter, received no monies on class A redemptions.
Note 3: Purchases and sales of securities
During the reporting period, the cost of purchases and the proceeds from sales, excluding short-term investments, were as follows:
| | |
| | Cost of purchases | Proceeds from sales |
| Investments in securities (Long-term) | $887,143,550 | $944,056,723 |
| U.S. government securities (Long-term) | — | — |
| Total | $887,143,550 | $944,056,723 |
The fund may purchase or sell investments from or to other Putnam funds in the ordinary course of business, which can reduce the fund’s transaction costs, at prices determined in accordance with SEC requirements and policies approved by the Trustees. During the reporting period, purchases or sales of long-term securities from or to other Putnam funds, if any, did not represent more than 5% of the fund’s total cost of purchases and/or total proceeds from sales.
Note 4: Capital shares
At the close of the reporting period, there were an unlimited number of shares of beneficial interest authorized. Transactions, including, if applicable, direct exchanges pursuant to share conversions, in capital shares were as follows:
| | | | |
| | SIX MONTHS ENDED 8/31/18 | YEAR ENDED 2/28/18 |
| Class A | Shares | Amount | Shares | Amount |
| Shares sold | 790,770 | $10,544,568 | 1,418,479 | $22,824,857 |
| Shares issued in connection with | | | | |
| reinvestment of distributions | — | — | 3,392,990 | 44,583,894 |
| | 790,770 | 10,544,568 | 4,811,469 | 67,408,751 |
| Shares repurchased | (1,162,357) | (15,874,094) | (3,242,670) | (53,946,918) |
| Net increase (decrease) | (371,587) | $(5,329,526) | 1,568,799 | $13,461,833 |
| | | | |
| | SIX MONTHS ENDED 8/31/18 | YEAR ENDED 2/28/18 |
| Class B | Shares | Amount | Shares | Amount |
| Shares sold | 4,378 | $44,635 | 30,975 | $399,949 |
| Shares issued in connection with | | | | |
| reinvestment of distributions | — | — | 88,286 | 907,575 |
| | 4,378 | 44,635 | 119,261 | 1,307,524 |
| Shares repurchased | (44,468) | (471,567) | (94,319) | (1,276,102) |
| Net increase (decrease) | (40,090) | $(426,932) | 24,942 | $31,422 |
| |
| | SIX MONTHS ENDED 8/31/18 | YEAR ENDED 2/28/18 |
| Class C | Shares | Amount | Shares | Amount |
| Shares sold | 74,158 | $787,917 | 227,197 | $3,062,701 |
| Shares issued in connection with | | | | |
| reinvestment of distributions | — | — | 633,875 | 6,484,542 |
| | 74,158 | 787,917 | 861,072 | 9,547,243 |
| Shares repurchased | (714,725) | (7,349,710) | (538,265) | (7,159,490) |
| Net increase (decrease) | (640,567) | $(6,561,793) | 322,807 | $2,387,753 |
| |
| | SIX MONTHS ENDED 8/31/18 | YEAR ENDED 2/28/18 |
| Class M | Shares | Amount | Shares | Amount |
| Shares sold | 4,496 | $53,245 | 17,823 | $283,844 |
| Shares issued in connection with | | | | |
| reinvestment of distributions | — | — | 40,398 | 465,390 |
| | 4,496 | 53,245 | 58,221 | 749,234 |
| Shares repurchased | (8,377) | (99,363) | (30,603) | (431,388) |
| Net increase (decrease) | (3,881) | $(46,118) | 27,618 | $317,846 |
| |
| | SIX MONTHS ENDED 8/31/18 | YEAR ENDED 2/28/18 |
| Class R | Shares | Amount | Shares | Amount |
| Shares sold | 12,715 | $169,846 | 39,236 | $619,815 |
| Shares issued in connection with | | | | |
| reinvestment of distributions | — | — | 21,632 | 277,757 |
| | 12,715 | 169,846 | 60,868 | 897,572 |
| Shares repurchased | (14,420) | (195,311) | (27,216) | (465,956) |
| Net increase (decrease) | (1,705) | $(25,465) | 33,652 | $431,616 |
| |
| | SIX MONTHS ENDED 8/31/18 | YEAR ENDED 2/28/18 |
| Class R5 | Shares | Amount | Shares | Amount |
| Shares sold | 2,846 | $40,326 | 10,524 | $180,497 |
| Shares issued in connection with | | | | |
| reinvestment of distributions | — | — | 10,164 | 140,773 |
| | 2,846 | 40,326 | 20,688 | 321,270 |
| Shares repurchased | (6,802) | (96,541) | (5,941) | (109,773) |
| Net increase (decrease) | (3,956) | $(56,215) | 14,747 | $211,497 |
| | | | |
| | SIX MONTHS ENDED 8/31/18 | YEAR ENDED 2/28/18 |
| Class R6 | Shares | Amount | Shares | Amount |
| Shares sold | 379,056 | $5,520,103 | 687,622 | $11,647,867 |
| Shares issued in connection with | | | | |
| reinvestment of distributions | — | — | 1,049,861 | 14,530,074 |
| | 379,056 | 5,520,103 | 1,737,483 | 26,177,941 |
| Shares repurchased | (989,602) | (14,442,046) | (977,795) | (16,886,667) |
| Net increase (decrease) | (610,546) | $(8,921,943) | 759,688 | $9,291,274 |
| |
| | SIX MONTHS ENDED 8/31/18 | YEAR ENDED 2/28/18 |
| Class Y | Shares | Amount | Shares | Amount |
| Shares sold | 863,729 | $12,420,277 | 5,180,735 | $91,186,345 |
| Shares issued in connection with | | | | |
| reinvestment of distributions | — | — | 2,774,442 | 38,287,303 |
| | 863,729 | 12,420,277 | 7,955,177 | 129,473,648 |
| Shares repurchased | (2,666,924) | (38,251,878) | (10,314,940) | (181,067,320) |
| Net decrease | (1,803,195) | $(25,831,601) | (2,359,763) | $(51,593,672) |
Note 5: Affiliated transactions
Transactions during the reporting period with any company which is under common ownership or control were as follows:
| | | | | |
| | | | | | Shares |
| | | | | | outstanding |
| | | | | | and fair |
| | Fair value as | Purchase | Sale | Investment | value as |
| Name of affiliate | of 2/28/18 | cost | proceeds | income | of 8/31/18 |
| Short-term investments | | | | | |
| Putnam Cash Collateral | | | | | |
| Pool, LLC* | $35,883,646 | $120,269,711 | $125,504,926 | $408,451 | $30,648,431 |
| Putnam Short Term | | | | | |
| Investment Fund** | 24,225,064 | 243,572,622 | 232,418,934 | 234,055 | 35,378,752 |
| Total Short-term | | | | | |
| investments | $60,108,710 | $363,842,333 | $357,923,860 | $642,506 | $66,027,183 |
* No management fees are charged to Putnam Cash Collateral Pool, LLC (Note 1). Investment income shown is included in securities lending income on the Statement of operations. There were no realized or unrealized gains or losses during the period.
** Management fees charged to Putnam Short Term Investment Fund have been waived by Putnam Management. There were no realized or unrealized gains or losses during the period.
Note 6: Market, credit and other risks
In the normal course of business, the fund trades financial instruments and enters into financial transactions where risk of potential loss exists due to changes in the market (market risk) or failure of the contracting party to the transaction to perform (credit risk). The fund may be exposed to additional credit risk that an institution or other entity with which the fund has unsettled or open transactions will default. Investments in foreign securities involve certain risks, including those related to economic instability, unfavorable political developments, and currency fluctuations.
Note 7: Summary of derivative activity
The volume of activity for the reporting period for any derivative type that was held during the period is listed below and was based on an average of the holdings at the end of each fiscal quarter:
| |
| Purchased equity option contracts (contract amount) | $760,000 |
| Written equity option contracts (contract amount) | $870,000 |
| Futures contracts (number of contracts) | 100 |
The following is a summary of the fair value of derivative instruments as of the close of the reporting period:
| | | | |
| Fair value of derivative instruments as of the close of the reporting period | |
| | ASSET DERIVATIVES | LIABILITY DERIVATIVES |
| Derivatives not | | | | |
| accounted for as | Statement of | | Statement of | |
| hedging instruments | assets and | | assets and | |
| under ASC 815 | liabilities location | Fair value | liabilities location | Fair value |
| | Investments, | | | |
| | Receivables, Net | | | |
| | assets — Unrealized | | | |
| Equity contracts | appreciation | $930,116* | Payables | $318,847 |
| Total | | $930,116 | | $318,847 |
* Includes cumulative appreciation/depreciation of futures contracts as reported in the fund’s portfolio. Only current day’s variation margin is reported within the Statement of assets and liabilities.
The following is a summary of realized and change in unrealized gains or losses of derivative instruments in the Statement of operations for the reporting period (Note 1):
| | | |
| Amount of realized gain or (loss) on derivatives recognized in net gain or (loss) on investments | |
| Derivatives not accounted for as hedging | | | |
| instruments under ASC 815 | Options | Futures | Total |
| Equity contracts | $653,849 | $589,369 | $1,243,218 |
| Total | $653,849 | $589,369 | $1,243,218 |
| |
| Change in unrealized appreciation or (depreciation) on derivatives recognized in net gain or (loss) |
| on investments | | | |
| Derivatives not accounted for as hedging | | | |
| instruments under ASC 815 | Options | Futures | Total |
| Equity contracts | $(694,667) | $51,852 | $(642,815) |
| Total | $(694,667) | $51,852 | $(642,815) |
Note 8: Offsetting of financial and derivative assets and liabilities
The following table summarizes any derivatives, repurchase agreements and reverse repurchase agreements, at the end of the reporting period, that are subject to an enforceable master netting agreement or similar agreement. For securities lending transactions or borrowing transactions associated with securities sold short, if any, see Note 1. For financial reporting purposes, the fund does not offset financial assets and financial liabilities that are subject to the master netting agreements in the Statement of assets and liabilities.
| | | | | | | | |
| | Bank of
America N.A. | Barclays Bank
PLC | Citibank, N.A. | Credit Suisse
International | JPMorgan
Chase Bank
N.A. | Merrill Lynch,
Pierce, Fenner
& Smith, Inc. | UBS AG | Total |
| Assets: | | | | | | | | |
| Futures contracts§ | $— | $— | $— | $— | $— | $83,155 | $— | $83,155 |
| Purchased | — | 145,781 | 123,774 | 60,660 | 359,685 | — | 188,364 | 878,264 |
| options**# | | | | | | | | |
| Total Assets | $— | $145,781 | $123,774 | $60,660 | $359,685 | $83,155 | $188,364 | $961,419 |
| Liabilities: | | | | | | | | |
| Futures contracts§ | — | — | — | — | — | — | — | — |
| Written options# | 30,946 | 94,916 | 38,482 | 49,237 | 21,550 | — | 83,716 | 318,847 |
| Total Liabilities | $30,946 | $94,916 | $38,482 | $49,237 | $21,550 | $— | $83,716 | $318,847 |
| Total Financial | | | | | | | | |
| and Derivative | $(30,946) | $50,865 | $85,292 | $11,423 | $338,135 | $83,155 | $104,648 | $642,572 |
| Net Assets | | | | | | | | |
| Total collateral | | | | | | | | |
| received | $(30,946) | $50,865 | $— | $11,423 | $310,000 | $— | $104,648 | |
| (pledged)†## | | | | | | | | |
| Net amount | $— | $— | $85,292 | $— | $28,135 | $83,155 | $— | |
| Controlled | | | | | | | | |
| collateral received | | | | | | | | |
| (including TBA | $— | $110,000 | $— | $20,000 | $310,000 | $— | $— | $440,000 |
| commitments)** | | | | | | | | |
| Uncontrolled | | | | | | | | |
| collateral received | $— | $— | $— | $— | $— | $— | $154,013 | $154,013 |
| Collateral (pledged) | | | | | | | | |
| (including TBA | $(40,910) | $— | $— | $— | $— | $— | $— | $(40,910) |
| commitments)** | | | | | | | | |
* Excludes premiums, if any. Included in unrealized appreciation and depreciation on OTC swap contracts on the Statement of assets and liabilities.
** Included with Investments in securities on the Statement of assets and liabilities.
† Additional collateral may be required from certain brokers based on individual agreements.
# Covered by master netting agreement (Note 1).
## Any over-collateralization of total financial and derivative net assets is not shown. Collateral may include amounts related to unsettled agreements.
§ Includes current day’s variation margin only as reported on the Statement of assets and liabilities, which is not collateralized. Cumulative appreciation/(depreciation) for futures contracts is represented in the tables listed after the fund’s portfolio. Collateral pledged for initial margin on futures contracts, which is not included in the table above, amounted to $940,407.
Services for shareholders
Investor services
Systematic investment plan Tell us how much you wish to invest regularly — weekly, semimonthly, or monthly — and the amount you choose will be transferred automatically from your checking or savings account. There’s no additional fee for this service, and you can suspend it at any time. This plan may be a great way to save for college expenses or to plan for your retirement.
Please note that regular investing does not guarantee a profit or protect against loss in a declining market. Before arranging a systematic investment plan, consider your financial ability to continue making purchases in periods when prices are low.
Systematic exchange You can make regular transfers from one Putnam fund to another Putnam fund. There are no additional fees for this service, and you can cancel or change your options at any time.
Dividends PLUS You can choose to have the dividend distributions from one of your Putnam funds automatically reinvested in another Putnam fund at no additional charge.
Free exchange privilege You can exchange money between Putnam funds free of charge, as long as they are the same class of shares. A signature guarantee is required if you are exchanging more than $500,000. The fund reserves the right to revise or terminate the exchange privilege.
Reinstatement privilege If you’ve sold Putnam shares or received a check for a dividend or capital gain, you may reinvest the proceeds with Putnam within 90 days of the transaction and they will be reinvested at the fund’s current net asset value — with no sales charge. However, reinstatement of class B shares may have special tax consequences. Ask your financial or tax representative for details.
Check-writing service You have ready access to many Putnam accounts. It’s as simple as writing a check, and there are no special fees or service charges. For more information about the check-writing service, call Putnam or visit our website.
Dollar cost averaging When you’re investing for long-term goals, it’s time, not timing, that counts. Investing on a systematic basis is a better strategy than trying to figure out when the markets will go up or down. This means investing the same amount of money regularly over a long period. This method of investing is called dollar cost averaging. When a fund’s share price declines, your investment dollars buy more shares at lower prices. When it increases, they buy fewer shares. Over time, you will pay a lower average price per share.
For more information
Visit the Individual Investors section at putnam.com A secure section of our website contains complete information on your account, including balances and transactions, updated daily. You may also conduct transactions, such as exchanges, additional investments, and address changes. Log on today to get your password.
Call us toll free at 1-800-225-1581 Ask a helpful Putnam representative or your financial advisor for details about any of these or other services, or see your prospectus.
Putnam family of funds
The following is a list of Putnam’s open-end mutual funds offered to the public. Investors should carefully consider the investment objective, risks, charges, and expenses of a fund before investing. For a prospectus, or a summary prospectus if available, containing this and other information for any Putnam fund or product, contact your financial advisor or call Putnam Investor Services at 1-800-225-1581. Please read the prospectus carefully before investing.
| |
| Blend | Value |
| Capital Spectrum Fund | Convertible Securities Fund |
| Emerging Markets Equity Fund | Equity Income Fund |
| Equity Spectrum Fund | International Value Fund |
| Europe Equity Fund | Small Cap Value Fund |
| Global Equity Fund | |
| International Capital Opportunities Fund | Income |
| International Equity Fund | Diversified Income Trust |
| Multi-Cap Core Fund | Emerging Markets Income Fund |
| Research Fund | Floating Rate Income Fund |
| | Global Income Trust |
| Global Sector | Government Money Market Fund* |
| Global Consumer Fund | High Yield Fund |
| Global Financials Fund | Income Fund |
| Global Health Care Fund | Money Market Fund† |
| Global Industrials Fund | Mortgage Securities Fund |
| Global Natural Resources Fund | Short Duration Bond Fund |
| Global Sector Fund | Short Duration Income Fund |
| Global Technology Fund | |
| Global Telecommunications Fund | Tax-free Income |
| Global Utilities Fund | AMT-Free Municipal Fund |
| | Intermediate-Term Municipal Income Fund |
| Growth | Short-Term Municipal Income Fund |
| Growth Opportunities Fund | Tax Exempt Income Fund |
| International Growth Fund | Tax-Free High Yield Fund |
| Small Cap Growth Fund | |
| Sustainable Future Fund | State tax-free income funds‡: |
| Sustainable Leaders Fund | California, Massachusetts, Minnesota, |
| New Jersey, New York, Ohio, and Pennsylvania. |
| |
| Absolute Return | Asset Allocation |
| Fixed Income Absolute Return Fund | Dynamic Risk Allocation Fund |
| Multi-Asset Absolute Return Fund | George Putnam Balanced Fund |
| |
| Putnam PanAgora** | Dynamic Asset Allocation Balanced Fund |
| Putnam PanAgora Managed Futures Strategy | Dynamic Asset Allocation Conservative Fund |
| Putnam PanAgora Market Neutral Fund | Dynamic Asset Allocation Growth Fund |
| Putnam PanAgora Risk Parity Fund | |
| Retirement Income Fund Lifestyle 1 |
| |
| | RetirementReady® 2060 Fund |
| | RetirementReady® 2055 Fund |
| | RetirementReady® 2050 Fund |
| | RetirementReady® 2045 Fund |
| | RetirementReady® 2040 Fund |
| | RetirementReady® 2035 Fund |
| | RetirementReady® 2030 Fund |
| | RetirementReady® 2025 Fund |
| | RetirementReady® 2020 Fund |
* You could lose money by investing in the fund. Although the fund seeks to preserve the value of your investment at $1.00 per share, it cannot guarantee it will do so. An investment in the fund is not insured or guaranteed by the Federal Deposit Insurance Corporation or any other government agency. The fund’s sponsor has no legal obligation to provide financial support to the fund, and you should not expect that the sponsor will provide financial support to the fund at any time.
† You could lose money by investing in the fund. Although the fund seeks to preserve the value of your investment at $1.00 per share, it cannot guarantee it will do so. The fund may impose a fee upon sale of your shares or may temporarily suspend your ability to sell shares if the fund’s liquidity falls below required minimums because of market conditions or other factors. An investment in the fund is not insured or guaranteed by the Federal Deposit Insurance Corporation or any other government agency. The fund’s sponsor has no legal obligation to provide financial support to the fund, and you should not expect that the sponsor will provide financial support to the fund at any time.
‡ Not available in all states.
** Sub-advised by PanAgora Asset Management.
Check your account balances and the most recent month-end performance in the Individual Investors section at putnam.com.
Putnam’s commitment to confidentiality
In order to conduct business with our shareholders, we must obtain certain personal information such as account holders’ names, addresses, Social Security numbers, and dates of birth. Using this information, we are able to maintain accurate records of accounts and transactions.
It is our policy to protect the confidentiality of our shareholder information, whether or not a shareholder currently owns shares of our funds. In particular, it is our policy not to sell information about you or your accounts to outside marketing firms. We have safeguards in place designed to prevent unauthorized access to our computer systems and procedures to protect personal information from unauthorized use.
Within the Putnam organization, your information is shared with those who need it to service your account or provide you with information about other Putnam products or services. Under certain circumstances, we must also share account information with outside vendors who provide services to us, such as mailings and proxy solicitations. In these cases, the service providers enter into confidentiality agreements with us, and we provide only the information necessary to process transactions and perform other services related to your account. It is also our policy to share account information with your financial advisor, if you've provided us with information about your advisor and that person is listed on your Putnam account.
If you would like clarification about our confidentiality policies or have any questions or concerns, please don't hesitate to contact us at 1-800-225-1581, Monday through Friday, 8:00 a.m. to 8:00 p.m. Eastern Time.
Fund information
Founded over 80 years ago, Putnam Investments was built around the concept that a balance between risk and reward is the hallmark of a well-rounded financial program. We manage 100 funds across income, value, blend, growth, asset allocation, absolute return, and global sector categories.
| | |
| Investment Manager | Trustees | Michael J. Higgins |
| Putnam Investment | Kenneth R. Leibler, Chair | Vice President, Treasurer, |
| Management, LLC | Liaquat Ahamed | and Clerk |
| 100 Federal Street | Ravi Akhoury | |
| Boston, MA 02110 | Barbara M. Baumann | Janet C. Smith |
| | Katinka Domotorffy | Vice President, |
| Investment Sub-Advisor | Catharine Bond Hill | Principal Financial Officer, |
| Putnam Investments Limited | Paul L. Joskow | Principal Accounting Officer, |
| 16 St James’s Street | Robert E. Patterson | and Assistant Treasurer |
| London, England SW1A 1ER | George Putnam, III | |
| | Robert L. Reynolds | Susan G. Malloy |
| Marketing Services | Manoj P. Singh | Vice President and |
| Putnam Retail Management | | Assistant Treasurer |
| 100 Federal Street | Officers | |
| Boston, MA 02110 | Robert L. Reynolds | Mark C. Trenchard |
| | President | Vice President and |
| Custodian | | BSA Compliance Officer |
| State Street Bank | Jonathan S. Horwitz | |
| and Trust Company | Executive Vice President, | Nancy E. Florek |
| | Principal Executive Officer, | Vice President, Director of |
| Legal Counsel | and Compliance Liaison | Proxy Voting and Corporate |
| Ropes & Gray LLP | | Governance, Assistant Clerk, |
| | Robert T. Burns | and Assistant Treasurer |
| | Vice President and | |
| | Chief Legal Officer | Denere P. Poulack |
| | | Assistant Vice President, Assistant |
| | James F. Clark | Clerk, and Assistant Treasurer |
| | Vice President and | |
| | Chief Compliance Officer | |
This report is for the information of shareholders of Putnam Small Cap Value Fund. It may also be used as sales literature when preceded or accompanied by the current prospectus, the most recent copy of Putnam’s Quarterly Performance Summary, and Putnam’s Quarterly Ranking Summary. For more recent performance, please visit putnam.com. Investors should carefully consider the investment objectives, risks, charges, and expenses of a fund, which are described in its prospectus. For this and other information or to request a prospectus or summary prospectus, call 1-800-225-1581 toll free. Please read the prospectus carefully before investing. The fund’s Statement of Additional Information contains additional information about the fund’s Trustees and is available without charge upon request by calling 1-800-225-1581.
| |
|
Item 3. Audit Committee Financial Expert: |
| |
|
Item 4. Principal Accountant Fees and Services: |
| |
|
Item 5. Audit Committee of Listed Registrants |
| |
|
Item 6. Schedule of Investments: |
| |
| The registrant's schedule of investments in unaffiliated issuers is included in the report to shareholders in Item 1 above. |
| |
| Item 7. Disclosure of Proxy Voting Policies and Procedures For Closed-End Management Investment Companies: |
| |
|
Item 8. Portfolio Managers of Closed-End Investment Companies |
| |
|
Item 9. Purchases of Equity Securities by Closed-End Management Investment Companies and Affiliated Purchasers: |
| |
|
Item 10. Submission of Matters to a Vote of Security Holders: |
| |
|
Item 11. Controls and Procedures: |
| |
| (a) The registrant's principal executive officer and principal financial officer have concluded, based on their evaluation of the effectiveness of the design and operation of the registrant's disclosure controls and procedures as of a date within 90 days of the filing date of this report, that the design and operation of such procedures are generally effective to provide reasonable assurance that information required to be disclosed by the registrant in this report is recorded, processed, summarized and reported within the time periods specified in the Commission's rules and forms. |
| |
| (b) Changes in internal control over financial reporting: Not applicable |
| |
| (a)(2) Separate certifications for the principal executive officer and principal financial officer of the registrant as required by Rule 30a-2(a) under the Investment Company Act of 1940, as amended, are filed herewith. |
| |
| (b) The certifications required by Rule 30a-2(b) under the Investment Company Act of 1940, as amended, are filed herewith. |
| |
| Pursuant to the requirements of the Securities Exchange Act of 1934 and the Investment Company Act of 1940, the registrant has duly caused this report to be signed on its behalf by the undersigned, thereunto duly authorized. |
| |
| By (Signature and Title): |
| |
| /s/ Janet C. Smith
Janet C. Smith
Principal Accounting Officer
|
| |
| Pursuant to the requirements of the Securities Exchange Act of 1934 and the Investment Company Act of 1940, this report has been signed below by the following persons on behalf of the registrant and in the capacities and on the dates indicated. |
| |
| By (Signature and Title): |
| |
| /s/ Jonathan S. Horwitz
Jonathan S. Horwitz
Principal Executive Officer
|
| |
| By (Signature and Title): |
| |
| /s/ Janet C. Smith
Janet C. Smith
Principal Financial Officer
|