| UNITED STATES SECURITIES AND EXCHANGE COMMISSION | ||
| Washington, D.C. 20549 | ||
FORM N-CSR | ||
| CERTIFIED SHAREHOLDER REPORT OF REGISTERED MANAGEMENT INVESTMENT COMPANIES | ||
| Investment Company Act file number: | (811-07237) |
| Exact name of registrant as specified in charter: | Putnam Investment Funds |
| Address of principal executive offices: | 100 Federal Street, Boston, Massachusetts 02110 |
| Name and address of agent for service: | Robert T. Burns, Vice President 100 Federal Street Boston, Massachusetts 02110 |
| Copy to: | Bryan Chegwidden, Esq. Ropes & Gray LLP 1211 Avenue of the Americas New York, New York 10036 |
| Registrant’s telephone number, including area code: | (617) 292-1000 |
| Date of fiscal year end: | August 31, 2019 |
| Date of reporting period: | September 1, 2018 — February 28, 2019 |
Item 1. Report to Stockholders: |
| The following is a copy of the report transmitted to stockholders pursuant to Rule 30e-1 under the Investment Company Act of 1940: | |||
Putnam PanAgora
Market Neutral
Fund
Semiannual report
2|28|19
IMPORTANT NOTICE: Delivery of paper fund reports
In accordance with regulations adopted by the Securities and Exchange Commission, beginning on January 1, 2021, reports like this one will no longer be sent by mail unless you specifically request it. Instead, they will be on Putnam’s website, and you will be notified by mail whenever a new one is available, and provided with a website link to access the report.
If you wish to stop receiving paper reports sooner, or if you wish to continue to receive paper reports free of charge after January 1, 2021, please see the back cover or insert for instructions. If you invest through a bank or broker, your choice will apply to all funds held in your account. If you invest directly with Putnam, your choice will apply to all Putnam funds in your account.
If you already receive these reports electronically, no action is required.
Message from the Trustees
April 10, 2019
Dear Fellow Shareholder:
If there is any lesson to be learned from constantly changing financial markets, it is the importance of positioning your investment portfolio for your long-term goals. We believe that one strategy is to diversify across different asset classes and investment approaches.
We also believe your mutual fund investment offers a number of advantages, including constant monitoring by experienced investment professionals who maintain a long-term perspective. Putnam’s portfolio managers and analysts take a research-intensive approach that includes risk management strategies designed to serve you through changing conditions.
Another key strategy, in our view, is seeking the counsel of a financial advisor. For over 80 years, Putnam has recognized the importance of professional investment advice. Your financial advisor can help in many ways, including defining and planning for goals such as retirement, evaluating the level of risk appropriate for you, and reviewing your investments on a regular basis and making adjustments as necessary.
As always, your fund’s Board of Trustees remains committed to protecting the interests of Putnam shareholders like you, and we thank you for investing with Putnam.


Current performance may be lower or higher than the quoted past performance, which cannot guarantee future results. Share price, principal value, and return will fluctuate, and you may have a gain or a loss when you sell your shares. Performance of class A shares assumes reinvestment of distributions and does not account for taxes. Fund returns in the bar chart do not reflect a sales charge of 5.75%; had they, returns would have been lower. See below and pages 8–9 for additional performance information. For a portion of the periods, the fund had expense limitations, without which returns would have been lower. To obtain the most recent month-end performance, visit putnam.com.
*Returns for the six-month period are not annualized, but cumulative.
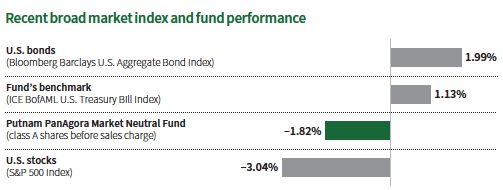
This comparison shows your fund’s performance in the context of broad market indexes for the six months ended 2/28/19. See above and pages 8–9 for additional fund performance information. Index descriptions can be found on pages 13–14.
| 2 PanAgora Market Neutral Fund | |

George D. Mussalli, CFA
Portfolio Manager
George is Chief Investment Officer and Head of Equity Research at PanAgora Asset Management. He has an M.B.A. from Sloan School of Business at the Massachusetts Institute of Technology and a B.S. from Tufts University. George joined PanAgora in 2004 and has been in the investment industry since 1995.
Richard Tan, CFA
Portfolio Manager
Richard is a Director in the Equity group at PanAgora Asset Management. He has an M.B.A. from Boston College Carroll Graduate School of Management, an M.S. in Computer Science from Rutgers University, and a B.A. from Shanghai Jiao Tong University. Richard joined PanAgora in 2008 and has been in the investment industry since 1997.
Please describe the global investing environment in 2018 and for the reporting period.
U.S. equities performed especially well in 2018 up until the last quarter of the year. Stable growth of the economy advanced U.S. equities to outperform other regions. Europe benefited mid-year 2018 as trade-war bickering between the United States and the European Union cooled. Emerging markets lagged developed markets as reverberating global trade tensions and rising U.S. interest rates weighed on the region.
The pockets of growth, however, were wiped out as a sell-off in equities picked up in the fourth quarter of 2018 and extended to all regions. U.S. equities, and small caps in particular, experienced steep declines during the month of December as investors rotated out of risky assets on the fears of slower earnings growth. European equities also declined over concerns about trade tariffs and the slowdown of economic growth. Emerging markets continued to decline due to increased U.S.–China trade disputes as well as the sharp drop in crude oil prices, which hurt oil-producing countries.
However, after a disappointing end to 2018, global equities staged a rally in the first two months of 2019. A dovish U.S. Federal Reserve [Fed], the abatement of the U.S.–China trade
| PanAgora Market Neutral Fund 3 |

The table shows the fund’s long and short exposures in each country or region and the percentage of the fund’s net assets that each represented as of 2/28/19. Allocations will not total 100% because the table reflects the notional value of derivatives (the economic value for purposes of calculating periodic payment obligations), in addition to the market value of securities. Holdings and allocations may vary over time.

dispute, and a less pessimistic view on the current earnings season helped equities achieve a remarkable comeback.
Despite the rally observed so far in 2019, U.S. equities finished the six-month period in negative territory, with the S&P 500 Index and Russell 2000 Index returning –3.04% and –8.86%, respectively. International developed markets recovered a fair amount of their fourth-quarter 2018 losses in January and February 2019, although the MSCI World ex-U.S. Index [ND] still finished the six-month period with a return of –3.41%. Emerging-market equities managed to finish the period slightly positive with the MSCI Emerging Markets Index [ND] gaining a modest 0.33%.
Bonds rallied considerably toward the end of 2018 and into 2019 as risk aversion returned to the marketplace amid heightened fears of a global economic slowdown, tanking crude oil prices, and a partial U.S. government shutdown. The yield on the benchmark 10-year U.S. Treasury note ended the six-month period at 2.73%, falling considerably from its peak of 3.24% observed in early November 2018. After posting strong results in January and throughout most of February 2019, bond markets retreated somewhat during the last week of the month. The bid for lessrisky assets cooled even more so at the end of the period, once U.S. fourth-quarter gross domestic product [GDP] came in at a better-than-expected 2.6% — well above previous estimates of a GDP of 2.2%. After the late-month December 2018 sell-off, Treasuries had been hanging on to modestly positive gains as investors digested the release of the minutes from the Fed’s first policy meeting of 2019.The Fed indicated a more prudent approach to future short-term interest-rate hikes and signaled an end to the reduction of its $4 trillion balance sheet later in 2019.
Yields for non-U.S. government bonds also edged upward, and prices fell as investor sentiment shifted amid progress in U.S.–China trade talks as well as the possibility of a delay of Brexit. For the six-month reporting period, the Bloomberg Barclays U.S. Treasury Index rose by 1.81%, while the FTSE WGBI ex-USD Index [Hedged] fared better, gaining 3.29%.
Commodities ended 2018 sharply down as losses accelerated in the fourth quarter. Crude oil, in particular, was hampered by global oversupply conditions in early October, and prices continued to fall into December despite production cuts by OPEC. However, commodities also began to rally in the new year and continued to recover in February, easing some
| 4 PanAgora Market Neutral Fund | |
losses experienced toward the end of 2018. The S&P GSCI Index ultimately finished the six-month period at –9.39%. From an industry perspective, energy and industrial metals have been the strongest performing segments of the commodity market year to date, while precious metals, livestock, and agriculture have lagged. Increased global demand amid the production cuts by OPEC have boosted crude oil prices as well as prices for gasoline, heating oil, and gas oil, which all were top-performing commodity contracts toward the end of the period. Copper has been the best performer among industrial metals as the price for the red metal has benefited from the perceived progress of U.S.–China trade negotiations.
How did the fund perform for the reporting period?
On an absolute basis, Putnam PanAgora Market Neutral Fund returned –1.82% for the six-month reporting period. The fund’s long-term portfolio contributed 0.09%, as underperformance in emerging markets was offset by positive performance in the fund’s developed positions. Intermediate-term strategies contributed 0.42%, while short-term strategies detracted by 1.48%.
What were the results of the long-term portfolio for the period?
The long-term portfolio contributed 0.09% for the period. Underperformance of long positions in Taiwan and Mexico were offset by the positive performance of short positions in Japan.
Developed international positions contributed positively during the period, with the majority of the performance coming from short mid/ large-cap stock positions in Japan. Factor performance within Japan was positive, with all three factor composites performing well on a spread basis. The external forces factor composite, which assesses the impact of elements for which company management has less direct control, was positive due to the strong performance of the macroeconomicfactor. The management capabilities factor composite, which consists of signals that assess the impact of company management decisions on the business, was also positive due to the good performance of quality metrics. Market intelligence factors, which assess the impact of the actions market participants have on the movement of a company’s future stock price, significantly outperformed due to momentum metrics; value metrics were flat for the time period.

Within the international market, January 2019 was a recovery period for both the market and factor investing. A number of quantitative factors posted decent performance, driven mainly by a short-term reversal (a number of factors were in the oversold regime late last year). Additionally, sector performance divergence is widening internationally. Research has shown that January’s performance does a poor job of predicting performance for the whole year, but volatility is a good predictor. This could mean cross-sectional volatility will keep at a high level in 2019.
By minimizing gains within the developed international strategy, emerging markets were a disappointment for the period. The majority of this underperformance came within the last two months of the reporting period. The alpha model did not perform well on a spread basis, as quality and value factor spreads deteriorated. Within emerging markets, Mexico was the largest detractor due to poor performance within the materials sector. The model within the materials sector did not perform well due to the underperformance of value and momentum metrics.
| PanAgora Market Neutral Fund 5 |
What were the results of the intermediate-term and short-term portfolios?
The intermediate strategies contributed 0.42% due to solid performance of U.S. merger-arbitrage-related trades. Merger and acquisition [M&A] signals produced solid contributions in the health-care and financials sectors over the past six months. Short-term strategies detracted by 1.48% over the period. Losses were driven by both index reconstitution and corporate-event-related trades. Some positions in corporate-event-related strategies were adversely affected by the release of fourth-quarter earnings. Positions in Keycorp and W.W. Grainger [both held long] beat earnings expectations but missed revenue estimates, causing them to underperform over the period. Other companies, such as Marvell Technology Group [held long], detracted due to their high sales to China, which pushed investors to sell the stock. We sold our positions in Keycorp and Marvell Technology Group during the period.
How did the fund use derivatives?
We used total return swaps to take long or short positions in equity securities.
What is your outlook for the fund going forward?
The fund seeks absolute returns, which are positive returns generated in diverse market environments over time. The fund uses a diversified set of strategies that have low correlation to one another. Their combination is expected to result in more stable returns over time than any individual strategy in and of itself.
Most of the fund’s assets are allocated to the long-term portfolio, which utilizes fundamentally based signals and is implemented across a broad universe of stocks. We expect the long-term strategy to outperform over a market cycle.
More than 10 years have passed since the start of the recovery, and we believe we are now well into the last stage of the economic cycle. Historically, these have been challenging
ABOUT DERIVATIVES
Derivatives are an increasingly common type of investment instrument, the performance of which isderivedfrom an underlying security, index, currency, or other area of the capital markets. Derivatives employed by the fund’s managers generally serve one purpose: to take long or short positions in equity securities.
For example, the fund’s managers may use derivatives, such as total return swaps, to take long or short positions in equity securities. The fund may also use derivatives as a substitute for a direct investment in the securities of one or more issuers.
Like any other investment, derivatives may not appreciate in value and may lose money. Derivatives may amplify traditional investment risks through the creation of leverage and may be less liquid than traditional securities. And because derivatives typically represent contractual agreements between two financial institutions, derivatives entail “counterparty risk,” which is the risk that the other party is unable or unwilling to pay. PanAgora monitors the counterparty risks we assume. For example, PanAgora often enters into collateral agreements that require the counterparties to post collateral on a regular basis to cover their obligations to the fund. Counterparty risk for exchange-traded futures and centrally cleared swaps is mitigated by the daily exchange of margin and other safeguards against default through their respective clearinghouses.
| 6 PanAgora Market Neutral Fund | |
times for diversified quantitative strategies as investors have been discarding stocks with stronger fundamentals and embracing expensive companies with compelling stories about their future growth. We navigate such turbulence by staying true to our belief that the characteristics identified by our quantitative models will continue to deliver better-than-market returns over a full economic cycle.
Thank you, George and Richard, for your time and insights today.
Past performance is not a guarantee of future results.
The opinions expressed in this article represent the current, good-faith views of the author(s) at the time of publication, are provided for limited purposes, are not definitive investment advice, and should not be relied on as such. The informationpresented in this article has been developed internally and/or obtained from sources believed to be reliable; however, PanAgora Asset Management, Inc. (PanAgora) does not guarantee the accuracy, adequacy or completeness of such information. Predictions, opinions, and other information contained in this article are subject to change continually and without notice of any kind and may no longer be true after the date indicated. As with any investment there is a potential for profit as well as the possibility of loss.
Any forward-looking statements speak only as of the date they are made, and PanAgora assumes no duty to and does not undertake to update forward-looking statements. Forward-looking statements are subject to numerous assumptions, risks, and uncertainties, which change over time. Actual results could differ materially from those anticipated in forward-looking statements. Any investments to which this material relates are available only to or will be engaged in only with investment professionals.
| PanAgora Market Neutral Fund 7 |
Your fund’s performance
This section shows your fund’s performance, price, and distribution information for periods ended February 28, 2019, the end of the first half of its current fiscal year. In accordance with regulatory requirements for mutual funds, we also include performance information as of the most recent calendar quarter-end and expense information taken from the fund’s current prospectus. Performance should always be considered in light of a fund’s investment strategy. Data represent past performance. Past performance does not guarantee future results. More recent returns may be less or more than those shown. Investment return and principal value will fluctuate, and you may have a gain or a loss when you sell your shares. Performance information does not reflect any deduction for taxes a shareholder may owe on fund distributions or on the redemption of fund shares. For the most recent month-end performance, please visit the Individual Investors section at putnam.com or call Putnam at 1-800-225-1581. Class R, R6, and Y shares are not available to all investors. See the Terms and definitions section in this report for definitions of the share classes offered by your fund.
Fund performanceTotal return for periods ended 2/28/19
| Life of fund | Annual average | 1 year | 6 months | |
| Class A(9/21/17) | ||||
| Before sales charge | –8.50% | –5.99% | –7.48% | –1.82% |
| After sales charge | –13.76 | –9.78 | –12.80 | –7.47 |
| Class B(9/21/17) | ||||
| Before CDSC | –9.40 | –6.63 | –8.02 | –2.05 |
| After CDSC | –13.02 | –9.25 | –12.62 | –6.95 |
| Class C(9/21/17) | ||||
| Before CDSC | –9.40 | –6.63 | –8.02 | –2.05 |
| After CDSC | –9.40 | –6.63 | –8.94 | –3.03 |
| Class M(9/21/17) | ||||
| Before sales charge | –9.10 | –6.42 | –7.90 | –1.94 |
| After sales charge | –12.28 | –8.71 | –11.13 | –5.37 |
| Class R(9/21/17) | ||||
| Net asset value | –8.80 | –6.20 | –7.60 | –1.94 |
| Class R6(9/21/17) | ||||
| Net asset value | –8.10 | –5.70 | –7.17 | –1.61 |
| Class Y(9/21/17) | ||||
| Net asset value | –8.10 | –5.70 | –7.17 | –1.61 |
Current performance may be lower or higher than the quoted past performance, which cannot guarantee future results. After-sales-charge returns for class A and M shares reflect the deduction of the maximum 5.75% and 3.50% sales charge, respectively, levied at the time of purchase. Class B share returns after contingent deferred sales charge (CDSC) reflect the applicable CDSC, which is 5% in the first year, declining over time to 1% in the sixth year, and is eliminated thereafter. Class C share returns after CDSC reflect a 1% CDSC for the first year that is eliminated thereafter.Class R, R6, and Y shares have no initial sales charge or CDSC.
For a portion of the periods, the fund had expense limitations, without which returns would have been lower.
| 8 PanAgora Market Neutral Fund | |
Comparative index returnsFor periods ended 2/28/19
| Life of fund | Annual average | 1 year | 6 months | |
| ICE BofAML U.S. | ||||
| Treasury Bill Index | 2.57% | 1.78% | 2.08% | 1.13% |
| Lipper Alternative | ||||
| Equity Market | ||||
| Neutral Funds | –1.43 | –1.04 | –1.99 | –1.21 |
| category average* |
Index and Lipper results should be compared with fund performance before sales charge, before CDSC, or at net asset value.
*Over the 6-month, 1-year and life-of-fund periods ended 2/28/19, there were 98, 97, and 97 funds, respectively, in this Lipper category.
Fund price and distribution informationFor the six-month period ended 2/28/19
| Class A | Class B | Class C | Class M | Class R | Class R6 | Class Y | |||
| Before | After | Net | Net | Before | After | Net | Net | Net | |
| sales | sales | asset | asset | sales | sales | asset | asset | asset | |
| Share value | charge | charge | value | value | charge | charge | value | value | value |
| 8/31/18 | $9.32 | $9.89 | $9.25 | $9.25 | $9.27 | $9.61 | $9.30 | $9.34 | $9.34 |
| 2/28/19 | 9.15 | 9.71 | 9.06 | 9.06 | 9.09 | 9.42 | 9.12 | 9.19 | 9.19 |
The classification of distributions, if any, is an estimate. Before-sales-charge share value and current dividend rate for class A and M shares, if applicable, do not take into account any sales charge levied at the time of purchase. After-sales-charge share value, current dividend rate, and current 30-day SEC yield, if applicable, are calculated assuming that the maximum sales charge (5.75% for class A shares and 3.50% for class M shares) was levied at the time of purchase. Final distribution information will appear on your year-end tax forms.
The fund made no distributions during the period.
Fund performance as of most recent calendar quarterTotal return for periods ended 3/31/19
| Life of fund | Annual average | 1 year | 6 months | |
| Class A(9/21/17) | ||||
| Before sales charge | –10.20% | –6.79% | –7.61% | –3.54% |
| After sales charge | –15.36 | –10.33 | –12.93 | –9.09 |
| Class B(9/21/17) | ||||
| Before CDSC | –11.20 | –7.47 | –8.26 | –3.90 |
| After CDSC | –14.75 | –9.91 | –12.85 | –8.70 |
| Class C(9/21/17) | ||||
| Before CDSC | –11.20 | –7.47 | –8.26 | –3.90 |
| After CDSC | –11.20 | –7.47 | –9.18 | –4.86 |
| Class M(9/21/17) | ||||
| Before sales charge | –10.80 | –7.20 | –7.95 | –3.67 |
| After sales charge | –13.92 | –9.34 | –11.17 | –7.04 |
| Class R(9/21/17) | ||||
| Net asset value | –10.50 | –7.00 | –7.83 | –3.56 |
| Class R6(9/21/17) | ||||
| Net asset value | –9.80 | –6.52 | –7.30 | –3.32 |
| Class Y(9/21/17) | ||||
| Net asset value | –9.90 | –6.59 | –7.40 | –3.43 |
See the discussion following the fund performance table on page 8 for information about the calculation of fund performance.
| PanAgora Market Neutral Fund 9 |
Your fund’s expenses
As a mutual fund investor, you pay ongoing expenses, such as management fees, distribution fees (12b-1 fees), and other expenses. In the most recent six-month period, your fund’s expenses were limited; had expenses not been limited, they would have been higher. Using the following information, you can estimate how these expenses affect your investment and compare them with the expenses of other funds. You may also pay one-time transaction expenses, including sales charges (loads) and redemption fees, which are not shown in this section and would have resulted in higher total expenses. For more information, see your fund’s prospectus or talk to your financial representative.
Expense ratios
| Class A | Class B | Class C | Class M | Class R | Class R6 | Class Y | |
| Net expenses for the fiscal year | |||||||
| ended 8/31/18*† | 1.82% | 2.57% | 2.57% | 2.32% | 2.07% | 1.58% | 1.57% |
| Total annual operating expenses for the | |||||||
| fiscal year ended 8/31/18* | 3.42% | 4.17% | 4.17% | 3.92% | 3.67% | 3.18% | 3.17% |
| Annualized expense ratio for the | |||||||
| six-month period ended 2/28/19 | 1.79% | 2.54% | 2.54% | 2.29% | 2.04% | 1.55% | 1.54% |
Fiscal-year expense information in this table is taken from the most recent prospectus, is subject to change, and may differ from that shown for the annualized expense ratio and in the financial highlights of this report.
Prospectus expense information also includes the impact of acquired fund fees and expenses of 0.03%, which is not included in the financial highlights or annualized expense ratios. Expenses are shown as a percentage of average net assets.
*Other expenses have been annualized.
†Reflects Putnam Management’s contractual obligation to limit certain fund expenses through 12/30/19.
Expenses per $1,000
The following table shows the expenses you would have paid on a $1,000 investment in each class of the fund from 9/1/18 to 2/28/19. It also shows how much a $1,000 investment would be worth at the close of the period, assumingactual returnsand expenses.
| Class A | Class B | Class C | Class M | Class R | Class R6 | Class Y | |
| Expenses paid per $1,000*† | $8.80 | $12.47 | $12.47 | $11.25 | $10.02 | $7.62 | $7.58 |
| Ending value (after expenses) | $981.80 | $979.50 | $979.50 | $980.60 | $980.60 | $983.90 | $983.90 |
*Expenses for each share class are calculated using the fund’s annualized expense ratio for each class, which represents the ongoing expenses as a percentage of average net assets for the six months ended 2/28/19. The expense ratio may differ for each share class.
†Expenses are calculated by multiplying the expense ratio by the average account value for the period; then multiplying the result by the number of days in the period; and then dividing that result by the number of days in the year.
| 10 PanAgora Market Neutral Fund | |
Estimate the expenses you paid
To estimate the ongoing expenses you paid for the six months ended 2/28/19, use the following calculation method. To find the value of your investment on 9/1/18, call Putnam at 1-800-225-1581.

Compare expenses using the SEC’s method
The Securities and Exchange Commission (SEC) has established guidelines to help investors assess fund expenses. Per these guidelines, the following table shows your fund’s expenses based on a $1,000 investment, assuming ahypothetical 5% annualized return. You can use this information to compare the ongoing expenses (but not transaction expenses or total costs) of investing in the fund with those of other funds. All mutual fund shareholder reports will provide this information to help you make this comparison. Please note that you cannot use this information to estimate your actual ending account balance and expenses paid during the period.
| Class A | Class B | Class C | Class M | Class R | Class R6 | Class Y | |
| Expenses paid per $1,000*† | $8.95 | $12.67 | $12.67 | $11.43 | $10.19 | $7.75 | $7.70 |
| Ending value (after expenses) | $1,015.92 | $1,012.20 | $1,012.20 | $1,013.44 | $1,014.68 | $1,017.11 | $1,017.16 |
*Expenses for each share class are calculated using the fund’s annualized expense ratio for each class, which represents the ongoing expenses as a percentage of average net assets for the six months ended 2/28/19. The expense ratio may differ for each share class.
†Expenses are calculated by multiplying the expense ratio by the average account value for the six-month period; then multiplying the result by the number of days in the six-month period; and then dividing that result by the number of days in the year.
| PanAgora Market Neutral Fund 11 |
Consider these risks before investing
There can be no assurance that the fund’s strategies will achieve any particular level of return. The fund’s allocation of assets may hurt performance, and efforts to generate returns under different market conditions and over different time horizons may be unsuccessful. Quantitative models or data may be incorrect or incomplete, and reliance on those models or data may not produce the desired results. Stock and bond prices may fall or fail to rise over time for several reasons, including general financial market conditions, changing market perceptions (including, in the case of bonds, perceptions about the risk of default and expectations about monetary policy or interest rates), changes in government intervention in the financial markets, and factors related to a specific issuer or industry. These and other factors may also lead to increased volatility and reduced liquidity in the fund’s portfolio holdings. Investments in small and/or midsize companies increase the risk of greater price fluctuations. Bond investments in which the fund invests (or has exposure to) are subject to interest-rate risk and credit risk. Interest-rate risk is generally greater for longer-term bonds, and credit risk is generally greater for below-investment-grade bonds. Risks associated with derivatives (including “short” derivatives) include losses caused by unexpected market movements (which are potentially unlimited), imperfect correlation between the price of the derivative and the price of the underlying asset, increased investment exposure (which may be considered leverage), the potential inability to terminate or sell derivatives positions, the potential need to sell securities at disadvantageous times to meet margin or segregation requirements, the potential inability to recover margin or other amounts deposited from a counterparty, and the potential failure of the other party to the instrument to meet its obligations. Leveraging can result in volatility in the fund’s performance and losses in excess of the amounts invested. International investing involves certain risks, such as currency fluctuations, economic instability, and political developments. Exposure to REITs subjects the fund to the risks associated with direct ownership in real estate, including economic downturns that have an adverse effect on real estate markets. By investing in open-end or closed-end investment companies and ETFs, the fund is indirectly exposed to the risks associated with direct ownership of the securities held by those investment companies or ETFs. Certain investments are not as readily traded as conventional securities, and the fund may be unable to sell these investments when it considers it desirable to do so. Frequent trading may cause the fund to experience increased brokerage commissions and other transaction costs, and the fund may be more likely to realize capital gains that must be distributed to shareholders as taxable ordinary income. You can lose money by investing in the fund.
| 12 PanAgora Market Neutral Fund | |
Terms and definitions
Important terms
Total returnshows how the value of the fund’s shares changed over time, assuming you held the shares through the entire period and reinvested all distributions in the fund.
Before sales charge, or net asset value, is the price, or value, of one share of a mutual fund, without a sales charge. Before-sales-charge figures fluctuate with market conditions, and are calculated by dividing the net assets of each class of shares by the number of outstanding shares in the class.
After sales chargeis the price of a mutual fund share plus the maximum sales charge levied at the time of purchase. After-sales-charge performance figures shown here assume the 5.75% maximum sales charge for class A shares and 3.50% for class M shares.
Contingent deferred sales charge (CDSC)is generally a charge applied at the time of the redemption of class B or C shares and assumes redemption at the end of the period. Your fund’s class B CDSC declines over time from a 5% maximum during the first year to 1% during the sixth year. After the sixth year, the CDSC no longer applies. The CDSC for class C shares is 1% for one year after purchase.
Share classes
Class A sharesare generally subject to an initial sales charge and no CDSC (except on certain redemptions of shares bought without an initial sales charge).
Class B sharesare closed to new investments and are only available by exchange from another Putnam fund or through dividend and/ or capital gains reinvestment. They are not subject to an initial sales charge and may be subject to a CDSC.
Class C sharesare not subject to an initial sales charge and are subject to a CDSC only if the shares are redeemed during the first year.
Class M shareshave a lower initial sales charge and a higher 12b-1 fee than class A shares and no CDSC.
Class R sharesare not subject to an initial sales charge or CDSC and are only available to employer-sponsored retirement plans.
Class R6 sharesare not subject to an initial sales charge or CDSC and carry no 12b-1 fee. They are generally only available to employer-sponsored retirement plans, corporate and institutional clients, and clients in other approved programs.
Class Y sharesare not subject to an initial sales charge or CDSC and carry no 12b-1 fee. They are generally only available to corporate and institutional clients and clients in other approved programs.
Comparative indexes
Bloomberg Barclays U.S. Aggregate Bond Indexis an unmanaged index of U.S. investment-grade fixed-income securities.
Bloomberg Barclays U.S. Treasury Indexis an unmanaged index of fixed-rate, nominal debt issued by the U.S. Treasury.
FTSE World Government Bond Index (WGBI) ex-U.S. (Hedged) Indexis an unmanaged index that represents the world bond market, excluding the United States.
ICE BofAML (Intercontinental Exchange Bank of America Merrill Lynch) U.S. Treasury Bill Indexis an unmanaged index that tracks the performance of U.S. dollar-denominated U.S. Treasury bills publicly issued in the U.S. domestic market. Qualifying securities must have a remaining term of at least one month to final maturity and a minimum amount outstanding of $1 billion.
MSCI Emerging Markets Index (ND)is a free float-adjusted market capitalization index that is designed to measure equity market performance in global emerging
| PanAgora Market Neutral Fund 13 |
markets. Calculated with net dividends (ND), this total return index reflects the reinvestment of dividends after the deduction of withholding taxes, using a tax rate applicable to non-resident institutional investors who do not benefit from double taxation treaties.
MSCI World ex-U.S. Index (ND)is an unmanaged index of equity securities from developed countries, excluding the United States. Calculated with net dividends (ND), this total return index reflects the reinvestment of dividends after the deduction of withholding taxes, using a tax rate applicable to non-resident institutional investors who do not benefit from double taxation treaties.
Russell 2000 Indexis an unmanaged index of 2,000 small companies in the Russell 3000 Index.
S&P 500 Indexis an unmanaged index of common stock performance.
S&P GSCI Indexis a composite index of commodity sector returns that represents a broadly diversified, unleveraged, long-only position in commodity futures.
Indexes assume reinvestment of all distributions and do not account for fees. Securities and performance of a fund and an index will differ. You cannot invest directly in an index.
ICE Data Indices, LLC (“ICE BofAML”), used with permission. ICE BofAML permits use of the ICE BofAML indices and related data on an “as is” basis; makes no warranties regarding same; does not guarantee the suitability, quality, accuracy, timeliness, and/or completeness of the ICE BofAML indices or any data included in, related to, or derived therefrom; assumes no liability in connection with the use of the foregoing; and does not sponsor, endorse, or recommend Putnam Investments, or any of its products or services.
Frank Russell Company is the source and owner of the trademarks, service marks, and copyrights related to the Russell Indexes. Russell® is a trademark of Frank Russell Company.
Lipperis a third-party industry-ranking entity that ranks mutual funds. Its rankings do not reflect sales charges. Lipper rankings are based on total return at net asset value relative to other funds that have similar current investment styles or objectives as determined by Lipper. Lipper may change a fund’s category assignment at its discretion. Lipper category averages reflect performance trends for funds within a category.
| 14 PanAgora Market Neutral Fund |
Other information for shareholders
Important notice regarding delivery of shareholder documents
In accordance with Securities and Exchange Commission (SEC) regulations, Putnam sends a single copy of annual and semiannual shareholder reports, prospectuses, and proxy statements to Putnam shareholders who share the same address, unless a shareholder requests otherwise. If you prefer to receive your own copy of these documents, please call Putnam at 1-800-225-1581, and Putnam will begin sending individual copies within 30 days.
Proxy voting
Putnam is committed to managing our mutual funds in the best interests of our shareholders. The Putnam funds’ proxy voting guidelines and procedures, as well as information regarding how your fund voted proxies relating to portfolio securities during the 12-month period ended June 30, 2018, are available in the Individual Investors section of putnam.com and on the SEC’s website, www.sec.gov. If you have questions about finding forms on the SEC’s website, you may call the SEC at1-800-SEC-0330. You may also obtain the Putnam funds’ proxy voting guidelines and procedures at no charge by calling Putnam’s Shareholder Services at 1-800-225-1581.
Fund portfolio holdings
The fund will file a complete schedule of its portfolio holdings with the SEC for the first and third quarters of each fiscal year on Form N-Q. Shareholders may obtain the fund’s Form N-Q on the SEC’s website at www.sec.gov.
Trustee and employee fund ownership
Putnam employees and members of the Board of Trustees place their faith, confidence, and, most importantly, investment dollars in Putnam mutual funds. As of February 28, 2019, Putnam employees had approximately $493,000,000 and the Trustees had approximately $68,000,000 invested in Putnam mutual funds. These amounts include investments by the Trustees’ and employees’ immediate family members as well as investments through retirement and deferred compensation plans.
| PanAgora Market Neutral Fund 15 |
Financial statements
These sections of the report, as well as the accompanying Notes, constitute the fund’s financial statements.
The fund’s portfoliolists all the fund’s investments and their values as of the last day of the reporting period. Holdings are organized by asset type and industry sector, country, or state to show areas of concentration and diversification.
Statement of assets and liabilitiesshows how the fund’s net assets and share price are determined. All investment and non-investment assets are added together. Any unpaid expenses and other liabilities are subtracted from this total. The result is divided by the number of shares to determine the net asset value per share, which is calculated separately for each class of shares. (For funds with preferred shares, the amount subtracted from total assets includes the liquidation preference of preferred shares.)
Statement of operationsshows the fund’s net investment gain or loss. This is done by first adding up all the fund’s earnings — from dividends and interest income — and subtracting its operating expenses to determine net investment income (or loss). Then, any net gain or loss the fund realized on the sales of its holdings — as well as any unrealized gains or losses over the period — is added toor subtracted from the net investment result to determine the fund’s net gain or loss for the fiscal period.
Statement of changes in net assetsshows how the fund’s net assets were affected by the fund’s net investment gain or loss, by distributions to shareholders, and by changes in the number of the fund’s shares. It lists distributions and their sources (net investment income or realized capital gains) over the current reporting period and the most recent fiscal year-end. The distributions listed here may not match the sources listed in the Statement of operations because the distributions are determined on a tax basis and may be paid in a different period from the one in which they were earned. Dividend sources are estimated at the time of declaration. Actual results may vary. Any non-taxable return of capital cannot be determined until final tax calculations are completed after the end of the fund’s fiscal year.
Financial highlightsprovide an overview of the fund’s investment results, per-share distributions, expense ratios, net investment income ratios, and portfolio turnover in one summary table, reflecting the five most recent reporting periods. In a semiannual report, the highlights table also includes the current reporting period.
| 16 PanAgora Market Neutral Fund | |
The fund’s portfolio2/28/19 (Unaudited)
| INVESTMENT COMPANIES (8.6%)* | Shares | Value |
| State Street Institutional U.S. Government Money Market Fund | 948,333 | $948,333 |
| Total investment companies (cost $948,333) | $948,333 | |
| SHORT-TERM INVESTMENTS (92.3%)* | Principal amount | Value |
| U.S. Treasury Bills with effective yields ranging from 2.404% | ||
| to 2.468%, 5/23/19 | $5,150,000 | $5,121,563 |
| U.S. Treasury Bills with effective yields ranging from 2.474% | ||
| to 2.577%, 9/12/19 Δ | 5,150,000 | 5,081,934 |
| Total short-term investments (cost $10,202,384) | $10,203,497 | |
| TOTAL INVESTMENTS | ||
| Total investments (cost $11,150,717) | $11,151,830 | |
| Key to holding’s abbreviations | |
| ADR/Adr | American Depository Receipts: represents ownership of foreign securities on deposit with a |
| custodian bank | |
| ETF/Etf | Exchange Traded Fund |
| GDR/Gdr | Global Depository Receipts: represents ownership of foreign securities on deposit with a |
| custodian bank | |
| NVDR/Nvdr | Non-voting Depository Receipts |
| OTC | Over-the-counter |
| PJSC/Pjsc | Public Joint Stock Company |
| SPDR/Spdr | S&P Depository Receipts |
Notes to the fund’s portfolio
Unless noted otherwise, the notes to the fund’s portfolio are for the close of the fund’s reporting period, which ran from September 1, 2018 through February 28, 2019 (the reporting period). Within the following notes to the portfolio, references to “Putnam Management” represent Putnam Investment Management, LLC, the fund’s manager, an indirect wholly-owned subsidiary of Putnam Investments, LLC and references to “ASC 820” represent Accounting Standards Codification 820Fair Value Measurements and Disclosures.
*Percentages indicated are based on net assets of $11,056,936.
ΔThis security, in part or in entirety, was pledged and segregated with the custodian for collateral on certain derivative contracts at the close of the reporting period. Collateral at period end totaled $4,025,804 and is included in Investments in securities on the Statement of assets and liabilities (Notes 1 and 8).
At the close of the reporting period, the fund maintained liquid assets totaling $8,523 to cover certain derivative contracts.
The dates shown on debt obligations are the original maturity dates.
| PanAgora Market Neutral Fund 17 |
| OTC TOTAL RETURN SWAP CONTRACTS OUTSTANDING at 2/28/19 (Unaudited) | ||||||
| Upfront | ||||||
| premium | Termina- | Payments | Total return | Unrealized | ||
| Swap counterparty/ | received | tion | received (paid) | received by | appreciation/ | |
| Notional amount | Value | (paid) | date | by fund | or paid by fund | (depreciation) |
| Morgan Stanley & Co. International PLC | ||||||
| $48,030 | $47,641 | $— | 1/29/20 | (Federal Funds | 3I Group Plc — | $(397) |
| Effective Rate US | Monthly | |||||
| plus 0.25%) — | ||||||
| Monthly | ||||||
| 13,181 | 12,533 | — | 1/27/20 | (Federal Funds | Aboitiz Power | (652) |
| Effective Rate US | Corp — Monthly | |||||
| plus 0.75%) — | ||||||
| Monthly | ||||||
| 68,426 | 67,948 | — | 1/29/20 | (Federal Funds | Advance Auto Parts | (489) |
| Effective Rate US | Inc — Monthly | |||||
| plus 0.25%) — | ||||||
| Monthly | ||||||
| 190,170 | 192,324 | — | 1/29/20 | (Federal Funds | Agilent | 2,127 |
| Effective Rate US | Technologies Inc — | |||||
| plus 0.25%) — | Monthly | |||||
| Monthly | ||||||
| 12,227 | 11,035 | — | 1/28/20 | (Federal Funds | Airasia Group Bhd — | (1,195) |
| Effective Rate US | Monthly | |||||
| plus 0.75%) — | ||||||
| Monthly | ||||||
| 81,014 | 81,084 | — | 1/29/20 | (Federal Funds | Akamai | 58 |
| Effective Rate US | Technologies Inc — | |||||
| plus 0.25%) — | Monthly | |||||
| Monthly | ||||||
| 45,452 | 46,148 | — | 1/29/20 | (Federal Funds | Alexion | 689 |
| Effective Rate US | Pharmaceuticals | |||||
| plus 0.25%) — | Inc — Monthly | |||||
| Monthly | ||||||
| 18,062 | 17,770 | — | 1/29/20 | (Federal Funds | Alfa Sab De Cv — | (295) |
| Effective Rate US | Monthly | |||||
| plus 0.90%) — | ||||||
| Monthly | ||||||
| 78,391 | 78,684 | — | 1/27/20 | (Federal Funds | Alfresa Holdings | 276 |
| Effective Rate US | Corp — Monthly | |||||
| plus 0.25%) — | ||||||
| Monthly | ||||||
| 44,409 | 45,070 | — | 1/29/20 | (Federal Funds | Allegion Plc — | 655 |
| Effective Rate US | Monthly | |||||
| plus 0.25%) — | ||||||
| Monthly | ||||||
| 39,207 | 39,523 | — | 1/29/20 | (Federal Funds | Allergan Plc — | 310 |
| Effective Rate US | Monthly | |||||
| plus 0.25%) — | ||||||
| Monthly | ||||||
| 194,096 | 186,624 | — | 1/29/20 | (Federal Funds | Allison Transmission | (7,501) |
| Effective Rate US | Holdings Inc — | |||||
| plus 0.25%) — | Monthly | |||||
| Monthly | ||||||
| 18 PanAgora Market Neutral Fund | |
| OTC TOTAL RETURN SWAP CONTRACTS OUTSTANDING at 2/28/19 (Unaudited)cont. | ||||||
| Upfront | ||||||
| premium | Termina- | Payments | Total return | Unrealized | ||
| Swap counterparty/ | received | tion | received (paid) | received by | appreciation/ | |
| Notional amount | Value | (paid) | date | by fund | or paid by fund | (depreciation) |
| Morgan Stanley & Co. International PLCcont. | ||||||
| $98,737 | $99,136 | $— | 1/29/20 | (Federal Funds | Alphabet Inc — | $385 |
| Effective Rate US | Monthly | |||||
| plus 0.25%) — | ||||||
| Monthly | ||||||
| 49,249 | 48,388 | — | 1/27/20 | (Federal Funds | Amada Holdings Co | (871) |
| Effective Rate US | Ltd — Monthly | |||||
| plus 0.25%) — | ||||||
| Monthly | ||||||
| 129,276 | 129,547 | — | 1/29/20 | (Federal Funds | Amazon.Com Inc — | 252 |
| Effective Rate US | Monthly | |||||
| plus 0.25%) — | ||||||
| Monthly | ||||||
| 44,594 | 44,928 | — | 1/29/20 | (Federal Funds | American Express | 327 |
| Effective Rate US | Co — Monthly | |||||
| plus 0.25%) — | ||||||
| Monthly | ||||||
| 54,890 | 54,460 | — | 1/29/20 | (Federal Funds | American National | (437) |
| Effective Rate US | Insurance Co — | |||||
| plus 0.25%) — | Monthly | |||||
| Monthly | ||||||
| 128,904 | 129,524 | — | 1/29/20 | (Federal Funds | Ameriprise Financial | 601 |
| Effective Rate US | Inc — Monthly | |||||
| plus 0.25%) — | ||||||
| Monthly | ||||||
| 64,016 | 64,380 | — | 1/29/20 | (Federal Funds | Ametek Inc — | 354 |
| Effective Rate US | Monthly | |||||
| plus 0.25%) — | ||||||
| Monthly | ||||||
| 20,918 | 20,556 | — | 1/28/20 | (Federal Funds | Ammb Holdings | (368) |
| Effective Rate US | Bhd — Monthly | |||||
| plus 0.75%) — | ||||||
| Monthly | ||||||
| 11,212 | 11,720 | — | 1/29/20 | (Federal Funds | Anta Sports | 507 |
| Effective Rate US | Products Ltd — | |||||
| plus 0.25%) — | Monthly | |||||
| Monthly | ||||||
| 45,391 | 43,004 | — | 1/29/20 | (Federal Funds | Anthem Inc — | (2,393) |
| Effective Rate US | Monthly | |||||
| plus 0.25%) — | ||||||
| Monthly | ||||||
| 10,948 | 11,621 | — | 1/29/20 | (Federal Funds | Arcosa Inc — | 672 |
| Effective Rate US | Monthly | |||||
| plus 0.25%) — | ||||||
| Monthly | ||||||
| 33,030 | 32,905 | — | 1/29/20 | (Federal Funds | Arkema — Monthly | (130) |
| Effective Rate US | ||||||
| plus 0.25%) — | ||||||
| Monthly | ||||||
| PanAgora Market Neutral Fund 19 |
| OTC TOTAL RETURN SWAP CONTRACTS OUTSTANDING at 2/28/19 (Unaudited)cont. | ||||||
| Upfront | ||||||
| premium | Termina- | Payments | Total return | Unrealized | ||
| Swap counterparty/ | received | tion | received (paid) | received by | appreciation/ | |
| Notional amount | Value | (paid) | date | by fund | or paid by fund | (depreciation) |
| Morgan Stanley & Co. International PLCcont. | ||||||
| $34,142 | $33,509 | $— | 1/27/20 | (Federal Funds | Asahi Group | $(640) |
| Effective Rate US | Holdings Ltd — | |||||
| plus 0.25%) — | Monthly | |||||
| Monthly | ||||||
| 49,548 | 49,021 | — | 1/29/20 | (Federal Funds | Ashtead Group | (534) |
| Effective Rate US | Plc — Monthly | |||||
| plus 0.25%) — | ||||||
| Monthly | ||||||
| 32,268 | 32,837 | — | 1/29/20 | (Federal Funds | Asm Pacific | 565 |
| Effective Rate US | Technology Ltd — | |||||
| plus 0.25%) — | Monthly | |||||
| Monthly | ||||||
| 44,047 | 45,625 | — | 1/29/20 | (Federal Funds | Assurant Inc — | 1,574 |
| Effective Rate US | Monthly | |||||
| plus 0.25%) — | ||||||
| Monthly | ||||||
| 18,064 | 16,824 | — | 1/27/20 | (Federal Funds | Astra International | (1,245) |
| Effective Rate US | Tbk Pt — Monthly | |||||
| plus 0.75%) — | ||||||
| Monthly | ||||||
| 65,119 | 64,163 | — | 1/29/20 | (Federal Funds | Astrazeneca Plc — | 492 |
| Effective Rate US | Monthly | |||||
| plus 0.25%) — | ||||||
| Monthly | ||||||
| 80,998 | 82,222 | — | 1/29/20 | (Federal Funds | Atlassian Corp Plc — | 1,212 |
| Effective Rate US | Monthly | |||||
| plus 0.25%) — | ||||||
| Monthly | ||||||
| 26,807 | 26,590 | — | 1/29/20 | (Federal Funds | Avista Corp — | (221) |
| Effective Rate US | Monthly | |||||
| plus 0.25%) — | ||||||
| Monthly | ||||||
| 57,784 | 57,926 | — | 1/29/20 | (Federal Funds | Axis Capital | 134 |
| Effective Rate US | Holdings Ltd — | |||||
| plus 0.25%) — | Monthly | |||||
| Monthly | ||||||
| 18,628 | 18,692 | — | 1/29/20 | (Federal Funds | Baidu Inc Adr — | 62 |
| Effective Rate US | Monthly | |||||
| plus 0.25%) — | ||||||
| Monthly | ||||||
| 21,853 | 22,765 | — | 1/27/20 | (Federal Funds | Banco Btg Pactual | 906 |
| Effective Rate US | Sa — Monthly | |||||
| plus 0.65%) — | ||||||
| Monthly | ||||||
| 30,162 | 29,996 | — | 1/29/20 | (Federal Funds | Bank Leumi Le- | (170) |
| Effective Rate US | Israel Bm — Monthly | |||||
| plus 0.70%) — | ||||||
| Monthly | ||||||
| 20 PanAgora Market Neutral Fund | |
| OTC TOTAL RETURN SWAP CONTRACTS OUTSTANDING at 2/28/19 (Unaudited)cont. | ||||||
| Upfront | ||||||
| premium | Termina- | Payments | Total return | Unrealized | ||
| Swap counterparty/ | received | tion | received (paid) | received by | appreciation/ | |
| Notional amount | Value | (paid) | date | by fund | or paid by fund | (depreciation) |
| Morgan Stanley & Co. International PLCcont. | ||||||
| $16,996 | $16,790 | $— | 1/29/20 | (Federal Funds | Bank Of | $(208) |
| Effective Rate US | Communications Co | |||||
| plus 0.25%) — | Ltd — Monthly | |||||
| Monthly | ||||||
| 52,520 | 53,644 | — | 1/29/20 | (Federal Funds | Barratt | 1,116 |
| Effective Rate US | Developments Plc — | |||||
| plus 0.25%) — | Monthly | |||||
| Monthly | ||||||
| 22,994 | 22,800 | — | 1/29/20 | (Federal Funds | Bemis Co Inc — | (197) |
| Effective Rate US | Monthly | |||||
| plus 0.25%) — | ||||||
| Monthly | ||||||
| 52,611 | 51,630 | — | 1/27/20 | (Federal Funds | Benesse Holdings | (992) |
| Effective Rate US | Inc — Monthly | |||||
| plus 0.25%) — | ||||||
| Monthly | ||||||
| 20,736 | 20,036 | — | 1/27/20 | (Federal Funds | Bid Corp Ltd — | (706) |
| Effective Rate US | Monthly | |||||
| plus 0.60%) — | ||||||
| Monthly | ||||||
| 23,593 | 23,168 | — | 1/29/20 | (Federal Funds | Bim Birlesik | (429) |
| Effective Rate US | Magazalar As — | |||||
| plus 0.70%) — | Monthly | |||||
| Monthly | ||||||
| 47,194 | 47,115 | — | 1/29/20 | (Federal Funds | Bluescope Steel | (87) |
| Effective Rate US | Ltd — Monthly | |||||
| plus 0.25%) — | ||||||
| Monthly | ||||||
| 80,233 | 82,712 | — | 1/29/20 | (Federal Funds | Boeing Co/The — | 2,468 |
| Effective Rate US | Monthly | |||||
| plus 0.25%) — | ||||||
| Monthly | ||||||
| 154,841 | 150,866 | — | 1/29/20 | (Federal Funds | Borgwarner Inc — | (3,366) |
| Effective Rate US | Monthly | |||||
| plus 0.25%) — | ||||||
| Monthly | ||||||
| 13,922 | 13,406 | — | 1/29/20 | (Federal Funds | Braskem Sa Adr — | (518) |
| Effective Rate US | Monthly | |||||
| plus 0.25%) — | ||||||
| Monthly | ||||||
| 42,644 | 43,726 | — | 1/29/20 | (Federal Funds | British Land Co Plc/ | 1,076 |
| Effective Rate US | The — Monthly | |||||
| plus 0.25%) — | ||||||
| Monthly | ||||||
| 83,993 | 85,858 | — | 1/29/20 | (Federal Funds | Bruker Corp — | 1,853 |
| Effective Rate US | Monthly | |||||
| plus 0.25%) — | ||||||
| Monthly | ||||||
| PanAgora Market Neutral Fund 21 |
| OTC TOTAL RETURN SWAP CONTRACTS OUTSTANDING at 2/28/19 (Unaudited)cont. | ||||||
| Upfront | ||||||
| premium | Termina- | Payments | Total return | Unrealized | ||
| Swap counterparty/ | received | tion | received (paid) | received by | appreciation/ | |
| Notional amount | Value | (paid) | date | by fund | or paid by fund | (depreciation) |
| Morgan Stanley & Co. International PLCcont. | ||||||
| $195,540 | $195,165 | $— | 1/29/20 | (Federal Funds | Cadence Design | $(404) |
| Effective Rate US | Systems Inc — | |||||
| plus 0.25%) — | Monthly | |||||
| Monthly | ||||||
| 92,145 | 95,198 | — | 1/29/20 | (Federal Funds | Capital One | 3,039 |
| Effective Rate US | Financial Corp — | |||||
| plus 0.25%) — | Monthly | |||||
| Monthly | ||||||
| 42,828 | 42,818 | — | 1/29/20 | (Federal Funds | Capri Holdings | (16) |
| Effective Rate US | Ltd — Monthly | |||||
| plus 0.25%) — | ||||||
| Monthly | ||||||
| 39,191 | 38,525 | — | 1/29/20 | (Federal Funds | Carnival Plc — | (672) |
| Effective Rate US | Monthly | |||||
| plus 0.25%) — | ||||||
| Monthly | ||||||
| 44,541 | 44,336 | — | 1/29/20 | (Federal Funds | Cbre Group Inc — | (211) |
| Effective Rate US | Monthly | |||||
| plus 0.25%) — | ||||||
| Monthly | ||||||
| 107,560 | 106,002 | — | 1/29/20 | (Federal Funds | Cdw Corp/De — | (1,574) |
| Effective Rate US | Monthly | |||||
| plus 0.25%) — | ||||||
| Monthly | ||||||
| 44,586 | 41,311 | — | 1/29/20 | (Federal Funds | Celgene Corp — | (3,282) |
| Effective Rate US | Monthly | |||||
| plus 0.25%) — | ||||||
| Monthly | ||||||
| 45,337 | 45,201 | — | 1/29/20 | (Federal Funds | Chevron Corp — | (143) |
| Effective Rate US | Monthly | |||||
| plus 0.25%) — | ||||||
| Monthly | ||||||
| 25,871 | 26,133 | — | 1/29/20 | (Federal Funds | China | 259 |
| Effective Rate US | Communications | |||||
| plus 0.25%) — | Services Corp Ltd — | |||||
| Monthly | Monthly | |||||
| 17,536 | 17,493 | — | 1/30/20 | (Federal Funds | China Development | (47) |
| Effective Rate US | Financial Holding | |||||
| plus 0.35%) — | Company — | |||||
| Monthly | Monthly | |||||
| 11,634 | 11,458 | — | 1/29/20 | (Federal Funds | China Hongqiao | (177) |
| Effective Rate US | Group Ltd — | |||||
| plus 0.25%) — | Monthly | |||||
| Monthly | ||||||
| 17,258 | 17,297 | — | 1/30/20 | (Federal Funds | China Life Insurance | 35 |
| Effective Rate US | Co Ltd/Taiwan — | |||||
| plus 0.35%) — | Monthly | |||||
| Monthly | ||||||
| 22 PanAgora Market Neutral Fund | |
| OTC TOTAL RETURN SWAP CONTRACTS OUTSTANDING at 2/28/19 (Unaudited)cont. | ||||||
| Upfront | ||||||
| premium | Termina- | Payments | Total return | Unrealized | ||
| Swap counterparty/ | received | tion | received (paid) | received by | appreciation/ | |
| Notional amount | Value | (paid) | date | by fund | or paid by fund | (depreciation) |
| Morgan Stanley & Co. International PLCcont. | ||||||
| $17,826 | $17,516 | $— | 1/29/20 | (Federal Funds | China National | $(313) |
| Effective Rate US | Building Material Co | |||||
| plus 0.25%) — | Ltd — Monthly | |||||
| Monthly | ||||||
| 28,360 | 27,751 | — | 1/29/20 | (Federal Funds | China Railway Group | (613) |
| Effective Rate US | Ltd — Monthly | |||||
| plus 0.25%) — | ||||||
| Monthly | ||||||
| 22,309 | 22,097 | — | 1/29/20 | (Federal Funds | China Resources | (216) |
| Effective Rate US | Pharmaceutical | |||||
| plus 0.25%) — | Group Ltd — | |||||
| Monthly | Monthly | |||||
| 11,451 | 11,374 | — | 1/29/20 | (Federal Funds | China Resources | (79) |
| Effective Rate US | Power Holdings Co | |||||
| plus 0.25%) — | Ltd — Monthly | |||||
| Monthly | ||||||
| 136,005 | 136,095 | — | 1/29/20 | (Federal Funds | Citrix Systems Inc — | 70 |
| Effective Rate US | Monthly | |||||
| plus 0.25%) — | ||||||
| Monthly | ||||||
| 42,404 | 42,500 | — | 1/29/20 | (Federal Funds | Civitas Solutions | 89 |
| Effective Rate US | Inc — Monthly | |||||
| plus 0.25%) — | ||||||
| Monthly | ||||||
| 31,857 | 31,931 | — | 1/29/20 | (Federal Funds | Ck Hutchison | 69 |
| Effective Rate US | Holdings Ltd — | |||||
| plus 0.25%) — | Monthly | |||||
| Monthly | ||||||
| 49,140 | 49,160 | — | 1/29/20 | (Federal Funds | Cnh Industrial Nv — | 13 |
| Effective Rate US | Monthly | |||||
| plus 0.25%) — | ||||||
| Monthly | ||||||
| 8,280 | 8,106 | — | 1/29/20 | (Federal Funds | Colbun Sa — | (176) |
| Effective Rate US | Monthly | |||||
| plus 1.25%) — | ||||||
| Monthly | ||||||
| 85,236 | 83,390 | — | 1/29/20 | (Federal Funds | Columbia | (1,860) |
| Effective Rate US | Sportswear Co — | |||||
| plus 0.25%) — | Monthly | |||||
| Monthly | ||||||
| 8,906 | 8,880 | — | 1/29/20 | (Federal Funds | Com2uS Corp — | (27) |
| Effective Rate US | Monthly | |||||
| plus 0.35%) — | ||||||
| Monthly | ||||||
| 150,111 | 151,397 | — | 1/29/20 | (Federal Funds | Comerica Inc — | 1,264 |
| Effective Rate US | Monthly | |||||
| plus 0.25%) — | ||||||
| Monthly | ||||||
| PanAgora Market Neutral Fund 23 |
| OTC TOTAL RETURN SWAP CONTRACTS OUTSTANDING at 2/28/19 (Unaudited)cont. | ||||||
| Upfront | ||||||
| premium | Termina- | Payments | Total return | Unrealized | ||
| Swap counterparty/ | received | tion | received (paid) | received by | appreciation/ | |
| Notional amount | Value | (paid) | date | by fund | or paid by fund | (depreciation) |
| Morgan Stanley & Co. International PLCcont. | ||||||
| $36,960 | $36,873 | $— | 1/29/20 | (Federal Funds | Compugroup | $(92) |
| Effective Rate US | Medical Se — | |||||
| plus 0.25%) — | Monthly | |||||
| Monthly | ||||||
| 55,368 | 54,969 | — | 1/29/20 | (Federal Funds | Computershare | (407) |
| Effective Rate US | Ltd — Monthly | |||||
| plus 0.25%) — | ||||||
| Monthly | ||||||
| 54,279 | 54,212 | — | 1/29/20 | (Federal Funds | Csx Corp — Monthly | 104 |
| Effective Rate US | ||||||
| plus 0.25%) — | ||||||
| Monthly | ||||||
| 178,607 | 177,204 | — | 1/29/20 | (Federal Funds | Cummins Inc — | (1,430) |
| Effective Rate US | Monthly | |||||
| plus 0.25%) — | ||||||
| Monthly | ||||||
| 89,845 | 88,923 | — | 1/29/20 | (Federal Funds | Cypress | (935) |
| Effective Rate US | Semiconductor | |||||
| plus 0.25%) — | Corp — Monthly | |||||
| Monthly | ||||||
| 19,814 | 19,766 | — | 1/29/20 | (Federal Funds | Dah Sing Financial | (51) |
| Effective Rate US | Holdings Ltd — | |||||
| plus 0.25%) — | Monthly | |||||
| Monthly | ||||||
| 61,718 | 59,205 | — | 1/27/20 | (Federal Funds | Daito Trust | (2,526) |
| Effective Rate US | Construction Co | |||||
| plus 0.25%) — | Ltd — Monthly | |||||
| Monthly | ||||||
| 55,757 | 56,279 | — | 1/29/20 | (Federal Funds | Darden Restaurants | 514 |
| Effective Rate US | Inc — Monthly | |||||
| plus 0.25%) — | ||||||
| Monthly | ||||||
| 48,944 | 52,244 | — | 1/29/20 | (Federal Funds | Dassault Aviation | 3,293 |
| Effective Rate US | Sa — Monthly | |||||
| plus 0.25%) — | ||||||
| Monthly | ||||||
| 61,098 | 60,118 | — | 1/29/20 | (Federal Funds | Dell Technologies | (989) |
| Effective Rate US | Inc — Monthly | |||||
| plus 0.25%) — | ||||||
| Monthly | ||||||
| 65,421 | 64,012 | — | 1/29/20 | (Federal Funds | Delphi Technologies | (1,419) |
| Effective Rate US | Plc — Monthly | |||||
| plus 0.25%) — | ||||||
| Monthly | ||||||
| 25,006 | 24,938 | — | 1/30/20 | (Federal Funds | Delta Electronics | (73) |
| Effective Rate US | Inc — Monthly | |||||
| plus 0.35%) — | ||||||
| Monthly | ||||||
| 24 PanAgora Market Neutral Fund | |
| OTC TOTAL RETURN SWAP CONTRACTS OUTSTANDING at 2/28/19 (Unaudited)cont. | ||||||
| Upfront | ||||||
| premium | Termina- | Payments | Total return | Unrealized | ||
| Swap counterparty/ | received | tion | received (paid) | received by | appreciation/ | |
| Notional amount | Value | (paid) | date | by fund | or paid by fund | (depreciation) |
| Morgan Stanley & Co. International PLCcont. | ||||||
| $55,237 | $54,577 | $— | 1/29/20 | (Federal Funds | Deutsche Wohnen | $(668) |
| Effective Rate US | Se — Monthly | |||||
| plus 0.25%) — | ||||||
| Monthly | ||||||
| 45,064 | 45,647 | — | 1/29/20 | (Federal Funds | Direct Line | 576 |
| Effective Rate US | Insurance Group | |||||
| plus 0.25%) — | Plc — Monthly | |||||
| Monthly | ||||||
| 7,830 | 7,318 | — | 1/27/20 | (Federal Funds | Dmci Holdings Inc — | (514) |
| Effective Rate US | Monthly | |||||
| plus 0.75%) — | ||||||
| Monthly | ||||||
| 50,830 | 50,479 | — | 1/29/20 | (Federal Funds | Dolby Laboratories | (358) |
| Effective Rate US | Inc — Monthly | |||||
| plus 0.25%) — | ||||||
| Monthly | ||||||
| 19,590 | 19,485 | — | 1/29/20 | (Federal Funds | Doosan Bobcat | (107) |
| Effective Rate US | Inc — Monthly | |||||
| plus 0.35%) — | ||||||
| Monthly | ||||||
| 45,610 | 45,265 | — | 1/29/20 | (Federal Funds | Dover Corp — | (112) |
| Effective Rate US | Monthly | |||||
| plus 0.25%) — | ||||||
| Monthly | ||||||
| 77,199 | 76,963 | — | 1/29/20 | (Federal Funds | E*Trade Financial | (247) |
| Effective Rate US | Corp — Monthly | |||||
| plus 0.25%) — | ||||||
| Monthly | ||||||
| 123,796 | 123,637 | — | 1/29/20 | (Federal Funds | East West Bancorp | (177) |
| Effective Rate US | Inc — Monthly | |||||
| plus 0.25%) — | ||||||
| Monthly | ||||||
| 50,022 | 45,781 | — | 1/29/20 | (Federal Funds | Easyjet Plc — | (2,062) |
| Effective Rate US | Monthly | |||||
| plus 0.25%) — | ||||||
| Monthly | ||||||
| 35,416 | 35,099 | — | 1/29/20 | (Federal Funds | Eaton Corp Plc — | (322) |
| Effective Rate US | Monthly | |||||
| plus 0.25%) — | ||||||
| Monthly | ||||||
| 7,626 | 7,489 | — | 1/29/20 | (Federal Funds | Ecopetrol Sa Adr — | (138) |
| Effective Rate US | Monthly | |||||
| plus 0.25%) — | ||||||
| Monthly | ||||||
| 97,361 | 95,551 | — | 1/29/20 | (Federal Funds | Edgewell Personal | (1,824) |
| Effective Rate US | Care Co — Monthly | |||||
| plus 0.25%) — | ||||||
| Monthly | ||||||
| PanAgora Market Neutral Fund 25 |
| OTC TOTAL RETURN SWAP CONTRACTS OUTSTANDING at 2/28/19 (Unaudited)cont. | ||||||
| Upfront | ||||||
| premium | Termina- | Payments | Total return | Unrealized | ||
| Swap counterparty/ | received | tion | received (paid) | received by | appreciation/ | |
| Notional amount | Value | (paid) | date | by fund | or paid by fund | (depreciation) |
| Morgan Stanley & Co. International PLCcont. | ||||||
| $8,765 | $8,729 | $— | 1/29/20 | (Federal Funds | Emaar Properties | $(38) |
| Effective Rate US | Pjsc — Monthly | |||||
| plus 1.20%) — | ||||||
| Monthly | ||||||
| 12,043 | 11,811 | — | 1/29/20 | (Federal Funds | Empresas Cmpc | (234) |
| Effective Rate US | Sa — Monthly | |||||
| plus 1.25%) — | ||||||
| Monthly | ||||||
| 154,743 | 151,410 | — | 1/29/20 | (Federal Funds | Encompass Health | (3,356) |
| Effective Rate US | Corp — Monthly | |||||
| plus 0.25%) — | ||||||
| Monthly | ||||||
| 19,893 | 16,856 | — | 1/29/20 | (Federal Funds | Enel Americas Sa | (3,039) |
| Effective Rate US | Adr — Monthly | |||||
| plus 0.25%) — | ||||||
| Monthly | ||||||
| 50,843 | 51,006 | — | 1/29/20 | (Federal Funds | Estee Lauder Cos | 295 |
| Effective Rate US | Inc/The — Monthly | |||||
| plus 0.25%) — | ||||||
| Monthly | ||||||
| 22,810 | 22,767 | — | 1/29/20 | (Federal Funds | Esterline | (46) |
| Effective Rate US | Technologies | |||||
| plus 0.25%) — | Corp — Monthly | |||||
| Monthly | ||||||
| 108,471 | 106,744 | — | 1/29/20 | (Federal Funds | Evercore Inc — | (1,743) |
| Effective Rate US | Monthly | |||||
| plus 0.25%) — | ||||||
| Monthly | ||||||
| 106,397 | 108,236 | — | 1/29/20 | (Federal Funds | Extended Stay | 1,824 |
| Effective Rate US | America Inc — | |||||
| plus 0.25%) — | Monthly | |||||
| Monthly | ||||||
| 46,488 | 46,707 | — | 1/29/20 | (Federal Funds | Exxon Mobil Corp — | 212 |
| Effective Rate US | Monthly | |||||
| plus 0.25%) — | ||||||
| Monthly | ||||||
| 4,348 | 4,206 | — | 1/26/20 | (Federal Funds | Ezdan Holding | (143) |
| Effective Rate US | Group Qsc — | |||||
| plus 1.20%) — | Monthly | |||||
| Monthly | ||||||
| 40,427 | 40,307 | — | 1/29/20 | (Federal Funds | Faurecia Sa — | (126) |
| Effective Rate US | Monthly | |||||
| plus 0.25%) — | ||||||
| Monthly | ||||||
| 115,799 | 116,305 | — | 1/29/20 | (Federal Funds | Fifth Third | 488 |
| Effective Rate US | Bancorp — Monthly | |||||
| plus 0.25%) — | ||||||
| Monthly | ||||||
| 26 PanAgora Market Neutral Fund | |
| OTC TOTAL RETURN SWAP CONTRACTS OUTSTANDING at 2/28/19 (Unaudited)cont. | ||||||
| Upfront | ||||||
| premium | Termina- | Payments | Total return | Unrealized | ||
| Swap counterparty/ | received | tion | received (paid) | received by | appreciation/ | |
| Notional amount | Value | (paid) | date | by fund | or paid by fund | (depreciation) |
| Morgan Stanley & Co. International PLCcont. | ||||||
| $87,247 | $87,282 | $— | 1/29/20 | (Federal Funds | Finisar Corp — | $(539) |
| Effective Rate US | Monthly | |||||
| plus 0.25%) — | ||||||
| Monthly | ||||||
| 137,409 | 137,959 | — | 1/29/20 | (Federal Funds | First Citizens | 530 |
| Effective Rate US | Bancshares Inc/ | |||||
| plus 0.25%) — | Nc — Monthly | |||||
| Monthly | ||||||
| 96,088 | 95,859 | — | 1/29/20 | (Federal Funds | First Data Corp — | (243) |
| Effective Rate US | Monthly | |||||
| plus 0.25%) — | ||||||
| Monthly | ||||||
| 126,143 | 127,467 | — | 1/29/20 | (Federal Funds | First Hawaiian Inc — | 1,306 |
| Effective Rate US | Monthly | |||||
| plus 0.25%) — | ||||||
| Monthly | ||||||
| 20,477 | 20,392 | — | 1/29/20 | (Federal Funds | Fomento | (89) |
| Effective Rate US | Economico | |||||
| plus 0.25%) — | Mexicano Sab De Cv | |||||
| Monthly | Adr — Monthly | |||||
| 29,044 | 26,515 | — | 1/29/20 | (Federal Funds | Fonterra Co- | (2,537) |
| Effective Rate US | Operative Group | |||||
| plus 0.25%) — | Ltd — Monthly | |||||
| Monthly | ||||||
| 43,899 | 44,461 | — | 1/29/20 | (Federal Funds | Foot Locker Inc — | 563 |
| Effective Rate US | Monthly | |||||
| plus 0.25%) — | ||||||
| Monthly | ||||||
| 25,033 | 23,681 | — | 1/29/20 | (Federal Funds | Ford Otomotiv | (1,357) |
| Effective Rate US | Sanayi As — Monthly | |||||
| plus 0.70%) — | ||||||
| Monthly | ||||||
| 13,899 | 13,712 | — | 1/30/20 | (Federal Funds | Formosa Chemicals | (191) |
| Effective Rate US | & Fibre Corp — | |||||
| plus 0.35%) — | Monthly | |||||
| Monthly | ||||||
| 10,226 | 11,616 | — | 1/29/20 | (Federal Funds | Frontdoor Inc — | 1,389 |
| Effective Rate US | Monthly | |||||
| plus 0.25%) — | ||||||
| Monthly | ||||||
| 13,446 | 13,594 | — | 1/29/20 | (Federal Funds | Fuchs Petrolub Se — | 146 |
| Effective Rate US | Monthly | |||||
| plus 0.25%) — | ||||||
| Monthly | ||||||
| 38,980 | 38,266 | — | 1/27/20 | (Federal Funds | Fukuoka Financial | (722) |
| Effective Rate US | Group Inc — Monthly | |||||
| plus 0.25%) — | ||||||
| Monthly | ||||||
| PanAgora Market Neutral Fund 27 |
| OTC TOTAL RETURN SWAP CONTRACTS OUTSTANDING at 2/28/19 (Unaudited)cont. | ||||||
| Upfront | ||||||
| premium | Termina- | Payments | Total return | Unrealized | ||
| Swap counterparty/ | received | tion | received (paid) | received by | appreciation/ | |
| Notional amount | Value | (paid) | date | by fund | or paid by fund | (depreciation) |
| Morgan Stanley & Co. International PLCcont. | ||||||
| $24,994 | $24,299 | $— | 1/29/20 | (Federal Funds | Fuyao | $(699) |
| Effective Rate US | Glass Industry | |||||
| plus 0.25%) — | Group Co Ltd — | |||||
| Monthly | Monthly | |||||
| 159,460 | 160,239 | — | 1/29/20 | (Federal Funds | Gallagher (Arthur J.) | 1,613 |
| Effective Rate US | & Co. — Monthly | |||||
| plus 0.25%) — | ||||||
| Monthly | ||||||
| 196,777 | 198,180 | — | 1/29/20 | (Federal Funds | Gardner Denver | 1,373 |
| Effective Rate US | Holdings Inc — | |||||
| plus 0.25%) — | Monthly | |||||
| Monthly | ||||||
| 53,285 | 53,489 | — | 1/29/20 | (Federal Funds | Garmin Ltd — | 196 |
| Effective Rate US | Monthly | |||||
| plus 0.25%) — | ||||||
| Monthly | ||||||
| 24,114 | 23,871 | — | 1/29/20 | (Federal Funds | Garrett Motion Inc — | (246) |
| Effective Rate US | Monthly | |||||
| plus 0.25%) — | ||||||
| Monthly | ||||||
| 18,290 | 18,290 | — | 1/29/20 | (Federal Funds | Gates Industrial | (4) |
| Effective Rate US | Corp Plc — Monthly | |||||
| plus 0.25%) — | ||||||
| Monthly | ||||||
| 110,127 | 109,689 | — | 1/29/20 | (Federal Funds | Gilead Sciences | (455) |
| Effective Rate US | Inc — Monthly | |||||
| plus 0.25%) — | ||||||
| Monthly | ||||||
| 11,223 | 11,340 | — | 1/29/20 | (Federal Funds | Grupo Aval Acciones | 155 |
| Effective Rate US | Y Valores Sa — | |||||
| plus 0.25%) — | Monthly | |||||
| Monthly | ||||||
| 16,932 | 16,868 | — | 1/29/20 | (Federal Funds | Grupo Financiero | (68) |
| Effective Rate US | Banorte Sab De | |||||
| plus 0.90%) — | Cv — Monthly | |||||
| Monthly | ||||||
| 16,937 | 17,067 | — | 1/29/20 | (Federal Funds | Gs Retail Co Ltd — | 128 |
| Effective Rate US | Monthly | |||||
| plus 0.35%) — | ||||||
| Monthly | ||||||
| 7,963 | 7,758 | — | 1/29/20 | (Federal Funds | Guangzhou | (206) |
| Effective Rate US | Baiyunshan | |||||
| plus 0.25%) — | Pharmaceutical | |||||
| Monthly | Holdings Co Ltd — | |||||
| Monthly | ||||||
| 17,657 | 18,212 | — | 1/27/20 | (Federal Funds | Gudang Garam Tbk | 551 |
| Effective Rate US | Pt — Monthly | |||||
| plus 0.75%) — | ||||||
| Monthly | ||||||
| 28 PanAgora Market Neutral Fund |
| OTC TOTAL RETURN SWAP CONTRACTS OUTSTANDING at 2/28/19 (Unaudited)cont. | ||||||
| Upfront | ||||||
| premium | Termina- | Payments | Total return | Unrealized | ||
| Swap counterparty/ | received | tion | received (paid) | received by | appreciation/ | |
| Notional amount | Value | (paid) | date | by fund | or paid by fund | (depreciation) |
| Morgan Stanley & Co. International PLCcont. | ||||||
| $117,085 | $117,921 | $— | 1/29/20 | (Federal Funds | Hartford Financial | $819 |
| Effective Rate US | Services Group Inc/ | |||||
| plus 0.25%) — | The — Monthly | |||||
| Monthly | ||||||
| 94,526 | 93,461 | — | 1/29/20 | (Federal Funds | Hd Supply Holdings | (1,079) |
| Effective Rate US | Inc — Monthly | |||||
| plus 0.25%) — | ||||||
| Monthly | ||||||
| 7,786 | 7,733 | — | 1/30/20 | (Federal Funds | Highwealth | (54) |
| Effective Rate US | Construction | |||||
| plus 0.35%) — | Corp — Monthly | |||||
| Monthly | ||||||
| 47,374 | 44,935 | — | 1/27/20 | (Federal Funds | Hitachi | (2,450) |
| Effective Rate US | Construction | |||||
| plus 0.25%) — | Machinery Co Ltd — | |||||
| Monthly | Monthly | |||||
| 38,960 | 38,890 | — | 1/29/20 | (Federal Funds | Hochtief Ag — | (75) |
| Effective Rate US | Monthly | |||||
| plus 0.25%) — | ||||||
| Monthly | ||||||
| 11,148 | 10,831 | — | 1/27/20 | (Federal Funds | Home Product | (319) |
| Effective Rate US | Center Pcl Nvdr — | |||||
| plus 0.75%) — | Monthly | |||||
| Monthly | ||||||
| 175,931 | 176,102 | — | 1/29/20 | (Federal Funds | Honeywell | 146 |
| Effective Rate US | International Inc — | |||||
| plus 0.25%) — | Monthly | |||||
| Monthly | ||||||
| 21,426 | 21,301 | — | 1/28/20 | (Federal Funds | Hong Leong | (130) |
| Effective Rate US | Financial Group | |||||
| plus 0.75%) — | Bhd — Monthly | |||||
| Monthly | ||||||
| 9,222 | 8,465 | — | 1/29/20 | (Federal Funds | Hua Hong | (758) |
| Effective Rate US | Semiconductor | |||||
| plus 0.25%) — | Ltd — Monthly | |||||
| Monthly | ||||||
| 14,435 | 14,373 | — | 1/29/20 | (Federal Funds | Hyundai | (64) |
| Effective Rate US | Department Store | |||||
| plus 0.35%) — | Co Ltd — Monthly | |||||
| Monthly | ||||||
| 18,292 | 18,296 | — | 1/29/20 | (Federal Funds | Hyundai Heavy | 1 |
| Effective Rate US | Industries Holdings | |||||
| plus 0.35%) — | Co Ltd — Monthly | |||||
| Monthly | ||||||
| 21,057 | 20,917 | — | 1/29/20 | (Federal Funds | Hyundai Marine & | (143) |
| Effective Rate US | Fire Insurance Co | |||||
| plus 0.35%) — | Ltd — Monthly | |||||
| Monthly | ||||||
| PanAgora Market Neutral Fund 29 |
| OTC TOTAL RETURN SWAP CONTRACTS OUTSTANDING at 2/28/19 (Unaudited)cont. | ||||||
| Upfront | ||||||
| premium | Termina- | Payments | Total return | Unrealized | ||
| Swap counterparty/ | received | tion | received (paid) | received by | appreciation/ | |
| Notional amount | Value | (paid) | date | by fund | or paid by fund | (depreciation) |
| Morgan Stanley & Co. International PLCcont. | ||||||
| $56,648 | $56,998 | $— | 1/29/20 | (Federal Funds | Incyte Corp — | $342 |
| Effective Rate US | Monthly | |||||
| plus 0.25%) — | ||||||
| Monthly | ||||||
| 12,588 | 12,722 | — | 1/27/20 | (Federal Funds | Indorama Ventures | 131 |
| Effective Rate US | Pcl Nvdr — Monthly | |||||
| plus 0.75%) — | ||||||
| Monthly | ||||||
| 88,578 | 88,396 | — | 1/29/20 | (Federal Funds | Integrated Device | (196) |
| Effective Rate US | Technology Inc — | |||||
| plus 0.25%) — | Monthly | |||||
| Monthly | ||||||
| 10,554 | 10,516 | — | 1/29/20 | (Federal Funds | Inter Rao Ues Pjsc — | (40) |
| Effective Rate US | Monthly | |||||
| plus 1.20%) — | ||||||
| Monthly | ||||||
| 715 | 717 | — | 3/06/20 | (Federal Funds | Interconexion | 2 |
| Effective Rate US | Electrica Sa Esp — | |||||
| plus 1.15%) — | Monthly | |||||
| Monthly | ||||||
| 12,263 | 12,295 | — | 1/30/20 | (Federal Funds | Inventec Corp — | 30 |
| Effective Rate US | Monthly | |||||
| plus 0.35%) — | ||||||
| Monthly | ||||||
| 51,277 | 54,833 | — | 1/29/20 | (Federal Funds | Ipsen Sa — Monthly | 3,548 |
| Effective Rate US | ||||||
| plus 0.25%) — | ||||||
| Monthly | ||||||
| 30,261 | 29,586 | — | 1/29/20 | (Federal Funds | Israel Discount Bank | (680) |
| Effective Rate US | Ltd — Monthly | |||||
| plus 0.70%) — | ||||||
| Monthly | ||||||
| 58,883 | 58,049 | — | 1/29/20 | (Federal Funds | Itt Inc — Monthly | (843) |
| Effective Rate US | ||||||
| plus 0.25%) — | ||||||
| Monthly | ||||||
| 67,964 | 61,686 | — | 1/28/20 | (Federal Funds | Jardine Cycle & | (6,294) |
| Effective Rate US | Carriage Ltd — | |||||
| plus 0.55%) — | Monthly | |||||
| Monthly | ||||||
| 29,909 | 28,620 | — | 1/27/20 | (Federal Funds | Jbs Sa — Monthly | (1,297) |
| Effective Rate US | ||||||
| plus 0.65%) — | ||||||
| Monthly | ||||||
| 49,696 | 48,893 | — | 1/27/20 | (Federal Funds | Jtekt Corp — | (814) |
| Effective Rate US | Monthly | |||||
| plus 0.25%) — | ||||||
| Monthly | ||||||
| 30 PanAgora Market Neutral Fund | |
| OTC TOTAL RETURN SWAP CONTRACTS OUTSTANDING at 2/28/19 (Unaudited)cont. | ||||||
| Upfront | ||||||
| premium | Termina- | Payments | Total return | Unrealized | ||
| Swap counterparty/ | received | tion | received (paid) | received by | appreciation/ | |
| Notional amount | Value | (paid) | date | by fund | or paid by fund | (depreciation) |
| Morgan Stanley & Co. International PLCcont. | ||||||
| $23,353 | $23,185 | $— | 1/29/20 | (Federal Funds | Kaisa Group | $(171) |
| Effective Rate US | Holdings Ltd — | |||||
| plus 0.25%) — | Monthly | |||||
| Monthly | ||||||
| 64,374 | 64,919 | — | 1/27/20 | (Federal Funds | Kamigumi Co Ltd — | 530 |
| Effective Rate US | Monthly | |||||
| plus 0.25%) — | ||||||
| Monthly | ||||||
| 41,643 | 41,530 | — | 1/29/20 | (Federal Funds | Keysight | (119) |
| Effective Rate US | Technologies Inc — | |||||
| plus 0.25%) — | Monthly | |||||
| Monthly | ||||||
| 92,449 | 91,712 | — | 1/29/20 | (Federal Funds | Kimberly-Clark | (752) |
| Effective Rate US | Corp — Monthly | |||||
| plus 0.25%) — | ||||||
| Monthly | ||||||
| 162,916 | 162,032 | — | 1/29/20 | (Federal Funds | Kla-Tencor Corp — | (910) |
| Effective Rate US | Monthly | |||||
| plus 0.25%) — | ||||||
| Monthly | ||||||
| 97,184 | 96,386 | — | 1/29/20 | (Federal Funds | Koninklijke Ahold | (812) |
| Effective Rate US | Delhaize Nv — | |||||
| plus 0.25%) — | Monthly | |||||
| Monthly | ||||||
| 9,733 | 9,221 | — | 1/29/20 | (Federal Funds | Korea Gas Corp — | (513) |
| Effective Rate US | Monthly | |||||
| plus 0.35%) — | ||||||
| Monthly | ||||||
| 11,278 | 11,183 | — | 1/29/20 | (Federal Funds | Korea Investment | (97) |
| Effective Rate US | Holdings Co Ltd — | |||||
| plus 0.35%) — | Monthly | |||||
| Monthly | ||||||
| 19,195 | 18,549 | — | 1/29/20 | (Federal Funds | Kumho | (648) |
| Effective Rate US | Petrochemical Co | |||||
| plus 0.35%) — | Ltd — Monthly | |||||
| Monthly | ||||||
| 33,883 | 33,099 | — | 1/27/20 | (Federal Funds | Kyocera Corp — | (791) |
| Effective Rate US | Monthly | |||||
| plus 0.25%) — | ||||||
| Monthly | ||||||
| 26,628 | 25,330 | — | 1/29/20 | (Federal Funds | L Brands Inc — | (1,302) |
| Effective Rate US | Monthly | |||||
| plus 0.25%) — | ||||||
| Monthly | ||||||
| 48,488 | 49,126 | — | 1/29/20 | (Federal Funds | L3 Technologies | 828 |
| Effective Rate US | Inc — Monthly | |||||
| plus 0.25%) — | ||||||
| Monthly | ||||||
| PanAgora Market Neutral Fund 31 |
| OTC TOTAL RETURN SWAP CONTRACTS OUTSTANDING at 2/28/19 (Unaudited)cont. | ||||||
| Upfront | ||||||
| premium | Termina- | Payments | Total return | Unrealized | ||
| Swap counterparty/ | received | tion | received (paid) | received by | appreciation/ | |
| Notional amount | Value | (paid) | date | by fund | or paid by fund | (depreciation) |
| Morgan Stanley & Co. International PLCcont. | ||||||
| $86,250 | $86,638 | $— | 1/29/20 | (Federal Funds | Lamb Weston | $376 |
| Effective Rate US | Holdings Inc — | |||||
| plus 0.25%) — | Monthly | |||||
| Monthly | ||||||
| 32,558 | 31,470 | — | 1/29/20 | (Federal Funds | Lanxess Ag — | (1,092) |
| Effective Rate US | Monthly | |||||
| plus 0.25%) — | ||||||
| Monthly | ||||||
| 107,724 | 104,500 | — | 1/29/20 | (Federal Funds | Lennar Corp — | (3,239) |
| Effective Rate US | Monthly | |||||
| plus 0.25%) — | ||||||
| Monthly | ||||||
| 8,939 | 8,863 | — | 1/29/20 | (Federal Funds | Lg Household & | (77) |
| Effective Rate US | Health Care Ltd — | |||||
| plus 0.35%) — | Monthly | |||||
| Monthly | ||||||
| 11,497 | 11,394 | — | 1/29/20 | (Federal Funds | Logan Property | (105) |
| Effective Rate US | Holdings Co Ltd — | |||||
| plus 0.25%) — | Monthly | |||||
| Monthly | ||||||
| 25,774 | 25,230 | — | 1/29/20 | (Federal Funds | Longfor Group | (548) |
| Effective Rate US | Holdings Ltd — | |||||
| plus 0.25%) — | Monthly | |||||
| Monthly | ||||||
| 50,309 | 50,338 | — | 1/29/20 | (Federal Funds | Lowe’S Cos Inc — | 21 |
| Effective Rate US | Monthly | |||||
| plus 0.25%) — | ||||||
| Monthly | ||||||
| 121,204 | 118,394 | — | 1/29/20 | (Federal Funds | Lpl Financial | (2,828) |
| Effective Rate US | Holdings Inc — | |||||
| plus 0.25%) — | Monthly | |||||
| Monthly | ||||||
| 19,372 | 19,365 | — | 1/29/20 | (Federal Funds | Ls Corp — Monthly | (10) |
| Effective Rate US | ||||||
| plus 0.35%) — | ||||||
| Monthly | ||||||
| 8,753 | 8,529 | — | 1/29/20 | (Federal Funds | Ls Industrial | (225) |
| Effective Rate US | Systems Co Ltd — | |||||
| plus 0.35%) — | Monthly | |||||
| Monthly | ||||||
| 53,899 | 48,873 | — | 1/29/20 | (Federal Funds | Lsc | (5,035) |
| Effective Rate US | Communications | |||||
| plus 0.25%) — | Inc — Monthly | |||||
| Monthly | ||||||
| 43,106 | 43,076 | — | 1/29/20 | (Federal Funds | Luxoft Holding Inc — | (36) |
| Effective Rate US | Monthly | |||||
| plus 0.25%) — | ||||||
| Monthly | ||||||
| 32 PanAgora Market Neutral Fund | |
| OTC TOTAL RETURN SWAP CONTRACTS OUTSTANDING at 2/28/19 (Unaudited)cont. | ||||||
| Upfront | ||||||
| premium | Termina- | Payments | Total return | Unrealized | ||
| Swap counterparty/ | received | tion | received (paid) | received by | appreciation/ | |
| Notional amount | Value | (paid) | date | by fund | or paid by fund | (depreciation) |
| Morgan Stanley & Co. International PLCcont. | ||||||
| $9,963 | $9,529 | $— | 1/29/20 | (Federal Funds | Maanshan Iron | $(436) |
| Effective Rate US | & Steel Co Ltd — | |||||
| plus 0.25%) — | Monthly | |||||
| Monthly | ||||||
| 10,776 | 10,660 | — | 1/29/20 | (Federal Funds | Magnitogorsk Iron & | (118) |
| Effective Rate US | Steel Works Pjsc — | |||||
| plus 1.20%) — | Monthly | |||||
| Monthly | ||||||
| 18,511 | 17,881 | — | 1/28/20 | (Federal Funds | Malaysia Airports | (635) |
| Effective Rate US | Holdings Bhd — | |||||
| plus 0.75%) — | Monthly | |||||
| Monthly | ||||||
| 2,957 | 2,881 | — | 1/29/20 | (Federal Funds | Marriott | (68) |
| Effective Rate US | International Inc — | |||||
| plus 0.25%) — | Monthly | |||||
| Monthly | ||||||
| 180,992 | 181,614 | — | 1/29/20 | (Federal Funds | Mastercard Inc — | 596 |
| Effective Rate US | Monthly | |||||
| plus 0.25%) — | ||||||
| Monthly | ||||||
| 45,061 | 45,156 | — | 1/29/20 | (Federal Funds | Maxwell | 89 |
| Effective Rate US | Technologies Inc — | |||||
| plus 0.25%) — | Monthly | |||||
| Monthly | ||||||
| 41,862 | 42,321 | — | 1/29/20 | (Federal Funds | Mbt Financial | 453 |
| Effective Rate US | Corp — Monthly | |||||
| plus 0.25%) — | ||||||
| Monthly | ||||||
| 87,356 | 88,177 | — | 1/29/20 | (Federal Funds | Medibank Private | 809 |
| Effective Rate US | Ltd — Monthly | |||||
| plus 0.25%) — | ||||||
| Monthly | ||||||
| 19,241 | 19,904 | — | 1/29/20 | (Federal Funds | Medy-Tox Inc — | 660 |
| Effective Rate US | Monthly | |||||
| plus 0.35%) — | ||||||
| Monthly | ||||||
| 151,230 | 153,059 | — | 1/29/20 | (Federal Funds | Metlife Inc — | 1,807 |
| Effective Rate US | Monthly | |||||
| plus 0.25%) — | ||||||
| Monthly | ||||||
| 38,150 | 37,814 | — | 1/29/20 | (Federal Funds | Metso Oyj — | (341) |
| Effective Rate US | Monthly | |||||
| plus 0.25%) — | ||||||
| Monthly | ||||||
| 9,294 | 8,484 | — | 1/29/20 | (Federal Funds | Mexichem Sab De | (812) |
| Effective Rate US | Cv — Monthly | |||||
| plus 0.90%) — | ||||||
| Monthly | ||||||
| PanAgora Market Neutral Fund 33 |
| OTC TOTAL RETURN SWAP CONTRACTS OUTSTANDING at 2/28/19 (Unaudited)cont. | ||||||
| Upfront | ||||||
| premium | Termina- | Payments | Total return | Unrealized | ||
| Swap counterparty/ | received | tion | received (paid) | received by | appreciation/ | |
| Notional amount | Value | (paid) | date | by fund | or paid by fund | (depreciation) |
| Morgan Stanley & Co. International PLCcont. | ||||||
| $35,098 | $33,399 | $— | 1/29/20 | (Federal Funds | Micron Technology | $(1,705) |
| Effective Rate US | Inc — Monthly | |||||
| plus 0.25%) — | ||||||
| Monthly | ||||||
| 45,247 | 44,354 | — | 1/27/20 | (Federal Funds | Mitsubishi Motors | (903) |
| Effective Rate US | Corp — Monthly | |||||
| plus 0.25%) — | ||||||
| Monthly | ||||||
| 9,329 | 8,956 | — | 1/29/20 | (Federal Funds | Momo Inc Adr — | (374) |
| Effective Rate US | Monthly | |||||
| plus 0.25%) — | ||||||
| Monthly | ||||||
| 19,570 | 18,304 | — | 1/27/20 | (Federal Funds | Mondi Ltd — | (1,272) |
| Effective Rate US | Monthly | |||||
| plus 0.60%) — | ||||||
| Monthly | ||||||
| 97,732 | 98,753 | — | 1/29/20 | (Federal Funds | Motorola Solutions | 1,007 |
| Effective Rate US | Inc — Monthly | |||||
| plus 0.25%) — | ||||||
| Monthly | ||||||
| 54,009 | 52,747 | — | 1/29/20 | (Federal Funds | Netapp Inc — | (1,270) |
| Effective Rate US | Monthly | |||||
| plus 0.25%) — | ||||||
| Monthly | ||||||
| 9,893 | 9,822 | — | 1/29/20 | (Federal Funds | Netease Inc Adr — | (72) |
| Effective Rate US | Monthly | |||||
| plus 0.25%) — | ||||||
| Monthly | ||||||
| 8,032 | 7,745 | — | 1/29/20 | (Federal Funds | New China Life | (287) |
| Effective Rate US | Insurance Co Ltd — | |||||
| plus 0.25%) — | Monthly | |||||
| Monthly | ||||||
| 63,680 | 61,933 | — | 1/29/20 | (Federal Funds | Nexeo Solutions | (1,752) |
| Effective Rate US | Inc — Monthly | |||||
| plus 0.25%) — | ||||||
| Monthly | ||||||
| 20,227 | 19,939 | — | 1/29/20 | (Federal Funds | Nexteer Automotive | (290) |
| Effective Rate US | Group Ltd — | |||||
| plus 0.25%) — | Monthly | |||||
| Monthly | ||||||
| 46,676 | 45,787 | — | 1/27/20 | (Federal Funds | Ngk Insulators Ltd — | (900) |
| Effective Rate US | Monthly | |||||
| plus 0.25%) — | ||||||
| Monthly | ||||||
| 57,229 | 57,182 | — | 1/29/20 | (Federal Funds | Nike Inc — Monthly | (55) |
| Effective Rate US | ||||||
| plus 0.25%) — | ||||||
| Monthly | ||||||
| 34 PanAgora Market Neutral Fund | |
| OTC TOTAL RETURN SWAP CONTRACTS OUTSTANDING at 2/28/19 (Unaudited)cont. | ||||||
| Upfront | ||||||
| premium | Termina- | Payments | Total return | Unrealized | ||
| Swap counterparty/ | received | tion | received (paid) | received by | appreciation/ | |
| Notional amount | Value | (paid) | date | by fund | or paid by fund | (depreciation) |
| Morgan Stanley & Co. International PLCcont. | ||||||
| $94,407 | $93,774 | $— | 1/29/20 | (Federal Funds | Norfolk Southern | $(647) |
| Effective Rate US | Corp — Monthly | |||||
| plus 0.25%) — | ||||||
| Monthly | ||||||
| 24,250 | 23,914 | — | 1/30/20 | (Federal Funds | Novatek | (342) |
| Effective Rate US | Microelectronics | |||||
| plus 0.35%) — | Corp — Monthly | |||||
| Monthly | ||||||
| 12,741 | 12,582 | — | 1/29/20 | (Federal Funds | Novolipetsk Steel | (160) |
| Effective Rate US | Pjsc Gdr — Monthly | |||||
| plus 0.25%) — | ||||||
| Monthly | ||||||
| 41,257 | 41,029 | — | 1/29/20 | (Federal Funds | Nutrisystem Inc — | (234) |
| Effective Rate US | Monthly | |||||
| plus 0.25%) — | ||||||
| Monthly | ||||||
| 71,062 | 71,530 | — | 1/29/20 | (Federal Funds | Nvent Electric Plc — | 458 |
| Effective Rate US | Monthly | |||||
| plus 0.25%) — | ||||||
| Monthly | ||||||
| 65,824 | 65,500 | — | 1/29/20 | (Federal Funds | Nvr Inc — Monthly | (334) |
| Effective Rate US | ||||||
| plus 0.25%) — | ||||||
| Monthly | ||||||
| 35,851 | 33,886 | — | 1/29/20 | (Federal Funds | Nws Holdings Ltd — | (1,971) |
| Effective Rate US | Monthly | |||||
| plus 0.25%) — | ||||||
| Monthly | ||||||
| 24,372 | 23,652 | — | 1/29/20 | (Federal Funds | Nxp | (724) |
| Effective Rate US | Semiconductors | |||||
| plus 0.25%) — | Nv — Monthly | |||||
| Monthly | ||||||
| 57,906 | 57,294 | — | 1/27/20 | (Federal Funds | Obic Co Ltd — | (624) |
| Effective Rate US | Monthly | |||||
| plus 0.25%) — | ||||||
| Monthly | ||||||
| 77,054 | 76,131 | — | 1/29/20 | (Federal Funds | Onemain Holdings | (934) |
| Effective Rate US | Inc — Monthly | |||||
| plus 0.25%) — | ||||||
| Monthly | ||||||
| 24,908 | 25,384 | — | 1/29/20 | (Federal Funds | Owens Realty | 473 |
| Effective Rate US | Mortgage Inc — | |||||
| plus 0.25%) — | Monthly | |||||
| Monthly | ||||||
| 72,621 | 72,128 | — | 1/29/20 | (Federal Funds | Pacific Biosciences | (504) |
| Effective Rate US | Of California Inc — | |||||
| plus 0.25%) — | Monthly | |||||
| Monthly | ||||||
| PanAgora Market Neutral Fund 35 |
| OTC TOTAL RETURN SWAP CONTRACTS OUTSTANDING at 2/28/19 (Unaudited)cont. | ||||||
| Upfront | ||||||
| premium | Termina- | Payments | Total return | Unrealized | ||
| Swap counterparty/ | received | tion | received (paid) | received by | appreciation/ | |
| Notional amount | Value | (paid) | date | by fund | or paid by fund | (depreciation) |
| Morgan Stanley & Co. International PLCcont. | ||||||
| $16,949 | $17,199 | $— | 4/13/20 | (Federal Funds | Pakistan Petroleum | $247 |
| Effective Rate US | Ltd — Monthly | |||||
| plus 0.75%) — | ||||||
| Monthly | ||||||
| 66,425 | 69,448 | — | 1/29/20 | (Federal Funds | Palo Alto Networks | 3,013 |
| Effective Rate US | Inc — Monthly | |||||
| plus 0.25%) — | ||||||
| Monthly | ||||||
| 58,823 | 59,725 | — | 1/29/20 | (Federal Funds | Paypal Holdings | 893 |
| Effective Rate US | Inc — Monthly | |||||
| plus 0.25%) — | ||||||
| Monthly | ||||||
| 71,174 | 72,018 | — | 1/29/20 | (Federal Funds | Pegasystems Inc — | 833 |
| Effective Rate US | Monthly | |||||
| plus 0.25%) — | ||||||
| Monthly | ||||||
| 16,512 | 16,327 | — | 1/29/20 | (Federal Funds | People’s Insurance | (187) |
| Effective Rate US | Co Group Of China | |||||
| plus 0.25%) — | Ltd/The — Monthly | |||||
| Monthly | ||||||
| 56,558 | 57,700 | — | 1/29/20 | (Federal Funds | Persimmon Plc — | 1,134 |
| Effective Rate US | Monthly | |||||
| plus 0.25%) — | ||||||
| Monthly | ||||||
| 11,257 | 11,120 | — | 1/29/20 | (Federal Funds | Perspecta Inc — | (139) |
| Effective Rate US | Monthly | |||||
| plus 0.25%) — | ||||||
| Monthly | ||||||
| 21,971 | 21,306 | — | 1/27/20 | (Federal Funds | Perusahaan Gas | (671) |
| Effective Rate US | Negara Tbk — | |||||
| plus 0.75%) — | Monthly | |||||
| Monthly | ||||||
| 21,020 | 20,863 | — | 1/27/20 | (Federal Funds | Petrobras | (163) |
| Effective Rate US | Distribuidora Sa — | |||||
| plus 0.65%) — | Monthly | |||||
| Monthly | ||||||
| 36,382 | 36,919 | — | 1/29/20 | (Federal Funds | Peugeot Sa — | 532 |
| Effective Rate US | Monthly | |||||
| plus 0.25%) — | ||||||
| Monthly | ||||||
| 59,389 | 59,089 | — | 1/29/20 | (Federal Funds | Pilgrim’S Pride | (309) |
| Effective Rate US | Corp — Monthly | |||||
| plus 0.25%) — | ||||||
| Monthly | ||||||
| 14,317 | 14,204 | — | 1/29/20 | (Federal Funds | Ping An Insurance | (115) |
| Effective Rate US | Group Co Of China | |||||
| plus 0.25%) — | Ltd — Monthly | |||||
| Monthly | ||||||
| 36 PanAgora Market Neutral Fund | |
| OTC TOTAL RETURN SWAP CONTRACTS OUTSTANDING at 2/28/19 (Unaudited)cont. | ||||||
| Upfront | ||||||
| premium | Termina- | Payments | Total return | Unrealized | ||
| Swap counterparty/ | received | tion | received (paid) | received by | appreciation/ | |
| Notional amount | Value | (paid) | date | by fund | or paid by fund | (depreciation) |
| Morgan Stanley & Co. International PLCcont. | ||||||
| $32,092 | $32,107 | $— | 1/29/20 | (Federal Funds | Porsche Automobil | $10 |
| Effective Rate US | Holding Se — | |||||
| plus 0.25%) — | Monthly | |||||
| Monthly | ||||||
| 88,226 | 89,858 | — | 1/29/20 | (Federal Funds | Post Holdings Inc — | 1,620 |
| Effective Rate US | Monthly | |||||
| plus 0.25%) — | ||||||
| Monthly | ||||||
| 24,975 | 24,847 | — | 1/29/20 | (Federal Funds | Powszechna Kasa | (132) |
| Effective Rate US | Oszczednosci Bank | |||||
| plus 0.70%) — | Polski Sa — Monthly | |||||
| Monthly | ||||||
| 91,195 | 92,767 | — | 1/29/20 | (Federal Funds | Premier Inc — | 1,559 |
| Effective Rate US | Monthly | |||||
| plus 0.25%) — | ||||||
| Monthly | ||||||
| 55,406 | 54,695 | — | 1/29/20 | (Federal Funds | Procter & Gamble | (719) |
| Effective Rate US | Co/The — Monthly | |||||
| plus 0.25%) — | ||||||
| Monthly | ||||||
| 38,644 | 40,091 | — | 1/29/20 | (Federal Funds | Prosiebensat.1 | 1,441 |
| Effective Rate US | Media Se — Monthly | |||||
| plus 0.25%) — | ||||||
| Monthly | ||||||
| 18,270 | 17,558 | — | 1/27/20 | (Federal Funds | Ptt Global Chemical | (717) |
| Effective Rate US | Pcl Nvdr — Monthly | |||||
| plus 0.75%) — | ||||||
| Monthly | ||||||
| 59,290 | 59,904 | — | 1/29/20 | (Federal Funds | Pure Storage Inc — | 606 |
| Effective Rate US | Monthly | |||||
| plus 0.25%) — | ||||||
| Monthly | ||||||
| 74,674 | 75,633 | — | 1/29/20 | (Federal Funds | Qantas Airways | 948 |
| Effective Rate US | Ltd — Monthly | |||||
| plus 0.25%) — | ||||||
| Monthly | ||||||
| 66,797 | 66,090 | — | 1/29/20 | (Federal Funds | Ralph Lauren | (717) |
| Effective Rate US | Corp — Monthly | |||||
| plus 0.25%) — | ||||||
| Monthly | ||||||
| 92,512 | 91,416 | — | 1/29/20 | (Federal Funds | Raymond James | (1,110) |
| Effective Rate US | Financial Inc — | |||||
| plus 0.25%) — | Monthly | |||||
| Monthly | ||||||
| 45,563 | 45,650 | — | 1/29/20 | (Federal Funds | Red Hat Inc — | 81 |
| Effective Rate US | Monthly | |||||
| plus 0.25%) — | ||||||
| Monthly | ||||||
| PanAgora Market Neutral Fund 37 |
| OTC TOTAL RETURN SWAP CONTRACTS OUTSTANDING at 2/28/19 (Unaudited)cont. | ||||||
| Upfront | ||||||
| premium | Termina- | Payments | Total return | Unrealized | ||
| Swap counterparty/ | received | tion | received (paid) | received by | appreciation/ | |
| Notional amount | Value | (paid) | date | by fund | or paid by fund | (depreciation) |
| Morgan Stanley & Co. International PLCcont. | ||||||
| $55,399 | $55,918 | $�� | 1/29/20 | (Federal Funds | Reinsurance Group | $510 |
| Effective Rate US | Of America Inc — | |||||
| plus 0.25%) — | Monthly | |||||
| Monthly | ||||||
| 26,516 | 26,060 | — | 1/29/20 | (Federal Funds | Resideo | (460) |
| Effective Rate US | Technologies Inc — | |||||
| plus 0.25%) — | Monthly | |||||
| Monthly | ||||||
| 44,567 | 44,538 | — | 1/29/20 | (Federal Funds | Ringcentral Inc — | (36) |
| Effective Rate US | Monthly | |||||
| plus 0.25%) — | ||||||
| Monthly | ||||||
| 21,153 | 20,873 | — | 1/27/20 | (Federal Funds | Rmb Holdings Ltd — | (284) |
| Effective Rate US | Monthly | |||||
| plus 0.60%) — | ||||||
| Monthly | ||||||
| 115,156 | 116,196 | — | 1/29/20 | (Federal Funds | Robert Half | 1,022 |
| Effective Rate US | International Inc — | |||||
| plus 0.25%) — | Monthly | |||||
| Monthly | ||||||
| 146,667 | 146,062 | — | 1/29/20 | (Federal Funds | Rockwell | (627) |
| Effective Rate US | Automation Inc — | |||||
| plus 0.25%) — | Monthly | |||||
| Monthly | ||||||
| 164,623 | 165,478 | — | 1/29/20 | (Federal Funds | Ross Stores Inc — | 831 |
| Effective Rate US | Monthly | |||||
| plus 0.25%) — | ||||||
| Monthly | ||||||
| 29,451 | 28,498 | — | 1/29/20 | (Federal Funds | Royal Unibrew | (958) |
| Effective Rate US | A/S — Monthly | |||||
| plus 0.25%) — | ||||||
| Monthly | ||||||
| 81,106 | 82,206 | — | 1/29/20 | (Federal Funds | Sabre Corp — | 1,088 |
| Effective Rate US | Monthly | |||||
| plus 0.25%) — | ||||||
| Monthly | ||||||
| 64,448 | 64,419 | — | 1/29/20 | (Federal Funds | Sage Group Plc/ | (39) |
| Effective Rate US | The — Monthly | |||||
| plus 0.25%) — | ||||||
| Monthly | ||||||
| 40,480 | 40,514 | — | 1/27/20 | (Federal Funds | Sankyo Co Ltd — | 25 |
| Effective Rate US | Monthly | |||||
| plus 0.25%) — | ||||||
| Monthly | ||||||
| 20,930 | 20,109 | — | 1/27/20 | (Federal Funds | Sanlam Ltd — | (826) |
| Effective Rate US | Monthly | |||||
| plus 0.60%) — | ||||||
| Monthly | ||||||
| 38 PanAgora Market Neutral Fund | |
| OTC TOTAL RETURN SWAP CONTRACTS OUTSTANDING at 2/28/19 (Unaudited)cont. | ||||||
| Upfront | ||||||
| premium | Termina- | Payments | Total return | Unrealized | ||
| Swap counterparty/ | received | tion | received (paid) | received by | appreciation/ | |
| Notional amount | Value | (paid) | date | by fund | or paid by fund | (depreciation) |
| Morgan Stanley & Co. International PLCcont. | ||||||
| $8,539 | $8,560 | $— | 1/27/20 | (Federal Funds | Santam Ltd — | $19 |
| Effective Rate US | Monthly | |||||
| plus 0.60%) — | ||||||
| Monthly | ||||||
| 26,759 | 26,728 | — | 1/29/20 | (Federal Funds | Santos Ltd — | (35) |
| Effective Rate US | Monthly | |||||
| plus 0.25%) — | ||||||
| Monthly | ||||||
| 50,552 | 48,705 | — | 1/29/20 | (Federal Funds | Schneider National | (1,854) |
| Effective Rate US | Inc — Monthly | |||||
| plus 0.25%) — | ||||||
| Monthly | ||||||
| 44,052 | 43,076 | — | 1/27/20 | (Federal Funds | Sega Sammy | (986) |
| Effective Rate US | Holdings Inc — | |||||
| plus 0.25%) — | Monthly | |||||
| Monthly | ||||||
| 13,825 | 13,519 | — | 1/29/20 | (Federal Funds | Severstal Pjsc Gdr — | (308) |
| Effective Rate US | Monthly | |||||
| plus 0.25%) — | ||||||
| Monthly | ||||||
| 44,960 | 44,747 | — | 1/27/20 | (Federal Funds | Shionogi & Co Ltd — | (223) |
| Effective Rate US | Monthly | |||||
| plus 0.25%) — | ||||||
| Monthly | ||||||
| 46,936 | 46,587 | — | 1/27/20 | (Federal Funds | Shizuoka Bank Ltd/ | (359) |
| Effective Rate US | The — Monthly | |||||
| plus 0.25%) — | ||||||
| Monthly | ||||||
| 19,727 | 19,161 | — | 1/29/20 | (Federal Funds | Sinopec | (569) |
| Effective Rate US | Engineering Group | |||||
| plus 0.25%) — | Co Ltd — Monthly | |||||
| Monthly | ||||||
| 8,669 | 8,186 | — | 1/29/20 | (Federal Funds | Sinotruk Hong Kong | (484) |
| Effective Rate US | Ltd — Monthly | |||||
| plus 0.25%) — | ||||||
| Monthly | ||||||
| 24,729 | 25,979 | — | 1/29/20 | (Federal Funds | Societe Generale | 1,247 |
| Effective Rate US | Sa — Monthly | |||||
| plus 0.25%) — | ||||||
| Monthly | ||||||
| 31,162 | 31,317 | — | 1/29/20 | (Federal Funds | Sonic Healthcare | 150 |
| Effective Rate US | Ltd — Monthly | |||||
| plus 0.25%) — | ||||||
| Monthly | ||||||
| 52,098 | 52,649 | — | 1/29/20 | (Federal Funds | Sonova Holding | 543 |
| Effective Rate US | Ag — Monthly | |||||
| plus 0.25%) — | ||||||
| Monthly | ||||||
| PanAgora Market Neutral Fund 39 |
| OTC TOTAL RETURN SWAP CONTRACTS OUTSTANDING at 2/28/19 (Unaudited)cont. | ||||||
| Upfront | ||||||
| premium | Termina- | Payments | Total return | Unrealized | ||
| Swap counterparty/ | received | tion | received (paid) | received by | appreciation/ | |
| Notional amount | Value | (paid) | date | by fund | or paid by fund | (depreciation) |
| Morgan Stanley & Co. International PLCcont. | ||||||
| $22,492 | $22,115 | $— | 1/27/20 | (Federal Funds | Spar Group Ltd/ | $(383) |
| Effective Rate US | The — Monthly | |||||
| plus 0.60%) — | ||||||
| Monthly | ||||||
| 44,019 | 43,960 | — | 1/29/20 | (Federal Funds | Spark Therapeutics | (64) |
| Effective Rate US | Inc — Monthly | |||||
| plus 0.25%) — | ||||||
| Monthly | ||||||
| 141,304 | 139,787 | — | 1/29/20 | (Federal Funds | State Street Corp — | (1,538) |
| Effective Rate US | Monthly | |||||
| plus 0.25%) — | ||||||
| Monthly | ||||||
| 38,161 | 37,570 | — | 1/27/20 | (Federal Funds | Sumitomo Electric | (599) |
| Effective Rate US | Industries Ltd — | |||||
| plus 0.25%) — | Monthly | |||||
| Monthly | ||||||
| 108,559 | 107,233 | — | 1/29/20 | (Federal Funds | Swedish Match Ab — | (1,341) |
| Effective Rate US | Monthly | |||||
| plus 0.25%) — | ||||||
| Monthly | ||||||
| 54,149 | 53,436 | — | 1/29/20 | (Federal Funds | Symantec Corp — | (721) |
| Effective Rate US | Monthly | |||||
| plus 0.25%) — | ||||||
| Monthly | ||||||
| 99,598 | 97,587 | — | 1/29/20 | (Federal Funds | Tapestry Inc — | (2,026) |
| Effective Rate US | Monthly | |||||
| plus 0.25%) — | ||||||
| Monthly | ||||||
| 190,236 | 190,956 | — | 1/29/20 | (Federal Funds | Teledyne | 692 |
| Effective Rate US | Technologies Inc — | |||||
| plus 0.25%) — | Monthly | |||||
| Monthly | ||||||
| 94,146 | 94,708 | — | 1/29/20 | (Federal Funds | Telephone & Data | 548 |
| Effective Rate US | Systems Inc — | |||||
| plus 0.25%) — | Monthly | |||||
| Monthly | ||||||
| 138,566 | 141,821 | — | 1/29/20 | (Federal Funds | Teradata Corp — | 3,234 |
| Effective Rate US | Monthly | |||||
| plus 0.25%) — | ||||||
| Monthly | ||||||
| 9,166 | 8,770 | — | 1/29/20 | (Federal Funds | Ternium Sa Adr — | (397) |
| Effective Rate US | Monthly | |||||
| plus 0.25%) — | ||||||
| Monthly | ||||||
| 57,313 | 57,124 | — | 1/29/20 | (Federal Funds | Textron Inc — | (198) |
| Effective Rate US | Monthly | |||||
| plus 0.25%) — | ||||||
| Monthly | ||||||
| 40 PanAgora Market Neutral Fund | |
| OTC TOTAL RETURN SWAP CONTRACTS OUTSTANDING at 2/28/19 (Unaudited)cont. | ||||||
| Upfront | ||||||
| premium | Termina- | Payments | Total return | Unrealized | ||
| Swap counterparty/ | received | tion | received (paid) | received by | appreciation/ | |
| Notional amount | Value | (paid) | date | by fund | or paid by fund | (depreciation) |
| Morgan Stanley & Co. International PLCcont. | ||||||
| $30,242 | $29,569 | $— | 1/29/20 | (Federal Funds | Tgs Nopec | $(677) |
| Effective Rate US | Geophysical Co | |||||
| plus 0.25%) — | Asa — Monthly | |||||
| Monthly | ||||||
| 51,556 | 49,156 | — | 1/27/20 | (Federal Funds | Thk Co Ltd — | (2,412) |
| Effective Rate US | Monthly | |||||
| plus 0.25%) — | ||||||
| Monthly | ||||||
| 61,602 | 59,986 | — | 1/29/20 | (Federal Funds | Thor Industries | (1,626) |
| Effective Rate US | Inc — Monthly | |||||
| plus 0.25%) — | ||||||
| Monthly | ||||||
| 33,367 | 32,737 | — | 1/27/20 | (Federal Funds | Tokyo Century | (638) |
| Effective Rate US | Corp — Monthly | |||||
| plus 0.25%) — | ||||||
| Monthly | ||||||
| 56,640 | 56,487 | — | 1/29/20 | (Federal Funds | Travelers Cos Inc/ | (161) |
| Effective Rate US | The — Monthly | |||||
| plus 0.25%) — | ||||||
| Monthly | ||||||
| 43,183 | 43,183 | — | 1/29/20 | (Federal Funds | Travelport | (6) |
| Effective Rate US | Worldwide Ltd — | |||||
| plus 0.25%) — | Monthly | |||||
| Monthly | ||||||
| 89,190 | 90,022 | — | 1/29/20 | (Federal Funds | Treehouse Foods | 819 |
| Effective Rate US | Inc — Monthly | |||||
| plus 0.25%) — | ||||||
| Monthly | ||||||
| 18,038 | 18,190 | — | 1/29/20 | (Federal Funds | Turkiye Is Bankasi | 149 |
| Effective Rate US | As — Monthly | |||||
| plus 0.70%) — | ||||||
| Monthly | ||||||
| 11,525 | 11,168 | — | 1/29/20 | (Federal Funds | Turkiye Sise Ve Cam | (359) |
| Effective Rate US | Fabrikalari As — | |||||
| plus 0.70%) — | Monthly | |||||
| Monthly | ||||||
| 44,620 | 44,241 | — | 1/29/20 | (Federal Funds | Twenty-First | (386) |
| Effective Rate US | Century Fox Inc — | |||||
| plus 0.25%) — | Monthly | |||||
| Monthly | ||||||
| 55,531 | 55,432 | — | 1/29/20 | (Federal Funds | Tyson Foods Inc — | 230 |
| Effective Rate US | Monthly | |||||
| plus 0.25%) — | ||||||
| Monthly | ||||||
| 99,582 | 95,058 | — | 1/29/20 | (Federal Funds | Ucb Sa — Monthly | (4,538) |
| Effective Rate US | ||||||
| plus 0.25%) — | ||||||
| Monthly | ||||||
| PanAgora Market Neutral Fund 41 |
| OTC TOTAL RETURN SWAP CONTRACTS OUTSTANDING at 2/28/19 (Unaudited)cont. | ||||||
| Upfront | ||||||
| premium | Termina- | Payments | Total return | Unrealized | ||
| Swap counterparty/ | received | tion | received (paid) | received by | appreciation/ | |
| Notional amount | Value | (paid) | date | by fund | or paid by fund | (depreciation) |
| Morgan Stanley & Co. International PLCcont. | ||||||
| $116,841 | $118,206 | $— | 1/29/20 | (Federal Funds | Umpqua Holdings | $1,348 |
| Effective Rate US | Corp — Monthly | |||||
| plus 0.25%) — | ||||||
| Monthly | ||||||
| 142,075 | 140,030 | — | 1/29/20 | (Federal Funds | Union Pacific | (1,332) |
| Effective Rate US | Corp — Monthly | |||||
| plus 0.25%) — | ||||||
| Monthly | ||||||
| 76,044 | 76,618 | — | 1/29/20 | (Federal Funds | U.S. Cellular Corp — | 563 |
| Effective Rate US | Monthly | |||||
| plus 0.25%) — | ||||||
| Monthly | ||||||
| 98,550 | 95,034 | — | 1/29/20 | (Federal Funds | Upm-Kymmene | (3,530) |
| Effective Rate US | Oyj — Monthly | |||||
| plus 0.25%) — | ||||||
| Monthly | ||||||
| 134,233 | 136,913 | — | 1/29/20 | (Federal Funds | Varian Medical | 2,660 |
| Effective Rate US | Systems Inc — | |||||
| plus 0.25%) — | Monthly | |||||
| Monthly | ||||||
| 102,959 | 101,403 | — | 1/29/20 | (Federal Funds | Veeva Systems Inc — | (1,572) |
| Effective Rate US | Monthly | |||||
| plus 0.25%) — | ||||||
| Monthly | ||||||
| 41,568 | 40,721 | — | 1/29/20 | (Federal Funds | Victrex Plc — | (853) |
| Effective Rate US | Monthly | |||||
| plus 0.25%) — | ||||||
| Monthly | ||||||
| 169,243 | 170,486 | — | 1/29/20 | (Federal Funds | Visa Inc — Monthly | 1,218 |
| Effective Rate US | ||||||
| plus 0.25%) — | ||||||
| Monthly | ||||||
| 74,744 | 85,131 | — | 1/29/20 | (Federal Funds | Wabco Holdings | 10,366 |
| Effective Rate US | Inc — Monthly | |||||
| plus 0.25%) — | ||||||
| Monthly | ||||||
| 24,325 | 23,024 | — | 1/29/20 | (Federal Funds | Wal-Mart De | (1,305) |
| Effective Rate US | Mexico Sab De Cv — | |||||
| plus 0.90%) — | Monthly | |||||
| Monthly | ||||||
| 55,661 | 55,830 | — | 1/29/20 | (Federal Funds | Walmart Inc — | 161 |
| Effective Rate US | Monthly | |||||
| plus 0.25%) — | ||||||
| Monthly | ||||||
| 55,283 | 56,295 | — | 1/29/20 | (Federal Funds | Waste Management | 1,004 |
| Effective Rate US | Inc — Monthly | |||||
| plus 0.25%) — | ||||||
| Monthly | ||||||
| 42 PanAgora Market Neutral Fund | |
| OTC TOTAL RETURN SWAP CONTRACTS OUTSTANDING at 2/28/19 (Unaudited)cont. | ||||||
| Upfront | ||||||
| premium | Termina- | Payments | Total return | Unrealized | ||
| Swap counterparty/ | received | tion | received (paid) | received by | appreciation/ | |
| Notional amount | Value | (paid) | date | by fund | or paid by fund | (depreciation) |
| Morgan Stanley & Co. International PLCcont. | ||||||
| $13,026 | $12,497 | $— | 1/29/20 | (Federal Funds | Weichai Power Co | $(531) |
| Effective Rate US | Ltd — Monthly | |||||
| plus 0.25%) — | ||||||
| Monthly | ||||||
| 119,953 | 118,538 | — | 1/29/20 | (Federal Funds | Wesco International | (1,433) |
| Effective Rate US | Inc — Monthly | |||||
| plus 0.25%) — | ||||||
| Monthly | ||||||
| 53,786 | 54,090 | — | 1/29/20 | (Federal Funds | Western Alliance | 296 |
| Effective Rate US | Bancorp — Monthly | |||||
| plus 0.25%) — | ||||||
| Monthly | ||||||
| 62,195 | 59,680 | — | 1/28/20 | (Federal Funds | Wilmar International | (2,531) |
| Effective Rate US | Ltd — Monthly | |||||
| plus 0.55%) — | ||||||
| Monthly | ||||||
| 34,446 | 35,264 | — | 1/29/20 | (Federal Funds | Wirecard Ag — | 813 |
| Effective Rate US | Monthly | |||||
| plus 0.25%) — | ||||||
| Monthly | ||||||
| 87,011 | 85,945 | — | 1/29/20 | (Federal Funds | Ww Grainger Inc — | (1,079) |
| Effective Rate US | Monthly | |||||
| plus 0.25%) — | ||||||
| Monthly | ||||||
| 46,131 | 46,111 | — | 1/29/20 | (Federal Funds | Wyndham | (27) |
| Effective Rate US | Destinations Inc — | |||||
| plus 0.25%) — | Monthly | |||||
| Monthly | ||||||
| 102,556 | 100,566 | — | 1/29/20 | (Federal Funds | Wyndham Hotels | (2,005) |
| Effective Rate US | & Resorts Inc — | |||||
| plus 0.25%) — | Monthly | |||||
| Monthly | ||||||
| 15,235 | 15,982 | — | 1/29/20 | (Federal Funds | Yuhan Corp — | 745 |
| Effective Rate US | Monthly | |||||
| plus 0.35%) — | ||||||
| Monthly | ||||||
| 191,709 | 190,160 | — | 1/29/20 | (Federal Funds | Yum China Holdings | (1,031) |
| Effective Rate US | Inc — Monthly | |||||
| plus 0.25%) — | ||||||
| Monthly | ||||||
| 185,118 | 182,865 | — | 1/29/20 | (Federal Funds | Zebra Technologies | (2,280) |
| Effective Rate US | Corp — Monthly | |||||
| plus 0.25%) — | ||||||
| Monthly | ||||||
| $51,553 | $51,295 | — | 1/29/20 | Federal Funds | 2U Inc — Monthly | 263 |
| Effective Rate US | ||||||
| minus 0.23% — | ||||||
| Monthly | ||||||
| PanAgora Market Neutral Fund 43 |
| OTC TOTAL RETURN SWAP CONTRACTS OUTSTANDING at 2/28/19 (Unaudited)cont. | ||||||
| Upfront | ||||||
| premium | Termina- | Payments | Total return | Unrealized | ||
| Swap counterparty/ | received | tion | received (paid) | received by | appreciation/ | |
| Notional amount | Value | (paid) | date | by fund | or paid by fund | (depreciation) |
| Morgan Stanley & Co. International PLCcont. | ||||||
| $57,161 | $56,617 | $— | 1/29/20 | Federal Funds | 3M Co — Monthly | $550 |
| Effective Rate US | ||||||
| minus 0.23% — | ||||||
| Monthly | ||||||
| 18,637 | 19,016 | — | 1/29/20 | Federal Funds | 3Sbio Inc — Monthly | (377) |
| Effective Rate US | ||||||
| minus 1.12% — | ||||||
| Monthly | ||||||
| 86,640 | 86,661 | — | 1/29/20 | Federal Funds | Accenture Plc — | (9) |
| Effective Rate US | Monthly | |||||
| minus 0.23% — | ||||||
| Monthly | ||||||
| 29,807 | 29,504 | — | 1/27/20 | Federal Funds | Aeon Co Ltd — | 94 |
| Effective Rate US | Monthly | |||||
| minus 0.30% — | ||||||
| Monthly | ||||||
| 15,050 | 15,008 | — | 1/29/20 | Federal Funds | Alibaba Group | 44 |
| Effective Rate US | Holding Ltd Adr — | |||||
| minus 0.23% — | Monthly | |||||
| Monthly | ||||||
| 63,885 | 63,318 | — | 1/29/20 | Federal Funds | Alliance Data | 577 |
| Effective Rate US | Systems Corp — | |||||
| minus 0.23% — | Monthly | |||||
| Monthly | ||||||
| 7,380 | 7,357 | — | 1/29/20 | Federal Funds | Aluminum Corp Of | 25 |
| Effective Rate US | China Ltd — Monthly | |||||
| minus 0.40% — | ||||||
| Monthly | ||||||
| 46,984 | 47,227 | — | 1/29/20 | Federal Funds | Ambu A/S — | (237) |
| Effective Rate US | Monthly | |||||
| minus 0.30% — | ||||||
| Monthly | ||||||
| 23,686 | 23,535 | — | 1/29/20 | Federal Funds | Amcor Ltd/ | 154 |
| Effective Rate US | Australia — Monthly | |||||
| minus 0.45% — | ||||||
| Monthly | ||||||
| 36,905 | 36,343 | — | 1/29/20 | Federal Funds | Amdocs Ltd — | 566 |
| Effective Rate US | Monthly | |||||
| minus 0.23% — | ||||||
| Monthly | ||||||
| 172,745 | 176,527 | — | 1/29/20 | Federal Funds | Amerco — Monthly | (3,761) |
| Effective Rate US | ||||||
| minus 0.23% — | ||||||
| Monthly | ||||||
| 165,835 | 163,339 | — | 1/29/20 | Federal Funds | American | 2,520 |
| Effective Rate US | International Group | |||||
| minus 0.23% — | Inc — Monthly | |||||
| Monthly | ||||||
| 44 PanAgora Market Neutral Fund |
| OTC TOTAL RETURN SWAP CONTRACTS OUTSTANDING at 2/28/19 (Unaudited)cont. | ||||||
| Upfront | ||||||
| premium | Termina- | Payments | Total return | Unrealized | ||
| Swap counterparty/ | received | tion | received (paid) | received by | appreciation/ | |
| Notional amount | Value | (paid) | date | by fund | or paid by fund | (depreciation) |
| Morgan Stanley & Co. International PLCcont. | ||||||
| $21,623 | $20,983 | $— | 1/29/20 | Federal Funds | Amorepacific | $642 |
| Effective Rate US | Corp — Monthly | |||||
| minus 0.40% — | ||||||
| Monthly | ||||||
| 60,342 | 60,218 | — | 1/29/20 | Federal Funds | Analog Devices | (173) |
| Effective Rate US | Inc — Monthly | |||||
| minus 0.23% — | ||||||
| Monthly | ||||||
| 88,703 | 89,080 | — | 1/29/20 | Federal Funds | Archer-Daniels- | (367) |
| Effective Rate US | Midland Co — | |||||
| minus 0.23% — | Monthly | |||||
| Monthly | ||||||
| 54,910 | 55,849 | — | 1/29/20 | Federal Funds | Argenx Se Adr — | (932) |
| Effective Rate US | Monthly | |||||
| minus 0.23% — | ||||||
| Monthly | ||||||
| 40,962 | 41,270 | — | 1/27/20 | Federal Funds | Asics Corp — | (299) |
| Effective Rate US | Monthly | |||||
| minus 0.30% — | ||||||
| Monthly | ||||||
| 80,205 | 81,098 | — | 1/29/20 | Federal Funds | Assured Guaranty | (884) |
| Effective Rate US | Ltd — Monthly | |||||
| minus 0.23% — | ||||||
| Monthly | ||||||
| 11,019 | 10,498 | — | 1/30/20 | Federal Funds | Asustek Computer | 522 |
| Effective Rate US | Inc — Monthly | |||||
| minus 0.40% — | ||||||
| Monthly | ||||||
| 111,701 | 110,525 | — | 1/29/20 | Federal Funds | Autoliv Inc — | 1,177 |
| Effective Rate US | Monthly | |||||
| minus 0.84% — | ||||||
| Monthly | ||||||
| 132,700 | 132,830 | — | 1/29/20 | Federal Funds | Automatic Data | (110) |
| Effective Rate US | Processing Inc — | |||||
| minus 0.23% — | Monthly | |||||
| Monthly | ||||||
| 69,521 | 68,722 | — | 1/29/20 | Federal Funds | Autonation Inc — | 807 |
| Effective Rate US | Monthly | |||||
| minus 0.23% — | ||||||
| Monthly | ||||||
| 18,184 | 18,109 | — | 1/27/20 | Federal Funds | Bdo Unibank Inc — | 76 |
| Effective Rate US | Monthly | |||||
| minus 2.50% — | ||||||
| Monthly | ||||||
| 168,139 | 167,996 | — | 1/29/20 | Federal Funds | Bank Of Hawaii | (1,099) |
| Effective Rate US | Corp — Monthly | |||||
| minus 0.23% — | ||||||
| Monthly | ||||||
| PanAgora Market Neutral Fund 45 |
| OTC TOTAL RETURN SWAP CONTRACTS OUTSTANDING at 2/28/19 (Unaudited)cont. | ||||||
| Upfront | ||||||
| premium | Termina- | Payments | Total return | Unrealized | ||
| Swap counterparty/ | received | tion | received (paid) | received by | appreciation/ | |
| Notional amount | Value | (paid) | date | by fund | or paid by fund | (depreciation) |
| Morgan Stanley & Co. International PLCcont. | ||||||
| $33,105 | $33,138 | $— | 1/27/20 | Federal Funds | Bank Of Kyoto Ltd/ | $(27) |
| Effective Rate US | The — Monthly | |||||
| minus 0.30% — | ||||||
| Monthly | ||||||
| 1,735 | 1,705 | — | 1/27/20 | Federal Funds | Bank Of The | 30 |
| Effective Rate US | Philippine Islands — | |||||
| minus 2.50% — | Monthly | |||||
| Monthly | ||||||
| 10,071 | 9,860 | — | 1/27/20 | Federal Funds | Banpu Pcl — | 212 |
| Effective Rate US | Monthly | |||||
| minus 1.63% — | ||||||
| Monthly | ||||||
| 30,531 | 30,671 | — | 1/29/20 | Federal Funds | Bawag Group Ag — | (136) |
| Effective Rate US | Monthly | |||||
| minus 0.30% — | ||||||
| Monthly | ||||||
| 101,728 | 101,483 | — | 1/29/20 | Federal Funds | Baxter International | (2) |
| Effective Rate US | Inc — Monthly | |||||
| minus 0.23% — | ||||||
| Monthly | ||||||
| 16,278 | 16,015 | — | 1/27/20 | Federal Funds | Bb Seguridade | 267 |
| Effective Rate US | Participacoes Sa — | |||||
| minus 1.00% — | Monthly | |||||
| Monthly | ||||||
| 6,457 | 6,502 | — | 1/29/20 | Federal Funds | Bbmg Corp — | (44) |
| Effective Rate US | Monthly | |||||
| minus 0.40% — | ||||||
| Monthly | ||||||
| 106,370 | 106,233 | — | 1/29/20 | Federal Funds | Becton Dickinson | 149 |
| Effective Rate US | And Co — Monthly | |||||
| minus 0.23% — | ||||||
| Monthly | ||||||
| 21,414 | 21,186 | — | 1/29/20 | Federal Funds | Beijing Enterprises | 230 |
| Effective Rate US | Water Group Ltd — | |||||
| minus 0.40% — | Monthly | |||||
| Monthly | ||||||
| 18,450 | 18,181 | — | 1/29/20 | Federal Funds | Bgf Retail Co Ltd — | 270 |
| Effective Rate US | Monthly | |||||
| minus 2.50% — | ||||||
| Monthly | ||||||
| 44,922 | 45,215 | — | 1/29/20 | Federal Funds | Boston Scientific | (288) |
| Effective Rate US | Corp — Monthly | |||||
| minus 0.23% — | ||||||
| Monthly | ||||||
| 19,226 | 18,745 | — | 1/27/20 | Federal Funds | Br Malls | 484 |
| Effective Rate US | Participacoes Sa — | |||||
| minus 1.00% — | Monthly | |||||
| Monthly | ||||||
| 46 PanAgora Market Neutral Fund | |
| OTC TOTAL RETURN SWAP CONTRACTS OUTSTANDING at 2/28/19 (Unaudited)cont. | ||||||
| Upfront | ||||||
| premium | Termina- | Payments | Total return | Unrealized | ||
| Swap counterparty/ | received | tion | received (paid) | received by | appreciation/ | |
| Notional amount | Value | (paid) | date | by fund | or paid by fund | (depreciation) |
| Morgan Stanley & Co. International PLCcont. | ||||||
| $15,353 | $14,308 | $— | 1/29/20 | Federal Funds | Brf Sa Adr — Monthly | $1,047 |
| Effective Rate US | ||||||
| minus 1.45% — | ||||||
| Monthly | ||||||
| 10,447 | 9,796 | — | 1/29/20 | Federal Funds | Brilliance China | 652 |
| Effective Rate US | Automotive | |||||
| minus 0.40% — | Holdings Ltd — | |||||
| Monthly | Monthly | |||||
| 24,930 | 25,675 | — | 1/29/20 | Federal Funds | Bristol-Myers | (742) |
| Effective Rate US | Squibb Co — | |||||
| minus 0.23% — | Monthly | |||||
| Monthly | ||||||
| 44,581 | 43,589 | — | 1/29/20 | Federal Funds | British American | 997 |
| Effective Rate US | Tobacco Plc — | |||||
| minus 0.30% — | Monthly | |||||
| Monthly | ||||||
| 60,619 | 61,491 | — | 1/29/20 | Federal Funds | Brown & Brown | (865) |
| Effective Rate US | Inc — Monthly | |||||
| minus 0.23% — | ||||||
| Monthly | ||||||
| 11,856 | 11,813 | — | 1/27/20 | Federal Funds | Bumrungrad | 44 |
| Effective Rate US | Hospital Pcl — | |||||
| minus 1.50% — | Monthly | |||||
| Monthly | ||||||
| 85,565 | 84,388 | — | 1/29/20 | Federal Funds | Bwx Technologies | 1,187 |
| Effective Rate US | Inc — Monthly | |||||
| minus 0.23% — | ||||||
| Monthly | ||||||
| 41,996 | 41,514 | — | 1/29/20 | Federal Funds | Caesars | 486 |
| Effective Rate US | Entertainment | |||||
| minus 0.23% — | Corp — Monthly | |||||
| Monthly | ||||||
| 162,044 | 136,968 | — | 1/29/20 | Federal Funds | Cantel Medical | 25,094 |
| Effective Rate US | Corp — Monthly | |||||
| minus 0.23% — | ||||||
| Monthly | ||||||
| 97,398 | 99,236 | — | 1/29/20 | Federal Funds | Carmax Inc — | (1,826) |
| Effective Rate US | Monthly | |||||
| minus 0.23% — | ||||||
| Monthly | ||||||
| 100,210 | 98,512 | — | 1/29/20 | Federal Funds | Carter’s Inc — | 1,711 |
| Effective Rate US | Monthly | |||||
| minus 0.23% — | ||||||
| Monthly | ||||||
| 15,298 | 15,237 | — | 1/30/20 | Federal Funds | Cathay Financial | 63 |
| Effective Rate US | Holding Co Ltd — | |||||
| minus 0.50% — | Monthly | |||||
| Monthly | ||||||
| PanAgora Market Neutral Fund 47 |
| OTC TOTAL RETURN SWAP CONTRACTS OUTSTANDING at 2/28/19 (Unaudited)cont. | ||||||
| Upfront | ||||||
| premium | Termina- | Payments | Total return | Unrealized | ||
| Swap counterparty/ | received | tion | received (paid) | received by | appreciation/ | |
| Notional amount | Value | (paid) | date | by fund | or paid by fund | (depreciation) |
| Morgan Stanley & Co. International PLCcont. | ||||||
| $15,390 | $15,395 | $— | 1/29/20 | Federal Funds | Ccc Sa — Monthly | $(5) |
| Effective Rate US | ||||||
| minus 0.75% — | ||||||
| Monthly | ||||||
| 15,975 | 16,074 | — | 1/29/20 | Federal Funds | Celltrion Healthcare | (111) |
| Effective Rate US | Co Ltd — Monthly | |||||
| minus 14.00% — | ||||||
| Monthly | ||||||
| 42,912 | 43,606 | — | 1/29/20 | Federal Funds | Centurylink Inc — | (689) |
| Effective Rate US | Monthly | |||||
| minus 0.23% — | ||||||
| Monthly | ||||||
| 129,524 | 128,996 | — | 1/29/20 | Federal Funds | Charter | 542 |
| Effective Rate US | Communications | |||||
| minus 0.23% — | Inc — Monthly | |||||
| Monthly | ||||||
| 18,407 | 18,480 | — | 1/30/20 | Federal Funds | Cheng Shin Rubber | (72) |
| Effective Rate US | Industry Co Ltd — | |||||
| minus 1.74% — | Monthly | |||||
| Monthly | ||||||
| 51,899 | 51,010 | — | 1/27/20 | Federal Funds | Chiba Bank Ltd — | 898 |
| Effective Rate US | Monthly | |||||
| minus 0.30% — | ||||||
| Monthly | ||||||
| 21,725 | 20,546 | — | 1/29/20 | Federal Funds | China Everbright | 1,182 |
| Effective Rate US | International Ltd — | |||||
| minus 0.40% — | Monthly | |||||
| Monthly | ||||||
| 17,205 | 16,816 | — | 1/29/20 | Federal Funds | China Merchants | 390 |
| Effective Rate US | Port Holdings Co | |||||
| minus 0.40% — | Ltd — Monthly | |||||
| Monthly | ||||||
| 22,092 | 21,440 | — | 1/29/20 | Federal Funds | China Power | 654 |
| Effective Rate US | International | |||||
| minus 0.48% — | Development Ltd — | |||||
| Monthly | Monthly | |||||
| 15,553 | 14,803 | — | 1/29/20 | Federal Funds | China State | 752 |
| Effective Rate US | Construction | |||||
| minus 0.40% — | International | |||||
| Monthly | Holdings Ltd — | |||||
| Monthly | ||||||
| 6,944 | 6,974 | — | 1/29/20 | Federal Funds | China Unicom Hong | (29) |
| Effective Rate US | Kong Ltd — Monthly | |||||
| minus 0.40% — | ||||||
| Monthly | ||||||
| 13,026 | 12,719 | — | 1/29/20 | Federal Funds | China Zhongwang | 306 |
| Effective Rate US | Holdings Ltd — | |||||
| minus 4.83% — | Monthly | |||||
| Monthly | ||||||
| 48 PanAgora Market Neutral Fund | |
| OTC TOTAL RETURN SWAP CONTRACTS OUTSTANDING at 2/28/19 (Unaudited)cont. | ||||||
| Upfront | ||||||
| premium | Termina- | Payments | Total return | Unrealized | ||
| Swap counterparty/ | received | tion | received (paid) | received by | appreciation/ | |
| Notional amount | Value | (paid) | date | by fund | or paid by fund | (depreciation) |
| Morgan Stanley & Co. International PLCcont. | ||||||
| $2,497 | $2,502 | $— | 1/29/20 | Federal Funds | Chongqing Rural | $(5) |
| Effective Rate US | Commercial Bank | |||||
| minus 0.40% — | Co Ltd — Monthly | |||||
| Monthly | ||||||
| 91,409 | 90,558 | — | 1/29/20 | Federal Funds | Chr Hansen Holding | 862 |
| Effective Rate US | A/S — Monthly | |||||
| minus 0.30% — | ||||||
| Monthly | ||||||
| 102,459 | 101,496 | — | 1/29/20 | Federal Funds | Chubb Ltd — | 978 |
| Effective Rate US | Monthly | |||||
| minus 0.23% — | ||||||
| Monthly | ||||||
| 10,014 | 10,020 | — | 1/30/20 | Federal Funds | Chunghwa Telecom | (4) |
| Effective Rate US | Co Ltd — Monthly | |||||
| minus 0.40% — | ||||||
| Monthly | ||||||
| 162,560 | 165,280 | — | 1/29/20 | Federal Funds | Cintas Corp — | (2,701) |
| Effective Rate US | Monthly | |||||
| minus 0.23% — | ||||||
| Monthly | ||||||
| 14,284 | 14,359 | — | 1/29/20 | Federal Funds | Cj Logistics Corp — | (73) |
| Effective Rate US | Monthly | |||||
| minus 1.88% — | ||||||
| Monthly | ||||||
| 104,907 | 107,145 | — | 1/29/20 | Federal Funds | Cme Group Inc — | (2,227) |
| Effective Rate US | Monthly | |||||
| minus 0.23% — | ||||||
| Monthly | ||||||
| 54,611 | 55,405 | — | 1/29/20 | Federal Funds | Coca-Cola Co/ | (788) |
| Effective Rate US | The — Monthly | |||||
| minus 0.23% — | ||||||
| Monthly | ||||||
| 149,811 | 148,559 | — | 1/29/20 | Federal Funds | Cognex Corp — | 1,129 |
| Effective Rate US | Monthly | |||||
| minus 0.23% — | ||||||
| Monthly | ||||||
| 108,664 | 106,464 | — | 1/29/20 | Federal Funds | Coherent Inc — | 2,212 |
| Effective Rate US | Monthly | |||||
| minus 0.23% — | ||||||
| Monthly | ||||||
| 52,833 | 53,239 | — | 1/29/20 | Federal Funds | Commerce | (400) |
| Effective Rate US | Bancshares Inc — | |||||
| minus 0.23% — | Monthly | |||||
| Monthly | ||||||
| 128,243 | 128,054 | — | 1/29/20 | Federal Funds | Constellation | 205 |
| Effective Rate US | Brands Inc — | |||||
| minus 0.23% — | Monthly | |||||
| Monthly | ||||||
| PanAgora Market Neutral Fund 49 |
| OTC TOTAL RETURN SWAP CONTRACTS OUTSTANDING at 2/28/19 (Unaudited)cont. | ||||||
| Upfront | ||||||
| premium | Termina- | Payments | Total return | Unrealized | ||
| Swap counterparty/ | received | tion | received (paid) | received by | appreciation/ | |
| Notional amount | Value | (paid) | date | by fund | or paid by fund | (depreciation) |
| Morgan Stanley & Co. International PLCcont. | ||||||
| $98,175 | $97,237 | $— | 1/29/20 | Federal Funds | Cooper Cos Inc/ | $950 |
| Effective Rate US | The — Monthly | |||||
| minus 0.23% — | ||||||
| Monthly | ||||||
| 54,937 | 54,048 | — | 1/29/20 | Federal Funds | Copa Holdings Sa — | 497 |
| Effective Rate US | Monthly | |||||
| minus 0.23% — | ||||||
| Monthly | ||||||
| 3,863 | 3,828 | — | 1/27/20 | Federal Funds | Coronation Fund | 36 |
| Effective Rate US | Managers Ltd — | |||||
| minus 0.98% — | Monthly | |||||
| Monthly | ||||||
| 8,348 | 8,240 | — | 1/29/20 | Federal Funds | Cosco Shipping | 109 |
| Effective Rate US | Energy | |||||
| minus 0.40% — | Transportation Co | |||||
| Monthly | Ltd — Monthly | |||||
| 19,616 | 19,388 | — | 1/29/20 | Federal Funds | Cosco Shipping | 228 |
| Effective Rate US | Holdings Co Ltd — | |||||
| minus 4.07% — | Monthly | |||||
| Monthly | ||||||
| 24,708 | 24,310 | — | 1/29/20 | Federal Funds | Coty Inc — Monthly | 125 |
| Effective Rate US | ||||||
| minus 0.23% — | ||||||
| Monthly | ||||||
| 111,201 | 111,285 | — | 1/29/20 | Federal Funds | Credit Acceptance | (77) |
| Effective Rate US | Corp — Monthly | |||||
| minus 1.14% — | ||||||
| Monthly | ||||||
| 57,304 | 54,100 | — | 1/27/20 | Federal Funds | Daifuku Co Ltd — | 3,214 |
| Effective Rate US | Monthly | |||||
| minus 0.30% — | ||||||
| Monthly | ||||||
| 41,931 | 41,651 | — | 1/28/20 | Federal Funds | Dairy Farm | 277 |
| Effective Rate US | International | |||||
| minus 1.50% — | Holdings Ltd — | |||||
| Monthly | Monthly | |||||
| 46,445 | 46,757 | — | 1/29/20 | Federal Funds | Davide Campari- | (306) |
| Effective Rate US | Milano Spa — | |||||
| minus 0.30% — | Monthly | |||||
| Monthly | ||||||
| 177,723 | 177,983 | — | 1/29/20 | Federal Funds | Deere & Co — | (239) |
| Effective Rate US | Monthly | |||||
| minus 0.23% — | ||||||
| Monthly | ||||||
| 15,164 | 15,172 | — | 1/30/20 | Federal Funds | E Sun Financial | (6) |
| Effective Rate US | Holding Co Ltd — | |||||
| minus 0.40% — | Monthly | |||||
| Monthly | ||||||
| 50 PanAgora Market Neutral Fund | |
| OTC TOTAL RETURN SWAP CONTRACTS OUTSTANDING at 2/28/19 (Unaudited)cont. | ||||||
| Upfront | ||||||
| premium | Termina- | Payments | Total return | Unrealized | ||
| Swap counterparty/ | received | tion | received (paid) | received by | appreciation/ | |
| Notional amount | Value | (paid) | date | by fund | or paid by fund | (depreciation) |
| Morgan Stanley & Co. International PLCcont. | ||||||
| $61,369 | $61,310 | $— | 1/29/20 | Federal Funds | Eaton Vance Corp — | $66 |
| Effective Rate US | Monthly | |||||
| minus 0.23% — | ||||||
| Monthly | ||||||
| 12,651 | 12,605 | — | 1/29/20 | Federal Funds | Emlak Konut | 39 |
| Effective Rate US | Gayrimenkul Yatirim | |||||
| minus 9.63% — | Ortakligi As — | |||||
| Monthly | Monthly | |||||
| 19,571 | 19,272 | — | 1/29/20 | Federal Funds | Empresa Nacional | 300 |
| Effective Rate US | De Telecomunica- | |||||
| minus 7.50% — | ciones Sa — Monthly | |||||
| Monthly | ||||||
| 102,740 | 101,406 | — | 1/29/20 | Federal Funds | Equifax Inc — | 1,346 |
| Effective Rate US | Monthly | |||||
| minus 0.23% — | ||||||
| Monthly | ||||||
| 61,052 | 61,653 | — | 1/29/20 | Federal Funds | Euronet Worldwide | (594) |
| Effective Rate US | Inc — Monthly | |||||
| minus 0.23% — | ||||||
| Monthly | ||||||
| 26,580 | 26,696 | — | 1/27/20 | Federal Funds | Familymart Uny | (646) |
| Effective Rate US | Holdings Co Ltd — | |||||
| minus 0.30% — | Monthly | |||||
| Monthly | ||||||
| 16,259 | 16,268 | — | 1/30/20 | Federal Funds | Far Eastone | (7) |
| Effective Rate US | Telecommunica- | |||||
| minus 0.60% — | tions Co Ltd — | |||||
| Monthly | Monthly | |||||
| 38,126 | 38,205 | — | 1/29/20 | Federal Funds | Fastenal Co — | (74) |
| Effective Rate US | Monthly | |||||
| minus 0.23% — | ||||||
| Monthly | ||||||
| 55,240 | 55,024 | — | 1/29/20 | Federal Funds | Fedex Corp — | 223 |
| Effective Rate US | Monthly | |||||
| minus 0.23% — | ||||||
| Monthly | ||||||
| 7,460 | 7,461 | — | 1/29/20 | Federal Funds | Fibra Uno | (1) |
| Effective Rate US | Administracion Sa | |||||
| minus 0.50% — | De Cv — Monthly | |||||
| Monthly | ||||||
| 78,822 | 80,426 | — | 1/29/20 | Federal Funds | Fidelity National | (1,595) |
| Effective Rate US | Financial Inc — | |||||
| minus 0.23% — | Monthly | |||||
| Monthly | ||||||
| 66,985 | 67,678 | — | 1/29/20 | Federal Funds | First Horizon | (685) |
| Effective Rate US | National Corp — | |||||
| minus 0.23% — | Monthly | |||||
| Monthly | ||||||
| PanAgora Market Neutral Fund 51 |
| OTC TOTAL RETURN SWAP CONTRACTS OUTSTANDING at 2/28/19 (Unaudited)cont. | ||||||
| Upfront | ||||||
| premium | Termina- | Payments | Total return | Unrealized | ||
| Swap counterparty/ | received | tion | received (paid) | received by | appreciation/ | |
| Notional amount | Value | (paid) | date | by fund | or paid by fund | (depreciation) |
| Morgan Stanley & Co. International PLCcont. | ||||||
| $42,229 | $42,450 | $— | 1/29/20 | Federal Funds | First Merchants | $(446) |
| Effective Rate US | Corp — Monthly | |||||
| minus 0.23% — | ||||||
| Monthly | ||||||
| 175,576 | 178,466 | — | 1/29/20 | Federal Funds | First Republic Bank/ | (2,871) |
| Effective Rate US | Ca — Monthly | |||||
| minus 0.23% — | ||||||
| Monthly | ||||||
| 58,480 | 59,224 | — | 1/29/20 | Federal Funds | First Solar Inc — | (738) |
| Effective Rate US | Monthly | |||||
| minus 0.23% — | ||||||
| Monthly | ||||||
| 97,936 | 97,902 | — | 1/29/20 | Federal Funds | Fiserv Inc — Monthly | 47 |
| Effective Rate US | ||||||
| minus 0.23% — | ||||||
| Monthly | ||||||
| 74,624 | 75,116 | — | 1/29/20 | Federal Funds | Fleetcor | (484) |
| Effective Rate US | Technologies Inc — | |||||
| minus 0.23% — | Monthly | |||||
| Monthly | ||||||
| 37,552 | 36,561 | — | 1/29/20 | Federal Funds | Fletcher Building | 995 |
| Effective Rate US | Ltd — Monthly | |||||
| minus 0.40% — | ||||||
| Monthly | ||||||
| 16,835 | 16,624 | — | 1/29/20 | Federal Funds | Fletcher Building | 213 |
| Effective Rate US | Ltd — Monthly | |||||
| minus 0.45% — | ||||||
| Monthly | ||||||
| 71,593 | 70,787 | — | 1/29/20 | Federal Funds | Flex Ltd — Monthly | 814 |
| Effective Rate US | ||||||
| minus 0.23% — | ||||||
| Monthly | ||||||
| 63,294 | 62,239 | — | 1/29/20 | Federal Funds | Floor & Decor | 1,062 |
| Effective Rate US | Holdings Inc — | |||||
| minus 0.23% — | Monthly | |||||
| Monthly | ||||||
| 119,113 | 116,936 | — | 1/29/20 | Federal Funds | Fluor Corp — | 2,195 |
| Effective Rate US | Monthly | |||||
| minus 0.23% — | ||||||
| Monthly | ||||||
| 107,520 | 108,495 | — | 1/29/20 | Federal Funds | Fnb Corp/Pa — | (962) |
| Effective Rate US | Monthly | |||||
| minus 0.23% — | ||||||
| Monthly | ||||||
| 66,696 | 61,851 | — | 1/29/20 | Federal Funds | Fortescue Metals | 1,780 |
| Effective Rate US | Group Ltd — | |||||
| minus 0.45% — | Monthly | |||||
| Monthly | ||||||
| 52 PanAgora Market Neutral Fund | |
| OTC TOTAL RETURN SWAP CONTRACTS OUTSTANDING at 2/28/19 (Unaudited)cont. | ||||||
| Upfront | ||||||
| premium | Termina- | Payments | Total return | Unrealized | ||
| Swap counterparty/ | received | tion | received (paid) | received by | appreciation/ | |
| Notional amount | Value | (paid) | date | by fund | or paid by fund | (depreciation) |
| Morgan Stanley & Co. International PLCcont. | ||||||
| $18,622 | $18,512 | $— | 1/27/20 | Federal Funds | Foschini Group Ltd/ | $112 |
| Effective Rate US | The — Monthly | |||||
| minus 0.90% — | ||||||
| Monthly | ||||||
| 137,583 | 136,995 | — | 1/29/20 | Federal Funds | Franklin Resources | 605 |
| Effective Rate US | Inc — Monthly | |||||
| minus 0.23% — | ||||||
| Monthly | ||||||
| 4,969 | 5,000 | — | 1/29/20 | Federal Funds | Fullshare Holdings | (34) |
| Effective Rate US | Ltd — Monthly | |||||
| minus 13.12% — | ||||||
| Monthly | ||||||
| 172,746 | 171,756 | — | 1/29/20 | Federal Funds | Gartner Inc — | 1,006 |
| Effective Rate US | Monthly | |||||
| minus 0.23% — | ||||||
| Monthly | ||||||
| 113,476 | 113,987 | — | 1/29/20 | Federal Funds | Gci Liberty Inc — | (498) |
| Effective Rate US | Monthly | |||||
| minus 0.23% — | ||||||
| Monthly | ||||||
| 14,135 | 14,938 | — | 1/29/20 | Federal Funds | Gds Holdings Ltd | (802) |
| Effective Rate US | Adr — Monthly | |||||
| minus 0.23% — | ||||||
| Monthly | ||||||
| 108,460 | 108,600 | — | 1/29/20 | Federal Funds | General Dynamics | (127) |
| Effective Rate US | Corp — Monthly | |||||
| minus 0.23% — | ||||||
| Monthly | ||||||
| 92,502 | 93,035 | — | 1/29/20 | Federal Funds | General Mills Inc — | (524) |
| Effective Rate US | Monthly | |||||
| minus 0.23% — | ||||||
| Monthly | ||||||
| 74,401 | 73,718 | — | 1/29/20 | Federal Funds | Genesee & Wyoming | 692 |
| Effective Rate US | Inc — Monthly | |||||
| minus 0.23% — | ||||||
| Monthly | ||||||
| 19,296 | 19,327 | — | 1/29/20 | Federal Funds | Genexine Co Ltd — | (36) |
| Effective Rate US | Monthly | |||||
| minus 8.88% — | ||||||
| Monthly | ||||||
| 19,678 | 19,608 | — | 1/28/20 | Federal Funds | Genting Plantations | 64 |
| Effective Rate US | Bhd — Monthly | |||||
| minus 6.50% — | ||||||
| Monthly | ||||||
| 45,170 | 44,931 | — | 1/29/20 | Federal Funds | Glanbia Plc — | 246 |
| Effective Rate US | Monthly | |||||
| minus 0.30% — | ||||||
| Monthly | ||||||
| PanAgora Market Neutral Fund 53 |
| OTC TOTAL RETURN SWAP CONTRACTS OUTSTANDING at 2/28/19 (Unaudited)cont. | ||||||
| Upfront | ||||||
| premium | Termina- | Payments | Total return | Unrealized | ||
| Swap counterparty/ | received | tion | received (paid) | received by | appreciation/ | |
| Notional amount | Value | (paid) | date | by fund | or paid by fund | (depreciation) |
| Morgan Stanley & Co. International PLCcont. | ||||||
| $5,263 | $5,175 | $— | 1/29/20 | Federal Funds | Gold Fields Ltd | $88 |
| Effective Rate US | Adr — Monthly | |||||
| minus 0.23% — | ||||||
| Monthly | ||||||
| 4,877 | 4,395 | — | 1/29/20 | Federal Funds | Great Wall Motor Co | 483 |
| Effective Rate US | Ltd — Monthly | |||||
| minus 5.00% — | ||||||
| Monthly | ||||||
| 19,180 | 18,955 | — | 1/29/20 | Federal Funds | Grupo Financiero | 228 |
| Effective Rate US | Inbursa Sab De Cv — | |||||
| minus 0.50% — | Monthly | |||||
| Monthly | ||||||
| 50,454 | 56,763 | — | 1/29/20 | Federal Funds | Gw Pharmaceuticals | (6,304) |
| Effective Rate US | Plc Adr — Monthly | |||||
| minus 0.55% — | ||||||
| Monthly | ||||||
| 139,783 | 139,035 | — | 1/29/20 | Federal Funds | Hanesbrands Inc — | 763 |
| Effective Rate US | Monthly | |||||
| minus 0.23% — | ||||||
| Monthly | ||||||
| 40,217 | 41,174 | — | 1/29/20 | Federal Funds | Hargreaves | (951) |
| Effective Rate US | Lansdown Plc — | |||||
| minus 0.30% — | Monthly | |||||
| Monthly | ||||||
| 15,208 | 13,766 | — | 1/27/20 | Federal Funds | Harmonic Drive | 1,437 |
| Effective Rate US | Systems Inc — | |||||
| minus 12.25% — | Monthly | |||||
| Monthly | ||||||
| 49,027 | 49,809 | — | 1/29/20 | Federal Funds | Harris Corp — | (776) |
| Effective Rate US | Monthly | |||||
| minus 0.23% — | ||||||
| Monthly | ||||||
| 151,179 | 155,446 | — | 1/29/20 | Federal Funds | Hormel Foods | (4,253) |
| Effective Rate US | Corp — Monthly | |||||
| minus 0.23% — | ||||||
| Monthly | ||||||
| 47,887 | 47,787 | — | 1/27/20 | Federal Funds | Hulic Co Ltd — | 111 |
| Effective Rate US | Monthly | |||||
| minus 0.30% — | ||||||
| Monthly | ||||||
| 94,636 | 89,218 | — | 1/29/20 | Federal Funds | Humana Inc — | 5,429 |
| Effective Rate US | Monthly | |||||
| minus 0.23% — | ||||||
| Monthly | ||||||
| 5,254 | 5,115 | — | 1/27/20 | Federal Funds | Hyprop Investments | 140 |
| Effective Rate US | Ltd — Monthly | |||||
| minus 0.90% — | ||||||
| Monthly | ||||||
| 54 PanAgora Market Neutral Fund | |
| OTC TOTAL RETURN SWAP CONTRACTS OUTSTANDING at 2/28/19 (Unaudited)cont. | ||||||
| Upfront | ||||||
| premium | Termina- | Payments | Total return | Unrealized | ||
| Swap counterparty/ | received | tion | received (paid) | received by | appreciation/ | |
| Notional amount | Value | (paid) | date | by fund | or paid by fund | (depreciation) |
| Morgan Stanley & Co. International PLCcont. | ||||||
| $44,241 | $44,766 | $— | 1/29/20 | Federal Funds | Ica Gruppen Ab — | $(533) |
| Effective Rate US | Monthly | |||||
| minus 4.00% — | ||||||
| Monthly | ||||||
| 43,210 | 43,894 | — | 1/29/20 | Federal Funds | Idexx Laboratories | (679) |
| Effective Rate US | Inc — Monthly | |||||
| minus 0.23% — | ||||||
| Monthly | ||||||
| 5,796 | 5,777 | — | 1/28/20 | Federal Funds | Ihh Healthcare | 18 |
| Effective Rate US | Bhd — Monthly | |||||
| minus 3.00% — | ||||||
| Monthly | ||||||
| 33,605 | 33,772 | — | 1/29/20 | Federal Funds | Ii-Vi Inc — Monthly | 15 |
| Effective Rate US | ||||||
| minus 0.23% — | ||||||
| Monthly | ||||||
| 16,085 | 15,404 | — | 1/28/20 | Federal Funds | Ijm Corp Bhd — | 678 |
| Effective Rate US | Monthly | |||||
| minus 4.00% — | ||||||
| Monthly | ||||||
| 11,469 | 11,124 | — | 1/27/20 | Federal Funds | Indocement | 343 |
| Effective Rate US | Tunggal Prakarsa | |||||
| minus 8.38% — | Tbk Pt — Monthly | |||||
| Monthly | ||||||
| 4,651 | 4,573 | — | 1/29/20 | Federal Funds | Industrias Penoles | 79 |
| Effective Rate US | Sab De Cv — | |||||
| minus 0.50% — | Monthly | |||||
| Monthly | ||||||
| 28,956 | 29,167 | — | 1/29/20 | Federal Funds | Ingenico Group Sa — | (208) |
| Effective Rate US | Monthly | |||||
| minus 0.30% — | ||||||
| Monthly | ||||||
| 92,355 | 91,304 | — | 1/29/20 | Federal Funds | International | 1,062 |
| Effective Rate US | Business Machines | |||||
| minus 0.23% — | Corp — Monthly | |||||
| Monthly | ||||||
| 61,428 | 61,332 | — | 1/29/20 | Federal Funds | Intuitive Surgical | 103 |
| Effective Rate US | Inc — Monthly | |||||
| minus 0.23% — | ||||||
| Monthly | ||||||
| 46,187 | 46,912 | — | 1/29/20 | Federal Funds | Investment Ab | (731) |
| Effective Rate US | Latour — Monthly | |||||
| minus 5.25% — | ||||||
| Monthly | ||||||
| 64,789 | 62,942 | — | 1/29/20 | Federal Funds | Ipg Photonics | 1,855 |
| Effective Rate US | Corp — Monthly | |||||
| minus 0.23% — | ||||||
| Monthly | ||||||
| PanAgora Market Neutral Fund 55 |
| OTC TOTAL RETURN SWAP CONTRACTS OUTSTANDING at 2/28/19 (Unaudited)cont. | ||||||
| Upfront | ||||||
| premium | Termina- | Payments | Total return | Unrealized | ||
| Swap counterparty/ | received | tion | received (paid) | received by | appreciation/ | |
| Notional amount | Value | (paid) | date | by fund | or paid by fund | (depreciation) |
| Morgan Stanley & Co. International PLCcont. | ||||||
| $12,194 | $12,165 | $— | 1/29/20 | Federal Funds | Iskenderun Demir Ve | $30 |
| Effective Rate US | Celik As — Monthly | |||||
| minus 16.76% — | ||||||
| Monthly | ||||||
| 6,093 | 5,918 | — | 1/27/20 | Federal Funds | Itau Unibanco | 175 |
| Effective Rate US | Holding Sa — | |||||
| minus 1.00% — | Monthly | |||||
| Monthly | ||||||
| 8,669 | 8,399 | — | 1/27/20 | Federal Funds | Itausa — | 272 |
| Effective Rate US | Investimentos Itau | |||||
| minus 1.00% — | Sa — Monthly | |||||
| Monthly | ||||||
| 116,967 | 114,310 | — | 1/29/20 | Federal Funds | Jabil Inc — Monthly | 2,670 |
| Effective Rate US | ||||||
| minus 0.23% — | ||||||
| Monthly | ||||||
| 40,930 | 40,850 | — | 1/29/20 | Federal Funds | Jack Henry & | (38) |
| Effective Rate US | Associates Inc — | |||||
| minus 0.23% — | Monthly | |||||
| Monthly | ||||||
| 62,524 | 61,680 | — | 1/29/20 | Federal Funds | Jacobs Engineering | 851 |
| Effective Rate US | Group Inc — Monthly | |||||
| minus 0.23% — | ||||||
| Monthly | ||||||
| 48,511 | 47,581 | — | 1/28/20 | Federal Funds | Jardine Matheson | 938 |
| Effective Rate US | Holdings Ltd — | |||||
| minus 0.35% — | Monthly | |||||
| Monthly | ||||||
| 51,856 | 52,581 | — | 1/29/20 | Federal Funds | Jeronimo Martins | (719) |
| Effective Rate US | Sgps Sa — Monthly | |||||
| minus 0.30% — | ||||||
| Monthly | ||||||
| 86,357 | 86,211 | — | 1/29/20 | Federal Funds | Jm Smucker Co/ | 153 |
| Effective Rate US | The — Monthly | |||||
| minus 0.23% — | ||||||
| Monthly | ||||||
| 38,003 | 36,457 | — | 1/29/20 | Federal Funds | John Wood Group | 1,550 |
| Effective Rate US | Plc — Monthly | |||||
| minus 0.30% — | ||||||
| Monthly | ||||||
| 49,410 | 47,718 | — | 1/27/20 | Federal Funds | Kansai Paint Co | 1,700 |
| Effective Rate US | Ltd — Monthly | |||||
| minus 0.30% — | ||||||
| Monthly | ||||||
| 103,049 | 102,230 | — | 1/29/20 | Federal Funds | Kansas City | 831 |
| Effective Rate US | Southern — Monthly | |||||
| minus 0.23% — | ||||||
| Monthly | ||||||
| 56 PanAgora Market Neutral Fund | |
| OTC TOTAL RETURN SWAP CONTRACTS OUTSTANDING at 2/28/19 (Unaudited)cont. | ||||||
| Upfront | ||||||
| premium | Termina- | Payments | Total return | Unrealized | ||
| Swap counterparty/ | received | tion | received (paid) | received by | appreciation/ | |
| Notional amount | Value | (paid) | date | by fund | or paid by fund | (depreciation) |
| Morgan Stanley & Co. International PLCcont. | ||||||
| $54,404 | $53,959 | $— | 1/29/20 | Federal Funds | Kaz Minerals Plc — | $451 |
| Effective Rate US | Monthly | |||||
| minus 0.30% — | ||||||
| Monthly | ||||||
| 48,949 | 49,585 | — | 1/27/20 | Federal Funds | Keio Corp — | (628) |
| Effective Rate US | Monthly | |||||
| minus 0.30% — | ||||||
| Monthly | ||||||
| 40,979 | 40,500 | — | 1/29/20 | Federal Funds | Kerry Group Plc — | 483 |
| Effective Rate US | Monthly | |||||
| minus 0.30% — | ||||||
| Monthly | ||||||
| 7,215 | 6,891 | — | 1/29/20 | Federal Funds | Kimberly-Clark De | 324 |
| Effective Rate US | Mexico Sab De Cv — | |||||
| minus 0.50% — | Monthly | |||||
| Monthly | ||||||
| 25,823 | 25,710 | — | 1/29/20 | Federal Funds | Kingfisher Plc — | 116 |
| Effective Rate US | Monthly | |||||
| minus 0.30% — | ||||||
| Monthly | ||||||
| 67,598 | 64,377 | — | 1/29/20 | Federal Funds | Kion Group Ag — | 3,229 |
| Effective Rate US | Monthly | |||||
| minus 0.30% — | ||||||
| Monthly | ||||||
| 162,229 | 158,534 | — | 1/29/20 | Federal Funds | Kirby Corp — | 3,715 |
| Effective Rate US | Monthly | |||||
| minus 0.23% — | ||||||
| Monthly | ||||||
| 40,994 | 40,334 | — | 1/27/20 | Federal Funds | Kobayashi | 667 |
| Effective Rate US | Pharmaceutical Co | |||||
| minus 0.30% — | Ltd — Monthly | |||||
| Monthly | ||||||
| 20,685 | 20,563 | — | 1/29/20 | Federal Funds | Komercni Banka | 125 |
| Effective Rate US | As — Monthly | |||||
| minus 0.50% — | ||||||
| Monthly | ||||||
| 13,625 | 13,572 | — | 1/29/20 | Federal Funds | Korea Electric | 55 |
| Effective Rate US | Power Corp — | |||||
| minus 0.49% — | Monthly | |||||
| Monthly | ||||||
| 97,908 | 97,244 | — | 1/29/20 | Federal Funds | Leggett & Platt Inc — | 675 |
| Effective Rate US | Monthly | |||||
| minus 0.23% — | ||||||
| Monthly | ||||||
| 61,535 | 61,666 | — | 1/29/20 | Federal Funds | Liberty Broadband | (123) |
| Effective Rate US | Corp — Monthly | |||||
| minus 0.23% — | ||||||
| Monthly | ||||||
| PanAgora Market Neutral Fund 57 |
| OTC TOTAL RETURN SWAP CONTRACTS OUTSTANDING at 2/28/19 (Unaudited)cont. | ||||||
| Upfront | ||||||
| premium | Termina- | Payments | Total return | Unrealized | ||
| Swap counterparty/ | received | tion | received (paid) | received by | appreciation/ | |
| Notional amount | Value | (paid) | date | by fund | or paid by fund | (depreciation) |
| Morgan Stanley & Co. International PLCcont. | ||||||
| $99,120 | $99,489 | $— | 1/29/20 | Federal Funds | Live Nation | $(359) |
| Effective Rate US | Entertainment Inc — | |||||
| minus 0.23% — | Monthly | |||||
| Monthly | ||||||
| 21,466 | 21,189 | — | 1/27/20 | Federal Funds | Localiza Rent A Car | 281 |
| Effective Rate US | Sa — Monthly | |||||
| minus 2.38% — | ||||||
| Monthly | ||||||
| 14,784 | 15,396 | — | 1/27/20 | Federal Funds | Lojas Americanas | (610) |
| Effective Rate US | Sa — Monthly | |||||
| minus 1.93% — | ||||||
| Monthly | ||||||
| 16,755 | 16,666 | — | 1/29/20 | Federal Funds | Lotte Corp — | 92 |
| Effective Rate US | Monthly | |||||
| minus 3.88% — | ||||||
| Monthly | ||||||
| 27,424 | 28,058 | — | 1/27/20 | Federal Funds | M3 Inc — Monthly | (629) |
| Effective Rate US | ||||||
| minus 0.30% — | ||||||
| Monthly | ||||||
| 124,917 | 124,476 | — | 1/29/20 | Federal Funds | Madison Square | 456 |
| Effective Rate US | Garden Co/The — | |||||
| minus 0.23% — | Monthly | |||||
| Monthly | ||||||
| 69,743 | 69,937 | — | 1/29/20 | Federal Funds | Mattel Inc — | (193) |
| Effective Rate US | Monthly | |||||
| minus 1.11% — | ||||||
| Monthly | ||||||
| 56,542 | 57,792 | — | 1/29/20 | Federal Funds | Mccormick & Co Inc/ | (1,243) |
| Effective Rate US | Md — Monthly | |||||
| minus 0.23% — | ||||||
| Monthly | ||||||
| 35,699 | 35,412 | — | 1/27/20 | Federal Funds | Mcdonald’s Co | 293 |
| Effective Rate US | Japan Ltd — | |||||
| minus 0.30% — | Monthly | |||||
| Monthly | ||||||
| 41,981 | 41,692 | — | 1/29/20 | Federal Funds | Mediclinic | 295 |
| Effective Rate US | International Plc — | |||||
| minus 1.00% — | Monthly | |||||
| Monthly | ||||||
| 58,619 | 57,993 | — | 1/29/20 | Federal Funds | Melrose Industries | 633 |
| Effective Rate US | Plc — Monthly | |||||
| minus 0.30% — | ||||||
| Monthly | ||||||
| 32,741 | 30,830 | — | 1/27/20 | Federal Funds | Mercari Inc — | 1,911 |
| Effective Rate US | Monthly | |||||
| minus 7.00% — | ||||||
| Monthly | ||||||
| 58 PanAgora Market Neutral Fund |
| OTC TOTAL RETURN SWAP CONTRACTS OUTSTANDING at 2/28/19 (Unaudited)cont. | ||||||
| Upfront | ||||||
| premium | Termina- | Payments | Total return | Unrealized | ||
| Swap counterparty/ | received | tion | received (paid) | received by | appreciation/ | |
| Notional amount | Value | (paid) | date | by fund | or paid by fund | (depreciation) |
| Morgan Stanley & Co. International PLCcont. | ||||||
| $102,224 | $102,817 | $— | 1/29/20 | Federal Funds | Mettler-Toledo | $(581) |
| Effective Rate US | International Inc — | |||||
| minus 0.23% — | Monthly | |||||
| Monthly | ||||||
| 51,479 | 51,288 | — | 1/29/20 | Federal Funds | Mgm China Holdings | 194 |
| Effective Rate US | Ltd — Monthly | |||||
| minus 0.40% — | ||||||
| Monthly | ||||||
| 52,948 | 53,296 | — | 1/29/20 | Federal Funds | Micro Focus | (1,630) |
| Effective Rate US | International Plc — | |||||
| minus 0.30% — | Monthly | |||||
| Monthly | ||||||
| 170,957 | 175,671 | — | 1/29/20 | Federal Funds | Middleby Corp/ | (4,694) |
| Effective Rate US | The — Monthly | |||||
| minus 0.23% — | ||||||
| Monthly | ||||||
| 23,368 | 23,931 | — | 1/27/20 | Federal Funds | Minor International | (561) |
| Effective Rate US | Pcl — Monthly | |||||
| minus 1.50% — | ||||||
| Monthly | ||||||
| 19,842 | 19,352 | — | 1/29/20 | Federal Funds | Mirae Asset Daewoo | 493 |
| Effective Rate US | Co Ltd — Monthly | |||||
| minus 0.40% — | ||||||
| Monthly | ||||||
| 1,207 | 1,202 | — | 1/29/20 | Federal Funds | Mirae Asset Daewoo | 5 |
| Effective Rate US | Co Ltd — Monthly | |||||
| minus 0.40% — | ||||||
| Monthly | ||||||
| 49,639 | 48,381 | — | 1/27/20 | Federal Funds | Misumi Group Inc — | 1,266 |
| Effective Rate US | Monthly | |||||
| minus 0.30% — | ||||||
| Monthly | ||||||
| 57,408 | 55,809 | — | 1/29/20 | Federal Funds | Mohawk Industries | 1,606 |
| Effective Rate US | Inc — Monthly | |||||
| minus 0.23% — | ||||||
| Monthly | ||||||
| 58,837 | 58,644 | — | 1/27/20 | Federal Funds | Monotaro Co Ltd — | 199 |
| Effective Rate US | Monthly | |||||
| minus 1.38% — | ||||||
| Monthly | ||||||
| 15,572 | 15,712 | — | 1/29/20 | Federal Funds | Moscow Exchange | (149) |
| Effective Rate US | Micex-Rts Pjsc — | |||||
| minus 12.26% — | Monthly | |||||
| Monthly | ||||||
| 17,527 | 17,137 | — | 1/27/20 | Federal Funds | Netcare Ltd — | 393 |
| Effective Rate US | Monthly | |||||
| minus 0.90% — | ||||||
| Monthly | ||||||
| PanAgora Market Neutral Fund 59 |
| OTC TOTAL RETURN SWAP CONTRACTS OUTSTANDING at 2/28/19 (Unaudited)cont. | ||||||
| Upfront | ||||||
| premium | Termina- | Payments | Total return | Unrealized | ||
| Swap counterparty/ | received | tion | received (paid) | received by | appreciation/ | |
| Notional amount | Value | (paid) | date | by fund | or paid by fund | (depreciation) |
| Morgan Stanley & Co. International PLCcont. | ||||||
| $21,266 | $20,459 | $— | 1/29/20 | Federal Funds | Netmarble Corp — | $797 |
| Effective Rate US | Monthly | |||||
| minus 10.38% — | ||||||
| Monthly | ||||||
| 41,395 | 40,413 | — | 1/27/20 | Federal Funds | Nitori Holdings Co | 990 |
| Effective Rate US | Ltd — Monthly | |||||
| minus 0.30% — | ||||||
| Monthly | ||||||
| 28,490 | 27,861 | — | 1/29/20 | Federal Funds | Novozymes A/S — | 166 |
| Effective Rate US | Monthly | |||||
| minus 0.30% — | ||||||
| Monthly | ||||||
| 76,230 | 72,710 | — | 1/29/20 | Federal Funds | On Semiconductor | 3,530 |
| Effective Rate US | Corp — Monthly | |||||
| minus 0.23% — | ||||||
| Monthly | ||||||
| 141,599 | 140,334 | — | 1/29/20 | Federal Funds | Oracle Corp — | 1,281 |
| Effective Rate US | Monthly | |||||
| minus 0.23% — | ||||||
| Monthly | ||||||
| 15,879 | 16,056 | — | 1/29/20 | Federal Funds | Orange Polska Sa — | (175) |
| Effective Rate US | Monthly | |||||
| minus 0.75% — | ||||||
| Monthly | ||||||
| 14,881 | 14,247 | — | 1/29/20 | Federal Funds | Orient Securities Co | 635 |
| Effective Rate US | Ltd — Monthly | |||||
| minus 0.40% — | ||||||
| Monthly | ||||||
| 43,434 | 43,424 | — | 1/29/20 | Federal Funds | Origin Energy Ltd — | 14 |
| Effective Rate US | Monthly | |||||
| minus 0.45% — | ||||||
| Monthly | ||||||
| 41,123 | 41,345 | — | 1/29/20 | Federal Funds | Osram Licht Ag — | (218) |
| Effective Rate US | Monthly | |||||
| minus 1.50% — | ||||||
| Monthly | ||||||
| 17,118 | 16,982 | — | 1/29/20 | Federal Funds | Ottogi Corp — | 137 |
| Effective Rate US | Monthly | |||||
| minus 0.88% — | ||||||
| Monthly | ||||||
| 46,134 | 45,810 | — | 1/27/20 | Federal Funds | Pan Pacific | 333 |
| Effective Rate US | International | |||||
| minus 0.38% — | Holdings Corp — | |||||
| Monthly | Monthly | |||||
| 40,425 | 40,307 | — | 1/27/20 | Federal Funds | Park24 Co Ltd — | 125 |
| Effective Rate US | Monthly | |||||
| minus 0.30% — | ||||||
| Monthly | ||||||
| 60 PanAgora Market Neutral Fund | |
| OTC TOTAL RETURN SWAP CONTRACTS OUTSTANDING at 2/28/19 (Unaudited)cont. | ||||||
| Upfront | ||||||
| premium | Termina- | Payments | Total return | Unrealized | ||
| Swap counterparty/ | received | tion | received (paid) | received by | appreciation/ | |
| Notional amount | Value | (paid) | date | by fund | or paid by fund | (depreciation) |
| Morgan Stanley & Co. International PLCcont. | ||||||
| $57,918 | $58,335 | $— | 1/29/20 | Federal Funds | Paycom Software | $(411) |
| Effective Rate US | Inc — Monthly | |||||
| minus 0.23% — | ||||||
| Monthly | ||||||
| 17,880 | 16,494 | — | 1/29/20 | Federal Funds | Pearl Abyss Corp — | 1,382 |
| Effective Rate US | Monthly | |||||
| minus 6.00% — | ||||||
| Monthly | ||||||
| 12,146 | 11,949 | — | 1/30/20 | Federal Funds | Pegatron Corp — | 199 |
| Effective Rate US | Monthly | |||||
| minus 0.66% — | ||||||
| Monthly | ||||||
| 33,699 | 34,274 | — | 1/29/20 | Federal Funds | Perkinelmer Inc — | (572) |
| Effective Rate US | Monthly | |||||
| minus 0.23% — | ||||||
| Monthly | ||||||
| 109,271 | 110,109 | — | 1/29/20 | Federal Funds | Pfizer Inc — Monthly | (826) |
| Effective Rate US | ||||||
| minus 0.23% — | ||||||
| Monthly | ||||||
| 103,744 | 104,762 | — | 1/29/20 | Federal Funds | Pinnacle Financial | (1,007) |
| Effective Rate US | Partners Inc — | |||||
| minus 0.23% — | Monthly | |||||
| Monthly | ||||||
| 20,184 | 20,126 | — | 1/29/20 | Federal Funds | Polymetal | 61 |
| Effective Rate US | International Plc — | |||||
| minus 0.30% — | Monthly | |||||
| Monthly | ||||||
| 173,215 | 171,346 | — | 1/29/20 | Federal Funds | Pool Corp — | 1,888 |
| Effective Rate US | Monthly | |||||
| minus 0.23% — | ||||||
| Monthly | ||||||
| 15,734 | 15,567 | — | 1/29/20 | Federal Funds | Postal Savings Bank | 169 |
| Effective Rate US | Of China Co Ltd — | |||||
| minus 0.40% — | Monthly | |||||
| Monthly | ||||||
| 18,424 | 18,213 | — | 1/28/20 | Federal Funds | Press Metal | 206 |
| Effective Rate US | Aluminium Holdings | |||||
| minus 5.49% — | Bhd — Monthly | |||||
| Monthly | ||||||
| 93,750 | 93,857 | — | 1/29/20 | Federal Funds | Principal Financial | (96) |
| Effective Rate US | Group Inc — Monthly | |||||
| minus 0.23% — | ||||||
| Monthly | ||||||
| 56,909 | 52,684 | — | 1/29/20 | Federal Funds | Quad/Graphics | 4,231 |
| Effective Rate US | Inc — Monthly | |||||
| minus 0.23% — | ||||||
| Monthly | ||||||
| PanAgora Market Neutral Fund 61 |
| OTC TOTAL RETURN SWAP CONTRACTS OUTSTANDING at 2/28/19 (Unaudited)cont. | ||||||
| Upfront | ||||||
| premium | Termina- | Payments | Total return | Unrealized | ||
| Swap counterparty/ | received | tion | received (paid) | received by | appreciation/ | |
| Notional amount | Value | (paid) | date | by fund | or paid by fund | (depreciation) |
| Morgan Stanley & Co. International PLCcont. | ||||||
| $47,329 | $50,328 | $— | 1/29/20 | Federal Funds | Ramsay Health Care | $(2,994) |
| Effective Rate US | Ltd — Monthly | |||||
| minus 0.45% — | ||||||
| Monthly | ||||||
| 16,173 | 16,079 | — | 1/27/20 | Federal Funds | Rand Merchant | 96 |
| Effective Rate US | Investment | |||||
| minus 0.90% — | Holdings Ltd — | |||||
| Monthly | Monthly | |||||
| 25,328 | 25,760 | — | 1/29/20 | Federal Funds | Ready Capital | (427) |
| Effective Rate US | Corp — Monthly | |||||
| minus 0.23% — | ||||||
| Monthly | ||||||
| 37,621 | 37,356 | — | 1/29/20 | Federal Funds | Reckitt Benckiser | 269 |
| Effective Rate US | Group Plc — Monthly | |||||
| minus 0.30% — | ||||||
| Monthly | ||||||
| 18,681 | 18,748 | — | 1/27/20 | Federal Funds | Reinet Investments | (65) |
| Effective Rate US | Sca — Monthly | |||||
| minus 0.90% — | ||||||
| Monthly | ||||||
| 18,121 | 17,573 | — | 1/27/20 | Federal Funds | Remgro Ltd — | 550 |
| Effective Rate US | Monthly | |||||
| minus 0.90% — | ||||||
| Monthly | ||||||
| 66,802 | 67,798 | — | 1/29/20 | Federal Funds | Remy Cointreau | (989) |
| Effective Rate US | Sa — Monthly | |||||
| minus 0.30% — | ||||||
| Monthly | ||||||
| 18,606 | 17,724 | — | 1/27/20 | Federal Funds | Resilient Reit Ltd — | 884 |
| Effective Rate US | Monthly | |||||
| minus 0.90% — | ||||||
| Monthly | ||||||
| 46,433 | 45,679 | — | 1/27/20 | Federal Funds | Ricoh Co Ltd — | 762 |
| Effective Rate US | Monthly | |||||
| minus 0.30% — | ||||||
| Monthly | ||||||
| 33,864 | 34,768 | — | 1/29/20 | Federal Funds | Royal Bank Of | (901) |
| Effective Rate US | Scotland Group | |||||
| minus 0.30% — | Plc — Monthly | |||||
| Monthly | ||||||
| 42,405 | 42,190 | — | 1/29/20 | Federal Funds | Ryanair Holdings Plc | 221 |
| Effective Rate US | Adr — Monthly | |||||
| minus 0.23% — | ||||||
| Monthly | ||||||
| 64,604 | 64,771 | — | 1/29/20 | Federal Funds | Ryder System Inc — | (159) |
| Effective Rate US | Monthly | |||||
| minus 0.23% — | ||||||
| Monthly | ||||||
| 62 PanAgora Market Neutral Fund | |
| OTC TOTAL RETURN SWAP CONTRACTS OUTSTANDING at 2/28/19 (Unaudited)cont. | ||||||
| Upfront | ||||||
| premium | Termina- | Payments | Total return | Unrealized | ||
| Swap counterparty/ | received | tion | received (paid) | received by | appreciation/ | |
| Notional amount | Value | (paid) | date | by fund | or paid by fund | (depreciation) |
| Morgan Stanley & Co. International PLCcont. | ||||||
| $86,768 | $90,454 | $— | 1/29/20 | Federal Funds | Sage Therapeutics | $(3,677) |
| Effective Rate US | Inc — Monthly | |||||
| minus 0.23% — | ||||||
| Monthly | ||||||
| 48,784 | 51,680 | — | 1/29/20 | Federal Funds | Saipem Spa — | (2,890) |
| Effective Rate US | Monthly | |||||
| minus 0.30% — | ||||||
| Monthly | ||||||
| 14,961 | 14,925 | — | 1/29/20 | Federal Funds | Samsung Card Co | 38 |
| Effective Rate US | Ltd — Monthly | |||||
| minus 0.40% — | ||||||
| Monthly | ||||||
| 17,623 | 17,567 | — | 1/29/20 | Federal Funds | Samsung Heavy | 58 |
| Effective Rate US | Industries Co Ltd — | |||||
| minus 0.88% — | Monthly | |||||
| Monthly | ||||||
| 10,466 | 10,460 | — | 1/29/20 | Federal Funds | Santander Bank | 7 |
| Effective Rate US | Polska Sa — Monthly | |||||
| minus 0.75% — | ||||||
| Monthly | ||||||
| 9,834 | 9,489 | — | 1/27/20 | Federal Funds | Security Bank | 342 |
| Effective Rate US | Corp — Monthly | |||||
| minus 6.75% — | ||||||
| Monthly | ||||||
| 11,855 | 11,770 | — | 1/28/20 | Federal Funds | Sembcorp Marine | 77 |
| Effective Rate US | Ltd — Monthly | |||||
| minus 9.00% — | ||||||
| Monthly | ||||||
| 11,879 | 11,521 | — | 1/29/20 | Federal Funds | Shanghai Electric | 358 |
| Effective Rate US | Group Co Ltd — | |||||
| minus 1.19% — | Monthly | |||||
| Monthly | ||||||
| 17,918 | 17,916 | — | 1/29/20 | Federal Funds | Shenzhen | 4 |
| Effective Rate US | Investment Ltd — | |||||
| minus 0.40% — | Monthly | |||||
| Monthly | ||||||
| 43,739 | 41,926 | — | 1/27/20 | Federal Funds | Shimano Inc — | 1,821 |
| Effective Rate US | Monthly | |||||
| minus 0.30% — | ||||||
| Monthly | ||||||
| 75,452 | 75,028 | — | 1/29/20 | Federal Funds | Siemens Gamesa | 424 |
| Effective Rate US | Renewable Energy | |||||
| minus 0.88% — | Sa — Monthly | |||||
| Monthly | ||||||
| 12,039 | 12,221 | — | 1/29/20 | Federal Funds | Sillajen Inc — | (186) |
| Effective Rate US | Monthly | |||||
| minus 9.00% — | ||||||
| Monthly | ||||||
| PanAgora Market Neutral Fund 63 |
| OTC TOTAL RETURN SWAP CONTRACTS OUTSTANDING at 2/28/19 (Unaudited)cont. | ||||||
| Upfront | ||||||
| premium | Termina- | Payments | Total return | Unrealized | ||
| Swap counterparty/ | received | tion | received (paid) | received by | appreciation/ | |
| Notional amount | Value | (paid) | date | by fund | or paid by fund | (depreciation) |
| Morgan Stanley & Co. International PLCcont. | ||||||
| $45,682 | $44,699 | $— | 1/29/20 | Federal Funds | Sino Land Co Ltd — | $988 |
| Effective Rate US | Monthly | |||||
| minus 0.40% — | ||||||
| Monthly | ||||||
| 9,798 | 9,803 | — | 1/30/20 | Federal Funds | Sinopac Financial | (4) |
| Effective Rate US | Holdings Co Ltd — | |||||
| minus 0.40% — | Monthly | |||||
| Monthly | ||||||
| 41,923 | 41,337 | — | 1/29/20 | Federal Funds | Six Flags | 591 |
| Effective Rate US | Entertainment | |||||
| minus 0.35% — | Corp — Monthly | |||||
| Monthly | ||||||
| 80,772 | 81,597 | — | 1/29/20 | Federal Funds | Skanska Ab — | (818) |
| Effective Rate US | Monthly | |||||
| minus 0.30% — | ||||||
| Monthly | ||||||
| 13,380 | 12,490 | — | 1/29/20 | Federal Funds | Sociedad Quimica | 892 |
| Effective Rate US | Y Minera De Chile Sa | |||||
| minus 14.45% — | Adr — Monthly | |||||
| Monthly | ||||||
| 20,964 | 20,354 | — | 1/29/20 | Federal Funds | Soho China Ltd — | 612 |
| Effective Rate US | Monthly | |||||
| minus 0.40% — | ||||||
| Monthly | ||||||
| 16,309 | 16,271 | — | 1/29/20 | Federal Funds | S-Oil Corp — | 41 |
| Effective Rate US | Monthly | |||||
| minus 0.40% — | ||||||
| Monthly | ||||||
| 26,084 | 25,247 | — | 1/29/20 | Federal Funds | Southern Copper | 840 |
| Effective Rate US | Corp — Monthly | |||||
| minus 0.23% — | ||||||
| Monthly | ||||||
| 5,380 | 4,832 | — | 1/28/20 | Federal Funds | Sp Setia Bhd | 544 |
| Effective Rate US | Group — Monthly | |||||
| minus 3.00% — | ||||||
| Monthly | ||||||
| 651,374 | 649,882 | — | 1/29/20 | Federal Funds | Spdr S&P 500 Etf | 1,609 |
| Effective Rate US | Trust — Monthly | |||||
| minus 0.23% — | ||||||
| Monthly | ||||||
| 78,278 | 76,280 | — | 1/29/20 | Federal Funds | Stanley Black | 2,008 |
| Effective Rate US | & Decker Inc — | |||||
| minus 0.23% — | Monthly | |||||
| Monthly | ||||||
| 110,924 | 111,049 | — | 1/29/20 | Federal Funds | Stericycle Inc — | (111) |
| Effective Rate US | Monthly | |||||
| minus 0.23% — | ||||||
| Monthly | ||||||
| 64 PanAgora Market Neutral Fund | |
| OTC TOTAL RETURN SWAP CONTRACTS OUTSTANDING at 2/28/19 (Unaudited)cont. | ||||||
| Upfront | ||||||
| premium | Termina- | Payments | Total return | Unrealized | ||
| Swap counterparty/ | received | tion | received (paid) | received by | appreciation/ | |
| Notional amount | Value | (paid) | date | by fund | or paid by fund | (depreciation) |
| Morgan Stanley & Co. International PLCcont. | ||||||
| $104,072 | $104,639 | $— | 1/29/20 | Federal Funds | Sterling Bancorp/ | $(554) |
| Effective Rate US | De — Monthly | |||||
| minus 0.23% — | ||||||
| Monthly | ||||||
| 84,655 | 86,149 | — | 1/29/20 | Federal Funds | Stryker Corp — | (1,482) |
| Effective Rate US | Monthly | |||||
| minus 0.23% — | ||||||
| Monthly | ||||||
| 36,600 | 36,176 | — | 1/27/20 | Federal Funds | Sumitomo | 433 |
| Effective Rate US | Dainippon Pharma | |||||
| minus 0.30% — | Co Ltd — Monthly | |||||
| Monthly | ||||||
| 3,311 | 3,251 | — | 3/06/20 | Federal Funds | Grupo De | 61 |
| Effective Rate US | Inversiones | |||||
| minus 1.50% — | Suramericana Sa — | |||||
| Monthly | Monthly | |||||
| 78,407 | 77,420 | — | 1/29/20 | Federal Funds | Switch Inc — | 994 |
| Effective Rate US | Monthly | |||||
| minus 0.31% — | ||||||
| Monthly | ||||||
| 42,246 | 42,245 | — | 1/29/20 | Federal Funds | Sydney Airport — | 6 |
| Effective Rate US | Monthly | |||||
| minus 0.45% — | ||||||
| Monthly | ||||||
| 33,802 | 34,024 | — | 1/29/20 | Federal Funds | Tabcorp Holdings | (218) |
| Effective Rate US | Ltd — Monthly | |||||
| minus 0.45% — | ||||||
| Monthly | ||||||
| 5,748 | 5,897 | — | 1/30/20 | Federal Funds | Taimed Biologics | (150) |
| Effective Rate US | Inc — Monthly | |||||
| minus 7.00% — | ||||||
| Monthly | ||||||
| 82,411 | 82,810 | — | 1/29/20 | Federal Funds | Target Corp — | (389) |
| Effective Rate US | Monthly | |||||
| minus 0.23% — | ||||||
| Monthly | ||||||
| 105,480 | 104,778 | — | 1/29/20 | Federal Funds | Tempur Sealy | 712 |
| Effective Rate US | International Inc — | |||||
| minus 0.66% — | Monthly | |||||
| Monthly | ||||||
| 32,158 | 31,969 | — | 1/29/20 | Federal Funds | Tesco Plc — Monthly | 193 |
| Effective Rate US | ||||||
| minus 0.30% — | ||||||
| Monthly | ||||||
| 22,637 | 24,311 | — | 1/29/20 | Federal Funds | Tesla Inc — Monthly | (1,671) |
| Effective Rate US | ||||||
| minus 2.43% — | ||||||
| Monthly | ||||||
| PanAgora Market Neutral Fund 65 |
| OTC TOTAL RETURN SWAP CONTRACTS OUTSTANDING at 2/28/19 (Unaudited)cont. | ||||||
| Upfront | ||||||
| premium | Termina- | Payments | Total return | Unrealized | ||
| Swap counterparty/ | received | tion | received (paid) | received by | appreciation/ | |
| Notional amount | Value | (paid) | date | by fund | or paid by fund | (depreciation) |
| Morgan Stanley & Co. International PLCcont. | ||||||
| $38,945 | $38,692 | $— | 1/29/20 | Federal Funds | Teva | $258 |
| Effective Rate US | Pharmaceutical | |||||
| minus 0.23% — | Industries Ltd Adr — | |||||
| Monthly | Monthly | |||||
| 4,590 | 4,344 | — | 1/29/20 | Federal Funds | Tivity Health Inc — | 246 |
| Effective Rate US | Monthly | |||||
| minus 0.23% — | ||||||
| Monthly | ||||||
| 50,086 | 49,722 | — | 1/27/20 | Federal Funds | Tokyu Fudosan | 373 |
| Effective Rate US | Holdings Corp — | |||||
| minus 0.30% — | Monthly | |||||
| Monthly | ||||||
| 14,633 | 13,844 | — | 1/28/20 | Federal Funds | Top Glove Corp | 783 |
| Effective Rate US | Bhd — Monthly | |||||
| minus 6.38% — | ||||||
| Monthly | ||||||
| 81,288 | 81,239 | — | 1/29/20 | Federal Funds | Torchmark Corp — | 59 |
| Effective Rate US | Monthly | |||||
| minus 0.23% — | ||||||
| Monthly | ||||||
| 165,399 | 166,256 | — | 1/29/20 | Federal Funds | Transdigm Group | (834) |
| Effective Rate US | Inc — Monthly | |||||
| minus 0.23% — | ||||||
| Monthly | ||||||
| 122,120 | 120,983 | — | 1/29/20 | Federal Funds | Trinity Industries | 1,151 |
| Effective Rate US | Inc — Monthly | |||||
| minus 0.23% — | ||||||
| Monthly | ||||||
| 7,956 | 8,011 | — | 1/29/20 | Federal Funds | Turkcell Iletisim | (54) |
| Effective Rate US | Hizmetleri As — | |||||
| minus 0.75% — | Monthly | |||||
| Monthly | ||||||
| 46,190 | 46,283 | — | 1/29/20 | Federal Funds | Tyler Technologies | (87) |
| Effective Rate US | Inc — Monthly | |||||
| minus 0.23% — | ||||||
| Monthly | ||||||
| 12,139 | 12,058 | — | 1/27/20 | Federal Funds | Unilever Indonesia | 79 |
| Effective Rate US | Tbk Pt — Monthly | |||||
| minus 4.00% — | ||||||
| Monthly | ||||||
| 44,207 | 42,733 | — | 1/29/20 | Federal Funds | Univar Inc — | 1,477 |
| Effective Rate US | Monthly | |||||
| minus 0.23% — | ||||||
| Monthly | ||||||
| 19,089 | 17,555 | — | 1/27/20 | Federal Funds | Universal Robina | 1,529 |
| Effective Rate US | Corp — Monthly | |||||
| minus 2.50% — | ||||||
| Monthly | ||||||
| 66 PanAgora Market Neutral Fund | |
| OTC TOTAL RETURN SWAP CONTRACTS OUTSTANDING at 2/28/19 (Unaudited)cont. | ||||||
| Upfront | ||||||
| premium | Termina- | Payments | Total return | Unrealized | ||
| Swap counterparty/ | received | tion | received (paid) | received by | appreciation/ | |
| Notional amount | Value | (paid) | date | by fund | or paid by fund | (depreciation) |
| Morgan Stanley & Co. International PLCcont. | ||||||
| $110,973 | $111,697 | $— | 1/29/20 | Federal Funds | Vail Resorts Inc — | $(710) |
| Effective Rate US | Monthly | |||||
| minus 0.23% — | ||||||
| Monthly | ||||||
| 49,410 | 48,062 | — | 1/29/20 | Federal Funds | Valeo Sa — Monthly | 1,355 |
| Effective Rate US | ||||||
| minus 0.30% — | ||||||
| Monthly | ||||||
| 76,381 | 77,447 | — | 1/29/20 | Federal Funds | Valmont Industries | (1,055) |
| Effective Rate US | Inc — Monthly | |||||
| minus 0.23% — | ||||||
| Monthly | ||||||
| 37,629 | 36,952 | — | 1/28/20 | Federal Funds | Venture Corp Ltd — | 681 |
| Effective Rate US | Monthly | |||||
| minus 0.35% — | ||||||
| Monthly | ||||||
| 37,441 | 37,433 | — | 1/29/20 | Federal Funds | Vicinity Centres — | 13 |
| Effective Rate US | Monthly | |||||
| minus 0.45% — | ||||||
| Monthly | ||||||
| 98,441 | 97,509 | — | 1/29/20 | Federal Funds | Wabtec Corp — | 941 |
| Effective Rate US | Monthly | |||||
| minus 0.85% — | ||||||
| Monthly | ||||||
| 16,685 | 16,587 | — | 1/29/20 | Federal Funds | Walt Disney Co/ | 99 |
| Effective Rate US | The — Monthly | |||||
| minus 0.23% — | ||||||
| Monthly | ||||||
| 150,010 | 150,365 | — | 1/29/20 | Federal Funds | Watsco Inc — | (333) |
| Effective Rate US | Monthly | |||||
| minus 0.23% — | ||||||
| Monthly | ||||||
| 55,360 | 56,501 | — | 1/29/20 | Federal Funds | Webster Financial | (1,135) |
| Effective Rate US | Corp — Monthly | |||||
| minus 0.23% — | ||||||
| Monthly | ||||||
| 16,929 | 16,473 | — | 1/29/20 | Federal Funds | Weibo Corp Adr — | 458 |
| Effective Rate US | Monthly | |||||
| minus 0.39% — | ||||||
| Monthly | ||||||
| 30,741 | 31,717 | — | 1/29/20 | Federal Funds | Weir Group Plc/ | (972) |
| Effective Rate US | The — Monthly | |||||
| minus 0.30% — | ||||||
| Monthly | ||||||
| 77,104 | 76,720 | — | 1/29/20 | Federal Funds | Welbilt Inc — | 394 |
| Effective Rate US | Monthly | |||||
| minus 0.23% — | ||||||
| Monthly | ||||||
| PanAgora Market Neutral Fund 67 |
| OTC TOTAL RETURN SWAP CONTRACTS OUTSTANDING at 2/28/19 (Unaudited)cont. | ||||||
| Upfront | ||||||
| premium | Termina- | Payments | Total return | Unrealized | ||
| Swap counterparty/ | received | tion | received (paid) | received by | appreciation/ | |
| Notional amount | Value | (paid) | date | by fund | or paid by fund | (depreciation) |
| Morgan Stanley & Co. International PLCcont. | ||||||
| $83,820 | $84,848 | $— | 1/29/20 | Federal Funds | Wendy’S Co/The — | $(1,508) |
| Effective Rate US | Monthly | |||||
| minus 0.23% — | ||||||
| Monthly | ||||||
| 81,349 | 82,666 | — | 1/29/20 | Federal Funds | White Mountains | (1,305) |
| Effective Rate US | Insurance Group | |||||
| minus 0.23% — | Ltd — Monthly | |||||
| Monthly | ||||||
| 23,951 | 23,626 | — | 1/30/20 | Federal Funds | Win | 309 |
| Effective Rate US | Semiconductors | |||||
| minus 8.13% — | Corp — Monthly | |||||
| Monthly | ||||||
| 6,950 | 6,921 | — | 1/30/20 | Federal Funds | Wistron Corp — | 30 |
| Effective Rate US | Monthly | |||||
| minus 3.13% — | ||||||
| Monthly | ||||||
| 45,468 | 46,276 | — | 1/29/20 | Federal Funds | Worldline Sa — | (803) |
| Effective Rate US | Monthly | |||||
| minus 0.30% — | ||||||
| Monthly | ||||||
| 64,018 | 63,324 | — | 1/29/20 | Federal Funds | Worldpay Inc — | 702 |
| Effective Rate US | Monthly | |||||
| minus 0.23% — | ||||||
| Monthly | ||||||
| 46,383 | 45,660 | — | 1/29/20 | Federal Funds | Wpp Plc — Monthly | 728 |
| Effective Rate US | ||||||
| minus 0.30% — | ||||||
| Monthly | ||||||
| 19,327 | 18,981 | — | 1/29/20 | Federal Funds | Wuxi Biologics | 348 |
| Effective Rate US | Cayman Inc — | |||||
| minus 0.40% — | Monthly | |||||
| Monthly | ||||||
| 62,486 | 60,613 | — | 1/29/20 | Federal Funds | Wynn Resorts Ltd — | 1,880 |
| Effective Rate US | Monthly | |||||
| minus 0.23% — | ||||||
| Monthly | ||||||
| 13,275 | 12,751 | — | 1/29/20 | Federal Funds | X5 Retail Group Nv | 525 |
| Effective Rate US | Gdr — Monthly | |||||
| minus 0.88% — | ||||||
| Monthly | ||||||
| 13,018 | 12,785 | — | 1/29/20 | Federal Funds | Xinyi Solar Holdings | 234 |
| Effective Rate US | Ltd — Monthly | |||||
| minus 1.38% — | ||||||
| Monthly | ||||||
| 14,999 | 15,227 | — | 1/29/20 | Federal Funds | Yapi Ve Kredi | (233) |
| Effective Rate US | Bankasi As — | |||||
| minus 0.75% — | Monthly | |||||
| Monthly | ||||||
| 68PanAgoraMarket Neutral Fund | |
| OTC TOTAL RETURN SWAP CONTRACTS OUTSTANDING at 2/28/19 (Unaudited)cont. | ||||||
| Upfront | ||||||
| premium | Termina- | Payments | Total return | Unrealized | ||
| Swap counterparty/ | received | tion | received (paid) | received by | appreciation/ | |
| Notional amount | Value | (paid) | date | by fund | or paid by fund | (depreciation) |
| Morgan Stanley & Co. International PLCcont. | ||||||
| $34,805 | $41,948 | $— | 1/29/20 | Federal Funds | Zalando Ag — | $(6,673) |
| Effective Rate US | Monthly | |||||
| minus 1.50% — | ||||||
| Monthly | ||||||
| 4,655 | 4,632 | — | 1/29/20 | Federal Funds | Zall Smart | 16 |
| Effective Rate US | Commerce Group | |||||
| minus 31.50% — | Ltd — Monthly | |||||
| Monthly | ||||||
| 4,936 | 4,798 | — | 1/29/20 | Federal Funds | Zhaojin Mining | 139 |
| Effective Rate US | Industry Co Ltd — | |||||
| minus 0.44% — | Monthly | |||||
| Monthly | ||||||
| 4,344 | 4,134 | — | 1/29/20 | Federal Funds | Zhongan Online | 211 |
| Effective Rate US | P&C Insurance Co | |||||
| minus 17.00% — | Ltd — Monthly | |||||
| Monthly | ||||||
| 39,416 | 39,151 | — | 1/29/20 | Federal Funds | Zillow Group Inc — | 269 |
| Effective Rate US | Monthly | |||||
| minus 0.23% — | ||||||
| Monthly | ||||||
| 56,281 | 56,726 | — | 1/29/20 | Federal Funds | Zoetis Inc — Monthly | (439) |
| Effective Rate US | ||||||
| minus 0.23% — | ||||||
| Monthly | ||||||
| Upfront premium received | — | Unrealized appreciation | 251,205 | |||
| Upfront premium (paid) | — | Unrealized (depreciation) | (262,056) | |||
| Total | $— | Total | $(10,851) | |||
ASC 820 establishes a three-level hierarchy for disclosure of fair value measurements. The valuation hierarchy is based upon the transparency of inputs to the valuation of the fund’s investments. The three levels are defined as follows:
Level 1: Valuations based on quoted prices for identical securities in active markets.
Level 2: Valuations based on quoted prices in markets that are not active or for which all significant inputs are observable, either directly or indirectly.
Level 3: Valuations based on inputs that are unobservable and significant to the fair value measurement.
The following is a summary of the inputs used to value the fund’s net assets as of the close of the reporting period:
| Valuation inputs | |||
| Investments in securities: | Level 1 | Level 2 | Level 3 |
| Investment companies | $948,333 | $— | $— |
| Short-term investments | — | 10,203,497 | — |
| Totals by level | $948,333 | $10,203,497 | $— |
| Valuation inputs | |||
| Other financial instruments: | Level 1 | Level 2 | Level 3 |
| Total return swap contracts | $— | $(10,851) | $— |
| Totals by level | $— | $(10,851) | $— |
The accompanying notes are an integral part of these financial statements.
| PanAgora Market Neutral Fund 69 |
Statement of assets and liabilities2/28/19 (Unaudited)
| ASSETS | |
| Investment in securities, at value (Note 1): | |
| Unaffiliated issuers (identified cost $11,150,717) | $11,151,830 |
| Interest and other receivables | 2,349 |
| Receivable for shares of the fund sold | 4,875 |
| Receivable for investments sold | 1,218,375 |
| Receivable from Manager (Note 2) | 27,526 |
| Unrealized appreciation on OTC swap contracts (Note 1) | 251,205 |
| Prepaid assets | 42,232 |
| Total assets | 12,698,392 |
| LIABILITIES | |
| Payable for investments purchased | 1,332,293 |
| Payable for custodian fees (Note 2) | 4,368 |
| Payable for investor servicing fees (Note 2) | 789 |
| Payable for Trustee compensation and expenses (Note 2) | 144 |
| Payable for administrative services (Note 2) | 37 |
| Payable for distribution fees (Note 2) | 3,720 |
| Unrealized depreciation on OTC swap contracts (Note 1) | 262,056 |
| Other accrued expenses | 38,049 |
| Total liabilities | 1,641,456 |
| Net assets | $11,056,936 |
| REPRESENTED BY | |
| Paid-in capital (Unlimited shares authorized) (Notes 1, 4 and 5) | $11,958,498 |
| Total distributable earnings (Note 1) | (901,562) |
| Total — Representing net assets applicable to capital shares outstanding | $11,056,936 |
| COMPUTATION OF NET ASSET VALUE AND OFFERING PRICE | |
| Net asset value and redemption price per class A share($9,115,447 divided by 995,688 shares) | $9.15 |
| Offering price per class A share(100/94.25 of $9.15)* | $9.71 |
| Net asset value and offering price per class B share($9,059 divided by 1,000 shares)** | $9.06 |
| Net asset value and offering price per class C share($9,059 divided by 1,000 shares)** | $9.06 |
| Net asset value and redemption price per class M share($9,092 divided by 1,000 shares) | $9.09 |
| Offering price per class M share(100/96.50 of $9.09)* | $9.42 |
| Net asset value, offering price and redemption price per class R share | |
| ($9,124 divided by 1,000 shares) | $9.12 |
| Net asset value, offering price and redemption price per class R6 share | |
| ($1,460,374 divided by 158,957 shares) | $9.19 |
| Net asset value, offering price and redemption price per class Y share | |
| ($444,781 divided by 48,418 shares) | $9.19 |
*On single retail sales of less than $50,000. On sales of $50,000 or more the offering price is reduced.
**Redemption price per share is equal to net asset value less any applicable contingent deferred sales charge.
The accompanying notes are an integral part of these financial statements.
| 70 PanAgora Market Neutral Fund | |
Statement of operationsSix months ended 2/28/19 (Unaudited)
| INVESTMENT INCOME | |
| Interest | $122,835 |
| Total investment income | 122,835 |
| EXPENSES | |
| Compensation of Manager (Note 2) | 68,674 |
| Investor servicing fees (Note 2) | 2,296 |
| Custodian fees (Note 2) | 3,116 |
| Trustee compensation and expenses (Note 2) | 231 |
| Distribution fees (Note 2) | 11,461 |
| Administrative services (Note 2) | 193 |
| Amortization of offering costs (Note 1) | 18,336 |
| Reports to shareholders | 12,123 |
| Auditing and tax fees | 25,399 |
| Blue sky expense | 43,220 |
| Other | 1,297 |
| Fees waived and reimbursed by Manager (Note 2) | (93,272) |
| Total expenses | 93,074 |
| Expense reduction (Note 2) | (15) |
| Net expenses | 93,059 |
| Net investment income | 29,776 |
| REALIZED AND UNREALIZED GAIN (LOSS) | |
| Net realized gain (loss) on: | |
| Swap contracts (Note 1) | (204,232) |
| Total net realized loss | (204,232) |
| Change in net unrealized appreciation (depreciation) on: | |
| Securities from unaffiliated issuers | 1,496 |
| Swap contracts | (17,743) |
| Total change in net unrealized depreciation | (16,247) |
| Net loss on investments | (220,479) |
| Net decrease in net assets resulting from operations | $(190,703) |
The accompanying notes are an integral part of these financial statements.
| PanAgora Market Neutral Fund 71 |
Statement of changes in net assets
| For the period 9/21/17 | ||
| (commencement of | ||
| INCREASE IN NET ASSETS | Six months ended 2/28/19* | operations) to 8/31/18 |
| Operations | ||
| Net investment income (loss) | $29,776 | $(19,625) |
| Net realized loss on investments | (204,232) | (770,553) |
| Change in net unrealized appreciation (depreciation) | ||
| of investments | (16,247) | 6,509 |
| Net decrease in net assets resulting from operations | (190,703) | (783,669) |
| Increase from capital share transactions (Note 4) | 533,924 | 1,497,384 |
| Total increase in net assets | 343,221 | 713,715 |
| NET ASSETS | ||
| Beginning of period (Note 5) | 10,713,715 | 10,000,000 |
| End of period(Note 1) | $11,056,936 | $10,713,715 |
*Unaudited.
The accompanying notes are an integral part of these financial statements.
| 72 PanAgora Market Neutral Fund | |
| This page left blank intentionally. |
| PanAgora Market Neutral Fund 73 |
Financial highlights(For a common share outstanding throughout the period)
| INVESTMENT OPERATIONS | LESS DISTRIBUTIONS | RATIOS AND SUPPLEMENTAL DATA | ||||||||||
| Ratio | ||||||||||||
| Net realized | of net investment | |||||||||||
| Net asset value, | and unrealized | Total from | From | Total return | Net assets, | Ratio of expenses | income (loss) | |||||
| beginning | Net investment | gain (loss) | investment | net investment | Total | Net asset value, | at net asset value | end of period | to average | to average | Portfolio | |
| Period ended | of period | income (loss)a | on investments | operations | income | distributions | end of period | (%)b | (in thousands) | net assets (%)c,d | net assets (%)d | turnover (%) |
| Class A | ||||||||||||
| February 28, 2019** | $9.32 | .02 | (.19) | (.17) | — | — | $9.15 | (1.82)* | $9,115 | .89* | .27* | — |
| August 31, 2018† | 10.00 | (.02) | (.66) | (.68) | — | — | 9.32 | (6.80)* | 9,275 | 1.69* | (.21)* | — |
| Class B | ||||||||||||
| February 28, 2019** | $9.25 | (.01) | (.18) | (.19) | — | — | $9.06 | (2.05)* | $9 | 1.26* | (.11)* | — |
| August 31, 2018† | 10.00 | (.09) | (.66) | (.75) | — | — | 9.25 | (7.50)* | 9 | 2.40* | (.92)* | — |
| Class C | ||||||||||||
| February 28, 2019** | $9.25 | (.01) | (.18) | (.19) | — | — | $9.06 | (2.05)* | $9 | 1.26* | (.11)* | — |
| August 31, 2018† | 10.00 | (.09) | (.66) | (.75) | — | — | 9.25 | (7.50)* | 9 | 2.40* | (.92)* | — |
| Class M | ||||||||||||
| February 28, 2019** | $9.27 | —e | (.18) | (.18) | — | — | $9.09 | (1.94)* | $9 | 1.13* | .02* | — |
| August 31, 2018† | 10.00 | (.06) | (.67) | (.73) | — | — | 9.27 | (7.30)* | 9 | 2.16* | (.68)* | — |
| Class R | ||||||||||||
| February 28, 2019** | $9.30 | .01 | (.19) | (.18) | — | — | $9.12 | (1.94)* | $9 | 1.01* | .14* | — |
| August 31, 2018† | 10.00 | (.04) | (.66) | (.70) | — | — | 9.30 | (7.00)* | 9 | 1.93* | (.45)* | — |
| Class R6 | ||||||||||||
| February 28, 2019** | $9.34 | .04 | (.19) | (.15) | — | — | $9.19 | (1.61)* | $1,460 | .77* | .39* | — |
| August 31, 2018† | 10.00 | .01 | (.67) | (.66) | — | — | 9.34 | (6.60)* | 971 | 1.46* | .13* | — |
| Class Y | ||||||||||||
| February 28, 2019** | $9.34 | .04 | (.19) | (.15) | — | — | $9.19 | (1.61)* | $445 | .76* | .39* | — |
| August 31, 2018† | 10.00 | .01 | (.67) | (.66) | — | — | 9.34 | (6.60)* | 431 | 1.45* | .11* | — |
*Not annualized.
**Unaudited.
†For the period September 21, 2017 (commencement of operations) to August 31, 2018.
aPer share net investment income (loss) has been determined on the basis of the weighted average number of shares outstanding during the period.
bTotal return assumes dividend reinvestment and does not reflect the effect of sales charges.
cIncludes amounts paid through expense offset and/or brokerage/service arrangements, if any (Note 2). Also excludes acquired fund fees and expenses, if any.
dReflects an involuntary contractual expense limitation in effect during the period. As a result of such limitation, the expenses of each class reflect a reduction of the following amounts (Note 2):
| Percentage of average net assets | |
| February 28, 2019 | 0.88% |
| August 31, 2018 | 3.71 |
eAmount represents less than $0.01 per share.
The accompanying notes are an integral part of these financial statements.
| 74 PanAgora Market Neutral Fund | PanAgora Market Neutral Fund 75 |
Notes to financial statements2/28/19 (Unaudited)
Within the following Notes to financial statements, references to “State Street” represent State Street Bank and Trust Company, references to “the SEC” represent the Securities and Exchange Commission, references to “Putnam Management” represent Putnam Investment Management, LLC, the fund’s manager, an indirect wholly-owned subsidiary of Putnam Investments, LLC and references to “OTC”, if any, represent over-the-counter. Unless otherwise noted, the “reporting period” represents the period from September 1, 2018 through February 28, 2019.
Putnam PanAgora Market Neutral Fund (the fund) is a diversified series of Putnam Investment Funds (the Trust), a Massachusetts business trust registered under the Investment Company Act of 1940, as amended, as an open-end management investment company. The goal of the fund is to seek absolute return (i.e. positive total return in diverse market environments over time). The fund pursues its goal by investing through a diversified set of long and short equity strategies that seek to identify and exploit multiple price inefficiencies that exist in global equity markets. PanAgora Asset Management, Inc. (“PanAgora”), the subadviser to the fund and an affiliate of Putnam Management, believes that these inefficiencies create investment opportunities in different market segments, at different times, and for different reasons, before they are ultimately arbitraged away. By using a diversified set of strategies that PanAgora believes have low correlation to one another, the fund seeks to generate returns under different market conditions and over different time horizons that are more stable over time than the returns of any individual strategy.
The fund’s strategies rely on quantitative models and information and data inputs to those models in an effort to capitalize on investment opportunities that exist when the prospects of a company’s likely success or failure are not fully recognized by market participants. PanAgora expects to implement the fund’s strategies primarily through investing in total return swap contracts.
The fund’s strategies are managed within three distinct sleeves of the fund designed to capitalize on long-term, intermediate-term, and short-term price inefficiencies. PanAgora strategically allocates the fund’s investments among the various strategies, varying the allocations from time to time based upon its assessment of the attractiveness of the available opportunity set, to seek to increase the potential for higher returns.
Although the fund may have net long or short exposure to the stock market at any time, PanAgora expects that, over time, the fund’s returns will not closely correlate with stock market movements. PanAgora may adjust the fund’s portfolio from time to time, and may use derivatives, to minimize exposure to stock market movements. The fund’s portfolio is also adjusted on a regular basis in an effort to manage risk from systematic factors (such as market or interest rate movements), risk from sector, country and region exposure, as well as excessive risk from any one security, by using derivatives, exchange traded funds (ETFs) and other risk management and portfolio construction techniques.
The fund expects to use total return swaps and may also use other derivatives (such as futures contracts, options, currency swaps and other swap contracts), to take long or short positions in equity securities (principally common stocks, American Depositary Receipts (ADRs), and real estate investment trusts (REITs)), fixed-income securities, and other investment companies (principally ETFs). The fund may have exposure to U.S. and non-U.S. (including both developed and emerging market) companies, to companies of any market capitalization and to fixed-income securities of any credit quality, duration or maturity (principally government-issued instruments, money market instruments, and investment-grade corporate instruments). At times, the fund may also hold these instruments directly. The fund may take “short” derivatives positions and may use derivatives to hedge and for speculative purposes.
A significant portion of the assets of the fund will be invested in short-term instruments, including cash and cash equivalents generally with one year or less term to maturity. These investments serve as collateral for the derivative positions the fund takes and also may earn income for the fund.
The fund offers class A, class B, class C, class M, class R, class R6 and class Y shares. Purchases of class B shares are closed to new and existing investors except by exchange from class B shares of another Putnam fund or through dividend and/or capital gains reinvestment. Class A and class M shares are sold with a maximum front-end sales charge of 5.75% and 3.50%, respectively. Class A shares generally are not subject to a contingent deferred sales charge, and class M, class R, class R6 and class Y shares are not subject to a contingent deferred sales charge. Class B shares, which convert to class A shares after approximately eight years, are not subject to a front-end sales charge and are subject to a contingent deferred sales charge if those shares are redeemed within six years of purchase. Class C shares are subject to a one-year 1.00% contingent deferred sales charge and generally convert to class A shares after approximately ten years. Class R shares, which are not available to all investors, are sold at net asset value. The expenses for class A, class B, class C, class M and class R shares may differ based on the
| 76 PanAgora Market Neutral Fund |
distribution fee of each class, which is identified in Note 2. Class R6 and class Y shares, which are sold at net asset value, are generally subject to the same expenses as class A, class B, class C, class M and class R shares, but do not bear a distribution fee, and in the case of class R6 shares, bear a lower investor servicing fee, which is identified in Note 2. Class R6 and class Y shares are not available to all investors.
In the normal course of business, the fund enters into contracts that may include agreements to indemnify another party under given circumstances. The fund’s maximum exposure under these arrangements is unknown as this would involve future claims that may be, but have not yet been, made against the fund. However, the fund’s management team expects the risk of material loss to be remote.
The fund has entered into contractual arrangements with an investment adviser, administrator, distributor, shareholder servicing agent and custodian, who each provide services to the fund. Unless expressly stated otherwise, shareholders are not parties to, or intended beneficiaries of these contractual arrangements, and these contractual arrangements are not intended to create any shareholder right to enforce them against the service providers or to seek any remedy under them against the service providers, either directly or on behalf of the fund.
Under the fund’s Amended and Restated Agreement and Declaration of Trust, any claims asserted against or on behalf of the Putnam Funds, including claims against Trustees and Officers, must be brought in state and federal courts located within the Commonwealth of Massachusetts.
Note 1: Significant accounting policies
The following is a summary of significant accounting policies consistently followed by the fund in the preparation of its financial statements. The preparation of financial statements is in conformity with accounting principles generally accepted in the United States of America and requires management to make estimates and assumptions that affect the reported amounts of assets and liabilities in the financial statements and the reported amounts of increases and decreases in net assets from operations. Actual results could differ from those estimates. Subsequent events after the Statement of assets and liabilities date through the date that the financial statements were issued have been evaluated in the preparation of the financial statements.
Investment income, realized and unrealized gains and losses and expenses of the fund are borne pro-rata based on the relative net assets of each class to the total net assets of the fund, except that each class bears expenses unique to that class (including the distribution fees applicable to such classes). Each class votes as a class only with respect to its own distribution plan or other matters on which a class vote is required by law or determined by the Trustees. If the fund were liquidated, shares of each class would receive their pro-rata share of the net assets of the fund. In addition, the Trustees declare separate dividends on each class of shares.
Security valuationPortfolio securities and other investments are valued using policies and procedures adopted by the Board of Trustees. The Trustees have formed a Pricing Committee to oversee the implementation of these procedures and have delegated responsibility for valuing the fund’s assets in accordance with these procedures to Putnam Management. Putnam Management has established an internal Valuation Committee that is responsible for making fair value determinations, evaluating the effectiveness of the pricing policies of the fund and reporting to the Pricing Committee.
Market quotations are not considered to be readily available for certain debt obligations (including short-term investments with remaining maturities of 60 days or less) and other investments; such investments are valued on the basis of valuations furnished by an independent pricing service approved by the Trustees or dealers selected by Putnam Management. Such services or dealers determine valuations for normal institutional-size trading units of such securities using methods based on market transactions for comparable securities and various relationships, generally recognized by institutional traders, between securities (which consider such factors as security prices, yields, maturities and ratings). These securities will generally be categorized as Level 2. Securities quoted in foreign currencies, if any, are translated into U.S. dollars at the current exchange rate.
Investments in open-end investment companies (excluding exchange-traded funds), if any, which can be classified as Level 1 or Level 2 securities, are valued based on their net asset value. The net asset value of such investment companies equals the total value of their assets less their liabilities and divided by the number of their outstanding shares.
To the extent a pricing service or dealer is unable to value a security or provides a valuation that Putnam Management does not believe accurately reflects the security’s fair value, the security will be valued at fair value by Putnam Management in accordance with policies and procedures approved by the Trustees. Certain investments, including certain restricted and illiquid securities and derivatives, are also valued at fair value following procedures approved by the Trustees. These valuations consider such factors as significant market or specific
| PanAgora Market Neutral Fund 77 |
security events such as interest rate or credit quality changes, various relationships with other securities, discount rates, U.S. Treasury, U.S. swap and credit yields, index levels, convexity exposures, recovery rates, sales and other multiples and resale restrictions. These securities are classified as Level 2 or as Level 3 depending on the priority of the significant inputs.
To assess the continuing appropriateness of fair valuations, the Valuation Committee reviews and affirms the reasonableness of such valuations on a regular basis after considering all relevant information that is reasonably available. Such valuations and procedures are reviewed periodically by the Trustees. The fair value of securities is generally determined as the amount that the fund could reasonably expect to realize from an orderly disposition of such securities over a reasonable period of time. By its nature, a fair value price is a good faith estimate of the value of a security in a current sale and does not reflect an actual market price, which may be different by a material amount.
Security transactions and related investment incomeSecurity transactions are recorded on the trade date (the date the order to buy or sell is executed). Gains or losses on securities sold are determined on the identified cost basis.
Interest income, net of any applicable withholding taxes, is recorded on the accrual basis.
All premiums/discounts are amortized/accreted on a yield-to-maturity basis.
Total return swap contractsThe fund entered into OTC and/or centrally cleared total return swap contracts, which are arrangements to exchange a market-linked return for a periodic payment, both based on a notional principal amount, to take long or short positions in equity securities.
To the extent that the total return of the security, index or other financial measure underlying the transaction exceeds or falls short of the offsetting interest rate obligation, the fund will receive a payment from or make a payment to the counterparty. OTC and/or centrally cleared total return swap contracts are marked to market daily based upon quotations from an independent pricing service or market maker. Any change is recorded as an unrealized gain or loss on OTC total return swaps. Daily fluctuations in the value of centrally cleared total return swaps are settled through a central clearing agent and are recorded in variation margin on the Statement of assets and liabilities and recorded as unrealized gain or loss. Payments received or made are recorded as realized gains or losses. Certain OTC and/or centrally cleared total return swap contracts may include extended effective dates. Payments related to these swap contracts are accrued based on the terms of the contract. The fund could be exposed to credit or market risk due to unfavorable changes in the fluctuation of interest rates or in the price of the underlying security or index, the possibility that there is no liquid market for these agreements or that the counterparty may default on its obligation to perform. The fund’s maximum risk of loss from counterparty risk or central clearing risk is the fair value of the contract. This risk may be mitigated for OTC total return swap contracts by having a master netting arrangement between the fund and the counterparty and for centrally cleared total return swap contracts through the daily exchange of variation margin. There is minimal counterparty risk with respect to centrally cleared total return swap contracts due to the clearinghouse guarantee fund and other resources that are available in the event of a clearing member default. Risk of loss may exceed amounts recognized on the Statement of assets and liabilities.
OTC and/or centrally cleared total return swap contracts outstanding, including their respective notional amounts at period end, if any, are listed after the fund’s portfolio.
Master agreementsThe fund is a party to ISDA (International Swaps and Derivatives Association, Inc.) Master Agreements (Master Agreements) with certain counterparties that govern OTC derivative and foreign exchange contracts entered into from time to time. The Master Agreements may contain provisions regarding, among other things, the parties’ general obligations, representations, agreements, collateral requirements, events of default and early termination. With respect to certain counterparties, in accordance with the terms of the Master Agreements, collateral posted to the fund is held in a segregated account by the fund’s custodian and, with respect to those amounts which can be sold or repledged, is presented in the fund’s portfolio.
Collateral pledged by the fund is segregated by the fund’s custodian and identified in the fund’s portfolio. Collateral can be in the form of cash or debt securities issued by the U.S. Government or related agencies or other securities as agreed to by the fund and the applicable counterparty. Collateral requirements are determined based on the fund’s net position with each counterparty.
Termination events applicable to the fund may occur upon a decline in the fund’s net assets below a specified threshold over a certain period of time. Termination events applicable to counterparties may occur upon a decline in the counterparty’s long-term and short-term credit ratings below a specified level. In each case,
| 78 PanAgora Market Neutral Fund |
upon occurrence, the other party may elect to terminate early and cause settlement of all derivative and foreign exchange contracts outstanding, including the payment of any losses and costs resulting from such early termination, as reasonably determined by the terminating party. Any decision by one or more of the fund’s counterparties to elect early termination could impact the fund’s future derivative activity.
At the close of the reporting period, the fund had a net liability position of $10,851 on open derivative contracts subject to the Master Agreements. Collateral posted by the fund at period end for these agreements totaled $4,025,804 and may include amounts related to unsettled agreements.
Interfund lendingThe fund, along with other Putnam funds, may participate in an interfund lending program pursuant to an exemptive order issued by the SEC. This program allows the fund to borrow from or lend to other Putnam funds that permit such transactions. Interfund lending transactions are subject to each fund’s investment policies and borrowing and lending limits. Interest earned or paid on the interfund lending transaction will be based on the average of certain current market rates. During the reporting period, the fund did not utilize the program.
Lines of creditThe fund participates, along with other Putnam funds, in a $317.5 million unsecured committed line of credit and a $235.5 million unsecured uncommitted line of credit, both provided by State Street. Borrowings may be made for temporary or emergency purposes, including the funding of shareholder redemption requests and trade settlements. Interest is charged to the fund based on the fund’s borrowing at a rate equal to 1.25% plus the higher of (1) the Federal Funds rate and (2) the overnight LIBOR for the committed line of credit and the Federal Funds rate plus 1.30% for the uncommitted line of credit. A closing fee equal to 0.04% of the committed line of credit and 0.04% of the uncommitted line of credit has been paid by the participating funds. In addition, a commitment fee of 0.21% per annum on any unutilized portion of the committed line of credit is allocated to the participating funds based on their relative net assets and paid quarterly. During the reporting period, the fund had no borrowings against these arrangements.
Federal taxesIt is the policy of the fund to distribute all of its taxable income within the prescribed time period and otherwise comply with the provisions of the Internal Revenue Code of 1986, as amended (the Code), applicable to regulated investment companies. It is also the intention of the fund to distribute an amount sufficient to avoid imposition of any excise tax under Section 4982 of the Code.
The fund is subject to the provisions of Accounting Standards Codification 740Income Taxes(ASC 740). ASC 740 sets forth a minimum threshold for financial statement recognition of the benefit of a tax position taken or expected to be taken in a tax return. The fund did not have a liability to record for any unrecognized tax benefits in the accompanying financial statements. No provision has been made for federal taxes on income, capital gains or unrealized appreciation on securities held nor for excise tax on income and capital gains. The fund’s federal tax return for the prior fiscal year remains subject to examination by the Internal Revenue Service.
Under the Regulated Investment Company Modernization Act of 2010, the fund will be permitted to carry forward capital losses incurred for an unlimited period and the carry forwards will retain their character as either short-term or long-term capital losses. At August 31, 2018, the fund had the following capital loss carryover available, to the extent allowed by the Code, to offset future net capital gain, if any:
| Loss carryover | ||
| Short-term | Long-term | Total |
| $14 | $— | $14 |
Pursuant to federal income tax regulations applicable to regulated investment companies, the fund has elected to defer $710,462 to its fiscal year ending August 31, 2019 of late year ordinary losses ((i) ordinary losses recognized between January 1, 2018 and August 31, 2018, and (ii) specified ordinary and currency losses recognized between November 1, 2017 and August 31, 2018).
Tax cost of investments includes adjustments to net unrealized appreciation (depreciation) which may not necessarily be final tax cost basis adjustments, but closely approximate the tax basis unrealized gains and losses that may be realized and distributed to shareholders. The aggregate identified cost on a tax basis is $11,157,609, resulting in gross unrealized appreciation and depreciation of $290,831 and $307,461, respectively, or net unrealized depreciation of $16,630.
Distributions to shareholdersDistributions to shareholders from net investment income are recorded by the fund on the ex-dividend date. Distributions from capital gains, if any, are recorded on the ex-dividend date and paid at least annually. The amount and character of income and gains to be distributed are determined
| PanAgora Market Neutral Fund 79 |
in accordance with income tax regulations, which may differ from generally accepted accounting principles. Dividend sources are estimated at the time of declaration. Actual results may vary. Any non-taxable return of capital cannot be determined until final tax calculations are completed after the end of the fund’s fiscal year. Reclassifications are made to the fund’s capital accounts to reflect income and gains available for distribution (or available capital loss carryovers) under income tax regulations.
For the fiscal year ended August 31, 2018, the fund had accumulated net investment loss of $717,354.
Expenses of the TrustExpenses directly charged or attributable to any fund will be paid from the assets of that fund. Generally, expenses of the Trust will be allocated among and charged to the assets of each fund on a basis that the Trustees deem fair and equitable, which may be based on the relative assets of each fund or the nature of the services performed and relative applicability to each fund.
Offering costsThe offering costs of $334,594 have been fully amortized on a straight-line basis over a twelvemonth period as of September 21, 2018. As of the close of the reporting period, the fund has reimbursed Putnam Management for the payment of these expenses.
Note 2: Management fee, administrative services and other transactions
The fund pays Putnam Management a management fee (based on the fund’s average net assets and computed and paid monthly) at annual rates that may vary based on the monthly average of the aggregate net assets of all open-end funds sponsored by Putnam Management for which PanAgora is acting as sub-adviser launched on or after the date of the fund’s management contract, as determined at the close of each business day during the month. Such annual rates may vary as follows:
| 1.300% | of the first $1 billion, | 1.280% | of the next $2 billion and | |
| 1.290% | of the next $2 billion, | 1.270% | of any excess thereafter. |
For the reporting period, the fee represented an effective rate (excluding the impact from any expense waivers in effect) of 0.645% of the fund’s average net assets.
Putnam Management has contractually agreed, through December 30, 2019, to waive fees and/or reimburse the fund’s expenses to the extent necessary to limit the cumulative expenses of the fund, exclusive of brokerage, interest, taxes, investment-related expenses, extraordinary expenses, acquired fund fees and expenses and payments under the fund’s investor servicing contract, investment management contract and distribution plans, on a fiscal year-to-date basis to an annual rate of 0.20% of the fund’s average net assets over such fiscal year-to-date period. During the reporting period, the fund’s expenses were reduced by $93,272 as a result of this limit.
PanAgora, an affiliate of Putnam Management, is authorized by the Trustees to make investment decisions for the assets of the fund as determined by Putnam Management from time to time. Putnam Management pays a quarterly sub-management fee to PanAgora for its services at an annual rate of 1.00% of the average net assets of the portion of the fund managed by PanAgora.
The fund reimburses Putnam Management an allocated amount for the compensation and related expenses of certain officers of the fund and their staff who provide administrative services to the fund. The aggregate amount of all such reimbursements is determined annually by the Trustees.
Custodial functions for the fund’s assets are provided by State Street. Custody fees are based on the fund’s asset level, the number of its security holdings and transaction volumes.
Putnam Investor Services, Inc., an affiliate of Putnam Management, provides investor servicing agent functions to the fund. Putnam Investor Services, Inc. received fees for investor servicing for class A, class B, class C, class M, class R and class Y shares that included (1) a per account fee for each direct and underlying non-defined contribution account (retail account) of the fund; (2) a specified rate of the fund’s assets attributable to defined contribution plan accounts; and (3) a specified rate based on the average net assets in retail accounts. Putnam Investor Services, Inc. has agreed that the aggregate investor servicing fees for each fund’s retail and defined contribution accounts for these share classes will not exceed an annual rate of 0.25% of the fund’s average assets attributable to such accounts.
| 80 PanAgora Market Neutral Fund | |
Class R6 shares paid a monthly fee based on the average net assets of class R6 shares at an annual rate of 0.05%.
During the reporting period, the expenses for each class of shares related to investor servicing fees were as follows:
| Class A | $1,930 | Class R | 2 | |
| Class B | 2 | Class R6 | 267 | |
| Class C | 2 | Class Y | 91 | |
| Class M | 2 | Total | $2,296 |
The fund has entered into expense offset arrangements with Putnam Investor Services, Inc. and State Street whereby Putnam Investor Services, Inc.’s and State Street’s fees are reduced by credits allowed on cash balances. For the reporting period, the fund’s expenses were reduced by $15 under the expense offset arrangements.
Each Independent Trustee of the fund receives an annual Trustee fee, of which $8, as a quarterly retainer, has been allocated to the fund, and an additional fee for each Trustees meeting attended. Trustees also are reimbursed for expenses they incur relating to their services as Trustees.
The fund has adopted a Trustee Fee Deferral Plan (the Deferral Plan) which allows the Trustees to defer the receipt of all or a portion of Trustees fees payable on or after July 1, 1995. The deferred fees remain invested in certain Putnam funds until distribution in accordance with the Deferral Plan.
The fund has adopted an unfunded noncontributory defined benefit pension plan (the Pension Plan) covering all Trustees of the fund who have served as a Trustee for at least five years and were first elected prior to 2004. Benefits under the Pension Plan are equal to 50% of the Trustee’s average annual attendance and retainer fees for the three years ended December 31, 2005. The retirement benefit is payable during a Trustee’s lifetime, beginning the year following retirement, for the number of years of service through December 31, 2006. Pension expense for the fund is included in Trustee compensation and expenses in the Statement of operations. Accrued pension liability is included in Payable for Trustee compensation and expenses in the Statement of assets and liabilities. The Trustees have terminated the Pension Plan with respect to any Trustee first elected after 2003.
The fund has adopted distribution plans (the Plans) with respect to the following share classes pursuant to Rule 12b–1 under the Investment Company Act of 1940. The purpose of the Plans is to compensate Putnam Retail Management Limited Partnership, an indirect wholly-owned subsidiary of Putnam Investments, LLC, for services provided and expenses incurred in distributing shares of the fund. The Plans provide payments by the fund to Putnam Retail Management Limited Partnership at an annual rate of up to the following amounts (Maximum %) of the average net assets attributable to each class. The Trustees have approved payment by the fund at the following annual rate (Approved %) of the average net assets attributable to each class. During the reporting period, the class-specific expenses related to distribution fees were as follows:
| Maximum % | Approved % | Amount | |
| Class A | 0.35% | 0.25% | $11,314 |
| Class B | 1.00% | 1.00% | 45 |
| Class C | 1.00% | 1.00% | 45 |
| Class M | 1.00% | 0.75% | 34 |
| Class R | 1.00% | 0.50% | 23 |
| Total | $11,461 |
For the reporting period, Putnam Retail Management Limited Partnership, acting as underwriter, received net commissions of $3 and no monies from the sale of class A and class M shares, respectively, and received no monies in contingent deferred sales charges from redemptions of class B and class C shares.
A deferred sales charge of up to 1.00% is assessed on certain redemptions of class A shares. For the reporting period, Putnam Retail Management Limited Partnership, acting as underwriter, received no monies on class A redemptions.
| PanAgora Market Neutral Fund 81 |
Note 3: Purchases and sales of securities
During the reporting period, the cost of purchases and the proceeds from sales, excluding short-term investments, were as follows:
| Cost of purchases | Proceeds from sales | |
| Investments in securities (Long-term) | $— | $— |
| U.S. government securities (Long-term) | — | — |
| Total | $— | $— |
Note 4: Capital shares
At the close of the reporting period, there were an unlimited number of shares of beneficial interest authorized. Transactions, including, if applicable, direct exchanges pursuant to share conversions, in capital shares were as follows:
| FOR THE PERIOD 9/21/17 | ||||
| (COMMENCEMENT OF OPERATIONS) | ||||
| SIX MONTHS ENDED 2/28/19 | TO 8/31/18 | |||
| Class A | Shares | Amount | Shares | Amount |
| Shares sold | 143 | $1,311 | 1,601 | $15,867 |
| Shares issued in connection with | ||||
| reinvestment of distributions | — | — | — | — |
| 143 | 1,311 | 1,601 | 15,867 | |
| Shares repurchased | (27) | (246) | (29) | (275) |
| Net increase | 116 | $1,065 | 1,572 | $15,592 |
| FOR THE PERIOD 9/21/17 | ||||
| (COMMENCEMENT OF OPERATIONS) | ||||
| SIX MONTHS ENDED 2/28/19 | TO 8/31/18 | |||
| Class B | Shares | Amount | Shares | Amount |
| Shares sold | — | $— | — | $— |
| Shares issued in connection with | ||||
| reinvestment of distributions | — | — | — | — |
| — | — | — | — | |
| Shares repurchased | — | — | — | — |
| Net increase (decrease) | — | $— | — | $— |
| FOR THE PERIOD 9/21/17 | ||||
| (COMMENCEMENT OF OPERATIONS) | ||||
| SIX MONTHS ENDED 2/28/19 | TO 8/31/18 | |||
| Class C | Shares | Amount | Shares | Amount |
| Shares sold | — | $— | — | $— |
| Shares issued in connection with | ||||
| reinvestment of distributions | — | — | — | — |
| — | — | — | — | |
| Shares repurchased | — | — | — | — |
| Net increase (decrease) | — | $— | — | $— |
| 82 PanAgora Market Neutral Fund |
| FOR THE PERIOD 9/21/17 | ||||
| (COMMENCEMENT OF OPERATIONS) | ||||
| SIX MONTHS ENDED 2/28/19 | TO 8/31/18 | |||
| Class M | Shares | Amount | Shares | Amount |
| Shares sold | — | $— | — | $— |
| Shares issued in connection with | ||||
| reinvestment of distributions | — | — | — | — |
| — | — | — | — | |
| Shares repurchased | — | — | — | — |
| Net increase (decrease) | — | $— | — | $— |
| FOR THE PERIOD 9/21/17 | ||||
| (COMMENCEMENT OF OPERATIONS) | ||||
| SIX MONTHS ENDED 2/28/19 | TO 8/31/18 | |||
| Class R | Shares | Amount | Shares | Amount |
| Shares sold | — | $— | — | $— |
| Shares issued in connection with | ||||
| reinvestment of distributions | — | — | — | — |
| — | — | — | — | |
| Shares repurchased | — | — | — | — |
| Net increase (decrease) | — | $— | — | $— |
| FOR THE PERIOD 9/21/17 | ||||
| (COMMENCEMENT OF OPERATIONS) | ||||
| SIX MONTHS ENDED 2/28/19 | TO 8/31/18 | |||
| Class R6 | Shares | Amount | Shares | Amount |
| Shares sold | 55,297 | $515,086 | 109,046 | $1,089,710 |
| Shares issued in connection with | ||||
| reinvestment of distributions | — | — | — | — |
| 55,297 | 515,086 | 109,046 | 1,089,710 | |
| Shares repurchased | (367) | (3,321) | (6,019) | (59,232) |
| Net increase | 54,930 | $511,765 | 103,027 | $1,030,478 |
| FOR THE PERIOD 9/21/17 | ||||
| (COMMENCEMENT OF OPERATIONS) | ||||
| SIX MONTHS ENDED 2/28/19 | TO 8/31/18 | |||
| Class Y | Shares | Amount | Shares | Amount |
| Shares sold | 2,714 | $24,821 | 46,110 | $460,664 |
| Shares issued in connection with | ||||
| reinvestment of distributions | — | — | — | — |
| 2,714 | 24,821 | 46,110 | 460,664 | |
| Shares repurchased | (406) | (3,727) | (1,000) | (9,350) |
| Net increase | 2,308 | $21,094 | 45,110 | $451,314 |
| PanAgora Market Neutral Fund 83 |
At the close of the reporting period, Putnam Investments, LLC owned the following shares of the fund:
| Shares owned | Percentage of ownership | Value | |
| Class A | 994,000 | 99.83% | $9,095,100 |
| Class B | 1,000 | 100.00 | 9,059 |
| Class C | 1,000 | 100.00 | 9,059 |
| Class M | 1,000 | 100.00 | 9,092 |
| Class R | 1,000 | 100.00 | 9,124 |
At the close of the reporting period, a shareholder of record owned 13.1% of the outstanding shares of the fund.
Note 5: Initial capitalization and offering of shares
The fund was established as a series of the Trust on September 20, 2017 and commenced operations on September 21, 2017. Prior to September 21, 2017, the fund had no operations other than those related to organizational matters, including as noted below, the initial capital contributions by Putnam Investments, LLC and issuance of shares:
| Capital contribution | Shares issued | |
| Class A | $9,940 000 | 994,000 |
| Class B | 10,000 | 1,000 |
| Class C | 10,000 | 1,000 |
| Class M | 10,000 | 1,000 |
| Class R | 10,000 | 1,000 |
| Class R6 | 10,000 | 1,000 |
| Class Y | 10,000 | 1,000 |
Note 6: Market, credit and other risks
In the normal course of business, the fund trades financial instruments and enters into financial transactions where risk of potential loss exists due to changes in the market (market risk) or failure of the contracting party to the transaction to perform (credit risk). The fund may be exposed to additional credit risk that an institution or other entity with which the fund has unsettled or open transactions will default.
Note 7: Summary of derivative activity
The volume of activity for the reporting period for any derivative type that was held during the period is listed below and was based on an average of the holdings at the end of each fiscal quarter:
| OTC total return swap contracts (notional) | $38,100,000 |
| 84 PanAgora Market Neutral Fund | |
The following is a summary of the fair value of derivative instruments as of the close of the reporting period:
| Fair value of derivative instruments as of the close of the reporting period | ||||
| ASSET DERIVATIVES | LIABILITY DERIVATIVES | |||
| Derivatives not | ||||
| accounted for as | Statement of | Statement of | ||
| hedging instruments | assets and | assets and | ||
| under ASC 815 | liabilities location | Fair value | liabilities location | Fair value |
| Equity contracts | Receivables | $251,205 | Payables | $262,056 |
| Total | $251,205 | $262,056 | ||
The following is a summary of realized and change in unrealized gains or losses of derivative instruments in the Statement of operations for the reporting period (Note 1):
| Amount of realized gain or (loss) on derivatives recognized in net gain or (loss) on investments | ||
| Derivatives not accounted for as | ||
| hedging instruments under ASC 815 | Swaps | Total |
| Equity contracts | $(204,232) | $(204,232) |
| Total | $(204,232) | $(204,232) |
| Change in unrealized appreciation or (depreciation) on derivatives recognized in net gain or (loss) | ||
| on investments | ||
| Derivatives not accounted for as | ||
| hedging instruments under ASC 815 | Swaps | Total |
| Equity contracts | $(17,743) | $(17,743) |
| Total | $(17,743) | $(17,743) |
| PanAgora Market Neutral Fund 85 |
Note 8: Offsetting of financial and derivative assets and liabilities
The following table summarizes any derivatives, repurchase agreements and reverse repurchase agreements, at the end of the reporting period, that are subject to an enforceable master netting agreement or similar agreement. For securities lending transactions or borrowing transactions associated with securities sold short, if any, see Note 1. For financial reporting purposes, the fund does not offset financial assets and financial liabilities that are subject to the master netting agreements in the Statement of assets and liabilities.
| Morgan Stanley & Co. International PLC | Total | |
| Assets: | ||
| OTC Total return swap contracts*# | $251,205 | $251,205 |
| Total Assets | $251,205 | $251,205 |
| Liabilities: | ||
| OTC Total return swap contracts*# | $262,056 | $262,056 |
| Total Liabilities | $262,056 | $262,056 |
| Total Financial and Derivative Net Assets | $(10,851) | $(10,851) |
| Total collateral received (pledged)†## | $(10,851) | |
| Net amount | $— | |
| Controlled collateral received (including | ||
| TBA commitments)** | $— | $— |
| Uncontrolled collateral received | $— | $— |
| Collateral (pledged) (including TBA commitments)** | $(4,025,804) | $(4,025,804) |
*Excludes premiums, if any. Included in unrealized appreciation and depreciation on OTC swap contracts on the Statement of assets and liabilities.
**Included with Investments in securities on the Statement of assets and liabilities.
†Additional collateral may be required from certain brokers based on individual agreements.
#Covered by master netting agreement (Note 1).
##Any over-collateralization of total financial and derivative net assets is not shown. Collateral may include amounts related to unsettled agreements.
| 86 PanAgora Market Neutral Fund | |
Putnam family of funds
The following is a list of Putnam’s open-end mutual funds offered to the public.Investors should carefully consider the investment objective, risks, charges, and expenses of a fund before investing. For a prospectus, or a summary prospectus if available, containing this and other information for any Putnam fund or product, contact your financial advisor or call Putnam Investor Services at 1-800-225-1581. Please read the prospectus carefully before investing.
| Blend | Value |
| Capital Spectrum Fund | Convertible Securities Fund |
| Emerging Markets Equity Fund | Equity Income Fund |
| Equity Spectrum Fund | International Value Fund |
| Europe Equity Fund | Small Cap Value Fund |
| Global Equity Fund | |
| International Capital Opportunities Fund | Income |
| International Equity Fund | Diversified Income Trust |
| Multi-Cap Core Fund | Floating Rate Income Fund |
| Research Fund | Global Income Trust |
| Government Money Market Fund* | |
| Global Sector | High Yield Fund |
| Global Communications Fund | Income Fund |
| Global Consumer Fund | Money Market Fund† |
| Global Financials Fund | Mortgage Securities Fund |
| Global Health Care Fund | Short Duration Bond Fund |
| Global Industrials Fund | Short Duration Income Fund |
| Global Natural Resources Fund | |
| Global Sector Fund | Tax-free Income |
| Global Technology Fund | AMT-Free Municipal Fund |
| Global Utilities Fund | Intermediate-Term Municipal Income Fund |
| Short-Term Municipal Income Fund | |
| Growth | Tax Exempt Income Fund |
| Growth Opportunities Fund | Tax-Free High Yield Fund |
| International Growth Fund | |
| Small Cap Growth Fund | State tax-free income funds‡: |
| Sustainable Future Fund | California, Massachusetts, Minnesota, |
| Sustainable Leaders Fund | New Jersey, New York, Ohio, and Pennsylvania. |
| PanAgora Market Neutral Fund 87 |
| Absolute Return | Asset Allocation |
| Fixed Income Absolute Return Fund | Dynamic Risk Allocation Fund |
| Multi-Asset Absolute Return Fund | George Putnam Balanced Fund |
| Putnam PanAgora** | Dynamic Asset Allocation Balanced Fund |
| Putnam PanAgora Managed Futures Strategy | Dynamic Asset Allocation Conservative Fund |
| Putnam PanAgora Market Neutral Fund | Dynamic Asset Allocation Growth Fund |
| Putnam PanAgora Risk Parity Fund | |
| Retirement Income Fund Lifestyle 1 | |
| RetirementReady®2060 Fund | |
| RetirementReady® 2055 Fund | |
| RetirementReady® 2050 Fund | |
| RetirementReady® 2045 Fund | |
| RetirementReady® 2040 Fund | |
| RetirementReady® 2035 Fund | |
| RetirementReady® 2030 Fund | |
| RetirementReady® 2025 Fund | |
| RetirementReady® 2020 Fund |
*You could lose money by investing in the fund. Although the fund seeks to preserve the value of your investment at $1.00 per share, it cannot guarantee it will do so. An investment in the fund is not insured or guaranteed by the Federal Deposit Insurance Corporation or any other government agency. The fund’s sponsor has no legal obligation to provide financial support to the fund, and you should not expect that the sponsor will provide financial support to the fund at any time.
†You could lose money by investing in the fund. Although the fund seeks to preserve the value of your investment at $1.00 per share, it cannot guarantee it will do so. The fund may impose a fee upon sale of your shares or may temporarily suspend your ability to sell shares if the fund’s liquidity falls below required minimums because of market conditions or other factors.An investment in the fund is not insured or guaranteed by the Federal Deposit Insurance Corporation or any other government agency. The fund’s sponsor has no legal obligation to provide financial support to the fund, and you should not expect that the sponsor will provide financial support to the fund at any time.
‡Not available in all states.
**Sub-advised by PanAgora Asset Management.
Check your account balances and the most recent month-end performance in the Individual Investors section at putnam.com.
| 88 PanAgora Market Neutral Fund | |
Fund information
Founded over 80 years ago, Putnam Investments was built around the concept that a balance between risk and reward is the hallmark of a well-rounded financial program. We manage funds across income, value, blend, growth, sustainable, asset allocation, absolute return, and global sector categories.
| Investment Manager | Trustees | Michael J. Higgins |
| Putnam Investment | Kenneth R. Leibler,Chair | Vice President, Treasurer, |
| Management, LLC | Liaquat Ahamed | and Clerk |
| 100 Federal Street | Ravi Akhoury | |
| Boston, MA 02110 | Barbara M. Baumann | Janet C. Smith |
| Katinka Domotorffy | Vice President, | |
| Investment Sub-Advisor | Catharine Bond Hill | Principal Financial Officer, |
| PanAgora Asset Management, Inc. | Paul L. Joskow | Principal Accounting Officer, |
| 470 Atlantic Ave. | Robert E. Patterson | and Assistant Treasurer |
| Boston, MA 02210 | George Putnam, III | |
| Robert L. Reynolds | Susan G. Malloy | |
| Marketing Services | Manoj P. Singh | Vice President and |
| Putnam Retail Management | Assistant Treasurer | |
| 100 Federal Street | Officers | |
| Boston, MA 02110 | Robert L. Reynolds | Mark C. Trenchard |
| President | Vice President and | |
| Custodian | BSA Compliance Officer | |
| State Street Bank | Jonathan S. Horwitz | |
| and Trust Company | Executive Vice President, | Nancy E. Florek |
| Principal Executive Officer, | Vice President, Director of | |
| Legal Counsel | and Compliance Liaison | Proxy Voting and Corporate |
| Ropes & Gray LLP | Governance, Assistant Clerk, | |
| Robert T. Burns | and Assistant Treasurer | |
| Vice President and | ||
| Chief Legal Officer | Denere P. Poulack | |
| Assistant Vice President, Assistant | ||
| James F. Clark | Clerk, and Assistant Treasurer | |
| Vice President and | ||
| Chief Compliance Officer |
This report is for the information of shareholders of Putnam PanAgora Market Neutral Fund. It may also be used as sales literature when preceded or accompanied by the current prospectus, the most recent copy of Putnam’s Quarterly Performance Summary, and Putnam’s Quarterly Ranking Summary. For more recent performance, please visit putnam.com. Investors should carefully consider the investment objectives, risks, charges, and expenses of a fund, which are described in its prospectus. For this and other information or to request a prospectus or summary prospectus, call 1-800-225-1581 toll free. Please read the prospectus carefully before investing. The fund’s Statement of Additional Information contains additional information about the fund’s Trustees and is available without charge upon request by calling 1-800-225-1581.
| Item 2. Code of Ethics: |
| Not applicable |
| Item 3. Audit Committee Financial Expert: |
| Not applicable |
| Item 4. Principal Accountant Fees and Services: |
| Not applicable |
| Item 5. Audit Committee of Listed Registrants |
| Not applicable |
| Item 6. Schedule of Investments: |
| The registrant’s schedule of investments in unaffiliated issuers is included in the report to shareholders in Item 1 above. |
| Item 7. Disclosure of Proxy Voting Policies and Procedures For Closed-End Management Investment Companies: |
| Not applicable |
| Item 8. Portfolio Managers of Closed-End Investment Companies |
| Not Applicable |
| Item 9. Purchases of Equity Securities by Closed-End Management Investment Companies and Affiliated Purchasers: |
| Not applicable |
| Item 10. Submission of Matters to a Vote of Security Holders: |
| Not applicable |
| Item 11. Controls and Procedures: |
| (a) The registrant’s principal executive officer and principal financial officer have concluded, based on their evaluation of the effectiveness of the design and operation of the registrant’s disclosure controls and procedures as of a date within 90 days of the filing date of this report, that the design and operation of such procedures are generally effective to provide reasonable assurance that information required to be disclosed by the registrant in this report is recorded, processed, summarized and reported within the time periods specified in the Commission’s rules and forms. |
| (b) Changes in internal control over financial reporting: Not applicable |
| Item 12. Disclosures of Securities Lending Activities for Closed-End Investment Companies: |
| Not Applicable |
| Item 13. Exhibits: |
| (a)(1) Not applicable |
| (a)(2) Separate certifications for the principal executive officer and principal financial officer of the registrant as required by Rule 30a-2(a) under the Investment Company Act of 1940, as amended, are filed herewith. |
| (b) The certifications required by Rule 30a-2(b) under the Investment Company Act of 1940, as amended, are filed herewith. |
| SIGNATURES |
| Pursuant to the requirements of the Securities Exchange Act of 1934 and the Investment Company Act of 1940, the registrant has duly caused this report to be signed on its behalf by the undersigned, thereunto duly authorized. |
| Putnam Investment Funds |
| By (Signature and Title): |
| /s/ Janet C. Smith Janet C. Smith Principal Accounting Officer |
| Date: April 26, 2019 |
| Pursuant to the requirements of the Securities Exchange Act of 1934 and the Investment Company Act of 1940, this report has been signed below by the following persons on behalf of the registrant and in the capacities and on the dates indicated. |
| By (Signature and Title): |
| /s/ Jonathan S. Horwitz Jonathan S. Horwitz Principal Executive Officer |
| Date: April 26, 2019 |
| By (Signature and Title): |
| /s/ Janet C. Smith Janet C. Smith Principal Financial Officer |
| Date: April 26, 2019 |