| | |
| UNITED STATES
SECURITIES AND EXCHANGE COMMISSION |
| | |
| CERTIFIED SHAREHOLDER REPORT OF REGISTERED
MANAGEMENT INVESTMENT COMPANIES
|
| | |
| Investment Company Act file number: | (811-07237) |
| | |
| Exact name of registrant as specified in charter: | Putnam Investment Funds |
| | |
| Address of principal executive offices: | 100 Federal Street, Boston, Massachusetts 02110 |
| | |
| Name and address of agent for service: | Robert T. Burns, Vice President
100 Federal Street
Boston, Massachusetts 02110 |
| | |
| Copy to: | Bryan Chegwidden, Esq.
Ropes & Gray LLP
1211 Avenue of the Americas
New York, New York 10036 |
| | |
| Registrant's telephone number, including area code: | (617) 292-1000 |
| | |
| Date of fiscal year end: | February 28, 2021 |
| | |
| Date of reporting period: | March 1, 2020 — February 28, 2021 |
| | |
|
Item 1. Report to Stockholders: | |
| | |
| The following is a copy of the report transmitted to stockholders pursuant to Rule 30e-1 under the Investment Company Act of 1940: | |
Putnam
Small Cap Value
Fund
Annual report
2 | 28 | 21
Message from the Trustees
April 6, 2021
Dear Fellow Shareholder:
Optimism about society emerging from the Covid-19 pandemic remains tempered by concern about newer, more aggressive strains of the virus. On the plus side, the U.S. infection rate has declined and the pace of vaccinations is accelerating. The economy registered growth above 4% in the fourth quarter of 2020, and recent employment data is encouraging.
Investors must keep in mind that when the bond market sees stronger economic growth and the chance of inflation ahead, bond prices typically fall and yields rise. In such conditions, stock prices might also weaken as investors consider how rising yields could change borrowing costs.
No matter how markets move, Putnam remains active with strategies that seek superior investment performance. The portfolio managers and analysts keep their focus on research and potential risks, a discipline intended to serve you through changing conditions.
As always, thank you for investing with Putnam.

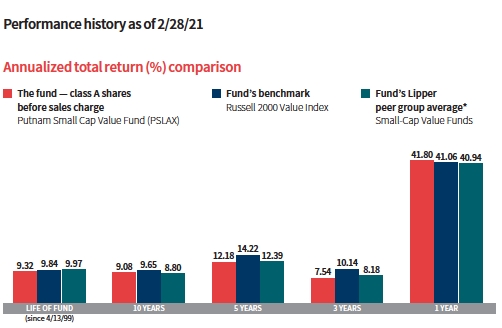
Current performance may be lower or higher than the quoted past performance, which cannot guarantee future results. Share price, principal value, and return will fluctuate, and you may have a gain or a loss when you sell your shares. Performance of class A shares assumes reinvestment of distributions and does not account for taxes. Fund returns in the bar chart do not reflect a sales charge of 5.75%; had they, returns would have been lower. See below and pages 8–10 for additional performance information. For a portion of the periods, the fund had expense limitations, without which returns would have been lower. To obtain the most recent month-end performance, visit putnam.com.
* Source: Lipper, a Refinitiv company.
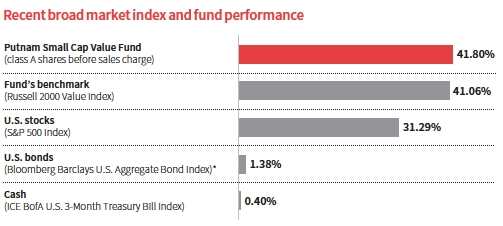
This comparison shows your fund’s performance in the context of broad market indexes for the 12 months ended 2/28/21. See above and pages 8–10 for additional fund performance information. Index descriptions can be found on pages 14–15.
* Source: Bloomberg Index Services Limited.


How was the market environment for U.S. small-cap value stocks during the 12 months ended February 28, 2021?
Small-cap value stocks reaped stellar gains, climbing 41.06% for the period, as measured by the Russell 2000 Value Index [the fund’s benchmark]. As the rally broadened in response to declining unemployment, Covid-19 vaccine developments, and expectations for the reopening of the U.S. economy, the Russell 2000 Index, a measure of small-cap stock performance, rose 51.00%. This was considerably higher than the 31.29% return for the S&P 500 Index, a broad measure of stock performance.
With investor sentiment moving into a risk-on mode, small-cap stocks also began to outperform large-cap stocks, showing more balanced value and growth across the small-cap asset class, with both style indexes rallying strongly. The Russell 2000 Growth Index, a measure of small-cap growth stocks, rose 58.88% for the 12-month period compared with the fund’s benchmark return of 41.06%.
This rally followed news of Covid-19 vaccine developments on November 9, 2020. As a result, November was an especially strong month for small-cap value stocks, as the fund’s
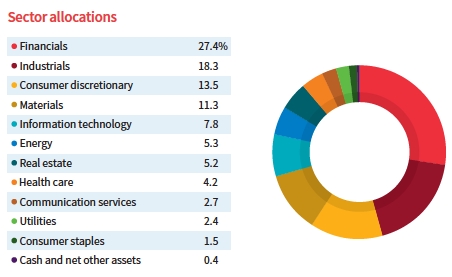
Allocations are shown as a percentage of the fund’s net assets. Cash and net other assets, if any, represent the market value weights of cash, derivatives, short-term securities, and other unclassified assets in the portfolio. Summary information may differ from the portfolio schedule included in the financial statements due to the inclusion of derivative securities, any interest accruals, the exclusion of as-of trades, if any, the use of different classifications of securities for presentation purposes, and rounding. Holdings and allocations may vary over time.
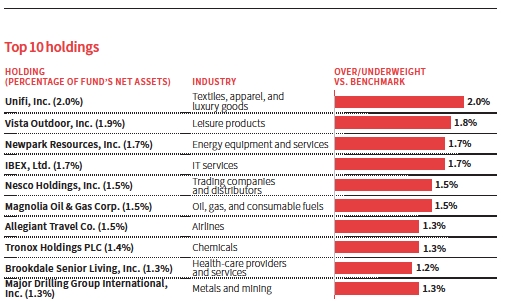
This table shows the fund’s top 10 holdings by percentage of the fund’s net assets as of 2/28/21. Short-term investments and derivatives, if any, are excluded. Holdings may vary over time.
benchmark rose 19.31%. Market leadership also shifted away from high-growth technology stocks to more economically sensitive cyclical stocks, small-cap value stocks, and those poised to benefit from the reopening of the U.S. economy.
As 2020 came to a close, the Federal Reserve held its key interest rates near zero and remained committed to its bond-buying program to support the credit markets, and Congress passed a $900 billion coronavirus stimulus package. The risk-on sentiment continued into January and February 2021, with economic recovery and expectations for the passage of a $1.9 trillion fiscal relief bill on the horizon. However, market volatility remained high amid a sell-off in high-growth technology stocks, rising U.S. Treasury yields, and the continued market rotation into cyclical and value-oriented stocks.
How did the fund perform during the reporting period?
The fund outperformed its benchmark and the average return of its Lipper peer group. Overweight positioning and stock selection within consumer cyclicals was the largest contributor, and our decision to underweight banks and overweight technology and consumer cyclicals relative to the benchmark during the first half of the period was beneficial given that health and economic challenges weighed on investor sentiment. With promising vaccine developments, we increased the portfolio’s exposure to banks to overweight relative to the benchmark, which positioned the fund to benefit from the rally in their stock prices when investors rotated into value stocks. The sudden rise in the benchmark 10-year Treasury note yield during the final weeks of the reporting period also supported bank stocks. Banks tend to benefit from rising bond yields, because it allows them to charge higher rates on mortgages and other types of loans.
We also maintained an underweight exposure to real-estate investment trust [REITs] throughout the period compared to the fund’s benchmark. This aided performance, as the asset class sold off sharply until November 2020 due to concerns about the commercial real-estate sector. While REITs began to recover in November, negative sentiment resumed in the final weeks of the period due to concerns about the magnitude and timing of any commercial real-estate recovery. As a result, stock selection within the REIT sector contributed to performance as well.

Could you discuss some additional holdings that aided performance?
The fund’s top contributor was Vista Outdoor, a global marketer of outdoor and shooting sports products, including CamelBak, Camp Chef, and Bushnell Outdoor. We initially invested in the stock in early 2020, based on management’s effective repositioning of its brands and distribution. Due to increased outdoor activity during the pandemic and higher ammunition sales, the stock climbed sharply. We remain enthusiastic about Vista’s longer-term prospects post-pandemic.
Purple Innovation, which is proving to be a disrupter in the traditional mattress industry with its innovative products, direct-to-consumer sales, and favorable return policies, was another top performer. Due to its robust online sales, the company gained market share from competitors whose brick-and-mortar stores closed during the pandemic. We strategically added to the position during a period of weakness and trimmed when the stock was rallying to lock in profits. The company’s prospects remain promising, in our
view, given its goal of expanding into stores and growing its market share.
Big Lots, which was helped by the recession as shoppers focused on value purchases, also benefited from retailers getting rid of seasonal inventory that failed to move during the pandemic and companies that went out of business. Prior to the recession, the stock was deeply undervalued, in our view. With several performance catalysts being realized, we sold the position to lock in profits during the second half of the period.
What were some holdings that detracted from investment results during the period?
Unitil, an interstate electricity and natural gas utility that serves New Hampshire, Massachusetts, and Maine, was the top detractor. With the Covid-19 pandemic forcing the closure of many businesses, demand for energy fell sharply, weighing on net income. We believe the stock is undervalued and should see some price recovery as businesses reopen, particularly since it provides needed services, even though it is our view that the states it serves will reopen more fully at different stages.
Limelight Networks, a content delivery service for digital media and software, faced headwinds during the period. We believe the content delivery network business is poised to grow, as consumption of online services increases. In a highly price competitive and fast-growing market where users expect flawless digital experiences, Limelight missed fourth-quarter 2020 earnings expectations, and the stock fell. Given management’s poor execution, we sold the stock at a loss and reallocated the sale proceeds into other opportunities with what we viewed as better prospects.
Cars.com, the online marketplace that connects car buyers and dealers, also struggled, due to falling sales amid the pandemic and heightened competition from direct-to-consumer competitors offering discounts. We sold the position at a loss in the first half of the reporting period and reinvested the proceeds into other consumer cyclical stocks.
What is your outlook for the coming months?
We believe the economy is improving given the Fed’s decidedly accommodative stance and multiple fiscal stimulus packages, including the $1.9 trillion Covid-19-relief bill signed by
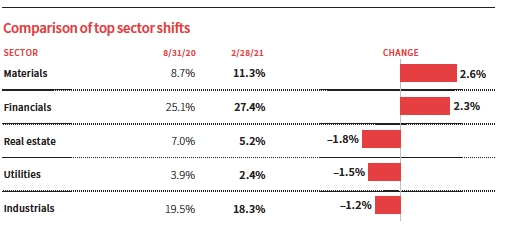
This chart shows the fund’s largest allocation shifts, by percentage, over the past six months. Allocations are shown as a percentage of the fund’s net assets. Current period summary information may differ from the portfolio schedule included in the financial statements due to the inclusion of derivative securities, any interest accruals, the exclusion of as-of trades, if any, the use of different classifications of securities for presentation purposes, and rounding. Holdings and allocations may vary over time.
President Biden after the close of the reporting period on March 11, 2021. However, we expect some choppiness in the months ahead, given the speed of the economic recovery during the past six months.
In our view, an environment of improving economic growth with low-to-modest inflation and relatively low interest rates would be positive for small-cap and value stocks, which have long underperformed large-cap and growth stocks. We believe this underperfor-mance will reverse in the current cycle, as stock market performance moves beyond the few large-cap tech stocks that have dominated for several years. We expect this broadening to be positive for small stocks that are not as widely followed and for value stocks that rely on strong economic growth rather than some captivating technology or product.
Thank you, Mike, for your time and insights today.
The views expressed in this report are exclusively those of Putnam Management and are subject to change. They are not meant as investment advice.
Please note that the holdings discussed in this report may not have been held by the fund for the entire period. Portfolio composition is subject to review in accordance with the fund’s investment strategy and may vary in the future. Current and future portfolio holdings are subject to risk.
Your fund’s performance
This section shows your fund’s performance, price, and distribution information for periods ended February 28, 2021, the end of its most recent fiscal year. In accordance with regulatory requirements for mutual funds, we also include performance information as of the most recent calendar quarter-end and expense information taken from the fund’s current prospectus. Performance should always be considered in light of a fund’s investment strategy. Data represent past performance. Past performance does not guarantee future results. More recent returns may be less or more than those shown. Investment return and principal value will fluctuate, and you may have a gain or a loss when you sell your shares. Performance information does not reflect any deduction for taxes a shareholder may owe on fund distributions or on the redemption of fund shares. For the most recent month-end performance, please visit the Individual Investors section at putnam.com or call Putnam at 1-800-225-1581. Class R, R5, R6, and Y shares are not available to all investors.
See the Terms and definitions section in this report for definitions of the share classes offered by your fund.
Fund performance Total return for periods ended 2/28/21
| | | | | | | | |
| | Annual | | | | | | | |
| | average | | Annual | | Annual | | Annual | |
| | (life of fund) | 10 years | average | 5 years | average | 3 years | average | 1 year |
| Class A (4/13/99) | | | | | | | | |
| Before sales charge | 9.32% | 138.44% | 9.08% | 77.69% | 12.18% | 24.38% | 7.54% | 41.80% |
| After sales charge | 9.02 | 124.73 | 8.43 | 67.47 | 10.86 | 17.23 | 5.44 | 33.64 |
| Class B (5/3/99) | | | | | | | | |
| Before CDSC | 9.10 | 127.80 | 8.58 | 71.18 | 11.35 | 21.54 | 6.72 | 40.77 |
| After CDSC | 9.10 | 127.80 | 8.58 | 69.39 | 11.12 | 18.67 | 5.87 | 35.77 |
| Class C (7/26/99) | | | | | | | | |
| Before CDSC | 8.94 | 121.17 | 8.26 | 71.20 | 11.35 | 21.48 | 6.70 | 40.70 |
| After CDSC | 8.94 | 121.17 | 8.26 | 71.20 | 11.35 | 21.48 | 6.70 | 39.70 |
| Class R (3/30/07) | | | | | | | | |
| Net asset value | 9.05 | 132.27 | 8.79 | 75.51 | 11.91 | 23.41 | 7.26 | 41.50 |
| Class R5 (11/1/13) | | | | | | | | |
| Net asset value | 9.60 | 145.32 | 9.39 | 80.41 | 12.53 | 25.34 | 7.82 | 42.22 |
| Class R6 (11/1/13) | | | | | | | | |
| Net asset value | 9.64 | 147.38 | 9.48 | 81.67 | 12.68 | 25.99 | 8.01 | 42.51 |
| Class Y (1/3/01) | | | | | | | | |
| Net asset value | 9.58 | 144.28 | 9.34 | 80.00 | 12.47 | 25.21 | 7.78 | 42.14 |
Current performance may be lower or higher than the quoted past performance, which cannot guarantee future results. After-sales-charge returns for class A shares reflect the deduction of the maximum 5.75% sales charge levied at the time of purchase. Class B share returns after contingent deferred sales charge (CDSC) reflect the applicable CDSC, which is 5% in the first year, declining over time to 1% in the sixth year, and is eliminated thereafter. Class C share returns after CDSC reflect a 1% CDSC for the first year that is eliminated thereafter. Class R, R5, R6, and Y shares have no initial sales charge or CDSC. Performance for class B, C, R, and Y shares before their inception is derived from the historical performance of class A shares, adjusted for the applicable sales charge (or CDSC) and the higher operating expenses for such shares, except for class Y shares, for which 12b-1 fees are not applicable. Performance for class R5 and R6 shares prior to their inception is derived from the historical performance of class Y shares and has not been adjusted for the lower investor servicing fees applicable to class R5 and R6 shares; had it, returns would have been higher.
For a portion of the periods, the fund had expense limitations, without which returns would have been lower.
Class B share performance reflects conversion to class A shares after six years.
Class C share performance reflects conversion to class A shares after 10 years.
Comparative index returns For periods ended 2/28/21
| | | | | | | | |
| | Annual | | | | | | | |
| | average | | Annual | | Annual | | Annual | |
| | (life of fund) | 10 years | average | 5 years | average | 3 years | average | 1 year |
| Russell 2000 Value Index | 9.84% | 151.28% | 9.65% | 94.37% | 14.22% | 33.61% | 10.14% | 41.06% |
| Lipper Small-Cap Value | | | | | | | | |
| Funds category average* | 9.97 | 134.36 | 8.80 | 80.13 | 12.39 | 26.91 | 8.18 | 40.94 |
Index and Lipper results should be compared with fund performance before sales charge, before CDSC, or at net asset value.
* Over the 1-year, 3-year, 5-year, 10-year, and life-of-fund periods ended 2/28/21, there were 218, 200, 182, 129, and 42 funds, respectively, in this Lipper category.
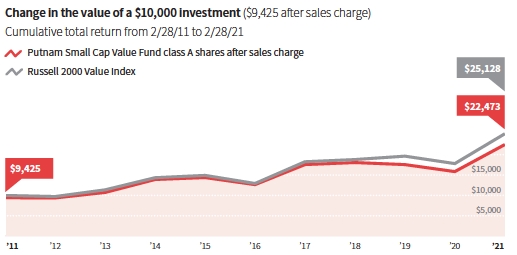
Past performance does not indicate future results. At the end of the same time period, a $10,000 investment in the fund’s class B and C shares would have been valued at $22,780 and $22,117, respectively, and no contingent deferred sales charges would apply. A $10,000 investment in the fund’s class R, R5, R6, and Y shares would have been valued at $23,227, $24,532, $24,738 and $24,428, respectively.
Fund price and distribution information For the 12-month period ended 2/28/21
| | | | | | | | |
| Distributions | Class A | Class B | Class C | Class R | Class R5 | Class R6 | Class Y |
| Number | 1 | 1 | 1 | 1 | 1 | 1 | 1 |
| Income | $0.060136 | $0.025105 | $0.043789 | $0.045540 | $0.077652 | $0.084658 | $0.072397 |
| Capital gains | — | — | — | — | — | — | — |
| Return of capital* | 0.042864 | 0.017895 | 0.031211 | 0.032460 | 0.055348 | 0.060342 | 0.051603 |
| Total | $0.103000 | $0.043000 | $0.075000 | $0.078000 | $0.133000 | $0.145000 | $0.124000 |
| | Before | After | Net | Net | Net | Net | Net | Net |
| | sales | sales | asset | asset | asset | asset | asset | asset |
| Share value | charge | charge | value | value | value | value | value | value |
| 2/29/20 | $9.46 | $10.04 | $6.97 | $6.93 | $9.19 | $10.09 | $10.08 | $10.06 |
| 2/28/21 | 13.29 | 14.10 | 9.76 | 9.66 | 12.91 | 14.19 | 14.19 | 14.15 |
The classification of distributions, if any, is an estimate. Before-sales-charge share value and current dividend rate for class A shares, if applicable, do not take into account any sales charge levied at the time of purchase. After-sales-charge share value, current dividend rate, and current 30-day SEC yield, if applicable, are calculated assuming that the maximum sales charge (5.75% for class A shares) was levied at the time of purchase. Final distribution information will appear on your year-end tax forms.
* See page 43.
Fund performance as of most recent calendar quarter Total return for periods ended 3/31/21
| | | | | | | | |
| | Annual | | | | | | | |
| | average | | Annual | | Annual | | Annual | |
| | (life of fund) | 10 years | average | 5 years | average | 3 years | average | 1 year |
| Class A (4/13/99) | | | | | | | | |
| Before sales charge | 9.57% | 147.39% | 9.48% | 76.15% | 11.99% | 32.68% | 9.88% | 115.63% |
| After sales charge | 9.28 | 133.16 | 8.83 | 66.02 | 10.67 | 25.05 | 7.74 | 103.23 |
| Class B (5/3/99) | | | | | | | | |
| Before CDSC | 9.35 | 136.24 | 8.98 | 69.64 | 11.15 | 29.65 | 9.04 | 113.89 |
| After CDSC | 9.35 | 136.24 | 8.98 | 67.86 | 10.91 | 26.65 | 8.19 | 108.89 |
| Class C (7/26/99) | | | | | | | | |
| Before CDSC | 9.28 | 132.75 | 8.81 | 69.57 | 11.14 | 29.67 | 9.05 | 113.99 |
| After CDSC | 9.28 | 132.75 | 8.81 | 69.57 | 11.14 | 29.67 | 9.05 | 112.99 |
| Class R (3/30/07) | | | | | | | | |
| Net asset value | 9.30 | 141.03 | 9.20 | 73.99 | 11.71 | 31.70 | 9.61 | 114.79 |
| Class R5 (11/1/13) | | | | | | | | |
| Net asset value | 9.85 | 154.39 | 9.79 | 78.73 | 12.32 | 33.71 | 10.17 | 116.19 |
| Class R6 (11/1/13) | | | | | | | | |
| Net asset value | 9.89 | 156.53 | 9.88 | 79.97 | 12.47 | 34.41 | 10.36 | 116.41 |
| Class Y (1/3/01) | | | | | | | | |
| Net asset value | 9.83 | 153.35 | 9.74 | 78.31 | 12.26 | 33.69 | 10.16 | 116.08 |
See the discussion following the fund performance table on page 8 for information about the calculation of fund performance.
Effective 3/1/21, class C shares will generally convert to class A shares after eight years. In this table, Class C share performance reflects conversion to class A shares after eight years.
Your fund’s expenses
As a mutual fund investor, you pay ongoing expenses, such as management fees, distribution fees (12b-1 fees), and other expenses. Using the following information, you can estimate how these expenses affect your investment and compare them with the expenses of other funds. You may also pay one-time transaction expenses, including sales charges (loads) and redemption fees, which are not shown in this section and would have resulted in higher total expenses. For more information, see your fund’s prospectus or talk to your financial representative.
Expense ratios
| | | | | | | |
| | Class A | Class B | Class C | Class R | Class R5 | Class R6 | Class Y |
| Total annual operating expenses for the | | | | | | | |
| fiscal year ended 2/29/20 | 1.56% | 2.31% | 2.31% | 1.81% | 1.23% | 1.13% | 1.31% |
| Annualized expense ratio for the | | | | | | | |
| six-month period ended 2/28/21* | 1.24% | 1.99% | 1.99% | 1.49% | 0.91% | 0.81% | 0.99% |
Fiscal year expense information in this table is taken from the most recent prospectus, is subject to change, and may differ from that shown for the annualized expense ratio and in the financial highlights of this report.
Prospectus expense information also includes the impact of acquired fund fees and expenses of 0.33%, which is not included in the financial highlights or annualized expense ratios. Expenses are shown as a percentage of average net assets.
* Expense ratios for each class are for the fund’s most recent fiscal half year. As a result of this, ratios may differ from expense ratios based on one-year data in the financial highlights.
Expenses per $1,000
The following table shows the expenses you would have paid on a $1,000 investment in each class of the fund from 9/1/20 to 2/28/21. It also shows how much a $1,000 investment would be worth at the close of the period, assuming actual returns and expenses.
| | | | | | | |
| | Class A | Class B | Class C | Class R | Class R5 | Class R6 | Class Y |
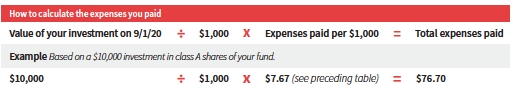
| Expenses paid per $1,000*† | $7.67 | $12.28 | $12.28 | $9.20 | $5.63 | $5.02 | $6.13 |
| Ending value (after expenses) | $1,493.80 | $1,488.90 | $1,488.60 | $1,491.30 | $1,496.40 | $1,497.90 | $1,495.80 |
* Expenses for each share class are calculated using the fund’s annualized expense ratio for each class, which represents the ongoing expenses as a percentage of average net assets for the six months ended 2/28/21. The expense ratio may differ for each share class.
† Expenses are calculated by multiplying the expense ratio by the average account value for the period; then multiplying the result by the number of days in the period; and then dividing that result by the number of days in the year.
Estimate the expenses you paid
To estimate the ongoing expenses you paid for the six months ended 2/28/21, use the following calculation method. To find the value of your investment on 9/1/20, call Putnam at 1-800-225-1581.
Compare expenses using the SEC’s method
The Securities and Exchange Commission (SEC) has established guidelines to help investors assess fund expenses. Per these guidelines, the following table shows your fund’s expenses based on a $1,000 investment, assuming a hypothetical 5% annualized return. You can use this information to compare the ongoing expenses (but not transaction expenses or total costs) of investing in the fund with those of other funds. All mutual fund shareholder reports will provide this information to help you make this comparison. Please note that you cannot use this information to estimate your actual ending account balance and expenses paid during the period.
| | | | | | | |
| | Class A | Class B | Class C | Class R | Class R5 | Class R6 | Class Y |
| Expenses paid per $1,000*† | $6.21 | $9.94 | $9.94 | $7.45 | $4.56 | $4.06 | $4.96 |
| Ending value (after expenses) | $1,018.65 | $1,014.93 | $1,014.93 | $1,017.41 | $1,020.28 | $1,020.78 | $1,019.89 |
* Expenses for each share class are calculated using the fund’s annualized expense ratio for each class, which represents the ongoing expenses as a percentage of average net assets for the six months ended 2/28/21. The expense ratio may differ for each share class.
† Expenses are calculated by multiplying the expense ratio by the average account value for the six-month period; then multiplying the result by the number of days in the six-month period; and then dividing that result by the number of days in the year.
Consider these risks before investing
Investments in small and/or midsize companies increase the risk of greater price fluctuations. Value stocks may fail to rebound, and the market may not favor value-style investing. The value of investments in the fund’s portfolio may fall or fail to rise over extended periods of time for a variety of reasons, including general economic, political, or financial market conditions; investor sentiment and market perceptions; government actions; geopolitical events or changes; and factors related to a specific issuer, geography, industry, or sector. These and other factors may lead to increased volatility and reduced liquidity in the fund’s portfolio holdings. These risks are generally greater for small and midsize companies. From time to time, the fund may invest a significant portion of its assets in companies in one or more related industries or sectors, which would make the fund more vulnerable to adverse developments affecting those industries or sectors. Our investment techniques, analyses, and judgments may not produce the outcome we intend. The investments we select for the fund may not perform as well as other securities that we do not select for the fund. We, or the fund’s other service providers, may experience disruptions or operating errors that could have a negative effect on the fund. You can lose money by investing in the fund.
Terms and definitions
Important terms
Total return shows how the value of the fund’s shares changed over time, assuming you held the shares through the entire period and reinvested all distributions in the fund.
Before sales charge, or net asset value, is the price, or value, of one share of a mutual fund, without a sales charge. Before-sales-charge figures fluctuate with market conditions, and are calculated by dividing the net assets of each class of shares by the number of outstanding shares in the class.
After sales charge is the price of a mutual fund share plus the maximum sales charge levied at the time of purchase. After-sales-charge performance figures shown here assume the 5.75% maximum sales charge for class A shares.
Contingent deferred sales charge (CDSC) is generally a charge applied at the time of the redemption of class B or C shares and assumes redemption at the end of the period. Your fund’s class B CDSC declines over time from a 5% maximum during the first year to 1% during the sixth year. After the sixth year, the CDSC no longer applies. The CDSC for class C shares is 1% for one year after purchase.
Share classes
Class A shares are generally subject to an initial sales charge and no CDSC (except on certain redemptions of shares bought without an initial sales charge).
Class B shares are closed to new investments and are only available by exchange from another Putnam fund or through dividend and/or capital gains reinvestment. They are not subject to an initial sales charge and may be subject to a CDSC.
Class C shares are not subject to an initial sales charge and are subject to a CDSC only if the shares are redeemed during the first year.
Class R shares are not subject to an initial sales charge or CDSC and are only available to employer-sponsored retirement plans.
Class R5 shares are not subject to an initial sales charge or CDSC and carry no 12b-1 fee. They are only available to employer-sponsored retirement plans.
Class R6 shares are not subject to an initial sales charge or CDSC and carry no 12b-1 fee. They are generally only available to employer-sponsored retirement plans, corporate and institutional clients, and clients in other approved programs.
Class Y shares are not subject to an initial sales charge or CDSC and carry no 12b-1 fee. They are generally only available to corporate and institutional clients and clients in other approved programs.
Comparative indexes
Bloomberg Barclays U.S. Aggregate Bond Index is an unmanaged index of U.S. investment-grade fixed-income securities.
ICE BofA (Intercontinental Exchange Bank of America) U.S. 3-Month Treasury Bill Index is an unmanaged index that seeks to measure the performance of U.S. Treasury bills available in the marketplace.
Russell 2000 Growth Index is an unmanaged index of those companies in the large-cap Russell 2000 Index chosen for their growth orientation.
Russell 2000 Value Index is an unmanaged index of those companies in the small-cap Russell 2000 Index chosen for their value orientation.
S&P 500 Index is an unmanaged index of common stock performance.
Indexes assume reinvestment of all distributions and do not account for fees. Securities and performance of a fund and an index will differ. You cannot invest directly in an index.
BLOOMBERG® is a trademark and service mark of Bloomberg Finance L.P. and its affiliates (collectively “Bloomberg”). BARCLAYS® is a trademark and service mark of Barclays Bank Plc (collectively with its affiliates, “Barclays”), used under license. Bloomberg or Bloomberg’s licensors, including Barclays, own all proprietary rights in the Bloomberg Barclays Indices. Neither Bloomberg nor Barclays approves or endorses this material, or guarantees the accuracy or completeness of any information herein, or makes any warranty, express or limited, as to the results to be obtained therefrom, and to the maximum extent allowed by law, neither shall have any liability or responsibility for injury or damages arising in connection therewith.
ICE Data Indices, LLC (“ICE BofA”), used with permission. ICE BofA permits use of the ICE BofA indices and related data on an “as is” basis; makes no warranties regarding same; does not guarantee the suitability, quality, accuracy, timeliness, and/or completeness of the ICE BofA indices or any data included in, related to, or derived therefrom; assumes no liability in connection with the use of the foregoing; and does not sponsor, endorse, or recommend Putnam Investments, or any of its products or services.
Frank Russell Company is the source and owner of the trademarks, service marks, and copyrights related to the Russell Indexes. Russell® is a trademark of Frank Russell Company.
Lipper, a Refinitiv company, is a third-party industry-ranking entity that ranks mutual funds. Its rankings do not reflect sales charges. Lipper rankings are based on total return at net asset value relative to other funds that have similar current investment styles or objectives as determined by Lipper. Lipper may change a fund’s category assignment at its discretion. Lipper category averages reflect performance trends for funds within a category.
Other information for shareholders
Proxy voting
Putnam is committed to managing our mutual funds in the best interests of our shareholders. The Putnam funds’ proxy voting guidelines and procedures, as well as information regarding how your fund voted proxies relating to portfolio securities during the 12-month period ended June 30, 2020, are available in the Individual Investors section of putnam.com and on the Securities and Exchange Commission (SEC) website, www.sec.gov. If you have questions about finding forms on the SEC’s website, you may call the SEC at 1-800-SEC-0330. You may also obtain the Putnam funds’ proxy voting guidelines and procedures at no charge by calling Putnam’s Shareholder Services at 1-800-225-1581.
Fund portfolio holdings
The fund will file a complete schedule of its portfolio holdings with the SEC for the first and third quarters of each fiscal year on Form N-PORT within 60 days of the end of such fiscal quarter. Shareholders may obtain the fund’s Form N-PORT on the SEC’s website at www.sec.gov.
Prior to its use of Form N-PORT, the fund filed its complete schedule of its portfolio holdings with the SEC on Form N-Q, which is available online at www.sec.gov.
Trustee and employee fund ownership
Putnam employees and members of the Board of Trustees place their faith, confidence, and, most importantly, investment dollars in Putnam mutual funds. As of February 28, 2021, Putnam employees had approximately $555,000,000 and the Trustees had approximately $78,000,000 invested in Putnam mutual funds. These amounts include investments by the Trustees’ and employees’ immediate family members as well as investments through retirement and deferred compensation plans.
Important notice regarding Putnam’s privacy policy
In order to conduct business with our shareholders, we must obtain certain personal information such as account holders’ names, addresses, Social Security numbers, and dates of birth. Using this information, we are able to maintain accurate records of accounts and transactions.
It is our policy to protect the confidentiality of our shareholder information, whether or not a shareholder currently owns shares of our funds. In particular, it is our policy not to sell information about you or your accounts to outside marketing firms. We have safeguards in place designed to prevent unauthorized access to our computer systems and procedures to protect personal information from unauthorized use.
Under certain circumstances, we must share account information with outside vendors who provide services to us, such as mailings and proxy solicitations. In these cases, the service providers enter into confidentiality agreements with us, and we provide only the information necessary to process transactions and perform other services related to your account. Finally, it is our policy to share account information with your financial representative, if you’ve listed one on your Putnam account.
Audited financial statements
These sections of the report, as well as the accompanying Notes, preceded by the Report of Independent Registered Public Accounting Firm, constitute the fund’s audited financial statements.
The fund’s portfolio lists all the fund’s investments and their values as of the last day of the reporting period. Holdings are organized by asset type and industry sector, country, or state to show areas of concentration and diversification.
Statement of assets and liabilities shows how the fund’s net assets and share price are determined. All investment and non-investment assets are added together. Any unpaid expenses and other liabilities are subtracted from this total. The result is divided by the number of shares to determine the net asset value per share, which is calculated separately for each class of shares. (For funds with preferred shares, the amount subtracted from total assets includes the liquidation preference of preferred shares.)
Statement of operations shows the fund’s net investment gain or loss. This is done by first adding up all the fund’s earnings — from dividends and interest income — and subtracting its operating expenses to determine net investment income (or loss). Then, any net gain or loss the fund realized on the sales of its holdings — as well as any unrealized gains or losses over the period — is added to or subtracted from the net investment result to determine the fund’s net gain or loss for the fiscal year.
Statement of changes in net assets shows how the fund’s net assets were affected by the fund’s net investment gain or loss, by distributions to shareholders, and by changes in the number of the fund’s shares. It lists distributions and their sources (net investment income or realized capital gains) over the current reporting period and the most recent fiscal year-end. The distributions listed here may not match the sources listed in the Statement of operations because the distributions are determined on a tax basis and may be paid in a different period from the one in which they were earned.
Financial highlights provide an overview of the fund’s investment results, per-share distributions, expense ratios, net investment income ratios, and portfolio turnover in one summary table, reflecting the five most recent reporting periods. In a semiannual report, the highlights table also includes the current reporting period.
Report of Independent Registered Public Accounting Firm
To the Board of Trustees of Putnam Investment Funds and
Shareholders of Putnam Small Cap Value Fund:
Opinion on the Financial Statements
We have audited the accompanying statement of assets and liabilities, including the fund’s portfolio, of Putnam Small Cap Value Fund (one of the funds constituting Putnam Investment Funds, referred to hereafter as the “Fund”) as of February 28, 2021, the related statement of operations and changes in net assets for the year ended February 28, 2021, including the related notes, and the financial highlights for the year ended February 28, 2021 (collectively referred to as the “financial statements”). In our opinion, the financial statements present fairly, in all material respects, the financial position of the Fund as of February 28, 2021, the results of its operations, changes in its net assets and the financial highlights for the year ended February 28, 2021 in conformity with accounting principles generally accepted in the United States of America.
The financial statements of the Fund as of and for the year ended February 29, 2020 and the financial highlights for each of the periods ended on or prior to February 29, 2020 (not presented herein, other than the statement of changes in net assets and the financial highlights) were audited by other auditors whose report dated April 6, 2020 expressed an unqualified opinion on those financial statements and financial highlights.
Basis for Opinion
These financial statements are the responsibility of the Fund’s management. Our responsibility is to express an opinion on the Fund’s financial statements based on our audit. We are a public accounting firm registered with the Public Company Accounting Oversight Board (United States) (“PCAOB”) and are required to be independent with respect to the Fund in accordance with the U.S. federal securities laws and the applicable rules and regulations of the Securities and Exchange Commission and the PCAOB.
We conducted our audit of these financial statements in accordance with the standards of the PCAOB. Those standards require that we plan and perform the audit to obtain reasonable assurance about whether the financial statements are free of material misstatement, whether due to error or fraud.
Our audit included performing procedures to assess the risks of material misstatement of the financial statements, whether due to error or fraud, and performing procedures that respond to those risks. Such procedures included examining, on a test basis, evidence regarding the amounts and disclosures in the financial statements. Our audit also included evaluating the accounting principles used and significant estimates made by management, as well as evaluating the overall presentation of the financial statements. Our procedures included confirmation of securities owned as of February 28, 2021 by correspondence with the custodian, transfer agent, portfolio company investee and brokers; when replies were not received from brokers, we performed other auditing procedures. We believe that our audit provides a reasonable basis for our opinion.
PricewaterhouseCoopers LLP
Boston, Massachusetts
April 6, 2021
We have served as the auditor of one or more investment companies in the Putnam Investments family of mutual funds since at least 1957. We have not been able to determine the specific year we began serving as auditor.
The fund’s portfolio 2/28/21
| | |
| COMMON STOCKS (96.3%)* | Shares | Value |
| Aerospace and defense (1.0%) | | |
| Vectrus, Inc. † | 38,420 | $2,097,732 |
| | | 2,097,732 |
| Air freight and logistics (1.0%) | | |
| Radiant Logistics, Inc. † | 294,500 | 1,993,765 |
| | | 1,993,765 |
| Airlines (1.5%) | | |
| Allegiant Travel Co. | 12,300 | 3,101,937 |
| | | 3,101,937 |
| Auto components (1.2%) | | |
| Patrick Industries, Inc. | 31,000 | 2,446,830 |
| | | 2,446,830 |
| Banks (16.6%) | | |
| Ameris Bancorp | 49,800 | 2,372,472 |
| Bancorp, Inc. (The) † | 109,700 | 2,223,619 |
| Berkshire Hills Bancorp, Inc. | 78,000 | 1,572,480 |
| Bryn Mawr Bank Corp. | 44,264 | 1,674,507 |
| Coastal Financial Corp./WA † | 24,674 | 690,872 |
| ConnectOne Bancorp, Inc. | 112,124 | 2,604,641 |
| CrossFirst Bankshares, Inc. † | 170,000 | 2,269,500 |
| First Bancshares, Inc. (The) | 57,200 | 1,834,404 |
| First Horizon Corp. | 157,200 | 2,546,640 |
| Independent Bank Corp./MI | 74,800 | 1,546,116 |
| Investors Bancorp, Inc. S | 201,265 | 2,684,875 |
| Lakeland Bancorp, Inc. | 163,800 | 2,568,384 |
| OFG Bancorp (Puerto Rico) | 133,600 | 2,579,816 |
| Professional Holding Corp. Class A † | 84,579 | 1,353,264 |
| QCR Holdings, Inc. | 50,183 | 2,077,576 |
| Southern First Bancshares, Inc. † | 41,646 | 1,832,424 |
| Univest Financial Corp. | 86,200 | 2,167,930 |
| | | 34,599,520 |
| Building products (1.9%) | | |
| Insteel Industries, Inc. | 61,100 | 1,886,768 |
| Quanex Building Products Corp. | 83,254 | 2,025,570 |
| | | 3,912,338 |
| Capital markets (1.0%) | | |
| Stifel Financial Corp. | 33,100 | 2,021,748 |
| | | 2,021,748 |
| Chemicals (2.7%) | | |
| AdvanSix, Inc. † | 53,733 | 1,493,777 |
| Atotech, Ltd. (United Kingdom) † S | 64,607 | 1,310,876 |
| Tronox Holdings PLC Class A (United Kingdom) | 154,612 | 2,835,584 |
| | | 5,640,237 |
| Commercial services and supplies (2.7%) | | |
| ACCO Brands Corp. | 201,300 | 1,630,530 |
| Clean Harbors, Inc. † | 24,400 | 2,077,660 |
| Deluxe Corp. | 50,200 | 1,984,406 |
| | | 5,692,596 |
| | |
| COMMON STOCKS (96.3%)* cont. | Shares | Value |
| Communications equipment (0.7%) | | |
| Ribbon Communications, Inc. † S | 180,700 | $1,561,248 |
| | | 1,561,248 |
| Construction and engineering (2.4%) | | |
| MYR Group, Inc. † | 26,111 | 1,539,243 |
| Sterling Construction Co., Inc. † | 69,200 | 1,576,376 |
| WillScot Mobile Mini Holdings Corp. † | 70,800 | 1,963,284 |
| | | 5,078,903 |
| Construction materials (0.7%) | | |
| Tecnoglass, Inc. (Colombia) | 202,800 | 1,498,692 |
| | | 1,498,692 |
| Containers and packaging (2.4%) | | |
| Berry Global Group, Inc. † | 28,300 | 1,567,820 |
| Myers Industries, Inc. | 86,300 | 1,910,682 |
| Silgan Holdings, Inc. | 43,100 | 1,618,836 |
| | | 5,097,338 |
| Diversified consumer services (1.0%) | | |
| Universal Technical Institute, Inc. † | 345,235 | 2,116,291 |
| | | 2,116,291 |
| Diversified telecommunication services (0.9%) | | |
| ORBCOMM, Inc. † | 257,782 | 1,966,877 |
| | | 1,966,877 |
| Electric utilities (1.0%) | | |
| Otter Tail Corp. | 52,000 | 2,107,040 |
| | | 2,107,040 |
| Electrical equipment (1.0%) | | |
| nVent Electric PLC (United Kingdom) | 76,900 | 2,019,394 |
| | | 2,019,394 |
| Electronic equipment, instruments, and components (1.5%) | | |
| Jabil, Inc. | 43,711 | 1,887,004 |
| Methode Electronics, Inc. | 34,800 | 1,354,764 |
| | | 3,241,768 |
| Energy equipment and services (1.7%) | | |
| Newpark Resources, Inc. † | 1,051,800 | 3,639,226 |
| | | 3,639,226 |
| Entertainment (1.8%) | | |
| IMAX Corp. (Canada) † | 94,000 | 1,942,980 |
| Lions Gate Entertainment Corp. Class A † S | 120,428 | 1,748,615 |
| | | 3,691,595 |
| Equity real estate investment trusts (REITs) (5.3%) | | |
| Alpine Income Property Trust, Inc. R | 88,899 | 1,628,630 |
| Diversified Healthcare Trust R | 377,129 | 1,697,081 |
| Gaming and Leisure Properties, Inc. R | 36,566 | 1,623,530 |
| RLJ Lodging Trust R | 127,600 | 2,003,320 |
| Spirit Realty Capital, Inc. R | 43,201 | 1,858,507 |
| Xenia Hotels & Resorts, Inc. R | 109,500 | 2,186,715 |
| | | 10,997,783 |
| Food and staples retail (1.5%) | | |
| Andersons, Inc. (The) | 79,600 | 2,080,744 |
| Ingles Markets, Inc. Class A | 19,618 | 1,019,351 |
| | | 3,100,095 |
| | |
| COMMON STOCKS (96.3%)* cont. | Shares | Value |
| Gas utilities (0.5%) | | |
| Chesapeake Utilities Corp. | 10,700 | $1,131,311 |
| | | 1,131,311 |
| Health-care equipment and supplies (1.0%) | | |
| Lantheus Holdings, Inc. † | 116,300 | 2,172,484 |
| | | 2,172,484 |
| Health-care providers and services (3.1%) | | |
| Acadia Healthcare Co., Inc. † | 32,587 | 1,800,106 |
| Brookdale Senior Living, Inc. † | 484,654 | 2,820,686 |
| RadNet, Inc. † | 106,400 | 1,962,016 |
| | | 6,582,808 |
| Hotels, restaurants, and leisure (2.6%) | | |
| Brinker International, Inc. | 21,000 | 1,440,390 |
| Cedar Fair LP | 37,500 | 1,843,875 |
| Everi Holdings, Inc. † | 142,300 | 2,150,153 |
| | | 5,434,418 |
| Household durables (1.9%) | | |
| Purple Innovation, Inc. † | 53,492 | 1,967,971 |
| Universal Electronics, Inc. † | 35,600 | 2,071,564 |
| | | 4,039,535 |
| Insurance (1.4%) | | |
| Argo Group International Holdings, Ltd. (Bermuda) | 36,600 | 1,691,286 |
| Heritage Insurance Holdings, Inc. | 135,669 | 1,317,346 |
| | | 3,008,632 |
| IT Services (2.8%) | | |
| IBEX, Ltd. † | 163,219 | 3,592,450 |
| Unisys Corp. † | 95,400 | 2,342,070 |
| | | 5,934,520 |
| Leisure products (1.9%) | | |
| Vista Outdoor, Inc. † | 126,442 | 3,996,832 |
| | | 3,996,832 |
| Machinery (4.6%) | | |
| Columbus McKinnon Corp./NY | 45,228 | 2,276,778 |
| Crane Co. | 19,200 | 1,610,112 |
| Hillenbrand, Inc. | 49,900 | 2,318,354 |
| Mayville Engineering Co., Inc. † | 128,265 | 1,796,993 |
| Wabash National Corp. | 88,400 | 1,465,672 |
| | | 9,467,909 |
| Metals and mining (3.6%) | | |
| Alamos Gold, Inc. Class A (Canada) | 197,700 | 1,403,670 |
| Commercial Metals Co. | 76,000 | 1,911,400 |
| Ferroglobe Representation & Warranty Insurance Trust † | 270,395 | — |
| Major Drilling Group International, Inc. (Canada) † | 510,000 | 2,817,303 |
| Olympic Steel, Inc. | 78,908 | 1,407,719 |
| | | 7,540,092 |
| Mortgage real estate investment trusts (REITs) (1.3%) | | |
| Ladder Capital Corp. R | 140,100 | 1,602,744 |
| New Residential Investment Corp. R | 114,700 | 1,179,116 |
| | | 2,781,860 |
| | |
| COMMON STOCKS (96.3%)* cont. | Shares | Value |
| Multi-utilities (0.8%) | | |
| Unitil Corp. | 42,100 | $1,761,464 |
| | | 1,761,464 |
| Oil, gas, and consumable fuels (3.6%) | | |
| Arch Resources, Inc. | 35,100 | 1,681,992 |
| Magnolia Oil & Gas Corp. Class A † | 261,700 | 3,156,102 |
| Range Resources Corp. † | 131,900 | 1,271,516 |
| Scorpio Tankers, Inc. S | 91,407 | 1,349,167 |
| | | 7,458,777 |
| Paper and forest products (1.9%) | | |
| Domtar Corp. | 53,600 | 1,985,880 |
| Verso Corp. Class A | 159,853 | 1,998,163 |
| | | 3,984,043 |
| Professional services (—%) | | |
| BancTec, Inc. 144A CVR F | 160,833 | — |
| | | — |
| Road and rail (0.8%) | | |
| Universal Logistics Holdings, Inc. | 74,800 | 1,751,068 |
| | | 1,751,068 |
| Semiconductors and semiconductor equipment (0.8%) | | |
| Photronics, Inc. † | 144,300 | 1,718,613 |
| | | 1,718,613 |
| Software (1.8%) | | |
| j2 Global, Inc. † | 17,900 | 1,993,702 |
| Xperi Holding Corp. | 86,500 | 1,825,150 |
| | | 3,818,852 |
| Specialty retail (3.0%) | | |
| Citi Trends, Inc. | 31,400 | 2,445,746 |
| Shoe Carnival, Inc. S | 34,400 | 1,684,224 |
| Zumiez, Inc. † | 45,800 | 2,064,664 |
| | | 6,194,634 |
| Textiles, apparel, and luxury goods (2.0%) | | |
| Unifi, Inc. † | 164,884 | 4,110,558 |
| | | 4,110,558 |
| Thrifts and mortgage finance (3.9%) | | |
| Flagstar Bancorp, Inc. | 9,700 | 420,883 |
| Meta Financial Group, Inc. | 50,400 | 2,232,216 |
| MGIC Investment Corp. | 128,900 | 1,570,002 |
| Premier Financial Corp. | 75,637 | 2,319,030 |
| Walker & Dunlop, Inc. | 17,000 | 1,694,220 |
| | | 8,236,351 |
| Trading companies and distributors (1.5%) | | |
| Nesco Holdings, Inc. (acquired 12/22/20, cost $1,196,050) (Private) † ∆∆ F þ | 239,210 | 1,743,841 |
| Nesco Holdings, Inc. † S | 173,661 | 1,406,654 |
| | | 3,150,495 |
| Total common stocks (cost $151,594,175) | | $201,898,209 |
| | |
| INVESTMENT COMPANIES (3.1%)* | Shares | Value |
| Barings BDC, Inc. | 185,000 | $1,794,500 |
| Crescent Capital BDC, Inc. | 42,149 | 701,781 |
| PennantPark Investment Corp. | 327,100 | 1,844,844 |
| Saratoga Investment Corp. | 65,271 | 1,506,455 |
| Trinity Capital, Inc. † | 43,237 | 653,311 |
| Total investment companies (cost $5,994,943) | | $6,500,891 |
| | | | |
| | Expiration | Strike | | |
| WARRANTS (—%)*† | date | price | Warrants | Value |
| Nesco Holdings, Inc. | 1/1/25 | $11.50 | 49,986 | $74,979 |
| Total warrants (cost $63,982) | | | | $74,979 |
| | |
| SHORT-TERM INVESTMENTS (5.4%)* | Shares | Value |
| Putnam Cash Collateral Pool, LLC 0.11% d | 8,428,979 | $8,428,979 |
| Putnam Short Term Investment Fund Class P 0.12% L | 2,929,444 | 2,929,444 |
| Total short-term investments (cost $11,358,423) | | $11,358,423 |
| |
| TOTAL INVESTMENTS | | |
| Total investments (cost $169,011,523) | | $219,832,502 |
Key to holding’s abbreviations
| |
| CVR | Contingent Value Rights |
Notes to the fund’s portfolio
Unless noted otherwise, the notes to the fund’s portfolio are for the close of the fund’s reporting period, which ran from March 1, 2020 through February 28, 2021 (the reporting period). Within the following notes to the portfolio, references to “Putnam Management” represent Putnam Investment Management, LLC, the fund’s manager, an indirect wholly-owned subsidiary of Putnam Investments, LLC and references to “ASC 820” represent Accounting Standards Codification 820 Fair Value Measurements and Disclosures.
* Percentages indicated are based on net assets of $209,667,127.
† This security is non-income-producing.
∆∆ This security is restricted with regard to public resale. The total fair value of this security and any other restricted securities (excluding 144A securities), if any, held at the close of the reporting period was $1,743,841, or 0.8% of net assets.
d Affiliated company. See Notes 1 and 5 to the financial statements regarding securities lending. The rate quoted in the security description is the annualized 7-day yield of the fund at the close of the reporting period.
F This security is valued by Putnam Management at fair value following procedures approved by the Trustees. Securities are classified as Level 3 for ASC 820 based on the securities’ valuation inputs (Note 1).
L Affiliated company (Note 5). The rate quoted in the security description is the annualized 7-day yield of the fund at the close of the reporting period.
R Real Estate Investment Trust.
S Security on loan, in part or in entirety, at the close of the reporting period (Note 1).
þ Represents the asset to be received in a private investment in public entity (PIPE) commitment, of which $1,196,050 is included in the Payable for purchases of delayed delivery securities (Note 1).
At the close of the reporting period, the fund maintained liquid assets totaling $1,944,930 to cover certain derivative contracts and the settlement of certain securities.
144A after the name of an issuer represents securities exempt from registration under Rule 144A of the Securities Act of 1933, as amended. These securities may be resold in transactions exempt from registration, normally to qualified institutional buyers.
| | | | |
| WRITTEN OPTIONS OUTSTANDING at 2/28/21 (premiums $45,307) | | |
| | Expiration | Notional | Contract | |
| Counterparty | date/strike price | amount | amount | Value |
| Barclays Bank PLC | | | | |
| Purple Innovation, Inc. (Call) | Mar-21/$40.00 | $688,782 | $18,722 | $40,251 |
| Total | | | | $40,251 |
ASC 820 establishes a three-level hierarchy for disclosure of fair value measurements. The valuation hierarchy is based upon the transparency of inputs to the valuation of the fund’s investments. The three levels are defined as follows:
Level 1: Valuations based on quoted prices for identical securities in active markets.
Level 2: Valuations based on quoted prices in markets that are not active or for which all significant inputs are observable, either directly or indirectly.
Level 3: Valuations based on inputs that are unobservable and significant to the fair value measurement.
The following is a summary of the inputs used to value the fund’s net assets as of the close of the reporting period:
| | | |
| | | | Valuation inputs | |
| Investments in securities: | Level 1 | Level 2 | Level 3 |
| Common stocks*: | | | |
| Communication services | $5,658,472 | $— | $— |
| Consumer discretionary | 28,339,098 | — | — |
| Consumer staples | 3,100,095 | — | — |
| Energy | 11,098,003 | — | — |
| Financials | 50,648,111 | — | — |
| Health care | 8,755,292 | — | — |
| Industrials | 36,522,296 | — | 1,743,841 |
| Information technology | 16,275,001 | — | — |
| Materials | 23,760,402 | — | — |
| Real estate | 10,997,783 | — | — |
| Utilities | 4,999,815 | — | — |
| Total common stocks | 200,154,368 | — | 1,743,841 |
| | | | |
| Investment companies | 6,500,891 | — | — |
| Warrants | 74,979 | — | — |
| Short-term investments | — | 11,358,423 | — |
| Totals by level | $206,730,238 | $11,358,423 | $1,743,841 |
| | | |
| | | | Valuation inputs | |
| Other financial instruments: | Level 1 | Level 2 | Level 3 |
| Written options outstanding | $— | $(40,251) | $— |
| Totals by level | $— | $(40,251) | $— |
* Common stock classifications are presented at the sector level, which may differ from the fund’s portfolio presentation.
At the start and close of the reporting period, Level 3 investments in securities represented less than 1% of the fund’s net assets and were not considered a significant portion of the fund’s portfolio.
The accompanying notes are an integral part of these financial statements.
Statement of assets and liabilities 2/28/21
| |
| ASSETS | |
| Investment in securities, at value, including $8,217,105 of securities on loan (Notes 1 and 8): | |
| Unaffiliated issuers (identified cost $157,653,100) | $208,474,079 |
| Affiliated issuers (identified cost $11,358,423) (Note 5) | 11,358,423 |
| Dividends, interest and other receivables | 156,741 |
| Receivable for shares of the fund sold | 373,665 |
| Receivable for investments sold | 1,658,664 |
| Prepaid assets | 52,249 |
| Total assets | 222,073,821 |
| |
| LIABILITIES | |
| Payable for investments purchased | 2,099,596 |
| Payable for purchases of delayed delivery securities (Note 1) | 1,196,050 |
| Payable for shares of the fund repurchased | 213,316 |
| Payable for compensation of Manager (Note 2) | 96,170 |
| Payable for custodian fees (Note 2) | 17,835 |
| Payable for investor servicing fees (Note 2) | 62,607 |
| Payable for Trustee compensation and expenses (Note 2) | 99,694 |
| Payable for administrative services (Note 2) | 443 |
| Payable for distribution fees (Note 2) | 61,575 |
| Written options outstanding, at value (premiums $45,307) (Note 1) | 40,251 |
| Collateral on securities loaned, at value (Note 1) | 8,428,979 |
| Other accrued expenses | 90,178 |
| Total liabilities | 12,406,694 |
| | |
| Net assets | $209,667,127 |
| |
| REPRESENTED BY | |
| Paid-in capital (Unlimited shares authorized) (Notes 1 and 4) | $211,949,993 |
| Total distributable earnings (Note 1) | (2,282,866) |
| Total — Representing net assets applicable to capital shares outstanding | $209,667,127 |
| |
| COMPUTATION OF NET ASSET VALUE AND OFFERING PRICE | |
| Net asset value and redemption price per class A share | |
| ($136,441,961 divided by 10,265,726 shares) | $13.29 |
| Offering price per class A share (100/94.25 of $13.29)* | $14.10 |
| Net asset value and offering price per class B share ($879,065 divided by 90,111 shares)** | $9.76 |
| Net asset value and offering price per class C share ($10,969,050 divided by 1,135,321 shares)** | $9.66 |
| Net asset value, offering price and redemption price per class R share | |
| ($1,015,222 divided by 78,618 shares) | $12.91 |
| Net asset value, offering price and redemption price per class R5 share | |
| ($116,049 divided by 8,178 shares) | $14.19 |
| Net asset value, offering price and redemption price per class R6 share | |
| ($20,843,189 divided by 1,469,314 shares) | $14.19 |
| Net asset value, offering price and redemption price per class Y share | |
| ($39,402,591 divided by 2,785,098 shares) | $14.15 |
*On single retail sales of less than $50,000. On sales of $50,000 or more the offering price is reduced.
**Redemption price per share is equal to net asset value less any applicable contingent deferred sales charge.
The accompanying notes are an integral part of these financial statements.
Statement of operations Year ended 2/28/21
| |
| INVESTMENT INCOME | |
| Dividends | $2,948,849 |
| Interest (including interest income of $6,871 from investments in affiliated issuers) (Note 5) | 6,947 |
| Securities lending (net of expenses) (Notes 1 and 5) | 40,214 |
| Total investment income | 2,996,010 |
| |
| EXPENSES | |
| Compensation of Manager (Note 2) | 930,265 |
| Investor servicing fees (Note 2) | 329,889 |
| Custodian fees (Note 2) | 18,525 |
| Trustee compensation and expenses (Note 2) | 6,951 |
| Distribution fees (Note 2) | 321,372 |
| Administrative services (Note 2) | 4,198 |
| Blue sky expense | 97,500 |
| Other | 110,773 |
| Total expenses | 1,819,473 |
| Expense reduction (Note 2) | (454) |
| Net expenses | 1,819,019 |
| | |
| Net investment income | 1,176,991 |
| |
| REALIZED AND UNREALIZED GAIN (LOSS) | |
| Net realized gain (loss) on: | |
| Securities from unaffiliated issuers (Notes 1 and 3) | (12,978,308) |
| Foreign currency transactions (Note 1) | (495) |
| Written options (Note 1) | 6,096 |
| Total net realized loss | (12,972,707) |
| Change in net unrealized appreciation (depreciation) on: | |
| Securities from unaffiliated issuers | 68,850,481 |
| Assets and liabilities in foreign currencies | 87 |
| Written options | 5,056 |
| Total change in net unrealized appreciation | 68,855,624 |
| | |
| Net gain on investments | 55,882,917 |
| |
| Net increase in net assets resulting from operations | $57,059,908 |
The accompanying notes are an integral part of these financial statements.
Statement of changes in net assets
| | |
| INCREASE (DECREASE) IN NET ASSETS | Year ended 2/28/21 | Year ended 2/29/20 |
| Operations | | |
| Net investment income | $1,176,991 | $2,431,045 |
| Net realized gain (loss) on investments | | |
| and foreign currency transactions | (12,972,707) | 2,291,537 |
| Change in net unrealized appreciation (depreciation) | | |
| of investments and assets and liabilities | | |
| in foreign currencies | 68,855,624 | (23,577,530) |
| Net increase (decrease) in net assets resulting | | |
| from operations | 57,059,908 | (18,854,948) |
| Distributions to shareholders (Note 1): | | |
| From ordinary income | | |
| Net investment income | | |
| Class A | (619,779) | (1,655,123) |
| Class B | (2,389) | (13,390) |
| Class C | (42,341) | (92,034) |
| Class R | (3,432) | (12,665) |
| Class R5 | (617) | (2,366) |
| Class R6 | (126,998) | (485,365) |
| Class Y | (202,023) | (678,322) |
| From return of capital | | |
| Class A | (441,761) | (105,969) |
| Class B | (1,703) | (857) |
| Class C | (30,180) | (5,893) |
| Class R | (2,447) | (811) |
| Class R5 | (439) | (151) |
| Class R6 | (90,521) | (31,075) |
| Class Y | (143,997) | (43,429) |
| Decrease from capital share transactions (Note 4) | (20,126,863) | (73,668,705) |
| Total increase (decrease) in net assets | 35,224,418 | (95,651,103) |
| |
| NET ASSETS | | |
| Beginning of year | 174,442,709 | 270,093,812 |
| End of year | $209,667,127 | $174,442,709 |
The accompanying notes are an integral part of these financial statements.
Financial highlights (For a common share outstanding throughout the period)
| | | | | | | | | | | | | | |
| | INVESTMENT OPERATIONS | LESS DISTRIBUTIONS | RATIOS AND SUPPLEMENTAL DATA |
| | | | | | | | | | | | | Ratio of | Ratio of net | |
| | Net asset | | Net realized | | | From | | | | | | expenses | investment | |
| | value, | | and unrealized | Total from | From net | net realized | From | | Net asset | Total return | Net assets, | to average | income (loss) | Portfolio |
| | beginning | Net investment | gain (loss) on | investment | investment | gain on | return of | Total | value, end | at net asset | end of period | net assets | to average | turnover |
| Period ended | of period | income (loss)a | investments | operations | income | investments | capital | distributions | of period | value (%)b | (in thousands) | (%)c | net assets (%) | (%) |
| Class A | | | | | | | | | | | | | | |
| February 28, 2021 | $9.46 | .07 | 3.86 | 3.93 | (.06) | — | (.04) | (.10) | $13.29 | 41.80 | $136,442 | 1.26 | .73 | 113 |
| February 29, 2020 | 10.63 | .10 | (1.12) | (1.02) | (.14) | — | (.01) | (.15) | 9.46 | (9.77) | 110,135 | 1.23 | .96 | 108 |
| February 28, 2019 | 13.06 | .07 | (.56) | (.49) | (.09) | (1.79) | (.06) | (1.94) | 10.63 | (2.78) | 138,636 | 1.22 | .58 | 534 |
| February 28, 2018 | 17.69 | .03 | .50 | .53 | (.08) | (5.08) | — | (5.16) | 13.06 | 2.85 | 159,252 | 1.21 | .18 | 469 |
| February 28, 2017 | 12.82 | .08 | 4.91 | 4.99 | (.12) | — | — | (.12) | 17.69 | 38.90 | 187,839 | 1.18e | .53e | 63 |
| Class B | | | | | | | | | | | | | | |
| February 28, 2021 | $6.97 | —d | 2.84 | 2.84 | (.03) | — | (.02) | (.05) | $9.76 | 40.77 | $879 | 2.01 | .03 | 113 |
| February 29, 2020 | 7.87 | .02 | (.83) | (.81) | (.08) | — | (.01) | (.09) | 6.97 | (10.47) | 977 | 1.98 | .24 | 108 |
| February 28, 2019 | 10.21 | (.01) | (.46) | (.47) | (.05) | (1.79) | (.03) | (1.87) | 7.87 | (3.57) | 1,774 | 1.97 | (.10) | 534 |
| February 28, 2018 | 14.93 | (.08) | .44 | .36 | — | (5.08) | — | (5.08) | 10.21 | 2.21 | 2,594 | 1.96 | (.56) | 469 |
| February 28, 2017 | 10.86 | (.03) | 4.14 | 4.11 | (.04) | — | — | (.04) | 14.93 | 37.80 | 3,424 | 1.93e | (.25) e | 63 |
| Class C | | | | | | | | | | | | | | |
| February 28, 2021 | $6.93 | (.01) | 2.81 | 2.80 | (.04) | — | (.03) | (.07) | $9.66 | 40.70 | $10,969 | 2.01 | (.11) | 113 |
| February 29, 2020 | 7.83 | .02 | (.82) | (.80) | (.09) | — | (.01) | (.10) | 6.93 | (10.43) | 6,905 | 1.98 | .22 | 108 |
| February 28, 2019 | 10.16 | (.01) | (.46) | (.47) | (.04) | (1.79) | (.03) | (1.86) | 7.83 | (3.60) | 9,845 | 1.97 | (.08) | 534 |
| February 28, 2018 | 14.88 | (.08) | .44 | .36 | — | (5.08) | — | (5.08) | 10.16 | 2.21 | 18,306 | 1.96 | (.57) | 469 |
| February 28, 2017 | 10.82 | (.03) | 4.13 | 4.10 | (.04) | — | — | (.04) | 14.88 | 37.88 | 22,025 | 1.93e | (.23)e | 63 |
| Class R | | | | | | | | | | | | | | |
| February 28, 2021 | $9.19 | .04 | 3.76 | 3.80 | (.05) | — | (.03) | (.08) | $12.91 | 41.50 | $1,015 | 1.51 | .46 | 113 |
| February 29, 2020 | 10.34 | .07 | (1.09) | (1.02) | (.12) | — | (.01) | (.13) | 9.19 | (10.02) | 734 | 1.48 | .72 | 108 |
| February 28, 2019 | 12.76 | .04 | (.55) | (.51) | (.07) | (1.79) | (.05) | (1.91) | 10.34 | (3.07) | 1,050 | 1.47 | .28 | 534 |
| February 28, 2018 | 17.40 | (.02) | .51 | .49 | (.05) | (5.08) | — | (5.13) | 12.76 | 2.64 | 1,146 | 1.46 | (.10) | 469 |
| February 28, 2017 | 12.62 | .04 | 4.82 | 4.86 | (.08) | — | — | (.08) | 17.40 | 38.55 | 977 | 1.43e | .29e | 63 |
| Class R5 | | | | | | | | | | | | | | |
| February 28, 2021 | $10.09 | .11 | 4.13 | 4.24 | (.08) | — | (.06) | (.14) | $14.19 | 42.22 | $116 | .93 | 1.09 | 113 |
| February 29, 2020 | 11.33 | .16 | (1.23) | (1.07) | (.16) | — | (.01) | (.17) | 10.09 | (9.61) | 97 | .90 | 1.47 | 108 |
| February 28, 2019 | 13.79 | .12 | (.59) | (.47) | (.12) | (1.79) | (.08) | (1.99) | 11.33 | (2.50) | 446 | .89 | .91 | 534 |
| February 28, 2018 | 18.39 | .08 | .54 | .62 | (.14) | (5.08) | — | (5.22) | 13.79 | 3.29 | 555 | .89 | .48 | 469 |
| February 28, 2017 | 13.32 | .13 | 5.11 | 5.24 | (.17) | — | — | (.17) | 18.39 | 39.36 | 469 | .87e | .80e | 63 |
| Class R6 | | | | | | | | | | | | | | |
| February 28, 2021 | $10.08 | .11 | 4.14 | 4.25 | (.08) | — | (.06) | (.14) | $14.19 | 42.51 | $20,843 | .83 | 1.14 | 113 |
| February 29, 2020 | 11.32 | .16 | (1.21) | (1.05) | (.18) | — | (.01) | (.19) | 10.08 | (9.42) | 14,260 | .80 | 1.43 | 108 |
| February 28, 2019 | 13.78 | .14 | (.59) | (.45) | (.13) | (1.79) | (.09) | (2.01) | 11.32 | (2.39) | 36,574 | .79 | 1.07 | 534 |
| February 28, 2018 | 18.39 | .10 | .53 | .63 | (.16) | (5.08) | — | (5.24) | 13.78 | 3.33 | 52,510 | .79 | .59 | 469 |
| February 28, 2017 | 13.31 | .14 | 5.12 | 5.26 | (.18) | — | — | (.18) | 18.39 | 39.54 | 56,106 | .77e | .85e | 63 |
See notes to financial highlights at the end of this section.
The accompanying notes are an integral part of these financial statements.
| |
| 28 Small Cap Value Fund | Small Cap Value Fund 29 |
Financial highlights cont.
| | | | | | | | | | | | | | |
| | INVESTMENT OPERATIONS | LESS DISTRIBUTIONS | RATIOS AND SUPPLEMENTAL DATA |
| | | | | | | | | | | | | Ratio of | Ratio of net | |
| | Net asset | | Net realized | | | From | | | | | | expenses | investment | |
| | value, | | and unrealized | Total from | From net | net realized | From | | Net asset | Total return | Net assets, | to average | income (loss) | Portfolio |
| | beginning | Net investment | gain (loss) on | investment | investment | gain on | return of | Total | value, end | at net asset | end of period | net assets | to average | turnover |
| Period ended | of period | income (loss)a | investments | operations | income | investments | capital | distributions | of period | value (%)b | (in thousands) | (%)c | net assets (%) | (%) |
| Class Y | | | | | | | | | | | | | | |
| February 28, 2021 | $10.06 | .10 | 4.11 | 4.21 | (.07) | — | (.05) | (.12) | $14.15 | 42.14 | $39,403 | 1.01 | 1.00 | 113 |
| February 29, 2020 | 11.28 | .14 | (1.19) | (1.05) | (.16) | — | (.01) | (.17) | 10.06 | (9.51) | 41,335 | .98 | 1.23 | 108 |
| February 28, 2019 | 13.74 | .12 | (.60) | (.48) | (.11) | (1.79) | (.08) | (1.98) | 11.28 | (2.66) | 79,881 | .97 | .93 | 534 |
| February 28, 2018 | 18.33 | .08 | .53 | .61 | (.12) | (5.08) | — | (5.20) | 13.74 | 3.20 | 126,302 | .96 | .45 | 469 |
| February 28, 2017 | 13.27 | .12 | 5.09 | 5.21 | (.15) | — | — | (.15) | 18.33 | 39.30 | 211,823 | .93e | .76e | 63 |
a Per share net investment income (loss) has been determined on the basis of the weighted average number of shares outstanding during the period.
b Total return assumes dividend reinvestment and does not reflect the effect of sales charges.
c Includes amounts paid through expense offset and brokerage/service arrangements, if any (Note 2). Also excludes acquired fund fees, if any.
d Amount represents less than $0.01 per share.
e Reflects a voluntary waiver of certain fund expenses in effect during the period. As a result of such waiver, the expenses of each class reflect a reduction of less than 0.01% as a percentage of average net assets.
The accompanying notes are an integral part of these financial statements.
| |
| 30 Small Cap Value Fund | Small Cap Value Fund 31 |
Notes to financial statements 2/28/21
Within the following Notes to financial statements, references to “State Street” represent State Street Bank and Trust Company, references to “the SEC” represent the Securities and Exchange Commission, references to “Putnam Management” represent Putnam Investment Management, LLC, the fund’s manager, an indirect wholly-owned subsidiary of Putnam Investments, LLC and references to “OTC”, if any, represent over-the-counter. Unless otherwise noted, the “reporting period” represents the period from March 1, 2020 through February 28, 2021.
Putnam Small Cap Value Fund (the fund) is a diversified series of Putnam Investment Funds (the Trust), a Massachusetts business trust registered under the Investment Company Act of 1940, as amended, as an open-end management investment company. The goal of the fund is to seek capital appreciation. The fund invests mainly in common stocks of small U.S. companies, with a focus on value stocks. Value stocks are issued by companies that Putnam Management believes are currently undervalued by the market. If Putnam Management is correct and other investors ultimately recognize the value of the company, the price of its stock may rise. Under normal circumstances, the fund invests at least 80% of its net assets in companies of a size similar to those in the Russell 2000 Value Index. This policy may be changed only after 60 days’ notice to shareholders. As of April 30, 2020, the index was composed of companies having market capitalizations of between approximately $14.5 million and $6.9 billion. Putnam Management may consider, among other factors, a company’s valuation, financial strength, growth potential, competitive position in its industry, projected future earnings, cash flows and dividends when deciding whether to buy or sell investments.
The fund offers class A, class B, class C, class R, class R5, class R6 and class Y shares. Purchases of class B shares are closed to new and existing investors except by exchange from class B shares of another Putnam fund or through dividend and/or capital gains reinvestment. Class A shares are sold with a maximum front-end sales charge of 5.75%. Class A shares generally are not subject to a contingent deferred sales charge, and class R, class R5, class R6 and class Y shares are not subject to a contingent deferred sales charge. Class B shares, which convert to class A shares after approximately six years, are not subject to a front-end sales charge and are subject to a contingent deferred sales charge if those shares are redeemed within six years of purchase. Class C shares are subject to a one-year 1.00% contingent deferred sales charge and generally convert to class A shares after approximately ten years. Effective March 1, 2021, class C shares will generally convert to class A shares after approximately eight years. Class R shares, which are not available to all investors, are sold at net asset value. The expenses for class A, class B, class C and class R shares may differ based on the distribution fee of each class, which is identified in Note 2. Class R5, class R6 and class Y shares, which are sold at net asset value, are generally subject to the same expenses as class A, class B, class C and class R shares, but do not bear a distribution fee, and in the case of class R5 and class R6 shares, bear a lower investor servicing fee, which is identified in Note 2. Class R5, class R6 and class Y shares are not available to all investors.
In the normal course of business, the fund enters into contracts that may include agreements to indemnify another party under given circumstances. The fund’s maximum exposure under these arrangements is unknown as this would involve future claims that may be, but have not yet been, made against the fund. However, the fund’s management team expects the risk of material loss to be remote.
The fund has entered into contractual arrangements with an investment adviser, administrator, distributor, shareholder servicing agent and custodian, who each provide services to the fund. Unless expressly stated otherwise, shareholders are not parties to, or intended beneficiaries of these contractual arrangements, and these contractual arrangements are not intended to create any shareholder right to enforce them against the service providers or to seek any remedy under them against the service providers, either directly or on behalf of the fund.
Under the fund’s Amended and Restated Agreement and Declaration of Trust, any claims asserted against or on behalf of the Putnam Funds, including claims against Trustees and Officers, must be brought in state and federal courts located within the Commonwealth of Massachusetts.
Note 1: Significant accounting policies
The following is a summary of significant accounting policies consistently followed by the fund in the preparation of its financial statements. The preparation of financial statements is in conformity with accounting principles generally accepted in the United States of America and requires management to make estimates and assumptions that affect the reported amounts of assets and liabilities in the financial statements and the reported amounts of increases and decreases in net assets from operations. Actual results could differ from those estimates. Subsequent events after the Statement of assets and liabilities date through the date that the financial statements were issued have been evaluated in the preparation of the financial statements.
Investment income, realized and unrealized gains and losses and expenses of the fund are borne pro-rata based on the relative net assets of each class to the total net assets of the fund, except that each class bears expenses unique to that class (including the distribution fees applicable to such classes). Each class votes as a class only with respect to its own distribution plan or other matters on which a class vote is required by law or determined by the Trustees. If the fund were liquidated, shares of each class would receive their pro-rata share of the net assets of the fund. In addition, the Trustees declare separate dividends on each class of shares.
Security valuation Portfolio securities and other investments are valued using policies and procedures adopted by the Board of Trustees. The Trustees have formed a Pricing Committee to oversee the implementation of these procedures and have delegated responsibility for valuing the fund’s assets in accordance with these procedures to Putnam Management. Putnam Management has established an internal Valuation Committee that is responsible for making fair value determinations, evaluating the effectiveness of the pricing policies of the fund and reporting to the Pricing Committee.
Investments for which market quotations are readily available are valued at the last reported sales price on their principal exchange, or official closing price for certain markets, and are classified as Level 1 securities under Accounting Standards Codification 820 Fair Value Measurements and Disclosures (ASC 820). If no sales are reported, as in the case of some securities that are traded OTC, a security is valued at its last reported bid price and is generally categorized as a Level 2 security.
Investments in open-end investment companies (excluding exchange-traded funds), if any, which can be classified as Level 1 or Level 2 securities, are valued based on their net asset value. The net asset value of such investment companies equals the total value of their assets less their liabilities and divided by the number of their outstanding shares.
Many securities markets and exchanges outside the U.S. close prior to the scheduled close of the New York Stock Exchange and therefore the closing prices for securities in such markets or on such exchanges may not fully reflect events that occur after such close but before the scheduled close of the New York Stock Exchange. Accordingly, on certain days, the fund will fair value certain foreign equity securities taking into account multiple factors including movements in the U.S. securities markets, currency valuations and comparisons to the valuation of American Depository Receipts, exchange-traded funds and futures contracts. The foreign equity securities, which would generally be classified as Level 1 securities, will be transferred to Level 2 of the fair value hierarchy when they are valued at fair value. The number of days on which fair value prices will be used will depend on market activity and it is possible that fair value prices will be used by the fund to a significant extent. Securities quoted in foreign currencies, if any, are translated into U.S. dollars at the current exchange rate. Short-term securities with remaining maturities of 60 days or less are valued using an independent pricing service approved by the Trustees, and are classified as Level 2 securities.
To the extent a pricing service or dealer is unable to value a security or provides a valuation that Putnam Management does not believe accurately reflects the security’s fair value, the security will be valued at fair value by Putnam Management in accordance with policies and procedures approved by the Trustees. Certain investments, including certain restricted and illiquid securities and derivatives, are also valued at fair value following procedures approved by the Trustees. These valuations consider such factors as significant market or specific security events such as interest rate or credit quality changes, various relationships with other securities, discount rates, U.S. Treasury, U.S. swap and credit yields, index levels, convexity exposures, recovery rates, sales and other multiples and resale restrictions. These securities are classified as Level 2 or as Level 3 depending on the priority of the significant inputs.
To assess the continuing appropriateness of fair valuations, the Valuation Committee reviews and affirms the reasonableness of such valuations on a regular basis after considering all relevant information that is reasonably available. Such valuations and procedures are reviewed periodically by the Trustees. The fair value of securities is generally determined as the amount that the fund could reasonably expect to realize from an orderly disposition of such securities over a reasonable period of time. By its nature, a fair value price is a good faith estimate of the value of a security in a current sale and does not reflect an actual market price, which may be different by a material amount.
Security transactions and related investment income Security transactions are recorded on the trade date (the date the order to buy or sell is executed). Gains or losses on securities sold are determined on the identified cost basis.
Interest income, net of any applicable withholding taxes, if any, is recorded on the accrual basis. Dividend income, net of any applicable withholding taxes, is recognized on the ex-dividend date except that certain dividends from foreign securities, if any, are recognized as soon as the fund is informed of the ex-dividend date. Non-cash dividends, if any, are recorded at the fair value of the securities received. Dividends representing a return of capital or capital gains, if any, are reflected as a reduction of cost and/or as a realized gain.
Foreign currency translation The accounting records of the fund are maintained in U.S. dollars. The fair value of foreign securities, currency holdings, and other assets and liabilities is recorded in the books and records of the fund after translation to U.S. dollars based on the exchange rates on that day. The cost of each security is determined using historical exchange rates. Income and withholding taxes are translated at prevailing exchange rates when earned or incurred. The fund does not isolate that portion of realized or unrealized gains or losses resulting from changes in the foreign exchange rate on investments from fluctuations arising from changes in the market prices of the securities. Such gains and losses are included with the net realized and unrealized gain or loss on investments. Net realized gains and losses on foreign currency transactions represent net realized exchange gains or losses on disposition of foreign currencies, currency gains and losses realized between the trade and settlement dates on securities transactions and the difference between the amount of investment income and foreign withholding taxes recorded on the fund’s books and the U.S. dollar equivalent amounts actually received or paid. Net unrealized appreciation and depreciation of assets and liabilities in foreign currencies arise from changes in the value of assets and liabilities other than investments at the period end, resulting from changes in the exchange rate.
Options contracts The fund uses options contracts to generate additional income for the portfolio and to hedge against changes in values of securities it owns, owned or expects to own.
The potential risk to the fund is that the change in value of options contracts may not correspond to the change in value of the hedged instruments. In addition, losses may arise from changes in the value of the underlying instruments if there is an illiquid secondary market for the contracts, if interest or exchange rates move unexpectedly or if the counterparty to the contract is unable to perform. Realized gains and losses on purchased options are included in realized gains and losses on investment securities. If a written call option is exercised, the premium originally received is recorded as an addition to sales proceeds. If a written put option is exercised, the premium originally received is recorded as a reduction to the cost of investments.
Exchange-traded options are valued at the last sale price or, if no sales are reported, the last bid price for purchased options and the last ask price for written options. OTC traded options are valued using prices supplied by dealers.
Options on swaps are similar to options on securities except that the premium paid or received is to buy or grant the right to enter into a previously agreed upon interest rate or credit default contract. Forward premium swap option contracts include premiums that have extended settlement dates. The delayed settlement of the premiums is factored into the daily valuation of the option contracts. In the case of interest rate cap and floor contracts, in return for a premium, ongoing payments between two parties are based on interest rates exceeding a specified rate, in the case of a cap contract, or falling below a specified rate in the case of a floor contract.
Written option contracts outstanding at period end, if any, are listed after the fund’s portfolio.
Master agreements The fund is a party to ISDA (International Swaps and Derivatives Association, Inc.) Master Agreements (Master Agreements) with certain counterparties that govern OTC derivative and foreign exchange contracts entered into from time to time. The Master Agreements may contain provisions regarding, among other things, the parties’ general obligations, representations, agreements, collateral requirements, events of default and early termination. With respect to certain counterparties, in accordance with the terms of the Master Agreements, collateral pledged to the fund is held in a segregated account by the fund’s custodian and, with respect to those amounts which can be sold or repledged, is presented in the fund’s portfolio.
Collateral pledged by the fund is segregated by the fund’s custodian and identified in the fund’s portfolio. Collateral can be in the form of cash or debt securities issued by the U.S. Government or related agencies or other securities as agreed to by the fund and the applicable counterparty. Collateral requirements are determined based on the fund’s net position with each counterparty.
Termination events applicable to the fund may occur upon a decline in the fund’s net assets below a specified threshold over a certain period of time. Termination events applicable to counterparties may occur upon a decline in the counterparty’s long-term and short-term credit ratings below a specified level. In each case,
upon occurrence, the other party may elect to terminate early and cause settlement of all derivative and foreign exchange contracts outstanding, including the payment of any losses and costs resulting from such early termination, as reasonably determined by the terminating party. Any decision by one or more of the fund’s counterparties to elect early termination could impact the fund’s future derivative activity.
At the close of the reporting period, the fund had a net liability position of $40,251 on open derivative contracts subject to the Master Agreements. There was no collateral pledged by the fund at period end for these agreements.
Securities lending The fund may lend securities, through its agent, to qualified borrowers in order to earn additional income. The loans are collateralized by cash in an amount at least equal to the fair value of the securities loaned. The fair value of securities loaned is determined daily and any additional required collateral is allocated to the fund on the next business day. The remaining maturities of the securities lending transactions are considered overnight and continuous. The risk of borrower default will be borne by the fund’s agent; the fund will bear the risk of loss with respect to the investment of the cash collateral. Income from securities lending, net of expenses, is included in investment income on the Statement of operations. Cash collateral is invested in Putnam Cash Collateral Pool, LLC, a limited liability company managed by an affiliate of Putnam Management. Investments in Putnam Cash Collateral Pool, LLC are valued at its closing net asset value each business day. There are no management fees charged to Putnam Cash Collateral Pool, LLC. At the close of the reporting period, the fund received cash collateral of $8,428,979 and the value of securities loaned amounted to $8,217,105.
Interfund lending The fund, along with other Putnam funds, may participate in an interfund lending program pursuant to an exemptive order issued by the SEC. This program allows the fund to borrow from or lend to other Putnam funds that permit such transactions. Interfund lending transactions are subject to each fund’s investment policies and borrowing and lending limits. Interest earned or paid on the interfund lending transaction will be based on the average of certain current market rates. During the reporting period, the fund did not utilize the program.
Lines of credit The fund participates, along with other Putnam funds, in a $317.5 million unsecured committed line of credit and a $235.5 million unsecured uncommitted line of credit, both provided by State Street. Borrowings may be made for temporary or emergency purposes, including the funding of shareholder redemption requests and trade settlements. Interest is charged to the fund based on the fund’s borrowing at a rate equal to 1.25% plus the higher of (1) the Federal Funds rate and (2) the Overnight Bank Funding Rate (overnight LIBOR prior to October 16, 2020) for the committed line of credit and 1.30% plus the higher of (1) the Federal Funds rate and (2) the Overnight Bank Funding Rate (1.30% prior to October 16, 2020) for the uncommitted line of credit. A closing fee equal to 0.04% of the committed line of credit and 0.04% of the uncommitted line of credit has been paid by the participating funds. In addition, a commitment fee of 0.21% per annum on any unutilized portion of the committed line of credit is allocated to the participating funds based on their relative net assets and paid quarterly. During the reporting period, the fund had no borrowings against these arrangements.
Federal taxes It is the policy of the fund to distribute all of its taxable income within the prescribed time period and otherwise comply with the provisions of the Internal Revenue Code of 1986, as amended (the Code), applicable to regulated investment companies. It is also the intention of the fund to distribute an amount sufficient to avoid imposition of any excise tax under Section 4982 of the Code.
The fund is subject to the provisions of Accounting Standards Codification 740 Income Taxes (ASC 740). ASC 740 sets forth a minimum threshold for financial statement recognition of the benefit of a tax position taken or expected to be taken in a tax return. The fund did not have a liability to record for any unrecognized tax benefits in the accompanying financial statements. No provision has been made for federal taxes on income, capital gains or unrealized appreciation on securities held nor for excise tax on income and capital gains. Each of the fund’s federal tax returns for the prior three fiscal years remains subject to examination by the Internal Revenue Service.
The fund may also be subject to taxes imposed by governments of countries in which it invests. Such taxes are generally based on either income or gains earned or repatriated. The fund accrues and applies such taxes to net investment income, net realized gains and net unrealized gains as income and/or capital gains are earned. In some cases, the fund may be entitled to reclaim all or a portion of such taxes, and such reclaim amounts, if any, are reflected as an asset on the fund’s books. In many cases, however, the fund may not receive such amounts for an extended period of time, depending on the country of investment.
Under the Regulated Investment Company Modernization Act of 2010, the fund will be permitted to carry forward capital losses incurred for an unlimited period and the carry forwards will retain their character as either
short-term or long-term capital losses. At February 28, 2021, the fund had the following capital loss carryovers available, to the extent allowed by the Code, to offset future net capital gain, if any:
| | |
| | Loss carryover | |
| Short-term | Long-term | Total |
| $29,882,351 | $18,178,124 | $48,060,475 |
Pursuant to federal income tax regulations applicable to regulated investment companies, the fund has elected to defer $43,468 to its fiscal year ending February 28, 2022 of late year ordinary losses ((i) ordinary losses recognized between January 1, 2021 and February 28, 2021, and (ii) specified ordinary and currency losses recognized between November 1, 2020 and February 28, 2021).
Distributions to shareholders Distributions to shareholders from net investment income are recorded by the fund on the ex-dividend date. Distributions from capital gains, if any, are recorded on the ex-dividend date and paid at least annually. The amount and character of income and gains to be distributed are determined in accordance with income tax regulations, which may differ from generally accepted accounting principles. These differences include temporary and/or permanent differences from losses on wash sale transactions, nontaxable dividends, partnership income, distributions in excess and a return of capital due to distributions which exceed those required under the excise rules. Reclassifications are made to the fund’s capital accounts to reflect income and gains available for distribution (or available capital loss carryovers) under income tax regulations. At the close of the reporting period, the fund reclassified $222,880 to decrease undistributed net investment income, $68,600 to decrease paid-in capital and $291,480 to decrease accumulated net realized loss.
Tax cost of investments includes adjustments to net unrealized appreciation (depreciation) which may not necessarily be final tax cost basis adjustments, but closely approximate the tax basis unrealized gains and losses that may be realized and distributed to shareholders. The tax basis components of distributable earnings and the federal tax cost as of the close of the reporting period were as follows:
| |
| Unrealized appreciation | $50,743,932 |
| Unrealized depreciation | (4,922,855) |
| Net unrealized appreciation | 45,821,077 |
| Capital loss carryforward | (48,060,475) |
| Late year ordinary loss deferral | (43,468) |
| Cost for federal income tax purposes | $173,971,174 |
Expenses of the Trust Expenses directly charged or attributable to any fund will be paid from the assets of that fund. Generally, expenses of the Trust will be allocated among and charged to the assets of each fund on a basis that the Trustees deem fair and equitable, which may be based on the relative assets of each fund or the nature of the services performed and relative applicability to each fund.
Note 2: Management fee, administrative services and other transactions
The fund pays Putnam Management a management fee (based on the fund’s average net assets and computed and paid monthly) at annual rates that may vary based on the average of the aggregate net assets of all open-end mutual funds sponsored by Putnam Management (excluding net assets of funds that are invested in, or that are invested in by, other Putnam funds to the extent necessary to avoid “double counting” of those assets). Such annual rates may vary as follows:
| | | | |
| 0.780% | of the first $5 billion, | | 0.580% | of the next $50 billion, |
| 0.730% | of the next $5 billion, | | 0.560% | of the next $50 billion, |
| 0.680% | of the next $10 billion, | | 0.550% | of the next $100 billion and |
| 0.630% | of the next $10 billion, | | 0.545% | of any excess thereafter. |
For the reporting period, the management fee represented an effective rate (excluding the impact from any expense waivers in effect) of 0.619% of the fund’s average net assets.
Putnam Management has contractually agreed, through June 30, 2021, to waive fees and/or reimburse the fund’s expenses to the extent necessary to limit the cumulative expenses of the fund, exclusive of brokerage, interest,
taxes, investment-related expenses, extraordinary expenses, acquired fund fees and expenses and payments under the fund’s investor servicing contract, investment management contract and distribution plans, on a fiscal year-to-date basis to an annual rate of 0.20% of the fund’s average net assets over such fiscal year-to-date period. During the reporting period, the fund’s expenses were not reduced as a result of this limit.
Putnam Investments Limited (PIL), an affiliate of Putnam Management, is authorized by the Trustees to manage a separate portion of the assets of the fund as determined by Putnam Management from time to time. PIL did not manage any portion of the assets of the fund during the reporting period. If Putnam Management were to engage the services of PIL, Putnam Management would pay a quarterly sub-management fee to PIL for its services at an annual rate of 0.35% of the average net assets of the portion of the fund managed by PIL.
The fund reimburses Putnam Management an allocated amount for the compensation and related expenses of certain officers of the fund and their staff who provide administrative services to the fund. The aggregate amount of all such reimbursements is determined annually by the Trustees.
Custodial functions for the fund’s assets are provided by State Street. Custody fees are based on the fund’s asset level, the number of its security holdings and transaction volumes.
Putnam Investor Services, Inc., an affiliate of Putnam Management, provides investor servicing agent functions to the fund. Putnam Investor Services, Inc. received fees for investor servicing for class A, class B, class C, class R and class Y shares that included (1) a per account fee for each direct and underlying non-defined contribution account (retail account) of the fund; (2) a specified rate of the fund’s assets attributable to defined contribution plan accounts; and (3) a specified rate based on the average net assets in retail accounts. Putnam Investor Services, Inc. has agreed that the aggregate investor servicing fees for each fund’s retail and defined contribution accounts for these share classes will not exceed an annual rate of 0.25% of the fund’s average assets attributable to such accounts.
Class R5 shares paid a monthly fee based on the average net assets of class R5 shares at an annual rate of 0.15%.
Class R6 shares paid a monthly fee based on the average net assets of class R6 shares at an annual rate of 0.05%.
During the reporting period, the expenses for each class of shares related to investor servicing fees were as follows:
| | | | |
| Class A | $236,222 | | Class R5 | 126 |
| Class B | 1,732 | | Class R6 | 7,382 |
| Class C | 14,666 | | Class Y | 68,035 |
| Class R | 1,726 | | Total | $329,889 |
The fund has entered into expense offset arrangements with Putnam Investor Services, Inc. and State Street whereby Putnam Investor Services, Inc.’s and State Street’s fees are reduced by credits allowed on cash balances. For the reporting period, the fund’s expenses were reduced by $454 under the expense offset arrangements.
Each Independent Trustee of the fund receives an annual Trustee fee, of which $123, as a quarterly retainer, has been allocated to the fund, and an additional fee for each Trustees meeting attended. Trustees also are reimbursed for expenses they incur relating to their services as Trustees.
The fund has adopted a Trustee Fee Deferral Plan (the Deferral Plan) which allows the Trustees to defer the receipt of all or a portion of Trustees fees payable on or after July 1, 1995. The deferred fees remain invested in certain Putnam funds until distribution in accordance with the Deferral Plan.
The fund has adopted an unfunded noncontributory defined benefit pension plan (the Pension Plan) covering all Trustees of the fund who have served as a Trustee for at least five years and were first elected prior to 2004. Benefits under the Pension Plan are equal to 50% of the Trustee’s average annual attendance and retainer fees for the three years ended December 31, 2005. The retirement benefit is payable during a Trustee’s lifetime, beginning the year following retirement, for the number of years of service through December 31, 2006. Pension expense for the fund is included in Trustee compensation and expenses in the Statement of operations. Accrued pension liability is included in Payable for Trustee compensation and expenses in the Statement of assets and liabilities. The Trustees have terminated the Pension Plan with respect to any Trustee first elected after 2003.
The fund has adopted distribution plans (the Plans) with respect to the following share classes pursuant to Rule 12b–1 under the Investment Company Act of 1940. The purpose of the Plans is to compensate Putnam Retail Management Limited Partnership, an indirect wholly-owned subsidiary of Putnam Investments, LLC, for services
provided and expenses incurred in distributing shares of the fund. The Plans provide payments by the fund to Putnam Retail Management Limited Partnership at an annual rate of up to the following amounts (Maximum %) of the average net assets attributable to each class. The Trustees have approved payment by the fund at the following annual rate (Approved %) of the average net assets attributable to each class. During the reporting period, the class-specific expenses related to distribution fees were as follows:
| | | |
| | Maximum % | Approved % | Amount |
| Class A | 0.35% | 0.25% | $248,254 |
| Class B | 1.00% | 1.00% | 7,255 |
| Class C | 1.00% | 1.00% | 62,242 |
| Class R | 1.00% | 0.50% | 3,621 |
| Total | | | $321,372 |
For the reporting period, Putnam Retail Management Limited Partnership, acting as underwriter, received net commissions of $11,411 from the sale of class A shares and received $207 and $79 in contingent deferred sales charges from redemptions of class B and class C shares, respectively.
A deferred sales charge of up to 1.00% is assessed on certain redemptions of class A shares. For the reporting period, Putnam Retail Management Limited Partnership, acting as underwriter, received $21 on class A redemptions.
Note 3: Purchases and sales of securities
During the reporting period, the cost of purchases and the proceeds from sales, excluding short-term investments, were as follows:
| | |
| | Cost of purchases | Proceeds from sales |
| Investments in securities (Long-term) | $171,866,235 | $191,899,789 |
| U.S. government securities (Long-term) | — | — |
| Total | $171,866,235 | $191,899,789 |
The fund may purchase or sell investments from or to other Putnam funds in the ordinary course of business, which can reduce the fund’s transaction costs, at prices determined in accordance with SEC requirements and policies approved by the Trustees. During the reporting period, purchases or sales of long-term securities from or to other Putnam funds, if any, did not represent more than 5% of the fund’s total cost of purchases and/or total proceeds from sales.
Note 4: Capital shares
At the close of the reporting period, there were an unlimited number of shares of beneficial interest authorized. Transactions, including, if applicable, direct exchanges pursuant to share conversions, in capital shares were as follows:
| | | | |
| | YEAR ENDED 2/28/21 | YEAR ENDED 2/29/20 |
| Class A | Shares | Amount | Shares | Amount |
| Shares sold | 1,951,630 | $17,670,707 | 893,632 | $9,507,140 |
| Shares issued in connection with | | | | |
| reinvestment of distributions | 94,111 | 1,038,041 | 160,735 | 1,713,431 |
| | 2,045,741 | 18,708,748 | 1,054,367 | 11,220,571 |
| Shares repurchased | (3,423,116) | (30,244,345) | (2,454,128) | (26,019,875) |
| Net decrease | (1,377,375) | $(11,535,597) | (1,399,761) | $(14,799,304) |
| | | | |
| | YEAR ENDED 2/28/21 | YEAR ENDED 2/29/20 |
| Class B | Shares | Amount | Shares | Amount |
| Shares sold | 6,364 | $45,160 | 10,130 | $77,690 |
| Shares issued in connection with | | | | |
| reinvestment of distributions | 499 | 4,048 | 1,785 | 14,045 |
| | 6,863 | 49,208 | 11,915 | 91,735 |
| Shares repurchased | (56,989) | (365,674) | (97,185) | (754,029) |
| Net decrease | (50,126) | $(316,466) | (85,270) | $(662,294) |
| |
| | YEAR ENDED 2/28/21 | YEAR ENDED 2/29/20 |
| Class C | Shares | Amount | Shares | Amount |
| Shares sold | 467,934 | $3,754,272 | 116,767 | $896,544 |
| Shares issued in connection with | | | | |
| reinvestment of distributions | 9,025 | 72,468 | 12,502 | 97,769 |
| | 476,959 | 3,826,740 | 129,269 | 994,313 |
| Shares repurchased | (338,282) | (2,115,899) | (389,983) | (3,000,916) |
| Net increase (decrease) | 138,677 | $1,710,841 | (260,714) | $(2,006,603) |
| |
| | | | YEAR ENDED 2/29/20* |
| Class M | | | Shares | Amount |
| Shares sold | | | 5,870 | $51,973 |
| Shares issued in connection with reinvestment of distributions | | — | — |
| | | | 5,870 | 51,973 |
| Shares repurchased | | | (214,361) | (1,956,880) |
| Net decrease | | | (208,491) | $(1,904,907) |
| |
| | YEAR ENDED 2/28/21 | YEAR ENDED 2/29/20 |
| Class R | Shares | Amount | Shares | Amount |
| Shares sold | 25,943 | $215,386 | 11,384 | $116,523 |
| Shares issued in connection with | | | | |
| reinvestment of distributions | 548 | 5,879 | 1,300 | 13,476 |
| | 26,491 | 221,265 | 12,684 | 129,999 |
| Shares repurchased | (27,728) | (232,665) | (34,422) | (362,802) |
| Net decrease | (1,237) | $(11,400) | (21,738) | $(232,803) |
| |
| | YEAR ENDED 2/28/21 | YEAR ENDED 2/29/20 |
| Class R5 | Shares | Amount | Shares | Amount |
| Shares sold | 2,306 | $20,230 | 8,309 | $92,684 |
| Shares issued in connection with | | | | |
| reinvestment of distributions | 90 | 1,056 | 222 | 2,517 |
| | 2,396 | 21,286 | 8,531 | 95,201 |
| Shares repurchased | (3,832) | (33,394) | (38,265) | (426,780) |
| Net decrease | (1,436) | $(12,108) | (29,734) | $(331,579) |
| | | | |
| | YEAR ENDED 2/28/21 | YEAR ENDED 2/29/20 |
| Class R6 | Shares | Amount | Shares | Amount |
| Shares sold | 728,078 | $6,871,904 | 557,643 | $6,257,390 |
| Shares issued in connection with | | | | |
| reinvestment of distributions | 18,496 | 217,519 | 45,310 | 514,376 |
| | 746,574 | 7,089,423 | 602,953 | 6,771,766 |
| Shares repurchased | (691,676) | (6,906,257) | (2,420,458) | (27,513,394) |
| Net increase (decrease) | 54,898 | $183,166 | (1,817,505) | $(20,741,628) |
| |
| | YEAR ENDED 2/28/21 | YEAR ENDED 2/29/20 |
| Class Y | Shares | Amount | Shares | Amount |
| Shares sold | 864,172 | $8,752,492 | 879,204 | $9,892,635 |
| Shares issued in connection with | | | | |
| reinvestment of distributions | 29,390 | 345,042 | 63,479 | 719,214 |
| | 893,562 | 9,097,534 | 942,683 | 10,611,849 |
| Shares repurchased | (2,219,129) | (19,242,833) | (3,911,612) | (43,601,436) |
| Net decrease | (1,325,567) | $(10,145,299) | (2,968,929) | $(32,989,587) |
* Effective November 25, 2019, the fund converted all of its class M shares to class A shares and class M shares were no longer able to be purchased.
At the close of the reporting period, a shareholder of record owned 7.2% of the outstanding shares of the fund.
Note 5: Affiliated transactions
Transactions during the reporting period with any company which is under common ownership or control were as follows:
| | | | | |
| | | | | | Shares |
| | | | | | outstanding |
| | | | | | and fair |
| | Fair value as | Purchase | Sale | Investment | value as |
| Name of affiliate | of 2/29/20 | cost | proceeds | income | of 2/28/21 |
| Short-term investments | | | | | |
| Putnam Cash Collateral | | | | | |
| Pool, LLC* | $15,762,450 | $105,270,529 | $112,604,000 | $74,935 | $8,428,979 |
| Putnam Short Term | | | | | |
| Investment Fund** | 2,751,533 | 54,538,085 | 54,360,174 | 6,871 | 2,929,444 |
| Total Short-term | | | | | |
| investments | $18,513,983 | $159,808,614 | $166,964,174 | $81,806 | $11,358,423 |
* No management fees are charged to Putnam Cash Collateral Pool, LLC (Note 1). Investment income shown is included in securities lending income on the Statement of operations. There were no realized or unrealized gains or losses during the period.
** Management fees charged to Putnam Short Term Investment Fund have been waived by Putnam Management. There were no realized or unrealized gains or losses during the period.
Note 6: Market, credit and other risks
In the normal course of business, the fund trades financial instruments and enters into financial transactions where risk of potential loss exists due to changes in the market (market risk) or failure of the contracting party to the transaction to perform (credit risk). The fund may be exposed to additional credit risk that an institution or other entity with which the fund has unsettled or open transactions will default. Investments in foreign securities involve certain risks, including those related to economic instability, unfavorable political developments, and currency fluctuations.
Beginning in January 2020, global financial markets have experienced, and may continue to experience, significant volatility resulting from the spread of a virus known as COVID–19. The outbreak of COVID–19 has resulted in travel and border restrictions, quarantines, supply chain disruptions, lower consumer demand, and general market uncertainty. The effects of COVID–19 have adversely affected, and may continue to adversely affect, the global economy, the economies of certain nations, and individual issuers, all of which may negatively impact the fund’s performance.
Note 7: Summary of derivative activity
The volume of activity for the reporting period for any derivative type that was held during the period is listed below and was based on an average of the holdings at the end of each fiscal quarter:
| |
| Written equity option contracts (contract amount) | $4,000 |
| Warrants (number of warrants) | 50,000 |
The following is a summary of the fair value of derivative instruments as of the close of the reporting period:
| | | | |
| Fair value of derivative instruments as of the close of the reporting period | |
| | ASSET DERIVATIVES | LIABILITY DERIVATIVES |
| Derivatives not | | | | |
| accounted for as | Statement of | | Statement of | |
| hedging instruments | assets and | | assets and | |
| under ASC 815 | liabilities location | Fair value | liabilities location | Fair value |
| Equity contracts | Investments | $74,979 | Payables | $40,251 |
| Total | | $74,979 | | $40,251 |
The following is a summary of realized and change in unrealized gains or losses of derivative instruments in the Statement of operations for the reporting period (Note 1):
| | | |
| Amount of realized gain or (loss) on derivatives recognized in net gain or (loss) on investments | |
| Derivatives not accounted for as hedging | | | |
| instruments under ASC 815 | Warrants | Options | Total |
| Equity contracts | $— | $6,096 | $6,096 |
| Total | $— | $6,096 | $6,096 |
| |
| Change in unrealized appreciation or (depreciation) on derivatives recognized in net gain or (loss) |
| on investments | | | |
| Derivatives not accounted for as hedging | | | |
| instruments under ASC 815 | Warrants | Options | Total |
| Equity contracts | $57,984 | $5,056 | $63,040 |
| Total | $57,984 | $5,056 | $63,040 |
Note 8: Offsetting of financial and derivative assets and liabilities
The following table summarizes any derivatives, repurchase agreements and reverse repurchase agreements, at the end of the reporting period, that are subject to an enforceable master netting agreement or similar agreement. For securities lending transactions or borrowing transactions associated with securities sold short, if any, see Note 1. For financial reporting purposes, the fund does not offset financial assets and financial liabilities that are subject to the master netting agreements in the Statement of assets and liabilities.
| | |
| | Barclays Bank PLC | Total |
| Assets: | | |
| Purchased options **# | $— | $— |
| Total Assets | $— | $— |
| Liabilities: | | |
| Written options # | 40,251 | 40,251 |
| Total Liabilities | $40,251 | $40,251 |
| Total Financial and Derivative Net Assets | $(40,251) | $(40,251) |
| Total collateral received (pledged)†## | $— | |
| Net amount | $(40,251) | |
| Controlled collateral received (including | | |
| TBA commitments)** | $— | $— |
| Uncontrolled collateral received | $— | $— |
| Collateral (pledged) (including TBA commitments)** | $— | $— |
** Included with Investments in securities on the Statement of assets and liabilities.
† Additional collateral may be required from certain brokers based on individual agreements.
# Covered by master netting agreement (Note 1).
##Any over-collateralization of total financial and derivative net assets is not shown. Collateral may include amounts related to unsettled agreements.
Note 9: Change in independent accountants (Unaudited)
On March 20, 2020, the Audit, Compliance and Risk Committee of the Trustees of the Putnam Funds approved and recommended the decision to change the Fund’s independent accountant and to not retain KPMG LLP, and on April 3, 2020, upon request of the Putnam Funds, KPMG LLP provided a letter of resignation, effective upon the completion of its audit with respect to the Fund’s financial statements for its fiscal year ended February 29, 2020, and the issuance of its report thereon. During the two previous fiscal years, KPMG LLP audit reports contained no adverse opinion or disclaimer of opinion; nor were its reports qualified or modified as to uncertainty, audit scope, or accounting principle. Further, in connection with its audits for the two previous fiscal years and the subsequent interim period through April 3, 2020: (i) there were no disagreements with KPMG LLP on any matter of accounting principles or practices, financial statement disclosure, or auditing scope or procedure, which disagreements if not resolved to the satisfaction of KPMG LLP would have caused it to make reference to the subject matter of the disagreements in its report on the Fund’s financial statements for such years, and (ii) there were no “reportable events” of the kind described in Item 304(a)(1)(v) of Regulation S-K under the Securities Act of 1933, as amended, and the Securities Exchange Act of 1934, as amended.
On April 17, 2020, the Audit, Compliance and Risk Committee of the Trustees of the Putnam Funds approved and recommended the decision to appoint PricewaterhouseCoopers LLP as the Fund’s independent accountant effective upon the completion of the audit by KPMG LLP of the Fund’s financial statements for the fiscal year ended February 29, 2020 and the issuance of KPMG LLP’s report thereon.
Federal tax information (Unaudited)
For the reporting period, a portion of the fund’s distribution represents a return of capital and is therefore not taxable to shareholders.
The fund designated 100% of ordinary income distributions as qualifying for the dividends received deduction for corporations.
For the reporting period, the fund hereby designates 100%, or the maximum amount allowable, of its taxable ordinary income distributions as qualified dividends taxed at the individual net capital gain rates.
For the reporting period, pursuant to §871(k) of the Internal Revenue Code, the fund hereby designates $2,905 of distributions paid as qualifying to be taxed as interest-related dividends, and no amount to be taxed as short-term capital gain dividends for nonresident alien shareholders.
The Form 1099 that will be mailed to you in January 2022 will show the tax status of all distributions paid to your account in calendar 2021.


* Mr. Reynolds is an “interested person” (as defined in the Investment Company Act of 1940) of the fund and Putnam Investments. He is President and Chief Executive Officer of Putnam Investments, as well as the President of your fund and each of the other Putnam funds.
The address of each Trustee is 100 Federal Street, Boston, MA 02110.
As of February 28, 2021, there were 98 Putnam funds. All Trustees serve as Trustees of all Putnam funds.
Each Trustee serves for an indefinite term, until his or her resignation, retirement at age 75, removal, or death.
Officers
In addition to Robert L. Reynolds, the other officers of the fund are shown below:
| |
| Robert T. Burns (Born 1961) | Richard T. Kircher (Born 1962) |
| Vice President and Chief Legal Officer | Vice President and BSA Compliance Officer |
| Since 2011 | Since 2019 |
| General Counsel, Putnam Investments, | Assistant Director, Operational Compliance, Putnam |
| Putnam Management, and Putnam Retail Management | Investments and Putnam Retail Management |
| |
| James F. Clark (Born 1974) | Susan G. Malloy (Born 1957) |
| Vice President and Chief Compliance Officer | Vice President and Assistant Treasurer |
| Since 2016 | Since 2007 |
| Chief Compliance Officer and Chief Risk Officer, | Head of Accounting and Middle Office Services, |
| Putnam Investments and Chief Compliance Officer, | Putnam Investments and Putnam Management |
| Putnam Management |
| Denere P. Poulack (Born 1968) |
| Nancy E. Florek (Born 1957) | Assistant Vice President, Assistant Clerk, |
| Vice President, Director of Proxy Voting and Corporate | and Assistant Treasurer |
| Governance, Assistant Clerk, and Assistant Treasurer | Since 2004 |
| Since 2000 |
| Janet C. Smith (Born 1965) |
| Michael J. Higgins (Born 1976) | Vice President, Principal Financial Officer, Principal |
| Vice President, Treasurer, and Clerk | Accounting Officer, and Assistant Treasurer |
| Since 2010 | Since 2007 |
| | Head of Fund Administration Services, |
| Jonathan S. Horwitz (Born 1955) | Putnam Investments and Putnam Management |
| Executive Vice President, Principal Executive Officer, | |
| and Compliance Liaison | Mark C. Trenchard (Born 1962) |
| Since 2004 | Vice President |
| | Since 2002 |
| | Director of Operational Compliance, Putnam |
| | Investments and Putnam Retail Management |
The principal occupations of the officers for the past five years have been with the employers as shown above, although in some cases they have held different positions with such employers. The address of each officer is 100 Federal Street, Boston, MA 02110.
Putnam family of funds
The following is a list of Putnam’s open-end mutual funds offered to the public. Investors should carefully consider the investment objective, risks, charges, and expenses of a fund before investing. For a prospectus, or a summary prospectus if available, containing this and other information for any Putnam fund or product, contact your financial advisor or call Putnam Investor Services at 1-800-225-1581. Please read the prospectus carefully before investing.
| |
| Blend | Income |
| Emerging Markets Equity Fund | Convertible Securities Fund |
| Focused Equity Fund | Diversified Income Trust |
| Focused International Equity Fund | Floating Rate Income Fund |
| International Capital Opportunities Fund | Global Income Trust |
| International Equity Fund | Government Money Market Fund* |
| Multi-Cap Core Fund | High Yield Fund |
| Research Fund | Income Fund |
| Money Market Fund† |
| Global Sector | Mortgage Opportunities Fund |
| Global Health Care Fund | Mortgage Securities Fund |
| Global Technology Fund | Short Duration Bond Fund |
| Ultra Short Duration Income Fund |
| Growth | |
| Growth Opportunities Fund | Tax-free Income |
| Small Cap Growth Fund | Intermediate-Term Municipal Income Fund |
| Sustainable Future Fund | Short-Term Municipal Income Fund |
| Sustainable Leaders Fund | Strategic Intermediate Municipal Fund |
| Tax Exempt Income Fund |
| Value | Tax-Free High Yield Fund |
| International Value Fund | |
| Large Cap Value Fund | State tax-free income funds‡: |
| Small Cap Value Fund | California, Massachusetts, Minnesota, |
| | New Jersey, New York, Ohio, and Pennsylvania. |
| |
| Absolute Return | Asset Allocation (cont.) |
| Fixed Income Absolute Return Fund | Putnam Retirement Advantage Maturity Fund |
| Multi-Asset Absolute Return Fund | Putnam Retirement Advantage 2065 Fund |
| | Putnam Retirement Advantage 2060 Fund |
| Putnam PanAgora§ | Putnam Retirement Advantage 2055 Fund |
| Putnam PanAgora Risk Parity Fund | Putnam Retirement Advantage 2050 Fund |
| | Putnam Retirement Advantage 2045 Fund |
| Asset Allocation | Putnam Retirement Advantage 2040 Fund |
| Dynamic Risk Allocation Fund | Putnam Retirement Advantage 2035 Fund |
| George Putnam Balanced Fund | Putnam Retirement Advantage 2035 Fund |
| | Putnam Retirement Advantage 2030 Fund |
| Dynamic Asset Allocation Balanced Fund | Putnam Retirement Advantage 2025 Fund |
| Dynamic Asset Allocation Conservative Fund | |
| Dynamic Asset Allocation Growth Fund | RetirementReady® Maturity Fund |
| | RetirementReady® 2065 Fund |
| | RetirementReady® 2060 Fund |
| | RetirementReady® 2055 Fund |
| | RetirementReady® 2050 Fund |
| | RetirementReady® 2045 Fund |
| | RetirementReady® 2040 Fund |
| | RetirementReady® 2035 Fund |
| | RetirementReady® 2030 Fund |
| | RetirementReady® 2025 Fund |
* You could lose money by investing in the fund. Although the fund seeks to preserve the value of your investment at $1.00 per share, it cannot guarantee it will do so. An investment in the fund is not insured or guaranteed by the Federal Deposit Insurance Corporation or any other government agency. The fund’s sponsor has no legal obligation to provide financial support to the fund, and you should not expect that the sponsor will provide financial support to the fund at any time.
† You could lose money by investing in the fund. Although the fund seeks to preserve the value of your investment at $1.00 per share, it cannot guarantee it will do so. The fund may impose a fee upon sale of your shares or may temporarily suspend your ability to sell shares if the fund’s liquidity falls below required minimums because of market conditions or other factors. An investment in the fund is not insured or guaranteed by the Federal Deposit Insurance Corporation or any other government agency. The fund’s sponsor has no legal obligation to provide financial support to the fund, and you should not expect that the sponsor will provide financial support to the fund at any time.
‡ Not available in all states.
§ Sub-advised by PanAgora Asset Management.
Check your account balances and the most recent month-end performance in the Individual Investors section at putnam.com.
Fund information
Founded over 80 years ago, Putnam Investments was built around the concept that a balance between risk and reward is the hallmark of a well-rounded financial program. We manage funds across income, value, blend, growth, sustainable, asset allocation, absolute return, and global sector categories.
| | |
| Investment Manager | Trustees | Michael J. Higgins |
| Putnam Investment | Kenneth R. Leibler, Chair | Vice President, Treasurer, |
| Management, LLC | Liaquat Ahamed | and Clerk |
| 100 Federal Street | Ravi Akhoury | |
| Boston, MA 02110 | Barbara M. Baumann | Jonathan S. Horwitz |
| | Katinka Domotorffy | Executive Vice President, |
| Investment Sub-Advisor | Catharine Bond Hill | Principal Executive Officer, |
| Putnam Investments Limited | Paul L. Joskow | and Compliance Liaison |
| 16 St James’s Street | George Putnam, III | |
| London, England SW1A 1ER | Robert L. Reynolds | Richard T. Kircher |
| Manoj P. Singh | Vice President and BSA |
| Marketing Services | Mona K. Sutphen | Compliance Officer |
| Putnam Retail Management | | |
| 100 Federal Street | Officers | Susan G. Malloy |
| Boston, MA 02110 | Robert L. Reynolds | Vice President and |
| President | Assistant Treasurer |
| Custodian | | |
| State Street Bank | Robert T. Burns | Denere P. Poulack |
| and Trust Company | Vice President and | Assistant Vice President, Assistant |
| Chief Legal Officer | Clerk, and Assistant Treasurer |
| Legal Counsel | | |
| Ropes & Gray LLP | James F. Clark | Janet C. Smith |
| Vice President, Chief Compliance | Vice President, |
| Independent Registered | Officer, and Chief Risk Officer | Principal Financial Officer, |
| Public Accounting Firm | | Principal Accounting Officer, |
| PricewaterhouseCoopers LLP | Nancy E. Florek | and Assistant Treasurer |
| | Vice President, Director of | |
| | Proxy Voting and Corporate | Mark C. Trenchard |
| | Governance, Assistant Clerk, | Vice President |
| | and Assistant Treasurer | |
This report is for the information of shareholders of Putnam Small Cap Value Fund. It may also be used as sales literature when preceded or accompanied by the current prospectus, the most recent copy of Putnam’s Quarterly Performance Summary, and Putnam’s Quarterly Ranking Summary. For more recent performance, please visit putnam.com. Investors should carefully consider the investment objectives, risks, charges, and expenses of a fund, which are described in its prospectus. For this and other information or to request a prospectus or summary prospectus, call 1-800-225-1581 toll free. Please read the prospectus carefully before investing. The fund’s Statement of Additional Information contains additional information about the fund’s Trustees and is available without charge upon request by calling 1-800-225-1581.

| |
| (a) The fund's principal executive, financial and accounting officers are employees of Putnam Investment Management, LLC, the Fund's investment manager. As such they are subject to a comprehensive Code of Ethics adopted and administered by Putnam Investments which is designed to protect the interests of the firm and its clients. The Fund has adopted a Code of Ethics which incorporates the Code of Ethics of Putnam Investments with respect to all of its officers and Trustees who are employees of Putnam Investment Management, LLC. For this reason, the Fund has not adopted a separate code of ethics governing its principal executive, financial and accounting officers. |
| |
| Item 3. Audit Committee Financial Expert: |
| |
| The Funds' Audit, Compliance and Risk Committee is comprised solely of Trustees who are “independent” (as such term has been defined by the Securities and Exchange Commission (“SEC”) in regulations implementing Section 407 of the Sarbanes-Oxley Act (the “Regulations”)). The Trustees believe that each member of the Audit, Compliance and Risk Committee also possesses a combination of knowledge and experience with respect to financial accounting matters, as well as other attributes, that qualifies him or her for service on the Committee. In addition, the Trustees have determined that each of Dr. Hill, Dr. Joskow, and Mr. Singh qualifies as an “audit committee financial expert” (as such term has been defined by the Regulations) based on their review of his or her pertinent experience and education; in the case of Dr. Joskow, including his experience serving on the audit committees of several public companies and institutions and his education and experience as an economist who studies companies and industries, routinely using public company financial statements in his research. The SEC has stated, and the funds' amended and restated agreement and Declaration of Trust provides, that the designation or identification of a person as an audit committee financial expert pursuant to this Item 3 of Form N-CSR does not impose on such person any duties, obligations or liability that are greater than the duties, obligations and liability imposed on such person as a member of the Audit, Compliance and Risk Committee and the Board of Trustees in the absence of such designation or identification. |
| |
| Item 4. Principal Accountant Fees and Services: |
| |
| The following table presents fees billed in each of the last two fiscal years for services rendered to the fund by the fund's independent auditor: |
| | | | | |
| Fiscal year ended | Audit Fees | Audit-Related Fees | Tax Fees | All Other Fees |
|
|
| | | | | |
| February 28, 2021 | $38,343 | $ — | $5,382 | $ — |
| February 29, 2020 | $45,432 | $ — | $4,910 | $ — |
| |
| For the fiscal years ended February 28, 2021 and February 29, 2020, the fund's independent auditor billed aggregate non-audit fees in the amounts of $619,076 and $4,910 respectively, to the fund, Putnam Management and any entity controlling, controlled by or under common control with Putnam Management that provides ongoing services to the fund. |
| |
| Audit Fees represent fees billed for the fund's last two fiscal years relating to the audit and review of the financial statements included in annual reports and registration statements, and other services that are normally provided in connection with statutory and regulatory filings or engagements. |
| |
| Audit-Related Fees represent fees billed in the fund's last two fiscal years for services traditionally performed by the fund's auditor, including accounting consultation for proposed transactions or concerning financial accounting and reporting standards and other audit or attest services not required by statute or regulation. |
| |
| Tax Fees represent fees billed in the fund's last two fiscal years for tax compliance, tax planning and tax advice services. Tax planning and tax advice services include assistance with tax audits, employee benefit plans and requests for rulings or technical advice from taxing authorities. |
| |
| Pre-Approval Policies of the Audit, Compliance and Risk Committee. The Audit, Compliance and Risk Committee of the Putnam funds has determined that, as a matter of policy, all work performed for the funds by the funds' independent auditors will be pre-approved by the Committee itself and thus will generally not be subject to pre-approval procedures. |
| |
| The Audit, Compliance and Risk Committee also has adopted a policy to pre-approve the engagement by Putnam Management and certain of its affiliates of the funds' independent auditors, even in circumstances where pre-approval is not required by applicable law. Any such requests by Putnam Management or certain of its affiliates are typically submitted in writing to the Committee and explain, among other things, the nature of the proposed engagement, the estimated fees, and why this work should be performed by that particular audit firm as opposed to another one. In reviewing such requests, the Committee considers, among other things, whether the provision of such services by the audit firm are compatible with the independence of the audit firm. |
| |
| The following table presents fees billed by the fund's independent auditor for services required to be approved pursuant to paragraph (c)(7)(ii) of Rule 2-01 of Regulation S-X. |
| | | | | |
| Fiscal year ended | Audit-Related Fees | Tax Fees | All Other Fees | Total Non-Audit Fees |
|
|
| February 28, 2021 | $ — | $613,694 | $ — | $ — |
| February 29, 2020 | $ — | $ — | $ — | $ — |
| |
| Item 5. Audit Committee of Listed Registrants |
| |
| Item 6. Schedule of Investments: |
| |
| The registrant's schedule of investments in unaffiliated issuers is included in the report to shareholders in Item 1 above. |
| |
| Item 7. Disclosure of Proxy Voting Policies and Procedures For Closed-End Management Investment Companies: |
| |
| Item 8. Portfolio Managers of Closed-End Investment Companies |
| |
| Item 9. Purchases of Equity Securities by Closed-End Management Investment Companies and Affiliated Purchasers: |
| |
| Item 10. Submission of Matters to a Vote of Security Holders: |
| |
| Item 11. Controls and Procedures: |
| |
| (a) The registrant's principal executive officer and principal financial officer have concluded, based on their evaluation of the effectiveness of the design and operation of the registrant's disclosure controls and procedures as of a date within 180 days of the filing date of this report, that the design and operation of such procedures are generally effective to provide reasonable assurance that information required to be disclosed by the registrant in this report is recorded, processed, summarized and reported within the time periods specified in the Commission's rules and forms. |
| |
| (b) Changes in internal control over financial reporting: Not applicable |
| |
| Item 12. Disclosures of Securities Lending Activities for Closed-End Management Investment Companies: |
| |
| (a)(1) The Code of Ethics of The Putnam Funds, which incorporates the Code of Ethics of Putnam Investments, is filed herewith. |
| |
| Pursuant to the requirements of the Securities Exchange Act of 1934 and the Investment Company Act of 1940, the registrant has duly caused this report to be signed on its behalf by the undersigned, thereunto duly authorized. |
| |
| By (Signature and Title): |
| |
| /s/ Janet C. Smith
Janet C. Smith
Principal Accounting Officer
|
| |
| Pursuant to the requirements of the Securities Exchange Act of 1934 and the Investment Company Act of 1940, this report has been signed below by the following persons on behalf of the registrant and in the capacities and on the dates indicated. |
| |
| By (Signature and Title): |
| |
| /s/ Jonathan S. Horwitz
Jonathan S. Horwitz
Principal Executive Officer
|
| |
| By (Signature and Title): |
| |
| /s/ Janet C. Smith
Janet C. Smith
Principal Financial Officer
|