| | |
| UNITED STATES
SECURITIES AND EXCHANGE COMMISSION |
| | |
| CERTIFIED SHAREHOLDER REPORT OF REGISTERED
MANAGEMENT INVESTMENT COMPANIES
|
| | |
| Investment Company Act file number: | (811-07237) |
| | |
| Exact name of registrant as specified in charter: | Putnam Investment Funds |
| | |
| Address of principal executive offices: | 100 Federal Street, Boston, Massachusetts 02110 |
| | |
| Name and address of agent for service: | Stephen Tate, Vice President
100 Federal Street
Boston, Massachusetts 02110 |
| | |
| Copy to: | Bryan Chegwidden, Esq.
Ropes & Gray LLP
1211 Avenue of the Americas
New York, New York 10036 |
| | |
| Registrant’s telephone number, including area code: | (617) 292-1000 |
| | |
| Date of fiscal year end: | August 31, 2021 |
| | |
| Date of reporting period: | September 1, 2020 – August 31, 2021 |
| | |
|
Item 1. Report to Stockholders: | |
| | |
| The following is a copy of the report transmitted to stockholders pursuant to Rule 30e-1 under the Investment Company Act of 1940: | |
Putnam PanAgora
Risk Parity
Fund
Annual report
8 | 31 | 21
Message from the Trustees
October 12, 2021
Dear Fellow Shareholder:
As the season changes to autumn, U.S. financial markets continue to generally perform well. Impressive corporate earnings have helped stock prices this year. Markets could face headwinds as the Federal Reserve weighs when to pare back its supportive policy measures. The Covid-19 pandemic also persists.
Putnam’s research teams, practicing their active discipline, continue to look for attractive new opportunities that the market may be mispricing. They carefully consider both potential return and risk as they select securities for portfolios to serve your financial objectives.
Thank you for investing with Putnam.


Current performance may be lower or higher than the quoted past performance, which cannot guarantee future results. Share price, principal value, and return will fluctuate, and you may have a gain or a loss when you sell your shares. Performance of class A shares assumes reinvestment of distributions and does not account for taxes. Fund returns in the bar chart do not reflect a sales charge of 5.75%; had they, returns would have been lower. See below and pages 7–9 for additional performance information. For a portion of the periods, the fund had expense limitations, without which returns would have been lower. To obtain the most recent month-end performance, visit putnam.com.
All Bloomberg indices provided by Bloomberg Index Services Limited.
Lipper peer group average provided by Lipper, a Refinitiv company.
* The Putnam PanAgora Risk Parity Blended Benchmark is an unmanaged index administered by Putnam Management, 35% of which is the MSCI ACWI (ND), 50% of which is the Bloomberg U.S. Long Treasury Index, and 15% of which is the S&P GSCI.

This comparison shows your fund’s performance in the context of broad market indexes for the 12 months ended 8/31/21. See above and pages 7–9 for additional fund performance information. Index descriptions can be found on pages 13–14.
All Bloomberg indices provided by Bloomberg Index Services Limited.
|
| 2 PanAgora Risk Parity Fund |

Please describe the global market environment during the 12-month reporting period ended August 31, 2021.
Both developed and emerging-market equities largely appreciated during the reporting period. The Covid-19 vaccine rollout and fiscal stimulus helped to reopen economies worldwide. Investors focused on inflationary risks. The U.S. Personal Consumption Expenditures price index rose 3.6% on a year-over-year basis through July 2021, its sharpest increase in nearly three decades. Toward period-end, equities surged after the U.S. Federal Reserve [Fed] signaled it would end its bond-buying program sometime in 2021.
During the period, inflation in the eurozone hit its highest level in a decade. Rising costs sparked by shortages of semiconductors increased consumer prices. As lockdowns were eased, business activity in the euro region expanded at its fastest rate in 15 years. IHS Markit’s Purchasing Managers’ Index data jumped to 59.5, representing a solid expansion compared with the previous month. As the Fed debated the need to raise interest rates, emerging-market countries such as Brazil and Chile raised interest rates as consumer prices moved higher over the period.
|
| PanAgora Risk Parity Fund 3 |

The table shows the fund’s total exposures as a percentage of the fund’s net assets as of 8/31/21. Allocations will not total 100% because the table reflects the notional value of derivatives (the economic value for purposes of calculating periodic payment obligations), in addition to the market value of securities. Holdings and allocations may vary over time.

Within the United States, small-cap equities outperformed large caps for the reporting period. The Russell 2000 Index posted a return of 47.08%, compared with 31.17% for the S&P 500 Index. Non-U.S. developed markets, as measured by the MSCI World ex-U.S. Index [ND], posted a strong return of 26.57%. Emerging-market equities, as measured by the MSCI Emerging Markets Index [ND], posted a return of 21.12%.
Performance of U.S. Treasuries were a laggard, trailing other segments of the bond market. The release of strong economic data, combined with FDA approval of world’s first Covid-19 vaccine, put a damper on the demand for safer assets at the end of the period. The yield on the benchmark U.S. 10-year Treasury note climbed 62 basis points over the period and closed at 1.30% [yields move inversely to prices]. Yields for European and Asia-Pacific developed-market government debt also increased, but to a lesser extent, as economies expanded and vaccines became more widely distributed.
For the 12-month reporting period, the Bloomberg U.S. Treasury Index reported a loss of 2.11%, while the FTSE World Government Bond ex-U.S. [Hedged] Index posted a gain of 0.85%. High inflation readings helped drive the Bloomberg World Government Inflation-Linked Bond [Hedged] Index up 6.26% by period-end. U.S. investment-grade credit also posted meaningful gains as the Bloomberg U.S. Credit Index advanced to 2.26%. U.S. corporate bond spreads narrowed throughout the period and demand picked up.
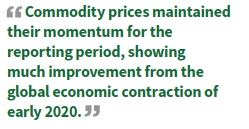
Commodity prices maintained their momentum for the reporting period, showing much improvement from the global economic contraction of early 2020. The more heavily energy-weighted S&P Goldman Sachs Commodity Index [GSCI] gained 43.86% for the period. The more balanced Bloomberg Commodity Index trailed behind, but still rose to 31.00% for the period. The price for WTI crude oil increased by approximately 84% over the reporting period. Supply/demand implications caused by Hurricane Ida also helped boost oil prices by period-end.
Can you describe some top contributors and detractors to fund performance for the reporting period?
On an absolute performance basis, Putnam PanAgora Risk Parity Fund class A shares generated a return of 10.28%. At the main asset class level, both equities and inflation-protected assets contributed positively to performance. This helped to offset the negative return contribution from nominal fixed
|
| 4 PanAgora Risk Parity Fund |
income. Within equities, exposure to each of the sub-asset classes contributed positively, with U.S. large- and small-cap equities contributing the most. In terms of inflation-protected assets, commodities were the top contributor to fund performance for the 12-month period. For nominal fixed income, the increase in yields and decline in prices resulted in exposure to U.S. and international government debt detracting from fund performance.
How did the fund perform relative to its benchmark during the period?
On a relative performance basis, the fund underperformed its blended benchmark by 1.37%. The fund’s benchmark, which is composed of 35% the MSCI ACWI [ND], 50% the Bloomberg U.S. Long Treasury Index, and 15% the S&P GSCI, posted a return of 11.65% for the period. The fund’s risk-balanced allocation to fixed income lagged the fixed income component of the blended benchmark. International government debt also had negative results, further detracting from fund performance. This asset class is not part of the blended benchmark. The fund’s risk-balanced exposure to commodities also slightly underperformed relative to the more heavily energy-weighted S&P GSCI component of the blended benchmark. Lastly, the fund’s risk-balanced exposure to equities outperformed relative to the capitalization-weighted equity exposure of the blended benchmark during the period.
ABOUT DERIVATIVES
Derivatives are an increasingly common type of investment instrument, the performance of which is derived from an underlying security, index, currency, or other area of the capital markets. Derivatives employed by the fund’s managers generally serve one of two main purposes: to gain exposure to different asset classes, or to gain exposure to different areas of risk.
For example, the fund’s managers might use futures contracts to gain exposure to equity securities, fixed-income securities, or commodities. These asset classes offer different return potential and exposure to different investment risks.
Like any other investment, derivatives may not appreciate in value and may lose money. Derivatives may amplify traditional investment risks through the creation of leverage and may be less liquid than traditional securities. And because derivatives typically represent contractual agreements between two financial institutions, derivatives entail “counterparty risk,” which is the risk that the other party is unable or unwilling to pay. PanAgora monitors the coun-terparty risks. For example, PanAgora often enters into collateral agreements that require the counterparties to post collateral on a regular basis to cover their obligations to the fund. Counterparty risk for exchange-traded futures and centrally cleared swaps is mitigated by the daily exchange of margin and other safeguards against default through their respective clearinghouses.
|
| PanAgora Risk Parity Fund 5 |
How did the fund use derivatives during the period?
We used futures to gain exposure to equities, fixed-income securities, and commodities.
As the fund enters a new fiscal year, what is your outlook and portfolio strategy?
Putnam PanAgora Risk Parity Fund seeks to generate stable wealth creation over time. We use a systematic multi-asset investing approach that combines better strategic asset allocation and tactical portfolio management. The fund is systematically rebalanced by the investment team at the beginning of each month.
As of the beginning of September 2021, the fund continued to be underweight in nominal fixed income and overweight in inflation-protected assets relative to the fund’s strategic [long-term] risk targets. Equities were closely in line with our strategic risk targets. As the markets evolve, the investment team continues to monitor and manage the fund through systematic portfolio rebalancing, targeting constant volatility, dynamic risk allocation, and risk diversification.
Thank you, Edward and Bryan, for your time and insights today.
Past performance is not a guarantee of future results.
The opinions expressed in this article represent the current, good faith views of the author(s) at the time of publication, are provided for limited purposes, are not definitive investment advice, and should not be relied on as such. The information presented in this article has been developed internally and/or obtained from sources believed to be reliable; however, PanAgora Asset Management, Inc. (PanAgora) does not guarantee the accuracy, adequacy, or completeness of such information. Predictions, opinions, and other information contained in this article are subject to change continually and without notice of any kind and may no longer be true after the date indicated. As with any investment there is a potential for profit as well as the possibility of loss.
Any forward-looking statements speak only as of the date they are made, and PanAgora assumes no duty to and does not undertake to update forward-looking statements. Forward-looking statements are subject to numerous assumptions, risks, and uncertainties, which change over time. Actual results could differ materially from those anticipated in forward-looking statements. This material is directed exclusively at investment professionals. Any investments to which this material relates are available only to or will be engaged in only with investment professionals.
|
| 6 PanAgora Risk Parity Fund |
Your fund’s performance
This section shows your fund’s performance, price, and distribution information for periods ended August 31, 2021, the end of its most recent fiscal year. In accordance with regulatory requirements for mutual funds, we also include performance information as of the most recent calendar quarter-end and expense information taken from the fund’s current prospectus. Performance should always be considered in light of a fund’s investment strategy. Data represent past performance. Past performance does not guarantee future results. More recent returns may be less or more than those shown. Investment return and principal value will fluctuate, and you may have a gain or a loss when you sell your shares. Performance information does not reflect any deduction for taxes a shareholder may owe on fund distributions or on the redemption of fund shares. For the most recent month-end performance, please visit the Individual Investors section at putnam.com or call Putnam at 1-800-225-1581. Class R, R6, and Y shares are not available to all investors. See the Terms and definitions section in this report for definitions of the share classes offered by your fund.
Fund performance Total return for periods ended 8/31/21
| | | | | |
| | Life of fund | Annual average | 3 years | Annual average | 1 year |
| Class A (9/20/17) | | | | | |
| Before sales charge | 35.08% | 7.91% | 34.12% | 10.28% | 10.28% |
| After sales charge | 27.31 | 6.31 | 26.41 | 8.12 | 3.94 |
| Class B (9/20/17) | | | | | |
| Before CDSC | 31.14 | 7.11 | 31.13 | 9.45 | 9.47 |
| After CDSC | 28.14 | 6.48 | 28.13 | 8.61 | 4.47 |
| Class C (9/20/17) | | | | | |
| Before CDSC | 31.17 | 7.11 | 31.16 | 9.46 | 9.48 |
| After CDSC | 31.17 | 7.11 | 31.16 | 9.46 | 8.48 |
| Class R (9/20/17) | | | | | |
| Net asset value | 33.81 | 7.65 | 33.13 | 10.01 | 10.01 |
| Class R6 (9/20/17) | | | | | |
| Net asset value | 36.30 | 8.16 | 34.94 | 10.50 | 10.56 |
| Class Y (9/20/17) | | | | | |
| Net asset value | 36.43 | 8.18 | 35.06 | 10.54 | 10.65 |
Current performance may be lower or higher than the quoted past performance, which cannot guarantee future results. After-sales-charge returns for class A shares reflect the deduction of the maximum 5.75% sales charge, respectively, levied at the time of purchase. Class B share returns after contingent deferred sales charge (CDSC) reflect the applicable CDSC, which is 5% in the first year, declining over time to 1% in the sixth year, and is eliminated thereafter. Class C share returns after CDSC reflect a 1% CDSC for the first year that is eliminated thereafter. Class R, R6, and Y shares have no initial sales charge or CDSC.
For a portion of the periods, the fund had expense limitations, without which returns would have been lower.
|
| PanAgora Risk Parity Fund 7 |
Comparative index returns For periods ended 8/31/21
| | | | | |
| | Life of fund | Annual average | 3 years | Annual average | 1 year |
| Putnam | | | | | |
| PanAgora Risk | | | | | |
| Parity Blended | 42.41% | 9.37% | 34.96% | 10.51% | 11.65% |
| Benchmark* | | | | | |
| Lipper Alternative | | | | | |
| Global Macro | | | | | |
| Funds category | 24.08 | 5.42 | 21.57 | 6.57 | 13.67 |
| average† | | | | | |
Index and Lipper results should be compared with fund performance before sales charge, before CDSC, or at net asset value.
All Bloomberg indices provided by Bloomberg Index Services Limited.
Lipper peer group average provided by Lipper, a Refinitiv company.
* The Putnam PanAgora Risk Parity Blended Benchmark is an unmanaged index administered by Putnam Management, 35% of which is the MSCI ACWI (ND), 50% of which is the Bloomberg U.S. Long Treasury Index, and 15% of which is the S&P GSCI.
† Over the 1-year, 3-year, and life-of-fund periods ended 8/31/21, there were 206, 194, and 191 funds, respectively, in this Lipper category.

Past performance does not indicate future results. At the end of the same time period, a $10,000 investment in the fund’s class B shares would have been valued at $13,114 ($12,814 after contingent deferred sales charge). A $10,000 investment in the fund’s class C shares would be valued at $13,117, and no contingent deferred sales charge would apply. A $10,000 investment in the fund’s class R, R6, and Y shares would have been valued at $13,381, $13,630 and $13,643, respectively.
All Bloomberg indices provided by Bloomberg Index Services Limited.
* The Putnam PanAgora Risk Parity Blended Benchmark is an unmanaged index administered by Putnam Management, 35% of which is the MSCI ACWI (ND), 50% of which is the Bloomberg U.S. Long Treasury Index, and 15% of which is the S&P GSCI.
|
| 8 PanAgora Risk Parity Fund |
Fund price and distribution information For the 12-month period ended 8/31/21
| | | | | | | | |
| Distributions | | Class A | | Class B | Class C | Class R | Class R6 | Class Y |
| Number | | 1 | | 1 | 1 | 1 | 1 | 1 |
| Income | | — | | — | — | — | — | — |
| Capital gains | | | | | | | | |
| Long-term gains | | $0.436 | | $0.436 | $0.436 | $0.436 | $0.436 | $0.436 |
| Short-term gains | | 0.164 | | 0.164 | 0.164 | 0.164 | 0.164 | 0.164 |
| Total | | $0.600 | | $0.600 | $0.600 | $0.600 | $0.600 | $0.600 |
| | Before | | After | Net | Net | Net | Net | Net |
| | sales | | sales | asset | asset | asset | asset | asset |
| Share value | charge | | charge | value | value | value | value | value |
| 8/31/20 | $10.49 | | $11.13 | $10.41 | $10.40 | $10.47 | $10.51 | $10.51 |
| 8/31/21 | 10.94 | | 11.61 | 10.77 | 10.76 | 10.89 | 10.99 | 11.00 |
The classification of distributions, if any, is an estimate. Before-sales-charge share value and current dividend rate for class A shares, if applicable, do not take into account any sales charge levied at the time of purchase. After-sales-charge share value, current dividend rate, and current 30-day SEC yield, if applicable, are calculated assuming that the maximum sales charge (5.75% for class A shares) was levied at the time of purchase. Final distribution information will appear on your year-end tax forms.
Fund performance as of most recent calendar quarter Total return for periods ended 9/30/21
| | | | | |
| | Life of fund | Annual average | 3 years | Annual average | 1 year |
| Class A (9/20/17) | | | | | |
| Before sales charge | 28.66% | 6.45% | 29.56% | 9.02% | 6.36% |
| After sales charge | 21.26 | 4.90 | 22.11 | 6.88 | 0.24 |
| Class B (9/20/17) | | | | | |
| Before CDSC | 24.81 | 5.65 | 26.71 | 8.21 | 5.50 |
| After CDSC | 22.81 | 5.23 | 23.71 | 7.35 | 0.51 |
| Class C (9/20/17) | | | | | |
| Before CDSC | 24.83 | 5.66 | 26.73 | 8.22 | 5.50 |
| After CDSC | 24.83 | 5.66 | 26.73 | 8.22 | 4.51 |
| Class R (9/20/17) | | | | | |
| Net asset value | 27.42 | 6.20 | 28.71 | 8.78 | 6.07 |
| Class R6 (9/20/17) | | | | | |
| Net asset value | 29.85 | 6.70 | 30.50 | 9.28 | 6.65 |
| Class Y (9/20/17) | | | | | |
| Net asset value | 29.86 | 6.70 | 30.51 | 9.28 | 6.54 |
See the discussion following the fund performance table on page 7 for information about the calculation of fund performance.
|
| PanAgora Risk Parity Fund 9 |
Your fund’s expenses
As a mutual fund investor, you pay ongoing expenses, such as management fees, distribution fees (12b-1 fees), and other expenses. In the most recent six-month period, your fund’s expenses were limited; had expenses not been limited, they would have been higher. Using the following information, you can estimate how these expenses affect your investment and compare them with the expenses of other funds. You may also pay one-time transaction expenses, including sales charges (loads) and redemption fees, which are not shown in this section and would have resulted in higher total expenses. For more information, see your fund’s prospectus or talk to your financial representative.
Expense ratios
| | | | | | |
| | Class A | Class B | Class C | Class R | Class R6 | Class Y |
| Net expenses for the fiscal year | | | | | | |
| ended 8/31/20*† | 1.31% | 2.06% | 2.06% | 1.56% | 1.07% | 1.06% |
| Total annual operating expenses for the | | | | | | |
| fiscal year ended 8/31/20† | 1.63% | 2.38% | 2.38% | 1.88% | 1.39% | 1.38% |
| Annualized expense ratio for the | | | | | | |
| six-month period ended 8/31/21 ‡Ω | 1.26% | 2.01% | 2.01% | 1.51% | 1.03% | 1.01% |
Fiscal year expense information in this table is taken from the most recent prospectus, is subject to change, and may differ from that shown for the annualized expense ratio and in the consolidated financial highlights of this report.
Prospectus expense information also includes the impact of acquired fund fees and expenses of 0.07%, which is not included in the financial highlights or annualized expense ratios. Expenses are shown as a percentage of average net assets.
* Reflects Putnam Management’s contractual obligation to limit certain fund expenses through 12/30/21.
† Includes management fee payable to Putnam Investment Management, LLC (“Putnam Management”) by the fund’s wholly-owned subsidiary. The management fee paid by the fund to Putnam Management is reduced by an amount equal to the management fee Putnam Management receives from the subsidiary under the management contract between Putnam Management and the subsidiary.
‡ Expense ratios for each class are for the fund’s most recent fiscal half year. As a result of this, ratios may differ from expense ratios based on one-year data in the financial highlights.
Ω Includes interest expense of 0.03%.
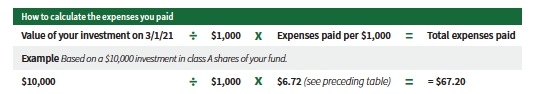
Expenses per $1,000
The following table shows the expenses you would have paid on a $1,000 investment in each class of the fund from 3/1/21 to 8/31/21. It also shows how much a $1,000 investment would be worth at the close of the period, assuming actual returns and expenses.
| | | | | | |
| | Class A | Class B | Class C | Class R | Class R6 | Class Y |
| Expenses paid per $1,000*† | $6.72 | $10.70 | $10.70 | $8.05 | $5.50 | $5.39 |
| Ending value (after expenses) | $1,116.30 | $1,111.50 | $1,111.60 | $1,114.60 | $1,116.90 | $1,117.90 |
* Expenses for each share class are calculated using the fund’s annualized expense ratio for each class, which represents the ongoing expenses as a percentage of average net assets for the six months ended 8/31/21. The expense ratio may differ for each share class.
† Expenses are calculated by multiplying the expense ratio by the average account value for the period; then multiplying the result by the number of days in the period (184); and then dividing that result by the number of days in the year (365).
|
| 10 PanAgora Risk Parity Fund |
Estimate the expenses you paid
To estimate the ongoing expenses you paid for the six months ended 8/31/21, use the following calculation method. To find the value of your investment on 3/1/21, call Putnam at 1-800-225-1581.
Compare expenses using the SEC’s method
The Securities and Exchange Commission (SEC) has established guidelines to help investors assess fund expenses. Per these guidelines, the following table shows your fund’s expenses based on a $1,000 investment, assuming a hypothetical 5% annualized return. You can use this information to compare the ongoing expenses (but not transaction expenses or total costs) of investing in the fund with those of other funds. All mutual fund shareholder reports will provide this information to help you make this comparison. Please note that you cannot use this information to estimate your actual ending account balance and expenses paid during the period.
| | | | | | |
| | Class A | Class B | Class C | Class R | Class R6 | Class Y |
| Expenses paid per $1,000*† | $6.41 | $10.21 | $10.21 | $7.68 | $5.24 | $5.14 |
| Ending value (after expenses) | $1,018.85 | $1,015.07 | $1,015.07 | $1,017.59 | $1,020.01 | $1,020.11 |
* Expenses for each share class are calculated using the fund’s annualized expense ratio for each class, which represents the ongoing expenses as a percentage of average net assets for the six months ended 8/31/21. The expense ratio may differ for each share class.
† Expenses are calculated by multiplying the expense ratio by the average account value for the six-month period; then multiplying the result by the number of days in the six-month period (184); and then dividing that result by the number of days in the year (365).
|
| PanAgora Risk Parity Fund 11 |
Consider these risks before investing
There can be no assurance that a “risk parity” approach will achieve any particular level of return or will, in fact, reduce volatility or potential loss. The fund’s allocation of assets may hurt performance, and efforts to diversify risk through the use of leverage may be unsuccessful. Quantitative models or data may be incorrect or incomplete, and reliance on those models or data may not produce the desired results.
The value of investments in the fund’s portfolio may fall or fail to rise over extended periods of time for a variety of reasons, including general economic, political, or financial market conditions; investor sentiment and market perceptions; government actions; geopolitical events or changes; and factors related to a specific issuer, asset class, geography, industry, or sector. These and other factors may lead to increased volatility and reduced liquidity in the fund’s portfolio holdings. Investments in small and/or midsize companies increase the risk of greater price fluctuations. Bond investments in which the fund invests (or has exposure to) are subject to interest-rate risk and credit risk. Interest-rate risk is generally greater for longer-term bonds, and credit risk is generally greater for below-investment-grade bonds. The value of inflation-protected securities generally declines during periods of rising real interest rates, and, when real interest rates rise faster than nominal interest rates, inflation-indexed bonds to which the fund is exposed may experience greater losses than other fixed income securities with similar durations. Exposure to the commodities markets may subject the fund to greater volatility than investments in traditional securities. Risks associated with derivatives (including “short” derivatives) include losses caused by unexpected market movements (which are potentially unlimited), imperfect correlation between the price of the derivative and the price of the underlying asset, increased investment exposure (which may be considered leverage), the potential inability to terminate or sell derivatives positions, the potential need to sell securities at disadvantageous times to meet margin or segregation requirements, the potential inability to recover margin or other amounts deposited from a counterparty, and the potential failure of the other party to the instrument to meet its obligations. Leveraging can result in volatility in the fund’s performance and losses in excess of the amounts invested. International investing involves certain risks, such as currency fluctuations, economic instability, and political developments.
The fund invests in (or provides exposure to) fewer issuers or makes large investments in (or provides large amounts of exposure to) a small number of issuers and involves more risk than a fund that invests more broadly. By investing in open-end or closed-end investment companies and ETFs, the fund is indirectly exposed to the risks associated with direct ownership of the securities held by those investment companies or ETFs. By investing in a subsidiary, the fund is indirectly exposed to the risks associated with the subsidiary’s investments.
Our investment techniques, analyses, and judgments may not produce the outcome we intend. The investments we select for the fund may not perform as well as other securities that we do not select for the fund. We, or the fund’s other service providers, may experience disruptions or operating errors that could have a negative effect on the fund. You can lose money by investing in the fund.
|
| 12 PanAgora Risk Parity Fund |
Terms and definitions
Important terms
Total return shows how the value of the fund’s shares changed over time, assuming you held the shares through the entire period and reinvested all distributions in the fund.
Before sales charge, or net asset value, is the price, or value, of one share of a mutual fund, without a sales charge. Before-sales-charge figures fluctuate with market conditions, and are calculated by dividing the net assets of each class of shares by the number of outstanding shares in the class.
After sales charge is the price of a mutual fund share plus the maximum sales charge levied at the time of purchase. After-sales-charge performance figures shown here assume the 5.75% maximum sales charge for class A shares.
Contingent deferred sales charge (CDSC) is generally a charge applied at the time of the redemption of class B or C shares and assumes redemption at the end of the period. Your fund’s class B CDSC declines over time from a 5% maximum during the first year to 1% during the sixth year. After the sixth year, the CDSC no longer applies. The CDSC for class C shares is 1% for one year after purchase.
Share classes
Class A shares are generally subject to an initial sales charge and no CDSC (except on certain redemptions of shares bought without an initial sales charge).
Class B shares are closed to new investments and are only available by exchange from another Putnam fund or through dividend and/or capital gains reinvestment. They are not subject to an initial sales charge and may be subject to a CDSC.
Class C shares are not subject to an initial sales charge and are subject to a CDSC only if the shares are redeemed during the first year.
Class R shares are not subject to an initial sales charge or CDSC and are only available to employer-sponsored retirement plans.
Class R6 shares are not subject to an initial sales charge or CDSC and carry no 12b-1 fee. They are generally only available to employer-sponsored retirement plans, corporate and institutional clients, and clients in other approved programs.
Class Y shares are not subject to an initial sales charge or CDSC and carry no 12b-1 fee. They are generally only available to corporate and institutional clients and clients in other approved programs.
Comparative indexes
Bloomberg Commodity Index is a broadly diversified index that measures the prices of commodities.
Bloomberg U.S. Aggregate Bond Index is an unmanaged index of U.S. investment-grade fixed-income securities.
Bloomberg U.S. Credit Index is an unmanaged index of U.S. dollar-denominated, investment-grade, fixed-rate, taxable corporate and government-related bonds.
Bloomberg U.S. Long Treasury Index is an unmanaged index of all publicly issued, U.S. Treasury securities that have a remaining maturity of 10 or more years, are investment-grade rated, and have $250 million or more of outstanding face value.
Bloomberg U.S. Treasury Index is an unmanaged index of U.S. dollar-denominated, fixed-rate, nominal debt issued by the U.S. Treasury.
Bloomberg World Government Inflation-Linked Bond Index (Hedged) is an unmanaged index that tracks the performance of government inflation-protected securities.
|
| PanAgora Risk Parity Fund 13 |
FTSE World Government Bond Index (WGBI) ex-U.S. (Hedged) is an unmanaged index that represents the world bond market, excluding the United States.
ICE BofA (Intercontinental Exchange Bank of America) U.S. 3-Month Treasury Bill Index is an unmanaged index that seeks to measure the performance of U.S. Treasury bills available in the marketplace.
MSCI ACWI (All Country World Index) (ND) is a free float-adjusted market capitalization index that is designed measure equity market performance in the global developed and emerging markets. Calculated with net dividends (ND), this total return index reflects the reinvestment of dividends after the deduction of withholding taxes, using a tax rate applicable to non-resident institutional investors who do not benefit from double taxation treaties.
MSCI Emerging Markets Index (ND) is a free float-adjusted market capitalization index that is designed to measure equity market performance in global emerging markets. Calculated with net dividends (ND), this total return index reflects the reinvestment of dividends after the deduction of withholding taxes, using a tax rate applicable to non-resident institutional investors who do not benefit from double taxation treaties.
MSCI World ex-U.S. Index (ND) is an unmanaged index of equity securities from developed countries, excluding the United States. Calculated with net dividends (ND), this total return index reflects the reinvestment of dividends after the deduction of withholding taxes, using a tax rate applicable to non-resident institutional investors who do not benefit from double taxation treaties.
Putnam PanAgora Risk Parity Blended Benchmark is an unmanaged index administered by Putnam Management, 35% of which is the MSCI ACWI Index (ND), 50% of which is the Bloomberg U.S. Long Treasury Index, and 15% of which is the S&P GSCI.
Russell 2000 Index is an unmanaged index composed of approximately 2,000 of the smallest companies in the Russell 3000 Index as measured by their market capitalization.
S&P 500 Index is an unmanaged index of common stock performance.
S&P GSCI is a composite index of commodity sector returns that represents a broadly diversified, unleveraged, long-only position in commodity futures.
Indexes assume reinvestment of all distributions and do not account for fees. Securities and performance of a fund and an index will differ. You cannot invest directly in an index.
BLOOMBERG® is a trademark and service mark of Bloomberg Finance L.P. and its affiliates (collectively “Bloomberg”). Bloomberg or Bloomberg’s licensors own all proprietary rights in the Bloomberg Indices. Neither Bloomberg nor Bloomberg’s licensors approve or endorse this material, or guarantee the accuracy or completeness of any information herein, or make any warranty, express or implied, as to the results to be obtained therefrom, and to the maximum extent allowed by law, neither shall have any liability or responsibility for injury or damages arising in connection therewith.
ICE Data Indices, LLC (“ICE BofA”), used with permission. ICE BofA permits use of the ICE BofA indices and related data on an “as is” basis; makes no warranties regarding same; does not guarantee the suitability, quality, accuracy, timeliness, and/or completeness of the ICE BofA indices or any data included in, related to, or derived therefrom; assumes no liability in connection with the use of the foregoing; and does not sponsor, endorse, or recommend Putnam Investments, or any of its products or services.
Frank Russell Company is the source and owner of the trademarks, service marks, and copyrights related to the Russell Indexes. Russell® is a trademark of Frank Russell Company.
FTSE Russell is the source and owner of the trademarks, service marks, and copyrights related to the FTSE Indexes. FTSE® is a trademark of FTSE Russell.
Lipper, a Refinitiv company, is a third-party industry-ranking entity that ranks mutual funds. Its rankings do not reflect sales charges. Lipper rankings are based on total return at net asset value relative to other funds that have similar current investment styles or objectives as determined by Lipper. Lipper may change a fund’s category assignment at its discretion. Lipper category averages reflect performance trends for funds within a category.
|
| 14 PanAgora Risk Parity Fund |
Other information for shareholders
Proxy voting
Putnam is committed to managing our mutual funds in the best interests of our shareholders. The Putnam funds’ proxy voting guidelines and procedures, as well as information regarding how your fund voted proxies relating to portfolio securities during the 12-month period ended June 30, 2021, are available in the Individual Investors section of putnam.com and on the Securities and Exchange Commission (SEC) website, www.sec.gov. If you have questions about finding forms on the SEC’s website, you may call the SEC at 1-800-SEC-0330. You may also obtain the Putnam funds’ proxy voting guidelines and procedures at no charge by calling Putnam’s Shareholder Services at 1-800-225-1581.
Fund portfolio holdings
The fund will file a complete schedule of its portfolio holdings with the SEC for the first and third quarters of each fiscal year on Form N-PORT within 60 days of the end of such fiscal quarter. Shareholders may obtain the fund’s Form N-PORT on the SEC’s website at www.sec.gov.
Prior to its use of Form N-PORT, the fund filed its complete schedule of its portfolio holdings with the SEC on Form N-Q, which is available online at www.sec.gov.
Trustee and employee fund ownership
Putnam employees and members of the Board of Trustees place their faith, confidence, and, most importantly, investment dollars in Putnam mutual funds. As of August 31, 2021, Putnam employees had approximately $583,000,000 and the Trustees had approximately $82,000,000 invested in Putnam mutual funds. These amounts include investments by the Trustees’ and employees’ immediate family members as well as investments through retirement and deferred compensation plans.
Liquidity risk management program
Putnam, as the administrator of the fund’s liquidity risk management program (appointed by the Board of Trustees), presented the most recent annual report on the program to the Trustees in April 2021. The report covered the structure of the program, including the program documents and related policies and procedures adopted to comply with Rule 22e-4 under the Investment Company Act of 1940, and reviewed the operation of the program from January 2020 through December 2020. The report included a description of the annual liquidity assessment of the fund that Putnam performed in November 2020. The report noted that there were no material compliance exceptions identified under Rule 22e-4 during the period. The report included a review of the governance of the program and the methodology for classification of the fund’s investments. The report also included a discussion of liquidity monitoring during the period, including during the market liquidity challenges caused by the Covid-19 pandemic, and the impact those challenges had on the liquidity of the fund’s investments. Putnam concluded that the program has been operating effectively and adequately to ensure compliance with Rule 22e-4.
|
| PanAgora Risk Parity Fund 15 |
Important notice regarding Putnam’s privacy policy
In order to conduct business with our shareholders, we must obtain certain personal information such as account holders’ names, addresses, Social Security numbers, and dates of birth. Using this information, we are able to maintain accurate records of accounts and transactions.
It is our policy to protect the confidentiality of our shareholder information, whether or not a shareholder currently owns shares of our funds. In particular, it is our policy not to sell information about you or your accounts to outside marketing firms. We have safeguards in place designed to prevent unauthorized access to our computer systems and procedures to protect personal information from unauthorized use.
Under certain circumstances, we must share account information with outside vendors who provide services to us, such as mailings and proxy solicitations. In these cases, the service providers enter into confidentiality agreements with us, and we provide only the information necessary to process transactions and perform other services related to your account. Finally, it is our policy to share account information with your financial representative, if you’ve listed one on your Putnam account.
|
| 16 PanAgora Risk Parity Fund |
Trustee approval of management contract
General conclusions
The Board of Trustees of The Putnam Funds oversees the management of each fund and, as required by law, determines annually whether to approve the continuance of your fund’s management contract with Putnam Investment Management, LLC (“Putnam Management”) and the sub-advisory contract with respect to your fund between Putnam Management and its affiliate, PanAgora Asset Management, Inc. (“PanAgora”). The Board, with the assistance of its Contract Committee, requests and evaluates all information it deems reasonably necessary under the circumstances in connection with its annual contract review. The Contract Committee consists solely of Trustees who are not “interested persons” (as this term is defined in the Investment Company Act of 1940, as amended (the “1940 Act”)) of The Putnam Funds (“Independent Trustees”).
At the outset of the review process, members of the Board’s independent staff and independent legal counsel considered any possible changes to the annual contract review materials furnished to the Contract Committee during the course of the previous year’s review and, as applicable, identified those changes to Putnam Management. Following these discussions and in consultation with the Contract Committee, the Independent Trustees’ independent legal counsel requested that Putnam Management and its affiliates, including PanAgora, furnish specified information, together with any additional information that Putnam Management and PanAgora considered relevant, to the Contract Committee. Over the course of several months ending in June 2021, the Contract Committee met on a number of occasions with representatives of Putnam Management, and separately in executive session, to consider the information that Putnam Management and PanAgora provided. Throughout this process, the Contract Committee was assisted by the members of the Board’s independent staff and by independent legal counsel for The Putnam Funds and the Independent Trustees.
In May 2021, the Contract Committee met in executive session to discuss and consider its recommendations with respect to the continuance of the contracts. At the Trustees’ June 2021 meeting, the Contract Committee met in executive session with the other Independent Trustees to review a summary of the key financial, performance and other data that the Contract Committee considered in the course of its review. The Contract Committee then presented its written report, which summarized the key factors that the Committee had considered and set forth its recommendations. The Contract Committee recommended, and the Independent Trustees approved, the continuance of your fund’s management contract and sub-advisory contract (as well as the management and sub-advisory contracts of its wholly-owned subsidiary) with respect to your fund between Putnam Management and PanAgora, effective July 1, 2021.
The Independent Trustees’ approval was based on the following conclusions:
• That the fee schedule in effect for your fund represented reasonable compensation in light of the nature and quality of the services being provided to the fund, the fees paid by competitive funds, the costs incurred by Putnam Management and PanAgora in providing services to the fund and the application of certain reductions and waivers noted below; and
• That the fee schedule in effect for your fund represented an appropriate sharing between fund shareholders and Putnam Management and PanAgora of any economies of scale as may exist in the management of the fund at current asset levels.
These conclusions were based on a comprehensive consideration of all information provided to the Trustees and were not the result of any single factor. Some of the factors that figured particularly in the Trustees’ deliberations and how the Trustees considered these factors are described below, although individual Trustees may have evaluated the information presented differently, giving different weights to various factors.
Management fee schedules and total expenses
The Trustees reviewed the management fee schedules in effect for all Putnam funds, including fee levels and breakpoints. Under its management contract, your fund has the benefit of breakpoints in its management fee schedule that provide shareholders with reduced fee levels as assets under management of all open-end funds sponsored by Putnam Management for which PanAgora acts as sub-adviser increase. (There are currently no other Putnam Management-sponsored open-end funds sub-advised by PanAgora.) The Trustees also reviewed the total expenses of each Putnam fund, recognizing that in most cases management
|
| PanAgora Risk Parity Fund 17 |
fees represented the major, but not the sole, determinant of total costs to fund shareholders. (Two funds have implemented so-called “all-in” management fees covering substantially all routine fund operating costs.)
In reviewing fees and expenses, the Trustees generally focus their attention on material changes in circumstances — for example, changes in assets under management, changes in a fund’s investment strategy, changes in Putnam Management’s operating costs or profitability, or changes in competitive practices in the mutual fund industry — that suggest that consideration of fee changes might be warranted. The Trustees concluded that the circumstances did not indicate that changes to the management fee schedule for your fund would be appropriate at this time.
As in the past, the Trustees also focused on the competitiveness of each fund’s total expense ratio. The Trustees and Putnam Management and the funds’ investor servicing agent, Putnam Investor Services, Inc. (“PSERV”), have implemented expense limitations that were in effect during your fund’s fiscal year ending in 2020. These expense limitations were: (i) a contractual expense limitation applicable to specified open-end funds, including your fund, of 25 basis points on investor servicing fees and expenses and (ii) a contractual expense limitation applicable to specified open-end funds, including your fund, of 20 basis points on so-called “other expenses” (i.e., all expenses exclusive of management fees, distribution fees, investor servicing fees, investment-related expenses, interest, taxes, brokerage commissions, acquired fund fees and expenses and extraordinary expenses). These expense limitations attempt to maintain competitive expense levels for the funds. Most funds had sufficiently low expenses that these expense limitations were not operative during their fiscal years ending in 2020. However, in the case of your fund, the second expense limitation applied during its fiscal year ending in 2020. Putnam Management and PSERV have agreed to maintain these expense limitations until at least December 30, 2022.
Putnam Management and PSERV’s commitment to these expense limitation arrangements, which were intended to support an effort to have fund expenses meet competitive standards, was an important factor in the Trustees’ decision to approve the continuance of your fund’s management and sub-advisory contracts.
The Trustees reviewed comparative fee and expense information for a custom group of competitive funds selected by Broadridge Financial Solutions, Inc. (“Broadridge”). This comparative information included your fund’s percentile ranking for effective management fees and total expenses (excluding any applicable 12b-1 fees), which provides a general indication of your fund’s relative standing. In the custom peer group, your fund ranked in the second quintile in effective management fees (determined for your fund and the other funds in the custom peer group based on fund asset size and the applicable contractual management fee schedule) and in the second quintile in total expenses (excluding any applicable 12b-1 fees) as of December 31, 2020. The first quintile represents the least expensive funds and the fifth quintile the most expensive funds. The fee and expense data reported by Broadridge as of December 31, 2020 reflected the most recent fiscal year-end data available in Broadridge’s database at that time.
In connection with their review of fund management fees and total expenses, the Trustees also reviewed the costs of the services provided and the profits realized by Putnam Management and its affiliates, including PanAgora, from their contractual relationships with the funds. This information included trends in revenues, expenses and profitability of Putnam Management and its affiliates relating to the investment management, investor servicing and distribution services provided to the funds. In this regard, the Trustees also reviewed an analysis of the revenues, expenses and profitability of Putnam Management and its affiliates, allocated on a fund-by-fund basis, with respect to the funds’ management, distribution and investor servicing contracts. For each fund, the analysis presented information about revenues, expenses and profitability for each of the agreements separately and for the agreements taken together on a combined basis. The Trustees also reviewed the costs incurred by PanAgora in providing its services under the sub-advisory contract and the resulting profitability to it in respect of your fund. The Trustees concluded that, at current asset levels, the fee schedules in place for the Putnam funds, including the fee schedule for your fund, represented reasonable compensation for the services being provided and represented an appropriate sharing between fund shareholders, Putnam Management and PanAgora of any economies of scale as may exist in the management of the fund at that time.
The information examined by the Trustees in connection with their annual contract review for the Putnam funds included information regarding services provided and fees charged by Putnam Management and its affiliates (including PanAgora) to other clients, including defined benefit pension
|
| 18 PanAgora Risk Parity Fund |
and profit-sharing plans, sub-advised mutual funds, private funds sponsored by affiliates of Putnam Management, model-only separately managed accounts and Putnam Management’s newly launched exchange-traded funds. This information included, in cases where a product’s investment strategy corresponds with a fund’s strategy, comparisons of those fees with fees charged to the Putnam funds, as well as an assessment of the differences in the services provided to these clients as compared to the services provided to the Putnam funds. The Trustees observed that the differences in fee rates between these clients and the Putnam funds are by no means uniform when examined by individual asset sectors, suggesting that differences in the pricing of investment management services to these types of clients may reflect, among other things, historical competitive forces operating in separate marketplaces. The Trustees considered the fact that in many cases fee rates across different asset classes are higher on average for mutual funds than for other clients, and the Trustees also considered differences between the services that Putnam Management and PanAgora provide to the Putnam funds and those that they provide to their other clients. The Trustees did not rely on these comparisons to any significant extent in concluding that the management fees paid by your fund are reasonable.
Investment performance
The quality of the investment process provided by Putnam Management and PanAgora, and the quality of services provided by Putnam Management and PanAgora with respect to your fund, represented major factors in the Trustees’ evaluation of the quality of services provided by Putnam Management under your fund’s management contract and by PanAgora under your fund’s sub-advisory contract. The Trustees were assisted in their review of Putnam Management’s and PanAgora’s investment processes and performance by the work of the investment oversight committees of the Trustees and the full Board of Trustees, which meet on a regular basis with individual portfolio managers and with senior management of Putnam Management’s Investment Division throughout the year. The Trustees concluded that Putnam Management and PanAgora generally provide a high-quality investment process — based on the experience and skills of the individuals assigned to the management of fund portfolios, the resources made available to them and in general Putnam Management’s and PanAgora’s ability to attract and retain high-quality personnel — but also recognized that this does not guarantee favorable investment results for every fund in every time period. With respect to its review of your fund’s investment performance, the Contract Committee, along with other members of the Board, discussed with representatives of Putnam Management your fund’s investment performance, and the Contract Committee also met with representatives of Putnam Management and PanAgora to further review the fund’s management and investment performance in connection with the discussion of Putnam Management’s and PanAgora’s responses to the requests for information from the Independent Trustees’ independent legal counsel.
The Trustees considered that, in the aggregate, The Putnam Funds generally performed well in 2020, which Putnam Management characterized as a challenging year with significant volatility and varied market dynamics. On an asset-weighted basis, the Putnam funds ranked in the second quartile of their peers as determined by Lipper Inc. (“Lipper”) for the year ended December 31, 2020 and, on an asset-weighted-basis, delivered a gross return that was 2.3% ahead of their benchmarks in 2020. In addition to the performance of the individual Putnam funds, the Trustees considered, as they had in prior years, the performance of The Putnam Fund complex versus competitor fund complexes. In this regard, the Trustees observed that The Putnam Funds’ relative performance, as reported in the Barron’s/Lipper Fund Families survey, continued to be exceptionally strong over the long term, with The Putnam Funds ranking as the 3rd best performing mutual fund complex out of 44 complexes for the ten-year period, with 2020 marking the fourth consecutive year that The Putnam Funds have ranked in the top ten fund complexes for the ten-year period. The Trustees noted that The Putnam Funds’ performance was solid over the one- and five-year periods, with The Putnam Funds ranking 22nd out of 53 complexes and 14th out of 50 complexes, respectively. In addition to the Barron’s/Lipper Fund Families Survey, the Trustees also considered the funds’ ratings assigned by Morningstar Inc., noting that 26 of the funds were four- or five-star rated at the end of 2020 (representing an increase of four funds year-over-year) and that this included seven funds that had achieved a five-star rating (representing an increase of two funds year-over-year). They also noted, however, the disappointing investment performance of some funds for periods ended December 31, 2020 and considered information provided by Putnam Management regarding the factors contributing to the underperformance and actions being taken to improve the performance
|
| PanAgora Risk Parity Fund 19 |
of these particular funds. The Trustees indicated their intention to continue to monitor closely the performance of those funds and evaluate whether additional actions to address areas of underperformance may be warranted.
For purposes of the Trustees’ evaluation of the Putnam funds’ investment performance, the Trustees generally focus on a competitive industry ranking of each fund’s total net return over a one-year, three-year and five-year period. For a number of Putnam funds with relatively unique investment mandates for which Putnam Management informed the Trustees that meaningful competitive performance rankings are not considered to be available, the Trustees evaluated performance based on their total gross and net returns and comparisons of those returns to the returns of selected investment benchmarks. In the case of your fund, the Trustees considered that its class A share cumulative total return performance at net asset value was in the following quartiles of its Lipper peer group (Lipper Alternative Global Macro Funds) for the one-year and three-year periods ended December 31, 2020 (the first quartile representing the best-performing funds and the fourth quartile the worst-performing funds):
| |
| One-year period | 1st |
| Three-year period | 1st |
For the three-year period ended December 31, 2020, your fund’s performance was in the top decile of its Lipper peer group. Over the one-year and three-year periods ended December 31, 2020, there were 207 funds and 198 funds, respectively, in your fund’s Lipper peer group. (When considering performance information, shareholders should be mindful that past performance is not a guarantee of future results.) The Trustees noted that the fund’s performance had been consistently strong since it was launched in 2017 through December 31, 2020.
The Trustees considered Putnam Management’s continued efforts to support fund performance through certain initiatives, including structuring compensation for portfolio managers to enhance accountability for fund performance, emphasizing accountability in the portfolio management process and affirming its commitment to a fundamental-driven approach to investing. The Trustees noted further that Putnam Management had made selective hires and internal promotions in 2020 to strengthen its investment team.
Brokerage and soft-dollar allocations; investor servicing
The Trustees considered various potential benefits that Putnam Management and PanAgora may receive in connection with the services they provide under the management and sub-advisory contracts with your fund. These include benefits related to brokerage allocation and the use of soft dollars, whereby a portion of the commissions paid by a fund for brokerage may be used to acquire research services that are expected to be useful to PanAgora in managing the assets of the fund and of other clients. Subject to policies established by the Trustees, soft dollars generated by these means are used predominantly to acquire brokerage and research services (including third-party research and market data) that enhance PanAgora’s investment capabilities and supplement PanAgora’s internal research efforts. The Trustees indicated their continued intent to monitor regulatory and industry developments in this area with the assistance of their Brokerage Committee. In addition, with the assistance of their Brokerage Committee, the Trustees indicated their continued intent to monitor the allocation of the Putnam funds’ brokerage in order to ensure that the principle of seeking best price and execution remains paramount in the portfolio trading process.
Putnam Management may also receive benefits from payments that the funds make to Putnam Management’s affiliates for investor or distribution services. In conjunction with the annual review of your fund’s management and sub-advisory contracts, the Trustees reviewed your fund’s investor servicing agreement with PSERV and its distributor’s contract and distribution plans with Putnam Retail Management Limited Partnership (“PRM”), both of which are affiliates of Putnam Management. The Trustees concluded that the fees payable by the funds to PSERV and PRM, as applicable, for such services are fair and reasonable in relation to the nature and quality of such services, the fees paid by competitive funds and the costs incurred by PSERV and PRM, as applicable, in providing such services. Furthermore, the Trustees were of the view that the investor services provided by PSERV were required for the operation of the funds, and that they were of a quality at least equal to those provided by other providers.
|
| 20 PanAgora Risk Parity Fund |
Audited consolidated financial statements
These sections of the report, as well as the accompanying Notes, preceded by the Report of Independent Registered Public Accounting Firm, constitute the fund’s audited consolidated financial statements.
The fund’s consolidated portfolio lists all the fund’s investments and their values as of the last day of the reporting period. Holdings are organized by asset type and industry sector, country, or state to show areas of concentration and diversification.
Consolidated statement of assets and liabilities shows how the fund’s net assets and share price are determined. All investment and non-investment assets are added together. Any unpaid expenses and other liabilities are subtracted from this total. The result is divided by the number of shares to determine the net asset value per share, which is calculated separately for each class of shares. (For funds with preferred shares, the amount subtracted from total assets includes the liquidation preference of preferred shares.)
Consolidated statement of operations shows the fund’s net investment gain or loss. This is done by first adding up all the fund’s earnings — from dividends and interest income — and subtracting its operating expenses to determine net investment income (or loss). Then, any net gain or loss the fund realized on the sales of its holdings —as well as any unrealized gains or losses over the period — is added to or subtracted from the net investment result to determine the fund’s net gain or loss for the fiscal period.
Consolidated statement of changes in net assets shows how the fund’s net assets were affected by the fund’s net investment gain or loss, by distributions to shareholders, and by changes in the number of the fund’s shares. It lists distributions and their sources (net investment income or realized capital gains) over the current reporting period and the most recent fiscal year-end. The distributions listed here may not match the sources listed in the Consolidated statement of operations because the distributions are determined on a tax basis and may be paid in a different period from the one in which they were earned.
Consolidated financial highlights provide an overview of the fund’s investment results, per-share distributions, expense ratios, net investment income ratios, and portfolio turnover in one summary table, reflecting the five most recent reporting periods. In a semiannual report, the highlights table also includes the current reporting period.
|
| PanAgora Risk Parity Fund 21 |
Report of Independent Registered Public Accounting Firm
To the Board of Trustees of Putnam Investment Funds and Shareholders of
Putnam PanAgora Risk Parity Fund:
Opinion on the Consolidated Financial Statements
We have audited the accompanying consolidated statement of assets and liabilities, including the fund’s consolidated portfolio, of Putnam PanAgora Risk Parity Fund and its subsidiary (one of the funds constituting Putnam Investment Funds, referred to hereafter as the “Fund”) as of August 31, 2021, the related consolidated statement of operations for the year ended August 31, 2021, the consolidated statement of changes in net assets for each of the two years in the period ended August 31, 2021, including the related notes, and the consolidated financial highlights for each of the periods indicated therein (collectively referred to as the “consolidated financial statements”). In our opinion, the consolidated financial statements present fairly, in all material respects, the financial position of the Fund as of August 31, 2021, the results of their operations for the year then ended, the changes in their net assets for each of the two years in the period ended August 31, 2021 and the financial highlights for each of the periods indicated therein in conformity with accounting principles generally accepted in the United States of America.
Basis for Opinion
These consolidated financial statements are the responsibility of the Fund’s management. Our responsibility is to express an opinion on the Fund’s consolidated financial statements based on our audits. We are a public accounting firm registered with the Public Company Accounting Oversight Board (United States) (“PCAOB”) and are required to be independent with respect to the Fund in accordance with the U.S. federal securities laws and the applicable rules and regulations of the Securities and Exchange Commission and the PCAOB.
We conducted our audits of these consolidated financial statements in accordance with the standards of the PCAOB. Those standards require that we plan and perform the audit to obtain reasonable assurance about whether the consolidated financial statements are free of material misstatement, whether due to error or fraud.
Our audits included performing procedures to assess the risks of material misstatement of the consolidated financial statements, whether due to error or fraud, and performing procedures that respond to those risks. Such procedures included examining, on a test basis, evidence regarding the amounts and disclosures in the consolidated financial statements. Our audits also included evaluating the accounting principles used and significant estimates made by management, as well as evaluating the overall presentation of the consolidated financial statements. Our procedures included confirmation of securities owned as of August 31, 2021 by correspondence with the custodian and brokers; when replies were not received from brokers, we performed other auditing procedures. We believe that our audits provide a reasonable basis for our opinion.
PricewaterhouseCoopers LLP
Boston, Massachusetts
October 12, 2021
We have served as the auditor of one or more investment companies in the Putnam Investments family of mutual funds since at least 1957. We have not been able to determine the specific year we began serving as auditor.
|
| 22 PanAgora Risk Parity Fund |
| | |
| The fund’s portfolio 8/31/21 | | |
|
| | | |
| SHORT-TERM INVESTMENTS (99.0%)* | Principal amount/
shares | Value |
| State Street Institutional Treasury Plus Money Market Fund, Investor Class 0.01% P | Shares | 20,505,358 | $20,505,358 |
| State Street Institutional U.S. Government Money Market Fund, Investor Class 0.01% P ΩΩ | Shares | 3,149,849 | 3,149,849 |
| U.S. Treasury Bills 0.05%, 9/16/21 # ΩΩ | | $25,400,000 | 25,399,683 |
| Total short-term investments (cost $49,054,715) | $49,054,890 |
|
| |
| TOTAL INVESTMENTS |
| Total investments (cost $49,054,715) | $49,054,890 |
|
| | | |
| Notes to the fund’s consolidated portfolio |
| Unless noted otherwise, the notes to the fund’s consolidated portfolio are for the close of the fund’s reporting period, which ran from September 1, 2020 through August 31, 2021 (the reporting period). Within the following notes to the fund’s consolidated portfolio, references to “Putnam Management” represent Putnam Investment Management, LLC, the fund’s manager, an indirect wholly-owned subsidiary of Putnam Investments, LLC, references to “the SEC” represent the Securities and Exchange Commission and references to “ASC 820” represent Accounting Standards Codification 820 Fair Value Measurements and Disclosures. |
| * | Percentages indicated are based on net assets of $49,546,889. |
| # | This security, in part or in entirety, was pledged and segregated with the broker to cover margin requirements for futures contracts at the close of the reporting period. Collateral at period end totaled $3,399,966 and is included in Investments in securities on the Consolidated statement of assets and liabilities (Notes 1 and 8). |
| P | A portion of these securities were purchased with cash that was pledged to the fund for collateral on certain futures contracts. Collateral at period end totaled $911,184. |
| ΩΩ | A portion of this holding is held by Putnam PanAgora Risk Parity Ltd., a wholly-owned and controlled subsidiary, valued at $5,549,819. |
| Unless otherwise noted, the rates quoted in Short-term investments security descriptions represent the weighted average yield to maturity. |
| The dates shown on debt obligations are the original maturity dates. |
|
| | | | | |
| FUTURES CONTRACTS OUTSTANDING at 8/31/21 |
| Number of
contracts | Notional
amount | Value | Expiration
date | Unrealized
appreciation/
(depreciation) |
| Amsterdam Exchange index (Long) | 6 | $1,115,979 | $1,115,668 | Sep-21 | $24,981 |
| Australian Government Treasury Bond 10 yr (Long) | 100 | 10,666,657 | 10,666,652 | Sep-21 | 271,383 |
Bloomberg Commodity Index
(Long) ## | 930 | 8,926,689 | 8,928,000 | Sep-21 | 74,038 |
| Canadian Government Bond 10 yr (Long) | 85 | 9,845,084 | 9,845,084 | Dec-21 | (45,076) |
| DAX Index (Long) | 2 | 934,864 | 932,793 | Sep-21 | 6,477 |
| Euro-Bobl 5 yr (Long) | 56 | 8,924,486 | 8,924,490 | Sep-21 | 47,285 |
| Euro-BTP Italian Government Bond (Long) | 19 | 3,438,946 | 3,438,948 | Sep-21 | 40,191 |
| Euro-Bund 10 yr (Long) | 22 | 4,557,577 | 4,557,579 | Sep-21 | 70,318 |
| Euro-Buxl 30 yr (Long) | 8 | 2,007,464 | 2,007,465 | Sep-21 | 82,288 |
| FTSE 100 Index (Long) | 18 | 1,761,934 | 1,756,192 | Sep-21 | 4,597 |
| Hang Seng Index (Long) | 10 | 1,663,719 | 1,655,684 | Sep-21 | 706 |
| |
PanAgora Risk Parity Fund 23 |
| | | | | |
| FUTURES CONTRACTS OUTSTANDING at 8/31/21 cont. |
| Number of
contracts | Notional
amount | Value | Expiration
date | Unrealized
appreciation/
(depreciation) |
| IBEX 35 Index (Long) | 8 | $835,650 | $833,799 | Sep-21 | $(3,571) |
| Japanese Government Bond 10 yr (Long) | 21 | 29,044,767 | 29,044,767 | Sep-21 | 71,974 |
| MSCI Emerging Markets Index (Long) | 46 | 3,009,942 | 2,988,160 | Sep-21 | (93,692) |
| OMXS 30 Index (Long) | 32 | 871,897 | 872,825 | Sep-21 | (10,113) |
| Russell 2000 Index E-Mini (Long) | 43 | 4,888,614 | 4,883,080 | Sep-21 | (60,634) |
| S&P 500 Index E-Mini (Long) | 48 | 10,854,432 | 10,849,200 | Sep-21 | 599,354 |
| S&P/TSX 60 Index (Long) | 10 | 1,951,938 | 1,949,669 | Sep-21 | 35,726 |
| SPI 200 Index (Long) | 13 | 1,791,450 | 1,777,684 | Sep-21 | 52,784 |
| Tokyo Price Index (Long) | 9 | 1,603,990 | 1,607,099 | Sep-21 | 11,377 |
| U.K. Gilt 10 yr (Long) | 55 | 9,697,092 | 9,697,093 | Dec-21 | (66,626) |
| U.S. Treasury Bond 30 yr (Long) | 50 | 8,148,438 | 8,148,438 | Dec-21 | 10,877 |
| U.S. Treasury Note 2 yr (Long) | 131 | 28,862,985 | 28,862,985 | Dec-21 | 21,314 |
| U.S. Treasury Note 5 yr (Long) | 133 | 16,454,594 | 16,454,594 | Dec-21 | 34,950 |
| U.S. Treasury Note 10 yr (Long) | 117 | 15,614,016 | 15,614,016 | Dec-21 | 7,974 |
| Unrealized appreciation | | | | 1,468,594 |
| Unrealized (depreciation) | | | | (279,712) |
| Total | $1,188,882 |
| ## Held by Putnam PanAgora Risk Parity Ltd., a wholly-owned and controlled subsidiary. |
|
| ASC 820 establishes a three-level hierarchy for disclosure of fair value measurements. The valuation hierarchy is based upon the transparency of inputs to the valuation of the fund’s investments. The three levels are defined as follows: |
Level 1: Valuations based on quoted prices for identical securities in active markets.
Level 2: Valuations based on quoted prices in markets that are not active or for which all significant inputs are observable, either directly or indirectly.
Level 3: Valuations based on inputs that are unobservable and significant to the fair value measurement.
| The following is a summary of the inputs used to value the fund’s net assets as of the close of the reporting period: |
|
| | | |
| | Valuation inputs |
| Investments in securities: | Level 1 | Level 2 | Level 3 |
| Short-term investments | $23,655,207 | $25,399,683 | $— |
| Totals by level | $23,655,207 | $25,399,683 | $— |
|
| | | |
| | Valuation inputs |
| Other financial instruments: | Level 1 | Level 2 | Level 3 |
| Futures contracts | $1,188,882 | $— | $— |
| Totals by level | $1,188,882 | $— | $— |
The accompanying notes are an integral part of these financial statements.
| |
24 PanAgora Risk Parity Fund |
Consolidated statement of assets and liabilities 8/31/21
| |
| ASSETS | |
| Investments in securities, at value, (Notes 1 and 8): | |
| Unaffiliated issuers (identified cost $49,054,715) | $49,054,890 |
| Cash | 223,587 |
| Interest and other receivable | 610 |
| Receivable for shares of the fund sold | 23,299 |
| Receivable for variation margin on futures contracts (Note 1) | 1,313,615 |
| Prepaid assets | 53,781 |
| Total assets | 50,669,782 |
| |
| LIABILITIES | |
| Payable for compensation of Manager (Note 2) | 5,569 |
| Payable for custodian fees (Note 2) | 3,276 |
| Payable for investor servicing fees (Note 2) | 3,052 |
| Payable for Trustee compensation and expenses (Note 2) | 786 |
| Payable for administrative services (Note 2) | 134 |
| Payable for auditing and tax fees | 63,874 |
| Payable for distribution fees (Note 2) | 7,587 |
| Payable for variation margin on futures contracts (Note 1) | 121,526 |
| Deposits due to Broker | 911,184 |
| Other accrued expenses | 5,905 |
| Total liabilities | 1,122,893 |
| | |
| Net assets | $49,546,889 |
| |
| REPRESENTED BY | |
| Paid-in-capital (Unlimited shares authorized (Notes 1 and 4) | $44,991,663 |
| Total distributable earnings (Note 1) | 4,555,226 |
| Total — Representing net assets applicable to capital shares outstanding | $49,546,889 |
| |
| COMPUTATION OF NET ASSET VALUE AND OFFERING PRICE | |
| Net asset value and redemption price per class A share ($18,024,761 divided by 1,647,749 shares) | $10.94 |
| Offering price per class A share (100/94.25 of $10.94)* | $11.61 |
| Net asset value and offering price per class B share ($20,960 divided by 1,946 shares)** | $10.77 |
| Net asset value and offering price per class C share ($16,694 divided by 1,551 shares)** | $10.76 |
| Net asset value, offering price and redemption price per class R share | |
| ($13,379 divided by 1,229 shares) | $10.89 |
| Net asset value, offering price and redemption price per class R6 share | |
| ($11,313,892 divided by 1,029,631 shares) | $10.99 |
| Net asset value, offering price and redemption price per class Y share | |
| (20,157,203 divided by 1,833,233 shares) | $11.00 |
*On single retail sales of less than $50,000. On sales of $50,000 or more the offering price is reduced.
**Redemption price per share is equal to net asset value less any applicable contingent deferred sales charge.
The accompanying notes are an integral part of these consolidated financial statements.
|
| PanAgora Risk Parity Fund 25 |
Consolidated statement of operations Year ended 8/31/21
| |
| INVESTMENT INCOME | |
| Interest | $18,803 |
| Total investment income | 18,803 |
| |
| EXPENSES | |
| Compensation of Manager (Note 2) | 336,155 |
| Investor servicing fees (Note 2) | 17,060 |
| Custodian fees (Note 2) | 8,229 |
| Trustee compensation and expenses (Note 2) | 1,817 |
| Distribution fees (Note 2) | 42,659 |
| Administrative services (Note 2) | 1,157 |
| Interest Expense | 26,631 |
| Blue sky expense | 82,127 |
| Reports to shareholders | 13,791 |
| Auditing and tax fees | 67,625 |
| Other | 24,757 |
| Fees waived and reimbursed by Manager (Note 2) | (109,459) |
| Total expenses | 512,549 |
| Expense reduction (Note 2) | (787) |
| Net expenses | 511,762 |
| | |
| Net investment loss | (492,959) |
| |
| REALIZED AND UNREALIZED GAIN (LOSS) | |
| Net realized gain (loss) on: | |
| Foreign currency transactions (Note 1) | 38,590 |
| Futures contracts (Note 1) | 6,712,199 |
| Total net realized gain | 6,750,789 |
| Change in net unrealized appreciation (depreciation) on: | |
| Securities from unaffiliated issuers | (725) |
| Assets and liabilities in foreign currencies | (181,915) |
| Futures contracts | (1,645,289) |
| Total change in net unrealized depreciation | (1,827,929) |
| | |
| Net gain on investments | 4,922,860 |
| |
| Net increase in net assets resulting from operations | $4,429,901 |
The accompanying notes are an integral part of these consolidated financial statements.
|
| 26 PanAgora Risk Parity Fund |
Consolidated statement of changes in net assets
| | |
| INCREASE IN NET ASSETS | Year ended 8/31/21 | Year ended 8/31/20 |
| Operations | | |
| Net investment loss | $(492,959) | $(30,358) |
| Net realized gain on investments | | |
| and foreign currency transactions | 6,750,789 | 818,392 |
| Change in net unrealized appreciation (depreciation) | | |
| of investments and assets and liabilities | | |
| in foreign currencies | (1,827,929) | 1,996,849 |
| Net increase in net assets resulting from operations | 4,429,901 | 2,784,883 |
| Distributions to shareholders (Note 1): | | |
| From ordinary income | | |
| Net investment income | | |
| Class A | — | (352,876) |
| Class B | — | (406) |
| Class C | — | (539) |
| Class R | — | (462) |
| Class R6 | — | (289,698) |
| Class Y | — | (1,003,581) |
| Net realized short-term gain on investments | | |
| Class A | (253,385) | (366,914) |
| Class B | (302) | (506) |
| Class C | (686) | (674) |
| Class R | (191) | (509) |
| Class R6 | (151,834) | (285,827) |
| Class Y | (262,227) | (990,253) |
| From net realized long-term gain on investments | | |
| Class A | (673,637) | (357,705) |
| Class B | (802) | (493) |
| Class C | (1,825) | (657) |
| Class R | (507) | (496) |
| Class R6 | (403,656) | (278,939) |
| Class Y | (697,141) | (965,395) |
| Increase from capital share transactions (Note 4) | 6,589,064 | 6,840,441 |
| Total increase in net assets | 8,572,772 | 4,729,394 |
| |
| NET ASSETS | | |
| Beginning of year | 40,974,117 | 36,244,723 |
| End of year | $49,546,889 | $40,974,117 |
The accompanying notes are an integral part of these consolidated financial statements.
|
| PanAgora Risk Parity Fund 27 |
Consolidated financial highlights (For a common share outstanding throughout the period)
| | | | | | | | | | | | | |
| | INVESTMENT OPERATIONS | LESS DISTRIBUTIONS | RATIOS AND SUPPLEMENTAL DATA |
| | | | | | | | | | | | Ratio | Ratio of net | |
| | Net asset | | Net realized | | | | | | | | of expenses | investment | |
| | value, | | and unrealized | Total from | From net | From net | | Net asset | Total return | Net assets, | to average | income (loss) | Portfolio |
| | beginning | Net investment | gain (loss) | investment | investment | realized gain | Total | value, end | at net asset | end of period | net assets | to average | turnover |
| Period ended | of period | income (loss)a | on investments | operations | income | on investments | distributions | of period | value (%)b | (in thousands) | (%)c,d | net assets (%)d | (%) |
| Class A | | | | | | | | | | | | | |
| August 31, 2021 | $10.49 | (.13) | 1.18 | 1.05 | — | (.60) | (.60) | $10.94 | 10.28 | $18,025 | 1.30f | (1.25) | — |
| August 31, 2020 | 11.26 | (.03) | .73 | .70 | (.48) | (.99) | (1.47) | 10.49 | 7.19 | 16,226 | 1.24 | (.31) | — |
| August 31, 2019 | 10.00 | .10 | 1.23 | 1.33 | (.07) | — | (.07) | 11.26 | 13.45 | 8,010 | 1.24 | .99 | — |
| August 31, 2018 † | 10.00 | .01 | .06 | .07 | — | (.07) | (.07) | 10.00 | .71* | 7,053 | 1.18* | .08* | — |
| Class B | | | | | | | | | | | | | |
| August 31, 2021 | $10.41 | (.21) | 1.17 | .96 | — | (.60) | (.60) | $10.77 | 9.47 | $21 | 2.05f | (2.01) | — |
| August 31, 2020 | 11.18 | (.10) | .72 | .62 | (.40) | (.99) | (1.39) | 10.41 | 6.39 | 12 | 1.99 | (.98) | — |
| August 31, 2019 | 9.93 | .02 | 1.23 | 1.25 | — | — | — | 11.18 | 12.59 | 11 | 1.99 | .24 | — |
| August 31, 2018 † | 10.00 | (.06) | .06 | —e | — | (.07) | (.07) | 9.93 | .01* | 10 | 1.89* | (.63)* | — |
| Class C | | | | | | | | | | | | | |
| August 31, 2021 | $10.40 | (.21) | 1.17 | .96 | — | (.60) | (.60) | $10.76 | 9.48 | $17 | 2.05f | (2.00) | — |
| August 31, 2020 | 11.17 | (.10) | .72 | .62 | (.40) | (.99) | (1.39) | 10.40 | 6.40 | 18 | 1.99 | (1.00) | — |
| August 31, 2019 | 9.93 | .03 | 1.22 | 1.25 | (.01) | — | (.01) | 11.17 | 12.60 | 15 | 1.99 | .24 | — |
| August 31, 2018 † | 10.00 | (.06) | .06 | —e | — | (.07) | (.07) | 9.93 | .01* | 13 | 1.89* | (.60)* | — |
| Class R | | | | | | | | | | | | | |
| August 31, 2021 | $10.47 | (.16) | 1.18 | 1.02 | — | (.60) | (.60) | $10.89 | 10.01 | $13 | 1.55f | (1.50) | — |
| August 31, 2020 | 11.23 | (.05) | .74 | .69 | (.46) | (.99) | (1.45) | 10.47 | 7.02 | 12 | 1.49 | (.49) | — |
| August 31, 2019 | 9.98 | .08 | 1.22 | 1.30 | (.05) | — | (.05) | 11.23 | 13.09 | 11 | 1.49 | .74 | — |
| August 31, 2018 † | 10.00 | (.01) | .06 | .05 | — | (.07) | (.07) | 9.98 | .51* | 10 | 1.42* | (.15)* | — |
| Class R6 | | | | | | | | | | | | | |
| August 31, 2021 | $10.51 | (.11) | 1.19 | 1.08 | — | (.60) | (.60) | $10.99 | 10.56 | $11,314 | 1.06f | (1.02) | — |
| August 31, 2020 | 11.28 | —e | .73 | .73 | (.51) | (.99) | (1.50) | 10.51 | 7.43 | 9,108 | 1.00 | (.05) | — |
| August 31, 2019 | 10.03 | .12 | 1.22 | 1.34 | (.09) | — | (.09) | 11.28 | 13.61 | 6,197 | 1.00 | 1.22 | — |
| August 31, 2018 † | 10.00 | .04 | .06 | .10 | — | (.07) | (.07) | 10.03 | 1.01* | 4,817 | .95* | .43* | — |
| Class Y | | | | | | | | | | | | | |
| August 31, 2021 | $10.51 | (.11) | 1.20 | 1.09 | — | (.60) | (.60) | $11.00 | 10.65 | $20,157 | 1.05f | (1.00) | — |
| August 31, 2020 | 11.28 | .01 | .72 | .73 | (.51) | (.99) | (1.50) | 10.51 | 7.44 | 15,598 | .99 | .08 | — |
| August 31, 2019 | 10.03 | .13 | 1.21 | 1.34 | (.09) | — | (.09) | 11.28 | 13.61 | 21,989 | .99 | 1.24 | — |
| August 31, 2018 † | 10.00 | .03 | .07 | .10 | — | (.07) | (.07) | 10.03 | 1.01* | 19,020 | .94* | .32* | — |
* Not annualized.
† For the period September 20, 2017 (commencement of operations) to August 31, 2018.
a Per share net investment income (loss) has been determined on the basis of the weighted average number of shares outstanding during the period.
b Total return assumes dividend reinvestment and does not reflect the effect of sales charges.
c Includes amounts paid through expense offset and/or brokerage/service arrangements, if any (Note 2). Also excludes acquired fund fees and expenses, if any.
d Reflects an involuntary contractual expense limitation in effect during the period. As a result of such limitation, the expenses of each class reflect a reduction of the following amounts (Note 2):
| | | |
| | Percentage of average net assets | | |
| August 31, 2021 | 0.24% | | |
| August 31, 2020 | 0.32 | | |
| August 31, 2019 | 0.47 | | |
| August 31, 2018 | 1.27 | | |
e Amount represents less than $0.01 per share.
f Includes interest expense, which amounted to 0.06% as a percentage of average net assets for each class.
The accompanying notes are an integral part of these consolidated financial statements.
| |
| 28 PanAgora Risk Parity Fund | PanAgora Risk Parity Fund 29 |
Notes to consolidated financial statements 8/31/21
Within the following Notes to consolidated financial statements, references to “State Street” represent State Street Bank and Trust Company, references to “the SEC” represent the Securities and Exchange Commission, references to “Putnam Management” represent Putnam Investment Management, LLC, the fund’s manager, an indirect wholly-owned subsidiary of Putnam Investments, LLC and references to “OTC”, if any, represent over-the-counter. Unless otherwise noted, the “reporting period” represents the period from September 1, 2020 through August 31, 2021.
Putnam PanAgora Risk Parity Fund (the fund) is a non-diversified series of Putnam Investment Funds (the Trust), a Massachusetts business trust registered under the Investment Company Act of 1940, as amended, as an open-end management investment company. The fund has adopted non-fundamental investment restrictions requiring the fund to be managed as a “diversified” investment company. The goal of the fund is to seek total return, which is composed of capital appreciation and income. The fund pursues an investment strategy designed to generate returns from investing in a combination of asset classes with diversified risk characteristics. The fund strategically allocates its investments among equities, fixed-income instruments and commodities in an effort to participate in periods of economic growth, preserve capital during periods of economic contraction, and preserve real rates of return during periods of heightened inflation.
In allocating the fund’s assets among the different asset classes, PanAgora Asset Management, Inc. (“PanAgora”), the subadviser to the fund, employs a proprietary “risk parity” approach, which relies on quantitative models and information and data inputs to those models to seek to diversify the fund’s portfolio risks across and within asset classes. When allocating investments across asset classes, the fund generally allocates a greater portion of its assets to asset classes PanAgora views as having lower risk, such as developed market bonds, than to asset classes PanAgora views as having higher risk, such as global equities. In its “neutral” position, the fund’s assets are generally strategically allocated among the different asset classes so that the anticipated contribution of each asset class to the overall risk of the fund will be approximately as follows: 40% from equity risk; 40% from fixed income risk; and 20% from inflation risk. However, PanAgora may seek different risk contributions from time to time, including in response to market conditions. When allocating investments within each asset class, PanAgora’s risk parity approach seeks to diversify the fund’s risk exposures across a variety of factors, including industry sectors, geographies, companies and commodity types.
The fund will gain exposure to different areas of risk either through direct investment or through derivative instruments, primarily including forwards, futures, and swaps, but which may also include, but are not limited to, options. The fund may invest without limit in equity securities, including, but not limited to, global developed markets large-cap equities, emerging markets equities, and U.S. small and mid-cap equities. The fund may additionally invest in fixed-income securities of any credit quality, duration or maturity (including, but not limited to, U.S. and non-U.S. sovereign bonds, global inflation-linked government bonds (including Treasury Inflation Protected Securities), and investment-grade corporate bonds), commodities (including through, but not limited to, commodity-linked notes and commodity-related derivative instruments (primarily commodity futures and swaps on commodity futures)), exchange-traded funds (“ETFs”), exchange-traded notes, and emerging markets and other currencies (including through cash bonds and currency forwards). These asset classes offer different return potential and exposure to different investment risks.
While the fund normally does not engage in borrowing, the fund typically uses derivatives to a significant extent and may take “short” derivatives positions.
A significant portion of the assets of the fund will be invested in short-term instruments, including cash and cash equivalents generally with one year or less term to maturity. These investments serve as collateral for the derivative positions the fund takes and also may earn income for the fund.
The fund may invest directly or indirectly through its wholly-owned and controlled subsidiary Putnam PanAgora Risk Parity, Ltd. (the “subsidiary”), which like the fund, is sub-advised by PanAgora. The fund may invest no more than 25% of its assets in the subsidiary. Generally, the subsidiary will invest primarily in commodity futures and swaps on commodity futures but it may also invest in other commodity-related instruments (such as financial futures, option and swap contracts) or other asset classes (including through derivatives). Unlike the fund, the subsidiary may invest without limitation in commodity-related instruments. Unless indicated otherwise, references to the fund’s investments, investment exposures or risks include its indirect investments, investment exposures and risks through the subsidiary.
The fund offers class A, class B, class C, class R, class R6 and class Y shares. Purchases of class B shares are closed to new and existing investors except by exchange from class B shares of another Putnam fund or through dividend
|
| 30 PanAgora Risk Parity Fund |
and/or capital gains reinvestment. Class A shares are sold with a maximum front-end sales charge of 5.75%. Class A shares generally are not subject to a contingent deferred sales charge, and class R, class R6 and class Y shares are not subject to a contingent deferred sales charge. Class B shares, which convert to class A shares after approximately eight years, are not subject to a front-end sales charge and are subject to a contingent deferred sales charge if those shares are redeemed within six years of purchase. Class C shares are subject to a one-year 1.00% contingent deferred sales charge and generally convert to class A shares after approximately eight years. Prior to March 1, 2021, class C shares would have generally converted to class A shares after approximately ten years. Class R shares, which are not available to all investors, are sold at net asset value. The expenses for class A, class B, class C and class R shares may differ based on the distribution fee of each class, which is identified in Note 2. Class R6 and class Y shares, which are sold at net asset value, are generally subject to the same expenses as class A, class B, class C and class R shares, but do not bear a distribution fee, and in the case of class R6 shares, bear a lower investor servicing fee, which is identified in Note 2. Class R6 and class Y shares are not available to all investors.
In the normal course of business, the fund enters into contracts that may include agreements to indemnify another party under given circumstances. The fund’s maximum exposure under these arrangements is unknown as this would involve future claims that may be, but have not yet been, made against the fund. However, the fund’s management team expects the risk of material loss to be remote.
The fund has entered into contractual arrangements with an investment adviser, administrator, distributor, shareholder servicing agent and custodian, who each provide services to the fund. Unless expressly stated otherwise, shareholders are not parties to, or intended beneficiaries of these contractual arrangements, and these contractual arrangements are not intended to create any shareholder right to enforce them against the service providers or to seek any remedy under them against the service providers, either directly or on behalf of the fund.
Under the fund’s Amended and Restated Agreement and Declaration of Trust, any claims asserted against or on behalf of the Putnam Funds, including claims against Trustees and Officers, must be brought in state and federal courts located within the Commonwealth of Massachusetts.
Note 1: Significant accounting policies
The following is a summary of significant accounting policies consistently followed by the fund in the preparation of its consolidated financial statements. The preparation of consolidated financial statements is in conformity with accounting principles generally accepted in the United States of America and requires management to make estimates and assumptions that affect the reported amounts of assets and liabilities in the consolidated financial statements and the reported amounts of increases and decreases in net assets from operations. Actual results could differ from those estimates. Subsequent events after the Consolidated statement of assets and liabilities date through the date that the consolidated financial statements were issued have been evaluated in the preparation of the consolidated financial statements.
Investment income, realized and unrealized gains and losses and expenses of the fund are borne pro-rata based on the relative net assets of each class to the total net assets of the fund, except that each class bears expenses unique to that class (including the distribution fees applicable to such classes). Each class votes as a class only with respect to its own distribution plan or other matters on which a class vote is required by law or determined by the Trustees. If the fund were liquidated, shares of each class would receive their pro-rata share of the net assets of the fund. In addition, the Trustees declare separate dividends on each class of shares.
Security valuation Portfolio securities and other investments are valued using policies and procedures adopted by the Board of Trustees. The Trustees have formed a Pricing Committee to oversee the implementation of these procedures and have delegated responsibility for valuing the fund’s assets in accordance with these procedures to Putnam Management. Putnam Management has established an internal Valuation Committee that is responsible for making fair value determinations, evaluating the effectiveness of the pricing policies of the fund and reporting to the Pricing Committee.
Investments for which market quotations are readily available are valued at the last reported sales price on their principal exchange, or official closing price for certain markets, and are classified as Level 1 securities under Accounting Standards Codification 820 Fair Value Measurements and Disclosures (ASC 820). If no sales are reported, as in the case of some securities that are traded OTC, a security is valued at its last reported bid price and is generally categorized as a Level 2 security.
Investments in open-end investment companies (excluding exchange-traded funds), if any, which can be classified as Level 1 or Level 2 securities, are valued based on their net asset value. The net asset value of such investment companies equals the total value of their assets less their liabilities and divided by the number of their outstanding shares.
|
| PanAgora Risk Parity Fund 31 |
Many securities markets and exchanges outside the U.S. close prior to the scheduled close of the New York Stock Exchange and therefore the closing prices for securities in such markets or on such exchanges may not fully reflect events that occur after such close but before the scheduled close of the New York Stock Exchange. Accordingly, on certain days, the fund will fair value certain foreign equity securities taking into account multiple factors including movements in the U.S. securities markets, currency valuations and comparisons to the valuation of American Depository Receipts, exchange-traded funds and futures contracts. The foreign equity securities, which would generally be classified as Level 1 securities, will be transferred to Level 2 of the fair value hierarchy when they are valued at fair value. The number of days on which fair value prices will be used will depend on market activity and it is possible that fair value prices will be used by the fund to a significant extent. Securities quoted in foreign currencies, if any, are translated into U.S. dollars at the current exchange rate. Short-term securities with remaining maturities of 60 days or less are valued using an independent pricing service approved by the Trustees, and are classified as Level 2 securities.
To the extent a pricing service or dealer is unable to value a security or provides a valuation that Putnam Management does not believe accurately reflects the security’s fair value, the security will be valued at fair value by Putnam Management in accordance with policies and procedures approved by the Trustees. Certain investments, including certain restricted and illiquid securities and derivatives, are also valued at fair value following procedures approved by the Trustees. These valuations consider such factors as significant market or specific security events such as interest rate or credit quality changes, various relationships with other securities, discount rates, U.S. Treasury, U.S. swap and credit yields, index levels, convexity exposures, recovery rates, sales and other multiples and resale restrictions. These securities are classified as Level 2 or as Level 3 depending on the priority of the significant inputs.
To assess the continuing appropriateness of fair valuations, the Valuation Committee reviews and affirms the reasonableness of such valuations on a regular basis after considering all relevant information that is reasonably available. Such valuations and procedures are reviewed periodically by the Trustees. The fair value of securities is generally determined as the amount that the fund could reasonably expect to realize from an orderly disposition of such securities over a reasonable period of time. By its nature, a fair value price is a good faith estimate of the value of a security in a current sale and does not reflect an actual market price, which may be different by a material amount.
Security transactions and related investment income Security transactions are recorded on the trade date (the date the order to buy or sell is executed). Gains or losses on securities sold are determined on the identified cost basis.
Interest income, net of any applicable withholding taxes, if any, and including amortization and accretion of premiums and discounts on debt securities, is recorded on the accrual basis.
Foreign currency translation The accounting records of the fund are maintained in U.S. dollars. The fair value of foreign securities, currency holdings, and other assets and liabilities is recorded in the books and records of the fund after translation to U.S. dollars based on the exchange rates on that day. The cost of each security is determined using historical exchange rates. Income and withholding taxes are translated at prevailing exchange rates when earned or incurred. The fund does not isolate that portion of realized or unrealized gains or losses resulting from changes in the foreign exchange rate on investments from fluctuations arising from changes in the market prices of the securities. Such gains and losses are included with the net realized and unrealized gain or loss on investments. Net realized gains and losses on foreign currency transactions represent net realized exchange gains or losses on disposition of foreign currencies, currency gains and losses realized between the trade and settlement dates on securities transactions and the difference between the amount of investment income and foreign withholding taxes recorded on the fund’s books and the U.S. dollar equivalent amounts actually received or paid. Net unrealized appreciation and depreciation of assets and liabilities in foreign currencies arise from changes in the value of assets and liabilities other than investments at the period end, resulting from changes in the exchange rate.
Futures contracts The fund uses futures contracts to provide exposure to equity securities, fixed-income securities and commodities.
The potential risk to the fund is that the change in value of futures contracts may not correspond to the change in value of the hedged instruments. In addition, losses may arise from changes in the value of the underlying instruments, if there is an illiquid secondary market for the contracts, if interest or exchange rates move unexpectedly or if the counterparty to the contract is unable to perform. With futures, there is minimal counterparty credit risk to the fund since futures are exchange traded and the exchange’s clearinghouse, as counterparty to all exchange traded futures, guarantees the futures against default. Risks may exceed amounts recognized on the
|
| 32 PanAgora Risk Parity Fund |
Consolidated statement of assets and liabilities. When the contract is closed, the fund records a realized gain or loss equal to the difference between the value of the contract at the time it was opened and the value at the time it was closed.
Futures contracts are valued at the quoted daily settlement prices established by the exchange on which they trade. The fund and the broker agree to exchange an amount of cash equal to the daily fluctuation in the value of the futures contract and any initial margin requirements. Such receipts or payments are known as “variation margin.” Futures contracts outstanding at period end, if any, are listed after the fund’s consolidated portfolio.
Interfund lending The fund, along with other Putnam funds, may participate in an interfund lending program pursuant to an exemptive order issued by the SEC. This program allows the fund to borrow from or lend to other Putnam funds that permit such transactions. Interfund lending transactions are subject to each fund’s investment policies and borrowing and lending limits. Interest earned or paid on the interfund lending transaction will be based on the average of certain current market rates. During the reporting period, the fund did not utilize the program.
Lines of credit The fund participates, along with other Putnam funds, in a $317.5 million unsecured committed line of credit and a $235.5 million unsecured uncommitted line of credit, both provided by State Street. Borrowings may be made for temporary or emergency purposes, including the funding of shareholder redemption requests and trade settlements. Interest is charged to the fund based on the fund’s borrowing at a rate equal to 1.25% plus the higher of (1) the Federal Funds rate and (2) the Overnight Bank Funding Rate for the committed line of credit and 1.30% plus the higher of (1) the Federal Funds rate and (2) the Overnight Bank Funding Rate for the uncommitted line of credit. A closing fee equal to 0.04% of the committed line of credit and 0.04% of the uncommitted line of credit has been paid by the participating funds. In addition, a commitment fee of 0.21% per annum on any unutilized portion of the committed line of credit is allocated to the participating funds based on their relative net assets and paid quarterly. During the reporting period, the fund had no borrowings against these arrangements.
Federal taxes It is the policy of the fund to distribute all of its taxable income within the prescribed time period and otherwise comply with the provisions of the Internal Revenue Code of 1986, as amended (the Code), applicable to regulated investment companies. It is also the intention of the fund to distribute an amount sufficient to avoid imposition of any excise tax under Section 4982 of the Code.
The fund is subject to the provisions of Accounting Standards Codification 740 Income Taxes (ASC 740). ASC 740 sets forth a minimum threshold for consolidated financial statement recognition of the benefit of a tax position taken or expected to be taken in a tax return. The fund did not have a liability to record for any unrecognized tax benefits in the accompanying consolidated financial statements. No provision has been made for federal taxes on income, capital gains or unrealized appreciation on securities held nor for excise tax on income and capital gains. The fund’s federal tax return for the prior three fiscal years remains subject to examination by the Internal Revenue Service.
The fund’s investment in the subsidiary is expected to provide the fund with exposure to the commodities markets within the limitations of the federal tax requirements of Subchapter M of the Code. The rules regarding the extent to which annual net income, if any, realized by the subsidiary and included in the fund’s annual income for U.S. federal income purposes will constitute “qualifying income” for purposes of the fund’s qualification as a regulated investment company under the Code are unclear and currently under consideration.
The fund may also be subject to taxes imposed by governments of countries in which it invests. Such taxes are generally based on either income or gains earned or repatriated. The fund accrues and applies such taxes to net investment income, net realized gains and net unrealized gains as income and/or capital gains are earned. In some cases, the fund may be entitled to reclaim all or a portion of such taxes, and such reclaim amounts, if any, are reflected as an asset on the fund’s books. In many cases, however, the fund may not receive such amounts for an extended period of time, depending on the country of investment.
Distributions to shareholders Distributions to shareholders from net investment income are recorded by the fund on the ex-dividend date. Distributions from capital gains, if any, are recorded on the ex-dividend date and paid at least annually. The amount and character of income and gains to be distributed are determined in accordance with income tax regulations, which may differ from generally accepted accounting principles. These differences include temporary and/or permanent differences from foreign currency gains and losses, from realized gains and losses on certain futures contracts, from unrealized gains and losses on certain futures contracts and from controlled foreign subsidiary income and gains. Reclassifications are made to the fund’s capital accounts to reflect income and gains available for distribution (or available capital loss carryovers) under income tax
|
| PanAgora Risk Parity Fund 33 |
regulations. At the close of the reporting period, the fund reclassified $1,635,013 to decrease undistributed net investment loss and $1,635,013 to decrease accumulated net realized gain.
Tax cost of investments includes adjustments to net unrealized appreciation (depreciation) which may not necessarily be final tax cost basis adjustments, but closely approximate the tax basis unrealized gains and losses that may be realized and distributed to shareholders. The tax basis components of distributable earnings and the federal tax cost as of the close of the reporting period were as follows:
| |
| Unrealized appreciation | $755,091 |
| Unrealized depreciation | (344,745) |
| Net unrealized appreciation | 410,346 |
| Undistributed ordinary income | 1,142,054 |
| Undistributed long-term gains | 1,210,887 |
| Undistributed short-term gains | 1,804,040 |
| Cost for federal income tax purposes | $49,833,426 |
Expenses of the Trust Expenses directly charged or attributable to any fund will be paid from the assets of that fund. Generally, expenses of the Trust will be allocated among and charged to the assets of each fund on a basis that the Trustees deem fair and equitable, which may be based on the relative assets of each fund or the nature of the services performed and relative applicability to each fund.
Note 2: Management fee, administrative services and other transactions
The fund pays Putnam Management a management fee (based on the fund’s average net assets and computed and paid monthly) at annual rates that may vary based on the monthly average of the aggregate net assets of all open-end funds sponsored by Putnam Management for which PanAgora is acting as sub-adviser launched on or after the date of the fund’s management contract, as determined at the close of each business day during the month. Such annual rates may vary as follows:
| | | | |
| 0.750% | of the first $1 billion, | | 0.730% | of the next $2 billion and |
| 0.740% | of the next $2 billion, | | 0.720% | of any excess thereafter |
The subsidiary pays a monthly management fee to Putnam Management at the same rate as the Fund. For so long as the fund invests in the subsidiary, the management fee paid by the fund to Putnam Management is reduced by an amount equal to the management fee Putnam Management receives from the subsidiary under the management contract between Putnam Management and the subsidiary.
For the reporting period, the fee represented an effective rate (excluding the impact from any expense waivers in effect) of 0.750% of the fund’s average net assets.
Putnam Management has contractually agreed, through December 30, 2022, to waive fees and/or reimburse the fund’s expenses to the extent necessary to limit the cumulative expenses of the fund, exclusive of brokerage, interest, taxes, investment-related expenses, extraordinary expenses, acquired fund fees and expenses and payments under the fund’s investor servicing contract, investment management contract and distribution plans, on a fiscal year-to-date basis to an annual rate of 0.20% of the fund’s average net assets over such fiscal year-to-date period. During the reporting period, the fund’s expenses were reduced by $109,459 as a result of this limit.
PanAgora, an affiliate of Putnam Management, is authorized by the Trustees to make investment decisions for the assets of the fund as determined by Putnam Management from time to time. Putnam Management pays a quarterly sub-management fee to PanAgora for its services at the following annual rates of the average net assets of the portion of the fund managed by PanAgora:
| | | | |
| 0.350% | of the first $250 million, | | 0.330% | of the next $250 million and |
| 0.340% | of the next $500 million, | | 0.300% | of any excess thereafter |
The fund reimburses Putnam Management an allocated amount for the compensation and related expenses of certain officers of the fund and their staff who provide administrative services to the fund. The aggregate amount of all such reimbursements is determined annually by the Trustees.
|
| 34 PanAgora Risk Parity Fund |
Custodial functions for the fund’s assets are provided by State Street. Custody fees are based on the fund’s asset level, the number of its security holdings and transaction volumes.
Putnam Investor Services, Inc., an affiliate of Putnam Management, provides investor servicing agent functions to the fund. Putnam Investor Services, Inc. received fees for investor servicing for class A, class B, class C, class R and class Y shares that included (1) a per account fee for each direct and underlying non-defined contribution account (retail account) of the fund; (2) a specified rate of the fund’s assets attributable to defined contribution plan accounts; and (3) a specified rate based on the average net assets in retail accounts. Putnam Investor Services, Inc. has agreed that the aggregate investor servicing fees for each fund’s retail and defined contribution accounts for these share classes will not exceed an annual rate of 0.25% of the fund’s average assets attributable to such accounts.
Class R6 shares paid a monthly fee based on the average net assets of class R6 shares at an annual rate of 0.05%.
During the reporting period, the expenses for each class of shares related to investor servicing fees were as follows:
| | | | |
| Class A | $5,822 | | Class R6 | 5,168 |
| Class B | 6 | | Class Y | 6,051 |
| Class C | 9 | | Total | $17,060 |
| Class R | 4 | | | |
The fund has entered into expense offset arrangements with Putnam Investor Services, Inc. and State Street whereby Putnam Investor Services, Inc.’s and State Street’s fees are reduced by credits allowed on cash balances. For the reporting period, the fund’s expenses were reduced by $787 under the expense offset arrangements.
Each Independent Trustee of the fund receives an annual Trustee fee, of which $30, as a quarterly retainer, has been allocated to the fund, and an additional fee for each Trustees meeting attended. Trustees also are reimbursed for expenses they incur relating to their services as Trustees.
The fund has adopted a Trustee Fee Deferral Plan (the Deferral Plan) which allows the Trustees to defer the receipt of all or a portion of Trustees fees payable on or after July 1, 1995. The deferred fees remain invested in certain Putnam funds until distribution in accordance with the Deferral Plan.
The fund has adopted an unfunded noncontributory defined benefit pension plan (the Pension Plan) covering all Trustees of the fund who have served as a Trustee for at least five years and were first elected prior to 2004. Benefits under the Pension Plan are equal to 50% of the Trustee’s average annual attendance and retainer fees for the three years ended December 31, 2005. The retirement benefit is payable during a Trustee’s lifetime, beginning the year following retirement, for the number of years of service through December 31, 2006. Pension expense for the fund is included in Trustee compensation and expenses in the Consolidated statement of operations. Accrued pension liability is included in Payable for Trustee compensation and expenses in the Consolidated statement of assets and liabilities. The Trustees have terminated the Pension Plan with respect to any Trustee first elected after 2003.
The fund has adopted distribution plans (the Plans) with respect to the following share classes pursuant to Rule 12b–1 under the Investment Company Act of 1940. The purpose of the Plans is to compensate Putnam Retail Management Limited Partnership, an indirect wholly-owned subsidiary of Putnam Investments, LLC, for services provided and expenses incurred in distributing shares of the fund. The Plans provide payments by the fund to Putnam Retail Management Limited Partnership at an annual rate of up to the following amounts (Maximum %) of the average net assets attributable to each class. The Trustees have approved payment by the fund at the following annual rate (Approved %) of the average net assets attributable to each class. During the reporting period, the class-specific expenses related to distribution fees were as follows:
| | | |
| | Maximum % | Approved % | Amount |
| Class A | 0.35% | 0.25% | $42,152 |
| Class B | 1.00% | 1.00% | 176 |
| Class C | 1.00% | 1.00% | 268 |
| Class R | 1.00% | 0.50% | 63 |
| Total | | | $42,659 |
|
| PanAgora Risk Parity Fund 35 |
For the reporting period, Putnam Retail Management Limited Partnership, acting as underwriter, received net commissions of $126 from the sale of class A shares and received no monies in contingent deferred sales charges from redemptions of class B and class C shares.
A deferred sales charge of up to 1.00% is assessed on certain redemptions of class A shares. For the reporting period, Putnam Retail Management Limited Partnership, acting as underwriter, received no monies on class A redemptions.
Note 3: Purchases and sales of securities
During the reporting period, the cost of purchases and the proceeds from sales, excluding short-term investments, were as follows:
| | |
| | Cost of purchases | Proceeds from sales |
| Investments in securities, (Long-term) | $— | $— |
| U.S. government securities (Long-term) | — | — |
| Total | $— | $— |
Note 4: Capital shares
At the close of the reporting period, there were an unlimited number of shares of beneficial interest authorized. Transactions, including, if applicable, direct exchanges pursuant to share conversions, in capital shares were as follows:
| | | | |
| | YEAR ENDED 8/31/21 | YEAR ENDED 8/31/20 |
| Class A | Shares | Amount | Shares | Amount |
| Shares sold | 18,227 | $194,700 | 740,276 | $7,282,442 |
| Shares issued in connection with | | | | |
| reinvestment of distributions | 88,795 | 927,021 | 109,948 | 1,077,495 |
| | 107,022 | 1,121,721 | 850,224 | 8,359,937 |
| Shares repurchased | (6,262) | (66,437) | (14,834) | (143,787) |
| Net increase | 100,760 | $1,055,284 | 835,390 | $8,216,150 |
| |
| | YEAR ENDED 8/31/21 | YEAR ENDED 8/31/20 |
| Class B | Shares | Amount | Shares | Amount |
| Shares sold | 688 | $7,520 | — | $— |
| Shares issued in connection with | | | | |
| reinvestment of distributions | 107 | 1,103 | 144 | 1,405 |
| | 795 | 8,623 | 144 | 1,405 |
| Shares repurchased | — | — | — | — |
| Net increase | 795 | $8,623 | 144 | $1,405 |
| |
| | YEAR ENDED 8/31/21 | YEAR ENDED 8/31/20 |
| Class C | Shares | Amount | Shares | Amount |
| Shares sold | 2,447 | $25,500 | 254 | $2,500 |
| Shares issued in connection with | | | | |
| reinvestment of distributions | 243 | 2,511 | 191 | 1,870 |
| | 2,690 | 28,011 | 445 | 4,370 |
| Shares repurchased | (2,877) | (28,751) | (47) | (463) |
| Net increase (decrease) | (187) | $(740) | 398 | $3,907 |
|
| 36 PanAgora Risk Parity Fund |
| | | | |
| | | | YEAR ENDED 8/31/20 * |
| Class M | | | Shares | Amount |
| Shares sold | | | — | $— |
| Shares issued in connection with reinvestment of distributions | | — | — |
| | | | — | — |
| Shares repurchased | | | (1,009) | (11,314) |
| Net decrease | | | (1,009) | $(11,314) |
| |
| | YEAR ENDED 8/31/21 | YEAR ENDED 8/31/20 |
| Class R | Shares | Amount | Shares | Amount |
| Shares sold | — | $— | — | $— |
| Shares issued in connection with | | | | |
| reinvestment of distributions | 67 | 697 | 150 | 1,467 |
| | 67 | 697 | 150 | 1,467 |
| Shares repurchased | — | — | — | — |
| Net increase | 67 | $697 | 150 | $1,467 |
| |
| | YEAR ENDED 8/31/21 | YEAR ENDED 8/31/20 |
| Class R6 | Shares | Amount | Shares | Amount |
| Shares sold | 230,567 | $2,428,252 | 328,940 | $3,316,224 |
| Shares issued in connection with | | | | |
| reinvestment of distributions | 53,055 | 555,490 | 87,101 | 854,463 |
| | 283,622 | 2,983,742 | 416,041 | 4,170,687 |
| Shares repurchased | (120,232) | (1,223,436) | (99,205) | (972,734) |
| Net increase | 163,390 | $1,760,306 | 316,836 | $3,197,953 |
| |
| | YEAR ENDED 8/31/21 | YEAR ENDED 8/31/20 |
| Class Y | Shares | Amount | Shares | Amount |
| Shares sold | 282,576 | $3,051,066 | 63,130 | $652,872 |
| Shares issued in connection with | | | | |
| reinvestment of distributions | 91,543 | 959,368 | 278,102 | 2,728,180 |
| | 374,119 | 4,010,434 | 341,232 | 3,381,052 |
| Shares repurchased | (24,348) | (245,540) | (806,837) | (7,950,179) |
| Net increase (decrease) | 349,771 | $3,764,894 | (465,605) | $(4,569,127) |
* Effective November 25, 2019, the fund converted all of its class M shares to class A shares and class M shares were no longer able to be purchased.
At the close of the reporting period, two shareholders of record owned 32.7% and 21.1%, respectively, of the outstanding shares of the fund.
At the close of the reporting period, Putnam Investments, LLC owned the following shares of the fund:
| | | |
| | Shares owned | Percentage of ownership | Value |
| Class A | 1,612,216 | 97.8% | $17,637,643 |
| Class B | 1,218 | 62.6 | 13,118 |
| Class C | 1,219 | 78.6 | 13,116 |
| Class R | 1,229 | 100.0 | 13,379 |
|
| PanAgora Risk Parity Fund 37 |
Note 5: Basis of consolidation
The accompanying consolidated financial statements of the fund include the account of the subsidiary which primarily invests in commodity-related instruments and other derivatives. The fund may invest up to 25% of its total assets in the subsidiary. The fund’s Consolidated portfolio and Consolidated financial statements include the positions and accounts, respectively, of the subsidiary. Intercompany accounts and transactions, if any, have been eliminated. The subsidiary is subject to the same investment policies and restrictions that apply to the fund, except that the subsidiary may invest without limitation in commodity-related instruments. As of the reporting period, the fund’s investment in its subsidiary totaled $5,531,250 which represented 11.2% of the fund’s net assets.
Note 6: Market, credit and other risks
In the normal course of business, the fund trades financial instruments and enters into financial transactions where risk of potential loss exists due to changes in the market (market risk) or failure of the contracting party to the transaction to perform (credit risk). The fund may be exposed to additional credit risk that an institution or other entity with which the fund has unsettled or open transactions will default. Investments in foreign securities involve certain risks, including those related to economic instability, unfavorable political developments, and currency fluctuations. Exposure to the commodities markets may subject the Fund to greater volatility than investments in traditional securities.
Beginning in January 2020, global financial markets have experienced, and may continue to experience, significant volatility resulting from the spread of a virus known as Covid–19. The outbreak of Covid–19 has resulted in travel and border restrictions, quarantines, supply chain disruptions, lower consumer demand, and general market uncertainty. The effects of Covid–19 have adversely affected, and may continue to adversely affect, the global economy, the economies of certain nations, and individual issuers, all of which may negatively impact the fund’s performance.
Note 7: Summary of derivative activity
The volume of activity for the reporting period for any derivative type that was held during the period is listed below and was based on an average of the holdings at the end of each fiscal quarter:
| |
| Futures contracts (number of contracts) | 2,000 |
The following is a summary of the fair value of derivative instruments as of the close of the reporting period:
| | | | |
| Fair value of derivative instruments as of the close of the reporting period | |
| | ASSET DERIVATIVES | LIABILITY DERIVATIVES |
| Derivatives not | Consolidated | | Consolidated | |
| accounted for as | statement of | | statement of | |
| hedging instruments | assets and | | assets and | |
| under ASC 815 | liabilities location | Fair value | liabilities location | Fair value |
| | Receivables, Net | | | |
| | assets — Unrealized | | Payables, Net assets — | |
| Equity contracts | appreciation | $736,002* | Unrealized depreciation | $168,010* |
| | Receivables, Net | | | |
| | assets — Unrealized | | Payables, Net assets — | |
| Interest rate contracts | appreciation | 658,554* | Unrealized depreciation | 111,702* |
| | Receivables, Net assets – | | | |
| Commodity contracts | Unrealized appreciation | 74,038* | Payables | — |
| Total | | $1,468,594 | | $279,712 |
* Includes cumulative appreciation/depreciation of futures contracts as reported in the fund’s consolidated portfolio. Only initial and current day’s variation margin is reported within the Consolidated statement of assets and liabilities.
|
| 38 PanAgora Risk Parity Fund |
The following is a summary of realized and change in unrealized gains or losses of derivative instruments in the Consolidated statement of operations for the reporting period (Note 1):
| | |
| Amount of realized gain or (loss) on derivatives recognized in net gain or (loss) on investments | |
| Derivatives not accounted for as | | |
| hedging instruments under ASC 815 | Futures | Total |
| Equity contracts | $6,863,819 | $6,863,819 |
| Interest rate contracts | (3,681,294) | $(3,681,294) |
| Commodity contracts | 3,529,674 | $3,529,674 |
| Total | $6,712,199 | $6,712,199 |
| |
| Change in unrealized appreciation or (depreciation) on derivatives recognized in net gain or (loss) |
| on investments | | |
| Derivatives not accounted for as | | |
| hedging instruments under ASC 815 | Futures | Total |
| Equity contracts | $(1,181,321) | $(1,181,321) |
| Interest rate contracts | 523,508 | $523,508 |
| Commodity contracts | (987,476) | $(987,476) |
| Total | $(1,645,289) | $(1,645,289) |
Note 8: Offsetting of financial and derivative assets and liabilities
The following table summarizes any derivatives, repurchase agreements and reverse repurchase agreements, at the end of the reporting period, that are subject to an enforceable master netting agreement or similar agreement. For securities lending transactions or borrowing transactions associated with securities sold short, if any, see Note 1. For financial reporting purposes, the fund does not offset financial assets and financial liabilities that are subject to the master netting agreements in the Consolidated statement of assets and liabilities.
| | |
| | BofA Securities, Inc. | Total |
| Assets: | | |
| Futures contracts | $1,313,615 | $1,313,615 |
| Total Assets | $1,313,615 | $1,313,615 |
| Liabilities: | | |
| Futures contracts | 121,526 | 121,526 |
| Total Liabilities | $121,526 | $121,526 |
| Total Financial and Derivative Net Assets | $1,192,089 | $1,192,089 |
| Total collateral received (pledged)†## | $(2,488,782) | |
| Net amount | $3,680,871 | |
| Controlled collateral received (including | | |
| TBA commitments)** | $911,184 | $911,184 |
| Uncontrolled collateral received | $— | $— |
| Collateral (pledged) (including TBA commitments)** | $(3,399,966) | $(3,399,966) |
** Included with Investments in securities and/or Deposits due to broker on the Consolidated Statement of assets and liabilities. With respect to future contracts, this amount represents collateral on initial and variation margin for outstanding contracts.
† Additional collateral may be required from certain brokers based on individual agreements.
##Any over-collateralization of total financial and derivative net assets is not shown. Collateral may include amounts related to unsettled agreements.
|
| PanAgora Risk Parity Fund 39 |
Federal tax information (Unaudited)
Pursuant to §852 of the Internal Revenue Code, as amended, the fund hereby designates $1,354,791 as a capital gain dividend with respect to the taxable year ended August 31, 2021, or, if subsequently determined to be different, the net capital gain of such year.
The Form 1099 that will be mailed to you in January 2022 will show the tax status of all distributions paid to your account in calendar 2021.
|
| 40 PanAgora Risk Parity Fund |

|
| PanAgora Risk Parity Fund 41 |

* Mr. Reynolds is an “interested person” (as defined in the Investment Company Act of 1940) of the fund and Putnam Investments. He is President and Chief Executive Officer of Putnam Investments, as well as the President of your fund and each of the other Putnam funds.
The address of each Trustee is 100 Federal Street, Boston, MA 02110.
As of August 31, 2021, there were 100 Putnam funds. All Trustees serve as Trustees of all Putnam funds.
Each Trustee serves for an indefinite term, until his or her resignation, retirement at age 75, removal, or death.
|
| 42 PanAgora Risk Parity Fund |
Officers
In addition to Robert L. Reynolds, the other officers of the fund are shown below:
| |
| James F. Clark (Born 1974) | Susan G. Malloy (Born 1957) |
| Vice President and Chief Compliance Officer | Vice President and Assistant Treasurer |
| Since 2016 | Since 2007 |
| Chief Compliance Officer and Chief Risk Officer, | Head of Accounting and Middle Office Services, |
| Putnam Investments, and Chief Compliance Officer, | Putnam Investments and Putnam Management |
| Putnam Management | |
| | Denere P. Poulack (Born 1968) |
| Nancy E. Florek (Born 1957) | Assistant Vice President, Assistant Clerk, |
| Vice President, Director of Proxy Voting and Corporate | and Assistant Treasurer |
| Governance, Assistant Clerk, and Assistant Treasurer | Since 2004 |
| Since 2000 | |
| | Janet C. Smith (Born 1965) |
| Michael J. Higgins (Born 1976) | Vice President, Principal Financial Officer, Principal |
| Vice President, Treasurer, and Clerk | Accounting Officer, and Assistant Treasurer |
| Since 2010 | Since 2007 |
| | Head of Fund Administration Services, |
| Jonathan S. Horwitz (Born 1955) | Putnam Investments and Putnam Management |
| Executive Vice President, Principal Executive Officer, | |
| and Compliance Liaison | Stephen J. Tate (Born 1974) |
| Since 2004 | Vice President and Chief Legal Officer |
| | Since 2021 |
| Richard T. Kircher (Born 1962) | General Counsel, Putnam Investments, |
| Vice President and BSA Compliance Officer | Putnam Management, and Putnam Retail Management |
| Since 2019 | |
| Assistant Director, Operational Compliance, Putnam | Mark C. Trenchard (Born 1962) |
| Investments and Putnam Retail Management | Vice President |
| | Since 2002 |
| | Director of Operational Compliance, Putnam |
| | Investments and Putnam Retail Management |
The principal occupations of the officers for the past five years have been with the employers as shown above, although in some cases they have held different positions with such employers. The address of each officer is 100 Federal Street, Boston, MA 02110.
|
| PanAgora Risk Parity Fund 43 |
Services for shareholders
Investor services
Systematic investment plan Tell us how much you wish to invest regularly — weekly, semimonthly, or monthly — and the amount you choose will be transferred automatically from your checking or savings account. There’s no additional fee for this service, and you can suspend it at any time. This plan may be a great way to save for college expenses or to plan for your retirement.
Please note that regular investing does not guarantee a profit or protect against loss in a declining market. Before arranging a systematic investment plan, consider your financial ability to continue making purchases in periods when prices are low.
Systematic exchange You can make regular transfers from one Putnam fund to another Putnam fund. There are no additional fees for this service, and you can cancel or change your options at any time.
Dividends PLUS You can choose to have the dividend distributions from one of your Putnam funds automatically reinvested in another Putnam fund at no additional charge.
Free exchange privilege You can exchange money between Putnam funds free of charge, as long as they are the same class of shares. A signature guarantee is required if you are exchanging more than $500,000. The fund reserves the right to revise or terminate the exchange privilege.
Reinstatement privilege If you’ve sold Putnam shares or received a check for a dividend or capital gain, you may reinvest the proceeds with Putnam within 90 days of the transaction and they will be reinvested at the fund’s current net asset value — with no sales charge. However, reinstatement of class B shares may have special tax consequences. Ask your financial or tax representative for details.
Check-writing service You have ready access to many Putnam accounts. It’s as simple as writing a check, and there are no special fees or service charges. For more information about the check-writing service, call Putnam or visit our website.
Dollar cost averaging When you’re investing for long-term goals, it’s time, not timing, that counts. Investing on a systematic basis is a better strategy than trying to figure out when the markets will go up or down. This means investing the same amount of money regularly over a long period. This method of investing is called dollar cost averaging. When a fund’s share price declines, your investment dollars buy more shares at lower prices. When it increases, they buy fewer shares. Over time, you will pay a lower average price per share.
For more information
Visit the Individual Investors section at putnam.com A secure section of our website contains complete information on your account, including balances and transactions, updated daily. You may also conduct transactions, such as exchanges, additional investments, and address changes. Log on today to get your password.
Call us toll free at 1-800-225-1581 Ask a helpful Putnam representative or your financial advisor for details about any of these or other services, or see your prospectus.
|
| 44 PanAgora Risk Parity Fund |
Fund information
Founded over 80 years ago, Putnam Investments was built around the concept that a balance between risk and reward is the hallmark of a well-rounded financial program. We manage funds across income, value, blend, growth, sustainable, asset allocation, absolute return, and global sector categories.
| | |
| Investment Manager | Trustees | Jonathan S. Horwitz |
| Putnam Investment | Kenneth R. Leibler, Chair | Executive Vice President, |
| Management, LLC | Liaquat Ahamed | Principal Executive Officer, |
| 100 Federal Street | Ravi Akhoury | and Compliance Liaison |
| Boston, MA 02110 | Barbara M. Baumann | |
| | Katinka Domotorffy | Richard T. Kircher |
| Investment Sub-Advisor | Catharine Bond Hill | Vice President and BSA |
| PanAgora Asset Management, Inc. | Paul L. Joskow | Compliance Officer |
| One International Place, 24th Floor | George Putnam, III | |
| Boston, MA 02110 | Robert L. Reynolds | Susan G. Malloy |
| | Manoj P. Singh | Vice President and |
| Marketing Services | Mona K. Sutphen | Assistant Treasurer |
| Putnam Retail Management | | |
| 100 Federal Street | Officers | Denere P. Poulack |
| Boston, MA 02110 | Robert L. Reynolds | Assistant Vice President, |
| | President | Assistant Clerk, and |
| Custodian | | Assistant Treasurer |
| State Street Bank | James F. Clark | |
| and Trust Company | Vice President, Chief Compliance | Janet C. Smith |
| | Officer, and Chief Risk Officer | Vice President, |
| Legal Counsel | | Principal Financial Officer, |
| Ropes & Gray LLP | Nancy E. Florek | Principal Accounting Officer, |
| Vice President, Director of | and Assistant Treasurer |
| Independent Registered Public | Proxy Voting and Corporate | |
| Accounting Firm | Governance, Assistant Clerk, | Stephen J. Tate |
| PricewaterhouseCoopers LLP | and Assistant Treasurer | Vice President and |
| | | Chief Legal Officer |
| | Michael J. Higgins | |
| | Vice President, Treasurer, | Mark C. Trenchard |
| | and Clerk | Vice President |
This report is for the information of shareholders of Putnam PanAgora Risk Parity Fund. It may also be used as sales literature when preceded or accompanied by the current prospectus, the most recent copy of Putnam’s Quarterly Performance Summary, and Putnam’s Quarterly Ranking Summary. For more recent performance, please visit putnam.com. Investors should carefully consider the investment objectives, risks, charges, and expenses of a fund, which are described in its prospectus. For this and other information or to request a prospectus or summary prospectus, call 1-800-225-1581 toll free. Please read the prospectus carefully before investing. The fund’s Statement of Additional Information contains additional information about the fund’s Trustees and is available without charge upon request by calling 1-800-225-1581.

| |
| (a) The fund’s principal executive, financial and accounting officers are employees of Putnam Investment Management, LLC, the Fund’s investment manager. As such they are subject to a comprehensive Code of Ethics adopted and administered by Putnam Investments which is designed to protect the interests of the firm and its clients. The Fund has adopted a Code of Ethics which incorporates the Code of Ethics of Putnam Investments with respect to all of its officers and Trustees who are employees of Putnam Investment Management, LLC. For this reason, the Fund has not adopted a separate code of ethics governing its principal executive, financial and accounting officers. |
| |
| (c) In April 2021, the Code of Ethics of Putnam Investments was amended. The key changes to the Code of Ethics are as follows: (i) Employees may invest in the Putnam Exchange Traded Funds (ETFs) with preclearing requirements for certain individuals (ii) All employees must hold Putnam ETFs in an approved Putnam broker (iii) All access persons must report Putnam ETF trades or holdings in the quarterly transaction report or annual holdings report. |
| |
| Item 3. Audit Committee Financial Expert: |
| |
| The Funds’ Audit, Compliance and Risk Committee is comprised solely of Trustees who are “independent” (as such term has been defined by the Securities and Exchange Commission (“SEC”) in regulations implementing Section 407 of the Sarbanes-Oxley Act (the “Regulations”)). The Trustees believe that each member of the Audit, Compliance and Risk Committee also possesses a combination of knowledge and experience with respect to financial accounting matters, as well as other attributes, that qualifies him or her for service on the Committee. In addition, the Trustees have determined that each of Dr. Hill, Dr. Joskow, and Mr. Singh qualifies as an “audit committee financial expert” (as such term has been defined by the Regulations) based on their review of his or her pertinent experience and education; in the case of Dr. Joskow, including his experience serving on the audit committees of several public companies and institutions and his education and experience as an economist who studies companies and industries, routinely using public company financial statements in his research. The SEC has stated, and the funds’ amended and restated agreement and Declaration of Trust provides, that the designation or identification of a person as an audit committee financial expert pursuant to this Item 3 of Form N-CSR does not impose on such person any duties, obligations or liability that are greater than the duties, obligations and liability imposed on such person as a member of the Audit, Compliance and Risk Committee and the Board of Trustees in the absence of such designation or identification. |
| |
| Item 4. Principal Accountant Fees and Services: |
| |
| The following table presents fees billed in each of the last two fiscal years for services rendered to the fund by the fund’s independent auditor: |
| | | | | |
| Fiscal year ended | Audit Fees | Audit-Related Fees | Tax Fees | All Other Fees |
|
|
| | | | | |
| August 31, 2021 | $55,560 | $ — | $8,466 | $ — |
| August 31, 2020 | $56,426 | $ — | $8,466 | $ — |
| |
| For the fiscal years ended August 31, 2021 and August 31, 2020, the fund’s independent auditor billed aggregate non-audit fees in the amounts of $273,365 and $354,308 respectively, to the fund, Putnam Management and any entity controlling, controlled by or under common control with Putnam Management that provides ongoing services to the fund. |
| |
| Audit Fees represent fees billed for the fund’s last two fiscal years relating to the audit and review of the financial statements included in annual reports and registration statements, and other services that are normally provided in connection with statutory and regulatory filings or engagements. |
| |
| Audit-Related Fees represent fees billed in the fund’s last two fiscal years for services traditionally performed by the fund’s auditor, including accounting consultation for proposed transactions or concerning financial accounting and reporting standards and other audit or attest services not required by statute or regulation. |
| |
| Tax Fees represent fees billed in the fund’s last two fiscal years for tax compliance, tax planning and tax advice services. Tax planning and tax advice services include assistance with tax audits, employee benefit plans and requests for rulings or technical advice from taxing authorities. |
| |
| Pre-Approval Policies of the Audit, Compliance and Risk Committee. The Audit, Compliance and Risk Committee of the Putnam funds has determined that, as a matter of policy, all work performed for the funds by the funds’ independent auditors will be pre-approved by the Committee itself and thus will generally not be subject to pre-approval procedures. |
| |
| The Audit, Compliance and Risk Committee also has adopted a policy to pre-approve the engagement by Putnam Management and certain of its affiliates of the funds’ independent auditors, even in circumstances where pre-approval is not required by applicable law. Any such requests by Putnam Management or certain of its affiliates are typically submitted in writing to the Committee and explain, among other things, the nature of the proposed engagement, the estimated fees, and why this work should be performed by that particular audit firm as opposed to another one. In reviewing such requests, the Committee considers, among other things, whether the provision of such services by the audit firm are compatible with the independence of the audit firm. |
| |
| The following table presents fees billed by the fund’s independent auditor for services required to be approved pursuant to paragraph (c)(7)(ii) of Rule 2–01 of Regulation S-X. |
| | | | | |
| Fiscal year ended | Audit-Related Fees | Tax Fees | All Other Fees | Total Non-Audit Fees |
|
|
| August 31, 2021 | $ — | $264,899 | $ — | $ — |
| August 31, 2020 | $ — | $345,842 | $ — | $ — |
| |
| Item 5. Audit Committee of Listed Registrants |
| |
| Item 6. Schedule of Investments: |
| |
| The registrant’s schedule of investments in unaffiliated issuers is included in the report to shareholders in Item 1 above. |
| |
| Item 7. Disclosure of Proxy Voting Policies and Procedures For Closed-End Management Investment Companies: |
| |
| Item 8. Portfolio Managers of Closed-End Investment Companies |
| |
| Item 9. Purchases of Equity Securities by Closed-End Management Investment Companies and Affiliated Purchasers: |
| |
| Item 10. Submission of Matters to a Vote of Security Holders: |
| |
| Item 11. Controls and Procedures: |
| |
| (a) The registrant’s principal executive officer and principal financial officer have concluded, based on their evaluation of the effectiveness of the design and operation of the registrant’s disclosure controls and procedures as of a date within 180 days of the filing date of this report, that the design and operation of such procedures are generally effective to provide reasonable assurance that information required to be disclosed by the registrant in this report is recorded, processed, summarized and reported within the time periods specified in the Commission’s rules and forms. |
| |
| (b) Changes in internal control over financial reporting: Not applicable |
| |
| Item 12. Disclosures of Securities Lending Activities for Closed-End Management Investment Companies: |
| |
| Pursuant to the requirements of the Securities Exchange Act of 1934 and the Investment Company Act of 1940, the registrant has duly caused this report to be signed on its behalf by the undersigned, thereunto duly authorized. |
| |
| By (Signature and Title): |
| |
| /s/ Janet C. Smith
Janet C. Smith
Principal Accounting Officer
|
| |
| Pursuant to the requirements of the Securities Exchange Act of 1934 and the Investment Company Act of 1940, this report has been signed below by the following persons on behalf of the registrant and in the capacities and on the dates indicated. |
| |
| By (Signature and Title): |
| |
| /s/ Jonathan S. Horwitz
Jonathan S. Horwitz
Principal Executive Officer
|
| |
| By (Signature and Title): |
| |
| /s/ Janet C. Smith
Janet C. Smith
Principal Financial Officer
|