ASC 820 establishes a three-level hierarchy for disclosure of fair value measurements. The valuation hierarchy is based upon the transparency of inputs to the valuation of the fund’s investments. The three levels are defined as follows:
Level 1: Valuations based on quoted prices for identical securities in active markets.
Level 2: Valuations based on quoted prices in markets that are not active or for which all significant inputs are observable, either directly or indirectly.
Level 3: Valuations based on inputs that are unobservable and significant to the fair value measurement.
The following is a summary of the inputs used to value the fund’s net assets as of the close of the reporting period:
| | | |
| | Valuation inputs |
| Investments in securities: | Level 1 | Level 2 | Level 3 |
| Common stocks*: | | | |
| Communication services | $11,849,714 | $— | $— |
| Consumer discretionary | 36,274,350 | — | — |
| Consumer staples | 10,027,797 | — | — |
| Financials | 19,111,412 | 6,103,616 | — |
| Health care | 86,936,704 | — | — |
| Industrials | 47,205,086 | 5,147,665 | — |
| Information technology | 98,237,430 | — | — |
| Materials | 11,829,678 | 5,182,399 | — |
| Real estate | 2,850,423 | — | — |
| Utilities | 6,078,290 | — | — |
| Total common stocks | 330,400,884 | 16,433,680 | — |
| Short-term investments | — | 7,785,295 | — |
| Totals by level | $330,400,884 | $24,218,975 | $— |
|
| | | |
| | Valuation inputs |
| Other financial instruments: | Level 1 | Level 2 | Level 3 |
| Forward currency contracts | $— | $(1,294,019) | $— |
| Totals by level | $— | $(1,294,019) | $— |
| * Common stock classifications are presented at the sector level, which may differ from the fund’s portfolio presentation. |
The accompanying notes are an integral part of these financial statements.
| |
Sustainable Future Fund 19 |
Statement of assets and liabilities 4/30/23
| |
| ASSETS | |
| Investment in securities, at value (Notes 1 and 8): | |
| Unaffiliated issuers (identified cost $299,377,860) | $348,131,181 |
| Affiliated issuers (identified cost $6,488,678) (Note 5) | 6,488,678 |
| Foreign currency (cost $256) (Note 1) | 259 |
| Dividends, interest and other receivables | 262,600 |
| Foreign tax reclaim | 151,729 |
| Receivable for shares of the fund sold | 167,689 |
| Receivable for investments sold | 2,923,833 |
| Unrealized appreciation on forward currency contracts (Note 1) | 133,868 |
| Prepaid assets | 54,171 |
| Total assets | 358,314,008 |
| |
| LIABILITIES | |
| Payable for investments purchased | 1,760,189 |
| Payable for shares of the fund repurchased | 363,508 |
| Payable for compensation of Manager (Note 2) | 162,130 |
| Payable for custodian fees (Note 2) | 11,247 |
| Payable for investor servicing fees (Note 2) | 101,073 |
| Payable for Trustee compensation and expenses (Note 2) | 89,830 |
| Payable for administrative services (Note 2) | 2,095 |
| Payable for distribution fees (Note 2) | 63,595 |
| Unrealized depreciation on forward currency contracts (Note 1) | 1,427,887 |
| Other accrued expenses | 100,954 |
| Total liabilities | 4,082,508 |
| | |
| Net assets | $354,231,500 |
| |
| REPRESENTED BY | |
| Paid-in capital (Unlimited shares authorized) (Notes 1 and 4) | $341,109,701 |
| Total distributable earnings (Note 1) | 13,121,799 |
| Total — Representing net assets applicable to capital shares outstanding | $354,231,500 |
| |
| COMPUTATION OF NET ASSET VALUE AND OFFERING PRICE | |
| Net asset value and redemption price per class A share | |
| ($267,881,034 divided by 16,779,744 shares) | $15.96 |
| Offering price per class A share (100/94.25 of $15.96)* | $16.93 |
| Net asset value and offering price per class B share ($78,975 divided by 5,996 shares)** | $13.17 |
| Net asset value and offering price per class C share ($6,231,730 divided by 474,971 shares)** | $13.12 |
| Net asset value, offering price and redemption price per class R share | |
| ($6,510,881 divided by 431,221 shares) | $15.10 |
| Net asset value, offering price and redemption price per class R6 share | |
| ($21,136,046 divided by 1,295,378 shares) | $16.32 |
| Net asset value, offering price and redemption price per class Y share | |
| ($52,392,834 divided by 3,233,039 shares) | $16.21 |
* On single retail sales of less than $50,000. On sales of $50,000 or more the offering price is reduced.
** Redemption price per share is equal to net asset value less any applicable contingent deferred sales charge.
The accompanying notes are an integral part of these financial statements.
|
| 20 Sustainable Future Fund |
Statement of operations Year ended 4/30/23
| |
| INVESTMENT INCOME | |
| Dividends (net of foreign tax of $131,350) | $2,254,111 |
| Interest (including interest income of $308,755 from investments in affiliated issuers) (Note 5) | 333,364 |
| Securities lending (net of expenses) (Notes 1 and 5) | 10,661 |
| Total investment income | 2,598,136 |
| |
| EXPENSES | |
| Compensation of Manager (Note 2) | 2,028,874 |
| Investor servicing fees (Note 2) | 632,104 |
| Custodian fees (Note 2) | 22,788 |
| Trustee compensation and expenses (Note 2) | 15,865 |
| Distribution fees (Note 2) | 814,529 |
| Administrative services (Note 2) | 12,116 |
| Other | 252,982 |
| Total expenses | 3,779,258 |
| Expense reduction (Note 2) | (3,138) |
| Net expenses | 3,776,120 |
| | |
| Net investment loss | (1,177,984) |
| |
| REALIZED AND UNREALIZED GAIN (LOSS) | |
| Net realized gain (loss) on: | |
| Securities from unaffiliated issuers (Notes 1 and 3) | (29,262,833) |
| Foreign currency transactions (Note 1) | 3,700 |
| Forward currency contracts (Note 1) | 1,726,615 |
| Total net realized loss | (27,532,518) |
| Change in net unrealized appreciation (depreciation) on: | |
| Securities from unaffiliated issuers | 2,661,345 |
| Assets and liabilities in foreign currencies | 4,899 |
| Forward currency contracts | (1,825,640) |
| Total change in net unrealized appreciation | 840,604 |
| | |
| Net loss on investments | (26,691,914) |
| |
| Net decrease in net assets resulting from operations | $(27,869,898) |
The accompanying notes are an integral part of these financial statements.
|
| Sustainable Future Fund 21 |
Statement of changes in net assets
| | |
| DECREASE IN NET ASSETS | Year ended 4/30/23 | Year ended 4/30/22 |
| Operations | | |
| Net investment loss | $(1,177,984) | $(3,499,539) |
| Net realized gain (loss) on investments | | |
| and foreign currency transactions | (27,532,518) | 41,019,558 |
| Change in net unrealized appreciation (depreciation) | | |
| of investments and assets and liabilities in foreign currencies | 840,604 | (186,096,851) |
| Net decrease in net assets resulting from operations | (27,869,898) | (148,576,832) |
| Distributions to shareholders (Note 1): | | |
| From ordinary income | | |
| Net realized short-term gain on investments | | |
| Class A | — | (12,391,715) |
| Class B | — | (9,985) |
| Class C | — | (398,834) |
| Class R | — | (314,958) |
| Class R6 | — | (939,169) |
| Class Y | — | (2,235,518) |
| From net realized long-term gain on investments | | |
| Class A | — | (51,594,910) |
| Class B | — | (41,572) |
| Class C | — | (1,660,609) |
| Class R | — | (1,311,376) |
| Class R6 | — | (3,910,382) |
| Class Y | — | (9,307,939) |
| Increase (decrease) from capital share transactions (Note 4) | (31,093,035) | 24,267,017 |
| Total decrease in net assets | (58,962,933) | (208,426,782) |
| |
| NET ASSETS | | |
| Beginning of year | 413,194,433 | 621,621,215 |
| End of year | $354,231,500 | $413,194,433 |
The accompanying notes are an integral part of these financial statements.
|
| 22 Sustainable Future Fund |
|
| This page left blank intentionally. |
|
| Sustainable Future Fund 23 |
Financial highlights
(For a common share outstanding throughout the period)
| | | | | | | | | | | | | |
| | INVESTMENT OPERATIONS | | | LESS DISTRIBUTIONS | | | | RATIOS AND SUPPLEMENTAL DATA | |
| | | | | | | | | | | | | Ratio of net | |
| | Net asset | | Net realized | | | | | | | | Ratio | investment | |
| | value, | | and unrealized | Total from | From net | From | | Net asset | Total return | Net assets, | of expenses | income (loss) | Portfolio |
| | beginning | Net investment | gain (loss) | investment | investment | net realized gain | Total | value, end | at net asset | end of period | to average | to average | turnover |
| Period ended | of period | income (loss)a | on investments | operations | income | on investments | distributions | of period | value (%)b | (in thousands) | net assets (%)c | net assets (%) | (%) |
| Class A | | | | | | | | | | | | | |
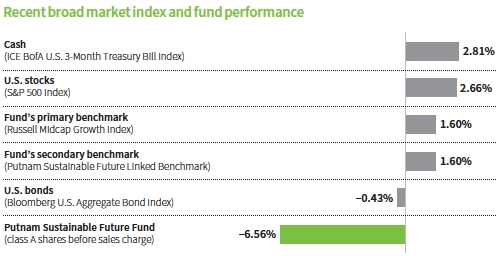
| April 30, 2023 | $17.08 | (.06) | (1.06) | (1.12) | — | — | — | $15.96 | (6.56) | $267,881 | 1.06 | (.36) | 43 |
| April 30, 2022 | 26.82 | (.15) | (5.87) | (6.02) | — | (3.72) | (3.72) | 17.08 | (25.87) | 323,726 | 1.00 | (.63) | 50 |
| April 30, 2021 | 17.52 | (.10) | 11.92 | 11.82 | — | (2.52) | (2.52) | 26.82 | 69.07 | 481,902 | 1.02 | (.43) | 43 |
| April 30, 2020 | 17.45 | (.03) | .59 | .56 | (.01) | (.48) | (.49) | 17.52 | 3.15 | 311,058 | 1.07 | (.18) | 72 |
| April 30, 2019 | 19.58 | .10 | 2.23 | 2.33 | (.23) | (4.23) | (4.46) | 17.45 | 14.92 | 324,312 | 1.09 | .51 | 31 |
| Class B | | | | | | | | | | | | | |
| April 30, 2023 | $14.20 | (.14) | (.89) | (1.03) | — | — | — | $13.17 | (7.25) | $79 | 1.81 | (1.10) | 43 |
| April 30, 2022 | 23.09 | (.29) | (4.88) | (5.17) | — | (3.72) | (3.72) | 14.20 | (26.41) | 199 | 1.75 | (1.38) | 50 |
| April 30, 2021 | 15.43 | (.25) | 10.43 | 10.18 | — | (2.52) | (2.52) | 23.09 | 67.75 | 358 | 1.77 | (1.19) | 43 |
| April 30, 2020 | 15.53 | (.14) | .52 | .38 | — | (.48) | (.48) | 15.43 | 2.39 | 146 | 1.82 | (.91) | 72 |
| April 30, 2019 | 17.92 | (.04) | 2.00 | 1.96 | (.12) | (4.23) | (4.35) | 15.53 | 14.08 | 216 | 1.84 | (.26) | 31 |
| Class C | | | | | | | | | | | | | |
| April 30, 2023 | $14.15 | (.14) | (.89) | (1.03) | — | — | — | $13.12 | (7.28) | $6,232 | 1.81 | (1.10) | 43 |
| April 30, 2022 | 23.02 | (.29) | (4.86) | (5.15) | — | (3.72) | (3.72) | 14.15 | (26.40) | 8,581 | 1.75 | (1.38) | 50 |
| April 30, 2021 | 15.38 | (.24) | 10.40 | 10.16 | — | (2.52) | (2.52) | 23.02 | 67.84 | 14,396 | 1.77 | (1.17) | 43 |
| April 30, 2020 | 15.48 | (.14) | .52 | .38 | — | (.48) | (.48) | 15.38 | 2.40 | 11,503 | 1.82 | (.92) | 72 |
| April 30, 2019 | 17.80 | (.03) | 1.98 | 1.95 | (.04) | (4.23) | (4.27) | 15.48 | 14.04 | 14,027 | 1.84 | (.20) | 31 |
| Class R | | | | | | | | | | | | | |
| April 30, 2023 | $16.20 | (.09) | (1.01) | (1.10) | — | — | — | $15.10 | (6.79) | $6,511 | 1.31 | (.61) | 43 |
| April 30, 2022 | 25.69 | (.21) | (5.56) | (5.77) | — | (3.72) | (3.72) | 16.20 | (26.05) | 7,931 | 1.25 | (.88) | 50 |
| April 30, 2021 | 16.89 | (.16) | 11.48 | 11.32 | — | (2.52) | (2.52) | 25.69 | 68.68 | 11,470 | 1.27 | (.68) | 43 |
| April 30, 2020 | 16.87 | (.07) | .57 | .50 | — | (.48) | (.48) | 16.89 | 2.92 | 8,318 | 1.32 | (.43) | 72 |
| April 30, 2019 | 19.06 | .05 | 2.16 | 2.21 | (.17) | (4.23) | (4.40) | 16.87 | 14.64 | 9,841 | 1.34 | .29 | 31 |
| Class R6 | | | | | | | | | | | | | |
| April 30, 2023 | $17.39 | —d | (1.07) | (1.07) | — | — | — | $16.32 | (6.15) | $21,136 | .68 | .02 | 43 |
| April 30, 2022 | 27.15 | (.07) | (5.97) | (6.04) | — | (3.72) | (3.72) | 17.39 | (25.62) | 23,724 | .65 | (.28) | 50 |
| April 30, 2021 | 17.65 | (.02) | 12.04 | 12.02 | — | (2.52) | (2.52) | 27.15 | 69.72 | 30,380 | .66 | (.09) | 43 |
| April 30, 2020 | 17.58 | .03 | .60 | .63 | (.08) | (.48) | (.56) | 17.65 | 3.51 | 15,191 | .68 | .19 | 72 |
| April 30, 2019 # | 20.59 | .14 | 1.35 | 1.49 | (.27) | (4.23) | (4.50) | 17.58 | 10.17* | 13,953 | .66* | .78* | 31 |
| Class Y | | | | | | | | | | | | | |
| April 30, 2023 | $17.30 | (.02) | (1.07) | (1.09) | — | — | — | $16.21 | (6.30) | $52,393 | .81 | (.11) | 43 |
| April 30, 2022 | 27.05 | (.10) | (5.93) | (6.03) | — | (3.72) | (3.72) | 17.30 | (25.68) | 49,034 | .75 | (.38) | 50 |
| April 30, 2021 | 17.61 | (.04) | 12.00 | 11.96 | — | (2.52) | (2.52) | 27.05 | 69.53 | 83,115 | .77 | (.17) | 43 |
| April 30, 2020 | 17.54 | .01 | .59 | .60 | (.05) | (.48) | (.53) | 17.61 | 3.38 | 41,056 | .82 | .06 | 72 |
| April 30, 2019 | 19.66 | .15 | 2.24 | 2.39 | (.28) | (4.23) | (4.51) | 17.54 | 15.23 | 32,539 | .84 | .79 | 31 |
See notes to financial highlights at the end of this section.
The accompanying notes are an integral part of these financial statements.
| |
| 24 Sustainable Future Fund | Sustainable Future Fund 25 |
Financial highlights cont.
Before March 21, 2018, the fund was managed with a materially different investment strategy and may have achieved materially different performance results under its current investment strategy from that shown for periods before that date.
* Not annualized.
# For the period May 22, 2018 (commencement of operations) to April 30, 2019.
a Per share net investment income (loss) has been determined on the basis of the weighted average number of shares outstanding during the period.
b Total return assumes dividend reinvestment and does not reflect the effect of sales charges.
c Includes amounts paid through expense offset and/or brokerage/service arrangements, if any (Note 2). Also excludes acquired fund fees and expenses, if any.
d Amount represents less than $0.01 per share.
The accompanying notes are an integral part of these financial statements.
|
| 26 Sustainable Future Fund |
Notes to financial statements 4/30/23
Within the following Notes to financial statements, references to “State Street” represent State Street Bank and Trust Company, references to “the SEC” represent the Securities and Exchange Commission, references to “Putnam Management” represent Putnam Investment Management, LLC, the fund’s manager, an indirect wholly-owned subsidiary of Putnam Investments, LLC. Additionally, references to “OTC”, if any, represent over-the-counter and references to “ESG”, if any, represent environmental, social and governance. Unless otherwise noted, the “reporting period” represents the period from May 1, 2022 through April 30, 2023.
Putnam Sustainable Future Fund (the fund) is a diversified series of Putnam Investment Funds (the Trust), a Massachusetts business trust registered under the Investment Company Act of 1940, as amended, as an open-end management investment company. The goal of the fund is to seek long-term capital appreciation. The fund invests mainly in common stocks of U.S. companies of any size, with a focus on companies whose products and services Putnam Management believes provide solutions that directly contribute to sustainable social, environmental and economic development (Solutions Companies). Stocks of this type of company are typically, but not always, considered to be growth stocks. Growth stocks are stocks of companies whose revenues, earnings, or cash flows are expected to grow faster than those of similar firms, and whose business growth and other characteristics may lead to an increase in stock price. Putnam Management may consider, among other factors, a company’s impact on sustainable environmental, social and economic development (as described below), valuation, financial strength, growth potential, competitive position in its industry, projected future earnings, cash flows and dividends when deciding whether to buy or sell investments. The fund may also invest in non-U.S. companies.
Putnam Management’s approach to sustainable investing incorporates fundamental research together with consideration of sustainable environmental, social and economic development impact. Putnam Management believes that companies whose products and services produce positive environmental, social and economic development impact also often demonstrate potential for strong financial growth. Under normal circumstances, the fund invests at least 80% of the value of its net assets in securities that meet Putnam Management’s sustainability criteria. These criteria are based on a proprietary sustainability solutions map that links to the United Nations Sustainable Development Goals (SDGs). In applying these criteria, Putnam Management will assign each company a proprietary environmental, social and/or corporate governance (ESG) rating ranging from 1 to 4 (1 indicating the highest (best) ESG rating and 4 indicating the lowest (worst) ESG rating). In order to meet Putnam Management’s sustainability criteria for purposes of this investment policy, a company must be rated 2 or 1 by us. This policy is non-fundamental and may be changed only after 60 days’ notice to shareholders. In selecting each investment, Putnam Management considers the extent to which a company’s products or services may provide solutions to forward-looking sustainability needs, creating positive impact in environmental, social and economic development areas. Environmental impacts may include, for example, reduction of carbon emissions and improved water quality. Social impacts may include, for example, improvements in employee well-being, supplier standards, or access to products, information, or security. Economic development impacts may include, for example, stakeholder analysis and shared value approaches to business practices, access to economic opportunity, or improvements in operational effectiveness or efficiency.
The fund offers the following share classes. The expenses for each class of shares may differ based on the distribution and investor servicing fees of each class, which are identified in Note 2.
| | | |
| Share class | Sales charge | Contingent deferred sales charge | Conversion feature |
| | | 1.00% on certain redemptions of shares | |
| Class A | Up to 5.75% | bought with no initial sales charge | None |
| | | | Converts to class A shares |
| Class B* | None | 5.00% phased out over five years | after 5 years |
| | | | Converts to class A shares |
| Class C | None | 1.00% eliminated after one year | after 8 years |
| Class R† | None | None | None |
| Class R6† | None | None | None |
| Class Y† | None | None | None |
* Purchases of class B shares are closed to new and existing investors except by exchange from class B shares of another Putnam fund or through dividend and/or capital gains reinvestment.
† Not available to all investors.
|
| Sustainable Future Fund 27 |
In the normal course of business, the fund enters into contracts that may include agreements to indemnify another party under given circumstances. The fund’s maximum exposure under these arrangements is unknown as this would involve future claims that may be, but have not yet been, made against the fund. However, the fund’s management team expects the risk of material loss to be remote.
The fund has entered into contractual arrangements with an investment adviser, administrator, distributor, shareholder servicing agent and custodian, who each provide services to the fund. Unless expressly stated otherwise, shareholders are not parties to, or intended beneficiaries of these contractual arrangements, and these contractual arrangements are not intended to create any shareholder right to enforce them against the service providers or to seek any remedy under them against the service providers, either directly or on behalf of the fund.
Under the fund’s Amended and Restated Agreement and Declaration of Trust, any claims asserted against or on behalf of the Putnam Funds, including claims against Trustees and Officers, must be brought in state and federal courts located within the Commonwealth of Massachusetts.
Note 1: Significant accounting policies
The following is a summary of significant accounting policies consistently followed by the fund in the preparation of its financial statements. The preparation of financial statements is in conformity with accounting principles generally accepted in the United States of America and requires management to make estimates and assumptions that affect the reported amounts of assets and liabilities in the financial statements and the reported amounts of increases and decreases in net assets from operations. Actual results could differ from those estimates. Subsequent events after the Statement of assets and liabilities date through the date that the financial statements were issued have been evaluated in the preparation of the financial statements.
Investment income, realized and unrealized gains and losses and expenses of the fund are borne pro-rata based on the relative net assets of each class to the total net assets of the fund, except that each class bears expenses unique to that class (including the distribution fees applicable to such classes). Each class votes as a class only with respect to its own distribution plan or other matters on which a class vote is required by law or determined by the Trustees. If the fund were liquidated, shares of each class would receive their pro-rata share of the net assets of the fund. In addition, the Trustees declare separate dividends on each class of shares.
Security valuation Portfolio securities and other investments are valued using policies and procedures adopted by the Board of Trustees. The Trustees have formed a Pricing Committee to oversee the implementation of these procedures and have delegated responsibility for valuing the fund’s assets in accordance with these procedures to Putnam Management. Putnam Management has established an internal Valuation Committee that is responsible for making fair value determinations, evaluating the effectiveness of the pricing policies of the fund and reporting to the Pricing Committee.
Investments for which market quotations are readily available are valued at the last reported sales price on their principal exchange, or official closing price for certain markets, and are classified as Level 1 securities under Accounting Standards Codification 820 Fair Value Measurements and Disclosures (ASC 820). If no sales are reported, as in the case of some securities that are traded OTC, a security is valued at its last reported bid price and is generally categorized as a Level 2 security.
Investments in open-end investment companies (excluding exchange-traded funds), if any, which can be classified as Level 1 or Level 2 securities, are valued based on their net asset value. The net asset value of such investment companies equals the total value of their assets less their liabilities and divided by the number of their outstanding shares.
Market quotations are not considered to be readily available for certain debt obligations (including short-term investments with remaining maturities of 60 days or less) and other investments; such investments are valued on the basis of valuations furnished by an independent pricing service approved by the Trustees or dealers selected by Putnam Management. Such services or dealers determine valuations for normal institutional-size trading units of such securities using methods based on market transactions for comparable securities and various relationships, generally recognized by institutional traders, between securities (which consider such factors as security prices, yields, maturities and ratings). These securities will generally be categorized as Level 2.
Many securities markets and exchanges outside the U.S. close prior to the scheduled close of the New York Stock Exchange and therefore the closing prices for securities in such markets or on such exchanges may not fully reflect events that occur after such close but before the scheduled close of the New York Stock Exchange. Accordingly, on certain days, the fund will fair value certain foreign equity securities taking into account multiple factors including movements in the U.S. securities markets, currency valuations and comparisons to the valuation of
|
| 28 Sustainable Future Fund |
American Depository Receipts, exchange-traded funds and futures contracts. The foreign equity securities, which would generally be classified as Level 1 securities, will be transferred to Level 2 of the fair value hierarchy when they are valued at fair value. The number of days on which fair value prices will be used will depend on market activity and it is possible that fair value prices will be used by the fund to a significant extent. At the close of the reporting period, fair value pricing was used for certain foreign securities in the portfolio. Securities quoted in foreign currencies, if any, are translated into U.S. dollars at the current exchange rate.
To the extent a pricing service or dealer is unable to value a security or provides a valuation that Putnam Management does not believe accurately reflects the security’s fair value, the security will be valued at fair value by Putnam Management in accordance with policies and procedures approved by the Trustees. Certain investments, including certain restricted and illiquid securities and derivatives, are also valued at fair value following procedures approved by the Trustees. These valuations consider such factors as significant market or specific security events such as interest rate or credit quality changes, various relationships with other securities, discount rates, U.S. Treasury, U.S. swap and credit yields, index levels, convexity exposures, recovery rates, sales and other multiples and resale restrictions. These securities are classified as Level 2 or as Level 3 depending on the priority of the significant inputs.
To assess the continuing appropriateness of fair valuations, the Valuation Committee reviews and affirms the reasonableness of such valuations on a regular basis after considering all relevant information that is reasonably available. Such valuations and procedures are reviewed periodically by the Trustees. The fair value of securities is generally determined as the amount that the fund could reasonably expect to realize from an orderly disposition of such securities over a reasonable period of time. By its nature, a fair value price is a good faith estimate of the value of a security in a current sale and does not reflect an actual market price, which may be different by a material amount.
Security transactions and related investment income Security transactions are recorded on the trade date (the date the order to buy or sell is executed). Gains or losses on securities sold are determined on the identified cost basis.
Interest income, net of any applicable withholding taxes, if any, is recorded on the accrual basis. Amortization and accretion of premiums and discounts on debt securities, if any, is recorded on the accrual basis.
Dividend income, net of any applicable withholding taxes, is recognized on the ex-dividend date except that certain dividends from foreign securities, if any, are recognized as soon as the fund is informed of the ex-dividend date. Non-cash dividends, if any, are recorded at the fair value of the securities received. Dividends representing a return of capital or capital gains, if any, are reflected as a reduction of cost and/or as a realized gain.
Foreign currency translation The accounting records of the fund are maintained in U.S. dollars. The fair value of foreign securities, currency holdings, and other assets and liabilities is recorded in the books and records of the fund after translation to U.S. dollars based on the exchange rates on that day. The cost of each security is determined using historical exchange rates. Income and withholding taxes are translated at prevailing exchange rates when earned or incurred. The fund does not isolate that portion of realized or unrealized gains or losses resulting from changes in the foreign exchange rate on investments from fluctuations arising from changes in the market prices of the securities. Such gains and losses are included with the net realized and unrealized gain or loss on investments. Net realized gains and losses on foreign currency transactions represent net realized exchange gains or losses on disposition of foreign currencies, currency gains and losses realized between the trade and settlement dates on securities transactions and the difference between the amount of investment income and foreign withholding taxes recorded on the fund’s books and the U.S. dollar equivalent amounts actually received or paid. Net unrealized appreciation and depreciation of assets and liabilities in foreign currencies arise from changes in the value of assets and liabilities other than investments at the period end, resulting from changes in the exchange rate.
Forward currency contracts The fund buys and sells forward currency contracts, which are agreements between two parties to buy and sell currencies at a set price on a future date. These contracts are used to hedge foreign exchange risk.
The U.S. dollar value of forward currency contracts is determined using current forward currency exchange rates supplied by a quotation service. The fair value of the contract will fluctuate with changes in currency exchange rates. The contract is marked to market daily and the change in fair value is recorded as an unrealized gain or loss. The fund records a realized gain or loss equal to the difference between the value of the contract at the time it was opened and the value at the time it was closed when the contract matures or by delivery of the currency. The fund could be exposed to risk if the value of the currency changes unfavorably, if the counterparties to the contracts
|
| Sustainable Future Fund 29 |
are unable to meet the terms of their contracts or if the fund is unable to enter into a closing position. Risks may exceed amounts recognized on the Statement of assets and liabilities.
Forward currency contracts outstanding at period end, if any, are listed after the fund’s portfolio.
Master agreements The fund is a party to ISDA (International Swaps and Derivatives Association, Inc.) Master Agreements (Master Agreements) with certain counterparties that govern OTC derivative and foreign exchange contracts entered into from time to time. The Master Agreements may contain provisions regarding, among other things, the parties’ general obligations, representations, agreements, collateral requirements, events of default and early termination. With respect to certain counterparties, in accordance with the terms of the Master Agreements, collateral pledged to the fund is held in a segregated account by the fund’s custodian and, with respect to those amounts which can be sold or repledged, is presented in the fund’s portfolio.
Collateral pledged by the fund is segregated by the fund’s custodian and identified in the fund’s portfolio. Collateral can be in the form of cash or debt securities issued by the U.S. Government or related agencies or other securities as agreed to by the fund and the applicable counterparty. Collateral requirements are determined based on the fund’s net position with each counterparty.
Termination events applicable to the fund may occur upon a decline in the fund’s net assets below a specified threshold over a certain period of time. Termination events applicable to counterparties may occur upon a decline in the counterparty’s long-term and short-term credit ratings below a specified level. In each case, upon occurrence, the other party may elect to terminate early and cause settlement of all derivative and foreign exchange contracts outstanding, including the payment of any losses and costs resulting from such early termination, as reasonably determined by the terminating party. Any decision by one or more of the fund’s counterparties to elect early termination could impact the fund’s future derivative activity.
At the close of the reporting period, the fund had a net liability position of $1,330,470 on open derivative contracts subject to the Master Agreements. Collateral pledged by the fund at period end for these agreements totaled $1,104,696 and may include amounts related to unsettled agreements.
Securities lending The fund may lend securities, through its agent, to qualified borrowers in order to earn additional income. The loans are collateralized by cash in an amount at least equal to the fair value of the securities loaned. The fair value of securities loaned is determined daily and any additional required collateral is allocated to the fund on the next business day. The remaining maturities of the securities lending transactions are considered overnight and continuous. The risk of borrower default will be borne by the fund’s agent; the fund will bear the risk of loss with respect to the investment of the cash collateral. Income from securities lending, net of expenses, is included in investment income on the Statement of operations. Cash collateral is invested in Putnam Cash Collateral Pool, LLC, a limited liability company managed by an affiliate of Putnam Management. Investments in Putnam Cash Collateral Pool, LLC are valued at its closing net asset value each business day. There are no management fees charged to Putnam Cash Collateral Pool, LLC. At the close of the reporting period, the fund had no securities out on loan.
Interfund lending The fund, along with other Putnam funds, may participate in an interfund lending program pursuant to an exemptive order issued by the SEC. This program allows the fund to borrow from or lend to other Putnam funds that permit such transactions. Interfund lending transactions are subject to each fund’s investment policies and borrowing and lending limits. Interest earned or paid on the interfund lending transaction will be based on the average of certain current market rates. During the reporting period, the fund did not utilize the program.
Lines of credit The fund participates, along with other Putnam funds, in a $320 million syndicated unsecured committed line of credit, provided by State Street ($160 million) and JPMorgan Chase Bank, N.A. ($160 million), and a $235.5 million unsecured uncommitted line of credit, provided by State Street. Prior to May 2, 2023, the fund participated, along with other Putnam funds, in a $100 million ($317.5 million prior to October 14, 2022) unsecured committed line of credit and a $235.5 million unsecured uncommitted line of credit, both provided by State Street. Borrowings may be made for temporary or emergency purposes, including the funding of shareholder redemption requests and trade settlements. Interest is charged to the fund based on the fund’s borrowing at a rate equal to 1.25% plus the higher of (1) the Federal Funds rate and (2) the Overnight Bank Funding Rate for the committed line of credit and 1.30% plus the higher of (1) the Federal Funds rate and (2) the Overnight Bank Funding Rate for the uncommitted line of credit. A closing fee equal to 0.04% of the committed line of credit and 0.04% of the uncommitted line of credit has been paid by the participating funds and a $75,000 fee has been paid by the participating funds to State Street as agent of the syndicated committed line of credit. In addition, a commitment fee of 0.21% per annum on any unutilized portion of the committed line of credit is allocated to the
|
| 30 Sustainable Future Fund |
participating funds based on their relative net assets and paid quarterly. During the reporting period, the fund had no borrowings against these arrangements.
Federal taxes It is the policy of the fund to distribute all of its taxable income within the prescribed time period and otherwise comply with the provisions of the Internal Revenue Code of 1986, as amended (the Code), applicable to regulated investment companies. It is also the intention of the fund to distribute an amount sufficient to avoid imposition of any excise tax under Section 4982 of the Code.
The fund is subject to the provisions of Accounting Standards Codification 740 Income Taxes (ASC 740). ASC 740 sets forth a minimum threshold for financial statement recognition of the benefit of a tax position taken or expected to be taken in a tax return. The fund did not have a liability to record for any unrecognized tax benefits in the accompanying financial statements. No provision has been made for federal taxes on income, capital gains or unrealized appreciation on securities held nor for excise tax on income and capital gains. Each of the fund’s federal tax returns for the prior three fiscal years remains subject to examination by the Internal Revenue Service.
The fund may also be subject to taxes imposed by governments of countries in which it invests. Such taxes are generally based on either income or gains earned or repatriated. The fund accrues and applies such taxes to net investment income, net realized gains and net unrealized gains as income and/or capital gains are earned. In some cases, the fund may be entitled to reclaim all or a portion of such taxes, and such reclaim amounts, if any, are reflected as an asset on the fund’s books. In many cases, however, the fund may not receive such amounts for an extended period of time, depending on the country of investment.
Under the Regulated Investment Company Modernization Act of 2010, the fund will be permitted to carry forward capital losses incurred for an unlimited period and the carry forwards will retain their character as either short-term or long-term capital losses. At April 30, 2023, the fund had the following capital loss carryovers available, to the extent allowed by the Code, to offset future net capital gain, if any:
| | |
| | Loss carryover | |
| Short-term | Long-term | Total |
| $29,357,716 | $— | $29,357,716 |
Pursuant to federal income tax regulations applicable to regulated investment companies, the fund has elected to defer $3,529,834 to its fiscal year ending April 30, 2024 of late year ordinary losses ((i) ordinary losses recognized between January 1, 2023 and April 30, 2023, and (ii) specified ordinary and currency losses recognized between November 1, 2022 and April 30, 2023).
Distributions to shareholders Distributions to shareholders from net investment income are recorded by the fund on the ex-dividend date. Distributions from capital gains, if any, are recorded on the ex-dividend date and paid at least annually. The amount and character of income and gains to be distributed are determined in accordance with income tax regulations, which may differ from generally accepted accounting principles. These differences include temporary and/or permanent differences from losses on wash sale transactions, foreign currency gains and losses, nontaxable dividends and late year loss deferrals. Reclassifications are made to the fund’s capital accounts to reflect income and gains available for distribution (or available capital loss carryovers) under income tax regulations. At the close of the reporting period, the fund reclassified $1,642,425 to decrease accumulated net investment loss and $1,642,425 to increase accumulated net realized loss.
Tax cost of investments includes adjustments to net unrealized appreciation (depreciation) which may not necessarily be final tax cost basis adjustments, but closely approximate the tax basis unrealized gains and losses that may be realized and distributed to shareholders. The tax basis components of distributable earnings and the federal tax cost as of the close of the reporting period were as follows:
| |
| Unrealized appreciation | $76,812,018 |
| Unrealized depreciation | (30,798,805) |
| Net unrealized appreciation | 46,013,213 |
| Capital loss carryforward | (29,357,716) |
| Late year ordinary loss deferral | (3,529,834) |
| Cost for federal income tax purposes | $307,312,627 |
|
| Sustainable Future Fund 31 |
Expenses of the Trust Expenses directly charged or attributable to any fund will be paid from the assets of that fund. Generally, expenses of the Trust will be allocated among and charged to the assets of each fund on a basis that the Trustees deem fair and equitable, which may be based on the relative assets of each fund or the nature of the services performed and relative applicability to each fund.
Note 2: Management fee, administrative services and other transactions
The fund pays Putnam Management a management fee (based on the fund’s average net assets and computed and paid monthly) at annual rates that may vary based on the average of the aggregate net assets of all open-end mutual funds sponsored by Putnam Management (excluding net assets of funds that are invested in, or that are invested in by, other Putnam funds to the extent necessary to avoid “double counting” of those assets). Such annual rates may vary as follows:
| | | | |
| 0.710% | of the first $5 billion, | | 0.510% | of the next $50 billion, |
| 0.660% | of the next $5 billion, | | 0.490% | of the next $50 billion, |
| 0.610% | of the next $10 billion, | | 0.480% | of the next $100 billion and |
| 0.560% | of the next $10 billion, | | 0.475% | of any excess thereafter. |
For the reporting period, the management fee represented an effective rate (excluding the impact from any expense waivers in effect) of 0.551% of the fund’s average net assets.
Putnam Management has contractually agreed, through August 30, 2023, to waive fees and/or reimburse the fund’s expenses to the extent necessary to limit the cumulative expenses of the fund, exclusive of brokerage, interest, taxes, investment-related expenses, extraordinary expenses, acquired fund fees and expenses and payments under the fund’s investor servicing contract, investment management contract and distribution plans, on a fiscal year-to-date basis to an annual rate of 0.20% of the fund’s average net assets over such fiscal year-to-date period. During the reporting period, the fund’s expenses were not reduced as a result of this limit.
Putnam Investments Limited (PIL), an affiliate of Putnam Management, is authorized by the Trustees to manage a separate portion of the assets of the fund as determined by Putnam Management from time to time. PIL did not manage any portion of the assets of the fund during the reporting period. If Putnam Management were to engage the services of PIL, Putnam Management would pay a quarterly sub-management fee to PIL for its services at an annual rate of 0.25% (prior to July 1, 2022, the annual rate was 0.35%) of the average net assets of the portion of the fund managed by PIL.
The fund reimburses Putnam Management an allocated amount for the compensation and related expenses of certain officers of the fund and their staff who provide administrative services to the fund. The aggregate amount of all such reimbursements is determined annually by the Trustees.
Custodial functions for the fund’s assets are provided by State Street. Custody fees are based on the fund’s asset level, the number of its security holdings and transaction volumes.
Putnam Investor Services, Inc., an affiliate of Putnam Management, provides investor servicing agent functions to the fund. Putnam Investor Services, Inc. received fees for investor servicing for class A, class B, class C, class R and class Y shares that included (1) a per account fee for each direct and underlying non-defined contribution account (retail account) of the fund; (2) a specified rate of the fund’s assets attributable to defined contribution plan accounts; and (3) a specified rate based on the average net assets in retail accounts. Putnam Investor Services, Inc. has agreed that the aggregate investor servicing fees for each fund’s retail and defined contribution accounts for these share classes will not exceed an annual rate of 0.25% of the fund’s average assets attributable to such accounts.
Class R6 shares paid a monthly fee based on the average net assets of class R6 shares at an annual rate of 0.05%.
During the reporting period, the expenses for each class of shares related to investor servicing fees were as follows:
| | | | |
| Class A | $507,054 | | Class R6 | 10,720 |
| Class B | 256 | | Class Y | 88,897 |
| Class C | 12,540 | | Total | $632,104 |
| Class R | 12,637 | | | |
|
| 32 Sustainable Future Fund |
The fund has entered into expense offset arrangements with Putnam Investor Services, Inc. and State Street whereby Putnam Investor Services, Inc.’s and State Street’s fees are reduced by credits allowed on cash balances. For the reporting period, the fund’s expenses were reduced by $3,138 under the expense offset arrangements.
Each Independent Trustee of the fund receives an annual Trustee fee, of which $322, as a quarterly retainer, has been allocated to the fund, and an additional fee for each Trustees meeting attended. Trustees also are reimbursed for expenses they incur relating to their services as Trustees.
The fund has adopted a Trustee Fee Deferral Plan (the Deferral Plan) which allows the Trustees to defer the receipt of all or a portion of Trustees fees payable on or after July 1, 1995. The deferred fees remain invested in certain Putnam funds until distribution in accordance with the Deferral Plan.
The fund has adopted an unfunded noncontributory defined benefit pension plan (the Pension Plan) covering all Trustees of the fund who have served as a Trustee for at least five years and were first elected prior to 2004. Benefits under the Pension Plan are equal to 50% of the Trustee’s average annual attendance and retainer fees for the three years ended December 31, 2005. The retirement benefit is payable during a Trustee’s lifetime, beginning the year following retirement, for the number of years of service through December 31, 2006. Pension expense for the fund is included in Trustee compensation and expenses in the Statement of operations. Accrued pension liability is included in Payable for Trustee compensation and expenses in the Statement of assets and liabilities. The Trustees have terminated the Pension Plan with respect to any Trustee first elected after 2003.
The fund has adopted distribution plans (the Plans) with respect to the following share classes pursuant to Rule 12b–1 under the Investment Company Act of 1940. The purpose of the Plans is to compensate Putnam Retail Management Limited Partnership, an indirect wholly-owned subsidiary of Putnam Investments, LLC, for services provided and expenses incurred in distributing shares of the fund. The Plans provide payments by the fund to Putnam Retail Management Limited Partnership at an annual rate of up to the following amounts (Maximum %) of the average net assets attributable to each class. The Trustees have approved payment by the fund at the following annual rate (Approved %) of the average net assets attributable to each class. During the reporting period, the class-specific expenses related to distribution fees were as follows:
| | | |
| | Maximum % | Approved % | Amount |
| Class A | 0.35% | 0.25% | $707,770 |
| Class B | 1.00% | 1.00% | 1,428 |
| Class C | 1.00% | 1.00% | 70,041 |
| Class R | 1.00% | 0.50% | 35,290 |
| Total | | | $814,529 |
For the reporting period, Putnam Retail Management Limited Partnership, acting as underwriter, received net commissions of $15,955 from the sale of class A shares and received $14 and $143 in contingent deferred sales charges from redemptions of class B and class C shares, respectively.
A deferred sales charge of up to 1.00% is assessed on certain redemptions of class A shares. For the reporting period, Putnam Retail Management Limited Partnership, acting as underwriter, received $66 on class A redemptions.
Note 3: Purchases and sales of securities
During the reporting period, the cost of purchases and the proceeds from sales, excluding short-term investments, were as follows:
| | |
| | Cost of purchases | Proceeds from sales |
| Investments in securities (Long-term) | $154,711,504 | $183,618,501 |
| U.S. government securities (Long-term) | — | — |
| Total | $154,711,504 | $183,618,501 |
The fund may purchase or sell investments from or to other Putnam funds in the ordinary course of business, which can reduce the fund’s transaction costs, at prices determined in accordance with SEC requirements and policies approved by the Trustees. During the reporting period, purchases or sales of long-term securities from or to other Putnam funds, if any, did not represent more than 5% of the fund’s total cost of purchases and/or total proceeds from sales.
|
| Sustainable Future Fund 33 |
Note 4: Capital shares
At the close of the reporting period, there were an unlimited number of shares of beneficial interest authorized. Transactions, including, if applicable, direct exchanges pursuant to share conversions, in capital shares were as follows:
| | | | |
| | YEAR ENDED 4/30/23 | YEAR ENDED 4/30/22 |
| Class A | Shares | Amount | Shares | Amount |
| Shares sold | 459,975 | $7,331,228 | 820,252 | $20,336,860 |
| Shares issued in connection with | | | | |
| reinvestment of distributions | — | — | 2,749,462 | 62,412,782 |
| | 459,975 | 7,331,228 | 3,569,714 | 82,749,642 |
| Shares repurchased | (2,631,223) | (41,679,620) | (2,584,239) | (62,077,878) |
| Net increase (decrease) | (2,171,248) | $(34,348,392) | 985,475 | $20,671,764 |
| |
| | YEAR ENDED 4/30/23 | YEAR ENDED 4/30/22 |
| Class B | Shares | Amount | Shares | Amount |
| Shares sold | 759 | $9,864 | 602 | $14,003 |
| Shares issued in connection with | | | | |
| reinvestment of distributions | — | — | 2,724 | 51,557 |
| | 759 | 9,864 | 3,326 | 65,560 |
| Shares repurchased | (8,756) | (117,448) | (4,831) | (94,918) |
| Net decrease | (7,997) | $(107,584) | (1,505) | $(29,358) |
| |
| | YEAR ENDED 4/30/23 | YEAR ENDED 4/30/22 |
| Class C | Shares | Amount | Shares | Amount |
| Shares sold | 66,950 | $871,334 | 75,932 | $1,572,338 |
| Shares issued in connection with | | | | |
| reinvestment of distributions | — | — | 108,638 | 2,048,916 |
| | 66,950 | 871,334 | 184,570 | 3,621,254 |
| Shares repurchased | (198,625) | (2,629,965) | (203,273) | (4,200,138) |
| Net decrease | (131,675) | $(1,758,631) | (18,703) | $(578,884) |
| |
| | YEAR ENDED 4/30/23 | YEAR ENDED 4/30/22 |
| Class R | Shares | Amount | Shares | Amount |
| Shares sold | 55,936 | $831,836 | 63,389 | $1,475,602 |
| Shares issued in connection with | | | | |
| reinvestment of distributions | — | — | 75,217 | 1,620,931 |
| | 55,936 | 831,836 | 138,606 | 3,096,533 |
| Shares repurchased | (114,407) | (1,689,184) | (95,424) | (2,231,854) |
| Net increase (decrease) | (58,471) | $(857,348) | 43,182 | $864,679 |
|
| 34 Sustainable Future Fund |
| | | | |
| | YEAR ENDED 4/30/23 | YEAR ENDED 4/30/22 |
| Class R6 | Shares | Amount | Shares | Amount |
| Shares sold | 320,115 | $5,193,057 | 487,425 | $12,490,851 |
| Shares issued in connection with | | | | |
| reinvestment of distributions | — | — | 210,119 | 4,849,551 |
| | 320,115 | 5,193,057 | 697,544 | 17,340,402 |
| Shares repurchased | (388,734) | (6,314,035) | (452,429) | (10,335,781) |
| Net increase (decrease) | (68,619) | $(1,120,978) | 245,115 | $7,004,621 |
| |
| | YEAR ENDED 4/30/23 | YEAR ENDED 4/30/22 |
| Class Y | Shares | Amount | Shares | Amount |
| Shares sold | 1,454,296 | $24,006,383 | 944,636 | $23,732,272 |
| Shares issued in connection with | | | | |
| reinvestment of distributions | — | — | 492,281 | 11,307,693 |
| | 1,454,296 | 24,006,383 | 1,436,917 | 35,039,965 |
| Shares repurchased | (1,056,059) | (16,906,485) | (1,674,807) | (38,705,770) |
| Net increase (decrease) | 398,237 | $7,099,898 | (237,890) | $(3,665,805) |
Note 5: Affiliated transactions
Transactions during the reporting period with any company which is under common ownership or control were as follows:
| | | | | |
| | | | | | Shares |
| | | | | | outstanding |
| | | | | | and fair |
| | Fair value as | Purchase | Sale | Investment | value as |
| Name of affiliate | of 4/30/22 | cost | proceeds | income | of 4/30/23 |
| Short-term investments | | | | | |
| Putnam Cash Collateral | | | | | |
| Pool, LLC* | $22,663,155 | $27,642,730 | $50,305,885 | $35,622 | $— |
| Putnam Short Term | | | | | |
| Investment Fund** | 7,615,020 | 86,110,585 | 87,236,927 | 308,755 | 6,488,678 |
| Total Short-term | | | | | |
| investments | $30,278,175 | $113,753,315 | $137,542,812 | $344,377 | $6,488,678 |
* No management fees are charged to Putnam Cash Collateral Pool, LLC (Note 1).Investment income shown is included in securities lending income on the Statement of operations. There were no realized or unrealized gains or losses during the period.
** Management fees charged to Putnam Short Term Investment Fund have been waived by Putnam Management.
There were no realized or unrealized gains or losses during the period.
|
| Sustainable Future Fund 35 |
Note 6: Market, credit and other risks
In the normal course of business, the fund trades financial instruments and enters into financial transactions where risk of potential loss exists due to changes in the market (market risk) or failure of the contracting party to the transaction to perform (credit risk). The fund may be exposed to additional credit risk that an institution or other entity with which the fund has unsettled or open transactions will default. Investments in foreign securities involve certain risks, including those related to economic instability, unfavorable political developments, and currency fluctuations.
Investing with a focus on companies that exhibit a commitment to sustainable business practices may result in the fund investing in certain types of companies, industries or sectors that the market may not favor. In evaluating an investment opportunity, Putnam Management may make investment decisions based on information and data that is incomplete or inaccurate. Due to changes in the products or services of the companies and issuers in which the fund invests, the fund may temporarily hold securities that are inconsistent with its sustainable investment criteria.
Note 7: Summary of derivative activity
The volume of activity for the reporting period for any derivative type that was held during the period is listed below and was based on an average of the holdings at the end of each fiscal quarter:
| |
| Forward currency contracts (contract amount) | $55,100,000 |
The following is a summary of the fair value of derivative instruments as of the close of the reporting period:
| | | | |
| Fair value of derivative instruments as of the close of the reporting period | |
| | ASSET DERIVATIVES | LIABILITY DERIVATIVES |
| Derivatives not | | | | |
| accounted for as | Statement of | | Statement of | |
| hedging instruments | assets and | | assets and | |
| under ASC 815 | liabilities location | Fair value | liabilities location | Fair value |
| Foreign exchange | | | | |
| contracts | Receivables | $133,868 | Payables | $1,427,887 |
| Total | | $133,868 | | $1,427,887 |
The following is a summary of realized and change in unrealized gains or losses of derivative instruments in the Statement of operations for the reporting period (Note 1):
| | |
| Amount of realized gain or (loss) on derivatives recognized in net gain or (loss) on investments | |
| Derivatives not accounted for as | Forward currency | |
| hedging instruments under ASC 815 | contracts | Total |
| Foreign exchange contracts | $1,726,615 | $1,726,615 |
| Total | $1,726,615 | $1,726,615 |
| | |
| Change in unrealized appreciation or (depreciation) on derivatives recognized in net gain or (loss) |
| on investments | | |
| Derivatives not accounted for as | Forward currency | |
| hedging instruments under ASC 815 | contracts | Total |
| Foreign exchange contracts | $(1,825,640) | $(1,825,640) |
| Total | $(1,825,640) | $(1,825,640) |
|
| 36 Sustainable Future Fund |
|
| This page left blank intentionally. |
|
| Sustainable Future Fund 37 |
Note 8: Offsetting of financial and derivative assets and liabilities
The following table summarizes any derivatives, repurchase agreements and reverse repurchase agreements, at the end of the reporting period, that are subject to an enforceable master netting agreement or similar agreement. For securities lending transactions or borrowing transactions associated with securities sold short, if any, see Note 1. For financial reporting purposes, the fund does not offset financial assets and financial liabilities that are subject to the master netting agreements in the Statement of assets and liabilities.
| | | | | | | | | |
| | Bank of
America N.A. | Barclays Bank
PLC | Citibank, N.A. | HSBC Bank
USA, National
Association | JPMorgan
Chase Bank
N.A. | Morgan
Stanley & Co.
International
PLC | NatWest
Markets PLC | State Street
Bank and
Trust Co. | Total |
| Assets: | | | | | | | | | |
| Forward currency contracts# | $4,368 | $— | $36,451 | $48,457 | $— | $19,988 | $18,210 | 6,394 | $133,868 |
| Total Assets | $4,368 | $— | $36,451 | $48,457 | $— | $19,988 | $18,210 | $6,394 | $133,868 |
| Liabilities: | | | | | | | | | |
| Forward currency contracts# | 273,729 | 168,541 | — | 473,107 | 37,766 | 240,783 | 41,135 | 192,826 | 1,427,887 |
| Total Liabilities | $273,729 | $168,541 | $— | $473,107 | $37,766 | $240,783 | $41,135 | $192,826 | $1,427,887 |
| Total Financial and Derivative Net Assets | $(269,361) | $(168,541) | $36,451 | $(424,650) | $(37,766) | $(220,795) | $(22,925) | $(186,432) | $(1,294,019) |
| Total collateral received (pledged)†## | $(243,292) | $(131,617) | $— | $(386,875) | $— | $(220,795) | $— | $(120,649) | |
| Net amount | $(26,069) | $(36,924) | $36,451 | $(37,775) | $(37,766) | $— | $(22,925) | $(65,783) | |
| Controlled collateral received (including TBA commitments)** | $— | $— | $— | $— | $— | $— | $— | $— | $— |
| Uncontrolled collateral received | $— | $— | $— | $— | $— | $— | $— | $— | $— |
| Collateral (pledged) (including TBA commitments)** | $(243,292) | $(131,617) | $— | $(386,875) | $— | $(222,263) | $— | $(120,649) | $(1,104,696) |
** Included with Investments in securities on the Statement of assets and liabilities.
† Additional collateral may be required from certain brokers based on individual agreements.
# Covered by master netting agreement (Note 1).
## Any over-collateralization of total financial and derivative net assets is not shown. Collateral may include amounts related to unsettled agreements.
Note 9: Subsequent event
On May 31, 2023, Franklin Resources, Inc. (“Franklin Resources”) and Great-West Lifeco Inc., the parent company of Putnam U.S. Holdings I, LLC (“Putnam Holdings”), announced that they have entered into a definitive agreement for a subsidiary of Franklin Resources to acquire Putnam Holdings in a stock and cash transaction.
As part of this transaction, Putnam Management, a wholly owned subsidiary of Putnam Holdings and investment manager to the Putnam family of funds (the “Putnam Funds”), would become an indirect wholly owned subsidiary of Franklin Resources.
The transaction is subject to customary closing conditions, including receipt of applicable regulatory approvals. Subject to such approvals and the satisfaction of these conditions, the transaction is currently expected to be consummated in the fourth quarter of 2023.
Under the Investment Company Act of 1940, as amended, consummation of the transaction will result in the automatic termination of the investment management contract between each Putnam Fund and Putnam Management and any related sub-management and sub-advisory contracts, where applicable. Therefore, the Board of Trustees of the Putnam Funds will be asked to approve a new investment management contract between each Putnam Fund and Putnam Management (and new sub-management and sub-advisory contracts, if applicable). If approved by the Board of Trustees, the new investment management contract will be presented to the shareholders of each Putnam Fund for their approval.
| |
| 38 Sustainable Future Fund | Sustainable Future Fund 39 |
Federal tax information (Unaudited)
The Form 1099 that will be mailed to you in January 2024 will show the tax status of all distributions paid to your account in calendar 2023.
|
| 40 Sustainable Future Fund |

|
| Sustainable Future Fund 41 |
* Mr. Reynolds is an “interested person” (as defined in the Investment Company Act of 1940) of the fund and Putnam Investments. He is President and Chief Executive Officer of Putnam Investments, as well as the President of your fund and each of the other Putnam funds.
The address of each Trustee is 100 Federal Street, Boston, MA 02110.
As of April 30, 2023, there were 88 mutual funds, 4 closed-end funds, and 12 exchange-traded funds in the Putnam funds complex. Each Trustee serves as Trustee of all funds in the Putnam funds complex.
Each Trustee serves for an indefinite term, until his or her resignation, retirement at age 75, removal, or death.
|
| 42 Sustainable Future Fund |
Officers
In addition to Robert L. Reynolds, the other officers of the fund are shown below:
| |
| James F. Clark (Born 1974) | Alan G. McCormack (Born 1964) |
| Vice President and Chief Compliance Officer | Vice President and Derivatives Risk Manager |
| Since 2016 | Since 2022 |
| Chief Compliance Officer and Chief Risk Officer, | Head of Quantitative Equities and Risk, |
| Putnam Investments, and Chief Compliance Officer, | Putnam Investments |
| Putnam Management | |
| | Denere P. Poulack (Born 1968) |
| Michael J. Higgins (Born 1976) | Assistant Vice President, Assistant Clerk, |
| Vice President, Treasurer, and Clerk | and Assistant Treasurer |
| Since 2010 | Since 2004 |
| | |
| Jonathan S. Horwitz (Born 1955) | Janet C. Smith (Born 1965) |
| Executive Vice President, Principal Executive Officer, | Vice President, Principal Financial Officer, Principal |
| and Compliance Liaison | Accounting Officer, and Assistant Treasurer |
| Since 2004 | Since 2007 |
| | Head of Fund Administration Services, |
| Richard T. Kircher (Born 1962) | Putnam Investments and Putnam Management |
| Vice President and BSA Compliance Officer | |
| Since 2019 | Stephen J. Tate (Born 1974) |
| Assistant Director, Operational Compliance, Putnam | Vice President and Chief Legal Officer |
| Investments and Putnam Retail Management | Since 2021 |
| | General Counsel, Putnam Investments, |
| Martin Lemaire (Born 1984) | Putnam Management, and Putnam Retail Management |
| Vice President and Derivatives Risk Manager | |
| Since 2022 | Mark C. Trenchard (Born 1962) |
| Risk Manager and Risk Analyst, Putnam Investments | Vice President |
| | Since 2002 |
| Susan G. Malloy (Born 1957) | Director of Operational Compliance, Putnam |
| Vice President and Assistant Treasurer | Investments and Putnam Retail Management |
| Since 2007 | |
| Head of Accounting and Middle Office Services, | |
| Putnam Investments and Putnam Management | |
The principal occupations of the officers for the past five years have been with the employers as shown above, although in some cases they have held different positions with such employers. The address of each officer is 100 Federal Street, Boston, MA 02110.
|
| Sustainable Future Fund 43 |
Services for shareholders
Investor services
Systematic investment plan Tell us how much you wish to invest regularly — weekly, semimonthly, or monthly — and the amount you choose will be transferred automatically from your checking or savings account. There’s no additional fee for this service, and you can suspend it at any time. This plan may be a great way to save for college expenses or to plan for your retirement.
Please note that regular investing does not guarantee a profit or protect against loss in a declining market. Before arranging a systematic investment plan, consider your financial ability to continue making purchases in periods when prices are low.
Systematic exchange You can make regular transfers from one Putnam fund to another Putnam fund. There are no additional fees for this service, and you can cancel or change your options at any time.
Dividends PLUS You can choose to have the dividend distributions from one of your Putnam funds automatically reinvested in another Putnam fund at no additional charge.
Free exchange privilege You can exchange money between Putnam funds free of charge, as long as they are the same class of shares. A signature guarantee is required if you are exchanging more than $500,000. The fund reserves the right to revise or terminate the exchange privilege.
Reinstatement privilege If you’ve sold Putnam shares or received a check for a dividend or capital gain, you may reinvest the proceeds with Putnam within 90 days of the transaction and they will be reinvested at the fund’s current net asset value — with no sales charge. However, reinstatement of class B shares may have special tax consequences. Ask your financial or tax representative for details.
Check-writing service You have ready access to many Putnam accounts. It’s as simple as writing a check, and there are no special fees or service charges. For more information about the check-writing service, call Putnam or visit our website.
Dollar cost averaging When you’re investing for long-term goals, it’s time, not timing, that counts. Investing on a systematic basis is a better strategy than trying to figure out when the markets will go up or down. This means investing the same amount of money regularly over a long period. This method of investing is called dollar cost averaging. When a fund’s share price declines, your investment dollars buy more shares at lower prices. When it increases, they buy fewer shares. Over time, you will pay a lower average price per share.
For more information
Visit the Individual Investors section at putnam.com A secure section of our website contains complete information on your account, including balances and transactions, updated daily. You may also conduct transactions, such as exchanges, additional investments, and address changes. Log on today to get your password.
Call us toll free at 1-800-225-1581 or, for exchange-traded funds only, 1-833-228-5577 Ask a helpful Putnam representative or your financial advisor for details about any of these or other services, or see your prospectus.
|
| 44 Sustainable Future Fund |
Fund information
Founded over 85 years ago, Putnam Investments was built around the concept that a balance between risk and reward is the hallmark of a well-rounded financial program. We manage funds across income, value, blend, growth, sustainable, and asset allocation categories.
| | |
| Investment Manager | Trustees | Richard T. Kircher |
| Putnam Investment | Kenneth R. Leibler, Chair | Vice President and |
| Management, LLC | Barbara M. Baumann, Vice Chair | BSA Compliance Officer |
| 100 Federal Street | Liaquat Ahamed | |
| Boston, MA 02110 | Katinka Domotorffy | Martin Lemaire |
| | Catharine Bond Hill | Vice President and |
| Investment Sub-Advisor | Jennifer Williams Murphy | Derivatives Risk Manager |
| Putnam Investments Limited | Marie Pillai | |
| 16 St James’s Street | George Putnam III | Susan G. Malloy |
| London, England SW1A 1ER | Robert L. Reynolds | Vice President and |
| | Manoj P. Singh | Assistant Treasurer |
| Marketing Services | Mona K. Sutphen | |
| Putnam Retail Management | | Alan G. McCormack |
| Limited Partnership | Officers | Vice President and |
| 100 Federal Street | Robert L. Reynolds | Derivatives Risk Manager |
| Boston, MA 02110 | President | |
| | | Denere P. Poulack |
| Custodian | James F. Clark | Assistant Vice President, |
| State Street Bank | Vice President, Chief Compliance | Assistant Clerk, and |
| and Trust Company | Officer, and Chief Risk Officer | Assistant Treasurer |
| | | |
| Legal Counsel | Michael J. Higgins | Janet C. Smith |
| Ropes & Gray LLP | Vice President, Treasurer, | Vice President, |
| | and Clerk | Principal Financial Officer, |
| Independent Registered Public | | Principal Accounting Officer, |
| Accounting Firm | Jonathan S. Horwitz | and Assistant Treasurer |
| PricewaterhouseCoopers LLP | Executive Vice President, | |
| | Principal Executive Officer, | Stephen J. Tate |
| | and Compliance Liaison | Vice President and |
| | | Chief Legal Officer |
| | | |
| | | Mark C. Trenchard |
| | | Vice President |
This report is for the information of shareholders of Putnam Sustainable Future Fund. It may also be used as sales literature when preceded or accompanied by the current prospectus, the most recent copy of Putnam’s Quarterly Performance Summary, and Putnam’s Quarterly Ranking Summary. For more recent performance, please visit putnam.com. Investors should carefully consider the investment objectives, risks, charges, and expenses of a fund, which are described in its prospectus. For this and other information or to request a prospectus or summary prospectus, call 1-800-225-1581 toll free. Please read the prospectus carefully before investing. The fund’s Statement of Additional Information contains additional information about the fund’s Trustees and is available without charge upon request by calling 1-800-225-1581.

| |
| (a) The fund’s principal executive, financial and accounting officers are employees of Putnam Investment Management, LLC, the Fund’s investment manager. As such they are subject to a comprehensive Code of Ethics adopted and administered by Putnam Investments which is designed to protect the interests of the firm and its clients. The Fund has adopted a Code of Ethics which incorporates the Code of Ethics of Putnam Investments with respect to all of its officers and Trustees who are employees of Putnam Investment Management, LLC. For this reason, the Fund has not adopted a separate code of ethics governing its principal executive, financial and accounting officers. |
| |
| (c) In January 2023, the Code of Ethics of Putnam Investments and Code of Ethics of Putnam Funds were amended. The key changes to the Putnam Investments Code of Ethics are as follows: (i) Prohibition on investments in a single stock ETFs and (ii) Revision to the 7-day blackout rule for Analysts. The key change to the Putnam Funds Code of Ethics was that the provisions of the Code of Ethics for employees of PanAgora Asset Management, inc. and any of its subsidiaries are excluded from the Putnam Funds’ Code of Ethics. |
| |
| Item 3. Audit Committee Financial Expert: |
| |
| The Funds’ Audit, Compliance and Risk Committee is comprised solely of Trustees who are “independent” (as such term has been defined by the Securities and Exchange Commission (“SEC”) in regulations implementing Section 407 of the Sarbanes-Oxley Act (the “Regulations”)). The Trustees believe that each member of the Audit, Compliance and Risk Committee also possesses a combination of knowledge and experience with respect to financial accounting matters, as well as other attributes, that qualifies him or her for service on the Committee. In addition, the Trustees have determined that each of Dr. Hill, Ms. Murphy and Mr. Singh qualifies as an “audit committee financial expert” (as such term has been defined by the Regulations) based on their review of his or her pertinent experience and education.The SEC has stated, and the funds’ amended and restated agreement and Declaration of Trust provides, that the designation or identification of a person as an audit committee financial expert pursuant to this Item 3 of Form N-CSR does not impose on such person any duties, obligations or liability that are greater than the duties, obligations and liability imposed on such person as a member of the Audit, Compliance and Risk Committee and the Board of Trustees in the absence of such designation or identification. |
| |
| Item 4. Principal Accountant Fees and Services: |
| |
| The following table presents fees billed in each of the last two fiscal years for services rendered to the fund by the fund’s independent auditor: |
| | | | | |
| Fiscal year ended | Audit Fees | Audit-Related Fees | Tax Fees | All Other Fees |
|
|
| | | | | |
| April 30, 2023 | $57,060 | $ — | $6,312 | $ — |
| April 30, 2022 | $54,276 | $ — | $5,382 | $ — |
| |
| For the fiscal years ended April 30, 2023 and April 30, 2022, the fund’s independent auditor billed aggregate non-audit fees in the amounts of $248,323 and $334,333 respectively, to the fund, Putnam Management and any entity controlling, controlled by or under common control with Putnam Management that provides ongoing services to the fund. |
| |
| Audit Fees represent fees billed for the fund’s last two fiscal years relating to the audit and review of the financial statements included in annual reports and registration statements, and other services that are normally provided in connection with statutory and regulatory filings or engagements. |
| |
| Audit-Related Fees represent fees billed in the fund’s last two fiscal years for services traditionally performed by the fund’s auditor, including accounting consultation for proposed transactions or concerning financial accounting and reporting standards and other audit or attest services not required by statute or regulation. |
| |
| Tax Fees represent fees billed in the fund’s last two fiscal years for tax compliance, tax planning and tax advice services. Tax planning and tax advice services include assistance with tax audits, employee benefit plans and requests for rulings or technical advice from taxing authorities. |
| |
| Pre-Approval Policies of the Audit, Compliance and Risk Committee. The Audit, Compliance and Risk Committee of the Putnam funds has determined that, as a matter of policy, all work performed for the funds by the funds’ independent auditors will be pre-approved by the Committee itself and thus will generally not be subject to pre-approval procedures. |
| |
| The Audit, Compliance and Risk Committee also has adopted a policy to pre-approve the engagement by Putnam Management and certain of its affiliates of the funds’ independent auditors, even in circumstances where pre-approval is not required by applicable law. Any such requests by Putnam Management or certain of its affiliates are typically submitted in writing to the Committee and explain, among other things, the nature of the proposed engagement, the estimated fees, and why this work should be performed by that particular audit firm as opposed to another one. In reviewing such requests, the Committee considers, among other things, whether the provision of such services by the audit firm are compatible with the independence of the audit firm. |
| |
| The following table presents fees billed by the fund’s independent auditor for services required to be approved pursuant to paragraph (c)(7)(ii) of Rule 2–01 of Regulation S-X. |
| | | | | |
| Fiscal year ended | Audit-Related Fees | Tax Fees | All Other Fees | Total Non-Audit Fees |
|
|
| April 30, 2023 | $ — | $242,011 | $ — | $ — |
| April 30, 2022 | $ — | $328,951 | $ — | $ — |
| |
| Item 5. Audit Committee of Listed Registrants |
| |
| Item 6. Schedule of Investments: |
| |
| The registrant’s schedule of investments in unaffiliated issuers is included in the report to shareholders in Item 1 above. |
| |
| Item 7. Disclosure of Proxy Voting Policies and Procedures For Closed-End Management Investment Companies: |
| |
| Item 8. Portfolio Managers of Closed-End Investment Companies |
| |
| Item 9. Purchases of Equity Securities by Closed-End Management Investment Companies and Affiliated Purchasers: |
| |
| Item 10. Submission of Matters to a Vote of Security Holders: |
| |
| Item 11. Controls and Procedures: |
| |
| (a) The registrant’s principal executive officer and principal financial officer have concluded, based on their evaluation of the effectiveness of the design and operation of the registrant’s disclosure controls and procedures as of a date within 90 days of the filing date of this report, that the design and operation of such procedures are generally effective to provide reasonable assurance that information required to be disclosed by the registrant in this report is recorded, processed, summarized and reported within the time periods specified in the Commission’s rules and forms. |
| |
| (b) Changes in internal control over financial reporting: Not applicable |
| |
| Item 12. Disclosures of Securities Lending Activities for Closed-End Management Investment Companies: |
| |
| (a)(1) The Code of Ethics of The Putnam Funds, which incorporates the Code of Ethics of Putnam Investments, is filed herewith. |
| |
| Pursuant to the requirements of the Securities Exchange Act of 1934 and the Investment Company Act of 1940, the registrant has duly caused this report to be signed on its behalf by the undersigned, thereunto duly authorized. |
| |
| By (Signature and Title): |
| |
| /s/ Janet C. Smith
Janet C. Smith
Principal Accounting Officer
|
| |
| Pursuant to the requirements of the Securities Exchange Act of 1934 and the Investment Company Act of 1940, this report has been signed below by the following persons on behalf of the registrant and in the capacities and on the dates indicated. |
| |
| By (Signature and Title): |
| |
| /s/ Jonathan S. Horwitz
Jonathan S. Horwitz
Principal Executive Officer
|
| |
| By (Signature and Title): |
| |
| /s/ Janet C. Smith
Janet C. Smith
Principal Financial Officer
|