
ANNUAL REPORT 2019

Table of Contents
| Management Discussion and Analysis | 4 |
| Schedules of Portfolio Investments | 16 |
| Statements of Assets and Liabilities | 38 |
| Statements of Operations | 40 |
| Statements of Changes in Net Assets | 42 |
| Financial Highlights | 44 |
| Notes to Financial Statements | 46 |
| Report of Independent Registered Public Accounting Firm | 54 |
| Additional Fund Information | 55 |
| Directors and Officers | 58 |
ANNUAL REPORT 2019
SHORT-INTERMEDIATE BOND FUND (Unaudited)
Investment Objective
The Tributary Short-Intermediate Bond Fund seeks to maximize total return in a manner consistent with the generation of current income, preservation of capital and reduced price volatility.
Manager Commentary
The trailing twelve month period began with indications of a robust U.S. economy, as healthy corporate earnings, a strong labor market, and high levels of business and consumer confidence caused growth to exceed expectations. Indeed, GDP growth of 4.2% and 3.4% in the second and third quarters of 2018 pushed market interest rates higher. The strong data and concerns over increasing labor costs allowed the Federal Reserve to continue raising the fed funds rate, and the U.S. Treasury curve continued to flatten. In the last half of the period, however, the domestic economy appeared to buckle under higher interest rates, slowing global growth, and concerns regarding U.S. trade policies, as witnessed by fourth quarter GDP growth decelerating to 2.5%. While market interest rates peaked in the fourth quarter and began declining in response to the slowdown, the Federal Reserve remained hawkish and raised the fed funds rate for the fourth time in late 2018. At the same time, fears of a monetary mistake toppled the markets and fixed income spreads widened dramatically as U.S. Treasury rates nosedived. With global financial markets tumbling, the Fed was forced to pivot away from its plan of additional rate hikes in 2019. Promising patience, the Fed announced that they are currently on hold and will wait for additional data, particularly inflation data, to determine whether its next move will be a hike or a cut in the fed funds rate. Cementing its transition from hawkish to dovish monetary policy, the Fed also announced at its March meeting that balance sheet runoff would end by the fourth quarter of 2019.
The Tributary Short-Intermediate Bond Fund returned 2.99% (net, Institutional Plus) for the year ended March 31, 2019 compared to a 3.54% return for the Bloomberg Barclays U.S. Government /Credit 1-5 Year Index. The U.S. Treasury yield curve flattened in the intermediate maturities, as short-term yields moved higher, with the 2-year yield ending essentially unchanged and the 5- and 10-year yields each finishing 33 bps lower. Lower-quality corporate bonds were once again the best performing asset class in fixed income (the Bloomberg Barclays Corporate High Yield Index returned over 6%), driven by healthy earnings and more recently, a patient, dovish Federal Reserve. Within the investment grade space, the non-agency securitized sectors posted the best returns, led by CMBS with a +0.81% excess return over similar maturity Treasuries, followed by traditional ABS with a +0.71% excess return and agency CMBS at +0.66%. Non-corporate credit was next with a +0.40% excess return, followed by corporate credit at +0.20%. Agency MBS returns matched the Treasury market, while the inflation-linked TIPS space significantly underperformed as inflation expectations fell. The predominant driver of the Fund’s relative performance was the downdraft in bond yields over the past year, specifically in the 3-5 year maturity segments where the Fund had less duration exposure versus the benchmark. Similar to the previous year, the largest positive impact on the Fund’s performance came from our sector allocation decision. Our overweight position in the credit and spread sectors of the market benefitted returns, as yield spreads on non-government securities tightened during the year (largely as a result of the sharp snap-back witnessed in the first three months of 2019). The Fund’s slight lower-quality bias versus the benchmark, and the related yield advantage, also benefitted relative performance for the period.
During the year the Fund’s overall sector allocation remained fairly consistent, with a modest increase in ABS securities and a corresponding decline in government and agency MBS securities. In the corporate sector we remained vigilant in our pursuit of improving the fundamental quality of the portfolio, trimming names with uncertain credit outlooks and extending maturities where opportunities arose to capture steep credit curves. In the securitized space we were active in the ABS sector, adding positions in shorter duration securities that we believe offered excellent value for high-quality assets, especially relative to corporate bonds. The agency MBS allocation drifted lower given our estimate of limited value in shorter duration securities, while we added to our exposure in non-agency RMBS product to offset legacy bonds that continue to paydown quickly. In terms of credit quality there was no significant change during the year, as the Fund maintained a AA- weighted average credit rating.
Many of the ominous signs we saw at the end of 2018 have receded to the background—primary debt markets are wide open even for low-quality issuers; measures of volatility have fallen; the government shutdown was resolved; and trade talks with China appear to be moving forward, etc. One could therefore make a strong case that Q4 of 2018 was the trough for financial markets, especially now that the Fed had shifted to a more dovish policy stance. Having said that, the fact remains that we are in the 10th year of an expansion and signs of late-cycle behavior remain, such as higher leverage metrics in corporate credit and looser underwriting trends in securitized markets. As such, we still lean toward caution with respect to overall risk exposure in the portfolio, knowing that being early could well mean underperformance in the near term. We continue to hold a below-index duration position (versus our stated 1-5Y benchmark), but remain slightly longer duration versus the 1-3Y Index. Regarding sector allocation, we remain overweight the non-agency RMBS and CMBS sectors, as well as the traditional ABS space, given our view that the risk-adjusted yield pickup is attractive. We remain over-weight duration in the corporate sector, but with a bias for high quality assets that can continue to provide interest income with less inherent risk. Lastly, we maintain a modest exposure to the agency MBS sector for the yield benefit, while remaining underweight in the traditional U.S. government bond sector.
As always, we remain committed to seeking prudent, value-enhancing investment opportunities consistent with our disciplined approach of managing for the long-term.
ANNUAL REPORT 2019
SHORT-INTERMEDIATE BOND FUND (Unaudited)
Return of a $10,000 Investment as of March 31, 2019

Portfolio Composition as of March 31, 2019
Percentage Based on Total Value of Investments
(Portfolio composition is subject to change)
| Government Securities | 31.3% |
| Corporate Bonds | 30.5% |
| Asset Backed Securities | 17.6% |
| Non-Agency Residential Mortgage Backed Securities | 7.7% |
| Non-Agency Commercial Mortgage Backed Securities | 5.9% |
| U.S. Government Mortgage Backed Securities | 5.8% |
| Short-Term Investments | 1.0% |
| Preferred Stocks | 0.2% |
| 100.0% |
Portfolio Analysis as of March 31, 2019
(Portfolio composition is subject to change)
| Weighted Average to Maturity: | 4.4 years |
Average Annual Total Returns for the Year Ended March 31, 2019*
| 1 Year | 5 Year | 10 Year | |
| Tributary Short-Intermediate Bond Fund — Institutional Class | 2.88% | 1.54% | 2.51% |
| Bloomberg Barclays U.S. Government/ Credit 1-5 Year Index | 3.54% | 1.57% | 2.20% |
| Prospectus Expense Ratio (Gross/Net)† | 1.22% | 0.77% | |
| Expense Ratio for the Year Ended March 31, 2019 (Gross/Net) | 1.17% | 0.76% |
| 1 Year | 5 Year | Since Inception†† | |
| Tributary Short-Intermediate Bond Fund — Institutional Plus Class | 2.99% | 1.75% | 2.17% |
| Bloomberg Barclays U.S. Government/ Credit 1-5 Year Index | 3.54% | 1.57% | 1.52% |
| Prospectus Expense Ratio (Gross/Net)† | 0.73% | 0.54% | |
| Expense Ratio for the Year Ended March 31, 2019 (Gross/Net) | 0.73% | 0.54% |
Past performance does not guarantee future results. The performance data quoted represents past performance and current returns may be lower to higher. Total returns include change in share price, reinvestment of dividends and capital gains. The investment return and principal value will fluctuate so that an investor’s shares, when redeemed may be worth more or less than the original cost. To obtain performance information current to the most recent month end, please visit our website at www.tributaryfunds.com.
| (†) | The expense ratios are from the Fund’s prospectus dated August 1, 2018. Net expense ratios are net of contractual waivers which are in effect through August 1, 2019. |
| (††) | Commencement date for the Institutional Plus Class was October 14, 2011. |
| (*) | Returns shown do not reflect the deduction of taxes that a shareholder would pay on Fund distributions or the redemption of Fund shares. Investment performance reflects contractual fee waivers in effect for certain periods. Without these fee waivers, the performance would have been lower. |
The line chart assumes an initial investment of $10,000 made on March 31, 2009. Total return is based on net change in net asset value (“NAV”) assuming reinvestment of all dividends and other distributions.
The performance of Institutional Plus Class will be different than Institutional Class based on differences in fees borne by each class. Bloomberg Barclays U.S. Government/Credit 1-5 Year Index is an unmanaged index which measures the performance of U.S. Treasury and agency securities, and corporate bonds with 1-5 year maturities. The index is unmanaged and does not reflect the deduction of fees or taxes associated with a mutual fund, such as investment management, administration and other operational fees. Investors cannot directly invest in the index.
ANNUAL REPORT 2019
INCOME FUND (Unaudited)
Investment Objective
The Tributary Income Fund seeks the generation of current income in a manner consistent with preserving capital and maximizing total return.
Manager Commentary
The trailing twelve month period began with indications of a robust U.S. economy, as healthy corporate earnings, a strong labor market, and high levels of business and consumer confidence caused growth to exceed expectations. Indeed, GDP growth of 4.2% and 3.4% in the second and third quarters of 2018 pushed market interest rates higher. The strong data and concerns over increasing labor costs allowed the Federal Reserve to continue raising the fed funds rate, and the U.S. Treasury curve continued to flatten. In the last half of the period, however, the domestic economy appeared to buckle under higher interest rates, slowing global growth, and concerns regarding U.S. trade policies, as witnessed by fourth quarter GDP growth decelerating to 2.5%. While market interest rates peaked in the fourth quarter and began declining in response to the slowdown, the Federal Reserve remained hawkish and raised the fed funds rate for the fourth time in late 2018. At the same time, fears of a monetary mistake toppled the markets and fixed income spreads widened dramatically as U.S. Treasury rates nosedived. With global financial markets tumbling, the Fed was forced to pivot away from its plan of additional rate hikes in 2019. Promising patience, the Fed announced that they are currently on hold and will wait for additional data, particularly inflation data, to determine whether its next move will be a hike or a cut in the fed funds rate. Cementing its transition from hawkish to dovish monetary policy, the Fed also announced at its March meeting that balance sheet runoff would end by the fourth quarter of 2019.
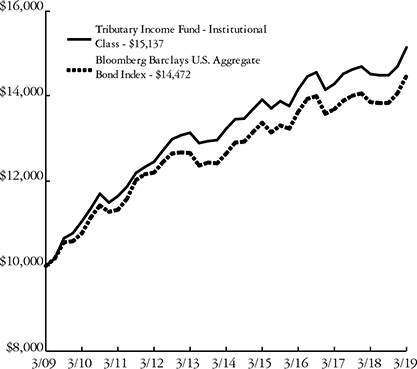
The Tributary Income Fund returned 4.50% (net, Institutional Plus) for the year ended March 31, 2019 compared to a 4.48% return for the Bloomberg Barclays U.S. Aggregate Bond Index. The U.S. Treasury yield curve moved in an odd fashion over the trailing 12 months, with very short-term yields moving higher, the 2-year yield ending essentially unchanged, the 10-year yield 33 bps lower, and the 30-year yield finishing 16 bps lower. Lower-quality corporate bonds were once again the best performing asset class in fixed income (the Bloomberg Barclays Corporate High Yield Index returned over 6%), driven by healthy earnings and more recently, a patient, dovish Federal Reserve. Within the investment grade space, the non-agency securitized sectors posted the best returns, led by CMBS with a +0.81% excess return over similar maturity Treasuries, followed by traditional ABS with a +0.71% excess return and agency CMBS at +0.66%. Non-corporate credit was next with a +0.40% excess return, followed by corporate credit at +0.20%. Agency MBS returns matched the Treasury market, while the inflation-linked TIPS space significantly underperformed as inflation expectations fell. Similar to the previous year, the largest positive impact on the Fund’s performance came from our sector allocation decision. Our overweight position in the credit and spread sectors of the market benefitted returns, as yield spreads on non-government securities tightened during the year (largely as a result of the sharp snap-back witnessed in the first three months of 2019). The Fund’s yield advantage versus the benchmark also benefitted relative performance, as did yield curve positioning given our underweight exposure to the 30-year segment of the curve. The primary detractor from relative performance was due to the downdraft in bond yields over the year, as the Fund’s lower duration exposure resulted in less price appreciation.
During the year the Fund’s overall sector allocation remained fairly consistent, with a modest increase in agency CMBS securities and a corresponding decline in government and non-agency RMBS securities. In the corporate sector we remained vigilant in our pursuit of improving the fundamental quality of the portfolio, trimming names with uncertain credit outlooks and extending maturities where opportunities arose to capture steep credit curves. In the securitized space we were active in the agency CMBS sector, adding positions in longer duration securities that we believe offered excellent value given the high-quality nature of the assets. We were relatively quiet in the agency MBS sector given muted value, thus allowing the allocation to drift lower during the year, while our exposure to non-agency RMBS product also declined modestly as legacy bonds rolled off. In terms of credit quality there was no significant change during the year, as the Fund maintained a AA- weighted average credit rating.
Many of the ominous signs we saw at the end of 2018 have receded to the background—primary debt markets are wide open even for low-quality issuers; measures of volatility have fallen; the government shutdown was resolved; and trade talks with China appear to be moving forward, etc. One could therefore make a strong case that Q4 of 2018 was the trough for financial markets, especially now that the Fed had shifted to a more dovish policy stance. Having said that, the fact remains that we are in the 10th year of an expansion and signs of late-cycle behavior remain, such as higher leverage metrics in corporate credit and looser underwriting trends in securitized markets. As such, we still lean toward caution with respect to overall risk exposure in the portfolio, knowing that being early could well mean underperformance in the near term. We continue to hold a below-index duration position, but have moved closer to neutral over the quarter. Regarding sector allocation, we remain underweight the traditional U.S. government sectors, in addition to an underweight in the agency MBS market. Our view has not changed with respect to the private-label securitized space, where we remain overweight the non-agency RMBS and CMBS sectors, as well as the traditional ABS space, given our view that the risk-adjusted yield pickup is attractive. We remain overweight in the broad corporate sector, largely due to exposure to the financial and industrial subsectors, offset by an underweight in the utility sector.
As always, we remain committed to seeking prudent, value-enhancing investment opportunities consistent with our disciplined approach of managing for the long-term.
ANNUAL REPORT 2019
INCOME FUND (Unaudited)
Return of a $10,000 Investment as of March 31, 2019
Portfolio Composition as of March 31, 2019
Percentage Based on Total Value of Investments
(Portfolio composition is subject to change)
| Corporate Bonds | 29.4% |
| U.S. Government Mortgage Backed Securities | 25.9% |
| U.S. Treasury Securities | 14.4% |
| Non-Agency Residential Mortgage Backed Securities | 10.4% |
| Asset Backed Securities | 8.0% |
| Non-Agency Commercial Mortgage Backed Securities | 6.5% |
| Treasury Inflation Index Securities | 1.6% |
| Municipals | 1.5% |
| Short-Term Investments | 1.5% |
| Investment Companies | 0.8% |
| 100.0% |
Portfolio Analysis as of March 31, 2019
(Portfolio composition is subject to change)
| Weighted Average to Maturity: | 11.5 years |
Average Annual Total Returns for the Year Ended March 31, 2019*
| 1 Year | 5 Year | 10 Year | |
| Tributary Income Fund — Institutional Class | 4.31% | 2.74% | 4.23% |
| Bloomberg Barclays U.S. Aggregate Bond Index | 4.48% | 2.74% | 3.77% |
| Prospectus Expense Ratio (Gross/Net)† | 1.48% | 0.78% | |
| Expense Ratio for the Year Ended March 31, 2019 (Gross/Net) | 1.48% | 0.80% |
| 1 Year | 5 Year | Since Inception†† | |
| Tributary Income Fund — Institutional Plus Class | 4.50% | 2.90% | 3.16% |
| Bloomberg Barclays U.S. Aggregate Bond Index | 4.48% | 2.74% | 2.58% |
| Prospectus Expense Ratio (Gross/Net)† | 0.82% | 0.60% | |
| Expense Ratio for the Year Ended March 31, 2019 (Gross/Net) | 0.82% | 0.61% |
Past performance does not guarantee future results. The performance data quoted represents past performance and current returns may be lower to higher. Total returns include change in share price, reinvestment of dividends and capital gains. The investment return and principal value will fluctuate so that an investor’s shares, when redeemed may be worth more or less than the original cost. To obtain performance information current to the most recent month end, please visit our website at www.tributaryfunds.com.
| (†) | The expense ratios are from the Fund’s prospectus dated August 1, 2018. Net expense ratios are net of contractual waivers which are in effect through August 1, 2019. |
| (††) | Commencement date for the Institutional Plus Class was October 28, 2011. |
| (*) | Returns shown do not reflect the deduction of taxes that a shareholder would pay on Fund distributions or the redemption of Fund shares. Investment performance reflects contractual fee waivers in effect for certain periods. Without these fee waivers, the performance would have been lower. |
The line chart assumes an initial investment of $10,000 made on March 31, 2009. Total return is based on net change in net asset value (“NAV”) assuming reinvestment of all dividends and other distributions.
The performance of Institutional Plus Class will be different than Institutional Class based on differences in fees borne by each class. Bloomberg Barclays U.S. Aggregate Bond Index is an unmanaged index and covers the USD-denominated, investment-grade, fixed-rate, taxable bond market of SEC-registered securities. The index includes bonds from the Treasury, Government Related, Corporate, MBS (agency fixed-rate and hybrid ARM passthroughs), ABS and CMS sectors. The index is unmanaged and does not reflect the deduction of fees or taxes associated with a mutual fund, such as investment management, administration and other operational fees. Investors cannot directly invest in the index.
ANNUAL REPORT 2019
NEBRASKA TAX-FREE FUND (Unaudited)
Investment Objective
The Tributary Nebraska Tax-Free Fund seeks as high a level of current income exempt from both federal and Nebraska income tax as is consistent with the preservation of capital.
Manager Commentary
The trailing twelve month period began with indications of a robust U.S. economy, as healthy corporate earnings, a strong labor market, and high levels of business and consumer confidence caused growth to exceed expectations. Indeed, GDP growth of 4.2% and 3.4% in the second and third quarters of 2018 pushed market interest rates higher. The strong data and concerns over increasing labor costs allowed the Federal Reserve to continue raising the fed funds rate, and the U.S. Treasury curve continued to flatten. In the last half of the period, however, the domestic economy appeared to buckle under higher interest rates, slowing global growth, and concerns regarding U.S. trade policies, as witnessed by fourth quarter GDP growth decelerating to 2.5%. While market interest rates peaked in the fourth quarter and began declining in response to the slowdown, the Federal Reserve remained hawkish and raised the fed funds rate for the fourth time in late 2018. At the same time, fears of a monetary mistake toppled the markets and fixed income spreads widened dramatically as U.S. Treasury rates nosedived. With global financial markets tumbling, the Fed was forced to pivot away from its plan of additional rate hikes in 2019. Promising patience, the Fed announced that they are currently on hold and will wait for additional data, particularly inflation data, to determine whether its next move will be a hike or a cut in the fed funds rate. For its part, the Nebraska economy fared better over the past year, with GDP growth hitting a solid 3.6% in the third quarter of 2018. The state unemployment rate has stayed below 3% since January 2017, while wages continued to grow, albeit at a more modest pace of 2.8% for the state compared to 3.2% nationally. The real estate market remained a positive contributor given the long-lasting low supply of residential homes in the two major metropolitan areas of the state; this was offset partially by a slowdown of new home construction in the second half of the year. A strengthening U.S. dollar and ongoing trade disputes continued to weigh on the Nebraska agricultural sector and drive weakness in global exports in 2018. Nonetheless, consumer sentiment and business surveys started trending higher in the fall of 2018 on renewed expectations of trade negotiations and more recently on the Federal Reserve’s dovish monetary policy pivot.
The Tributary Nebraska Tax-Free Fund returned 4.39% (net, Institutional Plus) for the year ended March 31, 2019 compared to a 5.09% return for the Bloomberg Barclays 1-15 Year Municipal Blend Index. The U.S. Treasury yield curve moved in a somewhat odd fashion over the trailing 12 months, with short-term yields moving higher, the 2-year yield ending essentially unchanged, the 10-year yield 33 bps lower, and the 30-year yield finishing 16 bps lower. The municipal market saw a more pronounced move in yields given strong retail demand for municipal bonds, with the 2-year yield 16bps lower, the 10-year yield 60 bps lower, and the 30-year yield 29 bps lower. Although the general downward shift of the yield curve drove positive returns in the bond market, relative performance of the Fund suffered as a result given our lower duration exposure. Specifically, the Fund’s underweight position in the intermediate portion of the curve detracted from relative performance versus the benchmark. The Fund’s higher credit quality also had a large impact on relative performance as higher-beta, BBB-rated credits significantly outperformed during the trailing 12-month period.
During the year the Fund’s overall sector allocation remained fairly consistent, with a modest increase in revenue bonds in the higher education, leasing, and single-family housing sectors, along with a reduction in the pre-refunded category in favor of local general obligation bonds. We actively sought out securities with longer call protection to increase our exposure to the 7-10-year portion of the curve, given that the majority of municipal issuance in the state comes with a 5-year call structure. In terms of credit quality there was no significant change during the year, as the Fund maintained a AA- weighted average credit rating.
Many of the ominous signs we saw at the end of the year have receded to the background—primary debt markets are wide open even for low-quality issuers; measures of volatility have fallen; the government shutdown was resolved; and trade talks with China appear to be moving forward, etc. One could therefore make a strong case that Q4 of 2018 was the trough for financial markets, especially now that the Fed had shifted to a more dovish policy stance. Having said that, the fact remains that we are in the 10th year of an expansion and signs of late-cycle behavior remain, such as higher leverage metrics in corporate credit and looser underwriting trends in many markets. With respect to Nebraska, we are positive on the state’s long-term fiscal health and growth fundamentals, but at the same time remain focused on a few near-term risks that could affect the state. The agricultural sector continues to experience weakness in the form of suppressed commodity prices, trade tariffs, and a strong U.S. dollar. More recently, the unprecedented flooding that occurred in the eastern half of the state has had a major impact on roads, bridges, and public infrastructure. While overall damages are quite significant (in the billion dollar range), market consensus seems to be that the combination of federal and state emergency funds and insurance proceeds will allow this natural disaster to pass with no major long-term negative effects. From a technical perspective, the municipal market also looks to be positioned favorably with flat to slightly lower supply expectations for the year and continued net investor demand for tax-exempt investments. We continue to hold a below-index duration position, but have moved closer to neutral over the quarter.
As always, we remain committed to seeking prudent, value-enhancing investment opportunities consistent with our disciplined approach of managing for the long-term.
ANNUAL REPORT 2019
NEBRASKA TAX-FREE FUND (Unaudited)
Return of a $10,000 Investment as of March 31, 2019

Portfolio Composition as of March 31, 2019
Percentage Based on Total Value of Investments
(Portfolio composition is subject to change)
| Municipals | 97.6% |
| Short-Term Investments | 2.4% |
| 100.0% |
Average Annual Total Returns for the Year Ended March 31, 2019*
| 1 Year | 5 Year | 10 Year | |
| Tributary Nebraska Tax-Free Fund — Institutional Plus Class | 4.39% | 2.87% | 3.25% |
| Bloomberg Barclays 1-15 Year Municipal Blend Index (1-17) | 5.09% | 3.05% | 3.84% |
| Bloomberg Barclays Municipal Bond Index | 5.38% | 3.73% | 4.72% |
| Prospectus Expense Ratio (Gross/Net)† | 0.67% | 0.45% | |
| Expense Ratio for the Year Ended March 31, 2019 (Gross/Net) | 0.66% | 0.45% |
Past performance does not guarantee future results. The performance data quoted represents past performance and current returns may be lower to higher. Total returns include change in share price, reinvestment of dividends and capital gains. The investment return and principal value will fluctuate so that an investor’s shares, when redeemed may be worth more or less than the original cost. To obtain performance information current to the most recent month end, please visit our website at www.tributaryfunds.com.
| (†) | The Fund’s Institutional Plus Class performance for periods prior to the commencement of operations (1/1/16) is that of a common trust fund managed by First National Bank of Omaha. The common trust fund commenced operations on December 31, 2007. |
| (††) | The expense ratios are from the Fund’s prospectus dated August 1, 2018. Net expense ratios are net of contractual waivers which are in effect through August 1, 2019. |
| (*) | Returns shown do not reflect the deduction of taxes that a shareholder would pay on Fund distributions or the redemption of Fund shares. Investment performance reflects contractual fee waivers in effect for certain periods. Without these fee waivers, the performance would have been lower. |
The line chart assumes an initial investment of $10,000 made on March 31, 2009. Total return is based on net change in net asset value (“NAV”) assuming reinvestment of all dividends and other distributions.
The Bloomberg Barclays 1-15 Year Municipal Blend Index represents the performance of municipal bonds with maturities from 1 to 17 years. The Bloomberg Barclays Municipal Bond Index is a broad-based benchmark that measures the investment grade, U.S. dollar-denominated, fixed tax exempt bond market. The index includes state and local general obligation, revenue, insured, and pre-refunded bonds. The Bloomberg Barclays Municipal Bond Index was incepted in January 1980. The index does not reflect the fees and expenses associated with a mutual fund, such as investment management, administration and other operational fees. Investors cannot invest directly in the index.
ANNUAL REPORT 2019
BALANCED FUND (Unaudited)
Investment Objective
The Tributary Balanced Fund seeks capital appreciation and current income.
Manager Commentary
For the fiscal year ending March 31, 2019, the Tributary Balanced Fund (FOBPX) (net, Institutional Plus) returned 7.43%. As compared to the Composite Index (60% Russell 3000; 40% Barclays Capital U.S. Intermediate Government/Credit), the Fund slightly outperformed the benchmark return of 7.29%.
There are three primary drivers of relative performance. First, the asset allocation mix between stocks, bonds and cash. During the fiscal year, the portfolio management team overweighted equities with an average allocation of 63.5% and underweighted bonds with average exposure of 32.8%. This tactical decision had a slight positive impact on performance as equities outperformed bonds over the last year. Second, stock selection positively impacted relative performance. Individual stock holdings returned 10.59% over the last year, well ahead of the Russell 3000 Index return of 8.77%. The Fund’s growth bias contributed to returns as growth stocks outperformed value stocks during this period. Third, fixed income returns were positive on an absolute basis and had a minimal impact on relative performance. Individual bond holdings returned 4.20% over the last 12 months, in-line with the Barclay’s Capital U.S. Intermediate Government/Credit Index return of 4.24%. The Fund’s fixed income duration was slightly shorter than the benchmark, which hurt relative performance as yields fell and bond prices rose.
In equities, our sector allocation was slightly negative due to the underweight position in Information Technology. Stock selection was positive in healthcare, consumer discretionary, real estate and information technology. The top five contributors were Eli Lilly (healthcare), O’Reilly Automotive (consumer discretionary), Chuck & Dwight (consumer staples), Ulta Beauty (consumer discretionary) and American Tower (real estate). In the fiscal year, stock selection was negative in Industrials and Financials. The bottom five detractors from performance include Constellation Brands (consumer staples), FedEx (industrials), Activision Blizzard (communication services), Ingredion (consumer staples) and Western Digital (information technology).
During the last year, volatility returned to the stock market, especially in the fourth quarter, as fears of a recession increased. The primary factors were the Federal Reserve increasing interest rates and the potential for trade wars to negatively impacting global economic activity. We maintained our conviction of continued economic growth and our overweight stock allocation during the market downturn. This decision contributed to returns as the change in Fed monetary policy and expectation of zero interest rate hikes in 2019 helped lead to the recent stock market rebound. In terms of relative valuations, equities are now trading slightly above historical averages and at reasonable levels compared to opportunities in the fixed income market.
We believe the biggest short-term risk is the possibility of a profits recession as a result of slowing global growth and the strong U.S. dollar. Although the corporate profit cycle has decelerated, the broad U.S. stock market is expecting earnings growth of 5.9% over the next 12 months. We continue to closely monitor earnings and specifically the profit outlook for companies owned in the Fund. Based on our outlook of continued economic growth and modest earnings expansion, we are maintaining a 62 - 63% stock allocation.
We have made modest changes to the sector positions in each asset class. For most of the last year, we held a slight bias in our allocation toward economically sensitive industries. Based on slowing global economic activity, we have reduced this overweight and now are relatively neutral between cyclical and defensive sectors. Our overweight position in communication services and health care is offset by the underweight position in information technology. Our philosophy and portfolio construction emphasizes driving additional returns through stock selection. We do this by owning companies with a positive profit outlook at reasonable valuations. In fixed income sectors, we emphasize residential and commercial mortgage-backed securities as well as traditional asset-backed securities. Within corporate bonds, we have a bias toward high quality assets that provide interest income with less inherent risk. With multiple asset classes in the Fund, we are well positioned to take advantage of market volatility and changes in the macro-economic environment.
ANNUAL REPORT 2019
BALANCED FUND (Unaudited)
Return of a $10,000 Investment as of March 31, 2019

Portfolio Composition as of March 31, 2019
Percentage Based on Total Value of Investments
(Portfolio composition is subject to change)
| Government Securities | 19.4% |
| Information Technology | 13.1% |
| Financials | 12.7% |
| Health Care | 9.6% |
| Consumer Discretionary | 7.4% |
| Communication Services | 7.3% |
| Industrials | 6.7% |
| Consumer Staples | 4.8% |
| Short-Term Investments | 3.7% |
| Energy | 3.6% |
| Real Estate | 2.6% |
| Utilities | 2.3% |
| Asset Backed Securities | 2.0% |
| Materials | 1.9% |
| Non-Agency Residential Mortgage Backed Securities | 1.4% |
| Non-Agency Commercial Mortgage Backed Securities | 0.9% |
| U.S. Government Mortgage Backed Securities | 0.6% |
| 100.0% |
Average Annual Total Returns for the Year Ended March 31, 2019*
| 1 Year | 5 Year | 10 Year | |
| Tributary Balanced Fund — Institutional Class | 7.22% | 5.87% | 11.79% |
| Composite Index | 7.29% | 7.17% | 10.93% |
| Bloomberg Barclays U.S. Intermediate Government/Credit Bond Index | 4.24% | 2.12% | 3.14% |
| Russell 3000 Index | 8.77% | 10.36% | 16.00% |
| Prospectus Expense Ratio (Gross/Net)† | 1.27% | 1.04% | |
| Expense Ratio for the Year Ended March 31, 2019 (Gross/Net) | 1.28% | 1.09% |
| 1 Year | 5 Year | Since Inception†† | |
| Tributary Balanced Fund — Institutional Plus Class | 7.43% | 6.07% | 8.72% |
| Composite Index | 7.29% | 7.17% | 9.34% |
| Bloomberg Barclays US Intermediate Government/Credit Bond Index | 4.24% | 2.12% | 2.14% |
| Russell 3000 Index | 8.77% | 10.36% | 14.11% |
| Prospectus Expense Ratio (Gross/Net)† | 1.03% | 0.85% | |
| Expense Ratio for the Year Ended March 31, 2019 (Gross/Net) | 1.04% | 0.90% |
Past performance does not guarantee future results. The performance data quoted represents past performance and current returns may be lower to higher. Total returns include change in share price, reinvestment of dividends and capital gains. The investment return and principal value will fluctuate so that an investor’s shares, when redeemed may be worth more or less than the original cost. To obtain performance information current to the most recent month end, please visit our website at www.tributaryfunds.com.
| (†) | The expense ratios are from the Fund’s prospectus dated August 1, 2018. Net expense ratios are net of contractual waivers which are in effect through August 1, 2019. |
| (††) | Commencement date for the Institutional Plus Class was October 14, 2011. |
| (*) | Returns shown do not reflect the deduction of taxes that a shareholder would pay on Fund distributions or the redemption of Fund shares. Investment performance reflects contractual fee waivers in effect for certain periods. Without these fee waivers, the performance would have been lower. |
The line chart assumes an initial investment of $10,000 made on March 31, 2009. Total return is based on net change in net asset value (“NAV”) assuming reinvestment of all dividends and other distributions.
The performance of Institutional Plus Class will be different than Institutional Class based on differences in fees borne by each class. The Composite Index is intended to provide a single benchmark that more accurately reflects the composition of securities held by the Fund. Sixty percent of the Composite Index is comprised of the Russell 3000 Index and forty percent of the Composite index is comprised of the Bloomberg Barclays U.S. Intermediate Government/Credit Bond Index. The Russell 3000 Index seeks to be a benchmark of the entire U.S. stock market. More specifically, this index encompasses the 3,000 largest U.S.-traded stocks, in which the underlying companies are all incorporated in the U.S. The Bloomberg Barclays U.S. Intermediate Government/Credit Bond Index is a market value weighted performance benchmark for government and corporate fixed-rate debt issues (rated Baa/BBB or higher) with maturities between one and ten years. The indices are unmanaged and do not reflect the deduction of fees or taxes associated with a mutual fund, such as investment management, administration and other operational fees. Investors cannot directly invest in the indices.
ANNUAL REPORT 2019
GROWTH OPPORTUNITIES FUND (Unaudited)
Investment Objective
The Tributary Growth Opportunities Fund seeks long-term capital appreciation.
Manager Commentary
For the fiscal year ending March 31, 2019, the Tributary Growth Opportunities Fund (FOGPX) (net, Institutional Plus) delivered a return of 12.56%— another year of double digit returns that beat the Russell Midcap Growth Index by 1.05%.
Entering the fiscal year, the equity markets were dealing with heightened price volatility as higher interest rates were beginning to have a dampening effect in some segments of the market, specifically financials. Domestic equities were working through the process of a two month correction, which essentially ended at the start of the Fiscal Year. From that point until the late summer months, the markets staged a nice rally, with the equity markets peaking in late September. A significant portion of these gains were supported by good earnings and improving business outlooks, especially in the information technology and consumer sectors.
Entering the winter months, the equity markets went on a wild roller coaster ride—as slowing revenue and earnings growth were beginning to spread to broader sectors of the market. At the same time, trade policy with China was an increasing uncertainty—yet Fed policy makers seemed intent on maintaining a somewhat restrictive monetary stance. With the U.S. Dollar strengthening, weaker corporate outlooks became even more apparent on foreign-based revenues—and inflation expectations were softening. September and December were particularly rough months for equity investors, with double-digit losses seen in the Mid Cap Growth segment in both months. Equity markets roughly bottomed near the end of the calendar year, as an abrupt about-face towards a more accommodative policy from the Fed reignited interest for risk assets during the final quarter of the fiscal year.
Despite all the volatility in the equity markets, we maintained our focus on stock selection over making sector bets. That proved to be a good strategy, as solid stock selection in the information technology, healthcare and consumer discretionary sectors added to more than a percent of contribution in each group. Essentially all of our positive contribution for the year came from making solid active management bets in sectors with double-digit price gains. As highlights, our 27.7% average return in the information technology sector was about 6% above the average sector return in the benchmark—which was an admittedly high hurdle to beat. We performed even better in healthcare, as our 24.8% average return beat the benchmark return by over 12 percentage points.
We did see a few items that detracted a bit from returns, however. In particular, it was a difficult year for our industrials holdings, as our average return in the Fund declined 5%—yet benchmark returns gained 5%. This wasn’t a great performing group even from a benchmark standpoint to begin with— so underperforming within the group due to weaker selections in Machinery and Trucking/Logistics was a real headwind for the Fund. Additionally, we encountered modest challenges again on the allocation side of portfolio performance, with our 2.5% average cash allocation and our seemingly persistent underweight position in information technology serving as the primary impediments to performance.
As we look into the new fiscal year, the Fund is positioned with a slight cyclical bias— as we expect to see the positive effects from recently implemented accommodative monetary actions from central banks start to take hold. While we still see an underlying trend of slowing revenue and earnings growth, we believe that signs of stabilization are beginning to appear. While our efforts undoubtedly remain on stock selection, we continue to focus our efforts on reducing our cash levels to fully participate in market advances. While there may be corrective pullbacks during the year, we intend to be opportunistic during such time periods.
While we are generally optimistic on the outlook for equities, we do recognize there are risks to consider. Despite a more accommodative stance by the Fed and other central banks, the short end of the yield curve hasn’t really declined materially—and the shape of the yield curve itself remains relatively flat. In addition, trade tensions with China remain unresolved—though the markets have tended to advance higher in anticipation of a major resolution. Perhaps just as important, we still economic activity on developed economies within Europe as quite weak, and a continued slowing trend in economic growth within China and the U.S.
Despite the ebbs and flows in central bank policies and macroeconomic outlooks, we remain committed to sticking to our knitting—by focusing our efforts on generating superior stock selection, while ensuring that the Fund remains fully diversified as a primary risk control measure. We believe we made great strides this past year on the risk control side of the equation within our investment process— even though investors may not see or visibly appreciate these efforts. Our ability to position the Fund to generate superior risk-adjusted returns remains a centerpiece of our investment philosophy— and we feel we’re in an improved position to do just that, as we continue to execute within our continually improving investment process.
ANNUAL REPORT 2019
GROWTH OPPORTUNITIES FUND (Unaudited)
Return of a $10,000 Investment as of March 31, 2019

Portfolio Composition as of March 31, 2019
Percentage Based on Total Value of Investments
(Portfolio composition is subject to change)
| Information Technology | 30.9% |
| Consumer Discretionary | 16.6% |
| Health Care | 15.5% |
| Industrials | 14.4% |
| Financials | 5.3% |
| Consumer Staples | 3.9% |
| Communication Services | 3.6% |
| Real Estate | 3.3% |
| Materials | 3.0% |
| Energy | 1.2% |
| Utilities | 0.5% |
| Short-Term Investments | 1.8% |
| 100.0% |
Average Annual Total Returns for the Year Ended March 31, 2019*
| 1 Year | 5 Year | 10 Year | |
| Tributary Growth Opportunities Fund — Institutional Class | 12.37% | 9.13% | 16.16% |
| Russell Midcap Growth Index | 11.51% | 10.89% | 17.60% |
| S&P 500® Index | 9.50% | 10.91% | 15.92% |
| Prospectus Expense Ratio (Gross/Net)† | 1.33% | 1.13% | |
| Expense Ratio for the Year Ended March 31, 2019 (Gross/Net) | 1.34% | 1.11% |
| 1 Year | 5 Year | Since Inception†† | |
| Tributary Growth Opportunities Fund — Institutional Plus Class | 12.56% | 9.34% | 13.07% |
| Russell Midcap Growth Index | 11.51% | 10.89% | 14.34% |
| S&P 500® Index | 9.50% | 10.91% | 14.28% |
| Prospectus Expense Ratio (Gross/Net)† | 0.97% | 0.94% | |
| Expense Ratio for the Year Ended March 31, 2019 (Gross/Net) | 0.97% | 0.94% |
Past performance does not guarantee future results. The performance data quoted represents past performance and current returns may be lower to higher. Total returns include change in share price, reinvestment of dividends and capital gains. The investment return and principal value will fluctuate so that an investor’s shares, when redeemed may be worth more or less than the original cost. To obtain performance information current to the most recent month end, please visit our website at www.tributaryfunds.com.
| (†) | The expense ratios are from the Fund’s prospectus dated August 1, 2018. Net expense ratios are net of contractual waivers which are in effect through August 1, 2019. |
| (††) | Commencement date for the Institutional Plus Class was October 14, 2011. |
| (*) | Returns shown do not reflect the deduction of taxes that a shareholder would pay on Fund distributions or the redemption of Fund shares. Investment performance reflects contractual fee waivers in effect for certain periods. Without these fee waivers, the performance would have been lower. |
The line chart assumes an initial investment of $10,000 made on March 31, 2009. Total return is based on net change in net asset value (“NAV”) assuming reinvestment of all dividends and other distributions.
The performance of Institutional Plus Class will be different than Institutional Class based on differences in fees borne by each class.
The Russell Midcap Growth Index measures the performance of the mid-cap growth segment of the U.S. equity universe. It includes those Russell Midcap Index companies with higher price-to-book ratios and higher forecasted growth values. The Fund’s primary index is the Russell Midcap Growth Index, however to provide a broader market comparative, the S&P 500 Index is a secondary benchmark. The S&P 500 Index is a broad based index of 500 selected common stocks, most of which are listed on the New York Stock Exchange, that measures the U.S. stock market as a whole. The index is heavily weighted towards stocks with large market capitalizations and represents approximately two-thirds of the total market value of all domestic common stocks. The indices are unmanaged and do not reflect the deduction of fees or taxes associated with a mutual fund, such as investment management, administration and other operational fees. Investors cannot directly invest in the indices.
ANNUAL REPORT 2019
SMALL COMPANY FUND (Unaudited)
Investment Objective
The Tributary Small Company Fund seeks long-term capital appreciation.
Manager Commentary
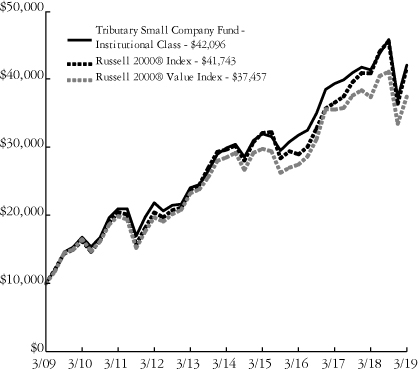
For the year ended March 31, 2019, the Tributary Small Company Fund returned 1.67% (Institutional Class at NAV) and 1.90% (Institutional Plus Class at NAV) compared to 2.05% for the Russell 2000 Index and 0.17% for the Russell 2000 Value Index.
While the returns for the Russell 2000 and Russell 2000 Value ended up being relatively small over the last 12 months, the journey was punctuated by several significant swings in the market. The Russell 2000 was up approximately 14% from the beginning of April 2018 through August 2018, reaching an all-time high on August 31st. Over the next four months, the Russell 2000 would plunge almost 27%, bottoming out on December 24th of 2018. The Russell 2000 would finish the year with a considerable rally from December 24th through the end of March 2019 of approximately 22%.
The best performing sectors in the Russell 2000 over the last 12 months were utilities (+21%), communications services (+18%) and information technology (+15%). The weakest performing sectors in the Russell 2000 over the last 12 months were energy (-18%), materials (-10%) and industrials (-5%).
The Tributary Small Company Fund’s strongest relative performance came from the consumer discretionary and healthcare economic sectors. In the consumer discretionary sector, the Fund returned approximately 27% over the last year compared to a return for the Russell 2000 consumer discretionary sector of approximately 3%. Five Below was the largest contributor to the Fund’s consumer discretionary return in the last 12 months due to strong same-store sales and continued growth in its store base. In the healthcare sector, the Fund generated a return of approximately +14% in the prior 12 months versus a return for healthcare stocks within the Russell 2000 of approximately 3%. Omnicell was the largest contributor to the Fund’s healthcare sector return as a result of positive sales momentum for their new automated medication and medical supply dispensing system. As of their most recent quarterly report, they remained optimistic that they are in the early innings of rolling out this product, which should continue to drive positive results for the company.
The Tributary Small Company Fund’s weakest relative performance came from the information technology and energy economic sectors. In the information technology sector, the Fund’s return was approximately -6% over the last year compared to a return for the Russell 2000 information technology sector of approximately 15%. Part of the underperformance was due to the Fund’s value orientation. The Russell 2000 Value technology sector returned approximately 9%, considerably behind the 18% for the Russell 2000 Growth technology sector. Within information technology, the software industry (~36% of the Russell 2000 sector’s 15% weight) was up 29% in the last 12 months and the Fund did not own any software companies during that period. The software industry tends to be populated with more growth-oriented companies, expensive valuations, and a significant number of them have negative projected earnings over the next 12 months. Our investment philosophy tends to steer us away from companies with these attributes. In addition to a lack of software exposure, CalAmp was the largest individual negative contributor to the Fund’s information technology return. The company announced negative quarterly results due to manufacturing and supply chain issues, coupled with sales weakness in Europe, South America and South Africa. In the energy sector, the Fund’s trailing 12-month return of approximately -39% lagged the Russell 2000 energy sector return of -18%. The price for WTI crude was down approximately 40% from the beginning of October 2018 through December 2018 and that helped contribute to the overall negative sector returns. In addition, Callon Petroleum was the largest negative contributor to sector performance in the Fund. In May of 2018, Callon announced the acquisition of acreage in the Delaware Basin and financed the transaction by issuing equity and debt. This capital raise likely contributed to the downturn in the stock. While leverage increased, it will not reach a level that changes the investment thesis for the company. On a positive note, the land Callon acquired is contiguous to currently owned acreage, which allows for longer lateral drilling, and the price they paid for the acreage was very reasonable.
Our approach to investing focuses on owning a fully invested, diversified portfolio of quality businesses at attractive prices. We believe the companies in our portfolio will continue to grow their intrinsic value for our shareholders and represent value that will be rewarded by the market over time.
ANNUAL REPORT 2019
SMALL COMPANY FUND (Unaudited)
Return of a $10,000 Investment as of March 31, 2019
Portfolio Composition as of March 31, 2019
Percentage Based on Total Value of Investments
(Portfolio composition is subject to change)
| Financials | 19.6% |
| Information Technology | 17.9% |
| Industrials | 14.2% |
| Health Care | 13.5% |
| Consumer Discretionary | 7.6% |
| Real Estate | 7.1% |
| Materials | 4.6% |
| Energy | 4.0% |
| Communication Services | 3.9% |
| Utilities | 3.1% |
| Short-Term Investments | 4.5% |
| 100.0% |
Average Annual Total Returns for the Year Ended March 31, 2019*
| 1 Year | 5 Year | 10 Year | |
| Tributary Small Company Fund — Institutional Class | 1.67% | 7.06% | 15.46% |
| Russell 2000 Index | 2.05% | 7.05% | 15.36% |
| Russell 2000 Value Index | 0.17% | 5.59% | 14.12% |
| Prospectus Expense Ratio (Gross/Net)† | 1.29% | 1.22% | |
| Expense Ratio for the Year Ended March 31, 2019 (Gross/Net) | 1.30% | 1.20% |
| 1 Year | 5 Year | Since Inception†† | |
| Tributary Small Company Fund — Institutional Plus Class | 1.90% | 7.29% | 9.92% |
| Russell 2000 Index | 2.05% | 7.05% | 10.07% |
| Russell 2000 Value Index | 0.17% | 5.59% | 8.95% |
| Prospectus Expense Ratio (Gross/Net)† | 1.08% | 0.99% | |
| Expense Ratio for the Year Ended March 31, 2019 (Gross/Net) | 1.08% | 0.99% |
Past performance does not guarantee future results. The performance data quoted represents past performance and current returns may be lower to higher. Total returns include change in share price, reinvestment of dividends and capital gains. The investment return and principal value will fluctuate so that an investor’s shares, when redeemed may be worth more or less than the original cost. To obtain performance information current to the most recent month end, please visit our website at www.tributaryfunds.com.
| (†) | The expense ratios are from the Fund’s prospectus dated August 1, 2018. Net expense ratios are net of contractual waivers which are in effect through August 1, 2019. |
| (††) | Commencement date for the Institutional Plus Class was December 17, 2010. |
| (*) | Returns shown do not reflect the deduction of taxes that a shareholder would pay on Fund distributions or the redemption of Fund shares. Investment performance reflects contractual fee waivers in effect for certain periods. Without these fee waivers, the performance would have been lower. |
The line chart assumes an initial investment of $10,000 made on March 31, 2009. Total return is based on net change in net asset value (“NAV”) assuming reinvestment of all dividends and other distributions.
The performance of Institutional Plus Class will be different than Institutional Class based on differences in fees borne by each class.
The Russell 2000 Index measures the performance of the small-cap segment of the U.S. equity universe. The Russell 2000 Index is a subset of the Russell 3000®Index representing approximately 10% of the total market capitalization of that index. It includes approximately 2000 of the smallest securities based on a combination of their market cap and current index membership. The Russell 2000 Value Index measures the performance of small-cap value segment of the U.S. equities universe. It includes those Russell 2000 companies with lower price-to-book ratios and lower forecasted growth values. The indices are unmanaged and do not reflect the deduction of fees or taxes associated with a mutual fund, such as investment management, administration and other operational fees. Investors cannot directly invest in the indices.
ANNUAL REPORT 2019
SCHEDULES OF PORTFOLIO INVESTMENTS
March 31, 2019
SHORT-INTERMEDIATE BOND FUND
| Principal Amount | Security Description | Value | ||||||
| Non-U.S. Government Agency Asset Backed Securities - 31.0% | ||||||||
| Asset Backed Securities - 17.5% | ||||||||
| $ | 865,000 | American Express Credit Account Master Trust (USD 1 Month LIBOR + 0.37%), 2.85%, 12/15/21 (a) | $ | 865,356 | ||||
| 830,670 | AmeriCredit Automobile Receivables Trust, 1.53%, 07/08/21 | 828,253 | ||||||
| 1,605,000 | Ascentium Equipment Receivables Trust, 3.27%, 10/12/21 (b) | 1,613,951 | ||||||
| 1,063,431 | Ascentium Equipment Receivables Trust, 2.29%, 06/10/21 (b) | 1,059,042 | ||||||
| 643,833 | Brazos Higher Education Authority, Inc.(USD 3 Month LIBOR + 0.85%), 3.62%, 07/25/29 (a) | 647,969 | ||||||
| 12,605 | Canadian Pacer Auto Receivables Trust, 2.55%, 10/21/19 (b) | 12,603 | ||||||
| 1,752,728 | Canadian Pacer Auto Receivables Trust, 2.05%, 03/19/21 (b) | 1,746,081 | ||||||
| 1,330,000 | Capital One Multi-Asset Execution Trust, 2.08%, 03/15/23 | 1,322,137 | ||||||
| 572,633 | CCG Receivables Trust REMIC, 2.50%, 06/16/25 (b) | 571,471 | ||||||
| 1,825,000 | CCG Receivables Trust REMIC, 3.09%, 12/15/25 (b) | 1,830,436 | ||||||
| 1,231,476 | Flagstar Mortgage Trust, 4.00%, 07/25/48 (b)(c) | 1,245,708 | ||||||
| 1,155,000 | Ford Credit Floorplan Master Owner Trust A, 2.16%, 11/15/21 | 1,148,616 | ||||||
| 344,297 | Goal Capital Funding Trust (USD 3 Month LIBOR + 0.70%), 3.35%, 08/25/48 (a)(b) | 345,756 | ||||||
| 1,370,000 | Great American Auto Leasing, Inc., 2.97%, 06/15/21 (b) | 1,372,788 | ||||||
| 1,760,000 | Honda Auto Receivables 2019-1 Owner Trust, 2.75%, 09/20/21 | 1,761,661 | ||||||
| 769,282 | Magnetite CLO, Ltd.CLO (USD 3 Month LIBOR + 1.00%), 3.77%, 07/25/26 (a)(b) | 769,284 | ||||||
| 749,095 | Missouri Higher Education Loan Authority (USD 1 Month LIBOR + 0.83%), 3.32%, 01/26/26 (a) | 742,308 | ||||||
| 932,387 | MMAF Equipment Finance, LLC, 2.57%, 06/09/33 (b) | 930,676 | ||||||
| 1,355,000 | MMAF Equipment Finance, LLC, 2.84%, 11/13/23 (b) | 1,359,989 | ||||||
| 1,928,000 | Panhandle-Plains Higher Education Authority, Inc. (USD 3 Month LIBOR + 0.95%), 3.75%, 10/01/37 (a) | 1,932,568 | ||||||
| Principal Amount | Security Description | Value | ||||||
| $ | 704,118 | Preferred Term Securities XII, Ltd./ Preferred Term Securities XII, Inc. (USD 3 Month LIBOR + 0.70%), 3.31%, 12/24/33 (a)(b) | $ | 701,442 | ||||
| 175,990 | Preferred Term Securities XII, Ltd./ Preferred Term Securities XII, Inc. (USD 3 Month LIBOR + 0.53%), 3.14%, 12/24/33 (a)(b) | 173,345 | ||||||
| 353,816 | Santander Drive Auto Receivables Trust, 2.58%, 10/15/20 | 353,765 | ||||||
| 1,049,399 | SLM Student Loan Trust (USD 3 Month LIBOR + 1.00%), 3.77%, 10/25/21 (a) | 1,050,308 | ||||||
| 1,437,360 | SLM Student Loan Trust (USD 3 Month LIBOR + 1.65%), 4.42%, 07/25/22 (a) | 1,453,478 | ||||||
| 716,256 | SLM Student Loan Trust (USD 3 Month LIBOR + 1.70%), 4.47%, 07/25/23 (a) | 725,559 | ||||||
| 681,537 | SLM Student Loan Trust (USD 3 Month LIBOR + 1.50%), 4.27%, 04/25/23 (a) | 689,389 | ||||||
| 1,093,101 | Social Professional Loan Program Trust, 2.64%, 08/25/47 (b) | 1,091,490 | ||||||
| 241,847 | Social Professional Loan Program Trust, 1.75%, 07/25/40 (b) | 240,381 | ||||||
| 436,694 | Sofi Consumer Loan Program Trust, 2.14%, 09/25/26 (b) | 435,568 | ||||||
| 440,808 | Sofi Consumer Loan Program Trust, 2.93%, 04/26/27 (b) | 440,387 | ||||||
| 825,357 | SoFi Consumer Loan Program Trust, 2.77%, 05/25/26 (b) | 822,663 | ||||||
| 489,592 | Stack Infrastructure Issuer, LLC, 4.54%, 02/25/44 (b) | 500,959 | ||||||
| 638,013 | Vantage Data Centers Issuer, LLC, 4.07%, 02/16/43 (b) | 647,680 | ||||||
| 484,412 | Verizon Owner Trust, 1.42%, 01/20/21 (b) | 483,236 | ||||||
| 31,916,303 | ||||||||
| Non-Agency Commercial Mortgage Backed Securities - 5.9% | ||||||||
| 1,630,000 | BANK 2019-BNK16, 3.93%, 02/15/52 | 1,698,404 | ||||||
| 650,000 | Bear Stearns Deutsche Bank Trust, 5.29%, 09/15/27 (b) | 655,831 | ||||||
| 1,845,290 | Citigroup Commercial Mortgage Trust Interest Only REMIC, 1.79%, 09/10/45 (b)(c) | 85,628 | ||||||
| 1,201,795 | COMM Mortgage Trust Interest Only REMIC, 1.06%, 03/10/46 (c) | 35,772 | ||||||
| 630,000 | COMM Mortgage Trust REMIC, 3.39%, 08/10/47 | 638,492 | ||||||
See accompanying Notes to Financial Statements.
ANNUAL REPORT 2019
SCHEDULES OF PORTFOLIO INVESTMENTS
March 31, 2019
SHORT-INTERMEDIATE BOND FUND
| Principal Amount | Security Description | Value | ||||||
| $ | 1,265,000 | Cosmopolitan Hotel Mortgage Trust REMIC (USD 1 Month LIBOR + 0.93%), 3.41%, 11/15/36 (a)(b) | $ | 1,264,100 | ||||
| 40,094 | DBUBS Mortgage Trust Interest Only REMIC, 0.34%, 08/10/44 (b)(c) | 230 | ||||||
| 201,165,181 | FREMF Mortgage Trust Interest Only, 0.10%, 08/25/44 (b) | 388,732 | ||||||
| 4,344,921 | GS Mortgage Securities Trust Interest Only REMIC, 1.34%, 08/10/44 (b)(c) | 104,783 | ||||||
| 23,107 | JPMorgan Chase Commercial Mortgage Securities Trust REMIC, 2.67%, 01/15/46 | 23,077 | ||||||
| 650,000 | LSTAR Commercial Mortgage Trust REMIC, 3.13%, 04/20/48 (b)(c) | 650,031 | ||||||
| 636,025 | LSTAR Commercial Mortgage Trust REMIC, 1.82%, 03/10/49 (b) | 626,163 | ||||||
| 1,296,174 | Morgan Stanley Bank of America Merrill Lynch Trust Interest Only REMIC, 0.99%, 12/15/48 (c) | 38,716 | ||||||
| 1,000,000 | Morgan Stanley Bank of America Merrill Lynch Trust REMIC, 3.48%, 06/15/47 | 1,012,441 | ||||||
| 331,905 | Wells Fargo Commercial Mortgage Trust REMIC, 2.53%, 10/15/45 | 330,734 | ||||||
| 1,010,000 | Wells Fargo Commercial Mortgage Trust REMIC, 2.97%, 09/15/48 | 1,008,768 | ||||||
| 124,542 | Wells Fargo-RBS Commercial Mortgage Trust Interest Only REMIC, 0.78%, 02/15/44 (b)(c) | 1,486 | ||||||
| 136,562 | Wells Fargo-RBS Commercial Mortgage Trust REMIC, 4.00%, 03/15/44 (b) | 137,203 | ||||||
| 17,679 | Wells Fargo-RBS Commercial Mortgage Trust REMIC, 4.39%, 06/15/44 (b) | 17,672 | ||||||
| 707,940 | Wells Fargo-RBS Commercial Mortgage Trust REMIC, 2.30%, 06/15/45 | 704,150 | ||||||
| 45,101 | Wells Fargo-RBS Commercial Mortgage Trust REMIC, 2.70%, 03/15/45 | 44,937 | ||||||
| 1,200,000 | Wells Fargo-RBS Commercial Mortgage Trust REMIC, 3.65%, 12/15/46 | 1,213,032 | ||||||
| 10,680,382 | ||||||||
| Non-Agency Residential Mortgage Backed Securities - 7.6% | ||||||||
| 1,169,797 | Asset Backed Securities Corp. Home Equity Loan Trust (USD 1 Month LIBOR + 0.80%), 3.28%, 07/25/35 (a) | 1,170,031 | ||||||
| 413,299 | Bayview Commercial Asset Trust REMIC (USD 1 Month LIBOR + 0.58%), 3.36%, 12/25/33 (a)(b) | 406,724 | ||||||
| Principal Amount | Security Description | Value | ||||||
| $ | 801,166 | Bayview Commercial Mortgage Pass- Through Trust REMIC (USD 1 Month LIBOR + 0.57%), 3.34%, 04/25/36 (a)(b) | $ | 799,892 | ||||
| 1,096,661 | Bayview Financial Acquisition Trust REMIC (USD 1 Month LIBOR + 2.33%), 4.82%, 05/28/44 (a) | 1,092,062 | ||||||
| 500,000 | Bayview Financial Acquisition Trust REMIC (USD 1 Month LIBOR + 2.10%), 4.60%, 04/28/39 (a) | 499,463 | ||||||
| 262,710 | Bayview Financial Acquisition Trust REMIC, 6.21%, 05/28/37 (d) | 265,720 | ||||||
| 676,559 | Cascade Funding Mortgage Trust, 4.00%, 10/25/68 (b)(c) | 687,479 | ||||||
| 7,318 | Citicorp Residential Mortgage Trust REMIC, 5.19%, 07/25/36 (d) | 7,401 | ||||||
| 146,100 | Citigroup Mortgage Loan Trust REMIC, 4.00%, 01/25/35 (b)(c) | 150,115 | ||||||
| 700,706 | Conseco Finance Corp. REMIC (USD 1 Month LIBOR + 2.75%), 5.23%, 04/15/32 (a) | 705,962 | ||||||
| 2,163 | Credit Suisse First Boston Mortgage Securities Corp. REMIC, 5.00%, 08/25/20 | 1,961 | ||||||
| 159,521 | Credit-Based Asset Servicing & Securitization, LLC REMIC (USD 1 Month LIBOR + 0.75%), 3.24%, 02/25/33 (a) | 161,387 | ||||||
| 304,646 | Credit-Based Asset Servicing & Securitization, LLC REMIC, 5.52%, 12/25/37 (b)(d) | 308,396 | ||||||
| 948,056 | EverBank Mortgage Loan Trust, 3.50%, 02/25/48 (b)(c) | 952,004 | ||||||
| 580,922 | Flagstar Mortgage Trust, 3.50%, 10/25/47 (b)(c) | 581,307 | ||||||
| 573,641 | Goldman Sachs Alternative Mortgage Products Trust REMIC (USD 1 Month LIBOR + 0.50%), 2.99%, 05/25/36 (a)(b) | 567,996 | ||||||
| 761,707 | GSAMP Trust (USD 1 Month LIBOR + 0.52%), 3.01%, 01/25/35 (a)(b) | 761,692 | ||||||
| 131,853 | JPMorgan Mortgage Acquisition Trust REMIC (USD 1 Month LIBOR + 0.23%), 2.72%, 07/25/36 (a) | 131,730 | ||||||
| 2,941 | Lehman ABS Manufactured Housing Contract Trust REMIC, 4.35%, 04/15/40 | 2,944 | ||||||
| 68,217 | New Residential Mortgage Loan Trust REMIC, 3.75%, 11/25/54 (b)(c) | 68,887 | ||||||
| 149,318 | New Residential Mortgage Loan Trust REMIC, 3.75%, 05/28/52 (b)(c) | 151,306 | ||||||
See accompanying Notes to Financial Statements.
ANNUAL REPORT 2019
SCHEDULES OF PORTFOLIO INVESTMENTS
March 31, 2019
SHORT-INTERMEDIATE BOND FUND
| Principal Amount | Security Description | Value | ||||||
| $ | 214,383 | New Residential Mortgage Loan Trust REMIC, 3.75%, 08/25/55 (b)(c) | $ | 216,849 | ||||
| 126,618 | NovaStar Home Equity Loan Trust REMIC (USD 1 Month LIBOR + 1.73%), 4.21%, 03/25/35 (a) | 127,566 | ||||||
| 290,795 | Oakwood Mortgage Investors, Inc. REMIC (USD 1 Month LIBOR + 0.38%), 2.86%, 03/15/21 (a)(b) | 288,346 | ||||||
| 213,609 | Park Place Securities, Inc.Asset-Backed Pass-Through Certificates REMIC (USD 1 Month LIBOR + 0.98%), 3.46%, 10/25/34 (a) | 214,146 | ||||||
| 11,679 | Residential Accredit Loans, Inc. Trust REMIC (USD 1 Month LIBOR + 14.76%), 10.20%, 03/25/20 (a) | 11,681 | ||||||
| 59,121 | Residential Accredit Loans, Inc. Trust REMIC, 5.50%, 02/25/35 | 58,837 | ||||||
| 30,785 | Residential Asset Securities Corp. Trust REMIC, 5.96%, 09/25/31 (c) | 31,680 | ||||||
| 16,243 | Residential Asset Securities Corp. Trust REMIC, 4.54%, 12/25/33 (c) | 16,536 | ||||||
| 13,144 | Residential Asset Securities Corp. Trust REMIC, 3.87%, 05/25/33 (c) | 13,265 | ||||||
| 12,638 | Residential Asset Securitization Trust REMIC, 3.75%, 10/25/21 | 12,551 | ||||||
| 113,403 | Salomon Brothers Mortgage Securities, 6.93%, 08/25/28 | 114,323 | ||||||
| 599,371 | Sequoia Mortgage Trust REMIC, 3.50%, 08/25/47 (b)(c) | 599,957 | ||||||
| 522,936 | Towd Point Mortgage Trust, 3.25%, 07/25/58 (b)(c) | 521,154 | ||||||
| 210,459 | Towd Point Mortgage Trust REMIC, 3.50%, 02/25/55 (b)(c) | 210,890 | ||||||
| 415,541 | Towd Point Mortgage Trust REMIC, 2.75%, 04/25/57 (b)(c) | 411,312 | ||||||
| 159,316 | Truman Capital Mortgage Loan Trust REMIC (USD 1 Month LIBOR + 0.43%), 2.92%, 03/25/37 (a)(b) | 161,749 | ||||||
| 1,460,853 | Wells Fargo Mortgage Backed Securities REMIC, 3.50%, 07/25/47 (b)(c) | 1,465,397 | ||||||
| 13,950,698 | ||||||||
| Total Non-U.S. Government Agency Asset Backed Securities (Cost $56,486,384) | 56,547,383 | |||||||
| Corporate Bonds - 30.3% | ||||||||
| Communication Services - 1.6% | ||||||||
| 1,780,000 | AT&T, Inc. (USD 3 Month LIBOR + 1.18%), 3.78%, 06/12/24 (a) | 1,765,734 | ||||||
| 970,000 | Verizon Communications, Inc., 5.15%, 09/15/23 | 1,066,733 | ||||||
| 2,832,467 | ||||||||
| Principal Amount | Security Description | Value | ||||||
| Consumer Discretionary - 4.4% | ||||||||
| $ | 800,000 | AMC Networks, Inc., 4.75%, 12/15/22 | $ | 806,000 | ||||
| 1,649,000 | CBS Corp., 3.38%, 03/01/22 | 1,662,210 | ||||||
| 1,740,000 | Comcast Corp., 3.45%, 10/01/21 | 1,774,668 | ||||||
| 1,783,000 | Dollar General Corp., 3.25%, 04/15/23 | 1,793,797 | ||||||
| 380,000 | Hanesbrands, Inc., 4.63%, 05/15/24 (b) | 381,026 | ||||||
| 380,000 | Hilton Worldwide Finance, LLC/Hilton Worldwide Finance Corp., 4.63%, 04/01/25 | 383,800 | ||||||
| 815,000 | Levi Strauss & Co., 5.00%, 05/01/25 | 839,450 | ||||||
| 470,000 | The Goodyear Tire & Rubber Co., 5.13%, 11/15/23 | 469,413 | ||||||
| 8,110,364 | ||||||||
| Consumer Staples - 2.8% | ||||||||
| 665,000 | Church & Dwight Co., Inc., 2.45%, 12/15/19 | 662,437 | ||||||
| 1,011,000 | Church & Dwight Co., Inc., 2.88%, 10/01/22 | 1,012,651 | ||||||
| 119,000 | Kraft Heinz Foods Co., 4.88%, 02/15/25 (b) | 121,724 | ||||||
| 395,000 | Land O'Lakes Capital Trust I, 7.45%, 03/15/28 (b) | 423,638 | ||||||
| 1,370,000 | Reckitt Benckiser Treasury Services PLC, 2.75%, 06/26/24 (b) | 1,347,067 | ||||||
| 1,615,000 | Walmart, Inc., 3.40%, 06/26/23 | 1,665,666 | ||||||
| 5,233,183 | ||||||||
| Financials - 14.9% | ||||||||
| 670,000 | AerCap Ireland Capital DAC/AerCap Global Aviation Trust, 3.50%, 01/15/25 | 646,543 | ||||||
| 1,800,000 | Bank of America Corp., 2.88%, 04/24/23 (c) | 1,795,066 | ||||||
| 1,130,000 | BB&T Corp., MTN, 2.15%, 02/01/21 | 1,119,557 | ||||||
| 475,000 | BB&T Corp., MTN, 3.20%, 09/03/21 | 480,313 | ||||||
| 375,000 | CBRE Services, Inc., 5.25%, 03/15/25 | 402,384 | ||||||
| 1,229,000 | Chubb INA Holdings, Inc., 2.30%, 11/03/20 | 1,223,057 | ||||||
| 1,805,000 | Citigroup, Inc., 2.88%, 07/24/23 (c) | 1,794,103 | ||||||
| 865,000 | Citigroup, Inc., 2.55%, 04/08/19 | 864,964 | ||||||
| 1,665,000 | Hartford Financial Services Group, Inc., 5.50%, 03/30/20 | 1,707,914 | ||||||
| 1,507,000 | Intercontinental Exchange, Inc., 4.00%, 10/15/23 | 1,581,795 | ||||||
| 1,765,000 | JPMorgan Chase & Co., 3.25%, 09/23/22 | 1,790,533 | ||||||
| 1,770,000 | KeyCorp, MTN, 2.90%, 09/15/20 | 1,774,370 | ||||||
| 1,655,000 | Metropolitan Life Global Funding I, 2.30%, 04/10/19 (b) | 1,654,873 | ||||||
| 625,000 | Metropolitan Life Global Funding I, 3.60%, 01/11/24 (b) | 643,993 | ||||||
| 1,820,000 | Morgan Stanley, MTN, 2.63%, 11/17/21 | 1,810,326 | ||||||
See accompanying Notes to Financial Statements.
ANNUAL REPORT 2019
SCHEDULES OF PORTFOLIO INVESTMENTS
March 31, 2019
SHORT-INTERMEDIATE BOND FUND
| Principal Amount | Security Description | Value | ||||||
| $ | 1,480,000 | Prudential Financial, Inc., MTN, 5.38%, 06/21/20 | $ | 1,527,886 | ||||
| 1,740,000 | Regions Financial Corp., 3.20%, 02/08/21 | 1,753,461 | ||||||
| 1,090,000 | The Charles Schwab Corp., 3.25%, 05/21/21 | 1,103,855 | ||||||
| 1,785,000 | The Goldman Sachs Group, Inc. (USD 3 Month LIBOR + 1.11%), 3.87%, 04/26/22 (a) | 1,794,560 | ||||||
| 1,610,000 | Wells Fargo & Co., Series K (callable at 100 beginning 06/15/19), 6.38%, 03/15/49 (c)(e) | 1,620,063 | ||||||
| 27,089,616 | ||||||||
| Health Care - 0.9% | ||||||||
| 1,743,000 | Becton Dickinson and Co., 2.68%, 12/15/19 | 1,737,365 | ||||||
| Industrials - 3.2% | ||||||||
| 1,740,000 | Huntington Ingalls Industries, Inc., 5.00%, 11/15/25 (b) | 1,783,500 | ||||||
| 1,795,000 | Roper Technologies, Inc., 2.80%, 12/15/21 | 1,789,550 | ||||||
| 1,715,000 | Textron, Inc., 3.65%, 03/01/21 | 1,728,324 | ||||||
| 545,000 | Union Pacific Corp., 3.20%, 06/08/21 | 550,569 | ||||||
| 5,851,943 | ||||||||
| Information Technology - 2.5% | ||||||||
| 1,803,000 | eBay, Inc., 2.75%, 01/30/23 | 1,781,360 | ||||||
| 815,000 | Harman International Industries, Inc., 4.15%, 05/15/25 | 839,183 | ||||||
| 1,807,000 | QUALCOMM, Inc., 2.90%, 05/20/24 | 1,777,269 | ||||||
| 4,397,812 | ||||||||
| Total Corporate Bonds (Cost $55,032,564) | 55,252,750 | |||||||
| Government & Agency Obligations - 36.9% | ||||||||
| GOVERNMENT SECURITIES - 31.1% | ||||||||
| Treasury Inflation Index Securities - 1.0% | ||||||||
| 1,819,478 | U.S.Treasury Inflation Indexed Bonds, 0.13%, 04/15/22 (f) | 1,803,165 | ||||||
| U.S. Treasury Securities - 30.1% | ||||||||
| 8,410,000 | U.S.Treasury Note, 1.13%, 03/31/20 | 8,306,518 | ||||||
| 25,225,000 | U.S.Treasury Note, 2.00%, 02/28/21 | 25,086,065 | ||||||
| 21,245,000 | U.S.Treasury Note, 1.63%, 11/15/22 | 20,805,992 | ||||||
| 730,000 | U.S.Treasury Note, 2.13%, 05/15/25 | 722,729 | ||||||
| 54,921,304 | ||||||||
| U.S. GOVERNMENT MORTGAGE BACKED SECURITIES - 5.8% | ||||||||
| Federal Home Loan Mortgage Corp. - 2.1% | ||||||||
| 640,482 | Federal Home Loan Mortgage Corp. Interest Only REMIC, 4.00%, 09/15/45 | 121,342 | ||||||
| 419,084 | Federal Home Loan Mortgage Corp. Interest Only REMIC, 4.00%, 11/15/43 | 62,066 | ||||||
| Principal Amount | Security Description | Value | ||||||
| $ | 268,453 | Federal Home Loan Mortgage Corp. Interest Only REMIC, 4.00%, 08/15/45 | $ | 47,513 | ||||
| 19,473 | Federal Home Loan Mortgage Corp. REMIC, 4.00%, 03/15/20 | 19,533 | ||||||
| 338,093 | Federal Home Loan Mortgage Corp. REMIC, 2.25%, 03/15/30 | 335,366 | ||||||
| 839,974 | Federal Home Loan Mortgage Corp. REMIC, 3.00%, 09/15/37 | 848,859 | ||||||
| 548,015 | Federal Home Loan Mortgage Corp. REMIC, 3.00%, 04/15/37 | 549,622 | ||||||
| 580,497 | Federal Home Loan Mortgage Corp. REMIC, 3.50%, 06/15/50 | 590,226 | ||||||
| 502,832 | Federal Whole Loan Securities Trust, 3.50%, 05/25/47 | 503,402 | ||||||
| 630,702 | FRESB Mortgage Trust, 2.16%, 04/25/22 (c) | 623,434 | ||||||
| 3,701,363 | ||||||||
| Federal National Mortgage Association - 0.7% | ||||||||
| 433,465 | Federal National Mortgage Association #AJ4087, 3.00%, 10/01/26 | 439,065 | ||||||
| 1,937,867 | Federal National Mortgage Association Interest Only, 0.68%, 02/25/22 (c) | 29,627 | ||||||
| 2,259,648 | Federal National Mortgage Association Interest Only, 0.22%, 01/25/22 (c) | 12,537 | ||||||
| 2,759,963 | Federal National Mortgage Association Interest Only, 0.37%, 07/25/22 (c) | 26,094 | ||||||
| 536,139 | Federal National Mortgage Association Interest Only, 2.60%, 01/25/39 (c) | 47,328 | ||||||
| 73,360 | Federal National Mortgage Association REMIC, 4.00%, 02/25/26 | 74,165 | ||||||
| 6,922 | Federal National Mortgage Association REMIC, 4.00%, 07/25/21 | 6,923 | ||||||
| 29,645 | Federal National Mortgage Association REMIC, 3.00%, 04/25/37 | 29,566 | ||||||
| 327,560 | Federal National Mortgage Association REMIC, 3.50%, 05/25/41 | 332,491 | ||||||
| 326,674 | Federal National Mortgage Association REMIC, 2.50%, 09/25/39 | 322,355 | ||||||
| 1,320,151 | ||||||||
| Government National Mortgage Association - 3.0% | ||||||||
| 1,481,827 | Government National Mortgage Association #511039, 6.30%, 12/15/40 | 1,481,754 | ||||||
| 137,386 | Government National Mortgage Association #559205, 7.25%, 09/15/31 | 137,453 | ||||||
| 179,663 | Government National Mortgage Association #559220, 7.00%, 01/15/33 | 179,757 | ||||||
See accompanying Notes to Financial Statements.
ANNUAL REPORT 2019
SCHEDULES OF PORTFOLIO INVESTMENTS
March 31, 2019
SHORT-INTERMEDIATE BOND FUND
| Principal Amount | Security Description | Value | ||||||
| $ | 122,960 | Government National Mortgage Association #610022, 5.60%, 08/15/34 | $ | 122,984 | ||||
| 383,647 | Government National Mortgage Association #632798, 5.13%, 11/15/34 | 383,742 | ||||||
| 1,148,283 | Government National Mortgage Association #675589, 7.13%, 04/15/35 | 1,234,111 | ||||||
| 394,394 | Government National Mortgage Association REMIC, 3.50%, 10/16/44 (c) | 394,742 | ||||||
| 1,156,819 | Government National Mortgage Association REMIC, 3.25%, 11/16/52 (c) | 1,150,855 | ||||||
| 346,078 | Government National Mortgage Association REMIC, 2.67%, 02/16/44 | 344,446 | ||||||
| 5,615 | Government National Mortgage Association REMIC #751404, 5.13%, 06/20/61 (c) | 5,665 | ||||||
| 5,435,509 | ||||||||
| Total Government & Agency Obligations (Cost $67,138,136) | 67,181,492 | |||||||
| Shares | Security Description | Value | ||||||
| Preferred Stocks - 0.3% | ||||||||
| Financials - 0.3% | ||||||||
| 550 | U.S.Bancorp, Series A (USD 3 Month LIBOR + 1.02%) (callable at 1,000 beginning 04/30/19), 3.81% (a)(e) | 434,643 | ||||||
| Total Preferred Stocks (Cost $564,327) | 434,643 | |||||||
| Short-Term Investments - 1.0% | ||||||||
| Investment Company - 1.0% | ||||||||
| 1,873,967 | BlackRock Liquidity Funds T-Fund Portfolio, Institutional Shares, 2.32% (g) | 1,873,967 | ||||||
| Total Short-Term Investments (Cost $1,873,967) | 1,873,967 | |||||||
| Investments, at value - 99.5% (Cost $181,095,378) | 181,290,235 | |||||||
| Other assets in excess of liabilities - 0.5% | 938,822 | |||||||
| NET ASSETS - 100.0% | $ | 182,229,057 | ||||||
| (a) | Floating rate security. Rate presented is as of March 31, 2019. |
| (b) | 144a Security, which is exempt from registration under the Securities Act of 1933. The Sub-Adviser has deemed this security to be liquid based on procedures approved by Tributary Funds’ Board of Directors. As of March 31, 2019, the aggregate value of these liquid securities were $37,994,068 or 20.8% of net assets. |
| (c) | Variable or adjustable rate security, the interest rate of which adjusts periodically based on changes in current interest rates. Rate represented is as of March 31, 2019. |
| (d) | Debt obligation initially issued at one coupon rate which converts to higher coupon rate at a specified date. Rate presented is as of March 31, 2019. |
| (e) | Perpetual maturity security. |
| (f) | U.S.Treasury inflation indexed security, par amount is adjusted for inflation. |
| (g) | Dividend yield changes daily to reflect current market conditions. Rate was the quoted yield as of March 31, 2019. |
| ABS | Asset Backed Security |
| CLO | Collateralized Loan Obligation |
| LIBOR | London Interbank Offered Rate |
| LLC | Limited Liability Company |
| MTN | Medium Term Note |
| PLC | Public Limited Company |
| RB | Revenue Bond |
| REMIC | Real Estate Mortgage Investment Conduit |
See accompanying Notes to Financial Statements.
ANNUAL REPORT 2019
SCHEDULES OF PORTFOLIO INVESTMENTS
March 31, 2019
INCOME FUND
| Principal Amount | Security Description | Value | ||||||
| Non-U.S. Government Agency Asset Backed Securities - 24.8% | ||||||||
| Asset Backed Securities - 8.0% | ||||||||
| $ | 1,455,000 | Cabela's Credit Card Master Note Trust, 2.71%, 02/17/26 (a) | $ | 1,452,208 | ||||
| 1,475,000 | Ford Credit Floorplan Master Owner Trust A, 2.16%, 11/15/21 | 1,466,847 | ||||||
| 1,063,901 | Magnetite CLO, Ltd. CLO (USD 3 Month LIBOR + 1.00%), 3.77%, 07/25/26 (a)(b) | 1,063,904 | ||||||
| 642,767 | Preferred Term Securities XII, Ltd./ Preferred Term Securities XII, Inc.(USD 3 Month LIBOR + 0.70%), 3.31%, 12/24/33 (a)(b) | 640,324 | ||||||
| 1,691,445 | Seasoned Credit Risk Transfer Trust, 3.50%, 03/25/58 | 1,719,291 | ||||||
| 1,277,046 | SLM Student Loan Trust (USD 3 Month LIBOR + 1.00%), 3.77%, 10/25/21 (b) | 1,278,153 | ||||||
| 1,944,286 | SLM Student Loan Trust (USD 3 Month LIBOR + 1.65%), 4.42%, 07/25/22 (b) | 1,966,088 | ||||||
| 520,257 | SLM Student Loan Trust (USD 3 Month LIBOR + 1.50%), 4.27%, 04/25/23 (b) | 526,252 | ||||||
| 1,223,450 | Social Professional Loan Program, 2.34%, 04/25/33 (a) | 1,201,462 | ||||||
| 1,221,215 | Social Professional Loan Program, 2.49%, 01/25/36 (a) | 1,209,577 | ||||||
| 875,000 | Sofi Consumer Loan Program Trust, 3.35%, 04/26/27 (a) | 877,629 | ||||||
| 566,575 | SoFi Consumer Loan Program Trust, 2.77%, 05/25/26 (a) | 564,726 | ||||||
| 428,579 | SoFi Consumer Loan Program Trust, 2.50%, 05/26/26 (a) | 425,448 | ||||||
| 514,571 | Stack Infrastructure Issuer, LLC, 4.54%, 02/25/44 (a) | 526,518 | ||||||
| 835,846 | Vantage Data Centers Issuer, LLC, 4.07%, 02/16/43 (a) | 848,511 | ||||||
| 15,766,938 | ||||||||
| Non-Agency Commercial Mortgage Backed Securities - 6.4% | ||||||||
| 1,200,000 | American Tower Trust #1, 3.07%, 03/15/23 (a) | 1,197,077 | ||||||
| 905,000 | BANK 2019-BNK16, 3.90%, 02/15/52 | 949,072 | ||||||
| 960,000 | CD Commercial Mortgage Trust, 4.21%, 08/15/51 | 1,022,626 | ||||||
| 590,000 | CFCRE Commercial Mortgage Trust REMIC, 3.83%, 12/15/47 | 601,670 | ||||||
| 2,801,124 | Citigroup Commercial Mortgage Trust Interest Only REMIC, 1.79%, 09/10/45 (a)(c) | 129,982 | ||||||
| Principal Amount | Security Description | Value | ||||||
| $ | 1,201,795 | COMM Mortgage Trust Interest Only REMIC, 1.06%, 03/10/46 (c) | $ | 35,772 | ||||
| 1,620,000 | Cosmopolitan Hotel Mortgage Trust REMIC (USD 1 Month LIBOR + 0.93%), 3.41%, 11/15/36 (a)(b) | 1,618,847 | ||||||
| 40,094 | DBUBS Mortgage Trust Interest Only REMIC, 0.34%, 08/10/44 (a)(c) | 230 | ||||||
| 214,321,029 | FREMF Mortgage Trust Interest Only, 0.10%, 08/25/44 (a) | 414,154 | ||||||
| 6,581,152 | GS Mortgage Securities Trust Interest Only REMIC, 1.34%, 08/10/44 (a)(c) | 158,713 | ||||||
| 24,875 | JPMorgan Chase Commercial Mortgage Securities Trust REMIC, 2.67%, 01/15/46 | 24,843 | ||||||
| 1,250,000 | LSTAR Commercial Mortgage Trust REMIC, 3.13%, 04/20/48 (a)(c) | 1,250,060 | ||||||
| 975,000 | Morgan Stanley Capital I Trust, 3.30%, 06/15/50 | 987,240 | ||||||
| 830,000 | UBS Commercial Mortgage Trust, 4.19%, 08/15/51 | 881,635 | ||||||
| 878,633 | Wells Fargo Commercial Mortgage Trust Interest Only REMIC, 1.78%, 10/15/45 (a)(c) | 43,722 | ||||||
| 632,539 | Wells Fargo Commercial Mortgage Trust REMIC, 2.53%, 10/15/45 | 630,307 | ||||||
| 3,007,631 | Wells Fargo-RBS Commercial Mortgage Trust Interest Only REMIC, 1.88%, 11/15/45 (a)(c) | 166,401 | ||||||
| 784,289 | Wells Fargo-RBS Commercial Mortgage Trust REMIC, 2.63%, 03/15/45 | 783,099 | ||||||
| 1,735,000 | Wells Fargo-RBS Commercial Mortgage Trust REMIC, 3.65%, 12/15/46 | 1,753,842 | ||||||
| 12,649,292 | ||||||||
| Non-Agency Residential Mortgage Backed Securities - 10.4% | ||||||||
| 489,192 | Bayview Commercial Asset Trust REMIC (USD 1 Month LIBOR + 0.58%), 3.36%, 12/25/33 (a)(b) | 481,409 | ||||||
| 597,435 | Bayview Financial Acquisition Trust REMIC (USD 1 Month LIBOR + 2.33%), 4.82%, 05/28/44 (b) | 594,929 | ||||||
| 811,199 | Bayview Financial Acquisition Trust REMIC (USD 1 Month LIBOR + 1.88%), 4.37%, 08/28/44 (b) | 819,842 | ||||||
| 560,000 | Bayview Financial Acquisition Trust REMIC (USD 1 Month LIBOR + 2.10%), 4.60%, 04/28/39 (b) | 559,398 | ||||||
| 8,771 | Citicorp Residential Mortgage Trust REMIC, 5.19%, 07/25/36 (d) | 8,869 | ||||||
| 1,008,444 | Citigroup Mortgage Loan Trust REMIC, 4.00%, 01/25/35 (a)(c) | 1,036,162 | ||||||
See accompanying Notes to Financial Statements.
ANNUAL REPORT 2019
SCHEDULES OF PORTFOLIO INVESTMENTS
March 31, 2019
INCOME FUND
| Principal Amount | Security Description | Value | ||||||
| $ | 207,504 | Citigroup Mortgage Loan Trust, Inc. REMIC, 6.50%, 07/25/34 | $ | 232,408 | ||||
| 31,724 | Credit Suisse First Boston Mortgage Securities Corp. REMIC, 5.75%, 04/25/33 | 32,521 | ||||||
| 2,163 | Credit Suisse First Boston Mortgage Securities Corp. REMIC, 5.00%, 08/25/20 | 1,961 | ||||||
| 159,521 | Credit-Based Asset Servicing & Securitization, LLC REMIC (USD 1 Month LIBOR + 0.75%), 3.24%, 02/25/33 (b) | 161,387 | ||||||
| 272,578 | Credit-Based Asset Servicing & Securitization, LLC REMIC, 5.52%, 12/25/37 (a)(d) | 275,933 | ||||||
| 685,816 | CSMLT Trust, 3.00%, 10/25/30 (a)(c) | 674,816 | ||||||
| 939,027 | EverBank Mortgage Loan Trust, 3.50%, 02/25/48 (a)(c) | 942,937 | ||||||
| 764,165 | Flagstar Mortgage Trust, 3.50%, 10/25/47 (a)(c) | 764,673 | ||||||
| 413,499 | Goldman Sachs Alternative Mortgage Products Trust REMIC (USD 1 Month LIBOR + 0.50%), 2.99%, 05/25/36 (a)(b) | 409,431 | ||||||
| 134,992 | JPMorgan Mortgage Acquisition Trust REMIC (USD 1 Month LIBOR + 0.23%), 2.72%, 07/25/36 (b) | 134,867 | ||||||
| 1,058,117 | JPMorgan Mortgage Trust, 3.50%, 12/25/48 (a)(c) | 1,061,233 | ||||||
| 843,118 | JPMorgan Mortgage Trust, 3.50%, 12/25/48 (a)(c) | 843,678 | ||||||
| 4,304 | Lehman ABS Manufactured Housing Contract Trust REMIC, 4.35%, 04/15/40 | 4,307 | ||||||
| 591,207 | Mill City Mortgage Loan Trust, 2.75%, 11/25/58 (a)(c) | 585,351 | ||||||
| 761,941 | New Residential Mortgage Loan Trust, 4.00%, 12/25/57 (a)(c) | 777,878 | ||||||
| 376,252 | New Residential Mortgage Loan Trust REMIC, 3.75%, 11/25/54 (a)(c) | 379,947 | ||||||
| 380,081 | New Residential Mortgage Loan Trust REMIC, 3.75%, 05/28/52 (a)(c) | 385,142 | ||||||
| 764,025 | New Residential Mortgage Loan Trust REMIC, 3.75%, 08/25/55 (a)(c) | 772,812 | ||||||
| 150,133 | NovaStar Home Equity Loan Trust REMIC (USD 1 Month LIBOR + 1.73%), 4.21%, 03/25/35 (b) | 151,257 | ||||||
| 13,711 | Residential Accredit Loans, Inc. Trust REMIC (USD 1 Month LIBOR + 14.76%), 10.20%, 03/25/20 (b) | 13,714 | ||||||
| 39,826 | Residential Accredit Loans, Inc. Trust REMIC, 5.50%, 02/25/35 | 39,634 | ||||||
| Principal Amount | Security Description | Value | ||||||
| $ | 25,859 | Residential Asset Securities Corp. Trust REMIC, 5.96%, 09/25/31 (c) | $ | 26,612 | ||||
| 20,567 | Residential Asset Securities Corp. Trust REMIC, 4.54%, 12/25/33 (c) | 20,939 | ||||||
| 381,895 | Salomon Brothers Mortgage Securities, 6.93%, 08/25/28 | 384,995 | ||||||
| 896,497 | Seasoned Credit Risk Transfer Trust, 2.50%, 05/25/57 (d) | 889,346 | ||||||
| 1,238,155 | Sequoia Mortgage Trust REMIC, 3.50%, 03/25/48 (a)(c) | 1,241,285 | ||||||
| 927,360 | Sequoia Mortgage Trust REMIC, 3.50%, 05/25/48 (a)(c) | 930,612 | ||||||
| 815,529 | Sequoia Mortgage Trust REMIC, 3.00%, 11/25/30 (a)(c) | 814,892 | ||||||
| 917,680 | Sequoia Mortgage Trust REMIC, 3.50%, 08/25/47 (a)(c) | 918,579 | ||||||
| 655,440 | Towd Point Mortgage Trust REMIC, 3.50%, 02/25/55 (a)(c) | 656,781 | ||||||
| 534,547 | Towd Point Mortgage Trust REMIC, 2.75%, 10/25/56 (a)(c) | 528,660 | ||||||
| 579,825 | Towd Point Mortgage Trust REMIC, 2.75%, 04/25/57 (a)(c) | 573,924 | ||||||
| 1,252,998 | Wells Fargo Mortgage Backed Securities, 3.50%, 07/25/47 (a)(c) | 1,256,406 | ||||||
| 20,389,527 | ||||||||
| Total Non-U.S. Government Agency Asset Backed Securities (Cost $48,743,539) | 48,805,757 | |||||||
| Corporate Bonds - 29.3% | ||||||||
| Consumer Discretionary - 6.2% | ||||||||
| 1,010,000 | AMC Networks, Inc., 4.75%, 12/15/22 | 1,017,575 | ||||||
| 1,190,000 | CBS Corp., 4.00%, 01/15/26 | 1,209,800 | ||||||
| 370,000 | Comcast Corp., 4.15%, 10/15/28 | 390,089 | ||||||
| 770,000 | Comcast Corp., Class A, 3.30%, 02/01/27 | 767,884 | ||||||
| 1,289,000 | Dollar General Corp., 3.25%, 04/15/23 | 1,296,806 | ||||||
| 700,000 | Hanesbrands, Inc., 4.63%, 05/15/24 (a) | 701,890 | ||||||
| 580,000 | Hilton Worldwide Finance, LLC/Hilton Worldwide Finance Corp., 4.63%, 04/01/25 | 585,800 | ||||||
| 920,000 | Levi Strauss & Co., 5.00%, 05/01/25 | 947,600 | ||||||
| 615,000 | Newell Brands, Inc., 4.00%, 06/15/22 | 610,095 | ||||||
| 410,000 | Newell Brands, Inc., 4.20%, 04/01/26 | 391,603 | ||||||
| 1,035,000 | NIKE, Inc., 3.88%, 11/01/45 | 1,059,043 | ||||||
| 860,000 | The Goodyear Tire & Rubber Co., 5.13%, 11/15/23 | 858,925 | ||||||
| 1,197,000 | The Walt Disney Co., Class E, 4.13%, 12/01/41 | 1,266,002 | ||||||
| 1,065,000 | Whirlpool Corp., 4.70%, 06/01/22 | 1,114,493 | ||||||
| 12,217,605 | ||||||||
See accompanying Notes to Financial Statements.
ANNUAL REPORT 2019
SCHEDULES OF PORTFOLIO INVESTMENTS
March 31, 2019
INCOME FUND
| Principal Amount | Security Description | Value | ||||||
| Consumer Staples - 1.7% | ||||||||
| $ | 1,100,000 | Church & Dwight Co., Inc., 2.88%, 10/01/22 | $ | 1,101,797 | ||||
| 530,000 | Land O'Lakes Capital Trust I, 7.45%, 03/15/28 (a) | 568,425 | ||||||
| 705,000 | Reckitt Benckiser Treasury Services PLC, 3.00%, 06/26/27 (a) | 682,617 | ||||||
| 895,000 | Walmart, Inc., 3.70%, 06/26/28 | 942,296 | ||||||
| 3,295,135 | ||||||||
| Energy - 0.7% | ||||||||
| 195,000 | ConocoPhillips Co., 4.95%, 03/15/26 | 217,408 | ||||||
| 1,150,000 | EOG Resources, Inc., 4.15%, 01/15/26 | 1,218,339 | ||||||
| 1,435,747 | ||||||||
| Financials - 11.3% | ||||||||
| 1,235,000 | AerCap Ireland Capital DAC/AerCap Global Aviation Trust, 3.50%, 01/15/25 | 1,191,763 | ||||||
| 350,660 | Altitude Investments 16, LLC, 2.49%, 03/14/26 | 349,724 | ||||||
| 1,197,000 | Bank of America Corp., MTN, 4.13%, 01/22/24 | 1,254,380 | ||||||
| 1,045,000 | CBRE Services, Inc., 5.25%, 03/15/25 | 1,121,309 | ||||||
| 1,220,000 | Citigroup, Inc., 3.89%, 01/10/28 (c) | 1,239,914 | ||||||
| 920,000 | CME Group, Inc., 3.00%, 03/15/25 | 925,272 | ||||||
| 494,000 | Crown Castle International Corp., 4.88%, 04/15/22 | 520,849 | ||||||
| 1,074,000 | Hartford Financial Services Group, Inc., 5.50%, 03/30/20 | 1,101,681 | ||||||
| 750,000 | Intercontinental Exchange, Inc., 4.25%, 09/21/48 | 783,310 | ||||||
| 1,295,000 | JPMorgan Chase & Co., 3.20%, 06/15/26 | 1,287,622 | ||||||
| 1,155,000 | KeyCorp, MTN, 2.90%, 09/15/20 | 1,157,852 | ||||||
| 710,000 | Metropolitan Life Global Funding I, 3.60%, 01/11/24 (a) | 731,576 | ||||||
| 1,195,000 | Morgan Stanley, GMTN, 3.75%, 02/25/23 | 1,225,635 | ||||||
| 1,030,000 | Prudential Financial, Inc., MTN, 7.38%, 06/15/19 | 1,039,034 | ||||||
| 1,210,000 | Regions Financial Corp., 3.80%, 08/14/23 | 1,244,364 | ||||||
| 1,190,000 | The Charles Schwab Corp., 3.85%, 05/21/25 | 1,251,428 | ||||||
| 1,097,000 | The Chubb Corp., 6.80%, 11/15/31 | 1,436,664 | ||||||
| 1,240,000 | The Goldman Sachs Group, Inc., 3.85%, 01/26/27 | 1,245,755 | ||||||
| 1,270,000 | U.S. Bancorp, Series J (callable at 100 beginning 04/15/27), 5.30%, 10/15/49 (c)(e) | 1,292,225 | ||||||
| 1,350,000 | Wells Fargo & Co., 3.00%, 04/22/26 | 1,320,244 | ||||||
| Principal Amount | Security Description | Value | ||||||
| $ | 454,000 | Wells Fargo & Co., Series K (callable at 100 beginning 06/15/19), 6.38%, 03/15/49 (c)(e) | $ | 456,838 | ||||
| 22,177,439 | ||||||||
| Health Care - 0.6% | ||||||||
| 1,109,000 | Becton Dickinson and Co., 3.73%, 12/15/24 | 1,126,632 | ||||||
| Industrials - 2.9% | ||||||||
| 1,200,000 | Burlington Northern Santa Fe, LLC, 4.55%, 09/01/44 | 1,319,910 | ||||||
| 1,184,000 | Huntington Ingalls Industries, Inc., 5.00%, 11/15/25 (a) | 1,213,600 | ||||||
| 1,037,000 | Raytheon Co., 4.88%, 10/15/40 | 1,226,317 | ||||||
| 1,123,000 | Textron, Inc., 3.65%, 03/01/21 | 1,131,725 | ||||||
| 645,000 | TTX Co., 4.60%, 02/01/49 (a) | 703,577 | ||||||
| 5,595,129 | ||||||||
| Information Technology - 2.3% | ||||||||
| 1,108,000 | eBay, Inc., 3.60%, 06/05/27 | 1,081,005 | ||||||
| 1,331,000 | Harman International Industries, Inc., 4.15%, 05/15/25 | 1,370,493 | ||||||
| 1,035,000 | Oracle Corp., 5.38%, 07/15/40 | 1,244,768 | ||||||
| 1,050,000 | QUALCOMM, Inc., 3.25%, 05/20/27 | 1,025,766 | ||||||
| 4,722,032 | ||||||||
| Materials - 1.1% | ||||||||
| 1,126,000 | Albemarle Corp., 5.45%, 12/01/44 | 1,165,389 | ||||||
| 959,000 | The Mosaic Co., 5.45%, 11/15/33 | 1,032,314 | ||||||
| 2,197,703 | ||||||||
| Real Estate - 0.6% | ||||||||
| 1,110,000 | National Retail Properties, Inc., 4.30%, 10/15/28 | 1,158,527 | ||||||
| Telecommunication Services - 1.3% | ||||||||
| 1,180,000 | AT&T, Inc., 5.15%, 03/15/42 | 1,209,008 | ||||||
| 1,264,000 | Verizon Communications, Inc., 4.27%, 01/15/36 | 1,280,298 | ||||||
| 2,489,306 | ||||||||
| Utilities - 0.6% | ||||||||
| 954,000 | PacifiCorp, 6.25%, 10/15/37 | 1,220,122 | ||||||
| Total Corporate Bonds (Cost $56,612,748) | 57,635,377 | |||||||
| Government & Agency Obligations - 43.3% | ||||||||
| GOVERNMENT SECURITIES - 17.5% | ||||||||
| Municipals - 1.5% | ||||||||
| 339,755 | Florida Housing Finance Corp., Florida RB FHLMC, 3.00%, 01/01/36 | 338,651 | ||||||
| 295,000 | Montana Board of Housing, Montana RB, 2.38%, 06/01/20 | 295,384 | ||||||
| 530,000 | New York City Transitional Finance Authority Future Tax Secured Revenue, New York RB, 5.77%, 08/01/36 | 634,680 | ||||||
| 340,000 | New York City Water & Sewer System, New York RB, 5.72%, 06/15/42 | 452,319 | ||||||
See accompanying Notes to Financial Statements.
ANNUAL REPORT 2019
SCHEDULES OF PORTFOLIO INVESTMENTS
March 31, 2019
INCOME FUND
| Principal Amount | Security Description | Value | ||||||
| $ | 225,000 | State of Connecticut, Connecticut GO, 4.95%, 12/01/20 | $ | 233,325 | ||||
| 225,000 | State of Connecticut, Connecticut GO, 5.63%, 12/01/29 | 259,443 | ||||||
| 240,000 | University of Michigan, Michigan RB, 6.01%, 04/01/25 | 240,000 | ||||||
| 410,000 | West Haymarket Joint Public Agency, Nebraska GO, 6.00%, 12/15/39 | 545,665 | ||||||
| 2,999,467 | ||||||||
| Treasury Inflation Index Securities - 1.7% | ||||||||
| 1,949,442 | U.S. Treasury Inflation Indexed Bond, 1.75%, 01/15/28 (f) | 2,124,036 | ||||||
| 1,111,450 | U.S. Treasury Inflation Indexed Note, 0.13%, 01/15/22 (f) | 1,103,419 | ||||||
| 3,227,455 | ||||||||
| U.S. Treasury Securities - 14.3% | ||||||||
| 1,545,000 | U.S. Treasury Bond, 5.38%, 02/15/31 | 2,010,190 | ||||||
| 1,765,000 | U.S. Treasury Bond, 4.75%, 02/15/37 | 2,319,389 | ||||||
| 10,005,000 | U.S. Treasury Bond, 3.63%, 08/15/43 | 11,520,210 | ||||||
| 500,000 | U.S. Treasury Note, 2.00%, 02/28/21 | 497,246 | ||||||
| 2,600,000 | U.S. Treasury Note, 1.63%, 11/15/22 | 2,546,274 | ||||||
| 9,370,000 | U.S. Treasury Note, 2.13%, 05/15/25 | 9,276,666 | ||||||
| 28,169,975 | ||||||||
| U.S. GOVERNMENT MORTGAGE BACKED SECURITIES - 25.8% | ||||||||
| Federal Home Loan Mortgage Corp. - 10.1% | ||||||||
| 955,000 | Federal Home Loan Mortgage Corp., 3.46%, 11/25/32 | 978,694 | ||||||
| 930,000 | Federal Home Loan Mortgage Corp., 3.78%, 10/25/28 (c) | 991,618 | ||||||
| 760,115 | Federal Home Loan Mortgage Corp. #A96132, 4.50%, 01/01/41 | 804,982 | ||||||
| 453,668 | Federal Home Loan Mortgage Corp. #C91345, 4.50%, 11/01/30 | 477,275 | ||||||
| 388,453 | Federal Home Loan Mortgage Corp. #C91386, 4.50%, 08/01/31 | 409,161 | ||||||
| 1,134,656 | Federal Home Loan Mortgage Corp. #G07801, 4.00%, 10/01/44 | 1,182,110 | ||||||
| 35,921 | Federal Home Loan Mortgage Corp. #G14820, 3.50%, 12/01/26 | 36,788 | ||||||
| 1,907,552 | Federal Home Loan Mortgage Corp. #G60344, 4.00%, 12/01/45 | 1,994,410 | ||||||
| 2,131,272 | Federal Home Loan Mortgage Corp. #V80169, 3.00%, 07/01/43 | 2,133,361 | ||||||
| 1,576,571 | Federal Home Loan Mortgage Corp. Interest Only REMIC, 4.00%, 09/15/45 | 298,688 | ||||||
| 118,256 | Federal Home Loan Mortgage Corp. REMIC, 4.50%, 06/15/21 | 118,596 | ||||||
| 319,183 | Federal Home Loan Mortgage Corp. REMIC, 4.00%, 06/15/37 | 323,016 | ||||||
| 905,127 | Federal Home Loan Mortgage Corp. REMIC, 4.00%, 03/15/40 | 938,887 | ||||||
| Principal Amount | Security Description | Value | ||||||
| $ | 302,073 | Federal Home Loan Mortgage Corp. REMIC, 4.00%, 02/15/39 | $ | 310,123 | ||||
| 350,822 | Federal Home Loan Mortgage Corp. REMIC, 3.50%, 06/15/50 | 356,702 | ||||||
| 514,774 | Federal Home Loan Mortgage Corp. REMIC, 4.00%, 04/15/41 | 527,780 | ||||||
| 322,544 | Federal Home Loan Mortgage Corp. REMIC, 3.50%, 11/15/42 | 328,485 | ||||||
| 1,167,133 | Federal Home Loan Mortgage Corp. REMIC, 3.50%, 07/15/42 | 1,191,738 | ||||||
| 1,689,727 | Federal Home Loan Mortgage Corp. REMIC, 3.00%, 01/15/55 | 1,725,256 | ||||||
| 692,136 | Federal Home Loan Mortgage Corp. REMIC, 4.00%, 03/15/43 | 722,509 | ||||||
| 960,000 | Federal Home Loan Mortgage Corp. REMIC, 3.50%, 06/15/37 | 983,250 | ||||||
| 519,064 | FRESB Mortgage Trust, 3.70%, 10/25/28 (c) | 537,911 | ||||||
| 1,637,714 | Seasoned Credit Risk Transfer Trust, 4.50%, 06/25/57 | 1,698,105 | ||||||
| 833,140 | Seasoned Credit Risk Transfer Trust, 2.75%, 07/25/56 (d) | 837,055 | ||||||
| 19,906,500 | ||||||||
| Federal National Mortgage Association - 15.2% | ||||||||
| 1,046,680 | Federal National Mortgage Association #386641, 5.80%, 12/01/33 | 1,044,584 | ||||||
| 28,554 | Federal National Mortgage Association #679256, 7.50%, 08/01/22 | 28,689 | ||||||
| 203,776 | Federal National Mortgage Association #725705, 5.00%, 08/01/34 | 219,250 | ||||||
| 196,218 | Federal National Mortgage Association #890310, 4.50%, 12/01/40 | 207,458 | ||||||
| 15,112 | Federal National Mortgage Association #933279, 5.50%, 08/01/37 | 16,128 | ||||||
| 32,215 | Federal National Mortgage Association #AA5564, 4.00%, 06/01/24 | 33,193 | ||||||
| 150,529 | Federal National Mortgage Association #AA7002, 4.50%, 06/01/39 | 159,935 | ||||||
| 758,714 | Federal National Mortgage Association #AB9814, 3.00%, 07/01/43 | 759,345 | ||||||
| 56,790 | Federal National Mortgage Association #AC0559, 4.00%, 10/01/24 | 58,515 | ||||||
| 328,487 | Federal National Mortgage Association #AD0575, 4.50%, 01/01/40 | 350,869 | ||||||
| 63,423 | Federal National Mortgage Association #AE0336, 6.00%, 09/01/38 | 69,993 | ||||||
| 733,574 | Federal National Mortgage Association #AL0240, 4.00%, 04/01/41 | 765,198 | ||||||
| 214,866 | Federal National Mortgage Association #AL2382, 4.00%, 02/01/42 | 224,807 | ||||||
| 388,128 | Federal National Mortgage Association #AL5404, 4.16%, 08/01/21 | 396,365 | ||||||
See accompanying Notes to Financial Statements.
ANNUAL REPORT 2019
SCHEDULES OF PORTFOLIO INVESTMENTS
March 31, 2019
INCOME FUND
| Principal Amount | Security Description | Value | ||||||
| $ | 907,305 | Federal National Mortgage Association #AL9970, 3.41%, 02/01/27 | $ | 946,799 | ||||
| 2,213,949 | Federal National Mortgage Association #AM2127, 3.31%, 01/01/33 | 2,223,417 | ||||||
| 1,339,597 | Federal National Mortgage Association #AM2922, 3.75%, 04/01/43 | 1,378,416 | ||||||
| 1,880,000 | Federal National Mortgage Association #AN8526, 3.53%, 03/01/28 | 1,941,994 | ||||||
| 1,043,946 | Federal National Mortgage Association #AS0784, 4.00%, 10/01/43 | 1,086,742 | ||||||
| 1,110,129 | Federal National Mortgage Association #AS3175, 4.50%, 08/01/44 | 1,178,800 | ||||||
| 1,993,512 | Federal National Mortgage Association #AS3909, 4.00%, 11/01/44 | 2,075,212 | ||||||
| 820,998 | Federal National Mortgage Association #AS5235, 3.50%, 06/01/45 | 839,555 | ||||||
| 3,131,702 | Federal National Mortgage Association #AS6994, 4.00%, 04/01/46 | 3,237,810 | ||||||
| 992,677 | Federal National Mortgage Association #CA0684, 3.50%, 11/01/47 | 1,013,504 | ||||||
| 1,514,418 | Federal National Mortgage Association Interest Only, 0.68%, 02/25/22 (c) | 23,153 | ||||||
| 3,986,613 | Federal National Mortgage Association Interest Only, 0.37%, 07/25/22 (c) | 37,691 | ||||||
| 832,727 | Federal National Mortgage Association Interest Only, 2.60%, 01/25/39 (c) | 73,510 | ||||||
| 1,975,000 | Federal National Mortgage Association Interest Only #AM7762, 3.49%, 01/01/35 | 1,968,635 | ||||||
| 59,059 | Federal National Mortgage Association REMIC, 3.00%, 04/25/37 | 58,901 | ||||||
| 296,169 | Federal National Mortgage Association REMIC, 3.50%, 05/25/41 | 300,627 | ||||||
| 491,393 | Federal National Mortgage Association REMIC, 4.00%, 01/25/33 | 516,853 | ||||||
| 278,015 | Federal National Mortgage Association REMIC, 5.00%, 02/25/32 | 302,472 | ||||||
| 703,749 | Federal National Mortgage Association REMIC, 4.00%, 07/25/39 | 718,638 | ||||||
| 668,196 | Federal National Mortgage Association REMIC, 2.50%, 09/25/39 | 659,362 | ||||||
| 1,054,923 | Federal National Mortgage Association REMIC, 1.50%, 01/25/40 | 1,044,785 | ||||||
| 1,374,809 | Federal National Mortgage Association REMIC, 3.00%, 08/25/43 | 1,394,890 | ||||||
| 1,381,984 | Federal National Mortgage Association REMIC, 3.00%, 08/25/45 | 1,389,375 | ||||||
| 955,000 | Federal National Mortgage Association REMIC, 4.00%, 11/25/37 | 1,024,567 | ||||||
| 29,770,037 | ||||||||
| Principal Amount | Security Description | Value | ||||||
| Government National Mortgage Association - 0.5% | ||||||||
| $ | 926,883 | Government National Mortgage Association #AD8811, 3.00%, 03/20/43 | $ | 933,319 | ||||
| 11,229 | Government National Mortgage Association REMIC #751404, 5.13%, 06/20/61 (c) | 11,331 | ||||||
| 944,650 | ||||||||
| Small Business Administration Participation Certificates - 0.0% | ||||||||
| 42,570 | SBA Small Business Investment Cos., 2.88%, 09/10/21 | 42,770 | ||||||
| Total Government & Agency Obligations (Cost $84,134,321) | 85,060,854 | |||||||
| Shares | Security Description | Value | ||||||
| Investment Company - 0.8% | ||||||||
| 157,307 | Federated Institutional High-Yield Bond Fund, Institutional Shares | 1,529,023 | ||||||
| Total Investment Company (Cost $1,447,368) | 1,529,023 | |||||||
| Short-Term Investments - 1.5% | ||||||||
| Investment Company - 1.5% | ||||||||
| 2,940,724 | BlackRock Liquidity Funds T-Fund Portfolio, Institutional Shares, 2.32% (g) | 2,940,724 | ||||||
| Total Investment Companies (Cost $2,940,724) | 2,940,724 | |||||||
| Total Short-Term Investments (Cost $2,940,724) | 2,940,724 | |||||||
| Investments, at value - 99.7% (Cost $193,878,700) | 195,971,735 | |||||||
| Other assets in excess of liabilities - 0.3% | 630,674 | |||||||
| NET ASSETS - 100.0% | $ | 196,602,409 | ||||||
| (a) | 144a Security, which is exempt from registration under the Securities Act of 1933. The Sub-Adviser has deemed this security to be liquid based on procedures approved by Tributary Funds’ Board of Directors. As of March 31, 2019, the aggregate value of these liquid securities were $34,703,719 or 17.7% of net assets. |
| (b) | Floating rate security. Rate presented is as of March 31, 2019. |
| (c) | Variable or adjustable rate security, the interest rate of which adjusts periodically based on changes in current interest rates. Rate represented is as of March 31, 2019. |
| (d) | Debt obligation initially issued at one coupon rate which converts to higher coupon rate at a specified date. Rate presented is as of March 31, 2019. |
| (e) | Perpetual maturity security. |
| (f) | U.S. Treasury inflation indexed security, par amount is adjusted for inflation. |
| (g) | Dividend yield changes daily to reflect current market conditions. Rate was the quoted yield as of March 31, 2019. |
See accompanying Notes to Financial Statements.
ANNUAL REPORT 2019
SCHEDULES OF PORTFOLIO INVESTMENTS
March 31, 2019
INCOME FUND
| ABS | Asset Backed Security |
| CLO | Collateralized Loan Obligation |
| FHLMC | Federal Home Loan Mortgage Corporation |
| GMTN | Global Medium Term Note |
| GO | General Obligation |
| LIBOR | London Interbank Offered Rate |
| LLC | Limited Liability Company |
| MTN | Medium Term Note |
| PLC | Public Limited Company |
| RB | Revenue Bond |
| REMIC | Real Estate Mortgage Investment Conduit |
See accompanying Notes to Financial Statements.
ANNUAL REPORT 2019
SCHEDULES OF PORTFOLIO INVESTMENTS
March 31, 2019
NEBRASKA TAX-FREE FUND
| Principal Amount | Security Description | Value | ||||||
| Government & Agency Obligations - 98.4% | ||||||||
| GOVERNMENT SECURITIES - 98.4% | ||||||||
| Municipals - 98.4% | ||||||||
| Iowa - 0.1% | ||||||||
| $ | 100,000 | Xenia Rural Water District, Iowa RB, 3.00%, 12/01/20 | $ | 101,122 | ||||
| Nebraska - 97.6% | ||||||||
| 210,000 | Cass County Sanitary & Improvement District No. 1, Nebraska GO, 2.30%, 10/15/23 | 206,713 | ||||||
| 185,000 | Cass County Sanitary & Improvement District No. 1, Nebraska GO, 2.40%, 10/15/24 | 183,248 | ||||||
| 250,000 | Cass County School District No. 56 Conestoga, Nebraska GO, 1.20%, 12/15/19 | 249,130 | ||||||
| 100,000 | Cass County School District No. 56 Conestoga, Nebraska GO, 1.30%, 12/15/20 | 99,399 | ||||||
| 500,000 | City of Bellevue NE, Nebraska GO, 1.65%, 12/15/20 | 499,910 | ||||||
| 215,000 | City of Blair NE, Nebraska GO, 2.15%, 09/15/23 | 216,714 | ||||||
| 220,000 | City of Blair NE, Nebraska GO, 2.30%, 09/15/24 | 222,292 | ||||||
| 650,000 | City of Columbus NE Combined Utilities System Revenue, Nebraska RB, 5.00%, 06/15/29 | 804,869 | ||||||
| 630,000 | City of Columbus NE Sales Tax Revenue, Nebraska RB, 5.00%, 09/15/23 | 712,927 | ||||||
| 345,000 | City of Fremont NE Combined Utility System Revenue, Nebraska RB, 3.00%, 10/15/25 | 354,412 | ||||||
| 65,000 | City of Grand Island NE Electric System Revenue, Nebraska RB, 5.00%, 08/15/27 | 74,142 | ||||||
| 275,000 | City of Hastings NE Combined Utility Revenue, Nebraska RB, 4.50%, 10/15/21 | 275,564 | ||||||
| 300,000 | City of Hastings NE Combined Utility Revenue, Nebraska RB, 4.50%, 10/15/26 | 300,591 | ||||||
| 375,000 | City of La Vista NE, Nebraska COP, 3.00%, 12/15/25 | 390,094 | ||||||
| 195,000 | City of La Vista NE, Nebraska GO, 1.00%, 05/01/21 | 194,809 | ||||||
| 235,000 | City of La Vista NE, Nebraska GO, 3.00%, 09/01/27 | 243,714 | ||||||
| 650,000 | City of Lincoln NE, Nebraska GO, 3.00%, 05/15/20 | 660,777 | ||||||
| Principal Amount | Security Description | Value | ||||||
| $ | 515,000 | City of Lincoln NE, Nebraska RB, 2.50%, 04/01/20 | $ | 518,904 | ||||
| 700,000 | City of Lincoln NE, Nebraska RB, 4.50%, 08/15/22 | 734,426 | ||||||
| 480,000 | City of Lincoln NE, Nebraska RB, 4.00%, 08/15/26 | 509,654 | ||||||
| 500,000 | City of Lincoln NE, Nebraska RB, 3.55%, 04/01/27 | 516,940 | ||||||
| 250,000 | City of Lincoln NE Electric System Revenue, Nebraska RB, 3.13%, 09/01/30 | 253,543 | ||||||
| 110,000 | City of Lincoln NE Electric System Revenue, Nebraska RB, 5.00%, 09/01/28 | 121,594 | ||||||
| 55,000 | City of Lincoln NE Electric System Revenue, Nebraska RB, 5.00%, 09/01/28 | 61,130 | ||||||
| 360,000 | City of North Platte NE, Nebraska GO, 3.00%, 12/15/26 | 375,948 | ||||||
| 29,000 | City of Ogallala NE, Nebraska COP, 1.15%, 10/15/19 | 28,898 | ||||||
| 575,000 | City of Omaha NE, Nebraska GO, 5.25%, 04/01/20 | 595,970 | ||||||
| 500,000 | City of Omaha NE, Nebraska GO, 5.00%, 01/15/29 | 606,585 | ||||||
| 500,000 | City of Omaha NE, Nebraska GO, 6.50%, 12/01/30 | 699,135 | ||||||
| 200,000 | City of Omaha NE, Nebraska GO, 5.00%, 05/01/33 | 230,198 | ||||||
| 500,000 | City of Omaha NE, Nebraska GO, 4.00%, 04/15/20 | 512,540 | ||||||
| 470,000 | City of Omaha NE, Nebraska GO, 4.00%, 04/15/22 | 503,520 | ||||||
| 190,000 | City of Omaha NE, Nebraska RB, 5.00%, 02/01/26 | 208,413 | ||||||
| 355,000 | City of Omaha NE, Nebraska Special Tax Bond, 5.00%, 01/15/28 | 433,246 | ||||||
| 200,000 | City of Omaha NE Sewer Revenue, Nebraska RB, 5.00%, 04/01/24 | 231,862 | ||||||
| 350,000 | City of Papillion NE, Nebraska GO, 3.00%, 09/15/26 | 362,610 | ||||||
| 285,000 | City of Papillion NE, Nebraska GO, 3.00%, 09/15/27 | 293,992 | ||||||
| 105,000 | City of Papillion NE Water Revenue, Nebraska RB, 1.80%, 10/01/20 | 105,255 | ||||||
| 105,000 | City of Papillion NE Water Revenue, Nebraska RB, 2.05%, 10/01/21 | 105,375 | ||||||
| 275,000 | County of Buffalo NE, Nebraska GO, 4.00%, 12/15/31 | 289,847 | ||||||
| 550,000 | County of Douglas NE, Nebraska RB, 5.60%, 07/01/25 | 577,252 | ||||||
See accompanying Notes to Financial Statements.
ANNUAL REPORT 2019
SCHEDULES OF PORTFOLIO INVESTMENTS
March 31, 2019
NEBRASKA TAX-FREE FUND
| Principal Amount | Security Description | Value | ||||||
| $ | 120,000 | County of Douglas NE, Nebraska RB, 3.60%, 10/01/27 | $ | 120,085 | ||||
| 250,000 | County of Sarpy NE, Nebraska COP, 2.80%, 12/15/20 | 254,268 | ||||||
| 150,000 | Douglas County Hospital Authority No. 1, Nebraska RB, AMBAC, 5.25%, 09/01/21 | 157,196 | ||||||
| 500,000 | Douglas County Hospital Authority No. 2, Nebraska RB, 5.50%, 01/01/30 | 512,370 | ||||||
| 1,000,000 | Douglas County Hospital Authority No. 2, Nebraska RB, 4.00%, 05/15/32 | 1,078,400 | ||||||
| 220,000 | Douglas County Hospital Authority No. 2, Nebraska RB, 5.00%, 05/15/26 | 263,679 | ||||||
| 750,000 | Douglas County Public Facilities Corp., Nebraska RB, 2.00%, 05/01/24 | 752,678 | ||||||
| 580,000 | Douglas County Sanitary & Improvement District No. 464, Nebraska GO, 3.65%, 03/15/33 | 580,122 | ||||||
| 260,000 | Douglas County Sanitary & Improvement District No. 484, Nebraska GO, 3.00%, 08/15/29 | 260,764 | ||||||
| 65,000 | Douglas County Sanitary & Improvement District No. 485, Nebraska GO, 2.65%, 10/01/20 | 65,010 | ||||||
| 105,000 | Douglas County Sanitary & Improvement District No. 509, Nebraska GO, 3.85%, 03/15/33 | 105,044 | ||||||
| 295,000 | Douglas County Sanitary & Improvement District No. 509, Nebraska GO, 3.90%, 03/15/34 | 295,133 | ||||||
| 210,000 | Douglas County Sanitary & Improvement District No. 509, Nebraska GO, 3.95%, 03/15/35 | 210,084 | ||||||
| 190,000 | Douglas County Sanitary & Improvement District No. 509, Nebraska GO, 4.00%, 03/15/36 | 190,084 | ||||||
| 250,000 | Douglas County Sanitary & Improvement District No. 515, Nebraska GO, 3.75%, 12/15/32 | 250,047 | ||||||
| 95,000 | Douglas County Sanitary & Improvement District No. 535, Nebraska GO, 2.55%, 10/15/20 | 95,203 | ||||||
| 115,000 | Douglas County Sanitary & Improvement District No. 541, Nebraska GO, 2.95%, 07/15/24 | 115,851 | ||||||
| 85,000 | Douglas County Sanitary & Improvement District No. 549, Nebraska GO, 3.10%, 05/15/30 | 84,513 | ||||||
| 100,000 | Douglas County Sanitary & Improvement District No. 549, Nebraska GO, 3.05%, 05/15/29 | 99,599 | ||||||
| Principal Amount | Security Description | Value | ||||||
| $ | 700,000 | Douglas County School District No. 10, Nebraska GO, 5.00%, 01/15/30 | $ | 757,820 | ||||
| 750,000 | Douglas County School District No. 59, Nebraska GO, 3.00%, 12/15/35 | 742,837 | ||||||
| 750,000 | Douglas County School District No. 59, Nebraska GO, 4.00%, 06/15/27 | 820,987 | ||||||
| 665,000 | Elkhorn School District, Nebraska GO, 4.00%, 12/15/34 | 720,754 | ||||||
| 1,430,000 | Elkhorn School District, Nebraska GO, 4.00%, 12/15/35 | 1,533,603 | ||||||
| 325,000 | Elkhorn School District, Nebraska GO, 5.00%, 12/15/28 | 409,315 | ||||||
| 300,000 | Elkhorn School District, Nebraska GO, 5.00%, 12/15/28 | 377,829 | ||||||
| 350,000 | Elkhorn School District, Nebraska GO, 5.00%, 12/15/29 | 434,427 | ||||||
| 250,000 | Elkhorn School District, Nebraska GO, 4.00%, 01/15/32 | 262,565 | ||||||
| 47,000 | Elm Creek Rural Fire Protection District No. 7, Nebraska GO, 1.40%, 10/15/20 | 46,922 | ||||||
| 265,000 | Grand Island Public Schools, Nebraska GO, 5.00%, 12/15/39 | 299,903 | ||||||
| 185,000 | Grand Island Public Schools, Nebraska GO, 4.00%, 12/15/24 | 196,877 | ||||||
| 455,000 | Gretna Public Schools, Nebraska GO, 5.00%, 06/15/33 | 560,610 | ||||||
| 735,000 | Gretna Public Schools, Nebraska GO, 4.00%, 12/15/24 | 813,674 | ||||||
| 265,000 | Gretna Public Schools, Nebraska GO, 4.00%, 12/15/25 | 297,152 | ||||||
| 105,000 | Knox County School District #501, Nebraska GO, 2.00%, 12/15/19 | 104,294 | ||||||
| 900,000 | Lancaster County Correctional Facility Joint Public Agency, Nebraska GO, 5.00%, 12/01/27 | 1,127,646 | ||||||
| 500,000 | Lancaster County School District 001, Nebraska GO, 4.00%, 01/15/31 | 564,165 | ||||||
| 750,000 | Lancaster County School District 001, Nebraska GO, 4.00%, 01/15/26 | 848,752 | ||||||
| 500,000 | Lincoln County Hospital Authority No. 1, Nebraska RB, 5.00%, 11/01/32 | 531,630 | ||||||
| 200,000 | Lincoln County Hospital Authority No. 1, Nebraska RB, 5.00%, 11/01/25 | 214,416 | ||||||
| 500,000 | Lincoln-Lancaster County Public Building Commission, Nebraska RB, 3.00%, 12/01/26 | 534,235 | ||||||
| 1,000,000 | Loup River Public Power District, Nebraska RB, 2.00%, 12/01/26 | 995,030 | ||||||
| 415,000 | Metropolitan Community College Area, Nebraska COP, 4.00%, 03/01/20 | 424,147 | ||||||
See accompanying Notes to Financial Statements.
ANNUAL REPORT 2019
SCHEDULES OF PORTFOLIO INVESTMENTS
March 31, 2019
NEBRASKA TAX-FREE FUND
| Principal Amount | Security Description | Value | ||||||
| $ | 500,000 | Metropolitan Community College Area, Nebraska COP, 3.00%, 03/01/26 | $ | 525,770 | ||||
| 500,000 | Metropolitan Utilities District of Omaha Gas System Revenue, Nebraska RB, 4.00%, 12/01/26 | 556,395 | ||||||
| 1,000,000 | Metropolitan Utilities District of Omaha Water System Revenue, Nebraska RB, 5.00%, 12/01/21 | 1,088,130 | ||||||
| 180,000 | Mid-Plains Community College Area Facilities Corp., Nebraska RB, 3.00%, 10/15/25 | 182,869 | ||||||
| 1,475,000 | Municipal Energy Agency of Nebraska, Nebraska RB, 5.00%, 04/01/30 | 1,598,620 | ||||||
| 140,000 | Municipal Energy Agency of Nebraska, Nebraska RB, 5.00%, 04/01/31 | 151,526 | ||||||
| 250,000 | Municipal Energy Agency of Nebraska, Nebraska RB, 5.38%, 04/01/39 | 250,000 | ||||||
| 210,000 | Municipal Energy Agency of Nebraska, Nebraska RB, 5.00%, 04/01/25 | 235,166 | ||||||
| 200,000 | Municipal Energy Agency of Nebraska, Nebraska RB, 5.00%, 04/01/26 | 217,836 | ||||||
| 540,000 | Municipal Energy Agency of Nebraska, Nebraska RB, 5.00%, 04/01/27 | 587,007 | ||||||
| 540,000 | Nebraska Investment Finance Authority, Nebraska RB, 1.40%, 09/01/20 | 538,310 | ||||||
| 445,000 | Nebraska Investment Finance Authority, Nebraska RB, 1.50%, 03/01/21 | 442,993 | ||||||
| 500,000 | Nebraska Investment Finance Authority, Nebraska RB, 2.00%, 03/01/24 | 499,970 | ||||||
| 330,000 | Nebraska Investment Finance Authority, Nebraska RB, 2.45%, 09/01/24 | 338,474 | ||||||
| 230,000 | Nebraska Investment Finance Authority, Nebraska RB, 2.80%, 09/01/26 | 239,490 | ||||||
| 175,000 | Nebraska Investment Finance Authority, Nebraska RB, 2.35%, 09/01/24 | 178,147 | ||||||
| 1,050,000 | Nebraska Public Power District, Nebraska RB, 5.00%, 01/01/32 | 1,132,320 | ||||||
| 540,000 | Nebraska Public Power District, Nebraska RB, 5.00%, 01/01/34 | 581,650 | ||||||
| 150,000 | Nebraska Public Power District, Nebraska RB, 5.00%, 01/01/26 | 163,067 | ||||||
| 200,000 | Nebraska Public Power District, Nebraska RB, 5.00%, 01/01/27 | 217,198 | ||||||
| 600,000 | Nebraska Public Power District, Nebraska RB, 5.00%, 01/01/29 | 649,740 | ||||||
| 1,995,000 | Nebraska Public Power District, Nebraska RB, 5.00%, 01/01/31 | 2,103,967 | ||||||
| 1,000,000 | Nebraska State College Facilities Corp., Nebraska RB, 5.00%, 07/15/26 | 1,200,520 | ||||||
| 315,000 | Nebraska State Colleges, Nebraska RB, 3.00%, 07/01/25 | 315,176 | ||||||
| Principal Amount | Security Description | Value | ||||||
| $ | 805,000 | Omaha Public Facilities Corp., Nebraska RB, 5.00%, 06/01/26 | $ | 809,572 | ||||
| 285,000 | Omaha Public Facilities Corp., Nebraska RB, 5.00%, 06/01/20 | 296,426 | ||||||
| 700,000 | Omaha Public Facilities Corp., Nebraska RB, 5.00%, 06/01/21 | 750,330 | ||||||
| 1,000,000 | Omaha Public Facilities Corp., Nebraska RB, 4.00%, 06/01/28 | 1,114,280 | ||||||
| 250,000 | Omaha Public Power District, Nebraska RB, 5.00%, 02/01/30 | 308,053 | ||||||
| 205,000 | Omaha Public Power District, Nebraska RB, 4.00%, 02/01/31 | 215,447 | ||||||
| 200,000 | Omaha Public Power District, Nebraska RB, 4.00%, 02/01/34 | 209,210 | ||||||
| 1,170,000 | Omaha Public Power District, Nebraska RB, 5.00%, 02/01/29 | 1,243,207 | ||||||
| 1,435,000 | Omaha Public Power District, Nebraska RB, 5.00%, 02/01/30 | 1,524,788 | ||||||
| 500,000 | Omaha Public Power District, Nebraska RB, 5.00%, 02/01/29 | 531,285 | ||||||
| 500,000 | Omaha School District, Nebraska GO, 4.00%, 12/15/32 | 561,265 | ||||||
| 180,000 | Omaha School District, Nebraska GO, 3.00%, 12/15/32 | 181,642 | ||||||
| 620,000 | Omaha School District, Nebraska GO, 3.13%, 12/15/33 | 627,167 | ||||||
| 1,500,000 | Omaha School District, Nebraska GO, 4.00%, 12/15/39 | 1,584,795 | ||||||
| 650,000 | Omaha School District, Nebraska GO, 4.00%, 12/15/22 | 665,515 | ||||||
| 590,000 | Omaha-Douglas Public Building Commission, Nebraska GO, 4.50%, 05/01/22 | 591,434 | ||||||
| 245,000 | Omaha-Douglas Public Building Commission, Nebraska GO, 4.50%, 05/01/23 | 245,605 | ||||||
| 400,000 | Papillion-La Vista School District No. 27, Nebraska GO, 1.75%, 12/01/22 | 401,444 | ||||||
| 350,000 | Papillion-La Vista School District No. 27, Nebraska GO, 3.00%, 12/01/26 | 364,990 | ||||||
| 750,000 | Papillion-La Vista School District No. 27, Nebraska GO, 4.00%, 12/01/29 | 859,320 | ||||||
| 125,000 | Platte County School District No. 1 Columbus Public Schools, Nebraska GO, 5.00%, 12/15/26 | 144,670 | ||||||
| 280,000 | Platte County School District No. 1 Columbus Public Schools, Nebraska GO, 5.00%, 12/15/28 | 323,159 | ||||||
| 160,000 | Sarpy County Sanitary & Improvement District No. 191, Nebraska GO, 3.55%, 10/15/32 | 160,050 | ||||||
See accompanying Notes to Financial Statements.
ANNUAL REPORT 2019
SCHEDULES OF PORTFOLIO INVESTMENTS
March 31, 2019
NEBRASKA TAX-FREE FUND
| Principal Amount | Security Description | Value | ||||||
| $ | 55,000 | Sarpy County Sanitary & Improvement District No. 191, Nebraska GO, 2.45%, 10/15/22 | $ | 55,010 | ||||
| 80,000 | Sarpy County Sanitary & Improvement District No. 242, Nebraska GO, 3.00%, 03/15/27 | 80,062 | ||||||
| 110,000 | Sarpy County Sanitary & Improvement District No. 279, Nebraska GO, 3.95%, 02/15/32 | 110,118 | ||||||
| 110,000 | Sarpy County Sanitary & Improvement District No. 279, Nebraska GO, 5.15%, 02/15/34 | 110,077 | ||||||
| 150,000 | Sarpy County Sanitary & Improvement District No. 68, Nebraska GO, 2.75%, 12/15/23 | 150,132 | ||||||
| 385,000 | Scotts Bluff County School District/ Gering School District, Nebraska GO, 5.00%, 12/01/23 | 423,219 | ||||||
| 220,000 | Southeast Community College, Nebraska COP, 5.00%, 12/15/25 | 265,142 | ||||||
| 225,000 | Southeast Community College, Nebraska COP, 5.00%, 12/15/26 | 276,512 | ||||||
| 300,000 | Southern Public Power District, Nebraska RB, 4.00%, 12/15/25 | 337,602 | ||||||
| 400,000 | Southern Public Power District, Nebraska RB, 4.00%, 12/15/26 | 449,468 | ||||||
| 200,000 | State of Nebraska, Nebraska COP, 1.40%, 03/15/20 | 198,978 | ||||||
| 200,000 | State of Nebraska, Nebraska COP, 1.60%, 03/15/21 | 199,154 | ||||||
| 500,000 | State of Nebraska, Nebraska COP, 3.00%, 12/15/22 | 524,180 | ||||||
| 350,000 | University of Nebraska, Nebraska RB, 5.00%, 05/15/24 | 406,928 | ||||||
| 350,000 | University of Nebraska, Nebraska RB, 5.00%, 05/15/25 | 415,821 | ||||||
| 1,000,000 | University of Nebraska, Nebraska RB, 4.00%, 07/01/31 | 1,095,890 | ||||||
| 500,000 | University of Nebraska Facilities Corp., Nebraska RB, 4.00%, 07/15/30 | 563,535 | ||||||
| 745,000 | University of Nebraska Facilities Corp., Nebraska RB, 2.00%, 07/15/19 | 746,028 | ||||||
| 500,000 | University of Nebraska Facilities Corp., Nebraska RB, 5.00%, 07/15/25 | 597,845 | ||||||
| 500,000 | University of Nebraska Facilities Corp., Nebraska RB, 5.00%, 07/15/26 | 610,870 | ||||||
| 1,000,000 | Village of Boys Town NE, Nebraska RB, 3.00%, 09/01/28 | 1,044,770 | ||||||
| 100,000 | West Haymarket Joint Public Agency, Nebraska GO, 5.00%, 12/15/22 | 109,020 | ||||||
| 200,000 | West Haymarket Joint Public Agency, Nebraska GO, 5.00%, 12/15/26 | 217,706 | ||||||
| Principal Amount | Security Description | Value | ||||||
| $ | 105,000 | West Haymarket Joint Public Agency, Nebraska GO, 4.00%, 12/15/28 | $ | 111,784 | ||||
| 200,000 | Westside Community Schools, Nebraska GO, 4.00%, 06/01/24 | 219,104 | ||||||
| 200,000 | Westside Community Schools, Nebraska GO, 4.00%, 06/01/25 | 218,030 | ||||||
| 230,000 | Westside Community Schools, Nebraska GO, 4.00%, 06/01/27 | 249,299 | ||||||
| 71,170,141 | ||||||||
| North Dakota - 0.7% | ||||||||
| 500,000 | City of Fargo ND, North Dakota GO, 3.00%, 05/01/34 | 502,740 | ||||||
| 71,774,003 | ||||||||
| Total Government & Agency Obligations (Cost $71,973,982) | 71,774,003 | |||||||
| Shares | Security Description | Value | ||||||
| Short-Term Investments - 2.4% | ||||||||
| Investment Company - 2.4% | ||||||||
| 1,747,058 | BlackRock Liquidity Funds T-Fund Portfolio, Institutional Shares, 2.32% (a) | 1,747,058 | ||||||
| Total Short-Term Investments (Cost $1,747,058) | 1,747,058 | |||||||
| Investments, at value - 100.8% (Cost $73,721,040) | 73,521,061 | |||||||
| Other liabilities in excess of assets - (0.8)% | (576,160 | ) | ||||||
| NET ASSETS - 100.0% | $ | 72,944,901 | ||||||
| (a) | Dividend yield changes daily to reflect current market conditions. Rate was the quoted yield as of March 31, 2019. |
| AMBAC | American Municipal Bond Assurance Corporation |
| COP | Certificate of Participation |
| GO | General Obligation |
| RB | Revenue Bond |
See accompanying Notes to Financial Statements.
ANNUAL REPORT 2019
SCHEDULES OF PORTFOLIO INVESTMENTS
March 31, 2019
BALANCED FUND
| Shares | Security Description | Value | ||||||
| Common Stocks - 61.8% | ||||||||
| Communication Services - 6.5% | ||||||||
| 6,300 | Activision Blizzard, Inc. | $ | 286,839 | |||||
| 1,378 | Alphabet, Inc., Class C (a) | 1,616,821 | ||||||
| 20,900 | Comcast Corp., Class A | 835,582 | ||||||
| 5,550 | Facebook, Inc., Class A (a) | 925,130 | ||||||
| 16,800 | Verizon Communications, Inc. | 993,384 | ||||||
| 4,657,756 | ||||||||
| Consumer Discretionary - 6.1% | ||||||||
| 525 | Amazon.com, Inc.(a) | 934,894 | ||||||
| 300 | Booking Holdings, Inc.(a) | 523,473 | ||||||
| 6,700 | NIKE, Inc., Class B | 564,207 | ||||||
| 1,390 | O'Reilly Automotive, Inc.(a) | 539,737 | ||||||
| 4,050 | Royal Caribbean Cruises, Ltd. | 464,211 | ||||||
| 4,400 | The Home Depot, Inc. | 844,316 | ||||||
| 1,390 | Ulta Beauty, Inc.(a) | 484,734 | ||||||
| 4,355,572 | ||||||||
| Consumer Staples - 4.2% | ||||||||
| 11,300 | Church & Dwight Co., Inc. | 804,899 | ||||||
| 2,500 | Constellation Brands, Inc., Class A | 438,325 | ||||||
| 2,950 | Costco Wholesale Corp. | 714,313 | ||||||
| 4,800 | Ingredion, Inc. | 454,512 | ||||||
| 7,980 | Lamb Weston Holdings, Inc. | 598,021 | ||||||
| 3,010,070 | ||||||||
| Energy - 3.3% | ||||||||
| 2,900 | Diamondback Energy, Inc. | 294,437 | ||||||
| 4,050 | EOG Resources, Inc. | 385,479 | ||||||
| 9,300 | Exxon Mobil Corp. | 751,440 | ||||||
| 5,450 | Occidental Petroleum Corp. | 360,790 | ||||||
| 3,600 | Phillips 66 | 342,612 | ||||||
| 5,900 | Schlumberger, Ltd. | 257,063 | ||||||
| 2,391,821 | ||||||||
| Financials - 7.7% | ||||||||
| 1,010 | BlackRock, Inc. | 431,644 | ||||||
| 10,300 | CenterState Bank Corp. | 245,243 | ||||||
| 3,950 | Chubb, Ltd. | 553,316 | ||||||
| 3,300 | CME Group, Inc. | 543,114 | ||||||
| 9,600 | First American Financial Corp. | 494,400 | ||||||
| 19,000 | Huntington Bancshares, Inc. | 240,920 | ||||||
| 9,800 | JPMorgan Chase & Co. | 992,054 | ||||||
| 15,700 | KeyCorp | 247,275 | ||||||
| 20,400 | Manulife Financial Corp. | 344,964 | ||||||
| 5,300 | Northern Trust Corp. | 479,173 | ||||||
| 8,700 | U.S.Bancorp | 419,253 | ||||||
| 11,200 | Wells Fargo & Co. | 541,184 | ||||||
| 5,532,540 | ||||||||
| Health Care - 9.4% | ||||||||
| 7,400 | AMN Healthcare Services, Inc.(a) | 348,466 | ||||||
| 8,200 | Baxter International, Inc. | 666,742 | ||||||
| 1,560 | Biogen, Inc.(a) | 368,753 | ||||||
| 14,400 | Boston Scientific Corp.(a) | 552,672 | ||||||
| 3,200 | Cigna Corp. | 514,624 | ||||||
| Shares | Security Description | Value | ||||||
| 3,400 | Edwards Lifesciences Corp.(a) | $ | 650,522 | |||||
| 6,500 | Eli Lilly & Co. | 843,440 | ||||||
| 1,700 | Humana, Inc. | 452,200 | ||||||
| 2,100 | Laboratory Corp. of America Holdings (a) | 321,258 | ||||||
| 4,739 | LHC Group, Inc.(a) | 525,365 | ||||||
| 3,300 | Thermo Fisher Scientific, Inc. | 903,276 | ||||||
| 5,700 | Zoetis, Inc. | 573,819 | ||||||
| 6,721,137 | ||||||||
| Industrials - 5.9% | ||||||||
| 2,500 | FedEx Corp. | 453,525 | ||||||
| 5,600 | Fortune Brands Home & Security, Inc. | 266,616 | ||||||
| 9,300 | KAR Auction Services, Inc. | 477,183 | ||||||
| 7,400 | MasTec, Inc.(a) | 355,940 | ||||||
| 2,650 | Raytheon Co. | 482,512 | ||||||
| 1,560 | Roper Technologies, Inc. | 533,473 | ||||||
| 9,400 | Southwest Airlines Co. | 487,954 | ||||||
| 9,000 | The Timken Co. | 392,580 | ||||||
| 7,200 | Waste Management, Inc. | 748,152 | ||||||
| 4,197,935 | ||||||||
| Information Technology - 12.2% | ||||||||
| 2,100 | Adobe, Inc.(a) | 559,629 | ||||||
| 9,450 | Apple, Inc. | 1,795,027 | ||||||
| 2,300 | Broadcom, Inc. | 691,633 | ||||||
| 2,300 | Cabot Microelectronics Corp. | 257,508 | ||||||
| 4,700 | CDW Corp. | 452,939 | ||||||
| 16,500 | Cisco Systems, Inc. | 890,835 | ||||||
| 3,900 | Citrix Systems, Inc. | 388,674 | ||||||
| 2,100 | FleetCor Technologies, Inc.(a) | 517,839 | ||||||
| 3,350 | Mastercard, Inc., Class A | 788,758 | ||||||
| 5,300 | Microchip Technology, Inc. | 439,688 | ||||||
| 16,150 | Microsoft Corp. | 1,904,731 | ||||||
| 8,687,261 | ||||||||
| Materials - 1.6% | ||||||||
| 5,400 | Berry Global Group, Inc.(a) | 290,898 | ||||||
| 5,900 | FMC Corp. | 453,238 | ||||||
| 5,518 | Livent Corp.(a) | 67,761 | ||||||
| 1,750 | Martin Marietta Materials, Inc. | 352,065 | ||||||
| 1,163,962 | ||||||||
| Real Estate - 2.6% | ||||||||
| 4,625 | American Tower Corp. REIT | 911,403 | ||||||
| 12,300 | First Industrial Realty Trust, Inc. REIT | 434,928 | ||||||
| 4,300 | Sun Communities, Inc. REIT | 509,636 | ||||||
| 1,855,967 | ||||||||
| Utilities - 2.3% | ||||||||
| 5,000 | Atmos Energy Corp. | 514,650 | ||||||
| 3,800 | NextEra Energy, Inc. | 734,616 | ||||||
| 4,600 | Southwest Gas Holdings, Inc. | 378,396 | ||||||
| 1,627,662 | ||||||||
| Total Common Stocks (Cost $29,434,966) | 44,201,683 | |||||||
See accompanying Notes to Financial Statements.
ANNUAL REPORT 2019
SCHEDULES OF PORTFOLIO INVESTMENTS
March 31, 2019
BALANCED FUND
| Principal Amount | Security Description | Value | ||||||
| Non-U.S. Government Agency Asset Backed Securities - 4.3% | ||||||||
| Asset Backed Securities - 2.0% | ||||||||
| $ | 380,000 | Cabela's Credit Card Master Note Trust, 2.71%, 02/17/26 (b) | $ | 379,271 | ||||
| 1,706 | Canadian Pacer Auto Receivables Trust, 2.55%, 10/21/19 (b) | 1,705 | ||||||
| 139,126 | Magnetite CLO, Ltd.CLO (USD 3 Month LIBOR + 1.00%), 3.77%, 07/25/26 (b)(c) | 139,126 | ||||||
| 101,260 | Missouri Higher Education Loan Authority (USD 1 Month LIBOR + 0.83%), 3.32%, 01/26/26 (c) | 100,343 | ||||||
| 107,546 | PHEAA Student Loan Trust 2011-1 (USD 3 Month LIBOR + 1.10%), 3.70%, 06/25/38 (b)(c) | 108,992 | ||||||
| 118,592 | Preferred Term Securities XII, Ltd./ Preferred Term Securities XII, Inc.(USD 3 Month LIBOR + 0.70%), 3.31%, 12/24/33 (b)(c) | 118,141 | ||||||
| 218,171 | SLM Student Loan Trust (USD 3 Month LIBOR + 1.65%), 4.42%, 07/25/22 (c) | 220,617 | ||||||
| 159,966 | Social Professional Loan Program Trust, 2.64%, 08/25/47 (b) | 159,730 | ||||||
| 64,946 | Stack Infrastructure Issuer, LLC, 4.54%, 02/25/44 (b) | 66,454 | ||||||
| 98,917 | Vantage Data Centers Issuer, LLC, 4.07%, 02/16/43 (b) | 100,415 | ||||||
| 1,394,794 | ||||||||
| Non-Agency Commercial Mortgage Backed Securities - 0.9% | ||||||||
| 375,000 | American Tower Trust #1, 3.07%, 03/15/23 (b) | 374,086 | ||||||
| 125,000 | CD Commercial Mortgage Trust, 4.21%, 08/15/51 | 133,154 | ||||||
| 26,469,103 | FREMF Mortgage Trust Interest Only, 0.10%, 08/25/44 (b) | 51,149 | ||||||
| 75,000 | UBS Commercial Mortgage Trust, 4.19%, 08/15/51 | 79,666 | ||||||
| 638,055 | ||||||||
| Non-Agency Residential Mortgage Backed Securities - 1.4% | ||||||||
| 116,239 | Bayview Commercial Asset Trust REMIC (USD 1 Month LIBOR + 0.58%), 3.36%, 12/25/33 (b)(c) | 114,390 | ||||||
| 160,000 | Bayview Financial Acquisition Trust REMIC (USD 1 Month LIBOR + 2.10%), 4.60%, 04/28/39 (c) | 159,828 | ||||||
| 45,433 | Citigroup Mortgage Loan Trust REMIC, 4.00%, 01/25/35 (b)(d) | 46,682 | ||||||
| 135,437 | EverBank Mortgage Loan Trust, 3.50%, 02/25/48 (b)(d) | 136,000 | ||||||
| Principal Amount | Security Description | Value | ||||||
| $ | 179,263 | Goldman Sachs Alternative Mortgage Products Trust REMIC (USD 1 Month LIBOR + 0.50%), 2.99%, 05/25/36 (b)(c) | $ | 177,499 | ||||
| 1,615 | Lehman ABS Manufactured Housing Contract Trust REMIC, 4.35%, 04/15/40 | 1,617 | ||||||
| 75,262 | New Residential Mortgage Loan Trust REMIC, 3.75%, 08/25/55 (b)(d) | 76,128 | ||||||
| 62,850 | Towd Point Mortgage Trust REMIC, 3.50%, 02/25/55 (b)(d) | 62,979 | ||||||
| 226,503 | Wells Fargo Mortgage Backed Securities, 3.50%, 07/25/47 (b)(d) | 227,120 | ||||||
| 1,002,243 | ||||||||
| Total Non-U.S.Government Agency Asset Backed Securities (Cost $2,994,829) | 3,035,092 | |||||||
| Corporate Bonds - 10.2% | ||||||||
| Communication Services - 0.8% | ||||||||
| 348,000 | AT&T, Inc., 4.30%, 02/15/30 | 352,475 | ||||||
| 237,000 | Verizon Communications, Inc., 4.33%, 09/21/28 | 251,273 | ||||||
| 603,748 | ||||||||
| Consumer Discretionary - 1.3% | ||||||||
| 330,000 | CBS Corp., 4.00%, 01/15/26 | 335,491 | ||||||
| 200,000 | Dollar General Corp., 3.25%, 04/15/23 | 201,211 | ||||||
| 100,000 | Hanesbrands, Inc., 4.63%, 05/15/24 (b) | 100,270 | ||||||
| 50,000 | Newell Brands, Inc., 4.20%, 04/01/26 | 47,756 | ||||||
| 215,000 | Whirlpool Corp., 4.70%, 06/01/22 | 224,992 | ||||||
| 909,720 | ||||||||
| Consumer Staples - 0.6% | ||||||||
| 175,000 | Church & Dwight Co., Inc., 2.88%, 10/01/22 | 175,286 | ||||||
| 100,000 | Reckitt Benckiser Treasury Services PLC, 3.00%, 06/26/27 (b) | 96,825 | ||||||
| 185,000 | Walmart, Inc., 3.40%, 06/26/23 | 190,804 | ||||||
| 462,915 | ||||||||
| Energy - 0.3% | ||||||||
| 212,000 | EOG Resources, Inc., 4.15%, 01/15/26 | 224,598 | ||||||
| Financials - 5.0% | ||||||||
| 230,000 | Bank of America Corp., MTN, 4.13%, 01/22/24 | 241,025 | ||||||
| 180,000 | CBRE Services, Inc., 5.25%, 03/15/25 | 193,144 | ||||||
| 240,000 | Citigroup, Inc., 3.89%, 01/10/28 (d) | 243,918 | ||||||
| 395,000 | CME Group, Inc., 3.00%, 03/15/25 | 397,263 | ||||||
| 175,000 | Hartford Financial Services Group, Inc., 5.50%, 03/30/20 | 179,510 | ||||||
| 245,000 | Intercontinental Exchange, Inc., 3.75%, 12/01/25 | 254,569 | ||||||
| 230,000 | JPMorgan Chase & Co., 3.25%, 09/23/22 | 233,327 | ||||||
See accompanying Notes to Financial Statements.
ANNUAL REPORT 2019
SCHEDULES OF PORTFOLIO INVESTMENTS
March 31, 2019
BALANCED FUND
| Principal Amount | Security Description | Value | ||||||
| $ | 120,000 | Metropolitan Life Global Funding I, 3.60%, 01/11/24 (b) | $ | 123,647 | ||||
| 260,000 | Morgan Stanley, GMTN, 3.75%, 02/25/23 | 266,665 | ||||||
| 190,000 | Prudential Financial, Inc., MTN, 7.38%, 06/15/19 | 191,666 | ||||||
| 235,000 | Regions Financial Corp., 3.80%, 08/14/23 | 241,674 | ||||||
| 220,000 | The Charles Schwab Corp., 3.85%, 05/21/25 | 231,356 | ||||||
| 265,000 | The Goldman Sachs Group, Inc., 3.00%, 04/26/22 | 264,872 | ||||||
| 230,000 | U.S.Bancorp, Series J (callable at 100 beginning 04/15/27), 5.30%, 10/15/49 (d)(e) | 234,025 | ||||||
| 270,000 | Wells Fargo & Co., 3.00%, 04/22/26 | 264,049 | ||||||
| 3,560,710 | ||||||||
| Health Care - 0.2% | ||||||||
| 132,000 | Becton Dickinson and Co., 3.73%, 12/15/24 | 134,099 | ||||||
| Industrials - 0.8% | ||||||||
| 150,000 | Roper Technologies, Inc., 2.80%, 12/15/21 | 149,545 | ||||||
| 200,000 | Textron, Inc., 3.65%, 03/01/21 | 201,554 | ||||||
| 225,000 | Union Pacific Corp., 3.95%, 09/10/28 | 236,179 | ||||||
| 587,278 | ||||||||
| Information Technology - 0.9% | ||||||||
| 215,000 | eBay, Inc., 3.60%, 06/05/27 | 209,762 | ||||||
| 200,000 | Oracle Corp., 3.40%, 07/08/24 | 204,873 | ||||||
| 185,000 | QUALCOMM, Inc., 3.45%, 05/20/25 | 186,477 | ||||||
| 601,112 | ||||||||
| Materials - 0.3% | ||||||||
| 209,000 | Albemarle Corp., 4.15%, 12/01/24 | 215,964 | ||||||
| Total Corporate Bonds (Cost $7,192,484) | 7,300,144 | |||||||
| Government & Agency Obligations - 20.0% | ||||||||
| GOVERNMENT SECURITIES - 19.4% | ||||||||
| Municipals - 1.3% | ||||||||
| 350,000 | California State University, California RB, 5.45%, 11/01/22 | 384,044 | ||||||
| 250,000 | City of Industry CA, California RB, 7.00%, 01/01/21 | 258,248 | ||||||
| 200,000 | Santa Monica Community College District, California GO, 5.73%, 08/01/24 | 208,122 | ||||||
| 100,000 | Vista Community Development Commission, California Tax Allocation Bond, 7.61%, 09/01/21 | 106,594 | ||||||
| 957,008 | ||||||||
| Treasury Inflation Index Securities - 1.1% | ||||||||
| 109,688 | U.S. Treasury Inflation Indexed Bond, 1.75%, 01/15/28 (f) | 119,477 | ||||||
| Principal Amount | Security Description | Value | ||||||
| $ | 677,779 | U.S. Treasury Inflation Indexed Note, 0.13%, 01/15/22 (f) | $ | 673,086 | ||||
| 792,563 | ||||||||
| U.S. Treasury Securities - 17.0% | ||||||||
| 95,000 | U.S. Treasury Note, 1.13%, 03/31/20 | 93,831 | ||||||
| 3,725,000 | U.S. Treasury Note, 2.00%, 02/28/21 | 3,704,483 | ||||||
| 3,835,000 | U.S. Treasury Note, 1.63%, 11/15/22 | 3,755,753 | ||||||
| 4,320,000 | U.S. Treasury Note, 2.13%, 05/15/25 | 4,276,969 | ||||||
| 325,000 | U.S. Treasury Note, 2.25%, 02/15/27 | 322,728 | ||||||
| 12,153,764 | ||||||||
| U.S. GOVERNMENT MORTGAGE BACKED SECURITIES - 0.6% | ||||||||
| Federal Home Loan Mortgage Corp. - 0.4% | ||||||||
| 115,000 | Federal Home Loan Mortgage Corp., 3.78%, 10/25/28 (d) | 122,619 | ||||||
| 146,067 | Federal Home Loan Mortgage Corp. REMIC, 4.00%, 03/15/40 | 151,516 | ||||||
| 274,135 | ||||||||
| Federal National Mortgage Association - 0.2% | ||||||||
| 73,639 | Federal National Mortgage Association #AL1321, 3.50%, 12/01/26 | 75,345 | ||||||
| 101,467 | Federal National Mortgage Association REMIC, 2.50%, 09/25/39 | 100,125 | ||||||
| 175,470 | ||||||||
| Total Government & Agency Obligations (Cost $14,177,146) | 14,352,940 | |||||||
| Shares | Security Description | Value | ||||||
| Short-Term Investments - 3.7% | ||||||||
| Investment Company - 3.7% | ||||||||
| 2,634,823 | BlackRock Liquidity Funds T-Fund Portfolio, Institutional Shares, 2.32% (g) | 2,634,823 | ||||||
| Total Short-Term Investments (Cost $2,634,823) | 2,634,823 | |||||||
| Investments, at value - 100.0% (Cost $56,434,248) | 71,524,682 | |||||||
| Other assets in excess of liabilities - 0.0% | 782 | |||||||
| NET ASSETS - 100.0% | $ | 71,525,464 | ||||||
| (a) | Non-income producing security. |
| (b) | 144a Security, which is exempt from registration under the Securities Act of 1933. The Sub-Adviser has deemed this security to be liquid based on procedures approved by Tributary Funds’ Board of Directors. As of March 31, 2019, the aggregate value of these liquid securities were $2,660,609 or 3.7% of net assets. |
| (c) | Floating rate security. Rate presented is as of March 31, 2019. |
| (d) | Variable or adjustable rate security, the interest rate of which adjusts periodically based on changes in current interest rates. Rate represented is as of March 31, 2019. |
| (e) | Perpetual maturity security. |
| (f) | U.S. Treasury inflation indexed security, par amount is adjusted for inflation. |
| (g) | Dividend yield changes daily to reflect current market conditions. Rate was the quoted yield as of March 31, 2019. |
See accompanying Notes to Financial Statements.
ANNUAL REPORT 2019
SCHEDULES OF PORTFOLIO INVESTMENTS
March 31, 2019
BALANCED FUND
| ABS | Asset Backed Security |
| CLO | Collateralized Loan Obligation |
| GMTN | Global Medium Term Note |
| GO | General Obligation |
| LIBOR | London Interbank Offered Rate |
| LLC | Limited Liability Company |
| MTN | Medium Term Note |
| PLC | Public Limited Company |
| RB | Revenue Bond |
| REIT | Real Estate Investment Trust |
| REMIC | Real Estate Mortgage Investment Conduit |
See accompanying Notes to Financial Statements.
ANNUAL REPORT 2019
SCHEDULES OF PORTFOLIO INVESTMENTS
March 31, 2019
GROWTH OPPORTUNITIES FUND
| Shares | Security Description | Value | ||||||
| Common Stocks - 98.0% | ||||||||
| Communication Services - 3.6% | ||||||||
| 10,900 | IAC/InterActiveCorp.(a) | $ | 2,290,199 | |||||
| 3,700 | The Madison Square Garden Co., Class A (a) | 1,084,581 | ||||||
| 52,900 | Twitter, Inc.(a) | 1,739,352 | ||||||
| 5,114,132 | ||||||||
| Consumer Discretionary - 16.6% | ||||||||
| 15,300 | Advance Auto Parts, Inc. | 2,609,109 | ||||||
| 35,800 | At Home Group, Inc.(a) | 639,388 | ||||||
| 11,200 | Carter's, Inc. | 1,128,848 | ||||||
| 24,900 | Dollar General Corp. | 2,970,570 | ||||||
| 20,100 | DR Horton, Inc. | 831,738 | ||||||
| 9,100 | Expedia, Inc. | 1,082,900 | ||||||
| 15,000 | Five Below, Inc.(a) | 1,863,750 | ||||||
| 9,900 | Grand Canyon Education, Inc.(a) | 1,133,649 | ||||||
| 11,120 | Lululemon Athletica, Inc.(a) | 1,822,234 | ||||||
| 5,700 | O'Reilly Automotive, Inc.(a) | 2,213,310 | ||||||
| 26,500 | Restaurant Brands International, Inc. | 1,725,415 | ||||||
| 27,600 | Ross Stores, Inc. | 2,569,560 | ||||||
| 5,300 | Ulta Beauty, Inc.(a) | 1,848,269 | ||||||
| 27,300 | Yum China Holdings, Inc. | 1,226,043 | ||||||
| 23,664,783 | ||||||||
| Consumer Staples - 3.8% | ||||||||
| 30,500 | Church & Dwight Co., Inc. | 2,172,515 | ||||||
| 20,490 | Lamb Weston Holdings, Inc. | 1,535,521 | ||||||
| 16,300 | Post Holdings, Inc.(a) | 1,783,220 | ||||||
| 5,491,256 | ||||||||
| Energy - 1.2% | ||||||||
| 21,700 | Apergy Corp.(a) | 891,002 | ||||||
| 7,000 | Concho Resources, Inc. | 776,720 | ||||||
| 1,667,722 | ||||||||
| Financials - 5.3% | ||||||||
| 14,700 | E*TRADE Financial Corp. | 682,521 | ||||||
| 7,400 | FactSet Research Systems, Inc. | 1,837,198 | ||||||
| 15,900 | First American Financial Corp. | 818,850 | ||||||
| 40,300 | KeyCorp | 634,725 | ||||||
| 19,120 | Nasdaq, Inc. | 1,672,809 | ||||||
| 11,100 | Northern Trust Corp. | 1,003,551 | ||||||
| 26,900 | OneMain Holdings, Inc. | 854,075 | ||||||
| 7,503,729 | ||||||||
| Health Care - 15.5% | ||||||||
| 7,500 | Bio-Techne Corp. | 1,489,125 | ||||||
| 22,900 | Centene Corp.(a) | 1,215,990 | ||||||
| 31,600 | DENTSPLY SIRONA, Inc. | 1,567,044 | ||||||
| 17,100 | Edwards Lifesciences Corp.(a) | 3,271,743 | ||||||
| 20,600 | Incyte Corp.(a) | 1,771,806 | ||||||
| 12,510 | Insulet Corp.(a) | 1,189,576 | ||||||
| 13,400 | Intercept Pharmaceuticals, Inc.(a) | 1,498,924 | ||||||
| Shares | Security Description | Value | ||||||
| 15,400 | LHC Group, Inc.(a) | $ | 1,707,244 | |||||
| 14,200 | PerkinElmer, Inc. | 1,368,312 | ||||||
| 13,300 | Sarepta Therapeutics, Inc.(a) | 1,585,227 | ||||||
| 18,500 | Seattle Genetics, Inc.(a) | 1,354,940 | ||||||
| 7,640 | Teleflex, Inc. | 2,308,502 | ||||||
| 6,000 | The Cooper Cos., Inc. | 1,777,020 | ||||||
| 22,105,453 | ||||||||
| Industrials - 14.4% | ||||||||
| 10,600 | Cintas Corp. | 2,142,366 | ||||||
| 18,100 | Crane Co. | 1,531,622 | ||||||
| 16,700 | Dover Corp. | 1,566,460 | ||||||
| 9,200 | EnerSys | 599,472 | ||||||
| 15,000 | Harris Corp. | 2,395,650 | ||||||
| 25,200 | ITT, Inc. | 1,461,600 | ||||||
| 8,400 | L3 Technologies, Inc. | 1,733,508 | ||||||
| 30,000 | MasTec, Inc.(a) | 1,443,000 | ||||||
| 9,900 | Old Dominion Freight Line, Inc. | 1,429,461 | ||||||
| 12,700 | Oshkosh Corp. | 954,151 | ||||||
| 57,300 | Quanta Services, Inc. | 2,162,502 | ||||||
| 5,900 | Roper Technologies, Inc. | 2,017,623 | ||||||
| 8,900 | Spirit AeroSystems Holdings, Inc., Class A | 814,617 | ||||||
| 5,700 | XPO Logistics, Inc.(a) | 306,318 | ||||||
| 20,558,350 | ||||||||
| Information Technology - 30.9% | ||||||||
| 22,400 | Akamai Technologies, Inc.(a) | 1,606,304 | ||||||
| 15,100 | Analog Devices, Inc. | 1,589,577 | ||||||
| 17,300 | Autodesk, Inc.(a) | 2,695,686 | ||||||
| 8,500 | Broadridge Financial Solutions, Inc. | 881,365 | ||||||
| 20,900 | CDK Global, Inc. | 1,229,338 | ||||||
| 15,100 | CDW Corp. | 1,455,187 | ||||||
| 15,600 | Citrix Systems, Inc. | 1,554,696 | ||||||
| 18,500 | CommScope Holding Co., Inc.(a) | 402,005 | ||||||
| 6,750 | DXC Technology Co. | 434,092 | ||||||
| 41,600 | First Data Corp., Class A (a) | 1,092,832 | ||||||
| 31,000 | Fiserv, Inc.(a) | 2,736,680 | ||||||
| 10,340 | FleetCor Technologies, Inc.(a) | 2,549,741 | ||||||
| 21,800 | Fortinet, Inc.(a) | 1,830,546 | ||||||
| 41,700 | Inphi Corp.(a) | 1,823,958 | ||||||
| 8,800 | Jack Henry & Associates, Inc. | 1,220,912 | ||||||
| 11,300 | Lam Research Corp. | 2,022,813 | ||||||
| 18,000 | Microchip Technology, Inc. | 1,493,280 | ||||||
| 31,500 | Paychex, Inc. | 2,526,300 | ||||||
| 54,400 | Pure Storage, Inc., Class A (a) | 1,185,376 | ||||||
| 15,000 | ServiceNow, Inc.(a) | 3,697,350 | ||||||
| 15,700 | Splunk, Inc.(a) | 1,956,220 | ||||||
| 42,100 | SS&C Technologies Holdings, Inc. | 2,681,349 | ||||||
| 22,000 | Twilio, Inc.(a) | 2,841,960 | ||||||
| 12,200 | Zebra Technologies Corp.(a) | 2,556,266 | ||||||
| 44,063,833 | ||||||||
See accompanying Notes to Financial Statements.
ANNUAL REPORT 2019
SCHEDULES OF PORTFOLIO INVESTMENTS
March 31, 2019
GROWTH OPPORTUNITIES FUND
| Shares | Security Description | Value | ||||||
| Materials - 3.0% | ||||||||
| 156,700 | Element Solutions, Inc.(a) | $ | 1,582,670 | |||||
| 16,800 | FMC Corp. | 1,290,576 | ||||||
| 15,713 | Livent Corp.(a) | 192,956 | ||||||
| 6,000 | Martin Marietta Materials, Inc. | 1,207,080 | ||||||
| 4,273,282 | ||||||||
| Real Estate - 3.2% | ||||||||
| 23,900 | American Homes 4 Rent, Class A REIT | 543,008 | ||||||
| 26,800 | CBRE Group, Inc., Class A (a) | 1,325,260 | ||||||
| 11,915 | Digital Realty Trust, Inc. REIT | 1,417,885 | ||||||
| 11,380 | Sun Communities, Inc. REIT | 1,348,758 | ||||||
| 4,634,911 | ||||||||
| Utilities - 0.5% | ||||||||
| 6,900 | Atmos Energy Corp. | 710,217 | ||||||
| Total Common Stocks (Cost $93,539,340) | 139,787,668 | |||||||
| Shares | Security Description | Value | ||||||
| Short-Term Investments - 1.9% | ||||||||
| Investment Company - 1.9% | ||||||||
| 2,632,703 | BlackRock Liquidity Funds T-Fund Portfolio, Institutional Shares, 2.32% (b) | 2,632,703 | ||||||
| Total Short-Term Investments (Cost $2,632,703) | 2,632,703 | |||||||
| Investments, at value - 99.9% (Cost $96,172,043) | 142,420,371 | |||||||
| Other assets in excess of liabilities - 0.1% | 163,229 | |||||||
| NET ASSETS - 100.0% | $ | 142,583,600 | ||||||
| (a) | Non-income producing security. |
| (b) | Dividend yield changes daily to reflect current market conditions. Rate was the quoted yield as of March 31, 2019. |
| REIT | Real Estate Investment Trust |
See accompanying Notes to Financial Statements.
ANNUAL REPORT 2019
SCHEDULES OF PORTFOLIO INVESTMENTS
March 31, 2019
SMALL COMPANY FUND
| Shares | Security Description | Value | ||||||
| Common Stocks - 95.4% | ||||||||
| Communication Services - 3.9% | ||||||||
| 434,300 | MSG Networks, Inc., Class A (a) | $ | 9,446,025 | |||||
| 205,700 | Nexstar Media Group, Inc., Class A | 22,291,709 | ||||||
| 31,737,734 | ||||||||
| Consumer Discretionary - 7.6% | ||||||||
| 288,800 | Big Lots, Inc. | 10,980,176 | ||||||
| 163,100 | Dave & Buster's Entertainment, Inc. | 8,133,797 | ||||||
| 164,300 | Dorman Products, Inc.(a) | 14,473,187 | ||||||
| 266,300 | La-Z-Boy, Inc. | 8,785,237 | ||||||
| 238,700 | Standard Motor Products, Inc. | 11,720,170 | ||||||
| 142,800 | Sturm Ruger & Co., Inc. | 7,571,256 | ||||||
| 61,663,823 | ||||||||
| Energy - 4.0% | ||||||||
| 1,425,100 | Callon Petroleum Co.(a) | 10,759,505 | ||||||
| 734,100 | Carrizo Oil & Gas, Inc.(a) | 9,154,227 | ||||||
| 638,800 | Matador Resources Co.(a) | 12,348,004 | ||||||
| 32,261,736 | ||||||||
| Financials - 19.5% | ||||||||
| 197,300 | Argo Group International Holdings, Ltd. | 13,941,218 | ||||||
| 341,300 | Carolina Financial Corp.(b) | 11,805,567 | ||||||
| 246,500 | Columbia Banking System, Inc. | 8,058,085 | ||||||
| 283,100 | Great Western Bancorp, Inc. | 8,943,129 | ||||||
| 256,100 | Mercantile Bank Corp.(b) | 8,379,592 | ||||||
| 790,500 | Old National Bancorp | 12,964,200 | ||||||
| 347,300 | Selective Insurance Group, Inc. | 21,977,144 | ||||||
| 211,700 | South State Corp. | 14,467,578 | ||||||
| 326,300 | Stifel Financial Corp. | 17,215,588 | ||||||
| 121,200 | UMB Financial Corp. | 7,761,648 | ||||||
| 496,600 | Union Bankshares Corp. | 16,055,078 | ||||||
| 494,200 | United Bankshares, Inc. | 17,909,808 | ||||||
| 159,478,635 | ||||||||
| Health Care - 13.5% | ||||||||
| 347,300 | AMN Healthcare Services, Inc.(a) | 16,354,357 | ||||||
| 459,400 | AngioDynamics, Inc.(a) | 10,501,884 | ||||||
| 233,900 | Cambrex Corp.(a) | 9,087,015 | ||||||
| 82,800 | Emergent BioSolutions, Inc.(a) | 4,183,056 | ||||||
| 331,100 | Integra LifeSciences Holdings Corp.(a) | 18,448,892 | ||||||
| 175,600 | LHC Group, Inc.(a) | 19,467,016 | ||||||
| 46,400 | Masimo Corp.(a) | 6,416,192 | ||||||
| 214,700 | Omnicell, Inc.(a) | 17,356,348 | ||||||
| 250,700 | Varex Imaging Corp.(a) | 8,493,716 | ||||||
| 110,308,476 | ||||||||
| Industrials - 14.2% | ||||||||
| 169,100 | American Woodmark Corp.(a) | 13,972,733 | ||||||
| 237,500 | Barnes Group, Inc. | 12,209,875 | ||||||
| 284,300 | Forward Air Corp. | 18,402,739 | ||||||
| 284,900 | Franklin Electric Co., Inc. | 14,555,541 | ||||||
| 294,500 | Granite Construction, Inc. | 12,707,675 | ||||||
| 344,900 | Kforce, Inc. | 12,112,888 | ||||||
| 245,900 | Lydall, Inc.(a) | 5,768,814 | ||||||
| 559,000 | Navigant Consulting, Inc. | 10,883,730 | ||||||
| Shares | Security Description | Value | ||||||
| 259,700 | Tetra Tech, Inc. | $ | 15,475,523 | |||||
| 116,089,518 | ||||||||
| Information Technology - 17.9% | ||||||||
| 206,900 | Ambarella, Inc.(a) | 8,938,080 | ||||||
| 175,100 | Anixter International, Inc.(a) | 9,824,861 | ||||||
| 385,100 | Benchmark Electronics, Inc. | 10,108,875 | ||||||
| 110,400 | CACI International, Inc., Class A (a) | 20,095,008 | ||||||
| 620,200 | CalAmp Corp.(a) | 7,802,116 | ||||||
| 288,500 | CTS Corp. | 8,473,245 | ||||||
| 239,300 | ExlService Holdings, Inc.(a) | 14,362,786 | ||||||
| 63,600 | Littelfuse, Inc. | 11,605,728 | ||||||
| 332,900 | Methode Electronics, Inc. | 9,580,862 | ||||||
| 290,900 | MTS Systems Corp. | 15,842,414 | ||||||
| 255,918 | PC Connection, Inc.(a)(b) | 9,384,513 | ||||||
| 220,700 | Silicon Motion Technology Corp., ADR | 8,748,548 | ||||||
| 407,300 | Sykes Enterprises, Inc.(a) | 11,518,444 | ||||||
| 146,285,480 | ||||||||
| Materials - 4.6% | ||||||||
| 145,700 | Balchem Corp. | 13,520,960 | ||||||
| 232,100 | Carpenter Technology Corp. | 10,641,785 | ||||||
| 200,900 | Sensient Technologies Corp. | 13,619,011 | ||||||
| 37,781,756 | ||||||||
| Real Estate - 7.1% | ||||||||
| 158,300 | Agree Realty Corp. REIT | 10,976,522 | ||||||
| 872,700 | Easterly Government Properties, Inc. REIT | 15,717,327 | ||||||
| 290,900 | LTC Properties, Inc. REIT | 13,323,220 | ||||||
| 434,900 | Marcus & Millichap, Inc.(a) | 17,713,477 | ||||||
| 57,730,546 | ||||||||
| Utilities - 3.1% | ||||||||
| 183,500 | IDACORP, Inc. | 18,265,590 | ||||||
| 129,000 | Unitil Corp.(b) | 6,987,930 | ||||||
| 25,253,520 | ||||||||
| Total Common Stocks (Cost $666,557,565) | 778,591,224 | |||||||
| Short-Term Investments - 4.5% | ||||||||
| Investment Company - 4.5% | ||||||||
| 36,833,605 | BlackRock Liquidity Funds T-Fund Portfolio, Institutional Shares, 2.32% (c) | 36,833,605 | ||||||
| Total Short-Term Investments (Cost $36,833,605) | 36,833,605 | |||||||
| Investments, at value - 99.9% (Cost $703,391,170) | 815,424,829 | |||||||
| Other assets in excess of liabilities - 0.1% | 563,734 | |||||||
| NET ASSETS - 100.0% | $ | 815,988,563 | ||||||
| (a) | Non-income producing security. |
| (b) | Securities have been determined to be illiquid by the investment adviser. Total illiquid securities held as of March 31, 2019 were $36,557,602, representing 4.48% of net assets. |
| (c) | Dividend yield changes daily to reflect current market conditions. Rate was the quoted yield as of March 31, 2019. |
| ADR | American Depositary Receipt |
| REIT | Real Estate Investment Trust |
See accompanying Notes to Financial Statements.
ANNUAL REPORT 2019
STATEMENTS OF ASSETS AND LIABILITIES
March 31, 2019
| SHORT-INTERMEDIATE BOND FUND | ||||
| Assets: | ||||
| Investments, at cost | $ | 181,095,378 | ||
| Unrealized appreciation (depreciation) of investments | 194,857 | |||
| Total investments, at value | 181,290,235 | |||
| Receivable for capital shares issued | 503,962 | |||
| Receivable for investments sold | – | |||
| Interest and dividends receivable | 964,174 | |||
| Prepaid expenses | 28,326 | |||
| Total Assets | 182,786,697 | |||
| Liabilities: | ||||
| Distributions payable | 279,348 | |||
| Payable for investments purchased | 179,977 | |||
| Payable for capital shares redeemed | 4,116 | |||
| Accrued expenses and other payables: | ||||
| Investment advisory fees | 50,717 | |||
| Administration fees payable to non-related parties | 7,087 | |||
| Administration fees payable to related parties | 10,663 | |||
| Shareholder service fees | 3,406 | |||
| Other fees | 22,326 | |||
| Total Liabilities | 557,640 | |||
| Net Assets | $ | 182,229,057 | ||
| Composition of Net Assets: | ||||
| Paid-In Capital | $ | 184,777,567 | ||
| Distributable earnings | (2,548,510 | ) | ||
| Net Assets | $ | 182,229,057 | ||
| Institutional Class: | ||||
| Net assets | 10,569,219 | |||
| Shares of beneficial interest (See note 5) | 1,140,644 | |||
| Net asset value, offering and redemption price per share | $ | 9.27 | ||
| Institutional Plus Class: | ||||
| Net assets | 171,659,838 | |||
| Shares of beneficial interest (See note 5) | 18,469,214 | |||
| Net asset value, offering and redemption price per share | $ | 9.29 | ||
See accompanying Notes to Financial Statements.
ANNUAL REPORT 2019
STATEMENTS OF ASSETS AND LIABILITIES
March 31, 2019
| INCOME FUND | NEBRASKA TAX-FREE FUND | BALANCED FUND | GROWTH OPPORTUNITIES FUND | SMALL COMPANY FUND | ||||||||||||||
| $ | 193,878,700 | $ | 73,721,040 | $ | 56,434,248 | $ | 96,172,043 | $ | 703,391,170 | |||||||||
| 2,093,035 | (199,979 | ) | 15,090,434 | 46,248,328 | 112,033,659 | |||||||||||||
| 195,971,735 | 73,521,061 | 71,524,682 | 142,420,371 | 815,424,829 | ||||||||||||||
| 216,040 | 163,545 | 11,741 | 289,069 | 1,396,851 | ||||||||||||||
| 676,898 | – | – | – | – | ||||||||||||||
| 1,232,060 | 735,427 | 215,127 | 69,218 | 699,749 | ||||||||||||||
| 29,684 | 4,814 | 16,636 | 22,820 | 58,445 | ||||||||||||||
| 198,126,417 | 74,424,847 | 71,768,186 | 142,801,478 | 817,579,874 | ||||||||||||||
| 408,209 | 169,290 | – | – | – | ||||||||||||||
| 961,585 | 1,277,049 | 97,943 | – | – | ||||||||||||||
| 43,587 | 1,275 | 82,273 | 99,831 | 861,301 | ||||||||||||||
| 68,565 | 14,358 | 36,022 | 85,806 | 558,022 | ||||||||||||||
| 7,626 | 2,854 | 2,797 | 5,550 | 32,113 | ||||||||||||||
| 11,474 | 4,294 | 4,209 | 8,353 | 48,322 | ||||||||||||||
| 2,198 | – | 8,233 | 4,507 | 18,041 | ||||||||||||||
| 20,764 | 10,826 | 11,245 | 13,831 | 73,512 | ||||||||||||||
| 1,524,008 | 1,479,946 | 242,722 | 217,878 | 1,591,311 | ||||||||||||||
| $ | 196,602,409 | $ | 72,944,901 | $ | 71,525,464 | $ | 142,583,600 | $ | 815,988,563 | |||||||||
| $ | 198,450,854 | $ | 74,353,550 | $ | 55,421,632 | $ | 94,848,703 | $ | 703,154,746 | |||||||||
| (1,848,445 | ) | (1,408,649 | ) | 16,103,832 | 47,734,897 | 112,833,817 | ||||||||||||
| $ | 196,602,409 | $ | 72,944,901 | $ | 71,525,464 | $ | 142,583,600 | $ | 815,988,563 | |||||||||
| 6,322,107 | – | 39,048,629 | 14,840,016 | 94,012,835 | ||||||||||||||
| 618,546 | – | 2,318,112 | 910,333 | 3,447,068 | ||||||||||||||
| $ | 10.22 | $ | – | $ | 16.85 | $ | 16.30 | $ | 27.27 | |||||||||
| 190,280,302 | 72,944,901 | 32,476,835 | 127,743,584 | 721,975,728 | ||||||||||||||
| 18,617,629 | 7,606,541 | 1,946,271 | 7,648,765 | 26,302,032 | ||||||||||||||
| $ | 10.22 | $ | 9.59 | $ | 16.69 | $ | 16.70 | $ | 27.45 | |||||||||
See accompanying Notes to Financial Statements.
ANNUAL REPORT 2019
STATEMENTS OF OPERATIONS
Year Ended March 31, 2019
| SHORT-INTERMEDIATE BOND FUND | ||||
| Investment Income: | ||||
| Interest | $ | 4,643,388 | ||
| Dividend | 76,112 | |||
| Foreign tax withholding | – | |||
| Total Income | 4,719,500 | |||
| Expenses: | ||||
| Investment advisory fees (Note 3) | 846,586 | |||
| Administration fees | 200,728 | |||
| Shareholder service fees - Institutional Class | 33,983 | |||
| Custodian fees | 14,427 | |||
| Chief compliance officer fees | 12,616 | |||
| Director fees | 7,920 | |||
| Registration and filing fees | 25,843 | |||
| Transfer agent fees | 60,979 | |||
| Pricing fees | – | |||
| Other Fees | 96,655 | |||
| Total expenses before waivers | 1,299,737 | |||
| Expenses waived by adviser (Note 3) | (351,554 | ) | ||
| Total Expenses | 948,183 | |||
| Net Investment Income (Loss) | 3,771,317 | |||
| Realized and Unrealized Gain (Loss) On Investments: | ||||
| Net realized gain (loss) on investments transactions | (458,292 | ) | ||
| Change in unrealized appreciation (depreciation) on investments | 1,845,975 | |||
| Net realized and unrealized gain on investments | 1,387,683 | |||
| Net increase in net assets from operations | $ | 5,159,000 | ||
See accompanying Notes to Financial Statements.
ANNUAL REPORT 2019
STATEMENTS OF OPERATIONS
Year Ended March 31, 2019
| INCOME FUND | NEBRASKA TAX-FREE FUND | BALANCED FUND | GROWTH OPPORTUNITIES FUND | SMALL COMPANY FUND | ||||||||||||||
| $ | 6,109,777 | $ | 1,992,834 | $ | 661,994 | $ | – | $ | – | |||||||||
| 145,814 | 36,691 | 740,520 | 1,115,207 | 9,373,398 | ||||||||||||||
| – | – | (1,762 | ) | (7,642 | ) | – | ||||||||||||
| 6,255,591 | 2,029,525 | 1,400,752 | 1,107,565 | 9,373,398 | ||||||||||||||
| 1,143,133 | 273,085 | 526,760 | 1,031,122 | 6,070,866 | ||||||||||||||
| 225,856 | 80,931 | 83,249 | 162,934 | 846,276 | ||||||||||||||
| 11,808 | – | 77,950 | 27,177 | 256,245 | ||||||||||||||
| 16,325 | 4,672 | 5,687 | 9,473 | 47,851 | ||||||||||||||
| 13,992 | 5,074 | 5,186 | 10,178 | 52,954 | ||||||||||||||
| 9,005 | 3,191 | 3,292 | 6,303 | 32,854 | ||||||||||||||
| 21,180 | 3,539 | 20,942 | 23,408 | 61,258 | ||||||||||||||
| 59,309 | 19,348 | 48,594 | 62,897 | 465,749 | ||||||||||||||
| – | 20,212 | – | – | – | ||||||||||||||
| 104,952 | 41,011 | 56,578 | 52,038 | 153,448 | ||||||||||||||
| 1,605,560 | 451,063 | 828,238 | 1,385,530 | 7,987,501 | ||||||||||||||
| (424,363 | ) | (143,841 | ) | (120,199 | ) | (66,014 | ) | (660,498 | ) | |||||||||
| 1,181,197 | 307,222 | 708,039 | 1,319,516 | 7,327,003 | ||||||||||||||
| 5,074,394 | 1,722,303 | 692,713 | (211,951 | ) | 2,046,395 | |||||||||||||
| (722,984 | ) | (37,571 | ) | 2,440,610 | 8,663,259 | 33,124,779 | ||||||||||||
| 3,977,777 | 1,310,968 | 1,704,434 | 7,148,950 | (15,604,091 | ) | |||||||||||||
| 3,254,793 | 1,273,397 | 4,145,044 | 15,812,209 | 17,520,688 | ||||||||||||||
| $ | 8,329,187 | $ | 2,995,700 | $ | 4,837,757 | $ | 15,600,258 | $ | 19,567,083 | |||||||||
See accompanying Notes to Financial Statements.
ANNUAL REPORT 2019
STATEMENTS OF CHANGES IN NET ASSETS
| SHORT-INTERMEDIATE BOND FUND | INCOME FUND | |||||||||||||||
| For the Year Ended March 31, 2019 | For the Year Ended March 31, 2018 | For the Year Ended March 31, 2019 | For the Year Ended March 31, 2018 | |||||||||||||
| Operations: | ||||||||||||||||
| Net investment income (loss) | $ | 3,771,317 | $ | 2,808,865 | $ | 5,074,394 | $ | 5,017,338 | ||||||||
| Net realized gain (loss) on investment transactions | (458,292 | ) | 39,695 | (722,984 | ) | 313,001 | ||||||||||
| Net change in unrealized appreciation (depreciation) on investments | 1,845,975 | (1,408,828 | ) | 3,977,777 | (1,729,865 | ) | ||||||||||
| Net increase in net assets from operations | 5,159,000 | 1,439,732 | 8,329,187 | 3,600,474 | ||||||||||||
| Distributions to Shareholders: | ||||||||||||||||
| Institutional Class | (334,436 | ) | (279,876 | )* | (191,515 | ) | (194,753 | )* | ||||||||
| Institutional Plus Class | (3,721,286 | ) | (3,126,164 | )** | (5,752,279 | ) | (5,913,220 | )** | ||||||||
| Return of capital | ||||||||||||||||
| Institutional Plus Class | – | – | – | – | ||||||||||||
| Change in net assets from distributions to shareholders | (4,055,722 | ) | (3,406,040 | ) | (5,943,794 | ) | (6,107,973 | ) | ||||||||
| Capital Transactions: | ||||||||||||||||
| Proceeds from shares issued | ||||||||||||||||
| Institutional Class | 3,335,867 | 8,882,547 | 269,705 | 1,362,850 | ||||||||||||
| Institutional Plus Class | 47,643,785 | 49,581,399 | 29,286,868 | 36,619,351 | ||||||||||||
| Proceeds from dividends reinvested | ||||||||||||||||
| Institutional Class | 192,225 | 178,022 | 191,275 | 193,659 | ||||||||||||
| Institutional Plus Class | 751,656 | 668,493 | 754,540 | 769,661 | ||||||||||||
| Cost of shares redeemed | ||||||||||||||||
| Institutional Class | (8,314,061 | ) | (3,517,318 | ) | (1,097,974 | ) | (1,203,641 | ) | ||||||||
| Institutional Plus Class | (25,017,947 | ) | (19,445,646 | ) | (34,143,903 | ) | (36,707,609 | ) | ||||||||
| Change in net assets from capital transactions | 18,591,525 | 36,347,497 | (4,739,489 | ) | 1,034,271 | |||||||||||
| Change in net assets | 19,694,803 | 34,381,189 | (2,354,096 | ) | (1,473,228 | ) | ||||||||||
| Net Assets: | ||||||||||||||||
| Beginning of Year | 162,534,254 | 128,153,065 | 198,956,505 | 200,429,733 | ||||||||||||
| End of Year | $ | 182,229,057 | $ | 162,534,254 | *** | $ | 196,602,409 | $ | 198,956,505 | *** | ||||||
| Share Transactions Institutional Class: | ||||||||||||||||
| Shares issued | 363,674 | 951,405 | 26,981 | 132,811 | ||||||||||||
| Shares reinvested | 20,920 | 19,125 | 19,138 | 18,873 | ||||||||||||
| Shares redeemed | (902,822 | ) | (377,163 | ) | (109,695 | ) | (117,270 | ) | ||||||||
| Change in shares | (518,228 | ) | 593,367 | (63,576 | ) | 34,414 | ||||||||||
| Share Transactions Institutional Plus Class: | ||||||||||||||||
| Shares issued | 5,166,572 | 5,306,495 | 2,927,218 | 3,570,084 | ||||||||||||
| Shares reinvested | 81,544 | 71,613 | 75,475 | 74,990 | ||||||||||||
| Shares redeemed | (2,715,227 | ) | (2,083,641 | ) | (3,418,489 | ) | (3,571,390 | ) | ||||||||
| Change in shares | 2,532,889 | 3,294,467 | (415,796 | ) | 73,684 | |||||||||||
| * | Distributions for March 31, 2018, were the result of net investment income of $266,350, $187,416 and $355,755 for Short-Intermediate Bond Fund, Income Fund and Balanced Fund, respectively, and net realized gains on investments of $13,526, $7,337, $3,122,745, $2,499,431 and $10,411,722 for Short-Intermediate Bond Fund, Income Fund, Balanced Fund, Growth Opportunities Fund and Small Company Fund, respectively. |
| ** | Distributions for March 31, 2018, were the result of net investment income of $2,996,701, $5,700,791, $2,288,818 and $334,714 for Short-Intermediate Bond Fund, Income Fund, Nebraska Tax-Free Fund and Balanced Fund, respectively, and net realized gains on investments of $129,463, $212,429, $2,354,341, $16,767,969 and $25,294,704 for Short-Intermediate Bond Fund, Income Fund, Balanced Fund, Growth Opportunities Fund and Small Company Fund, respectively. |
| *** | Includes accumulated (excess of distributions over) net investment income (loss) of $(400,377), $(370,030), $(834,783), $13,144 and $21,429 for Short-Intermediate Bond Fund, Income Fund, Nebraska Tax-Free Fund, Balanced Fund and Growth Opportunities Fund, respectively, at March 31, 2018. The requirement to disclose the corresponding amount as of March 31, 2019 was eliminated. |
See accompanying Notes to Financial Statements.
ANNUAL REPORT 2019
STATEMENTS OF CHANGES IN NET ASSETS
| NEBRASKA TAX-FREE FUND | BALANCED FUND | GROWTH OPPORTUNITIES FUND | SMALL COMPANY FUND | |||||||||||||||||||||||||||
| For the Year Ended March 31, 2019 | For the Year Ended March 31, 2018 | For the Year Ended March 31, 2019 | For the Year Ended March 31, 2018 | For the Year Ended March 31, 2019 | For the Year Ended March 31, 2018 | For the Year Ended March 31, 2019 | For the Year Ended March 31, 2018 | |||||||||||||||||||||||
| $ | 1,722,303 | $ | 1,788,744 | $ | 692,713 | $ | 655,419 | $ | (211,951 | ) | $ | (117,061 | ) | $ | 2,046,395 | $ | 673,472 | |||||||||||||
| (37,571 | ) | 8,828 | 2,440,610 | 4,204,203 | 8,663,259 | 12,602,909 | 33,124,779 | 13,063,340 | ||||||||||||||||||||||
| 1,310,968 | (812,074 | ) | 1,704,434 | 1,768,472 | 7,148,950 | 5,808,054 | (15,604,091 | ) | 20,739,130 | |||||||||||||||||||||
| 2,995,700 | 985,498 | 4,837,757 | 6,628,094 | 15,600,258 | 18,293,902 | 19,567,083 | 34,475,942 | |||||||||||||||||||||||
| – | – | (2,703,104 | ) | (3,478,500 | )* | (1,519,803 | ) | (2,499,431 | )* | (4,536,409 | ) | (10,411,722 | )* | |||||||||||||||||
| (1,732,027) | (2,288,818 | )** | (2,143,360 | ) | (2,689,055 | )** | (12,031,449 | ) | (16,767,969 | )** | (26,857,264 | ) | (25,294,704 | )** | ||||||||||||||||
| (561,894 | ) | – | – | – | – | – | – | – | ||||||||||||||||||||||
| (2,293,921 | ) | (2,288,818 | ) | (4,846,464 | ) | (6,167,555 | ) | (13,551,252 | ) | (19,267,400 | ) | (31,393,673 | ) | (35,706,426 | ) | |||||||||||||||
| – | – | 2,557,873 | 1,838,490 | 874,244 | 1,594,371 | 29,232,702 | 60,971,078 | |||||||||||||||||||||||
| 12,553,191 | 10,681,700 | 4,400,142 | 4,899,298 | 18,903,033 | 17,849,011 | 370,943,274 | 261,705,710 | |||||||||||||||||||||||
| – | – | 2,506,444 | 3,232,086 | 1,383,739 | 2,182,530 | 4,190,150 | 9,986,188 | |||||||||||||||||||||||
| 357,022 | 254,112 | 1,859,934 | 2,334,939 | 6,390,096 | 8,591,825 | 17,577,803 | 17,501,618 | |||||||||||||||||||||||
| – | – | (7,419,936 | ) | (13,187,220 | ) | (4,625,639 | ) | (4,807,012 | ) | (111,975,067 | ) | (111,046,227 | ) | |||||||||||||||||
| (6,192,682 | ) | (15,816,263 | ) | (2,367,661 | ) | (12,030,498 | ) | (18,550,810 | ) | (16,798,178 | ) | (174,615,302 | ) | (135,674,086 | ) | |||||||||||||||
| 6,717,531 | (4,880,451 | ) | 1,536,796 | (12,912,905 | ) | 4,374,663 | 8,612,547 | 135,353,560 | 103,444,281 | |||||||||||||||||||||
| 7,419,310 | (6,183,771 | ) | 1,528,089 | (12,452,366 | ) | 6,423,669 | 7,639,049 | 123,526,970 | 102,213,797 | |||||||||||||||||||||
| 65,525,591 | 71,709,362 | 69,997,375 | 82,449,741 | 136,159,931 | 128,520,882 | 692,461,593 | 590,247,796 | |||||||||||||||||||||||
| $ | 72,944,901 | $ | 65,525,591 | *** | $ | 71,525,464 | $ | 69,997,375 | *** | $ | 142,583,600 | $ | 136,159,931 | *** | $ | 815,988,563 | $ | 692,461,593 | ||||||||||||
| – | – | 149,596 | 106,140 | 53,755 | 96,071 | 1,044,934 | 2,149,554 | |||||||||||||||||||||||
| – | – | 155,678 | 191,311 | 96,227 | 139,906 | 164,642 | 356,141 | |||||||||||||||||||||||
| – | – | (442,756 | ) | (763,092 | ) | (281,948 | ) | (285,556 | ) | (3,835,822 | ) | (3,877,960 | ) | |||||||||||||||||
| – | – | (137,482 | ) | (465,641 | ) | (131,966 | ) | (49,579 | ) | (2,626,246 | ) | (1,372,265 | ) | |||||||||||||||||
| 1,327,450 | 1,101,144 | 262,116 | 285,412 | 1,153,836 | 1,039,772 | 13,396,018 | 9,183,474 | |||||||||||||||||||||||
| 37,781 | 26,281 | 116,413 | 139,306 | 434,110 | 540,027 | 686,633 | 621,506 | |||||||||||||||||||||||
| (655,692 | ) | (1,631,620 | ) | (139,960 | ) | (701,098 | ) | (1,145,807 | ) | (975,821 | ) | (6,160,102 | ) | (4,816,742 | ) | |||||||||||||||
| 709,539 | (504,195 | ) | 238,569 | (276,380 | ) | 442,139 | 603,978 | 7,922,549 | 4,988,238 | |||||||||||||||||||||
See accompanying Notes to Financial Statements.
ANNUAL REPORT 2019
FINANCIAL HIGHLIGHTS
For a Share Outstanding
| Investment Activities | Distributions to Shareholders from: | Ratios/Supplemental Data | ||||||||||||||||||||||||||||||||||||||||||||||||||||||
| Period Ended | Net Asset Value, Beginning of Period | Net Investment Income (Loss)(a) | Net Realized and Unrealized Gains (Losses) on Investments | Total from Investment Operations | Net Investment Income | Net Realized Gains on Investments | Return of Capital | Net Asset Value, End of Period | Total Return(b) | Net Assets, End of Period (000's) | Expense to Average Net Assets(c) | Net Investment Income (Loss) to Average Net Assets(c) | Expense to Average Net Assets(c)(d) | Portfolio Turnover(b) | ||||||||||||||||||||||||||||||||||||||||||
| SHORT-INTERMEDIATE BOND FUND | ||||||||||||||||||||||||||||||||||||||||||||||||||||||||
| Institutional Class | ||||||||||||||||||||||||||||||||||||||||||||||||||||||||
| 03/31/19 | $ | 9.21 | $ | 0.19 | $ | 0.07 | $ | 0.26 | $ | (0.19 | ) | $ | (0.01 | ) | $ | — | $ | 9.27 | 2.88 | % | $ | 10,569 | 0.76 | % | 2.03 | % | 1.17 | % | 43 | % | ||||||||||||||||||||||||||
| 03/31/18 | 9.32 | 0.16 | (0.07 | ) | 0.09 | (0.19 | ) | (0.01 | ) | — | 9.21 | 0.93 | 15,281 | 0.77 | 1.71 | 1.22 | 43 | |||||||||||||||||||||||||||||||||||||||
| 03/31/17 | 9.38 | 0.16 | (0.03 | ) | 0.13 | (0.18 | ) | (0.01 | ) | — | 9.32 | 1.48 | 9,933 | 0.75 | 1.75 | 1.28 | 48 | |||||||||||||||||||||||||||||||||||||||
| 03/31/16 | 9.45 | 0.14 | (0.04 | ) | 0.10 | (0.16 | ) | (0.01 | ) | — | 9.38 | 1.11 | 12,202 | 0.76 | 1.50 | 1.11 | 40 | |||||||||||||||||||||||||||||||||||||||
| 03/31/15 | 9.48 | 0.12 | — | 0.12 | (0.14 | ) | (0.01 | ) | — | 9.45 | 1.33 | 23,000 | 0.79 | 1.24 | 1.04 | 51 | ||||||||||||||||||||||||||||||||||||||||
| Institutional Plus Class | ||||||||||||||||||||||||||||||||||||||||||||||||||||||||
| 03/31/19 | 9.24 | 0.21 | 0.06 | 0.27 | (0.21 | ) | (0.01 | ) | — | 9.29 | 2.99 | 171,660 | 0.54 | 2.25 | 0.73 | 43 | ||||||||||||||||||||||||||||||||||||||||
| 03/31/18 | 9.35 | 0.18 | (0.07 | ) | 0.11 | (0.21 | ) | (0.01 | ) | — | 9.24 | 1.17 | 147,253 | 0.54 | 1.94 | 0.73 | 43 | |||||||||||||||||||||||||||||||||||||||
| 03/31/17 | 9.41 | 0.19 | (0.03 | ) | 0.16 | (0.21 | ) | (0.01 | ) | — | 9.35 | 1.70 | 118,220 | 0.54 | 1.98 | 0.75 | 48 | |||||||||||||||||||||||||||||||||||||||
| 03/31/16 | 9.48 | 0.16 | (0.04 | ) | 0.12 | (0.18 | ) | (0.01 | ) | — | 9.41 | 1.32 | 112,308 | 0.54 | 1.73 | 0.77 | 40 | |||||||||||||||||||||||||||||||||||||||
| 03/31/15 | 9.51 | 0.14 | 0.01 | 0.15 | (0.17 | ) | (0.01 | ) | — | 9.48 | 1.57 | 91,787 | 0.55 | 1.48 | 0.80 | 51 | ||||||||||||||||||||||||||||||||||||||||
| INCOME FUND | ||||||||||||||||||||||||||||||||||||||||||||||||||||||||
| Institutional Class | ||||||||||||||||||||||||||||||||||||||||||||||||||||||||
| 03/31/19 | 10.09 | 0.25 | 0.18 | 0.43 | (0.29 | ) | (0.01 | ) | — | 10.22 | 4.31 | 6,322 | 0.80 | 2.49 | 1.48 | 33 | ||||||||||||||||||||||||||||||||||||||||
| 03/31/18 | 10.22 | 0.24 | (0.08 | ) | 0.16 | (0.28 | ) | (0.01 | ) | — | 10.09 | 1.61 | 6,884 | 0.82 | 2.33 | 1.48 | 33 | |||||||||||||||||||||||||||||||||||||||
| 03/31/17 | 10.41 | 0.24 | (0.14 | ) | 0.10 | (0.28 | ) | (0.01 | ) | — | 10.22 | 0.89 | 6,621 | 0.82 | 2.29 | 1.62 | 44 | |||||||||||||||||||||||||||||||||||||||
| 03/31/16 | 10.51 | 0.24 | (0.05 | ) | 0.19 | (0.28 | ) | (0.01 | ) | — | 10.41 | 1.77 | 6,809 | 0.81 | 2.29 | 1.19 | 24 | |||||||||||||||||||||||||||||||||||||||
| 03/31/15 | 10.25 | 0.24 | 0.29 | 0.53 | (0.26 | ) | (0.01 | ) | — | 10.51 | 5.18 | 19,693 | 0.85 | 2.30 | 1.11 | 52 | ||||||||||||||||||||||||||||||||||||||||
| Institutional Plus Class | ||||||||||||||||||||||||||||||||||||||||||||||||||||||||
| 03/31/19 | 10.09 | 0.27 | 0.17 | 0.44 | (0.30 | ) | (0.01 | ) | — | 10.22 | 4.50 | 190,280 | 0.61 | 2.67 | 0.82 | 33 | ||||||||||||||||||||||||||||||||||||||||
| 03/31/18 | 10.22 | 0.26 | (0.08 | ) | 0.18 | (0.30 | ) | (0.01 | ) | — | 10.09 | 1.80 | 192,073 | 0.64 | 2.52 | 0.82 | 33 | |||||||||||||||||||||||||||||||||||||||
| 03/31/17 | 10.41 | 0.26 | (0.15 | ) | 0.11 | (0.29 | ) | (0.01 | ) | — | 10.22 | 1.07 | 193,808 | 0.64 | 2.47 | 0.83 | 44 | |||||||||||||||||||||||||||||||||||||||
| 03/31/16 | 10.52 | 0.25 | (0.07 | ) | 0.18 | (0.28 | ) | (0.01 | ) | — | 10.41 | 1.81 | 187,490 | 0.64 | 2.41 | 0.85 | 24 | |||||||||||||||||||||||||||||||||||||||
| 03/31/15 | 10.26 | 0.26 | 0.29 | 0.55 | (0.28 | ) | (0.01 | ) | — | 10.52 | 5.40 | 120,425 | 0.63 | 2.52 | 0.89 | 52 | ||||||||||||||||||||||||||||||||||||||||
| NEBRASKA TAX-FREE FUND | ||||||||||||||||||||||||||||||||||||||||||||||||||||||||
| Institutional Plus Class | ||||||||||||||||||||||||||||||||||||||||||||||||||||||||
| 03/31/19 | 9.50 | 0.24 | 0.17 | 0.41 | (0.25) | — | (0.07 | ) | 9.59 | 4.39 | 72,945 | 0.45 | 2.52 | 0.66 | 17 | |||||||||||||||||||||||||||||||||||||||||
| 03/31/18 | 9.69 | 0.25 | (0.12 | ) | 0.13 | (0.32 | ) | — | — | 9.50 | 1.31 | 65,526 | 0.45 | 2.56 | 0.67 | 5 | ||||||||||||||||||||||||||||||||||||||||
| 03/31/17 | 10.05 | 0.26 | (0.30 | ) | (0.04 | ) | (0.32 | ) | — | — | 9.69 | (0.43 | ) | 71,709 | 0.45 | 2.66 | 0.69 | 11 | ||||||||||||||||||||||||||||||||||||||
| 03/31/16 | (e) | 10.00 | 0.07 | 0.07 | 0.14 | (0.09 | ) | — | — | 10.05 | 1.35 | 57,029 | 0.45 | 2.96 | 0.85 | 5 | ||||||||||||||||||||||||||||||||||||||||
| BALANCED FUND | ||||||||||||||||||||||||||||||||||||||||||||||||||||||||
| Institutional Class | ||||||||||||||||||||||||||||||||||||||||||||||||||||||||
| 03/31/19 | 16.87 | 0.15 | 1.00 | 1.15 | (0.15 | ) | (1.02 | ) | — | 16.85 | 7.22 | 39,049 | 1.09 | 0.90 | 1.28 | 23 | ||||||||||||||||||||||||||||||||||||||||
| 03/31/18 | 16.86 | 0.13 | 1.29 | 1.42 | (0.14 | ) | (1.27 | ) | — | 16.87 | 8.46 | 41,426 | 1.18 | 0.76 | 1.27 | 15 | ||||||||||||||||||||||||||||||||||||||||
| 03/31/17 | 16.71 | 0.13 | 1.11 | 1.24 | (0.13 | ) | (0.96 | ) | — | 16.86 | 7.71 | 49,241 | 1.18 | 0.75 | 1.26 | 22 | ||||||||||||||||||||||||||||||||||||||||
| 03/31/16 | 17.66 | 0.05 | (0.57 | ) | (0.52 | ) | (0.06 | ) | (0.37 | ) | — | 16.71 | (2.93 | ) | 71,090 | 1.19 | 0.31 | 1.26 | 42 | |||||||||||||||||||||||||||||||||||||
| 03/31/15 | 17.61 | 0.01 | 1.58 | 1.59 | (0.01 | ) | (1.53 | ) | — | 17.66 | 9.40 | 70,615 | 1.17 | 0.06 | 1.26 | 69 | ||||||||||||||||||||||||||||||||||||||||
| Institutional Plus Class | ||||||||||||||||||||||||||||||||||||||||||||||||||||||||
| 03/31/19 | 16.73 | 0.19 | 0.98 | 1.17 | (0.19 | ) | (1.02 | ) | — | 16.69 | 7.43 | 32,477 | 0.90 | 1.10 | 1.04 | 23 | ||||||||||||||||||||||||||||||||||||||||
| 03/31/18 | 16.74 | 0.16 | 1.28 | 1.44 | (0.18 | ) | (1.27 | ) | — | 16.73 | 8.66 | 28,571 | 0.99 | 0.95 | 1.03 | 15 | ||||||||||||||||||||||||||||||||||||||||
| 03/31/17 | 16.61 | 0.16 | 1.10 | 1.26 | (0.17 | ) | (0.96 | ) | — | 16.74 | 7.90 | 33,209 | 0.99 | 0.94 | 1.03 | 22 | ||||||||||||||||||||||||||||||||||||||||
| 03/31/16 | 17.57 | 0.09 | (0.59 | ) | (0.50 | ) | (0.09 | ) | (0.37 | ) | — | 16.61 | (2.78 | ) | 35,592 | 0.99 | 0.51 | 1.01 | 42 | |||||||||||||||||||||||||||||||||||||
| 03/31/15 | 17.52 | 0.05 | 1.57 | 1.62 | (0.04 | ) | (1.53 | ) | — | 17.57 | 9.67 | 35,600 | 0.97 | 0.30 | 1.06 | 69 | ||||||||||||||||||||||||||||||||||||||||
See accompanying Notes to Financial Statements.
ANNUAL REPORT 2019
FINANCIAL HIGHLIGHTS
For a Share Outstanding
| Investment Activities | Distributions to Shareholders from: | Ratios/Supplemental Data | ||||||||||||||||||||||||||||||||||||||||||||||||||||||
| Period Ended | Net Asset Value, Beginning of Period | Net Investment Income (Loss)(a) | Net Realized and Unrealized Gains (Losses) on Investments | Total from Investment Operations | Net Investment Income | Net Realized Gains on Investments | Return of Capital | Net Asset Value, End of Period | Total Return(b) | Net Assets, End of Period (000's) | Expense to Average Net Assets(c) | Net Investment Income (Loss) to Average Net Assets(c) | Expense to Average Net Assets(c)(d) | Portfolio Turnover(b) | ||||||||||||||||||||||||||||||||||||||||||
| GROWTH OPPORTUNITIES FUND | ||||||||||||||||||||||||||||||||||||||||||||||||||||||||
| Institutional Class | ||||||||||||||||||||||||||||||||||||||||||||||||||||||||
| 03/31/19 | $ | 16.22 | $ | (0.05 | ) | $ | 1.83 | $ | 1.78 | $ | — | $ | (1.70 | ) | $ | — | $ | 16.30 | 12.37 | % | $ | 14,840 | 1.11 | % | (0.31 | )% | 1.34 | % | 42 | % | ||||||||||||||||||||||||||
| 03/31/18 | 16.48 | (0.04 | ) | 2.35 | 2.31 | — | (2.57 | ) | — | 16.22 | 14.66 | 16,906 | 1.13 | (0.25 | ) | 1.33 | 50 | |||||||||||||||||||||||||||||||||||||||
| 03/31/17 | 14.82 | (0.05 | ) | 2.65 | 2.60 | — | (0.94 | ) | — | 16.48 | 17.89 | 17,999 | 1.14 | (0.31 | ) | 1.25 | 36 | |||||||||||||||||||||||||||||||||||||||
| 03/31/16 | 19.02 | (0.06 | ) | (1.83 | ) | (1.89 | ) | — | (2.31 | ) | — | 14.82 | (9.78 | ) | 43,260 | 1.16 | (0.34 | ) | 1.27 | 57 | ||||||||||||||||||||||||||||||||||||
| 03/31/15 | 19.16 | (0.09 | ) | 2.41 | 2.32 | — | (2.46 | ) | — | 19.02 | 12.93 | 55,888 | 1.14 | (0.47 | ) | 1.23 | 50 | |||||||||||||||||||||||||||||||||||||||
| Institutional Plus Class | ||||||||||||||||||||||||||||||||||||||||||||||||||||||||
| 03/31/19 | 16.55 | (0.02 | ) | 1.87 | 1.85 | — | (1.70 | ) | — | 16.70 | 12.56 | 127,744 | 0.94 | (0.13 | ) | 0.97 | 42 | |||||||||||||||||||||||||||||||||||||||
| 03/31/18 | 16.74 | (0.01 | ) | 2.39 | 2.38 | — | (2.57 | ) | — | 16.55 | 14.86 | 119,254 | 0.94 | (0.06 | ) | 0.97 | 50 | |||||||||||||||||||||||||||||||||||||||
| 03/31/17 | 15.00 | (0.01 | ) | 2.69 | 2.68 | — | (0.94 | ) | — | 16.74 | 18.21 | 110,522 | 0.94 | (0.08 | ) | 0.98 | 36 | |||||||||||||||||||||||||||||||||||||||
| 03/31/16 | 19.19 | (0.02 | ) | (1.86 | ) | (1.88 | ) | — | (2.31 | ) | — | 15.00 | (9.63 | ) | 103,537 | 0.94 | (0.10 | ) | 0.99 | 57 | ||||||||||||||||||||||||||||||||||||
| 03/31/15 | 19.27 | (0.05 | ) | 2.43 | 2.38 | — | (2.46 | ) | — | 19.19 | 13.18 | 119,004 | 0.92 | (0.25 | ) | 1.01 | 50 | |||||||||||||||||||||||||||||||||||||||
| SMALL COMPANY FUND | ||||||||||||||||||||||||||||||||||||||||||||||||||||||||
| Institutional Class | ||||||||||||||||||||||||||||||||||||||||||||||||||||||||
| 03/31/19 | 28.21 | 0.03 | 0.35 | 0.38 | — | (1.32 | ) | — | 27.27 | 1.67 | 94,013 | 1.20 | 0.11 | 1.30 | 26 | |||||||||||||||||||||||||||||||||||||||||
| 03/31/18 | 28.28 | (0.02 | )(f) | 1.45 | 1.43 | — | (1.50 | ) | — | 28.21 | 5.11 | 171,338 | 1.22 | (0.06 | ) | 1.29 | 28 | |||||||||||||||||||||||||||||||||||||||
| 03/31/17 | 23.17 | 0.07 | 5.45 | 5.52 | (0.06 | ) | (0.35 | ) | — | 28.28 | 23.87 | 210,573 | 1.20 | 0.27 | 1.31 | 33 | ||||||||||||||||||||||||||||||||||||||||
| 03/31/16 | 24.06 | 0.02 | (0.20 | ) | (0.18 | ) | (0.04 | ) | (0.67 | ) | — | 23.17 | (0.65 | ) | 51,527 | 1.18 | 0.10 | 1.34 | 32 | |||||||||||||||||||||||||||||||||||||
| 03/31/15 | 24.39 | 0.02 | 1.65 | 1.67 | (0.01 | ) | (1.99 | ) | — | 24.06 | 6.97 | 51,296 | 1.20 | 0.09 | 1.31 | 29 | ||||||||||||||||||||||||||||||||||||||||
| Institutional Plus Class | ||||||||||||||||||||||||||||||||||||||||||||||||||||||||
| 03/31/19 | 28.35 | 0.09 | 0.35 | 0.44 | (0.02 | ) | (1.32 | ) | — | 27.45 | 1.90 | 721,976 | 0.99 | 0.32 | 1.08 | 26 | ||||||||||||||||||||||||||||||||||||||||
| 03/31/18 | 28.35 | 0.05 | 1.45 | 1.50 | — | (1.50 | ) | — | 28.35 | 5.34 | 521,124 | 0.99 | 0.17 | 1.08 | 28 | |||||||||||||||||||||||||||||||||||||||||
| 03/31/17 | 23.20 | 0.12 | 5.47 | 5.59 | (0.09 | ) | (0.35 | ) | — | 28.35 | 24.14 | 379,675 | 0.99 | 0.47 | 1.06 | 33 | ||||||||||||||||||||||||||||||||||||||||
| 03/31/16 | 24.12 | 0.07 | (0.21 | ) | (0.14 | ) | (0.11 | ) | (0.67 | ) | — | 23.20 | (0.48 | ) | 220,980 | 0.99 | 0.30 | 1.07 | 32 | |||||||||||||||||||||||||||||||||||||
| 03/31/15 | 24.43 | 0.08 | 1.64 | 1.72 | (0.04 | ) | (1.99 | ) | — | 24.12 | 7.17 | 217,291 | 0.98 | 0.34 | 1.09 | 29 | ||||||||||||||||||||||||||||||||||||||||
| (a) | Per share data calculated using average share method. |
| (b) | Not annualized for a period less than one year. |
| (c) | Annualized for a period less than one year. |
| (d) | Ratios excluding contractual and voluntary waivers. |
| (e) | Commencement of operations of Tributary Nebraska Tax-Free Fund - Institutional Plus Class shares was January 1, 2016. |
| (f) | Realized and unrealized gains and losses per share in this caption are balancing amounts necessary to reconcile the change in net asset value per share for the period, and may not reconcile with the aggregate gains and losses in the Statement of Operations due to share transactions for the period. |
See accompanying Notes to Financial Statements.
ANNUAL REPORT 2019
NOTES TO FINANCIAL STATEMENTS
March 31, 2019
1. Organization
Tributary Funds, Inc. (the “Company”) was organized in October 1994 as a Nebraska corporation and is registered under the Investment Company Act of 1940, as amended (the “1940 Act”), as an open-end management investment company issuing its shares in series. The Company consists of six series, Short-Intermediate Bond Fund, Income Fund, Nebraska Tax-Free Fund, Balanced Fund, Growth Opportunities Fund and Small Company Fund (collectively, the “Funds” and individually, a “Fund”). Short-Intermediate Bond Fund, Income Fund, Balanced Fund, Growth Opportunities Fund and Small Company Fund are all diversified series. Nebraska Tax-Free Fund is a non-diversified series. Each series represents a distinct portfolio with its own investment objectives and policies. Refer to the prospectus for each Fund’s investment objective.
All Funds offer Institutional Plus Class shares without a sales charge and the Short-Intermediate Bond Fund, Income Fund, Balanced Fund, Growth Opportunities Fund and Small Company Fund also offer Institutional Class shares. The two classes differ principally in applicable minimum investment and shareholder servicing fees. Shareholders bear the common expenses of each Fund and earn income and realized gains/ losses from each Fund pro rata based on the average daily net assets of each class, without discrimination between share classes. Each share class also has different voting rights on matters affecting a single class. No class has preferential dividend rights.
2. Significant Accounting Policies
The Funds are investment companies and follow accounting and reporting guidance under Financial Accounting Standards Board (“FASB”) Accounting Standards Codification (“ASC”) Topic 946, “Financial Services-Investment Companies”. The following is a summary of significant accounting policies consistently followed by the Company in the preparation of its financial statements. The policies are in conformity with accounting principles generally accepted in the United States of America (“GAAP”). The preparation of financial statements requires management to make estimates and assumptions that affect the reported amounts of assets and liabilities, the disclosure of contingent assets and liabilities at the date of financial statements and the reported amounts of income and expenses for the period. Actual results could differ from those estimates.
Security Valuation
The net asset value (“NAV”) per share of each Fund is determined each business day as of the close of the New York Stock Exchange (“NYSE”), which is normally 4 p.m. Eastern Time. In valuing a Fund’s assets for calculating the NAV, securities listed on a securities exchange, market or automated quotation system for which quotations are readily available, including traded over the counter securities, are valued at the official closing price on the primary exchange or market on which they traded or, if there is no such reported price on the valuation date, at the most recent quoted sale price or bid price. Investments in investment companies are valued at the NAV per share determined as of the close of the NYSE. Short-term debt investments (maturing within 60 days) may be valued on an amortized cost basis, unless such value does not approximate fair value. Debt securities (other than short-term investments) are valued at prices furnished by pricing services and generally reflect last reported sales price if the security is actively traded or an evaluated bid price obtained by employing methodologies that utilize actual market transactions; broker supplied valuations; or factors such as yield, maturity, call features, credit ratings, or developments relating to specific securities in arriving at the valuation. Prices provided by pricing services are subject to review and determination of the appropriate price whenever a furnished price is significantly different from the previous day’s furnished price.
Securities for which quotations are not readily available are valued at fair value as determined in good faith by the Company’s Fair Value Committee (“Fair Value Committee”) pursuant to procedures established by the Company’s Board of Directors (“Board”). Situations that may require an investment to be fair valued include instances where a security is thinly traded, halted, or restricted as to resale. In addition, investments may be fair valued based on the occurrence of a significant event. Significant events may be specific to a particular issuer, such as mergers, restructurings, or defaults. Alternatively, significant events may affect an entire market, such as natural disasters, government actions, and significant changes in the value of U.S. securities markets. Securities are fair valued based on observable and unobservable inputs, including the Fair Value Committee's own assumptions in determining fair value. Factors used in determining fair value include, but are not limited to: type of security or asset, trading activity of similar markets or securities, fundamental analytical data relating to the investment, evaluation of the forces that influence the market in which the security is purchased and sold, and information as to any transactions or offers with respect to the security.
Under the Company’s pricing and valuation procedures, the Board has delegated the daily operational oversight of the securities valuation function to the Fair Value Committee, which consists of representatives from the Funds’ Adviser, Sub-Adviser, and the Treasurer, who serves
ANNUAL REPORT 2019
NOTES TO FINANCIAL STATEMENTS
March 31, 2019
on the committee as a non-voting member. The Fair Value Committee is responsible for determining fair valuations for any security for which market quotations are not readily available. For those securities fair valued under procedures adopted by the Board, the Fair Value Committee reviews and affirms the reasonableness of the fair valuation determinations after considering all relevant information that is reasonably available. The Fair Valuation Committee’s determinations are subject to review by the Funds’ Board at its next regularly scheduled meeting covering the calendar quarter in which the fair valuation was determined.
The Funds use a framework for measuring fair value. Fair value is defined as the price that would be received to sell an asset or paid to transfer a liability in an orderly transaction between market participants (exit price). One component of fair value is a three-tier fair value hierarchy. The basis of the tiers is dependent upon various “inputs” used to determine the value of the Funds’ investments. These inputs are summarized in the three broad levels listed below:
Level 1 – includes valuations based on quoted prices of identical securities in active markets including valuations for securities listed on a securities exchange or investments in mutual funds.
Level 2 – includes valuations for which all significant inputs are observable, either directly or indirectly. Direct observable inputs include broker quotes in active markets, closing prices of similar securities in active markets, closing prices for identical or similar securities in non-active markets, or corporate action or reorganization entitlement values. Indirect significant observable inputs include factors such as interest rates, yield curves, prepayment speeds or credit ratings. Level 2 includes valuations for fixed income securities priced by pricing services, broker quotes in active markets, or ADRs and GDRs for which quoted prices in active markets are not available.
Level 3 – includes valuations based on inputs that are unobservable and significant to the fair value measurement, including the Fair Value Committee's own assumptions in determining the fair value of the investment. Inputs used to determine the fair value of Level 3 securities include security specific inputs such as: credit quality, issuer news, trading characteristics, or industry specific inputs such as: trading activity of similar markets or securities, changes in the security’s underlying index, or comparable securities’ models. Level 3 valuations include securities that are priced based on single source broker quotes, where prices may be unavailable due to halted trading, restricted to resale due to market events, newly issued or investments for which reliable quotes are not available.
To assess the continuing appropriateness of security valuations, the co-administrator regularly compares current day prices with prior day prices, transaction prices, and alternative vendor prices. When the comparison results exceed pre-defined thresholds, the co-administrator challenges the prices exceeding tolerance levels with the pricing service or broker. To substantiate Level 3 unobservable inputs, the adviser and co-administrator use a variety of techniques as appropriate, including, transaction backtesting or disposition analysis and review of related market activity.
The inputs or methodology used for valuing investments are not necessarily an indication of the risk associated with investing in those investments.
The following is a summary of the inputs used to value each Fund’s investments as of March 31, 2019, by category:
| LEVEL 1 – Quoted Prices | LEVEL 2 - Significant Observable Inputs | LEVEL 3 - Significant Unobservable Inputs | Total | |||||||||||||
| Short-Intermediate Bond Fund | ||||||||||||||||
| Asset Backed Securities | $ | – | $ | 31,916,303 | $ | – | $ | 31,916,303 | ||||||||
| Non-Agency Commercial Mortgage Backed Securities | – | 10,680,382 | – | 10,680,382 | ||||||||||||
| Non-Agency Residential Mortgage Backed Securities | – | 13,950,698 | – | 13,950,698 | ||||||||||||
| Corporate Bonds | – | 55,252,750 | – | 55,252,750 | ||||||||||||
| Government & Agency Obligations | – | 67,181,492 | – | 67,181,492 | ||||||||||||
| Preferred Stocks | 434,643 | – | – | 434,643 | ||||||||||||
| Short-Term Investments | 1,873,967 | – | – | 1,873,967 | ||||||||||||
| Total | $ | 2,308,610 | $ | 178,981,625 | $ | – | $ | 181,290,235 | ||||||||
ANNUAL REPORT 2019
NOTES TO FINANCIAL STATEMENTS
March 31, 2019
| LEVEL 1 – Quoted Prices | LEVEL 2 - Significant Observable Inputs | LEVEL 3 - Significant Unobservable Inputs | Total | |||||||||||||
| Income Fund | ||||||||||||||||
| Asset Backed Securities | $ | – | $ | 15,766,938 | $ | – | $ | 15,766,938 | ||||||||
| Non-Agency Commercial Mortgage Backed Securities | – | 12,649,292 | – | 12,649,292 | ||||||||||||
| Non-Agency Residential Mortgage Backed Securities | – | 20,389,527 | – | 20,389,527 | ||||||||||||
| Corporate Bonds | – | 57,635,377 | – | 57,635,377 | ||||||||||||
| Government & Agency Obligations | – | 85,060,854 | – | 85,060,854 | ||||||||||||
| Investment Company | 1,529,023 | – | – | 1,529,023 | ||||||||||||
| Short-Term Investments | 2,940,724 | – | – | 2,940,724 | ||||||||||||
| Total | $ | 4,469,747 | $ | 191,501,988 | $ | – | $ | 195,971,735 | ||||||||
| LEVEL 1 – Quoted Prices | LEVEL 2 - Significant Observable Inputs | LEVEL 3 - Significant Unobservable Inputs | Total | |||||||||||||
| Nebraska Tax-Free Fund | ||||||||||||||||
| Government & Agency Obligations | $ | – | $ | 71,774,003 | $ | – | $ | 71,774,003 | ||||||||
| Short-Term Investments | 1,747,058 | – | – | 1,747,058 | ||||||||||||
| Total | $ | 1,747,058 | $ | 71,774,003 | $ | – | $ | 73,521,061 | ||||||||
| LEVEL 1 – Quoted Prices | LEVEL 2 - Significant Observable Inputs | LEVEL 3 - Significant Unobservable Inputs | Total | |||||||||||||
| Balanced Fund | ||||||||||||||||
| Common Stocks* | $ | 44,201,683 | $ | – | $ | – | $ | 44,201,683 | ||||||||
| Asset Backed Securities | – | 1,394,794 | – | 1,394,794 | ||||||||||||
| Non-Agency Commercial Mortgage Backed Securities | – | 638,055 | – | 638,055 | ||||||||||||
| Non-Agency Residential Mortgage Backed Securities | – | 1,002,243 | – | 1,002,243 | ||||||||||||
| Corporate Bonds | – | 7,300,144 | – | 7,300,144 | ||||||||||||
| Government & Agency Obligations | – | 14,352,940 | – | 14,352,940 | ||||||||||||
| Short-Term Investments | 2,634,823 | – | – | 2,634,823 | ||||||||||||
| Total | $ | 46,836,506 | $ | 24,688,176 | $ | – | $ | 71,524,682 | ||||||||
| LEVEL 1 – Quoted Prices | LEVEL 2 - Significant Observable Inputs | LEVEL 3 - Significant Unobservable Inputs | Total | |||||||||||||
| Growth Opportunities Fund | ||||||||||||||||
| Common Stocks* | $ | 139,787,668 | $ | – | $ | – | $ | 139,787,668 | ||||||||
| Short-Term Investments | 2,632,703 | – | – | 2,632,703 | ||||||||||||
| Total | $ | 142,420,371 | $ | – | $ | – | $ | 142,420,371 | ||||||||
ANNUAL REPORT 2019
NOTES TO FINANCIAL STATEMENTS
March 31, 2019
| LEVEL 1 – Quoted Prices | LEVEL 2 - Significant Observable Inputs | LEVEL 3 - Significant Unobservable Inputs | Total | |||||||||||||
| Small Company Fund | ||||||||||||||||
| Common Stocks* | $ | 778,591,224 | $ | – | $ | – | $ | 778,591,224 | ||||||||
| Short-Term Investments | 36,833,605 | – | – | 36,833,605 | ||||||||||||
| Total | $ | 815,424,829 | $ | – | $ | – | $ | 815,424,829 | ||||||||
| * | See Schedules of Portfolio Investments for further industry classification. |
The following is a reconciliation of Level 3 investments for which significant unobservable inputs were used to determine fair value.
| Non-Agency Residential Mortgage Backed Securities | ||||
| Income Fund | ||||
| Balance as of 03/31/18 | $ | 965,010 | ||
| Paydowns | (98,911 | ) | ||
| Change in unrealized appreciation (depreciation) | 20,261 | |||
| Amortization (Accretion) | (34 | ) | ||
| Realized Gain (Loss) | 3,020 | |||
| Transfer out of Level 3 | (889,346 | ) | ||
| Balance as of 03/31/19 | $ | - | ||
| Net change in unrealized appreciation/ (depreciation) in investments as of 03/31/19 | $ | - | ||
Guarantees and Indemnifications
In the normal course of business, the Company may enter into contracts that contain a variety of representations which provide general indemnifications for certain liabilities. Each Fund’s maximum exposure under these arrangements is unknown. However, since their commencement of operations, the Funds have not had claims or losses pursuant to these contracts and expect the risk of loss to be remote.
Under the Company's organizational documents, its Officers and Directors are indemnified against certain liabilities arising out of the performance of their duties to the Funds. In addition, certain of the Company's contracts with service providers contain general indemnification clauses. The Funds’ maximum exposure under these arrangements is unknown since the amount of any future claims that may be made against the Funds cannot be determined and the Funds have no historical basis for predicting the likelihood of any such claims.
Security Transactions, Investment Income and Foreign Taxes
Securities transactions are accounted for no later than one business day following trade date. For financial reporting purposes, however, on the last business day of the reporting period, security transactions are accounted for on trade date. Interest income is recognized on the accrual basis and includes, where applicable, the amortization of premium or accretion of discount, using the effective interest method. Dividend income is recorded on the ex-dividend date. Dividends and interest from non-U.S. sources received by a Fund are generally subject to non-U.S. net withholding taxes. Such withholding taxes may be reduced or eliminated under the terms of applicable U.S. income tax treaties, and each Fund intends to undertake any procedural steps required to claim the benefits of such treaties. Gains or losses realized on the sales of securities are determined by comparing the identified cost of the security lot sold with the net sales proceeds. Withholding taxes on foreign dividends have been paid or provided for in accordance with each applicable country’s tax rules and rates.
Allocation of Expenses
Expenses directly attributable to a Fund are charged directly to that Fund, while expenses which are attributable to more than one Fund are allocated among the respective Funds based upon relative net assets or another appropriate basis. Expenses directly attributable to a class are charged directly to that class, while expenses attributable to both classes are allocated to each class based upon the ratio of net assets for each class as a percentage of total net assets.
ANNUAL REPORT 2019
NOTES TO FINANCIAL STATEMENTS
March 31, 2019
Distributions to Shareholders
Dividends from net investment income are declared daily and paid monthly for the Short-Intermediate Bond, Income, and Nebraska Tax-Free Funds. The Balanced Fund declares and pays dividends from net investment income, if any, quarterly. The Growth Opportunities Fund and Small Company Fund declare and pay dividends from net investment income, if any, annually. Distributions of net realized capital gains, if any, are declared and distributed at least annually for all the Funds only to the extent they exceed available capital loss carryovers. The amount and timing of distributions are determined in accordance with federal income tax regulations which may differ from GAAP and are recorded on the ex-dividend date.
3. Related Party Transactions and Fees and Agreements
Tributary Capital Management, LLC (“Tributary” or “Adviser”), a subsidiary of First National Bank of Omaha (“FNBO”), which is a subsidiary of First National Bank of Nebraska, Inc., serves as the investment adviser to the Funds. Each Fund pays a monthly fee at an annual rate of the following percentages of each Fund’s average daily net assets: 0.50% for the Short-Intermediate Bond Fund, 0.60% for the Income Fund, 0.40% for the Nebraska Tax-Free Fund, 0.75% for each of the Balanced Fund and Growth Opportunities Fund, and 0.85% for the Small Company Fund. First National Fund Advisers (“FNFA” or “Sub-Adviser”), a division of FNBO, serves as the investment sub-adviser for the Short-Intermediate Bond Fund, Income Fund, Nebraska Tax-Free Fund, Balanced Fund and Growth Opportunities Fund. Sub-advisory fees paid to FNFA are paid by Tributary. For the services provided and expenses assumed under the FNFA Sub-Advisory Agreement, Tributary pays FNFA a fee equal to 0.25% of the average daily net assets of the Short-Intermediate Bond Fund, 0.30% of the average daily net assets of the Income Fund, 0.20% of the average daily net assets of the Nebraska Tax-Free Fund, 0.375% of the average daily net assets of the Balanced Fund, and 0.375% of the average daily net assets of the Growth Opportunities Fund.
Tributary has contractually agreed to waive advisory fees and reduce the administration fee payable to the Adviser and/or reimburse other expenses of each Fund to the extent necessary to limit the total operating expenses of each Fund, exclusive of shareholder servicing fees (Institutional Class only), brokerage costs, interest, taxes and dividend and extraordinary expenses, to an annual rate of the percentage of each Fund’s average daily net assets as follows. Prior to August 1, 2018, the expense caps for the Income Fund and Balanced Fund were 0.64% and 0.99%, respectively.
| Expense Caps | |
| Short-Intermediate Bond Fund | 0.54% |
| Income Fund | 0.60 |
| Nebraska Tax-Free Fund | 0.45 |
| Balanced Fund | 0.85 |
| Growth Opportunities Fund | 0.94 |
| Small Company Fund | 0.99 |
The amounts waived for each Fund are recorded as expenses waived in each Fund’s Statement of Operations. Other Fund service providers have also contractually agreed to waive a portion of their fees. For the year ended March 31, 2019, fees waived were as follows:
| Investment Adviser Fees Waived | Other Waivers | Total Fees Waived and Expenses Reimbursed | ||||||||||
| Short-Intermediate Bond Fund | $ | 350,612 | $ | 942 | $ | 351,554 | ||||||
| Income Fund | 423,303 | 1,060 | 424,363 | |||||||||
| Nebraska Tax-Free Fund | 143,461 | 380 | 143,841 | |||||||||
| Balanced Fund | 119,809 | 390 | 120,199 | |||||||||
| Growth Opportunities Fund | 65,250 | 764 | 66,014 | |||||||||
| Small Company Fund | 656,533 | 3,965 | 660,498 | |||||||||
Tributary may recover fees waived or expenses reimbursed, if such payment is made within three years of the fee waiver or expense reimbursement. At March 31, 2019, the amount of potentially recoverable expenses are as follows: Short-Intermediate Bond Fund – $981,424; Income Fund – $1,242,655; Nebraska Tax-Free Fund – $455,485; Balanced Fund – $233,180; Growth Opportunities Fund – $212,543; Small Company Fund – $1,507,329.
ANNUAL REPORT 2019
NOTES TO FINANCIAL STATEMENTS
March 31, 2019
MUFG Union Bank, N.A. serves as the custodian for each of the Funds. DST Systems, Inc. serves as transfer agent for the Funds, whose functions include disbursing dividends and other distributions. Tributary and Atlantic Fund Services, LLC (“Co- Administrators”) serve as co-administrators of the Funds. Certain officers of the Funds are also officers or employees of the above named service providers, and during their terms of office received no compensation from the Funds. As compensation for its administrative services, each co-administrator is entitled to a fee, calculated daily and paid monthly based on each Fund's average daily net assets. Tributary receives 0.07% of each Fund's average daily net assets. Foreside Fund Officer Services, LLC provides the Funds’ Anti-Money Laundering Compliance Officer and Chief Compliance Officer services.
The Company has adopted an Administrative Services Plan, which allows the Funds' Institutional Class shares to charge a shareholder services fee, pursuant to which each Fund is authorized to pay compensation at an annual rate of up to 0.25% of the average daily net assets to banks and other financial institutions, that may include the advisers, their correspondent and affiliated banks, including FNBO (each a “Service Organization”). Under the Administrative Services Plan, the Funds may enter into a Servicing Agreement with a Service Organization whereby such Service Organization agrees to provide certain record keeping and/or administrative support services for their customers or account holders who are the beneficial or record owner of the shares of a Fund. One of the Servicing Agreements the Funds maintain is with FNBO. For the year ended March 31, 2019, the Funds paid FNBO as follows: Short-Intermediate Bond Fund – $2,604; Income Fund – $3,942; Balanced Fund – $958; Small Company Fund – $801. The amounts accrued for shareholder service fees are included under Shareholder service fees – Institutional Class within the Statements of Operations.
4. Investment Transactions
The aggregate cost of purchases and proceeds from sales of securities, excluding U.S. Government securities and short-term investments (maturing less than one year from acquisition), for the year ended March 31, 2019, were as follows:
| Purchases | Sales | |||||||
| Short-Intermediate Bond Fund | $ | 58,443,328 | $ | 39,109,221 | ||||
| Income Fund | 31,840,611 | 36,640,861 | ||||||
| Nebraska Tax-Free Fund | 18,572,041 | 11,083,326 | ||||||
| Balanced Fund | 9,229,485 | 14,156,691 | ||||||
| Growth Opportunities Fund | 56,920,532 | 66,852,286 | ||||||
| Small Company Fund | 264,588,208 | 175,956,733 | ||||||
The aggregate cost of purchases and proceeds from sales of long-term U.S. Government securities for the year ended March 31, 2019, were as follows:
| Purchases | Sales | |||||||
| Short-Intermediate Bond Fund | $ | 41,052,960 | $ | 30,130,559 | ||||
| Income Fund | 28,967,681 | 27,713,268 | ||||||
| Balanced Fund | 6,255,479 | 3,159,123 |
5. Capital Share Transactions
The Company is authorized to issue a total of 1,000,000,000 shares of common stock, 999,999,990 of which may be issued in series with a par value of $0.00001 per share. The Board is empowered to allocate such shares among different series of the Company’s shares without shareholder approval.
6. Federal Income Taxes
The following information is presented on an income tax basis. It is each Fund’s policy to continue to comply with the requirements of Subchapter M of the Internal Revenue Code of 1986, as amended, applicable to regulated investment companies, and to distribute all of its net taxable income, including any net realized gains on investments, to its shareholders sufficient to relieve it from all, or substantially all, federal income and excise taxes. Therefore, no provision is made for federal income or excise taxes.
Differences between amounts reported for financial statements and federal income tax purposes are primarily due to timing and character difference in recognizing gains and losses on investment transactions.
ANNUAL REPORT 2019
NOTES TO FINANCIAL STATEMENTS
March 31, 2019
To the extent the differences between the amounts recognized for financial statements and federal income tax purposes are permanent in nature, such amounts are reclassified within the capital accounts based on their federal income tax treatment; temporary differences do not require reclassification. Permanent differences may include but are not limited to the following: reclassifications related to net operating losses and equalization. These reclassifications have no impact on net assets.
| Net Increase (Decrease) | ||||||||
| Distributable Earnings | Paid-in-Capital | |||||||
| Short-Intermediate Bond Fund | $ | – | $ | – | ||||
| Income Fund | – | – | ||||||
| Nebraska Tax-Free Fund | – | – | ||||||
| Balanced Fund | – | – | ||||||
| Growth Opportunities Fund | (107,463 | ) | 107,463 | |||||
| Small Company Fund | (2,700,000 | ) | 2,700,000 | |||||
As of March 31, 2019, the cost of investments and the components of net unrealized appreciation/(depreciation) were as follows:
| Tax Cost of Investments | Gross Unrealized Appreciation | Gross Unrealized Depreciation | Net Unrealized Appreciation (Depreciation) | |||||||||||||
| Short-Intermediate Bond Fund | $ | 181,832,850 | $ | 612,757 | $ | (1,155,372 | ) | $ | (542,615 | ) | ||||||
| Income Fund | 195,202,786 | 2,747,960 | (1,979,011 | ) | 768,949 | |||||||||||
| Nebraska Tax-Free Fund | 74,476,840 | 813,164 | (1,768,943 | ) | (955,779 | ) | ||||||||||
| Balanced Fund | 56,587,859 | 15,673,052 | (736,229 | ) | 14,936,823 | |||||||||||
| Growth Opportunities Fund | 96,105,616 | 47,723,483 | (1,408,728 | ) | 46,314,755 | |||||||||||
| Small Company Fund | 706,052,126 | 150,254,368 | (40,881,665 | ) | 109,372,703 | |||||||||||
At March 31, 2019, the components of distributable taxable earnings for U.S. federal income tax purposes were as follows:
| Undistributed Net Investment Income* | Undistributed Net Long-Term Capital Gains | Other Temporary Differences | Unrealized Gain (Loss)** | Capital Loss Carry Forward*** | ||||||||||||||||
| Short-Intermediate Bond Fund | $ | 417,681 | $ | – | $ | (279,348 | ) | $ | (542,615 | ) | $ | (2,144,228 | ) | |||||||
| Income Fund | 898,242 | – | (408,209 | ) | 768,949 | (3,107,427 | ) | |||||||||||||
| Nebraska Tax-Free Fund | – | – | – | (955,779 | ) | (452,870 | ) | |||||||||||||
| Balanced Fund | 21,722 | 1,145,287 | – | 14,936,823 | – | |||||||||||||||
| Growth Opportunities Fund | – | 1,461,548 | – | 46,314,755 | (41,406 | ) | ||||||||||||||
| Small Company Fund | 1,323,239 | 2,137,875 | – | 109,372,703 | – | |||||||||||||||
| * | Undistributed net investment income includes any undistributed net short-term capital gains, if any. |
| ** | Unrealized gains (loss) are adjusted for open wash sale loss deferrals, market discount/premium amortization, return of capital paid by REIT securities, adjustments on inflation indexed securities and equity return of capital securities. |
| *** | Capital loss carry forward includes deferred post October loss and late year losses. |
The tax character of dividends and distributions paid during the Funds’ fiscal years ended March 31, 2019 and March 31, 2018, were as follows:
| Net Ordinary Income* | Tax Exempt Income | Net Long Term Capital Gains** | Return of Capital | Total Distributions Paid*** | ||||||||||||||||||||||||||||||||||||
| 2019 | 2018 | 2019 | 2018 | 2019 | 2018 | 2019 | 2018 | 2019 | 2018 | |||||||||||||||||||||||||||||||
| Short-Intermediate Bond | ||||||||||||||||||||||||||||||||||||||||
| Fund | $ | 4,015,041 | $ | 3,347,078 | $ | – | $ | – | $ | – | $ | – | $ | – | $ | – | $ | 4,015,041 | $ | 3,347,078 | ||||||||||||||||||||
| Income Fund | 5,954,743 | 6,103,546 | – | – | – | – | – | – | 5,954,743 | 6,103,546 | ||||||||||||||||||||||||||||||
| Nebraska Tax-Free Fund | 39,441 | 14,012 | 1,692,586 | 2,294,989 | – | – | 561,894 | – | 2,293,921 | 2,309,001 | ||||||||||||||||||||||||||||||
| Balanced Fund | 702,416 | 690,469 | – | – | 4,144,048 | 5,477,086 | – | – | 4,846,464 | 6,167,555 | ||||||||||||||||||||||||||||||
| Growth Opportunities Fund | – | – | – | – | 13,876,252 | 19,267,400 | – | – | 13,876,252 | 19,267,400 | ||||||||||||||||||||||||||||||
| Small Company Fund | 1,594,767 | 5,682,919 | – | – | 32,498,906 | 30,023,507 | – | – | 34,093,673 | 35,706,426 | ||||||||||||||||||||||||||||||
| * | Net ordinary income consists of net taxable income derived from dividends, interest, and net short-term capital gains, if any. |
| ** | The Funds designated as long-term dividend, pursuant to the Internal Revenue code section 852(b)(3), the amount necessary to reduce earnings and profits of the Funds related to net capital gains to zero for the fiscal year ended March 31, 2019. Equalization debits included in the long term distributions were $325,000 and $2,700,000 for Growth Opportunities Fund and Small Company Fund, respectively. |
| *** | Total distributions paid may differ from the Statements of Changes in Net Assets because distributions are recognized when actually paid for tax purposes. |
ANNUAL REPORT 2019
NOTES TO FINANCIAL STATEMENTS
March 31, 2019
At March 31, 2019, the following Funds had net capital loss carryforwards available for U.S. federal income tax purposes to offset future net realized capital gains. Details of the capital loss carryforwards are listed in the table below.
| No Expiration | ||||||||||||
| Short Term | Long Term | Total | ||||||||||
| Short-Intermediate Bond Fund | $ | 396,173 | $ | 1,748,055 | $ | 2,144,228 | ||||||
| Income Fund | 1,152,874 | 1,954,553 | 3,107,427 | |||||||||
| Nebraska Tax-Free Fund | 32,733 | 420,137 | 452,870 | |||||||||
Under current tax law, certain capital losses realized after October 31, and certain ordinary losses realized after December 31 but before the end of the fiscal year ("Post-October losses" and “Late Year Losses”, respectively) may be deferred and treated as occurring on the first business day of the following fiscal year. For the year ended March 31, 2019, the Funds deferred losses to April 1, 2019 as follows:
| Late Year Losses/Post-October Losses | ||||
| Growth Opportunities Fund | $ | 41,406 | ||
The Funds comply with FASB ASC Topic 740, “Income Taxes.” FASB ASC Topic 740 provides guidance for how uncertain tax positions should be recognized, measured, presented and disclosed in the financial statements. FASB ASC Topic 740 requires the affirmative evaluation of tax positions taken or expected to be taken in the course of preparing each Fund’s tax return to determine whether it is more-likely-than-not (i.e., greater than 50 percent) that each tax position will be sustained upon examination by a taxing authority based on the technical merits of the position. Funds with tax positions not deemed to meet the "more-likely-than-not" threshold would be required to record a tax expense in the current year. Management completed an evaluation of the Funds’ tax positions and based on that evaluation, determined that no tax liability resulted from unrecognized tax benefits related to uncertain tax positions and therefore no provision for federal income tax was required in the Funds’ financial statements for the year ended March 31, 2019. The Funds recognize interest and penalties, if any, related to unrecognized tax benefits as income tax expense in the Statements of Operations. During the period, the Funds did not incur any interest or penalties.
8. Recent Accounting Pronouncements
In August 2018, FASB issued Accounting Standards Update No. 2018-13 “Fair Value Measurement (Topic 820): Disclosure Framework – Changes to the Disclosure Requirements for Fair Value Measurement” (“ASU 2018-13”) which includes amendments intended to improve the effectiveness of disclosures in the notes to financial statements. For example, ASU 2018-13 includes additional disclosures regarding the range and weighted average of significant unobservable inputs used to develop Level 3 fair value measurements, and clarifications to the narrative description of measurement uncertainty disclosures. ASU 2018-13 is effective for interim and annual periods beginning after December 15, 2019. Early adoption is permitted and the Funds have adopted ASU 2018-13 within these financial statements.
In September 2018, the Securities and Exchange Commission released Final Rule 33-10532 captioned “Disclosure Update and Simplification,” include (i) and amendment to require presentation of the total, rather than the components, of distributable earnings on the Statement of Assets and Liabilities; and (ii) an amendment to require presentation of the total, rather than the components, of distributions to shareholders, except for tax return of capital distributions, on the Statement of Changes in Net Assets. The amendments also removed the requirement for parenthetical disclosure of undistributed net investment income on the Statement of Changes in Net Assets. These changes were effective November 5, 2018. These amendments are reflected in the Funds’ financial statements for the year ended March 31, 2019.
9. Subsequent Events
Management has evaluated subsequent events for the Funds through the date the financial statements are issued, and has concluded there were no events that require adjustments to the financial statements or disclosure in the notes.
ANNUAL REPORT 2019
REPORT OF INDEPENDENT REGISTERED PUBLIC ACCOUNTING FIRM
To the Shareholders and Board of Directors of
Tributary Funds, Inc.
Opinion on the Financial Statements
We have audited the accompanying statements of assets and liabilities, including the schedules of portfolio of investments, of Tributary Funds, Inc., comprising Tributary Short-Intermediate Bond Fund, Tributary Income Fund, Tributary Nebraska Tax-Free Fund, Tributary Balanced Fund, Tributary Growth Opportunities Fund, and Tributary Small Company Fund (the “Funds”), as of March 31, 2019, and the related statements of operations for the year then ended, the statements of changes in net assets for each of the two years in the period then ended, including the related notes, and the financial highlights for each of the four years or periods in the period then ended (collectively referred to as the “financial statements”). In our opinion, the financial statements present fairly, in all material respects, the financial position of each of the Funds as of March 31, 2019, the results of their operations for the year then ended, the changes in their net assets for each of the two years in the period then ended, and the financial highlights for each of the four years or periods in the period then ended, in conformity with accounting principles generally accepted in the United States of America.
The Funds’ financial highlights for the year ended March 31, 2015, were audited by other auditors whose report dated May 27, 2015, expressed an unqualified opinion on those financial highlights.
Basis for Opinion
These financial statements are the responsibility of the Funds’ management. Our responsibility is to express an opinion on the Funds’ financial statements based on our audits. We are a public accounting firm registered with the Public Company Accounting Oversight Board (United States) (“PCAOB”) and are required to be independent with respect to the Funds in accordance with the U.S. federal securities laws and the applicable rules and regulations of the Securities and Exchange Commission and the PCAOB.
We conducted our audits in accordance with the standards of the PCAOB. Those standards require that we plan and perform the audit to obtain reasonable assurance about whether the financial statements are free of material misstatement, whether due to error or fraud.
Our audits included performing procedures to assess the risks of material misstatement of the financial statements, whether due to error or fraud, and performing procedures that respond to those risks. Such procedures included examining, on a test basis, evidence regarding the amounts and disclosures in the financial statements. Our procedures included confirmation of securities owned as of March 31, 2019, by correspondence with the custodian and brokers or by other appropriate auditing procedures where replies from brokers or counterparties were not received. Our audits also included evaluating the accounting principles used and significant estimates made by management, as well as evaluating the overall presentation of the financial statements. We believe that our audits provide a reasonable basis for our opinion.
We have served as the Funds’ auditor since 2015.

COHEN & COMPANY, LTD.
Cleveland, Ohio
May 30, 2019
ANNUAL REPORT 2019
ADDITIONAL FUND INFORMATION (Unaudited)
March 31, 2019
Proxy Voting Policy
Information regarding the policies and procedures that the Funds use to determine how to vote proxies relating to portfolio securities is available without charge, upon request, by calling 1-800-662-4203. The information also is included in the Company’s Statement of Additional Information, which is available on the Funds' website at www.tributaryfunds.com and on the Securities and Exchange Commission’s (the "SEC") website at www.sec.gov.
Information relating to how each Fund voted proxies relating to portfolio securities held during the most recent twelve months ended June 30 is available without charge, upon request, by writing to the Company at P.O. Box 219022, Kansas City, Missouri, 64141-6002, by calling 1-800-662-4203 and on the SEC’s website at www.sec.gov.
Quarterly Holdings
The Company files a complete list of its portfolio holdings with the SEC for the first and third quarters of each fiscal year on Form N-PORT. Forms N-PORT are available free of charge on the SEC’s website at www.sec.gov or may be reviewed and copied at the SEC’s Public Reference Room in Washington, D.C. Information on the operation of the Public Reference Room may be obtained by calling 1-800-SEC-0330.
Other Federal Income Tax Information
The information reported below is for the year ended March 31, 2019. Foreign tax and qualified dividend information for the calendar year 2019 will be provided on your 2019 Form 1099-DIV.
For the year ended March 31, 2019, certain dividends paid by the Funds may be subject to a maximum tax rate of 20% as provided for by the American Taxpayer Relief Act of 2012. Complete information for calendar year 2019 will be reported in conjunction with your 2019 Form 1099-DIV.
For the year ended March 31, 2019, the following Funds hereby designate the following percentages, or the maximum amount allowable under the Internal Revenue Code (“Code”), as qualified dividends:
| Qualified Dividend Income | |
| Short-Intermediate Bond Fund | 0.50% |
| Balanced Fund | 92.52% |
| Small Company Fund | 100.00% |
For the year ended March 31, 2019, the following Funds hereby designate the following percentages, or the maximum amount allowable under the Code, as distributions eligible for the dividends received deduction for corporations:
| Dividends Received Deduction | |
| Short-Intermediate Bond Fund | 0.50% |
| Balanced Fund | 86.33% |
| Small Company Fund | 100.00% |
For the year ended March 31, 2019, the following Funds hereby designate the following percentages, or the maximum amount allowable under the Code, as qualified interest income exempt from U.S. tax for foreign shareholders:
| Qualified Interest Income | |
| Short-Intermediate Bond Fund | 89.04% |
| Income Fund | 81.31% |
| Balanced Fund | 41.74% |
For the year ended March 31, 2019, Small Company Fund designates 68.67% of its income dividends as short-term capital gain dividends exempt from U.S. tax for foreign shareholders and Nebraska Tax-Free Fund designates 97.86% of its income dividend distributed as tax-exempt dividends.
Table of Shareholder Expenses
As a shareholder of the Funds, you incur ongoing costs, including management fees, shareholder servicing fees and other Fund expenses. This example is intended to help you understand your ongoing costs (in dollars) of investing in the Funds and to compare these costs with the ongoing costs of investing in other mutual funds.
The example is based on an investment of $1,000 invested at the beginning of the period and held for the entire period from October 1, 2018, through March 31, 2019.
Actual Expenses – The first set of columns next to each Fund of the table below provides information about actual account values and actual expenses. You may use the information in this line, together with the amount you invested, to estimate the expenses that you paid over the period. Simply divide your account
ANNUAL REPORT 2019
ADDITIONAL FUND INFORMATION (Unaudited)
March 31, 2019
value by $1,000 (for example, an $8,600 account value divided by $1,000 = 8.6), then multiply the result by the number in the first set of columns under the heading entitled “Expenses Paid During Period” to estimate the expenses you paid on your account during the period.
Hypothetical Example for Comparison Purposes – The second line set of columns next to each Fund of the table below provides information about hypothetical account values and hypothetical expenses based on each Fund’s actual expense ratio and an assumed rate of return of 5% per year before expenses, which is not each Fund’s actual return. The hypothetical account values and expenses may not be used to estimate the actual ending account balance or expenses you paid for the period. You may use this information to compare the ongoing costs of investing in each Fund and other funds. To do so, compare this 5% hypothetical example with the 5% hypothetical examples that appear in the shareholder reports of other funds.
Please note that the expenses shown in the table are meant to highlight your ongoing costs only. Therefore, the second set of columns of the table is useful in comparing ongoing costs only, and will not help you determine the relative total costs of owning different funds.
ANNUAL REPORT 2019
ADDITIONAL FUND INFORMATION (Unaudited)
March 31, 2019
| Expenses Using Actual Fund Return | Expenses Using Hypothetical 5% Return | |||||||||||||||||||||||||||||||
| Beginning Account Value 10/1/18 | Ending Account Value 3/31/19 | Expense Paid During Period* | Expense Ratio During Period* | Beginning Account Value 10/1/18 | Ending Account Value 3/31/19 | Expenses Paid During Period* | Expense Ratio During Period* | |||||||||||||||||||||||||
| Short-Intermediate Bond Fund | ||||||||||||||||||||||||||||||||
| Institutional Class | $ | 1,000.00 | $ | 1,022.94 | $ | 3.78 | 0.75 | % | $ | 1,000.00 | $ | 1,021.19 | $ | 3.78 | 0.75 | % | ||||||||||||||||
| Institutional Plus Class | 1,000.00 | 1,022.85 | 2.72 | 0.54 | 1,000.00 | 1,022.24 | 2.72 | 0.54 | ||||||||||||||||||||||||
| Income Fund | ||||||||||||||||||||||||||||||||
| Institutional Class | $ | 1,000.00 | $ | 1,045.14 | $ | 3.98 | 0.78 | % | $ | 1,000.00 | $ | 1,021.04 | $ | 3.93 | 0.78 | % | ||||||||||||||||
| Institutional Plus Class | 1,000.00 | 1,046.05 | 3.06 | 0.60 | 1,000.00 | 1,021.94 | 3.02 | 0.60 | ||||||||||||||||||||||||
| Nebraska Tax-Free Fund | ||||||||||||||||||||||||||||||||
| Institutional Plus Class | $ | 1,000.00 | $ | 1,039.46 | $ | 2.29 | 0.45 | % | $ | 1,000.00 | $ | 1,022.69 | $ | 2.27 | 0.45 | % | ||||||||||||||||
| Balanced Fund | ||||||||||||||||||||||||||||||||
| Institutional Class | $ | 1,000.00 | $ | 1,001.53 | $ | 5.19 | 1.04 | % | $ | 1,000.00 | $ | 1,019.75 | $ | 5.24 | 1.04 | % | ||||||||||||||||
| Institutional Plus Class | 1,000.00 | 1,002.77 | 4.24 | 0.85 | 1,000.00 | 1,020.69 | 4.28 | 0.85 | ||||||||||||||||||||||||
| Growth Opportunities Fund | ||||||||||||||||||||||||||||||||
| Institutional Class | $ | 1,000.00 | $ | 987.34 | $ | 5.50 | 1.11 | % | $ | 1,000.00 | $ | 1,019.40 | $ | 5.59 | 1.11 | % | ||||||||||||||||
| Institutional Plus Class | 1,000.00 | 988.22 | 4.66 | 0.94 | 1,000.00 | 1,020.24 | 4.73 | 0.94 | ||||||||||||||||||||||||
| Small Company Fund | ||||||||||||||||||||||||||||||||
| Institutional Class | $ | 1,000.00 | $ | 917.83 | $ | 5.69 | 1.19 | % | $ | 1,000.00 | $ | 1,019.00 | $ | 5.99 | 1.19 | % | ||||||||||||||||
| Institutional Plus Class | 1,000.00 | 918.89 | 4.74 | 0.99 | 1,000.00 | 1,020.00 | 4.99 | 0.99 | ||||||||||||||||||||||||
| * | Expenses are equal to each Fund’s annualized expense ratio multiplied by the average account value over the period, multiplied by the number of days in the most recent fiscal half-year (182) divided by 365 to reflect the half-year period. |
ANNUAL REPORT 2019
DIRECTORS AND OFFICERS (Unaudited)
March 31, 2019
Overall, responsibility for management of the Company rests with its Board, which is elected by the shareholders of the Company. The Company is managed by the Directors in accordance with the laws governing corporations in Nebraska. The Board oversees all of the Funds. Directors serve until their respective successors have been elected and qualified or until their earlier death, resignation or removal. The Directors elect the officers of the Company to supervise its day-to-day operations.
Information about the Directors and officers of the Company is set forth below. The Funds’ Statement of Additional Information includes additional information about the Directors and is available, without charge, upon request, by calling 1-800-662-4203 or on the Funds’ website www.tributaryfunds.com.
| Name, Address(1), Age and Position(s) Held with Funds | Term of Office and Length of Time Served | Principal Occupation(s) During Past 5 Years | Number of Portfolios in Fund Complex Overseen by Director | Other Directorships Held by Director |
| Interested Directors | ||||
| Stephen C. Wade(2) Age: 53 | Indefinite; Since 2016. | Senior Vice President - Investment Services, First National Bank of Omaha (December 2013 to present); Managing Director - Institutional Trust, First National Bank of Omaha (February 2011 to December 2013). | 7 | Director, First National Capital Markets, Inc. |
| Director, Chairman of the Board and President | ||||
| Brittany A. Fahrenkrog(2) Age: 40 | Indefinite; Since 2016 | Director, Client Services, Tributary Capital Management, LLC (since May 2010) | 7 | None. |
| Director and Senior Vice President | ||||
| Independent Directors | ||||
| Robert A. Reed Age: 78 | Indefinite; Since 1994 | Retired. President and Chief Executive Officer, Physicians Mutual Insurance Company and Physicians Life Insurance Company (1974 to December 2014). | 7 | None. |
| Director; Chairman Corporate Governance and Nominations Committee | ||||
| Gary D. Parker Age: 73 | Indefinite; Since 2005 | Retired since 2000. | 7 | None. |
| Director; Chairman Audit Committee | ||||
| David F. Larrabee Age:58 | Indefinite; Since 2016 | Retired since 2012. Senior Vice President, Intermediary Sales, American Century Investments, Inc. and President and CEO, American Century Investment Services, Inc. (broker/dealer subsidiary) (2009 to May 2012); prior to 2009, Mr. Larrabee held various senior positions with American Century Investments, Inc. | 7 | None. |
| Director | ||||
| 1 | The address for all Directors is 1620 Dodge Street, Omaha, Nebraska 68197. |
| 2 | As defined in the 1940 Act, Mr. Wade is an “interested” Director because he is an officer of First National Bank of Omaha, the parent of the Funds' investment adviser, and an owner of securities issued by First National of Nebraska, Inc., and Ms. Fahrenkrog is an "interested" Director because she is an employee of Tributary Capital Management, LLC, the Funds' investment adviser, and an officer of First National Bank of Omaha. |
ANNUAL REPORT 2019
DIRECTORS AND OFFICERS (Unaudited)
March 31, 2019
| Name, Address(1), Age and Position(s) Held with Funds | Term of Office and Length of Time Served | Principal Occupation(s) During Past 5 Years | Number of Portfolios in Fund Complex Overseen by Director | Other Directorships Held by Director |
| Independent Directors (continued) | ||||
| Donna Walsh Age:55 | Indefinite; Since 2018 | Special Adviser, Panorama Point Partners (since 2018); Advisor, Tenaska Capital Management (2008- 2017); Co-Founder and Managing Director, Odin Capital Management (1999 to 2016). | 7 | None. |
| Director | ||||
| 1 | The address for all Directors is 1620 Dodge Street, Omaha, Nebraska 68197. |
| Name, Address, Age and Position(s) Held with Funds | Term of Office and Length of Time Served | Principal Occupation(s) During Past 5 Years |
| Officers | ||
| Karen Shaw(3) Age: 46 | Indefinite; Since August 2015 | Senior Vice President, Atlantic Fund Services (2008-present). |
| Treasurer, Principal Financial Officer | ||
| Rodney L. Ruehle(4) Age: 50 | Indefinite; Since August 2009 | Director, Foreside Management Services, LLC (2008 to present); Chief Compliance Officer of Praxis Mutual Funds (May 2015 to present); Chief Compliance Officer of Absolute Shares Trust (November 2017 to present); Chief Compliance Officer of Horizons ETF Trust (December 2016 to February 2019); Chief Compliance Officer of Context Capital Funds (November 2015 to March 2018); Chief Compliance Officer of Asset Management Fund (November 2009-April 2016); Chief Compliance Officer of Advisers Investment Trust (July 2011-December 2016 and March 2019 to present); Chief Compliance Officer of Penn Series Funds, Inc. (February 2012-November 2014). |
| Chief Compliance and Anti-Money Laundering Officer | ||
| Gino Malaspina(3) Age: 50 | Indefinite; Since July 2016 | Senior Counsel, Atlantic Fund Services (since June 2014); Senior Counsel and Managing Director, Cipperman & Company /Cipperman Compliance Services LLC (2010-2014); and Associate, Stradley Ronon Stevens & Young, LLP (2009-2010). |
| Secretary |
| 3 | The address for Ms. Shaw and Mr. Malaspina is Three Canal Plaza, Suite 600, Portland, ME 04101. |
| 4 | The address for Mr. Ruehle is 690 Taylor Road, Suite 210, Columbus, OH 43230. |

| (a) | Included as part of the report to shareholders under Item 1. |
| (b) | Not applicable. |
| By | /s/ Karen Shaw | |
Karen Shaw Treasurer | ||
| Date | May 30, 2019 |
| By | /s/ Stephen C. Wade | |
Stephen C. Wade President | ||
| Date | May 30, 2019 |
| By | /s/ Karen Shaw | |
| Karen Shaw Treasurer | ||
| Date | May 30, 2019 |