Exhibit 99.F
Budget Review
2011
National Treasury
Republic of South Africa
23 February 2011
ISBN: 978-0-621-39858-8
RP: 05/2011
The Budget Review is compiled using the latest available information from departmental and other sources. Some of this information is unaudited or subject to revision.
To obtain additional copies of this document, please contact:
Communications Directorate
National Treasury
Private Bag X115
Pretoria
0001
South Africa
Tel: +27 12 315 5526
Fax: +27 12 315 5126
The document is also available on the internet at: www.treasury.gov.za
ii
Foreword
The world economy is recovering from “the great recession”, but the return to growth is both uneven and fragile. The two-speed recovery is marked by dynamic growth in emerging markets and an anaemic performance in developed countries. To counteract the effects of the recession, many countries deployed extraordinary fiscal and monetary policies to stimulate growth. These measures will have to be withdrawn carefully to prevent a relapse.
In South Africa, the economy is growing and has begun to create jobs, but it will be some time before we are able to replace the 1 million jobs lost during 2008-2009. As we set out on a New Growth Path for sustainable job creation, we have to rebuild our defences to ensure that we can withstand future crises.
As recent events around the world have demonstrated, fiscal mismanagement can make social programmes, no matter how progressive, unaffordable.
To create jobs and eliminate the scourge of poverty, we have to create confidence in our economy. Building that confidence requires long-term fiscal planning, predictable actions and credible polices. The fiscal space that enabled us to respond to the recession was not something that we borrowed from ourselves: it is what we have borrowed from our children — and our children’s children. We would not be good parents if we did not repay our children and their descendants. To support sustainable job creation and healthy public finances, the 2011 fiscal stance builds on three principles: countercyclicality, long-term debt sustainability and inter-generational equity.
This is the first budget since Cabinet Ministers signed delivery agreements with the President. It has been a tough balancing act and a considerable change-management project for the National Treasury. The burden was not borne by us alone: the Ministers’ Committee on the Budget (MinComBud) worked diligently, providing political guidance in the minefield that is the prioritisation of priorities. A special word of thanks goes to Minister Gordhan, who chaired the MinComBud with immense political skill. Thanks also to Deputy Minister Nene, whose calm character brought sobriety to an otherwise turbo-charged Treasury team.
Age in the National Treasury is not measured by birthdays, but by budgets. This is the 15th budget that I have been a part of since joining the National Treasury, and the eighth since I was appointed Director-General. I have been privileged to be part of this amazing team of people — the staff of the National Treasury — who continue to define excellence in public service. We have moved from adhering to global best practice to setting the international benchmarks for budget transparency. Your diligence, dedication, commitment and professionalism have ensured that once again, we have produced high-quality budget documents.
On behalf of the National Treasury, I have the honour of presenting the 2011 Budget documentation to Parliament and the people of South Africa.
Realeboga! Pula nala!
Lesetja Kganyago
Director-General: National Treasury
iii
CONTENTS
Contents
| | | | | | | |
|
| Chapter 1 | | Inclusive growth and development | | | 1 | |
| | | Introduction to the 2011 Budget | | | 1 | |
| | | Social and economic progress: key indicators | | | 5 | |
| | | Summary of the 2011 Budget Review | | | 8 | |
| | | Budget documentation | | | 14 | |
| | | | | | | |
| Chapter 2 | | Economic policy and outlook | | | 15 | |
| | | Overview | | | 15 | |
| | | Global developments | | | 21 | |
| | | Balance of payments | | | 23 | |
| | | Real output trends | | | 27 | |
| | | Employment and remuneration | | | 32 | |
| | | Domestic expenditure | | | 33 | |
| | | Conclusion | | | 37 | |
| | | | | | | |
| Chapter 3 | | Employment | | | 39 | |
| | | Overview | | | 39 | |
| | | A global employment crisis | | | 40 | |
| | | Towards recovery in the domestic labour market | | | 42 | |
| | | Policies for faster job creation | | | 44 | |
| | | New Growth Path job targets | | | 48 | |
| | | Conclusion | | | 48 | |
| | | | | | | |
| Chapter 4 | | Fiscal policy | | | 49 | |
| | | Overview | | | 49 | |
| | | The budget framework | | | 50 | |
| | | Revisions and forward estimates for the consolidated government budget | | | 60 | |
| | | Public-sector borrowing requirement | | | 61 | |
| | | Conclusion | | | 62 | |
| | | | | | | |
| Chapter 5 | | Revenue trends and tax proposals | | | 63 | |
| | | Overview | | | 63 | |
| | | Budget revenue — revised estimates | | | 64 | |
| | | Overview of tax proposals | | | 67 | |
| | | | | | | |
| Chapter 6 | | Asset and liability management | | | 79 | |
| | | Overview | | | 79 | |
| | | Developments in South African debt markets | | | 80 | |
| | | Consolidated borrowing and financing | | | 83 | |
| | | National borrowing requirement | | | 84 | |
| | | Financing the national borrowing requirement | | | 85 | |
| | | National government’s debt portfolio | | | 90 | |
| | | State-owned entities’ capital programmes | | | 92 | |
| | | Development finance institutions | | | 96 | |
| | | Conclusion | | | 98 | |
| | | | | | | |
| Chapter 7 | | Social security and health care financing | | | 99 | |
| | | Overview | | | 99 | |
| | | Social assistance | | | 100 | |
| | | Social security funds | | | 104 | |
iv
2011 BUDGET REVIEW
| | | | | | | |
|
| | | A pressing need for administrative reform | | | 106 | |
| | | Retirement industry reforms | | | 107 | |
| | | Restructuring public health care | | | 108 | |
| | | | | | | |
| Chapter 8 | | Medium-term expenditure and division of revenue | | | 109 | |
| | | Sustaining quality service delivery | | | 109 | |
| | | Division of revenue | | | 110 | |
| | | Expenditure outcome and revised estimate: 2009/10 and 2010/11 | | | 115 | |
| | | Consolidated government expenditure | | | 115 | |
| | | Savings, reprioritisation and changes to expenditure plans | | | 117 | |
| | | Revised expenditure plans by function | | | 118 | |
| | | Conclusion | | | 129 | |
| | | | | | | |
| Annexure A | | Report of the Minister of Finance to Parliament | | | 133 | |
| | | Introduction | | | 133 | |
| | | Budgetary review and recommendation reports | | | 133 | |
| | | Joint recommendations on the fiscal framework | | | 134 | |
| | | Recommendations of the Select Committee on Appropriations | | | 138 | |
| | | Standing Committee on Appropriations on the 2010 Division of Revenue | | | 141 | |
| | | | | | | |
| Annexure B | | Statistical tables | | | 145 | |
| | | Explanatory notes on the statistical tables | | | 145 | |
| | | | | | | |
| Annexure C | | Miscellaneous tax amendments | | | 179 | |
| | | Tax expenditure statement: February 2011 | | | 179 | |
| | | Direct tax proposals | | | 182 | |
| | | Indirect tax proposals | | | 185 | |
| | | Miscellaneous tax amendments | | | 189 | |
| | | Employment, individuals and savings | | | 189 | |
| | | Business | | | 190 | |
| | | International | | | 192 | |
| | | Value-added tax | | | 193 | |
| | | Securities transfer tax: miscellaneous legislative proposals | | | 194 | |
| | | Technical corrections | | | 195 | |
| | | | | | | |
| Annexure D | | Budget summary | | | 198 | |
| | | | | | | |
| Annexure E | | Glossary | | | 201 | |
v
CONTENTS
Tables
| | | | | | | |
|
| 1.1 | | Macroeconomic outlook — summary | | | 9 | |
| 1.2 | | Consolidated government fiscal framework | | | 10 | |
| 1.3 | | Summary of tax proposals | | | 11 | |
| 1.4 | | Projected state debt and debt costs | | | 11 | |
| 1.5 | | Division of revenue | | | 13 | |
| 1.6 | | Consolidated expenditure by function | | | 14 | |
| | | | | | | |
| 2.1 | | Macroeconomic projections, 2007 — 2013 | | | 19 | |
| 2.2 | | Macroeconomic projections, 2009/10 — 2013/14 | | | 19 | |
| 2.3 | | Annual percentage change in GDP and consumer price inflation, selected regions/countries, 2010 — 2012 | | | 22 | |
| 2.4 | | Summary of South Africa’s balance of payments, 2006 — 2010 | | | 23 | |
| 2.5 | | Composition of South Africa’s trade and trade performance, 2009 — 2010 | | | 24 | |
| 2.6 | | Measures implemented since January 2010 to manage capital flows and reduce exchange rate appreciation | | | 27 | |
| 2.7 | | Growth in manufacturing output by sector, 2010 | | | 29 | |
| 2.8 | | Contribution to gross domestic expenditure growth, 2006 — 2010 | | | 33 | |
| 2.9 | | Bank credit extension to households and companies, 2008 — 2010 | | | 35 | |
| | | | | | | |
| 3.1 | | Employment response to falling output during the recession in selected countries | | | 40 | |
| 3.2 | | Composition of youth employment | | | 42 | |
| 3.3 | | Non-agricultural formal sector employment, 2008 — 2010 | | | 43 | |
| 3.4 | | Sector employment scenarios | | | 44 | |
| |
| 4.1 | | Consolidated government fiscal framework, 2007/08 — 2013/14 | | | 50 | |
| 4.2 | | Consolidated government revenue, 2007/08 — 2013/14 | | | 51 | |
| 4.3 | | Public sector infrastructure expenditure and estimates by sector, 2010/11 — 2013/14 | | | 55 | |
| 4.4 | | Major infrastructure projects | | | 56 | |
| 4.5 | | Revised estimates of consolidated government revenue and expenditure, 2009/10 and 2010/11 | | | 60 | |
| 4.6 | | Consolidated government budget medium-term estimates, 2011/12 — 2013/14 | | | 61 | |
| 4.7 | | Public-sector borrowing requirement, 2007/08 — 2013/14 | | | 62 | |
| | | | | | | |
| 5.1 | | Budget estimates and revenue outcome, 2009/10 and 2010/11 | | | 65 | |
| 5.2 | | Estimates of revenue before tax proposals, 2010/11 | | | 66 | |
| 5.3 | | Budget revenue, 2007/08 — 2013/14 | | | 67 | |
| 5.4 | | Impact of tax proposals on 2011/12 revenue | | | 68 | |
| 5.5 | | Personal income tax rate and bracket adjustments, 2010/11 — 2011/12 | | | 69 | |
| 5.6 | | Changes in specific excise duties, 2011/12 | | | 74 | |
| 5.7 | | Total combined fuel taxes on petrol and diesel, 2009/10 — 2011/12 | | | 75 | |
| | | | | | | |
| 6.1 | | Financing of consolidated government net borrowing requirement, 2007/08 — 2013/14 | | | 84 | |
| 6.2 | | National government net borrowing requirement, 2009/10 — 2013/14 | | | 84 | |
vi
2011 BUDGET REVIEW
| | | | | | | |
|
| 6.3 | | Financing of national government net borrowing requirement, 2009/10 — 2013/14 | | | 85 | |
| 6.4 | | Loan redemptions, 2009/10 — 2013/14 | | | 86 | |
| 6.5 | | Treasury bill issuance, 2010/11 — 2011/12 | | | 87 | |
| 6.6 | | Domestic long-term market loan issuance, 2010/11 | | | 88 | |
| 6.7 | | Interest rates on government retail bonds | | | 88 | |
| 6.8 | | National government cash balances, 2007/08 — 2013/14 | | | 89 | |
| 6.9 | | Total national government debt, 2007/08 — 2013/14 | | | 90 | |
| 6.10 | | Maturity distribution of domestic marketable bonds, 2008/09 — 2010/11 | | | 91 | |
| 6.11 | | Composition of domestic debt by instrument, 2007/08 — 2010/11 | | | 91 | |
| 6.12 | | National government debt-service costs, 2009/10 — 2013/14 | | | 92 | |
| 6.13 | | Major state-owned entities’ capital expenditure programmes, 2009/10 — 2014/15 | | | 93 | |
| 6.14 | | Projected major sources of funding for state-owned entities and development finance institutions, 2009/10 — 2014/15 | | | 93 | |
| 6.15 | | Guarantee exposure against major state-owned entities and development finance institutions, 2009/10 — 2010/11 | | | 94 | |
| 6.16 | | Composition of provisions and contingent liabilities, 2009/10 — 2013/14 | | | 96 | |
| | | | | | | |
| 7.1 | | Social grants values, 2010/11 and 2011/12 | | | 101 | |
| 7.2 | | SASSA expenditure, 2007/08 — 2013/14 | | | 102 | |
| 7.3 | | Social grants beneficiary numbers by type and province, 2007/08 — 2013/14 | | | 103 | |
| 7.4 | | Social grants expenditure by type and province, 2007/08 — 2013/14 | | | 103 | |
| 7.5 | | Social security funds, 2007/08 — 2013/14 | | | 104 | |
| 7.6 | | UIF benefits and recipient numbers, 2007/08 — 2010/11 | | | 105 | |
| 7.7 | | Benefits and administrative expenditure of five social security entities, 2010/11 — 2013/14 | | | 107 | |
| | | | | | | |
| 8.1 | | Division of nationally raised revenue, 2007/08 — 2013/14 | | | 111 | |
| 8.2 | | Conditional grants to provinces, 2010/11 — 2013/14 | | | 113 | |
| 8.3 | | National transfers to local government, 2007/08 — 2013/14 | | | 114 | |
| 8.4 | | Consolidated government expenditure by function, 2010/11 — 2013/14 | | | 116 | |
| 8.5 | | 2011 Budget priorities — additional MTEF allocations, 2011/12 — 2013/14 | | | 117 | |
| 8.6 | | Transport expenditure, 2007/08 — 2013/14 | | | 119 | |
| 8.7 | | Energy, communication and general economic affairs expenditure, 2007/08 — 2013/14 | | | 120 | |
| 8.8 | | Agriculture, forestry, fishing and land affairs expenditure, 2007/08 — 2013/14 | | | 121 | |
| 8.9 | | Housing and community amenities expenditure, 2007/08 — 2013/14 | | | 122 | |
| 8.10 | | Education expenditure, 2007/08 — 2013/14 | | | 123 | |
| 8.11 | | Health expenditure, 2007/08 — 2013/14 | | | 124 | |
| 8.12 | | Social protection expenditure, 2007/08 — 2013/14 | | | 125 | |
| 8.13 | | Recreation and culture expenditure, 2007/08 — 2013/14 | | | 126 | |
| 8.14 | | Public order and safety expenditure, 2007/08 — 2013/14 | | | 127 | |
| 8.15 | | Defence expenditure, 2007/08 — 2013/14 | | | 128 | |
| 8.16 | | General public services expenditure, 2007/08 — 2013/14 | | | 129 | |
vii
CONTENTS
Figures
| | | | | | | |
|
| 1.1 | | Unemployment, 2002 — 2010 | | | 4 | |
| | | | | | | |
| 2.1 | | GDP growth, selected countries and regions, 2010 — 2011 | | | 16 | |
| 2.2 | | Export volume growth, selected regions, 1980 — 2011 | | | 17 | |
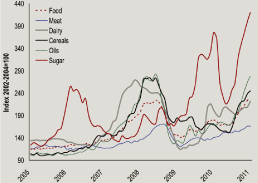
| 2.3 | | Gold, platinum, oil and food price trends, 2005 — 2011 | | | 22 | |
| 2.4 | | Export and import prices, 2005 — 2010 | | | 25 | |
| 2.5 | | Trade-weighted rand indices, 1994 — 2010 | | | 26 | |
| 2.6 | | Composition of GDP, selected countries, 2010 | | | 27 | |
| 2.7 | | Sector trends in fixed-capital formation, 2000 — 2010 | | | 28 | |
| 2.8 | | Manufacturing production, 2004 — 2010 | | | 29 | |
| 2.9 | | Formal sector non-agricultural employment, 2006 — 2010 | | | 32 | |
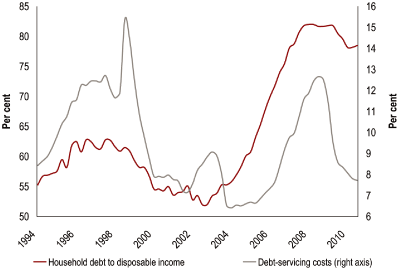
| 2.10 | | Debt-to-disposable-income and debt-service costs, 1994 — 2010 | | | 34 | |
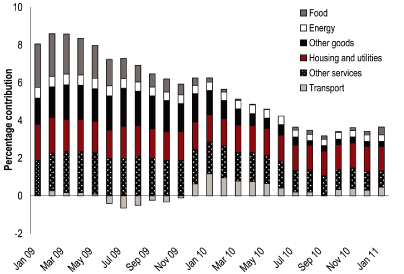
| 2.11 | | Contributions to CPI inflation, 2009 — 2010 | | | 35 | |
| | | | | | | |
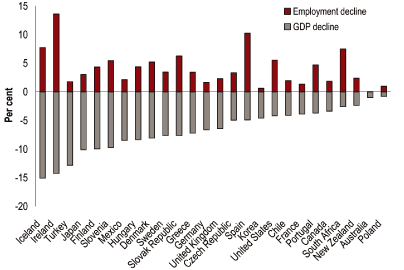
| 3.1 | | Peak-to-trough fall in output and employment, selected countries, 2007 — 2010 | | | 41 | |
| 3.2 | | Sector contributions to employment growth in selected economies, 2003 — 2007 | | | 44 | |
| 3.3 | | Labour productivity growth, 1990 — 2008 | | | 45 | |
| | | | | | | |
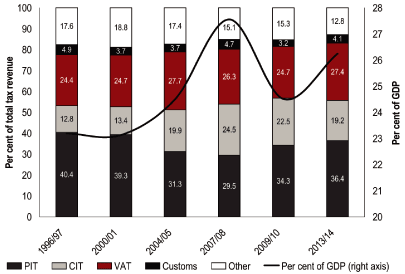
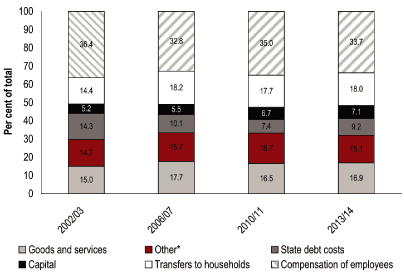
| 4.1 | | Structure of tax revenue 1996/97 — 2013/14 | | | 51 | |
| 4.2 | | Consolidated government expenditure | | | 53 | |
| 4.3 | | Structure of consolidated government expenditure, 2002/03 — 2013/14 | | | 54 | |
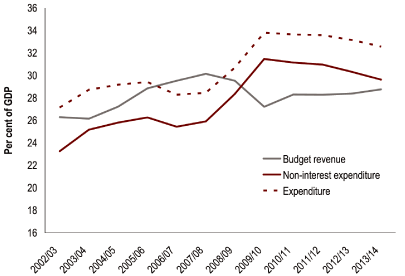
| 4.4 | | Revenue and expenditure, 2002/03 — 2013/14 | | | 58 | |
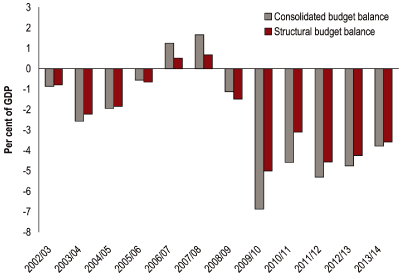
| 4.5 | | Budget balance and structural budget balance, 2002/03 — 2013/14 | | | 58 | |
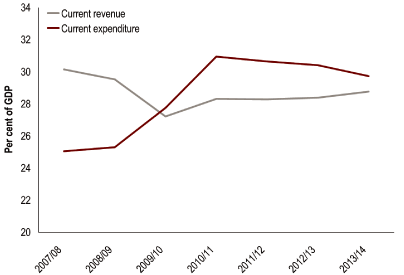
| 4.6 | | Current balance, 2007/08 — 2013/14 | | | 59 | |
| 4.7 | | Private, public and foreign savings, 1995 — 2009 | | | 59 | |
| | | | | | | |
| 6.1 | | Bond yields and net purchases by non-residents of bonds and equities, 2009 — 2011 | | | 81 | |
| 6.2 | | Domestic government bond ownership, 31 December 2010 | | | 82 | |
| 6.3 | | Turnover on domestic and international bond exchanges, 1995 — 2010 | | | 82 | |
| | | | | | | |
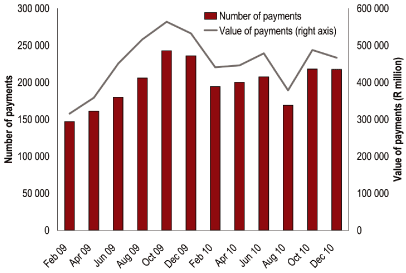
| 7.1 | | UIF payments and beneficiaries, 2009 — 2010 | | | 105 | |
| | | | | | | |
| 8.1 | | Structure of government accounts | | | 115 | |
viii
2011 BUDGET REVIEW
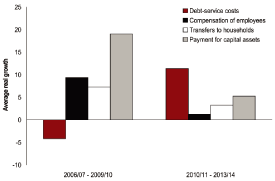
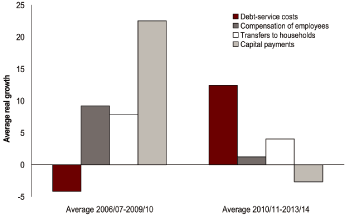
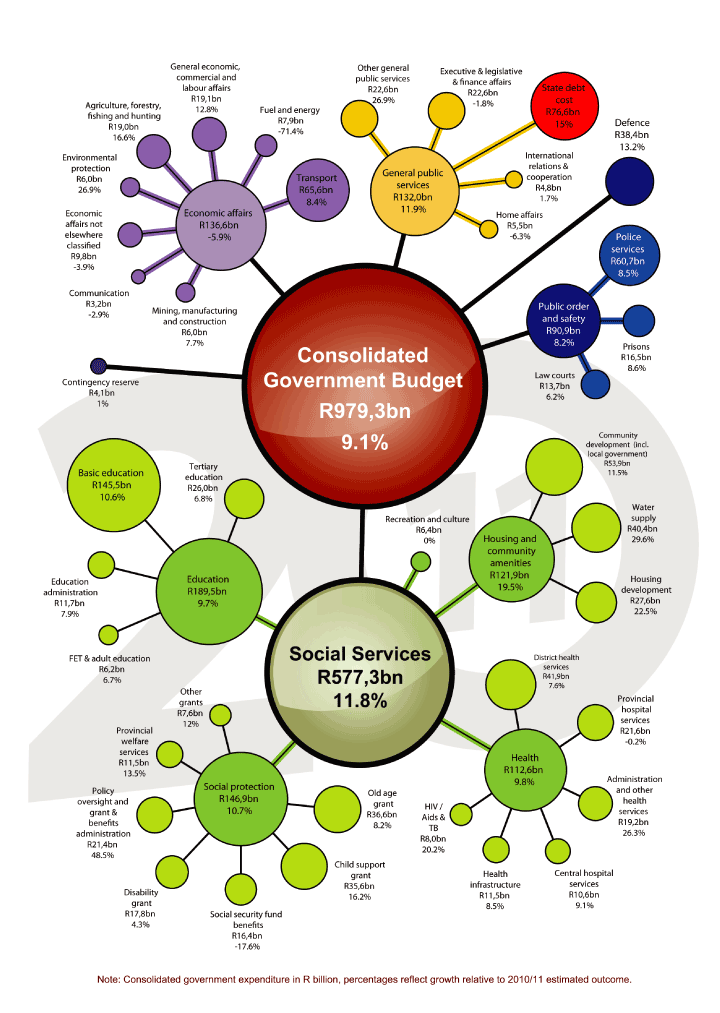
Note: Consolidated government expenditure in R billion, percentages reflect growth relative to 2010/11 estimated outcome.
ix
1
Inclusive growth and development
| | | |
▀ | | Introduction to the 2011 Budget |
South Africans want a faster pace of development and social progress
South Africans rightly want a faster pace of development and social progress. Though much has been done since 1994 to extend public services and dismantle barriers from the past, there is widespread frustration that poverty persists, inequality remains high and transformation is sluggish.
Worldwide discontent fuelled by inequality
Around the world there are related markers of discontent. The global financial crisis and subsequent recession have exposed vulnerabilities and structural imbalances in major economies. Income levels have diverged sharply in many countries. Anger over inequality has played a role in sparking social mobilisation in societies that have repressed dialogue and political participation for a generation. While rapid growth in leading emerging economies has raised living standards for many, it has heightened pressure on global resources. The international community confronts difficult questions about trade and financial flows, climate change, access to commodities, social mobility and remuneration trends.
Access to opportunity in South Africa is no longer cast rigidly along racial lines, but for poor communities the barriers to progress still seem insurmountable. Marginalised communities around the world now have access to advanced information technology and aspire to a better life, yet stable earning opportunities, income security and modern infrastructure amenities remain out of reach for hundreds of millions of people.
The New Growth Path
Every nation has to chart its own course
We are living through a sea change in the world economy, and every nation has to chart its own course. For South Africa to achieve a more inclusive and equitable economic future, rapid progress is needed on
1
2011 BUDGET REVIEW
several fronts. Government has set out five priorities: education, health care, fighting crime, rural development and creating jobs. These, in turn, are reflected in 12 outcomes adopted by Cabinet.
The Cabinet outcomes
| • | | High-quality basic education |
| |
| • | | Improved health and life expectancy |
| |
| • | | Greater public protection and safety |
| |
| • | | More rapid employment creation and inclusive growth |
| |
| • | | A skilled and capable workforce |
| |
| • | | Efficient economic infrastructure networks |
| |
| • | | Vibrant rural communities and food security |
| |
| • | | Sustainable human settlements and improved quality of household life |
| |
| • | | Responsive and accountable local government |
| |
| • | | Protection of environmental assets and natural resources |
| |
| • | | International cooperation for a better and safer world |
| |
| • | | A development-oriented public service and inclusive citizenship |
‘The creation of decent work is at the centre of our economic policies. We urge every sector and every business entity ... to focus on job creation’
— President Jacob Zuma
This wide-ranging programme has been translated into detailed delivery agreements and targets for national and provincial departments, agencies and municipalities. While these commitments address government’s broad mandate, the New Growth Path identifies a single encompassing objective of public policy: for the period ahead, employment creation will be the principal barometer of South Africa’s progress.
Job creation is an outcome of business investment and a thriving enterprise economy, as well as government activities and the regulatory environment. The New Growth Path will mobilise the public and private sectors to meet the goal of creating 5 million jobs over the decade ahead. The 2011 Budget sets out a series of proposals to accelerate job creation, including a youth employment subsidy and a Jobs Fund. Several complementary aspects are elaborated on in this Budget Review:
| • | | Education and skills development are the first priority in government expenditure allocations, boosted over the medium-term expenditure framework (MTEF) period through additional allocations for further education colleges, student financial assistance, school buildings and facilities, and learner support materials. |
| |
| • | | Investment in infrastructure of more than R800 billion is planned over the next three years. Building the power plants, ports, pipelines, roads, water and sanitation infrastructure that the country needs is central to economic growth. Improved maintenance of roads and other facilities is also critical, and will contribute significantly to job creation. |
| |
| • | | Social security reforms will be phased in over the period ahead. Proposals for alignment of social security arrangements and retirement savings arrangements will be tabled this year. Meanwhile, the 2011 Budget takes the first steps in implementing national health insurance (NHI) as part of the Minister of Health’s 10-point plan for restructuring public health. |
| |
| • | | In response to a request from Parliament, the National Treasury has prepared draft fiscal policy guidelines for consideration, based on the principles of stability over the business cycle, a sustainable public debt level and inter-generational fiscal equity. |
2
CHAPTER 1: INCLUSIVE GROWTH AND DEVELOPMENT
Highlights of the 2011 Budget
Towards inclusive growth and equitable development
| • | | South Africa’s New Growth Path aims to create 5 million jobs over the decade ahead |
| |
| • | | Education and skills development remain top priorities in government expenditure |
| |
| • | | Investment in infrastructure of over R800 billion over the next three years |
| |
| • | | Phased implementation of social security and national health insurance reform |
| |
| • | | Key fiscal policy guidelines: stability over the business cycle, sustainability and inter-generational equity |
Economic recovery and employment
| • | | Economic growth of 3.4% is projected for 2011, increasing to 4.4% by 2013 |
| |
| • | | Consumer price inflation fell from 7.1% in 2009 to 4.3% in 2010, and is expected to rise to 5.5% by 2013 |
| |
| • | | The current account deficit is projected to rise from 3.2% in 2010 to 5% in 2013 |
| |
| • | | 63 000 formal non-agricultural jobs were created between April and October 2010, and unemployment fell from 25.3% in the 3rd quarter to 24% in the 4th quarter |
| |
| • | | Job creation potential of 485 000 over the next three years in trade and construction sectors |
| |
| • | | Investment incentives for manufacturing, with a special focus on job creation |
| |
| • | | R9 billion Jobs Fund to co-finance employment initiatives with self-sustaining potential |
| |
| • | | Youth employment subsidy to create net 178 000 jobs over three years |
| |
| • | | Expansion of FET college and university enrolment, skills development and extension of learnership allowances proposed |
Fiscal framework
| • | | Additional R94.1 billion in government expenditure plans over the next three years |
| |
| • | | Budget deficit of 5.3% projected in 2010/11, 4.8% in 2011/12 and 3.8% in 2013/14 |
| |
| • | | National government net loan debt projected to rise from R526 billion at the end of 2008/09 to over R1.4 trillion in 2013/14 |
Tax proposals
| • | | Personal income tax relief of R8.1 billion |
| |
| • | | A third rebate for individuals 75 years and older |
| |
| • | | Conversion of medical tax deductions to tax credits |
| |
| • | | Transfer duty relief |
| |
| • | | General fuel levy increase of 10c a litre, and 8c a litre more for the Road Accident Fund |
| |
| • | | Increases of 4.5%-10.3% in taxes on alcohol and tobacco products |
| |
| • | | Taxation of gambling winnings |
Additions to spending plans over the next three years
| • | | R10 billion for job creation, small enterprise development, youth employment |
| |
| • | | R10.4 billion for public transport, roads and rail infrastructure |
| |
| • | | R9.5 billion to increase enrolment at further education colleges and promote skills development |
| |
| • | | R8.2 billion for upgrading school facilities and improved learner support materials |
| |
| • | | R7.9 billion to improve primary health care, revitalise hospitals and combat HIV and Aids |
| |
| • | | R7.2 billion for human settlement upgrading, municipal services and water infrastructure |
| |
| • | | R2.8 billion for rural development and emerging farmer support |
| |
| • | | R8.9 billion for social security benefits and social grants; old age and disability grants increase by R60 to R1 140 a month and a further R20 to R1 160 a month for those over the age of 75; the child support grant will increase to R260 in April and R270 in October |
| |
| • | | R1.8 billion for municipalities and provinces to deal with immediate disaster needs, and R600 million for post-recovery and reconstruction following the floods in early 2011. |
3
2011 BUDGET REVIEW
How will South Africa create jobs?
Recession reversed five years of employment gains
Between 2003 and 2008 South Africa made steady progress in reducing the unemployment rate, but these gains were reversed during the 2009 recession.
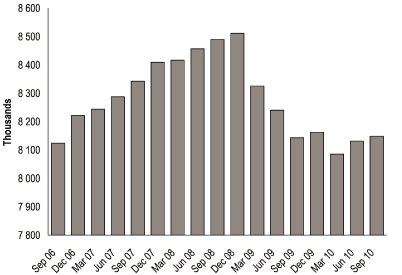
Figure 1.1 Unemployment, 2002 — 2010
| | |
| Source: Statistics South Africa |
Only two out of five South Africans have regular work
There are 13.1 million South Africans who have regular work — just 41 per cent of the working-age population. Of these, just over 8 million have formal, non-agricultural employment. To achieve the average emerging markets employment ratio of 56 per cent, and taking into account population growth, South Africa would have to create 9 million jobs over the next 10 years. The unemployment rate is particularly high for young people. Half of the population between 18 and 25 is unemployed.
Economic growth is the principal driver of employment creation. National Treasury projections suggest that economic expansion of 4 per cent a year over the next three years would generate about 900 000 jobs, mainly in the trade, construction and business services sectors.
Sustainable growth depends on improved industrial and trade performance
But sustainable growth depends on improved industrial and trade performance — strengthening those sectors in which South Africa has competitive potential in global markets. Chapter 2 illustrates how South Africa’s economic outlook is linked to global performance — higher commodity prices assist in sustaining export earnings, and in turn contribute to investment in mining and agricultural capacity. Further regulatory certainty needs to be created in the mining sector, and investment in commercial agriculture also depends on certainty of marketing arrangements and land rights.
Over the period ahead, a more stable and competitive currency is expected to enhance industrial competitiveness. Yet a weaker rand can only contribute so much. If South African industry and exports are to grow more rapidly, skills development, technology modernisation, and effective logistics investments are necessary building blocks of sectoral growth strategies.
4
CHAPTER 1: INCLUSIVE GROWTH AND DEVELOPMENT
Government is taking steps to ensure that the growth path is more inclusive
Steps are also required to ensure that the growth path is more inclusive. As South Africa’s labour capacity is also its most underutilised productive resource, well-targeted initiatives focused on job creation will also contribute over time to enhancing the economy’s growth capacity. Over the next three years, key employment initiatives will include the following:
| • | | Investment in further education and training (FET) colleges — expansion of enrolment, curricular improvements and improved access to student financial assistance |
| |
| • | | Stepped-up training for work-seekers under the auspices of Sector Education and Training Authorities and the National Skills Fund |
| |
| • | | Expansion of public works programme activities, including community-based projects, and maintenance of roads and infrastructure |
| |
| • | | Renewed tax incentives for manufacturing investment, with a focus on job-creation potential |
| |
| • | | Increased investment in housing, and residential infrastructure and services |
| |
| • | | Small enterprise development initiatives, including consolidated small business finance support and a focus on employment activation by the National Youth Development Agency |
| |
| • | | A youth employment subsidy, implemented through the tax system |
| |
| • | | A Jobs Fund to co-finance innovative public- and private-sector employment projects |
| |
| • | | Initiatives to promote rural employment, and stepped up support for agricultural producers, particularly emerging farmers |
| |
| • | | Support for renewable energy, environmental protection and “green” economy initiatives. |
Employment — especially for youth — must be at the centre of economic development
For many years ahead, employment will have to be at the centre of South Africa’s growth and development path — especially the creation of work and learning opportunities for young people. But the aim is not jobs for the sake of employment alone. South Africa’s New Growth Path is about job creation that forms part of a broad framework for improving living conditions, greater social cohesion, a competitive and dynamic economy — and a more equal and inclusive society. Alongside job-creation initiatives, steps are therefore under way to improve income security and social protection of employees, and to construct an NHI system.
These are long-term objectives, yet they must proceed with vigour. Success rests on stronger economic growth, effective implementation, and sound fiscal and financial management of the economy.
| | | |
▀ | | Social and economic progress: key indicators |
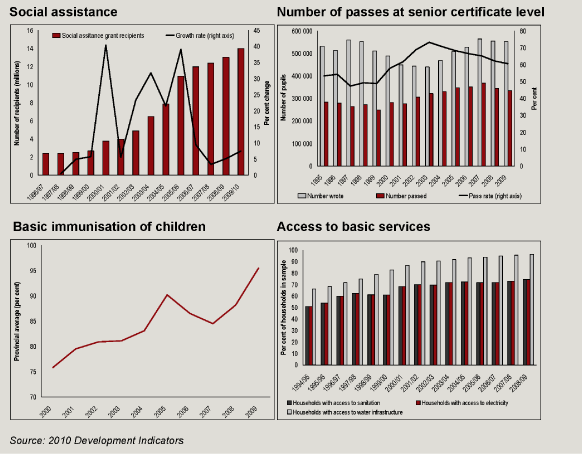
The 2010 Development Indicators, issued by the Presidency, provides a wide-ranging gauge of South Africa’s social and economic progress. Though the 2009 recession brought significant setbacks in economic performance and employment, the Indicators show steady improvements over the past decade in most of the 10 categories measured.
5
2011 BUDGET REVIEW
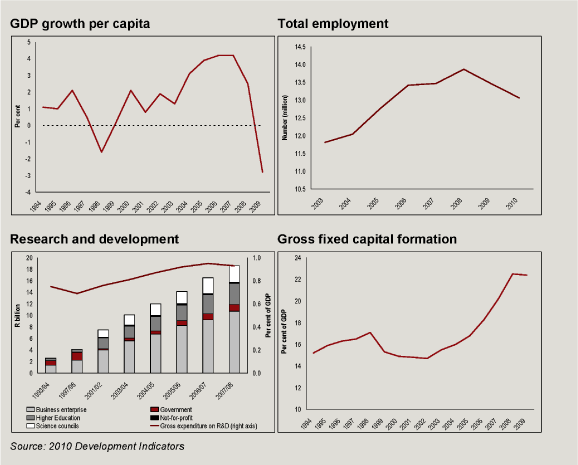
| • | | In the Economic growth and transformation category, real per capita GDP growth was negative in 2009 for the first time in 10 years, and gross fixed capital formation declined as a percentage of GDP after seven years of strong growth. Government debt has declined from nearly 50 per cent of GDP in the late 1990s to 28 per cent in 2009/10. Expenditure on research and development has improved. The percentage of senior managers who are black or female has increased. |
| |
| • | | Under Employment, the severity of the 2009 recession is evident, with nearly half of the jobs gained between 2003 and 2008 lost between December 2008 and June 2010. |
| |
| • | | There is mixed progress in Poverty and inequality. Real income and poverty headcount indicators show improvements in living standards of the poor, explained in part by rising social grants transfers. The percentage of the population below a poverty line of R283 per month per person (2008 prices) fell from 38 per cent in 2000 to 22 per cent in 2008. Inequality between black and white South Africans has narrowed, but overall inequality remains high and may have widened. |
| |
| | | Under Housing assets, it is recorded that nearly 3 million housing units have been financed by the Department of Human Settlements and its predecessor since 1994. The percentage of households in formal dwellings has increased from an estimated 64 per cent in 1996 to |
6
CHAPTER 1: INCLUSIVE GROWTH AND DEVELOPMENT
| | | 76 per cent in 2009. Access to clean water, electricity and sanitation has improved. Progress in land redistribution lags well behind targets. |
| |
| • | | Health shows significant gains in several indicators and deterioration in others. Child mortality and malnutrition have fallen and immunisation coverage has improved to over 95 per cent of children. HIV prevalence appears to have stabilised. The incidence of malaria has decreased. A steep rise in maternal mortality is evident, associated with HIV/Aids- related infections, hypertension and obstetric haemorrhage. |
| |
| • | | Education — the learner-educator ratio in public ordinary schools has declined from 34 in 1999 to 31 in 2009, gender equity has been achieved in both primary and secondary schooling, and adult literacy has improved from under 70 per cent in 1998 to 76 per cent in 2008. Measures of language and numeracy achievement in grades 3 and 6, and senior certificate mathematics performance, indicate significant shortcomings in the quality of schooling. |
| |
| • | | Indicators of Social cohesion suggest that there has been some deterioration in voter participation. South Africans are broadly confident in the future and are positive about race relations, though both measures have deteriorated somewhat since 2005. |
| |
| • | | Safety and security indicators show general reductions in the incidence of crime since 2002, with the exception of aggravated robberies. The court conviction rate has increased from 82 per cent in 2002/03 to 89 per cent in 2009/10. |
7
2011 BUDGET REVIEW
| • | | Indicators of progress in International relations include positive real GDP growth in sub-Saharan Africa, growth in the contribution of tourism to the economy and an increased number of diplomatic missions abroad. The number of democratic governments in Africa rose steadily between 1991 and 2006, but has since declined. |
| |
| • | | Indicators of Good governance include growth in the size of the income tax register from just over 3 million in 1996/97 to about 8 million today, and some improvement in provincial and local government financial management evidenced in audit reports. Public opinion on the delivery of basic services has deteriorated since 2004. |
Measures of development now reflected in ministerial and departmental performance agreements
The Department of Performance Monitoring and Evaluation will bring greater rigour and consistency to the measurement of service delivery, and identify corrective steps where needed.
| | | |
▀ | | Summary of the 2011 Budget Review |
Economic outlook and employment
China, India and Brazil are driving global growth
A recovery in the global economy is well under way, driven by strong growth in China, India, Brazil and other emerging economies. The South African economy is benefitting from resulting growth in trade and buoyant commodity prices. GDP growth is projected to be 3.4 per cent in 2011, rising to 4.4 per cent in 2013.
8
CHAPTER 1: INCLUSIVE GROWTH AND DEVELOPMENT
Table 1.1 Macroeconomic outlook — summary
| | | | | | | | | | | | | | | | | | |
| Real growth | | 2010 | | | 2011 | | 2012 | | 2013 |
| Percentage | | Estimate | | | | | Forecast | | |
| | | | |
| Household consumption | | | 4.6 | | | | | 4.2 | | | | 4.3 | | | | 4.5 | |
| Capital formation | | | -3.6 | | | | | 3.9 | | | | 5.5 | | | | 6.8 | |
| Exports | | | 5.3 | | | | | 6.0 | | | | 6.4 | | | | 7.3 | |
| Imports | | | 10.4 | | | | | 8.5 | | | | 7.0 | | | | 7.4 | |
Gross domestic product | | | 2.7 | | | | | 3.4 | | | | 4.1 | | | | 4.4 | |
| | | | |
| Consumer price inflation (CPI) | | | 4.3 | | | | | 4.9 | | | | 5.2 | | | | 5.5 | |
| | | | |
| Balance of payments current account (percentage of GDP) | | | -3.2 | | | | | -4.2 | | | | -4.9 | | | | -5.0 | |
| | | | |
Fiscal and monetary policies support higher growth
Chapter 2 explains how South Africa’s economic recovery has progressed, and reviews developments in the balance of payments and sectoral output trends. Macroeconomic and fiscal policy aims to support stronger economic growth. Spending will be directed towards core social priorities and economic infrastructure. Interest rates have fallen and inflation has moderated, which should support growth in household consumption. Business confidence and private fixed-capital formation have also improved in recent months.
The rand strengthened in 2010 but the exchange rate weakened in early 2011 in response to global capital movements and South Africa’s accumulation of foreign exchange reserves. The weaker rand will boost exports, as long as inflation remains in check.
New Growth Path targets infrastructure, construction, and greater economic efficiency
Government’s New Growth Path includes policies to accelerate growth and employment, focusing on job-creation targets and sector-based initiatives. Jobs drivers include substantial public investment in infrastructure, expansion of labour-absorbing sectors such as agriculture and light manufacturing, “green economy” initiatives and support for rural development — and improving efficiency across the economy This emphasis on jobs is the cornerstone of the government’s policies. Even though the economic recovery has led to an improvement in South Africa’s labour market following the sharp fall in employment in 2009 and early 2010, unemployment remains at critical levels.
Government needs to partner with the private sector, which creates most jobs
As Chapter 3 indicates, job creation around the world has lagged behind the economic recovery over the past year. Long-term joblessness has increased and youth unemployment has risen. These problems are especially severe in South Africa. As a result, the government is focused on creating millions of jobs and bringing more people into economic activity. Achieving large-scale job creation and a sustained reduction in employment will require greater cooperation between the public sector and the private sector — where most job creation takes place.
The fiscal framework
South Africa is committed to a sustainable fiscal path
Chapter 4 discusses fiscal policy and changes to the budget framework. Fiscal policy is the management of revenue, expenditure and debt in the context of a dynamic economic environment. By defining a sustainable fiscal path, government is able to pay for existing programmes without jeopardising the affordability of government services and policies.
9
2011 BUDGET REVIEW
The deficit will narrow from 5.3 per cent in 2010/11 to 3.8 per cent in 2013/14
Government’s share of GDP rose from 28.5 per cent in 2007/08 to 33.8 per cent in 2009/10. Growth in spending is expected to moderate over the medium term, bringing government’s expenditure ratio to GDP down to 32.6 by 2013/14. As the economic recovery gathers pace, budget revenue is expected to recover from 27.2 per cent of GDP in 2009/10 to 28.8 per cent by 2013/14. This means the deficit will narrow from 5.3 per cent in 2010/11 to 3.8 per cent by the end of the period.
Table 1.2 Consolidated government fiscal framework
| | | | | | | | | | | | | | | | | | |
| | | 2010/11 | | | | | | | |
| | | Revised | | | 2011/12 | | 2012/13 | | 2013/14 |
| R million | | estimate | | | Medium-term estimates |
| | | | |
Revenue | | | 755.0 | | | | | 824.5 | | | | 908.7 | | | | 1 017.2 | |
Percentage of GDP | | | 28.3 | % | | | | 28.3 | % | | | 28.4 | % | | | 28.8 | % |
Expenditure | | | 897.4 | | | | | 979.3 | | | | 1 061.6 | | | | 1 151.8 | |
Percentage of GDP | | | 33.6 | % | | | | 33.6 | % | | | 33.2 | % | | | 32.6 | % |
Budget balance | | | -142.4 | | | | | -154.8 | | | | -152.9 | | | | -134.6 | |
Percentage of GDP | | | -5.3 | % | | | | -5.3 | % | | | -4.8 | % | | | -3.8 | % |
| | | | |
Gross domestic product | | | 2 666.9 | | | | | 2 914.9 | | | | 3 201.3 | | | | 3 536.0 | |
| | | | |
Public-sector infrastructure expenditure to total R808.6 billion over next three years
Infrastructure expenditure by the public sector is projected to total R808.6 billion over the next three years. Eskom’s expansion of power generation capacity is responsible for much of this amount, alongside investment in ports and transport infrastructure by Transnet and other non-financial public enterprises. Over the MTEF period capital investment expenditure by the public sector will average 8.4 per cent of GDP.
The public-sector borrowing requirement is estimated at 10.5 per cent of GDP in 2010/11, and will moderate to 6.3 per cent by 2013/14. This includes financing for the major capital spending projects of state-owned enterprises and municipalities.
Fiscal guidelines to support sustainable public finances well into the future
In response to a request from Parliament, the National Treasury has developed a set of draft fiscal guidelines for discussion. The guidelines propose that government adopt an annual target for the structural budget balance consistent with long-term growth, the desired level of public debt and inter-generational considerations, and make explicit the costs of existing and new programmes that require expenditure commitments over the long term.
Tax policy
Tax revenues have begun to improve in line with economic growth
Chapter 5 discusses tax policy and proposals. Tax revenues have improved in 2010/11 in line with the economic recovery and are expected to grow steadily over the medium term. Recent data suggest a strong recovery in customs duties and value-added tax (VAT) revenues during 2010/11, while the recovery in corporate income tax revenue has been slower to respond owing to the lagged effects of the recession.
10
CHAPTER 1: INCLUSIVE GROWTH AND DEVELOPMENT
Table 1.3 Summary of tax proposals
| | | | | | | | | | | | | | |
| | | 2010/11 | | | 2011/12 |
| | | Budget | | Revised | | | Budget |
| R billion | | estimate | | estimate | | | estimate |
| | | | |
| Tax revenue (gross) | | | 647.9 | | | | 672.2 | | | | | 745.7 | |
| Non-tax revenue | | | 10.4 | | | | 12.3 | | | | | 10.0 | |
| Less: SACU payments | | | -15.0 | | | | -15.0 | | | | | -21.8 | |
Other adjustments1 | | | — | | | | -2.9 | | | | | — | |
| | | | |
Total revenue | | | 643.2 | | | | 666.6 | | | | | | |
Revenue before tax proposals | | | | | | | | | | | | 734.0 | |
| | | | |
Tax proposals | | | | | | | | | | | | -4.1 | |
| (Net) personal income tax relief | | | | | | | | | | | | -8.9 | |
| Business taxes | | | | | | | | | | | | 0.5 | |
| Taxes on property | | | | | | | | | | | | -0.8 | |
| Taxes on goods and services | | | | | | | | | | | | 5.0 | |
Revenue after tax proposals | | | | | | | | | | | | 729.9 | |
| | | | |
| | |
| 1. | | Payments to SACU partners in respect of a previous error in calculation of the 1969 agreement. |
Businesses to receive tax breaks to support skills development and job creation
The 2011 Budget tax proposals are intended to broaden the tax base. Various loopholes will be closed and tax equity will be improved by reforming the treatment of medical expenses and contributions to retirement funds. The secondary tax on companies is to be abolished and a new dividends tax will be introduced. Businesses will receive incentives to support skills development and job creation. Levies on fuel and taxes on alcohol and tobacco products will be raised.
Financing national health insurance will require adjustments to tax structure
Over the medium to long term, the revenue requirements of the NHI system will require upward adjustments in the tax structure. Increases in VAT, payroll taxes and a surcharge on the personal income tax base are financing options under consideration.
Government borrowing
Chapter 6 discusses government’s debt management and borrowing strategy. South Africa’s countercyclical response to the economic crisis generated a significant national government borrowing requirement, which peaked at 6.8 per cent of GDP in 2009/10. However, sound economic and fiscal policies, deep and liquid domestic capital markets, and the availability of international funding enabled government to finance the 2010/11 budget deficit at a lower cost than originally projected.
Table 1.4 Projected state debt and debt costs
| | | | | | | | | | | | | | | | | | | | | | |
| R billion | | 2010/11 | | | 2011/12 | | 2012/13 | | 2013/14 | | | | |
| | | | | | | | |
Net loan debt | | | 822.4 | | | | | 998.8 | | | | 1 199.7 | | | | 1 388.3 | | | | | |
Percentage of GDP | | | 30.8 | % | | | | 34.3 | % | | | 37.5 | % | | | 39.3 | % | | | | |
| Net domestic debt | | | 784.3 | | | | | 970.6 | | | | 1 148.0 | | | | 1 313.1 | | | | | |
| Foreign debt | | | 38.1 | | | | | 28.2 | | | | 51.7 | | | | 75.2 | | | | | |
| | | | |
State debt cost | | | 66.6 | | | | | 76.6 | | | | 90.8 | | | | 104.0 | | | | | |
Percentage of GDP | | | 2.5 | % | | | | 2.6 | % | | | 2.8 | % | | | 2.9 | % | | | | |
| | | | |
11
2011 BUDGET REVIEW
Debt-service costs are R4.8 billion lower than expected in 2010/11
As a result, debt-service costs for 2010/11 are R4.8 billion lower than expected. Lower debt-service costs create more space to fund investment in economic infrastructure, which creates jobs, and to increase spending on social priorities such as education and health. While the gap between expenditure and revenue is projected to narrow in line with the economic recovery, national government borrowing in the current year remains substantial at 5.4 per cent of GDP, declining to 4.2 per cent of GDP in 2013/14. Debt-service costs are expected to increase gradually to 2.9 per cent of GDP in 2013/14.
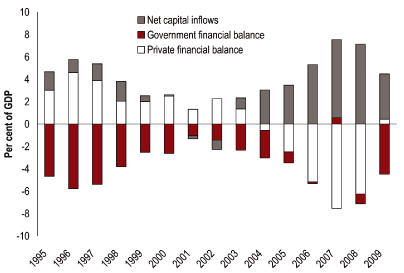
South Africa and other emerging markets experienced a surge of global capital flows in 2010
During 2010, emerging markets experienced a surge of global capital flows. South Africa attracted net inflows of R92 billion into bonds and equities from non-resident investors, whose holdings of government bonds grew by 58 per cent. Government has continued to support the Reserve Bank’s accumulation of foreign exchange reserves, moderating the impact of capital flows on the exchange rate and reducing the external vulnerability of the economy. In 2010, official foreign exchange reserves rose by US$3.7 billion.
Social security and health finance
Social security is part of the social wage, and plays a crucial role in alleviating poverty and supporting retrenched workers
Chapter 7 reviews the role of the social security system in providing income support for retrenched workers and helping to alleviate poverty. In 2010/11 the number of people receiving social grants will exceed 15 million people. This figure will rise in coming years due to the extension of the child support grant and an increase in the means test threshold for certain grants.
South Africa’s social security arrangements are being reformed to increase efficiency, improve service delivery and ensure effective use of funds. The consolidation of administrative capacity across social security entities is a key part of this process, and will lead to significant savings. Coordinated policy-making across these entities will also help to make their programmes more effective.
While there are considerable institutional challenges to social security reform, significant progress has been made this year in developing alternative arrangements to replace the costly and inequitable Road Accident Fund with a no-fault scheme. The Unemployment Insurance Fund has already demonstrated the benefits of effective reforms.
Government begins to roll out NHI as part of implementing the 10-point plan for public health
This year will also witness the first stages of NHI, and further steps in implementing the 10-point programme for improving health services. Money is set aside in this budget for investment in revitalised public health facilities, improved quality of care, family health teams and tighter monitoring and regulation of health services. Cost implications and financing arrangements for NHI are under review.
Medium-term expenditure and the division of revenue
Chapter 8 presents government’s spending priorities over the medium term and the division of nationally raised revenue.
South Africa has made progress in raising living standards over the past decade, yet the quality of public services too often falls short of
12
CHAPTER 1: INCLUSIVE GROWTH AND DEVELOPMENT
expectations, and increased expenditure has not always been matched by a commensurate improvement in services.
Budget channels resources to improve frontline services
Chapter 8 outlines initiatives aimed at addressing inefficiencies in the public sector, while targeting resources to improve the effectiveness of frontline services. It is noted that improved maintenance of infrastructure and capital spending needs to be prioritised alongside growth in the public service and improvements in conditions of service. Management of the public-sector wage bill is a key element in ensuring a balanced and well-targeted government expenditure framework.
The 2011 Budget is aligned to the objectives of the New Growth Path, to bolster economic growth, create jobs and promote equity. Over the next three years, spending is targeted to bring about higher rates of growth and development, with priority given to job creation, education and skills, health, infrastructure and rural development.
Table 1.5 Division of revenue
| | | | | | | | | | | | | | | | | | |
| R billion | | 2010/11 | | | 2011/12 | | 2012/13 | | 2013/14 |
| | | | |
| National allocations | | | 359.1 | | | | | 380.2 | | | | 408.4 | | | | 439.0 | |
| Provincial allocations | | | 323.1 | | | | | 357.9 | | | | 380.4 | | | | 404.3 | |
Equitable share | | | 265.1 | | | | | 288.5 | | | | 305.7 | | | | 323.6 | |
Conditional grants | | | 57.9 | | | | | 69.4 | | | | 74.7 | | | | 80.6 | |
| Local government allocations | | | 61.2 | | | | | 70.2 | | | | 77.0 | | | | 82.3 | |
| | | | |
Total allocations | | | 743.4 | | | | | 808.3 | | | | 865.9 | | | | 925.6 | |
| | | | |
Changes to baseline | | | | | | | | | | | | | | | | | |
| National allocations | | | — | | | | | 9.9 | | | | 14.7 | | | | 24.2 | |
| Provincial allocations | | | 2.4 | | | | | 9.5 | | | | 13.4 | | | | 17.3 | |
Equitable share | | | 4.2 | | | | | 7.8 | | | | 10.3 | | | | 12.0 | |
Conditional grants | | | -1.8 | | | | | 1.7 | | | | 3.1 | | | | 5.3 | |
| Local government allocations | | | 0.2 | | | | | 1.3 | | | | 1.5 | | | | 2.3 | |
| | | | |
Total | | | 2.6 | | | | | 20.7 | | | | 29.6 | | | | 43.8 | |
| | | | |
2011 Budget provides R743.4 billion to be shared between national, provincial and local government in 2011/12
After setting aside debt-service costs and a contingency reserve, the 2011 Budget provides for R743.4 billion to be shared between national, provincial and local government in 2011/12. The division of nationally raised revenue over the period ahead provides for strong growth in provincial and local government allocations, in support of education, health services, housing and community infrastructure.
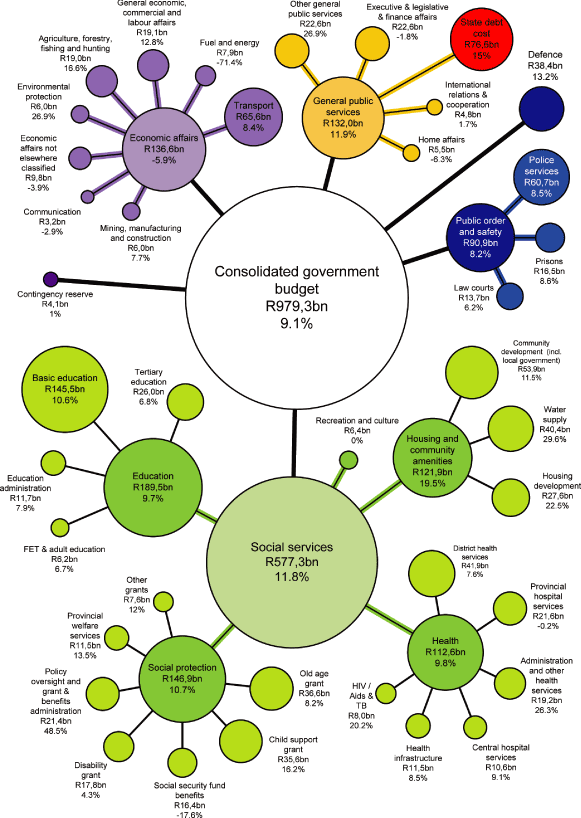
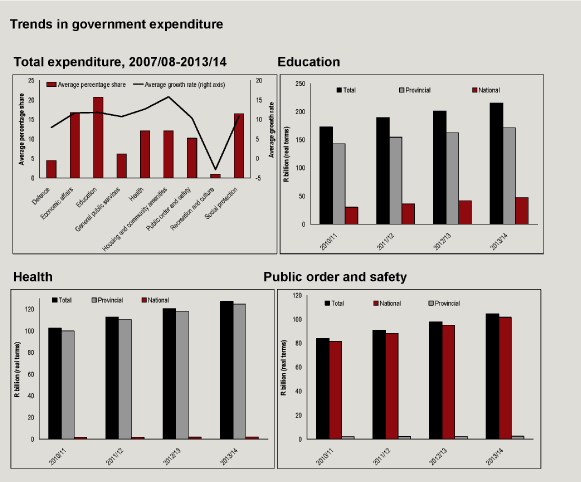
Estimated consolidated government expenditure, including provincial departments, social security funds and public entities, amounts to R979.3 billion in 2011/12, of which R76.6 billion goes to debt-service costs. Excluding the interest bill, general public services, housing and community amenities and environmental protection are the fastest-growing categories of expenditure over the MTEF period ahead.
Government’s outcomes approach lays the basis for achieving greater efficiency in public services, providing a platform for increased scrutiny of state programmes and measuring performance by results. The Department of Performance Monitoring and Evaluation will oversee reporting of progress against the agreed outputs and targets. This approach requires closer cooperation between national, provincial and local government, and with all agencies responsible for delivery of key services.
13
2011 BUDGET REVIEW
Table 1.6 Consolidated expenditure by function
| | | | | | | | | | | | | | |
| | | | | | | | | | | | % Average |
| | | 2010/11 | | 2011/12 | | | growth |
| | | Revised | | Budget | | | 2010/11 — |
| R billion | | estimate | | estimate | | | 2013/14 |
| | | | |
| General public services | | | 51.3 | | | | 55.4 | | | | | 5.8 | % |
| Defence | | | 34.0 | | | | 38.4 | | | | | 8.9 | % |
| Public order and safety | | | 84.0 | | | | 90.9 | | | | | 7.5 | % |
| Economic affairs | | | 140.3 | | | | 130.5 | | | | | 2.1 | % |
| Environmental protection | | | 4.7 | | | | 6.0 | | | | | 9.1 | % |
| Housing and community amenities | | | 102.1 | | | | 121.9 | | | | | 10.7 | % |
| Health | | | 102.5 | | | | 112.6 | | | | | 7.5 | % |
| Recreation and culture | | | 6.4 | | | | 6.4 | | | | | 2.9 | % |
| Education | | | 172.7 | | | | 189.5 | | | | | 7.6 | % |
| Social protection | | | 132.8 | | | | 146.9 | | | | | 9.0 | % |
| Contingency reserve | | | — | | | | 4.1 | | | | | | |
| | | | |
Non-interest expenditure | | | 830.8 | | | | 902.7 | | | | | 7.2 | % |
| State debt cost | | | 66.6 | | | | 76.6 | | | | | 16.0 | % |
| | | | |
Total expenditure | | | 897.4 | | | | 979.3 | | | | | 8.7 | % |
| | | | |
The printed Budget Review includes several annexures:
| • | | A: Report of the Minister of Finance to Parliament |
| |
| • | | B: Statistical tables |
| |
| • | | C: Miscellaneous tax amendments |
| |
| • | | D: Budget summary |
| |
| • | | E: Glossary |
Two further annexures are available on the National Treasury website:
| • | | W1: Explanatory memorandum to the division of revenue |
| |
| • | | W2: Structure of the government accounts |
The Budget Review accompanies several other documents and submissions tabled in Parliament on Budget Day. These include:
| • | | The Budget Speech |
| |
| • | | The Division of Revenue Bill |
| |
| • | | The Appropriation Bill |
| |
| • | | Estimates of National Expenditure |
| |
| • | | The People’s Guide to the Budget. |
| |
| • | | Response of the National Treasury to the Budgetary Review and Recommendation Reports of the Portfolio Committees. |
Two other documents are being released on Budget Day: A policy document entitled A Safer Financial Sector to Serve South Africa Better and a discussion document entitled Confronting Youth Unemployment: Policy Options for South Africa.
These and other fiscal and financial publications are available at www.treasury.gov.za.
14
2
Economic policy and outlook
n Overview
The global economy is strengthening, and South African GDP growth is expected to reach 3.4 per cent in 2011
Economic prospects continue to improve in the wake of “the great recession”. Dynamic emerging economies, particularly China, India and Brazil, have fuelled global growth. The South African economy is expected to recover gradually over the medium term, with projected gross domestic product (GDP) growth of 3.4 per cent in 2011, rising to 4.4 per cent in 2013. Fiscal and monetary policies remain supportive of the recovery. Spending is focused on core social priorities and economic infrastructure, and interest rates remain low. The New Growth Path will support economic and employment growth.
Domestic economic activity has gathered pace in recent months, with a pickup in business confidence and private-sector fixed-capital formation. The rate of unemployment has started to decline. Demand for labour, however, is only expected to grow moderately, and it will be some time before employment levels recover from the loss of 1 million jobs during 2009 and 2010.
Government continues to monitor the effect of capital flows on the rand
If the rand continues to depreciate and is sustained at a more competitive level — and if inflation remains in check — a stronger recovery in South African industry and exports can be expected. The National Treasury has studied measures used to offset the impact of capital inflows on currencies internationally, and analysed their effectiveness and appropriateness. Government will continue to monitor the effects of capital flows.
Opportunities for South Africa in the changing world economy
The financial crisis in developed countries accelerated the shift in world manufacturing, trade and investment that had been under way for some time. Up until the turn of the century, advanced economies accounted for
15
2011 BUDGET REVIEW
about 80 per cent of global output. The emergence of China and other fast-growing countries as major sources of economic growth has led the International Monetary Fund (IMF) to forecast that by 2015, developing countries will account for two-fifths of world economic output. This sea change in the world economy heralds an array of new opportunities and risks for South Africa, and for the African continent as a whole.
Figure 2.1 GDP growth, selected countries and regions, 2010 — 2011
| | |
| Source: International Monetary Fund (IMF), National Treasury forecasts for South Africa |
Risks to the global outlook include a weak recovery in advanced economies and higher inflation in developing countries
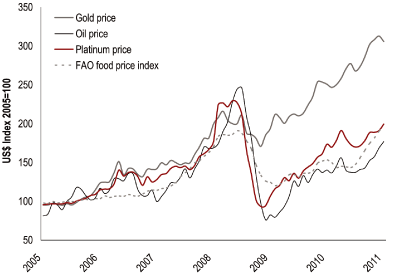
South Africa’s economic prospects are highly dependent on global trade and investment patterns, and risks to the global outlook must be considered. These risks include the anaemic recovery in many advanced economies and the possibility of sovereign debt contagion in Europe. In emerging markets, stronger growth has resulted in higher inflation from rising food and oil prices, which threaten renewed social tension in some regions, and the possibility of tighter monetary policies.
Notwithstanding these concerns, the strengthening global recovery provides important growth opportunities for the South African economy over the medium term. The capital infrastructure programme offers significant potential for job creation, as do services and construction. Commodity exporters continue to benefit from high prices. Taking advantage of these opportunities is essential to realise progress on the ambitious job-creation targets set out in government’s New Growth Path.
The unwinding of global imbalances presents South Africa and the region with opportunities to expand
Over the longer term, the unwinding of global imbalances is expected to result in more competitively priced imported capital inputs from advanced economies. Currency appreciation and rising price levels in Asia should also support higher exports by South African producers. As retooling and industrial expansion become more affordable, and as locally produced goods become more competitive, South African and African businesses can expand their market reach. Such long-term industrial possibilities can be realised with more focused efforts to promote economic growth, draw more people into economic activity, and pursue regional and global economic integration.
16
CHAPTER 2: ECONOMIC POLICY AND OUTLOOK
BRICS: a gateway to dynamic emerging markets
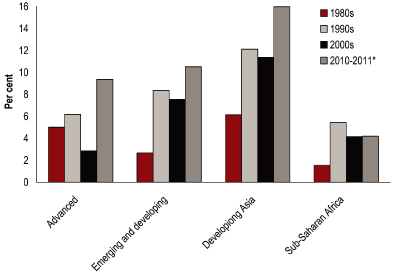
South Africa’s participation in BRICS (Brazil, Russia, India, China and South Africa) will give local firms expanded access to fast-growing markets and investment opportunities, and strengthen beneficial trade links for the African continent. Economic expansion in Africa has been robust and durable, with sub-Saharan Africa growing by a cumulative 74 per cent since 2000.
The primary opportunity facing South Africa is to advance the transition to an inclusive, diversified economy by encouraging a virtuous cycle of savings and investment, economic participation and sustainable job creation, infrastructure development and skills upgrading.
Figure 2.2 Export volume growth, selected regions, 1980 — 2011
| | |
| Source: IMF. * 2010-2011 are estimates. |
The New Growth Path and job creation
New Growth Path aims to create 5 million jobs over the next decade
The New Growth Path outlines an approach to accelerate growth and employment, focusing on job-creation targets and sector-based actions that will help to achieve them. Jobs drivers are identified as:
| • | | Continuing public investment in infrastructure, creating employment directly in construction, operation, maintenance and the production of inputs, and indirectly by improving efficiency across the economy. |
| |
| • | | Targeting more labour-absorbing activities in the agricultural and mining value chains, manufacturing, construction and services. |
| |
| • | | Promoting innovation through “green economy” initiatives. |
| |
| • | | Supporting rural development and regional integration. |
Sound macroeconomic policy enables South Africa to fund social and economic priorities
Prudent macroeconomic policy that takes into account global volatility and the need to sustain growth will support the New Growth Path. While many countries are tightening their fiscal belts, South Africa’s macroeconomic approach affords government the space to grow expenditure at a moderate pace to support social and economic priorities. Public spending in support of social programmes has been strong and, if combined with more rapid job creation, will significantly increase inclusion and income equality.
17
2011 BUDGET REVIEW
Over the period ahead, fiscal and monetary policy will work together in a countercyclical fashion to keep inflation and interest rates at low and stable levels, and to reduce the cost of capital. This will support a stable and competitive real exchange rate, foster greater competitiveness and create an environment conducive for investment, growth and employment.
Rebalancing the world economy
Leading up to the global financial crisis, the world economy was marked by growing imbalances, principally those between countries running large current account surpluses (China, Japan and Germany) and those with large deficits (the United States, Spain, United Kingdom and Australia).
These imbalances arose from an overreliance on US consumption patterns and China’s export model, large-scale international reserve accumulation, lax banking regulation and ballooning asset bubbles in the US and several European countries.
To achieve more balanced and sustainable global growth, traditional patterns of investment, consumption and savings need to change. Countries running large deficits need to promote higher savings and rely less on credit-fuelled consumption, and countries with large surpluses need to encourage the growth of their domestic markets. The growing weight of developing countries in world trade is contributing to the rebalancing that is already under way.
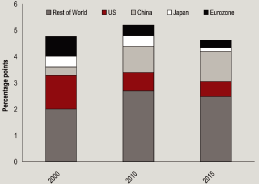
Brazil, Russia, India, China and South Africa
Over the next five years, the BRICS economies are expected to account for 36 per cent of world economic growth, increasing their combined share of global GDP to about 22 per cent, equivalent to that of the US. In December 2010, partly in recognition of its role as a gateway to the African continent, South Africa was invited to join this grouping, providing new opportunities for trade and investment.
Ranking and % share of global GDP, 2000 — 2015
| | | | | | | | | | | | | | | | | |
| 2000 | | 2010 | | 2015 |
| | | | | |
| 1 United States | | | 31.0 | % | | 1 United States | | | 23.6 | % | | 1 United States | | | 22.0 | % |
| 2 Japan | | | 14.5 | % | | 2 China | | | 9.3 | % | | 2 China | | | 12.2 | % |
| 3 Germany | | | 5.9 | % | | 3 Japan | | | 8.7 | % | | 3 Japan | | | 8.0 | % |
| 4 United Kingdom | | | 4.6 | % | | 4 Germany | | | 5.3 | % | | 4 Germany | | | 4.5 | % |
| 5 France | | | 4.1 | % | | 5 France | | | 4.1 | % | | 5 France | | | 3.6 | % |
| 6 China | | | 3.7 | % | | 8 Brazil | | | 3.3 | % | | 7 Brazil | | | 3.4 | % |
| 9 Brazil | | | 2.0 | % | | 10 Russia | | | 2.4 | % | | 8 Russia | | | 3.0 | % |
| 13 India | | | 1.5 | % | | 11 India | | | 2.3 | % | | 9 India | | | 2.9 | % |
| 19 Russia | | | 0.8 | % | | 27 South Africa | | | 0.6 | % | | 26 South Africa | | | 0.6 | % |
| 30 South Africa | | | 0.4 | % | | | | | | | | | | | | |
| BRIC | | | 8.0 | % | | BRIC | | | 17.2 | % | | BRIC | | | 21.6 | % |
| |
Contribution to global growth
The Group of 20: promoting sustainable growth
The G-20 agenda supports international cooperation to resolve global imbalances. Work has focused on a mutual assessment process that will strengthen multilateral cooperation to identify country-specific structural reforms that are necessary to achieve stronger, balanced, sustainable growth. Other focus areas include reform of the international monetary system, reducing commodity price volatility and strengthening financial regulation. Member states are also discussing measures to fight corruption, promote trade and encourage infrastructure development.
Reform of the International Monetary Fund and World Bank
In recognition of the growing economic weight of developing countries, the boards of the World Bank and IMF have agreed to reforms to allow for more equitable representation. The Bank has increased the voting power of developing and transition economies by 3 per cent, and the IMF will shift 6 per cent of quota shares to emerging and developing countries, and transfer a further 6 per cent from over-represented to under- represented countries. South Africa continues its effort to improve representation on the IMF board. Less-developed countries also need access to financial resources and technical assistance to support growth.
18
CHAPTER 2: ECONOMIC POLICY AND OUTLOOK
The domestic outlook
Key domestic indicators
The domestic economy grew by an estimated 2.7 per cent in 2010. Improving household consumption and accelerating investment will support a gradual increase in economic growth over the medium term. Real GDP growth is projected to reach 3.4 per cent in 2011, 4.1 per cent in 2012 and 4.4 per cent in 2013.
Table 2.1 Macroeconomic projections, 2007 — 2013
| | | | | | | | | | | | | | | | | | | | | | | | | | | | | | | | |
| | | 2007 | | 2008 | | | 2009 | | | 2010 | | | 2011 | | 2012 | | 2013 |
| Calendar year | | | | | | Actual | | | | | | | | Estimate | | | | | | | Forecast | | | | |
| | | | | | | | | | | | |
Percentage change unless otherwise indicated | | | | | | | | | | | | | | | | | | | | | | | | | | | | | |
| Final household consumption | | | 5.5 | | | | 2.2 | | | | | -2.0 | | | | | 4.6 | | | | | 4.2 | | | | 4.3 | | | | 4.5 | |
| Final government consumption | | | 4.1 | | | | 4.7 | | | | | 4.8 | | | | | 4.6 | | | | | 4.4 | | | | 4.1 | | | | 3.9 | |
| Gross fixed-capital formation | | | 14.0 | | | | 14.1 | | | | | -2.2 | | | | | -3.6 | | | | | 3.9 | | | | 5.5 | | | | 6.8 | |
| Gross domestic expenditure | | | 6.3 | | | | 3.4 | | | | | -1.7 | | | | | 4.1 | | | | | 4.2 | | | | 4.4 | | | | 4.6 | |
| Exports | | | 6.6 | | | | 1.8 | | | | | -19.5 | | | | | 5.3 | | | | | 6.0 | | | | 6.4 | | | | 7.3 | |
| Imports | | | 9.0 | | | | 1.5 | | | | | -17.4 | | | | | 10.4 | | | | | 8.5 | | | | 7.0 | | | | 7.4 | |
Real GDP growth | | | 5.6 | | | | 3.6 | | | | | -1.7 | | | | | 2.7 | | | | | 3.4 | | | | 4.1 | | | | 4.4 | |
| | | | | | | | | | | | |
| GDP inflation | | | 8.1 | | | | 8.9 | | | | | 7.2 | | | | | 6.3 | | | | | 5.3 | | | | 5.4 | | | | 5.8 | |
GDP at current prices
(R billion) | | | 2 016.2 | | | | 2 274.1 | | | | | 2 396.0 | | | | | 2 615.7 | | | | | 2 846.5 | | | | 3 122.0 | | | | 3 445.9 | |
| | | | | | | | | | | | |
| Headline CPI inflation | | | 6.1 | | | | 9.9 | | | | | 7.1 | | | | | 4.3 | | | | | 4.9 | | | | 5.2 | | | | 5.5 | |
Current account balance
(% of GDP) | | | -7.0 | | | | -7.1 | | | | | -4.1 | | | | | -3.2 | | | | | -4.2 | | | | -4.9 | | | | -5.0 | |
| | | | | | | | |
Table 2.2 Macroeconomic projections, 2009/10 — 2013/14
| | | | | | | | | | | | | | | | | | | | | | | |
| | | 2009/10 | | | 2010/11 | | | 2011/12 | | 2012/13 | | 2013/14 |
| Fiscal year | | Actual | | | Estimate | | | | | | | Forecast | | | | |
| | | | | | | |
Percentage change unless otherwise indicated | | | | | | | | | | | | | | | | | | | | | | |
| Real GDP growth | | | -0.9 | | | | | 3.1 | | | | | 3.6 | | | | 4.2 | | | | 4.4 | |
| GDP inflation | | | 6.6 | | | | | 5.9 | | | | | 5.5 | | | | 5.4 | | | | 5.8 | |
| Headline CPI inflation | | | 6.3 | | | | | 4.2 | | | | | 4.8 | | | | 5.3 | | | | 5.5 | |
GDP at current prices (R billion) | | | 2 442.6 | | | | | 2 666.9 | | | | | 2 914.9 | | | | 3 201.3 | | | | 3 536.0 | |
| | | | | | | |
The macroeconomic forecast
Low interest rates and inflation will support household consumption growth
Low nominal interest rates, low inflation and steady employment gains in the outer years of the forecast are expected to boost disposable incomes, supporting household consumption and investment. Household consumption growth is projected to add about 2.8 percentage points to GDP growth in each of the next three years. Overall employment is expected to grow by an average of 1.8 per cent a year over the medium term.
Private gross fixed-capital formation increased in the second and third quarters of 2010 — a marked turnaround after five successive quarters of decline. Total investment is expected to grow by 3.9 per cent in 2011, 5.5 per cent in 2012 and 6.8 per cent in 2013.
19
2011 BUDGET REVIEW
Defining inclusive growth
The New Growth Path outlines government’s commitment to inclusive growth. South Africa’s economic development must contribute to and reinforce complementary efforts to overcome widespread poverty and income inequality.
Inclusive growth also aims to address the low quality of life associated with poverty and inequity — poor education, poor health and poor opportunities of all kinds. As Amartya Sen argues, “While economic growth is an important boon for enhancing living conditions, its reach depends greatly on what we do with the fruits of growth.”1
Sustained economic growth can reduce poverty by lifting average incomes (both poor and rich float on a rising tide), but high inequality must also be addressed. Raghuram Rajan, former chief economist of the IMF, argues in a recent article2 that rising income inequality in the US was one of the “fault lines” that led to the financial crash and the widespread damage it caused.
Research has led several observers to conclude that developed countries with high levels of inequality are more likely to experience poorer average health outcomes, worse violence, weaker social cohesion and other ills. “The relationships between inequality and poor health and social problems are too strong to be attributable to chance,” write Richard Wilkinson and Kate Pickett.3
Government’s view is that higher levels of economic growth, accompanied by sustainable job creation through efficient and competitive enterprises and appropriate government interventions, can reduce poverty and inequality directly. In addition, economic and employment growth will provide growing revenues to finance public-sector investment in housing, education and health services, enabling millions of South Africans to seize the opportunities that poverty and inequality have denied them.
| | |
| 1. | | Sen, A. “Growth and other concerns”. The Hindu, 14 February 2011. |
| |
| 2. | | Rajan, R. “How inequality fuelled the crisis”. www.project-syndicate.org, 9 July 2010 |
| |
| 3. | | Wilkinson, R. and Pickett, K.2009. “The Spirit Level: Why More Equal Societies Nearly Always Do Better.” |
Growth in non-commodity exports is expected to remain sluggish
Real growth in exports is expected to average 6.5 per cent a year over the medium term as commodity exports benefit from strong demand and high prices. Overall growth in non-commodity exports is expected to remain sluggish, although key sectors such as autos and components have responded quickly to increased foreign demand. Import growth is expected to be strong throughout the forecast period.
Relative strength of the rand contributed to low consumer inflation during 2010
Inflation is forecast to remain within the target range of 3 — 6 per cent, edging towards the upper end of the range in 2013 as the economy strengthens. While interest rates are expected to remain low over the medium term, risks to the benign inflation outlook have recently emerged in the form of higher food and oil prices.
The current account deficit narrowed to an estimated 3.2 per cent of GDP in 2010, down from 4.1 per cent in 2009. The current account deficit is expected to widen to 4.2 per cent this year and 5 per cent in 2013.
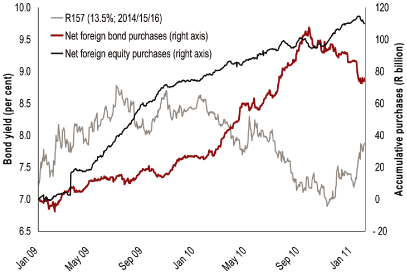
The rand appreciated by 12 per cent against a trade-weighted basket of currencies in 2010. From December 2010 to mid-February 2011, the currency has depreciated by about 10 per cent. Government will continue to assist the Reserve Bank to accumulate foreign exchange reserves and engage in foreign currency swaps to moderate the effect of capital flows on the exchange rate. While capital flows to developing economies are expected to continue over the long term, they remain inherently volatile.
20
CHAPTER 2: ECONOMIC POLICY AND OUTLOOK
n Global developments
‘The world economic recovery continues. But it remains a two-speed recovery.’
— Olivier Blanchard, IMF chief economist
After contracting by 0.6 per cent in 2009, the world economy grew by 5 per cent in 2010, supported by strong growth in developing countries, estimated at 7.1 per cent. The IMF expects world growth to moderate to 4.4 per cent in 2011 and 4.5 per cent in 2012 as stimulus measures are gradually removed.
Macroeconomic and fiscal risks to the global outlook
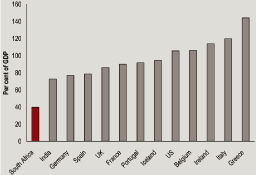
South Africa’s fiscal position and level of debt represent substantial strengths in the present global context.
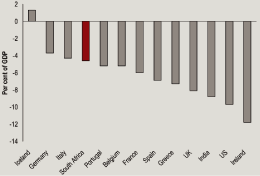
Debt contagion in Europe — Greece, Ireland, Portugal and Spain have implemented austerity measures to stabilise debt levels and contain upward pressure on borrowing costs. Banks in these countries remain vulnerable to falling asset prices. Eurozone contagion remains a serious risk.
Overheating in emerging markets — Fast-growing emerging markets are experiencing rising inflation fuelled by strong domestic demand and steep increases in commodity prices. Tighter monetary policy is necessary to rein in demand and reduce the risk of boom/bust economic cycles.
Volatile capital flows — Net private capital flows to emerging markets increased to US$908 billion in 2010 from US$581 billion in 2009. The Institute for International Finance expects these flows to remain elevated during 2011. High capital flows can finance domestic investment, but can also contribute to overvalued currencies and domestic asset bubbles. When large imbalances build up, a reversal of capital flows can fuel inflation, and harm growth and employment. Countercyclical fiscal and monetary policies are required to offset imbalances and reduce upward pressure on exchange rates. The IMF is promoting international “rules of the road” to manage capital flows and forestall the rush to protectionism or competitive devaluations.
Fiscal deficits by country, 2011
Gross government debt, 2011
| • | | In 2010, the US economy grew by 2.8 per cent, supported by fiscal and monetary stimuli. Growth is projected at 3 per cent in 2011. |
| |
| • | | The eurozone recorded growth of 1.8 per cent in 2010. Slower growth of 1.5 per cent is projected in 2011. The German economy remains resilient due to a strong rebound in household consumption and investment, but fiscal austerity measures in several countries, including Ireland, Greece and Spain, will weigh on regional growth. |
| |
| • | | The Chinese economy is projected to grow by 9.6 per cent in 2011, down from 10.3 per cent in 2010. The authorities have started to tighten monetary and credit policies to manage inflation. |
| |
| • | | Sub-Saharan Africa is well positioned to benefit from high commodity prices, strong Chinese demand and low global interest rates. Growth is projected to increase from 5 per cent in 2010 to 5.5 per cent in 2011. |
21
2011 BUDGET REVIEW
| | |
| Table 2.3 | | Annual percentage change in GDP and consumer price inflation, selected regions/countries, 2010 — 2012 |
| | | | | | | | | | | | | | | | | | | | | | | | | | |
| Region / Country | | 2010 | | 2011 | | 2012 | | | 2010 | | 2011 | | 2012 |
| Percentage | | GDP projections1 | | | CPI projections2 |
| | | | |
World | | | 5.0 | | | | 4.4 | | | | 4.5 | | | | | 3.7 | | | | 3.1 | | | | 2.9 | |
| US | | | 2.8 | | | | 3.0 | | | | 2.7 | | | | | 1.6 | | | | 1.7 | | | | 1.8 | |
| Eurozone | | | 1.8 | | | | 1.5 | | | | 1.7 | | | | | 1.6 | | | | 1.8 | | | | 1.7 | |
| UK | | | 1.7 | | | | 2.0 | | | | 2.3 | | | | | 3.3 | | | | 3.3 | | | | 2.0 | |
| Japan | | | 4.3 | | | | 1.6 | | | | 1.8 | | | | | -0.8 | | | | -0.3 | | | | 0.0 | |
Emerging markets and developing countries | | | 7.1 | | | | 6.5 | | | | 6.5 | | | | | 6.3 | | | | 6.0 | | | | 4.8 | |
Developing Asia | | | 9.3 | | | | 8.4 | | | | 8.4 | | | | | 6.1 | | | | 4.2 | | | | 3.2 | |
| China | | | 10.3 | | | | 9.6 | | | | 9.5 | | | | | 3.3 | | | | 4.3 | | | | 3.6 | |
| India | | | 9.7 | | | | 8.4 | | | | 8.0 | | | | | 9.7 | | | | 6.9 | | | | 6.6 | |
Middle East and North Africa | | | 3.9 | | | | 4.6 | | | | 4.7 | | | | | 6.8 | | | | 6.2 | | | | 6.2 | |
Sub-Saharan Africa | | | 5.0 | | | | 5.5 | | | | 5.8 | | | | | 7.5 | | | | 7.0 | | | | 6.3 | |
South Africa3 | | | 2.7 | | | | 3.4 | | | | 4.1 | | | | | 4.3 | | | | 4.9 | | | | 5.2 | |
| | | | |
| | |
| 1. | | GDP projections: IMF World Economic Outlook, January 2011. |
| |
| 2. | | Country data: Consensus Economics, January 2011; aggregate data: IMF, World Economic Outlook, October 2010 and January 2011. |
| |
| 3. | | National Treasury forecasts. |
Commodity trends
Continued boom in commodity prices is sustained by investment and a weak US dollar
Sustained demand and a weaker US dollar have supported commodity price increases over the past year. The IMF’s all-commodity index increased by 22 per cent between June and December 2010, with the metals index rising by nearly 30 per cent over the same period. Prices are expected to remain high, with inflationary consequences.
Figure 2.3 Gold, platinum, oil and food price trends, 2005 — 2011
| | |
| Source: Bloomberg, United Nations Food and Agriculture Organisation |
| • | | The gold price reached a record high of US$1 423/oz in November 2010 and averaged US$1 362/oz in January 2011. |
| |
| • | | The oil price has risen since the third quarter of 2010 on improved prospects for global growth and concerns about political stability in the |
22
CHAPTER 2: ECONOMIC POLICY AND OUTLOOK
| | | Middle East. The price of Brent crude oil has increased from US$75/barrel in July 2010 to about US$100/barrel in February 2011. |
| |
| • | | The platinum price rose from US$1 448/oz in December 2009 to average $1 612/oz during 2010 and US$1 789/oz in January 2011. |
| |
| • | | The United Nations Food and Agriculture Organisation index of global food prices recorded a 37 per cent increase between June 2010 and January 2011, when it reached a record high. |
n Balance of payments
Current account deficit narrowed to 3.2 per cent of GDP in 2010
The current account deficit narrowed to an estimated 3.2 per cent of GDP in 2010 from 4.1 per cent in 2009 as the trade surplus increased and net service, income and transfer payments to the rest of the world declined. The current account deficit is expected to rise to 4.2 per cent of GDP in 2011 and 5 per cent in 2013, as domestic demand strengthens and dividend payments to non-resident investors increase. Net purchases of South African bonds and equities by non-residents reached R92 billion in 2010 compared with R102 billion in 2009. Strong net inflows of foreign capital exceeded the external financing requirement, which contributed to the appreciation of the rand exchange rate — an experience common to other emerging markets and commodity producers.
Table 2.4 Summary of South Africa’s balance of payments, 2006 — 2010
| | | | | | | | | | | | | | | | | | | | | |
| Percentage of GDP | | 2006 | | 2007 | | 2008 | | 2009 | | 20101 |
| |
Total current account | | | -5.3 | | | | -7.0 | | | | -7.1 | | | | -4.1 | | | | -3.4 | |
| Trade balance | | | -1.7 | | | | -1.8 | | | | -1.6 | | | | 0.1 | | | | 0.4 | |
| Net services, income and current transfer payments | | | -3.7 | | | | -5.2 | | | | -5.6 | | | | -4.1 | | | | -3.8 | |
| Net service payments | | | -0.8 | | | | -0.9 | | | | -1.5 | | | | -1.0 | | | | -1.1 | |
| Net income payments | | | -2.0 | | | | -3.4 | | | | -3.2 | | | | -2.2 | | | | -2.0 | |
Net dividend payments | | | -1.6 | | | | -3.1 | | | | -2.6 | | | | -1.6 | | | | -1.5 | |
| Net current transfer payments (mainly SACU) | | | -0.9 | | | | -0.8 | | | | -0.8 | | | | -0.9 | | | | -0.7 | |
| Current account excluding net current transfers | | | -4.4 | | | | -6.1 | | | | -6.2 | | | | -3.1 | | | | -2.7 | |
Financial account balance | | | 7.0 | | | | 9.3 | | | | 8.3 | | | | 4.8 | | | | 5.1 | |
| Net portfolio investment | | | 7.3 | | | | 3.6 | | | | -5.9 | | | | 3.9 | | | | 5.2 | |
| Net direct investment | | | -2.5 | | | | 1.0 | | | | 4.4 | | | | 1.5 | | | | -0.2 | |
| Net other investment | | | 1.2 | | | | 3.0 | | | | 5.7 | | | | -0.7 | | | | -0.1 | |
| Unrecorded transactions | | | 0.9 | | | | 1.7 | | | | 4.0 | | | | 0.0 | | | | 0.2 | |
Change in net reserves due to BoP transactions | | | 1.7 | | | | 2.4 | | | | 1.1 | | | | 0.7 | | | | 1.7 | |
| |
| | |
| 1. | | Includes data for the first three quarters of 2010, seasonally adjusted and annualised. |
| |
| Source: Reserve Bank |
Current account
A solid performance for exports and imports during the first three quarters of 2010
South Africa’s exports and imports recovered strongly in the first nine months of 2010, with volume growth of 5.1 per cent and 9.1 per cent respectively compared with the previous year. Strong demand for raw materials pushed up the prices of major export commodities, boosting the country’s terms of trade by 5.5 per cent. In value terms, merchandise exports grew by 14.4 per cent and imports by 8.2 per cent in 2010.
Given tepid demand for capital goods imports, this helped to lift the trade surplus to 0.4 per cent of GDP in the first three quarters of 2010. Export
23
2011 BUDGET REVIEW
receipts were boosted by strong increases in precious metals, base metals and steel, coal and vehicles. Stronger domestic demand and a recovery in manufacturing production led to higher imports of transport equipment, chemicals, plastics and rubber, and vehicle components.
Initiatives to boost trade and build infrastructure in sub-Saharan Africa
Between 2000 and 2010, six of the world’s 10 fastest-growing economies were in sub-Saharan Africa, and a similar pattern is expected over the next five years. External trade and investment have grown rapidly on the strength of China’s demand for raw materials. In 2000, 4 per cent of sub-Saharan Africa’s exports went to China; in 2009, China absorbed 16 per cent of the region’s exports.
Yet despite strong growth, trade within sub-Saharan Africa remains low. Transport infrastructure in much of the region is inadequate, contributing to high costs, and customs bottlenecks act as a barrier to trade. The World Bank estimates that it would cost US$93 billion a year over a decade to overcome Africa’s infrastructure deficit. The Development Bank of Southern Africa (DBSA) is helping to plug this gap. The DBSA plans to invest at least R3.8 billion in infrastructure projects in Southern African Development Community (SADC) countries over the next 12 to 18 months, primarily in transport and energy.
In April 2011, South Africa will host a summit to establish a large free-trade area, building on two years of talks between the East African Community, the Common Market for East and Southern Africa and the SADC. The countries making up the free-trade zone would have a combined population of nearly 600 million people and a combined GDP of US$850 billion.
Table 2.5 Composition of South Africa’s trade and trade performance, 2009 — 2010
| | | | | | | | | | | | | | | | | | | | | | | | | | | | | | | | | | | |
| | | 2010 | | | Contribution to growth |
| | | Share of total trade | | | % change y-o-y | | | Exports | | Imports |
| | | Exports | | Imports | | | Exports | | Imports | | | 2009 | | 2010 | | 2009 | | 2010 |
| | | | | | | | | | | |
| Precious metals and stones | | | 25.6 | | | | 1.0 | | | | | 18.0 | | | | 20.6 | | | | | -2.8 | | | | 4.5 | | | | -0.6 | | | | 0.2 | |
| Mineral products (oil, coal, ore) | | | 21.3 | | | | 20.0 | | | | | 20.8 | | | | -0.7 | | | | | -2.3 | | | | 4.2 | | | | -7.6 | | | | -0.2 | |
| Base metals and steel | | | 15.8 | | | | 4.7 | | | | | 21.6 | | | | 17.3 | | | | | -6.1 | | | | 3.2 | | | | -1.7 | | | | 0.7 | |
| Raw and processed food products | | | 8.1 | | | | 6.0 | | | | | 0.9 | | | | -2.7 | | | | | 0.1 | | | | 0.1 | | | | -0.4 | | | | -0.2 | |
| Transport equipment | | | 8.5 | | | | 10.3 | | | | | 12.9 | | | | 25.5 | | | | | -3.4 | | | | 1.1 | | | | -3.2 | | | | 2.3 | |
| Machinery and appliances | | | 8.0 | | | | 25.4 | | | | | 7.3 | | | | 5.3 | | | | | -3.0 | | | | 0.6 | | | | -5.9 | | | | 1.4 | |
| Chemical products, plastics and rubber | | | 7.0 | | | | 13.7 | | | | | 7.8 | | | | 13.0 | | | | | -2.1 | | | | 0.6 | | | | -2.5 | | | | 1.7 | |
| Pulp and paper products | | | 1.9 | | | | 1.6 | | | | | 8.8 | | | | -0.2 | | | | | -0.3 | | | | 0.2 | | | | -0.2 | | | | 0.0 | |
Other1 | | | 2.1 | | | | 5.0 | | | | | -6.0 | | | | 4.5 | | | | | -0.2 | | | | -0.2 | | | | -0.8 | | | | 0.2 | |
| Miscellaneous manufacturers | | | 0.8 | | | | 1.6 | | | | | 14.4 | | | | 11.8 | | | | | -0.1 | | | | 0.1 | | | | -0.2 | | | | 0.2 | |
| Textiles, clothing and footwear | | | 0.8 | | | | 4.2 | | | | | -2.2 | | | | 9.3 | | | | | -0.1 | | | | 0.0 | | | | 0.0 | | | | 0.4 | |
| Vehicles components | | | 0.0 | | | | 6.5 | | | | | 231.3 | | | | 26.5 | | | | | 0.0 | | | | 0.0 | | | | -2.5 | | | | 1.5 | |
| | | | | | | | | | | |
Total | | | 100.0 | | | | 100.0 | | | | | 14.4 | | | | 8.2 | | | | | -20.5 | | | | 14.4 | | | | -25.7 | | | | 8.2 | |
| | | | | | | | | | | |
| | |
| 1. | | Other includes optical and photographical equipment, stone plaster, wood, hides, leather, skin etc. and articles thereof, works of art and unclassified products. |
| |
| Source: South African Revenue Service |
Total net external payments for services, income and current transfers fell to 3.8 per cent of GDP in the first nine months of 2010 from 4.1 per cent in 2009 as a whole. This component of the current account is likely to increase over the medium term as external dividend and interest payments rise.
24
CHAPTER 2: ECONOMIC POLICY AND OUTLOOK
Figure 2.4 Export and import prices, 2005 — 2010
Financial account
Capital inflows contributed to an overall surplus on South Africa’s balance of payments equivalent to 1.7 per cent of GDP in the first nine months of 2010, compared with 0.7 per cent in 2009 as a whole. Non-resident net purchases of bonds totalled R56 billion in 2010 compared with R27 billion in 2009 and a net outflow of R14 billion in 2008. Net equity purchases fell from R75 billion in 2009 to R36 billion in 2010. Between September of last year and February 2011, international investors became net sellers of R33 billion in government debt.
Exchange rate and international reserves
Capital flows to emerging markets have reversed course in recent months, with consequences for the rand
Strong capital flows to emerging markets during 2010 led to the strong appreciation of several emerging currencies, including the Brazilian real, the Indonesian rupee and the South Korean won. The rand appreciated by 12 per cent against a trade-weighted basket of currencies in 2010. Capital has begun to flow out of rand assets in recent months, resulting in a depreciation of about 10 per cent since mid-December. Rand volatility declined during 2010.
25
2011 BUDGET REVIEW
Figure 2.5 Trade-weighted rand indices, 1994 — 2010
In 2010 the Reserve Bank spent the equivalent of 2 per cent of GDP buying foreign exchange reserves
To help the exchange rate reach a more competitive level and moderate volatility, the Reserve Bank spent R53 billion on foreign exchange reserve accumulation in 2010, equivalent to about 2 per cent of GDP. Between December 2009 and the end of January 2011, South Africa’s gross foreign exchange reserves increased by US$5.8 billion to US$45.5 billion, while the international liquidity position stood at US$44.5 billion. Between August 2010 and January 2011, the Reserve Bank also entered into long-term foreign currency swaps worth US$4.3 billion to sterilise foreign currency flows related to large inward investments.
The problem of capital inflow management has largely been confined to a subset of emerging market economies — Brazil, China, India, Indonesia, Malaysia, Mexico, South Africa and Turkey. These countries received 95 per cent of portfolio equity flows, 78 per cent of short-term debt and nearly 50 per cent of bond flows to emerging markets in 2010. In most cases, these capital inflows have added to money supply and the expansion of demand, resulting in higher inflation and pushing economies towards overheating. The appreciation of exchange rates has weakened export competitiveness and shifted the composition of growth towards non-tradables.
In 2010, reserve accumulation was the tool most widely used to manage capital inflows
In 2010, reserve accumulation was the tool most widely used to manage capital inflows. The IMF estimates that world reserves rose by US$492 billion, of which two-thirds were purchased by emerging markets. Other measures taken to offset the effects of global capital movements are described in Table 2.6. Current trends suggest that the measures announced when the Medium Term Budget Policy Statement was tabled in October 2010 may be having the desired effect.
26
CHAPTER 2: ECONOMIC POLICY AND OUTLOOK
| | |
| Table 2.6 | | Measures implemented since January 2010 to manage capital flows and reduce exchange rate appreciation |
| | | | | |
| Country | | Measure | | Objective |
| |
| Colombia | | Reimpose withholding tax on income from foreign borrowing by domestic companies | | Reduce foreign borrowing and financial vulnerability |
| Costa Rica | | Impose reserve requirements on banks for short-term foreign borrowing | | |
| Indonesia | | Reinstate limit on short-term foreign borrowing by domestic lenders | | |
| Peru | | Raise reserve requirements for foreign currency bank loans | | |
| |
| Brazil | | Increase tax on fixed-income securities from 2% to 6% | | Reduce foreign demand |
| Taiwan | | Limit foreign holdings of local bonds | | for local bonds and |
| Thailand | | Impose withholding tax on interest earned and capital gains on government and state-owned enterprise bonds | | financial vulnerability |
| |
| Brazil | | Impose reserve requirements on banks’ short positions in the currency | | Reduce speculative trading and volatility |
| Indonesia | | Impose one-month minimum holding period for bond ownership | | |
| Israel | | Impose reserve requirements for foreign exchange swaps and forward transactions and increase reporting requirements for large bond transactions by foreigners | | |
| Peru | | Limit local bank trading in foreign exchange derivative transactions | | |
| South Korea | | Restrict local and foreign banks’ derivative positions in the foreign exchange market | | |
| Taiwan | | Limit banks’ holding of foreign exchange derivatives | | |
| |
| Chile | | Increase limits on foreign investments by pension funds | | Encourage capital |
| South Africa | | Reduce restrictions on overseas FDI and portfolio investments | | outflows |
| Thailand | | Reduce restrictions on overseas FDI and portfolio investments | | |
| |
n Real output trends
During 2010 the real economy grew by about 2.7 per cent. Growth of 4.6 per cent in the first quarter was tempered by growth rates below 3 per cent in the second and third quarters, partly as a result of industrial action.
Figure 2.6 Composition of GDP, selected countries, 2010
| | |
| Other industry: mining, utilities, construction. India, Indonesia, SA (2009), China (2008) |
| |
| Source: Economist Intelligence Unit, United Nations Industrial Development Organisation, Statistics South Africa (Stats SA) |
27
2011 BUDGET REVIEW
Manufacturing has contributed more than any other sector to South Africa’s growth in 2010, accounting for 0.9 percentage points of growth in value added over the first nine months of the year. Growth momentum has strengthened in recent months and the economy is projected to expand by 3.4 per cent in 2011, 4.1 per cent in 2012 and 4.4 per cent in 2013.
Agriculture
The maize harvest is expected to be lower than the prior year in response to softer prices
Real value added in agriculture, forestry and fishing fell by 2.5 per cent in the first nine months of 2010 compared with the same period in 2009. After a large maize harvest (12.8 million tons) in 2009/10, and in response to weaker prices, lower production is expected in 2010/11. Production of domestic wheat and other crops is also expected to be lower as a result of unusually heavy summer rainfall.
Mining
In contrast with strong output gains across a range of minerals, gold output fell
Real value added in mining increased by 4.8 per cent in the first nine months of 2010 compared with the same period in 2009. Chromium (61 per cent), manganese (58 per cent) and diamonds (47 per cent) recorded strong output gains in 2010. Production growth in the largest commodity exports was more muted. Platinum and coal output grew by 5.3 per cent and 2.1 per cent, while gold output declined by 4.6 per cent. Investment in machinery, equipment and in new construction works in the mining sector began to recover in the first nine months of 2010. The new Mining Charter, alongside measures to reduce regulatory uncertainty and improve transparency in the awarding of mining licenses, should also support higher investment.
Figure 2.7 Sector trends in fixed-capital formation, 2000 — 2010
28
CHAPTER 2: ECONOMIC POLICY AND OUTLOOK
Manufacturing
Manufacturing is recovering, but output remains below the pre-recession level
After falling by 10.4 per cent in 2009, real value added in manufacturing production increased by 5.3 per cent in the first three quarters of 2010 as global and domestic demand recovered and inventories were rebuilt. Output remains below the pre-recession level.
Figure 2.8 Manufacturing production, 2004 — 2010
| | |
| PMI = Purchasing Managers’ Index |
| |
| Source: Bureau of Economic Research, JP Morgan |
Production of motor vehicles, parts and accessories rebounded in 2010, leading to a 37 per cent rise in the number of vehicles exported compared with 2009. Petrochemicals and iron and steel output also recorded solid growth. The National Association of Automobile Manufacturers of South Africa projects export growth of 26 per cent in 2011.
Table 2.7 Growth in manufacturing output by sector, 2010
| | | | | | | | | | | | | | | | | | | |
| | | | | | | | | | | | | | | | | Output |
| | | | | | | | Growth (% change) | | | comparison |
| | | Weights1 | | | 2010 | | from recession low2 | | | 2008 — 2010 |
| | | | | | | |
| Basic iron and steel | | | 22.9 | % | | | | 4.4 | | | | 5.9 | | | | | -15.0 | |
| Petrochemicals | | | 22.1 | % | | | | 6.0 | | | | 6.1 | | | | | -4.7 | |
| Food and beverages | | | 15.4 | % | | | | 3.8 | | | | 11.9 | | | | | 5.9 | |
| Motor vehicles and parts | | | 10.9 | % | | | | 20.4 | | | | 54.8 | | | | | -8.6 | |
| Wood and paper | | | 10.2 | % | | | | 4.5 | | | | 4.8 | | | | | -11.0 | |
| Furniture and other | | | 5.2 | % | | | | -2.3 | | | | -4.8 | | | | | -21.9 | |
| Textiles and clothing | | | 4.9 | % | | | | -6.4 | | | | -5.8 | | | | | -19.7 | |
| Glass, etc | | | 4.8 | % | | | | -2.9 | | | | -1.0 | | | | | -15.1 | |
| Electrical machinery | | | 2.5 | % | | | | 5.2 | | | | 5.2 | | | | | 2.2 | |
| Radio and television | | | 1.1 | % | | | | -4.6 | | | | 0.3 | | | | | -11.2 | |
| | | | | | | |
Total | | | 100.0 | % | | | | 4.9 | | | | 9.5 | | | | | -8.4 | |
| | | | | | | |
| | |
| 1. | | Weights are based on the large sample manufacturing survey of 2005. |
| |
| 2. | | Seasonally adjusted manufacturing production was at its lowest level in April 2009.
|
| |
| Source: Statistics South Africa |
29
2011 BUDGET REVIEW
Determining the value of industrial subsidies
Government offers a range of subsidies to promote industrial development. On average, between 2005 and 2009, subsidies were worth 1.1 per cent of GDP per year, with expenditure expected to reach about R27.6 billion in 2010/11.
The overall cost is calculated as the value of tax allowances associated with industrial policies, cash grants for sectors, preferential financing from the Industrial Development Corporation, and the costs to consumers from higher prices due to import tariffs. About 40 per cent of subsidies are financed by National Treasury transfers to departments. Most subsidies take the form of tax allowances and import tariff protection.
Total value of incentives per sector per year
| | | | | | | | | | | | | | | | | | | | | | | |
| | | | | Other | | Agriculture | | | | | | | | |
| | | | | manufact- | | and | | | | | | | | |
| R million | | Motor | | uring | | forestry | | BPO | | Film | | Tourism | | Total1 |
| |
| 2008/09 | | 16 554 | | 4 875 | | | 811 | | | | 130 | | | | 96 | | | | 356 | | | 23 686 |
| 2009/10 | | 17 249 | | 6 717 | | | 990 | | | | 254 | | | | 154 | | | | 417 | | | 26 696 |
| 2010/11 | | 17 876 | | 6 474 | | | 1 138 | | | | 262 | | | | 247 | | | | 440 | | | 27 612 |
| |
| | |
| 1. | | Includes other incentives that are not sector specific. |
Motor vehicles, parts and accessories received about 65 per cent of all incentives in 2010/11. In 2009/10, the subsidies were equivalent to 13 per cent of total sales in this sector.
Electricity, water and gas
Construction of the Medupi power plant has reached an advanced stage
Real value added in the electricity, gas and water sector grew by 2.1 per cent in the first nine months of 2010. Construction of the 4 788MW Medupi power plant is at an advanced stage, while the 4 800MW Kusile plant is in an early phase. To address water quality and infrastructure backlogs, the Department of Water Affairs plans to initiate 15 large-scale water projects over the next eight years.
Transport and communication
Johannesburg launched the bus rapid transit system and phase 1 of Gautrain began operating in 2010
Value added by the transport, storage and communications sector grew by 2.7 per cent in the first three quarters of 2010 compared to the same period in 2009. Stronger economic activity boosted volumes in freight transport, and new public transport services included the opening of the bus rapid transit system in Johannesburg and the first section of the Gautrain. Broadband capacity has increased substantially in recent years. Over the long term this should help to lower prices and improve access.
Reducing the cost of broadband in South Africa
An affordable, efficient and widely distributed telecommunications network is important for raising productivity and accelerating economic growth. South Africa’s telecommunications infrastructure has improved significantly over the past few years. Two new undersea cable networks (SEACOM and EASSy) have increased available bandwidth. This has contributed to faster internet speeds and lower prices.
The cost of internet access, however, remains high and penetration is still relatively low. Only a quarter of broadband subscribers have fixed-line (ADSL) connections. Fixed-line broadband technology is cheaper and faster than wireless technology. Telkom’s monopoly of the local loop — the last stretch of infrastructure connecting homes or businesses to exchanges — means that fixed-line prices remain high. To encourage competition and stimulate growth, government aims to unbundle the local loop by November 2011.
Broadband penetration and cost
| | | | | | | | | | | | | | | | | |
| Country | | Korea | | Norway | | Australia | | Germany | | Chile | | Mexico | | Turkey | | South Africa |
| |
| Subscribers per 100 inhabitants | | 64.7 | | 53.5 | | 35.3 | | 27.5 | | 8.4 | | 5.3 | | 5.3 | | 4.6 |
Price range, Mbit/second
(US$ PPP) 2009 | | 0.37 - 4.9 | | 2.36 - 21.82 | | 0.7 - 168.33 | | 1.03 - 17.61 | | n/a | | 9.75 - 94.64 | | 2.39 - 76.11 | | 130.1 - 1342.8 |
| |
Source: Organisation for Economic Cooperation and Development, Research ICT Africa, National Treasury calculations
30
CHAPTER 2: ECONOMIC POLICY AND OUTLOOK
Microeconomic reforms to promote sustainable growth
Microeconomic reforms can help alleviate constraints to rapid growth and draw more people into employment.
The Commission for Growth and Development* identified underlying policies that helped a range of countries to achieve average annual growth rates of 7 per cent for a quarter-century. Applied to South Africa, these microeconomic lessons can be distilled as follows:
| • | | Develop transport, telecommunications and community infrastructure that supports productivity by lowering costs and crowding-in private investment. |
| |
| • | | Reduce regulatory barriers and promote competition in all sectors, including transport and energy. |
| |
| • | | Use skills development and employment incentives to encourage businesses to hire and expand. |
| |
| • | | Monitor the impact of regulation on the cost of doing business and consumer welfare. Adjust rules and regulations to minimise tax and compliance burdens for small business. Ease access to finance. |
| |
| • | | Ensure that trade reforms lower costs for businesses and consumers, and redesign industrial development zones to support exports and job creation. |
| |
| • | | Improve incentives for research and development. |
| | | |
| * | | The 22-member international commission sought to identify policies and strategies underlying sustained economic growth and poverty reduction. |
Construction
Construction should revive in tandem with a gradual increase in private investment
Real growth in value added in the construction sector slowed to 1.8 per cent in the first nine months of 2010 compared with the same period in 2009. Construction activity slowed in the face of weak housing demand, high vacancy rates in commercial buildings and the completion of projects related to the football World Cup. Some infrastructure projects have been delayed by capacity constraints in provincial and local government. As discussed elsewhere in this Budget Review, government is working to remedy these problems.
The construction sector is expected to revive in tandem with a gradual recovery in private investment over the medium term, improved municipal spending on housing and infrastructure projects, low interest rates and rising credit extension.
Finance, insurance, real estate and business services
Subdued growth in finance, insurance, real estate and business services in 2010
The finance, insurance, real estate and business services sector recorded subdued growth of 1.4 per cent in the first nine months of 2010. The profitability of banks has been weighed down by weak credit extension, high levels of non-performing loans and sluggish housing market activity.
Growth in bank loans and advances to the private sector picked up modestly to 4.3 per cent in December 2010, mainly due to stronger credit extension to households. Credit growth should continue to rise over the medium term, supported by more relaxed lending criteria, a revival of credit demand and low interest rates.
31
2011 BUDGET REVIEW
A safer financial sector to serve South Africa better
To promote sustained economic growth and development, South Africa needs a stable financial services sector that is accessible to all. A policy document on this topic is being released with the 2011 Budget. It sets out government’s proposals, emphasising financial stability, consumer protection and inclusion. The main proposal is to separate prudential and market conduct regulation. In addition it addresses:
| • | | Stability. The Reserve Bank’s mandate for financial stability will be underpinned by a new Financial Stability Oversight Committee, co-chaired by the Reserve Bank Governor and the Minister of Finance. |
| |
| • | | Consumer protection. Government will enhance consumer protection. The structure of the Financial Services Board (FSB) will be broadened to include a banking services market conduct regulator. |
| |
| • | | Access to financial services. Financial access will be broadened. The Financial Sector Charter will be reviewed and reforms undertaken to encourage “micro-insurance”. |
| |
| • | | Coordination. Regulatory coordination will be enhanced, and regulators strengthened as required. The Council of Financial Regulators will be formalised. |
| |
| • | | Comprehensiveness. All businesses in the financial sector should be licensed or registered. Institutions providing similar services should be regulated by the same agency. |
New legislation will be required to implement the proposals. Several bills dealing with banking, financial markets, credit rating agencies and the regulatory powers of financial supervisors will be tabled in Parliament during 2011. The policy document will be available on www.treasury.gov.za.
n Employment and remuneration
Formal-sector employment appears to have stabilised, and unemployment stands at 24 per cent
Formal-sector employment stabilised during 2010. According to the Statistics South Africa (Stats SA) Quarterly Employment Statistics survey, formal-sector non-agricultural employment contracted by 14 000 jobs between December 2009 and September 2010. The Quarterly Labour Force Survey shows that 157 000 jobs were created in the fourth quarter of 2010. Gradual recovery in most sectors, and the bottoming out of job losses in manufacturing and construction, suggest that a moderate improvement in the jobs market will occur during 2011.
Unemployment stands at 24 per cent, 2.2 percentage points higher than at the end of 2008. Many people have given up looking for work.
Figure 2.9 Formal sector non-agricultural employment, 2006 — 2010
| | |
| Source: Stats SA, Quarterly Employment Statistics |
32
CHAPTER 2: ECONOMIC POLICY AND OUTLOOK
Number of discouraged workers has risen by 440 000 over past year
The labour force participation rate fell from 57.5 per cent in December 2008 to 53.6 per cent in December 2010. The number of discouraged workers has risen by 440 000 over the past 12 months, pushing the broad unemployment rate up to 32.4 per cent from 30.9 per cent in 2009. Nominal unit labour costs increased by 10.2 per cent in the first nine months of 2010.
n Domestic expenditure
Gross domestic expenditure grew by an estimated 4.1 per cent between 2009 and 2010, supported by sustained government consumption, an improvement in household consumption and the rebuilding of inventories. Household and government consumption rose by 4.6 per cent in 2010, while fixed capital investment contracted for a second year. Growth in domestic expenditure is expected to be strong over the medium term, averaging 4.4 per cent a year, and supported by higher private investment.
Table 2.8 Contribution to gross domestic expenditure growth, 2006 — 2010
| | | | | | | | | | | | | | | | | | | | | |
| Percentages | | 2006 | | 2007 | | 2008 | | 2009 | | 20101 |
| |
| Household consumption expenditure | | | 5.2 | | | | 3.4 | | | | 1.3 | | | | -1.2 | | | | 2.7 | |
| Government consumption expenditure | | | 1.0 | | | | 0.8 | | | | 0.9 | | | | 0.9 | | | | 0.9 | |
| Gross fixed capital formation | | | 2.0 | | | | 2.4 | | | | 2.6 | | | | -0.5 | | | | -1.0 | |
| Change in inventories | | | 0.3 | | | | -0.2 | | | | -1.8 | | | | -1.2 | | | | 1.4 | |
| |
Gross domestic expenditure | | | 8.6 | | | | 6.3 | | | | 3.4 | | | | -1.7 | | | | 3.6 | |
| |
| | |
| 1. | | First three quarters of 2010 compared to the same period in 2009. |
| |
| Source: Reserve Bank |
Household debt and consumption expenditure
The recovery in household consumption in 2010 was underpinned by an increase in disposable income in households that were not directly affected by job losses, and supported by low inflation and nominal interest rates. Real disposable income grew by 4.5 per cent in the first nine months of 2010 compared with the same period in 2009.
Debt-service costs have subsided, but household debt levels remain high
Despite lower debt-service costs, household debt levels remain elevated at 78.3 per cent of disposable income in the third quarter of 2010. Household consumption growth is expected to average 4.3 per cent over the next three years as low interest rates and higher employment levels support a broader-based recovery in spending.
33
2011 BUDGET REVIEW
Figure 2.10 Debt-to-disposable-income and debt-service costs, 1994 — 2010
Gross fixed-capital formation
Real investment continued to contract during 2010, but momentum appears to be turning
Real investment expenditure contracted by about 3.6 per cent between 2009 and 2010. Momentum is turning, with quarterly investment growing since April 2010 and rising fixed-capital formation in several sectors, including mining and transport. The ratio of gross fixed-capital formation to GDP should remain at about 20 per cent of GDP over the medium term.
Uncertainty about the strength of global and domestic demand, subdued business confidence, and high levels of spare capacity were a drag on private investment, which contracted by 5.9 per cent in the first nine months of 2010 compared with the same period in 2009. Investment by public corporations grew by 3.9 per cent in the first nine months of 2010, compared with average annual growth of 32.3 per cent over the preceding three years.
General government investment spending declined by 12.5 per cent in the first three quarters of 2010 compared with 2009. The sharp decline reflected a general reduction in spending as 2010 World Cup projects were completed, and underspending on planned investment and maintenance projects, particularly at the municipal level.
Growth in private-sector gross fixed-capital investment forecast to average 5.6 per cent a year over medium term
Gross fixed-capital formation is expected to grow by 3.9 per cent in 2011, reaching 6.8 per cent in 2013. Over the medium term, growth in fixed capital investment is forecast to average 5.6 per cent a year for the private sector, 5.7 per cent for public corporations and 4 per cent for general government.
34
CHAPTER 2: ECONOMIC POLICY AND OUTLOOK
Money supply and credit extension
A stronger recovery in credit extension is expected in 2011 after a steady improvement in 2010
The recovery in economic activity helped to boost growth in broad money supply by 6.9 per cent in December 2010 from 1.8 per cent at the end of 2009. Credit extended to the private sector and to households has recovered modestly, while credit to companies remains weak as a result of subdued investment and high corporate savings levels. A stronger recovery in credit extension is expected in 2011.
Table 2.9 Bank credit extension to households and companies, 2008 — 2010
| | | | | | | | | | | | | | | | | | | | | | |
| | | % of total advances | | | % growth over 12 months |
| Percentage | | 2009 | | 2010 | | | 2008 | | 2009 | | 2010 |
| | | | |
| To household sector | | | 55.4 | | | | 56.7 | | | | | 15.5 | | | | 2.9 | | | | 6.9 | |
| To corporate sector | | | 44.6 | | | | 43.3 | | | | | 12.3 | | | | -4.6 | | | | 1.2 | |
By type of advance: | | | | | | | | | | | | | | | | | | | | | |
| Mortgage advances | | | 53.8 | | | | 53.7 | | | | | 13.2 | | | | 3.6 | | | | 4.0 | |
| Instalment sale credit and leasing finance | | | 12.7 | | | | 12.4 | | | | | 7.5 | | | | -6.0 | | | | 2.1 | |
| Overdraft | | | 6.8 | | | | 6.4 | | | | | 3.9 | | | | -7.2 | | | | -2.1 | |
| Credit card advances | | | 3.0 | | | | 2.9 | | | | | 3.8 | | | | -2.8 | | | | 1.5 | |
| General advances | | | 23.7 | | | | 24.6 | | | | | 24.9 | | | | -4.1 | | | | 8.5 | |
| | | | |
Total loans and advances | | | 100.0 | | | | 100.0 | | | | | 14.0 | | | | -0.6 | | | | 4.3 | |
| | | | |
Inflation and interest rates
CPI fell to 3.2 per cent in September 2010, but health, education and administered prices remain above the inflation target
Consumer price inflation reached a low of 3.2 per cent in September 2010 from its peak of 13.6 per cent in August 2008. The relative strength of the rand, lower global food and oil prices, and weak domestic demand contributed to the downward trend last year and offset pressures resulting from above-inflation wage settlements.
Core inflation, which excludes food, non-alcoholic beverages and petrol, moderated to 3.5 per cent in January 2011. Health, education and administered price inflation remained above the upper band of the target throughout 2010.
Figure 2.11 Contributions to CPI inflation, 2009 — 2010
35
2011 BUDGET REVIEW
The impact of rising global food prices
Food prices have increased sharply since June 2010 in response to strong demand and adverse weather in major food-producing countries such as Russia, Australia and Brazil. The Food and Agriculture Organisation’s global food price index, which includes prices of cereals, oils, sugar and meat, is at an all-time high. Food inflation is currently above 10 per cent in China, Russia, India, South Korea and Argentina.
Global food price indices, 2005-2011
| | |
| Source: United Nations Food and Agriculture Organisation |
Food inflation in emerging markets, 2011
| | | | | |
| | | % change y-o-y, |
| | | January 2011 |
| |
| India | | | 15.6 | |
| Russia | | | 14.2 | |
Argentina1 | | | 13.1 | |
South Korea1 | | | 11.6 | |
| China | | | 10.3 | |
Turkey1 | | | 7.1 | |
| South Africa | | | 2.9 | |
| Brazil | | | 1.2 | |
| |
| | |
| 1. | | CPI for food and non-alcoholic beverages. |
| |
| Source: Bloomberg, National Treasury forecasts |
Commodities futures suggest that prices will remain high in 2011 and 2012, with significant upside risks. For the time being, food inflation remains subdued in South Africa, with an average increase of just 0.8 per cent between January and December 2010. Subdued domestic demand, the strength of the rand and a maize surplus that lowered local prices have helped contain domestic food inflation pressures. The impact of rising food prices on headline inflation should remain moderate.
Inflation expectations are declining. According to the Bureau for Economic Research, inflation is expected to average 5.5 per cent in 2011, compared with an expectation of 6.5 per cent in June 2010.
Lower inflation enabled the Reserve Bank to lower the repo rate to its lowest point in 30 years
Lower inflation outcomes combined with weakness in the domestic economy and uncertainties about global growth prospects enabled the Reserve Bank to lower the repo rate by 1.5 percentage points in 2010 to 5.5 per cent — the lowest rate in 30 years — bringing the total reduction to 6.5 percentage points since December 2008. Keeping in mind rising food and oil prices, monetary policy cannot be expected to remain accommodative in the event of strong inflation pressures.
36
CHAPTER 2: ECONOMIC POLICY AND OUTLOOK
Strengthening prudential regulation and modernising cross-border direct investment
Prudential foreign exposure limits
The National Treasury is releasing a research paper entitled Prudential Regulation of Foreign Exposure for South African Institutional Investors. The paper, produced by the Centre for Research into Economics and Finance in Southern Africa, discusses the definition of foreign assets for purposes of prudential regulation. It argues that the classification of foreign companies with listings on the JSE as domestic assets weakens the prudential regulatory framework.
The National Treasury will consult on these matters during 2011. However, any change to the classification system would be forward-looking and would not affect the current classification of non-resident JSE listings.
A review framework for cross-border direct investment
South Africa lacks a coherent, harmonised policy framework to regulate cross-border direct investment. As a result, government lacks a formal, coordinated policy framework that informs the responses of different departments, particularly concerning investments in strategic sectors. This has led to overreliance on the application of exchange controls to assess the benefits of cross-border investments.
To address this policy gap, the National Treasury is releasing a discussion document entitled A Review Framework for Cross-border Direct Investment into South Africa.
Invitation to comment
The discussion papers will be made available on www.treasury.gov.za. Comments on the discussion documents are invited from all interested parties. Written comments should be emailed to: financial.policy@treasury.gov.za or faxed to 012 315 5206 not later than 30 April 2011.
n Conclusion
Macroeconomic stability and sound policy will provide the foundation for growth.
The world economy is undergoing a sea change. Patterns of manufacturing, trade and investment are shifting towards fast-growing emerging markets. The G-20 is overseeing a broad-based effort to encourage more sustainable growth, and international financial institutions are beginning to reform.
South Africa faces new challenges and opportunities in this dynamic environment. The New Growth Path identifies core elements needed to promote faster, inclusive growth and job creation, including partnerships between government, business and labour.
The domestic economic recovery is expected to strengthen over the period ahead, supported by robust household consumption growth and accelerating investment. Macroeconomic stability, alongside sound countercyclical management of the public finances and monetary policy, will provide the foundation for growth.
To achieve and sustain rapid economic growth that will draw millions into the workforce and out of poverty requires concerted action to address structural and microeconomic constraints. The public-sector infrastructure programme will help to raise South Africa’s long-term growth potential, while creating large numbers of jobs over the medium term. Urgent policy adjustments need to address regulatory reform, enhance competition, and develop a better—educated, more skilled workforce. Tackling these constraints will raise the potential for inclusive growth, large-scale job creation and improved living standards for all.
37
2011 BUDGET REVIEW
This page has been left blank intentionally.
38
3
Employment
n Overview
Employment is not only about earning an income —it is the condition for a decent life
South Africa faces a chronic employment crisis. Creating millions of jobs and bringing more people into economic activity is at the centre of government’s agenda. Employment is not only about earning an income — it is the condition for a decent life. The 2011 State of the Nation address emphasised government’s focus on job creation.
The 2008-2009 financial crisis led to a massive spike in global unemployment. While world economic growth picked up during 2010, job creation has lagged behind, long-term joblessness has increased and youth unemployment has risen. Recovery in the global labour market is likely to be protracted. South Africa has experienced similar trends, but domestic unemployment has its own stubborn characteristics, rooted in the structure and institutions of the economy, that require attention. Removing these barriers is critical to achieving more labour-absorbing, inclusive growth.
After a severe decline in employment in 2009 and early 2010, the labour market has started to show signs of recovery. According to Statistics South Africa (Stats SA), about 63 000 formal non-agricultural jobs were created between April and October 2010. Certain sectors have the potential to create tens of thousands of jobs as economic growth picks up.
The base of sustainable job creation is the growth of output by a dynamic private sector
The New Growth Path targets the creation of 5 million jobs over the next 10 years. The proposals, building on policies already in place, focus on creating jobs in infrastructure, agriculture, mining, the “green economy”, tourism, business services and manufacturing. The base of sustainable job creation is the growth of output by a dynamic private sector able to compete in expanding world markets. Achieving large-scale job creation and a sustained reduction in unemployment will require greater cooperation between the public sector and the private sector.
39
2011 BUDGET REVIEW
Job creation and inclusion
South Africa is one of the world’s most unequal societies. Inclusive growth and poverty reduction necessitates much faster and sustained economic growth and labour absorption.
Only two out of five persons of working age are employed, and youth unemployment is a critical problem
Out of a population of nearly 50 million, 13.1 million South Africans are employed. Only two out of five persons of working age (41 per cent) have a job, compared with 65 per cent in Brazil, 71 per cent in China and 55 per cent in India. To match the emerging markets average of 56 per cent, South Africa would need to employ 18 million people — 5 million more than are employed today. To keep pace with the number of people entering the labour market, this would require the economy to create about 9 million jobs over the next 10 years.
One of the most pressing concerns is the lack of jobs for young people. The unemployment rate among working-age youth below 25 years of age is about 50 per cent. If not addressed urgently and effectively, this problem will lead to exceptionally negative consequences for South Africa.
Capital infrastructure programme will continue to create jobs
Over the medium term, government’s capital infrastructure programme will contribute to job creation. Policy will encourage an environment conducive to business investment and hiring. Enhanced employment services, more focused skills development and improved further education, will support job growth. The 2011 Budget funds two initiatives targeted at creating jobs, particularly for young people: a Jobs Fund to support projects with high employment potential, and a youth employment subsidy. Social security reform will ensure that income protection and basic savings arrangements are extended to workers currently excluded from formal employment arrangements.
n A global employment crisis
Global unemployment has risen by nearly 28 million since 2007
The human cost of the global downturn has been reflected in a large increase in joblessness. The International Labour Organisation estimates global unemployment to be 205 million, up by 27.6 million since 2007.
Table 3.1 Employment response to falling output during the recession in selected countries
| | | | | | | | | | | | | |
| | | | | | | | | | | Responsive- |
| | | GDP | | Employment | | ness to 1% fall |
| Percentage | | contraction | | contraction | | in GDP |
| |
| Korea | | | -4.6 | | | | -0.6 | | | | -0.1 | |
| Turkey | | | -12.8 | | | | -1.8 | | | | -0.1 | |
| Germany | | | -6.6 | | | | -1.6 | | | | -0.2 | |
| Mexico | | | -8.5 | | | | -2.1 | | | | -0.3 | |
| United Kingdom | | | -6.4 | | | | -2.3 | | | | -0.4 | |
| Chile | | | -4.1 | | | | -2.0 | | | | -0.5 | |
| Ireland | | | -14.3 | | | | -13.6 | | | | -1.0 | |
| United States | | | -4.1 | | | | -5.4 | | | | -1.3 | |
| Spain | | | -4.9 | | | | -10.2 | | | | -2.1 | |
South Africa | | | -2.6 | | | | -7.5 | | | | -2.9 | |
| |
Source: OECD and Statistics South Africa
40
CHAPTER 3: EMPLOYMENT
Scale of job losses was large given the relatively small contraction in output
Most of this increase is attributable to the large drop in global production that accompanied the recession. As Table 3.1 shows, the scale of job losses in South Africa was large given the relatively small contraction in output.
Growth, flexibility and job creation
In some countries, flexible policies allowed governments to stave off job losses
National economic conditions played an important role in the scale of employment losses. Where housing bubbles popped, construction firms retrenched large numbers of workers. Construction sector employment relative to 2007 levels has fallen by 28 per cent in the US, 39 per cent in Spain and 68 per cent in Ireland. In contrast, where the shock to the economy was a temporary contraction in export demand or the reversal of foreign capital flows, the impact was more limited. In Germany, Korea and Mexico, which experienced temporary declines in output, government policies helped to stave off job losses. The most effective policies allowed for a flexible adjustment in wages, modification of working conditions and short-time work schemes.
Figure 3.1 Peak-to-trough fall in output and employment, selected countries, 2007 — 2010
About 400 000 jobs a year needed to return absorption rate to pre-crisis level
While net job creation is taking place internationally, it will be some time before many countries return to pre-crisis employment levels. South Africa faces similar challenges in securing both accelerated economic growth and a higher employment intensity. The National Treasury’s employment scenario analysis suggests that if labour force participation rates return to their pre-recession level of 58 per cent, about 400 000 jobs a year will be needed just to keep the unemployment rate at 24 per cent. Reducing unemployment will require a much faster pace of job creation.
Long-term unemployment
Lengthy periods of joblessness create their own inertia. The probability of finding a job declines with the length of time a person spends out of work. Moreover, the resulting depreciation of skills lowers potential growth — the rate at which an economy can grow sustainably. In South Africa there are
41
2011 BUDGET REVIEW
2.8 million long-term unemployed persons, accounting for 68 per cent of the total, up from 61 per cent in 2008.
Youth unemployment
A global crisis of youth employment — and an acute one in South Africa
Young people were among the worst affected by the global economic crisis. Youth unemployment has increased by six percentage points in Organisation for Economic Cooperation and Development (OECD) countries and stands at 19 per cent. According to the International Labour Organisation, about 38 per cent of the world’s unemployed, or 78 million persons, are between 15 and 24 years old.
Table 3.2 Composition of youth employment
| | | | | | | | | | | | | | | | | | | |
| Sector | | Type of business | | Firm size |
| | | | | | | | | |
| | | | | | | | | Small | | | |
| | | | | Other | | | | Public | | | Private | | Private | | and | | | Medium |
| Agriculture | | Manufacturing | | industry | | Services | | sector | | | sector | | households | | micro | | | and large |
| | | | | | | | | |
| 5.6% | | 11.6% | | 12.6% | | 65.1% | | 7.2% | | | 86.2% | | 5.9% | | 67.9% | | | 27.8% |
| | | | | | | |
| | |
| Source: | | Statistics South Africa, Quarterly Labour Force Survey |
The problem of youth unemployment in South Africa, already acute, has worsened over the past two years. Youth accounted for about 40 per cent of all job losses during this period, as employment of 15- to 24-year olds fell by 21.8 per cent (355 000) compared with an overall decline of 6.4 per cent. Fewer than half of all those who enter school successfully complete Grade 12, and about 85 per cent enter the labour market without formal further or higher education.
Almost 15 million working-age adults are under 30 years of age, equal to just under half of the country’s working-age population (46 per cent). And the population is getting younger. South Africa’s demographics present both a challenge and an opportunity. Inclusive growth requires greater participation and employment, particularly among young people.
The importance of previous work experience in finding a job
The probability of finding a job in six months’ time rises with age. An unemployed person aged 18 to 24 years old has about an 11 per cent chance of finding a job in six months, compared with 22 per cent for a person aged 25 to 54 years. Work experience reduces this disparity. The youth employment subsidy described in this chapter is one of several government initiatives, alongside training and skills opportunities, designed to help young people gain work experience.
n Towards recovery in the domestic labour market
South Africa experienced one of the largest percentage declines in employment
In South Africa, the decline in employment over the past two years has been particularly severe given the relative shallowness of the domestic recession. Output contracted by just 2.6 per cent — a low figure by international comparison — while employment fell by 7.5 per cent (1 million jobs), between its peak of 14 million in December 2008 and its low point of 13 million in September 2010. This was a larger percentage fall in employment than any OECD member country experienced, apart from Spain, Ireland and Iceland.
42
CHAPTER 3: EMPLOYMENT
Table 3.3 Non—agricultural formal sector employment, 2008 — 2010
| | | | | | | | | | | | | | | | | | | | | | | | | | | | | | | |
| | | | | | | | | | | | | | | | Employment | | | |
| | | Employment, end of period | | | change | | | Employment |
| | | | | | | (thousands) | | | | | | | (thousands) | | | change (%) |
| | | | | | | | | |
| | | 2008 | | 2009 | | 20101 | | | 2009 | | 20101 | | | 2009 | | 20101 |
| | | | | | | |
| Mining | | | 518 | | | | 488 | | | | 503 | | | | | -30 | | | | 15 | | | | | -5.8 | | | | 3.1 | |
| Manufacturing | | | 1 275 | | | | 1 185 | | | | 1 163 | | | | | -90 | | | | -22 | | | | | -7.1 | | | | -1.9 | |
| Electricity, gas and water | | | 59 | | | | 56 | | | | 58 | | | | | -3 | | | | 2 | | | | | -5.1 | | | | 3.6 | |
| Construction | | | 474 | | | | 415 | | | | 406 | | | | | -59 | | | | -9 | | | | | -12.4 | | | | -2.2 | |
| Trade and accomodation | | | 1 747 | | | | 1 665 | | | | 1 648 | | | | | -82 | | | | -17 | | | | | -4.7 | | | | -1.0 | |
| Transport and communications | | | 366 | | | | 359 | | | | 356 | | | | | -7 | | | | -3 | | | | | -1.9 | | | | -0.8 | |
| Financial, real estate and business services | | | 1 914 | | | | 1 796 | | | | 1 773 | | | | | -118 | | | | -23 | | | | | -6.2 | | | | -1.3 | |
| Community and personal services | | | 2 159 | | | | 2 199 | | | | 2 242 | | | | | 40 | | | | 43 | | | | | 1.9 | | | | 2.0 | |
| | | | | | | |
Total | | | 8 512 | | | | 8 163 | | | | 8 149 | | | | | -349 | | | | -14 | | | | | -4.1 | | | | -0.2 | |
| | | | | | | |
| | |
| 1. | | September 2010, change compared with December 2009. |
| |
| Source: | | Statistics South Africa, Quarterly Employment Statistics |
Large job losses took place in the financial, real estate and business services sector, the trade sector and in manufacturing. In construction, employment fell by 14.3 per cent between 2008 and 2010. The weak housing market has translated into fewer building plans passed, fewer residential buildings completed and a decline in residential investment.
Falloff in global trade led to lower external demand for goods and services
The sharp fall in global trade resulted in lower external demand for South Africa’s goods and services. Manufacturing exports fell by 28 per cent in 2009 and capacity utilisation was 9 per cent below its 2007 levels, contributing to the 9 per cent fall in manufacturing employment since the end of 2008.
Over the past two years, unit labour costs spiked as real wages in the non-agricultural formal sector have risen by 14.6 per cent, despite the contraction in employment.
Nascent recovery in the labour market
Stats SA data suggests that employment has begun to increase
Employment levels have started to recover after falling sharply in 2009 and during the first quarter of 2010. The Quarterly Employment Statistics shows that employment in many services sectors rose during the second and third quarters of 2010, consistent with the strong rebound in household consumption.
The Quarterly Labour Force Survey recorded that employment rose by a net 157 000 jobs across the formal and informal sectors in the final three months of 2010.
Sectoral employment scenarios
Job creation will strengthen over the medium term
Employment growth is likely to strengthen over the medium term as business confidence improves, excess capacity declines, investment rises and companies begin hiring again. Job-creation trends leading up to the recession can help to identify sectors that are most likely to begin hiring in large numbers.
43
2011 BUDGET REVIEW
Trade and construction sectors can create about 485 000 jobs over the next three years
The National Treasury has compiled sector employment scenarios using the Budget forecast and pre-recession employment trends as a foundation. If growth performs as expected, the trade and construction sectors can create about 485 000 jobs over the next three years.
Table 3.4 Sector employment scenarios
| | | | | | | | | | | | | | | | | | | | | | |
| | | Assumed | | Employment | | | | | | | | | |
| | | annual | | elasticity of | | Employment | | | Employment | | |
| | | growth, (%) | | growth | | 2010 | | | growth (%) | | Job creation |
| | | 2011 — 2013 | | 2003 — 2008 | | (thousands) | | | 2011 — 2013 | | (thousands) |
| | | | |
| Manufacturing | | | 4.0 | | | | 0.5 | | | | 1 783 | | | | | 5.5 | | | | 97 | |
| Utilities | | | 3.5 | | | | 1.5 | | | | 94 | | | | | 16.6 | | | | 16 | |
| Construction | | | 5.5 | | | | 1.1 | | | | 1 056 | | | | | 18.9 | | | | 200 | |
| Trade | | | 4.3 | | | | 0.7 | | | | 2 975 | | | | | 9.6 | | | | 285 | |
| Transport and communications | | | 4.0 | | | | 0.7 | | | | 761 | | | | | 8.9 | | | | 68 | |
| Financial, real estate and business services | | | 4.3 | | | | 1.0 | | | | 1 594 | | | | | 13.6 | | | | 217 | |
| | | | |
Figure 3.2 Sector contributions to employment growth in selected economies, 2003 — 2007
Other industry is mining, utilities and construction. Brazil data is for 2002-2006
Source: International Labour Organisation, Statistics South Africa
n Policies for faster job creation
Government encourages private investment and contributes directly through public-sector job initiatives
To achieve the higher rate of sustainable job creation envisioned in the New Growth Path, the economy needs to grow more rapidly. Government’s contribution to job creation operates on two levels. First, economic policies promote an environment that is conducive to private-sector growth and investment, including appropriate regulation and microeconomic reform. Second, government makes a direct contribution through public-sector hiring and targeted job-creation programmes.
To promote growth and investment, government will continue to provide stability, certainty and guidance through sound macroeconomic management of the economy, while encouraging reforms that enable businesses to flourish and create jobs.
44
CHAPTER 3: EMPLOYMENT
The employment cost of missing out on the commodities boom
Employment scenarios can indicate how many mining jobs South Africa may have missed out on by failing to exploit the commodities boom over the past decade. While South African gold mines are in the midst of a long-term decline, non-gold mining production and employment increased over the period 2003 to 2008. For every 1 per cent increase in value added, employment rose by 2.7 per cent.
The table presents hypothetical scenarios. What would have happened if mining had expanded at rates observed in Australia (Scenario A) or Brazil (Scenario B) over this period? Had the South African mining sector grown at the same rate as Brazil, an additional 51 000 jobs would have been created between 2003 and 2008.
| | | | | | | | | | | | | | | | | |
| | | Annual rate of growth 2003 — 2008 | | | | |
| | | Production | | Value added | | Employment | | Additional jobs |
| | | | | | | | | (thousands) |
| |
| Actual | | | 1.3 | % | | | 1.9 | % | | | 5.0 | % | | | | |
Scenario A (Australia)1 | | | 3.6 | % | | | 5.0 | % | | | 6.5 | % | | | 19 | |
Scenario B (Brazil)1 | | | 5.0 | % | | | 6.9 | % | | | 9.0 | % | | | 51 | |
| |
| | |
| 1. | | Assumes employment increases by 1.3 per cent for every 1 per cent rise in value added. |
Providing the right regulatory environment and incentives will be critical for South Africa to make best use of its mineral resources, and to achieve higher levels of mining investment, output and employment.
Boost productivity
To be globally competitive, South African businesses need to boost productivity
To compete in world markets, South African businesses need to increase their productivity. Unit labour costs are an important indicator of competitiveness. Over the past two decades, real wage growth in South Africa has outpaced growth in labour productivity, which has been relatively slow.
Figure 3.3 Labour productivity growth, 1990 — 2008
| | |
| * China’s labour productivity growth was 305 per cent over this period |
| |
| Source: | | International Labour Organisation |
45
2011 BUDGET REVIEW
Develop skills and competencies
The school-to-work transition needs to be eased and more school leavers need to get work experience
To meet the demands of a growing economy, South Africa requires a skilled, well-educated workforce. In recent years government has placed more emphasis on high-quality foundation-phase education, and promoted measures to upgrade workforce skills. Policy adjustments can also facilitate the school-to-work transition by reducing high-school dropout rates and helping school leavers to obtain the work experience needed for longer-term job prospects.
Further education and training (FET) college pass rates were very low in 2009 — 9.6 per cent for level two and 12.4 per cent for level three of the national vocational certificate. These figures underscore the need for investment in quality improvements before significant skills growth can be achieved through the FET system. Government is planning to support additional training for all lecturers, targeted interventions for subjects where performance is especially low, and student support programmes. Work-placement opportunities would strengthen links between FET colleges and employers.
Reforms to SETAs are necessary
Reforms to the Sector Education and Training Authorities (SETAs) and implementation of the new National Skills Development Strategy will promote expanded and improved skills development across the economy, stepped up training for work-seekers and higher workplace productivity. Analysis of the current scheme will improve its effectiveness and impact on job creation. As of December 2010, 33 552 workers had enrolled in training through the learnership incentive in 2010/11. The National Skills Fund and SETAs will receive an estimated R5.8 billion and R23.1 billion, respectively, over the next three years.
Several industrial policy incentives also encourage job creation and training. Renewed tax incentives for the manufacturing sector will support labour-intensive investments and provide an additional training allowance of R36 000 per employee, to be offset against taxable income.
Support for job seekers
Department of Labour is enhancing services provided at labour centres
More cohesive and extensive employment services are needed to develop job readiness, and more intensive job-search assistance is necessary to match workers with jobs. Employment services can be provided by public or private agencies, but in either case they require sufficient capacity and skills to ensure a cost-effective, long-term impact. The Department of Labour will extend the services offered at labour centres, including the registration of job seekers and placement opportunities, matching services, referrals to training and career information. Specialised services are available for youth, women and people in rural areas.
Targeted job-creation initiatives
Support for small business
Consolidation and strengthening of support for small business
Small businesses create jobs. Firms with fewer than 50 workers account for about 68 per cent of private employment and 77 per cent of all hiring that takes place. Consolidating and strengthening small business financial
46
CHAPTER 3: EMPLOYMENT
and advisory support, drawing on both public and private sector capacity, should contribute to more rapid growth of employment opportunities in this sector.
Jobs Fund
R9 billion Jobs Fund will support projects that can employ younger workers
Government has created a R9 billion Jobs Fund to support projects with the potential to create large numbers of jobs — particularly for younger workers. The fund will request proposals from public and private-sector implementing organisations, including non-governmental and civil society organisations. Projects supported by the fund are expected to employ 50 000 to 100 000 people over the medium term.
Youth employment incentives
Youth employment subsidy to result in creation of 178 000 net new jobs
Government is developing a range of incentives to promote youth employment. These include a youth employment subsidy, intended to increase demand for young workers. The subsidy will lower the relative cost of labour for businesses without affecting a worker’s wages. The experience and training gained during the period of subsidised work will improve longer-term career prospects. It is estimated that this subsidy will support 423 000 new jobs for young workers. Given that industry would have employed a certain number of young workers without the subsidy, net new job creation is projected to be 178 000 jobs. The subsidy will cost R5 billion over the three-year spending period.
Training layoff scheme
Government created the training layoff scheme to mitigate the effects of the recession on employers in distress. The scheme was allocated R2.4 billion from the National Skills Fund and the Unemployment Insurance Fund to subsidise the temporary suspension of work in favour of training. As of January 2011, the scheme had supported 7 286 workers at a cost of R21.3 million in training allowances.
Expanded public works
Expanded public works will create nearly 800 000 jobs of 104 days average duration in 2011/12
The expanded public works programme consists of infrastructure, social, environmental and community projects administered by various departments, municipalities and partner organisations. Overall expenditure is budgeted at about R73 billion over the next three years. The programme has created about 1 million short-term jobs since the beginning of the second phase in April 2009, and targets the creation of nearly 800 000 short-term jobs of 104 days average duration in 2011/12. About 440 000 of these will be in infrastructure projects, such as provincial road maintenance.
The community works programme, introduced in 2009, has grown rapidly and employed about 81 000 persons in part-time jobs by the end of 2010.
47
2011 BUDGET REVIEW
n New Growth Path job targets
The New Growth Path aims to create 5 million jobs over 10 years. The sector targets are as follows:
| • | | Infrastructure development and housing — 250 000 jobs a year to 2015 |
| |
| • | | Agriculture and agro-processing — 500 000 jobs by 2020 |
| |
| • | | Mining — 140 000 jobs by 2020 |
| |
| • | | Manufacturing (industrial policy action plan) — 350 000 jobs by 2020 |
| |
| • | | Tourism — 225 000 jobs by 2015 |
| |
| • | | “Green”, “knowledge” and “social” economies — 660 000 jobs by 2020 |
| |
| • | | Health, education and policing — 100 000 jobs by 2020 |
| |
| • | | Regional integration — 150 000 jobs by 2020. |
n Conclusion
As the economy recovers, there is potential for stronger growth in employment
Employment levels have started to rise. Accelerating economic growth over the medium term will create the potential for more rapid job creation.
The New Growth Path proposes a range of initiatives for sectoral employment, building on policies already in place. In the near term, these proposals focus on creating jobs in infrastructure, agriculture, mining, the “green economy”, tourism, business services and manufacturing.
Cooperation between public and private sectors is needed to support massive job creation
Achieving large-scale job creation and a sustained reduction in unemployment is at the heart of the country’s inclusive growth challenge. This will require greater cooperation between the public sector and the private sector — where most job creation takes place. Government also needs to address the structural impediments to job creation and provide an enabling environment that allows the private sector to grow, invest and accelerate hiring.
48
4
Fiscal policy
n Overview
The countercyclical fiscal stance contributes to economic growth and job creation
Economic growth is the prerequisite for reducing poverty and improving livelihoods. By offsetting the effects of the business cycle, countercyclical fiscal policy contributes to growth and job creation. When the economy is doing well, the budget balance improves to build fiscal space, limit increases in the cost of financing and counteract inflationary pressures. When the economy is underperforming, government allows the budget balance to deteriorate, using the fiscal space built up beforehand to fund expenditure and stimulate economic activity.
Owing to sound management of the fiscus during the preceding six years of strong economic growth (2002-2007), government entered the 2008-2009 recession with healthy public finances and a comparatively low level of debt. This allowed for a flexible response to deteriorating economic conditions. Spending increased to reinforce the social security net during a period of exceptional hardship for many South Africans, and provided an economic stimulus through the infrastructure programme.
Government debt needs to be managed sustainably
To ensure that public expenditure is not crowded out by an ever-rising interest burden, government debt needs to be managed sustainably. Long-term fiscal planning, predictable actions and credible policies create confidence in the future of the economy. South Africa’s ability to continue building roads, schools and hospitals will depend on how quickly the economy grows, the long-term level of spending, and the choices made about financing social programmes.
The projected budget deficit in 2010/11 is R142.4 billion, or 5.3 per cent of GDP. As economic growth strengthens, and tax revenue recovers, government will reduce the budget deficit gradually to 3.8 per cent of GDP by 2013/14.
49
2011 BUDGET REVIEW
n The budget framework
Table 4.1 summarises the medium-term budget framework. Key features of the 2011 Budget include the following:
| • | | Tax revenue increases from 25.2 per cent of GDP in 2010/11 to 26.2 per cent in 2013/14 |
| |
| • | | Baseline expenditure additions total R94.1 billion |
| |
| • | | Real non-interest expenditure growth averages 2.8 per cent a year |
| |
| • | | Debt-service costs rise from 2.5 per cent of GDP in 2010/11 to 2.9 per cent by 2013/14 |
| |
| • | | The budget deficit improves to 3.8 per cent in 2013/14. |
Table 4.1 Consolidated government fiscal framework, 2007/08 — 2013/14
| | | | | | | | | | | | | | | | | | | | | | | | | | | | | | | |
| | | | | | | | | | 2010/11 | | | | | | | |
| | | 2007/08 | | 2008/09 | | 2009/10 | | | Revised | | | 2011/12 | | 2012/13 | | 2013/14 |
| R million | | | | | | Outcome | | | | | | | estimate | | | Medium-term estimates |
| | | | | | | |
Revenue | | | 626 705 | | | | 682 997 | | | | 664 840 | | | | | 755 023 | | | | | 824 466 | | | | 908 714 | | | | 1 017 187 | |
Percentage of GDP | | | 30.1 | % | | | 29.5 | % | | | 27.2 | % | | | | 28.3 | % | | | | 28.3 | % | | | 28.4 | % | | | 28.8 | % |
Expenditure | | | 591 522 | | | | 710 523 | | | | 825 917 | | | | | 897 376 | | | | | 979 265 | | | | 1 061 582 | | | | 1 151 773 | |
Percentage of GDP | | | 28.5 | % | | | 30.7 | % | | | 33.8 | % | | | | 33.6 | % | | | | 33.6 | % | | | 33.2 | % | | | 32.6 | % |
Budget balance | | | 35 183 | | | | -27 526 | | | | -161 076 | | | | | -142 353 | | | | | -154 799 | | | | -152 868 | | | | -134 586 | |
Percentage of GDP | | | 1.7 | % | | | -1.2 | % | | | -6.6 | % | | | | -5.3 | % | | | | -5.3 | % | | | -4.8 | % | | | -3.8 | % |
| | | | | | | |
Gross domestic product | | | 2 078 822 | | | | 2 312 965 | | | | 2 442 593 | | | | | 2 666 894 | | | | | 2 914 862 | | | | 3 201 299 | | | | 3 536 002 | |
| | | | | | | |
Government will consolidate the fiscal position in line with economic growth
Over the next three years, as economic growth strengthens, government will consolidate the fiscal position by moderating the rate of expenditure growth. Priority spending will continue to be financed as government stabilises its borrowing. Fiscal policy will maintain this trajectory as long as economic growth continues to strengthen, rebuilding fiscal space to respond to future crises.
National Treasury proposes fiscal guidelines for South Africa
‘Nothing is free, absolutely nothing ... it is paid for from revenue collected from those who pay taxes.’ — President Jacob Zuma
The current debt crisis in several European countries, which has tested the durability of the currency union, is a stark reminder that fiscal mismanagement can make social programmes unaffordable. During 2010, Parliament asked the National Treasury to investigate how government could sustainably afford its expenditure over the long term. In response, the National Treasury is proposing guidelines for sustainable management of the public finances. The guidelines are informed by three principles:
| • | | Countercyclicality: The budget balance should be set to counteract variations in the business cycle. |
| |
| • | | Long-term debt sustainability: Spending levels must ensure that debt and interest costs do not rise indefinitely. |
| |
| • | | Inter-generational equity: The long-term costs of spending programmes should be considered. |
Developing fiscal policy based on these principles will strengthen parliamentary oversight of the budget process, encourage greater transparency and enhance public accountability. It will also facilitate sustainable progress on the New Growth Path by encouraging investment, a more stable economy and higher growth. To give effect to these principles, the National Treasury proposes that government:
| • | | Adopt an annual target for the structural budget balance consistent with long-term growth, the desired level of public debt and inter-generational considerations. |
| |
| • | | Make explicit the costs of existing and new programmes that require a long-term commitment. |
| |
| • | | Set out a timeline to bring the budget back on target following large fiscal shocks. |
50
CHAPTER 4: FISCAL POLICY
Revenue
Tax revenue expected to recover as economy grows and tax base broadens
Tax revenue, which accounts for most revenue available to government, has become more sensitive to changes in the economic cycle since the tax base was restructured in the early 1990s. As a result, tax revenue tends to accelerate when the economy is doing well, and to slow sharply when the economy is underperforming. If revenue does not cover expenditure, borrowing is a short-term solution, but higher government expenditure as a share of GDP ultimately requires a growing tax base or higher tax rates. At the height of the recession in 2009/10, revenue underperformed expectations by R60.6 billion. Over the medium term, tax revenue is expected to recover as the economy grows and the tax base broadens.
Figure 4.1 Structure of tax revenue, 1996/97 — 2013/14
Table 4.2 presents consolidated government revenue outcomes from 2007/08 to the present, and the three-year projection.
Table 4.2 Consolidated government revenue, 2007/08 — 2013/14
| | | | | | | | | | | | | | | | | | | | | | | | | | | | | | | |
| | | | | | | | | | 2010/11 | | | | | | | |
| | | 2007/08 | | 2008/09 | | 2009/10 | | | Revised | | | 2011/12 | | 2012/13 | | 2013/14 |
| R million | | | | | | Outcome | | | | | | | estimate | | | Medium-term estimates |
| | | | | | | |
Tax revenue | | | 572 815 | | | | 625 100 | | | | 598 705 | | | | | 672 200 | | | | | 741 620 | | | | 827 310 | | | | 927 960 | |
Percentage of GDP | | | 27.6 | % | | | 27.0 | % | | | 24.5 | % | | | | 25.2 | % | | | | 25.4 | % | | | 25.8 | % | | | 26.2 | % |
Non tax revenue1 | | | 12 693 | | | | 12 616 | | | | 8 889 | | | | | 12 254 | | | | | 10 001 | | | | 11 540 | | | | 12 351 | |
of which: | | | | | | | | | | | | | | | | | | | | | | | | | | | | | | |
Mineral royalties | | | — | | | | — | | | | — | | | | | 3 712 | | | | | 4 890 | | | | 5 150 | | | | 5 430 | |
Estimate of SACU payments2 | | | -24 713 | | | | -28 921 | | | | -27 915 | | | | | -14 991 | | | | | -21 763 | | | | -32 432 | | | | -35 997 | |
Other adjustment3 | | | — | | | | — | | | | — | | | | | -2 900 | | | | | — | | | | — | | | | — | |
| Provinces, social security funds and selected public entities | | | 65 910 | | | | 74 201 | | | | 85 162 | | | | | 88 460 | | | | | 94 609 | | | | 102 296 | | | | 112 873 | |
| | | | | | | |
Budget revenue | | | 626 705 | | | | 682 997 | | | | 664 840 | | | | | 755 023 | | | | | 824 466 | | | | 908 714 | | | | 1 017 187 | |
Percentage of GDP | | | 30.1 | % | | | 29.5 | % | | | 27.2 | % | | | | 28.3 | % | | | | 28.3 | % | | | 28.4 | % | | | 28.8 | % |
| | | | | | | |
Gross domestic product | | | 2 078 822 | | | | 2 312 965 | | | | 2 442 593 | | | | | 2 666 894 | | | | | 2 914 862 | | | | 3 201 299 | | | | 3 536 002 | |
| | | | | | | |
| | |
| 1. | | Includes mineral and petroleum royalties, mining leases and departmental revenue. |
| |
| 2. | | Estimates are based on National Treasury projections. Actual payment will be determined by outcomes of customs and excise revenue collections in line with the SACU agreement. |
| |
| 3. | | Payments to SACU partners in respect of a previous error in calculation of the 1969 agreement. |
51
2011 BUDGET REVIEW
Payments to SACU partners have been revised upwards as customs revenue has begun to recover
Non-tax revenue, made up of departmental revenue and mineral royalties, remains about 0.4 per cent of GDP over the forecast period. Changes in interest income and dividend payments account for revisions to departmental revenue estimates since February 2010. Revenue from mineral royalties is expected to be higher than projected a year ago given high commodity prices. Payments to South Africa’s Southern African Customs Union (SACU) partners have been revised upwards as a result of a recovery in customs and excise revenue since 2009/10.
Budget revenue also includes revenue from the social security funds, provinces, the RDP Fund and extra-budgetary institutions. According to the medium-term projection, social security fund revenue will benefit from increased contributions to the Unemployment Insurance Fund and Compensation Funds, while a higher fuel levy (see Chapter 5) will boost income for the Road Accident Fund. Provincial and extra-budgetary institution revenue is expected to remain in line with previously published estimates.
The financial crisis and Southern African Customs Union reforms
Botswana, Lesotho, Namibia, Swaziland and South Africa are members of SACU. The customs and excise revenue of each member state is collected in a common revenue pool, distribution of which is governed by a revenue-sharing formula. SACU revenues make up between 20 and 70 per cent of total government income for South Africa’s SACU partners.
The global downturn has resulted in a major loss of income to the SACU common revenue pool. As a result, Botswana, Lesotho, Namibia, and Swaziland have taken steps to adjust their public finances:
| • | | On the revenue side, measures include the introduction of VAT (Swaziland), increases in VAT rates and taxes (Botswana, Lesotho, Swaziland), and improved tax administration (Botswana, Lesotho, Swaziland). |
| |
| • | | Spending reductions are planned for public-sector wages and non-priority consumption expenditure. |
The dependency of South Africa’s fellow SACU members on the volatile revenue pool resulted in a decision by the Council of Ministers to review the arrangement. The goals of this review are to identify a more equitable distribution of revenue and to enhance economic integration. An independent study has recommended the following reforms:
| • | | An entitlement based on the taxes that each country generates through customs and excise duties, combined with an adjustment based on the extent to which a member state benefits or is disadvantaged by belonging to SACU. |
| |
| • | | A fund to support infrastructure and trade projects that promote regional integration and development. |
Expenditure
Fiscal framework adds R94.1 billion to baseline expenditure over the medium term
The fiscal framework adds R20.7 billion to expenditure in 2011/12, R29.6 billion in 2012/13 and R43.8 billion in 2013/14, resulting in average real growth of 2.8 per cent in government non-interest spending over the next three years. These additions to baseline include:
| • | | R26.3 billion to cover the carry-through costs of the 2010 public-sector wage agreement, including a 7.5 per cent cost-of-living adjustment and an R800 monthly housing allowance |
| |
| • | | R23.9 billion allocated from the policy reserve for priority expenditure in job creation, skills, health and education |
| |
| • | | R40.8 billion in adjustments to baselines for existing programmes, including education, health, public safety and social protection |
52
CHAPTER 4: FISCAL POLICY
| • | | R3.1 billion allocated from the contingency reserve to provide flood and drought relief to provinces. |
R30.6 billion in savings reprioritised over the MTEF
For the past two years government has worked to improve the efficiency of public expenditure. Total savings of R30.6 billion have been identified over the medium-term expenditure framework (MTEF) period and allocated to priority expenditure. Over the next three years, departments will be called on to increase support to effective programmes, and to cut or curtail ineffective ones. These plans are discussed in Chapter 8.
Balancing the composition of expenditure
Government has to balance capital and consumption expenditure
Government expenditure falls into two broad categories: capital spending and consumption spending (including wages, goods and services, and interest payments). Expenditure needs to be balanced appropriately to promote effective public-service delivery, and to ensure that spending contributes to economic growth without fuelling inflation.
Figure 4.2 Consolidated government expenditure
Real growth in expenditure
Transfers and subsidies
Payment for capital assets
Current payments
The 2010 public-sector wage negotiations resulted in a 7.5 per cent wage increase, which was 3.4 percentage points higher than the expected inflation rate. This required an extra allocation of R6.5 billion to cover compensation of employees in 2010/11.
Between 2002/03 and 2009/10 prudent management of the fiscus drove down debt-service costs as a percentage of GDP. During the recession,
53
2011 BUDGET REVIEW
government borrowing increased, and as a result of the higher debt burden, interest costs are projected to be the fastest-growing area of expenditure over the medium term. As debt costs consume a rising share of expenditure over the next three years, government must ensure that it can maintain expenditure on social and economic priorities. A higher wage bill, in conjunction with a rising interest bill, can reduce spending on maintenance, capital investment, and public-service employment growth.
Framework makes provision for 6.6 per cent average annual growth in compensation
To cover wage increases and the additional employment, the proposed fiscal framework makes provision for 6.6 per cent average annual growth in compensation. Over this period, consumer price inflation is projected to average 5.2 per cent.
Figure 4.3 Structure of consolidated government expenditure, 2002/03 — 2013/14
| | |
| * | | Other includes rent on land, payments for financial assets and other transfers |
15 million people depend on government transfers to households
Over the medium term, real growth in government transfers to households is projected to average 3.2 per cent. Nearly 15 million people now depend on some form of government grant, and for many households social security payments are the only regular source of income.
Since 2002/03, consolidated government spending on capital1 has increased from 5.2 per cent of consolidated government expenditure to 6.7 per cent in 2010/11. Over the next three years, the rate of capital expenditure will slow moderately as higher interest costs, wage pressures and growth in social grants claim a greater share of expenditure.
Public-sector infrastructure
To meet present and future demand, and to grow the economy more rapidly, South Africa needs sufficient power to run factories, mines, schools and households; well-maintained road and rail networks to transport people and goods; and ports and pipelines to facilitate trade.
| | |
| 1 | | Does not include expenditure on maintenance or capital transfers to municipalities and non-financial public enterprises. |
54
CHAPTER 4: FISCAL POLICY
Infrastructure programme works in tandem with the job-creation goals of the New Growth Path
Infrastructure expenditure includes spending on new buildings and fixed structures, as well as maintaining and rehabilitating existing structures. Infrastructure spending by the public sector, including municipalities and state-owned enterprises, supports priority economic and social objectives, and the job-creation goals of the New Growth Path.
Table 4.3 Public-sector infrastructure expenditure and estimates by sector, 2010/11 — 2013/14
| | | | | | | | | | | | | | | | | | | | | | | | | | | |
| | | 2010/11 | | | | | | | | | | | | |
| | | Revised | | | 2011/12 | | 2012/13 | | 2013/14 | | | MTEF | | % |
| R million | | estimate | | | Medium-term estimates | | | Total | | of total |
| | | | | | | |
Economic Services | | | 228 657 | | | | | 216 181 | | | | 219 380 | | | | 228 507 | | | | | 664 067 | | | | 82.1 | % |
| Energy | | | 102 782 | | | | | 96 500 | | | | 98 140 | | | | 96 769 | | | | | 291 409 | | | | 36.0 | % |
| Water and sanitation | | | 20 990 | | | | | 26 836 | | | | 25 367 | | | | 28 196 | | | | | 80 400 | | | | 9.9 | % |
| Transport and logistics | | | 80 530 | | | | | 67 452 | | | | 69 096 | | | | 75 554 | | | | | 212 102 | | | | 26.2 | % |
Other economic services1 | | | 24 356 | | | | | 25 393 | | | | 26 777 | | | | 27 987 | | | | | 80 157 | | | | 9.9 | % |
Social services | | | 26 249 | | | | | 29 519 | | | | 34 932 | | | | 44 268 | | | | | 108 719 | | | | 13.4 | % |
| Health | | | 8 546 | | | | | 10 256 | | | | 15 114 | | | | 20 624 | | | | | 45 993 | | | | 5.7 | % |
| Education | | | 6 757 | | | | | 9 155 | | | | 10 092 | | | | 11 487 | | | | | 30 735 | | | | 3.8 | % |
| Community facilities | | | 6 045 | | | | | 6 360 | | | | 5 873 | | | | 7 952 | | | | | 20 185 | | | | 2.5 | % |
Other social services2 | | | 4 902 | | | | | 3 749 | | | | 3 853 | | | | 4 205 | | | | | 11 806 | | | | 1.5 | % |
Justice and protection services3 | | | 3 100 | | | | | 3 322 | | | | 7 080 | | | | 10 171 | | | | | 20 573 | | | | 2.5 | % |
Central government administrative and financial services | | | 2 104 | | | | | 3 827 | | | | 7 946 | | | | 3 474 | | | | | 15 248 | | | | 1.9 | % |
| | | | | | | |
Total | | | 260 109 | | | | | 252 850 | | | | 269 337 | | | | 286 420 | | | | | 808 608 | | | | 100.0 | % |
Percentage of GDP | | | 9.8 | % | | | | 8.7 | % | | | 8.4 | % | | | 8.1 | % | | | | | | | | | |
| | | | | | | |
Gross domestic product | | | 2 666 894 | | | | | 2 914 862 | | | | 3 201 299 | | | | 3 536 002 | | | | | | | | | | |
| | | | | | | |
| | |
| 1. | | Other economic services includes agriculture, environmental infrastructure, telecommunications, housing and industrial development zones. |
| |
| 2. | | Other social services includes labour centres, heritage institutions and national libraries. |
| |
| 3. | | Other justice and protection services includes the Legal Aid Board and private security industry regulatory authorities. |
Medium-term public infrastructure spending projected at R808.6 billion
Public-sector spending on infrastructure has increased from 4.6 per cent of GDP in 2006/07 to 9.8 per cent of GDP in 2010/11, and is expected to average 8.4 per cent of GDP over the forecast period, totalling R808.6 billion. Economic services make up 82.1 per cent of infrastructure development over the medium term. Infrastructure projects in this category include power plant construction, transport network expansion and upgrades, and the provision of new sanitation and water infrastructure.
The social services category makes up 13.4 per cent of spending, of which education and health account for 3.8 per cent and 5.7 per cent respectively.
Reforming how government budgets for capital expenditure
Government will apply a systematic approach to appraising public-sector infrastructure projects to ensure maximum value for money invested.
The intention is to create a register of “shovel-ready” projects that have been fully costed and planned (including long-term maintenance), so that when funds become available through the budget, infrastructure investment can flow smoothly.
This approach will apply initially to all projects involving public-private partnerships; over time, it will begin to cover government’s mega-projects, in tandem with improved project appraisal capacity.
55
2011 BUDGET REVIEW
Table 4.4 Major infrastructure projects
| | | | | | | | | |
| | | Total | | | | |
| | | project | | | | |
| | | cost | | Implementation | | |
| Project name | | R billion | | agent | | Project objective and completion target date |
| |
Energy | | | | | | | | |
| Kusile power station | | | 142 | | | Eskom | | Construction of a 4 800MW coal-fired power station (to be completed in 2012). |
| Medupi power station | | | 125 | | | Eskom | | Construction of 4 788MW coal-fired power station (to be completed in 2015). |
Ingula pumped-storage
scheme | | | 15.6 | | | Eskom | | Construction of a 1 332MW hydroelectric power station (first unit to be completed in 2013). |
| Eskom’s return-to-service projects | | | 27 | | | Eskom | | Demothballing of three coal-fired power stations - Camden, Grootvlei and Komati (to be completed in 2012). |
| |
Transport | | | | | | | | |
Gauteng freeway
improvement scheme | | | 20.7 | | | South African National
Roads Agency Limited | | Upgrade and lane additions to Gauteng’s highway. Phase 1 (2012) and phase 2 (2020). |
New multi-product
pipeline phase 1 | | | 23.4 | | | Transnet | | Construction of a 8.7 billion litres per year pipeline (to be commissioned in 2011). |
| Iron-ore line | | | 11.6 | | | Transnet | | Upgrade of the iron-ore line to 60 million tons per year (scheduled for completion in 2013). |
Ngqura container
terminal | | | 10 | | | Transnet | | Improving port capacity by an additional 800 000
20-foot equivalent units |
| | | | | | | | | (scheduled for completion in 2013). |
| |
Water | | | | | | | | |
Mokolo-Crocodile water
augmentation project | | | 15 | | | Trans-Caledon Tunnel
Authority | | Phase 1 to deliver water (2012) and phase 2 (2015). |
Olifants River water
resource development
project | | | 16.1 | | | Trans-Caledon Tunnel
Authority | | Construction of a dam and bulk distribution (to be completed in 2016). |
| |
Housing | | | | | | | | |
Cornubia housing
development | | | 5.1 | | | The Housing Development Agency and eThekw ini | | Construction of 19 313 mixed-income, mixed-density houses (scheduled to be completed 2016/17). |
| | | | | | | Metropolitan Municipality | | |
| N2 Gateway | | | 2.3 | | | The Housing Development
Agency | | The creation of sustainable communities through the construction of 22 000 low-income houses |
| | | | | | | | | (scheduled for completion in 2013). |
| |
Hospitals | | | | | | | | |
Limpopo Academic
Hospital | | | 4 | | | Limpopo Department of Health | | Development of an academic hospital with tertiary facilities and services |
| | | | | | | | | (scheduled for completion in 2013). |
Nelson Mandela
Hospital | | | 4 | | | Eastern Cape Department of Health | | Improved health care through the upgrade and rehabilitation of the Nelson Mandela Hospital |
| | | | | | | | | (scheduled for completion in 2013). |
Chris Hani
Baragw anath Hospital | | | 4 | | | Gauteng Department of Health | | Improved health care through the upgrade and rehabilitation of the Sow eto hospital |
| | | | | | | | | (scheduled for completion in 2013). |
Dr George Mukhari
Hospital | | | 4 | | | Gauteng Department of Health | | Improved health care through the upgrade and rehabilitation of the George Mukhari Hospital |
| | | | | | | | | (scheduled for completion in 2013). |
King Edward VIII
Hospital | | | 4 | | | KZN Department of Health | | Improved health care through the upgrade and rehabilitation of the King Edward VIII Hospital |
| | | | | | | | | (scheduled for completion in 2013). |
| |
Correctional | | | | | | | | |
| PPP Prisons | | | 8 | | | Department of Correctional Services | | Upgrading of accomodation and related services to support the transformation process of correctional services facilities |
| | | | | | | | | (scheduled for completion in 2013). |
56
CHAPTER 4: FISCAL POLICY
Over the forecast period, the bulk of economic infrastructure will be provided by non-financial public enterprises, which are projected to spend R392.6 billion. Provincial infrastructure spending is expected to total R150.3 billion, and municipal infrastructure spending R131.6 billion.
Capital spending continues to underperform budgeted amounts
Capital expenditure continues to underperform budgeted amounts. Since 2006/07, provincial capital expenditure has averaged about 86 per cent of allocated capital budgets. The municipal performance has improved from 72 per cent in 2006/07 to 85 per cent in 2008/09, before declining to 80 per cent in 2009/10. Non-financial public enterprises spent 72 per cent of their capital budgets in 2009/10.
The box below elaborates on the reasons for underspending.
Reasons for underspending on infrastructure
| | | | | |
|
National government | | • | | Lack of critical skills to plan, manage risk and execute projects |
| | | | | |
| | | • | | Service-level agreements between departments and implementing agents that are difficult to enforce |
| | | | | |
| | | • | | Lack of flexibility in choosing procurement and project implementation agents that would ensure delivery of projects on time and on budget |
| | | | | |
Provincial government | | • | | Lack of integrated planning for health, education, housing infrastructure |
| | | | | |
| | | • | | Poor supply chain management, inadequate risk management |
| | | | | |
| | | • | | General lack of skills, especially in project management |
| | | | | |
Local government | | • | | Unrealistic financial targets result in cost overruns and funding shortfalls |
| | | | | |
| | | • | | Inefficient supply-chain management |
| | | | | |
| | | • | | Subdued revenue levels |
| | | | | |
| | | • | | Lack of capacity to plan and meet requirements for conditional grants |
| | | | | |
Non-financial public
enterprises | | • | | Recession — Downward revisions in plans and a postponement of projects, higher borrowing costs, delays in drawing down World Bank loan to Eskom |
| | | | | |
| | | • | | Signoff deadlines on agreements between departments and commercial project partners not met or treated with urgency |
| | | | | |
| | | • | | Delays in procurement of inputs |
| | | | | |
| | | • | | Inclusion of projects on budget that are not yet ready for implementation |
| | | | | |
| | | • | | Decline in construction material costs, leading to lower budgets |
The fiscal deficit
Borrowing to finance consumption is costly and unproductive
The fiscal framework supports a reduction of debt over time, which will reduce interest repayments and create fiscal space. Government borrowing to fund capital expenditure — such as the Gautrain — increases the overall wealth of the economy. Conversely, borrowing to finance consumption creates debt obligations that must be paid off long after the funds have been spent.
Moderating expenditure and recovering revenue will consolidate the fiscus over the medium term
Figure 4.4 shows the trajectory of the fiscus back towards long-term sustainability. The current position — the result of higher borrowing during the recession — is not sustainable over the long term. A moderation in the growth of expenditure, combined with a recovery in revenue, will consolidate the fiscus over the medium term. The projected improvement in the budget deficit is in line with the economic forecast.
57
2011 BUDGET REVIEW
Figure 4.4 Revenue and expenditure, 2002/03 — 2013/14
The 2010 Budget projected that debt stock would stabilise at about 44 per cent of GDP in 2015/16. As a result of improved economic growth, debt stock is now expected to stabilise at about 40 per cent of GDP in 2015/16. Any deterioration in the growth outlook, interest rates or the budget balance will prolong the fiscal recovery.
Structural budget deficit expected to improve to 3.6 per cent of GDP by outer year
Figure 4.5 shows the budget balance and the structural budget balance. The structural budget is a representation of what government revenue and expenditure would be if output were at its potential level, with cyclical variations stripped out. Over the next three years the budget deficit is projected to narrow to 3.8 per cent of GDP. Improvements in potential GDP growth should lead to a gradual rise in structural revenue. In combination with more moderate spending growth, this will lead to the structural budget deficit improving to 3.6 per cent of GDP by 2013/14.
Figure 4.5 Budget balance and structural budget balance, 2002/03 — 2013/14
58
CHAPTER 4: FISCAL POLICY
Savings
Savings represent domestic resources available to fund investment
Over the past 30 years, corporate, government and household savings have gradually declined, and consequently the pool of resources available to fund investment from a domestic base has become smaller.
Figure 4.6 Current balance, 2007/08 — 2013/14
South Africa has become more reliant on foreign savings to finance expenditure
Government reduced its dissaving2 between 2003/04 and 2007/08, and was able to effectively mobilise the savings collected during the growth period to fund revenue-generating capital projects. As government has drawn down savings, the fiscus has become reliant on foreign savings to finance the current balance and the capital investment programme.
Figure 4.7 Private, public and foreign savings, 1995 — 2009
Source: Reserve Bank
| | |
| 2 | | An excess of current expenditure, including the depreciation of fixed capital, over current income. |
59
2011 BUDGET REVIEW
A recovery in the current balance improves government savings
The current balance is the difference between current expenditure and current revenue, and acts as a proxy for government savings. Figure 4.6 shows that government is currently borrowing to finance short-term consumption. Long-term debt is being used to finance higher current expenditure on wages, interest and goods and services. An improvement in the current balance will lead to a recovery in government savings, reducing South Africa’s reliance on capital inflows, as shown in Figure 4.7.
n Revisions and forward estimates for the consolidated government budget
The budget deficit outcome in 2009/10 was R58 billion higher than projected. This was mainly due to lower-than-projected tax revenue collections of R60.6 billion, partially offset by under-expenditure of R8.4 billion. In 2010/11, a slower-than-anticipated recovery in revenue and continued growth in expenditure is expected to result in a deficit of R142.4 billion. Due to the improved economic and revenue outlook, as well as some savings on debt-service costs, the budget deficit is expected to be R26.2 billion lower than projected at the time of the 2010 Budget.
Table 4.5 Revised estimates of consolidated government revenue and expenditure, 2009/10 and 2010/11
| | | | | | | | | | | | | | | | | | | | | | | | | | | | | | | |
| | | 2009/10 | | | 2010/11 | | | % change |
| | | Budget | | | | | | | | | | | Budget | | Revised | | | | | | | 2009/10 — |
| R million | | estimate | | Outcome | | Deviation | | | estimate | | estimates | | Deviation | | | 2010/11 |
| | | | | | | |
Revenue | | | | | | | | | | | | | | | | | | | | | | | | | | | | | | |
| Tax revenue | | | 659 304 | | | | 598 705 | | | | -60 599 | | | | | 647 850 | | | | 672 200 | | | | 24 350 | | | | | 12.3 | % |
| Non-tax revenue | | | 11 602 | | | | 8 889 | | | | -2 713 | | | | | 10 380 | | | | 12 254 | | | | 1 874 | | | | | 37.9 | % |
| Less: SACU payments | | | -27 915 | | | | -27 915 | | | | -0 | | | | | -14 991 | | | | -14 991 | | | | — | | | | | -46.3 | % |
Other adjustment1 | | | — | | | | — | | | | — | | | | | — | | | | -2 900 | | | | -2 900 | | | | | | |
Other2 | | | 88 245 | | | | 85 162 | | | | -3 083 | | | | | 95 165 | | | | 88 460 | | | | -6 704 | | | | | 3.9 | % |
| | | | | | | |
Budget revenue | | | 731 235 | | | | 664 840 | | | | -66 395 | | | | | 738 404 | | | | 755 023 | | | | 16 619 | | | | | 13.6 | % |
Percentage of GDP | | | 29.6 | % | | | 27.2 | % | | | | | | | | 27.3 | % | | | 28.3 | % | | | | | | | | | |
| | | | | | | |
Expenditure | | | | | | | | | | | | | | | | | | | | | | | | | | | | | | |
| Current payments | | | 472 376 | | | | 474 252 | | | | 1 876 | | | | | 527 892 | | | | 534 072 | | | | 6 179 | | | | | 12.6 | % |
of which: | | | | | | | | | | | | | | | | | | | | | | | | | | | | | | |
Debt-service cost | | | 55 268 | | | | 57 129 | | | | 1 861 | | | | | 71 358 | | | | 66 570 | | | | -4 787 | | | | | 16.5 | % |
| Transfers and subsidies | | | 264 611 | | | | 263 936 | | | | -675 | | | | | 284 016 | | | | 282 269 | | | | -1 747 | | | | | 6.9 | % |
| Payments for capital assets | | | 61 349 | | | | 56 017 | | | | -5 332 | | | | | 68 163 | | | | 59 781 | | | | -8 382 | | | | | 6.7 | % |
| Payments for financial assets | | | 30 000 | | | | 31 711 | | | | 1 711 | | | | | 20 893 | | | | 21 254 | | | | 362 | | | | | -33.0 | % |
| Contingency reserve | | | 6 000 | | | | — | | | | -6 000 | | | | | 6 000 | | | | — | | | | -6 000 | | | | | 0.0 | % |
| | | | | | | |
Total expenditure | | | 834 336 | | | | 825 917 | | | | -8 419 | | | | | 906 964 | | | | 897 376 | | | | -9 588 | | | | | 8.7 | % |
Percentage of GDP | | | 33.7 | % | | | 33.8 | % | | | | | | | | 33.6 | % | | | 33.6 | % | | | | | | | | | |
| | | | | | | |
Budget balance3 | | | -103 100 | | | | -161 076 | | | | -57 976 | | | | | -168 560 | | | | -142 353 | | | | 26 207 | | | | | -11.6 | % |
Percentage of GDP | | | -4.2 | % | | | -6.6 | % | | | -2.4 | % | | | | -6.2 | % | | | -5.3 | % | | | 0.9 | % | | | | | |
| | | | | | | |
Gross domestic product | | | 2 474 214 | | | | 2 442 593 | | | | | | | | | 2 699 888 | | | | 2 666 894 | | | | | | | | | | |
| | | | | | | |
| | |
| 1. | | Payments to SACU partners in respect of a previous error in calculation of the 1969 agreement. |
| |
| 2. | | Includes provinces, social security funds and selected entities. |
| |
| 3. | | A positive number reflects a surplus and a negative number a deficit. |
60
CHAPTER 4: FISCAL POLICY
The 2011 Budget adjusts the forward estimates tabled in the 2010 Budget for 2011/12 and 2012/13 to take account of changes in the economic environment and policy priorities, and adds projections for 2013/14. Table 4.6 illustrates the changes to revenue and expenditure forecasts since February 2010.
Table 4.6 Consolidated government budget medium-term estimates, 2011/12 — 2013/14
| | | | | | | | | | | | | | | | | | | | | | | | | | | | | | | |
| | | 2011/12 | | | 2012/13 | | | 2013/14 |
| | | 2010 | | | | | | Change | | | 2010 | | | | | | | | | | | |
| | | Forward | | 2011 | | to | | | Forward | | 2011 | | Change to | | | 2011 |
| R million | | estimate | | Budget | | baseline | | | estimate | | Budget | | baseline | | | Budget |
| | | | | | | |
Revenue | | | | | | | | | | | | | | | | | | | | | | | | | | | | | | |
| Tax revenue | | | 721 477 | | | | 741 620 | | | | 20 143 | | | | | 818 298 | | | | 827 310 | | | | 9 012 | | | | | 927 960 | |
| Non-tax revenue | | | 11 483 | | | | 10 001 | | | | -1 482 | | | | | 12 379 | | | | 11 540 | | | | -839 | | | | | 12 351 | |
| Less: SACU payments | | | -11 211 | | | | -21 763 | | | | -10 552 | | | | | -22 781 | | | | -32 432 | | | | -9 651 | | | | | -35 997 | |
Other1 | | | 105 993 | | | | 94 609 | | | | -11 384 | | | | | 114 382 | | | | 102 296 | | | | -12 085 | | | | | 112 873 | |
| | | | | | | |
Budget revenue | | | 827 742 | | | | 824 466 | | | | -3 276 | | | | | 922 278 | | | | 908 714 | | | | -13 564 | | | | | 1 017 187 | |
Percentage of GDP | | | 27.9 | % | | | 28.3 | % | | | | | | | | 28.0 | % | | | 28.4 | % | | | | | | | | 28.8 | % |
| | | | | | | |
Expenditure | | | | | | | | | | | | | | | | | | | | | | | | | | | | | | |
| Current payments | | | 580 140 | | | | 587 702 | | | | 7 562 | | | | | 623 715 | | | | 635 953 | | | | 12 237 | | | | | 684 638 | |
of which: | | | | | | | | | | | | | | | | | | | | | | | | | | | | | | |
Debt-service cost | | | 88 463 | | | | 76 579 | | | | -11 884 | | | | | 104 022 | | | | 90 808 | | | | -13 214 | | | | | 104 036 | |
| Transfers and subsidies | | | 315 049 | | | | 315 097 | | | | 49 | | | | | 337 335 | | | | 340 806 | | | | 3 471 | | | | | 363 099 | |
| Payments for capital assets | | | 69 418 | | | | 71 608 | | | | 2 191 | | | | | 73 567 | | | | 73 410 | | | | -157 | | | | | 80 656 | |
| Payments for financial assets | | | 754 | | | | 767 | | | | 13 | | | | | 5 | | | | 8 | | | | 3 | | | | | 4 | |
| Contingency reserve | | | 12 000 | | | | 4 090 | | | | -7 910 | | | | | 24 000 | | | | 11 405 | | | | -12 595 | | | | | 23 375 | |
| | | | | | | |
Total expenditure | | | 977 361 | | | | 979 265 | | | | 1 904 | | | | | 1 058 622 | | | | 1 061 582 | | | | 2 960 | | | | | 1 151 773 | |
Percentage of GDP | | | 32.9 | % | | | 33.6 | % | | | | | | | | 32.1 | % | | | 33.2 | % | | | | | | | | 32.6 | % |
| | | | | | | |
Budget balance2 | | | -149 619 | | | | -154 799 | | | | -5 180 | | | | | -136 344 | | | | -152 868 | | | | -16 524 | | | | | -134 586 | |
Percentage of GDP | | | -5.0 | % | | | -5.3 | % | | | -0.3 | % | | | | -4.1 | % | | | -4.8 | % | | | -0.6 | % | | | | -3.8 | % |
| | | | | | | |
Gross domestic product | | | 2 967 560 | | | | 2 914 862 | | | | | | | | | 3 295 749 | | | | 3 201 299 | | | | | | | | | 3 536 002 | |
| | | | | | | |
| | |
| 1. | | Includes provinces, social security funds and selected public entities. |
| |
| 2. | | A positive number reflects a surplus and a negative number a deficit. |
n Public-sector borrowing requirement
The public-sector borrowing requirement represents the funds needed by the public sector to cover any deficit in financing its own activities.
Public-sector borrowing requirement narrows to 6.3 per cent of GDP by 2013/14
The public-sector borrowing requirement continues to be higher than borrowing by general government, reflecting borrowing by public enterprises to finance capital expenditure. The public-sector borrowing requirement is expected to be 10.5 per cent of GDP in 2010/11, declining to 6.3 per cent of GDP in 2013/14, largely as a result of improvement in the consolidated government budget balance.
The largest contributors to government’s capital infrastructure programme are Eskom and Transnet. Borrowing by these enterprises will continue to support their capital programmes. Relatively few municipalities borrow funds to finance their capital budgets; those that do are scaling back their borrowing plans because they have reached or exceeded prudential limits.
61
2011 BUDGET REVIEW
Table 4.7 Public-sector borrowing requirement1, 2007/08 — 2013/14
| | | | | | | | | | | | | | | | | | | | | | | | | | | | | | | |
| | | | | | | | | | | | | | | | 2010/11 | | | | | | | |
| | | 2007/08 | | 2008/09 | | 2009/10 | | | Revised | | | 2011/12 | | 2012/13 | | 2013/14 |
| R million | | | | Outcome | | | | | estimate | | | Medium-term estimates |
| | | | | | | |
National budget | | | -19 352 | | | | 27 158 | | | | 167 518 | | | | | 143 361 | | | | | 159 066 | | | | 161 713 | | | | 148 715 | |
| Extraordinary payments | | | 776 | | | | 4 284 | | | | 671 | | | | | 802 | | | | | 150 | | | | — | | | | — | |
| Extraordinary receipts | | | -1 850 | | | | -8 203 | | | | -6 435 | | | | | -3 148 | | | | | -1 350 | | | | — | | | | — | |
| | | | | | | |
Borrowing requirement | | | -20 426 | | | | 23 238 | | | | 161 754 | | | | | 141 015 | | | | | 157 866 | | | | 161 713 | | | | 148 715 | |
| Social security funds | | | -8 614 | | | | -12 362 | | | | -10 624 | | | | | -10 778 | | | | | -10 388 | | | | -11 578 | | | | -11 208 | |
| Provinces | | | -1 062 | | | | 8 927 | | | | 189 | | | | | 1 587 | | | | | -1 094 | | | | -3 138 | | | | -5 973 | |
| Extra-budgetary institutions | | | -6 155 | | | | 3 802 | | | | 3 993 | | | | | 8 183 | | | | | 7 215 | | | | 5 870 | | | | 3 052 | |
| Local authorities | | | 4 571 | | | | 13 298 | | | | 16 723 | | | | | 7 470 | | | | | 9 105 | | | | 8 152 | | | | 8 641 | |
| | | | | | | |
General government borrowing | | | -31 686 | | | | 36 904 | | | | 172 036 | | | | | 147 478 | | | | | 162 704 | | | | 161 020 | | | | 143 227 | |
Percentage of GDP | | | -1.5 | % | | | 1.6 | % | | | 7.0 | % | | | | 5.5 | % | | | | 5.6 | % | | | 5.0 | % | | | 4.1 | % |
Non-financial public enterprises2 | | | 35 503 | | | | 61 804 | | | | 45 325 | | | | | 133 731 | | | | | 113 718 | | | | 99 063 | | | | 78 733 | |
Percentage of GDP | | | 1.7 | % | | | 2.7 | % | | | 1.9 | % | | | | 5.0 | % | | | | 3.9 | % | | | 3.1 | % | | | 2.2 | % |
| | | | | | | |
Public-sector borrowing requirement | | | 3 817 | | | | 98 708 | | | | 217 361 | | | | | 281 209 | | | | | 276 422 | | | | 260 083 | | | | 221 959 | |
Percentage of GDP | | | 0.2 | % | | | 4.3 | % | | | 8.9 | % | | | | 10.5 | % | | | | 9.5 | % | | | 8.1 | % | | | 6.3 | % |
| | | | | | | |
Gross domestic product | | | 2 078 822 | | | | 2 312 965 | | | | 2 442 593 | | | | | 2 666 894 | | | | | 2 914 862 | | | | 3 201 299 | | | | 3 536 002 | |
| | | | | | | |
| | |
| 1. | | A negative number reflects a surplus and a positive number a deficit. |
| |
| 2. | | 2010/11 — 2013/14 are based on National Treasury estimates. |
n Conclusion
South Africa responded to the recession by maintaining social expenditure and continuing to invest in infrastructure, providing a stimulus to economic activity. With a decline in revenue, government raised its borrowing level, bringing the fiscal position from a deficit of 1.2 per cent of GDP in 2008/09 to a deficit of 6.6 per cent of GDP in 2009/10. This was an appropriate response to the economic crisis.
As the economy recovers, government will reduce the budget deficit
As the economy recovers, government will reduce the budget deficit. By consolidating the fiscal position over the medium term, South Africa will be well placed to take advantage of growth opportunities.
62
5
Revenue trends and tax proposals
n Overview
Medium- to long-term spending priorities require adjustments to tax and expenditure framework
Raising sufficient revenue to support projected expenditure on government’s economic and social priorities will require adjustments to the tax and expenditure framework over the medium to long term. This framework should contribute towards sustainable economic growth and job creation, while addressing the significant disparities in South African society.
The 2009 recession sharply reduced the income available for public expenditure, with nominal tax revenues declining in 2009/10. Revenues have improved in 2010/11 and are expected to track modest real economic growth over the medium term. Recent data suggests a strong recovery in customs duties and value-added tax (VAT) revenues during 2010/11, but the recovery in corporate income tax revenue is lagging behind.
Businesses to receive tax breaks to support job creation and skills development
The 2011 Budget tax proposals are intended to broaden the tax base in support of inclusive growth. Businesses will receive tax breaks to support skills development and job creation, particularly for young workers. Various loopholes will be closed and tax equity will be improved by reforming the tax treatment of contributions to medical schemes and contributions to retirement funds. The new dividends tax will be implemented, replacing the secondary tax on companies. Consumption-related taxes, which also address environmental and health concerns, will be increased.
The main tax proposals include:
| • | | Personal income tax relief of R8.1 billion |
| |
| • | | A third rebate for individuals 75 years and older |
| |
| • | | Conversion of medical tax deductions to tax credits |
63
2011 BUDGET REVIEW
| • | | Transfer duty relief |
| |
| • | | Higher taxes on fuel |
| |
| • | | Higher taxes on alcohol and tobacco |
| |
| • | | Taxation of gambling winnings. |
n Budget revenue — revised estimates
Table 5.1 highlights budget estimates and revenue outcomes of the major tax instruments for 2009/10, and revised projected revenue outcomes for 2010/11. Tables 2 and 3 in Annexure B set out these trends in more detail.
Outcome for 2009/10 and revised estimates for 2010/11
2009/10 revenue of R598.7 billion was R26.4 billion lower than the prior year
Audited results show that tax revenue for 2009/10 of R598.7 billion was R26.4 billion or 4.2 per cent lower than for 2008/09. Lower corporate income tax (18.5 per cent down from the previous year), customs duties (13.6 per cent down) and VAT (4.1 per cent down) accounted for this overall decline.
Tax revenues recovered during 2010/11, with revised estimates R73.5 billion or 12.3 per cent higher than in 2009/10. This was the result of strong recoveries in personal income tax (11.1 per cent), VAT (22.6 per cent) and customs duties (34.9 per cent). However, nominal corporate income tax revenue declined by 1.8 per cent, an indication of the lag effect of the 2009 recession.
Tax expenditure statement
This Budget Review includes, for the first time, a tax expenditure statement. The statement, found in Annexure C, is a summary of tax revenues that were foregone as a result of various tax incentives to help achieve government’s social and economic objectives. Such forms of indirect expenditure are often hidden. Government is committed to transparency in the budget process, and publication of the tax expenditure statement promotes that objective.
The conservative estimate of total tax expenditure in 2008/09 was R78.1 billion, or 3.4 per cent of GDP.
64
CHAPTER 5: REVENUE TRENDS AND TAX PROPOSALS
Table 5.1 Budget estimates and revenue outcome, 2009/10 and 2010/11
| | | | | | | | | | | | | | | | | | | | | | | | | | | | | | | |
| | | | | | | | | | | | | | | | | | | | | | | | | | | | | 2009/10 – |
| | | | | | | | | | | | | | | | | | | | | | | | | | | | | 2010/11 |
| | | 2009/10 | | | 2010/11 | | | % |
| R million | | Budget | | Outcome | | Deviation | | | Budget | | Revised | | Deviation | | | change 1 |
| | | | | | | |
Taxes on income and profits | | | 389 040 | | | | 359 045 | | | | -29 995 | | | | | 377 716 | | | | 380 080 | | | | 2 364 | | | | | 5.9 | % |
| Persons and individuals | | | 207 450 | | | | 205 145 | | | | -2 305 | | | | | 224 676 | | | | 228 000 | | | | 3 324 | | | | | 11.1 | % |
| Companies | | | 160 000 | | | | 134 883 | | | | -25 117 | | | | | 133 650 | | | | 132 500 | | | | -1 150 | | | | | -1.8 | % |
| Secondary tax on companies | | | 19 000 | | | | 15 468 | | | | -3 532 | | | | | 16 500 | | | | 16 500 | | | | — | | | | | 6.7 | % |
| Tax on retirement funds | | | — | | | | 43 | | | | 43 | | | | | — | | | | — | | | | — | | | | | 0.0 | % |
Other taxes on income and profits 2 | | | 2 590 | | | | 3 506 | | | | 916 | | | | | 2 890 | | | | 3 080 | | | | 190 | | | | | -12.1 | % |
Taxes on payroll and workforce | | | 7 750 | | | | 7 805 | | | | 55 | | | | | 8 424 | | | | 8 420 | | | | -4 | | | | | 7.9 | % |
Taxes on property | | | 10 420 | | | | 8 826 | | | | -1 594 | | | | | 9 960 | | | | 9 365 | | | | -595 | | | | | 6.1 | % |
Domestic taxes on goods and services | | | 226 757 | | | | 203 667 | | | | -23 090 | | | | | 230 880 | | | | 247 540 | | | | 16 660 | | | | | 21.5 | % |
| Value-added tax | | | 168 807 | | | | 147 941 | | | | -20 866 | | | | | 164 000 | | | | 181 335 | | | | 17 335 | | | | | 22.6 | % |
| Specific excise duties | | | 22 600 | | | | 21 289 | | | | -1 311 | | | | | 24 250 | | | | 22 900 | | | | -1 350 | | | | | 7.6 | % |
Ad valorem excise duties | | | 1 350 | | | | 1 276 | | | | -74 | | | | | 1 200 | | | | 1 900 | | | | 700 | | | | | 48.9 | % |
| General fuel levy | | | 30 090 | | | | 28 833 | | | | -1 257 | | | | | 34 600 | | | | 34 300 | | | | -300 | | | | | 19.0 | % |
Other domestic taxes on goods and services3 | | | 3 910 | | | | 4 328 | | | | 418 | | | | | 6 830 | | | | 7 105 | | | | 275 | | | | | 64.2 | % |
Taxes on international trade and transactions | | | 25 337 | | | | 19 319 | | | | -6 018 | | | | | 20 850 | | | | 26 790 | | | | 5 940 | | | | | 38.7 | % |
| Customs duties | | | 24 635 | | | | 19 577 | | | | -5 058 | | | | | 20 500 | | | | 26 400 | | | | 5 900 | | | | | 34.9 | % |
| Miscellaneous customs and excise receipts | | | 702 | | | | -258 | | | | -960 | | | | | 350 | | | | 390 | | | | 40 | | | | | -251.0 | % |
Stamp duties and fees | | | — | | | | 49 | | | | 49 | | | | | 20 | | | | 5 | | | | -15 | | | | | -89.9 | % |
State miscellaneous revenue4 | | | — | | | | -6 | | | | -6 | | | | | — | | | | — | | | | — | | | | | 0.0 | % |
| | | | | | | |
Total tax revenue | | | 659 304 | | | | 598 705 | | | | -60 599 | | | | | 647 850 | | | | 672 200 | | | | 24 350 | | | | | 12.3 | % |
| | | | | | | |
Non-tax revenue5 | | | 11 602 | | | | 8 889 | | | | -2 713 | | | | | 10 380 | | | | 12 254 | | | | 1 874 | | | | | 37.9 | % |
of which: | | | | | | | | | | | | | | | | | | | | | | | | — | | | | | 0.0 | % |
Mining royalties | | | — | | | | — | | | | — | | | | | 3 540 | | | | 3 712 | | | | 172 | | | | | 0.0 | % |
Mining leases and ownership | | | 325 | | | | 633 | | | | 308 | | | | | — | | | | 900 | | | | 900 | | | | | 42.2 | % |
| Less: SACU payments | | | -27 915 | | | | -27 915 | | | | -0 | | | | | -14 991 | | | | -14 991 | | | | — | | | | | -46.3 | % |
Other adjustment6 | | | — | | | | — | | | | — | | | | | — | | | | -2 900 | | | | -2 900 | | | | | 0.0 | % |
| | | | | | | |
National budget revenue | | | 642 990 | | | | 579 679 | | | | -63 312 | | | | | 643 239 | | | | 666 563 | | | | 23 324 | | | | | 15.0 | % |
| | | | | | | |
| Provinces, social security funds and selected public entities | | | 88 245 | | | | 85 162 | | | | -3 083 | | | | | 95 165 | | | | 88 460 | | | | -6 704 | | | | | 3.9 | % |
Budget Revenue | | | 731 235 | | | | 664 840 | | | | -66 395 | | | | | 738 404 | | | | 755 023 | | | | 16 619 | | | | | 13.6 | % |
| | | | | | | |
| | |
| 1. | | Percentage change 2009/10 outcome versus 2010/11 revised estimate. |
| |
| 2. | | Includes interest on overdue income tax and small business tax amnesty levy. |
| |
| 3. | | Includes air departure tax, plastic bags levy, electricity levy and Universal Service Fund. |
| |
| 4. | | Revenue received by SARS that could not be allocated to a specific tax instrument. |
| |
| 5. | | Includes mineral royalities, mining leases and departmental revenue. |
| |
| 6. | | Payments to Southern African Customs Union (SACU) partners for a previous error in calculation of the 1969 agreement. |
Revenue estimates and 2011/12 tax proposals
Table 5.2 sets out the estimates of revenue before consideration of the tax proposals for 2011/12.
65
2011 BUDGET REVIEW
Table 5.2 Estimates of revenue before tax proposals, 2010/11
| | | | | | | | | | | | | | | |
| | | | | | | | 2011/12 | | | 2010/11 – |
| | | 2010/11 | | | Before tax | | | 2011/12% |
| R million | | Revised | | | proposals | | | change |
| | | | | | | |
Taxes on income and profits | | | 380 080 | | | | | 426 695 | | | | | 12.3 | % |
| Persons and individuals | | | 228 000 | | | | | 261 600 | | | | | 14.7 | % |
| Companies | | | 132 500 | | | | | 143 665 | | | | | 8.4 | % |
| Secondary tax on companies | | | 16 500 | | | | | 18 100 | | | | | 9.7 | % |
| Tax on retirement funds | | | — | | | | | — | | | | | 0.0 | % |
Other taxes on income and profits1 | | | 3 080 | | | | | 3 330 | | | | | 8.1 | % |
Taxes on payroll and workforce | | | 8 420 | | | | | 9 150 | | | | | 8.7 | % |
Taxes on property | | | 9 365 | | | | | 10 340 | | | | | 10.4 | % |
Domestic taxes on goods and services | | | 247 540 | | | | | 269 225 | | | | | 8.8 | % |
| Value-added tax | | | 181 335 | | | | | 200 880 | | | | | 10.8 | % |
| Specific excise duties | | | 22 900 | | | | | 23 300 | | | | | 1.7 | % |
Ad valorem excise duties | | | 1 900 | | | | | 2 080 | | | | | 9.5 | % |
| General fuel levy | | | 34 300 | | | | | 35 000 | | | | | 2.0 | % |
| Electicity levy | | | 290 | | | | | 5 380 | | | | | | |
Other domesic taxes on goods and services2 | | | 415 | | | | | 2 585 | | | | | 522.9 | % |
Taxes on international trade and transactions | | | 26 790 | | | | | 30 325 | | | | | 13.2 | % |
| Customs duties | | | 26 400 | | | | | 29 860 | | | | | 13.1 | % |
| Miscellaneous customs and excise receipts | | | 390 | | | | | 465 | | | | | 19.2 | % |
Stamp duties and fees | | | 5 | | | | | — | | | | | -100.0 | % |
State miscellaneous revenue | | | — | | | | | — | | | | | 0.0 | % |
| | | | | | | |
Total tax revenue | | | 672 200 | | | | | 745 735 | | | | | 10.9 | % |
| | | | | | | |
Non-tax revenue3 | | | 12 254 | | | | | 10 001 | | | | | -18.4 | % |
of which | | | | | | | | | | | | | 0.0 | % |
Mineral royalties | | | 3 712 | | | | | 4 890 | | | | | 31.7 | % |
Mining leases and ownership | | | 900 | | | | | — | | | | | -100.0 | % |
| Less: SACU payments | | | -14 991 | | | | | -21 763 | | | | | 45.2 | % |
Other adjustment4 | | | -2 900 | | | | | | | | | | -100.0 | % |
| | | | | | | |
National budget revenue | | | 666 563 | | | | | 733 973 | | | | | 10.1 | % |
| | | | | | | |
| Provinces, social security funds and selected public entities. | | | 88 460 | | | | | 94 609 | | | | | 7.0 | % |
Budget Revenue | | | 755 023 | | | | | 828 581 | | | | | 9.7 | % |
| | | | | | | |
| | |
| 1. | | Includes interest on overdue income tax and small business tax amnesty levy. |
| |
| 2. | | Includes air departure tax, plastic bags levy and Universal Service Fund. |
| |
| 3. | | Includes mineral royalties, mining leases and departmental revenue. and sales of capital assets. |
| |
| 4. | | Payments to SACU partners for a previous error in calculation of the 1969 agreement. |
Revenue recovery expected to continue in line with improved economic growth
Tax revenue should continue to improve during 2011/12 in line with improved economic growth prospects. The total tax revenue before tax proposals is expected to increase by 10.9 per cent.
Actual revenue collections and medium-term estimates
Table 5.3 sets out actual revenue collections for 2007/08 to 2009/10, the revised estimate for 2010/11 and the estimates for 2011/12 to 2013/14.
66
CHAPTER 5: REVENUE TRENDS AND TAX PROPOSALS
Without any tax changes, tax revenue as a percentage of GDP is expected to increase from 25.2 per cent in 2010/11 to 26.2 per cent in 2013/14.
Table 5.3 Budget revenue, 2007/08 – 2013/14
| | | | | | | | | | | | | | | | | | | | | | | | | | | | | | | |
| | | 2007/08 | | 2008/09 | | 2009/10 | | | 2010/11 | | | 2011/12 | | 2012/13 | | 2013/14 |
| R million | | Outcome | | | | | | | Revised | | | Medium-term estimates |
| | | | | | | |
Taxes on income and profits1 | | | 332 058 | | | | 383 483 | | | | 359 045 | | | | | 380 080 | | | | | 418 345 | | | | 469 709 | | | | 533 561 | |
Of which: | | | | | | | | | | | | | | | | | | | | | | | | | | | | | | |
Personal income tax | | | 168 774 | | | | 195 115 | | | | 205 145 | | | | | 228 000 | | | | | 252 750 | | | | 292 710 | | | | 337 970 | |
Coporate income tax | | | 140 120 | | | | 165 378 | | | | 134 883 | | | | | 132 500 | | | | | 144 165 | | | | 161 350 | | | | 178 230 | |
| Taxes on payroll and workforce | | | 6 331 | | | | 7 327 | | | | 7 805 | | | | | 8 420 | | | | | 9 150 | | | | 9 610 | | | | 10 130 | |
| Taxes on property | | | 11 884 | | | | 9 477 | | | | 8 826 | | | | | 9 365 | | | | | 9 590 | | | | 11 060 | | | | 12 695 | |
| Domestic taxes on goods and services | | | 194 690 | | | | 201 416 | | | | 203 667 | | | | | 247 540 | | | | | 274 210 | | | | 302 880 | | | | 333 170 | |
of which: | | | | | | | | | | | | | | | | | | | | | | | | | | | | | | |
Value-added tax | | | 150 443 | | | | 154 343 | | | | 147 941 | | | | | 181 335 | | | | | 200 880 | | | | 226 900 | | | | 254 330 | |
| Taxes on international trade and | | | 27 082 | | | | 22 852 | | | | 19 319 | | | | | 26 790 | | | | | 30 325 | | | | 34 050 | | | | 38 404 | |
| Stamp duties and fees | | | 557 | | | | 572 | | | | 49 | | | | | 5 | | | | | — | | | | — | | | | — | |
State miscellaneous revenue2 | | | 212 | | | | -27 | | | | -6 | | | | | — | | | | | — | | | | — | | | | — | |
| | | | | | | |
Tax revenue | | | 572 815 | | | | 625 100 | | | | 598 705 | | | | | 672 200 | | | | | 741 620 | | | | 827 310 | | | | 927 960 | |
Non-tax revenue3 | | | 12 693 | | | | 12 616 | | | | 8 889 | | | | | 12 254 | | | | | 10 001 | | | | 11 540 | | | | 12 351 | |
of which: | | | | | | | | | | | | | | | | | | | | | | | | | | | | | | |
Mineral and petroleum royalties | | | — | | | | — | | | | — | | | | | 3 712 | | | | | 4 890 | | | | 5 150 | | | | 5 430 | |
| Less: SACU payments | | | -24 713 | | | | -28 921 | | | | -27 915 | | | | | -14 991 | | | | | -21 763 | | | | -32 432 | | | | -35 997 | |
Other adjustment4 | | | | | | | | | | | | | | | | -2 900 | | | | | | | | | | | | | | |
| | | | | | | |
National budget revenue | | | 560 795 | | | | 608 796 | | | | 579 679 | | | | | 666 563 | | | | | 729 858 | | | | 806 418 | | | | 904 314 | |
| | | | | | | |
| Provinces, social security funds and selected public entities | | | 65 910 | | | | 74 201 | | | | 85 162 | | | | | 88 460 | | | | | 94 609 | | | | 102 296 | | | | 112 873 | |
| | | | | | | |
Budget Revenue | | | 626 705 | | | | 682 997 | | | | 664 840 | | | | | 755 023 | | | | | 824 466 | | | | 908 714 | | | | 1 017 187 | |
Tax revenue as a percentage of GDP | | | 27.6 | % | | | 27.0 | % | | | 24.5 | % | | | | 25.2 | % | | | | 25.4 | % | | | 25.8 | % | | | 26.2 | % |
Budget revenue as a | | | 30.1 | % | | | 29.5 | % | | | 27.2 | % | | | | 28.3 | % | | | | 28.3 | % | | | 28.4 | % | | | 28.8 | % |
GDP (R billion) | | | 2 079 | | | | 2 313 | | | | 2 443 | | | | | 2 667 | | | | | 2 915 | | | | 3 201 | | | | 3 536 | |
Tax/GDP multiplier | | | 1.05 | | | | 0.81 | | | | -0.75 | | | | | 1.34 | | | | | 1.11 | | | | 1.18 | | | | 1.16 | |
| | | | | | | |
| | |
| 1. | | Also includes secondary tax on companies and interest on overdue income tax and small business tax amnesty levy. |
| |
| 2. | | Revenue received by SARS in respect of taxation which could not be allocated to a specific tax instrument. 3. Includes mineral royalties, mining leases and departmental revenue. |
| |
| 4. | | Payments to SACU partners in respect of a previous error in calculation of the 1969 agreement. |
n Overview of tax proposals
Table 5.4 shows the expected impact of tax proposals on revenue collection in 2011/12, the net effect of which is to reduce the estimated total tax revenues by R4.1 billion
Income tax relief for individuals
Personal income tax relief of R8.1 billion
The Budget 2011 proposes direct tax relief to individuals of R8.1 billion through adjustments to personal income tax brackets and rebates. These adjustments compensate for the effects of inflation (fiscal drag).
67
2011 BUDGET REVIEW
In addition to the primary and secondary rebates, a third rebate of R2 000 per year is proposed for taxpayers 75 years and older, increasing the tax threshold for eligible individuals to R104 261.
Table 5.5 provides a summary of the 2011/12 income tax brackets, rates and rebates for individuals. Taxpayers with an annual taxable income of up to R270 000 will receive 50 per cent of this relief, those with an annual taxable income between R270 000 and R580 000 receive 33 per cent, those between R580 000 and R1 million receive 12 per cent and those with taxable income above R1 million receive 5 per cent.
Those with taxable income over R580 000 will account for 39 per cent of income tax revenue in 2011/12
Personal income tax provides the foundation for an equitable tax system. In 2011/12, 14.3 per cent of individual taxpayers — those with annual income between R270 000 and R580 000 — will account for 33 per cent of revenues from personal income taxes, and the 5.7 per cent of individuals with an annual taxable income above R580 000 will account for 39 per cent of personal income tax revenues.
Table 5.4 Impact of tax proposals on 2011/12 revenue
| | | | | | | | | |
| R million | | Effect of tax proposals |
| |
| Tax revenue | | | | | | | 745 735 | |
| Non-tax revenue | | | | | | | 10 001 | |
| Less: SACU payments | | | | | | | -21 763 | |
| |
National budget revenue | | | | | | | 733 973 | |
| |
| Provinces, social security funds and selected public entities | | | | | | | 94 609 | |
| |
Budget revenue (before tax proposals) | | | | | | | 828 581 | |
Budget 2011/12 proposals: | | | | | | | -4 115 | |
Taxes on individuals and companies | | | -8 350 | | | | | |
| Personal income tax | | | -8 850 | | | | | |
Adjustment in personal tax rate structure | | | -8 100 | | | | | |
Adjustment in monetary thresholds | | | -750 | | | | | |
| Business taxes | | | 500 | | | | | |
Closure of dividend cession schemes | | | 500 | | | | | |
Taxes on property | | | -750 | | | | | |
| Adjustment in transfer duties | | | -750 | | | | | |
Indirect taxes | | | 4 985 | | | | | |
| Increase in general fuel levy | | | 1 900 | | | | | |
| Increase in excise duties on tobacco | | | 1 785 | | | | | |
| Increase in Ad valorem excise duties | | | 150 | | | | | |
| Increase in electricity levy | | | 1 150 | | | | | |
| |
Budget revenue (after tax proposals) | | | | | | | 824 466 | |
| |
Medical deductions and conversion to medical tax credits
Increases in monthly monetary caps for contributions to medical schemes
Taxpayer contributions to medical schemes up to a specified monetary threshold are tax deductible, as are qualifying out-of-pocket medical expenses. The 2011 Budget proposes to increase the monthly monetary threshold for tax-deductible contributions to medical schemes from R670 to R720 for the first two beneficiaries, and from R410 to R440 for each additional beneficiary. This will become effective on 1 March 2011.
The monthly deductions for contributions to medical schemes and for qualifying out-of-pocket medical expenses will be converted into tax
68
CHAPTER 5: REVENUE TRENDS AND TAX PROPOSALS
credits effective 1 March 2012. A tax credit provides for more equitable tax relief, as the relative value of the relief does not increase as the marginal tax rate of the individual increases, as is currently the case. A discussion document on these credits will be published by the end of March 2011.
Table 5.5 Personal income tax rate and bracket adjustments, 2010/11 – 2011/12
| | | | | | | | |
| 2010/11 | | | 2011/12 |
| Taxable income (R) | | Rates of tax | | | Taxable income (R) | | Rates of tax |
| | | | |
| R0 - R140 000 | | 18% of each R1 | | | R0 - R150 000 | | 18% of each R1 |
| R140 001 - R221 000 | | R25 200 + 25% of the amount | | | R150 001 - R235 000 | | R27 000 + 25% of the amount |
| | | above R140 000 | | | | | above R150 000 |
| R221 001 - R305 000 | | R45 450 + 30% of the amount | | | R235 001 - R325 000 | | R48 250 + 30% of the amount |
| | | above R221 000 | | | | | above R235 000 |
| R305 001 - R431 000 | | R70 650 + 35% of the amount | | | R325 001 - R455 000 | | R75 250 + 35% of the amount |
| | | above R305 000 | | | | | above R325 000 |
| R431 001 - R552 000 | | R114 750 + 38% of the amount | | | R455 001 - R580 000 | | R120 750 + 38% of the amount |
| | | above R431 000 | | | | | above R455 000 |
| R552 001 and above | | R160 730 + 40% of the amount | | | R580 001 | | R168 250 + 40% of the amount |
| | | above R552 000 | | | | | above R580 000 |
| | | | |
Rebates | | | | | Rebates | | |
| Primary | | R10 260 | | | Primary | | R10 755 |
| Secondary | | R5 675 | | | Secondary | | R6 012 |
| | | | | | Third rebate | | R2 000 |
Tax threshold | | | | | Tax threshold | | |
| Below age 65 | | R57 000 | | | Below age 65 | | R59 750 |
| Age 65 and over | | R88 528 | | | Age 65 and over | | R93 150 |
| | | | | | Age 75 and over | | R104 261 |
| | | | |
National health insurance
Payroll tax, higher VAT and a surcharge on taxable income are under consideration to finance NHI
Government expects that national health insurance (NHI) will be phased in over 14 years. While initial allocations are made in the 2011 Budget, the NHI system will require funding over and above current revenues allocated to public health. Preliminary analysis indicates that the phasing in of a payroll tax (payable by employers), an increase in the VAT rate and a surcharge on individuals’ taxable income could be considered as funding options. The feasibility and practicality of co-payments or user charges will also be explored. Announcements about specific funding instruments will be made in the 2012 Budget.
Savings
Interest income is not taxed up to a certain threshold. As from 1 March 2011, government will increase the tax-free interest-income annual threshold from R22 300 to R22 800 for individuals below 65 years, and from R32 000 to R33 000 for individuals 65 years and over. The foreign interest-income threshold will remain at R3 700.
Incentives to encourage savings for housing and higher education
Several countries use tax incentives to encourage people to save towards specific goals such as education, healthcare, housing or retirement, or to promote general savings. Government will explore two incentivised savings schemes - one for housing (deposit for first-time homeowners)
69
2011 BUDGET REVIEW
and another for higher education — as alternatives to tax-free interest-income thresholds.
The possibility of a more consistent tax treatment of all forms of income from capital, such as interest, dividends and capital gains, will also be considered.
Social security and retirement reforms
Tax treatment of contributions to retirement funds
Reforms of the tax treatment of contributions to retirement funds
Taxpayers are allowed income tax deductions for contributions to pension and retirement annuity funds. In addition, employers may contribute to retirement funds on behalf of employees. These contributions by employers are not currently taxed in the hands of employees. Several changes are proposed to improve tax administration and promote greater equity in the income tax system. From 1 March 2012:
| • | | An employer’s contribution on behalf of an employee will be deemed a taxable fringe benefit in the hands of the employee. Individuals will be allowed to deduct up to 22.5 per cent of their taxable income for contributions to pension, provident and retirement annuity funds. |
| • | | To ensure greater equity, two thresholds will be established — a minimum annual deduction of R12 000 and an annual maximum of
R200 000. |
| • | | The base on which contributions to retirement funds and other social security taxes is calculated will be streamlined. |
To protect workers’ savings, government proposes to subject lump-sum withdrawals from provident funds to the one-third limit applying to pension and retirement annuities. The implementation date of any changes in the rules governing provident funds will be subject to thorough consultation with trade unions and other interested parties, and vested rights will be protected.
Enhanced competition for provision of living annuities
Government will broaden the list of entities that can offer living annuities
Living annuities can only be provided by long-term insurers. To encourage competition, government proposes to broaden the list of service providers allowed to provide these annuities to include collective investment schemes and the National Treasury’s retail savings bond scheme.
Review tax treatment of risk benefits
To ensure equity, the tax system should not treat lump-sum payments more favourably than annuity payments. Government proposes that any compensation from the Road Accident Fund and its no-fault successor, whether as a lump-sum payment or an annuity, be exempted from income tax. At the same time, alignment of the tax treatment of risk benefits paid by private-sector funds will be investigated.
70
CHAPTER 5: REVENUE TRENDS AND TAX PROPOSALS
Taxation of lump sum benefits upon retirement
As from 1 March 2011, government will increase the tax-free lump sum benefit upon retirement from R300 000 to R315 000. The revised tax table appears in Table C.7 of Annexure C.
Adjustment of monetary thresholds
Proposed increase in various monetary thresholds
In addition to the measures mentioned above, government proposes to increase capital gains exclusion amounts as follows as from 1 March 2011:
| • | | For individuals and special trusts from R17 500 to R20 000 annually |
| |
| • | | On death from R120 000 to R200 000 |
| |
| • | | On disposal of a small business when a person is over 55 years old from R750 000 to R900 000 |
The annual trading income exemption for public benefit organisations will increase from R150 000 to R200 000, and for recreational clubs from R100 000 to R120 000.
Gambling
All winnings over R25 000 to be subject to 15 per cent withholding tax
Government proposes that with effect from 1 April 2012 all gambling winnings above R25 000, including those from the National Lottery, be subject to a final 15 per cent withholding tax. Similar gambling taxes exist in India, the Netherlands and the United States.
Business taxes
Dividends tax
Introduction of dividends tax on 1 April 2012
The dividends tax will take effect on 1 April 2012, replacing the secondary tax on companies. The introduction of the tax should correct the impression that a tax on dividends is another tax on businesses: legally and economically, it will be a tax on individuals and non-resident shareholders.
Closure of dividend schemes
Several dividend schemes undermine the tax base. One method involves the use of dividend cessions, where taxpayers effectively purchase tax-free dividends without any stake in the underlying shares. Another scheme involves the receipt of dividends from shares in which the taxpayer has no meaningful economic risk (e.g. has an offsetting derivative position). Some arrangements make use of preference shares that generate allegedly tax-free dividends, while the dividends are indirectly generated from interest-yielding debt. All these schemes will be closed by treating the dividends at issue as ordinary revenue.
71
2011 BUDGET REVIEW
Internal company restructuring
Adjustments to tax rules to ensure appropriate tax relief for debtors in the event of debt cancellations
The Income Tax Act (1962) provides special rules for debt cancellation and similar adjustments. Government will consider exempting otherwise taxable gains or ordinary revenue imposed on the debtor if the debt is cancelled or reduced. Relief will be limited to insolvent debtors to ensure that this does not give rise to tax avoidance.
Venture capital company
Many small and medium-sized businesses find it difficult to access equity finance. This led government to introduce the concept of a venture capital company into the Income Tax Act. The response to this vehicle has been poor and the provisions will be reviewed.
Islamic finance
The 2010 Budget announced that the taxation of Islamic financial products would be aligned with conventional financial instruments. Provisions were introduced to cover several instruments. This year the rules will address ijara products, which act like commercial finance leases. Amendments to legislation will facilitate the issue of Islamic-compliant government bonds.
Research and development tax incentive
Proposed pre-approval process for research and development tax incentive
The research and development tax incentive is intended to encourage innovation and job creation. Government proposes to streamline the current incentive, introducing an approval process by the Department of Science and Technology before a taxpayer can claim this incentive. This should limit opportunities for retrospective reclassification of spending.
Promoting skills development and job creation
Learnership tax incentive
Five-year extension of learnership tax incentive pending outcome of review
The learnership tax incentive, designed to support youth employment, will expire in September 2011. The tax expenditure associated with this incentive is estimated to have amounted to R324 million in 2007/08, but its effectiveness is difficult to assess. Government proposes to extend the incentive for five years, subject to an analysis of its effectiveness by businesses, sector and training authorities, and the Department of Higher Education and Training. The review will take place during 2011.
Youth employment subsidy
To support job creation, a youth employment subsidy in the form of a tax credit costing R5 billion over three years will be introduced. It will be administered by the South African Revenue Service (SARS) through the PAYE system to limit abuse, ensure maximum liquidity and ease business compliance.
72
CHAPTER 5: REVENUE TRENDS AND TAX PROPOSALS
Industrial development zones
Additional tax relief for businesses making greenfield investments in IDZs
To support the objectives of the industrial policy action plan and the New Growth Path, businesses making greenfield and/or brownfield investments qualify for tax relief. Greenfield investments in industrial development zones (IDZs) qualify for additional relief. Government will consider expanding incentives for labour-intensive projects in IDZs.
International taxation
Gateway into Africa — headquarter regime
During 2010, tax rules were amended to enable regional investments to flow through South Africa without being taxed. These measures were intended to encourage the development of regional investment banks and holding companies in South Africa. However, current rules could lead to double taxation. There are also concerns about the manner of imposition of residence-based taxation. These concerns will be reviewed.
Refinement of controlled foreign company legislation
Controlled foreign company rules to be made more targeted
The main purpose of controlled foreign company rules is to prevent South African residents from shifting passive income offshore. Some provisions are overly complex and can interfere with normal business conduct, while others create unintended loopholes. Adjustments will focus the rules without compromising their purpose.
Transfer duty
Transfer duty exemption threshold to increase from R500 000 to R600 000
Government proposes to increase the transfer duty exemption threshold from R500 000 to R600 000. A rate of 3 per cent will be applicable to the value from R600 001 to R1 000 000; an amount of R12 000 plus 5 per cent to the value between R1.0 and R1.5 million; and an amount of R37 000 plus 8 per cent to amounts above R1.5 million. This revised rate structure will apply to properties acquired under purchase agreements concluded on or after 23 February 2011. It will also be applicable to legal persons (close corporations, companies and trusts).
Excise duties on tobacco and alcohol
The proposed adjustments to alcohol and tobacco taxes are as follows:
| • | | The current indirect tax burden (excise duties plus VAT) as a percentage of the weighted average retail selling price for wine, clear beer and spirits at 23, 33, and 43 per cent respectively will be maintained for 2011/12. Excise duties on alcoholic beverages will be increased by between 4.5 and 10.0 per cent as shown in Table 5.6. |
| • | | The targeted total tax burden on tobacco products (excise duties plus VAT) is 52 per cent. Accordingly, the 2011 Budget proposes a 6 per cent increase on the excise duty for cigars, a 9 per cent increase for cigarettes, a 8.2 per cent increase for cigarette tobacco and a 10.3 per cent increase for pipe tobacco. |
73
2011 BUDGET REVIEW
In the 2010 Budget, the Minister of Finance announced a review of the excise duty structure for alcoholic beverages. A discussion document will be published for public comment in July 2011.
Ad valorem excise duties
Excise tax rate on motor vehicles increases from 20 per cent to 25 per cent
Passenger cars and light commercial vehicles are subject to a “luxury” excise tax that increases with the price of the vehicle. Government proposes to increase the maximum nominal ad valorem excise tax rate on these vehicles from 20 per cent to 25 per cent.
Ad valorem excise duties on monitors were abolished in 2004 based on the assumption that they were used as computer screens. However, some monitors are also used as televisions, which are subject to ad valorem tax. Ad valorem excise duties on monitors will be reinstated at a flat rate of 7 per cent. These amendments will take effect on 1 April 2011.
Table 5.6 Changes in specific excise duties, 2011/12
| | | | | | | | | | | | | | |
| | | Current excise | | Proposed excise | | | Percentage change |
| Product | | duty rate | | duty rate | | | Nominal | | Real |
| | | | |
| Malt beer | | R50.20 / litre of absolute alcohol | | R53.97 / litre of absolute alcohol | | | | 7.51 | % | | | 2.71 | % |
| Traditional African beer | | 7.82c / litre | | 7.82c / litre | | | | 0.00 | % | | | -4.80 | % |
| Traditional African beer powder | | 34.70c / kg | | 34.70c / kg | | | | 0.00 | % | | | -4.80 | % |
| Unfortified wine | | R2.14 / litre | | R2.32 / litre | | | | 8.41 | % | | | 3.61 | % |
| Fortified wine | | R4.03 / litre | | R4.33 / litre | | | | 7.44 | % | | | 2.64 | % |
| Sparkling wine | | R6.67 / litre | | R6.97 / litre | | | | 4.50 | % | | | -0.30 | % |
| Ciders and alcoholic fruit beverages | | R2.52 / litre (85.69c / average 340ml can) | | R2.71 / litre (92.14c / average 340ml can) | | | | 7.54 | % | | | 2.74 | % |
| Spirits | | R84.57 / litre of absolute alcohol | | R93.03 / litre of absolute alcohol | | | | 10.00 | % | | | 5.20 | % |
| Cigarettes | | R8.94/ 20 cigarettes | | R9.74/ 20 cigarettes | | | | 8.95 | % | | | 4.15 | % |
| Cigarette tobacco | | R9.73/ 50g | | R10.53/ 50g | | | | 8.18 | % | | | 3.38 | % |
| Pipe tobacco | | R2.70/ 25g | | R2.98/ 25g | | | | 10.25 | % | | | 5.45 | % |
| Cigars | | R47.66 / 23g | | R50.52 / 23g | | | | 6.00 | % | | | 1.20 | % |
Fuel taxes
Fuel tax levy to increase by 10 cents per litre
Government proposes to increase the general fuel levy by 10c/l on both petrol and diesel effective from 6 April 2011. The RAF levy will be increased by 8c/l to 80c/l on the same date. Table 5.7 provides a summary of the proposed fuel tax rates for 2011/12.
74
CHAPTER 5: REVENUE TRENDS AND TAX PROPOSALS
Table 5.7 Total combined fuel taxes on petrol and diesel, 2009/10 – 2011/12
| | | | | | | | | | | | | | | | | | | | | | | | | | | |
| | | 2009/10 | | | 2010/11 | | | 2011/12 |
| | | 93 Octane | | | | | | | 93 Octane | | | | | | | 93 Octane | | |
| c / litre | | petrol | | Diesel | | | petrol | | Diesel | | | petrol | | Diesel |
| | | | | | | |
| General fuel levy | | | 150.00 | | | | 135.00 | | | | | 167.50 | | | | 152.50 | | | | | 177.50 | | | | 162.50 | |
| Road Accident Fund levy | | | 64.00 | | | | 64.00 | | | | | 72.00 | | | | 72.00 | | | | | 80.00 | | | | 80.00 | |
| Customs and excise levy | | | 4.00 | | | | 4.00 | | | | | 4.00 | | | | 4.00 | | | | | 4.00 | | | | 4.00 | |
| Illuminating paraffin marker | | | 0.00 | | | | 0.01 | | | | | 0.00 | | | | 0.01 | | | | | 0.00 | | | | 0.01 | |
| | | | | | | |
Total | | | 218.00 | | | | 203.01 | | | | | 243.50 | | | | 228.51 | | | | | 261.50 | | | | 246.51 | |
Pump price: Gauteng (as in February)1 | | | 643.00 | | | | 649.35 | | | | | 785.00 | | | | 701.85 | | | | | 884.00 | | | | 814.05 | |
| | | | | | | |
Taxes as % of pump price | | | 33.9 | % | | | 31.3 | % | | | | 31.0 | % | | | 32.6 | % | | | | 29.6 | % | | | 30.3 | % |
| | | | | | | |
| | |
| 1. | | Diesel (0.05% sulphur) wholesale price (retail price not regulated.) |
Environmental taxation
Carbon tax discussion paper
Work on a proposed carbon emission tax is under way
As part of its response to climate change, government is considering a carbon tax. A discussion paper entitled Reducing Greenhouse Gas Emissions: The Carbon Tax Option was published for public comment in December 2010. Comments are due by the end of February 2011. The design features of a proposed tax and a schedule for its introduction will be announced in the 2012 Budget.
Electricity levy
Increase in the electricity levy
Government proposes to increase the levy applied to electricity generated from non-renewable and nuclear energy sources by 0.5c/kWh to 2.5c/kWh from 1 April 2011. Some of this revenue will be set aside to fund the rehabilitation of roads damaged as a result of the haulage of coal for electricity generation. The increase should have no impact on electricity tariffs, because it has already been taken into account in the National Energy Regulator tariff structure.
International air passenger departure tax
From 1 October 2011, the air passenger departure tax on flights to Southern African Customs Union member states and other international destinations will increase from R80 and R150 per passenger respectively to R100 and R190 per passenger.
Tax administration
Review of the turnover tax for micro businesses
Turnover tax for micro businesses adjusted to encourage participation
The turnover tax was implemented in 2009 to broaden the tax base and simplify tax for micro businesses with annual turnover up to R1 million. Only about 7 700 businesses have registered for this approach, of which 88 per cent were previously registered for income tax. The tax rates will be adjusted from 1 March 2011 so that a micro business only becomes liable
75
2011 BUDGET REVIEW
to pay turnover tax if its turnover exceeds R150 000 (currently R100 000) a year.
Micro businesses that register for VAT will no longer be barred from registering for turnover tax
From 1 March 2012, micro businesses that register for VAT will no longer be barred from registering for turnover tax. The three-year bar on voluntary deregistration from the turnover tax will also be lifted. SARS will be empowered to register unregistered micro businesses that it detects for the turnover tax.
Tax payments by individuals with more than one source of income
The Minister of Finance has received several letters from widows and widowers who have experienced increases in their tax liability subsequent to the death of a spouse. This happens in cases where the surviving spouse receives a pension from the pension fund of the deceased, from which little or no PAYE is deducted. SARS will contact such taxpayers and advise them to ask their insurance company or employer to deduct additional taxes.
Voluntary disclosure programme
Voluntary disclosure programme will remain open until 31 October 2011
To encourage taxpayers to come forward to regularise their tax affairs without the imposition of additional tax, penalties and interest, the voluntary disclosure programme that began in November 2010 will remain open until 31 October 2011. More than 1 200 applicants have already come forward under the programme.
Tax Administration Bill
The Tax Administration Bill, which incorporates several generic administrative provisions from different tax acts into one piece of legislation, will be introduced in the National Assembly during 2011.
Customs
SARS has launched its customs modernisation programme. Customs codes aligned with procedures prescribed in the Kyoto Convention have been introduced, and during 2011 automated inspection services and electronic acquittals will be implemented. Later this year, two bills will be introduced to Parliament to provide an internationally aligned legal framework that will support customs modernisation.
Audit
SARS plans to make greater use of data provided by credit bureaus to build detailed taxpayer profiles and identify non-compliance. SARS is also extending its cooperation with other tax administrations in the areas of information exchange, skills transfer and audit.
Tax policy research projects
The following tax policy research projects are under way:
| • | | Taxation of financial derivatives. |
76
CHAPTER 5: REVENUE TRENDS AND TAX PROPOSALS
| • | | Taxation of long-term insurers. |
| • | | Housing tax incentive for developers. To increase the supply of affordable housing (below R300 000), the feasibility of an income tax credit for developers will be explored. |
| • | | Provincial motor vehicle licence fees. Minimum national standards to include an environmental tax component in provincial licence fee structures will be considered. |
| • | | VAT treatment of public passenger transport services. The VAT treatment of public passenger transport, rail, bus and taxi, will be reviewed with the objective to facilitate higher levels of investments in passenger transport infrastructure. |
| • | | VAT and educational accommodation. VAT treatment and apportionment rules concerning educational institutions that provide contract research and student accommodation will be reviewed. |
| • | | Estate duty. The effectiveness of estate duty (20 per cent on the net value of estates in excess of R3.5 million) is being reviewed, with several options under consideration. |
| • | | User charges and other fees. Mechanisms for the setting of user charges and administrative fees will be reviewed. The setting of such fees should be transparent and subject to public consultation, particularly where these are not regulated by an independent agency. |
77
2011 BUDGET REVIEW
This page has been left blank intentionally.
78
6
Asset and liability management
n Overview
In 2011/12, government’s net borrowing requirement will amount to R157.9 billion
Government expenditure is financed through revenue and borrowing, with state-owned entities and development finance institutions complementing delivery capacity. In 2011/12, government’s net borrowing requirement will amount to R157.9 billion, while state-owned entities and development finance institutions will borrow R106.3 billion. Over the next three years, development finance institutions are expected to expand their loan books by about R115 billion.
Lower debt-service costs allow for greater capital investment and spending on education and health
Owing to sound economic and fiscal policies, deep and liquid capital markets, and the availability of international funding, government was able to finance the 2010/11 budget deficit at a lower cost than anticipated. As a result, debt-service costs for 2010/11 are R4.8 billion lower than expected. Lower debt-service costs create more space to sustainably fund investment in economic infrastructure, which creates jobs, and to increase spending on social priorities such as education and health.
While the gap between expenditure and revenue is projected to narrow in line with the economic recovery, government borrowing in the current year remains substantial at 5.3 per cent of GDP, declining to 4.2 per cent of GDP in 2013/14.
Reserve accumulation has markedly reduced the economy’s external vulnerability
During 2010, global capital surged into emerging markets. South Africa attracted net inflows of R92 billion into bonds and equities (inflows of R224 billion, outflows of R132 billion) from non-resident investors, whose holdings of government bonds grew by 58 per cent. Government’s strategy of reserve accumulation has markedly reduced the external vulnerability of the economy. In 2010, government purchased official foreign exchange reserves of US$3.7 billion.
79
2011 BUDGET REVIEW
The Reserve Bank will continue to accumulate foreign exchange reserves
Over the medium term, government will work with the Reserve Bank to continue accumulating foreign exchange reserves and prefunding forex spending commitments. Taking these steps contributes to achieving a more competitive currency and strengthens South Africa’s ability to respond to sudden changes in market conditions, such as a reversal in capital flows.
Credit ratings: a stable outlook for South Africa
All major credit rating agencies rate South Africa at investment grade. In January 2011, both Fitch Ratings (BBB+) and Standard & Poor’s (BBB+) affirmed South Africa’s sovereign credit rating, while revising the rating outlook from negative to stable. Moody’s Investor Services (A3) and Rating and Investment Information, Inc. (A-), maintained a stable outlook.
These ratings reflect sound management of the economy and the public finances, and the underlying attractiveness of the country as an investment destination.
Since February 2010, rating agencies have downgraded their outlook for five developed countries and nine developing countries.
South Africa’s positive credit outlook reflects relatively low levels of public debt and government’s intention to contain debt over the long term.
The borrowing requirement is estimated at R141 billion in 2010/11
Government’s borrowing requirement, estimated at R141 billion in 2010/11, is projected to be R148.7 billion by 2013/14. Net government debt will reach R822.4 billion by the end of this fiscal year, and is set to rise to R999 billion in 2011/12, peaking at R1.4 trillion or 39.3 per cent of GDP by 2013/14. Debt-service costs will amount to R66.6 billion in 2010/11, rising to R104 billion in 2013/14.
The primary source of funding remains domestic borrowing through a combination of Treasury bills, and fixed-income and inflation-linked bonds. No new domestic bonds are anticipated and current weekly auction levels in existing fixed-income and inflation-linked bonds will be maintained over the short term. Refinancing risk will be actively managed by switching R26.8 billion of debt that matures over the forecast period into longer-term debt instruments.
Enhanced oversight of state-owned entities and development finance institutions
The New Growth Path highlights the need for development finance institutions and state-owned entities to support infrastructure development, economic growth and job creation. These institutions are expected to seek out opportunities to cooperate with the private sector in co-financing infrastructure investment in South Africa and the region over the medium term. Government will increase oversight of these entities to ensure that they become more effective and financially sustainable. As the economy improves, the criteria for issuing government guarantees will be tightened.
n Developments in South African debt markets
Domestic bond market
South Africa benefited from a wave of capital inflows, and government bond yields declined to record lows
Over the past year, emerging markets experienced a wave of capital inflows, driven by the expectation of higher returns and favourable interest rate differentials. In South Africa’s case, this surge included unprecedented demand for debt, and yields on government bonds declined to record low levels.
80
CHAPTER 6: ASSET AND LIABILITY MANAGEMENT
Spread between short- and long-term bond yields widened in anticipation of higher growth and long-term inflation expectations
Debt at government’s weekly auctions was easily absorbed despite higher issuance by both the public and private sector. The short-dated R157 (13.5 per cent; 2014/15/16) bond yield declined 6 per cent year-on-year as at 31 January 2011, reaching a record low level of 6.89 per cent in November 2010. The spread between short- and long-term bond yields widened in anticipation of higher GDP growth and long-term inflation expectations.
| | |
| Figure 6.1 | | Bond yields and net purchases by non-residents of bonds and equities, 2009 – 2011 |
Source: Bloomberg
Non-residents more than doubled their purchases of government bonds in 2010
The strength of South Africa’s macroeconomic indicators and higher global demand for emerging market debt has led to rising international interest in South African government bonds. Non-residents’ purchases of domestic bonds more than doubled from a net R27 billion in 2009 to a net R56 billion in 2010. In the first nine months of 2010, non-residents purchased a net of R73 billion worth of domestic bonds, leading to a decline in bond yields. In the fourth quarter, yields rose as investors shifted into equities.
Domestic pension funds own the largest share (36.5 per cent) of government’s bond portfolio, followed by non-resident investors (21.8 per cent). Government expects that it will be able to manage the impact of a sudden moderation in global capital flows should it occur.
81
2011 BUDGET REVIEW
| | |
| Figure 6.2 | | Domestic government bond ownership, 31 December 2010 |
Source: STRATE
Turnover in municipal debt fell from R27.5 billion in 2009 to R24 billion in 2010
The annual turnover of bonds registered on the Johannesburg Stock Exchange increased from R13.4 trillion in 2009 to R16.9 trillion in 2010, and trades in RSA bonds abroad were R2.9 trillion, bringing total trades in domestic bonds to R19.8 trillion. Turnover in municipal debt declined from R27.5 billion in 2009 to R24 billion in 2010. The largest municipal bond issuers were Johannesburg (R3.4 billion), Cape Town (R2 billion) and Ekurhuleni (R815 million).
| | |
| Figure 6.3 | | Turnover on domestic and international bond exchanges, 1995 – 2010 |
Source: Johannesburg Stock Exchange
The R157 is the most liquid government bond, followed by the R206
The R157 (13.5 per cent; 2014/15/16) bond remains government’s most liquid debt instrument, with a turnover ratio of 74 times its outstanding amount. The R206 (7.5 per cent; 2014) bond has replaced the
82
CHAPTER 6: ASSET AND LIABILITY MANAGEMENT
R186 (10.5 per cent; 2025/26/27) as the second most liquid fixed-income bond. Turnover on inflation-linked bonds remains low due to the buy-and-hold nature of the investor base.
Domestic money market
In 2010, South Africa’s three-month money market benchmark rate – the Johannesburg Interbank Acceptance Rate (JIBAR) – declined by 168 basis points to 5.55 per cent in response to the 1.5 percentage point decline in the repurchase rate. Over the same period, the 91-day Treasury bill rate followed other money market rates, declining from 7.27 per cent to 5.6 per cent. The 91-day Treasury bill continues to reflect supply pressures in the short end of the money market, remaining at higher average rates than the repo and JIBAR rates.
Global capital markets
Nearly US$908 billion in capital flows surged into emerging markets during 2010
During 2010, fears of a sovereign debt crisis in Europe, exceptionally low interest rates in developed countries and currency volatility drove sentiment in global capital markets. Nearly US$908 billion of capital flows surged into emerging markets. Foreign currency issuance by emerging markets amounted to more than US$75 billion.
Emerging market bond spreads have been narrowing, and South Africa’s bond spreads traded below those of many of our peers. On 15 November 2010, the RSA global bond maturing in 2020 reached a spread of 95 basis points over the underlying US Treasury bond.
Higher sovereign debt issuance in world markets and non-resident purchases of domestic bonds reduced demand for rand-denominated debt issued in Europe (Eurorand bonds) and in Japan (Uridashi bonds), with negative net issuances of R10.5 billion and R7 billion respectively in 2010.
n Consolidated borrowing and financing
The consolidated government borrowing requirement includes the financing requirement of national and provincial government, the social security funds and national extra-budgetary institutions.
Consolidated borrowing will increase to R153.6 billion in 2011/12 and decline to R134.6 billion in 2013/14
Consolidated borrowing in 2011/12 will increase to R153.6 billion before declining to R134.6 billion in 2013/14. The consolidated borrowing requirement is lower than that of the national government – mainly because of large investments held by the social security funds and capital reserves held by extra-budgetary institutions, which constitute prefunding for infrastructure investment.
Extra-budgetary institutions also raise loans to finance large-scale infrastructure investment, including South African National Roads Agency Limited and Trans Caledon Tunnel Authority project loans, which amount to about R22 billion over the medium term.
83
2011 BUDGET REVIEW
| | |
| Table 6.1 | | Financing of consolidated government net borrowing requirement, 2007/08 – 2013/14 |
| | | | | | | | | | | | | | | | | | | | | | | | | | | | | | | |
| | | 2007/08 | | 2008/09 | | 2009/10 | | | 2010/11 | | | 2011/12 | | 2012/13 | | 2013/14 |
| R billion | | Actual | | | Estimate | | | Medium-term estimates |
| | | | | | | |
Budget balance | | | 35.2 | | | | -27.5 | | | | -161.1 | | | | | -142.4 | | | | | -154.8 | | | | -152.9 | | | | -134.6 | |
| Extraordinary receipts and payments | | | 1.1 | | | | 3.9 | | | | 5.8 | | | | | 2.3 | | | | | 1.2 | | | | — | | | | — | |
| | | | | | | |
Net borrowing requirement | | | 36.3 | | | | -23.6 | | | | -155.3 | | | | | -140.0 | | | | | -153.6 | | | | -152.9 | | | | -134.6 | |
| | | | | | | |
| Domestic loans | | | 6.1 | | | | 46.0 | | | | 177.1 | | | | | 188.1 | | | | | 175.3 | | | | 158.5 | | | | 144.8 | |
| Foreign loans | | | -4.7 | | | | -4.0 | | | | 23.3 | | | | | -2.3 | | | | | 5.0 | | | | -3.5 | | | | -9.6 | |
| Change in cash and other balances | | | -37.6 | | | | -18.5 | | | | -45.0 | | | | | -45.9 | | | | | -26.7 | | | | -2.1 | | | | -0.6 | |
| | | | | | | |
Financing | | | -36.3 | | | | 23.6 | | | | 155.3 | | | | | 140.0 | | | | | 153.6 | | | | 152.9 | | | | 134.6 | |
| | | | | | | |
n National borrowing requirement
Net borrowing requirement is expected to peak at R161.7 billion in 2012/13
The net borrowing requirement for 2009/10, the revised estimate for 2010/11 and estimates for the medium term are set out in Table 6.2. In 2010/11, the net borrowing requirement is expected to amount to R141 billion, increasing to R161.7 billion in 2012/13 before declining to R148.7 billion in 2013/14. Changes in cash balances also affect the borrowing requirement.
Table 6.2 National government net borrowing requirement, 2009/10 – 2013/14
| | | | | | | | | | | | | | | | | | | | | | | | | | | |
| | | 2009/10 | | | 2010/11 | | | 2011/12 | | 2012/13 | | 2013/14 |
| R million | | Outcome | | | Budget | | Revised | | | Medium-term estimates |
| | | | | | | |
National budget balance1 | | | -167 518 | | | | | -174 904 | | | | -143 360 | | | | | -159 066 | | | | -161 714 | | | | -148 715 | |
Extraordinary receipts | | | 6 435 | | | | | — | | | | 3 148 | | | | | 1 350 | | | | — | | | | — | |
Premiums on loan transactions2 | | | 1 631 | | | | | — | | | | 1 850 | | | | | 1 300 | | | | — | | | | — | |
| Special dividends | | | 538 | | | | | — | | | | 362 | | | | | — | | | | — | | | | — | |
| Vodacom / Vodafone transaction | | | 3 934 | | | | | — | | | | — | | | | | — | | | | — | | | | — | |
| Revaluation profits on foreign currency | | | 212 | | | | | — | | | | 86 | | | | | — | | | | — | | | | — | |
transactions3 | | | | | | | | | | | | | | | | | | | | | | | | | | |
| Liquidation of SASRIA investment | | | 104 | | | | | — | | | | 150 | | | | | 50 | | | | — | | | | — | |
| Equalisation Fund account transfer | | | — | | | | | — | | | | 700 | | | | | — | | | | — | | | | — | |
| Other | | | 16 | | | | | — | | | | — | | | | | — | | | | — | | | | — | |
Extraordinary payments | | | -671 | | | | | — | | | | -802 | | | | | -150 | | | | — | | | | — | |
Premiums on loan transactions2 | | | — | | | | | — | | | | -230 | | | | | — | | | | — | | | | — | |
| Revaluation losses on foreign currency | | | -435 | | | | | — | | | | -400 | | | | | — | | | | — | | | | — | |
transactions3 | | | | | | | | | | | | | | | | | | | | | | | | | | |
Defrayal of GFECRA losses4 | | | -181 | | | | | — | | | | -172 | | | | | -150 | | | | — | | | | — | |
| Settlement of Saambou Bank liability | | | -55 | | | | | — | | | | — | | | | | — | | | | — | | | | — | |
| | | | | | | |
Borrowing requirement | | | -161 755 | | | | | -174 904 | | | | -141 014 | | | | | -157 866 | | | | -161 714 | | | | -148 715 | |
| | | | | | | |
| | |
| 1. | | A negative number reflects a deficit. |
| |
| 2. | | Premiums received or incurred on new loan issues, bond switch and buy-back transactions. |
| |
| 3. | | Revaluation profits or losses on government’s foreign exchange deposits at the Reserve Bank when used to meet government’s foreign exchange commitments. |
| |
| 4. | | Realised losses on the Gold and Foreign Exchange Contingency Reserve Account. |
Extraordinary receipts and payments
Extraordinary receipts of R3.1 billion included R1.9 billion premiums on bond transactions
A total of R3.1 billion in extraordinary receipts is expected in 2010/11, consisting of premiums of R1.9 billion on bond transactions, proceeds of R150 million from government’s liquidation of its investments in the
84
CHAPTER 6: ASSET AND LIABILITY MANAGEMENT
South African Special Risk Insurance Association (SASRIA), a special dividend of R362 million from Telkom, revaluation profits of R86 million on foreign currency transactions and a transfer of R700 million from the petroleum products equalisation fund.
In 2011/12, provision is made for the receipt of R50 million from SASRIA and R1.3 billion of premiums on bond transactions. No further receipts are projected over the medium term. Additional proceeds may be generated if non-strategic assets are identified and liquidated. Such proceeds could be used to buy back debt and to support state-owned entities and development finance institutions.
Extraordinary payments of R802 million in 2010/11
Extraordinary payments of R802 million are expected in 2010/11. These consist of losses on the Gold and Foreign Exchange Contingency Reserve Account (GFECRA) of R172 million, revaluation losses of R400 million on foreign currency transactions and premiums of R230 million paid on bond transactions. In 2011/12 provision is made for losses of R150 million on the GFECRA.
n Financing the national borrowing requirement
Domestic borrowing levels maintained to support foreign exchange accumulation
Table 6.3 provides information on the funding of government’s net borrowing requirement for 2009/10, revised estimates for 2010/11, and projections for 2011/12 to 2013/14. Although there has been a measured decline in the borrowing requirement, government maintained the 2010 Budget funding levels, using the surplus cash to buy foreign currency.
| | |
| Table 6.3 | | Financing of national government net borrowing requirement, 2009/10 – 2013/141 |
| | | | | | | | | | | | | | | | | | | | | | | | | | | |
| | | 2009/10 | | | 2010/11 | | | 2011/12 | | 2012/13 | | 2013/14 |
| R million | | Outcome | | | Budget | | Revised | | | Medium-term estimates |
| | | | | | | |
Domestic short-term loans (net) | | | 49 770 | | | | | 22 000 | | | | 35 100 | | | | | 22 000 | | | | 22 000 | | | | 21 000 | |
| Treasury bills | | | 49 540 | | | | | 22 000 | | | | 21 610 | | | | | 22 000 | | | | 22 000 | | | | 21 000 | |
| Corporation for public deposits | | | 230 | | | | | — | | | | 13 490 | | | | | — | | | | — | | | | — | |
Domestic long-term loans (net) | | | 118 856 | | | | | 137 740 | | | | 139 150 | | | | | 135 367 | | | | 124 240 | | | | 111 839 | |
| Market loans | | | 132 395 | | | | | 151 344 | | | | 152 614 | | | | | 150 400 | | | | 150 676 | | | | 143 450 | |
Redemptions2 | | | -13 539 | | | | | -13 604 | | | | -13 464 | | | | | -15 033 | | | | -26 436 | | | | -31 611 | |
Foreign loans (net) | | | 23 258 | | | | | 11 564 | | | | -2 267 | | | | | 4 999 | | | | -3 546 | | | | -9 630 | |
| Market loans | | | 30 873 | | | | | 14 439 | | | | — | | | | | 7 150 | | | | 7 870 | | | | 8 690 | |
| Arms procurement loan agreements | | | 800 | | | | | 352 | | | | 512 | | | | | 1 009 | | | | 26 | | | | — | |
| Redemptions (including revaluation | | | -8 415 | | | | | -3 227 | | | | -2 779 | | | | | -3 160 | | | | -11 442 | | | | -18 320 | |
| of loans) | | | | | | | | | | | | | | | | | | | | | | | | | | |
Change in cash and other balances3 | | | -30 129 | | | | | 3 600 | | | | -30 969 | | | | | -4 500 | | | | 19 020 | | | | 25 506 | |
| Rand | | | -4 953 | | | | | 3 600 | | | | 1 096 | | | | | 10 496 | | | | 3 600 | | | | 3 600 | |
| Foreign currency | | | -25 176 | | | | | — | | | | -32 065 | | | | | -14 996 | | | | 15 420 | | | | 21 906 | |
| | | | | | | |
Financing | | | 161 755 | | | | | 174 904 | | | | 141 014 | | | | | 157 866 | | | | 161 714 | | | | 148 715 | |
| | | | | | | |
| | |
| 1. | | A longer time series is presented in Table 1 of Annexure B. |
| |
| 2. | | Redemption figures are net of anticipated switches, reducing redemptions by R7.8 billion in 2011/12 and by R35 billion in 2012/13. |
| |
| 3. | | A negative change indicates an increase in cash balances. |
Lower-than-projected loan redemptions as a result of favourable exchange rates
The net borrowing requirement excludes loan redemptions – the repurchase of bonds at or before maturity – which also need to be financed. Scheduled loan redemptions are set out in Table 6.4. Loan
85
2011 BUDGET REVIEW
redemptions in 2010/11 amount to R16.2 billion – R588 million lower than anticipated, mainly due to redemption of foreign loans at favourable rates. Loan redemptions are projected to reach R49.9 billion in 2013/14. Government actively manages refinancing risk through the domestic switch programme, which has already reduced the redemption value of the R189 (6.25 per cent; 2013) bond by R16 billion.
Table 6.4 Loan redemptions, 2009/10 – 2013/14
| | | | | | | | | | | | | | | | | | | | | | | | | | | |
| | | 2009/10 | | | 2010/11 | | | 2011/12 | | 2012/13 | | 2013/14 |
| R million | | Outcome | | | Budget | | Revised | | | Medium-term estimates |
| | | | | | | |
Domestic loans | | | 13 539 | | | | | 13 604 | | | | 13 464 | | | | | 15 033 | | | | 26 436 | | | | 31 611 | |
Foreign loans | | | 8 415 | | | | | 3 227 | | | | 2 779 | | | | | 3 160 | | | | 11 442 | | | | 18 320 | |
| Principal | | | 7 608 | | | | | 2 387 | | | | 2 439 | | | | | 2 998 | | | | 13 967 | | | | 13 466 | |
| Revaluation | | | 807 | | | | | 840 | | | | 340 | | | | | 162 | | | | -2 525 | | | | 4 854 | |
| | | | | | | |
Total | | | 21 954 | | | | | 16 831 | | | | 16 243 | | | | | 18 193 | | | | 37 878 | | | | 49 931 | |
| | | | | | | |
Excludes: Source bonds in domestic switch auctions | | | — | | | | | — | | | | — | | | | | 7 805 | | | | 35 000 | | | | - | |
| | | | | | | |
Managing refinancing risk
An excess of short-term debt increases refinancing risk. Short-dated debt must be regularly refinanced, raising the risk that this will be done at higher interest rates than planned, leading to higher costs. Government has reduced this risk by exchanging maturing debt before due date for longer-dated bonds, in what are referred to as switch auctions.
In 2008/09, government switched R66.3 billion of domestic debt maturing over the subsequent three years into longer-dated bonds. This reduced domestic bond redemptions to an average of 8.2 per cent of the gross borrowing requirement over the period 2009/10 to 2011/12, lowering costs and making more funds available to fund a countercyclical response to the recession.
Domestic bond redemptions as a percentage of gross domestic borrowing will remain low compared with those of most Organisation for Economic Cooperation and Development member countries. In 2010/11, a new switch programme was launched to reduce the redemption values of the R205 (floating; 2012) and R189 (6.25 per cent; 2013) bonds by R42.8 billion.
The redemption values of the R157 (13.5 per cent; 2014/15/16) and R201 (8.75 per cent; 2014) bonds, amounting to over R100 billion, will also have to be reduced.
Impact of bond switches on domestic maturity profile
The domestic switch programme will continue. The funding strategy takes into account risk benchmarks of 70/30 fixed-rate versus non-fixed-rate
86
CHAPTER 6: ASSET AND LIABILITY MANAGEMENT
domestic debt, and a 20 per cent maximum exposure to foreign debt as a percentage of total gross debt.
Domestic short-term loans
Short-term borrowing consists of Treasury bill issuance and borrowing of surplus cash from the broader public sector. Provinces and some public entities are required to invest their surplus cash with the Corporation for Public Deposits, and government borrows from the Corporation to finance a portion of its borrowing requirement.
Domestic short-term loans increased by R35.1 billion in 2010/11
In 2010/11, domestic short-term loans increased by R35.1 billion, comprising R21.6 billion of Treasury bill issuance and R13.5 billion of borrowing from the Corporation for Public Deposits. As shown in Table 6.5, issuance of Treasury bills was concentrated in 9- and 12- month maturities, increasing the weighted average term to maturity of the Treasury bill portfolio from 186 days in 2009/10 to 204 days in 2010/11.
Table 6.5 Treasury bill issuance, 2010/11 – 2011/12
| | | | | | | | | | | | | | | | | | | | | | | | | | | | | | | |
| | | | | | | 2010/11 | | | | | | | 2011/12 | | | 2010/11 | | 2011/12 |
| Maturity | | Opening | | Net | | Closing | | | Net | | Closing | | | Weekly auction |
| R million | | balance | | increase | | balance | | | increase | | balance | | | estimates |
| | | | | | | |
| 91-day | | | 48 225 | | | | 1 500 | | | | 49 725 | | | | | — | | | | 49 725 | | | | | 3 825 | | | | 3 825 | |
| 182-day | | | 24 275 | | | | 3 675 | | | | 27 950 | | | | | 7 930 | | | | 35 880 | | | | | 1 075 | | | | 1 380 | |
| 273-day | | | 27 865 | | | | 6 260 | | | | 34 125 | | | | | 4 100 | | | | 38 225 | | | | | 875 | | | | 980 | |
| 364-day | | | 14 175 | | | | 10 175 | | | | 24 350 | | | | | 9 970 | | | | 34 320 | | | | | 475 | | | | 660 | |
| | | | | | | |
Total | | | 114 540 | | | | 21 610 | | | | 136 150 | | | | | 22 000 | | | | 158 150 | | | | | 6 250 | | | | 6 845 | |
| | | | | | | |
Over the medium term, Treasury bill net issuance is expected to average R22 billion a year. Currently no provision is made for further borrowing from the Corporation for Public Deposits.
Domestic long-term loans
Fixed-income bonds account for 78 per cent of total bond issuance
Government’s funding strategy in domestic long-term loans makes use of fixed-income bonds, inflation-linked bonds, floating-rate notes and retail bonds. Domestic long-term loan issuance amounts to R152.6 billion in 2010/11. Fixed-income bond issuance was concentrated in the medium-term maturities as shown in Table 6.6. These bonds constitute 78 per cent of total bond issuance. Fixed-income bonds were issued at a weighted average nominal yield of 8.3 per cent, while inflation-linked bonds were issued at a weighted average real yield of 2.9 per cent.
The new fixed-income bonds, R213 (7 per cent; 2031) and R214 (6.5 per cent; 2041), were well received. As at 31 January 2011, issuance in the R213 bond reached R10.7 billion and R5.5 billion in the R214 bond, showing high demand for ultra-long benchmarks. Demand for inflation-linked bonds remained high, with 61 per cent of issuance in the longer maturity R202 (3.45 per cent; 2033) and R210 (2.6 per cent; 2028) bonds.
87
2011 BUDGET REVIEW
Current weekly auction levels in domestic bonds will be broadly maintained in the year ahead
Over the next two years, domestic long-term loan issuance will average R150.5 billion, decreasing to R143.5 billion in 2013/14. In 2011/12, issuance in fixed-income and inflation-linked bonds will be in existing benchmark bonds. It is anticipated that the current weekly auction levels in domestic bonds will be broadly maintained in 2011/12.
The non-competitive auctions in domestic fixed-income bonds, which provide primary dealers a 48-hour option of taking up an additional 30 per cent of their allocation at the auction clearing yield, will remain a source of funding.
Table 6.6 Domestic long-term market loan issuance, 2010/11
| | | | | | | | | | | | | |
| | | | Average | | |
| As of 31 January 2011 | | Cash | | yield | | Nominal |
| R million | | value | | % | | outstanding |
| |
Fixed-income1 | | | 96 441 | | | | 8.32 | | | | 396 108 | |
| R203 (8.25%; 2017) | | | 17 684 | | | | 8.13 | | | | 61 750 | |
| R204 (8%; 2018) | | | 15 581 | | | | 8.39 | | | | 60 968 | |
| R207 (7.25%; 2020) | | | 15 100 | | | | 8.19 | | | | 69 949 | |
| R208 (6.75%; 2021) | | | 18 539 | | | | 8.34 | | | | 58 341 | |
| R186 (10.5%; 2025/26/27) | | | 4 512 | | | | 8.53 | | | | 79 684 | |
| R213 (7%; 2031) | | | 9 251 | | | | 8.43 | | | | 10 719 | |
| R209 (6.25%; 2036) | | | 6 678 | | | | 8.54 | | | | 40 325 | |
| R214 (6.5%; 2041) | | | 4 330 | | | | 8.52 | | | | 5 534 | |
| Retail | | | 4 766 | | | | 8.25 | | | | 8 838 | |
Inflation-linked | | | 27 771 | | | | 2.87 | | | | 126 752 | |
| R211 (2.5%; 2017) | | | 3 278 | | | | 2.51 | | | | 17 138 | |
| R212 (2.75%; 2022) | | | 5 953 | | | | 2.82 | | | | 7 763 | |
| R197 (5.5%; 2023) | | | 1 541 | | | | 3.14 | | | | 57 478 | |
| R210 (2.6%; 2028) | | | 7 189 | | | | 2.95 | | | | 14 100 | |
| R202 (3.45%; 2033) | | | 9 776 | | | | 2.91 | | | | 30 110 | |
| Retail | | | 34 | | | | 2.35 | | | | 163 | |
| |
Total | | | 124 212 | | | | | | | | | |
| |
| | |
| 1. | | Includes non-competitive auction allocations of R13 billion. |
Total investment in retail bonds amounts to R9 billion
Retail bonds consist of 2-, 3- and 5-year fixed-rate and 3-, 5- and 10-year inflation-linked bonds. During 2010/11, investment in retail bonds amounted to R4.8 billion, of which R220 million was reinvestment of maturing bonds and capitalised interest. Total investment in retail bonds amounts to R9 billion. The interest rates on retail bonds are shown in Table 6.7.
Table 6.7 Interest rates on government retail bonds
| | | | | | | | | | | | | |
| Effective from | | |
| Percentage | | Bond maturity |
| |
Fixed-rate | | 2-year | | 3-year | | 5-year |
| | | |
| 1 May 2010 | | | 8.50 | | | | 8.75 | | | | 9.00 | |
| 1 Oct 2010 | | | 8.00 | | | | 8.25 | | | | 8.50 | |
| 1 Dec 2010 | | | 7.50 | | | | 7.75 | | | | 8.00 | |
Inflation-linked | | 3-year | | 5-year | | 10-year |
| | | |
| 1 Dec 2009 | | | 2.25 | | | | 2.50 | | | | 3.00 | |
| 1 Dec 2010 | | | 2.00 | | | | 2.25 | | | | 2.75 | |
| |
88
CHAPTER 6: ASSET AND LIABILITY MANAGEMENT
As at 31 January 2011, R217 million of benchmark bonds were made available to primary dealers as an overnight facility at zero per cent interest to facilitate settlements in the bond market.
Foreign loans
Awards for a US$2 billion bond issuance, which was three times oversubscribed
Government did not issue any bonds in the international market in 2010/11. The US$2 billion issuance planned for 2010/11 took place in 2009/10 in response to favourable market conditions. The bond issue was more than three times oversubscribed. Euroweek named this instrument the emerging market bond of 2010, and Credit Magazine called it the best bond for Africa in 2010.
Drawdowns on the arms procurement loan agreements in 2011/12 amount to R1 billion, with final drawdowns of R26 million in 2012/13.
Global borrowing of US$1 billion a year to maintain foreign currency benchmarks
Over the medium term, government intends to borrow about US$1 billion a year in global markets to maintain benchmarks in major currencies and meet part of its foreign currency commitments. The balance of these commitments will be met from foreign currency bank balances and purchases in the domestic market.
Cash balances
Government’s total cash consists of deposits in rand and in foreign currency. These deposits are held with commercial banks and the Reserve Bank, as shown in Table 6.8.
Table 6.8 National government cash balances, 2007/08 – 2013/14
| | | | | | | | | | | | | | | | | | | | | | | | | | | | | | | |
| | | 2007/08 | | 2008/09 | | 2009/10 | | | 2010/11 | | | 2011/12 | | 2012/13 | | 2013/14 |
| R billion | | | | | | Actual | | | | | | | Estimate | | | Medium-term estimates |
| | | | | | | |
Reserve Bank | | | | | | | | | | | | | | | | | | | | | | | | | | | | | | |
| Sterilisation deposits | | | 63.1 | | | | 66.1 | | | | 67.2 | | | | | 67.2 | | | | | 67.2 | | | | 67.2 | | | | 67.2 | |
| Foreign currency deposits | | | — | | | | — | | | | 25.2 | | | | | 57.1 | | | | | 72.2 | | | | 56.8 | | | | 34.9 | |
| Corporation for Public Deposits | | | 0.2 | | | | 4.0 | | | | 1.0 | | | | | — | | | | | — | | | | — | | | | — | |
Commercial banks | | | | | | | | | | | | | | | | | | | | | | | | | | | | | | |
| Tax and loan accounts | | | 30.5 | | | | 31.3 | | | | 38.4 | | | | | 41.9 | | | | | 35.0 | | | | 35.0 | | | | 35.0 | |
Foreign currency deposits1 | | | — | | | | — | | | | — | | | | | 0.1 | | | | | — | | | | — | | | | — | |
| | | | | | | |
Total | | | 93.8 | | | | 101.4 | | | | 131.8 | | | | | 166.3 | | | | | 174.4 | | | | 159.0 | | | | 137.1 | |
| | | | | | | |
Of which: | | | | | | | | | | | | | | | | | | | | | | | | | | | | | | |
Rand | | | 93.8 | | | | 101.4 | | | | 106.6 | | | | | 109.1 | | | | | 102.2 | | | | 102.2 | | | | 102.2 | |
Foreign currency | | | — | | | | — | | | | 25.2 | | | | | 57.2 | | | | | 72.2 | | | | 56.8 | | | | 34.9 | |
| | | | | | | |
| | | |
| 1. | | Amounts drawn on the arms procurement loan agreements and deposited into an interest bearing escrow account until actual expenditure takes place. |
Foreign currency deposits with Reserve Bank to increase to R72.2 billion in 2011/12
Government’s foreign exchange deposits with the Reserve Bank are made from money borrowed in the international markets and from purchases of foreign currency in the local market. These deposits are used to meet government’s foreign currency commitments. The rand equivalent of foreign currency deposits with the Reserve Bank is expected to rise to R72.2 billion by 2011/12 and will decrease to R34.9 billion in 2013/14 after large scheduled foreign loan redemptions and interest payments.
89
2011 BUDGET REVIEW
In view of their role in managing money market liquidity, sterilisation deposits are only available for short-term cash management.
Operational cash in the tax and loan accounts is used to meet government’s rand expenditure. Total cash balances will rise to R174.4 billion in 2011/12, declining to R137.1 billion in 2013/14. The losses and profits on the foreign exchange activities of the Reserve Bank are accounted for on the Gold and Foreign Exchange Contingency Reserve Account. The balance on this account is split into transactions with a cash flow and non-cash flow impact. Due to a stronger currency, the balance of valuation gains and losses decreased to a net R18.3 billion as of 31 December 2010, R17.5 billion lower than a year earlier.
n National government’s debt portfolio
Total debt
At 4.6 per cent of net loan debt, foreign net loan debt is well below risk benchmark
Net loan debt consists of total domestic and foreign debt, less the cash balances of the National Revenue Fund. In 2010/11, lower foreign issuance and a higher foreign currency cash balance are expected to reduce foreign net loan debt to 4.6 per cent of total net loan debt. Gross foreign loan debt exposure as a percentage of total gross loan debt is expected to remain well below the National Treasury’s 20 per cent risk benchmark, declining from 9.6 per cent in 2010/11 to 7.2 per cent in 2013/14.
Table 6.9 Total national government debt, 2007/08 – 2013/14
| | | | | | | | | | | | | | | | | | | | | | | | | | | | | | | |
| | | 2007/08 | | 2008/09 | | 2009/10 | | | 2010/11 | | | 2011/12 | | 2012/13 | | 2013/14 |
| R billion | | | | | | Outcome | | | | | | | Estimate | | | Medium-term estimates |
| | | | | | | |
Domestic debt | | | | | | | | | | | | | | | | | | | | | | | | | | | | | | |
Gross loan debt1 | | | 480.8 | | | | 529.7 | | | | 705.5 | | | | | 893.4 | | | | | 1072.8 | | | | 1250.2 | | | | 1415.3 | |
| Cash balances | | | -93.8 | | | | -101.3 | | | | -106.6 | | | | | -109.1 | | | | | -102.2 | | | | -102.2 | | | | -102.2 | |
Net loan debt2 | | | 387.0 | | | | 428.4 | | | | 598.9 | | | | | 784.3 | | | | | 970.6 | | | | 1148.0 | | | | 1313.1 | |
| | | | | | | |
Foreign debt | | | | | | | | | | | | | | | | | | | | | | | | | | | | | | |
Gross loan debt1 | | | 96.2 | | | | 97.3 | | | | 99.5 | | | | | 95.3 | | | | | 100.4 | | | | 108.5 | | | | 110.1 | |
| Cash balances | | | — | | | | — | | | | -25.2 | | | | | -57.2 | | | | | -72.2 | | | | -56.8 | | | | -34.9 | |
Net loan debt2 | | | 96.2 | | | | 97.3 | | | | 74.3 | | | | | 38.1 | | | | | 28.2 | | | | 51.7 | | | | 75.2 | |
| | | | | | | |
Total gross loan debt | | | 577.0 | | | | 627.0 | | | | 805.0 | | | | | 988.7 | | | | | 1173.2 | | | | 1358.7 | | | | 1525.4 | |
Total net loan debt | | | 483.2 | | | | 525.7 | | | | 673.2 | | | | | 822.4 | | | | | 998.8 | | | | 1199.7 | | | | 1388.3 | |
| | | | | | | |
As percentage of GDP: | | | | | | | | | | | | | | | | | | | | | | | | | | | | | | |
Total gross loan debt | | | 27.8 | | | | 27.1 | | | | 33.0 | | | | | 37.1 | | | | | 40.2 | | | | 42.4 | | | | 43.1 | |
Total net loan debt | | | 23.2 | | | | 22.7 | | | | 27.6 | | | | | 30.8 | | | | | 34.3 | | | | 37.5 | | | | 39.3 | |
Foreign debt as percentage of: | | | | | | | | | | | | | | | | | | | | | | | | | | | | | | |
Gross loan debt | | | 16.7 | | | | 15.5 | | | | 12.4 | | | | | 9.6 | | | | | 8.6 | | | | 8.0 | | | | 7.2 | |
Net loan debt | | | 19.9 | | | | 18.5 | | | | 11.0 | | | | | 4.6 | | | | | 2.8 | | | | 4.3 | | | | 5.4 | |
| | | | | | | |
| | | |
| 1. | | Forward estimates are based on projections of exchange and inflation rates. |
| |
| 2. | | Net loan debt is calculated with due account of the cash balances of the National Revenue Fund (bank balances of government’s accounts with the Reserve Bank and commercial banks). |
By the end of 2010/11, financing of the net borrowing requirement, the impact of currency movements and inflation are expected to increase net loan debt to R822.4 billion. Net loan debt is projected to rise to R1.4 trillion or 39.3 per cent of GDP at the end of the forecast period.
90
CHAPTER 6: ASSET AND LIABILITY MANAGEMENT
Maturity distribution and composition of government debt
Table 6.10 shows the weighted average maturity distribution of the domestic bond portfolio. The average maturity of the portfolio will increase marginally to 10.2 years in 2010/11. The short-term end of the portfolio increased to 11.9 per cent as the R189 (6.25 per cent; 2013) inflation-linked bond approached its redemption date.
Table 6.10 Maturity distribution of domestic marketable bonds, 2008/09 – 2010/11
| | | | | | | | | | | | | | | | | | |
| | | | | | | 2010/11 |
| Percentage of total | | 2008/09 | | 2009/10 | | | Estimates |
| Years | | Portfolio1 | | | Funding2 | | Portfolio1 |
| | | | |
| 0 – 3 | | | 8.4 | | | | 5.7 | | | | | — | | | | 11.9 | |
| 3 – 7 | | | 32.2 | | | | 31.5 | | | | | 17.0 | | | | 25.6 | |
| 7 – 10 | | | 17.5 | | | | 24.4 | | | | | 25.5 | | | | 18.9 | |
| 10 – 19 | | | 34.3 | | | | 29.6 | | | | | 31.9 | | | | 31.0 | |
| Longer than 19 | | | 7.6 | | | | 8.8 | | | | | 25.6 | | | | 12.6 | |
| | | | |
Weighted average years to maturity | | | 10.2 | | | | 10.1 | | | | | 13.1 | | | | 10.2 | |
| | | | |
| | | |
| 1. | | The total bond portfolio as at the end of the period. |
| |
| 2. | | Bond issuances for the fiscal year. |
Non-fixed portion of domestic debt portfolio exceeds benchmark
The non-fixed component of the domestic portfolio, comprising floating-rate notes, inflation-linked bonds and short-term loans, will grow from 30 per cent in 2008/09 to 38 per cent in 2010/11, exceeding the National Treasury risk benchmark of 30 per cent non-fixed debt.
The deviation was necessary to fund government’s large borrowing requirement and in response to greater demand for inflation-linked bonds and Treasury bills. Over the medium term, government will seek to move closer to the non-fixed debt benchmark.
Table 6.11 Composition of domestic debt by instrument, 2007/08 – 2010/11
| | | | | | | | | | | | | | | | | | |
| End of period | | 2007/08 | | 2008/09 | | 2009/10 | | | 2010/11 |
| R billion | | Outcome | | | Estimate |
| | | | |
Short-term loans | | | 52.9 | | | | 65.0 | | | | 114.9 | | | | | 149.9 | |
Shorter than 91-days1 | | | 1.0 | | | | — | | | | 0.3 | | | | | 13.7 | |
| 91-days | | | 31.7 | | | | 37.7 | | | | 48.2 | | | | | 49.7 | |
| 182-days | | | 10.4 | | | | 13.8 | | | | 24.3 | | | | | 28.0 | |
| 273-days | | | 9.8 | | | | 12.9 | | | | 27.9 | | | | | 34.1 | |
| 364-days | | | — | | | | 0.6 | | | | 14.2 | | | | | 24.4 | |
Long-term loans | | | 427.9 | | | | 464.7 | | | | 590.6 | | | | | 743.5 | |
| Fixed-income | | | 350.8 | | | | 369.0 | | | | 445.6 | | | | | 556.3 | |
| Floating rate | | | 4.8 | | | | 7.8 | | | | 7.8 | | | | | 7.8 | |
| Zero coupon | | | 2.2 | | | | 2.1 | | | | 2.1 | | | | | 1.0 | |
Inflation-linked2 | | | 68.6 | | | | 83.9 | | | | 130.4 | | | | | 168.7 | |
| Retail | | | 1.3 | | | | 1.7 | | | | 4.6 | | | | | 9.6 | |
Other3 | | | 0.2 | | | | 0.2 | | | | 0.1 | | | | | 0.1 | |
| | | | |
Total | | | 480.8 | | | | 529.7 | | | | 705.5 | | | | | 893.4 | |
| | | | |
| | | |
| 1. | | Mainly borrowing from the Corporation for Public Deposits. |
| |
| 2. | | Includes revaluation as a result of changes in CPI. |
| |
| 3. | | Loan levies, former regional authorities and Namibian debt. |
91
2011 BUDGET REVIEW
The foreign debt portfolio consists mainly of US dollar-denominated (57 per cent) and euro-denominated (30 per cent) debt.
Debt-service costs
Debt-service costs are influenced by the volume of debt, new borrowing and market variables such as interest rates, inflation and exchange rates. Table 6.12 summarises trends and projections to 2013/14.
Table 6.12 National government debt-service costs, 2009/10 – 2013/14
| | | | | | | | | | | | | | | | | | | | | | | | | | | |
| | | 2009/10 | | | 2010/11 | | | 2011/12 | | 2012/13 | | 2013/14 |
| R million | | Outcome | | | Budget | | Revised | | | Medium-term estimates |
| | | | | | | |
| Domestic | | | 52 170 | | | | | 65 549 | | | | 61 084 | | | | | 70 797 | | | | 84 551 | | | | 97 061 | |
| Foreign | | | 4 959 | | | | | 5 809 | | | | 5 486 | | | | | 5 782 | | | | 6 257 | | | | 6 975 | |
| | | | | | | |
Total | | | 57 129 | | | | | 71 358 | | | | 66 570 | | | | | 76 579 | | | | 90 808 | | | | 104 036 | |
| | | | | | | |
As percentage of: | | | | | | | | | | | | | | | | | | | | | | | | | | |
GDP | | | 2.3 | | | | | 2.6 | | | | 2.5 | | | | | 2.6 | | | | 2.8 | | | | 2.9 | |
GDP-accrual 1 | | | 2.4 | | | | | 2.9 | | | | 2.8 | | | | | 2.9 | | | | 3.1 | | | | 3.2 | |
Expenditure | | | 7.6 | | | | | 8.7 | | | | 8.2 | | | | | 8.6 | | | | 9.4 | | | | 9.9 | |
Revenue | | | 9.9 | | | | | 11.1 | | | | 10.0 | | | | | 10.5 | | | | 11.3 | | | | 11.5 | |
| | | | | | | |
| | | |
| 1. | | Debt-service costs adjusted for the amortisation of discount on domestic bond issues. |
In 2010/11, revised debt-service costs are expected to be R4.8 billion lower than projected, mainly due to favourable interest and exchange rates.
n State-owned entities’ capital programmes
Government works with state-owned entities to ensure low-cost financing for capital investments
The state-owned entities are mandated to give effect to government’s priorities. The main entities are in energy, rail, roads, ports, water and sanitation. For several years the largest entities have been investing in key economic infrastructure necessary to support long-term economic growth. During the recession, these infrastructure investments helped to stimulate the economy. To support the capital infrastructure programme, government provided cash injections, loans and guarantees to ensure the continued availability of funding at the lowest possible cost. To function sustainably, however, state-owned entities need to borrow mainly on the strength of their balance sheets.
Government will continue to help Eskom raise funding for its infrastructure commitments
Government support has reduced borrowing costs and eased pressure on the domestic capital market. The average spread between guaranteed and nonguaranteed domestic debt of state-owned entities amounted to 80 basis points in 2010/11. In the case of Eskom, this translates into an estimated saving of R1.3 billion over the period 2009/10 to 2014/15. In January 2011, Eskom issued 10-year unsecured notes amounting to US$1.8 billion in the global capital market. Government will continue to explore mechanisms to support Eskom in raising funding for its infrastructure commitments through 2017.
State-owned entities will continue to pursue funding opportunities in domestic and foreign capital markets. Multilateral agencies (the World Bank, European Investment Bank, African Development Bank, Agence Française de Développement and Kreditanstalt für Wiederaufbau) that
92
CHAPTER 6: ASSET AND LIABILITY MANAGEMENT
provide cost-effective long-term loans will also continue to be sources of finance.
In the five years to 2014/15, capital expenditure by the major state-owned entities is projected at R623.6 billion
Between 2010/11 and 2014/15, capital expenditure by the major state-owned entities is projected at R623.6 billion (2010: R699.6 billion). This estimate is 10.9 per cent lower than previously published figures as a result of revisions to capital expenditure estimates. Contract prices have fallen somewhat and some projects have been delayed as a result of a slowdown in demand due to the recession.
Table 6.13 Major state-owned entities’ capital expenditure programmes, 2009/10 – 2014/15
| | | | | | | | | | | | | | | | | | | | | | | | | | | | | | | |
| | 2009/10 | | | 2010/11 | | | 2011/12 | | 2012/13 | | 2013/14 | | 2014/15 |
| R billion | | Outcome | | | Budget | | Revised | | | Medium-term estimate |
| | | | | | |
| Capital expenditure | | | 88.6 | | | | | 149.5 | | | | 136.2 | | | | | 136.5 | | | | 122.7 | | | | 104.3 | | | | 123.9 | |
Of which: | | | | | | | | | | | | | | | | | | | | | | | | | | | | | | |
Eskom | | | 48.4 | | | | | 96.3 | | | | 86.8 | | | | | 93.7 | | | | 85.2 | | | | 67.0 | | | | 88.9 | |
Transnet | | | 18.4 | | | | | 19.4 | | | | 22.8 | | | | | 21.9 | | | | 17.1 | | | | 16.2 | | | | 15.2 | |
Central Energy Fund | | | 1.4 | | | | | 5.8 | | | | 6.8 | | | | | 4.3 | | | | 8.2 | | | | 10.1 | | | | 5.5 | |
South African National Roads | | | 11.6 | | | | | 13.5 | | | | 8.4 | | | | | 2.6 | | | | 2.0 | | | | 1.5 | | | | 1.5 | |
Agency Limited | | | | | | | | | | | | | | | | | | | | | | | | | | | | | | |
Trans-Caledon Tunnel Authority | | | 0.4 | | | | | 7.1 | | | | 5.0 | | | | | 9.0 | | | | 4.8 | | | | 4.8 | | | | 2.9 | |
Airports Company of South Africa Limited | | | 5.2 | | | | | 1.6 | | | | 1.3 | | | | | 0.8 | | | | 1.1 | | | | — | | | | — | |
| | | | | | | |
Over the same five-year period, the capital expenditure programmes and refinancing needs of major state-owned entities will be financed through internally generated resources (42 per cent), government funding (5 per cent) and a combination of long-term and short-term borrowing in the domestic (28 per cent) and foreign markets (25 per cent).
| | |
| Table 6.14 | | Projected major sources of funding for state-owned entities and development finance institutions, 2009/10 – 2014/15 |
| | | | | | | | | | | | | | | | | | | | | | | | | | | | | | | |
| | | 2009/10 | | | 2010/11 | | | 2011/12 | | 2012/13 | | 2013/14 | | 2014/15 |
| R billion | | Outcome | | | Budget | | Revised | | | | | | | Medium-term estimates | | | | |
| | | | | | | |
Domestic loans (gross) | | | 110.6 | | | | | 75.9 | | | | 81.3 | | | | | 59.2 | | | | 51.6 | | | | 52.9 | | | | 65.7 | |
| Short-term | | | 29.6 | | | | | 11.7 | | | | 20.2 | | | | | 17.9 | | | | 13.5 | | | | 11.3 | | | | 12.7 | |
| Long-term | | | 81.0 | | | | | 64.2 | | | | 61.1 | | | | | 41.3 | | | | 38.1 | | | | 41.6 | | | | 53.0 | |
Foreign loans (gross) | | | 6.9 | | | | | 50.4 | | | | 66.2 | | | | | 47.1 | | | | 30.5 | | | | 32.0 | | | | 12.9 | |
| Long-term | | | — | | | | | 9.8 | | | | 20.8 | | | | | 22.1 | | | | 17.0 | | | | 25.1 | | | | 9.6 | |
| Multilateral institutions | | | 4.6 | | | | | 32.6 | | | | 28.0 | | | | | 18.1 | | | | 7.9 | | | | 3.5 | | | | 1.2 | |
| Export credit agencies | | | 2.3 | | | | | 8.0 | | | | 17.4 | | | | | 6.9 | | | | 5.6 | | | | 3.4 | | | | 2.1 | |
| | | | | | | |
Total | | | 117.5 | | | | | 126.3 | | | | 147.5 | | | | | 106.3 | | | | 82.1 | | | | 84.9 | | | | 78.6 | |
| | | | | | | |
As percentage of total: | | | | | | | | | | | | | | | | | | | | | | | | | | | | | | |
Domestic loans | | | 94.1 | | | | | 60.1 | | | | 55.1 | | | | | 55.7 | | | | 62.9 | | | | 62.3 | | | | 83.6 | |
Foreign loans | | | 5.9 | | | | | 39.9 | | | | 44.9 | | | | | 44.3 | | | | 37.1 | | | | 37.7 | | | | 16.4 | |
| | | | | | | |
93
2011 BUDGET REVIEW
Contingent liabilities
Contingent liabilities may be incurred depending on future events. In 2010/11, new guarantees were issued to Eskom (R174 billion) and the existing guarantee to Denel (R1.9 billion) was extended by a year. Fees of R43.9 million were received in 2010/11 on various guarantees provided. The major public entities that hold guarantees are shown in Table 6.15. Details of guarantee commitments are set out in Table 9 of Annexure B.
| | |
| Table 6.15 | | Guarantee exposure against major state-owned entities and development finance institutions, 2009/10 – 2010/11 |
| | | | | | | | | | | | | | | | | | | |
| Institution | | | 2009/10 | | | 2010/11 |
| R billion | | | Guarantee | | Exposure | | | Guarantee | | Exposure |
| | | | | | | |
Total | | | | 298.4 | | | | 129.1 | | | | | 470.5 | | | | 159.8 | |
Of which: | | | | | | | | | | | | | | | | | | |
Eskom | | | | 176.0 | | | | 46.7 | | | | | 350.0 | | | | 71.3 | |
South African National Roads Agency Limited | | | | 38.9 | | | | 12.3 | | | | | 38.9 | | | | 23.7 | |
Development Bank of Southern Africa | | | | 29.3 | | | | 26.6 | | | | | 29.3 | | | | 25.7 | |
Trans-Caledon Tunnel Authority | | | | 25.4 | | | | 20.7 | | | | | 25.4 | | | | 18.8 | |
Transnet | | | | 11.4 | | | | 11.6 | | | | | 9.5 | | | | 9.9 | |
Land Bank | | | | 3.8 | | | | 2.6 | | | | | 3.8 | | | | 1.8 | |
| | | | | | | |
Eskom
State support led to cancellation of Eskom’s credit watch
In February 2009, government approved guarantees totalling R176 billion to support construction of new power plants; the guarantee was increased by R174 billion in October 2010, bringing the total to R350 billion. The additional state support has led to the cancellation of an Eskom credit watch. Part of the increase in the guarantee was precautionary, aimed at ensuring more rapid progress on urgent projects through 2017, including the completion of the Kusile power plant. Eskom is now able to borrow with a mix of unsecured and secured debt instruments.
Trans-Caledon Tunnel Authority
As at 31 March 2011 the Trans-Caledon Tunnel Authority will have borrowed a total of R18.8 billion against an authorised guaranteed amount of R25.4 billion for the Lesotho Highlands Water Project. Income from water sales is proving adequate to service debt.
South African National Road Agency Limited
SANRAL will continue to source finance to fund expansion of toll roads in Gauteng and Western Cape
In 2009/10, SANRAL received a guarantee of R31.9 billion and raised R11.4 billion. SANRAL will continue to source finance over the medium term to fund the expansion and upgrade of toll roads as part of the Gauteng Freeway Improvement Project and the N1/N2 Winelands project.
Transnet
Guarantees to Transnet were provided in 1998 (R3.5 billion) and 2004 (R6 billion) to enable financing of capital expenditure projects. Since then Transnet’s financial position has improved and it can fund its capital expenditure programme on the strength of its balance sheet.
94
CHAPTER 6: ASSET AND LIABILITY MANAGEMENT
Denel
Government extended Denel’s R1.9 billion of existing guarantees to 2011. Of the eight business units, four are profitable. Government is working with Denel to find a way for loss-making entities such as Denel Saab Aerostructures, Denel Dynamics and Rooivalk to become sustainable.
South African Airways
SAA’s R1.6 billion guarantee was restructured
Although no additional support was required during 2010, government restructured the R1.6 billion perpetual guarantee provided to South African Airways (SAA) in 2009 to provide security required by international air services licensing councils for tickets purchased in advance.
South African Broadcasting Corporation
Task team is working to ensure SABC’s adherence to conditions of guarantee
In 2009/10, government approved a R1.5 billion guarantee for the South African Broadcasting Corporation (SABC). A R1 billion term loan facility was concluded in December 2009 and issuance against the remaining guarantee is contingent on approval by government. The Ministers of Communications and Finance have established a task team to oversee a turnaround at the SABC and ensure adherence to guarantee conditions.
Passenger Rail Agency of South Africa
The 2010 Budget included a recapitalisation of the Passenger Rail Agency of South Africa to the value of R797 million. This transfer supported repayment of a loan under the R1.4 billion guarantee for the acquisition of buses for the 2010 World Cup. The rail agency is working with government to ensure that the remainder of the loan will be repaid.
Provisions and contingent liabilities
Projections for provisions and contingent liabilities are shown in Table 6.16. Provisions are liabilities for which the payment date or amount is uncertain. The provisions for the multilateral institutions are the unpaid portion of subscriptions to these institutions, payable on request.
As at 31 March 2010, net loan debt, provisions and contingent liabilities amounted to 41 per cent of GDP, and are projected to reach 51 per cent of GDP by 2013/14. This is well below the Southern African Development Community’s macroeconomic convergence target of 60 per cent of GDP, and compares favourably with many developed countries.
95
2011 BUDGET REVIEW
Table 6.16 Composition of provisions and contingent liabilities1, 2009/10 – 2013/14
| | | | | | | | | | | | | | | | | | | | | | | |
| End of period | | 2009/10 | | | 2010/11 | | | 2011/12 | | 2012/13 | | 2013/14 |
| R billion | | Outcome | | | Estimate | | | Medium-term estimates |
| | | | | | | |
Net loan debt | | | 673.2 | | | | | 822.4 | | | | | 998.8 | | | | 1 199.7 | | | | 1 388.3 | |
Provisions | | | 58.4 | | | | | 58.5 | | | | | 75.2 | | | | 79.4 | | | | 84.0 | |
| Special drawing rights | | | 0.8 | | | | | 0.8 | | | | | 0.8 | | | | 0.8 | | | | 0.8 | |
International Monetary Fund2 | | | 23.6 | | | | | 23.6 | | | | | 23.6 | | | | 23.6 | | | | 23.6 | |
International Bank for Reconstruction and Development2 | | | 11.2 | | | | | 11.0 | | | | | 10.9 | | | | 12.0 | | | | 13.3 | |
Multilateral Investment Guarantee Agency2 | | | 0.1 | | | | | 0.1 | | | | | 0.1 | | | | 0.1 | | | | 0.1 | |
African Development Bank2 | | | 8.1 | | | | | 7.9 | | | | | 24.1 | | | | 26.6 | | | | 29.3 | |
Development Bank of Southern Africa Limited3 | | | 4.8 | | | | | 4.8 | | | | | 4.8 | | | | 4.8 | | | | 4.8 | |
| Government employees leave credits | | | 9.8 | | | | | 10.3 | | | | | 10.9 | | | | 11.5 | | | | 12.1 | |
Contingent liabilities | | | 267.9 | | | | | 298.2 | | | | | 316.6 | | | | 327.4 | | | | 331.9 | |
| Guarantees | | | 129.1 | | | | | 159.8 | | | | | 175.8 | | | | 188.0 | | | | 193.5 | |
| Post-retirement medical assistance | | | 56.0 | | | | | 56.0 | | | | | 56.0 | | | | 56.0 | | | | 56.0 | |
| Road Accident Fund | | | 45.4 | | | | | 44.1 | | | | | 46.2 | | | | 45.6 | | | | 45.3 | |
| Government employees pension funds | | | — | | | | | — | | | | | — | | | | — | | | | — | |
| Claims against government departments | | | 24.2 | | | | | 24.2 | | | | | 24.2 | | | | 24.2 | | | | 24.2 | |
| Export Credit Insurance Corporation | | | 9.2 | | | | | 9.9 | | | | | 10.0 | | | | 8.9 | | | | 7.7 | |
| Unemployment Insurance Fund | | | 3.7 | | | | | 3.9 | | | | | 4.1 | | | | 4.4 | | | | 4.9 | |
Other4 | | | 0.3 | | | | | 0.3 | | | | | 0.3 | | | | 0.3 | | | | 0.3 | |
| | | | | | | |
Total | | | 999.5 | | | | | 1 179.1 | | | | | 1 390.6 | | | | 1 606.5 | | | | 1 804.2 | |
| | | | | | | |
Total as percentage of GDP | | | 40.9 | | | | | 44.2 | | | | | 47.7 | | | | 50.2 | | | | 51.0 | |
| | | | | | | |
| | | |
| 1. | | Medium-term forecasts of some figures are not available and are kept constant. |
| |
| 2. | | Represents the unpaid portion of government’s subscription to these institutions. |
| |
| 3. | | Represents callable capital provided for in terms of the Development Bank of Southern Africa Act. |
| |
| 4. | | Represents a liability to Reserve Bank in respect of old coinage in circulation and other unconfirmed balances by departments. |
n Development finance institutions
Development finance to support infrastructure and industrial development in South Africa and region
South Africa’s development finance institutions are well placed to deliver on government’s development priorities. The asset base of the major development finance institutions amounted to R153 billion as at 31 March 2010, and over the next three years their lending capacity will be an estimated R115 billion. Over the period ahead, these institutions will focus on infrastructure and industrial development, low-cost housing, rural development and land reform, financing small businesses and black economic empowerment enterprises, and supporting regional development.
Development finance institutions require adequate resources to deliver on their mandates. Government works with these institutions and other state-owned entities to ensure orderly participation in bond auctions, and to make use of favourable market conditions to extend their debt maturities to reduce refinancing risk. To ensure better coordination, guidance and monitoring, and a more cost-effective approach, government has established the Development Finance Institutions Council, made up of Cabinet ministers responsible for the various entities.
96
CHAPTER 6: ASSET AND LIABILITY MANAGEMENT
Review of development finance institutions
In 2008 government commissioned a review on the role of development finance institutions. The purpose of the review was to ensure that these institutions were effectively supporting South Africa’s social and economic policy objectives, and working within a well-coordinated policy and governance framework.
The review focused on the 12 main institutions.* Its key findings were as follows:
| • | | Mandates: The mandates are broad and lack focus. There is considerable overlap and duplication in the purpose and function of these entities, leading to wastage of resources. |
| • | | Governance: A uniform legal and regulatory framework is required for these institutions. |
| • | | Coordination: Development finance institutions are not well coordinated at central government level. Improved coordination would support efficiency in service delivery. |
| • | | Risk management: More emphasis must be placed on risk management to contain losses. Staff technical skills should be improved, boards trained and risk management programmes developed. |
| • | | Development effectiveness: Monitoring and evaluation frameworks are weak or absent, making it difficult for government to assess the real impact of development finance activities. |
| • | | Financial sustainability: The institutions should be able to cover their costs with their own income. While maintaining commercial loans, a growing proportion of funds should be directed towards development. |
The review recommended that government introduce a more meaningful performance monitoring and evaluation system to assess and guide delivery on development interventions. It also proposed the establishment of a Development Finance Council to coordinate and guide the activities of these entities. The council is now in place and is overseeing the implementation of the recommendations made in the review.
* Development Bank of Southern Africa, Independent Development Trust, Industrial Development Corporation, Khula Enterprise Finance, Land Bank, Micro Agricultural Finance Institute of South Africa, National Empowerment Fund, National Housing Finance Corporation, National Urban Reconstruction and Housing Agency, Rural Housing Loan Fund, South African Micro Finance Apex Fund and Umsobomvu Youth Fund.
Development Bank of Southern Africa
DBSA to step up support for municipalities in services and infrastructure
Government and the Development Bank of Southern Africa (DBSA) have agreed that the bank should step up its support for municipalities and expand its support to provinces and other priority programmes.
The DBSA will work to improve delivery of services, operations and infrastructure maintenance, with spinoffs for local employment. The Bank is also encouraged to champion a model that involves private-sector co-financing of such projects. To support these initiatives, government committed to raise the Bank’s callable capital by R15.2 billion to R20 billion, increasing its lending capacity to R140 billion. A legislative amendment will effect this change. Government is also exploring ways to reduce the DBSA’s exposure when lending to municipalities that are credit risks. This will help to accelerate municipal infrastructure programmes.
Land Bank
Land Bank has refocused to provide support for emerging farmers and boost agricultural production
The Land Bank is refocusing to prioritise support for emerging farmers, and to increase South Africa’s production of food and fibre. The Bank is working with the relevant national departments to implement a support programme for emerging farmers, starting with those who cannot service their Land Bank loans. The Bank has improved its financial performance, moving from a profit of R168.1 million in 2008/09 to R379 million in 2009/10. During 2011/12, the Bank will receive a tranche amounting to R750 million, reducing its extended guarantee to R1 billion. The intention is to complete the recapitalisation over the next two years, eliminating the
97
2011 BUDGET REVIEW
guarantee. During 2010, the Land Bank successfully issued a 3-year floating rate note. Government will help the Bank to access longer-term multilateral funding to extend its debt-maturity profile.
National Housing Finance Corporation
NHFC has borrowed from international agencies
Government approved NHFC requests to borrow equivalent of €50 million from European agencies
In March 2010, government approved a request by the National Housing Finance Corporation (NHFC) to borrow the rand-denominated equivalent of €30 million from the European Investment Bank and €20 million from the Agence Française de Développement. The Department of Human Settlements and the NHFC are investigating a mortgage default insurance programme, backed by a R1 billion government guarantee. The National Treasury is considering a reclassification under the Public Finance Management Act that would allow the NHFC to borrow.
Industrial Development Corporation
IDC plans to invest more than R70 billion over the next five years
The Industrial Development Corporation (IDC) plans to invest more than R70 billion to fund industrial and business development over the next five years, with R10 billion set aside for projects with high job-creation potential. The IDC will also continue to assist selected businesses that are in distress as a result of the recent recession through the R6.1 billion fund announced in 2009 (R2.9 billion in 2009/10 and R3.2 billion in 2010/11). By the end of 2010, the IDC had committed R3.6 billion to 66 businesses under this programme, with 23 322 jobs saved as a result.
n Conclusion
Deep and liquid capital markets have supported the borrowing programme
During 2010/11, South Africa’s deep and liquid capital markets facilitated the financing of the elevated public-sector borrowing requirement of R281.2 billion, including the main budget deficit of R143.4 billion. Government has strengthened the development finance institutions through guarantees and capital injections to help them to leverage more resources in support of the development agenda.
98
7
Social security and health care financing
n Overview
Social security promotes a more inclusive society
In the face of persistent high unemployment and difficult economic conditions, the social security system has continued to play a crucial role, providing income support for retrenched workers and helping to alleviate poverty. Social assistance reaches nearly 15 million people and benefits millions of others in beneficiary households. Social security promotes inclusion by ensuring that people who are unable to work, either permanently or temporarily, remain active in their communities.
The social wage includes social security and access to housing, transport, health and sanitation services
Social security is part of the social wage, which includes access to housing, transport, sanitation, health services and basic infrastructure. In addition to its traditional role of providing citizens with a safety net, social security must also work hand-in-hand with policies to create jobs and raise standards of employment. Social security should not cultivate dependency, nor act as a disincentive to look for work.
South Africa’s social security arrangements are being reformed. The goal of these efforts is a fully functioning system that will support workers when they are out of work, and help to get them back into employment. It will provide income security in old age, and family support in the event of disability and death. It will help children to stay in school so that they can live full, productive lives. And it will complement programmes to increase employment and bring about sustainable social development.
To encourage efficiency, administrative capacity will be consolidated across agencies
To provide timely assistance for those in need, and to fulfil the longer-term objectives described above, South Africa’s social security institutions need to become more efficient, ensuring the effective use of funds and providing better service. As part of the broader reforms under way, government proposes, over time, to consolidate administrative
99
2011 BUDGET REVIEW
arrangements for social security. The aim is to ensure that workers’ contributions are not consumed by separate bureaucracies or drained by operational inefficiencies. Establishing coordinated policy-making across these entities will help to make their programmes more effective.
Financial and operational reforms at UIF and RAF show significant progress
While there are considerable institutional challenges to social security reform, significant progress has been made this year in developing proposals for the new Road Accident Benefit Scheme, which will expand access, improve administration, reduce legal and compliance costs, and align this fund to other social security arrangements. The Unemployment Insurance Fund (UIF) has also demonstrated the benefits of effective reforms. Over the past five years the UIF has improved its financial position, and is now able to improve benefits to retrenched workers even as it contends with elevated levels of unemployment.
Social security and employment
Social security provides income support, and the system also needs to help get people back to work
South Africa’s economy is growing again, but the economic climate remains challenging and employment has not yet recovered. Social security provides essential support to workers who have lost their income — and it is equally important that the system helps get people back to work.
The relationship between social security and employment is central to the operations of the UIF. Employees and employers contribute in equal proportion to the fund every month. If workers are retrenched, they receive benefits based on their final salary, providing them and their families with a moderate income while they seek to return to work. Moreover, when they collect their unemployment benefits, work seekers are registered at government labour centres and have access to job-search services.
Medical rehabilitation is a key component of RAF and Compensation Funds support
The Compensation Funds, which are funded by employers, also fulfil a dual function: they pay benefits to workers injured on the job, and they fund medical treatment and rehabilitation that allow employees to return to work at the earliest opportunity. Rehabilitation is also an important component of the RAF benefit.
n Social assistance
Nearly 15 million people — more than a quarter of the population — receive social grants
There are now almost 15 million people receiving social grants in South Africa — which is more than a quarter of the population and over six times the number of grant beneficiaries in 1998. Social assistance will contribute R97.6 billion to household income in 2011/12, representing a substantial and enduring programme of poverty alleviation.
Social grants and household welfare
Income support makes a tangible difference to households with little or no income, along with in-kind transfers, fee waivers, subsidies and other benefits that form part of the social wage. At present:
| • | | More than 10 million people receive child support grants, and nearly 440 000 caregivers receive care dependency or foster care grants |
| |
| • | | Almost 2.6 million older persons receive a non-contributory pension |
100
CHAPTER 7: SOCIAL SECURITY AND HEALTH CARE FINANCING
| • | | 7.1 million children are exempt from school fees |
| |
| • | | 432 727 preschool children are subsidised in early childhood development centres |
| |
| • | | 8.1 million children benefit from the school feeding programme |
| |
| • | | Comprehensive health services are available to all children |
| |
| • | | Primary health care is available free of charge for all residents, and tertiary care is provided at minimal cost to adults. |
Reforming the means test
Social grants means tests are intended to ensure that support is provided to beneficiaries who need it, and that social assistance is both fair and financially sustainable. But the tests have several drawbacks:
| • | | They are complicated. |
| |
| • | | They prevent poor households whose income is marginally above threshold from receiving support. |
| |
| • | | They increase administrative costs. |
| |
| • | | They can have adverse consequences on people’s behaviour — for example, by creating an incentive for older workers to divest their assets and liquidate savings prior to retirement. |
The means test threshold for the child support grant is set at 10 times the value of the grant. At or below that level, recipients receive the full grant. The means test for the old-age grant and the disability grant operates differently. Up to a certain income — the “disregard level” — recipients get the full grant. The grant level falls as incomes rise above the disregard level. Above the means test threshold, no grant is payable. The adult grants also impose asset thresholds. Recipients cannot own assets worth more than 40 times the value of the grant (R518 400 in 2010/11).
In 2010/11, the disregard level was R7 272 and the means test threshold was R31 296. Someone earning at the means test threshold was entitled to a grant of R100 per month. The budget for 2011/12 will raise the disregard level to R13 680, the means test threshold to R44 880 and the asset threshold to R547 200.
It is expected that the disregard level and the means test threshold will be raised in subsequent budgets until the means test threshold is in line with the tax threshold. This reform will benefit households with limited means, and alignment with the tax threshold will reduce administrative complexity.
Child support grant has been extended and eligibility for the old-age grant has increased
Since 1998 social grants have increased both in reach and value. Over this period eligibility for the child support grant has been progressively extended. The grant initially supported children in poor households up to the age of seven; as of 2013/14 children will be eligible for the grant up to their 18th birthday. Eligibility for the old-age grant has also increased following the equalisation of the age at which men and women receive the grant, which was completed in 2010.
Table 7.1 shows the cost-of-living adjustments for all grants in 2011/12. The means test thresholds for the old-age and disability grants will also be raised, as discussed in the accompanying box, and the old-age grant will be increased by an additional R20 a month for recipients over the age of 75.
Table 7.1 Social grants values, 2010/11 and 2011/12
| | | | | | | | | | | | | |
| Rand | | 2010/11 | | 2011/12 | | Increase |
| |
| State old-age grant | | | 1 080 | | | | 1 140 | | | | 60 | |
| State old-age grant, over 75s | | | 1 080 | | | | 1 160 | | | | 80 | |
| War veterans grant | | | 1 100 | | | | 1 160 | | | | 60 | |
| Disability grant | | | 1 080 | | | | 1 140 | | | | 60 | |
| Foster care grant | | | 710 | | | | 740 | | | | 30 | |
| Care dependency grant | | | 1 080 | | | | 1 140 | | | | 60 | |
Child support grant1 | | | 250 | | | | 270 | | | | 20 | |
| | |
| 1. | | Increase of R10 in April and R10 in October. |
101
2011 BUDGET REVIEW
South African Social Security Agency
SASSA has nearly halved its deficit this year
The South African Social Security Agency (SASSA) administers the social grant system. Over the past year SASSA has reduced its deficit from R884 million in 2009/10 to a projected deficit of R460 million in 2010/11. It is hoped that the agency will clear its operating deficit in 2011/12. SASSA’s baseline allocation, as shown in Table 7.2, will increase from R5.6 billion in 2010/11 to R6.1 billion in 2011/12. SASSA has extended its contracts with external cash disbursement businesses to September 2011. Over the next six months, SASSA is developing a new social grant payment system that will aim to ensure:
| • | | Security of funds — As far as possible, grants should be transferred electronically and kept in accounts at regulated organisations |
| |
| • | | Accessibility of funds — Beneficiaries should be able to access their funds anywhere and at any time |
| |
| • | | Cost effectiveness for both government and beneficiaries. |
Successful implementation of the new payment model in 2011/12 will free up considerable resources for SASSA to achieve its broader mandate of integrating social security administration.
Table 7.2 SASSA expenditure, 2007/08 – 2013/14
| | | | | | | | | | | | | | | | | | | | | | | | | | | | | | | |
| | | | | | | | | | | | | | | | 2010/11 | | | | | | | |
| | | 2007/08 | | 2008/09 | | 2009/10 | | | Revised | | | 2011/12 | | 2012/13 | | 2013/14 |
| R million | | | | Actual | | | | | estimate | | | Medium-term estimates |
| | | | | | | |
| Social grants transfers | | | 62 467 | | | | 70 715 | | | | 79 260 | | | | | 88 268 | | | | | 97 560 | | | | 106 256 | | | | 114 409 | |
| SASSA administration | | | 4 143 | | | | 4 630 | | | | 5 169 | | | | | 5 631 | | | | | 6 144 | | | | 6 200 | | | | 6 540 | |
| | | | | | | |
Total | | | 66 610 | | | | 75 345 | | | | 84 429 | | | | | 93 899 | | | | | 103 704 | | | | 112 456 | | | | 120 949 | |
Percentage of GDP | | | 3.2 | % | | | 3.3 | % | | | 3.5 | % | | | | 3.5 | % | | | | 3.6 | % | | | 3.5 | % | | | 3.4 | % |
| | | | | | | |
Source: Estimates of National Expenditure
Social assistance beneficiary and expenditure trends
Beneficiary numbers have grown by 6.4 per cent on average over past six years
Table 7.3 shows the growth in social grant beneficiary numbers by grant and province since 2007/08. Table 7.4 sets out grant expenditure since 2007/08 and spending forecasts over the medium-term expenditure framework (MTEF) period.
| • | | The average annual growth in the number of beneficiaries was 6.4 per cent over the six years to 2010/11. |
| |
| • | | The child support grant is the largest by number of recipients, accounting for 69 per cent (over 10 million children) in 2010/11; the old-age grant is the largest by expenditure (R33.8 billion in 2010/11). |
| |
| • | | The number of foster care beneficiaries grew at the annual rate of 12.1 per cent, largely as a result of a growing number of orphans associated with the impact of Aids, and courts’ enhanced capacity to provide oversight under the Children’s Act (2005). |
| |
| • | | There has been a 1.2 per cent average reduction in disability grant beneficiaries, largely as a result of SASSA’s improved review process. |
| |
| • | | Social assistance grants expenditure is projected to increase at an average annual rate of 10.6 per cent between 2010/11 and 2013/14. |
102
CHAPTER 7: SOCIAL SECURITY AND HEALTH CARE FINANCING
Table 7.3 Social grants beneficiary numbers by type and province, 2007/08 – 2013/14
| | | | | | | | | | | | | | | | | | | | | | | | | | | | | | | | | | | | |
| | | 2007/08 | | 2008/09 | | 2009/10 | | | 2010/111 | | | 2011/12 | | 2012/13 | | 2013/14 | | | % Growth |
| Thousands | | | | | | | | | | | | | | Projected | | | | | per year |
| | | | | | | | | | |
Type of grant | | | | | | | | | | | | | | | | | | | | | | | | | | | | | | | | | | | |
| Old-age | | | 2 219 | | | | 2 344 | | | | 2 490 | | | | | 2 647 | | | | | 2 729 | | | | 2 786 | | | | 2 844 | | | | | 4.2 | % |
| War veterans | | | 2 | | | | 2 | | | | 1 | | | | | 1 | | | | | 1 | | | | 1 | | | | 1 | | | | | -17.7 | % |
| Disability | | | 1 413 | | | | 1 372 | | | | 1 299 | | | | | 1 233 | | | | | 1 265 | | | | 1 290 | | | | 1 315 | | | | | -1.2 | % |
| Foster care | | | 443 | | | | 476 | | | | 489 | | | | | 554 | | | | | 613 | | | | 709 | | | | 820 | | | | | 10.8 | % |
| Care dependency | | | 102 | | | | 107 | | | | 119 | | | | | 121 | | | | | 128 | | | | 135 | | | | 141 | | | | | 5.6 | % |
| Child support | | | 8 196 | | | | 8 765 | | | | 9 381 | | | | | 10 336 | | | | | 10 977 | | | | 11 303 | | | | 11 589 | | | | | 5.9 | % |
| | | | | | | | | | |
Total | | | 12 375 | | | | 13 066 | | | | 13 779 | | | | | 14 892 | | | | | 15 713 | | | | 16 223 | | | | 16 709 | | | | | 5.1 | % |
| | | | | | | | | | |
Province | | | | | | | | | | | | | | | | | | | | | | | | | | | | | | | | | | | |
| Eastern Cape | | | 2 292 | | | | 2 347 | | | | 2 416 | | | | | 2 569 | | | | | 2 738 | | | | 2 797 | | | | 2 847 | | | | | 3.7 | % |
| Free State | | | 756 | | | | 766 | | | | 806 | | | | | 895 | | | | | 927 | | | | 957 | | | | 987 | | | | | 4.5 | % |
| Gauteng | | | 1 452 | | | | 1 538 | | | | 1 702 | | | | | 1 842 | | | | | 1 917 | | | | 1 993 | | | | 2 092 | | | | | 6.3 | % |
| Kw aZulu-Natal | | | 3 033 | | | | 3 317 | | | | 3 454 | | | | | 3 692 | | | | | 3 868 | | | | 4 004 | | | | 4 130 | | | | | 5.3 | % |
| Limpopo | | | 1 799 | | | | 1 894 | | | | 1 974 | | | | | 2 140 | | | | | 2 299 | | | | 2 336 | | | | 2 379 | | | | | 4.8 | % |
| Mpumalanga | | | 925 | | | | 978 | | | | 1 009 | | | | | 1 072 | | | | | 1 159 | | | | 1 181 | | | | 1 201 | | | | | 4.4 | % |
| Northern Cape | | | 307 | | | | 327 | | | | 348 | | | | | 388 | | | | | 413 | | | | 436 | | | | 454 | | | | | 6.8 | % |
| North West | | | 980 | | | | 1 015 | | | | 1 071 | | | | | 1 137 | | | | | 1 170 | | | | 1 210 | | | | 1 236 | | | | | 3.9 | % |
| Western Cape | | | 831 | | | | 886 | | | | 997 | | | | | 1 156 | | | | | 1 222 | | | | 1 308 | | | | 1 383 | | | | | 8.9 | % |
| | | | | | | | | | |
Total | | | 12 375 | | | | 13 066 | | | | 13 779 | | | | | 14 892 | | | | | 15 713 | | | | 16 223 | | | | 16 709 | | | | | 5.1 | % |
| | | | | | | | | | |
| | |
| 1. | | Projected numbers at fiscal year end. |
Source: Provincial budgets and expenditure review / Socpen system
Table 7.4 Social grants expenditure by type and province, 2007/08 – 2013/14
| | | | | | | | | | | | | | | | | | | | | | | | | | | | | | | | | | | |
| | | | | | | | | | | | | | | | 2010/11 | | | | | | | | | | | | | |
| | | 2007/08 | | 2008/09 | | 2009/10 | | | Revised | | | 2011/12 | | 2012/13 | | 2013/14 | | % Growth |
| R million | | | | Actual | | | | | estimate | | | | | Projected | | | | per year |
| | | | | | | |
| Old-age | | | 22 801 | | | | 25 934 | | | | 29 826 | | | | | 33 797 | | | | | 36 571 | | | | 39 913 | | | | 42 975 | | | | 11.1 | % |
| War veterans | | | 22 | | | | 20 | | | | 17 | | | | | 14 | | | | | 12 | | | | 11 | | | | 10 | | | | -12.3 | % |
| Disability | | | 15 280 | | | | 16 474 | | | | 16 567 | | | | | 17 080 | | | | | 17 813 | | | | 19 439 | | | | 20 626 | | | | 5.1 | % |
| Foster care | | | 3 414 | | | | 3 934 | | | | 4 434 | | | | | 4 898 | | | | | 5 536 | | | | 5 833 | | | | 6 281 | | | | 10.7 | % |
| Care dependency | | | 1 132 | | | | 1 292 | | | | 1 434 | | | | | 1 582 | | | | | 1 727 | | | | 1 885 | | | | 2 129 | | | | 11.1 | % |
| Child support | | | 19 625 | | | | 22 348 | | | | 26 670 | | | | | 30 594 | | | | | 35 564 | | | | 38 810 | | | | 41 993 | | | | 13.5 | % |
| Grant-in-aid | | | 87 | | | | 90 | | | | 146 | | | | | 160 | | | | | 177 | | | | 190 | | | | 205 | | | | 15.4 | % |
| Social relief of distress | | | 106 | | | | 623 | | | | 165 | | | | | 143 | | | | | 160 | | | | 175 | | | | 190 | | | | 10.2 | % |
| | | | | | | |
Total | | | 62 467 | | | | 70 715 | | | | 79 260 | | | | | 88 268 | | | | | 97 560 | | | | 106 256 | | | | 114 409 | | | | 10.6 | % |
| | | | | | | |
Province | | | | | | | | | | | | | | | | | | | | | | | | | | | | | | | | | | |
| Eastern Cape | | | 11 636 | | | | 12 557 | | | | 13 914 | | | | | 15 455 | | | | | 17 071 | | | | 18 586 | | | | 20 079 | | | | | |
| Free State | | | 4 122 | | | | 4 573 | | | | 5 055 | | | | | 5 576 | | | | | 6 117 | | | | 6 671 | | | | 7 363 | | | | | |
| Gauteng | | | 7 318 | | | | 8 289 | | | | 9 390 | | | | | 10 629 | | | | | 11 833 | | | | 12 871 | | | | 13 725 | | | | | |
| Kw aZulu-Natal | | | 15 105 | | | | 17 590 | | | | 19 454 | | | | | 21 536 | | | | | 23 685 | | | | 25 791 | | | | 27 394 | | | | | |
| Limpopo | | | 8 439 | | | | 9 656 | | | | 10 855 | | | | | 12 070 | | | | | 13 419 | | | | 14 629 | | | | 15 081 | | | | | |
| Mpumalanga | | | 4 322 | | | | 4 943 | | | | 5 567 | | | | | 6 080 | | | | | 6 751 | | | | 7 367 | | | | 7 601 | | | | | |
| Northern Cape | | | 1 622 | | | | 5 711 | | | | 2 227 | | | | | 2 500 | | | | | 2 766 | | | | 3 018 | | | | 3 429 | | | | | |
| North West | | | 5 187 | | | | 1 962 | | | | 6 366 | | | | | 6 899 | | | | | 7 515 | | | | 8 161 | | | | 8 921 | | | | | |
| Western Cape | | | 4 716 | | | | 5 434 | | | | 6 432 | | | | | 7 523 | | | | | 8 403 | | | | 9 162 | | | | 10 816 | | | | | |
| | | | | | | | | | | |
Total | | | 62 467 | | | | 70 715 | | | | 79 260 | | | | | 88 268 | | | | | 97 560 | | | | 106 256 | | | | 114 409 | | | | | |
| | | | | | | | | | | |
Source: Socpen system
103
2011 BUDGET REVIEW
n Social security funds
Contributory social security funds provide conditional income support or compensation to workers and road users who are injured or out of work. They include the UIF, the Compensation Funds and the RAF.
Table 7.5 Social security funds, 2007/08 — 2013/14
| | | | | | | | | | | | | | | | | | | | | | | | | | | | | | | |
| | | | | | | | | | | | | | | | 2010/11 | | | | | | | |
| | | 2007/08 | | 2008/09 | | 2009/10 | | | Revised | | | 2011/12 | | 2012/13 | | 2013/14 |
| R million | | | | Outcome | | | | | estimate | | | Medium-term estimates |
| | | | | | | |
Unemployment Insurance | | | | | | | | | | | | | | | | | | | | | | | | | | | | | | |
Fund | | | | | | | | | | | | | | | | | | | | | | | | | | | | | | |
| Revenue | | | 11 324 | | | | 13 691 | | | | 14 199 | | | | | 14 382 | | | | | 15 526 | | | | 16 681 | | | | 17 827 | |
| Expenditure | | | 3 592 | | | | 4 636 | | | | 6 581 | | | | | 8 138 | | | | | 9 385 | | | | 10 485 | | | | 11 607 | |
Compensation Funds | | | | | | | | | | | | | | | | | | | | | | | | | | | | | | |
| Revenue | | | 5 661 | | | | 6 860 | | | | 7 364 | | | | | 7 288 | | | | | 7 705 | | | | 8 217 | | | | 8 632 | |
| Expenditure | | | 3 567 | | | | 3 451 | | | | 3 923 | | | | | 2 754 | | | | | 3 939 | | | | 4 014 | | | | 4 229 | |
Road Accident Fund | | | | | | | | | | | | | | | | | | | | | | | | | | | | | | |
| Revenue | | | 8 104 | | | | 11 865 | | | | 11 785 | | | | | 14 218 | | | | | 14 858 | | | | 16 512 | | | | 18 442 | |
| Expenditure | | | 9 316 | | | | 11 966 | | | | 12 221 | | | | | 14 218 | | | | | 14 378 | | | | 15 333 | | | | 17 856 | |
| | | | | | | |
Total: Social security funds | | | | | | | | | | | | | | | | | | | | | | | | | | | | | | |
| Tax revenue | | | 20 868 | | | | 23 288 | | | | 27 001 | | | | | 30 427 | | | | | 32 225 | | | | 35 065 | | | | 38 175 | |
| Non-tax revenue | | | 4 212 | | | | 6 619 | | | | 6 338 | | | | | 5 449 | | | | | 5 851 | | | | 6 332 | | | | 6 711 | |
| Grants received | | | 9 | | | | 2 509 | | | | 10 | | | | | 12 | | | | | 12 | | | | 13 | | | | 14 | |
| | | | | | | |
Total revenue | | | 25 089 | | | | 32 416 | | | | 33 348 | | | | | 35 888 | | | | | 38 089 | | | | 41 410 | | | | 44 900 | |
Total expenditure | | | 16 475 | | | | 20 054 | | | | 22 725 | | | | | 25 110 | | | | | 27 701 | | | | 29 832 | | | | 33 693 | |
Budget balance1 | | | 8 614 | | | | 12 362 | | | | 10 624 | | | | | 10 778 | | | | | 10 388 | | | | 11 578 | | | | 11 208 | |
| | | | | | | |
| | |
| 1. | | A positive number reflects a surplus and a negative number a deficit. |
Unemployment Insurance Fund
The UIF provides short-term unemployment insurance to qualifying workers. It pays benefits to contributors or their dependants in cases of unemployment, illness, maternity, adoption of a child or death. The fund is financed by a tax payable by both employers and employees at a rate of 1 per cent of earnings, up to a threshold of R12 478 a month.
UIF is in a strong financial position, despite higher payouts resulting from elevated unemployment
The UIF is in a position to meet its cash-flow requirements for a wide range of possible scenarios over the next decade. An actuarial valuation conducted in March 2010 estimated that the reserve requirement was R16.2 billion, and the fund had capital and reserves amounting to R41.2 billion as at 31 March 2010, mainly invested with the Public Investment Corporation.
For the first nine months of 2010/11, an average of 63 260 new claims per month reached the UIF. Average monthly benefit payments amounted to R466.8 million to 207 646 beneficiaries. Since the recession began workers have on average spent longer periods out of work. Expenditure on UIF benefits increased by 58.5 per cent between 2008/09 and 2010/11.
UIF is developing tools to help place unemployed workers in jobs or training
Through its links with Department of Labour employment centres and its jobs database, the UIF is developing mechanisms to support the placement of unemployed workers in jobs or training.
Improvements to the UIF benefit structure are currently under consideration as part of the broader reform of social security.
104
CHAPTER 7: SOCIAL SECURITY AND HEALTH CARE FINANCING
Figure 7.1 UIF payments and beneficiaries, 2009 – 2010
Table 7.6 UIF benefits and recipient numbers, 2007/08 – 2010/11
| | | | | | | | | | | | | | | | | | |
| | | | | | | | | | | | | | | | 2010/11 |
| | | 2007/08 | | 2008/09 | | 2009/10 | | | Revised |
| | | | | Outcome | | | | | estimate |
| | | | |
Benefits (R million) | | | | | | | | | | | | | | | | | |
| Unemployment | | | 2 031 | | | | 2 834 | | | | 3 942 | | | | | 4 280 | |
| Illness | | | 187 | | | | 212 | | | | 355 | | | | | 387 | |
| Maternity/adoption benefits | | | 460 | | | | 538 | | | | 832 | | | | | 901 | |
| Dependant benefits | | | 243 | | | | 264 | | | | 491 | | | | | 532 | |
| | | | |
Total benefits paid1 | | | 2 921 | | | | 3 848 | | | | 5 620 | | | | | 6 100 | |
| | | | |
Beneficiaries (thousand) | | | | | | | | | | | | | | | | | |
| Unemployment | | | 397 | | | | 475 | | | | 529 | | | | | 582 | |
| Illness | | | 25 | | | | 26 | | | | 26 | | | | | 29 | |
| Maternity/adoption | | | 89 | | | | 94 | | | | 98 | | | | | 108 | |
| Dependant | | | 16 | | | | 16 | | | | 18 | | | | | 20 | |
| | | | |
Total beneficiaries | | | 527 | | | | 611 | | | | 671 | | | | | 739 | |
| | | | |
| | | |
| 1. | | Numbers are recorded on an accrual basis, excluding provisions. |
Road Accident Fund
The RAF provides compensation for losses incurred due to the wrongful or negligent driving of another vehicle. Losses covered by the RAF include the loss of earnings or support, medical expenses and funeral costs, as well as non-financial losses such as pain and suffering. The RAF is funded from a dedicated levy on fuel. The fuel levy will increase from the current 72c/l to 80c/l in April 2011.
RAF has made savings, but legal and administrative costs consume a higher portion of the fuel levy
The RAF has heeded the call for efficiency savings by reducing projected administrative expenditure by R131 million over the next three years. However, the legal and administrative cost of finalising claims has remained at about 30 per cent of fuel levy proceeds. Reducing these costs is an important element in the reform of the road accident benefit system.
105
2011 BUDGET REVIEW
The RAF reduced the number of outstanding claims from 261 390 in 2008/09 to 209 186 in 2009/10. Claims expenditure increased by an annual average of 15 per cent between 2007/08 and 2010/11, and will continue to grow over the MTEF period at an average rate of 8 per cent a year. The estimated outstanding liability increased to R44.1 billion in 2010/11.
The shift to a no-fault road accident insurance system is under way
The Road Accident Fund Amendment Act (2005) and the shift to a no-fault benefit scheme have been subject to legal challenge. In November 2010, the Constitutional Court dismissed the main challenge to the reform and found that the no-fault benefit approach would support the objectives of making the fund financially viable — and compensation more transparent, predictable and equitable.
New scheme will move emphasis away from claims settlement and towards medical coverage
In February 2010 the Department of Transport published a proposal for a no-fault Road Accident Benefit Scheme. The scheme would provide for a more equitable, affordable and sustainable system of benefits, and conform to the fundamental rights to social security and health care established by the Constitution. The new system would shift expenditure away from claims settlement and legal costs towards medical expenditure, ensuring beneficiaries’ access to timely and appropriate healthcare, encourage rehabilitation and provide for life-long care for those seriously injured.
Successful implementation of the new scheme is expected to reduce costs by 7.5 per cent compared with the existing RAF.
Compensation Funds
The Compensation Funds provide medical care and income benefits to workers who are injured on the job or who develop occupational diseases, survivor benefits to families of victims of employment-related fatalities and funding for rehabilitation of disabled workers. Costs are recovered through levies on employers. The largest fund is the Compensation Fund, run by the Department of Labour. The Department of Health oversees the Compensation Commissioner for Occupational Diseases. The funds’ financial performance is reflected in Table 7.5.
n A pressing need for administrative reform
Social security and assistance agencies are burdened with high administrative costs
High administrative costs burden both the social assistance and the statutory social security funds. Excessive administrative costs in the grants system represent an unproductive use of revenue set aside for those with the greatest need. In the case of the statutory funds, administrative costs reduce the value of workers’ benefits in relation to their contributions.
The main reason for high costs is the duplication of functions across agencies. Social security entities essentially perform the same tasks: they collect contributions, manage accounts and disburse benefits. Yet none of these functions are shared. Information gathered this year from the five largest agencies underscores the extent of the problem. As shown in Table 7.7, administrative costs vary significantly. For example, SASSA’s administration ratio is 6 per cent, the UIF’s is 25 per cent and the Compensation Fund spends over 40 per cent of costs on administration.
106
CHAPTER 7: SOCIAL SECURITY AND HEALTH CARE FINANCING
Table 7.7 Benefits and administrative expenditure of five social security entities, 2010/11 – 2013/14
| | | | | | | | | | | | | | | | | | |
| | | 2010/11 | | | | | | | |
| | | Revised | | | 2011/12 | | 2012/13 | | 2013/14 |
| | | estimate | | | Medium-term estimates |
| | | | |
Benefit (R thousand) | | | | | | | | | | | | | | | | | |
| SASSA | | | 89 368 | | | | | 97 479 | | | | 106 029 | | | | 112 682 | |
CCOD1 | | | 91 | | | | | 104 | | | | 121 | | | | 121 | |
| RAF | | | 14 935 | | | | | 15 049 | | | | 15 790 | | | | 16 461 | |
| UIF | | | 6 099 | | | | | 6 952 | | | | 7 926 | | | | 9 778 | |
| Compensation Fund | | | 2 689 | | | | | 3 807 | | | | 4 018 | | | | 4 219 | |
| | | | |
Total | | | 113 182 | | | | | 123 390 | | | | 133 883 | | | | 143 260 | |
| | | | |
Administrative expenditure (Rand) | | | | | | | | | | | | | | | | | |
| SASSA | | | 5 487 | | | | | 5 686 | | | | 5 975 | | | | 5 525 | |
| CCOD | | | 9 | | | | | 10 | | | | 11 | | | | 11 | |
| RAF | | | 1 077 | | | | | 1 078 | | | | 1 128 | | | | 1 179 | |
| UIF | | | 1 543 | | | | | 1 578 | | | | 1 652 | | | | 1 743 | |
| Compensation Fund | | | 1 079 | | | | | 1 048 | | | | 1 230 | | | | 1 291 | |
| | | | |
Total | | | 9 196 | | | | | 9 402 | | | | 9 996 | | | | 9 749 | |
| | | | |
Administration ratio | | | | | | | | | | | | | | | | | |
| SASSA | | | 6.0 | % | | | | 6.0 | % | | | 6.0 | % | | | 5.0 | % |
| CCOD | | | 10.0 | % | | | | 10.0 | % | | | 9.0 | % | | | 9.0 | % |
| RAF | | | 7.0 | % | | | | 7.0 | % | | | 7.0 | % | | | 7.0 | % |
| UIF | | | 25.0 | % | | | | 23.0 | % | | | 21.0 | % | | | 18.0 | % |
| Compensation Fund | | | 40.0 | % | | | | 28.0 | % | | | 31.0 | % | | | 31.0 | % |
| | | | |
Total | | | 8.0 | % | | | | 8.0 | % | | | 7.0 | % | | | 7.0 | % |
| | | | |
| | | �� |
| 1. | | Compensation Commissioner for Occupational Diseases. |
These numbers do not tell the whole story. For example, SASSA’s distribution costs are high due to expensive cash-payment contracts. Without these costs, administrative expenditure as a percentage of benefit payments would have fallen over time. The UIF has 948 service points, compared with 540 for SASSA and a total of 1 700 across all social security entities. Sharing the 1 700 service points would reduce costs, increase the presence of some entities, and enhance service delivery.
Ministerial committee has called for unification of administration
In 2010 the inter-ministerial committee on social security reform and health financing called for the unification of administrative functions, alignment of benefits and coordination of policy-making across agencies.
n Retirement industry reforms
In the absence of a statutory retirement fund, many workers rely on the state old-age grant
The absence of a statutory retirement fund means that workers’ income in retirement comes from occupational schemes or individual savings arrangements. Coverage of occupational funds in South Africa is high relative to other countries of similar income level, though coverage varies across sectors and households generally do not save adequately for retirement. Many low-income workers rely only on the old-age grant.
A key reason for the disparity in coverage levels and savings rates is the lack of preservation: workers often liquidate their savings when they leave a job rather than transfer them to a new fund. The National Treasury will consult with the public this year regarding the viability of mandating preservation upon change of jobs, or in the event of divorce.
107
2011 BUDGET REVIEW
Reforms proposed to Regulation 28, which governs where pension funds can invest
The savings industry requires careful regulation. In 2010 the National Treasury proposed changes to Regulation 28 of the Pensions Fund Act (1956), which imposes limits on where funds can invest. The intention is to ensure that retirement savings are invested in a prudent manner that protects fund members, while promoting economic development.
The Pensions Fund Act does not cover public-sector funds. Discussions are under way regarding the way these funds will be regulated in future.
Consolidation among South Africa’s 3 200 pension funds is necessary and achievable
Strong supervisory capacity is also required to ensure that funds obey the rules. The Financial Services Board (FSB), which supervises South African pension funds and insurers, struggles to fulfil its obligations due to some funds’ poor reporting standards. The profusion of funds adds to the FSB’s workload: although the number of active pension funds has declined significantly in recent years to about 3 200 today, more consolidation is both desirable and achievable.
Pension funds also need to improve their level of disclosure to clients. A lack of transparency prevents customers from being able to compare products across funds, and often results in excessive charges. During 2011, the National Treasury will consult with pension fund industry bodies to draft a code of ethics and address concerns over high fees.
n Restructuring public health care
Budget takes first steps in NHI by strengthening the health system
The 2011 Budget takes the first steps in establishing national health insurance (NHI), which is part of the Minister of Health’s 10-point plan for improving health outcomes in South Africa. The public health system is being strengthened, a health infrastructure grant has been established, new facilities are being built and existing ones upgraded. In addition:
| • | | A family health approach to primary health care is being launched (R1.2 billion) |
| |
| • | | The quality of care in hospitals is being improved (R2.7 billion) |
| |
| • | | The Office of Standards Compliance is being established as an independent authority, which will include an inspectorate and an ombudsman (R117 million). |
To work properly, the NHI must be adequately financed
The delivery of primary health care through family health teams draws on lessons from the successful adoption of this approach in Brazil. The teams will consist of nurses, doctors and community health workers, looking after families in revitalised public health facilities, with an emphasis on prevention rather than cure.
These and other improvements to the public health system will require higher revenues to ensure adequate financing over the long term. The NHI will also rely on efficient delivery structures for health services and a sound payment approach for health providers. Joint work of the National Treasury and the Department of Health is in progress on the fiscal and financial arrangements for these reforms. Due in part to the complex nature of financing and accrediting facilities for participation in the system, and investment in health service capacity that is required, implementation of this reform will be phased over a period of 14 years.
108
8
Medium-term expenditure and division of revenue
n Sustaining quality service delivery
Social and economic infrastructure investments will be scaled up
The medium-term expenditure framework (MTEF) for the period ahead reflects government’s commitment to creating jobs, growing the economy, promoting equity and accelerating access to quality social services. Growth in spending focuses on education and skills development, improved health outcomes, integrated and sustainable human settlements, and rural development. In addition, social and economic infrastructure investments are to be scaled up.
Expenditure growth will be accompanied by reprioritised budgets that support frontline service delivery. More efficient and effective administration is needed to achieve and sustain improvements in the quality and accessibility of public services.
Managing public-sector expenditure involves balancing competing priorities
Over the past decade, progress has been made in raising South Africa’s living standards. Yet much work lies ahead. Maintenance of infrastructure assets has to be prioritised and training within the public service enhanced. Effective management of the public service is central not only to the quality and character of service delivery, but also to the careers of employees in national and provincial departments. Steady growth of public-sector employment, and improvements in conditions of service over time, have to be accommodated within an affordable wage bill. Managing public-sector expenditure involves balancing a range of competing priorities. A better mix between personnel, capital and goods and services spending is needed.
This chapter discusses the division of revenue between national, provincial and local government; consolidated government spending; savings and
109
2011 BUDGET REVIEW
reprioritisation; and proposed revisions to expenditure plans. The medium-term allocations are grouped by function.
n Division of revenue
In keeping with provisions of the Constitution, monies appropriated from the National Revenue Fund — the “main budget” — are to be shared between national government, provinces and municipalities through an annual Division of Revenue Act.
The budget framework provides R808.3 billion to be allocated in 2011/12
Excluding a contingency reserve of R38.9 billion and provision made for debt-service costs, the MTEF provides for a total of R808.3 billion to be allocated in 2011/12, R865.9 billion in 2012/13 and R925.6 billion in 2013/14. Aggregate expenditure over the next three years includes R94.1 billion in additional non-interest allocations over the baseline projections of the 2010 Budget. National government receives R48.8 billion, provinces R40.2 billion and local government R5.1 billion of these additional allocations. Total non-interest spending, including the contingency reserve, grows by 8.5 per cent a year over the period ahead, or about 3.3 per cent in real terms.
The proposed division of revenue is in line with government’s medium-term priorities and is informed by the recommendations made by the Financial and Fiscal Commission (FFC).
110
CHAPTER 8: MEDIUM-TERM EXPENDITURE AND DIVISION OF REVENUE
Explanatory Memorandum to the Division of Revenue outlines government’s response to the FFC
The Explanatory Memorandum to the Division of Revenue, which is tabled annually with the Division of Revenue Bill, outlines how this division takes into account the FFC’s recommendations. The memorandum contains detailed information on funds allocated to provinces and municipalities, and should be read together with this chapter. The memorandum is available as Annexure W1 of the Budget Review on the National Treasury website (www.treasury.gov.za).
Table 8.1 shows the division of revenue for the 2011 Budget, taking account of the revenue-raising capacities and spending responsibilities of each sphere of government.
Table 8.1 Division of nationally raised revenue, 2007/08 – 2013/14
| | | | | | | | | | | | | | | | | | | | | | | | | | | | | | | |
| | | | | | | | | | | | | | | | 2010/11 | | | | | | | |
| | | 2007/08 | | 2008/09 | | 2009/10 | | | Revised | | | 2011/12 | | 2012/13 | | 2013/14 |
| R million | | | | Outcome | | | | | estimate | | | Medium-term estimates |
| | | | | | | |
| Debt-service cost | | | 52 877 | | | | 54 394 | | | | 57 129 | | | | | 66 570 | | | | | 76 579 | | | | 90 808 | | | | 104 036 | |
| Non-interest expenditure | | | 488 566 | | | | 581 560 | | | | 690 068 | | | | | 743 353 | | | | | 812 345 | | | | 877 324 | | | | 948 992 | |
Percentage increase | | | 16.9 | % | | | 19.0 | % | | | 18.7 | % | | | | 7.7 | % | | | | 9.3 | % | | | 8.0 | % | | | 8.2 | % |
| | | | | | | |
Total expenditure | | | 541 443 | | | | 635 953 | | | | 747 197 | | | | | 809 923 | | | | | 888 923 | | | | 968 132 | | | | 1 053 029 | |
Percentage increase | | | 15.2 | % | | | 17.5 | % | | | 17.5 | % | | | | 8.4 | % | | | | 9.8 | % | | | 8.9 | % | | | 8.8 | % |
| Unallocated | | | | | | | | | | | | | | | | | | | | | 40 | | | | 330 | | | | 530 | |
| Contingency reserve | | | — | | | | — | | | | — | | | | | — | | | | | 4 090 | | | | 11 405 | | | | 23 375 | |
| | | | | | | |
Division of available funds | | | | | | | | | | | | | | | | | | | | | | | | | | | | | | |
National departments | | | 242 580 | | | | 289 236 | | | | 345 366 | | | | | 359 120 | | | | | 380 154 | | | | 408 439 | | | | 439 049 | |
Provinces | | | 207 504 | | | | 246 836 | | | | 293 164 | | | | | 323 080 | | | | | 357 929 | | | | 380 450 | | | | 404 251 | |
| Equitable share | | | 171 054 | | | | 201 796 | | | | 236 891 | | | | | 265 139 | | | | | 288 493 | | | | 305 725 | | | | 323 604 | |
| Conditional grants | | | 36 451 | | | | 45 040 | | | | 52 073 | | | | | 57 941 | | | | | 69 436 | | | | 74 724 | | | | 80 647 | |
| Gautrain loan | | | — | | | | — | | | | 4 200 | | | | | — | | | | | — | | | | — | | | | — | |
Local government | | | 38 482 | | | | 45 487 | | | | 51 537 | | | | | 61 152 | | | | | 70 171 | | | | 77 029 | | | | 82 317 | |
Equitable share1 | | | 20 676 | | | | 25 560 | | | | 23 845 | | | | | 30 559 | | | | | 34 108 | | | | 37 573 | | | | 39 960 | |
| General fuel levy sharing | | | — | | | | — | | | | 6 800 | | | | | 7 542 | | | | | 8 573 | | | | 9 040 | | | | 9 613 | |
| Conditional grants | | | 17 806 | | | | 19 928 | | | | 20 892 | | | | | 23 051 | | | | | 27 490 | | | | 30 416 | | | | 32 743 | |
| | | | | | | |
Total | | | 488 566 | | | | 581 560 | | | | 690 068 | | | | | 743 353 | | | | | 808 254 | | | | 865 919 | | | | 925 617 | |
| | | | | | | |
Percentage shares | | | | | | | | | | | | | | | | | | | | | | | | | | | | | | |
| National departments | | | 49.7 | % | | | 49.7 | % | | | 50.0 | % | | | | 48.3 | % | | | | 47.0 | % | | | 47.2 | % | | | 47.4 | % |
| Provinces | | | 42.5 | % | | | 42.4 | % | | | 42.5 | % | | | | 43.5 | % | | | | 44.3 | % | | | 43.9 | % | | | 43.7 | % |
| Local government | | | 7.9 | % | | | 7.8 | % | | | 7.5 | % | | | | 8.2 | % | | | | 8.7 | % | | | 8.9 | % | | | 8.9 | % |
| | | | | | | |
| | |
| 1. | | With effect from 2006/07, the local government equitable share includes compensation for the termination of Regional Services Council (RSC) and Joint Services Board (JSB) levies for metros and district municipalities. From 2009/10 the RSC levies replacement grant is only allocated to district municipalities. |
Several changes to the conditional grant framework for provinces and municipalities should be noted:
| • | | To align planning and implementation with sector needs, and to reduce persistent backlogs, the infrastructure grant to provinces has been restructured. Funds will now be transferred through three conditional grants — the health infrastructure grant, the education infrastructure grant and the provincial roads maintenance grant — on the votes of the departments of Health, Basic Education and Transport. The National Treasury will work closely with these departments to strengthen planning and organisational capacity at national and provincial level. |
| • | | A new conditional grant is introduced to replace inappropriate and unsafe school structures, and to address backlogs in basic services to |
111
2011 BUDGET REVIEW
| | | schools. The programme will be completed over three years, after which the grant will be discontinued. |
| |
| • | | In response to the different operational and funding needs of large cities, small towns and rural areas, government is making progressive improvements to local government conditional grants. The introduction of the urban settlements development grant, created by merging the municipal infrastructure grant for cities and a portion of the human settlements development grant, is a step forward in this process. It will allow the eight metropolitan municipalities to take a more integrated approach to upgrading urban informal settlements. |
| • | | Two new conditional grants are introduced under the National Disaster Management Centre to allow provinces and municipalities to respond more rapidly to disasters. |
Conditional grants to provinces over the MTEF period ahead are set out in Table 8.2, and transfers to municipalities are summarised in
Table 8.3.
112
CHAPTER 8: MEDIUM-TERM EXPENDITURE AND DIVISION OF REVENUE
Table 8.2 Conditional grants to provinces, 2010/11 – 2013/14
| | | | | | | | | | | | | | | | | | | | | | | |
| | | | | | | | | | | | | | | | | | | | | Total for |
| R million | | 2010/11 | | | 2011/12 | | 2012/13 | | 2013/14 | | | MTEF |
| | | | | | | |
Agriculture, Forestry and Fisheries | | | 1 167 | | | | | 1 487 | | | | 1 684 | | | | 1 867 | | | | | 5 038 | |
| Comprehensive agricultural support programme | | | 862 | | | | | 1 029 | | | | 1 148 | | | | 1 315 | | | | | 3 492 | |
| Agriculture disater management grant | | | 50 | | | | | — | | | | — | | | | — | | | | | — | |
| Ilima/letsema projects | | | 200 | | | | | 400 | | | | 420 | | | | 443 | | | | | 1 263 | |
| Land care programme: poverty relief and infrastructure development | | | 55 | | | | | 58 | | | | 116 | | | | 109 | | | | | 282 | |
Arts and Culture | | | 513 | | | | | 543 | | | | 571 | | | | 602 | | | | | 1 716 | |
| Community library services | | | 513 | | | | | 543 | | | | 571 | | | | 602 | | | | | 1 716 | |
Basic Education | | | 7 107 | | | | | 10 546 | | | | 11 331 | | | | 11 954 | | | | | 33 831 | |
| Dinaledi schools | | | — | | | | | 70 | | | | 100 | | | | 106 | | | | | 276 | |
| HIV and Aids (life skills education) | | | 188 | | | | | 199 | | | | 209 | | | | 221 | | | | | 629 | |
| National school nutrition programme | | | 3 663 | | | | | 4 579 | | | | 4 928 | | | | 5 199 | | | | | 14 706 | |
| Technical secondary schools recapitalisation | | | 50 | | | | | 200 | | | | 210 | | | | 222 | | | | | 632 | |
| Education Infrastructure grant | | | 3 206 | | | | | 5 498 | | | | 5 883 | | | | 6 207 | | | | | 17 588 | |
Cooperative Governance and Traditional Affairs | | | 214 | | | | | 305 | | | | 180 | | | | 190 | | | | | 675 | |
| Provincial disaster grant | | | — | | | | | 305 | | | | 180 | | | | 190 | | | | | 675 | |
| Provincial Infrastructure disaster relief | | | 214 | | | | | — | | | | — | | | | — | | | | | — | |
Health | | | 20 483 | | | | | 23 948 | | | | 25 746 | | | | 28 175 | | | | | 77 869 | |
| Comprehensive HIV and Aids | | | 6 052 | | | | | 7 493 | | | | 8 825 | | | | 10 607 | | | | | 26 924 | |
| Forensic pathology services | | | 557 | | | | | 590 | | | | — | | | | — | | | | | 590 | |
| Health professions training and development | | | 1 865 | | | | | 1 977 | | | | 2 076 | | | | 2 190 | | | | | 6 244 | |
| Health Infrastructure grant | | | 840 | | | | | 1 702 | | | | 1 821 | | | | 1 921 | | | | | 5 444 | |
| Hospital revitalisation | | | 3 771 | | | | | 4 136 | | | | 4 336 | | | | 4 068 | | | | | 12 540 | |
| National tertiary services | | | 7 398 | | | | | 8 049 | | | | 8 689 | | | | 9 389 | | | | | 26 127 | |
Higher Education and Training | | | 3 804 | | | | | 4 326 | | | | 4 705 | | | | 5 262 | | | | | 14 293 | |
| Further education and training colleges | | | 3 804 | | | | | 4 326 | | | | 4 705 | | | | 5 262 | | | | | 14 293 | |
Human Settlements | | | 13 033 | | | | | 14 942 | | | | 15 599 | | | | 16 457 | | | | | 46 998 | |
| Housing disaster relief | | | 134 | | | | | — | | | | — | | | | — | | | | | — | |
| Human settlements development | | | 12 899 | | | | | 14 942 | | | | 15 599 | | | | 16 457 | | | | | 46 998 | |
Public Works | | | 2 181 | | | | | 2 271 | | | | 2 505 | | | | 2 778 | | | | | 7 554 | |
| Devolution of property rate funds | | | 1 865 | | | | | 1 803 | | | | 1 938 | | | | 2 091 | | | | | 5 832 | |
| Expanded public works programme Incentive grant for provinces | | | 259 | | | | | 267 | | | | 325 | | | | 402 | | | | | 994 | |
| Social sector expanded public works programme incentive for provinces | | | 57 | | | | | 200 | | | | 242 | | | | 286 | | | | | 728 | |
Sport and Recreation South Africa | | | 426 | | | | | 452 | | | | 475 | | | | 501 | | | | | 1 427 | |
| Mass sport and recreation participation | | | 426 | | | | | 452 | | | | 475 | | | | 501 | | | | | 1 427 | |
Transport | | | 9 013 | | | | | 10 616 | | | | 11 929 | | | | 12 860 | | | | | 35 404 | |
| Gautrain rapid rail link | | | 438 | | | | | 5 | | | | — | | | | — | | | | | 5 | |
| Overload control | | | 11 | | | | | — | | | | — | | | | — | | | | | — | |
| Public transport operations | | | 3 863 | | | | | 4 153 | | | | 4 361 | | | | 4 601 | | | | | 13 115 | |
| Provincial roads maintenance grant | | | 4 700 | | | | | 6 457 | | | | 7 568 | | | | 8 259 | | | | | 22 284 | |
| | | | | | | |
Total | | | 57 941 | | | | | 69 436 | | | | 74 724 | | | | 80 647 | | | | | 224 807 | |
| | | | | | | |
Indirect transfers | | | — | | | | | 700 | | | | 2 315 | | | | 5 189 | | | | | 8 204 | |
| School infrastructure backlogs grant | | | — | | | | | 700 | | | | 2 315 | | | | 5 189 | | | | | 8 204 | |
| | | | | | | |
113
2011 BUDGET REVIEW
Table 8.3 National transfers to local government, 2007/08 – 2013/14
| | | | | | | | | | | | | | | | | | | | | | | | | | | | | | | |
| | | | | | | | | | | | | | | | 2010/11 | | | | | | | |
| | | 2007/08 | | 2008/09 | | 2009/10 | | | Revised | | | 2011/12 | | 2012/13 | | 2013/14 |
| R million | | | | Outcome | | | | | estimate | | | Medium-term estimates |
| | | | | | | |
Direct transfers | | | | | | | | | | | | | | | | | | | | | | | | | | | | | | |
Equitable share and related | | | 20 676 | | | | 25 560 | | | | 23 845 | | | | | 30 559 | | | | | 34 108 | | | | 37 573 | | | | 39 960 | |
Fuel levy sharing | | | — | | | | — | | | | 6 800 | | | | | 7 542 | | | | | 8 573 | | | | 9 040 | | | | 9 613 | |
Infrastructure | | | 16 290 | | | | 18 562 | | | | 18 812 | | | | | 20 972 | | | | | 25 596 | | | | 28 642 | | | | 30 774 | |
| Municipal infrastructure grant | | | 6 967 | | | | 6 968 | | | | 8 788 | | | | | 9 515 | | | | | 11 444 | | | | 13 914 | | | | 14 679 | |
| Urban settlement development grant | | | 2 950 | | | | 3 590 | | | | 4 285 | | | | | 4 855 | | | | | 6 267 | | | | 7 410 | | | | 8 127 | |
| Public transport infrastructure and systems grant | | | 1 174 | | | | 2 920 | | | | 2 418 | | | | | 3 699 | | | | | 4 803 | | | | 5 000 | | | | 5 564 | |
| Integrated national electrification programme grant | | | 462 | | | | 589 | | | | 914 | | | | | 1 020 | | | | | 1 097 | | | | 1 151 | | | | 1 215 | |
| Neighbourhood development partnership grant | | | 41 | | | | 182 | | | | 506 | | | | | 1 030 | | | | | 750 | | | | 800 | | | | 800 | |
| 2010 FIFA World Cup stadiums development grant | | | 4 605 | | | | 4 295 | | | | 1 661 | | | | | 302 | | | | | — | | | | — | | | | — | |
| Municipal disaster grant | | | — | | | | — | | | | — | | | | | — | | | | | 470 | | | | 330 | | | | 350 | |
| Rural transport services and infrastructure grant | | | — | | | | 9 | | | | 10 | | | | | 10 | | | | | 35 | | | | 37 | | | | 39 | |
| Electricity demand-side management | | | — | | | | — | | | | 175 | | | | | 220 | | | | | 280 | | | | — | | | | — | |
| Municipal drought relief grant | | | 90 | | | | 9 | | | | 54 | | | | | 320 | | | | | 450 | | | | — | | | | — | |
Capacity building and other current transfers | | | 1517 | | | | 1 365 2 | | | | 081 2 | | | | | 080 | | | | | 1 894 | | | | 1 774 | | | | 1 969 | |
| 2010 FIFA World Cup host city operating grant | | | — | | | | — | | | | 508 | | | | | 210 | | | | | — | | | | — | | | | — | |
| Restructuring grant | | | 530 | | | | — | | | | — | | | | | — | | | | | — | | | | — | | | | — | |
| Financial management grant | | | 145 | | | | 180 | | | | 300 | | | | | 365 | | | | | 435 | | | | 479 | | | | 526 | |
| Municipal systems improvements grant | | | 200 | | | | 200 | | | | 200 | | | | | 212 | | | | | 219 | | | | 230 | | | | 243 | |
| Expanded public w orks programme incentive grant for municipalities | | | — | | | | — | | | | 202 | | | | | 623 | | | | | 680 | | | | 666 | | | | 779 | |
| Water services operating subsidy grant | | | 642 | | | | 985 | | | | 871 | | | | | 670 | | | | | 561 | | | | 399 | | | | 421 | |
| | | | | | | |
Sub total direct transfers | | | 38 483 | | | | 45 487 5 | | | | 1 538 6 | | | | | 1 152 | | | | | 70 171 | | | | 77 029 | | | | 82 317 | |
| | | | | | | |
Indirect transfers | | | | | | | | | | | | | | | | | | | | | | | | | | | | | | |
Infrastructure transfers | | | 1 334 | | | | 1 928 | | | | 2 754 | | | | | 2 947 | | | | | 3 892 | | | | 4 445 | | | | 4 734 | |
| Regional bulk infrastructure grant | | | 300 | | | | 450 | | | | 612 | | | | | 893 | | | | | 1 704 | | | | 2 003 | | | | 2 176 | |
| Backlogs in the electrification of clinics and schools | | | — | | | | 90 | | | | 149 | | | | | — | | | | | — | | | | — | | | | — | |
| Backlogs in water and sanitation at clinics and schools | | | — | | | | 186 | | | | 350 | | | | | — | | | | | — | | | | — | | | | — | |
| Integrated national electrification programme (Eskom) grant | | | 973 | | | | 1 148 | | | | 1 478 | | | | | 1 720 | | | | | 1 738 | | | | 1 882 | | | | 1 986 | |
| Neighbourhood development partnership grant | | | 61 | | | | 54 | | | | 90 | | | | | 125 | | | | | 100 | | | | 80 | | | | 55 | |
| Electricity demand side management | | | — | | | | — | | | | 75 | | | | | 109 | | | | | 119 | | | | — | | | | — | |
| Rural households infrastructure grant | | | — | | | | — | | | | — | | | | | 100 | | | | | 232 | | | | 480 | | | | 517 | |
Capacity-building and other | | | 550 | | | | 379 | | | | 243 | | | | | 148 | | | | | 100 | | | | — | | | | — | |
| Financial management grant (DBSA) | | | 53 | | | | 50 | | | | — | | | | | — | | | | | — | | | | — | | | | — | |
| Water services operating subsidy grant | | | 497 | | | | 329 | | | | 243 | | | | | 148 | | | | | 100 | | | | — | | | | — | |
| | | | | | | |
Sub total indirect transfers | | | 1 884 | | | | 2 307 | | | | 2 997 | | | | | 3 095 | | | | | 3 992 | | | | 4 445 | | | | 4 734 | |
| | | | | | | |
Total | | | 40 367 | | | | 47 794 | | | | 54 535 | | | | | 64 247 | | | | | 74 164 | | | | 81 474 | | | | 87 051 | |
| | | | | | | |
114
CHAPTER 8: MEDIUM-TERM EXPENDITURE AND DIVISION OF REVENUE
n Expenditure outcome and revised estimate: 2009/10 and 2010/11
Expenditure on national votes (including transfers to provinces and municipalities) amounted to R747.2 billion in 2009/10, out of a total adjusted appropriation of R755.5 billion, or 98.9 per cent of available funds. Provinces spent R305.4 billion against an adjusted budget of R303.9 billion, or 100.5 per cent of their budgets. Municipalities underspent their budgets by a net R16.7 billion, compared with R16.8 billion in 2008/09.
Overspending on personnel costs is evident in several provinces, as is underspending on infrastructure
Overspending on personnel costs is evident in several provincial education and health departments. Underspending is apparent in transport and human settlements votes. The revised estimate of expenditure for 2010/11 shows projected underspending of R6.4 billion on national department allocations. State debt costs are expected to be R1 billion lower than projected in the 2010 Medium Term Budget Policy Statement. Provinces are projected to underspend by R2.2 billion in 2010/11.
n Consolidated government expenditure
Understanding the different levels of the government accounts
Alongside the main budget, summarised above, government expenditure also includes social security funds, public entities, provincial and municipal activities. Although financed in part through dedicated contributions (such as the Unemployment Insurance Fund contribution) or user charges (such as toll fees or water tariffs), the expenditure of social security funds and government agencies is part of the government accounts and is governed by statute. The overview of government expenditure by function that follows includes provinces, government agencies, public entities and transfers to municipalities, but does not include municipal spending out of own revenue.
Figure 8.1 Structure of government accounts
115
2011 BUDGET REVIEW
Over MTEF non-interest expenditure grows by an annual average of 8 per cent
Trends in the functional classification of consolidated government expenditure are set out in Table 8.4. Consolidated government expenditure is projected to increase from R897.4 billion in 2010/11 to R1.2 trillion in 2013/14, largely financed through the national budget. Over the next three years, non-interest government expenditure grows by an annual average of 8 per cent, compared with annual average growth of 16.8 per cent over the previous three years. State debt cost, in contrast, increases by 16 per cent over the period ahead following an average increase of 3.1 per cent a year since 2007/08.
Table 8.4 Consolidated government expenditure by function, 2010/11 – 2013/14
| | | | | | | | | | | | | | | | | | | | | | | | | | | |
| | | | | | | | | | | | | | | | | | | | | Average annual |
| | | 2010/11 | | | | | | | | | | | | | | | | growth |
| | | Revised | | | 2011/12 | | 2012/13 | | 2013/14 | | | 2007/08 – | | 2010/11 – |
| R million | | estimate | | | Medium-term estimates | | | 2010/11 | | 2013/14 |
| | | | | | | |
General public services | | | 51 325 | | | | | 55 398 | | | | 56 718 | | | | 60 850 | | | | | -15.9 | % | | | 5.8 | % |
Defence | | | 33 958 | | | | | 38 436 | | | | 41 352 | | | | 43 895 | | | | | 6.7 | % | | | 8.9 | % |
Public order and safety | | | 84 050 | | | | | 90 904 | | | | 97 856 | | | | 104 555 | | | | | 13.1 | % | | | 7.5 | % |
| Police services | | | 55 950 | | | | | 60 691 | | | | 64 847 | | | | 69 605 | | | | | 13.4 | % | | | 7.6 | % |
| Law courts | | | 12 912 | | | | | 13 712 | | | | 15 270 | | | | 16 197 | | | | | 14.9 | % | | | 7.8 | % |
| Prisons | | | 15 187 | | | | | 16 501 | | | | 17 739 | | | | 18 754 | | | | | 10.9 | % | | | 7.3 | % |
Economic affairs | | | 140 319 | | | | | 130 538 | | | | 140 144 | | | | 149 194 | | | | | 19.5 | % | | | 2.1 | % |
| General economic, commercial and labour affairs | | | 27 107 | | | | | 28 889 | | | | 30 433 | | | | 32 488 | | | | | 36.7 | % | | | 6.2 | % |
| Agriculture, forestry, fishing and hunting | | | 16 303 | | | | | 19 015 | | | | 20 179 | | | | 21 033 | | | | | 5.4 | % | | | 8.9 | % |
| Fuel and energy | | | 27 560 | | | | | 7 895 | | | | 7 539 | | | | 6 343 | | | | | 71.4 | % | | | -38.7 | % |
| Mining, manufacturing and construction | | | 5 530 | | | | | 5 954 | | | | 6 446 | | | | 6 579 | | | | | 2.4 | % | | | 6.0 | % |
| Transport | | | 60 522 | | | | | 65 584 | | | | 72 813 | | | | 79 791 | | | | | 15.8 | % | | | 9.7 | % |
| Communication | | | 3 297 | | | | | 3 201 | | | | 2 734 | | | | 2 960 | | | | | 15.5 | % | | | -3.5 | % |
Environmental protection | | | 4 745 | | | | | 6 019 | | | | 5 740 | | | | 6 159 | | | | | 7.8 | % | | | 9.1 | % |
Housing and community amenities | | | 102 061 | | | | | 121 921 | | | | 130 353 | | | | 138 377 | | | | | 20.7 | % | | | 10.7 | % |
| Housing development | | | 22 530 | | | | | 27 593 | | | | 30 842 | | | | 32 557 | | | | | 22.9 | % | | | 13.1 | % |
| Community development | | | 48 356 | | | | | 53 938 | | | | 59 583 | | | | 63 466 | | | | | 21.7 | % | | | 9.5 | % |
| Water supply | | | 31 175 | | | | | 40 391 | | | | 39 928 | | | | 42 353 | | | | | 17.9 | % | | | 10.8 | % |
Health | | | 102 522 | | | | | 112 575 | | | | 120 641 | | | | 127 394 | | | | | 17.8 | % | | | 7.5 | % |
Recreation and culture | | | 6 351 | | | | | 6 352 | | | | 6 581 | | | | 6 919 | | | | | -9.8 | % | | | 2.9 | % |
Education | | | 172 713 | | | | | 189 523 | | | | 201 349 | | | | 215 121 | | | | | 16.0 | % | | | 7.6 | % |
Social protection | | | 132 761 | | | | | 146 930 | | | | 158 635 | | | | 171 897 | | | | | 12.6 | % | | | 9.0 | % |
| | | | | | | |
Allocated expenditure | | | 830 806 | | | | | 898 596 | | | | 959 369 | | | | 1 024 362 | | | | | 12.0 | % | | | 7.2 | % |
| State debt cost | | | 66 570 | | | | | 76 579 | | | | 90 808 | | | | 104 036 | | | | | 8.0 | % | | | 16.0 | % |
| Contingency reserve | | | — | | | | | 4 090 | | | | 11 405 | | | | 23 375 | | | | | | | | | | |
| | | | | | | |
Consolidated expenditure 1 | | | 897 376 | | | | | 979 265 | | | | 1 061 582 | | | | 1 151 773 | | | | | 11.7 | % | | | 8.7 | % |
| | | | | | | |
| | |
| 1. | | Consisting of national, provincial, social security funds and selected public entities. Refer to Annexure W2 for a detailed list of entities included. |
The budget framework includes a contingency reserve of R4.1 billion, R11.4 billion and R23.4 billion over the next three years, which allows for possible new priorities or unanticipated commitments to be accommodated within the projected framework. These amounts include provision for events that cannot be foreseen, such as natural disasters.
Additional allocations and adjustments to consolidated expenditure plans over the 2011 Budget MTEF period are summarised in Table 8.5.
116
CHAPTER 8: MEDIUM-TERM EXPENDITURE AND DIVISION OF REVENUE
Table 8.5 2011 Budget priorities – additional MTEF allocations, 2011/12 – 2013/14
| | | | | | | | | | | | | | | | | | |
| R million | | 2011/12 | | 2012/13 | | 2013/14 | | | Total |
| | | | |
Job Creation | | | | | | | | | | | | | | | | | |
| Job creation, small enterprise development, youth employment | | | 2 301 | | | | 3 352 | | | | 4 415 | | | | | 10 067 | |
Economic Affairs and Infrastructure Development | | | | | | | | | | | | | | | | | |
| Public transport | | | 2 107 | | | | 3 607 | | | | 4 701 | | | | | 10 415 | |
| Rural development & emerging farmer support | | | 622 | | | | 919 | | | | 1 303 | | | | | 2 844 | |
| Consolidation of economic regulatory capacity | | | 353 | | | | 177 | | | | 205 | | | | | 735 | |
| Enterprise investment programme | | | 150 | | | | 200 | | | | 250 | | | | | 600 | |
| Infrastructure projects | | | — | | | | 265 | | | | 297 | | | | | 562 | |
| Green economy | | | 200 | | | | 300 | | | | 500 | | | | | 1 000 | |
| Broadband ICT: universal access & cost reduction | | | 100 | | | | 150 | | | | 200 | | | | | 450 | |
Housing and Community Amenities | | | | | | | | | | | | | | | | | |
| Human settlements upgrading & municipal services | | | 794 | | | | 1 618 | | | | 2 452 | | | | | 4 865 | |
| Water infrastructure & services; acid mine drainage response | | | 840 | | | | 944 | | | | 666 | | | | | 2 450 | |
Education | | | | | | | | | | | | | | | | | |
| FET college expansion & skills development | | | 2 022 | | | | 3 337 | | | | 4 158 | | | | | 9 517 | |
| School infrastructure & facilities, improved learner support materials | | | 780 | | | | 2 315 | | | | 5 189 | | | | | 8 284 | |
| Funza Lushaka teacher bursaries and bursaries for scientific post graduate students | | | 5 | | | | 272 | | | | 677 | | | | | 954 | |
Health | | | | | | | | | | | | | | | | | |
| Hospital revitalisation and primary health family care teams | | | 858 | | | | 1 931 | | | | 2 730 | | | | | 5 519 | |
| HIV/AIDS and ARVs | | | 60 | | | | 560 | | | | 1 860 | | | | | 2 480 | |
Social protection | | | | | | | | | | | | | | | | | |
| Other (including social grants) | | | 1 164 | | | | 2 644 | | | | 5 102 | | | | | 8 910 | |
Public Order and Safety | | | | | | | | | | | | | | | | | |
| Police personnel expansion & training | | | 100 | | | | 400 | | | | 1 283 | | | | | 1 783 | |
General Public Services | | | | | | | | | | | | | | | | | |
| Municipal disaster grant | | | 470 | | | | 330 | | | | 350 | | | | | 1 150 | |
| Provincial disaster grant | | | 305 | | | | 180 | | | | 190 | | | | | 675 | |
| Post-recovery and reconstruction for current floods | | | 600 | | | | — | | | | — | | | | | 600 | |
| Municipal charges | | | 683 | | | | 964 | | | | 1 149 | | | | | 2 796 | |
Compensation of employees adjustments | | | | | | | | | | | | | | | | | |
| Wages (including additional personnel) | | | 11 413 | | | | 13 164 | | | | 14 806 | | | | | 39 382 | |
| Other adjustments | | | -5 185 | | | | -8 057 | | | | -8 685 | | | | | -21 927 | |
| | | | |
Total | | | 20 742 | | | | 29 573 | | | | 43 797 | | | | | 94 112 | |
| | | | |
n Savings, reprioritisation and changes to expenditure plans
A more moderate rate of public expenditure growth alongside delivery of quality services
Over the next three years, government will moderate the pace of public expenditure growth while accelerating the delivery of quality services. Spending baselines have undergone rigorous review and current expenditure has been realigned to support government’s 12 outcomes. In the budgeting process, greater emphasis has been placed on assessing several factors:
| • | | The capacity of departments and public entities to manage resources |
| |
| • | | The link between outcomes, expenditure and departmental mandates |
| |
| • | | Expenditure trade-offs between different budget proposals |
| |
| • | | Non-performing and/or underperforming programmes and entities. |
117
2011 BUDGET REVIEW
Savings of R30.6 billion include 0.3 per cent reduction in department baselines
The 2011 Budget makes available R94.1 billion above budget baselines over the MTEF. This includes savings of R30.6 billion. Of these savings, R21.6 billion is reprioritised within departmental budget baselines to meet existing commitments. The remaining R9 billion is added to the fiscal framework to channel more resources to key outcomes.
The savings include R6 billion resulting from a 0.3 per cent reduction in the baseline budgets across national and provincial departments. To accommodate this, government departments were asked to decrease spending on noncore goods and services, reschedule expenditure, adjust foreign exchange projections, reduce transfers to certain public entities, improve financial management and cut expenditure on administration.
Examples of savings and reprioritisation areas over the medium term are shown in the box below.
Major savings and reprioritisation over the MTEF
| | | | | |
|
| Function | | Savings identified | | Major savings1 redirected to: |
| | | | | |
| Economic affairs | | Non-core goods and services: R2 billion | | Road maintenance: R950 million |
| | | | | |
| | | Underperforming programmes: R1.3 billion | | Expansion of public transport infrastructure and system grant: R580 million |
| | | | | |
| | | | | Rural development and land reform: |
| | | | | R1.3 billion |
| | | | | |
| Housing and community amenities | | Underperforming programmes: R600 million | | Completion of De Hoop Dam and a portion of bulk distribution system: R1 billion |
| | | Non-core goods and services: R478 million | | |
| | | | | Regional bulk infrastructure: R600 million |
| | | Rescheduling of expenditure: R759 million | | |
| Public order and safety | | Non-essential items: R555 million | | Antiretroviral drugs for inmates: R82 million |
| | | | | |
| | | | | Additional police personnel: R383 million |
| | | | | |
| Defence | | Non-core goods and services: R1.3 billion | | New remuneration dispensation: R1.3 billion |
| | |
| 1. | | Major savings column does not include all savings identified. |
The Estimates of National Expenditure provides greater detail on national government spending across all departments. The Explanatory Memorandum to the Division of Revenue details transfers to provincial and local government. The spending plans of provinces are published in the two weeks following the tabling of the national budget, and draft budgets of municipalities will be published by 31 March 2011.
n Revised expenditure plans by function
Economic affairs and infrastructure development
Upgrading the nation’s roads, transport, energy and environmental protection provides a foundation for industrial expansion, agricultural production and distribution, and broad-based development. Over the medium term, government intends to step up infrastructure investment.
118
CHAPTER 8: MEDIUM-TERM EXPENDITURE AND DIVISION OF REVENUE
The economic affairs function is central to ensuring an efficient, competitive and responsive infrastructure network to support economic and social development and create jobs. A total of R419.8 billion is allocated for the economic affairs function over the next three years. With an additional R21 billion allocated over the medium term, the economic affairs baseline increases from R107 billion in 2010/11 to R121 billion in 2013/14. The largest component in this function is transport, which makes up 33 per cent of expenditure in 2011/12.
Transport
Transport receives an additional R10.3 billion
An additional allocation of R10.3 billion over the MTEF will support efforts to improve national and provincial road maintenance, rail signalling and rolling stock, and public transport infrastructure. The South African National Roads Agency will receive an additional R2.7 billion, of which R1.8 billion is for maintenance of 2 156km of coal haulage roads and R950 million is for maintenance of 2 284km of the national road network.
Funding of R1.5 billion for provincial road maintenance and weighbridges is provided through the new provincial roads maintenance grant. An additional R2.1 billion is provided for the coal haulage network. This grant totals R22.3 billion over the MTEF. The Passenger Rail Agency of South Africa is allocated R1.1 billion to upgrade and replace 16 per cent of Metrorail’s signalling infrastructure, and R350 million is provided for the upgrade and refurbishment of 40 motor coaches and 277 trailers.
Table 8.6 Transport expenditure, 2007/08 – 2013/14
| | | | | | | | | | | | | | | | | | | | | | | | | | | | | | | |
| | | 2007/08 | | 2008/09 | | 2009/10 | | | 2010/11 | | | 2011/12 | | 2012/13 | | 2013/14 |
| R billion | | | | Outcome | | | | | Revised | | | Medium-term estimates |
| | | | | | | |
| National departments | | | 4.4 | | | | 9.7 | | | | 7.6 | | | | | 9.5 | | | | | 8.3 | | | | 9.0 | | | | 9.8 | |
| Provincial departments | | | 22.1 | | | | 28.8 | | | | 28.2 | | | | | 26.7 | | | | | 28.7 | | | | 30.0 | | | | 31.8 | |
| Public entities | | | 12.4 | | | | 18.0 | | | | 30.2 | | | | | 24.3 | | | | | 28.5 | | | | 33.8 | | | | 38.3 | |
| | | | | | | |
Total | | | 38.9 | | | | 56.5 | | | | 66.0 | | | | | 60.5 | | | | | 65.6 | | | | 72.8 | | | | 79.8 | |
| | | | | | | |
An additional R2.7 billion has been made available to 12 municipalities through the public transport infrastructure and systems conditional grant to plan, upgrade and expand integrated public transport. The funding will allow bus rapid transport services to increase peak-hour passenger loads from the current 30 000 to 110 000 in 2013/14.
Energy and environmental protection
A continued commitment to universal national electrification
Expenditure on energy will be markedly lower over the MTEF in comparison with preceding years because the final tranche of the Eskom subordinated loan was paid in 2010/11. Medium-term spending will focus on universal access to electricity through the integrated national electrification programme, which will grow to R3.2 billion in 2013/14.
119
2011 BUDGET REVIEW
Table 8.7 Energy, communication and general economic affairs expenditure, 2007/08 – 2013/14
| | | | | | | | | | | | | | | | | | | | | | | | | | | | | | | |
| | | 2007/08 | | 2008/09 | | 2009/10 | | | 2010/11 | | | 2011/12 | | 2012/13 | | 2013/14 |
| R billion | | | | Outcome | | | | | Revised | | | Medium-term estimates |
| | | | | | | |
| National departments | | | 14.8 | | | | 25.6 | | | | 47.5 | | | | | 37.8 | | | | | 20.9 | | | | 22.3 | | | | 23.3 | |
| Provincial departments | | | 5.0 | | | | 4.8 | | | | 6.1 | | | | | 5.7 | | | | | 5.4 | | | | 5.6 | | | | 5.9 | |
| Public entities | | | 9.7 | | | | 13.1 | | | | 15.7 | | | | | 20.0 | | | | | 19.6 | | | | 19.3 | | | | 19.2 | |
| | | | | | | |
Total | | | 29.4 | | | | 43.4 | | | | 69.4 | | | | | 63.5 | | | | | 45.9 | | | | 47.2 | | | | 48.4 | |
| | | | | | | |
Additional support for research and development, including energy-efficiency initiatives
To reduce wasteful electricity consumption patterns and South Africa’s carbon usage, government is strengthening research and development in energy-efficiency technologies. Over the three-year spending period the Department of Energy is allocated an additional R369.7 million, of which R66.5 million is for the establishment of the South African Energy Development Institute. Research and development conducted by this institute will support energy-efficiency objectives pioneered through the electricity demand-side management grant, which is scheduled to come to an end at the end of 2011/12. The Department of Energy receives R282 million for outstanding payments to the 2010 World Cup Local Organising Committee for generators and electrical connections.
The budget allocates an additional R391 million over the MTEF to the Department of Environmental Affairs. These funds will allow the department to step up efforts to prevent wildlife trafficking; boost its capacity to implement legislation dealing with air quality, waste and coastline management; and increase South Africa’s ability to respond to oil spills. Expanded public works projects related to the environment, which will create an estimated 41 131 jobs, are supported with a total allocation of R2.2 billion over the medium term. This allocation also covers the costs of organising the United Nations Conference on Climate Change.
South Africa to host UN climate change conference in Durban
In November 2011, South Africa will host the 17th annual Conference of Parties (COP 17) for signatories of the United Nations Framework Convention on Climate Change. The event, known as COP 17, will bring an estimated 20 000 delegates from around the world to Durban.
COP 17 is expected to discuss a global emissions target, a common carbon accounting framework, an enforcement mechanism and a registry of national mitigation efforts. South Africa continues to push for a strong binding agreement that will bring in key global players such as China, India and the US.
Industrial development
R2 billion for Department of Economic Development
Additions to baseline for the Department of Economic Development amount to R2 billion over the MTEF, including R1.5 billion allocated to six public entities. The Competition Commission is allocated R461 million to upscale its work on anti-competitive practices in four priority sectors, and to create a unit focusing on cartels. The Industrial Development Corporation will launch a fund with capitalisation of R250 million over the MTEF to support the start-up agro-processing businesses.
Additional support for small business
Government is supporting small businesses with an allocation to the South African Micro-finance Apex Fund. The fund receives R282 million to provide wholesale funding and to build capacity in financial intermediary firms that lend to small businesses. A direct-lending project for Khula
120
CHAPTER 8: MEDIUM-TERM EXPENDITURE AND DIVISION OF REVENUE
Enterprises receives R55 million in 2011/12 for credit indemnities, wholesale lending to retail finance institutions and support services for small businesses.
Industrial policy action plan incentives to promote investment and job creation receive R10 billion
Over the period ahead, about R10 billion has been allocated to various incentive schemes to promote investment, job creation and broad-based black economic empowerment under the industrial policy action plan. The largest are:
| • | | Automotive production and development programme — R3 billion |
| |
| • | | Enterprise investment for manufacturing and tourism — R2.3 billion |
| |
| • | | Clothing and textiles production incentives — R2.1 billion |
| |
| • | | Small and medium enterprise development for manufacturing and tourism — R912 million |
| |
| • | | Film and television production incentive — R844 million. |
The National Tooling Initiative receives R119.7 million over the MTEF. The pre-apprenticeship programme began in February 2010 with 175 students.
The Department of Science and Technology receives an allocation amounting to R14.8 billion over the MTEF (R4.4 billion, R4.9 billion and R5.5 billion). Additional funds of R535 million were allocated for human capital, scientific equipment and the establishment of the National Intellectual Property Management Office. An amount of R358 million has been allocated to post-graduate education.
Agriculture, forestry, fisheries and land affairs
Allocations to enhance agricultural development and improve rural livelihoods
Government’s land reform and agricultural development programmes are intended to enhance rural advancement, job creation and poverty reduction, while expanding South Africa’s agricultural produce. Over the MTEF, the Department of Agriculture, Forestry and Fisheries receives a total allocation of R15.5 billion, of which R1.1 billion (R194 million in 2012/13, R405 million in 2012/13 and R512 million in 2013/14) is an additional allocation.
Table 8.8 Agriculture, forestry, fishing and land affairs expenditure, 2007/08 – 2013/14
| | | | | | | | | | | | | | | | | | | | | | | | | | | | | | | |
| | | 2007/08 | | 2008/09 | | 2009/10 | | | 2010/11 | | | 2011/12 | | 2012/13 | | 2013/14 |
| R billion | | | | | | Outcome | | | | | | | Revised | | | Medium-term estimates |
| | | | | | | |
| National departments | | | 7.8 | | | | 7.9 | | | | 6.1 | | | | | 6.7 | | | | | 6.2 | | | | 6.7 | | | | 7.0 | |
| Provincial departments | | | 4.9 | | | | 6.0 | | | | 7.1 | | | | | 7.2 | | | | | 8.4 | | | | 8.8 | | | | 9.3 | |
| | | | | | | |
| Public entities | | | 1.2 | | | | 1.4 | | | | 4.5 | | | | | 2.4 | | | | | 4.5 | | | | 4.6 | | | | 4.7 | |
| | | | | | | |
Total | | | 13.9 | | | | 15.3 | | | | 17.7 | | | | | 16.3 | | | | | 19.0 | | | | 20.2 | | | | 21.0 | |
| | | | | | | |
A further R400 million is added over the medium term (R50 million, R120 million and R230 million) to the comprehensive agricultural support programme to provide post-settlement support to land reform beneficiaries and other emerging farmers. An additional R100 million is provided to the land care programme grant, bringing the three-year allocation to R293 million for 2 847km of fencing to protect ecologically sensitive areas from livestock.
121
2011 BUDGET REVIEW
New funds for National Rural Youth Services Corps
The Department of Rural Development and Land Reform receives an additional R1.1 billion (R150 million in 2012/13, R350 million in 2012/13 and R600 million in 2013/14) for the comprehensive rural development programme. These funds will support the intake of an additional 5 000 recruits for the National Rural Youth Services Corps and the construction of a poultry house in Limpopo.
Housing and community amenities
Building adequate and safe human settlements raises living standards and creates new job opportunities. Realising this outcome will require speeding up service delivery, eliminating regular patterns of underspending in certain provinces, and improving the efficiency of local government housing processes.
Table 8.9 Housing and community amenities expenditure, 2007/08 – 2013/14
| | | | | | | | | | | | | | | | | | | | | | | | | | | | | | | |
| | | 2007/08 | | 2008/09 | | 2009/10 | | | 2010/11 | | | 2011/12 | | 2012/13 | | 2013/14 |
| R billion | | | | | | Outcome | | | | | | | Revised | | | Medium-term estimates |
| | | | | | | |
| National departments | | | 31.6 | | | | 38.0 | | | | 46.5 | | | | | 56.7 | | | | | 66.0 | | | | 74.2 | | | | 79.3 | |
| Provincial departments | | | 11.3 | | | | 14.2 | | | | 16.9 | | | | | 19.6 | | | | | 23.6 | | | | 25.0 | | | | 26.0 | |
| Public entities | | | 15.0 | | | | 16.4 | | | | 18.1 | | | | | 25.7 | | | | | 32.3 | | | | 31.1 | | | | 33.1 | |
| | | | | | | |
Total | | | 58.0 | | | | 68.6 | | | | 81.5 | | | | | 102.1 | | | | | 121.9 | | | | 130.4 | | | | 138.4 | |
| | | | | | | |
With an additional R6.1 billion allocated over the medium term, planned expenditure on housing and community amenities increases from R102.1 billion in 2010/11 to R138.4 billion in 2013/14. The largest component in this function is community development, which makes up 47.4 per cent of expenditure in 2011/12. Transfers to provincial and local government include earmarked grants for the delivery of housing, water, sanitation and electricity to households.
A boost for bulk water infrastructure projects
Spending at the national level in this function relates mainly to the provision of bulk water infrastructure. Investment in water services is expected to increase from R9.9 billion in 2011/12 to R10.9 billion in 2013/14. This includes an additional R3.6 billion over the MTEF period allocated to the Department of Water Affairs, of which R1 billion is for completion of the De Hoop Dam and bulk distribution pipelines, R952 million for regional bulk infrastructure, R520 million for completion of the 78km Nandoni Pipeline, R450 million for emergency drought relief in the Nelson Mandela Bay Metropolitan Municipality, and R225 million for addressing acid mine drainage and its consequences in Gauteng. More than 1 million people will benefit from the Nandoni Pipeline, and more than 2 million people will benefit from the De Hoop Dam water system. To support local government delivery R1.2 billion has been added to the local equitable share.
Informal settlement upgrades receive targeted support through cities
Government aims to upgrade 400 000 households in informal settlements by 2014. Nearly 60 per cent of all households in informal settlements are in the country’s eight metropolitan municipalities. An additional amount of R2.1 billion has been allocated over the medium term to the Department of Human Settlements for municipal infrastructure to support informal settlement upgrading through the new urban settlements development
122
CHAPTER 8: MEDIUM-TERM EXPENDITURE AND DIVISION OF REVENUE
grant. This grant will enable cities to take more control of planning and budgeting for the provision of housing and basic services.
The capital restructuring grant for social housing receives an additional R972 million over the medium term to build 6 000 affordable rental units.
Cities: engines of growth and development
South African cities face myriad challenges. Above all, cities need to help grow the economy by building and maintaining infrastructure, and funding improved social services.
To support these objectives, government has given cities greater autonomy in land use management. Public transport functions have been devolved to the large metropolitan cities through the National Land Transport Act. The housing accreditation process will strengthen the ability of municipalities to manage their built environment. And several measures will help to roll back the apartheid spatial relations that continue to mark the urban landscape:
| • | | Introduction of the urban settlements development grant to upgrade informal settlements and accelerate land release. |
| |
| • | | Measures to stimulate rental housing. |
| |
| • | | Operating subsidies for bus and commuter rail services will be transferred directly to municipalities, enabling them to coordinate and guide public transport services. |
In collaboration with the World Bank, government will embark on a large-scale programme to strengthen urban management. The initiative will seek to foster improvements across a wide range of areas, including infrastructure investment, asset management, land use management, service delivery capacity, public transport management, anti-corruption strategies and financial management.
Education and skills development
Education is key to sustaining long-term growth, increasing employment and reducing inequality. Challenges in this sector include backlogs in school infrastructure; low levels of achievement in literacy, mathematics and science; an insufficient number of qualified teachers; and low enrolment and high failure rates in universities and further education and training (FET) colleges.
Table 8.10 Education expenditure, 2007/08 – 2013/14
| | | | | | | | | | | | | | | | | | | | | | | | | | | | | | | |
| | | 2007/08 | | 2008/09 | | 2009/10 | | | 2010/11 | | | 2011/12 | | 2012/13 | | 2013/14 |
| R billion | | | | | | Outcome | | | | | | | Revised | | | Medium-term estimates |
| | | | | | | |
| National departments | | | 12.9 | | | | 15.1 | | | | 16.6 | | | | | 19.5 | | | | | 22.7 | | | | 25.8 | | | | 30.1 | |
| Provincial departments | | | 90.5 | | | | 110.3 | | | | 126.3 | | | | | 143.2 | | | | | 154.5 | | | | 162.4 | | | | 171.2 | |
| Public entities | | | 7.3 | | | | 9.2 | | | | 9.3 | | | | | 10.1 | | | | | 12.4 | | | | 13.1 | | | | 13.9 | |
| | | | | | | |
Total | | | 110.7 | | | | 134.6 | | | | 152.2 | | | | | 172.7 | | | | | 189.5 | | | | 201.3 | | | | 215.1 | |
| | | | | | | |
Support to increase poor students’ access to FET colleges
Spending on education and skills development increased by 16 per cent a year from 2007/08 to 2010/11, and will grow from R172.7 billion in 2010/11 to R215.1 billion in 2013/14, an average annual growth rate of 7.6 per cent. Additional allocations of R24.3 billion over the medium term are accommodated, mainly for a baseline adjustment in provincial education departments, for improving infrastructure at schools, for increasing access for poor students at FET colleges and universities, and for additional personnel at the national departments.
Provincial education spending is expected to grow by 6.5 per cent over the medium term from R143.2 billion in 2010/11 to R171.2 billion in 2013/14, mainly due to growth in compensation of employees.
123
2011 BUDGET REVIEW
Unsafe school structures to be abolished
The Department of Basic Education receives an additional R9.1 billion over the MTEF, of which R8.2 billion is to address backlogs in school infrastructure through a new school infrastructure backlogs indirect grant. This will enable 3 627 identified informal and unsafe school structures to be replaced, and contribute to provision of water, sanitation and electricity at all schools. The department receives R75 million to strengthen oversight, monitoring and evaluation.
National assessments in literacy and numeracy for all grades 3, 6 and 9 learners will be conducted in 2011. Newly developed learner workbooks and teacher lesson plans have been provided for grades R to 6. In total, more than 6.6 million learners and 125 000 teachers are to receive high-quality teaching and learning materials for the 2011 academic year. A further R596 million is provided over the next three years for Funza Lushaka bursaries, bringing the total allocation for this programme to R2 billion. This will increase the number of prospective teachers receiving bursaries in subject areas such as mathematics, science and the foundation phase from 10 150 in 2010 to 15 217 by 2013.
FET baseline grows to R14.3 billion over medium term to increase enrolment and raise quality of training
To bolster skills development, an amount of R1.4 billion over the medium term is added to the FET colleges grant, bringing the baseline to R14.3 billion over the period. This will increase FET enrolment from about 198 000 in 2010 to 315 000 in 2011. The state bursary scheme for FET college students increases to R5 billion over the MTEF, including an additional R3.9 billion over the period to enable an additional 120 600 poor learners to access college opportunities. Other interventions are aimed at improving the performance of students in vocational programmes.
First allocation to help establish new universities in Mpumalanga and Northern Cape
The Department of Higher Education and Training receives an additional R8.1 billion over the next three years. To improve poor students’ access to universities, R3.6 billion is added to the National Student Financial Aid Scheme, bringing the available funds to R9.7 billion for student bursaries and loans. Some 154 890 students (including about 57 300 final-year students) received financial aid from the scheme in 2010. An initial allocation of R300 million is made for establishing new universities in Mpumalanga and the Northern Cape.
Health services
Government is intensifying investment in health services as part of the 10-point plan to restructure public health, which includes national health insurance (NHI). The challenges facing the health sector include high rates of infant and maternal mortality, HIV and Aids, inadequate health infrastructure, weak hospital management and a shortage of skilled health workers.
Table 8.11 Health expenditure, 2007/08 – 2013/14
| | | | | | | | | | | | | | | | | | | | | | | | | | | | | | | |
| | | 2007/08 | | 2008/09 | | 2009/10 | | | 2010/11 | | | 2011/12 | | 2012/13 | | 2013/14 |
| R billion | | | | | | Outcome | | | | | | | Revised | | | Medium-term estimates |
| | | | | | | |
| National departments | | | 0.9 | | | | 1.1 | | | | 1.3 | | | | | 1.4 | | | | | 1.4 | | | | 1.5 | | | | 1.6 | |
| Provincial departments | | | 58.7 | | | | 70.0 | | | | 85.7 | | | | | 96.8 | | | | | 106.6 | | | | 114.1 | | | | 120.3 | |
| Public entities | | | 3.1 | | | | 3.8 | | | | 4.1 | | | | | 4.3 | | | | | 4.5 | | | | 5.0 | | | | 5.5 | |
| | | | | | | |
Total | | | 62.7 | | | | 75.0 | | | | 91.1 | | | | | 102.5 | | | | | 112.6 | | | | 120.6 | | | | 127.4 | |
| | | | | | | |
124
CHAPTER 8: MEDIUM-TERM EXPENDITURE AND DIVISION OF REVENUE
Spending on the health sector has grown strongly over the past three years, from R63 billion in 2007/08 to R102.5 billion 2010/11. Expenditure is expected to grow to R113 billion in 2011/12 and R127 billion in 2013/14 — an average annual growth rate of 7.5 per cent. The function is allocated an additional R18.7 billion over the medium term (R3.6 billion in 2011/12, R6.5 billion in 2012/13 and R8.6 billion in 2013/14) mainly to cater for infant and maternal health care, HIV and Aids treatment, and health infrastructure and improving health facilities.
Training for 400 nurses and midwives to improve maternal and child health services
The budget allocates an additional R1.4 billion to improve maternal and child health services through a wide range of interventions, including training of 400 nurses and midwives, improved school health services, and enhanced supervision of obstetric and paediatric services in district hospitals. To reinforce gains made in the fight against HIV and Aids, R2.5 billion has been allocated to increase HIV counselling and testing and to extend the lower entry threshold for antiretroviral (ARV) treatment over the medium term. This will increase the total number of people on ARV treatment from 1.2 million in 2010/11 to 2.6 million by 2013/14.
Reform of tender and procurement processes in public health has begun to achieve benefits.
To help retain experienced personnel in the public health sector, R1.6 billion has been allocated for various personnel categories, including 30 therapeutic health professional groups, and for occupation-specific dispensations for medical officers and junior specialist doctors. Provision is also made to increase the numbers of trainee medical specialists from 2 200 to 2 500. An additional R2.9 billion is allocated to improve health facilities, medical equipment and systems over the medium term. Reform of tender and procurement processes in public health has begun to achieve benefits. For example, government can buy more ARV medicines at lower cost, increasing the number of patients on ARV therapy.
As one of the first steps in establishing NHI, primary health care services are being reformed. An allocation of R1.2 billion will launch a family health system, comprising locally based teams of doctors, nurses and community health workers.
Social protection
Social protection budget reaches R171.9 billion by outer year
The social protection budget grows from R132.8 billion in 2010/11 to R146.9 billion in 2011/12, and is projected to increase to R171.9 billion by 2013/14. About 70 per cent of spending is on transfers to households in the form of social grants, and 17 per cent is accounted for by social security transfers such as maternity and unemployment benefits, medical and disablement compensation and road accident compensation. Administration costs amount to 6.4 per cent of the social protection budget.
Table 8.12 Social protection expenditure, 2007/08 – 2013/14
| | | | | | | | | | | | | | | | | | | | | | | | | | | | | | | |
| | | 2007/08 | | 2008/09 | | 2009/10 | | | 2010/11 | | | 2011/12 | | 2012/13 | | 2013/14 |
| R billion | | | | | | Outcome | | | | | | | Revised | | | Medium-term estimates |
| | | | | | | |
| National departments | | | 65.1 | | | | 73.6 | | | | 85.0 | | | | | 91.8 | | | | | 101.6 | | | | 110.4 | | | | 118.8 | |
| Provincial departments | | | 6.2 | | | | 8.3 | | | | 9.1 | | | | | 10.1 | | | | | 11.5 | | | | 12.0 | | | | 12.7 | |
| Public entities and social security funds | | | 21.7 | | | | 25.7 | | | | 28.5 | | | | | 30.8 | | | | | 33.8 | | | | 36.2 | | | | 40.4 | |
| | | | | | | |
Total | | | 92.9 | | | | 107.7 | | | | 122.5 | | | | | 132.8 | | | | | 146.9 | | | | 158.6 | | | | 171.9 | |
| | | | | | | |
125
2011 BUDGET REVIEW
Strong increases in the social protection budget have extended income support to poor households
Strong increases in the social protection budget have enabled income support to poor households to be extended substantially over the past decade, mainly through expansion of the child support grant. As outlined in Chapter 7, proposals for an integrated social security system and consolidation of administrative capacity are well advanced.
Over the next three years, the South African Social Security Agency will receive R870 million for the implementation of a new grants application process that will reduce waiting times, modernise records management and reduce fraud.
Recreation and culture
Arts, culture, sport and recreation play an important role in creating an informed, empowered, fair and inclusive citizenry. Challenges in this area include the need to establish clear roles and responsibilities between national, provincial and local initiatives, finding ways to support sustainable job creation, and rectifying corporate governance shortcomings at the SABC.
Table 8.13 Recreation and culture expenditure, 2007/08 – 2013/14
| | | | | | | | | | | | | | | | | | | | | | | | | | | | | | | |
| | | 2007/08 | | 2008/09 | | 2009/10 | | | 2010/11 | | | 2011/12 | | 2012/13 | | 2013/14 |
| R billion | | | | | | Outcome | | | | | | | Revised | | | Medium-term estimates |
| | | | | | | |
| National departments | | | 5.5 | | | | 5.4 | | | | 3.2 | | | | | 1.7 | | | | | 1.3 | | | | 1.4 | | | | 1.5 | |
| Provincial departments | | | 2.2 | | | | 3.3 | | | | 3.3 | | | | | 3.3 | | | | | 3.6 | | | | 3.9 | | | | 4.0 | |
| Public entities | | | 0.9 | | | | 1.1 | | | | 1.2 | | | | | 1.3 | | | | | 1.4 | | | | 1.3 | | | | 1.4 | |
| | | | | | | |
Total | | | 8.7 | | | | 9.8 | | | | 7.7 | | | | | 6.4 | | | | | 6.4 | | | | 6.6 | | | | 6.9 | |
| | | | | | | |
Expenditure on recreation and culture, including allocations to the SABC, increases from R6.4 billion in 2010/11 to R6.9 billion in 2013/14; an average annual growth rate of 2.5 per cent. The function is allocated additional funding of R116 million in 2011/12, R151.4 million in 2012/13 and R194.1 million in 2013/14.
New support for local film industry aims to create 4 200 jobs
The Department of Arts and Culture receives an additional R255.8 million over the medium term. The National Film and Video Foundation receives an additional R135.2 million, bringing its total MTEF allocation to R265.8 million. The additional funding has been earmarked to support further growth of the local film industry, creating about 4 200 jobs by training scriptwriters, script editors, producers and other crew.
Competitive sports leagues to be established in each province
Sport and Recreation receives an additional R205.7 million over the medium term, including R136 million for the sports federations. This brings the MTEF allocation to sport federations to R229.1 million to enhance development and transformation, and to establish competitive leagues in each province.
Public order and safety
Funding aims to clear court backlogs and integrate information systems
Crime reduction remains one of the government’s top priorities. Although crime is declining according to latest statistics, the rates of violent crime remain high. Over the medium term, additional funds are provided to bring
126
CHAPTER 8: MEDIUM-TERM EXPENDITURE AND DIVISION OF REVENUE
down crime levels, clear court case backlogs and integrate criminal justice information systems.
Table 8.14 Public order and safety expenditure, 2007/08 – 2013/14
| | | | | | | | | | | | | | | | | | | | | | | | | | | | | | | |
| | | 2007/08 | | 2008/09 | | 2009/10 | | | 2010/11 | | | 2011/12 | | 2012/13 | | 2013/14 |
| R billion | | | | | | Outcome | | | | | | | Revised | | | Medium-term estimates |
| | | | | | | |
| National departments | | | 55.1 | | | | 63.2 | | | | 71.5 | | | | | 79.9 | | | | | 86.5 | | | | 93.2 | | | | 99.7 | |
| Provincial departments | | | 1.6 | | | | 1.8 | | | | 1.9 | | | | | 2.0 | | | | | 2.2 | | | | 2.3 | | | | 2.5 | |
| Public entities | | | 1.3 | | | | 1.9 | | | | 1.9 | | | | | 2.1 | | | | | 2.1 | | | | 2.3 | | | | 2.4 | |
| | | | | | | |
Total | | | 58.1 | | | | 66.9 | | | | 75.3 | | | | | 84.0 | | | | | 90.9 | | | | 97.9 | | | | 104.6 | |
| | | | | | | |
Public order and safety budget increases by 15 per cent to reach R104.6 billion in 2013/14
Over the MTEF period, the public order and safety budget increases by 15 per cent from R90.9 billion in 2011/12 to R104.6 billion in 2013/14. A total of R12.8 billion is allocated to the national departments of Police, Justice and Constitutional Development, Correctional Services and the Independent Complaints Directorate. The Financial Intelligence Centre receives an additional allocation of R100 million. Provinces are projected to spend an additional R203 million on community safety.
A total of R4.7 billion from efficiency savings and delayed expenditure on prison construction is reprioritised to cater for other priorities in the cluster. These include the construction of courts, upgrading of information technology infrastructure and additional personnel to boost visible policing, detective services and crime intelligence, and to promote access to justice.
Personnel costs are the main cost drive in public order and safety
Personnel costs, including salary adjustments and occupation-specific dispensations, are the major cost driver in this cluster. Significant amounts are also spent on construction projects (building of courts, police stations and prisons) and information technology systems.
Over the MTEF a total of R2.1 billion is provided for increasing the number of police personnel from 200 600 in 2012/13 to 202 260 by 2013/14. These staff increases will support more visible policing, detective and crime intelligence services. An additional R140 million is allocated to strengthen about 20 trained tactical response teams and to establish an effective personnel vetting structure for criminal intelligence services.
The criminal justice system requires modern, integrated systems to coordinate work across agencies, and to track persons and cases. An additional R670 million is allocated over the medium term for the upgrade of IT infrastructure.
Allocations reduce prison overcrowding
South Africa’s prisons remain overcrowded, which hampers effective inmate rehabilitation. An allocation of R243 million is provided to cater for operational costs of three correctional facilities currently being upgraded, two of which are partly operational. The facilities will eventually accommodate an additional 1 883 inmates.
An additional R490 million is allocated for the construction of new courts, including high courts in Nelspruit and Polokwane, bringing the total number of high courts to 16.
127
2011 BUDGET REVIEW
An additional R45 million will support greater investigative capacity in the Special Investigating Unit to allow for the unit to employ an additional 49 investigators, bringing the total to 669 by 2013/14.
Defence
The defence function includes the departments of Defence and Military Veterans, the State Security Agency and earmarked allocations for the Crime Intelligence Division of SAPS.
Table 8.15 Defence expenditure, 2007/08 – 2013/14
| | | | | | | | | | | | | | | | | | | | | | | | | | | | | | | |
| | | 2007/08 | | 2008/09 | | 2009/10 | | | 2010/11 | | | 2011/12 | | 2012/13 | | 2013/14 |
| R billion | | | | | | Outcome | | | | | | | Revised | | | Medium-term estimates |
| | | | | | | |
| National departments | | | 26.4 | | | | 28.8 | | | | 32.8 | | | | | 32.4 | | | | | 36.7 | | | | 39.5 | | | | 41.9 | |
| Public entities | | | 1.5 | | | | 2.1 | | | | 1.8 | | | | | 1.6 | | | | | 1.8 | | | | 1.9 | | | | 1.9 | |
| | | | | | | |
Total | | | 27.9 | | | | 30.9 | | | | 34.6 | | | | | 34.0 | | | | | 38.4 | | | | 41.4 | | | | 43.9 | |
| | | | | | | |
Defence is allocated additional funding of R1.3 billion in 2011/12, R1.6 billion in 2012/13 and R2 billion in 2013/14. Over the medium term, expenditure is expected to increase from R34 billion in 2010/11 to R43.9 billion in 2013/14 at an average annual rate of 8.8 per cent. Additional allocations are mainly for improved conditions of service, municipal charges, maintaining defence capabilities, peace support operations, improved border control and regional crime intelligence capacity. The main cost drivers of this function are compensation of employees and capital acquisitions.
SANDF has taken a greater role in guarding the borders
Partly to help combat illegal immigration, the role of the South African National Defence Force in safeguarding the country’s borders has been enhanced. Over the next three years, R600 million is provided to deploy soldiers at the borders, and to upgrade and maintain facilities and equipment. The number of troops deployed will increase from 1 168 in 2011/12 to 2 158 in 2013/14.
The Department of Military Veterans receives R57.5 million over the MTEF period to establish, manage and coordinate programmes promoting the well-being of military veterans.
The defence force conducted an assessment of slow-performing programmes and non-core spending items, as a result of which R1.6 billion has been reprioritised to fund the new SANDF salary dispensation.
General public services
Additional R15.2 billion for general public services helps defray costs of census and elections
With an additional R15.2 billion allocated over the medium term, the budget of the general public services function increases from R117.9 billion in 2010/11 to R164.9 billion in 2013/14, rising by an annual average of 6.7 per cent in real terms. Additional funds will primarily be used for building capacity in various departments, improving conditions of service, the 2011 Census and preparing for elections in 2013/14.
Functional reprioritised savings amount to R2.9 billion, which were generated mainly from slow spending projects in the function and from adjusting foreign exchange projections.
128
CHAPTER 8: MEDIUM-TERM EXPENDITURE AND DIVISION OF REVENUE
Table 8.16 General public services expenditure, 2007/08 – 2013/14
| | | | | | | | | | | | | | | | | | | | | | | | | | | | | | | |
| | | 2007/08 | | 2008/09 | | 2009/10 | | | 2010/11 | | | 2011/12 | | 2012/13 | | 2013/14 |
| R billion | | | | | | Outcome | | | | | | | Revised | | | Medium-term estimates |
| | | | | | | |
| National departments | | | 60.4 | | | | 66.8 | | | | 71.5 | | | | | 81.4 | | | | | 93.7 | | | | 105.4 | | | | 119.2 | |
| Provincial departments | | | 10.1 | | | | 13.6 | | | | 14.3 | | | | | 15.6 | | | | | 16.8 | | | | 17.9 | | | | 19.6 | |
| Public entities | | | 15.9 | | | | 17.1 | | | | 17.8 | | | | | 20.9 | | | | | 21.5 | | | | 24.2 | | | | 26.2 | |
| | | | | | | |
Total | | | 86.4 | | | | 97.5 | | | | 103.5 | | | | | 117.9 | | | | | 132.0 | | | | 147.5 | | | | 164.9 | |
| | | | | | | |
Statistics South Africa receives an additional R500 million in 2011/12 to conduct the census. These funds should contribute to a more accurate census, partly through employing 120 000 additional short-term staff on contracts ranging from three to 18 months.
R1.5 billion to meet obligations of the Political Office Bearers’ Pension Fund
The National Treasury receives an additional R1.5 billion to meet obligations of the Political Office Bearers’ Pension Fund, as well as increases in costs to government for post-retirement benefits and injury-on-duty expenditure. As at 30 September 2010, 73 246 people were receiving post-retirement benefits and 9 981 people were receiving injury-on-duty benefits.
Payment of property rates for provincial properties owned by government was devolved to provinces in 2008/09. Since then, changes in property holdings and cost escalations associated with the Property Rates Act have necessitated upward adjustments in the provision for provincial property rates. An additional amount of R2.2 billion over the MTEF period is provided. The provincial property rates allocations will in due course be shifted into the provincial equitable shares.
Electoral commission receives funds to run elections over the next several years
The Independent Electoral Commission receives an additional R80 million in 2011/12 for the administration of the local government elections, and R120 million in 2013/14 for national and provincial elections to be held during 2014. Funding will be used to employ 192 604 personnel, and to improve equipment and logistical operations during the elections.
n Conclusion
Government’s outcomes approach lays the basis for achieving greater efficiency in public services, providing a platform for increased scrutiny of state programmes and measuring performance by results. Delivery agreements for the 12 outcomes have been concluded, and the Department of Performance Monitoring and Evaluation will oversee regular reporting of progress against the agreed outputs and targets. This approach requires closer cooperation between national, provincial and local government, and with all agencies responsible for delivery of key services.
To help improve the effectiveness of the public service, government is developing and will pilot an institutional performance assessment tool to assess the quality of management practices in government departments and municipalities. Areas assessed will include supply chain management, financial management, human resources management and service standards.
129
2011 BUDGET REVIEW
More rapid, inclusive growth depends on strengthened partnerships between public and private sectors
Government recognises that social development and economic progress are outcomes of a wide range of initiatives by all social partners, from community organisations to major businesses and trade union federations. Public spending programmes are aimed at more effective delivery of services that are government’s direct responsibility, and co-financing of activities that draw on both public- and private-sector capacity and initiative. More rapid, inclusive growth depends on improved cooperation and strengthened partnerships for progress and development.
130
ANNEXURES
In addition to the material published in the Budget Review, the following annexures are available at www.treasury.gov.za
| | • | | Annexure W1: Explanatory memorandum to the division of revenue |
| |
| | • | | Annexure W2: Structure of the government accounts |
2011 BUDGET REVIEW
This page has been left blank intentionally.
A
Report of the Minister of Finance to Parliament
n Introduction
Section 7(4) of the Money Bills Amendment Procedure and Related Matters Act (2009, the Act) prescribes that the Minister of Finance (the Minister) must submit a report to Parliament at the time of the budget explaining how the Division of Revenue Bill and the national budget give effect to, or the reasons for not taking into account, the recommendations contained in:
| • | | Budgetary review and recommendation reports submitted by committees of the National Assembly in terms of Section 5 of the Act. |
| |
| • | | Reports on the fiscal framework proposed in the Medium Term Budget Policy Statement (MTBPS) submitted by the finance committees in terms of section 6 of the Act. |
| |
| • | | Reports on the proposed division of revenue and the conditional grant allocation to provinces and local governments set out in the MTBPS submitted by the appropriations committees in terms of section 6 of the Act. |
n Budgetary review and recommendation reports
Section 5 of the Act sets out a procedure to be followed before the introduction of the national budget by the National Assembly, through its committees, for assessing the performance of each national department. This procedure provides for committees to prepare budgetary review and recommendation reports which:
| • | | Must provide an assessment of the department’s service delivery performance given available resources. |
| |
| • | | Must provide an assessment of the effectiveness and efficiency of the department’s use and forward allocation of available resources. |
| |
| • | | May include recommendations on the forward use of resources. |
At the time of tabling the annual budget the Minister is required to explain how the budget gives effect to these recommendations, or why they have not been taken into account.
This is the first year that budgetary review and recommendation (BRR) reports have been submitted to the Minister, and the first time that the Minister’s response to the reports has accompanied the annual budget. The BRR reports were tabled by the relevant portfolio committees during October, November and December 2010.
133
2011 BUDGET REVIEW
Due to the large number of BRR reports, a separate document will be tabled in Parliament with detailed responses to the committees’ recommendations. In many cases, however, the different committees have made the same recommendations to a number of departments. This report contains a summary of these overarching concerns, drawing on responses to the specific issues raised on each committee’s report.
General issues
The concerns consistently raised by the BRR reports across departments are often related. It is not possible or necessary to prioritise between them, and their ordering below is not significant:
| • | | Adherence to financial requirements: Departments need to adhere more stringently to their financial and legal requirements, such as the Public Finance Management Act (1999). In many cases departments are instructed to adhere fully to the demands of the Auditor-General. |
| |
| • | | Reporting: Departments are urged to improve the standard and increase the regularity of their reporting. They are urged to report not only to the portfolio committees, especially on issues raised in BRR reports, but also to communicate better with interested parties, including the public. |
| |
| • | | Measurable objectives: A corollary of good reporting is the adoption of clear objectives. Only when departments establish clear objectives can their success or failure to achieve these be assessed. Operational plans need to be accurately costed and sufficiently detailed prior to implementation. |
| |
| • | | Monitoring and evaluation: Departments need to establish effective mechanisms for monitoring and evaluation of programmes and projects. The portfolio committees called for departments to establish both financial and non-financial performance indicators. |
| |
| • | | Internal controls and oversight: Monitoring staff is as important as monitoring projects. Where there are agencies and state-owned enterprises reporting to departments, the need for greater departmental oversight is stated repeatedly. |
| |
| • | | Control of funds: Departments should establish effective and efficient financial control over funds and ensure the appropriate allocation of the same. |
| |
| • | | Accountability: Departmental staff members who have demonstrably failed in their tasks under the terms of their performance agreement should be held accountable for their failure and dereliction. |
| |
| • | | Service delivery: The commitment of a number of departments to service delivery has been questioned, and these departments are urged to make service delivery a priority. |
| |
| • | | Asset management and supply chain: A number of departments are urged to establish systems for asset management that will count, verify, record and document all assets. The BRR reports also underscored the importance of effective supply chain mechanisms. |
| |
| • | | Filling vacant positions: Most, if not all, government departments struggle to fill vacant positions. The problem is especially common at senior management level, where the absence of staff is a hindrance to the effective management of departments. Recruitment processes need to be accelerated. |
| |
| • | | Capacity building: A number of departments should provide training to existing members of staff to ensure that they are better able to do their jobs. Institutional capacity can also be enhanced by effective administration, and information and communication technology (ICT) capabilities. |
| |
| • | | Communication between departments: Departments are asked to improve their communication with, and the flow of information between, other departments whose work overlaps with their own. |
n Joint recommendations on the fiscal framework
As provided for in section 6(1) of the Act, the Minister submitted the MTBPS to Parliament on 27 October 2010. The Act provides in section 6(7) that reports of the finance committees of the National Assembly and the National Council of Provinces on the proposed fiscal framework for the next three
134
ANNEXURE A: REPORT OF THE MINISTER OF FINANCE TO PARLIAMENT
financial years be submitted to the Minister. The reports of these committees as tabled contain the following recommendations:
Reducing the level of debt
That National Treasury should take appropriate steps aimed at reducing the level of debt at a faster rate in order to further create “an economic cushion” in the event of another economic recession in the near term.
Since February 2010, the forecast for economic recovery has been revised upwards, with a lower inflation level. This means that national net loan debt is now expected to peak at about 40 per cent of GDP before stabilising and declining in 2015/16. At the time of the publication of the 2010 Budget Review, debt was forecast to peak at 44 per cent of GDP in the same period.
The MTBPS framework also includes an improved revenue outlook, lower levels of non-interest expenditure as a proportion of GDP and lower interest costs. All these factors assist in contributing to a faster recovery in the budget balance. In February 2010, the consolidated government balance was expected to move from 6.2 per cent of GDP in 2010/11 to 4.1 per cent in 2012/13. The 2011 medium-term expenditure framework (MTEF) indicates a budget position of 5.4 per cent of GDP in 2010/11, narrowing to 4.4 per cent in 2012/13 and then to 3.7 per cent in 2013/14.
This rate of recovery is in line with National Treasury modelling on the gap between actual GDP and potential GDP. Forecasting shows that while South Africa has moved out of recession, the economy is still performing below its long-run level and will continue to do so until about 2014/15. Until this gap between actual and potential closes, the fiscus will continue to support the economic recovery and inclusive growth.
Guaranteeing fiscal stability
That National Treasury should provide a detailed report to the committee on how government intends to guarantee fiscal stability, including a contingency plan in case of a “double dip” recession.
Fiscal and monetary policies in major developed and developing economies have supported stronger demand, but the recovery remains fragile and marked by persistent global imbalances. South Africa’s countercyclical response during the recession partly offset the sharp reduction in trade, and will continue to support a recovery in private investment and consumption. Monetary policy has also adjusted to weak demand, with interest rates declining further this year in response to lower-than-expected inflation. The combination of tighter fiscal policy and looser monetary policy will support demand while moderating the build-up of imbalances arising from strong capital inflows. Over the medium term, the strength of South Africa’s recovery is highly dependent on the trajectory of the world economy, though stronger growth can be achieved through appropriate policy measures.
While the international outlook is more positive, a sharp slowdown in growth momentum since mid-year highlights the fragility of the recovery. Factors weighing on global growth prospects include:
| • | | Continued depression in employment and demand in many countries, particularly in the United States, where the impact of stimulus measures is fading. |
| |
| • | | Deflation, which remains a threat in advanced economies due to low levels of capacity utilisation and weak demand. With limited scope for additional fiscal stimulus some governments are taking extraordinary monetary policy measures, such as large-scale purchases of government bonds, to boost liquidity. |
| |
| • | | The challenge of reducing non-performing banking system assets, boosting productivity and adjusting fiscal policy to reduce public debt in most of the world’s largest economies. |
135
2011 BUDGET REVIEW
| • | | Concern about the development of asset bubbles in China. To prevent overheating of the Chinese economy, the authorities are tightening monetary policy. |
South Africa’s fiscal policy framework is designed to ensure that our wellbeing is not unfairly purchased at the expense of future generations. Programmes that raise the level of government spending need to be clear about how the required revenue will be raised, and at what cost to the productive sectors of our economy. As mentioned in the Minister’s 27 October 2010 MTBPS speech, the National Treasury is preparing a paper on fiscal guidelines for wider discussion. The paper will promote greater public understanding of the principles of fiscal sustainability, now and in the future.
Expenditure forecasts
That National Treasury should take appropriate steps to accelerate the rate of decline in expenditure.
Over the MTEF average real growth in non-interest expenditure is forecast to be 2.7 per cent a year. This is much lower than in previous years. Figure 1 illustrates average real growth in elements of expenditure under this scenario. The figure shows that despite a contraction in the fiscal deficit, most of the growth in expenditure is being driven by interest costs on debt. Further reductions in expenditure would only lead to less money available for essential services.
The measured unwinding of the fiscal deficit laid out in the 2011 fiscal framework means that debt stock and interest costs will stabilise in 2015/16. This rate of recovery is in line with National Treasury modelling on the gap between actual GDP and potential GDP. These forecasts show that while South Africa has moved out of recession, the economy is still performing below its long run level and will continue to do so until about 2014/15. Until this gap between actual and potential closes, the fiscus will continue to support the economic recovery and inclusive growth. The 2011 fiscal framework provides the resources to achieve these outcomes.
Figure A.1 Real growth in expenditure, 2006/07 – 2013/14
Creating fiscal space
National Treasury should provide the committee with a detailed report on how government would rebuild the fiscal space.
Countercyclical fiscal policy assists in defining a sustainable fiscal path by ensuring that expenditure that seems affordable when the economy is overperforming remains affordable during a recession; and by encouraging a growth-friendly environment with low inflation, a low cost of capital and a competitive real exchange rate. This fiscal stance enables government to save for future economic downturns.
136
ANNEXURE A: REPORT OF THE MINISTER OF FINANCE TO PARLIAMENT
The National Treasury has already begun the process of creating addtional fiscal space. In addition, the Treasury is preparing a discussion document, to be released at the time of the 2011 Budget, that will discuss how government can promote long-term fiscal space and stabililty. The Budget Review provides further details on this issue in Chapter 4.
National Treasury should provide the committee with a detailed report on the impact of a zero-rating value-added tax on books on the fiscal framework.
The proposal to zero-rate books is not supported for the following reasons:
| • | | Very little of the benefits will be passed on to consumers in the form of lower prices. |
| |
| • | | Of the limited benefits that will be passed on to consumers, most will accrue to middle-and upper-income households. |
| |
| • | | Zero-rating of books will trigger requests for similar relief measures for other “merit” goods and services. This might undermine VAT as an efficient revenue raising instrument. |
| |
| • | | Redistribution is better achieved through the expenditure side of the budget and through a progressive personal income tax system. |
Based on the results of a study commissioned by the National Treasury, it is doubtful whether the zero-rating of books would achieve the desired outcome of more affordable academic books. Also, attempts to restrict a VAT concession to educational publications would be arbitrary and lead to compliance and administration complexities for both the industry and revenue authorities.
It is unlikely that a preferential VAT treatment for books would lead to a substantial price reduction for consumers. The study suggests that consumers would probably enjoy only about 13 per cent of any VAT concession, while 87 per cent of the benefits would accrue to publishers and distributors. Of the limited benefits that would be passed on to consumers, most of it would be enjoyed by middle-and upper-income groups.
The relatively low book penetration in South Africa appears to be due primarily to low literacy levels. This problem could be more effectively addressed through enhanced literacy programmes and expenditure programmes to provide a variety of reading materials to all public primary and secondary schools, and to public libraries.
National Treasury should resolve issues pertaining to the SACU’s revenue-sharing formula as a matter of urgency
An international consultancy that specialises in economic policy has been contracted by the Southern African Customs Union Secretariat to formulate proposals pertaining to the review of the SACU revenue-sharing formula. A first draft of the report has been circulated to member states, and discussions on the initial findings between member countries are under way. The purpose of the review is to establish a more equitable formula. However, given the uneven sizes of the participating economies, it is expected that SACU member states will be affected differently through a redesign of the formula. Following these discussions at officials’ level, it is expected that this matter will be discussed by the Council of Ministers of Finance, after which official negotiations towards a revised formula will commence.
The Minister of Finance should consider tabling the Medium Term Budget Policy Statement early in October in order to allow parliamentary processes to follow accordingly.
The MTBPS is the South African pre-budget statement issued to provide an indication of the policy priorities and macroeconomic and fiscal framework that will inform the main Budget proposal. It is currently tabled in the last week of October.
This ensures that the fiscal framework can be updated for the most recent macroeconomic outcomes and revenue performance. The South African Reserve Bank publishes its bulletins on a quarterly basis. The
137
2011 BUDGET REVIEW
budget process allows for the National Treasury to update its macroeconomic forecasts twice in a year. The Budget Review tabled with the main budget includes data up to and including December and the MTBPS includes data up to and including September. The September bulletin is usually only released in the final week of September. The National Treasury takes only two weeks to update its assumptions about macroeconomic performance over the next three years and finalise its forecasts in line with the information in the bulletin. Revenues are updated with outcomes for the year up to and including September. This is an important inclusion in the process as several companies pay provisional tax in September.
Extended Cabinet usually meets in the second week of October. At this meeting the National Treasury presents the Division of Revenue and fiscal framework for approval. Once amendments have been indicated and approval of the executive obtained, the Treasury takes less than two weeks to finalise the MTBPS and have it printed.
It should also be noted that the Adjusted Appropriation Bill, amending the estimates of expenditure of the current financial year, is tabled at the same time. Along with this the Adjusted Estimates of National Expenditure publication and amended Division of Revenue Bill are tabled. In order to arrive at financial estimates for the remainder of this financial year, departments provide information to National Treasury on their expenditure up to and including September (six-month actual expenditure). This information is only submitted by mid-October and is incorporated into documents that are printed in time for tabling at the end of October.
To ensure that the most recent and accurate information informs the proposals that are tabled for legislative consideration, it is not possible to table the proposals sooner, owing to the sequencing of important decisions and data releases.
n Recommendations of the Select Committee on Appropriations
As required by both sections 9 and 10 of the Money Bills Amendment Procedure and Related Matters Act, the Select Committee on Appropriations held public hearings on 5 March 2010 in line with section 9(5)(b) of the Act. The Committee received written and/or oral submissions from the following stakeholders: national Department of Higher Education and Training, the national Department of Basic Education, the national Department of Health, the national Department of Rural Development and Land Reform, the national Department of Energy, the South African Local Government Association (SALGA), the Aids Law Project, the South African Institute of Chartered Accountants, the Financial and Fiscal Commission (FFC), the City of Cape Town and Eskom.
The Committee noted the changes in the 2010/11 Division of Revenue Bill, including the new conditional grants. The Committee’s report addresses in some detail the 2010 Division of Revenue and intergovernmental transfers, including:
| • | | Recommendations by the FFC on the 2010 Division of Revenue and Government’s response to the FFC recommendations on the 2010 Division of Revenue |
| |
| • | | Recommendations by provinces on the 2010 Division of Revenue |
| |
| • | | Conditional grants to provinces with respect to the health sector, including HIV and Aids |
| |
| • | | Conditional grants to provinces with respect to the education sector |
| |
| • | | Roles and functions of the national Department of Rural Development and Land Reform |
| |
| • | | Specific recommendations by SALGA on transfers to local government and the National Treasury’s responses to SALGA’s submission |
| |
| • | | Specific recommendations by the City of Cape Town on the funding of public transport and by the South African Institute of Chartered Accountants on municipal capacity financing |
| |
| • | | Conditional grants to municipalities and Eskom for electrification. |
138
ANNEXURE A: REPORT OF THE MINISTER OF FINANCE TO PARLIAMENT
The Minister wishes to record his appreciation that the Select Committee on Appropriations, having considered the 2010 Division of Revenue Bill and submissions through public hearings, recommended the adoption of the 2010 Division of Revenue Bill.
All recommendations made by the Select Committee on Appropriations are noted and will be considered as part of the next budget process, which will be informed by priorities contained in the medium-term strategic framework and departmental priorities. The division of revenue process requires that trade-offs be made when deciding on how the national revenue will be divided between the three spheres of government, and whether such funding will be directed through conditional grants or the equitable share.
The fiscal framework and the division of revenue on which the MTEF budgets are based are driven politically through a committee that includes of a number of national ministers, chaired by the Minister of Finance (the Ministers’ Committee on the Budget, or MinComBud) and submitted to Cabinet for approval. Provinces and the South African Local Government Association (SALGA) are also consulted via the Budget Council and Budget Forum.
The concluding recommendations, as adopted by the Select Committee on Appropriations on 24 March 2010, are set out below, together with the response of the Minister.
Conditional grant for early childhood development
Treasury should introduce a grant for early childhood development (ECD) for the national Department of Basic Education in order to ensure that ECD is prioritised as one of the department’s key functions.
The Minister agrees that there is a case for ECD to be appropriately prioritised as one of the key priorities of government and that sufficient resources need to be directed towards this function. Provinces have prioritised the funding of ECD in their budgets, where this type of expenditure shows the largest growth in education expenditure over the 2010 MTEF (28 per cent compared to the average growth of 7.6 per cent). This means that expenditure on ECD of R1.6 billion in 2009/10 will increase to R2.7 billion in 2010/11 and amount to R3.3 billion in 2012/13.
Ways to enhance ECD will be explored. This recommendation will be brought to the attention of MinComBud and the Cabinet member responsible for the Basic Education as requests for the introduction of new conditional grants are made by national departments during the budget process. That motivation should include a description of the purpose of the grant, its goals, the conditions, allocation criteria used to share the grant across provinces and motivation as to why the activities the grant funds should not be funded from the provincial equitable share.
Universities be established in Mpumalanga and the Northern Cape
The national Department of Higher Education and Training should establish at least one university (in phases, starting with faculties producing scarce skills) in Mpumalanga and Northern Cape provinces before the end of the 2009-2014 government term.
The recommendation is noted and will be brought to the attention of MinComBud and the Cabinet member responsible for Higher Education and Training. The National Institute for Higher Education (NIHE) in Mpumalanga and the NIHE in the Northern Cape have already been established. These institutes improve access to university education programmes by coordinating the delivery of university programmes in those provinces. During 2010/11 the department will explore the viability of a model for the NIHE as post-school institutes.
139
2011 BUDGET REVIEW
Include senior leaders of provincial governments in the review of the provincial equitable share
The National Treasury should consider the need to include senior leaders of provincial governments in the task team dealing with the comprehensive review of the provincial equitable shares formula to ensure that the views and concerns of provinces on the matter are taken on board and there is a common understanding by all stakeholders involved on how equitable shares are allocated.
The National Treasury is consulting widely in the review of the provincial equitable share formula and will continue to do so through the Budget Council (consisting of the Minister of Finance and MECs for Finance) and through joint MINMECs (consisting of national minister responsible for a sector and MECs of that sector). Senior government officials from provinces and national government are and will be included in these consultations. Once agreement has been reached on the final structure of the new formula, the National Treasury will make information on how the shares are allocated available and make presentations to interested and affected parties.
Introduce a special grant to build capacity at genuinely poor municipalities
The National Treasury in conjunction with the national Department of Cooperative Governance and Traditional Affairs should conduct a study to identify all municipalities that are 100 per cent dependent on the conditional grants (and do not have any revenue base due to economic and other related circumstances and who are genuinely poor); and should develop support mechanisms to help them with funds and financial management skills so that they can be able to provide services to the community. National Treasury may want to introduce a special grant for such municipalities to achieve the same purpose mentioned here.
It is agreed that there is a need to appropriately support municipalities with a weak fiscal base. The responsibility is therefore placed on national and provincial government to support and strengthen the capacity of municipalities to manage their own affairs. No municipality is fully (100 per cent) dependent on conditional grants, as all municipalities receive equitable share allocations commensurate to their service delivery responsibilities to poor households. Also, the institutional component of the equitable share makes provision for basic institutional and governance costs.
Concerns have been raised that the current local government equitable share formula does not appropriately cater for the funding needs of poorly resourced municipalities. The local government fiscal framework and equitable share formula are accordingly being reviewed to ensure that the funding needs of all municipalities, including poorly resourced municipalities, are adequately addressed. Various reforms have already been made to the local government fiscal framework to increasingly focus on the funding needs of poorly resourced municipalities, such as the introduction of a minimum municipal infrastructure grant to ensure that they are not unfairly penalised due to small population sizes. Further reforms are being explored by the National Treasury, in conjunction with the national Department of Cooperative Governance and Traditional Affairs, to support poorly resourced municipalities.
Any increased fiscal support to poorly resourced municipalities, however, will not have the intended benefits if these increases are not supported with complementary capacity interventions. The National Treasury has prescribed competency frameworks and relevant financial management qualifications, and introduced financial management and budget reforms.
Together with provincial treasuries, the National Treasury has also worked to ensure that appropriately capacitated staff are appointed in municipalities to undertake financial management and budget functions. The local government turnaround strategy has been introduced by the Department of Cooperative Governance and Traditional Affairs to address the current capacity constraints in municipalities. It is important that these interventions, reforms and frameworks are supported by the
140
ANNEXURE A: REPORT OF THE MINISTER OF FINANCE TO PARLIAMENT
appointment of appropriate candidates into key positions and ongoing support to municipalities from the relevant provincial departments.
Treasury should engage with FFC and Statistics SA on data used in the equitable share formula
The National Treasury should engage the Financial and Fiscal Commission, Statistics South Africa and all relevant stakeholders entrusted with the responsibilities of compiling data used in determining the formula for the allocation of equitable shares to find a reasonable, fair and equitable way of updating data with specific attention to the fact that the South Africa’s census that is conducted once in a decade becomes greatly outdated towards the end of a ten-year period results.
The Minister notes and supports this recommendation. The National Treasury will engage the FFC, Stats SA and other interested parties on this matter. This will include exploring the possibility of using the results of the 2007 community survey in conjunction with the 2001 census and possible other credible data sources to inform the population, poverty and service delivery data that underpins the local government equitable share formula.
n Standing Committee on Appropriations on the 2010 Division of Revenue
As required by both sections 9 and 10 of the Money Bills Amendment Procedure and Related Matters Act, the Standing Committee on Appropriations held public hearings with selected departments to support their budget proposals. These include the Departments of Health, Cooperative Governance and Traditional Affairs, Basic Education, Higher Education and Public Works. The FFC and National Treasury are invited to these hearings. The Committee provided a report on the Committee’s perspective on the Division of Revenue Bill and recommendations to the House for consideration.
The Committee’s report addresses the 2010 Division of Revenue and intergovernmental transfers, including:
| • | | Conditional grants to provinces with respect to the education sector |
| |
| • | | Conditional grants to provinces with respect to the health sector |
| |
| • | | Public Works conditional grants |
| |
| • | | Conditional grants to municipalities. |
The Minister wishes to record his appreciation that, having noted the budget increase and the new government approach to outcome-based performance, the Committee recommended the adoption of the 2010 Division of Revenue Bill.
All recommendations made by the Standing Committee on Appropriations are noted and have been considered as part of this budget process, informed by priorities contained in the MTSF and departmental priorities. The division of revenue process requires that tradeoffs be made when deciding on how the national revenue will be divided between the three spheres of government and whether such funding will be directed through conditional grants or equitable share. The fiscal framework and the division of revenue on which the MTEF budgets are based are driven politically through MinComBud and submitted to Cabinet for approval. Provinces and organised local government are also consulted via the Budget Council and Budget Forum. The concluding recommendations, as adopted by the Standing Committee on Appropriations on 3 March 2010, are set out below, together with the response of the Minister.
141
2011 BUDGET REVIEW
Control of government expenditure
The overall expenditure of government at the end of the second quarter of each financial year needs to be at 50 per cent. This will most likely lead to improved quality of spending and reduce the level of unauthorised spending and fiscal dumping at the end of the financial year.
The flow of government spending throughout the year depends on the timing of the rollout of projects and programmes. Most current expenditure items can be budgeted for on a monthly basis and divided evenly across the year. These include expenditures on wages and salaries, medicines, textbooks, fuel and so on. Elements of current expenditure such as the purchase of military equipment or large defence infrastructure, however, would occur once off and thus could not be spread over the year.
Compliance with the PFMA
National Treasury should monitor compliance with section 43 of the PFMA and report its findings to Parliament. The National Treasury must regularly engage Parliament on the Money Bills Amendment Procedure and Related Matters Act and the PFMA in respect of virements amounting to more than 8 per cent to avoid irregularities.
The National Treasury consistently monitors compliance with section 43 of the PFMA. An accounting officer may shift funds between main divisions (i.e., budget programmes) not exceeding 8 per cent appropriated under the main division, with certain exceptions, without seeking Treasury approval. This is in keeping with the spirit and intent of the PFMA, which ensures that the onus of financial responsibility lies with the department. Shifts are disclosed to Parliament in the Adjustments Appropriations at the mid-point of the financial year and in the annual report. Shifts in excess of 8 per cent represent a significant change from the way the allocations are presented in the Appropriations Act; consequently, it is appropriate for Parliament to monitor these shifts more closely.
Guidelines for the shifting of funds
In the event that funds are shifted, the relevant departments should ensure that their budgets are aligned to their respective strategic plans and must be utilised for the intended purposes.
The PFMA provides recourse against departments who are found guilty of excessive underspending and fiscal dumping in the form of wasteful expenditure. This government is spending more money on service delivery than any previous government. The fiscal consolidation and return to sustainability requires that the questions about value for money, efficiency of expenditure and optimal service delivery be examined and addressed. Areas of inefficient spending need to be saved or reappropriated to more critical projects that are new or underfunded.
Provinces should have detailed savings plans
Provinces should come up with detailed saving plans and promote value for money in their spending. In promoting transparency and accountability, provincial departments and parastatals should reflect their amount and areas of savings during their quarterly reporting.
The Committee’s endorsement that savings and value for money spending should be encouraged in provinces is appreciated and this initiative is already being implemented. Since the start of 2009/10, provinces have been required to produce savings plans and reprioritise any savings away from low-level priorities to higher-level priorities. The spending of provincial departments is closely monitored on a
142
ANNEXURE A: REPORT OF THE MINISTER OF FINANCE TO PARLIAMENT
monthly basis and areas of saving are discussed between the National Treasury and provincial treasuries on a quarterly basis.
Review the scholar transport policy
The Department of Basic Education in conjunction with the Department of Transport should urgently review the scholar transport policy in addressing the challenge of learners walking excessive long distances to school. The portfolio committee on basic education should monitor this development very closely.
This recommendation is noted and will be brought to the attention of MinComBud and the Cabinet members responsible for Basic Education and Transport.
Address overdraft facilities that consume grant funds
The National Treasury must facilitate discussions with the provincial treasuries and provincial departments of Cooperative Governance and Traditional Affairs to address a challenge of overdraft facilities that consume grant funds. A more coherent and coordinated approach in the management of conditional grants is required in ensuring prudent spending and achievement of the intended objectives.
The Minister agrees that steps should be taken to prevent grant funds being used to pay the interest on municipal overdraft facilities, or to repay the funds withdrawn from such facilities.
The National Treasury has engaged with the provincial treasuries on the implementation of the intergovernmental cash coordinating (IGCC) project. Cash to provinces is distributed in line with a payment schedule determined by the National Treasury for the equitable share formula, and payment schedules for the conditional grants which are agreed to by the National Treasury and the relevant national department. The IGCC project will coordinate cash management through a single facility, which will enable National Treasury to provide incentives that encourage good cash management and reduce the transaction costs and risks associated with each province managing its cash reserves independently. It will also enable better monitoring of cash management at provinces by national government.
As with provincial government, the National Treasury has introduced, through the Division of Revenue Act, payment schedules for both the equitable share and conditional grants allocations of both national and provincial government to municipalities.
The National Treasury has also introduced new budget and reporting regulations that require municipalities to budget for conditional grants explicitly, and report on their use transparently. Municipalities are required to budget only for the grants as stipulated in the national and provincial gazettes. This will facilitate more effective monitoring of the implementation of the Division of Revenue Act, as the budgets will have to reflect exactly where the conditional grant funds are to be used. Furthermore, the grant frameworks require that only projects that have been thoroughly planned and that have been through the evaluation processes prior to the start of the year should be funded.
The in-year reporting requirements set out in the new budget and reporting regulations also provide for explicit reporting of how conditional grant funds are used. This means the National Treasury and the provincial treasuries will be getting more regular information on the application of conditional grant funds. In instances where municipalities are not spending conditional grant funds in accordance with the prescribed conditions they will be subjected to close monitoring to ensure that they do not use those funds for other purposes. The budgeting and reporting requirements set out in the new regulations will result in the problem being greatly reduced and eliminated over time.
143
2011 BUDGET REVIEW
Assessment of the conditional grants
The Committee recommends thorough assessment of the conditional grants by the national transferring officers in conjunction with National Treasury to determine their impact and the extent to which their intended objectives have been achieved prior to their termination. More consultation with, and oversight by respective parliamentary committees should be performed prior to the termination of conditional grants.
The Minister acknowledges and welcomes this recommendation. National transferring officers responsible for a conditional grant that has been identified for termination will be required to undertake a thorough assessment of their non-financial performance prior to termination. More stringent oversight by respective parliamentary committees of the performance of these conditional grants is also supported.
Departments of Energy and Water and Environmental Affairs should address backlogs in water and sanitation at schools
As government terminates grants for backlogs in water and sanitation at clinics and schools, and the backlogs in electrification of clinics and schools, the departments of Energy and Water and Environmental Affairs should provide sufficient funding to address backlogs that still remain in the existing schools.
This recommendation is noted and will be brought to the attention of MinComBud and the Cabinet members responsible for Energy, Human Settlements and Water.
Department of Health to reconsider its moratorium on vacancies
The Committee recommends that the Department of Health should reconsider its moratorium on vacancies and other outstanding issues which will eventually enable it to address capacity issues.
This recommendation is noted and will be brought to the attention of MinComBud and the Cabinet member responsible for Health.
144
B
Statistical tables
| | | |
|
| 1 | | Main budget: Revenue, expenditure, deficit and financing, 2004/05 to 2013/14 |
| | | |
| 2 | | Main budget: Summary of revenue, 1993/94 to 2013/14 |
| | | |
| 3 | | Main budget: Revenue — detailed classification, 2007/08 to 2011/12 |
| | | |
| 4 | | Main budget: Expenditure estimates by vote, 2007/08 to 2013/14 |
| | | |
| 5 | | Consolidated national, provincial and social security funds expenditure: Economic classification, 2007/08 to 2013/14 |
| | | |
| 6 | | Consolidated national, provincial and social security funds expenditure: Functional classification, 2007/08 to 2013/14 |
| | | |
| 7 | | Consolidated government expenditure: Functional and economic classification, 2007/08 to 2013/14 |
| | | |
| 8 | | Total debt of government, 1986/87 to 2013/14 |
| | | |
| 9 | | Financial guarantees: Amounts drawn on government guarantees, 2007/08 to 2010/11 |
▀ Explanatory notes on the statistical tables
General remarks
This annexure presents details of the main budget, consolidated national and provincial expenditure, consolidated government expenditure, the borrowing requirement and financing thereof, government debt and financial guarantees. While government revenues are concentrated at the national government level, expenditure shifted from the national towards the provincial sphere after 1994. Equitable share transfers to the nine provinces as a statutory commitment of government began in 1998/99, and the 1998 Budget marked the introduction of the local government equitable share. In the 2010 Budget the coverage on the consolidated government account is extended to include the accounts of all the listed public entities of national government, a further step towards the publication of a complete set of consolidated accounts for general government. The consolidation also includes several business enterprises of national government.
Since more than 70 per cent of total expenditure on the main budget of 2011/12 comprises transfer payments to other levels of general government, economic and functional classifications of national budget expenditure are not comprehensive. For purposes of analysis, it would be preferable to present economic and functional classifications of the expenditure of general government. This requires information on expenditure at all levels of general government and on its financing through revenue, balances brought forward and transfer payments (mainly from the national budget). This information is
145
not readily available for local government, making it impossible to present consolidated general government finances at the time of the national budget. Historical data on general government finances are, however, published by the Reserve Bank in its Quarterly Bulletin and by Statistics South Africa.
Treatment of foreign grants to the Reconstruction and Development Programme (RDP) Fund
Prior to 1999/00, foreign grants were paid to the National Revenue Fund and expenditure was included in departmental appropriations. From 1999/00 onwards, no foreign grants for RDP-related purposes have been included in the appropriations of national departments. All foreign technical assistance and other RDP-related grants are paid to the RDP Fund account, which is separated from the accounts of government. Departments incur expenditure on RDP-related projects by direct requisitions from the RDP Fund account. However, disbursements of foreign grants and technical assistance are included in the consolidated national and provincial expenditure estimates in Tables 5 and 6 and in the consolidated government expenditure in Table 7.
In 2002/03 and 2003/04, amounts of R117.5 million and R66.7 million respectively were included in revenue as grants received from international donors. These were contributions to defray expenditure on the Burundi peacekeeping mission, appropriated on the budget of the Department of Defence.
Prior-year adjustments due to function shifts
Function shifts implemented in previous budgets affect the presentation of the government accounts. These include:
| • | | The establishment of the South African Social Security Agency (SASSA), responsible for administering the delivery of social assistance grants, resulting in function shifts between national and provincial government and public entities. The shifting of this function to national results in transfers to provincial revenue funds being reclassified as transfers to households and transfers to departmental agencies and accounts. |
| |
| • | | The introduction of an accommodation charge payable by national departments for the use of government properties, levied by the property management trading entity and included in the books of the Department of Public Works. This results in the presentation of individual departments being amended to provide for these accommodation charges and a new trading entity being introduced for the Department of Public Works. |
| |
| • | | Expenditure related to Regional Services Council levies, previously included as a departmental expenditure item, and in previous budgets presented as a transfer to local government forming part of the local government equitable share, is now replaced by a direct charge financed by the general fuel levy and paid by the National Treasury to metropolitan municipalities. This adjustment is effected in the government accounts as from 2006/07. |
| |
| • | | In previous budgets, payment of benefits to former employees for civil and military pensions and contributions to medical funds were classified as compensation of employees and transfers to households respectively. After further consultation of the international standard for classification, the Government Finance Statistics Manual (GFS 2001), it was determined that payment for medical benefits to former employees should also be classified as transfers to households and not as compensation of employees, and the data in the Budget Review has been adjusted accordingly. |
146
ANNEXURE B: STATISTICAL TABLES
Adjustments due to transactions in government debt
As part of the restructuring of government’s debt portfolio, bonds are repurchased or switched into new government bonds. In the process, government may make a capital profit, which is a book entry change in the discount on government bonds and is regarded as an extraordinary receipt. As such, capital profit does not represent an actual cash flow and is regarded as a “book profit”, and recorded as a negative receipt and loan redemption for analysis purposes.
A premium may also be accrued, or be payable, when restructuring government’s debt portfolio. Premiums paid are accounted for as extraordinary payments and premiums received as extraordinary receipts.
Sources of information
The information in Tables 1 to 7 on national, provincial government and public entity finances is obtained from the following sources:
| • | | Reports of the Auditor-General on the Appropriation and Miscellaneous Accounts in respect of General Affairs (1987/88 to 1993/94), the Accounts of the National Government (1994/95 to 1999/00), Audited Annual Financial Statements of National and Provincial Departments and Public Entities (2000/01 to 2008/09), as well as draft financial statements for some of the provinces and the revenue accounts of the former self-governing territories and TBVC states. |
| |
| • | | Printed estimates of revenue and expenditure for the national and provincial budgets. |
| |
| • | | The Reserve Bank. |
| |
| • | | The Development Bank of Southern Africa. |
| |
| • | | Annual statements of Inland Revenue and Customs and Excise (previously of the Department of Finance) and of the South African Revenue Service (SARS). |
| |
| • | | Monthly press releases of the National Treasury, published in terms of Section 32 of the Public Finance Management Act (1999). |
Revenue, expenditure, budget deficit and financing (Table 1)
Table 1 summarises the main budget balances since 2004/05 and medium-term estimates to 2013/14. To be in line with the economic reporting format, the revenue classification has been amended to show departmental sales of capital assets separately. These were previously included in non-tax current revenue.
Repayments of loans and advances, which were previously shown as negative expenditure, have been reclassified as revenue. Given that the same amount is added to both revenue and expenditure, the national budget deficit is unaffected.
Appropriations by vote are divided into current payments, transfers and subsidies, and payments for capital assets. The provision for standing appropriations has been shifted from direct charges against the National Revenue Fund to the transfers and subsidies line item and the history adjusted accordingly. Both current and capital transfers are included in transfers and subsidies, in line with the requirements of the economic reporting format.
The size of the deficit figures presented in this table differ from those presented in budgets prior to 1995/96, as a number of items that were previously regarded as “below-the-line” expenditure have been included in total expenditure. In addition, revaluations of foreign loan obligations are now excluded from expenditure, in keeping with international practice.
Under loan redemptions and financing, short-term loans include the net result of transactions in Treasury bills and borrowing from the Corporation for Public Deposits. Long-term loans include all transactions in
147
government bonds and foreign loans (i.e. new loan issues, repayments on maturity, buy-backs, switches and reverse purchase transactions).
Extraordinary issues represent the settlement of extraordinary payments by means of government bond issues. This excludes extraordinary payments in cash.
Prior to the 1998 Budget Review, transfers from the Strategic Fuel Fund and the National Supplies Procurement Fund, as well as proceeds from the sale and restructuring of state assets, were treated as financing items. These, together with extraordinary payments unrelated to expenditure, are now shown below the budget balance and before financing. The reclassification does not affect the budget balance.
Main budget revenue (Tables 2 and 3)
Table 2 presents a summary of revenue; the details are set out in Table 3. Main budget revenue collections are recorded on an adjusted cash basis (cash book — revenue recorded as it is received in the ledgers of SARS). Tax revenue is classified according to standard international categories and departmental receipts according to the requirements of the economic reporting format.
Certain receipts into the National Revenue Fund are not regarded as revenue. These include proceeds from the restructuring of state assets and adjustments due to transactions in government bonds.
The historical data presented in Table 3 has been reclassified to be in line with the economic reporting format introduced in 2004/05. However, a large amount of the data cannot be reclassified, as departments captured these transactions within their ledgers as miscellaneous receipts. These amounts are therefore reported as unspecified receipts.
Medium-term expenditure estimates by votes (Table 4)
Table 4 contains estimates of expenditure on national budget votes for the period 2007/08 to 2013/14. In 2009/10, amounts appropriated in the main budget, the adjusted estimates and preliminary estimates of spending on each vote are shown. Since the new government administration took office, a number of new departments were created while some of the existing departments were renamed or functions shifted between departments. The historical data has been adjusted for function shifts between the various departments and therefore the detail amounts of some departments might differ from financial statements produced by those departments. However, total expenditure is not influenced by these changes.
Consolidated national and provincial budgets (Tables 5 and 6)
Tables 5 and 6 show the economic and functional classification of payments for consolidated national and provincial government and the social security funds. The social security funds include the Unemployment Insurance Fund, the Road Accident Fund and the Compensation Funds. The national expenditure figures are for the 2011 Budget. In the provinces, however, expenditure estimates are preliminary, as their budgets are tabled after the national budget. Provincial estimates are based on preliminary budget statements provided by the provinces and are subject to change before being tabled in provincial legislatures.
The National Treasury introduced a new economic classification in the 2004 Budget that brings budget reporting in line with international best practice. Over the past few financial years the National Treasury has been working on a project to further improve the standard chart of accounts. This is the culmination of work on various initiatives to improve financial data, such as the infrastructure reporting process and improvement to item classification, and takes into account lessons learnt from data observances over the past four years. The changes were implemented on 1 April 2008.
The functional classification categories in the 2011 Budget Review are aligned to the Classification of Functions of Government as set out in the GFS, which differs from the categories used in budgets prior to 2009. The historical data published in these tables has been reclassified to be in line with the new classification categories. Specific adjustments to functional categories are listed below:
148
ANNEXURE B: STATISTICAL TABLES
| • | | Health — Payments made by provincial health departments to the National Health Laboratory Service have been eliminated as inter-entity transactions due to improvements in the classification of the service’s revenue. Military Health Services have been reclassified from function Health to function Defence because a substantial portion of this spending relates to the provision of medical services to defence staff, similar to medical aid contributions paid for staff in other functions. In addition, the expenditure related to the Forensic Health Laboratories has been reclassified as Public order and safety, as these laboratories provide a specific service to the police and do not relate to general health services. |
| |
| • | | Economic affairs — Expenditure related to the Sector Education and Training Authorities (SETAs) and the National Skills Fund has been reclassified to function Education. While these programmes facilitate labour mobility and promote employment, their main purpose is to equip individuals with theoretical and practical skills through formal education. |
| |
| • | | The various tourism programmes included in the Department of Environmental Affairs were previously classified as function Environmental affairs. With the establishment of the new Department of Tourism, activities could be more clearly identified and expenditure is now classified as Economic affairs in terms of the international definition used for classification. |
| |
| • | | General public services — Civil and military pensions have been reclassified as Social protection because it provides social security to individuals either through direct cash benefits or contributions to identified funds. |
Consolidated government budget (Table 7)
Table 7 shows the economic and functional classification of payments for the consolidated government budget, which consists of the consolidated national, provincial and social security numbers presented in Tables 5 and 6 combined with entities forming part of the general government sector, as well as some government business enterprises.
The government budget consolidation includes all entities controlled and mainly financed by government revenue, where such revenue is defined as either taxes, levies and administrative or service fees prescribed by government, or direct budgetary support in the form of transfer payments. This consolidation also includes a number of government business enterprises, based on the principle that they either sell most of their goods and services produced to government institutions or departments at regulated prices, and are therefore not businesses in the true sense of the word, or they are directly involved in infrastructure financing and development.
Based on this principle these entities are broadly identified as one of the following:
| • | | Enterprises that sell mainly to government departments or institutions, have no clear competitors and whose prices are therefore not clearly market related. |
| |
| • | | Science councils that conduct research or fulfil a regulatory or advisory function, where regulatory or administration fees are determined by government. |
| |
| • | | Government-regulated businesses that are primarily financed by a dedicated tax, administration fee or levy, the level of which is dictated by government, or that are directly involved in the maintenance or extension of critical infrastructure. |
To present consolidated accounts, it is necessary that all units being consolidated adopt the same accounting standards and policies. Thus, the format of the accounts, terminology used, classification, transaction coverage and accounting base (cash or accrual) must be the same. In this respect the consolidated government budget is prepared on the adjusted cash basis of accounting. This is not strictly comparable to the financial information published in the consolidated financial statements, which have two components — a consolidation of departments using the modified cash basis of accounting, and a separate consolidation of public entities that apply the accruals basis of accounting.
149
In the consolidated government budget the accrual data of public entities is converted into cash. This involves the adjustment of the data presented in the statement of financial performance with changes that are due to non-cash transactions. These adjustments are based on all relevant changes in balances on the statement of financial position, which once removed from the statement of financial performance results in the presentation of only the cash receipts and payments for the accounting period.
Once the data has been converted into a comparable set of numbers, a consolidated account can be produced. Consolidation involves the elimination of all transactions that occur between the units being consolidated. A transaction of one unit is matched with the same transaction as recorded for the second unit and both transactions are eliminated from the consolidation. For example, if a public entity sells a service to a government department and data for the two units are being consolidated, neither the sale nor the purchase of the service is reported. In this way only transactions between government and non-government entities are recorded and total government expenditure is not inflated with internal transactions.
In the consolidation process all intra-entity transactions must be eliminated. However, in the accounting systems of government and many of its agencies not all intra-entity transactions are currently identifiable, complicating the consolidation process. Therefore, in preparing the consolidated government budget only identifiable intra-entity transactions have been eliminated. These broadly include:
| • | | Transactions involving transfers from one government unit to another, including transfers made by national departments to public entities, and transfers from public entities to other public entities (e.g. Water Trading Entity transfers to water boards). |
| |
| • | | Purchases of goods and services from other government units included in the consolidation, for example transactions between the Trans-Caledon Tunnel Authority, water boards and the Water Trading Entity. |
This does not represent all intra-entity transactions that must be eliminated. As data collection and recording procedures for transactions are improved over time, additional intra-entity transactions will be identified and removed from the consolidated government budget.
In the 2011 Budget, a total of 160 national and provincial departments and 181 entities are included in the consolidated government budget. The National Treasury is committed to presenting a full consolidation of the whole of general government. That implies that the consolidated account presented in this budget must be extended to include the accounts of local government. A process has been initiated and initial data sets for local government have been published in the Local Government Budgets and Expenditure Review. However, considerable work remains to align this data to the data included in the consolidated account.
A discussion on the consolidation procedures, as well as a detailed list of all entities included in the consolidation, is available in Annexure W2 on the National Treasury website: www.treasury.gov.za.
Total debt of government (Table 8)
Table 8 shows the major components of government debt. Total loan debt net consists of total domestic and foreign debt less the cash balances of the National Revenue Fund. Realised profits and losses on the Gold and Foreign Exchange Contingency Reserve Account are also disclosed. The projections for 2010/11 to 2013/14 are based on national budget data.
Financial guarantees: Amounts drawn on government guarantees (Table 9)
The national government furnishes guarantees to various institutions that will realise as liabilities to the government only if these institutions are unable to meet their commitments. It is not possible to anticipate the portion of these guarantees that will realise as liabilities to the national government, and
150
ANNEXURE B: STATISTICAL TABLES
they are therefore disclosed as contingent liabilities in the national government’s consolidated financial information. Amounts drawn in respect of guarantees and interest on these amounts, if guaranteed, are disclosed.
151
2011 BUDGET REVIEW
| | | | | | | | | | | | | | | | | | | | | | | | | | | | | |
| Table 1 | | | | | | | | | | | | | | | | | | | | | | |
| Main Budget: | | | | | | | | | | | | | | | | | | | | | | |
| Revenue, expenditure, budget balance and financing 1) | | | | | | | | | | | | | | | | | | | |
| |
| | | | | | | 2004/05 | | | 2005/06 | | | 2006/07 | | | 2007/08 | | | 2008/09 | | | 2009/10 | |
| R million | | | | | | Actual outcome | | | Preliminary outcome | |
Main budget revenue | | | | | | | | | | | | | | | | | | | | | | | | | | | | |
| Current revenue | | | | | | | 347 824.2 | | | | 411 668.6 | | | | 481 158.2 | | | | 559 267.6 | | | | 607 867.4 | | | | 578 685.2 | |
Tax revenue (gross) | | | 2) | | | | 354 978.8 | | | | 417 195.7 | | | | 495 548.6 | | | | 572 814.6 | | | | 625 100.2 | | | | 598 705.4 | |
Less: SACU payments | | | | | | | -13 327.8 | | | | -14 144.9 | | | | -25 194.9 | | | | -24 712.6 | | | | -28 920.6 | | | | -27 915.4 | |
Other adjustment | | | 3) | | | | — | | | | — | | | | — | | | | — | | | | — | | | | — | |
Non-tax revenue (departmental receipts) | | | 4) | | | | 6 173.2 | | | | 8 617.8 | | | | 10 804.5 | | | | 11 165.6 | | | | 11 687.9 | | | | 7 895.2 | |
| Financial transactions in assets and liabilities | | | | | | | | | | | | | | | | | | | 1 296.9 | | | | 797.1 | | | | 957.1 | |
| Sales of capital assets | | | | | | | 30.2 | | | | 79.3 | | | | 38.8 | | | | 230.1 | | | | 131.2 | | | | 36.3 | |
| | | | | | | |
Total revenue | | | | | | | 347 854.4 | | | | 411 747.9 | | | | 481 197.0 | | | | 560 794.6 | | | | 608 795.7 | | | | 579 678.6 | |
| | | | | | | | | | | | | | | | | | | | | | | | | | | | | |
Main budget expenditure | | | | | | | | | | | | | | | | | | | | | | | | | | | | |
| Direct charges against the National Revenue Fund | | | | | | | 175 496.3 | | | | 192 340.8 | | | | 208 090.9 | | | | 231 642.6 | | | | 265 332.8 | | | | 310 813.2 | |
Cost of servicing state debt | | | 5) | | | | 48 851.2 | | | | 50 912.0 | | | | 52 192.2 | | | | 52 877.1 | | | | 54 393.7 | | | | 57 129.2 | |
Provincial equitable share | | | | | | | 120 884.5 | | | | 135 291.6 | | | | 149 245.6 | | | | 171 053.7 | | | | 201 795.6 | | | | 236 890.8 | |
General fuel levy sharing with metros | | | | | | | — | | | | — | | | | — | | | | — | | | | — | | | | 6 800.1 | |
Skills levy and Setas | | | | | | | 4 725.4 | | | | 4 883.3 | | | | 5 328.4 | | | | 6 284.3 | | | | 7 234.1 | | | | 7 815.6 | |
Other | | | 6) | | | | 1 035.3 | | | | 1 253.9 | | | | 1 324.7 | | | | 1 427.6 | | | | 1 909.3 | | | | 2 177.5 | |
| Appropriated by vote | | | | | | | 192 963.0 | | | | 224 343.2 | | | | 262 101.6 | | | | 309 800.8 | | | | 370 620.6 | | | | 436 383.5 | |
Current payments | | | 7) | | | | 61 481.7 | | | | 68 568.7 | | | | 76 586.8 | | | | 87 084.5 | | | | 101 467.1 | | | | 114 952.4 | |
Transfers and subsidies | | | 8) | | | | 126 136.6 | | | | 148 790.8 | | | | 178 111.1 | | | | 214 591.9 | | | | 249 672.4 | | | | 280 675.8 | |
Payments for capital assets | | | 9) | | | | 5 344.7 | | | | 6 983.7 | | | | 6 067.8 | | | | 7 018.5 | | | | 8 508.4 | | | | 9 202.2 | |
Payments for financial assets | | | 10) | | | | — | | | | — | | | | 1 335.8 | | | | 1 105.9 | | | | 10 972.6 | | | | 31 553.0 | |
| Plus: Unallocated funds | | | | | | | — | | | | — | | | | — | | | | — | | | | — | | | | — | |
| Contingency reserve | | | | | | | — | | | | — | | | | — | | | | — | | | | — | | | | — | |
| | | | | | | |
Total expenditure | | | | | | | 368 459.4 | | | | 416 684.0 | | | | 470 192.5 | | | | 541 443.4 | | | | 635 953.3 | | | | 747 196.8 | |
| | | | | | | | | | | | | | | | | | | | | | | | | | | | | |
Budget balance | | | | | | | -20 604.9 | | | | -4 936.1 | | | | 11 004.5 | | | | 19 351.2 | | | | -27 157.6 | | | | -167 518.2 | |
Budget balance as percentage of GDP | | | | | | | -1.4 | % | | | -0.3 | % | | | 0.6 | % | | | 0.9 | % | | | -1.2 | % | | | -6.9 | % |
| Extraordinary payments | | | 11) | | | | -9 787.3 | | | | -4 553.9 | | | | -4 213.7 | | | | -775.6 | | | | -4 284.1 | | | | -671.2 | |
| Extraordinary receipts | | | 12) | | | | 2 492.0 | | | | 6 905.2 | | | | 3 438.1 | | | | 1 849.8 | | | | 8 203.4 | | | | 6 434.6 | |
| | | | | | | |
Net borrowing requirement (-) | | | | | | | -27 900.2 | | | | -2 584.8 | | | | 10 228.9 | | | | 20 425.4 | | | | -23 238.3 | | | | -161 754.8 | |
| | | | | | | |
| | | | | | | | | | | | | | | | | | | | | | | | | | | | | |
Financing | | | | | | | | | | | | | | | | | | | | | | | | | | | | |
Change in loan liabilities | | | | | | | | | | | | | | | | | | | | | | | | | | | | |
| | | | | | | | | | | | | | | | | | | | | | | | | | | | | |
Domestic short-term loans (net) | | | | | | | 6 132.0 | | | | 5 716.4 | | | | 5 334.1 | | | | 5 672.9 | | | | 12 225.1 | | | | 49 770.3 | |
| | | | | | | | | | | | | | | | | | | | | | | | | | | | | |
Domestic long-term loans (net) | | | | | | | 33 409.3 | | | | 23 086.0 | | | | 891.7 | | | | -2 448.2 | | | | 23 059.0 | | | | 118 855.8 | |
Market loans | | | | | | | 50 300.2 | | | | 44 932.0 | | | | 36 938.3 | | | | 26 820.2 | | | | 42 354.3 | | | | 132 394.9 | |
Extraordinary issues | | | | | | | 9 460.8 | | | | 4 539.0 | | | | — | | | | — | | | | — | | | | — | |
Redemptions | | | | | | | -26 351.7 | | | | -26 385.0 | | | | -36 046.6 | | | | -29 268.4 | | | | -19 295.3 | | | | -13 539.1 | |
| | | | | | | | | | | | | | | | | | | | | | | | | | | | | |
Foreign loans (net) | | | | | | | 4 537.9 | | | | 518.0 | | | | 181.5 | | | | -4 745.4 | | | | -3 954.4 | | | | 23 257.5 | |
Market loans | | | | | | | 9 872.9 | | | | — | | | | 3 617.9 | | | | -1 568.0 | | | | — | | | | 30 872.4 | |
Arms procurement loan agreements | | | | | | | — | | | | 2 896.8 | | | | 3 690.0 | | | | 2 426.5 | | | | 3 057.3 | | | | 800.0 | |
World Bank loans | | | | | | | — | | | | 50.0 | | | | — | | | | 20.0 | | | | 1.4 | | | | — | |
Redemptions (including revaluation of loans) | | | 13) | | | | -5 335.0 | | | | -2 428.8 | | | | -7 126.4 | | | | -5 623.9 | | | | -7 013.1 | | | | -8 414.9 | |
| | | | | | | | | | | | | | | | | | | | | | | | | | | | | |
Change in cash and other balances (- increase) | | | | | | | -16 178.9 | | | | -26 735.6 | | | | -16 636.2 | | | | -18 904.7 | | | | -8 091.4 | | | | -30 128.9 | |
| | | | | | | | | | | | | | | | | | | | | | | | | | | | | |
| | | | | | | |
Total financing (net) | | | | | | | 27 900.2 | | | | 2 584.8 | | | | -10 228.9 | | | | -20 425.4 | | | | 23 238.3 | | | | 161 754.8 | |
| |
Gross domestic product (GDP) | | | | | | | 1 449 020 | | | | 1 613 812 | | | | 1 832 763 | | | | 2 078 822 | | | | 2 312 965 | | | | 2 442 593 | |
| |
| | | |
| 1) | | This table summarises revenue, expenditure and the main budget balance since 2004/05. As available data are incomplete, the estimates are not fully consistent with other sources, such as the government finance statistics series of the South African Reserve Bank. |
| |
| 2) | | Mining leases and ownership has been reclassified as non-tax revenue (rent on land). Historical numbers have been adjusted for comparative purposes. |
| |
| 3) | | Payment to SACU partners in respect of a previous error in calculation of the 1969 agreement. |
| |
| 4) | | Excludes sales of capital assets, discount and premium on the issuance of new government debt instruments, premium on debt portfolio restructuring and revaluation of foreign loan repayments. |
| |
| 5) | | Includes cost of raising loans and management cost. |
| |
| 6) | | Include direct appropriations iro the salaries of the President, Deputy President, judges, magistrates and members of Parliament. Standing appropriations have been reclassified as transfers and subsidies. |
152
ANNEXURE B: STATISTICAL TABLES
| | | | | | | | | | | | | | | | | | | | | | | | | | | | | |
| | | | | | | | | | | | | | | | | | | | | | | | | | | | | Table 1
Main Budget:
Revenue, expenditure, budget balance and financing 1) |
| |
| 2010/11 | | 2011/12 | | | 2012/13 | | | 2013/14 | | | | | | | |
| Budget | | | Revised | | | | | | | | | | | | | | | | | | | | |
| estimate | | | estimate | | | Deviation | | | Medium-term estimates | | | | | | | | R million |
| | | | | | | | | | | | | | | | | | | | | | | | | | | | | Main budget revenue |
| | 641 839.7 | | | | 665 521.7 | | | | 23 682.0 | | | | 728 901.1 | | | | 806 352.9 | | | | 904 245.2 | | | | | | | Current revenue |
| | 647 850.0 | | | | 672 200.0 | | | | 24 350.0 | | | | 741 620.0 | | | | 827 310.0 | | | | 927 960.0 | | | | 2) | | | Tax revenue (gross) |
| | -14 991.3 | | | | -14 991.3 | | | | — | | | | -21 763.2 | | | | -32 431.8 | | | | -35 997.4 | | | | | | | Less: SACU payments |
| | — | | | | -2 900.0 | | | | -2 900.0 | | | | — | | | | — | | | | — | | | | 3) | | | Other adjustment |
| | 8 981.0 | | | | 11 213.0 | | | | 2 232.1 | | | | 9 044.4 | | | | 11 474.7 | | | | 12 282.6 | | | | 4) | | | Non-tax revenue (departmental receipts) |
| | 1 341.3 | | | | 982.6 | | | | | | | | 894.4 | | | | | | | | | | | | | | | Financial transactions in assets and liabilities |
| | 58.0 | | | | 58.3 | | | | 0.3 | | | | 62.2 | | | | 65.3 | | | | 68.5 | | | | | | | Sales of capital assets |
| | | | | | | |
| | 643 239.0 | | | | 666 562.7 | | | | 23 682.3 | | | | 729 857.7 | | | | 806 418.2 | | | | 904 313.7 | | | | | | | Total revenue |
| | | | | | | | | | | | | | | | | | | | | | | | | | | | | |
| | | | | | | | | | | | | | | | | | | | | | | | | | | | | Main budget expenditure |
| | 350 625.0 | | | | 350 003.5 | | | | -621.5 | | | | 385 312.0 | | | | 418 016.1 | | | | 450 423.3 | | | | | | | Direct charges against the National Revenue Fund |
| | 71 357.6 | | | | 66 570.4 | | | | -4 787.2 | | | | 76 578.7 | | | | 90 807.7 | | | | 104 036.2 | | | | 5) | | | Cost of servicing state debt |
| | 260 973.7 | | | | 265 139.4 | | | | 4 165.7 | | | | 288 492.8 | | | | 305 725.4 | | | | 323 604.4 | | | | | | | Provincial equitable share |
| | 7 542.4 | | | | 7 542.4 | | | | — | | | | 8 573.1 | | | | 9 039.7 | | | | 9 613.4 | | | | | | | General fuel levy sharing with metros |
| | 8 424.2 | | | | 8 424.2 | | | | — | | | | 9 148.7 | | | | 9 606.1 | | | | 10 134.5 | | | | | | | Skills levy and Setas |
| | 2 327.1 | | | | 2 327.1 | | | | — | | | | 2 518.6 | | | | 2 837.0 | | | | 3 034.8 | | | | 6) | | | Other |
| | 461 517.9 | | | | 459 919.7 | | | | -1 598.2 | | | | 499 480.9 | | | | 538 380.2 | | | | 578 700.1 | | | | | | | Appropriated by vote |
| | 128 611.4 | | | | 132 986.2 | | | | 4 374.8 | | | | 145 241.7 | | | | 153 373.6 | | | | 163 849.1 | | | | 7) | | | Current payments |
| | 302 727.5 | | | | 297 226.8 | | | | -5 500.7 | | | | 342 282.2 | | | | 371 182.8 | | | | 397 386.3 | | | | 8) | | | Transfers and subsidies |
| | 9 290.5 | | | | 8 817.0 | | | | -473.5 | | | | 11 206.9 | | | | 13 823.7 | | | | 17 464.5 | | | | 9) | | | Payments for capital assets |
| | 20 888.6 | | | | 20 889.7 | | | | 1.1 | | | | 750.1 | | | | 0.1 | | | | 0.1 | | | | 10) | | | Payments for financial assets |
| | — | | | | — | | | | — | | | | 40.0 | | | | 330.0 | | | | 530.0 | | | | | | | Plus: Unallocated funds |
| | 6 000.0 | | | | — | | | | -6 000.0 | | | | 4 090.4 | | | | 11 405.4 | | | | 23 375.2 | | | | | | | Contingency reserve |
| | | | | | | |
| | 818 142.9 | | | | 809 923.3 | | | | -8 219.7 | | | | 888 923.3 | | | | 968 131.7 | | | | 1 053 028.6 | | | | | | | Total expenditure |
| | | | | | | | | | | | | | | | | | | | | | | | | | | | | |
| | -174 903.9 | | | | -143 360.6 | | | | 31 543.4 | | | | -159 065.6 | | | | -161 713.5 | | | | -148 714.8 | | | | | | | Budget balance |
| | -6.5 | % | | | -5.4 | % | | | 1.1 | % | | | -5.5 | % | | | -5.1 | % | | | -4.2 | % | | | | | | Budget balance as percentage of GDP |
| | — | | | | -802.0 | | | | -802.0 | | | | -150.0 | | | | — | | | | — | | | | 11) | | | Extraordinary payments |
| | — | | | | 3 148.0 | | | | 3 148.0 | | | | 1 350.0 | | | | — | | | | — | | | | 12) | | | Extraordinary receipts |
| | | | | | | |
| | -174 903.9 | | | | -141 014.6 | | | | 33 889.4 | | | | -157 865.6 | | | | -161 713.5 | | | | -148 714.8 | | | | | | | Net borrowing requirement (-) |
| | | | | | | |
| | | | | | | | | | | | | | | | | | | | | | | | | | | | | Financing |
| | | | | | | | | | | | | | | | | | | | | | | | | | | | | Change in loan liabilities |
| |
| | 22 000.0 | | | | 35 100.0 | | | | 13 100.0 | | | | 22 000.0 | | | | 22 000.0 | | | | 21 000.0 | | | | | | | Domestic short-term loans (net) |
| | | | | | | | | | | | | | | | | | | | | | | | | | | | | |
| | 137 740.2 | | | | 139 150.0 | | | | 1 409.8 | | | | 135 366.7 | | | | 124 238.9 | | | | 111 838.9 | | | | | | | Domestic long-term loans (net) |
| | 151 344.3 | | | | 152 613.8 | | | | 1 269.5 | | | | 150 400.0 | | | | 150 675.0 | | | | 143 450.0 | | | | | | | Market loans |
| | — | | | | — | | | | — | | | | — | | | | — | | | | — | | | | | | | Extraordinary issues |
| | -13 604.1 | | | | -13 463.8 | | | | 140.3 | | | | -15 033.3 | | | | -26 436.1 | | | | -31 611.1 | | | | | | | Redemptions |
| | | | | | | | | | | | | | | | | | | | | | | | | | | | | |
| | 11 563.9 | | | | -2 267.0 | | | | -13 830.9 | | | | 4 998.7 | | | | -3 545.5 | | | | -9 629.9 | | | | | | | Foreign loans (net) |
| | 14 439.0 | | | | — | | | | -14 439.0 | | | | 7 150.0 | | | | 7 870.0 | | | | 8 690.0 | | | | | | | Market loans |
| | 352.0 | | | | 512.0 | | | | 160.0 | | | | 1 009.0 | | | | 26.0 | | | | — | | | | | | | Arms procurement loan agreements |
| | — | | | | — | | | | — | | | | — | | | | — | | | | — | | | | | | | World Bank loans |
| | -3 227.1 | | | | -2 779.0 | | | | 448.1 | | | | -3 160.3 | | | | -11 441.5 | | | | -18 319.9 | | | | 13) | | | Redemptions (including revaluation of loans) |
| | 3 600.0 | | | | -30 968.7 | | | | -34 568.7 | | | | -4 499.6 | | | | 19 020.6 | | | | 25 505.5 | | | | | | | Change in cash and other balances
(-increase) |
| | | | | | | |
| | | | | | | | | | | | | | | | | | | | | | | | | | | | | |
| | 174 903.9 | | | | 141 014.3 | | | | -33 889.7 | | | | 157 865.7 | | | | 161 713.9 | | | | 148 714.5 | | | | | | | Total financing (net) |
| |
| | 2 699 888 | | | | 2 666 894 | | | | -32 994 | | | | 2 914 862 | | | | 3 201 299 | | | | 3 536 002 | | | | | | | Gross domestic product (GDP) |
| |
| | |
| 7) | | Includes compensation of employees, payments for goods and services, interest on overdue accounts and rent on land. Payment for medical benefits to former employees has been moved to transfers. |
| |
| 8) | | Includes current and capital transfers and subsidies to business, households, foreign countries and other levels and funds of general government. |
| |
| 9) | | Includes acquisition and own account construction of new assets and the cost of upgrading, improving and extentions to existing capital assets. |
| |
| 10) | | Consists mainly of lending to public corporations or making equity investments in them for policy purposes. Previously included in transfers and subsidies. |
| |
| 11) | | Includes premiums incurred on loan issues, bond switch and buy-back transactions and revaluation adjustments when utilising foreign exchange deposits. |
| |
| 12) | | Includes proceeds from the sale of state assets and strategic supplies as well as premiums received on loan issues, bond switches and buy-back transactions and revaluation adjustment when utilising foreign exchange deposits. |
| |
| 13) | | Revaluation estimates are based on National Treasury’s projection of exchange rates. |
153
2011 BUDGET REVIEW
| | | | | | | | | | | | | | | | | | | | | | | | | | | | | | | | | |
| Table 2 | | | | | | | | | | | | | | | | | | | | | | | | | |
| Main Budget: Estimates of national revenue | | | | | | | | | | | | | | | | | | | | | | |
| Summary of revenue 1) | | | | | | | | | | | | | | | | | | | | | | | | | |
| |
| | | | | | | 1993/94 | | | 1994/95 | | | 1995/96 | | | 1996/97 | | | 1997/98 | | | 1998/99 | | | 1999/00 | |
| R million | | | | | | Actual collections | |
Taxes on income and profits | | | | | | | 50 933.7 | | | | 61 004.7 | | | | 68 883.8 | | | | 82 876.1 | | | | 95 003.6 | | | | 108 021.5 | | | | 116 148.9 | |
| Persons and individuals | | | | | | | 37 805.3 | | | | 44 972.8 | | | | 51 179.3 | | | | 59 519.8 | | | | 68 342.4 | | | | 77 733.9 | | | | 85 883.8 | |
| Gold mines | | | | | | | 622.5 | | | | 1 172.7 | | | | 893.7 | | | | 507.7 | | | | 332.5 | | | | 1 88.6 | | | | — | |
| Other mines | | | | | | | 508.6 | | | | 457.2 | | | | 714.8 | | | | 1 341.6 | | | | 1 349.4 | | | | 1946.1 | | | | — | |
| Companies | | | | | | | 10 359.3 | | | | 11 961.3 | | | | 14 059.0 | | | | 16 985.0 | | | | 19 696.4 | | | | 20 388.0 | | | | 20 971.6 | |
| Secondary tax on companies | | | | | | | 876.7 | | | | 1 303.6 | | | | 1 262.2 | | | | 1 337.9 | | | | 1 446.4 | | | | 1 930.8 | | | | 3 149.9 | |
| Tax on retirement funds | | | | | | | — | | | | — | | | | — | | | | 2 565.5 | | | | 3 229.7 | | | | 5 098.8 | | | | 5 330.4 | |
| Other | | | 2) | | | | 761.4 | | | | 1 137.1 | | | | 774.8 | | | | 618.6 | | | | 606.8 | | | | 735.3 | | | | 813.1 | |
| | | | | | | | | | | | | | | | | | | | | | | | | | | | | | | | | |
Taxes on payroll and workforce | | | | | | | — | | | | — | | | | — | | | | — | | | | — | | | | — | | | | 0.1 | |
| Skills development levy | | | 3) | | | | — | | | | — | | | | — | | | | — | | | | — | | | | — | | | | 0.1 | |
| | | | | | | | | | | | | | | | | | | | | | | | | | | | | | | | | |
Taxes on property | | | | | | | 1 500.9 | | | | 2 074.7 | | | | 2 233.9 | | | | 2 359.3 | | | | 2 618.4 | | | | 2 830.4 | | | | 3 808.4 | |
| Donations tax | | | | | | | 39.0 | | | | 104.4 | | | | 61.0 | | | | 46.7 | | | | 17.7 | | | | 9.1 | | | | 15.2 | |
| Estate duty | | | | | | | 118.3 | | | | 125.3 | | | | 181.3 | | | | 181.8 | | | | 302.6 | | | | 256.4 | | | | 304.2 | |
| Securities transfer tax | | | 4) | | | | 267.0 | | | | 431.5 | | | | 462.9 | | | | 397.3 | | | | 442.3 | | | | 721.1 | | | | 1 090.4 | |
| Transfer duties | | | | | | | 1 076.7 | | | | 1 413.5 | | | | 1 528.7 | | | | 1 733.5 | | | | 1 855.8 | | | | 1 565.4 | | | | 1 821.6 | |
| Demutualisation charge | | | | | | | — | | | | — | | | | — | | | | — | | | | — | | | | 278.5 | | | | 577.0 | |
| | | | | | | | | | | | | | | | | | | | | | | | | | | | | | | | | |
Domestic taxes on goods and services | | | | | | | 38 949.2 | | | | 44 070.3 | | | | 48 881.7 | | | | 53 572.9 | | | | 60 619.0 | | | | 66 213.2 | | | | 72 184.7 | |
| Value-added tax | | | 5) | | | | 25 449.0 | | | | 29 288.4 | | | | 32 768.2 | | | | 35 902.9 | | | | 40 095.6 | | | | 43 985.4 | | | | 48 376.8 | |
| Specific excise duties | | | | | | | 4 628.3 | | | | 5 431.3 | | | | 6 075.0 | | | | 5 912.4 | | | | 7 425.8 | | | | 8052.8 | | | | 8 886.1 | |
Ad valorem excise duties | | | | | | | 338.7 | | | | 372.9 | | | | 400.2 | | | | 718.7 | | | | 581.6 | | | | 518.9 | | | | 584.3 | |
| General fuel levy | | | | | | | 7 860.2 | | | | 8 351.5 | | | | 8 928.0 | | | | 10 391.6 | | | | 12 091.2 | | | | 13 640.0 | | | | 14 289.8 | |
| Air departure tax | | | | | | | — | | | | — | | | | — | | | | — | | | | — | | | | — | | | | — | |
| Electricity levy | | | | | | | — | | | | — | | | | — | | | | — | | | | — | | | | — | | | | — | |
| Other | | | 6) | | | | 673.0 | | | | 626.2 | | | | 710.2 | | | | 647.2 | | | | 424.8 | | | | 16.0 | | | | 47.6 | |
| | | | | | | | | | | | | | | | | | | | | | | | | | | | | | | | | |
Taxes on international trade and transactions | | | | | | | 5 246.9 | | | | 5 606.4 | | | | 6 169.6 | | | | 7 200.5 | | | | 5 638.6 | | | | 6 052.5 | | | | 6 778.1 | |
| Customs duties | | | | | | | 3 413.4 | | | | 4 247.0 | | | | 5 325.9 | | | | 6 518.0 | | | | 6 055.7 | | | | 5 985.7 | | | | 6 517.8 | |
| Import surcharges | | | | | | | 1 756.1 | | | | 1 170.8 | | | | 456.7 | | | | -5.9 | | | | -1.4 | | | | 1.6 | | | | 0.4 | |
| Other | | | 7) | | | | 77.3 | | | | 188.5 | | | | 387.1 | | | | 688.4 | | | | -415.7 | | | | 65.2 | | | | 259.9 | |
| | | | | | | | | | | | | | | | | | | | | | | | | | | | | | | | | |
Stamp duties and fees | | | | | | | 846.7 | | | | 942.9 | | | | 1 024.8 | | | | 1 202.4 | | | | 1 483.8 | | | | 1 489.0 | | | | 1 618.9 | |
| | | | | | | | | | | | | | | | | | | | | | | | | | | | | | | | | |
State miscellaneous revenue | | | 8) | | | | 10.3 | | | | 75.6 | | | | 84.1 | | | | 121.2 | | | | -36.0 | | | | 179.3 | | | | 727.0 | |
| |
| | | | | | | | | | | | | | | | | | | | | | | | | | | | | | | | | |
TOTAL TAX REVENUE (gross) | | | | | | | 97 487.7 | | | | 113 774.5 | | | | 127 278.0 | | | | 147 332.3 | | | | 165 327.4 | | | | 184 785.9 | | | | 201 265.9 | |
Non-tax revenue | | | 9) | | | | 2 275.7 | | | | 1 802.2 | | | | 2 614.9 | | | | 3 522.7 | | | | 3 299.4 | | | | 4 796.2 | | | | 4 093.8 | |
Less: SACU payments | | | 10) | | | | -3 089.4 | | | | -3 248.8 | | | | -3 890.1 | | | | -4 362.7 | | | | -5 237.2 | | | | -5 576.7 | | | | -7 197.3 | |
| |
| | | | | | | | | | | | | | | | | | | | | | | | | | | | | | | | | |
TOTAL MAIN BUDGET REVENUE | | | | | | | 96 674.0 | | | | 112 327.9 | | | | 126 002.7 | | | | 146 492.4 | | | | 163 389.6 | | | | 184 005.4 | | | | 198 162.4 | |
| |
| | | | | | | | | | | | | | | | | | | | | | | | | | | | | | | | | |
Current revenue | | | | | | | 96 645.2 | | | | 112 312.4 | | | | 125 979.4 | | | | 146 477.7 | | | | 163 371.2 | | | | 183 978.6 | | | | 198 120.7 | |
| Direct taxes | | | | | | | 51 091.0 | | | | 61 234.4 | | | | 69 126.1 | | | | 83 104.6 | | | | 95 323.9 | | | | 108 565.5 | | | | 117 045.3 | |
| Indirect taxes | | | | | | | 46 386.4 | | | | 52 464.5 | | | | 58 067.7 | | | | 64 106.6 | | | | 70 039.5 | | | | 76 041.1 | | | | 83 493.7 | |
| State miscellaneous revenue | | | | | | | 10.3 | | | | 75.6 | | | | 84.1 | | | | 121.2 | | | | -36.0 | | | | 179.3 | | | | 727.0 | |
| Non-tax revenue (excluding sales of capital assets) | | | 12) | | | | 2 246.9 | | | | 1 786.7 | | | | 2 591.5 | | | | 3 508.0 | | | | 3 280.9 | | | | 4 769.3 | | | | 4 052.1 | |
| Less: SACU payments | | | | | | | -3 089.4 | | | | -3 248.8 | | | | -3 890.1 | | | | -4 362.7 | | | | -5 237.2 | | | | -5 576.7 | | | | -7 197.3 | |
Sales of capital assets | | | | | | | 28.8 | | | | 15.5 | | | | 23.4 | | | | 14.7 | | | | 18.4 | | | | 26.9 | | | | 41.7 | |
| |
Extraordinary receipts | | | 13) | | | | 1 583.7 | | | | 1 201.0 | | | | 1 391.4 | | | | 1 629.4 | | | | 2 947.4 | | | | 2 757.6 | | | | 7 238.3 | |
| |
| | |
| 1) | | Data prior to 1994/95 (representing the former State Revenue Account) are adjusted to be comparable to the current National Revenue Fund (see introductory notes to this statistical annexure). Data prior to 1995/96 include collections by the former TBVC states and self-governing territories. |
| |
| 2) | | Includes interest on overdue income tax, non-resident shareholders’ tax (prior to 1999/00), non-residents’ tax on interest (prior to 1999/00), undistributed profits tax (prior to 1999/00) and small business tax amnesty (in 2006/07, 2007/08 and 2008/09). |
| |
| 3) | | Levy on payroll dedicated to skills development. |
| |
| 4) | | The Securities Transfer Tax (STT) replaced the Uncertificated Securities Tax (UST) as from 1 July 2008. The UST replaced the marketable securities tax as from 1 June 1999. |
| |
| 5) | | The value-added tax (VAT) replaced the general sales tax in September 1991. |
| |
| 6) | | Includes plastic bag levy (from 2004/05), Universal Service Fund (from 1998/99), Human Resources Fund and Universal Service Agency (in 1998/99 and 1999/00), levies on financial services (up to 2004/05) and CO2 motor vehicle emissions tax (from 2010/11). Mining leases and ownership has been reclassified as non-tax revenue. The historical years from 1998/99 have been adjusted for comparative purposes. |
154
ANNEXURE B: STATISTICAL TABLES
| | | | | | | | | | | | | | | | | | | | | | | | | | | | | | | | | |
| | | | | | | | | | | | | | | | | | | | | | | | | | | | | | | | | Table 2 |
| | | | | | | | | | | | | | | | | | | | | | | | | | | | | | | | | Main Budget: Estimates of national revenue |
| | | | | | | | | | | | | | | | | | | | | | | | | | | | | | | | | Summary of revenue 1) |
| |
| 2000/01 | | | 2001/02 | | | 2002/03 | | | 2003/04 | | | 2004/05 | | | 2005/06 | | | 2006/07 | | | | | | | |
| | | | | | | | | Actual collections | | | | | | | | | | | | | | | | | | | R million |
| | 126 145.2 | | | | 147 310.4 | | | | 164 565.9 | | | | 171 962.8 | | | | 195 219.1 | | | | 230 803.6 | | | | 279 990.5 | | | | | | | Taxes on income and profits |
| | 86 478.0 | | | | 90 389.5 | | | | 94 336.7 | | | | 98 495.1 | | | | 110 981.9 | | | | 125 645.3 | | | | 140 578.3 | | | | | | | Persons and individuals |
| | — | | | | — | | | | — | | | | — | | | | — | | | | — | | | | — | | | | | | | Gold mines |
| | — | | | | — | | | | — | | | | — | | | | — | | | | — | | | | — | | | | | | | Other mines |
| | 29 491.8 | | | | 42 354.5 | | | | 55 745.1 | | | | 60 880.8 | | | | 70 781.9 | | | | 86 160.8 | | | | 118 998.6 | | | | | | | Companies |
| | 4 031.3 | | | | 7 162.7 | | | | 6 325.6 | | | | 6 132.9 | | | | 7 487.1 | | | | 12 277.6 | | | | 15 291.4 | | | | | | | Secondary tax on companies |
| | 5 219.8 | | | | 6 190.6 | | | | 6 989.7 | | | | 4 897.7 | | | | 4 406.1 | | | | 4 783.1 | | | | 3 190.5 | | | | | | | Tax on retirement funds |
| | 924.3 | | | | 1 213.1 | | | | 1 169.0 | | | | 1 556.3 | | | | 1 562.2 | | | | 1 936.7 | | | | 1 931.7 | | | | 2) | | | Other |
| | | | | | | | | | | | | | | | | | | | | | | | | | | | | | | | | |
| | 1 257.4 | | | | 2 717.3 | | | | 3 352.1 | | | | 3 896.4 | | | | 4 443.3 | | | | 4 872.0 | | | | 5 597.4 | | | | | | | Taxes on payroll and workforce |
| | 1 257.4 | | | | 2 717.3 | | | | 3 352.1 | | | | 3 896.4 | | | | 4 443.3 | | | | 4 872.0 | | | | 5 597.4 | | | | 3) | | | Skills development levy |
| | | | | | | | | | | | | | | | | | | | | | | | | | | | | | | | | |
| | 3 978.8 | | | | 4 628.3 | | | | 5 084.6 | | | | 6 707.5 | | | | 9 012.6 | | | | 11 137.5 | | | | 10 332.3 | | | | | | | Taxes on property |
| | 32.1 | | | | 20.6 | | | | 17.7 | | | | 17.1 | | | | 25.2 | | | | 29.5 | | | | 47.0 | | | | | | | Donations tax |
| | 442.7 | | | | 481.9 | | | | 432.7 | | | | 417.1 | | | | 506.9 | | | | 624.7 | | | | 747.4 | | | | | | | Estate duty |
| | 1 102.1 | | | | 1 212.8 | | | | 1 205.2 | | | | 1 101.1 | | | | 1 365.9 | | | | 1 973.4 | | | | 2 763.9 | | | | 4) | | | Securities transfer tax |
| | 2 401.9 | | | | 2 913.0 | | | | 3 429.0 | | | | 5 172.1 | | | | 7 114.6 | | | | 8 510.0 | | | | 6 774.0 | | | | | | | Transfer duties |
| | — | | | | — | | | | — | | | | — | | | | — | | | | — | | | | — | | | | | | | Demutualisation charge |
| | | | | | | | | | | | | | | | | | | | | | | | | | | | | | | | | |
| | 78 877.5 | | | | 86 885.1 | | | | 97 311.5 | | | | 110 108.6 | | | | 131 980.6 | | | | 151 223.7 | | | | 174 671.4 | | | | | | | Domestic taxes on goods and services |
| | 54 455.2 | | | | 61 056.6 | | | | 70 149.9 | | | | 80 681.8 | | | | 98 157.9 | | | | 114 351.6 | | | | 134 462.6 | | | | 5) | | | Value-added tax |
| | 9 126.6 | | | | 9797.2 | | | | 10 422.6 | | | | 11 364.6 | | | | 13 066.7 | | | | 14 546.5 | | | | 16 369.5 | | | | | | | Specific excise duties |
| | 693.9 | | | | 776.1 | | | | 1 050.2 | | | | 1 016.2 | | | | 1 015.2 | | | | 1 157.3 | | | | 1 282.7 | | | | | | | Ad valorem excise duties |
| | 14 495.3 | | | | 14 923.2 | | | | 15 333.8 | | | | 16 652.4 | | | | 19 190.4 | | | | 20 506.7 | | | | 21 844.6 | | | | | | | General fuel levy |
| | 85.8 | | | | 296.4 | | | | 324.8 | | | | 367.2 | | | | 412.2 | | | | 458.2 | | | | 484.8 | | | | | | | Air departure tax |
| | — | | | | — | | | | — | | | | — | | | | — | | | | — | | | | — | | | | | | | Electricity levy |
| | 20.7 | | | | 35.5 | | | | 30.3 | | | | 26.5 | | | | 138.3 | | | | 203.4 | | | | 227.2 | | | | 6) | | | Other |
| | | | | | | | | | | | | | | | | | | | | | | | | | | | | | | | | |
| | 8 226.6 | | | | 8 680.1 | | | | 9 619.8 | | | | 8 414.3 | | | | 13 286.5 | | | | 18 201.9 | | | | 24 002.2 | | | | | | | Taxes on international trade and transactions |
| | 7 853.6 | | | | 8 632.2 | | | | 9 330.7 | | | | 8 479.4 | | | | 12 888.4 | | | | 18 303.5 | | | | 23 697.0 | | | | | | | Customs duties |
| | 0.0 | | | | 0.5 | | | | 0.0 | | | | — | | | | — | | | | — | | | | — | | | | | | | Import surcharges |
| | 372.9 | | | | 47.5 | | | | 289.1 | | | | -65.1 | | | | 398.1 | | | | -101.6 | | | | 305.2 | | | | 7) | | | Other |
| | | | | | | | | | | | | | | | | | | | | | | | | | | | | | | | | |
| | 1 561.6 | | | | 1 767.2 | | | | 1 572.4 | | | | 1 360.1 | | | | 1 167.7 | | | | 792.8 | | | | 615.7 | | | | | | | Stamp duties and fees |
| | | | | | | | | | | | | | | | | | | | | | | | | | | | | | | | | |
| | 72.0 | | | | 306.7 | | | | 433.0 | | | | -7.1 | | | | -130.9 | | | | 164.2 | | | | 339.2 | | | | 8) | | | State miscellaneous revenue |
| |
| | | | | | | | | | | | | | | | | | | | | | | | | | | | | | | | | |
| | 220 119.1 | | | | 252 295.0 | | | | 281 939.3 | | | | 302 442.6 | | | | 354 978.8 | | | | 417 195.7 | | | | 495 548.6 | | | | | | | TOTAL TAX REVENUE (gross) |
| | | | | | | | | | | | | | | | | | | | | | | | | | | | | | | | | |
| | 3 868.8 | | | | 4 172.2 | | | | 4 827.9 | | | | 6 711.3 | | | | 6 203.3 | | | | 8 697.1 | | | | 10 843.3 | | | | 9) | | | Non-tax revenue |
| | -8 396.1 | | | | -8 204.8 | | | | -8 259.4 | | | | -9 722.7 | | | | -13 327.8 | | | | -14 144.9 | | | | -25 194.9 | | | | 10) | | | Less: SACU payments |
| | | | | | | | | | | | | | | | | | | | | | | | | | | | | | | | | |
| |
| | 215 591.9 | | | | 248 262.4 | | | | 278 507.7 | | | | 299 431.2 | | | | 347 854.4 | | | | 411 747.9 | | | | 481 197.0 | | | | | | | TOTAL MAIN BUDGET REVENUE |
| |
| | 215 548.4 | | | | 248 258.2 | | | | 278 449.9 | | | | 299 414.7 | | | | 347 824.2 | | | | 411 668.6 | | | | 481 158.2 | | | | | | | Current revenue |
| | 127 877.4 | | | | 150 530.1 | | | | 168 368.4 | | | | 176 293.5 | | | | 200 194.5 | | | | 236 329.7 | | | | 286 382.4 | | | | | | | Direct taxes |
| | 92 169.7 | | | | 101 458.2 | | | | 113 137.9 | | | | 126 156.1 | | | | 154 915.3 | | | | 180 701.8 | | | | 208 827.1 | | | | | | | Indirect taxes |
| | 72.0 | | | | 306.7 | | | | 433.0 | | | | -7.1 | | | | -130.9 | | | | 164.2 | | | | 339.2 | | | | | | | State miscellaneous revenue |
| | 3 825.4 | | | | 4 168.0 | | | | 4 770.0 | | | | 6 694.8 | | | | 6 173.2 | | | | 8 617.8 | | | | 10 804.5 | | | | 12) | | | Non-tax revenue (excluding sales of capital assets) |
| | -8 396.1 | | | | -8 204.8 | | | | -8 259.4 | | | | -9 722.7 | | | | -13 327.8 | | | | -14 144.9 | | | | -25 194.9 | | | | | | | Less: SACU payments |
| | 43.5 | | | | 4.2 | | | | 57.8 | | | | 16.5 | | | | 30.2 | | | | 79.3 | | | | 38.8 | | | | | | | Sales of capital assets |
| |
| | 2 983.5 | | | | 4 159.1 | | | | 8 167.9 | | | | 1 598.2 | | | | 2 492.0 | | | | 6 905.2 | | | | 3 438.1 | | | | 13) | | | Extraordinary receipts |
| |
| | |
| 7) | | Includes miscellaneous customs and excise receipts, ordinary levy (up to 2004/05) and diamond export duties. |
| |
| 8) | | Includes revenue received by SARS which could not be allocated to a specific revenue type. |
| |
| 9) | | Includes sales of goods and services, fines, penalties and forfeits, interest, dividends and rent on land (including mineral and petroleum royalties), sales of capital assets as well as transactions in financial assets and liabilities. |
| |
| 10) | | Payments in terms of Southern African Custom Union (SACU) agreements. |
| |
| 11) | | Payment to SACU partners in respect of a previous error in calculation of the 1969 agreement. |
| |
| 12) | | Excludes sales of capital assets. |
| |
| 13) | | Sales of strategic fuel stocks, proceeds from sales of state assets and certain other receipts are, by law, paid into the National Revenue Fund, but are not regarded as departmental receipts. |
155
| | | | | | | | | | | | | | | | | | | | | | | | | | | | | | | | | |
| Table 2 | | | | | | | | | | | | | | | | | | | | | | | | | | | |
| Main Budget: Estimates of national revenue | | | | | | | | | | | | | | | | | | | | | | | | |
| Summary of revenue 1) | | | | | | | | | | | | | | | | | | | | | | | | | | | | | | | | |
| | | | | | | 2007/08 | | | 2008/09 | | | 2009/10 | | | 2010/11 | | | 2011/12 | |
| | | | | | | | | | | | | | | | | | | | | | | % change | | | Budget estimates | |
| | | | | | | | | | | Actual | | | | | | | Revised | | | on actual | | | Before | | | After | |
| R million | | | | | | | | | | collections | | | | | | | estimates | | | 2009/10 | | | tax proposals | |
| |
Taxes on income and profits | | | | | | | 332 058.3 | | | | 383 482.7 | | | | 359 044.8 | | | | 380 080.0 | | | | 5.9 | % | | | 426 694.6 | | | | 418 344.6 | |
| Persons and individuals | | | | | | | 168 774.4 | | | | 195 115.0 | | | | 205 145.0 | | | | 228 000.0 | | | | 11.1 | % | | | 261 600.0 | | | | 252 750.0 | |
| Companies | | | | | | | 140 119.8 | | | | 165 378.3 | | | | 134 883.4 | | | | 132 500.0 | | | | -1.8 | % | | | 143 665.0 | | | | 144 165.0 | |
| Secondary tax on companies | | | | | | | 20 585.4 | | | | 20 017.6 | | | | 15 467.8 | | | | 16 500.0 | | | | 6.7 | % | | | 18 100.0 | | | | 18 100.0 | |
| Tax on retirement funds | | | | | | | 285.4 | | | | 143.3 | | | | 42.7 | | | | — | | | | -100.0 | % | | | — | | | | — | |
| Other | | | 2) | | | | 2 293.3 | | | | 2 828.6 | | | | 3 505.9 | | | | 3 080.0 | | | | -12.1 | % | | | 3 329.6 | | | | 3 329.6 | |
| | | | | | | | | | | | | | | | | | | | | | | | | | | | | | | | | |
Taxes on payroll and workforce | | | | | | | 6 330.9 | | | | 7 327.5 | | | | 7 804.8 | | | | 8 420.0 | | | | 7.9 | % | | | 9 150.0 | | | | 9 150.0 | |
| Skills development levy | | | 3) | | | | 6 330.9 | | | | 7 327.5 | | | | 7 804.8 | | | | 8 420.0 | | | | 7.9 | % | | | 9 150.0 | | | | 9 150.0 | |
| | | | | | | | | | | | | | | | | | | | | | | | | | | | | | | | | |
Taxes on property | | | | | | | 11 883.9 | | | | 9 477.1 | | | | 8 826.4 | | | | 9 365.0 | | | | 6.1 | % | | | 10 340.0 | | | | 9 590.0 | |
| Donations tax | | | | | | | 27.6 | | | | 125.0 | | | | 60.1 | | | | 65.0 | | | | — | | | | 70.0 | | | | 70.0 | |
| Estate duty | | | | | | | 691.0 | | | | 756.7 | | | | 759.3 | | | | 800.0 | | | | 5.4 | % | | | 870.0 | | | | 870.0 | |
| Securities transfer tax | | | 4) | | | | 3 757.1 | | | | 3 664.5 | | | | 3 324.0 | | | | 3 000.0 | | | | -9.7 | % | | | 3 300.0 | | | | 3 300.0 | |
| Transfer duties | | | | | | | 7 408.2 | | | | 4 930.9 | | | | 4 683.0 | | | | 5 500.0 | | | | 17.4 | % | | | 6 100.0 | | | | 5 350.0 | |
| | | | | | | | | | | | | | | | | | | | | | | | | | | | | | | | | |
Domestic taxes on goods and services | | | | | | | 194 690.3 | | | | 201 416.0 | | | | 203 666.8 | | | | 247 540.0 | | | | 21.5 | % | | | 269 225.0 | | | | 274 210.0 | |
| Value-added tax | | | 5) | | | | 150 442.8 | | | | 154 343.1 | | | | 147 941.3 | | | | 181 335.0 | | | | 22.6 | % | | | 200 880.0 | | | | 200 880.0 | |
| Specific excise duties | | | | | | | 18 218.4 | | | | 20 184.5 | | | | 21 289.3 | | | | 22 900.0 | | | | 7.6 | % | | | 23 300.0 | | | | 25 085.0 | |
Ad valorem excise duties | | | | | | | 1 480.5 | | | | 1 169.5 | | | | 1 275.9 | | | | 1 900.0 | | | | 48.9 | % | | | 2 080.0 | | | | 2 230.0 | |
| General fuel levy | | | | | | | 23 740.5 | | | | 24 883.8 | | | | 28 832.5 | | | | 34 300.0 | | | | 19.0 | % | | | 35 000.0 | | | | 36 900.0 | |
| Air departure tax | | | | | | | 540.6 | | | | 549.4 | | | | 580.3 | | | | 705.0 | | | | 21.5 | % | | | 730.0 | | | | 730.0 | |
| Electricity levy | | | | | | | — | | | | — | | | | 3 341.7 | | | | 5 200.0 | | | | 55.6 | % | | | 5 380.0 | | | | 6 530.0 | |
| Other | | | 6) | | | | 267.5 | | | | 285.7 | | | | 405.7 | | | | 1 200.0 | | | | 195.8 | % | | | 1 855.0 | | | | 1 855.0 | |
| | | | | | | | | | | | | | | | | | | | | | | | | | | | | | | | | |
Taxes on international trade and transactions | | | | | | | 27 081.9 | | | | 22 852.4 | | | | 19 318.9 | | | | 26 790.0 | | | | 38.7 | % | | | 30 325.4 | | | | 30 325.4 | |
| Customs duties | | | | | | | 26 469.9 | | | | 22 751.0 | | | | 19 577.1 | | | | 26 400.0 | | | | 34.9 | % | | | 29 860.4 | | | | 29 860.4 | |
| Other | | | 7) | | | | 612.0 | | | | 101.4 | | | | -258.3 | | | | 390.0 | | | | -251.0 | % | | | 465.0 | | | | 465.0 | |
| | | | | | | | | | | | | | | | | | | | | | | | | | | | | | | | | |
Stamp duties and fees | | | | | | | 557.1 | | | | 571.8 | | | | 49.5 | | | | 5.0 | | | | -89.9 | % | | | — | | | | — | |
| | | | | | | | | | | | | | | | | | | | | | | | | | | | | | | | | |
State miscellaneous revenue | | | 8) | | | | 212.2 | | | | -27.4 | | | | -5.7 | | | | — | | | | — | | | | — | | | | — | |
| |
| | | | | | | | | | | | | | | | | | | | | | | | | | | | | | | | | |
TOTAL TAX REVENUE (gross) | | | | | | | 572 814.6 | | | | 625 100.2 | | | | 598 705.4 | | | | 672 200.0 | | | | 12.3 | % | | | 745 735.0 | | | | 741 620.0 | |
| | | | | | | | | | | | | | | | | | | | | | | | | | | | | | | | | |
Non-tax revenue | | | 9) | | | | 12 692.6 | | | | 12 616.2 | | | | 8 888.5 | | | | 12 254.0 | | | | 37.9 | % | | | 10 000.9 | | | | 10 000.9 | |
Less: SACU payments | | | 10) | | | | -24 712.6 | | | | -28 920.6 | | | | -27 915.4 | | | | -14 991.3 | | | | -46.3 | % | | | -21 763.2 | | | | -21 763.2 | |
Other adjustment | | | 11) | | | | — | | | | — | | | | — | | | | -2 900.0 | | | | — | | | | — | | | | — | |
| |
TOTAL MAIN BUDGET REVENUE | | | | | | | 560 794.6 | | | | 608 795.7 | | | | 579 678.6 | | | | 666 562.7 | | | | 15.0 | % | | | 733 972.7 | | | | 729 857.7 | |
| |
| | | | | | | | | | | | | | | | | | | | | | | | | | | | | | | | | |
Current revenue | | | | | | | 560 564.4 | | | | 608 664.5 | | | | 579 642.3 | | | | 669 404.4 | | | | 15.5 | % | | | 733 910.5 | | | | 729 795.5 | |
| Direct taxes | | | | | | | 339 107.8 | | | | 391 691.9 | | | | 367 669.0 | | | | 389 365.0 | | | | 5.9 | % | | | 436 784.6 | | | | 428 434.6 | |
| Indirect taxes | | | | | | | 233 494.6 | | | | 233 435.6 | | | | 231 042.1 | | | | 282 835.0 | | | | 22.4 | % | | | 308 950.4 | | | | 313 185.4 | |
| State miscellaneous revenue | | | | | | | 212.2 | | | | -27.4 | | | | -5.7 | | | | — | | | | — | | | | — | | | | — | |
| Non-tax revenue (excluding sales of capital assets) | | | 12) | | | | 12 462.4 | | | | 12 485.0 | | | | 8 852.3 | | | | 12 195.7 | | | | 37.8 | % | | | 9 938.7 | | | | 9 938.7 | |
| Less: SACU payments | | | | | | | -24 712.6 | | | | -28 920.6 | | | | -27 915.4 | | | | -14 991.3 | | | | -46.3 | % | | | -21 763.2 | | | | -21 763.2 | |
Sales of capital assets | | | | | | | 230.2 | | | | 131.2 | | | | 36.3 | | | | 58.3 | | | | 60.8 | % | | | 62.2 | | | | 62.2 | |
| | | | | | | | | | | | | | | | | | | | | | | | | | | | | | | | | |
| |
Extraordinary receipts | | | 13) | | | | 1 849.8 | | | | 8 202.3 | | | | 6 434.6 | | | | 3 148.0 | | | | | | | | — | | | | — | |
| |
| | |
| 1) | | Data prior to 1994/95 (representing the former State Revenue Account) are adjusted to be comparable to the current National Revenue Fund (see introductory notes to this statistical annexure). Data prior to 1995/96 include collections by the former TBVC states and self-governing territories. |
| |
| 2) | | Includes interest on overdue income tax, non-resident shareholders’ tax (prior to 1999/00), non-residents’ tax on interest (prior to 1999/00), undistributed profits tax (prior to 1999/00) and small business tax amnesty (in 2006/07, 2007/08 and 2008/09). |
| |
| 3) | | Levy on payroll dedicated to skills development. |
| |
| 4) | | The Securities Transfer Tax (STT) replaced the Uncertificated Securities Tax (UST) as from 1 July 2008. The UST replaced the marketable securities tax as from 1 June 1999. |
| |
| 5) | | The value-added tax (VAT) replaced the general sales tax in September 1991. |
| |
| 6) | | Includes plastic bag levy (from 2004/05), Universal Service Fund (from 1998/99), Human Resources Fund and Universal Service Agency (in 1998/99 and 1999/00), levies on financial services (up to 2004/05) and CO 2 motor vehicle emissions tax (from 2010/11). Mining leases and ownership has been reclassified as non-tax revenue. The historical years from 1998/99 have been adjusted for comparative purposes. |
156
ANNEXURE B: STATISTICAL TABLES
| | | | | | | | | | | | | | | | | | | | | | | | | | | | | |
| | | | | | | | | | | | | | | | | | | | | | | | | | | | | Table 2 |
| | | | | | | | | | | | | | | | | | | | | | | | | | | | | Main Budget: Estimates of national revenue |
| | | | | | | | | | | | | | | | | | | | | | | | | | | | | Summary of revenue 1) |
| | | | | | | | | | | | | | |
| 2011/12 | | | 2012/13 | | | 2013/14 | | | | | | | |
| % change | | | % of | | | | | | | % change on | | | | | | | % change | | | | | | | |
| on revised | | | total budget | | | | | | | after tax proposals | | | | | | | on | | | | | | | |
| 2010/11 | | | revenue | | | Estimates | | | 2011/12 | | | Estimates | | | 2012/13 | | | | | | | R million |
| |
| | 10.1 | % | | | 57.3 | % | | | 469 709.1 | | | | 12.3 | % | | | 533 560.6 | | | | 13.6 | % | | | | | | Taxes on income and profits |
| | 10.9 | % | | | 34.6 | % | | | 292 709.8 | | | | 15.8 | % | | | 337 970.0 | | | | 15.5 | % | | | | | | Persons and individuals |
| | 8.8 | % | | | 19.8 | % | | | 161 349.5 | | | | 11.9 | % | | | 178 230.2 | | | | 10.5 | % | | | | | | Companies |
| | 9.7 | % | | | 2.5 | % | | | 11 990.0 | | | | -33.8 | % | | | 13 320.0 | | | | 11.1 | % | | | | | | Secondary tax on companies |
| | — | | | | — | | | | — | | | | — | | | | — | | | | — | | | | | | | Tax on retirement funds |
| | 8.1 | % | | | 0.5 | % | | | 3 659.8 | | | | 9.9 | % | | | 4 040.4 | | | | 10.4 | % | | | 2) | | | Other |
| | | | | | | | | | | | | | | | | | | | | | | | | | | | | |
| | 8.7 | % | | | 1.3 | % | | | 9 610.0 | | | | 5.0 | % | | | 10 130.0 | | | | 5.4 | % | | | | | | Taxes on payroll and workforce |
| | 8.7 | % | | | 1.3 | % | | | 9 610.0 | | | | 5.0 | % | | | 10 130.0 | | | | 5.4 | % | | | 3) | | | Skills development levy |
| | | | | | | | | | | | | | | | | | | | | | | | | | | | | |
| | 2.4 | % | | | 1.3 | % | | | 11 060.0 | | | | 15.3 | % | | | 12 695.4 | | | | 14.8 | % | | | | | | Taxes on property |
| | 7.7 | % | | | 0.0 | % | | | 80.0 | | | | 14.3 | % | | | 85.4 | | | | 6.7 | % | | | | | | Donations tax |
| | 8.7 | % | | | 0.1 | % | | | 960.0 | | | | 10.3 | % | | | 1 060.0 | | | | 10.4 | % | | | | | | Estate duty |
| | 10.0 | % | | | 0.5 | % | | | 3 630.0 | | | | 10.0 | % | | | 4 010.0 | | | | 10.5 | % | | | 4) | | | Securities transfer tax |
| | -2.7 | % | | | 0.7 | % | | | 6 390.0 | | | | 19.4 | % | | | 7 540.0 | | | | 18.0 | % | | | | | | Transfer duties |
| | | | | | | | | | | | | | | | | | | | | | | | | | | | | |
| | 10.8 | % | | | 37.6 | % | | | 302 880.3 | | | | 10.5 | % | | | 333 170.0 | | | | 10.0 | % | | | | | | Domestic taxes on goods and services |
| | 10.8 | % | | | 27.5 | % | | | 226 900.0 | | | | 13.0 | % | | | 254 330.0 | | | | 12.1 | % | | | 5) | | | Value-added tax |
| | 9.5 | % | | | 3.4 | % | | | 25 910.0 | | | | 3.3 | % | | | 26 660.0 | | | | 2.9 | % | | | | | | Specific excise duties |
| | 17.4 | % | | | 0.3 | % | | | 2 450.0 | | | | 9.9 | % | | | 2 710.0 | | | | 10.6 | % | | | | | | Ad valorem excise duties |
| | 7.6 | % | | | 5.1 | % | | | 38 110.0 | | | | 3.3 | % | | | 39 190.0 | | | | 2.8 | % | | | | | | General fuel levy |
| | 3.5 | % | | | 0.1 | % | | | 760.0 | | | | 4.1 | % | | | 790.0 | | | | 3.9 | % | | | | | | Air departure tax |
| | 25.6 | % | | | 0.9 | % | | | 6 800.0 | | | | 4.1 | % | | | 7 460.0 | | | | 9.7 | % | | | | | | Electricity levy |
| | 54.6 | % | | | 0.3 | % | | | 1 950.3 | | | | 5.1 | % | | | 2 030.0 | | | | 4.1 | % | | | 6) | | | Other |
| | | | | | | | | | | | | | | | | | | | | | | | | | | | | |
| | 13.2 | % | | | 4.2 | % | | | 34 050.7 | | | | 12.3 | % | | | 38 404.1 | | | | 12.8 | % | | | | | | Taxes on international trade and transactions |
| | 13.1 | % | | | 4.1 | % | | | 33 530.0 | | | | 12.3 | % | | | 37 820.0 | | | | 12.8 | % | | | | | | Customs duties |
| | 19.2 | % | | | 0.1 | % | | | 520.7 | | | | 12.0 | % | | | 584.1 | | | | 12.2 | % | | | 7) | | | Other |
| | | | | | | | | | | | | | | | | | | | | | | | | | | | | |
| | — | | | | — | | | | — | | | | — | | | | — | | | | — | | | | | | | Stamp duties and fees |
| | | | | | | | | | | | | | | | | | | | | | | | | | | | | |
| | — | | | | — | | | | — | | | | — | | | | — | | | | — | | | | 8) | | | State miscellaneous revenue |
| | | | | | | | | | | | | | | | | | | | | | | | | | | | | |
| |
| | 10.3 | % | | | 101.6 | % | | | 827 310.0 | | | | 11.6 | % | | | 927 960.0 | | | | 12.2 | % | | | | | | TOTAL TAX REVENUE (gross) |
| | | | | | | | | | | | | | | | | | | | | | | | | | | | | |
| | -18.4 | % | | | 1.4 | % | | | 11 540.0 | | | | 15.4 | % | | | 12 351.1 | | | | 7.0 | % | | | 9) | | | Non-tax revenue |
| | 45.2 | % | | | -3.0 | % | | | -32 431.8 | | | | 49.0 | % | | | -35 997.4 | | | | 11.0 | % | | | 10) | | | Less: SACU payments |
| | — | | | | — | | | | — | | | | — | | | | — | | | | — | | | | 11) | | | Other adjustment |
| | | | | | | | | | | | | | | | | | | | | | | | | | | | | |
| |
| | 9.5 | % | | | 100.0 | % | | | 806 418.2 | | | | 10.5 | % | | | 904 313.7 | | | | 12.1 | % | | | | | | TOTAL MAIN BUDGET REVENUE |
| |
| | | | | | | | | | | | | | | | | | | | | | | | | | | | | |
| | 9.0 | % | | | 100.0 | % | | | 806 352.9 | | | | 10.5 | % | | | 904 245.2 | | | | 12.1 | % | | | | | | Current revenue |
| | 10.0 | % | | | 58.7 | % | | | 480 359.1 | | | | 12.1 | % | | | 544 836.0 | | | | 13.4 | % | | | | | | Direct taxes |
| | 10.7 | % | | | 42.9 | % | | | 346 951.0 | | | | 10.8 | % | | | 383 124.1 | | | | 10.4 | % | | | | | | Indirect taxes |
| | — | | | | — | | | | — | | | | — | | | | — | | | | — | | | | | | | State miscellaneous revenue |
| | -18.5 | % | | | 1.4 | % | | | 11 474.7 | | | | 15.5 | % | | | 12 282.6 | | | | 7.0 | % | | | 12) | | | Non-tax revenue (excluding sales of capital assets) |
| | 45.2 | % | | | -3.0 | % | | | -32 431.8 | | | | 49.0 | % | | | -35 997.4 | | | | 11.0 | % | | | | | | Less: SACU payments |
| | 6.6 | % | | | 0.0 | % | | | 65.3 | | | | 5.0 | % | | | 68.5 | | | | 5.0 | % | | | | | | Sales of capital assets |
| | | | | | | | | | | | | | | | | | | | | | | | | | | | | |
| |
| | | | | | | | | | — | | | | | | | | — | | | | | | | | 13) | | | Extraordinary receipts |
| |
| | |
| 7) | | Includes miscellaneous customs and excise receipts, ordinary levy (up to 2004/05) and diamond export duties. |
| |
| 8) | | Includes revenue received by SARS which could not be allocated to a specific revenue type. |
| |
| 9) | | Includes sales of goods and services, fines, penalties and forfeits, interest, dividends and rent on land (including mineral and petroleum royalties), sales of capital assets as well as transactions in financial assets and liabilities. |
| |
| 10) | | Payments in terms of Southern African Custom Union (SACU) agreements. |
| |
| 11) | | Payment to SACU partners in respect of a previous error in calculation of the 1969 agreement. |
| |
| 12) | | Excludes sales of capital assets. |
| |
| 13) | | Sales of strategic fuel stocks, proceeds from sales of state assets and certain other receipts are, by law, paid into the National Revenue Fund, but are not regarded as departmental receipts. |
157
| | | | | | | | | | | | | | | | | | | | | | | | | | | | | |
| Table 3 | | | | | | | | | | | | | |
| Main Budget: Estimates of national revenue | | | | | | | | | | | | | |
| Detailed classification of revenue | | | | | | | | |
| | | | | | | 2007/08 | | | 2008/09 | | | 2009/10 | |
| | | | | | | Actual | | | Before | | | After | | | Revised | | | Actual | |
| R thousands | | | | | | collections | | | tax proposals | | | estimate | | | collection | |
| |
Taxes on income and profits | | | | | | | 332 058 296 | | | | 383 482 732 | | | | 403 590 000 | | | | 389 040 000 | | | | 352 800 000 | | | | 359 044 847 | |
| Income tax on persons and individuals | | | | | | | 168 774 352 | | | | 195 115 008 | | | | 221 000 000 | | | | 207 450 000 | | | | 203 500 000 | | | | 205 145 021 | |
| Tax on corporate income | | | | | | | | | | | | | | | | | | | | | | | | | | | | |
| Companies | | | | | | | 140 119 831 | | | | 165 378 278 | | | | 161 000 000 | | | | 160 000 000 | | | | 130 500 000 | | | | 134 883 420 | |
| Secondary tax on companies | | | | | | | 20 585 421 | | | | 20 017 580 | | | | 19 000 000 | | | | 19 000 000 | | | | 16 000 000 | | | | 15 467 795 | |
| Tax on retirement funds | | | | | | | 285 357 | | | | 143 251 | | | | — | | | | — | | | | — | | | | 42 699 | |
| Other | | | | | | | | | | | | | | | | | | | | | | | | | | | | |
| Interest on overdue income tax | | | | | | | 2 280 507 | | | | 2 776 988 | | | | 2 560 000 | | | | 2 560 000 | | | | 2 700 000 | | | | 3 433 025 | |
| Small business tax amnesty | | | | | | | 12 828 | | | | 51 627 | | | | 30 000 | | | | 30 000 | | | | 100 000 | | | | 72 888 | |
| | | | | | | | | | | | | | | | | | | | | | | | | | | | | |
Taxes on payroll and workforce | | | | | | | 6 330 917 | | | | 7 327 463 | | | | 7 749 980 | | | | 7 749 980 | | | | 7 749 980 | | | | 7 804 829 | |
| Skills development levy | | | | | | | 6 330 917 | | | | 7 327 463 | | | | 7 749 980 | | | | 7 749 980 | | | | 7 749 980 | | | | 7 804 829 | |
| | | | | | | | | | | | | | | | | | | | | | | | | | | | | |
Taxes on property | | | | | | | 11 883 869 | | | | 9 477 079 | | | | 10 420 000 | | | | 10 420 000 | | | | 9 000 000 | | | | 8 826 422 | |
| Estate, inheritance and gift taxes | | | | | | | | | | | | | | | | | | | | | | | | | | | | |
| Donations tax | | | | | | | 27 551 | | | | 124 992 | | | | 80 000 | | | | 80 000 | | | | 60 000 | | | | 60 084 | |
| Estate duty | | | | | | | 691 031 | | | | 756 738 | | | | 700 000 | | | | 700 000 | | | | 740 000 | | | | 759 273 | |
| Taxes on financial and capital transactions | | | | | | | | | | | | | | | | | | | | | | | | | | | | |
| Securities transfer tax | | | 1) | | | | 3 757 114 | | | | 3 664 484 | | | | 4 300 000 | | | | 4 300 000 | | | | 3 600 000 | | | | 3 324 017 | |
| Transfer duties | | | | | | | 7 408 173 | | | | 4 930 865 | | | | 5 340 000 | | | | 5 340 000 | | | | 4 600 000 | | | | 4 683 047 | |
| | | | | | | | | | | | | | | | | | | | | | | | | | | | | |
Domestic taxes on goods and services | | | | | | | 194 690 295 | | | | 201 416 062 | | | | 216 832 000 | | | | 226 757 000 | | | | 201 995 000 | | | | 203 666 753 | |
| Value-added tax | | | | | | | 150 442 849 | | | | 154 343 122 | | | | 168 807 000 | | | | 168 807 000 | | | | 146 500 000 | | | | 147 941 322 | |
| Specific excise duties | | | | | | | | | | | | | | | | | | | | | | | | | | | | |
| Beer | | | | | | | 5 141 862 | | | | 5 514 810 | | | | 5 907 600 | | | | 6 512 800 | | | | 5 772 000 | | | | 5 738 164 | |
| Sorghum beer and sorghum flour | | | | | | | 34 675 | | | | 38 240 | | | | 40 500 | | | | 40 500 | | | | 41 000 | | | | 34 394 | |
| Wine and other fermented beverages | | | | | | | 1 253 881 | | | | 1 358 440 | | | | 1 414 300 | | | | 1 559 200 | | | | 1 489 000 | | | | 1 482 517 | |
| Spirits | | | | | | | 2 364 130 | | | | 2 511 160 | | | | 2 501 300 | | | | 2 807 500 | | | | 2 808 000 | | | | 2 790 309 | |
| Cigarettes and cigarette tobacco | | | | | | | 7 665 368 | | | | 8 659 210 | | | | 8 812 300 | | | | 9 614 000 | | | | 9 100 000 | | | | 9 187 982 | |
| Pipe tobacco and cigars | | | | | | | 379 064 | | | | 596 030 | | | | 457 700 | | | | 679 700 | | | | 400 000 | | | | 482 195 | |
| Petroleum products | | | 2) | | | | 901 269 | | | | 880 630 | | | | 876 300 | | | | 876 300 | | | | 880 000 | | | | 872 701 | |
| Revenue from neighbouring countries | | | 3) | | | | 478 198 | | | | 626 020 | | | | 490 000 | | | | 510 000 | | | | 510 000 | | | | 701 017 | |
Ad valorem excise duties | | | | | | | 1 480 454 | | | | 1 169 529 | | | | 1 350 000 | | | | 1 350 000 | | | | 1 100 000 | | | | 1 275 942 | |
| General fuel levy | | | | | | | 23 740 511 | | | | 24 883 776 | | | | 25 200 000 | | | | 30 090 000 | | | | 29 000 000 | | | | 28 832 536 | |
| Taxes on use of goods or permission to use goods or to perform activities | | | | | | | | | | | | | | | | | | | | | | | | | | | | |
| Air passenger tax | | | | | | | 540 635 | | | | 549 365 | | | | 650 000 | | | | 770 000 | | | | 600 000 | | | | 580 326 | |
| Plastic bags levy | | | | | | | 86 314 | | | | 78 563 | | | | 75 000 | | | | 90 000 | | | | 140 000 | | | | 110 510 | |
| Electricity levy | | | | | | | — | | | | — | | | | — | | | | 2 780 000 | | | | 3 400 000 | | | | 3 341 691 | |
| Incandescent light bulb levy | | | | | | | — | | | | — | | | | — | | | | 20 000 | | | | 20 000 | | | | 63 880 | |
CO2 tax — motor vehicle emissions | | | | | | | — | | | | — | | | | — | | | | — | | | | — | | | | — | |
| Turnover tax for micro businesses | | | | | | | — | | | | — | | | | — | | | | — | | | | 10 000 | | | | 6 493 | |
| Other | | | | | | | | | | | | | | | | | | | | | | | | | | | | |
| Universal Service Fund | | | | | | | 181 085 | | | | 207 167 | | | | 250 000 | | | | 250 000 | | | | 225 000 | | | | 224 774 | |
| | | | | | | | | | | | | | | | | | | | | | | | | | | | | |
Taxes on international trade and transactions | | | | | | | 27 081 900 | | | | 22 852 428 | | | | 25 287 000 | | | | 25 337 000 | | | | 18 830 000 | | | | 19 318 860 | |
| Import duties | | | | | | | | | | | | | | | | | | | | | | | | | | | | |
| Customs duties | | | | | | | 26 469 876 | | | | 22 751 022 | | | | 24 635 000 | | | | 24 635 000 | | | | 18 500 000 | | | | 19 577 115 | |
| Other | | | | | | | | | | | | | | | | | | | | | | | | | | | | |
| Miscellaneous customs and excise receipts | | | | | | | 612 024 | | | | 101 239 | | | | 652 000 | | | | 652 000 | | | | 280 000 | | | | -294 020 | |
| Diamond export levy | | | | | | | — | | | | 167 | | | | — | | | | 50 000 | | | | 50 000 | | | | 35 766 | |
| | | | | | | | | | | | | | | | | | | | | | | | | | | | | |
Other taxes | | | | | | | 557 123 | | | | 571 838 | | | | — | | | | — | | | | 50 000 | | | | 49 457 | |
| Stamp duties and fees | | | | | | | 557 123 | | | | 571 838 | | | | — | | | | — | | | | 50 000 | | | | 49 457 | |
| | | | | | | | | | | | | | | | | | | | | | | | | | | | | |
State miscellaneous revenue | | | 4) | | | | 212 236 | | | | -27 439 | | | | — | | | | — | | | | — | | | | -5 724 | |
| | | | | | | | | | | | | | | | | | | | | | | | | | | | | |
| |
TOTAL TAX REVENUE (gross) | | | | | | | 572 814 636 | | | | 625 100 163 | | | | 663 878 980 | | | | 659 303 980 | | | | 590 424 980 | | | | 598 705 444 | |
| |
| | | | | | | | | | | | | | | | | | | | | | | | | | | | | |
Less: SACU payments | | | 5) | | | | -24 712 567 | | | | -28 920 624 | | | | -27 915 405 | | | | -27 915 405 | | | | -27 915 405 | | | | -27 915 405 | |
| Payments in terms of Customs Union agreements (sec. 51(2) of Act 91 of 1964) | | | | | | | -24 712 567 | | | | -28 920 624 | | | | -27 915 405 | | | | -27 915 405 | | | | -27 915 405 | | | | -27 915 405 | |
| Other adjustment | | | 6) | | | | — | | | | — | | | | — | | | | — | | | | — | | | | — | |
| |
TOTAL TAX REVENUE (net of SACU payments) | | | | | | | 548 102 069 | | | | 596 179 539 | | | | 635 963 575 | | | | 631 388 575 | | | | 562 509 575 | | | | 570 790 038 | |
| |
| | |
| 1) | | The Securities Transfer Tax (STT) replaced the Uncertificated Securities Tax (UST) as from 1 July 2008. |
| |
| 2) | | Specific excise duties on petrol, distillate fuel, residual fuel and base oil. |
| |
| 3) | | Excise duties which are collected by the Botswana, Lesotho, Namibia and Swaziland (BLNS) countries. |
158
ANNEXURE B: STATISTICAL TABLES
| | | | | | | | | | | | | | | | | | | | | | | | | | | | | |
| | | | | | | | | | | | | | | | | | | | | | | | | | | | | Table 3 |
| | | | | | | | | | | | | | | | | | | | | | | | | | | | | Main Budget: Estimates of national revenue |
| | | | | | | | | | | | | | | | | | | | | | | | | | | | | Detailed classification of revenue |
| | | | | 2010/11 | | | | | | | 2011/12 | | | | | | | |
| Budget estimates | | | | | | | | | | | % change on | | | | | | | | | | | | | |
| Before | | | | | | | Revised | | | 2009/10 | | | Before | | | After | | | | | | | |
| tax proposals | | | After | | | estimate | | | actual | | | tax proposals | | | | | | | R thousands |
| |
| | 384 465 800 | | | | 377 715 800 | | | | 380 080 000 | | | | 5.9 | % | | | 426 694 589 | | | | 418 344 589 | | | | | | | Taxes on income and profits |
| | 230 075 800 | | | | 224 675 800 | | | | 228 000 000 | | | | 11.1 | % | | | 261 600 000 | | | | 252 750 000 | | | | | | | Income tax on persons and individuals |
| | | | | | | | | | | | | | | | | | | | | | | | | | | | | Tax on corporate income |
| | 135 000 000 | | | | 133 650 000 | | | | 132 500 000 | | | | -1.8 | % | | | 143 665 000 | | | | 144 165 000 | | | | | | | Companies |
| | 16 500 000 | | | | 16 500 000 | | | | 16 500 000 | | | | 6.7 | % | | | 18 100 000 | | | | 18 100 000 | | | | | | | Secondary tax on companies |
| | — | | | | — | | | | — | | | | -100.0 | % | | | — | | | | — | | | | | | | Tax on retirement funds |
| | | | | | | | | | | | | | | | | | | | | | | | | | | | | Other |
| | 2 780 000 | | | | 2 780 000 | | | | 3 050 000 | | | | -11.2 | % | | | 3 329 589 | | | | 3 329 589 | | | | | | | Interest on overdue income tax |
| | 110 000 | | | | 110 000 | | | | 30 000 | | | | -58.8 | % | | | — | | | | — | | | | | | | Small business tax amnesty |
| | | | | | | | | | | | | | | | | | | | | | | | | | | | | |
| | 8 424 228 | | | | 8 424 228 | | | | 8 420 000 | | | | 7.9 | % | | | 9 150 000 | | | | 9 150 000 | | | | | | | Taxes on payroll and workforce |
| | 8 424 228 | | | | 8 424 228 | | | | 8 420 000 | | | | 7.9 | % | | | 9 150 000 | | | | 9 150 000 | | | | | | | Skills development levy |
| | | | | | | | | | | | | | | | | | | | | | | | | | | | | |
| | 9 960 000 | | | | 9 960 000 | | | | 9 365 000 | | | | 6.1 | % | | | 10 340 000 | | | | 9 590 000 | | | | | | | Taxes on property |
| | | | | | | | | | | | | | | | | | | | | | | | | | | | | Estate, inheritance and gift taxes |
| | 60 000 | | | | 60 000 | | | | 65 000 | | | | 8.2 | % | | | 70 000 | | | | 70 000 | | | | | | | Donations tax |
| | 800 000 | | | | 800 000 | | | | 800 000 | | | | 5.4 | % | | | 870 000 | | | | 870 000 | | | | | | | Estate duty |
| | | | | | | | | | | | | | | | | | | | | | | | | | | | | Taxes on financial and capital transactions |
| | 4 100 000 | | | | 4 100 000 | | | | 3 000 000 | | | | -9.7 | % | | | 3 300 000 | | | | 3 300 000 | | | | 1) | | | Securities transfer tax |
| | 5 000 000 | | | | 5 000 000 | | | | 5 500 000 | | | | 17.4 | % | | | 6 100 000 | | | | 5 350 000 | | | | | | | Transfer duties |
| | | | | | | | | | | | | | | | | | | | | | | | | | | | | |
| | 224 579 990 | | | | 230 880 000 | | | | 247 540 000 | | | | 21.5 | % | | | 269 225 000 | | | | 274 210 000 | | | | | | | Domestic taxes on goods and services |
| | 164 000 000 | | | | 164 000 000 | | | | 181 335 000 | | | | 22.6 | % | | | 200 880 000 | | | | 200 880 000 | | | | | | | Value-added tax |
| | | | | | | | | | | | | | | | | | | | | | | | | | | | | Specific excise duties |
| | 6 046 860 | | | | 6 665 290 | | | | 6 554 622 | | | | 14.2 | % | | | 6 669 113 | | | | 7 180 030 | | | | | | | Beer |
| | 42 950 | | | | 47 350 | | | | 44 217 | | | | 28.6 | % | | | 44 989 | | | | 48 436 | | | | | | | Sorghum beer and sorghum flour |
| | 1 559 900 | | | | 1 719 440 | | | | 1 498 867 | | | | 1.1 | % | | | 1 525 048 | | | | 1 641 882 | | | | | | | Wine and other fermented beverages |
| | 2 941 710 | | | | 3 242 570 | | | | 2 908 354 | | | | 4.2 | % | | | 2 959 155 | | | | 3 185 854 | | | | | | | Spirits |
| | 9 533 330 | | | | 10 508 330 | | | | 9 685 087 | | | | 5.4 | % | | | 9 854 259 | | | | 10 609 188 | | | | | | | Cigarettes and cigarette tobacco |
| | 419 050 | | | | 461 900 | | | | 553 403 | | | | 14.8 | % | | | 563 069 | | | | 606 205 | | | | | | | Pipe tobacco and cigars |
| | 921 900 | | | | 1 016 190 | | | | 1 039 081 | | | | 19.1 | % | | | 1 057 231 | | | | 1 138 224 | | | | 2) | | | Petroleum products |
| | 534 290 | | | | 588 930 | | | | 616 369 | | | | -12.1 | % | | | 627 136 | | | | 675 180 | | | | 3) | | | Revenue from neighbouring countries |
| | 1 200 000 | | | | 1 200 000 | | | | 1 900 000 | | | | 48.9 | % | | | 2 080 000 | | | | 2 230 000 | | | | | | | Ad valorem excise duties |
| | 31 000 000 | | | | 34 600 000 | | | | 34 300 000 | | | | 19.0 | % | | | 35 000 000 | | | | 36 900 000 | | | | | | | General fuel levy |
| | | | | | | | | | | | | | | | | | | | | | | | | | | | | Taxes on use of goods or permission to use goods or to perform activities |
| | 750 000 | | | | 750 000 | | | | 705 000 | | | | 21.5 | % | | | 730 000 | | | | 730 000 | | | | | | | Air passenger tax |
| | 150 000 | | | | 150 000 | | | | 290 000 | | | | 162.4 | % | | | 300 000 | | | | 300 000 | | | | | | | Plastic bags levy |
| | 5 200 000 | | | | 5 200 000 | | | | 5 200 000 | | | | 55.6 | % | | | 5 380 000 | | | | 6 530 000 | | | | | | | Electricity levy |
| | 20 000 | | | | 20 000 | | | | 165 000 | | | | 158.3 | % | | | 75 000 | | | | 75 000 | | | | | | | Incandescent light bulb levy |
| | — | | | | 450 000 | | | | 505 000 | | | | — | | | | 1 200 000 | | | | 1 200 000 | | | | | | | CO2 tax — motor vehicle emissions |
| | 10 000 | | | | 10 000 | | | | 5 000 | | | | -23.0 | % | | | 15 000 | | | | 15 000 | | | | | | | Turnover tax for micro businesses |
| | | | | | | | | | | | | | | | | | | | | | | | | | | | | Other |
| | 250 000 | | | | 250 000 | | | | 235 000 | | | | 4.5 | % | | | 265 000 | | | | 265 000 | | | | | | | Universal Service Fund |
| | | | | | | | | | | | | | | | | | | | | | | | | | | | | |
| | 20 850 000 | | | | 20 850 000 | | | | 26 790 000 | | | | 38.7 | % | | | 30 325 440 | | | | 30 325 440 | | | | | | | Taxes on international trade and transactions |
| | | | | | | | | | | | | | | | | | | | | | | | | | | | | Import duties |
| | 20 500 000 | | | | 20 500 000 | | | | 26 400 000 | | | | 34.9 | % | | | 29 860 400 | | | | 29 860 400 | | | | | | | Customs duties |
| | | | | | | | | | | | | | | | | | | | | | | | | | | | | Other |
| | 300 000 | | | | 300 000 | | | | 340 000 | | | | -215.6 | % | | | 409 540 | | | | 409 540 | | | | | | | Miscellaneous customs and excise receipts |
| | 50 000 | | | | 50 000 | | | | 50 000 | | | | 39.8 | % | | | 55 500 | | | | 55 500 | | | | | | | Diamond export levy |
| | | | | | | | | | | | | | | | | | | | | | | | | | | | | |
| | 20 000 | | | | 20 000 | | | | 5 000 | | | | -89.9 | % | | | — | | | | — | | | | | | | Other taxes |
| | 20 000 | | | | 20 000 | | | | 5 000 | | | | -89.9 | % | | | — | | | | — | | | | | | | Stamp duties and fees |
| | | | | | | | | | | | | | | | | | | | | | | | | | | | | |
| | — | | | | — | | | | — | | | | -100.0 | % | | | — | | | | — | | | | 4) | | | State miscellaneous revenue |
| |
| | 648 300 018 | | | | 647 850 028 | | | | 672 200 000 | | | | 12.3 | % | | | 745 735 029 | | | | 741 620 029 | | | | | | | TOTAL TAX REVENUE (gross) |
| |
| | | | | | | | | | | | | | | | | | | | | | | | | | | | | |
| | -14 991 309 | | | | -14 991 309 | | | | -14 991 309 | | | | -46.3 | % | | | -21 763 239 | | | | -21 763 239 | | | | 5) | | | Less: SACU payments |
| | | | | | | | | | | | | | — | | | | | | | | | | | | | | | Payments in terms of Customs Union agreements |
| | -14 991 309 | | | | -14 991 309 | | | | -14 991 309 | | | | -46.3 | % | | | -21 763 239 | | | | -21 763 239 | | | | | | | (sec. 51(2) of Act 91 of 1964) |
| | — | | | | — | | | | -2 900 000 | | | | — | | | | — | | | | — | | | | 6) | | | Other adjustment |
| |
| | 633 308 709 | | | | 632 858 719 | | | | 654 308 691 | | | | 14.6 | % | | | 723 971 790 | | | | 719 856 790 | | | | | | | TOTAL TAX REVENUE (net of SACU payments) |
| |
| | |
| 4) | | Revenue received by SARS in respect of taxation which could not be allocated to specific revenue types. |
| |
| 5) | | Payments in terms of Southern African Custom Union (SACU) agreements. |
| |
| 6) | | Payment to SACU partners in respect of a previous error in calculation of the 1969 agreement. |
159
2011 BUDGET REVIEW
| | | | | | | | | | | | | | | | | | | | | | | | | | | | | |
| Table 3 | | | | | | | | | | | | | |
| Main Budget: Estimates of national revenue | | | | | | | | | | | | | |
| Detailed classification of revenue | | | | | | | | | | | | | |
| | | | | | | 2007/08 | | | 2008/09 | | | 2009/10 | |
| | | | | | | Actual | | | Before | | | After | | | Revised | | | Actual | |
| R thousands | | | | | | collections | | | tax proposals | | | estimate | | | collection | |
| |
TOTAL TAX REVENUE (net of SACU payments) | | | | | | | 548 102 069 | | | | 596 179 539 | | | | 635 963 575 | | | | 631 388 575 | | | | 562 509 575 | | | | 570 790 038 | |
| |
| |
Sales of goods and services other than capital assets | | | | | | | 2 841 309 | | | | 3 392 687 | | | | 3 256 336 | | | | 3 256 336 | | | | 1 802 843 | | | | 2 313 946 | |
| Sales of goods and services produced by departments | | | | | | | | | | | | | | | | | | | | | | | | | | | | |
| Sales by market establishments | | | 7) | | | | 83 112 | | | | 40 923 | | | | 57 341 | | | | 57 341 | | | | 61 882 | | | | 34 744 | |
| Administrative fees | | | | | | | 2 287 559 | | | | 2 849 094 | | | | 2 461 784 | | | | 2 461 784 | | | | 1 259 183 | | | | 1 529 124 | |
| Other sales | | | | | | | 446 893 | | | | 431 361 | | | | 695 599 | | | | 695 599 | | | | 455 874 | | | | 726 067 | |
| Sales of scrap, waste, arms and other used current goods | | | | | | | 23 745 | | | | 71 309 | | | | 41 612 | | | | 41 612 | | | | 25 904 | | | | 24 011 | |
| | | | | | | | | | | | | | | | | | | | | | | | | | | | | |
Transfers received | | | | | | | 4 171 | | | | 291 605 | | | | 152 985 | | | | 152 985 | | | | 196 951 | | | | 231 615 | |
| | | | | | | | | | | | | | | | | | | | | | | | | | | | | |
Fines, penalties and forfeits | | | | | | | 1 469 019 | | | | 478 895 | | | | 471 355 | | | | 471 355 | | | | 1 663 720 | | | | 1 698 145 | |
| | | | | | | | | | | | | | | | | | | | | | | | | | | | | |
Interest, dividends and rent on land | | | | | | | 6 851 070 | | | | 7 524 686 | | | | 6 623 509 | | | | 6 623 509 | | | | 3 827 734 | | | | 3 651 459 | |
| Interest | | | | | | | | | | | | | | | | | | | | | | | | | | | | |
| Cash and cash equivalents | | | | | | | 91 240 | | | | 90 080 | | | | 118 263 | | | | 118 263 | | | | 40 170 | | | | 1 739 970 | |
| Interest investments | | | | | | | 42 684 | | | | 41 882 | | | | 48 125 | | | | 48 125 | | | | 16 360 | | | | — | |
| Exchequer investments | | | | | | | 1 756 587 | | | | 1 847 642 | | | | 1 518 000 | | | | 1 518 000 | | | | 867 983 | | | | 392 782 | |
| Sterilisation deposits | | | | | | | 3 109 463 | | | | 2 981 834 | | | | 2 600 000 | | | | 2 600 000 | | | | 1 260 457 | | | | — | |
| Dividends | | | | | | | | | | | | | | | | | | | | | | | | | | | | |
| Airports Company South Africa (ACSA) | | | | | | | 100 709 | | | | — | | | | 110 000 | | | | 110 000 | | | | — | | | | — | |
| Eskom | | | | | | | — | | | | — | | | | — | | | | — | | | | — | | | | — | |
| Industrial Development Corporation (IDC) | | | | | | | 75 000 | | | | 100 000 | | | | 85 000 | | | | 85 000 | | | | 100 000 | | | | 120 000 | |
| Registration of Deeds Trading Account surplus | | | | | | | 119 215 | | | | — | | | | — | | | | — | | | | — | | | | — | |
| SA Reserve Bank (SARB) surplus | | | | | | | 1 685 | | | | 119 005 | | | | 150 000 | | | | 150 000 | | | | — | | | | — | |
| Telkom | | | | | | | 1 242 285 | | | | 1 366 514 | | | | 1 366 514 | | | | 1 366 514 | | | | 465 847 | | | | 465 857 | |
| Department of Mineral Resources | | | | | | | — | | | | — | | | | — | | | | — | | | | — | | | | — | |
| Reserve Bank (National Treasury) | | | | | | | — | | | | — | | | | 93 369 | | | | 93 369 | | | | 86 000 | | | | 78 911 | |
| Rent on land | | | | | | | | | | | | | | | | | | | | | | | | | | | | |
| Mineral and petroleum royalties | | | 8) | | | | — | | | | — | | | | — | | | | — | | | | — | | | | — | |
| Mining leases and ownership | | | 9) | | | | 55 916 | | | | 708 413 | | | | 325 000 | | | | 325 000 | | | | 810 000 | | | | 633 125 | |
| Royalties, prospecting fees and surface rental | | | 10) | | | | 244 101 | | | | 255 680 | | | | 122 852 | | | | 122 852 | | | | — | | | | 210 579 | |
| Land rent | | | | | | | 12 185 | | | | 13 636 | | | | 86 386 | | | | 86 386 | | | | 180 917 | | | | 10 235 | |
| | | | | | | | | | | | | | | | | | | | | | | | | | | | | |
Sales of capital assets | | | | | | | 230 100 | | | | 131 244 | | | | 42 991 | | | | 42 991 | | | | 59 003 | | | | 36 263 | |
| | | | | | | | | | | | | | | | | | | | | | | | | | | | | |
Financial transactions in assets and liabilities | | | 11) | | | | 1 296 910 | | | | 797 067 | | | | 1 054 399 | | | | 1 054 399 | | | | 1 432 319 | | | | 957 093 | |
| |
TOTAL NON-TAX REVENUE | | | | | | | 12 692 579 | | | | 12 616 184 | | | | 11 601 575 | | | | 11 601 575 | | | | 8 982 570 | | | | 8 888 521 | |
| |
| |
TOTAL MAIN BUDGET REVENUE | | | | | | | 560 794 648 | | | | 608 795 723 | | | | 647 565 150 | | | | 642 990 150 | | | | 571 492 145 | | | | 579 678 559 | |
| |
| |
Extraordinary receipts | | | | | | | 1 849 837 | | | | 8 202 270 | | | | 6 100 000 | | | | 6 100 000 | | | | 6 536 000 | | | | 6 434 648 | |
Adjustments due to transactions in government stock | | | | | | | 245 326 | | | | 4 921 428 | | | | 2 100 000 | | | | 2 100 000 | | | | 2 048 927 | | | | 1 947 575 | |
Agricultural Debt Account surrender | | | | | | | 250 000 | | | | 703 849 | | | | 150 000 | | | | 150 000 | | | | — | | | | — | |
Proceeds from the sale of Telkom’s share in Vodacom | | | | | | | — | | | | — | | | | 3 500 000 | | | | 3 500 000 | | | | 3 933 903 | | | | 3 933 903 | |
Incorrect deposit to the exchequer | | | | | | | | | | | | | | | | | | | | | | | 5 899 | | | | 5 899 | |
Surplus cash from ICASA | | | | | | | | | | | | | | | | | | | | | | | 8 947 | | | | 8 947 | |
Profits on GFECRA | | | | | | | 319 273 | | | | — | | | | — | | | | — | | | | — | | | | — | |
Special dividends | | | | | | | | | | | | | | | | | | | | | | | | | | | | |
Telkom | | | | | | | 1 035 238 | | | | — | | | | — | | | | — | | | | 538 324 | | | | 538 324 | |
Special restructuring proceeds from SASRIA | | | | | | | — | | | | 2 141 531 | | | | 350 000 | | | | 350 000 | | | | — | | | | — | |
Winding down of Diabo Share Trust | | | | | | | — | | | | 435 462 | | | | — | | | | — | | | | — | | | | — | |
| |
| | | |
| 7) | | New item introduced on the Standard Chart of Accounts (SCOA) from 2008/09. |
| |
| 8) | | Mineral royalties imposed on the transfer of mineral resources in terms of the Mineral and Petroleum Resources Royalty Act, 2008, which came into operation on 1 May 2009. |
| |
| 9) | | Mining leases and ownership has been reclassified as non-tax revenue. The historical years from 1998/99 have been adjusted for comparative purposes. |
160
ANNEXURE B: STATISTICAL TABLES
| | | | | | | | | | | | | | | | | | | | | | | | | | | | | |
| | | | | | | | | | | | | | | | | | | | | | | | | | | | | Table 3 |
| | | | | | | | | | | | | | | | | | | | | | | | | | | | | Main Budget: Estimates of national revenue |
| | | | | | | | | | | | | | | | | | | | | | | | | | | | | Detailed classification of revenue |
| 2010/11 | | | 2011/12 | | | | | | | |
| Budget estimates | | | | | | | | | | | % change on | | | | | | | | | | | | | |
| Before | | | | | | | Revised | | | 2009/10 | | | Before | | | After | | | | | | | |
| tax proposals | | | After | | | estimate | | | actual | | | tax proposals | | | | | | | R thousands |
| |
| | 633 308 709 | | | | 632 858 719 | | | | 654 308 691 | | | | 14.6 | % | | | 723 971 790 | | | | 719 856 790 | | | | | | | TOTAL TAX REVENUE (net of SACU payments) |
| |
| | 1 924 561 | | | | 1 924 561 | | | | 1 645 451 | | | | -28.9 | % | | | 1 548 626 | | | | 1 548 626 | | | | | | | Sales of goods and services other than capital assets |
| | | | | | | | | | | | | | | | | | | | | | | | | | | | | Sales of goods and services produced by departments |
| | 72 965 | | | | 72 965 | | | | 143 662 | | | | 313.5 | % | | | 69 505 | | | | 69 505 | | | | 7) | | | Sales by market establishments |
| | 1 318 712 | | | | 1 318 712 | | | | 838 361 | | | | -45.2 | % | | | 945 028 | | | | 945 028 | | | | | | | Administrative fees |
| | 503 160 | | | | 503 160 | | | | 634 608 | | | | -12.6 | % | | | 510 041 | | | | 510 041 | | | | | | | Other sales |
| | 29 724 | | | | 29 724 | | | | 28 820 | | | | 20.0 | % | | | 24 052 | | | | 24 052 | | | | | | | Sales of scrap, waste, arms and other used current goods |
| | | | | | | | | | | | | | | | | | | | | | | | | | | | | |
| | 195 682 | | | | 195 682 | | | | 195 771 | | | | -15.5 | % | | | 172 353 | | | | 172 353 | | | | | | | Transfers received |
| | | | | | | | | | | | | | | | | | | | | | | | | | | | | |
| | 506 473 | | | | 506 473 | | | | 1 334 122 | | | | -21.4 | % | | | 526 859 | | | | 526 859 | | | | | | | Fines, penalties and forfeits |
| | | | | | | | | | | | | | | | | | | | | | | | | | | | | |
| | 6 354 246 | | | | 6 354 246 | | | | 8 037 694 | | | | 120.1 | % | | | 6 796 512 | | | | 6 796 512 | | | | | | | Interest, dividends and rent on land |
| | | | | | | | | | | | | | | | | | | | | | | | | | | | | Interest |
| | 39 375 | | | | 39 375 | | | | 1 825 000 | | | | 4.9 | % | | | 500 000 | | | | 500 000 | | | | | | | Cash and cash equivalents |
| | 16 036 | | | | 16 036 | | | | 75 000 | | | | — | | | | 400 000 | | | | 400 000 | | | | | | | Interest investments |
| | 850 810 | | | | 850 810 | | | | 91 713 | | | | -76.7 | % | | | 112 459 | | | | 112 459 | | | | | | | Exchequer investments |
| | 1 235 519 | | | | 1 235 519 | | | | 600 000 | | | | — | | | | — | | | | — | | | | | | | Sterilisation deposits |
| | | | | | | | | | | | | | | | | | | | | | | | | | | | | Dividends |
| | 115 000 | | | | 115 000 | | | | 115 000 | | | | — | | | | 124 000 | | | | 124 000 | | | | | | | Airports Company South Africa (ACSA) |
| | — | | | | — | | | | — | | | | — | | | | — | | | | — | | | | | | | Eskom |
| | 90 000 | | | | 90 000 | | | | — | | | | -100.0 | % | | | 95 400 | | | | 95 400 | | | | | | | Industrial Development Corporation (IDC) |
| | — | | | | — | | | | — | | | | — | | | | — | | | | — | | | | | | | Registration of Deeds Trading Account surplus |
| | — | | | | — | | | | — | | | | — | | | | — | | | | — | | | | | | | SA Reserve Bank (SARB) surplus |
| | 238 105 | | | | 238 105 | | | | 621 143 | | | | 33.3 | % | | | 621 143 | | | | 621 143 | | | | | | | Telkom |
| | — | | | | — | | | | 4 220 | | | | — | | | | — | | | | — | | | | | | | Department of Mineral Resources |
| | — | | | | — | | | | — | | | | -100.0 | % | | | — | | | | — | | | | | | | Reserve Bank (National Treasury) |
| | | | | | | | | | | | | | — | | | | | | | | — | | | | | | | Rent on land |
| | 3 540 000 | | | | 3 540 000 | | | | 3 712 000 | | | | — | | | | 4 890 000 | | | | 4 890 000 | | | | 8) | | | Mineral and petroleum royalties |
| | — | | | | — | | | | 900 000 | | | | 42.2 | % | | | — | | | | — | | | | 9) | | | Mining leases and ownership |
| | — | | | | — | | | | 90 623 | | | | -57.0 | % | | | 23 063 | | | | 23 063 | | | | 10) | | | Royalties, prospecting fees and surface rental |
| | 229 401 | | | | 229 401 | | | | 2 995 | | | | -70.7 | % | | | 30 447 | | | | 30 447 | | | | | | | Land rent |
| | | | | | | | | | | | | | | | | | | | | | | | | | | | | |
| | 58 022 | | | | 58 022 | | | | 58 322 | | | | 60.8 | % | | | 62 177 | | | | 62 177 | | | | | | | Sales of capital assets |
| | | | | | | | | | | | | | | | | | | | | | | | | | | | | |
| | 1 341 298 | | | | 1 341 298 | | | | 982 640 | | | | 2.7 | % | | | 894 350 | | | | 894 350 | | | | 11) | | | Financial transactions in assets and liabilities |
| |
| | 10 380 282 | | | | 10 380 282 | | | | 12 254 000 | | | | 37.9 | % | | | 10 000 877 | | | | 10 000 877 | | | | | | | TOTAL NON-TAX REVENUE |
| |
| |
| | 643 688 991 | | | | 643 239 001 | | | | 666 562 691 | | | | 15.0 | % | | | 733 972 667 | | | | 729 857 667 | | | | | | | TOTAL MAIN BUDGET REVENUE |
| |
| |
| | | | | | | | | | 3 148 000 | | | | | | | | | | | | | | | | | | | Extraordinary receipts |
| | | | | | | | | | 2 636 000 | | | | | | | | | | | | | | | | | | | Adjustments due to transactions in government stock |
| | | | | | | | | | — | | | | | | | | | | | | | | | | | | | Agricultural Debt Account surrender |
| | | | | | | | | | — | | | | | | | | | | | | | | | | | | | Proceeds from the sale of Telkom’s share in Vodacom |
| | | | | | | | | | — | | | | | | | | | | | | | | | | | | | Incorrect deposit to the exchequer |
| | | | | | | | | | — | | | | | | | | | | | | | | | | | | | Surplus cash from ICASA |
| | | | | | | | | | — | | | | | | | | | | | | | | | | | | | Profits on GFECRA |
| | | | | | | | | | | | | | | | | | | | | | | | | | | | | Special dividends |
| | | | | | | | | | 362 000 | | | | | | | | | | | | | | | | | | | Telkom |
| | | | | | | | | | 150 000 | | | | | | | | | | | | | | | | | | | Special restructuring proceeds from SASRIA |
| | | | | | | | | | — | | | | | | | | | | | | | | | | | | | Winding down of Diabo Share Trust |
| |
| | | |
| 10) | | Royalties, prospecting fees and surface rental collected by the Department of Minerals and Energy. |
| |
| 11) | | Includes recoveries of loans and advances. |
161
2011 BUDGET REVIEW
| | | | | | | | | | | | | | | | | | | | | | | | | |
| Table 4 | | | | | | | | | | |
| Main Budget: Expenditure defrayed from the | | | | | | | | | | |
| National Revenue Fund by vote | | | | | | | | | | |
| | | | | | | 2007/08 | | | 2008/09 | |
| | | | | | | Expenditure | | | of which | | | Expenditure | | | of which | |
| | | | | | | on budget | | | transfers | | | transfers | | | on budget | | | transfers | |
| | | | | | | vote | | | to | | | to local | | | vote | | | to | |
| R million | | | | | | Outcome | | | provinces 1) | | | government 2) | | | Outcome | | | provinces 1) | |
| |
Central Government Administration | | | | | | | | | | | | | | | | | | | | | | | | |
| The Presidency | | | | | | | 649.4 | | | | — | | | | — | | | | 308.8 | | | | — | |
| Parliament | | | | | | | 849.8 | | | | — | | | | — | | | | 1 071.5 | | | | — | |
| Cooperative Governance and Traditional Affairs | | | | | | | 28 359.9 | | | | — | | | | 27 842.9 | | | | 33 386.0 | | | | 29.7 | |
Of which: Local government equitable share | | | | | | | — | | | | — | | | | 20 675.6 | | | | — | | | | — | |
| Home Affairs | | | | | | | 3 241.7 | | | | — | | | | — | | | | 4 666.6 | | | | — | |
| International Relations and Cooperation | | | | | | | 4 069.7 | | | | — | | | | — | | | | 5 472.3 | | | | — | |
| Public Works | | | | | | | 3 402.3 | | | | 836.6 | | | | — | | | | 4 197.0 | | | | 889.3 | |
| Women, Children and People with Disabilities | | | | | | | 52.5 | | | | — | | | | — | | | | 61.9 | | | | — | |
| Performance Monitoring and Evaluation | | | | | | | 2.0 | | | | — | | | | — | | | | 3.6 | | | | — | |
Financial and Administrative Services | | | | | | | | | | | | | | | | | | | | | | | | |
| Government Communication and Information System | | | | | | | 380.9 | | | | — | | | | — | | | | 427.5 | | | | — | |
| National Treasury | | | | | | | 12 569.3 | | | | — | | | | 716.5 | | | | 23 762.8 | | | | — | |
| Public Enterprises | | | | | | | 4 604.0 | | | | — | | | | — | | | | 3 265.1 | | | | — | |
| Public Service and Administration | | | | | | | 609.6 | | | | — | | | | — | | | | 630.6 | | | | — | |
| Statistics South Africa | | | | | | | 1 054.3 | | | | — | | | | — | | | | 1 323.1 | | | | — | |
Social Services | | | | | | | | | | | | | | | | | | | | | | | | |
| Arts and Culture | | | | | | | 1 585.8 | | | | 163.2 | | | | — | | | | 2 114.5 | | | | 344.6 | |
| Basic Education | | | | | | | 4 799.5 | | | | 4 012.9 | | | | — | | | | 6 384.0 | | | | 5 215.6 | |
| Health | | | | | | | 13 578.6 | | | | 12 368.6 | | | | — | | | | 16 424.5 | | | | 14 988.7 | |
| Higher Education and Training | | | | | | | 15 999.1 | | | | 2 435.3 | | | | — | | | | 18 767.8 | | | | 3 005.8 | |
| Labour | | | | | | | 1 431.5 | | | | — | | | | — | | | | 1 507.2 | | | | — | |
| Social Development | | | | | | | 67 191.4 | | | | — | | | | — | | | | 76 096.7 | | | | — | |
| Sport and Recreation South Africa | | | | | | | 5 048.0 | | | | 194.0 | | | | 4 605.0 | | | | 4 871.4 | | | | 293.7 | |
Justice, Crime Prevention and Security | | | | | | | | | | | | | | | | | | | | | | | | |
| Correctional Services | | | | | | | 11 122.4 | | | | — | | | | — | | | | 12 822.6 | | | | — | |
| Defence and Military Veterans | | | | | | | 25 180.1 | | | | — | | | | — | | | | 27 801.3 | | | | — | |
| Independent Complaints Directorate | | | | | | | 80.9 | | | | — | | | | — | | | | 99.3 | | | | — | |
| Justice and Constitutional Development | | | | | | | 7 194.0 | | | | — | | | | — | | | | 8 244.4 | | | | — | |
| Police | | | | | | | 36 525.9 | | | | — | | | | — | | | | 41 635.2 | | | | — | |
Economic Services and Infrastructure | | | | | | | | | | | | | | | | | | | | | | | | |
| Agriculture, Forestry and Fisheries | | | | | | | 3 957.2 | | | | 761.7 | | | | — | | | | 3 564.9 | | | | 898.0 | |
| Communications | | | | | | | 1 911.8 | | | | — | | | | — | | | | 2 328.6 | | | | — | |
| Economic Development | | | | | | | 245.1 | | | | — | | | | — | | | | 220.4 | | | | — | |
| Energy | | | | | | | 2 229.8 | | | | — | | | | 462.5 | | | | 2 961.7 | | | | — | |
| Environmental Affairs | | | | | | | 1 564.5 | | | | — | | | | — | | | | 1 789.9 | | | | — | |
| Human Settlements | | | | | | | 10 503.0 | | | | 6 988.5 | | | | 2 948.3 | | | | 13 269.5 | | | | 8 727.6 | |
| Mineral Resources | | | | | | | 717.5 | | | | — | | | | — | | | | 768.3 | | | | — | |
| Rural Development and Land Reform | | | | | | | 5 896.6 | | | | — | | | | — | | | | 6 669.8 | | | | — | |
| Science and Technology | | | | | | | 3 127.3 | | | | — | | | | — | | | | 3 703.5 | | | | — | |
| Tourism | | | | | | | 1 056.0 | | | | — | | | | — | | | | 1 202.2 | | | | — | |
| Trade and Industry | | | | | | | 5 050.2 | | | | — | | | | — | | | | 4 836.7 | | | | — | |
| Transport | | | | | | | 19 155.9 | | | | 5 853.7 | | | | 1 174.0 | | | | 28 161.7 | | | | 7 663.3 | |
| Water Affairs | | | | | | | 4 802.9 | | | | — | | | | 732.9 | | | | 5 797.8 | | | | — | |
| | | | | | | |
| | | | | | | | 309 800.8 | | | | 33 614.6 | | | | 38 482.0 | | | | 370 620.6 | | | | 42 056.3 | |
| Plus: | | | | | | | | | | | | | | | | | | | | | | | | |
| Unallocated/Projected underspending | | | | | | | — | | | | | | | | | | | | — | | | | — | |
| Contingency Reserve | | | | | | | — | | | | — | | | | — | | | | — | | | | — | |
| | | | | | | |
Subtotal: Appropriations by vote | | | | | | | 309 800.8 | | | | 33 614. 6 | | | | 38 482.0 | | | | 370 620.6 | | | | 42 056.3 | |
| | | | | | | | | | | | | | | | | | | | | | | | | |
| Plus: | | | | | | | | | | | | | | | | | | | | | | | | |
Direct charges against the National Revenue Fund | | | | | | | | | | | | | | | | | | | | | | | | |
| President and Deputy President salary (The Presidency) | | | | | | | 2.3 | | | | — | | | | — | | | | 4.0 | | | | — | |
| Members remuneration (Parliament) | | | | | | | 240.7 | | | | — | | | | — | | | | 304.2 | | | | — | |
| State debt costs (National Treasury) | | | 4) | | | | 52 877.1 | | | | — | | | | — | | | | 54 393.7 | | | | — | |
| Provincial equitable share (National Treasury) | | | | | | | 171 053.7 | | | | 171 053.7 | | | | — | | | | 201 795.6 | | | | 201 795.6 | |
| General fuel levy sharing with metros (National Treasury) | | | | | | | — | | | | — | | | | — | | | | — | | | | — | |
| Skills levy and Setas (Higher Education and Training) | | | | | | | 6 284.3 | | | | — | | | | — | | | | 7 234.1 | | | | — | |
| Judges and magistrates salaries (Justice and Const. Dev.) | | | | | | | 1 184.5 | | | | | | | | — | | | | 1 601.1 | | | | — | |
| Unemployment Insurance Fund (Labour) | | | | | | | — | | | | — | | | | — | | | | — | | | | — | |
| Road Accident Fund (Transport) | | | | | | | | | | | | | | | | | | | | | | | | |
| | | | | | | |
Main budget expenditure | | | | | | | 541 443.4 | | | | 204 668.3 | | | | 38 482.0 | | | | 635 953.3 | | | | 243 851.9 | |
| |
| | | |
| 1) | | Includes provincial equitable share and conditional grants allocated to provinces. |
| |
| 2) | | Includes local government equitable share and conditional grants allocated to local government as well as general fuel levy sharing with metros. |
162
ANNEXURE B: STATISTICAL TABLES
| | | | | | | | | | | | | | | | | | | | | | | | | | | |
| | | | | | | | | | | | | | | | | | | | | | | | | | | Table 4 |
| | | | | | | | | | | | | | | | | | | | | | | | | | | Main Budget: Expenditure defrayed from the |
| | | | | | | | | | | | | | | | | | | | | | | | | | | National Revenue Fund by vote |
| 2008/09 | | | 2009/10 | | | 2010/11 | | | | | |
| of which | | | Expenditure | | | of which | | | | | | | | | | | | |
| transfers | | | on budget | | | transfers | | | transfers | | | | | | | Adjusted | | | | | |
| to local | | | vote | | | to | | | to local | | | Budget | | | appro- | | | | | |
| government 2) | | | Outcome | | | provinces 1) | | | government 2) | | | estimate 3) | | | priation | | | | | R million |
| |
| | | | | | | | | | | | | | | | | | | | | | | | | | | Central Government Administration |
| | — | | | | 659.1 | | | | — | | | | — | | | | 702.2 | | | | 766.9 | | | | | The Presidency |
| | — | | | | 1 009.0 | | | | — | | | | — | | | | 1 179.2 | | | | 1 201.6 | | | | | Parliament |
| | 32 746.0 | | | | 33 661.6 | | | | — | | | | 32 833.8 | | | | 41 096.9 | | | | 41 748.5 | | | | | Cooperative Governance and Traditional Affairs |
| | 25 559.7 | | | | — | | | | — | | | | 23 845.5 | | | | — | | | | — | | | | | Of which: Local government equitable share |
| | — | | | | 5 195.4 | | | | — | | | | — | | | | 5 719.6 | | | | 5 834.4 | | | | | Home Affairs |
| | — | | | | 5 417.4 | | | | — | | | | — | | | | 4 824.4 | | | | 4 715.8 | | | | | International Relations and Cooperation |
| | — | | | | 5 533.6 | | | | 1 466.0 | | | | 100.5 | | | | 6 446.3 | | | | 7 364.8 | | | | | Public Works |
| | — | | | | 77.5 | | | | — | | | | — | | | | 97.8 | | | | 106.2 | | | | | Women, Children and People with Disabilities |
| | — | | | | 10.4 | | | | — | | | | — | | | | 20.4 | | | | 40.5 | | | | | Performance Monitoring and Evaluation |
| | | | | | | | | | | | | | | | | | | | | | | | | | | Financial and Administrative Services |
| | — | | | | 495.4 | | | | — | | | | — | | | | 546.2 | | | | 550.2 | | | | | Government Communication and Information System |
| | 361.5 | | | | 53 240.6 | | | | 4 200.0 | | | | 808.1 | | | | 38 715.4 | | | | 38 704.9 | | | | | National Treasury |
| | — | | | | 3 983.3 | | | | — | | | | — | | | | 350.6 | | | | 555.5 | | | | | Public Enterprises |
| | — | | | | 670.8 | | | | — | | | | — | | | | 651.5 | | | | 658.7 | | | | | Public Service and Administration |
| | — | | | | 1 555.8 | | | | — | | | | — | | | | 1 973.4 | | | | 2 101.4 | | | | | Statistics South Africa |
| | | | | | | | | | | | | | | | | | | | | | | | | | | Social Services |
| | — | | | | 2 224.9 | | | | 440.6 | | | | — | | | | 2 406.7 | | | | 2 441.2 | | | | | Arts and Culture |
| | — | | | | 7 854.3 | | | | 6 460.1 | | | | — | | | | 10 918.5 | | | | 10 924.3 | | | | | Basic Education |
| | — | | | | 19 168.6 | | | | 17 523.8 | | | | — | | | | 22 967.9 | | | | 23 132.5 | | | | | Health |
| | — | | | | 20 684.4 | | | | 3 155.3 | | | | — | | | | 23 720.7 | | | | 23 776.2 | | | | | Higher Education and Training |
| | — | | | | 1 698.7 | | | | — | | | | — | | | | 1 783.9 | | | | 1 835.8 | | | | | Labour |
| | — | | | | 85 318.2 | | | | — | | | | — | | | | 95 929.1 | | | | 95 941.1 | | | | | Social Development |
| | 4 295.0 | | | | 2 866.4 | | | | 402.3 | | | | 2 168.7 | | | | 1 245.6 | | | | 1 255.5 | | | | | Sport and Recreation South Africa |
| | | | | | | | | | | | | | | | | | | | | | | | | | | Justice, Crime Prevention and Security |
| | — | | | | 13 687.3 | | | | — | | | | — | | | | 15 129.0 | | | | 15 427.5 | | | | | Correctional Services |
| | — | | | | 31 324.2 | | | | — | | | | — | | | | 30 715.3 | | | | 30 442.6 | | | | | Defence and Military Veterans |
| | — | | | | 106.2 | | | | — | | | | — | | | | 129.3 | | | | 131.4 | | | | | Independent Complaints Directorate |
| | — | | | | 9 653.5 | | | | — | | | | — | | | | 10 250.5 | | | | 10 787.3 | | | | | Justice and Constitutional Development |
| | — | | | | 47 662.5 | | | | — | | | | — | | | | 52 556.4 | | | | 53 529.7 | | | | | Police |
| | | | | | | | | | | | | | | | | | | | | | | | | | | Economic Services and Infrastructure |
| | — | | | | 3 961.8 | | | | 973.7 | | | | — | | | | 3 708.0 | | | | 4 003.9 | | | | | Agriculture, Forestry and Fisheries |
| | — | | | | 2 301.9 | | | | — | | | | — | | | | 2 114.0 | | | | 2 138.0 | | | | | Communications |
| | — | | | | 314.6 | | | | — | | | | — | | | | 418.6 | | | | 449.8 | | | | | Economic Development |
| | 589.1 | | | | 3 690.9 | | | | — | | | | 1 074.6 | | | | 5 535.4 | | | | 5 648.7 | | | | | Energy |
| | — | | | | 2 124.3 | | | | — | | | | — | | | | 2 557.8 | | | | 2 438.5 | | | | | Environmental Affairs |
| | 3 572.4 | | | | 16 407.4 | | | | 10 819.3 | | | | 4 418.2 | | | | 19 215.6 | | | | 19 305.9 | | | | | Human Settlements |
| | — | | | | 853.8 | | | | — | | | | — | | | | 1 030.0 | | | | 995.8 | | | | | Mineral Resources |
| | — | | | | 5 863.8 | | | | — | | | | — | | | | 6 769.6 | | | | 7 293.4 | | | | | Rural Development and Land Reform |
| | — | | | | 4 183.9 | | | | — | | | | — | | | | 4 615.5 | | | | 4 128.0 | | | | | Science and Technology |
| | — | | | | 1 145.6 | | | | — | | | | — | | | | 1 151.8 | | | | 1 183.8 | | | | | Tourism |
| | — | | | | 5 923.3 | | | | — | | | | — | | | | 6 150.1 | | | | 6 194.2 | | | | | Trade and Industry |
| | 2 928.7 | | | | 28 664.0 | | | | 10 832.1 | | | | 2 431.0 | | | | 30 178.0 | | | | 30 380.8 | | | | | Transport |
| | 994.6 | | | | 7 188.6 | | | | — | | | | 902.4 | | | | 7 996.6 | | | | 8 203.2 | | | | | Water Affairs |
| | | | | |
| | 45 487.3 | | | | 436 383.5 | | | | 56 273.0 | | | | 44 737.2 | | | | 461 517.9 | | | | 466 338.6 | | | | | |
| | | | | | | | | | | | | | | | | | | | | | | | | | | Plus: |
| | — | | | | | | | | | | | | — | | | | — | | | | -1 700.0 | | | | | Unallocated/Projected underspending |
| | — | | | | — | | | | — | | | | — | | | | 6 000.0 | | | | — | | | | | Contingency Reserve |
| | | | | |
| | 45 487.3 | | | | 436 383.5 | | | | 56 273.0 | | | | 44 737.2 | | | | 467 517.9 | | | | 464 638.6 | | | | | Subtotal: Appropriations by vote |
| | | | | | | | | | | | | | | | | | | | | | | | | | | |
| | | | | | | | | | | | | | | | | | | | | | | | | | | Plus: |
| | | | | | | | | | | | | | | | | | | | | | | | | | | Direct charges against the National Revenue Fund |
| | — | | | | 3.8 | | | | — | | | | — | | | | 4.6 | | | | 4.6 | | | | | President and Deputy President salary (The Presidency) |
| | — | | | | 398.8 | | | | — | | | | — | | | | 392.7 | | | | 392.7 | | | | | Members remuneration (Parliament) |
| | — | | | | 57 129.2 | | | | — | | | | — | | | | 71 357.6 | | | | 67 606.9 | | | 4) | | State debt costs (National Treasury) |
| | — | | | | 236 890.8 | | | | 236 890.8 | | | | — | | | | 260 973.7 | | | | 265 139.4 | | | | | Provincial equitable share (National Treasury) |
| | — | | | | 6 800.1 | | | | — | | | | 6 800.1 | | | | 7 542.4 | | | | 7 542.4 | | | | | General fuel levy sharing with metros (National Treasury) |
| | — | | | | 7 815.6 | | | | — | | | | — | | | | 8 424.2 | | | | 8 424.2 | | | | | Skills levy and Setas (Higher Education and Training) |
| | | | | | 1 774.9 | | | | — | | | | — | | | | 1 929.9 | | | | 1 929.9 | | | | | Judges and magistrates salaries (Justice and Const. Dev.) |
| | — | | | | — | | | | — | | | | — | | | | — | | | | — | | | | | Unemployment Insurance Fund (Labour) |
| | | | | |
| | 45 487.3 | | | | 747 196.8 | | | | 293 163.8 | | | | 51 537.3 | | | | 818 142.9 | | | | 815 678.6 | | | | | Main budget expenditure |
| |
| | | |
| 3) | | Budget estimate adjusted for function shifts. |
| |
| 4) | | Provincial equitable share, excluding conditional grants to provinces. |
163
Table 4
Main Budget: Expenditure defrayed from the
National Revenue Fund by vote
| | | | | | | | | | | | | | | | | | | | | | | | | | | | | |
| | | | | | | 2010/11 | | 2011/12 |
| | | | | | | | | | | of which | | | | | | of which |
| | | | | | | Projected | | transfers | | transfers | | | | | | transfers | | transfers |
| | | | | | | vote | | to | | to local | | Budget | | to | | to local |
| R million | | | | | | outturn | | provinces 1) | | government 2) | | estimate | | provinces 1) | | government 2) |
| | | | | | | |
Central Government Administration | | | | | | | | | | | | | | | | | | | | | | | | | | | | |
| The Presidency | | | | | | | 766.9 | | | | — | | | | — | | | | 815.0 | | | | — | | | | — | |
| Parliament | | | | | | | 1 201.6 | | | | — | | | | — | | | | 1 265.3 | | | | — | | | | — | |
| Cooperative Governance and Traditional Affairs | | | | | | | 41 748.5 | | | | 214.4 | | | | 40 285.3 | | | | 47 933.6 | | | | 305.0 | | | | 46 240.8 | |
Of which: Local government equitable share | | | | | | | — | | | | — | | | | 30 558.6 | | | | — | | | | — | | | | 34 107.9 | |
| Home Affairs | | | | | | | 5 834.4 | | | | — | | | | — | | | | 5 464.1 | | | | — | | | | — | |
| International Relations and Cooperation | | | | | | | 4 715.8 | | | | — | | | | — | | | | 4 796.8 | | | | — | | | | — | |
| Public Works | | | | | | | 7 138.7 | | | | 2 181.3 | | | | 551.4 | | | | 7 819.3 | | | | 2 270.9 | | | | 679.6 | |
| Women, Children and People with Disabilities | | | | | | | 106.2 | | | | — | | | | — | | | | 117.9 | | | | — | | | | — | |
| Performance Monitoring and Evaluation | | | | | | | 40.5 | | | | — | | | | — | | | | 75.8 | | | | — | | | | — | |
Financial and Administrative Services | | | | | | | | | | | | | | | | | | | | | | | | | | | | |
| Government Communication and Information System | | | | | | | 550.2 | | | | — | | | | — | | | | 496.4 | | | | — | | | | — | |
| National Treasury | | | | | | | 38 375.4 | | | | — | | | | 1 186.6 | | | | 22 598.2 | | | | — | | | | 1 184.6 | |
| Public Enterprises | | | | | | | 555.5 | | | | — | | | | — | | | | 230.2 | | | | — | | | | — | |
| Public Service and Administration | | | | | | | 656.7 | | | | — | | | | — | | | | 690.1 | | | | — | | | | — | |
| Statistics South Africa | | | | | | | 1 741.7 | | | | — | | | | — | | | | 3 240.9 | | | | — | | | | — | |
Social Services | | | | | | | | | | | | | | | | | | | | | | | | | | | | |
| Arts and Culture | | | | | | | 2 339.7 | | | | 512.7 | | | | — | | | | 2 468.6 | | | | 543.4 | | | | — | |
| Basic Education | | | | | | | 9 093.0 | | | | 7 107.4 | | | | — | | | | 13 868.1 | | | | 10 546.4 | | | | — | |
| Health | | | | | | | 22 218.7 | | | | 20 483.0 | | | | — | | | | 25 731.6 | | | | 23 947.7 | | | | — | |
| Higher Education and Training | | | | | | | 23 757.2 | | | | 3 804.0 | | | | — | | | | 28 228.6 | | | | 4 326.0 | | | | — | |
| Labour | | | | | | | 1 793.2 | | | | — | | | | — | | | | 1 981.5 | | | | — | | | | — | |
| Social Development | | | | | | | 94 841.0 | | | | — | | | | — | | | | 104 732.7 | | | | — | | | | — | |
| Sport and Recreation South Africa | | | | | | | 1 249.6 | | | | 426.4 | | | | 512.6 | | | | 802.7 | | | | 452.0 | | | | — | |
Justice, Crime Prevention and Security | | | | | | | | | | | | | | | | | | | | | | | | | | | | |
| Correctional Services | | | | | | | 15 232.5 | | | | — | | | | — | | | | 16 559.2 | | | | — | | | | — | |
| Defence and Military Veterans | | | | | | | 30 442.6 | | | | — | | | | — | | | | 34 605.0 | | | | — | | | | — | |
| Independent Complaints Directorate | | | | | | | 131.4 | | | | — | | | | — | | | | 151.6 | | | | — | | | | — | |
| Justice and Constitutional Development | | | | | | | 10 742.3 | | | | — | | | | — | | | | 11 413.5 | | | | — | | | | — | |
| Police | | | | | | | 53 529.7 | | | | — | | | | — | | | | 58 061.5 | | | | — | | | | — | |
Economic Services and Infrastructure | | | | | | | | | | | | | | | | | | | | | | | | | | | | |
| Agriculture, Forestry and Fisheries | | | | | | | 4 003.9 | | | | 1 166.9 | | | | — | | | | 4 719.7 | | | | 1 487.1 | | | | — | |
| Communications | | | | | | | 2 138.0 | | | | — | | | | — | | | | 1 889.1 | | | | — | | | | — | |
| Economic Development | | | | | | | 384.5 | | | | — | | | | — | | | | 594.5 | | | | — | | | | — | |
| Energy | | | | | | | 5 648.7 | | | | — | | | | 1 240.1 | | | | 6 089.9 | | | | — | | | | 1 376.6 | |
| Environmental Affairs | | | | | | | 2 359.8 | | | | — | | | | — | | | | 2 846.1 | | | | — | | | | — | |
| Human Settlements | | | | | | | 19 305.9 | | | | 13 032.1 | | | | 5 157.6 | | | | 22 578.5 | | | | 14 941.5 | | | | 6 267.0 | |
| Mineral Resources | | | | | | | 995.8 | | | | — | | | | — | | | | 1 036.2 | | | | — | | | | — | |
| Rural Development and Land Reform | | | | | | | 7 293.4 | | | | — | | | | — | | | | 8 124.2 | | | | — | | | | — | |
| Science and Technology | | | | | | | 4 128.0 | | | | — | | | | — | | | | 4 404.6 | | | | — | | | | — | |
| Tourism | | | | | | | 1 183.8 | | | | — | | | | — | | | | 1 242.9 | | | | — | | | | — | |
| Trade and Industry | | | | | | | 6 075.5 | | | | — | | | | — | | | | 6 786.9 | | | | — | | | | — | |
| Transport | | | | | | | 29 989.4 | | | | 9 012.8 | | | | 3 709.9 | | | | 35 084.0 | | | | 10 615.9 | | | | 4 838.8 | |
| Water Affairs | | | | | | | 7 609.7 | | | | — | | | | 966.3 | | | | 9 936.2 | | | | — | | | | 1 010.8 | |
| | | | | | | |
| | | | | | | | 459 919.7 | | | | 57 940.8 | | | | 53 609.8 | | | | 499 480.9 | | | | 69 435.8 | | | | 61 598.2 | |
| | | | | | | | | | | | | | | | | | | | | | | | | | | | | |
| Plus: | | | | | | | | | | | | | | | | | | | | | | | | | | | | |
| Unallocated/Projected underspending | | | | | | | — | | | | — | | | | — | | | | 40.0 | | | | — | | | | — | |
| Contingency Reserve | | | | | | | — | | | | — | | | | — | | | | 4 090.4 | | | | — | | | | — | |
| | | | | | | |
Subtotal: Appropriations by vote | | | | | | | 459 919.7 | | | | 57 940.8 | | | | 53 609.8 | | | | 503 611.3 | | | | 69 435.8 | | | | 61 598.2 | |
| | | | | | | | | | | | | | | | | | | | | | | | | | | | | |
| Plus: | | | | | | | | | | | | | | | | | | | | | | | | | | | | |
Direct charges against the National Revenue Fund | | | | | | | | | | | | | | | | | | | | | | | | | | | | |
| President and Deputy President salary (The Presidency) | | | | | | | 4.6 | | | | — | | | | — | | | | 4.8 | | | | — | | | | — | |
| Members remuneration (Parliament) | | | | | | | 392.7 | | | | — | | | | — | | | | 409.6 | | | | — | | | | — | |
| State debt costs (National Treasury) | | | 4 | ) | | | 66 570.4 | | | | — | | | | — | | | | 76 578.7 | | | | — | | | | — | |
| Provincial equitable share (National Treasury) | | | | | | | 265 139.4 | | | | 265 139.4 | | | | — | | | | 288 492.8 | | | | 288 492.8 | | | | — | |
| General fuel levy sharing with metros (National Treasury) | | | | | | | 7 542.4 | | | | — | | | | 7 542.4 | | | | 8 573.1 | | | | — | | | | 8 573.1 | |
| Skills levy and Setas (Higher Education and Training) | | | | | | | 8 424.2 | | | | — | | | | — | | | | 9 148.7 | | | | — | | | | — | |
| Judges and magistrates salaries (Justice and Const. Dev.) | | | | | | | 1 929.9 | | | | — | | | | | | | | 2 104.2 | | | | — | | | | — | |
| Unemployment Insurance Fund (Labour) | | | | | | | — | | | | — | | | | — | | | | — | | | | — | | | | — | |
| Road Accident Fund (Transport) | | | | | | | | | | | | | | | | | | | | | | | | | | | | |
| | | | | | | |
Main budget expenditure | | | | | | | 809 923.3 | | | | 323 080.3 | | | | 61 152.1 | | | | 888 923.3 | | | | 357 928.6 | | | | 70 171.4 | |
| |
| | |
| 1) | | Includes provincial equitable share and conditional grants allocated to provinces. |
| |
| 2) | | Includes local government equitable share and conditional grants allocated to local government as well as general fuel levy sharing with metros. |
164
ANNEXURE B: STATISTICAL TABLES
| | | | | | | | | | | | | | | | | | | | | | | | | | | |
| | | | | | | | | | | | | | | | | | | | | | | | | | | Table 4 |
| | | | | | | | | | | | | | | | | | | | | | | | | | | Main Budget: Expenditure defrayed from the |
| | | | | | | | | | | | | | | | | | | | | | | | | | | National Revenue Fund by vote |
| | | | | | | | | | | | | | | | | | | | | | | | | | | |
| 2012/13 | | 2013/14 | | | | |
| | | | | of which | | | | | | of which | | | | |
| | | | | transfers | | transfers | | | | | | transfers | | transfers | | | | |
| Budget | | to | | to local | | Budget | | to | | to local | | | | |
| estimate | | provinces 1) | | government 2) | | estimate | | provinces 1) | | government 2) | | R million |
| |
| | | | | | | | | | | | | | | | | | | | | | | | | | | Central Government Administration |
| | 887.5 | | | | — | | | | — | | | | 924.2 | | | | — | | | | — | | | | | The Presidency |
| | 1 315.9 | | | | — | | | | — | | | | 1 387.6 | | | | — | | | | — | | | | | Parliament |
| | 53 842.8 | | | | 180.0 | | | | 52 047.6 | | | | 57 120.8 | | | | 190.0 | | | | 55 232.4 | | | | | Cooperative Governance and Traditional Affairs |
| | — | | | | — | | | | 37 573.4 | | | | — | | | | — | | | | 39 960.3 | | | | | Of which: Local government equitable share |
| | 5 249.7 | | | | — | | | | — | | | | 5 864.3 | | | | — | | | | — | | | | | Home Affairs |
| | 5 154.9 | | | | — | | | | — | | | | 5 569.3 | | | | — | | | | — | | | | | International Relations and Cooperation |
| | 8 061.2 | | | | 2 504.8 | | | | 665.7 | | | | 8 900.1 | | | | 2 778.5 | | | | 779.5 | | | | | Public Works |
| | 129.5 | | | | — | | | | — | | | | 140.8 | | | | — | | | | — | | | | | Women, Children and People with Disabilities |
| | 141.0 | | | | — | | | | — | | | | 160.4 | | | | — | | | | — | | | | | Performance Monitoring and Evaluation |
| | | | | | | | | | | | | | | | | | | | | | | | | | | Financial and Administrative Services |
| | 524.4 | | | | — | | | | — | | | | 552.0 | | | | — | | | | — | | | | | Government Communication and Information System |
| | 23 469.1 | | | | — | | | | 1 279.3 | | | | 25 578.9 | | | | — | | | | 1 326.1 | | | | | National Treasury |
| | 199.7 | | | | — | | | | — | | | | 210.4 | | | | — | | | | — | | | | | Public Enterprises |
| | 726.2 | | | | — | | | | — | | | | 774.5 | | | | — | | | | — | | | | | Public Service and Administration |
| | 1 698.3 | | | | — | | | | — | | | | 1 717.7 | | | | — | | | | — | | | | | Statistics South Africa |
| | | | | | | | | | | | | | | | | | | | | | | | | | | Social Services |
| | 2 625.1 | | | | 570.8 | | | | — | | | | 2 784.7 | | | | 602.2 | | | | — | | | | | Arts and Culture |
| | 16 557.9 | | | | 11 330.6 | | | | — | | | | 20 409.6 | | | | 11 953.7 | | | | — | | | | | Basic Education |
| | 27 610.8 | | | | 25 746.5 | | | | — | | | | 30 136.7 | | | | 28 175.2 | | | | — | | | | | Health |
| | 31 318.5 | | | | 4 705.1 | | | | — | | | | 33 688.2 | | | | 5 262.4 | | | | — | | | | | Higher Education and Training |
| | 2 098.5 | | | | — | | | | — | | | | 2 221.7 | | | | — | | | | — | | | | | Labour |
| | 113 524.0 | | | | — | | | | — | | | | 122 075.5 | | | | — | | | | — | | | | | Social Development |
| | 852.3 | | | | 474.6 | | | | — | | | | 915.5 | | | | 500.7 | | | | — | | | | | Sport and Recreation South Africa |
| | | | | | | | | | | | | | | | | | | | | | | | | | | Justice, Crime Prevention and Security |
| | 17 805.0 | | | | — | | | | — | | | | 18 827.8 | | | | — | | | | — | | | | | Correctional Services |
| | 37 371.2 | | | | — | | | | — | | | | 39 702.2 | | | | — | | | | — | | | | | Defence and Military Veterans |
| | 161.0 | | | | — | | | | — | | | | 170.4 | | | | — | | | | — | | | | | Independent Complaints Directorate |
| | 12 674.3 | | | | — | | | | — | | | | 13 409.3 | | | | — | | | | — | | | | | Justice and Constitutional Development |
| | 62 077.6 | | | | — | | | | — | | | | 66 696.7 | | | | — | | | | — | | | | | Police |
| | | | | | | | | | | | | | | | | | | | | | | | | | | Economic Services and Infrastructure |
| | 5 312.0 | | | | 1 683.9 | | | | — | | | | 5 503.2 | | | | 1 866.9 | | | | — | | | | | Agriculture, Forestry and Fisheries |
| | 1 721.7 | | | | — | | | | — | | | | 1 851.7 | | | | — | | | | — | | | | | Communications |
| | 674.7 | | | | — | | | | — | | | | 713.3 | | | | — | | | | — | | | | | Economic Development |
| | 5 575.3 | | | | — | | | | 1 151.4 | | | | 4 304.8 | | | | — | | | | 1 214.8 | | | | | Energy |
| | 2 399.3 | | | | — | | | | — | | | | 2 643.0 | | | | — | | | | — | | | | | Environmental Affairs |
| | 24 875.1 | | | | 15 599.4 | | | | 7 409.5 | | | | 26 674.7 | | | | 16 457.4 | | | | 8 126.8 | | | | | Human Settlements |
| | 1 107.5 | | | | — | | | | — | | | | 1 178.7 | | | | — | | | | — | | | | | Mineral Resources |
| | 8 674.1 | | | | — | | | | — | | | | 9 381.1 | | | | — | | | | — | | | | | Rural Development and Land Reform |
| | 4 887.4 | | | | — | | | | — | | | | 5 510.1 | | | | — | | | | — | | | | | Science and Technology |
| | 1 273.9 | | | | — | | | | — | | | | 1 345.3 | | | | — | | | | — | | | | | Tourism |
| | 7 366.9 | | | | — | | | | — | | | | 7 572.4 | | | | — | | | | — | | | | | Trade and Industry |
| | 38 204.4 | | | | 11 928.5 | | | | 5 037.2 | | | | 41 198.9 | | | | 12 860.0 | | | | 5 602.9 | | | | | Transport |
| | 10 231.5 | | | | — | | | | 399.0 | | | | 10 883.5 | | | | — | | | | 420.9 | | | | | Water Affairs |
| | | | | |
| | 538 380.2 | | | | 74 724.2 | | | | 67 989.8 | | | | 578 700.1 | | | | 80 647.0 | | | | 72 703.4 | | | | | |
| | | | | | | | | | | | | | | | | | | | | | | | | | | Plus: |
| | 330.0 | | | | | | | | — | | | | 530.0 | | | | | | | | — | | | | | Unallocated/Projected underspending |
| | 11 405.4 | | | | — | | | | — | | | | 23 375.2 | | | | — | | | | — | | | | | Contingency Reserve |
| | | | | |
| | 550 115.6 | | | | 74 724.2 | | | | 67 989.8 | | | | 602 605.3 | | | | 80 647.0 | | | | 72 703.4 | | | | | Subtotal: Appropriations by vote |
| | | | | | | | | | | | | | | | | | | | | | | | | | | Plus: |
| | | | | | | | | | | | | | | | | | | | | | | | | | | Direct charges against the National Revenue Fund |
| | 5.1 | | | | — | | | | — | | | | 5.3 | | | | — | | | | — | | | | | President and Deputy President salary (The Presidency) |
| | 430.1 | | | | — | | | | — | | | | 453.8 | | | | — | | | | — | | | | | Members remuneration (Parliament) |
| | 90 807.7 | | | | — | | | | — | | | | 104 036.2 | | | | — | | | | — | | | 4) | | State debt costs (National Treasury) |
| | 305 725.4 | | | | 305 725.4 | | | | — | | | | 323 604.4 | | | | 323 604.4 | | | | — | | | | | Provincial equitable share (National Treasury) |
| | 9 039.7 | | | | — | | | | 9 039.7 | | | | 9 613.4 | | | | — | | | | 9 613.4 | | | | | General fuel levy sharing with metros (National Treasury) |
| | 9 606.1 | | | | — | | | | — | | | | 10 134.5 | | | | — | | | | — | | | | | Skills levy and Setas (Higher Education and Training) |
| | 2 401.9 | | | | — | | | | — | | | | 2 575.7 | | | | — | | | | — | | | | | Judges and magistrates salaries (Justice and Const. Dev.) |
| | — | | | | — | | | | — | | | | — | | | | — | | | | — | | | | | Unemployment Insurance Fund (Labour) |
| | | | | |
| | 968 131.7 | | | | 380 449.6 | | | | 77 029.4 | | | | 1 053 028.6 | | | | 404 251.4 | | | | 82 316.7 | | | | | Main budget expenditure |
| |
| | |
| 3) | | 3) Budget estimate adjusted for function shifts. |
| |
| 4) | | 4) Provincial equitable share excluding conditional grants to provinces. |
165
2011 BUDGET REVIEW
| | | | | | | | | | | | | | | | | | | | | | | | | | | | | | | | | |
| Table 5 | | | | | | | | | | | | | | | | |
| Consolidated national, provincial and social security | | | | | | | | | | | | | | | | |
| funds expenditure: Economic classification 1) | | | | | | | | | | | | | | | | |
| | | | | | | 2007/08 | | | 2008/09 | | | 2009/10 | | | 2010/11 | |
| | | | | | | | | | | % of | | | | | | | % of | | | | | | | % of | | | Revised | |
| R million | | | | | | Outcome | | | total | | | Outcome | | | total | | | Outcome | | | total | | | estimate | |
| |
Current payments | | | | | | | 308 166.6 | | | | 54.2 | % | | | 361 883.6 | | | | 53.6 | % | | | 412 302.9 | | | | 52.7 | % | | | 470 138.7 | |
| Compensation of employees | | | | | | | 177 101.1 | | | | 31.2 | % | | | 211 164.1 | | | | 31.3 | % | | | 248 612.3 | | | | 31.8 | % | | | 286 060.6 | |
| Goods and services | | | | | | | 78 074.4 | | | | 13.7 | % | | | 96 074.8 | | | | 14.2 | % | | | 106 218.6 | | | | 13.6 | % | | | 117 452.1 | |
| Interest and rent on land | | | | | | | 52 991.1 | | | | 9.3 | % | | | 54 644.7 | | | | 8.1 | % | | | 57 471.9 | | | | 7.3 | % | | | 66 626.0 | |
| | | | | | | | | | | | | | | | | | | | | | | | | | | | | | | | | |
Transfers and subsidies | | | | | | | 234 757.6 | | | | 41.3 | % | | | 271 865.4 | | | | 40.3 | % | | | 305 605.0 | | | | 39.1 | % | | | 325 490.3 | |
| Municipalities | | | | | | | 38 945.3 | | | | 6.9 | % | | | 46 225.4 | | | | 6.9 | % | | | 55 549.1 | | | | 7.1 | % | | | 66 005.2 | |
of which: Local government share | | | 2) | | | | 38 482.0 | | | | 6.8 | % | | | 45 487.3 | | | | 6.7 | % | | | 51 537.3 | | | | 6.6 | % | | | 61 152.1 | |
| Departmental agencies and accounts | | | | | | | 53 552.2 | | | | 9.4 | % | | | 62 901.3 | | | | 9.3 | % | | | 67 994.3 | | | | 8.7 | % | | | 64 029.9 | |
| Universities and technikons | | | | | | | 12 126.9 | | | | 2.1 | % | | | 14 043.9 | | | | 2.1 | % | | | 15 563.6 | | | | 2.0 | % | | | 17 727.1 | |
| Foreign governments and international organisations | | | | | | | 935.8 | | | | 0.2 | % | | | 1 017.4 | | | | 0.2 | % | | | 1 366.7 | | | | 0.2 | % | | | 1 359.3 | |
| Public corporations and private enterprises | | | | | | | 24 193.1 | | | | 4.3 | % | | | 24 692.7 | | | | 3.7 | % | | | 25 884.5 | | | | 3.3 | % | | | 24 889.8 | |
| Public corporations | | | | | | | 16 285.8 | | | | 2.9 | % | | | 15 698.7 | | | | 2.3 | % | | | 21 297.5 | | | | 2.7 | % | | | 20 445.6 | |
Subsidies on products and production | | | | | | | 6 555.0 | | | | 1.2 | % | | | 8 431.3 | | | | 1.2 | % | | | 9 621.2 | | | | 1.2 | % | | | 11 200.4 | |
Other transfers | | | | | | | 9 730.9 | | | | 1.7 | % | | | 7 267.5 | | | | 1.1 | % | | | 11 676.3 | | | | 1.5 | % | | | 9 245.3 | |
| Private enterprises | | | | | | | 7 907.3 | | | | 1.4 | % | | | 8 994.0 | | | | 1.3 | % | | | 4 587.0 | | | | 0.6 | % | | | 4 444.2 | |
Subsidies on products and production | | | | | | | 6 740.7 | | | | 1.2 | % | | | 8 094.5 | | | | 1.2 | % | | | 2 780.5 | | | | 0.4 | % | | | 2 691.3 | |
Other transfers | | | | | | | 1 166.5 | | | | 0.2 | % | | | 899.4 | | | | 0.1 | % | | | 1 806.5 | | | | 0.2 | % | | | 1 752.9 | |
| Non-profit institutions | | | | | | | 11 651.4 | | | | 2.1 | % | | | 14 998.9 | | | | 2.2 | % | | | 16 472.7 | | | | 2.1 | % | | | 17 559.3 | |
| Households | | | | | | | 93 352.8 | | | | 16.4 | % | | | 107 985.7 | | | | 16.0 | % | | | 122 774.1 | | | | 15.7 | % | | | 133 919.7 | |
| Social benefits | | | | | | | 80 313.2 | | | | 14.1 | % | | | 92 253.9 | | | | 13.7 | % | | | 105 710.5 | | | | 13.5 | % | | | 114 165.3 | |
| Other transfers to households | | | | | | | 13 039.6 | | | | 2.3 | % | | | 15 731.8 | | | | 2.3 | % | | | 17 063.6 | | | | 2.2 | % | | | 19 754.4 | |
| | | | | | | | | | | | | | | | | | | | | | | | | | | | | | | | | |
Payments for capital assets | | | | | | | 24 100.0 | | | | 4.2 | % | | | 29 861.2 | | | | 4.4 | % | | | 32 607.6 | | | | 4.2 | % | | | 31 496.2 | |
| Buildings and other fixed structures | | | | | | | 17 804.5 | | | | 3.1 | % | | | 23 357.2 | | | | 3.5 | % | | | 25 629.0 | | | | 3.3 | % | | | 24 681.9 | |
| Buildings | | | | | | | 11 681.2 | | | | 2.1 | % | | | 15 580.2 | | | | 2.3 | % | | | 17 340.5 | | | | 2.2 | % | | | 16 049.5 | |
| Other fixed structures | | | | | | | 6 123.3 | | | | 1.1 | % | | | 7 777.0 | | | | 1.2 | % | | | 8 288.4 | | | | 1.1 | % | | | 8 632.4 | |
| Machinery and equipment | | | | | | | 5 834.8 | | | | 1.0 | % | | | 6 137.1 | | | | 0.9 | % | | | 6 389.3 | | | | 0.8 | % | | | 6 612.6 | |
| Transport equipment | | | | | | | 1 952.9 | | | | 0.3 | % | | | 1 939.8 | | | | 0.3 | % | | | 1 988.1 | | | | 0.3 | % | | | 2 378.3 | |
| Other machinery and equipment | | | | | | | 3 881.9 | | | | 0.7 | % | | | 4 197.3 | | | | 0.6 | % | | | 4 401.2 | | | | 0.6 | % | | | 4 234.3 | |
| Land and sub-soil assets | | | | | | | 159.3 | | | | 0.0 | % | | | 76.5 | | | | 0.0 | % | | | 237.9 | | | | 0.0 | % | | | 67.5 | |
| Software and other intangible assets | | | | | | | 285.7 | | | | 0.1 | % | | | 284.4 | | | | 0.0 | % | | | 257.2 | | | | 0.0 | % | | | 90.9 | |
| Other assets | | | 3) | | | | 15.7 | | | | 0.0 | % | | | 6.0 | | | | 0.0 | % | | | 94.1 | | | | 0.0 | % | | | 43.3 | |
| | | | | | | | | | | | | | | | | | | | | | | | | | | | | | | | | |
Payments for financial assets | | | | | | | 1 253.6 | | | | 0.2 | % | | | 11 032.9 | | | | 1.6 | % | | | 31 711.2 | | | | 4.1 | % | | | 21 254.2 | |
| | | | | | | | | | | | | | | | | | | | | | | | | | | | | | | | | |
| | | | | | | |
Subtotal: Votes and Direct charges | | | | | | | 568 277.7 | | | | 100 | % | | | 674 643.1 | | | | 100 | % | | | 782 226.6 | | | | 100 | % | | | 848 379.4 | |
| | | | | | | | | | | | | | | | | | | | | | | | | | | | | | | | | |
Plus: | | | | | | | | | | | | | | | | | | | | | | | | | | | | | | | | |
| Contingency reserve | | | | | | | — | | | | — | | | | — | | | | — | | | | — | | | | — | | | | — | |
| | | | | | | | | | | | | | | | | | | | | | | | | | | | | | | | | |
| | | | | | | |
Total consolidated expenditure | | | | | | | 568 277.7 | | | | 100 | % | | | 674 643.1 | | | | 100 | % | | | 782 226.6 | | | | 100 | % | | | 848 379.4 | |
| |
| | |
| 1) | | These figures were estimated by the National Treasury and may differ from data published by Statistics South Africa and the South African Reserve Bank. The numbers in this table are not strictly comparable to those published in previous years due to the reclassification of expenditure items for previous years. Data for the history years have been adjusted accordingly. |
166
ANNEXURE B: STATISTICAL TABLES
| | | | | | | | | | | | | | | | | | | | | | | | | | | | | | | | | |
| | | | | | | | | | | | | | | | | | | | | | | | | | | | | | | | | Table 5 |
| | | | | | | | | | | | | | | | | | | | | | | | | | | | | | | | | Consolidated national, provincial and social security |
| | | | | | | | | | | | | | | | | | | | | | | | | | | | | | | | | funds expenditure: Economic classification 1) |
| | | | | 2011/12 | | | 2012/13 | | | 2013/14 | | | | | | | |
| % of | | | Budget | | | % of | | | Budget | | | % of | | | Budget | | | % of | | | | | | | |
| total | | | estimate | | | total | | | estimate | | | total | | | estimate | | | total | | | �� | | | | R million |
| |
| | 55.4 | % | | | 516 153.4 | | | | 55.7 | % | | | 555 963.0 | | | | 55.2 | % | | | 596 952.1 | | | | 54.6 | % | | | | | | Current payments |
| | 33.7 | % | | | 308 803.4 | | | | 33.3 | % | | | 326 068.8 | | | | 32.4 | % | | | 346 198.3 | | | | 31.7 | % | | | | | | Compensation of employees |
| | 13.8 | % | | | 130 429.8 | | | | 14.1 | % | | | 138 754.6 | | | | 13.8 | % | | | 146 426.1 | | | | 13.4 | % | | | | | | Goods and services |
| | 7.9 | % | | | 76 920.3 | | | | 8.3 | % | | | 91 139.7 | | | | 9.0 | % | | | 104 327.7 | | | | 9.5 | % | | | | | | Interest and rent on land |
| | 38.4 | % | | | 366 747.2 | | | | 39.6 | % | | | 396 542.1 | | | | 39.4 | % | | | 424 315.1 | | | | 38.8 | % | | | | | | Transfers and subsidies |
| | 7.8 | % | | | 73 933.0 | | | | 8.0 | % | | | 80 911.8 | | | | 8.0 | % | | | 86 831.9 | | | | 7.9 | % | | | | | | Municipalities |
| | 7.2 | % | | | 70 171.4 | | | | 7.6 | % | | | 77 029.4 | | | | 7.6 | % | | | 82 316.7 | | | | 7.5 | % | | | 2) | | | of which: Local government share |
| | 7.5 | % | | | 75 118.0 | | | | 8.1 | % | | | 80 281.8 | | | | 8.0 | % | | | 85 977.5 | | | | 7.9 | % | | | | | | Departmental agencies and accounts |
| | 2.1 | % | | | 19 525.8 | | | | 2.1 | % | | | 20 937.4 | | | | 2.1 | % | | | 22 134.2 | | | | 2.0 | % | | | | | | Universities and technikons |
| | 0.2 | % | | | 1 464.7 | | | | 0.2 | % | | | 1 725.0 | | | | 0.2 | % | | | 1 832.0 | | | | 0.2 | % | | | | | | Foreign governments and international organisations |
| | 2.9 | % | | | 27 879.1 | | | | 3.0 | % | | | 29 548.6 | | | | 2.9 | % | | | 30 209.1 | | | | 2.8 | % | | | | | | Public corporations and private enterprises |
| | 2.4 | % | | | 22 473.8 | | | | 2.4 | % | | | 23 959.5 | | | | 2.4 | % | | | 24 298.6 | | | | 2.2 | % | | | | | | Public corporations |
| | 1.3 | % | | | 11 236.0 | | | | 1.2 | % | | | 11 439.3 | | | | 1.1 | % | | | 10 309.0 | | | | 0.9 | % | | | | | | Subsidies on products and production |
| | 1.1 | % | | | 11 237.8 | | | | 1.2 | % | | | 12 520.3 | | | | 1.2 | % | | | 13 989.6 | | | | 1.3 | % | | | | | | Other transfers |
| | 0.5 | % | | | 5 405.3 | | | | 0.6 | % | | | 5 589.1 | | | | 0.6 | % | | | 5 910.5 | | | | 0.5 | % | | | | | | Private enterprises |
| | 0.3 | % | | | 3 566.9 | | | | 0.4 | % | | | 3 571.4 | | | | 0.4 | % | | | 3 800.7 | | | | 0.3 | % | | | | | | Subsidies on products and production |
| | 0.2 | % | | | 1 838.4 | | | | 0.2 | % | | | 2 017.7 | | | | 0.2 | % | | | 2 109.9 | | | | 0.2 | % | | | | | | Other transfers |
| | 2.1 | % | | | 20 046.5 | | | | 2.2 | % | | | 21 556.1 | | | | 2.1 | % | | | 22 829.9 | | | | 2.1 | % | | | | | | Non-profit institutions |
| | 15.8 | % | | | 148 780.0 | | | | 16.0 | % | | | 161 581.5 | | | | 16.0 | % | | | 174 500.5 | | | | 16.0 | % | | | | | | Households |
| | 13.5 | % | | | 126 467.9 | | | | 13.6 | % | | | 137 560.0 | | | | 13.7 | % | | | 149 577.3 | | | | 13.7 | % | | | | | | Social benefits |
| | 2.3 | % | | | 22 312.1 | | | | 2.4 | % | | | 24 021.5 | | | | 2.4 | % | | | 24 923.2 | | | | 2.3 | % | | | | | | Other transfers to households |
| | | | | | | | | | | | | | | | | | | | | | | | | | | | | | | | | |
| | 3.7 | % | | | 39 503.0 | | | | 4.3 | % | | | 43 308.2 | | | | 4.3 | % | | | 49 098.2 | | | | 4.5 | % | | | | | | Payments for capital assets |
| | 2.9 | % | | | 31 624.7 | | | | 3.4 | % | | | 35 291.0 | | | | 3.5 | % | | | 40 568.2 | | | | 3.7 | % | | | | | | Buildings and other fixed structures |
| | 1.9 | % | | | 20 818.1 | | | | 2.2 | % | | | 23 799.9 | | | | 2.4 | % | | | 28 006.5 | | | | 2.6 | % | | | | | | Buildings |
| | 1.0 | % | | | 10 806.6 | | | | 1.2 | % | | | 11 491.1 | | | | 1.1 | % | | | 12 561.7 | | | | 1.1 | % | | | | | | Other fixed structures |
| | 0.8 | % | | | 7 604.2 | | | | 0.8 | % | | | 7 801.8 | | | | 0.8 | % | | | 8 300.2 | | | | 0.8 | % | | | | | | Machinery and equipment |
| | 0.3 | % | | | 2 577.6 | | | | 0.3 | % | | | 2 320.6 | | | | 0.2 | % | | | 2 399.5 | | | | 0.2 | % | | | | | | Transport equipment |
| | 0.5 | % | | | 5 026.5 | | | | 0.5 | % | | | 5 481.3 | | | | 0.5 | % | | | 5 900.7 | | | | 0.5 | % | | | | | | Other machinery and equipment |
| | 0.0 | % | | | 104.3 | | | | 0.0 | % | | | 44.8 | | | | 0.0 | % | | | 62.1 | | | | 0.0 | % | | | | | | Land and sub-soil assets |
| | 0.0 | % | | | 148.6 | | | | 0.0 | % | | | 148.6 | | | | 0.0 | % | | | 144.6 | | | | 0.0 | % | | | | | | Software and other intangible assets |
| | 0.0 | % | | | 21.2 | | | | 0.0 | % | | | 21.9 | | | | 0.0 | % | | | 23.0 | | | | 0.0 | % | | | 3) | | | Other assets |
| | | | | | | | | | | | | | | | | | | | | | | | | | | | | | | | | |
| | 2.5 | % | | | 767.1 | | | | 0.1 | % | | | 8.0 | | | | 0.0 | % | | | 4.5 | | | | 0.0 | % | | | | | | Payments for financial assets |
| | | | | | | | | | | | | | | | | | | | | | | | | | | | | | | | | |
| | | | | | | |
| | 100 | % | | | 923 170.8 | | | | 99.6 | % | | | 995 821.4 | | | | 98.9 | % | | | 1 070 369.8 | | | | 97.9 | % | | | | | | Subtotal: Votes and Direct charges |
| | | | | | | | | | | | | | | | | | | | | | | | | | | | | | | | | |
| | | | | | | | | | | | | | | | | | | | | | | | | | | | | | | | | Plus: |
| | — | | | | 4 090.4 | | | | — | | | | 11 405.4 | | | | — | | | | 23 375.2 | | | | — | | | | | | | Contingency reserve |
| | | | | | | | | | | | | | | | | | | | | | | | | | | | | | | | | |
| | | | | | | |
| | 100 | % | | | 927 261.2 | | | | 100 | % | | | 1 007 226.8 | | | | 100 | % | | | 1 093 745.0 | | | | 100 | % | | | | | | Total consolidated expenditure |
| |
| | |
| 2) | | Includes equitable share and conditional grants to local government. |
| |
| 3) | | Includes biological, heritage and specialised military assets |
167
| | | | | | | | | | | | | | | | | | | | | | | | | | | | | | | | | |
| Table 6 | | | | | | | | | | | | | | | | |
| Consolidated national, provincial and social security | | | | | | | | | | | | | | | | |
| funds expenditure: Functional classification 1) | | | | | | | | | | | | | | | | |
| | | | | | | 2007/08 | | | 2008/09 | | | 2009/10 | | | 2010/11 | |
| | | | | | | Estimated | | | % of | | | Estimated | | | % of | | | Estimated | | | % of | | | Revised | |
| R million | | | | | | outcome | | | total | | | outcome | | | total | | | outcome | | | total | | | estimate | |
| |
General public services | | | 2 | ) | | | 84 893.8 | | | | 14.9 | % | | | 95 098.4 | | | | 14.1 | % | | | 102 321.8 | | | | 13.1 | % | | | 115 057.0 | |
of which: State debt cost | | | | | | | 52 877.1 | | | | 9.3 | % | | | 54 393.7 | | | | 8.1 | % | | | 57 129.2 | | | | 7.3 | % | | | 66 570.4 | |
| | | | | | | | | | | | | | | | | | | | | | | | | | | | | | | | | |
Defense | | | | | | | 27 764.4 | | | | 4.9 | % | | | 30 644.9 | | | | 4.5 | % | | | 34 376.5 | | | | 4.4 | % | | | 33 749.3 | |
Public order and safety | | | | | | | 57 938.7 | | | | 10.2 | % | | | 66 640.4 | | | | 9.9 | % | | | 75 136.5 | | | | 9.6 | % | | | 83 880.8 | |
| Police services | | | | | | | 38 370.8 | | | | 6.8 | % | | | 43 837.0 | | | | 6.5 | % | | | 49 939.1 | | | | 6.4 | % | | | 55 950.1 | |
| Law courts | | | | | | | 8 432.2 | | | | 1.5 | % | | | 9 939.4 | | | | 1.5 | % | | | 11 511.3 | | | | 1.5 | % | | | 12 743.2 | |
| Prisons | | | | | | | 11 135.8 | | | | 2.0 | % | | | 12 864.0 | | | | 1.9 | % | | | 13 686.1 | | | | 1.7 | % | | | 15 187.4 | |
| | | | | | | | | | | | | | | | | | | | | | | | | | | | | | | | | |
Economic affairs | | | | | | | 73 236.8 | | | | 12.9 | % | | | 95 981.7 | | | | 14.2 | % | | | 123 646.5 | | | | 15.8 | % | | | 114 741.3 | |
| General economic, commercial and labour affairs | | | | | | | 9 143.3 | | | | 1.6 | % | | | 8 999.4 | | | | 1.3 | % | | | 9 909.5 | | | | 1.3 | % | | | 10 222.1 | |
| Agriculture, forestry, fishing and hunting | | | | | | | 13 335.4 | | | | 2.3 | % | | | 14 607.0 | | | | 2.2 | % | | | 14 969.9 | | | | 1.9 | % | | | 15 739.8 | |
| Fuel and energy | | | | | | | 4 742.8 | | | | 0.8 | % | | | 14 720.0 | | | | 2.2 | % | | | 35 439.0 | | | | 4.5 | % | | | 25 680.8 | |
| Mining, manufacturing and construction | | | | | | | 4 746.4 | | | | 0.8 | % | | | 3 805.5 | | | | 0.6 | % | | | 4 808.9 | | | | 0.6 | % | | | 4 570.1 | |
| Transport | | | | | | | 34 657.2 | | | | 6.1 | % | | | 45 675.2 | | | | 6.8 | % | | | 49 192.9 | | | | 6.3 | % | | | 49 449.7 | |
| Communication | | | | | | | 1 975.1 | | | | 0.3 | % | | | 2 794.0 | | | | 0.4 | % | | | 2 589.1 | | | | 0.3 | % | | | 2 330.4 | |
| Economic affairs not elsewhere classified | | | | | | | 4 636.6 | | | | 0.8 | % | | | 5 380.5 | | | | 0.8 | % | | | 6 737.2 | | | | 0.9 | % | | | 6 748.5 | |
| | | | | | | | | | | | | | | | | | | | | | | | | | | | | | | | | |
Environmental protection | | | | | | | 2 803.1 | | | | 0.5 | % | | | 3 278.6 | | | | 0.5 | % | | | 3 373.8 | | | | 0.4 | % | | | 3 473.0 | |
Housing and community amenities | | | | | | | 46 966.8 | | | | 8.3 | % | | | 57 002.3 | | | | 8.4 | % | | | 69 122.7 | | | | 8.8 | % | | | 82 335.2 | |
| Housing development | | | | | | | 11 720.0 | | | | 2.1 | % | | | 15 005.3 | | | | 2.2 | % | | | 18 082.3 | | | | 2.3 | % | | | 21 706.0 | |
| Community development | | | | | | | 26 037.5 | | | | 4.6 | % | | | 31 498.9 | | | | 4.7 | % | | | 38 135.5 | | | | 4.9 | % | | | 47 262.2 | |
| Water supply | | | | | | | 9 209.3 | | | | 1.6 | % | | | 10 498.2 | | | | 1.6 | % | | | 12 904.9 | | | | 1.6 | % | | | 13 367.0 | |
| | | | | | | | | | | | | | | | | | | | | | | | | | | | | | | | | |
Health | | | | | | | 62 266.3 | | | | 11.0 | % | | | 74 448.0 | | | | 11.0 | % | | | 90 747.6 | | | | 11.6 | % | | | 102 023.4 | |
Recreation and culture | | | | | | | 8 488.8 | | | | 1.5 | % | | | 9 651.8 | | | | 1.4 | % | | | 7 544.3 | | | | 1.0 | % | | | 5 961.9 | |
Education | | | | | | | 111 508.4 | | | | 19.6 | % | | | 135 055.6 | | | | 20.0 | % | | | 153 560.7 | | | | 19.6 | % | | | 173 923.3 | |
Social protection | | | | | | | 92 410.7 | | | | 16.3 | % | | | 106 841.4 | | | | 15.8 | % | | | 122 396.3 | | | | 15.6 | % | | | 133 234.1 | |
| | | | | | | | | | | | | | | | | | | | | | | | | | | | | | | | | |
| | | | | | | |
Subtotal: Votes and Direct charges | | | | | | | 568 277.7 | | | | 100 | % | | | 674 643.1 | | | | 100 | % | | | 782 226.6 | | | | 100 | % | | | 848 379.4 | |
| | | | | | | | | | | | | | | | | | | | | | | | | | | | | | | | | |
Plus: | | | | | | | | | | | | | | | | | | | | | | | | | | | | | | | | |
| Contingency reserve | | | | | | | — | | | | — | | | | — | | | | — | | | | — | | | | — | | | | — | |
| | | | | | | | | | | | | | | | | | | | | | | | | | | | | | | | | |
| | | | | | | |
Total consolidated expenditure | | | | | | | 568 277.7 | | | | — | | | | 674 643.1 | | | | — | | | | 782 226.6 | | | | — | | | | 848 379.4 | |
| |
| | |
| 1) | | These figures were estimated by the National Treasury and may differ from data published by Statistics South Africa. The numbers in this table is not strictly comparable to those published in previous years due to the allocation of some of the unallocable expenditure for previous years. Data for the history years has been adjusted accordingly. |
168
ANNEXURE B: STATISTICAL TABLES
| | | | | | | | | | | | | | | | | | | | | | | | | | | | | | | | | |
| | | | | | | | | | | | | | | | | | | | | | | | | | | | | | | | | Table 6 |
| | | | | | | | | | | | | | | | | | | | | | | | | | | | | | | | | Consolidated national, provincial and social security |
| | | | | | | | | | | | | | | | | | | | | | | | | | | | | | | | | funds expenditure: Functional classification 1) |
| | | | | 2011/12 | | | 2012/13 | | | 2013/14 | | | | | | | |
| % of | | | Budget | | | % of | | | Budget | | | % of | | | Budget | | | % of | | | | | | | |
| total | | | estimate | | | total | | | estimate | | | total | | | estimate | | | total | | | | | | | R million |
| |
| | 13.6 | % | | | 129 438.0 | | | | 14.0 | % | | | 143 512.5 | | | | 14.4 | % | | | 160 755.0 | | | | 15.0 | % | | | 2) | | | General public services |
| | 7.8 | % | | | 76 578.7 | | | | 8.3 | % | | | 90 807.7 | | | | 9.1 | % | | | 104 036.2 | | | | 9.7 | % | | | | | | of which: State debt cost |
| | | | | | | | | | | | | | | | | | | | | | | | | | | | | | | | | |
| | 4.0 | % | | | 38 223.5 | | | | 4.1 | % | | | 41 126.8 | | | | 4.1 | % | | | 43 662.5 | | | | 4.1 | % | | | | | | Defense |
| | 9.9 | % | | | 90 729.8 | | | | 9.8 | % | | | 97 678.7 | | | | 9.8 | % | | | 104 364.2 | | | | 9.8 | % | | | | | | Public order and safety |
| | 6.6 | % | | | 60 658.0 | | | | 6.6 | % | | | 64 818.3 | | | | 6.5 | % | | | 69 585.4 | | | | 6.5 | % | | | | | | Police services |
| | 1.5 | % | | | 13 570.8 | | | | 1.5 | % | | | 15 121.2 | | | | 1.5 | % | | | 16 024.8 | | | | 1.5 | % | | | | | | Law courts |
| | 1.8 | % | | | 16 501.0 | | | | 1.8 | % | | | 17 739.2 | | | | 1.8 | % | | | 18 754.0 | | | | 1.8 | % | | | | | | Prisons |
| | | | | | | | | | | | | | | | | | | | | | | | | | | | | | | | | |
| | 13.5 | % | | | 106 906.9 | | | | 11.6 | % | | | 113 237.6 | | | | 11.4 | % | | | 119 572.2 | | | | 11.2 | % | | | | | | Economic affairs |
| | 1.2 | % | | | 13 034.7 | | | | 1.4 | % | | | 14 025.3 | | | | 1.4 | % | | | 15 541.6 | | | | 1.5 | % | | | | | | General economic, commercial and labour affairs |
| | 1.9 | % | | | 18 292.0 | | | | 2.0 | % | | | 19 447.3 | | | | 2.0 | % | | | 20 299.1 | | | | 1.9 | % | | | | | | Agriculture, forestry, fishing and hunting |
| | 3.0 | % | | | 6 141.1 | | | | 0.7 | % | | | 5 587.8 | | | | 0.6 | % | | | 4 318.0 | | | | 0.4 | % | | | | | | Fuel and energy |
| | 0.5 | % | | | 4 870.7 | | | | 0.5 | % | | | 5 277.7 | | | | 0.5 | % | | | 5 436.1 | | | | 0.5 | % | | | | | | Mining, manufacturing and construction |
| | 5.8 | % | | | 55 323.3 | | | | 6.0 | % | | | 58 846.1 | | | | 5.9 | % | | | 62 786.0 | | | | 5.9 | % | | | | | | Transport |
| | 0.3 | % | | | 1 948.1 | | | | 0.2 | % | | | 1 783.2 | | | | 0.2 | % | | | 1 912.5 | | | | 0.2 | % | | | | | | Communication |
| | 0.8 | % | | | 7 297.0 | | | | 0.8 | % | | | 8 270.2 | | | | 0.8 | % | | | 9 279.0 | | | | 0.9 | % | | | | | | Economic affairs not elsewhere classified |
| | | | | | | | | | | | | | | | | | | | | | | | | | | | | | | | | |
| | 0.4 | % | | | 4 425.3 | | | | 0.5 | % | | | 4 053.6 | | | | 0.4 | % | | | 4 383.5 | | | | 0.4 | % | | | | | | Environmental protection |
| | 9.7 | % | | | 96 424.7 | | | | 10.4 | % | | | 106 306.9 | | | | 10.7 | % | | | 113 044.9 | | | | 10.6 | % | | | | | | Housing and community amenities |
| | 2.6 | % | | | 26 742.4 | | | | 2.9 | % | | | 29 619.7 | | | | 3.0 | % | | | 31 297.4 | | | | 2.9 | % | | | | | | Housing development |
| | 5.6 | % | | | 53 030.2 | | | | 5.7 | % | | | 58 401.1 | | | | 5.9 | % | | | 62 387.9 | | | | 5.8 | % | | | | | | Community development |
| | 1.6 | % | | | 16 652.2 | | | | 1.8 | % | | | 18 286.0 | | | | 1.8 | % | | | 19 359.6 | | | | 1.8 | % | | | | | | Water supply |
| | | | | | | | | | | | | | | | | | | | | | | | | | | | | | | | | |
| | 12.0 | % | | | 112 488.1 | | | | 12.2 | % | | | 120 444.4 | | | | 12.1 | % | | | 127 152.9 | | | | 11.9 | % | | | | | | Health |
| | 0.7 | % | | | 5 844.9 | | | | 0.6 | % | | | 6 251.0 | | | | 0.6 | % | | | 6 589.5 | | | | 0.6 | % | | | | | | Recreation and culture |
| | 20.5 | % | | | 191 230.6 | | | | 20.7 | % | | | 204 216.5 | | | | 20.5 | % | | | 218 544.5 | | | | 20.4 | % | | | | | | Education |
| | 15.7 | % | | | 147 459.1 | | | | 16.0 | % | | | 158 993.5 | | | | 16.0 | % | | | 172 300.6 | | | | 16.1 | % | | | | | | Social protection |
| | | | | | | | | | | | | | | | | | | | | | | | | | | | | | | | | |
| | | | | | | |
| | 100 | % | | | 923 170.8 | | | | 100 | % | | | 995 821.4 | | | | 100 | % | | | 1 070 369.8 | | | | 100 | % | | | | | | Subtotal: Votes and Direct charges |
| | | | | | | | | | | | | | | | | | | | | | | | | | | | | | | | | |
| | | | | | | | | | | | | | | | | | | | | | | | | | | | | | | | | Plus: |
| | — | | | | 4 090.4 | | | | — | | | | 11 405.4 | | | | — | | | | 23 375.2 | | | | — | | | | | | | Contingency reserve |
| | | | | | | | | | | | | | | | | | | | | | | | | | | | | | | | | |
| | | | | | | |
| | — | | | | 927 261.2 | | | | — | | | | 1 007 226.8 | | | | — | | | | 1 093 745.0 | | | | — | | | | | | | Total consolidated expenditure |
| |
| | |
| 2) | | Mainly general administration, cost of raising loans and unallocatable capital expenditure. |
169
Table 7
Consolidated government revenue and expenditure 1)
| | | | | | | | | | | | | | | | | | | | | | | | | | | | | | | | | |
| | | | | | | 2007/08 | | | 2008/09 | | | 2009/10 | | | 2010/11 | |
| | | | | | | | | | | % of | | | | | | | % of | | | | | | | % of | | | Revised | |
| R million | | | | | | Outcome | | | total | | | Outcome | | | total | | | Outcome | | | total | | | estimate | |
| |
Revenue | | | | | | | | | | | | | | | | | | | | | | | | | | | | | | | | |
| Current revenue | | | | | | | 626 488.6 | | | | 100.0 | % | | | 682 774.7 | | | | 100.0 | % | | | 664 551.7 | | | | 100.0 | % | | | 754 828.9 | |
Tax revenue (net of SACU) | | | | | | | 574 218.7 | | | | 91.6 | % | | | 624 877.7 | | | | 91.5 | % | | | 602 503.9 | | | | 90.6 | % | | | 691 116.7 | |
Non-tax revenue | | | | | | | 52 269.9 | | | | 8.3 | % | | | 57 896.9 | | | | 8.5 | % | | | 62 047.8 | | | | 9.3 | % | | | 63 712.2 | |
| Sales of capital assets | | | | | | | 216.5 | | | | 0.0 | % | | | 222.5 | | | | 0.0 | % | | | 288.8 | | | | 0.0 | % | | | 194.2 | |
| | | | | | | |
Total revenue | | | | | | | 626 705.1 | | | | 100.0 | % | | | 682 997.2 | | | | 100.0 | % | | | 664 840.5 | | | | 100.0 | % | | | 755 023.1 | |
Expenditure | | | | | | | | | | | | | | | | | | | | | | | | | | | | | | | | |
Economic classification | | | | | | | | | | | | | | | | | | | | | | | | | | | | | | | | |
Current payments | | | | | | | 351 148.4 | | | | 59.4 | % | | | 411 705.7 | | | | 57.9 | % | | | 474 252.4 | | | | 57.4 | % | | | 534 071.7 | |
| Compensation of employees | | | | | | | 194 986.6 | | | | 33.0 | % | | | 232 542.6 | | | | 32.7 | % | | | 273 095.5 | | | | 33.1 | % | | | 314 157.2 | |
| Goods and services | | | | | | | 99 239.6 | | | | 16.8 | % | | | 120 492.7 | | | | 17.0 | % | | | 138 566.7 | | | | 16.8 | % | | | 148 378.3 | |
| Interest and rent on land | | | | | | | 56 922.2 | | | | 9.6 | % | | | 58 670.4 | | | | 8.3 | % | | | 62 590.2 | | | | 7.6 | % | | | 71 536.2 | |
Transfers and subsidies | | | | | | | 206 079.1 | | | | 34.8 | % | | | 238 199.5 | | | | 33.5 | % | | | 263 936.3 | | | | 32.0 | % | | | 282 269.1 | |
| Municipalities | | | | | | | 40 351.7 | | | | 6.8 | % | | | 46 520.5 | | | | 6.5 | % | | | 55 858.2 | | | | 6.8 | % | | | 66 788.2 | |
| Departmental agencies and accounts | | | | | | | 19 485.0 | | | | 3.3 | % | | | 23 586.7 | | | | 3.3 | % | | | 20 407.2 | | | | 2.5 | % | | | 11 539.4 | |
| Universities and technikons | | | | | | | 12 126.9 | | | | 2.1 | % | | | 14 043.9 | | | | 2.0 | % | | | 15 563.6 | | | | 1.9 | % | | | 17 855.5 | |
| Foreign governments and international organisations | | | | | | | 1 289.9 | | | | 0.2 | % | | | 1 499.1 | | | | 0.2 | % | | | 1 701.8 | | | | 0.2 | % | | | 1 760.4 | |
| Public corporations and private enterprises | | | | | | | 24 768.2 | | | | 4.2 | % | | | 25 455.5 | | | | 3.6 | % | | | 26 435.6 | | | | 3.2 | % | | | 25 661.5 | |
| Non-profit institutions | | | | | | | 12 261.3 | | | | 2.1 | % | | | 15 902.8 | | | | 2.2 | % | | | 18 320.0 | | | | 2.2 | % | | | 21 673.6 | |
| Households | | | | | | | 95 796.0 | | | | 16.2 | % | | | 111 191.0 | | | | 15.6 | % | | | 125 649.9 | | | | 15.2 | % | | | 136 990.6 | |
Payments for capital assets | | | | | | | 33 040.7 | | | | 5.6 | % | | | 49 584.6 | | | | 7.0 | % | | | 56 016.6 | | | | 6.8 | % | | | 59 781.4 | |
| Buildings and other fixed structures | | | | | | | 24 575.6 | | | | 4.2 | % | | | 39 595.9 | | | | 5.6 | % | | | 43 158.2 | | | | 5.2 | % | | | 46 025.8 | |
| Machinery and equipment | | | | | | | 7 498.4 | | | | 1.3 | % | | | 8 628.4 | | | | 1.2 | % | | | 11 504.0 | | | | 1.4 | % | | | 12 297.7 | |
| Land and sub-soil assets | | | | | | | 199.1 | | | | 0.0 | % | | | 376.1 | | | | 0.1 | % | | | 290.9 | | | | 0.0 | % | | | 195.5 | |
| Software and other intangible assets | | | | | | | 716.0 | | | | 0.1 | % | | | 852.5 | | | | 0.1 | % | | | 830.9 | | | | 0.1 | % | | | 1 142.8 | |
| Other assets | | | 2) | | | | 51.5 | | | | 0.0 | % | | | 131.7 | | | | 0.0 | % | | | 232.5 | | | | 0.0 | % | | | 119.7 | |
Payments for financial assets | | | | | | | 1 253.6 | | | | 0.2 | % | | | 11 032.9 | | | | 1.6 | % | | | 31 711.2 | | | | 3.8 | % | | | 21 254.2 | |
| | | | | | | |
Subtotal: Economic classification | | | | | | | 591 521.7 | | | | 100 | % | | | 710 522.7 | | | | 100.0 | % | | | 825 916.6 | | | | 100.0 | % | | | 897 376.4 | |
| |
Functional classification | | | | | | | | | | | | | | | | | | | | | | | | | | | | | | | | |
General public services | | | 3) | | | | 86 412.3 | | | | 14.6 | % | | | 97 471.5 | | | | 13.7 | % | | | 103 505.6 | | | | 12.5 | % | | | 117 895.1 | |
of which: State debt cost | | | | | | | 52 877.1 | | | | 8.9 | % | | | 54 393.7 | | | | 7.7 | % | | | 57 129.2 | | | | 6.9 | % | | | 66 570.4 | |
Defense | | | | | | | 27 934.0 | | | | 4.7 | % | | | 30 889.0 | | | | 4.3 | % | | | 34 621.1 | | | | 4.2 | % | | | 33 958.2 | |
Public order and safety | | | | | | | 58 061.8 | | | | 9.8 | % | | | 66 855.0 | | | | 9.4 | % | | | 75 271.3 | | | | 9.1 | % | | | 84 049.8 | |
| Police services | | | | | | | 38 403.0 | | | | 6.5 | % | | | 43 837.1 | | | | 6.2 | % | | | 49 918.4 | | | | 6.0 | % | | | 55 950.1 | |
| Law courts | | | | | | | 8 523.1 | | | | 1.4 | % | | | 10 154.0 | | | | 1.4 | % | | | 11 666.8 | | | | 1.4 | % | | | 12 912.3 | |
| Prisons | | | | | | | 11 135.8 | | | | 1.9 | % | | | 12 864.0 | | | | 1.8 | % | | | 13 686.1 | | | | 1.7 | % | | | 15 187.4 | |
Economic affairs | | | | | | | 82 298.8 | | | | 13.9 | % | | | 115 180.5 | | | | 16.2 | % | | | 153 090.1 | | | | 18.5 | % | | | 140 319.0 | |
| General economic, commercial and labour affairs | | | | | | | 10 612.2 | | | | 1.8 | % | | | 12 327.0 | | | | 1.7 | % | | | 14 084.0 | | | | 1.7 | % | | | 16 948.3 | |
| Agriculture, forestry, fishing and hunting | | | | | | | 13 911.1 | | | | 2.4 | % | | | 15 267.6 | | | | 2.1 | % | | | 17 690.4 | | | | 2.1 | % | | | 16 303.1 | |
| Fuel and energy | | | | | | | 5 469.7 | | | | 0.9 | % | | | 15 852.6 | | | | 2.2 | % | | | 36 914.5 | | | | 4.5 | % | | | 27 560.4 | |
| Mining, manufacturing and construction | | | | | | | 5 151.5 | | | | 0.9 | % | | | 4 318.4 | | | | 0.6 | % | | | 5 557.4 | | | | 0.7 | % | | | 5 530.3 | |
| Transport | | | | | | | 38 948.2 | | | | 6.6 | % | | | 56 471.2 | | | | 7.9 | % | | | 66 023.9 | | | | 8.0 | % | | | 60 521.9 | |
| Communication | | | | | | | 2 138.7 | | | | 0.4 | % | | | 3 313.5 | | | | 0.5 | % | | | 3 446.0 | | | | 0.4 | % | | | 3 296.6 | |
| Economic affairs not elsewhere classified | | | | | | | 6 067.5 | | | | 1.0 | % | | | 7 630.2 | | | | 1.1 | % | | | 9 373.9 | | | | 1.1 | % | | | 10 158.4 | |
Environmental protection | | | | | | | 3 784.2 | | | | 0.6 | % | | | 4 403.3 | | | | 0.6 | % | | | 4 285.7 | | | | 0.5 | % | | | 4 745.1 | |
Housing and community amenities | | | | | | | 57 981.7 | | | | 9.8 | % | | | 68 642.5 | | | | 9.7 | % | | | 81 543.7 | | | | 9.9 | % | | | 102 061.0 | |
| Housing development | | | | | | | 12 146.3 | | | | 2.1 | % | | | 15 829.9 | | | | 2.2 | % | | | 18 886.6 | | | | 2.3 | % | | | 22 530.0 | |
| Community development | | | | | | | 26 801.1 | | | | 4.5 | % | | | 32 373.2 | | | | 4.6 | % | | | 38 941.8 | | | | 4.7 | % | | | 48 356.1 | |
| Water supply | | | | | | | 19 034.2 | | | | 3.2 | % | | | 20 439.4 | | | | 2.9 | % | | | 23 715.4 | | | | 2.9 | % | | | 31 174.8 | |
Health | | | | | | | 62 745.5 | | | | 10.6 | % | | | 74 969.2 | | | | 10.6 | % | | | 91 137.1 | | | | 11.0 | % | | | 102 522.2 | |
Recreation and culture | | | | | | | 8 657.9 | | | | 1.5 | % | | | 9 823.1 | | | | 1.4 | % | | | 7 734.3 | | | | 0.9 | % | | | 6 351.4 | |
Education | | | | | | | 110 702.5 | | | | 18.7 | % | | | 134 601.1 | | | | 18.9 | % | | | 152 241.8 | | | | 18.4 | % | | | 172 713.2 | |
Social protection | | | | | | | 92 943.0 | | | | 15.7 | % | | | 107 687.4 | | | | 15.2 | % | | | 122 485.7 | | | | 14.8 | % | | | 132 761.3 | |
| |
Subtotal: Functional classification | | | | | | | 591 521.7 | | | | 100.0 | % | | | 710 522.7 | | | | 100.0 | % | | | 825 916.6 | | | | 100.0 | % | | | 897 376.4 | |
Plus: | | | | | | | | | | | | | | | | | | | | | | | | | | | | | | | | |
| Contingency reserve | | | | | | | — | | | | — | | | | — | | | | — | | | | — | | | | — | | | | — | |
| | | | | | | |
Total consolidated expenditure | | | | | | | 591 521.7 | | | | — | | | | 710 522.7 | | | | — | | | | 825 916.6 | | | | — | | | | 897 376.4 | |
Consolidated budget balance | | | | | | | 35 183.4 | | | | | | | | -27 525.5 | | | | | | | | -161 076.1 | | | | | | | | -142 353.3 | |
| |
| | |
| 1) | | Consisting of national and provincial government, social security funds and selected public entities. Refer to Annexure W2 for a detailed list of entities included. In some cases figures were estimated by the National Treasury and may differ from data published by Statistics South Africa and the Reserve Bank. |
170
ANNEXURE B: STATISTICAL TABLES
| | | | | | | | | | | | | | | | | | | | | | | | | | | | | | | |
| | | | | | | | | | | | | | | | | | | | | | | | | Table 7
Consolidated government revenue and expenditure 1) |
| | | | | | | | | | | | | | | | | | | | | | | | | | | | | | | |
| 2010/11 | | | 2011/12 | | | 2012/13 | | | 2013/14 | | | | |
| % of | | | Budget | | | % of | | | Budget | | | % of | | | Budget | | | % of | | | | | |
| total | | | estimate | | | total | | | estimate | | | total | | | estimate | | | total | | | | | R million |
| |
| | | | | | | | | | | | | | | | | | | | | | | | | | | | | | | Revenue |
| | 100.0 | % | | | 824 347.9 | | | | 100.0 | % | | | 908 632.8 | | | | 100.0 | % | | | 1 017 097.5 | | | 100.0 | % | | | | | Current revenue |
| | 91.5 | % | | | 758 773.7 | | | | 92.0 | % | | | 837 085.0 | | | | 92.1 | % | | | 937 731.5 | | | 92.2 | % | | | | | Tax revenue (net of SACU) |
| | 8.4 | % | | | 65 574.3 | | | | 8.0 | % | | | 71 547.8 | | | | 7.9 | % | | | 79 366.0 | | | 7.8 | % | | | | | Non-tax revenue |
| | 0.0 | % | | | 118.5 | | | | 0.0 | % | | | 81.2 | | | | 0.0 | % | | | 89.6 | | | 0.0 | % | | | | | Sales of capital assets |
| | | | | | | |
| | 100.0 | % | | | 824 466.5 | | | | 100.0 | % | | | 908 713.9 | | | | 100.0 | % | | | 1 017 187.1 | | | 100.0 | % | | | | | Total revenue |
| | | | | | | | | | | | | | | | | | | | | | | | | | | | | | | Expenditure |
| | | | | | | | | | | | | | | | | | | | | | | | | | | | | | | Economic classification |
| | 59.5 | % | | | 587 702.4 | | | | 60.3 | % | | | 635 952.9 | | | | 60.6 | % | | | 684 638.5 | | | 60.7 | % | | | | | Current payments |
| | 35.0 | % | | | 338 572.0 | | | | 34.7 | % | | | 357 925.5 | | | | 34.1 | % | | | 380 229.0 | | | 33.7 | % | | | | | Compensation of employees |
| | 16.5 | % | | | 164 622.7 | | | | 16.9 | % | | | 177 866.6 | | | | 16.9 | % | | | 190 702.9 | | | 16.9 | % | | | | | Goods and services |
| | 8.0 | % | | | 84 507.6 | | | | 8.7 | % | | | 100 160.9 | | | | 9.5 | % | | | 113 706.7 | | | 10.1 | % | | | | | Interest and rent on land |
| | 31.5 | % | | | 315 097.1 | | | | 32.3 | % | | | 340 806.2 | | | | 32.5 | % | | | 363 098.8 | | | 32.2 | % | | | | | Transfers and subsidies |
| | 7.4 | % | | | 74 976.1 | | | | 7.7 | % | | | 82 028.7 | | | | 7.8 | % | | | 88 040.3 | | | 7.8 | % | | | | | Municipalities |
| | 1.3 | % | | | 13 751.4 | | | | 1.4 | % | | | 14 405.9 | | | | 1.4 | % | | | 14 588.6 | | | 1.3 | % | | | | | Departmental agencies and accounts |
| | 2.0 | % | | | 19 636.6 | | | | 2.0 | % | | | 20 963.6 | | | | 2.0 | % | | | 22 370.9 | | | 2.0 | % | | | | | Universities and technikons |
| | 0.2 | % | | | 1 950.1 | | | | 0.2 | % | | | 2 220.2 | | | | 0.2 | % | | | 2 357.2 | | | 0.2 | % | | | | | Foreign governments and international organisations |
| | 2.9 | % | | | 30 270.7 | | | | 3.1 | % | | | 32 070.7 | | | | 3.1 | % | | | 32 937.2 | | | 2.9 | % | | | | | Public corporations and private enterprises |
| | 2.4 | % | | | 23 057.8 | | | | 2.4 | % | | | 24 604.8 | | | | 2.3 | % | | | 25 151.3 | | | 2.2 | % | | | | | Non-profit institutions |
| | 15.3 | % | | | 151 454.4 | | | | 15.5 | % | | | 164 512.4 | | | | 15.7 | % | | | 177 653.3 | | | 15.7 | % | | | | | Households |
| | 6.7 | % | | | 71 608.3 | | | | 7.3 | % | | | 73 409.8 | | | | 7.0 | % | | | 80 656.2 | | | 7.1 | % | | | | | Payments for capital assets |
| | 5.1 | % | | | 57 200.4 | | | | 5.9 | % | | | 58 918.4 | | | | 5.6 | % | | | 65 817.9 | | | 5.8 | % | | | | | Buildings and other fixed structures |
| | 1.4 | % | | | 13 120.0 | | | | 1.3 | % | | | 13 438.1 | | | | 1.3 | % | | | 13 813.7 | | | 1.2 | % | | | | | Machinery and equipment |
| | 0.0 | % | | | 237.4 | | | | 0.0 | % | | | 193.5 | | | | 0.0 | % | | | 228.3 | | | 0.0 | % | | | | | Land and sub-soil assets |
| | 0.1 | % | | | 991.7 | | | | 0.1 | % | | | 837.8 | | | | 0.1 | % | | | 773.2 | | | 0.1 | % | | | | | Software and other intangible assets |
| | 0.0 | % | | | 58.8 | | | | 0.0 | % | | | 22.0 | | | | 0.0 | % | | | 23.0 | | | 0.0 | % | | 2) | | | Other assets |
| | 2.4 | % | | | 767.1 | | | | 0.1 | % | | | 8.0 | | | | 0.0 | % | | | 4.5 | | | 0.0 | % | | | | | Payments for financial assets |
| | | | | | | |
| | 100.0 | % | | | 975 174.9 | | | | 100.0 | % | | | 1 050 176.9 | | | | 100.0 | % | | | 1 128 398.0 | | | 100.0 | % | | | | | Subtotal: Economic classification |
| |
| | | | | | | | | | | | | | | | | | | | | | | | | | | | | | | Functional classification |
| | 13.1 | % | | | 131 976.8 | | | | 13.5 | % | | | 147 525.3 | | | | 14.0 | % | | | 164 886.6 | | | 14.6 | % | | 3) | | | General public services |
| | 7.4 | % | | | 76 578.7 | | | | 7.9 | % | | | 90 807.7 | | | | 8.6 | % | | | 104 036.2 | | | 9.2 | % | | | | | of which: State debt cost |
| | 3.8 | % | | | 38 435.9 | | | | 3.9 | % | | | 41 352.4 | | | | 3.9 | % | | | 43 894.7 | | | 3.9 | % | | | | | Defense |
| | 9.4 | % | | | 90 904.0 | | | | 9.3 | % | | | 97 856.1 | | | | 9.3 | % | | | 104 555.3 | | | 9.3 | % | | | | | Public order and safety |
| | 6.2 | % | | | 60 691.3 | | | | 6.2 | % | | | 64 847.3 | | | | 6.2 | % | | | 69 604.7 | | | 6.2 | % | | | | | Police services |
| | 1.4 | % | | | 13 711.7 | | | | 1.4 | % | | | 15 269.7 | | | | 1.5 | % | | | 16 196.7 | | | 1.4 | % | | | | | Law courts |
| | 1.7 | % | | | 16 501.0 | | | | 1.7 | % | | | 17 739.2 | | | | 1.7 | % | | | 18 754.0 | | | 1.7 | % | | | | | Prisons |
| | 15.6 | % | | | 130 538.2 | | | | 13.4 | % | | | 140 143.9 | | | | 13.3 | % | | | 149 193.6 | | | 13.2 | % | | | | | Economic affairs |
| | 1.9 | % | | | 19 125.4 | | | | 2.0 | % | | | 19 804.5 | | | | 1.9 | % | | | 20 523.7 | | | 1.8 | % | | | | | General economic, commercial and labour affairs |
| | 1.8 | % | | | 19 015.3 | | | | 1.9 | % | | | 20 178.8 | | | | 1.9 | % | | | 21 033.1 | | | 1.9 | % | | | | | Agriculture, forestry, fishing and hunting |
| | 3.1 | % | | | 7 894.9 | | | | 0.8 | % | | | 7 538.9 | | | | 0.7 | % | | | 6 342.7 | | | 0.6 | % | | | | | Fuel and energy |
| | 0.6 | % | | | 5 954.2 | | | | 0.6 | % | | | 6 446.4 | | | | 0.6 | % | | | 6 578.9 | | | 0.6 | % | | | | | Mining, manufacturing and construction |
| | 6.7 | % | | | 65 583.9 | | | | 6.7 | % | | | 72 812.9 | | | | 6.9 | % | | | 79 791.2 | | | 7.1 | % | | | | | Transport |
| | 0.4 | % | | | 3 200.6 | | | | 0.3 | % | | | 2 734.0 | | | | 0.3 | % | | | 2 960.0 | | | 0.3 | % | | | | | Communication |
| | 1.1 | % | | | 9 763.9 | | | | 1.0 | % | | | 10 628.4 | | | | 1.0 | % | | | 11 964.0 | | | 1.1 | % | | | | | Economic affairs not elsewhere classified |
| | 0.5 | % | | | 6 019.2 | | | | 0.6 | % | | | 5 740.3 | | | | 0.5 | % | | | 6 159.2 | | | 0.5 | % | | | | | Environmental protection |
| | 11.4 | % | | | 121 921.4 | | | | 12.5 | % | | | 130 352.9 | | | | 12.4 | % | | | 138 376.8 | | | 12.3 | % | | | | | Housing and community amenities |
| | 2.5 | % | | | 27 592.8 | | | | 2.8 | % | | | 30 842.1 | | | | 2.9 | % | | | 32 557.4 | | | 2.9 | % | | | | | Housing development |
| | 5.4 | % | | | 53 937.8 | | | | 5.5 | % | | | 59 582.6 | | | | 5.7 | % | | | 63 466.2 | | | 5.6 | % | | | | | Community development |
| | 3.5 | % | | | 40 390.8 | | | | 4.1 | % | | | 39 928.2 | | | | 3.8 | % | | | 42 353.3 | | | 3.8 | % | | | | | Water supply |
| | 11.4 | % | | | 112 574.8 | | | | 11.5 | % | | | 120 641.0 | | | | 11.5 | % | | | 127 394.4 | | | 11.3 | % | | | | | Health |
| | 0.7 | % | | | 6 351.7 | | | | 0.7 | % | | | 6 580.8 | | | | 0.6 | % | | | 6 919.1 | | | 0.6 | % | | | | | Recreation and culture |
| | 19.2 | % | | | 189 522.7 | | | | 19.4 | % | | | 201 349.3 | | | | 19.2 | % | | | 215 121.1 | | | 19.1 | % | | | | | Education |
| | 14.8 | % | | | 146 930.1 | | | | 15.1 | % | | | 158 634.8 | | | | 15.1 | % | | | 171 897.2 | | | 15.2 | % | | | | | Social protection |
| |
| | 100.0 | % | | | 975 174.9 | | | | 100.0 | % | | | 1 050 176.9 | | | | 100.0 | % | | | 1 128 398.0 | | | 100.0 | % | | | | | Subtotal: Functional classification |
| | | | | | | | | | | | | | | | | | | | | | | | | | | | | | | Plus: |
| | — | | | | 4 090.4 | | | | — | | | | 11 405.4 | | | | — | | | | 23 375.2 | | | — | | | | | | Contingency reserve |
| | | | | | | |
| | — | | | | 979 265.3 | | | | — | | | | 1 061 582.3 | | | | — | | | | 1 151 773.2 | | | — | | | | | | Total consolidated expenditure |
| | | | | | -154 798.8 | | | | | | | | -152 868.3 | | | | | | | | -134 586.1 | | | | | | | | | |
| |
| | | |
| 2) | | Includes biological, heritage and specialised military assets |
| |
| 3) | | Mainly general administration, cost of raising loans and unallocatable capital expenditure. |
171
2011 BUDGET REVIEW
Table 8
Total debt of government 1)
| | | | | | | | | | | | | | | | | | | | | | | | | | | | | | | | | |
| R million | | | | | | 1986/87 | | | 1987/88 | | | 1988/89 | | | 1989/90 | | | 1990/91 | | | 1991/92 | | | 1992/93 | |
| |
Domestic debt | | | | | | | | | | | | | | | | | | | | | | | | | | | | | | | | |
| Marketable | | | | | | | 39 956 | | | | 47 385 | | | | 61 124 | | | | 72 923 | | | | 85 546 | | | | 104 646 | | | | 138 681 | |
Government bonds | | | | | | | 39 195 | | | | 47 173 | | | | 60 860 | | | | 71 026 | | | | 82 824 | | | | 100 662 | | | | 132 853 | |
Treasury bills | | | | | | | 761 | | | | 212 | | | | 264 | | | | 1 897 | | | | 2 722 | | | | 3 984 | | | | 5 828 | |
Bridging bonds | | | | | | | — | | | | — | | | | — | | | | — | | | | — | | | | — | | | | — | |
| Non-marketable | | | 3) | | | | 4 443 | | | | 7 675 | | | | 5 386 | | | | 6 883 | | | | 7 989 | | | | 6 520 | | | | 4 703 | |
| Gross loan debt | | | | | | | 44 399 | | | | 55 060 | | | | 66 510 | | | | 79 806 | | | | 93 535 | | | | 111 166 | | | | 143 384 | |
| Cash balances | | | 4) | | | | -1 573 | | | | -1 588 | | | | -3 785 | | | | -11 181 | | | | -8 524 | | | | -9 762 | | | | -4 750 | |
| Net loan debt | | | | | | | 42 826 | | | | 53 472 | | | | 62 725 | | | | 68 625 | | | | 85 011 | | | | 101 404 | | | | 138 634 | |
| | | | | | | |
Foreign debt | | | | | | | | | | | | | | | | | | | | | | | | | | | | | | | | |
| Gross loan debt | | | 5) | | | | 2 446 | | | | 2 442 | | | | 2 227 | | | | 2 090 | | | | 1 770 | | | | 2 940 | | | | 2 348 | |
| Cash balances | | | 4) | | | | — | | | | — | | | | — | | | | — | | | | — | | | | — | | | | — | |
| Net loan debt | | | | | | | 2 446 | | | | 2 442 | | | | 2 227 | | | | 2 090 | | | | 1 770 | | | | 2 940 | | | | 2 348 | |
| | | | | | | |
Gross loan debt | | | | | | | 46 845 | | | | 57 502 | | | | 68 737 | | | | 81 896 | | | | 95 305 | | | | 114 106 | | | | 145 732 | |
Net loan debt | | | | | | | 45 272 | | | | 55 914 | | | | 64 952 | | | | 70 715 | | | | 86 781 | | | | 104 344 | | | | 140 982 | |
| | | | | | | |
| Gold and Foreign Exchange Contingency Reserve Account | | | 6) | | | | -3 469 | | | | -2 554 | | | | -11 158 | | | | -14 140 | | | | -10 351 | | | | -12 508 | | | | -8 934 | |
| |
Composition of gross debt (excluding deduction of cash balances) | | | | | | | | | | | | | | | | | | | | | | | | | | | | | | | | |
| Marketable domestic debt | | | | | | | 85.3 | % | | | 82.4 | % | | | 88.9 | % | | | 89.0 | % | | | 89.8 | % | | | 91.7 | % | | | 95.2 | % |
Government bonds | | | | | | | 83.7 | % | | | 82.0 | % | | | 88.5 | % | | | 86.7 | % | | | 86.9 | % | | | 88.2 | % | | | 91.2 | % |
Treasury bills | | | | | | | 1.6 | % | | | 0.4 | % | | | 0.4 | % | | | 2.3 | % | | | 2.9 | % | | | 3.5 | % | | | 4.0 | % |
Bridging bonds | | | | | | | 0.0 | % | | | 0.0 | % | | | 0.0 | % | | | 0.0 | % | | | 0.0 | % | | | 0.0 | % | | | 0.0 | % |
| Non-marketable domestic debt | | | 3) | | | | 9.5 | % | | | 13.3 | % | | | 7.8 | % | | | 8.4 | % | | | 8.4 | % | | | 5.7 | % | | | 3.2 | % |
| | | | | | | |
| Domestic debt | | | | | | | 94.8 | % | | | 95.8 | % | | | 96.8 | % | | | 97.4 | % | | | 98.1 | % | | | 97.4 | % | | | 98.4 | % |
| Foreign debt | | | 5) | | | | 5.2 | % | | | 4.2 | % | | | 3.2 | % | | | 2.6 | % | | | 1.9 | % | | | 2.6 | % | | | 1.6 | % |
| |
Total as percentage of GDP: | | | | | | | | | | | | | | | | | | | | | | | | | | | | | | | | |
| Gross domestic debt | | | | | | | 28.5 | % | | | 30.3 | % | | | 30.3 | % | | | 30.6 | % | | | 31.2 | % | | | 32.3 | % | | | 37.5 | % |
| Net domestic debt | | | | | | | 27.5 | % | | | 29.4 | % | | | 28.6 | % | | | 26.3 | % | | | 28.4 | % | | | 29.5 | % | | | 36.2 | % |
| Gross foreign debt | | | | | | | 1.6 | % | | | 1.3 | % | | | 1.0 | % | | | 0.8 | % | | | 0.6 | % | | | 0.9 | % | | | 0.6 | % |
| Net foreign debt | | | | | | | 1.6 | % | | | 1.3 | % | | | 1.0 | % | | | 0.8 | % | | | 0.6 | % | | | 0.9 | % | | | 0.6 | % |
| Gross loan debt | | | | | | | 30.1 | % | | | 31.6 | % | | | 31.3 | % | | | 31.4 | % | | | 31.8 | % | | | 33.2 | % | | | 38.1 | % |
| Net loan debt | | | | | | | 29.1 | % | | | 30.7 | % | | | 29.6 | % | | | 27.1 | % | | | 29.0 | % | | | 30.3 | % | | | 36.8 | % |
| |
Source: National Treasury and South African Reserve Bank.
| | |
| 1) | | Debt of the central government, excluding extra-budgetary institutions and social security funds. |
| |
| 2) | | As projected at the end of January 2011. |
| |
| 3) | | Includes non-marketable Treasury bills, retail bonds, former Namibian loans and loan levies. |
172
ANNEXURE B: STATISTICAL TABLES
Table 8
Total debt of government 1)
| | | | | | | | | | | | | | | | | | | | | | | | | | | | | | | | | |
| 1993/94 | | | 1994/95 | | | 1995/96 | | | 1996/97 | | | 1997/98 | | | 1998/99 | | | 1999/00 | | | | | | R million |
| |
| | | | | | | | | | | | | | | | | | | | | | | | | | | | | | | | | Domestic debt |
| | 181 460 | | | | 225 662 | | | | 263 844 | | | | 290 424 | | | | 318 773 | | | | 344 938 | | | | 354 706 | | | | | | | Marketable |
| | 174 892 | | | | 210 191 | | | | 248 877 | | | | 276 124 | | | | 301 488 | | | | 325 938 | | | | 332 706 | | | | | | | Government bonds |
| | 6 568 | | | | 7 018 | | | | 10 700 | | | | 14 300 | | | | 17 285 | | | | 19 000 | | | | 22 000 | | | | | | | Treasury bills |
| | — | | | | 8 453 | | | | 4 267 | | | | — | | | | — | | | | — | | | | — | | | | | | | Bridging bonds |
| | 3 310 | | | | 5 705 | | | | 4 700 | | | | 6 421 | | | | 2 778 | | | | 2 013 | | | | 998 | | | | 3) | | | Non-marketable |
| | 184 770 | | | | 231 367 | | | | 268 544 | | | | 296 845 | | | | 321 551 | | | | 346 951 | | | | 355 704 | | | | | | | Gross loan debt |
| | -4 591 | | | | -6 665 | | | | -8 630 | | | | -2 757 | | | | -4 798 | | | | -5 166 | | | | -7 285 | | | | 4) | | | Cash balances |
| | 180 179 | | | | 224 702 | | | | 259 914 | | | | 294 088 | | | | 316 753 | | | | 341 785 | | | | 348 419 | | | | | | | Net loan debt |
| | | | | | | |
| | | | | | | | | | | | | | | | | | | | | | | | | | | | | | | | | Foreign debt |
| | 5 201 | | | | 8 784 | | | | 10 944 | | | | 11 394 | | | | 14 560 | | | | 16 276 | | | | 25 799 | | | | 5) | | | Gross loan debt |
| | — | | | | — | | | | — | | | | — | | | | — | | | | — | | | | — | | | | 4) | | | Cash balances |
| | 5 201 | | | | 8 784 | | | | 10 944 | | | | 11 394 | | | | 14 560 | | | | 16 276 | | | | 25 799 | | | | | | | Net loan debt |
| | | | | | | |
| | 189 971 | | | | 240 151 | | | | 279 488 | | | | 308 239 | | | | 336 111 | | | | 363 227 | | | | 381 503 | | | | | | | Gross loan debt |
| | 185 380 | | | | 233 486 | | | | 270 858 | | | | 305 482 | | | | 331 313 | | | | 358 061 | | | | 374 218 | | | | | | | Net loan debt |
| | | | | | | |
| | | | | | | | | | | | | | | | | | | | | | | | | | | | | | | | | Gold and Foreign Exchange |
| | -2 190 | | | | -4 147 | | | | — | | | | -2 169 | | | | -73 | | | | -14 431 | | | | -9 200 | | | | 6) | | | Contingency Reserve Account |
| |
| | | | | | | | | | | | | | | | | | | | | | | | | | | | | | | | | Composition of gross debt (excluding deduction of cash balances) |
| | 95.5 | % | | | 94.0 | % | | | 94.4 | % | | | 94.2 | % | | | 94.8 | % | | | 95.0 | % | | | 93.0 | % | | | | | | Marketable domestic debt |
| | 92.1 | % | | | 87.5 | % | | | 89.0 | % | | | 89.6 | % | | | 89.7 | % | | | 89.7 | % | | | 87.2 | % | | | | | | Government bonds |
| | 3.5 | % | | | 2.9 | % | | | 3.8 | % | | | 4.6 | % | | | 5.1 | % | | | 5.2 | % | | | 5.8 | % | | | | | | Treasury bills |
| | 0.0 | % | | | 3.5 | % | | | 1.5 | % | | | 0.0 | % | | | 0.0 | % | | | 0.0 | % | | | 0.0 | % | | | | | | Bridging bonds |
| | 1.7 | % | | | 2.4 | % | | | 1.7 | % | | | 2.1 | % | | | 0.8 | % | | | 0.6 | % | | | 0.3 | % | | | 3) | | | Non-marketable domestic debt |
| | | | | | | |
| | 97.3 | % | | | 96.3 | % | | | 96.1 | % | | | 96.3 | % | | | 95.7 | % | | | 95.5 | % | | | 93.2 | % | | | | | | Domestic debt |
| | 2.7 | % | | | 3.7 | % | | | 3.9 | % | | | 3.7 | % | | | 4.3 | % | | | 4.5 | % | | | 6.8 | % | | | 5) | | | Foreign debt |
| |
| | | | | | | | | | | | | | | | | | | | | | | | | | | | | | | | | Total as percentage of GDP: |
| | 41.8 | % | | | 46.5 | % | | | 47.6 | % | | | 46.7 | % | | | 45.9 | % | | | 45.8 | % | | | 42.5 | % | | | | | | Gross domestic debt |
| | 40.8 | % | | | 45.2 | % | | | 46.1 | % | | | 46.3 | % | | | 45.3 | % | | | 45.1 | % | | | 41.6 | % | | | | | | Net domestic debt |
| | 1.2 | % | | | 1.8 | % | | | 1.9 | % | | | 1.8 | % | | | 2.1 | % | | | 2.1 | % | | | 3.1 | % | | | | | | Gross foreign debt |
| | 1.2 | % | | | 1.8 | % | | | 1.9 | % | | | 1.8 | % | | | 2.1 | % | | | 2.1 | % | | | 3.1 | % | | | | | | Net foreign debt |
| | 43.0 | % | | | 48.3 | % | | | 49.5 | % | | | 48.5 | % | | | 48.0 | % | | | 48.0 | % | | | 45.6 | % | | | | | | Gross loan debt |
| | 41.9 | % | | | 47.0 | % | | | 48.0 | % | | | 48.1 | % | | | 47.3 | % | | | 47.3 | % | | | 44.7 | % | | | | | | Net loan debt |
| |
Source: National Treasury and South African Reserve Bank.
| | |
| 4) | | Bank balances of the National Revenue Fund (balnaces of government’s accounts with the Reserve Bank and commercial banks). |
| |
| 5) | | Valued at appropriate foreign exchange rates up to 31 March 2010 as at the end of each period. Forward estimates are based on exchange rates prevailing at 31 January 2011, projected to depreciate in line with inflation differentials. |
| |
| 6) | | The balance on the Gold and Foreign Exchange Contingency Reserve Account on 31 March 2011 represents an estimated balance on the account. |
| |
| | | No provision for any profits or losses on this account has been made for subsequent years. A negative balance indicates a loss and a positive balance a profit. |
173
Table 8
Total debt of government 1)
| | | | | | | | | | | | | | | | | | | | | | | | | | | | | | | | | |
| R million | | | | | 2000/01 | | | 2001/02 | | | 2002/03 | | | 2003/04 | | | 2004/05 | | | 2005/06 | | | 2006/07 | |
| |
Domestic debt | | | | | | | | | | | | | | | | | | | | | | | | | | | | | | | | |
| Marketable | | | | | | | 365 231 | | | | 349 415 | | | | 350 870 | | | | 388 300 | | | | 428 593 | | | | 457 780 | | | | 467 864 | |
Government bonds | | | | | | | 339 731 | | | | 331 505 | | | | 328 820 | | | | 359 700 | | | | 394 143 | | | | 417 380 | | | | 422 064 | |
Treasury bills | | | | | | | 25 500 | | | | 17 910 | | | | 22 050 | | | | 28 600 | | | | 34 450 | | | | 40 400 | | | | 45 800 | |
Bridging bonds | | | | | | | — | | | | — | | | | — | | | | — | | | | — | | | | — | | | | — | |
| Non-marketable | | | 3) | | | | 2 382 | | | | 2 030 | | | | 1 910 | | | | 1 999 | | | | 3 498 | | | | 3 699 | | | | 3 238 | |
| |
| Gross loan debt | | | | | | | 367 613 | | | | 351 445 | | | | 352 780 | | | | 390 299 | | | | 432 091 | | | | 461 479 | | | | 471 102 | |
| Cash balances | | | 4) | | | | -2 650 | | | | -6 549 | | | | -9 730 | | | | -12 669 | | | | -30 870 | | | | -58 187 | | | | -75 315 | |
| Net loan debt | | | | | | | 364 963 | | | | 344 896 | | | | 343 050 | | | | 377 630 | | | | 401 221 | | | | 403 292 | | | | 395 787 | |
| | | | | | | |
Foreign debt | | | | | | | | | | | | | | | | | | | | | | | | | | | | | | | | |
| Gross loan debt | | | 5) | | | | 31 938 | | | | 82 009 | | | | 74 286 | | | | 64 670 | | | | 69 405 | | | | 66 846 | | | | 82 581 | |
| Cash balances | | | 4) | | | | — | | | | — | | | | — | | | | — | | | | — | | | | — | | | | — | |
| Net loan debt | | | | | | | 31 938 | | | | 82 009 | | | | 74 286 | | | | 64 670 | | | | 69 405 | | | | 66 846 | | | | 82 581 | |
| | | | | | | |
| |
Gross loan debt | | | | | | | 399 551 | | | | 433 454 | | | | 427 066 | | | | 454 969 | | | | 501 496 | | | | 528 325 | | | | 553 683 | |
Net loan debt | | | | | | | 396 901 | | | | 426 905 | | | | 417 336 | | | | 442 300 | | | | 470 626 | | | | 470 138 | | | | 478 368 | |
| | | | | | | |
| Gold and Foreign Exchange | | | | | | |
| Contingency Reserve Account | | | 6) | | | | -18 170 | | | | -28 024 | | | | -36 577 | | | | -18 036 | | | | -5 292 | | | | 1 751 | | | | 28 514 | |
| |
Composition of gross debt (excluding deduction of cash balances) | | | | | | | | | | | | | | | | | | | | | | | | | | | | | | | | |
| Marketable domestic debt | | | | | | | 91.4 | % | | | 80.6 | % | | | 82.2 | % | | | 85.3 | % | | | 85.5 | % | | | 86.6 | % | | | 84.5 | % |
Government bonds | | | | | | | 85.0 | % | | | 76.5 | % | | | 77.0 | % | | | 79.1 | % | | | 78.6 | % | | | 79.0 | % | | | 76.2 | % |
Treasury bills | | | | | | | 6.4 | % | | | 4.1 | % | | | 5.2 | % | | | 6.3 | % | | | 6.9 | % | | | 7.6 | % | | | 8.3 | % |
Bridging bonds | | | | | | | 0.0 | % | | | 0.0 | % | | | 0.0 | % | | | 0.0 | % | | | 0.0 | % | | | 0.0 | % | | | 0.0 | % |
| Non-marketable domestic debt | | | 3) | | | | 0.6 | % | | | 0.5 | % | | | 0.4 | % | | | 0.4 | % | | | 0.7 | % | | | 0.7 | % | | | 0.6 | % |
| | | | | | | |
| Domestic debt | | | | | | | 92.0 | % | | | 81.1 | % | | | 82.6 | % | | | 85.8 | % | | | 86.2 | % | | | 87.3 | % | | | 85.1 | % |
| Foreign debt | | | 5) | | | | 8.0 | % | | | 18.9 | % | | | 17.4 | % | | | 14.2 | % | | | 13.8 | % | | | 12.7 | % | | | 14.9 | % |
| |
Total as percentage of GDP: | | | | | | | | | | | | | | | | | | | | | | | | | | | | | | | | |
| Gross domestic debt | | | | | | | 38.6 | % | | | 33.5 | % | | | 29.3 | % | | | 29.9 | % | | | 29.8 | % | | | 28.6 | % | | | 25.7 | % |
| Net domestic debt | | | | | | | 38.3 | % | | | 32.9 | % | | | 28.5 | % | | | 29.0 | % | | | 27.7 | % | | | 25.0 | % | | | 21.6 | % |
| Gross foreign debt | | | | | | | 3.4 | % | | | 7.8 | % | | | 6.2 | % | | | 5.0 | % | | | 4.8 | % | | | 4.1 | % | | | 4.5 | % |
| Net foreign debt | | | | | | | 3.4 | % | | | 7.8 | % | | | 6.2 | % | | | 5.0 | % | | | 4.8 | % | | | 4.1 | % | | | 4.5 | % |
| Gross loan debt | | | | | | | 42.0 | % | | | 41.3 | % | | | 35.5 | % | | | 34.9 | % | | | 34.6 | % | | | 32.7 | % | | | 30.2 | % |
| Net loan debt | | | | | | | 41.7 | % | | | 40.7 | % | | | 34.7 | % | | | 33.9 | % | | | 32.5 | % | | | 29.1 | % | | | 26.1 | % |
| |
Source: National Treasury and South African Reserve Bank.
| | |
| 1) | | Debt of the central government, excluding extra-budgetary institutions and social security funds. |
| |
| 2) | | As projected at the end of January 2011. |
| |
| 3) | | Includes non-marketable Treasury bills, retail bonds, former Namibian loans and loan levies. |
174
ANNEXURE B: STATISTICAL TABLES
| | | | | | | | | | | | | | | | | | | | | | | | | | | | | | | | |
Table 8
Total debt of government 1) |
| | | | | | | | | | | | | 2) | | | | | | | | | | | | | | | |
| 2007/08 | | | 2008/09 | | | 2009/10 | | | 2010/11 | | | 2011/12 | | | 2012/13 | | | 2013/14 | | | | | | R million |
| |
| | | | | | | | | | | | | | | | | | | | | | | | | | | | | | | | | Domestic debt |
| | 478 265 | | | | 527 751 | | | | 700 532 | | | | 869 947 | | | | 1 047 828 | | | | 1 224 651 | | | | 1 387 671 | | | | | | | Marketable |
| | 426 415 | | | | 462 751 | | | | 585 992 | | | | 733 797 | | | | 889 678 | | | | 1 044 501 | | | | 1 186 521 | | | | | | | Government bonds |
| | 51 850 | | | | 65 000 | | | | 114 540 | | | | 136 150 | | | | 158 150 | | | | 180 150 | | | | 201 150 | | | | | | | Treasury bills |
| | — | | | | — | | | | — | | | | — | | | | — | | | | — | | | | — | | | | | | | Bridging bonds |
| | 2 555 | | | | 1 956 | | | | 4 943 | | | | 23 448 | | | | 25 004 | | | | 25 593 | | | | 27 585 | | | | 3) | | | Non-marketable |
| | 480 821 | | | | 529 707 | | | | 705 475 | | | | 893 395 | | | | 1 072 832 | | | | 1 250 244 | | | | 1 415 256 | | | | | | | Gross loan debt |
| | -93 809 | | | | -101 349 | | | | -106 550 | | | | -109 053 | | | | -102 157 | | | | -102 157 | | | | -102 157 | | | | 4) | | | Cash balances |
| | 387 012 | | | | 428 358 | | | | 598 925 | | | | 784 342 | | | | 970 675 | | | | 1 148 087 | | | | 1 313 099 | | | | | | | Net loan debt |
| | | | | | | |
| | | | | | | | | | | | | | | | | | | | | | | | | | | | | | | | | Foreign debt |
| | 96 218 | | | | 97 268 | | | | 99 454 | | | | 95 289 | | | | 100 391 | | | | 108 530 | | | | 110 074 | | | | 5) | | | Gross loan debt |
| | — | | | | — | | | | -25 176 | | | | -57 241 | | | | -72 237 | | | | -56 817 | | | | -34 911 | | | | 4) | | | Cash balances |
| | 96 218 | | | | 97 268 | | | | 74 278 | | | | 38 048 | | | | 28 154 | | | | 51 713 | | | | 75 163 | | | | | | | Net loan debt |
| | | | | | | |
| | 577 039 | | | | 626 975 | | | | 804 929 | | | | 988 684 | | | | 1 173 223 | | | | 1 358 774 | | | | 1 525 330 | | | | | | | Gross loan debt |
| | 483 230 | | | | 525 626 | | | | 673 203 | | | | 822 390 | | | | 998 829 | | | | 1 199 800 | | | | 1 388 262 | | | | | | | Net loan debt |
| | | | | | | |
| | | | | | | | | | | | | | | | | | | | | | | | | | | | | | | | | Gold and Foreign Exchange |
| | 72 189 | | | | 101 585 | | | | 35 618 | | | | 17 270 | | | | 17 270 | | | | 17 270 | | | | 17 270 | | | | 6) | | | Contingency Reserve Account |
| |
| | | | | | | | | | | | | | | | | | | | | | | | | | | | | | | | | Composition of gross debt (excluding deduction of cash balances) |
| | 82.9 | % | | | 84.2 | % | | | 87.0 | % | | | 88.0 | % | | | 89.3 | % | | | 90.1 | % | | | 91.0 | % | | | | | | Marketable domestic debt |
| | 73.9 | % | | | 73.8 | % | | | 72.8 | % | | | 74.2 | % | | | 75.8 | % | | | 76.9 | % | | | 77.8 | % | | | | | | Government bonds |
| | 9.0 | % | | | 10.4 | % | | | 14.2 | % | | | 13.8 | % | | | 13.5 | % | | | 13.3 | % | | | 13.2 | % | | | | | | Treasury bills |
| | 0.0 | % | | | 0.0 | % | | | 0.0 | % | | | 0.0 | % | | | 0.0 | % | | | 0.0 | % | | | 0.0 | % | | | | | | Bridging bonds |
| | 0.4 | % | | | 0.3 | % | | | 0.6 | % | | | 2.4 | % | | | 2.1 | % | | | 1.9 | % | | | 1.8 | % | | | 3) | | | Non-marketable domestic debt |
| | | | | | | |
| | 83.3 | % | | | 84.5 | % | | | 87.6 | % | | | 90.4 | % | | | 91.4 | % | | | 92.0 | % | | | 92.8 | % | | | | | | Domestic debt |
| | 16.7 | % | | | 15.5 | % | | | 12.4 | % | | | 9.6 | % | | | 8.6 | % | | | 8.0 | % | | | 7.2 | % | | | 5) | | | Foreign debt |
| |
| | | | | | | | | | | | | | | | | | | | | | | | | | | | | | | | | Total as percentage of GDP: |
| | 23.1 | % | | | 22.9 | % | | | 28.9 | % | | | 33.5 | % | | | 36.8 | % | | | 39.1 | % | | | 40.0 | % | | | | | | Gross domestic debt |
| | 18.6 | % | | | 18.5 | % | | | 24.5 | % | | | 29.4 | % | | | 33.3 | % | | | 35.9 | % | | | 37.1 | % | | | | | | Net domestic debt |
| | 4.6 | % | | | 4.2 | % | | | 4.1 | % | | | 3.6 | % | | | 3.4 | % | | | 3.4 | % | | | 3.1 | % | | | | | | Gross foreign debt |
| | 4.6 | % | | | 4.2 | % | | | 3.0 | % | | | 1.4 | % | | | 1.0 | % | | | 1.6 | % | | | 2.1 | % | | | | | | Net foreign debt |
| | 27.8 | % | | | 27.1 | % | | | 33.0 | % | | | 37.1 | % | | | 40.2 | % | | | 42.4 | % | | | 43.1 | % | | | | | | Gross loan debt |
| | 23.2 | % | | | 22.7 | % | | | 27.6 | % | | | 30.8 | % | | | 34.3 | % | | | 37.5 | % | | | 39.3 | % | | | | | | Net loan debt |
| |
Source: National Treasury and South African Reserve Bank.
| | |
| 4) | | Bank balances of the National Revenue Fund (balnaces of government’s accounts with the Reserve Bank and commercial banks). |
| |
| 5) | | Valued at appropriate foreign exchange rates up to 31 March 2010 as at the end of each period. Forward estimates are based on exchange rates prevailing at 31 January 2011, projected to depreciate in line with inflation differentials. |
| |
| 6) | | The balance on the Gold and Foreign Exchange Contingency Reserve Account on 31 March 2011 represents an estimated balance on the account. |
| |
| | | No provision for any profits or losses on this account has been made for subsequent years. A negative balance indicates a loss and a positive balance a profit. |
175
Table 9
Financial guarantees:
Amounts drawn on government guarantees
| | | | | | | | | | | | | | | | | | | | | | | | | |
| | | 2007/08 | | | 2008/09 | |
| R million | | Domestic | | | Foreign | | | Total | | | Domestic | | | Foreign | | | Total | |
| |
General Government Sector | | | 872 | | | | — | | | | 872 | | | | 595 | | | | — | | | | 595 | |
| | | | | | | | | | | | | | | | | | | | | | | | | |
| Central Government | | | 872 | | | | — | | | | 872 | | | | 595 | | | | — | | | | 595 | |
| | | | | | | | | | | | | | | | | | | | | | | | | |
Former regional authorities | | | 212 | | | | — | | | | 212 | | | | 206 | | | | — | | | | 206 | |
Guarantee scheme for housing loans to employees | | | 374 | | | | — | | | | 374 | | | | 255 | | | | — | | | | 255 | |
Guarantee scheme for motor vehicles — senior officials | | | 10 | | | | — | | | | 10 | | | | 8 | | | | — | | | | 8 | |
Universities and Technikons | | | 276 | | | | — | | | | 276 | | | | 126 | | | | — | | | | 126 | |
| | | | | | | | | | | | | | | | | | | | | | | | | |
Public Entities | | | 44 646 | | | | 18 781 | | | | 63 427 | | | | 42 976 | | | | 19 315 | | | | 62 291 | |
| | | | | | | | | | | | | | | | | | | | | | | | | |
| Non-financial | | | 42 304 | | | | 5 173 | | | | 47 477 | | | | 41 334 | | | | 5 521 | | | | 46 855 | |
| | | | | | | | | | | | | | | | | | | | | | | | | |
Central Energy Fund | | | — | | | | 243 | | | | 243 | | | | — | | | | 130 | | | | 130 | |
Denel | | | — | | | | — | | | | — | | | | 880 | | | | — | | | | 880 | |
Eskom | | | — | | | | — | | | | — | | | | — | | | | — | | | | — | |
Irrigation Boards | | | 43 | | | | — | | | | 43 | | | | 43 | | | | — | | | | 43 | |
Kalahari East Water Board | | | 16 | | | | — | | | | 16 | | | | 16 | | | | — | | | | 16 | |
Komati Basin Water Authority | | | 1 514 | | | | — | | | | 1 514 | | | | 1 453 | | | | — | | | | 1 453 | |
Lesotho Highlands Development Authority | | | 9 | | | | 604 | | | | 613 | | | | 7 | | | | 517 | | | | 524 | |
Nuclear Energy Corporation of South Africa | | | 20 | | | | — | | | | 20 | | | | 20 | | | | — | | | | 20 | |
Passenger Rail Agency of South Africa | | | — | | | | — | | | | — | | | | — | | | | — | | | | — | |
South African Airways | | | 4 460 | | | | — | | | | 4 460 | | | | 4 460 | | | | — | | | | 4 460 | |
South African Broadcasting Corporation | | | — | | | | — | | | | — | | | | — | | | | — | | | | — | |
South African National Roads Agency Limited | | | 6 441 | | | | — | | | | 6 441 | | | | 6 708 | | | | — | | | | 6 708 | |
Telkom South Africa | | | — | | | | 140 | | | | 140 | | | | — | | | | 138 | | | | 138 | |
Trans-Caledon Tunnel Authority | | | 19 021 | | | | 250 | | | | 19 271 | | | | 19 363 | | | | 225 | | | | 19 588 | |
Transnet | | | 10 780 | | | | 3 936 | | | | 14 716 | | | | 8 384 | | | | 4 511 | | | | 12 895 | |
| | | | | | | | | | | | | | | | | | | | | | | | | |
| Financial | | | 2 342 | | | | 13 608 | | | | 15 950 | | | | 1 642 | | | | 13 794 | | | | 15 436 | |
| | | | | | | | | | | | | | | | | | | | | | | | | |
Development Bank of Southern Africa | | | — | | | | 12 414 | | | | 12 414 | | | | — | | | | 12 348 | | | | 12 348 | |
Industrial Development Corporation of South Africa | | | — | | | | 1 194 | | | | 1 194 | | | | — | | | | 1 446 | | | | 1 446 | |
Land Bank | | | 1 500 | | | | — | | | | 1 500 | | | | 1 500 | | | | — | | | | 1 500 | |
South African Reserve Bank | | | 842 | | | | — | | | | 842 | | | | 142 | | | | — | | | | 142 | |
| | | | | | | | | | | | | | | | | | | | | | | | | |
Private Sector | | | 95 | | | | — | | | | 95 | | | | 94 | | | | — | | | | 94 | |
| | | | | | | | | | | | | | | | | | | | | | | | | |
| Agricultural Co-operatives | | | 95 | | | | — | | | | 95 | | | | 94 | | | | — | | | | 94 | |
| | | | | | | | | | | | | | | | | | | | | | | | | |
Foreign Sector | | | 91 | | | | — | | | | 91 | | | | 58 | | | | — | | | | 58 | |
| | | | | | | | | | | | | | | | | | | | | | | | | |
| Foreign Central Banks and Governments | | | 91 | | | | — | | | | 91 | | | | 58 | | | | — | | | | 58 | |
| | | |
Total | | | 45 704 | | | | 18 781 | | | | 64 485 | | | | 43 723 | | | | 19 315 | | | | 63 038 | |
| |
1) As projected at the end of December 2010.
176
ANNEXURE B: STATISTICAL TABLES
| | | |
|
| | | Table 9 |
| | | Financial guarantees: |
| | | Amounts drawn on government guarantees |
| | | | | | | | | | | | | | | | | | | | | | | | | |
| | | | | | | | | | | | | | | | | | | | | | | | |
| 2009/10 | | | 2010/111) | | | |
| Domestic | | | Foreign | | | Total | | | Domestic | | | Foreign | | | Total | | | R million |
| |
| | 418 | | | | — | | | | 418 | | | | 374 | | | | — | | | | 374 | | | General Government Sector |
| | | | | | | | | | | | | | | | | | | | | | | | | |
| | 418 | | | | — | | | | 418 | | | | 374 | | | | — | | | | 374 | | | Central Government |
| | | | | | | | | | | | | | | | | | | | | | | | | |
| | 190 | | | | — | | | | 190 | | | | 145 | | | | — | | | | 145 | | | Former regional authorities |
| | 154 | | | | — | | | | 154 | | | | 156 | | | | — | | | | 156 | | | Guarantee scheme for housing loans to employees |
| | 3 | | | | — | | | | 3 | | | | 2 | | | | — | | | | 2 | | | Guarantee scheme for motor vehicles — senior officials |
| | 71 | | | | — | | | | 71 | | | | 71 | | | | — | | | | 71 | | | Universities and Technikons |
| | 111 403 | | | | 17 159 | | | | 128 562 | | | | 118 036 | | | | 41 288 | | | | 159 324 | | | Public Entities |
| | | | | | | | | | | | | | | | | | | | | | | | | |
| | 93 703 | | | | 5 037 | | | | 98 740 | | | | 101 086 | | | | 29 972 | | | | 131 058 | | | Non-financial |
| |
| | — | | | | 19 | | | | 19 | | | | — | | | | — | | | | — | | | Central Energy Fund |
| | 1 850 | | | | — | | | | 1 850 | | | | 1 850 | | | | — | | | | 1 850 | | | Denel |
| | 46 678 | | | | — | | | | 46 678 | | | | 45 633 | | | | 25 669 | | | | 71 302 | | | Eskom |
| | 46 | | | | — | | | | 46 | | | | 46 | | | | — | | | | 46 | | | Irrigation Boards |
| | 16 | | | | — | | | | 16 | | | | 17 | | | | — | | | | 17 | | | Kalahari East Water Board |
| | 1 406 | | | | — | | | | 1 406 | | | | 1 400 | | | | — | | | | 1 400 | | | Komati Basin Water Authority |
| | 5 | | | | 396 | | | | 401 | | | | 4 | | | | 243 | | | | 247 | | | Lesotho Highlands Development Authority |
| | 20 | | | | — | | | | 20 | | | | 20 | | | | — | | | | 20 | | | Nuclear Energy Corporation of South Africa |
| | 1 217 | | | | — | | | | 1 217 | | | | 1 400 | | | | — | | | | 1 400 | | | Passenger Rail Agency of South Africa |
| | 1 300 | | | | 51 | | | | 1 351 | | | | 1 300 | | | | — | | | | 1 300 | | | South African Airways |
| | 1 000 | | | | — | | | | 1 000 | | | | 1 000 | | | | — | | | | 1 000 | | | South African Broadcasting Corporation |
| | 12 287 | | | | — | | | | 12 287 | | | | 23 699 | | | | — | | | | 23 699 | | | South African National Roads Agency Limited |
| | — | | | | 108 | | | | 108 | | | | — | | | | 88 | | | | 88 | | | Telkom South Africa |
| | 20 523 | | | | 198 | | | | 20 721 | | | | 18 630 | | | | 170 | | | | 18 800 | | | Trans-Caledon Tunnel Authority |
| | 7 355 | | | | 4 265 | | | | 11 620 | | | | 6 087 | | | | 3 802 | | | | 9 889 | | | Transnet |
| | | | | | | | | | | | | | | | | | | | | | | | | |
| | 17 700 | | | | 12 122 | | | | 29 822 | | | | 16 950 | | | | 11 316 | | | | 28 266 | | | Financial |
| | | | | | | | | | | | | | | | | | | | | | | | | |
| | 15 200 | | | | 11 170 | | | | 26 370 | | | | 15 200 | | | | 10 533 | | | | 25 733 | | | Development Bank of Southern Africa |
| | — | | | | 952 | | | | 952 | | | | — | | | | 783 | | | | 783 | | | Industrial Development Corporation of South Africa |
| | 2 500 | | | | — | | | | 2 500 | | | | 1 750 | | | | — | | | | 1 750 | | | Land Bank |
| | — | | | | — | | | | — | | | | — | | | | — | | | | — | | | South African Reserve Bank |
| | | | | | | | | | | | | | | | | | | | | | | | | |
| | 94 | | | | — | | | | 94 | | | | 94 | | | | — | | | | 94 | | | Private Sector |
| | | | | | | | | | | | | | | | | | | | | | | | | |
| | 94 | | | | — | | | | 94 | | | | 94 | | | | — | | | | 94 | | | Agricultural Co-operatives |
| | | | | | | | | | | | | | | | | | | | | | | | | |
| | 25 | | | | — | | | | 25 | | | | 25 | | | | — | | | | 25 | | | Foreign Sector |
| | | | | | | | | | | | | | | | | | | | | | | | | |
| | 25 | | | | — | | | | 25 | | | | 25 | | | | — | | | | 25 | | | Foreign Central Banks and Governments |
| | | |
| | 111 940 | | | | 17 159 | | | | 129 099 | | | | 118 529 | | | | 41 288 | | | | 159 817 | | | Total |
177
Miscellaneous tax amendments
| n | | Tax expenditure statement: February 2011 |
This abbreviated tax expenditure statement provides a first step towards greater transparency of expenditures incurred through the tax system. Such tax expenditures can take the form of tax exemptions, accelerated depreciation, additional allowances, reduced rates, tax deferrals and / or tax credits.
A tax expenditure statement serves three broad objectives:
| • | | Increases fiscal transparency and accountability |
| |
| • | | Creates comparability between direct and indirect government expenditures |
| |
| • | | Assists in the design of tax policy by promoting and informing public debate. |
The first Katz Commission Report in 1994 argued that tax expenditure analysis holds fundamental implications for tax policy in South Africa. An attempt by the commission to quantify the cost of incentives was abandoned “due to the lack of useful and accurate data and a serious manpower shortage in revenue offices. This is a most unfortunate development which must be changed if South Africa is to develop a rational tax policy” (par. 13.5.2). The commission reported that where data was available, the cost of tax expenditures seemed to be substantial (par. 13.5.3). The commission recommended that steps be taken to provide the necessary computer facilities and staff to undertake a comprehensive audit of all incentives. The report included an appendix, listing provisions of the Income Tax Act (1962), the Value-added Tax (VAT) Act (1991) and the Customs and Excise Act (1964) that were considered tax expenditures. A list of tax expenditure provisions was also published in the 2003 and 2006 Budget Reviews.
What is a tax expenditure?
Tax expenditures are indirect government expenditures that are not reported in the normal budget process. They are tax provisions that reduce the amount of tax revenue that could otherwise have been collected.
Tax expenditures can be defined as deviations from the benchmark of a current standard tax legislative framework. A benchmark is a reference point against which the nature and extent of a concession can be identified — it is the standard taxation treatment that should apply to similar taxpayers or types of economic activities. Tax expenditures deviate from this benchmark of a good tax system that adheres to the basic principles of neutrality and equity.
A less robust but more practical approach is to define tax expenditures merely as a deviation from the basic tax structure, without reference to an ideal benchmark. For example, the United States Treasury’s definition of a tax expenditure states that a tax expenditure must: (a) be special in that it applies to a
179
ANNEXURE C: MISCELLANEOUS TAX AMENDMENTS
narrow class of transactions or taxpayers; and (b) have a general provision and a specific provision that provides an exemption.
Once tax expenditures have been identified, one of the three methods below can be used to measure the estimated loss to the fiscus:
| • | | Revenue foregone |
| |
| • | | Revenue gain |
| |
| • | | Outlay equivalence. |
The revenue foregone method estimates tax expenditures by calculating the amount of tax revenue that would have been collected in the absence of the tax expenditure, and assumes that the behavioural response of taxpayers remains unchanged. This is the most commonly used method to measure tax expenditures because of its relative simplicity, and it was used in this draft report.
The revenue gain method measures tax expenditures by calculating tax revenue that would have been collected in the absence of the tax expenditure, taking into account behavioural responses associated with the removal of a tax expenditure provision. However, modelling taxpayer behaviour is quite complex.
With the outlay equivalence method, tax expenditures are measured by estimating the amount of direct government expenditures that would be required to provide the same benefit to taxpayers. This approach allows for a comparative analysis with direct expenditures to provide the same level of benefits.
The attached preliminary estimates are not exhaustive or complete, but a summary of the major tax expenditure items. These estimates do not take into account possible behavioural changes that may result from removing a particular tax provision.
Estimates of tax expenditures
The following table is a summary of tax expenditures in terms of the Income Tax Act 58, the VAT Act 89 and the Customs and Excise Act.
180
2011 BUDGET REVIEW
Table C.1 Tax expenditure estimates — R million
| | | | | | | | | | | | | | | | | |
| | | 2005/06 | | | 2006/07 | | | 2007/08 | | | 2008/09 | |
| Personal income tax | | | | | | | | | | | | | | | | |
| |
Pension and retirement annuity1 | | | 12 722 | | | | 13 538 | | | | 15 464 | | | | 18 349 | |
-pension contributions employees | | | 4 711 | | | | 4 911 | | | | 5 495 | | | | 6 567 | |
-pension contributions employers | | | 5 298 | | | | 5 523 | | | | 6 180 | | | | 7 386 | |
-retirement annuity | | | 2 713 | | | | 3 105 | | | | 3 790 | | | | 4 397 | |
| Medical | | | 9 155 | | | | 12 841 | | | | 5 753 | | | | 6 742 | |
-medical contributions & deductions employees | | | 3 521 | | | | 4 939 | | | | 5 753 | | | | 6 742 | |
- medical contributions — employers 3 | | | 5 634 | | | | 7 902 | | | | n/a | | | | n/a | |
| Interest exemptions | | | 1 290 | | | | 1 715 | | | | 2 283 | | | | 3 033 | |
| Secondary rebate (65 years and older) | | | 739 | | | | 739 | | | | 769 | | | | 828 | |
| Donations | | | 141 | | | | 178 | | | | 230 | | | | 282 | |
| Capital gains tax (annual exclusion) | | | 74 | | | | 98 | | | | 121 | | | | 69 | |
| |
Total: Personal income tax | | | 24 122 | | | | 29 109 | | | | 24 620 | | | | 29 303 | |
| |
| | | | | | | | | | | | | | | | | |
Corporate income tax | | | | | | | | | | | | | | | | |
| |
| Small business corporation tax savings | | | 178 | | | | 627 | | | | 747 | | | | 675 | |
| Research and development (R &D) | | | 183 | | | | 313 | | | | 286 | | | | 219 | |
| Learnership allowances | | | 179 | | | | 221 | | | | 324 | | | | 193 | |
Strategic Industrial Policy3 | | | 513 | | | | 281 | | | | 228 | | | | 61 | |
| Film incentive | | | 186 | | | | 194 | | | | 319 | | | | n/a | |
| Urban development zones (UDZ) | | | 28 | | | | 65 | | | | 90 | | | | 85 | |
| |
Total: Corporate income tax | | | 1 267 | | | | 1 701 | | | | 1 995 | | | | 1 233 | |
| |
| | | | | | | | | | | | | | | | | |
Value-added tax | | | | | | | | | | | | | | | | |
Zero-rated supplies | | | | | | | | | | | | | | | | |
| |
19 Basic Food items4 | | | 10 036 | | | | 11 376 | | | | 13 107 | | | | 13 907 | |
Petrol5 | | | 6 837 | | | | 7 763 | | | | 9 176 | | | | 10 524 | |
Diesel5 | | | 586 | | | | 736 | | | | 948 | | | | 1 249 | |
Paraffin5 | | | 430 | | | | 454 | | | | 516 | | | | 520 | |
| Municipal property rates | | | — | | | | 2 618 | | | | 3 008 | | | | 3 774 | |
| Reduced rates for “commercial” accommodation | | | 80 | | | | 85 | | | | 95 | | | | 113 | |
Subtotal: zero-rated supplies | | | 17 969 | | | | 23 032 | | | | 26 849 | | | | 30 086 | |
| |
Exempt supplies (Public transport & education) | | | 604 | | | | 682 | | | | 785 | | | | 832 | |
| |
| | | | | | | | | | | | | | | | | |
Customs duties and excise | | | | | | | | | | | | | | | | |
| |
Motor vehicles (MIDP, including IRCCs)6 | | | 15 438 | | | | 13 179 | | | | 16 169 | | | | 12 089 | |
Textile and clothing (Duty Credits — DCCs)6 | | | 2 189 | | | | 1 563 | | | | 1 829 | | | | 2 024 | |
| Furniture and fixtures | | | 120 | | | | 145 | | | | 166 | | | | 128 | |
Other customs7 | | | 924 | | | | 636 | | | | 1 141 | | | | 1 231 | |
| Diesel refund (mining, agriculture and fishing) | | | 753 | | | | 811 | | | | 1 205 | | | | 1 181 | |
Total customs and excise | | | 19 425 | | | | 16 335 | | | | 20 509 | | | | 16 653 | |
| |
Total tax expenditure | | | 63 387 | | | | 70 859 | | | | 74 758 | | | | 78 107 | |
| |
Tax expenditure as % of total gross tax revenue | | | 15.2 | % | | | 14.3 | % | | | 13.1 | % | | | 12.5 | % |
Total gross tax revenue | | | 417 196 | | | | 495 549 | | | | 572 815 | | | | 625 100 | |
| |
Tax expenditure as % of GDP | | | 3.9 | % | | | 3.9 | % | | | 3.6 | % | | | 3.4 | % |
| |
| | | |
| 1. | | Some of this tax expenditure is recouped when amounts are withdrawn as either a lump sum or an annuity |
| |
| 2. | | Employer contributions after the introduction of the monetary caps is difficult to estimate. |
| |
| 3. | | The amount for 2005/06 includes that for the previous two years |
| |
| 4. | | VAT relief in respect of basic food items based on an independent study |
| |
| 5. | | Based on fuel volumes and average retail selling prices. |
| |
| 6. | | MIDP=Motor industrial development programme, DCC=Duty credit certificate |
| |
| 7. | | Goods manufactured exclusively for exports, television monitors and agricultural goods exempted. |
181
ANNEXURE C: MISCELLANEOUS TAX AMENDMENTS
The accelerated depreciation of business assets is a potentially significant tax expenditure item, particularly the immediate deduction in mining capital expenditures, which has not been included in the above statement. In this case, the tax relief relates to the time-value of money and would require a comparison of the depreciation allowed in terms of the Income Tax Act, against the economic depreciation of the relevant capital assets. Data to undertake such an exercise is not readily available at present.
Estimates from the 2005/06 Income and Expenditure Survey by Statistics South Africa (StatsSA) suggest that the poorest 20 per cent of households accounted for about 7.9 per cent of total expenditure on food and non-alcoholic beverages, and the top 20 per cent of households accounted for 39.9 per cent. Assuming that the poorer households’ share of expenditure that is VAT zero rated on the list of “basic food items” is slightly higher (about 10 per cent), the monetary benefit that accrued to them was about R1.4 billion (10 per cent of R13.9 billion) in 2008/09, while the upper 20 per per cent of households received a benefit of R5 billion (about 36 per cent of R13.9 billion).This is not the most effective form of relief for the poor.
Personal income tax rate and bracket structure
The primary rebate is increased to R10 755 per year for all individuals. The secondary rebate, which applies to individuals aged 65 years and over, is increased to R6 012 per year. A third rebate, which applies to individuals aged 75 years and over, is introduced at R2 000 per year. The resulting income tax threshold, below which individuals are not liable for personal income tax, is increased to R59 700 of taxable income per year for those below the age of 65, and to R93 150 per year for those aged 65 and over. The tax threshold for individuals aged 75 years and over is R104 261. The rates for the 2010/11 tax year and those proposed for 2011/12 are set out in Table C.2.
Table C.2 Personal income tax rate and bracket adjustments, 2010/11 — 2011/12
| | | | | | | |
| Taxable | | 2010/11 | | | | 2011/12 |
| income (R) | | Rates of tax | | Taxable income (R) | | Rates of tax |
| |
| R0 — R140 000 | | 18% of each R1 | | R0 — R150 000 | | 18% of each R1 |
| R140 001 — R221 000 | | R25 200 + 25% of the amount
above R140 000 | | R150 001 — R235 000 | | R27 000 + 25% of the amount
above R150 000 |
| R221 001 — R305 000 | | R45 450 + 30% of the amount
above R221 000 | | R235 001 — R325 000 | | R48 250 + 30% of the amount
above R235 000 |
| R305 001 — R431 000 | | R70 650 + 35% of the amount
above R305 000 | | R325 001 — R455 000 | | R75 250 + 35% of the amount
above R325 000 |
| R431 001 — R552 000 | | R114 750 + 38% of the amount
above R431 000 | | R455 001 — R580 000 | | R120 750 + 38% of the amount
above R455 000 |
| R552 001 and above | | R160 730 + 40% of the amount
above R552 000 | | R580 001 | | R168 250 + 40% of the amount
above R580 000 |
Rebates | | | | Rebates | | |
| Primary | | R10 260 | | Primary | | R10 755 |
| Secondary | | R5 675 | | Secondary | | R6 012 |
Tax threshold | | | | Third rebate | | R2 000 |
| Below age 65 | | R57 000 | | Tax threshold | | |
| Age 65 and over | | R88 528 | | Below age 65 | | R59 750 |
| | | | | Age 65 and over | | R93 150 |
| | | | | Age 75 and over | | R104 261 |
182
The proposed tax schedule compensates individuals for the effect of inflation on income tax liabilities and results in reduced tax liability for taxpayers at all income levels. These tax reductions are set out in Tables C.3, C.4 and C.5. The average tax rates (tax as a percentage of taxable income) for individuals are illustrated in Figures C.1, C.2 and C.3.
Table C.3 Income tax payable, 2010/11 (taxpayers below age 65)
| | | | | | | | | | | | | |
| Taxable income | | 2010 rates | | Proposed rates | | Tax deduction | | |
| (Rands) | | (Rands) | | (Rands) | | (Rands) | | % reduction |
| |
| 60 000 | | | 540 | | | | 45 | | | -495 | | -91.7% |
| 65 000 | | | 1 440 | | | | 945 | | | -495 | | -34.4% |
| 70 000 | | | 2 340 | | | | 1 845 | | | -495 | | -21.2% |
| 75 000 | | | 3 240 | | | | 2 745 | | | -495 | | -15.3% |
| 80 000 | | | 4 140 | | | | 3 645 | | | -495 | | -12.0% |
| 85 000 | | | 5 040 | | | | 4 545 | | | -495 | | -9.8% |
| 90 000 | | | 5 940 | | | | 5 445 | | | -495 | | -8.3% |
| 100 000 | | | 7 740 | | | | 7 245 | | | -495 | | -6.4% |
| 120 000 | | | 11 340 | | | | 10 845 | | | -495 | | -4.4% |
| 150 000 | | | 17 440 | | | | 16 245 | | | -1 195 | | -6.9% |
| 200 000 | | | 29 940 | | | | 28 745 | | | -1 195 | | -4.0% |
| 250 000 | | | 43 890 | | | | 41 995 | | | -1 895 | | -4.3% |
| 300 000 | | | 58 890 | | | | 56 995 | | | -1 895 | | -3.2% |
| 400 000 | | | 93 640 | | | | 90 745 | | | -2 895 | | -3.1% |
| 500 000 | | | 130 710 | | | | 127 095 | | | -3 615 | | -2.8% |
| 750 000 | | | 229 670 | | | | 225 495 | | | -4 175 | | -1.8% |
| 1 000 000 | | | 329 670 | | | | 325 495 | | | -4 175 | | -1.3% |
Figure C.1 Average tax rates for taxpayers under age 65
183
ANNEXURE C: MISCELLANEOUS TAX AMENDMENTS
Table C.4 Income tax payable, 2010/11 (taxpayers age 65 and over)
| | | | | | | | | |
| | | 2010 rates | Proposed rates | Tax deduction | |
| Taxable income (Rands) | (Rands) | (Rands) | (Rands) | % reduction |
| |
| 90 000 | | 265 | | — | | -265 | | -100.0% |
| 100 000 | | 2 065 | | 1 233 | | -832 | | -40.3% |
| 120 000 | | 5 665 | | 4 833 | | -832 | | -14.7% |
| 150 000 | | 11 765 | | 10 233 | | -1 532 | | -13.0% |
| 200 000 | | 24 265 | | 22 733 | | -1 532 | | -6.3% |
| 250 000 | | 38 215 | | 35 983 | | -2 232 | | -5.8% |
| 300 000 | | 53 215 | | 50 983 | | -2 232 | | -4.2% |
| 400 000 | | 87 965 | | 84 733 | | -3 232 | | -3.7% |
| 500 000 | | 125 035 | | 121 083 | | -3 952 | | -3.2% |
| 750 000 | | 223 995 | | 219 483 | | -4 512 | | -2.0% |
| 1 000 000 | | 323 995 | | 319 483 | | -4 512 | | -1.4% |
Figure C.2 Average tax rates for taxpayers age 65 and over
Table C.5 Income tax payable, 2011/12 (taxpayers age 75 and over)
| | | | | | | | | |
| | | 2010 rates | Proposed rates | Tax deduction | |
| Taxable income (Rands) | (Rands) | (Rands) | (Rands) | % reduction |
| |
| 100 000 | | 2 065 | | — | | -2 065 | | -100.0% |
| 120 000 | | 5 665 | | 2 833 | | -2 832 | | -50.0% |
| 150 000 | | 11 765 | | 8 233 | | -3 532 | | -30.0% |
| 200 000 | | 24 265 | | 20 733 | | -3 532 | | -14.6% |
| 250 000 | | 38 215 | | 33 983 | | -4 232 | | -11.1% |
| 300 000 | | 53 215 | | 48 983 | | -4 232 | | -8.0% |
| 400 000 | | 87 965 | | 82 733 | | -5 232 | | -5.9% |
| 500 000 | | 125 035 | | 119 083 | | -5 952 | | -4.8% |
| 750 000 | | 223 995 | | 217 483 | | -6 512 | | -2.9% |
| 1 000 000 | | 323 995 | | 317 483 | | -6 512 | | -2.0% |
184
Figure C.3 Average tax rates for taxpayers age 75 and over
It is proposed that the customs and excise duties in the Customs and Excise Act 91 (schedule 1, part 2 of section A) be amended with effect from 23 February 2011 to the extent shown in Table C.6.
185
ANNEXURE C: MISCELLANEOUS TAX AMENDMENTS
Table C.6 Specific excise duties, 2010/11 – 2011/12
| | | | | | | | | | | | | | | |
| | | | | | | | | 2010/11 | | 2011/12 |
| | | | | | | | | Present rate of duty | | Proposed rate of duty |
| Tariff item | | Tariff heading | | Description | | Excise | Customs | | Excise | Customs |
104.00 | | | | | | Prepared foodstuffs; beverages, spirits and vinegar; tobacco | | | | | | | | |
| | | | | | | | | | | | | | | |
| 104.01 | | | 19.01 | | | Malt extract; food preparations of flour, groats, meal, starch or malt extract, not containing cocoa or containing less than 40 per cent by mass of cocoa calculated on a totally defatted basis, not elsewhere specified or included; food preparations of goods of headings 04.01 to 04.04, not containing cocoa or containing less than 5 per cent by mass of cocoa calculated on a totally defatted basis not elsewhere specified or included: | | | | | | | | |
| | | | | | | | | | | | | | | |
| .10 | | | | | | Traditional African beer powder as defined in Additional Note 1 to Chapter | | 34.7c/kg | | 34.7c/kg | | 34.7c/kg | | 34.7c/kg |
| | | | | | | | | | | | | | | |
| 104.10 | | | 22.03 | | | Beer made from malt: | | | | | | | | |
| | | | | | | | | | | | | | | |
| .10 | | | | | | Traditional African beer as defined in Additional Note 1 to Chapter 22 | | 7.82c/l | | 7.82c/l | | 7.82c/l | | 7.82c/l |
| | | | | | | | | | | | | | | |
| .20 | | | | | | Other | | R50.20/l | | R50.20/l | | R53.97/l | | R53.97/l |
| | | | | | | | | | | | | | | |
| | | | | | | | | of absolute alcohol | | of absolute alcohol |
| | | | | | | | | | | | | | | |
| 104.15 | | | 22.04 | | | Wine of fresh grapes, including fortified wines; grape must (excluding that of heading 20.09): | | | | | | | | |
| | | | | | | | | | | | | | | |
| | | | 22.05 | | | Vermouth and other wine of fresh grapes flavoured with plants or aromatic substances: | | | | | | | | |
| | | | | | | | | | | | | | | |
| .02 | | | | | | Sparkling | | R6.67/l | | R6.67/l | | R6.97/l | | R6.97/l |
| | | | | | | | | | | | | | | |
| .03 | | | | | | Unfortified wine of heading 22.04, with an alcoholic strength by volume exceeding 6.5 per cent vol. but not exceeding 16,5 per cent vol. | | R2.14/l | | R2.14/l | | R2.32/l | | R2.32/l |
| | | | | | | | | | | | | | | |
| .04 | | | | | | Unfortified wine of heading 22.05, with an alcoholic strength by volume exceeding 6.5 per cent vol. but not exceeding 15 per cent vol. | | R2.14/li | | R2.14/li | | R2.32/l | | R2.32/l |
| | | | | | | | | | | | | | | |
| .05 | | | | | | Fortified wine of heading 22.04 and 22.05 with an alcoholic strength by volume exceeding 15 per cent vol. but not exceeding 22 per cent vol. | | R4.03/l | | R4.03/l | | R4.33/l | | R4.33/l |
| | | | | | | | | | | | | | | |
| .06 | | | | | | Other | | | | | | R93.03/li aa | | R93.03/li aa |
186
Table C.6 Specific excise duties, 2010/11 – 2011/12
| | | | | | | | | | | | | | | |
| | | | | | | | | 2010/11 | | 2011/12 |
| | | | | | | | | Present rate of duty | | Proposed rate of duty |
| Tariff item | | Tariff heading | | Description | | Excise | Customs | | Excise | Customs |
| 104.17 | | | 22.06 | | | Other fermented beverages (for example, cider, perry and mead); mixtures of fermented beverages and mixtures of fermented beverages and non-alcoholic beverages, not elsewhere specified or included: | | | | | | | | |
| | | | | | | | | | | | | | | |
| .03 | | | | | | Sparkling beverages | | | | | | R6.97/l | | R6.97/l |
| | | | | | | | | | | | | | | |
| .05 | | | | | | Traditional African beer as defined in Additional Note 1 to Chapter 22 | | 7.82c/l | | 7.82c/l | | 7.82c/l | | 7.82c/l |
| | | | | | | | | | | | | | | |
| .15 | | | | | | Other fermented beverages, unfortified, with an alcoholic strength by volume not exceeding 9 per cent vol. | | R2.52/l | | R2.52/l | | R2.71/l | | R2.71/l |
| | | | | | | | | | | | | | | |
| .16 | | | | | | Other fermented beverages, unfortified, with an alcoholic strength by volume exceeding 9 per cent vol. but not exceeding 15 per cent vol. | | R2.52/li | | R2.52/li | | R2.71/l | | R2.71/l |
| | | | | | | | | | | | | | | |
| .17 | | | | | | Other fermented beverages, fortified, with an alcoholic streng by volume exceeding 15 per cent vol. but not exceeding 23 per cent vol. | | R5.15/l | | R5.15/l | | R38.00/li aa | | R38.00/li aa |
| | | | | | | | | | | | | | | |
| .22 | | | | | | Other, mixtures of fermented beverages and mixtures of fermented beverages and non-alcoholic beverages, with an alcoholic strength by volume not exceeding 9 per cent vol. | | R2.52/li | | R2.52/li | | R2.71/l | | R2.71/l |
| | | | | | | | | | | | | | | |
| .25 | | | | | | Other, mixtures of fermented beverages and mixtures of fermented beverages and non-alcoholic beverages, with an alcoholic strength by volume exceeding 9 per cent vol. but not exceeding 15 per cent vol. | | R2.52/li | | R2.52/li | | R2.71/l | | R2.71/li |
| | | | | | | | | | | | | | | |
| .90 | | | | | | Other | | R84.57/li aa | | R84.57/li aa | | R93.03/li aa | | R93.03/li aa |
| | | | | | | | | | | | | | | |
| 104.20 | | | 22.07 | | | Undenatured ethyl alcohol of an alcoholic strength by volume of 80 per cent volume or higher; ethyl alcohol and other spirits, denatured, of any strength; | | | | | | | | |
| | | | | | | | | | | | | | | |
| | | | 22.08 | | | Undenatured ethyl alcohol of an alcoholic strength by volume of less than 80 per cent volume; spirits, liqueurs and other spirituous beverages: | | | | | | | | |
| | | | | | | | | | | | | | | |
| .10 | | | | | | Wine spirits, manufactured by the distillation of wine | | R84.57/li aa | | R84.57/li aa | | R93.03/li aa | | R93.03/li aa |
| | | | | | | | | | | | | | | |
| .15 | | | | | | Spirits, manufactured by the distillation of | | R84.57/li aa | | R84.57/li aa | | R93.03/li aa | | R93.03/li aa |
| | | | | | | | | | | | | | | |
| .25 | | | | | | Spirits, manufactured by the distillation of | | R84.57/li aa | | R84.57/li aa | | R93.03/li aa | | R93.03/li aa |
| | | | | | | | | | | | | | | |
| .29 | | | | | | Other spirits | | R84.57/li aa | | R84.57/li aa | | R93.03/li aa | | R93.03/li aa |
| | | | | | | | | | | | | | | |
| | | | | | | Liiqueurs and other spirituous beverages: | | | | | | | | |
| | | | | | | | | | | | | | | |
| .41 | | | | | | With an alcoholic strength by volume exceeding 15 per cent vol. but not exceeding 23 per cent vol. | | | | | | R38.00/li aa | | R38.00/li aa |
| | | | | | | | | | | | | | | |
| .42 | | | | | | Other | | R84.57/li aa | | R84.57/li aa | | R93.03/li aa | | R93.03/li aa |
187
ANNEXURE C: MISCELLANEOUS TAX AMENDMENTS
Table C.6 Specific excise duties (continued)
| | | | | | | | | | | | | | | | | | | | | | | |
| | | | | | | | | 2010/11 | | 2011/12 |
| | | | | | | Present rate of duty | | Proposed rate of duty |
| Tariff item | | Tariff heading | | Description | | Excise | | Customs | | Excise | | Customs |
| 104.30 | | | 24.02 | | | Cigars, cheroots, cigarillos and cigarettes, of tobacco or of tobacco substitutes: | | | | | | | | | | | | | | | | |
| | | | 2402.10 | | | Cigars, cheroots and cigarillos containing tobacco: | | | | | | | | | | | | | | | | |
| .01 | | | 402.10.10 | | | Imported from Switzerland | | | | | | | R2 072.31 | | | | | | | | R2 196.65 | |
| | | | | | | | | /kg net | | /kg net |
| .03 | | | 402.10.90 | | | Other | | | R2 072.31 | | | | R2 072.31 | | | | R2 196.65 | | | | R2 196.65 | |
| | | | | | | | | /kg net | | /kg net |
| | | | 2402.20 | | | Cigarettes containing tobacco: | | | | | | | | | | | | | | | | |
| .05 | | | 402.20.10 | | | Imported from Switzerland | | | | | | | R4.47 | | | | | | | | R4.87 | |
| | | | | | | | | /10 cigarettes | | /10 cigarettes |
| .07 | | | 402.20.90 | | | Other | | | R4.47 | | | | R4.47 | | | | R4.87 | | | | R4.87 | |
| | | | | | | | | /10 cigarettes | | /10 cigarettes |
| | | | 2402.90.1 | | | Cigars, cheroots and cigarillos of tobacco substitutes: | | | | | | | | | | | | | | | | |
| .09 | | | 402.90.12 | | | Imported from Switzerland | | | | | | | R2 072.31 | | | | | | | | R2 196.65 | |
| | | | | | | | | /kg net | | /kg net |
| .11 | | | 402.90.14 | | | Other | | | R2 072.31 | | | | R2 072.31 | | | | R2 196.65 | | | | R2 196.65 | |
| | | | | | | | | /kg net | | /kg net |
| | | | 2402.90.2 | | | Cigarette of tobacco substitues: | | | | | | | | | | | | | | | | |
| .13 | | | 402.90.22 | | | Imported from Switzerland | | | | | | | R4.47 | | | | R4.87 | | | | R4.87 | |
| | | | | | | | | /10 cigarettes | | /10 cigarettes |
| .15 | | | 402.90.24 | | | Other | | | 4.5 | | | | 4.5 | | | | 4.9 | | | | 4.9 | |
| | | | | | | | | /10 cigarettes | | /10 cigarettes |
| 104.35 | | | 24.03 | | | Other manufactured tobacco and manufactured tobacco substitutes; “homogenised” or “reconstituted” tobacco; tobacco extracts and essences: | | | | | | | | | | | | | | | | |
| | | | 2403.10 | | | Smoking tobacco, whether or not
containing tobacco substitutes in any
proportions: | | | | | | | | | | | | | | | | |
| .01 | | | 403.10.10 | | | Pipe tobacco, in immediate packings of a content of less than 5 kg | | | R108.08 | | | | R108.08 | | | | R119.16 | | | | R119.16 | |
| | | | | | | | | /kg net | | /kg net |
| .03 | | | 403.10.20 | | | Other pipe tobacco | | | R108.08 | | | | R108.08 | | | | R119.16 | | | | R119.16 | |
| | | | | | | | | /kg net | | /kg net |
| .05 | | | 403.10.30 | | | Cigarette tobacco | | | R194.60 | | | | R194.60 | | | | R210.51 | | | | R210.51 | |
| | | | | | | | | /kg net | | /kg net |
| | | | 2403.99 | | | Other: | | | | | | | | | | | | | | | | |
| .07 | | | 403.99.30 | | | Other cigarette tobacco substitutes | | | R194.60 | | | | R194.60 | | | | R210.51 | | | | R210.51 | |
| | | | | | | | | /kg net | | /kg net |
| .09 | | | 403.99.40 | | | Other pipe tobacco substitutes | | | R108.08 | | | | R108.08 | | | | R119.16 | | | | R119.16 | |
| | | | | | | | | /kg net | | /kg net |
| | |
| * | | Please note that the Notes to Part 1 of Schedule No. 1 will be amended to provide for the following: |
| |
| 1. | | “Fortified wine” means wine which is the final product of the alcoholic fermentation of the must of fresh grapes, to which a spirit obtained by distilling grape wine or grape marc has been added to such an extent that the alcohol strength by volume thereof is at least 15,0 per cent vol. but not exceeding 22 per cent vol. |
| |
| 2. | | Tariff item 104.20.41 shall only apply to liqueurs, cordials and other spirituous beverages with a- |
| |
| | | (a) fermented alcoholic base |
| |
| | | (other than those made from beer of heading 22.03 or wine of headings 22.04 and 22.05); or |
| |
| | | (b) wine spirit base, |
| |
| | | to which other non-alcoholic ingredients have been added. |
188
The taxation of lump sums upon retirement
The revised rates for the taxation of lump sums upon retirement and involuntary retrenchments are set out in Table C.7.
Table C.7 Taxation of lump sums
| | | |
| Proposed rates | | |
| Taxable lump sum | | Rate of tax |
| 0 — R315 000 | | 0 per cent of amount |
| R315 001 — R630 000 | | R0 plus 18 per cent of amount exceeding R315 000 |
| R630 001 — R945 000 | | R56 700 plus 27 per cent of amount exceeding R630 000 |
| R945 001 and above | | R141 750 plus 36 per cent of amount exceeding R945 000 |
n Miscellaneous tax amendments
Provided below is a series of miscellaneous tax amendments proposed for the upcoming tax legislative cycle. These amendments eliminate small anomalies to ensure a more workable tax system within the current framework (these amendments do not represent fundamental policy shifts).
n Employment, individuals and savings
The anti-avoidance rules regarding share incentive schemes are constantly being refined. Well-established anti-avoidance rules exist to ensure that executives cannot readily convert salary (taxable as ordinary revenue) into capital gain. Nonetheless, this area of the law continues to give rise to tax issues because of the variety of plans and sizeable sums involved. At present, two sets of issues have emerged.
| • | | It is arguable whether deferred taxation of share incentive schemes should give rise to the Skills Development Levy or required Unemployment Insurance Fund contributions once employees have left the employment that gave rise to the shares. The goal would be to free ex-employees of these ancillary dispensations. |
| |
| • | | Employer-provided employment trusts appear to result in unintended double taxation and allow for the conversion of disguised salary into tax-free dividends. The goal is to ensure that one level of ordinary tax properly applies. |
Refinement of employer-provided long-term insurance plans
In 2010, amendments were introduced to clarify the legal distinction between plans that protect employers against lost profits and plans covering employees (and their families) against death and disability. This distinction is important because plans for the benefit of employees should trigger fringe benefit tax for them (while employer coverage has no adverse consequence for employees). Despite these changes, certain ambiguities and peripheral issues remain, relating to potential capital gain and the use of employer plans to fund the buy-out of key deceased shareholders/partners. It is proposed that these concerns are rationalised.
Exemption for private employment compensation entities
Compensation for death or personal injury suffered under contract of employment is largely regulated by the 1993 Compensation for Occupational Injuries and Diseases Act (COIDA). Most employees are covered by the government-controlled Compensation Fund. In addition, contributions and payouts by
189
ANNEXURE C: MISCELLANEOUS TAX AMENDMENTS
two privately-owned entities (both of which predate the Compensation Fund) are equally covered by COIDA. The provision of the same income and VAT exemptions as the Compensation Fund is being considered, as these entities are offering the same benefits.
Termination of the capital gain foreign currency rules
To ensure theoretical consistency, capital profits from foreign currency adjustments should be fully taxed when they are realised. Because taxing currency based on realisation can be extremely onerous, a currency pooling concept was introduced that defers any foreign currency capital gain/loss until that foreign currency is converted into a different currency. Despite this deferral, taxing individuals on their currency gains is simply impractical. The cost of compliance typically outweighs any revenue to the fiscus. Given these concerns, it is proposed that the capital gain charge for foreign currency be completely removed.
Relief for long-term commuting by the judiciary
Employees receive tax relief for company vehicles associated with work travel, but not for private travel or ordinary commuting to work. Even though this exclusion for commuting is theoretically sound, it creates unfair results for judges presiding over multiple courts or over a court that is located a long distance from the judge’s home. Government provides judges with vehicles to cover these costs, and it is proposed that this unusual work-travel arrangement be eligible for tax relief.
n Business
Completion of dividends tax
As discussed in Chapter 5 of the Budget Review, the new dividends tax is set to replace the secondary tax on companies from 1 April 2012. To date, most issues have been resolved with the assistance of public consultation. In 2011, final issues will be resolved, most notably:
| • | | Inbound foreign dividends — The proposed taxation of inbound foreign dividends remains unresolved. Generally, foreign dividends are taxable at varying levels. Some dividends are exempt and others are taxable at top marginal rates (40 per cent or 28 per cent). Given the proposed changes to the taxation of domestic dividends, the exemptions and rates need to be adjusted in line with the new dividends tax. |
| |
| • | | Foreign-owned South African branches — Foreign-owned South African branches are currently subject to tax at a 33 per cent rate instead of the standard 28 per cent rate for local companies. The 33 per cent rate serves as a simplified alternative to a branch profits tax for physical branch repatriations. However, this higher level of tax is only made possible by certain exceptions made to various non-discriminatory provisions within tax treaties. At this stage, it must be determined whether the change from a secondary tax on companies for dividends to a new dividends tax renders these exceptions null-and-void for treaty purposes, thereby calling into question the 33 per cent branch rate as a whole. When the new dividends tax comes into effect, it is proposed that this rate be repealed if discriminatory. |
Revised tax rules for capital distributions and for pre-2001 capital gain assets
Dividend distributions are subject to the secondary tax on companies, while capital distributions are subject to the capital gains tax. The capital gains tax impact on capital distributions has had a checkered history. In essence, the most appropriate (and internationally acceptable) result is for capital distributions to reduce the distributing share base cost, with gains only taking effect once base cost is exceeded. However, this result has proven elusive over the years, as the pre-2001 capital gains tax rules prevent
190
taxpayers from knowing the base cost of pre-2001 assets until disposal. Therefore, a revised and simplified system for determining the base cost of pre-2001 assets will be considered that does not require the base-cost determination of pre-2001 to be deferred until disposal. If this is achieved, the rules for capital distributions can be realigned with international practice.
Transfer of contingent liabilities
If a business is acquired as a going concern, the purchaser often assumes contingent liabilities (such as warranty obligations). These acquisitions may be taxable or tax-free. The seller is relieved of these liabilities and they are removed from the seller’s books. The impact of these contingent liabilities is an issue that needs to be addressed. In the case of taxable asset acquisitions, a set of explicit rules will be established to ensure these transfers do not give rise to double deductions or double inclusions. In the case of tax-deferred reorganisations, it is proposed that contingent liabilities be completely transferred from seller to buyer.
Taxation of debt
The tax rules for interest were altered several years ago to close certain avoidance schemes. However, this alteration has given rise to technical difficulties, especially concerning debt with indefinite or indeterminable maturities. This problem exists because the interest calculation requires a set term period that is lacking. It is therefore proposed that a special calculation be used in these circumstances to reach an appropriate yield without reliance on a set a term date. It is also proposed that the disposal of debt instruments before their maturity generate ordinary revenue because the gain or loss reflects implied interest differentials to overall market rates.
Film incentive revision
Film investors are entitled to claim a full upfront deduction for production and post-production expenditure incurred due to film ownership costs. Unfortunately, this incentive has been widely abused over the years by many taxpayers who claimed deductions based on artificial expenditure. Due to previous weaknesses in the incentive, taxpayers inflated their expenditure by borrowing through artificial non-recourse loans or by incurring excessive costs imposed by connected persons. In view of these difficulties, the incentive will be transformed into a tax incentive that encourages profits.
Income tax relief for international shipping
National Treasury announced the intention to provide tax relief for the shipping industry in the 2005 Budget Review to stimulate South African shipping transport. While National Treasury remains committed in this regard, it is fully understood that tax is only one contributing factor to the shortfall in the South African shipping register. A working group consisting of all relevant government stakeholders was formed to reformulate government’s policies and rebuild South Africa’s shipping industry. This effort will lead to engagement with the industry and a revision of legislation, including tax relief (such as a proposed tonnage tax).
Government grants to private stakeholders
The Income Tax Act exempts certain government grants if they are approved by the Minister of Finance. This approval depends on a list of factors, but the main issue is distinguishing between: (i) grants representing an indirect form of compensation for goods and/or services that should be taxed, and (ii) other grants designed as a subsidy mainly for the benefit of the grantee. It is proposed that a new set of clear and transparent principles be established to determine this distinction.
191
ANNEXURE C: MISCELLANEOUS TAX AMENDMENTS
n International
Offshore cell companies
In 2010, National Treasury announced its intent to review offshore cell companies due to concerns of large-scale avoidance. After discussions with stakeholders, it is proposed that offshore cells be taxed according to their substance — as multiple-investment entities. This will trigger imputed income for each party controlling each offshore cell. Consideration will also be given to enhancing the recoupment system when funds are directly or indirectly returned to the insured parties paying the premiums.
Completion of the cross-border withholding tax
In 2010, South Africa enacted a 10 per cent withholding tax on cross-border interest payable by residents to foreign persons, while retaining the current exemption for cross-border portfolio debt. The new tax will become effective from January 2013 (the delay caused by the need to renegotiate certain tax treaties). In the meantime, the withholding enforcement mechanisms will be adjusted to enhance future South African Revenue Service (SARS) enforcement and taxpayer compliance.
Tax treaty coordination of similar taxes
Tax treaties apply to income tax and similar taxes. The scope of the term “similar taxes” is an issue, especially when the different treaties have differing lists of similar taxes. It is proposed that the income tax be amended to list all similar taxes (including the impending dividends tax and interest withholding tax) as explicitly eligible for tax treaty relief.
Company-structured management investment funds
Mutual and private equity funds are showing an increased interest in Africa, including the use of South African management to channel these funds. Unfortunately, this use of South African management triggers significant additional South African tax, even though the investment funds have a foreign origin and destination. While tax changes in 2010 have sought to alleviate certain intermediary partnership and conduit entities, the vast majority of funds use offshore intermediary companies that fall outside this new relief. It is proposed that these intermediary companies receive tax relief from the effective management test to remove the negative tax consequences associated with South African management.
South African multinational offshore restructurings
Many South African multinationals seek to restructure their offshore operations. These restructurings often occur when multinationals acquire foreign companies with inconveniently located subsidiaries and move to more efficient locations within the South African multinational group. In light of the current economic downturn, these restructurings have accelerated to reduce costs and increase efficiency. Because many of these offshore restructurings give rise to immediate tax, even if the restructured offshore entities remain wholly under the control of the South African group, it is proposed that tax relief be provided in these circumstances.
Currency transactions indirectly connected to certain foreign hedges
Foreign currency held for business use is largely taxed on an annual mark-to-market basis with certain exemptions and deferrals until actual disposition. For example, certain loans to offshore foreign subsidiaries fall outside the mark-to-market regime, as do certain currency hedges against the purchase of foreign shares. In essence, once certain assets linked to currency gains and losses are exempt, all linked instruments should also be exempt. It is proposed that a further set of linked arrangements be excluded
192
from mark-to-market taxation. These newly exempt arrangements will include foreign bank loans used to fund further intra-group loans, the latter of which already fall outside mark-to-market taxation.
n Value-added tax
VAT and transfer duty nexus
A notional VAT input credit may be claimed when a VAT vendor buys a fixed property from a non-VAT vendor. To combat abuse, this notional VAT input is currently limited to the transfer duty paid by the purchasing VAT vendor. It is proposed that the notional VAT input credit be delinked from the transfer duty payable, and that the quantum of the notional VAT input credit is set equal to the tax fraction (14/114) of the lower of the:
| • | | Selling price (consideration) payable for the property |
| |
| • | | Open-market value of the property |
| |
| • | | Current municipal value of the property |
| |
| • | | VAT-inclusive acquisition price, including improvements, by the non-vendor selling the property. |
Synchronising VAT and customs for temporary import relief
The VAT exemption for temporary imports is encountering operational barriers in the case of customs duty-free imported goods. This is due to coordination issues between the VAT and customs rules. The lack of relief for temporary imports is causing problems for mining and manufacturing operations that temporarily import and upgrade foreign goods, which undermines South Africa’s ability to export value-added goods. To address this issue, technical adjustments will be made to the applicable customs item number to accommodate duty-free goods.
Minimum exemption for imported services
VAT is payable on the import of goods and services into South Africa. VAT provides for a R100 minimum threshold exemption for certain imported goods, but lacks any minimum threshold exemption for imported services. A similar exemption will be introduced for the import of services, easing SARS enforcement and taxpayer compliance. Both exemptions will be set at R500.
Value correction for warehoused goods entered for home consumption
If goods in a storage warehouse are sold to a buyer and the buyer subsequently enters the goods for home consumption, VAT (and possibly customs) applies. However, the VAT Act fails to specify the value on which VAT is calculated in this case. Due to this lack of specificity, many taxpayers claim that the value is based upon entry into the warehouse, not the actual sales value. It is proposed that actual sales value be used as the most accurate value.
Relief for outstanding debt between group members
Most VAT vendors operate on an invoice (i.e. accrual) basis for calculating output tax and input credits. When a VAT vendor makes a purchase, the vendor has a “grace period” of 12 months to pay the invoice, failing which the purchaser must return the input tax claimed to SARS on the theoretical assumption that the debt will probably never be paid. Purchases between VAT vendors within a single group of companies are an issue, as the 12-month period is often commercially unrealistic with intra-group loans clearing at a later date (e.g. two to three years later). Relief from this 12-month claw-back is being considered; provided the selling group member is prevented from claiming a VAT refund before the purchaser is subject to the claw-back of VAT input credits.
193
ANNEXURE C: MISCELLANEOUS TAX AMENDMENTS
Removal of mining right conversion rules
The Mineral and Petroleum Resources Development Act (2002) requires holders of old-order mineral rights to convert their rights into new-order rights after approval by the Department of Mineral Resources. New-order mineral production rights cannot last for more than 30 years, but holders can obtain approval for renewal. Although the current zero rating for conversions and renewals is designed to protect mineral-rights holders from being subject to VAT due to regulatory compliance, the zero rating is unnecessary and misplaced. These conversions and renewals should simply be viewed as a non-event (i.e. a non-supply) in line with common law and without specific legislative relief. It is proposed that the zero rating for mineral-right conversions or renewals be removed to prevent the distortion of collateral VAT issues (e.g. the VAT turnover calculation).
Manufacturer/producer rebates for retail goods
Manufacturers (or producers) may issue coupons that customers redeem when purchasing goods from dealers (or retailers). These coupons (often referred to as a rebate) are used to offset the purchase price of the goods. The question of how to fully account for these three-party relationships in VAT terms is an issue. More specifically, the customer should be prevented from claiming input credits for this full amount. These input credits should only be available for the non-coupon consideration actually incurred by the customer.
Revised starting date for alternative apportionment methods (administration)
If a vendor utilises goods or services for both taxable and other non-taxable purposes (mixed purposes), only a portion of the VAT may be claimed as input tax credits. In this regard, SARS has prescribed the use of the turnover-based method as the default method, and SARS has the discretion to approve alternative methods with retrospective effect. In theory, however, any retroactive input credits caused by the alternative method should be accompanied by a reduction in income tax offsets for the same prior periods. But this corresponding income tax reduction rarely occurs, with taxpayers receiving VAT refunds without any corresponding tax increase (i.e. without amending previously submitted tax returns). It is proposed that retroactive changes of apportionment be limited to periods within current open years of income tax assessment.
Limiting month-end cut-off changes
Vendors account for VAT according to tax periods that generally end on the last day of a calendar month, and the VAT Act allows a vendor to change the month-end cut-off date to another fixed date. This other fixed date must be within 10 days before or after the month end. However, some vendors are regularly changing their end dates solely to reduce VAT. These constant changes were never intended and are a drain on SARS enforcement. It is therefore proposed that end dates should not be changed more than once per 12-month period.
n Securities transfer tax: miscellaneous legislative proposals
Clarifying the broker exemption
Members of a stock exchange (brokers) are exempt from securities transfer tax. While the exemption has existed for years, its initial intent is not entirely clear. Upon review of industry practice, it appears that the exemption is used by brokers as market makers for shares to enhance liquidity and to facilitate the role of banking institutions. It is now proposed that the exemption be revised to clarify that it applies solely to players engaged as market makers.
194
n Technical corrections
In addition to the amendments described above, the 2011 tax amendment bills (like all annual amendment bills) will contain various technical corrections. The main thrust of these technical corrections is to cover inconsequential items. These items remedy typing errors, grammar, punctuation, numbering, misplaced cross-references, misleading headings and definitions, differences between the two language texts of legislation, updating or removing obsolete provisions, the removal of superfluous text and the incorporation of regulations and commonly accepted secondary interpretations into formal law. Technical corrections further include changes to effective dates and the proper coordination of transitional tax changes.
A final set of technical corrections relates to modifications that account for practical implementation of the tax law. Although tax amendments go through an intensive comment and review process, new issues arise (including obvious omissions and ambiguities) once the law is applied. Issues of this nature typically arise when returns are prepared for the first time after legislation is implemented. Technical corrections of this nature are almost exclusively limited to recent legislative changes.
195
ANNEXURE C: MISCELLANEOUS TAX AMENDMENTS
This page has been left blank intentionally
196
ANNEXURE D: BUDGET SUMMARY
| | | | | | | | | | | | | | | | | | | | | |
| Summary of the national budget | |
| | | 2010/11 | | | 2011/12 | | | 2012/13 | | | 2013/14 | |
| | | Budget | | | Revised | | | Budget | | | | |
| R million | | estimate | | | estimate | | | estimate | | | Medium term estimates | |
| |
REVENUE | | | | | | | | | | | | | | | | | | | | |
| | | | | | | | | | | | | | | | | | | | | |
Estimate of revenue before tax proposals | | | | | | | | | | | 733 973 | | | | 806 418 | | | | 904 314 | |
| | | | | | | | | | | | | | | | | | | | | |
Budget 2011/12 proposals: | | | | | | | | | | | | | | | | | | | | |
| | | | | | | | | | | | | | | | | | | | | |
Taxes on individuals and companies | | | | | | | | | | | | | | | | | | | | |
| | | | | | | | | | | | | | | | | | | | | |
Personal income tax | | | | | | | | | | | -8 850 | | | | | | | | | |
Adjust personal income tax rate structure | | | | | | | | | | | -8 100 | | | | | | | | | |
Adjustment in monetary thresholds | | | | | | | | | | | -750 | | | | | | | | | |
Business taxes | | | | | | | | | | | | | | | | | | | | |
Closure of dividend cession schemes | | | | | | | | | | | 500 | | | | | | | | | |
| | | | | | | | | | | | | | | | | | | | | |
Taxes on property | | | | | | | | | | | | | | | | | | | | |
Adjustment in transfer duties | | | | | | | | | | | -750 | | | | | | | | | |
| | | | | | | | | | | | | | | | | | | | | |
Indirect Taxes | | | | | | | | | | | 4 985 | | | | | | | | | |
Increase in general fuel levy | | | | | | | | | | | 1 900 | | | | | | | | | |
Increase in excise duties on tobacco products and alcoholic beverages | | | | | | | | | | | 1 785 | | | | | | | | | |
Increase in ad valorem excise duties | | | | | | | | | | | 150 | | | | | | | | | |
Increase in electricity levy | | | | | | | | | | | 1 150 | | | | | | | | | |
| |
Estimate of revenue after tax proposals | | | 643 239 | | | | 666 563 | | | | 729 858 | | | | 806 418 | | | | 904 314 | |
Percentage change from previous year | | | | | | | | | | | 9.5 | % | | | 10.5 | % | | | 12.1 | % |
| |
| | | | | | | | | | | | | | | | | | | | | |
EXPENDITURE | | | | | | | | | | | | | | | | | | | | |
| | | | | | | | | | | | | | | | | | | | | |
Direct charges against the National Revenue Fund | | | 350 625 | | | | 350 004 | | | | 385 312 | | | | 418 016 | | | | 450 423 | |
| | | | | | | | | | | | | | | | | | | | | |
| Cost of servicing state debt | | | 71 358 | | | | 66 570 | | | | 76 579 | | | | 90 808 | | | | 104 036 | |
| Provincial equitable share | | | 260 974 | | | | 265 139 | | | | 288 493 | | | | 305 725 | | | | 323 604 | |
| General fuel levy sharing with metros | | | 7 542 | | | | 7 542 | | | | 8 573 | | | | 9 040 | | | | 9 613 | |
| Skills development levy and Setas | | | 8 424 | | | | 8 424 | | | | 9 149 | | | | 9 606 | | | | 10 134 | |
Other 1 | | | 2 327 | | | | 2 327 | | | | 2 519 | | | | 2 837 | | | | 3 035 | |
| | | | | | | | | | | | | | | | | | | | | |
Appropriated by vote | | | 461 518 | | | | 459 920 | | | | 499 481 | | | | 538 380 | | | | 578 700 | |
| | | | | | | | | | | | | | | | | | | | | |
| Current payments | | | 128 611 | | | | 132 986 | | | | 145 242 | | | | 153 374 | | | | 163 849 | |
| Transfers and subsidies | | | 302 728 | | | | 297 227 | | | | 342 282 | | | | 371 183 | | | | 397 386 | |
| Payments for capital assets | | | 9 291 | | | | 8 817 | | | | 11 207 | | | | 13 824 | | | | 17 465 | |
| Payments for financial assets | | | 20 889 | | | | 20 890 | | | | 750 | | | | 0 | | | | 0 | |
Plus: | | | | | | | | | | | | | | | | | | | | |
| Unallocated funds | | | — | | | | — | | | | 40 | | | | 330 | | | | 530 | |
| Contingency reserve | | | 6 000 | | | | — | | | | 4 090 | | | | 11 405 | | | | 23 375 | |
| |
| | | | | | | | | | | | | | | | | | | | | |
Estimate of national expenditure | | | 818 143 | | | | 809 923 | | | | 888 923 | | | | 968 132 | | | | 1 053 029 | |
Percentage change from previous year | | | | | | | | | | | 9.8 | % | | | 8.9 | % | | | 8.8 | % |
| |
| | | | | | | | | | | | | | | | | | | | | |
2010 Budget estimate of expenditure | | | | | | | 818 143 | | | | 888 338 | | | | 964 314 | | | | | |
Increase / decrease (-) | | | | | | | -8 220 | | | | 585 | | | | 3 818 | | | | | |
| |
| | | | | | | | | | | | | | | | | | | | | |
Gross domestic product | | | 2 699 888 | | | | 2 666 894 | | | | 2 914 862 | | | | 3 201 299 | | | | 3 536 002 | |
| |
| | | |
| 1) | | Consists mainly of salaries of Members of Parliament, judges and magistrates. |
198
2011 BUDGET REVIEW
| | | | | | | | | | | | | | | | | | | | | |
| Summary of the consolidated budget | |
| | | 2010/11 | | | 2011/12 | | | 2012/13 | | | 2013/14 | |
| | | Budget | | | Revised | | | Budget | | | | |
| R million | | estimate | | | estimate | | | estimate | | | Medium term estimates | |
| |
National budget revenue 1) | | | 643 239 | | | | 666 563 | | | | 729 858 | | | | 806 418 | | | | 904 314 | |
| | | | | | | | | | | | | | | | | | | | | |
| Revenue of provinces, social security funds and selected public entities | | | 95 165 | | | | 88 460 | | | | 94 609 | | | | 102 296 | | | | 112 873 | |
| | | |
| | | | | | | | | | | | | | | | | | | | | |
Consolidated budget revenue 2) | | | 738 404 | | | | 755 023 | | | | 824 466 | | | | 908 714 | | | | 1 017 187 | |
| | | |
| | | | | | | | | | | | | | | | | | | | | |
National budget expenditure 1) | | | 818 143 | | | | 809 923 | | | | 888 923 | | | | 968 132 | | | | 1 053 029 | |
| | | | | | | | | | | | | | | | | | | | | |
| Expenditure of provinces, social security funds and selected public entities | | | 88 821 | | | | 87 453 | | | | 90 342 | | | | 93 451 | | | | 98 745 | |
| | | |
| | | | | | | | | | | | | | | | | | | | | |
Consolidated budget expenditure 2) | | | 906 964 | | | | 897 376 | | | | 979 265 | | | | 1 061 582 | | | | 1 151 773 | |
| | | |
| | | | | | | | | | | | | | | | | | | | | |
| |
| | | | | | | | | | | | | | | | | | | | | |
Consolidated budget balance | | | -168 560 | | | | -142 353 | | | | -154 799 | | | | -152 868 | | | | -134 586 | |
Percentage of GDP | | | -6.2 | % | | | -5.3 | % | | | -5.3 | % | | | -4.8 | % | | | -3.8 | % |
| | | | | | | | | | | | | | | | | | | | | |
| Extraordinary payments | | | | | | | -802 | | | | -150 | | | | — | | | | — | |
| Extraordinary receipts | | | | | | | 3 148 | | | | 1 350 | | | | — | | | | — | |
| | | | | | | | | | | | | | | | | | | | | |
Consolidated borrowing requirement (net) 3) | | | | | | | -140 007 | | | | -153 599 | | | | -152 868 | | | | -134 586 | |
| |
| | | | | | | | | | | | | | | | | | | | | |
FINANCING | | | | | | | | | | | | | | | | | | | | |
| | | | | | | | | | | | | | | | | | | | | |
Domestic loans (net) | | | | | | | 188 144 | | | | 175 314 | | | | 158 469 | | | | 144 841 | |
| | | | | | | | | | | | | | | | | | | | | |
Foreign loans (net) | | | | | | | -2 267 | | | | 4 999 | | | | -3 546 | | | | -9 630 | |
| | | | | | | | | | | | | | | | | | | | | |
| Market loans | | | | | | | — | | | | 7 150 | | | | 7 870 | | | | 8 690 | |
| Arms procurement loan agreements | | | | | | | 512 | | | | 1 009 | | | | 26 | | | | — | |
| World Bank loans | | | | | | | — | | | | — | | | | — | | | | — | |
| Redemptions (including revaluation of loans) | | | | | | | -2 779 | | | | -3 160 | | | | -11 442 | | | | -18 320 | |
| | | | | | | | | | | | | | | | | | | | | |
Change in cash and other balances | | | | | | | -45 870 | | | | -26 714 | | | | -2 054 | | | | -625 | |
| |
| | | | | | | | | | | | | | | | | | | | | |
Total financing (net) | | | | | | | 140 007 | | | | 153 599 | | | | 152 869 | | | | 134 586 | |
| |
| | |
| 1) | | Transfers to provinces, social security funds and selected public entities presented as part of the national budget. |
| |
| 2) | | Flows between national, provincial, social security funds and selected public entities are netted out. |
| |
| 3) | | Consolidated budgeted borrowing requirement for 2010/11 not available in comparable format. |
199
E
Glossary
| | | |
|
Accounting officer | | The civil servant in a department who is accountable to Parliament for financial management, usually the director-general or head of the department. |
| | | |
Accrual | | An accounting convention by which payments and receipts are recorded as they occur, even if no cash flow takes place. |
| | | |
Ad valorem duties | | Duties levied on commodities as a certain percentage of their value. |
| | | |
Adjustments estimate | | Presentation to Parliament of the amendments to be made to the appropriations voted in the main budget for the year. |
| | | |
Administered prices | | Prices set outside ordinary market processes, through administrative decisions by government, a public entity or a regulator. |
| | | |
Allocated expenditure | | The part of the national budget that can be divided between the national, provincial and local spheres of government, after interest and the contingency reserve have been taken into account. |
| | | |
Amortisation | | The repayment of a loan by instalments over the duration of the loan. |
| | | |
Appropriation | | The approval by Parliament of spending from the National Revenue Fund, or by a provincial legislature from a provincial revenue fund. |
| | | |
Asset price bubble | | A condition occurring when prices for a category of assets rise above the level justified by economic fundamentals. |
| | | |
Asset swap | | An arrangement in which financial institutions exchange a portfolio of South African shares and securities for a portfolio of foreign shares and securities. |
| | | |
Balance of payments | | A summary statement of all the international transactions of the residents of a country with the rest of the world over a particular period of time. |
| | | |
Baseline | | The initial allocations used during the budget process, derived from the previous year’s forward estimates. |
| | | |
Bond | | A certificate of debt issued by a government or corporation guaranteeing payment of the original investment plus interest by a specified future date. |
| | | |
Bond premium | | Amount by which the purchase price of a bond is greater than its par value. |
200
2011 BUDGET REVIEW
| | | |
|
Bond spread | | The difference in yield between two bonds. |
| | | |
Budget balance | | The difference between budgeted expenditure and budgeted revenue. If expenditure exceeds revenue the budget is in deficit or, if the reverse is true, it is in surplus. |
| | | |
Capital asset | | Property of any kind, including assets that are movable or immovable, tangible or intangible, fixed or circulating, but excluding trading stock held for the purpose of realising a financial or economic return. |
| | | |
Capital expenditure | | Expenditure on assets such as buildings, land, infrastructure and equipment. |
| | | |
Capital formation | | A measure of the net increase in the country’s total stock of capital goods, after allowing for depreciation. |
| | | |
Capital gains tax | | Tax levied on the income realised from the disposal of a capital asset by a taxpayer. A capital gain is the excess of the selling price over the purchase price of the capital asset. |
| | | |
Capital goods | | Durable goods used over a period of time for the production of other goods. See also intermediate goods. |
| | | |
Capital flow | | A flow of investments in and out of the country. |
| | | |
Capital-output ratio | | The amount of units of capital employed to produce a certain level of output. |
| | | |
Carbon tax | | An environmental tax on emissions of carbon dioxide (CO2). |
| | | |
Category A, B and C municipalities | | The Constitution establishes three categories of municipality: Category A, or metropolitan municipalities; Category B, or local municipalities; and Category C, or district municipalities. |
| | | |
Collective bargaining | | Negotiations between employees and employers on procedures and rules to cover conditions of work and rates of pay. |
| | | |
Conditional grants | | Allocations of money from one sphere of government to another, conditional on certain services being delivered or on compliance with specified requirements. |
| | | |
Consolidated government
expenditure | | Total expenditure by national and provincial government, social security funds and selected public entities, including transfers and subsidies to municipalities, businesses and other entities. |
| | | |
Consolidated general
government | | National, provincial and local government, as well as extra-budgetary government institutions and social security funds. |
| | | |
Consumer price index (CPI) | | The measure of inflation based on prices in a basket of goods and services. |
| | | |
Consumption expenditure | | Expenditure on goods and services, including salaries, which are used up within a short period of time, usually a year. |
201
ANNEXURE E: GLOSSARY
| | | |
|
Contingency reserve | | An amount set aside, but not allocated in advance, to accommodate changes to the economic environment and to meet unforeseeable spending pressures. |
| | | |
Contingent liabilities | | A government obligation that will only result in expenditure upon the occurrence of a specific event – such as a government guarantee. |
| | | |
Controlled foreign entity | | A foreign business in which South Africans hold a greater than 50 per cent interest, usually of the share capital of a company. |
| | | |
Corporatisation | | The transformation of state-owned enterprises into commercial entities, subject to commercial legal requirements and governance structures, while retaining state ownership. |
| | | |
Cost-push inflation | | Inflation that is caused by an increase in production costs, such as wages or oil prices. |
| | | |
Countercyclical fiscal policy | | Policy that has the opposite effect on economic activity to that caused by the business cycle, such as slowing spending growth in a boom period and accelerating spending in a recession. |
| | | |
Coupon (bond) | | The periodic interest payment made to bondholders during the life of the bond. The interest is usually paid twice a year. |
| | | |
Credit rating | | An indicator of the risk of default by a borrower or the riskiness of a financial instrument. |
| | | |
Crowding-in | | Increase of private investment through the income-raising effect of government spending financed by deficits. |
| | | |
Crowding-out | | A fall in private investment or consumption as a result of increased government expenditure financed through borrowing, thereby competing for loanable funds and raising the interest rate, which curtails private investment and consumption spending. |
| | | |
Current account (of the balance of payments) | | The difference between total imports and total exports, also taking into account service payments and receipts, interest, dividends and transfers. The current account can be in deficit or surplus. See also trade balance. |
| | | |
Current expenditure | | Government expenditure on goods and services, such as salaries, rent, maintenance and interest payments. See also consumption expenditure. |
| | | |
Customs duties | | Tax levied on imported goods. |
| | | |
Debt service costs | | The cost of interest on government debt and other costs directly associated with borrowing. |
| | | |
Debt switching | | The exchange of bonds to manage refinancing risk or improve tradability. |
| | | |
Deleveraging | | The reduction of debt previously used to increase the potential return of an investment. |
| | | |
Depreciation (capital) | | A reduction in the value of fixed capital as a result of wear and tear or redundancy. |
202
2011 BUDGET REVIEW
| | | |
|
Depreciation (exchange rate) | | A reduction in the external value of a currency. |
| | | |
Derivative financial instrument | | A financial asset that derives its value from an underlying asset, which may be a physical asset such as gold, or a financial asset such as a government bond. |
| | | |
Designated countries | | Foreign countries from which income may be exempt from South African tax under certain circumstances. See also double tax agreement. |
| | | |
Development finance
institutions (DFIs) | | State agencies that aim to meet the credit needs of riskier but socially and economically desirable projects that are beyond the acceptance limits of commercial banks. |
| | | |
Direct taxes | | Taxes charged on taxable income or capital of individuals and legal entities. |
| | | |
Disposable income | | Total income by households less all taxes and employee contributions. |
| | | |
Dissaving | | An excess of current expenditure, including the depreciation of fixed capital, over current income. |
| | | |
Division of revenue | | The allocation of funds between spheres of government, as required by the Constitution. See also equitable share. |
| | | |
Domestic demand | | The total level of spending in an economy, including imports but excluding exports. |
| | | |
Double tax agreement | | An agreement between two countries to prevent income that is taxed in one country from being taxed in the other as well. See also designated countries. |
| | | |
Economic growth | | An increase in the total amount of output, income and spending in the economy. |
| | | |
Economically active population | | The part of the population that is of working age and is either employed or seeking work. |
| | | |
Economic cost | | The cost of an alternative that must be forgone to pursue a certain action. Put another way, the benefits that could have been received by taking an alternative action. |
| | | |
Economic rents | | The difference between the return made by a factor of production (capital or labour) and the return necessary to keep the factor in its current occupation. For example: a firm making excess profits is earning economic rent. |
| | | |
Effective tax rate | | Actual tax liability (or a reasonable estimate thereof) expressed as a percentage of a pre-tax income base rather than as a percentage of taxable income, i.e. tax rates that take into account not only the statutory or nominal tax rate, but also other aspects of the tax system (e.g. allowable deductions), which determine the tax liability. |
| | | |
Emerging economies | | A name given by international investors to middle–income economies. |
203
| | | |
|
Employment coefficient | | The ratio of employment growth to economic growth. |
| | | |
Equalisation Fund levy | | A dedicated fuel levy used to subsidise the local synthetic fuel industry. It is also used to smooth the impact of fluctuations in the international oil price (and exchange rate) on the domestic fuel price. |
| | | |
Equity finance | | Raising money by selling shares of stock to investors, who receive an ownership interest in return. |
| | | |
Equitable share | | The allocation of revenue to the national, provincial and local spheres of government as required by the Constitution. See also division of revenue. |
| | | |
Exchange control | | Rules that regulate the flow of currency out of South Africa, or restrict the amount of foreign assets held by South African individuals and companies. |
| | | |
Excise duties | | Taxes on the manufacture or sale of certain domestic or imported products. Excise duties are usually charged on products such as alcoholic beverages, tobacco and petroleum. |
| | | |
Extra-budgetary institutions | | Public entities not directly funded from the fiscus. |
| | | |
Extraordinary payments | | Payments, excluding departmental appropriated payments, that are not expected to recur frequently. |
| | | |
Extraordinary receipts | | Receipts, other than departmental receipts, that are not expected to recur frequently. |
| | | |
Financial account | | A statement of all financial transactions between the nation and the rest of the world, including portfolio and fixed investment flows and movements in foreign reserves. |
| | | |
Financial and Fiscal Commission (FFC) | | An independent body established by the Constitution to make recommendations to Parliament and provincial legislatures about financial issues affecting the three spheres of government. |
| | | |
Financial Services Board | | An independent institution established by statute that regulates insurers, intermediaries, retirement funds, friendly societies, unit trust schemes, management companies and financial markets. |
| | | |
Financial Stability Board | | An international body made up of representatives of financial authorities and institutions, and central banks. It proposes regulatory, supervisory and other policies in the interest of financial stability. |
| | | |
Financial year | | The 12 months according to which companies and organisations budget and account. See also fiscal year. |
| | | |
Fiscal incidence | | The combined overall economic impact that fiscal policy has on the economy. |
| | | |
Fiscal policy | | Policy on taxation, public spending and borrowing by the government. |
| | | |
Fiscal year | | The 12 months on which government budgets are based, beginning 1 April and ending 31 March of the subsequent calendar year. |
204
2011 BUDGET REVIEW
| | | |
|
Fiscal space | | The ability of government’s budget to provide additional resources for a desired programme without jeopardising fiscal or debt sustainability. |
| | | |
Fixed income bond | | A bond that pays a specific interest rate. |
| | | |
Fixed investment/capital
formation | | Spending on buildings, machinery and equipment contributing to production capacity in the economy. See also gross fixed capital formation. |
| | | |
Floating rate notes | | A bond on which the interest rate is reset periodically in line with a money market reference rate. |
| | | |
Foreign currency swaps | | The exchange of principal and/or interest payments in one currency for those in another. |
| | | |
Foreign direct investment
(FDI) | | The acquisition of a controlling interest by governments, institutions or individuals of a business in another country. |
| | | |
Forward book | | The total amount of contracts for the future exchange of foreign currency entered into by the Reserve Bank at any given point in time. |
| | | |
Forward cover | | Transactions involving an agreed exchange rate at which foreign currency will be purchased or sold at a future date. |
| | | |
Forward markets | | Markets in which currencies, commodities or securities are bought and sold at agreed prices for delivery at specified future dates. |
| | | |
Fuel levy | | An excise tax on liquid fuels. |
| | | |
Function shift | | The movement of a function from one departmental vote or sphere of government to another. |
| | | |
Funded pension
arrangements | | A pension scheme in which expected future benefits are funded in advance and as entitlement accrues. |
| | | |
GDP inflation | | A measure of the total increase in prices in the whole economy. Unlike CPI inflation, GDP inflation includes price increases in goods that are exported and intermediate goods such as machines, but excludes imported goods. |
| | | |
Gold and foreign exchange reserve account | | Reserves held by the South African Reserve Bank to meet foreign exchange obligations and to maintain liquidity in the presence of external shocks. |
| | | |
Government debt | | The total amount of money owed by the government as a consequence of its borrowing in the past. |
| | | |
Gross borrowing
requirement | | The sum of the main budget balance, extraordinary receipts and payments, and maturing debt. The amount is funded through domestic short- and long-term loans, foreign loans and changes in cash balances. |
205
ANNEXURE E: GLOSSARY
| | | |
|
Gross domestic product
(GDP) | | A measure of the total national output, income and expenditure in the economy. GDP per head is the simplest overall measure of welfare, although it does not take account of the distribution of income, nor of goods and services that are produced outside the market economy, such as work within the household. |
| | | |
Gross fixed capital
formation | | The addition to a country’s fixed capital stock during a specific period,before provision for depreciation. |
| | | |
Hedging | | An action taken by a buyer or seller to protect income against changes in prices, interest rates or exchange rates. |
| | | |
Horizontal equity | | A principle in taxation that holds that similarly situated taxpayers should face a similar tax treatment or tax burden, i.e. taxpayers with the same amount of income or capital should be accorded equal treatment. |
| | | |
Import parity pricing | | When a firm sells goods locally at the price that customers would pay if they were to import the same goods from another country. |
| | | |
Inclusion rate | | The portion of the net capital gain derived from the disposal of an asset that will be taxed at the applicable rate. |
| | | |
Inflation | | An increase in the general level of prices. |
| | | |
Inflation targeting | | A monetary policy framework intended to achieve price stability over a certain period of time. The Reserve Bank and government agree on a target range to be achieved over a stipulated period. |
| | | |
Intermediate goods | | Goods produced to be used as inputs in the production of final goods. |
| | | |
Inventories | | Stocks of goods held by firms. An increase in inventories reflects an excess of output relative to spending over a period. |
| | | |
Labour intensity | | The relative amount of labour used to produce a unit of output. |
| | | |
Liquidity | | The ease with which assets can be bought and sold. |
| | | |
Liquidity requirements | | The amount of liquid or freely convertible assets that banks are required to hold relative to their liabilities, for prudential and regulatory purposes. |
| | | |
M3 | | The broadest definition of money supply in South Africa, including notes and coins, demand and fixed deposits, and credit. |
| | | |
Macroeconomics | | The branch of economics that deals with the whole economy – including issues such as growth, inflation, unemployment and the balance of payments. |
| | | |
Marginal lending rate | | A penalty rate of interest charged by the Reserve Bank for lending to financial institutions in the money market in excess of the daily liquidity provided to the money market at the repurchase rate. See also repurchase agreements. |
| | | |
Marginal income tax rate | | The rate of tax on an incremental unit of income. |
206
| | | |
|
Marketable securities | | Tradeable financial securities listed with a securities exchange. |
| | | |
Medium Term Expenditure
Committee (MTEC) | | The technical committee responsible for evaluating the MTEF budget submissions of national departments and making recommendations to the Minister of Finance regarding allocations to national departments. |
| | | |
Medium-term expenditure
framework (MTEF) | | The three-year spending plans of national and provincial governments, published at the time of the Budget. |
| | | |
Microeconomics | | The branch of economics that deals with the behaviour of individual firms, consumers and sectors. |
| | | |
Ministers’ Committee on the
Budget | | The political committee that considers key policy and budgetary issues that pertain to the budget process before they are tabled in Cabinet. |
| | | |
MinMEC | | A political forum where national and provincial departments in the same sector discuss policy issues. It consists of the national minister and the nine provincial ministers, supported by key departmental officials. |
| | | |
Monetary policy | | Policy concerning total money supply, exchange rates and the general level of interest rates. |
| | | |
Money supply | | The total stock of money in an economy. |
| | | |
National budget | | The projected revenue and expenditures that flow through the National Revenue Fund. It does not include spending by provinces or local government from their own revenues. |
| | | |
National Revenue Fund | | The consolidated account of the national government into which all taxes, fees and charges collected by SARS and departmental revenue must be paid. |
| | | |
Negotiable certificate of deposit (NCD) | | Short-term deposit instruments issued by banks, at a variable interest rate, for a fixed period. |
| | | |
Net borrowing requirement | | The sum of the main budget balance, extraordinary receipts and extraordinary payments. Deficits increase the borrowing requirement; surpluses reduce the requirement, leading to a negative requirement. |
| | | |
Net exports | | Exports less imports. |
| | | |
Net open foreign currency position (NOFP) | | Gold and foreign exchange reserves minus oversold forward book. The figure is expressed in dollars. |
| | | |
Nominal exchange rates | | The current rate of exchange between the rand and foreign currencies. The “effective” exchange rate is a trade–weighted average of the rates of exchange with other currencies. |
| | | |
Nominal wage | | The return, or wage, to employees at the current price level. |
| | | |
Non-financial public
enterprises | | Government-owned or controlled organisations that deliver goods and non-financial services, trading as business enterprises, such as Eskom or Transnet. |
207
| | | |
|
Non-interest expenditure | | Total expenditure by government less debt service costs. |
| | | |
Non-tax revenue | | Income received by the government as a result of administrative charges, licences, fees, sales of goods and services, etc. |
| | | |
Occupation-specific salary
dispensation | | Revised salary structures unique to identified occupations in the public service, including doctors, nurses and teachers. |
| | | |
Opportunity cost | | The value of that which must be given up to achieve or acquire something. It is represented by the next highest valued alternative use of a resource. |
| | | |
Organisation for Economic Cooperation and Development (OECD) | | An organisation of 30 mainly industrialised member countries. South Africa is not a member. |
| | | |
Outputs | | Goods and services delivered by government. |
| | | |
Personal saving rate | | Saving as a percentage of disposable income. |
| | | |
Portfolio investment | | Investment in financial assets such as stocks and bonds. |
| | | |
Policy reserve | | Additional money in the fiscus to fund new and crucial priorities. |
| | | |
Price discovery | | The process of determining the price level of a commodity or asset based on supply and demand factors. |
| | | |
Primary deficit/surplus | | The difference between total revenue and non-interest expenditure. When revenue exceeds non-interest expenditure there is a surplus. |
| | | |
Primary sector | | The agricultural and mining sectors of the economy. |
| | | |
Private sector credit
extension | | Credit provided to the private sector. This includes all loans, credit cards and leases. |
| | | |
Privatisation | | The full or partial sale of state-owned enterprises to private individuals or companies. |
| | | |
Producer price inflation
(PPI) | | Price increases measured by the producer price index – a measure of the prices paid based mainly on producers’ published price lists. |
| | | |
Productivity | | A measure of the amount of output generated from every unit of input. Typically used to measure changes in labour efficiency. |
| | | |
Public entities | | Companies, agencies, funds and accounts that are fully or partly owned by government or public authorities and are regulated by law. |
| | | |
Public-benefit organisations
(PBOs) | | Organisations that are mainly funded by donations from the public and other institutions, which engage in social activities meeting the needs of the general public. |
| | | |
Public goods | | Goods and services that would not be fully provided in a pure free-market system (e.g. defence), and are largely provided by government. |
208
| | | |
|
Public Investment
Corporation (PIC) | | A government-owned investment management company that invests funds on behalf of public-sector entities. Its largest client is the Government Employees Pension Fund. |
| | | |
Public-private partnerships
(PPPs) | | A contractual arrangement whereby a private party performs part of a government function and assumes the associated risks. In return, the private party receives a fee according to predefined performance criteria. |
| | | |
Public sector | | National government, provincial government, local government, extra– budgetary governmental institutions, social security funds and non-financial public enterprises. |
| | | |
Public sector borrowing
requirement (PSBR) | | The consolidated cash borrowing requirement of general government and non-financial public enterprises. |
| | | |
Purchasing Managers’
Index (PMI) | | A composite index measuring the change in manufacturing activity compared with the previous month. An index value of 50 indicates no change in the activity, a value above 50 indicates increased activity and a value below 50 indicates decreased activity. |
| | | |
Quantitative easing | | A measure used to stimulate economic growth when interest rates are near zero. A central bank creates money and purchases long-term government bonds or financial assets. As a result, money supply increases and yields on the targeted financial assets fall, helping to stimulate credit extension. |
| | | |
Rating agency | | Companies that evaluate the ability of countries or other borrowers to honour their debt obligations. Credit ratings are used by international investors as indications of sovereign risk. See also credit rating. |
| | | |
Real effective exchange rate | | A measure of the rate of exchange of the rand relative to a trade-weighted average of South Africa’s trading partners’ currencies, adjusted for price trends in South Africa and the countries included. |
| | | |
Real exchange rate | | The level of the exchange rate taking account of inflation differences. |
| | | |
Real expenditure | | Expenditure measured in constant prices, i.e. after taking account of inflation. |
| | | |
Real wage | | The return, or wage, to employees, measured at a constant price level. |
| | | |
Recession | | A period in which national output and income decline. A recession is usually defined as two consecutive quarters of negative growth. |
| | | |
Regional integration | | An economic policy intended to boost economic activity in a geographical area extending beyond one country. |
| | | |
Remuneration | | The costs of personnel including salaries, housing allowances, car allowances and other benefits received by personnel. |
| | | |
Repurchase (repo) rate | | The rate at which the Reserve Bank lends to commercial banks. |
209
| | | |
|
Repurchase agreements | | Short-term contracts between the Reserve Bank and private banks in the money market to sell specified amounts of money at an interest rate determined by daily auction. |
| | | |
Reserves (foreign exchange) | | Holdings of foreign exchange, either by the Reserve Bank only or by the Reserve Bank and domestic banking institutions. |
| | | |
Residence-based income tax
system | | A tax system in which the worldwide income accruing to a resident of a country is subject to the taxes of that country. |
| | | |
Revaluation gain/loss | | The difference between the value of a foreign currency deposit from original (historic) rate to execution of a trade based on the spot rate. |
| | | |
Saving | | The difference between income and spending. |
| | | |
Seasonally adjusted and annualised | | The process of removing the seasonal volatility (monthly or quarterly) from a time series. This provides a measure of the underlying trend in the data. |
| | | |
Secondary rebate | | A rebate from income tax, in addition to the primary rebate, that is available to taxpayers aged 65 years and older. |
| | | |
Secondary sector | | The part of the economy concerned with the manufacture of goods. |
| | | |
Secondary tax on companies
(STC) | | Tax on dividends declared by a company, calculated at the rate of 10 per cent of the net amount of dividends declared. |
| | | |
Section 21 company | | Non-profit entities registered in terms of Section 21 of the Companies Act. |
| | | |
Secured debt instruments | | Debt backed or secured by collateral to reduce the risk of lending. |
| | | |
Service and transfer payments | | Services involve transactions of non-tangible commodities, while transfers are unrequited transactions that do not generate a counter-economic value (e.g. gifts and grants). |
| | | |
Sector Education and
Training Authorities | | Institutions funded through employer training levies, responsible for learnership programmes and implementing strategic sector skills plans. |
| | | |
Skills development levy | | A payroll tax designed to finance training initiatives, in terms of the skills development strategy. |
| | | |
Source-based income tax
system | | A system in which income is taxed in the country where the income originates. |
| | | |
Southern African Customs Union (SACU) agreement | | An agreement that allows for the unrestricted flow of goods and services, and the sharing of customs and excise revenue, between South Africa, Botswana, Namibia, Lesotho and Swaziland. |
| | | |
Southern African Development Community (SADC) | | A regional governmental organisation that promotes collaboration, economic integration and technical cooperation throughout Southern Africa. |
| | | |
Sovereign debt rating | | An assessment of the likelihood that a government will default on its debt obligations. |
210
| | | |
|
Specific excise duty | | A tax on each unit of output or sale of a good, unrelated to the value of a good. |
| | | |
Standing appropriations | | Government’s expenditure obligations that do not require a vote or statutory provision, including contractual guarantee commitments and international agreements. |
| | | |
Statutory appropriations | | Amounts appropriated to be spent in terms of statutes and not requiring appropriation by vote. |
| | | |
Sterilisation | | Action taken by the Reserve Bank to neutralise excess cash created in the money market when purchasing foreign currency. |
| | | |
Structural budget balance | | A representation of what government revenue and expenditure would be if output were at its potential level, with cyclical variations stripped out. |
| | | |
Switch auction | | Auctions to exchange bonds to manage refinancing risk or improve tradability. |
| | | |
Syndicated loan | | A large loan in which a group of banks work together to provide funds which they solicit from their clients for the borrower. |
| | | |
Tax amnesty | | A period allowed by tax authorities during which taxpayers who are outside the tax net, but should be registered for tax purposes, can register for tax without incurring penalties. |
| | | |
Tax avoidance | | When individuals or businesses legitimately use provisions in the tax law to reduce their tax liability. |
| | | |
Tax base | | The aggregate value of income, sales or transactions on which particular taxes are levied. |
| | | |
Tax evasion | | When individuals or businesses illegally reduce their tax liability. |
| | | |
Tax gap | | A measure of tax evasion that emerges from comparing the tax liability or tax base declared to the tax authorities with the tax liability or tax base calculated from other sources. |
| | | |
Tax incentives | | Specific provisions in the tax code that provide favourable tax treatment to individuals and businesses to encourage specific behaviour or activities. |
| | | |
Tax incidence | | The final distribution of the burden of tax. Statutory incidence defines where the law requires a tax to be levied. Economic incidence refers to those who experience a decrease in real income as a result of the imposition of a tax. |
| | | |
Tax loopholes | | Unintended weaknesses in the legal provisions of the tax system used by taxpayers to avoid paying tax liability. |
| | | |
Tax-to-GDP ratio | | For public finance comparison purposes, a country’s tax burden, or tax-to-GDP ratio, is computed by taking the total tax payments for a particular fiscal year as a fraction or percentage of the GDP for that year. |
211
| | | |
|
Terms of trade | | An index measuring the ratio of a country’s export prices relative to its import prices. |
| | | |
Tertiary sector | | The part of the economy concerned with the provision of services. |
| | | |
Total factor productivity
(TFP) | | An index used to measure the efficiency of all inputs that contribute to the production process. Increases in TFP are usually attributable to technological improvements. |
| | | |
Trade balance | | The monetary record of a country’s net imports and exports of physical merchandise. See also current account. |
| | | |
Trade regime | | The system of tariffs, quotas and quantitative restrictions applied to protect domestic industries, together with subsidies and incentives used to promote international trade. |
| | | |
Trade-weighted rand | | The value of the rand pegged to or expressed relative to a market basket of selected foreign currencies. |
| | | |
Trademark | | A legal right pointing distinctly to the origin or ownership of merchandise to which it is applied and legally reserved for the exclusive use of the owner as maker or seller. |
| | | |
Treasury committee | | The Cabinet committee that evaluates all requests for additional funds for unavoidable and unforeseen expenditure during a financial year. |
| | | |
Trend GDP growth | | The theoretical level of GDP growth determined by the full utilisation of all factors of production (land, labour and capital). Growth above the trend rate results in macroeconomic imbalances such as rising inflation or a weakening of the current account. Increases in trend GDP growth are achieved through capital formation, growth in employment and/or technological development. |
| | | |
Unallocated reserves | | Potential expenditure provision not allocated to a particular use. It mainly consists of the contingency reserve and amounts of money left unallocated by provinces. |
| | | |
Unemployment (broad
definition) | | All those of working age that are unemployed, including those actively seeking employment and discouraged workers. |
| | | |
Unemployment (official
definition) | | Those of working age, that are unemployed and actively seeking work opportunities (excludes discouraged work seekers). |
| | | |
Unit labour cost | | The cost of labour per unit of output, calculated by dividing average wages by productivity (output per worker per hour). |
| | | |
Unsecured debt instruments | | Debt not backed or secured by collateral to reduce the risk of lending. |
| | | |
User charge | | Payments made in exchange for direct benefits accrued, e.g. road toll fees. |
| | | |
Vertical division | | The division of revenue between spheres of government. |
212
| | | |
|
Vertical equity | | A doctrine in taxation that holds that differently situated taxpayers should be treated differently in terms of income tax provisions – i.e. taxpayers with more income and/or capital should pay more tax. |
| | | |
Virement | | The transfer of resources from one programme to another within the same department during a financial year. |
| | | |
Vote | | An appropriation voted by Parliament. |
| | | |
Withholding tax | | Tax on income deducted at source. Withholding taxes are widely used in respect of dividends, interest and royalties. |
| | | |
Yield | | A financial return or interest paid to buyers of government bonds. The yield/rate of return on bonds takes into account the total of annual interest payments, the purchase price, the redemption value and the amount of time remaining until maturity. |
| | | |
Yield curve | | A graph showing the relationship between the yield on bonds of the same credit quality but different maturity at a given point in time. |
213