© South African Reserve Bank All rights reserved. No part of this publication may be reproduced, stored in a retrieval system, or transmitted in any form or by any means, electronic, mechanical, photocopying, recording or otherwise, without fully acknowledging the Quarterly Bulletin of the South African Reserve Bank as the source. The contents of this publication are intended for general information only and are not intended to serve as financial or other advice. While every precaution is taken to ensure the accuracy of information, the South African Reserve Bank shall not be liable to any person for inaccurate information or opinions contained in this publication. Enquiries relating to this Bulletin should be addressed to: Head: Economic Statistics Department South African Reserve Bank P O Box 427 Pretoria 0001 Tel. +27 12 313 3668/3676 http://www.resbank.co.za ISSN 0038-2620 Android IOS Windows Printed by Publishing Section of South African Reserve Bank MARCH 2020
Contents Quarterly Economic Review Introduction ............................................................................................................................... Global economic developments ................................................................................................ Domestic economic developments ........................................................................................... Domestic output ............................................................................................................... Real gross domestic expenditure ...................................................................................... Gross nominal saving ........................................................................................................ Employment ...................................................................................................................... Labour cost and productivity ............................................................................................ Prices ................................................................................................................................ External economic accounts ..................................................................................................... Current account ................................................................................................................ Financial account .............................................................................................................. Foreign-owned assets in South Africa ............................................................................... South African-owned assets abroad ................................................................................. Foreign debt...................................................................................................................... International investment position ....................................................................................... International reserves and liquidity .................................................................................... Exchange rates ................................................................................................................. Turnover in the South African foreign exchange market..................................................... Monetary developments, interest rates and financial markets ................................................... Money supply.................................................................................................................... Credit extension ................................................................................................................ Interest rates and yields .................................................................................................... Money market ................................................................................................................... Bond market ..................................................................................................................... Share market..................................................................................................................... Market for exchange-traded derivatives ............................................................................ Non-bank financial intermediaries ..................................................................................... Flow of funds..................................................................................................................... Public finance............................................................................................................................ Non-financial public sector borrowing requirement ........................................................... Budget comparable analysis of national government finance ............................................ 1 4 7 7 13 25 28 32 33 41 41 46 47 48 49 50 51 52 54 56 56 58 62 66 68 70 72 76 77 79 79 83 Boxes Box 1 Box 2 Household wage and income statistics......................................................................... The link between the deficit and surplus funding positions of domestic institutional sectors and the rest of the world .................................................................................. Introducing collateral substitution for repurchase auctions ........................................... Unpacking the drivers of residential property prices ..................................................... The 2020 Budget Review.............................................................................................. 18 26 66 73 80 Box 3 Box 4 Box 5 Notes to tables ......................................................................................................................... 90 Abbreviations ........................................................................................................................... 91 Statistical tables Contents ..................................................................................................................................... S–0 Statistical tables .......................................................................................................................... S–2 Key information ....................................................................................................................... S–148 MARCH 2020
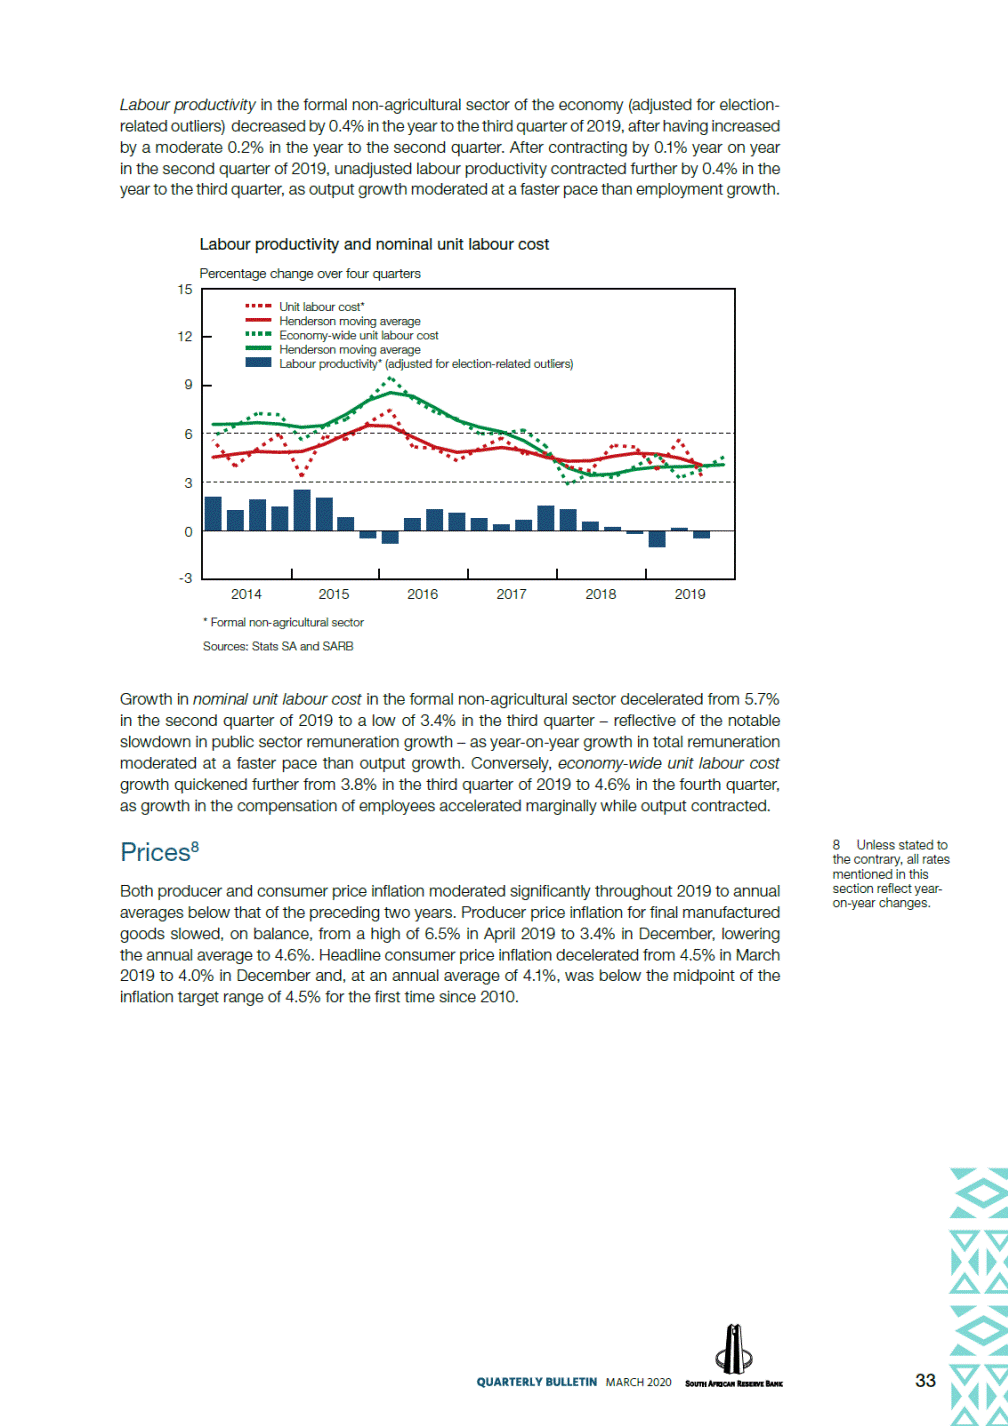
[LOGO]
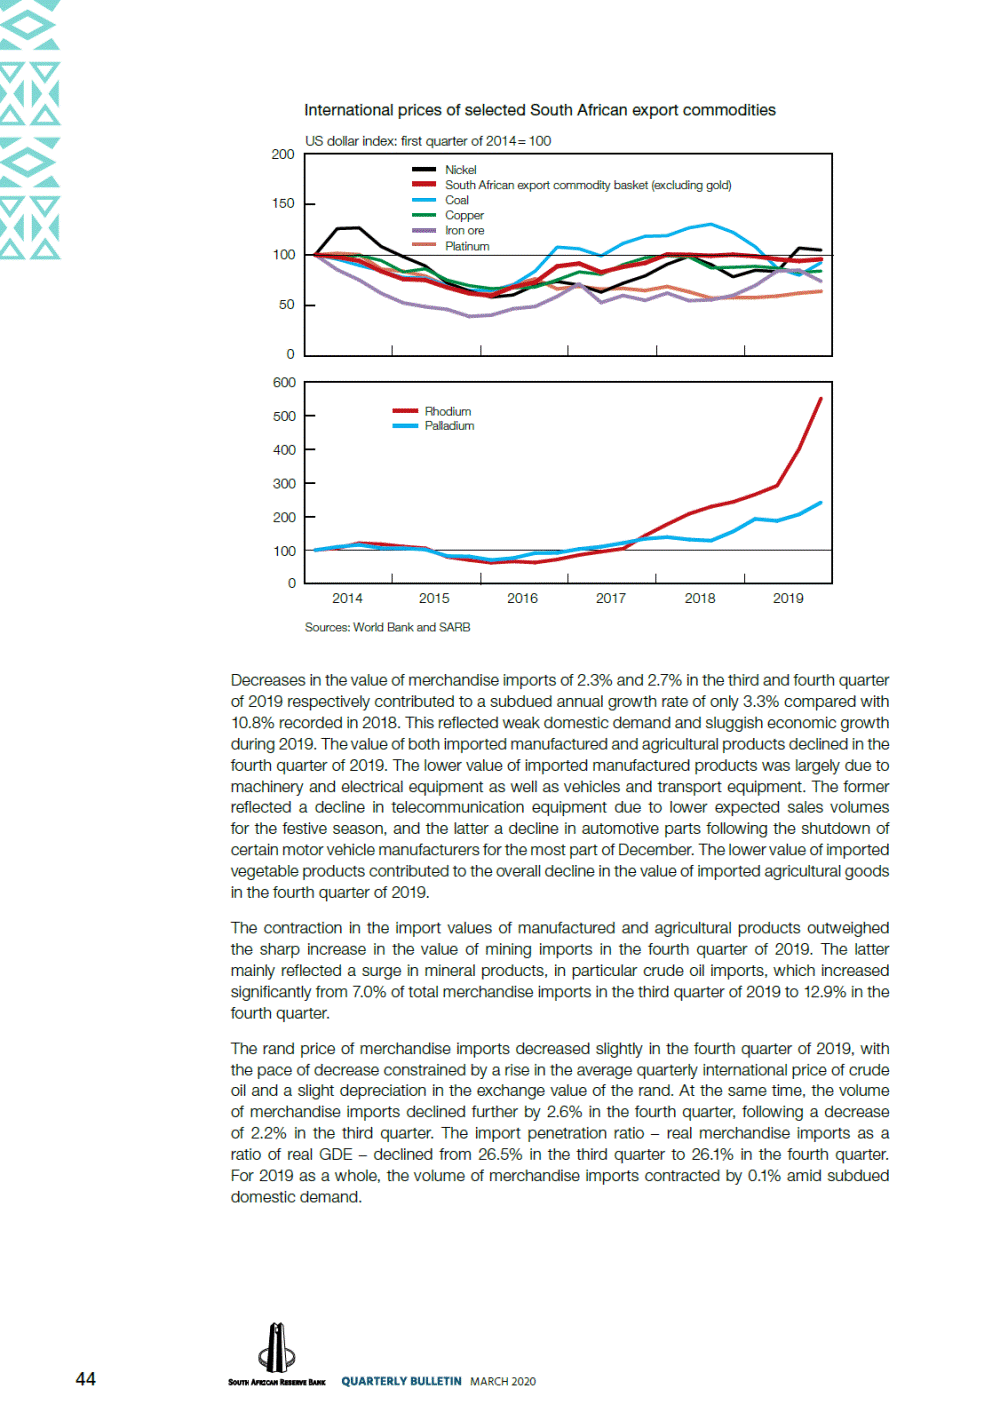
Quarterly Economic Review Introduction Global economic growth slowed further to 2.5% in the fourth quarter of 2019 as output growth decelerated sharply in the advanced economies and moderated in emerging markets. The annual expansion of 3.0% in the world economy in 2019 was the weakest since the 2007–08 global financial crisis. With the exception of the United States (US), growth in most advanced economies slowed significantly in the fourth quarter. Latin America and emerging Europe led the moderation in emerging markets, which was contrasted by a slight acceleration in China and India. World trade volumes contracted for the seventh consecutive month in December 2019, particularly in emerging markets, as trade tensions continued to weigh on sentiment. Global inflation remained muted throughout 2019. In the fourth quarter of 2019, a further decline in the international prices of metals and minerals contrasted a modest increase in that of agricultural products and energy. The price of Brent crude oil initially rose to a recent high of US$69 per barrel in early January 2020 amid optimism that a US–China trade deal would boost global economic growth prospects. In mid-February, however, oil prices decreased sharply due to concerns that the outbreak of the coronavirus disease 2019 (COVID-19) would weaken global demand. Oil prices declined further in early March as the virus spread to several countries. With Russia not cutting production in line with the Organization of the Petroleum Exporting Countries (OPEC), and Saudi Arabia then announcing an increase in production, oil prices fell significantly to around US$31 per barrel in mid-March. These developments contributed to a significant change in investors’ risk appetite, with global equity and bond prices falling sharply in the first two weeks of March. The South African economy entered a second technical recession since the first quarter of 2018, with real gross domestic product (GDP) contracting by a further 1.4% in the fourth quarter of 2019 following a revised contraction of 0.8% in the third quarter. The weakness in economic activity in the fourth quarter was broad-based, with output contracting in the primary, secondary and tertiary sectors. Annual output growth slowed further from 0.8% in 2018 to only 0.2% in 2019 – the lowest growth rate since the sharp contraction in 2009 following the global financial crisis. The faster pace of contraction in the real output of the agricultural sector was the main driver of the decrease in the real gross value added (GVA) by the primary sector in the fourth quarter of 2019 as mining output increased somewhat. On an annual basis, both agricultural and mining output contracted for a second successive year in 2019. Encouragingly, expectations of a much larger domestic maize crop could support agricultural output in 2020. The real GVA by the secondary sector decreased further in the fourth quarter of 2019 as output contracted in all the subsectors. The renewed implementation of load-shedding, and the intensity thereof, weighed on electricity production and also adversely affected manufacturing output in addition to continued weak demand. The real output of the construction sector, which decreased for a sixth successive quarter in the fourth quarter of 2019 and for a third consecutive year, reflected subdued fixed investment amid persistent low business confidence and sluggish economic activity. The real output of the tertiary sector reverted from an increase in the third quarter of 2019 to a decrease in the fourth quarter. Despite fairly strong Black Friday sales, which boosted retail trade in the fourth quarter, declines in wholesale and motor trade resulted in a contraction in the real GVA by the commerce sector. The output of the transport, storage and communication sector contracted notably further in the fourth quarter of 2019, consistent with the decline in import volumes. By contrast, growth in real economic activity in the finance, insurance, real estate and business services sector accelerated. Real gross domestic expenditure (GDE) decreased by a further 4.6% in the fourth quarter of 2019 following a similar decrease in the third quarter. Both real gross fixed capital formation and real final consumption expenditure by general government reverted from increases to contractions, alongside a much faster pace of real inventory de-accumulation. Real net exports contributed the most to growth in real GDP in the fourth quarter of 2019, but were offset by the run-down of inventories. Growth in real final consumption expenditure by households accelerated somewhat in the fourth quarter of 2019, supported by faster growth in real disposable income. Real spending on services, non-durable goods and, in particular, semi-durable goods increased at a faster pace, boosted by 1 MARCH 2020
strong Black Friday promotion sales. By contrast, households purchased less durable goods in the fourth quarter, as consumer confidence and wage growth remained weak. Household debt increased at a faster pace than disposable income in the fourth quarter of 2019, with the ratio of debt to disposable income rising slightly to 73.0%. However, households’ net wealth still increased as the value of equity portfolios and housing stock increased at a faster pace than the increase in household debt. Equity holdings were boosted by an increase of 4.1% in the FTSE/JSE All-Share Price Index (Alsi) in the fourth quarter of 2019, which was in line with international bourses. Real gross fixed capital formation contracted sharply in the fourth quarter of 2019, following two consecutive quarters of expansion. Private business enterprises, public corporations and general government all reduced capital outlays in the fourth quarter. On an annual basis, real capital expenditure decreased for a second successive year in 2019, affected by persistent low business confidence, sluggish real economic activity and the further deterioration in the fiscal position. Consequently, the ratio of nominal fixed capital formation to nominal GDP declined further to 17.9% in 2019 – the lowest since 2005. South Africa’s official unemployment rate remained unchanged at a record-high of 29.1% in the fourth quarter of 2019, with the seasonally adjusted unemployment rate increasing to a new all-time high of 29.6%. Contrary to the usual sharp seasonal decrease in unemployment in the fourth quarter of each year, the number of unemployed people remained fairly elevated in the fourth quarter of 2019 due to a significant number of new entrants in search of employment. The downward trend in wage growth continued as the pace of increase in the nominal remuneration per worker in the formal non-agricultural sector decelerated notably to an all-time low year-on-year rate of 3.0% in the third quarter of 2019, with both public and private sector remuneration growth slowing. The deceleration in public sector remuneration growth was exacerbated by the high base following the delayed implementation of the annual public sector wage increase in 2018. In addition, the average wage settlement rate in collective bargaining agreements decreased further to a 12-year low of 6.7% in 2019. The moderation in wage growth resulted in a deceleration in the growth of formal non-agricultural nominal unit labour cost to 3.4% in the third quarter of 2019. In line with the muted growth in unit labour cost and subdued demand pressures in the domestic economy, both producer and consumer price inflation slowed significantly throughout 2019. The moderation in domestic inflationary pressures was driven by a marked deceleration in fuel price inflation, muted food price increases and a renewed slowdown in underlying inflation. Core inflation slowed to 3.7% in January 2020, driven largely by the deceleration in consumer services price inflation to a record-low of 4.0%. Consumer goods price inflation accelerated somewhat in December 2019 and January 2020 as fuel price inflation quickened notably, largely due to base effects. South Africa’s trade surplus with the rest of the world more than doubled from the third to the fourth quarter of 2019 as the value of merchandise imports decreased further, while that of net gold and merchandise exports increased further. The value of merchandise exports was boosted by mining exports, in particular of platinum group metals (PGMs) as well as pearls and semi-precious stones. The value of PGM exports benefitted from higher prices, especially palladium and rhodium. Despite a notable increase in the value of crude oil imports in the fourth quarter of 2019, lower volumes of manufacturing imports reduced the total value of merchandise imports. The deficit on the services, income and current transfer account narrowed markedly from the third to the fourth quarter of 2019, mainly due to a notably smaller deficit on the income account as gross dividend payments receded from an exceptionally high level in the third quarter. This, together with the larger trade surplus, resulted in a significant narrowing in the deficit on the current account of the balance of payments as a ratio of GDP from 3.7% in the third quarter of 2019 to 1.3% in the fourth quarter – the smallest deficit since the fourth quarter of 2010. The net inflow of capital on the financial account of the balance of payments decreased sharply from R73.9 billion in the third quarter of 2019 to R10.1 billion in the fourth quarter. On a net basis, portfolio investment, financial derivatives and reserve assets recorded inflows, while direct and other investment recorded outflows. South Africa’s positive net international investment position decreased further from the end of June 2019 to the end of September as the value of foreign assets decreased more than that of foreign liabilities. Both foreign assets and liabilities declined as a result of the restructuring of a large South 2 MARCH 2020
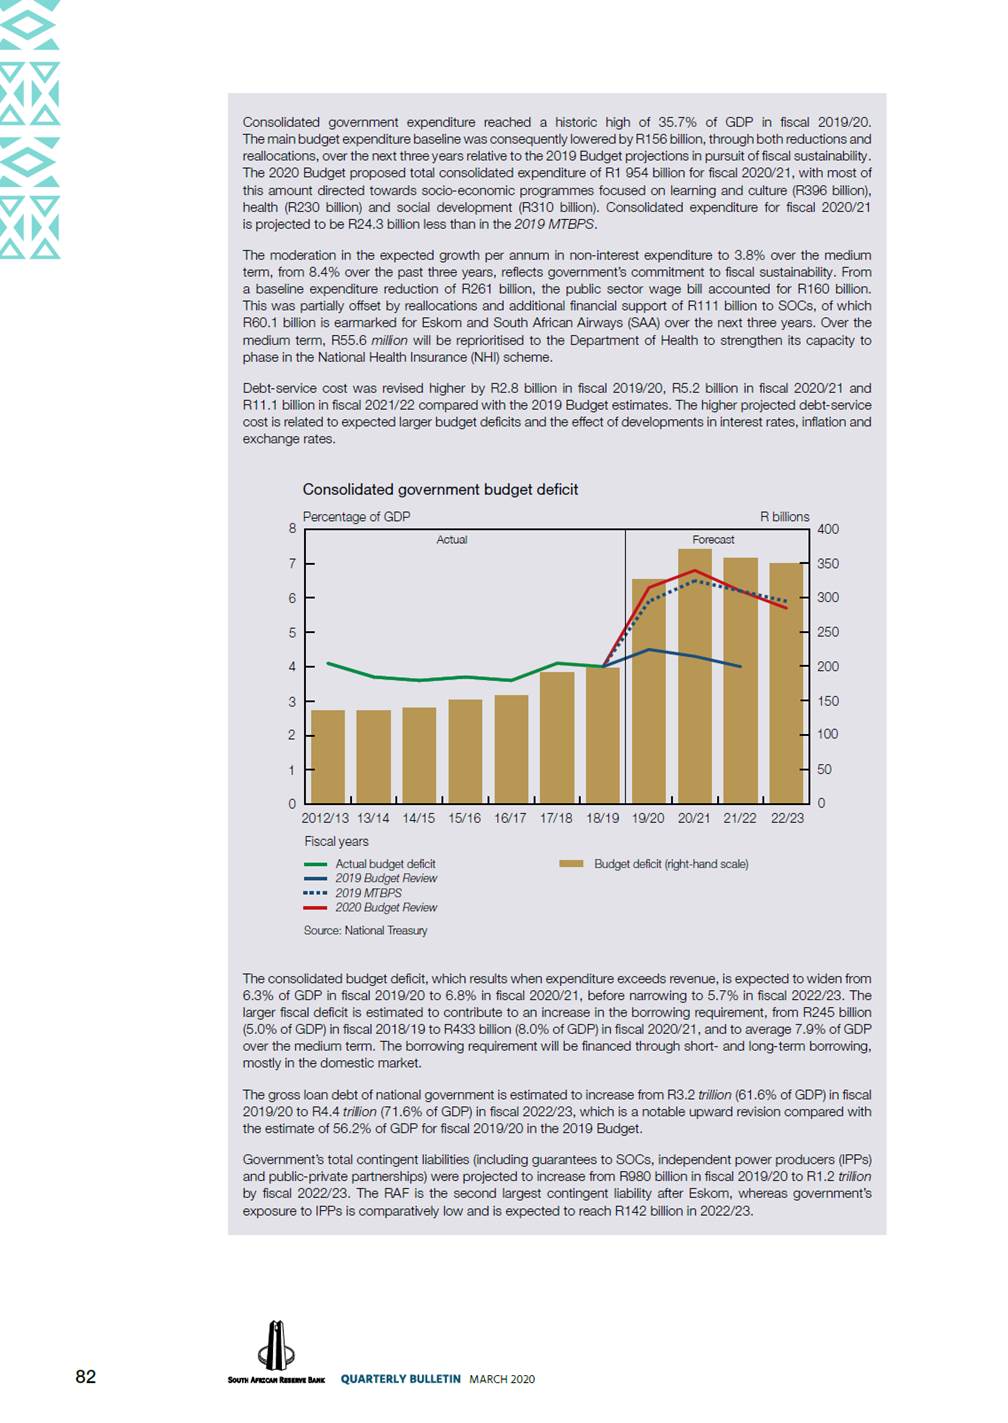
African company. In addition, the decrease in the nominal effective exchange rate (NEER) of the rand over the period affected foreign assets more than foreign liabilities. Following its decrease in the third quarter of 2019, the NEER increased by 6.1% in the fourth quarter and outperformed many other emerging market currencies. This reflected notable increases in November and December 2019, attributable to the increased risk appetite of global investors following some relief from geopolitical tensions and an interest rate cut by the US Federal Reserve. However, in January and February 2020, the exchange value of the rand depreciated notably due to, among other factors, renewed downward revisions to South Africa’s economic growth projections, continued electricity-supply interruptions and a further deterioration in the fiscal position. In addition, the COVID-19 outbreak in China resulted in increased risk aversion and capital flows to safe-haven assets. In the first two weeks of March 2020, the exchange value of the rand depreciated further as the rapid spread of the virus disrupted global supply chains and sparked fears of a possible global recession. Yields on South African government bonds increased from mid-July 2019 up to early December, initially reflecting heightened global risk aversion due to the ongoing US–China trade tensions, and later also government’s recapitalisation of some state-owned companies (SOCs), in particular Eskom, as well as the larger government budget deficit and increased debt levels projected in the October 2019 Medium Term Budget Policy Statement (2019 MTBPS). Domestic bond yields then declined up to the end of February 2020, along with lower international yields and optimism over a US-China trade deal as well as notable non-resident net purchases of domestic bonds. However, bond yields increased markedly again in the first two weeks of March as a result of the expected impact of the COVID-19 outbreak on global economic activity and the related domestic currency weakness, as well as higher domestic inflation outcomes and higher debt-to-GDP levels projected in the February 2020 Budget. Domestic short-term money market interest rates trended moderately higher in late 2019, but quickly adjusted lower following the 25 basis point reduction in the repurchase (repo) rate in January 2020. Rates on forward rate agreements (FRAs) had already started to trend lower from late 2019 following the earlier appreciation in the exchange value of the rand and favourable inflation outcomes. FRA rates declined further in March 2020 as market participants started discounting the possibility of even lower interest rates due to the negative implications of COVID-19 for global and domestic economic growth, and following policy rate reductions by a number of major central banks. Growth in the broadly defined money supply (M3) decelerated in both the third and fourth quarter of 2019, in line with weak domestic economic activity. A significant slowdown in corporate sector deposit growth in the second half of 2019 drove the overall moderation in M3, while household deposit growth fluctuated marginally higher. Growth in total loans and advances extended by monetary institutions to the domestic private sector decelerated in the nine months up to January 2020. Similar to the slowdown in M3, the moderation in credit extension was also led by companies, while growth in credit to households continued at a fairly sturdy pace. Credit extension to the household sector was driven by steady growth in mortgage advances and fairly lively growth in general loans. The moderation in corporate credit growth in the fourth quarter of 2019 resulted mainly from a slowdown in loans to non-financial companies. The preliminary non-financial public sector borrowing requirement increased by R70.8 billion year on year in the first nine months of fiscal 2019/20, as the cash book deficit of national government increased markedly. The larger borrowing requirement resulted from the fairly buoyant growth in national government expenditure which continued to outpace the modest growth in revenue. The revenue shortfall reflected continued weaker-than-expected domestic economic activity and higher tax refunds. Higher debt-service costs and, in particular, the recapitalisation of some SOCs boosted government spending. National government’s total gross loan debt increased significantly to 62.2% of GDP as at 31 December 2019, from 56.7% of GDP a year earlier. In the interest of fiscal consolidation and sustainability, the February 2020 Budget proposed a reduction in government expenditure, partly through a decrease in the public sector wage bill as well as the reform of SOCs, despite additional support to some SOCs. On the revenue side, taxes were not increased as in recent years due to the weak economic environment and expected low future growth. The consolidated budget deficit is expected to widen from 6.3% of GDP in fiscal 2019/20 to 6.8% in fiscal 2020/21, before narrowing to 5.7% in fiscal 2022/23. The budget projected a debt-to-GDP ratio of 61.6% at the end of fiscal 2019/20, which is expected to increase to 71.6% at the end of fiscal 2022/23. 3 MARCH 2020
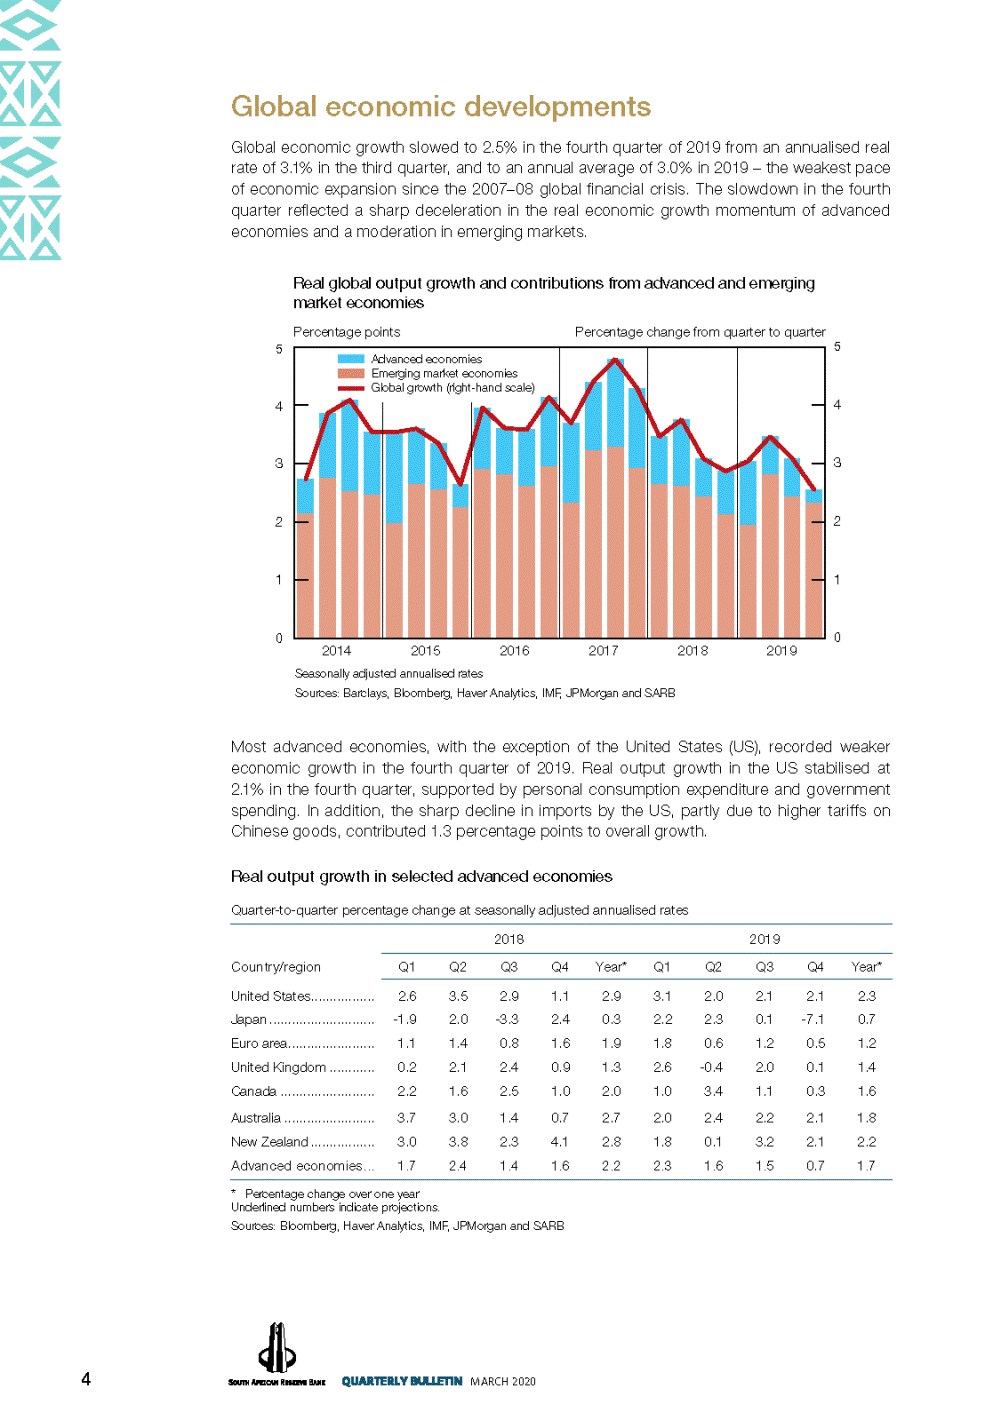
Global economic developments Global economic growth slowed to 2.5% in the fourth quarter of 2019 from an annualised real rate of 3.1% in the third quarter, and to an annual average of 3.0% in 2019 – the weakest pace of economic expansion since the 2007–08 global financial crisis. The slowdown in the fourth quarter reflected a sharp deceleration in the real economic growth momentum of advanced economies and a moderation in emerging markets. Real global output growth and contributions from advanced and emerging market economies Percentage points Percentage change from quarter to quarter 5 5 4 4 3 3 2 2 1 1 0 0 2014 2015 2016 2017 2018 2019 Seasonally adjusted annualised rates Sources: Barclays, Bloomberg, Haver Analytics, IMF, JPMorgan and SARB Most advanced economies, with the exception of the United States (US), recorded weaker economic growth in the fourth quarter of 2019. Real output growth in the US stabilised at 2.1% in the fourth quarter, supported by personal consumption expenditure and government spending. In addition, the sharp decline in imports by the US, partly due to higher tariffs on Chinese goods, contributed 1.3 percentage points to overall growth. Real output growth in selected advanced economies Quarter-to-quarter percentage change at seasonally adjusted annualised rates 2018 2019 Country/region Q1 Q2 Q3 Q4 Year* Q1 Q2 Q3 Q4 Year* United States................. Japan ............................ Euro area....................... United Kingdom ............ Canada ......................... Australia ........................ New Zealand ................. Advanced economies... 2.6 -1.9 1.1 0.2 2.2 3.7 3.0 1.7 3.5 2.0 1.4 2.1 1.6 3.0 3.8 2.4 2.9 -3.3 0.8 2.4 2.5 1.4 2.3 1.4 1.1 2.4 1.6 0.9 1.0 0.7 4.1 1.6 2.9 0.3 1.9 1.3 2.0 2.7 2.8 2.2 3.1 2.2 1.8 2.6 1.0 2.0 1.8 2.3 2.0 2.3 0.6 -0.4 3.4 2.4 0.1 1.6 2.1 0.1 1.2 2.0 1.1 2.2 3.2 1.5 2.1 -7.1 0.5 0.1 0.3 2.1 2.1 0.7 2.3 0.7 1.2 1.4 1.6 1.8 2.2 1.7 * Percentage change over one year Underlined numbers indicate projections. Sources: Bloomberg, Haver Analytics, IMF, JPMorgan and SARB 4 MARCH 2020 Advanced economies Emerging market economies Global growth (right-hand scale)
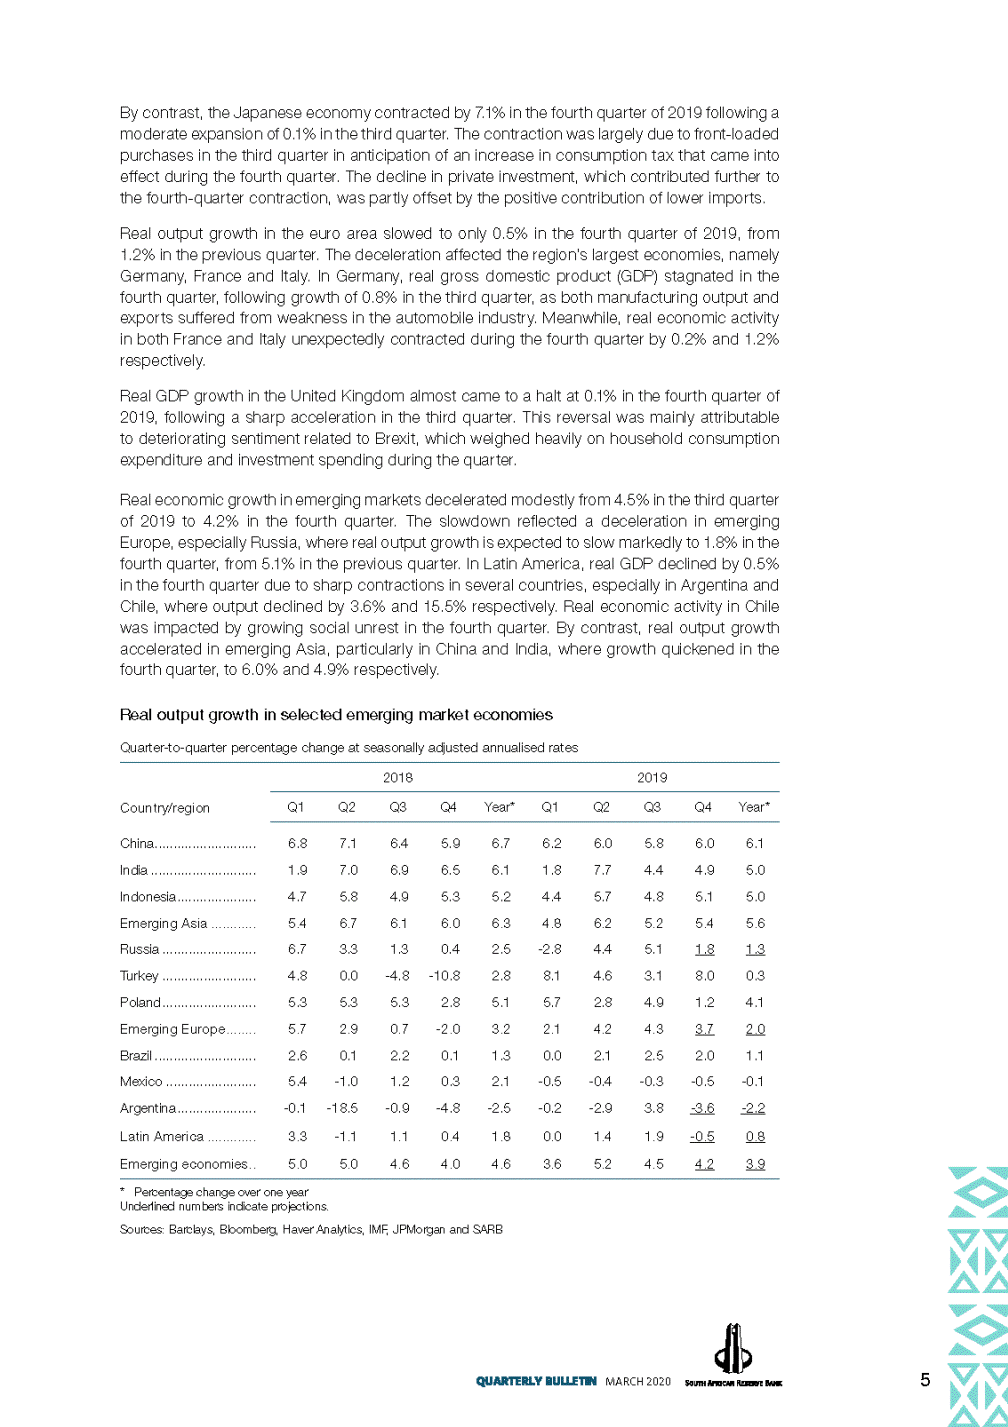
By contrast, the Japanese economy contracted by 7.1% in the fourth quarter of 2019 following a moderate expansion of 0.1% in the third quarter. The contraction was largely due to front-loaded purchases in the third quarter in anticipation of an increase in consumption tax that came into effect during the fourth quarter. The decline in private investment, which contributed further to the fourth-quarter contraction, was partly offset by the positive contribution of lower imports. Real output growth in the euro area slowed to only 0.5% in the fourth quarter of 2019, from 1.2% in the previous quarter. The deceleration affected the region’s largest economies, namely Germany, France and Italy. In Germany, real gross domestic product (GDP) stagnated in the fourth quarter, following growth of 0.8% in the third quarter, as both manufacturing output and exports suffered from weakness in the automobile industry. Meanwhile, real economic activity in both France and Italy unexpectedly contracted during the fourth quarter by 0.2% and 1.2% respectively. Real GDP growth in the United Kingdom almost came to a halt at 0.1% in the fourth quarter of 2019, following a sharp acceleration in the third quarter. This reversal was mainly attributable to deteriorating sentiment related to Brexit, which weighed heavily on household consumption expenditure and investment spending during the quarter. Real economic growth in emerging markets decelerated modestly from 4.5% in the third quarter of 2019 to 4.2% in the fourth quarter. The slowdown reflected a deceleration in emerging Europe, especially Russia, where real output growth is expected to slow markedly to 1.8% in the fourth quarter, from 5.1% in the previous quarter. In Latin America, real GDP declined by 0.5% in the fourth quarter due to sharp contractions in several countries, especially in Argentina and Chile, where output declined by 3.6% and 15.5% respectively. Real economic activity in Chile was impacted by growing social unrest in the fourth quarter. By contrast, real output growth accelerated in emerging Asia, particularly in China and India, where growth quickened in the fourth quarter, to 6.0% and 4.9% respectively. Real output growth in selected emerging market economies Quarter-to-quarter percentage change at seasonally adjusted annualised rates 2018 2019 Country/region Q1 Q2 Q3 Q4 Year* Q1 Q2 Q3 Q4 Year* China........................... India ............................ Indonesia..................... Emerging Asia ............ Russia ......................... Turkey ......................... Poland......................... Emerging Europe........ Brazil ........................... Mexico ........................ Argentina ..................... Latin America ............. 6.8 1.9 4.7 5.4 6.7 4.8 5.3 5.7 2.6 5.4 -0.1 3.3 7.1 7.0 5.8 6.7 3.3 0.0 5.3 2.9 0.1 -1.0 -18.5 -1.1 6.4 6.9 4.9 6.1 1.3 -4.8 5.3 0.7 2.2 1.2 -0.9 1.1 5.9 6.5 5.3 6.0 0.4 -10.8 2.8 -2.0 0.1 0.3 -4.8 0.4 6.7 6.1 5.2 6.3 2.5 2.8 5.1 3.2 1.3 2.1 -2.5 1.8 6.2 1.8 4.4 4.8 -2.8 8.1 5.7 2.1 0.0 -0.5 -0.2 0.0 6.0 7.7 5.7 6.2 4.4 4.6 2.8 4.2 2.1 -0.4 -2.9 1.4 5.8 4.4 4.8 5.2 5.1 3.1 4.9 4.3 2.5 -0.3 3.8 1.9 6.0 4.9 5.1 5.4 1.8 8.0 1.2 3.7 2.0 -0.5 -3.6 -0.5 6.1 5.0 5.0 5.6 1.3 0.3 4.1 2.0 1.1 -0.1 -2.2 0.8 Emerging economies.. 5.0 5.0 4.6 4.0 4.6 3.6 5.2 4.5 4.2 3.9 * Percentage change over one year Underlined numbers indicate projections. Sources: Barclays, Bloomberg, Haver Analytics, IMF, JPMorgan and SARB 5 MARCH 2020
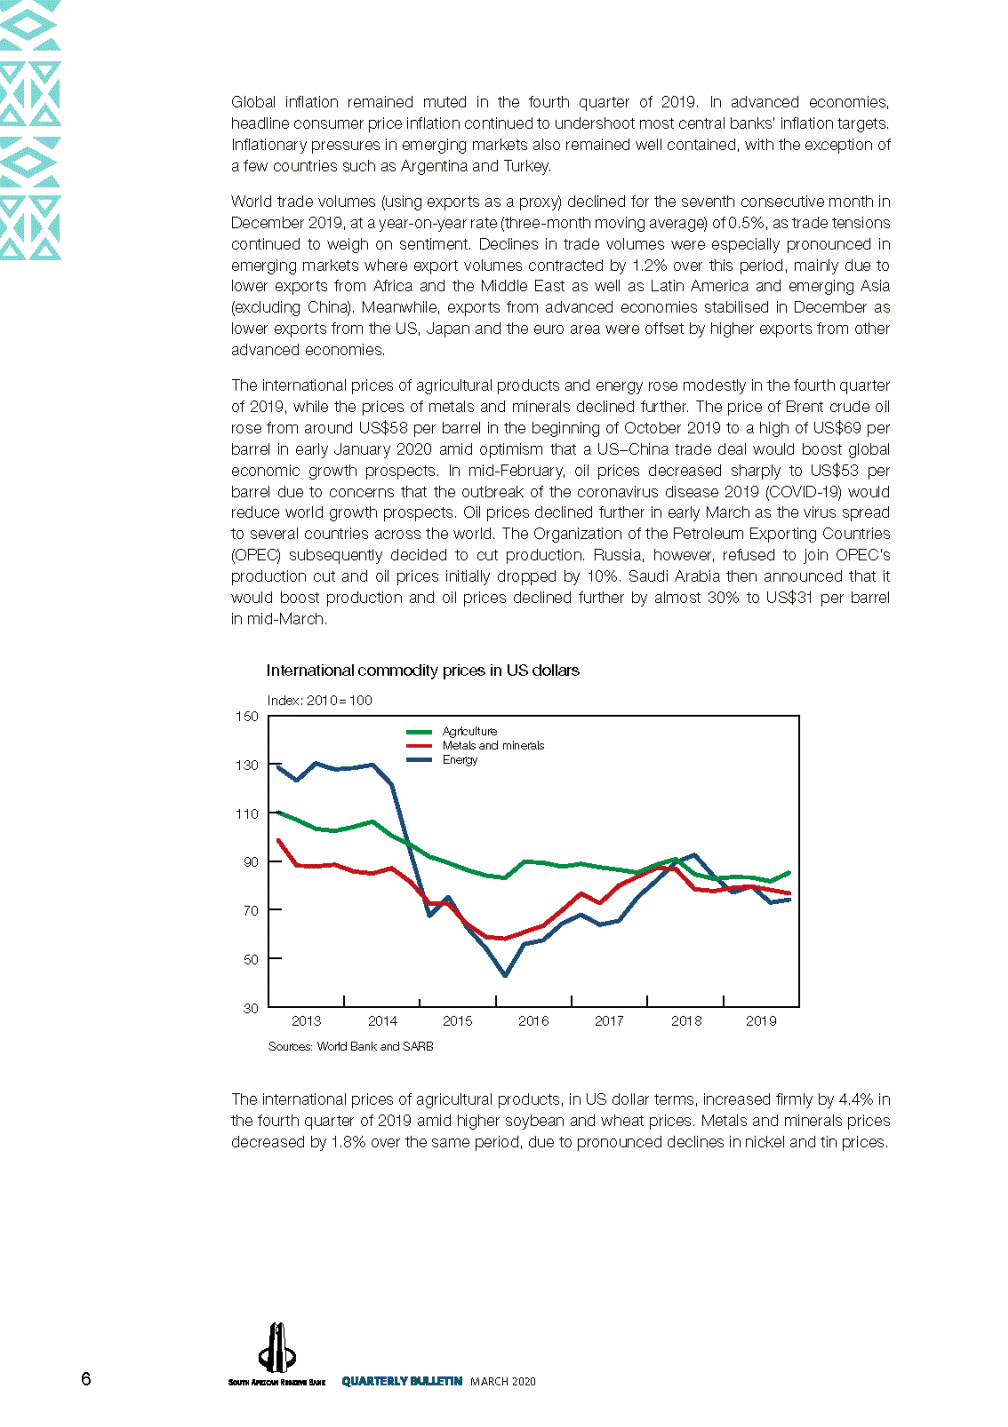
Global inflation remained muted in the fourth quarter of 2019. In advanced economies, headline consumer price inflation continued to undershoot most central banks’ inflation targets. Inflationary pressures in emerging markets also remained well contained, with the exception of a few countries such as Argentina and Turkey. World trade volumes (using exports as a proxy) declined for the seventh consecutive month in December 2019, at a year-on-year rate (three-month moving average) of 0.5%, as trade tensions continued to weigh on sentiment. Declines in trade volumes were especially pronounced in emerging markets where export volumes contracted by 1.2% over this period, mainly due to lower exports from Africa and the Middle East as well as Latin America and emerging Asia (excluding China). Meanwhile, exports from advanced economies stabilised in December as lower exports from the US, Japan and the euro area were offset by higher exports from other advanced economies. The international prices of agricultural products and energy rose modestly in the fourth quarter of 2019, while the prices of metals and minerals declined further. The price of Brent crude oil rose from around US$58 per barrel in the beginning of October 2019 to a high of US$69 per barrel in early January 2020 amid optimism that a US–China trade deal would boost global economic growth prospects. In mid-February, oil prices decreased sharply to US$53 per barrel due to concerns that the outbreak of the coronavirus disease 2019 (COVID-19) would reduce world growth prospects. Oil prices declined further in early March as the virus spread to several countries across the world. The Organization of the Petroleum Exporting Countries (OPEC) subsequently decided to cut production. Russia, however, refused to join OPEC’s production cut and oil prices initially dropped by 10%. Saudi Arabia then announced that it would boost production and oil prices declined further by almost 30% to US$31 per barrel in mid-March. International commodity prices in US dollars Index: 2010 = 100 150 130 110 90 70 50 30 2013 2014 2015 2016 2017 2018 2019 Sources: World Bank and SARB The international prices of agricultural products, in US dollar terms, increased firmly by 4.4% in the fourth quarter of 2019 amid higher soybean and wheat prices. Metals and minerals prices decreased by 1.8% over the same period, due to pronounced declines in nickel and tin prices. 6 MARCH 2020 Agriculture Metals and minerals Energy
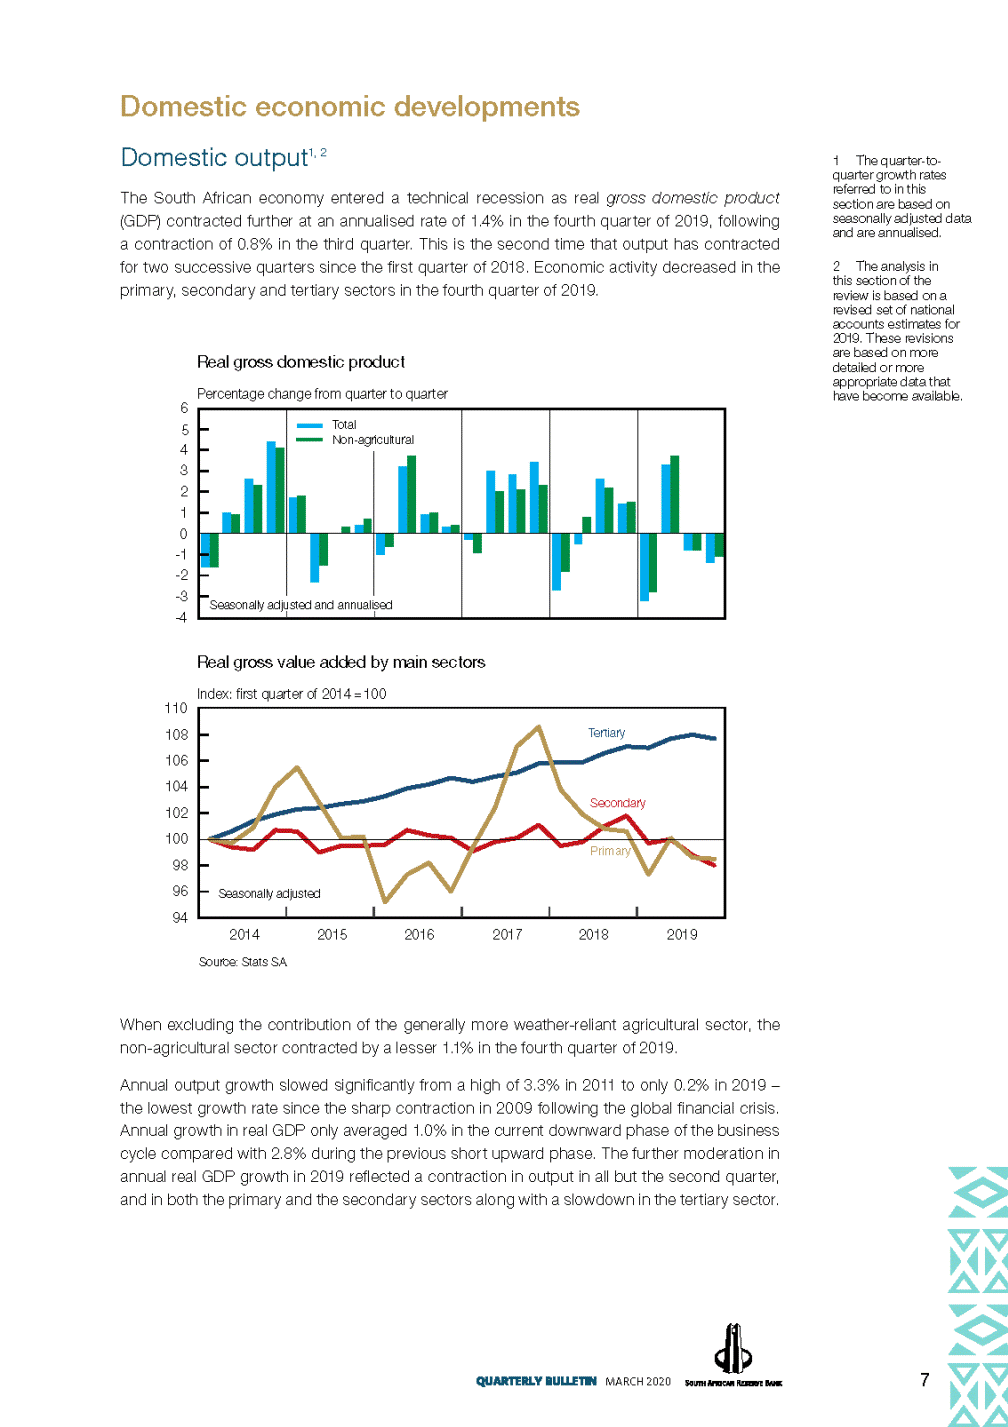
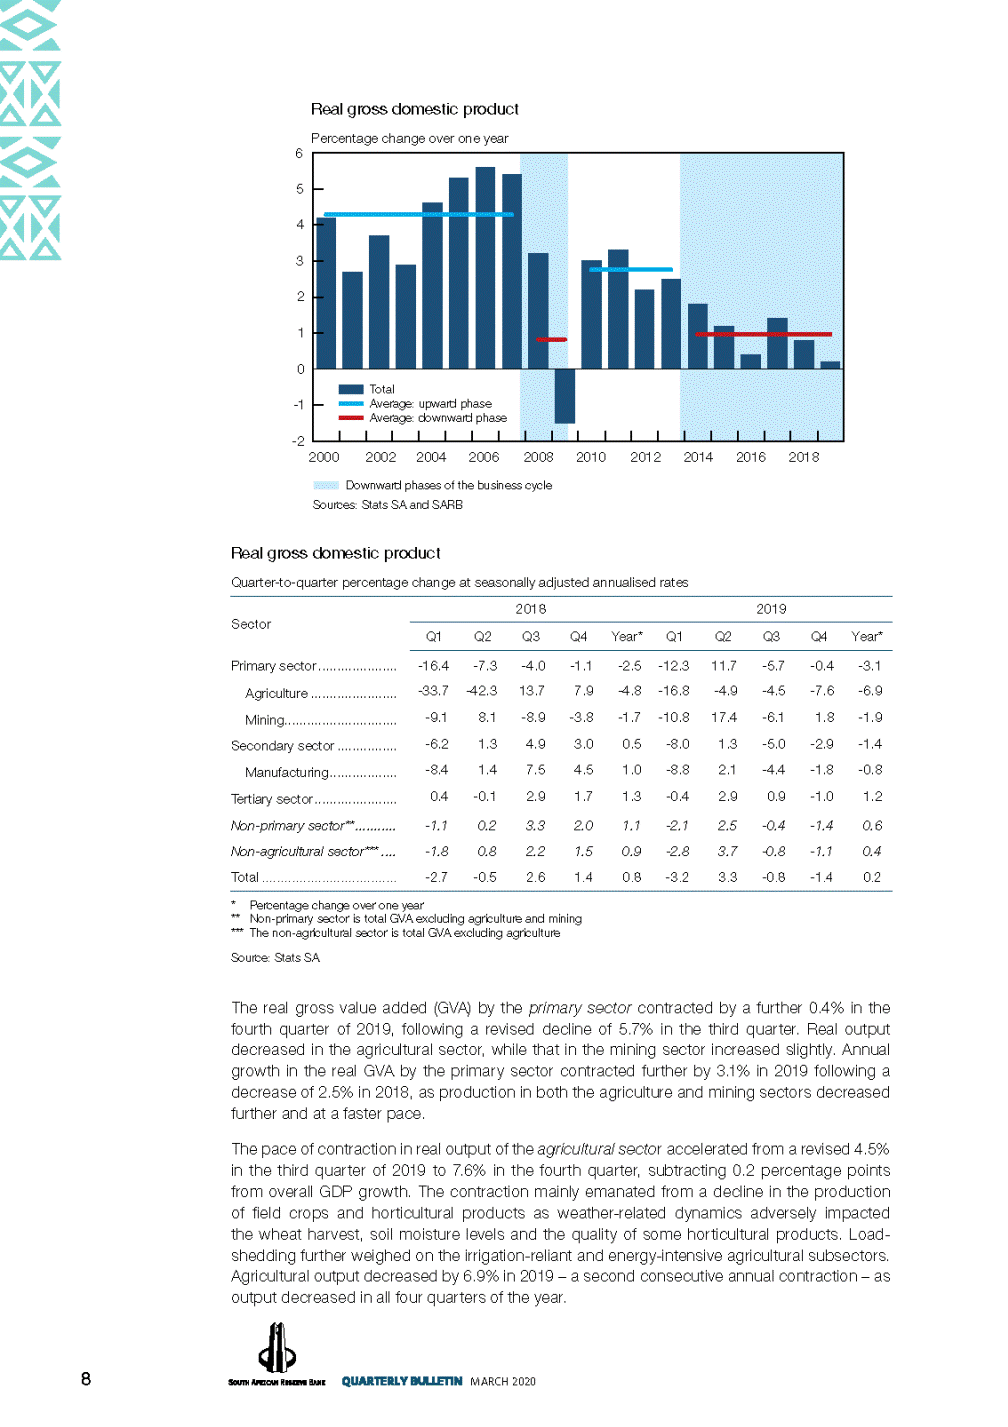
Domestic economic developments Domestic output1, 2 The South African economy entered a technical recession as real gross domestic product (GDP) contracted further at an annualised rate of 1.4% in the fourth quarter of 2019, following a contraction of 0.8% in the third quarter. This is the second time that output has contracted for two successive quarters since the first quarter of 2018. Economic activity decreased in the primary, secondary and tertiary sectors in the fourth quarter of 2019. 1The quarter-to-quarter growth rates referred to in this section are based on seasonally adjusted data and are annualised. 2The analysis in this section of the review is based on a revised set of national accounts estimates for 2019. These revisions are based on more detailed or more appropriate data that have become available. Real gross domestic product Percentage change from quarter to quarter 6 5 4 3 2 1 0 -1 -2 -3 -4 Real gross value added by main sectors Index: first quarter of 2014 = 100 110 108 106 104 102 100 98 96 94 Tertiary Secondary 2014 Source: Stats SA 2015 2016 2017 2018 2019 When excluding the contribution of the generally more weather-reliant agricultural sector, the non-agricultural sector contracted by a lesser 1.1% in the fourth quarter of 2019. Annual output growth slowed significantly from a high of 3.3% in 2011 to only 0.2% in 2019 – the lowest growth rate since the sharp contraction in 2009 following the global financial crisis. Annual growth in real GDP only averaged 1.0% in the current downward phase of the business cycle compared with 2.8% during the previous short upward phase. The further moderation in annual real GDP growth in 2019 reflected a contraction in output in all but the second quarter, and in both the primary and the secondary sectors along with a slowdown in the tertiary sector. 7 MARCH 2020 Primary Seasonally adjusted Total Non-agricultural Seasonally adjusted and annualised
Real gross domestic product Percentage change over one year 6 5 4 3 2 1 0 -1 Average: upward phase -2 2000 2002 2004 2006 2008 2010 2012 2014 2016 2018 Downward phases of the business cycle Sources: Stats SA and SARB Real gross domestic product Quarter-to-quarter percentage change at seasonally adjusted annualised rates 2018 2019 Sector Q1 Q2 Q3 Q4 Year* Q1 Q2 Q3 Q4 Year* Primary sector ..................... Agriculture ....................... Mining.............................. Secondary sector ................ Manufacturing.................. Tertiary sector...................... Non-primary sector** ........... Non-agricultural sector*** .... Total .................................... -16.4 -33.7 -9.1 -6.2 -8.4 0.4 -7.3 -42.3 8.1 1.3 1.4 -0.1 -4.0 13.7 -8.9 4.9 7.5 2.9 -1.1 7.9 -3.8 3.0 4.5 1.7 -2.5 -4.8 -1.7 0.5 1.0 1.3 -12.3 -16.8 -10.8 -8.0 -8.8 -0.4 11.7 -4.9 17.4 1.3 2.1 2.9 -5.7 -4.5 -6.1 -5.0 -4.4 0.9 -0.4 -7.6 1.8 -2.9 -1.8 -1.0 -3.1 -6.9 -1.9 -1.4 -0.8 1.2 -1.1 -1.8 -2.7 0.2 0.8 -0.5 3.3 2.2 2.6 2.0 1.5 1.4 1.1 0.9 0.8 -2.1 -2.8 -3.2 2.5 3.7 3.3 -0.4 -0.8 -0.8 -1.4 -1.1 -1.4 0.6 0.4 0.2 * Percentage change over one year ** Non-primary sector is total GVA excluding agriculture and mining *** The non-agricultural sector is total GVA excluding agriculture Source: Stats SA The real gross value added (GVA) by the primary sector contracted by a further 0.4% in the fourth quarter of 2019, following a revised decline of 5.7% in the third quarter. Real output decreased in the agricultural sector, while that in the mining sector increased slightly. Annual growth in the real GVA by the primary sector contracted further by 3.1% in 2019 following a decrease of 2.5% in 2018, as production in both the agriculture and mining sectors decreased further and at a faster pace. The pace of contraction in real output of the agricultural sector accelerated from a revised 4.5% in the third quarter of 2019 to 7.6% in the fourth quarter, subtracting 0.2 percentage points from overall GDP growth. The contraction mainly emanated from a decline in the production of field crops and horticultural products as weather-related dynamics adversely impacted the wheat harvest, soil moisture levels and the quality of some horticultural products. Load-shedding further weighed on the irrigation-reliant and energy-intensive agricultural subsectors. Agricultural output decreased by 6.9% in 2019 – a second consecutive annual contraction – as output decreased in all four quarters of the year. 8 MARCH 2020 Total Average: downward phase
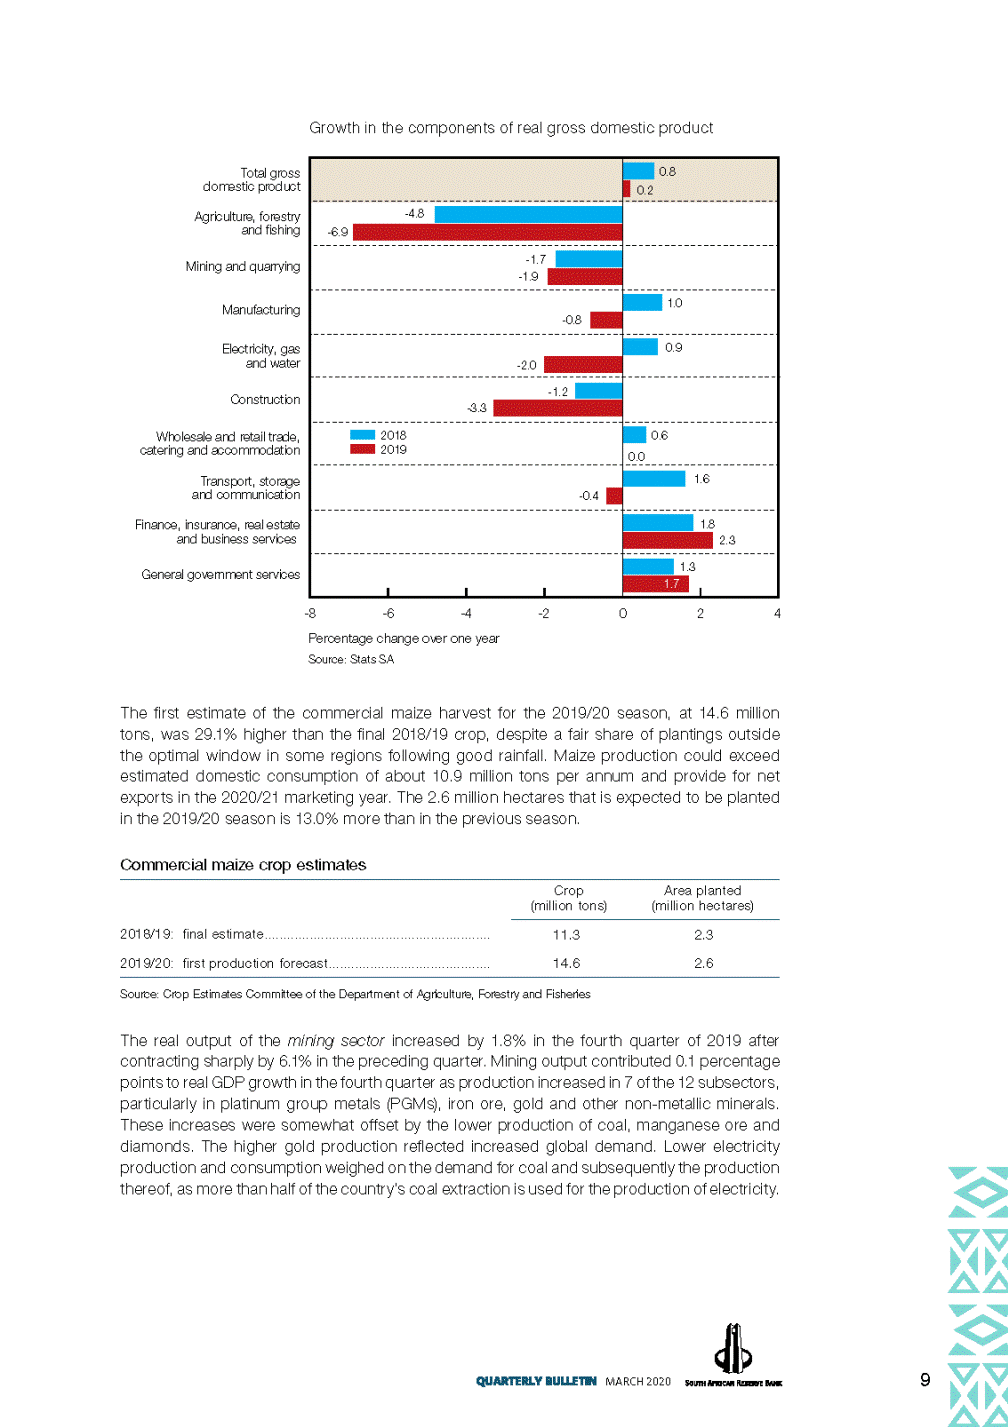
Growth in the components of real gross domestic product Total gross domestic product Agriculture, forestry and fishing Mining and quarrying Manufacturing Electricity, gas and water Construction Wholesale and retail trade, catering and accommodation Transport, storage and communication Finance, insurance, real estate and business services General government services -8 -6 -4 -2 0 2 4 Percentage change over one year Source: Stats SA The first estimate of the commercial maize harvest for the 2019/20 season, at 14.6 million tons, was 29.1% higher than the final 2018/19 crop, despite a fair share of plantings outside the optimal window in some regions following good rainfall. Maize production could exceed estimated domestic consumption of about 10.9 million tons per annum and provide for net exports in the 2020/21 marketing year. The 2.6 million hectares that is expected to be planted in the 2019/20 season is 13.0% more than in the previous season. Commercial maize crop estimates Crop (million tons) Area planted (million hectares) 2018/19: final estimate............................................................ 11.3 2.3 2019/20: first production forecast........................................... 14.6 2.6 Source: Crop Estimates Committee of the Department of Agriculture, Forestry and Fisheries The real output of the mining sector increased by 1.8% in the fourth quarter of 2019 after contracting sharply by 6.1% in the preceding quarter. Mining output contributed 0.1 percentage points to real GDP growth in the fourth quarter as production increased in 7 of the 12 subsectors, particularly in platinum group metals (PGMs), iron ore, gold and other non-metallic minerals. These increases were somewhat offset by the lower production of coal, manganese ore and diamonds. The higher gold production reflected increased global demand. Lower electricity production and consumption weighed on the demand for coal and subsequently the production thereof, as more than half of the country’s coal extraction is used for the production of electricity. 9 MARCH 2020 0.8 0.2 -4.8 -6.9 -1.7 -1.9 1.0 -0.8 0.9 -2.0 -1.2 -3.3 2018 2019 0.6 0.0 1.6 -0.4 1.8 2.3 1.3 1.7
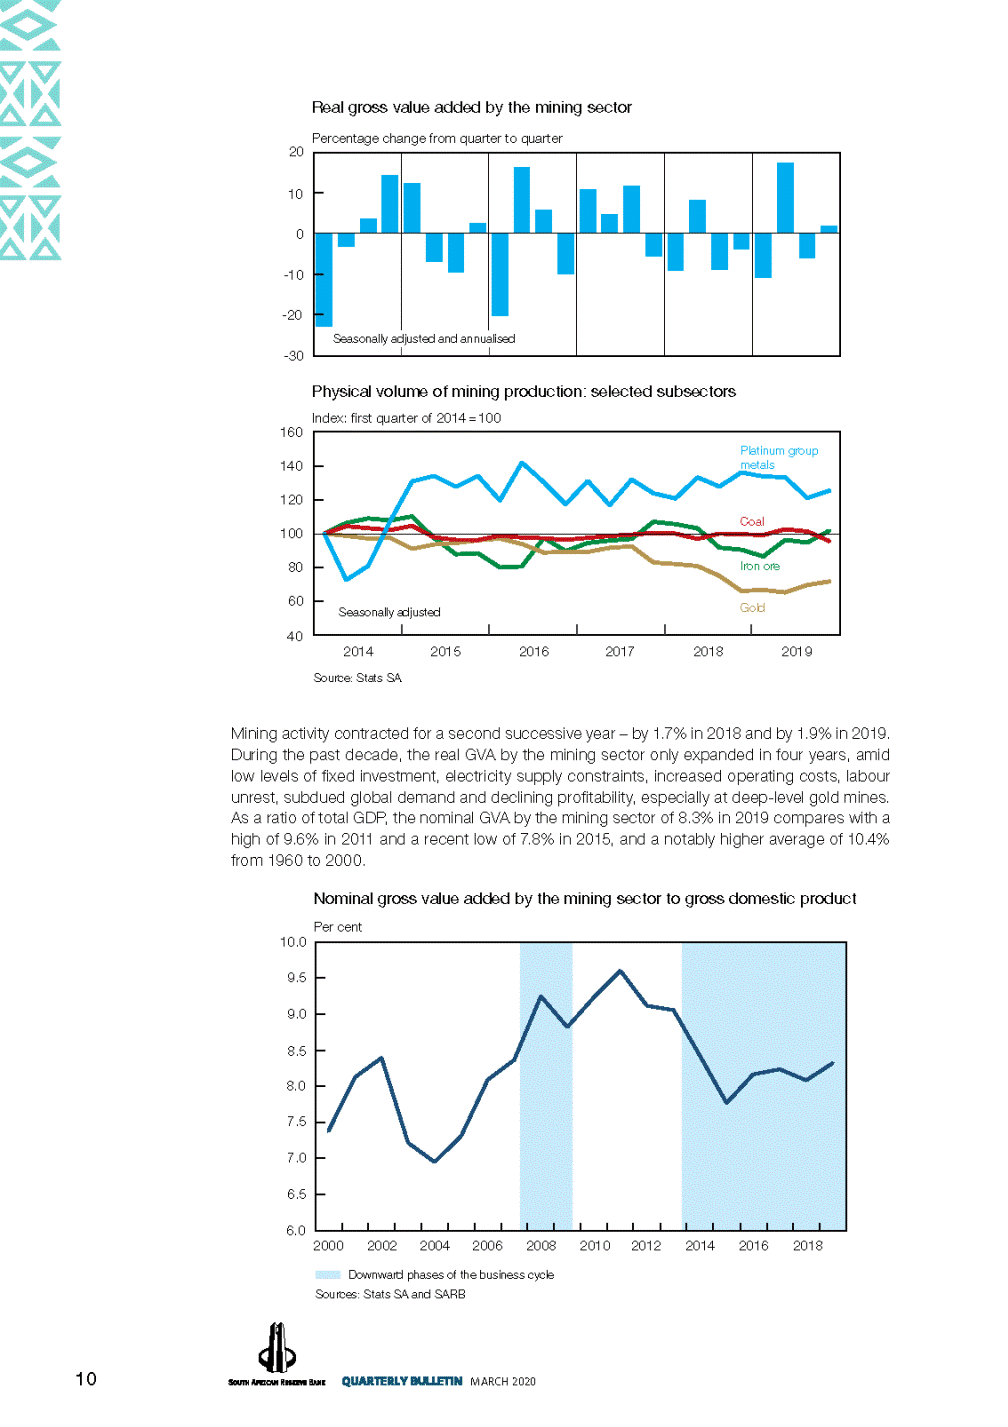
Real gross value added by the mining sector Percentage change from quarter to quarter 20 10 0 -10 -20 -30 Physical volume of mining production: selected subsectors Index: first quarter of 2014 = 100 160 140 metals 120 100 80 Iron ore 60 40 2014 Source: Stats SA 2015 2016 2017 2018 2019 Mining activity contracted for a second successive year – by 1.7% in 2018 and by 1.9% in 2019. During the past decade, the real GVA by the mining sector only expanded in four years, amid low levels of fixed investment, electricity supply constraints, increased operating costs, labour unrest, subdued global demand and declining profitability, especially at deep-level gold mines. As a ratio of total GDP, the nominal GVA by the mining sector of 8.3% in 2019 compares with a high of 9.6% in 2011 and a recent low of 7.8% in 2015, and a notably higher average of 10.4% from 1960 to 2000. Nominal gross value added by the mining sector to gross domestic product Per cent 10.0 9.5 9.0 8.5 8.0 7.5 7.0 6.5 6.0 2000 2002 2004 2006 2008 2010 2012 2014 2016 2018 Downward phases of the business cycle Sources: Stats SA and SARB 10 MARCH 2020 Platinum group Coal Seasonally adjustedGold Seasonally adjusted and annualised
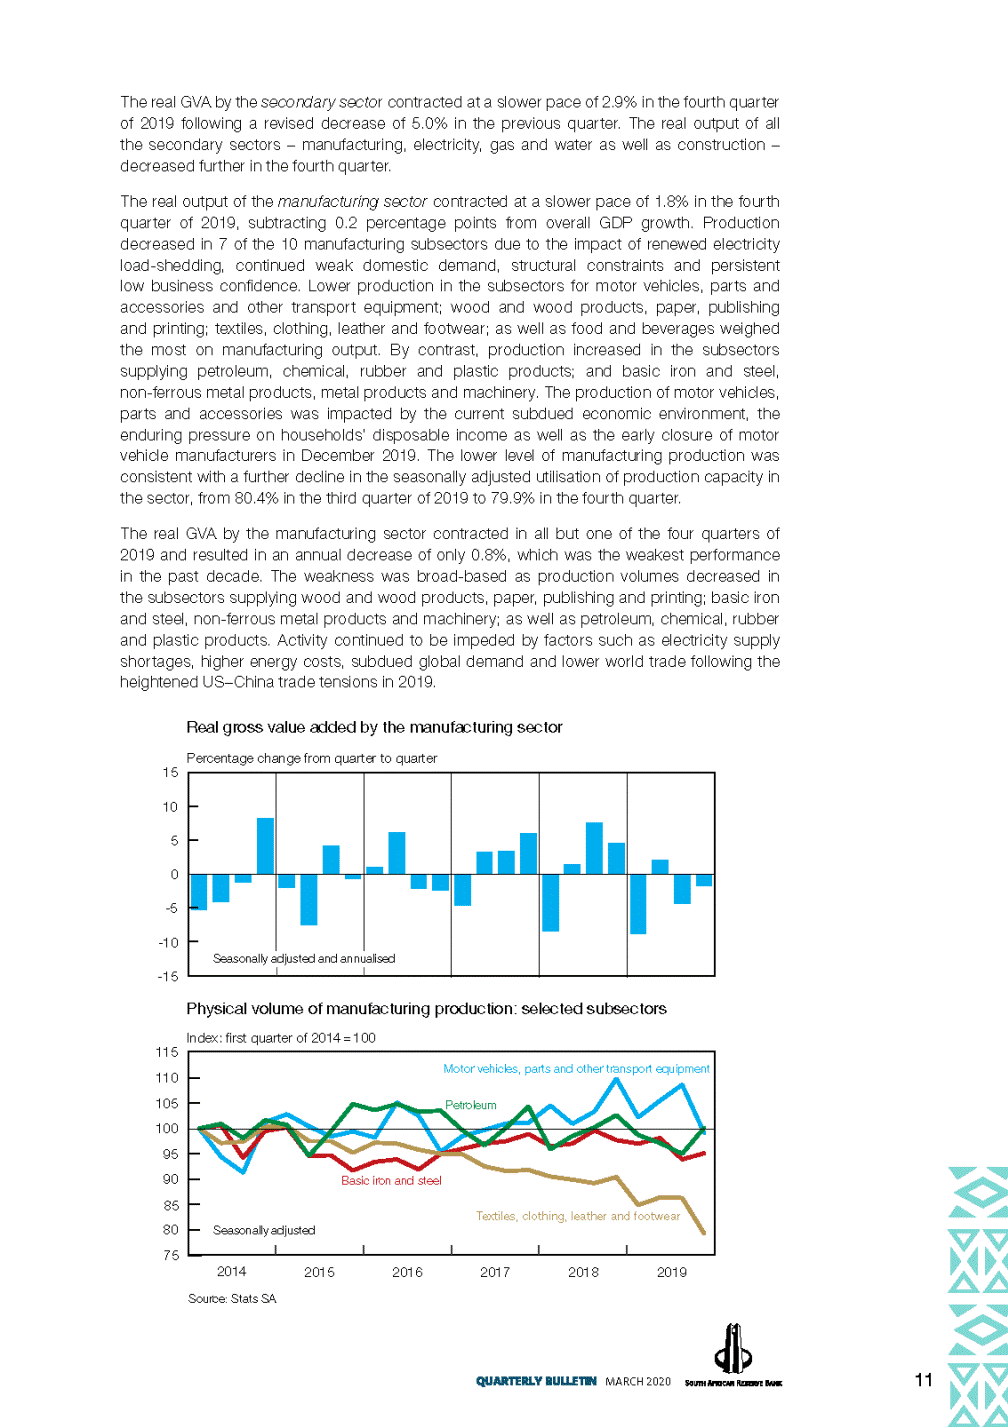
The real GVA by the secondary sector contracted at a slower pace of 2.9% in the fourth quarter of 2019 following a revised decrease of 5.0% in the previous quarter. The real output of all the secondary sectors – manufacturing, electricity, gas and water as well as construction – decreased further in the fourth quarter. The real output of the manufacturing sector contracted at a slower pace of 1.8% in the fourth quarter of 2019, subtracting 0.2 percentage points from overall GDP growth. Production decreased in 7 of the 10 manufacturing subsectors due to the impact of renewed electricity load-shedding, continued weak domestic demand, structural constraints and persistent low business confidence. Lower production in the subsectors for motor vehicles, parts and accessories and other transport equipment; wood and wood products, paper, publishing and printing; textiles, clothing, leather and footwear; as well as food and beverages weighed the most on manufacturing output. By contrast, production increased in the subsectors supplying petroleum, chemical, rubber and plastic products; and basic iron and steel, non-ferrous metal products, metal products and machinery. The production of motor vehicles, parts and accessories was impacted by the current subdued economic environment, the enduring pressure on households’ disposable income as well as the early closure of motor vehicle manufacturers in December 2019. The lower level of manufacturing production was consistent with a further decline in the seasonally adjusted utilisation of production capacity in the sector, from 80.4% in the third quarter of 2019 to 79.9% in the fourth quarter. The real GVA by the manufacturing sector contracted in all but one of the four quarters of 2019 and resulted in an annual decrease of only 0.8%, which was the weakest performance in the past decade. The weakness was broad-based as production volumes decreased in the subsectors supplying wood and wood products, paper, publishing and printing; basic iron and steel, non-ferrous metal products and machinery; as well as petroleum, chemical, rubber and plastic products. Activity continued to be impeded by factors such as electricity supply shortages, higher energy costs, subdued global demand and lower world trade following the heightened US–China trade tensions in 2019. Real gross value added by the manufacturing sector Percentage change from quarter to quarter 15 10 5 0 -5 -10 -15 Physical volume of manufacturing production: selected subsectors Index: first quarter of 2014 = 100 115 110 105 100 95 90 85 80 75 Basic iron and steel Textiles, clothing, leather and footwear Seasonally adjusted 2014 Source: Stats SA 2015 2016 2017 2018 2019 11 MARCH 2020 Motor vehicles, parts and other transport equipment Petroleum Seasonally adjusted and annualised
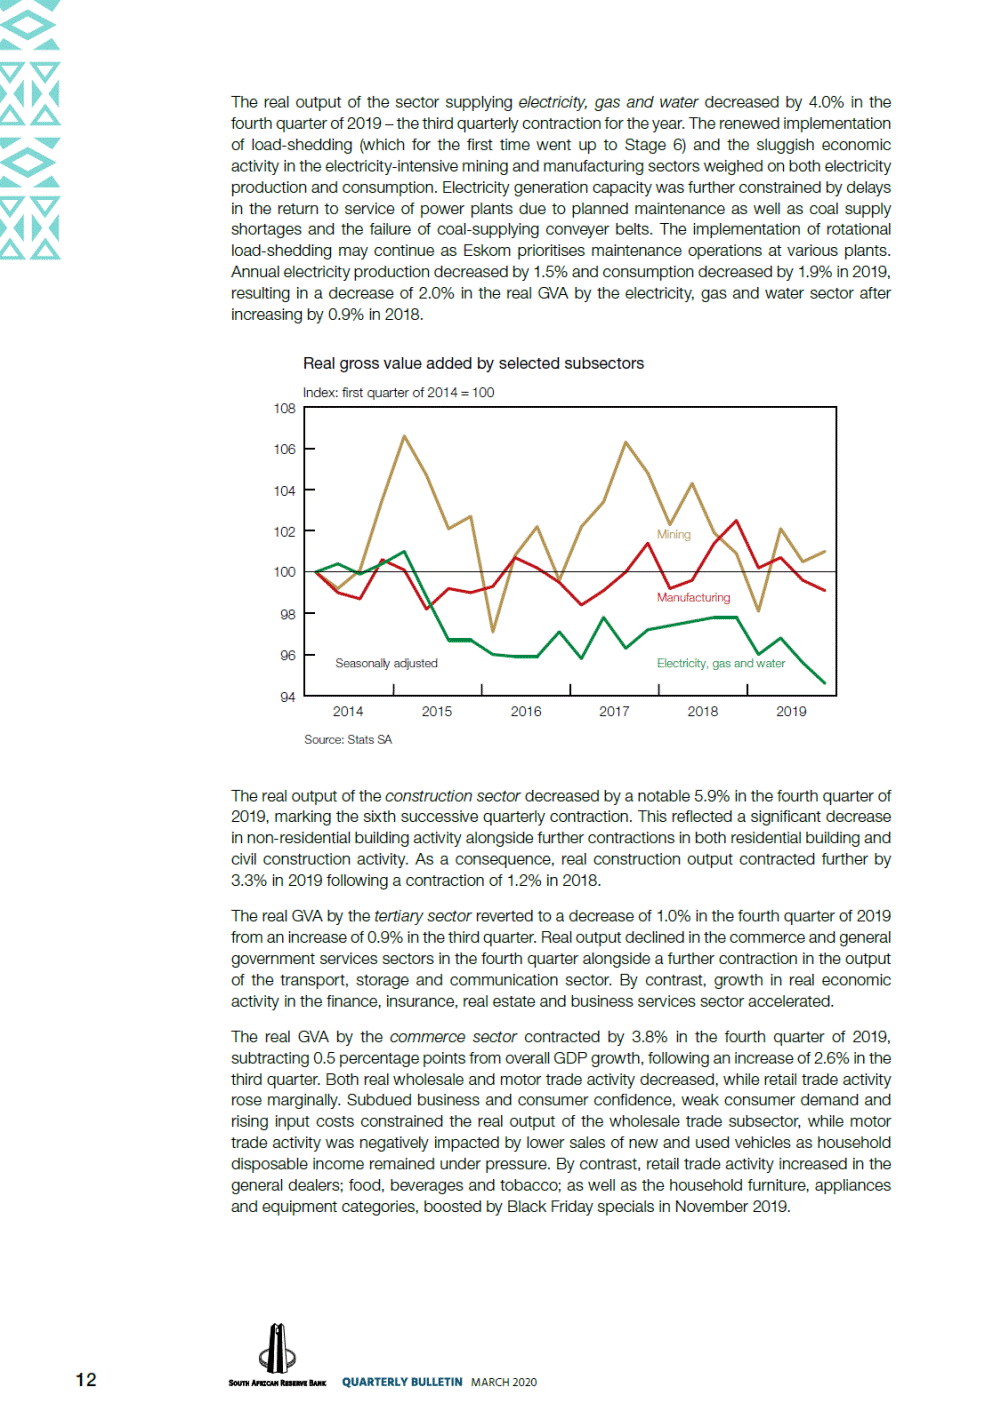
The real output of the sector supplying electricity, gas and water decreased by 4.0% in the fourth quarter of 2019 – the third quarterly contraction for the year. The renewed implementation of load-shedding (which for the first time went up to Stage 6) and the sluggish economic activity in the electricity-intensive mining and manufacturing sectors weighed on both electricity production and consumption. Electricity generation capacity was further constrained by delays in the return to service of power plants due to planned maintenance as well as coal supply shortages and the failure of coal-supplying conveyer belts. The implementation of rotational load-shedding may continue as Eskom prioritises maintenance operations at various plants. Annual electricity production decreased by 1.5% and consumption decreased by 1.9% in 2019, resulting in a decrease of 2.0% in the real GVA by the electricity, gas and water sector after increasing by 0.9% in 2018. Real gross value added by selected subsectors Index: first quarter of 2014 = 100 108 106 104 102 100 98 96 94 2014 2015 2016 2017 2018 2019 Source: Stats SA The real output of the construction sector decreased by a notable 5.9% in the fourth quarter of 2019, marking the sixth successive quarterly contraction. This reflected a significant decrease in non-residential building activity alongside further contractions in both residential building and civil construction activity. As a consequence, real construction output contracted further by 3.3% in 2019 following a contraction of 1.2% in 2018. The real GVA by the tertiary sector reverted to a decrease of 1.0% in the fourth quarter of 2019 from an increase of 0.9% in the third quarter. Real output declined in the commerce and general government services sectors in the fourth quarter alongside a further contraction in the output of the transport, storage and communication sector. By contrast, growth in real economic activity in the finance, insurance, real estate and business services sector accelerated. The real GVA by the commerce sector contracted by 3.8% in the fourth quarter of 2019, subtracting 0.5 percentage points from overall GDP growth, following an increase of 2.6% in the third quarter. Both real wholesale and motor trade activity decreased, while retail trade activity rose marginally. Subdued business and consumer confidence, weak consumer demand and rising input costs constrained the real output of the wholesale trade subsector, while motor trade activity was negatively impacted by lower sales of new and used vehicles as household disposable income remained under pressure. By contrast, retail trade activity increased in the general dealers; food, beverages and tobacco; as well as the household furniture, appliances and equipment categories, boosted by Black Friday specials in November 2019. 12 MARCH 2020 Mining Manufacturing Seasonally adjustedElectricity, gas and water
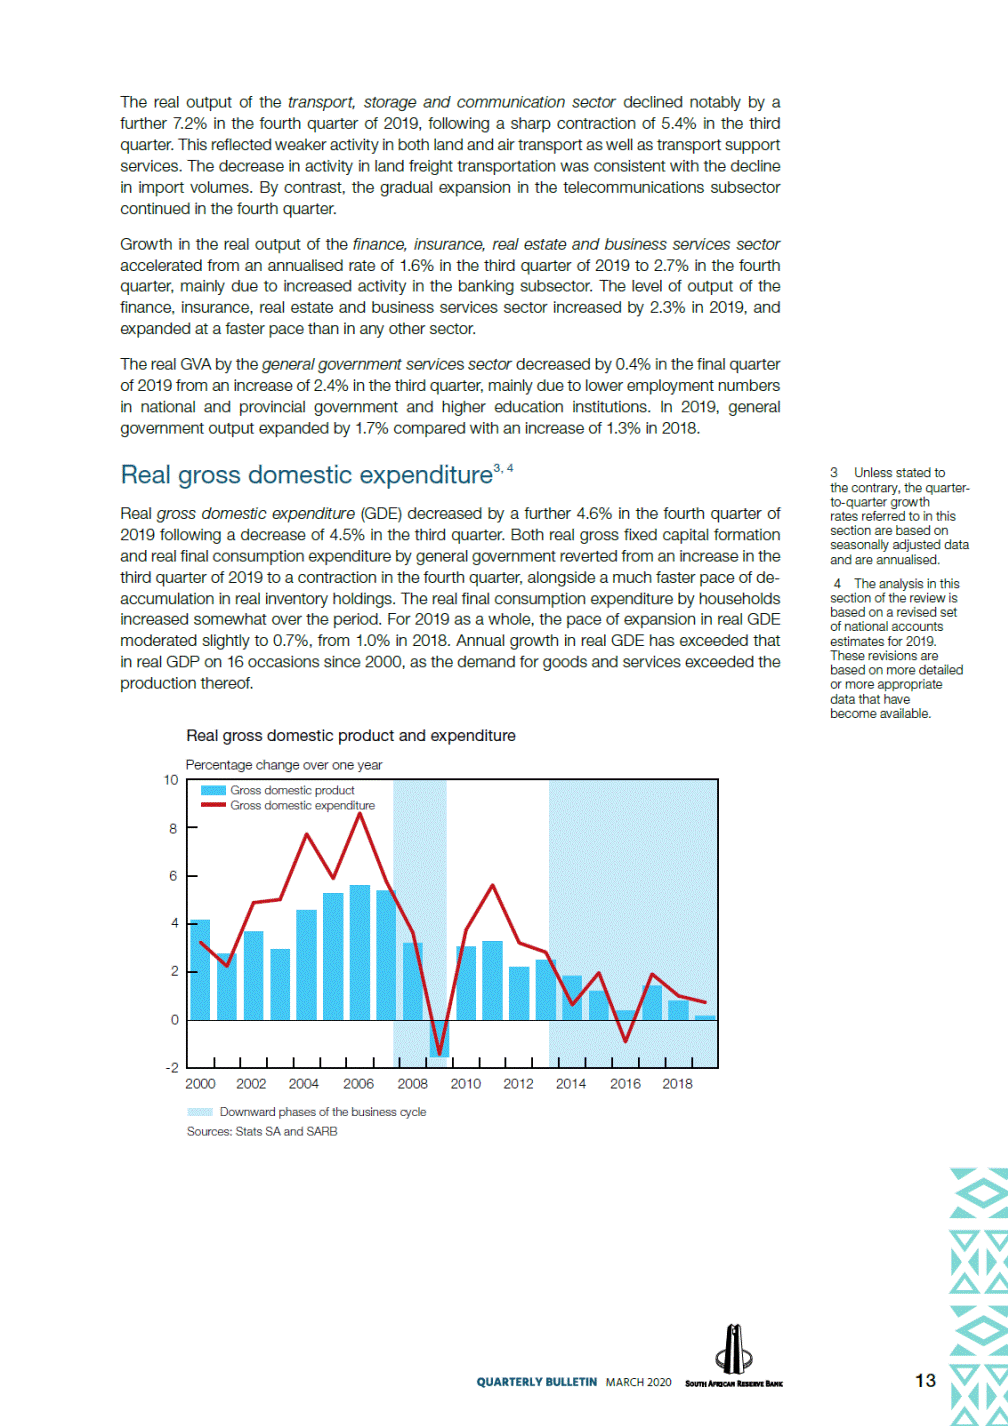
The real output of the transport, storage and communication sector declined notably by a further 7.2% in the fourth quarter of 2019, following a sharp contraction of 5.4% in the third quarter. This reflected weaker activity in both land and air transport as well as transport support services. The decrease in activity in land freight transportation was consistent with the decline in import volumes. By contrast, the gradual expansion in the telecommunications subsector continued in the fourth quarter. Growth in the real output of the finance, insurance, real estate and business services sector accelerated from an annualised rate of 1.6% in the third quarter of 2019 to 2.7% in the fourth quarter, mainly due to increased activity in the banking subsector. The level of output of the finance, insurance, real estate and business services sector increased by 2.3% in 2019, and expanded at a faster pace than in any other sector. The real GVA by the general government services sector decreased by 0.4% in the final quarter of 2019 from an increase of 2.4% in the third quarter, mainly due to lower employment numbers in national and provincial government and higher education institutions. In 2019, government output expanded by 1.7% compared with an increase of 1.3% in 2018. general Real gross domestic expenditure3, 4 Real gross domestic expenditure (GDE) decreased by a further 4.6% in the fourth quarter of 2019 following a decrease of 4.5% in the third quarter. Both real gross fixed capital formation and real final consumption expenditure by general government reverted from an increase in the third quarter of 2019 to a contraction in the fourth quarter, alongside a much faster pace of de-accumulation in real inventory holdings. The real final consumption expenditure by households increased somewhat over the period. For 2019 as a whole, the pace of expansion in real GDE moderated slightly to 0.7%, from 1.0% in 2018. Annual growth in real GDE has exceeded that in real GDP on 16 occasions since 2000, as the demand for goods and services exceeded the production thereof. 3Unless stated to the contrary, the quarter-to-quarter growth rates referred to in this section are based on seasonally adjusted data and are annualised. 4 The analysis in this section of the review is based on a revised set of national accounts estimates for 2019. These revisions are based on more detailed or more appropriate data that have become available. Real gross domestic product and expenditure Percentage change over one year 10 8 6 4 2 0 -2 2000 2002 2004 2006 2008 2010 2012 20142016 2018 Downward phases of the business cycle Sources: Stats SA and SARB 13 MARCH 2020 Gross domestic product Gross domestic expenditure
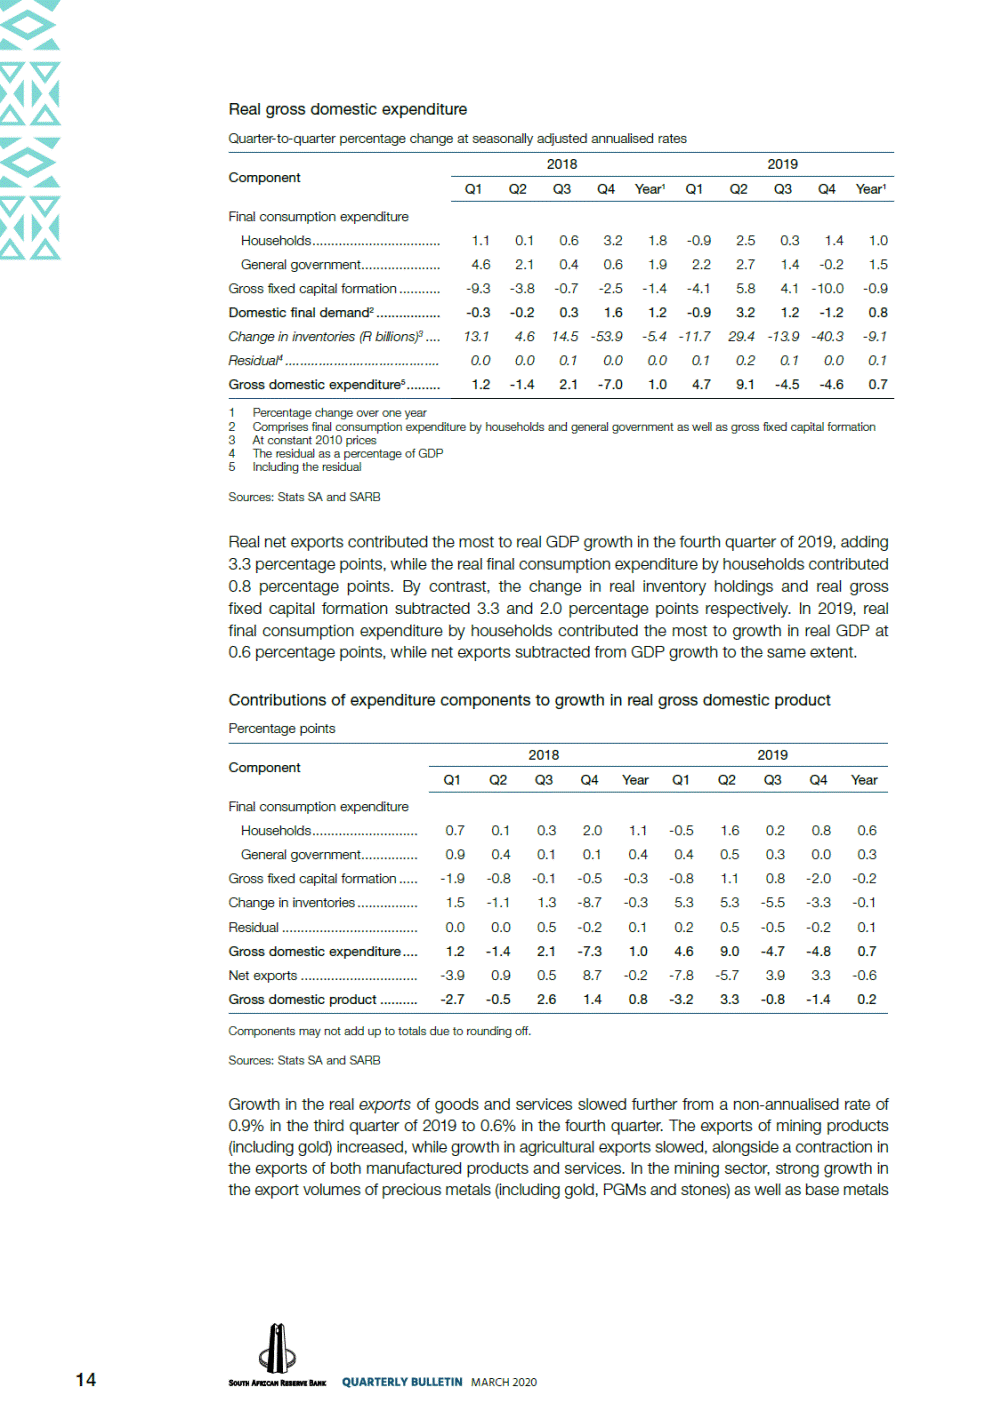
Real gross domestic expenditure Quarter-to-quarter percentage change at seasonally adjusted annualised rates 2018 2019 Component Q1 Q2 Q3 Q4 Year1 Q1 Q2 Q3 Q4 Year1 Final consumption expenditure Households.................................. General government..................... Gross fixed capital formation ........... Domestic final demand2 ................. Change in inventories (R billions)3 .... Residual4 ......................................... Gross domestic expenditure5 ......... 1.1 4.6 -9.3 -0.3 13.1 0.0 1.2 0.1 2.1 -3.8 -0.2 4.6 0.0 -1.4 0.6 0.4 -0.7 0.3 14.5 0.1 2.1 3.2 0.6 -2.5 1.6 -53.9 0.0 -7.0 1.8 1.9 -1.4 1.2 -5.4 0.0 1.0 -0.9 2.2 -4.1 -0.9 -11.7 0.1 4.7 2.5 2.7 5.8 3.2 29.4 0.2 9.1 0.3 1.4 4.1 1.2 -13.9 0.1 -4.5 1.4 -0.2 -10.0 -1.2 -40.3 0.0 -4.6 1.0 1.5 -0.9 0.8 -9.1 0.1 0.7 1 2 3 4 5 Percentage change over one year Comprises final consumption expenditure by households and general government as well as gross fixed capital formation At constant 2010 prices The residual as a percentage of GDP Including the residual Sources: Stats SA and SARB Real net exports contributed the most to real GDP growth in the fourth quarter of 2019, adding 3.3 percentage points, while the real final consumption expenditure by households contributed 0.8 percentage points. By contrast, the change in real inventory holdings and real gross fixed capital formation subtracted 3.3 and 2.0 percentage points respectively. In 2019, real final consumption expenditure by households contributed the most to growth in real GDP at 0.6 percentage points, while net exports subtracted from GDP growth to the same extent. Contributions of expenditure components to growth in real gross domestic product Percentage points 2018 2019 Component Q1 Q2 Q3 Q4 Year Q1 Q2 Q3 Q4 Year Final consumption expenditure Households............................ General government............... Gross fixed capital formation ..... Change in inventories ................ Residual .................................... Gross domestic expenditure .... Net exports ............................... Gross domestic product .......... 0.7 0.9 -1.9 1.5 0.0 1.2 -3.9 -2.7 0.1 0.4 -0.8 -1.1 0.0 -1.4 0.9 -0.5 0.3 0.1 -0.1 1.3 0.5 2.1 0.5 2.6 2.0 0.1 -0.5 -8.7 -0.2 -7.3 8.7 1.4 1.1 0.4 -0.3 -0.3 0.1 1.0 -0.2 0.8 -0.5 0.4 -0.8 5.3 0.2 4.6 -7.8 -3.2 1.6 0.5 1.1 5.3 0.5 9.0 -5.7 3.3 0.2 0.3 0.8 -5.5 -0.5 -4.7 3.9 -0.8 0.8 0.0 -2.0 -3.3 -0.2 -4.8 3.3 -1.4 0.6 0.3 -0.2 -0.1 0.1 0.7 -0.6 0.2 Components may not add up to totals due to rounding off. Sources: Stats SA and SARB Growth in the real exports of goods and services slowed further from a non-annualised rate of 0.9% in the third quarter of 2019 to 0.6% in the fourth quarter. The exports of mining products (including gold) increased, while growth in agricultural exports slowed, alongside a contraction in the exports of both manufactured products and services. In the mining sector, strong growth in the export volumes of precious metals (including gold, PGMs and stones) as well as base metals 14 MARCH 2020
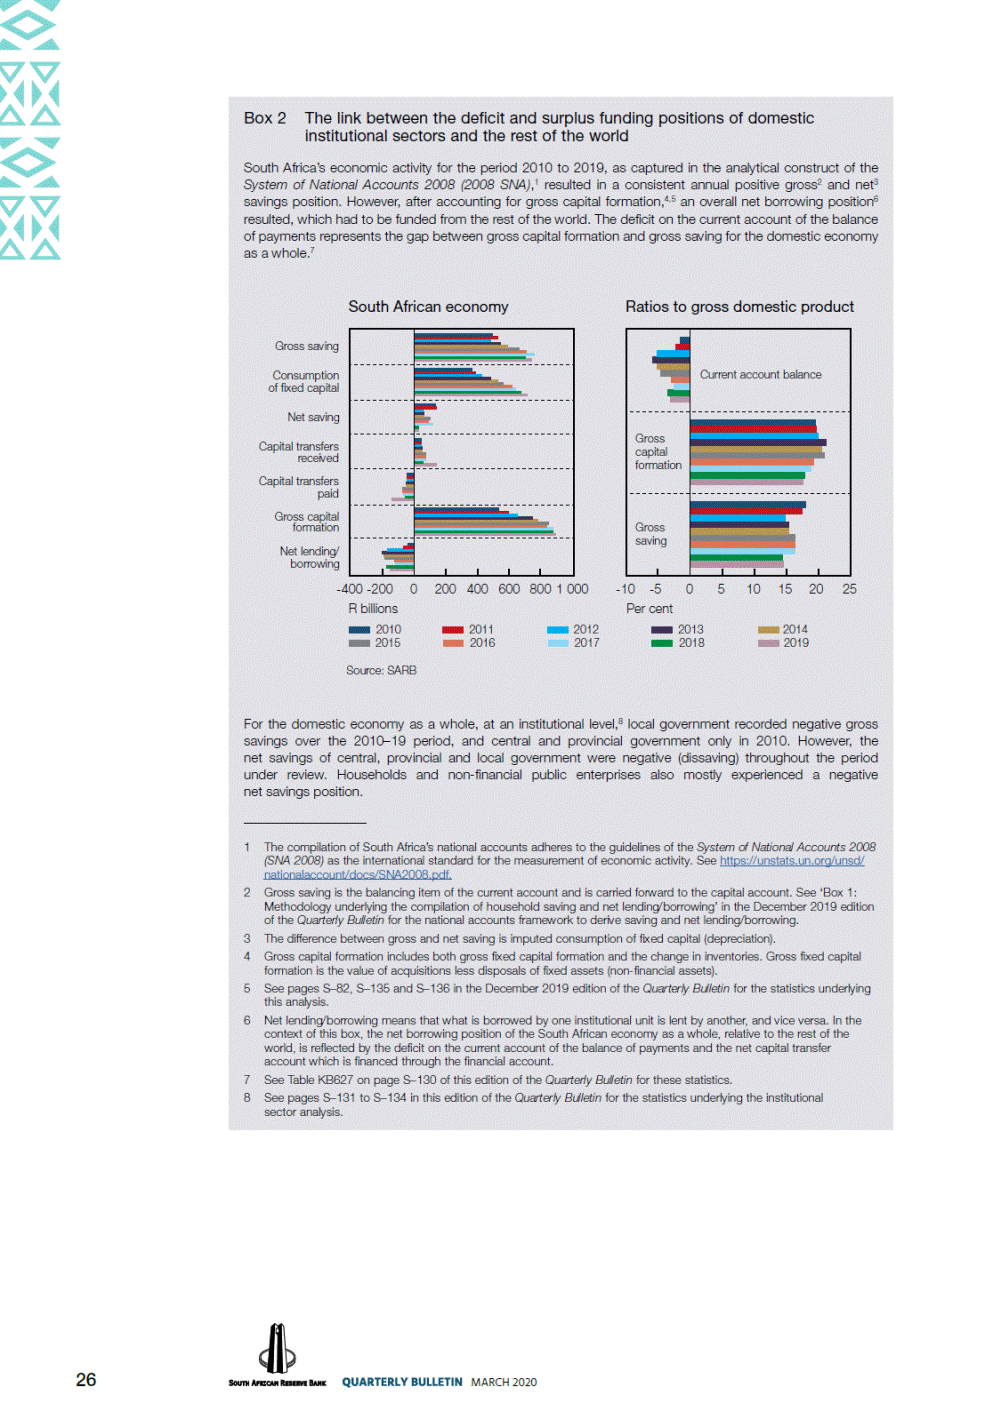
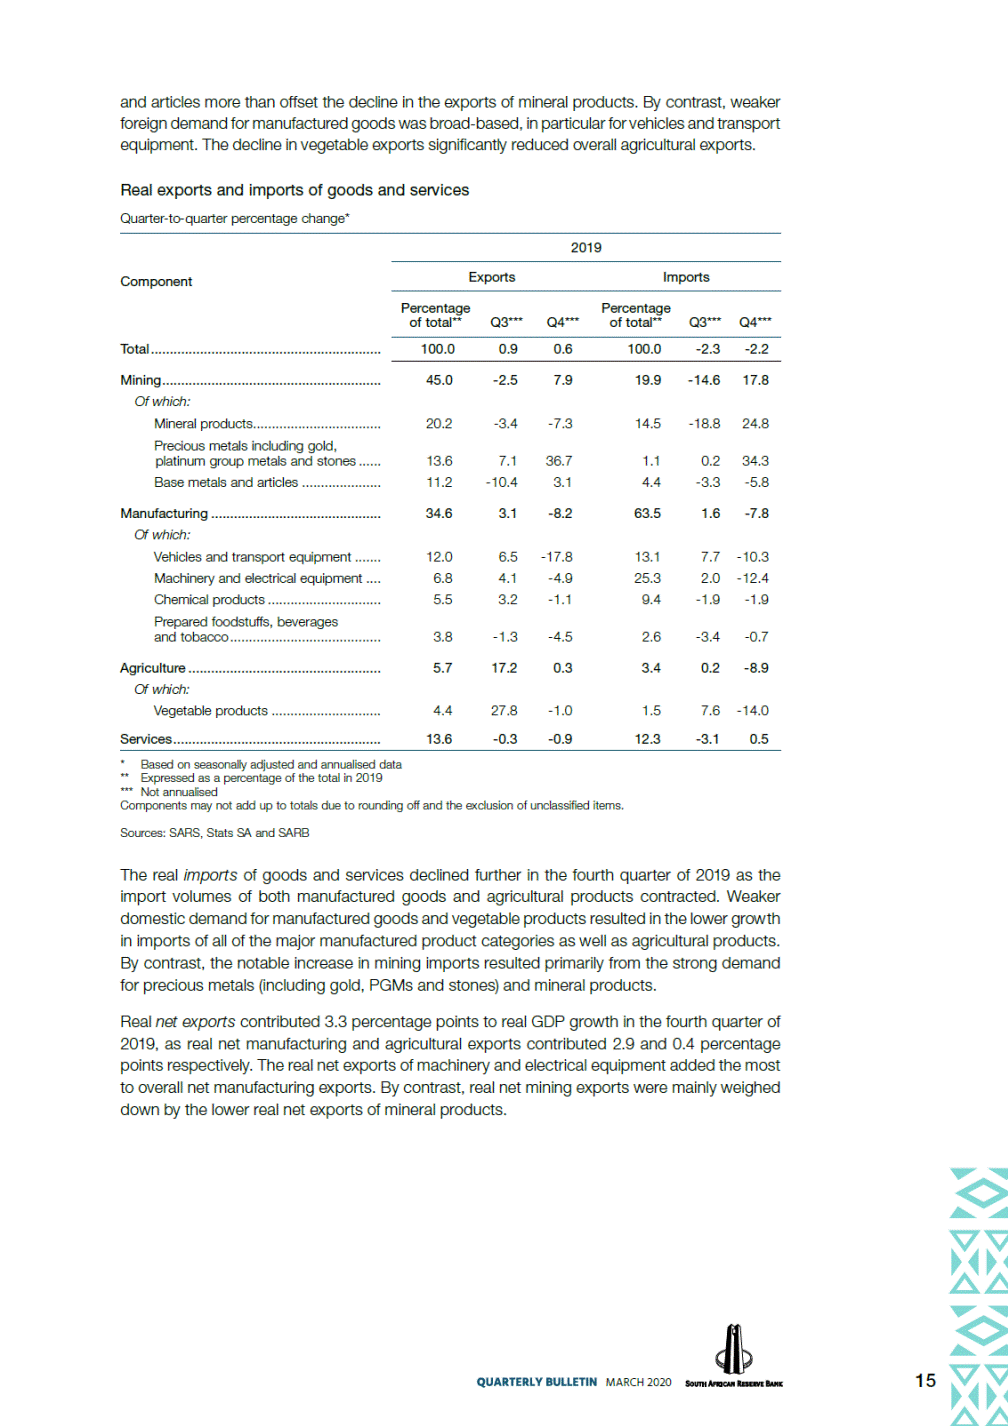
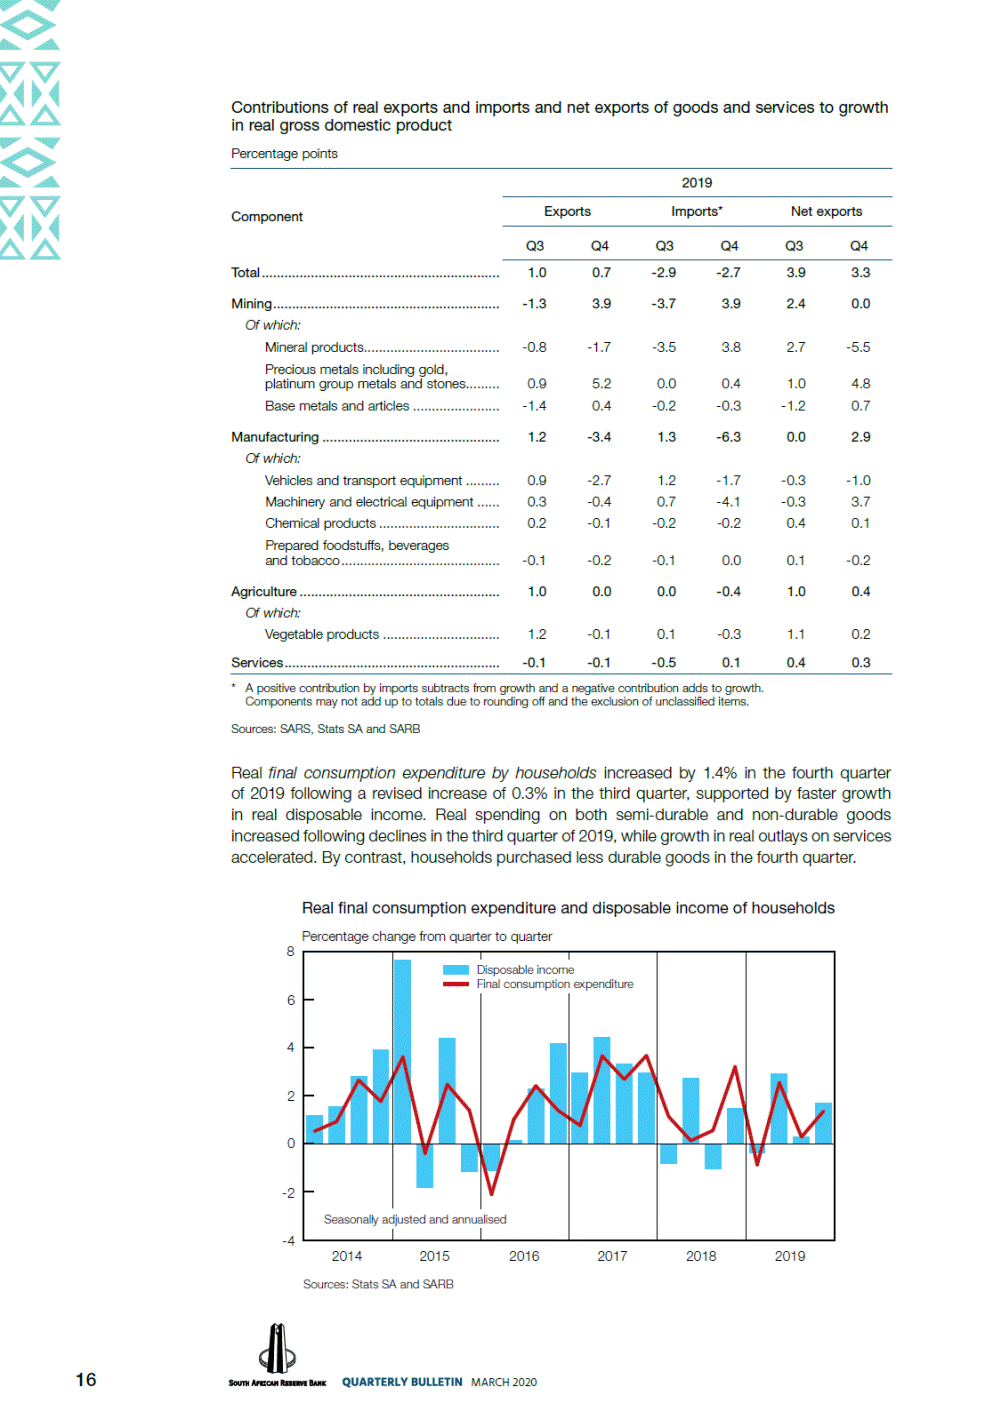
and articles more than offset the decline in the exports of mineral products. By contrast, weaker foreign demand for manufactured goods was broad-based, in particular for vehicles and transport equipment. The decline in vegetable exports significantly reduced overall agricultural exports. Real exports and imports of goods and services Quarter-to-quarter percentage change* 2019 Exports Imports Component Percentage of total** Percentage of total** Q3*** Q4*** Q3*** Q4*** Total ............................................................. 100.0 0.9 0.6 100.0 -2.3 -2.2 Mining.......................................................... Of which: Mineral products.................................. Precious metals including gold, platinum group metals and stones ...... Base metals and articles ..................... 45.0 -2.5 7.9 19.9 -14.6 17.8 20.2 -3.4 -7.3 14.5 -18.8 24.8 13.6 11.2 7.1 -10.4 36.7 3.1 1.1 4.4 0.2 -3.3 34.3 -5.8 Manufacturing ............................................. Of which: Vehicles and transport equipment ....... Machinery and electrical equipment .... Chemical products .............................. Prepared foodstuffs, beverages and tobacco ........................................ 34.6 3.1 -8.2 63.5 1.6 -7.8 12.0 6.8 5.5 6.5 4.1 3.2 -17.8 -4.9 -1.1 13.1 25.3 9.4 7.7 2.0 -1.9 -10.3 -12.4 -1.9 3.8 -1.3 -4.5 2.6 -3.4 -0.7 Agriculture ................................................... Of which: Vegetable products ............................. 5.7 17.2 0.3 3.4 0.2 -8.9 4.4 27.8 -1.0 1.5 7.6 -14.0 Services ....................................................... 13.6 -0.3 -0.9 12.3 -3.1 0.5 * Based on seasonally adjusted and annualised data ** Expressed as a percentage of the total in 2019 *** Not annualised Components may not add up to totals due to rounding off and the exclusion of unclassified items. Sources: SARS, Stats SA and SARB The real imports of goods and services declined further in the fourth quarter of 2019 as the import volumes of both manufactured goods and agricultural products contracted. Weaker domestic demand for manufactured goods and vegetable products resulted in the lower growth in imports of all of the major manufactured product categories as well as agricultural products. By contrast, the notable increase in mining imports resulted primarily from the strong demand for precious metals (including gold, PGMs and stones) and mineral products. Real net exports contributed 3.3 percentage points to real GDP growth in the fourth quarter of 2019, as real net manufacturing and agricultural exports contributed 2.9 and 0.4 percentage points respectively. The real net exports of machinery and electrical equipment added the most to overall net manufacturing exports. By contrast, real net mining exports were mainly weighed down by the lower real net exports of mineral products. 15 MARCH 2020
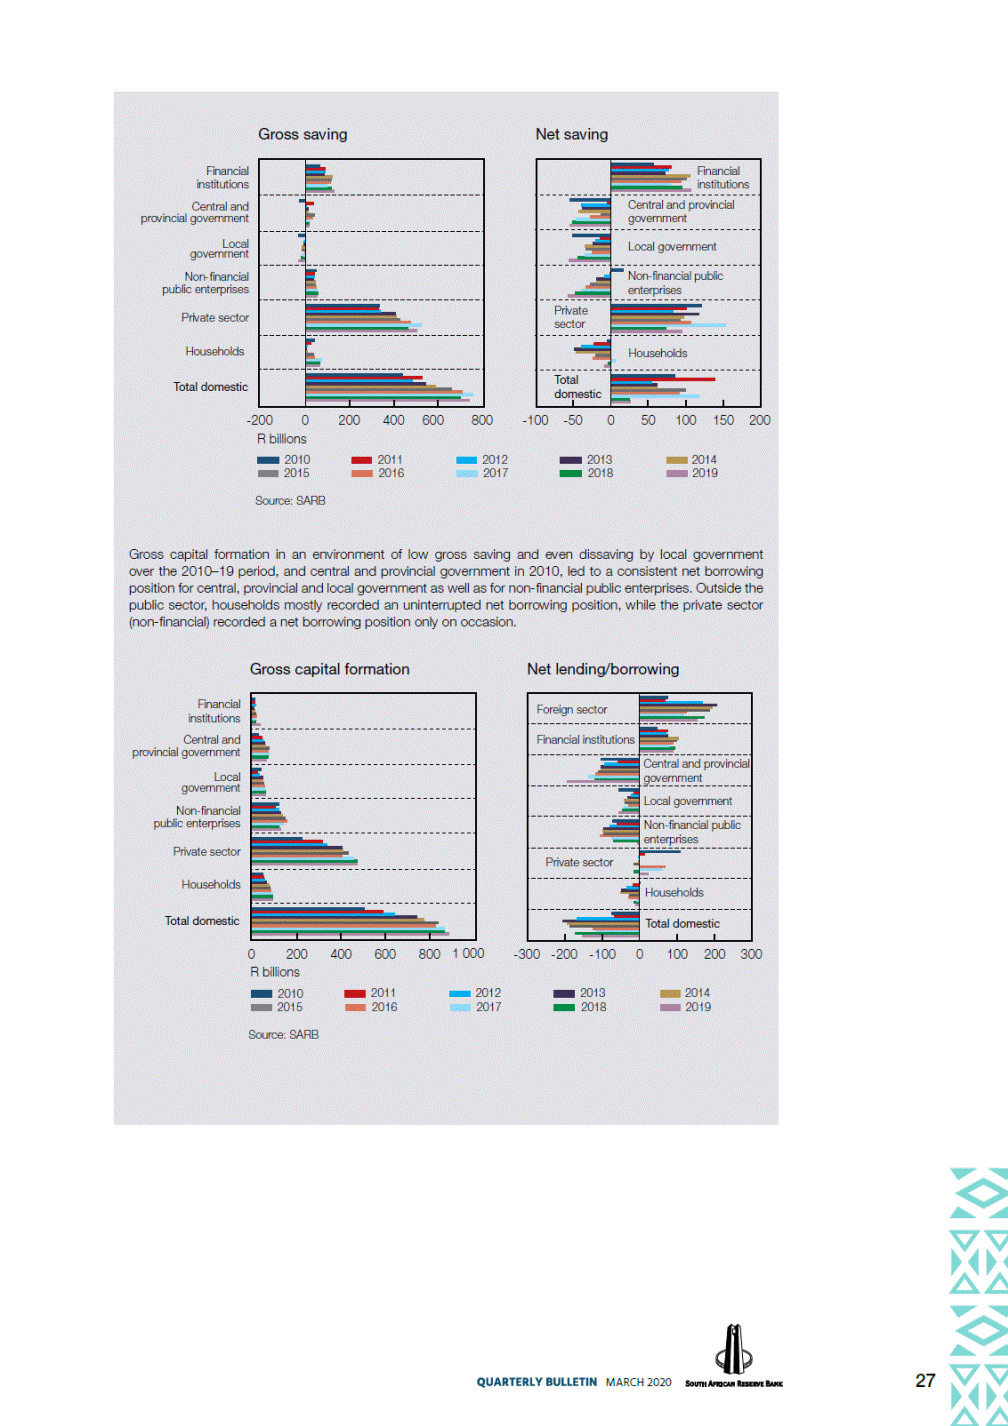
Contributions of real exports and imports and net exports of goods and services to growth in real gross domestic product Percentage points 2019 Exports Imports* Net exports Component Q3 Q4 Q3 Q4 Q3 Q4 Total ............................................................... 1.0 0.7 -2.9 -2.7 3.9 3.3 Mining............................................................ Of which: Mineral products.................................... Precious metals including gold, platinum group metals and stones......... Base metals and articles ....................... -1.3 3.9 -3.7 3.9 2.4 0.0 -0.8 -1.7 -3.5 3.8 2.7 -5.5 0.9 -1.4 5.2 0.4 0.0 -0.2 0.4 -0.3 1.0 -1.2 4.8 0.7 Manufacturing ............................................... Of which: Vehicles and transport equipment ......... Machinery and electrical equipment ...... Chemical products ................................ Prepared foodstuffs, beverages and tobacco .......................................... 1.2 -3.4 1.3 -6.3 0.0 2.9 0.9 0.3 0.2 -2.7 -0.4 -0.1 1.2 0.7 -0.2 -1.7 -4.1 -0.2 -0.3 -0.3 0.4 -1.0 3.7 0.1 -0.1 -0.2 -0.1 0.0 0.1 -0.2 Agriculture ..................................................... Of which: Vegetable products ............................... 1.0 0.0 0.0 -0.4 1.0 0.4 1.2 -0.1 0.1 -0.3 1.1 0.2 Services ......................................................... -0.1 -0.1 -0.5 0.1 0.4 0.3 * A positive contribution by imports subtracts from growth and a negative contribution adds to growth. Components may not add up to totals due to rounding off and the exclusion of unclassified items. Sources: SARS, Stats SA and SARB Real final consumption expenditure by households increased by 1.4% in the fourth quarter of 2019 following a revised increase of 0.3% in the third quarter, supported by faster growth in real disposable income. Real spending on both semi-durable and non-durable goods increased following declines in the third quarter of 2019, while growth in real outlays on services accelerated. By contrast, households purchased less durable goods in the fourth quarter. Real final consumption expenditure and disposable income of households Percentage change from quarter to quarter 8 6 4 2 0 -2 -4 2014 2015 2016 2017 2018 2019 Sources: Stats SA and SARB 16 MARCH 2020 Disposable income Final consumption expenditure Seasonally adjusted and annualised
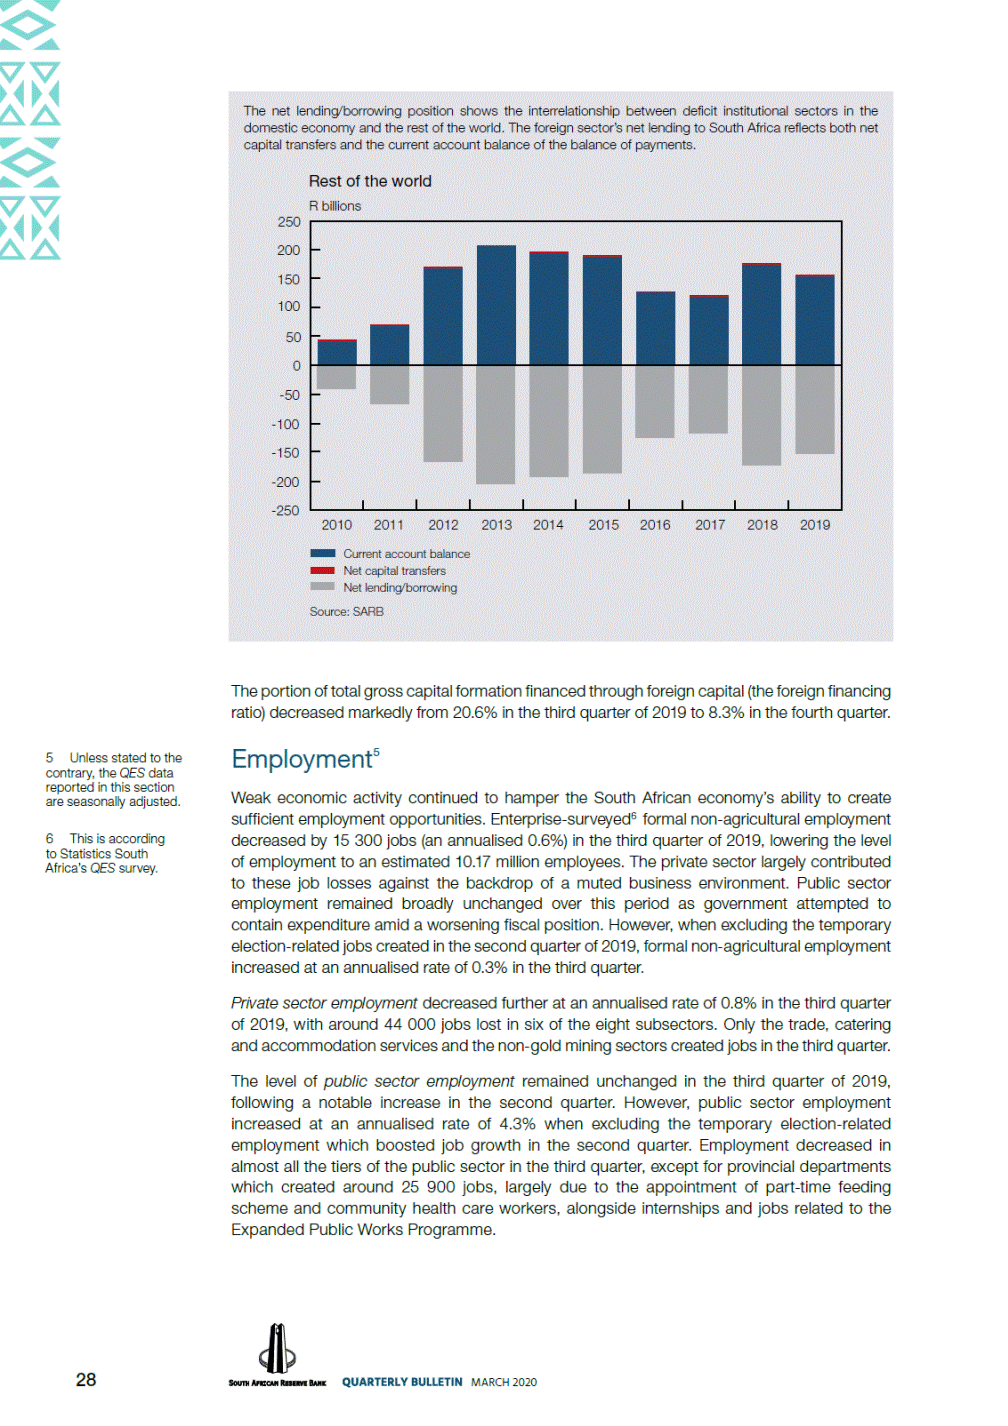
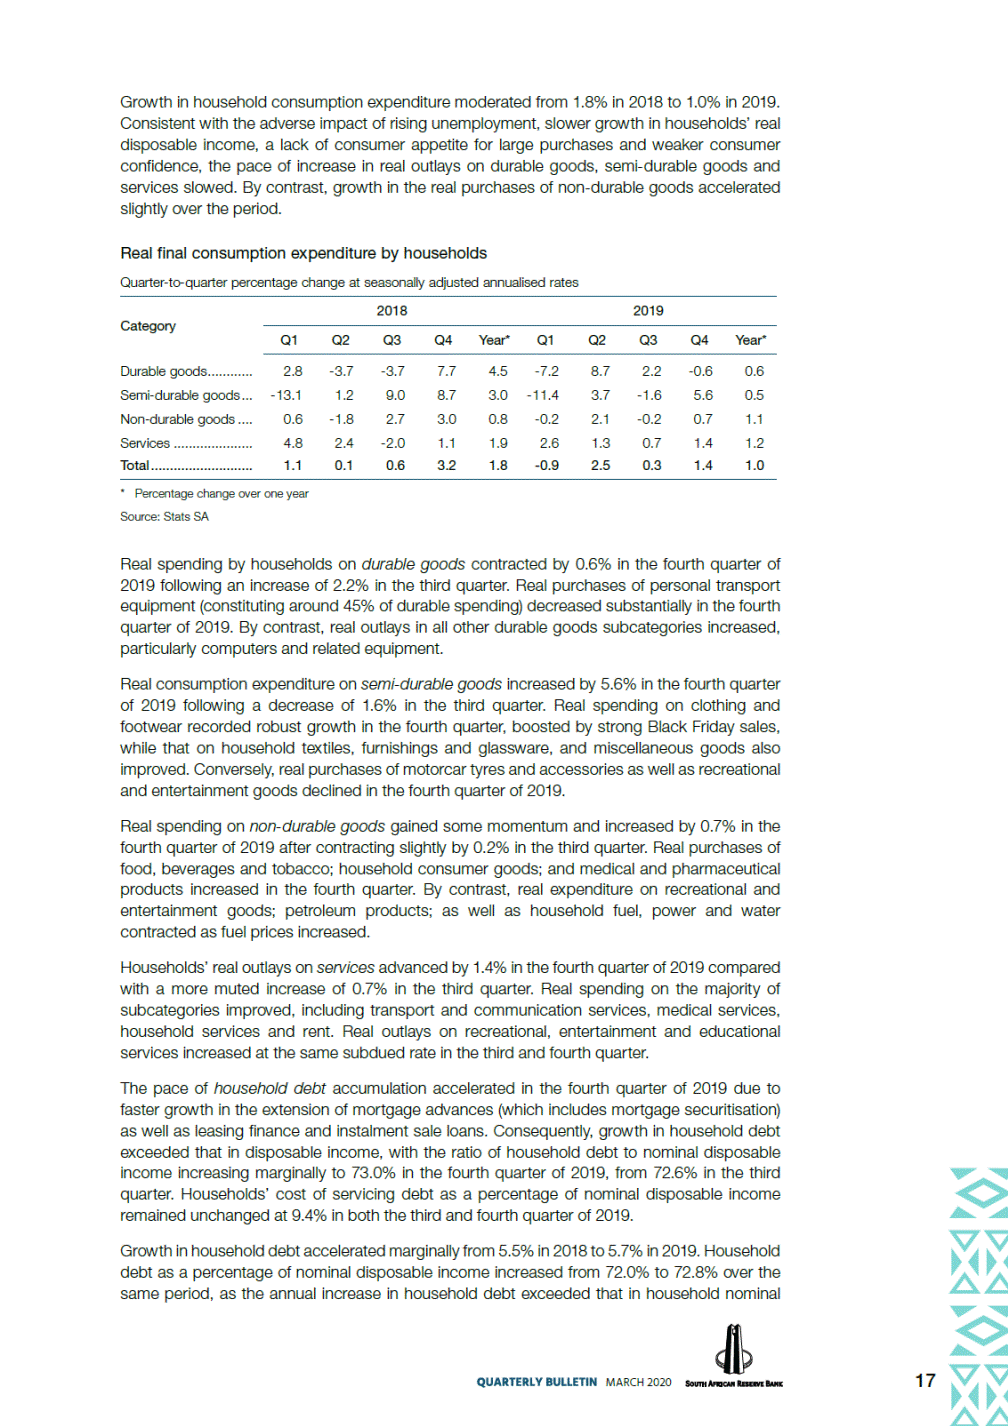
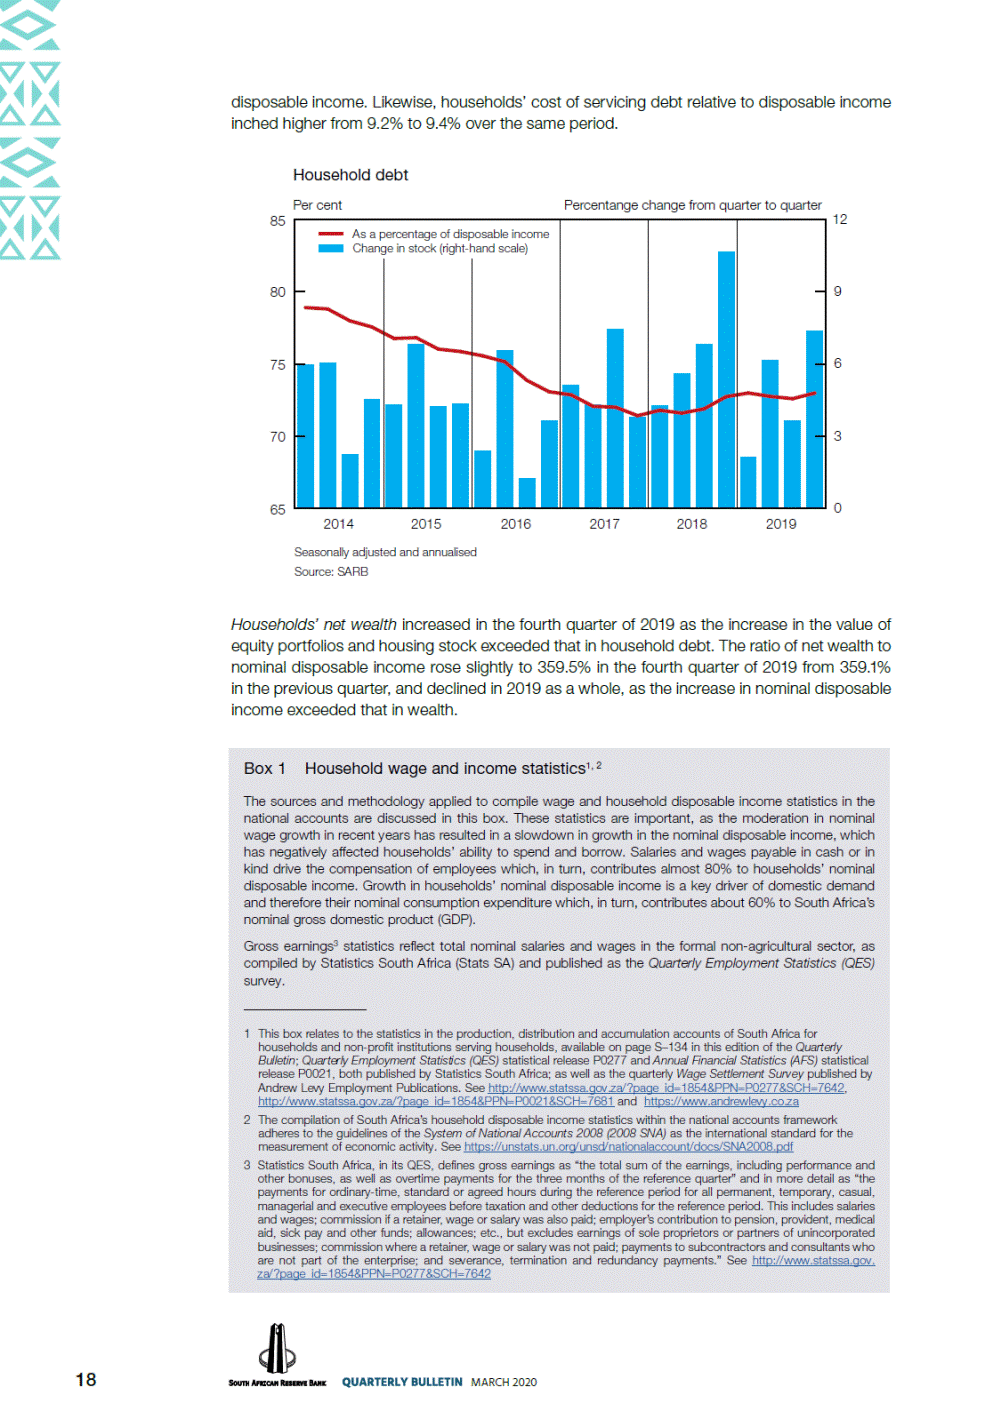
Growth in household consumption expenditure moderated from 1.8% in 2018 to 1.0% in 2019. Consistent with the adverse impact of rising unemployment, slower growth in households’ real disposable income, a lack of consumer appetite for large purchases and weaker consumer confidence, the pace of increase in real outlays on durable goods, semi-durable goods and services slowed. By contrast, growth in the real purchases of non-durable goods accelerated slightly over the period. Real final consumption expenditure by households Quarter-to-quarter percentage change at seasonally adjusted annualised rates 2018 2019 Category Q1 Q2 Q3 Q4 Year* Q1 Q2 Q3 Q4 Year* Durable goods............ Semi-durable goods ... Non-durable goods .... Services ..................... Total ........................... 2.8 -13.1 0.6 4.8 1.1 -3.7 1.2 -1.8 2.4 0.1 -3.7 9.0 2.7 -2.0 0.6 7.7 8.7 3.0 1.1 3.2 4.5 3.0 0.8 1.9 1.8 -7.2 -11.4 -0.2 2.6 -0.9 8.7 3.7 2.1 1.3 2.5 2.2 -1.6 -0.2 0.7 0.3 -0.6 5.6 0.7 1.4 1.4 0.6 0.5 1.1 1.2 1.0 * Percentage change over one year Source: Stats SA Real spending by households on durable goods contracted by 0.6% in the fourth quarter of 2019 following an increase of 2.2% in the third quarter. Real purchases of personal transport equipment (constituting around 45% of durable spending) decreased substantially in the fourth quarter of 2019. By contrast, real outlays in all other durable goods subcategories increased, particularly computers and related equipment. Real consumption expenditure on semi-durable goods increased by 5.6% in the fourth quarter of 2019 following a decrease of 1.6% in the third quarter. Real spending on clothing and footwear recorded robust growth in the fourth quarter, boosted by strong Black Friday sales, while that on household textiles, furnishings and glassware, and miscellaneous goods also improved. Conversely, real purchases of motorcar tyres and accessories as well as recreational and entertainment goods declined in the fourth quarter of 2019. Real spending on non-durable goods gained some momentum and increased by 0.7% in the fourth quarter of 2019 after contracting slightly by 0.2% in the third quarter. Real purchases of food, beverages and tobacco; household consumer goods; and medical and pharmaceutical products increased in the fourth quarter. By contrast, real expenditure on recreational and entertainment goods; petroleum products; as well as household fuel, power and water contracted as fuel prices increased. Households’ real outlays on services advanced by 1.4% in the fourth quarter of 2019 compared with a more muted increase of 0.7% in the third quarter. Real spending on the majority of subcategories improved, including transport and communication services, medical services, household services and rent. Real outlays on recreational, entertainment and educational services increased at the same subdued rate in the third and fourth quarter. The pace of household debt accumulation accelerated in the fourth quarter of 2019 due to faster growth in the extension of mortgage advances (which includes mortgage securitisation) as well as leasing finance and instalment sale loans. Consequently, growth in household debt exceeded that in disposable income, with the ratio of household debt to nominal disposable income increasing marginally to 73.0% in the fourth quarter of 2019, from 72.6% in the third quarter. Households’ cost of servicing debt as a percentage of nominal disposable income remained unchanged at 9.4% in both the third and fourth quarter of 2019. Growth in household debt accelerated marginally from 5.5% in 2018 to 5.7% in 2019. Household debt as a percentage of nominal disposable income increased from 72.0% to 72.8% over the same period, as the annual increase in household debt exceeded that in household nominal 17 MARCH 2020
disposable income. Likewise, households’ cost of servicing debt relative to disposable income inched higher from 9.2% to 9.4% over the same period. Household debt Per cent Percentange change from quarter to quarter 12 85 9 80 75 6 3 70 0 65 2014 2015 2016 2017 2018 2019 Seasonally adjusted and annualised Source: SARB Households’ net wealth increased in the fourth quarter of 2019 as the increase in the value of equity portfolios and housing stock exceeded that in household debt. The ratio of net wealth to nominal disposable income rose slightly to 359.5% in the fourth quarter of 2019 from 359.1% in the previous quarter, and declined in 2019 as a whole, as the increase in nominal disposable income exceeded that in wealth. 18 MARCH 2020 Box 1 Household wage and income statistics1, 2 The sources and methodology applied to compile wage and household disposable income statistics in the national accounts are discussed in this box. These statistics are important, as the moderation in nominal wage growth in recent years has resulted in a slowdown in growth in the nominal disposable income, which has negatively affected households’ ability to spend and borrow. Salaries and wages payable in cash or in kind drive the compensation of employees which, in turn, contributes almost 80% to households’ nominal disposable income. Growth in households’ nominal disposable income is a key driver of domestic demand and therefore their nominal consumption expenditure which, in turn, contributes about 60% to South Africa’s nominal gross domestic product (GDP). Gross earnings3 statistics reflect total nominal salaries and wages in the formal non-agricultural sector, as compiled by Statistics South Africa (Stats SA) and published as the Quarterly Employment Statistics (QES) survey. 1 This box relates to the statistics in the production, distribution and accumulation accounts of South Africa for households and non-profit institutions serving households, available on page S–134 in this edition of the Quarterly Bulletin; Quarterly Employment Statistics (QES) statistical release P0277 and Annual Financial Statistics (AFS) statistical release P0021, both published by Statistics South Africa; as well as the quarterly Wage Settlement Survey published by Andrew Levy Employment Publications. See http://www.statssa.gov.za/?page_id=1854&PPN=P0277&SCH=7642, http://www.statssa.gov.za/?page_id=1854&PPN=P0021&SCH=7681 and https://www.andrewlevy.co.za 2 The compilation of South Africa’s household disposable income statistics within the national accounts framework adheres to the guidelines of the System of National Accounts 2008 (2008 SNA) as the international standard for the measurement of economic activity. See https://unstats.un.org/unsd/nationalaccount/docs/SNA2008.pdf 3 Statistics South Africa, in its QES, defines gross earnings as “the total sum of the earnings, including performance and other bonuses, as well as overtime payments for the three months of the reference quarter” and in more detail as “the payments for ordinary-time, standard or agreed hours during the reference period for all permanent, temporary, casual, managerial and executive employees before taxation and other deductions for the reference period. This includes salaries and wages; commission if a retainer, wage or salary was also paid; employer’s contribution to pension, provident, medical aid, sick pay and other funds; allowances; etc., but excludes earnings of sole proprietors or partners of unincorporated businesses; commission where a retainer, wage or salary was not paid; payments to subcontractors and consultants who are not part of the enterprise; and severance, termination and redundancy payments.” See http://www.statssa.gov. za/?page_id=1854&PPN=P0277&SCH=7642 As a percentage Change in stock of disposable income (right-hand scale)
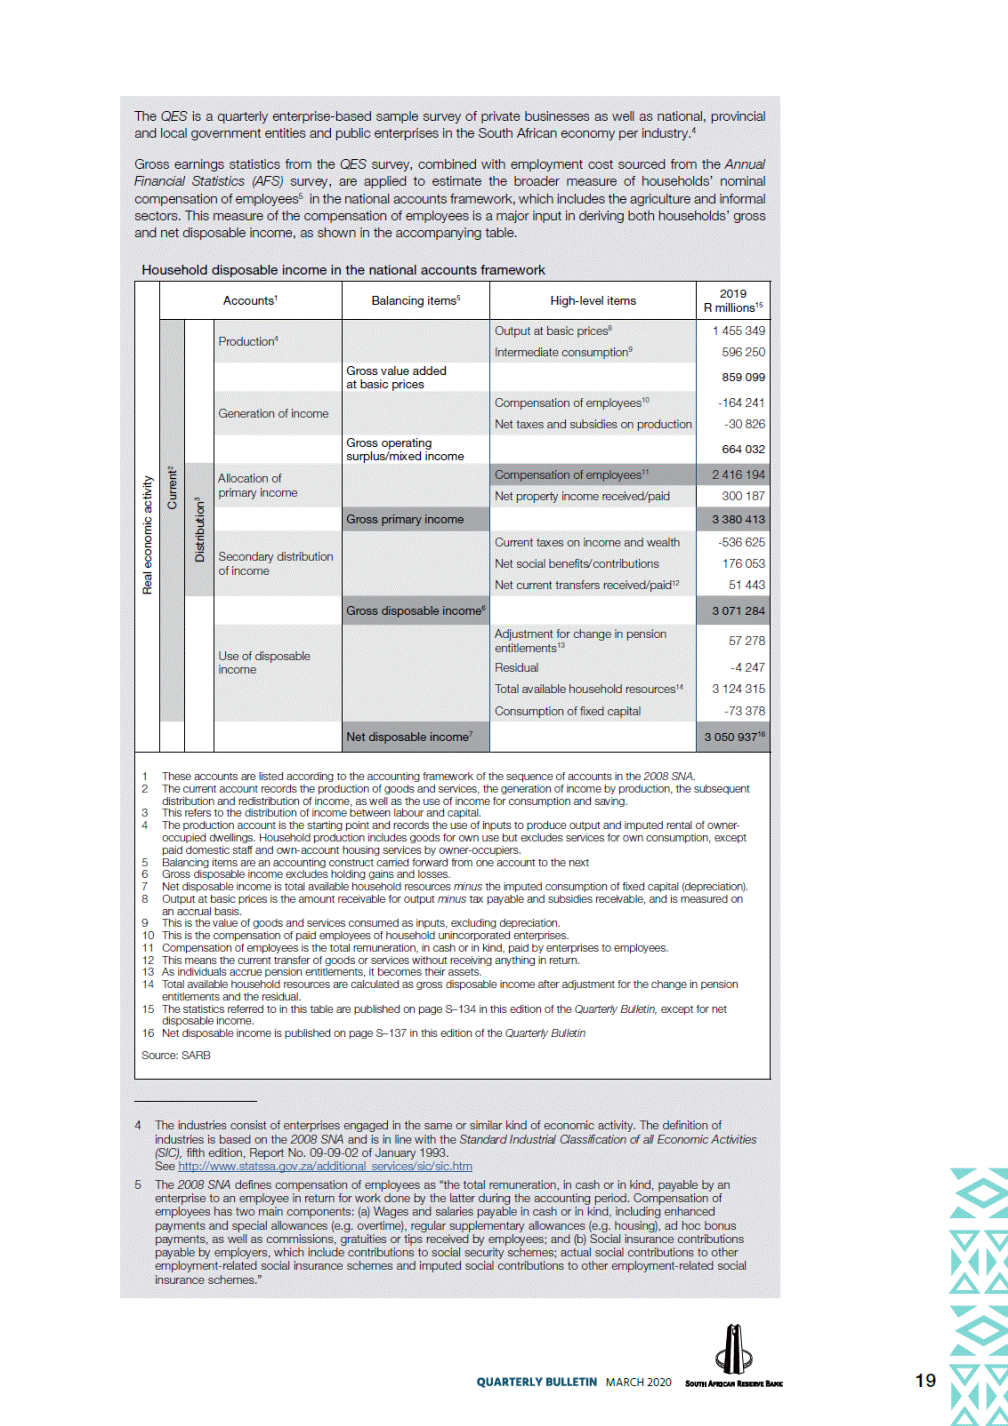
19 MARCH 2020 The QES is a quarterly enterprise-based sample survey of private businesses as well as national, provincial and local government entities and public enterprises in the South African economy per industry.4 Gross earnings statistics from the QES survey, combined with employment cost sourced from the Annual Financial Statistics (AFS) survey, are applied to estimate the broader measure of households’ nominal compensation of employees5 in the national accounts framework, which includes the agriculture and informal sectors. This measure of the compensation of employees is a major input in deriving both households’ gross and net disposable income, as shown in the accompanying table. Household disposable income in the national accounts framework R millions15 at basic prices surplus/mixed income 4 The industries consist of enterprises engaged in the same or similar kind of economic activity. The definition of industries is based on the 2008 SNA and is in line with the Standard Industrial Classification of all Economic Activities (SIC), fifth edition, Report No. 09-09-02 of January 1993. See http://www.statssa.gov.za/additional_services/sic/sic.htm 5 The 2008 SNA defines compensation of employees as “the total remuneration, in cash or in kind, payable by an enterprise to an employee in return for work done by the latter during the accounting period. Compensation of employees has two main components: (a) Wages and salaries payable in cash or in kind, including enhanced payments and special allowances (e.g. overtime), regular supplementary allowances (e.g. housing), ad hoc bonus payments, as well as commissions, gratuities or tips received by employees; and (b) Social insurance contributions payable by employers, which include contributions to social security schemes; actual social contributions to other employment-related social insurance schemes and imputed social contributions to other employment-related social insurance schemes.” Real economic activity Accounts1 Balancing items5 High-level items 2019 Current2 Production4 Output at basic prices8 Intermediate consumption9 1 455 349 596 250 859 099 -164 241 -30 826 664 032 Gross value added Generation of income Compensation of employees10 Net taxes and subsidies on production Gross operating Distribution3 Allocation of primary income Compensation of employees11 2 416 194 Net property income received/paid 300 187 Gross primary income 3 380 413 Secondary distribution of income Current taxes on income and wealth Net social benefits/contributions Net current transfers received/paid12 -536 625 176 053 51 443 Gross disposable income6 3 071 284 Use of disposable income Adjustment for change in pension entitlements13 Residual Total available household resources14 Consumption of fixed capital 57 278 -4 247 3 124 315 -73 378 Net disposable income7 3 050 93716 1 These accounts are listed according to the accounting framework of the sequence of accounts in the 2008 SNA. 2 The current account records the production of goods and services, the generation of income by production, the subsequent distribution and redistribution of income, as well as the use of income for consumption and saving. 3 This refers to the distribution of income between labour and capital. 4 The production account is the starting point and records the use of inputs to produce output and imputed rental of owner-occupied dwellings. Household production includes goods for own use but excludes services for own consumption, except paid domestic staff and own-account housing services by owner-occupiers. 5 Balancing items are an accounting construct carried forward from one account to the next 6 Gross disposable income excludes holding gains and losses. 7 Net disposable income is total available household resources minus the imputed consumption of fixed capital (depreciation). 8 Output at basic prices is the amount receivable for output minus tax payable and subsidies receivable, and is measured on an accrual basis. 9 This is the value of goods and services consumed as inputs, excluding depreciation. 10 This is the compensation of paid employees of household unincorporated enterprises. 11 Compensation of employees is the total remuneration, in cash or in kind, paid by enterprises to employees. 12 This means the current transfer of goods or services without receiving anything in return. 13 As individuals accrue pension entitlements, it becomes their assets. 14 Total available household resources are calculated as gross disposable income after adjustment for the change in pension entitlements and the residual. 15 The statistics referred to in this table are published on page S–134 in this edition of the Quarterly Bulletin, except for net disposable income. 16 Net disposable income is published on page S–137 in this edition of the Quarterly Bulletin Source: SARB
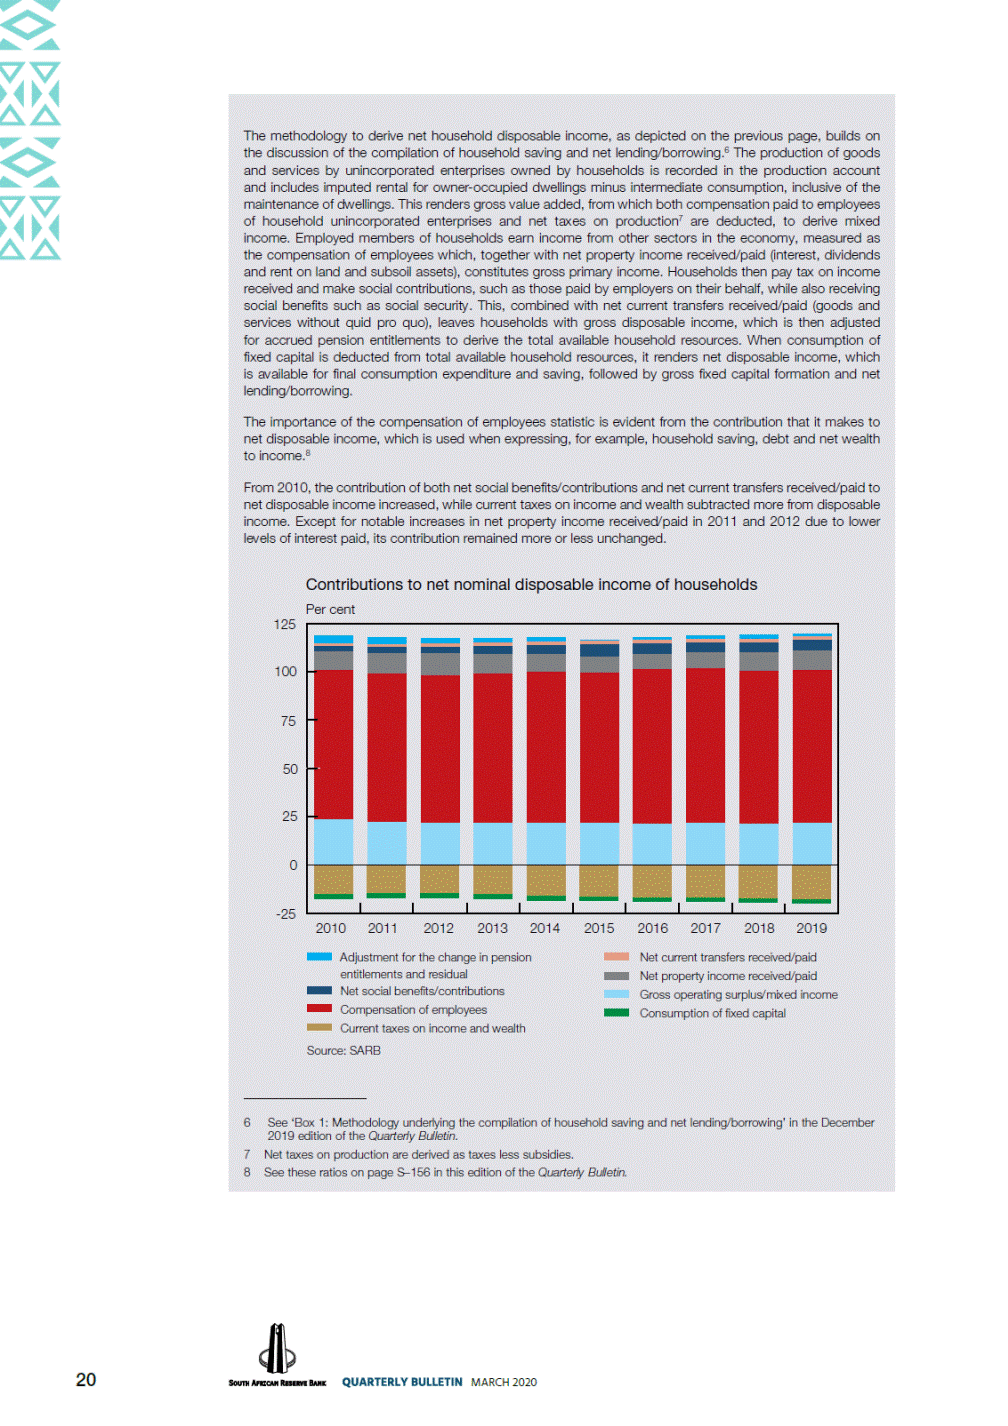
20 MARCH 2020 The methodology to derive net household disposable income, as depicted on the previous page, builds on the discussion of the compilation of household saving and net lending/borrowing.6 The production of goods and services by unincorporated enterprises owned by households is recorded in the production account and includes imputed rental for owner-occupied dwellings minus intermediate consumption, inclusive of the maintenance of dwellings. This renders gross value added, from which both compensation paid to employees of household unincorporated enterprises and net taxes on production7 are deducted, to derive mixed income. Employed members of households earn income from other sectors in the economy, measured as the compensation of employees which, together with net property income received/paid (interest, dividends and rent on land and subsoil assets), constitutes gross primary income. Households then pay tax on income received and make social contributions, such as those paid by employers on their behalf, while also receiving social benefits such as social security. This, combined with net current transfers received/paid (goods and services without quid pro quo), leaves households with gross disposable income, which is then adjusted for accrued pension entitlements to derive the total available household resources. When consumption of fixed capital is deducted from total available household resources, it renders net disposable income, which is available for final consumption expenditure and saving, followed by gross fixed capital formation and net lending/borrowing. The importance of the compensation of employees statistic is evident from the contribution that it makes to net disposable income, which is used when expressing, for example, household saving, debt and net wealth to income.8 From 2010, the contribution of both net social benefits/contributions and net current transfers received/paid to net disposable income increased, while current taxes on income and wealth subtracted more from disposable income. Except for notable increases in net property income received/paid in 2011 and 2012 due to lower levels of interest paid, its contribution remained more or less unchanged. Contributions to net nominal disposable income of households Per cent 125 100 75 50 25 0 -25 2010201120122013201420152016201720182019 Adjustment for the change in pensionNet current transfers received/paid entitlements and residualNet property income received/paid Net social benefits/contributionsGross operating surplus/mixed income Compensation of employeesConsumption of fixed capital Current taxes on income and wealth Source: SARB 6 See ‘Box 1: Methodology underlying the compilation of household saving and net lending/borrowing’ in the December 2019 edition of the Quarterly Bulletin. 7 Net taxes on production are derived as taxes less subsidies. 8 See these ratios on page S–156 in this edition of the Quarterly Bulletin.
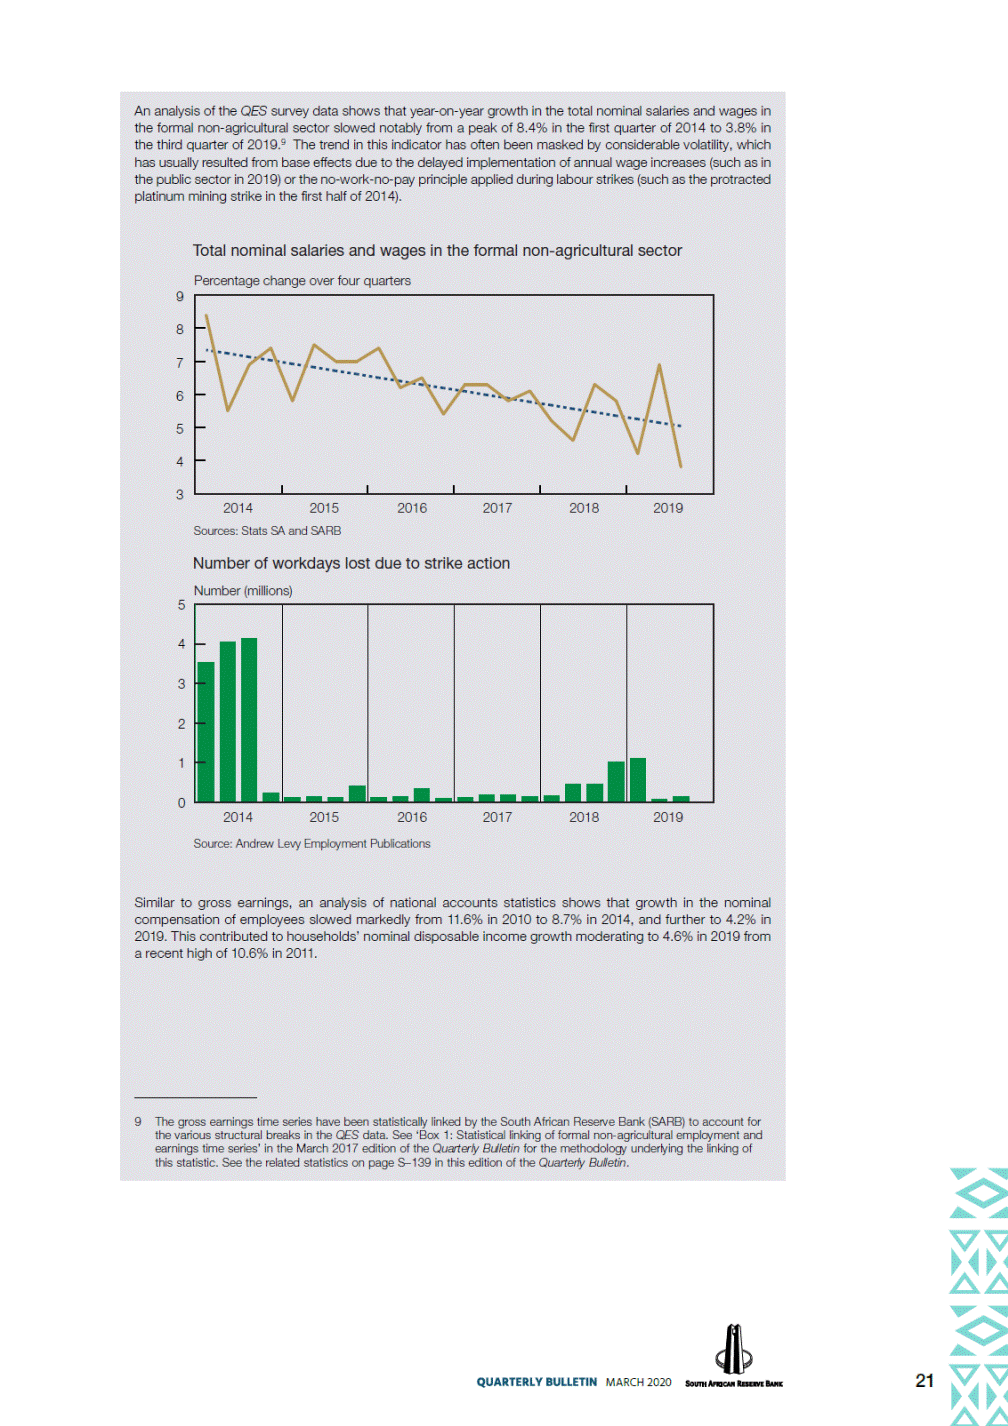
2014 2015 2016 2017 2018 2019 21 MARCH 2020 An analysis of the QES survey data shows that year-on-year growth in the total nominal salaries and wages in the formal non-agricultural sector slowed notably from a peak of 8.4% in the first quarter of 2014 to 3.8% in the third quarter of 2019.9 The trend in this indicator has often been masked by considerable volatility, which has usually resulted from base effects due to the delayed implementation of annual wage increases (such as in the public sector in 2019) or the no-work-no-pay principle applied during labour strikes (such as the protracted platinum mining strike in the first half of 2014). Total nominal salaries and wages in the formal non-agricultural sector Percentage change over four quarters 9 8 7 6 5 4 3 Sources: Stats SA and SARB Number of workdays lost due to strike action Number (millions) 5 4 3 2 1 0 2014 2015 2016 2017 2018 2019 Source: Andrew Levy Employment Publications Similar to gross earnings, an analysis of national accounts statistics shows that growth in the nominal compensation of employees slowed markedly from 11.6% in 2010 to 8.7% in 2014, and further to 4.2% in 2019. This contributed to households’ nominal disposable income growth moderating to 4.6% in 2019 from a recent high of 10.6% in 2011. 9 The gross earnings time series have been statistically linked by the South African Reserve Bank (SARB) to account for the various structural breaks in the QES data. See ‘Box 1: Statistical linking of formal non-agricultural employment and earnings time series’ in the March 2017 edition of the Quarterly Bulletin for the methodology underlying the linking of this statistic. See the related statistics on page S–139 in this edition of the Quarterly Bulletin.
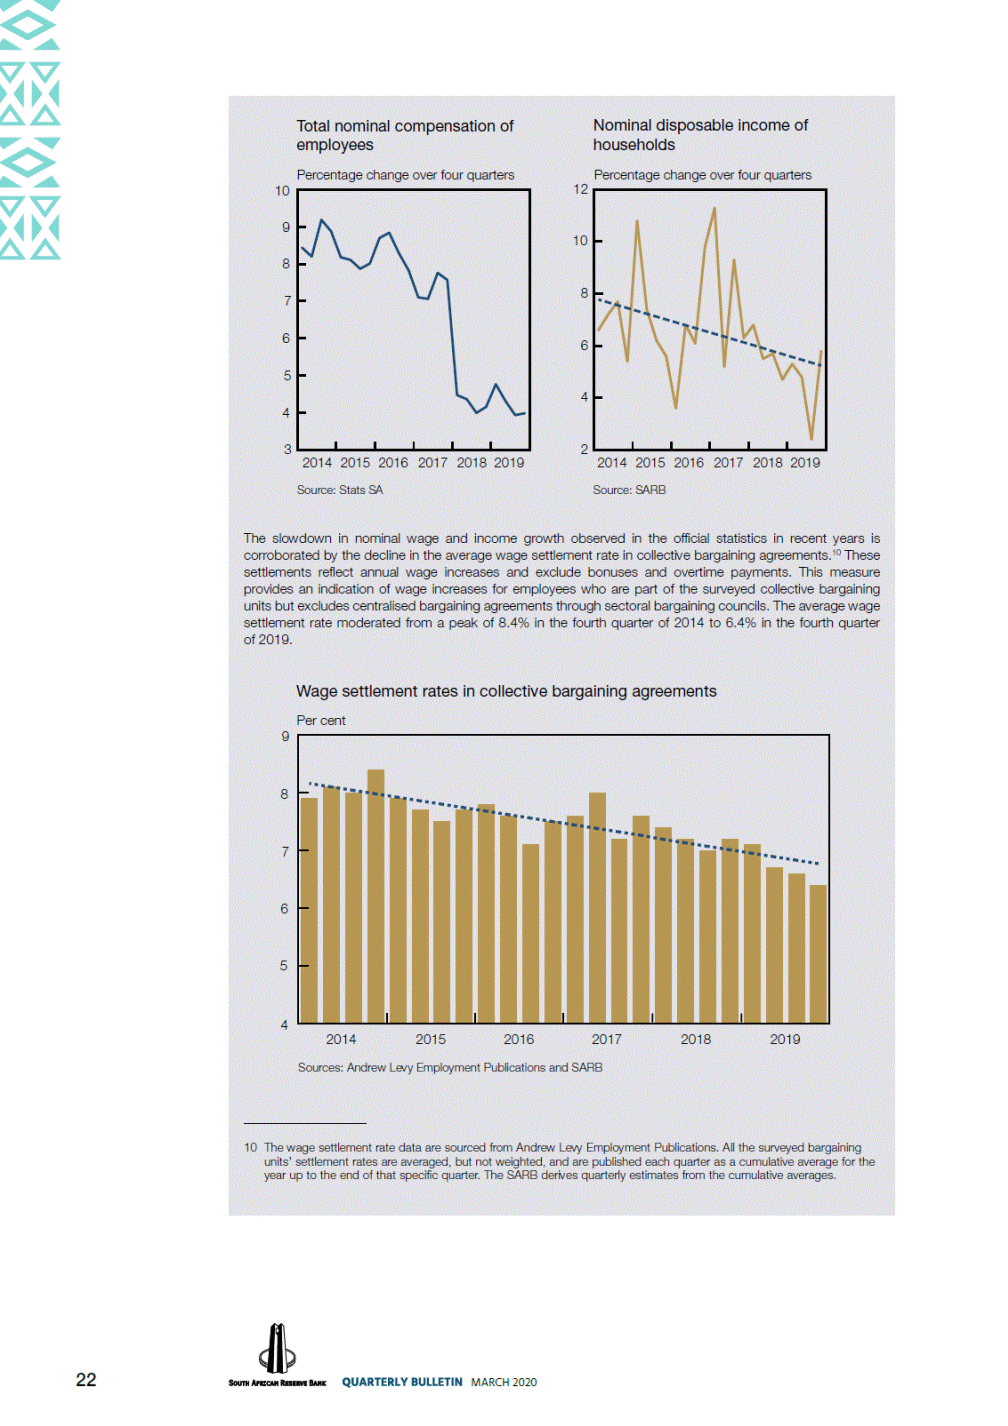
10 2014 2015 2016 2017 2018 2019 2014 2015 2016 2017 2018 2019 22 MARCH 2020 Total nominal compensation of Nominal disposable income of employeeshouseholds Percentage change over four quartersPercentage change over four quarters 1012 9 8 78 66 5 4 4 32 Source: Stats SASource: SARB The slowdown in nominal wage and income growth observed in the official statistics in recent years is corroborated by the decline in the average wage settlement rate in collective bargaining agreements.10 These settlements reflect annual wage increases and exclude bonuses and overtime payments. This measure provides an indication of wage increases for employees who are part of the surveyed collective bargaining units but excludes centralised bargaining agreements through sectoral bargaining councils. The average wage settlement rate moderated from a peak of 8.4% in the fourth quarter of 2014 to 6.4% in the fourth quarter of 2019. Wage settlement rates in collective bargaining agreements Per cent 9 8 7 6 5 4 201420152016201720182019 Sources: Andrew Levy Employment Publications and SARB 10 The wage settlement rate data are sourced from Andrew Levy Employment Publications. All the surveyed bargaining units’ settlement rates are averaged, but not weighted, and are published each quarter as a cumulative average for the year up to the end of that specific quarter. The SARB derives quarterly estimates from the cumulative averages.
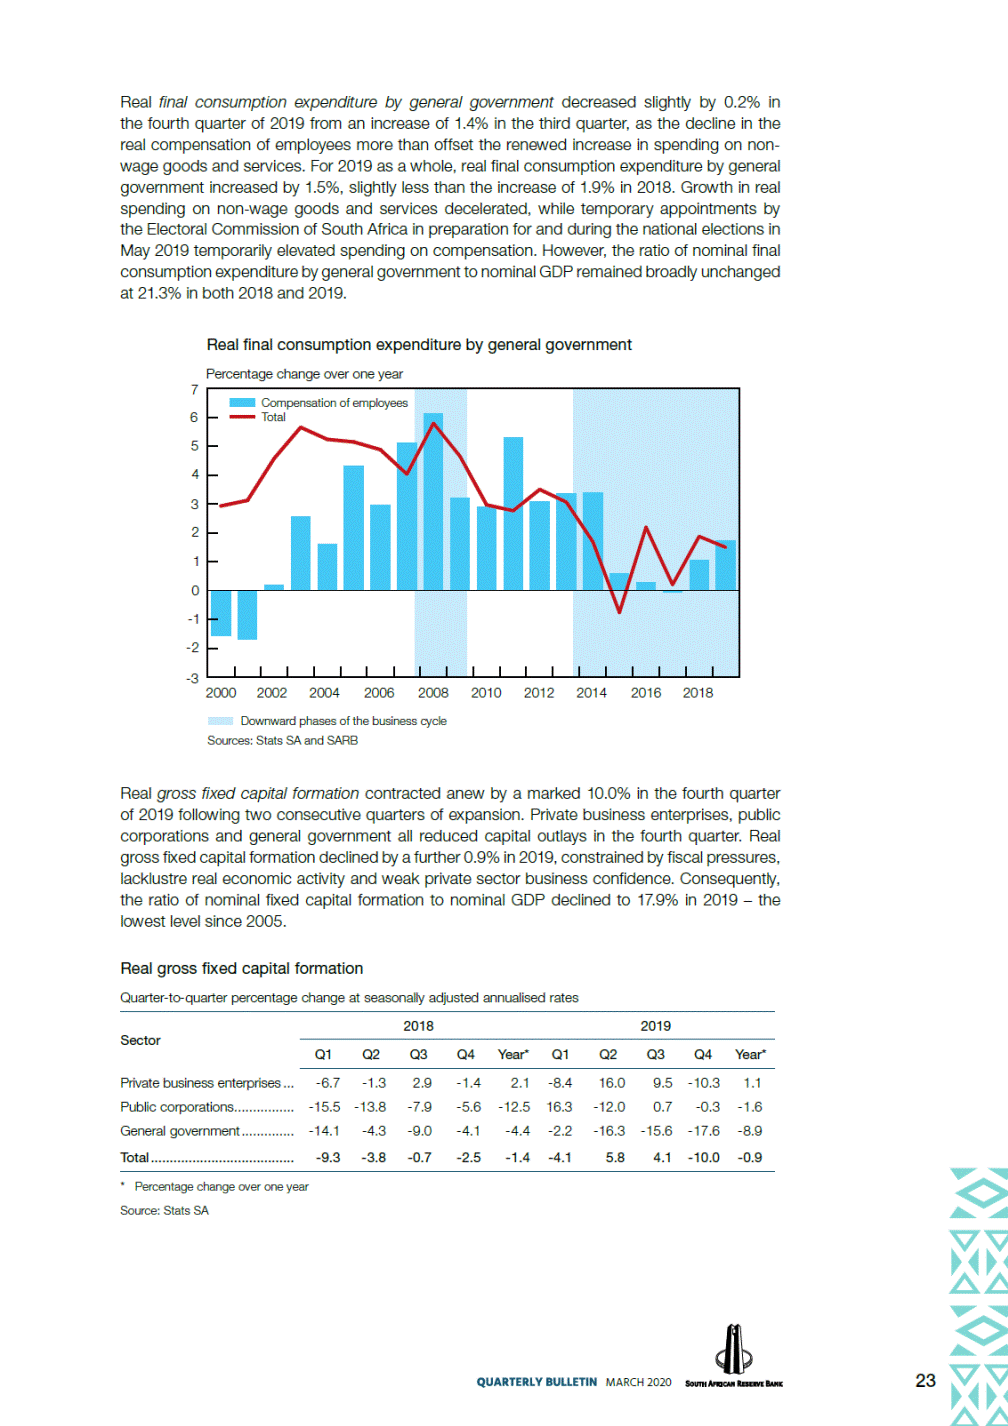
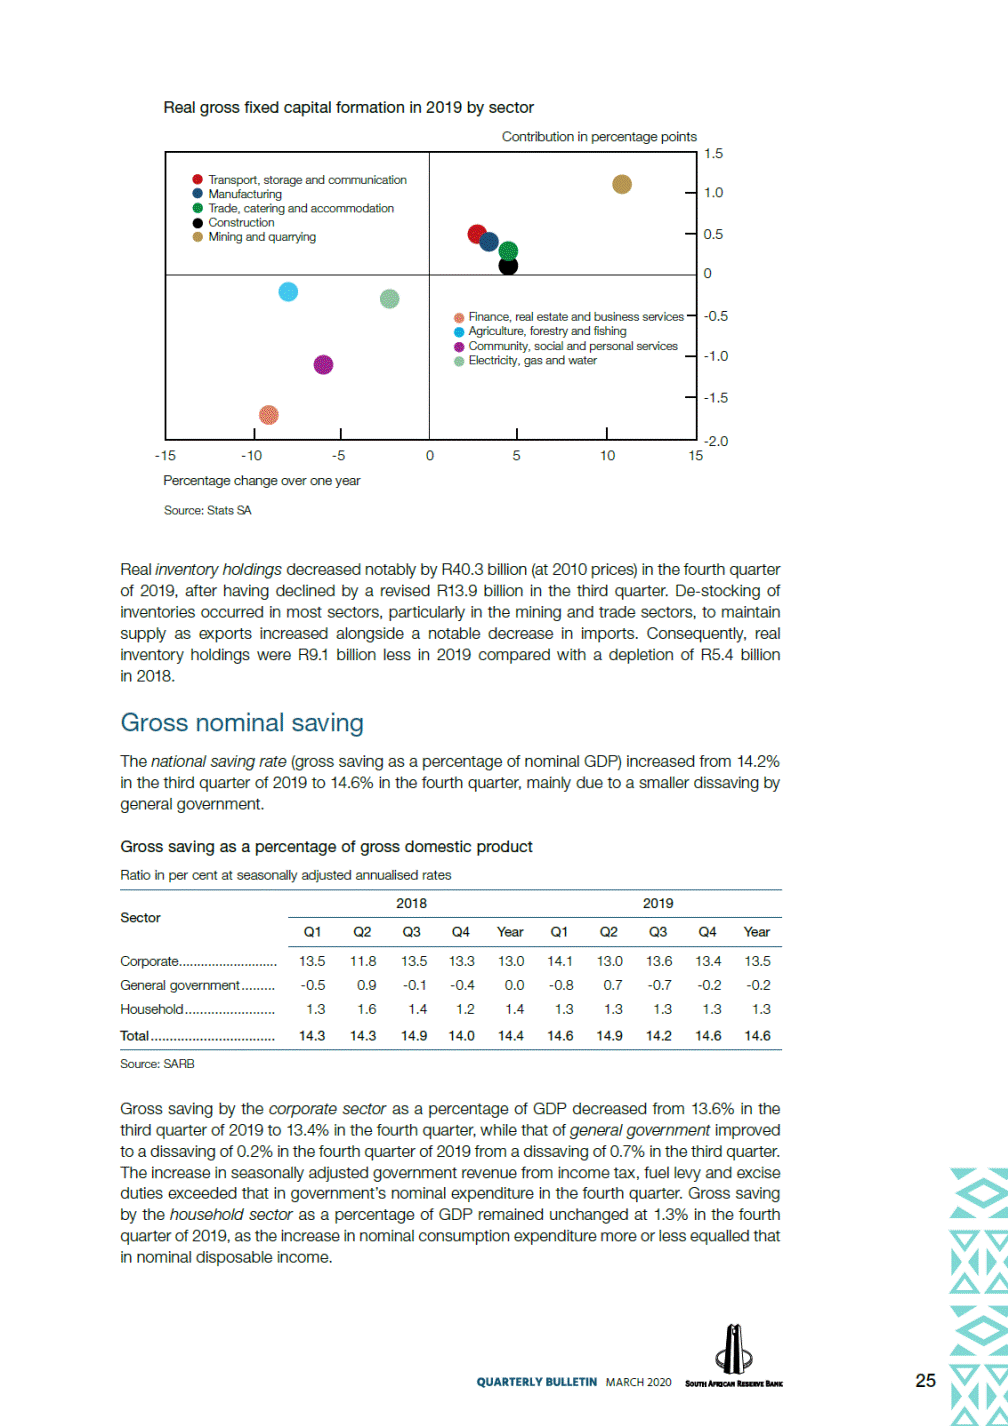
Real final consumption expenditure by general government decreased slightly by 0.2% in the fourth quarter of 2019 from an increase of 1.4% in the third quarter, as the decline in the real compensation of employees more than offset the renewed increase in spending on non-wage goods and services. For 2019 as a whole, real final consumption expenditure by general government increased by 1.5%, slightly less than the increase of 1.9% in 2018. Growth in real spending on non-wage goods and services decelerated, while temporary appointments by the Electoral Commission of South Africa in preparation for and during the national elections in May 2019 temporarily elevated spending on compensation. However, the ratio of nominal final consumption expenditure by general government to nominal GDP remained broadly unchanged at 21.3% in both 2018 and 2019. Real final consumption expenditure by general government Percentage change over one year 7 6 5 4 3 2 1 0 -1 -2 -3 2000 2002 2004 2006 2008 2010 2012 2014 2016 2018 Downward phases of the business cycle Sources: Stats SA and SARB Real gross fixed capital formation contracted anew by a marked 10.0% in the fourth quarter of 2019 following two consecutive quarters of expansion. Private business enterprises, public corporations and general government all reduced capital outlays in the fourth quarter. Real gross fixed capital formation declined by a further 0.9% in 2019, constrained by fiscal pressures, lacklustre real economic activity and weak private sector business confidence. Consequently, the ratio of nominal fixed capital formation to nominal GDP declined to 17.9% in 2019 – the lowest level since 2005. Real gross fixed capital formation Quarter-to-quarter percentage change at seasonally adjusted annualised rates 2018 2019 Sector Q1 Q2 Q3 Q4 Year* Q1 Q2 Q3 Q4 Year* Private business enterprises ... Public corporations................ General government .............. Total ...................................... -6.7 -15.5 -14.1 -9.3 -1.3 -13.8 -4.3 -3.8 2.9 -7.9 -9.0 -0.7 -1.4 -5.6 -4.1 -2.5 2.1 -12.5 -4.4 -1.4 -8.4 16.3 -2.2 -4.1 16.0 -12.0 -16.3 5.8 9.5 0.7 -15.6 4.1 -10.3 -0.3 -17.6 -10.0 1.1 -1.6 -8.9 -0.9 * Percentage change over one year Source: Stats SA 23 MARCH 2020 Compensation of employees Total
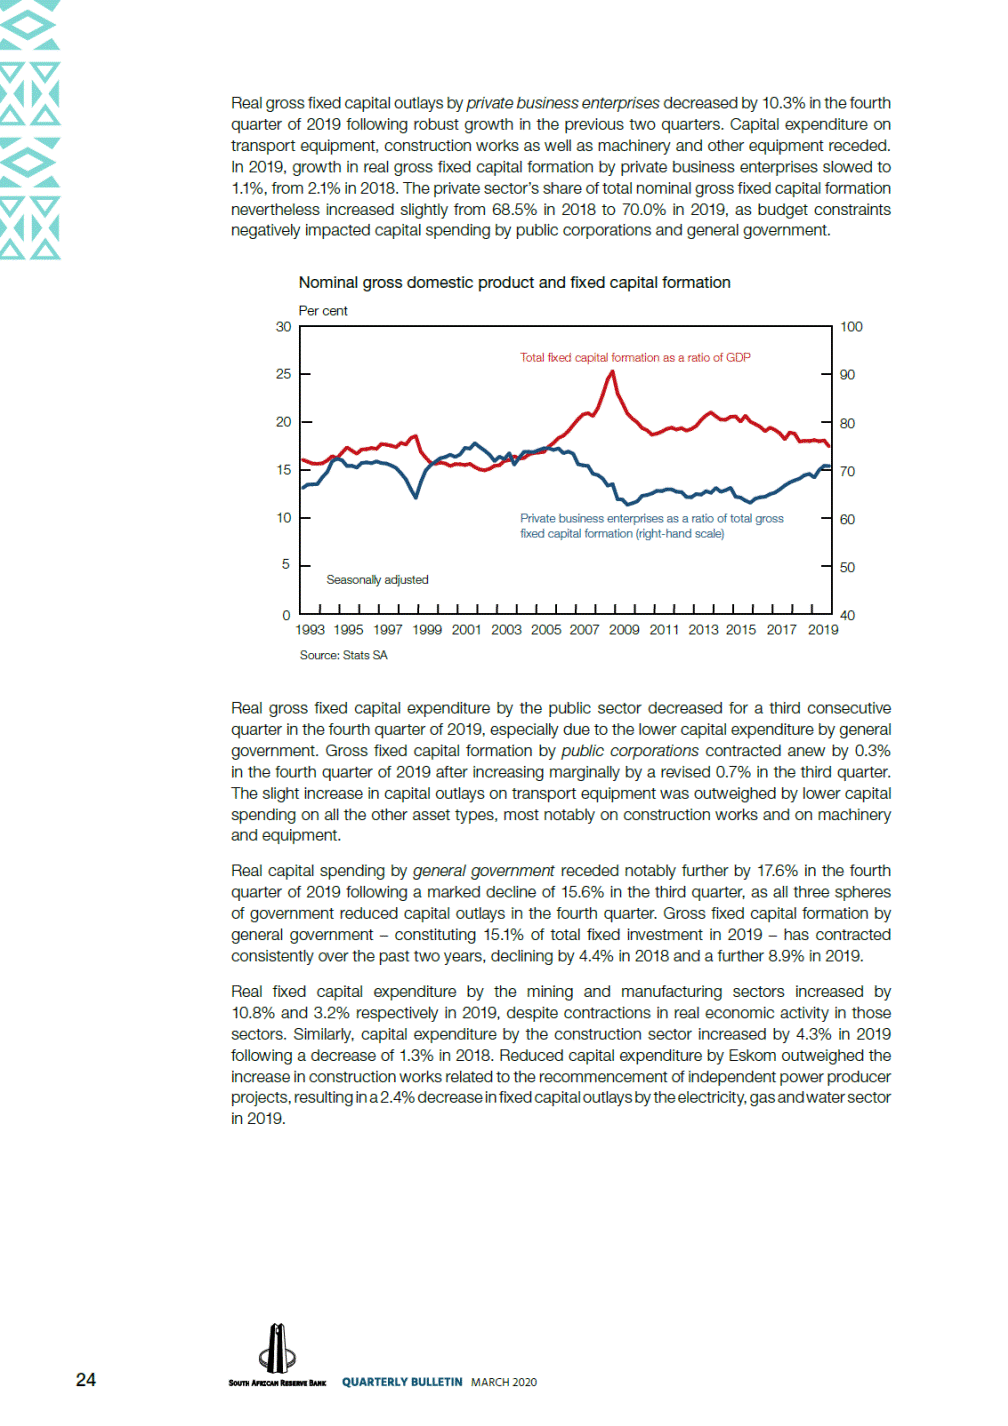
Real gross fixed capital outlays by private business enterprises decreased by 10.3% in the fourth quarter of 2019 following robust growth in the previous two quarters. Capital expenditure on transport equipment, construction works as well as machinery and other equipment receded. In 2019, growth in real gross fixed capital formation by private business enterprises slowed to 1.1%, from 2.1% in 2018. The private sector’s share of total nominal gross fixed capital formation nevertheless increased slightly from 68.5% in 2018 to 70.0% in 2019, as budget constraints negatively impacted capital spending by public corporations and general government. Nominal gross domestic product and fixed capital formation Per cent 30 100 25 90 20 80 15 70 10 60 5 50 0 40 1993 1995 1997 1999 2001 2003 2005 2007 2009 2011 2013 2015 2017 2019 Source: Stats SA Real gross fixed capital expenditure by the public sector decreased for a third consecutive quarter in the fourth quarter of 2019, especially due to the lower capital expenditure by general government. Gross fixed capital formation by public corporations contracted anew by 0.3% in the fourth quarter of 2019 after increasing marginally by a revised 0.7% in the third quarter. The slight increase in capital outlays on transport equipment was outweighed by lower capital spending on all the other asset types, most notably on construction works and on machinery and equipment. Real capital spending by general government receded notably further by 17.6% in the fourth quarter of 2019 following a marked decline of 15.6% in the third quarter, as all three spheres of government reduced capital outlays in the fourth quarter. Gross fixed capital formation by general government – constituting 15.1% of total fixed investment in 2019 – has contracted consistently over the past two years, declining by 4.4% in 2018 and a further 8.9% in 2019. Real fixed capital expenditure by the mining and manufacturing sectors increased by 10.8% and 3.2% respectively in 2019, despite contractions in real economic activity in those sectors. Similarly, capital expenditure by the construction sector increased by 4.3% in 2019 following a decrease of 1.3% in 2018. Reduced capital expenditure by Eskom outweighed the increase in construction works related to the recommencement of independent power producer projects, resulting in a 2.4% decrease in fixed capital outlays by the electricity, gas and water sector in 2019. 24 MARCH 2020 Total fixed capital formation as a ratio of GDP Private business enterprises as a ratio of total gross fixed capital formation (right-hand scale) Seasonally adjusted
Real gross fixed capital formation in 2019 by sector Contribution in percentage points 1.5 1.0 0.5 0 -0.5 -1.0 -1.5 -2.0 -15 -10 -5 0 5 10 15 Percentage change over one year Source: Stats SA Real inventory holdings decreased notably by R40.3 billion (at 2010 prices) in the fourth quarter of 2019, after having declined by a revised R13.9 billion in the third quarter. De-stocking of inventories occurred in most sectors, particularly in the mining and trade sectors, to maintain supply as exports increased alongside a notable decrease in imports. Consequently, real inventory holdings were R9.1 billion less in 2019 compared with a depletion of R5.4 billion in 2018. Gross nominal saving The national saving rate (gross saving as a percentage of nominal GDP) increased from 14.2% in the third quarter of 2019 to 14.6% in the fourth quarter, mainly due to a smaller dissaving by general government. Gross saving as a percentage of gross domestic product Ratio in per cent at seasonally adjusted annualised rates 2018 2019 Sector Q1 Q2 Q3 Q4 Year Q1 Q2 Q3 Q4 Year Corporate........................... General government ......... Household ........................ Total ................................. 13.5 -0.5 1.3 14.3 11.8 0.9 1.6 14.3 13.5 -0.1 1.4 14.9 13.3 -0.4 1.2 14.0 13.0 0.0 1.4 14.4 14.1 -0.8 1.3 14.6 13.0 0.7 1.3 14.9 13.6 -0.7 1.3 14.2 13.4 -0.2 1.3 14.6 13.5 -0.2 1.3 14.6 Source: SARB Gross saving by the corporate sector as a percentage of GDP decreased from 13.6% in the third quarter of 2019 to 13.4% in the fourth quarter, while that of general government improved to a dissaving of 0.2% in the fourth quarter of 2019 from a dissaving of 0.7% in the third quarter. The increase in seasonally adjusted government revenue from income tax, fuel levy and excise duties exceeded that in government’s nominal expenditure in the fourth quarter. Gross saving by the household sector as a percentage of GDP remained unchanged at 1.3% in the fourth quarter of 2019, as the increase in nominal consumption expenditure more or less equalled that in nominal disposable income. 25 MARCH 2020 Transport, storage and communication Manufacturing Trade, catering and accommodation Construction Mining and quarrying Finance, real estate and business services Agriculture, forestry and fishing Community, social and personal services Electricity, gas and water
received formation 26 MARCH 2020 Box 2The link between the deficit and surplus funding positions of domestic institutional sectors and the rest of the world South Africa’s economic activity for the period 2010 to 2019, as captured in the analytical construct of the System of National Accounts 2008 (2008 SNA),1 resulted in a consistent annual positive gross2 and net3 savings position. However, after accounting for gross capital formation,4,5 an overall net borrowing position6 resulted, which had to be funded from the rest of the world. The deficit on the current account of the balance of payments represents the gap between gross capital formation and gross saving for the domestic economy as a whole.7 South African economy Ratios to gross domestic product Gross saving Consumption of fixed capital Net saving Capital transfers Capital transfers paid Gross capital Net lending/ borrowing -400 -200 0 200 400 600 800 1 000 -10 -5 0 5 10 15 20 25 R billionsPer cent 2010 2011 2012 2013 2014 2015 2016 2017 2018 2019 Source: SARB For the domestic economy as a whole, at an institutional level,8 local government recorded negative gross savings over the 2010–19 period, and central and provincial government only in 2010. However, the net savings of central, provincial and local government were negative (dissaving) throughout the period under review. Households and non-financial public enterprises also mostly experienced a negative net savings position. 1 The compilation of South Africa’s national accounts adheres to the guidelines of the System of National Accounts 2008 (SNA 2008) as the international standard for the measurement of economic activity. See https://unstats.un.org/unsd/ nationalaccount/docs/SNA2008.pdf. 2 Gross saving is the balancing item of the current account and is carried forward to the capital account. See ‘Box 1: Methodology underlying the compilation of household saving and net lending/borrowing’ in the December 2019 edition of the Quarterly Bulletin for the national accounts framework to derive saving and net lending/borrowing. 3 The difference between gross and net saving is imputed consumption of fixed capital (depreciation). 4 Gross capital formation includes both gross fixed capital formation and the change in inventories. Gross fixed capital formation is the value of acquisitions less disposals of fixed assets (non-financial assets). 5 See pages S–82, S–135 and S–136 in the December 2019 edition of the Quarterly Bulletin for the statistics underlying this analysis. 6 Net lending/borrowing means that what is borrowed by one institutional unit is lent by another, and vice versa. In the context of this box, the net borrowing position of the South African economy as a whole, relative to the rest of the world, is reflected by the deficit on the current account of the balance of payments and the net capital transfer account which is financed through the financial account. 7 See Table KB627 on page S–130 of this edition of the Quarterly Bulletin for these statistics. 8 See pages S–131 to S–134 in this edition of the Quarterly Bulletin for the statistics underlying the institutional sector analysis. Current account balance Gross capital formation Gross saving
government institutions government 27 MARCH 2020 Gross savingNet saving Financial institutions Central and provincial government Local Non-financial public enterprises Private sector Households Total domestic -200 0 200 400 600 800 -100 -50 0 50 100 150 200 R billions 2010 2011 2012 2013 2014 2015 2016 2017 2018 2019 Source: SARB Gross capital formation in an environment of low gross saving and even dissaving by local government over the 2010–19 period, and central and provincial government in 2010, led to a consistent net borrowing position for central, provincial and local government as well as for non-financial public enterprises. Outside the public sector, households mostly recorded an uninterrupted net borrowing position, while the private sector (non-financial) recorded a net borrowing position only on occasion. Gross capital formation Net lending/borrowing Financial Central and provincial government Local Non-financial public enterprises Private sector Households Total domestic 0 200 400 600 800 1 000 -300 -200 -100 0 100 200 300 R billions 2010 2011 2012 2013 2014 2015 2016 2017 2018 2019 Source: SARB Foreign sector Financial institutions Central and provincial government Local government Non-financial public enterprises Private sector Households Total domestic Financial institutions Central and provincial government Local government Non-financial public enterprises Private sector Households Total domestic
The portion of total gross capital formation financed through foreign capital (the foreign financing ratio) decreased markedly from 20.6% in the third quarter of 2019 to 8.3% in the fourth quarter. Employment5 Weak economic activity continued to hamper the South African economy’s ability to create sufficient employment opportunities. Enterprise-surveyed6 formal non-agricultural employment decreased by 15 300 jobs (an annualised 0.6%) in the third quarter of 2019, lowering the level of employment to an estimated 10.17 million employees. The private sector largely contributed to these job losses against the backdrop of a muted business environment. Public sector employment remained broadly unchanged over this period as government attempted to contain expenditure amid a worsening fiscal position. However, when excluding the temporary election-related jobs created in the second quarter of 2019, formal non-agricultural employment increased at an annualised rate of 0.3% in the third quarter. 5Unless stated to the contrary, the QES data reported in this section are seasonally adjusted. 6This is according to Statistics South Africa’s QES survey. Private sector employment decreased further at an annualised rate of 0.8% in the third quarter of 2019, with around 44 000 jobs lost in six of the eight subsectors. Only the trade, catering and accommodation services and the non-gold mining sectors created jobs in the third quarter. The level of public sector employment remained unchanged in the third quarter of 2019, following a notable increase in the second quarter. However, public sector employment increased at an annualised rate of 4.3% when excluding the temporary election-related employment which boosted job growth in the second quarter. Employment decreased in almost all the tiers of the public sector in the third quarter, except for provincial departments which created around 25 900 jobs, largely due to the appointment of part-time feeding scheme and community health care workers, alongside internships and jobs related to the Expanded Public Works Programme. 28 MARCH 2020 The net lending/borrowing position shows the interrelationship between deficit institutional sectors in the domestic economy and the rest of the world. The foreign sector’s net lending to South Africa reflects both net capital transfers and the current account balance of the balance of payments. Rest of the world R billions 250 200 150 100 50 0 -50 -100 -150 -200 -250 2010201120122013201420152016201720182019 Current account balance Net capital transfers Net lending/borrowing Source: SARB
Formal non-agricultural employment Number (millions) 2.5 7.96 2.4 7.87 2.3 7.78 2.2 7.69 2.1 7.60 2014 2015 2016 2017 2018 2019 * Adjusted for election-related outliers Sources: Stats SA and SARB Mining sector employment increased further in the third quarter of 2019, albeit at a much slower pace than in the preceding quarter. Gold-mining employment continued its long-term decline, along with the persistent decrease in gold production over the past three years. However, non-gold mining employment continued its impressive gains, with a cumulative 31 000 jobs created since the fourth quarter of 2016 – the only industry among the goods-producing sectors that created additional jobs over this period. Manufacturing sector employment and output Percentage change over four quarters 4 10 GVA Employment (right-hand scale) 0 0 -4 -10 -8 -20 200920102011 201220132014 2015 2016201720182019 Sources: Stats SA and SARB Employment in the manufacturing sector decreased for a third successive quarter in the third quarter of 2019, in line with persistent weak output growth and depressed sentiment. Manufacturing business confidence7 remained way below its long-term average of 41 index points, despite increasing from a near record-low of 16 index points in the third quarter of 2019 to 24 index points in the fourth quarter. Despite the improvement, overall business conditions remained tough, with little improvement expected going forward. Manufacturers’ rating of insufficient demand as a constraint to business conditions rose to its highest level in more than 7As measured by the Bureau for Economic Research’s Absa Manufacturing Survey. 29 MARCH 2020 Real Public sector Public sector* Private sector (right-hand scale) Seasonally adjusted
10 years. Both domestic and export demand were under pressure in the fourth quarter, as were turnover and profitability. The survey results also suggest that the sector is still experiencing a significant slack in capacity which, in turn, is suppressing new capital investment. Furthermore, a strong and sustained recovery in manufacturing business confidence is not expected, as the global economy still faces significant headwinds alongside a fairly muted domestic outlook. Construction sector employment and business confidence Number (thousands) Per cent 740 75 700 50 660 25 620 0 580 2010 2011 2012 2013 2014 20152016 2017 2018 2019 * Average of the FNB/BER civil and building confidence indices Sources: BER, Stats SA and SARB Construction sector employment decreased at a faster pace in the third quarter of 2019, with a further loss of around 13 600 jobs. The ongoing retrenchments reflected the increasingly unfavourable operating environment in this sector over the past two years. The First National Bank/Bureau for Economic Research (FNB/BER) Civil Confidence Index shows that overall conditions in the construction industry remained challenging, with close to 80% of respondents indicating their dissatisfaction with current business conditions. The increase of 7 index points to 22 index points in the fourth quarter of 2019 was a welcome improvement, after remaining below 20 index points since the third quarter of 2017. However, the percentage of respondents rating the lack of new construction work as a constraint remained high at 90% for two consecutive quarters, which does not bode well for future activity. The FNB/BER Building Confidence Index also rose slightly by 3 index points to a still-low 25 index points in the fourth quarter of 2019, but remained weighed down by a sharp decline in confidence among building material manufacturers. Respondents indicated improved building activity in the residential sector but unchanged activity in the non-residential sector. The Bureau for Economic Research (BER) noted that the constraint of insufficient demand for new work remained extremely high in both subsectors, which suggests that growth in building activity may be limited in the short term. The finance, insurance, real estate and business services sector shed some jobs in the third quarter of 2019, after having created a cumulative 62 800 employment opportunities over the previous five quarters. By contrast, the trade, catering and accommodation services sector gained 25 700 jobs in the third quarter, which more than compensated for the losses in the previous quarter. Moreover, the BER’s Retail Survey reported an increase in retailer business confidence from a multi-decade low of 17 index points in the third quarter of 2019 to 30 index points in the fourth quarter. This improvement was supported solely by a recovery in sales volumes which were boosted by strong Black Friday sales, while the lack of pricing power and persistent upward pressure on input costs continued to weigh on profitability and general business conditions. With consumer incomes still under significant pressure, a meaningful and sustained acceleration in consumer spending over the coming quarters is unlikely. 30 MARCH 2020 Employment Business confidence* (right-hand scale)
Household-surveyed labour market statistics Thousands 2018 2019 Dec Mar Jun Sep Dec a. Total employment ......................................... b. Total unemployment (official definition) .......... c. Total economically active (= a + b)................ d. Total not economically active ........................ e. Total aged 15-64 years (= c + d) ................. f. Official unemployment rate (= b*100/c)......... 16 529 6 139 22 668 15 466 38 134 27.1% 16 291 6 201 22 492 15 791 38 283 27.6% 16 313 6 655 22 968 15 465 38 433 29.0% 16 375 6 734 23 109 15 474 38 582 29.1% 16 420 6 726 23 146 15 581 38 727 29.1% Source: Stats SA Total household-surveyed employment increased by 45 000 jobs from the third to the fourth quarter of 2019, while the decrease of 108 000 jobs (or 0.7%) over the four quarters to the fourth quarter of 2019 lowered the level of total employment to approximately 16.42 million employees. Annual job losses occurred in the informal sector (83 000), private households (46 000) and in the formal non-agricultural sector (15 000), while the agricultural sector recorded job gains (36 000). In the year to the fourth quarter of 2019, employment gains in community and social services (168 000) and transport (46 000) were outweighed by job losses in construction (131 000), trade (71 000), manufacturing (46 000), finance (43 000), electricity (14 000) and mining (8 000). The bulk of these job losses took place in the category for workers with limited duration contracts, totalling 115 000. Another 9 000 employees with permanent contracts also lost their jobs, while only 1 000 unspecified duration jobs were gained. Unemployment rate Per cent 30 29 28 27 26 25 24 2014 2015 2016 2017 2018 2019 Sources: Stats SA and SARB The number of unemployed South Africans decreased by a mere 8 000 in the fourth quarter of 2019 but increased notably by 587 000 (or 9.6%) from a year earlier. Contrary to the usual sharp seasonal decrease in unemployment in the fourth quarter of each year, the number of unemployed people remained fairly elevated in the fourth quarter of 2019 as a significant number of new entrants (119 000) entered the labour market in search of employment. The marked year-on-year increase in unemployment was driven largely by a notable increase in long-term unemployment as well as the number of job losers and, to a lesser extent, new entrants. The official unemployment rate remained unchanged at a record-high of 29.1% in the fourth quarter, which was significantly higher than the 27.1% recorded a year earlier. 31 MARCH 2020 Official Seasonally adjusted
The seasonally adjusted unemployment rate increased from 29.0% to an all-time high of 29.6% in the fourth quarter of 2019. The number of discouraged work seekers increased by 62 000 in the fourth quarter to 2.86 million, and by 14 000 when measured over four quarters. Discouragingly, the youth unemployment rate (for people aged 15 to 24 years) decreased only marginally from 58.2% in the third quarter of 2019 to 58.1% in the fourth quarter, which was significantly higher than the 54.7% recorded a year earlier. Labour cost and productivity The pace of increase in nominal remuneration per worker in the formal non-agricultural sector moderated notably from a year-on-year rate of 5.6% in the second quarter of 2019 to an all-time low of 3.0% in the third quarter, as both public and private sector remuneration growth per worker slowed. Growth in nominal remuneration per public sector worker moderated from 10.5% in the second quarter of 2019 to a low of 1.7% in the third quarter, and from 9.4% to 1.7% over the same period when excluding temporary election-related employment. The low growth rate in the third quarter reflected the high base created a year earlier, following the implementation of the delayed annual public sector wage increase. Nominal wage growth per worker slowed at provincial and national departmental levels as well as in other public sector enterprises. Conversely, wage growth quickened at local government level and in the government transport, storage and communication sector. Formal non-agricultural nominal remuneration per worker Percentage change over four quarters 12 9 6 3 0 2014 2016 2017 2018 2019 2015 * Adjusted for election-related outliers Sources: Stats SA and SARB Likewise, private sector remuneration growth per worker moderated from 4.1% in the second quarter of 2019 to 3.3% in the third quarter. Remuneration growth per worker slowed in most of the private subsectors in the third quarter, with the exception of gold mining; manufacturing; and private community, social and personal services. According to Andrew Levy Employment Publications, the average wage settlement rate in collective bargaining agreements decreased further to a 12-year low of 6.7% in 2019 compared with an average of 7.2% in 2018. In addition, the number of working days lost due to strike action decreased from 1.95 million in 2018 to 1.20 million in 2019. 32 MARCH 2020 Public* Total* Private
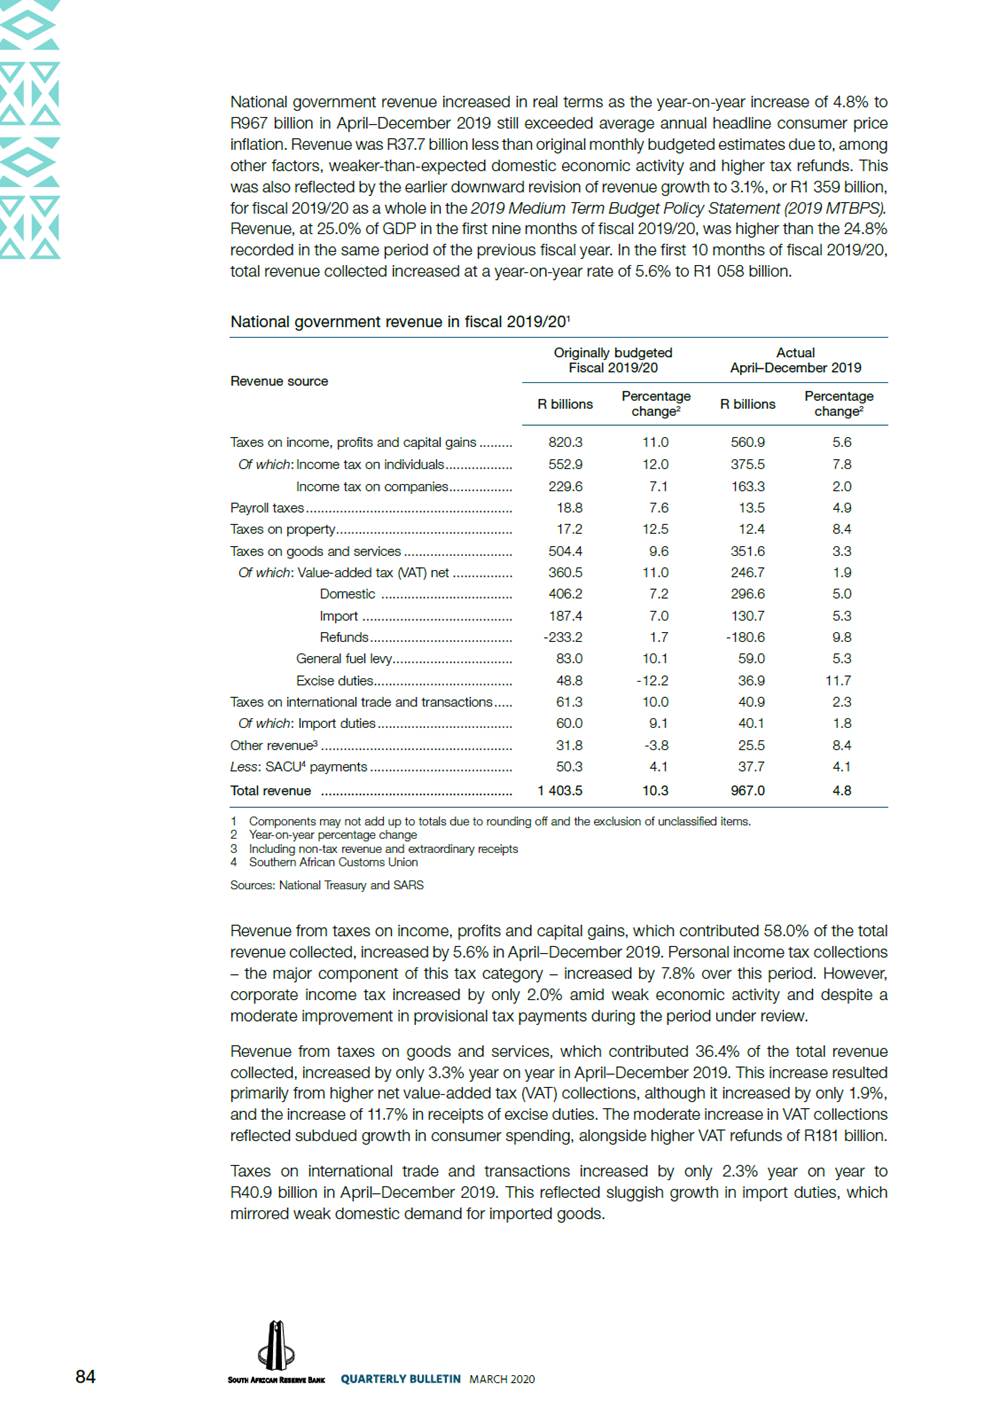
Labour productivity in the formal non-agricultural sector of the economy (adjusted for election-related outliers) decreased by 0.4% in the year to the third quarter of 2019, after having increased by a moderate 0.2% in the year to the second quarter. After contracting by 0.1% year on year in the second quarter of 2019, unadjusted labour productivity contracted further by 0.4% in the year to the third quarter, as output growth moderated at a faster pace than employment growth. Labour productivity and nominal unit labour cost Percentage change over four quarters 15 Economy-wide unit labour cost Henderson moving average Labour productivity* (adjusted for election-related outliers) 12 9 6 3 0 -3 2014 2015 2016 2017 2018 2019 * Formal non-agricultural sector Sources: Stats SA and SARB Growth in nominal unit labour cost in the formal non-agricultural sector decelerated from 5.7% in the second quarter of 2019 to a low of 3.4% in the third quarter – reflective of the notable slowdown in public sector remuneration growth – as year-on-year growth in total remuneration moderated at a faster pace than output growth. Conversely, economy-wide unit labour cost growth quickened further from 3.8% in the third quarter of 2019 to 4.6% in the fourth quarter, as growth in the compensation of employees accelerated marginally while output contracted. Prices8 Both producer and consumer price inflation moderated significantly throughout 2019 to annual averages below that of the preceding two years. Producer price inflation for final manufactured goods slowed, on balance, from a high of 6.5% in April 2019 to 3.4% in December, lowering the annual average to 4.6%. Headline consumer price inflation decelerated from 4.5% in March 2019 to 4.0% in December and, at an annual average of 4.1%, was below the midpoint of the inflation target range of 4.5% for the first time since 2010. 8Unless stated to the contrary, all rates mentioned in this section reflect year-on-year changes. 33 MARCH 2020 Unit labour cost* Henderson moving average
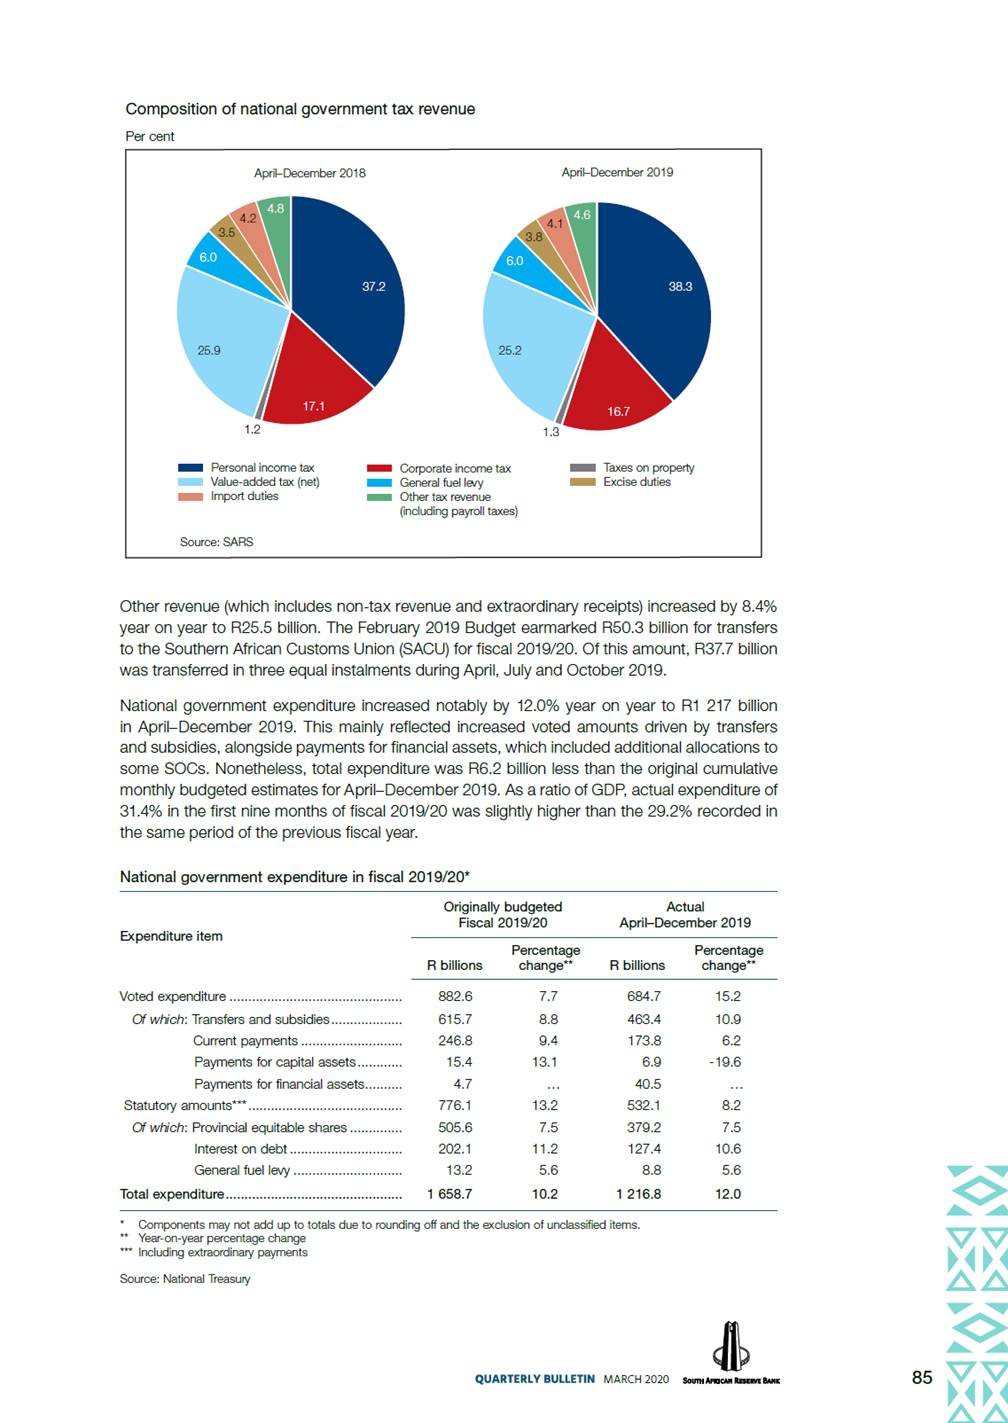
Producer and consumer price inflation Percentage change over 12 months 9 8 7 6 5 4 3 2 2016 2017 2018 2019 2020 Midpoint of the inflation target range (4.5%) Source: Stats SA The moderation in both measures of domestic price inflation throughout 2019 was mostly driven by the marked deceleration in fuel price inflation from a high of 12.0% in April 2019 to -6.6% in November and, to a lesser extent, persistent muted food price inflation throughout the year. Most measures of underlying inflation also slowed further in 2019. Domestic fuel price inflation accelerated notably in January 2020, largely due to base effects, lifting headline consumer price inflation to 4.5%. Consumer food and fuel price inflation Percentage change over 12 months 15 30 12 20 9 10 6 0 3 -10 0 2018 2019 2020 2017 Midpoint of the inflation target range (4.5%) Source: Stats SA Of the other producer price inflation measures, two moderated and two accelerated. Producer price inflation for intermediate manufactured goods slowed from an annual average of 3.5% in 2018 to 2.7% in 2019, mainly due to the slowdown in price inflation for chemical, rubber and plastic products. Producer price inflation for agriculture, forestry and fishing products also decelerated significantly from an annual average of 1.5% in 2018 to -1.8% in 2019, led mainly by the deflation in agricultural product prices throughout the year. 34 MARCH 2020 Food Fuel (right-hand scale) Final manufactured producer price index Headline consumer price index
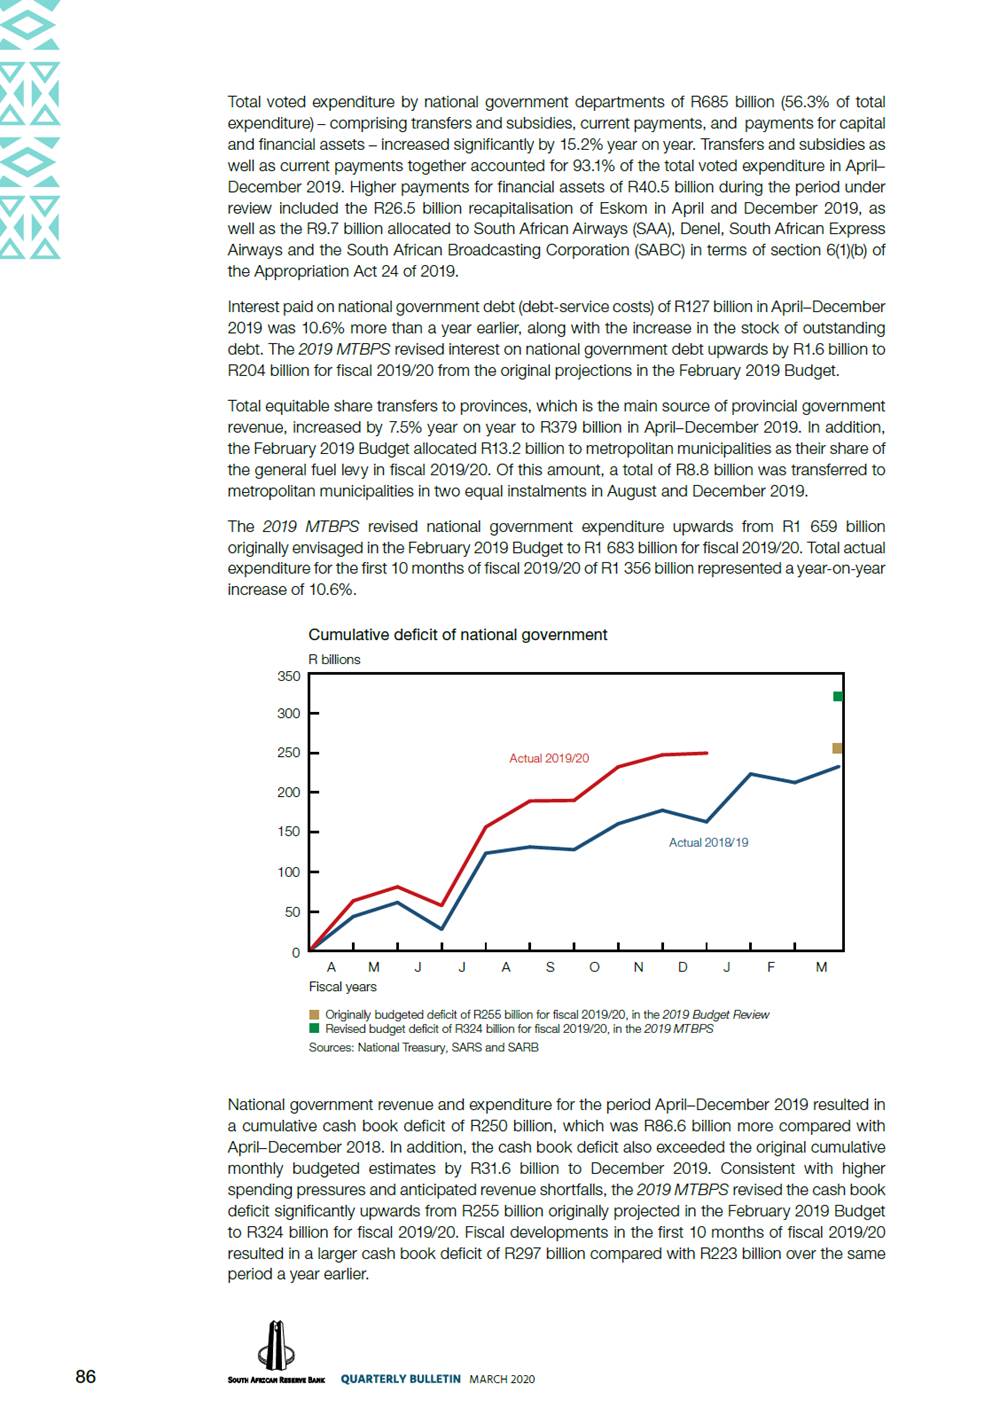
Producer price inflation Annual average percentage change 2017 2018 2019 Jan 2020* Final manufactured goods .................................................... Intermediate manufactured goods ........................................ Electricity and water ............................................................. Mining .................................................................................. Agriculture, forestry and fishing............................................. 4.9 4.0 6.0 5.5 0.5 5.4 3.5 5.3 2.9 1.5 4.6 2.7 11.2 17.3 -1.8 4.6 0.7 13.0 32.2 -0.9 * Changes in prices from January 2019 to January 2020 Source: Stats SA Producer price inflation for electricity and water more than doubled to an annual average of 11.2% in 2019. Electricity price inflation quickened significantly following higher tariff increases awarded to Eskom, while water price inflation remained elevated. Producer price inflation for mining products also accelerated markedly from an annual average of 2.9% in 2018 to 17.3% in 2019 as the prices of gold and non-ferrous metal ores surged. Heightened global demand for gold as a safe-haven asset boosted the US dollar price of gold, while the depreciation in the exchange value of the rand from 2018 to 2019 further elevated the rand prices of minerals. Producer price inflation for mining products then accelerated further to 32.2% in January 2020 – the highest rate of increase since the inception of this measure in January 2008. Consumer goods price inflation moderated for a third consecutive year to an annual average of 3.6% in 2019. The moderation was primarily the result of lower non-durable goods price inflation which was assisted by the marked slowdown in fuel price inflation, while food price inflation remained subdued. This, notwithstanding the marginal acceleration in both durable and semi-durable goods price inflation throughout 2019, reflected limited exchange rate pass-through in an environment of both weak domestic demand and economic growth. The acceleration in fuel price inflation elevated consumer goods price inflation to 4.9% in January 2020. Consumer price inflation Annual average percentage change Weight 2017 2018 2019 Jan 2020* Headline CPI ....................................................... 100.00 5.3 4.7 4.1 4.5 Headline CPI excluding food and non-alcoholic beverages, fuel and electricity.............................. Goods ........................................................... Non-durable ............................................. Semi-durable ............................................ Durable..................................................... Services ......................................................... 74.43 48.70 7.81 5.68 35.21 51.30 4.8 5.1 6.1 3.1 2.6 5.5 4.3 4.2 5.4 1.2 1.3 5.1 4.1 3.6 4.2 1.8 2.2 4.6 3.7 4.9 6.1 1.8 2.3 4.0 * Changes in prices from January 2019 to January 2020 Source: Stats SA Consumer services price inflation moderated to a 12-year low of 4.6% in 2019 as housing and utility services price inflation, in particular, decelerated from 4.9% in 2018 to 4.1% in 2019. This measure accounts for almost 40% of the consumer services basket and includes both rental and water prices as well as municipal assessment rates. The slowdown in 2019 was broad-based, with price inflation moderating in all but one of the nine services subcategories, namely transport services. Restaurant and hotel services price inflation decelerated further to 3.3% in 2019 – its lowest annual average rate of increase since the inception of this price index in 2008. 35 MARCH 2020
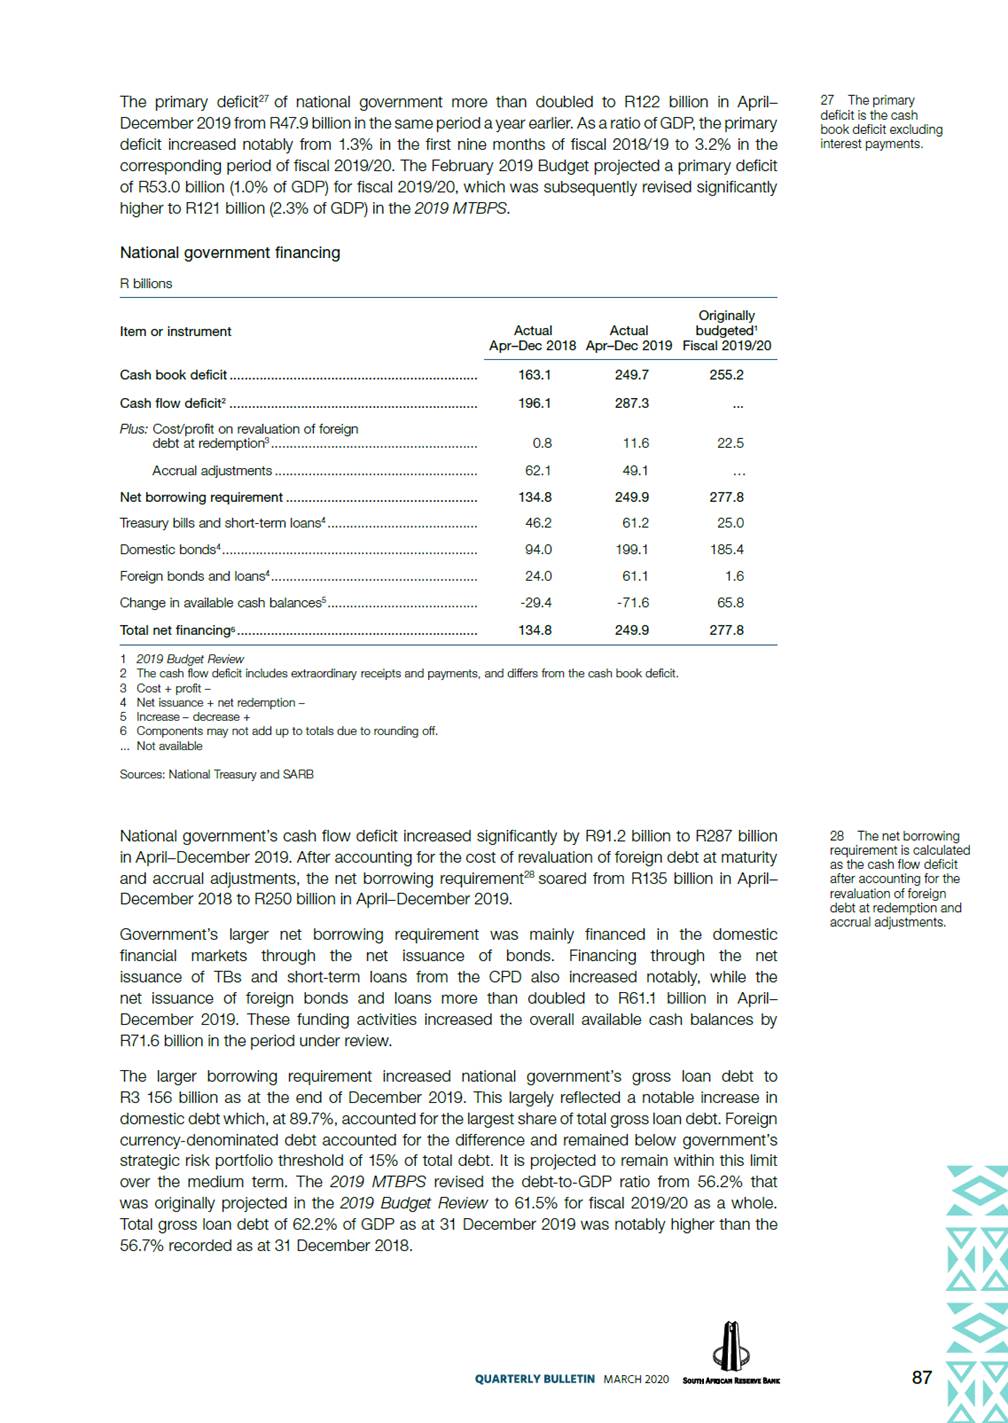
Consumer services price inflation slowed further to 4.0% in January 2020 – its lowest rate of increase since the adoption of the classification of individual consumption by purpose (COICOP) by Statistics South Africa (Stats SA) in January 2008. Consumer price inflation Percentage change over 12 months 9 8 7 6 5 4 3 2 1 2016 2017 2018 2019 2020 Midpoint of the inflation target range (4.5%) Source: Stats SA Domestic consumer food price inflation receded in 2019, despite the divergence between food price measures at the producer level. Final manufactured food price inflation accelerated from 0.2% in 2018 to 4.5% in 2019, while agricultural food price inflation decelerated from 0.6% to -3.6% over the same period, mainly due to the decrease in the prices of live animals and animal products. Agricultural live animal price inflation, which is a leading indicator of consumer meat price inflation, slowed markedly in 2019. Conversely, consumer bread and cereals price inflation accelerated gradually to an annual average of 7.0% in 2019, following the notable increase of 18.0% in the prices of cereals and other field crops at the agricultural level in 2019. This increase resulted from higher domestic maize prices following expectations of a lower domestic maize crop in 2019. Nevertheless, annual average consumer food price inflation moderated to 3.1% in 2019 – its lowest rate since 2010 – as meat price inflation, in particular, decelerated significantly from 6.9% in 2018 to only 0.3% in 2019. Consumer food price inflation remained fairly muted at 3.7% in January 2020. The most recent estimate suggests that the 2020 maize crop could be the second largest on record, which should assist in containing domestic food price inflation, in particular bread and cereals as well as meat price inflation. Food price inflation Annual average percentage change 2017 2018 2019 Jan 2020* Agricultural producer food prices......................................... Manufactured producer food prices..................................... Consumer food prices ......................................................... FAO international food prices (rand-denominated) ............... -0.8 4.3 7.0 -1.8 0.6 0.2 3.3 -4.2 -3.6 4.5 3.1 11.5 -2.9 4.3 3.7 15.6 * Changes in prices from January 2019 to January 2020 Sources: FAO and Stats SA 36 MARCH 2020 Total Services Goods
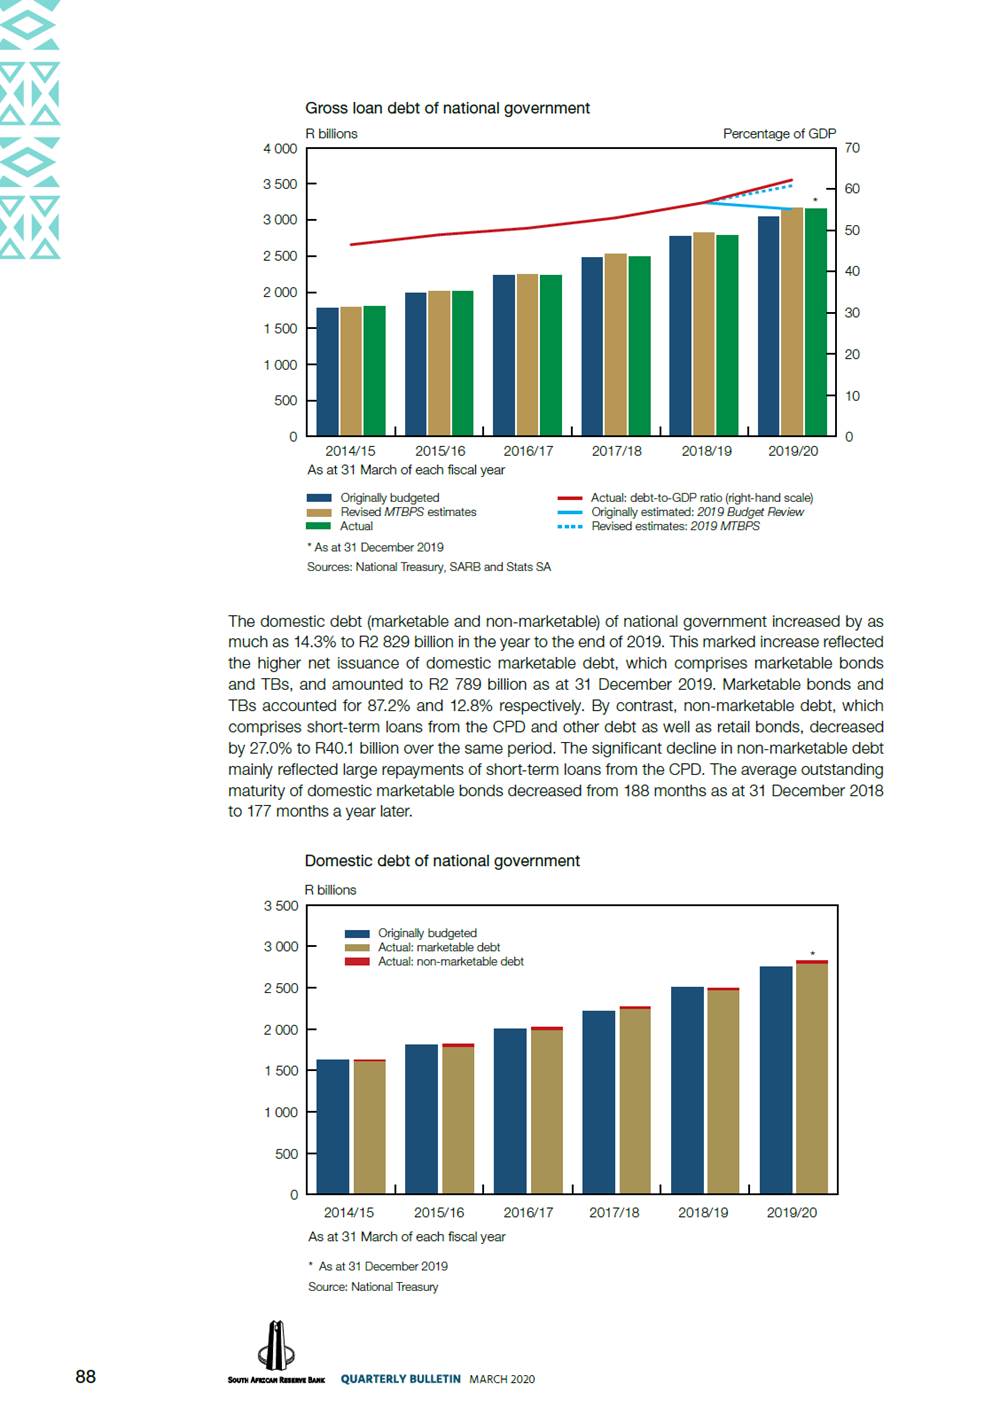
Producer and consumer food price inflation Percentage change over 12 months 18 30 Final manufactured 15 25 Agricultural (right-hand scale) 12 20 9 15 6 10 3 5 0 0 -5 -3 -10 -6 2016 Source: Stats SA 2017 2018 2019 2020 The moderation in domestic consumer food price inflation in 2019 materialised in spite of the marked acceleration in rand-denominated international food prices, as measured by the Food and Agriculture Organization (FAO) of the United Nations, which reverted from -4.2% in 2018 to 11.5% in 2019. The depreciation in the exchange value of the rand over the period exacerbated the acceleration relative to the muted increase of only 1.8% in the US dollar-denominated international food price index. In the first two months of 2020, international food price inflation receded somewhat in US dollar terms, but remained elevated in rand terms due to the depreciation in the exchange value of the rand. Underlying inflationary pressures receded further in 2019 in an environment of weak domestic consumer demand. When subtracting the impact of food, non-alcoholic beverages and fuel prices from headline consumer price inflation, the resultant measure of underlying inflation amounted to 4.4% in 2019. The South African Reserve Bank’s (SARB) preferred measure of core inflation (also excluding electricity prices) remained below the midpoint of the inflation target range throughout 2019, and amounted to an annual average of 4.1% for the year – the lowest rate since 2011. Core inflation receded further to 3.7% in January 2020. Headline and underlying measures of consumer price inflation Percentage change over 12 months 8 7 6 5 4 3 Consumer price index excluding food* and fuel 2 1 2016 2017 2018 2019 2020 * Food includes non-alcoholic beverages Midpoint of the inflation target range (4.5%) Source: Stats SA 37 MARCH 2020 Consumer price index Consumer price index excluding food*, fuel and electricity Consumer
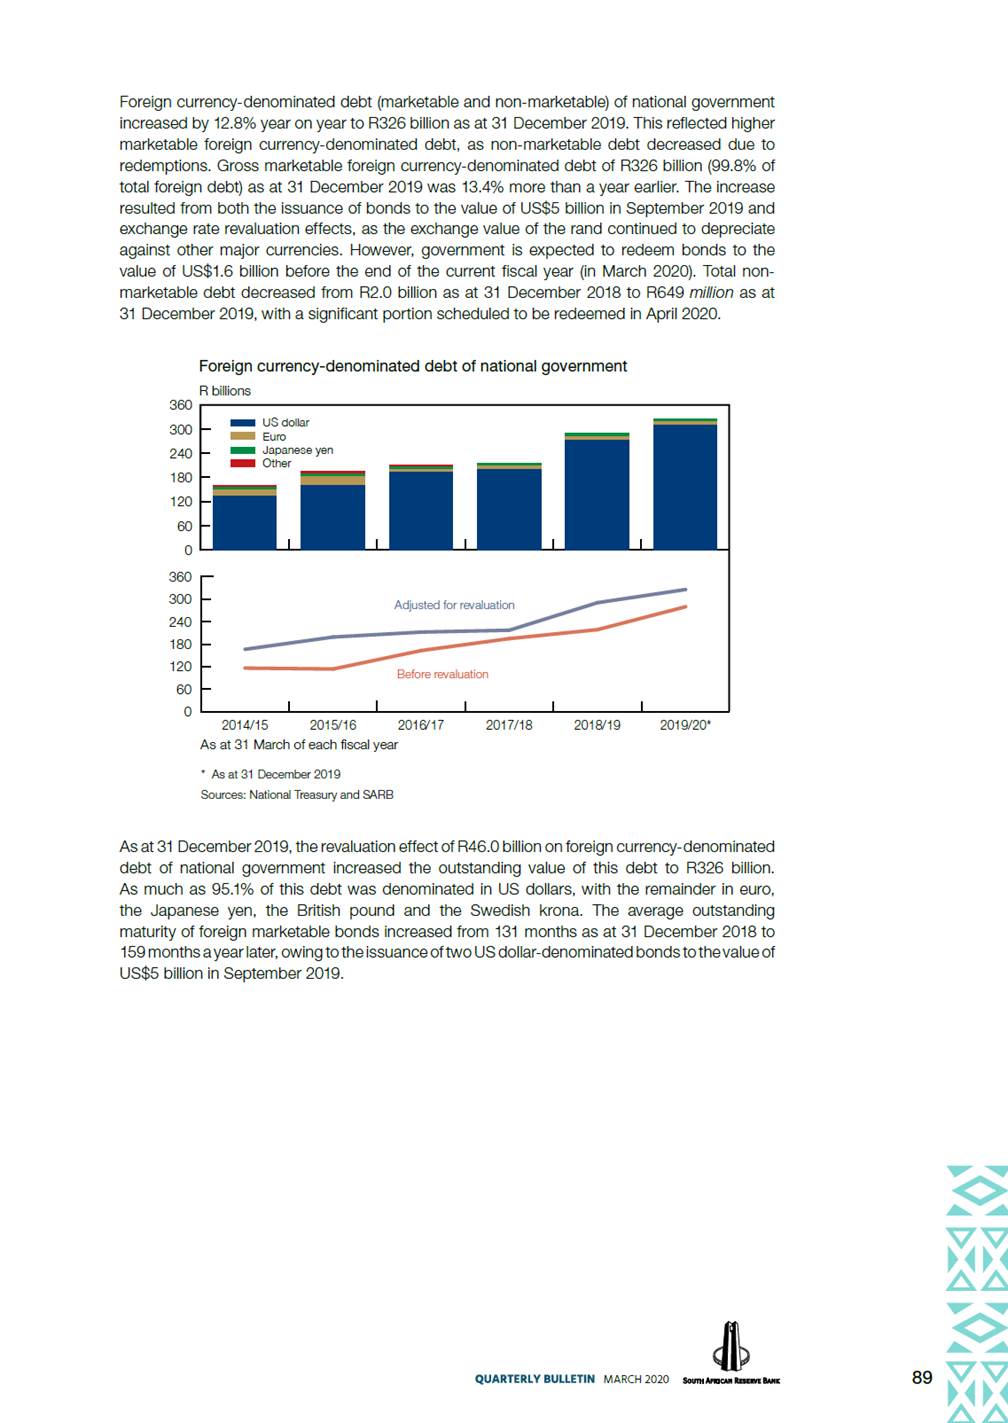
Price changes according to the COICOP categories do not fully reflect the moderation in inflationary pressures from 2018 to 2019. In 2019, annual average consumer price inflation moderated in only seven of the twelve COICOP categories, accelerated in four and remained unchanged in one. However, annual consumer price inflation in only one of the COICOP categories exceeded the upper limit of the inflation target range of 6% in 2019 compared with two in 2018. Annual average price inflation in seven categories was below the midpoint of the inflation target range of 4.5% in 2019 compared with six in the previous year. The housing and utilities category was once again the main contributor to annual consumer price inflation in 2019, followed by the miscellaneous goods and services category. The contribution by the transport category decreased the most, moving from the second highest contributor in 2018 to the fourth highest contributor in 2019, as the decline in international crude oil prices led to a sharp decrease in domestic fuel prices. Inflation in the transport category also decelerated the most of all the 12 COICOP categories, from an annual average of 6.9% in 2018 to 3.7% in 2019. Contributions to annual average headline consumer price inflation by COICOP category Housing and utilities Miscellaneous goods and services Food and non-alcoholic beverages Transport Alcoholic beverages and tobacco Education Household content and services Restaurants and hotels Clothing and footwear Health 2019 Recreation and culture Communication 10 0 Per cent 5 15 20 25 30 Source: Stats SA Administered price inflation decelerated throughout 2019, mirroring the marked moderation in fuel price inflation from an annual average of 14.5% in 2018 to 2.5% in 2019. However, when excluding fuel prices, administered price inflation accelerated in 2019 due to a marked increase in electricity price inflation and, to a lesser extent, a slight acceleration in municipal assessment rates. When also excluding electricity prices, administered price inflation moderated marginally but, in general, has remained at around 6.5% over the past two years. More recently, administered price inflation accelerated from 3.0% in November 2019 to 9.2% in January 2020, following higher fuel prices. 38 MARCH 2020 2018

Administered price index Percentage change over 12 months 15 Total excluding fuel and electricity 12 9 6 3 0 2016 2017 2018 2019 2020 Midpoint of the inflation target range (4.5%) Source: Stats SA Average annual headline inflation expectations, as measured by the survey conducted by the BER in the fourth quarter of 2019, declined further for all three forecast periods. Financial analysts, business as well as trade union representatives expected headline inflation of 4.5%, on average, in 2019 (0.1 percentage points lower than previously expected), 4.8% in 2020 (0.2 percentage points lower than previously expected) and 5.0% in 2021 (0.1 percentage points lower than previously expected). Average inflation expectations for 2019 have fallen by 1.5 percentage points over the past three years – from 6.0% when first surveyed in the first quarter of 2017 to 4.5% in the most recent survey. Similarly, inflation expectations for 2020 have declined from 5.4% to 4.8% over the past two years. Since respondents were surveyed for the first time one year ago on their 2021 inflation outlook, their expectations have receded from 5.3% to 5.0%. In the fourth quarter of 2019, all three respondent groups lowered their 2020 expectations. Financial analysts and business representatives also revised their 2021 forecasts downwards. Although they reduced their forecasts by 0.2 percentage points across all forecast periods, business representatives’ expectations remained higher than those of financial analysts and trade union representatives. Headline consumer price inflation expectations Per cent, as surveyed in the fourth quarter of 2019 Financial analysts Business representatives Trade union representatives All surveyed participants Average inflation expected for: 2019.......................................................... 2020.......................................................... 2021.......................................................... The next five years .................................... 4.2 4.7 4.7 4.7 4.8 5.1 5.3 5.3 4.6 4.7 4.9 4.8 4.5 4.8 5.0 4.9 Source: BER Average annual five-year inflation expectations declined by a further 0.1 percentage points to 4.9% in the fourth quarter of 2019. All three respondent groups trimmed their long-term projections by this magnitude from the previous survey. 39 MARCH 2020 Total Total excluding fuel
Household inflation expectations declined to between 5.0% and 5.5% for most of the period from 2018, after fluctuating between 6.0% and 7.0% for the period between 2011 and 2017. In the fourth quarter of 2019, household inflation expectations amounted to 5.4%, up from the 5.1% and 5.2% recorded in the second and third quarter respectively, but still noticeably lower than the high of 6.0% recorded in the first quarter of the year. Inflation expectations and headline consumer price inflation Percentage points 8 7 6 5 4 3 2 2016 2017 2018 2019 2020 Midpoint of the inflation target range (4.5%) Sources: BER and Stats SA 40 MARCH 2020 Two years ahead Five years ahead One year ahead Current year Headline consumer price inflation
External economic accounts Current account9 South Africa’s trade surplus more than doubled from R44.0 billion in the third quarter of 2019 to R102 billion in the fourth quarter, and as a percentage of GDP widened to 2.0% – the largest quarterly trade surplus since the second quarter of 2011. The larger trade surplus reflected a contraction in merchandise imports and an increase in merchandise and net gold exports. The decline in the value of merchandise imports reflected lower volumes, in particular that of manufactured products. An increase in the value of mining exports (including gold) also contributed to the larger trade surplus, with a share of total goods exports of 52% for 2019 as a whole. Over the past 10 years, the contribution of mining exports has varied from a high of 59% in 2011 and a low of 49% in 2016. 9Unless stated to the contrary, the current account transaction flows referred to in this section are all seasonally adjusted and annualised. Contributions to the total value of exported goods Per cent 60 58 56 54 52 50 48 46 44 42 40 2010 2011 2012 2013 2014 2015 2016 2017 2018 2019 Seasonally adjusted and annualised Sources: Stats SA and SARB Current account of the balance of payments R billions, seasonally adjusted and annualised 2018 2019 Year Q1 Q2 Q3 Q4 Year Merchandise exports ....................................................... Net gold exports.............................................................. 1 176 72 1 193 56 -1 207 42 -192 -150 1 233 50 -1 314 -31 -175 -207 1 258 70 -1 284 44 -232 -188 1 260 93 -1 250 102 -171 -68 1 236 67 -1 264 39 -192 -153 Merchandise imports ....................................................... -1 223 Trade balance ................................................................. Net service, income and current transfer payments......... Balance on current account ........................................... As a percentage of gross domestic product Trade balance.................................................................. Services balance ............................................................. Income balance ............................................................... Current transfer balance .................................................. Balance on current account ........................................... 24 -197 -173 0.5 -0.2 -3.2 -0.7 -3.5 0.9 -0.3 -2.9 -0.7 -3.0 -0.6 -0.3 -2.4 -0.7 -4.1 0.9 -0.2 -3.6 -0.7 -3.7 2.0 -0.3 -2.3 -0.7 -1.3 0.8 -0.3 -2.8 -0.7 -3.0 Components may not add up to totals due to rounding off. Sources: Stats SA and SARB 41 MARCH 2020 Mining, including net gold exports Other
The larger trade surplus – which coincided with a sizeable narrowing of the shortfall on the services, income and current transfer account – significantly narrowed the deficit on the current account of the balance of payments from R188 billion in the third quarter of 2019 to R68.1 billion in the fourth quarter. As a ratio of GDP, the deficit on the current account declined from 3.5% in 2018 to 3.0% in 2019, and significantly from 3.7% in the third quarter of 2019 to 1.3% in the fourth quarter – the smallest deficit since the fourth quarter of 2010. Current account of the balance of payments R billions 150 100 50 0 -50 -100 -150 -200 -250 Per cent 0 0 -50 -2 -100 -4 -150 -200 -6 -250 -8 -300 2014 2015 2016 2017 2018 2019 Seasonally adjusted and annualised Sources: Stats SA and SARB Following an increase of 2.0% in the third quarter of 2019, the value of merchandise exports increased marginally by 0.1% in the fourth quarter. Non-gold mining exports increased over the period, despite severe electricity outages, driven by strong increases in the exports of PGMs as well as pearls and semi-precious stones. PGMs benefitted from higher production at certain mines and inventory drawdowns of refined product, and were also boosted by higher prices, especially of palladium and rhodium. The contribution of these two metals to the total export value of PGMs increased from 32.6% and 19.7% respectively in the third quarter of 2019 to 33.0% and 24.2% respectively in the fourth quarter. This, together with a marginal increase in the value of exported base metals and articles of base metals, outweighed the contraction in mineral products. The second consecutive quarterly decrease in exports of mineral products reflected a continued decrease in manganese exports – especially those destined for China. The contraction in mineral exports was also partly affected by a decrease in the value of iron ore exports, which mainly reflected lower prices. By contrast, the value of agricultural and manufacturing exports contracted in the fourth quarter of 2019. The decline in manufacturing exports were broad-based, along with significant decreases in especially textiles and articles of textiles, machinery and electrical equipment as well as vehicles and transport equipment, with the latter mostly reflecting base effects relative to a substantial increase in the third quarter of 2019. According to statistics of the National Association of Automobile Manufacturers of South Africa, the highest number of vehicle exports 42 MARCH 2020 Balance on current account Current account to GDP (right-hand scale) Trade balance Balance on services, income and current transfer account
was recorded in the third quarter compared with the other quarters of 2019. Agricultural products reflected a sharp decrease in citrus exports in the fourth quarter of 2019. Value of merchandise exports R billions 1 400 1 200 1 000 800 600 400 200 0 350 300 250 200 150 100 50 0 2014 2015 2016 2017 2018 2019 Seasonally adjusted and annualised Sources: Stats SA and SARB For 2019 as a whole, the increase of 4.5% in the value of non-gold mining exports reflected higher rand prices of most South African commodities. The value of merchandise exports increased by 5.1%, from R1 176 billion in 2018 to R1 236 billion in 2019, compared with an increase of 6.7% in 2018. This increase was largely attributable to higher rand prices, while volumes remained constrained. South Africa’s top five export destinations for 2019 were China (10.7%), Germany (8.3%), the United States (6.9%), the United Kingdom (5.2%) and Japan (4.8%). Although the ranking remained the same as in 2018, China and Germany’s share increased from 9.1% and 7.5% respectively. The larger share of exports to China in 2019 was in line with the increase in South Africa’s mining exports relative to total merchandise exports. The rand price of merchandise exports increased by 0.4% in the fourth quarter of 2019. In US dollar terms, the price of a basket of domestically produced non-gold export commodities rebounded by 3.7% in the fourth quarter of 2019, following three consecutive quarterly declines. Increases in the prices of coal, copper, palladium, rhodium and platinum outweighed declines in the prices of other commodities, such as iron ore and nickel. The volume of merchandise exports declined by 0.3% in the fourth quarter of 2019 due to lower manufacturing exports, and also contracted on an annual basis. The average US dollar price of gold on the London market increased marginally from US$1 474 per fine ounce in the third quarter of 2019 to US$1 482 per fine ounce in the fourth quarter – the highest quarterly average since the first quarter of 2013. At the same time, the average realised rand price of net gold exports rose by 2.8% which, together with a sharp increase in volumes, contributed to a rise in the value. However, the value of net gold exports contracted on an annual basis, primarily due to lower production given deep-level mining supply constraints which offset the significant increase of 20.1% in the average international rand price of gold to a historical annual average high of R20 154 per fine ounce in 2019. 43 MARCH 2020 Mineral products Vehicles and transport equipment Platinum group metals Total
International prices of selected South African export commodities US dollar index: first quarter of 2014 = 100 200 150 100 50 0 600 500 Palladium 400 300 200 100 0 2014 2015 2016 2017 2018 2019 Sources: World Bank and SARB Decreases in the value of merchandise imports of 2.3% and 2.7% in the third and fourth quarter of 2019 respectively contributed to a subdued annual growth rate of only 3.3% compared with 10.8% recorded in 2018. This reflected weak domestic demand and sluggish economic growth during 2019. The value of both imported manufactured and agricultural products declined in the fourth quarter of 2019. The lower value of imported manufactured products was largely due to machinery and electrical equipment as well as vehicles and transport equipment. The former reflected a decline in telecommunication equipment due to lower expected sales volumes for the festive season, and the latter a decline in automotive parts following the shutdown of certain motor vehicle manufacturers for the most part of December. The lower value of imported vegetable products contributed to the overall decline in the value of imported agricultural goods in the fourth quarter of 2019. The contraction in the import values of manufactured and agricultural products outweighed the sharp increase in the value of mining imports in the fourth quarter of 2019. The latter mainly reflected a surge in mineral products, in particular crude oil imports, which increased significantly from 7.0% of total merchandise imports in the third quarter of 2019 to 12.9% in the fourth quarter. The rand price of merchandise imports decreased slightly in the fourth quarter of 2019, with the pace of decrease constrained by a rise in the average quarterly international price of crude oil and a slight depreciation in the exchange value of the rand. At the same time, the volume of merchandise imports declined further by 2.6% in the fourth quarter, following a decrease of 2.2% in the third quarter. The import penetration ratio – real merchandise imports as a ratio of real GDE – declined from 26.5% in the third quarter to 26.1% in the fourth quarter. For 2019 as a whole, the volume of merchandise imports contracted by 0.1% amid subdued domestic demand. 44 MARCH 2020 Rhodium Nickel South African export commodity basket (excluding gold) Coal Copper Iron ore Platinum
Value of merchandise imports R billions 1 000 70 900 800 700 60 600 500 400 50 300 200 100 0 40 2014 2015 2016 2017 2018 2019 Seasonally adjusted and annualised Sources: Stats SA and SARB The terms of trade improved further in the fourth quarter of 2019 as the rand price of exports increased more than that of imports. Terms of trade* Index: 2010 = 100 115 110 105 100 95 2014 2015 2016 2017 2018 2019 * Including gold Sources: Stats SA and SARB The deficit on the services, income and current transfer account narrowed substantially from an all-time high of R232 billion in the third quarter of 2019 to R171 billion in the fourth quarter. The smaller deficit reflected a noticeable smaller shortfall on the income account, whereas the deficit on the services account widened somewhat and that of the current transfer account only increased marginally. The overall deficit relative to GDP narrowed from 4.5% in the third quarter of 2019 to 3.3% in the final quarter and, on an annual basis, narrowed slightly from 4.0% in 2018 to 3.8% in 2019. 45 MARCH 2020 Manufacturing Agriculture (right-hand scale) Mining
Services, income and current transfer balance Per cent 0.0 -0.5 -1.0 -1.5 -2.0 -2.5 -3.0 -3.5 -4.0 Services, income and current transfer balance to GDP -4.5 -5.0 2014 2015 2016 2017 2018 2019 Seasonally adjusted and annualised Sources: Stats SA and SARB The smaller deficit on the income account of the balance of payments recorded in the fourth quarter of 2019 was caused by a large decrease in gross dividend payments, following an exceptionally high level of payments in the previous quarter. However, gross dividend payments still contracted marginally by 0.5% for the year as a whole – indicative of the current subdued domestic economic conditions. Dividend receipts increased somewhat in the fourth quarter, but increased significantly by 26% for 2019 as a whole, supported by the weakening in the exchange value of the rand and liquidity needs of domestic companies. Gross interest payments increased slightly in the fourth quarter. However, on an annual basis, the growth decelerated to only 8.6% for 2019 compared with an annual average growth of 18.7% between 2011 and 2018. The shortfall on the services account widened somewhat in the fourth quarter of 2019 as payments for services increased, while receipts displayed almost no change. A slight decline in gross travel receipts in the third quarter of 2019 was followed by a marginal increase in the fourth quarter, resulting in the third quarterly increase for 2019. For the year as a whole, travel receipts grew by 2.3% compared with meagre growth of only 0.7% in 2018. Concomitantly, gross travel payments also increased slightly in the fourth quarter of 2019. However, in contrast to travel receipts, annual growth in travel payments slowed to 1.2% compared with an increase of 3.4% in 2018 – reflective of relatively constrained disposable income. Payments for other services also increased in the fourth quarter of 2019. A second consecutive quarterly decrease in freight-related services, which was consistent with the contraction in merchandise imports and reflective of the sluggish domestic economy, curbed the services shortfall somewhat. Net current transfer payments increased marginally in the fourth quarter of 2019, as both gross current transfer receipts and payments increased. Financial account The net inflow of capital on South Africa’s financial account of the balance of payments (excluding unrecorded transactions) decreased substantially from R74.3 billion in the third quarter of 2019 to R10.1 billion in the fourth quarter. On a net basis, portfolio investment, financial derivatives and reserve assets recorded inflows during the fourth quarter, while direct and other investment recorded outflows. The cumulative inflows of R119 billion in 2019 was less than the R140 billion recorded in 2018. Overall, net financial account inflows relative to GDP declined from 5.7% in the third quarter of 2019 to only 0.8% in the fourth quarter, and annually from 2.9% in 2018 to 2.3% in 2019. 46 MARCH 2020 Average since 2014
Net financial transactions R billions 2018 2019 Year Q1 Q2 Q3 Q4 Year Change in liabilities Direct investment ................................................ Portfolio investment ............................................ Financial derivatives ............................................ Other investment ................................................ Change in assets Direct investment ................................................ Portfolio investment ............................................ Financial derivatives ............................................ Other investment ................................................ Reserve assets ................................................... Total identified financial transactions*................... As a percentage of gross domestic product ....... 72.1 90.0 -218.6 115.0 11.0 28.5 -43.0 35.8 27.9 10.0 -31.5 -4.9 17.3 40.2 -37.9 0.9 10.5 9.3 -50.8 -42.0 66.8 88.0 -163.2 -10.2 -54.0 -56.8 225.6 -21.5 -11.3 140.4 2.9 -16.5 -17.9 40.9 -51.9 34.2 21.3 1.8 5.5 17.5 31.0 -50.3 7.7 12.8 1.0 -21.6 34.7 34.8 83.0 -77.2 74.3 5.7 -12.4 8.7 52.3 24.6 9.9 10.1 0.8 -45.1 43.1 159.0 5.4 -25.4 118.5 2.3 * Excluding unrecorded transactions. Components may not add up to totals due to rounding off. Inflow + outflow - Source: SARB Foreign-owned assets in South Africa South Africa’s direct investment liabilities increased by R10.5 billion in the fourth quarter of 2019 following an inflow of R17.3 billion in the preceding quarter, as foreign parent companies scaled down debt funding to South African subsidiaries. This was partly offset by foreign parent companies’ increased equity funding of domestic subsidiaries. Inward direct investment flows decreased from R72.1 billion in 2018 to R66.8 billion in 2019. Portfolio investment liability inflows of R9.3 billion in the fourth quarter of 2019 were much less than the inflow of R40.2 billion in the previous quarter. This reflected non-residents’ net purchases of domestic debt securities, which outweighed net sales of domestic equity securities. Non-residents acquired domestic debt securities of R42.1 billion in the fourth quarter of 2019 following the acquisition of R72.5 billion in the third quarter, while non-resident net sales of domestic equity securities increased marginally from R32.3 billion to R32.8 billion over the same period. Non-residents’ cumulative acquisition of domestic debt and equity securities of R88.0 billion in 2019 was almost similar to the R90.0 billion acquired in 2018. Other investment liabilities reverted from a small inflow of R0.9 billion in the third quarter of 2019 to an outflow of R42.0 billion in the fourth quarter, as the domestic private non-banking sector repaid loans obtained from non-residents. Other investment inflows plummeted from R115 billion in 2018 to an outflow of R10.2 billion in 2019. 47 MARCH 2020
Financial account of the balance of payments R billions 40 30 20 10 0 -10 -20 -30 -40 -50 100 80 60 40 20 0 -20 -40 -60 -80 120 100 80 60 40 20 0 -20 -40 -60 Net other investment 100 80 60 40 20 0 -20 2014 2015 2016 2017 2018 2019 Source: SARB South African-owned assets abroad South Africa’s direct investment assets abroad increased by R12.4 billion during the fourth quarter of 2019, following R21.6 billion in the third quarter. This was mainly driven by a domestic mining company that acquired a company abroad. Outward direct investment flows of R45.1 billion in 2019 were somewhat less than outflows of R54.0 billion recorded in 2018. 48 MARCH 2020 Total (including reserve assets and financial derivatives, excluding unrecorded transactions) Net portfolio investment Net direct investment
South African residents sold foreign portfolio assets of R8.7 billion in the fourth quarter of 2019 following sales of R34.7 billion in the previous quarter. This inflow ensued largely from the domestic private non-banking sector’s sale of foreign equity securities, which outweighed South African residents’ purchases of foreign debt securities. Cumulatively, South African residents’ net sales of foreign portfolio assets of R43.1 billion in 2019 were contrasted by net purchases of R56.8 billion in 2018. Other investment assets recorded inflows of R24.6 billion in the fourth quarter of 2019, significantly less than the inflow of R83.0 billion in the third quarter. This was due to the domestic private banking sector increasing its deposits abroad, while non-residents repaid short-term loans to the domestic private banking and non-banking sectors. Other investment asset flows reverted from an outflow of R21.5 billion in 2018 to an inflow of R5.4 billion in 2019. Foreign debt South Africa’s total external debt decreased from US$181 billion at the end of June 2019 to US$178 billion at the end of September, mainly as a result of a decrease in the market value of non-residents’ domestic rand-denominated bond holdings. South Africa’s gross external debt, expressed in rand terms, increased by 5.7%, from R2 555 billion to R2 700 billion over the same period. Foreign debt US$ billions 120 200 Rand-denominated 100 (right-hand scale) 180 80 60 160 40 140 20 0 120 Per cent 180 160 140 120 100 80 60 40 20 0 60 Debt to export earnings 50 40 30 20 10 0 2014 2015 2016 2017 2018 2019 Source: SARB Foreign currency-denominated external debt increased from US$87.4 billion at the end of June 2019 to US$93.2 billion at the end of September, mainly due to the issuance of two international government bonds. 49 MARCH 2020 Debt to GDP (right-hand scale) Foreign currency-denominated Total
Foreign debt of South Africa US$ billions at end of period 2018 2019 Q2 Q3 Q4 Q1 Q2 Q3 Foreign currency-denominated debt.................. Debt securities .................................................... Other ................................................................... Public sector ................................................... Monetary sector .............................................. Non-monetary private sector ........................... Rand-denominated debt .................................... Debt securities................................................. Other ............................................................... Total foreign debt ............................................... As a percentage of gross domestic product .... As a percentage of total export earnings ......... 81.6 29.3 52.3 10.1 16.3 25.9 89.3 52.4 36.9 170.9 46.2 148.6 83.5 30.7 52.8 10.4 14.3 28.1 84.7 49.7 35.0 168.1 45.7 144.6 87.9 30.7 57.1 10.4 18.6 28.2 84.6 48.1 36.5 172.5 46.8 146.9 88.5 30.7 57.8 10.5 17.9 29.4 87.5 50.4 37.1 176.0 49.1 152.7 87.4 29.0 58.4 10.4 18.0 30.0 93.2 55.1 38.1 180.6 51.5 158.5 93.2 33.5 59.7 10.9 17.8 31.0 84.5 50.0 34.5 177.7 50.7 156.4 Source: SARB Rand-denominated external debt, expressed in US dollars, decreased notably from US$93.2 billion at the end of June 2019 to US$84.5 billion at the end of September. Although the external debt of all sectors decreased, it mainly reflected a decrease in the market value of non-residents’ domestic bond holdings and a decline in the US dollar value of rand-denominated external debt due to the depreciation in the exchange value of the rand over the period. South Africa’s total external debt as a ratio of GDP decreased from 51.5% at the end of June 2019 to 50.7% at the end of September. Similarly, the ratio of external debt to export earnings decreased from 158.5% to 156.4% over the same period. International investment position South Africa’s positive net international investment position (IIP) decreased from R760 billion at the end of June 2019 to R683 billion at the end of September as foreign assets decreased more than foreign liabilities. Both foreign assets and liabilities declined as a result of the restructuring of a large South African company. The decrease in the nominal effective exchange rate (NEER) of the rand of 4.2% over the period affected foreign assets more than foreign liabilities. The market value of South Africa’s foreign assets (outward investment) decreased by 4.2%, from R7 566 billion at the end of June 2019 to R7 245 billion at the end of September, following a decrease of 1.7% in the previous quarter. The market value of direct and other investment assets decreased in the third quarter of 2019, while portfolio investment, financial derivatives and reserve assets increased. Direct investment, in particular, decreased considerably due to the disposal of shares in a foreign direct investment enterprise by a South African company. The domestic company listed its foreign subsidiary on a foreign stock exchange and, consequently, foreign portfolio assets increased as South African investors participated in the distribution of these shares. The increase was augmented by the decrease in the NEER and an increase of 1.2% in the US Standard & Poor’s (S&P) 500 Index in the third quarter of 2019. Other investment assets declined, mainly due to the decrease in the domestic private banking sector’s foreign-currency deposits and the repayment of short-term loans under resale agreements by non-residents. Reserve assets increased as a result of the proceeds from the issuance of two international government bonds that were deposited at the SARB as well as the decrease in the NEER. 50 MARCH 2020
South Africa's international investment position R billions 8 000 1 200 7 600 Foreign assets 1 000 7 200 800 6 800 600 6 400 6 000 400 5 600 200 5 200 0 4 800 -200 4 400 4 000 -400 2014 2015 2016 2017 2018 2019 Source: SARB The market value of South Africa’s foreign liabilities (inward investment) declined by 3.6%, from R6 806 billion at the end of June 2019 to R6 562 billion at the end of September, following an increase of 2.4% in the second quarter. This reflected a decrease in portfolio investment, while all the other functional categories increased marginally. A decrease of 5.8% in the FTSE/ JSE All-Share Price Index (Alsi) in the third quarter of 2019 as well as the lower value of a large South African company following the distribution of some of its shares in a foreign company, as mentioned in the discussion of foreign assets, contributed to the lower value of foreign portfolio investment in equity securities. The issuance of two international government bonds was only partially countered by non-resident net sales of domestic debt securities and contributed to the higher value of foreign portfolio investment in debt securities. The increase in other investment liabilities resulted mainly from non-residents’ increased foreign-currency deposits with the domestic banking sector, while direct investment increased as a result of an increase in debt financing. Foreign assets as a ratio of South Africa’s annual GDP decreased from 152.1% at the end of June 2019 to 144.3% in September, while foreign liabilities decreased from 136.8% to 130.7% over the same period. This resulted in a decline in the positive net IIP to 13.6% of GDP at the end of September 2019. International reserves and liquidity South Africa’s international reserve assets decreased by R9.9 billion in the fourth quarter of 2019, following a substantial increase of R77.2 billion in the third quarter. The US dollar value of South Africa’s gross gold and other foreign reserves (i.e. the international reserves of the SARB before accounting for reserves-related liabilities) increased marginally from US$54.9 billion at the end of September 2019 to US$55.1 billion at the end of December, mainly as a result of foreign exchange swaps conducted for liquidity management purposes as well as a slight increase in the US dollar price of gold. The country’s gross gold and other foreign reserves then decreased to US$54.7 billion at the end of February 2020. South Africa’s international liquidity position10 increased from US$44.1 billion at the end of September 2019 to US$44.9 billion at the end of December, and further to US$45.4 billion at the end of February 2020. 10 This is calculated as the SARB’s gross gold and foreign reserves minus foreign currency-denominated liabilities against both domestic and foreign counterparties plus/minus the forward position in foreign currency. 51 MARCH 2020 Foreign liabilities Net international investment position (right-hand scale)
International reserves US$ billions Months 60 7.0 6.5 55 6.0 50 5.5 5.0 45 4.5 40 4.0 2014 Source: SARB 2015 2016 2017 2018 2019 The level of import cover (i.e. the value of gross international reserves relative to the value of merchandise imports, as well as services and income payments) decreased from 5.5 months at the end of September 2019 to 5.4 months at the end of December. Exchange rates11 The NEER increased by 6.1% in the fourth quarter of 2019, following a decrease of 4.2% in the third quarter. The marginal decline of 0.7% in the NEER in October 2019 was reversed in November and December with increases of 3.4% and 3.2% respectively. However, from the end of December 2019 to the end of January and February 2020, the NEER declined by 4.5% and 4.3% respectively. 11 Unless stated to the contrary, all percentage changes in this section are based on the end of the period. Exchange rates of the rand Percentage change 29 Mar 2019 to 28 Jun 2019 28 Jun 2019 to 30 Sep 2019 30 Sep 2019 to 31 Dec 2019 31 Dec 2019 to 13 Mar 2020 Weighted average* .............................. Euro ..................................................... US dollar .............................................. Chinese yuan........................................ British pound ........................................ Japanese yen ....................................... 3.1 1.7 3.2 5.5 5.9 0.3 -4.2 -3.1 -6.9 -3.2 -4.1 -6.7 6.1 5.5 8.2 5.6 1.5 9.0 -12.6 -13.8 -14.0 -13.6 -10.4 -16.1 * Trade-weighted exchange rate against a basket of 20 currencies (nominal effective exchange rate) Depreciation – appreciation + Source: SARB The exchange value of the rand initially appreciated notably against the US dollar, from R15.20 at the end of September 2019 to R14.04 at the end of December, before depreciating to R16.32 on 13 March 2020. During the fourth quarter of 2019, the rand also outperformed other emerging market currencies such as the Chinese yuan, Russian rouble, Mexican peso and Brazilian real. Much of the rand’s appreciation towards the end of 2019 can be attributed to the increased risk appetite of global investors due to some relief from geopolitical tensions, the interest rate cut by the US Federal Reserve and less trading activity in the domestic market over December. 52 MARCH 2020 Gross reserves International liquidity position Import cover ratio (right-hand scale)
However, at the start of 2020, the exchange value of the rand depreciated notably due to, among other factors, renewed downward revisions to South Africa’s economic growth projections and continued power supply interruptions. In addition, the COVID-19 outbreak in China resulted in a global sell-off of perceived risky assets and capital flows to safe-haven assets such as the US dollar. Emerging market currencies against the US dollar Index: 31 December 2018 = 100 115 110 105 100 95 90 85 80 Jan Feb Mar Apr May Jun Jul Aug 2019 Sep Oct Nov Dec Jan Feb Mar 2020 Russian rouble South African rand Mexican peso Polish zloty Chinese yuan Brazilian real Indian rupee Source: SARB The exchange value of the rand was quite volatile during 2019, initially appreciating significantly during the early part of the first quarter and then depreciated thereafter, primarily due to the resurgence of domestic fiscal concerns. The depreciation continued in the second and third quarter, initially as global economic growth slowed further and later due to the weak domestic economic environment and renewed credit-rating downgrade concerns. Effective exchange rates of the rand Index: 2010 = 100 100 90 80 70 60 50 2014 2015 2016 2017 2018 2019 2020 Source: SARB The real effective exchange rate (REER) of the rand decreased by 0.2% from December 2018 to December 2019, making domestic producers slightly more competitive in foreign markets. 53 MARCH 2020 Stronger rand = higher Real effective exchange rate Nominal effective exchange rate Stronger emerging market currency unit = higher
Turnover in the South African foreign exchange market The net average daily turnover12 in the South African foreign exchange market (FX) decreased by 10.3%, from US$15.0 billion in the third quarter of 2019 to US$13.4 billion in the fourth quarter. The value of FX transactions against both the rand and third currencies decreased. FX transactions against the rand decreased from US$10.9 billion in the third quarter of 2019 to US$9.8 billion in the fourth quarter, while those in third currencies decreased from US$4.1 billion to US$3.6 billion over the same period. 12 This is calculated as the daily average of all new foreign exchange transactions concluded during a specified period, adjusted for local interbank double counting. Net average daily turnover in the South African foreign exchange market US$ billions 30 25 20 15 10 5 0 2014 2015 2016 2017 2018 2019 Source: SARB Non-residents continued to dominate participation in FX transactions against the rand in the domestic FX market. However, the quarterly decline in FX transactions against the rand was driven by a decrease in non-resident participation in the domestic FX market, from US$6.8 billion in the third quarter of 2019 to US$6.1 billion in the fourth quarter. This coincided with non-resident sales of domestic bonds and shares in the fourth quarter, along with increased risk aversion in global financial markets. Composition of net average daily turnover in the South African foreign exchange market against the rand US$ billions 25 Monetary sector Other residents 20 15 10 5 0 2014 2015 2016 2017 2018 2019 Source: SARB 54 MARCH 2020 Non -residents Total Transactions in third currencies Transactions against the rand
Transactions against the rand within the monetary sector also decreased from US$1.9 billion in the third quarter of 2019 to US$1.6 billion in the fourth quarter. FX transactions against the rand with other resident counterparties remained broadly unchanged for the fourth consecutive quarter at around US$2.2 billion in the final quarter of 2019. Likewise, the decrease in turnover of FX transactions in third currencies from the third to the fourth quarter of 2019 was mainly the result of a decline in non-resident participation, from US$3.7 billion to US$3.3 billion over this period, and reflected a fourth consecutive quarterly decline. FX transactions in third currencies with other resident counterparties also decreased, from US$0.3 billion in the third quarter of 2019 to US$0.2 billion in the fourth quarter. Meanwhile, FX transactions in third currencies within the monetary sector remained unchanged US$0.1 billion over this period. at Composition of net average daily turnover in the South African foreign exchange market in third currencies US$ billions 8 7 6 5 4 3 2 1 0 2014 2015 2016 2017 2018 2019 Source: SARB 55 MARCH 2020 Monetary sector Other residents Non-residents
Monetary developments, interest rates and financial markets Money supply Growth in the broadly defined money supply (M3) decelerated in both the third and fourth quarter of 2019, in line with the listless state of the domestic economy. Despite the slowdown, growth in M3 still exceeded that in nominal GDP over this period. A significant deceleration in corporate sector deposits in the second half of 2019 drove the overall moderation in M3, while that of households fluctuated marginally higher over this period. The quarter-to-quarter seasonally adjusted and annualised growth in M3 decelerated from 5.9% in the third quarter of 2019 to only 1.3% in the fourth quarter. The income velocity of circulation of M3 increased from 1.37 in the third quarter of 2019 to 1.38 in the fourth quarter, as the quarterly expansion in nominal GDP exceeded that in M3. Money supply and gross domestic product Year-on-year percentage change 12 10 8 6 4 2 0 2015 2016 2017 2018 2019 2020 Sources: Stats SA and SARB Year-on-year growth in M3, which fluctuated between a low of 5.0% in January 2019 and a high of 9.0% in May, ended the year at 6.1%, with annual average growth accelerating from 6.2% in 2018 to 7.2% in 2019. Growth in the deposit holdings of the corporate sector13 slowed from a high of 9.2% in June 2019 to 4.8% in December, as the deposit holdings of financial companies decelerated notably. Growth in the deposits of financial companies waned from 12.0% to 3.7% over this period, but still exceeded the 2018 annual average of 2.8%, before moderating further to 3.2% in January 2020. The rate of increase in the deposit holdings of non-financial companies slowed from a high of 7.8% in April 2019 to 4.7% in November, before accelerating to 8.7% in January 2020 which reflected, among other factors, the partial offset between the payment of equitable share transfers from national government to local government and outflows related to provisional tax payments. Year-on-year growth in the deposit holdings of the household sector averaged 8.4% in 2019 – its fourth consecutive annual moderation amid constrained income growth. However, growth in household deposits accelerated somewhat in the second half of 2019 and remained lively at 9.6% in January 2020. 13 The deposit holdings of the corporate sector include local government deposits. 56 MARCH 2020 M3 Nominal GDP
Deposit holdings of households and companies Percentage change over 12 months 16 12 Households Financial 8 4 0 -4 2015 2016 2017 2018 2019 2020 Source: SARB The preference for long-term deposits remained fairly buoyant as banks continued to entice depositors with favourable savings and investment products. Long-term deposits grew at double-digit rates throughout 2019, but decelerated from a six-year high of 19.0% in November 2019 to 10.0% in January 2020. Growth in short-and medium-term deposits averaged 4.8% in 2019, accelerating gradually from a low of 0.6% in January to 7.3% in December, before moderating slightly to 7.1% in January 2020. The rate of increase in the more liquid cash, cheque and other demand deposits category fluctuated between a low of 4.0% in February 2019 and a high of 9.0% in June, before decelerating gradually to 5.8% in January 2020. Deposits by maturity Percentage change over 12 months 20 15 Long term 10 5 0 -5 -10 2015 2016 2017 2018 2019 2020 Source: SARB The increase in total M3 deposit holdings of R218 billion in 2019 – driven by households and non-financial companies – was notably more than the increase of R187 billion in 2018. The decrease in total M3 deposit holdings of R1.6 billion in the fourth quarter of 2019 was in contrast to the increase of R72.6 billion in the third quarter, but was on par with the decrease of R3.2 billion in the fourth quarter of the previous year. The decrease in corporate sector deposit holdings of R22.8 billion in the fourth quarter of 2019 was partly affected by provisional tax payments, as evidenced by a R62.5 billion decrease in financial company deposits. 57 MARCH 2020 Cash, cheque and other demand Short and medium term companies Non-financial companies
The increase in non-financial company deposits of R39.7 billion reflected, among other factors, the payment of equitable share transfers from national government to municipalities, and higher turnover related to Black Friday promotions. The increase of R21.2 billion in the deposit holdings of the household sector in the fourth quarter of 2019 significantly exceeded the increase of R11.6 billion in the fourth quarter of the previous year. The deposits of the household sector increased from about 30% of total M3 in 2014 to almost 36% in 2019, reflecting banks’ success in attracting household deposits as a source of stable funding. M3 holdings of households and companies * Expressed as a percentage of the total outstanding balance as at December of each year Source: SARB 14 This is the difference between government deposits and banks’ claims on government (mainly holdings of government securities). Statistically, the counterparts to the decrease of R1.6 billion in M3 in the fourth quarter of 2019 consisted of a decrease of R68.8 billion in the net foreign assets of the monetary sector and a decrease of R6.9 billion in net credit extended to the government sector.14 This was almost entirely offset by increases of R38.6 billion in net other assets (a contra-entry absorbing the changes in foreign assets, among other factors) and R35.6 billion in claims against the domestic private sector. Credit extension Growth in total loans and advances extended by monetary institutions to the domestic private sector decelerated, on balance, from a recent high of 7.5% in April 2019 to 4.8% in January 2020 amid protracted weakness in domestic economic activity. The moderation in credit extension was led by companies, while growth in credit to households continued at a fairly steady pace for a third year in succession. The pace of increase in credit extension to the household sector inched higher from 6.1% in January 2019 to 6.7% in October, before moderating again to 6.1% in January 2020. Households’ relatively steady demand for credit possibly reflected financial strain amid low income growth. By contrast, growth in credit extension to the corporate sector moderated from 8.5% in April 2019 to 3.5% in January 2020, reflective of weak demand and the disruptive impact of electricity load-shedding. 58 MARCH 2020 Households ......................... Companies: Total.................. Of which: Financial ........... Non-financial..... Total M3 deposits ................ Year-on-year change R billions Percentage of total M3 deposit holdings* 2016201720182019 2016201720182019 95.6102.087.1107.0 85.1100.699.5111.0 49.949.746.547.1 35.150.953.063.9 180.6202.6186.6218.0 33.334.335.035.8 66.765.765.064.2 37.036.335.734.8 29.729.429.429.4 100.0100.0100.0100.0
Bank loans and gross domestic product Year-on-year percentage change 20 16 12 8 4 0 Total loans and advances to the private sector Percentage change 15 10 5 0 2015 2016 2017 2018 2019 2020 Sources: Stats SA and SARB The quarter-to-quarter seasonally adjusted and annualised growth in total loans and advances to the domestic private sector decelerated from 9.2% in the second quarter of 2019 to 3.6% in the fourth quarter. Nonetheless, the increase of R187 billion for the year as a whole exceeded that of R167 billion in 2018. The credit-to-GDP ratio declined slightly from 74.8% in the first quarter of 2019 to 74.4% in the fourth quarter, as the expansion in nominal GDP exceeded that in credit extension. Real credit growth fluctuated in a narrow range at around 2% in 2019, but moderated to 0.3% in January 2020. Total loans and advances Percentage change over 12 months 12 10 Nominal 8 6 4 Real* 2 0 -2 -4 2015 2016 2017 2018 2019 2020 * Deflated with the consumer price index Source: SARB 59 MARCH 2020 Over 12 months Quarterly at seasonally adjusted annualised rates Loans to companies Loans to households Nominal GDP
The decrease of R1.8 billion in credit extension to the corporate sector in the fourth quarter of 2019 contrasted the increases of R23.2 billion in the third quarter, and R3.1 billion in the fourth quarter of 2018. However, for 2019 as a whole, the corporate sector’s utilisation of bank funding increased by R84.1 billion, almost similar to the R79.9 billion increase in the previous year. Non-financial companies dominated the demand for credit in terms of magnitude in 2019. However, corporate demand for credit varied quite substantially in 2019, with financial companies’ (e.g. companies involved in fund management, securities trading and vehicle financing) demand once again increasing in the fourth quarter of 2019 after contracting for two quarters. By contrast, non-financial companies’ demand for credit decreased during the fourth quarter when firms involved in retail trade, telecommunications and technology, consumer services as well as beverage manufacturing repaid loans. Mortgage advances Percentage change over 12 months 18 16 14 12 10 8 6 4 2 0 2015 2016 2017 2018 2019 2020 Source: SARB Growth in total mortgage advances fluctuated within a narrow range of between 4.2% and 4.9% for close on 30 months before exceeding 5.0% in July 2019 and accelerating further to 6.0% in December. This contributed to an annual increase of R85.3 billion in 2019 compared with an increase of R63.7 billion in 2018. Mortgage advances on commercial property increased by R36.3 billion in 2019, exceeding the increase of R23.0 billion in the previous year. Similarly, the increase in residential and farm mortgage advances of R49.4 billion in 2019 also exceeded the increase of R38.3 billion in 2018. Year-on-year growth in mortgage advances on commercial property quickened from a low of 4.4% in February 2019 to 9.2% in January 2020. Growth in mortgage advances on residential and agricultural property accelerated only gradually from 4.3% in January 2019 to 4.9% a year later, probably constrained by weak employment and income growth as well as uncertainty around land expropriation. Credit extension to the household sector increased by R103 billion in 2019 compared with an increase of R87.2 billion in 2018. Of the total increase in 2019, mortgage advances contributed R48.3 billion and general loans R25.7 billion, followed by R16.7 billion for instalment sale credit and leasing finance, R10.7 billion for credit card advances and R1.4 billion for overdrafts. Year-on-year growth in general loans to the household sector accelerated from a low of 2.7% in December 2017 to 10.4% in December 2018 and further to 12.1% in September 2019, before moderating slightly to 10.9% in January 2020. Instalment sale credit and leasing finance to households increased, on averaged, by 6.9% in 2019 compared with 6.2% in 2018. Growth in credit card advances receded from a recent high of 12.5% in October 2019 to 9.4% in January 2020. 60 MARCH 2020 Commercial property Residential property Total
Selected loans and advances Corporate sector Percentage change over 12 months Household sector Percentage change over 12 months 14 20 18 16 14 12 10 8 6 4 2 0 -2 -4 12 10 8 6 4 2 0 -2 2018 2019 2020 2018 2019 2020 Mortgages General loans Credit cards Instalment sale credit and leasing finance Overdrafts Source: SARB Instalment sale credit and leasing finance, mainly used for the financing of new and used vehicles, increased by R30.7 billion in 2019 compared with an increase of R26.8 billion in 2018. Annual average growth accelerated from 5.7% in 2018 to 7.9% in 2019, but moderated somewhat to 7.3% in January 2020 alongside weak vehicle sales. Year-on-year growth in overdrafts initially accelerated from 10.1% in January 2019 to 16.0% in April, but then decelerated towards year-end and contracted by 0.3% in January 2020. Overdrafts to households and, in particular, to companies declined during the second half of 2019. In January 2020, overdrafts comprised only 2.8% of loans to the household sector and 10.1% of loans to the corporate sector. Growth in bank credit by economic sector Percentage change over four quarters 2018 2019 Percentage of total credit extension* Economic sector Q4 Q1 Q2 Q3 Q4 Households ................................................................... Finance and insurance .................................................. Real estate .................................................................... Wholesale and retail trade ............................................. Manufacturing ............................................................... Business services .......................................................... Transport, storage and communication ......................... Electricity, gas and water............................................... Agriculture, forestry and fishing...................................... Mining and quarrying ..................................................... Construction.................................................................. Community, social and personal services, and other..... Total .............................................................................. 5.8 -0.5 10.5 17.7 2.5 6.4 10.8 -0.4 4.8 24.2 9.9 8.2 6.2 6.2 0.8 5.6 6.7 9.5 7.0 10.2 1.2 5.4 29.3 17.7 10.5 6.3 6.8 -1.2 6.5 2.9 6.3 1.9 10.0 -1.3 7.9 0.2 5.9 -0.5 3.8 7.8 -5.4 10.9 0.3 5.2 -1.9 4.8 9.8 -4.4 1.0 2.3 -3.1 2.9 7.6 -7.2 8.0 -7.3 0.1 -4.1 3.1 10.4 -7.5 -6.5 5.7 7.8 2.8 36.8 16.0 11.7 5.1 4.2 3.3 3.1 2.4 2.0 1.6 0.9 12.9 100.0 * Expressed as a percentage of the total outstanding balance for December 2019 Source: SARB 61 MARCH 2020
The credit demand of domestic economic sectors diverged somewhat in 2019. Credit extension to the electricity, gas and water supply sector accelerated notably in the second half of 2019 amid electricity supply challenges and the commencement of construction activity under Bid Window 4 of the Independent Power Producer Programme. By contrast, credit extension to the agriculture, mining and business services sectors contracted in the fourth quarter of 2019. Credit extension to the finance and insurance sector as well as the wholesale and retail sector also contracted alongside weak domestic demand conditions, while that to the manufacturing and construction sectors remained positive but moderated during the year. Fairly buoyant growth occurred in the real estate sector, despite continued weakness in residential property prices. Interest rates and yields The Monetary Policy Committee (MPC) of the SARB lowered the repurchase (repo) rate by 25 basis points from 6.50% to 6.25%, effective from 17 January 2020, following a lower inflation forecast and an improved risk profile. The MPC welcomed the lower inflation outcomes of recent months as well as the continued moderation in inflation expectations. In March 2020, the MPC lowered the repo rate by a further 100 basis points. Domestic short-term money market interest rates trended moderately higher in late 2019, reflective of the muted outlook for domestic economic growth that was exacerbated by the disrupting impact of frequent power outages. Subsequently, money market interest rates adjusted quickly following the reduction in the repo rate in January 2020. For example, the 3-month Johannesburg Interbank Average Rate (Jibar) decreased to 6.56% on 21 January 2020 after hovering at around 6.80% for most of December 2019 and early January 2020. The 3-month Jibar then remained static at this level up to late February, but decreased to 6.38% on 13 March. The 6-month Jibar fluctuated higher from 7.22% on 30 October 2019 to 7.32% on 14 December, before decreasing to 6.74% in the second week of March. The 12-month Jibar followed a similar trajectory, initially increasing by 21 basis points from 7.57% on 28 October 2019 to 7.78% on 3 December, before decreasing to 6.95% on 13 March 2020. The tender rate on 91-day Treasury bills (TBs) increased by 45 basis points from 10 October 2019 to 7.19% on 24 December 2019 alongside seasonal lower demand during the holiday period, notwithstanding reduced issuance by National Treasury. The rate on 91-day TBs then decreased to 6.43% on 13 March 2020, broadly aligned with the reduction in other money market interest rates after the change in the repo rate. Money market rates Per cent 9.0 8.5 8.0 7.5 7.0 6.5 6.0 Jan Mar May Jul Sep Nov Jan Mar May Jul Sep Nov Jan Mar May Jul Sep Nov Jan Mar 2020 2017 2018 2019 Source: SARB Funding conditions in the market for interbank lending were mostly stable and remained aligned to movements in the prevailing repo rate. However, the overnight FX rate breached the lower standing facility band between 30 December 2019 and 1 January 2020 due to seasonal 62 MARCH 2020 12-month Jibar 6-month Jibar 91-day Treasury bills 3-month Jibar Repurchase rate
dislocation, while the South African Benchmark Overnight Rate (Sabor) on deposits continued to fluctuate within the upper and lower standing facility limits. Despite minor deviations on a daily basis, movements in the Sabor closely matched the repo rate and averaged 6.50% between August 2019 and early January 2020, before declining to 6.31% on 13 March. By contrast, the overnight FX rate fluctuated within a wider range due to changes in demand for liquidity, and then increased by 86 basis points, from 6.55% on 2 October 2019 to 7.41% on 23 November, before fluctuating lower. In February 2020, it varied between a low of 6.40% at the start of the month and 7.25% towards month-end, before declining to 6.45% in the second week of March. Benchmark overnight rates Per cent 11 10 Standing facility 9 8 7 6 Standing facility 5 4 2017 2018 2019 2020 Source: SARB Rates on forward rate agreements (FRAs) started to trend lower from late 2019, following the appreciation in the exchange value of the rand and favourable inflation outcomes. The 3x6-month FRA decreased from 6.75% on 2 December to 6.60% in early January 2020, followed by a further decrease to 5.96% on 13 March. Longer-term FRAs decreased even more sharply from late January 2020, with the 9x12-month FRA decreasing to 5.81% in early March 2020 from a recent high of 6.73% on 11 November 2019. More recently, market participants started discounting the possibility of even lower interest rates due to the negative implications of COVID-19 on global and domestic economic growth. Forward rate agreements Per cent 8.5 8.0 7.5 7.0 6.5 6.0 5.5 Jan Mar May Jul Sep Nov Jan Mar May Jul Sep Nov Jan Mar May Jul Sep Nov Jan Mar 2017 2018 2019 2020 Source: SARB 63 MARCH 2020 3x6 months 6x9 months 9x12 months 18x21 months Overnight FX rate Sabor upper band lower band
Commercial banks adjusted their deposit and lending rates lower in January 2020 in line with the 25 basis point reduction in the repo rate. The prime lending rate, which was maintained at 10.00% from July 2019 to December, decreased to 9.75% in January 2020. Similarly, the weighted-average flexible rate charged by banks on mortgage advances decreased from 9.53% in December 2019 to 9.36% in January 2020, while the average interest rate offered on call deposits also decreased from 6.26% to 6.08% over the same period. The yields on 10-year South African rand-denominated government bonds issued and traded in the domestic market increased from 8.48% on 18 July 2019 to 9.17% on 3 December. This reflected increased global risk aversion related to continued trade tensions between the US and China as well as an announcement that the US would also impose tariffs on imports from Brazil and Argentina. In addition, domestic factors such as the financial position of some state-owned companies (SOCs) and the related fiscal outlook heightened concerns of sovereign credit rating downgrades which, together with a depreciation in the exchange value of the rand, contributed to the higher bond yields. Subsequently, the 10-year South African government bond yield declined by 51 basis points from 3 December 2019 to 8.66% on 26 February 2020, along with lower international bond yields and optimism over the US-China trade deal as well as notable non-resident net purchases of domestic bonds and the reduction in the repo rate. Thereafter, the bond yield increased markedly to 9.86% on 13 March as a result of the impact of the COVID-19 outbreak on global financial markets as well as domestic currency weakness, higher inflation outcomes and higher debt-to-GDP levels projected in the February 2020 Budget. Government bond yield and the exchange rate Per cent Rand per US dollar 17 10.5 16 10.0 15 9.5 14 9.0 13 8.5 12 8.0 11 7.5 10 7.0 9 8 6.5 2014 2015 2016 2017 2018 2019 2020 South African 10-year yield Exchange rate (right-hand scale) Sources: IRESS, JSE and SARB Break-even inflation rates15 in the two-year maturity range decreased from a high of 4.23% on 6 August 2019 to 2.95% on 13 March 2020, and those in the eight-year maturity range decreased from 4.95% to 4.28% over the same period as nominal government bond yields increased less than real yields on inflation-linked government bonds. 15 The break-even inflation rate is measured as the difference between the nominal yield on conventional government bonds and the yield on inflation-linked government bonds. The level of the yield curve moved higher from mid-July 2019 to 3 December in line with the increase in longer-term domestic bond yields following adverse global political developments and the deterioration in the domestic fiscal outlook, while the short end of the yield curve remained anchored to the unchanged repo rate. The yield curve then shifted lower to 26 February 2020 and flattened somewhat at the zero-to four-year maturity range along with the decline in the repo rate in January 2020, while it steepened for longer-term maturities. The decline in bond yields reflected increased demand for domestic bonds. Subsequently, the level of the yield curve moved higher up to 13 March in line with the depreciation in the exchange value of the rand. The yield gap,16 on balance, widened significantly from 283 basis points on 18 July 2019 to 476 basis points on 13 March 2020. 16 The yield gap is measured as the difference between yields at the extreme long and short ends of the yield curve. 64 MARCH 2020
Yield curve Per cent 12 11 10 9 18 July 2019 3 December 2019 26 February 2020 13 March 2020 8 7 6 0 5 10 15 20 25 30 Unexpired maturity in years Sources: IRESS and JSE The yield spread for emerging market US dollar-denominated bonds relative to US government bonds, as measured by the JPMorgan Emerging Markets Bond Index Plus (EMBI+),17 narrowed significantly from 437 basis points at the end of August 2019 to 298 basis points in December – the narrowest spread since July 2014. The narrowing followed an improvement in investor confidence in emerging market bonds amid the implementation of the first phase of the US- China trade agreement as well as interest rate decreases by the US Federal Reserve and some other major central banks. Subsequently, the yield spread widened considerably to 473 basis points on 13 March 2020 due to, among other factors, the COVID-19 outbreak and volatile international crude oil prices related to tensions in the Middle East following a US air strike in Iraq. Similarly, South Africa’s sovereign risk premium18 on US dollar-denominated government bonds, according to the EMBI+, widened significantly from 286 basis points on 8 January 2020 to 474 basis points on 13 March. 17 The EMBI+ measures the total returns on US dollar-denominated debt instruments of emerging market economies. 18 This is the differential between the yield on South African government US dollar-denominated bonds and that on US dollar-denominated bonds of the US government. Sovereign spreads* Basis points 700 600 500 400 300 200 100 2014 2015 2016 2017 2018 20192020 Global emerging markets Turkey South Africa Brazil * JPMorgan Emerging Markets Bond Index Plus Source: Bloomberg 65 MARCH 2020
Money market The average actual daily liquidity requirement of private sector banks was maintained at around R56.0 billion in the fourth quarter of 2019. During this period, the requirement for liquidity varied between a low of R52.6 billion, as a result of banks depositing funds into the end-of-day South African Multiple Option Settlement (SAMOS) facility to square off their positions, and a high of R59.7 billion, when supplementary repos were offered to enhance liquidity. On average, the SARB managed to maintain the money market shortage at around R56 billion per day for the whole of 2019, in accordance with the standard set at the time of the implementation of the revised liquidity management strategy in September 2016. Envisaged changes to the collateral requirements for the weekly repo auctions are discussed in the accompanying box. Liquidity requirement R billions 100 170 160 90 150 80 140 70 130 60 120 110 50 100 40 Estimated weekly liquidity requirement Actual daily liquidity requirement Notes and coin in circulation (right-hand scale) 90 30 80 20 70 Sep Nov Jan Mar May Jul Sep Nov Jan Mar May Jul Sep Nov Jan Mar 2020 Jan Mar May Jul 2017 2018 2019 Source: SARB 66 MARCH 2020 Box 3 Introducing collateral substitution for repurchase auctions Participating commercial banks1 are currently required to pledge2 collateral3 at the weekly main repurchase (repo) auction with the South African Reserve Bank (SARB), as the central bank does not provide unsecured loans. The pledged collateral cannot be replaced or substituted during the term of the contract, which is normally for a duration of seven days. The new approach to be implemented will introduce the option to replace or substitute pledged collateral in a repo transaction with assets of at least equal quality. This flexibility will enhance the effectiveness of both repo-based refinancing 4,5 and monetary policy implementation. The SARB’s systems are in place to accommodate this new collateral substitution approach and implementation is anticipated during the second quarter of 2020, once the Global Master Repurchase Agreement has been signed by all stakeholders. The initiative will align the SARB’s repo operations with global best practices and improve the efficiency of internal workflows, while market participants will benefit from collateral optimisation.6 Substitution will facilitate the efficient allocation of collateral and will be mainly focused on the main repo auction. On aggregate, there will be reduced fragmentation across the SARB’s operations and functions (as large quantities of collateral 1 Commercial banks are required to enter into a Global Master Repurchase Agreement with the SARB to participate in the weekly main repo auctions. 2 Securities pledged by participating banks as collateral are kept in the Central Bank Collateral Management System. 3 Securities eligible as collateral for repo transactions are stipulated in a money market operational notice. See http://www.resbank.co.za/Markets/Domestic/MarketDocuments/Pages/List-of-Eligible-Collateral.aspx 4 Repo-based refinancing was introduced on 9 March 1998. 5 Such refinancing is concluded through open market operations where the central bank provides liquidity to the money market in exchange for high-quality liquid assets as collateral, with an agreement that such securities are repurchased at maturity of the repo, usually after one week. 6 Collateral optimisation is a process that identifies and allocates collateral within all the parameters set out by the lender (SARB) and the borrower (a commercial bank) in the most efficient manner.
2020 2017 2018 2019 Money market liquidity expanded by a net amount of R5.1 billion in the fourth quarter of 2019 compared with an expansion of R5.7 billion in the third quarter. An increase in notes and coin in circulation outside the SARB of R8.5 billion, which drained liquidity, was partly offset by a decrease of R3.8 billion in private banks’ required cash reserve deposits. In addition, liquidity management operations by the SARB injected liquidity to the value of R11.8 billion on a net basis. This included the placement of R12.9 billion in deposits by the Corporation for Public Deposits (CPD) at private sector banks, which was partly countered by FX swap transactions entered into, to the value of R1.1 billion. FX transactions undertaken by the SARB in the spot market tightened money market liquidity by R0.2 billion. No issuance of long-term reverse repo agreements occurred in the fourth quarter of 2019, as market participants preferred the returns 67 MARCH 2020 are held for banks’ prudential requirements),7 while also assisting to collateralise intraday payments settled in the South African Multiple Option Settlement (SAMOS) system. This will afford banks access to collateral held at the SARB for interbank funding. Further benefits include increased money market stability and liquidity in times of financial stress, given the mobility and ease of identifying surplus collateral. This will also ensure that over-collateralisation is avoided and contribute to compliance with regulatory requirements. The SARB’s open market operations8 are conducted to influence money market liquidity conditions to maintain a liquidity shortage. Monetary policy is implemented through repo-based refinancing of commercial banks’ money market liquidity shortage at the repo rate. The money market liquidity shortage is currently maintained at a daily average of R56 billion, with bids received in the weekly main repo auction exceeding both the estimated weekly liquidity requirement and the amount allotted by a significant margin, as indicated in the accompanying figure. Liquidity requirement R billions 80 70 60 50 40 Weekly main repo auctions R billions 300 260 220 180 140 100 60 20 2017 2018 2019 2020 Source: SARB 7 Basel III regulatory reforms partly necessitated the review of the current system of collateral requirements as it created increased demand for high-quality liquid assets. 8 Open market operations are policy actions implemented by a central bank to either inject or drain liquidity from the market as a whole. The SARB utilises various instruments at its disposal to maintain liquidity at the required level, including reverse repo transactions, SARB debentures, foreign exchange swap transactions and the movement of public sector funds between the SARB and the market. These are described in the money market section of the Quarterly Bulletin as some of the factors that influence money market liquidity conditions. Bids received Amount allotted Estimated weekly liquidity requirement Actual daily liquidity requirement
offered by other higher-yielding instruments. In January and February 2020, overall money market liquidity contracted by R13.8 billion as the cash reserve requirement of banks, together with maturing forward FX contracts and the placement of CPD call deposits with the SARB, drained liquidity. This was partly counteracted by a sizeable contraction in notes and coin in circulation. Capital redemption payments and scheduled coupon interest payments on various government bonds of R67.8 billion were paid from the government tax and loan accounts from October 2019 to February 2020, with only R201 million accruing to the SARB. Factors influencing money market liquidity conditions Notes and coin in circulation Change in cash reserve accounts Spot foreign exchange transactions Government deposits with SARB Reverse repurchase transactions SARB debentures Forward position (swaps) CPD call deposits Other Liquidity provided to the banking system 5 -20 -15 -10 -5 0 10 15 20 R billions October–December 2019 January–February 2020 Source: SARB 19The public sector bond issuance includes issuance by national and local governments as well as public corporations. Bond market National government continued to dominate funding in the domestic primary bond market in 2019. The public sector19 raised R343 billion through the net issuance of listed bonds in 2019 – 53.4% more than in 2018. The redemption of the R207 government bond reduced net issues of public sector bonds in January 2020. Similarly, the value of private sector20 net bond issuance increased to an all-time high of R81.7 billion in 2019 compared with only R9.0 billion in 2018, following high redemptions by banks in the year. These 2018 redemptions reflected a large portion of tier 221 instruments issued by banks in 2013 which had matured. 20 The private sector includes banks, non-bank companies and special purpose vehicles. 21 Under the Basel Accord tier 2 capital adequacy requirement, instruments to be held by banks include supplementary capital such as undisclosed reserves, subordinated term debts, hybrid financial products and other non-core capital instruments. Banks dominated private sector funding in 2019 at 58.7% of the total net issuance of R81.7 billion, whereas non-bank companies and special purpose vehicles only accounted for 36.1% and 5.2% respectively. This compares with net redemptions by the latter two types of institutions in 2018. Banks’ high net issuance in 2019 reflected, among other factors, regulatory capital adequacy requirements in accordance with the Basel III framework. Record-high corporate net bond issuance was also in line with investors’ increased demand for higher-68 MARCH 2020 -8.5 14.5 3.8 -9.8 -0.2 -0.1 Tightening (draining) Easing (injecting) -1.1 -10.0 12.9 -7.2 -1.9 -1.2 5.1 -13.8
yielding instruments and a shift from equities to bonds. The higher net issuance in 2019 and an additional net issuance of R32.5 billion in the first two months of 2020 brought the total outstanding amount of listed bonds in issue to R3.4 trillion at the end of February 2020. Private sector net issuances of listed bonds in the primary market R billions 100 80 60 40 20 0 -20 Contribution to the value of private sector listed bonds in issue Per cent 100 80 60 40 20 0 2010 2011 2012 2013 2014 2015 2016 2017 2018 2019 Banks Non-bank companies Special purpose vehicles Source: JSE The value of turnover in the domestic secondary bond market in 2019 was supported by higher volumes and new record highs in the All-Bond Index. The daily average turnover increased by 20.0% to an all-time annual high of R146 billion in 2019, and increased further to R155 billion in the first two months of 2020. The outstanding amount of rand-denominated debt securities in issue in the European and Japanese bond markets increased by R7.5 billion in 2019 following a decrease of R23.7 billion in 2018. Further net issuances amounted to R5.6 billion in the first two months of 2020 as high yields lured investors, despite credit rating uncertainty. Rand-denominated bonds issued in international bond markets, January to December R millions Eurorand Uridashi Total 2018 2019 2018 2019 2018 2019 Issues................................................ Redemptions ..................................... Net .................................................... 11 190 29 423 -18 233 40 423 25 075 15 348 921 6 379 -5 458 1 082 8 957 -7 875 12 111 35 802 -23 691 41 505 34 032 7 473 Source: Bloomberg 69 MARCH 2020
According to data published by the JSE Limited (JSE), non-residents’ net purchases of domestic bonds amounted to R2.3 billion in the fourth quarter of 2019 amid an appreciation in the exchange value of the rand and lower inflation outcomes. This followed net sales of R57.4 billion in the second and third quarter, resulting in cumulative net sales of R39.1 billion in 2019 as a whole, which was much less than net sales of R88.5 billion in 2018. Subsequently, non-residents’ holdings of domestic listed bonds declined by R4.0 billion in the first two months of 2020. At the end of February 2020, non-residents held 36.9% of domestic national government bonds in issue on the JSE. Non-resident net transactions in the domestic bond market R billions 50 25 0 -25 -50 -75 2014 2015 2016 2017 2018 2019 2020 * January and February Source: JSE Share market Equity capital raised by companies listed on the JSE in the domestic and international primary share markets decreased from R55.6 billion in 2018 to R35.8 billion in 2019 – the lowest annual amount since 2003. Persistent low business confidence and weak domestic economic growth contributed to this decline. This was also reflected by fewer listings and more delistings, with the number of new listings on the JSE declining to an all-time low of only six in 2019. Primary listed companies in the financial sector contributed the most to the total value of capital raised, at 56.4%, in 2019. As much as 70.0% of the capital raised through the 10 largest share issues was used to fund domestic financial operations in 2019, while the remainder funded off-shore financial operations and an acquisition. The value of shares issued in the first two months of 2020 was R12.4 billion. Number of listings on the various boards of the JSE Venture and development capital boards For the year As at year-end Main board New listings AltX Total De-listings 31 December 2017 ...................... 31 December 2018 ...................... 31 December 2019 ...................... 2020* ........................................... 53 46 42 40 4 3 4 4 320 323 308 308 377 372 354 352 21 12 6 1 32 17 24 3 * As at 29 February Source: JSE 70 MARCH 2020 Net purchases * Net sales
The daily average value of turnover in the secondary share market of the JSE decreased somewhat from R22.2 billion in 2018 to R20.7 billion in 2019 along with lower volumes traded, and edged even lower to R19.4 billion in the first two months of 2020. The market capitalisation of all shares listed on the JSE increased significantly from a low of R12.5 trillion in November 2018 to R15.7 trillion in February 2019, reflective of higher share prices and the conversion of some interest rate market notes to equity-structured products. The market capitalisation then increased further to an all-time high of R17.5 trillion in September, in line with an increase of 3.6% in the number of shares in issue on the JSE, before subsiding to R15.8 trillion in February 2020. Non-residents’ net sales of JSE-listed shares of R40.5 billion in the final quarter of 2019 resulted in the first year of persistent quarterly net sales since 2016. For 2019 as a whole, non-residents’ cumulative net sales of domestic listed shares of R114 billion was more than double the R53.0 billion recorded in 2018. This was followed by further net sales of R11.2 billion in the first two months of 2020, as non-resident investor sentiment was weighed down by concerns over global economic growth prospects, especially after the COVID-19 outbreak and continued electricity load-shedding. Non-residents’ participation in the secondary share market declined from 21.8% in January 2019 to 16.6% in February 2020. Non-resident participation in the domestic share market R billions Per cent 25 40 30 20 20 10 15 0 -10 10 -20 5 -30 2014 2015 2016 2017 2018 2019 2020 Sources: JSE and SARB Share prices of JSE-listed companies increased in the fourth quarter of 2019 in line with international bourses, supported by the alleviation in trade tensions between the US and China and a more accommodative monetary policy stance by many central banks. The Alsi gained 4.1% in the fourth quarter of 2019 and 8.2% in the year as a whole, following a decline of 11.4% in 2018. However, negative sentiment as from mid-January 2020, mainly as a result of continued power outages, lower international share prices as well as uncertainty concerning the financial position of some SOCs and concerns about the possible impact of COVID-19, saw the Alsi declining significantly by 25.1% from a recent high of 59 002 index points on 17 January 2020 to 44 178 index points on 13 March – the lowest level since 18 December 2013. The overall historical price-earnings ratio of ordinary shares listed on the JSE receded from a recent high of 21.5 in June 2019 to 17.8 in February 2020, as total earnings increased and share prices declined. 71 MARCH 2020 Net transactions Participation rate (right-hand scale)
Share prices Index: 2 January 2014 = 100 250 200 150 100 50 2014 2015 2016 2017 2018 2019 2020 FTSE/JSE All-Share (rand) S&P500 Composite (US dollar) Euro Stoxx 50 (euro) FTSE/JSE All-Share (US dollar) Shanghai A Share (yuan) Sources: IRESS, JSE and SARB Market for exchange-traded derivatives The spot price of white and yellow maize contracts traded on the JSE declined by 13.8% and 11.1% respectively from 15 July 2019 to 2 January 2020 along with lower international maize prices. Subsequently, these spot prices increased to R2 953 per ton and R2 591 per ton respectively on 13 March following the depreciation in the exchange value of the rand. However, estimates of a larger maize area planted in the 2019/20 production season by the Department of Agriculture, Forestry and Fisheries’ Crop Estimates Committee may lower maize prices. A significant area was, however, planted during a sub-optimal period, which may hamper the ability of the crop to withstand the impact of frost if it occurs later in the season. South African grain prices Rand per ton 6 000 5 000 4 000 3 000 2 000 1 000 2014 2015 2016 2017 2018 2019 2020 Source: JSE 72 MARCH 2020 Wheat White maize Yellow maize
The spot price of domestic wheat contracts trended higher during most of 2019 supported by the depreciation in the exchange value of the rand, which more than offset lower international wheat prices. However, the spot price of wheat declined briefly by 10.8% in the fourth quarter of 2019, from a recent high of R4 847 per ton on 19 September to R4 322 per ton at the end of December, alongside the appreciation in the exchange value of the rand. Subsequently, domestic wheat prices increased again to R4 982 per ton on 13 March 2020 following a weaker exchange value of the rand and a smaller estimated harvest. The wheat import tariff was lowered from R1 008.60 per ton to R776.20 per ton in January 2020, and again to R516.60 per ton in March. Turnover in equity and currency derivatives increased marginally from 2018 to 2019, while that in interest rate derivatives decreased. By contrast, turnover in commodity derivatives increased notably in 2019. Turnover in commodity derivatives reached a high of R97.6 billion in November 2019 and contributed to an annual increase of 19.3%, which reflected increased hedging activity against adverse commodity price movements. Derivatives turnover on the JSE Change over one year (Per cent) Value (R billions) Type of derivative 2019 Jan–Feb 2020 2019 Jan–Feb 2020 Equity ................................................ Warrants............................................ Commodity........................................ Interest rate ....................................... Currency............................................ 6 559 1 810 1 252 1 072 629 0.2 126 336 101 9 45 19 -5 1 8 7 -2 21 -9 Source: JSE 73 MARCH 2020 Box 4 Unpacking the drivers of residential property prices In the absence of an official residential property price index, growth in nominal residential property prices in South Africa is derived from an average1 nominal house price index that is based on the indices of private data providers.2 Double-digit rates of increase in average nominal house prices prior to the global financial crisis in 2007– 08 steadily decelerated to such an extent that prices, when measured over a year, actually decreased in the second half of 2008 and the first half of 2009. Subsequently, average house price inflation accelerated gradually to 7.4% in the year to October 2015 before moderating significantly to 3.6% in the year to January 2020. Adjusted for consumer price inflation, average house prices have almost consistently decreased on a year-on-year basis since August 2016. 1 The average nominal house price index used in this analysis is derived as an arithmetic average of the house price indices of First National Bank (FNB), Standard Bank and Lightstone, with 2010 = 100. 2 This analysis is based on data sourced from FNB, Standard Bank and Lightstone. The FNB House Price Index is based on repeat sales, which measure the rate of change in the prices of individual houses when transacted between two points in time, and the Case–Shiller methodology. See https://dl.airtable.com/.attachments/ecaae9de07c34049df39fa9a84a7bb07/95de64ec/Property-barometer-Q4.pdf The Standard Bank House Price Index tracks movements of assessed values per square metre of properties financed and is combined with a trimmed mean methodology to remove outliers in order to isolate the underlying movement in house prices. See https://ws15.standardbank.co.za/ResearchPortal/Report?YYY2162_ FISRqWkWXsgxcqoVXWBmtG6fFf0mKfnhdwqpCH+nsE7odFHmvRGjE9aA49CJjdGc/xoiITm+eZwiBgfM+HUiBA==&a=-1 The Lightstone House Price Index is based on repeat sales. See https://lightstoneproperty.co.za/adminNews/news.aspx?cId=3
10 8 6 4 8 6 2 4 74 MARCH 2020 Nominal house prices Percentage change over 12 months 40 36 32 28 24 20 16 12 8 4 0 -4 -8 -12 -16 2004 05 06 07 08 09 10 11 12 13 14 15 16 17 18 19 20 First National BankStandard Bank LightstoneNominal average Real average* *Deflated by the headline consumer price index Sources: First National Bank, Standard Bank, Lightstone and SARB The rate of change in house prices is determined by various economic factors. Growth in house prices and higher mortgage interest costs, combined with subdued growth in household disposable income, affect the affordability of residential property, while increases in consumer goods and services prices reduce households’ ability to service capital and interest payments on mortgage loans. Weak demand, as indicated by the extended time that residential properties remained on the market, has reflected subdued economic growth, high unemployment and weak consumer confidence in recent years. In addition, mortgage lending was also curtailed by the introduction of stricter lending criteria. Inflation, interest rates, disposable income and house prices Percentage change over 12 monthsPercentage change over four quarters 1616 14 1414 12 1210 12 810 6 4 2 00 -2 -2 -4 2-4 -6 0-6 2008 10 11 12 13 14 15 16 17 18 19 202008 10 11 12 13 14 15 16 17 18 19 Average nominal house pricesAverage nominal house prices Headline consumer price inflationNominal household disposable income Home mortgage interest rate (right-hand scale) Sources: Stats SA and SARB Rental practices and the dynamics between buying and renting a property also affect residential property prices. Rental inflation comprises both actual and owners’ equivalent rent,3 as measured by Statistics South 3 Houses are either occupied by the owner or rented to a tenant. Actual rentals are the amounts paid by tenants to the owner for the provision of accommodation and has a weight of 3.52% in the CPI basket, whereas imputed owners’ equivalent rent measures the value of the services of the use of an owner-occupied dwelling in terms of the corresponding market rental value for the same type of dwelling and has a weight of 13.32% in the CPI basket. See http://www.statssa.gov.za/cpi/documents/The_South_African_CPI_sources_and_methods_May2017.pdf
6 2008 10 11 12 13 14 15 16 17 18 19 2017 2018 2019 4 12 100 75 MARCH 2020 Africa. An increase in the flat vacancy rate4 from an average of 4.3% in the first quarter of 2017 to 5.5% in the fourth quarter of 2019, as measured by Rode and Associates, also contributed to muted flat rental inflation, along with subdued flat rental demand and an oversupply of rental stock. Rental inflation, vacancy rate and house prices Percentage change over four quartersPercentage change over four quarters 207 15 10 5 5 4 0 -5 3 Actual rental inflationFlat rental inflation Owners’ equivalent rental inflationFlat vacancy rate (smoothed)* Average nominal house prices * As smoothed by Rode and Associates Sources: Stats SA, Rode and Associates, and SARB The supply of houses is influenced by building costs,5 which are driven by factors such as the cost of labour, building materials and financing. Building costs also influence house prices. The fairly rapid pace of increase in the real value of residential buildings completed since 2014 was reflected in the slowdown in the rate of increase in average nominal house prices. Building costs, residential buildings completed and house prices Percentage change over four quartersR billions 8 24 160 6 18 140 2 6 120 0 0 -2 -6 -4 -12 -6 -18 80 2008 10 11 12 13 14 15 16 17 18 19 2008 10 11 12 13 14 15 16 17 18 19 Average nominal house pricesReal value of residential buildings completed BER Building Cost Index (right-hand scale) Sources: BER, Stats SA and SARB Residential property price developments represent the culmination of various factors, with some gaining more prominence than others at certain stages in the business cycle. However, not all factors can be linked to the stance of the business cycle, as some are more exogenous in nature. As such, the residential property market was also impacted by demographic factors, crime, migration and population growth. 4 Flat vacancy rates represent the percentage of flats that are unoccupied during a specific period. 5 Building costs are proxied by the BER Building Cost Index, which is a measure of the percentage change in average building costs in South Africa. It is based on an analysis of tariffs (rates) in accepted tenders by building contractors. See https://www.ber.ac.za/Research/Indices/Building-Costs/
22 These consist of unit trusts, the Public Investment Corporation, long-and short-term insurance companies, public and private pension funds, participation bond schemes, finance companies and non-monetary public financial corporations. Non-bank financial intermediaries22 The consolidated assets of non-bank financial institutions increased by 0.8% to R10.0 trillion in the final quarter of 2019, alongside higher asset prices. Increases of 0.9% and 1.4% in the assets of unit trusts and insurance companies respectively contributed the most to growth in the non-bank financial institutions’ balance sheet. On a year-on-year basis, the value of non-bank financial institutional assets increased by 7.1% in the fourth quarter of 2019. Total assets of non-bank financial institutions Percentage of total assets R billions 12 000 60 10 000 50 8 000 40 30 6 000 4 000 20 2 000 10 0 0 2014 2015 2016 2017 2018 2019 Shares Cash and deposits Total assets (right-hand scale) Interest-bearing securities Other assets Source: SARB The share portfolio of these institutions was supported by an increase of 4.1% in share prices in the fourth quarter of 2019. The contribution of shares to total assets increased by 0.4 percentage points from the third quarter of 2019 to 54.7% in the fourth quarter, despite weak real economic activity. Holdings of interest-bearing securities declined by 0.3 percentage points from the third quarter of 2019 to 31.1% of total assets in the fourth quarter. However, the portion of assets held in interest-bearing securities increased by 0.5 percentage points in 2019. The continued decline in bond yields might weigh negatively on the investment income of these institutions. The holdings of cash and deposits as a percentage of total assets declined slightly by 0.1 percentage points from the third quarter of 2019 to 5.9% in the fourth quarter. Money market unit trusts recorded a net outflow of R16.7 billion over the same period. Money market funds attracted net inflows of R12.6 billion in 2019 compared with R11.3 billion in 2018. The holdings of cash and deposits by the Public Investment Corporation and unit trusts declined the most in the fourth quarter of 2019, by 14.8% and 3.0% respectively. The balance sheet of finance companies declined by 0.1% from the third quarter of 2019 to R321 billion in the fourth quarter. Loans extended by finance companies, however, increased by 0.2 percentage points to 83.6% of total assets in the final quarter of 2019. 76 MARCH 2020
Flow of funds Net financial inflows from non-residents into the domestic economy increased in the third quarter of 2019. The net acquisition of domestic financial assets increased markedly from R20.4 billion in the second quarter of 2019 to R49.7 billion in the third quarter. A favourable yield differential supported net purchases of domestic long-term government bonds of R72.8 billion in the third quarter of 2019, whereas net sales of shares amounted to R29.3 billion. Cumulative net sales of shares by non-residents during the first three quarters of 2019 mainly resulted from investors’ concerns regarding the outlook for global economic growth. Foreign investors increased their deposits with domestic banks by R39.3 billion and extended long-term loans of R21.0 billion in the third quarter of 2019. Funds sourced by financial intermediaries23 increased in the third quarter of 2019, despite the contraction in real domestic economic activity. Deposits with monetary institutions increased by R156 billion, with the main deposit holders being non-residents, households and non-financial private corporate business enterprises. Financial intermediaries’ net acquisition of financial assets reflected net purchases of fixed-interest securities of R172 billion in the third quarter of 2019, which more than offset net sales of shares of R50.1 billion. Over the same period, total credit extended, in particular trade credit and other short-term loans, declined by R7.8 billion. 23 Excluding the Public Investment Corporation. The financing needs of general government increased from R55.3 billion in the second quarter of 2019 to R90.4 billion in the third quarter, partly reflecting the further capitalisation of Eskom. Despite increases in certain taxes in 2019, the fiscal position worsened due to lower revenue collections within a subdued economic growth environment, while expenditure continued to increase. General government sourced funds through the net issuances of long-term government bonds to the value of R153 billion from both the domestic and international financial markets, together with R18.9 billion through TBs. The foreign sector’s cumulative net purchases of long-term government bonds since 2009 increased from R674 billion in the second quarter of 2019 to R746 billion in the third quarter. In addition, general government repaid loans of R20.6 billion and increased their deposit holdings by R15.7 billion over the same period. The rising debt-service cost of general government continued to crowd out capital spending. Cumulative* net acquisition of long-term government bonds by sector R billions 800 600 400 200 0 2014 2015 2016 2017 2018 2019 Foreign sector Banks Insurers and retirement funds Public Investment Corporation * Cumulative from 2009 Source: SARB 77 MARCH 2020
Fixed investment by public and private non-financial corporate business enterprises increased further from R175 billion in the second quarter of 2019 to R178 billion in the third quarter. The increase in fixed investment by private non-financial corporate business enterprises mostly reflected construction activities associated with renewable energy projects. The contribution of private non-financial corporate business enterprises to corporate gross capital formation was 79.2% in the third quarter of 2019. Public and private non-financial corporate business enterprises increased their cash and deposit holdings by R33.1 billion in the third quarter of 2019 compared with R22.2 billion in the second quarter. During the same period, corporate business enterprises acquired credit of only R9.3 billion, which was much lower than the R46.4 billion acquired in the second quarter. Capital outlays by corporate business enterprises R billions 200 150 100 50 0 2014 2015 2016 2017 2018 2019 Source: SARB The gross saving by the household sector decreased to R32.2 billion in the third quarter of 2019, which was consistent with a marginal increase in nominal disposable income. Some of these funds were allocated to deposits of R30.0 billion, whereas interest in retirement and life funds amounted to R36.6 billion. The marginal decrease in the repo rate in the third quarter of 2019 assisted household saving somewhat. Households’ demand for credit increased to R47.3 billion in the third quarter of 2019 compared with R21.1 billion in the second quarter. 78 MARCH 2020 Private sector Public sector
Public finance24 Non-financial public sector borrowing requirement25 The preliminary non-financial public sector borrowing requirement of R44.4 billion in the third quarter of fiscal 2019/20 (October–December 2019) contributed to an overall cumulative cash deficit of R185 billion in the first nine months of fiscal 2019/20 (April–December 2019). This was R70.8 billion more than in April–December 2018. The larger borrowing requirement resulted primarily from the wider deficit of consolidated general government on account of national government. Over this nine-month period, the larger deficit of consolidated general government was somewhat offset by a combined cash surplus of R84.3 billion in all other tiers of consolidated general government. By contrast, the deficit of the non-financial public enterprises and corporations, better known as state-owned companies (SOCs), decreased in the first nine months of fiscal 2019/20. As a ratio of GDP, the non-financial public sector borrowing requirement increased from 3.1% in April–December 2018 to 4.8% in April–December 2019. 24 Unless stated to the contrary, the year-on-year rates of increase in this section compare April–December 2019 to April–December 2018. Data for both periods are unaudited and preliminary. 25 The non-financial public sector borrowing requirement is calculated as the cash deficit/surplus of the consolidated general government as well as non-financial public enterprises and corporations. Non-financial public sector borrowing requirement R billions Level of government Apr–Dec 2018* Apr–Dec 2019* Consolidated general government ......................................................... National government.......................................................................... Extra-budgetary institutions ............................................................... Social security funds.......................................................................... Provincial governments...................................................................... Local governments ............................................................................ Non-financial public enterprises and corporations ................................. Total** ................................................................................................... As a percentage of gross domestic product ...................................... 82.6 145.0 -14.8 -12.5 -5.2 -29.9 32.0 114.7 3.1 160.2 244.5 -30.2 -20.5 -11.5 -22.1 25.3 185.5 4.8 * Deficit + surplus – ** Components may not add up to totals due to rounding off. Sources: National Treasury, Stats SA and SARB Non-financial public sector borrowing requirement R billions Per cent 10 100 80 8 60 6 40 4 20 2 0 0 -20 -2 -40 -4 2014/15 Fiscal years 2015/16 2016/17 2017/18 2018/19 2019/20* * April–December 2019 Sources: National Treasury, Stats SA and SARB 79 MARCH 2020 Non-financial public enterprises and corporations Consolidated general government Deficit Percentage of GDP (right-hand scale) Surplus
The preliminary cash deficit of non-financial SOCs narrowed by R6.7 billion to R25.3 billion in April–December 2019 compared with the same period a year earlier. The smaller cash deficit could be attributed to moderately higher growth in cash receipts from operating activities and slower growth in total expenditure,26 with capital investment programmes remaining constrained. The non-financial SOCs’ cash receipts from operating activities increased at a year-on-year rate of 8.0% to R368 billion in April–December 2019. 26Total expenditure includes cash payments for operating activities and net investment in non-financial assets. Financial activities of non-financial public enterprises and corporations R billions 160 140 120 100 eceipts 80 60 40 20 0 2016/17 2017/18 2018/19 2019/20* 2014/15 Fiscal years 2015/16 * April–December 2019 ** Including both operating cash payments and net investment in non-financial assets Source: SARB Total expenditure by non-financial SOCs increased by 5.5% from R373 billion in the first nine months of fiscal 2018/19 to R394 billion in the same period of fiscal 2019/20. The higher expenditure resulted primarily from a pronounced year-on-year increase of 9.3% to R338 billion in cash payments for operating activities, indicative of increased employment costs and rapidly growing debt-service costs. Net investment in non-financial assets declined to R55.3 billion in April–December 2019, some R8.1 billion less than a year earlier, indicating the winding down of construction activity and, more importantly, a further deterioration in the financial condition of several non-financial SOCs. 80 MARCH 2020 Box 5 The 2020 Budget Review South Africa’s public finances continued to deteriorate in fiscal 2019/20, following the impact of weak economic growth on revenue collection together with the financial obligations associated with non-financial state-owned companies (SOCs). The 2020 Budget focused on faster and sustainable economic growth to increase revenue in order to reduce pressure on public finances by narrowing the budget deficit and containing debt. Alleviating the constraint of electricity-supply shortages on the economy was prioritised, along with other structural reforms. In the interest of fiscal consolidation and sustainability, a reduction in government expenditure was proposed, partly through a decrease in the public service wage bill as well as the reform of SOCs. On the revenue side, taxes were not increased as in recent years, due to the weak economic environment and expected low future growth. Projected real economic growth for 2020 was revised lower to 0.9% from the 1.7% initially expected in the 2019 Budget. Thereafter, it is expected that real gross domestic product (GDP) will accelerate gradually to 1.3% in 2021 and 1.6% in 2022 – lower than the increases of 1.6% and 1.7% respectively that were estimated in the 2019 Medium-Term Budget Policy Statement (2019 MTBPS). Consumer price inflation is expected to accelerate to 4.5% in 2020, mainly due to higher meat and electricity prices, and to then average 4.6% over the medium term, which renders an improved inflation outlook when compared with the average of 4.8% estimated in the 2019 MTBPS. Total expenditure** Total operating r Net investment in n on-financial assets
81 MARCH 2020 Macroeconomic projections* Percentage Real GDP growth ................... Consumer price inflation ......... Current account balance*** .... 20172018 2019 202020212022 Outcome 201920192020 Budget MTBPS Budget Medium-term estimates** 1.40.8 5.34.7 -2.5 -3.5 1.50.50.3 5.24.34.1 -3.4 -3.4 -3.4 0.91.31.6 4.54.64.6 -3.4 -3.5 -3.7 * Calendar years ** 2020 Budget Review *** As a percentage of GDP Source: National Treasury The revenue outlook continued to deteriorate along with weaker-than-expected economic growth. The projected revenue for fiscal 2019/20 was revised lower by R63.3 billion relative to the 2019 Budget. This shortfall is also significantly higher than the expected shortfall of R52.5 billion in the 2019 MTBPS. Weak employment creation, moderate wage growth and sluggish economic activity continued to weigh on both personal and corporate income tax collections. The expected decrease in tax buoyancy1 to 0.93 primarily reflects anticipated lower personal income tax receipts in the wake of the proposed reduction in the public service wage bill. No major tax changes were proposed in the 2020 Budget. The main tax proposals were related to personal income tax relief through above-inflation adjustments of all tax brackets, an increase in the fuel and Road Accident Fund (RAF) levies as well as changes to excise duties on alcohol and tobacco products, and environmental taxes, as summarised below: - Fuel levy: an increase of 25 cents per litre, of which 16 cents per litre is to be allocated for the general fuel levy and 9 cents per litre for the RAF levy. - Excise duties: an increase of between 4.4% and 7.5% on alcohol and tobacco products respectively, effective from 26 February 2020. - Plastic bag levy: an increase from 12 cents to 25 cents per bag. - Carbon tax: an increase in the tax rate of 5.6% to R127 per tonne of carbon dioxide emissions equivalent. Consolidated fiscal framework indicators* * Fiscal years. This is the consolidated budget framework of national and provincial government as well as social security funds and selected public entities. Budget data are therefore not strictly comparable with the data published in the SARB’s Quarterly Bulletin. ** 2020 Budget Review *** Refers to national government or main budget Source: National Treasury 1 Tax buoyancy is calculated as the ratio of tax revenue growth to nominal GDP growth and is a measure of the performance of revenue collections. R billions 2017/18 2018/19 2019/20 2020/21 2021/22 2022/23 Outcome 201920192020 Budget MTBPS Budget Medium-term estimates** Consolidated revenue..............1 3511 445 Percentage of GDP ...............28.829.4 Consolidated expenditure ........1 5421 643 Percentage of GDP ...............32.833.4 Consolidated budget deficit.....-190.5 -197.4 Percentage of GDP ...............-4.1 -4.0 Gross loan debt***...................2 4902 788 Percentage of GDP ...............53.056.7 Net loan debt*** ......................2 2602 545 Percentage of GDP ...............48.151.7 1 5841 5381 517 29.329.529.4 1 8271 8441 844 33.735.435.7 -242.7 -306.2 -327 -4.5 -5.9 -6.3 3 0433 1683 176 56.260.861.6 2 8292 9242 938 52.356.157.0 1 5841 6831 791 29.229.229.2 1 9542 0402 141 36.035.434.9 -371 -358 -350 -6.8 -6.2 -5.7 3 5623 9784 384 65.669.171.6 3 3403 7524 153 61.565.167.8
8 400 82 MARCH 2020 Consolidated government expenditure reached a historic high of 35.7% of GDP in fiscal 2019/20. The main budget expenditure baseline was consequently lowered by R156 billion, through both reductions and reallocations, over the next three years relative to the 2019 Budget projections in pursuit of fiscal sustainability. The 2020 Budget proposed total consolidated expenditure of R1 954 billion for fiscal 2020/21, with most of this amount directed towards socio-economic programmes focused on learning and culture (R396 billion), health (R230 billion) and social development (R310 billion). Consolidated expenditure for fiscal 2020/21 is projected to be R24.3 billion less than in the 2019 MTBPS. The moderation in the expected growth per annum in non-interest expenditure to 3.8% over the medium term, from 8.4% over the past three years, reflects government’s commitment to fiscal sustainability. From a baseline expenditure reduction of R261 billion, the public sector wage bill accounted for R160 billion. This was partially offset by reallocations and additional financial support of R111 billion to SOCs, of which R60.1 billion is earmarked for Eskom and South African Airways (SAA) over the next three years. Over the medium term, R55.6 million will be reprioritised to the Department of Health to strengthen its capacity to phase in the National Health Insurance (NHI) scheme. Debt-service cost was revised higher by R2.8 billion in fiscal 2019/20, R5.2 billion in fiscal 2020/21 and R11.1 billion in fiscal 2021/22 compared with the 2019 Budget estimates. The higher projected debt-service cost is related to expected larger budget deficits and the effect of developments in interest rates, inflation and exchange rates. Consolidated government budget deficit Percentage of GDPR billions 7 350 6 300 5 250 4 200 3 150 2 100 1 50 0 0 2012/13 13/14 14/15 15/16 16/17 17/18 18/19 19/20 20/21 21/22 22/23 Fiscal years Actual budget deficitBudget deficit (right-hand scale) 2019 Budget Review 2019 MTBPS 2020 Budget Review Source: National Treasury The consolidated budget deficit, which results when expenditure exceeds revenue, is expected to widen from 6.3% of GDP in fiscal 2019/20 to 6.8% in fiscal 2020/21, before narrowing to 5.7% in fiscal 2022/23. The larger fiscal deficit is estimated to contribute to an increase in the borrowing requirement, from R245 billion (5.0% of GDP) in fiscal 2018/19 to R433 billion (8.0% of GDP) in fiscal 2020/21, and to average 7.9% of GDP over the medium term. The borrowing requirement will be financed through short-and long-term borrowing, mostly in the domestic market. The gross loan debt of national government is estimated to increase from R3.2 trillion (61.6% of GDP) in fiscal 2019/20 to R4.4 trillion (71.6% of GDP) in fiscal 2022/23, which is a notable upward revision compared with the estimate of 56.2% of GDP for fiscal 2019/20 in the 2019 Budget. Government’s total contingent liabilities (including guarantees to SOCs, independent power producers (IPPs) and public-private partnerships) were projected to increase from R980 billion in fiscal 2019/20 to R1.2 trillion by fiscal 2022/23. The RAF is the second largest contingent liability after Eskom, whereas government’s exposure to IPPs is comparatively low and is expected to reach R142 billion in 2022/23. ActualForecast
5 000 80 70 Budget comparable analysis of national government finance National government expenditure continued to increase at a much faster pace than revenue, resulting in a year-on-year increase of R86.6 billion in the cash book deficit to R250 billion in the first nine months of fiscal 2019/20 (April–December 2019). The cash book deficit was largely financed in the domestic financial markets through the issuance of government bonds, which contributed to a further increase in gross loan debt to R3 156 billion as at 31 December 2019. National government finances Originally budgeted1 Fiscal 2019/20 Actual April–December 2018 Actual April–December 2019 Percentage change2 Percentage change2 Percentage change2 R billions R billions R billions Revenue ................................ Percentage of GDP ............... 923 24.8 1 086 29.2 -163 -4.4 -47.9 -1.3 2 764 56.7 8.2 967 25.0 1 217 31.4 -250 -6.5 -122 -3.2 3 156 62.2 4.8 1 403 25.9 1 659 30.6 -255 -4.7 -53.0 -1.0 3 043 56.2 10.3 Expenditure ........................... Percentage of GDP ............... 4.6 12.0 10.2 Cash book balance3 .............. Percentage of GDP ............... Primary balance3 ................... Percentage of GDP ............... Gross loan debt4................... Percentage of GDP .............. 12.0 14.2 9.1 1 2 3 4 2019 Budget Review Year-on-year percentage change Cash book deficit (-)/surplus (+) excluding interest payments As at 31 December for rand values Sources: National Treasury, Stats SA and SARS 83 MARCH 2020 National government gross loan debt Percentage of GDPR billions 4 500 4 000 60 3 500 503 000 402 500 302 000 1 500 20 1 000 10500 00 2012/13 13/14 14/15 15/16 16/17 17/18 18/19 19/20 20/21 21/22 22/23 As at 31 March of each fiscal year Actual gross loan debtGross loan debt (right-hand scale) 2019 Budget Review 2019 MTBPS 2020 Budget Review Source: National Treasury Major risks to the fiscal outlook include uncertainty regarding the outlook for economic growth, contingent liabilities, the financial position of SOCs and public sector wage negotiations which, together with high debt levels, could put the sovereign credit rating at risk. ActualForecast
National government revenue increased in real terms as the year-on-year increase of 4.8% to R967 billion in April–December 2019 still exceeded average annual headline consumer price inflation. Revenue was R37.7 billion less than original monthly budgeted estimates due to, among other factors, weaker-than-expected domestic economic activity and higher tax refunds. This was also reflected by the earlier downward revision of revenue growth to 3.1%, or R1 359 billion, for fiscal 2019/20 as a whole in the 2019 Medium Term Budget Policy Statement (2019 MTBPS). Revenue, at 25.0% of GDP in the first nine months of fiscal 2019/20, was higher than the 24.8% recorded in the same period of the previous fiscal year. In the first 10 months of fiscal 2019/20, total revenue collected increased at a year-on-year rate of 5.6% to R1 058 billion. National government revenue in fiscal 2019/201 Originally budgeted Fiscal 2019/20 Actual April–December 2019 Revenue source Percentage change2 Percentage change2 R billions R billions Taxes on income, profits and capital gains ......... Of which: Income tax on individuals.................. Income tax on companies................. Payroll taxes ....................................................... Taxes on property............................................... Taxes on goods and services ............................. Of which: Value-added tax (VAT) net ................ Domestic ................................... Import ........................................ Refunds ...................................... General fuel levy................................ Excise duties..................................... Taxes on international trade and transactions ..... Of which: Import duties .................................... Other revenue³ ................................................... Less: SACU4 payments ...................................... Total revenue ................................................... 820.3 552.9 229.6 18.8 17.2 504.4 360.5 406.2 187.4 -233.2 83.0 48.8 61.3 60.0 31.8 50.3 1 403.5 11.0 12.0 7.1 7.6 12.5 9.6 11.0 7.2 7.0 1.7 10.1 -12.2 10.0 9.1 -3.8 4.1 10.3 560.9 375.5 163.3 13.5 12.4 351.6 246.7 296.6 130.7 -180.6 59.0 36.9 40.9 40.1 25.5 37.7 967.0 5.6 7.8 2.0 4.9 8.4 3.3 1.9 5.0 5.3 9.8 5.3 11.7 2.3 1.8 8.4 4.1 4.8 1 2 3 4 Components may not add up to totals due to rounding off and the exclusion of unclassified items. Year-on-year percentage change Including non-tax revenue and extraordinary receipts Southern African Customs Union Sources: National Treasury and SARS Revenue from taxes on income, profits and capital gains, which contributed 58.0% of the total revenue collected, increased by 5.6% in April–December 2019. Personal income tax collections – the major component of this tax category – increased by 7.8% over this period. However, corporate income tax increased by only 2.0% amid weak economic activity and despite a moderate improvement in provisional tax payments during the period under review. Revenue from taxes on goods and services, which contributed 36.4% of the total revenue collected, increased by only 3.3% year on year in April–December 2019. This increase resulted primarily from higher net value-added tax (VAT) collections, although it increased by only 1.9%, and the increase of 11.7% in receipts of excise duties. The moderate increase in VAT collections reflected subdued growth in consumer spending, alongside higher VAT refunds of R181 billion. Taxes on international trade and transactions increased by only 2.3% year on year to R40.9 billion in April–December 2019. This reflected sluggish growth in import duties, which mirrored weak domestic demand for imported goods. 84 MARCH 2020
Composition of national government tax revenue Per cent 4.6 4.2 4.1 Other revenue (which includes non-tax revenue and extraordinary receipts) increased by 8.4% year on year to R25.5 billion. The February 2019 Budget earmarked R50.3 billion for transfers to the Southern African Customs Union (SACU) for fiscal 2019/20. Of this amount, R37.7 billion was transferred in three equal instalments during April, July and October 2019. National government expenditure increased notably by 12.0% year on year to R1 217 billion in April–December 2019. This mainly reflected increased voted amounts driven by transfers and subsidies, alongside payments for financial assets, which included additional allocations to some SOCs. Nonetheless, total expenditure was R6.2 billion less than the original cumulative monthly budgeted estimates for April–December 2019. As a ratio of GDP, actual expenditure of 31.4% in the first nine months of fiscal 2019/20 was slightly higher than the 29.2% recorded in the same period of the previous fiscal year. National government expenditure in fiscal 2019/20* Originally budgeted Fiscal 2019/20 Actual April–December 2019 Expenditure item Percentage change** Percentage change** R billions R billions Voted expenditure .............................................. Of which: Transfers and subsidies ................... Current payments ........................... Payments for capital assets ............ Payments for financial assets.......... Statutory amounts*** ......................................... Of which: Provincial equitable shares .............. Interest on debt .............................. General fuel levy ............................. Total expenditure ............................................... 882.6 615.7 246.8 15.4 4.7 776.1 505.6 202.1 13.2 1 658.7 7.7 8.8 9.4 13.1 … 13.2 7.5 11.2 5.6 10.2 684.7 463.4 173.8 6.9 40.5 532.1 379.2 127.4 8.8 1 216.8 15.2 10.9 6.2 -19.6 … 8.2 7.5 10.6 5.6 12.0 * Components may not add up to totals due to rounding off and the exclusion of unclassified items. ** Year-on-year percentage change *** Including extraordinary payments Source: National Treasury 85 MARCH 2020 April–December 2018April–December 2019 4.8 3.53.8 6.06.0 37.238.3 25.9 25.2 17.116.7 1.21.3 Personal income taxCorporate income taxTaxes on property Value-added tax (net)General fuel levyExcise duties Import dutiesOther tax revenue (including payroll taxes) Source: SARS
Total voted expenditure by national government departments of R685 billion (56.3% of total expenditure) – comprising transfers and subsidies, current payments, and payments for capital and financial assets – increased significantly by 15.2% year on year. Transfers and subsidies as well as current payments together accounted for 93.1% of the total voted expenditure in April– December 2019. Higher payments for financial assets of R40.5 billion during the period under review included the R26.5 billion recapitalisation of Eskom in April and December 2019, as well as the R9.7 billion allocated to South African Airways (SAA), Denel, South African Express Airways and the South African Broadcasting Corporation (SABC) in terms of section 6(1)(b) of the Appropriation Act 24 of 2019. Interest paid on national government debt (debt-service costs) of R127 billion in April–December 2019 was 10.6% more than a year earlier, along with the increase in the stock of outstanding debt. The 2019 MTBPS revised interest on national government debt upwards by R1.6 billion to R204 billion for fiscal 2019/20 from the original projections in the February 2019 Budget. Total equitable share transfers to provinces, which is the main source of provincial government revenue, increased by 7.5% year on year to R379 billion in April–December 2019. In addition, the February 2019 Budget allocated R13.2 billion to metropolitan municipalities as their share of the general fuel levy in fiscal 2019/20. Of this amount, a total of R8.8 billion was transferred to metropolitan municipalities in two equal instalments in August and December 2019. The 2019 MTBPS revised national government expenditure upwards from R1 659 billion originally envisaged in the February 2019 Budget to R1 683 billion for fiscal 2019/20. Total actual expenditure for the first 10 months of fiscal 2019/20 of R1 356 billion represented a year-on-year increase of 10.6%. Cumulative deficit of national government R billions 350 300 250 Actual 2019/20 200 150 Actual 2018/19 100 50 0 A M J J A S O N D J F M Fiscal years Originally budgeted deficit of R255 billion for fiscal 2019/20, in the 2019 Budget Review Revised budget deficit of R324 billion for fiscal 2019/20, in the 2019 MTBPS Sources: National Treasury, SARS and SARB National government revenue and expenditure for the period April–December 2019 resulted in a cumulative cash book deficit of R250 billion, which was R86.6 billion more compared with April–December 2018. In addition, the cash book deficit also exceeded the original cumulative monthly budgeted estimates by R31.6 billion to December 2019. Consistent with higher spending pressures and anticipated revenue shortfalls, the 2019 MTBPS revised the cash book deficit significantly upwards from R255 billion originally projected in the February 2019 Budget to R324 billion for fiscal 2019/20. Fiscal developments in the first 10 months of fiscal 2019/20 resulted in a larger cash book deficit of R297 billion compared with R223 billion over the same period a year earlier. 86 MARCH 2020
The primary deficit27 of national government more than doubled to R122 billion in April– December 2019 from R47.9 billion in the same period a year earlier. As a ratio of GDP, the primary deficit increased notably from 1.3% in the first nine months of fiscal 2018/19 to 3.2% in the corresponding period of fiscal 2019/20. The February 2019 Budget projected a primary deficit of R53.0 billion (1.0% of GDP) for fiscal 2019/20, which was subsequently revised significantly higher to R121 billion (2.3% of GDP) in the 2019 MTBPS. 27 The primary deficit is the cash book deficit excluding interest payments. National government financing R billions Originally budgeted1 Fiscal 2019/20 Actual Apr–Dec 2018 Actual Apr–Dec 2019 Item or instrument Cash book deficit .................................................................. 163.1 196.1 249.7 287.3 255.2 ... Cash flow deficit2 .................................................................. Plus: Cost/profit on revaluation of foreign debt at redemption3 ....................................................... Accrual adjustments ...................................................... Net borrowing requirement ................................................... Treasury bills and short-term loans4 ........................................ Domestic bonds4 .................................................................... Foreign bonds and loans4 ....................................................... Change in available cash balances5 ........................................ 0.8 62.1 134.8 46.2 94.0 24.0 -29.4 11.6 49.1 249.9 61.2 199.1 61.1 -71.6 22.5 … 277.8 25.0 185.4 1.6 65.8 Total net financing6 ................................................................ 134.8 249.9 277.8 1 2 3 4 5 6 2019 Budget Review The cash flow deficit includes extraordinary receipts and payments, and differs from the cash book deficit. Cost + profit – Net issuance + net redemption – Increase – decrease + Components may not add up to totals due to rounding off. ... Not available Sources: National Treasury and SARB National government’s cash flow deficit increased significantly by R91.2 billion to R287 billion in April–December 2019. After accounting for the cost of revaluation of foreign debt at maturity and accrual adjustments, the net borrowing requirement28 soared from R135 billion in April– December 2018 to R250 billion in April–December 2019. 28 The net borrowing requirement is calculated as the cash flow deficit after accounting for the revaluation of foreign debt at redemption and accrual adjustments. Government’s larger net borrowing requirement was mainly financed in the domestic financial markets through the net issuance of bonds. Financing through the net issuance of TBs and short-term loans from the CPD also increased notably, while the net issuance of foreign bonds and loans more than doubled to R61.1 billion in April– December 2019. These funding activities increased the overall available cash balances by R71.6 billion in the period under review. The larger borrowing requirement increased national government’s gross loan debt to R3 156 billion as at the end of December 2019. This largely reflected a notable increase in domestic debt which, at 89.7%, accounted for the largest share of total gross loan debt. Foreign currency-denominated debt accounted for the difference and remained below government’s strategic risk portfolio threshold of 15% of total debt. It is projected to remain within this limit over the medium term. The 2019 MTBPS revised the debt-to-GDP ratio from 56.2% that was originally projected in the 2019 Budget Review to 61.5% for fiscal 2019/20 as a whole. Total gross loan debt of 62.2% of GDP as at 31 December 2019 was notably higher than the 56.7% recorded as at 31 December 2018. 87 MARCH 2020
Gross loan debt of national government R billions Percentage of GDP 70 4 000 3 500 60 3 000 50 2 500 40 2 000 30 1 500 20 1 000 10 500 0 0 2014/15 2015/16 2016/17 2017/18 2018/19 2019/20 As at 31 March of each fiscal year Originally budgeted Revised MTBPS estimates Actual Actual: debt-to-GDP ratio (right-hand scale) Originally estimated: 2019 Budget Review Revised estimates: 2019 MTBPS * As at 31 December 2019 Sources: National Treasury, SARB and Stats SA The domestic debt (marketable and non-marketable) of national government increased by as much as 14.3% to R2 829 billion in the year to the end of 2019. This marked increase reflected the higher net issuance of domestic marketable debt, which comprises marketable bonds and TBs, and amounted to R2 789 billion as at 31 December 2019. Marketable bonds and TBs accounted for 87.2% and 12.8% respectively. By contrast, non-marketable debt, which comprises short-term loans from the CPD and other debt as well as retail bonds, decreased by 27.0% to R40.1 billion over the same period. The significant decline in non-marketable debt mainly reflected large repayments of short-term loans from the CPD. The average outstanding maturity of domestic marketable bonds decreased from 188 months as at 31 December 2018 to 177 months a year later. Domestic debt of national government R billions 3 500 3 000 Actual: marketable debt 2 500 2 000 1 500 1 000 500 0 2014/15 2015/16 2016/17 2017/18 2018/19 2019/20 As at 31 March of each fiscal year * As at 31 December 2019 Source: National Treasury 88 MARCH 2020 Originally budgeted Actual: non-marketable debt* *
Foreign currency-denominated debt (marketable and non-marketable) of national government increased by 12.8% year on year to R326 billion as at 31 December 2019. This reflected higher marketable foreign currency-denominated debt, as non-marketable debt decreased due to redemptions. Gross marketable foreign currency-denominated debt of R326 billion (99.8% of total foreign debt) as at 31 December 2019 was 13.4% more than a year earlier. The increase resulted from both the issuance of bonds to the value of US$5 billion in September 2019 and exchange rate revaluation effects, as the exchange value of the rand continued to depreciate against other major currencies. However, government is expected to redeem bonds to the value of US$1.6 billion before the end of the current fiscal year (in March 2020). Total non-marketable debt decreased from R2.0 billion as at 31 December 2018 to R649 million as at 31 December 2019, with a significant portion scheduled to be redeemed in April 2020. Foreign currency-denominated debt of national government R billions 360 300 240 180 120 60 0 360 300 240 180 120 60 0 US dollar Foreign debt before revaluation Foreign debt 2014/15 2015/16 2016/17 2017/18 2018/19 2019/20* As at 31 March of each fiscal year * As at 31 December 2019 Sources: National Treasury and SARB As at 31 December 2019, the revaluation effect of R46.0 billion on foreign currency-denominated debt of national government increased the outstanding value of this debt to R326 billion. As much as 95.1% of this debt was denominated in US dollars, with the remainder in euro, the Japanese yen, the British pound and the Swedish krona. The average outstanding maturity of foreign marketable bonds increased from 131 months as at 31 December 2018 to 159 months a year later, owing to the issuance of two US dollar-denominated bonds to the value of US$5 billion in September 2019. 89 MARCH 2020 Euro Japanese yen Other Adjusted for revaluation Before revaluation
Notes to tables Key information: Prices – Table S–158 In the prices table (KB815) on page S–158, the consumer price index (CPI) excluding food and non-alcoholic beverages and fuel has been replaced by the South African Reserve Bank’s preferred measure of core inflation, namely the CPI excluding food and non-alcoholic beverages, fuel and electricity. 90 MARCH 2020
Abbreviations Alsi BER COICOP COVID-19 CPD CPI EMBI+ FAO Fed FNB FRA FX GDE GDP GVA IIP IMF IPP Jibar JSE MPC MTBPS NEER OPEC PGM QES RAF REER S&P Sabor SARB SARS SNA SOC Stats SA TB US VAT All-Share Price Index Bureau for Economic Research classification of individual consumption by purpose coronavirus disease 2019 Corporation for Public Deposits consumer price index Emerging Markets Bond Index Plus Food and Agriculture Organization United States Federal Reserve First National Bank forward rate agreement foreign exchange gross domestic expenditure gross domestic product gross value added international investment position International Monetary Fund independent power producer Johannesburg Interbank Average Rate JSE Limited Monetary Policy Committee Medium Term Budget Policy Statement nominal effective exchange rate Organization of the Petroleum Exporting Countries platinum group metal Quarterly Employment Statistics Road Accident Fund real effective exchange rate Standard & Poor’s South African Benchmark Overnight Rate South African Reserve Bank South African Revenue Service System of National Accounts state-owned company Statistics South Africa Treasury bill United States value-added tax 91 MARCH 2020